Methoden zur Lösung grundlegender Probleme der Datenqualität in DEA-basierten Effizienzanalysen
Upload
khangminh22Category
view
0download
0
1
Kinetic Studies of Hydroxyquinone Formation from Water Soluble Benzoquinones
Éva Józsa,a Mihály Purgel,a,b Marianna Bihari,a Péter Pál Fehér,a Gábor Sustyák,a Balázs
Várnagy,a Virág Kiss,a Eszter Ladó,a Katalin Ősza*
a Department of Physical Chemistry, University of Debrecen, H-4032 Debrecen, Egyetem tér
1., Hungary
b Research Group of Homogeneous Catalysis and Reaction Mechanism, H-4032 Debrecen,
Egyetem tér 1., Hungary
* Corresponding author. Tel: + 36 52-512-900 Ext.: 22387; E-mail:

2
Table of contents entry
The kinetics of the reactions between 1,4-benzoquinones and hydrogen peroxide were studied.
A systematic study of substituent effects revealed a Hammett-like correlation, where the rate
of reaction is mainly determined by electronic effects.

3
Abstract
The kinetics and mechanisms of the redox reactions between hydrogen peroxide and 1,4-
benzoquinone, 2-methyl-1,4-benzoquinone, 2,6-dimethyl-1,4-benzoquinone, 2-chloro-1,4-
benzoquinone and 2,6-dichloro-1,4-benzoquinone were studied in aqueous media using
spectrophotometric monitoring. The formation and decay of a hydroxylated 1,4-benzoquinone
was detected. The formation of the intermediate was first order with respect to the parent 1,4-
bezoquinone and hydrogen peroxide, whereas inverse first order dependence was revealed
with respect to hydrogen ion. The decomposition reaction had two parallel pathways: one was
first order with respect to the intermediate, while the other showed second-order dependence.
The values of the rate constant measured for the formation step were successfully correlated
with both the redox potentials of the substituted quinone/hydroquinone systems and the pKa
values of the hydroxylated quinone derivatives. Therefore, electronic effects govern the
reactivity of the quinones in this process. NMR and GC-MS measurements were carried out to
identify the products in the system. Quantum mechanical calculations were also carried out in
these systems.

4
1. Introduction
Benzoquinones play an important role in the living organisms as electron acceptors.1,2
Bioelectrochemical cells were constructed to utilize solar energy, mimicking the
photosynthetic system using a quinone as a mediator.3,4 Upon the UV irradiation of
benzoquinone derivatives in aqueous media, hydroquinone, hydroxyquinone and oxygen are
formed.5-7 In photoelectrochemical energy conversion systems, hydroxylation of quinones is
considered a side reaction because it decreases the amount of the reducible compound thus
causing the decay of such cells. The effect of substituents on the hydroxyquinone formation
and the quinone reduction is not well understood.7 The direct formation of hydroxyquinone in
the photochemical process is unlikely because the triplet excited states of benzoquinones are
strong oxidizing agents.8,9 Thus, it is more likely that this triplet quinone oxidizes another
quinone molecule to hydroxyquinone.
Triplet quinone is highly unstable in aqueous solution. To understand the reaction
mechanism to hydroxyquinone oxidation and the substituent effects in this reaction, more
stable oxidizing agents are required that do not react with water. Our choices were hydrogen
peroxide and periodate ion.
The oxidation of numerous quinones to hydroxyquinones was reported in the
literature.10 Hydroxy-para-benzoquinone, 2-hydroxy-5-methoxy-3-(8',Z, 11' Z)-pentadeca-8',
11',14',-trienyl-1,4-benzoquinone, metachromin-A, 2-hydroxyphenanthrene-1,4-quinone were
prepared through the Thiele-Winter acetoxylation.11-17 Hydroxy-benzoquinone was prepared
by the oxidation of hydroxyhydroquinone (benzene-1,2,4-triol).18,19 6-Hydroxy-1,2,3,4-
tetrahydronaphthalene-5,8-dione was obtained by the demethylation of the trimethoxy
derivatives.20 The synthesis of naturally occurring maesanin, (-)-illimaquinone, (±)-
mamanuthaquinone was carried out by the oxidative demethylation of tetramethoxybenzene
with cerium(IV) ammonium nitrate.21-23

5
The kinetics of the formation of 3,5-dichloro-2-hydroxy-1,4-benzoquinone was
studied in detail in the oxidation reaction of 2,6-dichloro-1,4-benzoquinone with hydrogen
peroxide as a function of reactant concentrations and pH. The process was found to be first
order with respect to both reagents and inverse first order with respect to hydrogen ion
concentration. This latter finding was explained by the assumption that the deprotonated form
of hydrogen peroxide, HO2−, is the actual reactive form of the oxidizing agent even though the
pH range of the studies was far from the known first pKa of H2O2. This interpretation was in
good qualitative agreement with the fact that extremely fast reaction rates were found at
higher pH, but evidence for the occurrence of numerous side reactions were also obtained in
this more basic medium.24
In this paper, our aim was to study the formation kinetics of some hydroxyquinones
containing electron donating or electron withdrawing substituents. The hydroxyquinone
derivatives were formed by oxidizing the corresponding 1,4-benzoquinones with hydrogen
peroxide or potassium periodate in aqueous solution. Hydrogen peroxide is a strong oxidizing
agent that has high oxidation potential in a wide pH range: E = 1.763 V at pH 0 and E = 0.878
V at pH 14.25 It is used extensively in chemical syntheses since its decomposition products,
namely H2O and O2 are environmentally friendly, but its reactivity is often moderate:
catalysts are regularly needed in its reactions. In addition, stock solutions of hydrogen
peroxide are not very stable and cannot be stored for extended times. Potassium periodate was
the other oxidant used here. Due to its high oxidizing power and high reactivity, it is often
used in organic oxidation reactions. In its solid form, no stability problems are encountered
and the oxidation by-product, iodide ion, does not pose a major known environmental risk.
There seems to be a literature contradiction about the dominating aqueous form of periodate
ion (IO4− or H4IO6
−),26-30 but this is seldom important from the view point of redox chemistry.
6
2. Experimental
2.1. Materials
Solid 1,4-benzoquinone (Q) and its derivatives (QR) were purchased from Alfa Aesar and
used as received. The concentrations of the stock solutions in our experiments were typically
1×10⁻³ mol dm–3. 1,4-Benzoquinones are photosensitive compounds in solution,7,8,31-37
therefore fresh solutions were prepared for all experiments in brown glass volumetric flask.
30 % (w/w) hydrogen peroxide solution (analytical grade, purissimum) was purchased
from VWR. The accurate concentrations of the solutions used for the oxidation experiments
were determined by permanganometric titrations.
Solid potassium periodate was purchased from Reanal, Hungary and used without
further purification to prepare aqueous stock solutions.
Oxidation reactions were proved to be pH sensitive. Therefore, NaH2PO4/Na2HPO4
buffer solutions at pH ~6.5 were prepared using sodium dihydrogen phosphate dihydrate
(analytical grade, normapur) and di-sodium hydrogen phosphate dodecahydrate (analytical
grade, normapur), both purchased from VWR. For further experiments at pH ~4.5,
CH3COOH/CH3COONa buffer solutions were prepared using the two buffer components
purchased from VWR.
2.2. Instruments and softwares for kinetic measurements
pH measurements of the buffered benzoquinone solutions were carried out using a Methrohm
hydrogen ion selective glass electrode binding with an ABU 93 Triburette potentiometric
titrator. The stability of the pH was also followed during some of the kinetic runs for a total of
8-hour measurement time.
A Shimadzu UV-1601 double beam spectrophotometer with UV-Probe software was
used for the kinetic study on the formation and the decomposition of hydroxyquinones. After

7
measuring the spectrum of the hydroxyquinone product, only one wavelength at the maximum
absorbance in the visible range was used to follow the reaction. In contrast with a diode array
spectrophotometer and full-scan mode, the light intensity passing through the samples in this
way is low enough not to initiate photochemical decomposition of 1,4-benzoquinones. This
was also proved experimentally. Most reactions (except for the temperature dependent kinetic
curves) were measured in 1.00-cm path length quartz cuvettes at 25.0±0.1 °C.
Temperature dependent kinetic measurements were performed after a 10-min pre-
thermostation period of the samples and in the 10-40 °C temperature range.
For the oxidation reactions of unsubstituted 1,4-benzoquinone and at higher hydrogen
peroxide concentrations, rapid kinetic experiments were carried out in an Applied
Photophysics DX-17 MV stopped-flow instrument with a photomultiplier tube as the detector.
Absorbance traces were collected using an optical cell of 1.00 cm path length. The dead time
of the stopped-flow instrument was determined to be 1.51±0.03 ms using a standard method.38
The least squares fitting of the measured data was carried out using the general fitting
software MicroMath SCIENTIST.39
2.3. GC-MS measurements
For the GC-MS measurements, a sample containing the benzoquinone derivative in 1×10⁻³
mol dm−3 and H2O2 in 0.576 mol dm−3concentration was prepared. The reaction was followed
spectrophotometrically. One GC-MS measurement was performed when the concentration of
the hydroxyquinone was at the maximum, and another after 1 day, when the decomposition of
the hydroxyquinone was complete. A GC-MS measurement of a sample containing only the
benzoquinone was also performed.
The measurements were carried out using a Shimadzu GCMS-QP2010plus system.
Compounds were separated on a Zebron ZB-5MS capillary column (30 m × 0.25 mm i.d. ×

8
0.25 µm.). The temperature of the column was 50 °C for 1.5 min after injection. Later, it was
programmed to increase at 20 °C min−1 to 100 ºC then at 10 °C min−1 to 280 ºC, and finally
maintained at that temperature for 4 min. Helium was used as the carrier gas and the injector
temperature was 300 ºC. A split ratio of 10:1 and a column flow rate of 1.1 cm3 min−1 were
applied. The MS parameters were as follows: interface temperature 300 °C; ionization mode
EI+; electron energy 70 eV. Compounds were identified by using NIST05 library spectra.
2.4. NMR measurements
1H-NMR spectra were measured on a BRUKER DRX 400 instrument operating at 400 MHz
and at 25 °C. As a solvent, 99.99 % D2O (for the 2-methyl-1,4-benzoquinone only) or
H2O:D2O = 70:15 (after addition of the oxidant) was used. The pH of the solution was kept
constant using a 0.50 mol dm–3 phosphate buffer (pH 6.3). Chemical shifts were referenced to
the water signal. For the evaluation of the spectra, the MestReNova NMR software was used.
2.5. Cyclic voltammetric measurements
The cyclic voltammograms of the benzoquinone(QR)/hydroquinone(QR-H2) redox systems
were obtained by means of a Metrohm VA 746 Trace Analyzer equipped with 747 VA Stand
controlled by a personal computer. All the measurements were carried out in aqueous solution
at slightly acidic or physiological pH (0.20 mol dm–3 Na2SO4 was used as the supporting
electrolyte). The solutions were degassed by using argon. The systems were analyzed at 25.0
°C with a three electrode assembly. During the experiments, platinum (Metrohm 6.1204.120)
was used as the working electrode. The counter electrode was also a platinum electrode
(distributed by ALS Co. Japan), while the reference electrode was a Vycor tip Ag/AgCl
electrode stored in 3.0 mol dm–3 NaCl (BASI Instr. RE-5B, MF-2079). The concentration of
benzoquinone was 1×10⁻³ mol dm–3. The pH of the sample was adjusted using 0.05 and 0.005

9
mol dm–3 H2SO4 or KOH solutions. The volume of the sample was 20.0 cm3. Before each
scan, the working electrode was treated with alumina paste (0.03 micron ordered from
Buehler Company) and the surface was cleaned with the help of sandpaper.
The electrochemical measuring system was calibrated with the
[Fe(CN)6]3¬/[Fe(CN)6]
4– redox system. 40 The potential range was changed between +800 mV
and –800 mV. The voltammograms were recorded at 100 mV/sec sweep rates. For the
analysis of the voltammograms, the CACYVO program was used. The half-wave potential
(E½) values were calculated based on the following equation:
(1)
where Epc and Epa are the cathodic and anodic peak potentials, respectively. Considering that
E½ = E0, E0 values throughout this work were referenced to NHE taking into account that
versus is +0.209 V at 25.0 °C.41
(2)
2.6. Spectrophotometric determination of pKa values
For the determination of the pKa values of the hydroxyquinone derivatives, they were
prepared by illuminating 50.0 cm3 of the appropriate 1×10⁻³ mol dm–3 aqueous solutions of
1,4-benzoquinone and its derivatives with a high intensity Spectroline FC-100/F UV-A lamp
emitting at 365 nm.42 The photon flux of this lamp is 2.7×10¹⁷ s−1 in the geometric
arrangement used in our experiments.43 Photoreactions of these samples result in the
formation of colored hydroxyquinones and colorless hydroquinones, the mixture of which
seems to be stable for several days even under normal laboratory light conditions.44 The
formation reaction was followed using a pH-stat titrating system (ABU 91 AUTOBURETTA

10
RADIOMETER COPENHAGER) and was completed for all substituted derivatives after a
maximum illumination time of 1 hour.
Then, spectrophotometric titrations of 2.50 cm3 samples prepared in this way were
performed that is well-known volumes of 0.010 mol dm–3 HCl or 0.042 mol dm–3 KOH
solutions were added to the samples to adjust the pH of the solution and both the pH and the
absorption spectrum were measured. For every derivative, 15-20 data pairs were measured
mainly in the pH range of the deprotonation process. The MicroMath SCIENTIST39 program
was used to evaluate the data. The fitted mathematical equation took also the dilution of the
samples into account. For a given derivative, 8-14 carefully chosen wavelengths were used for
the calculations.
Since the ratio of the two products of the photoreaction was not known, the molar
absorption coefficient values for the hydroxyquinone derivatives could not be determined
from these data, only the ε(QR-OH)/ε(QR-O−) ratio could be determined.
2.7. Theoretical calculations
We performed DFT calculations with the B3LYP exchange-correlation functional.45-47 6-
31G(d), 6-31+G(d), 6-311+G(d) and 6-311+G(d,p) were the standard split-valence basis sets.
The M06 functional with 6-31G(d) basis set was also used to calibrate the method for the
structural parameters. Geometry optimizations were carried out both in vacuo and using the
polarizable continuum model (PCM) to account for solvent effects.48,49 For PCM calculations,
we used Gaussian 09’s default Integral Equation Formalism variant (IEFPCM) PCM
model.50,51 The transition states were optimized by means of the synchronous transit-guided
quasi-Newton method.52,53 The lack of imaginary frequencies in vibrational spectral
calculations were taken to verify that the calculated stationary points on the potential energy
surfaces (PES) represented true minima as opposed to transition states (TS). The reactants and

11
products are obtained from intrinsic reaction coordinate (IRC) calculations. The relative
energies are Gibbs free energies obtained by frequency analysis.
In addition to DFT calculations, in vacuo geometry optimizations were also done
using the MP2 method54-58 with 6-31G(d) basis set. These calculations were carried out for the
minima of the PES but not for the transition states.
All these calculations were carried out using the Gaussian 09 software package.59

12
3. Results and discussion
The reaction between benzoquinone derivatives and hydrogen peroxide was measured for
different substituted benzoquinones. For all measurements, a high excess of H2O2 ensured the
constant concentration for the oxidant. At the same time, the pH of the solution was kept
constant by using a phosphate buffer in high excess compared to the benzoquinone
concentration. So, under our experimental conditions, the shape of the kinetic curve only
depends on the reaction order with respect to benzoquinone and/or hydroxyquinone
concentrations. In the absence of any buffer, the pH of the solution becomes acidic during the
measurements because of the acidic proton in the product hydroxyquinone. E.g., for 1,4-
benzoquinone, the pH drops from 6.5 to 3.4 during the reaction.
The formation of hydroxyquinone, a colored product, was shown in all measurements,
followed by the decomposition of the hydroxyquinone indicated by the fading of the color
formed. The benzoquinones are almost colorless in the visible wavelength range, and the
same is true for the final solutions after the decomposition of the hydroxyquinones. So,
absorbance-time curves measured in the visible wavelength range are selective for the
hydroxyquinone (see: Figure 1). Selected wavelength values for the different derivatives are
as follows: 480 nm for 1,4-benzoquinone, 490 nm for 2-methy-1,4-benzoquinone, 530 nm for
2,6-dimethy-1,4-benzoquinone, 510 nm for 2-chloro-1,4-benzoquinone and 520 nm for 2,6-
dichloro-1,4-benzoquinone.
Kinetic curves could be well fitted for all derivatives and under all measured
conditions using the following kinetic scheme:
QR QR-OH (or QR-O−) v1 = kΨ1 [QR] (3)
QR-OH v2 = kΨ2 [QR-OH] (4)
v3 = kΨ3 [QR-OH]2 (5)

13
where QR is an R-substituted 1,4-benzoquinone and QR-OH (or QR-O−) is the corresponding
substituted hydroxyquinone. From least squares fitting with MicroMath SCIENTIST, molar
absorption coefficients of QR, QR-OH (or QR-O−) and the decomposition product(s) and kΨ1-
kΨ3 apparent rate constants were calculated. The molar absorbance values are pH-dependent
in the pH range around the pKa of the hydroxyquinones. The dependence of the apparent rate
constants on the concentration of the oxidant and the pH were studied in detail and used to
deduct the full rate equations of the processes. Temperature dependence was also studied to
calculate activation parameters.
Figure 1: Kinetic curves measured for the reaction between 2-methyl-1,4-benzoquinone
(QMe) and hydrogen peroxide at 25.0 °C. c(QMe) = 9×10⁻⁴ mol dm−3, pH = 6.6, c(H2O2)
values in mol dm−3 unit are given in the legends.

14
Attempts were made to react 1,4-benzoquinone with periodate ion. Unfortunately, the
oxidation reaction did not stop at the hydroxyquinone, so this oxidant was not investigated
further.
3.1. Formation kinetics of the hydroxyquinone
3.1.1. Dependence of kΨ1 on the hydrogen peroxide concentration
From fitting of the kinetic curves, kΨ1 apparent rate constants were calculated at many
different hydrogen peroxide concentrations for all substituted benzoquinone derivatives.
These kΨ1 values were used to determine the rate equation of the benzoquinone oxidation
process by observing the dependence of the kΨ1 values on the hydrogen peroxide
concentration. For all derivatives, the data showed a linear relationship with an almost 0
intercept. The process was studied at c(H2O2) = 0 as well, and some formation of the
hydroxyquinone was detected because of the photosensitivity of the aqueous benzoquinone
solutions. This was at least three orders of magnitude lower than the initial rate of the
oxidation at the lowest hydrogen peroxide concentration studied. To avoid the photoreaction
as much as possible, a scanning spectrophotometer was used in single wavelength
measurement mode.
The kΨ1 values are shown in Figure 2 as a function of the concentration of hydrogen
peroxide for the 1,4-benzoquinone – hydrogen peroxide system at pH 6.56-6.59. Molar
absorption coefficients for the same pH value are as follows: ε480(Q) = 24±1 dm3 mol–1 cm–1
and ε480(Q-O−) = 1703±88 dm3 mol–1 cm–1.

15
Figure 2: H2O2 concentration dependence of the kΨ1 apparent rate constants in the 1,4-
benzoquinone (Q) – H2O2 system at pH 6.56-6.59 and 25.0 °C. Small dots (•) are from
spectrophotometric and large triangles (∆) are from stopped-flow experiments.
The same kinds of experiments were performed for 2-methyl-1,4-benzoquinone and 2-
chloro-1,4-benzoquinone. In all cases, the same linear hydrogen peroxide concentration
dependence of the kΨ1 values was found (see: Tables S1-S3 and Figures S1-S3 in the
Supplementary Information). 2,6-Dimethyl-1,4-benzoquinone was also reacted with H2O2, but
there was no measureable change after 20 min even and at the highest hydrogen peroxide
concentrations, c(H2O2) = 0.58 mol dm−3 and c(H2O2) = 2.3 mol dm−3.
3.1.2. Dependence of kΨ1 on the hydrogen ion concentration

16
In the case of 1,4-benzoquinone and 2-methyl-1,4-benzoquinone, pH dependent kinetic curves
were also measured. For the experiments using the methyl derivative, c(H2O2) was 0.58 mol
dm−3 and c(2-methyl-1,4-benzoquinone) was 0.95 mmol dm−3. The apparent rate constant
decreased an order of magnitude when the pH was decreased by 1 unit (at pH 6.59, kΨ1 was
(8.03±0.06)×10−3 s−1 and at pH 5.69, kΨ1 was (9.5±0.2)×10−4 s−1). A similar pH dependence
was found for the unsubstituted 1,4-benzoquinone oxidation reaction.
Based on these data, both the 2-methyl and the unsubstituted derivative show the same
inverse first order hydrogen ion concentration dependence as the 2,6-dichloro derivative.24
The pH dependence of the 2-chloro derivative was not checked but assumed to be the same:
that is
(6)
Based on this equation, k1 values for the different substituted derivatives were calculated by
multiplying the slopes of the kΨ1 versus c(H2O2) values with the hydrogen ion concentration
of the solutions (when the pH is constant), or, by finding the slopes of the kΨ1×[H+] versus
c(H2O2) fittings (Figures S2 and S3 in the Supplementary Information). Calculated k1 values
for different derivatives are shown in Table 1 together with some other measured parameters
for the different derivatives.
Table 1: k1, pKa(QR-OH) and E0(QR/QR-H2) values for different 1,4-benzoquinone
derivatives at 25.0 °C
Derivative k1
(s–1)
pKa(QR-OH) E0(QR/QR-H2) at pH 5.1
(V)
2-methyl-1,4-
benzoquinone (QMe)
(3.46±0.01)×10−9 4.5±0.4 0.059

17
1,4-benzoquinone (Q) (1.23±0.02)×10−8 3.4±0.1 0.120
2-chloro-1,4-
benzoquinone
(1.49±0.03)×10−7 2.8±0.6 0.188
2,6-dichloro-1,4-
benzoquinone
2.7×10−7* 1.8±0.6 0.244
* From Ref. 24.
The rate equation described by equation (6) can be explained by the mechanism that
was proposed for the 2,6-dichloro-benzoquinone – hydrogen peroxide reaction:24
fast pre-equilibrium; (7)
QR-OH + OH− (or QR-O− + H2O) rate determining step (8)
Based on this mechanism, the rate constant of the rate determining step, kb can be calculated
as follows:
that is (9)
To support this assumed mechanism further, activation parameters for the rate determining
step (8) of the 2-methyl-1,4-benzoquinone – hydrogen peroxide reaction were determined
both experimentally and by DFT calculations.
3.1.3. Temperature dependence of hydroxyquinone formation
To determine the activation parameters for the rate determining step of the mechanism
described by equations (7) and (8), temperature dependent kinetic curves were measured in
the 2-methyl-1,4-benzoquinone – hydrogen peroxide system. The temperature range for these
measurements was 10-40 °C. In the case of the temperature dependent experiments, c(QMe) =
9.5×10⁻⁴ mol dm−3, c(H2O2) = 0.58 mol dm−3 and pH = 6.39 were used. Kinetic curves

18
measured at different temperatures are shown in Figure 3. It is clear that both the formation
and the decomposition reaction of the hydroxyquinone become faster with increasing
temperature.
Figure 3: Kinetic curves measured at different temperatures for the reaction between 2-
methyl-1,4-benzoquinone and hydrogen peroxide. c(QMe) = 9.5×10⁻⁴ mol dm−3, c(H2O2)
= 0.58 mol dm−3, pH = 6.39
All curves were fitted as described earlier to determine temperature dependent kΨ1
values. Using these, kb values were calculated using equations (6) and (9) together with the
pKa(H2O2) values known from the literature.60
Using these temperature dependent kb values, Arrhenius and Eyring plots were drawn
to determine the activation parameters, namely the Ea activation energy, Gibbs energy (or
19
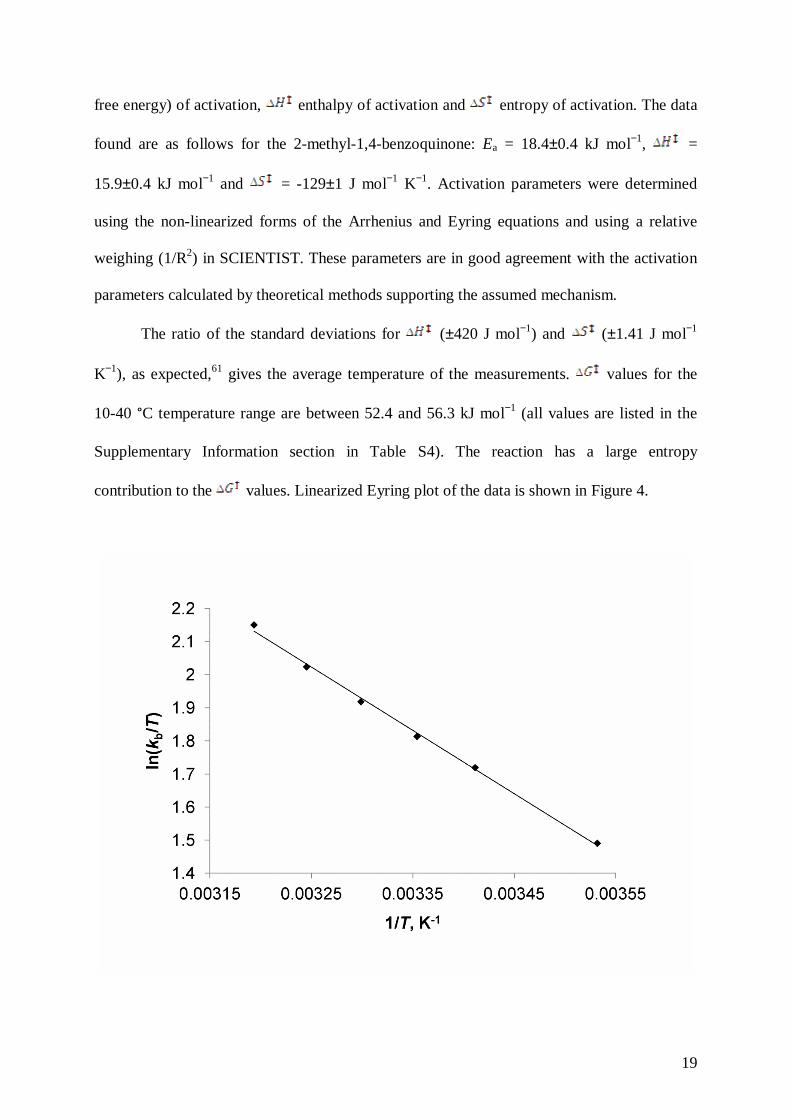
free energy) of activation, enthalpy of activation and entropy of activation. The data
found are as follows for the 2-methyl-1,4-benzoquinone: Ea = 18.4±0.4 kJ mol−1, =
15.9±0.4 kJ mol−1 and = -129±1 J mol−1 K−1. Activation parameters were determined
using the non-linearized forms of the Arrhenius and Eyring equations and using a relative
weighing (1/R2) in SCIENTIST. These parameters are in good agreement with the activation
parameters calculated by theoretical methods supporting the assumed mechanism.
The ratio of the standard deviations for (±420 J mol−1) and (±1.41 J mol−1
K−1), as expected,61 gives the average temperature of the measurements. values for the
10-40 °C temperature range are between 52.4 and 56.3 kJ mol−1 (all values are listed in the
Supplementary Information section in Table S4). The reaction has a large entropy
contribution to the values. Linearized Eyring plot of the data is shown in Figure 4.

20
Figure 4: Plot of the linearized Eyring equation for the QMe + QMe-O−
+ H2O reaction. c(QMe) = 9.5×10⁻⁴ mol dm−3, c(H2O2) = 0.58 mol dm−3, pH = 6.39
Also, the position of the hydroxyl group in the hydroxyquinone is a question in the
case of the methyl (or any mono-substituted derivative) because the three available positions
(numbered 3, 5 and 6 on the quinone ring) are different. To find out the structure of the
hydroxyquinone formed during the reaction, 1H-NMR measurements were performed. Based
on the spectra, it seems more likely that the hydroxylation happens in the 5th or 6th position
and not in the neighboring position to the methyl group. This finding is in good agreement
with the results of the theoretical calculations as will be discussed later.
3.1.4. Mechanism of the formation of hydroxyquinone
We have studied the mechanism of the formation of the hydroxyquinones using DFT and
MP2 methods. B3LYP and M06 functionals were also tested to find out the structural
parameters of the starting reagent benzoquinone. We concluded that there is no significant
difference between the structural parameters calculated by the two functionals, so, in our
further calculations for investigating the possible mechanisms, only the B3LYP functional
was used. The B3LYP functional was earlier proved to be a useful level for the calculations in
studying the reactions between variously substituted quinones and hydrogen peroxide.62,63 We
used the 6-311+G(d,p) basis set in our calculations to obtain the mechanism of the reaction
between benzoquinone (Q) and H2O2. Geometry optimizations were carried out using the
default polarizable continuum model (PCM) of the Gaussian 09 software. The stationary
points were identified by frequency analysis and with IRC calculations, too. (In vacuo results
obtained with smaller basis sets, such as 6-31G(d) and 6-31+G(d) at B3LYP level, and also

21
the results of the MP2 calculations with 6-31G(d) basis set are collected in the Supplementary
Information.)
The reaction of Q with H2O2 did not give any product, while the coordination of
OOH− to the C1 carbon atom of Q resulted in an adduct (Q–OOH1). (Note that this structure
could not be found as an intermediate using smaller basis sets.) From the Q–OOH1 structure,
we found another form (Q–OOH2), where the OOH− is coordinated to C2 of Q: there is an
intramolecular hydrogen bond in this case. The structures of Q–OOH1 and Q–OOH2 can be
seen in Figure 5. The energy barrier of the Q–OOH1 → Q–OOH2 realignment is 21.8 kJ
mol−1, as shown by TS1 in Figure 6.
Figure 5: The structures of Q–OOH1, Q–OOH2, Q–OOH3 and EQ. The inserted pictures
show the bent ring of EQ from different view.
22
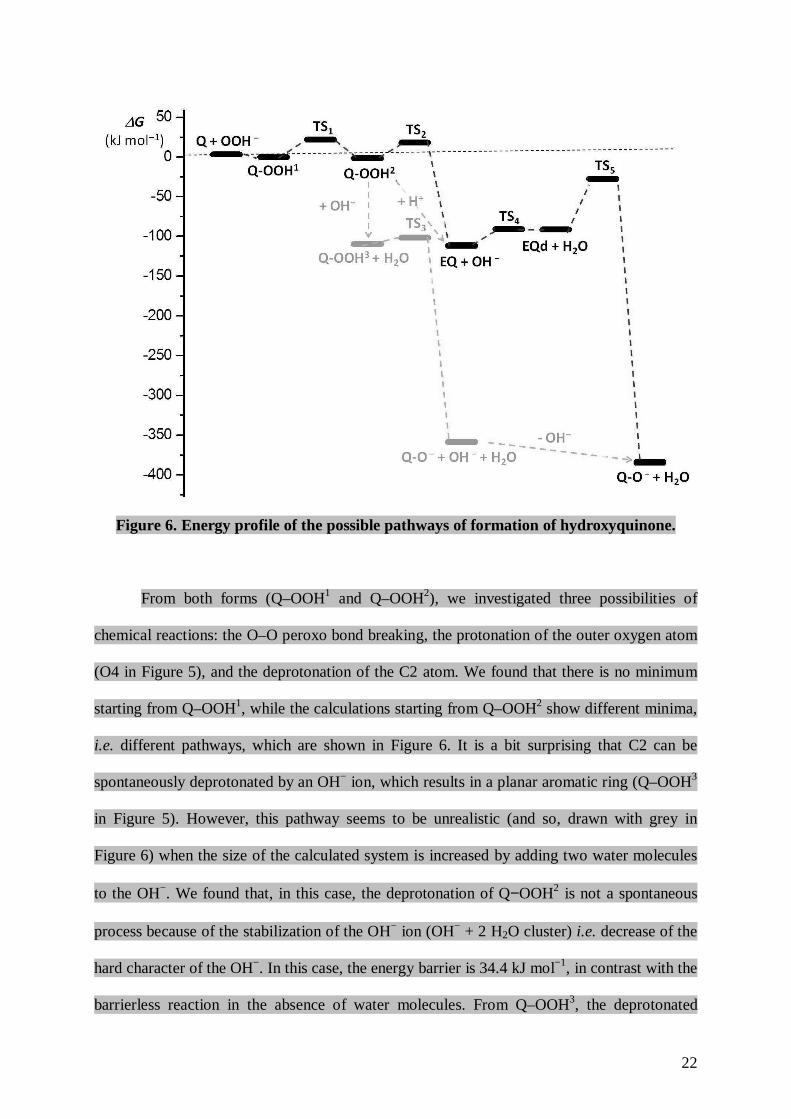
Figure 6. Energy profile of the possible pathways of formation of hydroxyquinone.
From both forms (Q–OOH1 and Q–OOH2), we investigated three possibilities of
chemical reactions: the O–O peroxo bond breaking, the protonation of the outer oxygen atom
(O4 in Figure 5), and the deprotonation of the C2 atom. We found that there is no minimum
starting from Q–OOH1, while the calculations starting from Q–OOH2 show different minima,
i.e. different pathways, which are shown in Figure 6. It is a bit surprising that C2 can be
spontaneously deprotonated by an OH− ion, which results in a planar aromatic ring (Q–OOH3
in Figure 5). However, this pathway seems to be unrealistic (and so, drawn with grey in
Figure 6) when the size of the calculated system is increased by adding two water molecules
to the OH−. We found that, in this case, the deprotonation of Q−OOH2 is not a spontaneous
process because of the stabilization of the OH− ion (OH− + 2 H2O cluster) i.e. decrease of the
hard character of the OH−. In this case, the energy barrier is 34.4 kJ mol−1, in contrast with the
barrierless reaction in the absence of water molecules. From Q–OOH3, the deprotonated
23
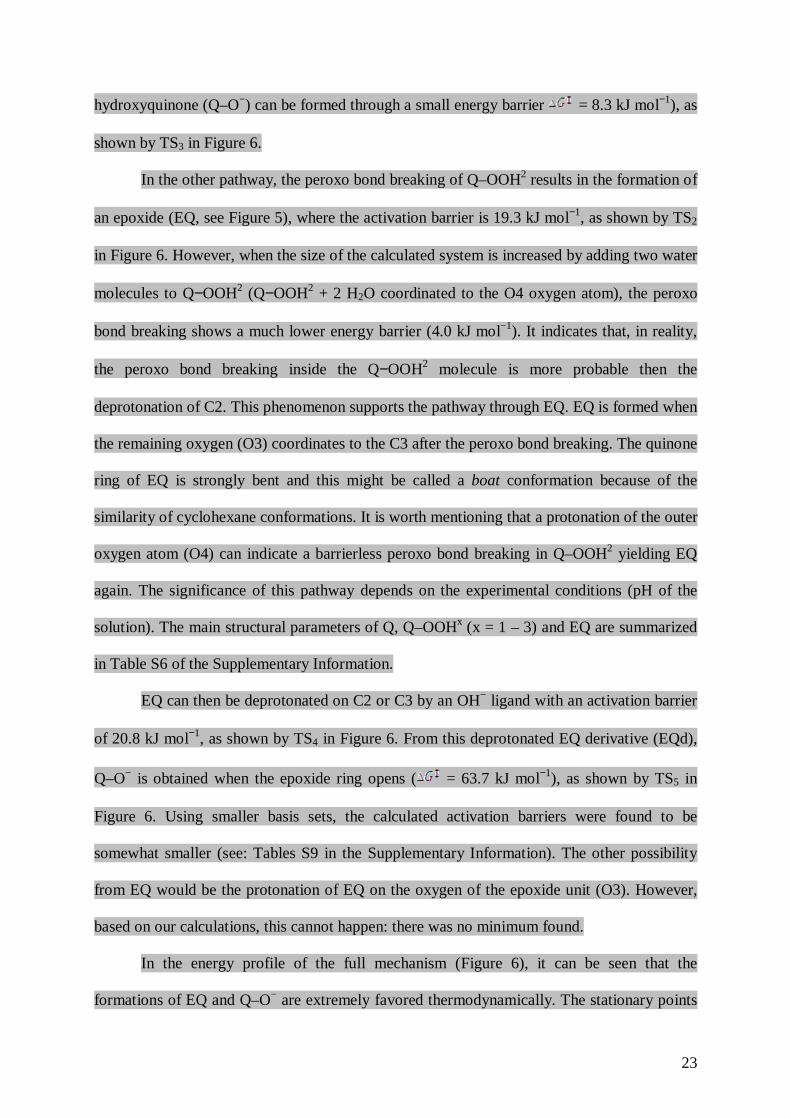
hydroxyquinone (Q–O−) can be formed through a small energy barrier = 8.3 kJ mol−1), as
shown by TS3 in Figure 6.
In the other pathway, the peroxo bond breaking of Q–OOH2 results in the formation of
an epoxide (EQ, see Figure 5), where the activation barrier is 19.3 kJ mol−1, as shown by TS2
in Figure 6. However, when the size of the calculated system is increased by adding two water
molecules to Q−OOH2 (Q−OOH2 + 2 H2O coordinated to the O4 oxygen atom), the peroxo
bond breaking shows a much lower energy barrier (4.0 kJ mol−1). It indicates that, in reality,
the peroxo bond breaking inside the Q−OOH2 molecule is more probable then the
deprotonation of C2. This phenomenon supports the pathway through EQ. EQ is formed when
the remaining oxygen (O3) coordinates to the C3 after the peroxo bond breaking. The quinone
ring of EQ is strongly bent and this might be called a boat conformation because of the
similarity of cyclohexane conformations. It is worth mentioning that a protonation of the outer
oxygen atom (O4) can indicate a barrierless peroxo bond breaking in Q–OOH2 yielding EQ
again. The significance of this pathway depends on the experimental conditions (pH of the
solution). The main structural parameters of Q, Q–OOHx (x = 1 – 3) and EQ are summarized
in Table S6 of the Supplementary Information.
EQ can then be deprotonated on C2 or C3 by an OH− ligand with an activation barrier
of 20.8 kJ mol−1, as shown by TS4 in Figure 6. From this deprotonated EQ derivative (EQd),
Q–O− is obtained when the epoxide ring opens ( = 63.7 kJ mol−1), as shown by TS5 in
Figure 6. Using smaller basis sets, the calculated activation barriers were found to be
somewhat smaller (see: Tables S9 in the Supplementary Information). The other possibility
from EQ would be the protonation of EQ on the oxygen of the epoxide unit (O3). However,
based on our calculations, this cannot happen: there was no minimum found.
In the energy profile of the full mechanism (Figure 6), it can be seen that the
formations of EQ and Q–O− are extremely favored thermodynamically. The stationary points

24
of the rate determining step, i.e. the epoxide ring opening, can be seen in Figure 7. All
structures (xyz coordinates and pictures) of the full mechanism and IRC pathways can be seen
in the Supplementary Information.
Figure 7. The reactant (EQd + H2O), transition state (TS5) and product (Q–O− + H2O) of
the rate determining step (epoxide ring opening).
The EQ intermediate is a stable form, so there is a straightforward deprotonation of
EQ and (finally) ring opening from this point. The very high negative value determined
experimentally for the entropy of activation is also in conceptual agreement with the
formation of an epoxide structure in the transition state, as this process certainly means a
major loss of translational degrees of freedom.
We also carried out calculations for the 2-methyl-1,4-benzoquinone (QMe) derivative.
At first, the relative energies of the possible isomers were checked (Figure 8). The
intermediates for all possible pathways can be found in the Supplementary Information as
Figure S8.

25
Figure 8. The structures and the relative energies of the possible isomers of the
QMe−OOH complex.
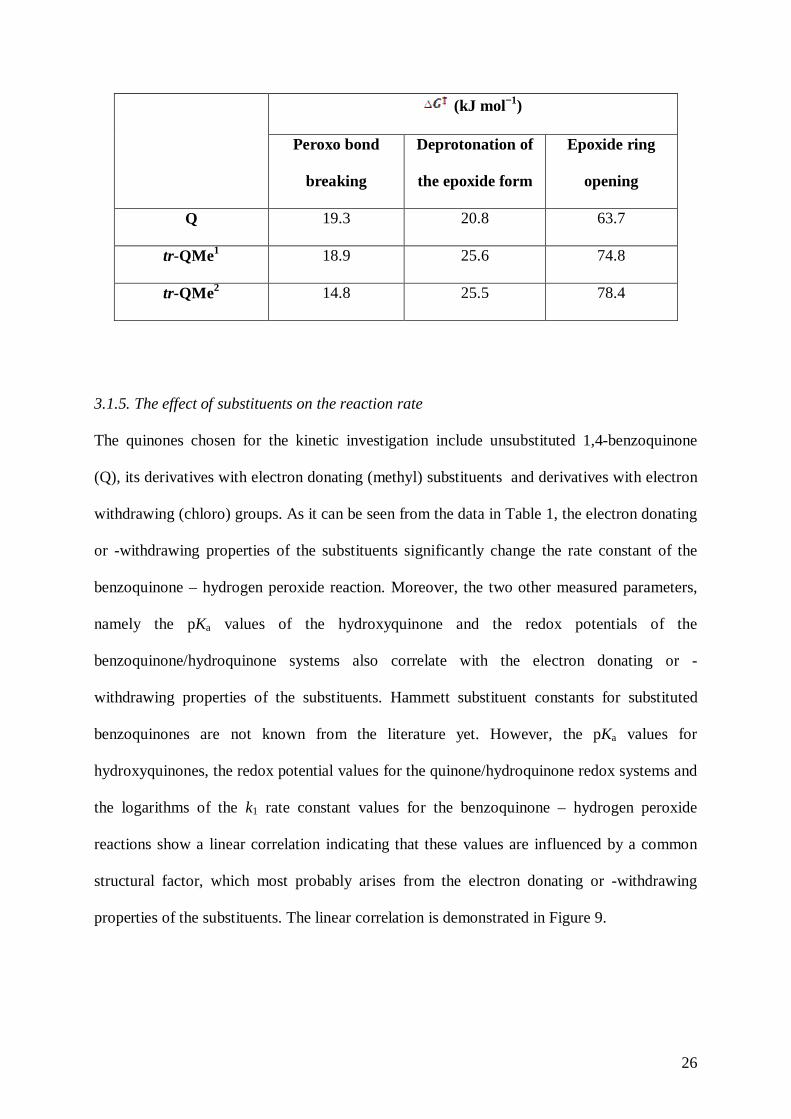
It can be seen that the cis isomer is not favored at all. Therefore, no further
calculations were run for that. We found that the mechanism is the same for the two trans-
QMe isomers (tr-QMe1 and tr-QMe2) as for unsubstituted Q. We were mainly interested in
the activation barrier of the rate-determining step (epoxide ring opening) to make a
comparison with the theoretical calculations for Q and with the experimental data. It can be
seen that the activation barrier of the ring opening is higher in the case of methyl derivatives
than for Q (see Table 2). It is in good agreement with the experimental data (see k1 values in
Table 1), which show that the process is a bit slower for the methyl derivative.
Experimentally, we found that the values for the methyl derivative are between 52.4 kJ
mol−1 and 56.3 kJ mol−1 for the 10-40 °C temperature range (Table S4 in the Supplementary
Information). These values are in acceptable agreement with the calculated one (Table 2).
The unfavored formation of the cis isomer may also explain why no hydroxylated
product was detected for 2,6-dimethyl-1,4-benzoquinone experimentally: in this case, both
available positions are cis to one of the methyl substituents.
Table 2. The activation Gibbs free energies of the Q and trans-QMe complexes.
26
(kJ mol−1)
Peroxo bond
breaking
Deprotonation of
the epoxide form
Epoxide ring
opening
Q 19.3 20.8 63.7
tr-QMe1 18.9 25.6 74.8
tr-QMe2 14.8 25.5 78.4
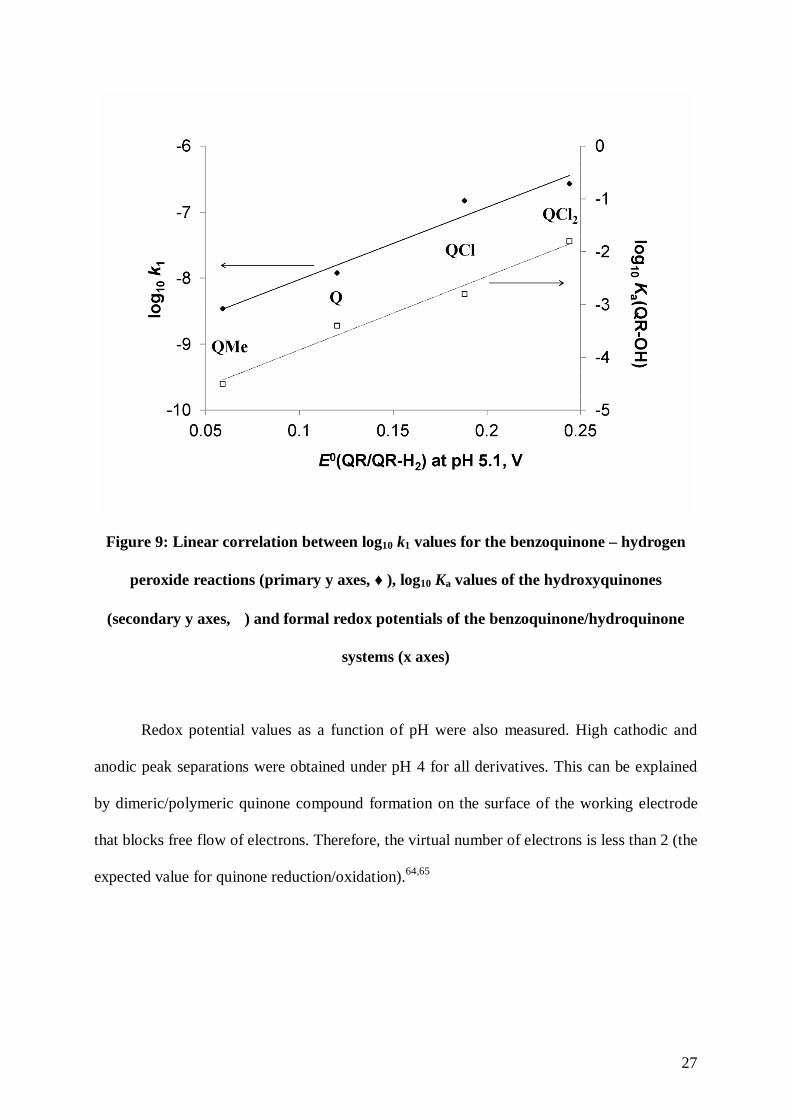
3.1.5. The effect of substituents on the reaction rate
The quinones chosen for the kinetic investigation include unsubstituted 1,4-benzoquinone
(Q), its derivatives with electron donating (methyl) substituents and derivatives with electron
withdrawing (chloro) groups. As it can be seen from the data in Table 1, the electron donating
or -withdrawing properties of the substituents significantly change the rate constant of the
benzoquinone – hydrogen peroxide reaction. Moreover, the two other measured parameters,
namely the pKa values of the hydroxyquinone and the redox potentials of the
benzoquinone/hydroquinone systems also correlate with the electron donating or -
withdrawing properties of the substituents. Hammett substituent constants for substituted
benzoquinones are not known from the literature yet. However, the pKa values for
hydroxyquinones, the redox potential values for the quinone/hydroquinone redox systems and
the logarithms of the k1 rate constant values for the benzoquinone – hydrogen peroxide
reactions show a linear correlation indicating that these values are influenced by a common
structural factor, which most probably arises from the electron donating or -withdrawing
properties of the substituents. The linear correlation is demonstrated in Figure 9.
27
Figure 9: Linear correlation between log10 k1 values for the benzoquinone – hydrogen
peroxide reactions (primary y axes, ♦), log10 Ka values of the hydroxyquinones
(secondary y axes, �) and formal redox potentials of the benzoquinone/hydroquinone
systems (x axes)
Redox potential values as a function of pH were also measured. High cathodic and
anodic peak separations were obtained under pH 4 for all derivatives. This can be explained
by dimeric/polymeric quinone compound formation on the surface of the working electrode
that blocks free flow of electrons. Therefore, the virtual number of electrons is less than 2 (the
expected value for quinone reduction/oxidation).64,65

28
Figure 10: Pourbaix-diagram of different 1,4-benzoquinone derivatives: � = 1,4-
benzoquinone (Q), ♦ = 2-methyl-1,4-benzoquinone (QMe), • = 2-chloro-1,4-
benzoquinone (QCl) and ∆ = 2,6-dichloro-1,4-benzoquinone (QCl2)
3.2. Decomposition kinetics of the hydroxyquinone
3.2.1. Dependence of kΨ2 and kΨ3 on the hydrogen peroxide and hydrogen ion concentrations
Fitting the kinetic curves yielded not only apparent rate constants for the hydroxyquinone
formation, but also pseudo-first and -second order rate constants for the hydroxyquinone
decomposition. These values are shown in Figure 11 for the 2-methyl derivative and in Table
S5 of the Supplementary Information. Both kΨ2 and kΨ3 values show a linear dependence
when fitted against c(H2O2) under certain conditions. The pH dependence for the
hydroxyquinone decomposition reaction is more complex and will not be discussed in this
paper.

29
Figure 11: H2O2 concentration dependence of the kΨ2 and kΨ3 apparent rate constants in
the 2-methyl-1,4-benzoquinone (QMe) – H2O2 system at pH 6.5-6.7 and 25.0 °C
The main importance of the whole curve measurement and fitting for the
determination of k1 values is demonstrated by Figure 1 for 2-methyl-1,4-benzoquinone (and in
the Supplementary Information by Figure S5 for 1,4-benzoquinone). In Figure 1, the
concentration of 2-methyl-1,4-benzoquinone is the same in all samples. However, the
maximum absorbance measured strongly depends on the concentration of the hydrogen
peroxide (Amax = 0.36 for c(H2O2) = 1.081 mol dm−3 and Amax = 0.21 for c(H2O2) = 0.054 mol
dm−3). This is even more characteristic when not only the c(H2O2) but also the pH of the two
solutions are different. In many cases, the increasing part of the curves can be fitted using a
smaller molar absorption coefficient value than the real one and resulting in the calculation of

30
a larger kΨ1 than the real. To avoid this pitfall, a careful analysis of the calculated molar
absorption coefficients was used, which involved an inspection of the effect of hydrogen
peroxide concentration and the results were accepted only if there was no trend in the values.
The other method to avoid this problem was a simultaneous fitting of all measured curves for
a given derivative together with only one ε(QR-O−) parameter. Additionally, full kinetic
curves were measured in many cases and fitted to obtain even more reliable data for the first
step.
Another reason for the pH-dependent hydroxyquinone molar absorption coefficient
values can be the deprotonation process of the hydroxyquinone derivative, which can be
described by its pKa value. In the case of our measurements, however, this was never the case
since all measurements were carried out at least 1 pH unit above the pKa value of the
appropriate 2-hydroxy-1,4-benzoquinone, so, the absorbing species was the deprotonated
hydroxyquinone in all measurements and the determined molar absorption coefficient was the
ε(QR-O−), not the ε(QR-OH).
3.2.2. Attempts to identify the decomposition products
To identify the decomposition products, both NMR and GC-MS measurements were
performed. In the GC-MS spectra, we could identify the starting 2-methyl-1,4-benzoquinone
before adding hydrogen peroxide to the sample. After adding hydrogen peroxide, dominating
MS peaks with 44 and 32 m/z values were found indicating a full oxidation of the sample to
CO2 (44 m/z) as the final product and decomposition of the hydrogen peroxide excess to O2
(32 m/z) under GC-MS conditions. NMR measurements show that the hydroxyquinone
decomposes (the intensity of the aromatic region decreases) but in the aliphatic region, there
are new signals indicating the decomposition of the hydroxyquinone to smaller aliphatic
fragments.

31
It is also known from the spectrophotometric kinetic traces that the final products of
the decomposition reactions have no absorbance at the wavelengths of the kinetic
measurements (that is between 480 and 510 nm). This is in good agreement with the findings
of the other two techniques.
32
4. Conclusion
The data presented here show that the reaction of hydrogen peroxide with 1,4-benzoquinone
derivates is primarily determined by the electronic effects of the substituents. The formation
of the intermediate hydroxylated quinone is first order with respect to both reagents, and
inverse first order with respect to hydrogen ion. The process is accelerated by electron
withdrawing substituents on the benzoquinone ring. The decomposition of the hydroxyl-
quinone intermediate is mixed first and second order with respect to the limiting reagent, and
depends on the concentrations of the oxidant and hydrogen ion in a more complex manner.
DFT calculations are in good agreement with the experimental data. The mechanism
of the hydroxyquinone is a multi-step process where the rate determining step is the epoxide
ring opening. The calculated energies are similar to the activation parameters. The mechanism
is in agreement with the experimentally found rate equation. The 2-methyl-1,4-benzoquinone
prefers the trans position for the formation of the 2-methyl-hydroxyquinone while the
mechanism is the same as for the unsubstituted 1,4-benzoquinone.

33
5. Acknowledgements
The research work performed by Éva Józsa for this manuscript was supported by the
European Union and the State of Hungary, co-financed by the European Social Fund in the
framework of TÁMOP 4.2.4. A/2-11-1-2012-0001 ‘National Excellence Program’.
Hungarian Science Funding Agency OTKA is also acknowledged for support under contract
no. K77936.
The research was supported by the EU and co-financed by the European Social Fund under
the projects ENVIKUT (TÁMOP-4.2.2.A-11/1/KONV-2012-0043) and TÁMOP 4.2.2/B-
10/1-2010-0024.
This work was partially supported by the European Union and the European Social Fund
through project Supercomputer, the national virtual lab, grant no.: TÁMOP-4.2.2.C-
11/1/KONV-2012-0010.
The authors wish to thank Sarolta Timári, Lajos Nagy, Zoltán Nagy, Gábor Lente and Mónika
Galajda for helpful discussions.

34
6. References
1 M.Y. Okamura, M.L. Paddock, M.S. Graige and G. Feher, Biochim. Biophys. Acta,
2000, 1458, 148.
2 M. Kawamukai, J. Biosci. Bioeng., 2002, 94, 511.
3 T. Yagishita, S. Sawayama, K. Tsukahara and T. Ogi, J. Biosci. Bioeng., 1999, 88, 210.
4 S. Tsujimura, A. Wadano, K. Kano and T. Ikeda, Enzyme Microb. Technol., 2001, 225.
5 P.A. Leighton and G.S. Forbes, J. Am. Chem. Soc., 1929, 51, 3549.
6 G. Lente and J.H. Espenson, J. Photochem. Photobiol., A, 2004, 163, 249.
7 H.I. Joschek and S.I. Miller, J. Am. Chem. Soc., 1966, 88, 3273.
8 A. Pochon, P.P. Vaughan, D. Gan, P. Vath, N.V. Blough and D.E. Falvey, J. Phys.
Chem., A, 2002, 106, 2889.
9 A.D. Broadbent and R.P. Newton, Can. J. Chem., 1972, 50, 381.
10 S. Spyroudis, Molecules, 2000, 5, 1291.
11 J.F.W. McOmie and J.M. Blatchly, The Thiele-Winter acetoxylation of quinones in
Organic Reactions, Wiley, New York, 1972, vol. 19, pp. 199.
12 K.T. Finley, in The Chemistry of the Quinoid Compounds, ed. S. Patai and Z.
Rappoport, Wiley-Interscience, New York, 1988, vol. 2, pp. 537.
13 D. Villemin, N. Bar and M. Hammadi, Tetrahedron Lett., 1997, 38, 4777.
14 W.P. Almeida and C.R.D. Correia, Tetrahedron Lett., 1994, 35, 1367.
15 M.V. Sargent and S. Wangchareontrakul, J. Chem. Soc., Perkin Trans., 1990, 1429.
16 H. Suginome, H. Kamekawa, H. Sakurai, A. Konishi, H. Senboku and K. Kobayashi, J.
Chem. Soc., Perkin Trans., 1994, 471.
17 R. Huot and P. Brassard, Can. J. Chem., 1974, 52, 88.
18 E. Waldhör, B. Schwederski and W. Kaim, J. Chem. Soc., Perkin Trans., 1993, 2109.
19 G.C.A. Luijkx, F. van Rantwijk and H. van Bekkum, Carbohydr. Res., 1993, 242, 131.

35
20 K. Kobayashi, Y. Kanno and H. Suginome, J. Chem. Soc., Perkin Trans., 1993, 1449.
21 S. Poigny, M. Guyot and M. Samadi, Tetrahedron, 1998, 54, 14791.
22 S. Poigny, M. Guyot and M. Samadi, J. Org. Chem., 1998, 63, 5890.
23 T. Yoon, S.J. Danishefski and S. de Cala, Angew. Chem., Int. Ed. Engl., 1994, 33, 853.
24 G. Lente and J.H. Espenson, New J. Chem., 2004, 28, 847.
25 J.M. Campos-Martin, G. Blanco-Brieva and J.L.G. Fierro, Angew. Chem., Int. Ed.,
2006, 45, 6962.
26 C.E. Crouthamel, H.V. Meek, D.S. Martin and C.V. Banks, J. Am. Chem. Soc., 1949,
71, 3031.
27 K. Kustin and E. C. Lieberman, J. Phys. Chem., 1964, 68, 3869.
28 I. Pecht and Z. Lutz, J. Am. Chem. Soc., 1965, 87, 4068.
29 J. Evans, W. Levason and M.D. Spicer, J. Chem. Soc., Dalton Trans., 1990, 2307.
30 I. Kerezsi, G. Lente and I. Fábián, Dalton Trans., 2004, 342.
31 K.C. Kurien and P.A. Robins, J. Chem. Soc. B, 1970, 855.
32 M. Shirai, T. Awatsuji and M. Tanaka, Bulletin of the Chemical Society of Japan, 1975,
48, 1329.
33 A.I. Ononye, A.R. McIntosh and J.R. Bolton, J. Phys. Chem., 1986, 90, 6266.
34 A.I. Ononye and J.R. Bolton, J. Phys. Chem., 1986, 90, 6270.
35 A.E. Alegría, A. Ferrer and E. Sepúlveda, Photochem. Photobiol., 1997, 66, 436.
36 A.E. Alegría, A.Ferrer, G. Santiago and E. Sepúlveda, W. Flores, J. Photochem.
Photobiol., A, 1999, 127, 57.
37 H. Görner and C. Sonntag, J. Phys. Chem. A, 2008, 112, 10257.
38 B. Tonomura, H. Nakatani, M. Ohnishi, J. Yamaguchi-Ito and K. Hiromi, Anal.
Biochem., 1978, 84, 370.
39 Scientist 2.01, Micromath Software, Salt Lake City, UT, 1995.

36
40 E. Farkas, P. Buglyó, É.A. Enyedy and M.A. Santos, Inorg. Chim. Acta, 2004, 357,
2451.
41 A.W. Bott, Current Separations, 1995, 14, 64.
42 http://spectroline.drupalgardens.com/content/fc-series
43 T. Lehóczki, É. Józsa and K. Ősz, J. Photochem. Photobiol., A, 2013, 251, 63.
44 M. Gombár, É. Józsa, M. Braun and K. Ősz, Photochem. Photobiol. Sci., 2012, 11,
1592.
45 A.D. Becke, J. Chem. Phys., 1993, 98, 5648.
46 C. Lee, W. Yang and R.G. Parr, Phys. Rev., 1988, B37, 785.
47 P.J. Stephens, F.J. Devlin, C.F. Chabalowski and M.J. Frisch, J. Phys. Chem., 1994, 98,
11623.
48 J. Tomasi, B. Mennucci and R. Cammi, Chem. Rev., 2005, 105, 2999.
49 G. Scalmani and M.J. Frisch, J. Chem. Phys., 2010, 11, 114110.
50 J. Tomasi, B. Mennucci and E. Cancès, J. Mol. Struct. (Theochem), 1999, 464, 211.
51 J.L. Pascual-Ahuir, E. Silla and I. Tuñón, J. Comp. Chem., 1994, 15, 1127.
52 C. Peng, P.Y. Ayala, H.B. Schlegel and M.J. Frisch, J. Comput. Chem., 1996, 17, 49.
53 C. Peng and H.B. Schlegel, Isr. J. Chem., 1994, 33, 449.
54 M. Head-Gordon, J.A. Pople and M.J. Frisch, Chem. Phys. Lett., 1988, 153, 503.
55 M. Head-Gordon and T. Head-Gordon, Chem. Phys. Lett., 1994, 220, 122.
56 S. Saebo and J. Almlof, Chem. Phys. Lett., 1989, 154, 83.
57 M.J. Frisch, M. Head-Gordon and J.A. Pople, Chem. Phys. Lett., 1990, 166, 275.
58 M.J. Frisch, M. Head-Gordon and J.A. Pople, Chem. Phys. Lett., 1990, 166, 281.
59 M.J. Frisch, G.W. Trucks, H.B. Schlegel, G.E. Scuseria, M.A. Robb, J.R. Cheeseman,
G. Scalmani, V. Barone, B. Mennucci, G.A. Petersson, H. Nakatsuji, M. Caricato, X.
Li, H.P. Hratchian, A.F. Izmaylov, J. Bloino, G. Zheng, J.L. Sonnenberg, M. Hada, M.

37
Ehara, K. Toyota, R. Fukuda, J. Hasegawa, M. Ishida, T. Nakajima, Y. Honda, O.
Kitao, H. Nakai, T. Vreven, J.A. Montgomery, J.E. Peralta, F. Ogliaro, M. Bearpark, J.
J. Heyd, E. Brothers, K.N. Kudin, V.N. Staroverov, R. Kobayashi, J. Normand, K.
Raghavachari, A. Rendell, J.C. Burant, S.S. Iyengar, J. Tomasi, M. Cossi, N. Rega, N.J.
Millam, M. Klene, J.E. Knox, J.B. Cross, V. Bakken, C. Adamo, J. Jaramillo, R.
Gomperts, R.E. Stratmann, O. Yazyev, A.J. Austin, R. Cammi, C. Pomelli, J.W.
Ochterski, R.L. Martin, K. Morokuma, V.G. Zakrzewski; G.A. Voth, P. Salvador, J.J.
Dannenberg, S. Dapprich, A.D. Daniels, Ö. Farkas, J.B. Foresman, J.V. Ortiz, J.
Cioslowski and D.J. Fox, Gaussian 09, Gaussian, Inc.: Wallingford CT, 2009.
60 M.G. Evans and N. Uri., Trans. Faraday Soc., 1949, 45, 224.
61 G. Lente, I. Fábián and A.J. Poe, New J. Chem., 2005, 29, 759.
62 T. Hosoya and T. Rosenau, J. Org. Chem., 2013, 78, 3176.
63 P. Li, W. Wang, S. Bi and H. Sun, Struct. Chem., 2013, 24, 1253.
64 R.D. Rieke, T. Saji and N. Kujundzic, J. Electroanal. Chem., 1979, 102, 397.
65 S.I. Bailey and I.N. Ritchie, Electrochim. Acta, 1985, 30, 3.
Copyright © 2022 FDOKUMEN