Seismic axial collapse of shear damaged heavily reinforced ...
42
1 Seismic axial collapse of shear damaged heavily reinforced shear walls experiencing cyclic tension-compression excursions: A Modified Mohr’s Axial Capacity Model D.T.W. Looi, R.K.L. Su* Department of Civil Engineering, The University of Hong Kong, Pokfulam Road, Hong Kong *Corresponding author: Ray K.L. Su, Email address: [email protected] ABSTRACT A special class of RC shear wall is identified with short shear span, attributed to the high coupling degree in the elastic design of tall buildings located in low-to-moderate seismicity regions. The short shear span characteristic precludes plastic hinge formation and increase the susceptibility of shear failure during seismic events. It is noted that shear damage alone does not indicate collapse by default. This paper formulates a Modified Mohr’s Axial Capacity Model associated with out-of-plane buckling, to quantify the residual axial capacity of shear damaged heavily reinforced walls. The model was benchmarked against four walls previously tested to axial failure. Keywords: reinforced concrete shear walls; short shear span; axial collapse, out-of-plane buckling; Mohr’s circle; low-to-moderate seismic region Shortened title: Axial collapse model for shear walls 1. Introduction
-
Upload
khangminh22 -
Category
Documents
-
view
0 -
download
0
Transcript of Seismic axial collapse of shear damaged heavily reinforced ...

1
Seismic axial collapse of shear damaged heavily reinforced shear walls
experiencing cyclic tension-compression excursions: A Modified Mohr’s Axial
Capacity Model
D.T.W. Looi, R.K.L. Su*
Department of Civil Engineering, The University of Hong Kong, Pokfulam Road, Hong Kong
*Corresponding author: Ray K.L. Su, Email address: [email protected]
ABSTRACT
A special class of RC shear wall is identified with short shear span, attributed to the high
coupling degree in the elastic design of tall buildings located in low-to-moderate seismicity
regions. The short shear span characteristic precludes plastic hinge formation and increase the
susceptibility of shear failure during seismic events. It is noted that shear damage alone does not
indicate collapse by default. This paper formulates a Modified Mohr’s Axial Capacity Model
associated with out-of-plane buckling, to quantify the residual axial capacity of shear damaged
heavily reinforced walls. The model was benchmarked against four walls previously tested to
axial failure.
Keywords: reinforced concrete shear walls; short shear span; axial collapse, out-of-plane
buckling; Mohr’s circle; low-to-moderate seismic region
Shortened title: Axial collapse model for shear walls
1. Introduction

2
The axial collapse of a special class of reinforced concrete (RC) shear walls due to seismic
activity has been experimentally investigated in Looi et al. [2017] and Looi [2017] with seven
walls; see Table 1. This special class of RC shear walls is largely found in shear wall buildings
located in low-to-moderate seismic regions but at the same time, experience high typhoon winds
(such as Hong Kong). The buildings are not seismically designed but strongly coupled with
coupling beams to control roof drift. These walls, which have the distinct features of a short
shear span (with or without a transfer structure), the ability to sustain a considerable axial load
and are not designed with a strength hierarchy, are essentially a sub-structure at the base of a
coupled shear wall. Figs. 1(a) and 1(b) are typical examples of these types of walls, where the
wall adjacent to the transfer structure as shown in Fig. 1(b) has the smallest ratio of the shear
span-to-length (SLR = a/L, where a is the shear span of the wall and L is the length of the wall).
Bending moment diagrams (BMD) are drawn next to the walls to show the shear span changes.
The axial collapse behaviour of RC walls with a short shear span is found to be significantly
dependent on the applied axial stress to shear stress capacity ratio (p/v) in previous test results
[Looi, 2017]. Fig. 2 illustrates the unique variations in the patterns of axial stiffness (Kaxial) of
wall specimens with a short shear span that spans the drift ratios (DR). Fluctuations in the axial
stiffness are observed in Fig. 2(a) for Specimens C30-N-ALR01, C30-N-ALR02, C30-B-ALR02
and C30-N1%-ALR02 with p/v < 2. These wall specimens show axial tensile extension at certain
drifts due to the tension of the vertical reinforcements, rotation of the diagonal struts in the
concrete, and unrecoverable cracks. The vertical reinforcement was monolithically cast with
sufficient anchorage length provided by a continuous 90 degree hook in the base, allowing full
development of bond strength, hence the possibility of steel being pulled-out from the footing is
unlikely and may not cause axial tensile extension. Degradation of axial stiffness under

3
compression action can be observed in Fig. 2(b) for p/v ≥ 2, including cases with a high axial
load (C30-N-ALR03 and C30-N-ALR04) and more concrete strength (C60-N-ALR02), which
differentiate them from those with previous fluctuating behaviour. Plotting the axial stiffness
degradation is useful for providing a unique perspective into the governing failure mode. Table 2
summarises the p/v ratio of the tested walls. In the opinion of the author, a p/v ratio of 2 appears
to be the point that differentiates between the two different types of axial stiffness behaviours
(i.e., tension-compression or compression-compression excursions). Interestingly, the axial load
ratio (ALR = Po / (Ag fc,m′), where Po is the axial load sustained by the wall at zero eccentricity,
Ag is a gross cross-sectional area of the wall and fc,m′ is the mean strength of the concrete) is not
a direct indication of axial collapse but also depends on the shear stress capacity to differentiate
the failure mode from axial collapse. For example, p/v < 2 applies to an ALR of about 0.2 on a
30 MPa wall (C30-N-ALR02) whereas p/v ≥ 2 would apply to an ALR of about 0.2 on a 60
MPa wall (C60-N-ALR02).
Occasionally, a compression-compression load history (p/v ≥ 2) may also be found at the
wall edge where there may not be tensile strain beyond yielding. However, such sudden brittle
failure in the inelastic compression range as demonstrated in the testing of C30-N-ALR03, C30-
N-ALR04 and C60-N-ALR02 suggests that precaution should be taken with a wall with p/v ≥ 2.
A simple fix is to limit the p/v ratio in structural framing (and not simply the ALR as observed in
design codes) or apply capacity design factors to form flexural hinges, which means that this will
not be a wall with a short spear span. If p/v ≥ 2 is unavoidable, Looi et al. [2017] recommended
a check for collapse caused by drifting to determine whether there is axial collapse. Note that the
scope of the model proposed in this work is to specifically address walls with short shear span
with p/v < 2 that are subjected to cyclic tension-compression excursions.

4
2. Research significance
The detrimental effects of axial loading as evidenced from past experiences with earthquakes
[Carpenter et al., 2011; Westenenk et al., 2012] demonstrate the risk of shear wall failure under
axial loading after experiencing shear failure. The shortcomings of structural features in many
low-to-moderate seismic regions, such as vertical irregularities with shear walls constructed
adjacent to transfer structures and the inability of shear walls to form plastic hinges prior to shear
failure indicate that there is a need for structural engineers to re-examine the seismic
performance of this special class of RC walls with short shear span. However, there is no
appropriate method available to perform this check. Hence, a Modified Mohr’s Axial Capacity
Model is proposed in this paper along with a set of procedures that explicitly check the seismic
capacity for axial collapse of shear walls with short shear span. This analytical model is
expressed as an ALR based on Mohr’s circle framework, which involves the compression
buckling of vertical steel reinforcements at the onset of instability, as opposed to the
conventional consideration of tension and compression steel in designing for in-plane force in
RC membrane panel [Clark, 1976] with a standard Mohr’s circle.
3. Literature review
3.1 Axial collapse model of shear walls
With the understanding of the potential risk of the axial collapse of walls due to seismic
activity, a quick review of the literature shows that the focus of many in the literature is on the
axial collapse of columns and not walls [Elwood and Moehle, 2005; Hashemi et al., 2017].

5
Wallace et al. [2008] investigated a method to assess the axial load-carrying capacity of lightly
reinforced wall piers (0.3% reinforcement ratio) but derived a shear friction model which cannot
be directly applied to the context of Hong Kong for walls with short shear span because common
practice is heavy reinforcement and shear friction failure is not the dominant mode of failure as
observed in related experiments [Looi et al., 2017; Looi, 2017].
An arch resistance model [Yang et al., 2015] was proposed to evaluate the residual axial load
carrying capacity of RC columns. The model was based on the sound theory of structural
mechanics by extending the shear friction model [Wallace et al., 2008] to confined concrete with
partially crushed core. However, the study did not consider buckling of the vertical
reinforcement prior to axial collapse which contradicts the experimental evidence in the extant
literature [Looi et al., 2017; Looi, 2017].
3.2 Out-of-plane buckling model of shear walls
Fig. 3 shows the out-of-plane buckling of shear walls observed in the Christchurch
earthquake [Kam et al., 2011] and experiments carried out by the authors [Looi et al., 2017; Looi,
2017]. Similar out-of-plane buckling was experimentally observed by others (see [Goodsir, 1985;
Rosso et al., 2016]). By examining the axial collapse of walls through the conventional energy
method or kinematic relations (similar to the formulation by Euler [1759] for structurally
unstable critical load in columns), it is postulated that axial collapse is closely associated with
out-of-plane buckling under in-plane cyclic loading with the presence of axial loading. The
distinct effects of the p/v ratio for categorising the failure mode associated with out-of-plane
buckling are schematically shown in Fig. 4. When p/v < 2, tensile stress is present which
indicates that the wall may experience cyclic inelastic tension-compression excursions (see Fig.
4(a)). When p/v ≥ 2, the applied ALR is two times larger than the normalised shear stress, and

6
the entire wall experiences cyclic compression-compression loading with elastic recoverable
tensile strain (see Fig. 4(b)). Underlying this assumption are three key mechanical models
developed for out-of-plane buckling, namely: (i) Paulay and Priestley [1993] (hereinafter PP-93),
(ii) Chai and Elayer [1999] (hereinafter CE-99) and (iii) Parra and Moehle [2017] (hereinafter
PM-17).
Eq. (1) shows the indicative value of normalised out-of-plane displacement (ξ) as a function
of the mechanical ratio of the longitudinal reinforcement (m) at the wall edge proposed by
Paulay and Priestley [1993].
ξ ≤ 0.5(1 + 2.35m - √5.53m2+4.70m) (1)
where m equals to ρv fy,v / fc′, ρv is the vertical reinforcement ratio, fy,v is the yield strength of the
vertical reinforcement and fc′ is the strength of the concrete cylinder.
Various equations to estimate the maximum residual tensile strain (εsm) of the longitudinal
reinforcement in the preceding cycle before buckling occurs are shown in Eqs. (2) to (4) for PP-
93, CE-99 and PM-17 respectively.
PP-93: εsm = 8 βcr (t
Lbuck
)2 ξ (2)
CE-99: εsm = π2
2(
t
Lbuck
)2 ξ + 3εy (3)
PM-17: εsm = κπ2 (t
Lbuck
)2 ξ + 0.005 (4)
where βcr and κ are 0.8 to take account for the distance from the vertical reinforcement to the
point of the initial crack closure, t is the thickness of the wall, Lbuck is the buckling length along
the wall height, ξ is in accordance with Eq. (1) and εy is the yield strength of the vertical

7
reinforcement. Besides the publications by respective authors of PP-93, CE-99 and PM-17, more
detailed form of derivation can be followed by referring to Appendix B in Maffei et al. [2014].
The models of PP-93, CE-99 and PM-17 are broadly similar but with subtle differences in
assumptions of the out-of-plane buckling curvature shape (i.e. constant curvature or sinusoidal
curvature) and in the buckling length (i.e. buckling length of wall or full height of pinned-pinned
column). Some studies [see for e.g., Rosso et al., 2016; Chai and Elayer, 1999; Menegon et al.,
2015] have concluded that both the PP-93 and CE-99 models provide conservative estimations of
the residual tensile strain, but that provided by Eq. (3) of CE-99 is closer to the test results of
columns [Chai and Elayer, 1999] and walls [Menegon et al., 2015]. Nonetheless, the wall
experimental results [Rosso et al., 2016] showed that normalised out-of-plane displacement (ξ)
can be greater than 0.5, which will affect the estimation of maximum residual tensile strain (εsm).
The simplification in PM-17 [Parra and Moehle, 2017] is supposed to be a reasonable
approximation that describes the behaviour of uniformly loaded columns tested by Chai and
Elayer [1999].
3.3 Modelling of post-yield buckling of rebar
Eqs. (2) to (4) are useful for estimating the maximum residual tensile strain in vertical
reinforcements prior to buckling; however, they do not provide the equivalent buckling stress of
the reinforcements. To address this limitation, Dhakal and Maekawa [2002a] provided a simple
model which can estimate the critical buckling stress (σbuck) of vertical bars based on the inter-
relationship between the average tension and the compression envelope. The model is
mathematically expressed in Eqs. (5a) to (5c) as summarised below.

8
0.1≤≤75.0;5.1
≤;300
-+75.0=where
2.0≥*);100
016.0-1.1(=*
*
7≥100
3.2-55=*
:*) *,(point teintermediaat
y
u
y
shu
y
y
s
buck
l
y
s
buck
y
l
f
f
ffL
fL
(5a)
)-*
-)(
*
*-1(-1=
:*)≤≤(plateau yieldat
y
ysm
ll
buck
smy
(5b)
ysmsbuck
sm
fE 2.0≥*)-(02.0-*=
:*)≥( slope descendingn compressio hardening,strain at tension
(5c)
where ε* and σl* are the strain and stress respectively of a special intermediate point on the
tension envelope when the compression stress starts to decrease, σ* is the corresponding stress of
the intermediate point, σl is the point-wise stress corresponding to strain ε, εy denotes the yield
strain of steel, εu denotes the ultimate strain of steel, εsh denotes the strain of the steel at the
beginning of strain-hardening, εsm was defined in Eqs. (2) to (4), s is the diameter of the steel, fy
is the yield strength of the steel, fu is the ultimate strength of the steel and Es is the modulus of
elasticity of the steel.
4. Analytical model development
4.1 Modified Mohr’s Axial Capacity Model
In this paper, the ALR capacity prior to collapse is formulated based on Mohr’s circle
framework [Clark, 1976], but modified with the inclusion of reinforcement buckling. Fig. 5

9
illustrates the vertical axial capacity formulation expressed in a Mohr’s circle framework, with
normalised normal stress (σ/fc΄) as the abscissa and normalised shear stress (τ/fc΄) as the ordinate.
Fig. 5(a) is the envelope circle of steel reinforcements provided by horizontal steel reinforcement
in tension and vertical steel reinforcement in compression buckling. Fig. 5(b) plots the
contribution of cracked concrete, where the cracked concrete is assumed to have zero tension
capacity at the onset of collapse. The axial collapse of the shear wall due to the buckling of the
vertical reinforcement is assumed to take place after diagonal shear failure of the reinforced
concrete. The limitations of the model are discussed in the latter part of this paper. Eq. (6) is a
mathematical representation of Figs. 5(a) and 5(b) at the compression stress axis.
'+
'=ALR
'+
'=
'
+=
cap
cc
buckv
cc
buckv
c
cap
buckvcap
f
v
f
f
v
ff
p
vp
(6)
where pcap is the axial compression stress capacity, ALRcap is the ALR capacity of the wall, ρv is
the vertical reinforcement ratio at the wall edge or centre, σbuck is the compression buckling stress
of the reinforcement and v/fc′ is the normalised shear stress capacity. The compression buckling
stress capacity (σbuck) given by the vertical reinforcement can be estimated by using the Dhakal
and Maekawa model [2002a], which is modified in this paper in Eqs. (5a) to (5c).
4.2 Estimation of maximum shear stress capacity
In Fig. 5(c), the applied axial stress (p) is a known parameter in engineering design. The
challenge is then to estimate the shear stress capacity (v) of the wall with a short shear span. The

10
shear stress capacity can be conveniently estimated by using Eqs. (7a) to (7c) proposed in Looi et
al. [2017] for RC walls with short shear span.
da
da
da
da
f
vbevhv
c
/10.0+08.0-=D
/20.0-80.0=C
/25.0-60.0=B
/10.0-15.0=Awhere
limit)(design 0.2≤
limit)(upper 0.5≤
D+C+B+)ALR(A+02.0=' ,
4.0
(7a)
where ωv, ωh and ωv,be are the mechanical ratio of the vertical longitudinal reinforcement,
horizontal stirrups and vertical reinforcement of the boundary confinement on one side,
respectively and defined in Eq. 7(b).
'=;
'=;
'=
,
,,
,,
cc
bey
bevbev
c
hy
hh
c
vy
vv f
f
f
f
f
f (7b)
where ρv is the vertical and longitudinal reinforcement ratio, ρh is the horizontal stirrup ratio, ρv,be
is the vertical reinforcement ratio of the boundary confinement on one side, fy,v is the yield
strength of the vertical longitudinal reinforcement, fy,h is the yield strength of the horizontal
stirrups, fy,be is the yield strength of the vertical reinforcements of the boundary confinement and
fcc′ is the confined concrete strength of the boundary confinement. It should be noted that the
reinforcement ratios (ρv, ρh and ρv,be) are decimal numbers (not percentage) when applying the
model. a denotes the shear span of the wall and the effective shear depth (d) is assumed to be 0.8
L, where L is the wall length.
The confined concrete strength is defined in Eq. 7(c).

11
)
'
1)()((,1min=
where
+'='
,
,
,,
,,
c
hoopy
volhoopbe
vbeh
be
hoopv
be
conf
hoopyvolhoopbeconfccc
f
fs
l
s
lC
fCff
(7c)
where lbe is the length of the boundary confinement along the in-plane direction of the wall
specimen, sv,hoop is the vertical distance between the hoops on the specimen in the boundary
confinement, sh,vbe is the horizontal distance between the vertical reinforcements in the boundary
confinement along the in-plane direction of the wall specimen, ρhoopbe,vol is the volumetric ratio of
the hoop steel reinforcements (in percentage) and fy,hoop is the yield strength of the hoops.
5. Analytical model calibration by using numerical analysis
5.1 Numerical modelling of RC walls with short shear span
Non-linear finite element analysis (NLFEA) models were constructed by using VecTor2
[Vecchio, 1989] to benchmark with the experimental results in Looi et al. [2017] and Looi
[2017]. VecTor2 is based on the modified compression field theory (MCFT) [Vecchio and
Collins, 1986] and a refined version of the disturbed stress field model (DSFM) [Vecchio, 2000]
implemented into NLFEA routines for concrete structures.
The base compression pre-peak and post-peak curves for the concrete constitutive model
were assigned the Popovics model for normal-strength concrete [Popovics, 1973] or Popovics
model for high-strength concrete [Collins and Porasz, 1989; Thorenfeidt et al., 1987] depending
on the concrete strength for walls with p/v < 2. A substantial sharp reduction in the compression

12
post-peak for walls with p/v ≥ 2 was found to be better simulated with the modified Park-Kent
model [Kent and Park, 1971; Park et al., 1982]. Compression softening was modelled by using
Vecchio 1992-B (e1/e0-Form) [Vecchio, 1992]; the tension stiffening effects were modelled by
using the modified Bentz 2003 model [Bentz, 2005] and the tension softening effects were
modelled by using nonlinear tension softening (derived by Hordijk who used data from
Cornelissen et al. [1986]). VecTor2 uniquely considers both tension stiffening in cracked
concrete and tension softening in regular concrete by taking the larger value in the post-cracking
principal tensile stress [Wong et al., 2002]. Other inputs for concrete are shown in Table 3,
which are taken from the literature [Wong et al., 2002; Palermo and Vecchio, 2007].
For the steel constitutive model, Seckin’s model [1981] which accounts for the Bauschinger
effects was selected; dowel actions that use the Tassios crack slip model [Vintzeleou and Tassios,
1986] were included due to the heavily reinforced features of the wall specimens which may
increase the shear capacity. The reinforcement buckling is modelled by using the model in
Akkaya et al. (modified Dhakal-Maekawa model) [Akkaya et al., 2013] to account for the
buckling effects of the reinforcement.
The wall was modelled with plane membrane elements and the meshing was fixed at 50 x 50
mm, which is finer than the recommended mesh size in related VecTor2 mesh sensitivity studies
[Palermo and Vecchio, 2007; Lu and Henry, 2017]. Nonetheless, a quick sensitivity study
showed that a finer mesh of 25 x 25 mm provides comparable results. The wall was subjected to
reverse-cyclic loading (by support displacement) with two repeated cycles at each target
displacement at the centroid node at a height of 950 mm above the base beam. Vertical loading
was applied along the top rigid RC beam by distributing the load onto 19 nodes. The base of the
walls was modelled as a fixed boundary with multiple nodes that are pinned. As observed from

13
the experiment [Looi et al., 2017], there was no noticeable shear sliding. The contribution of
friction resistance between wall-base of the monolithically cast specimen is exceptionally high,
and hence interface joint element was not considered for this case.
Due to the size difference of the concrete wall and base, the shrinkage effects were
investigated by using the pre-strain function in VecTor2 [Vecchio, 1989]. A -400 microstrain
suggested by Palermo and Vecchio [2002] and up to an average ultimate of -780 microstrain
proposed in ACI 209.2R-08 [2008] was applied over a wall height of about twice the thickness
(i.e., 150 mm) above the base. It was found that a larger pre-strain “softens” the stiffness.
However, there was no significant effects on the peak strength, post-peak values and pinching of
hysteresis loop. Interestingly, the initial stiffness of the model without considering pre-strain fits
the best with all the walls tested previously by the authors in Looi et al. [2017].
Since walls with short shear span are commonly heavily reinforced (1% to 2% of the
reinforcement ratio), the use of smeared reinforcements in modelling can thus be justified. It is
worth noting that even for lightly reinforced walls, some researchers have found that smeared
reinforcement models provide as good or a similar degree of accuracy compared to explicit truss-
link reinforcement models [Hoult et al., 2017]. The default non-linear analysis parameters are
used which is recommended for shear wall analysis. Typical NLFEA models of the tested walls
[Looi et al., 2017; Looi, 2017] simulated with a pre-processor, FormWorks, developed for
VecTor2 modelling [Wong et al., 2002] are shown in Fig. 6, in which Fig. 6(a) shows the model
for C30-B-ALR02 with distinct regions of the boundary confinement and Fig. 6(b) shows the
model for the rest of the tested walls with different configurations of the applied axial stress,
concrete strength and reinforcement ratio.
14
The results of the NLFEA models can be readily extracted by using a program called
Augustus as a post-processing tool [Bentz, 2010]. The maximum residual tensile strain at the
cycle before buckling instability takes place was extracted from the elements found at the two
edges at the bottom of the wall with p/v < 2.
5.2 Calibration of buckling length
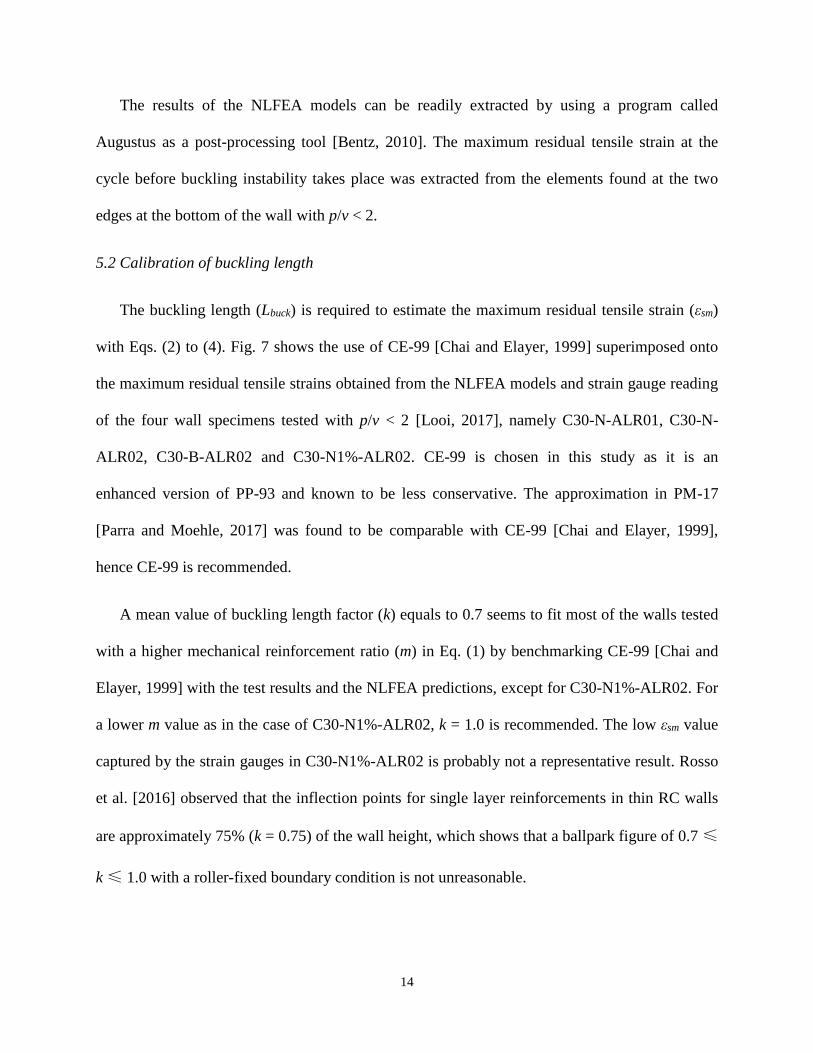
The buckling length (Lbuck) is required to estimate the maximum residual tensile strain (εsm)
with Eqs. (2) to (4). Fig. 7 shows the use of CE-99 [Chai and Elayer, 1999] superimposed onto
the maximum residual tensile strains obtained from the NLFEA models and strain gauge reading
of the four wall specimens tested with p/v < 2 [Looi, 2017], namely C30-N-ALR01, C30-N-
ALR02, C30-B-ALR02 and C30-N1%-ALR02. CE-99 is chosen in this study as it is an
enhanced version of PP-93 and known to be less conservative. The approximation in PM-17
[Parra and Moehle, 2017] was found to be comparable with CE-99 [Chai and Elayer, 1999],
hence CE-99 is recommended.
A mean value of buckling length factor (k) equals to 0.7 seems to fit most of the walls tested
with a higher mechanical reinforcement ratio (m) in Eq. (1) by benchmarking CE-99 [Chai and
Elayer, 1999] with the test results and the NLFEA predictions, except for C30-N1%-ALR02. For
a lower m value as in the case of C30-N1%-ALR02, k = 1.0 is recommended. The low εsm value
captured by the strain gauges in C30-N1%-ALR02 is probably not a representative result. Rosso
et al. [2016] observed that the inflection points for single layer reinforcements in thin RC walls
are approximately 75% (k = 0.75) of the wall height, which shows that a ballpark figure of 0.7 ≤
k ≤ 1.0 with a roller-fixed boundary condition is not unreasonable.

15
Calculations were carried out by using an alternative solution based on RC columns [Dhakal
and Maekawa, 2002b]. The buckling length is approximately in the order of the distance of two
to four stirrups which is about 150 mm to 400 mm (except for C30-N1%-ALR02) which
corresponds to k = 0.5, and about a distance of four stirrups (560 mm corresponds to k = 0.7) for
C30-N1%-ALR02. The results indicated that a higher εsm can be attained but subjected to
uncertainties. The actual behaviour is indeed more complex than the idealised mechanism
proposed by PP-93 [Paulay and Priestley, 1993], CE-99 [Chai and Elayer, 1999] or PM-17 [Parra
and Moehle, 2017]; for example, the redistribution of internal forces takes place after concrete
cover and partial core spallings, imperfect vertical alignment of the reinforcements which causes
eccentricity and strain gradients along the wall length are likely to affect the local buckling
length at the edge of the walls. Therefore, for this study, Lbuck for walls with p/v < 2 is considered
with a buckling length factor in the range of 0.7 ≤ k ≤ 1.0, which most approximates the
experimental and NLFEA results.
6. Explicit check on axial collapse validated with experimental results
A systematic and explicit check on the axial collapse of RC walls with short shear span that
incorporates the Modified Mohr’s Axial Capacity Model is proposed here to serve as a final
check after the routine structural design of walls. A flowchart is provided in Fig. 8 to better
explain the process. Two of the most important factors, namely the ALR capacity and the axial
stress demand will be elaborated, as follows.
6.1 Axial capacity of RC shear walls with short shear span

16
The axial capacity of RC shear walls with short shear span can be estimated in eight steps, as
shown on the left diagram of Fig. 8. They are as follows.
Step 1: The SLR is determined.
Prior to achieving a wall with a short shear span, the SLR needs to be determined. The SLR can
be obtained after carrying out a standard structural analysis with M/(VL) computation, where M
is the bending moment at the base of the wall, V is the shear force at the base of the wall and M/V
yields the shear span (a). The results of a previous study carried out by the authors [Su and Looi,
2016; Looi et al., 2015] indicated that two distinct types of shear performances are identified in
two groups, namely Group 1 which has a strut angle of 30° (SLR = 1.7) and Group 2 which has
strut angles of 45° and 60° (SLR = 1.0 and 0.6 respectively). It should be noted that these strut
angles refer to angles formed by the diagonal strut imposed by a point load with respect to the
longitudinal axis of a deep RC beam, and not to be confused with the strut angle in RC walls
with short shear span. However, the SLR parameter is commonly shared among them.
Furthermore, a study on SLR [Looi, 2017] indicated that a wall with a short shear span should
have an SLR of less than or equal to 1.5. If a wall has an SLR greater than 1.5, it is a slender wall
and hence beyond the scope of this study.
Step 2: The shear stress capacity is estimated.
After confirming that the shear wall is a wall with short shear span, the shear stress capacity (v)
which is the shear response of the wall with short shear span that interacts with the axial stress
(vp), concrete strength (vc) and reinforcement (vs), has to be estimated. The previously developed
model [Looi et al., 2017] that is rewritten in Eqs. (7a) to (7c) are the recommended empirical
equations for estimating the shear stress of walls with short shear span.

17
Step 3: Zone S or F
A standard analysis of the axial moment with a slope of the axial-moment (P-M) is carried out to
theoretically obtain the flexural moment (Mf) and further compute the associated shear (Vf) by
dividing Mf by its shear span (Vf = Mf/a). The ratio of the Vf to the shear capacity (V = v x bd)
calculated in Step 2 is to further differentiate the wall with short shear span into either a shear
controlled (Zone S) or flexural controlled (Zone F) wall. If a segment of the wall has a Vf / V that
is less than unity, it is a flexural controlled wall in Zone F and hence beyond the scope of this
study. On the contrary, if the wall has Vf/V that is more or equal to unity (i.e., Zone S), then Step
4 is carried out.
Step 4: The axial stress over shear stress (p/v) ratio and its governing failure modes are used.
The axial stress demand (p) is a known parameter in engineering design and the shear stress
capacity (v) is calculated in Step 2. The distinct use of the p/v ratio for categorising the failure
modes have been previously discussed, where p/v < 2 denotes cyclic tension-compression
excursions and p/v ≥ 2 denotes cyclic compression-compression excursions.
Step 5a: The buckling length is estimated.
The buckling length factor (k) was calibrated from the NLFEA models and tests, based on the
physical formulation of CE-99 [Chai and Elayer, 1999]. k = 0.7 is recommended for a higher
reinforcement ratio of 2% vertical reinforcement (m > 0.4 with approximately fy,v = 600 MPa and
fc′ = 30 in Eq. (1)) and k = 1.0 is recommended for a lower reinforcement ratio of 1% vertical
reinforcement (m < 0.4).
Step 5b: Collapse due to drift is checked.

18
A check for collapse due to drift is recommended per Looi et al. [2017] for walls with short shear
span with p/v < 2 before proceeding to Step 6.
Step 6: The maximum residual tensile strain of the vertical reinforcement is estimated.
With k determined in Step 5a, the maximum residual tensile strain (εsm) can be easily estimated
by using Eq. (3). CE-99 [Chai and Elayer, 1999] is applied here as it is known to be less
conservative and particularly important as an ultimate check for axial collapse in the rare event
of an earthquake in low-to-moderate seismic region.
Step 7: Post-yield buckling of rebar is modelled.
The critical buckling stress (σbuck) of the vertical bars that is formulated based on the inter-
relationship between the average tension and the compression envelope [Dhakal and Maekawa,
2002a] can be estimated by using Eqs. (5a) to (5c).
Step 8: The ALR capacity is computed.
The ALR capacity that is mathematically formulated in Eq. (6) is computed based on the
proposed Modified Mohr’s Axial Capacity Model.
6.2 Axial stress demand on RC shear walls with short shear span
Out-of-plane buckling in a wall typically occurs at the edges before it takes place at the
centre of the wall. The axial damage at the edge of a wall with short shear span may lead to
significant P-delta effects from the walls above that are beyond the shear span, and eventually
leads to a near collapse state in which the walls cannot be repaired. Hence, axial collapse is
assumed when the axial stress of an element at the edge of a wall exceeds its axial capacity. The
axial stress of RC walls with short shear span can be calculated in two steps (Steps 9 to 10) as

19
shown on the right side of Fig. 8. Steps 11 to 12 are optional steps to determine whether there is
axial collapse at the centre of the wall.
Step 9: The strut-and-tie method is adapted.
The strut-and-tie method (STM) can be adapted to provide another perspective, in which the
walls can be idealised with an embedded diagonal strut balanced by a tension tie that has yielded
in the longitudinal steel in cyclic tension-compression (p/v < 2) (see Fig. 9(a)). On the other hand,
in cyclic compression-compression (p/v ≥ 2), the walls can be considered as a large fan shaped
strut in the STM, which induces significant crushing of the web at the base (see Fig. 9(b)). The
diagonal and fan shaped struts will impose additional axial stress at the wall edges, and hence
commonly, axial failure takes place at the wall edges first.
Depending on the SLR of the wall, additional vertical stress is induced by the diagonal strut
with the use of the STM. Eq. (8) is formulated to compound the total ALR demand at the wall
edges, where limits to the SLR are recommended, roughly corresponding to a strut angle (θ) of
30˚ ≤ θ ≤ 60˚ with respect to the horizontal axis of the shear wall.
5.1≤SLR≤5.0 where'
SLR×+=ALRedge
cf
vp (8)
Step 10: Axial collapse is checked at the wall edges.
The ALR capacity calculated in Step 8 is compared to the ALR demand at the wall edges in Step
9. If demand exceeds the capacity, axial failure will occur. Further calculations in Step 11 as
shown in Fig. 8 are then optional. However, if axial failure does not occur at the wall edges, the
wall is considered to be stable although it is experiencing shear damage.

20
6.3 Previously tested shear walls - examples
The procedure outlined above for explicitly checking axial collapse by using the Modified
Mohr’s Axial Capacity Model is applied to walls with short shear span that have been previously
tested [Looi, 2017]. Figs. 10(a) to 10(d) show the checks with the use of the Mohr’s circle for the
four tested walls with p/v < 2, namely C30-N-ALR01, C30-N-ALR02, C30-B-ALR02 and C30-
N1%-ALR02 respectively. The post-processed results of digital image correlation (DIC) show
that the cracks and spalled concrete are included to illustrate failure in the form of collapse at the
wall edges and centre of the wall near the base of the wall.
C30-N-ALR01 fails at the edges due to local out-of-plane buckling without causing a
noticeable decrease in axial stress during the test; nonetheless, the significant damage at the wall
edges cannot be repaired and axial shortening is a sign of axial collapse. Interestingly, the
Mohr’s circle of the applied ALRcentre in Fig. 10(a) is situated to the right of the Mohr’s circle of
the cracked concrete, thus indicating the existence of tension in the vertical steel. This explains
the large amount of concrete spalling observed in the testing.
Fig. 10(b) to 10(d) show the state of axial collapse at the wall edges and excluded the state at
the wall centre for clarity. C30-N-ALR02 experiences axial collapse at the wall edges (see Fig.
10(b)). C30-B-ALR02 has boundary confinements, which shows marginal failure due to axial
collapse at the wall edges (see Fig. 10(c)). It is worth noting that the computation for boundary
confinements requires a vertical steel ratio (ρv) of the boundary confinement on one side, and in
this case, it is about 3%. The ratio was calculated by taking the cover thickness into account,
with a wall thickness area of 80 mm and a boundary confinement length of 200 mm. C30-N1%-
ALR02 is a wall with less reinforcement, so its capacity is clearly less. Hence, C30-N1%-ALR-
02 fails at the wall (see Fig. 10(d)).

21
The results of the explicit checks concur well with the experimental results [Looi, 2017].
Details on the calculations used to estimate the maximum residual tensile strain by using CE-99
[Chai and Elayer, 1999] and buckling stress [Dhakal and Maekawa, 2002a] for one of the walls
with p/v < 2 (i.e. C30-N-ALR01) are found in Appendix A as an example of the ease of carrying
out the calculation steps. Table 4 shows a summary of the calculations in a tabulated form.
6.4 Limitations of the model
Assumptions were made in developing the Modified Mohr’s Axial Capacity Model. The
known limitations are highlighted here to remind engineers to use the model with care in
practical applications.
(a) The RC walls with short shear span are not designed with a strength hierarchy, have an SLR
that is less than 1.5, vertical reinforcement ratio that is more than 1%, and shear failure precedes
the formation of plastic hinges;
(b) axial collapse behaviour is assumed to be closely related to out-of-plane buckling;
(c) the Modified Mohr’s Axial Capacity Model should be only used to check walls with p/v < 2;
(d) walls with short shear span (with any value of p/v) should be checked for collapse by
examining the limits of drift;
(e) cracked concrete with zero tension capacity is assumed; and
(f) post-peak shear sliding failure is assumed does not occur at the base of walls with sufficient
dowel action, and hence axial collapse by means of concrete crushing and rebar buckling at the
wall edge precedes the shear yielding of the vertical reinforcements. The buckling of the vertical
reinforcement is assumed to take place after diagonal shear failure of the reinforced concrete.

22
This failure mode was observed from the experiment in Looi et al. [2017], with insignificant
pinching of hysteresis loop induced by shear sliding.
7. Summary
RC walls with short shear span are a special class of shear walls largely found in low-to-
moderate seismic regions. The risk of collapse of these walls due to seismic activity in the rare
event of an earthquake has called for a suitable method that can be used to check the ultimate
seismic performance of these walls. Hence, this paper has provided a Modified Mohr’s Axial
Capacity Model for estimating the axial collapse of RC walls with short shear span in seismic
events, which is expressed as an ALR formulated based on Mohr’s circle framework.
The Modified Mohr’s Axial Capacity Model assumes that the axial collapse of walls due to
seismic activity is closely related to out-of-plane buckling. The model incorporates the maximum
shear capacity of cracked concrete and the compression buckling of vertical steel reinforcements
at the onset of instability. The buckling length which is inter-dependent with the residual
maximum tensile strain is calibrated by using NLFEA numerical models and corroborated with
strain gauge readings from previous tests. A systematic procedure for determining the axial
collapse of RC walls with short shear span has been elaborated, and shown to agree well with the
observed axial collapse of four tested RC walls. Given that the proposed Modified Mohr’s Axial
Capacity Model along with an explicit process for determining axial collapse, structural
engineers can now perform checks on RC walls with short shear span within the limitations of
this model.

23
ACKNOWLEDGEMENTS
The research carried out in this paper gratefully acknowledges financial support from the
Research Grants Council of the Hong Kong SAR (Project No. HKU 17202315).
REFERENCES
ACI 209.2R-08 [2008] “Guide for modeling and calculating shrinkage and creep in hardened concrete,” American
Concrete Institute, Farmington Hills, MI, US.
Akkaya, Y., Guner, S. and Vecchio, F.J. [2013] “Modeling inelastic buckling behavior of reinforcing bars,” Proc. of
the American Concrete Institute Conference, Phoenix, AZ, US.
Bentz, E. [2005] “Explaining the riddle of tension stiffening models for shear panel experiments,” Journal of
structural engineering 131(9), 1422-1425.
Bentz, E. [2010] Augustus finite element analysis of reinforced concrete post processor for VecTor2 (Version 5.6.5),
Department of Civil Engineering, University of Toronto, Canada.
Carpenter, L.D., Naeim, F., Lew, M., Youssef, N.F., Rojas, F., Saragoni, G.R. and Adaros, M.S. [2011]
“Performance of tall buildings in Vina del Mar in the 27 February 2010 offshore Maule, Chile earthquake,” The
Structural Design of Tall and Special Buildings 20, 17-36.
Chai, Y.H. and Elayer, D.T. [1999] “Lateral stability of reinforced concrete columns under axial reversed cyclic
tension and compression,” ACI Structural Journal 96(5), 780-789.
Clark, L.A. [1976] “The provision of tension and compression reinforcement to resist in-plane forces,” Magazine of
Concrete Research 28(94), 3-12.

24
Collins, M.P. and Porasz, A. [1989] “Shear strength for high strength concrete,” in Bull. No. 193-Design Aspects of
High Strength Concrete, Comit6 Euro-International du Beton (CEB), 75-83.
Cornelissen, H.A.W., Hordijk, D.A. and Reinhardt, H.W. [1986] “Experimental determination of crack softening
characteristics of normalweight and lightweight concrete,” HERON 31(2), 45-56.
Dhakal, R.P. and Maekawa, K. [2002a] “Modeling for postyield buckling of Reinforcement,” Journal of Structural
Engineering, 128(9), 1139-1147.
Dhakal, R.P. and Maekawa, K. [2002b] “Reinforcement stability and fracture of cover concrete in reinforced
concrete members,” Journal of Structural Engineering 128(10), 1253-1262.
Elwood, K.J. and Moehle, J.P. [2005] “Axial capacity model for shear-damaged columns,” ACI Structural Journal
12(4), 578-587.
Euler, L. [1759] “Sur le forces des colonnes. Memoires de l’Academie Royale des Sciences et Belles Lettres,” 13,
Berlin (in French).
Goodsir, W.J. [1985] “The design of coupled frame-wall structures for seismic actions,” Ph.D. thesis, University of
Canterbury, Christchurch, New Zealand.
Gupta, P.R. [1998] “Shear design of reinforced concrete members under axial compression,” Ph.D. thesis,
Department of Civil Engineering, University of Toronto, Canada.
Hashemi, M., Tsang, H.H., Al-Ogaidi, Y., Wilson, J.L. and Al-Mahaidi, R. [2017] “Collapse assessment of
reinforced concrete building columns through Multi-Axis Hybrid Simulation,” ACI Structural Journal 114(2),
437-449.
Hoult, R., Goldsworthy, H. and Lumantarna, E. [2017] “Plastic hinge length for lightly reinforced rectangular
concrete walls,” Journal of Earthquake Engineering, DOI: https://doi.org/10.1080/13632469.2017.1286619.

25
Kam, W.Y., Pampanin, S. and Elwood, K.J. [2011] “Seismic performance of reinforced concrete buildings in the 22
February Christchurch (Lyttelton) earthquake,” Bulletin of The New Zealand Society for Earthquake
Engineering 44(4), 239-278.
Kent, D.C. and Park, R. [1971] “Flexural members with confined concrete,” Journal of the Structural Division
ASCE 97(7), 1969-1990.
Kupfer, H., Hilsdorf, H.K. and Rusch, H. [1969] “Behavior of concrete under biaxial stress,” ACI Journal 87(2),
656-666.
Looi, D.T.W. [2017] “Seismic axial collapse of short shear span reinforced concrete shear walls,” Ph.D. thesis,
Department of Civil Engineering, The University of Hong Kong, S.A.R. Hong Kong.
Looi, D.T.W., Su, R.K.L., Cheng, B. and Tsang, H.H. [2017] “Effects of axial load on seismic performance of
reinforced concrete walls with short shear span,” Engineering Structures 151, 312-326.
Looi, D.T.W., Su, R.K.L. and Lam, E.S.S. [2015] “A unified shear stress limit for reinforced concrete beam design,”
HKIE Transactions 22(4), 223-234.
Lu, Y.Q. and Henry, R.S. [2017] “Numerical modelling of reinforced concrete walls with minimum vertical
reinforcement,” Engineering Structures 143, 330-345.
Maffei, J., Bonelli, P., Kelly, D., Lehman, D.E., Lowes, L., Moehle, J., Telleen, K., Wallace, J. and Willford, M.
[2014] “Recommendations for seismic design of reinforced concrete wall buildings based on studies of the 2010
Maule, Chile Earthquake,” Grant/Contract Reports NIST GCR 14-917-25.
Menegon, S.J., Wilson, J.L., Gad, E.F. and Lam, N.T.K. [2015] “Out-of-plane buckling of limited ductile reinforced
concrete walls under cyclic loads,” Proc. of the 2015 New Zealand Society for Earthquake Engineering (NZSEE)
Annual Technical Conference, Rotorua, New Zealand.
Palermo, D. and Vecchio, F.J. [2002] “Behaviour and analysis of reinforced concrete walls subjected to reversed
cyclic loading,” Publication No. 2002-01, Department of Civil Engineering, University of Toronto, Canada.

26
Palermo, D. and Vecchio, F.J. [2007] “Simulation of cyclically loaded concrete structures based on the finite-
element method,” Journal of Structural Engineering 133(5), 728-738.
Park, R., Priestley, M.J.N. and Gill, W.D. [1982] “Ductility of square confined concrete columns,” Journal of
Structural Division ASCE 108(4), 929-950.
Parra, P.F. and Moehle, J.P. [2017] “Stability of slender wall boundaries subjected to earthquake loading,” ACI
Structural Journal 114(6), 1627-1636.
Paulay, T. and Priestley, M.J.N. [1993] “Stability of ductile structural walls,” ACI Structural Journal 90(4), 385-392.
Popovics, S. [1973] “A numerical approach to the complete stress-strain curve of concrete,” Cement and Concrete
Research 3(5), 583-599.
Richart, F.E., Brandtzaeg, A. and Brown, R.L. [1928] “A study of the failure of concrete under combined
compressive stresses,” Bulletin No.185, University of Illinois Engineering Experimental Station, Urbana,
Illinois, US.
Rosso, A., Almeida, J.P. and Beyer, K. [2016] “Stability of thin reinforced concrete walls under cyclic loads: state-
of-the-art and new experimental findings,” Bulletin of Earthquake Engineering 14(2), 455-484.
Seckin, M. [1981] “Hysteretic behaviour of cast-in-place exterior beam-column-slab subassemblies,” Ph.D. thesis,
Department of Civil Engineering, University of Toronto, Canada.
Su, R.K.L. and Looi, D.T.W. [2016] “Revisiting the unreinforced strut efficiency factor,” ACI Structural Journal
113(2), 301-312.
Thorenfeidt, E., Tomaszewicz, A. and Jensen, J.J. [1987] “Mechanical properties of high-strength concrete and
application in design,” Proc. of the Symposium Utilization of High-Strength Concrete, Stavanger, Norway,
Tapir Trondheim.
Vecchio, F.J. [1989] “Nonlinear finite element analysis of reinforced concrete membranes,” ACI Structural Journal
86(1), 26-35.

27
Vecchio, F.J. [1992] “Finite element modeling of concrete expansion and confinement,” Journal of Structural
Engineering 118(9), 2390-2406.
Vecchio, F.J. [2000] “Disturbed stress field model for reinforced concrete: formulation,” Journal of Structural
Engineering 126(9), 1070-1077.
Vecchio, F.J. and Collins, M.P. [1986] “The modified compression field theory for reinforced concrete elements
subjected to shear,” ACI Journal Proceedings 83(2), 219-231.
Vintzeleou, E.N. and Tassios, T.P. [1986] “Mathematical models for dowel action under monotonic and cyclic
conditions,” Magazine of Concrete Research, 38(134), 13-22.
Wallace, J.W., Elwood, K.J. and Massone, L.M. [2008] “Investigation of the axial load capacity for lightly
reinforced wall piers,” Journal of Structural engineering 134(9), 1548-1557.
Walraven, J.C. [1981] “Fundamental analysis of aggregate interlock,” Journal of the Structural Division 107(11),
2245-2270.
Westenenk, B., de la Llera, J.C., Besa, J.J., Junemann, R., Moehle, J., Luders, C., Inaudi, J.A., Elwood, K.J. and
Hwang, S.J. [2012] “Response of reinforced concrete buildings in Concepcion during the Maule Earthquake,”
Earthquake Spectra 28(S1), S257-280.
Wong, P.S., Vecchio, F.J. and Trommels, H. [2002] VecTor2 & Formworks user’s manual (Second edition),
Department of Civil Engineering, University of Toronto, Canada.
Yang, Y., Matsukawa, K., Choi, H. and Nakano, Y. [2015] “Evaluation of residual axial load capacity of RC
columns after shear failure,” Proc. of the 10th Pacific Conference on Earthquake Engineering (PCEE 2015),
Sydney, Australia.

28
APPENDIX A
An example of calculating the maximum residual tensile strain (εsm) by using CE-99 [Chai and
Elayer, 1999] and extending the model by calculating the buckling stress with the reinforcement
post-yield model [Dhakal and Maekawa, 2002a] is presented here with C30-N-ALR01 from Looi
et al. [2017].
Dimensions and properties of C30-N-ALR01
H = 800 mm, L = 800 mm, t = 80 mm; fc΄ = 29.1 MPa, ρv = 1.96%, fyv = 601 MPa, fu = 644 MPa,
εy = 0.003, εsh = 0.02, εu = 0.12, s = 10 mm, and Es = 203,000 MPa
Step 1: Estimating maximum residual tensile strain [Paulay and Priestley, 1993; Chai and
Elayer, 1999]
From Eq. (1), 41.0=1.29
)601(0196.0=
'=
c
yvv
f
fm
(A.1)
( )( ) 14.0=)41.0(70.4+)41.0(53.5-)41.0(35.2+15.0=
70.4+53.5-35.2+15.0=
2
2 mmm (A.2)
Buckling length, mm560=)800(7.0==buck kHL (A.3)
From Eq. (3),
023.0=)003.0(3+14.0)560
80(
2=3+)(
2= 2
2
2
2
sm
y
buckL
t (A.4)
Step 2: Calculating buckling stress by using reinforcement post-yield model [Dhakal and
Maekawa, 2002a]

29
From Eq. 5(a),
3.137=100
601
10
560=
100
y
s
buckfL
(A.5)
At intermediate point (ε*, σl*):
7=*
hence;7<261-=)3.137(3.2-55=100
3.2-55=*
y
y
s
buck
y
fL
(A.7)
75.0=hence;0.1≤≤75.0;0.71≤;86.0=
0.1≤≤75.0;)601(5.1
644≤;
)003.0(300
.020-.120+75.0=
0.1≤≤75.0;5.1
≤;300
-+75.0=
y
u
y
shu
f
f
(A.8)
Following point wise stress-strain relationship:
2.120=* hence);601(2.0≥*;82.0-=)]3.137(016.0-1.1[75.0=
2.0≥*);100
016.0-1.1(=*
*
MPa601==* hence;8≥
y
y
s
buck
l
yvlysm
ffL
f
(A.9)
At yield plateau (εy ≤ εsm ≤ ε*):
From Eq. 5(b), point wise stress-strain relationship is followed
1.70= hence ];.0030-(0.003)7
.0030-.0230)[
601
2.120-1(-1=
)-*
-)(
*
*-1(-1=
MPa601== hence;8≥
y
ysm
ll
yvlysm f
(A.10)
At tension strain hardening, compression descending slope (εsm ≥ ε*):

30
From Eq. 5(c),
2.120= hence ;2.120<4.119=
)601(2.0≥](0.003)7-023.0)[203000(02.0-2.120=
2.0≥*)-(02.0-*=
ysms fE
(A.11)
Since εsm = 0.023 > ε* = 7(0.003) = 0.021, hence σbuck = 120.2 MPa

31
Table 1 - Previously tested RC walls with short shear span in Looi et al. [2017] and Looi [2017]
Specimen Average
axial load
(Po), kN
ALR Vertical
reinforcement ratio
(ρv), %
Remarks on the test objective
C30-N-ALR01 220 0.12 2 Low axial load
C30-N-ALR02 380 0.22 2 Common axial load in Hong
Kong
C30-N-ALR03 680 0.38 2 Higher axial load anticipated in
an earthquake event
C30-N-ALR04 780 0.44 2 Highest limit of axial load
C60-N-ALR02 850 0.22 2 Higher concrete strength
C30-B-ALR02 420 0.24 3 (edge), 2 (centre) Boundary element detailing
C30-N1%-ALR02 410 0.21 1.2 Lower steel ratio
Table 2 - Axial stress over shear stress ratios (p/v) of tested wall specimens.
Specimen Shear capacity
obtained from
experiment,
kN
p/v Remarks on the cyclic excursion
at the wall edge
C30-N-ALR01 252.5 0.87 tension-compression
C30-N-ALR02 245.0 1.55 tension-compression
C30-N-ALR03 249.3 2.73 compression-compression
C30-N-ALR04 250.9 3.11 compression-compression
C60-N-ALR02 395.5 2.15 compression-compression
C30-B-ALR02 310.6 1.35 tension-compression
C30-N1%-ALR-02 240.4 1.71 tension-compression

32
Table 3 - Miscellaneous inputs for concrete in VecTor2 [Vecchio, 1989].
Input
parameter
Model Input
parameter
(continued)
Model
Confined
strength
Kupfer/Richart [Kupfer et al.,
1969; Richart et al., 1928]
Crack width
check
Agg/2.5 Max. Crack Width
Dilation Variable – Isotropic [Kupfer et
al., 1969]
Crack slip
calculation
Walraven [1981]
Cracking
criterion
Gupta 1998 [Gupta, 1998] Creep and
relaxation
Not considered
Crack stress
calculation
Basic (DSFM/MCFT)
[Vecchio and Collins, 1986;
Vecchio, 2000]
Hysteretic
response
Palermo 2002 (w/Decay)
[Palermo and Vecchio, 2002]

33
Table 4 - Explicit check for two-tier axial collapse due to seismic events on tested specimens with p/v < 2.
Specimen Concrete
cylinder
strength
(fc'),
MPa
Shear
stress
capacity
(v),
MPa
Vertical
reinforcement
ratio (ρv),
%
Buckling
stress
(σbuck),
MPa
ALRcap
=
v/fc΄ +
ρv σbuck/ fc΄
Applied ALRedge
=
(p + v x SLR)/ fc΄
Status at
wall edge
Applied
ALRcentre
=
p/ fc΄
Status at
wall centre
(optional
check)
C30-N-ALR01 29.1 3.95 2 120.2 0.22 0.25 Collapse 0.12 OK
C30-N-ALR02 26.4 3.83 2 120.2 0.23 0.37 Collapse 0.22 OK
(marginal)
C30-B-ALR02 27.3 4.85 3 (edge),
2 (centre)
146.9 0.39 0.42 Collapse
(marginal)
0.24 OK
C30-N1%-ALR02 30.8 3.76 1.2 202.2 0.20 0.33 Collapse 0.21 OK
(marginal)

34
Fig. 1 - RC shear walls with short shear span (a) over-strength of coupling shear wall (b) over-
strength of coupling shear wall on transfer structure

35
Fig. 2 - Axial stiffness degradation for (a) p/v < 2, cyclic tension-compression excursion (b) p/v
≥ 2, cyclic compression-compression excursion.
Fig. 3 - Out-of-plane buckling of shear walls under seismic action (a) Christchurch earthquake
[Kam et al., 2011] (b) Experiment [Looi et al., 2017; Looi, 2017]

36
Fig. 4 - Inter-relationship between axial collapse and out-of-plane buckling in walls with short
shear span (a) p/v < 2, cyclic tension-compression excursion (b) p/v ≥ 2, cyclic compression-
compression excursion.

37
Fig. 5 - Schematic illustration of Modified Mohr’s Axial Capacity Model (a) contribution from
envelope of steel (b) contribution from cracked concrete (c) applied ALR

38
Fig. 6 - NLFEA model using VecTor2 [Vecchio, 1989] (a) wall with boundary confinement (i.e.
C30-B-ALR-02) (b) other walls with different configuration of applied axial stress, concrete
strength and reinforcement ratio

39
Fig. 7 – Calibration of buckling length factor (k) with maximum residual tensile strain (εsm) of
experimental results, NLFEA and prediction model of CE-99 [Chai and Elayer, 1999].

40
Fig. 8 - Flowchart of explicit check for axial collapse of RC walls with short shear span in seismic events.

41
Fig. 9 - STM for (a) p/v < 2, cyclic tension-compression excursion with diagonal strut and
yielded ties (b) p/v ≥ 2, cyclic compression-compression excursion with fan shaped strut and
elastic ties.

42
Fig. 10 - Examples of checks for axial collapse on walls with short shear span that experience
cyclic tension-compression excursion (p/v < 2) (a) C30-N-ALR01 (b) C30-N-ALR02 (c) C30-B-
ALR02 (d) C30-N1%-ALR02