Predicting Column Axial Forces in Sequential Loading ...
10
International Journal of Engineering Research and Technology. ISSN 0974-3154, Volume 12, Number 11 (2019), pp. 1919-1928 © International Research Publication House. http://www.irphouse.com 1919 Predicting Column Axial Forces in Sequential Loading Analysis Using the Difference Between One-Step and Cumulative Typical Floor Analysis Axial Forces James Kimani Kihiu 1* Silvester Ochieng Abuodha 2 Raphael N. Mutuku 3 1 MSc. Student, Department of Civil Engineering, Pan African University Institute for Basic Science, Technology and Innovation (PAUSTI), P.O. Box 62000-00200, Nairobi, Kenya. 2 Professor, Department of Civil and Construction Engineering, University of Nairobi (UON)), Nairobi, Kenya. 3 Professor, Department of Building and Civil Engineering, Technical University of Mombasa (TUM), Mombasa, Kenya. *Corresponding author email: [email protected] ORCID: 000-0002-3580-5146 (James Kihiu) Abstract. The work below tried to predict the column axial forces in Sequential loading analysis (SLA) by using the differences between one-step loading analysis (OSLA) and cumulative typical floor analysis (CTFA) axial forces considering the dead loads. The CTFA, OSLA and SLA for a forty-floor concrete frame were carried out using commercial software Midas Gen 2019 according to Eurocode standard. From the numerical modelling analysis between the OSLA and SLA axial forces, differences with the OSLA and CTFA column axial forces, a linear and 2 nd -degree polynomial equations were developed with 0.9877 and 0.9901 determinant of coefficient respectively. The validation results unveil a higher correlation with the predicted value ranging (between 94% and 105%) of the actual value. Keyworlds: Construction stage analysis, Column axial shortening, Tall building, Creep, shrinkage. I. INTRODUCTION. Land scarcity and improved material’s engineering have been one of the drives to the increase in high rise reinforced cement concrete structures (RCC). [1]. These structure has resulted in new design challenges as a result of vertical structural elements deferential axial shortening [2], which causes structural defects, beam and slab cracks, and non-structural defects such as cracks to infill walls and façade and building services [3]as shown in figure 1 if not addressed. Differential axial shortening causes self stressing (Fig.1) due to load distribution between vertical members resulting in exaggerated linear elastic analysis results which call for complex analysis [1] Cracks on the infill walls due to Axial shortening. [2] a) Deformation due to the axial shortening b) Corresponding induced internal Forces. [1] Fig. 1. Effects of Column axial shortening.
-
Upload
khangminh22 -
Category
Documents
-
view
1 -
download
0
Transcript of Predicting Column Axial Forces in Sequential Loading ...

International Journal of Engineering Research and Technology. ISSN 0974-3154, Volume 12, Number 11 (2019), pp. 1919-1928
© International Research Publication House. http://www.irphouse.com
1919
Predicting Column Axial Forces in Sequential Loading Analysis Using the
Difference Between One-Step and Cumulative Typical Floor Analysis Axial
Forces
James Kimani Kihiu1* Silvester Ochieng Abuodha2 Raphael N. Mutuku3
1MSc. Student, Department of Civil Engineering, Pan African University Institute for Basic Science,
Technology and Innovation (PAUSTI), P.O. Box 62000-00200, Nairobi, Kenya.
2 Professor, Department of Civil and Construction Engineering, University of Nairobi (UON)), Nairobi, Kenya.
3Professor, Department of Building and Civil Engineering, Technical University of Mombasa (TUM), Mombasa, Kenya.
*Corresponding author email: [email protected]
ORCID: 000-0002-3580-5146 (James Kihiu)
Abstract.
The work below tried to predict the column axial forces in
Sequential loading analysis (SLA) by using the differences
between one-step loading analysis (OSLA) and cumulative
typical floor analysis (CTFA) axial forces considering the
dead loads. The CTFA, OSLA and SLA for a forty-floor
concrete frame were carried out using commercial software
Midas Gen 2019 according to Eurocode standard. From the
numerical modelling analysis between the OSLA and SLA
axial forces, differences with the OSLA and CTFA column
axial forces, a linear and 2nd-degree polynomial equations
were developed with 0.9877 and 0.9901 determinant of
coefficient respectively. The validation results unveil a higher
correlation with the predicted value ranging (between 94%
and 105%) of the actual value.
Keyworlds: Construction stage analysis, Column axial
shortening, Tall building, Creep, shrinkage.
I. INTRODUCTION.
Land scarcity and improved material’s engineering have been
one of the drives to the increase in high rise reinforced cement
concrete structures (RCC). [1]. These structure has resulted in
new design challenges as a result of vertical structural
elements deferential axial shortening [2], which causes
structural defects, beam and slab cracks, and non-structural
defects such as cracks to infill walls and façade and building
services [3]as shown in figure 1 if not addressed. Differential
axial shortening causes self stressing (Fig.1) due to load
distribution between vertical members resulting in
exaggerated linear elastic analysis results which call for
complex analysis [1]
Cracks on the infill walls due to Axial shortening. [2]
a) Deformation due to the axial shortening
b) Corresponding induced internal Forces. [1]
Fig. 1. Effects of Column axial shortening.

International Journal of Engineering Research and Technology. ISSN 0974-3154, Volume 12, Number 11 (2019), pp. 1919-1928
© International Research Publication House. http://www.irphouse.com
1920
The complex analysis mentioned above entails the
combination of finite element and construction stage analysis
putting into consideration the RCC time-dependent properties,
which is a time-consuming undertaking [4], contrary to the
conventional one-step analysis approach where the material
strength gain is treated as instant. Over the years, several
time-dependent material properties prediction models such as
CEB-FIB (1978,1990, 2010), ACI, European, GL 2000 and
Portland Cement Association Standard (PCA) have been
developed [5]. Sequential loading analysis results from
previous research have shown that; increase in reinforcement
quantity to more deformed vertical elements, offsetting
vertical elements height during construction, use of outriggers
beams material engineering [6] among others reduces the
differential shortening.In concept designs stage it is time-
saving to use a simplified method to predict the construction
stage analysis results [1]. From this dimension, in this work,
a straight forward numerical method was developed that used
the axial forces differences between OSLA and CTFA to
predict the complex SLA columns axial forces. The developed
numerical model was validated by comparing the projected
results with the results obtained from Midas Gen 2019
commercial software using its non-linear construction stage
analysis package.
II. METHOD AND MATERIAL.
II.I. Analytical Model
A forty floor reinforced cement concrete frame (Fig 2) with
750x375 mm beam size, 1550x1550 mm, 1350x1350,
1100x1100,775 x775 mm column sizes from the 1st to the
40th storey section reducing after ten floors with the core wall
sizes changed together with columns from 475 mm to 400 mm
with a decrement of 25 mm. Apart from the structural
elements dead loads, a 7.5 kN/m2 slab self-weight, 1.875
kN/m2 finishes, 1.2 kN/m2 partition walls and 2.5 kN/m2
imposed load were used to size the structural members as per
[7] standard. The lateral forces considered were, 27 m/s basic
wind speed and 0.08g m/s2 ground peak acceleration
earthquake loads were incorporated in the member sizing.
The column and core walls concrete compressive strength
were 45 N/mm2 (C45/55) and 35 N/mm2 (C35/45) for the
beams. A relative humidity of 70% was adopted, with
effective section determined using CEB-FIT 2010 Equation.
The SLA was carried out according to step -by step method
(SSM).
Typical floor Layout Plan.
40 Storeys analytical frame 3D View.
Fig. 2. Analytical model typical floor plan and 3D view.
II.II Analysis
Three analysis CTFA, OSLA and SLA were carried out and
the columns C1,C2, C1A, and C2A axial forces recorded at
every floor level. In CTFA, the columns axial force for a
typical floor (Ft) was multiplied by the number of floors (N)
above the storey level to get the cumulative axial force (FT) at
respective storey level using Equation 1. In OSLA, material
strength gain with time was instant and the typical floors
loading was activated once and the observed column axial
force due to the dead load was recorded at every storey level.
In SLA, typical floor loads were activated at seven days
interval, after nineteen days the concrete was loaded by
deactivating false work support system. This analysis was
carried out with the help of a commercial software MIDAS
Gen construction stage analysis package where the dead load
was considered and the column axial forces recorded at 1095
days after construction.
FT = N*Ft (1)

International Journal of Engineering Research and Technology. ISSN 0974-3154, Volume 12, Number 11 (2019), pp. 1919-1928
© International Research Publication House. http://www.irphouse.com
1921
II.III Material Properties.
Strength and Elastic Modulus.
The concrete mean compressive strength with time (fcm(t)) is
a function of mean compressive strength at 28 days (fcm) and
age coefficient (βcc(t)) as shown in Equation 2&3. The
variation of modulus of elasticity with time (Ecm(t)) is
proportional to the elastic modulus at 28 days (Ecm) which
was determined using Equation 4 . [7]
𝑓𝑐𝑚(𝑡) = 𝛽𝑐𝑐(𝑡) 𝑓𝑐𝑚 (2)
𝛽𝑐𝑐(𝑡) = 𝑒𝑥𝑝 {0.25[1 − (28/(𝑡
𝑡1))(
1
2)]} (3)
𝐸𝑐𝑚(𝑡) = (𝑓𝑐𝑚(𝑡)
𝑓𝑐𝑚)0.3𝐸𝑐𝑚 (4)
Creep and Shrinkage.
Creep coefficient ∅(t, to) is a function of creep stain
(εcc(t, to)) at time t and elastic strain εcc(t, to) subject to the
service stress being less than 0.4 * fcm Equation (5) and the
total shrinkage strain (εcs) is the summation εcds of dry and
autogenous shrinkage εcas Equation (6) [7]
∅(𝑡, 𝑡𝑜) =𝜀𝑐𝑐(𝑡,𝑡𝑜)
𝜀𝑐𝑖(𝑡𝑜) (5)
𝜀𝑐𝑠 = 𝜀𝐶𝐴𝑆 + 𝜀𝐶𝐷𝑠 (6)
II.IV Numerical models.
The arithmetic analysis was carried out to determine posibility
of a relation between column axial forces among the prior
carried out three analysis. Two sets of axial forces that is;
(OSLA-SLA and OSL-CTFA ) were used to determine the
existing correlation by carrying out regression analysis. Excel
was used as a tool.
II.V Validation.
Validation analytical model.
To validate the developed numerical model, a 40 storey RCC
frame typical floor layout shown in Fig 3 [8], with 750x500
beam size, 1300x1300 mm columns size at the bottom ten
floors reducing with 100 mm at every ten floors and 600 mm
thick centre core wall at the bottom ten floor, reducing with
100 mm at every 10 floors and the slab dead load taken as 3.6
kN/.m was used. Floor to floor height was 3000 mm and the
construction sequence equal to 3 days per floor.
Fig. 3. Validation model Typical Floor Layout Plan [8]
The analysis was carried out using the MIDAS Gen
construction stage analysis package with the material time-
dependent properties determined using the PCA standard.
The accuracy of the validation model was affirmed by
comparing the column shortening results with the previous
research on Predicting Axial Shortening of Vertical Elements
in High Rise Buildings by Using PCA Method in 2016 [8].
The detailed material properties used are tabulated in Table 1.
Validation model material properties.
The equations below were used to determine the material
properties with time were as shoen below. [8] [9]
Compressive strength 𝑓′𝑐(𝑡) =
𝑓28𝑡
4.0+0.85𝑡 (7)
Elastic Modulus 𝐸𝑐(𝑡) = 0.43𝑊 √𝑓′𝑐(𝑡)1.5 𝑀𝑃𝑎 (8)
Shrinkage strain 𝜀𝑠ℎ,𝑡 = (𝜀𝑠ℎ)𝑢 ∗ 𝑆𝐻𝑉:𝑆 ∗ 𝑆𝐻𝑡 ∗ 𝑆𝐻𝐻 ∗ 𝑆𝐻𝑅
(9)
𝑆𝐻𝑡 =𝑡−𝑡𝑠
20.0𝑒0.36(𝑉:𝑆)+(𝑡−𝑡𝑠) (10)
𝐶𝑟𝑒𝑒𝑝 𝑠𝑡𝑟𝑎𝑖𝑛 𝐸𝑐𝑟, 𝑡 = 𝜎 ∗ (𝜀𝑐𝑟)𝑢 ∗ 𝐶𝑅𝑡𝑟 ∗ 𝐶𝑅𝑉:𝑆:∗ 𝐶𝑅𝑡 ∗𝐶𝑅𝐻 ∗ 𝐶𝑅𝑅 (11)
𝐶𝑅𝑡 = ((𝑡−𝑡𝑟)𝑜.6
10.6+(𝑡−𝑡𝑟)𝑜.6) (12)
Where:
t = Age of the concrete in Days
f28 = strength of concrete at 28 days
w = unit weight of concrete
(εsh)u = Ultimate shrinkage strain.,
SHV:S =Coeficient of volume to the surface area of the
member

International Journal of Engineering Research and Technology. ISSN 0974-3154, Volume 12, Number 11 (2019), pp. 1919-1928
© International Research Publication House. http://www.irphouse.com
1922
SHt = Shrinkage with time
SHH = Shrinkage with relative humidity
SHR =Residual shrinkage of reinforced concrete.
ts = time in days of initial wet curing.
V: S Volume to surface area ratio.
σ = Acting stress
(εcr)u = Specific creep
CRtr = Age of concrete at loading
CRV:S = Member size
CRt = Creep with time
CRH = Creep with relative humidity
CRR = Residual creep of reinforced concrete
t’ = time in days to first loading after concrete pouring
III. RESULTS AND DISCUSSION.
From the CTFA, OSLA and SLA, the difference in axial
forces due to the dead load for the four columns highlighted in
Fig 2. were as tabulated in Table 2. The three analyses gave
different values at every floor level as shown in Fig 4. From
the observed value, the difference between OSLA with CFA
and OSLA with SLA at specific level increased with an
increase in the number of storeys above the level as shown in
Fig 5 & 6. These findings are attributed to deferential
shortening resulting to axial load distribution by the horizontal
elements between among the vertical elements [6].
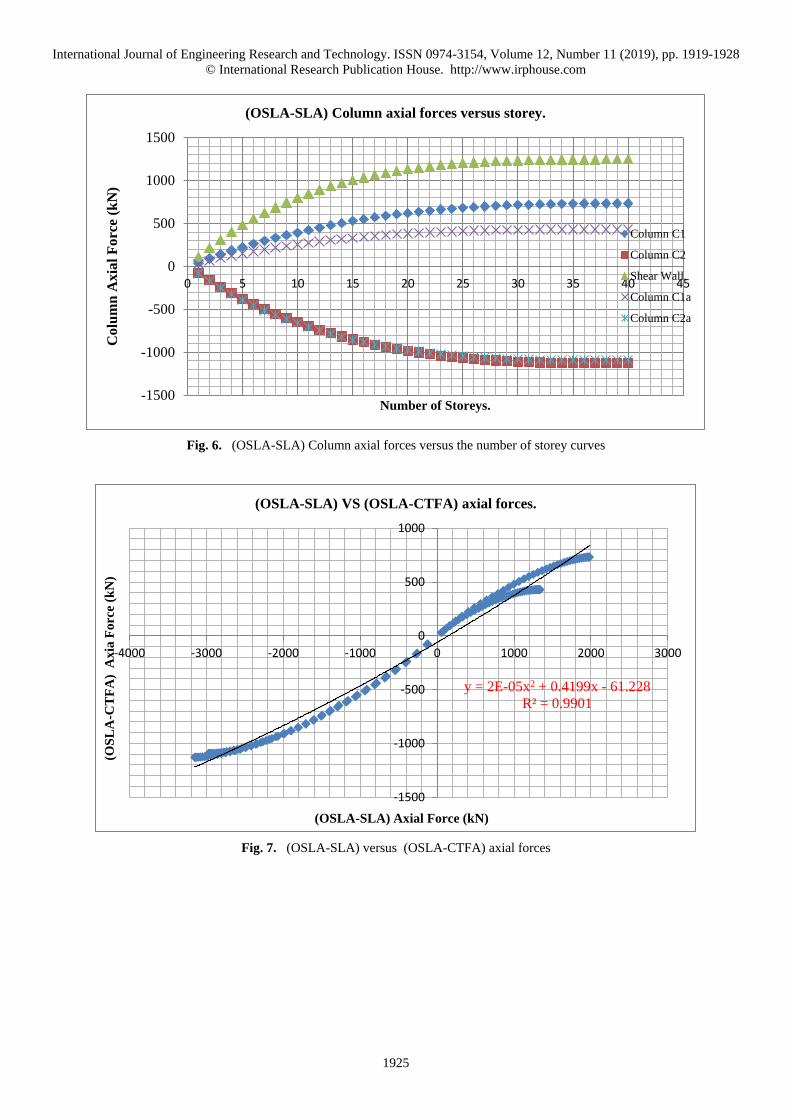
Regression analysis was carried out between the two data
which unveiled result in existence of a polynomial and linear
relationship as shown by Equation (13&14) and Fig (7&8)
with a coefficient of the determinant of 0.9901 and 0.9877
respectively.
�̂�𝑐𝑙 =2
105 𝑥𝑐𝑙2 +
4199
1000𝑥𝑐𝑙 − 61.228 (13)
�̂�𝑐𝑙 =249
625𝑥𝑐𝑙 − 17.635 (14)
�̂�𝑐𝑙 = 𝑂𝑆𝐿𝐴 − 𝑆𝐿𝐴 (15)
𝑥𝑐𝑙 = 𝑂𝑆𝐿𝐴 − 𝐶𝑇𝐹 (16)
Table 1. Validation analytical model material data.
Storey Section.
(mm)
Compressi
ve
Strength
(N/mm2)
Relativ
e
Humid
ity
(%)
Ultima
te
Creep
Strain.
(1/Fc*1
0-3)
Ultimate
Shrinka
ge
Strain.
(10-6)
Volume Strain
Ration (mm)
%
Reinforc
ement
used.
ESteel
(Gpa)
Columns.
1-10 1300x1300 50 70 4 780 325 0.8 200
11-20 1200x1200 45 70 4 780 300 0.98 200
20-30 1100x1100 40 70 4 780 275 1.18 200
31-40 1000x100 35 70 4 780 250 1.45 200
Core Wall.
1-10 600 50 70 4 780 282(9 m wall),
261(4 mm wall)
0.4 200
11-20 500 45 70 4 780 237(9 m wall),
222(4 mm wall)
0.4 200
20-30 400 40 70 4 780 192(9 m wall),
182(4 mm wall)
0.4 200
31-40 400 35 70 4 780 145(9 m wall),
140(4 mm wall)
0.4 200

International Journal of Engineering Research and Technology. ISSN 0974-3154, Volume 12, Number 11 (2019), pp. 1919-1928
© International Research Publication House. http://www.irphouse.com
1923
Fig. 4. Curve of CTFA, OSLA & SLA columns axial forces against the
number of storeys.
Fig. 5. (OSLA - CTFL) columns Axial forces versus number of storeys.
-4000
-3000
-2000
-1000
0
1000
2000
3000
4000
0 5 10 15 20 25 30 35 40 45
Co
lum
n A
xia
l F
orc
e (k
N)
Number of Storeys
(OSLA-CTFL) Axial forces versus storey for columns.
Column C1
Column C2
Shear Wall.
Column C1a
Column C2a

International Journal of Engineering Research and Technology. ISSN 0974-3154, Volume 12, Number 11 (2019), pp. 1919-1928
© International Research Publication House. http://www.irphouse.com
1924
Table 2. Column axial forces differences between OSLA with CTFA and OSLA with SLA. Used in mathematical modelling.
Structural
Element.
Column C1 Axial
Force (KN)
Column C2 Axial
Force (KN)
Column C1A Axial
Force (KN)
Column C2A Axial
Force (KN)
Storey
Level
(OTLA –
CTFA)
(OSLA –
SLA)
(OTLA -
CTFA )
(OSLA -
SLA)
(OTLA-
CTFA)
(OSLA-
SLA)
(OTLA -
CTFA)
(OSLA-
SLA)
1 1979.11 731.66 -3152.13 -1127.78 1337.4 428.91 -2972.64 -1092.54
2 1975.8 732.02 -3146.74 -1128.25 1334.99 429.25 -2968.34 -1092.82
3 1969.51 731.94 -3136.57 -1128.31 1330.45 429.48 -2960.11 -1092.92
4 1960.39 731.54 -3121.88 -1128.07 1323.93 429.69 -2948.15 -1092.83
5 1948.52 730.74 -3102.82 -1127.42 1315.48 429.78 -2932.62 -1092.46
6 1933.98 729.49 -3079.54 -1126.25 1305.19 429.72 -2913.68 -1091.73
7 1916.87 727.75 -3052.19 -1124.46 1293.13 429.47 -2891.49 -1090.54
8 1897.26 725.44 -3020.91 -1121.97 1279.37 428.97 -2866.19 -1088.79
9 1875.24 722.53 -2985.87 -1118.69 1263.99 428.18 -2837.95 -1086.41
10 1850.89 718.94 -2947.17 -1114.47 1247.06 427.06 -2806.9 -1083.29
11 1824.41 714.83 -2905.14 -1109.51 1228.71 425.67 -2773.29 -1079.48
12 1794.81 710.12 -2858.18 -1103.62 1208.22 423.95 -2735.07 -1074.85
13 1762.45 704.49 -2806.94 -1096.48 1185.93 421.77 -2692.56 -1069.2
14 1727.48 697.95 -2751.65 -1088.07 1161.95 419.11 -2646 -1062.44
15 1689.99 690.42 -2692.48 -1078.26 1136.37 415.91 -2595.58 -1054.42
16 1650.09 681.83 -2629.59 -1066.92 1109.26 412.11 -2541.52 -1045.03
17 1607.88 672.11 -2563.14 -1053.93 1080.7 407.64 -2484.01 -1034.13
18 1563.46 661.21 -2493.31 -1039.18 1050.77 402.47 -2423.24 -1021.59
19 1516.95 649.07 -2420.26 -1022.57 1019.56 396.55 -2359.43 -1007.33
20 1468.38 635.52 -2344.06 -1003.85 987.1 389.77 -2292.69 -991.13
21 1418.28 621.14 -2265.41 -983.66 953.67 382.4 -2223.59 -973.33
22 1365.18 606.07 -2181.58 -961.93 917.92 374.46 -2149.03 -953.89
23 1309.37 589.24 -2093.66 -937.73 880.57 365.53 -2069.49 -932.23
24 1251.19 570.85 -2002.07 -911.17 841.81 355.69 -1985.42 -908.31
25 1190.74 550.75 -1907.01 -882.06 801.73 344.84 -1897.1 -881.89
26 1128.17 528.87 -1808.7 -850.23 760.42 332.9 -1804.85 -852.77
27 1063.63 505.12 -1707.34 -815.51 717.99 319.82 -1708.96 -820.76
28 997.23 479.39 -1603.14 -777.72 674.5 305.48 -1609.7 -785.64
29 929.17 451.68 -1496.37 -736.81 630.08 289.88 -1507.42 -747.3
30 859.25 421.43 -1386.85 -692.1 584.7 272.73 -1402.13 -705.25
31 789.5 391.09 -1276.88 -646.15 539.04 255.05 -1295.56 -660.93
32 717.44 363.8 -1160.31 -601.08 489.28 237.56 -1182.82 -615.9
33 642.08 332.7 -1038.99 -550.82 437.81 217.99 -1063.86 -566.35
34 564.96 299.47 -914.75 -496.99 385.26 197.03 -940.28 -512.93
35 486.08 263.59 -787.71 -438.92 331.68 174.36 -812.51 -454.96
36 405.73 225 -658.32 -376.36 277.26 149.88 -681.2 -392.06
37 324.17 183.57 -526.98 -309.05 222.13 123.44 -546.98 -323.87
38 241.53 139.03 -393.96 -236.59 166.41 94.86 -410.34 -249.94
39 158.66 92.17 -260.32 -159.59 110.45 64.37 -272.33 -170.48
40 72.66 38.59 -122.96 -73.79 53.37 30.35 -131.26 -82.79
International Journal of Engineering Research and Technology. ISSN 0974-3154, Volume 12, Number 11 (2019), pp. 1919-1928
© International Research Publication House. http://www.irphouse.com
1925
Fig. 6. (OSLA-SLA) Column axial forces versus the number of storey curves
Fig. 7. (OSLA-SLA) versus (OSLA-CTFA) axial forces
-1500
-1000
-500
0
500
1000
1500
0 5 10 15 20 25 30 35 40 45
Colu
mn
Axia
l F
orc
e (k
N)
Number of Storeys.
(OSLA-SLA) Column axial forces versus storey.
Column C1
Column C2
Shear Wall.
Column C1a
Column C2a
y = 2E-05x2 + 0.4199x - 61.228
R² = 0.9901
-1500
-1000
-500
0
500
1000
-4000 -3000 -2000 -1000 0 1000 2000 3000
(OS
LA
-CT
FA
) A
xia
Fo
rce
(kN
)
(OSLA-SLA) Axial Force (kN)
(OSLA-SLA) VS (OSLA-CTFA) axial forces.

International Journal of Engineering Research and Technology. ISSN 0974-3154, Volume 12, Number 11 (2019), pp. 1919-1928
© International Research Publication House. http://www.irphouse.com
1926
Fig. 8. (OSLA-SLA) versus (OSLA-CTFA) axial forces
The model validation results were as tabulated in Table 3 with
the predicted results from both equation 13 & 14 showing a
good correlation with the validation model column axial
forces as shown in figure 9 with values ranging between 94%
and 105%) as shown in figure 10.
Table 3. Column C3, True and the predicted axial forces using the developed, polynomial and linear equations
Storey
Level.
SLA Actual
Value. (KN)
Linear
Equation (KN)
Polynomial
Equation. (KN)
Storey
Level.
Summation
(KN)
Linear Equation
(KN)
Polynomial
Equation.
40 400.4 379.736 423.337 20 8417.46 7835.53 7877.66
39 806.92 743.222 786.779 19 8829.26 8231.44 8273.4
38 1210.55 1106.4 1149.92 18 9239.56 8627.46 8669.24
37 1612.58 1469.62 1513.11 17 9648.63 9023.58 9065.19
36 2012.86 1832.86 1876.31 16 10056.42 9419.81 9461.23
35 2411.44 2196.12 2239.55 15 10462.95 9816.14 9857.37
34 2808.33 2559.44 2602.82 14 10868.2 10212.5 10253.6
33 3203.55 2922.79 2966.13 13 11272.14 10609 10649.8
32 3597.15 3286.2 3329.51 12 11674.78 11005.5 11046.1
31 3988.74 3649.62 3692.88 11 12075.93 11402 11442.4
30 4395.58 4027.94 4071.13 10 12494.14 11815.8 11856
29 4802.61 4406.57 4449.69 09 12911.77 12229.5 12269.4
28 5207.86 4785.28 4828.3 08 13327.82 12643.2 12682.9
27 5611.7 5164.11 5207.05 07 13742.45 13056.8 13096.2
26 6014.12 5543.06 5585.91 06 14567.11 13883.6 13922.6
25 6415.15 5922.15 5964.9 05 14567.11 13883.6 13922.6
24 6814.81 6301.37 6344.01 04 14977.03 14296.8 14335.5
23 7213.12 6680.73 6723.26 03 15385.1 14709.8 14748.3
22 7610.13 7060.22 7102.63 02 15791.98 15122.4 15160.8
21 8005.62 7439.82 7482.1 01 16193.69 15535 15573.1
y = 0.3984x - 17.635
R² = 0.9877
-1500
-1000
-500
0
500
1000
-4000 -3000 -2000 -1000 0 1000 2000 3000
(OS
LA
-CT
FA
) A
xia
Fo
rce
(kN
)
(OSLA-SLA) Axial Force (kN)
(OSLA-SLA) versus (OSLA-CTFA) Axial Forces.

International Journal of Engineering Research and Technology. ISSN 0974-3154, Volume 12, Number 11 (2019), pp. 1919-1928
© International Research Publication House. http://www.irphouse.com
1927
Fig. 9. Correlation between Column C3 true value and predicted axial force from the developed linear and polynomial equations
Fig. 10. Percentage (%) of the predicted Column C3 axial force to the true value.
IV. CONCLUSION.
From the result cumulative typical floor, one step loading and
sequential loading analysis for the forty story building, the
column axial forces due to dead loads were analysed and the
results showed that:
1. In relation to the sequential loading analysis results, one-
step loading analysis results are exaggerated on the higher
side for external columns that would result in
overdesigning whereas, in cumulative typical floor
loading, the effect is reversed. In regard to the inner
columns, the effect is the vice versa thus the need for
sequential analysis for high rise buildings.
2. There exist a 2nd-degree polynomial and a linear equation
between the column axial forces difference between the
one-step loading with sequential loading and one step
loading with cumulative typical floors analysis.
3. Further work is to be carried out to determine the effect
in variations of the number of floors, concrete loading age
and humidity).
V. ACKNOWLEDGEMENT
The authors would like to acknowledge the support and
contribution of the African Union (AU) and MIDAS IT in
sponsoring the research through the Pan African University,
Institute for Basic Sciences, Technology and Innovation
(PAUSTI).
0
2000
4000
6000
8000
10000
12000
14000
16000
18000
1 2 3 4 5 6 7 8 9 10 11 12 13 14 15 16 17 18 19 20 21 22 23 24 25 26 27 28 29 30 31 32 33 34 35 36 37 38 39 40
Co
lum
n A
Xia
l F
orc
es. (k
N)
Number of Storey
Actual & predicted column axial forces versus number of storey.
Linear
Actual Value.
Polynomial
80
85
90
95
100
105
110
1 2 3 4 5 6 7 8 9 10 11 12 13 14 15 16 17 18 19 20 21 22 23 24 25 26 27 28 29 30 31 32 33 34 35 36 37 38 39 40
Pe
rce
nta
ge (
%)
Number of Storey
Percentage of the predicted to actual column axial force.
Linear
Polynomial
International Journal of Engineering Research and Technology. ISSN 0974-3154, Volume 12, Number 11 (2019), pp. 1919-1928
© International Research Publication House. http://www.irphouse.com
1928
REFERENCES
[1] R. Correia and P. S. Lobo, “Simplified Assessment of the
Effects of Column Shortening on the Response of Tall
Buildings,” Procedia Structural Integrity., vol. 5, pp. 179-
186, 2017.
[2] M. Fintel, S. Ghoshengar and H. Iyengar, “Column
Shortening in Tall Buildings-Prediction And
Compensation,” Portland cement Association, no. 3, pp. 1-
34, 1987.
[3] P. M. David, T. Nimal and T. . C. Perera, “A numerical
method to quantify differential axial shortening in
concrete buildings,” Engineering Structures, vol. 32, no.
8, pp. 2310-2317, 2010.
[4] H. S. Kim and S. H. Shin, “Column Shortening Analysis
with Lumped Construction Sequences,” Procedia
Engineering, vol. 14, pp. 1791-1798, 2011.
[5] N. Gardner, “Comparison of Prediction Provisions for
Drying Shrinkage and Creep of Normal Strength
Concretes,” Canadian Journal of Civil Engineering, vol.
31, no. 5, pp. 767-775, 2011.
[6] H. Kim, “Effects of Outriggers on Differential Column
Shortening in Tall Buildings.,” International Journal of
High-Rise Buildings, vol. 6, no. 1, pp. 91-99, 2017.
[7] British Standards Institution, "Eurocode 2 : design of
concrete structures," British Standard, London, 2004.
[8] D. Patil and M. . N. Bajad, “Predicting Axial Shortening
of Vertical Elements in High Rise Buildings by Using
PCA Method,” International Journal of Innovative
Research in Science Engineering and Technology, vol. 5,
no. 7, pp. 12512-12519, 2016.
[9] ACI-Committee-209, " Prediction of Creep, Shrinkage,
and Temperature Effects in Concrete Structures".