Mineralogy and geochemistry of sedimentary rocks and eolian ...
Upload
khangminh22Category
view
0download
0
EXPERIMENTAL INVESTIGATION OF COLLAPSE IN
EOLIAN SOIL: A CASE STUDY IN MAYAPO, COLOMBIA.
INVESTIGACIÓN EXPERIMENTAL DEL COLAPSO EN
SUELOS EÓLICOS: UN CASO DE ESTUDIO EN MAYAPO
COLOMBIA
Kandy Manuela Teheran Ochoa
Universidad Nacional de Colombia
Facultad de Minas, Departamento de Ingeniería Civil
Medellín, Colombia
2021

IV

V
EXPERIMENTAL INVESTIGATION OF COLLAPSE IN
EOLIAN SOIL: A CASE STUDY IN MAYAPO, COLOMBIA.
INVESTIGACIÓN EXPERIMENTAL DEL COLAPSO EN
SUELOS EÓLICOS: UN CASO DE ESTUDIO EN MAYAPO
COLOMBIA
Kandy Manuela Teheran Ochoa
Research thesis presented as partial requirement to obtain the title:
Master in Geotechnical Engineering
Director:
Manuel Roberto Villarraga Herrera
Codirector:
Oscar Echeverri Ramirez
Research line:
Unsaturated soils Mechanic
Universidad Nacional de Colombia
Facultad de Minas, Departamento de Ingeniería Civil
Medellín, Colombia
2021
VI
To my dear Mother: Olga Lucia Ochoa
To my brother: Juan Diego Teheran
For their love and support throughout this travel

VII
ACKNOWLEDGMENTS
Es un placer para mí expresar mi más sincero agradecimiento a DIOS, y a todas las personas
que con su soporte científico y humano han contribuido al desarrollo y finalización de esta
tesis de maestría.
Quisiera expresar mi más profundo agradecimiento a mi director de tesis, al profesor Manuel
Villarraga Herrera por su apoyo incondicional y acertada orientación desde el día en que se
inició esta investigación hasta la última discusión del contenido, por creer en mí desde el
principio y por ser una gran fuente de inspiración.
Mi más sincero agradecimiento a mi codirector de tesis, el profesor Oscar Echeverri
Ramírez, quien fue un apoyo incondicional durante el desarrollo del proyecto de tesis y en
mi estancia en Francia, su orientación y soporte fue fundamental para la finalización de este
proyecto.
Un agradecimiento muy especial al Dr. Daniel Ruiz Restrepo por su apoyo incondicional
durante la tesis de maestría, por su orientación y aliento a lo largo de este esfuerzo. Trabajar
con Daniel ha sido una experiencia de aprendizaje memorable, y los resultados que aquí se
presentan son posibles gracias a su apoyo y su experiencia.
Pour le soutien durant mon stage, je tiens à remercier mes collègues du groupe REEG au
CEREMA Toulouse, France. Mon cher chief Didier Virely pour son soutien dans le travail
expérimental et sa compréhension dans les moments difficiles. Je tenais aussi à remercier,
pour le soutien et l'aide durant le stage, Stéphane MOULIGNE, Florence, Philippe, Jean
Claude, les directeurs Pascal SAUVAGNAC et Quentin GAUTIER, et le groupe REGG
pour avoir toujours voulu m’aider dans le dans le travail expérimental et de m’avoir fait me
sentir comme chez moi dans un pays qui m’était inconnu.
Agradezco también a las instituciones que han hecho posible la realización del trabajo
presentado por la ayuda económica brindada por la Universidad Nacional de Colombia, por
el Centre d'études et d'expertise sur les risques, l'environnement, la mobilité et
l'aménagement CEREMA y por Colciencias. Gracias por la ayuda y confianza en mi
depositada.

VIII
Finalmente, agradezco a mi familia por su apoyo, compresión, comunicación constante y
sacrificio en circunstancias muy difíciles. Especialmente, a mí madre Olga Lucia, quien ha
compartido mis alegrías y angustias, por su aliento a superarme cada día. Esta tesis va
dedicada a ella.
A todas aquellas personas que colaboraron en la realización de este trabajo, Gracias.

IX
Content
CHAPTER 1 – INTRODUCTION……………………………………………………..1-1
CHAPTER 2- STATE OF THE ART…………………………………………………………..2-1
2.2. Soil, a multiphase porous medium……………………….……….…..…...…….2-3
2.3. Unsaturated state of soils………………………………………....……............2-3
2.3.1.Overview for saturated/ unsaturated soil mechanic…………………..…..…2-3
2.3.2.Definition of suction……………...…..……..……………………..……..…2-5
2.4. Collapsible soils……………………………………………….…………..…….2-7
2.4.1.Definition……..…...…………………………………………….………..…2-7
2.4.2.Collapse mechanism…………………………………………………………2-8
2.4.3.Analysis and identification of collapsing soils……………..………....…....2-10
2.4.4.Eolian soils ………….…………………………………………………..…2-11
2.5. Stress-strain behaviour of unsaturated soils ……………………………….…...2-12
2.6. Technique of controlling suction. Axis translation technique……………...…..2-13
2.7. Constitutive model for the behaviour of unsaturated soils……………..….…...2-15
2.8. Mathematical model………………………………………………………..…..2-17
2.9. Previous studies………………………………………………………………...2-20
2.10. Chapter conclusions………………………………...………………………....2-21
2.11. References……………………………………………………………………..2-23
CHAPTER 3 – EOLIAN SOILS OF MAYAPO……………………………………...3-1
3.1. Introduction…………………………………………………………………..3-2
3.2. Localization of the site………………………………………………………..3-3

X
3.3. Climate……………………………………………………………………….3-4
3.4. Geology………………………………………………………………………3-5
3.5. Geomorphology…………….………...……………...………..………………3-7
3.6. Chapter Conclusions…………….……...……………………………………..3-8
3.7. References………………………………...…………………...………………3-9
CHAPTER 4- EXPERIMENTAL PROGRAM…………………...……………4-1
4.1. Introduction………………………………………………………………..…….4-2
4.2. General scheme of the experimental program………………………………..….4-3
4.3. Sampling of the eolian soils………………..…………………………………....4-4
4.4. Soil classification………………………………………………………………..4-5
4.4.1.Sedimentation hydrometer analysis………………………………………….4-5
4.4.2.Granulometric analysis of soils. Laser diffraction method…………………..4-6
4.4.3.Blue of methylene absorption capacity………………………………………4-7
4.5. Microstructure…….......………………………………………………………...4-9
4.5.1.X-ray diffraction……………………………………………………………..4-9
4.5.2.Optical microscope analysis from thin sections……………………………...4-9
4.5.3.Scanning electronic microscopy analysis (SEM)…………………………...4-10
4.5.4.Energy dispersive X-ray spectrometry (EDS)………………………………4-11
4.6. Suction measurement…………………………………………………………..4-12
4.6.1.Water retention curve (WRC) by filter paper method……………………...4-12
4.6.2.Pore water extraction by squeezing method. Osmotic suction measurement4-13
4.7. Volumetric behaviour…………………………………………………………..4-15
4.7.1.Experimental design………………………………………………………...4-15
4.7.2.Classical oedometers………………………………………………………..4-19
4.7.3.Unsaturated oedometers…………………………………………………….4-21
4.8. Chapter conclusions……………………………………………………………4-31
4.9. References……………………………………………………………………...4-32
CHAPTER 5- ANALYSIS OF EXPERIMENTAL RESULTS 5-1
5.1. Introduction……………………………………………………………………...5-2
5.2. Geotechnical classification and characterization of the eolian soils of Mayapo...5-3

XI
5.2.1.Particles size distribution by sedimentation method…………………..……..5-5
5.2.2.Particle size analysis using laser diffraction method………………….…….5-10
5.2.3.Particle size analysis using blue of methylene method……………………..5-12
5.3. Micro-visualization…………………………………………………………….5-13
5.3.1.X-ray diffraction……………………………………………………………5-13
5.3.2.Microstructural analysis with thin sections…………………………………5-13
5.3.3.Scanning electronic microscopy (SEM) for direct fabric viewing………….5-16
5.3.4.Energy dispersive X-ray spectrometry EDS………………………………..5-22
5.4. Suction measurement…………………………………………………………...5-28
5.4.1.Water retention curve. Total and matric suction measurement……………..5-28
5.4.2.Pore water extraction by squeezing technique. Osmotic suction
measurement…………………………………………………………………5-34
5.5. Volumetric behaviour…………………………………………………………..5-35
5.5.1.Classical oedometers……………………………………………………….5-35
5.5.2.Unsaturated oedometer tests………………………………………………..5-47
5.6. Procedure of sampling and characterization of the volumetric behaviour of eolian
soils……………………………………………………………………………..5-56
5.7. Chapter conclusions…………………………………………………………….5-58
5.8. References……………………………………………………………………...5-61
CHAPTER 6- GENERAL CONCLUSION AND FUTURE WORK……………6-1
6.1. General conclusions……………………………………………………………...6-2
6.2. Recommendations and future work……………………………………………...6-3

XII
List of Figures
Figure 1 1. Thesis structure………………………………………………………………1-5
Figure 2 1. Scheme for the soil mechanics (Fredlund, 1999)…………………………….2-4
Figure 2 2. Scheme of an unsaturated soil (Gens, 2010)…………………………………2-4
Figure 2 3. Meniscus between two sand particles (Gens, 2010)…………………………2-6
Figure 2 4. Scheme of water retention curve to represent the suction (Toll et al., 2015)..2-7
Figure 2 5. Mechanism of collapse (Gens, 2010)………………………………………...2-9
Figure 2 6. Varieties of bonding agents in collapsing soils (Rogers, 1995)…………….2-10
Figure 2 7. Axis translation (adapted of HILF, 1956; Richards, 1941)…………………2-14
Figure 2 8. (a) Idealized scheme of consolidation lines at different suction values. (b)
Definition of LC (Loading-collapse) yield curve (Alonso et al., 1990)………………...2-15
Figure 2 9. Displacement of the LC yield curve on loading at constant suction (path L) and
wetting at constant applied stress (path C) (Gens, 2010)……………………………….2-16
Figure 2 10. Compression curves for saturated and unsaturated soil (Alonso et al.,
1990)…………………………………………………………………………………….2-17
Figure 3 1. Localization and extension of eolian deposits in Mayapo, Colombia………3-3
Figure 3 2. Eolian soils in Mayapo, Colombia…………………………………………...3-4
Figure 3 3. Flooding in the eolian soils area during the wet season……………………...3-5
Figure 3 4. Geological map of site of eolian soils (Adapted from Ingeominas, 2009)…..3-6
Figure 3 5.a) Gullied in eolian deposit formation. b & c) Flaser bedding………………..3-7
Figure 4 1. Experimental program………………………………………………………..4-3
Figure 4 2. Procedure for cubical block sampling of eolian soils………………………..4-4
Figure 4 3. Cubical samples of the eolian soils…………………………………………..4-6
Figure 4 4. Hydrometer test………………………………………………………………4-7
Figure 4 5. Left: Magnetic stirrer. Right: Laser particle size analyzer…………………...4-7
Figure 4 6. Blue of methylene absorption capacity procedure………………………….4-10

XIII
Figure 4 7. Optical microscope for thin sections………………………………………..4-12
Figure 4 8. Sample preparation for SEM. Left: Geometry samples and putting the sample
in the slides. Right: Sputter coating process…………………………………………….4-13
Figure 4 9. Left: Sample drying. Right: Saturation process…………………………….4-14
Figure 4 10. Contact and noncontact filter paper methods for measuring matric and total
suction, respectively (adapted of Fredlund & Rahardjo, 1993)…………………………4-15
Figure 4 11. Left: Centrifuged process in eolian soils. Right: Measurement of electrical
conductivity in pore water extracted……………………………………………………4-16
Figure 4 12. Experimental design of the oedometer tests……………………………….4-20
Figure 4 13. Oedometer test in Automatic oedometer system GDS……………………4-21
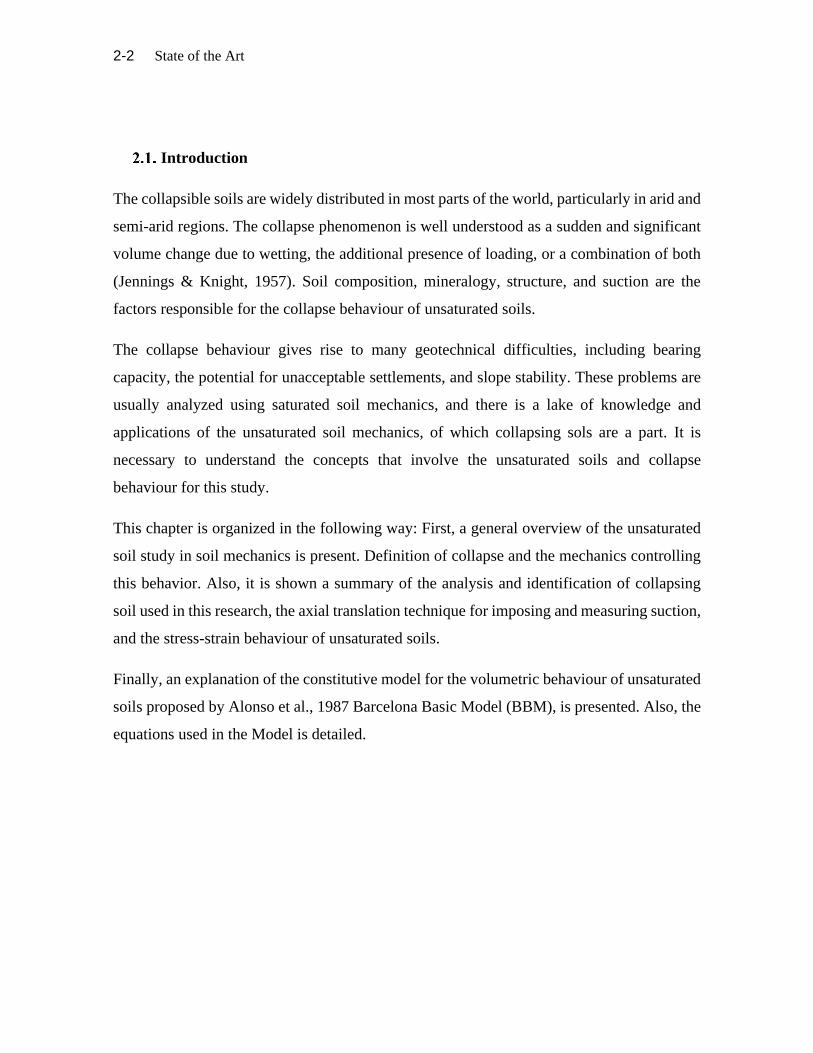
Figure 4 14. Left: Oedometers for the tests. Right: Soil specimens for the tests……….4-22
Figure 4 15. Scheme of single oedometer test result……………………………………4-22
Figure 4 16. Scheme and picture of the suction controlled oedometer cell……………..4-23
Figure 4 17. Parts of the equipment……………………………………………………..4-24
Figure 4 18. Scheme oedometer with auxiliary devices………………………………...4-25
Figure 4 19. Procedure to assemble the equipment a) sample base b) sample base and ring
clamp c) assemble the sample d) assemble the part superior to the cell………………..4-27
Figure 4 20. Time evolution of equalization stage of water content change under controlled
matric suction tests……………………………………………………………………...4-30
Figure 4 21. Left: Paths for controlled suction oedometer tests, loading at constant suction.
Right: Paths for controlled suction oedometer tests with soak at different loads……….4-31
Figure 5 1. Results of physical index of eolian soils of Mayapo………………………...5-4
Figure 5 2. Particle size distribution obtained by sedimentation method for eolian soils of
Mayapo…………………………………………………………………………………...5-5
Figure 5 3. Left: Coefficient of curvature (Cc) of the eolian soils. Right: Coefficient of
uniformity (Cu) of the eolian soils……………………………………………………….5-7
Figure 5 4. Left: Fines percentage of the eolian soils. Right: Clay particles of the eolian
soils……………………………………………………………………………………….5-8

XIV
Figure 5 5. Right: Clay aggregated of the eolian soil of Mayapo (Equation 5-1). Left: Clay
aggregates percentage of the eolian soils (Equation 5-2)………………………………...5-9
Figure 5 6. Results of granulometry by laser diffraction method………………………5-11
Figure 5 7. Comparison between fines percentage of laser diffraction and hydrometer test
without deflocculant. Both methods are useful to obtain the percentage of the fines of the
eolian soils………………………………………………………………………………5-11
Figure 5 8. Eolian soils classification Norme française 11-300, 1992………………….5-12
Figure 5 9. Drx results of the eolian soils of Mayapo…………………………………..5-13
Figure 5 10. Micrographics of thin sections…………………………………………….5-14
Figure 5 11. SEM Photomicrographs of eolian soils and the graphic representation of
porosity in the samples. Pores are black and particles white……………………………5-17
Figure 5 12. SEM images and EDS spectra of element dune 1…………………………5-20
Figure 5 13. Element distributions maps using SEM-EDS dune 1……………………..5-20
Figure 5 14. SEM images and EDS spectra of element dune 2…………………………5-21
Figure 5 15. Element distributions maps using SEM-EDS dune 2……………………..5-21
Figure 5 16. SEM images and EDS spectra of element dune 3…………………………5-22
Figure 5 17. Element distributions maps using SEM-EDS dune 3……………………..5-22
Figure 5 18. SEM images and EDS spectra of element dune 4…………………………5-23
Figure 5 19. Element distributions maps using SEM-EDS dune 4……………………..5-23
Figure 5 20. Simple water retention curves (WCR) for dune 1 and 4…………………..5-25
Figure 5 21. Water retention curve of macro-structure and micro-structure of dune 1…5-26
Figure 5 22. Water retention curve of macro-structure and micro-structure of dune 4…5-27
Figure 5 23. Double water retention curves (WRC) of dune 1 and 4 respectively……..5-27
Figure 5 24. Electrical conductivity and filter paper techniques for osmotic suction
measurement…………………………………………………………………………….5-29
Figure 5 25. Compression curve from double oedometer tests of eolian soils………….5-30

XV
Figure 5 26. Compressibility curves normalized of double oedometer tests……………5-33
Figure 5 27. Graphic of interval of the factor collapse potential (Minitab analysis)…...5-34
Figure 5 28. Compressibility curves of dune 1 and 2 under different vertical effective
stresses…………………………………………………………………………………..5-35
Figure 5 29. Compressibility curves of dune 3 and 4 under different vertical effective
stresses…………………………………………………………………………………..5-36
Figure 5 30. Graphic of principal effects of factors for collapse potential (Minitab
analysis)…………………………………………………………………………………5-38
Figure 5 31. Graphic of factor interaction of factors for collapse potential (Minitab
analysis)…………………………………………………………………………………5-39
Figure 5 32. Left: Scheme of the increase in saturation with the increase in deformation.
Right: Suction and stress paths of double oedometer and oedometer at different vertical
effective stress tests……………………………………………………………………..5-40
Figure 5 33. Compressibility curves from oedometer tests at constant suction………...5-42
Figure 5 34. LC curve of eolian soil of Mayapo from experimental test at constant
suction…………………………………………………………………………………...5-43
Figure 5 35. Approximation between theoretical loading collapse curve and the
experimental loading collapse curves…………………………………………………...5-45
Figure 5 36. Evolution of the Loading Collapse curve of the eolian soil………………5-46
Figure 5 37. Response of the model to alternative loading-collapse paths. Left: Loading
collapse of eolian soils Right: Variation of void ratio with vertical net stress applied…5-47
Figure 5 38. Relation of the strains at suction change (collapse path) in unsaturated
oedometer tests at different stress paths………………………………………………...5-48
Figure 5 39. Experimental procedure for sampling and characterization of the volumetric
behaviour of undisturbed eolian soils…………………………………………………...5-50

XVI
List of Tables
Table 2 1 Collapse Severity Classification (Jennings & Knight, 1957)………………...2-11
Table 3 1. Site coordinates of the excavations in the area studied……………………….3-3
Table 4 1. Factors and levels of the factor for each oedometer test…………………….4-18
Table 4 2. Response variable for each test……………………………………………...4-19
Table 4 3. Experimental design of each oedometer tests……………………………….4-19
Table 4 4. Initial conditions of controlled suction oedometer tests……………………..4-30
Table 5 2. Summary of grain size percentage, Cu and Cc of eolian soils………………..5-6
Table 5 3. Results of particle size analysis using blue of methylene method…………..5-12
Table 5 4. Results of analysis of graphic representation of SEM Photomicrographs…..5-16
Table 5 5. Elemental composition in weight percent of the dunes……………………...5-19
Table 5 6. Po and λ parameters from water retention curves of the eolian soils………..5-25
Table 5 7. Po and λ parameters from water retention curves of the eolian soils………..5-28
Table 5 8. Initial conditions of the oedometer tests and collapse potential (CP) of eolian
soils…………………………………………………………………………………...…5-31
Table 5 9. Cc, Cr and yield stresses from compressibility curves of the eolian soils….5-32
Table 5 10. Initial condition of oedometer tests under different vertical effective
stresses…………………………………………………………………………………..5-34
Table 5 11. Collapse potential results of oedometer tests under different vertical effective
stresses…………………………………………………………………………………..5-37
Table 5 12. Fitted means of collapse potential for void ratio…………………………...5-38
Table 5 13. Fitted means of collapse potential for soaking load……………………….5-38
Table 5 14. Fitted means of collapse potential for saturation degree…………………...5-39
Table 5 15. Conditions of the unsaturated tests at constant suction…………………….5-41
Table 5 16. Compressibility parameters of eolian soil of Mayapo at constant suction…5-43

XVII
Table 5 17. Parameters of the eolian soils from compressibility curves and the theoretical
yield stress………………………………………………………………………………5-44
Table 5 18. Initial and final conditions of the suction controlled oedometer tests……...5-46

XVIII
ABSTRACT
The principal target of this research is to focus on the study of the volumetric behavior of
the eolian soil and the influence of the geology, the soil structure, and suction on possible
collapse behaviour of the eolian soils. An experimental program of laboratory tests was
designed including geotechnical classification tests, Micro-structure tests, suction
measurement, and oedometer tests included classical and unsaturated in order to know the
characteristics and properties of the eolian soils.
The experimental investigation was realized on undisturbed samples of the eolian soil from
Mayapo, Colombia. The geology was studied by thin sections and DRX, and the soil
structure of the eolian soils was characterized by a scanning electronic microscope. The
distribution of the elements is analyzed by energy dispersive diffraction EDS. The suction
and total suction is measured by the paper filter method and the osmotic suction by the
electrical conductivity of the pore water of the soil. The volumetric behaviour is studied by
double oedometer and oedometer at different vertical effective stress to know the collapse
potential and the load where the soil suffers the most collapse.
Suction-controlled oedometer tests were developed. The experimental tests included an
increase in the vertical net stress at constant suction levels and variations in stress and
suction paths. The principal aspect analyzed was the volumetric behaviour at suction levels,
the yield stress generated by increased in the vertical net stress or increased in suction levels.
The eolian soil was classified as silty sand (SM) poorly graded, with very low fines
percentage. The main minerals of the eolian soil of Mayapo are quartz, plagioclases, and
feldspars. Also, there are salt particles in the soil and bonding materials of aluminum and
iron oxides bordering the grains.
There are large and continuous macropores between grains and a low amount of micropores.
The macropores could control the volumetric behaviour of the eolian soils. the presence of
macropores is also demonstrated in the double water retention curve (WRC), where it is
demonstrated that the soil present low suction levels and it behaviour is controlled by
macropores of the soil.

XIX
The salt concentration influences the osmotic suction and the total suction of the eolian soil,
affecting its hydraulic condition. It can govern the water flow and attract more water to the
soil, increasing the saturation degree, causing a decrease in total suction in the soil. This
change in suction component influence the collapse behaviour, increasing the strain with the
decrease in suction.
The collapse potential of the eolian soils was classified as a moderated problem. The
collapse potential increase with the increment of the initial void ratio. The suction also plays
an important role in the collapse potential. As suction decreases and soil wets, water menisci
between liquid and vapour phase disappears, and the empty pores are flooded, and it causes
a loss in the soil stiffness.
The unsaturated oedometer tests allowed to understand the influence of suction on the
volumetric behaviour of the eolian soils. The suction allows the soil to sustain higher applied
stress: The higher the suction, the higher is the stress that can be sustained before yield. The
suction increases the stiffness of the eolian soils. A constitutive model was proposed to
describe the volumetric behaviour of the eolian soil. The model is represented by a Loading
Collapse (LC) curve, and to allow knowing the reversible compressive volumetric strains
for any stress path of loading (L), collapse (C), or both in the elastic domain and to predict
irreversible compressive volumetric strain for any stress loading or collapse paths. There is
an important dependence of collapse and loading paths in the volumetric behaviour of the
eolian soils. The deformations are very small at suction changes. The soils will suffer higher
deformations in loading paths at low suction levels due to the soil stiffness is less.
At last, an experimental procedure was proposed for sampling and characterization of the
volumetric behaviour of undisturbed eolian soils.
Key words: Collapse, Eolian soils, Strain

XX
RESUMEN
El objetivo principal de esta investigación es centrarse en el estudio del comportamiento
volumétrico del suelo eólico y la influencia de la geología, la estructura del suelo y la succión
en el posible colapso de los suelos eólicos. Se diseñó un programa experimental de ensayos
de laboratorio que incluye ensayos de clasificación geotécnica, ensayos de visualización de
la microestructura, medición de succión y ensayos edométricos convencionales realizados
con el procedimiento clásico de la norma y ensayos edométricos no saturados, para conocer
las características y propiedades de los suelos eólicos.
La investigación experimental se realizó sobre muestras inalteradas del suelo eólico de
Mayapo, Colombia. La geología se estudió mediante secciones delgadas y DRX, y la
estructura del suelo de los suelos eólicos se caracterizó mediante un microscopio electrónico
de barrido. La distribución de los elementos se analiza mediante EDS por difracción de
energía dispersiva. La succión y succión total se mide por el método de filtro de papel y la
succión osmótica por la conductividad eléctrica del agua de los poros del suelo. El
comportamiento volumétrico se estudia mediante edómetro doble y edómetro a diferentes
esfuerzos verticales efectivos para conocer el potencial de colapso y la carga donde el suelo
sufre más colapso.
Se desarrollaron pruebas de edómetro controladas por succión. Las pruebas experimentales
incluyeron un aumento en la tensión neta vertical a niveles de succión constantes y
variaciones en las trayectorias de tensión y succión. El principal aspecto analizado fue el
comportamiento volumétrico a los niveles de succión, el límite elástico generado por el
aumento de la tensión neta vertical o el aumento de los niveles de succión.
El suelo eólico fue clasificado como arena limosa (SM) pobremente graduada, con muy bajo
porcentaje de finos. Los principales minerales del suelo eólico de Mayapo son el cuarzo, las
plagioclasas y los feldespatos. Además, hay partículas de sal en el suelo y materiales de
unión de óxido de hierro y aluminio que bordean los granos.
El suelo presenta gran cantidad de macroporos entre los granos y una pequeña cantidad de
microporos. Los macroporos podrían controlar el comportamiento volumétrico de los suelos

XXI
eólicos. la presencia de estos se demuestra en la doble curva de retención de agua (WRC),
donde se demuestra que el suelo presenta bajos niveles de succión y su comportamiento está
controlado por macroporos del suelo.
La concentración de sal influye en la succión osmótica y la succión total del suelo eólico,
afectando su condición hidráulica. Puede gobernar el flujo de agua y atraer más agua al
suelo, aumentando el grado de saturación, provocando una disminución de la succión total
en el suelo. Este cambio en el componente de succión influye en el comportamiento de
colapso de los suelos eólicos estudiados, aumentando la deformación al disminuir la succión.
El potencial de colapso de los suelos eólicos se clasificó como un problema moderado. El
potencial de colapso aumenta con el incremento de la proporción de vacíos inicial. La
succión también juega un papel importante en el potencial de colapso. A medida que la
succión disminuye y el suelo se humedece, los meniscos de agua desaparecen y los poros
vacíos se inundan, lo que provoca una pérdida de rigidez del suelo.
Las pruebas en el edómetro no saturado permitieron comprender la influencia de la succión
en el comportamiento volumétrico de los suelos eólicos. El componente de succión en el
suelo hace que este soporte una mayor tensión aplicada: cuanto mayor es la succión, mayor
es la tensión que se puede sostener antes del rendimiento. La succión aumenta la rigidez de
los suelos eólicos. Se utilizó el Modelo Básico de Barcelona, propuesto por Alonso et al,
1999, para describir el comportamiento volumétrico de los suelos eólicos de Mayapo,
Colombia. El modelo está representado por una curva de colapso de carga (LC) y permite
conocer las deformaciones volumétricas compresivas reversibles para cualquier trayectoria
de carga (L), colapso (C) o ambos en el dominio elástico y para predecir deformaciones
volumétricas compresivas irreversibles. para cualquier carga de tensión o rutas de colapso.
Existe una dependencia importante de las rutas de colapso y carga en el comportamiento
volumétrico de los suelos eólicos. Las deformaciones son muy pequeñas en los cambios de
succión. Los suelos sufrirán mayores deformaciones en los caminos de carga a bajos niveles
de succión debido a que la rigidez del suelo es menor.
Finalmente, se propuso un procedimiento experimental para el muestreo y caracterización
del comportamiento volumétrico de suelos eólicos no perturbados.
Palabras claves: Colapso, Suelos eólicos, Deformación.

Introduction 1-1
1. CHAPTER 1 – INTRODUCTION
1. CHAPTER 1 – INTRODUCTION .............................................................................. 1-1
General aspects ..................................................................................................... 1-2
Aims of the research ............................................................................................. 1-3
Relevance of the research ..................................................................................... 1-3
Hypothesis ............................................................................................................ 1-4
Thesis layout ......................................................................................................... 1-4
References ............................................................................................................. 1-6

1-2 Introduction
General aspects
The collapse phenomenon is defined as a significant volume reduction caused by water
content changes in an unsaturated soil under load (Delage et al., 2005). The collapse
phenomenon is well understood as a sudden and significant volume change due to wetting,
the additional presence of loading, or a combination of both (Jennings & Knight, 1957). It is
fundamental to consider this behaviour when investigating the mechanical response of the
soil.
The eolian deposits are known for their high potential of collapse behaviour. Many
researchers have studied these soils because of problems related to stability in trains lines
(Delage et al., 2005), landslide induced by irrigation (Leng et al., 2018), slope failures related
to internal erosion, tunnel gullying (Yates et al., 2018). These problems are the result of a
strong volume reduction of soil caused by water content changes.
In the north of Colombia, near to Riohacha, capital of the department of La Guajira, there is
a town called Mayapo. This town present extensive areas covered by sand deposits attributed
to eolian processes. Although the precipitation is rare in these regions, heavy rain episodes
may occur generated by storms from the Caribbean sea (Arango et al., 2014). The soil
features, along with the climate, can trigger the soil collapse.
The area studied has been enhancing tourism (Mejia and Bolaño, 2014), which has a
remarkable effect on urban development, value the landscape, and generate infrastructure
demands. However, indiscriminate use of soil is present without widespread attention of the
deformation behaviour of eolian soils, aggravated by a lack of urban and tourism planning
(CCG, 2017). Major projects could face increasing problems related to unsaturated eolian
deposits, which result in pathological affectations as structural failures associated with
differential settlements, cause major economic losses (Gaaver, 2012). From this point of
view, it is important to identify and analyze problems related to the soil collapse in this area.

Introduction 1-3
Aims of the research
This research intends to determinate influencing factors in the possible collapse of the eolian
deposits in Mayapo, Colombia.
The specific objectives of this work included:
▪ To realize the geological characterization of eolian soil from the Eolic Deposit Formation
(Qe), correlating the current properties with the geological history of this area, including
types of soils, mineralogy, cementation, chemical composition.
▪ Determinate the collapse potential of sand eolian soils from Eolic Deposit Formation (Qe)
in Mayapo, Colombia.
▪ To correlate the structure, the physical, chemical, and mineralogical properties, and the
suction in the possible collapse of the eolian soils.
▪ To propose a sampling and characterization protocol to evaluate the collapse behaviour
in eolian soils.
Relevance of the research
This research is a first approach to knowledge in the eolian soils in the country. It is due to
no serious study tackling a comprehensive investigation of the collapse in eolian soils in
Colombia. The neglect in studying these soils is understandable because they are usually
present in predominantly regions where economic development is limited. Thus, it will make
a valuable contribution to the research communities at regional and national levels.
On the other hand, this research will impulse to more scientific investigations will be carried
out in other parts of the country where the eolian soils are present, to establish whether the
collapse phenomenon and geotechnical problems related to this are presented.
Besides, it is convenient for the local authorities to consider the results obtained in this
research within the territorial arrangement planning. Thus, the soil will be distributed
effectively in engineering projects. And include the collapse phenomenon of this soils in the
potential risk for the area.

1-4 Introduction
It is also significant the process carried out of the installation and assembly from scratch of
a controlled suction oedometer for unsaturated soils in the CEREMA geotechnical laboratory
in Toulouse, France, and the creation of a manual of the equipment for future research. Also,
this stage allowed knowing the deformational behaviour of the eolian soil and obtaining
parameters to model the soil, which has extended the scope initially proposed in this research.
Hypothesis
The eolian soils of Mayapo exhibit characteristic and properties of collapsible soils.
Thesis layout
To fulfil the objectives mentioned above, the thesis is organized in six chapters, as follows:
Chapter 2 reviews the state of the art of unsaturated soils and suction, a summary of
collapsible soils, collapse mechanism, properties, and the analysis and criteria for estimating
the collapse. Also, the theory of stress-strain behaviour of unsaturated soils, the axis
translation technique used in the unsaturated test, and a brief description of the Barcelona
Basic Model (BBM) used to model the soil.
Chapter 3 gives brief information about the site. It presents the site localization and describes
the climate, geology, geomorphology of the region, and the area studied.
Chapter 4 refers to the methodology and experimental techniques, where the procedures
attached to the preparation of tests and the laboratory are described.
Chapter 5 presents the results and analysis of experimental tests. The micro-visualization
analysis (X-ray diffractogram, microscopic analysis, and Scanning Electronic Microscope
SEM) and their influence on volumetric behaviour are presented. The water retention curves
of the total and matric suction and the results of osmotic suction are also detailed. The
volumetric behaviour analysis of the eolian soils of Mayapo is presented by the classic and
unsaturated oedometer test results. By last, it presents the parameters obtained from the
experimental tests in the oedometer with controlled suction. The parameters are used to
model the eolian soils using the constitutive model Barcelona Basic Model (BBM).

Introduction 1-5
Finally, Chapter 6 summarizes this work and presents general conclusions and future work.
Figure 1-1. Thesis structure
MicrostructureMicrostructureMicrostructure

1-6 Introduction
References
Arango, C., Dorado, J., Guzmán, D., & Ruiz, J. . (2014). Climatología trimestral de
Colombia. In IDEAM.
Camara de Comercio de La Guajira. (2017). Informe Socio-Economico Sector Turismo de
La Guajira.
Delage, P., Cui, Y. J., & Pereira, J. M. (2005). Geotechnical problems related with loess
deposits in Northern France. Proceedings of International Conference on Problematic
Soils, May, 517–540.
FHWA. (2015). Soil Nail Walls Reference Manual. Geotechnical Engineering Circular
NO. 7, 132085, 425.
Gaaver, K. E. (2012). Geotechnical properties of Egyptian collapsible soils. Alexandria
Engineering Journal, 51(3), 205–210.
Jennings, J., & Knight, K. (1957). The Additional Settlement of Foundations due to a
Collapse of Structure of Sandy Subsoils on Wetting. Proceedings, 4th International
Conference on Soil Mechanics and Foundation Engineering, London, 1, 316–319.
Leng, Y., Peng, J., Wang, Q., Meng, Z., & Huang, W. (2018). A fluidized landslide
occurred in the Loess Plateau: A study on loess landslide in South Jingyang tableland.
Engineering Geology, 236(July 2016), 129–136.
Mejia, L., & Bolaño, L. (2014). La calidad de las ofertas turisticas en el departamento de la
guajira Colombia. Dimension Empresarial, 12, 139–149.
Yates, K., Fenton, C. H., & Bell, D. H. (2018). A review of the geotechnical characteristics
of loess and loess-derived soils from Canterbury, South Island, New Zealand.
Engineering Geology, 236(July 2017), 11–21.

State of the Art 2-1
2. CHAPTER 2- STATE OF THE ART
2. CHAPTER 2- STATE OF THE ART .......................................................................... 2-1
Introduction ........................................................................................................... 2-2
Soil, a multiphase porous medium ........................................................................ 2-3
Unsaturated state of soils ...................................................................................... 2-3
2.3.1. Overview for saturated/ unsaturated soil mechanics ..................................... 2-3
2.3.2. Definition of suction ...................................................................................... 2-5
Collapsible soils .................................................................................................... 2-7
2.4.1. Definition ....................................................................................................... 2-7
2.4.2. Collapse mechanism ...................................................................................... 2-8
2.4.3. Analysis and identification of collapsing soils ............................................ 2-10
2.4.4. Eolian soils .................................................................................................. 2-11
Stress-strain behaviour of unsaturated soils ........................................................ 2-12
Technique of controlling suction. Axis translation technique. ........................... 2-13
Constitutive model for the behaviour of unsaturated soils ................................. 2-14
2.7.1. Mathematical model .................................................................................... 2-16
Previous studies .................................................................................................. 2-19
Chapter conclusions ............................................................................................ 2-20
References ....................................................................................................... 2-22
2-2 State of the Art
Introduction
The collapsible soils are widely distributed in most parts of the world, particularly in arid and
semi-arid regions. The collapse phenomenon is well understood as a sudden and significant
volume change due to wetting, the additional presence of loading, or a combination of both
(Jennings & Knight, 1957). Soil composition, mineralogy, structure, and suction are the
factors responsible for the collapse behaviour of unsaturated soils.
The collapse behaviour gives rise to many geotechnical difficulties, including bearing
capacity, the potential for unacceptable settlements, and slope stability. These problems are
usually analyzed using saturated soil mechanics, and there is a lake of knowledge and
applications of the unsaturated soil mechanics, of which collapsing sols are a part. It is
necessary to understand the concepts that involve the unsaturated soils and collapse
behaviour for this study.
This chapter is organized in the following way: First, a general overview of the unsaturated
soil study in soil mechanics is present. Definition of collapse and the mechanics controlling
this behavior. Also, it is shown a summary of the analysis and identification of collapsing
soil used in this research, the axial translation technique for imposing and measuring suction,
and the stress-strain behaviour of unsaturated soils.
Finally, an explanation of the constitutive model for the volumetric behaviour of unsaturated
soils proposed by Alonso et al., 1987 Barcelona Basic Model (BBM), is presented. Also, the
equations used in the Model is detailed.

State of the Art 2-3
Soil, a multiphase porous medium
“The porous medium of soils is composed of three species: mineral, water, and air. It is
distributed in three phases: solid, liquid, and gas. And it is assumed that the mineral species
is the solid phase. However, the liquid phase may contain dissolved air, and the gas phase is
a mixture of water vapor and dry air” (Gens, 2010).
Unsaturated state of soils
2.3.1. Overview for saturated/ unsaturated soil mechanics
The importance of differentiating the saturated and unsaturated soils is the compressibility
of the pore fluid in soils. The water in saturated soil is incompressible. In contrast,
unsaturated soils have air bubbler into the water, and it makes water becomes “compressible”
(Croney, 1952).
Gens, 2010 describes the variables to represent unsaturated soils: the liquid degree of
saturation 𝑆𝑙, which is the proportion of the pores occupied by the liquid phase, and gas
degree of saturation 𝑆𝑔 is the proportion of the pores occupied by the gas phase”. Then 𝑆𝑙 =
1 − 𝑆𝑔. However, it is difficult to measure the degree of saturation and use it to analyze
unsaturated soil behaviour (Croney, 1952). Any soil in which pore water pressure is negative
can be saturated or contain air bubbles in an occluded form. This behaviour is also presented
in some soils with positive water pore pressures as soils with organic material, the gases
(methane and carbon dioxide) are under pressure, the air bubbles decreases and the gas
dissolves in the water, giving it the appearance of saturated soil.
Figure 2-1 shows an overview of the geotechnical world. A mid-level horizontal line
symbolizing the water table is the soil level where the soil water is at atmospheric pressure.
The saturated soil is localized below this water table, and usually, the pore water pressures
are positive and increase linearly with depth. Also, the effective stress is the difference
between total stress and pore pressure (Fredlund, 1999).

2-4 State of the Art
Figure 2-1. Scheme for the soil mechanics (Fredlund, 1999).
The unsaturated soils are above the water table, the pore space is occupied by more than a
fluid, and a new component is added, the gas phase, see Figure 2-2. (Gens, 2010). In these,
the pore water pressure (measured from atmospheric pressure as zero) is negative and
increases to zero with the depth (Croney, 1952).
Figure 2-2. Scheme of an unsaturated soil (Gens, 2010).
The liquid phase is held in the soil above the water table because of surface tension and
absorptive forces (Fredlund, 1999). For unsaturated soils, the effective stress concept is not
enough to explain volumetric behaviour. Fredlund and Morgenstern, 1976 proposed two
stress state variables, namely the net normal stress (s-𝑢𝑎 ) and the matric suction (𝑢𝑤 −
𝑢𝑎), which plays an important role in the volumetric behaviour of unsaturated soils.
The net normal stress and the suction changes influence the soil stiffness, triggering changes
in the soil structure. The suction increment contributes to stiffening the soil against change
in the applied stress. (Alonso et al., 1987). Also, the soil structure stiffness increases with an
increase in net normal stress, regardless of the type of soil structure. (Fredlund & Rahardjo,
1993)

State of the Art 2-5
The phenomena caused by the change in the net normal stress and suction are swelling and
collapse. The swelling phenomenon is typically associated with plastic clay rich in expansive
clay minerals that attract and absorb water. When the expansive clays are in contact with
water, the clay layers are forced further apart, increasing the soil pore pressure, and then the
soil will expand in volume to a point when the pressures are in balances (Holtz & Kovacs,
1981).
In contrast, the collapsible soils are characterized by open structure and with low plasticity.
The presence of water causes weakening of the structure, and consequently, a decreased soil
volume. It has been demonstrated that more significant swelling and collapse occur at low
suction (Alonso et al., 1987). Likewise, in collapsible and swelling soil, the stiffness
increases with the increment of suction. The suction concept and collapse phenomenon are
detailed in this chapter.
2.3.2. Definition of suction
Gens, 2010 defines suction as “the amount of work that must be done per unit mass of pure
water to transport reversibly and isothermally an infinitesimal quantity of water from a
reservoir of pure water at a specified elevation and gas pressure to the soil point under
consideration”. It can be defined as a total potential that controls the flow of water.
The total potential ѱ is divided into four components: gravitational potential, ѱ𝑚, gas
pressure potential ѱ𝑝; matric potential ѱ𝑚, and osmotic potential ѱ𝑜 (Aitchison, 1965).
Ѱ= ѱ𝑔 + ѱ𝑝 + ѱ𝑚 + ѱ𝑜 Eq. 2-1
However, the components of total potential have different effects on the mechanical
behaviour of soil. The gravitational potential and gas pressure potential do not affect its
behaviour. Thus, the principal components that affect the mechanical response of soil are the
sum of matric and osmotic potential; each one with different magnitude depends on the type
of soil. (Aitchison, 1965). The name potential is often replaced by suction if the work is done
per unit volume, not per unit mass. The matric suction is the component with more attention
by engineers due to this stress variable is strongly influenced by the environmental changes.

2-6 State of the Art
The suction is express in terms of pressure in negative values. Matric suction ѱ𝑚 is related
to the interaction between liquid and solid (Gens, 2010). The osmotic suction π is a function
of the amount of dissolved salt in the pore fluid in terms of pressure (Fredlund, 1999). Then,
equation (1) can now be written below this concept:
Ѱ= ѱ𝑚 + π Eq. 2-2
The matric suction is the component with more attention by engineers due to this stress
variable is strongly influenced by the environmental changes (Fredlund, 1999). The matric
suction is commonly related to the surface tension of water. This tension generates
intermolecular forces between soil particles that tend to influence the soil skeleton, and this
behaviour is associated with the capillary phenomenon. The pores soils with small radio act
as capillary tubes called the meniscus that rise above the water table, see Figure 2-3.
Figure 2-3. Meniscus between two sand particles (Gens, 2010).
The meniscus gives rise to a difference between the pore-air pressure, 𝑢𝑎, and the pore-water
pressure 𝑢𝑤. The radius of the meniscus is inversely proportional to this difference, and it is
called matric suction, ѱ𝑚=𝑢𝑎-𝑢𝑤. (Fredlund & Rahardjo, 1993). In other words, the
reduction of the meniscus area often causes an increase in suction.
On the other hand, the role of osmotic suction is related to the salt content in the pore-water,
and its change can affect the mechanical behaviour of soil. However, most engineering
problems related to the soil stability are primarily associated with matric suction component,
and osmotic suction changes are less significant in soil behaviour (Fredlund & Rahardjo,
1993).
The soil suction can be expressed by the water retention curve, that define the relationship
between the suction and the water in the pores in the soil. The relationship humidity-suction

State of the Art 2-7
is not-lineal and is specific for each soil. The shape of the water retention curve depends on
the size and shape of the soil particles and the soil pores, the structure, and the stress history.
Figure 2-4 shows a scheme of water retention curves for the soils (Fredlund & Rahardjo,
1993).
Figure 2-4. Scheme of water retention curve to represent the suction (Toll et al., 2015).
Several equations have been developed to adjust the water retention curve (Brooks & Corey,
1964; Gardner, 1957; van Genuchten, 1980), which include empiric parameters of adjusting
relate to air entry value and residual water content. The water entry value represents the
suction required for air to enter larger pores and begins the desaturation of the soil. Residual
water content is the humidity in which the water in the pores begins to be discontinuous and
these are mainly filled with air, observing a decrease in the rate of change of humidity with
suction.
Collapsible soils
2.4.1. Definition
A collapsible soil is defined as an unsaturated soil that undergoes a sudden and significant
volume change due to wetting, an additional presence of loading, or a combination of both.
It causes a rearrangement of particles and consequently changes in structure (Jennings &
Knight, 1957).

2-8 State of the Art
The collapse phenomenon takes place when the negative pore-water pressures at depth
increase to zero due to an increment in water volume. The wetting of collapsing soil results
in a volume decrease. A collapsible soil commonly has a metastable structure, affected by a
gradual reduction in matric suction (Fredlund & Rahardjo, 1993).
The collapse phenomenon also can be understood by making a difference with the
consolidation phenomenon. The collapse occurs due to the increment in moisture content
because of the expulsion of air from the soil, and the consolidation implies water expulsion
(Rogers, 1995). The consolidation is progressive soil densification, and the collapse is a
sudden volume decreased due to radical particle rearrangement. There is a possibility that the
consolidation can be present after the collapse.
2.4.2. Collapse mechanism
The collapse mechanism can be divided into three phases that, however, take place
simultaneously (Klukanova & Frankovska, 1995). A graphic explanation of the collapse
phases is shown in Figure 2-5.
In Phase 1, Soil particles are in contact with interparticle bondings. The destruction stage of
the original microstructure of soil begins. This occurs due to an increase in water content and
external pressure. Interparticle forces, clay films, and bridges begin to break, and the
aggregates and microaggregates disintegrate.
In Phase 2, The destruction of the microstructure continues, the bonding material is dissolved
and transported by water. Due to this, the particles are free to slide, and other fabric elements
compress. Finally, the total volume of the soil decreases.
Finally, Phase 3 shows a new microstructure developed after the collapse. The bonding
elements were removed or destroyed, and there are no interparticle forces. The soil porosity
is reduced, and the soil structure becomes a heterogeneous structure in contrast with the
homogenous structure original.

State of the Art 2-9
Figure 2-5. Mechanism of collapse (Gens, 2010).
According to studies, A soil potentially collapsible commonly possesses such features as high
porosity, an open structure, a low dry density, a high porosity, sensitivity to water,
geologically younger or recently altered deposits, and low interparticle bond strength. These
features working together, play an important role in the volume loss of soil and rearrangement
of structure (Rogers, 1995).
Particle shape also influences the soil structure. An angular particle will facilitate to soil with
a loss packing structure maintains a vulnerable and metastable structure until cementation
can resist stress involved or an external factor causes collapse. Unlike a soil formed by
uniform spherical particles, the grains make up a denser soil (Rogers, 1995).
Collapsible soils must have a factor to avoid the particles make up a denser structure. Particle
attraction plays an important role in the collapse behaviour. It can occur by chemical
components, physical phenomena, cementation, or negative pore pressure (suction). The
particle attraction can be represented in clay bridges, carbonates, gypsum, and capillary
tension, and this last is a typical feature in arid soil (Rogers, 1995). Figure 2-6 presents the
varieties of bonding agents in collapsible soils.
Figure 2-6. Varieties of bonding agents in collapsing soils (Rogers, 1995).
Although stiffness is considered a general characteristic in rock mechanics, the stiffness and
strength can be controlled and increased by bonding agents in soils, not only stress history
and porosity (Leroueil & Vaughan†, 1990).

2-10 State of the Art
2.4.3. Analysis and identification of collapsing soils
The Collapse phenomenon of soil is usually interpreted and studied into two main categories,
micromechanical methods, relate to the analysis of the microstructure of soils, and
macromechanical methods, the usual way to identify the collapse by measuring stresses and
deformations. Thus, the study of collapsible soils should follow those two directions (Feda,
1995).
In micromechanical interpretation, the collapse involves the soil structure, interparticle force,
bonding material, particle shape, pore size distribution, and mineralogy of collapsible soils.
These studies have been performed using electronic microscopes and image processing tools
(Derbyshire et al., 1995).
In Macromechanical interpretation, the collapse is triggered by the critical load, the most
common in saturated soils. Another collapse trigger is to wetting, most common in
unsaturated soils (Feda, 1995). Several criteria have been developed to identify whether a
soil may exhibit collapsing tendency.
The first intends to quantify the volume change that occurs when a soil undergoes collapse
was suggested by Abelev, 1948. Single oedometer tests were performed to measure the
decrease in volume at constant load after flooding the soil sample. The collapse of potential
Cp is defined as:
𝐶𝑃 = ∆𝜀 =∆𝑒
1+𝑒0 Eq. 2-3
Where 𝑒0 is the natural void ratio of the soil, ∆𝑒 is the reduction of void ratio due to wetting
and ∆𝜀 is the vertical strain.
Although the collapse potential is not a design parameter, the results guide the researchers
regarding the collapse situation and indicate whether there is a need for further investigations.
Interpretation of the severity of collapse is based on the values of collapse potential given by
Jennings & Knight, 1957. Table 2-1 shows this classification.

State of the Art 2-11
Table 2-1 Collapse Severity Classification (Jennings & Knight, 1957)
Collapse potential (%) Severity of problem
0-1 No problem
1-5 A Moderate problem
5-10 Problem
10-20 Severe problem
> 20 Very severe problem
Researchers have developed empirical equations base on parameters that govern collapse
behaviour are mainly the type of soil, dry density, water content, Atterberg limits, degree of
saturation, and suction changes (Basma & Tuncer, 1993). However, none of these criteria
directly measure the amount of deformation that could be expected. Besides, Most of these
criteria are based on compacted or remolded soil properties, and the influence of natural soil
fabric is not considered (Lutenegger & Saber, 1988).
2.4.4. Eolian soils
Eolian soils have been studied around the world because of the problems related with the
collapse phenomenon. These soils include loess, dunes and other windblown deposits
encountered in different parts of the world, covering about 17 % of the United States, about
17 % of Europe, 15 % of Russia and Siberia, and large areas of China. Loess and Dunes are
also encountered in South America and southern Africa (Clemence & Finbarr, 1981).
The main features of the eolian soils are loose open metastructure, bonded by cementing
agents, which upon wetting, become weak and may dissolve causing collapse. Related to the
mineralogy, these soils are composed primarily of quartz with feldspar and clay minerals.
The amount of clay mineral affects the collapse in the soil, with the increment in the clay
mineral content decreases the likelihood of collapse (Bell & Bruyn, 1973).
Another feature plays an important role of the collapse of this kind of soils is spaced pores
which are associated with spaced arrangement of the eolian deposits. They are also
characterized by the size larger that surrounding particles poorly cemented and more likely
in point-contact relation. Space pores contribute to favorable spatial conditions for collapse

2-12 State of the Art
to occur (Li et al., 2016). When the soil gets wet and bonding breaks, the particles fall into
spaced pores and soil collapse.
Stress-strain behaviour of unsaturated soils
The stress-strain behaviour of the unsaturated soil has been studied considering a two-
dimensional stress space: Net stress- suction. Net stress (p) is defined as the excess of total
stress over gas pressure. Based on accumulated experiences on unsaturated soil behaviour,
several tests with different stress paths in net stress and suction, Alonso et al., 1987, have
summarized the following points to define the stress-strain behaviour in unsaturated soils:
1. The suction increased contributes to increment in the soil stiffness. Also, the apparent
preconsolidation stress is increased. The suction increment also causes an increase in
the yield stress for collapsing soils. These behaviour are demonstrated in
experimental tests of Duddley, 1980, Aitchison, and Woodburn, 1969. However, the
increase in stiffness is not indefinite, the relationship between stiffness and suction is
non-linear, reaching a maximum stiffness value for suction that exceeds a specific
value.
2. Applied mean stress controls the amount of swelling experienced by plastic and
expansive clays soils when subjected to a decrease in suction. The more significant
swelling takes place at low suction values. In expansive soils, cyclical wetting and
drying processes cause a plastic expansion in the first wetting, and from it, the
behaviour is practically elastic.
3. Soils with an open structure collapse when suction is decreased. The amount of
collapse induced by a suction decrease increases with the intensity of stress (Duddley,
1980; Jennings & Knight, 1957). The value of the load or which maximum collapse
occurs depends, among other factors, on the type of soil, the initial humidity, and the
initial dry density.
4. Most soils with low plasticity silty clays can swell and collapse. With high loads, the
soil collapses, but the soil expands at small loads. The net stress value that reverses
volumetric behaviour from swelling to collapse is called “critical” stress. It is difficult
to determine this value due to this double swelling-collapse character is depending

State of the Art 2-13
on the confining stress, density, the suction, and, in addition, the volume change
associated with a decrease in suction, for a given applied stress, may change its sign
along the suction path (Escario & Saez, 1973).
5. When the confining stress increases, the collapse in unsaturated soil increases to the
maximum value, and then the value decreases to a negligible value. The vertical stress
in test oedometers at which the maximum value of collapse occurs depends on
depending on the type of soil. It is demonstrated in studies of Booth, 1975; Yudhbir,
1982.
6. For a given soil and a given applied load, the suction changes induce irreversible or
plastic volumetric strains. The suction changes can produce irreversible strain
volumetric. In terms of microstructure, these changes are explained as a change in the
soil fabric induced by the increasing suction.
Technique of controlling suction. Axis translation technique.
Two main techniques of measuring and controlling the matric suction have been developed,
the axis-translation technique (Richards, 1941) and the osmotic technique (P. Delage & Cui,
2008). For oedometer tests, the axis-translation technique has been used to control the matric
suction for suction under 1.5 MPa in soil samples. Romero, 1999 used this technique to study
the thermo-hydromechanical behaviour of compacted boom clay.
In an unsaturated soil, pore-air pressure is atmospheric, and pore water pressure is negative
concerning the atmospheric pressure (Vanapalli et al., 2008). The objective of the axis
translation technique is to reach a constant air pressure 𝑢𝑎 to simulate an artificial increase
in the atmospheric pressure in which the soil is immersed. This increase generates a negative
pore water pressure, which is increased by an equal amount to a positive water pressure 𝑢𝑤
to reach the matric suction required 𝑢𝑎 − 𝑢𝑤 (Romero, 1999). The air pressure and water
pressure were maintained a different value to generate the matric suction.
The axis translation technique allows us to measure and control the pore pressure in
unsaturated soil. Figure 2-7 shows a scheme of the axis translation technique and its
components. A High Air Entry Value (HAEV) ceramic disc is used as an interface permeable

2-14 State of the Art
to water but not to air. This interface maintains the pressure difference between extracted
water and water in the soil (Richards, 1941). Also, HAEV ceramic disc separates air and
water phases. The high air entry value is the maximum air value to which the disc can be
subjected before free air passes through the disc (Vanapalli et al., 2008). For the Rowe and
Barden oedometer, the air entry value of the HAEV ceramic disc is 500 kPa.
Figure 2-7. Axis translation (adapted of HILF, 1956; Richards, 1941).
The soil specimen is placed on the top of the HAEV ceramic disc, which is previously
saturated. More details related to the saturation of HAEV ceramic disc is detailed in chapter
4. Figure 2-7 shows the tendency of the water to go into the soil. However, this is resisted by
increasing the water pressure in the chamber until an equilibrium condition is reached
(Vanapalli et al., 2008).
Net vertical stress also called overburden pressure is applied upper the sample and is the
result of the equilibrium of vertical pressure (𝜎𝑣1) and applied air pressure 𝑢𝑎 in the sample,
𝜎𝑣1 − 𝑢𝑎, these pressures are separated by a membrane.
Constitutive model for the behaviour of unsaturated soils
Typical constitutive models used in saturated soils usually are based on the relationship
between stress and volume change. However, this relationship is generally limited when
trying to model the general behaviour of unsaturated soils. This is due to considers partial
aspects of behaviour without establishing consistent links between different features of
behaviour.

State of the Art 2-15
In this context, Alonso et al., 1987, to explain the volumetric behaviour of unsaturated soil,
have developed The Barcelona Basic Model (BBM), one of the most widely used
elastoplastic models for unsaturated soils. This model expresses qualitatively the full
behaviour of unsaturated soils and especially the volumetric collapse behaviour upon
wetting. The BBM is used to model soils where the collapse potential increase with
increasing stress. Alonso et al., 1990 also presented a mathematical formulation of an
elastoplastic model validating the theoretical concept with experimental data.
One of the objectives of the model was to construct a complete and consistent framework
capable of providing qualitative prediction by simple manipulation of the components of the
model. The relevant stress state variables in the BBM are the net normal stress (s-𝑢𝑎), and
matric suction (s), and the elastic changes are related to these (Gens, 2010).
The Barcelona basic model (BBM) is depicted schematically in Figure 2-8 (a), when the
idealized results of consolidation tests under constant suction are shown. The yield point
increases for suctions greater than 0 or saturated conditions. Suction allows the soil to keep
the applied stress before the yield, the higher the suction, the higher is the yield. This yield
point can be represented in the isotropic space of mean net stress-suction in Figure 2-8 (b).
The points connected form the Loading Collapse (LC) curve. The Loading collapse curve
represents the limit where the soil goes from elastic volumetric strains called elastic domain
to irreversible plastic volumetric strains.
Figure 2-8. (a) Idealized scheme of consolidation lines at different suction values. (b)
Definition of LC (Loading-collapse) yield curve (Alonso et al., 1990).
(a) (b)

2-16 State of the Art
The loading collapse curve can predict irreversible plastic volumetric strain for any stress
path which implied an increment in the stress (path L) or decrement in suction (Path C) or
both, see Figure 2-9. The LC curve movement is related to the evolution of the soil structure.
The loading and collapse at a structural level produce the same effect in the LC curve.
Figure 2-9. Displacement of the LC yield curve on loading at constant suction (path L) and
wetting at constant applied stress (path C) (Gens, 2010).
The movement of the LC curve can be expressed as shown in Figure 2-9, the LC curve will
move from position LC1 to LC2. The first path is related to increased loading L while the
suction is maintained constant. The second path is wetting the soil (where the suction is
reduced) under constant stress. The movement of LC yield curve is the same for both, and
the same irreversible plastic volumetric strains will ensue. Therefore, the LC curve links
together the compressive strains due to loading with the collapse strains due to wetting.
(Gens, 2010).
2.7.1. Mathematical model
An appropriate stress space to describe the behaviour for unsaturated soils in an isotropic
state is space (s,p), where p = 𝜎1+2𝜎3
3− 𝑢𝑎=𝜎𝑚 − 𝑢𝑎 (net mean stress), 𝜎𝑚 is the excess mean
pressure over air pressure.
Parallel to the behaviour of saturated soils subjected to stress increment for a determined
constant suction, the change in specific volume is given by:
𝑣 = 𝑁(𝑠) − 𝜆(𝑠)𝑙𝑛𝑝
𝑝𝑐 Eq. 2-4

State of the Art 2-17
𝑝𝑐 is a reference stress state for which 𝑣 = 𝑁(𝑠) and 𝜆(𝑠) are dependent on suction. Then,
when suction increase the soil stiffness increase in the stress ranges used. On unloading and
reloading curves with constant suction, the soil behaviour (consider elastic) was proposed
based on the relationship:
𝑑𝑣 = −𝜅𝑑𝑝
𝑝 Eq. 2-5
The slope 𝜅 of the unloading was considered as constant value and independent of the suction
to ensure that the model was conservative.
Figure 2-10 shows the response of two samples of the same soil subjected to different suction
(s=0 and s=constant), in isotropic stress paths in which p varies. For saturated soil, the
preconsolidation pressure is 𝑝0∗ and for unsaturated soil the preconsolidation pressures is 𝑝0.
Figure 2-10. Compression curves for saturated and unsaturated soil (Alonso et al., 1990).
The generic relationship between 𝑝0∗ and 𝑝0in the space (s,p) was obtained by relating the
specific volume (v) at points 1 and 3, in a 1:2:3 paths such that:
𝑣1 + ∆𝑣𝑝 + ∆𝑣𝑠 = 𝑣3 Eq. 2-6
The recoverable swelling that occurs in the 2:3 stretch was defined from the expression:
𝑑𝑣 = −𝜅𝑠𝑑𝑠
(𝑠+𝑝𝑎𝑡𝑚) Eq. 2-7

2-18 State of the Art
𝜅𝑠 is the slope of the line that relates 𝑣𝑠 and ln(s+𝑝𝑎𝑡𝑚) in unloading line and reloading. Atmospheric
pressure (𝑝𝑎𝑡𝑚) was incorporated to prevent that very low values of the suction 𝑑𝑣 or 𝑣 tend to
infinity.
From equations (4) (5) (7) is obtain:
𝑁(𝑠) − 𝜆(𝑠)𝑙𝑛𝑝0
𝑝𝑐 + 𝜅 𝑙𝑛𝑝0
𝑝0∗ + 𝜅𝑠 𝑙𝑛
𝑠+𝑝𝑎𝑡𝑚
𝑝𝑎𝑡𝑚= 𝑁(0) − 𝜆(0)𝑙𝑛
𝑝0∗
𝑝𝑐 Eq.
2-8
A convenient choice of 𝑝𝑐 and N(s) in order to simplify the before equation is to assume:
∆𝑣(𝑝𝑐)0𝑠 = 𝑁(0) − 𝑁(𝑠) = 𝜅𝑠𝑙𝑛
𝑠+𝑝𝑎𝑡𝑚
𝑝𝑎𝑡𝑚 Eq.
2-9
Where 𝑝𝑐is the mean stress at which one may reach the saturated virgin state from an
unsaturated condition, through wetting paths. If the equation (2-8) and (2-9) are joined the
following relationship is obtained:
𝑝0
𝑝𝑐 = 𝑝0
∗
𝑝𝑐
[𝜆(0)−𝜅]
[𝜆(𝑠)−𝜅] Eq. 2-10
This equation defines the set of yield 𝑝0 values for each associated suction in the space (s,p)
in LC yield curve and the position is determined by the preconsolidation stress (𝑝0∗), which
is a stiffness parameter of the model. Note that when 𝑝0∗ = 𝑝𝑐 , the LC yield curve becomes a
straight line 𝑝0 = 𝑝𝑐. To consider possible changes in soil stiffness with increased suction is
adopted the following expression:
𝜆(𝑠) = 𝜆(0)[(1 − 𝑟) exp(−𝛽𝑠) + 𝑟] Eq. 2-11
r is a constant related to maximum soil stiffness for infinite suction, and 𝛽 is a parameter that
controls the rate of increase of soil stiffness with suction.
It was adopted a suction value 𝑠0(p) considered the highest value of soil have been suggested
in all the history for each spherical stress, so when the suction reaches this value, occur
apparent deformations. 𝑠0(p) is a new LC yield curve of the soil, consider constant in the first

State of the Art 2-19
approximation. It is also proposed a logarithm relationship between the specific volume 𝑣
and the suction 𝑠 in the unloading and reloading. The specific volume change 𝑑𝑣 is expressed
as:
𝑑𝑣 = −𝜆𝑠𝑑𝑠
(𝑠+𝑝𝑎𝑡𝑚) Eq. 2-12
Hardening law
The evolution of the yield surface is controlled by hardening parameters 𝑝0∗ and 𝑠0
Hardening law is the change in the position of the surface, and it is considered dependent on
the increment of plastic deformation 𝑑ℰ𝑣𝑝 of the microstructure and is express as follows:
𝑑𝑝0
∗
𝑝0∗
=(1+𝑒)
𝜆(0)−𝜅 𝑑ℰ𝑣
𝑝 Eq. 2-13
Previous studies
Collapsible soils are found in several countries around the world, mainly in arid and semi-
arid regions, and cover a wide variety of geological materials. Among the cases documented
in the literature, include eolian, alluvial, residual, colluvial soils, volcanic flows, and
mudflows.
Larges areas of the earth´s surface as the western United States, parts of Asia, and southern
Africa, Francia, are covered with a type of eolian soils called Loess. Loess is a material
consisting of well-selected particles of silt fraction, connected by clay films. It has a high
load capacity without suffering major deformations, however, when flooded, it is susceptible
to large decreases in volume. (Pier Delage et al., 2005; Howayek et al., 2011; Lutenegger &
Saber, 1988; Nouaouria et al., 2008; Yates et al., 2018)
Some researchers as Gaaver, 2012, Olyansky, Kuzmenko, & Shchekochikhina, 2016 have
studied the collapsibility phenomenon in eolian soils. These studies focus on the effect of
wetting on geotechnical properties of eolian soils and predict wetting-induced collapse
behaviour.

2-20 State of the Art
Suction is another factor that plays an important role in the collapse behaviour and has been
studied by researchers as Muñoz-Casteblanco, Pereira, Delage, & Cui, 2012, Xie, Li,
Vanapalli, & Wang, 2018. The researchers demonstrate the influence of the suction in the
collapse behaviour of eolian soils due to sensitivity to change in moisture content.
On the other hand, researchers study the soil structure of a type of eolian soils, (Muñoz-
Casteblanco et al., 2012;Assadi-Langroudi, Ng’ambi, & Smalley, 2018; Leroueil &
Vaughan, 1990). The researchers show the influence of the form and the particle distribution
of the soil in the collapse behaviour when is subjected to changes in the natural water content.
In Colombia, collapsible soils have been identified. Currently, several cases of occurrence,
covering particularly a large area of central regions in Colombia. The collapsible soil studied
consists of alluvial deposits, colluvial deposits in Florida Blanca, Santander (Quijano Arias
& Tenjo Ramos, 2018), residual deposits in Barbosa, Antioquia (Orozco et al., 2010) y
volcanic flows in Pereira (Molina & Alzate, 2018). However, there are no previous formal
studies about the collapse behaviour in the eolian soils in Colombia.
Chapter conclusions
The collapse phenomenon has been studied into unsaturated soil mechanics. A soil
potentially collapsible commonly possesses such features as high porosity, an open structure,
a high porosity, sensitivity to water, geologically younger or recently altered deposits, and
low interparticle bond strength.
The concept of collapse and the mechanism have been presented. The collapse phenomenon
can be analyzed using micromechanical methods, relate to the analysis of the microstructure
of soils, and macromechanical methods, the usual way to identify the collapse by measuring
stresses and deformations in soils. A general explanation of the methods used in this research
to measure the collapse has been present.
The suction plays a fundamental role in unsaturated soils. The increment of suction
contributes to stiffening the soil. The general concept and suction components have been
presented. The concept used to apply the matric suction in soil used in this research have
been also presented.

State of the Art 2-21
The collapsible soils present the stress-strain behaviour typical of unsaturated soils, and it is
summarized in the following statements: The suction increased contributes to increment in
the soil stiffness, soils with an open structure collapse with decreased of suction, When the
confining stress increases the collapse increases to the maximum value and the value
decreases to a negligible value.
The general explanation of the Barcelona Basic Model (BBM) and the equations applied have
been presented. The model expresses qualitatively the full behaviour of unsaturated soils and
especially the volumetric collapse behaviour upon wetting. With this model was constructed
a complete and consistent framework capable of providing qualitative prediction by simple
manipulation of the components of the model.
Several researchers have studied and analyses the deformational behaviour of collapsible
soils. These studies are focus on the influence of the suction in the soil, the structure, particle
distribution, change in the saturation and stress, in the Collapse behaviour of soils. In
Colombia, collapse phenomenon has been found and analyzed in residual soil, alluvial and
colluvial deposits and volcanic flows. However, there is no formal studied about the collapse
behaviour in the eolian soil in Colombia.

2-22 State of the Art
References
Abelev, Y. M. (1948). The essentials of Designing and Building on Microporous Soils.
Stroital Naya Promyshlemast, 10, 127–130.
Aitchison, G. D. (1965). Soil properties, shear strength and consolidation. 6th Int Cong.
Soil Mechanics Found., 318–321.
Aitchison, G. D., & Woodburn, J. A. (1969). Soil suction in foundation design. 7th
ICSMFE.
Alonso, E. E., Gens, A., & D., W. (1987). Groundwater Effects in Geotechnical
Engineering. The Ninth European Conference on Soil Mechanics and Foundation
Engineering, 3.
Alonso, E. E., Gens, A., & Josa, A. (1990). A constitutive model for partially saturated
soils G ”. Géotechnique, 40(3), 405–430.
Assadi-Langroudi, A., Ng’ambi, S., & Smalley, I. (2018). Loess as a collapsible soil: Some
basic particle packing aspects. Quaternary International, 469, 20–29.
Basma, A. A., & Tuncer, E. R. (1993). Evaluation and control of collapaible soils. Journal
of Geotechnical Engineering, 118(10), 1491–1504.
Bell, F., & Bruyn, I. (1973). Sensitive, expansive, dispersive and collapsive soils. Bull Int
Assoc Eng Geol.
Booth, A. R. (1975). The factors influencing collapse settlement in compacted soils. 6th.
Reg. Conf. for Africa on SMFE, 57–63.
Brooks, R. H., & Corey, A. T. (1964). Hydraulic properties of porous media. Colorado
state university.
Clemence, S., & Finbarr, A. (1981). Considerations for collapsible soils. Geotechnical
Engineering Division.
Croney, D. (1952). The movement and distribution of water in soils. Geotechnique, 3(1), 1–
16.
Delage, P., & Cui, Y. J. (2008). An evaluation of the Osmotic Method of Controlling
Suction. Geomechanics and Geoengineering, 3(1), 1–11.
Delage, Pier, Cui, Y. J., & Pereira, J. M. (2005). Geotechnical problems related with loess
deposits in Northern France. Proceedings of International Conference on Problematic
Soils, May, 517–540.

State of the Art 2-23
Derbyshire, E., Dijkstra, T., & Lan, S. (1995). Genesis and Properties of Collapsible Soils.
Proceedings of the NATO Advanced Research.
Duddley, J. H. (1980). Review of collapsing soils. ASCE, 925–947.
Escario, V., & Saez, J. (1973). Measurement of the properties of swelling and collapsing
soils under controlled suction. 3rd Int. Conf. Expansive Soils, 195–200.
Feda, J. (1995). Mechanisms of Collapse of Soil Structure. Genesis and Properties of
Collapsible Soils, 149–172.
Fredlund, D. G. (1999). The emergence of unsaturated soils mechanics. Fredlund volume.
In A. W. Clifton, G. W. Wilson, & S. L. Barbour (Eds.), NRC Research Press.
Fredlund, D. G., & Morgenstern, N. R. (1976). Constitutive Relations for Volume Change
in Unsaturated Soils. Canadian Geotechnical Journal, 13(3), 261–276.
Fredlund, D. G., & Rahardjo, H. (1993). Soil Mechanics for Unsaturated Soils. John Wiley
& Sons, Inc., 30(2), 113–123.
Gaaver, K. E. (2012). Geotechnical properties of Egyptian collapsible soils. Alexandria
Engineering Journal, 51(3), 205–210.
Gardner, W. R. (1957). Some steady-state solutions of the unsaturated moisture flow
eqaution with application to evaporation from a water table. Soil Science.
Gens, A. (2010). Soil Environment Interactions in Geotechnical Engineering.
Geotechnique, 60(1), 3–74.
HILF, J. W. (1956). An investigation of pore-water pressure in compacted cohesive soils.
United States Bureau of Reclamation.
Holtz, R., & Kovacs, W. (1981). An Introduction to Geotehcnical Engineering. Prentice
Hall.
Howayek, A. El, Huang, P., Bisnett, R., & Santagata, M. C. (2011). Identification and
Behavior of Collapsible Soils.
Jennings, J., & Knight, K. (1957). The Additional Settlement of Foundations due to a
Collapse of Structure of Sandy Subsoils on Wetting. Proceedings, 4th International
Conference on Soil Mechanics and Foundation Engineering, London, 1, 316–319.
Klukanova, A., & Frankovska, J. (1995). The Slovak Carpathians Loess Sediments, their
Fabric and Properties. Genesis and Porperties of Collpasible Soils, 129–147.
Leroueil, S., & Vaughan†, P. R. (1990). The general and congruent effects of structure in

2-24 State of the Art
natural soils and weak rocks. Geotechnique, 40(3), 467–488.
Leroueil, S., & Vaughan, P. R. (1990). The general and congruent effects of structure in
natural soils and weak rocks. Géotechnique, 40(3), 467–488.
Li, P., Vanapalli, S., & Li, T. (2016). Review of collapse triggering mechanism of
collapsible soils due to wetting. Journal of Rock Mechanics and Geotechnical
Engineering, 8(2), 256–274.
https://doi.org/https://doi.org/10.1016/j.jrmge.2015.12.002
Lutenegger, A. J., & Saber, R. T. (1988). Determination of Collapse Potential of Soils.
Geotechnical Testing Journal, 11(3), 173–178.
Molina, G., & Alzate, A. (2018). Potencial de Colapso de Suelos Derivados de Cenizas
Volcánicas de la Zona de Expansión Urbana de Pereira. Universidad Libre Seccional
Pereira.
Muñoz-Casteblanco, J. A., Pereira, J. M., Delage, P., & Cui, Y. J. (2012). The water
retention properties of a natural unsaturated loess from northern France. Géotechnique,
62(2), 95–106.
Nouaouria, M. S., Guenfoud, M., & Lafifi, B. (2008). Engineering properties of loess in
Algeria. Engineering Geology, 99(1–2), 85–90.
Olyansky, Y. I., Kuzmenko, I. Y., & Shchekochikhina, E. V. (2016). Features of
Construction Buildings on the Loessial Soil of Central Moldova. Procedia
Engineering, 150, 2208–2212.
Orozco, J. M., Ramos, J., & Valencia, Y. (2010). Evaluación de la colapsabilidad de los
suelos en la doble calzada Hatillo-Barbosa. XIII Congreso Colombiano de Geotecnia -
VII Seminario Colombiano de Geotecnia, 1(March 2014), 101–107.
Quijano Arias, D. A., & Tenjo Ramos, E. A. (2018). Análisis de efectividad en la
estabilización de suelos colapsables en el tramo II de la transversal el bosque en el
municipio de floridablanca, santander. 88.
Richards, L. A. (1941). A Pressure-Membrane Extraction Apparatus for Soil Solution. Soil
Science, 51(5), 377–386.
Rogers, C. D. F. (1995). Types and Distribution of Collapsible Soils. 1–17.
Romero, E. (1999). Characterisation and thermo-hydromechanical behaviour of
unsaturated boom clay: an experimental study. Univesitad Politecnica de Cataluna.

State of the Art 2-25
Toll, D. G., Asquith, J. D., Fraser, A., Hassan, A. A., Liu, G., Lourenço, S. D. N., Mendes,
J., Noguchi, T., Osinski, P., & Stirling, R. (2015). Tensiometer techniques for
determining soil water retention curves. Unsaturated Soil Mechanics from Theory to
Practice - Proceedings of the 6th Asia-Pacific Conference on Unsaturated Soils,
October, 15–22.
van Genuchten, M. T. (1980). A Closed-form Equation for Predicting the Hydraulic
Conductivity of Unsaturated Soils. Soil Science Society of America Journal, 44(5),
892–898.
Vanapalli, S., Nicotera, M. V., & Sharma, R. (2008). Axis translation and Negative Water
Column Techniques for Suction Control. Geotechnical and Geological Engineering,
26(6), 645–660.
Xie, W. L., Li, P., Vanapalli, S. K., & Wang, J. D. (2018). Prediction of the wetting-
induced collapse behaviour using the soil-water characteristic. Journal of Asian Earth
Sciences, 151(October 2017), 259–268.
Yates, K., Fenton, C. H., & Bell, D. H. (2018). A review of the geotechnical characteristics
of loess and loess-derived soils from Canterbury, South Island, New Zealand.
Engineering Geology, 236(July 2017), 11–21.
Yudhbir, Y. (1982). Collapsing behavior of collapsing soils. 7th Southeast Asia
Geotechnical Conference, 915–930.

Eolian Soils of Mayapo 3-1
CHAPTER 3 – EOLIAN SOILS OF MAYAPO
CHAPTER 3 – EOLIAN SOILS OF MAYAPO ......................................................... 3-1
Introduction ........................................................................................................... 3-2
Localization of the site .......................................................................................... 3-3
Climate .................................................................................................................. 3-4
Geology ................................................................................................................. 3-5
Geomorphology .................................................................................................... 3-7
Chapter conclusions .............................................................................................. 3-8
References ............................................................................................................. 3-9

3-2 Eolian Soils of Mayapo
Introduction
To carry out a better comprehension of the volumetric behaviour of the eolian soils, the
processes that originated the soil must be considered in the first instance, due to the
environmental factors are determining in the formation and evolution of the soil and as a
consequence in the properties and the volumetric behaviour.
This research intends to characterize the volumetric deformation of eolian soils. This
characterization is carried out in the eolian soil of Mayapo, a town located in the north of
Colombia. The choice of sampling site was made considering the materials that could be
potentially collapsible.
The soil of this research has been originated by physical alteration of igneous rocks. The
process the soil formation includes the weathering of the parental rock, transport by wind and
deposition. These processes influence the mineral composition, soil structure, the shape and
size particle, and the porosity. Its influence is controlled by weather conditions and time.
In this chapter, the information of the eolian soil from Mayapo is presented, begins with a
description of the localization of the site, the climate, the geology description, and
geomorphology of the eolian soils. The information presented in this chapter is obtained
through field studies and bibliographic research presented by Lockwood, 1984; Alcaldía de
Riohacha, 2001; IDEAM, 2005; Ingeominas, 2009,.

Eolian Soils of Mayapo 3-3
Localization of the site
The research area involves eolian soils of the north of Colombia, particularly, is placed in the
small town called Mayapo in the Department of La Guajira. Figure 3-1 shows the extension
of the eolian deposits in Mayapo. The area studied is next to the Caribbean Sea. The choice
of site was made considering the materials that could presents geotechnical problems.
Figure 3-1. Localization and extension of eolian deposits in Mayapo, Colombia.
Figure 3-1 also shows the localization of the excavations to study the properties and collapse
behaviour of these eolian soils in the region. The sampling sites are specifically located in
the coordinates shown in Table 3-1.
Table 3-1. Site coordinates of the excavations in the area studied
Dune Latitude Longitude m.s.n.m
1 11°36'45.84"N 72°49'54.08"O 1
2 11°36'30.30"N 72°50'3.16"O 3
3 11°36'19.08"N 72°50'11.80"O 1
4 11°36'28.03"N 72°50'35.14"O 1

3-4 Eolian Soils of Mayapo
The area is characterized by large extensions of eolian soils and dunes, see Figure 3-2. These
deposits have approximately 4 meters high. The area of study has an approximate elevation
of 1 meter above sea level. This area is distinguished in the region for its tourist attraction
due to the coastal location and the desert landscapes.
Figure 3-2. Eolian soils in Mayapo, Colombia.
Climate
La Guajira is the region with the least precipitation in Colombia, and the climate is arid with
temperatures ranges from 27° to 34° and maximum up to 45°. The average precipitation of 0
to 250 mm for the first three trimesters. However, La Guajira lost its marked drought during
September, October, and November reaching ranges of 250 to 750 mm during this trimester
(Arango et al., 2014) .
The region has quite marked seasons. A rainy season is manifested for three months.
Precipitation is concentrated in September to November. In this season, precipitation exceeds
evaporation, and it causes flooding in some regions. Figure 3-3 shows a flooding present in
the area of eolian soils it the rainy season. These events could trigger collapse phenomena in
the region and in the soils studied (IDEAM, 2005).
2m

Eolian Soils of Mayapo 3-5
Figure 3-3. Flooding in the eolian soils area during the wet season.
Subsequently, a season of drought and night cold, from January to April, with wind blow
with strong intensity prevailing from the northeast. Following this period, a long dry period
continues, from May to September, characterized by a continuous wind that comes from the
northeast with increasing force and very hot. These marked seasons influenced the geology
and geomorphology of La Guajira Department, and the area studied.
Geology
The geology in the area is recent, formed in the quaternary period. Figure 3-4 shows the
formations of the site, Recent Alluvial Deposits (Qale), Sand Dune Deposits (Qe), Evaporitic
Deposits and Recent Lagoons (Qes), Recent Alluvial Deposits (Qal), which share some
sediments due to receive contributions from eolian currents and fluvial systems present in
the area.
The Sand Dune deposits (Qe), where the area of interest is located, were deposited during
one or more periods in the Pleistocene when the sea level was lower than the current one,
this generated an extended plain to the east and northeast of the peninsula, which would have
been the source for the large volumes of sand deposited in the area Lockwood, 1984.

3-6 Eolian Soils of Mayapo
Figure 3-4. Geological map of site of eolian soils (Adapted from Ingeominas, 2009).
Sand Dunes deposits Formation (Qe) is predominantly composed of quartz of medium size
and rounded well selected, potassium feldspar, red lithic grains with medium size and
rounded. There is no trace of calcareous material in the dunes. This indicates that the dunes
are derived primarily from silicate rocks localized distant from the marine platforms. The
dunes are deposited above recent alluvial deposits.
Ingeominas, 2009 recognized the main two types of these sediments: Active dunes and
stabilized dunes. Active dunes are formed from eolian deposition and are around three meters
high and are generally loose deposits with little vegetation, and particles are transported on
a seasonal to daily basis. In contrast, stabilized dunes have a stabilizing vegetation cover
allowed by a positive moisture balance. Inactive dunes usually present little or no movement,
these dunes reach heights of approximately five meters.
Transported soil type determines its corresponding engineering problem. The eolian soils are
transported by wind, and usually, the grains are sand size. The problems to anticipate are
collapsible grain structure and compressibility (Yaw, 2015).

Eolian Soils of Mayapo 3-7
Geomorphology
The geomorphology depends on geological material and the predominant geomorphologic
processes. In the area, eolian and fluvial processes govern the shapes of the surface of the
geological formations, and it helps to understand their genesis and their current behaviour.
Sand Dunes Formation (Qe) has deposits in which the thicknesses vary geographically, from
1 to 3 meters high. Based on Davies, 1980 classification, these deposits are Impeded
Primary, in which vegetation plays a major role, impeding the downwind transport and the
development of the dune (Figure 3-2). These kinds of dunes are significantly influenced by
wave action, generating erosional forces. Based on the shape and orientation of dunes, the
predominant wind direction is East-West.
Figure 3-5 shows some sedimentation structures present in the eolian soils. Gullied are
created by running water eroding sharply into soil, see (a). The soil is more prone to gully
erosion where there is less vegetation, the dunes have been reworked by the water currents
that drain the area. Also, there is a Flaser bedding observed in the block samples. These are
presents by isolate thin layers of mud amongst the cross-laminate of the sand, see (b and c).
Figure 3-5.a) Gullied in eolian deposit formation. b & c) Flaser bedding.
The shapes caused by the geomorphological processes and sedimentation that, together with
the geology and soil loose structure, demonstrate the strong material heterogeneity and the
poor mechanical properties of the material.
a)
c) b)
Flaser bedding

3-8 Eolian Soils of Mayapo
Chapter conclusions
The information of the Eolian soil of Mayapo presented includes the climate, geology
geomorphology, and it is determining to know the evolution the soil and have a better
comprehension of the volumetric behaviour of the eolian soils.
The climate in this region is arid with high temperatures from 27° to 34° and maximum up
to 45°. The average precipitation of 250 mm for the first three trimesters, reaching the higher
value of precipitation of 700 mm in September to December. In this season, precipitation
exceeds evaporation, and it causes flooding in some regions.
The eolian soils are predominantly composed by quartz of medium size and rounded well
selected, potassium feldspar, red lithic grains with medium size and rounded. There is no
trace of calcareous material in the dunes. This indicates that the dunes are derived primarily
from silicate rocks localized distant from the marine platforms.
According to the geomorphologic analysis, dunes are classified as active dunes and stabilized
dunes. Active dunes are generally loose deposits with little vegetation, and particles are
transported on a seasonal to daily basis. In contrast, stabilized dunes have a stabilizing
vegetation cover allowed by a positive moisture balance. Inactive dunes usually present little
or no movement. The problems to anticipate consider these kinds of soils are collapsible grain
structure and compressibility.
The geoforms presented in the eolian soils includes gullied, formed due to soil reworked by
the water currents that drain the area, and Flaser bedding, composed by mud amongst the
cross-laminate of the sand. The shapes caused by the geomorphological processes and
sedimentation that, together with the geology and soil loose structure, demonstrate the strong
material heterogeneity and the poor mechanical properties of the material.

Eolian Soils of Mayapo 3-9
References
Alcaldía de Riohacha. (2001). Plan De Ordenamiento Territorial Del Municipio De
Riohacha, Guajira. Alcaldia Municipal de Riohacha.
Arango, C., Dorado, J., Guzmán, D., & Ruiz, J. . (2014). Climatología trimestral de
Colombia. Ideam, 19.
Davies, J. L. (1980). Geographical variation in coastal development.
IDEAM. (2005). Atlas climatológico de Colombia.
Ingeominas. (2009a). Geología de las Planchas 7-8 Ranchería y Riohacha.
Ingeominas, A. M. (2009b). Cartogafría Geológica de las Planchas 7-Rancheria 8-
Riohacha, 9-Uribia- Dibulla, 14- 4- Albania y 15-15 bis Maicao.
Lockwood, J. P. (1984). Geology of the serranía de Jarara Area. Guajira Peninsula,
Colombia. Princeton University.
Yaw, A. S. (2015). Alternate Methods To Determine the Microstructure of potentailly
collapsible soils.

Experimental Program 4-1
4 CHAPTER 4- EXPERIMENTAL PROGRAM
4 CHAPTER 4- EXPERIMENTAL PROGRAM ........................................................... 4-1
Introduction ........................................................................................................... 4-2
General scheme of the experimental program ...................................................... 4-3
Sampling of the eolian soils. ................................................................................. 4-4
Soil classification .................................................................................................. 4-5
Sedimentation hydrometer analysis ............................................................... 4-5
Granulometric analysis of soils. Laser diffraction method ........................... 4-6
Blue of methylene absorption capacity ......................................................... 4-6
Microstructure ....................................................................................................... 4-8
X-ray diffraction ............................................................................................ 4-8
Optical microscope analysis from thin sections ............................................ 4-8
Scanning electronic microscopy analysis (SEM) .......................................... 4-9
Energy dispersive X-ray spectrometry (EDS) ............................................. 4-10
Suction measurement .......................................................................................... 4-11
Water retention curve (WRC) by filter paper method ................................. 4-11
Pore water extraction by squeezing method. Osmotic suction measurement.. 4-
12
Volumetric behaviour ......................................................................................... 4-14
Experimental design .................................................................................... 4-14
Classical oedometers ................................................................................... 4-18
Unsaturated oedometers .............................................................................. 4-20
Chapter conclusions ............................................................................................ 4-29
References ........................................................................................................... 4-31

4-2 Experimental Programs
Introduction
This research is mainly focused on the characterization of volumetric behaviour of eolian
soils from an experimental point of view. In order to study and understand this soil behaviour,
the designed experimental program is presented in this chapter.
The experimental program includes tests to characterize the volumetric behaviour, analyzing
the soil properties as mineralogy and its distribution, the soil structure, bonding, the suction
behaviour, and the volumetric behaviour under different stress and suction paths. In this way,
the objective and standards used for each test are described.
In this chapter, the methods of eolian soils sampling and preparing the samples are present,
as well as the equipment and procedures adopted during the realization of the experimental
program. This program includes the soil classification tests, the microstructure tests with X-
ray diffraction, the optical microscopic, and Scanning Electronic Microscopic, also the
suction measurement tests to determine the water retention curve by the paper filter method
and electrical conductivity method to determine the osmotic suction. Finally, oedometer tests
were carried out to know the volumetric behaviour of the eolian soils. For that, the equipment,
and procedures of simple oedometer test, double oedometer tests, and oedometer with
suction-controlled tests are described.
It is worth noting that, the tests of geotechnical classification, microstructure, suction
measurement and classical oedometers were carried out in Universidad Nacional de
Colombia, in Medellín. The soil classification with laser method and blue the methylene, and
the oedometer tests with suction-controlled was carried out in the geotechnical laboratory of
CEREMA in Toulouse, France.

Experimental Program 4-3
General scheme of the experimental program
The experimental program was design to reach each objective raised in this research. Figure
4-1 summarized the experimental program of this research. The microstructure tests are
carried out to know the minerals, the soil structure and elemental distribution, suction
measurement test in order to know the principal component of suction, total, matric and
osmotic suction, and the end the oedometer test to know the volumetric behaviour of eolian
soil. The target is to characterize the volumetric behaviour of the eolian soils.
Figure 4-1. Experimental program.

4-4 Experimental Programs
Sampling of the eolian soils.
The sampling procedure in the soil was performed according to the guidelines of Standard
practices for obtaining intact block (Cubical and Cylindrical) samples of soils described in
ASTM D7015, 2018. This method was applied in order to maintain the soil structure and
evaluate the volumetric behaviour with the “in situ” conditions of the eolian soil.
Eleven undisturbed samples that are expected to exhibit collapse behaviour are collected
from the bottom of twelve pits that were dug at four sites in the area of eolian soils in Mayapo.
Figure 4-2 shows the process of sampling of undisturbed samples. The exposed faces were
covered with several layers of plastic wrap in order to preserve the natural moisture. The
initial water content of the sample was measured in situ. The samples were transferred to the
laboratory and covered using melted paraffin instead of melted wax.
Figure 4-2. Procedure for cubical block sampling of eolian soils.
Figure 4-3 shows the samples of eolian soil extracted at each point. Samples were obtained
from depths of between 0.8 to 1 m. The size of the undisturbed block samples was 15 cm per
side approximately.
Figure 4-3. Cubical samples of the eolian soils.

Experimental Program 4-5
Soil classification
General geotechnical tests were realized to classify the eolian soils from Mayapo. These tests
were carried out in order to obtain the geotechnical characterization of the eolian soils and
group the samples with similar characteristics according to their volumetric behaviour.
The water content of the soil in the natural state was realized based on ASTM D2216, 2019.
The Specific gravity tests of soil particles were realized based on ASTM D854, 2014, the
tests were realized twice in order to verify the results. The consistency limits tests were
realized based on ASTM D4318, 2017.
Sedimentation hydrometer analysis
The particle size distribution analysis was realized using sedimentation hydrometer analysis
(ASTM D7928, 2017). The tests were carried out in the geotechnical laboratory of
Universidad Nacional de Colombia, Medellín, see Figure 4-4. The objective was to know the
distribution of soil particles from a diameter of 4.75 mm to particles of 1µ. Eleven samples
were tested with a dispersing agent to cause the breakdown of the aggregates as standard
procedure suggests. The tests were also realized without the dispersing agent to obtain the
flocculation percent due to it can affect volumetric behaviour of the eolian soil.
Figure 4-4. Hydrometer test.

4-6 Experimental Programs
Granulometric analysis of soils. Laser diffraction method
These tests were carried out to analyze the fines particles in the sample soil and compare with
the hydrometer tests. The analysis of granulometry of the eolian soil using the laser
diffraction method was based on the Frances standard NF ISO 13320-1, 2000. The tests were
carried out in the geotechnical laboratory of CEREMA in Toulouse, France. The method
consists of determinate the weight distribution of the size of fine particles of the soil.
Figure 4-5. Left: Magnetic stirrer. Right: Laser particle size analyzer.
The laser granulometry calculates the particle size form the diffraction of laser radiation: any
particle of the same size diffracts at the same angle and the diffracted ray, therefore,
illuminates the same detector. Four tests were carried out, one for each Dune. Five grams of
the sample was separated and suspended in water. The whole of the solution is homogenized
using a magnetic stirrer. Then the particle concentration of the solutions is measured by the
laser particle size analyzer, see Figure 4-5. The weight distribution of the particle size is
calculated from these data.
Blue of methylene absorption capacity
The test allows classifying the soil based on the French standard and comparing the results
with the obtained by sedimentation hydrometer test. Measuring the adsorption capacity of
methylene blue from the soil was based on the Norme française, 1998. The tests were carried
out in the geotechnical laboratory of CEREMA in Toulouse, France. The test consists of
measuring by dosage the amount of methylene blue can be adsorbed by the material

Experimental Program 4-7
suspended in water, see Figure 4-6. The blue value of the soil was directly related to the
specific surface of the particles constituting the soil.
Figure 4-6. Blue of methylene absorption capacity procedure.
The test was carried out by successively adding different methylene blue quantities and
controlling the adsorption after each addition. To do this, we take a drop of the suspension,
which was deposited on a filter paper, creating a spot. The maximum adsorption was reached
when a persistent light blue aureole appears at the periphery of the spot, see Figure 4-6.
To calculate the methylene blue value of the sample, the following expression was used:
𝑉𝐵𝑆 =𝐵
𝑚0

4-8 Experimental Programs
Where:
VBS = Soil Blue of methylene Value
B = mass of blue of methylene introduced
𝑚0 = dry mass of the test sample
Microstructure
These tests allow realizing the geological characterization of the eolian soil, correlating the
current properties with the geological history of this area, including the chemical
composition, mineralogy, structure, and bonding material. Also, it allows evaluating the
collapse behaviour focusing on the micro-scale level, having a better understanding of the
relationship between the geological features and volumetric behaviour of the soil.
X-ray diffraction
The main objective is to identify the minerals in the silt and clay fraction of the sample and
to obtain a semi-quantitative analysis. The tests were carried out in the Chemical laboratory
of Universidad de Antioquia, Medellín. For this test, a sample of eolian soil was selected and
dried in the oven. The sample was sieved using sieve N° 200 to separate the soil fraction less
than 76 µm. The sample was powdered in order to make pass all the material through the
sieve. The X-ray diffraction was carried out in an EMPYREAN diffractometer Model 2012.
The incident radiation wavelength was of l= 1.7903 Å and a step size of 0.026°. The platform
configuration used was spinner transmission reflection. The diffractogram was refined using
the Rietveld method.
Optical microscope analysis from thin sections
The samples were also subjected to optical microscope analysis to know the grain structure,
mineralogy, and bonding material between grains, which can affect the volumetric behaviour
of the eolian soil. The tests were carried out in the optical laboratory of Universidad Nacional
de Colombia in Medellín.
Four thin sections representing each dune studied were prepared using resin in order to keep
the natural fabric. The preparation consists of cut the sample into a thin tabular form. Then,

Experimental Program 4-9
the sample is placed into an activated polylite resin. The soaked sample is placed into a
vacuum desiccator to evacuate the air bubbles. The sample gets hard in 1-2 hours. After that,
the sections were polished to a thickness of approximately 20 µm. By last, the slice is put in
a cover slip and fixed with a cover slip. The thin sections were analyzed using a petrographic
microscope, see Figure 4-7. The samples were examined under plane-polarized light (PPL)
and cross-polarized light (XPL).
Figure 4-7. Optical microscope for thin sections.
Scanning electronic microscopy analysis (SEM)
The test target was to know the soil structure, describe the porosity, the shape of grains of
the eolian soils to relate these features with the soil response. The tests were carried out in
the biomaterials laboratory of Universidad Nacional de Colombia, Medellín.
Four undisturbed samples of eolian soils were studied for the test, as shown in Figure 4-8.
The volume of each sample was around 1 cm3. The specimen was fractured without carving
them to preserve the fracture preference that was considered representative of the undisturbed
fabric. For the eolian soils, the preparation process could be difficult because soil particles
were removable. The equipment used to analyze the specimens was the scanning electron
microscope SEM Carl Zeiss EVO MA10. This equipment uses a vacuum sample chamber.
For this reason, samples were dried in the oven at 105° Celsius, to the vacuum process was
faster. The thin sections were analyzed by scanning electronic microscope using the same
process.

4-10 Experimental Programs
Figure 4-8. Sample preparation for SEM. Left: Geometry samples and putting the sample in
the slides. Right: Sputter coating process.
SEMs were capable of imaging from conductive or semi-conductive materials. Due to the
soil was a non-conductive material, SEMs could present difficulty in imaging. The soils can
behave as an electron trap and gather them on its surface. This phenomenon is known as
charging and create white regions in the images. For this reason, samples must be prepared
before the tests to prevent surface charging and loss of resolution (Mitchell & Sangrey, 1975).
The process is called sputter coating and consists of covering the soil with a thin layer of a
conductive metal in a closed recipient, which is pumped down to a vacuum base (Constantin
et al., 2011). In this case, the samples were covered by 5 nanometers of gold to enhance the
SEM images. To enable the ignition of plasma was used argon gas in the chamber up to a
pressure of 0.5 Pa.
The processing and analyzing the SEM photomicrographic was made by ImageJ, an open
source image analysis tool (Ferreira & Rasband, 2012). Images obtained from SEM were
converted to grayscale. Then, the images were converted to binary (black and white)
following the image analysis steps through the transformation of the micrograph.
Energy dispersive X-ray spectrometry (EDS)
The energy dispersive X-ray spectrometry (EDS) tests were realized to know the distribution
of the elements in a section of the dune. The tests were carried out in the biomaterials
laboratory of Universidad Nacional de Colombia, Medellín. The main objective was to
determine if a bonding material between grains would provide higher stiffness to the soil.
Due to the soil being exposed to marine environments, it could have carbonates and salts in
the contacts between the grains acting as bonding material affecting the volumetric behaviour
of the soil. EDS tests also could give a response to this hypothesis.

Experimental Program 4-11
For the energy dispersive x-ray spectrometry EDS tests, four thin sections of the eolian soils
were used. The same process described for the SEM was made for preparing and analyzing
the samples in the EDS tests.
Suction measurement
These tests were carried out to know the suction range of the soil due to the unsaturated soil
that can have higher suctions and affect the collapse behaviour. The test target is to know the
range of suction of the eolian soil, likewise, to design the suction paths to the unsaturated
tests.
Water retention curve (WRC) by filter paper method
The filter paper method was applied to measure the total and matric suction of the eolian soils
to obtain the water retention curves. The tests were realized following the procedure
described in ASTM D5298, 2016. The tests were carried out in the geotechnical laboratory
of Universidad Nacional de Colombia in Medellín.
Eighteen soil specimens with 56 mm of diameters and 20 mm of high to obtain two water
retention curves. For these tests, the saturated path was analyzed. The soil specimens were
carved and then air-dried, and saturated to different degrees to get proper distribution in the
water retention curves, see Figure 4-9. The test procedure involves placing pieces of filter
paper against the soil specimen, as shown in Figure 4-10, and sealing the whole to prevent
evaporation. The Whatman 42 filter paper was used in all tests.
Figure 4-9. Left: Sample drying. Right: Saturation process.

4-12 Experimental Programs
Figure 4-10. Contact and noncontact filter paper methods for measuring matric and total
suction, respectively (adapted of Fredlund & Rahardjo, 1993).
For 15 days, the filter paper wets up to reach a water content in equilibrium with the
magnitude of matric and total suction. Then, the water content of the filter paper was
measured, which allows us to obtain the soil suction from a previously established
correlation.
Pore water extraction by squeezing method. Osmotic suction measurement
The eolian soils of this research were exposed to marine environments, and the salt content
is present and evidenced in the microstructure tests. The test target is evaluating the osmotic
suction related to salt content in the soil. The osmotic suction has effect in the hydraulic
conditions of the eolian soils. The water flow is governed not only by the matric suction but
also osmotic suction and can attract more water increasing the saturation, and then affecting
the volumetric behaviour of soil. This test was also carried out in order to do a chemical
analysis of the water pore of the eolian soils of Mayapo to understand its influence in the
possible collapse behaviour.
There are several techniques to measure the osmotic suction based on the extraction of pore
water from the soil sample: immiscible liquid displacement, gas extraction method,
centrifuging method, saturation extract method, and mechanical squeezing method, and
others (Iyer, 1990). In these, the osmotic suction is indirectly estimated by measuring the
electrical conductivity of the pore-water from the soil (Fredlund & Rahardjo, 1993). The pore
water of the soil contains dissolved salts with high and electrical conductivity compared to

Experimental Program 4-13
pure water. The concentration of dissolved salts can be indicated by the electrical
conductivity, which was related to the osmotic suction of the soil. The salinity of soil is not
dependent on the quantity of water (Romero, 1999).
In this research, the centrifuging method was employed for pore water extraction of soil. This
method is reported to be satisfactory with sand and silts (Iyer, 1990). The test was carried out
in the chemical laboratory of Universidad Nacional de Colombia in Medellín. A centrifuge
Thermo electron, IEC CL31R Multispeed, was used to extract soil water with a limit rotation
of 10000 rpm. Six soil samples of a total volume of 300 mL were employed in the test. Water
was added to the sample up to reach 100% of saturation in order to obtain the electrical
conductivity in the saturated state of the soil.
Once saturated, the samples were placed in the centrifugation device and were centrifuged
up to obtain 10 ml of pore water. After that, the pore water in the soil was extracted, and
electrical conductivity was then measured using a portable conductometer CRISON, see
Figure 4-11.
Figure 4-11. Left: Centrifuged process in eolian soils. Right: Measurement of electrical
conductivity in pore water extracted.
Osmotic suction was estimated from electrical conductivity using empirical relationships of
equation 1 and 2, based on exponential correlations between electrical conductivity and
osmotic suction. The first expression was proposed by the USDA, agricultural Handbook
N.60 1954; after Fredlund & Rahardjo, 1993, and was obtained with a mixture of dissolved
salts in water. The second one were determined with homoionic NaCl solutions by Romero,

4-14 Experimental Programs
1999. The difference between the two curves were of 15% for osmotic suction greater than
40 kPa.
𝜋 = 0.0191 𝐸𝐶1.074 (U.S.D.A, 1950) (1)
𝜋 = 0.0240 𝐸𝐶1.065 ((Romero, 1999) (2)
Where,
𝜋 = Osmotic pressure (kPa).
EC = Electrical conductivity (µS/cm).
Volumetric behaviour
These tests were focused on studying the volume change behaviour of the eolian soils due to
loading and wetting. The test results and analysis are correlated with the microstructure
analysis to have a better understanding of volumetric behaviour of the eolian soil.
Experimental design
The experimental design was realized based on the design of experiments proposed by Fisher,
1947. The design of experiments consists of determining what test should be made and how
to obtain data, which will statistically provide evidence to allow answers to questions raised.
An explaining each step of planning experimental design and associating them with the
oedometer tests experimental design is presented in this section.
Hypothesis definition
Recognition of the hypothesis of the research gives a clear statement of the problem. It
contributes to a better understanding of the phenomenon being studied and the final solution
to the problem. For these tests, the following hypothesis is proposed: “Changes in suction
and stress paths influence the volumetric behaviour of the eolian soil”.
Choice of factors and levels
A factor is an independent and controllable variable, and the levels are the measures which
the factor will be evaluated. The factors and levels influence the performance of the system,
and its combination or treatments helps to answer the hypothesis. How these factors are

Experimental Program 4-15
controlled to keep them at the desired levels should be considered. Table 4-1 presents the
factor and levels selected to evaluate the volumetric behaviour of the eolian soils.
Table 4-1. Factors and levels of the factor for each oedometer tests
Test type Factor Levels
Double oedometer A: Void ratio
0.6
0.65
0.81
0.82
Oedometer at different
loads
A: Void ratio
0.69
0.71
0.72
0.77
B: Soaking load (kPa)
80
200
400
800
Loading at constant
suction A: Suction (kPa)
0
30
100
200
300
Stress-suction paths A: Vertical net stress (kPa) for
collapse 30 kPa
10
300
Experimental Unit
Also called the measurement object, it is the place or context used to produce in a condition
to obtain a representative measurement. For each unit is applied a single treatment (which is
a combination of many factors. For oedometer tests, the eolian soils of Mayapo was selected
to evaluate volumetric behaviour.
Selection of response variable
The response variable is the value of the product of interest. The experimenter should be
certain that this variable really provides useful information about the process under study.

4-16 Experimental Programs
Table 4-2 shows the four types of experimental tests were carried out in order to answer the
hypothesis proposed.
Table 4-2. Response variable for each test
Test type Response variable
Double oedometer Collapse potential
Oedometer at different loads Collapse potential
Loading at constant suction Yield stress to LC curve
Stress-suction paths Yield stress
Choice of experimental design
Two experimental designs were selected to obtain the response variable of each test type and
to analysis the volumetric behaviour of the eolian soils. Table 4-3 show the experimental
design for each test.
Table 4-3. Experimental design of each oedometer tests
Test type Response variable
Double oedometer Experiment with a single factor
Oedometer at different loads Full factorial General
Loading at constant suction Experiment with a single factor
Stress-suction paths Experiment with a single factor
For the tests using the “experimental with a single factor”, it will evaluate the influence of
the factor levels in the response variable. The tests analyzed with “Full Factorial Design”; it
will evaluate all possible combinations of the levels of the factors.
Figure 4-12 shows the experimental design with the treatments or combinations of the level
of the factors, showing the variation of levels of factors. Twenty-seven response variables
were obtained to characterize the volumetric behaviour of the eolian soils.

Experimental Program 4-17
Figure 4-12. Experimental design of the oedometer tests.
High levels of soaking load were selected to know the complete paths of the compressive
curves of the eolian soils, knowing the load in which the soil experiment the highest collapse
and determinate if the collapse increment with the load. On the other hand, the level suction
paths were selected based on the results obtained in the double water retention curves.
Oedometer tests were conducted randomly to neutralize the effects of strange factors that
may be present. With the randomization, the observations (or errors) be independently
distributed random variable. It is necessary to obtain valid significance tests.
Results analysis
Statistical methods should be used to analyze the data so that the results and conclusions are
objective rather than operational. The principal effects of the levels of the factors and the
influence of interaction between factors in the variable response. The software of statistical
analysis Minitab was used for the analysis.

4-18 Experimental Programs
Classical oedometers
Classical oedometers were performed to identify the collapse of the soil. From these tests
results the magnitude of collapse of the eolian soils is calculated. The oedometer tests were
realized based on the procedure indicated in ASTM D2435, 2011. Some modifications were
made to understand the volumetric behaviour of the eolian soil under different stresses and
wetting paths. The methods are described below.
Simple oedometer
This test was realized base in Norme Française, 2017. The tests were carried out in the
geotechnical laboratory of CEREMA in Toulouse, France. This test was made in order to
obtain the consolidation curve at 0 kPa of suction to complete the Loading Collapse (LC)
curve in the results of the unsaturated tests. Figure 4-13 shows the equipment used for the
test. The apparatus consists of a consolidation cell, a smart keypath, a 10 kN load cell, a 10
mm LVDT. It was not needed manually placed weights.
Figure 4-13. Oedometer test in Automatic oedometer system of Global Digital Systems
GDS.
One undisturbed specimen was soaked and then loaded at the following stresses: 30, 80,
200, 400, and 800 kPa.
Double oedometer test
The tests were carried out in the geotechnical laboratory of Universidad Nacional de
Colombia in Medellín. The test target was to know the magnitude of the collapse in the eolian
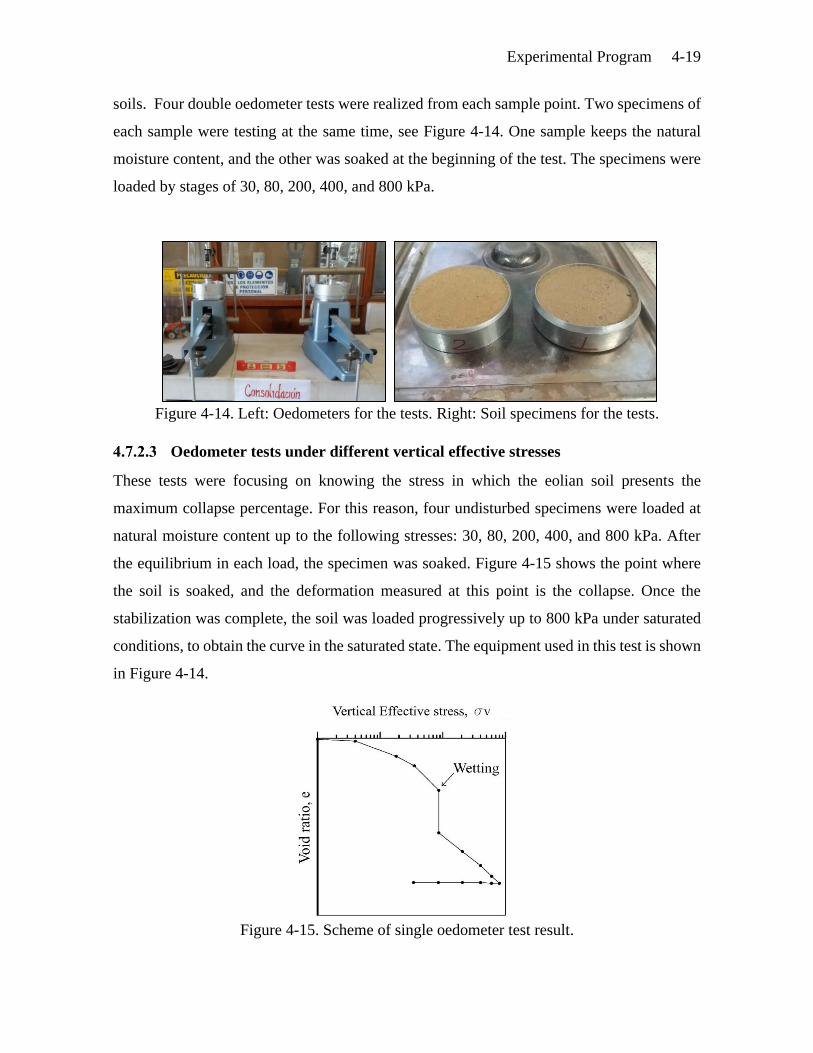
Experimental Program 4-19
soils. Four double oedometer tests were realized from each sample point. Two specimens of
each sample were testing at the same time, see Figure 4-14. One sample keeps the natural
moisture content, and the other was soaked at the beginning of the test. The specimens were
loaded by stages of 30, 80, 200, 400, and 800 kPa.
Figure 4-14. Left: Oedometers for the tests. Right: Soil specimens for the tests.
Oedometer tests under different vertical effective stresses
These tests were focusing on knowing the stress in which the eolian soil presents the
maximum collapse percentage. For this reason, four undisturbed specimens were loaded at
natural moisture content up to the following stresses: 30, 80, 200, 400, and 800 kPa. After
the equilibrium in each load, the specimen was soaked. Figure 4-15 shows the point where
the soil is soaked, and the deformation measured at this point is the collapse. Once the
stabilization was complete, the soil was loaded progressively up to 800 kPa under saturated
conditions, to obtain the curve in the saturated state. The equipment used in this test is shown
in Figure 4-14.
Figure 4-15. Scheme of single oedometer test result.

4-20 Experimental Programs
Unsaturated oedometers
The collapse phenomenon is attributed to the loss of stiffness associate with suction decrease
because of wetting. For this reason, with the unsaturated oedometer tests using suction-
controlled, the collapse behaviour of eolian soils at different stresses and suction paths is
investigated. As well as it was performed to the identification of the parameters to model the
soil using the Barcelona Basic Model (BBM). The tests were carried out in the geotechnical
laboratory of CEREMA in Toulouse, France.
Description of the oedometer cell
The features and procedures described in these items are based on the GDS handbook for the
GDS Consolidation testing system (GDS, n.d.). The suction controller oedometer cells have
been utilized by many researchers to study the influence of suction on compressibility and
swelling properties of soils (Delage et al., 2008). Figure 4-16 shows a scheme and picture of
the suction controller oedometer cell Rowe and Barden type. The equipment provides a test
chamber in which the pressure conditions can be controlled. The parameters that can be
controlled and measured are water back pressure, air pressure, specimen volume change, pore
pressure, axial displacement, axial stress (GDS, n.d.).
Figure 4-16. Scheme and picture of the suction controlled oedometer cell.
The cell consists of three main parts join by o-rings and screws to ensure closure of the
system. The superior part connected to the air pressure, the cell base connected to

Experimental Program 4-21
backpressure and rings to place the sample. All parts of the equipment are detailed in Figure
4-17. The thickness of the chamber wall is sufficiently thick for maintaining the pressure in
the equipment (Vanapalli et al., 2008).
Figure 4-17. Parts of the equipment.
Auxiliary devices
The suction oedometer cell requires auxiliary devices in order to control and measure the
pressure, volume, and deformation during the test. Figure 4-18 shows a scheme of the Rowe
and Barden cell and the auxiliary devices used with Rowe and Barden Cell. Each device is
described below.
GDS pressure/volume controllers: The equipment requires GDS pressure/volume controllers.
The controllers measure the water volume changes, air volume changes, and control the
supply pressures.
Two water pressure/volume controllers are used to supply the backpressure in the sample and
supply the vertical pressure upper soil sample. The volume change is measured in cubic
millimeters. The axial displacement can be measured indirectly using the values of air
volume change and water volume change.

4-22 Experimental Programs
Figure 4-18. Scheme oedometer with auxiliary devices.
One air pressure/volume controller is connected to the top of the test specimen to impose the
air backpressure. The air pressure/volume controller is pre-pressurized at using a compressed
air source to save volumetric capacity used up in pressurizing itself. The air pressure is
connected to the top of the test specimen.
Axial displacement transducer: An axial displacement transducer is used to measure directly
axial deformation in the sample using an LVDT transducer. The LVDT is placed over the
piston.
Pore pressure transducer: The pore pressure transducer is connected to the sample base using
a rigid pore pressure sensor to measure the pore pressure. This transducer does not control
the pore pressure. Naturally, there will have a small difference between measurement by the

Experimental Program 4-23
transducer and the same pressure applied by the GDS controller. This difference is normal
and should be considered when interpreting the results because this inherent discrepancy is
not controllable. However, pore water measurement is not essential. (GDS, n.d.)
Acquisition pad: The acquisition pad is used for the data acquisition of axial displacement
and pore water pressure. Simultaneously, it is connected to the water and air pressure/volume
controllers to program the imposed pressures during the test.
Assembly of suction-controlled cell
The first step is to assembly the superior part of the Rowe and Barden cell. This step should
be made carefully to avoid leakages of water and air during the tests. The procedure is
realized once, and the superior part is maintaining assembled between tests. The steps to
assemble the superior part of the equipment is described below:
1. The membrane and all the o-rings are lightly lubricated with silicone grease before the
assembly.
2. The piston is joined with the top cell feeding the piston up carefully through the cell top.
3. The clamping nut and the piston are screwed to the membrane using a flat screwdriver
to stop the piston rotating.
4. The clamping ring is placed inside the membrane and after inside the ring retainer.
5. The cell top and the ring retainer are attached using the four bolts on the top of the
equipment.
6. The nut (which has the air pressure connector) at the top of the piston is screwed to the
main part of the piston while a flat screwdriver is used to stop the piston rotating.
7. The air pressure tube is screwed to the top of the main body of the cell. This process is
realized just once to ensemble the membrane in the superior part of the equipment and
when the membrane is lubricated or changed.
Disassembly the part superior is carried out by reversing the process described above.
Between essays, the part superior never is separated. (GDS, n.d.)
The procedure to assemble the equipment is shown in Figure 4-19. The sample base with the
HAEV ceramic disc is attached up the cell base with screws, see Figure 4-19 (a). Care must
be taken to the drainage holes are aligned, and the o-rings between them are put correctly and

4-24 Experimental Programs
then insert and tighten the retaining bolts. This step does not need to be repeated between
essays, except for cleaning. One O-ring is placed around the pedestal on the cell base and
attached the cell ring clamp to the cell base with screws, see Figure 4-19 (b).
Figure 4-19. Procedure to assemble the equipment a) sample base b) sample base and ring
clamp c) assemble the sample d) assemble the part superior to the cell.
Water upper the ceramic is removed almost completely, leaving a thin film of water to avoid
desaturation and guaranty adequate contact with soil water. The specimen is weighted and is
placed upper the pedestal, covering it with a plastic paper to prevent drying due to
evaporation.
The sample ring retainer is placed around the pedestal and the sample. A second O-ring is
attached to the top edge to avoid part of the cell in contact with the piston (GDS, n.d.). The
axial stress is generated by the pressure in the top chamber and is constant during each test
stage.
Saturation stage
Before the tests, the HAEV ceramic disc should be saturated to apply the pore pressure. The
saturation process consists mainly of dissolving air bubbles under high water pressures
(Romero, 1999). The direct contact between the sample and the HAEV ceramic disc could
result in cavitation of the meta-stable water in a closed system. Air is entrapped in
microscopic crevices, resulting in erroneous estimation of the imposed matric suction.
Therefore, it is recommended to realize the saturation process in the HAEV ceramic disc
(Ridley & Wray, 1996). The procedure is realized based on the procedure of Romero, 1999,
and the Rowe and Barden cell handbook GDS, n.d.
For speeding up the saturation process, the HAEV ceramic disc is dipped in distilled water
for one week. Air is purged from individual pipes before connecting to the pedestal base, and
a) b) c) d)

Experimental Program 4-25
the base pedestal is put in place. For removing air from connectors, these are pressurized
under 25 kPa. The non-pressurized connector is dipped in water until no further visible
bubbles come out of the pipework. This process is realized in both directions. Usually, the
pressure under the HAEV ceramic disc should not exceed 50 kPa. Positive water pressure of
30 kPa is applied to the ceramic disc until water pooled on the top surface of the disc. For
500 kPa air entry value disc used in this research, the process to remove air is completed in
2 hours.
The cell is pressurized to make water flow through the HAEV ceramic disc to atmospheric
pressure. The sample ring is filled with water, and the odometer is pressurized under 520
kPa. For water to flow through the HAEV, pressure in the odometer should exceed the high
air entry value. The pore-pressure connectors are opened to the atmosphere, and the pipework
dipped in de-aired water. The water flows through the HAEV in the opposite direction, and
burbles come out. This process is completed when no air remained in the pipework. The
valve connected to the atmosphere is closed, and the cell pressure is kept in 520 kPa. This
process is made in order to dissolve air entrapped in a microscopic crevice (Romero, 1999).
For applying the chamber pressure is used water instead of air. The water is used to visualize
any leakages in the vertical pressure more easily.
It is essential to maintain the test under low-temperature conditions. The desaturation of the
HAEV ceramic disc could occur at high temperatures with relative humidity around 50%
(Romero, 1999).
The hydraulic conductivity of the HAEV ceramic disc is measured to verify the ceramic disc
is not cracked. After the saturation process, a thin film of water is left over the disc, and the
test is started rapidly in order to avoid the desaturated.
Equalization stages
The equalization time is dependent on the type of soil, size of the specimen, and air-entry
value of the disk, hydraulic conductivity of the specimen tested, and the hydraulic
conductivity of the HAEV ceramic discs.
When net vertical stress is applied, an excess of pore air and water pressure is generated
within the sample. The excess pore air is dissipated rapidly up to reach the backpressure due

4-26 Experimental Programs
to the air permeability. However, excess of pore water pressure takes more time to dissipate
to the target water backpressure. It is mainly caused by the low permeability of the HAEV
ceramic disc.
Figure 4-20 shows an example of the time evolution of the water volume change in the
equalization stage of the application of a loading step and during the subsequent
consolidation period at select nodes of the eolian soils. Time load increment was selected
according to the previous values in order not to have significant creep. This way, the
equalization period was around 0,4 week and the primary consolidation was completed
within 24 hours. The time evolution of air volume change was not measured.
Two stages are evidenced in the volumetric strain evolution. The primary consolidation
denoted in the curve of volume change. It usually occurs cause of air voids interconnected
and the compression of burbles. The secondary consolidation is dependent on time, and it
happens due to the water mass movement in air void space and the gradual dissolution of
bubbles during the evolution of vertical net stress (Romero, 1999). Volumetric deformation
is maintained, with 83 % of the total volume change.
Figure 4-20. Time evolution of equalization stage of water content change under controlled
matric suction tests.
Test Procedure and paths
The test program is intended to analyses the volumetric behavior of the eolian soil associated
with suction and stress changes. Also, it intent to obtain the shape of Loading-Collapse LC
curve. The planned laboratory testing program includes, in consequence, different stress

Experimental Program 4-27
paths to follow to reveal different aspects of constitutive models. Two types of controlled
suction test are performed:
• Controlled suction oedometer tests with constant suction (Tests 1-2-3-4)
• Controlled suction oedometer tests with soak at different loads (Tests 5-6)
Table 4-4 Show the data of the initial conditions of each sample for the tests. The tests are
realized with different water and air pressures values to generate the matric suction required
for the test.
Table 4-4. Initial conditions of controlled suction oedometer tests.
The stresses and suction paths for the Controlled suction oedometer tests with constant
suction and soak at different loads are shown in Figure 4-21.
Figure 4-21. Left: Paths for controlled suction oedometer tests, loading at constant suction.
Right: Paths for controlled suction oedometer tests with soak at different loads.
Test eo Suction,
kPa
Air pressure
(Ua), kPa
Water pressure
(Uw), kPa
Time
(days)
1 0,7508 300 330 30 30
2 0,7525 200 220 20 30
3 0,7534 100 80 20 30
4 0,7631 30 50 20 30
5 0,7335 200 220 20 30
6 0,7436 200 220 20 30

4-28 Experimental Programs
The stress path planning procedure is based on the process of the oedometer tests by Romero,
1999. The process is detailed below:
• The HAEV ceramic disc is pressurized to 15 kPa before the test in order to keep
it saturated and minimize the application of suction time.
• Before putting the sample in the HAEV ceramic, water upper the ceramic is
removed with an absorbent paper, leaving a thin layer of water to avoid any
desaturation of the ceramic disc.
• When the equipment is assembled, a pressure of 5 kPa is applied to adjust the
membrane with the upper porous disc. This can be noticed when the axial
displacement transducer registered movement.
• To reach the suction required in the soil is necessary to increase the air pressure
before the water backpressure. The air pressure must be imposed at the same time
as vertical stress in steps of 50 kPa. During pressures increased, the difference
between pressures should keep in 25 kPa.
• Once the air pressure is reached, the HAEV ceramic disc is pressurized with water
to the desired value to achieve the suction required. The equilibrium of the pore
pressure can be measured with the water volume change in GDS.
• When the water pressure needed is reached, the vertical pressure is raised to the
desired value, and the compressive strain is measured and monitored. The
equilibrium of the pore pressure should be reached before the next vertical stress.
• For the tests at constant suction, four tests at constant suction of 30, 100, 200, and
300 kPa are carried out, see Figure 4-21. Each soil specimen is loaded with the
following vertical net stresses: 30, 80, 200, 400, and 800 kPa, to compare the
behaviour with the classic oedometers results.
• For the tests soaked at different loads, two tests at different suction and stress
paths are carried out, see Figure 4-21. the initial test conditions are 10 kPa of
stress and 200 kPa of suction. For test 5, the soil specimen is wetting at the initial
condition to reach 30 kPa of suction. After, the soil specimen is loaded at 300
kPa. For test 6, the soil specimen is subjected to a load of 300 kPa under constant

Experimental Program 4-29
suction. Subsequently, the sample is wetting under a constant load to reach 30
kPa of suction.
• By last, the samples are weight, and the water content is calculated to determine
the relation of suction imposed and water content.
Many of the test failed by different causes: electrical power interruption, desaturation of the
HAEV ceramic disc due to diffused air accumulation, water, and air pressures leaks during
the tests. however, these failed tests were used to state the repeatability. In general,
repeatability and consistency in the results were observed in terms of volumetric strains.
Chapter conclusions
The experimental program was realized to characterize the volumetric behaviour of the eolian
soils. The objective and procedure for each test were presented.
To maintain the soil structure and evaluate the volumetric behaviour with the “in situ”
conditions, the soil was sampling using the block sampling method. Soil classification of the
eolian soil was realized to obtain the geotechnical characterization of the eolian soils and
group the samples with similar geotechnical properties.
Also, microstructure tests were carried out to realize a geological characterization of the
eolian soil, correlating the current properties with the geological history of this area,
including the chemical composition, mineralogy, structure, and bonding material. Also, it
allows evaluating the collapse behaviour focusing on the micro-scale level, having a better
understanding of the relationship between the geological features and volumetric behaviour
of the soil. The microstructure tests are x-ray diffraction, microscope analysis, scanning
electronic microscope and x-ray spectrometry.
On the other hand, the suction behaviour of the soil was also studied. The procedure to obtain
total and matric suction of the eolian soil and the water retention curves is detailed. The
squeezing method to obtain the osmotic suction is also described, and the target is to evaluate
the influence of the osmotic suction related to the salt content in the soil and the effect in the
hydraulic conditions of the eolian soils.

4-30 Experimental Programs
Finally, the tests to understand the volumetric behaviour is also explained. Classical
oedometer and unsaturated oedometer tests were focused on studying the volume change
behaviour of the eolian soils due to loading and wetting, on identifying the collapse of the
soil, and know volumetric behaviour at different stress and suction paths.

Experimental Program 4-31
References
ASTM D2216. (2019). Standard Test Method for Laboratory Determination of Water
(Moisture) Content of Soil and Rock by Mass. ASTM International, January, 1–5.
ASTM D2435. (2011). Standard Test Methods for One-Dimensional Consolidation
Properties of Soils Using. ASTM Standards, 04(June), 1–10.
ASTM D4318. (2017). Standard Test Methods for Liquid Limit, Plastic Limit, and
Plasticity Index of Soils. Report, 04(March 2010), 1–14.
ASTM D5298. (2016). Standard Test Method for Measurement of Soil Potential (Suction)
using filter paper. 1–6.
ASTM D7015. (2018). Standard Practices for Obtaining Intact Block (Cubical and
Cylindrical) Samples of Soil. 1–7.
ASTM D7928. (2017). Standard Test Method for Particle-Size Distribution (Gradation) of
Fine-Grained Soils Using the Sedimentation (Hydrometer) Analysis. ASTM
International, West Conshohocken, PA., 1–25.
ASTM D854. (2014). Standard Test Methods for Specific Gravity of Soil Solids by Water
Pycnometer. Astm D854, 1–7.
Constantin, D. g, Apreutesei, M., Arvinte, R., Marin, A., Andrei, O. C., & Munteanu, D.
(2011). Magnetron Sputtering Technique Used for Coatings Deposition ; Technologies
and Applications. 7 International Conference on Materials Science and Enginering,
12(March), 24–26.
Delage, P., Romero, E., & Tarantino, A. (2008). Recent Developments in the Techniques of
Controlling and Measuring Suction in Unsaturated Soils. Unsaturated Soils: Advances
in Geo-Engineering - Proceedings of the 1st European Conference on Unsaturated
Soils, E-UNSAT 2008, November, 33–52.
Ferreira, T., & Rasband, W. (2012). ImageJ User Guide. XXVI Focus on Bioimage
Informatics.
Fisher, R. A. (1947). Design of experiments. In Society for Industrial and Applied
Mathematics.
Fredlund, D. G., & Rahardjo, H. (1993). Soil Mechanics for Unsaturated Soils. John Wiley
& Sons, Inc., 30(2), 113–123.
GDS. (n.d.-a). 164 Helpsheet Hardware Rowen and Barden Cell Removing the Old Top-

4-32 Experimental Programs
Bag.
GDS. (n.d.-b). The GDS Consolidation Testing System and Constant Rate of Strain
Harware Handbook.
Iyer, B. (1990). Pore water extraction. Comparison of saturation extract and high-pressure
squeezing. ASTM Special Technical Publication, 1095, 159–170.
Mitchell, R. J., & Sangrey, D. A. (1975). Soil Specimen Preparation for Laboratory testing.
ASTM.
Norme française. (1998). Mesure de la capacité d’adsorption de bleu de méthylène d’un sol
ou d’un matériau rocheux.
Norme Française. (2000). Particle size analysis-Laser Diffraction methods.
Norme Française. (2017). Reconnaissance et essais géotechniques-Essais de laboratoire
sur les sols-Partie 5: Essai de chargement par palier à l´œdomètre (ISO 17892-5).
Article ISO 17892-5.
Ridley, A. M., & Wray, W. K. (1996). Suction measurement: A review of current theory
and practices. In E. E. Alonso & P. Delage (Eds.), 1st Int. Conf. on Unsaturated Soils.
Romero, E. (1999). Characterisation and thermo-hydromechanical behaviour of
unsaturated boom clay: an experimental study. Univesitad Politecnica de Cataluna.
U.S.D.A. (1950). Diagnosis and Improvement of saline and alkali soils. Soil Science
Society of America Journal, 18, 348.
Vanapalli, S., Nicotera, M. V., & Sharma, R. (2008). Axis translation and Negative Water
Column Techniques for Suction Control. Geotechnical and Geological Engineering,
26(6), 645–660.

Analysis of experimental Results 5-1
5. CHAPTER 5- ANALYSIS OF EXPERIMENTAL RESULTS
5. CHAPTER 5- ANALYSIS OF EXPERIMENTAL RESULTS ............................ 5-1
Introduction ......................................................................................................... 5-2
Geotechnical classification and characterization of the eolian soils of Mayapo. 5-3
Particles size distribution by sedimentation method ........................................ 5-4
Particle size analysis using laser diffraction method ....................................... 5-8
Particle size analysis using blue of methylene method .................................. 5-10
Microstructure ................................................................................................... 5-11
X-ray diffraction ............................................................................................. 5-11
Microstructural analysis with thin sections. ................................................... 5-11
Scanning electronic microscopy (SEM) for direct fabric viewing ................. 5-14
Energy dispersive X-ray spectrometry EDS .................................................. 5-16
Suction measurement ........................................................................................ 5-22
Water retention curve. Total and matric suction measurement ...................... 5-22
Pore water extraction by squeezing technique. Osmotic suction measurement . 5-
26
Volumetric behaviour ....................................................................................... 5-28
Classical oedometers ...................................................................................... 5-28
Unsaturated oedometer tests .......................................................................... 5-38
Procedure of sampling and characterization of the volumetric behaviour of eolian
soils. 5-46
Chapter conclusions .......................................................................................... 5-49
References ......................................................................................................... 5-52

5-2 Analysis of experimental Results
Introduction
This chapter presents the experimental results obtained in this dissertation. The results are
analyzed and discussed as they are presented.
Initially, the geotechnical properties and geological characterization of eolian soils of
Mayapo are presented, describing the soil mineralogy, the soil structure, the contacts between
grains, and the distribution of minerals in the soil in order to know their influence in the
volumetric behaviour of the eolian soils. Three components of suction are determined and
analyzed: matric, total, and osmotic suction. The total and matric suction are analyzed with
a double water retention curve to know the influence of the soil structure in the suction
behaviour of the soils, the osmotic suction was analyzed using the pore water by squeezing
technique. The results are also correlated to the geological and geotechnical characteristics.
Subsequently, the collapse potential of the eolian soils of Mayapo is determined through
quantitative criteria by double oedometer tests. The maximum load when the soil presents
the maximum collapse potential is also determined by the oedometer tests at different vertical
net stresses. An analysis of results and their correlation with the geological and geotechnical
properties is presented.
The influence of suction in the eolian soils of Mayapo is analyzed by the results of the
unsaturated tests at suction controlled. First, the volumetric behaviour of the soil at different
suction levels is analyzed by compressibility curves. Based on the results of the oedometer
tests at constant suction, a constitutive model of the eolian soils is proposed based on the
Barcelona Basic Model (BBM) proposed by Alonso et al., 1990. The model allows us to
know the elastic domain of the eolian soils and the Loading collapse (LC) curve from which
the soil presents irreversible deformations. By last, two unsaturated tests at different stress
and suction path has been conducted in order and to evaluate the volumetric behaviour at
different paths and to correlate the results with the LC curve.

Analysis of experimental Results 5-3
Geotechnical classification and characterization of the eolian soils of Mayapo.
This section presents the geotechnical classification and characterization of the eolian soils
of Mayapo. Table 5-1 presents the physical index of the eolian sands including the water
content, specific gravity, void ratio, and saturation.
Table 5-1. Results of physical index of the eolian soils of Mayapo.
Sample Moisture content (%) Void ratio (e) Specific Gravity
1A 5,5 0,605 2,68
1B 3,8 0,604 2,68
1C 5,1 0,605 2,65
2A 4,2 0,897 2,61
2B 5,6 0,78 2,62
2C 3,1 0,645 2,62
3A 12,2 0,755 2,64
3B 5,1 0,876 2,62
4A 7,4 0,813 2,63
4B 7,9 0,810 2,65
4C 5,4 0,686 2,64
The results of physical index are plotted in Figure 5-1. The results of the index properties do
not exhibit large variations. The specific weight of solids is between the range of 26,10 and
26,80 kN/m3. The samples present low moisture content, representing a low degree of
saturation between 10 to 30 These values are representative of sands. The void ratio varies
from 0,61 to 0,89. These values are representative of loose silty sand and loose uniform sand,
according to Coduto, 1999.

5-4 Analysis of experimental Results
Figure 5-1. Results of physical index of eolian soils of Mayapo.
Although the physicals index are similar between the dunes and these properties are
representative of loose uniform sand, there are small variations in the results, in the order of
20%, that could be due to are undisturbed samples and the soil structure, density, and porosity
for each sample could be slightly different. These differences can also be presented from the
origin of the material.
Particles size distribution by sedimentation method
Figure 5-2 shows the results of eolian soil particle size cumulative distribution in natural and
deflocculated state. Table 5-2 presents the percent of the sand silt a clay particle, uniformity
coefficient (Cu), and Curvature Coefficient (Cc) of the eolian soils.

Analysis of experimental Results 5-5
Figure 5-2. Particle size distribution obtained by sedimentation method for eolian soils of
Mayapo.
According to the Unified soil Classification System, the classification for each sample of the
eolian soils was Silty Sand (SM). The soil constituted sand with very low fines content. The
soil is poorly graded soil. For the plasticity, the eolian soils were classified as non-plastic.

5-6 Analysis of experimental Results
Table 5-2. Summary of grain size percentage, Cu and Cc of eolian soils.
Despite the soil being classified as silty sand (SM), the sedimentation process of these soils
occurs during several events causing the soil heterogeneity, as flaser beddings as detailed
Chapter 3. The compositions of the bed flaser are mainly clay and sands with different
sorting. The soil heterogeneity influences the volumetric behaviour of the soil directly.
Figure 5-3 shows a graphic representation of the coefficient of curvature (Cc) and coefficient
of uniformity (Cu) of the eolian soils. The coefficient of curvature has a range of 0 to 1,50,
and the coefficient of uniformity is in a range of 3,20 to 4,50, excepting the sample 2 with
Cu of 9. The general results evidence that the soil is poorly graded, and the particles are
uniforms. The uniformity in soil particles in the eolian soils could give a more porous
structure to the soil and contribute to the collapse behaviour.
Sand ID Sand
(%)
Silt
(%)
Clay
(%)
Uniformity
coefficient (Cu)
Coefficient of
curvature (Cc)
1A Natural 81,29 16,16 2,55 3,84 1,16
Deflocculated 80,54 10,46 9,00 -- --
1B Natural 73,92 21,69 4,39 4,50 0,98
Deflocculated 75,17 13,63 11,2 -- --
1C Natural 85,59 13,52 0,89 3,23 1,43
Deflocculated 87,32 8,76 3,92 -- --
2A Natural 78,01 21,65 0,34 4,75 0,04
Deflocculated 77,05 14,15 8,80 -- --
2B Natural 66,06 27,68 6,26 9,00 0,69
Deflocculated 67,22 18,78 14,00 -- --
2C Natural 80,68 15,14 4,18 3,81 1,04
Deflocculated 80,18 10,82 9,00 -- --
3A Natural 73,76 21,65 4,59 5,14 0,99
Deflocculated 73,45 16,65 9,90 -- --
3B Natural 72,17 23,96 3,87 3,55 0,88
Deflocculated 71,77 19,12 9,11 -- --
4A Natural 71,50 28,12 0,38 3,20 0,80
Deflocculated 69,75 18,65 11,60 -- --
4B Natural 72,33 27,31 0,36 3,33 0,94
Deflocculated 73,01 12,39 14,60 -- --
4C Natural 79,90 18,17 1,93 3,27 1,01
Deflocculated 78,99 12,70 8,31 -- --

Analysis of experimental Results 5-7
Figure 5-3. Left: Coefficient of curvature (Cc) of the eolian soils. Right: Coefficient of
uniformity (Cu) of the eolian soils.
Figure 5-4 shows a graphic representation of fines percentage and the clay particles
percentage in the natural and deflocculated eolian soils. The eolian soils have an average of
25% fines and a maximum of 33%. The fines maintain a similar percentage in the natural and
deflocculated soils. This behaviour demonstrates that most of the aggregates are present only
in fines size particles, and the sand particles present a low amount of aggregates.
Figure 5-4. Left: Fines percentage of the eolian soils. Right: Clay particles of the eolian
soils.
To evaluate the clay aggregated in the eolian soils, the expressions proposed by Araki, 1997
were used. It is shown in Eq 5-1 and 5-2. The clay percentages were obtained from the

5-8 Analysis of experimental Results
granulometry tests with and without deflocculant. Figure 5-5 shows the results of the clay
aggregated, and clay aggregated percentage of the eolian soils.
Clay aggregates (%) = Deflocculated clay size (%) - Natural clay size (%) Eq. 5-1
Clay aggregates percentage (%) =Clay aggregates (%)
Deflocculated clay size (%) Eq. 5-2
The eolian soil of Mayapo presents a small amount of clay aggregates in a range of 9 to 19
percent, the clay aggregates percentage in the soil varies from 65 to 97 percent.
Figure 5-5. Right: Clay aggregated of the eolian soil of Mayapo (Equation 5-1). Left: Clay
aggregates percentage of the eolian soils (Equation 5-2).
Particle size analysis using laser diffraction method
Figure 5-1 and Figure 5-6 shows the results of the granulometry curves of the four dunes in
natural state obtained by the laser diffraction method. The soil was classified as silty sand
(SM). The predominant grain size in the eolian soil of Mayapo is sand of 0,03 millimeters in
diameter. Also, there are silt particles with 0,03 mm of diameter. The curves obtained are
bimodal due to two-particle size predominant.

Analysis of experimental Results 5-9
Figure 5-6. Results of granulometry by laser diffraction method.
Figure 5-7 shows the relation between particle size analysis results by the laser diffraction
and hydrometer tests without deflocculant. The fines percentage in the laser method varies
from 15 to 20 %. The fines percentage obtained by laser diffraction is similar to the results
of the sedimentation method.
Figure 5-7. Comparison between fines percentage of laser diffraction and hydrometer test
without deflocculant. Both methods are useful to obtain the percentage of the fines of the
eolian soils.

5-10 Analysis of experimental Results
Particle size analysis using blue of methylene method
The volume of blue of methylene introduced for the measurement was 60 cc, the total of VBS
was 1,30, see Table 5-3. The passing percentage of 80 µm is 28,5. According to the Norme
française 11-300, 1992, the soils is classified as 𝐵5 how is shown in Figure 5-8, the soils are
classified as very silty sands and gravels. The classification coincides with the USCS
classification realized with the hydrometer tests.
Table 5-3. Results of particle size analysis using blue of methylene method.
Mass (g) 54,84
Moisture content (%) 1,74
Dry mass (g) 53,91
Volume de Blue introduced (10 g/l) 60 cc
VBS 1,3
Passing 80 μm (%) 28,5
Figure 5-8. Eolian soils classification Norme française 11-300, 1992.
The soil classification and analysis of the percentage of the particles, the void ratio, and the
soil density demonstrate that the soil presents similar physical index. Therefore, the tests of
microstructure and volumetric behaviour were carried out in the four dunes studied. The main
target is to have a better comprehension of the general behaviour of eolian soil of Mayapo
regarding the geology, soil structure, suction and volumetric behaviour.
Analysis of experimental Results 5-11
Microstructure
X-ray diffraction
Figure 5-9 shows the results of X-ray Diffraction carried out in the dune 4 of the
eolian soil of Mayapo. The Figure 5-9 shows the minerals and its percentage in the sample.
The predominant component of the eolian soil of Mayapo is α quartz or quartz low. This
mineral was formed in low temperatures.
Figure 5-9. DRX results of the eolian soils of Mayapo.
The DRX results showed that the eolian sands are predominantly composed of quartz in
90,1%. It also presents minerals of Anorthite with 5% and orthoclase with 4,9%, a variety of
plagioclase and feldspars, respectively. These minerals are characterized as igneous rock
formers. It can infer that the origin of eolian soil studied is igneous rocks. Most of the sand-
size particles of the eolian soils of Mayapo are composed of quartz crystals, this mineral is
representative of these kinds of soils, which is resistant to the physical and chemical
weathering.
Microstructural analysis with thin sections.
Figure 5-10 shows the results of the analysis of the thin section through the petrographic
microscope. Thin Sections from each dune were observed, seeking to identify the minerals
present and the contact between grains. The thin sections analysis shows that the mineralogic
characteristics of the eolian soils are similar. Due to this, the analysis presented in this section
is according to the four thin section results.

5-12 Analysis of experimental Results
Figure 5-10. Micrographics of thin sections.
200 µm 200 µm
200 µm 200 µm
200 µm 200 µm
200 µm 200 µm
Iron and Aluminum oxides
Sedimentary lithic
Quartz
Tangential contact
Long contact
Epidote
Dune 1
Dune 2
Dune 3
Dune 4

Analysis of experimental Results 5-13
The soil presents similar grain size, according to granulometry analysis results, where the
eolian soil is classified as poorly graded. The soil contains more sand-size grains than clay
minerals.
The particles of the eolian soils are terrigenous minerals. The thin sections confirm the
information of the x-ray diffraction test. The soil is mainly composed of crystals of quartz,
plagioclases, and feldspars, minerals typic of these kinds of soils. Other minerals are present,
such as titanium, zircon. In general, the crystals show evidence of reworking, and the
minerals are formed in igneous environments.
The crystals of quartz present are colorless, fractured with fluid intrusions. The shape of
quartz crystals is subangular to angular, evidencing that the wind transport was short, and the
mineral could have more mechanic resistance. Also, it presents intrusions of zircon. The
epidote crystals are also present in the eolian soils. This mineral is fractured with intrusions.
The feldspars are present as grains and clay minerals, they are very fractured and reworked.
Also, some opaque fine-granular minerals are distributed in the matrix, generally anhedral
due to wear during eolic transport. The soil presents sedimentary lithics of mudstone with
organic material.
There are two types of contacts: tangential contact or punctual contact and long contact. The
contacts between the silt and sand particles are observed represented in light brown color,
composed of iron and aluminum oxide. The contacts act as a bonding material and can be
assimilated apparent cementation between the grains. This behaviour is typic of soil from
arid regions when the temperature and the oxides, carbonates, or silica generate this
cementation.
According to the geological history, the minerals presented are originally formed in igneous
rocks, the origin could have from rocks of the river next to the eolian soils region, which has
contribution from different geological formations. After that, the eolian soils presented sort
transport, evidencing in the angular shape mineral.

5-14 Analysis of experimental Results
Scanning electronic microscopy (SEM) for direct fabric viewing
Figure 5-11 shows four photomicrographs of the eolian soils with a magnification of 110x.
These images have been taken of the undisturbed samples of the eolian soils from Mayapo.
Also, it is presented the digitized and processed photomicrographs. The Scanning electronic
microcopy was also used to analyses the thin sections, which is presents in EDS results.
These deposits comprise angular, silt, and sand-size particles. The grains have marked edges
and are characterized primarily by conchoidal breakage patters, v-shaped pits, and curved
grooves. Angular grains are evidencing that transport distance was short. Many impacts may
be observed on the grain surface that is typical of eolian transport because of the impact of
the edges of some grains against others during transport. This particle shape can influence
soil structure stability.
Figure 5-11 also shows graphic representations of the SEM photomicrographs of eolian soil.
The black and white scale was used to differentiate pores from the soil particles. Dark pixels
are the pores, and the white pixels are the soil particles. Some results of the analysis of
graphic representations are shown in Table 5-4. The diameter of the grains is of the order of
90 µm. The porosity percentage is an average of 26 %. However, these values were calculated
of a small section of the sample, and it just give an idea of these values in all samples
Table 5-4. Results of analysis of graphic representation of SEM Photomicrographs.
Dune Porosity (%) Size grain prom (µm)
1 24 80
2 26 87
3 24 98
4 20 98

Analysis of experimental Results 5-15
Figure 5-11. SEM Photomicrographs of eolian soils and the graphic representation of
porosity in the samples. Pores are black and particles white.
Micropores

5-16 Analysis of experimental Results
The eolian soils present some punctual contacts, as shown in Figure 5-11. This type of contact
could cause particles to slide over each other, leading to a rearrangement of the structure.
Particles with punctual contact are mostly naked, making the soil more susceptible to
collapse.
The soil presents large and continuous macropores. Due to this, the eolian soils have a low
density, high permeability. The micropores are also present in the eolian soils it can be
observed between the soil aggregates. The micropores presented contributes to the collapse
behaviour and the susceptibility, but the total collapse of eolian soils could be controlled by
the presence of macropores.
The SEM analysis can be reinforced considering the results of the analysis of particle size
distribution. The type of porosity of the eolian soils is associated with the particle size of the
eolian soil. The soil is composed mostly of grains sand-size, which is associated with the
presence of the macropores. The low presence of micropores is attributed to the low
percentage of fines in the soil. It can be inferred that the eolian soils have a behaviour typic
of the granular soils.
Energy dispersive X-ray spectrometry EDS
The element distributions maps of eolian soils are shown in this section. The dispersive
energy X-ray spectrometry with SEM is used to determine the distribution of chemical
elements in the section studied. Table 5-5 shows the elemental composition in weight percent
of the dunes.

Analysis of experimental Results 5-17
Table 5-5. Elemental composition in weight percent of the dunes.
Figure 5-12 to Figure 5-19 shows the distribution of the elements of the dunes. Each figure is
composed of an SEM micrograph, a graphic representation of the percentage of the element,
and the distribution maps for each element in the section analyzed, see Figure 5-13.
The four EDS spectra show very similar results, i.e.., the presence of silica, oxygen, iron,
aluminum, chlorine, sodium have similar relative intensities. The silica (Si) and oxygen (O)
are present on the map with the same distribution. The combined distribution of these
elements can be interpreted as the presence of quartz mineral.
The salts are evidenced in chorine (Cl), and sodium (Na) maps. The salt particles are not in
the contact between the grains, but it is presented in the disseminated form. It can be inferred
that the collapse behaviour would not be governed by the dissolution of these salts. However,
the presence of salt particles affects the suction of the eolian soil, attracting more water to
the soil.
The calcium element is concentrated in a region of the calcium map. It can be inferred that
the element is a seashell fragment. The calcium is not forming carbonates bonding in the
eolian soils. It was the hypothesis raised at the beginning of the research because the dunes
were sampling in blocks and the dunes were formed in marine environments.
Names of elements Elemental composition -weight (%)
Dune 1 Dune 2 Dune 3 Dune 4
Silica (Si) 43,20 38,88 39,06 42,16
Oxygen (O) 52,06 49,51 51,95 50,79
Aluminum (Al) 2,36 5,22 3,80 2,69
Iron (Fe) 0,90 2,43 1,87 1,02
Sodium (Na) 0,24 0,85 0,51 0,49
Chlorine (Cl) 0,37 ---- 0,42 0,41
Titanium (Ti) ---- 1,14 0,18 ----
Calcium (Ca)
Potassium (K)
Magnesium (Mg)
----
0,87
----
1,08
0,89
----
1,12
0,81
0,28
----
0,86
----

5-18 Analysis of experimental Results
Figure 5-12. SEM images and EDS spectra of element dune 1.
Figure 5-13. Element distributions maps using SEM-EDS dune 1.

Analysis of experimental Results 5-19
Figure 5-14. SEM images and EDS spectra of element dune 2.
Figure 5-15. Element distributions maps using SEM-EDS dune 2.

5-20 Analysis of experimental Results
Figure 5-16. SEM images and EDS spectra of element dune 3.
Figure 5-17. Element distributions maps using SEM-EDS dune 3.

Analysis of experimental Results 5-21
Figure 5-18. SEM images and EDS spectra of element dune 4.
Figure 5-19. Element distributions maps using SEM-EDS dune 4.

5-22 Analysis of experimental Results
The Aluminum (Al) and Iron (Fe) elements are distributed around the minerals of quartz and
feldspars, providing further evidence that the aluminum oxides and iron oxides act as a
bonding material between grains as show the results obtained in thin sections. The four EDS
spectra show similar results, i.e.., the presence of silica, oxygen, iron, aluminum, chlorine,
sodium have similar relative intensities. The bonding of aluminum and iron oxides are
bordering the grains in all samples of the eolian soils. However, the Aluminum and Iron
elements do not exceed 6% in the EDS micrographs. It can be inferred that although these
oxides can have influence in the soil behaviour acting as a bonding material, the total collapse
behaviour won´t be controlled by this cementation due to the low percentage of these.
Suction measurement
Water retention curve. Total and matric suction measurement
The results of suction measured using the paper filter method is presented in this section. The
water retention curve (WRC) linking suction and equivalent degree of saturation is given by
the following modified van Genuchten, 1980 equation:
𝑆𝑒 =𝑆𝑟−𝑆𝑟𝑟𝑒𝑠
𝑆𝑟𝑚𝑎𝑥−𝑆𝑟𝑟𝑒𝑠= (1 + (
𝑃𝑔−𝑃𝐿
𝑃)
1
1−𝜆)
−𝜆
Eq.
5-3
Where,
𝑆𝑒 is the equivalent saturation degree.
𝑆𝑟, 𝑆𝑟𝑚𝑎𝑥, 𝑆𝑟𝑟𝑒𝑠 are the actual, the maximum and the residual saturation degree.
𝑃 = The air entry value.
𝜆 = A model parameter, the shape function for retention curve.
𝑃𝑔 and 𝑃𝐿 = The gas and liquid pressure.
For Van Genuchten equation 𝑆𝑟𝑚𝑎𝑥 is 1 and 𝑆𝑟𝑟𝑒𝑠 is 0. Figure 5-20 shows fitted simple water
retention curves for total and matric suction according to the experimental data of dunes 1
and 4. The red line represents the simple water retention curves for total suction, and the blue

Analysis of experimental Results 5-23
line is the simple water retention curves for matric suction. A simple WRC can be fitted for
both soils. It means that related to the water attraction to the soil, the behaviour of the dune
is similar.
The simple water retention curves represent the behaviour of the macropores. The parameters
obtained from the simple water retention curves based on the Van Genuchten equation are
Po that represents the air entry values (AEV), and λ representing the slope to which the soil
desaturates. The results are summarized in Table 5-7.
Figure 5-20. Simple water retention curves (WCR) for dune 1 and 4.
Table 5-6. Po and λ parameters from water retention curves of the eolian soils.
Suction Pores Po: Air entry
value (AEV). kPa
λ (parameter in function of
curve shape).
Matric Macropores
15 0,70
Total 550 0,60
However, the simple water retention curve is not sufficient to fully represent the suction of
the eolian soils. Due to this, a double water retention curves proposed by Durner, 1994 was
calculated. The double retention curve describes properly the retention characteristics of soil
with the heterogenous pore systems: macropores and micropores. It can be obtained by the
following equation constructed by a linear superposition of sub-curves of the Van Genuchten
type:

5-24 Analysis of experimental Results
𝑆𝑒 =𝑆𝑟−𝑆𝑟𝑟𝑒𝑠
𝑆𝑟𝑚𝑎𝑥−𝑆𝑟𝑟𝑒𝑠= 𝑤1[𝑊𝑅𝐶]1 + 𝑤2[𝑊𝑅𝐶]2 Eq. 5-4
Where,
𝑆𝑒 is the equivalent saturation degree of each structural level
𝑆𝑟, 𝑆𝑟𝑚𝑎𝑥, 𝑆𝑟𝑟𝑒𝑠 are the actual, the maximum and the residual saturation degree of each
structural level (micro and macro)
𝑤 are weighting factors for the sub-curves, subject to 0 < 𝑤 < 1 and Σ 𝑤=1
[𝑊𝑅𝐶]1 is the water retention curve Van Genuchten type for macropores
[𝑊𝑅𝐶]2 is the water retention curve Van Genuchten type for micropores
Figure 5-21 and Figure 5-22 show the water retention sub-curves for the macropores and
micropores of the eolian soils.
Figure 5-21. Water retention curve of macro-structure and micro-structure of dune 1.

Analysis of experimental Results 5-25
Figure 5-22. Water retention curve of macro-structure and micro-structure of dune 4.
To construct the double water retention curves for the eolian soils, a weighting factor of 0,20
was assigned for micropores and 0,80 for the macropores. These weighing factors were
assigned according to the granulometry distribution. it shows the double water retention
curves for the eolian soils using Durner, 1994 equation. Figure 5-23 It can be observed that
the curve bends at a saturation of 0,20. This behaviour shows that the weight of the
microstructure is very low and corresponds to the small fraction of clay present between
grains of soil.
Figure 5-23. Double water retention curves (WRC) of dune 1 and 4 respectively.

5-26 Analysis of experimental Results
The parameters obtained from the double water retention curves are Po, the air entry values
(AEV), and λ representing the slope to which the soil desaturates. The results are summarized
in Table 5-7.
Table 5-7. Po and λ parameters from water retention curves of the eolian soils.
Suction Pores Dune 1 Dune 4
Po (AEV) λ Po (AEV) λ
Matric Macro 10 0,65 10 0,68
Micro 5000 0,8 5000 0,58
Total Macro 550 0,6 550 0,45
Micro 5000 0,8 5000 0,80 Po: Air entry value (AEV) kPa. λ: Parameter in function of curve shape
It can be demonstrated that at low saturation degrees, the water flow can be controlled by the
fines present in the micropores. From 0 to 20% of saturation, and the water will come out of
the soil with greater difficulty because the micropores govern the suction at these degrees of
saturation. According to the physical index tests, the eolian soils have saturation values in
the order of 20% in its natural state, representing high suction levels, generating interparticle
forces, and providing stiffened to the soil. These high levels of suction can influence the
collapse behaviour due to, with small increases in saturation, the suction will become
governed by the macropores, and the suction will decrease sharply.
Pore water extraction by squeezing technique. Osmotic suction
measurement
With the purpose of determining the osmotic suction in the eolian soils was to use the pore
water extraction by squeezing technique. The electrical conductivity of the pore water from
the eolian soils in saturated conditions was 8,46 mS/cm = 8460 µS/cm. The osmotic suction
of this pore water containing mixtures of dissolved salts, estimated from the electrical
conductivity is 𝜋 = 315 kPa according to USDA,1950, and 𝜋 = 365 kPa obtained from the
NaCl calibration curve of Romero, 1999. Figure 5-24 shows the electrical conductivity
results of osmotic suction, the relationships between osmotic suction, and osmotic suction
obtained by Wan et al., 1995, calculated as the numerical difference between total and matric
suction obtained with filter paper technique.

Analysis of experimental Results 5-27
Figure 5-24. Electrical conductivity and filter paper techniques for osmotic suction
measurement.
Figure 5-24 also shows that the value estimated of osmotic suction based on the electrical
conductivity is agreed with the osmotic suction obtained by Wan et al., 1995, for the highest
saturation degree. This close agreement, also demonstrated in Romero, 1999, indicates the
reliability of the pore water extraction by squeezing technique for osmotic suction
measurements, and certain support of the validity of matric and osmotic suctions being
components of total suction. Also, it can be inferred that the osmotic suction appears to be
dependent on the saturation degree.
Figure 5-24 shows that with the decreased in saturation degree, the osmotic suction increases
for the region of macropores. Subsequently, the matric suction plays an important role in the
total suction, increasing its value by the presence of fines, causing a decrease in osmotic
suction.
The osmotic suction can be physically explained by the presence of salts particle shows in
the EDS test results. The salt concentration influences the osmotic suction and the total
suction of the eolian soil. Osmotic suction could affect the hydraulic conditions of the eolian
soil. It can govern the water flow and attract more water to the soil, increasing the saturation
Wan et al

5-28 Analysis of experimental Results
degree. The increase in saturation causes a decrease in total suction in the soil, affecting the
volumetric behaviour of soil.
Volumetric behaviour
Classical oedometers
Double oedometer test
The double oedometer tests were carried out to know if the eolian soils from Mayapo are collapsible.
Test results from double oedometer tests are shown in Figure 5-25, when vertical net stress applied
is plotted versus Void ratio.
Figure 5-25. Compression curve from double oedometer tests of eolian soils.

Analysis of experimental Results 5-29
Table 5-8 shows the initial conditions of the double oedometer tests and the results of the
collapse potential. The initial matric suction of each oedometer test was determined from the
eolian soil Water retention curve (WRC) and using the initial moisture content of each test.
Table 5-8. Initial conditions of the oedometer tests and CP of the eolian soils.
Dune %w
initial
Saturation
initial (%)
Matric suction
initial (kPa) 𝒆𝟎
CP
(%)
Severity of the
problem
1 6,64 29 40 0,600 1,56 A Moderate problem
2 7,34 22 80 0,65 2,28 A Moderate problem
3 3,84 15 4000 0,847 4,49 A Moderate problem
4 4,73 15 4000 0,810 2,73 A Moderate problem
According to the results shown in Table 5-8, the eolian soils were classified related to the
severity of the problem as a moderated problem based on Jennings and Knight, 1957
classification. It can be denoted the maximum collapse is presented in dune 3, which has the
lower moisture content and the highest void ratio. However, the value of collapse potential
for this dune can be considerate as problematic in practical engineering.
The collapse presented can be explained by the high quantity of macropores, which
contribute to the overall collapse due to the particle rearrangement in the soil. Although the
grains are covered by the bonding of iron and aluminum oxides, the percentage of these is
very low, and the particles rearrange easier between the macropores. Regarding the
micropores, this can contribute to the initial soil collapse due to the suction decreases rapidly
when the soil gets wet, decreasing the suction also. However, the most amount of collapse is
due to the soil rearrangement in the macropores.
The suction also plays an important role in the results of the collapse potential. As suction
decreases and soil wets, water menisci coalesce, and the empty pores are flooded, and it
causes a loss in the soil stiffness. On the other hand, it can be inferred that the collapse
potential increases as the initial matric suction increases. This indicates that higher initial
matric suction levels try to maintain the meta-stable bound between particles without
significant settlement but eventually collapse upon inundation (Alonso et al., 1990).

5-30 Analysis of experimental Results
The high initial suction levels in dunes 3 and 4 also indicate that the initial suction is initially
governed by the micropores as shown in the double water retention curve. However, the
suction decreases rapidly during the saturation process due to the matric suction will become
governed by macropores, and the soils experience more collapse.
Although these results give a little knowledge about the role of suction in the collapse
behaviour, the classical oedometer tests are not sufficient to explain fully the influence of the
suction on the volumetric behaviour of the soils, therefore, it will be investigated using
suction-controlled tests.
Table 5-9 shows the compression index, recompression index, and the yield stress from the
compressibility curves of the double oedometer tests. The results indicate that the
compression index Cc and Cr are lower in soaked specimens than the specimens in natural
states. Also, the yield stress values are lower in specimens collapsed. These results can
indicate that the stiffness of the eolian soils decreases when the soil is collapsed due to the
bonding materials (water meniscus and ferromagnesian minerals) are dissolved and
transported by water (Rogers, 1995).
Table 5-9. Cc, Cr and yield stresses from compressibility curves of the eolian soils.
Dune
Soaked Natural
Cc Cr Yield stress
(kPa) Cc Cr
Yield stress
(kPa)
1 0,061 0,035 40 0,058 0,032 60
2 0,042 0,077 50 0,041 0,027 60
3 0,091 0,050 25 0,072 0,023 40
4 0,091 0,052 40 0,079 0,040 60
Comparing the compression index Cc y Cr in the natural and soaked state between dunes, it
can be denoted a higher difference in dunes 3 and 4 than in dunes 1 and 2. Due to this, it is
inferred that in dunes 3 and 4, the change in the stiffness is greater, and therefore, the collapse
potential is higher. These results are consistent with the physical index, due to the initial
moisture content is smaller and the void ratio are higher for dunes 3 and 4, as shown Table
5-8.

Analysis of experimental Results 5-31
Figure 5-26 show the normalized curves from the compressibility curve of the double
oedometer tests.
Figure 5-26. Compressibility curves normalized of double oedometer tests.
Figure 5-27 shows a graphic representation of the influence of the void ratio variable in the
collapse behaviour for the double oedometer tests. It is denoted that the collapse potential
increase with the increment of the initial void ratio. Dune 3 presents the maximum collapse
potential with a void ratio of 0,847.

5-32 Analysis of experimental Results
Figure 5-27. Graphic of interval of the factor collapse potential (Minitab analysis).
Oedometer tests under different vertical effective stresses
Figure 5-28 and Figure 5-29 show the results of oedometer tests under different vertical
effective stresses on several samples of the eolian soils of Mayapo. Table 5-10 shows the
initial condition for the tests. The tests were corrected to a common initial average void ratio.
The saturation degree is quite low (Sr<19%). According to water retention curves of the
eolian soil of Mayapo (Figure 5-23), the soil suction initial is very high, in the order of 300
kPa of suction for dune 1, 3, and 4. For dune 2, the suction is in the order of 800 kPa
approximately.
Table 5-10. Initial condition of oedometer tests under different vertical effective stresses.
Dune 𝒆𝟎 𝒆𝟎 average Soaking load (kPa) Initial saturation degree (%)
1
0,697
0,691
0,690
0,697
0.69
80 17,90
200 18,10
400 18,87
800 18,35
2
0,770
0,771
0,761
0,760
0,77
80 8,74
200 10,14
400 10,13
800 8,84
3
0,724
0,718
0,723
0,732
0,72
80 17,89
200 18,03
400 17,92
800 17,68
4
0,709
0,715
0.716
0.712
0,71
80 16,50
200 16,74
400 16,43
800 15,31

Analysis of experimental Results 5-33
Figure 5-28. Compressibility curves of dune 1 and 2 under different vertical effective
stresses.

5-34 Analysis of experimental Results
Figure 5-29. Compressibility curves of dune 3 and 4 under different vertical effective
stresses.
The results of the collapse potential based on Jennings and Knight, 1957 method are
summarized in Table 5-11. The maximum collapse in the eolian soils is at 200 kPa of vertical
effective stress. It also observed that the maximum collapse is in dune 2, where the initial
saturation degree is low and consequently presents a high suction level. There may be
deducted that a saturation degree affects the collapse behaviour of the eolian soils.

Analysis of experimental Results 5-35
Table 5-11. Collapse potential results of oedometer tests under different vertical effective
stresses.
Dune 𝒆𝟎 𝒑𝒓𝒐𝒎 Soaking load Collapse
potential (%)
Severity of the
problem
1 0,69
80 1,21 Moderate problem
200 1,37 Moderate problem
400 1,26 Moderate problem
800 0,6 No problem
2 0,77
80 1,8 Moderate problem
200 2,6 Moderate problem
400 1,38 Moderate problem
800 0,9 No problem
3 0,72
80 1,87 Moderate problem
200 2,34 Moderate problem
400 1,3 Moderate problem
800 0,77 No problem
4 0,71
80 0,94 No problem
200 1,37 Moderate problem
400 1,16 Moderate problem
800 0,73 No problem
A reduction in the collapse deformation is observed as the magnitude of the vertical stress
applied increases. This trend is due when applying large stress, the pore volume in the soil is
reduced, and it is created a new denser structure, which avoids the development of collapse
strains. These results also confirm the typical behaviour of unsaturated soil exposed in the
experimental test of Booth, 1975; Yudhbir, 1982, the collapse in an unsaturated soil increase
up to maximum value, and the value decreases to a negligible value (Alonso et al., 1987).
This behaviour can also be explained by the consolidation phenomenon. When the soil is
loaded up to 200 kPa, it can maintain the bonding between grains in unsaturated conditions,
and the larger strains will take place when the soil is wetted. On the other hand, when higher
loads are applied after collapse (400 and 800 kPa), the bonding between the grains will break
by load instead of by wetting, and when the soil will be soaked will suffer lower strains.
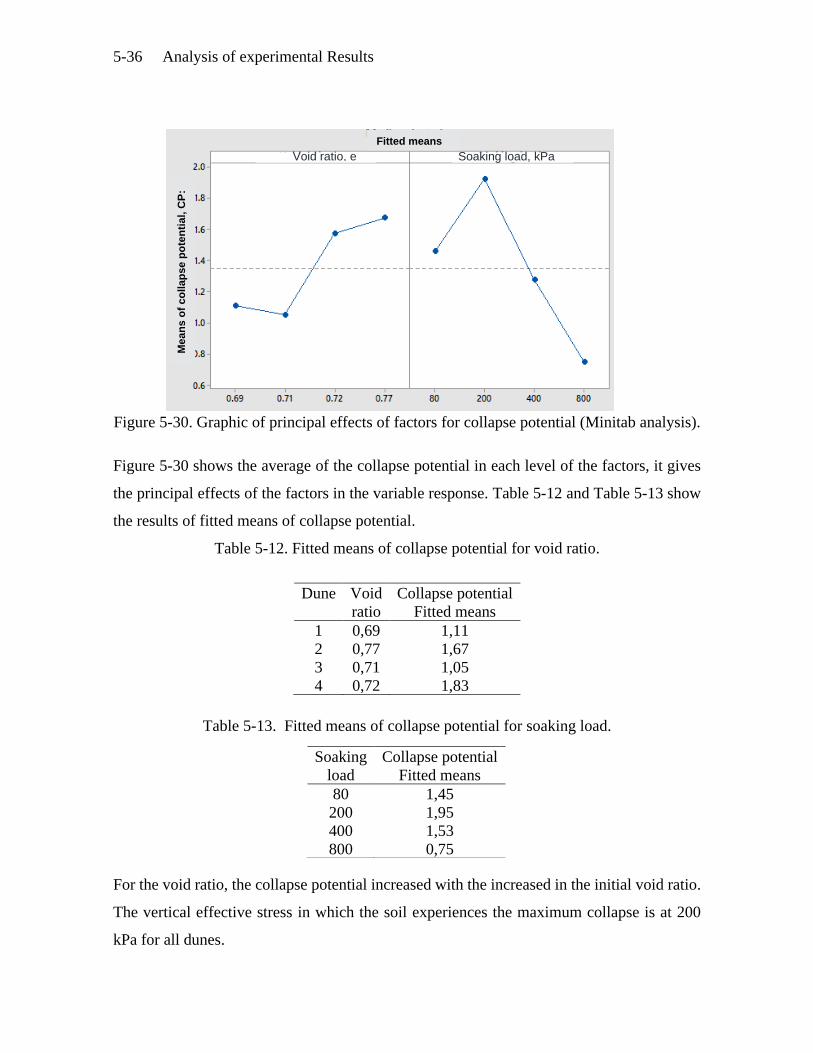
5-36 Analysis of experimental Results
Figure 5-30. Graphic of principal effects of factors for collapse potential (Minitab analysis).
Figure 5-30 shows the average of the collapse potential in each level of the factors, it gives
the principal effects of the factors in the variable response. Table 5-12 and Table 5-13 show
the results of fitted means of collapse potential.
Table 5-12. Fitted means of collapse potential for void ratio.
Dune Void
ratio
Collapse potential
Fitted means
1 0,69 1,11
2 0,77 1,67
3 0,71 1,05
4 0,72 1,83
Table 5-13. Fitted means of collapse potential for soaking load.
For the void ratio, the collapse potential increased with the increased in the initial void ratio.
The vertical effective stress in which the soil experiences the maximum collapse is at 200
kPa for all dunes.
Soaking
load
Collapse potential
Fitted means
80 1,45
200 1,95
400 1,53
800 0,75
Fitted means
Mean
s o
f co
llap
se p
ote
nti
al, C
P:
Soaking load, kPa Void ratio, e

Analysis of experimental Results 5-37
Figure 5-31. Graphic of factor interaction of factors for collapse potential (Minitab
analysis).
Figure 5-31 shows the interaction between void ratio and soaking load in the collapse
potential. Each curve represents the collapse potential at the same soaking load for the four
dunes analyzed. It can be inferred that the maximum collapse is present at 200 kPa of soaking
load. Evaluating the simple effects, the void ratio change is not significant in the collapse
behaviour for soaking loads of 400 and 800 kPa. The changes in void ratio have more
significance in the soaking load of 200 kPa, in which the collapse potential is the highest.
Table 5-14 shows the saturation degree and the collapse potential obtained for each dune.
Table 5-14. Fitted means of collapse potential for saturation degree.
A low level of saturation in the eolian soils, the collapse potential increases. It can be
observed in the saturation of 9,46 the collapse potential is the highest. This behaviour can be
associated with suction. However, this information could not be enough to have a complete
Dune Saturation, S Collapse potential
Fitted means
1 18,30 1,11
2 9,46 1,67
3 17,88 1,57
4 16,24 1,05
Mean
s o
f co
llap
se p
ote
nti
al,
Fitted means

5-38 Analysis of experimental Results
comprehension of the suction influence in the volumetric behaviour of the eolian soil because
of the saturation degree changes during the test and the lack of control of this variable.
Figure 5-32 shows a scheme of the saturation increase caused by a strain increase. With a
load increment, unsaturated soil will suffer strains, decreasing the air volume (Va). Even if
the water maintains the same volume, the relationship between the water volume (Vw) and
void volume (Vv), which represents the saturation degree, will increase because the Vv will
decrease with each load increment.
Figure 5-32. Left: Scheme of the increase in saturation with the increase in deformation.
Right: Suction and stress paths of double oedometer and oedometer at different vertical
effective stress tests (Alonso et al., 1990).
For this reason, suction-controlled tests were carried out in order to study the suction
influence in the volumetric behaviour of the eolian soils.
Unsaturated oedometer tests
The volumetric behaviour of the eolian soils has been analyzed through two independent
variables of stress state: (𝜎𝑣 − 𝑢𝑎) net stress and matric suction (𝑢𝑎 − 𝑢𝑤), where 𝜎𝑣 is the
total stress, and 𝑢𝑎 and 𝑢𝑤 correspond to the pressure of the gas and liquid phase
respectively. The study of these unsaturated soils was based on the Barcelona Basic Model
propose by Alonso et al., 1990. The suction levels for suction controlled oedometer tests are
selected based on the water retention curve WRC of the dunes obtained with the paper filter
Double oedometer test
Oedometer at different loads

Analysis of experimental Results 5-39
method. The suction levels range is 10 kPa to 300 kPa, in which the soil presents large
changes in suction levels with small changes in the saturation degree.
5.5.2.1. Suction-controlled oedometer test: constant suction.
Five oedometer tests at constant matric suction of 0, 30, 100, 200, and 300 kPa were
conducted to know the volumetric behaviour of dune 4 of the eolian soils and obtain yield
stress and the stiffness parameters as κ(s) λ(s). Table 5-15 shows the initial conditions of the
tests carried out. Figure 5-33 shows the compressibility curves of the eolian soils obtained
from the unsaturated tests at constant suction.
Table 5-15. Conditions of the unsaturated tests at constant suction for Dune 4.
Suction
(kPa)
𝒆𝟎 Initial moisture
content (%)
Inicial saturation
degree (%)
0 0,798 5,0 16,54
30 0,763 5,6 19,20
100 0,753 5,0 17,53
200 0,752 5,2 18,18
300 0,751 3,0 18,74
Figure 5-33. Compressibility curves from oedometer tests at constant suction.

5-40 Analysis of experimental Results
In the compressibility test at constant suctions of the eolian soils, the large deformations
occur in the soil when the vertical net stress applied reaches yield stress. Also, it can be
inferred that the higher the matric suction levels, the larger the yields stress. Therefore, the
suction increased. The compression index Cc and recompression index Cr values decrease
with the matric suction increment. It means that the suction improves the stiffness of the
eolian soils. Table 5-16 shows the saturation final and the yield stress obtained from the
compressibility curves. It can be observed that the saturation degree results measured after
each test are consistent with the results from the water retention curve of the eolian soils from
Mayapo. The suction imposed in the samples is normally reached at these saturation degrees.
For the suctions of 200 and 300 kPa, the saturation degree presents similar values due to, as
shown by the water retention curve, at low saturation degrees the soil has the biggest changes
in suction level and the change of 200 to 300 kPa is small compared with the values presents
in this region of the WRC, see Figure 5-23.
Table 5-16. Compressibility parameters of eolian soil of Mayapo at constant suction.
The volumetric behaviour of the eolian soils is described following the constitutive model
proposed in Alonso et al., 1990. In Figure 5-34 are plotted the yield stresses obtained at
different suction of eolian soils in two-dimensional stress space: vertical net stress (𝜎𝑣 − 𝑢𝑎)
and suction (𝑢𝑎 − 𝑢𝑤). A yield surface is drawn through these points. The yield surface
allows knowing the reversible compressive volumetric strains for any stress path of loading
(L), collapse (C), or both in the elastic domain. Also, it can predict irreversible compressive
volumetric strain for any stress loading or collapse paths. The LC curve obtained for the
eolian soils support the concept of the LC model.
Suction (kPa) Final Saturation
degree (%)
Yield stress
(kPa)
Cc Cr
0 89 60 0,145 0,055
30 20,43 70 0,134 0,034
100 18,75 120 0,113 0,026
200 12,21 170 0,112 0,014
300 12,22 180 0,110 0,008

Analysis of experimental Results 5-41
Figure 5-34. LC curve of eolian soil of Mayapo from experimental test at constant suction.
It can be observed in LC curve that the yield stress moves further to the right as suction
increases. The suction in the soil allows the soil to sustain higher applied stress: The higher
the suction, the higher the stress can be sustained before yield.
A theoretical yield curve can be obtained by the equation proposed by Alonso et al.,
1990)(Reznik, 2007)(Reznik, 2007)(Reznik, 2007)(Reznik, 2007)(Reznik, 2007):
𝑝0 = 𝑝𝑐 (𝑝0
∗
𝑝𝑐)
𝝀(𝟎)−𝜿
𝝀(𝐬)−𝜿 and 𝝀(𝐬) = 𝝀(𝟎)[𝒓 + (𝟏 − 𝒓)𝒆−𝛽𝑠] Eq. 5-5
Where,
λ(s) = Compressibility parameters in the post-yield range
κ(s) = Compressibility parameter in the pre-yield range
r = Parameter defining the maximum macrostructural soil stiffness
𝑝𝑐 = Reference stress
𝛽 = Parameter controlling the rate of increase of macrostructural soil stiffness with suction
𝑃0∗ = Yield stress at saturated conditions
𝜆 =𝐶𝑐
𝐿𝑛(10) Eq. 5-6
𝑘 =𝐶𝑟
𝐿𝑛(10) Eq. 5-7

5-42 Analysis of experimental Results
To obtain los parameters of theorical yield curve is assumed 𝑘𝑜=1. Then,
𝑝 =𝜎1+𝜎2+𝜎3
3 =
𝜎1+2𝜎3
3=
𝜎1+2(𝑘𝑜∗𝜎1)
3 Eq. 5-8
The compressibility parameters of eolian soils obtain from the compressibility curves at
different constant suction values are summarized in Table 5-17.
Table 5-17. Parameters of the eolian soils from compressibility curves and the theoretical
yield stress.
Suction
(kPa) λ(s) κ(s) r (𝛌(𝐬)
𝛌(𝐨)⁄ ) 𝒑𝒄 𝜷 Theoretical Yield
stress (kPa)
0 0,063 0,024
1,3 2,5
50
30 0,058 0,014 0,92 69
100 0,049 0,011 0,78 156
200 0,048 0,006 0,77 163
300 0,047 0,003 0,76 180
The compressibility parameters values κ and λ decrease with the increase in matric suction.
This implies that the suction contributes to the stiffening of the eolian soils subjected to
external stresses. Figure 5-35 shows the approximation between the experimental LC curve
of the eolian soils with theoretical yield stress and experimental yield stress. A remarkable
similarity is observed between the theoretical and experimental results. The LC curve allows
to solve boundary value problems and evaluate closer to real situations in engineering.
The evolution of the LC curve can be obtained from the theoretical LC curve of the eolian
soils. Figure 5-36 shows a scheme of the evolution of the LC curve. After yield stress in the
compressibility curves, the soil will suffer plastic volumetric strains, which would be equal
to the irreversible plastic volumetric strains of the LC curve. The soil state will follow new
paths of loading and (or) collapse and the yield curve will move from position 𝐿𝐶1 to 𝐿𝐶2.
The new LC curve is associated with the final plastic strains of the compressibility curves
(Δ), representing the new yield stresses of the soil. The 𝐿𝐶2 curve can be obtained with the
yield stress at saturated conditions and using the theoretical equation proposed by Alonso et
al., 1990.

Analysis of experimental Results 5-43
Figure 5-35. Approximation between theoretical loading collapse curve and the
experimental loading collapse curves.
Figure 5-36. Evolution of the Loading Collapse curve of the eolian soil.
5.5.2.2. Suction controlled oedometer tests: stress paths.
These tests are focus on the analysis of volumetric behaviour of the eolian soils associated
with suction and vertical net stress changes. The tests start from the same state of 10 kPa of
vertical net stress and 200 kPa of suction, and the final state is at 300 kPa of vertical net stress
and 30 kPa of suction. The paths from each test are detailed in

5-44 Analysis of experimental Results
Figure 5-37. The initial and final conditions of the tests are summarized in Table 5-18.
Table 5-18. Initial and final conditions of the suction controlled oedometer tests., Dune 4.
Test 𝒆𝟎 W%
initial
S final
(%)
W %
final
Cc Cr
5 0,737 3 23,304 4,3 0,176 0,1
6 0,738 2,9 20,67 4,5 0,135 0,051
Figure 5-37. Response of the model to alternative loading-collapse paths. Left: Loading collapse of
eolian soils Right: Variation of void ratio with vertical net stress applied.
In test 5, represented by path 1-2-3, the soil starts with a small strain by decreasing the suction
to 30 kPa. The next path consists of loading at 300 kPa under constant suction of 30 kPa.
During this load increment, the soil reaches the yield stress of 70 kPa, and then the soil
compresses plastically. It can be noted that the yield stress obtains from the compressibility
curve agrees with the yield stress obtained from the LC curve at 30 kPa.
In test 6, presented as path 1-4-3, the soil is loaded to 300 kPa at constant suction of 200 kPa,
and then, the suction decreased to 30 kPa. It can be observed that the soil compresses
elastically with small strains up to reach the yield stress of 170 kPa, and then, the soil
compresses plastically. The results are also associated with the LC curve obtained for the
eolian soils due to it can predict the yield stress obtained in the compressibility curve. Once

Analysis of experimental Results 5-45
the soil reaches 300 kPa of net vertical stress, the suction is decreased to 30 kPa inducing
settlement.
The results denoted that larger strains occur when the soil is loaded (2-3 and 1-4 paths)
instead of when the suction decreases (1-2 and 4-3 paths). Figure 5-38 shows a comparison
between the strains of both tests for the suction paths. It can be observed that the strains are
very small at suction changes. Therefore, it can deduct that the strains are controlled by the
constant suction value in which the soil is loaded. The suction change paths are more
important if the soil would have expansive minerals (Romero, 1999).
It can be observed that for test 5 the elastic domain is smaller, and the total strains are larger
than for test 6. This can be demonstrated in the compressibility curves, where the total strain
in test 5 is 12% larger than the test 6. This behaviour is caused by the suction level in which
the soil is loaded. This behaviour also can be denoted comparing the compressive index Cc
and re-compressive index Cr results, Cc and Cr are lower at higher suction levels in which
the soil is loaded, and the soil stiffness increases. It can be inferred that the Cc and Cr depend
on suction.
Figure 5-38. Relation of the strains at suction change (collapse path) in unsaturated
oedometer tests at different stress paths.

5-46 Analysis of experimental Results
It can be concluded that there is an important dependence of collapse and loading paths in
the volumetric behaviour of the eolian soil. The deformations are very small at suction
changes. The soils will suffer higher deformations in loading paths at low suction levels due
to the soil stiffness is less.
Procedure of sampling and characterization of the volumetric behaviour of
eolian soils.
The methodology and results obtained from the experimental investigation in the eolian soils
form Mayapo, Colombia have allowed us to define an experimental procedure for sampling
and characterization of the volumetric behaviour of undisturbed eolian soils. The steps are
listed as follow:
1. Carry out the soil sampling according to the guideline of standard practices for
obtaining intact blocks (see section 4.3).
2. Define the physical properties and geotechnical classification of eolian soils. (see
section 4.4)
3. Define the mineral composition, the soil structure, and the distribution of the element
by microstructure tests. These features can directly influence volumetric behaviour.
(see section 4.5)
4. Determinate the water retention curve for matric and total suction by the paper filter
method. The suction plays an important role in the volumetric behaviour of this kind
of unsaturated soils. (see section 4.6.1)
5. Define the osmotic suction at a saturated condition by measuring the conductivity
electric of the soil pore water extracted by the squeezing method. (see section 4.6.2)
6. Determinate the collapse potential of the soils. The equation used to calculate the
collapse behaviour is proposed by Jennings and Knight, 1957, (See section 4.7.2).
7. Define the stress in which the eolian soil has the maximum collapse potential (See
section 4.7.2).
8. Determinate compressibility curve of eolian soils at constant suction (see section
4.7.3)

Analysis of experimental Results 5-47
9. Define the experimental yield stresses of the eolian soils from the compressibility
curve. (see section 5.5.2.1).
10. Define the Loading-Collapse curve for the eolian soils with the yield stress according
to Barcelona Basic Model proposed by Alonso et al., 1987 (see section 5.5.2.1).
11. Define the parameters of the soil from the compressibility curves (see section 5.5.2.1)
12. Obtain the theoretical yield stresses using the Eq. 5-9 proposed by Alonso et al., 1987.
(see section 5.5.2.1)
13. Define the theoretical loading collapse curve with the theoretical yield stresses and
compare them with the experimental results. It can model the volumetric behaviour
of the eolian soil (see section 5.5.2.1).
Figure 5-39 summarized the proposed protocol for sampling and characterization of the
volumetric behaviour of the eolian soil.

5-48 Analysis of experimental Results
Figure 5-39. Experimental procedure for sampling and characterization of the volumetric
behaviour of undisturbed eolian soils.

Analysis of experimental Results 5-49
Chapter conclusions
• Most of the sand-size particles are composed of quartz crystals. The soil is also
composed of plagioclases and feldspars. These minerals are characterized as igneous
rocks formed. The shape of crystals is subangular to angular, which could affect the
mechanic resistance. The salt particles are also present in the eolian soils, appearing
in disseminated form.
• Most of the fine particles are Aluminum and Iron oxides, presented in the contacts
between grains. These oxides act as a bonding material and can be assimilated
apparent cementation between the grains. The bonding is bordering the grains in all
samples of the eolian soils. However, the Aluminum and Iron elements do not exceed
6% in the samples, and this apparent cementation won´t control the collapse
behaviour.
• The analysis of the soil structure by SEM allows identifying large and continuous
macropores between the grains sand sized. The micropores are also present in the
eolian soils between the soil aggregates. But the total collapse of eolian soils could be
controlled by the presence of macropores.
• According to the geological history, the eolian soils have minerals representative of
the igneous rocks, the origin could have from rocks of the river next to the eolian soils
region, which has contribution from different geological formations. After that, the
eolian soils presented sort transport until reach the actual localization.
• Double water retention curves for the eolian soils were calculated to have a better
comprehension of the suction behaviour and the influence of the porosity
(microstructure and macrostructure) in the eolian soil suction. It can be demonstrated
that at low saturation degrees (0-20%) the water flow is controlled by the micropores,
and the water will come out of the soil with greater difficulty. With small increases in
saturation, the suction will become governed by the macropores and will decrease
sharply.

5-50 Analysis of experimental Results
• The osmotic suction estimated from the electrical conductivity was π=315 kPa,
according to USDA,1950, and π= 365 kPa according to Romero,1999. The value of
osmotic suction can be physically explained by the presence of salt particles. The salt
concentration influences the osmotic suction and the total suction of the eolian soil,
affecting its hydraulic condition. It can govern the water flow and attract more water
to the soil, increasing the saturation degree. The increase in saturation causes a
decrease in total suction in the soil, affecting the volumetric behaviour of soil.
• Based on the classical oedometer tests results, the collapse potential of the eolian soils
was classified as a moderated problem. The collapse potential increase with the
increment of the initial void ratio. The suction also plays an important role in the
collapse potential. As suction decreases and soil wets, water menisci coalesce, and the
empty pores are flooded, and it causes a loss in the soil stiffness. On the other hand,
the collapse potential increases as the initial matric suction increases. This indicates
that higher initial matric suction levels try to maintain the meta-stable bound between
particles without significant settlement but eventually collapse upon inundation. The
stiffness of the eolian soils decreases when the soil is collapsed.
• The maximum collapse in the eolian soils is at 200 kPa of vertical effective stress.
After that, a reduction in the collapse deformation takes place as the magnitude of the
vertical stress applied increases. This trend is due when applying large stress, the pore
volume in the soil is reduced, and it is created a new denser structure, which avoids
the development of collapse strains.
• The unsaturated oedometer tests allowed to understand the influence of suction on the
volumetric behaviour of the eolian soils. The suction allows the soil to sustain higher
applied stress: The higher the suction, the higher is the stress that can be sustained
before yield. The suction increases the stiffness of the eolian soils. A constitutive
model was proposed to describe the volumetric behaviour of the eolian soil. The model
is represented by a Loading Collapse (LC) curve, and to allow knowing the reversible
compressive volumetric strains for any stress path of loading (L), collapse (C), or both

Analysis of experimental Results 5-51
in the elastic domain and to predict irreversible compressive volumetric strain for any
stress loading or collapse paths.
• The parameters obtained from the oedometer tests at constant suction allowed to
calculate yield stresses and drawing a theoretical LC curve. The experimental and
theoretical yield curves show a good agreement. This demonstrated a good consistency
in the development of the unsaturated tests, and in the volumetric behaviour of the
eolian soils although the tests have been done on undisturbed samples.
• There is an important dependence of collapse and loading paths in the volumetric
behaviour of the eolian soils. The deformations are very small at suction changes. The
soils will suffer higher deformations in loading paths at low suction levels due to the
soil stiffness is less.
• It is to highlight that, there is a close relationship between the experimental results of
this dissertation. It can be denoted that the bonding material as iron and aluminum
oxide and the meniscus water play an important role in the volumetric behavior of the
eolian soils of Mayapo, it contributes to the stiffness of the soil. The bonding of the
water menisci between grains is the most representative in the eolian soils. Its
behaviour is evidenced in the water retention curve of the soil, which shows the
suction of the soil at different saturation degree. The component of suction and the
water menisci are also related to the macrostructure and the microstructure of the soil.
It can be denoted that the low suction levels take place in the macropores where the
water menisci present larger areas, conversely, high suction levels take place in
micropores where the water menisci area is smaller.

5-52 Analysis of experimental Results
References
Alonso, E. E., Gens, A., & D., W. (1987). Groundwater Effects in Geotechnical
Engineering. The Ninth European Conference on Soil Mechanics and Foundation
Engineering, 3.
Alonso, E. E., Gens, A., & Josa, A. (1990). A constitutive model for partially saturated
soils G ”. Géotechnique, 40(3), 405–430.
Araki, M. S. (1997). Aspectos Relativos às Propriedades dos Solos Porosos Colapsíveis do
Distrito Federal. University of Brasília, College of Technology.
Booth, A. R. (1975). The factors influencing collapse settlement in compacted soils. 6th.
Reg. Conf. for Africa on SMFE, 57–63.
Coduto, D. (1999). Geotechnical engineering principles and practices. In Engineers
Australia (Vol. 73, Issue 4). https://doi.org/10.2113/gseegeosci.iii.1.156
Durner, W. (1994). Hydraulic conductivity estimation for soils with heterogeneous pore
structure. Water Resources Research, 30(2), 211–223.
Jennings, J., & Knight, K. (1957). The Additional Settlement of Foundations due to a
Collapse of Structure of Sandy Subsoils on Wetting. Proceedings, 4th International
Conference on Soil Mechanics and Foundation Engineering, London, 1, 316–319.
Classification des matériaux utilisables dans la construction des remblais et des couches de
forme d´infrastructures routières, (1992).
Reznik, Y. M. (2007). Influence of physical properties on deformation characteristics of
collapsible soils. Engineering Geology, 92(1), 27–37.
https://doi.org/https://doi.org/10.1016/j.enggeo.2007.03.001
Rogers, C. D. F. (1995). Types and Distribution of Collapsible Soils. 1–17.
Romero, E. (1999). Characterisation and thermo-hydromechanical behaviour of
unsaturated boom clay: an experimental study. Univesitad Politecnica de Cataluna.
van Genuchten, M. T. (1980). A Closed-form Equation for Predicting the Hydraulic
Conductivity of Unsaturated Soils. Soil Science Society of America Journal, 44(5),
892–898.
Wan, A. W. L., Gray, M. N., & Graham, J. (1995). On the relations of suction , moisture
content and soil structure in compacted clays. In E. E. Alonso & P. Delage (Eds.), 1st.

Analysis of experimental Results 5-53
International Conference on Unsaturated Soils (Issue December, pp. 215–222).
Yudhbir, Y. (1982). Collapsing behavior of collapsing soils. 7th Southeast Asia
Geotechnical Conference, 915–930.

General Conclusion and Future Work 6-1
6 CHAPTER 6- GENERAL CONCLUSION AND FUTURE WORK
6 CHAPTER 6- GENERAL CONCLUSION AND FUTURE WORK 6-1
6.1 General conclusions 6-2
6.2. Recommendations and future work 6-2
6-2 General Conclusion and Future Work
6.1 General conclusions
All conclusions were described in each chapter of this dissertation. Therefore, the general
conclusions are detailed below:
Although the eolian soils of Mayapo present a moderate collapse potential, in specific levels
of factor the soil experiment more collapse, when the soil is soaked at 200 kPa of loading,
the void ratio greater than 0.8, saturation degrees values higher that 20 %, when the
macropores governs the soil suction. These values levels must be considered in construction
in this area studied.
The eolian soils are collapsible, and there is a close relationship between the volumetric
behaviour with the soil structure: The collapse is governed by the macropores. The suction also
plays an important role: The macropores govern most of the suction soils. There are important
variations in suction at low saturation degrees, which is governed by micropores.
The understanding of the geological characteristics and its relationship with the collapse
potential allow to contribute to the knowledge of the influence of mineralogy and structure
in the volumetric behaviour of this kind of soils.
The importance of the LC curve results justifies performing controlled suction tests, due to
it is possible to have a better understanding of the influence of suction on collapse, because
in classical oedometer tests, the suction is not controlled and measured. The model
constitutive realized of the eolian soils is an important contribution in the knowledge of
eolian soils. It is noteworthy that although the tests were carried out on undisturbed samples,
and the variation in the initial properties of the soil could affect the results, the consistency
in the results obtained was good.
6.2.Recommendations and future work
The experimental research of this thesis has allowed a better understanding of the volumetric
behaviour of the eolian. However, there are some natural extensions to this work that would
help expand and strengthen the results. The new lines of work are described below:
Due to the eolian soils are formed in arid regions, the change in the ambient temperature can
affect the volumetric behaviour of the soil. An experimental program of unsaturated tests at

General Conclusion and Future Work 6-3
constant suction is proposed in order to analyze the volumetric behaviour at different relative
humidity, and to compare with the results obtain in this research.
Numerical simulation can be developed considering certain field situation and using the
parameters obtained from double water retention curves of the eolian soils and the parameters
obtained from Loading collapse (LC) curve to predict the future behaviour of the eolian soil
at a certain situation.
From the point of view of unsaturated tests, the testing techniques developed could be
improved, including the measurement of lateral forces. It would allow expanding the
knowledge of the evolution of k0 with suction and the influence in the constitutive model
proposed.
New stress paths of loading collapse are suggested, including the soil wetting at different
loads in order to know the maximum load when the soil can experience the maximum
collapse at constant suction.
It is also proposed unsaturated oedometer tests, testing eolian soils with denser structure, to
know the experimental yield stresses with this new soil structure. This would make it possible
to verify whether the soil under this condition has a behaviour that can be explained with the
evolution of the loading collapse curve and the parameters derived from the tests carried out
in this research.
It is suggested to carry out the tests with repeatability. For this research, this process was not
carried out for all tests because of the high cost of transport from the site of extraction of the
soils to the site of testing, and the time required for the realization of the test. However, this
investigation is an important improvement in the knowledge of the volumetric behaviour of
the eolian soils in Colombia.
Copyright © 2022 FDOKUMEN