Large-Scale Spatial Distribution Patterns of Gastropod Assemblages in Rocky Shores
13
Large-Scale Spatial Distribution Patterns of Gastropod Assemblages in Rocky Shores Patricia Miloslavich 1 *, Juan Jose ´ Cruz-Motta 1 , Eduardo Klein 1 , Katrin Iken 2 , Vanessa Weinberger 3 , Brenda Konar 2 , Tom Trott 4 , Gerhard Pohle 5 , Gregorio Bigatti 6 , Lisandro Benedetti-Cecchi 7 , Yoshihisa Shirayama 8 , Angela Mead 9 , Gabriela Palomo 10 , Manuel Ortiz 11 , Judith Gobin 12 , Adriana Sardi 1 , Juan Manuel Dı´az 13 , Ann Knowlton 2 , Melisa Wong 14 , Ana C. Peralta 1 1 Departamento de Estudios Ambientales and Centro de Biodiversidad Marina, Universidad Simo ´ n Bolı ´var, Caracas, Miranda, Venezuela, 2 School of Fisheries and Ocean Sciences, University of Alaska Fairbanks, Fairbanks, Alaska, United States of America, 3 Departamento de Ecologı ´a, Pontificia Universidad Cato ´ lica de Chile, Santiago de Chile, Chile, 4 Suffolk University, Boston, Massachusetts, United States of America, 5 The Huntsman Marine Science Centre, St. Andrews, New Brunswick, Canada, 6 Centro Nacional Patago ´ nico, Puerto Madryn, Chubut, Argentina, 7 Dipartimento di Biologia, University of Pisa, Pisa, Tuscany, Italy, 8 Seto Marine Biological Laboratory, Field Science Education and Research Center, Kyoto University, Shirahama, Wakayama, Japan, 9 University of Cape Town, Cape Town, Western Cape, South Africa, 10 Laboratorio de Ecosistemas Costeros, Museo Argentino de Ciencias Naturales ‘‘Bernardino Rivadavia’’, Buenos Aires, Argentina, 11 Centro de Investigaciones Marinas, Universidad de La Habana, La Habana, Cuba, 12 Department of Life Sciences, The University of The West Indies, St. Augustine, Trinidad and Tobago, 13 Universidad Nacional de Colombia, Bogota ´, Colombia, 14 Bedford Institute of Oceanography, Dartmouth, Nova Scotia, Canada Abstract Gastropod assemblages from nearshore rocky habitats were studied over large spatial scales to (1) describe broad-scale patterns in assemblage composition, including patterns by feeding modes, (2) identify latitudinal pattern of biodiversity, i.e., richness and abundance of gastropods and/or regional hotspots, and (3) identify potential environmental and anthropogenic drivers of these assemblages. Gastropods were sampled from 45 sites distributed within 12 Large Marine Ecosystem regions (LME) following the NaGISA (Natural Geography in Shore Areas) standard protocol (www.nagisa.coml. org). A total of 393 gastropod taxa from 87 families were collected. Eight of these families (9.2%) appeared in four or more different LMEs. Among these, the Littorinidae was the most widely distributed (8 LMEs) followed by the Trochidae and the Columbellidae (6 LMEs). In all regions, assemblages were dominated by few species, the most diverse and abundant of which were herbivores. No latitudinal gradients were evident in relation to species richness or densities among sampling sites. Highest diversity was found in the Mediterranean and in the Gulf of Alaska, while highest densities were found at different latitudes and represented by few species within one genus (e.g. Afrolittorina in the Agulhas Current, Littorina in the Scotian Shelf, and Lacuna in the Gulf of Alaska). No significant correlation was found between species composition and environmental variables (r#0.355, p.0.05). Contributing variables to this low correlation included invasive species, inorganic pollution, SST anomalies, and chlorophyll-a anomalies. Despite data limitations in this study which restrict conclusions in a global context, this work represents the first effort to sample gastropod biodiversity on rocky shores using a standardized protocol across a wide scale. Our results will generate more work to build global databases allowing for large- scale diversity comparisons of rocky intertidal assemblages. Citation: Miloslavich P, Cruz-Motta JJ, Klein E, Iken K, Weinberger V, et al. (2013) Large-Scale Spatial Distribution Patterns of Gastropod Assemblages in Rocky Shores. PLoS ONE 8(8): e71396. doi:10.1371/journal.pone.0071396 Editor: Andrew Davies, Bangor University, United Kingdom Received October 30, 2012; Accepted June 28, 2013; Published August 13, 2013 Copyright: ß 2013 Miloslavich et al. This is an open-access article distributed under the terms of the Creative Commons Attribution License, which permits unrestricted use, distribution, and reproduction in any medium, provided the original author and source are credited. Funding: Funding was provided by multiple sources, including the Alfred P. Sloan Foundation through the NaGISA project, the History of the Near Shore (HNS) program, the History of Marine Populations (HMAP), Fisheries and Oceans Canada (DFO), Suffolk University, the Gulf of Maine (GoMA) project, Chevron-Venezuela, Decanato de Investigacio ´ n y Desarrollo – Universidad Simo ´ n Bolı ´var, Exxon Valdez Oil Spill Trustee Council - Gulf Ecosystem Monitoring, SAEON (South African Environmental Observation Network), and SANCOR Seachange Program and the Centre for Invasion Biology (CIB). The funders had no role in study design, data collection and analysis, decision to publish, or preparation of the manuscript. Competing Interests: The authors have declared that no competing interests exist. * E-mail: [email protected] Introduction It has been long and generally recognized that the diversity of coexisting species has a fundamental influence on many ecological processes, including those processes that determine the stability of the community itself [1–2]. However, no general consensus has been reached on the ‘‘shape’’ or ‘‘characteristics’’ of this relationship (diversity-function); because, among many other reasons, the observed shape of the relationship depends on the scale of the observation. Consequently, any understanding of this relationship has to depart from a proper description of the distribution patterns of diversity across different spatial and temporal scales [3–9]. Moreover, it has also been shown, that the shape of the relationship might be subjected to anthropogenic influences operating at different spatial scales [10]. Insight of how species assemblages are established and the processes that shape their patterns of biodiversity is critical for understanding various aspects of global change. The impacts of global change range from climate effects on community structure, productivity and nutrient cycling to human-induced effects such as fishing pressure and the introduction of non-native species, although the latter can also PLOS ONE | www.plosone.org 1 August 2013 | Volume 8 | Issue 8 | e71396
-
Upload
independent -
Category
Documents
-
view
0 -
download
0
Transcript of Large-Scale Spatial Distribution Patterns of Gastropod Assemblages in Rocky Shores
Large-Scale Spatial Distribution Patterns of GastropodAssemblages in Rocky ShoresPatricia Miloslavich1*, Juan Jose Cruz-Motta1, Eduardo Klein1, Katrin Iken2, Vanessa Weinberger3,
Brenda Konar2, Tom Trott4, Gerhard Pohle5, Gregorio Bigatti6, Lisandro Benedetti-Cecchi7,
Yoshihisa Shirayama8, Angela Mead9, Gabriela Palomo10, Manuel Ortiz11, Judith Gobin12, Adriana Sardi1,
Juan Manuel Dıaz13, Ann Knowlton2, Melisa Wong14, Ana C. Peralta1
1 Departamento de Estudios Ambientales and Centro de Biodiversidad Marina, Universidad Simon Bolıvar, Caracas, Miranda, Venezuela, 2 School of Fisheries and Ocean
Sciences, University of Alaska Fairbanks, Fairbanks, Alaska, United States of America, 3 Departamento de Ecologıa, Pontificia Universidad Catolica de Chile, Santiago de
Chile, Chile, 4 Suffolk University, Boston, Massachusetts, United States of America, 5 The Huntsman Marine Science Centre, St. Andrews, New Brunswick, Canada, 6 Centro
Nacional Patagonico, Puerto Madryn, Chubut, Argentina, 7 Dipartimento di Biologia, University of Pisa, Pisa, Tuscany, Italy, 8 Seto Marine Biological Laboratory, Field
Science Education and Research Center, Kyoto University, Shirahama, Wakayama, Japan, 9 University of Cape Town, Cape Town, Western Cape, South Africa,
10 Laboratorio de Ecosistemas Costeros, Museo Argentino de Ciencias Naturales ‘‘Bernardino Rivadavia’’, Buenos Aires, Argentina, 11 Centro de Investigaciones Marinas,
Universidad de La Habana, La Habana, Cuba, 12 Department of Life Sciences, The University of The West Indies, St. Augustine, Trinidad and Tobago, 13 Universidad
Nacional de Colombia, Bogota, Colombia, 14 Bedford Institute of Oceanography, Dartmouth, Nova Scotia, Canada
Abstract
Gastropod assemblages from nearshore rocky habitats were studied over large spatial scales to (1) describe broad-scalepatterns in assemblage composition, including patterns by feeding modes, (2) identify latitudinal pattern of biodiversity, i.e.,richness and abundance of gastropods and/or regional hotspots, and (3) identify potential environmental andanthropogenic drivers of these assemblages. Gastropods were sampled from 45 sites distributed within 12 Large MarineEcosystem regions (LME) following the NaGISA (Natural Geography in Shore Areas) standard protocol (www.nagisa.coml.org). A total of 393 gastropod taxa from 87 families were collected. Eight of these families (9.2%) appeared in four or moredifferent LMEs. Among these, the Littorinidae was the most widely distributed (8 LMEs) followed by the Trochidae and theColumbellidae (6 LMEs). In all regions, assemblages were dominated by few species, the most diverse and abundant ofwhich were herbivores. No latitudinal gradients were evident in relation to species richness or densities among samplingsites. Highest diversity was found in the Mediterranean and in the Gulf of Alaska, while highest densities were found atdifferent latitudes and represented by few species within one genus (e.g. Afrolittorina in the Agulhas Current, Littorina in theScotian Shelf, and Lacuna in the Gulf of Alaska). No significant correlation was found between species composition andenvironmental variables (r#0.355, p.0.05). Contributing variables to this low correlation included invasive species,inorganic pollution, SST anomalies, and chlorophyll-a anomalies. Despite data limitations in this study which restrictconclusions in a global context, this work represents the first effort to sample gastropod biodiversity on rocky shores using astandardized protocol across a wide scale. Our results will generate more work to build global databases allowing for large-scale diversity comparisons of rocky intertidal assemblages.
Citation: Miloslavich P, Cruz-Motta JJ, Klein E, Iken K, Weinberger V, et al. (2013) Large-Scale Spatial Distribution Patterns of Gastropod Assemblages in RockyShores. PLoS ONE 8(8): e71396. doi:10.1371/journal.pone.0071396
Editor: Andrew Davies, Bangor University, United Kingdom
Received October 30, 2012; Accepted June 28, 2013; Published August 13, 2013
Copyright: � 2013 Miloslavich et al. This is an open-access article distributed under the terms of the Creative Commons Attribution License, which permitsunrestricted use, distribution, and reproduction in any medium, provided the original author and source are credited.
Funding: Funding was provided by multiple sources, including the Alfred P. Sloan Foundation through the NaGISA project, the History of the Near Shore (HNS)program, the History of Marine Populations (HMAP), Fisheries and Oceans Canada (DFO), Suffolk University, the Gulf of Maine (GoMA) project, Chevron-Venezuela,Decanato de Investigacion y Desarrollo – Universidad Simon Bolıvar, Exxon Valdez Oil Spill Trustee Council - Gulf Ecosystem Monitoring, SAEON (South AfricanEnvironmental Observation Network), and SANCOR Seachange Program and the Centre for Invasion Biology (CIB). The funders had no role in study design, datacollection and analysis, decision to publish, or preparation of the manuscript.
Competing Interests: The authors have declared that no competing interests exist.
* E-mail: [email protected]
Introduction
It has been long and generally recognized that the diversity of
coexisting species has a fundamental influence on many ecological
processes, including those processes that determine the stability of
the community itself [1–2]. However, no general consensus has
been reached on the ‘‘shape’’ or ‘‘characteristics’’ of this
relationship (diversity-function); because, among many other
reasons, the observed shape of the relationship depends on the
scale of the observation. Consequently, any understanding of this
relationship has to depart from a proper description of the
distribution patterns of diversity across different spatial and
temporal scales [3–9]. Moreover, it has also been shown, that
the shape of the relationship might be subjected to anthropogenic
influences operating at different spatial scales [10]. Insight of how
species assemblages are established and the processes that shape
their patterns of biodiversity is critical for understanding various
aspects of global change. The impacts of global change range from
climate effects on community structure, productivity and nutrient
cycling to human-induced effects such as fishing pressure and the
introduction of non-native species, although the latter can also
PLOS ONE | www.plosone.org 1 August 2013 | Volume 8 | Issue 8 | e71396
occur through the extension of species distribution range in
response to climate (e.g., [11–15]).
Even though many studies have been done on describing
patterns of spatial and temporal distribution of species at small
scales, those at large scales pose various challenges, as they cannot
be easily extrapolated from models developed at small, local scales
(e.g., [16–18]).
At large spatial scales, it has long been accepted that one of the
most invariant patterns of biodiversity is the latitudinal cline of
species richness, and consequently that ecological processes or
factors associated to the latitudinal gradient (i.e. temperature,
harshness) would be the key factors on determining patterns of
spatial distribution of diversity at large spatial scales [19–24].
Although there are a few studies that either support or reject this
pattern (especially in marine systems), these may not be
comparable because they were focused on different geographical
areas, with different sampling efforts, and taxonomic resolution.
Therefore, a standardized approach, including a standardized
protocol is needed. The implementation of such standard protocol
would allow for a large scale analysis of taxon groups and habitat
types improving our understanding of mechanisms underlying
dynamics of a taxon assemblage, and providing the basis for new
hypotheses. As a response to the need of data standardization for a
better understanding of diversity patterns [23,25,26], the NaGISA
Natural Geography in Shore Areas, a field program of the Census
of Marine Life project, was implemented in 2003 as a global
initiative to study coastal diversity, distribution, and abundance by
using a standardized protocol in shallow marine habitats. By 2010,
NaGISA had sampled more than 250 sites within 28 globally
distributed countries, of which 182 sites were rocky shores.
Analysis of data collected under this scheme has shown that
patterns of distribution of diversity and biomass of various
taxonomic groups (e.g. macroalgae, decapods and echinoderms)
are very complex and not always follow the expected latitudinal
gradient of species diminution towards the poles [27–31], or
appear to be superseded by regional diversity hotspots [29]. The
NaGISA database has also allowed correlation analyses between
species diversity or composition and environmental-anthropogenic
variables at large spatial scales, showing that potential drivers of
diversity at large scale vary depending on the group being analysed
[27–31]. Given this variability of outcomes for different taxonomic
groups, this study will focus on gastropods, one of the most diverse
and ecologically important groups in the rocky shore environ-
ments.
Gastropods are an important and representative component of
rocky shore assemblages [32–35]. They are the most species rich
class within the mollusks with a reasonably well-known taxonomy
[36–38], and has been, after fishes, the most studied group in
marine systems, so there is an extensive ecological literature to
compare results with. The gastropods were one of the first groups
in which a clear latitudinal cline in benthic marine species richness
was observed [39,40], a trend that was re-confirmed in more
recent studies [41–43], but not demonstrated in the southern
hemisphere [25] or in any case, different from the northern
hemisphere [44,45]. Most of these studies were carried out by
analyzing local and regional species lists compiled from all marine
ecosystems, however such regional inventories are known to be
incomplete even in the best sampled regions [46]. Regions with the
highest number of gastropod species are the waters surrounding
Japan [47] and Australia [48] with more than 6000 species, while
the poorest regions in terms of species richness are the Canadian
Arctic [49] and the Tropical West Atlantic with less than 210
species [50]. The problem of determining species diversity and
furthermore, abundance, is even more critical in lesser-known
regions due to severe restrictions in sampling efforts (e.g. number
of samples, ecosystems sampled, lack of standardization in
collection methods), taxonomic capacity and expertise, and
general resources to support this type of research [46,51].
Therefore, this study aims to describe diversity and abundance
distribution patterns of gastropods from near shore rocky habitats
and to identify possible drivers that might be related such patterns.
Description of these patterns is the first necessary step to then
propose specific hypotheses about specific drivers for these
assemblages. For this, we used the NaGISA dataset to (1) describe
broad scale patterns of gastropod diversity and abundance,
including patterns based on feeding modes, (2) evaluate the
existence of latitudinal pattern of gastropod richness, abundance
and/or regional hotspots, and (3) identify environmental and
anthropogenic drivers that may explain large scale patterns of
these assemblages.
Materials and Methods
SamplingGastropod diversity and abundance were estimated using the
NaGISA standardized protocol developed for the Census of
Marine Life program [34]. Gastropod surveys were done at 45
widely distributed rocky shore shallow sites and grouped within 12
Large Marine Ecosystems (LMEs) as defined by the National
Oceanic and Atmospheric Administration (NOAA) [52] to allow
for large-scale comparisons. Selection of sites was based, as much
as possible, on relatively pristine conditions and remoteness from
direct human influence. However, within each LME, site selection
was biased by accessibility and location of contributing investiga-
tors, resulting in an unbalanced distribution of sampling localities
across latitude and longitude. Most samples were collected in the
northern and western hemispheres (Table 1). Between one and 11
sites were sampled in each LME. Although this sampling size is
clearly an under-representation of each LME [27–31], it still
allows for comparisons of larger-scale patterns above the local
variability (Figure 1). Within each site, five replicate 0.0625 m2
quadrats (25625 cm2) were sampled randomly distributed along a
30–50 m transect at the high, mid, and low intertidal strata and at
1, 5, and 10 m (when available) depth in the subtidal. The
epibenthic assemblage was removed from the quadrat area, sieved
over 500 mm mesh, and gastropods were sorted and identified to
the lowest taxonomic level possible (species in most of the cases).
Sampling took place between June 2004 and January 2009. Since
sampling of the sites did not take place at the same time, no
analysis on temporal variation was carried out, however, to
diminish the effects of temporal (i.e. seasonal) variation on our
spatial analyses, we selected from the database the data
corresponding to the warmer season for each site.
All necessary permits were obtained for the described field
studies: University of Pisa and Council of Livorno, Italy
(Mediterranean sites), Department of Fisheries and Oceans,
Canada (Canso and Simposon Island sites), Alaska Department
of Fish and Game (Gulf of Alaska sites: Kachemak Bay - National
Estuarine Research Reserve-, Outside Beach, Cohen Island, and
Elephant Island), Maine Department of Marine Resources (Birch
Island/Outer Birch Island sites), Oficina Administrativa de
Permisiones del Ministerio del Poder Popular del Ambiente,
Venezuela (Venezuelan sites – National Parks-), and South African
Department of Environmental Affairs (South African sites).
Antarctic samples were collected under the umbrella of the
United States Antarctic Program (USAP) at McMurdo Antarctic
Station. For the rest of the sites, no specific permits were required
for the described field studies as the locations were not privately-
Large-Scale Gastropod Distribution in Rocky Shores
PLOS ONE | www.plosone.org 2 August 2013 | Volume 8 | Issue 8 | e71396

owned or protected in any way, and the field studies did not
involve endangered or protected species.
Environmental DataTo link the gastropod assemblages in rocky shores with
environmental variables, 15 environmental variables considered
either as ‘‘natural’’ or as ‘‘anthropogenic’’ (Table 2) were
examined to test if these could be important drivers of gastropod
diversity and abundance associated with these ecosystems.
Variables grouped as ‘‘natural’’ and not directly related to human
activities were sea-surface temperature (SST), sea-surface temper-
ature anomalies (SSTa), chlorophyll-a (CHA), chlorophyll-a
anomalies (CHAa), rainfall (RAI), rainfall anomalies (RAIa),
photoperiod (PHO), and mean value of tidal amplitude (TID).
SST and CHA data were provided by the MODIS Aqua mission,
RAI data were compiled using the TOVAS web-based applica-
tion, PHO was calculated as the difference between the sunrise
and sunset time [53], and TID was calculated using the Program
WXTide32 Version 4.7. Anomalies for each of these variables
were defined as the numbers of events that surpassed two standard
deviations of the average for each of those variables for a given
year at any given location. Variables grouped as ‘‘anthropogenic’’
or directly related to human activities were inorganic pollution
(INP), organic pollution (ORP), acidification (AC), incidence of
invasive species (INV), human population pressure (HUM),
shipping activity (SH), and ocean-based pollution (OBP) using
the categories provided by Halpern et al. [54] (see more specifics
in Table 2). Since environmental data could not always be
collected or predicted from the exact sampling sites, and there was
some inaccuracy of satellite-derived data from optical sea-surface
properties (e.g., CHA) at small spatial scales [54], we used the
LME scale to allow for the interpretation of large-scale variability.
While the nearshore is a notably variable environment at the local
scale, large-scale variability has reported to be even higher [27,28].
Data AnalysesTo provide a local estimate of taxon richness we combined the
data from the intertidal and subtidal strata for each site. Given that
the sampling effort between LMEs was unbalanced in the number
of samples (e.g. 10 sampling units in Agulhas Current vs 308
sampling units in the Gulf of Alaska), we standardized the number
of taxa at each site with different sample numbers. For this, we
used saturation curves following the Ugland-Gray-Ellingsen or
UGE method [55], which estimates how many taxa would have
been found at each site if a specific number of sampling units
( = quadrats) had been sampled at each site (for 999 permutations).
Here, we standardized the analysis for an arbitrary sampling size
of 10 replicates [56], so only those sites in the NaGISA database in
which 10 or more sampling units across all depth and intertidal
levels had been sampled were considered in the analyses. The
number of sites within one LME varied between 1 (Agulhas
Current and Scotian Shelf) to 11 (Beaufort Sea). To detect possible
patterns of species distribution across different latitudes, a Pearson
correlation analysis was done between taxon richness and
abundance per site and latitude. Average densities of total
gastropod taxa were standardized for the total area sampled at
each site and scaling those data to a standard 0.0625 m2 area (a
25625 cm2 quadrat). Additionally, we also searched for patterns
of the most widely distributed families, which in this work, we
considered as those that were present in four or more LME’s.
To examine geographical patterns of community similarity, we
used multivariate methods [57–59] and the Primer 6.1.3 (Ply-
mouth Routines in Multivariate Ecological Research) Permano-
va+software package. We transformed the taxon composition data
per site into a presence-absence matrix, which was then used to
construct a similarity matrix based on the taxonomic dissimilarity
coefficient Theta [60,61]. Theta is a Presence/Absence (P/A)
measure (similar to Kulczynski’s) but that takes into consideration
the distance (w) through the taxonomic tree from species i of
Figure 1. Global distribution of the sampling sites within the Large Marine Ecosystems (LME). BfS: Beaufort Sea; GoA: Gulf of Alaska; CBS:Celtic-Biscay Shelf; StS: Scotian Shelf; NCS: North East US Coast Shelf; KuC: Kuroshio Current; MdS: Mediterranean Sea; CbS: Caribbean Sea; AgC:Agulhas Current; BgC: Benguela Current; PaS: Patagonian Shelf.doi:10.1371/journal.pone.0071396.g001
Large-Scale Gastropod Distribution in Rocky Shores
PLOS ONE | www.plosone.org 3 August 2013 | Volume 8 | Issue 8 | e71396
sample 1 to species j of sample 2 (see [61] for Theta equation). The
Theta coefficient allows for comparison of samples across large
geographical scales that do not share many species and also
considers the taxonomic relationship of species found in each
sample [61]. To visualize the distances among centroids of
sampling sites [59], we performed a Canonical Analysis of
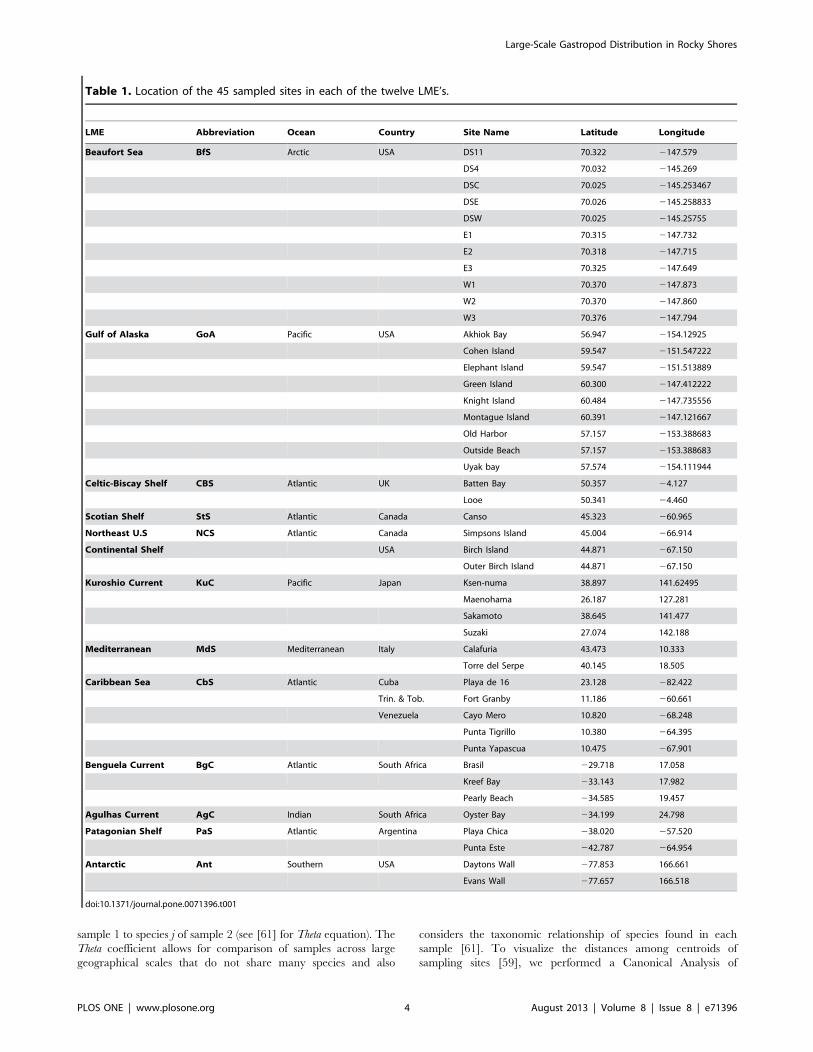
Table 1. Location of the 45 sampled sites in each of the twelve LME’s.
LME Abbreviation Ocean Country Site Name Latitude Longitude
Beaufort Sea BfS Arctic USA DS11 70.322 2147.579
DS4 70.032 2145.269
DSC 70.025 2145.253467
DSE 70.026 2145.258833
DSW 70.025 2145.25755
E1 70.315 2147.732
E2 70.318 2147.715
E3 70.325 2147.649
W1 70.370 2147.873
W2 70.370 2147.860
W3 70.376 2147.794
Gulf of Alaska GoA Pacific USA Akhiok Bay 56.947 2154.12925
Cohen Island 59.547 2151.547222
Elephant Island 59.547 2151.513889
Green Island 60.300 2147.412222
Knight Island 60.484 2147.735556
Montague Island 60.391 2147.121667
Old Harbor 57.157 2153.388683
Outside Beach 57.157 2153.388683
Uyak bay 57.574 2154.111944
Celtic-Biscay Shelf CBS Atlantic UK Batten Bay 50.357 24.127
Looe 50.341 24.460
Scotian Shelf StS Atlantic Canada Canso 45.323 260.965
Northeast U.S NCS Atlantic Canada Simpsons Island 45.004 266.914
Continental Shelf USA Birch Island 44.871 267.150
Outer Birch Island 44.871 267.150
Kuroshio Current KuC Pacific Japan Ksen-numa 38.897 141.62495
Maenohama 26.187 127.281
Sakamoto 38.645 141.477
Suzaki 27.074 142.188
Mediterranean MdS Mediterranean Italy Calafuria 43.473 10.333
Torre del Serpe 40.145 18.505
Caribbean Sea CbS Atlantic Cuba Playa de 16 23.128 282.422
Trin. & Tob. Fort Granby 11.186 260.661
Venezuela Cayo Mero 10.820 268.248
Punta Tigrillo 10.380 264.395
Punta Yapascua 10.475 267.901
Benguela Current BgC Atlantic South Africa Brasil 229.718 17.058
Kreef Bay 233.143 17.982
Pearly Beach 234.585 19.457
Agulhas Current AgC Indian South Africa Oyster Bay 234.199 24.798
Patagonian Shelf PaS Atlantic Argentina Playa Chica 238.020 257.520
Punta Este 242.787 264.954
Antarctic Ant Southern USA Daytons Wall 277.853 166.661
Evans Wall 277.657 166.518
doi:10.1371/journal.pone.0071396.t001
Large-Scale Gastropod Distribution in Rocky Shores
PLOS ONE | www.plosone.org 4 August 2013 | Volume 8 | Issue 8 | e71396
Principal Coordinates (CAP) ordination [58], in which the LME is
considered the predictor variable that creates in a priori fashion the
taxonomic differences in the data.
To analyze if taxon composition patterns of gastropod
assemblages were correlated to environmental drivers, we created
a variable-by-site matrix with variables normalized to a common
scale. To detect possible effects of distances among sampling sites,
geographic coordinates were included in this matrix for further
analyses. Co-linearity was examined prior to analyses to avoid
using redundant data. Redundant environmental variables and
proper transformations of the data were identified using multiple
correlation analysis (draftsman plots) after square-root transfor-
mation of skewed variables and excluded from the analysis. To
select the combination of variables that best explained the
observed biological distribution patterns, a similarity matrix of
environmental variables based on Euclidean distances was linked
to the taxonomic dissimilarities patterns (Theta matrix) among
LMEs using the BEST routine BIOENV [62] from the PRIMER-
E [63] with PERMANOVA [59] software.
Results
A total of 393 gastropod taxa were collected within 87 families
(Table S1). Nearly 14% of these families were represented by 10 or
more species, while the majority of the families (86%) were
represented by 1 to 9 species. The richest families in the overall
dataset in terms of number of species were the Trochidae and the
Rissoidae with 32 and 30 species, respectively, followed by the
Lottiidae (24 species), Littorinidae (22), Muricidae (21), Fissur-
ellidae (17), Collumbellidae (16), Patellidae and Buccinidae (15
species each), Conidae (12), and Cerithiidae and Pyramidellidae
(10 species each). None of the species found at each of the sites are
listed as alien/invasive for their particular locality except for
Littorina littorea which has been reported as an early introduced
species in the Western North Atlantic [64]. In all LMEs,
assemblages were dominated by few species and most other
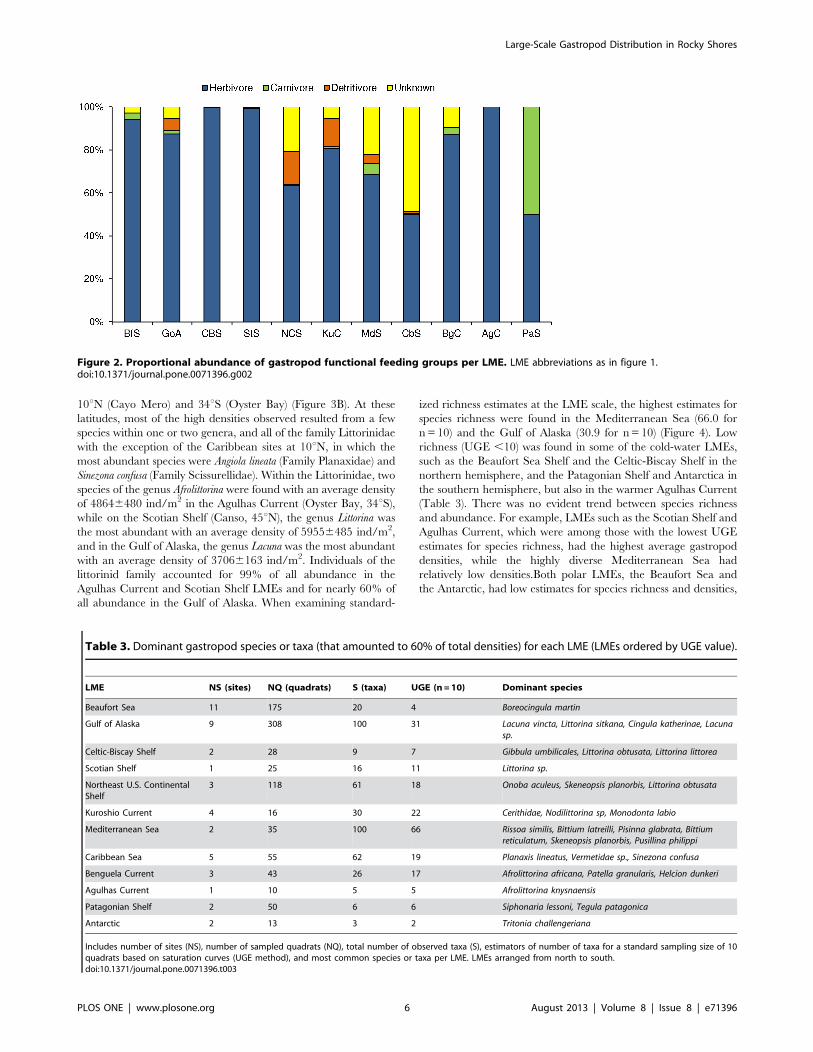
species were rare (Table 3). In terms of trophic groups, herbivores
were the most diverse and abundant in all LMEs (Figure 2).
Carnivorous gastropods were rare in all LMEs (,5% when
present), and a considerable number (30%–40%) of gastropods
species with unknown trophic preferences were found in the
Kuroshio Current, Mediterranean Sea and Caribbean Sea LMEs.
In the Antarctic, only one of the three taxa found was identified to
species level (Tritonia challengeriana: carnivore).
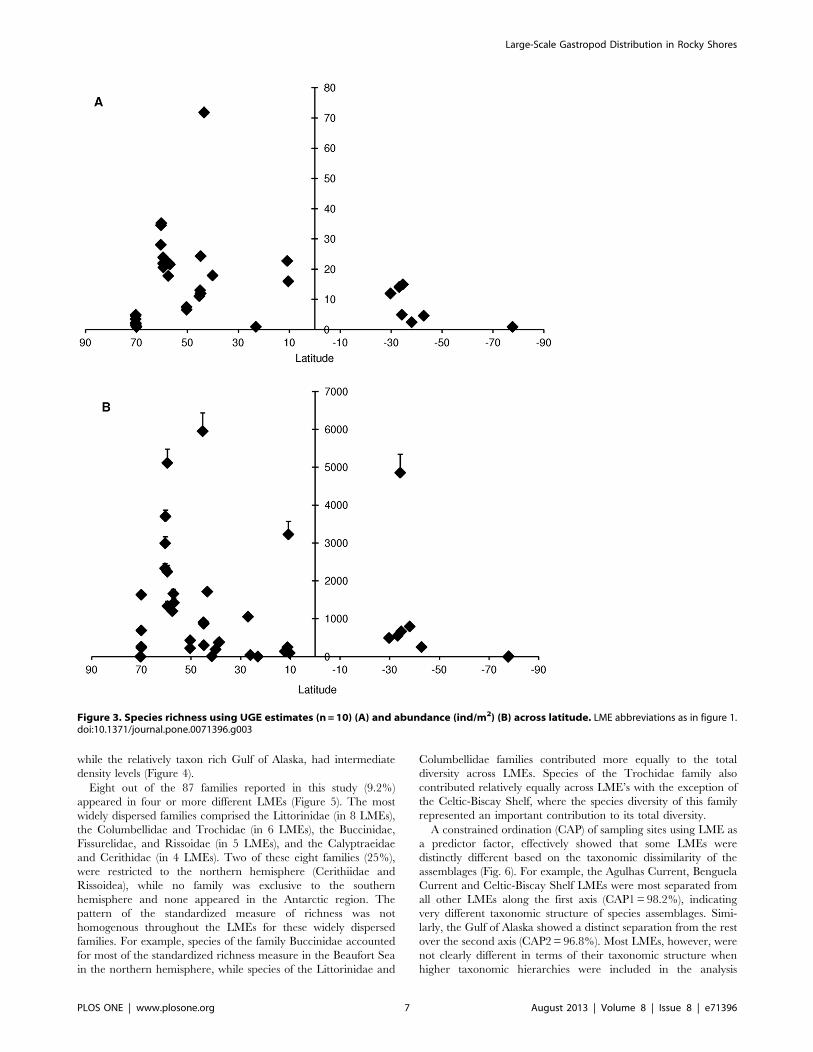
The Pearson correlation test did not support a relationship
between latitude and the UGE standardized estimate of species
richness (r = 0.16, T = 0.9675, p.0.05). In fact, a greater
dispersion of standardized richness was observed among sites
within similar latitudes than across latitude (Figure 3A). For
example, at 42u–45u N, sites with either high (Calafuria in the
Mediterranean, UGE = 71.9 for n = 10) and low (Canso in the
Scotian Shelf, UGE = 11.0 for n = 10) estimates of standardized
richness were found. Similarly, no latitudinal trend was observed
in terms of gastropod average densities (Pearson r = 0.077,
T = 0.52, p.0.05). Sites with high densities were observed near
60uN (Elephant, Knight, and Montague Islands), 45uN (Canso),
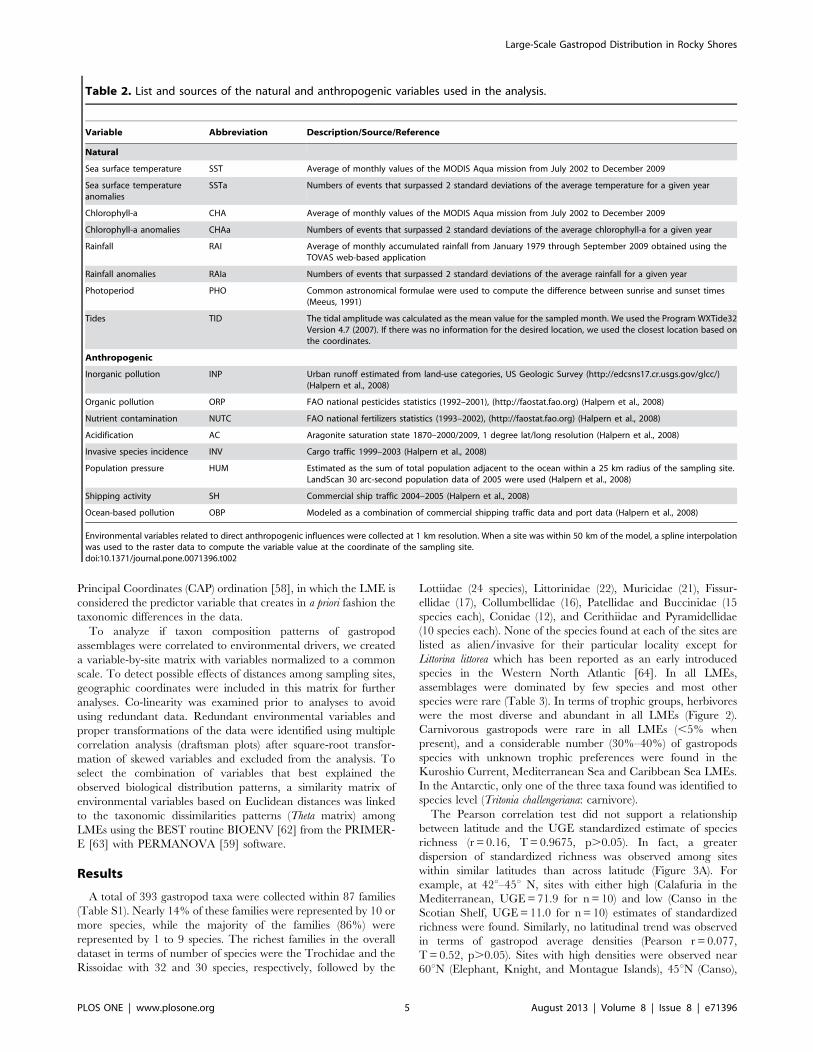
Table 2. List and sources of the natural and anthropogenic variables used in the analysis.
Variable Abbreviation Description/Source/Reference
Natural
Sea surface temperature SST Average of monthly values of the MODIS Aqua mission from July 2002 to December 2009
Sea surface temperatureanomalies
SSTa Numbers of events that surpassed 2 standard deviations of the average temperature for a given year
Chlorophyll-a CHA Average of monthly values of the MODIS Aqua mission from July 2002 to December 2009
Chlorophyll-a anomalies CHAa Numbers of events that surpassed 2 standard deviations of the average chlorophyll-a for a given year
Rainfall RAI Average of monthly accumulated rainfall from January 1979 through September 2009 obtained using theTOVAS web-based application
Rainfall anomalies RAIa Numbers of events that surpassed 2 standard deviations of the average rainfall for a given year
Photoperiod PHO Common astronomical formulae were used to compute the difference between sunrise and sunset times(Meeus, 1991)
Tides TID The tidal amplitude was calculated as the mean value for the sampled month. We used the Program WXTide32Version 4.7 (2007). If there was no information for the desired location, we used the closest location based onthe coordinates.
Anthropogenic
Inorganic pollution INP Urban runoff estimated from land-use categories, US Geologic Survey (http://edcsns17.cr.usgs.gov/glcc/)(Halpern et al., 2008)
Organic pollution ORP FAO national pesticides statistics (1992–2001), (http://faostat.fao.org) (Halpern et al., 2008)
Nutrient contamination NUTC FAO national fertilizers statistics (1993–2002), (http://faostat.fao.org) (Halpern et al., 2008)
Acidification AC Aragonite saturation state 1870–2000/2009, 1 degree lat/long resolution (Halpern et al., 2008)
Invasive species incidence INV Cargo traffic 1999–2003 (Halpern et al., 2008)
Population pressure HUM Estimated as the sum of total population adjacent to the ocean within a 25 km radius of the sampling site.LandScan 30 arc-second population data of 2005 were used (Halpern et al., 2008)
Shipping activity SH Commercial ship traffic 2004–2005 (Halpern et al., 2008)
Ocean-based pollution OBP Modeled as a combination of commercial shipping traffic data and port data (Halpern et al., 2008)
Environmental variables related to direct anthropogenic influences were collected at 1 km resolution. When a site was within 50 km of the model, a spline interpolationwas used to the raster data to compute the variable value at the coordinate of the sampling site.doi:10.1371/journal.pone.0071396.t002
Large-Scale Gastropod Distribution in Rocky Shores
PLOS ONE | www.plosone.org 5 August 2013 | Volume 8 | Issue 8 | e71396
10uN (Cayo Mero) and 34uS (Oyster Bay) (Figure 3B). At these
latitudes, most of the high densities observed resulted from a few
species within one or two genera, and all of the family Littorinidae
with the exception of the Caribbean sites at 10uN, in which the
most abundant species were Angiola lineata (Family Planaxidae) and
Sinezona confusa (Family Scissurellidae). Within the Littorinidae, two
species of the genus Afrolittorina were found with an average density
of 48646480 ind/m2 in the Agulhas Current (Oyster Bay, 34uS),
while on the Scotian Shelf (Canso, 45uN), the genus Littorina was
the most abundant with an average density of 59556485 ind/m2,
and in the Gulf of Alaska, the genus Lacuna was the most abundant
with an average density of 37066163 ind/m2. Individuals of the
littorinid family accounted for 99% of all abundance in the
Agulhas Current and Scotian Shelf LMEs and for nearly 60% of
all abundance in the Gulf of Alaska. When examining standard-
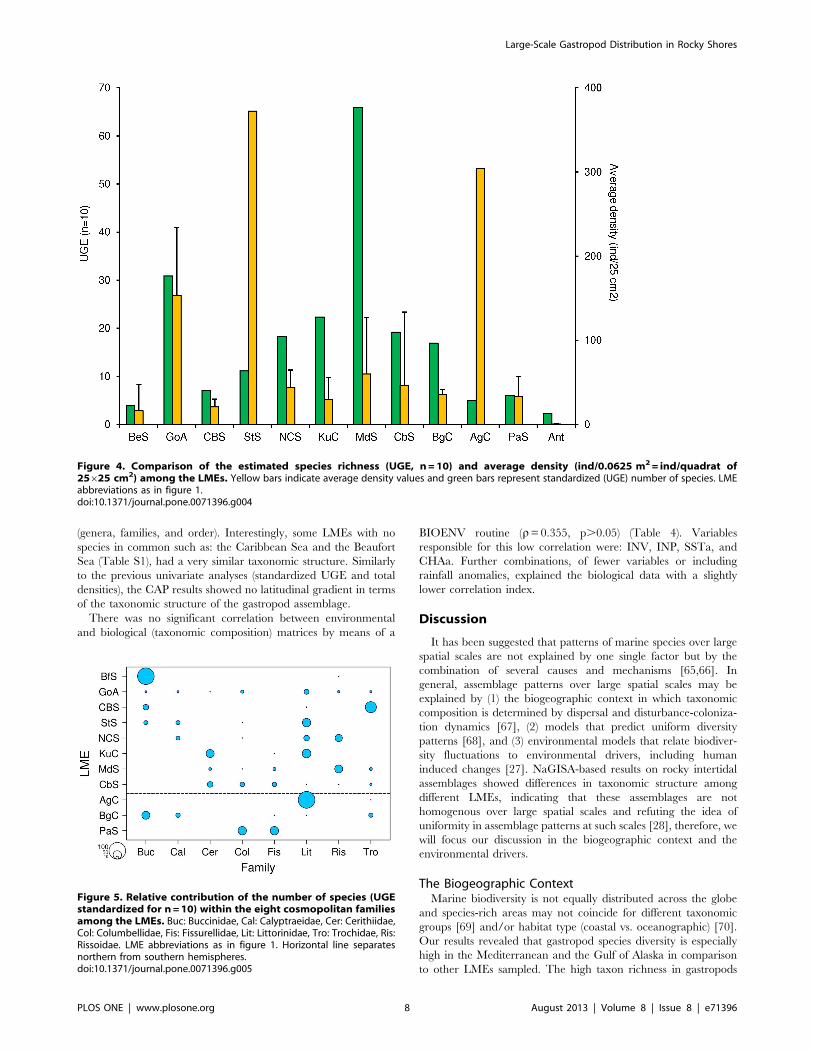
ized richness estimates at the LME scale, the highest estimates for
species richness were found in the Mediterranean Sea (66.0 for
n = 10) and the Gulf of Alaska (30.9 for n = 10) (Figure 4). Low
richness (UGE ,10) was found in some of the cold-water LMEs,
such as the Beaufort Sea Shelf and the Celtic-Biscay Shelf in the
northern hemisphere, and the Patagonian Shelf and Antarctica in
the southern hemisphere, but also in the warmer Agulhas Current
(Table 3). There was no evident trend between species richness
and abundance. For example, LMEs such as the Scotian Shelf and
Agulhas Current, which were among those with the lowest UGE
estimates for species richness, had the highest average gastropod
densities, while the highly diverse Mediterranean Sea had
relatively low densities.Both polar LMEs, the Beaufort Sea and
the Antarctic, had low estimates for species richness and densities,
Figure 2. Proportional abundance of gastropod functional feeding groups per LME. LME abbreviations as in figure 1.doi:10.1371/journal.pone.0071396.g002
Table 3. Dominant gastropod species or taxa (that amounted to 60% of total densities) for each LME (LMEs ordered by UGE value).
LME NS (sites) NQ (quadrats) S (taxa) UGE (n = 10) Dominant species
Beaufort Sea 11 175 20 4 Boreocingula martin
Gulf of Alaska 9 308 100 31 Lacuna vincta, Littorina sitkana, Cingula katherinae, Lacunasp.
Celtic-Biscay Shelf 2 28 9 7 Gibbula umbilicales, Littorina obtusata, Littorina littorea
Scotian Shelf 1 25 16 11 Littorina sp.
Northeast U.S. ContinentalShelf
3 118 61 18 Onoba aculeus, Skeneopsis planorbis, Littorina obtusata
Kuroshio Current 4 16 30 22 Cerithidae, Nodilittorina sp, Monodonta labio
Mediterranean Sea 2 35 100 66 Rissoa similis, Bittium latreilli, Pisinna glabrata, Bittiumreticulatum, Skeneopsis planorbis, Pusillina philippi
Caribbean Sea 5 55 62 19 Planaxis lineatus, Vermetidae sp., Sinezona confusa
Benguela Current 3 43 26 17 Afrolittorina africana, Patella granularis, Helcion dunkeri
Agulhas Current 1 10 5 5 Afrolittorina knysnaensis
Patagonian Shelf 2 50 6 6 Siphonaria lessoni, Tegula patagonica
Antarctic 2 13 3 2 Tritonia challengeriana
Includes number of sites (NS), number of sampled quadrats (NQ), total number of observed taxa (S), estimators of number of taxa for a standard sampling size of 10quadrats based on saturation curves (UGE method), and most common species or taxa per LME. LMEs arranged from north to south.doi:10.1371/journal.pone.0071396.t003
Large-Scale Gastropod Distribution in Rocky Shores
PLOS ONE | www.plosone.org 6 August 2013 | Volume 8 | Issue 8 | e71396
while the relatively taxon rich Gulf of Alaska, had intermediate
density levels (Figure 4).
Eight out of the 87 families reported in this study (9.2%)
appeared in four or more different LMEs (Figure 5). The most
widely dispersed families comprised the Littorinidae (in 8 LMEs),
the Columbellidae and Trochidae (in 6 LMEs), the Buccinidae,
Fissurelidae, and Rissoidae (in 5 LMEs), and the Calyptraeidae
and Cerithidae (in 4 LMEs). Two of these eight families (25%),
were restricted to the northern hemisphere (Cerithiidae and
Rissoidea), while no family was exclusive to the southern
hemisphere and none appeared in the Antarctic region. The
pattern of the standardized measure of richness was not
homogenous throughout the LMEs for these widely dispersed
families. For example, species of the family Buccinidae accounted
for most of the standardized richness measure in the Beaufort Sea
in the northern hemisphere, while species of the Littorinidae and
Columbellidae families contributed more equally to the total
diversity across LMEs. Species of the Trochidae family also
contributed relatively equally across LME’s with the exception of
the Celtic-Biscay Shelf, where the species diversity of this family
represented an important contribution to its total diversity.
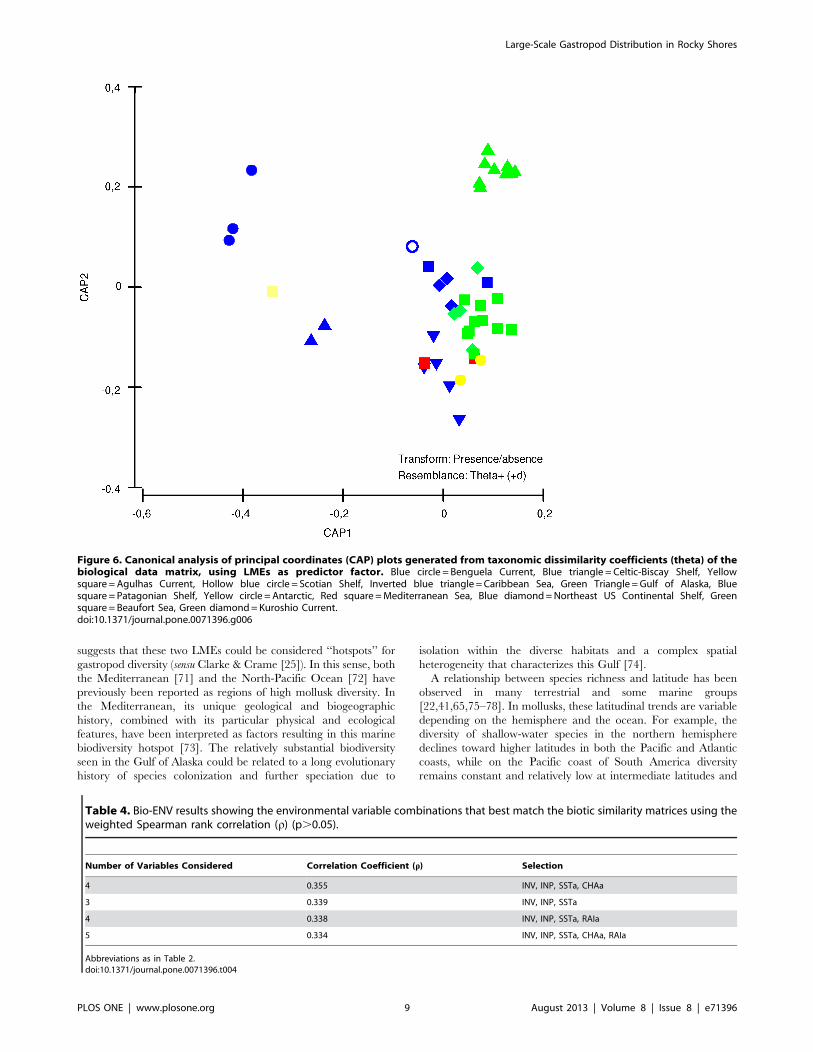
A constrained ordination (CAP) of sampling sites using LME as
a predictor factor, effectively showed that some LMEs were
distinctly different based on the taxonomic dissimilarity of the
assemblages (Fig. 6). For example, the Agulhas Current, Benguela
Current and Celtic-Biscay Shelf LMEs were most separated from
all other LMEs along the first axis (CAP1 = 98.2%), indicating
very different taxonomic structure of species assemblages. Simi-
larly, the Gulf of Alaska showed a distinct separation from the rest
over the second axis (CAP2 = 96.8%). Most LMEs, however, were
not clearly different in terms of their taxonomic structure when
higher taxonomic hierarchies were included in the analysis
Figure 3. Species richness using UGE estimates (n = 10) (A) and abundance (ind/m2) (B) across latitude. LME abbreviations as in figure 1.doi:10.1371/journal.pone.0071396.g003
Large-Scale Gastropod Distribution in Rocky Shores
PLOS ONE | www.plosone.org 7 August 2013 | Volume 8 | Issue 8 | e71396
(genera, families, and order). Interestingly, some LMEs with no
species in common such as: the Caribbean Sea and the Beaufort
Sea (Table S1), had a very similar taxonomic structure. Similarly
to the previous univariate analyses (standardized UGE and total
densities), the CAP results showed no latitudinal gradient in terms
of the taxonomic structure of the gastropod assemblage.
There was no significant correlation between environmental
and biological (taxonomic composition) matrices by means of a
BIOENV routine (r= 0.355, p.0.05) (Table 4). Variables
responsible for this low correlation were: INV, INP, SSTa, and
CHAa. Further combinations, of fewer variables or including
rainfall anomalies, explained the biological data with a slightly
lower correlation index.
Discussion
It has been suggested that patterns of marine species over large
spatial scales are not explained by one single factor but by the
combination of several causes and mechanisms [65,66]. In
general, assemblage patterns over large spatial scales may be
explained by (1) the biogeographic context in which taxonomic
composition is determined by dispersal and disturbance-coloniza-
tion dynamics [67], (2) models that predict uniform diversity
patterns [68], and (3) environmental models that relate biodiver-
sity fluctuations to environmental drivers, including human
induced changes [27]. NaGISA-based results on rocky intertidal
assemblages showed differences in taxonomic structure among
different LMEs, indicating that these assemblages are not
homogenous over large spatial scales and refuting the idea of
uniformity in assemblage patterns at such scales [28], therefore, we
will focus our discussion in the biogeographic context and the
environmental drivers.
The Biogeographic ContextMarine biodiversity is not equally distributed across the globe
and species-rich areas may not coincide for different taxonomic
groups [69] and/or habitat type (coastal vs. oceanographic) [70].
Our results revealed that gastropod species diversity is especially
high in the Mediterranean and the Gulf of Alaska in comparison
to other LMEs sampled. The high taxon richness in gastropods
Figure 4. Comparison of the estimated species richness (UGE, n = 10) and average density (ind/0.0625 m2 = ind/quadrat of25625 cm2) among the LMEs. Yellow bars indicate average density values and green bars represent standardized (UGE) number of species. LMEabbreviations as in figure 1.doi:10.1371/journal.pone.0071396.g004
Figure 5. Relative contribution of the number of species (UGEstandardized for n = 10) within the eight cosmopolitan familiesamong the LMEs. Buc: Buccinidae, Cal: Calyptraeidae, Cer: Cerithiidae,Col: Columbellidae, Fis: Fissurellidae, Lit: Littorinidae, Tro: Trochidae, Ris:Rissoidae. LME abbreviations as in figure 1. Horizontal line separatesnorthern from southern hemispheres.doi:10.1371/journal.pone.0071396.g005
Large-Scale Gastropod Distribution in Rocky Shores
PLOS ONE | www.plosone.org 8 August 2013 | Volume 8 | Issue 8 | e71396
suggests that these two LMEs could be considered ‘‘hotspots’’ for
gastropod diversity (sensu Clarke & Crame [25]). In this sense, both
the Mediterranean [71] and the North-Pacific Ocean [72] have
previously been reported as regions of high mollusk diversity. In
the Mediterranean, its unique geological and biogeographic
history, combined with its particular physical and ecological
features, have been interpreted as factors resulting in this marine
biodiversity hotspot [73]. The relatively substantial biodiversity
seen in the Gulf of Alaska could be related to a long evolutionary
history of species colonization and further speciation due to
isolation within the diverse habitats and a complex spatial
heterogeneity that characterizes this Gulf [74].
A relationship between species richness and latitude has been
observed in many terrestrial and some marine groups
[22,41,65,75–78]. In mollusks, these latitudinal trends are variable
depending on the hemisphere and the ocean. For example, the
diversity of shallow-water species in the northern hemisphere
declines toward higher latitudes in both the Pacific and Atlantic
coasts, while on the Pacific coast of South America diversity
remains constant and relatively low at intermediate latitudes and
Figure 6. Canonical analysis of principal coordinates (CAP) plots generated from taxonomic dissimilarity coefficients (theta) of thebiological data matrix, using LMEs as predictor factor. Blue circle = Benguela Current, Blue triangle = Celtic-Biscay Shelf, Yellowsquare = Agulhas Current, Hollow blue circle = Scotian Shelf, Inverted blue triangle = Caribbean Sea, Green Triangle = Gulf of Alaska, Bluesquare = Patagonian Shelf, Yellow circle = Antarctic, Red square = Mediterranean Sea, Blue diamond = Northeast US Continental Shelf, Greensquare = Beaufort Sea, Green diamond = Kuroshio Current.doi:10.1371/journal.pone.0071396.g006
Table 4. Bio-ENV results showing the environmental variable combinations that best match the biotic similarity matrices using theweighted Spearman rank correlation (r) (p.0.05).
Number of Variables Considered Correlation Coefficient (r) Selection
4 0.355 INV, INP, SSTa, CHAa
3 0.339 INV, INP, SSTa
4 0.338 INV, INP, SSTa, RAIa
5 0.334 INV, INP, SSTa, CHAa, RAIa
Abbreviations as in Table 2.doi:10.1371/journal.pone.0071396.t004
Large-Scale Gastropod Distribution in Rocky Shores
PLOS ONE | www.plosone.org 9 August 2013 | Volume 8 | Issue 8 | e71396
increases toward higher latitudes (south of 42uS) [44]. It has been
hypothesized that this biodiversity peak in the Pacific above 42uSis related to several factors: an increase in shelf area at this latitude,
the geographic isolation due to the divergence of major oceanic
currents, and the existence of refugia during glaciations which
favored speciation and radiation. In contrast, radiation may have
been limited on the narrow continental shelves at 10u–42u S [44].
For bivalves, latitudinal and longitudinal gradients exist but are
not symmetric between the northern and the southern hemi-
spheres, and a biodiversity hotspot is observed in the Australian
provinces in the southern hemisphere [45]. Similarly, an
asymmetry has been observed in the diversity of prosobranch
gastropods in the eastern Pacific coast from Alaska (70uN) to Cape
Horn (55uS) [41,44]. In the eastern Pacific coast, the highest
diversity of prosobranch species occurs between 0u–30u N,
decreasing towards higher latitudes in the northern hemisphere,
remaining relatively low between 20u–40u S, but increasing
towards the pole from 42uS [41,44]. While our data in intertidal
gastropods showed biodiversity hotspots, no clear pattern of
species richness in relation to latitude, was observed. In part this
may be due to important gaps in our data in terms of small
sampling size (which may underestimate taxon richness), geo-
graphic cover (lack of data from known species-rich regions such as
Australia and in general poor coverage of the southern
hemisphere) and the fact that our work is restricted to the
shallow-water rocky shore ecosystem. It is possible that especially
for these shallow-water (intertidal and down to 10 m depth)
assemblages, local variability and patterns override any latitudinal
trends that have previously been observed for deeper-water
mollusk assemblages. Our results may, therefore, provide support
for the hypotheses that different shallow-water taxa may be
structured differently along latitude [28] and/or that high species
richness may be contained within regional diversity hotspots
[29,70,79]. For example, analyses for other taxa based on data
from the NaGISA project also showed no clear latitudinal pattern
of species richness in intertidal rocky shore assemblages of
macroalgae and macrofauna (mostly colonial organisms) [28],
but have suggested some particular latitudinal trends for macro-
algae in the northern hemisphere [30], small intertidal echino-
derms [29], and decapods [31].
As with gastropod taxon richness, no latitudinal pattern in
gastropod abundance was evident in the present study. The two
sites that showed highest gastropod densities (within the Scotian
Shelf and Agulhas Current LMEs) were dominated by a single
species of Littorinidae, Littorina littorea and Afrolittorina africana,
respectively, both known to numerically dominate vast areas of
rocky shores [80–82]. However, other sites within these same
LMEs did not present high densities of these same gastropods
species or within the same genera. The Gulf of Alaska was also
characterized by the high abundance of the widely distributed
littorinid species Lacuna vincta. Numerical dominance of a single
species at some sites suggests that some local (small scale) features
or processes could be regulating these patterns of high abundanc-
es. For example, gastropod density in the rocky intertidal has been
reported to be directly related to a local feature such as habitat
structure and complexity [83].
Herbivory is key in early succession stages [84] as well as in
regulating biodiversity in rocky shore assemblages [85,86]. Among
all the LMEs considered in this study, more than 50% of the
gastropod species were herbivores. Warmer regions such as the
Kuroshio Current, Mediterranean Sea and Caribbean Sea seemed
to have more diversity in feeding habits (despite a large number of
species with unknown feeding habits in the Caribbean Sea), which
was also the case for the colder Northeast US Coastal Shelf. In
contrast, some mid to high-latitude LMEs are characterized nearly
exclusively by herbivorous gastropods (Scotian Shelf, Celtic-Biscay
Shelf and Agulhas Current) or where they represent more than
90% (Beaufort Sea, Patagonian Shelf, Gulf of Alaska). Such
dominance in herbivores and in high densities could be related to
high macroalgal biomass particularly between 45u to 60u N [30].
For example, all of the highly abundant species described above
are herbivores, and the sites where they occur are also known to
have high macroalgal biomass (e.g., 3.28 kg/m2 macroalgae for
Canso in the Scotian Shelf, 21.38 kg/m2 macroalgae for Old
Harbor in the Gulf of Alaska, Konar et al., 2010; 14.2 kg/m2
macroalgae for Oyster Bay in the Agulhas Current site, Angela
Mead, NaGISA unpublished data).
Despite the high family diversity found across LMEs, relatively
few of them have wide distributions (less than 10% of the families
found in four or more LMEs), indicating that assemblages across
regions are quite distinct even at the family level. For example, the
Rissoidea, which had the highest species diversity in the overall
dataset, were only found in the Gulf of Alaska, the Mediterranean,
and the Caribbean Sea. A review of the diversity patterns of this
family in the Atlantic and Mediterranean region suggested that the
main source regions of speciation for this family are the
Mediterranean and the Caribbean, along with the Canaries/
Madeira and Cape Verde archipelagos [87]. Hence, high diversity
in our study coincided with the suggested speciation centers.
Generally, the most common gastropods that graze in rocky shores
are true limpets (e.g., Patellidae and Lottiidae within the
Patellogastropoda), key-hole limpets (Fissurellidae within the
Vetigastropoda), periwinkles (Littorinidae within the Caenogas-
tropoda), and topshells (Trochidae within the Vetigastropoda)
[88]. In our study, only Littorinidae, Trochidae, and Fissurellidae
were found to be widely distributed, while the relatively high
species diversity of Patellidae was restricted to the Mediterranean,
the Benguela Current, and the Celtic-Biscay Shelf, and the
Lottidae were restricted to the Gulf of Alaska, the Kuroshio
Current, and the Scotian Shelf. The distribution patterns of these
common families in our study correlate well with their known
general biogeographic patterns and phylogenetic history [81,89–
93].
In addition to phylogenetic history, these family patterns may
also be related to the reproductive mode and dispersal capacity as
these may influence gene flow and speciation [94]. In bivalves, a
latitudinal diversity gradient from the tropics towards higher
latitudes is correlated with larval developmental modes, with
planktotrophy (supposedly wider disperal range) dominating the
tropics while non-planktotrophy (limited dispersal) increases
towards the poles [95]. A review of the reproductive modes
characterizing the eight widely distributed families found in this
study indicates that all have a wide diversity of reproductive
strategies with representatives having planktonic larvae or
undergoing direct development (Table S2). Hence, we did not
see a close relationship between reproductive mode and wide
distribution. Improving our knowledge of the reproductive modes
of all rocky shore gastropod species will certainly be helpful to
better understand their distribution and global biodiversity but
cannot be used alone to explain patterns in biogeography. For
example, within the genus Littorina, despite extensive knowledge on
the reproductive mode of species and a robust species level
phylogeny, it is still not clear how non-planktotrophic development
evolved [94]. This limits our understanding of how dispersal and
gene flow restrictions are responsible for the biogeography of the
group.
Large-Scale Gastropod Distribution in Rocky Shores
PLOS ONE | www.plosone.org 10 August 2013 | Volume 8 | Issue 8 | e71396
The Environmental ModelEnvironmental variables, either natural or anthropogenic, have
been reported to explain species richness or composition in some
taxonomic groups using NaGISA data [27–29,31]. Given these
previous results with the same database, and the fact that
gastropod species richness has been correlated either directly or
inversely with sea surface temperature [41,44] it was surprising to
find no significant correlation between environmental and biotic
parameters with our data. This could be due however to the fact
that we combined the subtidal and intertidal assemblages. In this
sense, temperature (SST) would affect more the intertidal than the
subtidal assemblages, whereas inorganics (INP) and chlorophyl-a
(CHAa) may affect more the subtidal than the intertidal
assemblages. SST has been suggested to play an important role
in the distribution patterns of rocky shore assemblages [28,96] as
climatic warming may cause changes in species abundance and
geographic range [97]. As global warming continues to accelerate
[98] and nutrient input to increase, it is expected that anomalies in
SST and CHA concentration will become more common; and
may consequently alter the structure and functioning of rocky
shore gastropod assemblages. The effect of INP may affect the
gastropod assemblage either directly by altering organism survival,
growth and reproduction [99–101], or indirectly by altering the
primary producer food sources with consequences in shifts in
community structure, diversity, and abundance particularly of the
largely abundant herbivores [99,102,103]. Pollution was ranked as
one of the two most important threats to biodiversity across 25
globally distributed oceanic regions, followed by invasive species
and altered temperature [46]. In this work, the perceived
correlation with invasive species (INV) likely derives from the fact
that some high diversity regions in this study also are known to
have high invasive species incidence. The Mediterranean, for
example, found in this study to be a rocky shore gastropod hotspot,
is also known to be a region with the highest number of marine
introduced species (n = 637), of which more than 30% are mollusks
[73]. This is three times the total number of introduced species,
and four times as many mollusk introduced species, as found in the
European Atlantic, a region ranked as second in invasive species
[46]. In the Agulhas Current site, the invasive bivalve Mytilus
galloprovincialis has proliferated along the coast since 1979, and is
now the dominant mussel to be found within the low/lower and
upper-mid intertidal zones [104–106]. It forms a complex three-
dimensional matrix in comparison to the native mussels, which
provides biogenic habitat for juvenile gastropods but marginalizes
adult gastropods, specifically limpets [107]. In parallel, sea
temperatures have cooled at a rate of 1uC per decade, whereas
air temperatures have increased [108–112]. Another impact of the
spread of the M. galloprovincialis mussel beds has been to minimize
bare rock surface where algal holdfasts can attach (personal
observation, Angela Mead). This may have impacted the biomass
of algae. Interestingly, it is the crustose algal forms that now
dominate in these areas [109].
The NaGISA database has several limitations, some of which
have already been discussed [31]. In this particular case, the first is
the restricted geographic coverage: it sampled less than 20% of the
64 LMEs leaving un-sampled areas of high gastropod diversity
(e.g. Australia). The second is the heterogeneity of the sampling
efforts. This imposed the need to carry out diversity standardiza-
tions to a relatively low number of samples (n = 10 in this case),
therefore ‘‘loosing’’ information from well sampled sites. A third
limitation, is the fact that for highly diverse areas, the number of
samples was simply not enough to collect rare species. Despite
these constraints, we still were able to provide a large scale view of
rocky shore gastropod diversity and abundance, identify hotspots,
dominant species, and widely dispersed families, and explore the
environmental parameters which may drive these assemblages.
This experience encourages the continuation of large scale
research and monitoring activities and initiate them in currently
un-sampled localities. One of the largest NaGISA follow-up
initiatives at the regional level is the creation of the South
American Research Group in Coastal Ecosystems (SARCE). This
initiative will continue to assess marine diversity and biomass, and
the monitoring of rocky shore ecosystems, with an improved
protocol in more than 50 localities in South America while
studying ecosystem function and human impacts. Another
initiative that will use NaGISA based sampling protocols is the
Monitoring Sites 1000 Project conducted by the Ministry of
Environment in Japan implemented in 2008 to assess climate
change through ecosystem monitoring at 1000 sites including
coastal rocky shores throughout Japan for 100 years (http://japan.
wetlands.org). Finally, in order to improve our understanding of
the role that species have within their assemblages and, therefore,
the services that they provide to the ecosystem, these and other
similar programs would also benefit from incorporating field
experiments on species interactions such as predation, competition
and herbivory, as well as observations on recruitment at the global
level.
Supporting Information
Table S1 List of gastropod species and taxa found ateach LME.
(DOC)
Table S2 Number of reported species according to theWorld Register of Marine Species (WoRMS: http://www.
marinespecies.org/) and developmental mode of the eightwidely distributed families (found in 4 or more LMEs)reported in this paper. Reported hatching modes: plankto-
trophic larva (PL), pediveliger (PV), lecithotrophic larva (LL),
crawling juvenile (CJ), vivipary (V).
(DOC)
Acknowledgments
We wish to acknowledge the countless collaborators, including students
from our different institutions for their valuable help in collecting and
sorting the samples. We are also grateful to the gastropod taxonomists from
the different locations for providing accurate identifications for the
hundreds of species used in this study, to Julio Castillo (Remote Sensing
Lab-USB) for providing the environmental data, and Cesar Paz (Marine
Biology Lab-USB) for assistance with the bibliographic format. We also
wish to acknowledge discussions with Anthony Underwood and Gee
Chapman (University of Sydney) related to sampling protocols and
limitations.
Author Contributions
Conceived and designed the experiments: PM JJCM KI BK G. Pohle LBC
YS. Performed the experiments: PM JJCM KI BK TT G. Pohle GB LBC
YS AM G. Palomo MO JG AK MW ACP. Analyzed the data: PM JJCM
EK VW AS. Contributed reagents/materials/analysis tools: PM JJCM KI
BK TT GP G. Pohle GB LBC YS AM G. Palomo MO JG MW. Wrote the
paper: PM JJCM KI VW BK TT GP G. Pohle GB LBS AM G. Palomo
JG JMD MW.
Large-Scale Gastropod Distribution in Rocky Shores
PLOS ONE | www.plosone.org 11 August 2013 | Volume 8 | Issue 8 | e71396
References
1. Hooper DU, Vitousek PM (1997) The Effects of Plant Composition and
Diversity on Ecosystem Processes. Science 277: 1302–1305.
2. Solan M, Cardinale BJ, Downing AL, Engelhardt KAM, Ruesink JL, et al.
(2004) Extinction and ecosystem function in the marine benthos. Science 306:1177–1180.
3. May RM (1972) Will a large complex system be stable? Nature 238: 413–414.
4. May RM (1973) Stability and complexity in model ecosystems. New Jersey:
Princeton University Press.
5. Yodzis P (1981) The stability of real ecosystems. Nature 289: 674–676.
6. McCann KS (2000) The diversity-stability debate. Nature 405: 228–233.
7. Levin SA (1992) The Problem of pattern and scale in ecology: The Robert H.MacArthur Award Lecture. Ecology 73: 1943–1967.
8. May R (1999) Unanswered questions in ecology. Phil Trans R Soc Lond B 354:
1951–1959.
9. Agrawal AA, Ackerly DD, Adler F, Arnold AE, Caceres C, et al. (2007) Filling
key gaps in population and community ecology. Front Ecol Environ 5: 145–152.
10. Mora C, Aburto-Oropeza O, Ayala A, Ayotte PM, Banks S, et al. (2011)
Global human footprint on the linkage between diversity and ecosystemfunctioning in reef fishes. PlosBiology 9: e1000606.
11. Sagarin RD, Barry JP, Gilman SE, Baxter CH (1999) Climate-related changein an intertidal community over short and long time scales. Ecol Monogr 69:
465–490.
12. Loreau M, Naeem S, Inchausti P, Bengtsson J, Grime JP, et al. (2001)Biodiversity and ecosystem functioning: current knowledge and future
challenges. Science 294: 804–808.
13. Loreau M, Naeem S, Inchausti P, editors (2002) Biodiversity and ecosystemfunctioning: synthesis and perspectives. Oxford University Press.
14. Kennedy TA, Naeem S, Howe KM, Knops JMH, Tilman D, et al. (2002)Biodiversity as a barrier to ecological invasion. Nature 417: 636–638.
15. Worm B, Barbier EB, Beaumont N, Duffy JE, Folke C, et al. (2006) Impacts of
biodiversity loss on ocean ecosystem services. Science 314: 787–790.
16. Chave J, Muller-Landau HC, Levin SA (2002) Comparing classical communitymodels: theoretical consequences for patterns of diversity. Am Nat 159: 1–23.
17. McGill BJ (2003) A test of the unified neutral theory of biodiversity. Nature
422: 881–885.
18. McGill BJ, Enquist BJ, Weiher E, Westoby M (2006) Rebuilding community
ecology from functional traits. Trends Ecol Evolut 21: 178–185.
19. Pianka ER (1966) Latitudinal gradients in species diversity - a review ofconcepts. Am Nat1 100: 33–46.
20. Rohde K (1992) Latitudinal gradients in species diversity: the search for the
primary cause. Oikos 65: 514–527.
21. Rosenzweig ML (1995) Species diversity in space and time. Cambridge:Cambridge University Press.
22. Willig MR, Kaufman DM, Stevens RD (2003) Latitudinal gradients of
biodiversity: pattern, process, scale, and synthesis. Annu Rev Ecol Evol Syst 34:
273–309.
23. Hillebrand H (2004) On the generality of the latitudinal diversity gradient. AmNat 163: 192–211.
24. Mittelbach GG, Schemske DW, Cornell HV, Allen AP, Brown JM, et al. (2007)
Evolution and the latitudinal diversity gradient: speciation, extinction andbiogeography. Ecol Lett 10: 315–331.
25. Clarke A, Crame JA (1997) Diversity, latitude and time: patterns in the shallowsea. In: Ormond RJD, Gage JD, Angel MV, editors. Marine biodiversity:
Patterns and processes. Cambridge: Cambridge University Press. 122–147.
26. Clarke A, Lidgard S (2000) Spatial patterns of diversity in the sea: bryozoanspecies richness in the North Atlantic. J Anim Ecol 69: 799–814.
27. Benedetti-Cecchi L, Iken K, Konar B, Cruz-Motta J, Knowlton A, et al. (2010)
Spatial relationships between polychaete assemblages and environmental
variables over broad geographical scales. PloS one 5: e12946.
28. Cruz-Motta JJ, Miloslavich P, Palomo G, Iken K, Konar B, et al. (2010)Patterns of spatial variation of assemblages associated with intertidal rocky
shores: a global perspective. PloS one 5: e14354.
29. Iken K, Konar B, Benedetti-Cecchi L, Cruz-Motta JJ, Knowlton A, et al.(2010) Large-scale spatial distribution patterns of echinoderms in nearshore
rocky habitats. PloS one 5: e13845.
30. Konar B, Iken K, Cruz-Motta JJ, Benedetti-Cecchi L, Knowlton A, et al.
(2010) Current patterns of macroalgal diversity and biomass in northernhemisphere rocky shores. PloS one 5: e13195.
31. Pohle G, Iken K, Clarke KR, Trott T, Konar B, et al. (2011) Aspects of benthic
decapod diversity and distribution from rocky nearshore habitat at geograph-ically widely dispersed sites. PloS one 6: e18606.
32. Leigh EG, Paine RT, Quinn JF, Suchanek TH (1987) Wave Energy and
Intertidal Productivity. Proc National Acad of Sci U S A 84: 1314–1318.
33. Bustamante RH, Branch GM, Eekhout S, Robertson B, Zoutendyk P, et al.
(1995) Gradients of intertidal primary productivity around the coast of SouthAfrica and their relationships with consumer biomass. Oecologia 102: 189–201.
34. Menge BA, Daley BA, Wheeler PA, Dahlhoff EP, Sanford E, et al. (1997)
Benthic-pelagic links and rocky intertidal communities: Bottom-up effects ontop-down control? Proc Natl Acad Sci U S A 94: 14530–14535.
35. Roy K, Jablonski D, Valentine JW (2000) Dissecting latitudinal diversity
gradients: functional groups and clades of marine bivalves. Proc R Soc Lond B267: 293–299.
36. Ponder WF, Lindberg DR (1997) Towards a phylogeny of gastropod molluscs:
an analysis using morphological characters. Zool J Linnean Soc 119: 83–265.
37. Bouchet P (2006) The magnitude of marine biodiversity. In: Duarte CM,editor. The Exploration of Marine Biodiversity: Scientific and Technological
Challenges. Madrid, Spain: Fundacion BBVA. 32–64.
38. Rigby PR, Iken K, Shirayama Y (2007) Sampling biodiversity in coastalcommunities. NaGISA protocols for seagrass and macroalgal habitats. Japan:
Kyoto University Press.
39. Valentine JW (1966) Numerical analysis of marine molluscan ranges on theextratropical northeast Pacific shelf. Limnol Oceanogr 11: 198–211.
40. Taylor JD, Taylor CN (1977) Latitudinal distribution of predatory gastropods
on the eastern Atlantic shelf. J Biogeogr 4: 73–81.
41. Roy K, Jablonski D, Valentine JW, Rosenberg G (1998) Marine latitudinaldiversity gradients: Tests of causal hypotheses. Proc Natl Acad Sci USA 95:
3699–3702.
42. Rex MA, Crame JA, Stuart CT, Clarke A (2005) Large-scale biogeographicpatterns in marine mollusk: a confluence of history and productivity? Ecology
86: 2288–2297.
43. Barnes RSK (2010) Regional and latitudinal variation in the diversity,dominance and abundance of microphagous microgastropods and other
benthos in intertidal beds of dwarf eelgrass, Nanozostera spp. Mar Biodiversity40: 95–106.
44. Valdovinos C, Navarrete SA, Marquet PA (2003) Mollusk species diversity in
the Southeastern Pacific: why are there more species towards the pole?Ecography 26: 139–144.
45. Crame JA (2000) Evolution of taxonomic diversity gradients in the marine
realm: evidence from the composition of Recent bivalve faunas. Paleobiology26: 188–214.
46. Costello MJ, Coll M, Danovaro R, Halpin P, Ojaveer H, et al. (2010) A census
of marine biodiversity knowledge, resources, and future challenges. PloS one 5:e12110.
47. Fujikura K, Lindsay D, Kitazato H, Nishida S, Shirayama Y (2010) Marine
biodiversity in Japanese waters. PloS one 5: e11836.
48. Butler AJ, Rees T, Beesley P, Bax NJ (2010) Marine biodiversity in theAustralian region. PloS one 5: e11831.
49. Archambault P, Snelgrove PVR, Fisher JAD, Gagnon J-M, Garbary DJ, et al.
(2010) From Sea to Sea: Canada’s Three Oceans of Biodiversity. PLoS ONE 5:e12182.
50. Miloslavich P, Klein E, Dıaz JM, Hernandez CE, Bigatti G, et al. (2011)
Marine biodiversity in the Atlantic and Pacific coasts of South America:knowledge and gaps. PloS one 6: e14631.
51. Miloslavich P, Dıaz JM, Klein E, Alvarado JJ, Dıaz C, et al. (2010) Marine
biodiversity in the Caribbean: regional estimates and distribution patterns. PloSone 5: e11916.
52. Sherman K, Aquarone M, Adams S (2007) NOAA Technical Memorandum
NMFS-NE-208. Global Applications of the Large Marine Ecosystem Concept2007–2010. Woods Hole: US Department of Commerce.
53. Meeus J (1991) Astronomical Algorithms. Richmond, Virginia: Willmann-Bell,
Inc.
54. Halpern BS, Walbridge S, Selkoe KA, Kappel CV, Micheli F, et al. (2008) Aglobal map of human impact on marine ecosystems. Science 319: 948–952.
55. Ugland KI, Gray JS, Ellingsen KE (2003) The species-accumulation curve and
estimation of species richness. J Anim Ecol 72: 888–897.
56. Krebs C (1999) Ecological Methodology. California: Addison-Wesley Long-man, Inc.
57. Clarke KR (1993) Non-parametric multivariate analyses of changes in
community structure. Aust J Ecol 18: 117–143.
58. Anderson MJ, Willis TJ (2003) Canonical analysis of principal coordinates: Auseful method of constrained ordination for ecology. Ecology 84: 511–525.
59. Anderson M, Gorley R, Clarke K (2008) PERMANOVA for PRIMER: Guide
to software and statistical methods. Plymouth: PRIMER-E Ltd.60. Clarke KR, Warwick RM (1998) A taxonomic distinctness index and its
statistical properties. J Appl Ecol 35: 523–531.
61. Clarke KR, Somerfield PJ, Chapman MG (2006) On resemblance measures forecological studies, including taxonomic dissimilarities and a zero-adjusted
Bray–Curtis coefficient for denuded assemblages. J Exp Mar Biol Ecol 330: 55–
80.62. Clarke KR, Somerfield PJ, Gorley RN (2008) Testing of null hypotheses in
exploratory community analyses: similarity profiles and biota-environment
linkage. J Exp Mar Biol Ecol 366: 56–69.63. Clarke K, Warwick R (2001) Change in marine communities: An approach to
statistical analysis and interpretation. Plymouth: PRIMER-E Ltd.
64. Blakeslee AMH, Byers JE, Lesser MP (2008) Solving cryptogenic histories using
host and parasite molecular genetics: the resolution of Littorina littorea’s NorthAmerican origin. Mol Ecol 17: 3684–3696.
65. Gaston KJ (2000) Global patterns in biodiversity. Nature 405: 220–227.
66. Macpherson E (2002) Large-scale species-richness gradients in the AtlanticOcean. Proc R Soc London, Ser B 269: 1715–1720.
Large-Scale Gastropod Distribution in Rocky Shores
PLOS ONE | www.plosone.org 12 August 2013 | Volume 8 | Issue 8 | e71396

67. Hubbell S (2001) The unified neutral theory of biodiversity and biogeography.
New Jersey: Princeton University.68. Legendre P, Borcard D, Peres-Neto PR (2005) Analyzing beta diversity:
Partitioning the spatial variation of community composition data. Ecol Monogr
75: 435–450.69. Prendergast JR, Quinn RM, Lawton JH, Eversham BC, Gibbons DW (1993)
Rare species, the coincidence of diversity hotspots and conservation strategies.Nature 365: 335–337.
70. Tittensor DP, Mora C, Jetz W, Lotze HK, Ricard D, et al. (2010) Global
patterns and predictors of marine biodiversity across taxa. Nature 466: 1098–10101.
71. Gofas S, Le Renard J, Bouchet P (2001) Mollusca. In: Costello MJ, EmblowCS, White RJ, editors. European register of marine species: a check-list of the
marine species in Europe and a bibliography of guides to their identification.Collection Patrimoines Naturels. 50: 180–213.
72. Vermeij GJ (1991) When biotas meet: understanding biotic interchange.
Science 253: 1099–10104.73. Coll M, Piroddi C, Steenbeek J, Kaschner K, Ben Rais Lasram F, et al. (2010)
The biodiversity of the Mediterranean Sea: estimates, patterns, and threats.PloS one 5: e11842.
74. Weingartner T, Eisner L, Eckert GL, Danielson S (2009) Southeast Alaska:
oceanographic habitats and linkages. J Biogeogr 36: 387–400.75. Kerr J (2001) Global biodiversity patterns: from description to understanding.
Trends Ecol Evol 16: 424–425.76. Clarke A (1992) Is there a latitudinal diversity cline in the sea? Trends Ecol
Evol 7: 286–287.77. Broitman BR, Navarrete SA, Smith F, Gaines SD (2001) Geographic variation
of southeastern Pacific intertidal communities. Mar Ecol Prog Ser 224: 21–34.
78. Bolton JJ (1994) Global seaweed diversity - patterns and anomalies. Bot Marina37: 241–245.
79. Renema W, Bellwood DR, Braga JC, Bromfield K, Hall R, et al. (2008)Hopping hotspots: global shifts in marine biodiversity. Science 321: 654–657.
80. Behrens Yamada S (1977) Geographic range limitation of the intertidal
gastropods Littorina sitkana and L. planaxis. Mar Biol 39: 61–65.81. Williams ST, Reid DG, Littlewood DTJ (2003) A molecular phylogeny of the
Littorininae (Gastropoda: Littorinidae): unequal evolutionary rates, morpho-logical parallelism, and biogeography of the Southern Ocean. Mol Phylogenet
Evol 28: 60–86.82. Reid DG, Williams ST (2004) The subfamily Littorininae (Gastropoda:
Littorinidae) in the temperate Southern Hemisphere: the genera Nodilittorina,
Austrolittorina and Afrolittorina. Rec Aust Mus 56: 75–122.83. Beck M (1998) Comparison of the measurement and effects of habitat structure
on gastropods in rocky intertidal and mangrove habitats. Mar Ecol Prog Ser169: 165–178.
84. Lubchenco J (1983) Littorina and Fucus: effects of herbivores, substratum,
heterogeneity, and plant escapes during succession. Ecology 64: 1116–1123.85. Lubchenco J (1978) Plant species diversity in a marine intertidal community:
importance of herbivore food preference and algal competitive abilities. AmNat 112: 23–39.
86. Lubchenco J, Gaines SD (1981) A Unified Approach to Marine Plant-Herbivore Interactions. I. Populations and Communities. Annu Rev Ecol Syst
12: 405–437.
87. Avila SP, Goud J, de Frias Martins AM (2012) Patterns of diversity of theRissoidae (Mollusca: Gastropoda) in the Atlantic and the Mediterranean
region. TheScientificWorldJournal 2012: 164890.88. Little C, Kitching JA (1996) The biology of rocky shores. New York: Oxford
University Press.
89. Hickman CS, Mclean JH (1990) Systematic revision and supragenericclassification of trochacean gastropods Natural History Museum of Los
Angeles County Science Series No 35. 1–169.90. Donald K, Kennedy M, Spencer H (2004) Biogeography and Evolution of
South Pacific Topshells (Gastropoda, Trochidae) and their Trematode
Parasites. 16th Annual Colloquium of the Spatial Information Research
Centre. Dunedin, New Zealand: University of Otago.
91. Nakano T, Ozawa T (2004) Phylogeny and historical biogeography of limpetsof the order Patellogastropoda based on mitochondrial DNA sequences. J Moll
Stud 70: 31–41.
92. Nakano T, Ozawa T (2006) Worldwide phylogeography of limpets of the orderPatellogastropoda: molecular, morphological and palaeontological evidence.
J Moll Stud 73: 79–99.
93. Veliz D, Vasquez JA (2000) La Familia Trochidae (Mollusca: Gastropoda) en elnorte de Chile: consideraciones ecologicas y taxonomicas. Rev Chil Hist Nat
73: 757–769.
94. Reid DG, Dyal P, Williams ST (2012) A global molecular phylogeny of 147periwinkle species (Gastropoda, Littorininae). Zool Scripta 41: 125–136.
95. Valentine JW, Jablonski D (2010) Origins of marine patterns of biodiversity:
some correlates and applications. Palaeontology 53: 1203–1210.
96. Blanchette CA, Wieters EA, Broitman BR, Kinlan BP, Schiel DR (2009)Trophic structure and diversity in rocky intertidal upwelling ecosystems: A
comparison of community patterns across California, Chile, South Africa andNew Zealand. Prog Oceanogr 83: 107–116.
97. Hawkins S, Moore P, Burrows M, Poloczanska E, Mieszkowska N, et al. (2008)
Complex interactions in a rapidly changing world: responses of rocky shorecommunities to recent climate change. Clim Res 37: 123–133.
98. IPCC (2007) Climate change 2007: the physical science basis. Contribution of
Working Group I to the Fourth Assessment Report of the IntergovernmentalPanel on Climate Change. Cambridge: Cambridge University Press.
99. Camargo JA, Alonso A (2006) Ecological and toxicological effects of inorganic
nitrogen pollution in aquatic ecosystems: A global assessment. Environ Int 32:831–849.
100. Nevo E, Noy R, Lavie B, Beiles A, Muchtar S (1986) Genetic diversity and
resistance to marine pollution. Biol J Linnean Soc 29: 139–144.
101. Lavie B, Nevo E (1987) Differential fitness of allelic isozymes in the marinegastropods Littorina punctata and Littorina neritoides, exposed to the environmental
stress of the combined effects of cadmium and mercury pollution. EnvironManagement 11: 345–349.
102. Ramakrishnana B, Megharajbc M, Venkateswarlud K, Naidubc R, Sethu-
nathane N (2010) The Impacts of Environmental Pollutants on Microalgae andCyanobacteria. Crit Rev Environ Sci Technol 40: 699–821.
103. Gorostiaga J, Dıez I (1996) Changes in the sublittoral benthic marine
macroalgae in the polluted area of Abra de Bilbao and proximal coast(Northern Spain). Mar Ecol Prog Ser 130: 157–167.
104. Robinson T, Griffiths C, McQuaid C, Rius M (2005) Marine alien species of
South Africa – status and impacts. Afr J Mar Sci 27: 297–306.
105. Mead A, Carlton JT, Griffiths CL, Rius M (2011) Revealing the scale of marinebioinvasions in developing regions: a South African re-assessment. Biol
Invasions 13: 1991–2008.
106. Mead A, Carlton JT, Griffiths CL, Rius M (2011) Introduced and cryptogenicmarine and estuarine species of South Africa. J Nat Hist 45: 2463–2524.
107. Hockey PAR, Van Erkom Shurink C (1992) The invasive biology of the mussel
Mytilus galloprovincialis on the southern African coast. Trans R Soc S Afr 48:123–149.
108. Kruger AC, Shongwe S (2004) Temperature trends in South Africa: 1960–
2003. Int J Climatol 24: 1929–1945.
109. Mead A (2010) Climate and bioinvasives: drivers of change on South African
Rocky Shores? South Africa: Cape Town University.
110. Rouault M, Servain J, Reason C, Bourles B, Rouault M, et al. (2009) Extensionof PIRATA in the tropical South-East Atlantic: an initial one-year experiment.
Afr J Mar Sci 31: 63–71.
111. Rouault M, Penven P, Pohl B (2009) Warming in the Agulhas Current systemsince the 1980’s. Geophys Res Lett 36: L12602.
112. Rouault M, Pohl B, Penven P (2010) Coastal oceanic climate change and
variability from 1982 to 2009 around South Africa. Afr J Mar Sci 32: 237–246.
Large-Scale Gastropod Distribution in Rocky Shores
PLOS ONE | www.plosone.org 13 August 2013 | Volume 8 | Issue 8 | e71396