TG/CA)n repeats in human gene families: abundance and selective patterns of distribution according...
12
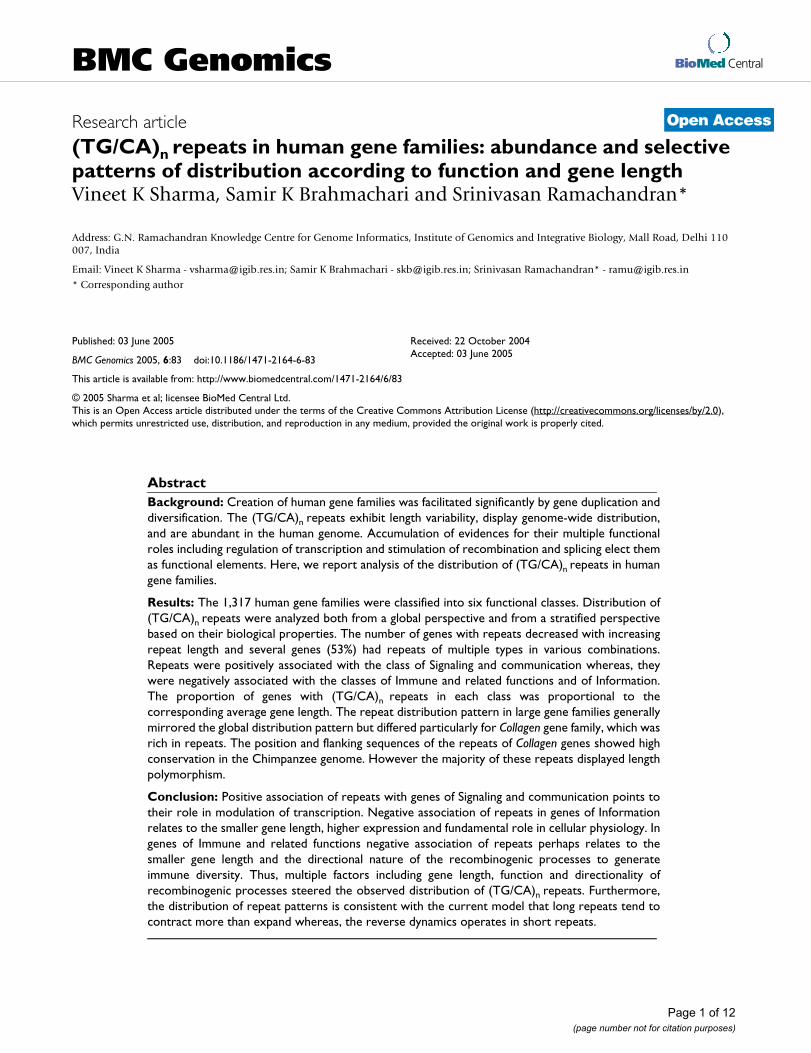
BioMed Central Page 1 of 12 (page number not for citation purposes) BMC Genomics Open Access Research article (TG/CA) n repeats in human gene families: abundance and selective patterns of distribution according to function and gene length Vineet K Sharma, Samir K Brahmachari and Srinivasan Ramachandran* Address: G.N. Ramachandran Knowledge Centre for Genome Informatics, Institute of Genomics and Integrative Biology, Mall Road, Delhi 110 007, India Email: Vineet K Sharma - [email protected]; Samir K Brahmachari - [email protected]; Srinivasan Ramachandran* - [email protected] * Corresponding author Abstract Background: Creation of human gene families was facilitated significantly by gene duplication and diversification. The (TG/CA) n repeats exhibit length variability, display genome-wide distribution, and are abundant in the human genome. Accumulation of evidences for their multiple functional roles including regulation of transcription and stimulation of recombination and splicing elect them as functional elements. Here, we report analysis of the distribution of (TG/CA) n repeats in human gene families. Results: The 1,317 human gene families were classified into six functional classes. Distribution of (TG/CA) n repeats were analyzed both from a global perspective and from a stratified perspective based on their biological properties. The number of genes with repeats decreased with increasing repeat length and several genes (53%) had repeats of multiple types in various combinations. Repeats were positively associated with the class of Signaling and communication whereas, they were negatively associated with the classes of Immune and related functions and of Information. The proportion of genes with (TG/CA) n repeats in each class was proportional to the corresponding average gene length. The repeat distribution pattern in large gene families generally mirrored the global distribution pattern but differed particularly for Collagen gene family, which was rich in repeats. The position and flanking sequences of the repeats of Collagen genes showed high conservation in the Chimpanzee genome. However the majority of these repeats displayed length polymorphism. Conclusion: Positive association of repeats with genes of Signaling and communication points to their role in modulation of transcription. Negative association of repeats in genes of Information relates to the smaller gene length, higher expression and fundamental role in cellular physiology. In genes of Immune and related functions negative association of repeats perhaps relates to the smaller gene length and the directional nature of the recombinogenic processes to generate immune diversity. Thus, multiple factors including gene length, function and directionality of recombinogenic processes steered the observed distribution of (TG/CA) n repeats. Furthermore, the distribution of repeat patterns is consistent with the current model that long repeats tend to contract more than expand whereas, the reverse dynamics operates in short repeats. Published: 03 June 2005 BMC Genomics 2005, 6:83 doi:10.1186/1471-2164-6-83 Received: 22 October 2004 Accepted: 03 June 2005 This article is available from: http://www.biomedcentral.com/1471-2164/6/83 © 2005 Sharma et al; licensee BioMed Central Ltd. This is an Open Access article distributed under the terms of the Creative Commons Attribution License (http://creativecommons.org/licenses/by/2.0 ), which permits unrestricted use, distribution, and reproduction in any medium, provided the original work is properly cited.
-
Upload
independent -
Category
Documents
-
view
1 -
download
0
Transcript of TG/CA)n repeats in human gene families: abundance and selective patterns of distribution according...
BioMed CentralBMC Genomics
ss
Open AcceResearch article(TG/CA)n repeats in human gene families: abundance and selective patterns of distribution according to function and gene lengthVineet K Sharma, Samir K Brahmachari and Srinivasan Ramachandran*Address: G.N. Ramachandran Knowledge Centre for Genome Informatics, Institute of Genomics and Integrative Biology, Mall Road, Delhi 110 007, India
Email: Vineet K Sharma - [email protected]; Samir K Brahmachari - [email protected]; Srinivasan Ramachandran* - [email protected]
* Corresponding author
AbstractBackground: Creation of human gene families was facilitated significantly by gene duplication anddiversification. The (TG/CA)n repeats exhibit length variability, display genome-wide distribution,and are abundant in the human genome. Accumulation of evidences for their multiple functionalroles including regulation of transcription and stimulation of recombination and splicing elect themas functional elements. Here, we report analysis of the distribution of (TG/CA)n repeats in humangene families.
Results: The 1,317 human gene families were classified into six functional classes. Distribution of(TG/CA)n repeats were analyzed both from a global perspective and from a stratified perspectivebased on their biological properties. The number of genes with repeats decreased with increasingrepeat length and several genes (53%) had repeats of multiple types in various combinations.Repeats were positively associated with the class of Signaling and communication whereas, theywere negatively associated with the classes of Immune and related functions and of Information.The proportion of genes with (TG/CA)n repeats in each class was proportional to thecorresponding average gene length. The repeat distribution pattern in large gene families generallymirrored the global distribution pattern but differed particularly for Collagen gene family, which wasrich in repeats. The position and flanking sequences of the repeats of Collagen genes showed highconservation in the Chimpanzee genome. However the majority of these repeats displayed lengthpolymorphism.
Conclusion: Positive association of repeats with genes of Signaling and communication points totheir role in modulation of transcription. Negative association of repeats in genes of Informationrelates to the smaller gene length, higher expression and fundamental role in cellular physiology. Ingenes of Immune and related functions negative association of repeats perhaps relates to thesmaller gene length and the directional nature of the recombinogenic processes to generateimmune diversity. Thus, multiple factors including gene length, function and directionality ofrecombinogenic processes steered the observed distribution of (TG/CA)n repeats. Furthermore,the distribution of repeat patterns is consistent with the current model that long repeats tend tocontract more than expand whereas, the reverse dynamics operates in short repeats.
Published: 03 June 2005
BMC Genomics 2005, 6:83 doi:10.1186/1471-2164-6-83
Received: 22 October 2004Accepted: 03 June 2005
This article is available from: http://www.biomedcentral.com/1471-2164/6/83
© 2005 Sharma et al; licensee BioMed Central Ltd. This is an Open Access article distributed under the terms of the Creative Commons Attribution License (http://creativecommons.org/licenses/by/2.0), which permits unrestricted use, distribution, and reproduction in any medium, provided the original work is properly cited.
Page 1 of 12(page number not for citation purposes)
BMC Genomics 2005, 6:83 http://www.biomedcentral.com/1471-2164/6/83
BackgroundThe evolution of organisms with increasing complexitywas significantly facilitated by duplication of genes andgenomes followed by diversification [1,2]. Gene duplica-tion per se produces two identical copies. Subsequently,one of the copies may either accumulate beneficialchanges to give rise to a functionally diversified gene oraccrue deleterious mutations to end up as a pseudogene,while the other copy retains its original function. Theformer mechanism leads to the creation of 'gene families'capable of carrying out diverse functions [2,3].
The classification of genes into gene families by HumanGene Nomenclature Committee (HGNC) on the basis ofsequence similarity of the encoded proteins [4] and theavailability of human genome sequence [5] allow us tocarry out a comprehensive survey of a class of importantfunctional element, namely the (TG/CA)n repeats. Analy-sis of the distribution of (TG/CA)nrepeats within genes in'present day' gene families holds the potential to provideinsights into the factors steering their abundance andselective distribution. Although the characteristic propertyof (TG/CA)n repeats exhibiting length polymorphism hasbeen widely used in genetic mapping [6], a growing bodyof evidence accumulating over several years point to theirmultiple functional roles in various biological processes.
The (TG/CA)n repeats have a propensity to undergo struc-tural transitions [7-10] and have been shown to modulatetranscription in several genes including rat α-lactalbumin[9], rat prolactin [11], MMP-9 [12], IFN-γ [13], EGFR [14],HSD11B2 [15], tilipia prolactin1 [16] and human house-keeping genes [17]. Furthermore, the (TG)n tracts havebeen observed to act as stimulator in recombination andin mRNA splicing [18-22].
In the current study, the analysis of distribution of (TG/CA)n repeats in human gene families affords assessmentof the distribution of these repeats by examining for posi-tive association or negative association with respect togene length and function.
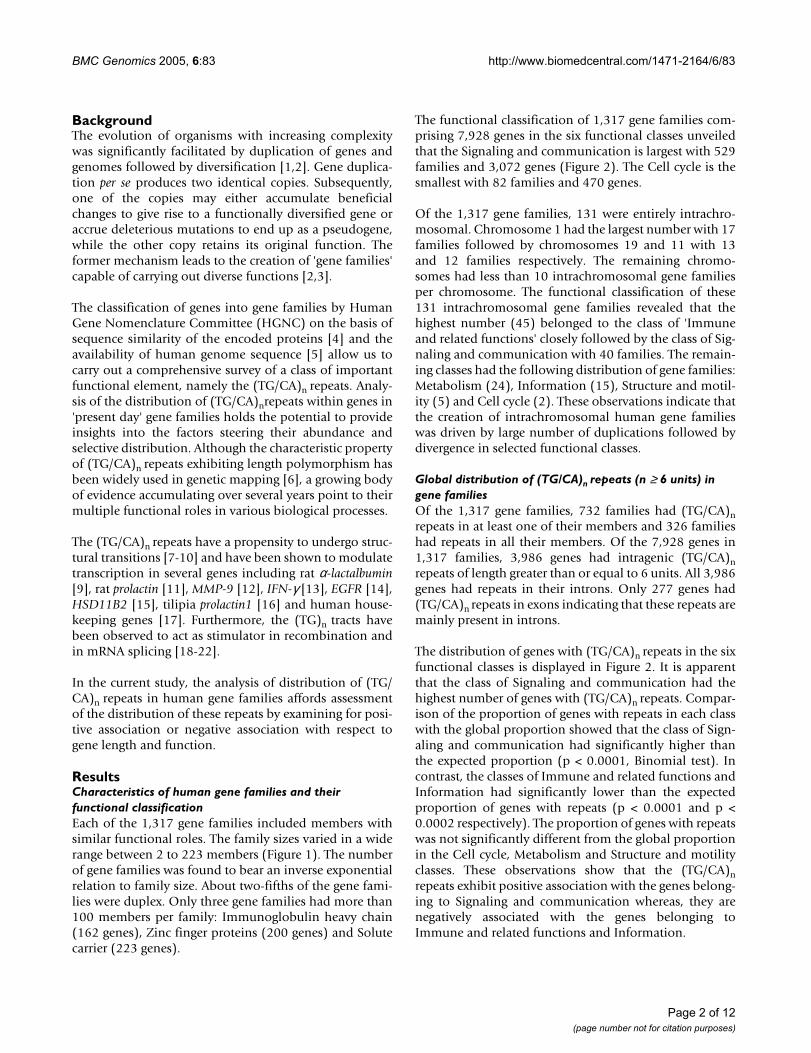
ResultsCharacteristics of human gene families and their functional classificationEach of the 1,317 gene families included members withsimilar functional roles. The family sizes varied in a widerange between 2 to 223 members (Figure 1). The numberof gene families was found to bear an inverse exponentialrelation to family size. About two-fifths of the gene fami-lies were duplex. Only three gene families had more than100 members per family: Immunoglobulin heavy chain(162 genes), Zinc finger proteins (200 genes) and Solutecarrier (223 genes).
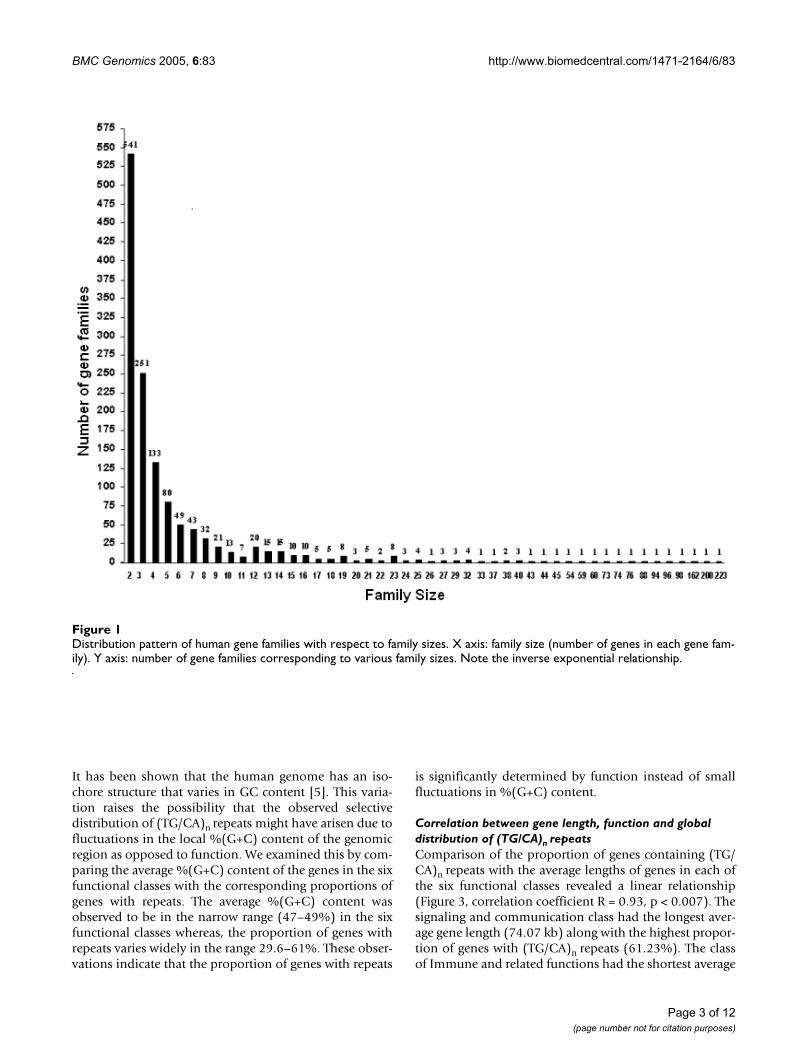
The functional classification of 1,317 gene families com-prising 7,928 genes in the six functional classes unveiledthat the Signaling and communication is largest with 529families and 3,072 genes (Figure 2). The Cell cycle is thesmallest with 82 families and 470 genes.
Of the 1,317 gene families, 131 were entirely intrachro-mosomal. Chromosome 1 had the largest number with 17families followed by chromosomes 19 and 11 with 13and 12 families respectively. The remaining chromo-somes had less than 10 intrachromosomal gene familiesper chromosome. The functional classification of these131 intrachromosomal gene families revealed that thehighest number (45) belonged to the class of 'Immuneand related functions' closely followed by the class of Sig-naling and communication with 40 families. The remain-ing classes had the following distribution of gene families:Metabolism (24), Information (15), Structure and motil-ity (5) and Cell cycle (2). These observations indicate thatthe creation of intrachromosomal human gene familieswas driven by large number of duplications followed bydivergence in selected functional classes.
Global distribution of (TG/CA)n repeats (n ≥ 6 units) in gene familiesOf the 1,317 gene families, 732 families had (TG/CA)nrepeats in at least one of their members and 326 familieshad repeats in all their members. Of the 7,928 genes in1,317 families, 3,986 genes had intragenic (TG/CA)nrepeats of length greater than or equal to 6 units. All 3,986genes had repeats in their introns. Only 277 genes had(TG/CA)n repeats in exons indicating that these repeats aremainly present in introns.
The distribution of genes with (TG/CA)n repeats in the sixfunctional classes is displayed in Figure 2. It is apparentthat the class of Signaling and communication had thehighest number of genes with (TG/CA)n repeats. Compar-ison of the proportion of genes with repeats in each classwith the global proportion showed that the class of Sign-aling and communication had significantly higher thanthe expected proportion (p < 0.0001, Binomial test). Incontrast, the classes of Immune and related functions andInformation had significantly lower than the expectedproportion of genes with repeats (p < 0.0001 and p <0.0002 respectively). The proportion of genes with repeatswas not significantly different from the global proportionin the Cell cycle, Metabolism and Structure and motilityclasses. These observations show that the (TG/CA)nrepeats exhibit positive association with the genes belong-ing to Signaling and communication whereas, they arenegatively associated with the genes belonging toImmune and related functions and Information.
Page 2 of 12(page number not for citation purposes)
BMC Genomics 2005, 6:83 http://www.biomedcentral.com/1471-2164/6/83
It has been shown that the human genome has an iso-chore structure that varies in GC content [5]. This varia-tion raises the possibility that the observed selectivedistribution of (TG/CA)n repeats might have arisen due tofluctuations in the local %(G+C) content of the genomicregion as opposed to function. We examined this by com-paring the average %(G+C) content of the genes in the sixfunctional classes with the corresponding proportions ofgenes with repeats. The average %(G+C) content wasobserved to be in the narrow range (47–49%) in the sixfunctional classes whereas, the proportion of genes withrepeats varies widely in the range 29.6–61%. These obser-vations indicate that the proportion of genes with repeats
is significantly determined by function instead of smallfluctuations in %(G+C) content.
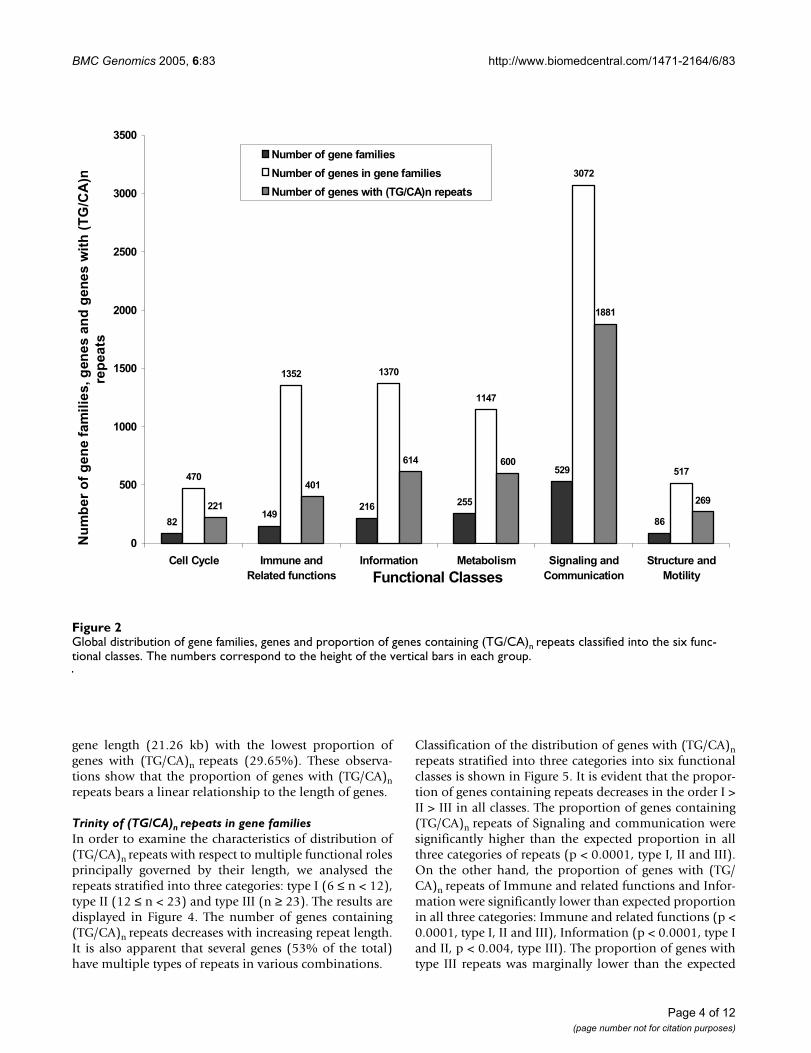
Correlation between gene length, function and global distribution of (TG/CA)n repeatsComparison of the proportion of genes containing (TG/CA)n repeats with the average lengths of genes in each ofthe six functional classes revealed a linear relationship(Figure 3, correlation coefficient R = 0.93, p < 0.007). Thesignaling and communication class had the longest aver-age gene length (74.07 kb) along with the highest propor-tion of genes with (TG/CA)n repeats (61.23%). The classof Immune and related functions had the shortest average
Distribution pattern of human gene families with respect to family sizesFigure 1Distribution pattern of human gene families with respect to family sizes. X axis: family size (number of genes in each gene fam-ily). Y axis: number of gene families corresponding to various family sizes. Note the inverse exponential relationship.
Page 3 of 12(page number not for citation purposes)
BMC Genomics 2005, 6:83 http://www.biomedcentral.com/1471-2164/6/83
gene length (21.26 kb) with the lowest proportion ofgenes with (TG/CA)n repeats (29.65%). These observa-tions show that the proportion of genes with (TG/CA)nrepeats bears a linear relationship to the length of genes.
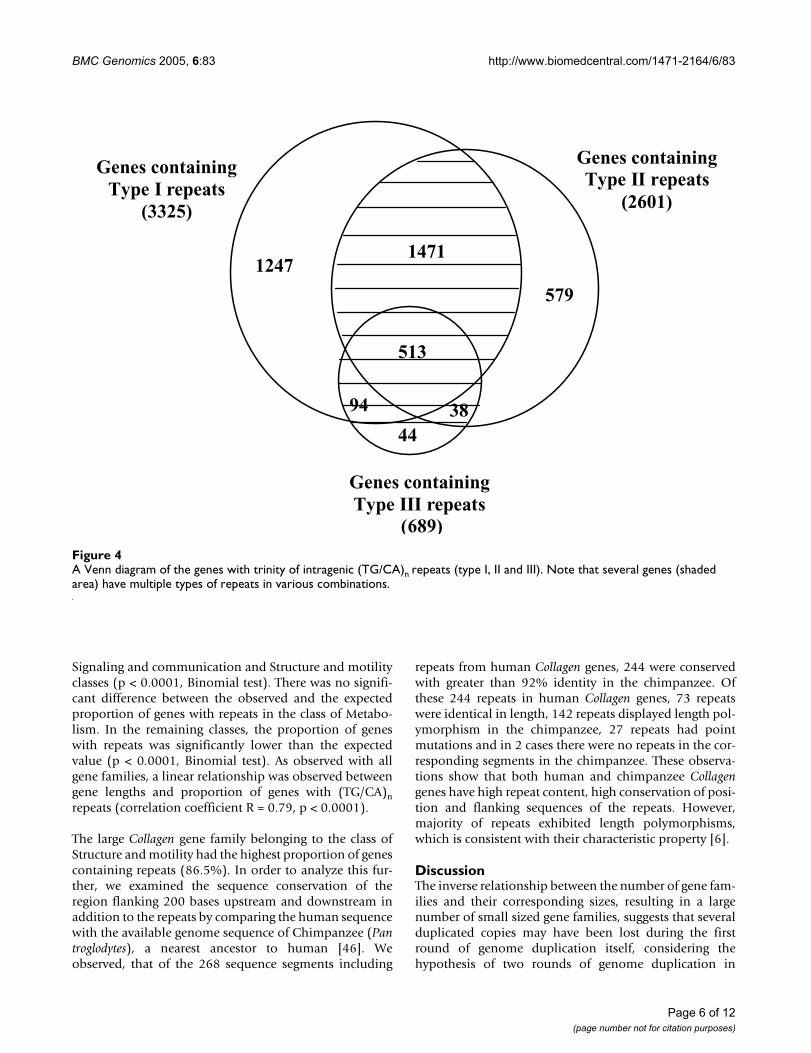
Trinity of (TG/CA)n repeats in gene familiesIn order to examine the characteristics of distribution of(TG/CA)n repeats with respect to multiple functional rolesprincipally governed by their length, we analysed therepeats stratified into three categories: type I (6 ≤ n < 12),type II (12 ≤ n < 23) and type III (n ≥ 23). The results aredisplayed in Figure 4. The number of genes containing(TG/CA)n repeats decreases with increasing repeat length.It is also apparent that several genes (53% of the total)have multiple types of repeats in various combinations.
Classification of the distribution of genes with (TG/CA)nrepeats stratified into three categories into six functionalclasses is shown in Figure 5. It is evident that the propor-tion of genes containing repeats decreases in the order I >II > III in all classes. The proportion of genes containing(TG/CA)n repeats of Signaling and communication weresignificantly higher than the expected proportion in allthree categories of repeats (p < 0.0001, type I, II and III).On the other hand, the proportion of genes with (TG/CA)n repeats of Immune and related functions and Infor-mation were significantly lower than expected proportionin all three categories: Immune and related functions (p <0.0001, type I, II and III), Information (p < 0.0001, type Iand II, p < 0.004, type III). The proportion of genes withtype III repeats was marginally lower than the expected
Global distribution of gene families, genes and proportion of genes containing (TG/CA)n repeats classified into the six func-tional classesFigure 2Global distribution of gene families, genes and proportion of genes containing (TG/CA)n repeats classified into the six func-tional classes. The numbers correspond to the height of the vertical bars in each group.
82149
216 255
529
86
470
1352 1370
1147
3072
517
221
401
614 600
1881
269
0
500
1000
1500
2000
2500
3000
3500
Cell Cycle Immune andRelated functions
Information Metabolism Signaling andCommunication
Structure andMotilityFunctional Classes
Nu
mb
er o
f g
ene
fam
ilies
, gen
es a
nd
gen
es w
ith
(T
G/C
A)n
rep
eats
Number of gene families
Number of genes in gene families
Number of genes with (TG/CA)n repeats
Page 4 of 12(page number not for citation purposes)
BMC Genomics 2005, 6:83 http://www.biomedcentral.com/1471-2164/6/83
proportion in Metabolism class (p < 0.01) and marginallyhigher than the expected proportion in Structure andmotility class (p < 0.02). The proportion of genes withrepeats in the three categories was not significantly differ-ent from the expected value in the class of Cell cycle. Theseobservations show that repeats of all types are positivelyassociated with the genes of Signaling and communica-tion whereas they are negatively associated with the genesof Immune and related functions and Information.
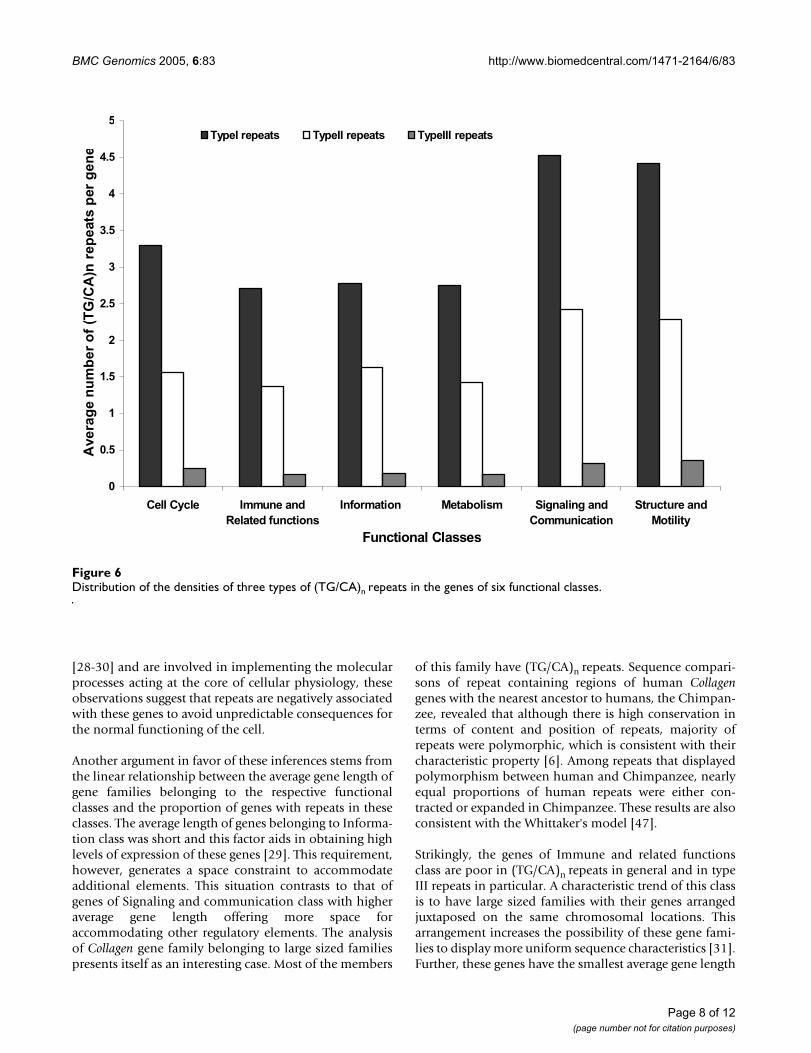
The distribution of average number of (TG/CA)n repeatsper gene in the three categories in the six functional classesis displayed in Figure 6. Comparison of the averagenumber of repeats per gene in the three categories with theglobal distribution pattern revealed that in most cases theobserved number was significantly lower than theexpected value, except for the genes belonging to Signal-ing and communication and Structure and motility,which had significantly higher average number of repeatsper gene than the expected value (p < 0.0004 in all threecategories, both classes). The average number of type III
repeats per gene in the class of Cell cycle was not signifi-cantly different from the expected value. These observa-tions show that the repeat densities were higher in thegenes belonging to Signaling and communication andStructure and motility classes whereas, the genes belong-ing to other classes had lower repeat densities.
Large gene familiesAs a special case of this study, we examined the distribu-tion of (TG/CA)n repeats in the top 2% large families (27).The family sizes of this category varied widely from 32 to223 members. Functional classification of these large fam-ilies revealed the following distribution: Immune andrelated functions (9), Signaling and communication (8),Information (6), Metabolism (2), Structure and motility(1) and Cell cycle (1).
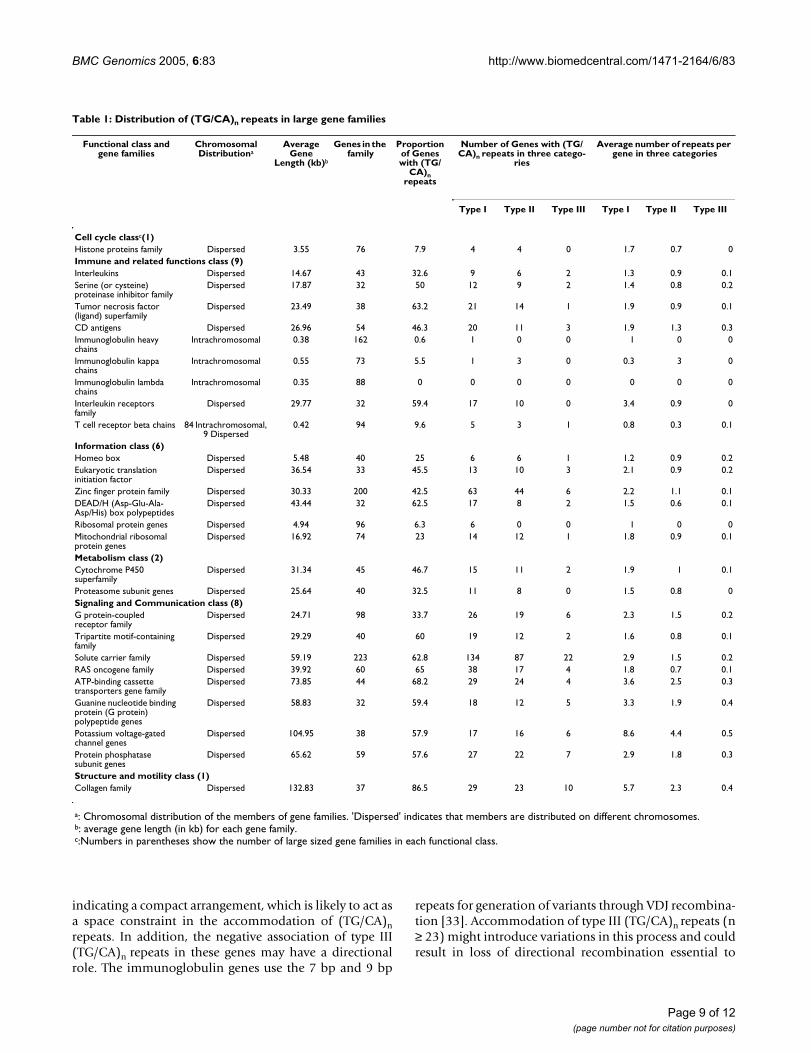
The proportion of genes with (TG/CA)n repeats in largefamilies is displayed in Table 1. Comparison with the glo-bal distribution showed that the proportion of genes withrepeats was significantly higher than expected value in the
Relationship between proportion of genes with (TG/CA)n repeats in each functional class and the average gene length in the corresponding functional classesFigure 3Relationship between proportion of genes with (TG/CA)n repeats in each functional class and the average gene length in the corresponding functional classes. X axis: Proportion of genes with (TG/CA)n repeats (%); Y axis: Average gene length (kb) (CC: Cell cycle; IN: Information; IR: Immune and related functions; MET: Metabolism; SC: Signaling and communication; STM: Structure and motility)
0
10
20
30
40
50
60
70
80
0 10 20 30 40 50 60 70
Proportion of genes with (TG/CA)n repeats (%)
Av
era
ge
ge
ne
len
gth
(kb
)
SC
STM
MET
IN
IR
CC
(R = 0.93, p < 0.007)
Page 5 of 12(page number not for citation purposes)
BMC Genomics 2005, 6:83 http://www.biomedcentral.com/1471-2164/6/83
Signaling and communication and Structure and motilityclasses (p < 0.0001, Binomial test). There was no signifi-cant difference between the observed and the expectedproportion of genes with repeats in the class of Metabo-lism. In the remaining classes, the proportion of geneswith repeats was significantly lower than the expectedvalue (p < 0.0001, Binomial test). As observed with allgene families, a linear relationship was observed betweengene lengths and proportion of genes with (TG/CA)nrepeats (correlation coefficient R = 0.79, p < 0.0001).
The large Collagen gene family belonging to the class ofStructure and motility had the highest proportion of genescontaining repeats (86.5%). In order to analyze this fur-ther, we examined the sequence conservation of theregion flanking 200 bases upstream and downstream inaddition to the repeats by comparing the human sequencewith the available genome sequence of Chimpanzee (Pantroglodytes), a nearest ancestor to human [46]. Weobserved, that of the 268 sequence segments including
repeats from human Collagen genes, 244 were conservedwith greater than 92% identity in the chimpanzee. Ofthese 244 repeats in human Collagen genes, 73 repeatswere identical in length, 142 repeats displayed length pol-ymorphism in the chimpanzee, 27 repeats had pointmutations and in 2 cases there were no repeats in the cor-responding segments in the chimpanzee. These observa-tions show that both human and chimpanzee Collagengenes have high repeat content, high conservation of posi-tion and flanking sequences of the repeats. However,majority of repeats exhibited length polymorphisms,which is consistent with their characteristic property [6].
DiscussionThe inverse relationship between the number of gene fam-ilies and their corresponding sizes, resulting in a largenumber of small sized gene families, suggests that severalduplicated copies may have been lost during the firstround of genome duplication itself, considering thehypothesis of two rounds of genome duplication in
A Venn diagram of the genes with trinity of intragenic (TG/CA)n repeats (type I, II and III)Figure 4A Venn diagram of the genes with trinity of intragenic (TG/CA)n repeats (type I, II and III). Note that several genes (shaded area) have multiple types of repeats in various combinations.
1247
579
1471
513
443894
Genes containingType I repeats
(3325)
Genes containingType II repeats
(2601)
Genes containingType III repeats
(689)
Page 6 of 12(page number not for citation purposes)

BMC Genomics 2005, 6:83 http://www.biomedcentral.com/1471-2164/6/83
vertebrate evolution [1,23,24]. The non-uniform distribu-tion of the number of gene families across the six func-tional classes suggests that widespread gene duplicationacross gene families spanning a wide range of functionsmay have been less productive in attaining higher levels ofcomplexity. An alternate course involving large amount ofduplications followed by divergence producing a widerange of functions in selected classes might have beenfavorable. The support for the latter hypothesis emergesfrom the fact that large sized gene families, inherently lowin number, mainly belong to Immune and related func-tions (required to tackle a wide range of infections), Sign-aling and communication (required to respond to diverseenvironmental stimuli) and Information class (requiredto implement complex molecular processes throughsupramolecular assemblies or organelles). A few membersof large sized gene families of Metabolism class functionin bioenergetics and xenobiotic metabolism and of Cellcycle class function in packaging of nuclear DNA. Simi-larly the large Collagen gene family of Structure and motil-ity class offers a useful repertoire for the formation ofmultiple tissues [25].
It is apparent that short repeats are abundant in humangenes and long repeats are rare. Our findings are consist-ent with the observations by Whittaker et al. (2003), whoshowed that longer repeats are more likely to contractthan expand [47]. Accordingly, contraction of longrepeats in time would result in accumulation of highernumber of short repeats.
Of the six functional classes, the Signaling and communi-cation class was the richest in repeats including the pro-portion of genes with repeats and repeat densities. Manyof the genes belonging to this class function at the inter-face between the body and its environment that appearsto be a distinct feature of eukaryotes [28] to confer spe-cies-specific advantages [24,41]. The positive associationof (TG/CA)n repeats associated with genes of this classstrongly argues for a positive temporal regulatory role thatcould provide for variations in gene expression to comple-ment the enormous diversity characteristic of this class.Compared to this class, the anciently evolved gene fami-lies of Information and Cell cycle are poor in repeats.Considering the fact that these genes are highly conserved
Distribution of proportion of genes with three types of (TG/CA)n repeats in the six functional classesFigure 5Distribution of proportion of genes with three types of (TG/CA)n repeats in the six functional classes.
0
10
20
30
40
50
60
Cell Cycle Immune andRelated functions
Information Metabolism Signaling andCommunication
Structure andMotility
Functional Classes
Pro
po
rtio
n o
f g
enes
co
nta
inin
g (
TG
/CA
)n r
epea
ts(%
)
TypeI TypeII TypeIII
Page 7 of 12(page number not for citation purposes)
BMC Genomics 2005, 6:83 http://www.biomedcentral.com/1471-2164/6/83
[28-30] and are involved in implementing the molecularprocesses acting at the core of cellular physiology, theseobservations suggest that repeats are negatively associatedwith these genes to avoid unpredictable consequences forthe normal functioning of the cell.
Another argument in favor of these inferences stems fromthe linear relationship between the average gene length ofgene families belonging to the respective functionalclasses and the proportion of genes with repeats in theseclasses. The average length of genes belonging to Informa-tion class was short and this factor aids in obtaining highlevels of expression of these genes [29]. This requirement,however, generates a space constraint to accommodateadditional elements. This situation contrasts to that ofgenes of Signaling and communication class with higheraverage gene length offering more space foraccommodating other regulatory elements. The analysisof Collagen gene family belonging to large sized familiespresents itself as an interesting case. Most of the members
of this family have (TG/CA)n repeats. Sequence compari-sons of repeat containing regions of human Collagengenes with the nearest ancestor to humans, the Chimpan-zee, revealed that although there is high conservation interms of content and position of repeats, majority ofrepeats were polymorphic, which is consistent with theircharacteristic property [6]. Among repeats that displayedpolymorphism between human and Chimpanzee, nearlyequal proportions of human repeats were either con-tracted or expanded in Chimpanzee. These results are alsoconsistent with the Whittaker's model [47].
Strikingly, the genes of Immune and related functionsclass are poor in (TG/CA)n repeats in general and in typeIII repeats in particular. A characteristic trend of this classis to have large sized families with their genes arrangedjuxtaposed on the same chromosomal locations. Thisarrangement increases the possibility of these gene fami-lies to display more uniform sequence characteristics [31].Further, these genes have the smallest average gene length
Distribution of the densities of three types of (TG/CA)n repeats in the genes of six functional classesFigure 6Distribution of the densities of three types of (TG/CA)n repeats in the genes of six functional classes.
0
0.5
1
1.5
2
2.5
3
3.5
4
4.5
5
Cell Cycle Immune andRelated functions
Information Metabolism Signaling andCommunication
Structure andMotility
Functional Classes
Ave
rag
e n
um
ber
of
(TG
/CA
)n r
epea
ts p
er g
ene
TypeI repeats TypeII repeats TypeIII repeats
Page 8 of 12(page number not for citation purposes)
BMC Genomics 2005, 6:83 http://www.biomedcentral.com/1471-2164/6/83
indicating a compact arrangement, which is likely to act asa space constraint in the accommodation of (TG/CA)nrepeats. In addition, the negative association of type III(TG/CA)n repeats in these genes may have a directionalrole. The immunoglobulin genes use the 7 bp and 9 bp
repeats for generation of variants through VDJ recombina-tion [33]. Accommodation of type III (TG/CA)n repeats (n≥ 23) might introduce variations in this process and couldresult in loss of directional recombination essential to
Table 1: Distribution of (TG/CA)n repeats in large gene families
Functional class and gene families
Chromosomal Distributiona
Average Gene
Length (kb)b
Genes in the family
Proportion of Genes with (TG/
CA)n repeats
Number of Genes with (TG/CA)n repeats in three catego-
ries
Average number of repeats per gene in three categories
Type I Type II Type III Type I Type II Type III
Cell cycle classc(1)Histone proteins family Dispersed 3.55 76 7.9 4 4 0 1.7 0.7 0Immune and related functions class (9)Interleukins Dispersed 14.67 43 32.6 9 6 2 1.3 0.9 0.1Serine (or cysteine) proteinase inhibitor family
Dispersed 17.87 32 50 12 9 2 1.4 0.8 0.2
Tumor necrosis factor (ligand) superfamily
Dispersed 23.49 38 63.2 21 14 1 1.9 0.9 0.1
CD antigens Dispersed 26.96 54 46.3 20 11 3 1.9 1.3 0.3Immunoglobulin heavy chains
Intrachromosomal 0.38 162 0.6 1 0 0 1 0 0
Immunoglobulin kappa chains
Intrachromosomal 0.55 73 5.5 1 3 0 0.3 3 0
Immunoglobulin lambda chains
Intrachromosomal 0.35 88 0 0 0 0 0 0 0
Interleukin receptors family
Dispersed 29.77 32 59.4 17 10 0 3.4 0.9 0
T cell receptor beta chains 84 Intrachromosomal, 9 Dispersed
0.42 94 9.6 5 3 1 0.8 0.3 0.1
Information class (6)Homeo box Dispersed 5.48 40 25 6 6 1 1.2 0.9 0.2Eukaryotic translation initiation factor
Dispersed 36.54 33 45.5 13 10 3 2.1 0.9 0.2
Zinc finger protein family Dispersed 30.33 200 42.5 63 44 6 2.2 1.1 0.1DEAD/H (Asp-Glu-Ala-Asp/His) box polypeptides
Dispersed 43.44 32 62.5 17 8 2 1.5 0.6 0.1
Ribosomal protein genes Dispersed 4.94 96 6.3 6 0 0 1 0 0Mitochondrial ribosomal protein genes
Dispersed 16.92 74 23 14 12 1 1.8 0.9 0.1
Metabolism class (2)Cytochrome P450 superfamily
Dispersed 31.34 45 46.7 15 11 2 1.9 1 0.1
Proteasome subunit genes Dispersed 25.64 40 32.5 11 8 0 1.5 0.8 0Signaling and Communication class (8)G protein-coupled receptor family
Dispersed 24.71 98 33.7 26 19 6 2.3 1.5 0.2
Tripartite motif-containing family
Dispersed 29.29 40 60 19 12 2 1.6 0.8 0.1
Solute carrier family Dispersed 59.19 223 62.8 134 87 22 2.9 1.5 0.2RAS oncogene family Dispersed 39.92 60 65 38 17 4 1.8 0.7 0.1ATP-binding cassette transporters gene family
Dispersed 73.85 44 68.2 29 24 4 3.6 2.5 0.3
Guanine nucleotide binding protein (G protein) polypeptide genes
Dispersed 58.83 32 59.4 18 12 5 3.3 1.9 0.4
Potassium voltage-gated channel genes
Dispersed 104.95 38 57.9 17 16 6 8.6 4.4 0.5
Protein phosphatase subunit genes
Dispersed 65.62 59 57.6 27 22 7 2.9 1.8 0.3
Structure and motility class (1)Collagen family Dispersed 132.83 37 86.5 29 23 10 5.7 2.3 0.4
a: Chromosomal distribution of the members of gene families. 'Dispersed' indicates that members are distributed on different chromosomes.b: average gene length (in kb) for each gene family.c:Numbers in parentheses show the number of large sized gene families in each functional class.
Page 9 of 12(page number not for citation purposes)

BMC Genomics 2005, 6:83 http://www.biomedcentral.com/1471-2164/6/83
generate diversity in immunoglobulins and T cell receptorchains in an ordered manner.
ConclusionThe (TG/CA)n repeat distribution pattern observed inhuman gene families is consistent with Whittaker's modelof repeat expansion and contraction. It appears that mul-tiple factors including gene length, function and direc-tionality of recombination processes steered the observedselective patterns of distribution of (TG/CA)n repeats inhuman gene families.
MethodsSequence retrieval and mapping of (TG/CA)n repeatsSequences of 35,114 human genes (build number 33)were retrieved from LocusLink http://www.ncbi.nlm.nih.gov/LocusLink/[43] using a JavaScriptprogram. A sum of 192 genes could not be retrievedbecause of either inaccessibility to the LocusLink page orabsence of the link for retrieving the gene sequence. Agene in this analysis is considered as the nucleotidesequence from the start of first exon to the end of lastexon. If alternate splicing was reported, the gene lengthconsidered was the start of first exon to the last knownexon including all alternatively spliced products for thatgene.
Perl scripts, 'SimRep' and 'RepGene' were written for theidentification and mapping of perfect intragenic (TG/CA)n repeats of length n ≥ 6 units in genes [17]. Through-out this work we have used n ≥ 6 units as the minimumcut-off to identify (TG/CA)n repeats. All repeats werescored in the intragenic region (exons and introns only).
Categorization of (TG/CA)n repeatsWe grouped (TG/CA)n repeats into three categories (typesI, II and III), according to their length and biological prop-erties. Type I (TG/CA)n repeats, in the range 6 ≤ n <12units, are short repeats based on the observation that arepeat length of 8 units (n = 8) is minimum to be likelypolymorphic [34,35]. Type II (TG/CA)n repeats compriseof 12 ≤ n < 23 units and is based on the observation thatmore than 93% of the (CA)n repeats of n ≥ 12 units arepolymorphic [6]. Further, repeats of this length have alsobeen shown to have preferential binding to nuclear factorscompared to short repeats [36] and can also stimulatemRNA splicing [21,22]. Type III repeats consist ofrelatively long reiterations of (TG/CA)n (n ≥ 23 units) andhave propensity to adopt structures such as Z DNA[8,9,37]. Other studies have shown that (TG/CA)n repeatsof length greater than 22.5 units can stimulate recombina-tion [18-20].
Clustering of genes into gene familiesFunctional roles of a large number of human genes are notwell known. Presently, these genes are assigned hypothet-ical annotations. Genes labeled as 'LOC', 'DFKZP', 'FLJ','HSPC', 'HSU', 'HT', 'KIAA', 'ORF', 'hypothetical', 'PRO'and 'pseudogenes' without clear functional details werefiltered out. A total of 22,688 genes were removed in thisfiltering exercise. Out of the remaining 12,426 genes, atotal of 8,778 genes (25% of total) were clustered intogene families based on their gene root symbols as definedin the guidelines of Human Gene Nomenclature Commit-tee (2002) [4]. The remaining 3,648 genes could not beclustered into gene families and are solitary.
The HGNC guidelines consider sequence and functionalsimilarity of proteins encoded by genes while groupingthem into gene families [4,38,39]. A root symbol signifiesa gene family. The family members are designated by Ara-bic numerals placed immediately after the gene root sym-bol, for example GPR1, GPR2, GPR3 for genes of the Gprotein-coupled receptor family. A Perl script namelyClustergene was written to cluster 8,778 human genes into1,556 gene families. The Perl script called ChromoClusterwas written to report gene families located on the samechromosome. Subsequently these gene families were clas-sified into the six functional classes as described below.
Functional Classification of gene families for comparative analysisThe gene families were classified into six functional classesnamely, 'Information', 'Cell cycle', 'Metabolism', 'Signal-ing and communication', 'Immune and related functions'and 'Structure and motility' based on the scheme definedby Adams et al. [40]. We combined the functional classesof replication, transcription, RNA processing and transla-tion into 'Information' class based on Andrade et al. [41].
'Cell cycle' includes cell cycle, apoptosis, chromosomalstructure and DNA repair; 'Immune and related functions'includes immunology, homeostasis, carrier proteins/membrane transport and stress response; 'Information'includes protein synthesis, translation factors, ribosomalproteins, post-translational modification/targeting, pro-tein degradation, tRNA synthesis/metabolism, RNA syn-thesis, transcription factors, RNA polymerase, RNAprocessing, RNA degradation, DNA synthesis/replicationand DNA repair; 'Metabolism' includes amino acids,nucleotides, sugars, lipids, cofactors, proteinmodification, energy and carrier proteins/membranetransport; 'Signaling and communication' includes recep-tors, hormone/growth factors, intracellular transducers,effectors/modulators, metabolism, cell adhesion andchannels/transport proteins; 'Structure and motility'includes cytoskeletal, microtubule-associated proteins/motors and extracellular matrix.
Page 10 of 12(page number not for citation purposes)

BMC Genomics 2005, 6:83 http://www.biomedcentral.com/1471-2164/6/83
Assignment of gene families to each of the functionalclasses was carried out according to their annotations inGene Ontology [42] and LocusLink [43] databases. Out ofthe total 1,556 gene families, 1,317 could be classifiedinto any of the six functional classes. The remaining 239families could not be classified unambiguously due tolimited information on gene function. Subsequent analy-sis, with respect to functional classification and distribu-tion of (TG/CA)n repeats, presented here is from 1,317gene families comprising of 7,928 genes.
Alignment of human (TG/CA)n repeats and flanking sequences with Chimpanzee genome sequenceThe repeats present in human Collagen genes were alignedwith Chimpanzee (Pan troglodytes) genome by using'BLAT' software available at UCSC Genome Bioinformat-ics Site http://www.genome.ucsc.edu/cgi-bin/hgBlat[49].Nucleotide segments including the repeats and containing200 nucleotides upstream of the start and 200 nucleotidesdownstream from the end of each of the (TG/CA)n repeatwere extracted for human Collagen genes [48]. These seg-ments were aligned with the Chimpanzee genome (Build1, version 1, Nov 2003) using BLAT. Only those segmentsthat showed more than 92% identity were noted asconserved.
Statistical methodsSignificance of the differences between the proportions ofgenes containing repeats and repeats densities in the sixfunctional classes compared with global distribution wastested using Binomial proportions test. The observed pro-portion in each class was tested against the expected pro-portion, which was computed assuming no preferencewith respect to function. Correlation coefficient (R) wascomputed to examine the relationship between averagegene length of gene families belonging to a functionalclass and the proportion of genes with (TG/CA)n repeatsin the corresponding functional classes. The 'InteractiveStatistical Calculation Pages' website http://members.aol.com/johnp71/javastat.html was used to performthe statistical tests.
Authors' contributionsVKS conceived of the idea, developed algorithms in Perl,carried out the analysis and wrote the manuscript. SKBgave scientific suggestions for improving the quality of thework and participated in manuscript preparation. SR isthe group leader, gave scientific suggestions, helped in thestatistical analysis, critical examination, presentation,writing and manuscript preparation.
AcknowledgementsVKS is a recipient of Senior Research Fellowship from CSIR. We thank Pan-kaj Bhatnagar for help in writing programs and the anonymous reviewers for their insightful comments. SKB and SR thank CSIR for funding support
in the form of a grant (CMM0017) Task Force on "In Silico Biology for Drug target development".
References1. Meyer A, Schart M: Gene and genome duplications in verte-
brates: the one-to-four (-to-eight in fish) rule and the evolu-tion of novel gene functions. Current Opinion in Cell Biology 1999,11:699-704.
2. Wagner A: Selection and gene duplication: a view from thegenome. Genome Biol 2002, 3(5):. reviews1012
3. King RC, Stansfield WD: A Dictionary of Genetics. Oxford Uni-versity Press; 1990.
4. Wain HM, Bruford EA, Lovering RC, Lush MJ, Wright MW, Povey S:Guidelines for human gene nomenclature. Genomics 2002,79(4):464-470.
5. International Human Genome Sequencing Consortium: Initialsequencing and analysis of the human genome. Nature 2001,409:860-921.
6. Dib C, Faure S, Fizames C, Samson D, Drouot N, Vignal A, MillasseauP, Marc S, Hazan J, Seboun E, Lathrop M, Gyapay G, Morissette J,Weissenbach J: A comprehensive genetic map of the humangenome based on 5,264 microsatellites. Nature 1996,380:152-4.
7. Brahmachari SK, Meera G, Sarkar PS, Balagurumoorthy P, Tripathi J,Raghavan S, Shaligram U, Pataskar S: Simple repetitive sequencesin the genome: structure and functional significance. Electro-phoresis 1995, 16(9):1705-14.
8. Nordheim A, Rich A: The sequence (dC-dA)n X (dG-dT)nforms left-handed Z-DNA in negatively supercoiledplasmids. Proc Natl Acad Sci 1983, 80:1821-1825.
9. Meera G, Ramesh N, Brahmachari SK: Zintrons in rat α-lactalbu-man gene. FEBS Lett 1989, 251:245-249.
10. Tripathi J, Brahmachari SK: Distribution of simple repetitive(TG/CA)n and (CT/AG)n sequences in human and rodentgenomes. J Biomol Struct Dyn 1991, 9(2):387-97.
11. Naylor LH, Clark EM: d(TG)n.d(CA)n sequences upstream ofthe rat prolactin gene form Z-DNA and inhibit genetranscription. Nucleic Acids Res 1990, 18:1595-1601.
12. Shimajiri S, Arima N, Tanimoto A, Murata Y, Hamada T, Wang KY,Sasaguri Y: Shortened microsatellite d(CA)21 sequencedown-regulates promoter activity of matrix metalloprotein-ase 9 gene. FEBS Lett 1999, 455:70-4.
13. Pravica V, Asderakis A, Perrey C, Hajeer A, Sinnott PJ, Hutchinson IV:In vitro production of IFN-gamma correlates with CA repeatpolymorphism in the human IFN-gamma gene. Eur JImmunogenet 1999, 26:1-3.
14. Gebhardt F, Zanker KS, Brandt B: Modulation of epidermalgrowth factor receptor gene transcription by a polymorphicdinucleotide repeat in intron 1. J Biol Chem 1999,274:13176-13180.
15. Agarwal AK, Giacchetti G, Lavery G, Nikkila H, Palermo M, RickettsM, McTernan C, Bianchi G, Manunta P, Strazzullo P, Mantero F, WhitePC, Stewart PM: CA-Repeat polymorphism in intron 1 ofHSD11B2: effects on gene expression and salt sensitivity.Hypertension 2000, 36:187-94.
16. Streelman JT, Kocher TD: Microsatellite variation associatedwith prolactin expression and growth of salt-challengedtilapia. Physiol Genomics 2002, 9:1-4.
17. Sharma VK, B-Rao C, Sharma A, Brahmachari SK, Ramachandran S:(TG/CA)n repeats in human housekeeping genes. J BiomolStruct Dyn 2003, 21(2):303-10.
18. Tracy RB, Baumohl JK, Kowalczykowski SC: The preference forGT-rich DNA by the yeast Rad51 protein defines a set of uni-versal pairing sequences. Genes Dev 1997, 11(24):3423-31.
19. Dutreix M: (GT)n repetitive tracts affect several stages ofRecA-promoted recombination. J Mol Biol 1997, 273(1):105-13.
20. Majewski J, Ott J: GT Repeats are associated with recombina-tion on human chromosome 22. Genome Research 2000,10(8):1108-14.
21. Gabellini N: A polymorphic GT repeat from the human car-diac Na + Ca2+ exchanger intron 2 activates splicing. Eur JBiochem 2001, 268(4):1076-83.
22. Hui J, Stangl K, Lane WS, Bindereif A: HnRNP L stimulates splic-ing of the eNOS gene by binding to variable-length CArepeats. Nat Struct Biol 2003, 10(1):33-7.
Page 11 of 12(page number not for citation purposes)
http://www.ncbi.nlm.nih.gov/entrez/query.fcgi?cmd=Retrieve&db=PubMed&dopt=Abstract&list_uids=8600387
http://www.ncbi.nlm.nih.gov/entrez/query.fcgi?cmd=Retrieve&db=PubMed&dopt=Abstract&list_uids=8600387
http://www.ncbi.nlm.nih.gov/entrez/query.fcgi?cmd=Retrieve&db=PubMed&dopt=Abstract&list_uids=8582360
http://www.ncbi.nlm.nih.gov/entrez/query.fcgi?cmd=Retrieve&db=PubMed&dopt=Abstract&list_uids=8582360
http://www.ncbi.nlm.nih.gov/entrez/query.fcgi?cmd=Retrieve&db=PubMed&dopt=Abstract&list_uids=6572943
http://www.ncbi.nlm.nih.gov/entrez/query.fcgi?cmd=Retrieve&db=PubMed&dopt=Abstract&list_uids=6572943
http://www.ncbi.nlm.nih.gov/entrez/query.fcgi?cmd=Retrieve&db=PubMed&dopt=Abstract&list_uids=6572943
http://www.ncbi.nlm.nih.gov/entrez/query.fcgi?cmd=Retrieve&db=PubMed&dopt=Abstract&list_uids=2753162
http://www.ncbi.nlm.nih.gov/entrez/query.fcgi?cmd=Retrieve&db=PubMed&dopt=Abstract&list_uids=2753162
http://www.ncbi.nlm.nih.gov/entrez/query.fcgi?cmd=Retrieve&db=PubMed&dopt=Abstract&list_uids=1741969
http://www.ncbi.nlm.nih.gov/entrez/query.fcgi?cmd=Retrieve&db=PubMed&dopt=Abstract&list_uids=1741969
http://www.ncbi.nlm.nih.gov/entrez/query.fcgi?cmd=Retrieve&db=PubMed&dopt=Abstract&list_uids=1741969
http://www.ncbi.nlm.nih.gov/entrez/query.fcgi?cmd=Retrieve&db=PubMed&dopt=Abstract&list_uids=2158081
http://www.ncbi.nlm.nih.gov/entrez/query.fcgi?cmd=Retrieve&db=PubMed&dopt=Abstract&list_uids=2158081
http://www.ncbi.nlm.nih.gov/entrez/query.fcgi?cmd=Retrieve&db=PubMed&dopt=Abstract&list_uids=2158081
http://www.ncbi.nlm.nih.gov/entrez/query.fcgi?cmd=Retrieve&db=PubMed&dopt=Abstract&list_uids=9407034
http://www.ncbi.nlm.nih.gov/entrez/query.fcgi?cmd=Retrieve&db=PubMed&dopt=Abstract&list_uids=9407034
http://www.ncbi.nlm.nih.gov/entrez/query.fcgi?cmd=Retrieve&db=PubMed&dopt=Abstract&list_uids=9407034
http://www.ncbi.nlm.nih.gov/entrez/query.fcgi?cmd=Retrieve&db=PubMed&dopt=Abstract&list_uids=9367750
BMC Genomics 2005, 6:83 http://www.biomedcentral.com/1471-2164/6/83
Publish with BioMed Central and every scientist can read your work free of charge
"BioMed Central will be the most significant development for disseminating the results of biomedical research in our lifetime."
Sir Paul Nurse, Cancer Research UK
Your research papers will be:
available free of charge to the entire biomedical community
peer reviewed and published immediately upon acceptance
cited in PubMed and archived on PubMed Central
yours — you keep the copyright
Submit your manuscript here:http://www.biomedcentral.com/info/publishing_adv.asp
BioMedcentral
23. Hinegardner R: Evolution of cellular DNA content in teleostfishes. Am Nat 1968, 102:517-523.
24. Fyodor A, Kondrashov FA, Rogozin IB, Wolf YI, Koonin EV: Selec-tion in the evolution of gene duplications. Genome Biol 2002,3(2):. RESEARCH0008
25. Gelse K, Poschl E, Aigner T: Collagens – structure, function, andbiosynthesis. Adv Drug Deliv Rev 2003, 55(12):1531-46.
26. Hardison RC: Conserved noncoding sequences are reliableguides to regulatory elements. Trends Genet 2000, 16:369-372.
27. Tagle DA, Koop BF, Goodman M, Slightom JL, Hess DL, Jones RT:Embryonic epsilon and gamma globin genes of a prosimianprimate (Galago crassicaudatus). Nucleotide and amino acidsequences, developmental regulation and phylogeneticfootprints. J Mol Biol 1988, 203:439-455.
28. Rivera MC, Jain R, Moore JE, Lake JA: Genomic evidence for twofunctionally distinct gene classes. Proc Natl Acad Sci USA 1998,95:6239-6244.
29. Castillo-Davis CI, Mekhedov SL, Hartl DL, Koonin EV, KondrashovFA: Selection for short introns in highly expressed genes. NatGenet 2002, 31:415-418.
30. Dotan I, Ziv E, Dafni N, Beckman JS, McCann RO, Glover CV, CanaaniD: Functional Conservation between the Human, Nema-tode, and Yeast CK2 Cell Cycle Genes. Biochem Biophys ResCommun 2001, 288:603-609.
31. Dover GA: Evolution of genetic redundancy for advancedplayers. Curr Opin Genet Dev 1993, 3(6):902-10.
32. Ramachandran GN, Sasisekharan V: Structure of collagen. Nature1961, 190:1004-5.
33. Alt FW, Oltz EM, Young F, Gorman J, Taccioli G, Chen J: VDJrecombination. Immunol Today 1992, 13(8):306-14.
34. Fondon JW 3rd, Mele GM, Brezinschek RI, Cummings D, Pande A,Wren J, O'Brien KM, Kupfer KC, Wei MH, Lerman M, Minna JD, Gar-ner HR: Computerized polymorphic marker identification:experimental validation and a predicted human polymor-phism catalog. Proc Natl Acad Sci 1998, 95:7514-7519.
35. Rockman MV, Wray GA: Abundant raw material for Cis – regu-latory evolution in humans. Mol Biol Evol 2002, 19:1991-2004.
36. Epplen C, Santos EJ, Maueler W, van Helden P, Epplen JT: On simplerepetitive DNA sequences and complex diseases. Electro-phoresis 1997, 18(9):1577-85.
37. Yagil G: Paranemic structures of DNA and their role in DNAunwinding. Crit Rev Biochem Mol Biol 1991, 26(5):475-559.
38. Nelson DR, Koymans L, Kamataki T, Stegeman JJ, Feyereisen R, Wax-man DJ, Waterman MR, Gotoh O, Coon MJ, Estabrook RW, Gun-salus IC, Nebert DW: P450 superfamily: update on newsequences, gene mapping, accession numbers andnomenclature. Pharmacogenetics 1996, 6:1-42.
39. Mackenzie PI, Owens IS, Burchell B, Bock KW, Bairoch A, BelangerA, Fournel-Gigleux S, Green M, Hum DW, Iyanagi T, Lancet D, Loui-sot P, Magdalou J, Chowdhury JR, Ritter JK, Schachter H, Tephly TR,Tipton KF, Nebert DW: The UDP glycosyltransferase genesuperfamily: recommended nomenclature update based onevolutionary divergence. Pharmacogenetics 1997, 7:255-69.
40. Adams MD, Kerlavage AR, Fleischmann RD, Fuldner RA, Bult CJ, LeeNH, Kirkness EF, Weinstock KG, Gocayne JD, White O, Sutton G,Blake JA, Brandon RC, Chiu M, Clayton RA, Cline RT, Cotton MD,Earle-Hughes J, Fine LD, FitzGerald LM, FitzHugh WM, Fritchman JL,Geoghagen NSM, Glodek A, Gnehm CL, Hanna MC, Hedblom E, Hin-kle PS Jr, Kelley JM, Klimek KM, Kelley JC, Liu L, Marmaros SM, Mer-rick JM, Moreno-Palanques RF, McDonald LA, Nguyen DT, PellegrinoSM, Phillips CA, Ryder SE, Scott JL, Saudek DM, Shirley R, Small KV,Spriggs TA, Utterbach TR, Weidman JF, Li Y, Barthlow R, BednarikDP, Cao L, Cepeda MA, Coleman TA, Collins E, Dimke D, Feng P,Ferrie A, Fischer C, Hastings GA, He W, Hu J, Huddleston KA,Greene JM, Gruber J, Hudson P, Kim A, Kozak DL, Kunsch C, Ji H, LiH, Meissner PS, Olsen H, Raymond L, Wei Y, Wing J, Xu C, Yu G,Ruben SM, Dillon PJ, Fannon MR, Rosen CA, Haseltine WA, Fields C,Fraser CM, Venter JC: Initial assessment of human gene diver-sity and expression patterns based upon 83 million nucle-otides of cDNA sequence. Nature 1995, 377:3-174.
41. Andrade MA, Ouzounis C, Sander C, Tamames J, Valencia A: Func-tional classes in the three domains of life. J Mol Evol 1999,49:551-557.
42. Harris MA, Clark J, Ireland A, Lomax J, Ashburner M, Foulger R, Eil-beck K, Lewis S, Marshall B, Mungall C, Richter J, Rubin GM, Blake JA,Bult C, Dolan M, Drabkin H, Eppig JT, Hill DP, Ni L, Ringwald M,
Balakrishnan R, Cherry JM, Christie KR, Costanzo MC, Dwight SS,Engel S, Fisk DG, Hirschman JE, Hong EL, Nash RS, Sethuraman A,Theesfeld CL, Botstein D, Dolinski K, Feierbach B, Berardini T, Mun-dodi S, Rhee SY, Apweiler R, Barrell D, Camon E, Dimmer E, Lee V,Chisholm R, Gaudet P, Kibbe W, Kishore R, Schwarz EM, SternbergP, Gwinn M, Hannick L, Wortman J, Berriman M, Wood V, de la CruzN, Tonellato P, Jaiswal P, Seigfried T, White R, Gene Ontology Con-sortium: The Gene Ontology (GO) database and informaticsresource. Nucleic Acids Res 2004:D258-61.
43. Wheeler DL, Church DM, Edgar R, Federhen S, Helmberg W, Mad-den TL, Pontius JU, Schuler GD, Schriml LM, Sequeira E, Suzek TO,Tatusova TA, Wagner L: Database resources of the NationalCenter for Biotechnology Information: update. Nucleic AcidsRes 2004, 32(Database):D35-40.
44. Gu Z, Rifkin SA, White KP, Li Wen-Hsiung: Duplicate genesincrease gene expression diversity within and betweenspecies. Nature Genetics 2004, 36:577-579.
45. Thornton JW, DeSalle R: Gene family evolution and homology:Genomics Meets Phylogenetics. Annu Rev Genomics Hum Genet2000, 1:41-73.
46. Check E: Geneticists study chimp-human divergence. Nature2004, 428(6980):242.
47. Whittaker JC, Harbord RM, Boxall N, Mackay I, Dawson G, Sibly RM:Likelihood-based estimation of microsatellite mutationrates. Genetics 2003, 164:781-787.
48. Sainudiin R, Durrett RT, Aquadro CF, Nielsen R: Microsatellitemutation models: insights from a comparison of humans andchimpanzees. Genetics 2004, 168(1):383-95.
49. Karolchik D, Baertsch R, Diekhans M, Furey TS, Hinrichs A, Lu YT,Roskin KM, Schwartz M, Sugnet CW, Thomas DJ, Weber RJ, HausslerD, Kent WJ, University of California Santa Cruz: The UCSCGenome Browser Database. Nucleic Acids Res 2003, 31(1):51-4.
Page 12 of 12(page number not for citation purposes)
http://www.ncbi.nlm.nih.gov/entrez/query.fcgi?cmd=Retrieve&db=PubMed&dopt=Abstract&list_uids=3199442
http://www.ncbi.nlm.nih.gov/entrez/query.fcgi?cmd=Retrieve&db=PubMed&dopt=Abstract&list_uids=3199442
http://www.ncbi.nlm.nih.gov/entrez/query.fcgi?cmd=Retrieve&db=PubMed&dopt=Abstract&list_uids=3199442
http://www.ncbi.nlm.nih.gov/entrez/query.fcgi?cmd=Retrieve&db=PubMed&dopt=Abstract&list_uids=9600949
http://www.ncbi.nlm.nih.gov/entrez/query.fcgi?cmd=Retrieve&db=PubMed&dopt=Abstract&list_uids=9600949
http://www.ncbi.nlm.nih.gov/entrez/query.fcgi?cmd=Retrieve&db=PubMed&dopt=Abstract&list_uids=8118216
http://www.ncbi.nlm.nih.gov/entrez/query.fcgi?cmd=Retrieve&db=PubMed&dopt=Abstract&list_uids=8118216
http://www.ncbi.nlm.nih.gov/entrez/query.fcgi?cmd=Retrieve&db=PubMed&dopt=Abstract&list_uids=1510813
http://www.ncbi.nlm.nih.gov/entrez/query.fcgi?cmd=Retrieve&db=PubMed&dopt=Abstract&list_uids=1510813
http://www.ncbi.nlm.nih.gov/entrez/query.fcgi?cmd=Retrieve&db=PubMed&dopt=Abstract&list_uids=9636181
http://www.ncbi.nlm.nih.gov/entrez/query.fcgi?cmd=Retrieve&db=PubMed&dopt=Abstract&list_uids=9636181
http://www.ncbi.nlm.nih.gov/entrez/query.fcgi?cmd=Retrieve&db=PubMed&dopt=Abstract&list_uids=9636181
http://www.ncbi.nlm.nih.gov/entrez/query.fcgi?cmd=Retrieve&db=PubMed&dopt=Abstract&list_uids=9378125
http://www.ncbi.nlm.nih.gov/entrez/query.fcgi?cmd=Retrieve&db=PubMed&dopt=Abstract&list_uids=9378125
http://www.ncbi.nlm.nih.gov/entrez/query.fcgi?cmd=Retrieve&db=PubMed&dopt=Abstract&list_uids=1662125
http://www.ncbi.nlm.nih.gov/entrez/query.fcgi?cmd=Retrieve&db=PubMed&dopt=Abstract&list_uids=1662125
http://www.ncbi.nlm.nih.gov/entrez/query.fcgi?cmd=Retrieve&db=PubMed&dopt=Abstract&list_uids=8845856
http://www.ncbi.nlm.nih.gov/entrez/query.fcgi?cmd=Retrieve&db=PubMed&dopt=Abstract&list_uids=8845856
http://www.ncbi.nlm.nih.gov/entrez/query.fcgi?cmd=Retrieve&db=PubMed&dopt=Abstract&list_uids=8845856
http://www.ncbi.nlm.nih.gov/entrez/query.fcgi?cmd=Retrieve&db=PubMed&dopt=Abstract&list_uids=9295054
http://www.ncbi.nlm.nih.gov/entrez/query.fcgi?cmd=Retrieve&db=PubMed&dopt=Abstract&list_uids=9295054
http://www.ncbi.nlm.nih.gov/entrez/query.fcgi?cmd=Retrieve&db=PubMed&dopt=Abstract&list_uids=9295054
http://www.ncbi.nlm.nih.gov/entrez/query.fcgi?cmd=Retrieve&db=PubMed&dopt=Abstract&list_uids=7566098
http://www.ncbi.nlm.nih.gov/entrez/query.fcgi?cmd=Retrieve&db=PubMed&dopt=Abstract&list_uids=7566098