Avoidance of Long Mononucleotide Repeats in Codon Pair Usage
61
Copyright Ó 2010 by the Genetics Society of America DOI: 10.1534/genetics.110.121137 Avoidance of Long Mononucleotide Repeats in Codon Pair Usage Tingting Gu,* ,1 Shengjun Tan,* ,1 Xiaoxi Gou,* Hitoshi Araki* ,†,2 and Dacheng Tian* *State Key Laboratory of Pharmaceutical Biotechnology, Department of Biology, Nanjing University, Nanjing 210093, China and † Department of Fish Ecology and Evolution, Eawag, Swiss Federal Institute of Aquatic Science and Technology, Center of Ecology, Evolution and Biogeochemistry, 6047 Kastanienbaum, Switzerland Manuscript received July 20, 2010 Accepted for publication August 27, 2010 ABSTRACT Protein is an essential component for life, and its synthesis is mediated by codons in any organisms on earth. While some codons encode the same amino acid, their usage is often highly biased. There are many factors that can cause the bias, but a potential effect of mononucleotide repeats, which are known to be highly mutable, on codon usage and codon pair preference is largely unknown. In this study we performed a genomic survey on the relationship between mononucleotide repeats and codon pair bias in 53 bacteria, 68 archaea, and 13 eukaryotes. By distinguishing the codon pair bias from the codon usage bias, four general patterns were revealed: strong avoidance of five or six mononucleotide repeats in codon pairs; lower observed/expected (o/ e) ratio for codon pairs with C or G repeats (C/G pairs) than that with A or T repeats (A/T pairs); a negative correlation between genomic GC contents and the o/ e ratios, particularly for C/G pairs; and avoidance of C/G pairs in highly conserved genes. These results support natural selection against long mononucleotide repeats, which could induce frameshift mutations in coding sequences. The fact that these patterns are found in all kingdoms of life suggests that this is a general phenomenon in living organisms. Thus, long mononucleotide repeats may play an important role in base composition and genetic stability of a gene and gene functions. A MONG the many components of life, protein is most essential because living organisms use pro- teins not only for body structuring but also for its functioning. After the discovery of the genetic code for protein biosynthesis (Crick et al. 1961), redundancy in the genetic code attracted great attention. Highly biased use of synonymous codons is one of them, and the codon usage bias is common not only among spe- cies but also within species (Grosjean and Fiers 1982; Akashi 2001). Previous studies showed that codon us- age bias is linked to several factors, such as efficiency and accuracy of translation (Robinson et al. 1984; Bulmer 1991; Akashi 1994; Plotkin et al. 2004), com- positional bias (Muto and Osawa 1987; McLean et al. 1998), and genome size or other nonselective forces (Lawrence and Ochman 1998; dos Reis et al. 2004). One additional factor is the sequence environment. It is known that nucleotides surrounding a codon can influence the codon usage preference, called context- dependent codon bias (Yarus and Folley 1985). The context-dependent codon bias affects the efficiency and accuracy of translation (Taniguchi and Weissmann 1978; Irwin et al. 1995) and the suppression of both premature stop codons and missense codons (Bossi and Ruth 1980; Murgola et al. 1984). Reflecting the context-dependent codon bias, a strong codon pair bias is detected in both prokaryotic and eukaryotic genomes (Gutman and Hatfield 1989; Buchan et al. 2006; Tats et al. 2008). It has been suggested that codon pair preference is influenced by all three nucleotides of the ribosomal A-site codon and the third nucleotide of the P-site codon (Buchan et al. 2006). Therefore, tRNA geometry within the ribosome was presumed to be the key factor governing genomic codon pair patterns, as it might enhance the fidelity and/or rate of translation. A mononucleotide repeat is a homogeneous run of the same nucleotides. Potentially deleterious effects of a mononucleotide repeat in coding sequences (CDS) have been pointed out: the mononucleotide repeats in CDS are prone to transcriptional and translational slippage, which leads to functional disruption of the corresponding gene products (Wagner et al. 1990; Gurvich et al. 2003; Baranov et al. 2005); a strong association between mononucleotide repeats and the occurrence of insertion/deletion (indel) during the DNA replication process will elevate the risk of frame- shift mutations (Strauss 1999), which might have severe fitness consequences. The list of diseases result- ing from changes of unstable repeats continues to grow (Gatchel and Zoghbi 2005). In addition, previous studies suggested that in long mononucleotide runs, errors during the process of DNA synthesis are easier to Supporting information is available online at http://www.genetics.org/ cgi/content/full/genetics.110.121137/DC1. 1 These authors contributed equally to this work. D.T. and H.A. are equal senior authors. 2 Corresponding author: Seestrasse 79, 6047 Kastanienbaum, Switzerland. E-mail: [email protected] Genetics 186: 1077–1084 (November 2010)
-
Upload
independent -
Category
Documents
-
view
1 -
download
0
Transcript of Avoidance of Long Mononucleotide Repeats in Codon Pair Usage

Copyright � 2010 by the Genetics Society of AmericaDOI: 10.1534/genetics.110.121137
Avoidance of Long Mononucleotide Repeats in Codon Pair Usage
Tingting Gu,*,1 Shengjun Tan,*,1 Xiaoxi Gou,* Hitoshi Araki*,†,2 and Dacheng Tian*
*State Key Laboratory of Pharmaceutical Biotechnology, Department of Biology, Nanjing University, Nanjing 210093, China and†Department of Fish Ecology and Evolution, Eawag, Swiss Federal Institute of Aquatic Science and Technology,
Center of Ecology, Evolution and Biogeochemistry, 6047 Kastanienbaum, Switzerland
Manuscript received July 20, 2010Accepted for publication August 27, 2010
ABSTRACT
Protein is an essential component for life, and its synthesis is mediated by codons in any organisms onearth. While some codons encode the same amino acid, their usage is often highly biased. There are manyfactors that can cause the bias, but a potential effect of mononucleotide repeats, which are known to behighly mutable, on codon usage and codon pair preference is largely unknown. In this study weperformed a genomic survey on the relationship between mononucleotide repeats and codon pair bias in53 bacteria, 68 archaea, and 13 eukaryotes. By distinguishing the codon pair bias from the codon usagebias, four general patterns were revealed: strong avoidance of five or six mononucleotide repeats in codonpairs; lower observed/expected (o/e) ratio for codon pairs with C or G repeats (C/G pairs) than that withA or T repeats (A/T pairs); a negative correlation between genomic GC contents and the o/e ratios,particularly for C/G pairs; and avoidance of C/G pairs in highly conserved genes. These results supportnatural selection against long mononucleotide repeats, which could induce frameshift mutations incoding sequences. The fact that these patterns are found in all kingdoms of life suggests that this is ageneral phenomenon in living organisms. Thus, long mononucleotide repeats may play an important rolein base composition and genetic stability of a gene and gene functions.
AMONG the many components of life, protein ismost essential because living organisms use pro-
teins not only for body structuring but also for itsfunctioning. After the discovery of the genetic code forprotein biosynthesis (Crick et al. 1961), redundancyin the genetic code attracted great attention. Highlybiased use of synonymous codons is one of them, andthe codon usage bias is common not only among spe-cies but also within species (Grosjean and Fiers 1982;Akashi 2001). Previous studies showed that codon us-age bias is linked to several factors, such as efficiencyand accuracy of translation (Robinson et al. 1984;Bulmer 1991; Akashi 1994; Plotkin et al. 2004), com-positional bias (Muto and Osawa 1987; McLean et al.1998), and genome size or other nonselective forces(Lawrence and Ochman 1998; dos Reis et al. 2004).
One additional factor is the sequence environment. Itis known that nucleotides surrounding a codon caninfluence the codon usage preference, called context-dependent codon bias (Yarus and Folley 1985). Thecontext-dependent codon bias affects the efficiency andaccuracy of translation (Taniguchi and Weissmann
1978; Irwin et al. 1995) and the suppression of both
premature stop codons and missense codons (Bossi
and Ruth 1980; Murgola et al. 1984). Reflecting thecontext-dependent codon bias, a strong codon pair biasis detected in both prokaryotic and eukaryotic genomes(Gutman and Hatfield 1989; Buchan et al. 2006; Tats
et al. 2008). It has been suggested that codon pairpreference is influenced by all three nucleotides of theribosomal A-site codon and the third nucleotide of theP-site codon (Buchan et al. 2006). Therefore, tRNAgeometry within the ribosome was presumed to be thekey factor governing genomic codon pair patterns, as itmight enhance the fidelity and/or rate of translation.
A mononucleotide repeat is a homogeneous run ofthe same nucleotides. Potentially deleterious effects of amononucleotide repeat in coding sequences (CDS)have been pointed out: the mononucleotide repeats inCDS are prone to transcriptional and translationalslippage, which leads to functional disruption of thecorresponding gene products (Wagner et al. 1990;Gurvich et al. 2003; Baranov et al. 2005); a strongassociation between mononucleotide repeats and theoccurrence of insertion/deletion (indel) during theDNA replication process will elevate the risk of frame-shift mutations (Strauss 1999), which might havesevere fitness consequences. The list of diseases result-ing from changes of unstable repeats continues to grow(Gatchel and Zoghbi 2005). In addition, previousstudies suggested that in long mononucleotide runs,errors during the process of DNA synthesis are easier to
Supporting information is available online at http://www.genetics.org/cgi/content/full/genetics.110.121137/DC1.
1These authors contributed equally to this work. D.T. and H.A. areequal senior authors.
2Corresponding author: Seestrasse 79, 6047 Kastanienbaum, Switzerland.E-mail: [email protected]
Genetics 186: 1077–1084 (November 2010)

escape from polymerase proofreading or mismatchrepair (MMR) systems (Kroutil et al. 1996; Tran et al.1997). C/G mononucleotide runs are found to be moreunstable than A/T runs in Escherichia coli (Sagher et al.1999), yeast (Harfe and Jinks-Robertson 2000), andmammalian cells (Boycheva et al. 2003). Indeed, someof the mononucleotide repeats, such as GGGGGn, arefound to be among the unpreferred codon pairs invarious species (Tats et al. 2008). Therefore, the num-ber of mononucleotide repeats, as well as their basecompositions (A/T runs or C/G runs), might affect theoccurrence of indels and the genetic stability of CDS.
In this study, we conducted a systematic survey of 134genomes in bacteria, archaea, and eukaryotes to evalu-ate the potential influence of the mononucleotiderepeats on codon pair preference. We used the ob-served/expected (o/e) ratio of codon pairs with mono-nucleotide repeats to distinguish the codon pair biasfrom the codon usage bias. Our results suggest a strongavoidance of long (five or six) mononucleotide runs inCDS, most likely due to natural selection against thehigh mutability, which may shed new light on the forcesexerted on both codon and codon-pair usage.
MATERIALS AND METHODS
Databases: To cover a diverse range of species, 13 eukary-otic, 53 bacterial, and 68 archaeal genomes were selected fromonline databases (supporting information, Table S1, Table S2,and Table S3). In addition, four sequence alignments (Sac-charomyces cerevisiae and S. paradoxus, Caenorhabditis elegans andC. briggsae, Drosophila melanogaster and D. yakuba, and Homosapiens and Mus musculus) were obtained from the UCSCGenome Informatics website (http://hgdownload.cse.ucsc.edu). Protein-coding regions were determined on the basisof the annotations in these databases. The 13 eukaryoticgenomes, including fungi, plants, and animals, were ran-domly selected to represent a wide range of species (TableS1). The 53 bacterial genome sequences were selected onthe basis of a criterion of .4 Mb to give sufficient data (TableS2), whereas this criterion was not applied to the archaealgenomes because of their small genome sizes (2.24 Mb onaverage; Table S3).
Studied codon pairs: We first analyzed codon pairs that havemononucleotides spanning the two codons (sense:sense pairs,Table S4). Among 4096 (¼ 46) possible codon pairs, 928sense:sense pairs contained two to six mononucleotides in thepair junction, when excluding the pairs containing a stopcodon. A/T pairs (codon pairs with A’s or T’s spanning twocodons) or C/G pairs (codon pairs with C’s or G’s spanningtwo codons) were analyzed together not only because A and Tor C and G are parallel in the nucleotide chain position, butalso because the level of bias was similar (Figure S1). Codonpairs with the same number and composition (A/Tor C/G) ofmononucleotide runs in the pair junction were classified as agroup.
In the analysis, codon pairs containing mononucleotiderepeats other than those spanning the two codons areexcluded because in such codon pairs the mononucleotiderun size is not affected by the adjacent codon. For example,the number of longest mononucleotide repeats in codon pairAAATCG is three, which is the same as the single codon AAA.
If there are any factors contributing to the reduction in themononucleotide repeats, the single codon (AAA) would bethe actual target, independent of the adjacent codons. Werefer this as codon bias, not codon pair bias.
To further confirm the effect of mononucleotide repeatson codon pair bias, we also analyzed synonymous codon pairs,which are defined as a codon pair that has a choice ofnucleotide bases that alter the number of mononucleotiderepeats (from two to six) without changing the encodedamino acid sequences (Table S5). The possible longest mono-nucleotide run in the codon pair was two, three, five or six(Table S5). For example, codon pairs encoding dipeptidelysine:lysine had four possible compositions: AAGAAG, AA-GAAA, AAAAAG, and AAAAAA, for which the numbers of thelongest mononucleotide runs were two, three, five, and six,respectively.
The two types of codon pairs above have a partial overlapespecially when we consider long mononucleotide repeats.Particularly, six mononucleotide repeats (6N) are entirelyshared by both types of codon pairs (Table S4 and Table S5).For shorter mononucleotide runs (#5N), however, these typesof codon pairs generally include different sets of codon pairs.We also analyzed sense:sense codon pairs excluding synony-mous codon pairs.
Normalizing codon pair frequencies: Codon pair bias couldbe attributed to codon usage bias. To eliminate this effect, wenormalized the expectation of codon pair occurrence by thefrequency of used codons (Gutman and Hatfield 1989;Buchan et al. 2006). First we calculated the observed (oij) andthe expected number (eij) of a codon pair (codon i and codonj), on the basis of the estimated codon frequencies in the kthopen reading frame (ORFk) (Buchan et al. 2006),
eij ;k ¼cicj N p
N 2tot
;
where ci is the observed count of codon i, Ntot is the totalnumber of codons, and Np ¼ Ntot � 1 represents the totalnumber of codon pairs in the ORFk. The effect of dipeptidebias on codon pairing was removed by normalizing theexpected values of each codon pair, to generate enor,
enor ¼ enorij ;k ¼P
mnðodip;mnÞPmnðedip;mnÞ
3 eij ;k ¼P
mnðodip;mnÞPmnðcmcn=N 2
tot 3 N pÞ3 eij;k
(Gutman and Hatfield 1989; Buchan et al. 2006), whereodip,mn and edip,mn are the observed and expected codon paircounts, respectively, encoding dipeptide mn. Observed andexpected codon pair counts were then summed up at thegenomic level. The numbers of codon pairs were calculatedusing a Perl script.
Because the codon pairs in each type encode the samedipeptide for synonymous pairs, the sum of the observedcounts (enor) is equal to the sum of expectation. For sense:sense pairs, on the other hand, the sum of the observed countsis equal to the sum of expectation only when all 4096 possiblecodon pairs are included (the 0–1 mononucleotides in thepair junction).
Analyzing codon pair bias: The o/e ratio for each group ofcodon pairs with the same number (p) of mononucleotide Qin the pair junction was calculated as follows:
o=epQ ¼P
oijPeij:
The average o/e ratio for a group of genomes was cal-culated as the geometric mean of the respective ratio of eachgenome.
1078 T. Gu et al.

To measure the difference between the observed andexpected values of a single codon pair, a normalized offsetvalue defined as r was calculated,
r ¼ oij � eij
Dexp¼ oij � eijffiffiffiffiffiffiffiffiffiffiffiffiffiffiffiffiffiffiffiffiffiffiffiffiffiffiffiffiffiffiffiffiffiffiffiffiffiffiffiffiffi
eij 3 ð1 � eij=N totÞp
(Boycheva et al. 2003), where Dexp is the expected randomdeviation. The r value is considered to be significant when theabsolute value is .2.0 (Boycheva et al. 2003).
Analyzing codon pair usage in conserved regions: A Perlscript was written to calculate the number of nucleotidesubstitutions and indels throughout the following combina-tions of alignments: S. cerevisiae and S. paradoxus, C. elegansand C. briggsae, D. melanogaster and D. yakuba, and H. sapiensand M. musculus. The average nucleotide divergence (D) wasadjusted with the Jukes and Cantor correction (Jukes andCantor 1969).
First, CDS were extracted according to the annotations of S.cerevisiae, C. elegans, D. melanogaster, and H. sapiens, respec-tively. Then the CDS of each of the four comparisons wereclassified into three groups according to D. Each group hadan equal length of sequences, and the one with the smallest Dwas regarded as the highly conserved region, while the onewith the largest D was the less conserved region. The observedand expected counts of each codon pair were analyzed inboth highly and less conserved regions (see Table S6 fordetails).
RESULTS
Avoidance of long mononucleotide runs in codonpairs: In the sense:sense codon pairs, the o/e ratio wasapparently less than one in codon pairs with longmononucleotide runs, such as five- or six-mononucleo-tide repeats for C/G pairs (o/e5C/G or o/e6C/G) and 6Nfor A/T pairs (o/e6A/T, Figure 1). The geometric meanof the o/e ratio for the 6N pairs was 0.528 in eukaryotes,0.488 for bacteria, and 0.596 for archaea (Table S7,
Table S8, and Table S9). The ratios for codon pairs withshorter runs (,4N mononucleotides) were significantlylarger than those for pairs with longer runs (.4N mono-nucleotides) (P , 0.05, t-test). The consistently lowernumber of observations than expected values (o/e , 1.0for the 6N pairs in 133/134 genomes, or 99.2%; FigureS2 and Table S7, Table S8, and Table S9) suggests auniversal avoidance of long mononucleotide runs forsense:sense codon pairs in these organisms. The onlyexception was Geobacter uraniireducens, which showedo/e ¼ 1.084 for the 6N pairs (Table S8).
In addition, the o/e ratios for codon pairs with longA/T mononucleotide runs (o/e5A/T or o/e6A/T) weresignificantly higher than those for C/G pairs in bothprokaryotes and eukaryotes (P , 0.05, paired t-test,except for o/e5A/T vs. o/e5C/G in mammals, discussedbelow). For example, in eukaryotic genomes, o/e6A/T
was 1.8 times higher than o/e6C/G, where the o/e6C/G wasonly 0.335. This result indicates that the 6C/G is themost unfavorable of codon pairs.
On the other hand, there was a pattern unique tomammals. Unlike the other genomes, higher o/e ratiosfor C/G pairs than for A/T pairs were generallyobserved in mammals except for 6Ns (Figure 1C). Inaddition, the o/e ratios for A/T pairs with long mono-nucleotide runs were higher in prokaryotes than ineukaryotes (o/e5A/T ¼ 0.952 and o/e6A/T ¼ 0.696 inbacteria; and 0.963 and 0.669 in archaea vs. 0.831 and0.602 in eukaryotes, respectively, both P , 0.05 byt-test). For long mononucleotide C/G runs, however,no clear difference was detected between prokaryotesand eukaryotes. The only exception was o/e5C/G ineukaryotes, which was significantly larger than o/e5C/G
in bacteria (0.651 vs. 0.551, P , 0.05 by t-test, Table S7and Table S8). But the difference drastically decreased
Figure 1.—(A–D) o/e ratios for all possiblesense:sense codon pairs. Circles represent A/Tpairs; triangles represent C/G pairs. The geomet-ric mean of the o/e ratio for each type of sense:sense codon pair is plotted with standard error.
Avoidance of Mononucleotide Repeats 1079

when the mammals were excluded (o/e5C/G ¼ 0.574for nonmammalian eukaryotes, Table S7).
Synonymous codon pairs showed similar patterns(Figure S3, Table S10, Table S11, and Table S12), andthe elimination of synonymous codon pairs from sense:-sense codon pairs resulted in virtually the same patterns(Figure S4). The negative relationships between the o/eratio and the number of mononucleotide runs in bothsense:sense and synonymous codon pairs further sup-port the consistent avoidance of long mononucleotideruns in codon pairs in the genome evolution ofprokaryotes and eukaryotes.
Effect of prokaryotic GC content on the o/e ratio:The results above revealed a stronger avoidance ofcodon pairs with long C/G runs relative to A/T runs.Because genomes with higher GC content would con-tain more C/G pairs under random expectation, weevaluated the effect of genomic GC content on thetolerance of genomes to the C/G mononucleotide runs.The wide range of GC content in prokaryotic genomes(29.9–72.8% in bacteria and 27.6–68.0% in archaea)provided an opportunity for investigating a correlationbetween o/e ratio and GC content.
When the 53 bacterial genomes were classified intothree groups depending on GC content—group I(GC% , 50%), group II (50% # GC% , 60%), andgroup III (GC% $ 60%)—their o/e ratios for sense:sense pairs were quite different (Figure 2A). The o/eratios for C/G pairs in group I were significantly higherthan those in group III (P , 0.05, t-test). For C/G pairs,the o/e ratios for group II were between those of groupsI and III. Notably, o/e6C/G for the high GC content,group III decreased to a very low value (0.223, Figure2A). This observation suggested that the avoidance oflong C/G mononucleotide runs was much stronger ingenomes with higher GC content. This propensity wasalso shown through the negative correlation betweenGC content of individual genomes and their o/e ratios forC/G codon pairs, e.g., o/e6C/G in Figure 2B (R¼ �0.550,P , 0.0001), and the other ratios in Figure S9B (P , 0.05).For A/T pairs, on the other hand, the negative relation-ship between the o/e ratio and GC content was muchweaker (Figure S5 and Figure S9A). All the patternsobserved in bacteria were also present in three groups ofthe archaeal genomes (Figure S6 and Figure S8, A–C;group I with GC% , 40%, group II with GC% rangingfrom 40 to 50%, and group III with GC% $ 50%).
The normalized offset value (r) measures the differ-ence between the observed and the expected counts of acertain codon pair (Boycheva et al. 2003). Our calcu-lations showed that the number of C/G codon pairs, inwhich the observed counts are significantly less thanexpected (r # �2), is positively correlated with thegenomic GC content (Figure 2C; P , 0.0001), reflect-ing the strong propensity of genomes with higher GCcontents to avoid C/G pairs. According to the linearregression, in the bacterial genomes with GC content of
70%, the proportion of significantly underrepresentedC/G pairs with mononucleotides in pair junctions was55.2% (274/496), whereas it was only 28.0% (139/496)in the genomes with low GC content (30%). Thenumber of A/T pairs, which are significantly less thanexpected, was weakly correlated with genomic GCcontent in prokaryotes (Figure S5A and Figure S7A).
The o/e ratios in conserved coding sequences: Giventhat long mononucleotide runs have a greater potential
Figure 2.—Correlation between biased usage of C/G co-don pairs and GC content in bacteria genomes. (A) The geo-metric mean of the o/e ratio of C/G pairs in bacteria group Iwith GC% , 50%, group II with 50% , GC% , 60%, andgroup III with GC% . 60%. The geometric mean of theo/e ratio for each type of synonymous codon pair is plottedwith standard error. (B) Correlation between o/e6C/G andGC content. (C) Correlation between GC content and thenumber of significantly underrepresented C/G codon pairsin individual genomes.
1080 T. Gu et al.

to produce indels, a lower o/e ratio was expected inmore conserved CDS. Since 6Ns had the smallest o/eratios in analyzed codon pairs with mononucleotidesin pair junctions in eukaryotes (Figure 1 and Table S7),o/e6N was analyzed in conserved regions in the fouralignments of the eight genomes (see materials and
methods).Indeed, o/e6N was significantly smaller in highly
conserved than in less-conserved regions in all align-ments of nonmammalian eukaryotes (Figure 3A, P ,
0.01 by chi-square test). Moreover, the 6N codonsappeared less frequently in highly conserved regionsin those three comparisons (Figure 3B). In the mam-malian sequences, no such differences were observed.Although o/e6N was slightly smaller in less-conservedregions in the human–mouse comparisons, the differ-ence was not significant.
DISCUSSION
The biased usage of codons or codon pairs is acommon phenomenon in a wide range of species(Gutman and Hatfield 1989; Buchan et al. 2006). Avariety of factors, selective or nonselective, might beresponsible for such bias. For example, the synonymouscodons decoded in the ribosomal A site by the sametRNA exhibit significantly similar ribosomal P-site pair-ing preference (Buchan et al. 2006). In other words, thecodon pair preference is primarily determined by theinterplay between nucleotides cP3 (the third nucleotideof the codon positioned at the ribosomal P site) andcA1/cA2 (the first/second nucleotide of the codonpositioned at the ribosomal A site) (Buchan et al. 2006).Our results suggest that the avoidance of mononucleo-tide repeats in pair junctions is an additional explana-tion. For codon pairs encoding a certain dipeptide,nucleotides cP3 and cA3 are degenerate, and cP3 ismore important in determining the mononucleotidesrun size. The interplay between cP3 and cA1/cA2largely determines the mononucleotide run size in thedegenerate codon pairs. Thus, the deleterious effect ofindels and the consequent avoidance of long mono-nucleotide repeats in CDS can contribute to the closeconnection between cP3 and cA1/cA2 as well.
In this study, we confirmed a deficit of codon pairswith long mononucleotide runs relative to those with
short mononucleotide runs in a variety of species byanalyzing two kinds of codon pairs. This result is alsoconsistent with previous studies, such as Tats et al.(2008) in which certain mononucleotide repeats areidentified as avoided codon pairs among several otherkinds (e.g., nnTAnn). In addition, we revealed threeadditional patterns: higher o/e ratio for A/T codonpairs than for C/G pairs; negative correlation betweenGC content of individual genomes and their o/e ratios,particularly for C/G codon pairs; and lower o/e ratiofor codon pairs with long mononucleotide runs inconserved coding sequences. These patterns cannot beexplained by the simplest tRNA geometry hypothesis.In E. coli, for example, the deficit of long mononucleo-tide A/T runs in codon pairs cannot be elucidated bytRNA geometry because the synonymous codons, AAGand AAA, and TTC and TTT, are recognized by thesame tRNA.
Natural selection on mutability of codons or codonpairs might be an alternative explanation. The highfrequency of indel occurrence has been confirmed to beclosely associated with simple nucleotide repeats(Strauss 1999). The previous investigation of themutability of mononucleotide runs in yeast showed thatthe mutation rate of 6N mononucleotide repeats was�10-fold of that of 2N or 3N (Greene and Jinks-Robertson 1997). The high indel mutability of longmononucleotide runs and the severely detrimentaleffect of coding indels can enforce the choice of thecodon or codon pair usage. Consequently, the avoid-ance of long mononucleotide runs in coding sequenceswill minimize the change of coding function, particu-larly in highly conserved regions. Thus, this model canexplain a scarcity of long runs in codon pairs and whythe conserved genes have less codon pairs with longmononucleotide runs.
Under this scenario, long A/T mononucleotides canbe better tolerated in codon pairs than in C/G runs,which exhibit higher mutability. For example, in aframeshift reversion assay in S. cerevisiae (Greene andJinks-Robertson 1997), the mutation events in a 4Crun were as many as in a 6A run, consistent with ourobservation that o/e4C/G was similar to o/e6A/T (0.841 vs.0.811 in S. cerevisiae, Table S7). It is known that C/Gmononucleotides are more prone to produce indels inE. coli and yeast (Greene and Jinks-Robertson 1997;
Figure 3.—Comparison of mononucleotideruns in highly conserved (open bars) and less-conserved (hatched bars) regions. (A) o/e6N infour comparisons of eukaryote genomes. (B) Fre-quency of 6N codon pairs. The four comparisonsare S. cerevisiae and S. paradoxus, D. melanogasterand D. yakuba, C. elegans and C. briggsae, andH. sapiens and M. musculus. **P , 0.01.
Avoidance of Mononucleotide Repeats 1081

Sagher et al. 1999; Harfe and Jinks-Robertson 2000),and the frameshift instability of mononucleotide C or Gruns may be due to stabilization of a stacked interme-diate (Sagher et al. 1999). Both the DNA polymerasefidelity (primarily avoidance of slippage) and theefficiency of the removal of frameshift intermediatesby the MMR system are affected by the composition ofmononucleotide runs; DNA polymerase slippage occursmore often while the MMR system removes frameshiftintermediates less efficiently in C/G than in A/Tmononucleotide runs (Gragg et al. 2002). Consideringthe greater ability to produce indels, long C/G runs areless favored in those regions sensitive to frameshifts andtheir appearance would be underrepresented. In con-trast, A/T mononucleotide runs would exert less in-fluence on the maintenance of sequence stability. Inhigher eukaryotes, there are no experimental data onthe mutability of mononucleotides, but it has beenreported that the mutation rate of G17 repeat sequenceswas much higher than those of A17 and (CA)17 inmismatch repair-proficient embryonic mouse fibro-blasts (Boyer et al. 2002).
If the avoidance of slippages from long mononucle-otide runs contributes to the biased usage of codonpairs, it is understandable that there is a negativecorrelation between GC content of individual genomesand their o/e ratios because the genomes with higherGC content are expected to have a higher possibility offorming long mononucleotide sequences. In the threebacterial groups with GC% , 50%, 50% , GC% , 60%,and GC% . 60%, the expected numbers of six C/Gpairs were 466, 745, and 1406 (P ¼ 0.057, P , 0.01, andP , 0.05 for comparison of groups 1 and 2, 1 and 3, and2 and 3, respectively, t-test), whereas the observed countswere roughly the same, 285, 329, and 361, respectively(P ¼ 0.524 � 0.787 for comparison of groups by t-test).The same tendency was observed in archaea as well.Therefore, prokaryotes may have evolved a mechanismto control the mutability of their genomes.
All analyzed genomes have o/e6C/G less than oneexcept G. uraniireducens. This bacterium was isolatedfrom subsurface sediment undergoing uranium bio-remediation. This species reduces metals includinguranium with acetate and other organic acids servingas the electron donor (Shelobolina et al. 2008). It isgenerally accepted that uranium induces DNA damageand subsequent high mutation rate through a combi-nation of chemical and radiological effects (Stearns
et al. 2005). G. uraniireducens may be able to toleratemore 6C/G codon pairs, due to its higher tolerance ofmutational constraints or the advantage of rapid evolu-tion for adaptation to its harsh environment.
A more frequent occurrence of indels in longer C/Gmononucleotides may partly explain why some aminoacids have more synonymous codons than others. It hasbeen shown that the genetic code is not a randomassignment of codons to amino acids and that the code
minimizes the effects of point mutation or mistransla-tion (Freeland and Hurst 1998). Therefore, a goodstrategy to avoid mutation would be a reduced usage ofcodons with higher GC content, potentially to minimizethe risk of longer C/G runs. To achieve this goal, suchcodons would have evolved as synonymous codons thatare used less often. In fact, this hypothesis can be testedby a GC analysis for all codons. There are 8 amino acidswith $4 synonymous codons. In these codons, theaverage GC content is as high as 68.1%, which issignificantly .33.3% (P , 0.001, t-test), the GC contentof the other 12 amino acids with ,3 synonymouscodons. Notably, only 6 codons of 23 for these 12 aminoacids have two GCs each, while 26/38 such codons arefound for the 8 amino acids with .3 synonymouscodons. In addition, the start and stop codons have onlyone or no G. Thus, almost all AT-rich codons are used forthe amino acids with limited synonymous codons orstop/start codons. Clearly, these codons have littlechance of forming long C/G mononucleotides andtherefore a higher opportunity to maintain stable genefunction.
The indel-mutability model can shed light on theusage of codons and codon pairs. Our results suggestthat the avoidance of long mononucleotides can main-tain the conserved gene function by preventing indeloccurrence in coding sequences. This may be the bestway to minimize mutation by constructing an appropri-ate gene composition, e.g., the choice of GC content andspecific nucleotide combination. In highly conservedgenes, on which mutations are supposed to be highlydeleterious, the maximal avoidance of long mononu-cleotide repeats might be essential. Our results on theconserved regions (Figure 3) are very consistent withthis scenario.
One exception was the case of mammalian genomes,which showed no consistent pattern compared to theother comparisons (Figure 3). Further study is requiredto understand the cause of the different patterns inmammals, although less efficient natural selection dueto the smaller effective population size in mammalsrelative to invertebrates and prokaryotes, typically at themagnitude of one or two orders (Lynch and Conery
2003), might explain the phenomenon.Results from recent studies suggest either up- or
downregulation of the mutability level. The gene com-position might be the first step in controlling themutability level. If a severely detrimental effect resultedfrom the occurrence of any particular indel in CDS, theindel would be removed efficiently (Chen et al. 2009).When a region can tolerate indels, the result could beinduction of more mutations (Tian et al. 2008; Zhu et al.2009), promotion of ectopic recombination (Sun et al.2008), or reduction of recombination for the surround-ing regions to maintain additional mutations (Du et al.2008). This process would be an efficient way to regulatethe mutation level and suggests that the mutability in a
1082 T. Gu et al.

gene is self-regulated, at least to some extent. From thispoint of view, the mechanism for an indel due toslippage might be a consequence of adaptive evolution,which can explain why this mechanism works well forlong C/G runs but less well for the same long A/Tmononucleotide sequences. The o/e ratio, particularlythe o/eC/G ratio, could be used as a measure of themutation potential for individual or multiple genes in aspecies. Therefore, these ubiquitous and selectivelymaintained mononucleotide runs can greatly contrib-ute to the high genetic diversities and to the molecularevolution. Analysis of the distribution of long mono-nucleotide runs will provide information for the evolu-tion of genes and genomes. With recent works that haverevealed the possible causes for codon bias, our studysuggests that the role played by mononucleotide runs insuch bias can be very important in shaping geneticevolution.
We thank Gary Stormo and two anonymous reviewers for helpfulcomments on the earlier version of this manuscript. This study wassupported by the National Science Foundation of China (30930049)(to D.T.) and the Swiss National Science Foundation (31003A_125213) (to H.A.).
LITERATURE CITED
Akashi, H., 1994 Synonymous codon usage in Drosophila melanogaster :natural selection and translational accuracy. Genetics 136: 927–935.
Akashi, H., 2001 Gene expression and molecular evolution. Curr.Opin. Genet. Dev. 11: 660–666.
Baranov, P. V., A. W. Hammer, J. Zhou, R. F. Gesteland and J. F.Atkins, 2005 Transcriptional slippage in bacteria: distributionin sequenced genomes and utilization in IS element gene expres-sion. Genome Biol. 6: R25.
Bossi, L., and J. R. Ruth, 1980 The influence of codon context ongenetic code translation. Nature 286: 123–127.
Boycheva, S., G. Chkodrov and I. Ivanov, 2003 Codon pairs inthe genome of Escherichia coli. Bioinformatics 19: 987–998.
Boyer, J. C., N. A. Yamada, C. N. Roques, S. B. Hatch, K. Riess et al.,2002 Sequence dependent instability of mononucleotide mi-crosatellites in cultured mismatch repair proficient and deficientmammalian cells. Hum. Mol. Genet. 11: 707–713.
Buchan, J. R., L. S. Aucott and I. Stansfield, 2006 tRNA proper-ties help shape codon pair preferences in open reading frames.Nucleic Acids Res. 34: 1015–1027.
Bulmer, M., 1991 The selection-mutation-drift theory of synony-mous codon usage. Genetics 129: 897–907.
Chen, J. Q., Y. Wu, H. Yang, J. Bergelson, M. Kreitman et al.,2009 Variation in the ratio of nucleotide substitution and indelrates across genomes in mammals and bacteria. Mol. Biol. Evol.26: 1523–1531.
Crick, F. H., L. Barnett, S. Brenner and R. J. Watts-Tobin,1961 General nature of the genetic code for proteins. Nature192: 1227–1232.
dos Reis, M., R. Savva and L. Wernisch, 2004 Solving the riddleof codon usage preferences: a test for translational selection.Nucleic Acids Res. 32: 5036–5044.
Du, J., T. Gu, H. Tian, H. Araki, Y. H. Yang et al., 2008 Groupednucleotide polymorphism: a major contributor to genetic varia-tion in Arabidopsis. Gene 426: 1–6.
Freeland, S. J., and L. D. Hurst, 1998 The genetic code is one in amillion. J. Mol. Evol. 47: 238–248.
Gatchel, J. R., and H. Y. Zoghbi, 2005 Diseases of unstable repeatexpansion: mechanisms and common principles. Nat. Rev.Genet. 6: 743–755.
Gragg, H., B. D. Harfe and S. Jinks-Robertson, 2002 Basecomposition of mononucleotide runs affects DNA polymerase
slippage and removal of frameshift intermediates by mismatchrepair in Saccharomyces cerevisiae. Mol. Cell. Biol. 22: 8756–8762.
Greene, C. N., and S. Jinks-Robertson, 1997 Frameshift inter-mediates in homopolymer runs are removed efficiently byyeast mismatch repair proteins. Mol. Cell. Biol. 17: 2844–2850.
Grosjean, H., and W. Fiers, 1982 Preferential codon usage in pro-karyotic genes: the optimal codon-anticodon interaction energyand the selective codon usage in efficiently expressed genes.Gene 18: 199–209.
Gurvich, O. L., P. V. Baranov, J. Zhou, A. W. Hammer, R. F. Gesteland
et al., 2003 Sequences that direct significant levels of frameshift-ing are frequent in coding regions of Escherichia coli. EMBO J.22: 5941–5950.
Gutman, G. A., and G. W. Hatfield, 1989 Nonrandom utilizationof codon pairs in Escherichia coli. Proc. Natl. Acad. Sci. USA 86:3699–3703.
Harfe, B. D., and S. Jinks-Robertson, 2000 Sequence compositionand context effects on the generation and repair of frameshiftintermediates in mononucleotide runs in Saccharomyces cerevi-siae. Genetics 156: 571–578.
Irwin, B., J. D. Heck and G. W. Hatfield, 1995 Codon pair utiliza-tion biases influence translational elongation step times. J. Biol.Chem. 270: 22801–22806.
Jukes, T. H., and C. R. Cantor, 1969 Mammalian protein metabo-lism, pp. 21–132 in Evolution of Protein Molecules. Academic Press,New York.
Kroutil, L. C., K. Register, K. Bebenek and T. A. Kunkel,1996 Exonucleolytic proofreading during replication of re-petitive DNA. Biochemistry 35: 1046–1053.
Lawrence, J. G., and H. Ochman, 1998 Molecular archaeology ofthe Escherichia coli genome. Proc. Natl. Acad. Sci. USA 95:9413–9417.
Lynch, M., and J. S. Conery, 2003 The origins of genome complex-ity. Science 302: 1401–1404.
McLean, M. J., K. H. Wolfe and K. M. Devine, 1998 Base compo-sition skews, replication orientation, and gene orientation in 12prokaryote genomes. J. Mol. Evol. 47: 691–696.
Murgola, E. J., F. T. Pagel and K. A. Hijazi, 1984 Codon contexteffects in missense suppression. J. Mol. Biol. 175: 19–27.
Muto, A., and S. Osawa, 1987 The guanine and cytosine content ofgenomic DNA and bacterial evolution. Proc. Natl. Acad. Sci. USA84: 166–169.
Plotkin, J. B., H. Robins and A. J. Levine, 2004 Tissue-specific co-don usage and the expression of human genes. Proc. Natl. Acad.Sci. USA 101: 12588–12591.
Robinson, M., R. Lilley, S. Little, J. S. Emtage, G. Yarranton
et al., 1984 Codon usage can affect efficiency of translationof genes in Escherichia coli. Nucleic Acids Res. 12: 6663–6671.
Sagher, D., A. Hsu and B. Strauss, 1999 Stabilization of the inter-mediate in frameshift mutation. Mutat. Res. 423: 73–77.
Shelobolina, E. S., H. A. Vrionis, R. H. Findlay and D. R. Lovley,2008 Geobacter uraniireducens sp. nov., isolated from subsur-face sediment undergoing uranium bioremediation. Int. J. Syst.Evol. Microbiol. 58: 1075–1078.
Stearns, D. M., M. Yazzie, A. S. Bradley, V. H. Coryell, J. T. Shelley
et al., 2005 Uranyl acetate induces hprt mutations and uranium-DNA adducts in Chinese hamster ovary EM9 cells. Mutagenesis20: 417–423.
Strauss, B. S., 1999 Frameshift mutation, microsatellites and mis-match repair. Mutat. Res. 437: 195–203.
Sun, X., Y. Zhang, S. Yang, J. Q. Chen, B. Hohn et al.,2008 Insertion DNA promotes ectopic recombination duringmeiosis in Arabidopsis. Mol. Biol. Evol. 25: 2079–2083.
Taniguchi, T., and C. Weissmann, 1978 Inhibition of Qbeta RNA70S ribosome initiation complex formation by an oligonucleo-tide complementary to the 39 terminal region of E. coli 16S ribo-somal RNA. Nature 275: 770–772.
Tats, A., T. Tenson and M. Remm, 2008 Preferred and avoidedcodon pairs in three domains of life. BMC Genomics 9: 463.
Tian, D., Q. Wang, P. Zhang, H. Araki, S. Yang et al., 2008 Single-nucleotide mutation rate increases close to insertions/deletionsin eukaryotes. Nature 455: 105–108.
Avoidance of Mononucleotide Repeats 1083

Tran, H. T., J. D. Keen, M. Kricker, M. A. Resnick and D. A. Gordenin,1997 Hypermutability of homonucleotide runs in mismatch re-pair and DNA polymerase proofreading yeast mutants. Mol. Cell.Biol. 17: 2859–2865.
Wagner, L. A., R. B. Weiss, R. Driscoll, D. S. Dunn and R. F.Gesteland, 1990 Transcriptional slippage occurs during elon-gation at runs of adenine or thymine in Escherichia coli. NucleicAcids Res. 18: 3529–3535.
Yarus, M., and L. S. Folley, 1985 Sense codons are found inspecific contexts. J. Mol. Biol. 182: 529–540.
Zhu, L., Q. Wang, P. Tang, H. Araki and D. Tian, 2009 Genome-wide association between insertions/deletions and the nucleotidediversity in bacteria. Mol. Biol. Evol. 26: 2353–2361.
Communicating editor: G. Stormo
1084 T. Gu et al.
GENETICSSupporting Information
http://www.genetics.org/cgi/content/full/genetics.110.121137/DC1
Avoidance of Long Mononucleotide Repeats in Codon Pair Usage
Tingting Gu, Shengjun Tan, Xiaoxi Gou, Hitoshi Araki and Dacheng Tian
Copyright � 2010 by the Genetics Society of AmericaDOI: 10.1534/genetics.110.121137

T. Gu et al. 2 SI
FIGURE S1.—Correlation between o/e ratio of A and T, C and G codon pairs in 13 eukaryotic (A) and 53 bacteria (B) and 68 archaea (C) genomes. Dashed line represents y=x.

T. Gu et al. 3 SI
FIGURE S2.—Proportion of genomes with o/e > 1.0 for different number of mononucleotide runs in sense:sense codon pair
junction (among 13 eukaryotic, 53 bacterial and 68 archaeal genomes). Under the null hypothesis of no bias (observation counts
= expected counts), the proportion should be around 50%, whereas the downward bias is obvious for codon pairs with long
mononucleotide runs (5N or 6N) in these organisms.

T. Gu et al. 4 SI
FIGURE S3.—o/e ratios for synonymous codon pairs. Circles represent A/T pairs; triangles represent C/G pairs. The geometric mean of the o/e ratio for each type of synonymous codon pairs is plotted with standard error.

T. Gu et al. 5 SI
FIGURE S4.—o/e ratios for sense:sense codon pairs excluding synonymous pairs. Circles represent A/T pairs; triangles
represent C/G pairs. The geometric mean of the o/e ratio for each type of sense:sense codon pairs is plotted with the indication of standard error. Note that 6Ns were entirely overlapped between sense:sense and synonymous codon pairs and not shown in
this figure.

T. Gu et al. 6 SI
FIGURE S5.—Correlation between usage of A/T codon pairs and GC-content in bacteria genomes. A: average o/e ratios in three bacteria groups. GC content of the three bacteria groups are GC%<50% for Bacteria I, 50%<GC%<60% for Bacteria II,
and GC%>60% for Bacteria III, respectively. Error bar represents standard error. B: Correlation between GC-content and the
number of significantly underrepresented A/T codon pairs in individual genomes (r=0.110, P=0.43).

T. Gu et al. 7 SI
FIGURE S6.—Correlation between biased usage of C/G codon pairs and GC-content in archaeal genomes. A: The geometric mean of the o/e ratio of C/G pairs in archaea group I with GC%<40%, group II with 40%<GC%<50% and group III with
GC%>50%. The geometric mean of the o/e ratio for each type of synonymous codon pairs is plotted with standard error. B:
Correlation between o/e6C/G and GC-content. C: Correlation between GC-content and the number of significantly
underrepresented C/G codon pairs in individual genomes.

T. Gu et al. 8 SI
FIGURE S7.—Correlation between usage of A/T codon pairs and GC-content in archaeal genomes. A: average o/e ratios in
three archaea groups. GC contents of the three archaea groups are GC%<40% for archaea I, 40%<GC%<50% for archaea II,
and GC%>50%, for archaea III respectively. B: Correlation between GC-content and the number of significantly
underrepresented A/T codon pairs in individual genomes (r=0.267, P=0.0278).

T. Gu et al. 9 SI
FIGURE S8.—Correlation between biased usage of codon pairs and GC content in archaeal genomes. A: Correlation between
o/eA/T and GC content. (R=- -0.42485, P = <0.0001; R= --0.46913, P= <0.0001; R=-0.31578, P= 0.0087; R=0.0618,
P=0.617; R= -0.34332, P= 0.0042; for 2 to 6 A/T pairs respectively); B: Negative correlation between o/eC/G and GC content.
(R=- -0.53118, P=<0.0001; R=-0.68802 P<0.0001; R=--0.6284, P<0.0001; R=-0.47772, P<0.0001; R= -0.26389, P = 0.030 for
2 to 6 C/G pairs respectively).
T. Gu et al. 10 SI
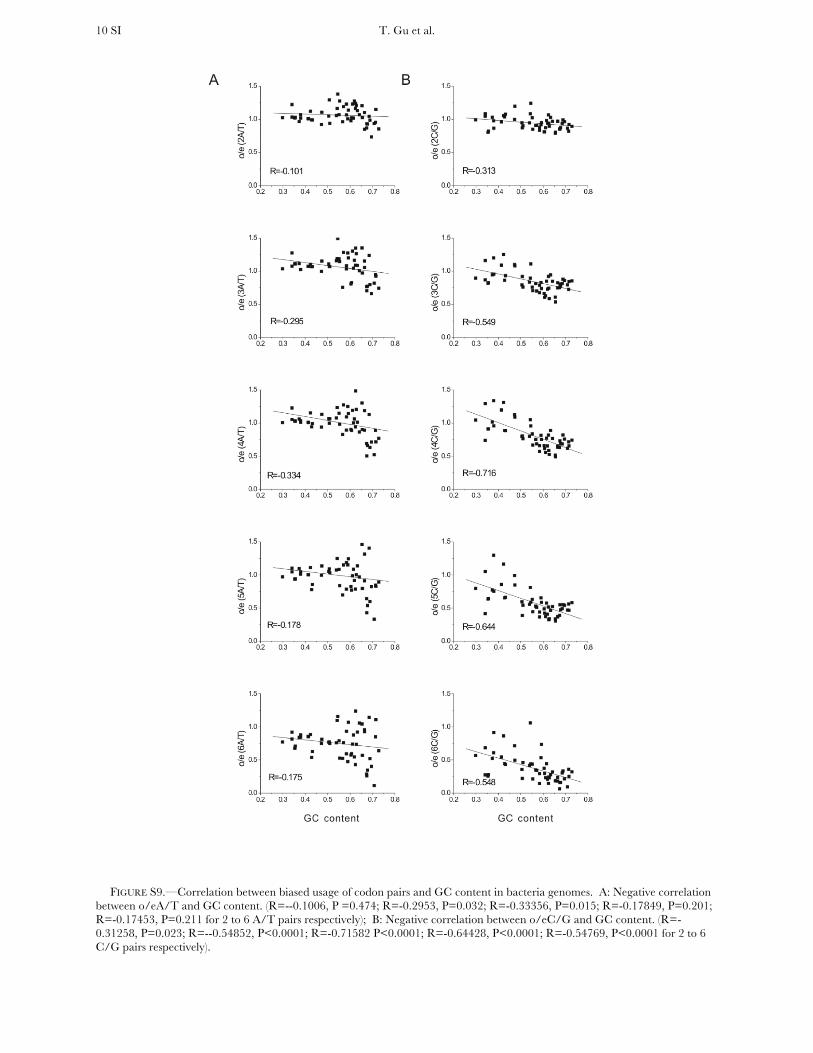
FIGURE S9.—Correlation between biased usage of codon pairs and GC content in bacteria genomes. A: Negative correlation
between o/eA/T and GC content. (R=--0.1006, P =0.474; R=-0.2953, P=0.032; R=-0.33356, P=0.015; R=-0.17849, P=0.201;
R=-0.17453, P=0.211 for 2 to 6 A/T pairs respectively); B: Negative correlation between o/eC/G and GC content. (R=-
0.31258, P=0.023; R=--0.54852, P<0.0001; R=-0.71582 P<0.0001; R=-0.64428, P<0.0001; R=-0.54769, P<0.0001 for 2 to 6
C/G pairs respectively).

T. Gu et al. 11 SI
TABLE S1
Eukaryotic genome data used in this study
Species Download Website
Saccharomyces cerevisiae http://www.yeastgenome.org
Caenorhabditis elegans http://genome.wustl.edu
Drosophila melanogaster http://flybase.bio.indiana.edu
Arabidopsis thaliana http://www.arabidopsis.org/
Oryza sativa http://rice.plantbiology.msu.edu/
Populus trichocarpa http://genome.jgi-psf.org/Poptr1_1/Poptr1_1.home.html
Vitis vinifera http://www.genoscope.cns.fr/externe/Download/Projets/Projet_ML/data/
Danio rerio http://www.sanger.ac.uk
Gallus gallus http://www.ncbi.nlm.nih.gov/Genomes/
Homo sapiens http://www.sanger.ac.uk
Pan troglodytes http://www.ncbi.nlm.nih.gov/Genomes/
Mus musculus http://www.sanger.ac.uk
Rattus norvegicus http://www.ncbi.nlm.nih.gov/Genomes/

T. Gu et al. 12 SI
TABLE S2
Bacterium strains used in this study
King Group Size
(Mb)
GC content
(%)
Acidobacteria bacterium Ellin345 B Acidobacteria 5.7 58.4
Solibacter usitatus Ellin6076 B Acidobacteria 10.0 61.9
Arthrobacter aurescens TC1 B Actinobacteria 4.6 62.4
Salinispora arenicola CNS-205 B Actinobacteria 5.8 69.5
Nocardia farcinica IFM 10152 B Actinobacteria 6.3 70.7
Mycobacterium vanbaalenii PYR-1 B Actinobacteria 6.5 67.8
Mycobacterium smegmatis str. MC2 155 B Actinobacteria 7.0 67.4
Frankia alni ACN14a B Actinobacteria 7.5 72.8
Rhodococcus sp. RHA1 B Actinobacteria 9.7 67.0
Roseobacter denitrificans OCh 114 B Alphaproteobacteria 4.3 58.9
Beijerinckia indica subsp. indica ATCC 9039 B Alphaproteobacteria 4.5 57.0
Methylobacterium radiotolerans JCM 2831 B Alphaproteobacteria 6.9 71.0
Bradyrhizobium sp. ORS278 B Alphaproteobacteria 7.5 65.5
Mesorhizobium loti MAFF303099 B Alphaproteobacteria 7.6 62.5
Rhizobium leguminosarum bv. Viciae 3841 B Alphaproteobacteria 7.8 55.0
Bacteroides fragilis NCTC 9343 B Bacteroidetes/Chlorobi 5.2 43.1
Flavobacterium johnsoniae UW101 B Bacteroidetes/Chlorobi 6.1 34.1
Bacteroides thetaiotaomicron VPI-5482 B Bacteroidetes/Chlorobi 6.3 42.9
Dechloromonas aromatica RCB B Betaproteobacteria 4.5 59.2
Polaromonas naphthalenivoransCJ2 B Betaproteobacteria 5.3 61.7
Acidovorax avenae subsp. Citrulli AAC00-1 B Betaproteobacteria 5.4 68.5
Delftia acidovorans SPH-1 B Betaproteobacteria 6.8 66.5
Chloroflexus aurantiacus J-10-fl B Chloroflexi 5.3 56.7
Roseiflexus castenholzii DSM 13941 B Chloroflexi 5.7 60.7
Roseiflexus sp. RS-1 B Chloroflexi 5.8 60.4
Herpetosiphon aurantiacus ATCC 23779 B Chloroflexi 6.7 50.9
Cyanothece sp. ATCC 51142 B Cyanobacteria 5.4 37.9
Microcystis aeruginosa NIES-843 B Cyanobacteria 5.8 42.3
Anabaena variabilis ATCC 29413 B Cyanobacteria 7.1 41.4
Nostoc sp. PCC 7120 B Cyanobacteria 7.2 41.3
Trichodesmium erythraeum IMS101 B Cyanobacteria 7.8 34.1
Acaryochloris marina MBIC11017 B Cyanobacteria 8.4 47.0
Geobacter uraniireducens Rf4 B Deltaproteobacteria 5.1 54.2
Desulfatibacillum alkenivorans B Deltaproteobacteria 6.5 54.5
Myxococcus xanthus DK 1622 B Deltaproteobacteria 9.1 68.9
Sorangium cellulosum 'So ce 56' B Deltaproteobacteria 13.0 71.4
Lysinibacillus sphaericus C3-41 B Firmicutes 4.8 37.1
Bacillus anthracis str. Ames B Firmicutes 5.2 35.4
Desulfitobacterium hafniense Y51 B Firmicutes 5.7 47.4
Bacillus weihenstephanensis KBAB4 B Firmicutes 5.9 35.5

T. Gu et al. 13 SI
Clostridium beijerinckii NCIMB 8052 B Firmicutes 6.0 29.9
Pectobacterium atrosepticum SCRI1043 B Gammaproteobacteria 5.1 51.0
Colwellia psychrerythraea 34H B Gammaproteobacteria 5.4 38.0
Serratia proteamaculans 568 B Gammaproteobacteria 5.5 55.0
Escherichia coli APEC O1 B Gammaproteobacteria 5.5 50.3
Pseudomonas entomophila L48 B Gammaproteobacteria 5.9 64.2
Pseudomonas putida KT2440 B Gammaproteobacteria 6.2 61.5
Pseudomonas syringae pv. tomato str. DC3000 B Gammaproteobacteria 6.5 58.3
Pseudomonas aeruginosa PA7 B Gammaproteobacteria 6.6 66.4
Pseudomonas fluorescens Pf-5 B Gammaproteobacteria 7.1 63.3
Hahella chejuensis KCTC 2396 B Gammaproteobacteria 7.2 53.9
Opitutus terrae PB90-1 B Other Bacteria 6.0 65.3
Rhodopirellula baltica SH 1 B Planctomycetes 7.1 55.4
These sequence data were downloaded from NCBI website (www.ncbi.nlm.nih.gov/sites/genome).

T. Gu et al. 14 SI
TABLE S3
Archaeal strains used in this study
King Group Size
(Mb)
GC content
(%)
Aeropyrum pernix K1 A Crenarchaeota 1.7 56.3
Archaeoglobus fulgidus DSM 4304 A Euryarchaeota 2.2 48.6
Archaeoglobus profundus DSM 5631 A Euryarchaeota 1.6 42.0
Caldivirga maquilingensis IC-167 A Crenarchaeota 2.1 43.1
Candidatus Korarchaeum cryptofilum OPF8 A Other Archaea 1.6 49.0
Candidatus Methanoregula boonei 6A8 A Euryarchaeota 2.5 54.5
Desulfurococcus kamchatkensis 1221n A Crenarchaeota 1.4 45.3
Halobacterium salinarum R1 A Euryarchaeota 2.0 68.0
Halobacterium sp. NRC-1 A Euryarchaeota 2.0 67.9
Halomicrobium mukohataei DSM 12286 A Euryarchaeota 3.1 65.6
Haloquadratum walsbyi DSM 16790 A Euryarchaeota 3.1 47.9
Halorhabdus utahensis DSM 12940 A Euryarchaeota 3.1 62.9
Haloterrigena turkmenica DSM 5511 A Euryarchaeota 3.9 65.8
Hyperthermus butylicus DSM 5456 A Crenarchaeota 1.7 53.7
Ignicoccus hospitalis KIN4/I A Crenarchaeota 1.3 56.5
Metallosphaera sedula DSM 5348 A Crenarchaeota 2.2 46.2
Methanobrevibacter smithii ATCC 35061 A Euryarchaeota 1.9 31.0
Methanocaldococcus fervens AG86 A Euryarchaeota 1.5 32.2
Methanocaldococcus jannaschii DSM 2661 A Euryarchaeota 1.7 31.4
Methanocaldococcus vulcanius M7 A Euryarchaeota 1.7 31.5
Methanocella paludicola SANAE A Euryarchaeota 3.0 54.9
Methanococcoides burtonii DSM 6242 A Euryarchaeota 2.6 40.8
Methanococcus aeolicus Nankai-3 A Euryarchaeota 1.6 30.0
Methanococcus maripaludis C5 A Euryarchaeota 1.8 33.0
Methanococcus maripaludis C6 A Euryarchaeota 1.7 33.4
Methanococcus maripaludis C7 A Euryarchaeota 1.8 33.3
Methanococcus maripaludis S2 A Euryarchaeota 1.7 33.1
Methanococcus vannielii SB A Euryarchaeota 1.7 31.3
Methanocorpusculum labreanum Z A Euryarchaeota 1.8 50.0
Methanoculleus marisnigri JR1 A Euryarchaeota 2.5 62.1
Methanopyrus kandleri AV19 A Euryarchaeota 1.7 61.2
Methanosaeta thermophila PT A Euryarchaeota 1.9 53.5
Methanosarcina acetivorans C2A A Euryarchaeota 5.8 42.7
Methanosarcina barkeri str. Fusaro_1 A Euryarchaeota 4.8 39.3
Methanosarcina mazei Go1 A Euryarchaeota 4.1 41.5
Methanosphaera stadtmanae DSM 3091 A Euryarchaeota 1.8 27.6
Methanosphaerula palustris E1-9c A Euryarchaeota 2.9 55.4
Methanospirillum hungatei JF-1 A Euryarchaeota 3.5 45.1
Nanoarchaeum equitans Kin4-M A Nanoarchaeota 0.5 31.6

T. Gu et al. 15 SI
Natronomonas pharaonis DSM 2160 A Euryarchaeota 2.6 63.4
Nitrosopumilus maritimus SCM1 A Crenarchaeota 1.6 34.2
Picrophilus torridus DSM 9790 A Euryarchaeota 1.5 36.0
Pyrobaculum aerophilum str. IM2 A Crenarchaeota 2.2 51.4
Pyrobaculum arsenaticum DSM 13514 A Crenarchaeota 2.1 55.1
Pyrobaculum calidifontis JCM 11548 A Crenarchaeota 2.0 57.2
Pyrobaculum islandicum DSM 4184 A Crenarchaeota 1.8 49.6
Pyrococcus abyssi GE5 A Euryarchaeota 1.8 44.7
Pyrococcus furiosus DSM 3638 A Euryarchaeota 1.9 40.8
Pyrococcus horikoshii OT3 A Euryarchaeota 1.7 41.9
Staphylothermus marinus F1 A Crenarchaeota 1.6 35.7
Sulfolobus acidocaldarius DSM 639 A Crenarchaeota 2.2 36.7
Sulfolobus islandicus L.S.2.15 A Crenarchaeota 2.7 35.1
Sulfolobus islandicus M.14.25 A Crenarchaeota 2.6 35.1
Sulfolobus islandicus M.16.27 A Crenarchaeota 2.7 35.0
Sulfolobus islandicus M.16.4 A Crenarchaeota 2.6 35.0
Sulfolobus islandicus Y.G.57.14 A Crenarchaeota 2.7 35.4
Sulfolobus islandicus Y.N.15.51 A Crenarchaeota 2.8 35.3
Sulfolobus solfataricus P2 A Crenarchaeota 3.0 35.8
Sulfolobus tokodaii str. 7 A Crenarchaeota 2.7 32.8
Thermococcus gammatolerans EJ3 A Euryarchaeota 2.0 53.6
Thermococcus kodakarensis KOD1 A Euryarchaeota 2.1 52.0
Thermococcus onnurineus NA1 A Euryarchaeota 1.8 51.3
Thermococcus sibiricus MM 739 A Euryarchaeota 1.8 40.2
Thermofilum pendens Hrk 5 A Crenarchaeota 1.8 57.7
Thermoplasma acidophilum DSM 1728 A Euryarchaeota 1.6 46.0
Thermoplasma volcanium GSS1 A Euryarchaeota 1.6 39.9
Thermoproteus neutrophilus V24Sta A Crenarchaeota 1.8 59.9
uncultured methanogenic archaeon RC-I A Euryarchaeota 3.2 54.6
These sequence data were downloaded from NCBI website (www.ncbi.nlm.nih.gov/sites/genome).

T. Gu et al. 16 SI
TABLE S4
Examples of sense:sense codon pairs with mononucleotide repeats.
2 3 4 5 6
CGAATC (132) CAAATG (57) CAAAAC (29) CAAAAA (5) AAAAAA (1) A/T
CGTTAC (108) GTTTAC (63) TTTTCG (30) TTTTTC (6) TTTTTT (1)
ATCCGA (144) ACCCGT (72) AACCCC (33) CCCCCA (6) CCCCCC (1) sense:sense pairs
C/G ACGGTA (132) CCGGGT (69) TGGGGA (32) TGGGGG (6) GGGGGG (1)
The numbers in bracket represent the number of codon pairs belong to each category, except those including a
stop codon (TGA, TAA, TAG). The italic letters marked the mononucleotides considered and the non-italic letters
could be any letter except for those which consisted of stop codon.

T. Gu et al. 17 SI
TABLE S5
Synonymous codon pairs with mononucleotide repeats
2 3 4 5 6
AAGAAG (1) AAGAAA (1) - AAAAAG (1) AAAAAA (1) A/T
TTCTTC (1) TTCTTT (1) - TTTTTC (1) TTTTTT (1)
CCTCCA (9) CCTCCC (3) - CCCCCA (3) CCCCCC (1) synonymous pairs
C/G GGAGGT (9) GGTGGG (3) - GGGGGA (3) GGGGGG (1)
The numbers in bracket represent the number of codon pairs belong to each category. The italic letters
indicate mononucleotide repeats considered. TTT and TTC encoding phenylalanine, AAA and AAG
encoding lysine, CCC, CCG, CCA and CCT encoding proline, GGG, GGC, GGA and GGT encoding
glycine.

T. Gu et al. 18 SI
TABLE S6
The average nucleotide divergence (D) and o/e6N in four comparisons of eukaryote genomes
conserved
level
CDS
length(bp)
CDS
number D spectrum
D
average o/e(6N)
Frequency of
6N( 10-3)
highly 1293144 1019 0 ~ 0.099 0.078 0.727 1.984
moderately 1294212 808 0.099 ~ 0.119 0.109 0.808 2.79 S. cerevisiae
less 1293987 1020 0.119 ~ 0.447 0.155 0.851 3.442
highly 1205748 730 0.005 ~ 0.066 0.051 0.368 0.438
moderately 1209369 658 0.066 ~ 0.089 0.077 0.399 0.471 D. melanogaster
less 1207668 939 0.089 ~ 0.646 0.14 0.591 0.956
highly 2923812 2541 0.013 ~ 0.227 0.181 0.509 0.946
moderately 2924169 2302 0.227 ~ 0.286 0.255 0.533 1.423 C. elegans
less 2923314 2674 0.286 ~ 0.665 0.36 0.581 1.931
highly 8411730 4986 0.015 ~ 0.131 0.101 0.532 1.41
moderately 8412294 4612 0.131 ~ 0.186 0.157 0.519 1.341 H. sapiens
less 8413053 5722 0.186 ~ 0.677 0.266 0.547 1.409

T. Gu et al. 19 SI
TABLE S7
o/e ratio of the sense:sense codon pairs in eukaryote genomes
A/T C/G A/T/C/G Species Repeats
o enor o/enor o enor o/enor o/enor
S. cerevisiae 2 201889 197990 1.020 167549 162261 1.033 1.026
3 178267 163699 1.089 59361 62948 0.943 1.048
4 117516 113094 1.039 16705 19861 0.841 1.010
5 33927 33743 1.005 2254 3060 0.737 0.983
6 7937 9792 0.811 198 417 0.475 0.797
0-1* 0.992
C. elegans 2 567119 520919 1.089 522210 561887 0.929 1.006
3 410468 393201 1.044 153728 189534 0.811 0.968
4 304855 283980 1.074 34235 45583 0.751 1.029
5 86434 89241 0.969 3355 6461 0.519 0.938
6 15833 24782 0.639 226 713 0.317 0.630
0-1* 1.003
D. melanogaster 2 251705 268062 0.939 877223 835307 1.050 1.023
3 209235 192237 1.088 255596 284561 0.898 0.975
4 106933 103017 1.038 58466 95913 0.610 0.831
5 25179 27044 0.931 7456 21430 0.348 0.673
6 3792 5510 0.688 658 4006 0.164 0.468
0-1* 1.008
A. thaliana 2 714185 663626 1.076 728585 782412 0.931 0.998
3 498667 494190 1.009 225671 288579 0.782 0.925
4 276121 309740 0.891 63055 90381 0.698 0.848
5 52733 82159 0.642 6200 15240 0.407 0.605
6 8108 20070 0.404 338 2196 0.154 0.379
0-1* 1.022
O. sativa 2 556373 558487 0.996 1669273 1660040 1.006 1.003
3 368494 370947 0.993 472982 603007 0.784 0.864
4 199742 203693 0.981 229157 258185 0.888 0.929
5 39691 51474 0.771 31925 58624 0.545 0.650
6 6541 10944 0.598 3525 12737 0.277 0.425
0-1* 1.020
P. trichocarpa 2 277857 262950 1.057 277825 271904 1.022 1.039
3 203342 194859 1.044 100401 106686 0.941 1.007
4 122776 123761 0.992 37303 40213 0.928 0.976
5 25343 32351 0.783 4744 7185 0.660 0.761
6 4372 7628 0.573 572 1304 0.439 0.553
0-1* 0.998
V. vinifera 2 490649 469022 1.046 598311 563878 1.061 1.054
3 357270 347570 1.028 227353 229066 0.993 1.014
4 211015 214280 0.985 91345 95028 0.961 0.978
5 44180 56117 0.787 11890 17024 0.698 0.767

T. Gu et al. 20 SI
6 7776 13017 0.597 1213 3465 0.350 0.545
0-1* 0.994
D. rerio 2 151680 198024 0.766 445213 441558 1.008 0.933
3 134432 125556 1.071 137434 154413 0.890 0.971
4 82117 89221 0.920 47664 56106 0.850 0.893
5 20039 24448 0.820 6869 10155 0.676 0.778
6 3952 7338 0.539 575 1789 0.321 0.496
0-1* 1.024
G. gallus 2 144489 160816 0.898 318367 306458 1.039 0.991
3 116509 109159 1.067 102821 107594 0.956 1.012
4 76297 77541 0.984 45823 47233 0.970 0.979
5 18799 22323 0.842 6506 8814 0.738 0.813
6 3751 6230 0.602 1159 2002 0.579 0.596
0-1* 1.006
H. sapiens 2 377178 433388 0.870 1193583 1081926 1.103 1.037
3 292616 285525 1.025 435475 418807 1.040 1.034
4 196623 202258 0.972 226520 214999 1.054 1.014
5 48859 57139 0.855 40482 45473 0.890 0.871
6 9542 15155 0.630 4767 11687 0.408 0.533
0-1* 0.992
P. troglodytes 2 315073 358318 0.879 931009 843754 1.103 1.037
3 248097 240328 1.032 336977 324156 1.040 1.036
4 167552 171994 0.974 170817 162067 1.054 1.013
5 41826 48876 0.856 29913 33455 0.894 0.871
6 8256 13032 0.634 3455 8318 0.415 0.549
0-1* 0.992
M. musculus 2 382538 459862 0.832 1216049 1112579 1.093 1.017
3 285771 294416 0.971 434098 425154 1.021 1.000
4 177784 193336 0.920 202323 199192 1.016 0.968
5 42836 53152 0.806 33101 39828 0.831 0.817
6 7897 13219 0.597 3241 8985 0.361 0.502
0-1* 1.002
R. norvegicus 2 256795 310109 0.828 855218 780508 1.096 1.020
3 193492 199737 0.969 305122 298271 1.023 1.001
4 119635 129586 0.923 143179 140749 1.017 0.972
5 28647 35564 0.805 23170 27776 0.834 0.818
6 5311 8897 0.597 2252 6228 0.362 0.500
0-1* 1.001
Eukaryotes 2 - - 0.940 - - 1.035 1.014
3 - - 1.032 - - 0.928 0.988
4 - - 0.975 - - 0.884 0.955
5 - - 0.831 - - 0.651 0.789
6 - - 0.602 - - 0.335 0.528
0-1* - - - - 1.004
Mammal 2 - - 0.852 - - 1.099 1.027

T. Gu et al. 21 SI
3 - - 0.999 - - 1.031 1.018
4 - - 0.947 - - 1.035 0.992
5 - - 0.830 - - 0.862 0.844
6 - - 0.614 - - 0.386 0.520
0-1* - - 0.997
Non-mammal 2 - - 0.982 - - 1.008 1.008
3 - - 1.048 - - 0.886 0.975
4 - - 0.988 - - 0.824 0.939
5 - - 0.832 - - 0.574 0.765
6 - - 0.596 - - 0.314 0.531
0-1* - - - - 1.007
* codon pairs with 0-1 repeats represents those with no mononucleotides in the pair junction. For each species, if all the
codon pairs with 0-6 repeats are considered, the sum of e equals the sum of the counts of o. At the bottom of the table is the
summary of o/enor for eukaryotes overall, mammals and non-mammalian species. They were calculated as a geometric mean
based on observed number of codon pairs. Group ‘Mammal’ includes H. sapiens (human), P. troglodytes (common chimpanzee),
M. musculus (house mouse) and R. norvegicus (brown rat).

T. Gu et al. 22 SI
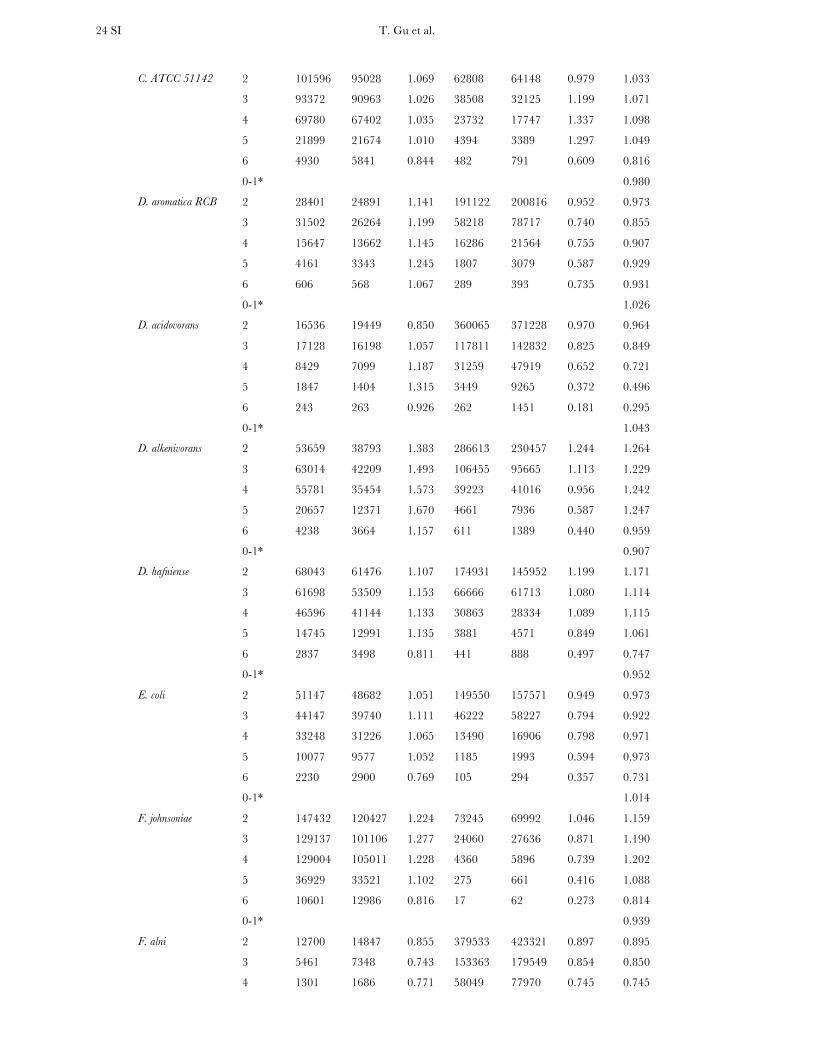
TABLE S8
o/e ratio of the sense:sense codon pairs in bacteria genomes
A/T C/G A/T/C/G Species Repeats
o enor o/enor o enor o/enor o/enor
A. marina 2 71024 76948 0.923 149442 149494 1.000 0.974
3 68945 69054 0.998 68822 62496 1.101 1.047
4 41287 43870 0.941 34060 30227 1.127 1.017
5 11545 11592 0.996 5343 5393 0.991 0.994
6 2105 2813 0.748 811 1137 0.713 0.738
0-1* 1.000
A. bacterium 2 44622 36261 1.231 197726 236762 0.835 0.888
3 34437 33265 1.035 55619 82189 0.677 0.780
4 15113 16922 0.893 15973 27858 0.573 0.694
5 3432 4372 0.785 1479 4033 0.367 0.584
6 429 722 0.594 91 627 0.145 0.385
0-1* 1.060
A. avenae 2 13125 12569 1.044 286322 304739 0.940 0.944
3 13456 10863 1.239 93685 115308 0.812 0.849
4 4543 4021 1.130 29435 42974 0.685 0.723
5 1058 753 1.404 3892 7911 0.492 0.571
6 142 124 1.143 421 1386 0.304 0.373
0-1* 1.051
A. variabilis 2 99528 98529 1.010 95162 98885 0.962 0.986
3 95146 88362 1.077 45886 42002 1.092 1.082
4 58133 57642 1.009 21374 17836 1.198 1.053
5 16300 16294 1.000 2576 3004 0.857 0.978
6 3065 3599 0.852 290 531 0.546 0.812
0-1* 0.992
A.aurescens 2 29349 25217 1.164 210683 197560 1.066 1.077
3 22202 20326 1.092 74346 80666 0.922 0.956
4 7437 7900 0.941 25254 30795 0.820 0.845
5 1102 1401 0.787 2694 5208 0.517 0.574
6 74 172 0.430 97 657 0.148 0.206
0-1* 0.997
B. anthracis 2 98645 96493 1.022 50693 62936 0.805 0.937
3 88678 79538 1.115 17005 20767 0.819 1.054
4 68363 66181 1.033 6303 6915 0.911 1.021
5 20581 21987 0.936 604 949 0.636 0.924
6 4679 6919 0.676 46 180 0.256 0.666
0-1* 1.007
B. weihenstephanensis 2 101264 98338 1.030 53614 65246 0.822 0.947
3 90626 81487 1.112 17720 21453 0.826 1.053
4 69630 67688 1.029 6807 7461 0.912 1.017

T. Gu et al. 23 SI
5 21138 22471 0.941 662 1026 0.645 0.928
6 5164 7307 0.707 54 193 0.279 0.696
0-1* 1.006
B.fragilis 2 77608 78312 0.991 127573 118289 1.078 1.044
3 66468 62159 1.069 42091 45070 0.934 1.012
4 46063 46405 0.993 12681 14322 0.885 0.967
5 12105 14155 0.855 1307 1968 0.664 0.832
6 2782 4440 0.627 108 250 0.432 0.616
0-1* 0.997
B. thetaiotaomicron 2 98798 99423 0.994 148563 143103 1.038 1.020
3 83578 78330 1.067 46506 53792 0.865 0.985
4 52576 55764 0.943 13547 15241 0.889 0.931
5 12965 16659 0.778 1275 1950 0.654 0.765
6 2610 4849 0.538 92 207 0.444 0.534
0-1* 1.006
B. indica subsp 2 31199 26180 1.192 134784 148182 0.910 0.952
3 33380 25986 1.285 41978 59637 0.704 0.880
4 17586 13813 1.273 13965 20373 0.685 0.923
5 3868 3365 1.150 1723 3355 0.514 0.832
6 448 589 0.760 172 502 0.343 0.568
0-1* 1.027
B.sp. ORS278 2 23196 22600 1.026 307338 380962 0.807 0.819
3 17130 17633 0.971 74997 139409 0.538 0.587
4 5500 6093 0.903 17985 36640 0.491 0.550
5 844 1060 0.796 1611 5284 0.305 0.387
6 78 136 0.571 111 597 0.186 0.258
0-1* 1.108
C. aurantiacus 2 40609 42127 0.964 155138 170549 0.910 0.920
3 23224 30644 0.758 55240 67912 0.813 0.796
4 11880 14347 0.828 18481 24473 0.755 0.782
5 2370 3390 0.699 2071 3930 0.527 0.607
6 375 716 0.524 213 610 0.349 0.443
0-1* 1.047
C. beijerinckii 2 146755 143077 1.026 48404 48673 0.994 1.018
3 109494 105601 1.037 15422 17178 0.898 1.017
4 90548 89874 1.007 5494 5255 1.045 1.010
5 25430 26186 0.971 572 718 0.797 0.966
6 6147 7965 0.772 56 99 0.568 0.769
0-1* 0.997
C. psychrerythraea 2 95371 93660 1.018 62415 72083 0.866 0.952
3 81117 79027 1.026 26322 27568 0.955 1.008
4 62969 62187 1.013 6952 7261 0.957 1.007
5 18454 17622 1.047 650 863 0.753 1.034
6 4804 5473 0.878 88 96 0.913 0.878
0-1* 1.006
T. Gu et al. 24 SI
C. ATCC 51142 2 101596 95028 1.069 62808 64148 0.979 1.033
3 93372 90963 1.026 38508 32125 1.199 1.071
4 69780 67402 1.035 23732 17747 1.337 1.098
5 21899 21674 1.010 4394 3389 1.297 1.049
6 4930 5841 0.844 482 791 0.609 0.816
0-1* 0.980
D. aromatica RCB 2 28401 24891 1.141 191122 200816 0.952 0.973
3 31502 26264 1.199 58218 78717 0.740 0.855
4 15647 13662 1.145 16286 21564 0.755 0.907
5 4161 3343 1.245 1807 3079 0.587 0.929
6 606 568 1.067 289 393 0.735 0.931
0-1* 1.026
D. acidovorans 2 16536 19449 0.850 360065 371228 0.970 0.964
3 17128 16198 1.057 117811 142832 0.825 0.849
4 8429 7099 1.187 31259 47919 0.652 0.721
5 1847 1404 1.315 3449 9265 0.372 0.496
6 243 263 0.926 262 1451 0.181 0.295
0-1* 1.043
D. alkenivorans 2 53659 38793 1.383 286613 230457 1.244 1.264
3 63014 42209 1.493 106455 95665 1.113 1.229
4 55781 35454 1.573 39223 41016 0.956 1.242
5 20657 12371 1.670 4661 7936 0.587 1.247
6 4238 3664 1.157 611 1389 0.440 0.959
0-1* 0.907
D. hafniense 2 68043 61476 1.107 174931 145952 1.199 1.171
3 61698 53509 1.153 66666 61713 1.080 1.114
4 46596 41144 1.133 30863 28334 1.089 1.115
5 14745 12991 1.135 3881 4571 0.849 1.061
6 2837 3498 0.811 441 888 0.497 0.747
0-1* 0.952
E. coli 2 51147 48682 1.051 149550 157571 0.949 0.973
3 44147 39740 1.111 46222 58227 0.794 0.922
4 33248 31226 1.065 13490 16906 0.798 0.971
5 10077 9577 1.052 1185 1993 0.594 0.973
6 2230 2900 0.769 105 294 0.357 0.731
0-1* 1.014
F. johnsoniae 2 147432 120427 1.224 73245 69992 1.046 1.159
3 129137 101106 1.277 24060 27636 0.871 1.190
4 129004 105011 1.228 4360 5896 0.739 1.202
5 36929 33521 1.102 275 661 0.416 1.088
6 10601 12986 0.816 17 62 0.273 0.814
0-1* 0.939
F. alni 2 12700 14847 0.855 379533 423321 0.897 0.895
3 5461 7348 0.743 153363 179549 0.854 0.850
4 1301 1686 0.771 58049 77970 0.745 0.745

T. Gu et al. 25 SI
5 196 219 0.893 8533 14686 0.581 0.586
6 18 28 0.639 919 2874 0.320 0.323
0-1* 1.072
G. uraniireducens 2 46581 39995 1.165 192878 178174 1.083 1.098
3 40075 33659 1.191 62165 69316 0.897 0.993
4 28196 22846 1.234 32299 30728 1.051 1.129
5 8642 6926 1.248 3987 4913 0.812 1.067
6 1977 1802 1.097 1010 954 1.059 1.084
0-1* 0.974
H. chejuensis 2 59918 56598 1.059 247494 261146 0.948 0.967
3 60572 52332 1.157 78656 94088 0.836 0.951
4 36439 33866 1.076 26080 32550 0.801 0.941
5 10534 9804 1.074 2802 5035 0.557 0.899
6 1937 2555 0.758 302 724 0.417 0.683
0-1* 1.015
H. aurantiacus 2 86642 66946 1.294 149147 171104 0.872 0.991
3 72525 67540 1.074 63578 69054 0.921 0.996
4 34885 34943 0.998 18840 23365 0.806 0.921
5 9952 9109 1.093 1372 3533 0.388 0.896
6 1574 2038 0.772 93 420 0.221 0.678
0-1* 1.007
L. sphaericus 2 77491 80151 0.967 64871 62929 1.031 0.995
3 72587 65066 1.116 19574 20713 0.945 1.074
4 54636 51513 1.061 7598 7471 1.017 1.055
5 17469 15921 1.097 759 983 0.772 1.078
6 4056 4823 0.841 94 180 0.523 0.830
0-1* 0.990
M. loti 2 35093 29020 1.209 294816 328383 0.898 0.923
3 34575 27328 1.265 74375 126778 0.587 0.707
4 14674 12166 1.206 17992 34130 0.527 0.706
5 2506 2502 1.002 1647 4866 0.338 0.564
6 257 348 0.738 125 541 0.231 0.430
0-1* 1.062
M. radiotolerans 2 8878 7711 1.151 332728 360218 0.924 0.928
3 5274 5687 0.927 121621 143866 0.845 0.848
4 1023 1431 0.715 33034 50478 0.654 0.656
5 169 204 0.829 3797 8093 0.469 0.478
6 33 30 1.107 310 1229 0.252 0.272
0-1* 1.063
M. aeruginosa 2 93611 83286 1.124 99129 93823 1.057 1.088
3 86176 78102 1.103 51837 41371 1.253 1.155
4 68568 59379 1.155 29336 22360 1.312 1.198
5 21875 19682 1.111 5155 4432 1.163 1.121
6 4930 5582 0.883 972 1129 0.861 0.879
0-1* 0.955

T. Gu et al. 26 SI
M. smegmatis 2 20061 23054 0.870 326748 383968 0.851 0.852
3 12195 15870 0.768 107452 142610 0.753 0.755
4 3127 4516 0.692 34823 55117 0.632 0.636
5 451 703 0.642 3490 8917 0.391 0.410
6 20 70 0.285 88 1386 0.063 0.074
0-1* 1.087
M.vanbaalenii 2 19477 20966 0.929 310369 355110 0.874 0.877
3 10960 14158 0.774 107135 138276 0.775 0.775
4 2614 3948 0.662 37871 54565 0.694 0.692
5 316 586 0.539 4276 9031 0.473 0.477
6 20 58 0.346 239 1473 0.162 0.169
0-1* 1.077
M. xanthus 2 22470 22740 0.988 543975 548434 0.992 0.992
3 13028 16328 0.798 175859 199546 0.881 0.875
4 2738 4319 0.634 71659 87169 0.822 0.813
5 346 577 0.599 8412 15233 0.552 0.554
6 29 56 0.519 1143 3438 0.332 0.335
0-1* 1.031
N. farcinica 2 10846 11560 0.938 306985 354835 0.865 0.867
3 6898 8400 0.821 112963 142149 0.795 0.796
4 1047 2009 0.521 33089 53458 0.619 0.615
5 87 262 0.332 4455 9461 0.471 0.467
6 3 27 0.112 129 1404 0.092 0.092
0-1* 1.088
N. PCC 7120 2 101174 99869 1.013 96331 99846 0.965 0.989
3 96744 90059 1.074 46479 42562 1.092 1.080
4 59788 59117 1.011 21905 18299 1.197 1.055
5 16821 16758 1.004 2599 3043 0.854 0.981
6 3163 3695 0.856 289 533 0.542 0.817
0-1* 0.991
O. terrae 2 24375 20209 1.206 242758 306422 0.792 0.818
3 25404 18811 1.350 67113 110286 0.609 0.717
4 13098 10064 1.301 19202 37092 0.518 0.685
5 3662 2508 1.460 1880 5608 0.335 0.683
6 477 457 1.043 151 806 0.187 0.497
0-1* 1.093
P. atrosepticum 2 45340 48191 0.941 144636 160392 0.902 0.911
3 41669 39014 1.068 42824 56242 0.761 0.887
4 29957 28090 1.066 13812 18096 0.763 0.948
5 8502 8216 1.035 1208 2227 0.543 0.930
6 1732 2317 0.748 163 354 0.460 0.710
0-1* 1.031
P. naphthalenivorans 2 19026 15334 1.241 205635 218273 0.942 0.962
3 22361 16582 1.348 64043 86072 0.744 0.842
4 16886 11383 1.483 14371 24479 0.587 0.872

T. Gu et al. 27 SI
5 6057 3234 1.873 1323 4066 0.325 1.011
6 1053 851 1.238 124 513 0.242 0.863
0-1* 1.032
P. aeruginosa 2 17464 15834 1.103 373102 382759 0.975 0.980
3 18251 15817 1.154 108821 145311 0.749 0.789
4 5203 5830 0.892 25216 39579 0.637 0.670
5 1000 1095 0.913 2030 5540 0.366 0.457
6 171 179 0.956 144 610 0.236 0.399
0-1* 1.046
P. entomophila 2 18830 17621 1.069 307326 315901 0.973 0.978
3 17708 17620 1.005 101885 119950 0.849 0.869
4 5698 6583 0.866 27827 36222 0.768 0.783
5 1305 1347 0.969 2638 5044 0.523 0.617
6 218 207 1.055 215 674 0.319 0.492
0-1* 1.031
P. fluorescens 2 25967 22983 1.130 367159 356426 1.030 1.036
3 25702 23619 1.088 135495 143623 0.943 0.964
4 10803 10665 1.013 42915 48275 0.889 0.911
5 2698 2373 1.137 3385 7271 0.466 0.631
6 376 409 0.920 269 970 0.277 0.468
0-1* 1.001
P. putida 2 27115 26627 1.018 289368 294366 0.983 0.986
3 26122 24964 1.046 95457 112234 0.851 0.886
4 10890 10855 1.003 25264 32669 0.773 0.831
5 2611 2402 1.087 2487 4329 0.574 0.757
6 356 407 0.875 257 580 0.443 0.621
0-1* 1.023
P. syringae 2 37157 34831 1.067 234624 267347 0.878 0.899
3 34865 32214 1.082 78096 99115 0.788 0.860
4 19931 18237 1.093 18023 27327 0.660 0.833
5 5515 4653 1.185 1548 3507 0.441 0.866
6 940 1008 0.933 128 437 0.293 0.739
0-1* 1.044
R. leguminosarum 2 28215 22899 1.232 197763 226519 0.873 0.906
3 29282 22436 1.305 53447 84840 0.630 0.771
4 12201 10229 1.193 12599 22647 0.556 0.754
5 1959 1989 0.985 1204 3234 0.372 0.606
6 203 275 0.739 86 369 0.233 0.449
0-1* 1.056
R. RHA1 2 26712 28583 0.935 358440 419010 0.855 0.860
3 12767 18083 0.706 131830 163191 0.808 0.798
4 2460 4873 0.505 48436 66072 0.733 0.717
5 273 636 0.429 5944 10814 0.550 0.543
6 17 65 0.260 268 1679 0.160 0.163
0-1* 1.077

T. Gu et al. 28 SI
R.baltica 2 92151 72214 1.276 228844 268980 0.851 0.941
3 78846 68796 1.146 66533 94091 0.707 0.893
4 32560 33095 0.984 22235 33283 0.668 0.825
5 6916 8256 0.838 2402 5412 0.444 0.682
6 819 1555 0.527 188 878 0.214 0.414
0-1* 1.032
R. castenholzii 2 34290 33519 1.023 188568 232168 0.812 0.839
3 21870 26451 0.827 48214 79488 0.607 0.662
4 10627 11966 0.888 19077 30948 0.616 0.692
5 2199 2856 0.770 1887 4459 0.423 0.559
6 330 554 0.596 224 758 0.296 0.422
0-1* 1.085
R. RS-1 2 35382 36136 0.979 197635 243391 0.812 0.834
3 22025 27250 0.808 55543 83691 0.664 0.699
4 11133 12307 0.905 21774 33015 0.660 0.726
5 2438 2955 0.825 2393 4886 0.490 0.616
6 319 556 0.574 328 873 0.376 0.453
0-1* 1.081
R. denitrificans 2 23575 23357 1.009 156714 170444 0.919 0.930
3 29926 23451 1.276 52747 63400 0.832 0.952
4 18548 14828 1.251 23872 29262 0.816 0.962
5 4368 3797 1.150 2851 4359 0.654 0.885
6 414 871 0.475 492 922 0.533 0.505
0-1* 1.024
S.arenicola 2 13336 18152 0.735 297474 308568 0.964 0.951
3 6464 9765 0.662 110957 129059 0.860 0.846
4 1653 2318 0.713 37365 49140 0.760 0.758
5 271 329 0.823 4593 8480 0.542 0.552
6 14 35 0.402 305 1416 0.215 0.220
0-1* 1.049
S. proteamaculans 2 39161 36594 1.070 213232 208091 1.025 1.032
3 39159 32998 1.187 61006 80244 0.760 0.885
4 26575 23141 1.148 19415 23186 0.837 0.993
5 7201 6643 1.084 1785 2818 0.633 0.950
6 1474 1868 0.789 175 401 0.437 0.727
0-1* 1.006
S. usitatus 2 65476 51345 1.275 436941 463126 0.943 0.977
3 53225 45719 1.164 126252 172919 0.730 0.821
4 22646 21337 1.061 45366 69268 0.655 0.751
5 4551 4966 0.916 4822 11829 0.408 0.558
6 421 771 0.546 447 2132 0.210 0.299
0-1* 1.039
S.cellulosum 2 22796 23780 0.959 603614 734549 0.822 0.826
3 12955 13642 0.950 193455 266490 0.726 0.737
4 3292 3698 0.890 92034 128663 0.715 0.720

T. Gu et al. 29 SI
5 558 660 0.846 12035 21442 0.561 0.570
6 67 79 0.850 1734 4827 0.359 0.367
0-1* 1.102
T. erythraeum 2 110636 107004 1.034 68293 63007 1.084 1.052
3 101064 93766 1.078 32841 28270 1.162 1.097
4 77174 73174 1.055 13499 10434 1.294 1.085
5 24320 23241 1.046 1753 1667 1.052 1.047
6 5656 6150 0.920 180 264 0.682 0.910
0-1* 0.975
geometric mean 2 - - 1.055 - - 0.940 0.962
3 - - 1.046 - - 0.831 0.898
4 - - 0.983 - - 0.788 0.861
5 - - 0.952 - - 0.551 0.737
6 - - 0.696 - - 0.325 0.488
0-1* - - - - 1.026
* codon pairs with 0-1 repeats represents those with no mononucleotides in the pair junction. For each species, if
all the codon pairs with 0-6 repeats are considered, the sum of e equals the sum of the counts of o.

T. Gu et al. 30 SI
TABLE S9
o/e ratio of the sense:sense codon pairs in archaeal genomes
A/T C/G A/T/C/G Species repeats
o enor o/enor o enor o/enor o/enor
A. pernix 2 15992 19076 0.838 62599 58359 1.073 1.015
3 7825 8767 0.893 28279 26638 1.062 1.020
4 3230 3488 0.926 16581 14980 1.107 1.073
5 475 587 0.809 3054 3007 1.016 0.982
6 35 88 0.397 555 813 0.683 0.655
0-1* 0.992
A. fulgidus 2 34868 27380 1.273 65443 67915 0.964 1.053
3 28630 21315 1.343 23753 25137 0.945 1.128
4 16783 13371 1.255 11190 10981 1.019 1.149
5 4599 3676 1.251 1346 1583 0.850 1.130
6 631 783 0.806 153 330 0.463 0.705
0-1* 0.970
A. profundus 2 33903 28932 1.172 30755 35392 0.869 1.005
3 26142 22822 1.145 12274 13715 0.895 1.051
4 13735 13948 0.985 3346 3858 0.867 0.959
5 3003 3423 0.877 321 482 0.666 0.851
6 398 704 0.566 19 73 0.259 0.537
0-1* 0.998
C. maquilingensis 2 50332 45251 1.112 50258 39265 1.280 1.190
3 15823 27266 0.580 25751 22070 1.167 0.843
4 4027 8250 0.488 9985 8762 1.140 0.824
5 470 1181 0.398 1484 1519 0.977 0.724
6 33 109 0.303 56 226 0.248 0.266
0-1* 0.990
C. Korarchaeum 2 23537 27571 0.854 43137 43248 0.997 0.941
3 11965 15365 0.779 22096 20347 1.086 0.954
4 4103 5021 0.817 12445 11328 1.099 1.012
5 650 763 0.852 1908 2056 0.928 0.907
6 81 124 0.652 209 504 0.415 0.462
0-1* 1.018
C. Methanoregula 2 21923 21332 1.028 96192 83986 1.145 1.122
3 16109 14775 1.090 39021 35527 1.098 1.096
4 13321 11199 1.189 16029 17402 0.921 1.026
5 4757 3896 1.221 2236 2720 0.822 1.057
6 1381 1328 1.040 330 640 0.516 0.869
0-1* 0.965
D. kamchatkensis 2 23833 27085 0.880 32018 29830 1.073 0.981
3 10915 13889 0.786 14210 13800 1.030 0.907
4 5226 7396 0.707 6374 6285 1.014 0.848
5 972 1433 0.678 934 1005 0.929 0.782

T. Gu et al. 31 SI
6 147 264 0.557 58 204 0.284 0.438
0-1* 1.022
H. salinarum 2 4379 4701 0.932 96719 112628 0.859 0.862
3 3267 3947 0.828 27541 35544 0.775 0.780
4 1084 1534 0.707 14672 18483 0.794 0.787
5 300 300 0.998 1709 2674 0.639 0.676
6 19 43 0.440 174 588 0.296 0.306
0-1* 1.073
H. sp. NRC-1 2 4452 4721 0.943 94553 109964 0.860 0.863
3 3249 3916 0.830 27007 34854 0.775 0.780
4 1080 1518 0.712 14412 18138 0.795 0.788
5 296 298 0.993 1699 2633 0.645 0.681
6 17 42 0.406 167 576 0.290 0.298
0-1* 1.072
H. mukohataei 2 7124 10506 0.678 134129 160943 0.833 0.824
3 4134 7455 0.555 39541 51383 0.770 0.742
4 1483 2451 0.605 16521 22884 0.722 0.711
5 432 465 0.929 1544 3110 0.496 0.553
6 28 69 0.408 141 626 0.225 0.243
0-1* 1.087
H. walsbyi 2 38559 40434 0.954 48943 60751 0.806 0.865
3 20631 25845 0.798 18326 21733 0.843 0.819
4 9028 11828 0.763 6170 8279 0.745 0.756
5 2088 2827 0.739 780 1194 0.653 0.713
6 347 464 0.747 85 223 0.382 0.629
0-1* 1.048
H. utahensis 2 12710 14790 0.859 126401 146933 0.860 0.860
3 9137 11726 0.779 41865 49070 0.853 0.839
4 3156 4173 0.756 17269 23238 0.743 0.745
5 706 793 0.891 1738 3173 0.548 0.616
6 25 89 0.281 165 721 0.229 0.235
0-1* 1.064
H. turkmenica 2 10898 10720 1.017 160816 197139 0.816 0.826
3 6400 8700 0.736 47936 62352 0.769 0.765
4 1791 2846 0.629 20107 27511 0.731 0.721
5 364 500 0.728 1705 3686 0.463 0.494
6 13 63 0.207 148 686 0.216 0.215
0-1* 1.084
H. butylicus 2 18267 21515 0.849 49468 49397 1.001 0.955
3 7756 9832 0.789 18376 19773 0.929 0.883
4 2814 3768 0.747 7235 7921 0.913 0.860
5 390 662 0.589 922 1192 0.773 0.708
6 19 99 0.192 80 235 0.340 0.296
0-1* 1.027
I. hospitalis 2 14710 11174 1.316 53659 52405 1.024 1.075
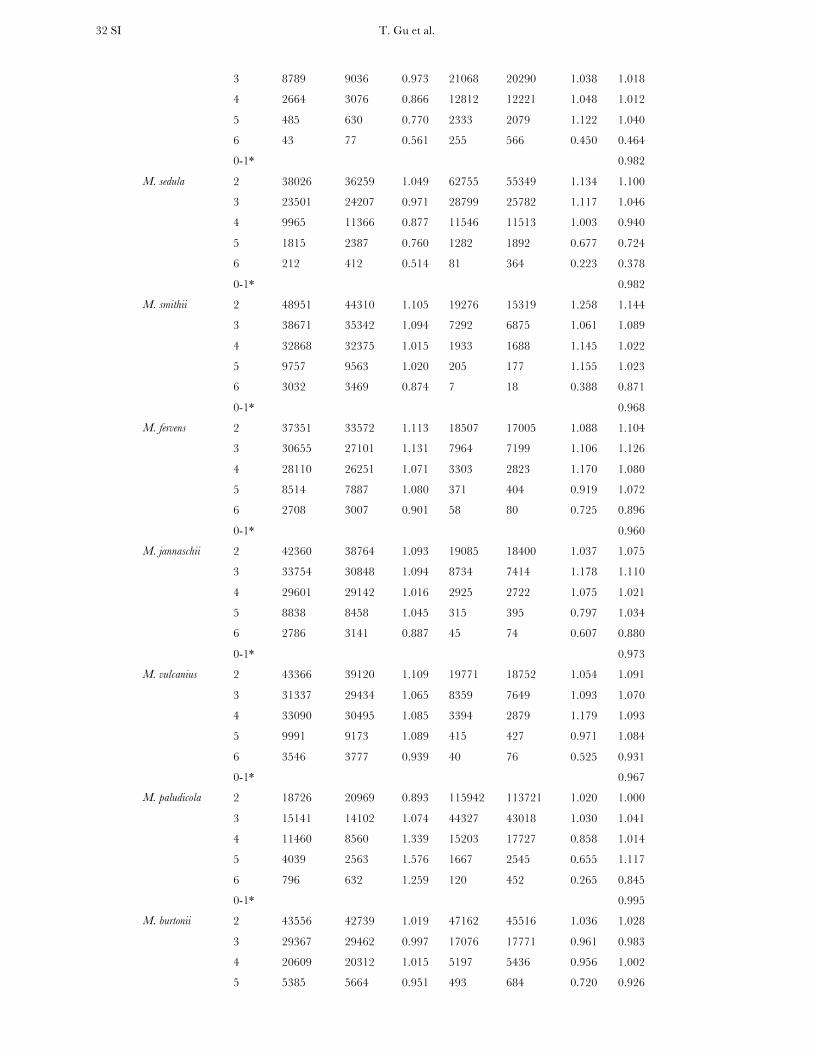
T. Gu et al. 32 SI
3 8789 9036 0.973 21068 20290 1.038 1.018
4 2664 3076 0.866 12812 12221 1.048 1.012
5 485 630 0.770 2333 2079 1.122 1.040
6 43 77 0.561 255 566 0.450 0.464
0-1* 0.982
M. sedula 2 38026 36259 1.049 62755 55349 1.134 1.100
3 23501 24207 0.971 28799 25782 1.117 1.046
4 9965 11366 0.877 11546 11513 1.003 0.940
5 1815 2387 0.760 1282 1892 0.677 0.724
6 212 412 0.514 81 364 0.223 0.378
0-1* 0.982
M. smithii 2 48951 44310 1.105 19276 15319 1.258 1.144
3 38671 35342 1.094 7292 6875 1.061 1.089
4 32868 32375 1.015 1933 1688 1.145 1.022
5 9757 9563 1.020 205 177 1.155 1.023
6 3032 3469 0.874 7 18 0.388 0.871
0-1* 0.968
M. fervens 2 37351 33572 1.113 18507 17005 1.088 1.104
3 30655 27101 1.131 7964 7199 1.106 1.126
4 28110 26251 1.071 3303 2823 1.170 1.080
5 8514 7887 1.080 371 404 0.919 1.072
6 2708 3007 0.901 58 80 0.725 0.896
0-1* 0.960
M. jannaschii 2 42360 38764 1.093 19085 18400 1.037 1.075
3 33754 30848 1.094 8734 7414 1.178 1.110
4 29601 29142 1.016 2925 2722 1.075 1.021
5 8838 8458 1.045 315 395 0.797 1.034
6 2786 3141 0.887 45 74 0.607 0.880
0-1* 0.973
M. vulcanius 2 43366 39120 1.109 19771 18752 1.054 1.091
3 31337 29434 1.065 8359 7649 1.093 1.070
4 33090 30495 1.085 3394 2879 1.179 1.093
5 9991 9173 1.089 415 427 0.971 1.084
6 3546 3777 0.939 40 76 0.525 0.931
0-1* 0.967
M. paludicola 2 18726 20969 0.893 115942 113721 1.020 1.000
3 15141 14102 1.074 44327 43018 1.030 1.041
4 11460 8560 1.339 15203 17727 0.858 1.014
5 4039 2563 1.576 1667 2545 0.655 1.117
6 796 632 1.259 120 452 0.265 0.845
0-1* 0.995
M. burtonii 2 43556 42739 1.019 47162 45516 1.036 1.028
3 29367 29462 0.997 17076 17771 0.961 0.983
4 20609 20312 1.015 5197 5436 0.956 1.002
5 5385 5664 0.951 493 684 0.720 0.926

T. Gu et al. 33 SI
6 1223 1519 0.805 57 103 0.551 0.789
0-1* 0.998
M. aeolicus 2 39765 37467 1.061 18702 12827 1.458 1.163
3 30475 26535 1.149 8557 6061 1.412 1.197
4 31098 28436 1.094 4192 2792 1.502 1.130
5 9040 8514 1.062 652 443 1.473 1.082
6 3284 3562 0.922 70 78 0.900 0.921
0-1* 0.938
M. maripaludis
C5 2 46221 37585 1.230 18172 17315 1.049 1.173
3 36159 29476 1.227 8825 7784 1.134 1.207
4 38369 32043 1.197 3352 2364 1.418 1.213
5 11523 10616 1.085 443 323 1.370 1.094
6 3643 4021 0.906 37 49 0.750 0.904
0-1* 0.931
M. maripaludis
C6 2 45755 36903 1.240 18583 17725 1.048 1.178
3 35373 28742 1.231 8995 7946 1.132 1.209
4 37535 31075 1.208 3390 2373 1.428 1.224
5 11083 10208 1.086 391 319 1.226 1.090
6 3474 3793 0.916 40 45 0.882 0.915
0-1* 0.929
M. maripaludis
C7 2 46327 37521 1.235 18663 17559 1.063 1.180
3 35863 29295 1.224 9171 7998 1.147 1.208
4 37801 31390 1.204 3427 2421 1.415 1.219
5 11229 10300 1.090 445 332 1.339 1.098
6 3467 3829 0.905 26 48 0.546 0.901
0-1* 0.929
M. maripaludis
S2 2 44525 35925 1.239 17098 16139 1.059 1.184
3 34439 27898 1.234 8578 7518 1.141 1.215
4 37456 31021 1.207 3139 2253 1.393 1.220
5 11064 10215 1.083 351 301 1.167 1.086
6 3554 3878 0.917 17 42 0.401 0.911
0-1* 0.928
M. vannielii 2 46156 37598 1.228 16659 13921 1.197 1.219
3 36755 29840 1.232 8676 6712 1.293 1.243
4 39078 32571 1.200 3754 2602 1.443 1.218
5 12311 11096 1.110 535 408 1.313 1.117
6 3921 4038 0.971 58 73 0.796 0.968
0-1* 0.915
M. labreanum 2 19577 19313 1.014 49616 52061 0.953 0.969
3 15373 14231 1.080 18462 20544 0.899 0.973
4 13754 11610 1.185 6370 7696 0.828 1.042

T. Gu et al. 34 SI
5 4093 3554 1.152 781 1071 0.729 1.054
6 1110 1234 0.899 80 181 0.443 0.841
0-1* 1.006
M. marisnigri 2 12000 11122 1.079 110946 113345 0.979 0.988
3 7206 8063 0.894 39791 42151 0.944 0.936
4 4101 4595 0.892 20011 23184 0.863 0.868
5 1074 1220 0.880 2626 3445 0.762 0.793
6 188 253 0.742 408 909 0.449 0.513
0-1* 1.020
M. kandleri 2 8873 10370 0.856 75340 76387 0.986 0.971
3 5202 6909 0.753 26701 28553 0.935 0.900
4 1949 2502 0.779 10156 12803 0.793 0.791
5 345 439 0.786 1075 1816 0.592 0.630
6 42 74 0.570 61 411 0.149 0.213
0-1* 1.032
M. thermophila 2 17175 22116 0.777 55871 61467 0.909 0.874
3 9218 9783 0.942 20524 23777 0.863 0.886
4 3585 3743 0.958 8064 9267 0.870 0.895
5 757 747 1.014 816 1264 0.646 0.782
6 136 139 0.976 73 222 0.329 0.579
0-1* 1.043
M. acetivorans 2 80873 69760 1.159 114247 100892 1.132 1.143
3 63399 52558 1.206 48041 42558 1.129 1.172
4 54134 44084 1.228 19080 19380 0.985 1.154
5 16511 14499 1.139 2098 2838 0.739 1.073
6 4096 4591 0.892 243 610 0.399 0.834
0-1* 0.950
M. barkeri str.
Fusaro_1 2 73194 65596 1.116 77897 70096 1.111 1.113
3 55428 47792 1.160 31212 29922 1.043 1.115
4 48938 40940 1.195 9946 11106 0.896 1.131
5 14469 13127 1.102 956 1508 0.634 1.054
6 3467 4024 0.862 70 262 0.267 0.825
0-1* 0.962
M. mazei 2 61774 54142 1.141 80930 71193 1.137 1.139
3 48485 39891 1.215 34959 30260 1.155 1.189
4 42617 34312 1.242 12450 13091 0.951 1.162
5 12994 11434 1.136 1235 1850 0.667 1.071
6 3226 3669 0.879 122 386 0.316 0.826
0-1* 0.949
M. stadtmanae 2 49678 50518 0.983 10605 9016 1.176 1.013
3 30597 33048 0.926 4499 3856 1.167 0.951
4 27496 29973 0.917 1095 803 1.364 0.929
5 7762 8331 0.932 106 82 1.288 0.935
6 2453 2887 0.850 3 8 0.384 0.849
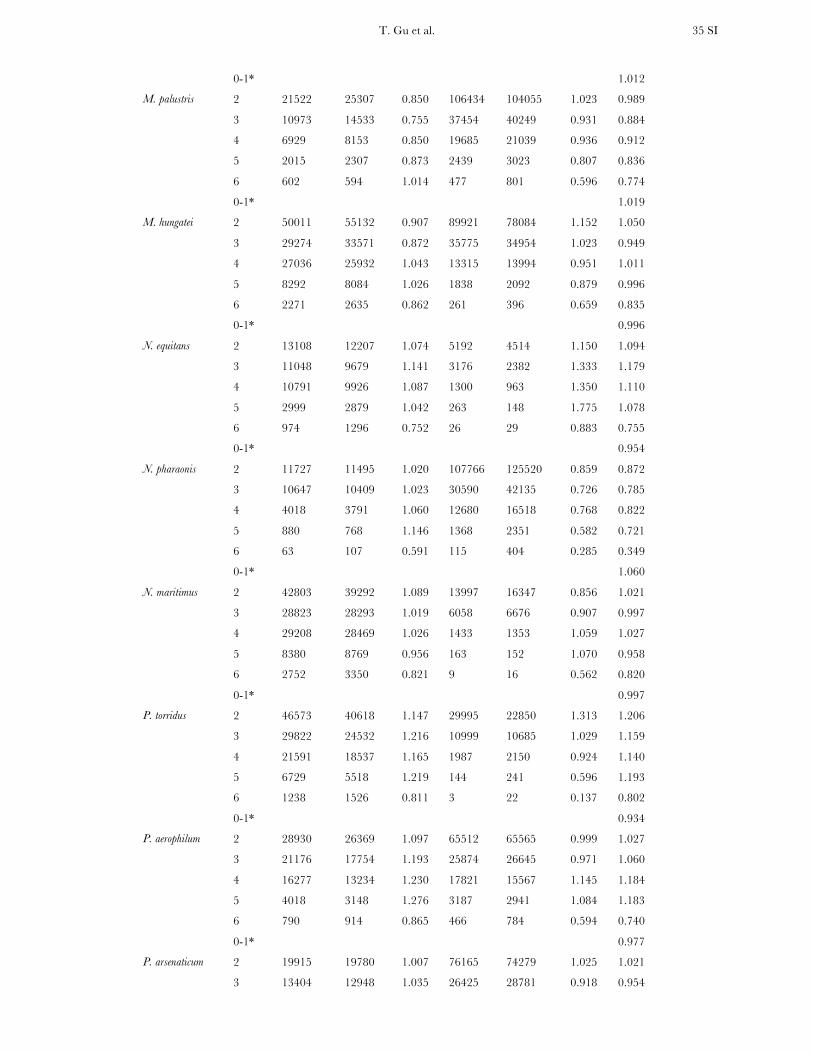
T. Gu et al. 35 SI
0-1* 1.012
M. palustris 2 21522 25307 0.850 106434 104055 1.023 0.989
3 10973 14533 0.755 37454 40249 0.931 0.884
4 6929 8153 0.850 19685 21039 0.936 0.912
5 2015 2307 0.873 2439 3023 0.807 0.836
6 602 594 1.014 477 801 0.596 0.774
0-1* 1.019
M. hungatei 2 50011 55132 0.907 89921 78084 1.152 1.050
3 29274 33571 0.872 35775 34954 1.023 0.949
4 27036 25932 1.043 13315 13994 0.951 1.011
5 8292 8084 1.026 1838 2092 0.879 0.996
6 2271 2635 0.862 261 396 0.659 0.835
0-1* 0.996
N. equitans 2 13108 12207 1.074 5192 4514 1.150 1.094
3 11048 9679 1.141 3176 2382 1.333 1.179
4 10791 9926 1.087 1300 963 1.350 1.110
5 2999 2879 1.042 263 148 1.775 1.078
6 974 1296 0.752 26 29 0.883 0.755
0-1* 0.954
N. pharaonis 2 11727 11495 1.020 107766 125520 0.859 0.872
3 10647 10409 1.023 30590 42135 0.726 0.785
4 4018 3791 1.060 12680 16518 0.768 0.822
5 880 768 1.146 1368 2351 0.582 0.721
6 63 107 0.591 115 404 0.285 0.349
0-1* 1.060
N. maritimus 2 42803 39292 1.089 13997 16347 0.856 1.021
3 28823 28293 1.019 6058 6676 0.907 0.997
4 29208 28469 1.026 1433 1353 1.059 1.027
5 8380 8769 0.956 163 152 1.070 0.958
6 2752 3350 0.821 9 16 0.562 0.820
0-1* 0.997
P. torridus 2 46573 40618 1.147 29995 22850 1.313 1.206
3 29822 24532 1.216 10999 10685 1.029 1.159
4 21591 18537 1.165 1987 2150 0.924 1.140
5 6729 5518 1.219 144 241 0.596 1.193
6 1238 1526 0.811 3 22 0.137 0.802
0-1* 0.934
P. aerophilum 2 28930 26369 1.097 65512 65565 0.999 1.027
3 21176 17754 1.193 25874 26645 0.971 1.060
4 16277 13234 1.230 17821 15567 1.145 1.184
5 4018 3148 1.276 3187 2941 1.084 1.183
6 790 914 0.865 466 784 0.594 0.740
0-1* 0.977
P. arsenaticum 2 19915 19780 1.007 76165 74279 1.025 1.021
3 13404 12948 1.035 26425 28781 0.918 0.954
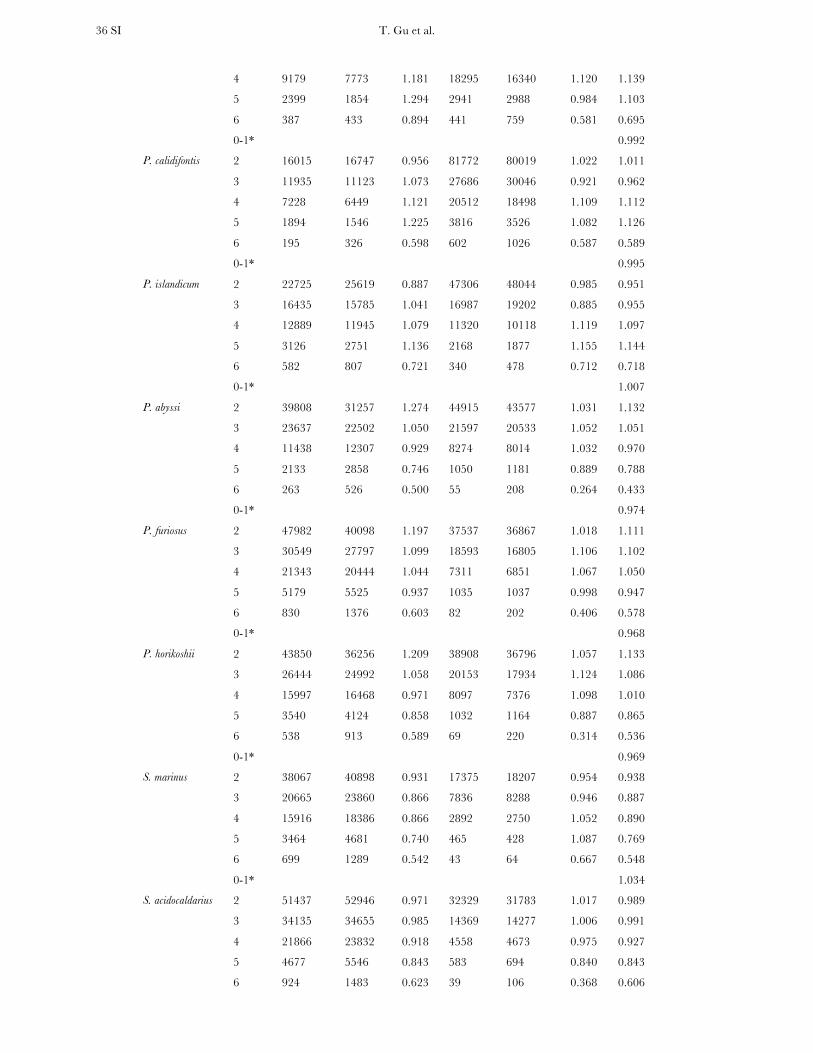
T. Gu et al. 36 SI
4 9179 7773 1.181 18295 16340 1.120 1.139
5 2399 1854 1.294 2941 2988 0.984 1.103
6 387 433 0.894 441 759 0.581 0.695
0-1* 0.992
P. calidifontis 2 16015 16747 0.956 81772 80019 1.022 1.011
3 11935 11123 1.073 27686 30046 0.921 0.962
4 7228 6449 1.121 20512 18498 1.109 1.112
5 1894 1546 1.225 3816 3526 1.082 1.126
6 195 326 0.598 602 1026 0.587 0.589
0-1* 0.995
P. islandicum 2 22725 25619 0.887 47306 48044 0.985 0.951
3 16435 15785 1.041 16987 19202 0.885 0.955
4 12889 11945 1.079 11320 10118 1.119 1.097
5 3126 2751 1.136 2168 1877 1.155 1.144
6 582 807 0.721 340 478 0.712 0.718
0-1* 1.007
P. abyssi 2 39808 31257 1.274 44915 43577 1.031 1.132
3 23637 22502 1.050 21597 20533 1.052 1.051
4 11438 12307 0.929 8274 8014 1.032 0.970
5 2133 2858 0.746 1050 1181 0.889 0.788
6 263 526 0.500 55 208 0.264 0.433
0-1* 0.974
P. furiosus 2 47982 40098 1.197 37537 36867 1.018 1.111
3 30549 27797 1.099 18593 16805 1.106 1.102
4 21343 20444 1.044 7311 6851 1.067 1.050
5 5179 5525 0.937 1035 1037 0.998 0.947
6 830 1376 0.603 82 202 0.406 0.578
0-1* 0.968
P. horikoshii 2 43850 36256 1.209 38908 36796 1.057 1.133
3 26444 24992 1.058 20153 17934 1.124 1.086
4 15997 16468 0.971 8097 7376 1.098 1.010
5 3540 4124 0.858 1032 1164 0.887 0.865
6 538 913 0.589 69 220 0.314 0.536
0-1* 0.969
S. marinus 2 38067 40898 0.931 17375 18207 0.954 0.938
3 20665 23860 0.866 7836 8288 0.946 0.887
4 15916 18386 0.866 2892 2750 1.052 0.890
5 3464 4681 0.740 465 428 1.087 0.769
6 699 1289 0.542 43 64 0.667 0.548
0-1* 1.034
S. acidocaldarius 2 51437 52946 0.971 32329 31783 1.017 0.989
3 34135 34655 0.985 14369 14277 1.006 0.991
4 21866 23832 0.918 4558 4673 0.975 0.927
5 4677 5546 0.843 583 694 0.840 0.843
6 924 1483 0.623 39 106 0.368 0.606

T. Gu et al. 37 SI
0-1* 1.011
S. islandicus
L.S.2.15 2 70447 67242 1.048 34249 33685 1.017 1.037
3 46376 46603 0.995 15313 15256 1.004 0.997
4 29398 31639 0.929 5067 5145 0.985 0.937
5 6683 7712 0.867 631 786 0.803 0.861
6 1087 1879 0.579 32 114 0.280 0.561
0-1* 1.001
S. islandicus
M.14.25 2 69029 65556 1.053 33082 32342 1.023 1.043
3 45052 45224 0.996 14886 14721 1.011 1.000
4 28325 30474 0.929 4803 4863 0.988 0.937
5 6350 7386 0.860 585 748 0.782 0.853
6 1055 1799 0.586 31 113 0.275 0.568
0-1* 1.000
S. islandicus
M.16.27 2 70270 67149 1.046 33632 32938 1.021 1.038
3 46327 46473 0.997 15152 14963 1.013 1.001
4 29182 31436 0.928 4870 4951 0.984 0.936
5 6551 7617 0.860 590 760 0.777 0.852
6 1092 1857 0.588 32 113 0.284 0.571
0-1* 1.001
S. islandicus
M.16.4 2 69784 66288 1.053 33637 32992 1.020 1.042
3 45472 45898 0.991 15116 14981 1.009 0.995
4 28866 31100 0.928 4836 4924 0.982 0.936
5 6589 7619 0.865 605 767 0.789 0.858
6 1090 1875 0.581 36 115 0.313 0.566
0-1* 1.001
S. islandicus
Y.G.57.14 2 71364 67633 1.055 35963 35314 1.018 1.043
3 46729 47088 0.992 16374 16066 1.019 0.999
4 29453 31675 0.930 5372 5429 0.989 0.939
5 6641 7718 0.860 639 812 0.787 0.853
6 1057 1861 0.568 33 119 0.277 0.550
0-1* 1.000
S. islandicus
Y.N.15.51 2 71401 67607 1.056 35291 34504 1.023 1.045
3 46819 47083 0.994 16040 15762 1.018 1.000
4 29784 31903 0.934 5224 5246 0.996 0.942
5 6767 7730 0.875 625 786 0.796 0.868
6 1086 1877 0.579 35 115 0.305 0.563
0-1* 0.999
S. solfataricus 2 74983 71204 1.053 40819 40189 1.016 1.040
3 49264 49785 0.990 18309 18163 1.008 0.994
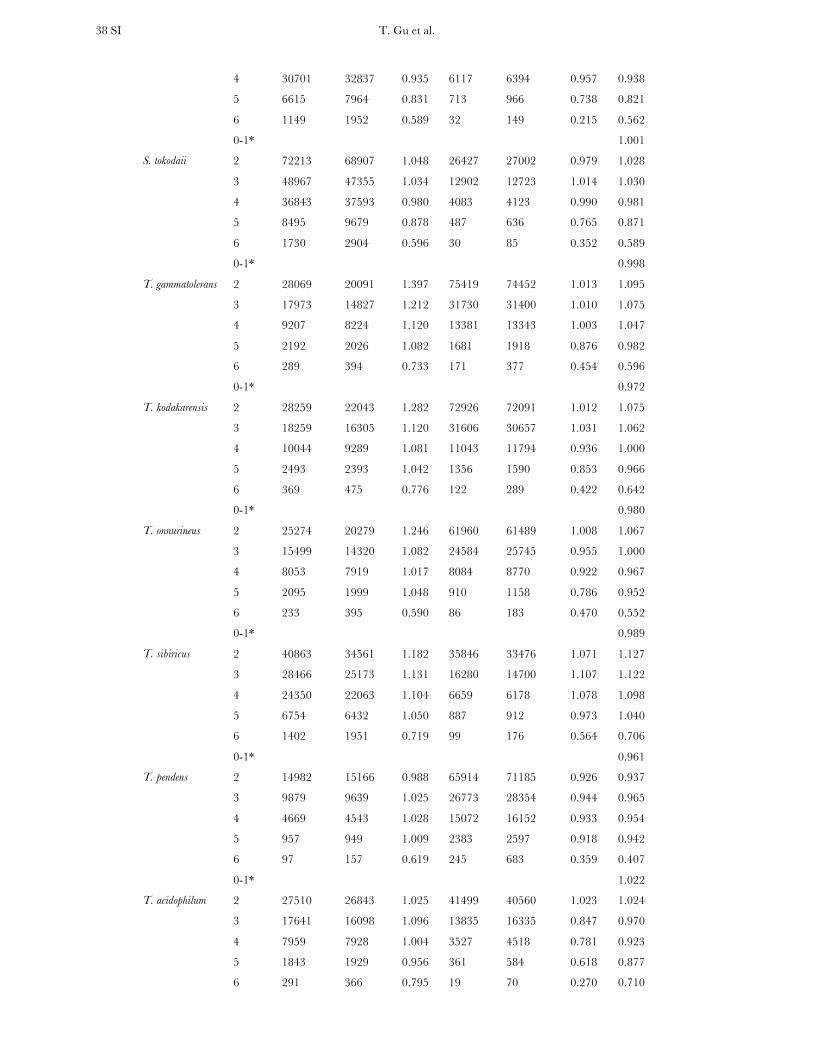
T. Gu et al. 38 SI
4 30701 32837 0.935 6117 6394 0.957 0.938
5 6615 7964 0.831 713 966 0.738 0.821
6 1149 1952 0.589 32 149 0.215 0.562
0-1* 1.001
S. tokodaii 2 72213 68907 1.048 26427 27002 0.979 1.028
3 48967 47355 1.034 12902 12723 1.014 1.030
4 36843 37593 0.980 4083 4123 0.990 0.981
5 8495 9679 0.878 487 636 0.765 0.871
6 1730 2904 0.596 30 85 0.352 0.589
0-1* 0.998
T. gammatolerans 2 28069 20091 1.397 75419 74452 1.013 1.095
3 17973 14827 1.212 31730 31400 1.010 1.075
4 9207 8224 1.120 13381 13343 1.003 1.047
5 2192 2026 1.082 1681 1918 0.876 0.982
6 289 394 0.733 171 377 0.454 0.596
0-1* 0.972
T. kodakarensis 2 28259 22043 1.282 72926 72091 1.012 1.075
3 18259 16305 1.120 31606 30657 1.031 1.062
4 10044 9289 1.081 11043 11794 0.936 1.000
5 2493 2393 1.042 1356 1590 0.853 0.966
6 369 475 0.776 122 289 0.422 0.642
0-1* 0.980
T. onnurineus 2 25274 20279 1.246 61960 61489 1.008 1.067
3 15499 14320 1.082 24584 25745 0.955 1.000
4 8053 7919 1.017 8084 8770 0.922 0.967
5 2095 1999 1.048 910 1158 0.786 0.952
6 233 395 0.590 86 183 0.470 0.552
0-1* 0.989
T. sibiricus 2 40863 34561 1.182 35846 33476 1.071 1.127
3 28466 25173 1.131 16280 14700 1.107 1.122
4 24350 22063 1.104 6659 6178 1.078 1.098
5 6754 6432 1.050 887 912 0.973 1.040
6 1402 1951 0.719 99 176 0.564 0.706
0-1* 0.961
T. pendens 2 14982 15166 0.988 65914 71185 0.926 0.937
3 9879 9639 1.025 26773 28354 0.944 0.965
4 4669 4543 1.028 15072 16152 0.933 0.954
5 957 949 1.009 2383 2597 0.918 0.942
6 97 157 0.619 245 683 0.359 0.407
0-1* 1.022
T. acidophilum 2 27510 26843 1.025 41499 40560 1.023 1.024
3 17641 16098 1.096 13835 16335 0.847 0.970
4 7959 7928 1.004 3527 4518 0.781 0.923
5 1843 1929 0.956 361 584 0.618 0.877
6 291 366 0.795 19 70 0.270 0.710

T. Gu et al. 39 SI
0-1* 1.002
T. volcanium 2 33407 31854 1.049 28224 27290 1.034 1.042
3 22994 21095 1.090 10634 11549 0.921 1.030
4 14620 14133 1.034 3041 3463 0.878 1.004
5 3651 3817 0.957 334 484 0.691 0.927
6 807 972 0.830 31 69 0.452 0.805
0-1* 0.991
T. neutrophilus 2 10565 12047 0.877 80404 75176 1.070 1.043
3 7776 7486 1.039 26075 28690 0.909 0.936
4 4621 3999 1.155 20087 17987 1.117 1.124
5 1166 861 1.354 3963 3605 1.099 1.148
6 140 170 0.824 762 1068 0.713 0.729
0-1* 0.988
uncultured
methanogenic
archaeon RC-I
2 20038 25717 0.779 110302 112718 0.979 0.942
3 15521 15876 0.978 41264 43271 0.954 0.960
4 11127 9990 1.114 14527 16163 0.899 0.981
5 3581 2884 1.242 1581 2322 0.681 0.991
6 532 711 0.749 134 365 0.367 0.619
0-1* 1.017
geometric
mean 2 - - 1.038 - - 1.024 1.032
3 - - 1.001 - - 1.001 1.002
4 - - 0.980 - - 1.004 0.987
5 - - 0.963 - - 0.848 0.912
6 - - 0.669 - - 0.398 0.596
0-1* - - - - 0.993
* codon pairs with 0-1 repeats represents those with no mononucleotides in the pair junction. For each species, if
all the codon pairs with 0-6 repeats are considered, the sum of e equals the sum of the counts of o.
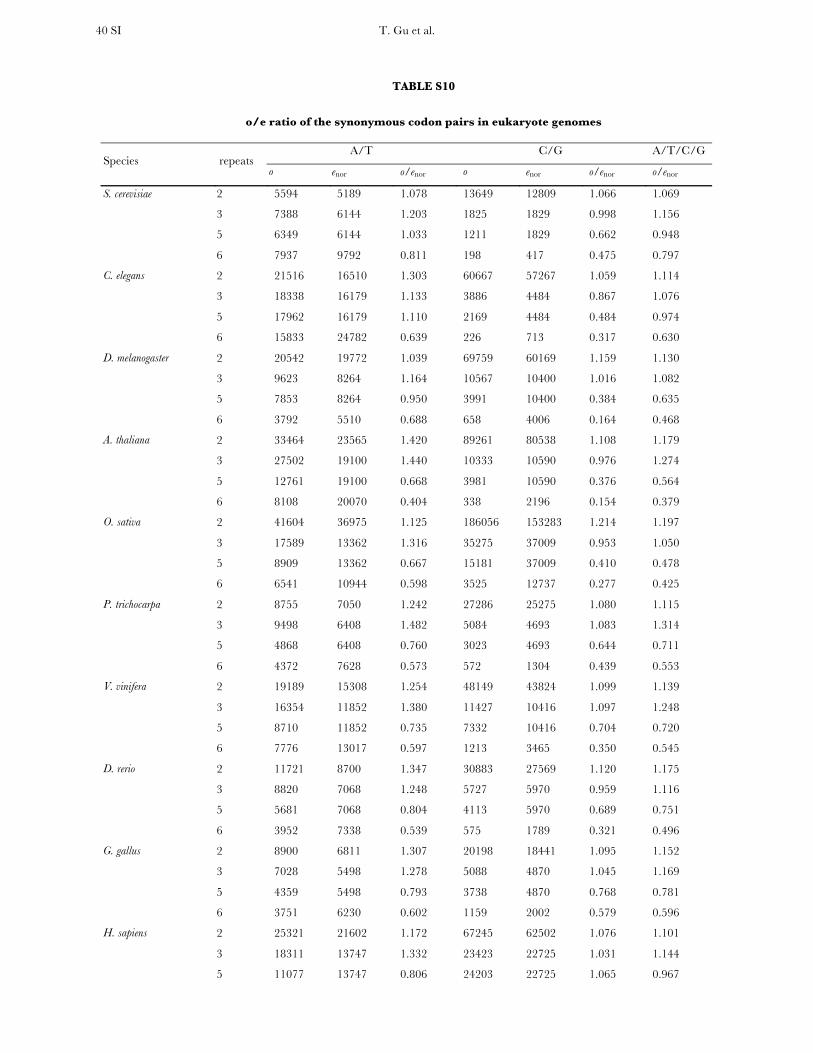
T. Gu et al. 40 SI
TABLE S10
o/e ratio of the synonymous codon pairs in eukaryote genomes
A/T C/G A/T/C/G Species repeats
o enor o/enor o enor o/enor o/enor
S. cerevisiae 2 5594 5189 1.078 13649 12809 1.066 1.069
3 7388 6144 1.203 1825 1829 0.998 1.156
5 6349 6144 1.033 1211 1829 0.662 0.948
6 7937 9792 0.811 198 417 0.475 0.797
C. elegans 2 21516 16510 1.303 60667 57267 1.059 1.114
3 18338 16179 1.133 3886 4484 0.867 1.076
5 17962 16179 1.110 2169 4484 0.484 0.974
6 15833 24782 0.639 226 713 0.317 0.630
D. melanogaster 2 20542 19772 1.039 69759 60169 1.159 1.130
3 9623 8264 1.164 10567 10400 1.016 1.082
5 7853 8264 0.950 3991 10400 0.384 0.635
6 3792 5510 0.688 658 4006 0.164 0.468
A. thaliana 2 33464 23565 1.420 89261 80538 1.108 1.179
3 27502 19100 1.440 10333 10590 0.976 1.274
5 12761 19100 0.668 3981 10590 0.376 0.564
6 8108 20070 0.404 338 2196 0.154 0.379
O. sativa 2 41604 36975 1.125 186056 153283 1.214 1.197
3 17589 13362 1.316 35275 37009 0.953 1.050
5 8909 13362 0.667 15181 37009 0.410 0.478
6 6541 10944 0.598 3525 12737 0.277 0.425
P. trichocarpa 2 8755 7050 1.242 27286 25275 1.080 1.115
3 9498 6408 1.482 5084 4693 1.083 1.314
5 4868 6408 0.760 3023 4693 0.644 0.711
6 4372 7628 0.573 572 1304 0.439 0.553
V. vinifera 2 19189 15308 1.254 48149 43824 1.099 1.139
3 16354 11852 1.380 11427 10416 1.097 1.248
5 8710 11852 0.735 7332 10416 0.704 0.720
6 7776 13017 0.597 1213 3465 0.350 0.545
D. rerio 2 11721 8700 1.347 30883 27569 1.120 1.175
3 8820 7068 1.248 5727 5970 0.959 1.116
5 5681 7068 0.804 4113 5970 0.689 0.751
6 3952 7338 0.539 575 1789 0.321 0.496
G. gallus 2 8900 6811 1.307 20198 18441 1.095 1.152
3 7028 5498 1.278 5088 4870 1.045 1.169
5 4359 5498 0.793 3738 4870 0.768 0.781
6 3751 6230 0.602 1159 2002 0.579 0.596
H. sapiens 2 25321 21602 1.172 67245 62502 1.076 1.101
3 18311 13747 1.332 23423 22725 1.031 1.144
5 11077 13747 0.806 24203 22725 1.065 0.967

T. Gu et al. 41 SI
6 9542 15155 0.630 4767 11687 0.408 0.533
P. troglodytes 2 19978 16874 1.184 51792 48351 1.071 1.100
3 15263 11430 1.335 17043 16801 1.014 1.144
5 9269 11430 0.811 17982 16801 1.070 0.965
6 8256 13032 0.634 3455 8318 0.415 0.549
M. musculus 2 29205 24900 1.173 68677 63294 1.085 1.110
3 19524 14934 1.307 21460 20848 1.029 1.145
5 11360 14934 0.761 20598 20848 0.988 0.893
6 7897 13219 0.597 3241 8985 0.361 0.502
R. norvegicus 2 20818 17773 1.171 46758 43028 1.087 1.111
3 13352 10412 1.282 14607 14362 1.017 1.129
5 8012 10412 0.770 14362 14362 1.000 0.903
6 5311 8897 0.597 2252 6228 0.362 0.500
Eukaryotes 2 - 1.212 - - 1.101 1.130
3 - - 1.296 - - 1.005 1.155
5 - - 0.812 - - 0.667 0.774
6 - - 0.602 - - 0.335 0.528
Mammal 2 - - 1.175 - - 1.080 1.106
3 - - 1.314 - - 1.023 1.141
5 - - 0.786 - - 1.030 0.932
6 - - 0.614 - - 0.386 0.520
Non-mammal 2 - - 1.229 - - 1.110 1.140
3 - - 1.289 - - 0.997 1.161
5 - - 0.823 - - 0.549 0.713
6 - - 0.596 - - 0.314 0.531
At the bottom of the table is the summary (geometric mean) of o/enor for mammals and non-mammalian eukaryotes.

T. Gu et al. 42 SI
TABLE S11
o/e ratio of the synonymous codon pairs in bacteria genomes
A/T C/G A/T/C/G Species repeats
o enor o/enor o enor o/enor o/enor
A . marina 2 990 968 1.023 7732 7639 1.012 1.013
3 1742 1329 1.311 2411 2392 1.008 1.116
5 1601 1329 1.205 2606 2392 1.090 1.131
6 2105 2813 0.748 811 1137 0.713 0.738
A. bacterium 2 4221 3891 1.085 12304 10968 1.122 1.112
3 1632 1332 1.225 2287 1881 1.216 1.220
5 996 1332 0.748 674 1881 0.358 0.520
6 429 722 0.594 91 627 0.145 0.385
A. avenae 2 2877 3042 0.946 12586 11573 1.088 1.058
3 309 274 1.130 4022 2771 1.451 1.422
5 385 274 1.407 1473 2771 0.531 0.610
6 142 124 1.143 421 1386 0.304 0.373
A. variabilis 2 638 605 1.055 9249 8692 1.064 1.063
3 1465 1191 1.230 1518 1662 0.914 1.046
5 1418 1191 1.190 1489 1662 0.896 1.019
6 3065 3599 0.852 290 531 0.546 0.812
A. aurescens 2 2416 2279 1.060 9611 8731 1.101 1.092
3 483 406 1.190 2246 1738 1.292 1.273
5 290 406 0.714 910 1738 0.524 0.560
6 74 172 0.430 97 657 0.148 0.206
B. anthracis 2 1552 1214 1.278 6605 6208 1.064 1.099
3 3841 2314 1.660 789 734 1.075 1.519
5 2689 2314 1.162 416 734 0.567 1.019
6 4679 6919 0.676 46 180 0.256 0.666
B. weihenstephanensis 2 1587 1255 1.264 6731 6350 1.060 1.094
3 3974 2451 1.621 873 785 1.113 1.498
5 2739 2451 1.117 455 785 0.580 0.987
6 5164 7307 0.707 54 193 0.279 0.696
B. fragilis 2 2305 2039 1.130 7099 6687 1.062 1.078
3 3709 2407 1.541 1009 927 1.088 1.415
5 2497 2407 1.038 576 927 0.621 0.922
6 2782 4440 0.627 108 250 0.432 0.616
B. thetaiotaomicron 2 3355 2782 1.206 8745 8232 1.062 1.099
3 4915 3002 1.637 962 915 1.051 1.500
5 2756 3002 0.918 470 915 0.514 0.824
6 2610 4849 0.538 92 207 0.444 0.534
B. indica 2 1331 1502 0.886 8152 7414 1.100 1.064
3 850 730 1.165 1779 1473 1.207 1.193
5 922 730 1.263 759 1473 0.515 0.763
6 448 589 0.760 172 502 0.343 0.568

T. Gu et al. 43 SI
B. sp. ORS278 2 4710 4518 1.043 18491 16496 1.121 1.104
3 542 483 1.121 2477 2292 1.081 1.088
5 291 483 0.602 599 2292 0.261 0.321
6 78 136 0.571 111 597 0.186 0.258
C. aurantiacus 2 1259 818 1.539 11018 9716 1.134 1.165
3 614 590 1.040 2580 2084 1.238 1.194
5 467 590 0.791 682 2084 0.327 0.430
6 375 716 0.524 213 610 0.349 0.443
C. beijerinckii 2 1342 1330 1.009 6530 6288 1.039 1.033
3 4243 2808 1.511 552 573 0.963 1.418
5 3179 2808 1.132 395 573 0.689 1.057
6 6147 7965 0.772 56 99 0.568 0.769
C. psychrerythraea 2 619 591 1.048 7068 6790 1.041 1.041
3 1799 1491 1.206 487 535 0.910 1.128
5 1824 1491 1.223 314 535 0.587 1.055
6 4804 5473 0.878 88 96 0.913 0.878
C. sp. ATCC 51142 2 470 424 1.109 5400 5871 0.920 0.932
3 1626 1219 1.334 1425 1782 0.800 1.017
5 1677 1219 1.376 2919 1782 1.638 1.531
6 4930 5841 0.844 482 791 0.609 0.816
D. aromatica. 2 2374 2646 0.897 9338 8728 1.070 1.030
3 1076 859 1.253 1581 1354 1.167 1.201
5 875 859 1.019 622 1354 0.459 0.676
6 606 568 1.067 289 393 0.735 0.931
D. acidovorans 2 3376 3452 0.978 15142 14145 1.070 1.052
3 603 535 1.128 3816 2344 1.628 1.535
5 562 535 1.051 1064 2344 0.454 0.565
6 243 263 0.926 262 1451 0.181 0.295
D. alkenivorans 2 1266 2918 0.434 10651 9724 1.095 0.943
3 1661 2816 0.590 3488 2560 1.362 0.958
5 5049 2816 1.793 1484 2560 0.580 1.215
6 4238 3664 1.157 611 1389 0.440 0.960
D. hafniense 2 1552 1745 0.889 6923 6666 1.039 1.008
3 2412 2097 1.150 2301 1983 1.160 1.155
5 2635 2097 1.257 1855 1983 0.935 1.100
6 2837 3498 0.811 441 888 0.497 0.747
E. coli 2 973 810 1.201 8634 7713 1.119 1.127
3 1590 1141 1.393 1181 1180 1.001 1.194
5 1199 1141 1.051 446 1180 0.378 0.709
6 2230 2900 0.769 105 294 0.357 0.731
F. johnsoniae 2 694 654 1.062 8286 7997 1.036 1.038
3 3538 2189 1.616 468 440 1.064 1.524
5 3185 2189 1.455 168 440 0.382 1.275
6 10601 12986 0.816 17 62 0.273 0.814
F. alni 2 2209 2181 1.013 21632 18981 1.140 1.127

T. Gu et al. 44 SI
3 87 86 1.009 9137 6405 1.426 1.421
5 68 86 0.789 2978 6405 0.465 0.469
6 18 28 0.639 919 2874 0.320 0.323
G. uraniireducens 2 2378 3081 0.772 7900 7170 1.102 1.003
3 1707 1908 0.895 2361 2210 1.068 0.988
5 2636 1908 1.382 1273 2210 0.576 0.949
6 1977 1802 1.097 1010 954 1.059 1.084
H. chejuensis 2 1975 2218 0.890 13276 11806 1.124 1.087
3 2311 1918 1.205 2251 2169 1.038 1.116
5 2386 1918 1.244 1040 2169 0.479 0.838
6 1937 2555 0.758 302 724 0.417 0.683
H. aurantiacus 2 754 547 1.379 11269 10153 1.110 1.124
3 812 796 1.021 2099 1669 1.257 1.181
5 1036 796 1.302 451 1669 0.270 0.603
6 1574 2038 0.772 93 420 0.221 0.678
L. sphaericus. 2 877 940 0.933 5380 5097 1.056 1.036
3 2111 1735 1.217 745 716 1.040 1.165
5 2189 1735 1.262 490 716 0.684 1.093
6 4056 4823 0.841 94 180 0.523 0.830
M. loti 2 4438 4342 1.022 16660 15269 1.091 1.076
3 966 860 1.123 2611 2085 1.252 1.215
5 749 860 0.871 584 2085 0.280 0.453
6 257 348 0.738 125 541 0.231 0.430
M. radiotolerans 2 3035 3003 1.011 14364 12231 1.174 1.142
3 76 83 0.910 3933 3205 1.227 1.219
5 56 83 0.671 1263 3205 0.394 0.401
6 33 30 1.107 310 1229 0.252 0.272
M. aeruginosa 2 521 686 0.759 6008 6268 0.958 0.939
3 1755 1498 1.171 1393 1885 0.739 0.931
5 2059 1498 1.374 2795 1885 1.482 1.435
6 4930 5582 0.883 972 1129 0.861 0.879
M. smegmatis 2 3271 3129 1.045 17253 14941 1.155 1.136
3 234 233 1.003 4932 3582 1.377 1.354
5 141 233 0.604 1217 3582 0.340 0.356
6 20 70 0.285 88 1386 0.063 0.074
M. vanbaalenii 2 2883 2750 1.048 16798 14503 1.158 1.141
3 178 201 0.886 5035 3849 1.308 1.287
5 129 201 0.642 1602 3849 0.416 0.427
6 20 58 0.346 239 1473 0.162 0.169
M. xanthus 2 6950 6772 1.026 22992 19358 1.188 1.146
3 289 285 1.012 7939 6301 1.260 1.249
5 131 285 0.459 3323 6301 0.527 0.524
6 29 56 0.519 1143 3438 0.332 0.335
N. farcinica 2 2451 2366 1.036 15111 13151 1.149 1.132
3 78 88 0.889 4945 3272 1.511 1.495

T. Gu et al. 45 SI
5 36 88 0.411 913 3272 0.279 0.282
6 3 27 0.112 129 1404 0.092 0.092
N. sp. PCC 7120 2 647 616 1.051 9263 8688 1.066 1.065
3 1448 1208 1.199 1528 1678 0.911 1.031
5 1468 1208 1.215 1497 1678 0.892 1.027
6 3163 3695 0.856 289 533 0.542 0.816
O. terrae 2 2668 2987 0.893 13292 11638 1.142 1.091
3 806 911 0.885 3157 2445 1.291 1.181
5 1315 911 1.444 733 2445 0.300 0.610
6 477 457 1.043 151 806 0.187 0.497
P. atrosepticum 2 1153 986 1.170 7763 6974 1.113 1.120
3 1583 1171 1.352 1399 1259 1.111 1.227
5 1177 1171 1.005 521 1259 0.414 0.699
6 1732 2317 0.748 163 354 0.460 0.709
P. naphthalenivorans 2 1105 1729 0.639 9481 8839 1.073 1.002
3 896 915 0.979 2076 1361 1.525 1.306
5 1357 915 1.482 393 1361 0.289 0.769
6 1053 851 1.238 124 513 0.242 0.863
P. aeruginosa 2 3868 4077 0.949 14883 13286 1.120 1.080
3 647 359 1.801 2693 2138 1.260 1.338
5 289 359 0.804 451 2138 0.211 0.296
6 171 179 0.956 144 610 0.236 0.399
P. entomophila 2 3029 3202 0.946 11144 10097 1.104 1.066
3 688 447 1.540 2485 1861 1.335 1.375
5 367 447 0.822 650 1861 0.349 0.441
6 218 207 1.055 215 674 0.319 0.491
P. fluorescens 2 3241 3481 0.931 13043 11184 1.166 1.110
3 1081 814 1.329 2881 2486 1.159 1.201
5 819 814 1.007 934 2486 0.376 0.531
6 376 409 0.920 269 970 0.277 0.468
P. putida 2 2740 2886 0.949 11080 10312 1.074 1.047
3 916 734 1.248 2386 1804 1.323 1.301
5 749 734 1.020 776 1804 0.430 0.601
6 356 407 0.875 257 580 0.443 0.621
P. syringae 2 1942 2201 0.882 10755 10036 1.072 1.038
3 1259 1166 1.079 2291 1615 1.419 1.277
5 1401 1166 1.201 528 1615 0.327 0.694
6 940 1008 0.933 128 437 0.293 0.739
R. leguminosarum 2 3173 3116 1.018 11031 10161 1.086 1.070
3 705 643 1.097 1776 1375 1.291 1.229
5 595 643 0.926 388 1375 0.282 0.487
6 203 275 0.739 86 369 0.233 0.449
R. sp. RHA1 2 3850 3685 1.045 18712 16075 1.164 1.142
3 235 223 1.055 5092 4138 1.230 1.222
5 94 223 0.422 1959 4138 0.473 0.471

T. Gu et al. 46 SI
6 17 65 0.260 268 1679 0.160 0.163
R. baltica 2 2753 2351 1.171 17670 15529 1.138 1.142
3 2065 1548 1.334 3281 2798 1.172 1.230
5 1365 1548 0.882 865 2798 0.309 0.513
6 819 1555 0.527 188 878 0.214 0.414
R. castenholzii 2 1372 1201 1.143 12652 10797 1.172 1.169
3 874 646 1.354 2997 2481 1.208 1.238
5 470 646 0.728 643 2481 0.259 0.356
6 330 554 0.596 224 758 0.296 0.422
R. sp. RS-1 2 1591 1324 1.202 12962 11291 1.148 1.154
3 791 669 1.183 3465 2710 1.279 1.260
5 516 669 0.772 830 2710 0.306 0.398
6 319 556 0.574 328 873 0.376 0.453
R. denitrificans 2 760 1068 0.712 6823 6305 1.082 1.028
3 1246 804 1.550 2788 2054 1.357 1.411
5 1127 804 1.402 1233 2054 0.600 0.826
6 414 871 0.475 492 922 0.533 0.505
S. arenicola 2 1762 1730 1.018 14665 12945 1.133 1.119
3 145 125 1.157 5052 3659 1.381 1.373
5 95 125 0.758 1657 3659 0.453 0.463
6 14 35 0.402 305 1416 0.215 0.220
S. proteamaculans 2 1427 1318 1.083 9648 8681 1.111 1.108
3 1530 1207 1.268 1469 1467 1.001 1.122
5 1168 1207 0.968 724 1467 0.494 0.708
6 1474 1868 0.789 175 401 0.437 0.727
S. usitatus 2 5762 5557 1.037 24365 21225 1.148 1.125
3 1809 1612 1.122 5886 4742 1.241 1.211
5 1560 1612 0.968 2144 4742 0.452 0.583
6 421 771 0.546 447 2132 0.210 0.299
S. cellulosum 2 7041 6928 1.016 38079 32320 1.178 1.150
3 394 354 1.114 13298 10930 1.217 1.213
5 212 354 0.599 5895 10930 0.539 0.541
6 67 79 0.850 1734 4827 0.359 0.367
T. erythraeum 2 539 595 0.907 7688 7695 0.999 0.992
3 1565 1505 1.040 1139 1104 1.032 1.036
5 1995 1505 1.326 1159 1104 1.050 1.209
6 5656 6150 0.920 180 264 0.682 0.910
geometric mean 2 - - 0.999 - - 1.095 1.077
3 - - 1.186 - - 1.175 1.236
5 - - 0.973 - - 0.472 0.662
6 - - 0.696 - - 0.325 0.488
At the bottom of the table is the summary (geometric mean) of o/enor for all the 53 bacteria.

T. Gu et al. 47 SI
TABLE S12
o/e ratio of the synonymous codon pairs in archaeal genomes
A/T C/G A/T/C/G Species repeats
o enor o/enor o enor o/enor o/enor
A. pernix 2 1086 981 1.107 3045 2874 1.060 1.072
3 170 186 0.916 1393 1287 1.082 1.061
5 149 186 0.803 1268 1287 0.985 0.962
6 35 88 0.397 555 813 0.683 0.655
A. fulgidus 2 2103 2094 1.004 2945 2878 1.023 1.015
3 838 1008 0.831 1243 819 1.518 1.139
5 1322 1008 1.311 505 819 0.617 1.000
6 631 783 0.806 153 330 0.463 0.705
A. profundus 2 1690 1454 1.162 2333 2195 1.063 1.103
3 967 834 1.159 335 292 1.147 1.156
5 771 834 0.924 165 292 0.565 0.831
6 398 704 0.566 19 73 0.259 0.537
C. maquilingensis 2 1064 883 1.205 3304 3159 1.046 1.081
3 278 222 1.254 769 713 1.079 1.121
5 60 222 0.271 681 713 0.956 0.793
6 33 109 0.303 56 226 0.248 0.266
C. Korarchaeum 2 1405 1301 1.080 2051 1790 1.146 1.118
3 337 282 1.196 981 835 1.175 1.180
5 166 282 0.589 722 835 0.865 0.795
6 81 124 0.652 209 504 0.415 0.462
C. Methanoregula 2 1014 1312 0.773 2816 2878 0.978 0.914
3 1068 1038 1.029 1551 1176 1.319 1.183
5 1253 1038 1.207 1173 1176 0.997 1.096
6 1381 1328 1.040 330 640 0.516 0.869
D. kamchatkensis 2 1033 806 1.281 1968 1859 1.059 1.126
3 438 375 1.168 570 522 1.092 1.124
5 202 375 0.539 511 522 0.979 0.795
6 147 264 0.557 58 204 0.284 0.438
H. salinarum 2 527 593 0.888 4032 3140 1.284 1.221
3 79 74 1.071 1334 1129 1.182 1.175
5 159 74 2.155 446 1129 0.395 0.503
6 19 43 0.440 174 588 0.296 0.306
H. sp. NRC-1 2 521 583 0.894 4009 3122 1.284 1.223
3 78 74 1.058 1310 1118 1.171 1.164
5 156 74 2.116 449 1118 0.401 0.507
6 17 42 0.406 167 576 0.290 0.298
H. mukohataei 2 893 918 0.973 5936 5163 1.150 1.123
3 131 136 0.963 2035 1489 1.367 1.333
5 207 136 1.521 655 1489 0.440 0.530
6 28 69 0.408 141 626 0.225 0.243

T. Gu et al. 48 SI
H. walsbyi 2 333 335 0.995 4795 4450 1.077 1.072
3 446 307 1.453 1003 824 1.218 1.282
5 287 307 0.935 437 824 0.531 0.640
6 347 464 0.747 85 223 0.382 0.629
H. utahensis 2 800 857 0.933 5634 4811 1.171 1.135
3 177 177 0.998 2269 1620 1.400 1.361
5 299 177 1.685 705 1620 0.435 0.558
6 25 89 0.281 165 721 0.229 0.235
H. turkmenica 2 1231 1205 1.022 7353 5946 1.237 1.200
3 170 159 1.068 1881 1641 1.146 1.139
5 172 159 1.080 533 1641 0.325 0.392
6 13 63 0.207 148 686 0.216 0.215
H. butylicus 2 1080 920 1.174 2971 2577 1.153 1.159
3 209 203 1.032 560 598 0.937 0.961
5 116 203 0.573 397 598 0.664 0.641
6 19 99 0.192 80 235 0.340 0.296
I. hospitalis 2 2101 2039 1.030 1361 1434 0.949 0.997
3 344 292 1.176 994 768 1.295 1.262
5 213 292 0.728 926 768 1.206 1.074
6 43 77 0.561 255 566 0.450 0.464
M. sedula 2 1678 1641 1.023 3188 2764 1.153 1.105
3 916 644 1.422 987 832 1.187 1.290
5 535 644 0.831 535 832 0.643 0.725
6 212 412 0.514 81 364 0.223 0.378
M. smithii 2 144 167 0.860 2565 2614 0.981 0.974
3 732 546 1.340 151 132 1.141 1.302
5 821 546 1.503 174 132 1.315 1.467
6 3032 3469 0.874 7 18 0.388 0.871
M. fervens 2 444 469 0.947 1750 1812 0.966 0.962
3 1059 1018 1.040 398 282 1.411 1.120
5 1301 1018 1.278 250 282 0.886 1.193
6 2708 3007 0.901 58 80 0.725 0.896
M. jannaschii 2 580 593 0.978 2088 2090 0.999 0.995
3 1208 1150 1.051 403 289 1.395 1.120
5 1460 1150 1.270 206 289 0.713 1.158
6 2786 3141 0.887 45 74 0.607 0.880
M. vulcanius 2 396 442 0.896 2073 2098 0.988 0.972
3 983 1081 0.910 407 312 1.303 0.998
5 1455 1081 1.346 279 312 0.893 1.245
6 3546 3777 0.939 40 76 0.525 0.931
M. paludicola 2 2548 3136 0.812 4215 3980 1.059 0.950
3 755 947 0.797 1274 988 1.289 1.049
5 1563 947 1.651 799 988 0.809 1.221
6 796 632 1.259 120 452 0.265 0.845
M. burtonii 2 978 1024 0.955 3256 3108 1.047 1.025

T. Gu et al. 49 SI
3 1248 985 1.268 455 420 1.083 1.212
5 1063 985 1.080 284 420 0.676 0.959
6 1223 1519 0.805 57 103 0.551 0.789
M. aeolicus 2 71 122 0.582 1773 1898 0.934 0.913
3 590 521 1.132 268 305 0.878 1.038
5 782 521 1.500 475 305 1.556 1.521
6 3284 3562 0.922 70 78 0.900 0.921
M. maripaludis C5 2 159 167 0.951 2150 2174 0.989 0.986
3 650 614 1.059 203 235 0.865 1.006
5 963 614 1.569 303 235 1.291 1.492
6 3643 4021 0.906 37 49 0.750 0.904
M. maripaludis C6 2 136 166 0.818 2106 2144 0.982 0.971
3 628 592 1.061 212 230 0.924 1.022
5 906 592 1.530 290 230 1.263 1.456
6 3474 3793 0.916 40 45 0.882 0.915
M. maripaludis C7 2 145 168 0.865 2134 2187 0.976 0.968
3 615 595 1.034 227 235 0.965 1.014
5 960 595 1.614 318 235 1.351 1.539
6 3467 3829 0.905 26 48 0.546 0.901
M. maripaludis S2 2 131 131 0.998 2176 2166 1.004 1.004
3 560 528 1.061 193 219 0.883 1.009
5 820 528 1.553 260 219 1.189 1.447
6 3554 3878 0.917 17 42 0.401 0.911
M. vannielii 2 100 160 0.627 1835 1863 0.985 0.957
3 484 672 0.720 271 298 0.910 0.778
5 1038 672 1.544 367 298 1.233 1.448
6 3921 4038 0.971 58 73 0.796 0.968
M. labreanum 2 617 629 0.981 2574 2541 1.013 1.007
3 567 626 0.905 765 526 1.456 1.156
5 822 626 1.312 354 526 0.674 1.021
6 1110 1234 0.899 80 181 0.443 0.841
M. marisnigri 2 1662 1504 1.105 3477 2946 1.180 1.155
3 437 407 1.075 1828 1417 1.290 1.242
5 284 407 0.698 976 1417 0.689 0.691
6 188 253 0.742 408 909 0.449 0.513
M. kandleri 2 902 870 1.036 2745 2306 1.190 1.148
3 183 156 1.173 1048 819 1.280 1.263
5 129 156 0.827 500 819 0.611 0.645
6 42 74 0.570 61 411 0.149 0.213
M. thermophila 2 1119 1079 1.037 2773 2494 1.112 1.089
3 231 256 0.902 842 645 1.306 1.191
5 245 256 0.957 317 645 0.492 0.624
6 136 139 0.976 73 222 0.329 0.579
M. acetivorans 2 1403 1706 0.822 5348 4855 1.102 1.029
3 2438 2313 1.054 1651 1431 1.153 1.092
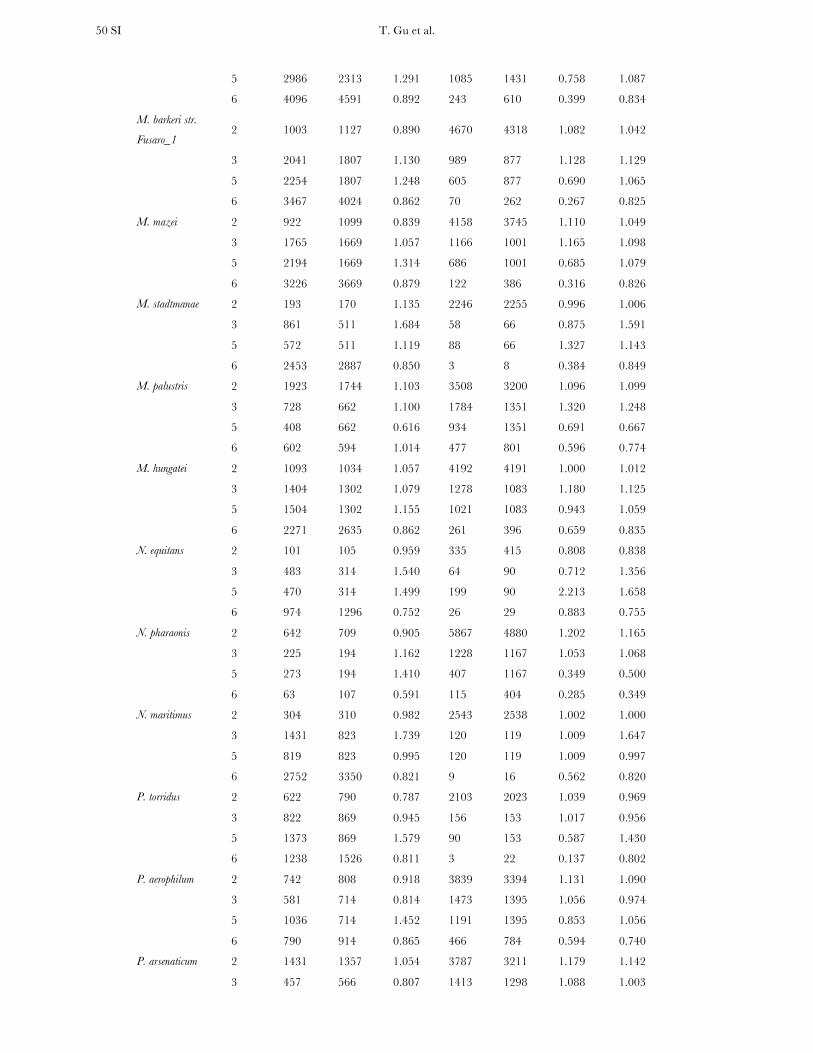
T. Gu et al. 50 SI
5 2986 2313 1.291 1085 1431 0.758 1.087
6 4096 4591 0.892 243 610 0.399 0.834
M. barkeri str.
Fusaro_1 2 1003 1127 0.890 4670 4318 1.082 1.042
3 2041 1807 1.130 989 877 1.128 1.129
5 2254 1807 1.248 605 877 0.690 1.065
6 3467 4024 0.862 70 262 0.267 0.825
M. mazei 2 922 1099 0.839 4158 3745 1.110 1.049
3 1765 1669 1.057 1166 1001 1.165 1.098
5 2194 1669 1.314 686 1001 0.685 1.079
6 3226 3669 0.879 122 386 0.316 0.826
M. stadtmanae 2 193 170 1.135 2246 2255 0.996 1.006
3 861 511 1.684 58 66 0.875 1.591
5 572 511 1.119 88 66 1.327 1.143
6 2453 2887 0.850 3 8 0.384 0.849
M. palustris 2 1923 1744 1.103 3508 3200 1.096 1.099
3 728 662 1.100 1784 1351 1.320 1.248
5 408 662 0.616 934 1351 0.691 0.667
6 602 594 1.014 477 801 0.596 0.774
M. hungatei 2 1093 1034 1.057 4192 4191 1.000 1.012
3 1404 1302 1.079 1278 1083 1.180 1.125
5 1504 1302 1.155 1021 1083 0.943 1.059
6 2271 2635 0.862 261 396 0.659 0.835
N. equitans 2 101 105 0.959 335 415 0.808 0.838
3 483 314 1.540 64 90 0.712 1.356
5 470 314 1.499 199 90 2.213 1.658
6 974 1296 0.752 26 29 0.883 0.755
N. pharaonis 2 642 709 0.905 5867 4880 1.202 1.165
3 225 194 1.162 1228 1167 1.053 1.068
5 273 194 1.410 407 1167 0.349 0.500
6 63 107 0.591 115 404 0.285 0.349
N. maritimus 2 304 310 0.982 2543 2538 1.002 1.000
3 1431 823 1.739 120 119 1.009 1.647
5 819 823 0.995 120 119 1.009 0.997
6 2752 3350 0.821 9 16 0.562 0.820
P. torridus 2 622 790 0.787 2103 2023 1.039 0.969
3 822 869 0.945 156 153 1.017 0.956
5 1373 869 1.579 90 153 0.587 1.430
6 1238 1526 0.811 3 22 0.137 0.802
P. aerophilum 2 742 808 0.918 3839 3394 1.131 1.090
3 581 714 0.814 1473 1395 1.056 0.974
5 1036 714 1.452 1191 1395 0.853 1.056
6 790 914 0.865 466 784 0.594 0.740
P. arsenaticum 2 1431 1357 1.054 3787 3211 1.179 1.142
3 457 566 0.807 1413 1298 1.088 1.003
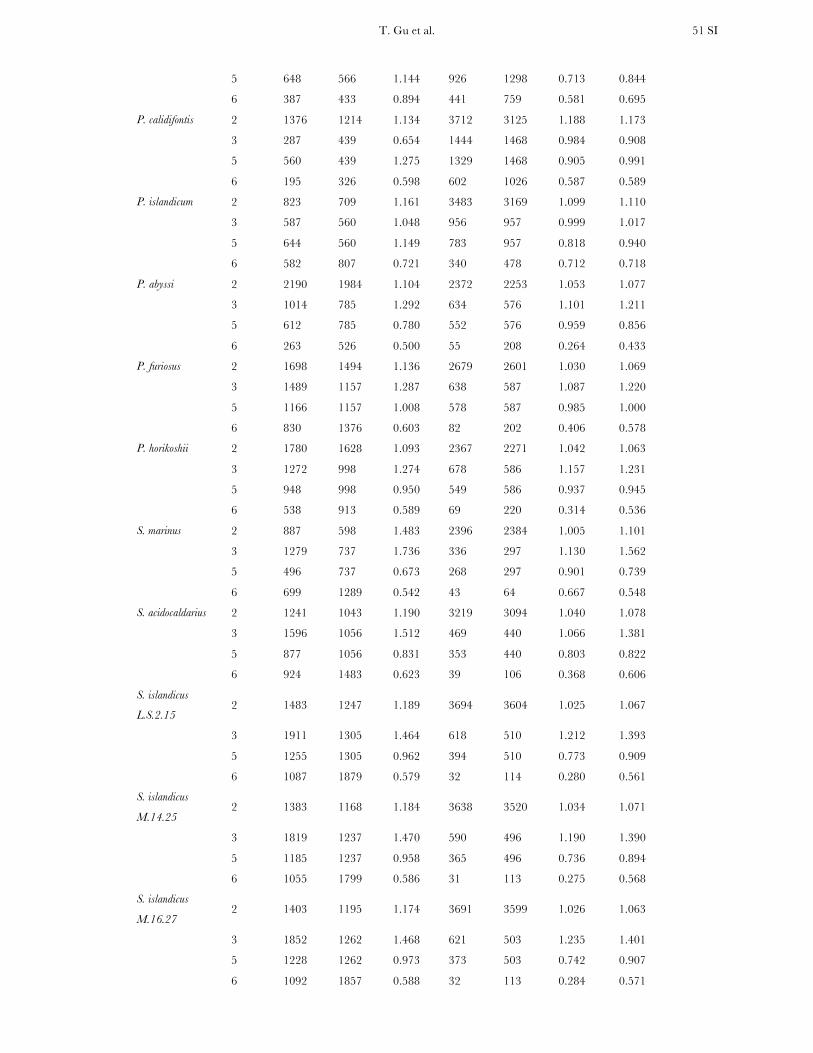
T. Gu et al. 51 SI
5 648 566 1.144 926 1298 0.713 0.844
6 387 433 0.894 441 759 0.581 0.695
P. calidifontis 2 1376 1214 1.134 3712 3125 1.188 1.173
3 287 439 0.654 1444 1468 0.984 0.908
5 560 439 1.275 1329 1468 0.905 0.991
6 195 326 0.598 602 1026 0.587 0.589
P. islandicum 2 823 709 1.161 3483 3169 1.099 1.110
3 587 560 1.048 956 957 0.999 1.017
5 644 560 1.149 783 957 0.818 0.940
6 582 807 0.721 340 478 0.712 0.718
P. abyssi 2 2190 1984 1.104 2372 2253 1.053 1.077
3 1014 785 1.292 634 576 1.101 1.211
5 612 785 0.780 552 576 0.959 0.856
6 263 526 0.500 55 208 0.264 0.433
P. furiosus 2 1698 1494 1.136 2679 2601 1.030 1.069
3 1489 1157 1.287 638 587 1.087 1.220
5 1166 1157 1.008 578 587 0.985 1.000
6 830 1376 0.603 82 202 0.406 0.578
P. horikoshii 2 1780 1628 1.093 2367 2271 1.042 1.063
3 1272 998 1.274 678 586 1.157 1.231
5 948 998 0.950 549 586 0.937 0.945
6 538 913 0.589 69 220 0.314 0.536
S. marinus 2 887 598 1.483 2396 2384 1.005 1.101
3 1279 737 1.736 336 297 1.130 1.562
5 496 737 0.673 268 297 0.901 0.739
6 699 1289 0.542 43 64 0.667 0.548
S. acidocaldarius 2 1241 1043 1.190 3219 3094 1.040 1.078
3 1596 1056 1.512 469 440 1.066 1.381
5 877 1056 0.831 353 440 0.803 0.822
6 924 1483 0.623 39 106 0.368 0.606
S. islandicus
L.S.2.15 2 1483 1247 1.189 3694 3604 1.025 1.067
3 1911 1305 1.464 618 510 1.212 1.393
5 1255 1305 0.962 394 510 0.773 0.909
6 1087 1879 0.579 32 114 0.280 0.561
S. islandicus
M.14.25 2 1383 1168 1.184 3638 3520 1.034 1.071
3 1819 1237 1.470 590 496 1.190 1.390
5 1185 1237 0.958 365 496 0.736 0.894
6 1055 1799 0.586 31 113 0.275 0.568
S. islandicus
M.16.27 2 1403 1195 1.174 3691 3599 1.026 1.063
3 1852 1262 1.468 621 503 1.235 1.401
5 1228 1262 0.973 373 503 0.742 0.907
6 1092 1857 0.588 32 113 0.284 0.571
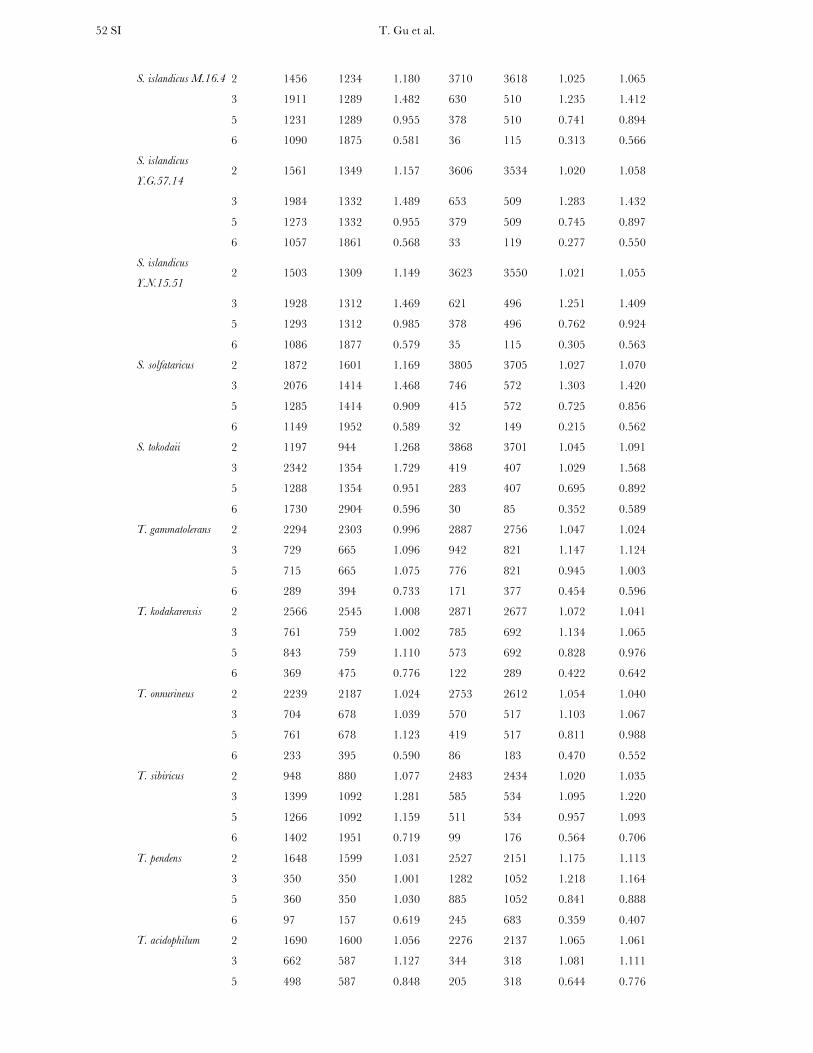
T. Gu et al. 52 SI
S. islandicus M.16.4 2 1456 1234 1.180 3710 3618 1.025 1.065
3 1911 1289 1.482 630 510 1.235 1.412
5 1231 1289 0.955 378 510 0.741 0.894
6 1090 1875 0.581 36 115 0.313 0.566
S. islandicus
Y.G.57.14 2 1561 1349 1.157 3606 3534 1.020 1.058
3 1984 1332 1.489 653 509 1.283 1.432
5 1273 1332 0.955 379 509 0.745 0.897
6 1057 1861 0.568 33 119 0.277 0.550
S. islandicus
Y.N.15.51 2 1503 1309 1.149 3623 3550 1.021 1.055
3 1928 1312 1.469 621 496 1.251 1.409
5 1293 1312 0.985 378 496 0.762 0.924
6 1086 1877 0.579 35 115 0.305 0.563
S. solfataricus 2 1872 1601 1.169 3805 3705 1.027 1.070
3 2076 1414 1.468 746 572 1.303 1.420
5 1285 1414 0.909 415 572 0.725 0.856
6 1149 1952 0.589 32 149 0.215 0.562
S. tokodaii 2 1197 944 1.268 3868 3701 1.045 1.091
3 2342 1354 1.729 419 407 1.029 1.568
5 1288 1354 0.951 283 407 0.695 0.892
6 1730 2904 0.596 30 85 0.352 0.589
T. gammatolerans 2 2294 2303 0.996 2887 2756 1.047 1.024
3 729 665 1.096 942 821 1.147 1.124
5 715 665 1.075 776 821 0.945 1.003
6 289 394 0.733 171 377 0.454 0.596
T. kodakarensis 2 2566 2545 1.008 2871 2677 1.072 1.041
3 761 759 1.002 785 692 1.134 1.065
5 843 759 1.110 573 692 0.828 0.976
6 369 475 0.776 122 289 0.422 0.642
T. onnurineus 2 2239 2187 1.024 2753 2612 1.054 1.040
3 704 678 1.039 570 517 1.103 1.067
5 761 678 1.123 419 517 0.811 0.988
6 233 395 0.590 86 183 0.470 0.552
T. sibiricus 2 948 880 1.077 2483 2434 1.020 1.035
3 1399 1092 1.281 585 534 1.095 1.220
5 1266 1092 1.159 511 534 0.957 1.093
6 1402 1951 0.719 99 176 0.564 0.706
T. pendens 2 1648 1599 1.031 2527 2151 1.175 1.113
3 350 350 1.001 1282 1052 1.218 1.164
5 360 350 1.030 885 1052 0.841 0.888
6 97 157 0.619 245 683 0.359 0.407
T. acidophilum 2 1690 1600 1.056 2276 2137 1.065 1.061
3 662 587 1.127 344 318 1.081 1.111
5 498 587 0.848 205 318 0.644 0.776

T. Gu et al. 53 SI
6 291 366 0.795 19 70 0.270 0.710
T. volcanium 2 1027 1007 1.020 2103 1979 1.063 1.048
3 1082 843 1.283 328 306 1.072 1.227
5 749 843 0.888 197 306 0.644 0.823
6 807 972 0.830 31 69 0.452 0.805
T. neutrophilus 2 1154 1087 1.062 3361 2738 1.228 1.181
3 199 295 0.674 1378 1395 0.988 0.933
5 354 295 1.199 1094 1395 0.785 0.857
6 140 170 0.824 762 1068 0.713 0.729
uncultured
methanogenic
archaeon RC-I
2 2379 2490 0.955 4571 4368 1.047 1.014
3 884 937 0.943 1186 937 1.265 1.104
5 1280 937 1.366 716 937 0.764 1.065
6 532 711 0.749 134 365 0.367 0.619
geometric mean 2 - - 1.010 - - 1.062 1.055
3 - - 1.130 - - 1.134 1.175
5 - - 1.080 - - 0.789 0.922
6 - - 0.669 - - 0.398 0.596
At the bottom of the table is the summary (geometric mean) of o/enor for all the 68 archaea.