Population Genetics of Y-Chromosome Short Tandem Repeats in Humans
12
ORIGINAL PAPER Short tandem repeat polymorphism evolution in humans F Calafell, A Shuster, WC Speed, JR Kidd and KK Kidd Department of Genetics, Yale University School of Medicine, USA Forty-five dinucleotide short tandem repeat polymorphisms were typed in ten large samples of a globally distributed set of populations. Although these markers had been selected for high heterozygosity in European populations, we found them to be sufficiently informative for linkage analysis in non- Europeans. Heterozygosity, mean number of alleles, and mean number of private alleles followed a common trend: they were highest in the African samples, were somewhat lower in Europeans and East Asians, and were lowest in Amerindians. Genetic distances also reflected this pattern, and distances modelled after the stepwise mutation model yielded trees that were less in agreement with other genetic and archaeological evidence than distances based on differentiation by drift (F ST ). Genetic variation in non- Africans seems to be a subset of that in Africans, supporting the replacement hypothesis for the origin of modern humans. Keywords: Short tandem repeat polymorphisms; microsatellites; human evolution; genetic distances; replacement hypothesis; multiregional hypothesis Introduction Short tandem repeat polymorphisms (STRPs, also known as microsatellites) present several properties that make them particularly useful in human popula- tion genetics: the huge number of STRP loci available 1 and the relative expediency with which they can be typed allow the gathering of genetic data for a large number of loci in population samples. STRPs present high heterozygosities and genetic diversities (as meas- ured by F ST , for instance) comparable to those revealed by blood group and protein polymorphisms (the so-called classical polymorphisms) 2,3 or slightly lower. 4 Due to their high heterozygosity, STRPs are expected to escape the allele frequency distortions observed at loci that were ascertained on the basis of polymorphism in Europeans. 5 Mutation in STRPs appears to follow a stepwise mutation model (SMM), in which mutation events involve the gain or loss of one to a few repeat units. The product of mutation is often an already existing allele; thus, mutation in STRPs violates the basic tenet of the infinite allele model (IAM), in which every mutation generates a new allele. A strict SMM, in which the gain or loss is limited to one repeat unit per mutation event, produced allele frequency distributions consistent with those observed, 6 but did not account for the observed variability in 10 STRPs in a Sardinian sample. 7 The average of the mutation rates for STRPs is several orders of magnitude higher than for single base- pair changes in single copy DNA, but there is appar- ently great variation in rate among loci. 8 Chakraborty et al 9 analyzed a large number of loci and inferred from Correspondence: Kenneth K Kidd, Department of Genetics, Yale University School of Medicine, 333 Cedar St, New Haven, CT 06520-8005, USA European Journal of Human Genetics (1998) 6, 38–49 © 1998 Stockton Press All rights reserved 1018–4813/98 $12.00
Transcript of Population Genetics of Y-Chromosome Short Tandem Repeats in Humans

ORIGINAL PAPER
Short tandem repeat polymorphism evolution inhumans
F Calafell, A Shuster, WC Speed, JR Kidd and KK Kidd
Department of Genetics, Yale University School of Medicine, USA
Forty-five dinucleotide short tandem repeat polymorphisms were typed in tenlarge samples of a globally distributed set of populations. Although thesemarkers had been selected for high heterozygosity in European populations,we found them to be sufficiently informative for linkage analysis in non-Europeans. Heterozygosity, mean number of alleles, and mean number ofprivate alleles followed a common trend: they were highest in the Africansamples, were somewhat lower in Europeans and East Asians, and werelowest in Amerindians. Genetic distances also reflected this pattern, anddistances modelled after the stepwise mutation model yielded trees that wereless in agreement with other genetic and archaeological evidence thandistances based on differentiation by drift (FST). Genetic variation in non-Africans seems to be a subset of that in Africans, supporting the replacementhypothesis for the origin of modern humans.
Keywords: Short tandem repeat polymorphisms; microsatellites; humanevolution; genetic distances; replacement hypothesis; multiregionalhypothesis
IntroductionShort tandem repeat polymorphisms (STRPs, alsoknown as microsatellites) present several propertiesthat make them particularly useful in human popula-tion genetics: the huge number of STRP loci available1
and the relative expediency with which they can betyped allow the gathering of genetic data for a largenumber of loci in population samples. STRPs presenthigh heterozygosities and genetic diversities (as meas-ured by FST, for instance) comparable to those revealedby blood group and protein polymorphisms (theso-called classical polymorphisms)2,3 or slightly lower.4
Due to their high heterozygosity, STRPs are expected
to escape the allele frequency distortions observed atloci that were ascertained on the basis of polymorphismin Europeans.5 Mutation in STRPs appears to follow astepwise mutation model (SMM), in which mutationevents involve the gain or loss of one to a few repeatunits. The product of mutation is often an alreadyexisting allele; thus, mutation in STRPs violates thebasic tenet of the infinite allele model (IAM), in whichevery mutation generates a new allele. A strict SMM, inwhich the gain or loss is limited to one repeat unit permutation event, produced allele frequency distributionsconsistent with those observed,6 but did not account forthe observed variability in 10 STRPs in a Sardiniansample.7 The average of the mutation rates for STRPs isseveral orders of magnitude higher than for single base-pair changes in single copy DNA, but there is appar-ently great variation in rate among loci.8 Chakraborty etal9 analyzed a large number of loci and inferred from
Correspondence: Kenneth K Kidd, Department of Genetics,Yale University School of Medicine, 333 Cedar St, NewHaven, CT 06520-8005, USA
European Journal of Human Genetics (1998) 6, 38–49© 1998 Stockton Press All rights reserved 1018–4813/98 $12.00

the repeat-size variance that mutation rate of dinucleo-tide repeats was higher than that of trinucleotiderepeats which, in turn, seemed to mutate faster thantetranucleotide repeats.
Several studies have undertaken the analysis ofSTRP variation in global sets of populations. Bowcocket al10 typed 14 populations for 30 STRPs, most ofwhich were dinucleotide repeats that mapped onchromosomes 13 or 15. Eight of the loci were locatedless than 1 cM away from their nearest neighbour, andlinkage disequilibrium was not assessed. Only smallsamples (20 chromosomes) of each population wereanalyzed, and their results showed that individualstended to cluster by population in a tree based on theproportion of shared alleles. Deka et al2 tested eightdinucleotide repeats in larger samples (100 to 222chromosomes) of eight populations. Their loci mappedon chromosome 13q; they tested for linkage dis-equilibrium and did not find it. Reduced levels ofheterozygosity were found in Pehuenche (Chile) andDogrib (Canada) Native Americans, as well as in NewGuineans. Deka et al2 also observed a significantdeparture from the allele frequency distributions pre-dicted by a strict SMM. Jorde et al4 typed 15 popula-tions for 30 unlinked tetranucleotide STRPs; except for140 chromosomes of mixed Northern European origin,most populations were represented by small numbersof chromosomes (10 to 44). The STRP results werecompared to hypervariable segment II mtDNAsequences and to 30 restriction site polymorphisms.They found that, although STRP data separated Afri-can populations from the rest, the African brancheswere shallow and, in their interpretation, not suppor-tive of a recent African origin of modern humans.Later, Jorde et al11 added 27 additional tetranucleotide,two trinucleotide, and one dinucleotide STRPs, andfocused on excess African heterozygosity, observed bypooling samples within Africa. Finally, Perez-Lezaun etal3 analyzed 20 unlinked tetranucleotide STRPs insmall samples (20 to 30 chromosomes each, except forsome of their European samples) of 16 populations.They compared different genetic distances and foundthat those not based on the SMM produced trees thatwere in agreement with other genetic and archaeo-logical evidence, whereas SMM-based distances gen-erated tree topologies that were difficult to reconcilewith such evidence.
In order to estimate a number of parameters ofinterest in population genetics, a relatively large num-ber of loci should be typed in samples of reasonable
size (eg).12 The combined data of a large number of locimay reveal overall patterns that could be masked bythe random effects of drift or by specific selectionpressures in one or a few loci. Increasing sample sizeleads to greater statistical power in hypothesis testing,and decreases sampling error. We present data on 45dinucleotide STRPs, mapping on chromosomes 9, 10,and 11, at an average distance of 11.3 cM (range:5–25 cM). These markers are part of the ABI PRISM™Linkage Mapping Sets. Their level of polymorphismand allele frequencies have previously been determinedonly in a sample consisting of individuals of mostlyNorthern European origin, with a few individuals ofNative American and African ancestry.13 We have typedsamples from ten specific populations from Africa,Europe, Asia, Australo-Melanesia, and the Americas.Sample sizes, with only one exception, ranged between80 and 128 chromosomes. The extensive analysis ofintra- and interpopulation variability in a large numberof loci in large samples allows us to characterizepolymorphism in this particular set of markers and toevaluate their usefulness for linkage studies in popula-tions other than Europeans. The data also illuminatedthe evolution of human STRPs, in terms of thegeneration of polymorphism and the characterizationof allele distribution. They also support one of the twohypotheses on the origin of anatomically modernHomo sapiens, that is, the replacement model (alsoknown as ‘Out of Africa’)14 in which modern humanshave a recent, African origin, and replaced archaicHomo, and argue against the multiregional hypoth-esis,15 according to which archaic Homo evolved intomodern humans in parallel throughout the OldWorld.
Materials and MethodsPopulation SamplesTen populations, from diverse locations around the world,were typed. These were the Mbuti Pygmies (Zaıre: 2N = 78)and the Biaka Pygmies (Central African Republic: 2N = 138)from Africa; the Danes (2N = 124) and the Druze (NorthernIsrael: 2N = 122) from Europe and the Middle East; ChineseHan (2N = 98), Japanese (2N = 102), and Yakut (Siberia:2N = 102) from East Asia; the Nasioi from Bougainville,Melanesia (2N = 46); and Maya (Yucatan, Mexico; 2N = 104)and Rondonia Surui (SW Amazonia; 2N = 94) from theAmericas. A more extensive description of these samples canbe found in,16,17 and on the Web page ⟨http://info.med.ya-le.edu/genetics/kkidd/pops.html⟩. All of these samples exist asEpstein-Barr virus transformed lymphoblastoid cell lines,which were established under approved human subjectsprotocols.
STRP evolution in humansF Calafell et al
39

Marker TypingForty-five dinucleotide STRPs out of the 51 loci from ABIPRISM™ Linkage Mapping Sets, Panels 13 through 16, weretyped; for a list of those loci, see the World Wide Web page⟨http://info.med.yale.edu/genetics/kkidd⟩. These markers mapto chromosomes 9, 10 and 11. All loci were amplified withfluorescently-labeled primer pairs and run in an ABI 373™DNA Sequencer following manufacturer’s protocols with thefollowing modifications: the gel concentration was increasedto 8% acrylamide, the electrophoresis was decreased to 15W,and the collection time was increased to 7 hours. Thesechanges in gel concentration and wattage increased theconsistency of allele-calling between and within populations,by minimizing gel–to–gel variation. Raw data were collectedwith the 672 GeneScan™ software and analyzed withGenotyper™ software. The decimal base pair sizes outputfrom the Genotyper program were translated into integervalues assigned as allele names.
Statistical AnalysisAllele frequencies were estimated by direct allele counting.Expected heterozygosity was estimated as one minus the sumof squared allele frequencies.18 Linkage disequilibrium wastested in contiguous pairs of loci by estimating pairwisehaplotype frequencies with the EM-HAPLO program,19 fromwhich independence was tested through a log-likelihood ratioø2 statistic. Heterozygosity, total number of alleles, andnumber of private alleles were found not to follow normaldistributions, and, accordingly, were compared across popula-tions with the appropriate non-parametric tests.
Genetic distances among populations were estimatedthrough FST,20,21 and three other genetic distances thatincorporate the stepwise mutation model: DSW,22 (δµ)2,23 andRST.24 Neighbor-joining trees25 were built from those dis-tances, and the statistical robustness of their nodes weretested through a bootstrap approach:26,27 loci were resampledwith replacement 1000 times. The LSSearch program28 wasused to discern whether any tree in the topological vicinity ofthe neighbor-joining tree was better by least-squares orminimum length criteria. Some of these procedures wereperformed with the PHYLIP 3.5c package.29
ResultsAllele Frequency Distributions andHardy-Weinberg EquilibriumThe allele frequencies of 45 STR loci in 10 populationscan be retrieved from the World Wide Web page ⟨http://info.med.yale.edu/genetics/kkidd⟩. For each locus, weincluded in the Web page the genotype of oneindividual from the CEPH families, in order to facilitatemeaningful comparisons with datasets produced in thefuture by other authors in different populations. Glob-ally, 620 different alleles were detected, with a range of6 to 29 alleles per locus (mean: 13.8). The observednumbers of heterozygous individuals for every popula-tion and locus were tested against Hardy-Weinbergexpectations. Out of 450 tests, 21 (4.67%) revealed
statistically significant discrepancies at a 0.05 sig-nificance level, essentially the number expected; afterBonferroni correction for multiple tests, only four casesremained significant at a nominal α = 0.05 significancelevel. Three of these involved locus D11S934 in theDanes, Druze, and Nasioi. The large deficiency ofheterozygotes could be attributed to a null allele (eg abase-pair variant in the primer complementarysequences) found at varying frequencies in differentpopulations; apparent non-parental transmission con-sistent with segregation of a null allele was detected infamily studies of Europeans (data not shown). Thefourth significant heterozygote deficiency involvedD10S591 in the Danes. Null alleles in STRs have beendetected in humans30 and in bears.31 Failure to amplifya STRP allele could be due to differential amplificationif the two allelles have extremely different sizes, or to amutation in the primer-complementary sequences.Callen et al30 demonstrated an 8-bp deletion in aprimer-complementary sequence, and found null allelesin 7 out of 22 dinucleotide loci in chromosome 16. Theactual incidence of null alleles is not known; someinstances of apparent lack of parental transmissioncould be, in fact, mutation events.
Even though a mean of 962 chromosomes per locuswas typed, the pooled allele distributions of 28 (62.2%)markers were not continuous, with gaps of up to fourintermediate allele positions. Within every population,a mean of 31.2 loci (69.3%) presented discontinuousallele frequency distributions, with a range from 26 lociin the Japanese to 36 loci in the Surui. At six loci(namely, D9S161, D9S273, D9S290, D9S164, D10S192,and D11S934) we found alleles that differ by one basepair from a perfect two-bp ladder. At four of six loci,the off-ladder alleles were specific to African popula-tions. One of those (D9S164) presented a series of eightAfrican-specific alleles interspersed within the two-bpladder. Complex polymorphism, beyond variation innumber of repeats, appears to be a common phenome-non even in dinucleotide STRPs (see2,32 for otherexamples).
Linkage DisequilibriumIn order to ascertain independence among the locianalyzed, we tested for linkage disequilibrium byestimating two-locus haplotype frequencies for all pairsof adjacent loci, separately in all ten populations. Wedid not test linkage disequilibrium beyond adjacent locibecause the high recombination fractions between loci(eg an average of 20.9 cM for next-to-adjacent pairs ofloci) make linkage disequilibrium extremely unlikely.
STRP evolution in humansF Calafell et al
40

From the haplotype frequencies, contingency tableswere analyzed through a log-likelihood ratio ø2 statistic.The number of possible haplotypes with two STRP lociis relatively high, and many will have low expectedfrequencies; under these conditions, an ordinary ø2 testwould perform poorly, and even a log-likelihood ratio islikely to err on the side of rejecting valid nullhypotheses. Forty-three pairs of loci were tested in eachof the ten populations; after Bonferroni correction, 22tests remained significant at a nominal α = 0.05 sig-nificance level. Sixteen of the significant tests involvedthe Surui. Family relations, especially paternal rela-tions, not recorded in ethnographic field notes, couldexplain this observation. However, in all other popula-tions, alleles at each of the loci studied appear to beindependent of the alleles present in neighboring loci.This is not an unexpected finding, given the recombina-tion fractions involved (eg an average of 11.3 cMbetween adjacent loci) and the presumable absence ofextensive selective hitchhiking effects.
Within-population Allele DiversityThe mean number of different alleles per locus found inAfrican populations was 9.67 ± 0.33 (10.31 ± 0.48 inthe Biaka and 9.02 ± 0.44 in the Mbuti; (Figure 1)), andthe number of different alleles per locus was succes-sively lower in Europeans (8.90 ± 0.33), East Asians(7.83 ± 0.25), and Native Americans (6.12 ± 0.22).Except for the Americas, these values are higher thanthose reported by Bowcock et al,10 which were based onmuch smaller numbers of individuals per population;
many of the same individuals were included in thelarger samples of those populations in this study. Thedifference in number of alleles was not statisticallysignificant between Africans and Europeans (MannWhitney’s U test, p = 0.060), but it was betweenEuropeans and East Asians (p = 0.010), and betweenEast Asians and Native Americans (p < 0.001). Anaverage of 75.98 ± 1.96% of the alleles found world-wide are found in the Biaka Pygmies. In contrast, only38.65 ± 1.87% of the alleles ever seen occur in theAmazonian Surui. At three loci, all the different allelesever found in the global sample were present in theBiaka.
A measure of the genetic distinctiveness of apopulation sample can be obtained from the number ofprivate alleles, ie, those alleles found exclusively in oneparticular population. Obviously, these are privatealleles only with respect to the other nine specificpopulations in this study. The Biaka had a total of 32private alleles across 45 loci, the Mbuti had 18, and noother population contained more than 9 private alleles(Figure 2). The difference in number of private allelesbetween the Biaka and the Mbuti was not statisticallysignificant (Mann-Whitney’s U, p = 0.119), while it wassignificant at a 0.01 level between the Biaka and anynon-African population, and, at a 0.05 level, betweenthe Mbuti and any non-African population (except forthe Chinese and the Japanese). Conversely, the Suruihad significantly fewer private alleles than all otherpopulations, except for the smaller Nasioi sample. Next,we pooled the samples into two groups: Africans andnon-Africans. Africans presented a mean of 1.73 ± 0.30African-specific alleles per locus, whereas non-Africans
Figure 1 Mean number of alleles per locus, estimated from 45STRP markers. Bars represent standard errors of the mean
Figure 2 Total number of alleles found exclusively in eachpopulation, across 45 loci
STRP evolution in humansF Calafell et al
41

Table 1 Mean, standard deviation, range and distribution of expected heterozygosities in 10 populations
Mean s.d. range 0–0.25a 0.25–0.5 0.5–0.75 0.75–1
Biaka 0.8066 0.0087 0.5330–0.8976 – – 9 (20%) 36 (80%)Mbuti 0.7764 0.1059 0.4175–0.9 – 2 (4.4%) 13 (28.9%) 30 (66.7%)Druze 0.7684 0.0077 0.5656–0.9185 – – 16 (35.6%) 29 (64.4%)Danes 0.7785 0.0072 0.5430–0.9007 – – 15 (33.3%) 30 (66.7%)Chinese 0.6745 0.1429 0.2605–0.8589 – 6 (13.3%) 22 (48.9%) 17 (37.8%)Japanese 0.6678 0.1617 0.1488–0.8534 2 (4.4%) 4 (8.9%) 19 (42.2%) 20 (44.4%)Yakut 0.6897 0.1327 0.2044–0.8597 1 (2.2%) 3 (6.7%) 24 (53.3%) 17 (37.8%)Nasioi 0.6592 0.1324 0.2580–0.8367 – 4 (8.9%) 30 (66.7%) 11 (24.4%)Maya 0.6617 0.1339 0.1665–0.8745 1 (2.2%) 1 (2.2%) 29 (64.4%) 14 (31.1%)Surui 0.5488 0.1905 0.0503–0.8103 5 (11.1%) 8 (17.8%) 28 (62.2%) 4 (8.9%)aNumber and percentage of loci with heterozygosities falling in the 0–0.25, 0.25–0.5, 0.5–0.75, and 0.75–1 ranges.
as a whole presented 2.16 ± 0.27 alleles specific to non-Africans. However, the average sample size for non-Africans was more than three times larger than theaverage African sample size (750.9 vs. 204.7 chromo-somes). We corrected for the difference in sample sizeby taking, for every locus, a random sub-sample withreplacement from the non-African allele distributionwith the sample size of the Africans, counting howmany private alleles were found, and averaging over10 000 sub-samples. Thus, when adjusted for samplesize, non-Africans presented a mean of 1.22 ± 0.17‘private’ alleles per locus, that is, 29.5% less thanAfricans. When the same procedure was applied toEuropeans, East Asians, and Native Americans, thenumber of private alleles in those continents wasalways significantly smaller (p < 0.001, Wilcoxon signedrank test) than the corrected number of alleles foundrespectively, in non-Europeans, non-Asians, and non-Native Americans. The combined average allele fre-quency of private alleles was 0.060 ± 0.011 in Africansand 0.044 ± 0.015 in non-Africans (p = 0.010, Wilcoxonsigned rank test).
In summary, the amount of genetic variability exclu-sive to Africans is larger than that of other continents(although a meaningful comparison with the smallerAustralo-Melanesian sample was not possible), and it iseven larger than that of all other continentscombined.
Mean and standard deviation of expected hetero-zygosities are shown in Table 1; most expected hetero-zygosities fell above 0.5 (Table 1). Depending on thepopulations, zero to six loci (0–13.3%) presentedheterozyosities below 0.5, the only exception being theSurui, with 13 (28.9%) loci below 0.5. Thus, eventhough they were selected for polymorphism in Euro-peans, most of the markers in this particular set ofSTRPs are informative enough to be used in geneticlinkage studies in non-European populations. The mean
expected heterozygosity (Figure 3) was highest inAfrica (0.792 ± 0.010), it was slightly lower in Europe(0.773 ± 0.008), and it declines in East Asia(0.677 ± 0.013), and especially in the Americas(0.605 ± 0.018). These values are comparable to thosefound by Jorde et al,11 and by Bowcock et al;10 samplesize does not appear to have a strong effect on theestimation of heterozygosity. All pairwise differences inheterozygosity between the continental groupings ofpopulations were statistically significant at a 0.05 level(Mann-Whitney’s U test).
Allele Size VarianceVariance can be used to roughly characterize thedistribution of the number of repeats in a STRP. Atequilibrium, and in the absence of bounds to allelelength,
v = 2Neµσ2m (1)
Figure 3 Mean expected heterozygosity in 45 STRP loci. Barsare standard errors of the mean
STRP evolution in humansF Calafell et al
42

where v is the variance in allele size, Ne is effectivepopulation size, µ is the mutation rate, and σ2
m is thevariance of the number of repeats gained or lost inevery mutation event.24,33–35 The average variance inallele size (an indirect measure of repeat number,Figure 4) was 8.11 ± 0.86 in African populations,6.48 ± 0.67 in Europeans, 6.20 ± 0.69 in East Asians,and 5.65 ± 0.82 in Native Americans. The distributionof variances across loci was highly skewed to the right,with one locus (D11S922) presenting a mean varianceof 41.61, more than six times the overall mean variance.African populations showed a mode around 5–7; modalvalues are shifted to lower values in Europeans andEast Asians, resulting in lower medians (Table 2), andthe distributions of variances across loci in NativeAmericans present peaks at lower values ( < 2), lowermedians, and long right tails (Table 2).
Taking logarithms in Equation (1), a linear model isobtained.9 We tested differences in the logarithm of thevariance by means of one way analysis of variance
(ANOVA), which revealed statistically significant dif-ferences across loci (p < 0.001). These can be inter-preted as differences in the pattern of mutation (theµσ2
m term), as population size is constant across loci. Aseparate ANOVA showed significant differences bypopulation (p < 0.001); thus, different populationscould have significantly different present or historicaleffective population sizes. In a survey of differentpublished datasets, Chakraborty et al9 found significantdifferences for loci within and between motif lengthclasses, but did not find statistically significant differ-ences across populations, probably because NativeAmerican populations were not included in thosedatasets. Neither the variance nor its logarithm fit anormal distribution, in violation of the requirements forANOVA. Thus, we performed a non-parametric test(Kruskal-Wallis’ H) and found that variances werestatistically significantly different (p < 0.001) amongloci and among populations. However, a non-para-metric test does not allow evaluation of fit to a linearmodel.
In summary, African populations present allele dis-tributions with more alleles, more private alleles, and ahigher variance than other populations, whereas Amer-ican populations have fewer alleles, fewer privatealleles, and repeat number distributions that were lessvariable on average, but more variable across loci. Theimplications of these findings will be discussed in detailbelow.
Genetic Diversity Among PopulationsMean FST among all populations was 0.0682 ± 0.0034,with a range from 0.0279 to 0.1189. Other global FST
values reported for STRPs are 0.0340,4 0.0859,3 and0.1072.2 Since FST measures variances among popula-tions, discrepancies in FST values among populationscan be due to the number and choice of populationstyped. By continent, the highest interpopulation diver-sity was found within the Americas (FST =0.0352 ± 0.0028) and Africa (FST = 0.0330 ± 0.0026),while the greater interpopulation similarities werefound among the East Asian (FST = 0.0183 ± 0.0016)and European (FST = 0.0146 ± 0.0011) samples.
Several genetic distances were computed among thepopulation samples: FST
20,21 DSW,22 (δµ)2,23 and RST.24
All distance matrices were positively correlated (Table3) and all correlation coefficients were statisticallysignificantly different from zero (p < 0.001) by theMantel test.36 However, most correlation coefficientsranged between 0.6 and 0.75, which means that only36% to 56% of the variance of one genetic distance can
Figure 4 Allele size variance, averaged across 45 STRPs.Allele size is expressed in number of repeats; bars representstandard errors of the mean
Table 2 Mean, median, and range of the variance in repeatnumber in 45 STRP loci in 10 populations
Mean Median Minimum Maximum
Biaka 8.11 6.25 0.86 53.67Mbuti 8.11 6.05 0.77 47.98Druze 6.39 4.59 0.53 43.05Danes 6.57 5.00 1.04 37.16Chinese 6.78 4.15 0.26 54.97Japanese 6.06 3.98 0.25 47.50Yakut 5.76 4.83 0.33 46.15Nasioi 5.44 4.39 0.21 32.90Maya 6.22 3.40 0.70 36.73Surui 5.08 1.95 0.22 40.90
STRP evolution in humansF Calafell et al
43

be explained by another genetic distance. Therefore, wekept all four distance measures when performing treeanalysis.
Goldstein et al23 showed that, under mutation-driftequilibrium, (δµ)2 increases linearly with time, with aslope equal to twice the mutation rate, and, with thedataset published by Bowcock et al,10 estimated the ageof the African vs non-African split at 156 000 years ago,with a 95% confidence interval of 75 000–287 000 years.The largest (δµ)2 value we found was 4.45 between theMbuti and the Maya. Applying the same parameterssuggested by Goldstein et al,23 that is, a mutation rate of5.6 3 10–4 and a generation time of 27 years, we obtaina total date (ie, the time needed to accumulate thegenetic distance between the Mbuti and the Maya) forthe tree of 107 000 years, with a 95% confidenceinterval (estimated by 1000 bootstrap iterations asdescribed by Goldstein et al23) of 43 500–220 000 years,which overlaps with the estimate by Goldstein et al.23
The estimate of divergence time depends linearly onthe mutation rate. However, using a more accurateaverage mutation rate estimate (7.8 3 10–4,13 which isbased on typing over 2000 loci (including most of thoseused in the present study) in large families, we obtaineda similar time estimate: 77 000 years with a 95%confidence interval of 31 000 to 158 000 years ago.
Neighbor-joining trees were built for all four geneticdistances (Figures 5a–d), and the robustness of theirbranches was tested by bootstrap. The LSSearchprogram28 showed no better (by least squares orminimum length) tree topologies in the vicinity of theneighbor-joining trees. The FST and DSW trees (Figures5a and 5b) showed the same topology: African samplesclustered on one end, followed by Europeans, NasioiMelanesians, East Asians, and Native Americans. Thesame topology was obtained by Cavalli-Sforza et al21
with 42 populations and 40 blood groups and proteinpolymorphisms, totaling 120 independent alleles. Forcomparison, we can estimate conservatively the rangeof independent alleles in the 45 STRPs as 94–230 (inthe Surui and Biaka, respectively), obtained by count-ing the number of alleles with frequencies larger than
0.05 and subtracting one at every locus. Bootstrapsupports were high, with only one value slightly below50%, and similar between the FST and DSW. Inparticular, branches grouping respectively Africans,Europeans, and Native Americans presented bootstrapsupports above 95%. The (δµ)2 tree (Figure 5c)displayed a topology that is harder to reconcile withother genetic and archeological evidence: for instance,the Japanese appear at the base of the branch leading tothe Africans. Moreover, bootstrap supports were lowerthan for the FST and DSW trees. Finally, RST (Figure 5d)shared the same tree topology with FST and DSW, exceptfor the position of the Melanesian Nasioi, whichclustered with the Brazilian Surui.
In terms of branch robustness, previous geneticevidence, and expectations based on current hypoth-eses on human origins. FST and DSW performedsimilarly to each other and better than both RST and(δµ)2. These results agree with those found by Perez-Lezaun et al,3 although their trees were even morediscrepant.
DiscussionA total sample of 962 chromosomes from a global set of10 populations was typed for 45 dinucleotide STR loci.These loci were originally selected for polymorphism ina sample comprising mostly families of mixed Euro-pean ancestry13 in order to obtain markers suitable forgenetic linkage analysis. However, linkage studies arenot restricted to European populations (see References37–39 among many possible examples). Many geneticdisorders are confined to specific populations or areas;and isolated populations, which are especially suitablefor mapping mutations responsible for genetic dis-orders, are often of non-European ancestry. In spite ofthe European bias in their selection, we have shownthat almost all of these markers are informative enoughfor linkage studies in non-Europeans. Even in popula-tions such as the Surui that have reduced geneticdiversity because of genetic drift, three quarters ofthese dinucleotide STRPs have heteozygosities above0.5, that is, they are more informative than any diallelicmarker.
Polymorphism in STRPs is not restricted to perfectmultiples of the repeat unit. In our dataset, six out of 45loci had alleles interspersed within, but not belongingto, a two-bp ladder. Deka et al2 found such alleles inthree out of eight dinucleotide STRPs, and Perez-Lezaun et al40 found similar off-ladder alleles at two out
Table 3 Mantel correlation coefficients36 between geneticdistances
DSW (δµ)2 RST
FST 0.8731a 0.6840a 0.6851a
DSW 0.9231a 0.7200a
(δµ)2 0.6311a
ap<0.001; significance was estimated from 100 000 matrixreshufflings.
STRP evolution in humansF Calafell et al
44

of twenty tetranucleotide STRPs. Sequence analysis isneeded to determine whether the source of these‘irregular’ alleles lies in the flanking regions,41 or withinthe repeat region. It has been shown that STR stretchescontaining imperfect repeats have a lower mutationrate than perfect repeats,32,42 and thus off-ladder allelescould add an additional layer of complexity to STRPmutation patterns. Since they exist at more than 10% ofthe loci surveyed, the nature(s) of the mutations thatgenerate them must be a significant factor in STRPevolution.
Off-ladder and null alleles are two examples ofcomplex polymorphism at STR loci; base substitutionscould also be present in the repeat sequences,43 but themethods we used did not allow for their detection. Suchcomplex polymorphism defies attempts to model STRPevolution as the result of an SMM. However, inhumans, such a distinction might not be relevant if, asdiscussed below, drift contributed significantly to shap-ing STRP allele frequencies.
After the discovery of STRPs and the suggestion thatthey mutate by adding or subtracting repeat units, there
Figure 5 Neighbor-joining trees derived from four different genetic distances. Figures are bootstrap percentages obtained from 1000replicates: (a) FST; (b) DSW; (c) (δµ)2; (d) RST
STRP evolution in humansF Calafell et al
45

has been a notable effort to adapt population geneticsparameters that assumed no mutation or an infiniteallele model to the stepwise mutation model, and, inparticular, several genetic distance measures have beendevised specifically for STRPs. We have used three suchSTRP-specific genetic distances, and we have found,using the criteria of reasonableness and agreement witharchaeological data and other (non-STRP) geneticdata, and in agreement with,4 that FST performs as wellas, or, in some instances, better than the STRP-specificdistance measures. Thus, modeling genetic distancesafter the SMM does not seem to improve theirperformance in human STRP analysis. Several reasonscan explain this apparent paradox, namely, samplingvariance, deviation from the SMM, and genetic drift.
Sampling varianceZhivotovski and Feldman44 suggested that the varianceof (δµ)2 grows with the number of loci, and the squareof the time elapsed since two populations diverged;Nauta and Weissing34 noted the high sampling error ofD0, the mean pairwise difference in number of repeatswithin a population, a parameter related to RST and(δµ)2. Takezaki and Nei45 simulated the evolution ofloci under the SMM in several populations and showedthat IAM-appropriate distances, such as Cavalli-Sforzaand Edwards’ chord distance and Nei et al’s DA
generally outperformed DSW and (δµ)2 in recoveringthe correct topology of a population tree. They attrib-uted that result to the large sampling variances of DSW
and (δµ)2. This could also explain why there was greaterdiscrepancy between the trees generated by Perez-Lezaun et al,4 with smaller sample sizes than betweenours.
Deviation from the SMMThis paper and previous reports show that STRPpolymorphism is by no means confined to simplevariation in repeat number: off-ladder alleles, nullalleles, and base substitutions have been repeatedlyfound. Interruptions of the repeat stretch have beenshown to decrease mutation rate,32 and longer allelesappear to have higher mutation rates.42 In five loci,intermediate alleles were missing from all ten popula-tion samples, which could be due to a mutationinvolving a large jump in the number of repeatsoccurring in a very deep branch of the coalescentprocess,6 and/or to some mechanical or selective con-straint. Thus, departure from a strict SMM could bepartly responsible for discontinuous allele distributions.Moreover, allele size can be constrained by upper and
lower bounds:34 selection against large repeat stretchesis seen in the genetic disorders caused by largeexpansions in some trinucleotide STRPs, although wehave not found evidence for such limits in the loci wehave analyzed (the variance in repeat number was one-third of that expected under a bound model). Thecomplexity of STRP polymorphism might be over-simplified by a strict SMM, and the distance measuressuggested for STRPs might not capture the complexityof their mutation pattern. However, some attemptshave been made to increase the sophistication of themodels implemented in STRP-specific genetic dis-tances. Thus, Feldman et al46 devised DL, a version of(δµ)2 corrected for size boundaries to allele variation.Unfortunately, DL requires that the mutation rate andthe maximum number of alleles be known and equalacross loci, and we and Chakraborty et al9 have shownthat mutation rate is likely to vary across loci.
Genetic DriftBeside the deviation factors noted, genetic drift couldalso have contributed extensively to the creation andmaintenance of discontinuous allele distributions. FST
and other genetic distances were modeled to be linearwith separation time between populations and constantpopulation size if differentiation occurred mainly orexclusively by drift. This could the case be for STRPevolution in humans, as argued by Perez-Lezaun et al.3
Drift rather than mutation certainly shaped allelefrequencies in genetic polymorphisms such as bloodgroups and protein electromorphs,21 RFLPs,47 and Alusequence insertions,48 which have a much slowermutation rate. At the CD4 locus, Tishkoff et al17 showedthat, in the CD4 pentanucleotide, mutation had notrestored the allelic diversity in non-Africans to the levelobserved in Africans in, according to their inter-pretation, about 5000 generations. It has beenshown18,49 that STRP and flanking RFLP alleles at theDRD2 locus are in strong disequilibrium in multiplepopulations and that variation in allele frequency at theSTRP is accounted for by variation in frequency for theentire haplotype, ie mutation has not restored linkageequilibrium.
Recently,50–52 it has been suggested that part of thegenetic variation in the â-globin locus and in the Ychromosome might have been generated in Asia andintroduced into Africa by an ancient ‘back to Africa’migration. If that were the case for a significant fractionof the genome, we would expect to see a shorter geneticdistance between Africa and Asia than between Africaand other continents. This is not the case (Figure
STRP evolution in humansF Calafell et al
46
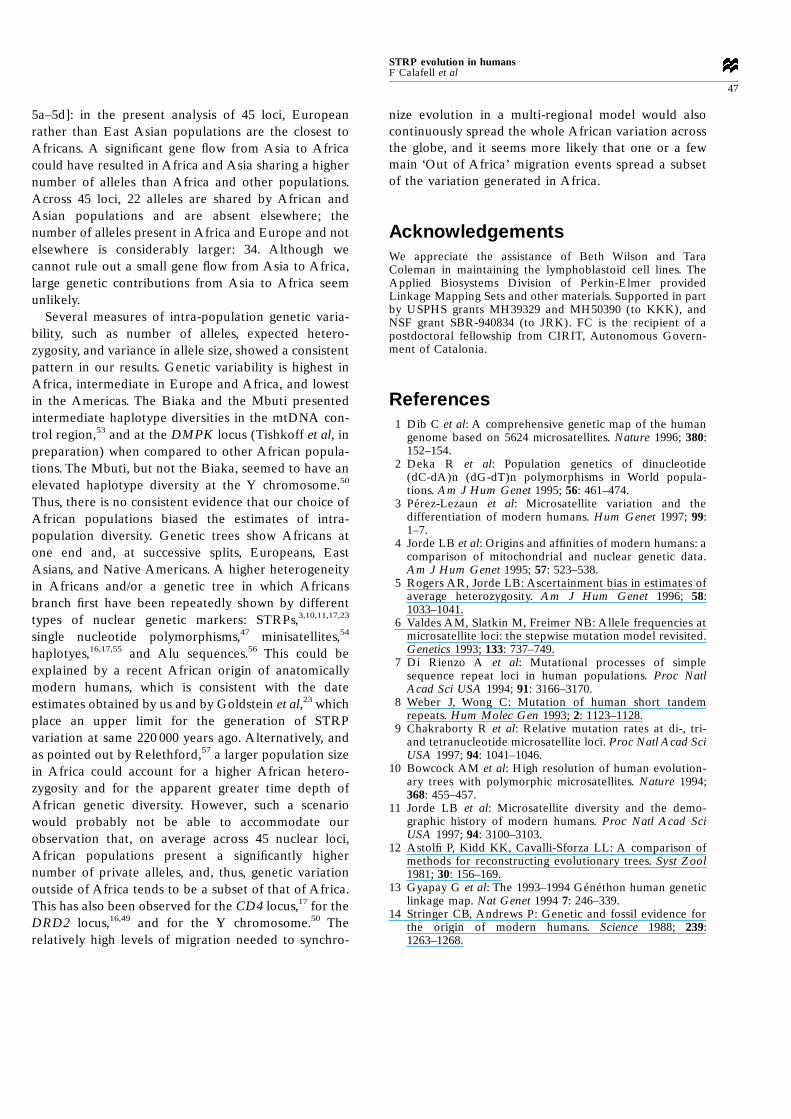
5a–5d]: in the present analysis of 45 loci, Europeanrather than East Asian populations are the closest toAfricans. A significant gene flow from Asia to Africacould have resulted in Africa and Asia sharing a highernumber of alleles than Africa and other populations.Across 45 loci, 22 alleles are shared by African andAsian populations and are absent elsewhere; thenumber of alleles present in Africa and Europe and notelsewhere is considerably larger: 34. Although wecannot rule out a small gene flow from Asia to Africa,large genetic contributions from Asia to Africa seemunlikely.
Several measures of intra-population genetic varia-bility, such as number of alleles, expected hetero-zygosity, and variance in allele size, showed a consistentpattern in our results. Genetic variability is highest inAfrica, intermediate in Europe and Africa, and lowestin the Americas. The Biaka and the Mbuti presentedintermediate haplotype diversities in the mtDNA con-trol region,53 and at the DMPK locus (Tishkoff et al, inpreparation) when compared to other African popula-tions. The Mbuti, but not the Biaka, seemed to have anelevated haplotype diversity at the Y chromosome.50
Thus, there is no consistent evidence that our choice ofAfrican populations biased the estimates of intra-population diversity. Genetic trees show Africans atone end and, at successive splits, Europeans, EastAsians, and Native Americans. A higher heterogeneityin Africans and/or a genetic tree in which Africansbranch first have been repeatedly shown by differenttypes of nuclear genetic markers: STRPs,3,10,11,17,23
single nucleotide polymorphisms,47 minisatellites,54
haplotyes,16,17,55 and Alu sequences.56 This could beexplained by a recent African origin of anatomicallymodern humans, which is consistent with the dateestimates obtained by us and by Goldstein et al,23 whichplace an upper limit for the generation of STRPvariation at same 220 000 years ago. Alternatively, andas pointed out by Relethford,57 a larger population sizein Africa could account for a higher African hetero-zygosity and for the apparent greater time depth ofAfrican genetic diversity. However, such a scenariowould probably not be able to accommodate ourobservation that, on average across 45 nuclear loci,African populations present a significantly highernumber of private alleles, and, thus, genetic variationoutside of Africa tends to be a subset of that of Africa.This has also been observed for the CD4 locus,17 for theDRD2 locus,16,49 and for the Y chromosome.50 Therelatively high levels of migration needed to synchro-
nize evolution in a multi-regional model would alsocontinuously spread the whole African variation acrossthe globe, and it seems more likely that one or a fewmain ‘Out of Africa’ migration events spread a subsetof the variation generated in Africa.
AcknowledgementsWe appreciate the assistance of Beth Wilson and TaraColeman in maintaining the lymphoblastoid cell lines. TheApplied Biosystems Division of Perkin-Elmer providedLinkage Mapping Sets and other materials. Supported in partby USPHS grants MH39329 and MH50390 (to KKK), andNSF grant SBR-940834 (to JRK). FC is the recipient of apostdoctoral fellowship from CIRIT, Autonomous Govern-ment of Catalonia.
References1 Dib C et al: A comprehensive genetic map of the human
genome based on 5624 microsatellites. Nature 1996; 380:152–154.
2 Deka R et al: Population genetics of dinucleotide(dC-dA)n (dG-dT)n polymorphisms in World popula-tions. Am J Hum Genet 1995; 56: 461–474.
3 Perez-Lezaun et al: Microsatellite variation and thedifferentiation of modern humans. Hum Genet 1997; 99:1–7.
4 Jorde LB et al: Origins and affinities of modern humans: acomparison of mitochondrial and nuclear genetic data.Am J Hum Genet 1995; 57: 523–538.
5 Rogers AR, Jorde LB: Ascertainment bias in estimates ofaverage heterozygosity. Am J Hum Genet 1996; 58:1033–1041.
6 Valdes AM, Slatkin M, Freimer NB: Allele frequencies atmicrosatellite loci: the stepwise mutation model revisited.Genetics 1993; 133: 737–749.
7 Di Rienzo A et al: Mutational processes of simplesequence repeat loci in human populations. Proc NatlAcad Sci USA 1994; 91: 3166–3170.
8 Weber J, Wong C: Mutation of human short tandemrepeats. Hum Molec Gen 1993; 2: 1123–1128.
9 Chakraborty R et al: Relative mutation rates at di-, tri-and tetranucleotide microsatellite loci. Proc Natl Acad SciUSA 1997; 94: 1041–1046.
10 Bowcock AM et al: High resolution of human evolution-ary trees with polymorphic microsatellites. Nature 1994;368: 455–457.
11 Jorde LB et al: Microsatellite diversity and the demo-graphic history of modern humans. Proc Natl Acad SciUSA 1997; 94: 3100–3103.
12 Astolfi P, Kidd KK, Cavalli-Sforza LL: A comparison ofmethods for reconstructing evolutionary trees. Syst Zool1981; 30: 156–169.
13 Gyapay G et al: The 1993–1994 Genethon human geneticlinkage map. Nat Genet 1994 7: 246–339.
14 Stringer CB, Andrews P: Genetic and fossil evidence forthe origin of modern humans. Science 1988; 239:1263–1268.
STRP evolution in humansF Calafell et al
47

15 Wolpoff MH: Multiregional evolution: the fossil alter-native to Eden. In: Mellar P, Stringer C (eds.)The HumanRevolution: Behavioural and Biological Perspectives on theOrigins of Modern Humans, Princeton University Press,Princeton, NJ, 1989, pp62–108.
16 Castiglione CM et al: Evolution of haplotypes at theDRD2 locus. Am J Hum Genet 1995; 57: 1445–1456.
17 Tishkoff SA et al: Global patterns of linkage disequilib-rium at the CD4 locus and modern human origins. Science1996; 271: 1380–1387.
18 Weir BS: Genetic data analysis II. Sinauer Associates,Sunderland, MA, 1996.
19 Hawley ME, Kid KK: HAPLO: a program using the EMalgorithm to estimate the frequencies of multi-site haplo-tyes. J Hered 1995; 86: 409–411.
20 Wright S: The genetical structure of populations. AnnEugenet 1951; 15: 323–354.
21 Cavalli-Sforza LL, Menozzi P, Piazza A: History andgeography of human genes. Princeton University Press,Princeton, NJ, 1994.
22 Shriver MD et al: A novel measure of genetic distance forhighly polymorphic tandem repeat loci. Mol Biol Evol1995; 12: 914–920.
23 Goldstein DB, Ruiz-Linares A, Cavalli-Sforza LL, Feld-man MW:Genetic absolute dating based on microsatellitesand the origin of modern humans. Proc Natl Acad SciUSA 1995; 92: 6723–6727.
24 Slatkin M: A measure of population subdivision based onmicrosatellite allele frequencies. Genetics 1995; 139:457–462.
25 Saitou N, Nei M: The neighbor-joining method: a newmethod for reconstructing phylogenetic trees. Mol BiolEvol 1987; 4: 406–425.
26 Efron B: The jackknife, the bootstrap, and other resam-pling plans. Society for Industrial and Applied Mathe-matics, Philadelphia, PA, 1982.
27 Felsenstein J: Confidence limits on phylogenies: anapproach using the bootstrap. Evolution 1985; 39:783–791.
28 Kidd KK, Sgaramella-Zonta LA: Phylogenetic analysis:concepts and methods. Am J Hum Genet 1971; 23:235–252.
29 Felsenstein J: PHYLIP – Phylogeny Inference Package(Version 3.2). Cladistics 1989; 5: 164–166.
30 Callen DF et al: Incidence and origin of ‘null’ alleles in the(AC)n microsatellite markers. Am J Hum Genet 1993; 52:922–927.
31 Paetkau D, Strobeck C: The molecular basis and evolu-tionary history of a microsatellite null allele in bears. MolEcol 1995; 4: 519–520.
32 Jin L et al: Mutation rate varies among alleles at amicrosatellite locus: phylogenetic evidence. Proc NatlAcad Sci USA 1996; 93: 15285–15288.
33 Moran PAP: Wandering distributions and the electro-phoretic profile. Theor pop biol 1975; 8: 318–330.
34 Nauta MJ, Weissing FJ: Constraints on allele size atmicrosatellite loci: implications for genetic differentiation.Genetics 1996; 143: 1021–1032.
35 Kimmel M, Chakraborty R, Stivers DN, Deka R: Dynam-ics of repeat polymorphisms under a forward-backwardmutation model: within and between variability at micro-satellite loci. Genetics 1996; 143: 549–555.
36 Mantel N: The detection of disease clustering and ageneralized regression approach. Cancer Res 1967; 27:209–220.
37 Takiyama Y et al: The gene for Machado-Joseph diseasemaps to human chromosome 14q. Nat Gen 1993; 4:300–304.
38 Yu CE et al: Positional cloning of the Werner’s syndromegene. Science 1996; 272: 258–262.
39 Norman RA et al: Absence of linkage of obesity andenergy metabolism to markers flanking homologues orrodent obesity genes in Pima Indians. Diabetes 1996; 45:1229–1232.
40 Perez-Lezaun A et al: Allele frequencies for 20 micro-satellite loci in a worldwide population survey. HumHered 1997; 47: 189–196.
41 Grimaldi MC, Crouau-Roy B: Microsatellite allelic homo-plasy due to variable flanking sequences. J Mol Evol 1997;44 336–340.
42 Murray A et al: The role of size, sequence and haplotype inthe stability of FRAXA and FRAXE alleles duringtransmission. Hum Molec Gen 1997; 6: 173–184.
43 Perez-Lezaun A: Identification of a base pair substitutionat the tetranucleotide tandem repeat locusDHFRP2(AAAC)n using non-denaturing gel electro-phoresis. Int J Leg Med 1996; 109: 159–160.
44 Zhivotovsky LA, Feldman MW: Microsatellite variabilityand genetic distances. Proc Natl Acad Sci USA 1995; 92:11549–11552.
45 Takezaki N, Nei M: Genetic distances and reconstructionof phylogenetic trees from microsatellite DNA. Genetics1996; 144: 389–399.
46 Feldman MW, Bergman A, Pollock DD, Goldstein DB:Microsatellite genetic distances with range constraints:analytic description and problems of estimation. Genetics1997; 145: 207–216.
47 Bowcock AM et al: Drift, admixture and selection inhuman evolution: A study with DNA polymorphisms.Proc Natl Acad Sci 1991; 88: 839–843.
48 Batzer MA et al: African origin of human-specific poly-morphic Alu insertions. Proc Natl Acad Sci USA 1994; 91:12288–12292.
49 Kidd KK et al: DRD2 haplotypes containing the TaqI A1allele: implications for alcoholism research. Alcohol ClinExp Res 1996; 20: 697–705.
50 Hammer MF et al: The geographic distribution of humanY chromosome variation. Genetics 1997; 145: 785–805.
51 Altheide TK, Hammer MF: Evidence for a possible Asianorigin of YAP + Y chromosomes. Am J Hum Genet 1997;61: 462–466.
52 Harding RM et al: Archaic African and Asian lineages inthe genetic ancestry of modern humans. Am J Hum Genet1997; 60: 772–789.
53 Watson E et al: mtDNA sequence diversity in Africa. AmJ Hum Genet 1996; 59: 437–444.
54 Armour JA et al: Minisatellite diversity supports a recentAfrican origin for modern humans. Nat Gen 1996; 13:154–160.
55 Kidd KK, Kidd JR: A nuclear perspective on humanevolution. In: Boyce AJ, Mascie-Taylor CGN (eds.)Molecular Biology and Human Diversity CambridgeUniversity Press, Cambridge, UK, 1996, pp242–264.
STRP evolution in humansF Calafell et al
48

56 Knight A et al: DNA sequences of the Alu elementsindicate a recent replacement of the human autosomalgenetic complement. Proc Natl Acad Sci USA 1996; 93:4360–4364.
57 Relethford J: Genetics and modern human origins. EvolAnthropol 1995; 4: 53–63.
STRP evolution in humansF Calafell et al
49