Photocatalyzed mineralization of cresols in aqueous media with irradiated titania*1
Marine Biology (1996) 125:321 332 �9 Springer-Verlag 1996
D. Piepenburg �9 M. K. Schmid
Distribution, abundance, biomass, and mineralization potential of the epibenthic megafauna of the Northeast Greenland shelf
Received: 21 November 1995/Accepted: 4 December 1995
Abstract The epibenthic megafauna of the high-Arctic Northeast Greenland shelf was investigated by means of seafloor photography and Agassiz trawl catches. At 54 stations in water depths between 40 and 770 m, sequences of color slides, each depicting about 1 m 2 of the seafloor, were obtained along photographic tran- sects of about 100 to 600 m length. The photographs were quantitatively analyzed for abundance of epiben- thic organisms identified by comparison with speci- mens collected from trawl catches. Megabenthic biomass was estimated by multiplying density values with average body mass figures. For five dominant brittle star species, the population oxygen uptake and, thus, organic carbon mineralization potential were ap- proximated by applying individual respiration rates of average-sized specimens to density figures. Multivari- ate analyses of the megabenthic species distribution revealed a distinct depth zonation. Shallow shelf banks ( < 150 m), characterized by coarse sediments, many stones and boulders as well as negative bottom water temperatures, housed a rich epifauna (30 to 340 ind m -2, 1.8 to 10.5 g AFDW m-2), strongly dom- inated (80 to 98% by numbers) by the brittle stars Ophiocten sericeum and Ophiura robusta. The oxygen uptake by brittle stars ranged from 0.4 to 95 pmol 02 m -2 h-1 (i.e., assuming a respiratory quotient of 0.8, an organic carbon mineralization of 0.1 to 21.9 mg C m 2 d-l) . At the bank flanks sloping to the shelf troughs (100 to 580m), finer sediments prevailed, stones were rare, and bottom water temperatures were positive due to the inflow of Atlantic water. Compared to bank sites, total epibenthic abundances as well as carbon mineralization by brittle stars were roughly ten
Communicated by O. Kinne, Oldendorf/Luhe
D. Piepenburg (1~) - M. K. Schmid Institut ffir Polar6kologie, Universit~t Kiel, Wischhofstr. 1-3, Geb. 12, D-24148 Kiel, Germany
times and total biomass about four times smaller. In deep shelf depressions as well as at the continental slope (200 to 770 m), stones were completely lacking, and sediments very fine. Epibenthic standing stock and carbon mineralization were one to two orders of mag- nitude lower than on the banks. The estimation of brittle star oxygen uptake indicates that a considerable portion of the organic carbon produced in the polynya and partitioned to the benthos may be remineralized by epibenthic bank assemblages.
Introduction
In contrast to the mostly ice-free eastern Fram Strait off Spitsbergen, the knowledge of the benthic commu- nities in the adjacent high-ArCtic western Fram Strait off Northeast Greenland had been scarce, primarily because this region is very difficult to reach due to the persistent ice cover (for a review see Curtis 1975). Prior to a series of German and American expeditions start- ing in 1985, only a few samples had been collected by Russian researchers during expeditions of R.V. "Ob" in 1956 and R.V. ~ in 1957 (Koltun and Balakshin 1964) as well as from the drifting ice island "Arlis II" in 1965 (Stendell 1967). However, since the mid-1980s the area has become the target of an international and multidisciplinary effort to study intensively the North- east Water (NEW), a polynya located in this region (Anonymous 1989; Deming 1993; Hirche and Kattner 1994).
Polynyas are permanent or recurrent ice-free or loosely ice-covered areas in the pack ice zone of polar seas, characterized by pronounced mesoscale gradients in hydrography and ice cover (Schneider and Bud~us 1994). Similar to marginal ice zones, they have been identified to be of special importance for physical and ecological processes (Smith et al. 1990; Gradinger 1995). Field studies demonstrated that in the NEW region, compared to the surrounding ice-covered areas,

322
pelagic primary production (Gradinger and Baumann 1991; Lara et al. 1994) as well as benthic standing stocks (Piepenburg 1988; Ambrose and Renaud 1995; Brandt 1995) are relatively high, whereas zooplankton grazing rates appear to be generally low (Hirche et al. 1994). These findings suggest a strong benthic-pelagic coupling in the NEW polynya.
A principal objective of the multidisciplinary project in the NEW region was to elucidate in some detail the pathways and mechanisms of the benthic-pelagic coupling in a high-latitude ice-covered marine ecosys- tem (Anonymous 1989). This goal demanded, besides information on the rates of various processes, a sound knowledge of the distribution, standing stock and, pre- ferably, carbon uptake of principal portions of both pelagic and benthic communities. During the study, the benthos was, therefore, investigated with a broad range of different approaches (corers, trawls, imaging) to ad- equately sample the various community fractions on various spatial scales.
The megabenthos (sensu Gage and Tyler 1991), the community fraction encompassing the benthic organ- isms which are large enough to be seen in bottom images and/or to be caught by trawls, i.e. those with body sizes on a scale of centimetres to metres, probably plays a more significant role in the functioning of ma- rine systems than their comparatively low abundance proportions would suggest (Romero-Wetzel and Gerlach 1991; Piepenburg et al. 1995). However, a quantitative assessment of megabenthic species is difficult, as they are not adequately sampled by corers (Thurston et al. 1994) or towed gears (Holme and Mclntyre 1984). Therefore, seabed imaging has been proposed as the most appropriate tool for assessing the standing crop of megabenthic communities (Rice et al. 1982).
In this paper, we present quantitative data on the spatial distribution, abundance, and biomass of the megabenthic epifauna, derived from seaftoor images. Furthermore, we give estimates of the population oxy- gen uptake of brittle stars, the most abundant mega- benthic taxon, by combining information derived from photographs and respiration measurements. Our study supplements the comprehensive inventory of the faun- istic composition of megabenthic communities (Piepen- burg 1988). In addition, it provides basic data for an assessment of the role of megafauna in a carbon flow budget of the polynya system.
Material and methods
Study area
The sea off Northeast Greenland is a high-Arctic shelf region, i.e. in general characterized by very low, but relatively constant water temperatures, long-lasting sea ice cover, and large seasonal fluctua- tions in light regime and, hence, primary productivity (Hempel
1985). The shelf morphology is complex (Fig. 1); very shallow banks, such as Ob Bank and Belgica Bank with water depths of < 40 to 150 m, are separated from each other and from the Greenland coast by a trough system (Be/gica Trough, Norske Trough and Westwind Trough with water depths of up to > 500 m) which, in turn, is probably divided by sills into a series of distinct basins. The hydro- graphy is primarily influenced by the East Greenland Current which transports very cold ( < 0 ~ surface water and sea ice from the Arctic Ocean along the Greenland coast to the south. However, over the Belgica Bank this generally southward surface-current regime is, at least temporally, modified by a mesoscale topography-driven anticyclonic gyre (Bourke et al. 1987; Bud~us and Schneider 1995). Of special ecological importance is also the Northeast Water poly- nya (NEW), a recurrent feature in the sea ice cover of variable size located over the northeastern Greenland shelf (Wadhams 1981; Smith et al. 1990). The opening and development of the polynya is influenced by a combination of different factors, including winds, insolation, surface water currents as well as two huge fast ice plates, the Ob Bank Ice Shelf and the Norske Oer Ice Shelf fixed on the shoals of Belgica Bank (Schneider and Bud6us 1994, 1995).
Sampling
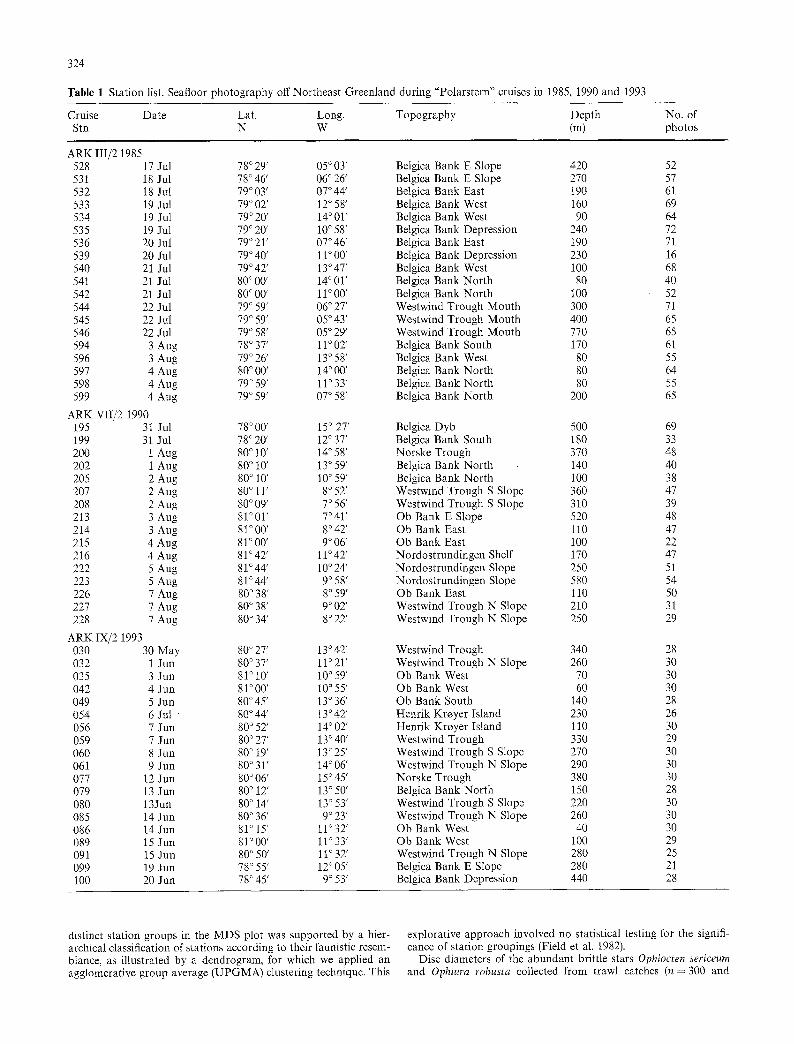
The epibenthic megafauna off Northeast Greenland was investi- gated by means of seafloor photography and Agassiz trawl catches during "Polarstern" expeditions ARK III/2, ARK VII/2 and ARK IX/2 in the summers of 1985, 1990, and 1993, respectively. For more information on the cruises see reports of Gersonde (1986), Krause (1991), and Hirche and Kattner (1994), respectively. At a total of 54 stations in water depths between 40 and 770 m (Fig. 1), sequences of 16 to 72 color slides (2358 in total, each depicting about 1 m 2 of the seafloor) were obtained with a camera probe that was vertically lowered from the drifting ship (Table 1). At each station, the slides were distributed along photographic transects of about 100 to 600 m length. For a detailed description of the probe and its operation see Piepenburg and von Juterzenka (1994). In addition, the megaben- thos was sampled using an Agassiz trawl hauled over the ground for 15 min at about 1 knot (Piepenburg 1988; Schmid 1994). The trawl's opening frame was 3 m wide and 1 m high, and its cod end had a mesh size of 10 ram. However, at most of the stations the cod end was clogged by sediment so that smaller animals were also caught in large quantities (Schmid 1994). Megabenthic specimens (or, if appro- priate, representive subsamples) were coIlected from the catches and preserved in a buffered 4% formalin seawater solution for further treatment in the laboratory.
Analyses
Megabenthic specimens collected from trawl catches were deter- mined to species (or putative species) and weighed (ash free dry weight: AFDW). Species identifications relied on Mortensen (1927), D'yakonov (1967) and Paterson (1985) for echinoderms, Kussakin (1982) for isopod crustaceans, and Ockelmann (1958) and Bernard (1979) for bivalves. The trawled specimens were used to (a) ensure the identification of individuals counted on the photographs and (b) to estimate the biomass of each species by multiplying average density values derived from photographic counts with average body mass figures obtained from weighings of caught specimens (Table 2).
The photographs were quantitatively analyzed by counting mega- benthic individuals on each slide. The smallest identifiable speci- mens had body sizes of about 1 mm (Piepenburg and yon Juterzenka 1994). The mean counts per station were raised to abundance figures (ind m-2) using the average area covered by each photograph of a given transect. The small-scale spatial distribution pattern, i.e. the dispersion of specimens along the photographic transects, was para- meterized by the measure of patchiness m'/m (Lloyd 1967). The

Fig. 1 Northeast Greenland shelf. Seafloor photography at 54 stations (11 July August 1985; �9 August 1990; �9 May-July 1993; numbers in symbols are station labels; T denotes times series station visited twice). Light shading denotes extent of fast ice in July 1993
8 0 ~
7 9 ~
7 8 ~
7 7 ~
1 5 ~
significance of departure from the expected random distribution (m'/m = 1) was tested by a two-tailed chi-square statistic (Elliot 1971).
The distribution and structure of distinct megabenthic assem- blages were examined by multivariate techniques using the PRIMER software package (Clarke and Warwick 1994). The ana- lyses were based on the photographically determined densities of the ten most abundant species. Classification and ordination procedures
2 0 ~ 15 ~ W 1 0 ~
323
8 2 ~
N
8 1 ~
8 0 ~ -I1
7 9 ~
7 8 ~
N
7 7 ~
1 0 ~ W 5 ~
were employed to delineate groups of stations with similar faunal composition (Field et al. 1982). The faunistic resemblance between stations was measured by the quantitative Bray-Curtis similarities of fourth-root transformed density data. Non-metric multi-dimen- sional scaling (MDS) was applied to the resemblance data to order the stations in a two-dimensional plane in a way that they reflect the faunistic similarities (Kruskal and Wish 1978). The discrimination of
324
Table 1 Station list. Seafloor photography off Northeast Greenland during "Polarstern" cruises in 1985, 1990 and 1993
Cruise Date Lat. Long. Topography Depth No. of Stn N W (m) photos
ARK III/2 1985 528 17 Jul 78 ~ 29' 05 ~ 03' Belgica Bank E Slope 420 52 531 18 Jul 78 ~ 46' 06 ~ 26' Belgica Bank E Slope 270 57 532 18 Jul 79 ~ 03' 07044 ' Belgica Bank East 190 61 533 19 Jul 79 ~ 02' 12 ~ 58' Belgica Bank West 160 69 534 19 Jul 79 ~ 20' 14 ~ 01' Belgica Bank West 90 64 535 19 Jul 79 ~ 20' 10 ~ 58' Belgica Bank Depression 240 72 536 20 Jul 79 ~ 21' 07 ~ 46' Belgica Bank East 190 71 539 20 Jul 79 ~ 40' 11 ~ 00' Belgica Bank Depression 230 16 540 21 Jul 79 ~ 42' 13 ~ 47' Belgica Bank West 100 68 54t 21 Jul 80 ~ 00' 14 ~ 01' Belgica Bank North 80 40 542 21 Jul 80 ~ 00' 11 ~ 00' Belgica Bank North 100 52 544 22 Jul 79 ~ 59' 06 ~ 27' Westwind Trough Mouth 300 71 545 22 Jul 79 ~ 59' 05 ~ 43' Westwind Trough Mouth 400 65 546 22 Jul 79 ~ 58' 05 ~ 29' Westwind Trough Mouth 770 65 594 3 Aug 78 ~ 37' 11 ~ 02' Belgica Bank South 170 61 596 3 Aug 79 ~ 26' 13 ~ 58' Belgica Bank West 80 55 597 4 Aug 80 ~ 00' 14 ~ 00' Belgica Bank North 80 64 598 4 Aug 79 ~ 59' 11 ~ 33' Belgica Bank North 80 55 599 4 Aug 79 ~ 59' 07 ~ 58' Belgica Bank North 200 65
ARK VII/2 1990 195 31 Jul 78 ~ 00' 15 ~ 27' Belgica Dyb 500 69 199 31 Jul 78 ~ 20' 12 ~ 37' Belgica Bank South 180 33 200 1 Aug 80 ~ 10' 14 ~ 58' Norske Trough 370 48 202 1 Aug 80 ~ 10' 13 ~ 59' Belgica Bank North 140 40 205 2 Aug 80 ~ 10' 10 ~ 59' Belgica Bank North 100 38 207 2 Aug 80 ~ 11' 8 ~ 52' Westwind Trough S Slope 360 47 208 2 Aug 80 ~ 09' 7 ~ 56' Westwind Trough S Slope 310 39 213 3 Aug 81 ~ 01' 7 ~ 41' Ob Bank E Slope 520 48 214 3 Aug 81 ~ 00' 8 ~ 42' Ob Bank East 110 47 215 4 Aug 81 ~ 00' 9 ~ 06' Ob Bank East 100 22 216 4 Aug 81 ~ 42' 11 ~ 42' Nordostrundingen Shelf 170 47 222 5 Aug 81 ~ 44' 10 ~ 24' Nordostrundingen Slope 250 51 223 5 Aug 81~ ` 9 ~ 58' Nordostrundingen Slope 580 54 226 7 Aug 80 ~ 38' 8 ~ 59' Ob Bank East 110 50 227 7 Aug 80 ~ 38' 9 ~ 02' Westwind Trough N Slope 210 31 228 7 Aug 80 ~ 34' 8 ~ 22' Westwind Trough N Slope 250 29
ARK IX/2 1993 030 30 May 80 ~ 27' 13 ~ 42' Westwind Trough 340 28 032 1 Jun 80 ~ 37' 11 ~ 21' Westwind Trough N Slope 260 30 035 3 Jun 81 ~ 10' 10 ~ 59' Ob Bank West 70 30 042 4 Jun 81~ ' 10 ~ 55' Ob Bank West 60 30 049 5 Jun 80~ ' 13 ~ 36' Ob Bank South 140 28 054 6 Jul " 80 ~ 44' 13 ~ 42' Henrik Kroyer Island 230 26 056 7 Jun 80 ~ 52' 14 ~ 02' Henrik Kroyer Island 110 30 059 7 Jun 80 ~ 27' 13 ~ 40' Westwind Trough 330 29 060 8 Jun 80 ~ 19' 13 ~ 25' Westwind Trough S Slope 270 30 061 9 Jun 80 ~ 31' 14 ~ 06' Westwind Trough N Slope 290 30 077 12 Jun 80 ~ 06' 15 ~ 45' Norske Trough 380 30 079 13 Jun 80 ~ 12' 13 ~ 50' Belgica Bank North 150 28 080 13Jun 80 ~ 14' 13 ~ 53' Westwind Trough S Slope 220 30 085 14 Jun 80 ~ 36' 9 ~ 23' Westwind Trough N Slope 260 30 086 14 Jun 81 ~ 15' l l ~ 32' Ob Bank West 40 30 089 15 Jun 81 ~ 00' l l ~ 33' Ob Bank West 100 29 091 15 Jun 80 ~ 50' 11 ~ 32' Westwind Trough N Slope 280 25 099 19 Jun 78 ~ 55' 12 ~ 05' Belgica Bank E Slope 280 21 100 20 Jun 78 ~ 45' 9 ~ 53' Belgica Bank Depression 440 28
distinct station groups in the MDS plot was supported by a hier- archical classification of stations according to their faunistic resem- blance, as illustrated by a dendrogram, for which we applied an agglomerative group average (UPGMA) clustering technique. This
explorative approach involved no statistical testing for the signifi- cance of station groupings (Field et al. 1982).
Disc diameters of the abundant brittle stars Ophiocten sericeurn and Ophiura robusta collected from trawl catches (n = 300 and

Table 2 Epibenthic megafauna off Northeast Greenland, investigated by means of seafloor photography. Species names, mean body mass (mg AFDW) and mean individual respiration rates (gmol O~ ind ~ h - ~; assessed only for Ophiuroidea, number of specimens measured in parentheses are given
325
Phylum Class Species Body mass Respiration rate
Bivalvia Arctinula greenlandica 18 (231) Isopoda Arcturus cf hastiger 10 (95) Crinoidea Heliornetra glacialis 531 (206) Ophiuroidea Ophioscolex glacialis 262 (469)
Ophiacantha bidenmta 40 (686) Ophiura robusta 2 (110) Ophioc~en sericeum 6 (300) Ophiopleura borealis 375 (956)
Echinoidea Strongylocentrotus sp. 272 (459) Holothuroidea Psolus sp. 158 (18)
Mollusca Crustacea Echinodermata
2.0 (7) 0.4(11) 0.2 (2) 0.3 (7) 3.0 (8)
B a n k
T r a n s
S l o p e
Deep
a,
S t a t i o n d e n d m g r a m
B ray -Cu r t i s s im i la r i t i es
0 10 20 30 40 50 60 70
I I I I I I 1 I
aa 35 421 . . . . . . . . . . . . . . . . . . . .
226 .'
49
79 540 534 . . . . . . . . . . . . . . . . . . .
56 214 202
91 54
227 599 215
85 228
32 532 594 533 536 216
61 222 223
6O I 59 30
200 199
99 80
528 2O8 207 100 544 539 535 531 545 213 ~ ! ~ . ~ ~2;~ ~ ' ~ ~'~ ~,:!~;~ ~ , ~ . ~ , ~ . ~ ~::,,~:~:~.,.~, ~ .:,:.:, .::..~:.:, : .: ,,,~,. 195 ~ , ~ x ~ : , ~ ; ~ ; l ~ , ~ ~
77 546 . . . . . . . . . . . . . . . . . . . . . . . . . . . . . . . . . . . . . . . . . . . . . . . . . . . . . . . ,', ........... ~ - -
MDS plot of s tat ions
B a n k O
O
~ o 0 � 9 ~
�9 ; . .
~ ~o 1"
o
S l o p e
80 I
n = 110, respectively) were measured under a dissecting binocular microscope at 16 x magnification from the base of an arm to the opposite interradius with a resolution of 0.1 mm. For these two and three additional brittle stars, the oxygen uptake of the populations was approximated by applying individual respiration rates, meas- ured for average-sized specimens (Table 2; see Schmid 1994 for details), to density figures. Oxygen consumption values were converted to carbon mineralization rates by applying a constant respiratory quotient (RQ) of 0.8, as proposed by Smith (1978) for megabenthic animals.
Results
Megabenthic species
Ten epibenthic species (among them the most numer- ous species found in the Agassiz trawl catches; cf. Piepenburg 1988) were identified and counted on sea- floor photographs (Table 2). The average body mass of the species considered ranged over two orders of magnitude (2 to 531 mg AFDW), the average indi- vidual oxygen uptake of brittle stars ranged over one order of magnitude (0.2 to 3 gmol 02 h- 1; for details see Schmid 1994).
Zonation in composition, abundance, biomass and mineralization potential
Classification and ordination of stations, according to their similarities calculated with the abundances of these ten species, revealed a distinct depth zonation in the distribution of megabenthic assemblages. Four faunistic zones were discernible in the cluster dendro- gram (Fig. 2a) and MDS plot (Fig. 2b).
Bank. This cluster encompassed 16 stations located on shallow shelf banks (Belgica Bank, Ob Bank) in depths
Fig. 2 Results of classification and ordination analyses, both based on between-station Bray Curtis similarities, calculated from the abundance data of ten epibenthic species quantified in seafloor photographs, a Cluster dendrogram (UPGMA linkage); b multi- dimensional scaling plot (grouping of stations according to cluster analysis is indicated by symbols b Bray-Curt is similarit ies MDS stress = 0.140

326
Table 3 Characteristics of epibenthic faunistic zones distinguished off Northeast Greenland. For each station cluster, number of sta- tions investigated, names of dominant species as well as ranges (median values in parentheses) of water depths (m), number of
species per station (n), evenness values (Pielou index), mean abundance (ind m 2) and biomass (g AFDW m - z) of ten megaben- thic species and oxygen uptake (gmol 02 m - 2 h 2) and minerali- zation potential (rag C m - z d-1) of five brittle star species are given
Cluster Stn Depth Species Dominant Evenness Abundance Biomass Respiration Mineralization number species
Bank 16 40 150 4-8 O. sericeum 0.03-0.71 28.5-335.0 1.8-10.5 0.4-94.9 0.1 21.9 (95) (6) O. robusta (0.31) (207.7) (3.1) (56.8) (13.1)
S. pallidus A. greenlandica
Trans 18 100-580 4-9 O. bidentata 0.16-0.77 1.3 95.0 0.1-1.7 0.5-30.0 0.1-6.9 (205) (6) O. sericeum (0.48) (11.3) (0.8) (5.3) (1.2)
Slope 16 180440 ~ 6 O. borealis 0.61-1.00 0.2-3.8 < 0.1-1.1 0.4-8.1 0.1 1.9 (305) (4) O. 9lacialis (0.83) (0.9) (0.2) (1.7) (0.4)
Deep 43 8~770 ~ 5 O. bidentata 0.19-1.00 0.2-2.2 < 0.1-0.1 < 0.1-1.0 < 0.1-0.2 (510) (2) (0.85) (0.4) ( < 0.1) (0.2) ( < 0.1)
of 40 to 150 m (Fig. 1). These sites were characterized by coarse sediments, many stones and boulders as well as negative bottom water temperatures (Bud6us and Schneider 1995). Stones and boulders constituted a va- riety of microhabitats, providing favourable conditions for epilithic organisms. Four to eight epibenthic species were found at the bank stations (Table 3). Mean abun- dances per station ranged from about 30 on the western Ob Bank in 60 m depth to 340 ind m-2, on the north- ern Belgica Bank in 80 m depth (Table 3). The assem- blages were strongly dominated by brittle stars (median = 91%), primarily by the two species Ophioc- ten sericeum and/or Ophiura robusta. Therefore, the evenness was comparatively low on the banks (Table 3). At some locations, the regular sea urchin Strongylocen- trotus pallidus and the pectinid bivalve Arctinula 9reen- landica reached abundances of 20 to 30 ind m - 2. The isopod Arcturus cf. hastiger was confined to bank sites shallower than 100m. Total megabenthic biomass, computed by multiplying specific mean body mass figures with photographically derived densities (Table 2), ranged from 1.8 to 10.5 g AFDW m -2 (Table 3). On average, brittle stars accounted for 39% of the megabenthic biomass. Their total oxygen uptake, com- puted by applying specific individual respiration rates to ophiuroid abundance values (Table 2), ranged from 0.4 to 95 gmol O2 m 2 h - 1 (Table 3). Thus, the median carbon mineralization by large epibenthic brittle stars on the shelf banks was estimated to be 11.1 mg C m - 2 d - 1, varying between 0.1 and 21.9 mg C m - 2 d- 1 (Table 3).
Trans. This zone includes 18 stations at the bank flanks sloping to the shelf troughs, in depths from 100 to 580 m. It constituted a transitional zone between the rich bank assemblages and the poor communities in the shelf depressions. Finer sediments prevailed, stones were rare, and bottom water temperatures were posi- tive due to the inflow of Atlantic water (Bud6us and
Schneider 1995). The species numbers were similar to those on the bank sites (Table 3; Mann-Whitney U- test: p = 0.357), but median epibenthic densities were roughly one order of magnitude and median biomass about four times lower (Table 3: ranges of 1 to 90 ind m - 2 and 0.1 to 1.7 g AFDW m -2, respectively). The obvious decrease in epibenthic standing stock was mainly because Ophiura robusta was virtually missing in this faunistic zone, and because Ophiocten sericeum became progressively rarer with increasing depth. Thus, the relative importance of the brittle star Ophiacantha bidentata (the only species found at all sites) increased. On average, about 88% of megaben- thic abundance and 45% of megabenthic biomass were made up by brittle stars. Corresponding to the trend in abundances, the population oxygen uptake of brittle stars and their carbon mineralization, ranging from 0.5 to 3 0 g m o l O z m - Z h -1 and from 0.1 to 6.9mg C m -2 d -a, respectively, were on average about ten times lower than on the banks (Table 3).
Slope. A group of 16 stations at the deeper parts of the shelf trough slopes or at the upper continental slope (Table 3: median depth about 300 m) was characterized by a poor epibenthic fauna dominated by the large brittle star species Ophiopleura borealis and Ophio- seolex 9lacialis (Table 3). Species numbers were signifi- cantly lower than in the shallower zones Bank and Trans (Mann-Whitney U-tests: p < 0.000 and p < 0.000, respectively), but the species evenness was significantly higher (Mann Whitney U-tests: p < 0.000 and p < 0.000, respectively). Mean abundances ranged from 0.2 to 3.8 ind m - 2 and were, thus, on average two and one orders of magnitude lower than at Bank and Trans stations, respectively (Table 3). Median biomass was 0.2 g AFDW m - 2 (Table 3), thus also significantly lower than in the shallower zones (Mann-Whitney U-tests: Slope vs Bank p < 0.000; Slope vs Trans p = 0.005). The megabenthic assemblages consisted almost completely ( > 95%) of brittle stars, both by

327
numbers and biomass. The median carbon minerali- zation by brittle stars was very low (0.4 mg C m - ~ d - 1), varying between 0.1 and 1.9 mg C m - 2 d a (Table 3).
Deep. In the deep shelf depressions as well as at the deepest continental slope stations (Table 3: four sta- tions in depths of 380 to 770 m), stones were completely lacking and sediments very fine. The epibenthic fauna was poor in every respect. Only few species occurred here, with Ophlacantha bidentata being most constant and (relatively) abundant. Species numbers as well as abundance, biomass and carbon mineralization rates were lower than in the other zones (Table 3 : 2 to 5 species, 0.2 to 2 .2 indm -2, <0.1 to 0.1g AFDW m - 2, and < 0.1 to 0.2 mg C m - 2 d - t, respec- tively). Except for species numbers and abundances in comparison to Slope stations, all differences were found to be significant (Mann-Whitney U-tests: p < 0.05).
In summary, a clear bathymetric trend was obvious (Fig. 3a, b, c); total megabenthic abundance, biomass as well as the carbon mineralization of brittle stars decreased significantly with water depths (Spearman rank correlations: p = - 0.877, p = - 0.869 and p = - 0.782, respectively).
Small-scale patchiness
While inter-station analyses of the station data re- vealed the depth zonation in the distribution of epiben- thic assemblages, intra-station examinations of the photographic transects provided information on the small-scale distribution (i.e. the patchiness on a 100-m scale) of abundant epibenthic species, such as the brittle stars Ophiocten sericeum and Ophiura robusta (Fig. 4).
Ophiocten sericeum was the most abundant species on the shelf banks (i.e. at Bank and upper Trans stations in water depths of 200m and less). There, specimens of O. sericeum were found on most single photographs, and the average densities were often > 100indm -2. The distribution along the transects
was, however, patchy; the specimen counts per photo- graph ranged between 0 and 523 (Fig. 4a, b,c: m'/m = 1.11, 1.08, and 1.28, respectively). The disc di- ameters of specimens sampled from Agassiz trawl catches taken on shallow bank stations (Stn. 534, Stn. 524) ranged between 4.5 and 11.2 mm, the median size was 7.4 mm (Fig. 5a).
At some shelf sites in 80 to 140 m depth, Ophiura robusta was the second dominant epibenthic species (Table 1). This brittle star was distinctly smaller than its close relative Ophiocten sericeum (Kolmogorov-Smir- nov test: p < 0.000); the disc diameters of O. robusta, caught with the Agassiz trawl at shelf sites, ranged between 3.5 and 7.7 mm, the median size was 5.9 mm (Fig. 5b). O. robusta was, however, distinctly less con- stant and, on average (excluding Stn. 49 on the Ob
Abundance 1 0 0 0 I I I ~ . . . . I . . . . I . . . . ] . . . . I . . . . ~ . . . . J I I I
I I~e Bank
== A
10 ................... < C ~ - - ~ . . . . . . . . . . . . . . . . . . . . . . . . . . . . . . . . . . . . . . . . . . . . . . . . . . . . . . . . . . . . . . . . . ~ ~ " **~,~ o S , o p e
o o 0.1 .... I .... I .... I .... I~,,,T,~,,I .... I ....
Biomass 100 " ' , . . . . , . . . . , . . . . I . . . . , . . . . I . . . . , ' "
Bank 'E 10 .......... le . . . . . . . . . . . . . . . . . . . . . . . . . . . . . . . . . . . . . . . . . . . . . . . . . . . . . . . . . . . . . . . . . . . . . . . . . . . . . . . . . . . . . . . . . . . . . . . .
U. 1 .......... ~ - O v - ~ C ~ l ~ ...........................................................................
. ~ o < ~ ' e e e �9 Slope 0.1 ...................... -.:-.--- ~----.-4,-..---~ ~ : . ~ .................... 0 .............................. :
o ~ ~0 E 0 � 9 1 6 2 1 7 4
,2 0 ,01 . . . . . . . . . . . . . . . . . . . . . . . . . . . . . . . . . . . . . . . . . . . . . . . . . . . . . . . . . . . . . . . . . . . . . . . . . . . . . . . . . . . . . . . . . . . . . . . . . . . . . . . . . . . . . . . . . . . . . . . .
ca 0
b 0 . 0 0 1 . . . . I . . . . [ . . . . I . . . . ~ . . . . J . . . . I . . . . ] . . . .
Oxygen Uptake Carbon Mineralization ~ ...................................................................................................................... 1 loo ~ - -
~' 100 r B a n k d "-o
o r o o 3 " ~ a ~ $
=L ~ A - t • t S l o p e q ~ c
' F " ............. ' ~ . . . . . . . . . . . . . . . . . . . . . . . . . .
o . 1 ...................................................................... . . . . . . . . . . . . . . . 0.01
o 0 100 2 0 0 300 ~00 5 0 0 6 0 0 7 0 0 8 0 0
o D e p t h (m)
Fig. 3 Depth zonation of epibenthic megafauna on the Northeast Greenland shelf, a Abundance; b biomass; e oxygen uptake of brittle stars
Bank), less abundant at each station than O. sericeum. Its small-scale patchiness was even more pronounced (Fig. 4d: m'/m = 2.19). This gregarious distribution re- flects the fact that O. robusta was almost exclusively found on hard bottom and did not occur on sediment patches between the irregularly dispersed stones, whereas O. sericeum did not exhibit such a conspicuous substrate preference. When both species were co-occur- ring (e.g. Fig. 4c, d: Stn. 205), their densities tended to be negatively correlated (Spearman rank correlation: p = - 0.459).
Discussion and conclusions
Species composition
More that 200 megabenthic species, ranging from hy- drozoans to fish, were found in trawl catches carried

328
Fig. 4 Small-scale spatial d is t r ibut ion of a b u n d a n t brittle stars a long pho tog raph ic 600 transects , presented as n u m b e r of specimens counted on c ~ 500 sequences of seafloor 0,
E pho tographs . (m'/m dispers ion "G 4 0 0 coefficient after Lloyd (1967); * c~ level of significance of depar ture m 300 - f rom expected r a n d o m n e s s "S II tested by chi -square statistic: *** ~ 200 - x~ p _< 0.001) a Ophiocten sericeum E at Stn. 534; b Ophiocten sericeum ~ 100 - at Stn. 598; e Ophiocten sericeum z at Stn. 205; d Ophiura robusta at 0 Stn. 205
600
B e t g i c a B a n k ( W e s t ) S t . 5 3 4
9 0 m
5 0 0 -
"~ 400-
3 0 0 - ~S
2 0 0 -
100 - Z
b 0
O . s e r i c e u m . . . . . . . . . . . . . . . . . . . . . . . . . . . . . . . . . . . . . . . . . . . . . . . . . . . . . . . . . . . . . . . . . . . . . . . . . . . . . . . . . . . . . . . . . . . . . . . . . . . . . . . . . . . . . . . . . .
h,,il,lliiiilii,ilirilillilhlil,i,lili[liilifi, ii,,i,ii,lili I I I I I I i I
B e t g i c a B a n k ( N o r t h ) S t . 5 9 8
8 0 m
E "O r
/ O. s e r i c e u m . . . . . . . . . . . . . . . . . . . . . . . . . . . . . . . . . . . . . . . . . . . . . . . . . . . . . . . . . . . . . . . . . . . . . . . . . . . . . . . . . . . . . . . . . . . . . . . . . . . . . . . . . . . . . .
iiiliillilii,ililililiiliillljll ! IJJililliliililliiliiiiii:ii: i I I I I I I I
B e t g i c a B a n k ( N o r t h ) S t . 205
1 0 0 m 600
O . s e r i c e u m 5 0 0 . . . . . . . . . . . . . . . . . . . . . . . . . . . . . . . . . . . . . . . . . . . . . . . . . . . . . . . . . . . . . . . . . . . . . . . . . . . . . . . . . . . . . . . . . . . . . . . . . . . . . . . . . . . . . . . . . . . . .
4 0 0 . . . . . . . . . . . . . . . . . . . . . . . . . . . . . . . . . . . . . . . . . . . . . . . . . . . . . . . . . . . . . . . . . . . . . . . . . . . . . . . . . . . . . . . . . . . . . . . . . . . . . . . . . . . . . . . . . . . . .
,, Ill[IllllilII,ll m 300 ..........................................................................................................
+~ lilliillJl,,,,, .13
E . . . . . . . . . . . . . . . . . . . . . . . . . . . . . . . . . . . . End of ............ 100 - z transect
I_.h 0 I I I I I I
B e t g i c a B a n k ( N o r t h ) S t . 2 0 5
100m 6 O O
~oo -I- .................................................................................... ~176 ...... E
3oo- "6
200 ......................... .13
E
Z
d
4 0 0 . . . . . . . . . . . . . . . . . . . . . . . . . . . . . . . . . . . . . . . . . . . . . . . . . . . . . . . . . . . . . . . . . . . . . . . . . . . . . . . . . . . . . . . . . . . . . . . . . . . . . . . . . . . . . . . . . . . I!i ............................................................................. : i , , i l ..................................... + .......... Enoo, . . . . . . . . . . . . ,oo i.~i llll . . , , , , , l , l d m , l t r a n s e c t
0 I I i i I i 0 10 20 30 40 50 60 '70
Transect of seabed photographs
n=64 min =53
median= 198
mean=191
max = 305 m ' / m = l . l 1 . 8 8
n=55 min = 100
median= 258
mean = 279
max=523 m ' /m= l .08 * . 8
n=51 rain=0
median= 180
mean = 178 max = 336
m, /m= 1.28 . 8 .
n=51 min=0
median= 5'7 mean= 96
max=415 m, /m= 2.19 * . 8

329
60 , n 300 / Ophiocten sericeum = 50 1 ....................................................................................... ;Median=7.4 mm
*= g
a , ~ i [ i i i i i I I i
60
50-
40-
=o 30 O
20- LL
10-
0
Ophiura robusta n=110 .................................................................. ~.Median= 5.9 mm . . . . . . . . . . . .
I I I I I I I I I L I
0 2 4 6 8 10 12 Disc diameter (ram)
Fig. 5 Size frequencies of abundant brittle stars. Percentages of disc diameters (l-ram classes) of specimens collected from trawl catches. a Ophiocten sericeum; b Ophiura robusta
out on the Northeast Greenland shelf (for a complete list see Piepenburg 1988). Echinoderms, particularly brittle stars (Ophiocten sericeum, Ophiura robusta, Ophiacantha bidentata, Ophiopleura borealis, Ophio- scolex glacialis), sea urchins ( Strongylocentrotus pallidus) and bivalves (Arctinula greenlandica) predominated. The ten species considered in our photographic inven- tory of the epibenthic megafauna contributed most to the catch yields. However, at some trawl stations, addi- tional species such as the polychaetes Onuphis con- chylega and Thelepus cincinnatus were found in rela- tively high numbers as well (Piepenburg 1988).
In terms of zoogeography, the megabenthic fauna of the study area consisted of boreal-Arctic species (Ophiocten sericeum, Ophiura robusta, Ophiacantha bidentata, Ophioscolex glacialis, StrongyIocentrotus pal- lidus, Psolus sp.) as well as of species (ArctinuIa green- landica, Arcturus cf hastiger, HeIiometra glacialis and Ophiopleura boreaIis) which have been described as being confined to the Arctic proper (Stephensen 1943; Blacker 1957; Ockelmann 1958; Anisimova 1989). However, the taxonomy of some geographically and bathymetrically widely distributed boreal-Arctic spe- cies is not thoroughly known. It is not clear, for in- stance, whether O. bidentata, found on the Greenland shelf, is the same as the North Atlantic deep-sea species which has a different reproduction cycle than the shelf populations (Paterson 1985). For more information on the general zoogeographic and bathymetric distribu- tion of the species considered see Mortensen (1927), Stephensen (1943), Blacker (1957), Ockelmann (1958),
D'yakonov (1967), Bernard (1979) and Anisimova (1989).
Standing stock
As in several other Arctic or sub-Arctic regions (e.g. Ellis 1960; Zenkevitch 1963; Paterson et al. 1982; Anisimova 1989; Carey 1991; Piepenburg and von Juterzenka 1994; Piepenburg and Schmid 1996), brittle stars were dominant megabenthic elements. Seafloor photographs revealed that brittle stars accounted for 45 to 98% of the visible specimens (present paper), and their relative abundances in Agassiz trawl catches ranged from 25 to 75% (Piepenburg 1988). Particularly on shallow banks, extremely high densities of Ophiocten sericeum (several hundred ind m-2) were found, being similar to abundances of O. sericeum on Barents Sea shoals (Piepenburg and Schmid 1996). From boreal coastal waters, mass occurrences of brittle stars have been reported for both endobenthic amphiurids and epibenthic Ophiura species (e.g. Muus 1981; Salzwedel et al. 1985). Also in off-shore waters, especially the upper bathyal, dense populations of epibenthic brittle stars have been found by imaging inventories, e.g. Ophiophthalmus normani at 1300m off California (16 ind m 2; Smith and Hamilton 1983), Ophiacantha fidelis at 450 m off Tasmania (350 ind m-2; Blaber et al. 1987), and Ophiura sarsi at 280m off Japan (370ind m-2; Fujita and Ohta 1989) and at 500 m off South Carolina ( > 30 ind m-2; Stancyk et al. 1994).
Zonation pattern
Principal feature in the megabenthic multispecies dis- tribution in the study area was a pronounced depth zonation. The findings of Brandt (1995) and Ambrose and Renaud (1995) for other benthic community frac- tions (peracarid crustaceans and mostly infaunal poly- chaetes, respectively) suggest, however, that the bathymetric pattern is modified by a complex of prob- ably interdependent factors. This complex includes sea- floor properties as well as hydrography and ice cover which ultimately control primary product ion in the euphotic zone and, hence, food supply to the benthos (Grebmeier and Barry 1991; Graf 1992). The general composition of the seabed, as derived from our images, indicate that average bot tom current velocities, advec- tive particle fluxes and, thus, nutrient supply to the benthos are higher in shallow shelf bank biotopes than in deeper habitats. The Northeast Water (NEW) poly- nya and an anti-cyclonic surface water circulation over the Belgica Bank are apparently of special importance. The high epibenthic standing stock on the shallow banks is probably sustained by an, at least temporarily, high pelagic and/or sympagic production in the poly- nya (Gradinger and Baumann 1991; Lara et al. 1994), of

330
which a large proportion is not consumed by pelagic grazers (Hirche et al. 1994; Ashjian et al. 1995) and is, thus, finally partitioned to the seafloor. The convergent gyre (Bourke et al. 1987) may act as a retention mecha- nism, accumulating both organic matter and mero- planktic larvae in the NEW area, thus favouring sedimentation and food supply of the benthos as well as survival and spatfall of the planktic offspring of benthic species such as, for instance, the very abundant Ophioc- ten sericeum (Thorson 1936).
Carbon mineralization
The respiration values derived for the brittle stars can be considered as conservative measures of total mega- faunal carbon mineralization. Brittle stars clearly dom- inated the epibenthos numerically, but it should be noted that at certain locations other species (e.g. the sea urchin Strongylocentrotus pallidus and the feather star Heliometra 9lacialis) also occurred at relatively high abundances and accounted for most of the megaben- thic biomass. Furthermore, additional epibenthic species which were not covered by our photographic survey, e.g. motile crustaceans with relatively high individual oxygen consumption rates (Schmid 1994), may also be important in an energy flow budget. At least on the bank stations, the total megabenthic car- bon mineralization is, therefore, clearly underestimated by confining the oxygen uptake estimates to brittle stars solely.
For a precise assessment, total respiration of the various species would have to be derived by summation of the oxygen uptake of different size classes (e.g. Smith 1983; Smith et al. 1987). This approach would require, however, the establishment of body size frequency dis- tributions and functional relationships between body size and respiration rate a feat which can practically not be achieved for each species at each station. Fur- thermore, having taken into account the narrow size range of the brittle stars, we supposed that it was sufficiently exact for the purpose of our study to evalu- ate the average oxygen consumption of specimens of a size near the median of the populations considered and to extrapolate to total population respiration by multiplying this value by mean abundance.
In the study area, a pronounced contrast was obvi- ous in the epibenthic oxygen demand and carbon min- eralization potential; while brittle star abundances and, thus, their oxygen consumption were low in the uni- formly soft-bottom shelf troughs (0.1 to 8 gmol 02 m - 2 h -1, i.e. <0.1 to 2 m g C m - 2 d - 1 ) , the dense brittle star populations on the heterogenuous seabed of the banks were estimated to consume up to 100 gmol 02 m - 2 h -~, i.e. they remineralized up to 23 mg C m-2 d-1. The organic carbon mineralization by the (primarily infaunal) sediment community in the shelf troughs was comparatively low; Graf (personal
communication) measured sediment oxygen demands (SOD) of 10 to 150~tmolO2m-2h -* (i.e. 3 to 43 mg C m - 2 d - 1, assuming a RQ of 1) by incubating cores sampled in 180 to 490 m depth. These values were not very different from average rates in greater depths of the Greenland-Iceland-Norwegian seas (Graf et al. 1995), ranging between 16 mg C m -2 d - 1 at the Voring Plateau off Norway (950 to 1450m) to about 60 mg C m - 2 d - 1 at the western Kolbeinsey Ridge off Iceland (800 to 950 m).
In the northern Barents Sea, a similar bathymetric pattern was found (Piepenburg et al. 1995); brittle stars were assessed to consume 2 to 6 gmol 02 m -2 h - 1 (0.5 to 1.5 mg C m - 2 d - 1) in deep shelf depressions (where SOD of the always fully oxidized sediments ranged between 105 and 179 g m o l O 2 m - 2 h - 1 ; Hulth et al. 1994) and 16 to > 2 0 0 g m o l O 2 m 2h-1 (3.5 to > 45 mg C m -2 d -a) on shallow shelf banks. Due to
technical problems, no SOD were available for bank sites both in the Barents Sea and off Northeast Green- land.
Thus, two different partitioning patterns in benthic community oxygen consumption and organic carbon mineralization, contrasting bank and trough biotopes, were discernible in the Barents Sea (Piepenburg et al. 1995) and off Northeast Greenland (present paper); while the total epibenthic oxygen uptake (approxi- mated by brittle star respiration) fell into the range of only < 1 to 5% of the SOD of fine trough sediments, the carbon mineralization rates of the dense brittle star assemblages on the banks were equal or locally even higher than those measured in troughs. For bank habi- tats, any estimate of benthic oxygen uptake, being based solely on sediment core incubations and, thus, implicitly excluding epibenthic respiration, would se- verely underestimate the actual mineralization rates. The habitat-related contrasts in the benthic oxygen and carbon flow seem to be a widespread phenomenon in Arctic seas and have to be taken into account in any attempt to construct general models of benthic-pelagic coupling and carbon cycling.
Conclusions
Our findings provide further evidence that brittle stars dominate epibenthic communities on Arctic shelves and occur locally in very high abundances. Dense beds of Ophiocten sericeum are apparently a characteristic assemblage of high-Arctic shelf banks. Furthermore, our results suggest that the megabenthic zonation of the Northeast Greenland shelf is controlled by a com- plex of interdependent factors (seabed properties, water current circulation, sea ice cover, pelagic and/or sym- pagic production). Water column and sea ice features, such as the NEW polynya as well as a convergent anti-cyclonic gyre over the Belgica Bank, are probably of special importance for benthic community patterns.

331
The e s t i m a t i o n of m e g a b e n t h i c oxygen u p t a k e indi - cates tha t a cons ide rab le p o r t i o n of the o rgan ic c a r b o n p r o d u c e d in the N E W p o l y n y a a n d p a r t i t i o n e d to the b e n t h o s m a y be r emine ra l i zed by ep iben th i c b a n k as- semblages.
Acknowledgements We thank the captain and crew of R.V. "Polar- stern" as well as the cruise participants for their help during the expeditions to Northeast Greenland. Thanks are also due to G. Graf (Kiel) for providing data on sediment oxygen demand. The com- ments of G. Graf as well as two anonymous reviewers on the manuscript are gratefully acknowledged. This work is a contribution to the Northeast Water Polynya Project (NEWP) of the Interna- tional Arctic Polynya Programme (IAPP) of the Arctic Ocean Sciences Board (AOSB). The expedition in 1990 was supported by Grant 03F0568A of the German Federal Ministry of Research and Technology to G. Hempel (Kiel), the cruise in 1993 by the Deutsche Forschungsgemeinschaft (in the framework of the Sonderforsch- ungsbereich 313 of Kiel University). This is publication No. 264 of the SFB 313.
References
Ambrose WG, Renaud PE (1995) Benthic response to water column productivity patterns: evidence for benthic-pelagic coupling in the Northeast Water Polynya. J geophys Res 100:4411-4421
Anisimova NA (1989) Distribution patterns of echinoderms in the Eurasian sector of the Arctic Ocean. In: Herman Y (ed) The Arctic seas. Van Nostrand, New York, pp 281-301
Anonymous (1989) International Arctic Polynya Programme (IAPP). Institute Marine Sciences of the University of Alaska, Fairbanks
Ashjian CJ, Smith SL, Lane PVZ (1995) The Northeast Water Polynya during summer 1992: distribution and aspects of sec- ondary production of copepods. J geophys Res 100:4371-4388
Bernard FR (1979) Bivalve mollusks of the western Beaufort Sea. Contr Sci 313:1-80
Blaber SJM, May NJ, Young JW, Bulman CM (1987) Population density and predators of Ophiacantha fidelis (Koehler, 1930) (Echinodermata: Ophiuroidea) on the continental slope of Tas- mania. Aust J mar Freshwat Res 38:243-247
Blacker RW (1957) Benthic animals as indicators of hydrographic conditions and climatic change in Svalbard waters. Fishery In- vest Lond 20:1-49
Bourke RH, Newton JL, Paquette RG, Tuunicliffe MD (1987) Cir- culation and water masses of the East Greenland Shelf. J geophys Res 92:6729-6740
Brandt A (1995) Peracarid fauna (Crustacea, Malacostraca) of the Northeast Water Polynya off Greenland: documenting close benthic-pelagic coupling in the Westwind Trough. Mar Ecol Prog Ser 121:39-51
Budbus G, Schneider W (1995) On the hydrography of the Northeast Water Polynya. J geophys Res 100:42874299
Carey AG (1991) Ecology of the North American Arctic continental shelf benthos: a review. Contin Shelf Res 11:865-883
Clarke KR, Warwick RM (1994) Change in marine communities: an approach to statistical analysis and interpretation. Natural Envi- ronment Research Council, Plymouth
Curtis MA (1975) The marine benthos of Arctic and sub-Arctic continental shelves. A review of regional studies and their general results. Polar Rec 17:595 626
Deming J (1993) Northeast Water Polynya: Polar Sea cruise results. EOS Trans Am geophys Un 74(16): 185,195 196
D'yakonov AM (1967) Keys to the Fauna of the USSR. Vol. 55. Ophiuroids of the USSR Seas. Israel Program for Scientific Translations, Jerusalem [translated from Russian]
Elliot JM (1971) Some methods for the statistical analysis of samples of benthic invertebrates. Scient Publs Freshwat biol Ass 25: 1 144
Ellis DV (1960) Marine infaunal benthos in Arctic North America. Arctic Inst North America Tech Pap 5:1-53
Field JG, Clarke KR, Warwick RM (1982) A practical strategy for analysing multispecies distribution patterns. Mar Ecol Prog Ser 8:37-52
Fujita T, Ohta S (1989) Spatial structure within a dense bed of the brittle star Ophiura sarsi (Ophiuroidea: Echinodermata) in the bathyal zone of Otsuchi, northeastern Japan. J oceanogr Soc Japan 45:289-300
Gage JD, Tyler PA (1991) Deep-sea biology: a natural history of organisms at the deep sea floor. Cambridge University Press, Cambridge
Gersonde R (ed) (1986) Die Expedition ARKTIS III mit F.S. "Polar- stern" 1985. Ber Polarforsch (Bremerhaven) 28:1-113
Gradinger R (1995) Climate change and biological oceanography of the Arctic Ocean. Phil Trans R Soc (Set A) 352:277 286
Gradinger RR, Baumann MEM (1991) Distribution of phytoplank- ton communities in relation to large-scale hydrographical regime in the Fram Strait. Mar Biol 111:311-321
Graf G (1992) Benthic-pelagic coupling: a benthic view. Oceanogr mar Biol A Rev 30:149-190
Graf G, Gerlach SA, Linke P, Queisser W, Ritzrau W, Scheltz A, Thomsen L, Witte U (1995) Benthic pelagic coupling in the Greenland-Norwegian Sea and its effect on the geological record. Geol Rdsch 84:49-58
Grebmeier JM, Barry JP (1991) The influence of oceanographic processes on pelagic-benthic coupling in polar regions: a benthic perspective. J mar Syst 2:495 518
Hempel G (1985) On the biology of polar seas, particularly the Southern Ocean. In: Gray JS, Christiansen ME (eds) Marine biology of polar regions and the effect of stress on marine organisms. Wiley, Chichester, pp 3-34
Hirche H-J, Hagen W, Mumm N, Richter C (1994) The Northeast Water Polynya. III. Meso- and macrozooplankton distribution and production of dominant herbivorous copepods during spring. Polar Biol 14:491 503
Hirche H-J, Kattner G (eds) (1994) The 1993 Northeast Water expedition: scientific cruise report of R.V. "Polarstern" Arctic cruises ARK IX/2 and 3, USCF "Polar Sea" cruise NEWP and the NEWL and expedition. Ber Polarforsch (Bremerhaven) 142: 1-190
Holme NA, McIntyre AD (eds) (1984) Methods for study of the marine benthos. Btackwell Scientific Publications, Oxford
Hulth S, Blackburn TH, Hall POJ (1994) Arctic sediments (Sval- bard): consumption and microdistribution of oxygen. Mar Chem 46:293-316
Koltun VM, BaIakshin LL (1964) Scientific results of the oceano- graphic expeditions to the Greenland Sea and the adjacent re- gions of the Arctic Basin in the years 1955-58. Transactions of the Arctic and Antarctic Institute, Leningrad (in Russian)
Krause G (ed) (1991) The expedition ARKTIS VII of R.V. "Polar- stern" in 1990: report of leg ARK VII/2. Ber Polarforsch (Bremerhaven) 93:1 55
Kruskal JB, Wish M (1978) Multidimensional scaling. Sage Publica- tions, Beverly Hills
Kussakin OG (1982) Morskie i solonovatovodnye ravnonogie rakoobrassnyc (Isopoda) cholodnych i umerennych vod sever- nogo polyshariya (Subord. Anthuridea, Microcereberidea, Val- vifera, Tyloidea). Vol. 2. Nauka, Leningrad (in Russian)
Lara RJ, Kattner G, Tillmann U (1994) The Northeast Water polynya (Greenland Sea). II. Mechanisms of nutrient supply and influence on phytoplankton distribution. Polar Biol 14:483-490
Lloyd M (1967) Mean crowding. J Anim Ecol 36:1-30 Mortensen T (1927) Handbook of the echinoderms of the British
Isles. Oxford University Press, Edinburgh Muus K (1981) Density and growth of juvenile Amphiurafiliformis
(Ophiuroidea) in the Oresund. Ophelia 20:153-168

332
Ockelmann WK (1958) The zoology of East Greenland: marine Lamellibranchiata. Meddr Gronland 122(4): 1 256
Paterson GLJ (1985) The deep-sea Ophiuroidea of the North Atlan- tic Ocean. Bull Br Mus nat Hist (D: Zool) 49:1-162
Paterson GLJ, Tyler PA, Gage JD (1982) The taxonomy and zoogeography of the genus Ophiocten (Echinodermata: Ophiuroidea) in the North Atlantic Ocean. Bull Br Mus nat Hist (D: Zool) 43:109 128
Piepenburg D (1988) Zur Zusammensetzung der Bodenfauna in der westlichen Fram-Strage. Ber Polarforsch (Bremerhaven) 52:1-118
Piepenburg D, Blackburn TH, Dorrien CF von, Gutt J, Hall POJ, Hulth S, Kendall MA, Opalinski KW, Rachor E, Schmid MK (1995) Partitioning of benthic community respiration in the Arc- tic (northwestern Barents Sea). Mar Ecol Prog Ser 118:199-213
Piepenburg D, Juterzenka K von (1994) Abundance, biomass and spatial distribution patterns of brittle stars (Echinodermata: Ophiuroidea) on the Kolbeinsey Ridge north of Iceland. Polar Biol 14:185-194
Piepenburg D, Schmid MK (1996) Brittle star fauna (Echinoder- mata: Ophiuroidea) of the Arctic northwestern Barents Sea: composition, abundance, biomass and spatial distribution. Polar Biol (in press)
Rice AL, Aldred RG, Darlington E, Wild RA (1982) The quantita- tive estimation of the deep-sea megabenthos: a new approach to an old problem. Oceanol Acta 5:63 72
Romero-Wetzel M, Gerlach S (1991) Abundance, biomass, size dis- tribution and bioturbation potential of deep-sea macrozooben- thos on the Voring Plateau (1200 1500m, Norwegian Sea). Meeresforsch Rep mar Res (Ber dt wiss Kommn Meeresforsch 33:247 265
Salzwedel H, Rachor E, Gerdes D (1985) Benthic macrofauna com- munities in the German Bight. Ver6ff Inst Meeresforsch Bremerh 20:199 267
Schmid MK (1994) Zur Verbreitung und Respiration 6kologisch wichtiger Bodentiere in den Gew/issern um Svalbard (Arktis). PhD thesis, Kiel University, Kiel
Schneider W, Bud6us G (1994) The North East Water polynya (Greenland Sea). I. A physical concept of its generation. Polar Biol 14:1-9
Schneider W, Bud6us G (1995) On the generation of the North-east Water Polynya. J geophys Res 100:4269-4286
Smith CR, Hamilton SC (1983) Epibenthic megafauna of a bathyal basin off southern California: patterns of abundance, biomass, and dispersion. Deep-Sea Res 30:907 928
Smith KL (1978) Benthic community respiration in the N.W. Atlan- tic Ocean: in situ measurements from 40 to 5200 m. Mar Bio147: 337 347
Smith KL (1983) Metabolism of two dominant epibenthic echinoderms measured at bathyal depths in the Santa Catalina Basin. Mar Biol 72:249-256
Smith KL, Carlucci AF, Jahnke RA, Craven DB (1987) Organic carbon mineralization in the Santa Clara Basin: benthic bound- ary layer metabolism. Deep-Sea Res 34:185-211
Smith SD, Muench RD, Pease CH (1990) Polynyas and leads: an overview of physical processes and environment. J geophys Res 95:9461-9479
Stancyk SE, Feller R J, Aronson, RB, Dobson WE, McKenzie JD (1994) Predation and regeneration of Ophiura sarsi on the US continental slope: use of a manned submersible to perform in situ experiments. In: David B, Guille A, F6ral J-P, Roux M (eds) Echinoderms through time. Balkema, Rotterdam, p 490
Stendell R (1967) Echinoderms collected from a drifting ice island off the East Greenland coast, with comparisons on their distribution in adjacent waters. J Fish Res Bd Can 24:833-842
Stephensen K (1943) The zoology of East Greenland: Leptostraca, Mysidacea, Cumacea, Tanaidacca, Isopoda and Euphausiacea. Meddr Gronland 121(10): 1 82
Thorson G (1936) The larval development, growth and metabolism of Arctic marine bottom invertebrates compared to those of other seas. Meddr Gronland 100(6): 1 115
Thurston MH, Bett, BJ, Rice AL, Jackson PAB (1994) Variations in the invertebrate abyssal megafauna in the North Atlantic Ocean. Deep-Sea Res 41:1321 1348
Wadhams P (1981) The ice cover in the Greenland and Norwegian Seas. Rev Geophys Space Phys 19:345-393
Zenkevitch L (1963) Biology of the seas of the USSR. George Allen & Unwin, London
Copyright © 2022 FDOKUMEN