Epibenthic macrofaunal community response after a mega‑earthquake and tsunami in a shallow bay ...
16
1 3 Mar Biol DOI 10.1007/s00227-013-2370-x ORIGINAL PAPER Epibenthic macrofaunal community response after a mega‑earthquake and tsunami in a shallow bay off central‑south Chile Eduardo Hernández‑Miranda · José Cisterna · Ernesto Díaz‑Cabrera · Rodrigo Veas · Renato A. Quiñones Received: 7 May 2013 / Accepted: 10 December 2013 © Springer-Verlag Berlin Heidelberg 2013 and by the proportional increase in non-dominant species; (4) Bathymetry and bottom dissolved oxygen also played significant roles in the spatial structure of this community; (5) Three years after the perturbation, total density and total community biomass were still considerably below those described under unperturbed conditions, mainly associ- ated with the decrease in density and biomass of dominant species. Therefore, in spite of this apparent community compositional recovery, the aggregate variability currently remains below the levels reported prior to the effect of the mega-earthquake and tsunami. These results provide evidence that supports both the Cross-Scale Resilience Hypothesis and the Response Diversity Hypothesis. Introduction On 27 February 2010, the Maule mega-thrust earthquake (27F) struck the coast of central Chile in the southern Pacific Ocean. This event had a registered moment magni- tude of 8.8 (M w ), making it the sixth largest event in the seismological record (Sobarzo et al. 2012; USGS 2013). The hypocenter (36°29′S, 73°24′W) was located in the ocean at a depth of 6.2 km, with a north–south rupture zone of approximately 500 km, affecting the Concepción- Constitución seismic gap (Ruegg et al. 2009) off central Chile (Farías et al. 2010; Madariaga et al. 2010; Vargas et al. 2011). 27F generated a maximum coastal horizon- tal displacement of almost 5 m, with a 2.4 ± 0.2 m maxi- mum vertical rise of the sea floor (Vargas et al. 2011). The waves generated by 27F propagated rapidly due to the shal- low bathymetry of this coastal zone (600 km h −1 to the north and 300 km h −1 to the south), and with short periods (~50 min to the north and ~130 min to the south), gener- ating a tsunami with waves of maximum height of almost Abstract On February 27, 2010, the world’s sixth strong- est earthquake on record (8.8 M w ) and tsunami hit central Chile. We assess the response of the epibenthic macrofau- nal community following this event in Coliumo Bay, one of the areas most affected by this mega-perturbation. The indicators of aggregate and compositional variability show that 3 years after this event, the community appears to have undergone the following dynamics: (1) At an inter-annual timescale, the community (both in density and biomass) shifted through different structures with apparent direction- ality; (2) Oceanographic and biological seasonality had a strong cyclical influence on the inter-annual community response; (3) There was spatial homogenization of the community over time (i.e., recovery of diversity), probably promoted by the ecological functionality of scavenger spe- cies (i.e., crab Cancer coronatus and snail Nassarius spp.) Communicated by M. G. Chapman. Electronic supplementary material The online version of this article (doi:10.1007/s00227-013-2370-x) contains supplementary material, which is available to authorized users. E. Hernández-Miranda (*) · J. Cisterna · E. Díaz-Cabrera · R. Veas · R. A. Quiñones Programa de Investigación Marina de Excelencia (PIMEX), Facultad de Ciencias Naturales y Oceanográficas, Universidad de Concepción, Concepción, Chile e-mail: [email protected] E. Hernández-Miranda · R. A. Quiñones Interdisciplinary Center for Aquaculture Research (INCAR), Casilla 160-C, Universidad de Concepción, Concepción, Chile J. Cisterna · R. A. Quiñones Graduate Program in Oceanography, Department of Oceanography, Casilla 160-C, University of Concepción, Concepción, Chile
Transcript of Epibenthic macrofaunal community response after a mega‑earthquake and tsunami in a shallow bay ...

1 3
Mar BiolDOI 10.1007/s00227-013-2370-x
OrIgInal PaPer
Epibenthic macrofaunal community response after a mega‑earthquake and tsunami in a shallow bay off central‑south Chile
Eduardo Hernández‑Miranda · José Cisterna · Ernesto Díaz‑Cabrera · Rodrigo Veas · Renato A. Quiñones
received: 7 May 2013 / accepted: 10 December 2013 © Springer-Verlag Berlin Heidelberg 2013
and by the proportional increase in non-dominant species; (4) Bathymetry and bottom dissolved oxygen also played significant roles in the spatial structure of this community; (5) Three years after the perturbation, total density and total community biomass were still considerably below those described under unperturbed conditions, mainly associ-ated with the decrease in density and biomass of dominant species. Therefore, in spite of this apparent community compositional recovery, the aggregate variability currently remains below the levels reported prior to the effect of the mega-earthquake and tsunami. These results provide evidence that supports both the Cross-Scale resilience Hypothesis and the response Diversity Hypothesis.
Introduction
On 27 February 2010, the Maule mega-thrust earthquake (27F) struck the coast of central Chile in the southern Pacific Ocean. This event had a registered moment magni-tude of 8.8 (Mw), making it the sixth largest event in the seismological record (Sobarzo et al. 2012; USgS 2013). The hypocenter (36°29′S, 73°24′W) was located in the ocean at a depth of 6.2 km, with a north–south rupture zone of approximately 500 km, affecting the Concepción-Constitución seismic gap (ruegg et al. 2009) off central Chile (Farías et al. 2010; Madariaga et al. 2010; Vargas et al. 2011). 27F generated a maximum coastal horizon-tal displacement of almost 5 m, with a 2.4 ± 0.2 m maxi-mum vertical rise of the sea floor (Vargas et al. 2011). The waves generated by 27F propagated rapidly due to the shal-low bathymetry of this coastal zone (600 km h−1 to the north and 300 km h−1 to the south), and with short periods (~50 min to the north and ~130 min to the south), gener-ating a tsunami with waves of maximum height of almost
Abstract On February 27, 2010, the world’s sixth strong-est earthquake on record (8.8 Mw) and tsunami hit central Chile. We assess the response of the epibenthic macrofau-nal community following this event in Coliumo Bay, one of the areas most affected by this mega-perturbation. The indicators of aggregate and compositional variability show that 3 years after this event, the community appears to have undergone the following dynamics: (1) at an inter-annual timescale, the community (both in density and biomass) shifted through different structures with apparent direction-ality; (2) Oceanographic and biological seasonality had a strong cyclical influence on the inter-annual community response; (3) There was spatial homogenization of the community over time (i.e., recovery of diversity), probably promoted by the ecological functionality of scavenger spe-cies (i.e., crab Cancer coronatus and snail Nassarius spp.)
Communicated by M. g. Chapman.
Electronic supplementary material The online version of this article (doi:10.1007/s00227-013-2370-x) contains supplementary material, which is available to authorized users.
e. Hernández-Miranda (*) · J. Cisterna · e. Díaz-Cabrera · r. Veas · r. a. Quiñones Programa de Investigación Marina de excelencia (PIMeX), Facultad de Ciencias naturales y Oceanográficas, Universidad de Concepción, Concepción, Chilee-mail: [email protected]
e. Hernández-Miranda · r. a. Quiñones Interdisciplinary Center for aquaculture research (InCar), Casilla 160-C, Universidad de Concepción, Concepción, Chile
J. Cisterna · r. a. Quiñones graduate Program in Oceanography, Department of Oceanography, Casilla 160-C, University of Concepción, Concepción, Chile

Mar Biol
1 3
14 m to the north of the epicenter and 8 m to the south (Vargas et al. 2011; Vigny et al. 2011; Sobarzo et al. 2012). The mega-earthquake and tsunami devastated coastal areas along approximately 500 km of coastline, strongly modi-fying intertidal and subtidal environments. Immediate and posterior effects described for this zone include the fol-lowing: the elevation of rocky intertidal and subtidal areas, which produced massive mortality of organisms (Castilla et al. 2010); strong modifications of the geomorphology of sandy beaches, negatively affecting populations of inter-tidal organisms (Jaramillo et al. 2012; Veas et al. 2013); and a strong negative effect on artisanal fisheries due to the temporary disappearance of commercial species (Marin et al. 2010), probably associated with the mass stranding of organisms observed immediately following the tsunami. These negative ecological impacts on the ecosystem, which were initially detected, will most likely have repercussions for years (nelson and Manley 1992; Castilla et al. 2010; Turner 2010; Jaramillo et al. 2012). One of the coastal areas most affected by the mega-earthquake and tsunami was Coliumo Bay. This bay was struck by at least four waves, which arrived between 03:54 and 06:40, 20 min to 3 h after the earthquake (Sobarzo et al. 2012). This series of waves of 6–8 m height (Vargas et al. 2011) emptied the bay com-pletely at least three times, eroding the sea floor, strongly impacting sedimentary beds, and drastically modifying the habitat of resident species. The sea floor in Coliumo Bay was raised by an estimated average of 0.5 m (Castilla et al. 2010; Vargas et al. 2011; Vigny et al. 2011; Sobarzo et al. 2012).
earlier studies of the sedimentary sea floor of Coliumo Bay reported the presence of a diverse epibenthic mac-rofaunal community composed of more than 70 species, dominated mainly by scavenger mollusks and crustaceans, along with bentho-demersal fish (Hernández-Miranda et al. 2010, 2012a, b). Prior to 27F, the temporal dynamics of this community were driven by two related oceanographic processes: coastal upwelling and natural hypoxic events. Coastal upwelling is a typical process in this area of con-tinental shelf of the southeast Pacific Ocean. It displays high seasonal variability with intermittent events, which are more frequent and intense in spring and summer (Shaffer et al. 1999; Sobarzo et al. 2007), and is the physical motor behind the high seasonal primary and secondary productiv-ity in this area of the Humboldt Current System (Fossing et al. 1995; Daneri et al. 2000, 2012; Sobarzo et al. 2007). as a result of the upwelling process, equatorial subsurface waters with low dissolved oxygen levels (<0.5 ml O2l
−1) intrude into the coastal zone (Quiñones et al. 2010). In extreme cases, this hypoxic water produces mass mortal-ity and stranding of organisms, mainly in semi-enclosed bays (ahumada and arcos 1976; Hernández-Miranda et al. 2010). Hernández-Miranda et al. (2010, 2012a) suggested
that the resident epibenthic macrofaunal community of Coliumo Bay is highly resilient to severe natural pertur-bations, such as hypoxia. This hypothesis is based on the community response observed following an intense natural hypoxic event, which occurred in January 2008. Imme-diately after this event, the community suffered a sharp decrease in total density, total biomass, and diversity, which was rapidly countered by the recovery of these variables in less than 3 months. In the 2 years that followed, however, the structure of the community was modified from being initially dominated by the decapod C. coronatus to being dominated by the gastropod Nassarius spp.; both species are defined as scavengers/carnivores (gutiérrez et al. 2000; laudien et al. 2007). This short-term recovery (i.e., months) and the subsequent inter-annual response appear to be asso-ciated with the seasonal reproductive cycles of the majority of species in this community (i.e., demographic processes) and the high connectivity with the adjacent coastal area via larval transport (Hernández-Miranda et al. 2012a). These biological/ecological processes are ultimately linked to the seasonal oceanographic conditions characteristic of this coastal zone in the southeast Pacific Ocean.
Building on previous studies, Coliumo Bay provides a unique opportunity to study the dynamics of the epiben-thic macrofaunal community after the mega-earthquake struck and to assess whether its response was similar to that observed after the strong perturbation caused by the severe natural hypoxic event in January 2008. We examined two main hypotheses: (i) the inter-annual dynamics of the epi-benthic macrofaunal community after 27F was driven by the seasonality of biological/ecological processes and oceanographic conditions, and (ii) the community dynam-ics following 27F shifted to a structure similar to that found in 2007, before the effect of the strong natural hypoxic event (i.e., return to unperturbed condition).
Thus, the objectives of this study were as follows: (1) temporally assess the aggregate and compositional vari-ability of the community following 27F, (2) assess the role of the spatial factor within Coliumo Bay (i.e., bathymetric response) on temporal dynamics, (3) identify the dominant species in the community after 27F and their spatial and temporal dynamics, and (4) verify whether after 27F the community structure approximated that reported prior to the severe natural hypoxia perturbation.
Materials and methods
Study area and data collection
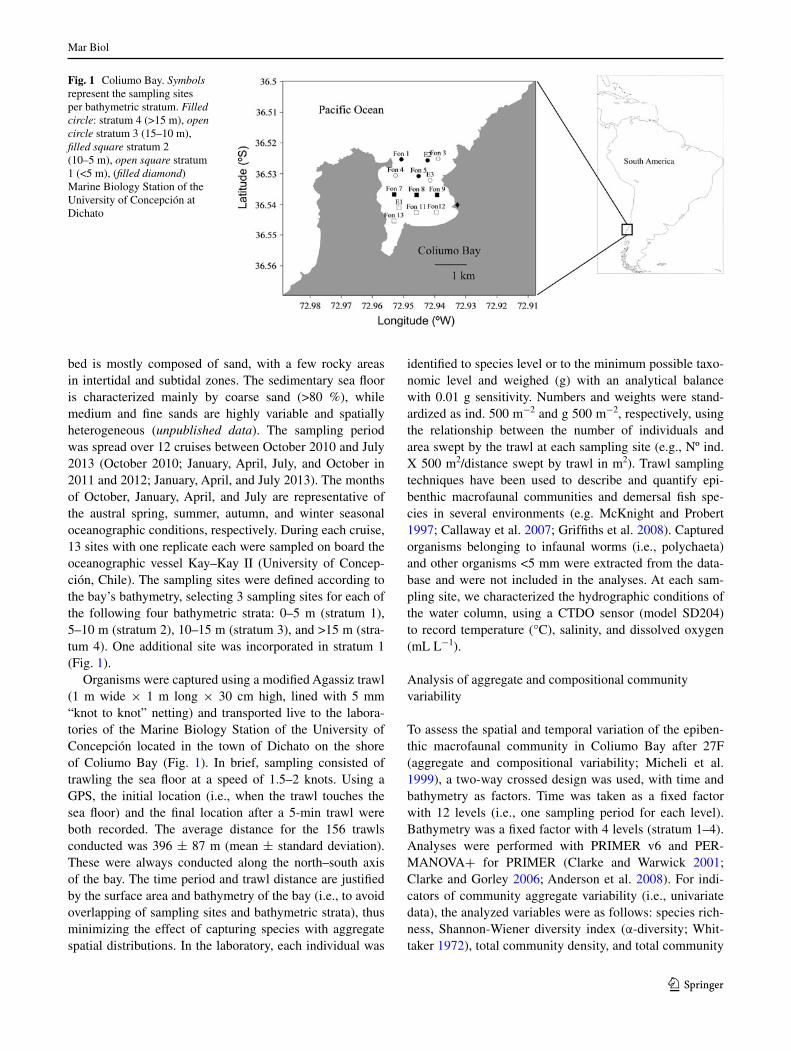
Coliumo (36°30′S, 72°56′W, Fig. 1) is a shallow semi-closed north-facing bay with an approximate surface area of 5 km2. Depths reach 25 m near the mouth and the sea
Mar Biol
1 3
bed is mostly composed of sand, with a few rocky areas in intertidal and subtidal zones. The sedimentary sea floor is characterized mainly by coarse sand (>80 %), while medium and fine sands are highly variable and spatially heterogeneous (unpublished data). The sampling period was spread over 12 cruises between October 2010 and July 2013 (October 2010; January, april, July, and October in 2011 and 2012; January, april, and July 2013). The months of October, January, april, and July are representative of the austral spring, summer, autumn, and winter seasonal oceanographic conditions, respectively. During each cruise, 13 sites with one replicate each were sampled on board the oceanographic vessel Kay–Kay II (University of Concep-ción, Chile). The sampling sites were defined according to the bay’s bathymetry, selecting 3 sampling sites for each of the following four bathymetric strata: 0–5 m (stratum 1), 5–10 m (stratum 2), 10–15 m (stratum 3), and >15 m (stra-tum 4). One additional site was incorporated in stratum 1 (Fig. 1).
Organisms were captured using a modified agassiz trawl (1 m wide × 1 m long × 30 cm high, lined with 5 mm “knot to knot” netting) and transported live to the labora-tories of the Marine Biology Station of the University of Concepción located in the town of Dichato on the shore of Coliumo Bay (Fig. 1). In brief, sampling consisted of trawling the sea floor at a speed of 1.5–2 knots. Using a gPS, the initial location (i.e., when the trawl touches the sea floor) and the final location after a 5-min trawl were both recorded. The average distance for the 156 trawls conducted was 396 ± 87 m (mean ± standard deviation). These were always conducted along the north–south axis of the bay. The time period and trawl distance are justified by the surface area and bathymetry of the bay (i.e., to avoid overlapping of sampling sites and bathymetric strata), thus minimizing the effect of capturing species with aggregate spatial distributions. In the laboratory, each individual was
identified to species level or to the minimum possible taxo-nomic level and weighed (g) with an analytical balance with 0.01 g sensitivity. numbers and weights were stand-ardized as ind. 500 m−2 and g 500 m−2, respectively, using the relationship between the number of individuals and area swept by the trawl at each sampling site (e.g., nº ind. X 500 m2/distance swept by trawl in m2). Trawl sampling techniques have been used to describe and quantify epi-benthic macrofaunal communities and demersal fish spe-cies in several environments (e.g. McKnight and Probert 1997; Callaway et al. 2007; griffiths et al. 2008). Captured organisms belonging to infaunal worms (i.e., polychaeta) and other organisms <5 mm were extracted from the data-base and were not included in the analyses. at each sam-pling site, we characterized the hydrographic conditions of the water column, using a CTDO sensor (model SD204) to record temperature (°C), salinity, and dissolved oxygen (ml l−1).
analysis of aggregate and compositional community variability
To assess the spatial and temporal variation of the epiben-thic macrofaunal community in Coliumo Bay after 27F (aggregate and compositional variability; Micheli et al. 1999), a two-way crossed design was used, with time and bathymetry as factors. Time was taken as a fixed factor with 12 levels (i.e., one sampling period for each level). Bathymetry was a fixed factor with 4 levels (stratum 1–4). analyses were performed with PrIMer v6 and Per-ManOVa+ for PrIMer (Clarke and Warwick 2001; Clarke and gorley 2006; anderson et al. 2008). For indi-cators of community aggregate variability (i.e., univariate data), the analyzed variables were as follows: species rich-ness, Shannon-Wiener diversity index (α-diversity; Whit-taker 1972), total community density, and total community
Fig. 1 Coliumo Bay. Symbols represent the sampling sites per bathymetric stratum. Filled circle: stratum 4 (>15 m), open circle stratum 3 (15–10 m), filled square stratum 2 (10–5 m), open square stratum 1 (<5 m), (filled diamond) Marine Biology Station of the University of Concepción at Dichato

Mar Biol
1 3
biomass. For indicators of community compositional variability (i.e., multivariate data), the entire community (N = 156 samples and p = 72 taxa) was analyzed sepa-rately for species density and species biomass. For univari-ate data, analyses were performed on the raw data using the Bray–Curtis dissimilarity measure. For multivari-ate data, analyses were conducted to assess the effect of using different resemblance measures and different stand-ardization/transformation of data (i.e., remove the effect of dominant species; anderson et al. 2006, 2011). The chosen analyses were as follows: (i) BCr: Bray–Curtis dissimilar-ity measure with raw data (for density and biomass), (ii) BCST: Bray–Curtis dissimilarity measure with standard-ized and fourth root transformed data (for density and bio-mass), and (iii) JDM: Jaccard dissimilarity measure with presence–absence data. all these analyses exclude joint absences. Probability values for main tests and pairwise comparisons (when statistical differences were detected) were obtained using 4,999 permutations of residuals under a reduced model with sums of squares type III. Temporal (intra- and inter-annual) and spatial (bathymetric) varia-tion was represented graphically using non-metric mul-tidimensional scaling (nMDS), performed with similar resemblance measures and standardization/transformation data above described. For the sake of simplicity, nMDS was represented, separately, for temporal and spatial fac-tors according to their estimated centroids. Finally, a set of selected variables was superimposed using techniques of proportional bubbles (Clarke and Warwick 2001; ander-son et al. 2008) on nMDS plots estimated using BCST for density. Biological variables were as follows: species richness, Shannon-Wiener index, total community density, total community biomass, density and biomass of C. coro-natus, Nassarius spp., Aphos porosus (toadfish), and the total density and biomass of the 67 non-dominant species of this community. environmental variables were bottom temperature, salinity, and dissolved oxygen. In the case of environmental variables, the resemblance measure was estimated from euclidean distance based on normalized data (eDn).
PerMDISP routines were conducted to test the homo-geneity of multivariate dispersions for the several resem-blance measures used. These analyses considered time and bathymetry factors separately. analyses were performed with similar criteria using for PerManOVa. PerMDISP output was also used to assess whether the spatial structure of the community was homogeneous throughout the bay over time (i.e., between sampling periods and years). For this analysis, the average dissimilarity was used as a mul-tivariate dispersion indicator (i.e., β-diversity; anderson et al. 2006, 2011). Temporal decrease in this multivariate indicator reveals spatial homogenization of the community in Coliumo Bay and indicates community recovery.
Finally, in order to assess the changes in the community over a longer timescale, from 3 years prior to 3 years fol-lowing 27F, we constructed a comparative table including both the hypoxia and the 27F event (i.e., pre-hypoxia, post-hypoxia and years 1, 2, and 3 post 27F). The indicators of community aggregate variability were species richness, the Shannon-Wiener index, and total community density and biomass. The indicators of community compositional vari-ability were biomass and proportional density of C. coro-natus, Nassarius spp., A. porosus and the total of non-dom-inant species of the community (Hernández-Miranda et al. 2012a). This analysis used information from January 2007 to July 2013 (27 sampling periods) from stations e1, e2, and e3 (see Fig. 1). This qualitative analysis did not use the same spatio-temporal methodology employed post 27F, since the thirteen stations were only sampled from October 2010 onward.
Results
Community aggregate variability
From samples collected after the 27F event, a total of 44635 individuals were identified and measured, belonging to 5 Phyla, 12 Classes, 31 Orders, 53 families, and 72 spe-cies (Table 1, Supplementary Material). The dominant spe-cies in terms of density were C. coronatus (44.8 %), Nas-sarius spp. (16.9 %), and A. porosus (4.7 %). The bivalve Mulinia edulis made up 22.4 %, due mostly to two peaks in January and april 2011. The dominant species in bio-mass were C. coronatus (79.6 %), Nassarius spp. (3.6 %), and the flatfish Paralichthys adspersus (2.4 %). A. porosus was in the sixth place with 1.2 %. There were significant temporal differences in total community density (Table 1a), with a tendency to decrease (Fig. 2a). The highest densities were observed in January and april of 2011; these months produced the majority of significant differences between sampling periods (See Table 2, Supplementary Material for pairwise comparisons). C. coronatus and the total of non-dominant species (67 species) showed a similar density pattern over time. Nassarius spp. showed high inter-annual variability, with a strong tendency to decrease over time, and the highest densities were generally recorded in Octo-ber. The density of A. porosus increased over time, mainly during the last year (Fig. 2a). Total community biomass displayed significant differences over time (Table 1b), but no inter-annual trends were detected (Fig. 2b). The high-est values were observed in January 2012, which accounts for most of the significant differences between sampling periods (See Table 2, Supplementary Material for pairwise comparisons). This pattern was strongly influenced by C. coronatus. There was an important increase in the total

Mar Biol
1 3
Table 1 PerManOVa output for the indicators of community aggregate variability
Bs bathymetric stratum, Sp sampling period. In bold, p values <0.05
Source df SS MS Pseudo-F P (perm) Unique perms
(a) Total density
Bs 3 2,031.3 677.11 0.49362 0.8862 4,975
Sp 11 74,905 6,809.5 4.9643 0.0002 4,971
Bs × Sp 33 56,671 1,717.3 1.252 0.081 4,951
res 104 142,660 1,371.7
Total 151 275,620
(b) Total biomass
Bs 3 4,324.4 1,441.5 0.89793 0.5074 4,985
Sp 11 31,137 2,830.7 1.7633 0.0144 4,974
Bs × Sp 33 53,570 1,623.3 1.0112 0.4584 4,953
res 104 166,950 1,605.3
Total 151 258,360
(c) Species richness
Bs 3 5,529 1,843 5.0115 0.001 4,985
Sp 11 8,488.7 771.7 2.0984 0.0096 4,976
Bs × Sp 33 14,040 425.46 1.1569 0.2494 4,966
res 104 38,246 367.75
Total 151 66,582
(d) Shannon-Wiener index
Bs 3 10,961 3,653.7 6.8857 0.0002 4,985
Sp 11 20,178 1,834.4 3.457 0.0002 4,979
Bs × Sp 33 25,576 775.04 1.4606 0.0244 4,966
res 104 55,185 530.62
Total 151 112,280
Den
sity
log
10(I
nd. 5
00 m
-2)
0.1
1
10
100
1000
10000
Time
Bio
mas
slog
10(g
500
m-2
)
Oct-2010
Jan-2011
Apr-2011
Jul-2
011
Oct-2011
Jan-2012
Apr-2012
Jul-2
012
Oct-2012
Jan-2013
Apr-2013
Jul-2
0130.01
0.1
1
10
100
1000
10000
a
b
1
10
100
1000
1 2 3 410
100
1000
10000
c
d
Bathymetricstratum
Fig. 2 Spatio-temporal dynamics of epibenthic macrofaunal commu-nity at Coliumo Bay. a time series of density, b time series of bio-mass, c density for bathymetric stratum, and d biomass for bathym-
etric stratum. Filled circle total community, open circle C. coronatus, open triangle Nassarius spp., inverted triangle A. porosus, and filled square 67 other species

Mar Biol
1 3
biomass of non-dominant species in april 2011, which was maintained in subsequent sampling periods. Nassarius spp. and A. porosus biomass displayed patterns similar to those of their respective densities (Fig. 2b). Species rich-ness varied significantly over time (Table 1c), but with no trend at an inter-annual scale (Fig. 3a). In general, the val-ues in spring and autumn were higher than those in sum-mer and winter (for pairwise comparisons see Table 3, Sup-plementary Material). The Shannon-Wiener diversity index was also significantly different over time, and was the only indicator of community aggregate variability that displayed a significant interaction with bathymetry (Table 1d). This variable showed a sustained tendency to increase over time (Fig. 3b), which was also observed in temporal compari-sons of seasonal sampling periods (for pairwise compari-sons see Table 3, Supplementary Material). The statistical interaction found in the Shannon-Wiener diversity index suggests that the continuous gradient, with increasing diversity between shallower to deeper zones of Coliumo Bay, was not found during all sampling periods. This may be explained by the similar diversity found between bathy-metries 2 and 3 (See Fig. 3d), which probably generated a diversity transition area between the shallowest and deep-est zones of the bay. The total community density did not show significant differences among depths (Table 1a). C.
coronatus and total density of non-dominant species tended to decrease at greater depths. Nassarius spp. increased in density at greater depths and A. porosus reached its high-est density within the third bathymetric stratum (Fig. 2c). Total biomass also showed no significant differences among depths (Table 1b). as with density, the biomass of C. coronatus tended to decrease at deeper depths and Nas-sarius spp. showed an inverse tendency. A. porosus had greater biomass at greater depths, and the total biomass of non-dominant species showed no differences between bathymetric strata (Fig. 2d). Both species richness and the Shannon-Wiener diversity index showed significant dif-ferences between depths (Table 1c, d, Fig. 3c, d). Both indicators had a significant tendency to increase at greater depths (See Table 4, Supplementary Material for pairwise comparisons).
Community compositional variability
The PerMDISP analysis for community density revealed significant dispersion differences among sampling periods (i.e., time factor) for all resemblance analyses performed (i.e., BCST: Pseudo-F11,140 = 2.3223, P (perm) = 0.024; Fig. 4). BCST pairwise differences were found in 10 of 66 tests (15.2 %). In the case of bathymetry, no significant
Time
Spe
cies
ric
hnes
s (S
)
5
10
15
Sha
nnon
-Wie
ner
inde
x (H
’)
Oct-2010
Jan-2011
Apr-2011
Jul-2
011
Oct-2011
Jan-2012
Apr-2012
Jul-2
012
Oct-2012
Jan-2013
Apr-2013
Jul-2
0130.0
0.6
1.2
1.8
7
8
9
10
11
12
Bathymetric stratum
ca
b
1 2 3 40.4
0.8
1.2
1.6d
Fig. 3 Spatio-temporal dynamics of epibenthic macrofaunal diver-sity parameters (mean ± Se) in Coliumo Bay. Time series of species richness (a) and Shannon-Wiener index (b). Species richness (c) and
Shannon-Wiener index (d) for bathymetric stratum. For a and b plots, symbols correspond to spring (filled circle), summer (open circle), autumn (filled triangle), and winter (open inverted triangle)

Mar Biol
1 3
dispersion differences were found for any of the analyses performed (i.e., BCST: Pseudo-F3,148 = 1.1359, P (perm): 0.3826). The PerMDISP analysis found significant dif-ferences in dispersion of biomass over time (i.e., BCST: Pseudo-F11,140 = 2.7781, P (perm): 0.012; Fig. 4), and for BCST analyses, only 12 of 66 (18.2 %) of the pairwise comparisons showed significant differences. as for den-sity, there were no significant differences in dispersion of the bathymetry factor for biomass (i.e., BCST: Pseudo-F3,148 = 1.909, P (perm): 0.1872). Density and biomass differences detected over time are explained only by 2 or 3 sampling periods (for pairwise comparisons see Tables 5 and 6, Supplementary Material). The PerMDISP analy-ses of environmental variables from the sea floor (tem-perature, salinity, and dissolved oxygen) showed a similar pattern to that of community density and biomass, with significant dispersion values for the time factor (eDn: Pseudo-F3,152 = 3.298, P (perm): 0.035), but without significant differences for the bathymetry factor (eDn: Pseudo-F3,152 = 1.8422, P (perm): 0.2082). For the time factor, 23 of 66 pairwise comparisons (34.8 %) showed sig-nificant differences (for pairwise comparisons see Table 7, Supplementary Material). These results, i.e., no significant differences for the bathymetry factor (See Fig. 1, Sup-plementary Material) and only a small percentage of dif-ferences detected for the time factor across all analyses, suggest that statistical inferences should focus mainly on a location effect using PerManOVa. Furthermore, a
decrease in average dissimilarity over time (β-diversity; Fig. 4) is a clear signal of spatial community recovery in Coliumo Bay.
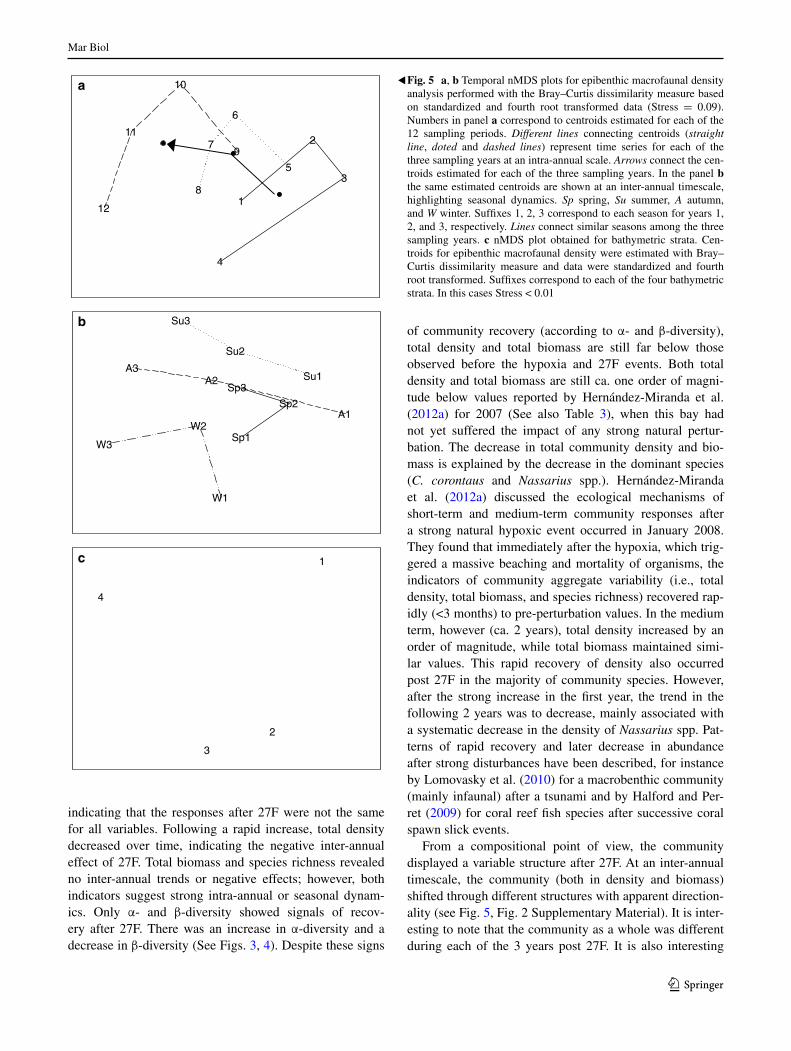
The PerManOVa analysis revealed a significant inter-action between time and bathymetry for density (Table 2a), as well as significant differences for the two factors sepa-rately. Similar results were obtained for each of the three resemblance analyses (See Table 8, Supplementary Mate-rial). The community responses on intra- and inter-annual timescales are clearly separated by the nMDS (Fig. 5). Independent of the dissimilarity measure and the data trans-formation, for the three post 27F years studied, there were intra-annual dynamics that began in spring (sampling peri-ods 1, 5, and 9) and ended in winter (sampling periods 4, 8, and 12) and appeared to have a cyclical trend. This pat-tern is even more notable if the weights of more abundant species are removed (See Fig. 2, Supplementary Material). Furthermore, two inter-annual patterns stand out: The first is the directional shift between samples of successive years, beginning with one community structure in the first year post 27F and changing to a different structure by the third year (see the arrow direction in the estimated inter-annual centroids; Fig. 5a). The second inter-annual pattern is the differentiation between different seasons of each year. For example, the summer sampling periods were segregated from the winters in the 3 years following 27F (Fig. 5b). as in the intra-annual dynamics, this pattern is more notable if the weights of the most abundant species are removed (See Fig. 2, Supplementary Material). Spatially, for all the resem-blance measures utilized, there was a gradient of commu-nity density from the shallowest to the deepest bathymetries (Fig. 5c). For biomass, the PerManOVa analysis found a significant interaction between time and bathymetry for the estimates with BCST (Table 2b). The nMDS for time and bathymetry showed patterns similar to those found for community density (See Figs. 3, 4, Table 9, Supplemen-tary Material). With slight differences, this temporal and bathymetric pattern was also found for the environmental variables on the bottom (Table 2c; Fig. 6. See also Table 10, Supplementary Material). Temporally, the variables which differentiated the community in the first year after 27F were total community density, C. coronatus density, and Nassar-ius spp. biomass and density, while the variables that dif-ferentiated the community in the third year after 27F were the A. porosus biomass and density, α-diversity (i.e., Shan-non-Wiener index), and bottom dissolved oxygen (Fig. 7). Bathymetrically, the variables which differentiated the com-munity toward the deepest stratum were species richness, α-diversity, and Nassarius spp. density and biomass, while the variables which differentiated the community toward the shallowest stratum were community density, density of C. coronatus, total biomass of non-dominant species, and dis-solved oxygen on the bottom (Fig. 8).
Oct-2010
Jan-2011
Apr-2011
Jul-2
011
Oct-2011
Jan-2012
Apr-2012
Jul-2
012
Oct-2012
Jan-2013
Apr-2013
Jul-2
01325
35
45
55A
vera
ge d
issi
mila
rity
(%)
Time
Fig. 4 Multivariate average dissimilarity (mean ± Se) for the epi-benthic macrofaunal community obtained by PerMDISP analyses. Percentages were estimated per sampling period. Symbols represent different data analyses: (filled inverted triangle) Jaccard dissimilar-ity measure with presence–absence data, (filled circle) Bray–Curtis dissimilarity measure with standardized and fourth root transformed density data, and (open circle) Bray–Curtis dissimilarity measure with standardized and fourth root transformed biomass data

Mar Biol
1 3
27F and hypoxia context
The indicators of aggregate and compositional variability, considering the periods defined as pre-hypoxia, post-hypoxia, and years 1, 2, and 3 post 27F, are given in Table 3. Species richness and the Shannon-Wiener index fell post-hypoxia, and the latter recovered normal values by year 3 post 27F. Total community density increased after hypoxia, decreasing in the following 3 years after 27F. at the end of this period, total community density decreased by one order of magni-tude with respect to pre-hypoxia conditions. Total community biomass was similar pre- and post-hypoxia, decreasing after 27F to almost one third of pre-hypoxia levels. each species was differentially affected by both perturbations. The density and biomass of C. coronatus fell post hipoxia, but recovered strongly in the first 2 years post 27F. However, only in year 3 post 27F was its proportional biomass greater than it was dur-ing pre-hypoxia. The Nassarius spp. increased both in density and biomass post-hypoxia, but showed a strong and sustained loss in the three post 27F years. The proportional density and biomass of A. porosus and the non-dominant species of the community fell post-hypoxia. However, following 27F, they experienced a systematic recovery, with maximum values recorded in year 3 post 27F.
Discussion
Community response after 27F
earthquakes and tsunamis produce strong changes in coastal areas, altering ecosystems directly and indirectly
and changing their configuration in space and time. This kind of disturbance may produce an abrupt resetting of the existing conditions and an opportunity for the appearance of new ecological dynamics (Holling 1973). The trajec-tory which these ecosystems adopt afterward will depend mainly upon two factors: the speed of recovery of the habitat, including its spatial heterogeneity; and the arrival of new organisms capable of colonizing, surviving, and reproducing in this new and altered environment (e.g., Hal-ford and Perret 2009; lomovasky et al. 2010). In physical terms, for example, changes have been reported in the sedi-mentary structure and in the microfossil content of the sea bed following the earthquake and tsunami in Japan in 2003 (noda et al. 2007). Changes have also been observed in the large amount of suspended sediment and the modifications in the morphology of intertidal coastal zones in the north-east Indian Ocean following the tsunami that hit Sumatra in 2004 (Yan and Tang 2008; ranjan et al. 2010; Meilianda et al. 2010). Biological changes were reported in the com-munity of sea grass beds as a result of the tsunami in Thai-land in 2004 (Whanpetch et al. 2010). an 8.0 earthquake and tsunami in Peru in 2007 produced changes in the epi-benthic faunal community of Paracas Bay, which affected functional groups, whereby the increased abundance and biomass of filter feeders also produced an increase in their predators (lomovasky et al. 2010). The uplift of the inter-tidal coastal zone off central Chile following a 7.8 earth-quake in 1985 led to strong modifications of this marine ecosystem, resulting in changes in species composition and diversity and in the local biogeography (Castilla 1988).
In Coliumo Bay, the indicators of community aggre-gate variability displayed contrasting temporal dynamics,
Table 2 PerManOVa output for (a) compositional density community, (b) compositional biomass community, and (c) bottom environmental water column (temperature, salinity, and dissolved oxygen)
Bs bathymetric stratum, Sp sampling period. In bold, p values <0.05
Source df SS MS Pseudo-F P (perm) Unique perms
(a) Bray–Curtis standardized and fourth root transformed data
Bs 3 21,837 7,279 5.4758 0.0002 4,971
Sp 11 99,872 9,079.2 6.8301 0.0002 4,957
Bs × Sp 33 60,371 1,829.4 1.3762 0.0002 4,935
res 104 138,250 1,329.3
Total 151 319,650
(b) Bray–Curtis standardized and fourth root transformed data
Bs 3 18,045 6,015 4.3524 0.0002 4,969
Sp 11 79,947 7,267.9 5.259 0.0002 4,945
Bs × Sp 33 58,448 1,771.1 1.2816 0.0024 4,944
res 104 143,730 1,382
Total 151 301,460
(c) euclidean distance based on normalized data
Bs 3 25.264 8.4214 10.802 0.0002 4,990
Sp 11 312.04 28.367 36.388 0.0002 4,980
Bs × Sp 33 37.062 1.1231 1.4406 0.0242 4,963
res 104 84.196 0.77959
Total 151 465
Mar Biol
1 3
indicating that the responses after 27F were not the same for all variables. Following a rapid increase, total density decreased over time, indicating the negative inter-annual effect of 27F. Total biomass and species richness revealed no inter-annual trends or negative effects; however, both indicators suggest strong intra-annual or seasonal dynam-ics. Only α- and β-diversity showed signals of recov-ery after 27F. There was an increase in α-diversity and a decrease in β-diversity (See Figs. 3, 4). Despite these signs
of community recovery (according to α- and β-diversity), total density and total biomass are still far below those observed before the hypoxia and 27F events. Both total density and total biomass are still ca. one order of magni-tude below values reported by Hernández-Miranda et al. (2012a) for 2007 (See also Table 3), when this bay had not yet suffered the impact of any strong natural pertur-bation. The decrease in total community density and bio-mass is explained by the decrease in the dominant species (C. corontaus and Nassarius spp.). Hernández-Miranda et al. (2012a) discussed the ecological mechanisms of short-term and medium-term community responses after a strong natural hypoxic event occurred in January 2008. They found that immediately after the hypoxia, which trig-gered a massive beaching and mortality of organisms, the indicators of community aggregate variability (i.e., total density, total biomass, and species richness) recovered rap-idly (<3 months) to pre-perturbation values. In the medium term, however (ca. 2 years), total density increased by an order of magnitude, while total biomass maintained simi-lar values. This rapid recovery of density also occurred post 27F in the majority of community species. However, after the strong increase in the first year, the trend in the following 2 years was to decrease, mainly associated with a systematic decrease in the density of Nassarius spp. Pat-terns of rapid recovery and later decrease in abundance after strong disturbances have been described, for instance by lomovasky et al. (2010) for a macrobenthic community (mainly infaunal) after a tsunami and by Halford and Per-ret (2009) for coral reef fish species after successive coral spawn slick events.
From a compositional point of view, the community displayed a variable structure after 27F. at an inter-annual timescale, the community (both in density and biomass) shifted through different structures with apparent direction-ality (see Fig. 5, Fig. 2 Supplementary Material). It is inter-esting to note that the community as a whole was different during each of the 3 years post 27F. It is also interesting
1
2
3
4
5
6
7
8
9
10
11
12
Sp1
Sp2
Sp3Su1
Su2
Su3
A1
A2A3
W1
W2
W3
a
b
1
2
3
4
c
Fig. 5 a, b Temporal nMDS plots for epibenthic macrofaunal density analysis performed with the Bray–Curtis dissimilarity measure based on standardized and fourth root transformed data (Stress = 0.09). numbers in panel a correspond to centroids estimated for each of the 12 sampling periods. Different lines connecting centroids (straight line, doted and dashed lines) represent time series for each of the three sampling years at an intra-annual scale. Arrows connect the cen-troids estimated for each of the three sampling years. In the panel b the same estimated centroids are shown at an inter-annual timescale, highlighting seasonal dynamics. Sp spring, Su summer, A autumn, and W winter. Suffixes 1, 2, 3 correspond to each season for years 1, 2, and 3, respectively. Lines connect similar seasons among the three sampling years. c nMDS plot obtained for bathymetric strata. Cen-troids for epibenthic macrofaunal density were estimated with Bray–Curtis dissimilarity measure and data were standardized and fourth root transformed. Suffixes correspond to each of the four bathymetric strata. In this cases Stress < 0.01
◂

Mar Biol
1 3
that this inter-annual differentiation displayed directional-ity or continuum, with no evidence of a return to the ini-tial state observed immediately after 27F. These temporal dynamics suggest that the community in Coliumo Bay
presents diverse compositional structures over time, which allow it to maintain its ecological functions (i.e., alterna-tive Stable States, aSS; Beisner et al. 2003). although the direction the community will take in the future is an open question, purely based on the observed inter-annual dynamics, it seems that seasonal biological processes and oceanographic conditions play an important role. as for the aggregate variability indicators, the beginning of the repro-ductive period each year (i.e., spring recruitment), associ-ated with seasonal oceanographic changes, could act cycli-cally, thus favoring the temporal stability of the community (Figs. 5, 6). That is, spring of each year would be a new starting point in the temporal community dynamics.
We also observed a spatial homogenization of the com-munity over time (i.e., increase in α-diversity and decrease in β-diversity). In other words, during each sampling period, the sites occupied by each species increased with respect to the previous period. We also detected a clear community differentiation with respect to the bathymetry factor (see Fig. 5c). a gradient between the deepest stratum and the shallowest was observed in community density, community biomass, and also in water column variables (temperature, salinity, and dissolved oxygen), suggest-ing a spatial relationship between the community and the hydrography of Coliumo Bay. Dissolved oxygen appears to be the most important factor driving community spatial differentiation. In fact, Hernández-Miranda et al. (2012a) found that low dissolved oxygen conditions had a negative effect on the aggregate and compositional structures of this community. The observed pattern of lower total density and biomass of the dominant species in the deepest zone (stra-tum 4, see Figs. 2, 8) is probably related to the presence of very low dissolved oxygen concentrations. However, the highest species richness and α-diversity of Coliumo Bay were found in this zone, probably due to the fact that no major hypoxia events (i.e., <0.5 ml O2 l−1) took place during the 3 years following 27F.
resilience in Coliumo Bay
The degree of stability and resilience of a community sub-jected to a mega-perturbation will determine whether it does or does not maintain its structure and functionality over time (Holling 1973; Peterson et al. 1998). These prop-erties obviously emerge from responses at different spatial and temporal scales (O’neill 2001). Mega-perturbations produce changes in environments, which can persist for tens or hundreds of years (nelson and Manley 1992; Turner 2010). Thus, the implications of such stochastic events are of great relevance to ecosystem functioning. In ecological community theory, a series of hypotheses have been pro-posed treating the role that species diversity plays in the recovery of ecosystems following stochastic perturbation
1
2
3 4
5
6
7 89
10
11
12
Sp1
Sp2 Sp3
Su1
Su2
Su3
A1A2
A3
W1W2
W3
a
b
1
2
3
4c
Fig. 6 a, b Temporal nMDS plots for bottom environmental vari-ables (temperature, salinity and dissolved oxygen) (Stress = 0.02). c nMDS plot obtained for bathymetric strata (Stress < 0.01). Centroids were estimated from euclidean distances based on normalized data. Suffixes, numbers, symbols, arrows, and connecting lines as in Fig. 5

Mar Biol
1 3
events, taking into consideration the periodicity and mag-nitude of such events. These include intermediate perturba-tions, dynamic equilibria, environmental heterogeneity, and ecological time, among others (e.g., Macarthur and Wilson 1967; Macarthur 1972; Huston 1979, 1994; Castilla 1988). In particular, the last two hypotheses may explain the
community dynamics of Coliumo Bay following 27F (i.e., more heterogeneous environments provide more niches and thus greater species diversity; while the latter proposes that the time which separates successive perturbations deter-mines the increase in species diversity and the restructur-ing of the affected community). The strongly perturbed
Sp
Su
A
W
Sp
Su
A
W
Sp
Su
A
W
Sp
Su
A
W
Sp
Su
A
W
Sp
Su
A
W
a b
c d
e f
g h
Sp
Su
A
W
Sp
Su
A
W
Sp
Su
A
W Sp
Su
A
W
Sp
Su
A
W
Sp
Su
A
W
Sp
Su
A
W
Sp
Su
A
W
Sp
Su
A
WSp
Su
A
W
Sp
Su
A
W
Sp
Su
A
W
Sp
Su
A
W
Sp
Su
A
W
Sp
Su
A
W
Sp
Su
A
W
Sp
Su
A
W
Sp
Su
A
W
Fig. 7 Temporal nMDS plots for epibenthic macrofaunal density. These plots correspond to analyses performed with the Bray–Curtis dissimilarity measure based on standardized and fourth root trans-formed data (Stress = 0.09; i.e., Fig. 5a). Superimposed bubbles cor-respond to a total community density, b C. coronatus density, c Nas-
sarius spp. density, d Nassarius spp. biomass, e A. porosus density, f A. porosus biomass, g Shannon-Wiener index, h bottom dissolved oxygen. Black filled circle Year 1, (open circle) Year 2, (gray filled circle) Year 3. Sp spring, Su summer, A autumn, W winter. Diameters of bubbles are proportional to the magnitude of each variable

Mar Biol
1 3
Coliumo Bay displayed (1) a severe loss of organisms, due to the initial mortality and homogenization of habitat immediately after 27F, and (2) the arrival of organisms to Coliumo Bay that allowed the recovery of the community over time. These results also favor the idea that stability
and resilience are also linked to the ecological functionality of species (Tilman et al. 1996; Peterson et al. 1998; loreau and Behera 1999; Walker et al. 1999; elmqvist et al. 2003; Hughes et al. 2005). In terms of the functional role of spe-cies in ensuring community resilience, Hernández-Miranda
1
2
3
4 1
23
4
1
23
4 1
23
4
1
23
4
1
23
4
1
23
4
1
23
4
a
c
e
g
b
d
f
h
Fig. 8 Bathymetric nMDS plots for epibenthic macrofaunal density. These plots correspond to analyses performed with the Bray–Curtis dissimilarity measure based on standardized and fourth root trans-formed data (Stress < 0.01; i.e. Fig. 5c). Superimposed bubbles cor-respond to a species richness, b Shannon-Wiener index, c Nassarius
spp. density, d Nassarius spp. biomass, e total community density, f C. coronatus density, g biomass of 67 other species, and h bottom dissolved oxygen. Suffixes correspond to each of the four bathymet-ric strata. Diameters of bubbles are proportional to the magnitude of each variable

Mar Biol
1 3
et al. (2012a) proposed that, in the short-term and medium-term community, there are two underlying ecological mechanisms in Coliumo Bay involved in the response of the epibenthic macrofaunal community to the strong natural perturbation: cross-scale resilience (Peterson et al. 1998) and response diversity (elmqvist et al. 2003). In this study, cross-scale resilience refers to (i) a high level of con-nectivity between Coliumo Bay and the adjacent coastal areas favoring the rapid arrival (i.e., weeks) of organisms from neighboring habitats of the continental shelf less affected by the perturbation, which have very similar epi-benthic macrofaunal communities in terms of composition (Hernández-Miranda et al. 2009) and (ii) the differential use of the habitat by the dominant species of the commu-nity. response diversity, on the other hand, means that the same ecological function could be performed by different species of the community (elmqvist et al. 2003). In the case of Coliumo Bay, this function could be that of scaven-ger organisms.
Within the context of the cross-scale resilience hypoth-esis, our results indicate that after 27F, and independ-ent of inter-annual trends, the greatest total community density, total community biomass, species richness, and α-diversity occurred mainly in spring and autumn (Figs. 2, 3). The recruits or juveniles that maintain these commu-nity attributes are the product of reproduction during the
winter–spring transition. They enter the bay at the end of spring, and secondarily during autumn, from the shelf and/or as the result of local reproduction within Coliumo Bay. Spatial connectivity between Coliumo Bay and the adjacent continental shelf could be determined by the synchronic seasonal reproduction of many of the species of the com-munity. Previous studies have indicated that maximum reproductive activity for this coastal zone off central Chile generally occurs at the end of winter and the beginning of the austral spring (September) (Castro et al. 2000; Poulin et al. 2002; Hernández-Miranda et al. 2003; Palma et al. 2006; Hernández-Miranda et al. 2009; Díaz-Cabrera et al. 2012; Veas et al. 2013). Mechanisms of cross-scale resil-ience may also be explained by the spatially different uses of resources by species. It is interesting to examine the case of C. coronatus and Nassarius spp., which are, in general, the most abundant species in the community throughout the entire study period. These scavenger species presented segregated patterns of spatial distribution (see Figs. 2, 8) suggesting a differential use of the food resources they potentially compete for. While C. coronatus preferably uses the shallowest zones of the bay, Nassarius spp. inhab-its deeper areas. also, the difference in body size suggests that displacement capacity is much greater in C. coronatus, which also decreases the possibility of competitive inter-ference between these two species. The second ecological
Table 3 average and standard deviation values of the indicators of aggregate and compositional variability for the epibenthic macrofaunal com-munity at Coliumo Bay
Comparative periods are related to two major perturbation events (January 3 2008 hypoxic event, and 27F mega-earthquake and tsunami). For these comparisons, only sites e1, e2 and e3 were considered (See Fig. 1 and “Materials and Methods” section for details). Density: Ind. 500 m−2. Biomass: g 500 m−2
Period
Pre-hypoxia2007
Post-hypoxia2008–2009
Year 1 post 27F 2010–2011
Year 2 post 27F2011–2012
Year 3 post 27F2012–2013
aggregate
Species richness 11.91 ± 3.14 10.85 ± 3.24 9.08 ± 2.57 7.92 ± 3.23 9 ± 3.74
Shannon-Wiener index 1.2 ± 0.41 1.1 ± 0.55 1 ± 0.65 1 ± 0.41 1.26 ± 0.5
Total community density 1,562.33 ± 1,472 3,889.27 ± 5,609.2 774.54 ± 1,270.18 243.78 ± 222.24 155.96 ± 115.8
Total community biomass 5,467.16 ± 3,210.9 5,596.7 ± 4,301.33 2,176.21 ± 2,011.28 4,221.86 ± 5,814.22 1,858.96 ± 2,393.32
Compositional species density (%)
C. coronatus 32.24 ± 29.41 23.85 ± 29.04 51.88 ± 38.45 58.82 ± 27.94 26.84 ± 21.54
Nassarius spp. 40.37 ± 40.33 55.66 ± 39.81 19.49 ± 30.26 19.57 ± 28.47 10.16 ± 13.86
A. porosus 10.31 ± 15.03 5.12 ± 7.77 0.46 ± 1.39 3.83 ± 5.09 25.2 ± 29.85
Others 67 spp. 17.09 ± 18.99 15.38 ± 17.38 28.16 ± 25.06 17.79 ± 19.2 37.8 ± 29.57
Species biomass (%)
C. coronatus 44.32 ± 34.13 37.65 ± 33.87 63.27 ± 40.79 81.35 ± 22.68 64.92 ± 37.92
Nassarius spp. 24.22 ± 34.29 34.86 ± 39.73 11.42 ± 28.23 4.32 ± 9.6 1.36 ± 1.49
A. porosus 2.6 ± 3.51 2.63 ± 6.25 0.72 ± 2.16 0.83 ± 1.14 3.33 ± 4.69
Others 67 spp. 28.87 ± 28.48 24.86 ± 23.63 24.59 ± 31.77 13.5 ± 20.24 30.39 ± 38.94
number of samples 11 27 12 12 12

Mar Biol
1 3
mechanism for explaining the maintenance of the commu-nity in Coliumo Bay is the response Diversity Hypothesis, also known as functional redundancy (Walker et al. 1999). The scavengers C. coronatus and Nassarius spp. belong to the same functional group, although they display opposite responses to 27F. Compared to the densities and biomass reported by Hernández-Miranda et al. (2012a), C. corona-tus increased proportionally after 27F, while Nassarius spp. suffered a drastic decrease (see also Table 3). Both species fulfill the fundamental role of re-incorporating organic mat-ter into the ecosystem, thus favoring the recovery of eco-logical functions carried out by the community and bio-geochemical functions of the ecosystem. The recovery of systems impacted by large perturbations has been attributed not only to an increase in the diversity of isolated species, but also to an increase in the diversity of functional groups, since species which perform similar ecosystem functions may operate at different scales and thus increase the rate of recovery (Tilman et al. 1996; Peterson et al. 1998).
Finally, within the context of two major perturbations that struck Coliumo Bay in the last 6 years (hypoxia and 27F), some similarity in compositional structure can be seen mainly due to the presence of dominant species. although 27F generated a decrease in dominant species, compositional structure was still generally dominated by C. coronatus, Nassarius spp, and A. porosus. These spe-cies grouped together changed on average from 82.3 to 62.2 % in density and from 71.1 to 69.6 % in biomass between the pre-hypoxic period and the third year after 27F. The non-dominant species increased in density from 17.09 to 37.8 % and from 28.87 to 30.39 % in biomass during this period. For the pre- and post-hypoxia com-munity, the analysis of community similarity showed that the species responsible for the temporal dynamics in total abundance and total biomass were C. coronatus, Nassarius spp., and A. porosus (Hernández-Miranda et al. 2012a, b). Following two major perturbations, the most affected spe-cies in the community remain the dominant species. This pattern of alternate dominance suggests a certain degree of long-term compositional macro-stability in this commu-nity. Beisner et al. (2003) proposed that the global stabil-ity of a community will be determined by the presence of different aSS, which given certain basic characteristics of functionality may be sustained over time. The inter-annual community dynamics observed in Coliumo Bay suggest that aSS are able to be developed by this community over time, and the roles of several species of this community are interchangeable. The response of the epibenthic macrofau-nal community of Coliumo Bay after 27F, with an overall structure that was directionally modified over time, sug-gests the presence of aSS sustained under two functional underlying ecological mechanisms: cross-scale resilience and response diversity.
Acknowledgments This study was funded by FOnDeCYT 11100334 and 1130868 to e. Hernández-Miranda and by the Pro-grama de Investigación Marina de excelencia (PIMeX) of the Faculty of natural and Oceanographic Sciences (University of Concepción, Chile). J. Cisterna was funded by a scholarship from COnICYT (Beca Magister 2010–2012) and by FOnDeCYT 11100334. r. a. Quiñones and e. Hernández-Miranda received additional funding from the Inter-disciplinary Center for aquaculture research (InCar; FOnDaP Pro-ject nº15110027). The authors would like to thank three anonymous reviewers and the associated editor Dr. M. g. Chapman for their valu-able comments and suggestions to improve the quality of the paper.
References
ahumada rB, arcos DF (1976) Descripción de un fenómeno de varada y mortandad de peces en la Bahía de Concepción, Chile. revista Comisión Permanente del Pacífico Sur 5:101–111
anderson MJ, ellingsen Ke, Mcardle BH (2006) Multivariate disper-sion as a measure of beta diversity. ecol lett 9:683–693
anderson MJ, gorley rn, Clarke Kr (2008) PerManOVa+ for PrIMer: guide to software and statistical methods. PrIMer-e, Plymouth
anderson MJ, Crist TO, Chase JM, Vellend M, Inouye BD, Freestone al, Sanders nJ, Cornell HV, Comita lS, Davies KF, Harrison SP, Kraft nJB, Stegen JC, Swenson ng (2011) navigating the multiple meanings of β diversity: a roadmap for the practicing ecologist. ecol lett 14:19–28
Beisner B, Haydon D, Cuddington K (2003) alternative stable states in ecology. Front ecol environ 1(7):376–382
Callaway r, engelhard gH, Dann J, Cotter J, rumohr H (2007) a century of north Sea epibenthos and trawling: comparison between 1902–1912, 1982–1985 and 2000. Mar ecol Prog Ser 197:27–43
Castilla JC (1988) earthquake-caused coastal uplift and its effects on rocky intertidal kelp communities. Science 242:440–443
Castilla JC, Manríquez P, Camaño a (2010) effects of rocky shore coseismic uplift and the 2010 Chilean mega-earthquake on inter-tidal biomarkers species. Mar ecol Prog Ser 418:17–23
Castro lr, Salinas gr, Hernández eH (2000) environmental influ-ences on winter spawning of the anchoveta Engraulis ringens off Central Chile. Mar ecol Prog Ser 197:247–258
Clarke Kr, gorley rn (2006) PrIMer v6: user manual/tutorial. PrIMer-e, Plymouth
Clarke Kr, Warwick rM (2001) Change in marine communities: an approach to statistical analysis and interpretation, 2nd edn. PrIMer-e, Plymouth
Daneri g, Dellarossa V, Quiñones ra, Jacob B, Montero P, Ulloa O (2000) Primary production and community respiration in the Humboldt Current System off Chile and associated oceanic areas. Mar ecol Prog Ser 197:41–49
Daneri g, lizárraga l, Montero P, gonzález He, Tapia FJ (2012) Wind forcing and short-term variability of phytoplankton and het-erotrophic bacterioplankton in the coastal zone off Concepción upwelling system (Central Chile). Prog Oceanogr 92(1):92–96
Díaz-Cabrera e, Hernández-Miranda e, Hernández Ce, Quiñones ra (2012) Mesoscale β diversity and spatial nestedness of crustacean larvae in the coastal zone off central southern Chile: population and community implications. ICeS J Mar Sci 69(3):429–438
elmqvist T, Folke C, nystrôm M, Peterson g, Bengtsson J, Walker B, norberg J (2003) response diversity, ecosystem change, and resilience. Front ecol environ 1:488–494
Farías M, Vargas g, Tassara a, Carretier S, Baize S, Melnick D, Bataille K (2010) land-level changes produced by the Mw 8.8 2010 Chilean earthquake. Science 329(5994):916

Mar Biol
1 3
Fossing H, gallardo Va, Jørgensen BB, Hüttel M, nielsen lP, Schulz H, Canfield De, Forster S, glud rn, gundersen JK, Küver J, ramsing nB, Teske a, Thamdrup B, Ulloa O (1995) Concentra-tion and transport of nitrate by the mat-forming sulphur bacte-rium Thioploca. nature 374:713–715
griffiths HJ, linse K, Barnes DKa (2008) Distribution of macroben-thic taxa across the Scotia arc, southern ocean. antarctic Sci 20(3):213–226
gutiérrez D, gallardo Va, Mayor S, neira C, Vasquez C, Sellanes J, rivas M, Baltazar M (2000) Bioturbation potential of macrofauna in sublittoral organic-rich sediments off central Chile: spatial and temporal variation under “el niño” 1997/98. Mar ecol Prog Ser 202:81–99
Halford ar, Perret J (2009) Patterns of recovery in catastrophically disturbed reef fish assemblages. Mar ecol Prog Ser 383:261–272
Hernández-Miranda e, Palma aT, Ojeda FP (2003) larval fish assem-blages in nearshore coastal waters off Central Chile: temporal and spatial patterns. estuar Coast Shelf Sci 56:1075–1092
Hernández-Miranda eH, Veas r, labra Fa, araneda a, Carrasco FD, Salamanca M, rojas JM, Fariña JM, Quiñones ra (2009) Bio-diversidad del ecosistema costero adyacente a la desembocadura del río Itata. In: Parra O, Castilla JC, romero H, Quiñones ra, Camaño a (eds) la cuenca Hidrográfica del río Itata. aportes científicos para su gestión sustentable. ediciones Universidad de Concepción, Chile, pp 143–159
Hernández-Miranda e, Quiñones ra, aedo g, Valenzuela a, Mer-moud n, roman C, Yañez F (2010) a major fish stranding caused by natural hypoxic event in a shallow bay of the eastern South Pacific Ocean. J Fish Biol 76:1543–1564
Hernández-Miranda e, Veas r, labra Fa, Salamanca M, Quiñones ra (2012a) response of the epibenthic macrofaunal commu-nity to a strong upwelling-driven hypoxic event in a shallow bay of the southern Humbold Current System. Mar environ res 79:16–28
Hernández-Miranda e, Quiñones ra, aedo g, Díaz-Cabrera e, Cis-terna J (2012b) The impact of a strong natural hypoxic event on the toadfish Aphos porosus in Coliumo Bay, south-central Chile. rev Biol Mar Oceanogr 47(3):475–487
Holling CS (1973) resilience and stability of ecological systems. annu rev ecol Syst 4:1–24
Hughes T, Bellwood D, Folke C, Steneck r, Wilson J (2005) new paradigms for supporting the resilience of marine ecosystems. Trends ecol evol 20(7):380–386
Huston M (1979) a general hypothesis of species diversity. am nat 113:81–101
Huston M (1994) Biological diversity: the coexistence of species on changing landscapes. Cambridge University Press, Cambridge
Jaramillo e, Dugan J, Hubbard D, Melnick D, Manzano M, Duarte C, Campos C, Sanchez r (2012) ecological implications of extreme events: footprints of the 2010 earthquake along the Chilean Coast. PloS One 7(5):e35348. doi:10.1371/journal.pone.0035348
laudien J, rojo Me, Oliva Me, arntz We, Thatje S (2007) Sublit-toral soft bottom communities and diversity of Mejillones Bay in northern Chile (Humbold Current Upwelling System). Helgol Mar res 61:103–116
lomovasky B, Firstater F, gamarra a, Mendo J, Iribarne O (2010) Macro benthic community assemblage before and after the 2007 tsunami and earthquake at Parakas Bay, Peru. J Sea res 65:205–212
loreau M, Behera n (1999) Phenotypic diversity and stability of eco-system processes. Theor Popul Biol 56:29–47
Macarthur r (1972) geographical ecology: patterns in the distribu-tion of species. Harper & row Publishers, new York
Macarthur r, Wilson Oe (1967) The theory of island biogeography. Princeton University Press, Princeton
Madariaga r, Métois M, Vigny C, Campos J (2010) Central Chile finally breaks. Science 9(328):181–182
Marin a, gelcich S, araya g, Olea g, espíndola M, Castilla JC (2010) The 2010 tsunami in Chile: devastation and sur-vival of coastal small-scale fishing communities. Mar Policy 34:1381–1384
McKnight Dg, Probert PK (1997) epibenthic communities on the Chatham rise, new Zealand. new Zeal J Mar Fresh 31:505–513
Meilianda e, Dohmen-Janssen CM, Maathius BHP, Hulscher SJMH, Mulder JPM (2010) Short-term morphological responses and developments of Banda aceh coast, Sumatra Island, Indonesia after the tsunami on 26 December 2004. Mar geol 275:96–109
Micheli F, Cottingham Kl, Bascompte J, Bjornstad On, eckert gl, Fisher JM, Keitt TH, Kendall Be, Klug Jl, rusak Ja (1999) The dual nature of community variability. Oikos 85(1):161–169
nelson ar, Manley W (1992) Holocene coseismic and aseismic uplift of Isla Mocha, south-central Chile. Quatern Int 15–16:61–76
noda a, Katayama H, Sagayama T, Suga K, Uchida Y, Satake K, abe K, Okamura Y (2007) evaluation of Tsunami impacts on shal-low marine sediments: an example from the tsunami caused by the 2003 Tokachi-oki earthquake, northern Japan. Sediment geol 200:314–327
O’neill rV (2001) Is it time to bury the ecosystem concept? (Whit full military honors, of course!). ecology 82:3275–3284
Palma a, Pardo lM, Veas r, Cartes C, Silva M, Manríquez K, Díaz a, Muñoz C, Ojeda FP (2006) Coastal brachyuran decapods: set-tlement and recruitment under contrasting coastal geometry con-ditions. Mar ecol Prog Ser 316:139–153
Peterson g, allen C, Holling CS (1998) ecological resilience, biodi-versity, and scale. ecosystems 1:6–18
Poulin e, Palma aT, leiva g, Hernández e, Martinez P, navarrete Sa, Castilla JC (2002) Temporal and spatial variation in the distribution of epineustonic component larvae of Concholepas concholepas along the central coast of Chile. Mar ecol Prog Ser 229:95–104
Quiñones ra, gutiérrez MH, Daneri g, gutiérrez Da, gonzález He, Chávez F (2010) Pelagic carbon fluxes in the Humboldt Current System. In: liu KK, atkinson l, Quiñones ra, Talaue-McManus l (eds) Carbon and nutrient fluxes in global continental margins: a global synthesis. IgBP Series Book, Springer, new York. pp 44–64
ranjan rK, routh J, ramanathan a (2010) Bulk organic matter char-acteristics in the Pichavaram mangrove-estuarine complex, south-eastern India. app geochem 25:1176–1186
ruegg JC, rudloff a, Vigny C, Madariaga r, Chabalier JB, Campos J, Kausel e, Barrientos S, Dimitrov V (2009) Interseismic strain accumulation measured by gPS in the seismic gap between Constitución and Concepción in Chile. Phys earth Planet In 175:78–85
Shaffer g, Hormazabal S, Pizarro g, Salinas S (1999) Seasonal and inter annual variability of currents and temperature off Central Chile. J geophys res 104:29951–29961
Sobarzo M, Bravo l, Donoso D, garcés-Vargas J, Schneider W (2007) Coastal upwelling and seasonal cycles that influence the water column over the continental shelf off Central Chile. Prog Oceanogr 75:363–382
Sobarzo M, garcés-Vargas J, Bravo l, Tassara a, Quiñones ra (2012) Observing sea level and current anomalies driven by mega thrust slope-shelf tsunami: the event on February 27, 2010 in Central Chile. Cont Shelf res 49:44–55
Tilman D, Wedin D, Knops J (1996) Productivity and sustainabil-ity influenced by biodiversity in grassland ecosystems. nature 379:718–720
Turner M (2010) Disturbance and landscape dynamics in a changing world. ecology 91:2833–2849

Mar Biol
1 3
USgS (2013) earthquake hazards program. http://earthquake.usgs.gov/earthquakes/world/historical_mag.php. accessed 18 January 2013
Vargas g, Farías M, Carretier S, Tassara a, Baize S, Melnick D (2011) Coastal uplift and tsunami effects associated to the 2010 Mw 8.8 Maule earthquake in Central Chile. and geol 38(1):219–238
Veas r, Hernández-Miranda e, Quiñones ra, Díaz-Cabrera e, rojas JM, Fariña JM (2013) The influence of environmental factors on the abundance and recruitment of the sand crab Emerita analoga (Stimpson 1857): a source-sink dynamics? Mar environ res 89:9–20
Vigny C, Socquet a, Peyrat S, ruegg C, Métois M, Madariaga r, Morvan S, lancieri M, laccasin r, Campos J, Carrizo D, Bejar-Pizarro M, Barrientos S, armijo r, aranda C, Valderas-Bermejo M, Ortega I, Bondoux F, Baize S, lyon-Caen H, Pavez a, Vilotte JP, Bevis M, Brooks B, Smalley r, Parra H, Baez J, Blanco M,
Cimbaro S, Kendrick e (2011) The 2010 Mw 8.8 Maule mega-thrust earthquake of Central Chile, monitored by gPS. Science 332(6036):1417–1421
Walker B, Kinzig a, langridge J (1999) Plant attribute diversity, resilience, and ecosystem function: the nature of significance of dominant and minor species. ecosystems 2:95–113
Whanpetch n, nakaoka M, Mukay H, Suzuki T, nojima S, Kawai T, aryuthaka C (2010) Temporal changes in benthic communities of sea grass beds impacted by a tsunami in the andaman Sea, Thai-land. estuar Coast Shelf Sci 87:246–252
Whittaker rH (1972) evolution and measurement of species diversity. Taxon 21:213–251
Yan Z, Tang D (2008) Changes in suspended sediments associated with 2004 Indian Ocean Tsunami. adv Space res 43:89–95