Geochemical models of Sb(-As,Au,Ag) mineralization in ...
238
Universität Bremen Geochemical models of Sb(-As,Au,Ag) mineralization in Archaean and modern hydrothermal settings - Examples from the Murchison Greenstone Belt and the Manus back-arc basin Dissertation zur Erlangung des Doktorgrades der Naturwissenschaften (Dr. rer. nat.) am Fachbereich Geowissenschaften der Universität Bremen vorgelegt von Nikki Blaauwbroek Bremen, Okt 2016 Referent: Prof. Dr. Wolfgang Bach Koreferent: PD Dr. Frank Lisker
-
Upload
khangminh22 -
Category
Documents
-
view
3 -
download
0
Transcript of Geochemical models of Sb(-As,Au,Ag) mineralization in ...

Universität Bremen
Geochemical models of Sb(-As,Au,Ag)mineralization in Archaean andmodern hydrothermal settings
-
Examples from the Murchison Greenstone Belt and the Manus back-arc
basin
Dissertation
zur Erlangung des
Doktorgrades der Naturwissenschaften
(Dr. rer. nat.)
am Fachbereich Geowissenschaften
der Universität Bremen
vorgelegt von
Nikki Blaauwbroek
Bremen, Okt 2016
Referent:
Prof. Dr. Wolfgang Bach
Koreferent:
PD Dr. Frank Lisker


Contents
Contents
Contents
List of Figures V
List of Tables IX
List of Minerals XI
Abbreviations XIII
Abstract XV
Kurzfassung XIX
Acknowledgements XXIII
1 Introduction 1
1.1 Historical uses of antimony (Sb) . . . . . . . . . . . . . . . . . . . . . . 1
1.2 Physicochemical properties and geochemical behavior of Sb . . . . . . . 3
1.3 Types of antimony deposits . . . . . . . . . . . . . . . . . . . . . . . . 4
1.4 Types of antimony deposits . . . . . . . . . . . . . . . . . . . . . . . . 8
1.5 Archaean VMS-mineralization . . . . . . . . . . . . . . . . . . . . . . . 12
1.6 Modern arc and back arc basins . . . . . . . . . . . . . . . . . . . . . 13
1.7 Hydrothermal activity at back-arc basins . . . . . . . . . . . . . . . . . 15
2 Motivation and outline 21
2.1 Motivation . . . . . . . . . . . . . . . . . . . . . . . . . . . . . . . . . 21
2.2 Outline . . . . . . . . . . . . . . . . . . . . . . . . . . . . . . . . . . . 23
2.3 Scientific contributions . . . . . . . . . . . . . . . . . . . . . . . . . . . 26
3 Ageochemicalmodel of the Sb-Asmineralization in theMurchisonGreen-
stone belt 29
I

Contents
3.1 Introduction . . . . . . . . . . . . . . . . . . . . . . . . . . . . . . . . 32
3.1.1 Regional geology . . . . . . . . . . . . . . . . . . . . . . . . . 36
3.2 Methods . . . . . . . . . . . . . . . . . . . . . . . . . . . . . . . . . . 38
3.3 Results . . . . . . . . . . . . . . . . . . . . . . . . . . . . . . . . . . . 41
3.3.1 Fieldwork . . . . . . . . . . . . . . . . . . . . . . . . . . . . . 41
3.3.2 Petrography and mineral chemistry . . . . . . . . . . . . . . . . 48
3.3.3 Trace element compositions of carbonates . . . . . . . . . . . . 52
3.3.4 Stable isotope compositions and geothermometry . . . . . . . . 55
3.3.5 Geochemical calculations and reaction path model results . . . . 58
3.4 Discussion . . . . . . . . . . . . . . . . . . . . . . . . . . . . . . . . . 69
3.4.1 Fluid source and temperatures of mineralization . . . . . . . . . 69
3.4.2 Paragenetic constraints on metasomatic mass transfers in the dif-
ferent lithological units . . . . . . . . . . . . . . . . . . . . . . . 73
3.4.3 Trapping mechanisms of Sb enrichment in the AL – the role of
metasomatic reactions . . . . . . . . . . . . . . . . . . . . . . 76
3.5 Summary and conclusions . . . . . . . . . . . . . . . . . . . . . . . . 83
3.6 Acknowledgements . . . . . . . . . . . . . . . . . . . . . . . . . . . . 83
4 Sb-As-Au mineralization at the Murchison Greenstone Belt, South Africa 93
4.1 Introduction . . . . . . . . . . . . . . . . . . . . . . . . . . . . . . . . 95
4.1.1 The Murchison Greenstone Belt . . . . . . . . . . . . . . . . . 96
4.2 Methods . . . . . . . . . . . . . . . . . . . . . . . . . . . . . . . . . . 98
4.3 Results . . . . . . . . . . . . . . . . . . . . . . . . . . . . . . . . . . . 103
4.3.1 Fieldwork . . . . . . . . . . . . . . . . . . . . . . . . . . . . . 103
4.3.2 Petrography and bulk mineralogy . . . . . . . . . . . . . . . . . 105
4.3.3 Major and minor metal concentrations . . . . . . . . . . . . . . 118
4.3.4 Geochemical modelling . . . . . . . . . . . . . . . . . . . . . . 126
4.4 Discussion . . . . . . . . . . . . . . . . . . . . . . . . . . . . . . . . . 134
4.4.1 Orogenic gold deposit style . . . . . . . . . . . . . . . . . . . . 134
4.4.2 Sb-As-Au mineralization . . . . . . . . . . . . . . . . . . . . . . 136
4.4.3 Model results . . . . . . . . . . . . . . . . . . . . . . . . . . . 137
4.5 Conclusions . . . . . . . . . . . . . . . . . . . . . . . . . . . . . . . . 138
4.6 Acknowledgments . . . . . . . . . . . . . . . . . . . . . . . . . . . . . 139
II

Contents
5 Geochemical modeling insight into Sb-As-Au-Ag mineralization at the
PacManus basin, Papua New Guinea 147
5.1 Introduction . . . . . . . . . . . . . . . . . . . . . . . . . . . . . . . . 149
5.1.1 Sb, As, Au and Ag enrichment in arc and back-arc settings . . . 150
5.2 Regional background hydrothermal system PACManus . . . . . . . . . . 153
5.2.1 Prominent vent sites located at PACManus site . . . . . . . . . . 155
5.3 Materials and Methods . . . . . . . . . . . . . . . . . . . . . . . . . . 158
5.4 Results . . . . . . . . . . . . . . . . . . . . . . . . . . . . . . . . . . . 162
5.4.1 Fluids samples . . . . . . . . . . . . . . . . . . . . . . . . . . 162
5.5 Whole rock dataset . . . . . . . . . . . . . . . . . . . . . . . . . . . . 167
5.6 Geochemical models . . . . . . . . . . . . . . . . . . . . . . . . . . . 179
5.7 Discussion and conclusion . . . . . . . . . . . . . . . . . . . . . . . . 189
5.7.1 Role of magma degassing . . . . . . . . . . . . . . . . . . . . 190
5.7.2 Transport and deposition . . . . . . . . . . . . . . . . . . . . . 192
5.7.3 Zone refining and supergenous enrichment as trapping mecha-
nisms . . . . . . . . . . . . . . . . . . . . . . . . . . . . . . . 194
5.8 Acknowledgements . . . . . . . . . . . . . . . . . . . . . . . . . . . . 197
6 Summary and Outlook 207
III

IV

List of Figures
List of Figures
1.1 Industrial use of antimony . . . . . . . . . . . . . . . . . . . . . . . . . 2
1.2 Antimony world production and reserve . . . . . . . . . . . . . . . . . . 3
1.3 Orogenic gold deposits . . . . . . . . . . . . . . . . . . . . . . . . . . 5
1.4 Distribution of Archaean cratons and greenstone belts . . . . . . . . . . 9
1.5 Sketch of a typical Archaean greenstone belt . . . . . . . . . . . . . . . 11
1.6 Localities of Au deposits . . . . . . . . . . . . . . . . . . . . . . . . . . 13
1.7 Localities of hydrothermal systems . . . . . . . . . . . . . . . . . . . . 15
3.1 Geological map of the Murchison Greenstone Belt . . . . . . . . . . . . 33
3.2 Linear relationship between temperature and ΔMgs-Dol . . . . . . . . . 40
3.3 Photos of sample locations I . . . . . . . . . . . . . . . . . . . . . . . . 44
3.4 Photos of sample locations II . . . . . . . . . . . . . . . . . . . . . . . 45
3.5 BSE images . . . . . . . . . . . . . . . . . . . . . . . . . . . . . . . . 50
3.6 Paragenetic sequence I . . . . . . . . . . . . . . . . . . . . . . . . . . 51
3.7 Paragenetic sequence II . . . . . . . . . . . . . . . . . . . . . . . . . . 52
3.8 Composition plot of carbonates . . . . . . . . . . . . . . . . . . . . . . 56
3.9 Cr2O3 vs Mg# of fuchsite, chlorite and dravite . . . . . . . . . . . . . . . 57
3.10 Histogram Sb content . . . . . . . . . . . . . . . . . . . . . . . . . . . 61
3.11 REE+Y of carbonates . . . . . . . . . . . . . . . . . . . . . . . . . . . 62
3.12 Stable isotope of dolomite and magnesite . . . . . . . . . . . . . . . . . 63
3.13 Activity diagram for Fe-Sb-Cu-S-O-H at 250 and 350 C . . . . . . . . . . 66
3.14 Reaction path modeling up to 600 ◦C . . . . . . . . . . . . . . . . . . . 67
3.15 Reaction path modeling from 500 to 300 ◦C . . . . . . . . . . . . . . . 68
4.1 Geological map of Murchison Greenstone Belt . . . . . . . . . . . . . . 99
4.2 XRD plot of A080 . . . . . . . . . . . . . . . . . . . . . . . . . . . . . 107
4.3 XRD plot of M121 . . . . . . . . . . . . . . . . . . . . . . . . . . . . . 107
4.4 Plate A080 . . . . . . . . . . . . . . . . . . . . . . . . . . . . . . . . . 108
4.5 Plate A082 . . . . . . . . . . . . . . . . . . . . . . . . . . . . . . . . . 109
4.6 Plate B028 . . . . . . . . . . . . . . . . . . . . . . . . . . . . . . . . . 110
V
List of Figures
4.7 Plate B033 . . . . . . . . . . . . . . . . . . . . . . . . . . . . . . . . . 111
4.8 Plate Bm048 . . . . . . . . . . . . . . . . . . . . . . . . . . . . . . . . 112
4.9 Plate M122B . . . . . . . . . . . . . . . . . . . . . . . . . . . . . . . . 113
4.10 [Plate M123 . . . . . . . . . . . . . . . . . . . . . . . . . . . . . . . . 114
4.11 Plate M124 . . . . . . . . . . . . . . . . . . . . . . . . . . . . . . . . 115
4.12 Plate M126 . . . . . . . . . . . . . . . . . . . . . . . . . . . . . . . . 116
4.13 Plate Mm107 . . . . . . . . . . . . . . . . . . . . . . . . . . . . . . . 117
4.14 Metal trace content . . . . . . . . . . . . . . . . . . . . . . . . . . . . 121
4.15 Elemental map of arsenopyrite . . . . . . . . . . . . . . . . . . . . . . 125
4.16 Elemental map of stibnite . . . . . . . . . . . . . . . . . . . . . . . . . 126
4.17 Activity diagrams of Fe-Sb-S-O; 150-500 ◦C . . . . . . . . . . . . . . . 127
4.18 Activity diagrams of Fe-As-S-O; 150-400 ◦C . . . . . . . . . . . . . . . 129
4.19 Activity diagram of Sb and Sb at 400 ◦C with varying concentrations . . . 129
4.20 Activity diagram of Sb-minerals at 250 ◦C . . . . . . . . . . . . . . . . . 130
4.21 Activity diagram of Sb at 250 ◦C . . . . . . . . . . . . . . . . . . . . . . 131
4.22 Activity diagram of Sb at 350 ◦C . . . . . . . . . . . . . . . . . . . . . . 131
4.23 Activity diagram of Sb-Cu at 350 ◦C . . . . . . . . . . . . . . . . . . . . 132
4.24 Activity diagram of As-Cu at 350 ◦C . . . . . . . . . . . . . . . . . . . . 133
4.25 Activity diagram of Au at 250 and 350 ◦C . . . . . . . . . . . . . . . . . 133
5.1 Geological map of the Manus Basin . . . . . . . . . . . . . . . . . . . . 153
5.2 Detailed bathymetry map of Fenway, Satanic Mills and Roman Ruins . . 155
5.3 Photographs at the Bambus cruise (2011) (Bach et al., 2011). . . . . . . 156
5.4 Fluid samples I . . . . . . . . . . . . . . . . . . . . . . . . . . . . . . 163
5.5 Fluid samples II . . . . . . . . . . . . . . . . . . . . . . . . . . . . . . 165
5.6 Fluid samples III . . . . . . . . . . . . . . . . . . . . . . . . . . . . . . 166
5.7 Fluid samples IV . . . . . . . . . . . . . . . . . . . . . . . . . . . . . . 167
5.8 Plate of thin sections . . . . . . . . . . . . . . . . . . . . . . . . . . . 168
5.9 Whole rock dataset sorted by locality . . . . . . . . . . . . . . . . . . . 174
5.10 Whole rock dataset sorted by vent type . . . . . . . . . . . . . . . . . . 175
5.11 Mineral mode open conduit system . . . . . . . . . . . . . . . . . . . . 176
5.12 Mineral mode massive sulfide system . . . . . . . . . . . . . . . . . . . 176
5.13 Mineral mode diffuser system . . . . . . . . . . . . . . . . . . . . . . . 177
VI

List of Figures
5.14 Mineral mode inactive system . . . . . . . . . . . . . . . . . . . . . . . 177
5.15 Solubility of Sb, As, Au and Ag . . . . . . . . . . . . . . . . . . . . . . 180
5.16 T-X sections of Fenway . . . . . . . . . . . . . . . . . . . . . . . . . . 183
5.17 T-X sections of Roman Ruins . . . . . . . . . . . . . . . . . . . . . . . 184
5.18 T-X sections of Satanic Mills . . . . . . . . . . . . . . . . . . . . . . . . 185
5.19 Step by step reaction path modeling, simulating zone refining . . . . . . 186
5.20 pH dependence . . . . . . . . . . . . . . . . . . . . . . . . . . . . . . 187
5.21 Zone refining plot of Satanic Mills . . . . . . . . . . . . . . . . . . . . . 188
5.22 Zone refining plot of Fenway . . . . . . . . . . . . . . . . . . . . . . . . 189
VII

VIII

List of Tables
List of Tables
3.1 Sb-hosted Precambrian and younger suture zones . . . . . . . . . . . . 34
3.2 ΔDol-H2O values at 293-673 K . . . . . . . . . . . . . . . . . . . . . . 40
3.3 Sample description . . . . . . . . . . . . . . . . . . . . . . . . . . . . 42
3.4 Mineral formula’s of chlorite, fuchsite and dravite . . . . . . . . . . . . . 49
3.5 Stibnite . . . . . . . . . . . . . . . . . . . . . . . . . . . . . . . . . . . 53
3.6 Arsenopyrite . . . . . . . . . . . . . . . . . . . . . . . . . . . . . . . . 55
3.7 Average REE+Y values of carbonates . . . . . . . . . . . . . . . . . . 58
3.8 Stable isotope of dolomite and magnesite . . . . . . . . . . . . . . . . . 59
3.9 Temperature calculations . . . . . . . . . . . . . . . . . . . . . . . . . 60
3.10 Temperature and ΔDol-H2O calculation . . . . . . . . . . . . . . . . . . 60
4.1 Sample summary and methods employed. . . . . . . . . . . . . . . . . 98
4.2 Log K values Sb-species . . . . . . . . . . . . . . . . . . . . . . . . . 100
4.3 Log K values As-species . . . . . . . . . . . . . . . . . . . . . . . . . 101
4.4 Log K values Au-species . . . . . . . . . . . . . . . . . . . . . . . . . 101
4.5 Log K values Sb-As minerals . . . . . . . . . . . . . . . . . . . . . . . 102
4.6 Petrological overview of most prominent sulfide minerals at MGB . . . . 106
4.7 EMPA results of pyrite . . . . . . . . . . . . . . . . . . . . . . . . . . . 119
4.8 EMPA results of pyrrhotite . . . . . . . . . . . . . . . . . . . . . . . . . 120
4.9 EMPA results of chalcopyrite . . . . . . . . . . . . . . . . . . . . . . . 122
4.10 Metal trace content . . . . . . . . . . . . . . . . . . . . . . . . . . . . 123
5.1 Fluid samples dataset . . . . . . . . . . . . . . . . . . . . . . . . . . . 164
5.2 Overview vent sites and vent types . . . . . . . . . . . . . . . . . . . . 169
5.3 Whole rock dataset . . . . . . . . . . . . . . . . . . . . . . . . . . . . 170
5.4 Mineral mode calculations . . . . . . . . . . . . . . . . . . . . . . . . . 172
IX

X

List of Minerals
List of Minerals
STIBNITE Sb2S3
TRIOXIDE Sb2O3
PENTOXIDE Sb2O5
SODIUM ANTIMONATE NaSbO3
TRISFULFIDE Sb2S3
PENTASULFIDE Sb2S5
TRIACETATE Sb(CH3COO))3
SENARMONTITE Sb2O3
JAMESONITE Pb4FeSb6S14
BERTHIERITE FeSb2S4
GUDMUNDITE FeSbS
ULLMANNITE NiSbS
VALENTINITE Sb2O3
GERSDORFFITE NiAsS
WESTERVELDITE (Fe, Ni)As
XI

XII
ABBREVIATIONS
Abbreviations
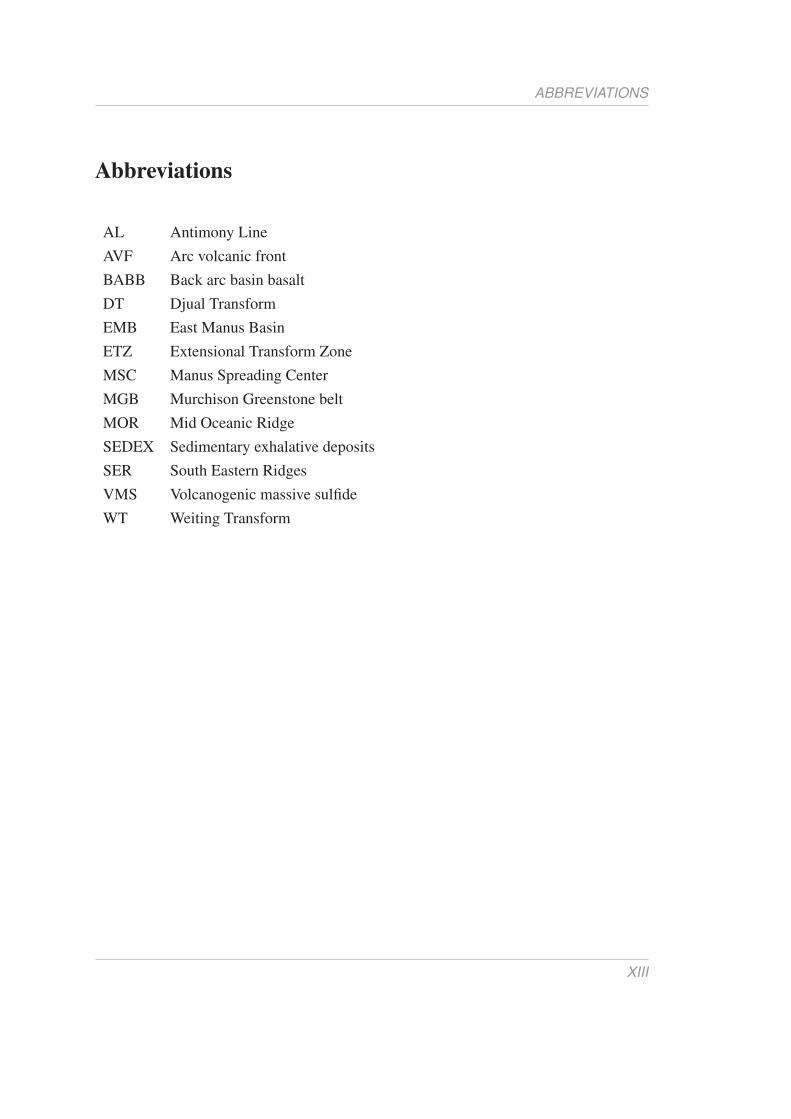
AL Antimony Line
AVF Arc volcanic front
BABB Back arc basin basalt
DT Djual Transform
EMB East Manus Basin
ETZ Extensional Transform Zone
MSC Manus Spreading Center
MGB Murchison Greenstone belt
MOR Mid Oceanic Ridge
SEDEX Sedimentary exhalative deposits
SER South Eastern Ridges
VMS Volcanogenic massive sulfide
WT Weiting Transform
XIII

XIV

ABSTRACT
Abstract
The topic of this PhD project was to deduce new geochemical models of Sb(-As,Au,Ag)
mineralization in Archaean and modern hydrothermal settings by studying extended
datasets from the Murchison Greenstone Belt (MGB) and the Manus back-arc basin.
To emphasize the parallels of the Antimony deposit (AL) deposit with modern back-arc
massive sulfide mineralization systems, an in depth qualitative and quantitative research
of the Sb(-As, Au, Au) behavior in magmatic-hydrothermal hypogene and supergene
deposits has been performed. The MGB has been interpreted as an Archaean orogenic
gold deposit, which has been formed under greenschist facies conditions with hydrother-
mal alteration assemblages developed whilst undergoing ductile to brittle deformation,
with temperatures around 200-420 ◦C and CO2-rich fluids. The primary mineralization
is connected to an ore fluid originating from a granitoid magmatic or a metamorphic
devolatization model, where the phase relations clearly indicate a shift from low f S2
and low f O2 to high f S2 and low f O2, caused by carbonation and silification. These
alteration processes have been identified in this study were induced by serpentinization
and listvenitization, caused by alteration and metasomatic reactions involving meta-
ultramafic rocks and felsic protoliths. From these results I propose that metasomatic
reactions involving ultramafic rocks may make for efficient traps of Sb and likely other
elements, like As, Ag, and Au.
The Sb, As, Ag and Au enrichments at the VMS deposit at PACManus are more pro-
nounced by a complex reaction path of magmatic degassing influenced by deep-seated
seawater-rock interaction of zone refining as well as near-seafloor sulfide deposition of
supergeneous enrichments, consequently re-working the primary sulfide mounds at a
sweet spot around 270 ◦C and pH between 2-3.
The dominant Sb species responsible for the Sb enrichments at these hydrothermal
systems at temperatures between 250-400 ◦C has been deduced to be the oxidized
Sb(OH)3, whereas main epithermal Sb-mineralization at T <150 ◦C is related to reduced
bisulfide Sb-complexes. A further striking and important observation is the unmistak-
able strong correlation between the geochemical behavior between As-Ag and Sb-Au.
These results imply that Sb is still present within hydrothermal systems at higher tem-
XV

ABSTRACT
perature and therefore could play an essential role within Au-rich hydrothermal ore de-
posits. The complexity of the geochemical behavior of Sb-Au is explained by the con-
tradicting behavior of reduced and oxidized complexes of Sb and Au (as well as As and
Ag). This study has shown that slight variations in temperature, oxygen fugacity and pH
of the percolating carrier fluid in combination with variations in buffering capacities of
host rock material can cause great diversities in metal and metalloids speciation within
ore deposits. Furthermore, the importance of geochemical analyses of non-prominent
metal concentrations within the field of ore petrology should be acknowledged.
XVI

XVII

XVIII

KURZFASSUNG
Kurzfassung
Im Rahmen dieser Doktorarbeit wurden auf Grundlage von umfangreichen Datensätzen
aus dem Murchison Greenstone Belt (MGB) und dem Manus Backarc-Becken neue
geochemische Modelle zur Sb (± As ± Au ± Ag) Mineralisation in archaischen sowie
rezenten Hydrothermalsystemen entwickelt. Um die Parallelen zwischen den archais-
chen Vererzungen der Antimonlinie und rezenten Backarc Massivsulfidmineralisationen
herauszuarbeiten wurden umfassende qualitative und quantitative Untersuchungen des
geochemischen Verhaltens von Sb (± As ± Au ± Ag) in magmatisch bis hydrother-
malen hypo- und supergenen Ablagerungen durchgeführt. Der Murchison Greenstone
Belt wird hierbei als orogene Goldlagerstätte interpretiert, die unter Herausbildung einer
Hydrothermalalterationsparagenese in einer duktil-spröden Deformation vor dem Hin-
tergrund von grünschieferfaziellen Bedingungen von 200-420 ◦C und unter Beteili-
gung eines CO2-reichen Fluides entstanden ist. Das die primäre Mineralisation her-
beiführende vererzende Fluid in diesem System kann entweder durch ein granitoid-
magmatisches oder durch ein metamorphes Devolatilisierungsmodel erklärt werden.
Die untersuchten Phasenbeziehungen deuten klar auf eine Verschiebung von anfänglich
niedrigen S2 und O2 Fugazitäten zu später deutlich erhöhten S2 bei gleichbleibend
niedrigen O2 Fugazitäten hin. Die beobachteten metasomatischen Alterationsprozesse
sind Folge einer Serpentinisierung und Listvenitisierung von Metaultramafiten sowie
eines felsischen Protoliths. Die Ergebnisse dieser Untersuchungen implizieren, dass
diese Art von metasomatischer Alteration ultramafischer Lithologien einen wirkungsvollen
Mechanismus zur Anreicherung von Sb und potentiell weiteren Elementen wie As, Ag
und Au darstellt. Die Anreicherungen von Sb, As, Ag und Au in volcanogenic mas-
sive sulfide (VMS) Lagerstätten am PACManus Hydrothermalfeld werden durch einen
komplexe Reaktion aus magmatischen Entgasungsprozessen verstärkt. Diese werden
zum einen durch tiefe, hypogene, ein sukzessives Zonerefining nach sich ziehende
Meerwasser-GesteinsWechselwirkungen beeinflusst und desWeiteren durch ein meeres-
bodennahe, supergene Sulfidanreicherung, die sich in einer fortgesetzten Umlagerung
der primären Sulfidablagerung äußert. Optimal läuft letzterer Prozess bei Bedingungen
nahe 270 ◦C und einem pH zwischen 2 und 3 ab.
XIX

KURZFASSUNG
Bei der Anreicherung von Antimon in diesen Hydrothermalsystemen dominiert für
den Temperaturbereich von 250 bis 400 ◦C die oxidierte Sb(OH)3 Spezies, wohinge-
gen unterhalb von 150 ◦C die dann dominierenden Bisulfid Sb-Komplexe den größten
Einfluss auf die resultierende Antimonmineralisation haben. Von maßgeblicher Be-
deutung ist außerdem eine festgestellte starke Korrelation zwischen dem geochemis-
chen Verhalten von As-Ag und Sb-Au. Die Beobachtungen legen nahe, dass Antimon
auch bei höheren Temperaturen noch in signifikanten Mengen in Hydrothermalsyste-
men auftreten und somit auch eine entscheidende Rolle bei der Bildung von Au-reichen
hydrothermalen Lagerstätten spielen kann. Hierbei lässt sich die Komplexität des wech-
selseitigen geochemischen Verhaltens von Sb und Au durch das gegensätzliche Verhal-
ten von reduzierten und oxidierten Sb und Au bzw. As und Ag Komplexen erklären.
Die vorliegende Arbeit zeigt auf, wie kleine Veränderungen in Temperatur, Sauer-
stofffugazität und pH des die Lithologie durchströmenden Trägerfluids in Kombination
mit Variationen in der Pufferkapazität des infiltrierten Gesteins zu einer großen Vielfalt
an Metall- und Metalloidspezies in Erzlagerstätten führen kann. Die Ergebnisse demon-
strieren zudem wie eine detaillierte Charakterisierung von bestimmten untergeordneten
Metallgruppen bei dem Verständnis solcher Systeme helfen kann und sie unterstreichen
somit deren Bedeutung für das Feld der Lagerstättenpetrologie insgesamt.
XX

XXI

XXII

ACKNOWLEDGEMENTS
Acknowledgements
I am sincerely thankful for the contribution and support during this thesis by my direct
supervisor at the University of Bremen, Wolfgang Bach. I truly appreciate his help,
feedback and the amount of time, he invested in me and this project. I am also very
grateful to dr. Ulrich Schwarz-Schampera (BGR) for initiating this project and pro-
viding me with the opportunity to conduct this Phd project. Furthermore, I would like
to thank Frank Lisker for being the second supervisor and reviewing this thesis. I am
grateful for Andreas Klügel, Stephan Sopke and Niels Jöns for providing help with both
LA-ICPMS and EMPA measurements. Additionally, I would like to thank is Michael
Hentscher, for his contribution and discussions on various modeling prospects.
Also, I like to thank all my colleagues, Svenja, Karin, Basti, Christian, Janis, Alex,
Andreas, Stefan, Wolf-Achim and Patrick for the pleasant time. Finally I would like
to thank Dominik, for always believing in me and providing support wherever it was
necessary as well as my friends and family for their impecable patience with me during
this project.
XXIII

0

Chapter 1
Introduction
1.1 Historical uses of antimony (Sb)
Humankind has known the element metal Sb for at least 6 centuries. Both stibium and
antimonium have mutually been used as the name for the element for centuries, where
antimonium comes from the Greek words anti (against) and monos (alone) (Wang, 1919;
T. Li et al., 1992). Throughout the oldest parts of history the main uses of antimony has
been medical and cosmetic. Even though nowadays, the scientific world acknowledges
the health hazards like skin irritation when in contact with the skin and even to be lethal,
similar to arsenic, when swallowed (Australian DrinkingWater Guidelines), this seemed
to not have bothered the ancient Egyptians. They used the mineral Stibnite (Sb2S3) as
the main ingredient for kohl and smeared it on their eyes to create the characteristically
known eye-make up. And the Greek recommended stibnite as a cure for skin ailments.
The Egyptians used Sb also as plating on copper articles by the middle of the third
millennium B.C. (Butterman and Carlin, 2004). From the Middle Ages on, medical
uses to aid ulcers continue to exist. More procedures are being explored and antimony
is started to be used to create the reflecting surface in mirrors and is added to bell metal
to generate more tones (T. Li et al., 1992).
Even though the Chaldeans tought themselves the art of winning the Sb from its ores,
1

Chapter 1 Introduction
Figure 1.1: U.S. end uses of antimony. Other industrial meanings, such as ammunitions, cable coverings,
fireworks, metal castings, paper, pigments, rubber products and sheet, pipe and type metal (USGS, 2015b).
Basil Valentile, an alchemist between 1350 and 1600 A.D., published his treatise “The
Triumphal Chariot of Antimony”. Whereas he wrote for the first time the extraction of
metallic antimony from its ore, he is known to be the one ‘discovered’ the element (K.
Li, 1953).
Throughout the 19th century, the number of uses for antimony remained small. A
brittle lead alloy was founded and been used for the spherical bullets contained used in
bothWWI andWWII (Butterman and Carlin, 2004). Furthermore, antimony-lead alloys
were largely incorporated in batteries. Nowadays antimony is used for flame-retardant
materials for metals and textiles, chemicals, glass, batteries and plastics (Figure 1.1).
In these applications, a large number of synthetic antimony compounds are being
used in the industry. These are based on the trioxide (Sb2O3), for example pentox-
ide (Sb2O5), sodium antimonate (NaSbO3), trisfulfide (Sb2S3), pentasulfide (Sb2S5)
and the triacetate (Sb(CH3COO))3). These synthetics are applied as flame retardants,
2

1.2 Physicochemical properties and geochemical behavior of Sb
(a) Antimony world production. (b) Antimony world reserves
Figure 1.2: Antimony world production of a total 160,000 ton and reserves of 2014 (USGS, 2015a).
pigments, heat and radiation stabilizers for plastic and catalyst precursors (Butterman
and Carlin, 2004; USGS, 2015b). Due to its hardness, brittleness and lack of malleabil-
ity, antimony in native state has no commercial uses as material. Instead it is a minor
component in many lead- and tin-based alloys (Butterman and Carlin, 2004).
1.2 Physicochemical properties and geochemical
behavior of Sb
Antimony, with atomic number 51 and atomic weight 121.75, is located in period 5,
group 11 of the periodic table and is a lustrous tin-white metalloid of the arsenic group.
It naturally occurs in four oxidation states: +5, +3, 0, -3 and has two stable isotopes:
121Sb (57.25 wt%) and 123Sb (42.75 wt%). Additionally, around 35 radioactive isotopes
of Sb are known.
Antimony is a poor conductor of heat and electricity. Moreover it is hard and brittle
and easily crushed into powder. The melting temperature of Sb is 630.6 ◦C, and has
a hardness of 3 to 3.5 on the Mohs scale and ±55 on the Brinell scale. Moreover, Sb
crystallizes in the rhombohedral class of the hexagonal system. Oxidation of stibnite
forms senarmontite (Sb2O3) as the most common phase.
3

Chapter 1 Introduction
Due to its position in the periodic table between the metals and nonmetals, Sb to-
gether with silicon, germanium, arsenic and tellerium has been classified as a semimetal
or metalloid. Antimony is a chalcophile element, similar to As, Hg and Pb, and the geo-
chemical behavior is intermediate between that of Hg and Pb (Pohl, 2011).
The average concentration of antimony in the Earth’s crust is 0.15-1 ppm, which is
less than tin, arsenic and REE though more than bismuth, mercury, or silver. It’s abun-
dance in lower in igneous rocks (around 0.2 ppm) when compared to pelitic sediments
(ca. 2 ppm) (Pohl, 2011). Like mercury and arsenic, antimony is commonly concen-
trated in near-surface epizonal hydrothermal systems typically associated with volcanic-
hydrothermal systems in convergent margin settings. The solubility of Sb in aqueous
solution is governed by its complexation in hydrothermal fluids and ligands may be de-
rived from water-rock reactions, degassing magma, or from pelites enriched in organic
matter. Mobilization of antimony is mostly observed in contact metamorphism or of
orogenic metamorphism (Pohl, 2011). On the other hand it seems to be immobilized
by enriching iron oxy hydroxides. It has been thought that Sb solubility is mainly con-
trolled by temperature, when looking at concentrations within fluids: ±10,000 ppm at
300 ◦C and ±1 ppm at 100 ◦C (Pohl, 2011).
1.3 Types of antimony deposits
Major producers of antimony are, in order of importance: China, Bolivia, Russia, South
Africa and Tajikistan (Figure 1.2a) (Carlin, 2011; USGS, 2015b). The most com-
mon and economically most important antimony ore mineral are stibnite (Sb2S3) and
jamesonite (Pb4FeSb6S14), which may host traces of Au, Ag, Fe and Cu (Pohl, 2011).
Other common Sb sulfides include berthierite (FeSb2S4) and gudmundite (FeSbS) as
4

1.3 Types of antimony deposits
Figure 1.3: An overview of orogenic gold deposits at different depths, showing Au-Sb mineralization in the
epizonal-mesozonal zone in greenschist facies (Goldfarb and Groves, 2015).
well as ullmannite (NiSbS). Important oxides of Sb are senarmontite (Sb2O3) and
valentinite (Sb2O3), associated with arsenic, bismuth or silver in sulfide ores Pohl
(2011).
Antimony is commonly distributed throughout many different types of mineral de-
posits and displays no evident affinity to any particular metallogenic period or province
(Boyle and Jonasson, 1984). Antimony is one of the main ore-forming elements not only
at antimony deposits, where it is present in ores as stibnite, berthierite, gudmundite, but
also prominently present at more complex deposits, such as Au-Sb, Ag-Sb, Pb-Zn-Sb,
Hg-Sb, Hg-Sb-W mineralizations. At these more complex settings, antimony will min-
eralize as both sulfides and sulfosalts containing Cu, Pb, Ag, Bi, Hg (Obolensky et al.,
2007). Additionally, many of the stibnite deposits are related to deep-seated fracture
5

Chapter 1 Introduction
systems often graben or uplifted orogenies (Boyle and Jonasson, 1984).
Several attempts have been made of grouping this extensive mineralization behav-
ior of antimony into low temperature hydrothermal and metamorphogene-hydrothermal
settings from solutions of different compositions and origins (Boyle and Jonasson, 1984;
Obolensky et al., 2007; USGS, 2015a).
1. (Low temperature) hydrothermal Sb deposits within plate rifting settings. (e.g.
volcanic massive sulfide ore (VMS); sedimentary exhalative deposits (SEDEX)
and Carlin type gold deposits). These deposits form below 200 ◦C and 100-600
bars. The temperature gradient does not exceed 7-12 ◦C/100 m. The metal-
enriched fluids range from diluted chlorite-carbonate composition and chloride-
bicarbonate to highly concentrated chloride mixed with dissolved CO2 and minor
N2 and H2S gases (Obolensky et al., 2007). The hydrothermal-exhalative sedi-
mentary deposits (SEDEX) are predominantly present within China and dominate
the antimony mining industry and thus commercially consumed antimony (Fig-
ure 1.2a). The SEDEX sulfide formation forms in stratiform sequences, when
hydrothermal fluids seep into a brine-type water reservoir like the ocean (Herzig,
2000). The Carlin-type gold deposits are epizonal hydrothermal (oxidized) re-
placements ore within sediments, predominantly limestone and dolomite (Boyle
and Jonasson, 1984; Volkov et al., 2006)
2. Sb and Sb-Hg deposits in subaerial volcanic belts on active continental margins.
These deposits form in subsurface conditions with a high vertical temperature
gradient of 30-35 ◦C/100m. The temperatures decreases from early stage of min-
eralization to the final stage of mineralization. The mineral-forming fluids have
low concentrations of salt and are originated from mixed fluid within recycling
6
1.3 Types of antimony deposits
hydrothermal settings. The dominant gas phases are CO2 and N2, with minor
CH4 and H2S (Obolensky et al., 2007).
3. Gold antimony metamorphogene-hydrothermal deposits. These deposits form
within orogenies with temperatures between 380-120 ◦C and varying pressures.
The fluid composition is enriched in CO2 (up to 60 wt.%) and varying amounts
of sulfurous-chloride (Obolensky et al., 2007). The ore are located within gold-
quartz veins, stockworks and carbonated silificied zones. The host rocks vary be-
tween greenstones, but also greywacke-slate sequences and granitic rocks (Boyle
and Jonasson, 1984).
However, the last two deposits described can be considered two of the most important
distinct settings for antimony enrichment: the (Archaean) gold deposits enriched both in
antimony and arsenic and the gold deposits in greywacke-slate-graphitic schist assem-
blages (Boyle and Jonasson, 1984). The antimony ore deposits associated with orogenic
gold systems (Figure 1.3) is more numerous in young orogenic belts, related to andesite
and rhyolite volcanism, due to erosion resulting in loss of near-surface formations (Pohl,
2011). However, several orogenic gold deposits have been preserved within Archaean
greenstone belt (Boyle and Jonasson, 1984; Powell et al., 1991), such as the Murchison
Greenstone Belt (South Africa) which has been interpreted as an epizonal example of an
orogenic gold system (Pohl, 2011; Jaguin et al., 2014). Here, komatiites have been al-
tered into massive talc-carbonate rocks in greenschist facies by hydrothermal alteration
along a shear zone that extends over 55 km (Davis et al., 1986).
7

Chapter 1 Introduction
1.4 Types of antimony deposits
Archaean greenstone belts
The first time the term ‘greenstone belt’ was mentioned when the Canadian Geolog-
ical Survey attempted in the 1900’s to describe the geology of Northwestern, Canada,
nowadays known as the Superior Craton (Figure 1.4). Following this event, the term
‘greenstone’ has never had an explicit description throughout time due to the complexity
of the deformed and metamorphosed Archaean cratons and surroundings (Anhaeusser,
2014). Within this dissertation the term ‘greenstone belt’ will be used by the definition
summarized by Anhaeusser (2014):
Deformed andmetamorphosed volcano-sedimentary successions, generally enveloped
by Archaean (>3600 to ±2500 Ma) granitic and gneissic rocks.
A distinction is made between these and Archaean volcano-sedimentary basins, which
are developed on top of continental basement instead of intracratonic Archaeanic basins.
Furthermore, the term has been used alternately with schist belts and gold belts, due to
substantial amounts of gold deposits located within shear zones have been found (Pow-
ell et al., 1991; Anhaeusser, 2014).
Overall, the oldest rocks on Earth have been dated between >4.0-3.2 Ga (Hadean-
Palaeoarchaean) and have been found in small crustal regions, called granite-greenstone
terranes, within relics of Archaean (3200-2500 Ma) cratonic basement which have been
tectonically stable since the Archean, spread out over the world (Figure 1.4) (Kusky and
Polat, 1999; Anhaeusser, 2014). Archaean cratons encompass mainly three different do-
mains, which can be characterized as a regional-metamorphosed stratigraphic sequence
(Anhaeusser, 2014). These involve (1) low-grade volcano-sedimentary greenstone belts
surrounded by (2) high-grade tonalitic gneisses or plutons and amphibolites and gener-
8

1.4 Types of antimony deposits
Figure 1.4: Overview Archaean cratons and greenstone belts. The areas shown in pink are poorly known,
but are considered to be underlain mostly by Archaean-Proterozoic terranes. Key to major provinces: 1 =
Yilgarn, 2 = Pilbara, 3 = Indian, 4 = North China, 5 = Aldan-Stanovik, 6 = Yenisei, 7 = Anabar, 8 = Kaapvaal,
9 = Zimbabwe, 10 = Central African (Tanzanian and northeastern Zaire), 11 = Kasai, 12 = West African
(Liberia, Sierra Leone, Mauritania), 13 = Ukranian, 14 = Baltic-Svecofennian (Inari-Kola, Karelian), 15 =
North Atlantic (Greenland, Scotland), 16 = Superior, 17 = Wyoming, 18 = Slave, 19 = São Francisco, 20 =
Amazonian (Guiana, Guaporé), 21 = East Antarctica (Anhaeusser, 2014).
9

Chapter 1 Introduction
ally intruded by (3) later granitoids covered by sediments (Figure 1.5) (Gorman et al.,
1978; K Condie, 1976; Anhaeusser, 2014).
The volcanic segments can be subdivided into an ultramafic group (Mg-rich, such
as komatiite, komatiitic-basalt and tholeiite) and a greenstone group (containing a range
from minor ultramafic rocks, tholeiite, to andesite and calc alkaline and felsic volcanics)
(Anhaeusser, 2014).
These Archaean granite-greenstone terranes have further been metamorphosed in the
course of a complex series of structural and magmatic events. First of all, buoyant slabs
of Archaean oceanic lithosphere may have been underplating the simultaneously thin-
ning crustal roots, causing LP-HT metamorphism. Dehydrated subducted slabs gener-
ated magmas of the sanukitoid suite, whereas the hydrated magmas, produced the TTG
suite (Powell et al., 1991; Kusky and Polat, 1999). Secondly, eventual collision with
continental blocks formed anatectic granites and thickened the crust to a point where
gravitational collapse and triggered decompressional release of granitoids. Moreover
fragments of mantle wedge were often trapped between the continental and oceanic
crust. Thirdly, shear and suture zones provided pathways for fluids and granitoids to
migrate into the mid- and upper crust, supposedly accountable for gold mineralization
(Powell et al., 1991; Kusky and Polat, 1999).
Orogenic lode gold deposits, of Middle Archean to Tertiary age, are perhaps the
largest gold deposit type existing in metamorphic belts, with several giants (>250 t Au)
deposit examples (Figure 1.3) (Groves et al., 2003). These deposits are miscellaneous
in means of age, geometry and structural control, though entailing different host rocks
reaching upper greenschist facies (250-500 ◦C; 0.5-5 kbars), with carbonate-muscovite-
biotite alterated wall rock associations with varying enrichments of Ag, As, B, Bi, Cu,
Pb, Sb, Te, W and Zn (Groves et al., 2003).
10

1.4 Types of antimony deposits
Figure 1.5: Idealized sketch of a typical Archaean greenstone belt (K.C. Condie, 1981).
11

Chapter 1 Introduction
1.5 Archaean VMS-mineralization
Besides the orogenic lode gold deposits, VMS deposits are likewise widely acknowl-
edged to be part of the oldest deposits on Earth (Anhaeusser, 2014; Hannington, 2014).
Generally, two types of VMS deposits can be distinguished: the Ni-rich and Cu-Zn-rich
deposits. The VMS (Ni-rich) deposits are best developed and preserved in the Canadian
Shield and the Yilgarn Craton, W. Australia. The VMS (Cu-Zn-rich) deposits are well
represented in the Abitibi Greenstone belt and to a lesser extent in the Superior Province.
Smaller deposits of this type also occur in the Barberton and Murchison Greenstone
belts in South Africa (Anhaeusser, 2014). The presence of the VMS deposits can de-
fended by the geological setting of the Archaean greenstone belts which are considered
to be spatially associated with convergent margins, (juvenile) island arcs, steep subduc-
tion zones, and rifted continental margins associated with early extension by back-arc
development (Figure 1.6) (Kusky and Polat, 1999; Vearncombe and Kerrich, 1999; C.
Scott et al., 2002).
The high-grade gneisses of the Archaean greenstone belts are believed to be originally
thick crustal segments and the greenstone belts like shield volcanoes, which have been
thrusted onto the crustal segments, together with seafloor sediments. This specific ge-
ological setting could be interpreted as an analogue with recent (back)-arc systems and
thus an explanation for the Archaean VMS deposits (Gorman et al., 1978; C. Scott et al.,
2002; Anhaeusser, 2014), due to the close proximity of back-arc basins with convergent
plate boundaries (Martinez et al., 2007).
Volcanism plays a dominant role for VMS deposits and felsic volcanics are thought
to be the principal hosts for about half of all VMS deposits (Boyle and Jonasson, 1984;
Hannington, 2014), though a close link to bimodal basalt-rhyolite volcanism has been
12

1.6 Modern arc and back arc basins
Figure 1.6: Varying localities of epithermal, porphyry, VMS and orogenic gold deposits. Note the VMS
deposit at back-arc settings (Goldfarb and Groves, 2015).
widely recognized (Anhaeusser, 2014). For the Cu-Zn-rich deposits, mafic volcanic
rocks are the dominant volcanic host rocks, although felsic rocks are generally promi-
nently present near most of the felsic volcanics and the corresponding deposits (An-
haeusser, 2014). Analogously, it is believed that the (Archaean) gold orogeny deposits
are related to the recent-style volcanogenic massive sulfide (VMS) deposits (Figure 1.6)
(Hannington, 2014; Goldfarb and Groves, 2015).
1.6 Modern arc and back arc basins
Back-arc basins are localities of extension and crustal accretion formed behind sub-
duction zones (Martinez et al., 2007). Back-arc spreading zones can be interpreted as
evolved island arc spreading systems, where arc volcanism can extend into back-arc
volcanism, but typically has an abrupt trenchward limit and maximum subparallel to the
trench. This process forms a chain of arc volcanoes, known as the arc volcanic front
(AVF) (Martinez et al., 2007). The difference between back-arc basins and mid-ocean
ridges is mainly based on the close proximity of back-arc basins to convergent plate
13

Chapter 1 Introduction
boundaries (Martinez et al., 2007).
Back-arc basin basalts (BABB) are typically enriched in fluids, though less than
the more hydrous arc volcanism nevertheless higher than open ocean ridge volcanism
(Langmuir et al., 2006). The relative enrichment of fluids is caused by subducted litho-
sphere that releases water into the overlying mantle wedge through metamorphic break-
down of hydrated minerals at a range of depths down to 150-200 km (Martinez et al.,
2007). Overall the BABB is known for its low FeO, MgO and TiO2 and high Al2O3 +
SiO2 (Langmuir et al., 2006) contents
The island arc system can gradually evolve into mature back-arc spreading, due to
changes in melt generations and modes of crustal accretion which affects the interaction
of several subduction-related processes and conditions, like (Martinez et al., 2007):
1. Changes in mantle dynamics from flux-melting and buoyancy-driven upwelling
at the arc volcanic front to decompression melting driven by plate separation at
back-arc spreading centers;
2. Re-circulation of refractory material through arc and back-arc melting regimes by
mantle wedge corner flow;
3. Changes in the locus of magmatic centers relative to the arc volcanic front;
4. Variable locus of initial rifting and breakup;
5. Spatially varying rheology attributable to mantle wedge hydration gradients with
distance from the slab;
6. Slab subduction rate, dip and length.
14

1.7 Hydrothermal activity at back-arc basins
Figure 1.7: Global distribution of hydrothermal systems (Hannington, Jamieson, et al., 2011).
1.7 Hydrothermal activity at back-arc basins
Hydrothermal activity at (back-)arc settings has long been known and studied (Han-
nington, De Ronde, et al., 2005; Martinez et al., 2007) (Figure 1.7). Modern fluid
venting from seafloor hydrothermal fields, is predominantly seawater heated by under-
lying magmatic bodies and their corresponding magmatic fluids (Yang and S. D. Scott,
2006). Magmatic fluids are supercritical, mainly composed of CO2 at the early stage
magma degassing and of H2O at a later stage. These fluids have unique chemical char-
acteristics, due to various levels of mixing between the two fluids sources, and large
variation of crustal chemistry (Yang and S. D. Scott, 2006; Martinez et al., 2007).
Generally, back-arc hydrothermal fluids have a pH of 2 to 3 (seawater is pH 7.8)
and contain high CO2 and CH4 values. The low pH results from the removal of Mg
from the heated seawater, due to the formation of Mg-OH-Si minerals and the release
15

Bibliography
of protons. Volatile gases (SO2 and HCl) can further decrease the pH of the venting
fluids. Due to the unique characteristics of the hydrothermal fluids, various ore metals
can be transported as chloride and sulfide complexes and are thus responsible for the
distribution of various VMS deposit styles (Gamo et al., 1997; Hannington, De Ronde,
et al., 2005; Yang and S. D. Scott, 2006; Martinez et al., 2007).
Although, a primary distinction can be made between mafic and felsic oceanic hy-
drothermal settings, due to the influence of fluids of subducted slabs in arc and back-arcs
settings when comparing to MOR-like settings (Hannington, De Ronde, et al., 2005;
Martinez et al., 2007). The influence of this extensive water-rock interaction can pro-
mote enrichments in metals (Cu, Au, Zn, Fe, Ag) and metalloids (Sb, As) (Hannington,
De Ronde, et al., 2005; Patten et al., 2016). Several back-arc related hydrothermal
vent areas at the East Manus basin, such as PACManus, North Pual, Desmos and SuSu
Knolls have been discovered and studied. The hydrothermal fluids of the east Manus
basin, expresses a large variability that corresponds with the complexity of a back-arc
setting (Binns and S. Scott, 1993; J.-M. Auzende et al., 1996; Hashimoto et al., 1999;
J. M. Auzende et al., 2000; Tivey et al., 2006; Bach et al., 2011; Reeves et al., 2011).
Bibliography
Anhaeusser, C.R. (2014). “Archaean greenstone belts and associated granitic rocks – A review”. In: J.
African Earth Sci. 100, pp. 684–732. DOI: 10.1016/j.jafrearsci.2014.07.019.
Auzende, Jean Marie et al. (2000). “Thinned crust in southwest pacific may harbor gas hydrate”. In: Eos
(Washington. DC). 81.17, pp. 182–185. DOI: 10.1029/00EO00127.
Auzende, Jean-Marie, Tetsuro Urabe, and Scientific Party (1996). “Cruise explores hydrothermal vents
of the Manus Basin”. In: Eos (Transactions, Am. Geophys. Union) 77.26, p. 244.
16

Bibliography
Bach, W. et al. (2011). “Carbonate veins trace seawater circulation during exhumation and uplift of mantle
rock: Results from ODP Leg 209”. In: Earth Planet. Sci. Lett. 311.3-4, pp. 242–252. DOI: 10.1016/
j.epsl.2011.09.021.
Binns, R.A. and S.D. Scott (1993). “Actively forming polymetallic sulfide deposits associated with felsic
volcanic rocks in the EasternManus back-arc basin, Papua NewGuinea”. In: Econ. Geol. 88, pp. 2226–
2236.
Boyle, R.W. and I.R. Jonasson (1984). “The geochemistry of antimony and its use as an indicator element
in geochemical prospecting”. In: J. Geochemical Explor. 20, pp. 223–302.
Butterman, W.C. and J.F. Carlin (2004). Mineral Commodity Profiles - Antimony. Tech. rep. U.S. Depart-
ment of the interior and U.S. Geological Survey.
Carlin, J.F. (2011). Mineral Commodity Summaries - Antimony. Tech. rep. U.S. Geological Survey,
pp. 18–19.
Condie, K (1976). “Trace-element geochemistry of archean greenstone belts”. In: Earth-Science Rev.
12.4, pp. 393–417. DOI: 10.1016/0012-8252(76)90012-X.
Condie, K.C. (1981). Archean greenstone belts. Vol. 17. 3. Elsevier, p. 201. DOI: http://dx.doi.org/
10.1016/0301-9268(82)90029-8.
Davis, D.R., D.B. Paterson, and D.H.C. Griffith (1986). “Antimony in South Africa”. In: J. S. Afr. Inst.
Min. Met. 86.6, pp. 173–193.
Gamo, T. et al. (1997). “Acidic and sulfate-rich hydrothermal fluids from the Manus back-arc basin,
Papua New Guinea”. In: Geology 25.2, pp. 139–142. DOI: 10.1130/0091-7613(1997)025<0139:
aasrhf>2.3.co;2.
Goldfarb, R.J. and D.I. Groves (2015). “Orogenic gold: Common or evolving fluid and metal sources
through time”. In: Lithos. DOI: 10.1016/j.lithos.2015.07.011.
Gorman, B.E., T.H. Pearce, and T.C. Birkett (1978). “On the structure of Archean Greenstone Belts”. In:
Precambrian Res. 6, pp. 23–41.
Groves, D.I. et al. (2003). “Gold Deposits in Metamorphic Belts: Overview of Current Understand-
ing,Outstanding Problems, Future Research, and Exploration Significance”. In: Econ. Geol. 98.1,
pp. 1–29. DOI: 10.2113/gsecongeo.98.1.1.
Hannington, M.D. (2014). “VolcanogenicMassive Sulfide Deposits”. In: Treatise on Geochemistry. 2nd ed.
Elsevier Ltd. Chap. 13.18, pp. 463–488. DOI: 10.1016/0169-1368(95)00022-4.
17

Bibliography
Hannington, M.D., C.E.J. De Ronde, and S. Petersen (2005). “Sea-Floor Tectonics and Submarine Hy-
drothermal Systems”. In: Econ. Geol. 100th Anni, pp. 111–141.
Hannington, M.D., J. Jamieson, et al. (2011). “The abundance of seafloor massive sulfide deposits”. In:
Geology 39.12, pp. 1155–1158. DOI: 10.1130/G32468.1.
Hashimoto, J. et al. (1999). “Hydrothermal vent communities in the Manus Basin, Papua New Guinea:
Results of the BIOACCESS cruises in ’96 and ’98.” In: InterRidge News 8, pp. 12–18.
Herzig, P.M. (2000). “Economic potential of sea-floor massive sulphide deposits : ancient and modern”.
In: R. Soc. 357, pp. 861–875.
Jaguin, J. et al. (2014). “Stable isotopes (O, C) and fluid inclusion study of quartz-carbonate veins from
the antimony line, Murchison Greenstone Belt”. In: Am. J. Sci. 314.7, pp. 1140–1170. DOI: 10.2475/
07.2014.03.
Kusky, T.M. and A. Polat (1999). “Growth of granite–greenstone terranes at convergent margins, and
stabilization of Archean cratons”. In: Tectonophysics 305.1-3, pp. 43–73. DOI: 10.1016/S0040-
1951(99)00014-1.
Langmuir, C.H. et al. (2006). “Chemical systematics and hydrous melting of the mantle in back-arc
basins”. In: Back-arc spreading Syst. Geol. Biol. Chem. Phys. Interact. Vol. 53. 9. Geophysical Mono-
graph Series, AGU, pp. 87–146. DOI: 10.1017/CBO9781107415324.004. arXiv: arXiv:1011.
1669v3.
Li, K.C. (1953). “Arsenic and antimony”. In: Mod. uses nonferrous Met. Ed. by C.H. Mathewson. 2nd.
York, Pennsylvania: The Maple Press, pp. 40–53.
Li, T., G.F. Archer, and S.C. Jr. Carapella (1992). “Antimony and antimony alloys”. In: Kirk-Othmer
Encycl. Chem. Technol. 4th. New York: John Wiley & Sons, pp. 367–381.
Martinez, F. et al. (2007). “Back-Arc Basins”. In: Oceanography 20.1, pp. 116–127. DOI: 10.5670/
oceanog.2007.85.
Obolensky, A.A. et al. (2007). “Antimony in hydrothermal processes: solubility, conditions of transfer,
and metal-bearing capacity of solutions”. In: Russ. Geol. Geophys. 48, pp. 992–1001. DOI: 10.1016/
j.rgg.200.
Patten, C.G.C. et al. (2016). “Mobility of Au and related elements during the hydrothermal alteration of
the oceanic crust: implications for the sources of metals in VMS deposits”. In: Miner. Depos. 51.2,
pp. 179–200. DOI: 10.1007/s00126-015-0598-8.
18

Bibliography
Pohl, W.L. (2011). Economic Geology Principles and Practice - Metals, minerals, coal and hydrocar-
bons - Introduction to formation and sustainable exploitation of mineral deposits. Vol. 1. July. Wiley-
Blackwell, pp. 1–699. DOI: 10.5962/bhl.title.18736.
Powell, R., T.M.Will, and G.N. Phillips (1991). “Metamorphism in Archaean greenstone belts: calculated
fluid compositions and implications for gold mineralization”. In: J. Metamorph. Geol. 9.2, pp. 141–
150. DOI: 10.1111/j.1525-1314.1991.tb00510.x.
Reeves, E.P. et al. (2011). “Geochemistry of hydrothermal fluids from the PACMANUS, Northeast Pual
and Vienna Woods hydrothermal fields, Manus Basin, Papua New Guinea”. In: Geochim. Cosmochim.
Acta 75.4, pp. 1088–1123. DOI: 10.1016/j.gca.2010.11.008.
Scott, C.R., W.U. Mueller, and P. Pilote (2002). “Physical volcanology, stratigraphy, and lithogeochem-
istry of an Archean volcanic arc: evolution from plume-related volcanism to arc rifting of SE Abitibi
Greenstone Belt, Val d’Or, Canada”. In: Precambrian Res. 115.1-4, pp. 223–260. DOI: 10.1016/
S0301-9268(02)00011-6.
Tivey, M. et al. (2006). Cruise report R/V Melville MAGELLAN-06. Tech. rep. Woods Hole Oceano-
graphic Institution, pp. 1–67.
USGS (2015a). Antimony. Tech. rep. U.S. Geological Survey, pp. 18–19. DOI: 10.1017/CBO9781107415324.
004. arXiv: arXiv:1011.1669v3.
– (2015b). “Antimony — A Flame Fighter”. In: April, pp. 4–5.
Vearncombe, S. and R. Kerrich (1999). “Geochemistry and geodynamic setting of volcanic and plutonic
rocks associated with Early Archaean volcanogenic massive sulphide mineralization, Pilbara Craton”.
In: Precambrian Res. 98.3-4, pp. 243–270. DOI: 10.1016/S0301-9268(99)00052-2.
Volkov, A.V. et al. (2006). “Volkov, A.V., Serafimosvki, T., Kochneva, N.T., Tomson, I.N., Tasev, G.,
2006, The Alshar epithermal Au-As-Sb-Tl deposit, southern Macedonia. Geology of ore deposits, 48,
p.175-192.” In: Geol. Ore Depos. 48, pp. 175–192.
Wang, C.Y. (1919). Antimony: its History, Chemistry, Mineralogy, Geology, Metallurgy, Uses, Prepara-
tions, Analysis, Production, and Valuation; with complete Bibliographies for Students, Manufacturers,
and Users of Antimony, pp. 1–225. DOI: 10.1038/081068a0.
Yang, K and S D Scott (2006). “Magmatic fluids as a source of metals in arc/back-arc hydrothermal
systems: evidence from melt inclusions and vesicles”. In: Back Arc Spreading Syst. Geol. Biol. Chem.
Phys. Interact. Geophysica.1, pp. 163–184.
19

20

Chapter 2
Motivation and outline
2.1 Motivation
This project was initiated by U. Schwarz-Schampera, BGR Hannover in order to give a
better understanding of the exceptionally well developed Sb-As-Au-Hg mineralization
within the Antimony Line (AL) in the Murchison Greenstone Belt (MGB), South Africa
and the possible relationship to recent VMS deposits. The AL is located in a prominent
suture zone within the MGB and is tied to metasomatically influenced metaultramafic
rocks. Metasomatism of ultramafic rocks is a core subject of the Petrology of the Ocean
Crust Group at the Universtität of Bremen. The principal goal of my PhD project was to
(1) identify the role of metasomatism in the AL deposit formation, and (2) compare the
AL deposit with modern back-arc massive sulfide mineralization systems. Goal (1) re-
lates to the comprehension that a knowledge gap still exists in the field of ore petrology
and geochemistry in regard to lode orogenic S-Au deposits within (Archaean) suture
zones and their possible relationship to recent back-arc settings. Goal (2) concerns the
Sb-As behavior in magmatic-hydrothermal hypogene and supergene deposits, which
is related to Au-Ag mineralizations in way that are incompletely understood. To try
to overcome these critical knowledge gaps, a comparison of Sb-As(-Au-Ag) mineral-
ization of a greenstone belt is made with a recent back-arc system: PACManus, New
21

Chapter 2 Motivation and outline
Guinea.
The MGB host an enrichment of Sb-As mineralization within the Antimony Line
suture zone, which runs paralelle to a zone of of major Cu-Zn mineralization (the Cu
line), which shows strong resemblance to modern seafloor massive sulfide mineraliza-
tions (Schwarz-Schampera et al., 2010). This relationship is less well established for the
AL, although modern back-arc VMS deposits often show Sb-As enrichments, which are
spatially and genetically related to Cu-Zn mineralizations. Schwarz-Schampera et al.
(2010) hence speculated that the AL, like the Cu line, is related to seafloor magmatic-
hydrothermal processes. Studying the MGB provides thus an exceptional insight in the
geochemical behavior of Sb-As mineralization. Expeditions (in 2006 and 2011) to the
PACManus hydrothermal system in the Manus Backarc Basin, Papua New Guinea, per-
formed by W. Bach and others, has provided a detailed metal concentration dataset of
both fluid and whole rock records. This dataset provides the uncommon opportunity to
look at the geochemical behavior of Sb-As-(Au-Ag) in an active black smoker system.
The research for this dissertation was conducted within the Department of Geo-
sciences of the University of Bremen and was in part funded by the BGR Hanover
“Bundesanstalt für Geowissenschaften und Rohstoffen”. Additional funding was re-
ceived through the MARUM “Center for Marine Environmental Sciences” as part of the
research area GB4. This project was carried out from October 2012 until June 2016.
The samples used in this work were collected by myself during fieldwork in 2013
made possible by an introduction of Ulrich Schwarz-Schampera and Friedhelm Henjes-
Kunst (BGR). This fieldwork has been preformed in cooperation with Blanka Sperner
and George LÖwe (University of Freiberg), with the goal to combine their structural
analyses with my geochemical analyses. Additionally samples have been provided by
a previous fieldwork in 2006 by U. Schwarz-Schampera. Furthermore, fluid and whole
22

2.2 Outline
rock data sets interpreted of the PACManus back-arc basin were collected during re-
search cruise MGLN06MV in 2006 (Tivey et al., 2006) and the SO-216 Bambus in
2011 (Bach et al., 2011), both led by Wolfgang Bach. These data were in part pro-
vided by Sven Petersen (GEOMAR) (ref appendix) and Paul Craddock (WHOI/MIT)
(Craddock, 2009).
2.2 Outline
The following two chapters present two geochemical studies at the Murchison Green-
stone belt, where major, trace element and stable isotopic studies have been preformed
on carbonated gangue material enriched with Sb-As as well as Sb-As sulfides to in-
vestigate the mobilizing and trapping mechanisms of a hydrothermal system and their
interaction with the surrounding host rocks. Geochemical reaction path modeling with
the use of Geochemical Workbench provided insights into the geochemical character-
istics of these mechanisms. The fifth chapter presents fluid data and whole rock of the
PACManus back-arc system, to provide insight the source, mobilization and precipita-
tion of Sb-As-Au-Ag within an active hydrothermal setting. The thesis is completed by
a conclusion and outlook.
Chapter 3: Geochemical model of the Sb-As mineralization at the Murchison
Greenstone Belt, South Africa
Authors: Nikki Blaauwbroek, Ulrich Schwarz-Schampera, Wolfgang Bach
(Submitted at Journal of Geochemical Exploration)
In this study new mineral chemistry and stable isotopic data of carbonates, silicates
and sulfides will be presented along with results of geochemical modeling of Sb-As
23
Chapter 2 Motivation and outline
mineralization within the MGB suture zone. The aim of this research is to comprehend
the solubility of Sb and As in aqueous solutions from magmatic precursor rocks and
the effect of later structural evolution of the greenstone belt and related alteration pro-
cesses like serpentinization and listvenization. Collecting samples on the geochemical
fieldwork of two weeks in 2013 has been made possible by a three-day introduction
by U. Schwarz-Schampera. The rock sampling has been preformed individually, with
local assistance navigating throughout the mines from the geologists working at Con-
solidated Murchison Limited (ConsMurch). Interpretation of the geological setting to-
gether with the collected dataset of the apparent enriched regions within carbonated and
fuchsite-enriched regions has been discussed on multiple occasions with B. Sperner, U.
Schwarz-Schampera and W. Bach. Geochemical analyses of both 2006 and 2013 sam-
ple sets of major and trace elements together with stable isotopes have been preformed
independently. Reaction path modeling has been made possible by the new acquired
database by the input of Moritz Wagner and Michael Hentscher. Modeling with the use
of Geochemical Workbench has been preformed in continuous dialogue with W. Bach.
Chapter 4: On the phase relations of Sb-As mineralization within an Archean
suture zone, Murchison Greenstone Belt, South Africa
Authors: Nikki Blaauwbroek, Wolfgang Bach, Niels Jöns
(Minerals, to be submitted)
In this study new petrography and mineralogy of the Sb-As mineralization will be
presented along with results of geochemical modeling of Sb-As mineralization within
the MGB. Extensive descriptions of this mineralization is made possible by XRF, XRD,
EMPA and LA-ICPMS analyses. The focus of this research is to describe the major
and trace metal concentrations of the Sb-As sulfides and gangue material hosting these
24

2.2 Outline
minerals. The aim of this research is to comprehend the behavior and relationship of
Sb and As mineralization amongst each other and correlate the behavior with the struc-
turally active plus serpentinized and listvenized greenstone belt. Electron microprobe
work was conducted at Universität Bremen and Universität Bochum by Niels Jöns and
myself. For this research only the samples of the 2013 fieldwork has been taken into
account, as described in the previous chapter. Interpretation of the geological setting
together with the collected dataset of the apparent enriched regions within carbonated
and fuchsite-enriched regions has been discussed on multiple occasions with B. Sperner
and W. Bach. Geochemical analyses of major and trace metal concentrations have been
preformed independently. XRD analyses on five samples have been preformed by T.
Flathmann for his bachelor thesis, within the mainframe of this project. Modeling with
the use of Geochemical Workbench has been preformed in continuous dialogue with W.
Bach.
Chapter 5: Sb-As-Au-Ag mineralization in an active back-arc system,
PACManus, New Guinea
Authors: Nikki Blaauwbroek, Michael Hentscher, Wolfgang Bach, Sven Petersen
(Mineralium Deposita, to be submitted)
In this study we represent geochemical characteristics of Sb, As, Ag and Au within
an active hydrothermal setting. The aim of this research is to define geochemical inter-
actions, connections and dependencies amongst these precious metals and whether they
can be used as tracers to determine a magmatic input of hydrothermal systems. These
relationships could be vital information for oceanic and continental mining prospects.
Extensive descriptions of their behavior are made possible by fluid and whole rock
datasets. Analyzes of these datasets have been preformed by P. Craddock and S. Pe-
25

Bibliography
tersen. Interpretation has been preformed in close dialogue with S. Petersen. Reaction
path modeling is based on a new database made by M. Hentscher and has been pre-
formed in close dialogue with M. Hentscher and W. Bach.
Chapter 6: Synthesis and outlook
This dissertation closes with a conclusion and outlook to emphasize the importance
of geochemical analyses of non-prominent metal concentrations within the field of ore
petrology. The importance of research on alteration processes such as serpentinization
and listvenization with their influence on ore-forming mechanisms will be outlined.
Finally, concepts for further investigations for understanding and defining Sb-As min-
eralization will be presented.
2.3 Scientific contributions
In the framework of this dissertation, comprehensive research activity resulted in three
first-author manuscripts that are presented in chapter three, four and five. For chapter 3
and 4, I produced all data myself, assisted by the persons mentioned above. For chapter
5, I used existing data. In each of these chapters, I led the synthesis of data and model
calculations and wrote the first drafts of manuscripts. I then edited the drafts with W.
Bach, before other coauthors contributed.
Bibliography
Bach, W. et al. (2011). “Carbonate veins trace seawater circulation during exhumation and uplift of mantle
rock: Results from ODP Leg 209”. In: Earth Planet. Sci. Lett. 311.3-4, pp. 242–252. DOI: 10.1016/
j.epsl.2011.09.021.
26

Bibliography
Craddock, P.R. (2009). “Geochemical traces of processes affecting the formation of seafloor hydrothermal
fluids and deposits in the Manus Back-arc basin”. PhD thesis, pp. 1–370.
Schwarz-Schampera, U., H. Terblanche, and T. Oberthür (2010). “Volcanic-hosted massive sulfide de-
posits in the Murchison greenstone belt, South Africa”. In: Miner. Depos. 45, pp. 113–145. DOI:
10.1007/s00126-009-0266-y.
Tivey, M. et al. (2006). Cruise report R/V Melville MAGELLAN-06. Tech. rep. Woods Hole Oceano-
graphic Institution, pp. 1–67.
27

28

Chapter 3
A geochemical model of the Sb-As mineralization in the
Murchison Greenstone belt
NIKKI BLAAUWBROEK1, ULRICH SCHWARZ-SCHAMPERA2, WOLFGANGBACH1
1 Department of Geosciences and MARUM – Center for Marine Environmental Sciences,
University of Bremen, Klagenfurter Str., 28359 Bremen, Germany
2 Bundesanstalt für Geowissenschaften und Rohstoffe (BGR),
Geozentrum Hannover, Stilleweg 2, 30655 Hanover, Germany
Submitted at Journal of geochemical exploration
Keywords: Antimony, stibnite, listvenite, suture zone, greenstone belt
29

Chapter 3 MGB
Abstract
We present a petrological and geochemical re-assessment of the Sb-As dominated min-
eralizations of four mines from the Antimony Line (AL) in the Murchison Greenstone
Belt (MBG), South Africa. The AL is a well-defined linear zone of carbonated-quartz
alteration with striking Sb-As-Au mineralization. The mineralization comprises two
principal types (i) arsenopyrite-chalcopyrite-gudmundite-ullmannite- berthierite-pyrite,
and (ii) stibnite±pyrite±berthierite. Type I is bound to metasomatized chlorite and
talc schists as well as listvenites, whereas type II occurs predominantly in completely
quartz-carbonate altered varieties of these rocks. High Cr contents of chlorite, fuch-
site, and dravite as well as the presence of Ni(Sb,As)S phases indicates that ultramafic
precursor rocks where involved in the genesis of the deposits. Stable O isotope data
of the carbonates (magnesite and dolomite) and quartz indicate, uncommonly high, for-
mation temperatures between 350 and 400 ◦C. The field and geochemical data reveal
a clear relationship between the mineralization and metasomatic reactions involving
meta-ultramafic rocks and felsic protoliths. We propose that these lithologies represent
a bimodal ultramafic-felsic magmatism, possibly in a subduction zone setting. Based
on these observations, we developed hypotheses for the genesis of the Sb-As-Au min-
eralizations and tested them rigorously by thermodynamic modeling. The Sb-As-Fe-
Cu-Au-S-O-H phase relations and solubilities were re-investigated in relationship to
PTX relations using a tailor-made and up-to-date thermodynamic database. The gen-
eral enrichment of Sb of the type I mineralization may have developed by water-rock
interactions and mass transfer of Sb (and As) across the main lithologic units from
the felsic into the ultramafic units. This mineralization took place during collision and
isoclinal folding (D1) in the MGB as part of the Limpopo suture zone. The type II
30
stibnite-dominated deposit appears to be linked to later transtensional movement (D2)
in this fault zone, during which tensional gashes allowed upwelling of deep crustal flu-
ids that gave rise to the pronounced quartz-carbonate-stibnite mineralization. Reaction
path modeling was also conducted to verify the petrological plausibility of the genetic
models. These computational results corroborate the key role of bimodal, felsic and
ultramafic, lithologies in turning the AL suture zone into a trap for Sb at fairly high
temperatures.
31

Chapter 3 MGB
3.1 Introduction
Sb-Au-As(-Hg)-mineralization within major orogenic suture zones such as Archaean
greenstone belts and younger analogues have been described from all over the world
(Table 3.1). The most prominent deposits that have been described are from the Ar-
chaean: the Ajjanahalli deposit at the Dharwar Craton (Bhattacharya et al., 2014), the
Kwekwe (Buchholz and Oberthür, 2007) andMurchison Greenstone Belts (Vearncombe
et al., 1992) in the Kaapvaal Craton, and the Abitibi Greenstone belt, Canada (Moritz,
Crocket, and Dickin, 1990; Moritz and Crocket, 1991). But Phanerozoic occurrences,
like the Snowbird deposit in the Canadian Cordillera (Madu et al., 1990), the Senator
Antimony deposit in Turkey (Bernasconi et al., 1980), and the Tsugu Gold-Antimony
vein deposit in Japan (Shikazono and Shimizu, 1988), also represent suture zones with
Sb-As enrichments. Although these deposits may vary in age, they have in common that
contrasting lithologies with ultramafic rocks were juxtaposed against quartz-feldspar-
bearing sedimentary and magmatic rocks that were subsequently modified by silicifica-
tion and carbonation processes. These consortia of rocks have witnessed deformation
under greenschist-facies conditions which were accompanied by drastic metasomatic
mass transfers in major shear zones fluxed with aqueous solutions low pressures at tem-
peratures of 250-400 ◦C. Some have clear metasomatic fronts at the juxtaposed rocks,
such as serpentinites at the Canadian Cordillera (Normand et al., 1996). In others in-
tense carbonization and silicification has obscured the nature of the protoliths in the
shear zones, but the common appearance of Cr-rich mica (fuchsite or mariposite) or
tourmaline in listvenites and related rocks suggests that ultramafic rock types were com-
monly present. Next to Sb-As mineralization the deposits in these suture zones either
have enrichments in Hg or Au(+Ag), and the relative enrichment of the various elements
32

3.1 Introduction
Figure 3.1: Geological map of Murchison Greenstone Belt. The Antimony Line and Cu-Zn line have been
marked and along the AL, together with the positions of the four mines (Athens, Beta, Gravelotte and
Monarch). Adjusted after Vearncombe et al. (1992) and Schwarz-Schampera et al. (2010).
may reflect temperature and depth within the basement.
In the past 80 years, several observations were made that are relevant to Sb and As
enrichments in these hypogene deposits associated with suture zones. Whitmore et
al. (1946) was one of the first to observe that fuchsite (chromium muscovite) within
Pre-Cambrian greenstone belts are typically found in Au-Sb-bearing districts. An-
haeusser (1976) stated that the mineralization is closely related to the presence of vari-
ous volcanological subdivisions within an Archaean greenstone belt. Madu et al. (1990)
thought that fluid fluxing within shear zones, caused precipitation of Sb-As minerals.
Active shear zones are permeable and can facilitate upflow of ore-forming solutions
(e.g. Buchholz and Oberthür (2007)). Others have pointed out similarities between
greenstone belt-hosted copper and antimony deposits to active (back-)arc hydrothermal
systems within a volcanic arc setting (Vearncombe, 1991; Schwarz-Schampera et al.,
33

Chapter3MGB
Table3.1:
Sum
mary
ofS
b-h
oste
dP
recam
brian
and
younger
sutu
rezones.
Deposit
and
regio
nM
inera
lassem
bla
ge
Hostro
ck
rela
ted
tom
inera
lassem
bla
ge
Possib
lefluid
regim
e
Ajja
nahalli
deposit.
Dharw
ar
Cra
tona
Au-A
s-S
bG
ranite.
meta
basalt.
gre
yw
acke
CO
2/C
H4
=7.1
3;C
=-5
.81
to1.1
4‰
Tim
min
sP
orc
upin
edis
tric
t.A
bitib
iG
reensto
ne
Beltb
Au-A
s-S
bC
arb
onatized
ultra
mafic
rocks
Unknow
n
Kw
ekw
edis
tric
t.M
idla
nds
Gre
ensto
ne
beltc
Au-S
b-A
sQ
uart
z-c
arb
onate
vein
betw
een
ultra
mafic
and
gra
nitoid
com
ple
xes
P=
0.8
to1.8
kbars
;T
=120
to230◦C
;P
=0.8
to1.8
kbars
Coolg
ard
ieG
old
field
.Y
ilgarn
Cra
tond
Ag-A
s-S
b-W
Mafic
rock.
gre
ensto
ne
conta
ct
O=
4to
8‰
;P
=2.3
-3.8
kbar;
T=
490
-525C
Nora
nda
dis
tric
t.C
anadae
Au-S
bLis
tvenite+
Carb
.arg
illite+
sla
te+
chert
T=
240◦C
Quebec
Antim
ony
deposit.
Appala
chia
nsf
Sb-A
sM
eta
sedim
ents
enclo
sed
inth
eserp
entinites
Shiftin
fluid
from
CO
2-r
ich
toC
H4
rich
Wilu
na
lode-g
old
deposits.
Austr
alia
gA
u-S
bK
om
atiite
juxta
posed
with
low
-Mg
basalt
and
do-
lerite
T=
290±
25◦C
;0.2
and
23
eq.
wt%
NaC
l
Canadia
nC
ord
illera
hA
u-S
bLis
tvenite
gra
de
into
carb
onaceous
arg
illite.
in-
truded
by
dio
rite
-andesite
T=
200-2
50◦C
;P
=2.7
kbar;
Tsugu
Gold
-Antim
ony
vein
deposit.
Japani
Au-H
g-S
b-A
sG
reen
tuff
juxta
posed
with
oute
rzone
SW
Japan
T=
208-3
50◦C
.lo
gaS
2=
-12
to-1
4
Senato
rA
ntim
ony
deposit.
Turk
eyj
Sb-A
sP
hylli
tes
intr
uded
by
ophio
litic
bodie
s(c
arb
ona-
ceous
tuffs)
Oxid
izin
gand
fluid
unm
ixin
g
*Com
parison
has
been
made
betw
een
diff
ere
ntsutu
rezones.
with
em
phasis
on
the
hostro
ck
and
fluid
regim
ere
late
dhypoth
esis
toS
b-m
inera
lassem
bla
ges.
a:
Sara
ngietal..
2013
b:
Moritz
and
Cro
cke
t.1991;
c:
Buchholz
and
Obert
hur.
2007
d:
Knig
htetal..
2000;
e:
Beaudoin
etal..
1987;
f:N
orm
and
etal..
1996
g:
Hagem
ann
and
Lüders
.2003;
h:
Madu
and
Nesbitt.
1996;
i:S
hik
azono
and
Shim
izu.
1988;
j:B
ern
asconietal..
1980.
34

3.1 Introduction
2010). These observations suggest a volcanic/metamorphic origin of the Sb-As miner-
alization in an active plate boundary setting. Furthermore, various trapping mechanisms
have been discussed. Fluid mixing (and adiabatic cooling) as well as decompressional
degassing, related cooling and changes in f S2 and/or f O2 have been identified as po-
tential ore trap mechanisms (Hagemann and Lüders, 2003). Likewise, changes in f S2
and/or f O2 in the course of serpentinization in contact with the ore-hosting metased-
iments have been identified as possible trap for Sb-sulfides (Normand et al., 1996).
Decreasing temperature (>300 ◦C) (Williams-Jones and Norman, 1997)and changes
in fluid pH and redox-potential (Obolensky, Gushchina, Borisenko, Borovikov, and
Nevol’ko, 2009) have also been suggested to play a major role in Sb-mineralization.
TheMurchison Greenstone Belt (MGB) in South Africa is one of the Archaean green-
stone belts along the Kaapvaal Craton. The MGB is known for the antimony enrichment
along the Antimony Line (AL) (Figure 3.1), and has been mined since 1928 for anti-
mony with gold as byproduct (Davis et al., 1986). The (primary) antimony mineraliza-
tion has been related to the emplacement of Maranda granodiorite intrusions that oc-
curred around 2.9 Ga (Poujol, 1996; Justine Jaguin et al., 2013) and that may be related
to orogeny in the Limpopo Belt, north of the MGB (Block et al., 2013). These felsic
intrusions have been interpreted by Schwarz-Schampera et al. (2010) to represent an
Archaean back-arc system with the associated VMS deposits. J. Jaguin, Boulvais, M.-
C. Boiron, et al. (2014) suggested the primary Sb-As mineralization is related to the
formation of albitites that they view as the metasomatized equivalent of the Maranda
granodiorite. The Sb-mineralization is mainly stibnite and hosted in listvenites and
related quartz-carbonated veins, which formed 2 Ga in a deformation zone with NNE-
SSW compression and isoclinal folding with steeply dipping stretching lineations and
boudinage (Poujol, 1996; Block et al., 2013; J. Jaguin, Boulvais, M.- C. Boiron, et al.,
35

Chapter 3 MGB
2014). In this study new mineral chemistry and stable isotopic data will be presented
along with results of geochemical modeling of Sb-As mineralization within the MGB
suture zone will be presented. We pay particular attention to the solubility of Sb and
As in aqueous solutions in the magmatic precursor rocks and during the later structural
evolution of the greenstone belt and related alteration processes like serpentinization
and listvenization.
3.1.1 Regional geology
The MGB is located in South Africa in the northwestern corner of the Kaapvaal Cra-
ton. The Kaapvaal Craton, 3.7-2.7 Ga (Schwarz-Schampera et al., 2010; Block et al.,
2013) consists of several subdomains that were merged together at 2.97 Ga (McCourt
and Reenen, 1992) and represents part of a collision zone of the Witwatersrand with the
Pietersburg terrains (Block et al., 2013). Several tonalites, trondhjemites, and granodi-
orites (TTGs) had intruded the komatiite on multiple occasions, approximately 2.9 Ga
ago (Poujol, 1996; Vearncombe et al., 1992), suggesting an (back-) arc-system (Poujol,
2001; Schwarz-Schampera et al., 2010). The MGB extends for 140 km ENE-WSW,
15-20 km N-S, is covered by the Neoarchaean to Palaeoproterozoic sediments and is
located parallel to the Murchison-Thabazimbi Lineament (Block et al., 2013).
The sedimentary formations are made up of metapelites (La France Formation) and
meta-arenites (MacKop Formation), whereas the volcanic formations vary between (ul-
tra) mafic-sedimentary successions (Leydsdorp and Mulati Formations) to intermediate
felsic lavas and tuffs (Rubbervale Formation), all ranging in age between 2.97 to 3.09
Ga (Vearncombe, 1991; Block et al., 2013; J. Jaguin, Boulvais, M.- C. Boiron, et al.,
2014). Serpentinite lenses have been found in the southern part of the belt (Davis et
36

3.1 Introduction
al., 1986; Vearncombe, 1991), though not along the AL. Each formation has undergone
unique contrasting metamorphic conditions, though in close proximity of each other
(Block et al., 2013). The Weigel Formation has reached greenschist- to lower amphi-
bolite facies grade, with P-T conditions from 1.30 to 2.8 kbar at 340-370 ◦C along the
AL, whereas the Lekkersmaak granite has reached up to 5.6 kbar and 570 ◦C. The Sil-
wana amphibolites, La France Formation and Rooiwater Complex have reached even
higher metamorphic P-T conditions in the proximity of 8.7 kbar and 600-670 ◦C (Block
et al., 2013). The AL is a locally discordant zone of brittle deformation within a zone of
heterogeneous ductile shear with a length of 12 km (Figure 3.1) (Vearncombe, 1988),
known for the enrichment in stibnite (Sb2S3) (Davis et al., 1986). The quartz-carbonate-
rich AL has been isoclinally folded into a narrow elongated sequence of carbonated de-
formed rocks, which are prominent features within the topography (Block et al., 2013)
and are locally cut by small-scale shear zones and breccias (Vearncombe et al., 1992).
Most geological domains exhibit evidence for a poly-phased deformation (Vearncombe,
1988; Block et al., 2013). In total three deformation episodes have been recognized:
The first deformation phase (D1) corresponds to the formation of isoclinal folding with
a S1 cleavage trending ENE (Vearncombe, 1988; Vearncombe et al., 1992; Block et
al., 2013). Along the AL, competent quartz-carbonate rocks are deformed by folding,
by boudinage and by brittle tension fracturing (Vearncombe et al., 1992). The tension
gashes are later filled by quartz, carbonate, stibnite and other ore minerals in smaller
quantities (Vearncombe et al., 1992). Deformation phase D2 transposed these isoclinal
folds by E-W trending asymmetrical S-shaped folds. The granitoid intrusions post-date
D1 (Vearncombe, 1988). D3 encompasses D2 and D1 and principally comprises kink
bands (Vearncombe et al., 1992); though found seldomly (Vearncombe, 1988). Overall
fold structures are intradomainal, with major tectonic faults present between each geo-
37

Chapter 3 MGB
logical domain (Vearncombe, 1988). Smaller-scale faults are found occasionally within
the mines (Vearncombe et al., 1992). The carbonated rocks have been thought to be
formed by hydrothermal alteration from an ultramafic rock type, based on their high
Mg, Cr and Ni concentrations (Vearncombe, 1988). North of the Antimony Line lies
the Cu-Zn line (Figure
3.2 Methods
Alternating quartz-carbonate veins and domains within Sb and As enriched zones have
been sampled in 2006 and 2011 from four mines located in the MGB: Athens, Monarch,
Gravelotte, Athens (Figure 3.1). Electron microprobe analyses were conducted on both
silicates and sulfides from the AL. The silicates have been measured by a JEOL JXA-
8900R, with 10 μm beamsize, 20 kV acceleration voltage, and 5 nA beam current at
Kiel University. The sulfides were measured at Bochum University with a Cameca
SXFiveFE, with fully focused beam, 20 kV acceleration voltage and 30 nA probe cur-
rent. Carbonate and quartz samples have been obtained by micro-drilling or handpicking
from crushed core material of veins (Figure 3.3h). While drilling, utmost care was taken
to distinguish between pure carbonate veins and mixed carbonate-quartz veins. δ18O and
δ13C isotopic compositions of both dolomite and magnesite samples were determined at
MARUM in Bremen with a Finnigan MAT 252 and MAT 251, respectively. δ18O values
of quartz separates were determined in the Geoscience department of the University of
Göttingen using CO2-laser fluorination and a Thermo MAT253 Gas mass spectrometer
(dual inlet mode). REE+Y+Sb concentrations and Mg# of the carbonates have been
obtained by laser ablation ICP-MS using a Thermo Element2 mass spectrometer and a
NewWave UP193ss laser at the Department of Geosciences in Bremen. Samples and
38

3.2 Methods
standards were ablated with an irradiance of 1 GW/cm2 a beam diameter of typically
75 mm and a pulse rate of 5 Hz. For data quantification we used the Cetac GeoProTM
software with Ca as internal standard, recalculated for both dolomite and magnesite.
Std610 and Std612 was used as reference material. Uncertainties of the concentrations
are <5%. Temperatures of dolomite-magnesite formation were computed according to
the theoretical calibration of (Chacko and Deines, 2008), using the following formula:
103lnα = ln β(mgs)−1000ln β(dol) (3.1)
where β is based on internal vibrational frequencies and Debye temperatures of the
two minerals. From the δ18O composition of dolomite, we then calculated the δ18O
composition of water. Unfortunately, values for ΔDol-H2O have not been devised by
Chacko and Deines (2008) for temperatures higher than 373 K. To expand the tempera-
ture range, theΔDol-H2O fractionation data from Horita (2014) have been incorporated
as well:
103lnα(dol −H2O) = 3.140(±0.022)x(10
6/T2)−3.14(±0.011) (3.2)
The Chacko and Deines (2008) and Horita (2014) data for ΔDol-H2O correspond to
each other within 0.7‰ for temperatures up to 100 ◦C, which validates the integration
of both models to determine both temperature and δ18O composition of the fluids (Table
3.2 and Figure 3.2). The average δ18O composition of the fluid was then used to calcu-
late temperatures from δ18O compositions of quartz, using the Zhang et al. (1989) and
39

Chapter 3 MGB
Figure 3.2: Linear relationship between temperature andΔMgs-Dol based on data in Table 3.2 (a: Chacko
and Deines (2008); b: Horita (2014)).
Sharp and Kirschner (1994) calibration.
Table 3.2: Integration ofΔDol-H2O values of temperature range between 293-673 K.
(a) 1000 ln ß 1000 ln ß (b)
106/T2 T (K) Mgs Dol ΔMgs-Dol ΔDol-H2O ΔDol-H2O
11.7 293 113.4 106.1 7.285 33.86 33.44
9.59 323 97.06 90.80 6.257 27.60 26.96
7.19 373 76.59 71.63 4.959 19.57 19.43
5.59 423 61.87 57.85 4.017 14.41
4.47 473 50.94 47.62 3.315 10.89
3.66 523 42.62 39.84 2.779 8.340
3.05 573 36.15 33.79 2.361 6.424
2.58 623 31.03 29.00 2.029 4.950
2.21 673 26.90 25.14 1.761 3.793
* Temperature range of 293-373 K forΔDol-H2O of (a) Chacko and Deines (2008) based on 1000 ln α formula (2). in compar-
ison with a temperature range from 293-673 K by (b) Horita (2014).
Reaction path modeling and activity-activity diagrams have been calculated using
Geochemist’s Workbench. There is no thermodynamic data for Sb-As-Au minerals and
aqueous species in the default GWB database. We have hence built a new database for
a pressure of 1 kbar and 25 to 600 ◦C, using SUPCRT92 (Johnson et al., 1992). The
database includes 112 aqueous species and 110 minerals. Data for major rock-forming
minerals were taken from Wolery and Jove-Colon (2004). Data for major solutes are
from Sverjensky et al. (1997) and Schock et al. (1997).These data were supplemented
by data for Sb, As and Au minerals as well as aqueous HS−, OH− and Cl− species
40

3.3 Results
of these elements from various sources, while maintaining internal consistency (Yund,
1962; Lynch, 1982; Wagman et al., 1982; Krupp, 1988; Seal, Essene, et al., 1990; Seal,
Robie, Barton, et al., 1992; Vink, 1996; Seal, Robie, Hemingway, et al., 1996; Williams-
Jones and Norman, 1997; Welham, 2001; Kantar, 2002; Stefánsson and Seward, 2003b;
Stefánsson and Seward, 2003a; Stefánsson and Seward, 2004; Castro and Baltierra,
2005; Pokrovski et al., 2006; Akinfiev and Zotov, 2010; Firdu and Taskinen, 2010).
3.3 Results
3.3.1 Fieldwork
Two fieldwork expeditions have been undertaken in 2009 and 2013. The focus of this
paper will lie on the 2013 fieldwork, though samples of the 2009 fieldwork have been
incorporated as well. The motivation of the 2013 fieldwork was to determine the rela-
tionship between host rock and vein system(s) in proximity to Sb and As enrichment.
Samples have been taken from four different mines from east to west: Gravelotte, Beta,
Athens, Monarch (Table 3.3). These mines lie along the AL, and are 1 to 8 km apart
from each other (Figure 3.1). In each of these mines, samples were taken where the
Sb-content was the highest. These are at different depths: Gravelotte decline from 0 to
20 m, Beta mine at 640-680 m, Athens at 1160-1240 m and Monarch decline from 0 to
1240 m depth.
Overall, we discriminated between chlorite schists, talc schists, variably mineralized
quartz-carbonate veins and boudins (dolomite-quartz, magnesite-quartz), and fuchsite-
bearing quartz-carbonate rocks (listvenite). This entire deposit-hosting unit is heavily
metasomatized and deformed. Frequently, different rock types are juxtaposed to each
41

Chapter3MGB
Table3.3:
Sam
ple
descriptions
of2006
and
2013
field
work
expeditio
natM
urc
his
on.
South
Afr
ica.
Min
eS
am
ple
nam
eD
escri
pti
on
Dep
thN
ear
fuch
sit
e?
Ph
oto
nr
Carb
o?
Gravelotte
Gr0
01
Dyke
of5m
thic
k(C
arb
oon
tim
e)
0-2
0m
No
--
Gr0
02
The
surr
oundin
gro
ck
ofth
edyke
0-2
0m
No
1-
Gr0
03
Schis
t+
vein
ofquart
/carb
oaltera
tion
0-2
0m
No
2M
ag
+q
Gr0
04
Schis
t+
vein
ofquart
/carb
oaltera
tion
0-2
0m
No
2Larg
edolve
inadja
centm
ag
(red)
Gr0
05
Schis
t+
vein
ofquart
/carb
oaltera
tion
0-2
0m
No
2Larg
edol.
cuttin
gm
ag.
recutted
by
sm
all
q
Gr0
06
Gre
en
carb
ove
inin
schis
t.sam
eoth
er
q-v
ein
s0-2
0m
?3
mag
matr
ix
Gr0
07
Chlo
rite
schis
t0-2
0m
15m
4m
ag
matr
ix
Gr0
08
Chlo
rite
schis
t+
red
carb
o0-2
0m
15m
5q
+dol+
redm
ag
boudin
aged
vein
s
Gr0
10
Car/
qaltera
tion
with
reddis
hdots
(realor
pain
t?)
0-2
0m
8m
6m
atr
ix
Gr0
14
Quart
zite
plu
salb
ite
gra
ins
and
sulfi
des.
adja
centto
fuchsite
laye
r0m
at
fuch
sit
e9
alb
itiz
ed
quart
z
SA
0973
Carb
onate
altera
tion
0-2
0m
at
fuch
sit
e-
mag
matr
ixw
ith
sm
all
qve
ins
+fu
chsite
Betaquarry
B020
Sam
ple
slo
cate
dfr
om
Wto
E.sam
ple
dfr
om
diff
ere
ntquart
zve
ins
0m
No
10
none
B021
Sam
ple
slo
cate
dfr
om
Wto
E.sam
ple
dfr
om
diff
ere
ntquart
zve
ins
0m
No
-none
B022
0m
No
-none
B023
0m
No
11
none
B024
Sam
ple
slo
cate
dfr
om
Wto
E.sam
ple
dfr
om
diff
ere
ntquart
zve
ins
0m
No
12
none
B025
Sam
ple
slo
cate
dfr
om
Wto
E.sam
ple
dfr
om
diff
ere
ntquart
zve
ins
0m
No
13
none
B026
Sam
ple
slo
cate
dfr
om
Wto
E.
sam
ple
dfr
om
diff
ere
nt
quart
zve
ins;
tensio
n
gashes
0m
No
-none
B028
Stibnite
ore
vein
(maybe
old
q/c
arb
oaltera
tion?
0m
No
15
larg
edolve
in
B029
Stibnite
ore
vein
cro
sscuttin
gD
2->
diff
ere
ntpre
cip
itation
sta
ge
than
B028
0m
No
16
-
B030
1.5
maltera
tion
zone
with
q+
car+
stib+
bert
hirie
te0m
No
-le
nses
+fr
actu
res
B031
hand
sam
ple
from
rubble
with
nic
estibnite
and
carb
onate
and
apy
plu
sq
0m
No
17
-
B032
car
plu
sapy
0m
No
17
matr
ix+
fractu
re
B033
car
plu
sapy
0m
No
-le
nses
+brittle
Betaquarry
Bm
040
Range
ofcarb
o’s
near
stibnite
ore
.in
larg
eq-v
ein
640-6
80m
talc
schis
t+
alb
itiz
ed
quart
zLarg
edol-m
ag
vein
Bm
041
Range
ofcarb
o’s
near
stibnite
ore
.in
larg
eq-v
ein
640-6
80m
talc
schis
t+
alb
itiz
ed
quart
zLarg
eQ
-carb
ove
ins
Bm
042
Range
ofcarb
o’s
near
stibnite
ore
.in
larg
eq-v
ein
640-6
80m
talc
schis
t+
alb
itiz
ed
quart
zLarg
eQ
-carb
ove
ins
Bm
043
Range
ofcarb
o’s
near
stibnite
ore
.in
larg
eq-v
ein
640-6
80m
talc
schis
t+
alb
itiz
ed
quart
zLarg
eQ
-carb
ove
ins
Bm
044
Range
ofcarb
o’s
near
stibnite
ore
.in
larg
eq-v
ein
640-6
80m
talc
schis
t+
alb
itiz
ed
quart
zLarg
eQ
-carb
ove
ins
Bm
045
Range
ofcarb
o’s
near
stibnite
ore
.in
larg
eq-v
ein
640-6
80m
talc
schis
t+
alb
itiz
ed
quart
zLarg
eQ
-carb
ove
ins
Bm
046
Range
ofcarb
o’s
near
stibnite
ore
.in
larg
eq-v
ein
640-6
80m
talc
schis
t+
alb
itiz
ed
quart
zLarg
eQ
-carb
ove
ins
Bm
047
carb
oplu
salb
ite
plu
spy/a
py
nextto
q+
stib
vein
640-6
80m
talc
schis
t+
alb
itiz
ed
quart
zLarg
eQ
-carb
ove
ins
Bm
048
carb
oplu
salb
ite
plu
spy/a
py
nextto
q+
stib
vein
640-6
80m
talc
schis
t+
alb
itiz
ed
quart
zLarg
eQ
-carb
ove
ins.
thre
ediff
ere
ntgra
insiz
es
Bm
049
carb
oplu
sapy
vein
s640-6
80m
talc
schis
t+
alb
itiz
ed
quart
zLarg
eQ
-carb
ove
ins
Bm
050
bt-
carb
/qschis
t640-6
80m
at
fuch
sit
e+
bio
tite
Bm
052
Car+
Q+
apy
inphylit
e640-6
80m
at
fuch
sit
e
Bm
053
yelo
wcarb
ove
incro
scuttin
gfu
chsite
640-6
80m
at
fuch
sit
esid
erite
Bm
054
yello
wcarb
ove
incro
scuttin
gfu
chsite
640-6
80m
at
fuch
sit
esid
erite
Bm
055
chlo
rite
-fuchite
altera
tion
640-6
80m
at
fuch
sit
esm
all
vein
sin
matr
ix
Bm
056
chlo
rite
-fuchite
altera
tion
640-6
80m
at
fuch
sit
esm
all
vein
sin
matr
ix
Bm
057
640-6
80m
at
fuch
sit
esm
all
vein
sin
matr
ix
Bm
058
the
carb
ore
late
dto
tofu
chsite
->occurr
ed
as
blo
cks
inquart
zve
ins
(larg
e
vein
s)
640-6
80m
at
fuch
sit
em
atr
ix+
quart
zve
in
Bm
059
the
carb
oblo
cks
insulfi
de
lenses
inbetw
een
fuchsite
640-6
80m
5m
mag
matr
ix
Bm
060
carb
ole
nses
ofm
afc
mate
rialin
fuch-q
furh
ter
aw
ay
from
fuchsite
schis
t640-6
80m
5m
-
Bm
061
carb
ole
nses
ofm
afc
mate
rialin
fuch-q
furh
ter
aw
ay
from
fuchsite
schis
t640-6
80m
5m
-
Bm
062
carb
ole
nses
ofm
afc
mate
rialin
fuch-q
furh
ter
aw
ay
from
fuchsite
schis
t440-4
80
mN
o-
42

3.3 ResultsM
ine
Sam
ple
nam
eD
escri
pti
on
Dep
thN
ear
fuch
sit
e?
Ph
oto
nr
Carb
o?
Betaquarry
SA
0947
Conta
ct
bio
tite
schis
t/ore
body
then
stibnite
ore
with
q-c
arb
inclin
ation
very
coars
egra
ined
surr
ounded
by
bio
titic
schis
t
440-4
80
m?
SA
0948
Stibnite-b
ert
hie
rite
ore
plu
squart
zand
sulfi
des
440-4
80
mat
fuch
sit
e
SA
0950
Stibnite
ore
with
bro
wn
+w
hite
quart
zand
som
ecarb
onate
–3rd
unites.
Quart
zve
inare
Au-b
earing
and
associa
ted
with
ars
enopyrite
.
980
at
fuch
sit
e
SA
0951
Talc
schis
tsw
ith
dolo
maite/c
arb
onate
.14th
leve
l.3-4
unite.
stibnite
inta
lcose
schis
ts
980
?
SA
0952
5m
thic
k.
Main
beta
ore
enve
loped
by
talc
schis
ts.
stibnite-c
arb
onate
/qart
z-
talc
.E
-WS
tibnite
980
?
SA
0953
Recry
sta
llized
coars
egra
ined
carb
onate
inta
lcschis
tplu
sq-c
arb
altera
tion
nort
h.
Hig
hgra
de
Au
inquart
zve
ins.
1160-1
240m
No
AthensA
080
apy+
py
at
rim
of
quart
zve
in.
adja
cent
tota
lcschis
tagain
with
cre
nula
tion
folia
tion
1160-1
240m
No
dol.m
ag
matr
ix
A081
q+
alb
ite
phenocry
sts
1160-1
240m
No
A082
sulfi
de
ore
(yello
wones
are
weath
ere
dS
b).
inta
lcschis
tboudin
aged
togeth
er
with
Qw
ith
flin
ters
offu
chsite
1160-1
240m
No
dol.m
ag
matr
ix
SA
0923
South
ern
countr
yro
ck.
More
carb
onate
and
talc
tow
ard
sore
zone.
1160-1
240m
No
SA
0924
South
ern
countr
yro
ck.
phylli
tic
with
chlo
rite
.carb
onate
and
pyrite
.Q
uart
z-
carb
lenses
alo
ng
D1
folia
ton
1160-1
240m
No
SA
0927
Quart
z-c
arb
onate
rem
obili
zed.
Fold
ed
with
chlo
ritic
schis
t.C
oars
egra
ined.
1160-1
240m
No
Monarchmine
Mm
100
Apy
reef
1160-1
240m
No
sm
all
vein
lets
inchlo
rite
matr
ix
Mm
101
apy
reef
1160-1
240m
No
sm
all
vein
lets
inchlo
rite
matr
ix
Mm
102
apy
reef
-N
osm
all
vein
lets
inchlo
rite
matr
ix
Mm
103
flin
tofS
b-r
eef
-N
o
Mm
104
transitio
nfr
om
apy
tosb-r
eef
-N
o
Mm
105
transitio
nfr
om
apy
tosb-r
eef
0-4
0m
No
bt.
Mm
106
transitio
nfr
om
apy
tosb-r
eef
0-4
0m
No
Mm
107
reachin
gta
lcschis
tnear
sb-r
eef
0-4
0m
No
Mm
108
bro
wn/g
reen
lenses
inbetw
een
q-v
ein
s(f
aultpla
ne).
near
bio
tite
0-4
0m
No
SA
0964
Apy
ore
recry
sta
llized
0-4
0m
-
SA
0968
Stibnite
ore
with
quart
z-c
arb
onate
0-4
0m
?
SA
0968_2
Stibnite
ore
with
quart
z-c
arb
onate
0-4
0m
?
Monarchdecline
M120
sm
all
vein
sw
ith
Sb
and
carb
orich!
0-4
0m
at
fuch
sit
edol+
mag
+q
uart
zve
ins.
mag
matr
ix
M121
Q-c
arb
oaltera
tion
vein
sin
sid
efu
chsite.
Sb-p
oor
(reef)
-at
fuch
sit
e
M122A
Sid
erite
-dolo
mite
vein
with
py
-at
fuch
sit
eye
llow
and
white
carb
o
M122B
Sid
erite
-dolo
mite
vein
with
py
-at
fuch
sit
eye
llow
and
white
carb
o
M123
q-c
arb
ove
inw
ith
sulfi
de
lenses.
Talc
schis
t-
talc
schis
t
M124
the
gre
en
vein
s.
pro
bchlo
rite
within
talc
schis
t-
talc
schis
t
M125
talc
schis
tw
ith
hig
her
chlo
ride
conte
nt
-ta
lcschis
t
M126
apy-r
ich
zone
-
SA
0901
Qtz
-carb
altera
tion
–fr
eesla
tezone
–C
lose
toS
1m
ain
shear
zone.
Shear
zone
min
era
lized
with
stibnite
10
?
SA
0902
Late
quart
z-c
arb
onate
stibnite
rem
obili
zation
-?
SA
0903
Late
quart
z-c
arb
onate
stibnite
rem
obili
zation
-?
SA
0904
Stibnite
ore
-?
SA
0906
Ars
enopyrite
ore
body
tightly
fold
ed
are
a.
Deve
lopm
entto
ward
sth
eM
onarc
h
‘pip
e’(m
ain
stibnite
ore
)
-no
SA
0907
Altere
dcountr
yta
lc.
Chlo
rite
-talc
-carb
onate
schis
tenve
lope
of
the
ore
body
south
ern
end
ofth
eM
onarc
hore
body.
-no
SA
0909
Apy
zone
-no
SA
0911
carb
onate
-quart
zre
mobili
azation
-no
SA
0914
Magnesite-q
uart
z.
No
min
era
lization
associa
tion.
-no
Dol-quart
z
SA
0915
Chesty
pyritic
ore
.P
yrite
bands
inth
epast
recry
sta
llized
pyrite
.in
part
sth
e
quart
zas
well
butstill
chert
ysili
ceous
ore
.
-no
*Footn
ote
:A
llsam
ple
sdescribed
per
min
eand
depth
ofsam
plin
g.
Specia
lnote
has
been
made
ofappro
xim
ity
near
fuchsite
(lis
tvenite)
min
era
lizatio
n.
43

Chapter 3 MGB
Figure 3.3: Photos of sample locations (A; B) and hand specimen (C; D) belonging to the metagranodiorite
unit
other in zones of the most intense shearing, and some workers may term those domains
listvenite (sensu lato). We use the term listvenite exclusively for rocks that contain
noticeable amounts of fuchsite as identified by their bright green color. Chlorite schists
are dark green and may grade into listvenite in carbonated domains. In these rocks with
pronounced pressure-solution schistosity, quartz-carbonate (dolomite-magnesite) veins
developed synkinematically as tension fractured and were folded and boudinaged. The
quartz-carbonate veins were more competent than the surrounding schist and stibnite
precipitated in pressure shadows around these microlithons as well as in brittle fractures
within them (Vearncombe et al., 1992).
At Gravelotte we declined to 20m through chlorite-rich schists cut by carbonate veins
44

3.3 Results
Figure 3.4: Photos of sample locations (A; B; C; D; F) and hand specimen (E; G; H) belonging to the
listvenite unit.
of variable widths. Occasionally, quartz was the dominant matrix material biotite was
found in the schists. Domains (cm-size) of fuchsite-rich rocks could be recognized
within these chlorite-schists. At the bottom of the decline, the stibnite ore body was
exposed; it is surrounded by large fuchsite-dolomite domains (m-size). At places in
between the fuchsite-dolomite domains (Figure 3.4c), quartz-albite domains (m-size)
were found (Figure 3.4h).
The focus of our sampling at the Beta mine was at the 16-17th level. Here we en-
tered the stibnite mineralization, which is surrounded by large quartz veins and fuch-
site mineralization. Stibnite mineralization is developed both along the margins of
45


Chapter 3 MGB
the heavily deformed and stibnite-rich domains of type 1 (Figure 3.4a). These veins
contain siderite and are free of stibnite away from the zones of major Sb mineralization.
Additionally, rare quartz-stibnite veins are developed that crosscut the foliations and
carbonate veins. These types have been grouped by paragenesis and appearance and
they document a transition from ductile to brittle deformation processes and increasing
abundance of quartz as vein fill.
3.3.2 Petrography and mineral chemistry
Chlorite, talc and fuchsite have undergone ductile to brittle deformation. Two types of
chlorite-schists have been distinguished: biotite-rich quartz-chlorite schist and quartz-
poor schist with chromium-rich chlorite. Dravite was sporadically found in the margins
of carbonate veins of type 1, throughout the AL, with no apparent relationship between
Sb-mineralization and dravite formation. Mineral formulas of fuchsite, chlorite and
dravite are represented in Table 3.4, respectively. Fuchsite has high Cr-numbers (Cr# =
Cr / (Cr+Al) at%), with Cr2O3 contents between 2.88 wt.% and 3.29 wt.% (Table 3.6).
The Cr2O3 contents of chlorite are more variable, ranging between 0.0 and 2.69 wt.%.
Dravite has the highest Cr contents though they vary between 0.8 and 6.9 wt.% (Figure
3.9). It is also apparent that both sulfides and silicates have low Mn contents. Mi-
crotextural observations show that the minerals formed during different mineralization
stages, which are represented by specific mineral assemblages, grouped by the previ-
ously mentioned lithological units. These observations are summarized in the following
paragenetic sequences (Figure 3.6 and 3.7).
As mentioned before, multiple carbonate minerals have been identified: dolomite,
magnesite and siderite (Figure 3.8). The carbonate-matrix of chlorite and fuchsite is
48

3.3 Results
Table 3.4: Average mineral formula of chlorite, fuchsite and dravite with Cr# and Mg#.
Chlorite Dravite Fuchsite
Athens Monarch Beta S.Egypta Monarch Beta Monarch Beta S.Egypta
Mine Decline Mine Mine Mine Mine Mine
n = 23 n = 2 n = 19 n = 7 n=22 n=8 n = 23 n = 3 n = 5
SiO2 26.50 27.02 28.71 29.09 37.83 37.66 47.34 49.67 49.56
TiO2 0.06 0.07 0.06 0.03 0.86 0.15 0.35 0.29 0.13
Al2O3 22.15 22.51 19.27 17.84 36.22 30.86 33.39 24.20 33.43
Cr2O3 0.23 0.03 2.36 5.47 0.22 4.37 2.88 3.29 1.04
FeO 20.79 16.24 10.73 9.26 3.06 2.45 1.20 1.13 0.42
MnO 0.06 0.04 0.03 0.00 0.02 0.01 0.03 0.01 0.04
MgO 18.90 20.86 24.92 25.34 8.49 8.40 2.98 4.18 0.94
CaO 0.02 0.05 0.01 0.03 0.08 0.02 0.00 0.16 0.15
Na2O 0.03 0.02 0.02 0.02 2.28 2.72 0.19 0.08 0.75
K2O 0.01 0.00 0.00 0.03 0.01 0.01 9.66 11.52 6.66
Total 88.77 87.04 86.48 87.12 89.06 86.64 98.00 95.24 93.10
Formula based on 14 anions Formula based on 24.5 anions Formula based on 11 anions
Si 2.7 2.7 2.9 3.0 5.9 6.0 3.1 3.4 4.0
Ti 0.0 0.0 0.0 0.0 0.1 5.8 0.0 0.0 0.0
Al 2.7 2.7 2.3 2.1 6.5 0.0 2.6 1.9 3.2
Cr 0.0 0.0 0.2 0.2 0.0 0.6 0.2 0.2 0.0
Fe 1.8 1.4 0.9 0.8 0.3 2.0 0.1 0.1 0.0
Mn 0.0 0.0 0.0 0.0 0.0 0.3 0.0 0.0 0.0
Mg 2.8 3.1 3.7 3.9 2.0 0.0 0.3 0.4 0.1
Ca 0.1 0.0 0.0 0.0 0.0 0.0 0.0 0.0 0.0
Na 0.0 0.0 0.0 0.0 0.7 0.8 0.0 0.1 0.1
K 0.0 0.0 0.0 0.0 0.0 0.0 0.8 1.0 0.7
Total 10.1 9.9 9.9 10.0 15.6 15.7 7.0 7.1 8.1
Mg# 0.6 0.7 0.8 0.8 0.9 0.9 0.8 0.9 0.9
Cr# 0.0 0.0 0.1 0.1 0.0 0.1 0.1 0.5 0.0
* EMPA dataset of groups of chlorite. fuchsite and dravite minerals within the MGB in comparison with listvenites of the South
Egypt ophiolite by (a) Emam and Zoheir (2013).
Cr# = (Cr / Cr+Al); Mg# = (Mg/ Mg+Fe)
49

Chapter 3 MGB
Apy
Po
Po
Ull
Py
Figure 3.5: BSE Images of thin sections from an Sb-enriched listvenite (A) from the Monarch mine and an
As-enriched granodiorite (B) from the Athens mine.
predominantly magnesite. Dolomite is mostly present within veins and/or fractures in
varying grain size and contains the highest amount of stibnite intergrowths. Addition-
ally, it appears that dolomite is the dominant host of Sb in the form of stibnite (Figure
3.10). Cogenetic magnesite-dolomite have highly variable Mg#’s and thus color. The
carbonates selected for geochemical analyses include examples from quartz-magnesite
and quartz-dolomite veins. Dolomite-magnesite-quartz veins and proximal to stibnite
mineralization were also selected. In these veins, the carbonate phases appeared to be
in textural equilibrium (cogenetic) with each other (Figure 3.4). Figure 3.8 depicts the
large variation of Mg# of all the carbonates within the MGB system. The carbonates
with high stibnite contents have the highest Mg#. The carbonates with the lowest Mg#
50

3.3 Results
Figure 3.6: Paragenetic sequence of the lithological unit metagranodiorite. Chlorite within this unit has
varying amounts of biotite and occasional chromium enrichments.
values, as well as the rare occurrences of siderite, are limited to the metagranodiorite
lithological units. Sb-As minerals are disseminated within the silicates and are predom-
inantly present within the metamorphic host rock. There are two types of Sb mineraliza-
tion. The first type is an apparently primary assemblage of berthierite, ullmannite and
gudmundite that co-occurs with pyrite, chalcopyrite and pyrrhotite. For instance, foli-
ated chlorite schists contain arsenopyrite, pyrite and pyrrhotite, gudmundite, chalcopy-
rite and to lesser extents berthierite and ullmannite. These rock domains have not been
affected by later-stage carbonate or quartz formation (Figure 3.5). A second type of Sb
mineralization has stibnite as sole Sb-mineral, which is accompanied by rare berthierite,
pyrite. In this apparently secondary formation, stibnite has been mobilized.and repre-
cipitated in tension gashes and pressure shadows.
The compositions of the dominant As and Sb minerals (arsenopyrite, berthierite, gud-
mundite, ullmannite and stibnite) are presented in Tables 3.5 and 3.6. The develop-
ment of an arsenopyrite, pyrite, pyrrhotite assemblage allows for the application of the
arsenopyrite geothermometer of Kretschmar and Scott (1976). Their calibration sug-
51

Chapter 3 MGB
Figure 3.7: Paragenetic sequence of the lithological unit listvenite. Chlorite within this unit is predominantly
chromium-rich.
gests that arsenopyrite with 30-32 at.% arsenic (Table 43.4) coexists with pyrite and
pyrrhotite at temperatures between 300 and 400 ◦C (cf. Figure 3.7 in Kretschmar and
Scott (1976)). Berthierite is present as main mineral or as rim of ullmannite within
the chlorite schist. Ullmannite has only been found surrounded by berthierite. Gud-
mundite has been found adjacent to arsenopyrite, within the arsenopyrite-rich zone in
the Monarch mine. Ullmannite and gudmundite lack in the carbonate-quartz metaso-
matized domains of the AL lithologies. In contrast, stibnite (and minor berthierite) is
exclusively found within tension fractures, like boudins, boudinages or veins and is
clearly related to isoclinal folding and subsequent episodes of deformation and veining.
3.3.3 Trace element compositions of carbonates
A distinction was made between pure carbonate and mixed carbonate-quartz veins in
terms of both dolomite and magnesite compositions (Table 3.7). When comparing the
different carbonate minerals, a clear difference in ΣREE+Y values between dolomite
and magnesite is evident. Dolomite (Figure 3.12a, 3.12b) is enriched in both LREE and
52

3.3 Results
Table 3.5: EMPA dataset of selected stibnite minerals.
Stibnite M123 Bm048 Bm048 Bm048
S 28.26 28.23 28.17 28.26
Mn 0.02 0.01 0.01 0.03
Fe 0.13 0.00 0.02 0.00
Co 0.02 0.00 0.02 0.00
Ni 0.00 0.00 0.00 0.01
Zn 0.00 0.00 0.02 0.00
As 0.03 0.06 0.01 0.03
Cd 71.43 71.60 71.71 71.66
Sb 0.04 0.04 0.00 0.02
Cu 0.00 0.00 0.00 0.00
Total 99.94 99.95 99.96 100.01
S 59.87 59.88 59.82 59.90
Mn 0.03 0.01 0.01 0.04
Fe 0.16 0.00 0.02 0.00
Co 0.03 0.00 0.02 0.00
Ni 0.00 0.00 0.00 0.01
Zn 0.00 0.00 0.02 0.00
As 0.03 0.06 0.01 0.03
Cd 39.85 40.00 40.10 40.00
Sb 0.05 0.05 0.00 0.02
Cu 0.00 0.00 0.00 0.00
Total 100 100 100 100
Ullmanite A080 B028a B028b M123a M123b
S 15.34 15.32 15.29 15.42 15.22
Mn 0.01 0.02 0.01 0.02 0.00
Fe 0.15 0.04 0.07 0.14 0.12
Co 0.00 0.00 0.00 0.06 0.10
Ni 27.28 27.17 26.94 27.37 26.98
Zn 0.03 0.00 0.00 0.01 0.08
As 1.07 0.07 0.04 2.90 0.98
Sb 56.04 57.44 57.42 54.16 56.29
Cu 0.00 0.00 0.00 0.00 0.00
Total wt.% 99.93 100.06 99.81 100.10 99.78
S 33.66 33.78 33.82 33.51 33.55
Mn 0.02 0.02 0.01 0.03 0.00
Fe 0.19 0.05 0.09 0.18 0.16
Co 0.00 0.00 0.00 0.08 0.12
Ni 32.69 32.72 32.55 32.48 32.48
Zn 0.04 0.00 0.00 0.01 0.09
As 1.00 0.07 0.04 2.70 0.92
Sb 32.39 33.35 33.45 31.00 32.68
Cu 0.00 0.00 0.00 0.00 0.00
Total at.% 100 100 100 100 100
53

Chapter 3 MGB
Gudmundite A082a A082b A082c A082d
S 15.60 15.53 15.45 15.61
Mn 0.04 0.00 0.00 0.00
Fe 26.46 26.57 26.13 26.97
Co 0.03 0.02 0.05 0.00
Ni 0.36 0.15 0.35 0.04
Zn 0.02 0.01 0.04 0.05
As 0.04 0.00 0.00 0.01
Sb 0.00 0.00 0.00 0.00
Cu 58.39 58.46 58.39 58.37
Ti 0.00 0.00 0.03 0.02
Total wt.% 100.94 100.74 100.42 101.07
S 33.59 33.57 33.54 33.56
Mn 0.05 0.00 0.00 0.00
Fe 32.72 32.96 32.55 33.28
Co 0.03 0.03 0.06 0.00
Ni 0.43 0.17 0.41 0.05
Zn 0.02 0.01 0.04 0.05
As 0.04 0.00 0.00 0.01
Sb 0.00 0.00 0.00 0.00
Cu 33.12 33.27 33.37 33.04
Ti 0.00 0.00 0.03 0.02
Total at.% 100 100 100 100
Berthierite M126 M126 M124 B028 B028
S 30.05 30.01 29.93 30.10 29.88
Mn 0.00 0.00 0.00 0.02 0.01
Fe 12.95 12.84 12.85 12.88 13.00
Co 0.00 0.00 0.00 0.00 0.02
Ni 0.01 0.00 0.00 0.00 0.02
Zn 0.06 0.01 0.02 0.02 0.00
As 0.11 0.11 0.07 0.02 0.00
Sb 56.75 57.00 57.10 56.95 57.02
Cu 0.04 0.02 0.00 0.00 0.03
Ti 0.00 0.00 0.00 0.00 0.00
Total wt.% 99.97 99.98 99.97 100.00 99.98
S 57.21 57.22 57.14 57.30 57.03
Mn 0.00 0.00 0.00 0.02 0.02
Fe 14.15 14.06 14.08 14.08 14.24
Co 0.00 0.00 0.00 0.00 0.02
Ni 0.01 0.00 0.00 0.00 0.02
Zn 0.06 0.01 0.01 0.02 0.00
As 0.09 0.09 0.06 0.02 0.00
Sb 28.45 28.61 28.71 28.55 28.65
Cu 0.04 0.02 0.00 0.00 0.03
Ti 0.00 0.00 0.00 0.00 0.00
Total at.% 100 100 100 100 100
54

3.3 Results
Table 3.6: EMPA dataset of selected arsenopyrite minerals.
Arsenopyrite A082a A082b M126a M126b M126c
S 20.55 21.68 20.37 20.86 20.72
Mn 0.01 0.00 0.02 0.00 0.00
Fe 34.86 34.91 34.77 34.80 34.63
Co 0.00 0.00 0.00 0.00 0.03
Ni 0.05 0.15 0.01 0.03 0.23
Zn 0.06 0.00 0.07 0.00 0.00
As 44.26 43.01 44.72 44.12 44.24
Cd 0.00 0.00 0.04 0.09 0.07
Sb 0.14 0.08 0.00 0.01 0.00
Cu 0.00 0.00 0.00 0.00 0.00
Total wt.% 99.92 99.85 100.00 99.92 99.91
S 34.48 35.99 34.22 34.91 34.71
Mn 0.01 0.00 0.02 0.00 0.00
Fe 33.58 33.27 33.53 33.43 33.31
Co 0.00 0.00 0.00 0.00 0.03
Ni 0.05 0.13 0.01 0.03 0.21
Zn 0.05 0.00 0.06 0.00 0.00
As 31.78 30.55 32.14 31.59 31.72
Cd 0.00 0.00 0.02 0.04 0.03
Sb 0.06 0.03 0.00 0.01 0.00
Cu 0.00 0.00 0.00 0.00 0.00
Total at.% 100 100 100 100 100
*Five selected samples from Athens mine (A-sample nr) and Monarch decline (M-sample nr).
HREE, while magnesite is depleted in LREE. Dolomite associated with quartz (Figure
3.12) displays a greater overall variation in the contents of REE than pure dolomite
veins (Figure 3.12). All dolomite associated with quartz shows positive Eu anomalies,
which is most pronounced in samples with low REE contents. Pure dolomite veins show
generally high REE contents with flat distribution patterns and a lack of Eu anoma-
lies. Magnesite from both pure magnesite and magnesite-quartz veins show distinct
LREE depletions with magnesite associated with quartz displaying very small positive
Eu anomalies. Dolomite has an average Mg# value of 0.87, and is more magnesian than
magnesite with an average Mg# of 0.71.
3.3.4 Stable isotope compositions and geothermometry
13CPDB values of pure dolomite range from -4.5 to -6 ‰ and those of pure magne-
site vary between -4 and 5.5 ‰ (Table 3.8). Another population of those carbonates,
55

Chapter 3 MGB
Figure 3.8: Compositional plot of dolomite, magnesite and siderite samples from the AL
however, has values indistinguishable from the ones presented here. δ18OSMOW values
range between 12 to 13.5 ‰ for dolomite and 14 to 16 ‰ for magnesite (Figure 3.9a).
The carbonate-quartz veins (Figure 3.9b) show similar C values, and slightly lighter
δ18OSMOW values. Samples from the Beta mine are lighter in δ18CPDB values than sam-
ples from Gravelotte by about 1.5, while samples from Athens and Monarch are more
variable (Figure 3.9d). δ18O values of quartz range from 12.8 to 15.2 and average at
13.6+/-0.7‰ (n=13; Table 12).
Estimations of carbonate vein formation temperature and calculations of δ18O com-
positions of the fluids (δ18OH2O) were conducted. In these calculations it was assumed
that dolomite and magnesite formed coevally. Textural evidence in support of this as-
sumption has been found in a subgroup of the carbonate-altered rocks that feature large
and intergrown grains of magnesite and dolomite (Figure 3.4f). Only two samples from
the entire sample set exhibited this kind of texture and were suited for geothermome-
try using dolomite-magnesite. According to the data of Chacko and Deines (2008), the
dolomite-magnesite fractionation has the following temperature dependence:
56

3.3 Results
Figure 3.9: Cr2O3 vs Mg# of fuchsite, chlorite and dravite. For comparison fuchsite and chlorite composi-
tions from (a) Emam and Zoheir (2013) and dravite from (b) Moritz and Crocket (1991) are also shown.
Table 3.3 presents the average calculation results for both locations, yielding temper-
atures of 357±19 ◦C for the Beta Mine and 402±24 ◦C for the Gravelotte decline. From
these temperatures and average dolomite compositions, we have calculated δ18OH2O
values of the carbonatizing fluids, using the Horita (2014) calibration of the dolomite-
water system (3.2) of 8.7 and 9.1 ‰. With an average δ18OH2O composition of 8.9 ‰
and the quartz-water calibration from Sharp and Kirschner (1994)
Δqtz−H20 = 3.65x10⁶/T2−2.9 (3.3)
we get temperatures of 424+/-31 ◦C for the quartz data from all quartz-carbonate
veins (Table 3.10). The calibration by Zhang et al. (1989)
57

Chapter 3 MGB
Table 3.7: Average REE+Y values of four groups of carbonate.
Avg Dol-Q Dol Mgs-Q Mgs
La 7.04 4.80 0.05 0.02
Ce 10.46 6.86 0.04 0.02
Pr 11.16 7.59 0.04 0.03
Nd 11.40 8.53 0.05 0.04
Sm 14.27 12.14 0.11 0.13
Eu 15.20 21.36 0.14 0.14
Gd 17.25 14.71 0.17 0.26
Tb 16.34 15.49 0.32 0.53
Dy 15.15 12.64 0.49 2.25
Y 17.87 13.76 0.62 1.10
Ho 12.87 14.67 0.74 1.15
Er 11.83 14.31 1.17 1.65
Tm 10.80 12.73 1.87 2.31
Yb 10.44 12.71 2.85 3.04
Lu 27.29 11.42 3.64 3.66
ΣREE+Y 187.90 186.59 12.28 14.90
ΣLREE 87.97 75.93 0.59 0.65
ΣHREE 81.24 96.90 10.38 13.15
Mg# 0.85 0.88 0.70 0.73
n 15 79 16 27
*Chondrite normalised values of two sets of carbonates: dolomite(-quartz) and magnesite(-quartz).
Chondrite values of Sun and McDough (1995).
Δqtz−H2O = 3.306x10⁶/T2−2.71 (3.4)
for the same data yields 399+/-31 ◦C.
3.3.5 Geochemical calculations and reaction path model results
We conducted thermodynamic calculations to depict the Fe-Cu-Sb-O-H-S phase rela-
tions and computed equilibrium reaction paths to examine possible sources and traps
for Sb, As, Au, Cu, and Fe in the specific setting of the AL in the MGB. The phase
relations were examined in H2(aq) vs. H2S(aq) activity plane at 1 kbar and temper-
atures of 350 and 250 ◦C (3.13a and b), indicate that the transition from early native
antimony and berthierite along with pyrrhotite to later stibnite and pyrite is consistent
58

3.3 Results
Table 3.8: Stable isotope dataset of dolomite and magnesite in close approximation of Sb-enrichments.
Dolomite Magnesite Quartz
δ13CPDB δ18OVMSOW Comment δ13CPDB δ18OVMSOW Comment Sample δ18O
SA
0947
-5.84 12.77
Gr0
08 -3.94 15.50 red B020 13.6
-5.81 12.90 -4.01 14.74 red B025A 13.2
-5.81 12.91 -4.11 14.83 red B026 13.5
-5.90 13.17Bm048
-5.06 15.31 B027 12.9
-5.76 13.16 -4.95 15.42 B032 12.8
-5.85 12.88
B026 -5.15 15.23 B033 13.3
-5.82 13.04 -5.13 14.73 Bm040 14.5
SA
0933
-5.28 13.00 -5.05 14.90 Bm053 13.2
-5.42 12.57
Gr0
04
-4.12 14.61 red Gr012 13.6
-5.21 11.27 -4.38 14.77 red M121 13.1
-4.98 13.54 -4.14 14.57 red M124 15.2
-5.21 11.28 -4.22 14.83 red M126 13.0
-5.77 12.61
Bm
040
-4.96 15.67
-5.77 13.29 -5.08 15.43
Gr0
08 -4.58 12.58 -5.19 15.34
-4.61 12.38 -4.99 15.58
-4.69 13.00 -4.62 15.06 yellow
Gr0
04 -4.66 13.05 -5.10 15.62
-4.66 12.58 -4.67 12.23
-4.69 12.85 -4.80 11.85
-4.60 12.74 -4.80 11.53
-4.59 12.55 -4.48 12.12
Bm
040
-5.53 13.29 -4.81 11.66
-5.53 13.47
-5.55 13.48
-5.42 13.47
-5.51 13.34
-5.54 13.36
-4.85 13.05
Gr0
06
-4.28 12.60 yellow
-4.21 12.44 yellow
-4.36 12.46 yellow
-4.26 12.44 yellow
M122
-4.15 13.23 yellow
-4.08 13.46 yellow
-4.22 13.32 yellow
-4.28 13.96
-4.71 12.22
-3.93 12.09 yellow
-4.44 13.22 yellow
-4.27 13.90 yellow
Gr0
05
-4.56 12.52
-4.20 13.90
-4.63 12.56
-4.59 12.44
59

Chapter 3 MGB
Table 3.9: Temperature calculations from MGB quartz.
Sample δ18Oqtz δ18OH2OT(K)a T(◦C) T(K)b T(◦C)
Gr012 136 62 6432 3702 6680 3950
B020 136 62 6432 3702 6680 3950
B025A 132 58 6600 3870 6849 4119
B026 135 61 6473 3743 6721 3991
B027 129 55 6734 4004 6985 4255
B032 128 54 6781 4051 7033 4303
B033 133 59 6557 3827 6806 4076
Bm043 144 7 6133 3403 6375 3645
Bm044 145 71 6098 3368 6340 3610
Bm052 132 58 6600 3870 6849 4119
M121 131 57 6644 3914 6894 4164
M124 152 78 5871 3141 6109 3379
M126 13 56 6689 3959 6939 4209
*Based on δ18OH2O=8.32 ‰) and δ18Oqtz and δ18OH2O
temperatures have been calculated based on geothermometers
of (a) Zhang et al. (1989) and (b) Sharp and Kirschner (1994).
Samples taken from Gravelotte mine (Gr-sample nr), Beta quarry (B-sample nr), Beta mine (Bm-sample nr) and Monarch
decline (M-sample nr).
Table 3.10: Temperature and ΔDol-H2O calculation of MGB carbonates.
δ18OMgs δ18ODol 1000 ln α T(K)a T (◦C) ΔDol-H2Ob δ18OH2O
15.67 13.00 2.67 603 330 5.50 7.50
15.43 13.47 1.95 659 385 4.09 9.38
15.34 13.48 1.87 681 408 3.63 9.84
15.58 13.47 2.11 624 350 4.93 8.54
14.61 13.05 1.57 779 506 2.03 11.00
14.77 12.58 2.18 610 336 5.31 7.27
14.57 12.58 1.71 727 453 2.81 10.00
14.83 12.74 2.09 628 355 4.82 7.92
* Calcuation based on based on the linear relationship (Figure 3.2) of Chacko and Deines (2008) (a) and Horita (2014) (b).
60

3.3 Results
Figure 3.10:Histogram of the frequency distribution of Sb content within dolomite and magnesite, revealing
dolomite to be the main host for Sb.
with a drop in the activity of aqueous dihydrogen, which causes an increase of sulfur
fugacity, according to
S2(g)+H2(aq) = H2S(aq) (3.5)
Isopleths for sulfur fugacities were calculated using this reaction and are also shown
in Figure 3.13. An increase or decrease in H2S(aq) activity can also cause the transi-
tion from berthierite to stibnite. A decrease in H2S activity can explain the berthierite-
stibnite transition only in the presence of magnetite, which is lacking in the AL assem-
blages. Likewise, degassive loss of both H2 and H2S in equal proportions would not
affect sulfur fucacity, so the berthierite-stibnite phase boundary can only be crossed if
magnetite were present. Because pyrite is commonly developed in the Sb-mineralized
rocks from the AL, the replacement of berthierite by stibnite as dominant Sb phase
can only be accomplished by decreasing aH2 or by increasing aH2S, both leading to in-
61
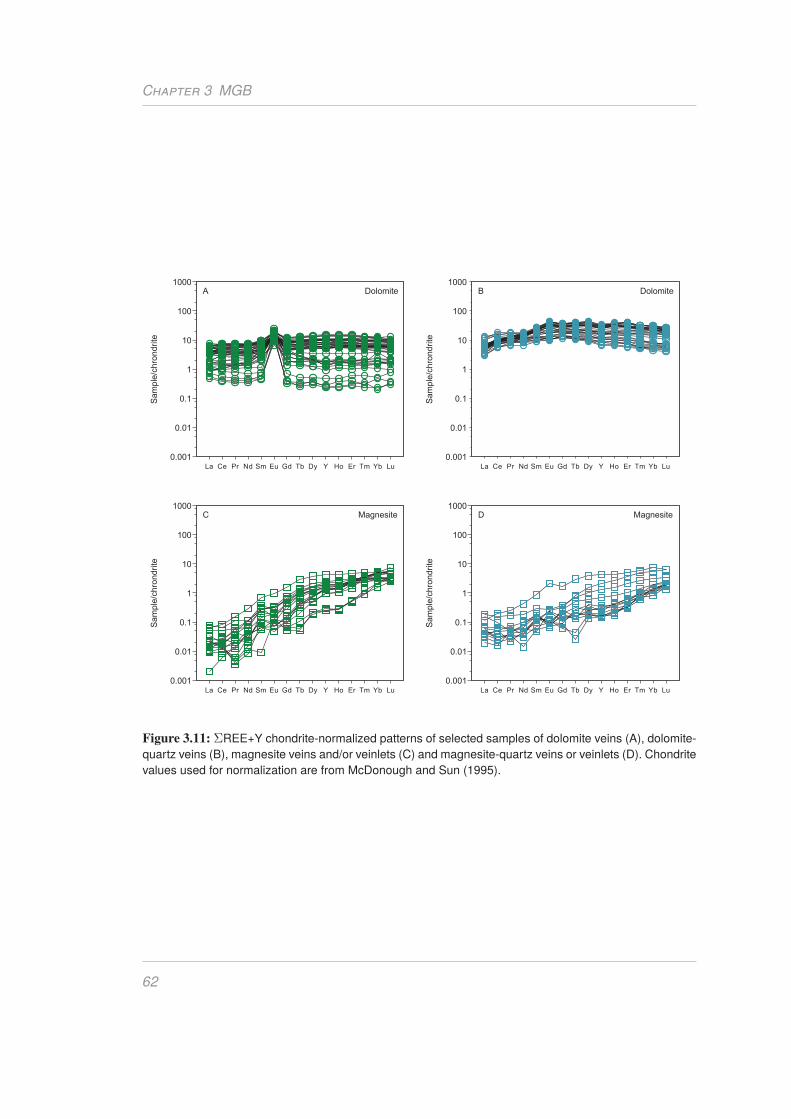
Chapter 3 MGB
Figure 3.11: ΣREE+Y chondrite-normalized patterns of selected samples of dolomite veins (A), dolomite-
quartz veins (B), magnesite veins and/or veinlets (C) and magnesite-quartz veins or veinlets (D). Chondrite
values used for normalization are from McDonough and Sun (1995).
62
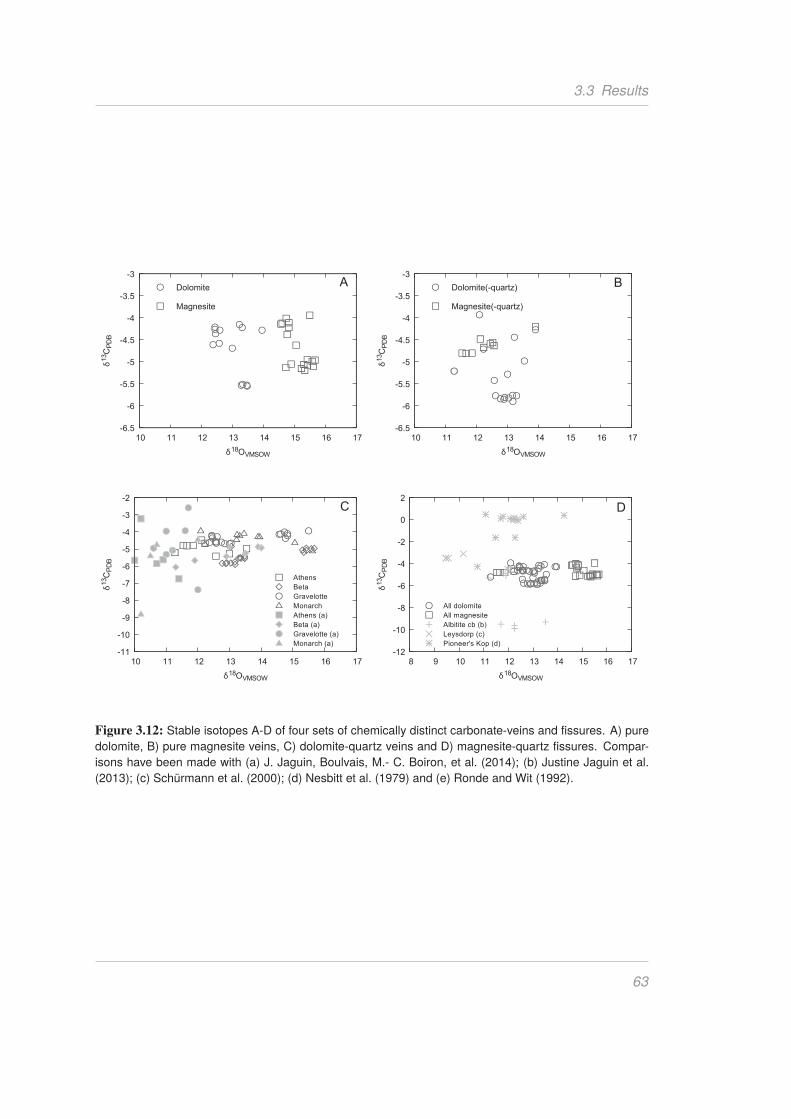
3.3 Resultsδ
δ
δ
δ
δ
δ
δ
δ
Figure 3.12: Stable isotopes A-D of four sets of chemically distinct carbonate-veins and fissures. A) pure
dolomite, B) pure magnesite veins, C) dolomite-quartz veins and D) magnesite-quartz fissures. Compar-
isons have been made with (a) J. Jaguin, Boulvais, M.- C. Boiron, et al. (2014); (b) Justine Jaguin et al.
(2013); (c) Schürmann et al. (2000); (d) Nesbitt et al. (1979) and (e) Ronde and Wit (1992).
63

Chapter 3 MGB
creased sulfur fugacities. The compositional consequences of degassing do not explain
the observed evolution of phase relations. The solubility of Sb (ppm) is contoured on
top of the solid phase relations in Figure 3.13c. The diagram depicts that Sb solubility
increases as aH2S goes down. Boiling and removal of HS will hence increase Sb solubil-
ity (cf. Hagemann and Lüders (2003)). The diagram also shows that increasing aH2 will
decrease Sb solubility. Hence Sb is quite soluble at 1 kb and 400 ◦C in a fluid in which
H2 and H2S are buffered by pyrite-hematite-magnetite. Fluids typical for serpentiniza-
tion have much lower Sb solubility. For a fluid to precipitate Sb in the stability field of
stibnite, increased aH2 at lowered aH2 would be ideal.
The reaction path model is set up to simulate the behavior of Sb, As, Fe, Cu, and
Au in a scenario that is consistent with the geological evolution of the AL in the MGB
(Vearncombe et al., 1992; J. Jaguin, Poujol, et al., 2013). In this scenario, intrusion
of the Maranda granodiorite into basement composed of sediments and peridotitic ko-
matiite gave rise to the primary Sb-mineralization in the tectonized and metasomatized
contact between the two lithologies. In a first step, the model assesses the solubility of
Sb, As, Fe, Cu, and Au within the granodiorite body (using average unmetasomatized
granodiorite composition from J. Jaguin, Poujol, et al. (2013)), under temperatures up to
600 ◦C. The model results indicate that at intermediate temperatures of 250-350 ◦C, the
solubility of Sb and As is greater than that of Fe and Cu (Figure 3.14a). In the following
step, we computed the geochemical consequences of reactions between 350 ◦C fluids
equilibrated with the granodiorite when such a fluid encounters ultramafic rock (using
average MGB serpentinite compositions from Madisha (1996) along its flow path.
The results indicate that even small amounts of ultramafic rock reacting with the fluids
would cause the solubilities of Sb and As (and Fe) to drop by 2-3 orders of magnitude,
while the solubility of Cu and Au would not be decreased along the same reaction path
64

3.3 Results
(Figure 3.14b). The levels of Fe that can be deposited are trivial compared to those of
As and Sb. This result suggests that the lithological contact between granodiorite and
komatiite would make an efficient trap for Sb and As, while Fe, Cu, and Au would not
be trapped very efficiently. It is the reducing conditions imposed by the serpentinization
of the komatiite that lowers the solubility of Sb. This relation is depicted in Figure 3.13c
which indicates high Sb solubilities only under conditions of fairly low H2 and high H2S
activities. Serpentinization environments, by contract are always characterized by high
H2 and low H2S activities (Klein and Bach, 2009).
Figure 3.14c predicts a primary mineralization of arsenopyrite-pyrrhotite-chalcopyrite-
gold-native antimony. In a second set of reaction path models, we reacted (1) fluid of
seawater salinity with quartz, albite, K-feldspar, muscovite, biotite, and calcitet at 500
◦C and (2) let this fluid react with metakomatiite and granodiorite (using the same rock
compositions as above), while cooling the system from 500 to 300 ◦C (Figure 3.15).
The initial fluid has an X(CO2) of 0.1, which is consistent with the compositions of
fluid inclusions in quartz from the AL (J. Jaguin, Boulvais, M.-C. Boiron, et al., 2014).
Initial As and Sb concentrations of 1000 ppm and a Au concentration of 1 ppm in the
starting fluid were assumed. These values are lower than solubility values for these ele-
ments in the starting fluid at 1 kbar and 500 ◦C. The results of these model runs indicate
that stibnite-rich quartz-magnesite rocks form from metakomatiite at high water-to-rock
rations at T<400 ◦C (Figure 3.15a). The chalcopyrite-pyrrhotite- berthierite assemblage
in this lithology is expected to be stable at lower water-to-rock ratios and higher tem-
peratures (Figure 3.15b). Arsenopyrite is predicted to be stable throughout much of the
reaction path. The granodiorite is predicted to form albite-quartz rich rocks with mi-
nor muscovite throughout much of the reaction path and quartz-stibnite rich rocks with
abundant dolomite at the highest water-to-rock ratios (Figure 3.15c). These model run
65

Chapter 3 MGB
-16-14-12-10 -12-10-8-6
5000 ppm
1000 ppm
500 ppm
100 ppm
100 ppm
500 ppm1000 ppm
Figure 3.13: Activity-activity diagram for 250 (a) and 350 ◦C (b) and 1 kb, of Fe-S-O system in blue and the
Fe-Sb-Cu-S-O-H system superimposed in red. Isopleths of sulfur fugacities are represented by the light
grey lines. Figure c shows the 250 ◦C activity-activity diagram with Sb concentrations contours in ppm.
66

3.3 Results
Figure 3.14:Reaction path modeling results revealing the compositions of fluids reacting with granodiorite,
while being heated up to 600 ◦C (a). Figure b shows the composition change of a fluid that was initially
equilibrated with granodiorite at 350 ◦C and then reacted with a metakomatiite. The concentrations of
antimony, arsenic, iron, copper and gold are presented and show different behaviors (depletions in Sb and
As vs. steady concentrations for Au and Cu). Figure c shows the sequences of mineral predicted to occur
while titrating the metakomatiite into the granodiorite-equilibrated fluid. See text for further details.
67
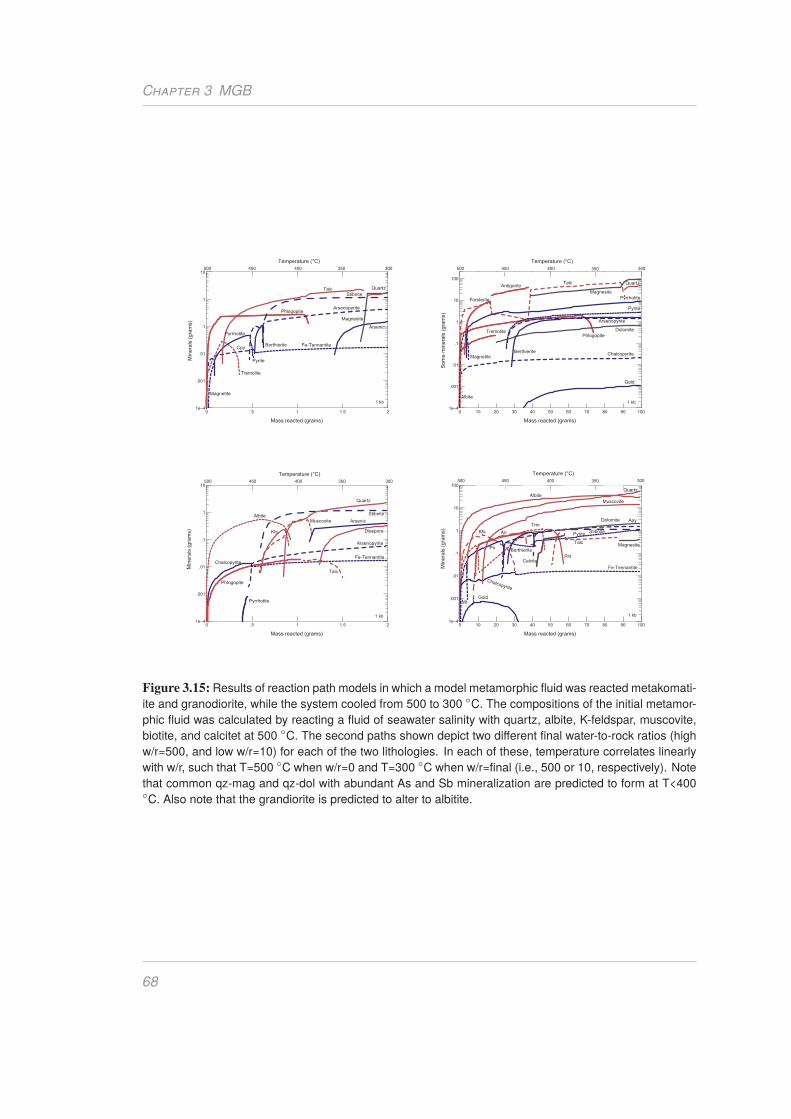
Chapter 3 MGB
Figure 3.15: Results of reaction path models in which a model metamorphic fluid was reacted metakomati-
ite and granodiorite, while the system cooled from 500 to 300 ◦C. The compositions of the initial metamor-
phic fluid was calculated by reacting a fluid of seawater salinity with quartz, albite, K-feldspar, muscovite,
biotite, and calcitet at 500 ◦C. The second paths shown depict two different final water-to-rock ratios (high
w/r=500, and low w/r=10) for each of the two lithologies. In each of these, temperature correlates linearly
with w/r, such that T=500 ◦C when w/r=0 and T=300 ◦C when w/r=final (i.e., 500 or 10, respectively). Note
that common qz-mag and qz-dol with abundant As and Sb mineralization are predicted to form at T<400◦C. Also note that the grandiorite is predicted to alter to albitite.
68

3.4 Discussion
results match the observed lithologies (listvenite and albitite) and mineralization (stib-
nite in quartz-carbonate rocks) remarkably well. Au enrichments on the order of up to
5-10 ppm are predicted to develop at intermediate and low water-to-rock rations in the
granodiorites (Figure 3.15d) and metakomatiites, respectively.
3.4 Discussion
3.4.1 Fluid source and temperatures of mineralization
The AL represents a suture zone in an Archaean greenstone Belt that features TTG
intrusions into the mafic-ultramafic/sedimentary basement. This suture zone has under-
gone multistage structural deformation and metasomatism (listvenitization) (2.0 Ga; J.
Jaguin, Boulvais, M.-C. Boiron, et al. (2014)). The events have carbonatized and sili-
cified the ultramafic host rock and deposited quartz-carbonate-stibnite veins that were
folded and boudinaged. The source of the metasomatizing fluids can be characterized
based on C and O isotopic compositions and fluid inclusions. Fluid inclusions have not
been incorporated in this study, due to the poor quality of the fluid inclusions. The MGB
has endured several deformation events over the 2.9 Ga that compromise the reliability
of the information to be retrieved from the fluid inclusions present. The most recent
published articles (J. Jaguin, Poujol, et al., 2013; J. Jaguin, Boulvais, M.-C. Boiron,
et al., 2014) have similarly investigated the stable isotopes and fluid inclusions of the
carbonates along the AL and have come with a more disperse isotope and temperature
data set (Figure 3.10). Their main objective was to investigate all the carbonates along
the AL, making no distinction which carbonates have been related to the Sb mineral-
ization, which is attempted in this study. Our data indicate that both magnesite and
69

Chapter 3 MGB
dolomite have a fairly uniform δ13C signature (≈ -5 ‰). J. Jaguin, Boulvais, M.-C. Bo-
iron, et al. (2014) find a larger range (-4 to -11‰) in their more diverse set of carbonate
samples from the AL. δ18O of the carbonates from the AL range from 11.5 to 16 ‰
(J. Jaguin, Boulvais, M.-C. Boiron, et al. (2014) and this work). The dolomite is uni-
formly around 13 ‰. Magnesite from Athens mine is lighter than magnesite from the
other mines. The discrepancy of δ18OV MSOW between the different mines may reflect
the distance between sample locations: Gravelotte and Athens mine lie ≈ 10 km apart
(Figure 3.1). Additionally, the Sb ore zones visited and sampled in every mine lie in sig-
nificantly different depths, from 0 to 1240 m (Table 3.2). δ18O of quartz associated with
the carbonates ranges from 12.9 to 15 ‰ in our data set, similar to the 11.9 to 14.3 ‰
range reported by J. Jaguin, Boulvais, M.-C. Boiron, et al. (2014). These data are gener-
ally similar to values retrieved for other mineralized Archaean greenstone belts. Ronde
and Wit (1992)has found slightly lighter δ13C (-4.4 to -2.2 ‰) values for Au-Sb asso-
ciated carbonates from similar fuchsite-carbonate-quartz or sericitet-carbonate-quartz
alteration zones and veins in the Barberton Greenstone belt. Their δ18O values (12-13.5
‰) overlap with those found in the AL (Figure 3.9). Likewise, Phanerozoic Sb-Au
deposits bound to quartz-carbonate veined listvenites show similarly heavy δ18O (4-16
‰) and δ13C values (-5 to -7 ‰) reconstructed for the metasomatizing fluids (Madu
et al. (1990) and references therein).
Schürmann et al. (2000) reports similar compositions of δ13C (-3.7 to -4.9 ‰) and
δ18O (12.8 to 13.2 ‰) from altered carbonatite dykes from the Barberton Greenstone
belt. If those dykes preserved the mantle signatures, their similarity in the δ13C and δ18O
signatures to the quartz-carbonate veins in the MGB and AL may indicate that the latter
are also derived from a mantle-derived fluid. But the larger range in δ13C reported by J.
Jaguin, Boulvais, M.-C. Boiron, et al. (2014) is more difficult to reconcile with a mantle
70

3.4 Discussion
origin. A perhaps more common hypothesis is that deep-seated fluids derived from de-
volatilization of metavolcanic and metasedimentary rocks released upon collision and
shearing from deeper crustal zones within the greenstone belt (McCuaig and Kerrich
(1998) and references therein). The calculated δ18OH2O ≈ 9 ‰ isotopic signature is
heavier than of modern hydrothermal vent fluids of 0.4-2.11 ‰ (De Ronde et al., 1997).
Jaffrés et al. (2007) calculated that Archaean seawater had δ18OV MSOW of -13 to -17 ‰
value at 2-3 Ga. Assuming a similar (2 ‰) fractionation during heating a reaction with
basement, Archaean seawater-derived hydrothermal solutions would have δ18OV MSOW
values of -11 to -15 ‰, which is >20 ‰ lighter than the reconstructed fluid signature.
We can hence exclude a marine source of the water that gave rise to the precipitation of
the MGB carbonate-quartz veins. In the Barberton GB, Ronde and Wit (1992) noted a
100 Ma hiatus between deformation and Sb-Au mineralization and ruled out devolati-
zation as a source for the ore-forming fluids. They argue that external fluids originating
from the contact of intruded tonalite underwent phase separation, which caused Sb-Au
mineralization to occur. Similarly, J. Jaguin, Poujol, et al. (2013) suggested a relation
between the intrusion of a TTG body (the Maranda and Baderoukwe intrusion) and the
antimony mineralization in the AL. However, the relation between the intrusion and Sb-
mineralization is more difficult to establish in the AL, because Sb-mineralization took
place synchronous with deformation and fuchsite-quartz-carbonate alteration 2 billion
years ago (J. Jaguin, Boulvais, M.-C. Boiron, et al., 2014). We suggest that the most
plausible source for water enriched in δ18O in low-grade mineralizations is metamor-
phic fluids or connate waters from sedimentary basins (cf., Wagner et al. (2010)). This
interpretation is in line with the fact that the regional carbonated schists away from
the mineralized zones and contact with granitoids show similar isotopic characteristics
(Kedda, 1992). The flat REE+Y patterns with the small positive Eu anomalies are con-
71

Chapter 3 MGB
sistent with a metamorphic origin of the fluids (Kontak and Jackson, 1999). The varia-
tions in total abundance may be due to variable fluid-to-rock ratios (Lottermoser, 1992)
or temperature (Kontak and Jackson, 1999). In addition, the positive Eu anomaly of the
inferred hydrothermal fluids could imply a low oxygen fugacity (Bau, 1991), although
this would be at odds with the presumed H2O-CO2 nature of the fluids. REE patterns of
replacive magnesite resemble those of ultramafic rocks, which confirms that magnesite
is an alteration product of komatiite. A clear distinction of REE+Y patterns can be seen
between dolomite and magnesite, as the distribution patterns of dolomite are flatter, with
higher ΣREE contents and positive Eu anomalies in a subset of the samples. It is to be
expected that a Ca-bearing mineral will be much more accommodating to incorpora-
tion of REE (and Eu+2 in particular) than a Mg-Fe phase. The fact that magnesite has
much lower ΣREE and light REE depleted patterns does therefore not indicate a differ-
ent source. The stable isotope data actually suggest that dolomite and magnesite formed
from the same fluid that also precipitated quartz. This can be concluded from the consis-
tent temperatures and reconstructed δ18O values of fluids we calculated using different
approaches. Also, the carbon isotopic composition of magnesite and dolomite are virtu-
ally identical to each other. We estimated the temperatures of the carbonatizing fluids to
be in the 350-400 ◦C range based on oxygen isotope magnesite-dolomite thermometry
of carefully selected samples (Chacko and Deines, 2008; Horita, 2014). Magnesite and
dolomite have fractionation factors for exchange with water that are different enough to
make a useful thermometer. The concept of combining multiple mineralization pairs to
estimate temperatures of listvenitization has been used before by Beinlich et al. (2012),
who deduced temperature of around 280 ◦C and then calculated δ18O of H2O of around
6-7‰. Our temperature estimates in the 350-400 ◦C range are generally consistent with,
although somewhat lower than, those estimated by J. Jaguin, Boulvais, M.-C. Boiron,
72

3.4 Discussion
et al. (2014) based on fluid inclusion work and phase relations (400-450 ◦C). J. Jaguin,
Boulvais, M.-C. Boiron, et al. (2014) presented δ18O data for pairs of calcitet and quartz
from the Malati pump location within the AL, that we used to calculate temperatures
between 340 and 380 ◦C using the Sharp and Kirschner (1994) calibration. In summary,
our mineral chemistry and geothermometry results suggest that metasomatic reactions
between metakomatiite and metagranodiorites (with the possible involvement of sedi-
ments) took place in the AL at temperatures roughly between 350 and 400 ◦C. The lack
of tremolite within the quartz-dolomite rocks of the AL confirms the geothermometry
results, indicating that the AL has not been exposed to amphibolite facies in the past
2.9 Ga (cf. Block et al. (2013)). At a temperature of 400 ◦C and 200 MPa pressure,
the X(CO2) of the fluid must have been >0.1 to account for the predominance of the
dolomite-quartz assemblage and the lack of talc-calcitet and tremolite-calcitet-quartz,
respectively. These moderate to high contents of CO2 in the fluid are consistent with the
compositions of fluid inclusions reported by J. Jaguin, Boulvais, M.-C. Boiron, et al.
(2014). These carbonic acid-rich fluids can be expected to be quite oxidizing, which
may seem at odds with the small positive Eu anomalies found in the dolomite-quartz
veins. However, at temperatures >250 ◦C and at high solution pH, fluids don’t have
to be particularly reduced to have dissolved Eu in its divalent redox state (Sverjensky,
1984).
3.4.2 Paragenetic constraints on metasomatic mass transfers in the
different lithological units
The exceedingly high Cr contents of chlorite, fuchsite, and dravite in the host rocks of
the quartz-carbonate-stibnite mineralization provide strong evidence for an ultramafic
73

Chapter 3 MGB
precursor lithology. Pearton (1980) suggested that these precursor rocks were peri-
dotitic komatiites, with low Ca and Al contents. Likewise, Madisha (1996) reported
whole rock and mineral chemical data of serpentinites from locations 25 and 33 km
ENE of the Gravelotte mine (Pike’s Kop and Pioneer Kop, respectively) indicative of
a peridotitic protolith composition. These komatiites are believed to have undergone
serpentinization, and locally carbonation, in a seafloor setting. This interpretation is
supported by the δ13C compositions of the carbonates, which are seawater-like (-2 to
1 ‰; Madisha (1996)) and clearly distinct from the carbonates in the Sb-mineralized
quartz-carbonate-fuchsite rocks in the main AL (-4.5 to -5.5 ‰). The serpentinites show
indications of prograde metamorphism (antigorite replacing lizardite) and deformation
(D1). They are not affected by the later deformation and Sb-mineralization events de-
veloped in the AL in the west. It is very likely, that these serpentinites represent the
ultramafic precursor rocks indicated by the Cr-enrichment of the chlorite and the abun-
dance of fuchsite in the AL. The high Cr contents suggest a relative mobile setting for
both Cr and Al, comparable to the listvenite in an ophiolite in S. Egypt (Emam and
Zoheir, 2013). Emam and Zoheir (2013) have found zonations of Cr within chlorite,
surrounding Cr-spinels. Likewise, Madisha (1996) reported the occurrence of Cr-rich
chlorite in association with partially altered Cr-spinel in serpentinites from the Pioneer
location. In the intensely quartz-carbonate altered metakomatiites in the main AL, Cr-
spinel has not been found, suggesting a complete alteration of spinel to chlorite (and
fuchsite). Conceivably, chromite was more pervasively altered during the severe flux-
ing by H2O-CO2 fluids that caused the quartz-carbonate-fuchsite alteration than during
serpentinization. However, at least on spatial scales greater than meters, Cr was appar-
ently immobile, which allows us to use it as tracer of an ultramafic protolith lithology.
Another indication of ultramafic precursors in the lithologies hosting the AL are the
74

3.4 Discussion
common appearance of Ni-bearing phases, like ullmannite and gersdorffite. Whereas
many of the dravite and chlorite analyses suggest very high Cr contents (and hence
point to an ultramafic precursor rock), an equally large population of the dataset shows
very low Cr contents, which are inconsistent with the concept of an ultramafic precur-
sor (Figure 3.9). We propose that the low Cr contents are due to the involvement of
other, metasedimentary or metagranodioritic lithologies that were in contact with the
metakomatiite. It is well established that pronounced metasomatic zonations, including
monomineralic zones of chlorite and talc, will develop by diffusional metasomatism at
the contact between ultramafic and felsic lithologies (e.g., Bach et al. (2013)).
We suggest that the common and spatially close relationship of chlorite and talc schist
represent such a lithological contact. It is likely that the diffusional metasomatism took
place during the prograde metamorphism that is preserved in the serpentinites in the
ENE extension of the AL (Madisha, 1996). During the main deformation (D1), the
talc-rich domains may have acted as lubricant and localized much of the strain, while
allowing ductile deformation to prevail under greenschist facies conditions. The ultra-
mafic rock unit was likely dismembered and intermingled with felsic lithologies, which
greatly enhanced the extent of metasomatic replacement. Later transtensional defor-
mation allowed large quantities of deeply rooted H2O-CO2 fluids to rise up and cause
fluid-infiltration-driven metasomatism of talc –> talc+dolomite –> magnesite+quartz.
The formation of fuchsite appears to be related to the alteration of chlorite, based on
textural relations in rocks that contain both phases (Madisha, 1996). The formation of
fuchsite was assisted by metasomatic mass transfers of K, Al, Si into and Mg as well as
Fe out of the fuchsite-bearing domains. Again, these mass transfers could be related to
the presence of felsic materials.
75

Chapter 3 MGB
3.4.3 Trapping mechanisms of Sb enrichment in the AL – the role of
metasomatic reactions
As mentioned before, most Sb-enriched deposits within orogenies are found within su-
ture zones where geochemically different rocks are juxtaposed against each other (Table
3.1). These juxtaposed rocks differ in acidity and/or reducing capacity. The intruded
granodiorites within the komatiite at the AL of the MGB are predominantly TTG suites,
which are known for their H2O-rich composition (Vearncombe, 1991; Condie, 2005;
Martin et al., 2005). Felsic volcanic / volcaniclastic rocks, such as the ones in the
Weigel formation that hosts the AL, are enriched in Sb (Boyle and Jonasson, 1984). The
metavolcaniclastic rocks of the Weigel formation host small TTG intrusive bodies, with
are in part albitized in particular in proximity to the Sb-mineralized quartz-carbonate
rocks (J. Jaguin, Boulvais, M.-C. Boiron, et al., 2014). As we discussed in the previous
section, the massive quartz-carbonate rocks that host the stibnite mineralization rep-
resent metasomatized komatiites, which were probably peridotitic in composition (cf.
Vearncombe et al. (1992)). The original komatiites that were part of the volcanic / vol-
caniclastic sequence of the Weigel formation were probably not enriched in Sb (Boyle
and Jonasson, 1984). However, the metasomatosed and veined metakomatiites are al-
ways associated with Sb mineralizations in the AL. This observation may indicate that
there is a relation between the Sb mineralization and the metasomatic events that af-
fected the komatiites and particularly the interfaces of komatiitic and felsic units. This
idea is corroborated by the results of the geochemical reaction path models (Section
3.5) indicating the solubilities of Sb drop by two orders of magnitude when percolating
fluids move across a lithologiy boundary from felsic into ultramafic rocks. Likewise the
solubility of As (and Au) will drop along the same reaction path. These reactions could
76

3.4 Discussion
have been taking place in the course of hydrothermal alteration in the original geotec-
tonic setting of the MGB, which is likely an arc/backarc setting (Vearncombe, 1991).
A submarine back-arc-related origin is indeed what Schwarz-Schampera et al. (2010)
proposed as most plausible setting in which the Cu-Zn line formed. This interpretation
of the Cu-Zn line in terms of synvolcanic VMS deposits put a firm age constraint on this
mineralization event: the Rubbervale volcanics were age-dated at 2.97±0.02 Ga (Pou-
jol, 1996). The Cu-Zn line runs parallel to the AL and follows the contact between the
felsic Rubbervale formation and the nearby Weigel formation (felsic-mafic-ultramafic).
It is conceivable, then, that hydrothermal circulation of seawater mobilized Sb and As
from the enriched felsic extrusives (modern felsic-rock hosted hydrothermal vents are
enriched in these elements; Douville et al. (1999)). The initial Sb-As-Fe-S mineraliza-
tion in the AL (with gudmundite, berthierite, pyrrhotite, pyrite, and arsenopyrite being
the main phases) may have formed in this type of seafloor setting, similar to the Cu-Zn
line. The volcanic and volcaniclastic rocks forming the Weigel formation are 3.09±0.01
Ga in age (Poujol, 1996), so apparently older than the Rubbervale volcanics. The two
might still be related as arc/back-arc systems do have lifetimes on the order of 10s of
millions of years. Potential traps of this original mineralization could have been the
seafloor (in analogy to the Cu-Zn line) or the lithologic boundary between felsic and ul-
tramafic rocks. The former scenario would correspond to the well-established concept
of mixing between hot, reducing, and acidic hydrothermal solutions with seawater and
cooling, neutralization and oxidation as trapping mechanism. Our modeling shows the
other trapping mechanism affective in lowering metalloid solubility by neutralization
and reduction may be related to serpentinization of the komatiite units. We are not the
first ones to propose this sort of trapping mechanism. In fact, Normand et al. (1996)
suggested that serpentinization would lead to the reduction of dissolved trivalent Sb and
77

Chapter 3 MGB
the precipitation of Sb as gudmundite or native Sb. The rationale behind Normand et
al.’s model is that the dominant Sb species in solution is probably Sb(OH)30(Williams-
Jones and Norman, 1997) and during serpentinization the oxygen fugacity will drop so
much that native Sb is expected to form according to:
Sb(OH)03= Sb(s)+3/2H2O+3/4O2 (3.6)
Our model calculations fully support this idea. It is noteworthy in this context to
point out that it is not the consumption of oxygen but the release of dihydrogen by
serpentinization that generates the driving force for this reaction:
2Sb(OH)03+3H2(aq) = 2Sb(s)+6H2O (3.7)
Only serpentinites will provide this type of trap, because the amounts of dihydro-
gen produced during serpentinization are orders of magnitude higher than during al-
teration of mafic or felsic rocks (e.g., McCollom and Bach (2009). In contrast to the
Cu-Zn line mineralizations and also the arsenopyrite-dominated mineralization within
theWeigel formation, the main Sb-mineralization in the AL is clearly structurally bound
and formed coevally with the carbonation and silicification event (listvenitzation). This
carbonation/silicification event took place during D2 and was caused by fluxing of the
shear zone by CO2-rich fluids. Stibnite is closely associated with the quartz-carbonate
altered rocks and veins. The D2 event has been associated with a tectono-thermal event
that affected the MGB roughly 2.75 Ga (Block et al., 2013). The 2.97-2.90 Ga old
78

3.4 Discussion
TTG intrusions were hydrothermally altered during this event; the albitites in the AL
are product of this alteration and have been assigned a key role in the Sb enrichment
(J. Jaguin, Poujol, et al., 2013). The occurrence of the stibnite in the AL (concentrated
in tension gashes of and in pressure shadows behind boudins) indicates that it is heavily
dynamically recrystallized during the D2 event. It is uncertain how the Sb enrichment
came about. A number of options appear plausible:
(1) Sb enrichment was already developed along with As and Fe (as in the submarine
hydrothermal scenario) and the reduced assemblage was later altered to stibnite, while
Fe and As were mobilized. This hypothesis is plausible from a phase etrology point
of view, because the intense fluxing by fluids would lead to an expected increase in
the variance of the system (i.e. a decrease in the number of phases stable). Another
possibility (2) is that the Sb was delivered by the fluxing fluids, like it is assumed in
the formation of typical orogenic Sb-Au deposits (Goldfarb and Groves, 2015). Within
this conceptual model, numerous different geochemical processes have been proposed,
invoking various fluid regimes, to be responsible of trapping economically important
Sb deposits, with stibnite as dominant phase (Davis et al., 1986). It has been estab-
lished that Sb is mostly associated with other elements (Au, As, Hg) within hypogene
deposits in brittle faults of orogenic suture zones (Goldfarb and Groves, 2015). Adding
H2S decreases Sb solubility at temperatures >250 ◦C, but solubility of Sb is generally
high at these temperatures regardless of the sulfide concentration in the system (Hage-
mann and Lüders, 2003; Obolensky, Gushchina, Borisenko, Borovikov, and Pavlova,
2007). Adding or removing H2S were hence likely not involved in the trapping mech-
anisms that led to the Sb enrichment in the AL. At these temperatures, both oxidizing
and reducing fluids can cause Sb mineralization. Fluids in which CO2 is the dominant
carbon species will favor stibnite, whereas more reducing CH4–bearing fluids will have
79

Chapter 3 MGB
native antimony and gudmundite form (Normand et al., 1996; Obolensky, Gushchina,
Borisenko, Borovikov, and Pavlova, 2007). We have shown that conditions under which
pyrrhotite is stable favour those reduced Sb minerals at 350 ◦C (Figure 3.14a). Both CO2
and CH4 dominant fluids could have been present in the AL, as CO2 is converted into
CH4 by during serpentinization favoring reduced and sulfur poor mineral assemblages
assemblages (Normand et al., 1996). Normand et al. (1996) suggested that stibnite can
form by alteration of gudmundite caused by acidic and/or iron poor fluids. One trap-
ping mechanims proposed is adiabatic cooling in these shear zones causes a drop in Sb
solubility (Williams-Jones and Norman, 1997).
Other (more efficient) cooling mechanisms include degassing of CO2 (2.5◦C / %CO2
degassing; Hagemann and Lüders (2003)) and isoenthalpic boiling (Obolensky, Gushchina,
Borisenko, Borovikov, and Pavlova, 2007). Adiabatic cooling may drive CO2 vand re-
lated cooling along fault zone movement lowering antimony saturation (Hagemann and
Lüders, 2003). This process is expected to play a role at temperatures <300 ◦C, where
there is a clear solvus in the CO2-H2O-NaCl system at pressures between 1 and 3 kbar
(Dubacq et al., 2013).
This study and earlier work (J. Jaguin, Boulvais, M.-C. Boiron, et al., 2014) have
shown that the temperatures of formation of the AL mineralization are much greater
than 300 ◦C, so it appears unlikely that cooling by CO2 unmixing played a major role as
antimony trap. There are two types of Sb mineralization in the AL. An apparently pri-
mary assemblage of berthierite, ullmannite and gudmnudite that co-occurs with pyrite,
chalcopyrite and pyrrhotite (Figure 3.5). A second type of Sb mineralization has stib-
nite as sole Sb-mineral, which is accompanied by rare berthierite and pyrite. In this
apparently secondary formation, stibnite has been mobilized. and reprecipitated in ten-
sion gashes and pressure shadows. This low variance assemblage essentially indicates
80

3.4 Discussion
rock-buffered conditions, and this mineralization is indeed developed in metamorphosed
and weakly metasomatized host rocks. In contrast, the other type of Sb mineraliza-
tion has stibnite as sole Sb-mineral, which is accompanied by pyrite-pyrrhotite. This
high-variance assemblage indicates open system fluid-dominated conditions of recrys-
tallization and is indeed developed only in the most heavily metasomatized listvenite
and albitite units and in carbonate-quartz veins. The type I assemblage is preserved in
less intensely carbonated domains, such as chlorite and talc schists. It has been shown
before, that dropping f O2 and f S2 fugacities decreases the Sb solubility by two orders of
magnitude (Obolensky, Gushchina, Borisenko, Borovikov, and Nevol’ko, 2009). Our
model calculations fully supports this notion. Thus, precipitation of Sb from such a
fluid is expected to occur close to a serpentinization metasomatic front (Normand et al.,
1996). Again, our model calculations suggest that serpentinization environments do
make for an efficient trap for Sb. CO2-rich fluid will radically change the redox condi-
tions and acidity, increasing the oxygen fugacity (f O2) and sulfur fugacity (f S2) (Klein
and Garrido, 2011) and recrystallizing pure Sb to berthierite and then stibnite within the
quartz-carbonate alteration veins (Hagemann and Lüders, 2003; Obolensky, Gushchina,
Borisenko, Borovikov, and Nevol’ko, 2009). This second mineralization stage involves
the input of deeply rooted H2O and CO2. CO2 enriched fluids are expected to oxidize
H2S, HS− and Sb-Au species within the fluid and solubilize Sb (Kerrich and Fyfe, 1981;
Boyle and Jonasson, 1984; Normand et al., 1996; Phillips and Evans, 2004; Obolensky,
Gushchina, Borisenko, Borovikov, and Nevol’ko, 2009). In the AL apparently this mo-
bilization of Sb has not taken place. Instead stibnite is enriched in quartz-carbonate
veins that are invariably associated with metakomatiite. This relation is manifest by
the enrichment of Cr within chlorite and muscovite (fuchsite) in the AL. Similar as-
sociations between metal enrichment of Au-Co-Sb has been linked to carbonation in
81

Chapter 3 MGB
the contact between felsic and ultramafic protoliths (Hansen et al., 2005; Emam and
Zoheir, 2013). The carbonization of the reduced komatiite, prevents the sulfide in the
fluids from becoming oxidized and maintains a trap for Sb. Apparently this trap is ef-
ficient even at temperatures of 350-400 ◦C, where cooling by CO2 exsolution does not
take place. Albitization has been linked to the CO2 fluxing and, thus, to listveniza-
tion (J. Jaguin, Boulvais, M.-C. Boiron, et al., 2014; Halls and Zhao, 1995). Thus, the
abundance of (albitized) quartz veins, within the metagranodiorite, reveals that silica
(including Sb and K) has been mobilized in the system (J. Jaguin, Poujol, et al., 2013)
by the same fluid that has been responsible for listvenization of the ultramafic protolith
(Halls and Zhao, 1995). This idea is entirely consistent with the results of our model
calculations, indicating that albitization of granodiorite and quartz-carbonate-stibnite
alteration of the metakomatiite in the AL could have been caused by the same CO2-rich
metamorphic fluid. Albitization has been dated at 2.8 Ga with an overprinting event
at 2.0 Ga (J. Jaguin, Boulvais, M.-C. Boiron, et al., 2014). As fuchsite clearly formed
during this listvenitization event, which has been dated at roughly 2.0 Ga (J. Jaguin,
Boulvais, M.-C. Boiron, et al., 2014; Sperner and Pfänder, n.d.). In fact, a very large
number of fuchsite separates from different mines in the AL gives ages that fall in a
very tight range between 2.00 and 2.04 Ga. Regardless of whether the age of the Sb
mineralization in the AL is 2.0 or 2.8 Ga, the MGB has undergone multiple extensive
structural events, causing dominant ductile and brittle deformation. The Sb enrichment
is clearly related to the D2 deformation and associated carbonation and silicification.
82

3.5 Summary and conclusions
3.5 Summary and conclusions
We assign a key role in the origin, trapping and (re)mobilizing of the Sb-species and
minerals to the presence of ultramafic rocks in the AL. The Sb enrichment is likely due
to suprasubduction-related submarine hydrothermal systems that were active contem-
peranously with the volcanic construction of the Weigel formation. The deeply rooted
CO2-rich fluids wiped out much of the primary mineral association and led to a uniform
stibnite-carbonate-quartz association. The high variance of this association is indica-
tive of major fluid-assisted metasomatic mass transfers. Those fluids were most likely
released from deep-seated prograde metamophic reactions releasing a H2O-CO2-rich
fluid phase that could migrate up the suture zone in which the AL is developed. Below
temperatures of around 400 ◦C, the ultramafic rocks were listvenitized and impregnated
by stibnite. The model calculations presented also help explain the origin of the albitites
that are also developed in the AL. The same fluid that turns metakomatiite into listvenite
is predicted to replace granodiorite by albitite, which is mineralized weakly by stibnite
and arsenopyrite. We propose that metasomatic reactions involving ultramafic rocks
may make for efficient traps of Sb and likely other elements (As, Ag, Hg, Au). They
may play a general role in the formation of many orogenic lode deposits.
3.6 Acknowledgements
The authors thank the management and acting geologists of Consolidated Murchison
Limited (ConsMurch) for their assistance and cooperation during our fieldwork in 2013.
Stephan Sopke, Andreas Klügel, PatrickMonien from the Universität Bremen are thanked
for their assistance in conducting the geochemical measurements. Moritz Wagner and
83

Bibliography
Michael Hentscher helped with assembling the thermodynamic databases. We thank
Chris Heinrich (ETH Zurich) for making his compilation of aqueous Au-species avail-
able to us. We thank Dr. Sperner (Freiberg University) for the numerous insightful
discussions. Furthermore, we would like to thank Barbara Mader (Universität Kiel) and
Dr. Jöns (Universität Bochum) for their extensive help with the EMPA.
Bibliography
Akinfiev, N.N. and A.V. Zotov (2010). “Thermodynamic description of chloride, hydrosulfide, and hy-
droxo complexes of Ag(I), Cu(I) and Au(I) at temperatures of 25-500◦C and pressures of 1-2000 bar”.
In: Geochemistry Int. 39.10, pp. 990–1006. DOI: 10.1134/S0016702910070074.
Anhaeusser, C.R. (1976). “Archean Metallogeny in Southern Africa”. In: Econ. Geol. 71, pp. 16–43.
Bach, W., N. Jöns, and F. Klein (2013). “Metasomatism of the ocean crust”. In: Metasomatism Meta-
morph. Ed. by D.E. Harlov and H. Austrheim. Springer, pp. 253–288. DOI: 10.1007/978-3-642-
28394-9_8.
Bau, M. (1991). “Rare-earth element mobility during hydrothermal and metamorphic fluid-rock interac-
tion and the significance of the oxidation state of europium”. In: Chem. Geol. 93.3-4, pp. 219–230.
DOI: 10.1016/0009-2541(91)90115-8.
Beinlich, A. et al. (2012). “Massive serpentinite carbonation at Linnajavri, N-Norway”. In: Terra Nov.
24.6, pp. 446–455. DOI: 10.1111/j.1365-3121.2012.01083.x.
Bernasconi, A, N. Glover, and R.P. Viljoen (1980). “The Geology and Geochemistry of the Senator An-
timony Deposit- Turkey”. In: Miner. Depos. 15, pp. 259–274.
Bhattacharya, S. et al. (2014). “Oxygen isotope ratio of quartz veins from the auriferous Ramagiri–Penakacherla
schist belt and surrounding granitoids in the Eastern Dharwar craton: A case for a possible link be-
tween gold mineralization and granite magmatism”. In: Ore Geol. Rev. 63, pp. 201–208. DOI: 10.
1016/j.oregeorev.2014.04.023.
84

Bibliography
Block, S. et al. (2013). “The Murchison Greenstone Belt, South Africa: Accreted slivers with contrasting
metamorphic conditions”. In: Precambrian Res. 227, pp. 77–98. DOI: 10.1016/j.precamres.
2012.03.005.
Boyle, R.W. and I.R. Jonasson (1984). “The geochemistry of antimony and its use as an indicator element
in geochemical prospecting”. In: J. Geochemical Explor. 20, pp. 223–302.
Buchholz, P. and T. Oberthür (2007). “Multistage Au-As-Sb Mineralization and Crustal-Scale Fluid Evo-
lution in the Kwekwe District , Midlands Greenstone Belt , Zimbabwe : A Combined Geochemical ,
Mineralogical , Stable Isotope , and Fluid Inclusion Study”. In: Econ. Geol. 102.1994, pp. 347–378.
Castro, S.H. and L. Baltierra (2005). “Study of the surface properties of enargite as a function of pH”. In:
Int. J. Miner. Process. 77.2, pp. 104–115. DOI: 10.1016/j.minpro.2005.03.002.
Chacko, T. and P. Deines (2008). “Theoretical calculation of oxygen isotope fractionation factors in car-
bonate systems”. In: Geochim. Cosmochim. Acta 72.15, pp. 3642–3660. DOI: 10.1016/j.gca.2008.
06.001.
Condie, K.C. (2005). “TTGs and adakites: are they both slab melts?” In: Lithos 80.1-4, pp. 33–44. DOI:
10.1016/j.lithos.2003.11.001.
Davis, D.R., D.B. Paterson, and D.H.C. Griffith (1986). “Antimony in South Africa”. In: J. S. Afr. Inst.
Min. Met. 86.6, pp. 173–193.
De Ronde, C.E.J. et al. (1997). “Fluid chemistry of Archean seafloor hydrothermal vents: Implications
for the composition of circa 3.2 Ga seawater”. In: Geochim. Cosmochim. Acta 61.19, pp. 4025–4042.
DOI: 10.1016/S0016-7037(97)00205-6.
Douville, E. et al. (1999). “Le comportement de I’arsenic (As) et de I’antimoine (Sb) dans les fluides
provenant de diffkents systgmes hydrothermaux océaniques”. In: Earth Planet. Sci. 328.2, pp. 97–
104.
Dubacq, B. et al. (2013). “An activity model for phase equilibria in the H2O-CO2-NaCl system”. In:
Geochim. Cosmochim. Acta 110, pp. 229–252.
Emam, A. and B. Zoheir (2013). “Au and Cr mobilization through metasomatism: Microchemical evi-
dence from ore-bearing listvenite, South Eastern Desert of Egypt”. In: J. Geochemical Explor. 125,
pp. 34–45. DOI: 10.1016/j.gexplo.2012.11.004.
Firdu, F.T. and P. Taskinen (2010). “Thermodynamics and phase equilibria in the (Ni, Cu, Zn)–(As, Sb,
Bi)–S systems at elevated temperatures (300–900 C)”. In: Espoo Aalto Univ. Publ. Mater. . . . Pp. 1–59.
85

Bibliography
Goldfarb, R.J. and D.I. Groves (2015). “Orogenic gold: Common or evolving fluid and metal sources
through time”. In: Lithos. DOI: 10.1016/j.lithos.2015.07.011.
Hagemann, S.G. and V. Lüders (2003). “P-T-X conditions of hydrothermal fluids and precipitation mecha-
nism of stibnite-gold mineralization at the Wiluna lode-gold deposits, Western Australia: conventional
and infrared microthermometric constraints”. In: Miner. Depos. 38.8, pp. 936–952. DOI: 10.1007/
s00126-003-0351-6.
Halls, C. and R. Zhao (1995). “Listvenite and related rocks: perspectives on terminology and mineralogy
with reference to an occurrence at Cregganbaun, Co. Mayo, Republic of Ireland”. In: Miner. Depos.
30.3-4, pp. 303–313. DOI: 10.1007/BF00196366.
Hansen, L.D. et al. (2005). “Carbonated serpentinite (listwanite) at Atlin, British Columbia: A geological
analogue to carbon dioxide sequestration”. In: Can. Mineral. 43.1, pp. 225–239. DOI: 10.2113/
gscanmin.43.1.225.
Horita, J. (2014). “Oxygen and carbon isotope fractionation in the system dolomite – water – CO2 to
elevated temperatures”. In: Geochemica Cosmochim. 129, pp. 111–124.
Jaffrés, J.B.D., G.A. Shields, and K. Wallmann (2007). “The oxygen isotope evolution of seawater: A
critical review of a long-standing controversy and an improved geological water cycle model for the
past 3.4 billion years”. In: Earth-Science Rev. 83, pp. 83–122. DOI: 10.1016/j.earscirev.2007.
04.002.
Jaguin, J., P. Boulvais, M.- C. Boiron, et al. (2014). “Stable isotopes (O, C) and fluid inclusion study
of quartz-carbonate veins from the antimony line, Murchison Greenstone Belt”. In: Am. J. Sci. 314.7,
pp. 1140–1170. DOI: 10.2475/07.2014.03.
Jaguin, J., P. Boulvais, M.-C. Boiron, et al. (2014). “Stable isotopes (O, C) and fluid inclusion study of
quartz-carbonate veins from the antimony line, Murchison Greenstone Belt”. In: Am. J. Sci. 314.7,
pp. 1140–1170. DOI: 10.2475/07.2014.03.
Jaguin, J., M. Poujol, et al. (2013). “Albitization in the Antimony Line, Murchison Greenstone Belt
(Kaapvaal Craton): A geochemical and geochronological investigation”. In: Lithos 168-169, pp. 124–
143. DOI: 10.1016/j.lithos.2013.01.010.
Jaguin, Justine et al. (2013). “Albitization in the Antimony Line, Murchison Greenstone Belt (Kaapvaal
Craton): A geochemical and geochronological investigation”. In: Lithos 168-169, pp. 124–143. DOI:
10.1016/j.lithos.2013.01.010.
86

Bibliography
Johnson, J.W., E.H. Oelkers, and H.C. Helgeson (1992). SUPCRT92: A software package for calculating
the standard molal thermodynamic properties of minerals, gases, aqueous species, and reactions from
1 to 5000 bar and 0 to 1000◦C. Vol. 18. 7. Pergmamon Press Ltd, pp. 899–947. DOI: 10.1016/0098-
3004(92)90029-Q.
Kantar, Cetin (2002). “Solution and flotation chemistry of enargite”. In: Colloids Surfaces A Physic-
ochem. Eng. Asp. 210.1, pp. 23–31. DOI: 10.1016/S0927-7757(02)00197-8.
Kedda, S.W. (1992). “Geochemical and stable isotope studies of gold bearing granitoids in the Murchison
Schist Belt, North Eastern Transvaal”. Dissertation. University of the Witwatersrand, Johannesburg.
Kerrich, R. and W.S. Fyfe (1981). “The gold-carbonate assocation: Source of CO2 and CO2 fixation
reactions reactions in Archaean lode deposits”. In: Chem. Geol. 33, pp. 265–294.
Klein, F. and W. Bach (2009). “Fe-Ni-Co-O-S Phase Relations in Peridotite-Seawater Interactions”. In:
J. Petrol. 50.1, pp. 37–59. DOI: 10.1093/petrology/egn071.
Klein, F. and C.J. Garrido (2011). “Thermodynamic constraints on mineral carbonation of serpentinized
peridotite”. In: Lithos 126.3-4, pp. 147–160. DOI: 10.1016/j.lithos.2011.07.020.
Kontak, D.J. and S.J. Jackson (1999). “Documentation of variable trace- and Rare Earth Element abun-
dances in carbonates veins from quartz in Meguma lode-gold Nova Scotia deposits”. In: Can. Mineral.
37, pp. 469–488.
Kretschmar, U. and S.D Scott (1976). “Phase relations involving arsenopyrite in the system Fe-As-S and
their application”. In: Can. Mineral. 14, pp. 364–386.
Krupp, E (1988). “Solnbility of stibnite in hydrogen sulfide solutions, speciation, and equilibrium con-
stants, from 25 to 350 ◦ C”. In: Geochemica Cosmochim. 52, pp. 3005–3015.
Lottermoser, B.G. (1992). “Rare earth elements and hydrothermal ore formation processes”. In: Ore Geol.
Rev. 7.1, pp. 25–41. DOI: 10.1016/0169-1368(92)90017-F.
Lynch, D C (1982). “Standard Free Energy of Formation of NiAsS”. In: Metall. Mater. Trans. B 13.June,
pp. 285–288.
Madisha, M.E. (1996). “Carbonate alteration of serpentinite in the Murchison Greenstone Belt, Kaapvaal
Craton: Implication for gold mineralization”. PhD thesis. Rand Afrikaans University.
Madu, B. E., B.E. Nesbitt, and K. Muehlenbachs (1990). “A mesothermal gold-stibnite-quartz vein oc-
curence in the Canadian Cordillera”. In: Econ. Geol. 85, pp. 1260–1268.
87

Bibliography
Martin, H. et al. (2005). “An overview of adakite, tonalite–trondhjemite–granodiorite (TTG), and sanuk-
itoid: relationships and some implications for crustal evolution”. In: Lithos 79.1-2, pp. 1–24. DOI:
10.1016/j.lithos.2004.04.048.
McCollom, T.M. and W. Bach (2009). “Thermodynamic constraints on hydrogen generation during ser-
pentinization of ultramafic rocks”. In: Geochim. Cosmochim. Acta 73.3, pp. 856–875. DOI: 10.1016/
j.gca.2008.10.032.
McCourt, S. and D. van Reenen (1992). “Structural geology and tectonic setting of the Sutherland Green-
stone Belt, Kaapvaal Craton, South Africa”. In: Precambrian Res. 55, pp. 93–110.
McCuaig, T.C. and R. Kerrich (1998). P—T—t—deformation—fluid characteristics of lode gold deposits:
evidence from alteration systematics. Vol. 12. 6, pp. 381–453. DOI: 10.1016/S0169- 1368(98)
80002-4.
McDonough, W.F. and S.-s. Sun (1995). McDonough_Sun(CG_95).pdf.
Moritz, R.P. and J.H. Crocket (1991). “Hydrothermal Wall-rock alteration and formation of the gold-
bearing quartz-fuchsite vein at the Dome Mine, Timmins Area, Ontario, Canada”. In: Econ. Geol. 86,
pp. 620–643.
Moritz, R.P., J.H. Crocket, and A.P. Dickin (1990). “Source of lead in the gold-bearing quartz-fuchsite
vein at the Dome mine , Timmins area , Ontario , Canada”. In: Miner. Depos. 280, pp. 272–280.
Nesbitt, R W, S.-S. Sun, and A.C. Purvis (1979). “Komatiites: Geochemistry and genesis”. In: Can.
Mineral. 17, pp. 165–186.
Normand, C., M. Gauthier, and M. Jébrak (1996). “The Québec Antimony deposit: An example of gud-
mundite - native antimony mineralization in the Ophiolitic mélange of the Southeastern Québec ap-
palachians”. In: Econ. Geol. 91.1, pp. 149–163. DOI: 10.2113/gsecongeo.91.1.149.
Obolensky, A.A., L.V. Gushchina, A.S. Borisenko, A.A. Borovikov, and P.A. Nevol’ko (2009). “Com-
puter thermodynamic modeling of the transport and deposition of Sb and Au during the formation of
Au-Sb deposits”. In: Russ. Geol. Geophys. 50.11, pp. 950–965. DOI: 10.1016/j.rgg.2009.10.004.
Obolensky, A.A., L.V. Gushchina, A.S. Borisenko, A.A. Borovikov, and G.G. Pavlova (2007). “Antimony
in hydrothermal processes: solubility, conditions of transfer, and metal-bearing capacity of solutions”.
In: Russ. Geol. Geophys. 48, pp. 992–1001. DOI: 10.1016/j.rgg.200.
Phillips, G.N. and K.A. Evans (2004). “Role of CO2 in the formation of gold deposits”. In: Nat. Publ. Gr.
429, pp. 860–863. DOI: 10.1038/nature02672.1..
88

Bibliography
Pokrovski, G.S. et al. (2006). “Antimony speciation in saline hydrothermal fluids: A combined X-ray
absorption fine structure spectroscopy and solubility study”. In: Geochim. Cosmochim. Acta 70.16,
pp. 4196–4214. DOI: 10.1016/j.gca.2006.06.1549.
Poujol, M. (1996). “3.07-2.97 Ga Greenstone Belt formation in the northeastern Kaapvaal Craton: Impli-
cations for the origin of the Witwatersrand Basin”. In: Econ. Geol. 91, pp. 1455–1461.
– (2001). “U-Pb isotopic evidence for episodic granitoid emplacement in the Murchison greenstone belt,
South Africa”. In: J. African Earth Sci. 33.1, pp. 155–163.
Ronde, C.E.J. de andM.J. deWit (1992). “Shear Zone-Related , Au Quartz Vein Deposits in the Barberton
Greenstone Africa : Field and Petrographic Characteristics , Fluid Properties , and Light Stable Isotope
Geochemistry”. In: 87, pp. 366–402.
Schock, E.L. et al. (1997). “Inorganic species in geologic fluids: correlations among standard molal ther-
modynamic properties of aqueous ions and hydroxide complexes.” In: Geochemica Cosmochim. 61.5,
pp. 907–950. DOI: 10.1017/CBO9781107415324.004. arXiv: arXiv:1011.1669v3.
Schürmann, L.W. et al. (2000). “Carbonate dykes associated with Archaean lode-Au mineralisation, Bar-
berton greenstone belt, South Africa”. In: J. African Earth Sci. 30.2, pp. 249–266.
Schwarz-Schampera, U., H. Terblanche, and T. Oberthür (2010). “Volcanic-hosted massive sulfide de-
posits in the Murchison greenstone belt, South Africa”. In: Miner. Depos. 45, pp. 113–145. DOI:
10.1007/s00126-009-0266-y.
Seal, R.R., E.J. Essene, and W.C. Kelly (1990). “Tetrahedrite and tennantite: Evaluation of thermody-
namic data and phase equilibria”. In: Can. Mineral. 28, pp. 725–738.
Seal, R.R., R.A. Robie, P.B. Barton, et al. (1992). “Superambient heat capacities of synthetic stibnite,
berthierite, and chalcostibite; revised thermodynamic properties and implications for phase equilibria”.
In: Econ. Geol. 87.7, pp. 1911–1918. DOI: 10.2113/gsecongeo.87.7.1911.
Seal, R.R., R.A. Robie, B.S. Hemingway, et al. (1996). “Heat capacity and entropy at the temperatures
5 K to 720 K and thermal expansion from the temperatures 298 K to 573 K of synthetic enargite
(Cu3AsS4)”. In: J. Chem. Thermodyn. 28.4, pp. 405–412. DOI: 10.1006/jcht.1996.0040.
Sharp, Z.D. and D.L. Kirschner (1994). “Quartz-calcite oxygen isotope thermometry: A calibration based
on natural isotopic variations”. In: Geochim. Cosmochim. Acta 58.21, pp. 4491–4501.
Shikazono, N. and M. Shimizu (1988). “Mercurian gold from the tsugu gold-antimony vein deposit in
japan”. In: Can. Mineral. 26, pp. 423–428.
89

Bibliography
Sperner, B. and J.A. Pfänder. “Insights into evolution and ore mineralisation of the Murchison Greenstone
Belt (South Africa) from 40 Ar / 39 Ar dating”. In: pp. 39–40.
Stefánsson, A. and T.M. Seward (2003a). “Stability of chloridogold(I) complexes in aqueous solutions
from 300 to 600◦C and from 500 to 1800 bar”. In: Geochim. Cosmochim. Acta 67.23, pp. 4559–4576.
DOI: 10.1016/S0016-7037(03)00391-0.
– (2003b). “The hydrolysis of gold(I) in aqueous solutions to 600◦c and 1500 bar”. In: Geochim. Cos-
mochim. Acta 67.9, pp. 1677–1688. DOI: 10.1016/S0016-7037(02)01131-6.
– (2004). “Gold(I) complexing in aqueous sulphide solutions to 500◦C at 500 bar”. In: Geochim. Cos-
mochim. Acta 68.20, pp. 4121–4143. DOI: 10.1016/j.gca.2004.04.006.
Sverjensky, D.A. (1984). “Europium redox equilibria in aqueous solution ’ n t”. In: Earth Planet. Sci.
Lett. 67, pp. 70–78.
Sverjensky, D.A., E.L. Shock, and H.C. Helgeson (1997). “Prediction of the thermodynamic properties of
aqueous metal complexes to 1000 degrees C and 5 kb.” In: Geochim. Cosmochim. Acta 61.7, pp. 1359–
1412. DOI: 10.1016/S0016-7037(97)00009-4.
Vearncombe, J.R. (1988). “Structure and metamorphism of the ArcheanMurchison belt, Kaapvaal Craton,
South Africa”. In: Tectonics 7.4, pp. 761–774.
– (1991). “A possible Archaean Island Arc in the Murchison Belt , Kaapvaal Craton , South Africa”. In:
J. African Earth Sci. 13.3, pp. 299–304.
Vearncombe, J.R. et al. (1992). Geology, Geophysics and mineralisation of the Murschison Schist Belt,
Rooiwater Complex and Surrounding granitoids. Geological. Department of Mineral and Energy af-
fairs.
Vink, B.W. (1996). “Stability relations of antimony and arsenic compounds in the light of revised and
extended Eh-pH diagrams”. In: Chem. Geol. 130.1-2, pp. 21–30. DOI: 10.1016/0009-2541(95)
00183-2.
Wagman, D.D. et al. (1982). The NBS Tables of Chemical Thermodynamic Properties.
Wagner, T., A.J. Boyce, and J. Erzinger (2010). “Fluid-rock interaction during formation of metamorphic
quartz veins: A REE and stable isotope study from the Rhenish Massif, Germany”. In: Am. J. Sci.
310.7, pp. 645–682. DOI: 10.2475/07.2010.04.
Welham, N J (2001). “Mechanochemical processing of enargite ( Cu3AsS4 )”. In: Hydrometallurgy 62,
pp. 165–173.
90

Bibliography
Whitmore, D.R.E., L.G. Berry, and J.E. Hawley (1946). “Chrome Micas”. In: J. Am. Mineral. 31.1-2,
pp. 1–21.
Williams-Jones, A.E. and C. Norman (1997). “Controls of mineral parageneses in the system Fe-Sb-S-O”.
In: Econ. Geol. 92.3, pp. 308–324. DOI: 10.2113/gsecongeo.92.3.308.
Wolery, T.J. and C.F. Jove-Colon (2004). Qualification of Thermodynamic Data for Geochemical Model-
ing of Mineral-Water Interactions in Dilute Systems. Tech. rep. November. Bechtel SAIC, pp. 1–212.
DOI: 10.2172/850412.
Yund, R.A. (1962). “The system NiAsS phase relations and mineralogical significance.pdf”. In: Am. J.
Sci. 260, pp. 761–782.
Zhang, L. et al. (1989). “Oxygen isotope fractionation in the quartz–water–salt system”. In: Econ. Geol.
84, pp. 1643–1650.
91

92

Chapter 4
Sb-As-Au mineralization at the Murchison Greenstone
Belt, South Africa
NIKKI BLAAUWBROEK1, NIELS JÖNS2, WOLFGANG BACH1
1 Department of Geosciences and MARUM – Center for Marine Environmental Sciences,
University of Bremen, Klagenfurter Str., 28359 Bremen, Germany
2 Department of Geology, Mineralogy and Geophysics,
Ruhr-University Bochum, Universitaetsstrasse 150, 44801 Bochum, Germany
Keywords: Antimony, stibnite, listvenite, greenstone belt
93

Chapter 4 Sb-As-Au mineralization at the Murchison Greenstone Belt, South Africa
Abstract
The Murchison Greenstone Belt (MGB) is an Archaean orogenic gold deposit, where
the primary mineralization is connected to an ore fluid originating from a granitoid
magmatic or a metamorphic devolatization model (Chapter 3). The Antimony Line
(AL) in the MGB is enriched in stibnite and is typified by stibnite-arsenopyrite-pyrite-
pyrrhotite-berthierite-ullmanite-gudmundite(-chalcopyrite) mineralization, which is dom-
inantly disseminated within the carbonated domains. Three generations of Sb mineral-
ization have been identified in this study: 1) gudmundite found adjacent to arsenopyrite;
2) berthierite-ullmannite outside dolomite-carbonation veins, in close proximity to ar-
senopyrite domains and finally 3) berthierite-stibnite mobilization within carbonatized
domains. Various trapping mechanisms for Sb, like fluid mixing, adiabatic cooling as
well as decompressional degassing and related cooling and changes in f S2 and/or f O2
have been suggested to be responsible for Sb enrichment within orogenic gold deposits.
The phase relations of this study clearly indicate that the system transitioned from low
f S2 and low f O2. Primary mineralization is As-Sb-Ni-Cu, and shifted towards As-
Sb-Fe-Cu, visibly the loss of ullmanite and enrichment of berthierite which was fol-
lowed by the alteration of berthierite into stibnite with high f S2 and f O2. However,
Sb solubility, (Sb(OH)3)(aq), remains low at high temperatures up to 350◦C and corre-
sponding acidity range, even as f O2 and f S2 creep up. These effects can be explained
by both pyritization and oxidation by carbonization lead to increased sulfur fugacities,
a common explanation for the genesis of orogenic gold deposits and serpentinization
environments.
94

4.1 Introduction
4.1 Introduction
Sb-Au-As(-Hg)-mineralizations within major orogenic suture zones such as Archaean
greenstone belts and younger analogues have been described from all over the world.
In the past 80 years, several observations were made that are relevant to Sb and As en-
richments in hypogene deposits associated with suture zones. Whitmore et al. (1946)
was one of the first to observe that fuchsite (chromium muscovite) within Pre-Cambrian
Greenstone belts are typically found in Au-Sb-bearing districts. Anhaeusser (1976)
stated that Sb-Au mineralization is closely related to the presence of various volcanolog-
ical subdivisions within an Archaean greenstone belt. Madu et al. (1990) thought that
fluid fluxing within shear zones, caused precipitation of Sb-As minerals. Active shear
zones are permeable and can facilitate upflow of ore-forming solutions (e.g. McCuaig
and Kerrich (1998), Hagemann and Lüders (2003), and Buchholz and Oberthür (2007))
and causing precipitation of ore minerals changes in the lithospheric pressure gradient
by the so-called fault valve model (Goldfarb, Groves, and Gardoll, 2001; Hagemann
and Lüders, 2003).
Although these deposits may vary in age, they have in common that contrasting
lithologies with ultramafic rocks were juxtaposed against quartz-feldspar-bearing sed-
imentary and magmatic rocks that were subsequently modified by silicification and
carbonation processes. These consortia of rocks have witnessed deformation under
greenschist-facies conditions which were accompanied by drastic metasomatic mass
transfers in major shear zones fluxed with aqueous solutions at low pressures and tem-
peratures of 250-400 ◦C. Some have clear metasomatic fronts at the juxtaposed rocks,
such as the serpentinites at the Canadian Cordillera (Normand et al., 1996).
Others have pointed out similarities between greenstone belt-hosted gold, copper and
95

Chapter 4 Sb-As-Au mineralization at the Murchison Greenstone Belt, South Africa
antimony deposits to VMS deposits of active (back-)arc hydrothermal systems (Vearn-
combe, 1991; McCuaig and Kerrich, 1998; Schwarz-Schampera et al., 2010; Goldfarb
and Groves, 2015). These observations suggest a volcanic/metamorphic origin of the
Sb-As mineralization in an active plate boundary setting.
Various trapping mechanisms have been discussed. Fluid mixing (and adiabatic cool-
ing) as well as decompressional degassing and related cooling and changes in f S2 and/or
f O2 have been identified as potential ore trap mechanisms (Hagemann and Lüders,
2003). Likewise, changes in f S2 and/or f O2 in the course of serpentinization in con-
tact with the ore-hosting metasediments have been identified as possible trap for Sb-
sulfides (Normand et al., 1996). Decreasing temperature (>300 ◦C) (Williams-Jones
and Norman, 1997) and changes in fluid pH and redox-potential (Obolensky, Gushchina,
Borisenko, Borovikov, and Nevol’ko, 2009) have also been suggested to play a major
role in Sb-mineralization.
Antimony is used for many industrial products, such as: flame retardant, catalyst in
plastic production, pigment in paints and lacquers, additive in glassware and ceramics,
and hardening agent in alloys for the production of batteries, ammunitions and brake
pads (Ashley et al., 2003; USGS, 2015). The need of antimony in these industrial appli-
cations makes antimony the ninth most mined metal worldwide (Ashley et al., 2003).
4.1.1 The Murchison Greenstone Belt
The Murchison Greenstone Belt (MGB) in South Africa is one of the Archaean green-
stone belts along the Kaapvaal Craton. The MGB is known for the antimony enrichment
along the Antimony Line (AL) and is believed to be the largest Archaean economic stib-
nite deposit in the world (Boyle and Jonasson, 1984; Davis et al., 1986), and has been
96

4.1 Introduction
mined since 1928 for antimony with gold as byproduct (e.g. Davis et al. (1986)).
The (primary) antimony mineralization in the AL has been proposed to relate to the
emplacement of Maranda granodiorite intrusions that occurred around 2.9 Ga (Poujol,
1996; Jaguin, Poujol, et al., 2013) and that may be related to orogeny in the Limpopo
Belt, north of the MGB (Block et al., 2013). The MGB hosts an Archaean suture zone
between a back-arc system and continental terrain (proto-Kaapvaal Craton) (Schwarz-
Schampera et al., 2010; Zeh et al., 2013). The primary suture zone hosts a VMS-type
deposit, responsible for the Cu-Zn line north of the AL (Schwarz-Schampera et al.,
2010) and probably accountable for the Au found in the Pietersberg greenstone belt (Zeh
et al., 2013). Jaguin, Boulvais, et al. (2014) suggested the primary Sb-As mineralization
in the AL is related to the metasomatic alteration of theMaranda grandiorites to albitites.
The principal Sb-mineralization in the AL is stibnite and is hosted in listvenites and
related quartz-carbonated veins, which formed 2 Ga ago in a deformation zone with
NNE-SSW compression and isoclinal folding with steeply dipping stretching lineations
and boudinage (Davis et al., 1986; Jaguin, Boulvais, et al., 2014).
Stibnite can be found as disseminations, with local (re)concentrations along the cleav-
age planes of the gangue minerals, being the richest in the core of the ore body. Fe-rich
antimony minerals, in contrast, can be found more at the margins of the ore body (Davis
et al., 1986). Gold is a byproduct of mining and occurs as coarse visible gold, as finer
disseminations or in close association as sub-microscopic intergrowths within the sul-
phides. Gold has been found associated with the arsenopyrite mineralization, in variable
distances from the antimony mineralization (Davis et al., 1986). For this study we pre-
formed ore petrology and geochemical analyses with the focus on sulfide mineralogy
on samples from six locations along the AL at the MGB.
97

Chapter 4 Sb-As-Au mineralization at the Murchison Greenstone Belt, South Africa
4.2 Methods
Table 4.1: Sample summary and methods employed.
Sample XRD SEM EMPA ICPMSA
thens A080 X X X X
A081 X
A082 X X X
Monarc
h
M112A X
M112B X X
M121 X X X
M123 X X X X
M124 X
M126 X
Monarch mine Mm107 X
Beta
quarr
y B028 X
B032 X X
B033 X
Beta mine Bm048 X X
Bulk mineralogy, together with major and trace elements have been varying and in-
tensively measured on selected samples enriched with Sb-As-sulfide mineralogy (Ta-
ble 4.1), collected from Sb-enriched regions as well as As-enriched regions from the
Athens, Beta, Gravelotte and Monarch mine, Murchison, South Africa (Figure 4.1).
Four hand specimen with varying end-member mineralogy has been picked for XRD
measurements and have been pulverized to grain sizes < 50 μm. SEM analyses have
been preformed as preparation for XRD measurements at Bremen University with a
20 kV acceleration voltage. Bulk rock mineralogy has been determined by X’pert Pro
by Panalytical X’Celerator at the University of Bremen. Data interpretation has been
preformed by the use of X’pert High Score with the ICSD database.
Major elements of the sulfides were measured at Bochum University with a Cameca
SXFiveFE, with fully focused beam, 20 kV acceleration voltage and 30 nA probe cur-
98

4.2 Methods
Figure 4.1: Geological map of Murchison Greenstone Belt. The Antimony Line and Cu-Zn line have been
marked and along the AL, together with the positions of the four mines (Athens, Beta, Gravelotte and
Monarch). Ld: Leydsdorp; Gr: Gravelotte; Pp: Pike’s Kop; Pnp; Pioneer’s Kop. The map has been adjusted
after Vearncombe et al. (1992) and Schwarz-Schampera et al. (2010).
rent. Trace metal concentrations of the sulfides have been obtained by laser ablation
ICP-MS using a Thermo Element2 mass spectrometer and a NewWave UP193ss laser
at the Department of Geosciences in Bremen. Samples and standards were ablated with
an irradiance of 1 GW/cm2 a beam diameter of typically 50-75 μm and a pulse rate of
5 Hz. For data quantification we used the Cetac GeoProTM software with Fe and S
for Fe-(As)S minerals and S for Sb-minerals as an internal standard. Mass-1 standard
has been used as reference material, for the measurement of 60Ni, PGE-Ni standard has
been used. Uncertainties of the concentrations are less than 5 %.
Reaction path modeling and stability diagrams have been calculated using Geochemist’s
Workbench. There is no thermodynamic data for Sb-As-Au minerals and aqueous
99

Chapter 4 Sb-As-Au mineralization at the Murchison Greenstone Belt, South Africa
species in the default GWB database, which goes up to 300 ◦C along the steam curve
of water. We have hence built a new database for a pressure of 1 kbar and 25 to 600 ◦C,
using SUPCRT92 (Johnson et al., 1992) (Tables 4.2 to 4.5. The database includes 112
aqueous species and 110 minerals. Data for major rock-forming minerals were taken
from Wolery and Jove-Colon (2004). Data for major solutes are from Sverjensky et al.
(1997) and Schock et al. (1997). These data were supplemented by data for Sb, As and
Au minerals as well as aqueous HS−, OH− and Cl− species of these elements from vari-
ous sources, while maintaining internal consistency (Yund, 1962; Lynch, 1982; Wagman
et al., 1982; Krupp, 1988; Seal, Essene, et al., 1990; Seal, Robie, Barton, et al., 1992;
Vink, 1996; Seal, Robie, Hemingway, et al., 1996; Williams-Jones and Norman, 1997;
Welham, 2001; Kantar, 2002; Stefánsson and Seward, 2003b; Stefánsson and Seward,
2003a; Stefánsson and Seward, 2004; Bessinger and Apps, 2005; Castro and Baltierra,
2005; Pokrovski et al., 2006; Padilla et al., 2008; Akinfiev and Zotov, 2010; Firdu and
Taskinen, 2010).
Table 4.2: Overview Log K values Sb-species.
T (◦C) Log K1 Log K2 Log K3 Log K4 Log K5 Log K6 Log K7 Log K8
25 - - - - 10.029 -58.151 4.737 14.137
100 - - - - 10.237 -47.871 4.742 12.857
200 - - - - 11.122 -40.418 5.06 12.597
300 -1.446 0.298 - - 12.254 -36.886 5.541 13.16
400 -4.481 0.106 -5.748 -8.772 13.514 -35.936 6.184 14.337
500 -6.095 -0.028 - - 14.908 -37.615 7.154 16.397
600 - - - - 16.384 -42.082 8.858 19.578
*Corresponding reactions: References: Remarks
1 H+ + Cl– + Sb(OH)3 = H2O + Sb(OH)2Cl Pokr+06
2 Sb(OH)3CL – = Sb(OH)3 + Cl– Pokr+06
3 2H+ +2Cl– + Sb(OH)3 = 2H2O + Sb(OH)Cl2 Pokr+06 600 bar
4 Sb(OH)3 + 3H+ + 3Cl– = 3H2O + SbCl3 Pokr+06 600 bar
5 Sb(OH)3 = H+ + H2SbO3 SSW+97
6 2Sb(OH)3 + 4HS– + 4H+ = 6H2O + H2Sb2S4 Bes05
7 HSb2S4– + H+ = H2Sb2S4 Bes05
8 H2SbS4 = 2H+ + Sb2S42− Bes05
100

4.2 Methods
Table 4.3: Overview Log K values As-species.
T (◦C) Log K1 Log K2 Log K3 Log K4 Log K5 Log K6 Log K7
25 23.78 -76.825 8.336 19.445 3.548 11.259 8.83
100 18.221 -62.625 9.103 19.908 2.898 9.739 8.275
200 13.308 -52.927 10.51 21.626 2.999 8.62 8.209
300 9.925 -48.734 12.195 24.018 1.881 8.143 8.558
400 7.366 -48.177 14.134 26.88 1.554 8.235 9.187
500 5.198 -51.484 16.528 30.337 1.242 9.199 10.155
600 3.167 -58.996 19.496 34.346 0.914 11.284 11.519
*Corresponding reactions: References:
1 As(OH)3 + 1/2 O2 =AsO(OH)3 PPB-08
2 3 As(OH)3 + 6 HS– + H+ = H3AsS6 + 9 H2O Bes05
3 HAsO4 + H+ = AsO(OH)3 PPB+08
4 AsO4−− + 2 H+ = AsO(OH)3 ??
5 H2As3S6– + H+ = H3As3S6 Bes05
6 HAs3S6−− +2H+ = H3AsS6 Bes05
7 H2AsO3– + H+ = As(OH)3 SW+97
Table 4.4: Overview log K Au-species (From Heinrich (2005)).
T (◦C) Log K1 Log K2 Log K3 Log K4 Log K5 Log K6
25 -17.45 -16.50 -9.23 -11.06 -7.26 6,53
100 -14.07 -12.86 -7.96 -8.38 -5.72 6.25
200 -10.35 -8.51 -7.13 -5.65 -4.27 6,32
300 -7.34 -4.61 -7.11 -3.64 -3.32 6.81
400 -4.83 -1.02 -7.69 -2.10 -2.67 7.64
500 -2.64 2.41 -8.68 -0.76 -2.14 8.71
600 -0.55 5.82 -9.85 0.63 -1.53 9,93
*Corresponding reactions:
1 AuHs - H+ = H2S(aq) + Au+
2 - Au(HS)2– - 2 H+ = 2 H2S(aq) + Au+
3 - AuCl2– = 2 Cl– + Au+
4 - Au(OH) - 2 H+ = Au2+ + H2O
5 - Au(s) - H+ - 1/4 O2(aq) = 1/2 H2O + Au+
6 - HS2– - H+ = H2S
101

Chapter 4 Sb-As-Au mineralization at the Murchison Greenstone Belt, South Africa
Table 4.5: Overview log K values of Sb-As minerals
T (◦C) Arsenolite Claedetite Orpiment Arsenic Realgar Loellingite Arsenopyrite Valentinite
25 -1.229 -1.362 -46.162 -17.569 -22.001 149.636 -12.284 -8.836
100 0.051 -0.118 -37.04 -13.379 -17.375 117.909 -9.814 -6.39
200 1.108 0.912 -30.428 -9.522 -13.755 90.477 -4.275 -4.275
300 1.787 1.578 -27.182 -6.765 -11.682 72.009 -2.792 -2.792
400 2.192 1.982 -26.123 -4.641 -10.576 58.46 -1.738 -1.738
500 3.303 2.099 -27.258 -2.872 -10.332 47.737 -1.025 -1.025
600 2.1 1.91 -30.695 -1.291 -10.925 38.812 -0.601 -0.601
T (◦C) Senarmontite Stibnite Chalcostibnite Berthierite Antimony Fe-Tennantite Fe-tetrahedrite Enargite
25 -9.817 -55.844 -51.954 -60.187 -16.738 -375.169 -361.34 -64.628
100 -7.314 -45.406 -42.851 -50.086 -13.041 -312.111 -302.324 -54.723
200 -4.882 -37.362 -35.553 -42.674 -9.431 -261.797 -254.758 -47.446
300 -3.182 -33.07 -31.368 -39.201 -6.776 -232.856 -227.403 -44.024
400 -1.967 -31.195 -29.079 -38.283 -4.383 -216.465 -211.994 -42.99
500 -1.13 -31.604 -28.224 -39.766 -2.879 -208.24 -204.289 -43.761
600 -0.608 -34.318 -28.432 -43.528 -1.192 -204.076 -200.236 -45.62
*Corresponding reactions:
1 As(OH)3 = As2O3 + H2O
2 As(OH)3 = As2O3 + H2O
3 As(OH)3 + 3HS– + 3H+ = 6H2O + As2S3
4 As(OH)3 + 1.5 H2 = 3H2O + As
5 As(OH)3 + H+ 0.5H2 = 3H2O + AsS
6 2As(OH)3 + Fe++ = 2H2O + FeAs2
7 As(OH)3 + Fe + H2 = 3H2O + H2 + FeAs
8 Sb(OH)3 = Sb2O3 + H2O
9 Sb(OH)3 = Sb2O3 + H2O
10 2Sb(OH)3 + 3HS– + H+ = 6H2O + Sb2S3
11 Sb(OH)3 + 2HS– + Cu++ + 0.5H2 = CuSbS2 + H2O
12 2 Sb(OH)3 + 4HS– + Fe++ + 2H+ = 6 H2O + FeSbS4
13 Sb(OH)3 + 0.5H2= Sb (s) + H2O
14 4 As(OH)3 + 13HS– +10Cu++ +5 H2 +Fe++ = Cu10Fe2As4S13 + 12 H2O + H+
15 4 Sb(OH)3 + 13HS– +10Cu++ +5 H2 +Fe++ = Cu10Fe2Sb4S13 + 12 H2O + H+
16 As(OH)3 + 4HS– + 3 Cu++ + 0.5H2 = 3 H2O + H+ + Cu3AsS4
102

4.3 Results
4.3 Results
4.3.1 Fieldwork
The focus of this paper lies on the interpretation of phase relations observed in rock sam-
ples collected during a 2013 field expedition to the AL. The motivation of this fieldwork
was to determine the relationship between host rock and vein system(s) in proximity to
Sb and As mineralization. Samples have been taken from four different mines from
east to west: Gravelotte, Beta, Athens, Monarch. These mines lie along the AL, and
are 1 to 8 km apart from each other (Figure 4.1). In each of these mines, samples were
taken where the Sb- and As-content were the highest. These locations are at different
depths per mine: Gravelotte decline from 0 to 20 m, Beta mine at 640-680m, Athens at
1160-1240m and Monarch decline from 0 to 1240m depth.
This entire deposit-hosting unit has been heavily metasomatized (serpentinized and
carbonatized) and is heavily structurally deformed (Chapter 3). Chlorite schists are dark
green and may grade into listvenite, light bright green, within carbonated domains. In
these rocks with pronounced pressure-solution schistosity, quartz-carbonate (dolomite-
magnesite) veins developed synkinematically as tension fractured and were folded and
boudinaged.
The quartz-carbonate veins were more competent than the surrounding schist and
stibnite precipitated in pressure shadows around these dolomite-dominant microlithons
as well as in brittle fractures within them (Vearncombe et al., 1992). These dolomite-
quartz veins were most present in quantity and size within and in close approximation of
the listvenite. Dolomite appears to be the main host of stibnite (Chapter 3). However in
several locations and without clear association with these dolomite-rich regions, highly
schistose chlorite-magnesite-quartz rocks contain abundant pyrite-pyrrhotite-arsenopyrite(-
103

Chapter 4 Sb-As-Au mineralization at the Murchison Greenstone Belt, South Africa
berthierite) mineralization.
Sb and As-reefs in the mines
Overall two distinct lithological units have been recognized in close proximity and/or in
contact with each other: 1) metagranodiorite and 2) listvenite. At the contact between
these two lithologies, chromium-rich chlorite schist is enriched with fuchsite and cut by
deformed networks of stibnite-rich carbonate veins. In contrast, the arsenopyrite-rich
domains were found notably outside the dolomite(-quartz) veins and within the schistose
chlorite-magnesite-quartz domains (cm-m scale). No direct relationship between the
Sb- and As-reef was perceived.
Dolomite-veins can be recognized as large veins or zones (meter scale), or smaller
fractures or fissures (mm scale). Dolomite(-quartz) veins are boudinaged or foliated and
surrounded by either chlorite, talc, or fuchsite. Fine-grained magnesite (often associated
with quartz) is disseminated within the chlorite-schist or in selvages of dolomite veins.
104

4.3 Results
4.3.2 Petrography and bulk mineralogy
Table 4.6 presents a petrological overview and comparison of the different samples that
have been used for geochemical analyses, presented in Table 4.1. A distinction has
been made between Sb- and As-reefs and samples where both Sb and As mineralization
was recognized. Furthermore, gangue material was depicted in varying combinations
of dolomite, magnesite and quartz. Arsenopyrite is concentrated in varying amounts
throughout the AL, though most prominent present with magnesite(-quartz) mineraliza-
tion. Stibnite is predominantly found along with dolomite (Chapter 3). However, both
enrichments can be developed in regions where both stibnite and arsenopyrite occur, and
possibly represent different generations of mineralization (samples M124 and M121).
Also, the results listed in table 4.6 indicate that pyrite-pyrrhotite(-chalcopyrite) miner-
alization is related to the arsenopyrite mineralization. Sb-mineralization is prevailing
monomineralic (stibnite), with rare accounts of berthierite.
Two samples have been chosen as representatives of end member situations for stib-
nite and arsenopyrite mineralization. Both have been characterized by x-ray diffraction
studies and the diffractograms are plotted in (Figures 4.2 and 4.3). These samples are
A080, from the Athens mine and M121 from the Monarch decline. Figure 4.2 shows
arsenopyrite, together with pyrite, surrounded by dolomite-magnesite-quartz and chlo-
rite in sample A080. Sample M121 differs in that fuchsite and gersdorffite present and
pyrite is not. This result is in line with the observations made within the mine and the
petrographic results in table 4.6.
105
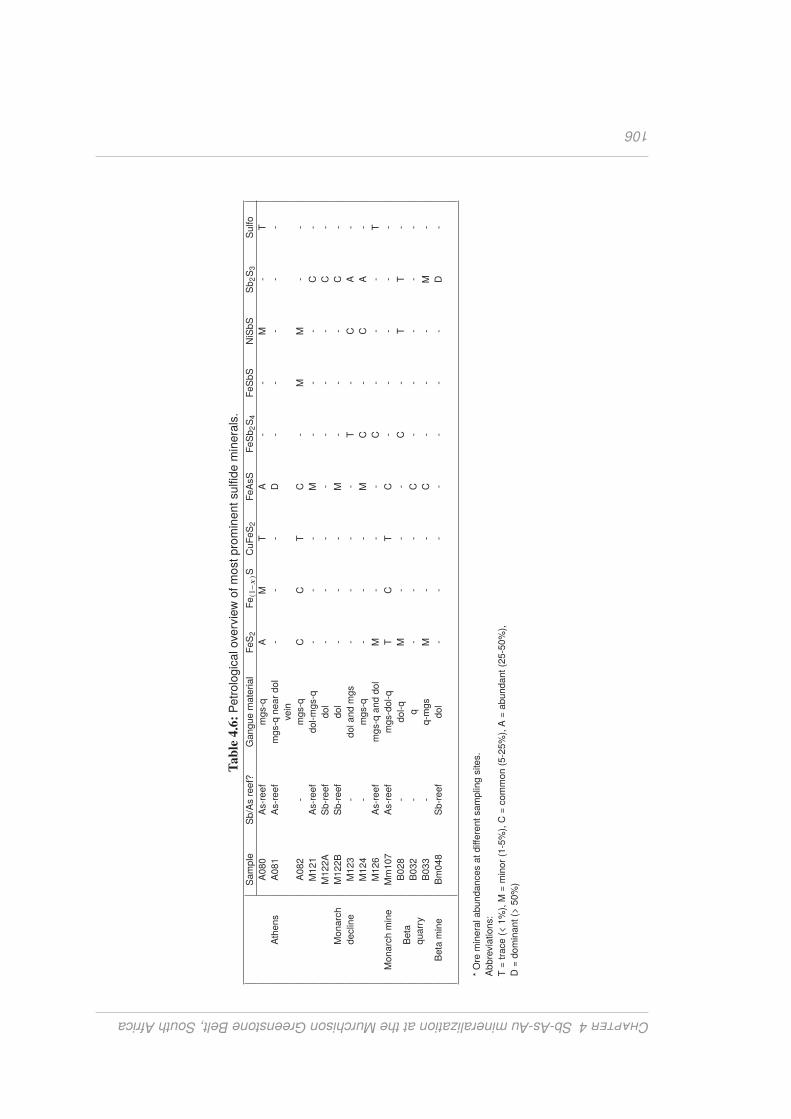
Chapter4Sb-As-AumineralizationattheMurchisonGreenstoneBelt,SouthAfrica
Table4.6:
Petr
olo
gic
alove
rvie
wofm
ostpro
min
entsulfi
de
min
era
ls.
Sam
ple
Sb/A
sre
ef?
Gangue
mate
rial
FeS
2F
e(1−x)S
CuF
eS
2F
eA
sS
FeS
b2S
4F
eS
bS
NiS
bS
Sb
2S
3S
ulfo
Ath
ens
A080
As-r
eef
mgs-q
AM
TA
--
M-
T
A081
As-r
eef
mgs-q
near
dol
vein
--
-D
--
--
-
A082
-m
gs-q
CC
TC
-M
M-
-
Monarc
h
declin
e
M121
As-r
eef
dol-m
gs-q
--
-M
--
-C
-
M122A
Sb-r
eef
dol
--
--
--
-C
-
M122B
Sb-r
eef
dol
--
-M
--
-C
-
M123
-doland
mgs
--
--
T-
CA
-
M124
-m
gs-q
--
-M
C-
CA
-
M126
As-r
eef
mgs-q
and
dol
M-
--
C-
--
T
Monarc
hm
ine
Mm
107
As-r
eef
mgs-d
ol-q
TC
TC
--
--
-
Beta
quarr
y
B028
-dol-q
M-
--
C-
TT
-
B032
-q
--
-C
--
--
-
B033
-q-m
gs
M-
-C
--
-M
-
Beta
min
eB
m048
Sb-r
eef
dol
--
--
--
-D
-
*O
rem
inera
labundances
atdiff
ere
ntsam
plin
gsites.
Abbre
via
tions:
T=
trace
(<1%
),M
=m
inor
(1-5
%),
C=
com
mon
(5-2
5%
),A
=abundant(2
5-5
0%
),
D=
dom
inant(>
50%
)
106

4.3 Results
Figure 4.2: XRD results of sample A080, showing arsenopyrite, pyrite together with chlorite, quartz and
dolomite.
Figure 4.3: XRD results of sample M121, showing stibnite and gersdorffite together with fuchsite, chlorite,
quartz and carbonates.
107

Chapter 4 Sb-As-Au mineralization at the Murchison Greenstone Belt, South Africa
Figure 4.4 to 4.13 are plates, where 9 samples are represented by 3 to 5 BSE images
each in addition to a photograph of each thin section billets cut from the handspecimen
as well as a scan of the entire thin section. In the thin section scans, pink square boxes
represent the locations of the EMPA measurements and the corresponding BSE plots.
Figure 4.4
Figure 4.4 - plate A080 represents an arsenopyrite-mineralized rock domain. Both
the billet and the thin section show clearly the sulfide mineralization within a chlo-
rite schist, surrounded by only minor amounts of magnesite and quartz. The dominant
mineral here is pyrite, with smaller amounts of pyrrhotite-chalcopyrite-ullmannite and
108

4.3 Results
arsenopyrite. Arsenopyrite is clearly recognized by its bright white reflection color in
comparison to the pyrrhotite (grey) and pyrite (darker grey). Different generations of
pyrite can be recognized; for example euhedral shaped as in box nr 5 (bottom left) or
disseminated in pyrrhotite in box 3 (middle left).
Figure 4.5
Figure 4.5 - plate A082 evidently shows the dominant sulfide mineralization in com-
parison to the surrounded chlorite schist (on plate A080). Here only small amounts
of chlorite are present, and larger amounts of (rounded) magnesite and quartz. Sb-
mineralization is manifest as myrmekitic ullmannite intergrown with chalcopyrite (box
109
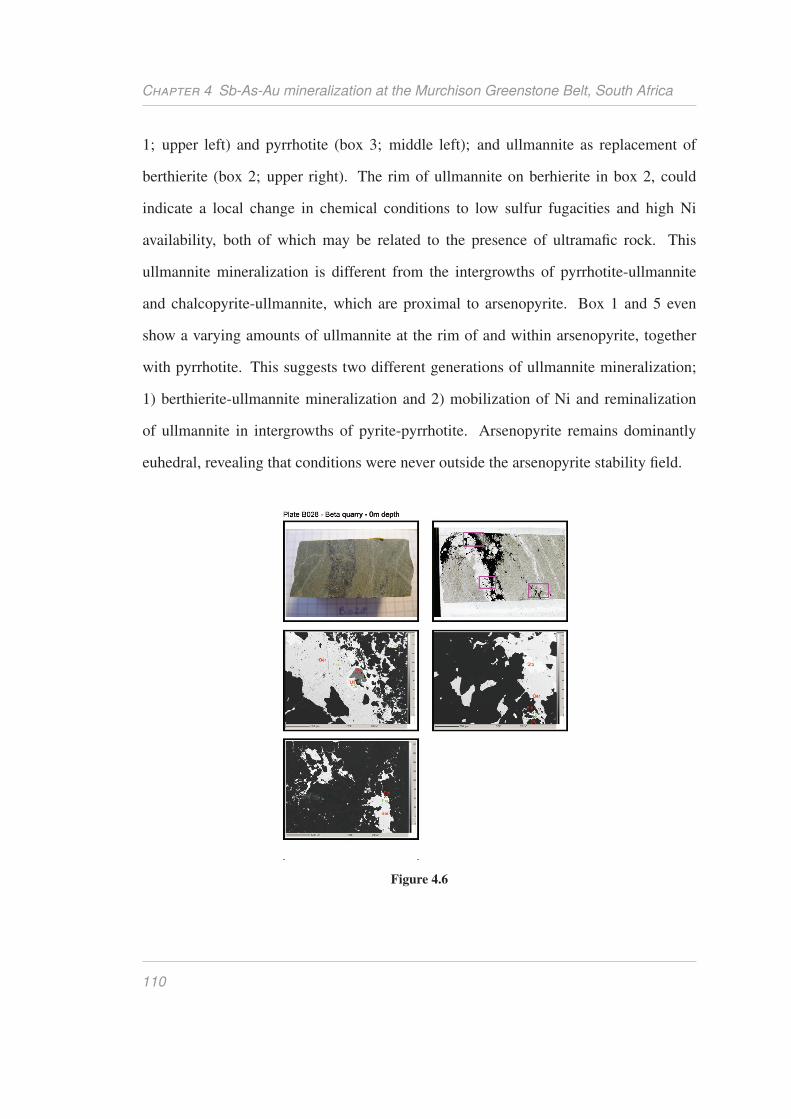
Chapter 4 Sb-As-Au mineralization at the Murchison Greenstone Belt, South Africa
1; upper left) and pyrrhotite (box 3; middle left); and ullmannite as replacement of
berthierite (box 2; upper right). The rim of ullmannite on berhierite in box 2, could
indicate a local change in chemical conditions to low sulfur fugacities and high Ni
availability, both of which may be related to the presence of ultramafic rock. This
ullmannite mineralization is different from the intergrowths of pyrrhotite-ullmannite
and chalcopyrite-ullmannite, which are proximal to arsenopyrite. Box 1 and 5 even
show a varying amounts of ullmannite at the rim of and within arsenopyrite, together
with pyrrhotite. This suggests two different generations of ullmannite mineralization;
1) berthierite-ullmannite mineralization and 2) mobilization of Ni and reminalization
of ullmannite in intergrowths of pyrite-pyrrhotite. Arsenopyrite remains dominantly
euhedral, revealing that conditions were never outside the arsenopyrite stability field.
Figure 4.6
110

4.3 Results
Figure 4.6 - plate B028 also shows a berhierite-ullmannite intergrowth in box 1 (up-
per left) and a berthierite-stibnite intergrowth in box 2 (upper right). The dominant
gangue material is quartz, therefore lacking the dolomite-mineralization common for
the dominance of stibnite. This intergrowth, however, may reveal that stibnite was not
remobilized here by carbonization events, but may represent altered berthierite, which
therefore possibly represents the first generation of stibnite within the AL.
Figure 4.7
Figure 4.7 - plate B033 is one of the rare locations where arsenopyrite and stibnite
are found in close proximity of one another (box 1). Disseminated pyrite-pyrrothite are
found in close relationship with euhedral arsenopyrite (box 2).
111

Chapter 4 Sb-As-Au mineralization at the Murchison Greenstone Belt, South Africa
Figure 4.8
Figure 4.8 - plate Bm048 has been sampled within a Sb-reef. The dominant miner-
alization is dolomite-quartz-stibnite with scattered occurrences of pyrite within quartz.
Box 1 and box 2 noticeably show the different regrowth of stibnite into smaller branches
within the dolomite. Box 2 in particular shows the dissolution of large stibnite grains
and remineralization into smaller stibnite minerals within the dolomite. This feature
is indicative of Sb immobility during dynamic recrystallization and carbonation of the
rocks in the AL.
112

4.3 Results
Figure 4.9
Figure 4.9 - plate M122B is a sample of both dolomite and siderite (yellow in hand
specimen), together with the common sulfide mineralization. Anhedral pyrite is the
main sulfide in this sample, with small inclusions of arsenopyrite (box 3; middle left).
Occasionally, anhedral arsenopyrite grains can be found, too (box 1; upper left). No
Sb-minerals have been detected in this sample.
113

Chapter 4 Sb-As-Au mineralization at the Murchison Greenstone Belt, South Africa
Figure 4.10
Figure 4.10 - plate M123 represents another example for a rock in which stibnite-
berthierite and arsenopyrite are found in close proximity of one another. The Sb-
dominated sulfide mineralization is developed within dolomite (two larger pink boxes
on thin section). In contrast, the sulfide mineralization within the chlorite-magnesite do-
main (left part thin section), contains arsenopyrite. The euhedral shapes of arsenopyrite
can even be recognized with the naked eye in the thin section. In box 3 (down; left) ull-
mannite is found also as inclusions of arsenopyrite. Moreover, later stibnite mineralized
on top of several arsenopyrite crystals.
114

4.3 Results
Figure 4.11
Figure 4.11 - plate M124 is a sample directly from a highly schistose chlorite-quartz
rock, which has only been minimally carbonatized. Arsenopyrite and berthierite are the
main sulfide mineralization within this sample, where berthierite appears to precipitate
during a later stage, as it fills void space between arsenopyrite grains.
115

Chapter 4 Sb-As-Au mineralization at the Murchison Greenstone Belt, South Africa
Figure 4.12
Figure 4.12 - plate M126 reveals overgrowth of stibnite and berthierite on arsenopy-
rite (filling and rimming) in a chlorite schist adjacent to a dolomite-rich vein (Box 1 and
3). Box 2 reveals a pyrite aggregate, adjacent to arsenopyrite and berthierite.
116

4.3 Results
Figure 4.13
Figure 4.13 - plate Mm107 is pyrite-pyrrhotite rich and reveals pyrrhotite as inclu-
sions of pyrite and arsenopyrite.
Overall Sb-As minerals are dominantly disseminated within the carbonated domains
and are predominantly present within the metagranodiorite. Stibnite is clearly mobile
on small spatial scales as it can be found mineralized throughout the carbonized sys-
tem in different grain sizes and as fillings between dolomite grains or as newly min-
eralized rims on arsenopyrite or other sulfides. Foliated chlorite schists, with enrich-
ments of magnesite(-quartz) contain arsenopyrite, pyrite and pyrrhotite, gudmundite,
chalcopyrite and to lesser extents berthierite and ullmannite. These rock domains have
not been affected by later-stage carbonate (dolomite) or quartz formation. T Different
generations of berthierite occur: 1) berthierite-stibnite mobilization and 2) berthierite-
117

Chapter 4 Sb-As-Au mineralization at the Murchison Greenstone Belt, South Africa
ullmannite outside dolomite-carbonation veins, in close proximity to arsenopyrite do-
mains. Berthierite is present as main mineral or as rim of ullmannite within the chlorite
schist. Ullmannite (NiSbS) has been surrounded by berthierite (FeSb2S4). Gudmundite
(FeSbS) has been found sporadically adjacent to arsenopyrite, within the arsenopyrite-
rich zone in the Monarch mine. All these phases lack in the carbonate-quartz metaso-
matized domains of the AL lithologies. Tennantite is found as inclusions within pyrite
and arsenopyrite. In contrast, stibnite is exclusively found within tension fractures, like
boudins, boudinages or veins and is clearly related to isoclinal folding and subsequent
episodes of deformation and veining.
4.3.3 Major and minor metal concentrations
Table 4.7 to 4.9 show selected mineral formulas of pyrite, pyrrhotite and chalcopyrite.
Mineral formulas of arsenopyrite and Sb-minerals can be found in chapter 3 and App-
pendices.
Table 4.7 shows mineral formulas of twelve distinct pyrite grains from samples de-
scribed in previous section. Roughly, five types of pyrite can be distinguished. Older
generations of pyrite within A080 contain low enrichments of As, whereas A082 has
only ‘pure pyrite’, with minor traces of other metals. From the other mines, besides
‘pure’ pyrite, several enrichments stand out: B028 has a slight enrichment of Ni, re-
flecting the high amount of ullmannite adjacent to the pyrite. Pyrite measured in M126
and M122B shows an enrichment in Sb, although no Sb-mineralization is present within
M122B. Cu-values are generally low, only in some Sb-enriched pyrites can a moder-
ate Cu-content be detected. Figure 14A represents all the pyrite measured with As#
(As/(Sb+As+Ni)), Sb# (Sb/(Sb+As+Ni)) and Ni# (Ni/(Sb+As+Ni)) values calculated.
118

4.3 Results
Table4.7:
EM
PA
data
setofsele
cte
dpyrite
min
era
ls
Pyrite
A080_37
A080_1
A080_2
A082a
B028
Mm
107
Mm
107_2
M122B
_6
M122B
_7
M122B
M126_23
M126
S54.2
753.8
454.0
553.3
051.2
252.8
853.0
952.8
552.7
950.8
552.4
548.0
4
Mn
0.0
30.0
10.0
30.0
00.0
10.0
30.0
20.0
10.0
20.0
20.0
00.0
1
Fe
46.1
946.0
546.0
846.4
245.5
945.9
346.3
646.7
547.0
345.3
844.6
545.3
8
Co
0.0
00.0
00.0
10.0
00.0
90.0
10.0
00.0
10.0
10.0
00.0
50.0
0
Ni
0.0
20.0
40.0
30.0
11.1
40.0
10.0
30.0
00.0
00.0
00.4
60.1
0
Zn
0.0
70.0
30.0
10.0
00.0
00.0
20.0
50.0
00.0
00.0
20.0
50.0
0
As
0.3
10.6
60.4
60.0
00.0
50.3
40.2
80.1
30.0
50.0
40.0
80.3
8
Cd
0.0
00.0
00.0
00.0
0-
--
--
--
-
Sb
0.0
00.0
00.0
00.1
80.0
20.0
00.0
00.0
00.0
03.0
20.8
13.5
6
Cu
0.0
50.0
00.0
60.0
50.0
00.0
20.0
10.0
00.0
20.0
00.8
10.1
6
Tota
lw
t.%
100.9
4100.6
4100.7
399.9
798.1
299.2
499.8
499.7
599.9
299.3
399.3
597.6
3
S66.9
966.8
066.9
166.6
065.5
966.5
666.4
666.2
666.1
365.4
166.3
663.7
7
Mn
0.0
20.0
10.0
20.0
00.0
10.0
20.0
10.0
00.0
10.0
10.0
00.0
1
Fe
32.7
432.8
032.7
533.3
033.5
133.1
933.3
233.6
533.8
233.5
232.4
334.5
8
Co
0.0
00.0
00.0
10.0
00.0
60.0
00.0
00.0
10.0
10.0
00.0
30.0
0
Ni
0.0
20.0
30.0
20.0
10.8
00.0
10.0
20.0
00.0
00.0
00.3
20.0
7
Zn
0.0
40.0
20.0
00.0
00.0
00.0
10.0
30.0
00.0
00.0
20.0
30.0
0
As
0.1
60.3
50.2
40.0
00.0
30.1
80.1
50.0
70.0
30.0
20.0
40.2
2
Cd
0.0
00.0
00.0
00.0
0-
0.0
00.0
00.0
00.0
0-
--
Sb
0.0
00.0
00.0
00.0
60.0
10.0
10.0
10.0
00.0
11.0
20.2
71.2
5
Cu
0.0
30.0
00.0
40.0
30.0
00.0
10.0
10.0
00.0
00.0
00.5
20.1
1
Tota
lat.%
100.0
0100.0
0100.0
0100.0
0100.0
0100.0
0100.0
0100.0
0100.0
0100.0
0100.0
0100.0
0
*Tw
elv
esele
cte
dsam
ple
s,
repre
senta
tive
with
their
dis
tinct
enrichm
ents
of
Sb,
Nior
As
from
Ath
ens
min
e(A
-sam
ple
nr)
,M
onarc
hdeclin
e(M
-sam
ple
nr)
,Beta
min
e(B
-sam
ple
nr)
and
the
Monarc
hm
ine
(Mm
-sam
ple
nr)
.
119

Chapter 4 Sb-As-Au mineralization at the Murchison Greenstone Belt, South Africa
Overall it can be stated that pyrites from the AL have high As# values, with variable
Sb# and Ni# values. These variable compositions could indicate different generations
of pyrite, or postdepositional trace element remobilization.
Table 4.8: EMPA dataset of selected pyrrhotite minerals.
Pyrrhotite A082a A082b A082_4 Mm107_19 Mm107a Mm107b A080 A080_10
S 40.17 39.95 40.12 38.02 39.87 39.17 39.94 40.06
Mn 0.00 0.02 0.00 0.02 0.02 0.00 0.00 0.00
Fe 58.68 59.83 59.54 58.16 58.60 58.68 58.75 58.55
Co 0.00 0.00 0.00 0.00 0.00 0.00 0.02 0.00
Ni 0.59 0.01 0.02 0.30 0.31 0.36 0.62 0.58
Zn 0.04 0.00 0.02 0.00 0.00 0.01 0.00 0.01
As 0.03 0.04 0.02 1.08 0.51 0.49 0.01 0.01
Cd 0.00 0.00 0.00 0.01 - - - 0.00
Sb 0.00 0.02 0.05 0.04 0.00 0.00 0.00 0.01
Cu 0.00 0.02 0.01 0.00 0.00 0.04 0.00 0.00
Total wt.% 99.51 99.88 99.79 97.63 99.31 98.75 99.34 99.21
S 54.13 53.74 53.96 52.76 53.94 53.44 53.95 54.14
Mn 0.00 0.01 0.00 0.01 0.01 0.00 0.00 0.00
Fe 45.40 46.20 45.97 46.33 45.52 45.96 45.56 45.42
Co 0.00 0.00 0.00 0.00 0.00 0.00 0.02 0.00
Ni 0.43 0.00 0.02 0.23 0.23 0.27 0.46 0.42
Zn 0.03 0.00 0.02 0.00 0.00 0.01 0.00 0.01
As 0.02 0.02 0.01 0.64 0.30 0.29 0.01 0.00
Cd 0.00 0.00 0.00 0.00 - - - 0.00
Sb 0.00 0.01 0.02 0.03 0.00 0.00 0.00 0.00
Cu 0.00 0.01 0.01 0.00 0.00 0.03 0.00 0.00
Total at.% 100.00 100.00 100.00 100.00 100.00 100.00 100.00 100.00
*Eight selected samples based on their representative enrichment of Ni and As from Athens mine (A-sample nr)
and the Monarch mine (Mm-sample nr).
Table 4.8 shows mineral formulas of eight distinct pyrrhotite grains. Pyrrhotite is
in general ‘cleaner’ than pyrite. Sb is absent and only small amounts of Ni and As
can be traced. This has been made visible within Figure 14B. In contrast to the pyrite,
no pyrrhotite with a dominant As# is measured, though from the three samples where
pyrrhotite has been measured varying amounts of Ni# must be noted.
Chalcopyrite compositions are presented in Table 4.9 with only small enrichments of
As. The concentrations of both Ni and Sb are below detection limit.
A larger set of trace elements has been analyzed by LA-ICPMS (Figure 4.14). Trace
elements have been measured in arsenopyrite, pyrrhotite, pyrite, stibnite and berthierite.
120

4.3 Results
Figure 4.14: LA-ICPMS results showing metal trace content of stibnite, arsenopyrite, pyrite, pyrrhotite.
121

Chapter 4 Sb-As-Au mineralization at the Murchison Greenstone Belt, South Africa
Table 4.9: EMPA dataset of five chalcopyrite minerals.
Chalcopyrite A080 A082a A082b Mm107a Mm107b
S 34.82 34.64 34.79 34.60 34.67
Mn 0.00 0.00 0.00 0.00 0.01
Fe 30.45 29.61 29.46 30.37 29.89
Co 0.00 0.00 0.00 0.00 0.02
Ni 0.00 0.00 0.00 0.00 0.02
Zn 0.00 0.03 0.00 0.06 0.00
As 0.00 0.47 0.39 0.02 0.04
Cd 0.00 0.00 0.00 - -
Sb 0.00 0.03 0.06 0.00 0.00
Cu 33.62 34.27 33.99 33.93 34.18
Total wt.% 98.90 99.04 98.68 98.98 98.84
S 50.27 50.09 50.40 50.01 50.16
Mn 0.00 0.00 0.00 0.00 0.01
Fe 25.24 24.58 24.50 25.20 24.82
Co 0.00 0.00 0.00 0.00 0.02
Ni 0.00 0.00 0.00 0.00 0.02
Zn 0.00 0.02 0.00 0.04 0.00
As 0.00 0.29 0.24 0.01 0.03
Cd 0.00 0.00 0.00 - -
Sb 0.00 0.01 0.02 0.00 0.00
Cu 24.49 25.00 24.84 24.74 24.95
Total at.% 100.00 100.00 100.00 100.00 100.00
**Five samples from Athens mine (A-sample nr) and Monarch mine (Mm-sample nr).
It was difficult to select grains for measurements, due to quality differences between the
thin sections and small sizes of sulfide grains. The results presented here are mostly
multiple grains from one specific sample (Table 4.10). It must be taken into account
that the results plotted can thus not be seen as a representative for the overall sulfide
mineralization. But the data collected help developing an understanding of the trace
element chemistry of these different minerals.
When looking at arsenopyrite (both Fe- and S-normalized), the enrichments in Sb
and Ni contents are most prominent. Also, there is considerable incorporation of gers-
dorffite (NiAsS) (e.g., Klemm (1965)) and likely gudmundite (FeSbS) components in
arsenopyrite solid solution. Both pyrite and pyrrhotite plots are difficult to read, due to
their relative low abundance of trace metals, though small enrichments of Sb-Ni are also
visible as expected by the EMPA measurements (Table 4.7 and 4.8).
122

4.3 Results
Table 4.10: Metal trace contents of arsenopyrite, pyrite, pyrrothite, stibnite and berhierite.
Mineral Sample Cr Mn Co Nix Cu Zn Se Cd Sb Te W Bi
apy
Fe
norm
aliz
ed
A082 9.97 - 20.97 210.03 - - 2.05 0.19 684.03 0.17 0.02 0.02
apy A082 1.99 9.97 107.56 711.88 45.60 1.38 1.97 0.12 774.84 0.52 0.01 0.04
apy A082 0.22 2.58 151.86 700.05 0.23 0.96 3.76 0.15 1108.73 0.42 0.01 0.02
apy A082 - 0.15 100.92 251.64 0.35 1.22 4.16 0.04 715.89 0.57 0.00 0.04
apy A082 2.46 0.14 12.11 151.44 18.72 1.10 3.54 0.19 860.21 0.31 0.01 0.03
apy A082 1.50 0.81 52.23 235.09 0.29 0.66 3.39 0.14 704.10 0.44 0.00 0.01
apy A082 0.92 28.81 36.30 168.41 605.49 1.53 1.88 0.15 1037.15 0.25 0.01 0.02
apy A082 0.50 1.73 29.21 229.74 0.19 0.57 3.27 0.06 706.63 0.27 0.01 0.01
apy A082 0.66 - 27.79 224.64 -0.07 0.09 6.38 0.28 262.66 0.66 0.17 0.02
apy A082 0.72 8.69 25.41 374.62 0.14 0.94 2.38 0.14 1167.99 0.52 0.01 0.01
apy A082 - 2.66 74.08 296.75 0.23 0.24 6.07 0.07 328.20 0.68 0.00 0.01
apy A082 0.51 62.49 105.02 649.87 4.42 1.31 10.56 0.15 930.88 0.47 0.06 0.03
apy A082 0.48 1.16 57.15 227.02 0.32 0.88 1.90 0.14 816.34 0.49 0.02 0.01
apy A082 0.52 21.72 38.16 193.43 1.15 1.40 2.83 0.20 921.27 0.52 0.04 0.01
apy A082 12.16 11.68 422.62 715.10 0.84 1.91 1.51 0.38 914.76 1.31 0.00 0.08
apy
Snorm
aliz
ed
A082 2.75 - 78.14 451.53 0.00 0.69 9.72 0.13 4259.39 0.12 0.01 0.11
apy A082 1.75 0.53 40.83 271.69 0.00 0.51 6.73 0.42 2528.24 0.60 0.02 0.26
apy A082 19.81 4.19 130.55 494.49 0.00 1.69 4.91 0.52 2190.51 0.49 0.12 0.02
apy A082 31.76 0.58 32.29 226.70 0.00 1.63 6.90 0.39 1796.38 0.45 0.01 0.02
apy A082 48.54 10.58 624.34 593.10 0.39 10.91 29.42 1.10 2564.60 0.50 0.04 0.15
apy A082 7.51 48.70 145.23 438.51 0.52 2.75 7.31 0.19 2198.44 1.36 0.02 0.01
apy A082 30.11 84.40 69.46 350.10 0.78 5.42 7.66 0.12 2414.27 0.16 0.10 0.01
apy A082 0.26 1.32 40.68 353.40 1.02 1.41 4.57 0.07 1459.58 0.42 - 0.00
apy A082 173.77 1.04 151.95 562.47 0.35 2.31 15.29 - 2919.45 0.66 0.28 0.05
apy A082 63.30 13.42 661.34 614.74 1.46 4.19 7.01 - 1422.95 2.01 0.01 0.46
pyr A082 1.44 0.49 0.29 32.41 - 2.51 5.05 0.11 0.87 - 0.00 0.04
pyr A082 - 0.18 0.31 23.88 - 2.87 5.05 - 0.43 0.30 0.00 0.03
pyr A082 4.00 2.73 0.32 393.08 3.22 3.85 2.16 0.64 82.73 0.00 0.02 0.28
pyr A082 0.34 2.89 0.53 129.65 1.28 2.80 7.94 0.08 230.45 0.63 0.00 0.08
stb Bm048 - - 0.05 0.79 86.73 1.11 5.82 0.35 - 7.16 0.03 2.04
stb Bm048 0.35 0.74 0.00 0.64 105.14 1.04 6.32 0.11 - 6.41 0.07 1.62
stb Bm048 - - - 1.79 97.74 0.98 6.54 0.06 - 6.79 0.03 1.34
stb Bm048 - - 0.02 1.32 112.97 1.31 5.99 0.10 - 6.74 0.01 1.18
stb Bm048 - 0.95 0.11 2.47 105.61 1.51 7.02 0.23 - 6.57 0.03 3.70
stb Bm048 0.64 1.63 0.09 1.11 107.35 1.35 6.73 0.22 - 6.82 0.03 3.38
stb Bm048 0.62 0.27 0.06 0.94 120.36 1.55 6.25 0.08 - 7.73 0.03 3.69
stb Bm048 1.29 - 0.04 1.02 74.39 1.39 4.79 0.10 - 6.31 0.01 3.63
stb Bm048 13.31 0.70 0.02 0.43 91.98 1.53 7.99 0.19 - 7.49 0.02 2.49
stb Bm048 3.50 0.75 0.03 0.52 98.64 0.72 6.69 0.28 - 9.87 0.25 1.58
stb Bm048 0.08 0.22 0.02 0.73 129.25 1.90 8.17 -0.05 - 7.00 0.01 4.28
stb Bm048 0.07 0.51 2.45 0.53 131.74 1.62 8.69 0.16 - 7.54 0.02 3.21
stb Bm048 0.28 2.24 0.14 0.61 139.18 1.34 7.56 0.07 - 7.49 0.03 2.31
stb Bm048 0.34 0.11 0.03 0.54 133.51 1.12 8.91 0.07 - 6.65 0.03 2.57
stb Bm048 0.37 0.57 0.09 0.72 104.54 1.58 9.33 0.07 - 7.26 0.03 8.26
stb Bm048 0.17 0.43 0.01 0.23 110.35 1.46 9.03 0.03 - 7.53 0.02 7.07
stb Bm048 0.23 0.28 0.02 0.85 129.05 0.82 8.24 0.12 - 7.72 0.02 5.33
stb Bm048 7.17 32.45 0.03 1.54 98.58 1.60 7.82 0.10 - 6.96 0.05 10.49
stb Bm048 0.18 0.09 0.02 0.56 141.78 0.97 8.91 0.06 - 7.75 0.02 4.21
stb Bm048 0.52 0.27 0.02 0.00 135.63 1.30 8.15 0.02 - 6.99 0.01 5.34
py A080 1.53 0.00 41.43 347.87 32.07 2.86 1.46 0.12 46.77 0.26 0.00 0.24
py A080 0.01 - 79.68 675.31 0.47 2.79 4.35 -0.01 1.35 0.11 0.00 0.09
py A080 1.15 0.15 7.59 354.60 0.06 4.01 3.91 0.06 -0.55 0.00 0.00 0.01
py A080 0.52 - 100.77 586.95 0.14 2.08 3.44 0.00 2.35 0.27 0.00 0.17
apy A080 52.76 4.39 13.70 508.92 5.40 2.77 9.66 0.15 445.19 0.42 6.17 0.21
apy A080 0.34 0.60 16.50 516.49 - 0.71 5.38 0.28 526.76 0.05 0.14 0.22
apy A080 103.13 3.62 306.44 1144.57 0.52 4.40 13.52 0.08 744.67 0.66 73.30 0.22
apy A080 120.01 31.51 34.46 530.89 0.34 18.83 9.43 0.13 1169.64 0.70 34.70 0.57
apy A080 9.43 2.85 13.62 87.08 0.31 1.04 2.00 0.00 1.35 - 0.30 0.11
apy A080 0.20 -0.25 11.05 284.44 0.29 0.71 7.22 0.00 689.38 0.21 0.01 0.06
py
Fe
norm
aliz
ed
M122 102.87 26.48 3.96 117.28 24.36 6.79 0.97 0.13 541.25 0.03 0.56 0.80
py M122 91.49 27.35 3.84 91.26 18.91 7.50 0.60 0.15 510.63 0.04 0.51 1.02
py M122 56.69 14.97 15.09 77.83 19.70 5.77 0.81 0.16 670.93 0.20 0.70 0.88
py M122 95.84 32.62 3.68 88.29 18.37 0.00 0.48 0.09 368.45 0.11 0.75 0.84
py M122 154.23 33.66 10.05 265.01 23.20 12.20 0.57 0.07 236.11 0.16 1.08 3.48
py M122 2.48 0.50 9.68 201.81 -0.63 0.05 3.83 0.06 214.01 - 1.54 0.06
py M122 2.61 0.52 16.80 223.13 5.06 0.41 1.62 0.06 204.10 0.03 0.01 0.60
*Metal trace contents on four samples, selected on their premisice to the Sb/As reefs.
X: normalised with PGE-Ni standard.
All values are in ppm.
123

Chapter 4 Sb-As-Au mineralization at the Murchison Greenstone Belt, South Africa
When comparing arsenopyrite and stibnite, it is prominent that the quantity of trace
elements is greater in arsenopyrite. This could be a reflection of the refractory character
of arsenopyrite. Stibnite reveals higher quantitites of Cu and Ni. Only slight differences
can be observed between different stibnite grains. The input of Cu, while lacking in
arsenopyrite, could also indicate a change in fluid type that is responsible for the mobi-
lization of stibnite. Element variability plots have been used to provide a more detailed
look at the relationship between the trace elements of arsenopyrite and stibnite. Due
to low quantities measured in pyrite and pyrrhotite, these minerals were not taken into
account in this step.
The elemental plots show the relationship and R2 of different elements with S within
that specific mineral. The green band reflects the standard deviation. The elemental
plots of arsenopyrite (Figure 4.15) show little to no relationship of S with the metal
elements, except Cr (R2: 0.38). One exception must be noted; a sample (marked by
the red cross at all elements) has an unusual high Cu-content, changing the R2 value
radically. When this sample is not taken into account, a high relationship would also be
detected with Cu. Overall, up to 100’s ppm of Sb and Ni must be noted.
Figure 4.16 of stibnite on the contrary, shows high relationships of Ni, Cu and Se
with S. A negative correlation for Cd is also present.
Overall, when combining both major and trace metal elements an affinity and rela-
tionship conjointly of As-Ni-Sb is noteworthy within the AL mineralogy. Wavering
amounts of Cu-content within the solid and aqueous species is also apparent.
124

4.3 Results
Figure 4.15: Elemental map of arsenopyrite, with calculated correlations (R2) between the different metal
concentrations.
125

Chapter 4 Sb-As-Au mineralization at the Murchison Greenstone Belt, South Africa
Figure 4.16: Elemental map of stibnite, with calculated correlations (R2) between the different metal con-
centrations.
4.3.4 Geochemical modelling
We conducted thermodynamic calculations to depict the Fe-Cu-Sb-O-H-S and Fe-Cu-
As-O-H-S phase relations. Furthermore we focused on computing the solubilities of As,
126

4.3 Results
Sb, and Au. The phase relations were examined in H2(aq) vs. H2S(aq) activity plane
(Figure 4.17 and 4.18) and in pH vs log f O2 plane (Figure 20-26) for a pressure of 1
kbar and temperatures of 350 and 250 ◦C.
Figure 4.17: Activity diagram Fe-Sb-S-O at 1kb ranging from 150-500 ◦C.
127

Chapter 4 Sb-As-Au mineralization at the Murchison Greenstone Belt, South Africa
The activity diagrams for Sb-phases (Figure 4.17) show that the stibnite-berthierite
phase boundary in the H2-H2S plane runs parallel and close to the pyrite-pyrrhotite
binary. It is hence likely that pyrite-pyrrhotite control H2-H2S activities in the system,
and that the stibnite-berthierite assemblage is a reflection of this control mechanism.
Additionally, it indicates that the transition from early native antimony and berthierite
along with pyrrhotite to later stibnite and pyrite is consistent with a drop in the activity
of aqueous dihydrogen, which causes an increase of sulfur fugacity, according to S2(g)
+ H2(aq) = H2S(aq) (Hagemann and Lüders, 2003). An increase or decrease in H2S(aq)
activity can also cause the transition from berthierite to stibnite. A decrease in H2S
activity, by for example boiling, can explain the berthierite-stibnite transition only in
the presence of magnetite, which is lacking in the AL assemblages. Likewise, degassive
loss of both H2 and H2S in equal proportions would not affect sulfur fugacity, so the
berthierite-stibnite phase boundary can only be crossed if magnetite were present.
128

4.3 Results
Figure 4.18: Activity diagram Fe-As-S-O at 1kb ranging from 150-400 ◦C.
Figure 4.19: Activity diagram of a) Sb and b) As phases with varying Sb and As concentrations at 1kb and
400 ◦C, with contourlines of Ni+ plotted in the background.
Figure 4.19 emphasizes the activity diagrams for both Sb and As phase relations at
400 ◦C, based on the primary mineralization temperature deduction around 380-400
129

Chapter 4 Sb-As-Au mineralization at the Murchison Greenstone Belt, South Africa
◦C calculated by Jaguin, Boulvais, et al. (2014) and chapter 3. The red lines indicate
variable Sb (10-10000 ppm) and As (10-1000 ppm) solubilities. In calculating these
phase relations, Ni was included as component (in addition to Cu-Fe-O-S-H-As/Sb), and
Fe-Ni-S phase relations are plotted in light blue. This treatment allows the inclusion of
gersdorffite and ullmannite (both are common in the AL) in the phase relation analyses.
A different approach of deducing stability of Sb and As-solubilities and phase rela-
tions in multicomponent space is to focus on acidity in relationship to oxygen fugacity,
as seen in Figure 4.20 - 4.25.
Figure 4.20: Activity diagram of Sb-minerals a) with Cu-content and b) without Cu-content at 250 ◦C and
1kb.
Figure 4.20 shows the stability fields of the solid minerals with and without Cu in
the system. The stibnite-berthierite-chalcostibite group is dominantly dependent on the
oxygen fugacity within the acidic to neutral regimes. In the presence of sulfate, the set-
ting is too oxidized to form Sb-sulfides and only senarmontite (Sb2O3) will be present.
130

4.3 Results
Figure 4.21: Activity diagram of Sb-species a) with Cu-content and b) without Cu-content at 250 ◦C and
1kb.
Figure 4.22: Activity diagram of Sb-minerals without Cu-content at 350 ◦C and 1kb.
Figure 4.21 and 4.22 examine the deposition of Sb(-Cu) minerals and Sb solubilities
at 1 kb and 250 ◦C and 350 ◦C, respectively, under varying f O2 and pH conditions.
When focusing on stibnite(-berthierite), the mineralization will be promoted under re-
ducing and acidic to neutral conditions, within the pyrite field. Native antimony will
only be deposited at fairly reducing conditions. The (OH)2Cl complex is dominant in
acidic conditions and prefers at 250 ◦C a more reducing setting, though slightly less
reduced at 350 ◦C. In contrast hydroxo-complexes are dominant in the more neutral
to basic conditions. Phase transitions between stibnite-berthierite-native antimony are
131

Chapter 4 Sb-As-Au mineralization at the Murchison Greenstone Belt, South Africa
dominantly controlled by oxygen fugacity. The acidity plays a major role in the pre-
cipitation of Sb-minerals as indicated by the strong pH-dependency of Sb solubility.
Adding Cu to the phase relation analyses will effect the stability of stibnite at high f O2
by introducing the sulfosalts chalcostibite and tetrahedrite.
Figure 4.23: Activity diagram of Sb-minerals with Cu-content at 350 ◦C and 1kb.
Figure 4.23 displays the same setting at 350 ◦C with Cu-content. Figure 24a dis-
plays the isopleths for 100 ppm and 1000 ppm Sb, while Figure 24b displays a range
of isopleths from 2000 to to 5000 to 10000 ppm Sb. A two-step visualization has been
chosen due to an increase in readability of the plot. The diagrams show that a miner-
alizing fluid would need at least 2000 ppm dissolved Sb in order to precipitate stibnite
at 350 ◦C. Berthierite and chalcostibite, in contrast, may occur already at 1000 ppm Sb.
Overall, Sb(OH)3 (aq) is the dominant aqueous Sb-species in solution.
Figure 4.24 examines the deposition of As(-Cu) minerals and As3+ species at 350 ◦C
and 1kb, under varying f O2 and pH conditions. Arsenopyrite + sulfosalt are stable under
acidic and reducing conditions inside the H2S(aq) predominance field. Under more
oxidizing and alkaline conditions, westerveldite ((Fe,Ni)As) is expected to mineralize.
As(OH)3 (aq) is the dominant aqueous Sb-species in solution.
132

4.3 Results
Figure 4.24: Activity diagram of As-minerals with Cu-content at 350 ◦C and 1kb.
Figure 4.25: Activity diagram of Au at a) 250 ◦C and b) 350 ◦C at 1kb.
Similar computations were conducted to investigate the solubility of gold considering
the stability of various Au-species at 250 ◦C (Figure 4.25a) and 350 ◦C (Figure 4.25b).
Gold is preferably transported as Au(HS)2− (c.f. e.g. Williams-Jones and Norman
(1997)) in fairly reducing settings at both temperatures. Its solubility is actually greater
at 250 ◦C than at 350 ◦C. The Au(HS)2− is destabilized by either taking H2S out of the
system or by adding sulfate and acidifying the solution. This can be understood in terms
of reaction
133

Chapter 4 Sb-As-Au mineralization at the Murchison Greenstone Belt, South Africa
8Au(HS)−2+SO
2−
4+15H
+= 8Au(s)+4H2O+15H2S. (4.1)
At both temperatures the maxima of gold concentrations and major drops of its solu-
bility lie within the pyrite stability field (and the stibnite stability field, cf. Figure 4.22.).
4.4 Discussion
4.4.1 Orogenic gold deposit style
The Murchison Greenstone Belt (MGB) in South Africa is one of the Archaean green-
stone belts along the Kaapvaal Craton and hosts the largest Archaean economic stibnite
deposit in the world (Boyle and Jonasson, 1984; Davis et al., 1986). The (primary)
antimony mineralization in the AL has been proposed to relate to the emplacement of
Maranda granodiorite intrusions that occurred around 2.9 Ga (Poujol, 1996; Jaguin,
Poujol, et al., 2013) and that may be related to orogeny in the Limpopo Belt, north of
the MGB (Block et al., 2013). The MGB hosts an Archaean suture zone with a VMS-
type deposit, responsible for the Cu-Zn line north of the AL (Schwarz-Schampera et
al., 2010) and probably accountable for the Au found in the Pietersberg greenstone belt
(Zeh et al., 2013).
The dominant mineralogy is stibnite-arsenopyrite-berthierite-ullmannite-pyrite-pyrrhotite,
with minor occurences of ullmannite, gersdorfite and chalcopyrite (Davis et al., 1986;
Vearncombe et al., 1992). It has been widely accepted that stibnite, tetrahedrite and a
great variety of other sulphosalts (e.g. berthierite) are the principal antimony minerals
in gold-quartz veins within carbonated silificied zones like greenstone belts (Boyle and
134

4.4 Discussion
Jonasson, 1984). Gold has not been found within scope of this paper, though is has
been recognized by others as visible and invisible gold in varying distances from the
dominant antimony mineralization (Davis et al., 1986; Vearncombe et al., 1992). The
invisible gold has been determined to occur as fine disseminations or as sub-microscopic
intergrowths in arsenopyrite-pyrite mineralization (Davis et al., 1986). Due to the Sb-
As-Au mineralogy (Hagemann and Lüders, 2003), together with geological setting of
a (back)-arc convergent plate setting within an in accretionary and collisional orogeny
(Groves et al., 1998), the AL is interpreted to be a unique example of an Archaean oro-
genic gold deposit (Foster and Piper, 1993), also conform by the definition set up by
Hagemann and Cassidy (2000). Furthermore, most orogenic gold deposits formed un-
der greenschist facies conditions with hydrothermal alteration assemblages developed
in ductile to brittle deformation, with temperatures around 200-420 ◦C and CO2-rich
fluids (Hutchinson, 1993; McCuaig and Kerrich, 1998) of granitoid magmatic or meta-
morphic origin (Ridley and Diamond, 2000), which all agrees to the temperature and
fluid regime determined by Jaguin, Boulvais, et al. (2014) and chapter 3. Jaguin, Poujol,
et al. (2013) and Jaguin, Boulvais, et al. (2014) assigned a major role in the formation
of the Sb-mineralization to the albititzation of the Maranda granite. Chapter 3 pre-
sented a comprehensive geochemical model that accounts for the formation of listven-
ite and albitite in the contact between granodiorite and komatiited in the AL suture
zone. These authors furthermore suggested that the metasomatic reactions forming the
deposit-hosting lithologies acted as trap for Sb (and As and Au). The earlier Ni-As-Sb-
Cu-Fe-S mineralization, however, could have formed prior to metasomatic replacement
of the host lithologies. We present here solubility calculations and additional phase rela-
tions that support the idea that the AL represents a special type of orogenic lode deposit,
in which metasomatic reactions rather than pressure-release and fluid boiling played a
135

Chapter 4 Sb-As-Au mineralization at the Murchison Greenstone Belt, South Africa
major role in the mineralization.
4.4.2 Sb-As-Au mineralization
Mineralization in the AL in theMGB is typified by stibnite-arsenopyrite-pyrite-pyrrhotite-
berthierite-ullmanite-gudmundite(-chalcopyrite) dominantly disseminated within the car-
bonated domains, with stibnite being the most dominant economic important mineral.
Different generations of Fe-Sb-S(-Cu) mineralization can be recognized throughout
the AL. Stibnite is clearly mobile on small spatial scales as it can be found mineral-
ized throughout the carbonatized system in different grain sizes and as fillings between
dolomite grains or as newly mineralized rims on arsenopyrite or other sulfides.
Three generations of Sb-mineralization occur: 1) gudmundite found adjacent to ar-
senopyrite; 2) berthierite-ullmannite outside dolomite-carbonation veins, in close prox-
imity to arsenopyrite domains and finally 3) berthierite-stibnite mobilization within car-
bonatized domains. Additionally, arsenopyrite-mineralization is not restricted to the
carbonization event and dolomite-mineralization, though dominantly found within ex-
tensively deformed and schistosed regions, and is thus interpreted to be from a gen-
eration before the carbonization-event(s). A prominent Sb-As mineralization event is
confirmed by the Sb-enrichment within arsenopyrite and pyrite and may be an indica-
tion of relatively high Sb-content in the primary sulfide forming fluids or reconcentra-
tion of Sb due do its ability to re-enter the arsenopyrite lattice when considering the
FeAsS-FeSbS solid solution (Cook et al., 2013). Pyrite-pyrrhotite is additionally de-
veloped in the Sb-mineralized within the carbonized rocks from the AL, therefore the
replacement of gudmundite to berthierite by stibnite in the presence of pyrite as dom-
inant Sb phase can be accomplished by decreasing aH2 or by increasing aH2S (Figure
136

4.4 Discussion
4.17) (Lambert, 1998; Craig, 1993). Both pyritization and oxidation by carbonization
lead to increased sulfur fugacities, a common explanation for the genesis of orogenic
gold deposits (Williams-Jones, Bowell, et al., 2009) and serpentinization environments
(Klein and Bach, 2009).
Arsenian pyrite, with As contents greater than 100 ppm and minor contents of Sb and
Ni, has been shown to be an economically important host for Au in epithermal gold
deposits (Reich et al., 2005) and in greenschist facies orogenic lode deposits (Cook et
al., 2013). Temperature changes plus alteration by hydrothermal fluids (Deditius et al.,
2014) and the decrease in H2S (Reich et al., 2005) additionally control incorporation of
Au and As quantity within pyrite at orogenic gold deposits.
Low content of chalcopyrite, though varying Cu-concentrations can be explained
the low amount of chalcopyrite in the primary mineralization event or the soft, non-
refractory, behavior of chalcopyrite. Presumably chalcopyrite has been remobilized
through the system, during the carbonization event and has not been redeposited due to
lower temperatures within the carbonization regime and hence mostly was lost from the
AL.
The high Ni contents can be explained by being a remnant of ultramafic precursor
rock (komatiite).
4.4.3 Model results
Though the AL is known for its unique enrichment of antimony, it’s uniqueness stands
out when compared with other (orogenic gold deposits) Archaean greenstone belts
where berthierite-gudmundite(-native antimony) are the dominant Sb-minerals within
their system instead of stibnite: Kwekwe district (Buchholz and Oberthür, 2007); Hemlo
137

Chapter 4 Sb-As-Au mineralization at the Murchison Greenstone Belt, South Africa
Archaean gold deposit (Pan and Fleet, 1995); Flin Flon greenstone belt (Healy and
Petruk, 1990); Barberton greenstone belt (Ronde and Wit, 1992); Abitibi greenstone
belt (Normand et al., 1996). The lack of native antimony and the reduced amount of
berthierite-gudmundite could be explained by higher f O2 conditions at the MGB (Fig-
ure 4.22).
Though greenschist facies conditions have been thought responsible for the Au con-
tent in these deposit styles, a controversy arrives when looking at antimony separately
within these settings. Goldfarb, Groves, and Gardoll (2001) summarized the geochem-
ical characteristics of antimony to be likely soluble as bisulfide complexes at relative
low temperatures (<200 ◦C). These results are disputed by our modeling results (Figure
4.21-4.22), showing that Sb(OH)3 is the dominant aqueous species, and mineralization
to be possible at higher temperature regimes (up to 350 ◦C) depending on pH and redox
conditions (cf. Obolensky, Gushchina, Borisenko, Borovikov, and Pavlova (2007) and
Obolensky, Gushchina, Borisenko, Borovikov, and Nevol’ko (2009)).
4.5 Conclusions
The Murchison Greenstone Belt is an Archaean orogenic gold deposit, where the pri-
mary mineralization is connected to an ore fluid originating from a granitoid magmatic
or a metamorphic devolatization model (Ridley and Diamond, 2000) (Chapter 3). The
phase relations clearly indicate that the system transitioned from low f S2 and low f O2.
Primary mineralization is As-Sb-Ni-Cu, and shifted towards As-Sb-Fe-Cu, visibly the
loss of ullmanite and enrichment of berthierite which was followed by the alteration of
berthierite into stibnite with high f S2 and f O2. These transitions are a consequence of
carbonation and silicification. The rock’s buffering capacities become eventually over-
138

4.6 Acknowledgments
whelmed. However, as the phase diagrams show, Sb solubility remains low at these
temperature and acidity range even as f O2 and f S2 creep up.
4.6 Acknowledgments
The authors thank the management and acting geologists of Consolidated Murchison
Limited (ConsMurch) for their assistance and cooperation during our fieldwork in 2013.
Andreas Klügel and Patrick Monien from the Universität Bremen are thanked for their
assistance in conducting the geochemical measurements at the LA-ICPMS at the Uni-
versity of Bremen. Moritz Wagner and Michael Hentscher helped with assembling the
thermodynamic databases. We thank Chris Heinrich (ETH Zurich) for making his com-
pilation of aqueous Au-species available to us.
Bibliography
Akinfiev, N.N. and A.V. Zotov (2010). “Thermodynamic description of chloride, hydrosulfide, and hy-
droxo complexes of Ag(I), Cu(I) and Au(I) at temperatures of 25-500◦C and pressures of 1-2000 bar”.
In: Geochemistry Int. 39.10, pp. 990–1006. DOI: 10.1134/S0016702910070074.
Anhaeusser, C R (1976). “Archean Metallogeny in Southern Africa”. In: Econ. Geol. 71, pp. 16–43.
Ashley, P.M. et al. (2003). “Environmental mobility of antimony around mesothermal stibnite deposits,
New South Wales, Australia and southern New Zealand”. In: J. Geochemical Explor. 77.1, pp. 1–14.
DOI: 10.1016/S0375-6742(02)00251-0.
Bessinger, B. and J.A. Apps (2005). The Hydrothermal Chemistry of Gold, Arsenic, Antimony, Mercury
and Silver. Tech. rep. Office of Science U.S. Department of Energy, pp. –52.
Block, S. et al. (2013). “The Murchison Greenstone Belt, South Africa: Accreted slivers with contrasting
metamorphic conditions”. In: Precambrian Res. 227, pp. 77–98. DOI: 10.1016/j.precamres.
2012.03.005.
139

Bibliography
Boyle, R.W. and I.R. Jonasson (1984). “The geochemistry of antimony and its use as an indicator element
in geochemical prospecting”. In: J. Geochemical Explor. 20, pp. 223–302.
Buchholz, P. and T. Oberthür (2007). “Multistage Au-As-Sb Mineralization and Crustal-Scale Fluid Evo-
lution in the Kwekwe District , Midlands Greenstone Belt , Zimbabwe : A Combined Geochemical ,
Mineralogical , Stable Isotope , and Fluid Inclusion Study”. In: Econ. Geol. 102.1994, pp. 347–378.
Castro, S.H. and L. Baltierra (2005). “Study of the surface properties of enargite as a function of pH”. In:
Int. J. Miner. Process. 77.2, pp. 104–115. DOI: 10.1016/j.minpro.2005.03.002.
Cook, N. et al. (2013). “Arsenopyrite-Pyrite Association in an Orogenic Gold Ore : Tracing mineraliza-
tion history from textures and trace elements”. In: Econ. Geol. 108, pp. 1273–1283.
Craig, J.R. (1993). “The Metamorphism of pyrite and pyritic ores: An overview”. In: Mineral. Mag.
57.386, pp. 3–18. DOI: 10.1180/minmag.1993.057.386.02.
Davis, D.R., D.B. Paterson, and D.H.C. Griffith (1986). “Antimony in South Africa”. In: J. S. Afr. Inst.
Min. Met. 86.6, pp. 173–193.
Deditius, A.P. et al. (2014). “The coupled geochemistry of Au and As in pyrite from hydrothermal ore
deposits”. In: Geochemica Cosmochim. 140, pp. 644–670. DOI: 10.1016/j.gca.2014.05.045.
Firdu, F.T. and P. Taskinen (2010). “Thermodynamics and phase equilibria in the (Ni, Cu, Zn)–(As, Sb,
Bi)–S systems at elevated temperatures (300–900 C)”. In: Espoo Aalto Univ. Publ. Mater. . . . Pp. 1–59.
Foster, R.P. and D.P. Piper (1993). “Archaean lode gold deposits in Africa: Crustal setting, metallogenesis
and cratonization”. In: Ore Geol. Rev. 8, pp. 303–347.
Goldfarb, R.J. and D.I. Groves (2015). “Orogenic gold: Common or evolving fluid and metal sources
through time”. In: Lithos. DOI: 10.1016/j.lithos.2015.07.011.
Goldfarb, R.J., D.I. Groves, and S. Gardoll (2001). “Orogenic gold and geologic time: A global synthe-
sis”. In: Ore Geol. Rev. 18.1-2, pp. 1–75. DOI: 10.1016/S0169-1368(01)00016-6.
Groves, D.I. et al. (1998). “Orogenic gold deposits: A proposed classification in the context of their
crustal distribution and relationship to other gold deposit types”. In: Ore Geol. Rev. 13.1-5, pp. 7–27.
DOI: 10.1016/S0169-1368(97)00012-7.
Hagemann, S.G. and K.F. Cassidy (2000). “Archean orogenic lode gold deposits”. In: Econ. Geol. 13.i,
pp. 382–384.
Hagemann, S.G. and V. Lüders (2003). “P-T-X conditions of hydrothermal fluids and precipitation mecha-
nism of stibnite-gold mineralization at the Wiluna lode-gold deposits, Western Australia: conventional
140

Bibliography
and infrared microthermometric constraints”. In: Miner. Depos. 38.8, pp. 936–952. DOI: 10.1007/
s00126-003-0351-6.
Healy, R.E. and W. Petruk (1990). “Petrology of Au-Ag-Hg alloy and invisible gold in the Trout lake
massive sulfide deposit, Flin Flon Manitoba”. In: Can. Mineral. 28.2, pp. 189–206.
Heinrich, C.A. (2005). “The physical and chemical evolution of low-salinity magmatic fluids at the por-
phyry to epithermal transition: A thermodynamic study”. In: Miner. Depos. 39.8, pp. 864–889. DOI:
10.1007/s00126-004-0461-9.
Hutchinson, R. W. (1993). “A multi-stage, multi-process genetic hypothesis for greenstone-hosted gold
lodes”. In: Ore Geol. Rev. 8.3-4, pp. 349–382. DOI: 10.1016/0169-1368(93)90022-Q.
Jaguin, J., P. Boulvais, et al. (2014). “Stable isotopes (O, C) and fluid inclusion study of quartz-carbonate
veins from the antimony line, Murchison Greenstone Belt”. In: Am. J. Sci. 314.7, pp. 1140–1170. DOI:
10.2475/07.2014.03.
Jaguin, J., M. Poujol, et al. (2013). “Albitization in the Antimony Line, Murchison Greenstone Belt
(Kaapvaal Craton): A geochemical and geochronological investigation”. In: Lithos 168-169, pp. 124–
143. DOI: 10.1016/j.lithos.2013.01.010.
Johnson, J.W., E.H. Oelkers, and H.C. Helgeson (1992). SUPCRT92: A software package for calculating
the standard molal thermodynamic properties of minerals, gases, aqueous species, and reactions from
1 to 5000 bar and 0 to 1000◦C. Vol. 18. 7. Pergmamon Press Ltd, pp. 899–947. DOI: 10.1016/0098-
3004(92)90029-Q.
Kantar, Cetin (2002). “Solution and flotation chemistry of enargite”. In: Colloids Surfaces A Physic-
ochem. Eng. Asp. 210.1, pp. 23–31. DOI: 10.1016/S0927-7757(02)00197-8.
Klein, F. and W. Bach (2009). “Fe-Ni-Co-O-S Phase Relations in Peridotite-Seawater Interactions”. In:
J. Petrol. 50.1, pp. 37–59. DOI: 10.1093/petrology/egn071.
Klemm, D.D. (1965). “Synthesen und Analysen in den Dreiecksdiagrammen FeS - CoAsS - NiAsS und
FeS2 - CoS2 - NiS2”. In: Neues Jahrb. Miner. 103, pp. 205–255.
Krupp, E (1988). “Solnbility of stibnite in hydrogen sulfide solutions, speciation, and equilibrium con-
stants, from 25 to 350 ◦ C”. In: Geochemica Cosmochim. 52, pp. 3005–3015.
Lambert, J.M. (1998). “Kinetics and mechanism of the pyrite to pyrrhotite transformation”. In: Metall.
Mater. Trans. B.
141

Bibliography
Lynch, D C (1982). “Standard Free Energy of Formation of NiAsS”. In: Metall. Mater. Trans. B 13.June,
pp. 285–288.
Madu, B. E., B.E. Nesbitt, and K. Muehlenbachs (1990). “A mesothermal gold-stibnite-quartz vein oc-
curence in the Canadian Cordillera”. In: Econ. Geol. 85, pp. 1260–1268.
McCuaig, T.C. and R. Kerrich (1998). P—T—t—deformation—fluid characteristics of lode gold deposits:
evidence from alteration systematics. Vol. 12. 6, pp. 381–453. DOI: 10.1016/S0169- 1368(98)
80002-4.
Normand, C., M. Gauthier, and M. Jébrak (1996). “The Québec Antimony deposit: An example of gud-
mundite - native antimony mineralization in the Ophiolitic mélange of the Southeastern Québec ap-
palachians”. In: Econ. Geol. 91.1, pp. 149–163. DOI: 10.2113/gsecongeo.91.1.149.
Obolensky, A.A., L.V. Gushchina, A.S. Borisenko, A.A. Borovikov, and P.A. Nevol’ko (2009). “Com-
puter thermodynamic modeling of the transport and deposition of Sb and Au during the formation of
Au-Sb deposits”. In: Russ. Geol. Geophys. 50.11, pp. 950–965. DOI: 10.1016/j.rgg.2009.10.004.
Obolensky, A.A., L.V. Gushchina, A.S. Borisenko, A.A. Borovikov, and G.G. Pavlova (2007). “Antimony
in hydrothermal processes: solubility, conditions of transfer, and metal-bearing capacity of solutions”.
In: Russ. Geol. Geophys. 48, pp. 992–1001. DOI: 10.1016/j.rgg.200.
Padilla, R., C.A. Rivas, and M.C. Ruiz (2008). “Kinetics of Pressure Dissolution of Enargite in Sulfate-
Oxygen Media”. In: Metall. Mater. Trans. B 39.3, pp. 399–407. DOI: 10.1007/s11663-008-9151-
9.
Pan, Y. and M.E. Fleet (1995). “The late Archean Hemlo gold deposit, Ontario, Canada: a review and
synthesis”. In: Ore Geol. Rev. 9.6, pp. 455–488. DOI: 10.1016/0169-1368(95)00003-K.
Pokrovski, G.S. et al. (2006). “Antimony speciation in saline hydrothermal fluids: A combined X-ray
absorption fine structure spectroscopy and solubility study”. In: Geochim. Cosmochim. Acta 70.16,
pp. 4196–4214. DOI: 10.1016/j.gca.2006.06.1549.
Poujol, M. (1996). “3.07-2.97 Ga Greenstone Belt formation in the northeastern Kaapvaal Craton: Impli-
cations for the origin of the Witwatersrand Basin”. In: Econ. Geol. 91, pp. 1455–1461.
Reich, M. et al. (2005). “Solubility of gold in arsenian pyrite”. In: Geochim. Cosmochim. Acta 69.11,
pp. 2781–2796. DOI: 10.1016/j.gca.2005.01.011.
Ridley, J.R. and L.W. Diamond (2000). Fluid chemistry of orogenic lode gold deposits and implications
for genetic models.
142

Bibliography
Ronde, C.E.J. de andM.J. deWit (1992). “Shear Zone-Related , Au Quartz Vein Deposits in the Barberton
Greenstone Africa : Field and Petrographic Characteristics , Fluid Properties , and Light Stable Isotope
Geochemistry”. In: 87, pp. 366–402.
Schock, E.L. et al. (1997). “Inorganic species in geologic fluids: correlations among standard molal ther-
modynamic properties of aqueous ions and hydroxide complexes.” In: Geochemica Cosmochim. 61.5,
pp. 907–950. DOI: 10.1017/CBO9781107415324.004. arXiv: arXiv:1011.1669v3.
Schwarz-Schampera, U., H. Terblanche, and T. Oberthür (2010). “Volcanic-hosted massive sulfide de-
posits in the Murchison greenstone belt, South Africa”. In: Miner. Depos. 45, pp. 113–145. DOI:
10.1007/s00126-009-0266-y.
Seal, R.R., E.J. Essene, and W.C. Kelly (1990). “Tetrahedrite and tennantite: Evaluation of thermody-
namic data and phase equilibria”. In: Can. Mineral. 28, pp. 725–738.
Seal, R.R., R.A. Robie, P.B. Barton, et al. (1992). “Superambient heat capacities of synthetic stibnite,
berthierite, and chalcostibite; revised thermodynamic properties and implications for phase equilibria”.
In: Econ. Geol. 87.7, pp. 1911–1918. DOI: 10.2113/gsecongeo.87.7.1911.
Seal, R.R., R.A. Robie, B.S. Hemingway, et al. (1996). “Heat capacity and entropy at the temperatures
5 K to 720 K and thermal expansion from the temperatures 298 K to 573 K of synthetic enargite
(Cu3AsS4)”. In: J. Chem. Thermodyn. 28.4, pp. 405–412. DOI: 10.1006/jcht.1996.0040.
Stefánsson, A. and T.M. Seward (2003a). “Stability of chloridogold(I) complexes in aqueous solutions
from 300 to 600◦C and from 500 to 1800 bar”. In: Geochim. Cosmochim. Acta 67.23, pp. 4559–4576.
DOI: 10.1016/S0016-7037(03)00391-0.
– (2003b). “The hydrolysis of gold(I) in aqueous solutions to 600◦c and 1500 bar”. In: Geochim. Cos-
mochim. Acta 67.9, pp. 1677–1688. DOI: 10.1016/S0016-7037(02)01131-6.
– (2004). “Gold(I) complexing in aqueous sulphide solutions to 500◦C at 500 bar”. In: Geochim. Cos-
mochim. Acta 68.20, pp. 4121–4143. DOI: 10.1016/j.gca.2004.04.006.
Sverjensky, D.A., E.L. Shock, and H.C. Helgeson (1997). “Prediction of the thermodynamic properties of
aqueous metal complexes to 1000 degrees C and 5 kb.” In: Geochim. Cosmochim. Acta 61.7, pp. 1359–
1412. DOI: 10.1016/S0016-7037(97)00009-4.
USGS (2015). “Antimony — A Flame Fighter”. In: April, pp. 4–5.
Vearncombe, J.R. (1991). “A possible Archaean Island Arc in the Murchison Belt , Kaapvaal Craton ,
South Africa”. In: J. African Earth Sci. 13.3, pp. 299–304.
143

Bibliography
Vearncombe, J.R. et al. (1992). Geology, Geophysics and mineralisation of the Murschison Schist Belt,
Rooiwater Complex and Surrounding granitoids. Geological. Department of Mineral and Energy af-
fairs.
Vink, B.W. (1996). “Stability relations of antimony and arsenic compounds in the light of revised and
extended Eh-pH diagrams”. In: Chem. Geol. 130.1-2, pp. 21–30. DOI: 10.1016/0009-2541(95)
00183-2.
Wagman, D.D. et al. (1982). The NBS Tables of Chemical Thermodynamic Properties.
Welham, N J (2001). “Mechanochemical processing of enargite ( Cu3AsS4 )”. In: Hydrometallurgy 62,
pp. 165–173.
Whitmore, D.R.E., L.G. Berry, and J.E. Hawley (1946). “Chrome Micas”. In: J. Am. Mineral. 31.1-2,
pp. 1–21.
Williams-Jones, A.E., R.J. Bowell, and A.A. Migdisov (2009). “Gold in solution”. In: Elements 5.5,
pp. 281–287. DOI: 10.2113/gselements.5.5.281.
Williams-Jones, A.E. and C. Norman (1997). “Controls of mineral parageneses in the system Fe-Sb-S-O”.
In: Econ. Geol. 92.3, pp. 308–324. DOI: 10.2113/gsecongeo.92.3.308.
Wolery, T.J. and C.F. Jove-Colon (2004). Qualification of Thermodynamic Data for Geochemical Model-
ing of Mineral-Water Interactions in Dilute Systems. Tech. rep. November. Bechtel SAIC, pp. 1–212.
DOI: 10.2172/850412.
Yund, R.A. (1962). “The system NiAsS phase relations and mineralogical significance.pdf”. In: Am. J.
Sci. 260, pp. 761–782.
Zeh, A. et al. (2013). “Juvenile crust formation in the northeastern Kaapvaal Craton at 2.97Ga—Implications
for Archean terrane accretion, and the source of the Pietersburg gold”. In: Precambrian Res. 233,
pp. 20–43. DOI: 10.1016/j.precamres.2013.04.013.
144

145

146

Chapter 5
Geochemical modeling insight into Sb-As-Au-Ag
mineralization at the PacManus basin, Papua New
Guinea
NIKKI BLAAUWBROEK1, MICHAELHENTSCHER1, SVEN PETRERSEN2, WOLF-
GANG BACH1
1 Department of Geosciences and MARUM – Center for Marine Environmental Sciences,
University of Bremen, Klagenfurter Str., 28359 Bremen, Germany
2 Geomar Helmholtz-Zentrum für Ozeanforschung Kiel,
Wischhofstrasse 1-3, 24148 Kiel, Germany
Keywords: auriferous VMS, back-arc basin, antimony, PACManus
147

Chapter 5 PACManus
Abstract
The tectonic and petrological characteristics of the East Manus Basin (EMB), and the
PACManus hydrothermal area on the dacitic Pual Ridge make it a useful analog for land-
based auriferous VMS ore mineralizations. Unlike black smoker systems on mid-ocean
ridges, these arc- and back-arc-systems are influenced strongly be magma degassing,
which has major consequences for the transport of elements like Sb, As, Ag, and Au. In
this study, geochemical data of solids and fluids from the PACManus hydrothermal area
in the Manus back-arc basin are used to examine the controls of host rock composition,
magma degassing, zone refining, and supergeneous processes in the distribution of these
elements in the massive sulfide. Geochemical modeling has been employed to assess
the consequences of fluid mixing, conductive cooling/heating, and zone refining. The
model results are compared with the variability observed in the compositions of vent
fluids and solids to identify common processes in subseafloor fluid mixing and fluid-
rock interactions and investigate their importance for seafloor massive sulfide deposits.
This study contributes robust geochemical constraints related to enrichments of Sb, As,
Au and Ag, in relation to other metals, like Zn and Cu, and thus provides a start for
understanding geochemical behavior between different metals and their corresponding
relationship between the (altered) oceanic crust and active hydrothermal venting.
148

5.1 Introduction
5.1 Introduction
Volcanogenic massive sulphide (VMS) deposits are commonly enriched in Cu, Zn and
Pb and can also be variably enriched in Au, As, Sb and Ag (Herzig and Hannington,
1995; Patten et al., 2016). Although the apparent diversity and corresponding complex-
ity, the gold-enriched VMS deposits was not in the least short in attention throughout
the past from for instance mining companies (e.g. Hannington, De Ronde, et al. (2005)
and Mercier-Langevin et al. (2011)). Gold-rich VMS deposits are important targets for
the mining industry (Mercier-Langevin et al., 2011) and are found on a diverge range
of oceanic and continental geological settings; from fast to slow spreading mid ocean
ridges; in sedimented rifts adjacent to continental margins and in subduction related
back-arc environments (Herzig and Hannington, 1995). (Auriferous) VMS deposits
are known for their complex mineral paragenesis, commonly associated with Cu-Zn-
Pb mineralization (Hannington, Poulsen, et al., 1999; Mercier-Langevin et al., 2011),
and at back-arc environments at high temperatures includes pyrrhotite, pyrite/marcasite,
sphalerite/wurzite, chalcopyrite, bornite and may contain galena, Pb-As-Sb sulfosalts,
realgar, orpiment and locally native gold with trace element enrichments of As, Sb, Ba,
Te and In (Herzig and Hannington, 1995; Moss and S. Scott, 2001; Patten et al., 2016).
Understanding the geochemical behavior of Au, Ag, As and Sb is interesting and in-
creasingly important for both oceanic and continental mining prospects, while precious
metal contents of seafloor sulfides are well within range of those found in land based
deposits (Herzig and Hannington, 1995; Moss and S. Scott, 2001; Mercier-Langevin
et al., 2011). However, until recently, no specific attention has been given to this spe-
cific group within these a range of gold deposits and their possible relationship with one
another and one can conclude that the geochemical behavior is thus not well understood
149
Chapter 5 PACManus
(Douville et al., 1999; Craddock, 2009; Patten et al., 2016). Nevertheless, recent pub-
lished studies, such as Patten et al. (2016) and Dekov et al. (2016) indicate an increase
in interest and consequently an increased necessity in understanding the geochemical
behavior of polymetallic mineralization.
5.1.1 Sb, As, Au and Ag enrichment in arc and back-arc settings
The coupling between magmatic and hydrothermal processes is perhaps most impres-
sive in suprasubduction systems, where volatile-rich melts are segregated from a mantle
wedge that is heavily flux-modified by slab-derived fluids (Hedenquist and Lowenstern,
1994; Richards, 2011). Degassing of magmatic fluids has been demonstrated to take
place in these systems and strongly affect the geochemical processes in hydrothermal
vents hosted in the arc volcanoes (Ronde, 1995; Ronde et al., 2001) and in the PAC-
Manus system in the Manus back-arc basin (Kamenetsky et al., 2001; K.H. Yang and
S. Scott, 1996; K Yang and S. D. Scott, 2006). On a global scale, arc systems are re-
sponsible for about 10% of the hydrothermal fluid flux, the remainder being associated
mostly with mid-ocean ridge processes (Baker et al., 2008). But because fluids venting
from arc volcanoes are enriched in elements such as As, Sb, Tl, Al, Ag, Au, Zn, Pb,
Bi and gases (in particular SO2 and CO2), the suprasubduction zone systems play an
important, yet largely unconstrained, role in global mass transfers between lithosphere
and the oceans. Fluid inclusion studies indicate high levels of metals in trapped mag-
matic vapors and support the idea that magma degassing can deliver metals directly to
the overlying hydrological system (Heinrich, Günther, et al., 1999; Heinrich, Driesner,
et al., 2004).
Thus far, studies laying the empirical (field) and theoretical (modeling) foundation
150

5.1 Introduction
of this hypothesis are missing, in particular for submarine volcano-hosted hydrothermal
systems. Au, Au, As and Sb exhibit a wide range of (geo)chemical behavior(s) that
could provide important constraints in subseafloor hydrothermal processes (Craddock,
2009). However previous studies have mainly focused on hydrothermal systems along
basalt-dominated MOR spreading centers (Craddock (2009) and references therein; Pat-
ten et al. (2016)), despite the fact that increased concentrations of precious metals like
Au and Ag, and metalloids like As and Sb at back-arc spreading centers have been ob-
served, relative to their mid-ocean ridge (MOR) vent deposit counterparts (Herzig and
Hannington, 1995; Douville et al., 1999; Hannington, Poulsen, et al., 1999; Moss and
S. Scott, 2001; Craddock, 2009). Although the overall enrichments of Zn, Pb, As, As,
Ag Au and Ba have been generally attributed to seawater-rock interaction within felsic
host rock (S. Scott and Binns, 1995), a magmatic origin for these elements has also
been proposed (Gamo et al., 1997; Douville et al., 1999). It was realized that some
of the extreme enrichments in these elements relative to the felsic host rocks (Stanton,
1994) are unlikely to result from leaching from host rocks alone (Ishibashi et al., 2008;
Hannington, Jonasson, et al., 1995; M. Tivey, 2007). It has even been suggested that
Sb, together with As, Pb and Zn, could be used as a (felsic) magmatophile trace element
(Boyle and Jonasson, 1984; Binns, 2004; Henley and Berger, 2013).
This paper focuses on the PACManus hydrothermal vent area, in the Manus back-arc
basin, Bismarck-Sea, Papua New Guinea (Figure 1) where As and Sb contents have
been measured in the vent fluids that are 10 to 100 fold higher than in typical MOR
fluids (Douville et al., 1999). Likewise, the VMS accumulations at PACManus are
enriched in As, Sb, Ag, and Au (Binns and S. Scott, 1993; Moss and S. Scott, 2001), but
details of the trapping mechanisms for these metals are unknown. Sulfides chimneys are
often zoned and mineralogically complex due to highly variable processes of conductive
151

Chapter 5 PACManus
cooling of hydrothermal vent fluids, conductive heating of seawater, and mixing of the
two fluids with variable extents of concomitant cooling or heating (e.g., Hannington,
Jonasson, et al. (1995)). These structures collapse with time and hydrothermal sulfide
mounds build up. Within these mounds, previously formed sulfides react with mixed
seawater-vent fluids that undergo conductive cooling. This process of zone refining
leads to precipitation of some minerals (e.g., pyrite) and dissolution of others (e.g.,
sphalerite) (M.K. Tivey, 1995). Finally, supergeneous enrichment of As, Sb, Ag, and
Au are commonly observed and are explained by remobilization of these elements inside
the mound followed by precipitation of them in the topmost part of the mound, where
seawater-derived fluids reside within the void spaces of the rubbly pile.
We are using geochemical modeling to systematically examine the behavior of As,
Ab, Ag, and Au in these different processes. We will attempt to identify the roles of
subseafloor entrainment of seawater and mixing with upwelling hydrothermal fluids un-
der different extents of conductive heating and cooling to identify which scenarios lead
to an enrichment in these elements in the primary sulfide structures. We will further-
more investigate the role of zone refining and supergenous processes in causing some of
the specific replacement textures and element enrichments observed in the VMS ma-
terials from the PACManus hydrothermal area. The main motivation for this study
is to try to understand the geochemical behavior of Au, Ag, Sb and As in hydrother-
mal seafloor settings, through a in depth comparison between fluid samples and whole
rock samples, taken at several PACManus hydrothermal vent sites, with a reaction path
model. The goal of this study is to demonstrate that these elements can provide im-
portant limitations on subseafloor hydrothermal processes in general and for auriferous
VMS deposits. Due to the constrained tectonic characteristics of the East Manus Basin
(EMB), the PACManus hydrothermal field can be considered as a rough analogy for a
152

5.2 Regional background hydrothermal system PACManus
land-based VMS ore body, hence increasing knowledge of the PACManus hydrothermal
system could play an important role in understanding and assessing VMS prospects.
5.2 Regional background hydrothermal system
PACManus
(a) Tectonics at the Manus
Basin, Papua New Guinea
(Thal et al., 2014). Ab-
breviations: WT= Weitin
Transform; DT= Djaul
Transform; WIT= Willaumez
Transform; METZ= Manus
Extensional Transform
Zone; SR= Southern
Ridges; MMP= Manus
Microplate; SER= Southeast
Ridges; MSC= Manus
Spreading Centre; Star=
Absolute Pole of South
Bismarck Plate Rotation.
(b) Multibeam bathymetry
map of South Eastern
Ridges (SER) region in
the Eastern Manus Basin
(EMB), showing PACManus
on top of the Pual Ridge.
WT = Weitin Transform; DJ
= Djaul Transform. SuSu
Knolls = South Su and North
Su Knolls. Data recorded
on BAMBUS - R/V Sonne
216 Cruise 2011 (Thal et al.,
2014)
Figure 5.1:
fig:chpt5 f ig1
The Manus basin is located in the Bismarck Sea and is a fast oblique opening back-
153

Chapter 5 PACManus
arc basin, associated by subduction of the Solomon Sea Plate at the New Britain Trench
(Figure 5.1a) (Binns and S. Scott, 1993; Martinez and Taylor, 1996; Thal et al., 2014).
Crustal rifting and spreading occurs along the Extensional Transform Zone (ETZ),
Manus Spreading Center (MSC) and the EMB (Martinez and Taylor, 1996). The EMB,
a pull apart basin, is located along the South Eastern Ridges (SER), a series of en ech-
elon volcanic ridges that are bounded by two transform faults, Weitin Transform (WT)
and Djaul Transform (DT) (Binns and S. Scott, 1993; Martinez and Taylor, 1996). The
arc-volcanism is characterized by volcanic cones, with basalt and (acidic) andesite-to-
rhyolitie composition (Binns and S. Scott, 1993; Hannington, De Ronde, et al., 2005).
The PACManus hydrothermal field, which lies at the height of the Pual Ridge (Figure
5.1b) (Binns and S. Scott, 1993), an elongated ridge of 35 km composed of stacked lava
flows of dacite with basaltic andesite and rhyodacite composition that stands 500-700 m
above the surrounding seafloor (Binns and S. Scott, 1993; Binns, Barriga, et al., 2007;
Beier et al., 2015). The PACManus hydrothermal system is distinguished by elevated
Au, Ag, Pb, As, Sb contents within polymetallic sulfides (Douville et al., 1999; Moss
and S. Scott, 2001; Binns, Barriga, et al., 2007; Craddock, 2009). The Sb-As-Ag-Au
enrichment has been interpreted as a result of deep-seated seawater-rock interaction,
magmatic input and near seafloor sulfide deposition and reworking (Douville et al.,
1999; Craddock, 2009), and shows a positive correlation with Au within sulfur-rich
samples (Moss and S. Scott, 2001). Gold occurs in copper-rich chimneys as inclusion
in chalcopyrite associated with sulfosalts, bornite and covellite. And in zinc-rich chim-
neys as in inclusions in tennantite associated with chalcopyrite and Fe-poor sphalerite
(Moss and S. Scott, 2001).
154

5.2 Regional background hydrothermal system PACManus
-168
5-1
690-1680
-1680
-1720
-1740
-1760
-1700-1
720
-173
5
-173
0
-172
5
-172
0
-1760
-1740
-1720
-1780
-1800
-1820
-1690
-169
5-168
5
Satanic Mills
Roman Ruins
Fenway
Figure 5.2: Detailed AUV ABE multibeam bathymetry map of Pual Ridge. The fluid samples are presented
as red dots on the primary PACManus hydrothermal fields Fenway, Satanic Mills and Roman Ruins.
5.2.1 Prominent vent sites located at PACManus site
Several principal areas of hydrothermal venting have been identified at the PACManus
site on the Pual Ridge in a 2.5 km2 area centered in 1640 to 1780 m water depth (Figure
5.2) (Bach, Rosner, et al., 2011): Romain Ruins, Roger Ruins, Satanic Mills, Fenway,
Snowcap, Solwara 6-8 and Tsukushi (Binns, Barriga, et al., 2007; Bach, Rosner, et al.,
2011; Reeves et al., 2011). They consist of active and inactive black smoker chimneys
and spires on sulfide mounds, where fluids escape as acid (pH between 2.5-3.8) and
temperatures up to 341 ◦C (Reeves et al., 2011). We refer to Thal et al. (2014) for a
detailed account of the vent fields and potential structural and magmatic controls of the
155

Chapter 5 PACManus
different vent sites in the PACManus hydrothermal area.
(a) PACManus, Fenway (b) PACManus, Roman Ruins
(c) PACManus, Satanic Mills
Figure 5.3: Photographs at the Bambus cruise (2011) (Bach et al., 2011).
Fenway The hydrothermal field Fenway has been newly discovered in 2006 and is
comprised of an anhydrite-hosted black smoker complex, called Big Papi, two small
chimney clusters and diffuse venting on the flanks of the mound (Bach, Rosner, et al.,
2011; Reeves et al., 2011). At the summit of Fenway a black smoker chimney complex
was found with temperatures up to 358 ◦C (Figure 5.3a) (Reeves et al., 2011). Fenway
is Au poor, and low in magma-volatile elements, with some traces of Ag within the
sulfides (See Appendix X).
156

5.2 Regional background hydrothermal system PACManus
Roman Ruins The Roman Ruins site is a long-lived system with a large sulfide
mound, made up of large (up to 20 meters and 3 in diameter) predominantly inactive
chimneys (Figure 5.3b) (Moss and S. Scott, 2001; Bach, Rosner, et al., 2011), and
is classified together with Roger Ruins as a ‘pure beehive’ system (Bach, Rosner, et
al., 2011). The central part is covered in sulfide chimney rubble, while on the south
side predominantly volcanic rock talus with moderate hydrothermal activity with low
H2S contents is present. Fe-oxyhydroxide deposits that occasionally form chimneys
are found in the Roman Ruins area (Bach, Rosner, et al., 2011). Overall low values of
Au, Ag, Sb and As were detected in the sulfides, mainly due to absence of tennantite
(As-sulfosalt). Au is predominantly located in sphalerite (See Appendix X).
Satanic Mills Abundant clusters of sulfide chimneys characterize SatanicMills, where
they are growing directly on top of fresh dacitic block lava (Thal et al. 2014). Fluids
have high temperatures, between 339-345 ◦C and overcritical venting CO2 fluid is ob-
served (Figure 5.3c) (Moss and S. Scott, 2001; Bach, Rosner, et al., 2011). Overall high,
though varying, Cu-grade is measured (Moss and S. Scott, 2001). Magmatic elements
such as Bi, In and Te as well as high As, Hg, Sb and Sn are detected (See Appendix X).
Snowcap The hydrothermal activity at Snowcap mostly comprises low temperature
diffuse venting through volcaniclastic sediments (Moss and S. Scott, 2001; Bach, Ros-
ner, et al., 2011; Reeves et al., 2011). The chimney’s are variably Cu- and Zn-rich,
although vent hydrothermal fluids reach only a maximum 224 ◦C. On top of the Snow-
cap knoll, countless diffuse fluid seepage is observed (Bach, Rosner, et al., 2011). As,
Bi, Sn and Te are barely present, however In, Sb and Au are remarkably enriched within
the sulfides. Gold is dominantly associated with chalcopyrite, primary bornite and sec-
ondary veins of digenite (See Appendix X).
157

Chapter 5 PACManus
Solwara 8 The Solwara 8 vent site lies southeast of Big Papi and is build up of chim-
ney clusters up to 12 m high. Two sets of chimneys are distinguished: the first one being
spiry (2-3 cm in diameter) and Cu-rich (up to 40 wt.%); the second one porous, larger
in diameter and Zn-rich (Bach, Rosner, et al. (2011); See Appendix X). Cu-enrichment
is mainly represent by primary bornite-digenite-tennantite formation together with pri-
mary chalcopyrite. Au, As and Ag concentrations are high (See Appendix X).
5.3 Materials and Methods
The fluid and solid compositions used in this study come from multiple sources. The
sample materials were retrieved during R/V Melville cruise MGLN06MW (July to
September, 2006) and R/V Sonne cruise SO216 (June-August, 2011). In both cruises,
the samples were retrieved from the seafloor by remotely operated vehicles (ROVs):
WHOI’s Jason2 ROV in 2006 and MARUM’s Quest4000 ROV in 2011. The cruise re-
ports M. Tivey et al. (2006) and Bach, Rosner, et al. (2011) give detailed information
about the goals and initial results of the cruises. Fluid compositions from the 2006 cruise
were analyzed by Eoghan Reeves, Paul Craddock, and Jeff Seewald and are published
in Reeves et al. (2011), Craddock (2009), Craddock and Bach (2010) and Seewald,
Reeves, et al. (2015).
The samples were collected in 755 ml Ti–syringes samplers (Damm et al., 1985) and
in 160 ml isobaric gas–tight samplers (Seewald, Doherty, et al., 2002). In all cases, flu-
ids were sampled in triplicate allowing an assessment of uncertainties and calculation
of end–member fluid compositions (i.e., extrapolated to zero Mg (Damm et al., 1985)).
For the fluids from the PACManus hydrothermal area, these triplicates gave consistent
Mg concentrations that were significantly above zero. We did hence not extrapolate
158

5.3 Materials and Methods
fluid end-member compositions to zero Mg, which is commonly done for vent fluids
from mid-ocean ridges (Damm et al., 1985). This was avoided for the acidic fluids from
the Manus back-arc basin, because the assumption of minimal Mg-solubility in vent flu-
ids is not valid form pH<3 fluids. Venting temperatures were measured with either the
ROV T–probe or with a thermocouple mounted directly on the sampler. Solid samples
were collected during both cruises by ROV operations in water depths between 1600
and 1800 m water depth. The rocks were rinsed in fresh water, dried and cut by a tile
saw. Aliquots of the cut slabs were used for the preparation of thin sections, while op-
posite pieces were crushed in an agate shatter box for whole rock analyses. The rock
powders were analyzed by ACTLAB, a commercial lab that has specialized in whole
rock analyses of ore materials, including sulfides. The data is reported by Craddock
(2009) and Sven Petersen at GEOMAR (unpublished report to Nautilus Minerals (Ap-
pendix)). Elements analyzed comprise Fe, Mn, Cu, Zn, Pb, S, Ba, Sr, Si, Co, Se, Mo,
Cd, As, Sb, Ag, and Au. From the total sulfur contents, sulfate concentrations were
calculated by assuming that all Ca and Ba in the rocks are tied to anhydrite and barite,
respectively. Sulfide concentrations were then calculated from the difference between
total S and S tied to sulfate. The data was used to calculate the mineralogical mode
of the sulfide samples, assuming that they are composed of pyrite, anhydrite, barite,
amorphous silica, sphalerite, galena, chalcopyrite, bornite, digenite, hematite, tennan-
tite. The EXCEL Solver was used to solve these mass balance problems. All data are
listed in the electronic appendix of this thesis.
Thermodynamic modeling was conducted using the Geochemist’s Workbench soft-
ware package and tailor-made (SUPCRT92; Johnson et al. (1992)) thermodynamic
databases for 250 bar and temperatures between 0 and 350 ◦C. The database is oth-
erwise identical in structure to the 1kbar-database used in chapters 3 and 4. It includes
159

Chapter 5 PACManus
112 aqueous species and 110 minerals. Data for major rock-forming minerals were
taken from Wolery and Jove-Colon (2004). Data for major solutes are from Sverjensky
et al. (1997) and Schock et al. (1997). These data were supplemented by data for Sb,
As and Au minerals as well as aqueous HS−, OH− and Cl− species of these elements
from various sources, while maintaining internal consistency (Yund, 1962; Lynch, 1982;
Wagman et al., 1982; Krupp, 1988; Seal, Essene, et al., 1990; Seal, Robie, Barton, et al.,
1992; Vink, 1996; Seal, Robie, Hemingway, et al., 1996; Williams-Jones and Norman,
1997; Welham, 2001; Kantar, 2002; Stefánsson and Seward, 2003b; Stefánsson and
Seward, 2003a; Stefánsson and Seward, 2004; Bessinger and Apps, 2005; Castro and
Baltierra, 2005; Pokrovski et al., 2006; Padilla et al., 2008; Akinfiev and Zotov, 2010;
Firdu and Taskinen, 2010).
The goal of the modeling was threefold:
1. Construct T-X sections for the major vent sites at PACManus to map out which
phase assemblages are thermodynamically stable in specific regimes of seawater
entrainment and mixing with upwelling hydrothermal fluids.
2. Calculate speciation and solubilities for Sb, As, Ag, and Au along specific mixing
paths to examine the potential reasons behind similar or dissimilar geochemical
behavior of these elements in the PACManus mineralization system.
3. Execute complex reaction path models to simulate the evolution of seafloor mas-
sive sulfide deposits in the critical stages of (i) mound-building, (ii) zone refining
within the mound, and (iii) supergeneous enrichment of certain elements in the
outmost parts of the mound.
A common workflow of modeling the VMS forming processes starts with the speci-
ation of the measured vent fluid compositions (from Reeves et al. (2011) and Craddock
160

5.3 Materials and Methods
and Bach (2010)) using the pH values measured after sampling in the laboratory (pH at
25 ◦C). This speciated fluid was then heated up to in situ temperatures, measured upon
sampling of the fluids (M. Tivey et al., 2006; Bach, Rosner, et al., 2011). This step
will speciate the fluid to ambient conditions inside the vent orifice from which it was
collected. The pH of the fluid determined in this step is the in situ pH. Determining this
in situ pH is critical for assessing element solubility in vent fluids. Likewise, it is crit-
ical to know the redox conditions of the fluids. Concentrations of dihydrogen (H2,aq)
from Reeves et al. (2011) were used to compute the fugacity of oxygen in the fluids.
These fluids were then mixed with ambient seawater, while assuming different extents
of conductive cooling or heating, respectively, to map out phase relations in T-X plane
for the three main vent sites at PACManus: Roman Ruins, Fenway, and Satanic Mills.
The speciation and solubilities of As, Sb, Ag, and Au were examined along two specific
mixing/cooling paths (isenthalpic cooling of the vent fluid by mixing with seawater, and
pure conductive cooling without mixing with seawater). In the complex reaction mod-
eling, we use the fluid end-member with seawater (4 ◦C) (Table 5.2) in a 1 to 9 ratio
to produce the minerals that make the chimney mound material. We then mix the vent
fluid end-member with seawater in a 1 to 0.1 ratio, while cooling the system to 275 ◦C A
temperature of 275 ◦C was chosen because it is commonly observed in PACManus vent
fluids that show geochemical evidence of subseafloor entrainment of seawater (Reeves
et al., 2011). In the following step, this 275 ◦C fluid is reacted with the precipitate pro-
duced in the earlier run, while keeping the temperature at 275 ◦C. This step simulates
the mobilization of elements upon mixing between vent fluid and entrained seawater
within the mound (zone refining). The resulting fluid is then mixed with seawater in a
1 to 9 ratio to simulate what should get precipitated on top of the mound upon mixing
between the zone-refined fluid and seawater. This last step simulates the precipitation
161

Chapter 5 PACManus
of minerals in the supergeneous zone and examines the enrichment of Sb, As, Ag, and
Au in these processes.
5.4 Results
Increased contents of Sb, As, Au and Ag are restricted to black smoker systems from
felsic basement in the Manus basin: PACManus and South Su (Figure 5.1b). Acid-
sulfate vents (DESMOS and North Su) and the basalt-hosted Vienna Woods vent field
have, by comparison, exceedingly low Sb and As contents (Craddock, 2009). Therefore
the main focus will lie on the hydrothermal sites of PACManus for fluid samples and
modeling results.
5.4.1 Fluids samples
The hydrothermal venting sites of Fenway, Roman Ruins and Satanic Mills were repeat-
edly sampled in 2006 and there are complete analyses of several fluid and solid samples
available from each of these sites. The location of the fluid samples is shown in Figure
5.2 and they will be the main point of focus for the reaction path modeling, the meth-
ods of which were outlined in Section 5.3. Those three sites were selected, based on
their prominent character in the PACManus area; additionally they represent the wide
spectrum of fluid compositions of the PACManus, interpreted by Reeves et al. (2011).
Overall the fluids measured at these sites are between 241 and 380 ◦C and they range
from 2.6 to 3.9 in pH at 25 ◦C (Table 5.1), with one exception at Fenway (5) where 78
◦C and pH of 4.9. The concentration of Sb, As, Au and Ag as well as Fe, Cu and Zn
are plotted against temperature and in situ pH in Figure 5.4. Overall As is dominantly
enriched within the fluid samples, with concentrations of Sb, Ag and Au in the order
162

5.4 Results
Figure 5.4: In situ Sb, As, Au and Ag, as well as Fe, Zn and Cu concentrations in fluid samples of Fenway,
Roman Ruins, Snowcap and Satanic Mills (Craddock, 2009).
of decreasing abundance. Au contents in the fluids lie for Fenway, Satanic Mills and
Roman Ruins between 1.5 and 12.4 nM; those of Ag span from 25 to 1700 nM, Sb
concentration are between 99 and 3800 nM and As from 132 to 336 μM. It is apparent
in Figure 5.4a and c, that two different peaks can be recognized: a primary peak for all
elements at 270 ◦C and a secondary peak at 310 ◦C. Fe, Cu and Zn show a general trend
of increasing concentrations with increasing temperatures. However, a small peak could
be discriminated around 270 ◦C, in particular for Zn. A coinciding peak for Sb, As, Au
and Ag can also be recognized in Figure 5.4c, at a pH of 2.7, which is also noticeable
for Zn, though not for Fe and Cu (Figure 5.4d). The tight relationships between the four
elements are surprisingly strong; when one element is enriched within a fluid sample,
the concentration of the other three are conjointly high.
163

Chapter5PACManus
Table5.1:
Flu
idsam
ple
sfr
om
Cra
ddock
(2009)
with
the
focus
on
pre
cio
us
meta
lsand
meta
lloid
sS
b,A
s,A
uand
Ag.
Mg
Fe
Zn
Cu
Sb
(nM
)A
s(n
M)
Au
(nM
)A
g(n
M)
Sam
ple
Tem
pera
ture
(◦C
)pH
(25◦C
)pH
(in
situ)
mM
μM
μM
μM
nM
μM
nM
nM
RM
R1
J2-2
08-1
-W2-I
GT
5314
2,3
2,8
8,0
5619
1300
141
570
26,0
1,7
690
RM
R2
J2-2
08-2
-W2-I
GT
2272
2,3
2,7
16,5
990
2200
44
3800
33,6
1,7
1700
RM
R3
J2-2
13-3
-W1-I
GT
7278
2,5
2,9
6,4
7385
927
38
690
30,0
1,5
298
RM
R4
J2-2
22-4
-W2-I
GT
1341
2,6
3,4
3,2
6468
440
190
250
18,0
1,6
190
S.M
.1J2-2
09-1
-W1-I
GT
6295
2,6
3,3
8,8
2790
300
120
350
16,6
2,0
103
S.M
.2J2-2
09-6
-W1-I
GT
4241
2,4
3,2
17,4
1045
223
580
1950
76,5
12,4
91
S.M
.3J2-2
14-3
-W2-I
GT
5288
2,5
3,1
10,1
960
135
115
225
13,2
2,0
67
SC
1J2-2
10-1
-W2-I
GT
5152
4,6
4,8
31,0
32
80
15
75
4,4
7,5
65
SC
2J2-2
11-9
-W1-I
GT
4180
3,4
3,9
24,0
135
15
460
6,6
0,4
17
FW
1J2-2
10-7
-W2-M
4329
2,5
3,2
5,8
7373
304
263
320
17,7
1,8
186
FW
2J2-2
12-2
-W2-I
GT
5343
2,7
3,7
4,7
13263
368
220
165
15,6
2,3
129
FW
3J2-2
12-6
-W1-I
GT
2358
2,7
3,9
4,5
11500
360
123
350
14,5
1,5
265
FW
4J2-2
16-2
-W2-I
GT
6284
2,4
3,0
9,4
6850
320
260
233
13,8
6,0
137
FW
5J2-2
16-5
-W1-I
GT
478
5,0
4,9
44,7
600
50
999
--
25
*Abbre
vations:
RM
R:R
om
an
Ruin
s;S
M:S
ata
nic
Mill
s;F
W:F
enw
ay.
The
bold
and
italic
mark
ed
row
sare
end-m
em
ber
ventsites
and
are
there
for
used
as
inputfo
rth
ere
action
path
modelin
g.
Aq
ueous
specie
sare
extr
apola
ted
toin
situ
Mg.
164

5.4 Results
Figure 5.5: Fluid samples of Vienna Woods (VW), Roman Ruins+Roger Ruins (RMR), Satanic Mills (SM),
Snowcap (SC) and Fenway (FW) showing positive correlations between Ag and As, Au and Sb in compar-
ison with the positive correlations of Sb and As as well as Au and Ag (Craddock, 2009).
This strong relationship between Sb, As, Au and Ag is also recognizable in Figure
5.2, where their contents from fluid samples of Fenway (FW), Roman Ruins (RMR),
Satanic Mills (SM) and Snowcap (SC) are plotted against each other. A clear positive
correlation, among every site separately and combined, can be observed between Sb
with Au and Agwith As. These correlations are comparable to the acknowledged related
Sb-As and Au-Ag. Additionally, every element is separately plotted versus temperature
in Figure 5.6 and Figure 5.7 to provide a more detailed synopsis. Figure 5.6a shows a
positive correlation between pH and temperature at Roman Ruins, Fenway and Satanic
Mills and not at Snowcap. Roman Ruins system shows an increase in Zn as T and pH
drop (Figure 5.6b). At Fenway and Satanic Mills, Zn is not mobilized. Fenway shows
some increase in Cu and Satanic Mills shows strong enrichment in Cu in one instance.
165

Chapter 5 PACManus
Figure 5.6: pH and in situ Fe, Zn and Cu concentrations in fluid samples of Fenway, Roman Ruins, Snow-
cap and Satanic Mills versus temperature (Craddock, 2009).
In comparison, Cu shows strong decoupling from Zn (Figure 5.6d).
This increased Cu concentration in the Satanic Mills fluid is matched by an equally
strong increase in As (Figure 5.7a). Arsenic is somewhat enriched at Roman Ruins.
Likewise, Ag is enriched in the zone refined fluids from Roman Ruins (Figure 5.7e).
Sb and Au show enrichments in some, but not all sites (Figures Figure 5.7a and d). Au
is mobilized in the Satanic MIlls and Snowcap sites (triangles in Figure 5.7d), though
not at the Roman Ruins site. The coldest of the four fluids from Fenway, on the other
hand, does show some Au enrichment. Sb is markedly enriched in two fluids, one from
Satanic Mills and one from Roman Ruins.
166

5.5 Whole rock dataset
Figure 5.7: In situ Sb, As, Au and Ag concentrations in fluid samples of Fenway, Roman Ruins, Snowcap
and Satanic Mills versus temperature (Craddock, 2009).
5.5 Whole rock dataset
The whole rock samples retrieved from the seafloor by remotely operated vehicles
(ROVs): WHOI’s Jason2 ROV in 2006 and MARUM’s Quest4000 ROV in 2011 have
been sorted to location and local chimney type (diffuser, massive sulfide/talus, open con-
duit and inactive) for Fenway, Satanic Mills, Roman Ruins, Snowcap and Solwara 6-8
(Figure 5.2 and Table 5.2). A quick overview is provided of the different mineralization
phases in Figure 5.8. Native gold is primarily found within Cu-rich, secondary digenite
and digenite-bornite intergrowths (Figure 5.8a, b and f), and occasionally within As-
sulfosalt; tennantite (Figure 5.8b) at Satanic Mills. Figure 5.8a is a thin section from
a sample taken from Snowcap. At this specific site oxidation of primary chalcopyrite-
bornite mineralization into digenite + gold is visible, fitting the moderate temperature of
167

Chapter 5 PACManus
maximum 224 ◦C. Figure 5.8b and 5.8f are from samples taken at Solwara 8, where Cu-
mineralization is represented by primary chalcopyrite overgrown by digenite-bornite
intergrowths (Figure 5.8b); and primary bornite-digenite-tennantite formation (Figure
5.8f). Gold is found within primary and secondary Cu-rich mineralization. In Figure
5.8d the gold flake is captured within a secondary tenanntite rim of chalcopyrite, and
not in a Cu-rich mineral as described from the other samples. Fenway is in general Au
poor, though Cu-rich with chalcopyrite overgrowing bornite (Figure 5.8e), with covelite
growth within the fractures of bornite.
Figure 5.8: Snowcap; Oxidation of pri-
mary chalcopyrite-bornite intergrowth al-
tered into digenite with finegrained gold
flakes. b: Solwara 8; Primary bornite-
digenite intergrowth overgrowing chalcopy-
rite, with native gold. c: Satanic Mills;
different generations of chalcopyrite and
digenite. d: Satanic Mills; Gold flake
and present within outskirt and digenite
within innerskirt of tennantite. e: Fen-
way; Chalcopyrite overgrowing fractured
bornite, with covelite growing within frac-
tures. f: Solwara 8; Primary bornite-
digenite intergrowth overgrowing chalcopy-
rite, with native gold.
A first comparison between (trace) element content of the whole rock samples is made
between Fenway, Satanic Mills+Snowcap, Solwara 6-8 and Roman Ruins (Figure 5.9)
and chimney style (Figure 5.10). The plots represent the tightest positive correlation
with another: the well established Sb-As and Au-Ag, though these relations are not
inferior to the positive correlations between As-Ag and Sb-Au (Figure 5.9c and d),
168
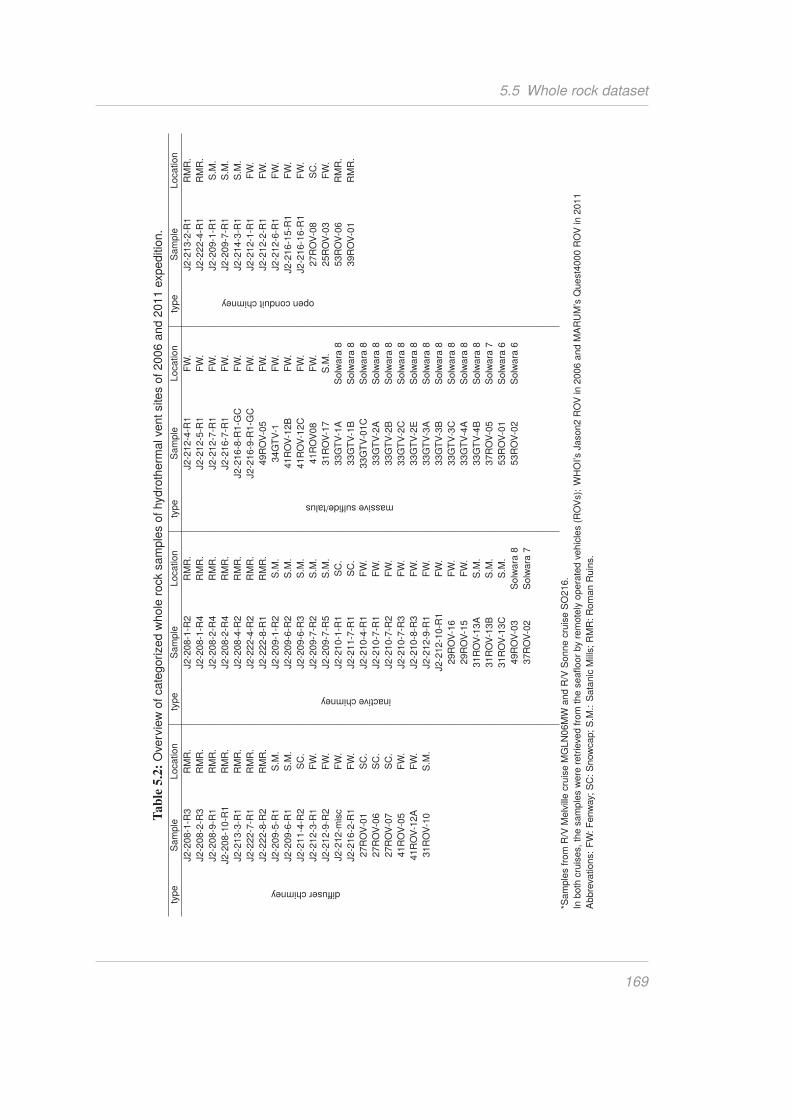
5.5 Whole rock dataset
Table5.2:
Ove
rvie
wofcate
gorized
whole
rock
sam
ple
sofhydro
therm
alve
ntsites
of2006
and
2011
expeditio
n.
type
Sam
ple
Location
type
Sam
ple
Location
type
Sam
ple
Location
type
Sam
ple
Location
diffuserchimney
J2-2
08-1
-R3
RM
R.
inactivechimney
J2-2
08-1
-R2
RM
R.
massivesulfide/talus
J2-2
12-4
-R1
FW
.
openconduitchimney
J2-2
13-2
-R1
RM
R.
J2-2
08-2
-R3
RM
R.
J2-2
08-1
-R4
RM
R.
J2-2
12-5
-R1
FW
.J2-2
22-4
-R1
RM
R.
J2-2
08-9
-R1
RM
R.
J2-2
08-2
-R4
RM
R.
J2-2
12-7
-R1
FW
.J2-2
09-1
-R1
S.M
.
J2-2
08-1
0-R
1R
MR
.J2-2
08-2
-R4
RM
R.
J2-2
16-7
-R1
FW
.J2-2
09-7
-R1
S.M
.
J2-2
13-3
-R1
RM
R.
J2-2
08-4
-R2
RM
R.
J2-2
16-8
-R1-G
CF
W.
J2-2
14-3
-R1
S.M
.
J2-2
22-7
-R1
RM
R.
J2-2
22-4
-R2
RM
R.
J2-2
16-9
-R1-G
CF
W.
J2-2
12-1
-R1
FW
.
J2-2
22-8
-R2
RM
R.
J2-2
22-8
-R1
RM
R.
49R
OV
-05
FW
.J2-2
12-2
-R1
FW
.
J2-2
09-5
-R1
S.M
.J2-2
09-1
-R2
S.M
.34G
TV
-1F
W.
J2-2
12-6
-R1
FW
.
J2-2
09-6
-R1
S.M
.J2-2
09-6
-R2
S.M
.41R
OV
-12B
FW
.J2-2
16-1
5-R
1F
W.
J2-2
11-4
-R2
SC
.J2-2
09-6
-R3
S.M
.41R
OV
-12C
FW
.J2-2
16-1
6-R
1F
W.
J2-2
12-3
-R1
FW
.J2-2
09-7
-R2
S.M
.41R
OV
08
FW
.27R
OV
-08
SC
.
J2-2
12-9
-R2
FW
.J2-2
09-7
-R5
S.M
.31R
OV
-17
S.M
.25R
OV
-03
FW
.
J2-2
12-m
isc
FW
.J2-2
10-1
-R1
SC
.33G
TV
-1A
Solw
ara
853R
OV
-06
RM
R.
J2-2
16-2
-R1
FW
.J2-2
11-7
-R1
SC
.33G
TV
-1B
Solw
ara
839R
OV
-01
RM
R.
27R
OV
-01
SC
.J2-2
10-4
-R1
FW
.33G
TV
-01C
Solw
ara
8
27R
OV
-06
SC
.J2-2
10-7
-R1
FW
.33G
TV
-2A
Solw
ara
8
27R
OV
-07
SC
.J2-2
10-7
-R2
FW
.33G
TV
-2B
Solw
ara
8
41R
OV
-05
FW
.J2-2
10-7
-R3
FW
.33G
TV
-2C
Solw
ara
8
41R
OV
-12A
FW
.J2-2
10-8
-R3
FW
.33G
TV
-2E
Solw
ara
8
31R
OV
-10
S.M
.J2-2
12-9
-R1
FW
.33G
TV
-3A
Solw
ara
8
J2-2
12-1
0-R
1F
W.
33G
TV
-3B
Solw
ara
8
29R
OV
-16
FW
.33G
TV
-3C
Solw
ara
8
29R
OV
-15
FW
.33G
TV
-4A
Solw
ara
8
31R
OV
-13A
S.M
.33G
TV
-4B
Solw
ara
8
31R
OV
-13B
S.M
.37R
OV
-05
Solw
ara
7
31R
OV
-13C
S.M
.53R
OV
-01
Solw
ara
6
49R
OV
-03
Solw
ara
853R
OV
-02
Solw
ara
6
37R
OV
-02
Solw
ara
7
*Sam
ple
sfr
om
R/V
Melv
ille
cru
ise
MG
LN
06M
Wand
R/V
Sonne
cru
ise
SO
216.
Inboth
cru
ises,th
esam
ple
sw
ere
retr
ieve
dfr
om
the
seafloor
by
rem
ote
lyopera
ted
vehic
les
(RO
Vs):
WH
OI’s
Jason2
RO
Vin
2006
and
MA
RU
M’s
Quest4
000
RO
Vin
2011
Abbre
vations:
FW
:F
enw
ay;
SC
:S
now
cap;S
.M.:
Sata
nic
Mill
s;R
MR
:R
om
an
Ruin
s.
169

Chapter5PACManusTable5.3:
Whole
rock
data
setbased
on
unpublis
hed
data
from
S.P
ete
rsen
and
Cra
ddock
(2009).
Sam
ple
Location
Fe
Cu
Zn
Pb
As
SO
4S
ulfi
de
Ca
Ba
SiO
2S
bA
gA
u
wt%
wt%
wt%
wt%
wt%
wt%
wt%
wt%
wt%
wt%
mg/k
gm
g/k
gm
g/k
g
J2-2
12-3
-R1
FW
.8.2
35.7
433.4
0.6
10.3
915.8
821.7
00.5
21.1
N.A
.869
363
41.1
J2-2
12-9
-R2
FW
.10.9
520.1
11.5
0.3
71.0
70.1
415.5
00.0
60
0.1
2430
126
9
J2-2
12-m
isc
FW
.14.2
10.4
14.0
50.4
0.2
61.3
719.5
00.5
70
0.2
2237
141
8.7
J2-2
16-2
-R1
FW
.10.1
626.6
6.6
20.1
51.4
99.6
016.0
00.2
313
N.A
.1050
98
50.4
41R
OV
-05
FW
.26.2
20.4
3.7
0.3
0.2
82
2.9
35.0
04.1
332
58
10.6
41R
OV
-12A
FW
.32.5
11
0.9
0.1
0.1
04
4.4
40.3
0.1
60.1
30
1.8
J2-2
10-4
-R1
FW
.9.3
519.6
13.2
0.3
72.1
80.1
217.5
00.0
50
0.3
982
203
10.9
J2-2
10-7
-R1
FW
.18.2
538.2
5.3
50.2
10.8
11.7
320.0
00.1
42
N.A
.797
95
17.4
J2-2
10-7
-R2
FW
.25
29.3
0.8
30.0
60.1
66.1
220.9
02.5
50
0.1
1236
40
7.4
J2-2
10-7
-R3
FW
.10.4
922.5
1.4
50.0
10.6
59.9
113.4
00.0
714
N.A
.530
82
10.3
J2-2
10-8
-R3
FW
.4.7
40.6
457.8
0.4
80.2
40.0
726.9
00.0
30
0.0
1924
534
10.5
J2-2
12-9
-R1
FW
.7.3
118.1
12.3
0.1
81.1
27.8
014.7
00.0
611
N.A
.499
127
13
J2-2
12-1
0-R
1F
W.
1.6
50.5
155.9
0.7
50.5
70.0
725.5
00.0
30
0.0
3338
611
15.4
29R
OV
-16
FW
.9
15.7
15.1
0.6
0.5
79
9.3
23.8
013.3
0.2
278
7.4
29R
OV
-15
FW
.11.1
30
11.8
0.5
2.7
5.6
26.4
0.2
7.3
0.3
352
16.8
J2-2
12-4
-R1
FW
.20.3
20.6
4.3
60.0
80.1
0.0
517.1
50.0
20.0
10.1
590
58
3.7
J2-2
12-5
-R1
FW
.34
9.0
91.2
20.0
60.1
10.1
034.5
00.0
40
0.1
557
31
5.4
J2-2
12-7
-R1
FW
.22.5
15.5
0.1
90.0
10.0
220.8
821.0
00.9
626.7
N.A
.25
73.4
J2-2
16-7
-R1
FW
.32.9
4.5
63.7
80.1
50.2
50.1
235.3
00.0
50
0.6
475
57
3.5
J2-2
16-8
-R1-G
CF
W.
2.6
30.2
432.3
1.6
10.6
90.0
717.4
50.0
30
4.4
61065
297
7.7
J2-2
16-9
-R1-G
CF
W.
38.3
1.4
80.8
0.1
0.2
76.0
337.8
00.1
68.1
1N
.A.
21
15
4.2
49R
OV
-05
FW
.41.8
10.7
0.3
0.0
822
0.6
51.2
00.8
0.2
16
1.8
34G
TV
-1F
W.
15.7
0.1
22.7
30.8
18
6.1
32.4
0.1
8.4
4.9
376
216
0.8
41R
OV
-12B
FW
.18.7
13.7
7.5
0.2
0.0
995
9.4
27.5
0.1
13
139
47
5.1
41R
OV
-12C
FW
.8.3
1.1
35.4
1.2
0.1
66
7.3
27.3
0.2
9.8
0.4
558
265
9.9
41R
OV
08
FW
.2.6
0.6
0.1
00.0
085
66.4
2.0
27.6
0.2
0.1
50.2
J2-2
12-1
-R1
FW
.9.1
55.0
70.5
0.0
30.0
532.4
221.6
013.3
50.5
5N
.A.
24
81.2
J2-2
12-2
-R1
FW
.14.5
7.0
11.2
60.0
40.0
631.7
620.0
013
0.8
1N
.A.
31
16
1.7
J2-2
12-6
-R1
FW
.9.2
85.9
60.4
10.0
20.0
438.7
423.1
016
0.4
9N
.A.
24
81.2
J2-2
16-1
5-R
1F
W.
7.2
95.6
70.8
60.0
30.0
337.1
617.3
015.4
0.2
9N
.A.
44
14
2.2
J2-2
16-1
6-R
1F
W.
11
8.9
30.1
10.0
10.0
233.7
319.7
014
0.1
8N
.A.
14
10
1.1
25R
OV
-03
FW
.8.4
4.3
0.2
00.0
174
52.2
11.4
21.7
0.2
77
0.7
J2-2
08-1
-R3
RM
R.
8.3
715.2
31.5
1.2
32.0
30.1
421.5
00.0
60
0.0
7871
267
13.7
J2-2
08-2
-R3
RM
R.
0.3
20.6
639.5
33
0.6
60.5
424.2
00.0
50.6
1N
.A.
5370
756
J2-2
08-9
-R1
RM
R.
0.4
30.1
353.2
2.1
10.5
33.6
217.8
00.0
65
N.A
.209
111
J2-2
08-1
0-R
1R
MR
.19.9
3.6
121.4
6.3
90.5
25.2
130.4
00.0
37.3
8N
.A.
779
278
5
J2-2
13-3
-R1
RM
R.
7.7
97.5
417.9
0.4
20.1
225.0
420.0
010
1.5
N.A
.597
143
67.9
J2-2
22-7
-R1
RM
R.
0.7
0.7
359.8
3.5
0.6
4.3
428.7
00.0
56.0
7N
.A.
612
785
10.1
J2-2
22-8
-R2
RM
R.
10.6
14.5
27.9
2.8
21.2
310.1
824.2
02.4
96.0
4N
.A.
2910
428
69.9
J2-2
08-1
-R2
RM
R.
1.4
40.7
253.1
2.0
20.8
20.1
024.7
00.0
40
0.3
11280
632
15.4
J2-2
08-1
-R4
RM
R.
4.6
11.6
64.4
50.2
50.1
22.1
74.6
60.9
0.0
155.2
159
56
5.4
J2-2
08-2
-R4
RM
R.
1.3
2.1
456.1
1.3
40.2
45.3
326.3
00.0
67.4
6N
.A.
4100
910
118
J2-2
08-2
-R4
RM
R.
0.1
90.8
452.7
13.0
50.7
62.3
827.2
00.4
61.8
4N
.A.
2580
1005
2.1
J2-2
08-4
-R2
RM
R.
0.4
70.3
745.8
8.9
71.0
70.1
021.7
00.0
40
1.7
91120
567
3.3
170

5.5 Whole rock datasetS
am
ple
Location
Fe
Cu
Zn
Pb
As
SO
4S
ulfi
de
Ca
Ba
SiO
2S
bA
gA
u
wt%
wt%
wt%
wt%
wt%
wt%
wt%
wt%
wt%
wt%
mg/k
gm
g/k
gm
g/k
g
J2-2
22-4
-R2
RM
R.
13.3
513.3
26.2
1.0
80.6
20.1
924.1
00.0
80
1.8
1731
340
50.9
J2-2
22-8
-R1
RM
R.
2.4
85.5
352.2
5.8
41.4
3.7
026.2
00.0
45.1
8N
.A.
262
577
2.5
J2-2
13-2
-R1
RM
R.
21.2
29.4
4.1
40.2
40.0
510.4
420.5
04.2
0.5
2N
.A.
111
76
5.1
J2-2
22-4
-R1
RM
R.
23
37.5
0.4
20.0
30.0
13.6
119.4
01.4
20.2
9N
.A.
88
1.2
53R
OV
-06
RM
R.
25.6
20.9
0.7
00.0
436
11.9
30.9
4.8
0.6
0.7
49
22
2
39R
OV
-01
RM
R.
25.4
37.6
0.1
00.0
597
1.2
32.0
0.1
1.3
1.1
74
34
3.9
J2-2
09-5
-R1
S.M
.3.5
214.1
29
1.6
11.6
914.9
620.3
00.0
321.4
N.A
.35
333
17.2
J2-2
09-6
-R1
S.M
.16.8
28.7
5.4
90.1
31.6
40.1
919.7
00.0
80
0.1
919
87
26.9
31R
OV
-10
S.M
.25.8
17.5
13.9
0.8
0.4
20.5
37.3
00.7
0.2
468
111
8
J2-2
09-1
-R2
S.M
.20.8
14.9
19.8
1.2
20.6
42.8
629.2
01.1
90
0.4
8541
154
13.8
J2-2
09-6
-R2
S.M
.23.3
19.9
7.2
20.2
11.0
10.0
527.2
00.0
20
0.2
4688
79
8.7
J2-2
09-6
-R3
S.M
.6.0
320.6
22
0.4
93.1
90.1
222.2
00.0
50
0.6
687
175
16.1
J2-2
09-7
-R2
S.M
.27.1
26.9
3.8
50.2
90.3
22.7
722.1
00.3
62.7
4N
.A.
453
67
10.2
J2-2
09-7
-R5
S.M
.27.5
34.7
0.9
90.0
80.2
90.7
121.4
00.0
20.9
5N
.A.
626
30
12.8
31R
OV
-13A
S.M
.5.6
6.8
39.4
1.1
0.8
35
4.5
27.6
0.2
5.7
0.1
1660
336
7.6
31R
OV
-13B
S.M
.27.2
32.6
1.9
0.1
0.1
02
1.7
34.6
0.3
1.4
0.2
184
46
6
31R
OV
-13C
S.M
.31.8
30.4
00
0.0
312
0.3
38.2
00.4
127
2.2
31R
OV
-17
S.M
.10.9
27.7
0.1
00.2
91
26.8
16.6
11
0.5
0.1
413
61
18
J2-2
09-1
-R1
S.M
.22.3
832.9
0.3
80.0
30.0
96.7
920.0
02.7
90.1
4N
.A.
475
13
3.5
J2-2
09-7
-R1
S.M
.22.6
330.1
0.1
70.0
10.0
49.2
920.0
03.8
0.2
5N
.A.
133
83
J2-2
14-3
-R1
S.M
.13.5
40.3
0.2
50.0
30.3
49.2
419.0
03.7
70.2
8N
.A.
519
54
18.8
J2-2
11-4
-R2
SC
.10.7
532
8.8
70.6
92.1
911.6
919.7
00.0
916.5
N.A
.2610
234
97.8
27R
OV
-01
SC
.12.3
20.5
26.4
1.1
0.3
67
2.4
27.2
0.1
3.1
0.1
2150
431
16.7
27R
OV
-06
SC
.3.9
1.9
55.1
1.9
0.0
473
2.0
32.4
0.6
0.8
1150
490
10.1
27R
OV
-07
SC
.1.6
1.4
59.9
2.4
0.1
48
1.0
30.9
0.1
1.1
1540
317
9.7
J2-2
10-1
-R1
SC
.5.3
618.4
519.3
50.5
31.2
20.1
216.6
50.0
50
0.3
438
310
3.9
J2-2
11-7
-R1
SC
.0.3
1.9
59.2
2.0
20.7
20.0
524.2
00.0
20
0.0
411
516
1.8
27R
OV
-08
SC
.27.8
39.7
0.1
00.0
399
0.4
35.1
0.1
0.2
0.2
172
28
11.9
53R
OV
-01
Solw
ara
64.7
5.6
15.7
1.1
0.1
416.1
18.1
0.1
22.6
1.1
7214
7.9
53R
OV
-02
Solw
ara
69.8
25.7
5.3
0.4
3.1
69.2
22.7
0.1
12.8
0.3
415
328
7.4
37R
OV
-02
Solw
ara
726.3
27.4
50.2
0.0
962
1.8
35.1
02.6
0.1
122
132
4.4
37R
OV
-05
Solw
ara
725.2
7.2
11.8
0.6
0.2
01
4.4
37.0
0.1
62.7
189
96
2.2
49R
OV
-03
Solw
ara
81.6
2.5
45.5
21.0
85
5.2
26.9
07.4
0.0
5116
455
5
33G
TV
-1A
Solw
ara
820.6
43.3
0.3
00.1
982
0.6
29.4
00.8
0.4
161
76
22
33G
TV
-1B
Solw
ara
827.2
32.6
1.9
0.1
0.1
02
1.7
34.6
0.3
1.4
0.2
184
46
6
33G
TV
-01C
Solw
ara
827.4
35.9
0.2
00.0
627
0.6
32.2
00.9
0.6
88
16
3.3
33G
TV
-2A
Solw
ara
86.2
41
7.4
0.2
1.5
65.0
22.8
0.1
6.8
0.9
1030
358
17
33G
TV
-2B
Solw
ara
82.6
36.2
13.9
0.9
1.5
86.3
21.8
09
838
438
40.8
33G
TV
-2C
Solw
ara
814.4
29.1
3.1
0.1
0.6
18
7.3
25.9
0.1
10.1
0.1
531
221
18.6
33G
TV
-2E
Solw
ara
86
48.5
4.6
0.3
1.3
73.3
24.3
04.7
0.2
888
465
17.8
33G
TV
-3A
Solw
ara
814.3
32.1
10.1
0.4
1.1
43.4
28.0
04.8
0.3
706
322
70.9
33G
TV
-3B
Solw
ara
814.4
36.6
1.3
0.1
0.9
25
4.9
23.6
0.1
6.7
0.4
756
311
65
33G
TV
-3C
Solw
ara
819.6
39.6
1.7
0.1
0.5
21
1.3
29.6
01.8
0.3
435
229
56.9
33G
TV
-4A
Solw
ara
85.9
10.3
29.9
11.6
56.1
26.7
0.1
8.3
0.1
602
414
5.6
33G
TV
-4B
Solw
ara
86.1
031.9
0.8
1.3
96.3
27.3
09
0.1
514
436
7.2
171

Chapter5PACManus
Table5.4:
Min
era
lm
ode
calc
ula
tions
based
on
whole
rock
data
setbased
on
unpublis
hed
data
from
S.P
ete
rsen
and
Cra
ddock
(2009).
type
Sam
ple
Location
Cpy
Pyrite
Sphale
rite
Gale
na
Dig
enite
Barite
Anhydrite
Tennantite
Born
ite
Sum
bor+
dig/b
or+
dig
+cpy
diffuserchimney
J2-2
08-1
-R3
RM
R.
0.1
50.0
00.4
50.0
10.0
00.0
00.0
00.0
20.1
30.7
60.4
7
J2-2
08-2
-R3
RM
R.
0.0
00.0
00.5
80.3
80.0
00.0
10.0
00.0
10.0
00.9
9-
J2-2
08-9
-R1
RM
R.
0.0
00.0
00.7
40.0
10.0
00.0
80.0
00.0
00.0
00.8
4-
J2-2
08-1
0-R
1R
MR
.0.1
00.3
20.3
10.0
70.0
00.1
30.0
00.0
00.0
00.9
30.0
0
J2-2
13-3
-R1
RM
R.
0.0
00.1
70.2
70.0
00.0
90.0
30.3
40.0
10.0
00.9
01.0
0
J2-2
22-7
-R1
RM
R.
0.0
00.0
00.8
80.0
40.0
00.1
00.0
00.0
10.0
01.0
31.0
0
J2-2
22-8
-R2
RM
R.
0.2
90.0
00.4
00.0
30.0
00.1
00.0
80.0
20.0
50.9
80.1
6
J2-2
09-5
-R1
S.M
.0.0
60.0
00.4
20.0
20.0
60.3
60.0
00.0
60.0
71.0
60.6
8
J2-2
09-6
-R1
S.M
.0.4
00.0
00.0
60.0
00.0
00.0
00.0
00.0
10.2
20.7
00.3
5
J2-2
11-4
-R2
SC
.0.1
70.0
00.1
20.0
10.0
00.2
80.0
00.0
70.3
61.0
10.6
7
J2-2
12-3
-R1
FW
.0.1
70.0
30.4
90.0
00.0
00.3
60.0
20.0
00.0
01.0
60.0
0
J2-2
12-9
-R2
FW
.0.2
40.0
00.1
50.0
00.0
30.0
00.0
00.0
00.1
40.5
70.4
1
J2-2
12-m
isc
FW
.0.3
00.0
70.2
00.0
00.0
00.0
00.0
20.0
00.0
00.5
90.0
0
J2-2
16-2
-R1
FW
.0.1
80.0
00.0
90.0
00.0
00.2
20.0
10.0
30.2
90.8
20.6
2
27R
OV
-01
SC
.0.3
30.0
00.3
90.0
10.0
00.0
50.0
00.0
00.1
40.9
20.3
0
27R
OV
-06
SC
.0.0
10.0
70.8
20.0
20.0
10.0
10.0
20.0
00.0
00.9
90.5
2
27R
OV
-07
SC
.0.0
30.0
10.8
90.0
30.0
10.0
20.0
10.0
00.0
00.9
80.1
8
41R
OV
-05
FW
.0.2
40.3
80.0
50.0
00.0
40.0
70.0
00.0
20.1
20.9
30.4
1
41R
OV
-12A
FW
.0.2
50.5
40.0
20.0
00.0
00.1
00.0
00.0
30.0
10.9
70.0
7
31R
OV
-10
S.M
.0.2
70.3
40.2
00.0
10.0
00.0
10.0
00.0
10.1
20.9
60.3
0
inactivechimney
J2-2
08-1
-R2
RM
R.
0.0
00.0
00.7
80.0
20.0
00.0
00.0
00.0
00.0
00.8
10.7
4
J2-2
08-1
-R4
RM
R.
0.0
50.0
40.0
60.0
00.0
00.0
00.0
30.0
00.0
00.1
80.0
0
J2-2
08-2
-R4
RM
R.
0.0
00.0
00.8
20.0
10.0
10.1
30.0
00.0
00.0
10.9
91.0
0
J2-2
08-2
-R4
RM
R.
0.0
00.0
00.7
80.1
50.0
00.0
30.0
20.0
10.0
00.9
91.0
0
J2-2
08-4
-R2
RM
R.
0.0
00.0
00.6
70.1
00.0
00.0
00.0
00.0
00.0
00.7
7-
J2-2
22-4
-R2
RM
R.
0.3
80.0
00.3
80.0
10.0
00.0
00.0
00.0
00.0
00.7
70.0
0
J2-2
22-8
-R1
RM
R.
0.0
10.0
00.7
60.0
60.0
20.0
90.0
00.0
10.0
41.0
00.8
4
J2-2
09-1
-R2
S.M
.0.4
30.1
20.2
80.0
10.0
00.0
00.0
40.0
00.0
00.8
90.0
0
J2-2
09-6
-R2
S.M
.0.5
70.0
90.1
00.0
00.0
00.0
00.0
00.0
00.0
00.7
70.0
0
J2-2
09-6
-R3
S.M
.0.1
30.0
00.3
20.0
00.0
50.0
00.0
00.1
10.1
20.7
30.5
6
J2-2
09-7
-R2
S.M
.0.7
50.0
00.0
20.0
00.0
00.0
50.0
10.0
00.0
00.8
30.0
0
J2-2
09-7
-R5
S.M
.0.6
70.0
00.0
00.0
00.0
00.0
20.0
00.0
00.1
60.8
50.1
9
J2-2
10-1
-R1
SC
.0.1
00.0
00.2
80.0
00.0
90.0
00.0
00.0
20.1
10.6
00.6
7
J2-2
11-7
-R1
SC
.0.0
00.0
00.8
50.0
20.0
10.0
00.0
00.0
00.0
00.8
81.0
0
J2-2
10-4
-R1
FW
.0.2
10.0
00.1
80.0
00.0
10.0
00.0
00.0
70.1
20.6
10.3
9
J2-2
10-7
-R1
FW
.0.3
40.0
00.0
50.0
00.0
00.0
30.0
00.0
00.4
00.8
30.5
4
J2-2
10-7
-R2
FW
.0.6
70.0
00.0
00.0
00.0
00.0
00.0
90.0
00.0
80.8
30.1
1
J2-2
10-7
-R3
FW
.0.2
40.0
00.0
10.0
00.0
00.2
40.0
00.0
00.2
20.7
10.4
8
J2-2
10-8
-R3
FW
.0.0
20.0
20.8
40.0
00.0
00.0
00.0
00.0
00.0
00.8
90.0
0
J2-2
12-9
-R1
FW
.0.1
30.0
00.1
70.0
00.0
00.1
90.0
00.0
20.1
90.7
10.5
9
J2-2
12-1
0-R
1F
W.
0.0
00.0
00.8
20.0
10.0
00.0
00.0
00.0
00.0
00.8
30.0
0
29R
OV
-16
FW
.0.0
00.1
90.2
30.0
10.1
50.2
30.0
00.0
40.0
30.8
81.0
0
29R
OV
-15
FW
.0.1
20.1
10.1
70.0
10.1
40.1
20.0
10.1
30.1
40.9
60.6
9
31R
OV
-13A
S.M
.0.0
50.0
80.5
80.0
10.0
20.1
00.0
10.0
40.0
30.9
20.4
7
31R
OV
-13B
S.M
.0.5
10.1
90.0
30.0
00.0
00.0
20.0
10.0
00.2
41.0
00.3
2
31R
OV
-13C
S.M
.0.5
90.2
60.0
00.0
00.0
00.0
10.0
00.0
00.1
61.0
10.2
1
49R
OV
-03
Solw
ara
80.0
00.0
40.6
80.0
20.0
00.1
30.0
00.0
60.0
00.9
31.0
0
37R
OV
-02
Solw
ara
70.3
90.2
50.0
70.0
00.0
00.0
40.0
00.0
00.2
20.9
80.3
6
172

5.5 Whole rock datasetty
pe
Sam
ple
Location
Cpy
Pyrite
Sphale
rite
Gale
na
Dig
enite
Barite
Anhydrite
Tennantite
Born
ite
Sum
bor+
dig/b
or+
dig
+cpy
massivesulfide/talus
J2-2
12-4
-R1
FW
.0.5
60.0
00.0
40.0
00.0
00.0
00.0
00.0
00.0
00.6
00.0
1
J2-2
12-5
-R1
FW
.0.2
60.5
10.0
00.0
00.0
00.0
00.0
00.0
00.0
00.7
80.0
0
J2-2
12-7
-R1
FW
.0.4
50.1
40.0
00.0
00.0
00.4
50.0
30.0
00.0
01.0
70.0
0
J2-2
16-7
-R1
FW
.0.1
30.5
80.0
40.0
00.0
00.0
00.0
00.0
00.0
00.7
60.0
0
J2-2
16-8
-R1-G
CF
W.
0.0
00.0
40.4
80.0
20.0
00.0
00.0
00.0
10.0
00.5
4-
J2-2
16-9
-R1-G
CF
W.
0.0
40.7
30.0
00.0
00.0
00.1
40.0
10.0
00.0
00.9
10.0
0
49R
OV
-05
FW
.0.0
00.9
20.0
10.0
00.0
00.0
10.0
00.0
30.0
00.9
81.0
0
34G
TV
-1F
W.
0.0
00.3
60.3
40.0
40.0
00.1
40.0
00.0
20.0
00.9
0-
41R
OV
-12B
FW
.0.1
30.3
00.1
10.0
00.0
60.2
20.0
00.0
00.0
70.9
00.5
0
41R
OV
-12C
FW
.0.0
20.1
60.5
30.0
10.0
00.1
70.0
10.0
10.0
00.9
10.0
0
41R
OV
08
FW
.0.0
10.0
40.0
00.0
00.0
00.0
00.9
40.0
00.0
00.9
90.4
9
31R
OV
-17
S.M
.0.2
80.0
00.0
00.0
00.0
70.0
10.3
70.0
00.1
90.9
40.4
8
33G
TV
-1A
Solw
ara
80.5
00.0
40.0
00.0
00.0
80.0
10.0
00.0
10.3
00.9
50.4
3
33G
TV
-1B
Solw
ara
80.5
10.1
90.0
30.0
00.0
00.0
20.0
10.0
00.2
41.0
00.3
2
33G
TV
-01C
Solw
ara
80.8
00.0
30.0
00.0
00.0
00.0
20.0
00.0
00.1
20.9
70.1
3
33G
TV
-2A
Solw
ara
80.0
00.1
20.1
10.0
00.4
50.1
20.0
00.0
80.0
40.9
11.0
0
33G
TV
-2B
Solw
ara
80.0
00.0
30.2
00.0
10.3
10.1
50.0
00.0
90.1
30.9
31.0
0
33G
TV
-2C
Solw
ara
80.0
00.2
70.0
40.0
00.2
30.1
70.0
00.0
30.1
50.9
11.0
0
33G
TV
-2E
Solw
ara
80.0
00.0
90.0
70.0
00.4
20.0
80.0
00.0
90.1
90.9
41.0
0
33G
TV
-3A
Solw
ara
80.1
70.1
40.1
50.0
00.1
70.0
80.0
00.0
50.1
70.9
40.6
6
33G
TV
-3B
Solw
ara
80.3
30.0
40.0
20.0
00.1
10.1
10.0
00.0
50.2
30.8
90.5
1
33G
TV
-3C
Solw
ara
80.2
50.1
90.0
20.0
00.2
10.0
30.0
00.0
10.2
30.9
30.6
4
33G
TV
-4A
Solw
ara
80.0
00.1
30.4
40.0
10.0
80.1
40.0
00.0
90.0
00.9
11.0
0
33G
TV
-4B
Solw
ara
80.0
00.1
70.4
80.0
10.0
00.1
50.0
00.0
30.0
00.8
4-
37R
OV
-05
Solw
ara
70.0
00.5
40.1
80.0
10.0
80.1
00.0
00.0
20.0
10.9
30.9
9
53R
OV
-01
Solw
ara
60.0
00.1
30.2
40.0
10.0
60.3
80.0
00.0
30.0
00.8
61.0
0
53R
OV
-02
Solw
ara
60.0
00.1
80.0
70.0
00.1
70.2
20.0
00.1
60.0
90.8
91.0
0
openconduitchimney
J2-2
13-2
-R1
RM
R.
0.5
40.0
00.0
40.0
00.0
00.0
10.1
40.0
00.1
50.8
80.2
2
J2-2
22-4
-R1
RM
R.
0.4
90.0
00.0
00.0
00.0
00.0
00.0
50.0
00.3
00.8
50.3
8
J2-2
09-1
-R1
S.M
.0.5
40.0
00.0
00.0
00.0
00.0
00.0
90.0
00.2
10.8
50.2
8
J2-2
09-7
-R1
S.M
.0.5
80.0
00.0
00.0
00.0
00.0
00.1
30.0
00.1
40.8
60.2
0
J2-2
14-3
-R1
S.M
.0.2
10.0
00.0
00.0
00.0
00.0
00.1
30.0
00.5
10.8
60.7
1
J2-2
12-1
-R1
FW
.0.0
00.2
70.0
30.0
10.0
30.0
10.4
50.0
80.0
00.8
81.0
0
J2-2
12-2
-R1
FW
.0.0
00.3
20.0
20.0
00.0
90.0
10.4
40.0
10.0
00.8
91.0
0
J2-2
12-6
-R1
FW
.0.0
00.2
80.0
30.0
10.0
40.0
10.5
40.0
90.0
01.0
01.0
0
J2-2
16-1
5-R
1F
W.
0.0
00.2
10.0
30.0
00.0
50.0
00.5
20.0
60.0
00.8
81.0
0
J2-2
16-1
6-R
1F
W.
0.0
00.2
70.0
10.0
00.1
00.0
00.4
80.0
40.0
00.9
01.0
0
27R
OV
-08
SC
.0.6
00.1
30.0
00.0
00.0
00.0
00.0
00.0
00.3
01.0
30.3
3
25R
OV
-03
FW
.0.0
70.1
40.0
00.0
00.0
10.0
00.7
40.0
20.0
10.9
90.2
0
53R
OV
-06
RM
R.
0.3
40.2
90.0
10.0
00.0
00.0
10.1
60.0
00.1
40.9
50.3
0
39R
OV
-01
RM
R.
0.6
80.0
50.0
00.0
00.0
00.0
20.0
00.0
00.2
20.9
80.2
5
173

Chapter 5 PACManus
Figure 5.9: Whole rock samples showing relationships between Sb, As, Au, Ag contents of sulfides from
Solwara 6-8; FW: Fenway; SM: Satanic Mills and RMR: Roman Ruins (Craddock, 2009).
corresponding the observations from the fluid samples (Figure 5.8).
The strongest correlation is between As-Ag (Figure 5.9c), while Sb-As and Au-Ag
have some scatter within the samples from Satanic Mills+Snowcap and Solwara. The
strongest correlation between all four elements exists at the Cu-rich Fenway chimneys.
The positive correlation between As-Ag and Sb-Au is even more pronounced when
looking at the different chimney types (Figure 5.10c and d). The lowest concentrations
of all four elements can be found within open conduit chimneys, where no significant
concentrations differences can be distinguished. Although the highest scatter between
concentrations occur at diffuser chimneys. The same geochemical data was used in
comparing the concentration of Sb, As, Ag and Au with calculated mineralogical modes
of the sulfide samples, assuming that they are composed of pyrite, anhydrite, barite,
174

5.5 Whole rock dataset
Figure 5.10: Whole rock samples showing relationships between Sb, As, Au, Ag contents from sulfides
from Solwara 6-8; FW: Fenway; SM: Satanic Mills and RMR: Roman Ruins categorized into four distinct
groups: Open conduit chimney; diffuser chimney; massive sulfide/talus; inactive chimney (Table 5.1) (Crad-
dock, 2009)
amorphous silica, sphalerite, galena, chalcopyrite, bornite, digenite, hematite, tennantite
(Table 5.4). These mineralogical modes provide the opportunity to look at the different
concentrations within the different chimneys in more depth (Figure 5.11 - 5.14).
175

Chapter 5 PACManus
Figure 5.11: Overview mineral mode calculations for the open conduit chimney, with the focus on a)
sphalerite, b) bornite, c) digenite and d) Cu-rich minerals (digenite+bornite)/(digenite+bornite+chalcopyrite).
Figure 5.12: Overview mode calculations for the massive sulfide/talus chimney, with the focus on a) spha-
lerite, b) bornite, c) digenite and d) Cu-rich minerals (digenite+bornite)/(digenite+bornite+chalcopyrite).
176

5.5 Whole rock dataset
Figure 5.13: Overview mode calculations diffuser chimney, with the focus on a) sphalerite, b) bornite, c)
digenite and d) Cu-rich minerals (digenite+bornite)/(digenite+bornite+chalcopyrite).
Figure 5.14: Overview mode calculations for the inactive chimney, with the focus on a) sphalerite, b)
bornite, c) digenite and d) Cu-rich minerals (digenite+bornite)/(digenite+bornite+chalcopyrite).
177

Chapter 5 PACManus
Figure 5.11 - 5.14 depict the concentrations of As, Sb, Ag, and Au within the ana-
lyzed sulfide samples versus the calculated contents of digenite, bornite, and sphalerite
as well as against the ratio of (digenite+bornite)/(digenite+bornite+chalcopyrite). The
latter proxy reflects the proportions of secondary Cu-minerals (digenite) and partly sec-
ondary Cu-phase (bornite) to the primary Cu-phase chalcopyrite. An unaltered rock will
have a ratio close to zero, while the values of strongly altered rocks approach unity. In
other words, a low percentage with high concentration of Sb, As, Ag and Au suggests
a preference of mineralization of these elements within chalcopyrite, while at high per-
centages the mineralization is tied to bornite+digenite. Figure 5.11 represents the open
conduit style, and corresponds clearly with the outcome of Figure 5.10, indicating that
at these sites the concentrations of As, Sb, Ag, and Au are lowest. Overall the plots
show scatter and real trends can often not be deduced.
However, there are suggestions of slight correlations between the concentrations of
As, Sb, Ag, and Au when plotted against the mode of the sulfide samples in the four
different sulfide types (Figures 5.11 - 5.14). The massive sulfide/talus type (Figure
5.12) has the greatest contents of bornite, digenite and sphalerite and represents within
this specific mineralization phase proportions the strongest evidence for zone refine-
ment and supergeneous enrichment. The open conduit chimney (Figure 5.11), the other
end-member, representing primary sulfide. The inactive chimney samples lie between
those of the active chimneys and the mound material in most instances. Both digenite
and bornite show an increase for all four elements with increasing dominance of both
minerals within the massive sulfide/talus chimneys; concentrations go up two orders
of magnitude for between 0 and 10% of digenite and bornite. And these values do
no drop, when increasing the amount of bornite and digenite present within a massive
sulfide/talus site. In sphalerite these values also increase two orders of magnitude, how-
178

5.6 Geochemical models
ever Au concentration drops rapidly afterwards, leaving the conjointed Sb, As and Ag
behind. The last plot with the (digenite+bornite)/(digenite+bornite+chalcopyrite) proxy
shows a increase of Sb, As, Ag and Au in favored digenite and bornite with the same
two orders of magnitude, in comparison to a minor increase in chalcopyrite.
Sphalerite is the dominant phase in the diffuser chimneys (Figure 5.13), with low
quantities of bornite and digenite and corresponding low concentrations of Sb, As,
Ag and Au. Au remains low within sphalerite, however relative high Sb contents, al-
most reaching the high concentration of As, is prevalent. Au is also low in the (di-
genite+bornite)/(digenite+bornite+chalcopyrite) plot, while As concentrations are uni-
formly high. Most notable is a correlation between sphalerite contents and the concen-
trations of Ag (and to a lesser extent Sb). This reflects a preference of sphalerite for Ag
and Sb while sphalerite apparently discriminates against Au. Au within a Zn-dominated
diffuser chimney appears to be following As into Cu-mineralization, reflecting a prob-
able preference for tenanntite. As to be expected, digenite is barely present within
inactive chimneys (Figure 14). As, Au, Sb and Ag are incorporated here, however, with
high scatter and thus no clear relationship.
5.6 Geochemical models
As described in section 5.3, one of the goals of applying geochemical modeling is to
look at the solubility differences of Ag, Au, As and Sb and the differences in aqueous
speciation as a function of temperature of the hydrothermal fluids without considering
hydrothermal alteration or leaching from host rock and/or primary sulfides and mix-
ing or entrainment of seawater. Figure 5.15 shows the different speciations of Sb, As,
Ag and Au when cooling a hydrothermal fluid down from 350 ◦C to 50 ◦C. Oxidized
179

Chapter 5 PACManus
(a) (b)
(c) (d)
Figure 5.15: Solubility of Sb, As, Au and Ag in a heated hydrothermal fluid, from 50-350 ◦C at 250 bar
species, like Sb(OH)3 and As(OH)3, are the dominant Sb- and As-species when cooling
down the fluid until T>70 ◦C. The reduced species, like H2Sb2S4 and HAs3S6– , show
reversed behaviors and are lost from the fluid at high temperatures (>250 ◦C). This trend
is also observed for Au and Ag complexes. Ag follows a more complex behavior as it
precipitates upon cooling to 270 ◦C, and then regains solubility to around 130 ◦C, from
where it starts to precipitate from the fluid again upon further cooling. Overall, Sb,
As, and Au are most soluble between 200-270 ◦C, and Ag between 150-250 ◦C. These
temperature ranges are similar to the temperatures of the fluid samples that showed ele-
vanted concentrations in these elements (Figure 5.4).
180

5.6 Geochemical models
Another goal of the modelling was to compute and assemble the T-X sections for
the major vent sites at PACManus, mapped out with respect to gangue minerals, Fe-
Cu-S, Sb-As-Au-Ag-O-S and Zn-Pb-Mn-Fe-O-S phase assemblages (Figure 5.16-5.18).
These plots visualize the mineral assemblages that should prevail within sulfide struc-
tures according to varying regimes of seawater entrainment (varying and/or increasing
amounts of fraction seawater in mixture) versus conductive cooling (no seawater in mix-
ture). There are a number of coherent messages to be taken home from studying these
diagrams:
1. Anhydrite will precipitate above 150◦C in mixtures of seawater and hydrothermal
fluids; however, in an area in T-X plane where conductive cooling of hydrothermal
fluids prevails, anhydrite is missing.
2. Magnetite forms only in specific regions within an area of the T-X plane domi-
nated by conductive heating of entrained seawater.
3. Covellite, hematite (goethite), pyrolusite form at low temperatures over a wide
range of mixing ratios between seawater and hydrothermal vent fluid.
4. bornite forms only upon conductive cooling of the hydrothermal fluid; Fe-tennantite
is also most stable in that regime, but its stability filed extends to higher propor-
tions of seawater in the mixture.
5. Pyrite and chalcopyrite are stable across large areas of the T-X plane, although at
Fenway chalcopyrite may give way to other Cu-phases (bornite and Cu-tennantite)
in cases of severe conductive cooling.
Focusing in on the Sb-As-Au-Ag plots, one can recognize that at all three vent sites
arsenopyrite, native gold and silver are predicted to precipitate between 150 and 250
181

Chapter 5 PACManus
◦C across a large range of composition. These phases are also predicted to appear at
higher temperature in region dominated by conductive cooling. Under these circum-
stances, this As-AgAu mineralization assemblage is then coeval with the precipitation
of bornite. A second group of arsenopyrite will precipitate, when enduring conservative
mixing amidst increasing amounts of seawater. At low temperatures (<150 ◦C) stibnite
and berthierite will precipitate, although berthierite is lacking at Satanic Mills, probably
due to its low Fe-iron contents (Reeves et al., 2011). Native gold and silver contin-
ues to precipitate at 150 ◦C, independent on the fraction of seawater while enduring
conservative mixing.
182

5.6 Geochemical models
(a) (b)
(c) (d)
Figure 5.16:Final T-X sections of Fenway, showing the result of simulating the evolution of seafloor massive
sulfide deposits in the critical stages of (i) mound-building, (ii) zone refining within the mound, and (iii)
supergeneous enrichment of certain elements in the outmost parts of the mound through reaction path
modeling.
A final goal of the modeling was to simulate processes within a hydrothermal sul-
fide mound using the complex reaction path modeling approach described in Section
5.3. We wish to examine if these processes may be responsible for some of the large
compositional variability within the fluid and solid geochemical data and the often-high
concentrations of As, Sb, Ag, and Au in some of the moderate temperature fluids vent-
183

Chapter 5 PACManus
ing at PACManus. We focused on the Roman Ruins vent site, but the general patterns
discerned should apply to other systems as well.
(a) (b)
(c) (d)
Figure 5.17: Final T-X sections of Roman Ruins, showing the result of simulating the evolution of seafloor
massive sulfide deposits in the critical stages of (i) mound-building, (ii) zone refining within the mound, and
(iii) supergeneous enrichment of certain elements in the outmost parts of the mound through reaction path
modeling.
184

5.6 Geochemical models
(a) (b)
(c) (d)
Figure 5.18: Final T-X plots of Satanic Mills, showing the result of simulating the evolution of seafloor
massive sulfide deposits in the critical stages of (i) mound-building, (ii) zone refining within the mound, and
(iii) supergeneous enrichment of certain elements in the outmost parts of the mound through reaction path
modeling.
The mineralogical succession of the sulfide formation is depicted in Figure 5.19a.
Figure 5.19b and c show the predicted results of interactions between this mixed and
cooled fluid with the solids produced in the model run depicted in Figure 5.19a.
They depict the predicted consequences of zone refining, i.e., reactions within the
mound upon reaction of the mound material with a mixed fluid (90% endmember vent
185
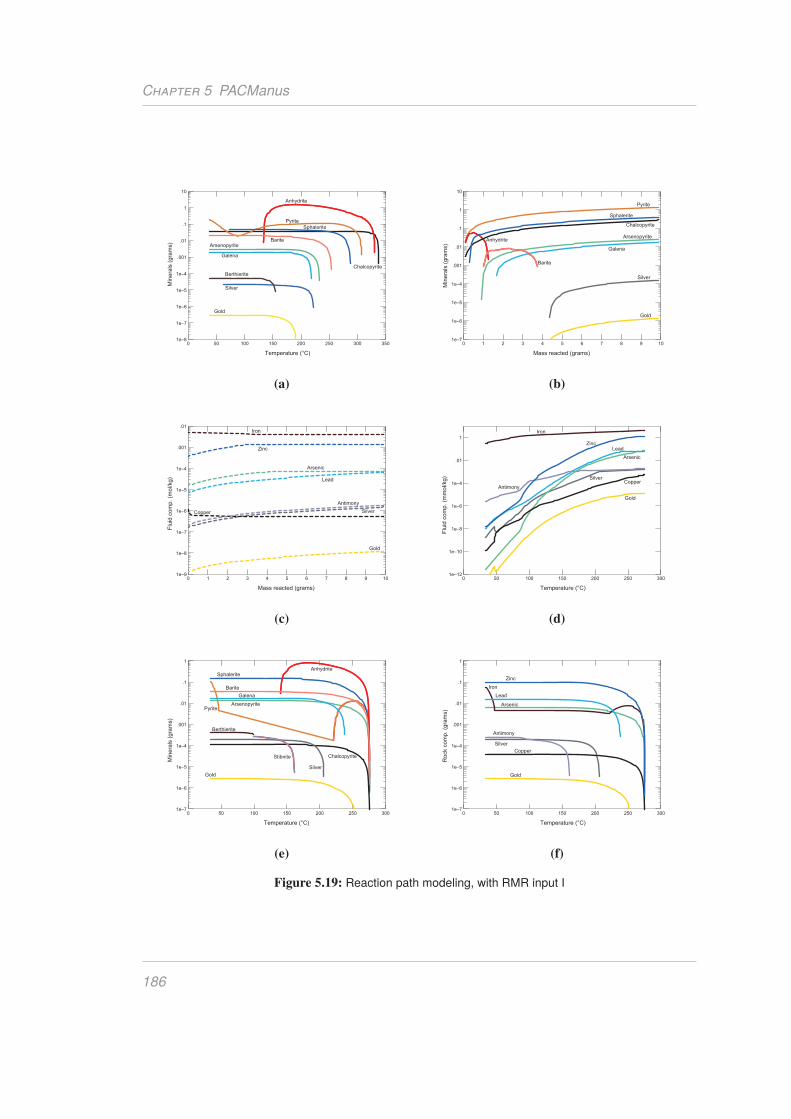
Chapter 5 PACManus
(a) (b)
(c) (d)
(e) (f)
Figure 5.19: Reaction path modeling, with RMR input I
186

5.6 Geochemical models
fluid and 10% entrained seawater). Figure 15.19b shows that the minerals expected to
form upon this interaction are dominated by pyrite, with lesser amounts of sphalerite,
chalcopyrite, galena and arsenopyrite. How these reactions insight the mound would
affect fluid composition is shown in Figure 5.15c: Fe and Cu are predicted to decrease
in concentration, while the contents of Zn, Pb, As, Sb, Ag, and Au are expected to in-
crease. The predicted consequences of this zone refining process are hence that Fe and
Cu become slightly enriched in the mound material, while the other elements shown
become depleted in the mound material and enriched in the fluid phase. When this fluid
phase percolates up to the surface of the mound, it will mix with cold seawater. Figures
5.19d-e show what is expected to happen in the topmost sections of the mound where
this fluid mixing takes place. This reaction path simulates the precipitation of minerals
in the supergeneous zone and examines the enrichment of Sb, As, Ag, and Au in these
processes The elements picked up by the fluid during zone refining within the mound
(As, Sb, Pb, Zn, Ag, Au) are predicted to come out of solution rapidly, whereas Fe con-
centrations remain high (Figure 5.15d). The minerals expected to form in the outermost
part of the mound are sphalerite, Sb and As phases, variable pyrite, and galena. Copper
Without mineral precipitation
With mineral precipitation
Figure 5.20: Reaction path modeling where addition of CO2 to the maximum concentrations soluble (sev-
eral hundred mmol/kg) is responsible for a pH drop.
187

Chapter 5 PACManus
(a) (b)
(c) (d)
Figure 5.21: Final solubility plots of Satanic Mills, showing the result of simulating the evolution of seafloor
massive sulfide deposits in the critical stages of (i) mound-building, (ii) zone refining within the mound, and
(iii) supergeneous enrichment of certain elements in the outmost parts of the mound through reaction path
modeling.
phases are subordinate, while Au and Ag are expected to become enriched (Figure 5.19).
The elemental composition of the outer mound material is depicted in Figure 5.19f. The
material is expected to be essentially Zn-Pb mineralized with high abundances of As,
Sb, Ag and Au. This expected loss of Sb, As, Ag and Au from the final hydrothermal
fluid at T<270 ◦C is confirmed in Figure 5.21 and 5.22, where the species are plotted of
the fluids from the final stage of Fenway and Satanic Mills.
188

5.7 Discussion and conclusion
(a) (b)
(c) (d)
Figure 5.22: Final solubility plots of Satanic Mills, showing the result of simulating the evolution of seafloor
massive sulfide deposits in the critical stages of (i) mound-building, (ii) zone refining within the mound, and
(iii) supergeneous enrichment of certain elements in the outmost parts of the mound through reaction path
modeling.
5.7 Discussion and conclusion
Due to the tectonic characteristics of the East Manus Basin (EMB) and the bimodal
volcanism there, the PACManus hydrothermal field is considered as a rough analogy for
land-based auriferous VMS ore deposits (Binns and S. Scott, 1993). Several principal
areas of hydrothermal venting have been identified at the PACManus site and used for
this study: Roman Ruins, Roger Ruins, Satanic Mills, Fenway, Snowcap, Solwara 6-8
189

Chapter 5 PACManus
and Tsukushi (Binns, Barriga, et al., 2007; Bach, Rosner, et al., 2011; Reeves et al.,
2011). These sites consist of active and inactive black smoker chimneys and spires on
sulfide mounds, where the venting fluids are acidic (pH=2.5-3.8) and have temperatures
up to 341 ◦C (Reeves et al., 2011). Like many VMS accumulations, the PACManus site
is enriched in As, Sb, Ag, and Au (S. Scott and Binns, 1995; Moss and S. Scott, 2001),
but details of a suitable origin, transport and trapping mechanisms for these metals are
unknown.
5.7.1 Role of magma degassing
The very gassy and metal-rich fluids observed in the PACManus hydrothermal area are
abundant in arc and back-arc hydrothermal systems (Baker et al., 2008; Butterfield et
al., 2011; Reeves et al., 2011; Ronde et al., 2001; Seewald, Reeves, et al., 2015).
These fluids show varied compositions from acid-sulfate type (Butterfield et al., 2011)
to extremely enriched in carbonic acid (Lupton et al., 2008). Both types of systems are
developed sometimes even within individual volcanoes (Ronde et al., 2001; Seewald,
Reeves, et al., 2015). It is conceivable that episodes of magmatic degassing or other tran-
sients lead to an increased geochemical variability of these vents. How these processes
affect metal fluxes to the seafloor and chemosynthesis-based ecosystems remains un-
known. We have not attempted comprehensive modeling to examine the consequences
of magma degassing on the concentrations of Sb, As, Au and Ag from the Manus back-
arc basin. Evidence for magmatic controls on metal and metalloid distribution exist, al-
though we do not know by which mechanism. Evidence from previous work indicating
the presence of solid sulfide phases on vesicle walls by scanning electron microscopy
and electron microprobe analyses (Kamenetsky et al., 2001; K.H. Yang and S. Scott,
190

5.7 Discussion and conclusion
1996). These phases have condensed from trapped magmatic fluids and indicate metal
mobility during magma degassing. These condensed phases in the subseafloor can be
expected to react with circulating seawater in the root zones of the hydrothermal vents
and release some of the magmatically derived metals and metalloids to the hydrother-
mal fluid. Another enrichment mechanism is direct input of metals and metalloids from
degassing magma, but the data presented in Craddock (2009) and Reeves et al. (2011)
and Seewald, Reeves, et al. (2015) do not show correlations between established tracers
of magma degassing (e.g., the sulfur isotopic composition of H2S or the concentrations
of fluorine) in the fluids from the larger eastern Manus Basin area. This hypothesis is
difficult to test by modeling, because phase separation cannot be handled by the codes
we were using. Another way magma degassing can affect the solubility of As, Sb, Ag,
and Au is by lowering the pH. We have calculated that addition of CO2 to the maximum
concentrations soluble (several hundred mmol/kg) at PACManus) will lower the pH by
the reactions CO2 + H2O = HCO3− + H+ to about 3.5 (Figure 5.20).
This is actually higher than the in situ pH-values calculated of 2.7-3, indicating that
another source of acidity is required. CO2 is also fairly unreactive at temperatures
around 300 ◦C (Bischoff and Rosenbauer, 1996), so we conclude that CO2 degassing
does not affect the transport of the four elements of interest too much. HF is a weak
acid that does not dissociate at the low pH-values determined for the PACManus sys-
tems. SO2 gas, however, is very reactive and rapidly disproportionates to sulfuric acid
and either native sulfur or H2S via the reactions:
4SO2+4H2O = 3H2SO4+H2S (5.1)
191

Chapter 5 PACManus
3SO2+2H2O = 2H2SO4+ S (5.2)
The sulfuric acid generated by these reactions will immediately dissociate and cause
very low pH-values to develop in hydrothermal fluids affected by titration of magmatic
SO2 into the system from underlying degassing magma reservoirs. Seewald, Reeves,
et al. (2015) showed that this is exactly what is taking place massively at North Su, 100
km east of PACManus. At PACManus, the evidence magma degassing is more subdued,
but still discernable (Bach, Roberts, et al., 2003; Craddock and Bach, 2010; Reeves et
al., 2011). Our model calculations have shown that the drop in pH associated with zone
refining will increase the solubility of As, Sb, Ag, and Au (along with that of Zn, Pb, but
not Cu and Fe). Although we have not conducted any modeling to address the effect of
magma degassing on the solubility of As, Sb, Ag, and Au, we anticipate that the effect
of lowering the pH by adding sulfuric acid would have very similar results. We expect
that magmatic degassing from felsic volcanism (the Pual Ridge hosting the PACManus
hydrothermal area is dacitic to rhyodacitic in composition; Beier et al., 2015) is partic-
ularly prone to SO2 degassing, because the speciation of sulfur dissolved in these melts
is shifted towards higher oxidations relative to that of basalt (Wallace, 2005).
5.7.2 Transport and deposition
In hydrothermal fluids metals have the ability to form strong aqueous complexes, with
various ligands (Williams-Jones and Migdisov, 2014). However, these complexes are
not yet understood for Sb, As and Ag. With our modeling, with new created databases,
we have made an attempt to model these elements for the first time together and pur-
192

5.7 Discussion and conclusion
sued to analyze the geochemical behavior systematically within a hydrothermal system.
From Figures 5.15 and 5.22 it is clear that the dominancy of Au and Ag complexes in
hydrothermal fluids around 280 ◦C and at PACManus in specific are from Au(HS)2−
and AuHS to AuCl2− and AuOH and for Ag AgCl2− to Ag(HS)2− and AgHS. These
results are conform the studies of Stefánsson and Seward (2004) and Williams-Jones,
Bowell, et al. (2009), arguing that AuCl2− tends to dominate under acidic and oxidiz-
ing conditions, while Au(HS) at acidic to intermediate pH and Au(HS)2− at higher pH,
based on the following reactions:
AuS+HS−+H+ +1/4O2 = Au(HS)+1/2H2O (5.3)
and
AuS+2HS−+H ++1/4O2= Au(HS)2−+1/2H2O (5.4)
However, around temperatures up to 350 ◦C, the complexes Au(HS)2− and AuHS are
dominant within a hydrothermal system, while at higher T (or at very low pH) stronger
bonding between Au and Cl− is expected, based on the hard-soft-acid-base (HSAB)
principle (Pearson, 1963; Williams-Jones, Bowell, et al., 2009). The expected strong
dependence on the HS− ligand does not apply for Ag, since Ag can form stronger
Cl-complexes than Au at lower temperatures (Williams-Jones, Bowell, et al., 2009;
Williams-Jones and Migdisov, 2014), verifying the dominant behavior of AgCl2− at
PACManus. Sb is dependent on the ‘harder’ OH- ligand, forming Sb(OH)3 T>250 ◦C
193

Chapter 5 PACManus
(Figure 5.15 and 5.22) (Zotov et al., 2003). The same behavior is observed for As,
where the dominant complex is As(OH)3. The similarity of this behavior between these
two elements, in comparison to Au and Ag, could be explained by the HSAB principle
that Sb-As are characterized as stronger acids than Au and Ag, and therefor prefer to
make a complex with the stronger OH− ligand (Pearson, 1963).
A further striking and important observation from the dataset and modeling results,
is the notable coherence in the geochemical behavior of Sb, As, Au and Ag. Through-
out this dataset a strong relationship has been observed specifically between As-Ag and
Sb-Au. These relationships observed, appear to be even stronger than the well acknowl-
edged Sb-As and Au-Ag relationships. Nonetheless, further research is needed to fully
comprehend the behavior of Sb, As, Au and Ag.
5.7.3 Zone refining and supergenous enrichment as trapping
mechanisms
From the samples taken at PACManus several unique and strong correlations have been
deduced: in general the vent fluid temperatures and pH vary between 100 and 350 ◦C,
and 1 and 5 respectively, however As, Sb, Au and Ag are unmistakably enriched in
mixed zone-refined fluid and seawater fluids at the sweet spot of T=250-280 ◦C and pH
2-3, corresponding to fluid samples (Figure 5.4 - 5.7) and reaction path modeling. As
suggested by M.K. Tivey (1995), zone refining reactions are driven by a drop in pH
caused by the precipitation of pyrite upon seawater-vent fluid mixing within the mound.
These processes cause the decreased pH in the 250-280 ◦C fluids and are responsi-
ble for the often increased abundance of As, Sb, Ag, and Au in these fluids. These
specific temperatures and acidity conditions apparently represent the ideal setting for
194

5.7 Discussion and conclusion
metal enrichment through zone refining. Zone refining has been identified as key pro-
cess in remobilization and redistribution of elements within an mineralization system.
Zone refining in the subbasement of marine massive sulfide accumulations is driven by
reactions between vent fluids, entrained seawater and minerals, foremost sulfide precip-
itates, in the basement. These reactions drive radical changes in the compositions of the
mixed fluids that make them corrosive and prone to remobilize elements. Figure 5.6 -
5.7 shows how mineral precipitation affects the pH of the mixed fluids, causing the pH
to be two log units lower at moderate temperatures than in a scenario in which these
reactions with minerals are suppressed. The characteristic drop in pH when vent fluids
are mixed with small portions of seawater is a hallmark of subseafloor mineral precipi-
tation that can lead to zone refining processes. This drop in pH is clearly shown by the
PACManus vent fluids, in which the in situ pH values drop, as temperatures decrease
by 50-70 ◦C (Figure 5.6a). This drop in pH will increase solubility of an element like
Zn by two orders of magnitude (ZnS + 2 H+ = Zn2+ + H2S), which is clearly visible at
Roman Ruins (Figure 5.6d). This behavior indicates that sphalerite is present in the sub-
surface of Roman Ruins (the biggest sulfide mound within the PACManus hydrothermal
area) and that Zn is remobilized upon zone refining reactions. At Fenway and Satanic
Mills, zone refining is also taking place, but apparently sphalerite is not present in the
subbasement there, so no Zn can get mobilized. Copper shows strong decoupling from
Zn (Figure 5.6d), however it is not enriched in the Roman Ruins zone refined fluids,
indicating that there is no Cu-accumulations in the subseafloor that release Cu upon
zone refining reactions. Fenway shows some increase in Cu and Satanic Miils shows
strong enrichment in Cu in one instance. This increased Cu concentration in the Sa-
tanic Mills fluid is matched by an equally strong increase in As (Figure 5.7a). This fluid
has apparently been affected by dissolution of tennantite. As is somewhat enriched in
195

Chapter 5 PACManus
zone refined fluids from Roman Ruins. These As enrichments could be released from
sphalerite that incorporates large amounts of As. Likewise, Ag is enriched in the zone
refined fluids from Roman Ruins (Figure 5.7b). Again, Ag is an element that partitions
into sphalerite, as indicated by the strong correlations between Zn and Ag contents in
the sulfide analyses. Au is mobilized in the gassy Satanic Mills and Snowcap sites (Fig-
ure 5.7d), but not in the Roman Ruins site. The coldest of the four fluids from Fenway,
on the other hand, does show some Au enrichment. Sb is markedly enriched at Satanic
Mills and one from Roman Ruins.
This notion of zone refining processes is not only fully supported by the fluid samples,
but also by the geochemical modeling results (Figure 5.17 - 5.18). Remobilization of
these elements inside the mound is followed by precipitation of them in the topmost part
of the mound, where seawater-derived fluids reside within the void spaces of the rubble
pile. There, a Zn-Pb rich mineralization with high abundance of As, Sb, Ag and Au is
expected to develop. The modeled concentrations of these four elements are roughly
5wt% As, 3000 ppm Sb, 1800 ppm Ag, and 30 ppm Au. These numbers are similar to
the maximum concentrations of As, Sb, Ag, and Au in the PACManus massive sulfide
bodies (2.3 wt.% As, 3000 ppm Sb, 400 ppm Ag, and 54 ppm Au; from Table 1 in
S. Scott and Binns (1995)). The massive sulfide/talus type (Figure 5.12), which has
undergone zone refinement and supergeneous enrichment, has the highest contents of
bornite, digenite and sphalerite. The highest Sb and As enrichments are found in altered
or secondary Cu-minerals (bornite and digenite) within these massive sulfide/talus sites,
independent of the geochemical characteristics of the primary hydrothermal fluid and
type mineral assemblage of the primary sulfide mound (Figure 5.16 - 5.18). Sb-minerals
are not present, due to lower temperatures required to precipitate stibnite and berthierite.
This observation confirms the recognized epithermal character of Sb mineralizing in the
196

5.8 Acknowledgements
form of stibnite and/or berthierite (Figure 5.16 - 5.18) (e.g. Pohl (2011)). At higher
temperatures, Sb may partition strongly into tennantite, leading to As-Sb correlations
in Cu-rich massive sulfides. PACManus has low Fe values in comparison with other
black smoker systems Reeves et al. (2011), which is specifically notable in sphalerite
with high As, Sb and Ag, and low Au contents. The low Fe contents in the sphalerite
of PACManus has been explained by the high sulfur fugacities in these systems (Keith
et al., 2014). An explanation for the high As and low Fe contents could be supercritical
phase separation, causing enrichment of As and depletion of Fe in the low salinity phase.
Leaching of the primary felsic (dacite-rhyodacite) rocks with high As/Fe ratios and Sb
contents could also have played a role (Boyle and Jonasson, 1984; Douville et al., 1999).
In summary, primary Sb, As, Ag and Au enrichments within VMS deposits on the
ocean floor are positively affected by these complex reaction following magmatic de-
gassing within a certain range of magma composition, temperature, and acidity. In ad-
dition, deep-seated seawater-rock interactions of zone refining and near-seafloor sulfide
deposition of supergeneous enrichments, can lead to enrichment in these elements. The
data in Figure 5.6, 5.7 and 5.19 show that zone refining is an important mechanism that
affects the compositions of vent fluids (and hence distribution of metals and metalloids
within the subbasement). Some of these enrichments are straightforward to interpret,
e.g., Ag following Zn, others, e.g., the apparently erratic behaviors of Sb and Au cannot
be fully understood based on current knowledge of the system.
5.8 Acknowledgements
We thank the captains and crews of expeditions MGLN06 (RV Melville) and SO218
(RV Sonne) and the Jason2 and MARUM Quest4000 ROV teams for excellent support
197

Bibliography
at sea. Chris Heinrich is thanked for helping with thermodynamic data for gold species.
Furthermore we would like to thank dr. Thal, for providing the newly produced Figure
5.2. The study is part of the lead author’s PhD thesis, which was financed through the
MARUM Center for Marine Environmental Research, University of Bremen.
Bibliography
Akinfiev, N.N. and A.V. Zotov (2010). “Thermodynamic description of chloride, hydrosulfide, and hy-
droxo complexes of Ag(I), Cu(I) and Au(I) at temperatures of 25-500◦C and pressures of 1-2000 bar”.
In: Geochemistry Int. 39.10, pp. 990–1006. DOI: 10.1134/S0016702910070074.
Bach, W., S. Roberts, et al. (2003). “Controls of fluid chemistry and complexation on rare-earth element
contents of anhydrite from the Pacmanus subseafloor hydrothermal system, Manus Basin, Papua New
Guinea”. In: Miner. Depos. 38.8, pp. 916–935. DOI: 10.1007/s00126-002-0325-0.
Bach, W., M. Rosner, et al. (2011). “Carbonate veins trace seawater circulation during exhumation and
uplift of mantle rock: Results from ODP Leg 209”. In: Earth Planet. Sci. Lett. 311.3-4, pp. 242–252.
DOI: 10.1016/j.epsl.2011.09.021.
Baker, E.T. et al. (2008). “Hydrothermal activiy and volcano distribution along the Mariana arc.” In: J.
Geophys. Res. 113, pp. 1689–1699. DOI: 10.1029/2007JB005423. arXiv: arXiv:1011.1669v3.
Beier, Christoph et al. (2015). “Origin of silicic magmas at spreading centres-An example from the South
East Rift, Manus Basin”. In: J. Petrol. 56.2, pp. 255–272. DOI: 10.1093/petrology/egu077.
Bessinger, B. and J.A. Apps (2005). The Hydrothermal Chemistry of Gold, Arsenic, Antimony, Mercury
and Silver. Tech. rep. Office of Science U.S. Department of Energy, pp. –52.
Binns, R.A. (2004). “Eastern Manus Basin, Papua New Guinea: guides for volcanogenic massive sulphide
exploration from a modern seafloor analogue”. In: CSIRO Explor. Pp. 59–80.
Binns, R.A., F.J.A.S. Barriga, and D.J. Miller (2007). “Leg 193 Synthesis: Anatomy of an active felsic-
hosted hydrothermal system, Eastern Manus Basin, Papua New Guinea”. In: Proc. Ocean Drill. Pro-
gram, Sci. Results 193.January, pp. 1–71. DOI: 10.2973/odp.proc.sr.193.201.2007.
198

Bibliography
Binns, R.A. and S.D. Scott (1993). “Actively forming polymetallic sulfide deposits associated with felsic
volcanic rocks in the EasternManus back-arc basin, Papua NewGuinea”. In: Econ. Geol. 88, pp. 2226–
2236.
Bischoff, J.L. and R.J. Rosenbauer (1996). “The alteration of rhyolite in CO2 charged water at 200 and
350◦C: The unreactivity of CO2 at higher temperature”. In: Geochemica Cosmochim. 60, pp. 3859–
3867.
Boyle, R.W. and I.R. Jonasson (1984). “The geochemistry of antimony and its use as an indicator element
in geochemical prospecting”. In: J. Geochemical Explor. 20, pp. 223–302.
Butterfield, D.A. et al. (2011). “High SO2 flux, sulfur accumulation, and gas fractionation at an erupting
submarine volcano”. In: Geology 39, pp. 803–806. arXiv: arXiv:1011.1669v3.
Castro, S.H. and L. Baltierra (2005). “Study of the surface properties of enargite as a function of pH”. In:
Int. J. Miner. Process. 77.2, pp. 104–115. DOI: 10.1016/j.minpro.2005.03.002.
Craddock, P.R. (2009). “Geochemical traces of processes affecting the formation of seafloor hydrothermal
fluids and deposits in the Manus Back-arc basin”. PhD thesis, pp. 1–370.
Craddock, P.R. and W. Bach (2010). “Insights to magmatic–hydrothermal processes in the Manus back-
arc basin as recorded by anhydrite”. In: Geochim. Cosmochim. Acta 74.19, pp. 5514–5536. DOI: 10.
1016/j.gca.2010.07.004.
Damm, K.L. von et al. (1985). “Chemistry of submarine hydrothermal solutions at 21N East Pacific Rise”.
In: Geochemica Cosmochim. 49.11, pp. 2197–2220. arXiv: arXiv:1011.1669v3.
Dekov, V.M. et al. (2016). “Enargite-luzonite hydrothermal vents in Manus Back-Arc Basin: submarine
analogues of high-sulfidation epithermal mineralization”. In: Chem. Geol. 438, pp. 36–57. DOI: 10.
1016/j.chemgeo.2016.05.021.
Douville, E. et al. (1999). “Le comportement de I’arsenic (As) et de I’antimoine (Sb) dans les fluides
provenant de diffkents systgmes hydrothermaux océaniques”. In: Earth Planet. Sci. 328.2, pp. 97–
104.
Firdu, F.T. and P. Taskinen (2010). “Thermodynamics and phase equilibria in the (Ni, Cu, Zn)–(As, Sb,
Bi)–S systems at elevated temperatures (300–900 C)”. In: Espoo Aalto Univ. Publ. Mater. . . . Pp. 1–59.
Gamo, T. et al. (1997). “Acidic and sulfate-rich hydrothermal fluids from the Manus back-arc basin,
Papua New Guinea”. In: Geology 25.2, pp. 139–142. DOI: 10.1130/0091-7613(1997)025<0139:
aasrhf>2.3.co;2.
199

Bibliography
Hannington, M.D., C.E.J. De Ronde, and S. Petersen (2005). “Sea-Floor Tectonics and Submarine Hy-
drothermal Systems”. In: Econ. Geol. 100th Anni, pp. 111–141.
Hannington, M.D., I.R. Jonasson, et al. (1995). “Physical and chemical processes of seafloor mineraliza-
tion at mid-ocean ridges”. In: Phys. Chem. Biol. Geol. Interact. Seafloor Hydrothermal Syst. Geophys.
Monogr. 91, pp. 115–157. DOI: 10.1029/GM091p0115.
Hannington, M.D., K.H. Poulsen, et al. (1999). “Volcanic Associated Massive Sulfide Deposits: Processes
and Examples in Modern and Ancient Settings”. In: Rev. Econ. Geol. Ed. by Barrie M.D. and T.C.
Hannington. Volume 8. Society of Economic Geologists. Chap. 14 - Volca, pp. 325–356.
Hedenquist, J.W. and J.B. Lowenstern (1994). “Theole of magmas in the formation of hydrothermal ore
deposits.” In: Nature 370, pp. 519–527.
Heinrich, C.A., T. Driesner, et al. (2004). “Magmatic vapor contraction and the transport of gold from
the porphyry environment to epithermal ore deposits”. In: Geology 32, pp. 761–764. arXiv: arXiv:
1011.1669v3.
Heinrich, C.A., D. Günther, et al. (1999). “Metal fractionation between magmatic brine and vapor, de-
termined by microanalysis of fluid inclusions”. In: Geology 27, pp. 755–758. arXiv: arXiv:1011.
1669v3.
Henley, R.W. and B.R. Berger (2013). “Nature’s refineries - Metals and metalloids in arc volcanoes”. In:
Earth-Science Rev. 125, pp. 146–170. DOI: 10.1016/j.earscirev.2013.07.007.
Herzig, P.M. and M.D. Hannington (1995). “Polymetallic massive sulfides at the modem seafloor A re-
view”. In: Ore Geol. Rev. 10, pp. 95–115.
Ishibashi, J.-I et al. (2008). “Marine shallow-water hydrothermal activity and mineralization at theWakamiko
crater in Kagoshima bay, south Kyushu, Japan”. In: J. Volcanol. Geotherm. Res. 173.1-2, pp. 84–98.
DOI: 10.1016/j.jvolgeores.2007.12.041.
Johnson, J.W., E.H. Oelkers, and H.C. Helgeson (1992). SUPCRT92: A software package for calculating
the standard molal thermodynamic properties of minerals, gases, aqueous species, and reactions from
1 to 5000 bar and 0 to 1000◦C. Vol. 18. 7. Pergmamon Press Ltd, pp. 899–947. DOI: 10.1016/0098-
3004(92)90029-Q.
Kamenetsky, V.S. et al. (2001). “Parental basaltic melts and fluids in eastern Manus backarc Basin:
Implications for hydrothermal mineralisation”. In: Earth Planet. Sci. Lett. 184, pp. 685–702. DOI:
10.1016/S0012-821X(00)00352-6.
200

Bibliography
Kantar, Cetin (2002). “Solution and flotation chemistry of enargite”. In: Colloids Surfaces A Physic-
ochem. Eng. Asp. 210.1, pp. 23–31. DOI: 10.1016/S0927-7757(02)00197-8.
Keith, M. et al. (2014). “Effects of temperature, sulfur, and oxygen fugacity on the composition of spha-
lerite from submarine hydrothermal vents”. In: Geology 42.8, pp. 699–702. DOI: 10.1130/G35655.1.
Krupp, E (1988). “Solnbility of stibnite in hydrogen sulfide solutions, speciation, and equilibrium con-
stants, from 25 to 350 ◦ C”. In: Geochemica Cosmochim. 52, pp. 3005–3015.
Lupton, J. et al. (2008). “Venting of a separate CO2-rich gas phase from submarine arc volcanoes: Ex-
amples from the Mariana and Tonga-Kermadec arcs”. In: J. Geophys. Res. 113. DOI: 10 . 1029 /
2007JB005467. arXiv: arXiv:1011.1669v3.
Lynch, D C (1982). “Standard Free Energy of Formation of NiAsS”. In: Metall. Mater. Trans. B 13.June,
pp. 285–288.
Martinez, F. and B. Taylor (1996). “Backarc spreading, rifting, and microplate rotation, between trans-
form faults in the Manus Basin”. In: Mar. Geophys. Res. 18.2-4, pp. 203–224. DOI: 10 . 1007 /
BF00286078.
Mercier-Langevin, P. et al. (2011). “The gold content of volcanogenic massive sulfide deposits”. In:
Miner. Depos. 46.5, pp. 509–539. DOI: 10.1007/s00126-010-0300-0.
Moss, R. and S.D. Scott (2001). “Geochemistry and mineralogy of gold-rich hydrothermal precipitates
from Eastern Manus Basin, Papua New Guinea”. In: Can. Mineral. 39.4, pp. 957–978. DOI: 10.2113/
gscanmin.39.4.957.
Padilla, R., C.A. Rivas, and M.C. Ruiz (2008). “Kinetics of Pressure Dissolution of Enargite in Sulfate-
Oxygen Media”. In: Metall. Mater. Trans. B 39.3, pp. 399–407. DOI: 10.1007/s11663-008-9151-
9.
Patten, C.G.C. et al. (2016). “Mobility of Au and related elements during the hydrothermal alteration of
the oceanic crust: implications for the sources of metals in VMS deposits”. In: Miner. Depos. 51.2,
pp. 179–200. DOI: 10.1007/s00126-015-0598-8.
Pearson, R.G. (1963). “Hard and soft acids and their bases”. In: J. Am. Chem. Soc. 85, pp. 3533–3539.
Pohl, W.L. (2011). Economic Geology Principles and Practice - Metals, minerals, coal and hydrocar-
bons - Introduction to formation and sustainable exploitation of mineral deposits. Vol. 1. July. Wiley-
Blackwell, pp. 1–699. DOI: 10.5962/bhl.title.18736.
201

Bibliography
Pokrovski, G.S. et al. (2006). “Antimony speciation in saline hydrothermal fluids: A combined X-ray
absorption fine structure spectroscopy and solubility study”. In: Geochim. Cosmochim. Acta 70.16,
pp. 4196–4214. DOI: 10.1016/j.gca.2006.06.1549.
Reeves, E.P. et al. (2011). “Geochemistry of hydrothermal fluids from the PACMANUS, Northeast Pual
and Vienna Woods hydrothermal fields, Manus Basin, Papua New Guinea”. In: Geochim. Cosmochim.
Acta 75.4, pp. 1088–1123. DOI: 10.1016/j.gca.2010.11.008.
Richards, J.P. (2011). “Magmatic to hydrothermal metal fluxes in convergent and collided margins”. In:
Ore Geol. Rev. 40.1, pp. 1–26. DOI: 10.1016/j.oregeorev.2011.05.006.
Ronde, C.E.J. de (1995). “Fluid chemistry and isotopic characteristics of seafloor hydrothermal system
and associated VMS deposits: potential for magmatic contributions”. In: Magmas, fluids ore Depos.
Vol. 23. Mineralogical Association of Canada, pp. 479–509. DOI: 10.1017/CBO9781107415324.
004. arXiv: arXiv:1011.1669v3.
Ronde, C.E.J. de et al. (2001). “Intra-oceanic subduction-related hydro- thermal venting, Kermadec vol-
canic arc, New Zealand”. In: Earth Planet. Sci. Lett. 193, pp. 359–369.
Schock, E.L. et al. (1997). “Inorganic species in geologic fluids: correlations among standard molal ther-
modynamic properties of aqueous ions and hydroxide complexes.” In: Geochemica Cosmochim. 61.5,
pp. 907–950. DOI: 10.1017/CBO9781107415324.004. arXiv: arXiv:1011.1669v3.
Scott, S.D. and R.A. Binns (1995). “Hydrothermal processes and contrasting styles of mineralization
in the western Woodlark and eastern Manus basins of the western Pacific”. In: Hydrothermal Vent.
Process. Vol. 87, pp. 191–205. DOI: 10.1144/GSL.SP.1995.087.01.16.
Seal, R.R., E.J. Essene, and W.C. Kelly (1990). “Tetrahedrite and tennantite: Evaluation of thermody-
namic data and phase equilibria”. In: Can. Mineral. 28, pp. 725–738.
Seal, R.R., R.A. Robie, P.B. Barton, et al. (1992). “Superambient heat capacities of synthetic stibnite,
berthierite, and chalcostibite; revised thermodynamic properties and implications for phase equilibria”.
In: Econ. Geol. 87.7, pp. 1911–1918. DOI: 10.2113/gsecongeo.87.7.1911.
Seal, R.R., R.A. Robie, B.S. Hemingway, et al. (1996). “Heat capacity and entropy at the temperatures
5 K to 720 K and thermal expansion from the temperatures 298 K to 573 K of synthetic enargite
(Cu3AsS4)”. In: J. Chem. Thermodyn. 28.4, pp. 405–412. DOI: 10.1006/jcht.1996.0040.
202

Bibliography
Seewald, J.S., K.W. Doherty, et al. (2002). “A new gas- tight isobaric sampler for hydrothermal fluids”. In:
Deep Sea Res. Part O Ocean. Res. Pap. 49.1, pp. 189–196. DOI: 10.1017/CBO9781107415324.004.
arXiv: arXiv:1011.1669v3.
Seewald, J.S., E.P. Reeves, et al. (2015). “Submarine Venting of Magmatic Volatiles in the Eastern Manus
Basin, Papua New Guinea.” In: Geochemica Cosmochim. Pp. 178–199. DOI: 10.1016/j.gca.2015.
04.023..
Stanton, R.L. (1994). Ore elements in arc lavas. Vol. 29. Geophysics, Oxford Monographs on Geology
and Geophysics, p. 391.
Stefánsson, A. and T.M. Seward (2003a). “Stability of chloridogold(I) complexes in aqueous solutions
from 300 to 600◦C and from 500 to 1800 bar”. In: Geochim. Cosmochim. Acta 67.23, pp. 4559–4576.
DOI: 10.1016/S0016-7037(03)00391-0.
– (2003b). “The hydrolysis of gold(I) in aqueous solutions to 600◦c and 1500 bar”. In: Geochim. Cos-
mochim. Acta 67.9, pp. 1677–1688. DOI: 10.1016/S0016-7037(02)01131-6.
– (2004). “Gold(I) complexing in aqueous sulphide solutions to 500◦C at 500 bar”. In: Geochim. Cos-
mochim. Acta 68.20, pp. 4121–4143. DOI: 10.1016/j.gca.2004.04.006.
Sverjensky, D.A., E.L. Shock, and H.C. Helgeson (1997). “Prediction of the thermodynamic properties of
aqueous metal complexes to 1000 degrees C and 5 kb.” In: Geochim. Cosmochim. Acta 61.7, pp. 1359–
1412. DOI: 10.1016/S0016-7037(97)00009-4.
Thal, J. et al. (2014). “Geologic setting of PACManus hydrothermal area — High resolution mapping and
in situ observations”. In: Mar. Geol. 355, pp. 98–114. DOI: 10.1016/j.margeo.2014.05.011.
Tivey, M. (2007). “Generation of Seafloor Hydrothermal Vent Fluids and Associated Mineral Deposits”.
In: Oceanography 20.1, pp. 50–65. DOI: 10.5670/oceanog.2007.80.
Tivey, M.K. (1995). “Modeling chimney growth and associated fluid flow at seafloor hydrothermal vent
sites”. In: Seafloor hydrothermal Syst. Ed. by S.E. Humphris et al. Washington, DC: American Geo-
physical Union, pp. 158–177. DOI: 10 . 1017 / CBO9781107415324 . 004. arXiv: arXiv : 1011 .
1669v3.
Tivey, M. et al. (2006). Cruise report R/V Melville MAGELLAN-06. Tech. rep. Woods Hole Oceano-
graphic Institution, pp. 1–67.
203

Bibliography
Vink, B.W. (1996). “Stability relations of antimony and arsenic compounds in the light of revised and
extended Eh-pH diagrams”. In: Chem. Geol. 130.1-2, pp. 21–30. DOI: 10.1016/0009-2541(95)
00183-2.
Wagman, D.D. et al. (1982). The NBS Tables of Chemical Thermodynamic Properties.
Wallace, Paul J. (2005). “Volatiles in subduction zone magmas: Concentrations and fluxes based on melt
inclusion and volcanic gas data”. In: J. Volcanol. Geotherm. Res. 140.1-3, pp. 217–240. DOI: 10.
1016/j.jvolgeores.2004.07.023.
Welham, N J (2001). “Mechanochemical processing of enargite ( Cu3AsS4 )”. In: Hydrometallurgy 62,
pp. 165–173.
Williams-Jones, A.E., R.J. Bowell, and A.A. Migdisov (2009). “Gold in solution”. In: Elements 5.5,
pp. 281–287. DOI: 10.2113/gselements.5.5.281.
Williams-Jones, A.E. and A.A. Migdisov (2014). “Experimental Constraints on the Transport and Depo-
sition of Metals in Ore-Forming Hydrothermal Systems”. In: Spec. Publ. Vol. 18. Society of Economic
Geologists. Chap. 5, pp. 77–95.
Williams-Jones, A.E. and C. Norman (1997). “Controls of mineral parageneses in the system Fe-Sb-S-O”.
In: Econ. Geol. 92.3, pp. 308–324. DOI: 10.2113/gsecongeo.92.3.308.
Yang, K and S D Scott (2006). “Magmatic fluids as a source of metals in arc/back-arc hydrothermal
systems: evidence from melt inclusions and vesicles”. In: Back Arc Spreading Syst. Geol. Biol. Chem.
Phys. Interact. Geophysica.1, pp. 163–184.
Yang, K.H. and S.D. Scott (1996). “Possible contribution of a metal-rich magmatic fluid to a sea-foor
hydrothermal system”. English. In: Nature 383.6599, pp. 420–423. DOI: 10.1038/383420a0.
Yund, R.A. (1962). “The system NiAsS phase relations and mineralogical significance.pdf”. In: Am. J.
Sci. 260, pp. 761–782.
Zotov, A.V., N.D. Shikina, and N.N. Akinfiev (2003). “Thermodynamic properties of the Sb (III) hydrox-
ide complex Sb(OH)3 (aq) at hydrothermal conditions”. In: Geochemica Cosmochim. 67.10, pp. 1821–
1836. DOI: 10.1016/S0016-7037(00)01281-4.
204

205

206

Chapter 6
Summary and Outlook
The topic of this PhD project was to deduce new geochemical models of Sb(-As,Au,Ag)
mineralization in Archaean andmodern hydrothermal settings, through extended datasets
from the Murchison Greenstone Belt (MGB) and the Manus back-arc basin. A compar-
ison can be made between these ore deposits, because the prominent Sb-mineralization
at the Antimony Line (AL) located at the MGB, South Africa, has been related to
seafloor magmatic-hydrothermal processes associated with an Archaean back-arc basin
(Schwarz-Schampera et al., 2010). To emphasize the parallels of the AL deposit with
modern back-arc massive sulfide mineralization systems, an in depth qualitative and
quantitive research of the Sb(-As-Ag-Au) behavior in magmatic-hydrothermal hypo-
gene and supergene deposits has been preformed. This study is built on the notion that
a knowledge gap still exists in the field of ore petrology and geochemistry regarding
Au-Sb(-As) deposits within (Archaean) suture zones and their possible relationship to
recent back-arc settings. Geochemical models of ore deposits, and in specific, Au-As-
Sb deposits are classified from low temperature hydrothermal to medium temperature
metamorphogone-hydrothermal settings (Obolensky et al., 2007; Pohl, 2011; USGS,
2015) and interpreted to be produced by boiling of CO2-rich fluids and adiabatic cool-
ing (Hagemann and Lüders, 2003; Pohl, 2011). This is based on the fact that antimony is
commonly distributed throughout many different types of mineral deposits and displays
207

Chapter 6 Summary and outlook
no evident affinity to any particular metallogenic period or province (Boyle and Jonas-
son, 1984). Despite these large diversities in geophysical, mineralogical and geochem-
ical settings, a more detailed geochemical model for Au-Sb(-As-Ag) mineralization is
desired.
Studying the MGB provided an insight in the solubility of Sb and As in aqueuous
solutions from felsic magmatic precursor rocks and the effect of later structural evo-
lution of the greenstone belt and related alteration processes like serpentinization and
listvenization. Major and trace elements of gangue material and Sb-As-Fe-Cu mineral-
ization, together with stable isotope δ18O and δ13C studies have been employed to com-
prehend the behavior and relationship of Sb and As mineralization and to investigate the
mobilizing and trapping mechanisms of the hydrothermal system combined with their
geochemical interaction with the surrounding host rocks. Geochemical reaction path
modeling with the use of Geochemical Workbench provided insights into the geochem-
ical characteristics of these geological mechanisms. The MGB has been interpreted as
an Archaean orogenic gold deposit, which has been formed under greenschist facies
conditions with hydrothermal alteration assemblages developed in ductile to brittle de-
formation, with temperatures around 200-420◦C and CO2-rich fluids where the primary
mineralization is connected to an ore fluid originating from a granitoid magmatic or
a metamorphic devolatization model (Hutchinson, 1993; McCuaig and Kerrich, 1998;
Ridley and Diamond, 2000), where the phase relations clearly indicate a shift from low
f S2 and low f O2 to high f S2 and low f O2, caused by carbonation and silicification.
The work presented in this thesis has clearly shown tha these alteration processes were
induced by serpentinization and listvenization due to mineralization and metasomatic
reactions involving the meta-ultramafic rocks and felsic protoliths. Primary mineral-
ization is located at the periphery between these ultramafic and felsic protoliths, and
208
is dominated by As-Sb-Ni-Cu, shifted towards As-Sb-Fe-Cu, as indicated by the loss
of ullmanite and enrichment of berthierite followed by the alteration of berthierite into
stibnite. From these results we propose that metasomatic reactions involving ultramafic
rocks may make for efficient traps of Sb and related elements (As, Ag, Hg, Au). The
buffering capacities of the host rocks could play a general role in the formation of many
orogenic lode deposits and should be acknowledged as a qualitative parameter for a geo-
chemical model for orogenic gold deposits. The possibility that metasomatic reactions
can provide an efficient trapping mechanism for elements like Sb, As, and Au had been
neglected before, except by Williams-Jones and Norman (1997). The hypotheses we
proposed in chapters 3 and 4 of this thesis provide a solid theoretical and observational
foundation upon which these ideas can be further explored. It is likely that the meta-
somatic processes proposed as trapping mechanisms in the AL in the MGB could also
have played a role in other orogenic lode deposits.
Following a similar methodological set up, the auriferous VMS deposit located in
the PACManus hydrothermal area in the Manus back-arc basin has been subjected to
a similar combination of quantitative observational and theoretical research methods.
The geochemical dataset of fluid samples and whole rock samples has been used in geo-
chemical modeling to demonstrate that the elevated concentrations of Sb, As, Au and
Ag at PACManus are likely related to magmatic degassing in a terrian dominated by
felsic volcanism. The Sb, As, Ag and Au enrichments are positively affected by com-
plex reactions that are in part due to magmatic degassing and are heavily influenced by
deep-seated seawater-rock interaction, zone refining in near-seafloor sulfide deposits at
temparetures around 250-280◦C and pH values between 2-3 followed by supergeneous
re-working the topmost sections of the sulfide mounds at lower temperatures.
The dominant Sb complex, responsible for the Sb enrichments at these hydrother-
209

Chapter 6 Summary and outlook
mal systems at temperatures between 250◦C-400◦C has been deduced to be Sb(OH)3,
whereas prominent epithermal Sb-mineralization at T<150◦C visible as stibnite-berthierite
mineralization has been related to reduced bisulfide Sb-complexes. These results are
based on our geochemical modeling and imply that Sb is still present within hydrother-
mal systems at higher temperature and therefore could play an essential role within
the (forming) ore deposit. A further striking and important observation is the unmis-
takable strong correlation between the geochemical behavior between Sb, As, Au and
Ag. Throughout the dataset a strong relationship has been observed between As-Ag
and Sb-Au. The complexity of the conjoined geochemical behavior is explained by the
contradicting behavior or different reduced and oxidized complexes present of Sb, As,
Au and Ag, due to the sensitivity to variations in oxygen fugacity, temperature and pH.
Lastly, these newly gained comprehension confirms that Sb, As, Au and Ag contents
could be used as new tracer elements for felsic magmatic input.
The Sb enrichments in the PACManus systems are moderate (up to 3000 ppm), in-
dicating that these processes can plausibly explain a pre-enrichment of Sb in supra-
subduction zone environments. In the Archean analogue, this would be the volcanic-
sedimentary Weigel formation that hosts the AL. However, the massive enrichment of
Sb in the AL is due to wholesale reworking of the Sb in the region upon orogenic pro-
cesses that post-date the formation of these primary lithologies by hundreds of millions
of years.
The overall result of the thesis wirk underlines the importance of quantitative re-
search, in other words comparing geochemical observations of major and trace elements
of both the gangue material and the sulfides of an ore deposit with geochemical reac-
tion path modeling. This approach is well-suited to examine the effects of variations in
host lithologies and the influence of (slight) variations in temperature, oxygen fugacity
210

Bibliography
and pH of the ore forming solutions. Both the transferring fluid and buffering capaci-
ties of host rock material can cause great diversities in metal and metalloid speciation
within hydrothermal fluids, sulfide mounds and suture zones. Finally, the importance
of geochemical analyses of non-prominent metal concentrations within the field of ore
petrology should be acknowledged. For instance, although further research in this di-
rection is needed, the tight relationships between Sb and Au indicate that Sb could be
used as a proxy for Au mineralization in VMS (and some orogenic lode) deposits.
Bibliography
Boyle, R.W. and I.R. Jonasson (1984). “The geochemistry of antimony and its use as an indicator element
in geochemical prospecting”. In: J. Geochemical Explor. 20, pp. 223–302.
Hagemann, S.G. and V. Lüders (2003). “P-T-X conditions of hydrothermal fluids and precipitation mecha-
nism of stibnite-gold mineralization at the Wiluna lode-gold deposits, Western Australia: conventional
and infrared microthermometric constraints”. In: Miner. Depos. 38.8, pp. 936–952. DOI: 10.1007/
s00126-003-0351-6.
Hutchinson, R. W. (1993). “A multi-stage, multi-process genetic hypothesis for greenstone-hosted gold
lodes”. In: Ore Geol. Rev. 8.3-4, pp. 349–382. DOI: 10.1016/0169-1368(93)90022-Q.
McCuaig, T.C. and R. Kerrich (1998). P—T—t—deformation—fluid characteristics of lode gold deposits:
evidence from alteration systematics. Vol. 12. 6, pp. 381–453. DOI: 10.1016/S0169- 1368(98)
80002-4.
Obolensky, A.A. et al. (2007). “Antimony in hydrothermal processes: solubility, conditions of transfer,
and metal-bearing capacity of solutions”. In: Russ. Geol. Geophys. 48, pp. 992–1001. DOI: 10.1016/
j.rgg.200.
Pohl, W.L. (2011). Economic Geology Principles and Practice - Metals, minerals, coal and hydrocar-
bons - Introduction to formation and sustainable exploitation of mineral deposits. Vol. 1. July. Wiley-
Blackwell, pp. 1–699. DOI: 10.5962/bhl.title.18736.
211

Bibliography
Ridley, J.R. and L.W. Diamond (2000). Fluid chemistry of orogenic lode gold deposits and implications
for genetic models.
Schwarz-Schampera, U., H. Terblanche, and T. Oberthür (2010). “Volcanic-hosted massive sulfide de-
posits in the Murchison greenstone belt, South Africa”. In: Miner. Depos. 45, pp. 113–145. DOI:
10.1007/s00126-009-0266-y.
USGS (2015). Antimony. Tech. rep. U.S. Geological Survey, pp. 18–19. DOI: 10.1017/CBO9781107415324.
004. arXiv: arXiv:1011.1669v3.
Williams-Jones, A.E. and C. Norman (1997). “Controls of mineral parageneses in the system Fe-Sb-S-O”.
In: Econ. Geol. 92.3, pp. 308–324. DOI: 10.2113/gsecongeo.92.3.308.
212