Assessing pyroclastic fall hazard through field data and numerical simulations: Example from...
11
Assessing pyroclastic fall hazard through field data and numerical simulations: Example from Vesuvius Raffaello Cioni, 1 Antonella Longo, 2 Giovanni Macedonio, 3 Roberto Santacroce, 2 Alessandro Sbrana, 2 Roberto Sulpizio, 2 and Daniele Andronico 4 Received 12 April 2001; revised 2 April 2002; accepted 7 May 2002; published 1 Feburary 2003. [1] A general methodology of pyroclastic fall hazard assessment is proposed on the basis of integrated results of field studies and numerical simulations. These approaches result in two different methods of assessing hazard: (1) the ‘‘field frequency,’’ based on the thickness and distribution of past deposits and (2) the ‘‘simulated probability,’’ based on the numerical modeling of tephra transport and fallout. The proposed methodology mostly applies to volcanoes that, by showing a clear correlation between the repose time and the magnitude of the following eruptions, allows the definition of a reference ‘‘maximum expected event’’ (MEE). The application to Vesuvius is shown in detail. Using the field frequency method, stratigraphic data of 24 explosive events in the 3–6 volcanic explosivity index range in the last 18,000 years of activity are extrapolated to a regular grid in order to obtain the frequency of exceedance in the past of a certain threshold value of mass loading (100, 200, 300, and 400 kg/m 2 ). Using the simulated probability method, the mass loading related to the MEE is calculated based on the expected erupted mass (5 10 11 kg), the wind velocity profiles recorded during 14 years, and various column heights and grain-size populations. The role of these factors was parametrically studied performing 160,000 simulations, and the probability that mass loading exceeded the chosen threshold at each node was evaluated. As a general rule, the field frequency method results are more reliable in proximal regions, provided that an accurate database of field measurements is available. On the other hand, the simulated probability method better describes events in middle distal areas, provided that the MEE magnitude can be reliably assumed. In the Vesuvius case, the integration of the two methods results in a new fallout hazard map, here presented for a mass loading value of 200 kg/m 2 . INDEX TERMS: 8404 Volcanology: Ash deposits; 3210 Mathematical Geophysics: Modeling; 1035 Geochemistry: Geochronology; 5480 Planetology: Solid Surface Planets: Volcanism (8450); 9335 Information Related to Geographic Region: Europe; KEYWORDS: Vesuvius, ash fallout, explosive eruptions, volcanic hazard, numerical modeling, hazard mapping Citation: Cioni, R., A. Longo, G. Macedonio, R. Santacroce, A. Sbrana, R. Sulpizio, and D. Andronico, Assessing pyroclastic fall hazard through field data and numerical simulations: Example from Vesuvius, J. Geophys. Res., 108(B2), 2063, doi:10.1029/2001JB000642, 2003. 1. Introduction: Criteria for Hazard Assessment [2] Volcanic activity shows a great variability of eruptive processes that are potentially hazardous (tephra fallout, pyroclastic flow, lava invasion, gas emission, debris ava- lanche, structural collapse, lahar, etc.), in some cases char- acterized by a time-dependent, gradual impact on the territory (e.g., the lava front motion, the static pressure of tephra blankets, the concentration of toxic gases). When assessing the volcanic hazard of an area each particular type of volcanic process (expected to be potentially hazardous) needs to be defined using some specific threshold values, which qualify its peculiar ability to have a dangerous impact on the territory and/or on population. The volcanic hazard of a given area within a given time interval is therefore the product of several partial hazards, each resulting from three different probabil- ities concerning: (1) the occurrence of the eruption, (2) the occurrence of the considered phenomenon, and (3) the exceeding of the chosen threshold in the chosen area. [3] The nearly constant eruptive behavior of many fre- quently erupting volcanoes, which are generally character- ized by open conduit conditions (e.g., Kilauea, Sakurajima, Piton de la Fournaise, Etna), allows a reliable estimate of their eruption frequency as well as of the main associated hazard- ous phenomena. Otherwise, when dealing with dormant volcanoes, the accuracy in the assessment of timing of their JOURNAL OF GEOPHYSICAL RESEARCH, VOL. 108, NO. B2, 2063, doi:10.1029/2001JB000642, 2003 1 Dipartimento di Scienze della Terra, Universita ` degli Studi di Cagliari, Cagliari, Italy. 2 Dipartimento di Scienze della Terra, Universita ` degli Studi di Pisa, Pisa, Italy. 3 Istituto Nazionale di Geofisica e Vulcanologia-Osservatorio Vesuvia- no, Naples, Italy. 4 Istituto Nazionale di Geofisica e Vulcanologia-Catania, Nicolosi Catania, Italy. Copyright 2003 by the American Geophysical Union. 0148-0227/03/2001JB000642$09.00 ECV 2 - 1
-
Upload
independent -
Category
Documents
-
view
1 -
download
0
Transcript of Assessing pyroclastic fall hazard through field data and numerical simulations: Example from...

Assessing pyroclastic fall hazard through field data and numerical
simulations: Example from Vesuvius
Raffaello Cioni,1 Antonella Longo,2 Giovanni Macedonio,3 Roberto Santacroce,2
Alessandro Sbrana,2 Roberto Sulpizio,2 and Daniele Andronico4
Received 12 April 2001; revised 2 April 2002; accepted 7 May 2002; published 1 Feburary 2003.
[1] A general methodology of pyroclastic fall hazard assessment is proposed on the basisof integrated results of field studies and numerical simulations. These approaches result intwo different methods of assessing hazard: (1) the ‘‘field frequency,’’ based on thethickness and distribution of past deposits and (2) the ‘‘simulated probability,’’ based onthe numerical modeling of tephra transport and fallout. The proposed methodology mostlyapplies to volcanoes that, by showing a clear correlation between the repose time and themagnitude of the following eruptions, allows the definition of a reference ‘‘maximumexpected event’’ (MEE). The application to Vesuvius is shown in detail. Using the fieldfrequency method, stratigraphic data of 24 explosive events in the 3–6 volcanicexplosivity index range in the last 18,000 years of activity are extrapolated to a regulargrid in order to obtain the frequency of exceedance in the past of a certain threshold valueof mass loading (100, 200, 300, and 400 kg/m2). Using the simulated probability method,the mass loading related to the MEE is calculated based on the expected eruptedmass (5 � 1011 kg), the wind velocity profiles recorded during 14 years, and variouscolumn heights and grain-size populations. The role of these factors was parametricallystudied performing �160,000 simulations, and the probability that mass loading exceededthe chosen threshold at each node was evaluated. As a general rule, the field frequencymethod results are more reliable in proximal regions, provided that an accurate database offield measurements is available. On the other hand, the simulated probability methodbetter describes events in middle distal areas, provided that the MEE magnitude can bereliably assumed. In the Vesuvius case, the integration of the two methods results in a newfallout hazard map, here presented for a mass loading value of 200 kg/m2. INDEX TERMS:
8404 Volcanology: Ash deposits; 3210 Mathematical Geophysics: Modeling; 1035 Geochemistry:
Geochronology; 5480 Planetology: Solid Surface Planets: Volcanism (8450); 9335 Information Related to
Geographic Region: Europe; KEYWORDS: Vesuvius, ash fallout, explosive eruptions, volcanic hazard,
numerical modeling, hazard mapping
Citation: Cioni, R., A. Longo, G. Macedonio, R. Santacroce, A. Sbrana, R. Sulpizio, and D. Andronico, Assessing pyroclastic fall
hazard through field data and numerical simulations: Example from Vesuvius, J. Geophys. Res., 108(B2), 2063,
doi:10.1029/2001JB000642, 2003.
1. Introduction: Criteria for Hazard Assessment
[2] Volcanic activity shows a great variability of eruptiveprocesses that are potentially hazardous (tephra fallout,pyroclastic flow, lava invasion, gas emission, debris ava-lanche, structural collapse, lahar, etc.), in some cases char-acterized by a time-dependent, gradual impact on the territory(e.g., the lava front motion, the static pressure of tephra
blankets, the concentration of toxic gases). When assessingthe volcanic hazard of an area each particular type of volcanicprocess (expected to be potentially hazardous) needs to bedefined using some specific threshold values, which qualifyits peculiar ability to have a dangerous impact on the territoryand/or on population. The volcanic hazard of a given areawithin a given time interval is therefore the product of severalpartial hazards, each resulting from three different probabil-ities concerning: (1) the occurrence of the eruption, (2) theoccurrence of the considered phenomenon, and (3) theexceeding of the chosen threshold in the chosen area.[3] The nearly constant eruptive behavior of many fre-
quently erupting volcanoes, which are generally character-ized by open conduit conditions (e.g., Kilauea, Sakurajima,Piton de la Fournaise, Etna), allows a reliable estimate of theireruption frequency as well as of the main associated hazard-ous phenomena. Otherwise, when dealing with dormantvolcanoes, the accuracy in the assessment of timing of their
JOURNAL OF GEOPHYSICAL RESEARCH, VOL. 108, NO. B2, 2063, doi:10.1029/2001JB000642, 2003
1Dipartimento di Scienze della Terra, Universita degli Studi di Cagliari,Cagliari, Italy.
2Dipartimento di Scienze della Terra, Universita degli Studi di Pisa,Pisa, Italy.
3Istituto Nazionale di Geofisica e Vulcanologia-Osservatorio Vesuvia-no, Naples, Italy.
4Istituto Nazionale di Geofisica e Vulcanologia-Catania, NicolosiCatania, Italy.
Copyright 2003 by the American Geophysical Union.0148-0227/03/2001JB000642$09.00
ECV 2 - 1

reactivation is quite hard to evaluate, as well as the size of thefuture eruption and the associated sequence of phenomena. Inthese cases the hazard can be assessed under the assumptionof the future occurrence of a predetermined event (e.g., thelargest, the most frequent, the most hazardous), to be chosenon the basis of the eruptive history of the volcano.[4] At volcanoes whose activities have shown recurrent or
clearly defined patterns, a useful concept is that of themaximum expected event (MEE), defined as the largestout of all the possible eruptions within a certain time window[Barberi et al., 1990]. The MEE represents also the referenceevent on which numerical simulations aimed at hazardassessment has to be based. The selection of the MEEinvolves the assumption of an expected eruption scenariothat accounts, by analogy with historical and volcanologicaldata, on past eruptions, for the most likely association andsequence of eruptive, possibly hazardous, phenomena. Thus,having fixed the eruption and the expected scenario, hazardassessment requires defining the probability that an area willbe affected by the selected hazardous phenomenon.[5] In this paper, results of tephra fallout hazard assess-
ment at Vesuvius, based on field studies and numericalsimulations of MEE, are matched. The two approachesresult in two different types of output data: ‘‘field fre-quency’’ of the past fallout deposits and ‘‘simulated prob-ability’’ of the fallout deposits obtained by numericalsimulations of MEE. Their integration represents a signifi-cant improvement in hazard zonation at Vesuvius andprovides a general methodology, which can be applied toother areas and to different phenomena.[6] In order to avoid misunderstandings or misinterpreta-
tions in the terminology used in the following, some maindefinitions are worth presenting hazard, the probability thata given event will induce an undesired effect; thresholdvalue, a value of a physical variable (thickness, velocity,mass loading, etc.) that might be exceeded to induce theundesired effect; field frequency, the fraction of past events(eruptions) which exceeded the threshold value; MEE, thelargest out of all the possible eruptions to be expected in agiven time window; and simulated probability, the percent-age of events exceeding the threshold in a numericallysimulated set of events.
2. Vesuvius Case
[7] Since its last eruption, in March 1944, Vesuvius hasremained dormant and no actual ‘‘signs’’ suggest impendingunrest. However, during its eruptive history Vesuvius oftenexperienced long periods of quiescence that lasted, in somecases, centuries or tens of centuries, with an ‘‘awakening’’more and more violent the longer the repose-time precedingthe eruption. Vesuvius has a relatively brief eruptive history.The Somma stratovolcano, the oldest edifice, formedmainly by lavas in a short time between 37 and 20 ka[Andronico et al., 1995]. The volcano experienced an abruptchange in the style of activity around 18 ka (Figure 1), whenthe first and largest Plinian event (Pomici di Base eruption[Bertagnini et al., 1998]) occurred. Related to this eruption,a polyphased caldera began to form, continuously changingand enlarging after each major explosive event [Cioni et al.,1999]. Other Plinian eruptions occurred at 8 ka (Pomici diMercato), 3.8 ka (Pomici di Avellino), and on A.D. 79
(‘‘Pompeii’’ eruption). Several sub-Plinian outbursts punc-tuated the inter-Plinian periods, the two most recent occur-ring in A.D. 472 and A.D. 1631. Alternating with thesemajor eruptions, several smaller explosive eruptionsoccurred. Evidences of lava effusions and cone buildingphases are lacking between about 15 ka and the A.D. 79
Figure 1. Chronostratigraphy of Vesuvius in the last 18kyr. Radiocarbon ages from Andronico et al. [1995]. Alsocalled Greenish Eruption [Santacroce, 1987].
ECV 2 - 2 CIONI ET AL.: ASSESSING PYROCLASTIC FALL HAZARD AT VESUVIUS

eruption. All the explosive eruptions were characterized bya paroxysmal fallout phase, which deposited tephra blanketsaround the volcano over thousands of km2. An importantincrease in the eruption frequency followed the ‘‘Pomici diAvellino’’ Plinian eruption, and was marked by a progres-sively larger number of events per unit time accompaniedby decreasing erupted volume associated with each event.[8] The pyroclastic fall deposits of the larger eruptions
typically consist of highly vesicular pumice, resulting in alow bulk density of the deposit. Wet, dense, phreatomag-matic ash is very frequent in the fallout sequences of manyeruptions, increasing the mass loading due to their higherbulk density.[9] When assessing fallout hazard in the Vesuvius area, a
complication is represented by the presence of the PhlegreanFields, a large caldera located about 25 km west of thevolcano. In the last 18 ka, at least three pumice fallout
blankets (Lagno Amendolare, Agnano Pomici Principali,and Agnano Monte Spina Plinian eruptions [Andronico,1997; Di Girolamo et al., 1984; de Vita et al., 1999]) andsome ash layers (e.g., Neapolitan Yellow Tuff [Orsi et al.,1992]) reached Vesuvius and the area north of the volcano,increasing the frequency of tephra fallout in this sector. Thecircum-Vesuvian areas have been therefore frequentlyexposed to tephra deposition in the last 18,000 years. In thispaper, hazard evaluation is restricted to Vesuvius activity,focusing on the probability of roof collapse related to massloading from pyroclastics erupted as fallout products.
3. Maximum Expected Event (MEE) at Vesuvius
[10] Several authors have recently suggested that, despitethe occurrence of some major eruptions which significantlyaffected the shallow magma system in the last 2000–3000
Figure 2. Isopach maps of selected eruptions at Vesuvius. For each class of event, the depositcorresponding to two extremes of magnitude are shown: VEI-6 Plinian (‘‘Pomici di Base’’ and‘‘Avellino’’), VEI-5 sub-Plinian (‘‘Pollena’’ and ‘‘A.D. 1631’’), and VEI-3/VEI-4 Vulcanian to violentStrombolian (‘‘AP3’’ and ‘‘1906’’). Thickness is expressed in cm.
CIONI ET AL.: ASSESSING PYROCLASTIC FALL HAZARD AT VESUVIUS ECV 2 - 3

years, no major variations occurred in the composition ofthe feeding magma and in the mean deep magma supplyrate at Vesuvius [Santacroce et al., 1993; Cioni et al., 1995,1998]. Indeed, during this period, Vesuvius can be consid-ered as a sort of steady state volcano, fed by the periodicarrival of high-T (1150–1200�C) K-tephritic magmabatches [Marianelli et al., 1995; Cioni et al., 1995]. Cortiniand Scandone [1982], on the basis of the A.D. 1754–1944activity, estimated an average eruption rate of 1.6 � 106 m3/yr. This value was used by Barberi et al. [1990] to assess amaximum eruptible mass of 2 � 1011 kg in the case of ashort-term (20–30 years) reactivation of volcanic activity atVesuvius. More recent papers [Civetta and Santacroce,1992; Santacroce et al., 1994] proposed a feeding rate2–3 times larger. A major consequence is that the magmastored in the hypothesized reservoir growing under thevolcano and available for the MEE has to be increased. Avalue of 5 � 1011 kg (2 � 108 m3) is used in this paper.Such volume of magma, if totally ejected during a singleexplosive event, should be comparable to those emittedduring A.D. 472 and A.D. 1631 eruptions [Rosi andSantacroce, 1983; Rosi et al., 1993; Rolandi et al., 1993],and belongs to the sub-Plinian range of magnitude ofVesuvius eruptions [Arrighi et al., 2001]. During theseevents, fallout deposits were generally formed during themain phases of sustained convective column. On the con-trary, coignimbritic ash deposits were very limited, due tothe relatively small size of the pyroclastic density currentsgenerated during these eruptions. In the last years, the A.D.1631 eruption, for which reliable eyewitness accounts andrecent volcanological studies exist [Rosi et al., 1993;Rolandi et al., 1993], was taken as the reference event forthe scenario of the ‘‘maximum expected event (MEE)’’ ofVesuvius. The National Emergency Plan of the Vesuvianarea adopted in 1995 was established on the basis of such ascenario, which involves, together with minor pyroclasticflow generation, the formation of a sustained convectiveeruptive column with the consequent downwind fallout oflapilli and ash.
4. Methods for Fallout Hazard Assessment
4.1. Fallout Hazard Assessment Using Field Data:Field Frequency Method
[11] The relative high frequency of fallout phenomena atVesuvius and the well-preserved stratigraphic record allowthe use of field data to assess the related hazard. Field datacan be used to obtain hazard maps for fallout depositionbased on thickness and weight per unit surface (massloading) of tephra. Mass loading of tephra deposits iscrucial in defining the level of possible damage to inhabitedareas [Blong, 1984]. Since the critical mass loadingexpected for roof collapses largely varies depending onroof typology, reference values of 100, 200, 300, and 400kg/m2 were considered in this paper. These values corre-spond, in the circum-Vesuvian area, to about 5 to 40% ofroof collapses [Cherubini et al., 2001].[12] In the following, the assessment of hazard was done
based on field data from 24 out of about 30 significantexplosive eruptions that occurred in the last 18 kyr. For allof them we were able to trace well-constrained dispersalmaps (Figure 2), just based on scattered thickness meas-
urements and their extrapolation to distal areas by meansof the best fitting curve of exponential thickness decrease.On the basis of volume and dispersal of tephra falloutdeposits, the volcanic explosivity index (VEI [Newall andSelf, l982]) of these eruptions was evaluated between 3and 6, corresponding to eruptions from violent Strombo-lian to Plinian (Table 1 and Figure 1). After visual tracing,the isopach maps were digitized and automaticallyextrapolated to a regular grid of 60 � 60 km aroundVesuvius (500 m spacing), in order to derive thicknessvalues at each node of the grid. The values were thentransformed into mass loading (kg/m2) by multiplying thethickness at each node by the bulk density of the deposit.Bulk density of fallout deposits was measured by weight-ing a known volume of actual deposit. Moreover, the bulkdensity of Plinian deposits was allowed to vary, dependingon the variations of grain-size and components (Table 1).The result of these calculations was the construction of aset of maps of isomass on the ground for each eruption(100–400 kg/m2). Figure 3 shows the total mass loadingfor the considered 24 tephra fallout deposits.[13] The large number of measured stratigraphic sections
(>100) and their evenly spaced distribution represents ahomogeneous data set, with a comparable accuracy for allthe eruptions, which allowed the definition of the fieldfrequency. This relative frequency is calculated at each nodeof the grid as the ratio between the number of eruptions
Table 1. Main Physical Characteristics of the 24 Events (VEI 3–
6) Used for the Geological Assessment of Mass Loadinga
Eruption VEI H, km A, km2 V, � 106 m3 r, kg/m3
A.D. 1944 3 4 270 110 1200A.D. 1906 3 13b 210 80 1100A.D. 1631 5 19 300 210c 1000PM6 3 - 35 10 900PM5 3 -PM4 3 - 60 100 900PM3 3 -PM2 3 10 65 40 900PM1 4 14 210 90 900Pollena 5 - 1000 420 900A.D. 79–472d 3 - 150 150 900Pompeii W 6 26 1540 1100 500Pompeii G 6 32 3430 1800 1000AP5 4 - 180 80 1500AP4 4 - 280 120 1300AP3 4 15 350 150 1500AP2 4–5 20 400 170 1500AP1 4–5 - 300 150 1500Avellino W 5 23 585 320e 400Avellino G 6 31 2420 1250e 800Mercato 6 22 2150 1400f 600Verdoline 5 20 885 430 1000Pomici di Base 6 - 2920 4400g 900
aFor the largest events (VEI 6), the bulk density of the deposits wasmeasured both at proximal and distal sites and show similar values, whichare reported as unique value in the table. H is column height (followingCarey and Sparks [1986]); A is area enclosed by the 10 cm isopach; V istotal volume of the fall deposit (following Pyle [1989]); r is density of thefall deposit.
bArrighi et al. [2001].cRosi et al. [1993].dTotal of four events.eCioni et al. [2000].f From proximal data.gBertagnini et al. [1998].
ECV 2 - 4 CIONI ET AL.: ASSESSING PYROCLASTIC FALL HAZARD AT VESUVIUS

giving a mass loading greater than the chosen threshold andthe total number of eruptions considered. From the same dataset, relative frequency can also be assessed for a subset ofdata representing a given class of events (eruptions of similarmagnitude eruptions in a certain time interval).[14] Up to now, hazard maps for tephra fallout have
generally been constructed based on thickness of the depos-its of selected eruptions [Booth, 1979; Crandell et al., 1984;Blong, 1984; Baker, 1985] or taking into account thestatistics of wind direction [Crandell and Mullineaux,1975; Westercamp, 1980; McKee et al., 1985; Miller,1989]. In contrast, the maps of mass loading give a moreprecise picture of the hazard. The possibility to consider aquite complete record of the natural variability of the pastactivity allows the discussion of data in terms of probability.Applying the maximum likelihood principle, the fieldfrequency can be considered the proxy for the probability.Using actualism, the number of eruptive deposits per unittime at a given site is used as a proxy for probability offuture eruptions of similar magnitude affecting that site.[15] In Figure 4, field frequency of a mass loading greater
than 200 kg/m2 of tephra is shown as an example. This maprepresents a faithful picture of all the past events, and thesize and shape of the curves are a function of the naturalrange of eruption magnitude and intensity shown by Vesu-vius during the last 18,000 years. Similar maps, obtained fora subset of eruptions with VEI between 3 and 5 (in the rangeof MEE) and thresholds of 100, 200, 300, and 400 kg/m2
are shown in Figure 5.
4.2. Probability of Tephra Fallout From NumericalModeling of the MEE: Simulated Probability Method
[16] A 3-D model of pyroclastic particle fallout from asustained eruption column [Armienti et al., 1988] was testedand validated on the Plinian A.D. 79 Vesuvius eruption[Macedonio et al., 1988]. In this paper, a 2-D simplifiedversion of the model is used to obtain MEE-based hazard
maps. The model is based on the solution of a 2-D transportequation for tephra particles, accounting for the advection ofwind, the settling of particles and the atmospheric turbulentdiffusion. Vertical diffusion and wind advection areneglected. As well, the model does not account for ballisticdispersal and the complex effects of clast dispersal near thevolcano, so suffering an inherent bias in the calculation ofproximal deposits, which was evidenced by Bursik et al.[1992]. Assuming a certain value of eddy diffusion coef-ficients and the vertical distribution of mass along thecolumn [Suzuki, 1983; Macedonio et al., 1990; Barberi etal., 1990], the input data of the model are the total eruptedmass, the wind velocity, the column height and the grain-size distribution of the eruptive mixture at the vent. Becauseof the simplifying assumption on the column features, themodel is appropriate for the calculation of fall deposits atdistances greater than the vertical spacing of the columndiscretization [Macedonio et al., 1990]. The output of themodel is a mass loading (in kg/m2) distribution on theground, from which the isomasses or isopachs of the simu-lated fallout deposit can be traced.[17] To verify its applicability to eruptions smaller than
Plinian, the model was initially tested by simulating thefallout of the sub-Plinian A.D. 1631 eruption. Although thefallout deposit suggests a clockwise rotation of wind withdistance [Rosi et al., 1993], an average wind direction wasimposed on the basis of the tephra dispersal. FollowingCarey and Sparks [1986], a typical midlatitude wind veloc-ity profile was assumed, linearly increasing with height upto a maximum at the tropopause, and with a stratosphericvalue equal to the 3/4 of the tropopause maximum. In thesimulations, the less constrained parameters were allowed tovary: the tropopause height (from 11 to 13 km); the windspeed at the tropopause (considered of 20, 30, and 40 m/s);the column height (between 12 and 22 km, according to theresults of Rosi et al. [1993]); the mass erupted for eachparticle size. An ‘‘artificial’’ deposit was calculated for each
Figure 3. Total mass loading (ton/m2) from falloutdeposits of the last 18 ka Vesuvius (black lines) andPhlegrean Fields (white lines) volcanoes.
Figure 4. Frequency (%) of occurrence of tephra loadinggreater than 200 kg/m2 from all the explosive events of thelast 18 ka Vesuvius activity.
CIONI ET AL.: ASSESSING PYROCLASTIC FALL HAZARD AT VESUVIUS ECV 2 - 5

different combination of these parameters. Each artificialdeposit was then compared with the field data, and the leastsquares were calculated to select those cases that gave thebest fit with the field data. Thus, the results of the leastsquares fit are sets of input parameters all representingequivalent choices of the values that best replicate thedeposit of the A.D. 1631 eruption. In particular, the massesof each particle size, which give the best fit to the field data,define a grain-size population representative of the eruptivemixture at the vent (1631-type distribution of Figure 6). Thebest fitting artificial deposit is compared in Figure 7 withthe field data, showing a generally satisfactory consistency.Main discrepancies occur for high (100 cm) thickness andare probably an inherent bias of the model, which does notaccount for ballistics and, generally, for the effects on clastdispersal in areas close to the vent.[18] Once the model was validated, a parametric study
was performed on the input data, in order to define the role ofthe main parameters (and of their uncertainties) in control-
ling the distribution of hazard probabilities. In order tosimulate the MEE, the total grain-size population of theeruptive mixture and the column height have to be chosen.Two different particle populations of the eruptive mixturehave been considered, to account for the generally differentdensity and size distribution of the clasts of Plinian and sub-Plinian fall deposits: (1631-type and 79-type distributions ofFigure 6). To account for the possible significant loss of finesfrom the column, a third particle population was created, byincreasing up to 50% by weight the fine fraction in the 1631-type population (‘‘1631 fines enriched’’, Figure 6).[19] As discussed above, a MEE with a maximum erup-
tible mass of 5 � 1011 kg can be inferred from the model ofbehavior accepted for the volcano. As the total mass eruptedduring the past events of similar size is not clearly related tothe intensity of the eruption [Andronico and Cioni, 2002;Arrighi et al., 2001] the column height for the MEEsimulations was allowed to vary in a range between 12and 22 km.
Figure 5. Frequency of occurrence (%) of tephra loading greater than (a) 100 kg/m2, (b) 200 kg/m2, (c)300 kg/m2, and (d) 400 kg/m2 from the VEI 3/5 explosive events of the last 18 ka Vesuvius activity. Forcomparison, the 5% probability curve from numerical simulations is shown (dashed line).
ECV 2 - 6 CIONI ET AL.: ASSESSING PYROCLASTIC FALL HAZARD AT VESUVIUS

[20] In order to account for the uncertainties in the inputparameters, numerical simulations of the fallout depositwere reiterated for different wind fields (3125 cases),considering three eruptive masses (1/2 of the MEE mass,the MEE mass and 3/2 of the MEE mass), six columnheights (12, 14, 16, 18, 20, and 22 km), and three particlepopulations (79, 1631, and 1631 fines enriched), producing54 different sets. The mass loading of the deposit wascomputed for a total area of 200 � 200 km, on a regulargrid with 1 km spacing. The differences in input databetween our modeling and that of Barberi et al. [1990]are summarized in Table 2.[21] The 3125 wind profiles result from data collected at
the Brindisi Meteo STAT over 14 years of observation, thusrepresenting the statistical winds distribution in the areawhich is potentially involved in tephra dispersal. As in thehazard assessment from field data, mass loadings of 100,200, 300 and 400 kg/m2 were considered.[22] The probability of exceeding a threshold, given as
the percent of simulations producing a deposit heavier thanthe chosen threshold, was calculated at each node of the gridfor each set of simulations. The results of simulations usingdifferent grain-size distribution, column height and total
Figure 6. (a), (c), (e) Grain size and (b), (d), (f ) settling velocity distributions used in the numericalmodeling of the MEE.
Figure 7. Comparison between the A.D. 1631 isopachmap [Rosi et al., 1993] and results from the numericalsimulation of the same eruption (gray scale). Input data forsimulations are column height 22 km, stratospheric wind 30m/s, and maximum wind 40 m/s.
CIONI ET AL.: ASSESSING PYROCLASTIC FALL HAZARD AT VESUVIUS ECV 2 - 7
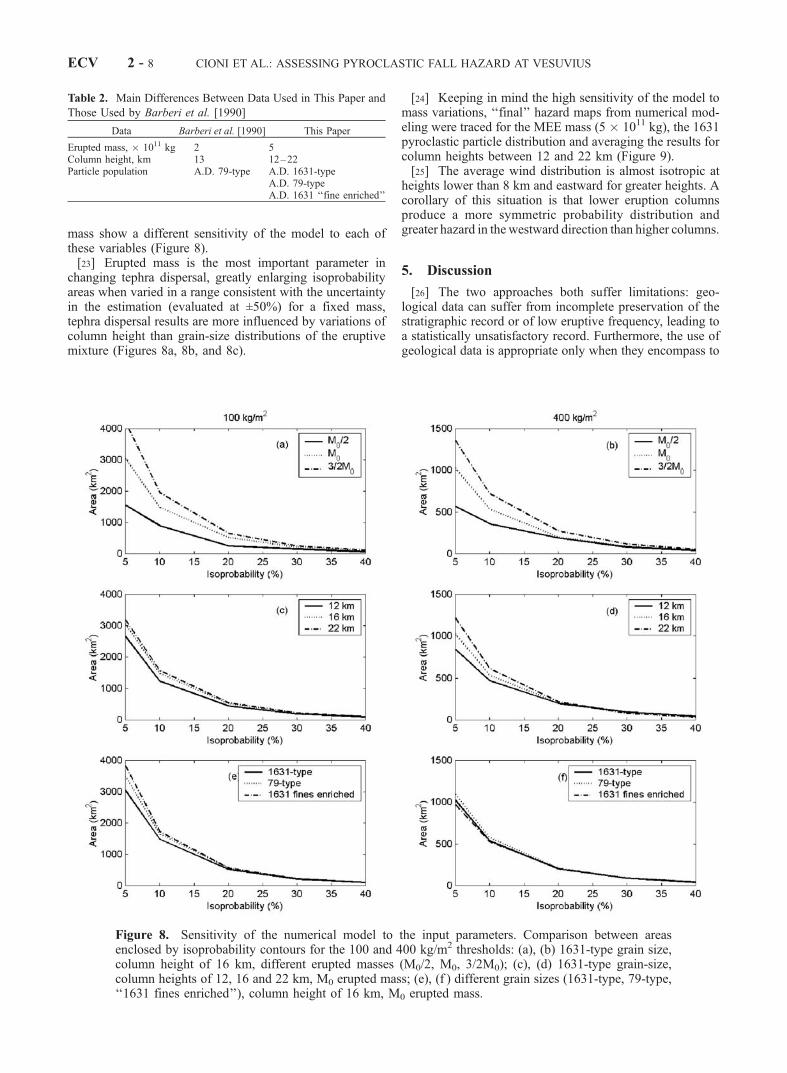
mass show a different sensitivity of the model to each ofthese variables (Figure 8).[23] Erupted mass is the most important parameter in
changing tephra dispersal, greatly enlarging isoprobabilityareas when varied in a range consistent with the uncertaintyin the estimation (evaluated at ±50%) for a fixed mass,tephra dispersal results are more influenced by variations ofcolumn height than grain-size distributions of the eruptivemixture (Figures 8a, 8b, and 8c).
[24] Keeping in mind the high sensitivity of the model tomass variations, ‘‘final’’ hazard maps from numerical mod-eling were traced for the MEE mass (5 � 1011 kg), the 1631pyroclastic particle distribution and averaging the results forcolumn heights between 12 and 22 km (Figure 9).[25] The average wind distribution is almost isotropic at
heights lower than 8 km and eastward for greater heights. Acorollary of this situation is that lower eruption columnsproduce a more symmetric probability distribution andgreater hazard in the westward direction than higher columns.
5. Discussion
[26] The two approaches both suffer limitations: geo-logical data can suffer from incomplete preservation of thestratigraphic record or of low eruptive frequency, leading toa statistically unsatisfactory record. Furthermore, the use ofgeological data is appropriate only when they encompass to
Table 2. Main Differences Between Data Used in This Paper and
Those Used by Barberi et al. [1990]
Data Barberi et al. [1990] This Paper
Erupted mass, � 1011 kg 2 5Column height, km 13 12–22Particle population A.D. 79-type A.D. 1631-type
A.D. 79-typeA.D. 1631 ‘‘fine enriched’’
Figure 8. Sensitivity of the numerical model to the input parameters. Comparison between areasenclosed by isoprobability contours for the 100 and 400 kg/m2 thresholds: (a), (b) 1631-type grain size,column height of 16 km, different erupted masses (M0/2, M0, 3/2M0); (c), (d) 1631-type grain-size,column heights of 12, 16 and 22 km, M0 erupted mass; (e), (f ) different grain sizes (1631-type, 79-type,‘‘1631 fines enriched’’), column height of 16 km, M0 erupted mass.
ECV 2 - 8 CIONI ET AL.: ASSESSING PYROCLASTIC FALL HAZARD AT VESUVIUS

a period of the volcano history in which no primary changesoccurred in its mode of operation.[27] Data derived from numerical simulations generally
have a weak point in the simplifying assumptions of theirequations and in neglecting important factors such asenhanced proximal deposition (by ballistic dispersal andsedimentation from inside the column edges) and ashaggregation. Proximal sedimentation remains a main flawin the model, and it is suggested in the following that thiscan be circumvented by using data derived from the fieldfrequency method. On the other hand, due to the quitecoarse grain size distribution of the erupting mixture used inthe modeling (Figure 8), ash aggregation becomes importantonly in the fine-grained, thin, distal deposits, correspondingto mass loading values well below the selected threshold.Furthermore, modeling of future eruptions is also stronglydependent on the expected magnitude and intensity of theMEE, which derives from the model of operation acceptedfor the volcano.
[28] When comparing isoprobability maps (Figures 5 and9), major differences emerge in the most proximal areas(<10 km from the vent) where the geological data have themaximum statistical reliability (thanks to the higher densityof measured sections) while the numerical simulation suffermajor uncertainties due to the neglecting of ballistic depo-sition and the oversimplified assumption on mass distribu-tion along the column [Suzuki, 1983]. The discrepancyamounts to at least a factor 2 in the >30% probabilityvalues (Figure 10a), suggesting that for such high proba-bilities, geological data give a more accurate picture of theexpected hazard. On the other hand, the wider areas sub-jected to hazard probability <30% shown by the mapsobtained from the numerical simulations reflect the largerwind statistics than the past events, which sampled only asmall subset of the whole population of wind fields.[29] The two methods are therefore complementary and
the most reliable hazard maps result from their combination.The 200 kg/m2 example is shown in Figure 10b, where the
Figure 9. Probability of occurrence of a mass loading greater than (a) 100 kg/m2, (b) 200 kg/m2, (c) 300kg/m2, and (d) 400 kg/m2 from numerical simulation.
CIONI ET AL.: ASSESSING PYROCLASTIC FALL HAZARD AT VESUVIUS ECV 2 - 9

<30% probability values come from the geological data andthe >30% from the numerical simulations.
6. Conclusions
[30] Two methods have been discussed for assessingtephra fallout hazard through the estimation of the proba-bility of mass loading greater than given thresholds: (1)field frequency based on field data and (2) simulatedprobability obtained by reiterating simulations of the MEEusing actual wind statistics.[31] Vesuvius is suitable for the application of both
methods because of (1) the extensive knowledge of itseruptive history and fallout deposits distribution and fea-
tures, allowing the reconstruction of ‘‘probability’’ geo-logical maps, which are not common in hazard literature;and (2) the reliability of the general operational model of thevolcano and hence of the chosen MEE.[32] A further complication to fallout hazard assessment
in the Vesuvian area, is the proximity of the PhlegreanFields caldera, whose products are mainly dispersed in anarea interfering with the Vesuvius deposits (Figure 3). It hasto be strongly recommended that hazard assessment in thesetwo areas be done with comparable methods, in order toallow the merging of the results in a volcanic hazard mapfor the whole Campanian Plain.
[33] Acknowledgments. We acknowledge the Senior Editor F. Albar-ede, C. Bonadonna, and the other JGR reviewers for their helpful com-ments. The research was done with funding of the Gruppo Nazionale diVulcanologia.
ReferencesAndronico, D., La stratigrafia dei prodotti dell’eruzione di Lagno Amendo-lare Campi Flegrei, Napoli, Atti Soc. Toscana. Sci. Nat. Pisa Mem., Ser.A, 104, 165–178, 1997.
Andronico, D., and R. Cioni, Contrasting styles of Mount Vesuvius activityin the period between the Avellino and Pompeii Plinian eruptions, andsome implications for assessment of future hazards, Bull. Volcanol., 64,372–391, 2002.
Andronico, D., G. Calderoni, R. Cioni, A. Sbrana, R. Sulpizio, and R.Santacroce, Geological map of Somma-Vesuvius volcano, Period. Miner-al., 64(1–2), 77–78, 1995.
Armienti, P., G. Macedonio, and M. T. Pareschi, A numerical model for thesimulation of tephra transport and deposition: Applications to May 18,1980, Mount St. Helens eruption, J. Geophys. Res., 93(B6), 6463–6476,1988.
Arrighi, S., C. Principe, and M. Rosi, Violent Strombolian and subplinianeruptions at Vesuvius during post-1631 activity, Bull. Volcanol., 63, 126–150, 2001.
Baker, P. E., Volcanic hazard on St. Kitts and Montserrat, West Indies,J. Geol. Soc. London, 142, 279–295, 1985.
Barberi, F., G. Macedonio, M. T. Pareschi, and R. Santacroce, Mapping thetephra fallout risk: An example from Vesuvius (Italy), Nature, 344, 142–144, 1990.
Bertagnini, A., P. Landi, M. Rosi, and A. Vigliargio, The Pomici di BasePlinian eruption of Somma-Vesuvius, J. Volcanol. Geotherm. Res., 83,219–239, 1998.
Blong, R. J., Volcanic Hazards, A Sourcebook on the Effects of Eruptions,Academic, San Diego, Calif., 1984.
Booth, B., Assessing volcanic risk, J. Geol. Soc. London, 136, 331–340,1979.
Bursik, M. I., R. S. J. Sparks, J. S. Gilbert, and S. N. Carey, Sedimentationof tephra by volcanic plumes, I, Theory and its comparison with a studyof the Fogo: A Plinian deposit, Sao Miguel (Azores), Bull. Volcanol., 54,329–344, 1992.
Carey, S., and R. S. J. Sparks, Quantitative models of the fallout anddispersal of tephra from volcanic eruption columns, Bull. Volcanol., 48,109–125, 1986.
Cherubini, A., S. M. Petrazzuoli, and G. Zuccaro, Vulnerabilita sismicadell’area Vesuviana, publication, Gruppo Naz. per la Difesa dai Terremo-ti, Rome, 2001.
Cioni, R., L. Civetta, P. Marianelli, N. Metrich, R. Santacroce, and A.Sbrana, Compositional layering and syn-eruptive mixing of a periodicallyrefilled shallow magma chamber: The A.D. 79 Plinian eruption of Vesu-vius, J. Petrol., 36(3), 739–776, 1995.
Cioni, R., P. Marianelli, and R. Santacroce, Thermal and compositionalevolution of the shallow magma chambers of Vesuvius: Evidence frompyroxene phenocrysts and melt inclusions, J. Geophys. Res., 103(B8),18,277–18,294, 1998.
Cioni, R., R. Santacroce, and A. Sbrana, Pyroclastic deposits as a guide forreconstructing the multi-stage evolution of the Somma-Vesuvius Caldera,Bull. Volcanol., 60, 207–222, 1999.
Cioni, R., S. Levi, and R. Sulpizio, Apulian Bronze Age pottery as a long-distance indicator of the Avellino Pumice eruption (Vesuvius, Italy), inThe Archaeology of Geological Catastrophes, edited by W. G. McGuireet al., Geol. Soc. Spec. Publ., 171, 159–177, 2000.
Civetta, L., and R. Santacroce, Steady-state magma supply in the last 3,400years of Vesuvius activity?, Acta Vulcanol., 2, 147–160, 1992.
Figure 10. (a) Comparison of field-based and numericalsimulation maps for tephra loading >200 kg/m2 and (b) finalhazard map for tephra loading >200 kg/m2, as results fromthe merging of field studies and numerical simulations.
ECV 2 - 10 CIONI ET AL.: ASSESSING PYROCLASTIC FALL HAZARD AT VESUVIUS

Cortini, M., and R. Scandone, The feeding system of Vesuvius between1754 and 1944, J. Volcanol. Geotherm. Res., 12, 393–400, 1982.
Crandell, D. R., and D. R. Mullineaux, Technique and rationale of volcanichazards appraisals in the Cascade Range, northwestern United States,Environ. Geol., 1, 23–32, 1975.
Crandell, D. R., B. Booth, K. Kazumadinata, D. Shimuzuru, G. P. L.Walker, and D. Westercamp, Natural Hazards, vol. 4, Source-Book forVolcanic-Hazards Zonation, 97 pp., UNESCO, Geneva, 1984.
de Vita, S., et al., The Agnano-Monte Spina eruption (4,100 years BP) inthe restless Campi Flegrei Caldera (Italy), J. Volcanol. Geotherm. Res.,91, 269–301, 1999.
Di Girolamo, P., M. R. Ghiara, L. Lirer, R. Munno, G. Rolandi, and D.Stanzione, Vulcanologia e petrologia dei Campi Flegrei, Boll. Soc. Geol.It., 103(2), 349–413, 1984.
Macedonio, G., M. T. Pareschi, and R. Santacroce, A numerical simulationof the Plinian fall phase of the 79 A.D. eruption of Vesuvius, J. Geophys.Res., 93(B12), 14,817–14,827, 1988.
Macedonio, G., M. T. Pareschi, and R. Santacroce, Renewal of volcanicactivity at Vesuvius: Tephra fallout, J. Volcanol. Geotherm. Res., 40,327–342, 1990.
Marianelli, P., N. Metrich, R. Santacroce, and A. Sbrana, Mafic magmabatches at Vesuvius: A glass inclusion approach to the modalities offeeding stratovolcanoes, Contrib. Mineral. Petrol., 120, 159–169, 1995.
McKee, C. O., R. W. Johnson, P. L. Lowenstein, S. J. Riley, R. J. Blong, P.De Saint’Ours, and B. Talai, Rabaul caldera, Papua New Guinea: Volca-nic hazards, surveillance, and eruption contingency planning, J. Volcanol.Geotherm. Res., 23, 195–237, 1985.
Miller, C. D., Potential hazards from future volcanic eruptions in California,U.S. Geol. Surv. Bull., 1847, 17 pp., 1989.
Newall, C. G., and S. Self, The volcanic explosivity index (VEI): Anestimate of explosive magnitude for historical volcanism, J. Geophys.Res., 87, 1231–1238, 1982.
Orsi, G., M. D’Antonio, S. de Vita, and G. Gallo, The Neapolitan YellowTuff, a large-magnitude trachytic phreatoplinian eruption: Eruptive dy-namics, magma withdrawal and caldera collapse, J. Volcanol. Geotherm.Res., 53, 275–287, 1992.
Pyle, D. M., The thickness, volume and grainsize of tephra fall deposits,Bull. Volcanol., 51, 1–15, 1989.
Rolandi, G., A. M. Barrella, and A. Borrelli, The 1631 eruption of Vesu-vius, J. Volcanol. Geotherm. Res., 58, 183–201, 1993.
Rosi, M., and R. Santacroce, The A.D. 472 ‘‘Pollena’’ eruption: volcano-logical and petrological data from this poorly known Plinian-type event atVesuvius, J. Volcanol. Geotherm. Res., 17, 249–271, 1983.
Rosi, M., C. Principe, and R. Vecci, The 1631 Vesuvian eruption: A re-construction based on historical and stratigraphical data, J. Volcanol.Geotherm. Res., 58, 151–182, 1993.
Santacroce, R., (Ed.), Somma-Vesuvius, Monografia, vol. 114(8), 230 pp.,Quad. de La Ric. Sci., CNR, Rome, 1987.
Santacroce, R., A. Bertagnini, L. Civetta, P. Landi, and A. Sbrana, Eruptivedynamics and petrogenetic processes in a very shallow magma reservoir:The 1906 eruption of Vesuvius, J. Petrol., 34, 383–425, 1993.
Santacroce, R., R. Cioni, L. Civetta, P. Marianelli, N. Metrich, and A.Sbrana, How Vesuvius works, in Atti Convegno, vol. 112, pp. 185–196, Accad. Naz. dei Lincei, Rome, 1994.
Suzuki, T., A theoretical model for dispersion of tephra, in Arc Volcanism:Physics and Tectonics, edited by D. Shimozuru and I. Yokoyama, pp.93–113, Terra Sci., Tokyo, 1983.
Westercamp, D., Une methode d’evaluation et de zonation des risquesvolcaniques a la Soufriere de Guadeloupe, Antilles Francaises, Bull. Vol-canol., 43, 431–452, 1980.
�����������������������D. Andronico, INGV- Catania, via Montirossi 12, 95030, Nicolosi
Catania, Italy.R. Cioni, Dipartimento di Scienze della Terra, Universita degli Studi di
Cagliari, via Trentino 51, 09127, Cagliari, Italy. ([email protected])A. Longo, R. Santacroce, A. Sbrana, and R. Sulpizio, Dipartimento di
Scienze della Terra, Universita degli Studi di Pisa, via S. Maria 53, 56126,Pisa, Italy. ([email protected]; [email protected]; [email protected]; [email protected])G. Macedonio, INGV-Osservatorio Vesuviano, via Diocleziano 328,
80124, Napoli, Italy. ([email protected])
CIONI ET AL.: ASSESSING PYROCLASTIC FALL HAZARD AT VESUVIUS ECV 2 - 11