Small scale shallow attenuation structure at Mt. Vesuvius, Italy
12
Physics of the Earth and Planetary Interiors 157 (2006) 257–268 Small scale shallow attenuation structure at Mt. Vesuvius, Italy Edoardo Del Pezzo a, ∗ , Francesca Bianco a , Luca De Siena a , Aldo Zollo b a Istituto Nazionale di Geofisica e Vulcanologia, Osservatorio Vesuviano, Napoli, Italy b Dipartimento di Scienze Fisiche, Universit` a di Napoli Federico II, Italy Received 27 January 2006; received in revised form 18 April 2006; accepted 20 April 2006 Abstract We present a high resolution 3D model of S-wave attenuation (Q −1 S ) for the volcanic structure of Mt. Vesuvius. Data from 959 waveforms relative to 332 volcano-tectonic earthquakes located close to the crater axis in a depth range between 1 and 4 km (below the sea level) recorded at 6 three-component seismic stations were used for the inversion. We obtained the estimate of Q −1 S for each source–station pair using a single-station method based on the normalization of the S-wave spectrum for the coda spectrum at 12 s lapse time. This is a modification of the well known coda-normalization method to estimate the average Q −1 S for a given area. We adopt a parabolic ray-tracing in the high resolution 3D velocity model which was previously estimated using almost the same data set; then we solve a linear inversion scheme using the L-squared norm with positive constraints in 900m-side cubic blocks, obtaining the estimate of Q −1 S for each block. Robusteness and stability of the results are tested changing in turn the input data set and the inversion technique. Resolution is tested with both checkerboard and spike tests. Results show that attenuation structure resembles the velocity structure, well reproducing the interface between the carbonates and the overlying volcanick rocks which form the volcano. Analysis is well resolved till to a depth of 4–5 km. Higher Q contrast is found for the block overlying the carbonate basement and close to the crater axis, almost cohincident with a positive P-wave velocity contrast located in the same volume and previously interpreted as the residual high density body related to the last eruptions of Mt. Vesuvius. We interpret this high-Q zone as the upper part of carbonate basement in which most of the high energy seismicity take place. The low-Q values found at shallow depth are interpreted as due to the high heterogeneity mainly caused by the mixing of lava layers and pyroclastic materials extruded during the last eruptions. ©2006 Elsevier B.V. All rights reserved. Keywords: Attenuation tomography; Mt. Vesuvius; Coda normalization method 1. Introduction Mt. Vesuvius, dormant since the last eruption in 1944, is considered as the most potentially dangerous vol- cano in the world, due to the presence of more than 700.000 people living in an area radially extended less than 15 km from the crater. Crucial for the people evacu- ∗ Corresponding author. Tel.: +39 081 6108324; fax: +39 081 6108 323. E-mail address: [email protected] (E. Del Pezzo).. ation in case of eruption renewal is the correct estab- lishment of possible scenarios, each one based on a volcanological model. Extreme scenarios are those re- lated to the occurrence of a plinian (that destroyed Pom- pei in 79 d.C.), or a sub-plinian eruption, like those of 472 or 1631 A.D (Scandone et al., 1993); The de- bate about the choice of the reference scenario for the revision of the actual evacuation plans from the Civil Protection of Italy is quite animated. The development of any scenario needs a structural model of the vol- cano, and in particular the details about the location 0031-9201/$ – see front matter ©2006 Elsevier B.V. All rights reserved. doi:10.1016/j.pepi.2006.04.009
Transcript of Small scale shallow attenuation structure at Mt. Vesuvius, Italy

A
wte1Wdoarfbpadd©
K
1
ic7t
f
0d
Physics of the Earth and Planetary Interiors 157 (2006) 257–268
Small scale shallow attenuation structure at Mt. Vesuvius, Italy
Edoardo Del Pezzoa,∗, Francesca Biancoa, Luca De Sienaa, Aldo Zollob
a Istituto Nazionale di Geofisica e Vulcanologia, Osservatorio Vesuviano, Napoli, Italyb Dipartimento di Scienze Fisiche, Universita di Napoli Federico II, Italy
Received 27 January 2006; received in revised form 18 April 2006; accepted 20 April 2006
bstract
We present a high resolution 3D model of S-wave attenuation (Q−1S ) for the volcanic structure of Mt. Vesuvius. Data from 959
aveforms relative to 332 volcano-tectonic earthquakes located close to the crater axis in a depth range between 1 and 4 km (belowhe sea level) recorded at 6 three-component seismic stations were used for the inversion. We obtained the estimate of Q−1
S forach source–station pair using a single-station method based on the normalization of the S-wave spectrum for the coda spectrum at2 s lapse time. This is a modification of the well known coda-normalization method to estimate the average Q−1
S for a given area.e adopt a parabolic ray-tracing in the high resolution 3D velocity model which was previously estimated using almost the same
ata set; then we solve a linear inversion scheme using the L-squared norm with positive constraints in 900 m-side cubic blocks,btaining the estimate of Q−1
S for each block. Robusteness and stability of the results are tested changing in turn the input data setnd the inversion technique. Resolution is tested with both checkerboard and spike tests. Results show that attenuation structureesembles the velocity structure, well reproducing the interface between the carbonates and the overlying volcanick rocks whichorm the volcano. Analysis is well resolved till to a depth of 4–5 km. Higher Q contrast is found for the block overlying the carbonateasement and close to the crater axis, almost cohincident with a positive P-wave velocity contrast located in the same volume andreviously interpreted as the residual high density body related to the last eruptions of Mt. Vesuvius. We interpret this high-Q zones the upper part of carbonate basement in which most of the high energy seismicity take place. The low-Q values found at shallow
epth are interpreted as due to the high heterogeneity mainly caused by the mixing of lava layers and pyroclastic materials extrudeduring the last eruptions.2006 Elsevier B.V. All rights reserved.n meth
eywords: Attenuation tomography; Mt. Vesuvius; Coda normalizatio. Introduction
Mt. Vesuvius, dormant since the last eruption in 1944,s considered as the most potentially dangerous vol-
ano in the world, due to the presence of more than00.000 people living in an area radially extended lesshan 15 km from the crater. Crucial for the people evacu-∗ Corresponding author. Tel.: +39 081 6108324;ax: +39 081 6108 323.
E-mail address: [email protected] (E. Del Pezzo)..
031-9201/$ – see front matter ©2006 Elsevier B.V. All rights reserved.oi:10.1016/j.pepi.2006.04.009
od
ation in case of eruption renewal is the correct estab-lishment of possible scenarios, each one based on avolcanological model. Extreme scenarios are those re-lated to the occurrence of a plinian (that destroyed Pom-pei in 79 d.C.), or a sub-plinian eruption, like thoseof 472 or 1631 A.D (Scandone et al., 1993); The de-bate about the choice of the reference scenario for the
revision of the actual evacuation plans from the CivilProtection of Italy is quite animated. The developmentof any scenario needs a structural model of the vol-cano, and in particular the details about the location
h and P
258 E. Del Pezzo et al. / Physics of the Eartand the volume of the possible magma patches under-neath.
Geophysics, and in particular seismology, provideuseful tools for partially answering to this question. TO-MOVES results (see the book by Capuano et al. (2003)and the numerous references therein) have provided theclearest picture actually available of the geological struc-ture underneath Mt. Vesuvius. The most important resultfrom TOMOVES is the existence of a magma sill at 8–10 km depth, inferred by the presence of a P to S conver-sion at a reflecting interface representing the top of thissill. Lateral extension is not well defined even thoughit is thought wide enough to reach the border of CampiFlegrei volcano, located about 20 km Eastward.
First-P arrival times from The TOMOVES projectalso provided refined 2D and 3D P-velocity models forthe upper 4–5 km underneath the whole Campanian PlainZollo et al. (2002) and Lomax et al. (2001). The inferred2D images of Mt. Vesuvius and Campanian Plain showa sharp P-velocity increase at a depth range of 2000–3000 m. This is attributed to a vertical transition betweenthe Plio-quaternary volcano-sedimentary sequence andMesozoic limestone basement. The limestone top ap-pears to have an irregular shape and generally dips fromthe edges of the Campanian Plain toward the Mt. Vesu-vius volcano, consistently with the Bouguer anomaliespattern Cassano and La Torre (1987) and Berrino et al.(1993).
Recently, the last 5 km underneath the ground levelhave been investigated by tomographic inversion of first-P arrival times from microearthquakes (Scarpa et al.,2002) reaching a resolution of about 300–500 m. Re-sults from this study allowed for a precise relocation ofthe local seismicity, almost all of volcano-tectonic type,in two space clusters separated by a zone of positive Vpcontrast; the main results are: (a) the presence of a highVp velocity body beneath the crater, surrounded laterallyby lower P-velocity volcanic rocks; and (b) the carbonatebasement at 2–2.5 km beneath the sea-level (consistentwith TOMOVES active seismic data modeling), at thetop of which almost all the high energy and stress-dropseismicity (Del Pezzo et al., 2004) is located in axis withthe crater. At the border of carbonate basement with theoverlying volcanic structures the maximum magnitudeearthquake ever recorded at Mt. Vesuvius in the last 40years took place (October 9, 1999, M = 3.6). Zollo etal. (2002) and Scarpa et al. (2002), hereafter cited asSCA02, interpreted the tomographic structures inferred
from active and passive seismic data in terms of the ab-sence of any small magma chamber in the investigateddepth range. A high Vp/Vs ratio in the upper layers (1 kmbelow the topography) was related by SCA02 to the pres-lanetary Interiors 157 (2006) 257–268
ence of a highly fractured aquifer, permeated by intensecirculation of hot fluids.
In the present paper we add a new image of the vol-canic shallow structure of Mt. Vesuvius, based on a total-Q tomographic model. We adopt a new technique to ob-tain the observables, based on the well known conceptof coda-normalization (Aki, 1980) applied to the sin-gle station estimate of total inverse-Q along the seismicpath. We trace rays in the 3D velocity model of SCA02and invert for total inverse-Q in cubic blocks with di-mension of 900 m. The technique produce stable androbust results, which indicate a structure similar to (eventhough with less resolution of) that inferred by SCA02.We interpret the new image jointly with the velocity to-mography, giving new insight on the shallow structure ofMt. Vesuvius.
2. Data and ray tracing
We use the waveforms recorded at five digital, highdynamic (120 dB, gain ranging), 1 Hz , three componentseismic stations with the addition of data from the ana-logical station OVO (66 dB dynamic range, three com-ponent), in operation since 1972 at the historical build-ing of Vesuvius Observatory. Digital stations are sam-pled at 125 s.p.s. whereas at OVO the sampling rate isset at 100 s.p.s. Analog anti-aliasing filter with 25 Hzcut-off frequency operated on all the data logger priorto sampling. We selected for the present analysis 332earthquakes on the base of the best signal to noise ratio,absence in the waveforms of spikes and other distur-bances, and coda lasting at least till to 15 s lapse timefrom earthquake origin time. In doing this selection weimplicitly restricted the magnitude in the range from 1.8to 3.0, as in the coda of the earthquakes with M > 3.0small aftershocks are often present. The time periodinvestigated is January–September 1999 and January–June 2000. The total number of waveforms resulted tobe 959. In Table 1 station name and coordinates are re-ported.
Location of the 332 earthquakes (Fig. 1) was ob-tained with a non linear procedure which uses a grid-search algorithm (Lomax et al., 2001) using a 3D ve-locity model based on results by (SCA02) . Ray lengthrange from 0.5 to 7 km, corresponding to S-travel timesfrom 0.3 to 3.9 s. We used an approximate ray-tracingtechnique to compute wave trajectories in the same ve-locity model utilized in the location procedure. We nu-
merically search for the best-adapted parabolas in thevertical plane connecting source and station, satisfyingthe Fermat’s principle of minimum travel time (Fig. 2).In this way we obtained an analytical representation of
E. Del Pezzo et al. / Physics of the Earth and Planetary Interiors 157 (2006) 257–268 259
Table 1
Station Latitude (◦) Longitude (◦) Altitude (a.s.l.) (km) x (km) y (km)
BKEM 40.4909 14.2633 0.863 5.41363 3.87329FTCM 40.4778 14.2636 0.35 5.42890 1.44879BAFM 40.4872 14.2471 0.594 3.10806 3.18792SGVM 40.4906 14.2485 0.734 3.30463 3.81697
0.8650.584
ttpbl
3s
ts
Frs
BKNM 40.4977 14.2578OVO 40.4965 14.2380
he ray-paths (three coefficients for each ray) that servedo save computer time in the inversion process. Thearabola coefficients for each source–receiver pair haveeen stored in a data base, successively used for calcu-ations.
. Estimate of the path attenuation and inversioncheme
The seismic total attenuation coefficient, proportionalo Q−1
T , the inverse total Q, is a parameter controlling theeismic energy density spectrum decay as a function of
ig. 1. Map of Mt. Vesuvius with station positions (black triangles) and hyepresent the S-N and W-E sections, respectively. Continuous lines connect thections.
4.61176 5.131751.92606 4.81669
lapse time as
Eij(f, r) = Si(f )θij(ϑ, φ)Ij(f )Tj(f )Gij(r)
× exp
(−2πf
tij(r)
QijT(r)
)(1)
where E(f, r) is the energy density spectrum and f isthe frequency of the S-wave radiation emitted by the
source i at total distance r measured along the source(i)–station (j) ray-path. Si(f ) is the energy spectrumat source, modulated by the radiation pattern θ(ϑ, φ).Ij is the instrument transfer function, Tj is the sitepocentral locations (black circles). Upper-left and downward panelse station positions on the map to the correspondent location onto the

260 E. Del Pezzo et al. / Physics of the Earth and P
)
Fig. 2. Ray-path projections on E-W and N-S sections of Mt. Vesuviofor the seismic events used in the present study. Rays obtained with aparabolic ray-tracing represent the Fermat’s paths of minimum traveltime.
transfer function and G is the geometrical spreadingterm. tij is the travel time along the ray whose co-
ordinate is r and QijT is the total quality factor mea-
sured along the ray-path. QT defines the fractional en-ergy lost per cycle, �E, through the formula Q =−2πE/�E.
The estimate of Q−1T from estimates of E(f, r) is
function of several factors depending on the responsesof instrument, site and source. Among these terms theone that is better known is the instrument response,while site and source effects are less known. This ismostly due to the complex task of discriminating onseismograms the site and source effects. By eliminat-ing the source and site terms in the estimate of to-tal Q with a single station method is consequently animportant pre-requisite for any attenuation tomography
problem.Based on the phenomenological properties of the codawaves, Aki (1980) expressed the coda energy spectrum,evaluated around a given lapse time, tc, as a function of
lanetary Interiors 157 (2006) 257–268
the “average” medium properties as
EC(f, tc) = Si(f )Ij(f )Tj(f )P(f, tc) (2)
where P(f, tc) is independent on both source–receiverdistance and directional azimuth and the radiation pat-tern term (θij(ϑ, φ)) disappears due to the well knownproperties of coda waves (Aki, 1980). The coda PowerP(f, tc) can in principle take any analytical form as it isindependent of the assumed scattering model. It dependson the average properties of the earth medium (Sato andFehler, 1998). Here we assume the validity of the singlescattering model for sake of simplicity, and hence
P(f, tc) = 2g0
t2c V 2
0
exp[−2πftc/Qc(f )] (3)
where Qc is the so called coda-Q, depending on fre-quency, g0 is the scattering coefficient (averaged on thevolume encompassed by the coda waves Sato and Fehler(1998)) and V0 is the average velocity. Dividing Eq. 1for Eq. 2 we obtain for each source–station pair, at lapsetime tc
Eij(f, r)
EC(f, tc)= θij(ϑ, φ)
P(f, tc)Gij(r) exp
[−2πf
∫ray
dl
v(l)Q(l)
]
(4
obtaining an expression independent of energy level atsource, site and instrument transfer function. In formula(4) the attenuation operator has been substituted withthe path integral along the seismic ray, where v(l) is thevelocity along the path l. θij(ϑ, φ) in principle dependson source azimuth φ and incidence angle ϑ.
We make the assumption that this dependence be-comes negligible when the estimate of Eij(f, r) of Eq.(4) is made on a time window of duration much greaterthan the source duration (Gusev and Abubakirov, 1999).This assumption is based on the following simple con-ceptual model. Source pulse signals propagates along theray path. Their amplitude and duration depends on theseismic moment rate function. In case of small (M < 3)earthquakes, the source pulse duration is of the orderof 0.2 s, given an expected source size of few hundredsof meters. The seismic pulses following the direct waveare generated by the interaction of the primary pulse withthe earth medium heterogeneities. These can be assumedrandomly located inside a volume surrounding the seis-mic ray. This sort of ray tube is the volume where thescattering processes generate the wave packet in the first
few seconds of seismogram after the direct S-arrival.Due to the random nature of the scattering process, theseismic radiation in the time window of duration T start-ing at the S-wave first arrival is a sort of natural average
h and Planetary Interiors 157 (2006) 257–268 261
paiap
sta
l
wtbefa
R
wpwot(
4
4
vfdfrhrfbrepltpr
Fig. 3. The standard deviation, σ, obtained calculating the average(over stations) of the log of spectral ratio between direct S radiationand coda radiation, after correcting the amplitudes for geometricalspreading and for the average Q, is represented in the lower panel as afunction of the time window duration, for a quake recorded at all the
E. Del Pezzo et al. / Physics of the Eart
roduced in a wide range of directions from the stationnd hence becomes independent on ϑ and φ at increas-ng T. We made a test confirming the validity of thisssumption that will be described later in the presentaper.
Taking G(r)=r20/r2, where r is the total length of the
eismic ray and r0 a reference length set at 1 km, andransforming energy in amplitude, Eq. (4) may be writtens
n
(|AS
ij(f )||AC
ij(f, tc)| · rij
)= K(f, tc) − πf
∫rij
dl
v(l)Q(l),
(5)
here ASij and AC
ij are the spectral amplitudes of respec-ively S and coda, K(f, tc) is constant for each frequencyand, depending only on the average properties of thearth medium and rij is the total length of the seismic rayor the couple ij. Introducing the slowness s(l) = 1/v(l),nd discretizing we can write
ij = K(f ) − πf
B∑b=1
lijbsbQ−1b , (6)
here Rij represents the log of amplitude spectral ratioremultiplied by r; index b indicates the b-th block inhich the earth medium is divided and B is the numberf blocks. sb and lijb are, respectively the slowness andhe length of the ray-segment crossing the bth block. Eq.6) can be linearly inverted for Q−1
b .
. Data analysis and results
.1. Test of independence from radiation pattern
We first visually check how much the quantity Rij
aries with S-wave window duration T. We observe thator T > 3 s, Rij does not significantly vary with the win-ow length. This should imply that a certain stabilityor the estimate of Rij is reached for 3 s window du-ation. Then we select few events among those withigh signal to noise ratio at all the stations. After cor-ecting the amplitudes for geometrical spreading andor the average Q already estimated for the same areay Bianco et al. (1999) we estimate the log of spectralatio between direct S radiation and coda radiation forach station (we average over the two horizontal com-onents of the ground motion). Coda window starts at
apse time of 8 s and ends at 12 s. Then we average overhe stations and estimate the standard deviation σ. Thisrocedure is repeated for different values of time du-ation of the S-wave window. As an example, we plotstations (an example at BKE station is reported in the upper panel).Downward arrow indicate the empirically determined optimal windowlength.
in Fig. 3 σ as a function of the time window durationfor a quake recorded at all stations. From the patternof σ we deduce that after around 3 s of duration, thestandard deviation of the spectral ratio averaged overthe stations falls below 70% of the maximum. Inter-preting the fluctuations around the average as mainlyproduced by radiation pattern effects, we deduce from
this pattern as an indirect confirmation of validity forthe assumption made in the conceptual model describedabove.
262 E. Del Pezzo et al. / Physics of the Earth and P
Table 2
flow fc(Hz) fhigh
2.4 3 3.64.7 6 7.2
8.2 12 15.812.4 18 23.6
4.2. Estimate of the observables, discretization, andinversion technique
For the considerations above reported, we set the du-ration of the S-waves time window at 3 s starting fromthe S-wave travel time. Coda signal time window startsat 8s lapse time and ends at 12 s. We set this value (12 s)because for most of data utilized the signal-to-noise ra-tio is greater than three for lapse times smaller than 12 s.An FFT is applied to the windowed signals (we used acosine taper window with tapering at 10% both for S andcoda) for both the horizontal components of the groundmotion. The spectral amplitude is log-averaged over thecomponents in the frequency bands centered at fc withbandwidths (±�f ), as reported in Table 2 is then calcu-lated, and finally the ratio between the S-wave windowand the coda window is calculated.
The natural logarithm of the ratio is premultiplied bythe ray path length to obtain an estimate of Rij . Rij iscalculated for the two horizontal components. The earthvolume under study has the surface extension of 9 km ×9 km and a depth extension of 4.5 km. We discretized thisvolume by a cubic grid with spacing of the grid nodeschosen on the base of two main criteria: the first is thatthe wavelength must be smaller than the grid spacing
(the wavelength of the seismic signals utilized in thiswork span from 0.1 to 0.6 km); the second is that theray density in each grid volume-cell must be sufficientlyhigh to guarantee a robustness of the inversion and anTable 3
Station fc = 3 Hz fc = 6 Hz
Q-coda inverseBKEM 7.7 4.9FTCM 8.1 5.3SGVM 6.4 7.1BKNM 8.0 4.7OVO 7 6.8
fc
3 Hz
6 Hz
12 Hz
18 Hz
Q-coda inverse (·103) estimated by Bianco et al. (1999) and 〈g〉, the averagpublication).
lanetary Interiors 157 (2006) 257–268
optimal resolution. We calculate the intersections of theray paths with volume cells, obtaining the quantities lijb.sb, the slowness in each volume cell, is the average in thevolume cell of the slowness values taken from velocitytomography (SCA02). The constant K (see formula (6))in the assumption of single scattering is given by
K = t2c V 2
0
2g0exp
(2πftc
Qc
)(7)
and can be independently estimated from the alreadydetermined estimates of Qc (Bianco et al., 1999) andg0 (Del Pezzo et al. submitted for publication) that arereported in Table 3.
We can invert the problem expressed by formula (6)simultaneously for K and the set of Q−1 , or we can a-priori set K to the value already estimated and resolveonly for the set of Q−1.
The inversion problem can be rewritten for sake ofcompactness in a simpler way, changing the couple ofindexes ij in a single integer index, k. k ranges from 1 toN pairs where N pairs is the number of source stationpairs, and designates the corresponding ray-path. Anal-ogously, N cells indicates the total number of blocks.Denoting K(f )/πf as C(f ) we rewrite formula (6) as
C(f ) − Rk
πf=
N cells∑b=1
lkbsbQ−1b (8)
In vectorial form, representing the suite of the ray-paths,
d(f ) = Gm(f ) (9)
where d contain the calculated spectral ratios for eachfrequency band, averaged over the two horizontal com-ponents of ground motion, for all the ray-paths. G is a
fc = 12 Hz fc = 18 Hz
5.2 3.93.7 4.25.6 4.75.9 4.76.5 6.4
〈g0〉1.92.11.61.5
e scattering coefficient, estimated by Del Pezzo et al. (submitted for
h and P
r
G
cells
cells
llssN c
aQ
sevlL
4
cai
Frru
E. Del Pezzo et al. / Physics of the Eart
ectangular sparse matrix as
=
⎡⎢⎢⎢⎢⎢⎢⎢⎢⎢⎢⎢⎢⎢⎣
l11s1 l12s2 · l1bsb 0 · l1N cellssN
l21s1 l22s2 · 0 0 · l2N cellssN
· · · · · · ·· 0 · lkbsb · 0 ·· · · · · · 0
0 · · · · · ·· · · · · · ·lN pairs1s1 · · 0 · · lN pairsN ce
nd m is the column vector containing the estimates of−1 for each volume cell. The problem can be solved
eparately for each frequency band. The inversion is lin-ar and needs to be constrained to obtain only positivealues of Q−1. We solve the problem using the positiveeast squares algorithm “lsqnonneg” deployed in MAT-AB (Lawson and Hanson, 1974).
.3. Resolution
We determined the optimal dimension of the cubicell together with the resolution of the method with a trialnd error approach. We base our test on two syntheticmages, the first consisting of a high Q-contrast block,
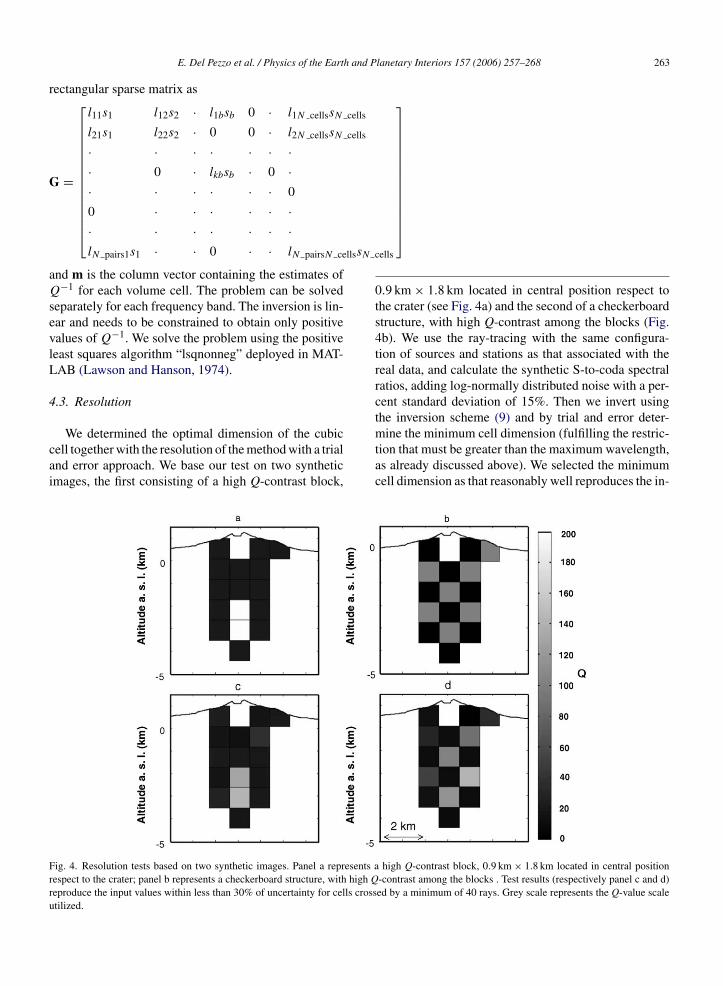
ig. 4. Resolution tests based on two synthetic images. Panel a represents aespect to the crater; panel b represents a checkerboard structure, with high Qeproduce the input values within less than 30% of uncertainty for cells crosstilized.
lanetary Interiors 157 (2006) 257–268 263
ells
⎤⎥⎥⎥⎥⎥⎥⎥⎥⎥⎥⎥⎥⎥⎦
0.9 km × 1.8 km located in central position respect tothe crater (see Fig. 4a) and the second of a checkerboardstructure, with high Q-contrast among the blocks (Fig.4b). We use the ray-tracing with the same configura-tion of sources and stations as that associated with thereal data, and calculate the synthetic S-to-coda spectralratios, adding log-normally distributed noise with a per-cent standard deviation of 15%. Then we invert usingthe inversion scheme (9) and by trial and error deter-
mine the minimum cell dimension (fulfilling the restric-tion that must be greater than the maximum wavelength,as already discussed above). We selected the minimumcell dimension as that reasonably well reproduces the in-high Q-contrast block, 0.9 km × 1.8 km located in central position-contrast among the blocks . Test results (respectively panel c and d)ed by a minimum of 40 rays. Grey scale represents the Q-value scale

264 E. Del Pezzo et al. / Physics of the Earth and Planetary Interiors 157 (2006) 257–268
Table 4
Block# 1 2 3 4 5 6 7 8Robusteness test
Q 33 29 185 72 122 139 262 440σ (from Covariance) 1 1 3 8 20 14 20 110σ, 5% of data reduction 1 1 5 16 17 34 35 119σ, 10% of data reduction 1 1 7 19 27 42 43 169σ, 20% of data reduction 4 7 7 23 57 64 76 220σ, 30% of data reduction 304 97 157 29 349 202 115 283
Block# 1 2 3 4 5 6 7 8Stability test
Q 33 29 185 72 122 139 262 440Q, gmin 33 29 185 72 122 139 262 439Q, gmax 33 29 185 72 121 138 263 440
Robusteness and stability. The upper table reports for eight blocks the estimate of Q from the inversion process applied to the entire data set (firstrow), the variance of this estimate (second row) and the variances calculated from the tests applied to a reducted number of equations. Till to a 20%
of reduction results show robusteness in the solution. The lower table reports(upper row) and those obtained fixing the g0 value of formula (7) at the extreFig. 5. Tomography results, obtained for the frequency band centered at 12 Hmain features of the attenuation structure of Mt. Vesuvius are essentially a latunder the volcano, and a heterogeneous Q-structure below this depth.
for the same eight blocks the values of Q from the inversion processmes of the confidence interval.
z. We use four different perspectives, each one shifted by 90◦. Theerally uniform low Q region in the first 1.8 km of crust (from the top)

h and P
pcuodcr
saoooebctotoipc
ig
Fi
E. Del Pezzo et al. / Physics of the Eart
ut image. In these test we empirically observe that cellsrossed by a minimum of 40 rays reproduce the input val-es within less than 30% uncertainty. The cell dimensionf 0.9 km results to be optimal. Fixing this volume cellimension and representing the results for the sole cellsrossed by more than 40 rays, the two synthetic imagesesult well resolved (Fig. 4c and d).
The robustness of the method is tested using a boot-trap approach Lees and Crosson (1989) and Tichelaarnd Ruff (1989) We reduced the number of equationsf 5%, 10%, 20% and 30% with a random extraction,btaining, for each percent group, 100 data set. For eachf these data set we resolved the inversion process, andstimated the Q factor and its standard deviation for eachlock from the average of the 100 solutions. Then, weompare these solutions with the solution obtained fromhe whole data set (and with its covariance matrix). Webserve a significative increase in standard deviation forhe random extraction of 30% of data, whereas for thatbtained for 5%, 10% and 20% the standard deviations comparable with that from the entire data set. We re-ort in Table 4 the output of this test (obtained at 18 Hz
entral frequency) for a number of eight selected blocks.Stability of the solution is indirectly tested by chang-ng the value of the constant C(f ) in formula (8), letting0 of Eq. (7) to vary between the values of gmin = 1
ig. 6. The same of Fig. 5, for the frequency band centered at 18 Hz. In thiss more evident than that imaged at 12 Hz.
lanetary Interiors 157 (2006) 257–268 265
and gmax = 2.5 that represent the error limits of this es-timates as reported by Del Pezzo et al. (submitted forpublication). Results from these tests ensure that the so-lution obtained is practically insensitive to C(f ) as re-ported in Table 4 for the same suite of eight selectedblocks reported for the robusteness test.
4.4. Results
We show in Figs. 5 and 6 the results obtained for thefrequency bands centered at 12 and 18 hz. In the bandcentered at 6 hz signal to noise ratio at 12 s lapse time isoften below the threshold. This implies that we considerfor the inversion a limited data set. Consequently, resultsfor the band centered at 6 hz show that at this frequencyonly few blocks can be resolved, and consequently arenot considered here. The main features of the attenua-tion structure of Mt. Vesuvius are essentially a laterallyuniform low Q region in the first 1.8 km from the topof the volcano, and an heterogeneous Q-structure belowthis depth. In the E-W sections (Fig. 7b and 8b) an highQ zone (blue and green colored blocks) centrally located
respect to the crater axis, surrounded by lower-Q blockscan be easily visualized. The results obtained at 18 hzare better defined than those at 12 hz showing five addi-tional resolved blocks. The high Q contrast blocks arefrequency band, the high-Q zone located at approximately 3 km b.s.l.

266 E. Del Pezzo et al. / Physics of the Earth and Planetary Interiors 157 (2006) 257–268
red at 1at of thA02). Ilinked
Fig. 7. Q-tomography results, obtained for the frequency band centeearth structure. The high Q contrast blocks have a pattern similar to thP-wave velocity structure inferred by the travel time tomography (SCsize proportional to magnitude and the low velocity layer toward N is
distributed in space similarly to the high velocity zonesinferred by the travel time velocity tomography (SCA02)which has been utilized in the present study for the raytracing, reported in the same figures for sake of com-parison. This high velocity zone has been interpreted bySCA02 as the upper part of the limestone basement andis consistent with the depth of the limestone top retrievedfrom active seismic tomography underneath Mt. Vesu-vius using the TOMOVES data set Zollo et al. (2002).
5. Discussion and conclusions
In the present paper we have measured the total atten-uation for S waves with a method almost independent of
2 Hz, representing W-E (panel b) and S-N (panel d) sections of thee high velocity zones in the (a) W-E and (c) N-S cross sections of then panels a and c white circles show the relocated hypocenters havingto the deepening of the limestone basement.
site and radiation pattern, obtaining a tomography imageof Mt. Vesuvius. As the S-wave high attenuation zonesmay be indicative of the presence of magma patches, theapplication of the present methodology is particularlysuitable to the study of volcanic areas (Figs. 7 and 8).
The total attenuation is represented by the inversequality factor, Q−1
T , that can be expressed as
Q−1T = Q−1
i + Q−1Sc (10)
where Q−1 is the inverse of the intrinsic quality factor
iand Q−1Sc is the inverse of the scattering quality factor(Sato and Fehler, 1998). How total Q is separated intoits parts needs to be known in order to correctly interpretthe attenuation images. The interpretation of the present

E. Del Pezzo et al. / Physics of the Earth and Planetary Interiors 157 (2006) 257–268 267
, for the
rptcpedTaToseflact
Fig. 8. The same of Fig. 7
esults may be facilitated by considering the results of arevious study (Bianco et al., 1999) on seismic attenua-ion on Mt. Vesuvius, and by a more recent observation,oncerning a reappraisal of the separated Q−1
i and Q−1Sc
arameters, averaged on the entire volcano (Del Pezzot al., submitted for publication). These two studies in-icate that Q−1
Sc could dominate in average over Q−1i .
hus, we think that the observed Q-anomalies may bettributed predominantly to variations of scattering Q.he low-Q materials composing the shallow structuref Mt. Vesuvius (quality factors as low as less than 50)hould indicate high heterogeneity. We attribute this het-rogeneity to the presence of a mixture of indurated lava
ows and relatively inconsolidated pyroclastic materi-ls, associated with the past eruptive activity of this vol-ano. This zone reaches a depth of about 2 km under theop of topography. Q-Tomography also evidences a zonefrequency band of 18 Hz.
with high Q, which coincides with the zones with highestP-wave velocity where most of the largest earthquakesoccurs. This zone should be the less heterogeneous. Wethink that it may be partly composed by the upper partof limestone basement under the volcano with a high ho-mogeneity and high rigidity respect to the surroundingrocks. We consequently exclude that this high-Q bodyis composed by the residual magma bodies emplacedduring the last 1944 and preceding eruptions. In syn-thesis, the S-wave attenuation tomography reproducesthe same features of the P-velocity tomography eventhough the resolution of the attenuation tomography ispoorer (a half of that associated with velocity tomogra-
phy) and can be interpreted in the same way. This sim-ilarity consequently reinforces one of the interpretationalready done by SCA02, that there are no evidences of ashallow magma body in the first 4 km below the ground
h and P
268 E. Del Pezzo et al. / Physics of the Eartsurface. The absence of shallow magma chambers canbe considered as an important constraint to be put on anydynamical model of Mt. Vesuvius. The inferences thatcan be made on the base of the present results can besummarized in the following main points:
• Largest earthquakes are located in a zone of relativelyhigh rigidity, possibly constituting the top part of thelimestone basement under Mt. Vesuvius, as describedin SCA02 and in (Lomax et al., 2001). The presenceof this high rigidity layer is clearly reproduced alsoby the attenuation imaging, that indicates a zone ofrelatively high total-Q.
• Shallowest materials are composed by an heteroge-neous structure, composed by the mixing of lava lay-ers and pyroclastic materials extruded during the lasteruptions. A pronounced aquifer below the centralcrater should have been the predominant cause ofmany past eruptions, as many hydrothermal eventshave been observed during plinian and sub-plinianevents. The present data are not in contrast with thisevidence, as the high scattering attenuation in the shal-low part of the volcanic structure is compatible withthe presence of shallow aquifers.
• There is no evidence of shallow patches of low-Q ma-terials at the depth between 2 and 3 km, at least at theresolution scale of this study. This should imply thatthe shallow magma chambers deduced by geochem-ical studies at 1–3 km depth (Marianelli et al., 1999)were possibly formed at the occurrence of the erup-tion and were after depleted at the end the eruptiveactivity.
Acknowledgements
This work is financed by INGV-DPC (Dipartimento diprotezione Civile Italiana) project V3 4. Routine analy-sis has been carried out in LAV (Laboratorio di Anal-isi aVanzate of INGV-Naples) by Simona Petrosinoand Paola Cusano, who are gratefully acknowledged.Gilberto Saccorotti, Vincenzo Nisii, Anna Tramelli, Lu-
cia Zaccarelli helped with numerous discussions. Threeanonimous reviewers and the editor are gratefully ac-knowledged for their useful comments and suggestionsthat greatly improved the paper.lanetary Interiors 157 (2006) 257–268
References
Aki, K., 1980. Attenuation of shear-waves in the lithosphere for fre-quencies from 0.05 to 25 Hz. Phys. Earth Planet. Inter. 21, 50–60.
Berrino, G., Coppa, U., De Natale, G., Pingue, F., 1993. Recent geo-physical investigation at Somma–Vesuvius volcanic complex. J.Volcanol. Geotherm. Res. 58, 239–262.
Bianco, F., Castellano, M., Del Pezzo, E., Ibanez, J.M., 1999. Attenua-tion of short period seismic waves at Mt. Vesuvius. Italy Geophys.J. Int. 138, 67–76.
Capuano, P., Gasparini P., Zollo A., Virieux J., Casale R., YeroyanniM., 2003. The internal structure of Mt. Vesuvius. A seismic tomog-raphy investigation. Liguori Editore ISBN 88–207-3503–2.
Cassano, E., La Torre, P., 1987. Geophysics, in Somma-Vesuvius. Ed-itore R. Santacroce, CNR quaderni 114, Roma, 175–196.
Del Pezzo, E., Bianco, F., Saccorotti, G., 2004. Seismic source dy-namics at Vesuvius volcano, Italy. J. Volcanol. Geotherm. Res.133, 23–39.
Del Pezzo, E., Bianco, F., Zaccarelli, L. Separation of Qi andQs from passive data at Mt. Vesuvius: a reappraisal ofseismic attenuation. Phys. Earth Planet. Inter., submitted forpublication.
Gusev, A.A., Abubakirov, I.R., 1999. Vertical profile of effective tur-bidity reconstructed from broadening of incoherent body-wavepulses. Geophys. J. Int. 136, 309–323.
Lawson, C.L., Hanson, R.J., 1974. Solving least squeres problems.Prentice-Hall, inc., New Jersey.
Lees, J.M., Crosson, R.S., 1989. Tomographic inversion for three-dimensional velocity structure at Mount St. Helens using earth-quake data. J. Geophys. Res. 94, 5716–5728.
Lomax, A., Zollo, A., Capuano, P., Virieux, J., 2001. Precise abso-lute earthquake location under Somma-Vesuvius volcano using anew three-dimensional velocity model. Geophys. J. Int. 146, 313–331.
Marianelli, P., Metrich, N., Sbrana, A., 1999. Shallow and deep reser-voirs involved in magma supply of the 1944 eruption of Vesuvius.Bull. Volcanol. 61, 48–63.
Sato, H., Fehler, M.C., 1998. Seismic Wave Propagation and Scatteringin the Heterogenous Earth. Springer.
Scandone, R., Giacomelli, L., Gasparini, P., 1993. Mt. Vesuvius: 2000years of volcanological observations. J. Volcanol. Geotherm. Res.58, 5–26.
Scarpa, R., Tronca, F., Bianco, F., Del Pezzo, E., 2002. High resolu-tion velocity structure beneath Mount Vesuvius from seismic array.Geophys. Res. Lett. 29 (21), 2040.
Tichelaar, B.W., Ruff, L.R., 1989. 1989 How good are our best models?EOS 70, 593–606.
Zollo, A., D’Auria, L., De Matteis, R., Herrero, A., Virieux, J., Gas-
parini, P., 2002. Bayesian estimation of 2-D P-velocity modelsfrom active seismic arrival time data: imaging of the shallow struc-ture of Mt. Vesuvius (Southern Italy). Geophys. J. Int. 151, 566–582.