Using HF radar coastal currents to correct satellite altimetry

Journal of Volcanology and Geothermal Research 283 (2014) 36–65
Contents lists available at ScienceDirect
Journal of Volcanology and Geothermal Research
j ourna l homepage: www.e lsev ie r .com/ locate / jvo lgeores
Review
Pyroclastic density currents: state of the art and perspectives
Sulpizio R. a,b, Dellino P. a, Doronzo D.M. a, Sarocchi D. c
a Dipartimento di Scienze della Terra e Geoambientali, via Orabona 4, 70125, Bari, Italyb IDPA-CNR, via Mario Bianco 9, Milan, Italyc Instituto de Geología, Fac. Ingeniería UASLP, Dr. M. Nava No 5, Zona Universitaria 78240, San Luis Potosí, Mexico
http://dx.doi.org/10.1016/j.jvolgeores.2014.06.0140377-0273/© 2014 Published by Elsevier B.V.
a b s t r a c t
a r t i c l e i n f oArticle history:Received 5 February 2014Accepted 28 June 2014Available online 9 July 2014
Keywords:Pyroclastic density currentsSedimentologyLaboratory experimentsNumerical simulationsDepositional modelsLarge ignimbrites
Pyroclastic density currents (PDCs) aremixtures of two components, namely solid particles and fluid (gas) phase.Theymacroscopically behave as dense,multiphase gravity currents (flowing pyroclasticmixtures of particles andgas) immersed in a less dense, almost isotropic fluid (the atmosphere). As for other natural phenomena, theirstudy needs a multidisciplinary approach consisting of direct observations, analysis of the associated deposits,replication through laboratory experiments, and numerical simulations. This review deals with the descriptionof the current state of the art of PDC physics, and combines analysis of data from various methodologies. All ofthe above-mentioned approaches have provided significant contributions to advancing the state of the art;in particular, laboratory experiments and numerical simulations deserve a special mention here for their tumul-tuous growth in recent years.A paragraph of the review is dedicated to the puzzling behaviour of large-scale ignimbrites, which are (fortunate-ly) too rare to be directly observed; they cannot be easily reproduced through laboratory experiments, or inves-tigated by means of numerical simulations.The final part is dedicated to a summary of the whole discussion, and to a comment on some perspectives forfuture developments of PDC studies.
© 2014 Published by Elsevier B.V.
Contents
1. Introductory statements . . . . . . . . . . . . . . . . . . . . . . . . . . . . . . . . . . . . . . . . . . . . . . . . . . . . . . . . . . 362. The physics of pyroclastic density currents: what we know and what we should know . . . . . . . . . . . . . . . . . . . . . . . . . . . . . 39
2.1. Direct observations . . . . . . . . . . . . . . . . . . . . . . . . . . . . . . . . . . . . . . . . . . . . . . . . . . . . . . . . . 392.2. Field studies . . . . . . . . . . . . . . . . . . . . . . . . . . . . . . . . . . . . . . . . . . . . . . . . . . . . . . . . . . . . 39
2.2.1. Sedimentological key concepts . . . . . . . . . . . . . . . . . . . . . . . . . . . . . . . . . . . . . . . . . . . . . . . 392.2.2. Extraction of physical data from PDC deposits using sedimentological models . . . . . . . . . . . . . . . . . . . . . . . . . . 42
2.3. Laboratory experiments . . . . . . . . . . . . . . . . . . . . . . . . . . . . . . . . . . . . . . . . . . . . . . . . . . . . . . 432.4. Numerical simulations . . . . . . . . . . . . . . . . . . . . . . . . . . . . . . . . . . . . . . . . . . . . . . . . . . . . . . . 48
3. The aerodynamics of the real world: influence of topography on PDC dynamics . . . . . . . . . . . . . . . . . . . . . . . . . . . . . . . . . 523.1. Break in slope . . . . . . . . . . . . . . . . . . . . . . . . . . . . . . . . . . . . . . . . . . . . . . . . . . . . . . . . . . . 533.2. Ridge (increasing slope) . . . . . . . . . . . . . . . . . . . . . . . . . . . . . . . . . . . . . . . . . . . . . . . . . . . . . . 533.3. Urban morphology . . . . . . . . . . . . . . . . . . . . . . . . . . . . . . . . . . . . . . . . . . . . . . . . . . . . . . . . . 55
4. Depositional models for PDCs . . . . . . . . . . . . . . . . . . . . . . . . . . . . . . . . . . . . . . . . . . . . . . . . . . . . . . . 565. The challenging behaviour of large-volume ignimbrites . . . . . . . . . . . . . . . . . . . . . . . . . . . . . . . . . . . . . . . . . . . . 576. Putting all together: conclusive remarks and future perspectives . . . . . . . . . . . . . . . . . . . . . . . . . . . . . . . . . . . . . . . 57Acknowledgements . . . . . . . . . . . . . . . . . . . . . . . . . . . . . . . . . . . . . . . . . . . . . . . . . . . . . . . . . . . . . . 61References . . . . . . . . . . . . . . . . . . . . . . . . . . . . . . . . . . . . . . . . . . . . . . . . . . . . . . . . . . . . . . . . . . 61

37S. R. et al. / Journal of Volcanology and Geothermal Research 283 (2014) 36–65
1. Introductory statements
Pyroclastic density currents (PDCs) are among the most amazingnatural phenomena, and involve some of the most complex and dan-gerous processes occurring during explosive volcanic eruptions.
PDCs are mixtures of pyroclastic particles and gas that move acrossthe landscape under the effect of gravity. They macroscopically behaveas dense, multiphase gravity currents (flowing pyroclastic mixturesof particles and gas) immersed in a less dense, almost isotropic fluid(the atmosphere).
The solid phase (particles) and the fluid phase (gas) are thetwo components of such currents, and the mixing of variousamounts of particles and gas defines a natural continuum from dilute(fluid-dominated) to concentrated (solid-dominated) PDCs. Thisimplies that the dilute counterpart of PDC spectra can be describedusing the laws of fluid dynamics (e.g., Huppert, 2006), whereas theconcentrated one more properly obeys the laws of granular matterphysics (e.g., Bursik et al., 2005). In between the two PDC end mem-bers the complex multiphase physics of dispersed flow must be ap-plied, which is a matter further complicated by the large variabilityof physical properties of both solid and fluid phases (e.g. Crowe,2006).
A transition between these dilute and concentrated end membersalso existswithin any single PDC, basically consisting of a buoyant phoe-nix plume and a dense underflow gradational to each other (e.g., Fisher,1966; Dade andHuppert, 1996; Baer et al., 1997; Branney and Kokelaar,2002). The underflow is denser than the atmosphere and moves indirect contact with the ground, consisting of a basal part dominatedby particle–particle interactions, and an overlying part dominated bytraction processes driven by fluid turbulence (e.g. Cas and Wright,1987). The phoenix or co-ignimbrite plume is less dense than the atmo-sphere and convectively lofts driven by buoyancy (Dobran et al., 1993;Sparks et al., 1997a).
Given that PDCs are described as gravity currents, their mobility(runout distance versus difference of height from source and depositfront) is greatly controlled by mass and height of generation of thecurrent (potential energy), efficiency of conversion from potential tokinetic energywithin the current (i.e. loss ofmomentumdue to friction-al processes both within the current and at its edges), and rate of atmo-spheric air entrainment. The rate of consumption of kinetic energy, thesolid mass partitioningwithin the current, and the rate of mass transferinto the pyroclastic deposits therefore control the PDC dynamics.Both the mass partitioning between underflow and phoenix plume,and the rate of kinetic energy consumption continuously change duringmotion, and this particularly occurs when: i) a slope change inducessedimentation (concave local curvature; Giordano and Dobran, 1994;Giordano, 1998; Bryan et al., 1998; Macias et al., 1998; Calder et al.,2000; Denlinger and Iverson, 2001; Saucedo et al., 2004); or ii) atmo-spheric air entrainment enhances mixing (i.e. acceleratingmovingmix-ture, convex local curvature; Branney and Kokelaar, 2002), or iii) a localchange in the substrate features (e.g. topographic jumps, surface rough-ness, standing water) affects the current's flow streamlines (Fisher,1990; Carey et al., 1996; Gurioli et al., 2002). It follows from theseconsiderations that particle volumetric concentration in PDCs is crucialin determining themain physical parameters of the flow, which are ve-locity, density, and clast-support mechanisms (Sparks, 1976;Middletonand Neal, 1989; Bonnecaze et al., 1993; Hallworth and Huppert, 1998;Branney and Kokelaar, 2002; Taddeucci and Palladino, 2002; Cao et al.,2003; Sulpizio et al., 2007; Sulpizio and Dellino, 2008; Dellino et al.,2010a), because the concentration affects mass distribution andfrictional processes (i.e. energy consumption) within the current. Parti-cle concentration in the pyroclastic mixture relates to the eruptionstyle (pyroclastic fountain or dome collapse, or radial expansion ofoverpressurized jet), the amount of solid and gas in the erupted prod-ucts, themechanical energy released at fragmentation, the block break-age during transport (Manga et al., 2011; Campbell et al., 2013), and the
abundance of accidental fragments (Sparks et al., 1997b; Dingwell,1998; Alidibirov and Dingwell, 2000; Buttner et al., 2006).
PDCs can be short-lived (highly unsteady) or relatively long-lived(sustained unsteady to quasi-steady) phenomena, and can be driveneither by magmatic or phreatomagmatic magma fragmentation(e.g. Cas and Wright, 1987; Carey, 1991; Branney and Kokelaar, 2002;Fig. 1). The duration of the current (sustained versus transient) dependsboth on total flow volume and volumetric flow rate at source, affectingthe depositional behaviour of PDCs. The latter can be inferred fromsedimentological analyses and lithofacies description (Branney andKokelaar, 2002; Sulpizio et al., 2007, 2010a).
Our understanding of PDC behaviour, from generation to deposition,derives from a multidisciplinary investigation spanning from directobservations and study of the pyroclastic geological record to the engi-neering of laboratory experiments and numerical simulations. As inother branches of Science, the direct observation of natural phenomenais the main tool to understand the governing physical processes. How-ever in the case of PDCs, the direct observation is limited by the hostilenature of the currents (Valentine, 1998a; Baxter et al., 2005), the unpre-dictability and limited forewarning of the eruptive event forming thecurrent, the dynamics of the event itself, and the logistical constraints(e.g. accessibility of eruptive site with appropriate instrumentation).As a result of all of these constraints, direct field-based observations ofnatural PDCs are generally incomplete and uncertain. Another sourceof natural data derives from the characterisation of PDC deposits inthe geological record, but the field data alone do not reveal all detailsof the currents. In principle, depositional processes can be inferredfrom the features of PDC deposits, but such inferences remain to bevalidated against direct observations of the actual phenomena. On theother hand, field data are essential and provide the measure againstwhich the applicability of observations from other sources (e.g. numer-ical simulations) must be ultimately assessed. These problems of acces-sibility and logistical field constraints are circumvented throughlaboratory experiments, because the case-study of physical processescan be repeatedly run. The knowledge of the initial and boundaryconditions for each run allows a direct correlation with the measurableexperimental outcomes. Themain disadvantage of such an investigationapproach is that a proper scaling of the experiments to nature is notstraightforward, because experiments are often engineered usingsynthetic (analogue) material that can be quite different from naturalpyroclastic material. Numerical simulations are valuable tools forunveiling the details of physical processes occurring in the opaque inte-riors of PDCs, making use of somewell-known laws of physics, althoughthe potential of computation is still far from reproducing the naturalcomplexity of such currents.
All of these considerations highlight that a multi-method approachis needed to improve our understanding of the physics of naturalPDCs, and to achieve significant scientific advancements in the state ofthe art. Generally, the observations of natural PDCs pose the scientificquestions, and the deposits suggest models guided by theory, whichneed to be validated through laboratory experiments. Finally, numericalsimulations attempt to replicate such physical models, and are to betested against actual field deposits in order to methodologically com-plete a full circle on PDC knowledge.
Several valuable reviews and books on PDC behaviour havebeen published in the last 25 years (e.g. Carey, 1991; Druitt, 1998;Freundt and Bursik, 1998; Freundt et al., 2000; Branney andKokelaar, 2002; Sulpizio and Dellino, 2008), with special emphasison field studies and small laboratory experiments. The tumultuousgrowth of PDC research in recent years, particularly in the fields ofnumerical simulations and large-scale laboratory experiments,calls for an updating of the previous work toward an improvementof our understanding of PDC physics. This review focuses on thestate of the art of PDC studies, bringing together field, laboratory,and numerical modelling approaches, and is organized in a seriesof sections, each illustrating the recent advancements of the

Fig. 1. Examples of generation of PDCs fromdifferent eruptivemechanisms. a)Dome collapse at Soufriere Hills volcano,Montserrat (photo fromMontserrat VolcanoObservatorywebsite);b) PDCs generated by partial column collapses during the September 23, 1984 eruption of Mayon volcano (photo from Newhall, USGS website); c) PDC generation by dome explosion atSoufriere Hills, Montserrat (photo fromMontserrat Volcano Observatorywebsite); d) radial expanding PDC generated during phreatomagmatic activity at Capelinhos, Azores (photo fromSan Diego State University website); e) generation of PDC by a lateral blast at the onset of May 18, 1980 eruption of St Helens volcano (photo from USGS website); f) example of PDCgeneration by continuous column collapse. The photograph is intended to show the mechanism, not the duration of the collapse (photo from the eruption offshore of Tonga on March18, 2009, photographer Dana Stephenson); g) example of PDC generation by boiling over of pyroclastic mixture. The photograph is intended to show the mechanism, not the durationof the collapse (photo details as for part f).
38 S. R. et al. / Journal of Volcanology and Geothermal Research 283 (2014) 36–65
different methods and investigation techniques, including a discus-sion on the open questions. Finally, a concluding paragraph is orga-nized around future research perspectives on PDC behaviour.
This review has not the presumption of being exhaustive of all theknowledge on PDCs, since the huge, and sometimes contradictory(sensu not exactly complementing to each other) literature prevents
any condensation of all theories and data in a single journal paper.This means that, due to available space, a number of potentially signifi-cant contributions so far are not mentioned, especially in the crucialfield of hazard assessment from PDCs. This review is also not fully im-partial, because in some cases it reflects the personal, still candid, viewof the authors on PDC behaviour.
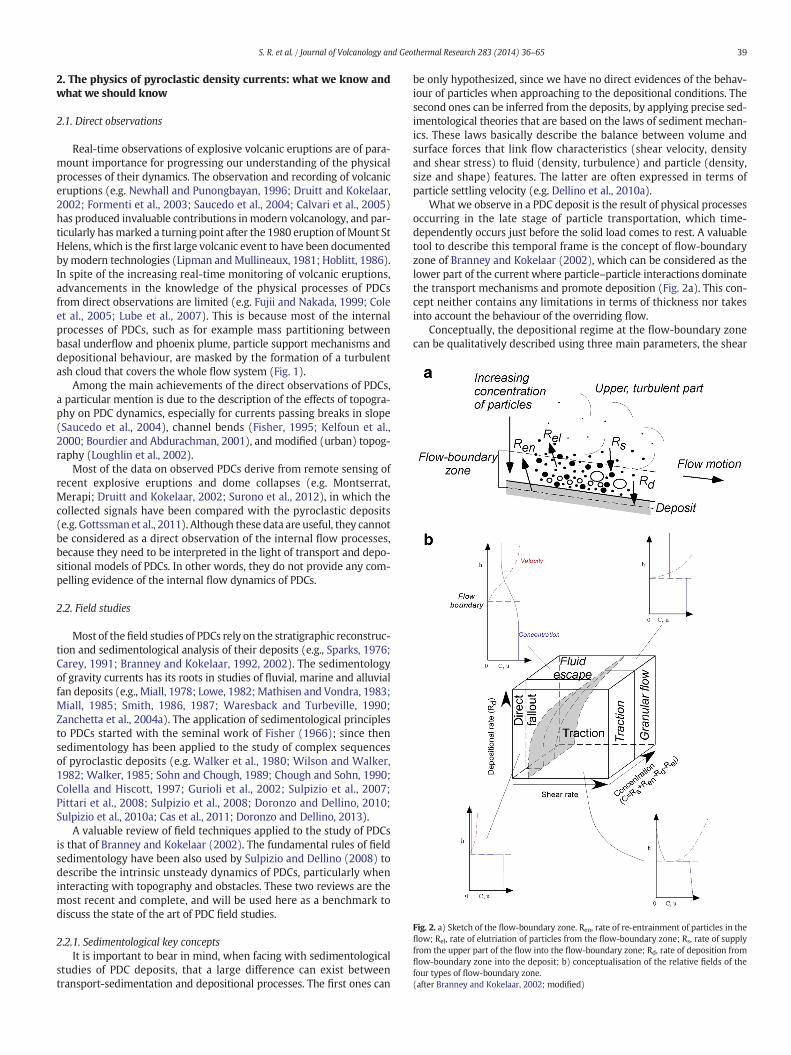
Fig. 2. a) Sketch of the flow-boundary zone. Ren, rate of re-entrainment of particles in theflow; Rel, rate of elutriation of particles from the flow-boundary zone; Rs, rate of supplyfrom the upper part of the flow into the flow-boundary zone; Rd, rate of deposition fromflow-boundary zone into the deposit; b) conceptualisation of the relative fields of thefour types of flow-boundary zone.(after Branney and Kokelaar, 2002; modified)
39S. R. et al. / Journal of Volcanology and Geothermal Research 283 (2014) 36–65
2. The physics of pyroclastic density currents: what we know andwhat we should know
2.1. Direct observations
Real-time observations of explosive volcanic eruptions are of para-mount importance for progressing our understanding of the physicalprocesses of their dynamics. The observation and recording of volcaniceruptions (e.g. Newhall and Punongbayan, 1996; Druitt and Kokelaar,2002; Formenti et al., 2003; Saucedo et al., 2004; Calvari et al., 2005)has produced invaluable contributions inmodern volcanology, and par-ticularly hasmarked a turning point after the 1980 eruption ofMount StHelens, which is the first large volcanic event to have been documentedbymodern technologies (Lipman andMullineaux, 1981; Hoblitt, 1986).In spite of the increasing real-time monitoring of volcanic eruptions,advancements in the knowledge of the physical processes of PDCsfrom direct observations are limited (e.g. Fujii and Nakada, 1999; Coleet al., 2005; Lube et al., 2007). This is because most of the internalprocesses of PDCs, such as for example mass partitioning betweenbasal underflow and phoenix plume, particle support mechanisms anddepositional behaviour, are masked by the formation of a turbulentash cloud that covers the whole flow system (Fig. 1).
Among the main achievements of the direct observations of PDCs,a particular mention is due to the description of the effects of topogra-phy on PDC dynamics, especially for currents passing breaks in slope(Saucedo et al., 2004), channel bends (Fisher, 1995; Kelfoun et al.,2000; Bourdier and Abdurachman, 2001), and modified (urban) topog-raphy (Loughlin et al., 2002).
Most of the data on observed PDCs derive from remote sensing ofrecent explosive eruptions and dome collapses (e.g. Montserrat,Merapi; Druitt and Kokelaar, 2002; Surono et al., 2012), in which thecollected signals have been compared with the pyroclastic deposits(e.g. Gottssmanet al., 2011). Although these data are useful, they cannotbe considered as a direct observation of the internal flow processes,because they need to be interpreted in the light of transport and depo-sitional models of PDCs. In other words, they do not provide any com-pelling evidence of the internal flow dynamics of PDCs.
2.2. Field studies
Most of thefield studies of PDCs rely on the stratigraphic reconstruc-tion and sedimentological analysis of their deposits (e.g., Sparks, 1976;Carey, 1991; Branney and Kokelaar, 1992, 2002). The sedimentologyof gravity currents has its roots in studies of fluvial, marine and alluvialfan deposits (e.g., Miall, 1978; Lowe, 1982;Mathisen and Vondra, 1983;Miall, 1985; Smith, 1986, 1987; Waresback and Turbeville, 1990;Zanchetta et al., 2004a). The application of sedimentological principlesto PDCs started with the seminal work of Fisher (1966); since thensedimentology has been applied to the study of complex sequencesof pyroclastic deposits (e.g. Walker et al., 1980; Wilson and Walker,1982; Walker, 1985; Sohn and Chough, 1989; Chough and Sohn, 1990;Colella and Hiscott, 1997; Gurioli et al., 2002; Sulpizio et al., 2007;Pittari et al., 2008; Sulpizio et al., 2008; Doronzo and Dellino, 2010;Sulpizio et al., 2010a; Cas et al., 2011; Doronzo and Dellino, 2013).
A valuable review of field techniques applied to the study of PDCsis that of Branney and Kokelaar (2002). The fundamental rules of fieldsedimentology have been also used by Sulpizio and Dellino (2008) todescribe the intrinsic unsteady dynamics of PDCs, particularly wheninteracting with topography and obstacles. These two reviews are themost recent and complete, and will be used here as a benchmark todiscuss the state of the art of PDC field studies.
2.2.1. Sedimentological key conceptsIt is important to bear in mind, when facing with sedimentological
studies of PDC deposits, that a large difference can exist betweentransport-sedimentation and depositional processes. The first ones can
be only hypothesized, since we have no direct evidences of the behav-iour of particles when approaching to the depositional conditions. Thesecond ones can be inferred from the deposits, by applying precise sed-imentological theories that are based on the laws of sediment mechan-ics. These laws basically describe the balance between volume andsurface forces that link flow characteristics (shear velocity, densityand shear stress) to fluid (density, turbulence) and particle (density,size and shape) features. The latter are often expressed in terms ofparticle settling velocity (e.g. Dellino et al., 2010a).
What we observe in a PDC deposit is the result of physical processesoccurring in the late stage of particle transportation, which time-dependently occurs just before the solid load comes to rest. A valuabletool to describe this temporal frame is the concept of flow-boundaryzone of Branney and Kokelaar (2002), which can be considered as thelower part of the current where particle–particle interactions dominatethe transport mechanisms and promote deposition (Fig. 2a). This con-cept neither contains any limitations in terms of thickness nor takesinto account the behaviour of the overriding flow.
Conceptually, the depositional regime at the flow-boundary zonecan be qualitatively described using three main parameters, the shear

40 S. R. et al. / Journal of Volcanology and Geothermal Research 283 (2014) 36–65
rate, deposition rate, and concentration (Fig. 2b; Branney and Kokelaar,2002). These concepts have been used to describe deposition of bothfully turbulent and granular flow-dominated small- to large-scale PDCs(Brown et al., 2007; Sulpizio et al., 2007; Ellis and Branney, 2010;Sulpizio et al., 2010a; Cas et al., 2011; Charbonnier and Gertisser, 2011;Doronzo, 2012; Brown and Branney, 2013), in which the thickness ofthe flow-boundary zone can range from several centimetres to meters,respectively.
The processes occurring in the flow-boundary zone determinelithofacies for the associated pyroclastic deposits, which can be de-scribed on the basis of non-genetic terms with reference to the sedi-mentary structures, grain-size, sorting and composition (Sohn andChough, 1989). Generally, lithofacies changes record a non-uniformityof the current with time and space, defining the so-called lithofaciesarchitecture of the pyroclastic successions. The study of lithofaciesarchitecture allows inference of the time- and space-dependent chang-es of the depositional regime, which can occur for a given PDC or for aseries of PDCs generated during the same eruption.
PDCs are intrinsically-heterogeneous media made of fluid and solidphases, and the multiphase flow motion results in the concurrent sup-port of the dispersed particles by both phases. The fluid phase supportsthe solid particles through differentmechanisms, which usually are sus-pension due to fluid turbulence, intermittent saltation, traction (slidingand rolling), and fluid support (fluidisation). The solid phase contrib-utes to supporting the particles themselves through particle–particlecollisions and matrix effects. Combinations of these different mecha-nisms acting on the particles are time- and space-dependent, resultingin variable shear intensities and solid concentrations as the particlessettle through the current and form the flow-boundary zone.
Fluid turbulence acts as a support mechanism for the particlesthrough fluid drag and lift forces (Fig. 3a), and is effectivewhen the vol-umetric particle concentration is less than a few volume% (dilute PDCs).
Solid particles in a fully turbulent PDC are subjected to vertical seg-regation, implying that particles with different hydraulic propertiescan occupy three partially-overlapping depths within the current,according to their main transport/support mechanisms: suspension,intermittent suspension and traction (Middleton and Southard, 1984;Fig. 3b, c, d, e). Whether a given particle pertains to one or another ofthese different support mechanisms can be assessed in sedimentmechanics through a dimensionless quantity, the Rouse number (Pni;Rouse, 1939; Valentine, 1987), which is defined as the ratio betweensettling and shear velocity:
Pni ¼ wi=ku� ð1Þ
where wi is the particle settling velocity for a given grain-size, k is thevon Karman's constant (0.4), and u* is the shear flow velocity. LowRouse numbers (Pni ~ b 0.5) characterize smaller and/or lighter particlesthat can be efficiently transported in suspension by fluid turbulence,whereas Rouse numbers N 2.5 characterize coarser and/or heavier parti-cles that cannot be transported by fluid turbulence. It is therefore clearfrom Eq. (1) that turbulence can only transport in suspension those par-ticles with low terminal velocities (smaller and/or lighter), meaningthat the grain-size fully supported by turbulence never exceeds that ofash (up to fine lapilli for very intense currents). For values of Pni around2.5 the particles can slide and roll over the deposit interface (traction;Middleton and Southard, 1984). Sliding and rolling processes are verycommon at the base of fully dilute and turbulent PDCs, but can alsooccur in more concentrated PDCs, where large blocks can roll at theflow-boundary under the drag force exerted by the overridingflow. Par-ticles rolling under the effect of fluid drag in turbulent PDCs can result inan alignment of clasts and/or in crudely stratified layers with imbrica-tion of the larger clasts (traction carpet; Sohn, 1997; Dellino et al.,2004; Pittari et al., 2008; Fig. 3b). For values of Pni between 2.5 and0.5 the particles move under the effect of fluid turbulence by intermit-tent suspension, and form the saltation population (Fig. 3c). This occurs
because turbulence leads tofluctuations in thenear-bed velocity, in turnleading to fluctuations of the forces acting on the particles in the basalpart of PDCs (Schmeeckle andNelson, 2003). Besides theRousenumber,a general dimensionless relation characterising the limiting conditionsfor the existence of the saltation population can be written as(Raudkivi, 1990):
F Re�p; τ�� �
¼ 0 ð2Þ
where Rep* = u*dp/v denotes the particle Reynolds number, dp isthe representative (mean) diameter of entrained particles, and v is thefluid kinematic viscosity. The term τ*=u*2 / (gRdp) is the dimensionlessbed shear stress (i.e. Shields' stress), where R= (ρs− ρ) / ρ denotes thesubmerged specific density, g is the acceleration due to gravity, and ρsand ρ are the entrained particle and fluid density, respectively. Eq. (2)can be used to represent the dimensionless limit for the particles to beentrained into a suspension that lies over a granular bed (Niño et al.,2003). In fact, u* is ameasure of turbulence intensity in the near-bed re-gion, whereas τ* can be interpreted as a measure of the ratio of turbu-lent lift to gravitational forces acting on the particles.
Particles that are not supported by turbulence can be transportedin the flow-boundary zone under fluid escape- and granular flow-dominated regimes (Fig. 3f, g, h, i; Branney and Kokelaar, 2002).
Gas fluidisation has been considered for a long time to be one of themain particle support mechanisms in PDCs (Druitt, 1998; Freundt andBursik, 1998; Giordano, 1998), and is frequently invoked to explainthe mobility of concentrated PDCs and some characteristics of theirdeposits, such as gradation, sorting and presence of elutriation pipes.Several fluidisation mechanisms have been hypothesized to actin PDCs, and exhaustive reviews of these mechanisms can be foundin the literature (Sparks, 1976, 1978; Wilson, 1980; Carey, 1991;Branney and Kokelaar, 2002). The escaping fluid supplies support tothe particles; however this effectively works only for those particleswith a settling velocity comparable to or lower than the upward gas ve-locity (e.g. Roche et al., 2004; 2010). Therefore, PDCs can be only partial-ly fluidized due to the wide spectra of grain-sizes that are typical ofexplosive volcanic eruptions. Particles with a settling velocity lowerthan the escaping fluid velocity are elutriated, whereas those withhigher settling velocity sink to the base if the particle density is greaterthan that of the surroundingmedium (multiphase flow) (Fig. 3g). PDCsare usually density-stratified, and the larger particles can be supportedby the lower and denser part of the current in a process known as ma-trix support. The pressure dropwith flow height induced by fluidisationhas been demonstrated to be directly proportional to the escaping gasvelocity and inversely proportional to the porosity of the particulatethrough the gas flow (Ergun equation; Roche et al., 2004). This impliesthat fines-rich grain-sizes (low porosity) and/or large amounts of gascontent/generation (high pore fluid pressure and/or escaping gas veloc-ity) within a PDC are favourable conditions for the development of afluid-escape regime. Deposits of PDCs dominated by fluid-escape re-gimes are fines-rich and usually show poor or absent grading of largerparticles. On the other hand, upward increases in the concentration oflarge pumice and/or lighter clasts can occur due tofloating processes re-lated to the density contrast between particle and matrix (e.g. normalgrading of lithic clasts and reverse grading of pumice).
Concentrated PDCs with fines-poor flow-boundary zones and/orwith entrapped fluid are dominated by granular flow depositional re-gimes (Fig. 3h, i), and in such cases particle support must be describedusing the laws of granular matter physics (Campbell, 1990; Iversonand Vallance, 2001). For example, in a rapid gravity-driven shearingmass of sediment (i.e. granular flow), the repulsion force originated byparticle–particle collisions and vibrations causes motion in each direc-tion, irrespective of the streamwise shear flow direction of the wholecurrent. Particle vibration can be considered as an analogue for the ther-mal motion of molecules, which is known as granular temperature in

Fig. 3. Different sediment support mechanisms and related deposits. a) Different mechanisms of fluid support of particles with different shapes in a diluted, fully turbulent PDC.(after Branney and Kokelaar, 2002; modified); b) theoretical mechanism of formation of lithofacies lensL(n,i) at the very base of the current driven by fluid drag; c) effect of fluid dragand fluid lift on saltation and rolling mechanisms of particle transport (lithofacies xsA); d) gentle settling (direct fallout regime) of fine particles from the ash cloud that accompaniesthewaningphase of the current (lithofaciesmaccrA); e) deposit left by a dilute, fully turbulent PDCof the Pollena eruption (AD472, Somma-Vesuvius, Italy; Sulpizio et al., 2007); f) depositof a PDCwith a flow-boundary zone dominated by fluid escape regime; g) sketch of mechanisms of particle support and segregation for a flow-boundary zone dominated by fluid escaperegime (from Sulpizio andDellino, 2008); h) deposit of a PDCwith a flow-boundary zone dominated by granular flow regime; i) sketch of mechanisms of particle support and segregationfor a flow-boundary zone dominated by granular flow regime; l) deposits from a flow-boundary zone dominated by direct fallout regime, for both lapilli (facies mL) and ash (facies mA)grain sizes;m) generalisation of theflowboundary zone concept to deposition from a sustained column responsible of deposition of faciesmL; n) sketch ofmechanisms of particle supportand segregation for a flow-boundary zone dominated by direct fallout regime in a diluted, fine-grained PDC.
41S. R. et al. / Journal of Volcanology and Geothermal Research 283 (2014) 36–65
the kinetic theory of gases (Savage, 1983, 1984; Iverson, 1997). Similar-ly to thermodynamic temperature, the granular temperature exerts apressure and governs the transfer of mass and momentum. However,the granular temperature cannot auto self-sustain because particle col-lisions are inelastic andmechanical energy dissipates as thermodynam-ic heat. This implies that the granular temperature is maintained byconversion of the kinetic energy intomechanical energy during themo-tion of the granular mass during motion. The granular temperature
varies as a function of squared shear rate of the granular mass(Campbell and Brennen, 1985), and is influenced by the slope angleand the shear stress exerted by the more dilute upper part of the flow.
Pressure associated with granular temperature is called dispersivepressure (Bagnold, 1954), and causes inflation of the whole granularmass. At high granular temperatures, the dispersive pressure can main-tain the granular mass in a liquefied state, while an inflation of such amass promotes particle segregation due to kinetic sieving. Kinetic

42 S. R. et al. / Journal of Volcanology and Geothermal Research 283 (2014) 36–65
sieving promotes the migration of smaller particles toward the base ofthe current because they can more easily fall down the inter-granularvoids between adjacent larger particles (Fig. 3i). This induces an appar-ent migration of the coarser particles toward the top of the flow-boundary zone, which is a process also promoted by kinematic squeez-ing. The latter is undergone by the larger clasts as they more frequentlycollide to each other with respect to smaller particles (Savage and Lun,1988; Sohn and Chough, 1993; Le Roux, 2003; Fig. 3i).
Currents dominated by mechanisms of granular temperature arecalled non-cohesive debris flows (Postma, 1986), and can be classifiedas: (i) true grainflows, in which the interstitial fluid has a negligible ef-fect on the physical state of the granular mass; and (ii) modifiedgrainflows (Lowe, 1982), in which the physical characteristics of themoving granular mass are modified by the interstitial fluid (Iversonand Vallance, 2001). The wide spectrum of PDCs can contain both ofthese end-members, but modified grainflows are more common dueto the abundance of gas in pyroclastic mixtures.
In PDCs with direct fallout-dominated depositional regime particlesare deposited with a prevalent vertical motion and negligible lateraltransportation, following the settling velocity vector (Fig. 3l, m, n).Direct fallout processes require a sufficiently dilute lower part of thecurrent characterized by low velocity able to prevent any substantialgranular interactions or tractive processes. The extreme case of applica-bility of this type of flow-boundary zone is that of centimetre- tometer-thick pyroclastic fallout deposits emplaced from eruptive columns andumbrella clouds with heights up to tens of kilometres (Sulpizio andDellino, 2008; Fig. 3 m). Currents with a flow-boundary zone sufficient-ly slow and dilute to be dominated by direct particle fallout can developin the late stage of PDC passage, or when the finest part of the phoenixplumemoves by advection under the effects of low-atmosphere (shear)winds (Fig. 3n). Such a flow-boundary zone has sharp rheologicaland concentration interfaces, and shows a relatively uniform velocityprofile (Fig. 2b). The associated deposits are generally massive dueto the absence of any segregation mechanisms, and the occurrenceof accretionary lapilli is common (Rosi, 1992; Gilbert and Lane, 1994;Schumacher and Schmincke, 1995; Brown et al., 2012).
2.2.2. Extraction of physical data from PDC deposits using sedimentologicalmodels
The reconstruction of the physical parameters of a current from thecharacteristics of its deposits is one of themain topics of sedimentology(e.g. Miall, 1978). In volcanology, the knowledge of the fluid dynamicbehaviour of PDCs is important to quantify their destructive power,and to predict the areas potentially subject to flow invasion. In doing
Fig. 4. Schematic representation of themain features of a dilute pyroclastic density current. a) P(from Sulpizio et al., 2007); b) cartoon showing the passage between the basal coarse layer andparticles vs. flow height; u(y) = velocity vs. flow height; ρf = flow density; y0 = reference le(from Dellino et al., 2008)
so, a significant contribution can be given to risk assessment, for exam-ple, by the calculation of flow dynamic pressure, Pdyn = 1/2ρf u2, whereρf is the flow density, and u is the flow velocity. The dynamic pressure,which is ameasure of the lateral stress that PDCs can exert on structureslike buildings (Valentine, 1998a,b; Doronzo, 2013), allows a quantifica-tion of the expected damage (Spence et al., 2004). The calculation ofparticle volumetric concentration, C, can be also useful when assessingthe risk of PDCs, as this parameter can pose a threat to the population.In fact, hot volcanic ash is lethal when people are exposed even to lowconcentrations of such currents (Baxter et al., 1998; Horwell andBaxter, 2006). In order to obtain these parameters from PDC deposits,we can use some of the common sedimentological principles developedin fluvial sedimentology. Their crude application to PDCs is limited bythe sometimes-significant differences of internal flow dynamics andboundary conditions changing from underwater to atmospheric flow.In particular, PDCs have a peculiar partition of the flow density, with re-spect to other sediment-laden gravity currents, depending on particleconcentration profile and density contrast between particles and hotgas (Fig. 4). For these reasons, methods for calculating some of the fun-damental parameters of PDCs like flow velocity and density from fielddata are few, and,when existing, they are usually not tested and validat-ed against laboratory experiments or observations (e.g. Lajoie et al.,1989; Brissette and Lajoie, 1990; Manville et al., 2002; Burgisser andGardner, 2006; Scolamacchia and Schouwenaars, 2009). An exceptionis themethod proposed by Dellino et al. (2008) for dilute and turbulentPDCs, which has been validated through large-scale experiments(Dellino et al., 2010a). This method is based on the turbulent boundarylayer shear flow approximation (Middleton and Southard, 1984;Furbish, 1997; Schlichting and Gersten, 2000) for dilute PDCs(Valentine, 1987; Dellino and La Volpe, 2000; Dellino et al., 2004), solv-ing for a three-equation system in which the unknown parameters areparticle concentration (C), flow velocity (u), and mixture density (ρf)as a function of flow height (Fig. 4). The concentration can be calculatedusing the Rouse equation for stratified sediment-laden flow (Rouse,1939):
C yð ÞC0y0
Htot−y0
Htot−yy
� �Pnð3Þ
defining particle volumetric concentration (C) as a function of flowheight (y), with respect to a reference level (y0) at which concentration(C0) is known, where Htot is the total flow thickness (Fig. 4b). The refer-ence level is generally assumed to be very close to the ground surface,where particle concentration is close tomaximumpacking (about 75%).
icture of the deposits of a dilute and turbulent PDC of Pollena eruption at Somma-Vesuviusthe upper stratified layer. τ= shear stress;α= slope angle; C(y)= concentration of solidvel of C0; Hsf = height of the shear flow; Htot = height of the flow.

43S. R. et al. / Journal of Volcanology and Geothermal Research 283 (2014) 36–65
The mixture density (ρf) can be related to the gas density (ρg), theparticle density (ρs), and the particle concentration (C) by:
ρ f ¼ 1−Cð Þρg þ C ρsð Þ: ð4Þ
The average velocity profile of the turbulent boundary layer shearflow can be approximated by various equations, and the most widelyused for practical applications in fluid dynamics is the “law of thewall” (Furbish, 1997):
u yð Þu�
¼ 1kln
yks
þ 8:5 ð5Þ
where ks is the roughness parameter proportional to the height ofroughness elements standing on the ground surface passed by theflow. Eq. (5) refers to the lower, still fully turbulent portion of thecurrent, and can be applied with a good approximation to the shearflow of dilute PDCs with equilibrium boundary layer. It is worth men-tioning that in turbulent currents the velocity continuously fluctuatesaround a statistical average, and these fluctuations are responsible forthe turbulent stress, the so-called Reynolds stress, that holds particlesin suspension. For practical purposes, Eq. (5) can be always consideredas a good approximation if one is interested in the macroscopic behav-iour of the current, and is not very much concerned with velocityvariations over the very short timescales of fluctuating components(typically much less than 1 s; Dellino et al., 2008). This averaging proce-dure is also implemented in numerical modelling, and is defined as theRANS (Reynolds Averaged Navier–Stokes) approach. The original meth-od was developed for deposits both with the coexistence of a tractioncarpet at the base and stratified deposits on top (see basal part ofFig. 4; Dellino et al., 2004), but was also successively modified solvingfor the principle of hydraulic equivalence applied to components ofdifferent densities, such as for example femic crystals and pumicefragments (Dellino et al., 2008). Results of these methods are reportedas a probability function of the flow variables, taking into accountthe uncertainty of the values that result from the relatively large vari-ability of particle density, shape and grain-size of the PDC deposits.Challengeably from numerical simulations, Doronzo et al. (2012) havefound the turbulent boundary layer theory to be applicable, from equi-librium to separated boundary layer, to that portion of any PDCs eruptedfrom stratovolcanoes above the basal underflow.
It is also worthy of mention that these methods can only be appliedto dilute and turbulent PDCs, whilemethods able to extract the physicalparameters of concentrated PDCs from the deposits are as of today notavailable.
2.3. Laboratory experiments
Since Galileo, experiments are central in scientific methodology,defining the fundamental tool to decipher and reproduce naturalphenomena. They are used for four primary purposes: i) to provide asystematic observation of the processes; ii) to determine the values ofkey parameters; iii) to test hypotheses and theoretical models; andiv) to validate computationalmodels. Experiments need to be reproduc-ible and scalable to reality in order to be considered as scientificallyvaluable.
When compared with other branches of Science, experimentson PDCs can be considered as in their infancy, although the contribu-tion they have provided to our understanding of PDCs has become ofparamount importance in the last few years (e.g. Roche et al., 2004;Dellino et al., 2007, 2010a,b; Roche et al., 2010; Girolami et al., 2011).Small-scale laboratory experiments date back to the '80s and '90s(Wilson, 1980; Woods and Caulfiled, 1992), and were mainly aimed atunderstanding the contribution of fluidization in PDC dynamics, and atanalysing the influence of topographic obstacles on flow behaviour.However, a significant issue for small-scale laboratory experiments is
that of finding a proper scale with respect to natural PDCs. As it iscommon in many natural systems, PDCs involve processes that operateover a range of spatial- and time-scales much wider than that measur-able through small-scale laboratory experiments (Burgisser et al.,2005). As an example, when reproducing dilute and turbulent PDCs(e.g. Andrews and Manga, 2012), the small scale impacts the Reynoldsnumber by keeping it far from the range of natural phenomena.This means that for any laboratory experiment, a careful dimensionalanalysis is needed in order to understand to what extent data andmodels can be extrapolated for the natural lengths and timescales.When considering the strengths and limitations of the experimental ap-proach, it is also important to distinguish experiments that use naturalmaterials or synthetic materials. The latter are the so-called analogues.Natural materials have the advantage of possessing the same physicalcharacteristics as the particles involved in real PDCs, simplifying thescaling problem of the experiments when extrapolating to reality. Syn-thetic materials have the advantage of possessing known physical char-acteristics, usually having a simple shape that allows better constrainingthe physical variables of the experiment.
The gap between the laboratory and real processes is evenlarger in experiments that use fluids of different densities as a proxyof PDCs penetrating the atmosphere (Woods and Caulfiled, 1992),which are not analogous to the multiphase gas–particle mixture ofnatural PDCs.
Only very recently, experiments at a larger scale have been carriedout, resulting in a fluid dynamic regime comparable to the naturalcurrents, and leaving measurable deposits on the ground (Dellino et al.,2007; Sulpizio et al., 2009; Dellino et al., 2010a,b, 2011; Dioguardi et al.,2013; Dellino et al., 2014). These have been the first experiments at ascale able to capture most parts of the turbulence range of naturalPDCs, and have been carried out using real pyroclastic particles, leavingmeasurable deposits on the ground including facies variations (Dellinoet al., 2007, 2010a).
The experiment design (Dellino et al., 2007; Fig. 5a) consists of aconduit that is loadedwith up to 500 kg of pyroclastic material, rangingin size from fine ash to lapilli. The apparatus is modular and consists of:i) interconnected gas bottles, serving as a storage compartment; ii) ahigh-pressure section, consisting of steel-reinforced rubber hoses each30 m long, with 8-mm internal diameter; iii) a rapid-compressionsection, consisting of steel-reinforced rubber hoses each 1.5 m long;and iv) a low-pressure section consisting of an up to 3.2-m-longstainless-steel conduit, which is made up of a stack of connected sectorsmounted on a massive-steel base plate, which connects to the rapidcompression section via cone shaped gas injectors (Fig. 5). Experimentsare performed both at ambient temperature and up to 300 °C. As the gasphase nitrogen is used as to avoid oxidation of the metallic parts of thesetup.
Upon firing of the trigger, a gasflow is established between the high-pressure section, the rapid compression section and the low-pressuresection (the conduit), and the mechanical coupling of the pressurizedgas to the pyroclastic material filling the conduit is realized. Thepressure quickly reaches a peak value in the compression section, andthen it stays quite constant for a brief period of time before a slow de-compression phase is registered (Dellino et al., 2010a). In this phase,the pyroclastic material starts moving as a granularmass, which succes-sively mixes with gas, and is expelled as a two-phase mixture out of theconduit. Depending on the balance between the pressure of the gasvolume in the high-pressure section, the mass of pyroclastic material,and the length of the conduit, various eruptive regimes are replicated,from plumes to collapsing pyroclastic fountains and to overpressurizedjets. In the following, wewill describe the results obtained with collaps-ing columns (pressure-balanced experiments) andoverpressurized jets,which are those generating experimental PDCs. The complete processleading to the formation of the gravity current can be monitored fromthe formation of the pyroclastic fountain to the development of a lateralshear current on the ground (Fig. 2a–e).

Fig. 5. The experimental facility for generation of laboratory PDCs at University of Bari, Italy. a) Sketch design of the various parts; b) photograph of th gas-storage compartment; c) pho-tograph of the pit with solenoid valves, and the base of the conduit with tennis balls on top of nozzles for scale; d) general view of the conduit with four sectors piled up. The blue plasticsheets for sampling and the scale-rod are visible.(from Dellino et al., 2007; modified)
44 S. R. et al. / Journal of Volcanology and Geothermal Research 283 (2014) 36–65
A dense collapsing column forms when a pressure-balanced flow(pressure of the issuing gas–particle mixture equal to atmosphericpressure) is not subject to significant atmospheric air entrainment, sothat particle volumetric concentration remains high and a convectiveplume cannot form (Fig. 7). Given the high density, the column collapsestarts at the height where the source kinetic energy is completely trans-formed into potential energy, following quite well the Bernoulli's equa-tion. The exit conditions leading to this type of collapsing columns areregulated by the densimetric Froude number (Dellino et al., 2014):
Fr0 ¼ w� ffiffiffiffiffiffir0g
0p ð6Þ
where w is the conduit exit velocity, r0 is the vent radius, and g′ is themodified gravity (g′ = (ρ′ − ρ)g/ρ), where ρ′ is the gas–particle mix-ture density, ρ is the atmospheric density, and g is the gravity accelera-tion. For Fr′ b 3, air entrainment is not significant and collapsingcolumns form, while for Fr′ N 3 convective plumes are generated. Theparticle volumetric concentration is high at the impact on the ground,meaning that the mixture is characterized by a high vertical mass flowrate (Fig. 7), and has a high sedimentation rate responsible for the for-mation of thick, massive poorly sorted deposits (Fig. 8). The grain-sizedistribution and componentry of these massive layers are identical tothose of the initial pyroclastic load standing in the conduit on the baseplate (Fig. 8). Thismeans that no significant transportationmechanismsare able to sort the original grain-size distribution in the collapse zone,which is compatible with massive deposition from a highly concentrat-ed thin flow. After the gas–particle mixture hits the ground, the verticalcollapsing flow is transformed into a lateral current that, a little bitfarther from the impact zone and thanks to the high shear stress, rapidlyaccelerates getting thicker due to air ingestion (Figs. 6, 7). The currentthen develops full turbulence, which helps taking the fine ash andparticles in suspension,while themedium ash particlesmove by traction.The experimental deposits acquire the typical asymmetrical well-sortedstructures (Fig. 8) generated by traction-suspension mechanisms,
which are related to the passage of the turbulent sediment-laden current.The grain-size of the deposits is characterized by the presence of two dis-tinct particle modes (Fig. 8), the coarser one representing the tractionprocess, and the finer one representing the suspension process. The cur-rent expansion continues until deposition leaves a residual (surviving)flow with such a low particle concentration (i.e. low density) that it de-couples from the ground lofting into the atmosphere as a phoenix cloud(Figs. 6, 7). Sensors placed at various heights in the current path have re-vealed how the flow is stratified, with steep gradients of flow velocity(increasing-upward) and concentration (decreasing-upward) as expect-ed for natural sediment-laden density currents. The combination of thesetwo gradients also leads to a strong gradient of flow dynamic pressurethat decreases upward (Dellino et al., 2010b). Fromafluid dynamic view-point, the lateral development of the current is similar to the evolution ofa turbulent boundary layer shear flow (Furbish, 1997), starting as a thinlaminar flow, and rapidly getting thicker (after dropping substantialmaterial in the collapse zone) and then developing turbulence. Fromthe deposit viewpoint, the lateral transition from a massive facies to astratified one showing traction features can be interpreted as the evolu-tion of the current from a concentrated to a dilute flow, decreasing theparticle concentration with distance from the collapse zone.
Overpressurized jets form when the gas–particle mixture has amuch higher pressure than the atmosphere at conduit exit (Fig. 9;Sulpizio et al., 2009; Dellino et al., 2010b). This leads to a suddendecom-pression of the jet at the vent, which transforms into a radiallyexpanding cloud (Fig. 9) that, due to the strong dilution related to gasexpansion, is subject to a strong reduction of the volumetric particleconcentration as comparedwith conduit exit. As a consequence, a dilutegas–particle mixture moving on the ground as a radial ash cloud is gen-erated (Fig. 9). The sudden jet decompression is a discrete, impulsiveevent, and cannot sustain a continuous, prolonged flow-feeding col-lapse. The radially expanding cloud is therefore short-lived, and rapidlydeposits its solidmaterial. In the case of overpressured jets, the PDCs arefed by a smaller amount of solidmaterial, meaning that the currents areshorter and travel less than the currents generated from the collapse of a

Fig. 6. Time-evolution of a typical collapsing column from large-scale experiments. a) Diagram showing data recorded by sensors during a typical collapsing column run. One volt corre-sponds to 100 bars in the pressure sensor data curve; b) formation of a vertical gas–particle mixture column. Frame shot 0.4 s after triggering; c) expansion of a column over the vent.Frame shot 0.9 s after triggering; d) column collapse. Frame shot 2.3 s after triggering; e) formation of a shear current. Frame shot 2.8 s after triggering; f) lateral development of ashear current and lobe formation. Frame shot 4.1 s after triggering.(from Dellino et al., 2007)
45S. R. et al. / Journal of Volcanology and Geothermal Research 283 (2014) 36–65
dense column. Currents formed by overpressured jets mimic the behav-iour of natural base surges, which are frequently associated with shal-low phreatomagmatic events.
Themain difference for an overpressured jet, with respect to a densecollapsing column, is the absence of a massive facies in the collapsezone, and this is in agreement with the fact that the gas–particlemixture approaches the ground as an already diluted cloud. The lateralevolution and turbulence development is similar to that of the dense
collapsing column, and also the tractive structures of the deposits aresimilar (Fig. 8e, f), although the dispersal area is smaller than in thecase of PDCs from pyroclastic fountaining.
The similarity between PDCs and turbulent boundary-layer shearflows (Fig. 10a) allows linking the particle features to flow characteris-tics and to infer the current flow-dynamic regime from deposits. Inparticular, the experiments results have been used to validate the sedi-mentologicalmodel proposed by Dellino et al. (2008), by comparing the

Fig. 7. Sequential images depicting the injection into the atmosphere and collapse of a pressure-adjusted pyroclastic jet.(from Sulpizio et al., 2009)
46 S. R. et al. / Journal of Volcanology and Geothermal Research 283 (2014) 36–65
outputs from analysis of the particles modes related to traction at thebase of the current (coarser mode) and turbulent suspension (finermode) extracted from deposits with data from sensors (Dellino et al.,2010b). Results show that flow data reconstructed by the deposit
features agree well with the actual measurements from the sensor net-work (Fig. 10b). This experimental validation allows using with confi-dence deposit data for reconstructing the flow characteristics, andimpact parameters, of diluted to intermediate PDCs at active volcanoes

Fig. 8.Deposits of a PDC generated by a pressure-adjusted column collapse. a) Overview of the deposits from proximal to distal; b) grain size histograms showing variations from proximalto distal samples. The upper right histogram shows the bulk grain size of the mixture used for the experiment; c) near impact deposits left by the main collapse in pressure-adjustedpyroclastic fountaining experiment. Note the hummocky, thick, and massive aspect of the deposits. Tennis balls are for scale; d) near impact deposits left by the collapses inoverpressurised jet experiment. Note the thin deposits even very close to the impact area; e) general view of the dispersal area of experimental PDC deposits; f) deposit showing thedowncurrent development of tractional structures.
47S. R. et al. / Journal of Volcanology and Geothermal Research 283 (2014) 36–65
(Fig. 11), as it has recently been done for PDCs frompast explosive erup-tions of active volcanoes of Southern Italy (Aeolian Islands, Dellino et al.,2011; Vesuvius,Mele et al., 2011; Sulpizio et al., 2010a), and PhlegraeanFields (Dellino et al., 2004). Convergence of results from experimentsand natural deposits also justifies the application to real eruptions ofthe previously described conceptual model of facies transition andflow stratification in the case of currents formed from dense collapsingcolumns and overpressured jets.
As of today, published results for similar large-scale experimentsdo not exist for concentrated PDCs dominated by particle–particle inter-actions. Most of the experiments using granular material have been car-ried out using small-scale laboratory systems (Felix and Thomas, 2004;
Cagnoli and Romano, 2010; Roche, 2012;Manzella and Labiouse, 2013),similar to those largely used to study the flow behaviour in granularmatter physics (e.g. GDR MiDi, 2004 for a review). These experimentshave been used to explain some characteristics of natural concentratedPDCs (e.g. Roche et al., 2010; Girolami et al., 2011; Roche et al., 2013),although the dynamics of granular flows at laboratory scale (especiallyat miniature one) can be quite different from actual gravity currents(Massey, 1983; Davies and McSaveney, 1999; Denlinger and Iverson,2001; Iverson and Denlinger, 2001; Iverson et al., 2004).
Large-scale equipments to study concentrated PDCs have beenrecently engineered (Bartali et al., 2012; Cronin et al., 2013), or areunder construction (Valentine et al., 2011a). The preliminary results

Fig. 9. Sequential images depicting the injection into the atmosphere and collapse of an overpressurised pyroclastic jet.(from Sulpizio et al., 2009)
48 S. R. et al. / Journal of Volcanology and Geothermal Research 283 (2014) 36–65
are yet to be consolidated through accurate experiments, but lookpromising for future improvements of our knowledge on the dynamicsof concentrated PDCs (Lube et al., 2013; Sulpizio et al., 2013). These ex-perimental systems will be illustrated in the conclusive section of thiswork, dealing with future research perspectives on PDCs.
2.4. Numerical simulations
In principle, PDC processes and interactions ought to be deductiblefrom the laws of physics, which is the essential precept that underliesmuch theory and numerical simulation. The natural system of PDCs is

Fig. 10. a) Close-up view of an experimental current taken at the location where pressuresensors were set. The velocity structure of the current is marked, as also shear currentheight (Hsf), and total flow thickness (Htot). In the inset the signal from one pressuresensor is shown; b) diagrams representing the statistical range of model solutions fromthemodel of dynamic pressure (Dellino et al., 2008) as comparedwith data from pressuresensors. For ease of visualization, height normalised to total flow thickness is plot alongthe vertical and dynamics pressure is plot along the horizontal. The solid line representsthe average model solution, the dashed line the maximum solution, and the dotted linethe minimum solution. Dots represent the value of dynamic pressure as measured bysensors during experimental runs.(from Dellino et al., 2010a)
49S. R. et al. / Journal of Volcanology and Geothermal Research 283 (2014) 36–65
however so complex that a number of simplifications and assumptionsare necessary to keep the underlyingmathematics human and tractable,whichmeans that some key parameters need to be obtained from labo-ratory experiments. Vice versa, mathematics alone, even themost com-plex, may not be worthy if that is not subject to empirical falsification.
Also, it is important to stress that a full validation of the numericalmodels can be only provided by comparison with field observationsand deposits, in keeping with modern Science.
Given the compressible behaviour of theflowwhen gas and particlesinteract with each other, these currents can be categorized as externalcompressible flow, even when passing drainage systems on the flanksof volcanoes as open channel flows (Johnson, 1998).
Numerical simulations are as of today less efficient, in addressingand solving for the physics that governs PDC dynamics, than field andscaled experimental investigations. Indeed, simulations are not de-signed in engineering to solve, but instead to simulate mathematicalequations, such as Navier–Stokes, that cannot be analytically solved.At the same time, in terms of assessing the hazard, andmapping the as-sociated risk, numerical simulations are necessary to reconstruct, andthen predict, the general dispersal of PDCs in the environment as theymove in uncontrolled conditions, and most importantly to quantifythe flow parameters, this flow being opaque and inaccessible (Dellinoet al., 2004; Esposti Ongaro et al., 2012). For all these reasons, numericalsimulations have been and are extensively used in volcanology to ap-proximate the PDC dynamics, numerical standing for algebraic ordiscretized, or more generally approximating the equations that governthe flow physics. On the other hand, the latter has not been completelyunderstood or described yet, resulting in some assumptions basedon theoretical models of PDCs, which are also necessary (Sparks et al.,1997a; Burgisser and Bergantz, 2002). In this section on numerical sim-ulations, the history and development of PDC modelling, whichcomputationally-speaking has started in the early eighties (Malin andSheridan, 1982; Sheridan and Malin, 1983), then greatly improvedand expanded thanks to the tumultuous computational growth(Valentine and Wohletz, 1989; Dobran et al., 1993; Neri et al., 2003;Pitman et al., 2003; Dartevelle, 2004; Todesco et al., 2006; Dufek andBergantz, 2007; Esposti Ongaro et al., 2008; Doronzo et al., 2011;Valentine et al., 2011b), are not exactly mentioned in chronologicalorder. Instead, the different models are introduced in light of the previ-ous sections on field and experimental studies, in order to provide acomplementary tool that contributes to the PDC dynamics from theviewpoint of numerical modelling. A recent discussion about the phys-ics and mathematics that describe the PDC dynamics can be found inRoche et al. (2013).
Numerical simulations of PDCs started as a useful tool to assist haz-ard and risk mapping, and the first ones were based on the energy lineconcept, which basically states that the flow runout distance dependson the height of volcanic column collapse generating the flow (Malinand Sheridan, 1982; Sheridan and Malin, 1983). The principle is thatof the conversion of potential energy (through height) into kinetic ener-gy (through distance), the energy line delineating a cone in threedimensions with height/distance ratio as slope. This slope would repre-sent a sort of friction parameter, and the intersection of the energy linewith the morphology gives the maximum runout distance of the simu-lated flow. Later and still today, this tool has developed and been used inthe broad context of granular mass flows (Denlinger and Iverson, 2001;Iverson andDenlinger, 2001; Lube et al., 2007; Kelfoun et al., 2009; Lubeet al., 2011), which are generally recognized to describe fairly well thebasal part of PDCs. Indeed, these currents are stratified by velocity andparticle concentration, among other variables, because they move inthe gravity field (Valentine, 1987; Druitt, 1998; Branney and Kokelaar,2002; Sulpizio andDellino, 2008). For this reason, shallowwatermodelshave appeared in volcanology to be applied to such basal flow. Thecomputer-assistedmodel including the actualmorphology of the volca-no traversed by the flow, Titan2D, has expanded the simple relationshipfrom the energy line concept, by solving the incompressible Navier–Stokes equations, and assuming that velocity does not vary with flowheight (Pitman et al., 2003; Patra et al., 2005). This procedure of shallowwater model for PDCs highlights the fact that the basal flow is relativelythin with respect to the whole current, but it may be very fast, as fromtheoretical models and field observations (Sparks et al., 1978; Wilson,

51S. R. et al. / Journal of Volcanology and Geothermal Research 283 (2014) 36–65
1985), and approximates the flow as only one phase (Pitman et al.,2003), or two (Pitman and Le, 2005). With focus on the single-phaseversion of the model, the flow is allowed to interact with the morphol-ogy by sliding, and to deformon the slip surface through two friction an-gles, respectively basal and internal, thus regulating the directproportionality between flow thickness and velocity. The main advan-tage of tools like Titan2D, which is widely used in volcanology, is thehigh speed of calculation due to the assumption of no-stratification ofthe flow, which greatly simplifies the numerical approximations duringimplementation, whereas the limitation is the impossibility to solve forvariables, such as velocity, in the neglected direction, that of flowheight.Shallow water models specifically solve for flow velocity and thickness,which is the reason why Titan2D does not capture the deformations ofthe flow as it interacts with and surmounts the morphology (Fig. 12a).Such simulated flows may correspond to natural flows with veryhigh dynamic pressures in confined environments, such as channels,gullies, and drainage systems, because of high particle concentrationin the basal part of PDCs; however the model is still not multiphase(Saucedo et al., 2005; Charbonnier and Gertisser, 2009; Sulpizio et al.,2010b; Oramas-Dorta et al., 2012). Given that PDCs are gravity currentsthat move in direct contact with topography, an important part ofthe current dynamics is controlled by interaction with ridges, hills,and human-made artefacts (Wilson, 1985; Fisher, 1995; Woods et al.,1998; Gurioli et al., 2002, 2005). In such cases, the opportunity toaccount also for the vertical deformations of the flow becomes a mustin PDC dynamics. Actually, the development and evolution of numericalsimulations of PDCs has given high attention to the problem of transfor-mations of the flow when interacting with morphology (Doyle et al.,2011; Esposti Ongaro et al., 2012). This effort to include a physics asclose as possible to the multiphase one in computing PDCs has startedin the late eighties, when multiphase numerical simulations have indi-cated the direction to go, both in terms of multiphase and compressibleprocesses (Valentine and Wohletz, 1989). Indeed, both behaviours arenecessary to get a point of junction between what occurs in the basalflow and the above interactions with obstacles (Kieffer and Sturtevant,1988).
Generally, the modelling of solid particles in multiphase physics canfollow two approaches: Eulerian and Lagrangian. Particles in a Eulerianfashion are treated as fluids, whereas in a Lagrangian fashion they aretreated as discrete particles (Crowe, 2006). It is then obvious that parti-cles transported in PDCs, which are granular systems characterized bygas–particle, particle–particle, andparticle–substrate interactions at dif-ferent degrees of chaos, are Lagrangian (Valentine et al., 2002;Dartevelle, 2004). However, in terms of modelling, and particularly inthe numerical simulations of these complex currents, the approxima-tions of the particles to Lagrangian entities are neither that obviousnor practical. PDCs transport and deposit billions of particles during ex-plosive eruptions, and computationally-speaking it is not possible, as oftoday, to simulate such a number of discrete particles interacting eachother, and with the gas and morphology (Roche et al., 2013). This is re-lated to the very large number of equations of particle motion that haveto be solved to simulate the particle trajectory oneby one.More precise-ly on the two approaches, they are defined as Eulerian–Eulerian andEulerian–Lagrangian, where the gas is the continuous phase, which ob-viously is Eulerian (Crowe, 2006). Both approaches are now used in vol-canology; however the first that has been used, and the most completeand flexible, is the Eulerian–Eulerian one. The computer-assistedmodels of the latter are MFIX (Syamlal et al., 1993), its GMFIX version(Dartevelle, 2004; Dartevelle et al., 2004), and PDAC (Dobran et al.,1993; Neri and Macedonio, 1996; Neri et al., 2003; Esposti Ongaroet al., 2008). All of them represent evolved versions of KFIX, which is a
Fig. 11.Variation of some physical parameters vs. current height calculatedwith themethod of Deruption (Somma-Vesuvius, Italy) 3 km from the vent. The solid line represents the average so(from Mele et al., 2011); b) fluid dynamic characteristics of the EU5b PDC from the Avellino er(from Sulpizio et al., 2010a)
numerical code used for the analysis of vapour–liquid flows in nuclearreactors (Rivard and Torrey, 1977), and they simulate the injectionand dispersal of gas–particle flows in the atmosphere. The Eulerian–Eulerian approach allows to solve the compressible Navier–Stokesequations, a set of which solve for each phase (gas, solid), and compo-nent (gas species, and pyroclasts like juvenile, crystals, lithics), by as-suming that all phases are mixed, thus mathematically bridging thegap with the granular system of discrete particles (Valentine andWohletz, 1989; Valentine et al., 1991). This way then leads to formula-tion of a hydrodynamic model called Implicit Multifield Formalism(IMF; Valentine, 1998b), having closure equations for granular temper-ature, interphasemomentumand heat transfers, thermodynamicmate-rial properties, and heat conductivity coefficients for turbulentmultiphase mixture. GMFIX differs from the other codes in accountingfor various granular rheological models, such as kinetic-collisional, pre-dominantly collisional, and frictional, besides the classic kinetic one(Lun et al., 1984; Gidaspow, 1994), in the closure for the viscous termsin the momentum equations of the solid phase (Dartevelle, 2004).This flexibility in the choice of rheological models may result in a betterdescription of the flowphysicswhen deformations are high, and/or par-ticle concentration is also high (i.e. when PDCs behave more like debrisor mud flows in interactingwithmorphology). The same GMIX code, aswell as MFIX and PDAC, can also simulate PDCs behaving like turbulentparticle-laden flows, in which case the role of closure models for turbu-lence (RANS, LES; Pope, 2000)may be important in regulating phenom-ena like air entrainment, and particle sedimentation (Esposti Ongaroet al., 2002; Todesco et al., 2002; Neri et al., 2003; Dartevelle, 2004;Dufek and Bergantz, 2007). On the other hand, the Eulerian–Lagrangianapproach has been recently adopted to simulate the depositional pro-cesses of PDCs when interacting with morphology (Doronzo et al.,2010; Valentine et al., 2011b), and structures like buildings (Doronzoand Dellino, 2011; Doronzo, 2013). The computer-assisted platformused to do this is Fluent (Fluent 6.3, 2006). The latter represents asub-platform for computational fluid dynamics, and belongs to awider platform (Ansys) used for any kind of computations in engineer-ing, from structural to electromagnetic, and aerodynamics and sportslike Formula 1 (Doronzo, 2009). The differences between the KFIX-derived and Fluent models in volcanology are mainly two: i) the firstones are open source, whereas the second ones are commercial; andii) the first ones are specific for multiphase flow, whereas the secondones are built for multiphase from a wider fluid dynamic platform. Itis obvious that entering platforms like Fluent requires additional instru-ments and constraints from experiments and field studies, in order firstto calibrate numerical parameters, such as under-relaxation factors(Patankar, 1980),whichmay not be under control in a commercial fash-ion during computation but may affect the results, then to validate thenumerical results in terms for example of flow thickness and pressure(Doronzo and Dellino, 2011; Doronzo et al., 2011; Fig. 12b). TheEulerian–Lagrangian approach allows solving the compressibleNavier–Stokes equations for the continuous phase, and the equationsof particle motion for the discrete particles. However, given the limitednumber of equations that can be solved for the solid phase of PDCs, par-ticles are not simulated one by one, but they are approximated as clus-ters of particles, each cluster representing a limitedmass of solid, and allclusters, up to millions but not billions, representing the whole mass ofparticles. A limitation arising from such an approach is that Lagrangianclustersmay not be appropriate in simulating the basal part of PDCs, be-cause of high particle concentration. In a depositional regime however,they reconstruct fairly well the particle concentration profiles (Doronzoet al., 2010; 2011), the particle-size distributions (Valentine et al.,2011b), and the flow-boundary zone (Brown and Branney, 2013). In
ellino et al. (2008) for dilute PDCs. a) fluid dynamic characteristics of the PDC6 ofMercatolution, the dashed line the maximum solution, and the dotted line the minimum solutionuption (Somma-Vesuvius, Italy) at a distance of 3 km and 11 km from the vent.

Fig. 12. a) Numerical simulation of a PDC using Titan2D tool to approximate the basal flowof currents at Volcán de Colima (Colima, Mexico) in terms of flow depth (modified afterSulpizio et al., 2010b); b) 3Dmultiphase numerical simulation of an experiment (see Sec-tion 2.3 for details) reproducing, by colours of time-dependent particle concentration, thecollapsemechanics consisting of a PDC generated from the collapse event. This simulationhas been experimentally validated.(post-processed after Doronzo et al., 2011)
52 S. R. et al. / Journal of Volcanology and Geothermal Research 283 (2014) 36–65
the numerical procedure, these clusters are tracked after the gas phaseis solved, and computationally-speaking this approach is faster thanthe Eulerian–Eulerian onewhen a fewmillions of clusters are computed(Doronzo et al., 2012). Another difference, with respect to Eulerian, isthat Lagrangian particles in such fashion cannot rebound from eachother, but they only interact with the gas and substrate, because particlevolume is neglected in the first stage of computation, then is accountedfor by two-way coupling. The latter is a technique that allows the parti-cles to affect the gas properties through momentum and energy ex-changes between phases, after both gas and solid phases are solved(Doronzo et al., 2010; see also Crowe, 2006). In order to account alsofor particle–particle interactions, which in the basal part of PDCs maydominate the transport (Branney and Kokelaar, 2002; Lube et al.,2007, 2011; Roche et al., 2013), methods like the discrete elementmethod (DEM) have recently appeared (Furbish et al., 2008; Estepand Dufek, 2012). This method allows simulating the trajectories ofthe particles one by one, and not as clusters, solving for the force chainsthat sustain the transport in the basal flow as a consequence of thoseinteractions. Force chains are the dynamic reason for particle motion ingranular mass flows, and may explain the actual physics occurring atthe base of PDCs (Estep andDufek, 2012). As of today however, the appli-cation of this method, which is part of recent versions of MFIX, is limited
to currents at laboratory scale because of the above-mentioned Lagrang-ian reasons. A particular combination between Eulerian–Eulerian andEulerian–Lagrangian approaches is the Eulerian–Eulerian–Lagrangianapproach, which has been used in the context of MFIX to investigatebasal processes occurring in PDCs, such as particle–substrate interactions(Dufek and Bergantz, 2007; Dufek et al., 2009). This variation, withrespect to the two classic approaches of multiphase physics, allowsconserving the advantages of treating most of the particles as Eulerianin terms of flexibility, and of simulating a few particles as Lagrangian,generally the bigger ones, and following their behaviour on the substrate.This technique differs from the two-way one used in Fluent for PDCs(Doronzo et al., 2010; 2011), and couples the Lagrangian particlesone-way with the gas, when those are volumetrically not significant,and reasonably do not affect the gas properties. The particles treated asfluids in the Eulerian–Eulerian approach, as well as in the Eulerian–Eulerian–Lagrangian one, affect the gas phase anyway through closureequations for interphase momentum and heat transfers (Neri et al.,2003; Dartevelle, 2004; Dufek and Bergantz, 2007). A simplified way toaccount for gas compressibility as affected by particles is that of assumingsmall particles (e.g. volcanic ash) to be in thermo-mechanical equilibriumwith the gas, thus approximating the latter as a single phase or dusty gas(Marble, 1970). Numerical simulations using the dusty gas approachhave been done for dilute PDCs (Ishimine, 2005; Doronzo et al., 2010;Valentine et al., 2011b), in some cases assuming thermal equilibriumonly, and allowing the particles to settle through the current as a functionof particle settling velocity (Cordoba, 2005). The computer-assistedmodels of this approach are the same as described above, taking into ac-count that gas properties like density, molecular viscosity, and specificheats are modified by the particles through specific relationships fordusty gases (Marble, 1970). A limitation of this approach arising fromthe equilibrium assumption is that it can only be applied to dilute PDCs,for example base surges, which have been experimentally described asdusty flows (Valentine et al., 2012). The dusty gas approach has beenalso combined with the Lagrangian one for bigger particles to study thedepositional processes of PDCs, and can be defined as Eulerian–Lagrang-ian anyway, or more technically as a dusty gas-Lagrangian approach(Doronzo et al., 2010; Valentine et al., 2011b).
Also important are the techniques and details of the computationaldomain (grid) discretizing the physical domain that contains the simu-lated PDCs (digital volcano and surrounding morphology). For themultiphase simulations, coarser grids (10–100 m resolution) havebeen used in combination with the Eulerian–Eulerian approach, usinga few particle-size classes to characterize the general behaviour ofPDCs (Valentine and Wohletz, 1989; Dobran et al., 1993; Neri et al.,2003; Dartevelle et al., 2004; Esposti Ongaro et al., 2008), whereasfiner grids (b10 m–few cm resolution) have been used in combinationwith the Eulerian–Lagrangian and Eulerian–Eulerian–Lagrangianapproaches, using several particle-size classes to characterize thedepositional processes, and particle–substrate interactions of PDCs(Dufek and Bergantz, 2007; Doronzo et al., 2010, 2011; Valentineet al., 2011b). In order to account for the three-dimensionality of PDCsas they interact withmorphology, techniques like the immersed bound-arymethod (IBM) (de'Michieli Vitturi et al., 2007; Doronzo et al., 2011),parallel computing (Esposti Ongaro et al., 2007), and adaptive grids(Pitman et al., 2003) have been also adopted.
3. The aerodynamics of the real world: influence of topography onPDC dynamics
With the exception of completelyflat topography, the landscapemor-phology can exert a major influence on the depositional mechanisms ofgravity-driven currents (e.g. Fisher, 1990; Giordano, 1998; Woods et al.,1998; Kneller and Buckee, 2000; Branney and Kokelaar, 2002; Pittariet al., 2006; Sulpizio and Dellino, 2008). In the case of PDCs, topographycan strongly influence flowdynamics, resulting in changes of fluid turbu-lence within the current, and of particle concentration in the flow-

53S. R. et al. / Journal of Volcanology and Geothermal Research 283 (2014) 36–65
boundary zone, or can partly block the current causing stripping inthe upper portion. The influence of topography on sediment-ladengravity-driven currents has been inferred frommany field-based studies(e.g. Valentine, 1987; Giordano, 1998; Branney and Kokelaar, 2002;Giordano et al., 2002; Saucedo et al., 2004; Zanchetta et al., 2004b;Sulpizio et al., 2007, 2008, 2010a; Cas et al., 2011; Jeon et al., 2011),although the effective mechanisms have been primarily investigatedthrough small-scale laboratory experiments (e.g. Edwards et al., 1994;Woods et al., 1998; Kneller and McCaffrey, 1999), and by means ofnumerical simulations (e.g. Dobran et al., 1994; Doronzo et al., 2010;Valentine et al., 2011b; Doronzo et al., 2012).
In this section, some examples of interactions between PDCs andcommon landscape morphologies are illustrated and discussed, neitherexclusively representing all possible natural conditions, nor covering allcombinations of interactions between flow and morphology.
3.1. Break in slope
The passage of a PDC over a break in slope (concave local curvature)is one of themost common occurrences duringmotion. The reduction oflocal curvature on the topographic slope (Fig. 13a) can change the
Fig. 13. Cartoon showing the passage of a PDC over a break in slope (concave upwardcurvature). a) Sketch of the changes in driving and resisting forces; b) conceptual sketchof an underflow that decelerates over a change in slope. The mass of fine material previ-ously transported in suspension from turbolence is sufficient to generate a PDC denserthan the atmosphere that propagates further; c) conceptual sketch of an underflow thatdecelerates over a change in slope. The elutriated and lofted fine material is lighter thanthe atmosphere and the PDC does not propagate further.(from Sulpizio and Dellino, 2008)
partition between driving and resisting forces within the current,resulting in a double response of the PDC to perturbation. The first onereflects a simple trade-off between reduced driving stress and increasedresisting stress that occurs as bed slopes decline (Fig. 13a). The secondone takes into account that in proximity to the bed slope reduction (inthe downstream direction) part of the depth-averaged momentumflux per unit area, ρfv2 is directed into the bed against the reactionforce coming from the ground. This external reaction force re-directsthe depth-averaged momentum flux, by keeping it parallel to the bed.Locally, the action–reaction occurring at the bed also increases the nor-mal stress at the bed itself by an amount (ρf hv2)/r, where r is the radiusof local bed curvature, v2/r is the associated centripetal acceleration, ρf isthe density of the flow, and h is the flow height (Iverson and Denlinger,2001). Hence, a significant change in slope increases the normal stress(low r value)more than aweak change (high r value), resulting in great-er normal bed frictional forces.
The deceleration of a current due to an increase of the normal bedstress and decrease of the slope enhances deposition and turbulence(Gray et al., 2005), increasing the elutriation of fines and lofting(Fig. 13a). Deposition induced by changes in slope has been document-ed in many papers on dry granular flows (e.g. Denlinger and Iverson,2001; Felix and Thomas, 2004), volcaniclastic flows (e.g. Zanchettaet al., 2004b), PDCs (e.g. Giordano, 1998; Macias et al., 1998; Coleet al., 2005; Sulpizio et al., 2007; Doronzo et al., 2010; Sulpizio et al.,2010a), and turbidity currents (e.g. Mulder and Alexander, 2001; Grayet al., 2005).
The part of the current above the decelerating flow-boundary zonebeyond the break in slope can react in two ways: i) the bulk density isstill greater than that of the surrounding ambient fluid, causing furtherpropagation as an independent gravity-driven current (Fig. 13b);or ii) the bulk density is less than that of the surrounding ambientfluid, causing convective lofting and stopping (Fig. 13c; Sulpizio et al.,2010a). The fate of the gravity-driven current is then a function of themass and grain-size, the local curvature at the break in slope, and theefficiency of energy transformation. These parameters control both theamount of material remaining in the transport system as the flowcrosses the break in slope, and the subsequent physical characteristicsof the surviving gravity-driven current.
3.2. Ridge (increasing slope)
When the path of a PDC includes a steepening of the slope, thechange of local curvature lessens the partition between driving andresisting forces, promoting deposition and flow stoppage (Fig. 14).Depending on the balance achieved between driving and resistingforces, the fate of the more concentrated basal part of the current maybe quite different from that of the more dilute upper counterpart. Forthe basal part of PDCs approaching a break in slope, the momentumflux per unit area is given by:
Mf ¼ ρ f hv2 ð7Þ
where v is the velocity, h the flow depth and ρf its density. Neglectingfor a moment deposition and bulking, the conservation of mass impliesthat the loss of momentum flux at the change in slope can only affectvelocity. In proximity to the change in slope, the local velocity (v0,Fig. 14) gets to a separation into two components (vt and vn, Fig. 14)as a consequence of the action of centripetal acceleration. In particular,the term vt represents the flow velocity at the base of the inclinedslope, and can be written as:
vt ¼ v0 cosθ−αð Þ ð8Þ
where α and θ are the slope angles before and beyond the break in slope(Fig. 14).

Fig. 14. Cartoon showing the passage of a PDC over an increase in slope. a) Sketch of the changes in driving and resisting forces for a PDC that moves over an inclined slope; b) simplediagram showing the splitting of the initial velocity (v0) into the normal (vn) and the tangential (vt) components due to the steepening of slope; c) Morphological profile (red line)from the Pollara depression (vent area) to the Malfa terrace over which the PDCs of the Upper Pollara eruption (Salina Island, Aeolian Archipelago, Italy) passed and deposited. Theblack lines indicate approximately the topography before the eruption; d) massive, coarse-grained deposits on the inner slopes of Pollara depression; e) diffusely stratified deposits onthe outer slopes of Pollara depression; f) massive, fine-grained, lenticular deposits in the Malfa terrace area.(from Sulpizio and Dellino, 2008)
54 S. R. et al. / Journal of Volcanology and Geothermal Research 283 (2014) 36–65
This implies that for θ− α=0 (i.e. curvature radius r→ ∞) vt = v0,while for θ − α = 90 (r → 0) vt = 0.
Under the assumption that frictional forces are only dissipatedas work at the PDC base, the length travelled along slope, L, can beassumed as (Sulpizio and Dellino, 2008):
L ¼ vt2 2g k cosθþsinθð Þ½ ��1 ð9Þ
where k is the dynamic friction coefficient. Inspecting Eq. (9) reveals it asrepresentative of a power-law function (i.e. parabola in L versus v space),and that L critically depends on slope, but dramatically increases for veryfast currents. A decrease of momentum due to flow deceleration on aslope also reduces the generation of turbulence, meaning that even thefully turbulent, homogeneous upper part of the flowmay develop a den-sity stratification. An increase of particle flux toward the base of the flowmay result in enhanced deposition by loss of mass from the current, withfeedback effects on themomentumequation (Legros andKelfoun, 2000):
M f ¼vdvdx
þ v2dm=mð Þdx
ð10Þ
where m is the initial mass and x is the distance from the slope change.The rate of material feeding the flow-boundary zone depends on therate of supply (Sulpizio and Dellino, 2008), and this implies that theupper part of the current proportionally loses the mass with rate dm/dt.At the same time, the flow decelerates on the slope at a rate proportionalto dv/dt. Therefore, the upper part of the current may stop and/or loftwhen the rate of supply drives the bulk flow density below that of thesurrounding atmosphere, in a way fast enough for the flow to overcomethe length of the slope. If the flow density does not fall below the atmo-spheric value, the upper part of the current can then overcome theslope and form a new (surviving) current with physical characteristicsdifferent from the original one, driven by residual kinetic energy andpotential energy transformation. A similar behaviour has been inferredfor example for the PDCs originated in the Upper Pollara eruption ofSalina Island (Southern Italy; Sulpizio et al., 2008; Fig. 14c), which isalso similar to the case of a PDC encountering a sharp valley bend(Druitt and Kokelaar, 2002; Loughlin et al., 2002).
The instance of a PDC encountering a vertical barrier is the extremecase of slope increase for the flow. The effects of a vertical topographicbarrier can vary as a function of: i) physical properties of the current

Fig. 15. Scheme of possible interactions among a fluid-like current and obstacleswith different heights. a) Diagram of Froude number vs. ratio between obstacle (hb) and flow heights (hf)(after Branney and Kokelaar, 2002; modified); b) interaction between a density-stratified flowwith ridges. Only the part above the dividing streamline is able to pass over the obstacle. Ifdiverted, the basal part can pass over the obstacle through saddles or at the end of the barrier.(after Valentine, 1987; modified)
55S. R. et al. / Journal of Volcanology and Geothermal Research 283 (2014) 36–65
(e.g. density stratification, height); ii) height of the obstacle; iii) angle ofincidence; and iv) topography of the surroundings. The physical proper-ties are particularly important to definewhether the current behaves asa fluid or as a granularmass of solid particles.When the current behavesas a fluid (i.e. fully dilute PDCs), one can imagine different mechanismsof interaction with the vertical obstacle, with effects on flow propaga-tion and deposition that mainly depend on flow height (hf), obstacleheight (hb), and Froude number (Rottman et al., 1985; Branney andKokelaar, 2002; Fig. 15).
For stratified currents, only the part above a certain critical flowheight, known as the dividing streamline (Sheppard, 1956; Snyderet al., 1985; Valentine, 1987; Fig. 15), is able to overcome the obstacle.In this case, the denser levels of the current are blocked or diverted,depending on the incidence angle with respect to the obstacle. Thediverted current can move along the obstacle and pass through saddlesand valleys (Fig. 15). Instead, the higher and more dilute levels ofthe current can be poorly constrained by topography when passingover the obstacle (Valentine, 1987; Sulpizio et al., 2010a; Jeon et al.,2011), which is an aspect to account for in risk assessments ofPDCs. The relative separation of the concentrated basal flow from themore dilute upper part is known as flow stripping (Piper and Normark,1983). Stripping of the upper part of PDCs is known to have causedmost devastation and fatalities in 1902 at Mt. Pelée (Fisher andHeiken, 1982), in 1991 at Unzen volcano (Yamamoto et al., 1993), andin 1997 at Montserrat (Loughlin et al., 2002).
3.3. Urban morphology
The complex architecture of urban areas consisting of road networksand agglomerates of differently-heighted and -shaped buildings canrepresent a very irregular morphology, greatly affecting flow runoutand deposition from PDCs in such areas. Despite several works havinginvestigated the impact of different types of gravity-driven currentson buildings and infrastructures (Newhall and Punongbayan, 1996;Baxter et al., 1998; Valentine, 1998a,b; Cioni et al., 2000; Druitt andKokelaar, 2002; Gurioli et al., 2002; Luongo et al., 2003a,b; Nunzianteet al., 2003; Petrazzuoli and Zuccaro, 2004; Spence et al., 2004;Zanchetta et al., 2004b; Zuccaro and Ianniello, 2004), few quantitativedata are available on the influence of urban environments on transportand deposition in these flows. The most detailed works on this topicconsider the interaction of PDCs from the AD 79 (Pompeii) eruptionof Somma-Vesuvius, Italy (Sigurdsson et al., 1985) with the Romanurban settlements of Herculaneum and Pompeii (Gurioli et al., 2002;2005). In particular, these works have demonstrated how the basalpart of PDCs can experience rapid variations both in flow directionand temperature when entering an urban area (Cioni et al., 2004;Gurioli et al., 2005). The effects of this interaction can be qualitativelyconsidered in terms of the internal flow structure (vertical velocity anddensity gradients), with respect to the scale of the local substrate rough-ness. Roughness induced by the close assemblage of buildings androads can locally increase both flow dynamic pressure in streamwise

56 S. R. et al. / Journal of Volcanology and Geothermal Research 283 (2014) 36–65
and transverse directions and turbulence (Doronzo, 2013). Also, theproduction of vortices is particularly enhanced when the space betweenedifices equals the obstacle heights (Oke, 1987; Doronzo and Dellino,2011). The development of strong vortices can cause a decrease of tem-perature in hot PDCs of the order of 150–200 °C (Gurioli et al., 2005).The interactionwith urban surroundingsmay therefore limitflow runoutby loss of kinetic energy on impact with obstacles; it can cause flowdeflection, and bore formation, and enhances turbulence.
4. Depositional models for PDCs
Depositional mechanisms affect all particles in the flow-boundaryzone until they come to a complete stop forming the deposit. Depositionaccompanies transport, whichmay therefore be affected by the deposi-tion itself (Branney and Kokelaar, 2002). Deposition can occur grain-by-grain or en masse when the shear flow velocity falls below the resis-tance force acting on large parts of the flow-boundary zone, and can de-velop as a steady, discontinuous or stepwise process. Steady depositionis a continuous phenomenon in which the thickness of the depositincreases at a constant rate with time (Fisher, 1966; Branney andKokelaar, 1992; Fig. 16a). Stepwise deposition defines periods of steadyor sharp increase of the deposit thickness, alternated with periods ofnon-deposition (Fig. 16a). Alternating periods of steady or stepwise de-position with episodes of erosion of the deposits leads to discontinuousdeposition, resulting in time-dependent fluctuations of the depositthickness (Fig. 16a).
Fig. 16. Conceptual behaviours of deposition of PDCs. a) Diagram showing the variation in thicdeposition of PDCs at Tungurahua volcano, Ecuador. The repetitive occurrence of alignments of cdeposition from a sustained PDC (Huychapan ignimrite, Mexico); d) discontinuous deposition
Historically, two main models of deposition have been proposedfor PDCs, en masse freezing (Sparks, 1976; Wright and Walker, 1981;Carey, 1991) and progressive aggradation (Fisher, 1966; Branney andKokelaar, 1992). In the en masse freezing model, the flow comes to anabrupt halt throughout its depth almost instantaneously forming thedeposit, whereas in the progressive aggradation model, the depositprogressively grows up due to continuous supply of material from thecurrent into the flow-boundary zone. Several different geologicalevidences support bothmodels. The existence of steep levees and lobatefronts in PDC deposits (e.g. Rowley et al., 1981; Miyabuchi, 1999;Iverson and Vallance, 2001) are indicative of currents with internalyield strength (Johnson, 1970; Sparks, 1976), resulting from thecontrasting effects of pore-fluid pressure, mixture agitation (granulartemperature) and forces exerted by grain interlocking at flow borders(Druitt, 1998; Iverson and Denlinger, 2001; Iverson and Vallance,2001). On the other hand, massive and extensive ignimbrite sheets sup-port deposition from progressive aggradation, because the depositthickness and lateral grain-size variations are successfully predicted bymodels that assume progressive aggradation from dilute turbulent sus-pensions (Bursik and Woods, 1996; Dade and Huppert, 1996; Freundtand Bursik, 1998).
Some ignimbrites show vertical variations in chemical composition(Branney and Kokelaar, 1992; 1997), or in the abundance, type or sizeof lithic clasts (Bryan et al., 1998), which are thought to reflect temporalchanges in the material supplied to the flow-boundary zone. Althoughthe progressive aggradation model satisfactorily describes large ignim-brite sheet deposits, it is more difficult to apply it to small-volume
kness of deposit with time for steady, stepwise and discontinuous deposition; b) stepwiseoarse clast indicate the superimposition of different pulseswith time; c) example of steadyfrom dilute and turbulent PDCs at Mylos island, Greece.

57S. R. et al. / Journal of Volcanology and Geothermal Research 283 (2014) 36–65
PDCs, because certain characteristics of the deposits (e.g. alignment oflarge blocks, concentration of pumices and lithics at the base or on topof the deposit) require fluctuations of the physical flow characteristicslike competence that are unlikely to occur on a very short time scale.
Sulpizio et al. (2007) proposed a model for small-scale PDCsthat joins together the en masse and the progressive aggradation depo-sitional models. This model builds upon the study of small-scale PDCsfrom the subplinian eruption of Pollena at Somma-Vesuvius, andsuccessfully applies to PDC deposits from other eruptions (Sulpizioet al., 2008, 2010b; Charbonnier and Gertisser, 2011; Sarocchi et al.,2011). The model assumes that most PDC deposits originate from strat-ified flows, in which the segregation of particles with higher settlingvelocities in the lowermost part can form a high concentration zone(Valentine, 1987; Branney and Kokelaar, 2002; Dellino et al., 2004).This basal part of the flowdoes not homogenouslymove downslope, in-stead developing flow partition at different densities. Lee and Leibig(1994) have numerically demonstrated how systems with an initial-ly random density field can evolve to a configuration in which nearbyregions have a high density contrast. At the early stage of such apartitioning, the density contrast between the nearby regions increaseslinearly with time, resulting, in the gravity field, in different velocitiesfor adjacent portions of the current:
U 1;2ð Þ ¼ j ρ1ð Þ− j ρ2ð Þð Þρ1−ρ2
ð11Þ
whereU(1, 2) is the velocity of the interface separating regionswith dif-ferent densities ρ1 and ρ2, and j(ρ1)- j(ρ1) is the difference of densityflux between the two regions. The differential motion at the interfacedetermines the evolution of the system, and the nature of the interac-tion between the adjacent parts leads to a final state inwhich large den-sity contrasts occur (Lee and Leibig, 1994). When sufficient time andspace are available, this mechanism leads to the formation of kineticwaves within the current (Fig. 17a). In light of this model, the currentcan be thought as a succession of pulses whose thickness varies as afunction of turbulence and flow kinematics. Also, each pulse in the cur-rent can be considered as a flow-boundary zone for its entire thickness,in which the contrasting effects between shear stress and particle con-centration control the distribution of turbulence within each pulse, andsubsequently determine the sedimentological features of the depositafter stoppage (Fig. 17). Pulse stoppage occurs enmassewhen the resis-tance forces exceed the driving forces, which occurs when the graininterlocking forces exceed the gravitational forces, inducing stepwiseaggradation of the different portions of the current through the pulses.The development of multiple pulses within a gravity current has beenobserved through large flume experiments (Iverson, 1997; Major,1997) and small-scale laboratory experiments (Savage, 1979; Brennenet al., 1983; Huppert et al., 1986), and has been hypothesized ormodelled both for volcaniclastic and pyroclastic deposits on the basisof field evidences (Chough and Sohn, 1990; Schwarzkopf et al., 2005;Sulpizio et al., 2006, 2007; Doronzo and Dellino, 2010).
5. The challenging behaviour of large-volume ignimbrites
The discussion on PDCs made in the previous sections represents afairly complete description of the characteristics of flow and depositsoccurring in most kinds of explosive eruptions. However, some of theeruptions generate large-volume ignimbrites that cannot be classifiedaccording to such a scheme. Also, these ignimbrites consisting of up tohundreds of cubic km of pyroclastic material are relatively rare events,compared with the other types of PDCs (Mason et al., 2004), and theiremplacement has never been directly observed.
In some cases, the models of facies transition previously describedcan be applied to large-volume ignimbrites, when showing transitionsfrom amassive to a stratified facies with distance from the vent, interac-tions with topographic barriers, and changes of slope angle (e.g. Fisher
et al., 1993; Wilson and Hildreth, 1997; Wilson, 2001; Wilson andHildreth, 2003). In such instances, the transition from a concentratedto a dilute current can be conceptually adopted by enlarging the scaleof the event, and thinking of giant currents as flows many hundreds tothousands of meters thick. However, there are some other instances ofdeposits showing very thick layers composed of massive, poorly sortedmaterial that rest on almost horizontal substrates, and that can be foundup to hundreds of kilometres far from the vent (e.g. Aguirre-Diaz et al.,2008; Cas et al., 2011). The monotonous structure of this poorly sortedthick massive layer suggests a high particle volumetric concentrationall the way from the vent toward the distal reaches. These large pyro-clastic bodies are generally associated with fissure eruptions and calde-ra collapses (e.g. Cas et al., 2011; Willcock et al., 2013). The simplemodel of a concentrated granular flow has difficulty justifying these ig-nimbrites, because the lack of significant slope angles does not provide asufficient shear stress to the granular mass to maintain high lateral mo-bility for very long distances. On the other hand, no evidences of a giantoverriding flow can be found in the field from analysis of the tops ofthese massive layers, which would justify regarding the massive faciesas the basal part of a homogeneous current (Bursik and Woods, 1996).The most plausible way to justify the formation of these intriguing geo-logical bodies is to think of low, highly concentrated eruptive fountainswith a very high mass flow rate due to relatively high particle concen-tration and relatively low exit velocity at the vent. In this way, the col-lapsing fountain has a high sedimentation rate (because of low inertiaand low velocity) and does not allow much air entrainment into theflow, which otherwise wouldmake the flowmore dilute. Consequently,most of the flow must be thermodynamically isolated from the sur-rounding ambient air, which is an hypothesis that seems to be con-firmed by the high emplacement temperature (above the Curietemperature) extracted from lithic fragments in ignimbrite deposits(Lesti et al., 2011). When the pyroclastic fountaining is maintained fora very long time, the mobility of the massive material can be ensuredby the prolonged lateral mass flow rate resulting from the low altitudecollapse. Fluid dynamically, the flow streamlines can keep going. Onecan envisage the lateral movement of the granular material as due tothe continuous “push” of the collapsing material, as a sort of sustainedlava flow. By this mechanism, high mobility can be maintained evenon very low slope angles, provided that the material supply from thevent continues for long timewith a sufficiently highmass flow rate. Un-fortunately, neither laboratory experiments nor numerical simulationshave been performed so far to investigate the flow mechanismsemplacing such large-volume ignimbrites. A big effort is then neededin the future to contribute to the validity of such a “lava flow”-likemodel against alternative views.
6. Putting all together: conclusive remarks and future perspectives
In recent years, significant goals have been achieved to understandthe physics of PDCs. Themost important achievement has led to the de-scription of the different types of PDCs as a continuumof phenomena, inwhich the dominance of fluid versus solid particles on motion deter-mines the wide range of the observed pyroclastic deposits. The involve-ment of granular flow theory is also of primary importance to describethe lower parts of PDCs dominated by particle–particle interactions.PDCs are density-stratified meaning that such interactions play a rolein all types of PDCs, with the likely exception of extremely dilutecurrents.
Nevertheless, a considerable gap in this general understanding re-mains between the documented deposit features, such as sorting, tex-ture and sedimentary structures, and the conceptual models of PDCs.Given that PDCs are physical phenomena, their nature and behaviourcould be further investigated with future research in three primaryways: observation in nature, reproduction in the laboratory, and nu-merical modelling. These approaches are not independent of each

Fig. 17. Sedimentological model for stepwise aggradation of different pulses within the same PDC for four depositional regimes. a) General conceptual scheme, in which the internalorganisation of theflow is hypothesised; b) natural counterpartwith turbulent phoenix cloud thatmakes the internal processes of the PDC invisible (PDCs of 2004 dome collapse at Colimavolcano, Mexico); c) aggradation of thick pulses in a flow-boundary zone dominated by granular flow regime. The idealized stratigraphic column is also shown; d) sketch of deposits fromaggradation of pulses that stop over a flat surface; e) sketch of deposit from aggradation of different pulses in a valley (valley-pond deposits); f) natural example of stepwise aggradationfrom granular-flow-dominated pulses (Nevado de Toluca, Mexico); g) sketch of deposit from aggradation of thick pulses from fluid-escape dominated regime. The idealized stratigraphiccolumn is also shown; h) natural example of deposit from a fluid-escape dominated PDC (Pollena eruption, Somma-Vesuvius, Italy; Sulpizio et al., 2007); i) development of thin pulses atthe base of a fully turbulent PDC. The idealized stratigraphic column is also shown; l) very dilute, fully turbulentflowwithout development of granular pulses at the verybase. The idealizedstratigraphic column is also shown;m) close view of lithofacies lensL(i) that developed on the lee side of a dune in the flow-boundary zone of a turbulent PDC (Pollena eruption, Somma-Vesuvius, Italy; Sulpizio et al., 2007). White triangles indicate the reverse grading of the different lenses.
58 S. R. et al. / Journal of Volcanology and Geothermal Research 283 (2014) 36–65
other as no progress can be possible without constraining or even vali-dating one with the others.
The new concepts emerged in the last few years on PDCs suggestthat research can strongly take advantage of a detailed analysis of thelateral and vertical facies transitions of pyroclastic deposits. In particu-lar, the model of facies architecture illustrated in the previous sections
well fits the actual deposits both of small-scale (few km runout) andlarge-scale (tens of km runout) PDCs. This is for example the case ofPDCs generated during large (e.g. Avellino, Somma-Vesuvius, Italy;Sulpizio et al., 2010a) or small (e.g. Hopi Buttes, USA; Vazquez andOrt, 2006) eruptions, showing the deposits to have a massive facies inproximal locations, and a thin laminated facies in medial and distal

59S. R. et al. / Journal of Volcanology and Geothermal Research 283 (2014) 36–65
reaches. When such a lateral facies transition is observed, the faciesmodel presented in this paper can help reconciling the contrastingconcepts of dilute and concentrated PDCs that have frequently charac-terized the discussion in volcanology over recent decades. More quanti-tatively, the application of the laws of sediment mechanics to dilutePDCs allows the extraction of the physical parameters of PDCs fromthe deposits of past eruptions in terms of flow velocity and density,and particle concentration. As of today, similar approaches for theextraction of such physical parameters from the deposits do not existfor concentrated PDCs.
Insights for filling these gaps of knowledge should be provided withthe help of properly designed laboratory experiments, which have beenspecifically carried out for the validation of already existing sedimento-logical models of dilute PDCs (Dellino et al., 2008, 2010a). Large-scaleexperiments represent themost intriguing frontier for the near future re-search on PDCdynamics, particularly as thefirst results are promising anddemand an intensification of the experimental investigations, in order tobetter understand the anatomy of PDCs. Further implementations of theexperimental design should include the realization of specifically tailored“ashy” wind tunnels, representing an evolution of the device recentlyadopted by Andrews and Manga (2012) and Douillet et al. (2014).These new facilities should include test sections instrumentedwithmod-ern techniques of flow visualization, such as Particle Image Velocimetry,so that measurements of velocity and density stratification at high
Fig. 18. Experimental apparatus for generation of laboratory PDCs engineered at Massey Univeexperimental flume; c) frontal view of different stages of PDC development along the experim(photos courtesy of G. Lube)
sampling rates could be possible. This would allow the characterizationof turbulence statistics and turbulence modulation in the flow due tothe presence of fine ash particles, contributing to better characterizationof the internal structure of PDCs. Also, new large-scale laboratory facilitieshave been recently engineered and tested through flume experiments onintermediate to concentrated PDCs (Bartali et al., 2012; Cronin et al.,2013; Figs. 18, 19). The preliminary results (Lube et al., 2013; Sulpizioet al., 2013) are promising and guarantee important advancementsin our understanding of the physical processes that control such PDCdynamics. In particular, the dense instrumentation of these facilities willallow monitoring those dynamic quantities regulating flow evolution,including particle–substrate interactions and their influence on transpor-tation and sedimentation.
The main results and potential of the numerical simulations of PDCshave been over the years and will inevitably in the future be affectedby the assumptions made on the basis of theoretical models of suchcurrents and interpretations of their deposits, and also by the ap-proximations that characterize the numerical aspects of modelling.The numerical results, along with field studies, have been a major con-tribution over the eighties and nineties in shedding light and new ideason PDC generation and propagation (Valentine and Wohletz, 1989;Dobran et al., 1993; Neri and Macedonio, 1996). Later they have con-tributed, along with field studies, sedimentological models, and labora-tory and large-scale experiments, to better characterize the interactions
rsity (New Zealand). a, b) Lateral views of different stages of PDC development along theental flume.

Fig. 19. Experimental apparatus for generation of laboratory granular-flows engineered at Universidad Autonoma de San Luis Potosì (Mexico). a) View of the experimental flume; b) viewof an unconfined granular-flow deposit obtained using natural volcanic material; c) lateral view of a confined granular-flow deposit obtained using natural volcanic material. Note thewell-developed reverse grading and the coarse front.
60 S. R. et al. / Journal of Volcanology and Geothermal Research 283 (2014) 36–65
between gas and particles, the depositional processes, and the mappingof hazard and risk of PDCs (Neri et al., 2003; Dartevelle et al., 2004;Saucedo et al., 2005; Neri et al., 2007; Esposti Ongaro et al., 2008; Dufeket al., 2009; Doronzo et al., 2010; Sulpizio et al., 2010b; Doronzo et al.,2011; Esposti Ongaro et al., 2012; Oramas-Dorta et al., 2012).
Fig. 20. a) Cartoon of the general dynamics of an explosive eruption as inferred fromnumerical snix plume (modified after Neri andDobran, 1994); b) Velocity andmass concentration of an expthe main structure of the current.(modified after Doronzo et al., 2011)
The main results coming from the numerical simulations of PDCshave allowed in modern volcanology, let’s say in the last 25 years(Cashman and Sparks, 2013), the characterization of the general flowdynamics, and themass partitioning of gas and particles into pyroclasticfountain and convective plume above the vent. The same partitioning
imulations, showing a partition ofmass into pyroclastic fountain, PDC, thermals and phoe-erimental PDC simulatedwith a Lagrangianmethod for the solid phase, and reconstructing

61S. R. et al. / Journal of Volcanology and Geothermal Research 283 (2014) 36–65
principles also apply to pyroclastic flow, thermals and phoenix plumeon the morphology (Fig. 20a), both for collapsing eruptive columnsand lateral explosions (Valentine and Wohletz, 1989; Dobran et al.,1993; Neri et al., 2002, 2003; Dartevelle et al., 2004; Todesco et al.,2006; Esposti Ongaro et al., 2012). They have also allowed characteriz-ing some specific processes in the basal part of PDCs, such as hinderedsettling, particle–substrate interactions, particle entrainment, flow-boundary zone and boundary-layer processes (Fig. 20b), and inferringand interpreting the facies architecture of PDC deposits (Valentineet al., 1992; Giordano and Dobran, 1994; Dartevelle et al., 2004; Dufeket al., 2009; Doronzo et al., 2010; Valentine et al., 2011b; Doronzoet al., 2012; Esposti Ongaro et al., 2012; Estep and Dufek, 2012). Theoptimum value of the numerical simulations of PDCs is generally thatof predicting the hazard and risk that may occur during an eruption,and at the same time of accounting for the depositional and basal flowprocesses,which are critical duringflow transport and deposit emplace-ment. The exact physics that links processes and deposits in PDCs how-ever is still not fully understood mainly for two reasons: 1) theoreticalmodels and experiments aremore devoted to inferring theflowphysics,the numerical counterpart thus approximating that physics; 2) themul-tiphase flow rheology is not completely known, resulting in preliminaryassumptions that impact the physics to be numerically computed.Muchwork is thus needed, particularly in the direction of complementingthe different approaches that operate in the numerical simulations ofPDCs to each other (Eulerian, Lagrangian, etc.), as well as between thedifferent investigation instruments, from field studies to numerical sim-ulations through experiments. Numerically-speaking, the Eulerian–Eulerian approach has given a great contribution to computing the glob-al dynamics of PDCs, and even in describing some physics when exper-iments were not common in volcanology, and the available data fromthe field were not so numerous as they are today. At the same time,this approach still contributes in quantifying the hazard of PDCs on 3Dcomplex morphologies, and the results globally reflect the features ofthe associated actual deposits. This is necessary when simulating pasteruptions. However, numerically accounting for the details of PDCs,particularly when involving flow transformations at the scale of fielddeposits, channels or structures that may strongly impact the boundarylayer, and the flow streamlines, requires the adoption of Lagrangiantreatments for the particles. The main problem that needs to be ad-dressed in the future is to increase the number of particles, possiblytreated with the DEM, to be simulated as representative of the wholeparticle population, not only in terms of numbers, but also in terms ofinteraction with the gas phase and flow transformations. The biggestlimit as of today is the constraint from the available computational capa-bilities, which are still not enough to simulate all PDC's particles one byone, which is a general problem faced in all branches of engineering,such as for example wind-driven rain and chemical engineering. Lastly,even in the physics of granular matter, the effort is generally that of ap-plying known methods, which is typical of engineering, rather than(theoretically-speaking) developing new ones, which is more typicalof physics. There are techniques like direct numerical simulation(DNS) that effectively are numerical experiments, and might also con-tribute to understanding the physics of complex currents like PDCs atthe micro- to meso-scale.
Finally, much effort is needed in the near future to unravel thedynamics of large-volume ignimbrites that show a monotonous faciesarchitecture consisting of thick poorly sorted beds, and that spreadover flat surfaces for tens of kilometres. They could be related to asustained and prolonged feeding ofmassive PDCswhen air entrainmentdoes not play any major role during motion. The source mass flow rateand height of the collapsing column could therefore be the key tointerpreting the mobility of these currents. Sophisticated rheologicalmodels of granular flow- and fluid escape-dominated PDCs, alongwith numerical simulations able to compute highly concentrated parti-cle flow, are needed in the future in order to shed light on and clarify thedetails of these large-volume ignimbrites.
Acknowledgements
To write a review paper on PDCs is a challenging issue for authors,reviewers and editors, because of the huge literature, the differentpoints of view, and the tumultuous growth of the research. Therefore,wewant towarmly thank Guido Giordano for the review and the EditorLionel Wilson for the careful handling of the manuscript. RS wishes tothank Muddy Waters for Rolling stone blues, and the Rolling Stonesfor music his life.
References
Aguirre-Diaz, G.J., Labarthe-Hernàndez, G., Tristàn-Gonzàlez, M., Nieto-Obregòn, J., IsaacGutiérrez-Palomares, I., 2008. The ignimbrite flare-up and graben calderas of theSierra Madre Occidental, Mexico. In: Martí, J., Gottsman, J. (Eds.), Caldera Volca-nism: Analysis, Modelling and Response. Developments in Volcanology, 10. Elsevier,pp. 143–180.
Alidibirov, M., Dingwell, D.B., 2000. Three fragmentation mechanisms for highly viscousmagma under rapid decompression. J. Volcanol. Geotherm. Res. 100, 413–421.
Andrews, B.J., Manga, M., 2012. Experimental study of turbulence, sedimentation, andcoignimbrite mass partitioning in dilute pyroclastic density currents. J. Volcanol.Geotherm. Res. 225–226, 30–44.
Baer, E.M., Fisher, R.V., Fuller, M., Valentine, G.A., 1997. Turbulent transport and deposi-tion of the Ito pyroclastic flow: determinations using anisotropy of magnetic suscep-tibility. J. Geophys. Res. 102, 22565–22586.
Bagnold, R.A., 1954. Experiments on a gravity-free dispersion of large solid spheres in aNewtonian fluid under shear. Proc. R. Soc. Lond. A 225, 49–63.
Bartali, R., Sarocchi, D., Nahmad-Molinari, Y., Rodríguez-Sedano, L.A., 2012. Estudio de flujosgranulares de tipo geológico por medio del simulador multisensor GRANFLOW-SIM.Bol. Soc. Geol. Mex. 64, 265–275.
Baxter, P.J., Neri, A., Todesco,M., 1998. Physicalmodeling andhuman serviva in pyroclasticflows. Nat. Hazards 17, 163–176.
Baxter, P.J., Boyle, R., Cole, P., Neri, A., Spence, R.S., Zuccaro, G., 2005. The impacts of pyro-clastic surges on buildings at the eruption of the Soufrière Hills volcano, Montserrat.Bull. Volcanol. 67, 292–313.
Bonnecaze, R.T., Huppert, H.E., Lister, J.R., 1993. Particle-driven gravity currents. J. FluidMech. 250, 339–369.
Bourdier, J.-L., Abdurachman, E.K., 2001. Decoupling of small-volume pyroclastic flowsand related hazards at Merapi volcano, Indonesia. Bull. Volcanol. 63, 309–325.
Branney, M.J., Kokelaar, B.P., 1992. A reappraisal of ignimbrite emplacement – progressiveaggradation and changes from particulate to nonparticulate flow during emplace-ment of high-grade ignimbrite. Bull. Volcanol. 54, 504–520.
Branney, M.J., Kokelaar, B.P., 1997. Giant bed from a sustained catastrophic densitycurrent flowing over topography: Acatlán ignimbrite, Mexico. Geology 25, 115–118.
Branney, M.J., Kokelaar, B.P., 2002. Pyroclastic density currents and the sedimentation ofignimbrites. Geol. Soc. Lond. Mem. 27.
Brennen, C.E., Sieck, K., Paslasky, J., 1983. Hydraulic jumps in granular material flow.Powder Technol. 35, 31–37.
Brissette, F.P., Lajoie, J., 1990. Depositional mechanics of turbulent nuée ardents (surges)from their grain sizes. Bull. Volcanol. 53, 60–66.
Brown, R.J., Branney, M.J., 2013. Internal flow variations and diachronous sedimentationwithin extensive, sustained, density-stratified pyroclastic density currents flowingdown gentle slopes, as revealed by the internal architectures on Tenerife. Bull.Volcanol. 75, 727–751.
Brown, R.J., Kokelaar, B.P., Branney, M.J., 2007. Widespread transport of pyroclasticdensity currents from large silicic tuff ring: the Glaramara tuff, Scafell caldera, EnglishLake District, UK. Sedimentology 54, 1163–1189.
Brown, R.J., Bonadonna, C., Durant, A.J., 2012. A review of volcanic ash aggregation. Phys.Chem. Earth 45–46, 65–78.
Bryan, S.E., Cas, R.A.F., Martí, J., 1998. Lithic breccias in intermediate volume phonolitic ig-nimbrites, Tenerife (Canary Islands): constraints on pyroclastic flow depositionalprocesses. J. Volcanol. Geotherm. Res. 81, 269–296.
Burgisser, A., Bergantz, G.W., 2002. Reconciling pyroclastic flow and surge: the multi-phase physics of pyroclastic density currents. Earth Planet. Sci. Lett. 202, 405–418.
Burgisser, A., Gardner, J.E., 2006. Using hydraulic equivalences to discriminate transportprocesses of volcanic flows. Geology 34, 157–160.
Burgisser, A., Bergantz, G.W., Breidenthal, R.E., 2005. Addressing complexity in laboratoryexperiments: the scaling of dilute multiphase flows in magmatic systems. J. Volcanol.Geotherm. Res. 141, 245–265.
Bursik, M.I., Woods, A.W., 1996. The dynamics and thermodynamics of large ash flows.Bull. Volcanol. 58, 175–193.
Bursik, M.I., Patra, A., Pitman, E.B., Nichita, C., Macias, J.L., Saucedo, R., Girina, O., 2005.Advances in studies of dense volcanic granular flows. Rep. Prog. Phys. 68, 271–301.
Buttner, R., Dellino, P., Raue, H., Sonder, I., Zimanowski, B., 2006. Stress-induced brittlefragmentation of magmatic melts: theory and experiments. J. Geophys. Res. 111,B08204. http://dx.doi.org/10.1029/2005JB003958.
Cagnoli, B., Romano, G.P., 2010. Effect of grain size on mobility of dry granular flows ofangular rock fragments: an experimental determination. J. Volcanol. Geotherm. Res.193, 18–24.
Calder, E.S., Sparks, R.S.J., Gardeweg, M.C., 2000. Erosion, transport and segregationof pumice and lithic clasts in pyroclastic flows inferred from ignimbrite at LascarVolcano, Chile. J. Volcanol. Geotherm. Res. 104, 201–235.

62 S. R. et al. / Journal of Volcanology and Geothermal Research 283 (2014) 36–65
Calvari, S., Spampinato, L., Lodato, L., Harris, A.J.L., Patrick, M.R., Dehn, J., Burton, M.R.,Andronico, D., 2005. Chronology and complex volcanic processes during the2002–2003 flank eruption at Stromboli volcano (Italy) reconstructed from directobservations and surveys with a handheld thermal camera. J. Geophys. Res. 110,B02201. http://dx.doi.org/10.1029/2004JB003129.
Campbell, C.S., 1990. Rapid granular flows. Annu. Rev. Fluid Mech. 22, 57–92.Campbell, C.S., Brennen, C.E., 1985. Computer simulation of granular shear flows. J. Fluid
Mech. 151, 167–188.Campbell, M., Russel, J.K., Porrit, L.A., 2013. Thermomechanical milling of accessory lithics
in volcanic conduits. Earth Planet. Sci. Lett. 377–378, 276–286.Cao, Z., Egashira, S., Carling, P.A., 2003. Role of sospende-sediment particle size in modify-
ing velocity profiles in open canne flows. Water Resour. Res. 39, 1–15.Carey, S.N., 1991. Transport and deposition of tephra by pyroclastic flows and surges.
SEPM Spec. Publ. 45, 39–57.Carey, S.N., Sigurdsson, H., Mandeville, C., Bronto, S., 1996. Pyroclastic flows and
surges over water: an example from the 1883 Krakatau eruption. Bull. Volcanol. 57,493–511.
Cas, R.A.F., Wright, J.V., 1987. Volcanic Successions: Modern and Ancient. Allen & Unwin.Cas, R.A.F., Wright, H.M.N., Folkes, C.B., Lesti, C., Porreca, M., Giordano, G., Viramonte, J.G.,
2011. The flow dynamics of an extremely large volume pyroclastic flow, the 2.08-MaCerro Galán Ignimbrite, NW Argentina, and comparison with other flow types. Bull.Volcanol. 73, 1583–1609.
Cashman, K.V., Sparks, R.S.J., 2013. How volcanoes work: a 25 year perspective. Geol. Soc.Am. Bull. 125, 664–690.
Charbonnier, S., Gertisser, R., 2009. Numerical simulations of block and ash flows usingthe Titan2D flow model: examples from the 2006 eruption of Merapi Volcano, Java,Indonesia. Bull. Volcanol. 71, 953–959.
Charbonnier, S.J., Gertisser, R., 2011. Deposit architecture and dynamics of the 2006block-and-ash flows of Merapi Volcano, Java, Indonesia. Sedimentology 58,1573–1612.
Chough, S.K., Sohn, Y.K., 1990. Depositional mechanisms and sequences of base surges,Songaksan tuff ring, Cheju Island, Korea. Sedimentology 37, 1115–1135.
Cioni, R., Gurioli, L., Sbrana, A., Vougioukalakis, G., 2000. Precursory phenomena and de-structive events related to the Late Bronze Age Minoan (Thera, Greece) and A.D. 79(Ve-suvius, Italy) Plinian eruptions: inferences from the stratigraphy in the archaeo-logical areas. In: McGuire, B., et al. (Eds.), The Archaeology of Geological Catastrophes.Geological Society (London) Special Publication, 171, pp. 123–141.
Cioni, R., Gurioli, L., Lanza, R., Zanella, E., 2004. Temperatures of the A.D. 79 pyroclasticdensity current deposits (Vesuvius, Italy). J. Geophys. Res. 109, 1–18.
Cole, P.D., Fernandez, E., Duarte, E., Duncan, A.M., 2005. Explosive activity and generationmechanisms of pyroclastic flows at Arenal volcano, Costa Rica between 1987 and2001. Bull. Volcanol. 67, 695–716.
Colella, A., Hiscott, R.N., 1997. Pyroclastic surges of the Pleistocene Monte Guardiasequence (Lipari island, Italy): depositional processes. Sedimentology 44, 47–66.
Cordoba, G., 2005. A numerical model for the dynamics of pyroclastic flows at GalerasVolcano, Colombia. J. Volcanol. Geotherm. Res. 139, 59–71.
Cronin, S.J., Lube, G., Breard, E., Jones, J., Valentine, G., Freundt, A., Hort, M.K.G., Bursik, M.I.,2013. Realizing life-scalable experimental pyroclastic density currents. AGU FallMeeting Abstract n° 1803825.
Crowe, C.T., 2006. Multiphase Flow Handbook. Taylor & Francis Group, LLC.Dade, B.W., Huppert, H.E., 1996. Emplacement of the Taupo ignimbrite by a dilute turbu-
lent flow. Nature 381, 509–512.Dartevelle, S., 2004. Numerical modeling of geophysical granular flows: 1. A comprehen-
sive approach to granular rheologies and geophysical multiphase flows. Geochem.Geophys. Geosyst. 5, Q08003. http://dx.doi.org/10.1029/2003GC000636.
Dartevelle, S., Rose, W.I., Stix, J., Kelfoun, K., Vallance, J.W., 2004. Numerical modeling ofgeophysical granular flows: 2. Computer simulation of Plinian clouds and pyroclasticflows and surges. Geochem. Geophys. Geosyst. 5, Q08004. http://dx.doi.org/10.1029/2003GC000637.
Davies, T.R.H., McSaveney, M.J., 1999. Runout of dry granular avalanches. Can. Geotech. J.36, 313–320.
de'Michieli Vitturi, M., Esposti Ongaro, T., Neri, A., Salvetti, M.V., Beux, F., 2007. Animmersed boundary method for compressible multiphase flow: application to thedynamics of pyroclastic density currents. Comput. Geosci. 11, 183–198.
Dellino, P., La Volpe, L., 2000. Structures and grain size distribution in surge deposits asa tool for modelling the dynamics of dilute pyroclastic density currents at La Fossadi Vulcano (Aeolian Islands, Italy). J. Volcanol. Geotherm. Res. 96, 57–78.
Dellino, P., Isaia, R., Veneruso, M., 2004. Turbulent boundary layer shear flow as an ap-proximation of base surge at Campi Flegrei. J. Volcanol. Geotherm. Res. 133, 211–228.
Dellino, P., Zimanowski, B., Buttner, R., La Volpe, L., Mele, D., Sulpizio, R., 2007. Large-scaleexperiments on the mechanics of pyroclastic flow: design, engineering, and first re-sults. J. Geophys. Res. 112, B04202. http://dx.doi.org/10.1029/2006JB004313.
Dellino, P., Mele, D., Sulpizio, R., La Volpe, L., Braia, G., 2008. A method for the calculation ofthe impact parameters of dilute pyroclastic density currents based on deposits particlecharacteristics. J. Geophys. Res. 113, B07206. http://dx.doi.org/10.1029/2007JB005365.
Dellino, P., Buttner, R., Dioguardi, F., Doronzo, D.M., La Volpe, L., Mele, D., Sonder, I.,Sulpizio, R., Zimanowski, B., 2010a. Experimental evidence links volcanic particlecharacteristics to pyroclastic flow hazard. Earth Planet. Sci. Lett. 295, 314–320.
Dellino, P., Dioguardi, F., Zimanowski, B., Buttner, R., Mele, D., La Volpe, L., Sulpizio, R.,Doronzo, D.M., Sonder, I., Bonasia, R., Calvari, S., Marotta, E., 2010b. Conduit flowexperiments help constraining the regime of explosive eruptions. J. Geophys. Res.115, B04204. http://dx.doi.org/10.1029/2009JB006781.
Dellino, P., De Astis, G., La Volpe, L., Mele, D., Sulpizio, R., 2011. Quantitative hazard assess-ment of phreatomagmatic eruptions at Vulcano (Aeolian Islands, Southern Italy) asobtained by combining stratigraphy, event statistics and physical modelling. J.Volcanol. Geotherm. Res. 201, 364–384.
Dellino, P., Dioguardi, F., Mele, D., D'Addabbo, M., Zimanowski, B., Büttner, R., Doronzo,D.M., Sonder, I., Sulpizio, R., Dürig, T., La Volpe, L., 2014. Volcanic jets, plumes and col-lapsing fountains: evidence from large-scale experiments, with particular emphasison the entrainment rate. Bull. Volcanol. 76, 834–852.
Denlinger, R.P., Iverson, R.M., 2001. Flow of variablyfluidized granularmasses across threedimensional terrain. II. Numerical predictions and experimental tests. J. Geophys. Res.106, 553–566.
Dingwell, D.B., 1998. A physical description of magma relevant to explosive silicic volca-nism. In: Gilbert, J.S., Sparks, R.S.J. (Eds.), The Physics of Explosive Volcanic Eruptions.Geological Society of London, Special Publications, 145, pp. 9–26.
Dioguardi, F., Dellino, P., de Lorenzo, S., 2013. Integration of large-scale experimentsand numerical simulations for the calibration of friction laws in volcanic conduitflows. J. Volcanol. Geotherm. Res. 250, 75–90.
Dobran, F., Neri, A., Macedonio, G., 1993. Numerical simulation of collapsing volcaniccolumns. J. Geophys. Res. 98, 4231–4259.
Dobran, F., Neri, A., Todesco, M., 1994. Assessing the pyroclastic flow hazard at Vesuvius.Nature 367, 551–554.
Doronzo, D.M., 2009.Where do you gowhen the volcano blows? Fluid flowmodeling aidsItalian university researchers in characterizing the effects of explosive eruptions onnearby buildings. Ansys Advantage 4 (1).
Doronzo, D.M., 2012. Two new end members of pyroclastic density currents: forcedconvection-dominated and inertia-dominated. J. Volcanol. Geotherm. Res. 219–220,87–91.
Doronzo, D.M., 2013. Aeromechanic analysis of pyroclastic density currents past a build-ing. Bull. Volcanol. 75, 684–689.
Doronzo, D.M., Dellino, P., 2010. A fluid dynamicmodel of volcaniclastic turbidity currentsbased on the similarity with the lower part of dilute pyroclastic density currents:evaluation of the ash dispersal from ash turbidites. J. Volcanol. Geotherm. Res. 191,193–204.
Doronzo, D.M., Dellino, P., 2011. Interaction between pyroclastic density currents and build-ings: numerical simulation and first experiments. Earth Planet. Sci. Lett. 310, 286–292.
Doronzo, D.M., Dellino, P., 2013. Hydraulics of subaqueous ash flows as deducedfrom their deposits: 2. Water entrainment, sedimentation, and deposition, with im-plications on pyroclastic density current deposit emplacement. J. Volcanol. Geotherm.Res. 258, 176–186.
Doronzo, D.M., Valentine, G.A., Dellino, P., de Tullio, M.D., 2010. Numerical analysis of theeffect of topography on deposition from dilute pyroclastic density currents. EarthPlanet. Sci. Lett. 300, 164–173.
Doronzo, D.M., de Tullio, M.D., Dellino, P., Pascazio, G., 2011. Numerical simulation ofpyroclastic density currents using locally refined Cartesian grids. Comput. Fluids 44,56–67.
Doronzo, D.M., Martí, J., Sulpizio, R., Dellino, P., 2012. Aerodynamics of stratovolcanoesduring multiphase processes. J. Geophys. Res. 117, B01207. http://dx.doi.org/10.1029/2011JB008769.
Douillet, G.A., Rasmussen, K.R., Kueppers, U., Lo Castro, D., Merrison, J.R., Iversen, J.J.,Dingwell, D.B., 2014. Saltation thresholds for pyroclasts at various bedslopes: windtunnel measurements. J. Volcanol. Geotherm. Res. 278-279, 14–24.
Doyle, E.E., Hogg, A.J., Mader, H.M., 2011. A two-layer approach tomodelling the transfor-mation of dilute pyroclastic currents into dense pyroclastic flows. Proc. R. Soc. A 467,1348–1371.
Druitt, T.H., 1998. Pyroclastic density currents. In: Gilbert, J.S., Sparks, R.S.J. (Eds.),The Physics of Explosive Volcanic Eruptions. Geological Society of London, SpecialPublications, 145, pp. 145–182.
Druitt, T.H., Kokelaar, B.P., 2002. The eruption of Soufrière Hills Volcano, Montserrat, from1995 to 1999. Geol. Soc. Lond. Mem. 21.
Dufek, J., Bergantz, G.W., 2007. Dynamics and deposits generated by the Kos Plateau Tufferuption: controls of basal particle loss on pyroclastic flow transport. Geochem.Geophys. Geosyst. 8, Q12007. http://dx.doi.org/10.1029/2007GC001741.
Dufek, J., Wexler, J., Manga, M., 2009. Transport capacity of pyroclastic density currents:experiments and models of substrate-flow interaction. J. Geophys. Res. 114,B11203. http://dx.doi.org/10.1029/2008JB006216.
Edwards, D.A., Leeder,M.R., Best, J.L., Pantin, H.M., 1994. Onexperimental reflecteddensitycurrents and the interpretation of certain turbidites. Sedimentology 41, 437–461.
Ellis, B., Branney, M.J., 2010. Silicic phreatomagmatism in the Snake River Plain: the Dead-eye Member. Bull. Volcanol. 72, 1241–1257.
Esposti Ongaro, T., Neri, A., Todesco, M., Macedonio, G., 2002. Pyroclastic flow hazardassessment at Vesuvius (Italy) by using numerical modeling. II. Analysis of flowvariables. Bull. Volcanol. 64, 178–191.
Esposti Ongaro, T., Neri, A., Cavazzoni, C., Erbacci, G., Salvetti, M.V., 2007. A parallelmultiphase flow code for the 3D simulation of explosive volcanic eruptions. ParallelComput. 33, 541–560.
Esposti Ongaro, T., Neri, A., Menconi, G., de'Michieli Vitturi,M., Marianelli, P., Cavazzoni, C.,Erbacci, G., Baxter, P.J., 2008. Transient 3D numerical simulations of column collapseand pyroclastic density current scenarios at Vesuvius. J. Volcanol. Geotherm. Res.178, 378–396.
Esposti Ongaro, T., Clarke, A.B., Voight, B., Neri, A., Widiwijayanti, C., 2012. Multiphaseflow dynamics of pyroclastic density currents during the May 18, 1980 lateral blastof Mount St. Helens (USA). J. Geophys. Res. 117, B06208. http://dx.doi.org/10.1029/2011JB009081.
Estep, J., Dufek, J., 2012. Substrate effects from force chain dynamics in dense granularflows. J. Geophys. Res. 117, F01028. http://dx.doi.org/10.1029/2011JF002125.
Felix, G., Thomas, N., 2004. Relation between dry granular flow regimes and morphologyof deposits; formation of levees in pyroclastic deposits. Earth Planet. Sci. Lett. 221,197–213.
Fisher, R.V., 1966. Mechanism of deposition from pyroclastic flows. Am. J. Sci. 264,350–363.

63S. R. et al. / Journal of Volcanology and Geothermal Research 283 (2014) 36–65
Fisher, R.V., 1990. Transport and deposition of a pyroclastic surge across an area of highrelief: the 18 May 1980 eruption of Mount St. Helens, Washington. Geol. Soc. Am.Bull. 102, 1038–1054.
Fisher, R.V., 1995. Decoupling of pyroclastic currents — hazards assessments. J. Volcanol.Geotherm. Res. 66, 257–263.
Fisher, R.V., Heiken, G., 1982. Mt. Pelée, Martinique: May 8 and 20, 1902, pyroclastic flowsand surges. J. Volcanol. Geotherm. Res. 13, 339–371.
Fisher, R.V., Orsi, G., Heiken, G., Ort, M., 1993. Mobility of a large-volume pyroclastic flow-emplacement of the Campanian Ignimbrite, Italy. J. Volcanol. Geotherm. Res. 56,205–220.
Fluent 6.3, 2006. Manual 2006. Fluent Inc.Formenti, Y., Druitt, T.H., Kelfoun, K., 2003. Characterization of the 1997 Vulcanian explo-
sions of Soufrière Hills Volcano, Montserrat, by video analysis. Bull. Volcanol. 65,587–605.
Freundt, A., Bursik, M.I., 1998. Pyroclastic flow transportmechanisms. In: Freundt, A., Rosi,M. (Eds.), From Magma to Tephra: Modelling Physical Processes of Explosive Volca-nism. Developments in Volcanology, 4. Elsevier, pp. 151–222.
Freundt, A., Carey, S., Wilson, C.J.N., 2000. Ignimbrites and block-and-ash flow deposits.In: Sigurdsson, H., et al. (Eds.), Encyclopedia of Volcanoes. Academic Press, NY-London, pp. 581–600.
Fujii, T., Nakada, S., 1999. The 15 September 1991 pyroclastic flows at Unzen Volcano(Japan): a flow model for associated ash-cloud surges. J. Volcanol. Geotherm. Res.89, 159–172.
Furbish, D.J., 1997. Fluid Physics in Geology. Oxford University Press.Furbish, D.J., Schmeeckle, M.W., Roering, J.J., 2008. Thermal and force-chain effects in an
experimental, sloping granular shear flow. Earth Surf. Process. Landf. 33, 2108–2117.Gidaspow, D., 1994. Multiphase Flow and Fluidization: Continuum and Kinetic Theory
Descriptions. Academic, San Diego, CA.Gilbert, J.S., Lane, S.J., 1994. The origin of accretionary lapilli. Bull. Volcanol. 56, 398–411.Giordano,G., 1998. The effect of paleotopographyon lithic distribution and facies associations
of small volume ignimbrites: the WTT Cupa (Roccamonfina volcano, Italy). J. Volcanol.Geotherm. Res. 87, 255–273.
Giordano, G., Dobran, F., 1994. Computer simulations of the Tuscolano Artemisio's secondpyroclastic flow unit (Alban Hills, Latium, Italy). J. Volcanol. Geotherm. Res. 61,69–94.
Giordano, G., De Rita, D., Cas, R.A.F., Rodani, S., 2002. Valley pond and ignimbrite veneerdeposits in the small-volume phreatomagmatic ‘Peperino Albano’ basic ignimbrite,Lago Albano maar, Colli Albani volcano, Italy: influence of topography. J. Volcanol.Geotherm. Res. 118, 131–144.
Girolami, L., Roche, O., Druitt, T.H., Corpetti, T., 2011. Particle velocity fields and deposi-tional processes in laboratory ash flows, with implications for the sedimentation ofdense pyroclastic flows. Bull. Volcanol. 72, 747–759.
Gottssman, J., De Angelis, S., Fournier, N., Van Camp, M., Sacks, S., Linde, A., Ripepe, M.,2011. On the geophysical fingerprint of Vulcanian explosions. Earth Planet. Sci. Lett.306, 98–104.
Gray, T.E., Alexander, J., Leeder, M.R., 2005. Quantifying velocity and turbulence structurein depositing sustained turbidity currents across breaks in slope. Sedimentology 4,1–22.
Gurioli, L., Cioni, R., Sbrana, A., Zanella, E., 2002. Transport and deposition of pyroclasticdensity currents over an inhabited area: thedeposits of theAD 79 eruption of Vesuviusat Herculaneum, Italy. Sedimentology 49, 1–26.
Gurioli, L., Pareschi, M.T., Zanella, E., Lanza, R., Deluca, E., Bisson, M., 2005. Interaction ofpyroclastic density currentswith human settlements: evidence from ancient Pompeii.Geology 33, 441–444.
Hallworth, M.A., Huppert, H.E., 1998. Abrupt transitions in high-concentration, particle-driven gravity currents. Phys. Fluids 10, 1083–1087.
Hoblitt, R.P., 1986. Observations of the eruptions of July 22 and August 7, 1980, at MountSt. Helens, Washington. US Geological Survey Professional Paper 1334.
Horwell, C.J., Baxter, P.J., 2006. The respiratory health hazards of volcanic ash: a review forvolcanic risk mitigation. Bull. Volcanol. 69, 1–24.
Huppert, H.E., 2006. Gravity currents: a personal perspective. J. FluidMech. 554, 299–322.Huppert, H.E., Turner, J.S., Carey, S.N., Sparks, R.S.J., Hallworth, M.A., 1986. A laboratory
simulation of pyroclastic flows down slopes. J. Volcanol. Geotherm. Res. 30, 179–199.Ishimine, Y., 2005. Numerical study of pyroclastic surges. J. Volcanol. Geotherm. Res. 139,
33–57.Iverson, R.M., 1997. The physics of debris flows. Rev. Geophys. 35, 254–296.Iverson, R.M., Denlinger, R.P., 2001. Flow of variably fluidized granular masses across
three dimensional terrain. I. Coulomb mixture theory. J. Geophys. Res. 106, 537–552.Iverson, R.M., Vallance, J.M., 2001. New views of granular mass flows. Geology 29,
115–118.Iverson, R.M., Logan, M., Denlinger, R.P., 2004. Granular avalanches across irregular
threedimensional terrain: 2. Experimental tests. J. Geophys. Res. 109 (F01015), 16.Jeon, Y.M., Kwon, C.W., Sohn, Y.K., 2011. Deposition from pyroclastic surges partially
blocked by a topographic obstacle: an example from the Ilchulbong tuff cone, Jejuisland, South Korea. Geosci. J. 15, 121–130.
Johnson, A.M., 1970. Physical Processes in Geology. Freeman, San Francisco, CA.Johnson, R.W., 1998. The Handbook of Fluid Dynamics. CRC Press.Kelfoun, K., Legros, F., Gourgaud, A., 2000. Statistical study of damaged trees related to the
pyroclastic flows of November 22, 1994 at Merapi volcano (central Java, Indonesia):relation between ash-cloud surge and block-and-ash flow. J. Volcanol. Geotherm. Res.100, 379–393.
Kelfoun, K., Samaniego, P., Palacios, P., Barba, D., 2009. Testing the suitability of frictionalbehaviour for pyroclastic flow simulation by comparison with a well-constrainederuption at Tungurahua volcano (Ecuador). Bull. Volcanol. 71, 1057–1075.
Kieffer, S.W., Sturtevant, B., 1988. Erosional furrows formed during the lateral blast atMount St. Helens, May 18, 1980. J. Geophys. Res. 93, 14793–14816.
Kneller, B.C., Buckee, C., 2000. The structure and fluid mechanics of turbidity currents: areview of some recent studies and their geological implications. Sedimentology 47,62–94.
Kneller, B.C., McCaffrey, W., 1999. Depositional effects of flow non uniformity and strati-fication within turbidity currents approaching a bounding slope: deflection, reflec-tion, and facies variation. J. Sediment. Res. 69, 980–991.
Lajoie, J., Boudon, G., Bourdier, J.L., 1989. Depositional mechanics of the 1902 pyroclasticnuée ardente deposits of Mt. Pelée, Martinique. J. Volcanol. Geotherm. Res. 38,131–142.
Le Roux, J.P., 2003. Can dispersive pressure cause inverse grading in grain flows? —
discussion. J. Sediment. Res. 73, 333–334.Lee, J., Leibig, M., 1994. Density waves in granular flow: a kinetic wave approach. J. Phys. I
Fr. 4, 507–514.Legros, F., Kelfoun, K., 2000. On the ability of pyroclasticflows to scale topographic obstacles.
J. Volcanol. Geotherm. Res. 98, 235–241.Lesti, C., Porreca, M., Giordano, G., Mattei, M., Cas, R.A.F., Wright, H.M.N., Folkes, C.B.,
Viramonte, J., 2011. High-temperature emplacement of the Cerro Galán and ToconquisGroup ignimbrites (Puna plateau, NW Argentina) determined by TRM analyses. Bull.Volcanol. 73, 1535–1565.
Lipman, P.W.,Mullineaux, D.R., 1981. The1980 eruptions ofMount St. Helens,Washington.US Geological Survey Professional Paper 1250.
Loughlin, S.C., Baxter, P.J., Aspinall, W.P., Darroux, B., Harford, C.L., Miller, A.D., 2002.Eyewitness accounts of the 25 June 1997 pyroclastic flows and surges at SoufrièreHills Volcano. Geol. Soc. Lond. Mem. 21, 211–230. http://dx.doi.org/10.1144/GSL.MEM.2002.021.01.10.
Lowe, D.R., 1982. Sedimentary gravity flows: II. Depositional models with special referenceto the deposits of high density turbidity currents. J. Sediment. Petrol. 52, 279–297.
Lube, G., Cronin, S.J., Platz, T., Freundt, A., Procter, J.N., Henderson, C., Sheridan, M.F., 2007.Flow and deposition of pyroclastic granular flows: a type example from the 1975Ngauruhoe eruption, New Zealand. J. Volcanol. Geotherm. Res. 161, 165–186.
Lube, G., Huppert, H.E., Sparks, R.S.J., Freundt, A., 2011. Granular column collapse downrough, inclined channels. J. Fluid Mech. 675, 347–368.
Lube, G., Cronin, S.J., Breard, E., Valentine, G., Bursik, M.I., Hort, M.K.G., Freundt, A., 2013.The perfect ash-storm: large-scale Pyroclastic Density Current experiments revealhighly mobile, self-fluidising and air-cushioned flow transport regime. AGU FallMeeting Abstract n° 1804338.
Lun, C.K.K., Savage, S.B., Jeffrey, D.J., Chepurnity, N., 1984. Kinetic theories of granularflow: inelastic particles in Couette flow and slightly inelastic particles in a generalflow field. J. Fluid Mech. 140, 223–256.
Luongo, G., Perrotta, A., Scarpati, C., 2003a. Impact of the AD 79 eruption on Pompeii, I.Relations amongst the depositional mechanisms of the pyroclast products, the frame-work of the buildings and the associated destructive events. J. Volcanol. Geotherm.Res. 126, 201–223.
Luongo, G., Perrotta, A., Scarpati, C., De Carolis, E., Patricelli, G., Ciarallo, A., 2003b. Impactof the A.D. 79 eruption on Pompeii, II. Causes of death of the inhabitants inferredby stratigraphic analysis and areal distribution of the human causalities. J. Volcanol.Geotherm. Res. 126, 169–200.
Macias, J.L., Espindola, J.M., Bursik, M.I., Sheridan, M.F., 1998. Development of lithic-breccias in the 1982 pyroclastic flow deposits of El Chichon volcano, Mexico. J.Volcanol. Geotherm. Res. 83, 173–196.
Major, J.J., 1997. Depositional processes in large-scale debris flow experiments. J. Geol.105, 345–366.
Malin, M.C., Sheridan, M.F., 1982. Computer assisted mapping of pyroclastic surges.Science 217, 637–639.
Manga, M., Patel, A., Dufek, J., 2011. Rounding of pumice clasts during transport: fieldmeasurements and laboratory studies. Bull. Volcanol. 73, 321–333.
Manville, V., Segschneider, B., White, J.D.L., 2002. Hydrodynamic behaviour ofTaupo 1800a pumice: implications for the sedimentology of remobilized pyroclasts.Sedimentology 49, 955–976.
Manzella, I., Labiouse, V., 2013. Empirical and analytical analyses of laboratory granularflows to investigate rock avalanche propagation. Landslides 10, 23–36.
Marble, F.E., 1970. Dynamics of dusty gases. Annu. Rev. Fluid Mech. 2, 397–446.Mason, B.G., Pyle, D.M., Oppenheimer, C., 2004. The size and frequency of the largest
explosive eruptions on Earth. Bull. Volcanol. 66, 735–748.Massey, B.S., 1983. Mechanics of Fluids. Van Nostrand Reinhold (UK) Co. Ltd.Mathisen, M.E., Vondra, C.F., 1983. The fluvial and pyroclastic deposits of the Cagayan
basin, Northern Luzon, Philippines — an example of non-marine volcaniclastic sedi-mentation in an interarc basin. Sedimentology 30, 369–392.
Mele, D., Sulpizio, R., Dellino, P., La Volpe, L., 2011. Stratigraphy and eruptive dynamicsof a pulsating Plinian eruption of Somma-Vesuvius: the Pomici di Mercato(8900 years B.P.). Bull. Volcanol. 73, 257–278.
Miall, A.D., 1978. Lithofacies types and vertical profiles models in braided river deposits: asummary. In: Miall, A.D. (Ed.), Fluvial Sedimentology. Canadian Society of PetroleumGeology Memoirs, 5, pp. 597–604.
Miall, A.D., 1985. Architectural-element analyses: a newmethod of facies analyses appliedto fluvial deposits. Earth Sci. Rev. 22, 261–308.
Middleton, G.V., Neal, W.J., 1989. Experiments on the thickness of beds deposited byturbidity currents. J. Sediment. Petrol. 59, 297–307.
Middleton, G.V., Southard, J.B., 1984. Mechanics of Sediment Movement. SEPM Press.MiDi, G.D.R., 2004. On dense granular flows. Eur. Phys. J. E 14, 341–365.Miyabuchi, Y., 1999. Deposits associated with the 1990–1995 eruption of Unzen volcano,
Japan. J. Volcanol. Geotherm. Res. 89, 139–158.Mulder, T., Alexander, J., 2001. The physical character of subaqueous sedimentary density
flows and their deposits. Sedimentology 48, 269–299.Neri, A., Dobran, F., 1994. Influence of eruption parameters on the thermofluid dynamics
of collapsing volcanic columns. J. Geophys. Res. 99, 11833–11857.

64 S. R. et al. / Journal of Volcanology and Geothermal Research 283 (2014) 36–65
Neri, A., Macedonio, G., 1996. Numerical simulation of collapsing volcanic columns withparticles of two sizes. J. Geophys. Res. 101, 8153–8174.
Neri, A., Di Muro, A., Rosi, M., 2002. Mass partitioning during collapsing and transitionalcolumns by using numerical simulations. J. Volcanol. Geotherm. Res. 115, 1–18.
Neri, A., Esposti Ongaro, T., Macedonio, G., Gidaspow, D., 2003. Multiparticle simulation ofcollapsing volcanic columns and pyroclastic flows. J. Geophys. Res. 108, B42202.http://dx.doi.org/10.1029/2001JB000508.
Neri, A., Esposti Ongaro, T., Menconi, G., De'Michieli Vitturi, M., Cavazzoni, C., Erbacci, G.,Baxter, P.J., 2007. 4D simulation of explosive eruption dynamics at Vesuvius.Geophys. Res. Lett. 34, L04309. http://dx.doi.org/10.1029/2006GL028597.
Newhall, C.G., Punongbayan, R.S., 1996. Fire and Mud: Eruptions and Lahars of MountPinatubo, Philippines. Philippine Institute of Volcanology and Seismology & Universi-ty of Washington Press, Quezon City & Seattle.
Niño, Y., Lopez, F., Garcia, M., 2003. Threshold for particle entrainment into suspension.Sedimentology 50, 247–263.
Nunziante, L., Fraldi, M., Lirer, L., Petrosino, P., Scotellaro, S., Cicirelli, C., 2003. Risk assess-ment of the impact of pyroclastic currents eruption. Nature 345, 519–521.
Oke, T., 1987. Boundary Layer Climates. Routledge, London.Oramas-Dorta, D., Cole, P.D., Wadge, G., Alvarado, G.E., Soto, G.J., 2012. Spatial and tempo-
ral controls on pyroclastic flow hazard at Arenal volcano, Costa Rica. J. Volcanol.Geotherm. Res. 225–226, 45–64.
Patankar, S.V., 1980. Numerical Heat Transfer and Fluid Flow. Hemisphere, New York.Patra, A., Bauer, A., Nichita, C., Pitman, B.E., Sheridan, M., Bursik, M.I., Rupp, B.,
Webber, A., Stinton, A.J., Namikawa, L.M., Renschler, C.S., 2005. Parallel adaptativenumerical simulation of dry avalanches over natural terrain. J. Volcanol. Geotherm.Res. 139, 1–22.
Petrazzuoli, S.M., Zuccaro, G., 2004. Structural resistance of reinforced concrete buildingsunder pyroclastic flows: a study of the Vesuvian area. J. Volcanol. Geotherm. Res. 133,1–15.
Piper, D.J.W., Normark, W.R., 1983. Turbidite depositional patterns and flow characteris-tics, Navy submarine fan, California borderland. Sedimentology 30, 681–694.
Pitman, B.E., Le, L., 2005. A two-fluid model for avalanche and debris flows. Phil. Trans. R.Soc. A 363, 1573–1601.
Pitman, B.E., Patra, A., Bauer, A., Nichita, C., Sheridan, M., Bursik, M.I., 2003. Computingdebris flows. Phys. Fluids 15, 3638–3646.
Pittari, A., Cas, R.A.F., Edgar, C., Nichols, H., Wolff, J.A., Martí, J., 2006. The influence ofpaleotopography on facies architecture and pyroclastic flow processes of a lithic-rich ignimbrite in a high gradient setting: the Abrigo Ignimbrite, Tenerife, CanaryIslands. J. Volcanol. Geotherm. Res. 152, 273–315.
Pittari, A., Cas, R.A.F., Wolff, J.A., Nichols, H.J., Larson, P.B., MArtì, J., 2008. The use of lithicclast distributions in pyroclastic deposits to understand pre- and syn-caldera collapseprocesses: a case study of the Abrigo Ignimbrite, Tenerife, Canary Islands. In: Martí, J.,Gottsman, J. (Eds.), Caldera Volcanism: Analysis, Modelling and Response. Develop-ments in Volcanology, 10. Elsevier, pp. 97–142.
Pope, S.B., 2000. Turbulent Flows. Cambridge University Press.Postma, G., 1986. Classification for sediment gravity flow deposits based on flow condi-
tions during sedimentation. Geology 14, 291–294.Raudkivi, A.J., 1990. Loose Boundary Hydraulics. Pergamon Press, New York.Rivard, W.C., Torrey, M.D., 1977. K-FIX: a computer program for transient, two-
dimensional, two-fluid flow. Los Alamos National Laboratory, Los Alamos, NM.Roche, O., 2012. Depositional processes and gas pore pressure in pyroclastic flows: an
experimental perspective. Bull. Volcanol. 74, 1807–1820.Roche, O., Gilbertson, M.A., Phillips, J.C., Sparks, R.S.J., 2004. Experimental study of gas-
fluidized granular flows with implications for pyroclastic flow emplacement. J.Geophys. Res. 109, B10201. http://dx.doi.org/10.1029/2003JB002916.
Roche, O., Montserrat, S., Niño, Y., Tamburrino, A., 2010. Pore fluid pressure and internalkinematics of gravitational laboratory air-particle flows: insights into the emplace-ment dynamics of pyroclastic flows. J. Geophys. Res. 115, B09206. http://dx.doi.org/10.1029/2009JB007133.
Roche, O., Phillips, J.C., Kelfoun, K., 2013. Pyroclastic density currents. In: Fagents, S.A.,Gregg, T.K.P., Lopes, R.M.C. (Eds.), Modeling Volcanic Processes: The Physics andMathematics of Volcanism. Cambridge University Press, pp. 203–229.
Rosi, M., 1992. A model for the formation of vesiculated tuff by the coalescence of accre-tionary lapilli. Bull. Volcanol. 54, 429–434.
Rottman, J.W., Simpson, J.E., Hunt, J.C.R., 1985. Unsteady gravity current flows over obsta-cles: some observations and analyses related to Phase II trials. J. Hazard. Mater. 11,325–340.
Rouse, H., 1939. An analysis of sediment transportation in the light of fluid turbulence.Soil Conservation Services Report, USDA SCS-TP-25.
Rowley, P.D., Kuntz, M.A., Macleod, N.S., 1981. Pyroclastic flow deposits. In: Lipman, P.W.,Mullineaux, D.R. (Eds.), The 1980 Eruption of Mount St Helens, Washinghton. USGSProfessional Paper, 1250, pp. 489–512.
Sarocchi, D., Sulpizio, R., Macías, J.L., Saucedo, R., 2011. The 17 July 1999 Block-And-AshFlow (BAF) at Colima Volcano: new insights on volcanic granular flows from texturalanalysis. J. Volcanol. Geotherm. Res. 204, 40–56.
Saucedo, R., Macías, J.L., Bursik, M.I., 2004. Pyroclastic flow deposits of the 1991 eruptionof Volcan de Colima. Bull. Volcanol. 66, 291–306.
Saucedo, R., Macías, J.L., Sheridan, M., Komorowski, J.C., 2005. Modeling of pyroclasticflows of Colima Volcano, Mexico: implications for hazard assessment. J. Volcanol.Geotherm. Res. 139, 103–115.
Savage, S.B., 1979. Gravity flow of cohesionless granular materials in chutes and channels.J. Fluid Mech. 92, 53–96.
Savage, S.B., 1983. Granular flows down rough inclines — review and extension. In:Jenkins, J.T., Satake, M. (Eds.), Mechanics of Granular Materials: New Models andConstitutive Relations. Elsevier, pp. 261–281.
Savage, S.B., 1984. The mechanics of rapid granular flows. Adv. Appl. Mech. 24, 289–366.
Savage, S.B., Lun, C.K.K., 1988. Particle size segregation in inclined chute flow of dry cohe-sionless granular solids. J. Fluid Mech. 189, 311–335.
Schlichting, H., Gersten, K., 2000. Boundary Layer Theory. Springer.Schmeeckle, M.W., Nelson, J.M., 2003. Direct numerical simulation of bedload transport
using a local, dynamic boundary condition. Sedimentology 50, 279–301.Schumacher, R., Schmincke, H.-U., 1995. Models for the origin of accretionary lapilli. Bull.
Volcanol. 56, 626–639.Schwarzkopf, L.M., Schmincke, H.U., Cronin, S.J., 2005. A conceptual model for block-and-
ash flow basal avalanche transport and deposition, based on deposit architecture of1998 and 1994 Merapi flows. J. Volcanol. Geotherm. Res. 139, 117–134.
Scolamacchia, T., Schouwenaars, R., 2009. High-speed impacts by ash particles in the 1982eruption of El Chichòn, Mexico. J. Geophys. Res. 114, B12206. http://dx.doi.org/10.1029/2008JB005848.
Sheppard, P.A., 1956. Airflow over mountains. Q. J. R. Meteorol. Soc. 82, 528–529.Sheridan, M.F., Malin, M.C., 1983. Application of computer-assisted mapping to volcanic
hazard evaluation of surge eruptions: Vulcano, Lipari, and Vesuvius. J. Volcanol.Geotherm. Res. 17, 187–202.
Sigurdsson, H., Carey, S., Cornell, W., Pescatore, T., 1985. The eruption of Vesuvius in A.D.79. Natl. Geogr. Res. 1, 332–387.
Smith, G.A., 1986. Coarse-grained nonmarine volcaniclastic sediment: terminology anddepositional processes. Geol. Soc. Am. Bull. 97, 1–10.
Smith, G.A., 1987. The influence of explosive volcanism on fluvial sedimentation: theDeschutes formation (Neogene) in central Oregon. J. Sediment. Petrol. 57, 613–629.
Snyder, W.H., Thompson, R.S., Eskridge, R.E., Lawson, R.E., Castro, I.P., Lee, J.T., Hunt, J.C.R.,Ogawa, Y., 1985. The structure of strongly stratified flow over hills: dividing-streamline concept. J. Fluid Mech. 152, 249–288.
Sohn, Y.K., 1997. On traction carpet sedimentation. J. Sediment. Res. 67, 502–509.Sohn, Y.K., Chough, S.K., 1989. Depositional processes of the Suwolbong tuff ring, Cheju
Island (Korea). Sedimentology 36, 837–855.Sohn, Y.K., Chough, S.K., 1993. The Udo tuff cone, Cheju Island, south Korea— transforma-
tion of pyroclastic fall into debris fall and grain flow on a steep volcanic cone slope.Sedimentology 40, 769–786.
Sparks, R.S.J., 1976. Grain size variations in ignimbrites and implications for the transportof pyroclastic flows. Sedimentology 23, 147–188.
Sparks, R.S.J., 1978. Gas release rates from pyroclastic flows: an assessments of the role offluidization in their emplacement. Bull. Volcanol. 41, 1–9.
Sparks, R.S.J., Wilson, L., Hulme, G., 1978. Theoretical modeling of the generation, move-ment, and emplacement of pyroclastic flows by column collapse. J. Geophys. Res.83, 1727–1739.
Sparks, R.S.J., Bursik, M.I., Carey, S.N., Gilbert, J.S., Glaze, L.S., Sigurdsson, H., Woods, A.W.,1997a. Volcanic Plumes. John Wiley, New York.
Sparks, R.S.J., Gardeweg, M.C., Calder, E.S., Matthews, S.J., 1997b. Erosion by pyroclasticflows on Lascar volcano, Chile. Bull. Volcanol. 58, 557–565.
Spence, R.J.S., Baxter, P.J., Zuccaro, G., 2004. Building vulnerability and human casualty es-timation for a pyroclastic flow: a model and its application to Vesuvius. J. Volcanol.Geotherm. Res. 133, 1–23.
Sulpizio, R., Dellino, P., 2008. Sedimentology, depositional mechanisms and pulsatingbehaviour of pyroclastic density currents. In: Martí, J., Gottsman, J. (Eds.), CalderaVolcanism: Analysis, Modelling and Response. Developments in Volcanology, 10.Elsevier, pp. 57–96.
Sulpizio, R., Zanchetta, G., Demi, F., Di Vito, M.A., Pareschi, M.T., Santacroce, R., 2006. TheHolocene syneruptive volcaniclastic debris-flows in the Vesuvian area: geologicaldata as a guide for hazard assessment. In: Siebe, C., Macias, J.L., Aguirre-Diaz, G.J.(Eds.), Neogene—Quaternary Continental Margin Volcanism: A Perspective fromMexico. GSA Special Paper, 402, pp. 203–221.
Sulpizio, R., Mele, D., Dellino, P., La Volpe, L., 2007. Deposits and physical properties of py-roclastic density currents during complex Subplinian eruptions: the AD 472 (Pollena)eruption of Somma-Vesuvius, Italy. Sedimentology 54, 607–635.
Sulpizio, R., De Rosa, R., Donato, P., 2008. The influence of variable topography on thedepositional behaviour of pyroclastic density currents: the examples of the UpperPollara eruption (Salina Island, southern Italy). J. Volcanol. Geotherm. Res. 175,367–385.
Sulpizio, R., Dellino, P., Mele, D., La Volpe, L., 2009. Generation of pyroclastic density cur-rents from pyroclastic fountaining or transient explosions: insights from large-scaleexperiments. IOP Conf. Series: Earth and Environmental Science, 3. http://dx.doi.org/10.1088/1755-1307/3/1/012020.
Sulpizio, R., Bonasia, R., Dellino, P., Mele, D., Di Vito, M.A., La Volpe, L., 2010a. The Pomici diAvellino eruption of Somma-Vesuvius (3.9 ka BP). Part II: Sedimentology and physi-cal volcanology of pyroclastic density current deposits. Bull. Volcanol. 72, 559–577.
Sulpizio, R., Capra, L., Sarocchi, D., Saucedo, R., Gavilanes-Ruiz, J.C., Varley, N.R., 2010b.Predicting the block-and-ash flow inundation areas at Volcán de Colima (Colima,Mexico) based on the present day (February 2010) status. J. Volcanol. Geotherm.Res. 193, 49–66.
Sulpizio, R., Sarocchi, D., Bartali, R., Rodriguez-Sedano, L.A., 2013. Laboratory experimentson transport and deposition of granular flows over a variable break in slope: insightsfor depositional behaviour of pyroclastic and volcaniclastic density currents. IAVCEAIgeneral assembly, Kagoshima, Japan, Abstract volume.
Surono, Jousset, P., Pallister, J., Boichu, M., Buongiorno, M.F., Budisantoso, A., Costa, F.,Andreastuti, S., Prata, F., Schneider, D., Clarisse, L., Humaida, H., Sumarti, S., Bignami,C., Griswold, J., Carn, S., Oppenheimer, C., Lavigne, F., 2012. The 2010 explosive erup-tion of Java's Merapi volcano — a ‘100-year’ event. J. Volcanol. Geotherm. Res. 241-242, 121–135.
Syamlal, M., Rogers, W., O'Brien, T.J., 1993. MFIX Documentation: Theory Guide. USDepartment of Energy, Washington, DC.
Taddeucci, J., Palladino, D.M., 2002. Particle size-density relationships in pyroclasticdeposits: inferences for emplacement processes. Bull. Volcanol. 64, 273–284.

65S. R. et al. / Journal of Volcanology and Geothermal Research 283 (2014) 36–65
Todesco, M., Neri, A., Esposti Ongaro, T., Papale, P., Macedonio, G., Santacroce, R., Longo, A.,2002. Pyroclastic flow hazard at Vesuvius from numerical modelling. I. Large-scaledynamics. Bull. Volcanol. 64, 155–177.
Todesco, M., Neri, A., Esposti Ongaro, T., Papale, P., Rosi, M., 2006. Pyroclastic flow dynam-ics and hazard in a caldera setting: application to Phlegrean Fields (Italy). Geochem.Geophys. Geosyst. 7, Q11003. http://dx.doi.org/10.1029/2006GC001314.
Valentine, G.A., 1987. Stratified flow in pyroclastic surges. Bull. Volcanol. 49, 616–630.Valentine, G.A., 1998a. Damage to structures by pyroclastic flows and surges, inferred
from nuclear weapons effects. J. Volcanol. Geotherm. Res. 87, 117–140.Valentine, G.A., 1998b. Eruption column physics. In: Freundt, A., Rosi, M. (Eds.), From
Magma to Tephra: Modelling Physical Processes of Explosive Volcanic Eruptions.Elsevier, New York, pp. 91–138.
Valentine, G.A., Wohletz, K.H., 1989. Numerical models of Plinian eruptions columns andpyroclastic flows. J. Geophys. Res. 94, 1867–1887.
Valentine, G.A., Wohletz, K.H., Kieffer, S.W., 1991. Sources of unsteady column dynamicsin pyroclastic flow eruptions. J. Geophys. Res. 96, 21887–21892.
Valentine, G.A.,Wohletz, K.H., Kieffer, S.W., 1992. Effects of topography on facies and com-positional zonation in caldera-related ignimbrites. Geol. Soc. Am. Bull. 104, 154–165.
Valentine, G.A., Zhang, D., Robinson, B.A., 2002. Modeling complex, nonlinear geologicalprocesses. Ann. Rev. Earth Planet. Sci. 30, 35–64.
Valentine, G.A., Bonadonna, C., Manzella, I., Clarke, A., Dellino, P., 2011a. Large-scaleexperiments on volcanic processes. EOS Trans. Am. Geophys. Union 92, 89–90.
Valentine, G.A., Doronzo, D.M., Dellino, P., de Tullio, M.D., 2011b. Effects of volcano shapeon dilute pyroclastic density currents: numerical simulations. Geology 39, 947–950.
Valentine, G.A., White, J.D.L., Ross, P.S., Amin, J., Taddeucci, J., Sonder, I., Johnson, P.J., 2012.Experimental craters formed by single and multiple buried explosions and implica-tions for volcanic craters with emphasis on maars. Geophys. Res. Lett. 39, L20301.http://dx.doi.org/10.1029/2012GL053716.
Vazquez, J.A., Ort, M.H., 2006. Facies variation of eruption units produced by the passage ofsingle pyroclastic surge currents, Hopi Buttes volcanic field, USA. J. Volcanol. Geotherm.Res. 154, 222–236.
Walker, G.P.L., 1985. Origin of coarse lithic breccias near ignimbrite source vents. J.Volcanol. Geotherm. Res. 25, 157–171.
Walker, G.P.L., Heming, R.F., Wilson, C.J.N., 1980. Low-aspect ratio ignimbrites. Nature283, 286–287.
Waresback, D.B., Turbeville, B.N., 1990. Evolution of a Plio-Pleistocene volcanogenicalluvial fan: the Puye formation, Jemez Mountains, New Mexico. Geol. Soc. Am.Bull. 102, 298–314.
Willcock, M.A.W., Cas, R.A.F., Giordano, G., Morelli, C., 2013. The eruption, pyroclastic flowbehaviour, and caldera in-filling processes of the extremely large volume(N1290 km3), intra- to extra-caldera, Permian Ora (Ignimbrite) Formation, SouthernAlps, Italy. J. Volcanol. Geotherm. Res. 265, 102–126.
Wilson, C.J.N., 1980. The role of fluidization in the emplacement of pyroclastic flows: anexperimental approach. J. Volcanol. Geotherm. Res. 8, 231–249.
Wilson, C.J.N., 1985. The Taupo eruption. New Zealand. II The Taupo ignimbrite. Philos.Trans. R. Soc. Lond. A 314, 229–310.
Wilson, C.J.N., 2001. The 26.5 ka Oruanui eruption, New Zealand: an introduction andoverview. J. Volcanol. Geotherm. Res. 112, 133–174.
Wilson, C.J.N., Hildreth,W.E., 1997. The Bishop Tuff: new insights fromeruptive stratigraphy.J. Geol. 105, 407–443.
Wilson, C.J.N., Hildreth, W.E., 2003. Assembling an ignimbrite: mechanical and thermalbuilding blocks in the Bishop Tuff, California. J. Geol. 111, 653–670.
Wilson, C.J.N., Walker, G.P.L., 1982. Ignimbrite depositional facies: the anatomy of a pyro-clastic flow. J. Geol. Soc. Lond. 139, 581–592.
Woods, A.W., Caulfiled, C.-C.P., 1992. A laboratory study of explosive volcanic eruptions. J.Geophys. Res. Solid Earth 97, 6699–6712.
Woods, A.W., Bursik, M.I., Kurbatov, A.V., 1998. The interaction of ash flows with ridges.Bull. Volcanol. 60, 38–51.
Wright, J.V., Walker, G.P.L., 1981. Eruption, transport and deposition of ignimbrite: a casestudy from Mexico. J. Volcanol. Geotherm. Res. 9, 111–131.
Yamamoto, T., Takarada, S., Suto, S., 1993. Pyroclastic flows from the 1991 eruption ofUnzen volcano, Japan. Bull. Volcanol. 55, 166–175.
Zanchetta, G., Sulpizio, R., Di Vito, M.A., 2004a. The role of volcanic activity and climate inalluvial fan growth at volcanic areas: an example from southern Campania (Italy).Sediment. Geol. 168, 249–280.
Zanchetta, G., Sulpizio, R., Pareschi, M.T., Leoni, F.M., Santacroce, R., 2004b. Characteristicsof May 5–6 1998 volcaniclastic debris flows in the Sarno area (Campania, SouthernItaly): relationships to structural damage and hazard zonation. J. Volcanol. Geotherm.Res. 133, 377–393.
Zuccaro, G., Ianniello, D., 2004. Interaction of pyroclastic flowswith building structures in anurban settlement: a fluid-dynamic simulation impactmodel. J. Volcanol. Geotherm. Res.133, 1–8.
Copyright © 2022 FDOKUMEN