Measuring currents, ice drift, and waves from space
18
Ocean Sci., 14, 337–354, 2018 https://doi.org/10.5194/os-14-337-2018 © Author(s) 2018. This work is distributed under the Creative Commons Attribution 4.0 License. Measuring currents, ice drift, and waves from space: the Sea surface KInematics Multiscale monitoring (SKIM) concept Fabrice Ardhuin 1 , Yevgueny Aksenov 2 , Alvise Benetazzo 3 , Laurent Bertino 4 , Peter Brandt 5 , Eric Caubet 6 , Bertrand Chapron 1 , Fabrice Collard 7 , Sophie Cravatte 8 , Jean-Marc Delouis 1 , Frederic Dias 9 , Gérald Dibarboure 10 , Lucile Gaultier 7 , Johnny Johannessen 4 , Anton Korosov 4 , Georgy Manucharyan 11 , Dimitris Menemenlis 12 , Melisa Menendez 13 , Goulven Monnier 14 , Alexis Mouche 1 , Frédéric Nouguier 1 , George Nurser 2 , Pierre Rampal 4 , Ad Reniers 15 , Ernesto Rodriguez 12 , Justin Stopa 1 , Céline Tison 10 , Clément Ubelmann 15 , Erik van Sebille 16 , and Jiping Xie 4 1 Laboratoire d’Océanographie Physique et Spatiale (LOPS), Univ. Brest, CNRS, Ifremer, IRD, Brest, France 2 National Oceanographic Center, Southampton, SO14 3ZH, UK 3 Institute of Marine Sciences, National Research Council (ISMAR-CNR), Venice, Italy 4 Nansen Environmental and Remote Sensing Center, Bergen, Norway 5 GEOMAR Helmholtz Centre for Ocean Research Kiel, Kiel, Germany 6 Thales Alenia Space, Toulouse, France 7 OceanDataLab, 870 Route de Deolen, 29280 Locmaria Plouzané, France 8 LEGOS, Université de Toulouse, CNES, CNRS, IRD, Toulouse, France 9 University College, Dublin, Ireland 10 CNES, 18 avenue Edouard Belin, 31400 Toulouse, France 11 Division of Geological and Planetary Sciences, California Institute of Technology, Pasadena, California, USA 12 Earth Sciences Division, Jet Propulsion Laboratory, California Institute of Technology, Pasadena, California, USA 13 Environmental Hydraulics Institute “IH Cantabria” Universidad de Cantabria, Santander, Spain 14 Scalian Alyotech, 2 rue Antoine Becquerel, 35700 Rennes, France 15 Collecte Localisation Satellite (CLS), 8–10 Rue Hermes, 31520 Ramonville St-Agne, France 16 Institute for Marine and Atmospheric Research, Utrecht University, Utrecht, the Netherlands Correspondence: Fabrice Ardhuin ([email protected]) Received: 19 July 2017 – Discussion started: 31 July 2017 Revised: 8 March 2018 – Accepted: 15 March 2018 – Published: 15 May 2018 Abstract. We propose a satellite mission that uses a near- nadir Ka-band Doppler radar to measure surface currents, ice drift and ocean waves at spatial scales of 40 km and more, with snapshots at least every day for latitudes 75 to 82 ◦ , and every few days for other latitudes. The use of incidence an- gles of 6 and 12 ◦ allows for measurement of the directional wave spectrum, which yields accurate corrections of the wave-induced bias in the current measurements. The instru- ment’s design, an algorithm for current vector retrieval and the expected mission performance are presented here. The in- strument proposed can reveal features of tropical ocean and marginal ice zone (MIZ) dynamics that are inaccessible to other measurement systems, and providing global monitor- ing of the ocean mesoscale that surpasses the capability of to- day’s nadir altimeters. Measuring ocean wave properties has many applications, including examining wave–current inter- actions, air–sea fluxes, the transport and convergence of ma- rine plastic debris and assessment of marine and coastal haz- ards. 1 Introduction Because the ocean surface is the interface between ocean, at- mosphere and land, surface currents play an important role in defining the fluxes of heat, momentum, carbon, water, etc. Published by Copernicus Publications on behalf of the European Geosciences Union.
-
Upload
khangminh22 -
Category
Documents
-
view
1 -
download
0
Transcript of Measuring currents, ice drift, and waves from space

Ocean Sci., 14, 337–354, 2018https://doi.org/10.5194/os-14-337-2018© Author(s) 2018. This work is distributed underthe Creative Commons Attribution 4.0 License.
Measuring currents, ice drift, and waves from space: the Sea surfaceKInematics Multiscale monitoring (SKIM) conceptFabrice Ardhuin1, Yevgueny Aksenov2, Alvise Benetazzo3, Laurent Bertino4, Peter Brandt5, Eric Caubet6,Bertrand Chapron1, Fabrice Collard7, Sophie Cravatte8, Jean-Marc Delouis1, Frederic Dias9, Gérald Dibarboure10,Lucile Gaultier7, Johnny Johannessen4, Anton Korosov4, Georgy Manucharyan11, Dimitris Menemenlis12,Melisa Menendez13, Goulven Monnier14, Alexis Mouche1, Frédéric Nouguier1, George Nurser2, Pierre Rampal4,Ad Reniers15, Ernesto Rodriguez12, Justin Stopa1, Céline Tison10, Clément Ubelmann15, Erik van Sebille16, andJiping Xie4
1Laboratoire d’Océanographie Physique et Spatiale (LOPS), Univ. Brest, CNRS, Ifremer, IRD, Brest, France2National Oceanographic Center, Southampton, SO14 3ZH, UK3Institute of Marine Sciences, National Research Council (ISMAR-CNR), Venice, Italy4Nansen Environmental and Remote Sensing Center, Bergen, Norway5GEOMAR Helmholtz Centre for Ocean Research Kiel, Kiel, Germany6Thales Alenia Space, Toulouse, France7OceanDataLab, 870 Route de Deolen, 29280 Locmaria Plouzané, France8LEGOS, Université de Toulouse, CNES, CNRS, IRD, Toulouse, France9University College, Dublin, Ireland10CNES, 18 avenue Edouard Belin, 31400 Toulouse, France11Division of Geological and Planetary Sciences, California Institute of Technology, Pasadena, California, USA12Earth Sciences Division, Jet Propulsion Laboratory, California Institute of Technology, Pasadena, California, USA13Environmental Hydraulics Institute “IH Cantabria” Universidad de Cantabria, Santander, Spain14Scalian Alyotech, 2 rue Antoine Becquerel, 35700 Rennes, France15Collecte Localisation Satellite (CLS), 8–10 Rue Hermes, 31520 Ramonville St-Agne, France16Institute for Marine and Atmospheric Research, Utrecht University, Utrecht, the Netherlands
Correspondence: Fabrice Ardhuin ([email protected])
Received: 19 July 2017 – Discussion started: 31 July 2017Revised: 8 March 2018 – Accepted: 15 March 2018 – Published: 15 May 2018
Abstract. We propose a satellite mission that uses a near-nadir Ka-band Doppler radar to measure surface currents, icedrift and ocean waves at spatial scales of 40 km and more,with snapshots at least every day for latitudes 75 to 82◦, andevery few days for other latitudes. The use of incidence an-gles of 6 and 12◦ allows for measurement of the directionalwave spectrum, which yields accurate corrections of thewave-induced bias in the current measurements. The instru-ment’s design, an algorithm for current vector retrieval andthe expected mission performance are presented here. The in-strument proposed can reveal features of tropical ocean andmarginal ice zone (MIZ) dynamics that are inaccessible toother measurement systems, and providing global monitor-
ing of the ocean mesoscale that surpasses the capability of to-day’s nadir altimeters. Measuring ocean wave properties hasmany applications, including examining wave–current inter-actions, air–sea fluxes, the transport and convergence of ma-rine plastic debris and assessment of marine and coastal haz-ards.
1 Introduction
Because the ocean surface is the interface between ocean, at-mosphere and land, surface currents play an important rolein defining the fluxes of heat, momentum, carbon, water, etc.
Published by Copernicus Publications on behalf of the European Geosciences Union.

338 F. Ardhuin et al.: Measuring surface velocity and waves with SKIM
among Earth system components. The ocean surface veloc-ity combines surface currents (mainly driven by winds, den-sity gradients, and tides), with a wave-induced drift, knownas Stokes drift. This total mass movement transports surfaceheat, salt and everything that is in the upper ocean, natural orman-made, including marine plastic debris (van Sebille et al.,2015). While vastly improving over the satellite era, thereare still important gaps in our knowledge of ocean currentsand waves. Satellite altimeters have been around for over 25years, revealing mesoscale ocean dynamics and providing aglobal view of the wind-generated waves.
Still, the along-track sea level anomaly misses most of themulti-scale motion of the ocean surface, because of limitedresolution (e.g., Fu and Ubelmann, 2014) and because a largecomponent of surface currents is not in geostrophic balance.The second aspect is particularly relevant near the Equator(Cravatte et al., 2016), in strong western boundary currents(Rouault et al., 2010; Rio et al., 2014) and remains a prob-lem everywhere due to near-inertial motion (Kim and Kosro,2013; Poulain et al., 2016; Elipot et al., 2016). Altimeter andsynthetic aperture radar (SAR) processing difficulties and thesmall scales of currents combine to make the edge of the seaice a blind spot in today’s observation systems (Korosov andRampal, 2017).
Other available measuring systems are very local, such ashigh-frequency (HF) radars, or global with sparse coverage,such as drifters (e.g., Elipot et al., 2016). As shown in Fig. 1,a single polar orbiting satellite with a swath width of 270 kmcould extend the capability of existing systems for monitor-ing ocean surface velocities, in particular for wavelengths be-tween 60 and 1000 km and periods ranging from 3 to 30 days.
Because larger scales move slower, the coarser time reso-lution at the Equator also yields a coarser spatial resolution.
As detailed below, the Sea surface KInematics Multiscalemonitoring (SKIM) mission, would use map surface wavesand currents with 6 km footprints resolved at 4 m resolutionin range. These footprints are distributed across a 270 kmwide swath, but do not cover the entire swath, leaving a gapbetween the features smaller than 6 km resolved with a foot-print and the features larger than 20 km fully mapped acrossthe swath. As the ocean is viewed in less than 1 min dur-ing a single pass, the observed scene is basically a snapshotin which many ocean processes are aliased. Only those cur-rent features that vary on timescales of several days, or thathave a constant phase and amplitude such as tides, can bemeasured without ambiguity. Evidence from HF radars incoastal areas suggests that even near-inertial motion is coher-ent over timescales as large as 6 days at mid-latitudes (Kimand Kosro, 2013). Hence even if currents are measured onlyevery 3 days, they can still provide useful constraints on theocean circulation.
Measurements of ocean surface currents from remotesensing platforms have been obtained using a wide range oftechniques. The most widely used at large scales includessatellite altimeters, possibly combined with scatterometer
1 mm 1 cm 0.1 m 1m 10 m 100 m 1 km 10 km 100 km 1000 km
10 years
1 year
1 month
1 day
1 hour
1'
1''
Wind-waves
Wave groups
Fronts
& filaments
Sea state
L3a: SKIM single pass
tides
Moorings HF radars
SKIM global
Drifters
Internal waves
Langmuir
L3b:
Single footprint
Tsunamis
Near-inertialEddies
ENSO
TIWs0°
78°
Figure 1. Typical periods and wavelengths of processes that con-tribute to the surface velocity. Ocean circulation processes are indark blue, wave-related processes are in light blue. Scales resolvedby existing measuring systems appear in green, and the proposedSKIM satellite mission in red, with different scales resolved in asingle-pass level 3a product (L3a), or the full time history of themeasurements gridded as a level 3b product (L3b). Note that lim-ited coverage in space or time leads to aliasing of the unresolvedscales that are in the pink boxes (e.g., Stammer et al., 2000; Gilleand Hughes, 2001). Due to the polar orbit, the resolved periods varyfrom 12 days at the Equator (0◦) to 1 day at 78◦ latitude.
wind and in situ drifters (e.g., Bonjean and Lagerloef, 2002;Sudre et al., 2013; Rio et al., 2014). Other techniques suchas image processing of optical or SAR imagery have beendemonstrated in many regions (see Isern-Fontanet et al.,2017, for a review). Direct measurement of the ocean surfacecurrent vector using Doppler techniques is now widely usedin land-based radar systems, with operational use for currentmapping in the HF band, ranging from 3 to 30 MHz (Barrick,1972). Interesting results have also been reported with land-based microwave radars (Forget et al., 2006, 2016), but themeasured radial velocity is not fully understood.
Air- and spaceborne measurements of surface velocityhave been taken with across-track interferometric (ATI)SARs using two antennas (Goldstein and Zebker, 1987). Thishas been generalized to squinted ATI SARs to provide thetwo components of the current vector (Buck, 2005; Woll-stadt et al., 2016). More recently, Chapron et al. (2005) haveshown the potential of using the Doppler centroid of oceanbackscatter received by a single antenna. Although this mea-surement is more noisy than ATI, resulting in coarser effec-tive resolution, the velocity given by the Doppler centroid isequivalent to an ATI measurement (Romeiser et al., 2014).Hence, the Doppler centroid method is a cost-effective solu-tion for deriving current information from existing satellitemissions such as Envisat and the Sentinel 1 constellation.This has already led to scientific application on the moni-toring of intense currents (Rouault et al., 2010).
This demonstration of Doppler oceanography from space,using measurements of opportunity, has led us to propose aspecially built Doppler radar altimeter that uses nadir and off-
Ocean Sci., 14, 337–354, 2018 www.ocean-sci.net/14/337/2018/

F. Ardhuin et al.: Measuring surface velocity and waves with SKIM 339
nadir beams in Ka-band. SKIM is designed to measure boththe horizontal surface velocity vector (U , V ), i.e., surfacecurrent or ice drift, and the directional wave spectrum E(k,θ), where k is the wavenumber and θ is the azimuth of wavepropagation. Wave spectra are used to correct for a wave-induced bias in the Doppler velocity. The purpose of thepresent paper is to describe the measurement principle andthe expected instrument performance based on a preliminaryanalysis.
Doppler measurements start from a line-of-sight veloc-ity ULOS which contains a very large non-geophysical com-ponent UNG due to the relative motion of the spacecraft rel-ative to the solid Earth. The anomaly relative to UNG can beinterpreted as a horizontal geophysical Doppler contribution,
UGD = (ULOS−UNG)/sin(θi) , (1)
where θi is the local incidence angle. The geometry of themeasurement is illustrated in Fig. 2.
Common to ATI and Doppler centroid techniques, is thecontribution of orbital velocity of wind-generated wavesto the geophysical velocity UGD, in the form of a wavebias UWB (Chapron et al., 2005; Mouche et al., 2008; Mar-tin et al., 2016), so that the radial current (projected onto themean sea surface in the azimuth of radar look) is
UR = (UGD−UWB) . (2)
UR is the radial component of the Lagrangian mean velocityvector U = (U , V ), defined from the average drift velocity ofwater parcels. This Lagrangian mean drift is U =UE+US,the sum of a quasi-Eulerian current (Jenkins, 1989) UE anda Stokes drift US (Stokes, 1849). US is the surface drift vec-tor due to waves, that arises from a correlation between thedisplacement and gradients of the velocity field: forward par-ticle velocity at a crest is faster than the backward velocity ata trough. The StoUS at the sea surface is on the order of 1.0 to1.8 % of the wind speed, typically larger than the local wind-induced quasi-Eulerian current known as the Ekman current,unless a strong stratification is present (Ardhuin et al., 2009).
Previous applications have used the radial windspeed U10,R projected in the range direction as a proxyfor estimating UWB. As we review in Sect. 2, this wind speedproxy is not sufficient for obtaining accurate instantaneouscurrent velocities. We therefore propose in Sect. 3 analgorithm for estimating UWB within 10 to 20 %, based onthe measurement of waves with a rotating radar system. Thistechnique forms the conceptual basis for SKIM. Its expectedoverall performance and effective resolution is described inSect. 4. A summary and review of potential applications andimprovements in processing follow in Sect. 5. The presentpaper focuses on currents, and a detailed description of wavemeasuring capabilities with SKIM will be given elsewhere.
Range r dr
True north
Grou
ndtr
ack
Azimuth
Swath width
Incidence anglei
ULOS
UR
(U,V)
γ Elevation
Figure 2. Geometry of measurement from a radar with a local in-cidence angle θi, looking towards azimuth θ . For simplicity of theschematic, we have taken UWB= 0 and UNG= 0, so that the line-of-sight velocity is simply ULOS= (U sinθ +V cosθ)sinθi. Notethat the diameter of the footprint (6 km) is exaggerated comparedto the swath width (270 km) for readability. The small differencebetween elevation γ and incidence angle θi is due to the Earth cur-vature.
2 Importance of mean slope speed or Stokes drift
2.1 Expected and observed dependence of UWB
Because the velocity or phase shift recorded by a radar corre-sponds to the velocity weighted by the backscattered power,the wave-induced bias UWB is related to the mean slope ve-locity vector, msv= (< ∂2ζ/∂x∂t >,< ∂2ζ/∂y∂t >), due tothe correlation between the normalized radar cross section(NRCS or σ0) and the surface slope (e.g., Nouguier et al.,2018). For linear waves, msv is equal to twice the surfaceStokes drift vector (US, V S).
In practice UWB is very close to a gain factor G multi-plied by US,R, the surface Stokes drift projected on the rangedirection (Chapron et al., 2005) with an additional correc-tion proportional to the Stokes drift in the azimuthal direction(Nouguier et al., 2018). G is a function of radar frequency,incidence angle and sea state. Figure 3 shows the expecteddependence of G on the incidence angle for average windspeeds and a fully developed sea state, using a physical opticsmodel or Kirchhoff approximation in the upwind direction
www.ocean-sci.net/14/337/2018/ Ocean Sci., 14, 337–354, 2018

340 F. Ardhuin et al.: Measuring surface velocity and waves with SKIM
0
5
10
15
20
25
30
35
40U = 5 m sU = 7 m sU = 9 m sU = 11 m s
C-band
G f
acto
r
(a) Incidence (degrees)0 5 10 15 20 25 30 35 40 0 5 10 15 20 25 30 35 40
G f
acto
r
(b) Incidence (degrees)
10
10
10
10
Ka-band0
5
10
15
20
25
30
35
40
-1-1
-1
-1
Figure 3.G factor in the upwind looking direction estimated using a Kirchhoff approximation for a wave spectrum given by Elfouhaily et al.(1997), representing a fully developed sea state for wind speeds U10 ranging from 5 to 11 m s−1. (a) C-band, appropriate for Envisat andSentinel 1, (b) Ka-band for SKIM. The vertical dashed lines show the incidence angles of the instruments.
(a) Station PAPA (WMO 46246)
0 5 10 15 20 250
0.05
0.1
0.15
0.2
0.25
0.3
0.35
U (m s )10
U(m
s
)S
Mean(U )SMean(US)−stdMean(US)+std
0 5 10 15 20 250
0.05
0.1
0.15
0.2
0.25
0.3
U (m s )10
U(m
s
)S
(b) Pierres Noires (WMO 62069)
-1 -1
-1-1
Figure 4. Example of mean value (in red) of the Stokes drift vector norm US= |(US, VS)| as a function of wind speed for two locations:station PAPA in the northeast Pacific, and buoy 62069 off the French Atlantic coast. The black symbols show the mean± 1 standard deviationfor each wind speed. The dashed grey line is US= 0.01U10. This estimation covers only frequencies up to 0.58 Hz.
(e.g., Nouguier et al., 2018). A typical order of magnitude inKa-band for incidence angles less than 15◦ is G' 25, whichis similar to values in C-band at higher incidence angles.
This dependency of UWB on the radial Stokes drift US,Rand incidence angle θi , as well as the order of magnitudeof G, are confirmed by the analysis of platform-based mea-surements by Yurovsky et al. (2018) and by airborne mea-surements from the AirSWOT instrument (e.g., Nouguieret al., 2018).
2.2 Estimation of UWB
The surface Stokes drift vector US= (US, VS) can be esti-mated from the directional wave spectrum, assuming linearwave theory (Kenyon, 1969). The wave spectrum E(k, θ)represents the distribution of the surface elevation varianceacross wavenumbers k and azimuthal wave propagation di-rections θ . For waves in deep water this is
(US,VS)= 2√g
2π∫0
∞∫0
(sinθ,cosθ)k1.5E(k,θ)dkdθ. (3)
This integral can be estimated from the first moments a1and b1 measured by directional wave buoys from the co-
spectra of vertical and horizontal accelerations (e.g., Kuiket al., 1988).
The projected Stokes drift US,R is correlated with the windspeed in the radial directionU10,R. Hence, the approximationof UWB as a function of U10,R is a logical first step proposedby Chapron et al. (2005) and Mouche et al. (2008), and usedby Rouault et al. (2010) to retrieve surface currents.
However, for a given wind speed the sea state introducesa typical variation of US,R that has a standard deviation of40 %. Further, the distribution of US,R as a function of U10,Rcan change significantly from one region of the ocean to an-other. These properties are illustrated in Fig. 4 with data forthe years 2011 to 2015, from the northeast Pacific stationPAPA, in deep water (Thomson et al., 2013), and a north-east Atlantic coastal buoy, Pierre Noires, at 60 m depth (Ard-huin et al., 2009). In both cases the wind speed is taken fromoperational ECMWF analyses. Directional wave momentswere downloaded from CDIP and CEREMA. The Stokesdrift was integrated over the frequency range of the DatawellWaverider buoy, from 0.025 to 0.58 Hz.
Using the order of magnitude US≈ 0.01U10, the sea-statevariation means that a wind-only proxy for UWB gives a rootmean square error (RMSE) on the current on the order of40 %×G× 0.01= 10 % of the wind vector. With a medianwind speed of 7 m s−1, this is a 70 cm s−1 error in the wind
Ocean Sci., 14, 337–354, 2018 www.ocean-sci.net/14/337/2018/

F. Ardhuin et al.: Measuring surface velocity and waves with SKIM 341
direction for C-band at 23◦ of incidence, or Ka-band at 12◦.Such a high value is not acceptable for a single satellite pass,but these errors cancel out when the Doppler velocity is av-eraged over many satellite passes, 10 or more, as done byCollard et al. (2008) and Rouault et al. (2010). Even at thehigher incidence angles of 58◦ proposed by Bourassa et al.(2016), for which we expectG' 7 in Ka-band, the wave biasis reduced by a factor of 4, but the RMSE on UWB is still sig-nificant at 20 cm s−1, even if there is no error on the wind.Larger incidence angles also suffer from lower backscatterlevels and thus a larger instrumental error in the raw line-of-sight velocity ULOS.
A possible intermediate approach is to use a numericalwave model to estimate US,R, with typical errors rangingfrom 15 to 20 % in open ocean and deepwater conditions ac-cording to Rascle and Ardhuin (2013). However, recent in-vestigation by Ardhuin et al. (2017b) on the impact of oceancurrents on small-scale sea-state variations suggests that itmay be difficult to separate the gradients in wave bias fromthe surface current at scales under 100 km.
Another more radical approach is to measure the sea-stateproperties necessary for the evaluation of US,R, in additionto the Doppler velocity ULOS. In general US,R can be esti-mated from the directional wave spectrum. The details of thisestimation with a rotating wave Doppler spectrometer, com-bining the ideas of Jackson et al. (1985) and Caudal et al.(2014), is presented in Appendix A. An overall accuracy of10 % for US,R is expected from our preliminary algorithm.
3 Restitution of the total surface velocity
The algorithm proposed to retrieve the field of surface ve-locity vectors and wave spectra is summarized in Fig. 5. Theelementary measured quantities are the power P and veloc-ity ULOS as a function of the range r within each footprintof diameter 6 km, with a resolution dr that is determined bythe 200 MHz radar bandwidth giving 0.75 m along the lineof sight, and less than 4 m projected on the horizontal forθi = 12◦. The range-averaged line-of-sight velocity is alsogiven by the phase difference between pairs of pulses (Zrnic,1977). This estimate requires a strong correlation betweenconsecutive echoes in spite of rapid motion of the footprint,which calls for a relatively high pulse repetition frequency,and thus averaging over many pulses to reduce the randomerror on small phase shifts. We also note that the horizon-tal current contribution to ULOS occurs through the apparentvertical motion of the surface as waves are advected by thecurrent (Nouguier et al., 2018). As a result, for depth-varyingcurrents, the measured current corresponds to the advectionvelocity (Kirby and Chen, 1989) for waves contributing tothe mean slope velocity. With our understanding of the in-strument it does not appear feasible to estimate a possiblevertical shear from the SKIM measurements that could oth-
Level 1 waves
1D spectra of σ and U 0
Level 1 mean velocity
U (r) & U (r)NG GD
Instrument data
P(r) for each cycle
Instrument data
U (r) for each cycleLOS
Auxiliary data
E(k,θ) spectrumU & gain factor GS,R
Level 2 waves Level 2 mean velocity
U = G x U U = U - U
WB S,R
R GD WB
Level 2b mean velocitysingle-swath mapsU = (U,V) & U =(U ,V ) S S S
Level 3 mean velocitymultiple-swath mapsU =(U , V )= U - U E E E S
Figure 5. Logical tree going from Level 0 raw data to Level 3 grid-ded fields of surface velocity and wave parameters. For griddingwith multiple satellite passes, we propose using the quasi-Euleriansurface velocity defined as UE=U−US (Jenkins, 1989).
erwise be possible with the larger integration times of othermeasurement systems (e.g., Shrira et al., 2001).
In summary, the basic measurement are highly resolvedin range but averaged over the footprint diameter in the per-pendicular (azimuthal) direction. This averaging is the basicprinciple of the wave spectrometer laid out by Jackson et al.(1985). Namely, only the waves aligned with the line of sightproduce a modulation of the signal in the range direction (seealso Nouguier et al., 2018, Eq. 46).
Several effects introduce measurement errors. We have in-vestigated the following three terms in the error budget forthe level 2 data (radial current velocity UR) in particular:
– errDC: the Doppler centroid estimation error is a func-tion of the strength of the radar backscatter, hence of theincidence angle, radar transmitted power, altitude andaveraging. Using broad margins (e.g., using only half ofthe rated Ka-band power) this was estimated to be under10 cm s−1 at θi = 12◦ and in the absence of ice (SKIMTeam, 2017). This error is a well-known function of theazimuth relative to the satellite ground track.
– errPA: a 5 cm s−1 second error corresponds to a Dopplershift of 56 Hz that can be obtained by an error in eleva-tion of 8× 10⁻⁵◦ (see Appendix B). However, such anerror is easily detected thanks to the rotating beam. Thisis because any small mispointing that varies slowly intime produces a clearly identifiable pattern as a functionof azimuth. This is detailed in Appendix B. As a result,with realistic attitude stability better than 2.7× 10⁻⁴◦
over 20 s, we expect an RMSE contribution to the cur-rent error of a few cm s−1. Our worst case scenario withrandom jumps of the attitude gave errors of 3 cm s−1.This error will be neglected in the following sections.
www.ocean-sci.net/14/337/2018/ Ocean Sci., 14, 337–354, 2018

342 F. Ardhuin et al.: Measuring surface velocity and waves with SKIM
Table 1. Summary of expected RMSEs for Level 2 radial velocity (for θi= 12◦) and along-track Level 3a (single swath snapshot) or zonalLevel 3b (multi-swath time-evolving field) velocity component, based on the preliminary algorithms in the case of the SKIM2 configuration(open burst, eight beams). TBD stands for to be determined.
Region Equator Fram Fram Gulf Oregon(open (ice) Stream coastwater)
errDC < 0.1 m s−1 < 0.1 m s−1 < 0.1 m s−1 < 0.01 m s−1 < 0.01 m s−1
errPA < 0.03 m s−1 < 0.03 m s−1 < 0.03 m s−1 < 0.03 m s−1 < 0.03 m s−1
errWB 0.05 m s−1 0.08 m s−1 0.02 m s−1 0.15 m s−1 0.13 m s−1
L3a, Le 89 km 59 km TBD 65 km 90 kmL3a error 0.03 m s−1 0.11 m s−1 TBD < 0.09 m s−1 0.04 m s−1
L3b, Le 290 km 62 km TBD 71 km 95 kmL3b error 0.14 m s−1 0.12 m s−1 TBD 0.23 m s−1 0.09 m s−1
– errWB: the wave bias error is explained and justifiedin Appendix A. We have performed a detailed analy-sis on the error err(US,R) in the estimation of the radialStokes drift US,R over each footprint, which contributesto errWB amplified by theG factor. Errors in the estima-tion of the G factor are not so easy to model but, for agiven mean square slope, G is expected to have a weakdependence on sea-state properties and it is related tothe ratio of the Doppler and σ0 spectra. We have there-fore assumed that errors on the estimation of G shouldnot cause a larger error than that due to uncertaintiesin US,R. Hence we used errWB= 2G err(US,R).
We have not considered the particular cases of extremelylow backscatter, for wind speeds under 2 m s−1, in whichthe three errors can be correlated, and we have assumed thatthese three error sources are uncorrelated.
4 Overall performance and effective resolution
4.1 From radial components to gridded vector fields
Here we show results corresponding to one particular set-up of the SKIM radar, which is called “SKIM2” (seeSKIM Team, 2017, for details). This configuration useseight beams, with one beam at nadir (θi = 0), two beams at6◦ and five beams at 12◦. These beams make 3.14 rotationsmin−1 (one turn in 17.5 s) thanks to the rotation of a platecarrying feed horns arranged as shown in Fig. 6a.
The horns are placed around the focal point of a parabolicreflector, similar to the wave scatterometer SWIM of theChina-France Ocean Satellite (CFOSAT) mission (Hauseret al., 2017). The main differences between SWIM andSKIM are the radar frequency (Ka-band instead of Ku-band,giving smaller footprints), and the Doppler capability ofSKIM. Using incidence angles up to 12◦ and altitude of695 km gives swath width of 270 km as shown in Fig. 6b.
(a)
(b)
Figure 6. (a) Pattern of beams (1 is at nadir, 4 and 7 are at 6◦,the others at 12◦ incidence). The different colors help associatingthe footprint patterns in (b) with each beam. Background colorsin (b) represent simulated current velocities off the Oregon coast(in m s−1), courtesy of Y. Chao, previously used by Fu and Ubel-mann (2014) for the evaluation of the SWOT mission performance.
Ocean Sci., 14, 337–354, 2018 www.ocean-sci.net/14/337/2018/

F. Ardhuin et al.: Measuring surface velocity and waves with SKIM 343
Figure 7. Illustration of current components U and V and radialcomponent UR in the case of the Gulf Stream.
For each beam this gives measurement cycles of1024 pulses each. The radar pulse repetition frequency is32 kHz. The line-of-sight velocity is determined from thephase shift between consecutive pulses. These parametersdefine the instrument error errDC, as listed in Table 1.
The other important source of error, caused by inaccura-cies in the wave bias correction is a function of the beamgeometry but also of the strength of gradients of the Stokesdrift, which are mostly caused by current gradients (Ardhuinet al., 2017b). This wave bias error is estimated following themethod laid out in Appendix A.
Finally, the last important source of error we have investi-gated is the mapping error, going from Level 2 data at eachfootprint to Level 3 data on a regular grid. This mapping er-
Figure 8. Average coherence of simulated SKIM Level 3a currentwith the “truth” provided by MITgcm simulations, in the case of theGulf Stream, for October 2011.
ror is similar to what happens with HF radars (e.g., Lipa andBarrick, 1983; Kim et al., 2008). In particular, SKIM onlymeasures radial components so that on the edges of the swathonly the cross-track component is measured, and in the centerthere are only measurements of the along-track component,as shown in Fig. 7.
The use of the two incidence angles, 6 and 12◦, allows usto fill the swath and obtain cross-track measurements closerto the center of the swath. We can also use the nadir altimeterbeam to obtain cross-track geostrophic velocities. An optimalinterpolation method specially designed to include covari-ances between the two current components has been adaptedto also include this additional nadir data (SKIM Team, 2017).
The combination of these three errors gives the total errorthat must be compared to the magnitude of the current. Wehave therefore defined an effective resolution wavelength Leas the scale above which the total error is larger than the sig-nal, as shown in Fig. 8 for the case of the Gulf Stream.
The overall error depends on many factors related to thepatterns in ocean currents and the instrument parameters. Wehave estimated all errors, in particular those of ocean con-ditions, using state-of-the-art models for the ocean circula-tion (e.g., Rocha et al., 2016; Gula et al., 2015) and associ-ated ocean waves (Roland and Ardhuin, 2014; Ardhuin et al.,2017b). Model simulations were performed at resolutions onthe order of 1.5 km for a set of regions for which we ex-pect SKIM to have a strong contribution, resolving processesthat are not accessible with today’s observing systems. Theseinclude an Arctic region with strong currents (Fram Strait),an equatorial region (in the Atlantic around 23◦W), a west-ern boundary current (the Gulf Stream) and a coastal region(Oregon).
The RMSE on current components and the resulting ef-fective resolution are summarized in Table 1, but they arebetter understood by comparing maps of currents from the
www.ocean-sci.net/14/337/2018/ Ocean Sci., 14, 337–354, 2018

344 F. Ardhuin et al.: Measuring surface velocity and waves with SKIM
(a) Modeled current (b) SKIM L3A (c) SWOT (d) Current from SSH
U (m s )-1
Figure 9. Simulated ocean currents over the Gulf Stream, and associated SKIM and SWOT simulated observations for a single satellite pass.
simulated SKIM processing to the input modeled currents.Several examples are given by SKIM Team (2017). It is alsointeresting to compare the results of different observing sys-tems. An important outcome of the SKIM simulations is thata wide swath is necessary to obtain the shorter revisit timeneeded to monitor the smaller ocean structures that evolvemore rapidly.
Interferometric SAR technology will be used to producea 120 km wide swath for the Surface Water Ocean Topog-raphy (SWOT) mission (see Fig. 9). The narrower swathgives a larger revisit time at mid-latitudes of 10 days withSWOT instead of 4 days with SKIM. As a result, only larger-scale motion can be monitored with SWOT, with an effectivewavelength of Le= 115 km in the Gulf Stream region, in-stead of 71 km with SKIM. The Doppler scatterometer mis-sion proposed by Bourassa et al. (2016) has a much widerswath, about 1800 km, and is designed to measure wind andcurrent vectors. Because it measures at larger incidence an-gles, for which signals are weaker, an accurate current esti-mate requires averaging over several passes, thereby reduc-ing the effective temporal resolution. As a result, this is agreat instrument for vector wind measurements but it is notclear if it would perform better than SKIM for current mea-surements.
In the case of SWOT, the interpretation of the sea surfaceheight (SSH) in terms of current relies on the geostrophicequilibrium. Unbalanced motion, such as internal waves, alsocontribute to the SSH. As a result this simple interpreta-tion of the SSH contains small-scale noise associated withageostrophic motion, shown in Fig. 9c and d. The separa-tion of balanced and unbalanced motion is the topic of activeresearch (e.g., Ponte et al., 2017). Further improvements inthe restitution of temporal evolution, and thus the reductionfor Le for L3b products from both SWOT and SKIM, willbenefit from dynamic methods which are under development(Ubelmann et al., 2016).
4.2 Challenges and opportunities over sea ice
With the expected widening of the marginal ice zone (MIZ)in the Arctic (e.g., Aksenov et al., 2017), this expanding andimportant region of the world ocean will not be well mon-itored in terms of currents by existing and planned satellitemissions.
Ice concentration is the only parameter that is well mon-itored near the ice edge, with difficulties in recovering icethickness and ice drift (Korosov and Rampal, 2017). Thevery rich dynamics across the ice edge offer great opportu-nities for Doppler-based measurements. In particular, narrowice jets and eddies are observed in satellite imagery (Johan-nessen et al., 1983) and reproduced in high-resolution models(Horvat et al., 2016).
These features cannot be monitored by today’s altimetrydue to their small scale and the changes in waveform shapesfrom open water to ice. In the ice, the wave-induced biasbecomes negligible as the wave amplitude is strongly atten-uated. On the contrary, the instrument noise is expected toincrease by about a factor of 2.5 due to a generally weaker(8 dB) backscatter over ice compared to open ocean at in-cidence angles under 12◦ (SKIM Team, 2017). A detailedanalysis of errors right at the ice edge requires taking intoaccount the strong variation in backscatter in all terms of theerror budget. This is beyond the scope of the present paper.
Also, it should be possible to measure waves in ice with-out the SAR processing used by Ardhuin et al. (2017a), butby using the Doppler spectrum and the modulation due torange bunching. Indeed, it is not clear how strong the tiltmodulation is over the ice, but range bunching is maximumfor a swell steepness ka= tanθi , which is 0.1 for θi = 6◦.A swell steepness of 0.025, as in the MIZ observations re-ported by Sutherland and Gascard (2016), still produces a20 % (0.9 dB) modulation of σ0.
Ocean Sci., 14, 337–354, 2018 www.ocean-sci.net/14/337/2018/

F. Ardhuin et al.: Measuring surface velocity and waves with SKIM 345
5 Preliminary study of surface current impact
In order to evaluate the contribution of a surface Dopplermeasurement in an ocean forecasting system, we have usedthe TOPAZ assimilation system, implemented in the Coper-nicus Arctic Marine Forecasting Center. This system uses aregional configuration of the HYCOM ocean model over theNorth Atlantic and Arctic Oceans – without tides – and as-similates different types of satellite and in situ observationswith an ensemble Kalman filter (EnKF), running 100 dy-namic members.
Each ensemble member receives random perturbations ofthe ocean surface conditions, including non-divergent ran-dom winds with an amplitude of 2.5 m s−1 (see Xie et al.,2017, for more information about the reanalysis). We haveused the simulated uncertainties of SKIM Level 2 surface ve-locities, following their description above, to produce a mea-sure of the impact of assimilating SKIM surface currents inconjunction with all other observations on a typical weeklycycle of the TOPAZ reanalysis in May 2015, in a period ofstable reanalysis operations following 24 years of data assim-ilation.
We measure the information content of the assimilateddata using the degrees of freedom for signal (DFS; Cardi-nali et al., 2004). This DFS has a maximum value of 100in the case of the EnKF used in TOPAZ. Target DFS valuesrange from 0 to 10, above which there is a risk of “over-assimilation” (Sakov et al., 2012). The observation impact iscalculated for each grid cell, using knowledge of the spaceand time location of the observations and their uncertaintyestimates, but not the actual observed values. Since all ob-servations are assimilated jointly, the impact of one observa-tion type reduces that of the other types. The DFS values aredependent on the background and observation uncertaintiesspecified in the TOPAZ system and are different in a differentocean data assimilation system.
Figure 10 exhibits the DFS values obtained by assimilat-ing simulated SKIM surface currents together with other realmeasurements. The highest DFS appears in frontal regionslike the Equatorial Counter Current, the Gulf Stream and theAzores Current. The area near the Equator shows particu-larly high values as the impact of traditional altimeter datais limited by the vanishing of the Coriolis force. The SouthAtlantic is artificially removed as the simulated SKIM dataused here only covers the North Atlantic.
The DFS values indicate that SKIM provides the secondlargest impact overall, and the largest information content inthe Gulf Stream and Equatorial regions for ocean data as-similation. It may seem counterintuitive that the impact ofsurface currents from SKIM exceeds the impact of depth-averaged currents as measured with traditional altimeters inthe Gulf Stream. This could be a transient effect due to thefirst-time assimilation of SKIM: the ensemble variance ofsurface currents may diminish in the following assimilationcycles and the DFS values diminish accordingly. Alterna-
tively it could be due to our assumption of negligible rep-resentativity errors.
The results presented here only utilize the surface currents,not yet the surface waves or the sea ice drift from SKIM. Thisobserving system simulation experiment (OSSE) is highlysimplified and does not resolve complex feedbacks of re-peated data assimilation cycles. Still, this OSSE indicatesthat there is a scope for assimilation of sea surface currents inan operational forecasting system and that SKIM data shouldprovide relevant information that is independent of existingocean observations.
6 Conclusions and perspectives
Using nadir and near-nadir radar beams with Doppler mea-surements, the Sea surface KInematics Multiscale monitor-ing (SKIM) mission is designed to measure surface veloc-ity vectors and ocean wave spectra. Measuring wave spectradown to wavelengths of 20 m and possibly less makes it pos-sible to estimate the surface Stokes drift vector and correctfor a strong wave-induced bias in the surface velocity vector,which is on the order of a gain coefficientG times the surfaceStokes drift.
The use of a rotating beam pattern is critical in reducingerrors caused by knowledge uncertainties in the platform at-titude, which is today the main source of error in the level 2surface current derived from the Sentinel 1 SAR constella-tion. Here we presented a performance analysis using the or-bit of Sentinel-1C (S1C), except for a 4◦ shift to the east. Thisis a Sun-synchronous orbit, with 98.2◦ inclination, 693 kmaltitude and 12-day repeat cycle. This geometry gives a swathwidth of 270 km and a relatively large signal-to-noise ratiothanks to the higher backscatter at these low incidence an-gles. The incidence angle of SKIM is limited to 12◦ by thechoice of antenna technology that uses a rotating horn plateand fixed parabolic reflector. With this configuration, largerincidences lead to beam distortions. The 4◦ shift allows fora large overlap between SKIM and S1C on ascending tracksthat could be useful for calibration purposes. Other choices insynergy with altimeters or radiometers could justify a higheraltitude, allowing for a wider swath at the price of a lowersignal-to-noise ratio for the radar-detected power.
Compared to the Envisat C-band measurements at inci-dence angles of 30◦ used by Rouault et al. (2010), in whichcase G' 12, the error on the wave bias is expected to bereduced by a factor of 4 or more, allowing single-pass esti-mation of the current components with an accuracy on theorder of 0.1 m s−1 for a wavelength of about 60 km.
When the radial components are combined to producemaps of gridded vector velocity, the effective wavelength re-solved, at which the signal is above the noise level, is on theorder of 60 to 90 km for a single swath, depending on thepattern of currents. Except for latitudes 78 to 83◦ where therevisit time is less than 1 day, the effective resolution is de-
www.ocean-sci.net/14/337/2018/ Ocean Sci., 14, 337–354, 2018

346 F. Ardhuin et al.: Measuring surface velocity and waves with SKIM
Figure 10. Degrees of freedom for signal of all assimilated observations over 1 week in May 2015. Top row from left to right: OSTIAsea surface temperature, CMEMS delayed-mode altimeter tracks and SKIM sea surface. Bottom row from left to right: OSI SAF sea iceconcentrations and in situ (including Argo) temperature and salinity profiles.
graded when the time evolution of the currents is considered.At mid-latitudes this gives 70<Le< 100 km, due to the 3-day revisit time.
Further improvement on the accuracy and effective reso-lution may come from many improvements in radar settings(e.g., use of full power instead of 50 %, evolution in ampli-fier technology) which could give larger transmitted powerand reduce the instrument noise errDC. Another source of im-provement will be the reduction of wave bias error errWB, inwhich our estimation of the G factor error may well be over-estimated, and a combined analysis or assimilation of wavesand currents could properly take into account the correlationsof waves and currents and lead to more accurate current es-timates. Hence the error level and resolution found in oursimulations are probably conservative.
Our results clearly show that Doppler oceanography fromspace can be a very useful technique for monitoring space-and timescales of the ocean currents that are not well ob-served today. Future altimeter designs should probably con-sider adding off-nadir rotating beams for more effective cov-erage of the ocean. In the present paper we have not dis-cussed much the added benefits of ocean wave measurementswith unprecedented spectral and spatial coverage. These willbe discussed in other publications. We only point out herethat the sea-state variability at small scales is probably domi-nated by the effect of ocean currents (Ardhuin et al., 2017b).It is thus logical to measure waves and currents together, andpossibly further use the measured variability of sea-state pa-rameters to further constrain the magnitude of current gradi-ents.
Ocean Sci., 14, 337–354, 2018 www.ocean-sci.net/14/337/2018/

F. Ardhuin et al.: Measuring surface velocity and waves with SKIM 347
Code and data availability. Numerical model results presented inthis article are available via ftp at ftp://ftp.ifremer.fr/ifremer/ww3/HINDCAST/OTHER/SKIM/.
www.ocean-sci.net/14/337/2018/ Ocean Sci., 14, 337–354, 2018

348 F. Ardhuin et al.: Measuring surface velocity and waves with SKIM
Appendix A: Estimation of wave-induced bias UWBfrom directional wave data
One important difficulty for the estimation of US,R by pro-jecting Eq. (3) in direction θ is that the Stokes drift containscontributions from all directions θ ′, whereas the measure-ment on a single footprint only gives contributions in the lookdirection θ . For each footprint in azimuth θ ′ we only have thecontribution of the waves propagating in direction θ ′, whichwe define as
US,1D(θ′)= 2
√g
kmax∫0
k1.5E(k,θ ′)dk
+F(kmax,θ
′)E(kmax,θ
′), (A1)
where kmax is the wavenumber of the shortest resolvedwaves. Assuming that the spectrum of shorter wave rollsoff like k3 and neglecting non-linear effects gives F(kmax,θ ′)=
√gk2.5
max. Using hourly averaged measured spectra atstation PAPA, this gives a typical random error of 6 % ifkmax corresponds to a 20 m wavelength. The general broad-ening of the directional spectrum towards high frequencygives a weaker importance of shorter waves (e.g., Peureuxet al., 2018).
Given that the wave spectrum varies both along the seasurface and with directions, we have to interpolate either inspectral space (from θ to θ ′) or in physical space (x and y).Simulations indicate that variations in physical space are lesssevere than those in directions, as illustrated in Fig. A1, overa Gulf Stream ring where the Stokes drift is enhanced bywind blowing against the current. We thus estimate US,R us-ing
US,R(x,y,θ)'∑
cos(θ − θ ′)US,1D(x′,y′,θ ′)1′θ , (A2)
where the sum is over all directions and the approximation isdue to the fact that the location (x, y) is different from (x′,y′) where the contribution US,1D(x
′, y′, θ ′) is measured. Inpractice we use the locations (x′, y′) that are closest to (x, y),separated by a distance r(θ ′).
The variations of US,1D(θ′) over the distance r(θ ′), which
is typically less than 50 km, is mostly due to the effect ofcurrents on waves (Ardhuin et al., 2017b).
In our simulations we have also varied the beam rota-tion speed, number of beams and number of azimuths perrotation. Because these parameters give different locationsof footprints we have used an approximation of the radialStokes driftUS,R from the map of Stokes drift vectors insteadof the full directional spectrum, this is
US,R(x,y,θ)'2π
∑US,R(x
′,y′,θ ′)cos(θ − θ ′)1′θ , (A3)
where the sum is over angles θ −π/2<θ ′<θ +π/2 and thenearest available footprints with these azimuths are taken.
−26 −25 −24 −23
−22 −21 −20 −19 −18 −17 −16 −15 −14 −13 −12 −11 −10 −9
−8 −7
−6
−5
−4
−3
−2
−1
0
1
2
3 4
5 6
7 8
9 10 11
12 13
14 15
16 17 18 19 20 21 22 23
24 25
26
0
0.02
0.04
0.06
0.08
0.1Uss (m s )-1
Figure A1. Illustration of the use of cycles in azimuth θ ′ (circles)for the estimation of the wave bias UWB=GUS,R at the location(black square) of cycle with direction θ . The background colorshows the magnitude of US, and the bottom spectra are at the lo-cation of different cycles, with wave energy plotted in the direc-tion from which it arrives. In each spectra the red arrow is direc-tion θ , and the black and grey arrows show θ ′ and θ ′+π . The dis-tance r(θ ′) is a source of error.
Equation (A3) relies on the assumption of small variability ofthe vector (US, V S) on the scale of the beam rotation. Indeed,US,R(θ) is the projection of (US, VS) in direction θ . If (US,VS) is uniform in space then US,R= |US, VS|cos(θ − θ0),with θ0 the direction of the Stokes drift vector.
We have performed realistic high-resolution simulations ina wide range of conditions: Oregon coast, Gulf Stream, equa-torial currents, Fram strait and Agulhas Current. Based on allthese simulations and assuming a constantG, we find that theerror errWB on the estimation of UWB, has a negligible biasand a standard deviation that is on the order of
SD(errWB)' εG SD(US)r2/20km, (A4)
where ε is a non-dimensional factor which ranges from 0.10in the case of the Equator near 23◦W to 0.18 in the GulfStream case. SD(US) is the standard deviation of the Stokesdrift magnitude over the region that contribute to US,R usingEq. (A2).
r2 =
√∑[r(θ ′)cos(θ − θ ′)]2/N (A5)
is the root mean square distance over theN cycles with direc-tions θ ′ that contribute to the estimation of US,R(θ), betweenthe position of the footprint for azimuth θ and the footprintsfor θ ′ weighted by cos(θ ′− θ). Hence, in the open ocean r2 iscompletely specified by the geometry of the footprints, itselfgiven by the rotation speed of the horn plate and the numberof beams. In the case presented here r2 is close to 20 km forthe 12◦ beams, and 15 km for the 6◦ beams.
Ocean Sci., 14, 337–354, 2018 www.ocean-sci.net/14/337/2018/

F. Ardhuin et al.: Measuring surface velocity and waves with SKIM 349
(a) Current U
34 35 36 37 38 39 40−2
−1
0
1
2
3
Latitude at nadir (s)
Rad
ial v
eloc
ity (m
s ) UR
UWB error
5 × US,R
0.1
0.08
0.06
0.04
0.02
0
2
1.6
1.2
0.8
0.4
0
(b)Stokes driftUS
(c)
−1
Figure A2. Example of (a) current in the Gulf Stream and asso-ciated (b) Stokes drift and (c) errors for the estimation of UWBfor beam 8 (12◦ incidence, green circles in a and b). In this ex-ample the standard deviation of errWB is 10 cm s−1, which is onthe order of 5US,R. Note that the measured geophysical Doppler isUGD=UWB+GUS,R with G' 25.
In order to take into account the variability of G and ran-dom errors in the estimation of the wave spectrum, we haveused an error twice as large as given by Eq. (A4).
The error errWB has smaller scales than both UR and US,R,as shown in Fig. A2. The largest errors are associated withcurrent gradients. This suggests that using some knowledgeon wave–current interactions could lead to smaller errors.
Appendix B: Attitude restitution using antenna rotation
The non-geophysical contribution to the Doppler centroidfrequency (fNG) arises from the acquisition geometry (satel-lite attitude and instrument pointing) and the platform ve-locity. This frequency is much higher than the geophysicalfrequency, and it must be estimated carefully. Its theoreticalexpression is given by Raney (1986)
fNG =2Vsc
λsinγ cosθ
×
[1−
ωe
ω(ε cosβ sin9 tanθ + cos9)
]+
2Vsc
λecosγ
sin(β −p)√1+ e2+ 2ecos(β −p)
, (B1)
where λ' 8 mm is the radar wavelength, Vsc is the spacecraftvelocity, γ is the elevation angle, θ is the azimuth angle, ε isequal to 1 if θ ∈ [0, −π ] and −1 otherwise, ωe is the angularrotation rate of the Earth, ω is the angular rotation rate of
Vsc
γ
θ’
γ’Expected beam center position
Real beam centerposition
Expected nadir
Real nadir
γ0
θ
θ0Z
ZZ
Figure B1. Definition of mispointing geometrical parameters γ0and θ0. We recall that Z is the satellite altitude.
the spacecraft, is 9 the angular position on the orbit, e is theeccentricity of the orbit and p the argument of the perigee.
All the parameters of fNG are well known except for un-certainties in the azimuth θ and the elevation γ of the radarbeam, due the imperfect knowledge of the satellite attitude.As given by Eq. (B2), the azimuth and elevation are per-turbed by a tilt γ0 that is maximum for the azimuth θ0 rel-ative to the ground-track azimuth. These angles are definedin Fig. B1.
We have assumed the following:
– The antenna rotation speed is very well known and verystable (it can also be re-estimated after launch on a reg-ular basis).
– The satellite attitude varies slowly (a preliminary re-quirement is below 10−4 ◦ s−1).
– Instrument noise is not correlated in time (pure whitenoise) and then is uncorrelated with any satellite attitudevariation. It is therefore not considered here.
Hence γ0 and θ0 define the difference between the ex-pected and the real nadir position projected on the groundintroduced by the satellite attitude misknowledge, so thatγ ′ and θ ′ are the parameter to be used instead of γ and θin Eq. (B1). It is very important to note that the γ0 and θ0 pa-rameters can vary in time. These time variations describe thesatellite attitude misknowledge changes.
Provided that γ0/γ � 1 then
γ ′ = γ + γ0 cos(θ − θ0) ,
θ ′ = θ − γ0 sin(θ − θ0) . (B2)
The Doppler shift residue δfNG(γ0, θ0) induced by thesatellite attitude misknowledge is computed using Eqs. (B1)and (B2).
The situation is better understood by using the fact thate� 1 and ωe/ω� 1, leading to simplified equation
1fNG (γ0,θ0)≈2Vsc
λγ0[
cosγ cosθ cos(θ − θ0)
+ sinγ sinθ sin(θ − θ0)]. (B3)
In our case, γ < 12◦, 1fNG(γ0, θ0) is dominated bythe term cosγ cosθ cos(θ − θ0) that contains only twice thebeam rotation frequency as shown in Fig. B2.
www.ocean-sci.net/14/337/2018/ Ocean Sci., 14, 337–354, 2018
350 F. Ardhuin et al.: Measuring surface velocity and waves with SKIM
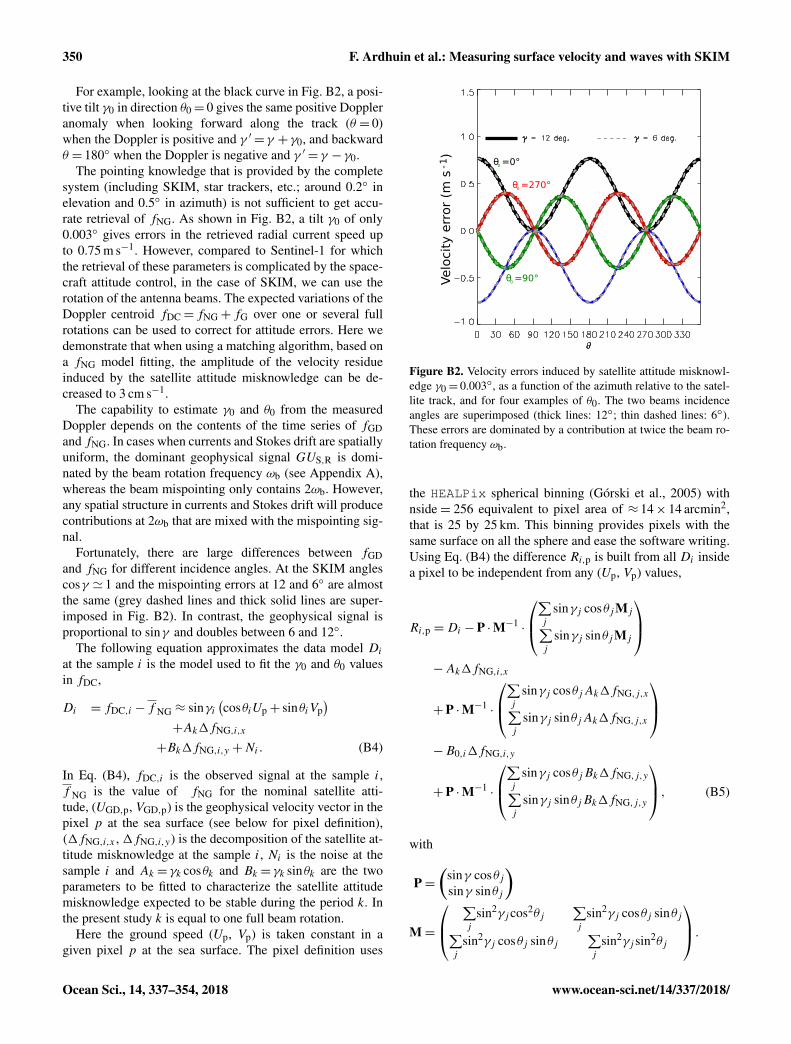
For example, looking at the black curve in Fig. B2, a posi-tive tilt γ0 in direction θ0= 0 gives the same positive Doppleranomaly when looking forward along the track (θ = 0)when the Doppler is positive and γ ′= γ + γ0, and backwardθ = 180◦ when the Doppler is negative and γ ′= γ − γ0.
The pointing knowledge that is provided by the completesystem (including SKIM, star trackers, etc.; around 0.2◦ inelevation and 0.5◦ in azimuth) is not sufficient to get accu-rate retrieval of fNG. As shown in Fig. B2, a tilt γ0 of only0.003◦ gives errors in the retrieved radial current speed upto 0.75 m s−1. However, compared to Sentinel-1 for whichthe retrieval of these parameters is complicated by the space-craft attitude control, in the case of SKIM, we can use therotation of the antenna beams. The expected variations of theDoppler centroid fDC= fNG+ fG over one or several fullrotations can be used to correct for attitude errors. Here wedemonstrate that when using a matching algorithm, based ona fNG model fitting, the amplitude of the velocity residueinduced by the satellite attitude misknowledge can be de-creased to 3 cm s−1.
The capability to estimate γ0 and θ0 from the measuredDoppler depends on the contents of the time series of fGDand fNG. In cases when currents and Stokes drift are spatiallyuniform, the dominant geophysical signal GUS,R is domi-nated by the beam rotation frequency ωb (see Appendix A),whereas the beam mispointing only contains 2ωb. However,any spatial structure in currents and Stokes drift will producecontributions at 2ωb that are mixed with the mispointing sig-nal.
Fortunately, there are large differences between fGDand fNG for different incidence angles. At the SKIM anglescosγ ' 1 and the mispointing errors at 12 and 6◦ are almostthe same (grey dashed lines and thick solid lines are super-imposed in Fig. B2). In contrast, the geophysical signal isproportional to sinγ and doubles between 6 and 12◦.
The following equation approximates the data model Diat the sample i is the model used to fit the γ0 and θ0 valuesin fDC,
Di = fDC,i − f NG ≈ sinγi(cosθiUp+ sinθiVp
)+Ak1fNG,i,x
+Bk1fNG,i,y +Ni . (B4)
In Eq. (B4), fDC,i is the observed signal at the sample i,f NG is the value of fNG for the nominal satellite atti-tude, (UGD,p, VGD,p) is the geophysical velocity vector in thepixel p at the sea surface (see below for pixel definition),(1fNG,i,x , 1fNG,i,y) is the decomposition of the satellite at-titude misknowledge at the sample i, Ni is the noise at thesample i and Ak = γk cosθk and Bk = γk sinθk are the twoparameters to be fitted to characterize the satellite attitudemisknowledge expected to be stable during the period k. Inthe present study k is equal to one full beam rotation.
Here the ground speed (Up, Vp) is taken constant in agiven pixel p at the sea surface. The pixel definition uses
Velo
city
err
or (m
s-1
)
θ =270°0
θ =90°0
θ =0°0
Figure B2. Velocity errors induced by satellite attitude misknowl-edge γ0= 0.003◦, as a function of the azimuth relative to the satel-lite track, and for four examples of θ0. The two beams incidenceangles are superimposed (thick lines: 12◦; thin dashed lines: 6◦).These errors are dominated by a contribution at twice the beam ro-tation frequency ωb.
the HEALPix spherical binning (Górski et al., 2005) withnside= 256 equivalent to pixel area of ≈ 14× 14 arcmin2,that is 25 by 25 km. This binning provides pixels with thesame surface on all the sphere and ease the software writing.Using Eq. (B4) the difference Ri,p is built from all Di insidea pixel to be independent from any (Up, Vp) values,
Ri,p =Di −P ·M−1·
∑j
sinγj cosθjMj∑j
sinγj sinθjMj
−Ak1fNG,i,x
+P ·M−1·
∑j
sinγj cosθjAk1fNG,j,x∑j
sinγj sinθjAk1fNG,j,x
−B0,i1fNG,i,y
+P ·M−1·
∑j
sinγj cosθjBk1fNG,j,y∑j
sinγj sinθjBk1fNG,j,y
, (B5)
with
P=(
sinγ cosθjsinγ sinθj
)
M=
∑j
sin2γj cos2θj∑j
sin2γj cosθj sinθj∑j
sin2γj cosθj sinθj∑j
sin2γj sin2θj
.Ocean Sci., 14, 337–354, 2018 www.ocean-sci.net/14/337/2018/

F. Ardhuin et al.: Measuring surface velocity and waves with SKIM 351
It is important to understand that several rotations are solvedtogether; otherwise the matrix M cannot be inverted bylack of redundant information in the same pixel. Thus,set of γk and θk values are extracted by minimizing theχ2=∑p,i(R2
i,p) combining different γ beams over several an-
tenna rotations to increase the azimuth sampling. There isstill potential correlation between 1fNG(γ0, θ0) and geo-physical Doppler frequency shifts because the hypothesisthat (Up, Vp) does not vary in time is not exactly true. Thetime variation between different measurements using differ-ent beams produces residual signal correlated with the timevariation of the geophysical signal. Thus, the1fNG (γ0,20)
fit is partly correlated with the geophysical information.Instrument noise does not introduce an average bias as
long as it is not correlated in time and not correlated to thelinear fit of 1fNG(γ0, θ0). Further investigation will checkthe level of the expected correlation between 1fNG(γ0, θ0)and the noise. In our estimates, the reconstructed values ofthe pair (γ0, θ0) are only affected by the correlation betweenthe non-geophysical and geophysical signals.
Simulations have been done to include random drifts ofthe satellite attitude within 10−4 ◦ s−1 variations. Geophys-ical Doppler contributions fGD have been computed fromsurface currents and wave-induced biases estimated from nu-merical models of the ocean circulation and waves. The caseof the Oregon coast is illustrated in Fig. B3. The standard de-viation of the error on Doppler velocity is found to be around0.04 m s−1 after cleaning and is related to the correlation be-tween the two simulated values of 1fNG(γ0, θ0) and fGD.The error induced by the satellite attitude misknowledge istypically higher when the signal has more structures. This ad-vocates for averaging the determination of these errors overa larger data set. This is possible if the satellite attitude ismore stable or the drift follows physical law decoupled fromexpected fGD signal.
In conclusion, the case of the Oregon coast illustrated inFig. B3 shows that the cleaned velocity error is relativelysmall (< 0.04 m s−1). The algorithm has been tested on otherregions (not illustrated here) with similar but often better re-sults.
Day no. 15
Figure B3. Velocity residual error (in cm s−1) for the Oregon coastsimulations non-corrected (red curve) and corrected (blue curve) byremoving the fit of the satellite attitude misknowledge, combiningbeams and eight (γ0, θ0) pairs by antenna rotation. (a) Simulateddata over one satellite pass for day 21. (b) Results for all satellitepasses in the domain shown in Fig. 6. This time frame in Septem-ber 2014 includes winds speeds up to 22 m s−1. For each pass theduration is stretched over 20 h in order to make it visible. UR andUR,S signals are also shown for scale. The satellite attitude driftsrandomly (10−4 ◦ s−1). The error induced by the satellite attitudemisknowledge is higher when the geophysical signal is stronger andless uniform.
www.ocean-sci.net/14/337/2018/ Ocean Sci., 14, 337–354, 2018
352 F. Ardhuin et al.: Measuring surface velocity and waves with SKIM
Author contributions. All authors have contributed to the writingof the paper. The wave bias error analysis was performed by FA,GM and EC analyzed the Doppler centroid estimation error, JMD,CT and EC analyzed the error due to platform attitude. LG andCU combined these errors to produce simulated data that was usedby JX for DFS analysis with TOPAZ. The optimal interpolationscheme was adapted by CU and will be described elsewhere in moredetail.
Competing interests. The authors declare that they have no conflictof interest.
Acknowledgements. Support from LabexMer via grant ANR-10-LABX-19-01, and Copernicus Marine Environment MonitoringService (CMEMS) as part of the Service Evolution program isgratefully acknowledged. Additional support from CNES wasgiven through the VASCO phase 0 study and R & T contracts.
Edited by: Eric J. M. DelhezReviewed by: Mark Bourassa and two anonymous referees
References
Aksenov, Y., Popova, E. E., Yool, A., Nurser, A. G., Williams,T. D., Bertino, L., and Bergh, J.: On the future naviga-bility of Arctic sea routes: High-resolution projections ofthe Arctic Ocean and sea ice, Marine Policy, 75, 300–317,https://doi.org/10.1016/j.marpol.2015.12.027, 2017.
Ardhuin, F., Marié, L., Rascle, N., Forget, P., and Roland,A.: Observation and estimation of Lagrangian, Stokesand Eulerian currents induced by wind and waves atthe sea surface, J. Phys. Oceanogr., 39, 2820–2838,https://doi.org/10.1175/2009JPO4169.1, 2009.
Ardhuin, F., Chapron, B., Collard, F., Smith, M., Stopa, J., Thom-son, J., Doble, M., Wadhams, P., Blomquist, B., Persson, O.,and Collins III, C. O.: Measuring ocean waves in sea ice us-ing SAR imagery: A quasi-deterministic approach evaluated withSentinel-1 and in situ data, Remote Sens. Environ., 189, 211–222, https://doi.org/10.1016/j.rse.2016.11.024, 2017a.
Ardhuin, F., Rascle, N., Chapron, B., Gula, J., Molemaker, J., Gille,S. T., Menemenlis, D., and Rocha, C.: Small scale currents havelarge effects on wind wave heights, J. Geophys. Res., 122, 4500–4517, https://doi.org/10.1002/2016JC012413, 2017b.
Barrick, D. E.: First order theory and analysis of MF/HF/VHF scat-ter from the sea, IEEE T. Antennas Propagat., AP-20, 2–10,1972.
Bonjean, F. and Lagerloef, G. S. E.: Diagnostic Model and Anal-ysis of the Surface Currents in the Tropical Pacific Ocean, J.Phys. Oceanogr., 32, 2938–2954, https://doi.org/10.1175/1520-0485(2002)032<2938:DMAAOT>2.0.CO;2, 2002.
Bourassa, M. A., Rodriguez, E., and Chelton, D.: Winds and cur-rent mission: Ability to observe mesoscale air/sea coupling,in: Proceedings of IEEE International Geoscience and RemoteSensing Symposium (IGARSS), Beijing, China, 7392–7395,https://doi.org/10.1109/IGARSS.2016.7730928, 2016.
Buck, C.: An extension to the wide swath ocean altimeter concept,in: vol. 8, Proceedings of the IEEE International Geoscienceand Remote Sensing Symposium (IGARSS), Seoul, Korea, 543–5439, https://doi.org/10.1109/IGARSS.2005.1525970, 2005.
Cardinali, C., Pezzulli, S., and Andersson, E.: Influence-matrix di-agnostic of a data assimilation system, Q. J. Roy. Meteorol. Soc.,130, 2767–2786, 2004.
Caudal, G., Hauser, D., Valentin, R., and Gac, C. L.: KuROS:A New Airborne Ku-Band Doppler Radar for Observa-tion of Surfaces, J. Atmos. Ocean Tech., 31, 2023–2245,https://doi.org/10.1175/JTECH-D-14-00013.1, 2014.
Chapron, B., Collard, F., and Ardhuin, F.: Direct measure-ments of ocean surface velocity from space: interpre-tation and validation, J. Geophys. Res., 110, C07008,https://doi.org/10.1029/2004JC002809, 2005.
Collard, F., Mouche, A., Chapron, B., Danilo, C., and Jo-hannessen, J.: Routine High Resolution Observation Of Se-lected Major Surface Currents From Space, in: Proceedingsof SEASAR 2008, SP-656, ESA, ESA – ESRIN, Frascati,Italy, http://earth.esa.int/workshops/seasar2008/participants/287/pres_287_Collard.pdf (last access: 12 April 2018), 2008.
Cravatte, S., Kessler, W. S., Smith, N., Wijffels, S. E.,and Contributing Authors: First Report of TPOS 2020,GOOS-215, 200 pp., http://tpos2020.org/first-report/ (last ac-cess: 12 April 2018), 2016.
Elfouhaily, T., Chapron, B., Katsaros, K., and Vandemark, D.:A unified directional spectrum for long and short wind-drivenwaves, J. Geophys. Res., 102, 15781–15796, 1997.
Elipot, S., Lumpkin, R., Perez, R. C., Lilly, J. M., Early,J. J., and Sykulski, A. M.: A global surface drifter dataset at hourly resolution, J. Geophys. Res., 121, 2937–2966,https://doi.org/10.1002/2016JC011716, 2016.
Forget, P., Saillard, M., and Broche, P.: Observations of thesea surface by coherent L band radar at low grazing anglesin a nearshore environment, J. Geophys. Res., 111, C09015,https://doi.org/10.1029/2005JC002900, 2006.
Forget, P., Saillard, M., Guérin, C.-A., Testud, J., and Bouar, E.L.: On the Use of X-Band Weather Radar for Wind Field Re-trieval in Coastal Zone, J. Atmos. Ocean Tech., 82, 899–917,https://doi.org/10.1175/JTECH-D-15-0206.1, 2016.
Fu, L.-L. and Ubelmann, C.: On the Transition from Profile Al-timeter to Swath Altimeter for Observing Global Ocean SurfaceTopography, J. Atmos. Ocean Tech., 31, 560–568, 2014.
Gille, S. T. and Hughes, C. W.: Aliasing of high-frequencyvariability by altimetry: Evaluation from bottom pres-sure recorders, Geophys. Res. Lett., 28, 1755–1758,https://doi.org/10.1029/1999GL011263, 2001.
Goldstein, R. M. and Zebker, H. A.: Interferometric radar measure-ment of ocean surface current, Nature, 328, 707–709, 1987.
Górski, K. M., Hivon, E., Banday, A. J., Wandelt, B. D., Hansen,F. K., Reinecke, M., and Bartelmann, M.: HEALPix: A Frame-work for High-Resolution Discretization and Fast Analysis ofData Distributed on the Sphere, Astrophys. J., 622, 759–771,https://doi.org/10.1086/427976, 2005.
Gula, J., Molemaker, M. J., and Mcwilliams, J. C.: Gulf StreamDynamics along the Southeastern U.S. Seaboard, J. Phys.Oceanogr., 45, 690–715, 2015.
Ocean Sci., 14, 337–354, 2018 www.ocean-sci.net/14/337/2018/

F. Ardhuin et al.: Measuring surface velocity and waves with SKIM 353
Hauser, D., Tison, C., Amiot, T., Delaye, L., Corcoral, N., andCastillan, P.: SWIM: The First Spaceborne Wave Scatterometer,IEEE T. Geosci. Remote, 55, 3000–3014, 2017.
Horvat, C., Tziperman, E., and Campin, J.-M.: Interaction of sea icefloe size, ocean eddies and sea ice melting, Geophys. Res. Lett.,43, 8083–8090, https://doi.org/10.1002/2016GL069742, 2016.
Isern-Fontanet, J., Ballabrera-Poy, J., Turiel, A., and García-Ladona, E.: Remote sensing of ocean surface currents: a reviewof what is being observed and what is being assimilated, Nonlin.Processes Geophys., 24, 613–643, https://doi.org/10.5194/npg-24-613-2017, 2017.
Jackson, F. C., Walton, W. T., and Peng, C. Y.: A comparison of insitu and airborne radar observations of ocean wave directionality,J. Geophys. Res., 90, 1005–1018, 1985.
Jenkins, A. D.: The use of a wave prediction model for drivinga near-surface current model, Deut. Hydrogr. Z., 42, 133–149,1989.
Johannessen, O. M., Johannessen, J. A., Morison, J., Farrelly, B.A., and Svendsen, E. A. S.: OceanographicC onditionsi n theMarginal Ice Zone North of Svalbard in Early Fall 1979 With anEmphasis on Mesoscale Processes, J. Geophys. Res., 88, 2755–2769, 1983.
Kenyon, K. E.: Stokes drift for random gravity waves, J. Geophys.Res., 74, 6991–6994, 1969.
Kim, S. Y. and Kosro, P. M.: Observations of near-inertial surface currents off Oregon: Decorrelation timeand length scales, J. Geophys. Res., 118, 3723–3736,https://doi.org/10.1002/jgrc.20235, 2013.
Kim, S. Y., Terrill, E. J., and Cornuelle, B. D.: Mapping sur-face currents from HF radar radial velocity measurementsusing optimal interpolation, J. Geophys. Res., 113, C10023,https://doi.org/10.1029/2007JC004244, 2008.
Kirby, J. T. and Chen, T.-M.: Surface waves on vertically shearedflows: approximate dispersion relations, J. Geophys. Res., 94,1013–1027, 1989.
Korosov, A. A. and Rampal, P.: A Combination of Feature Track-ing and Pattern Matching with Optimal Parametrization for SeaIce Drift Retrieval from SAR Data, Remote Sensing, 9, 258,https://doi.org/10.3390/rs9030258, 2017.
Kuik, A. J., van Vledder, G. P., and Holthuijsen, L. H.: A methodfor the routine analysis of pitch-and-roll buoy wave data, J.Phys. Oceanogr., 18, 1020–1034, https://doi.org/10.1175/1520-0485(1988)018<1020:amftra>2.0.co;2, 1988.
Lipa, B. J. and Barrick, D. E.: Least-squares methods for the extrac-tion of surface currents from CODAR crossed-loop data: Appli-cation at ARSLOE, IEEE J. Ocean. Eng., 8, 226–253, 1983.
Martin, A. C. H., Gommenginger, C., Marquez, J., Doody, S.,Navarro, V., and Buck, C.: Wind-wave-induced velocity inATI SAR ocean surface currents: First experimental evidencefrom an airborne campaign, J. Geophys. Res., 121, 1640–1653,https://doi.org/10.1002/2015JC011459, 2016.
Mouche, A. A., Chapron, B., and Reul, N.: PredictedDoppler shifts induced by ocean surface wave displace-ments using asymptotic electromagnetic wave scatteringtheories, Waves Random Complex Media, 18, 185–196,https://doi.org/10.1080/17455030701564644, 2008.
Nouguier, F., Chapron, B., Collard, F., Mouche, A., Rascle, N.,Ardhuin, F., and Wu, X.: Sea surface kinematics from near-
nadir radar measurements, IEEE T. Geosci. Remote, http://tiny.cc/SKIMonRG_NOUG, in press, 2018.
Peureux, C., Benetazzo, A., and Ardhuin, F.: Note on the directionalproperties of meter-scale gravity waves, Ocean Sci., 14, 41–52,https://doi.org/10.5194/os-14-41-2018, 2018.
Ponte, A. L., Klein, P., Dunphy, M., and Le Gentil, S.:Low-mode internal tides and balanced dynamics disentan-glement in altimetric observations: Synergy with surfacedensity observations, J. Geophys. Res., 122, 2143–2155,https://doi.org/10.1002/2016JC012214, 2017.
Poulain, P.-M., Bussani, A., Gerin, R., Jungwirth, R.,Mauri, E., Menna, M., and Notarstefano, G.: Mediter-ranean surface currents measured with drifters: Frombasin to subinertial scales, Oceanography, 26, 38–47,https://doi.org/10.5670/oceanog.2013.03, 2016.
Raney, R. K.: Doppler properties of radars in circular orbits, Int. J.Remote Sens., 7, 1153–1162, 1986.
Rascle, N. and Ardhuin, F.: A global wave parameter databasefor geophysical applications. Part 2: model validation with im-proved source term parameterization, Ocean Model., 70, 174–188, https://doi.org/10.1016/j.ocemod.2012.12.001, 2013.
Rio, M.-H., Mulet, S., and Picot, N.: Beyond GOCE for theocean circulation estimate: Synergetic use of altimetry, gravime-try, and in situ data provides new insight into geostrophicand Ekman currents, Geophys. Res. Lett., 41, 8918–8925,https://doi.org/10.1002/2014GL061773, 2014.
Rocha, C. B., Chereskin, T. K., and Gille, S. T.: Mesoscaleto Submesoscale Wavenumber Spectra in Drake Passage, J.Phys. Oceanogr., 46, 601–620, https://doi.org/10.1175/JPO-D-15-0087.1, 2016.
Roland, A. and Ardhuin, F.: On the developments of spectral wavemodels: numerics and parameterizations for the coastal ocean,Ocean Dynam., 64, 833–846, https://doi.org/10.1007/s10236-014-0711-z, 2014.
Romeiser, R., Runge, H., Suchandt, S., Kahle, R., Rossi, C., andBell, P.: Quality Assessment of Surface Current Fields FromTerraSAR-X and TanDEM-X Along-Track Interferometry andDoppler Centroid Analysis, IEEE T. Geosci. Remote, 52, 2759–2772, https://doi.org/10.1109/TGRS.2013.2265659, 2014.
Rouault, M. J., Mouche, A., Collard, F., Johannessen, J. A., andChapron, B.: Mapping the Agulhas Current from space: An as-sessment of ASAR surface current velocities, J. Geophys. Res.,41, C10026, https://doi.org/10.1029/2009JC006050, 2010.
Sakov, P., Counillon, F., Bertino, L., Lisæter, K. A., Oke, P. R., andKorablev, A.: TOPAZ4: an ocean-sea ice data assimilation sys-tem for the North Atlantic and Arctic, Ocean Sci., 8, 633–656,https://doi.org/10.5194/os-8-633-2012, 2012.
Shrira, V. I., Ivonin, D. V., Broche, P., and de Maistre, J. C.: On re-mote sensing of vertical shear of ocean surface currents by meansof a single-frequency VHF radar, Geophys. Res. Lett., 28, 3955–3958, 2001.
SKIM Team: Sea surface KInematics Multiscale moni-toring, full proposal for ESA EE9, Tech. rep., Lab-oratoire d’Océanographie Physique et Spatiale, Brest,France, prepared for European Space Agency, 192 pp.,https://doi.org/10.13140/RG.2.2.18902.86084/1, 2017.
Stammer, D., Wunsch, C., and Ponte, R. M.: De-aliasingof global high frequency barotropic motions in altime-
www.ocean-sci.net/14/337/2018/ Ocean Sci., 14, 337–354, 2018

354 F. Ardhuin et al.: Measuring surface velocity and waves with SKIM
ter observations, Geophys. Res. Lett., 27, 1175–1176,https://doi.org/10.1029/1999GL011263, 2000.
Stokes, G. G.: On the theory of oscillatory waves, Trans. Camb.Philos. Soc., 8, 441–455, 1849.
Sudre, J., Maes, C., and Garçon, V.: On the global estimates ofgeostrophic and Ekman surface currents, Limnol. Oceanogr., 3,1–20, https://doi.org/10.1215/21573689-2071927, 2013.
Sutherland, P. and Gascard, J. C.: Airborne remote sens-ing of ocean wave directional wavenumber spectra in themarginal ice zone, Geophys. Res. Lett., 43, 4659–4664,https://doi.org/10.1002/grl.53444, 2016.
Thomson, J., D’Asaro, E. A., Cronin, M. F., Rogers, W. E., Har-court, R. R., and Shcherbina, A.: Waves and the equilibriumrange at Ocean Weather Station P, J. Geophys. Res., 118, 595–5962, https://doi.org/10.1002/2013JC008837, 2013.
Ubelmann, C., Cornuelle, B., and Fu, L.-L.: Dynamic Mappingof Along-Track Ocean Altimetry: Method and Performancefrom Observing System Simulation Experiments, J. Atmos.Ocean Tech., 33, 1691–1699, https://doi.org/10.1175/JTECH-D-15-0163.1, 2016.
van Sebille, E., Wilcox, C., Lebreton, L., Maximenko, N.,Hardesty, B. D., van Franeker, J. A., Eriksen, M., Siegel,D., Galgani, F., and Law, K. L.: A global inventory ofsmall floating plastic debris, Environ. Res. Lett., 10, 124006,https://doi.org/10.1088/1748-9326/10/12/124006, 2015.
Wollstadt, S., López-Dekker, P., De Zan, F., and Younis,M.: Design Principles and Considerations for Space-borne ATI SAR-Based Observations of Ocean SurfaceVelocity Vectors, IEEE T. Geosci. Remote, 99, 1–20,https://doi.org/10.1109/TGRS.2017.2692880, 2016.
Xie, J., Bertino, L., Counillon, F., Lisæter, K. A., and Sakov,P.: Quality assessment of the TOPAZ4 reanalysis in the Arc-tic over the period 1991–2013, Ocean Sci., 13, 123–144,https://doi.org/10.5194/os-13-123-2017, 2017.
Yurovsky, Y. Y., Kudryavtsev, V. N., Chapron, B., andGrodsky, S. A.: Sea surface kinematics from near-nadir radar measurements, IEEE T. Geosci. Remote,https://doi.org/10.1109/TGRS.2017.2787459, in press, 2018.
Zrnic, D. S.: Spectral Moment Estimates from CorrelatedPulse Pairs, IEEE T. Aero. Elect. Syst., 13, 344–354,https://doi.org/10.1109/TAES.1977.308467, 1977.
Ocean Sci., 14, 337–354, 2018 www.ocean-sci.net/14/337/2018/