Geochemical monitoring of groundwaters (1998–2001) at Vesuvius volcano (Italy)
24
Geochemical monitoring of groundwaters (1998^2001) at Vesuvius volcano (Italy) Cinzia Federico a; , Alessandro Aiuppa b , Rocco Favara a , Sergio Gurrieri a , Mariano Valenza b a Istituto Nazionale di Geo¢sica e Vulcanologia (INGV), Sezione di Palermo, Via La Malfa 153, 90146 Palermo, Italy b Dipartimento CFTA, Universita ' di Palermo, Via Archira¢ 36, 90123 Palermo, Italy Received 26 February 2002; accepted 14 December 2002 Abstract This work presents the results of hydrogeochemical studies carried out at Vesuvius during the period May 1998^ December 2001, mostly focusing on compositional time variations observed during this time. Based on their chemistry, groundwater samples are distinguished into two groups, 1 and 2, representative of water circulation in the southern and northern sectors of the volcano, respectively. Waters from group 1 are typically more acidic, warmer, and more saline than those of group 2. They also have higher CO 2 and CH 4 contents, attributed to enhanced input of deep-rising volatiles and prolonged water^rock interactions. Time-series highlight the fairly constant chemical composition of the entire aquifer. Groundwater temperature, pH, bicarbonate content and dissolved CO 2 display quite stable values in the study period, particularly in deep wells (piezometric level more than 100 m deep). Shallower water bodies present more evident temporal variations, related to seasonal and anthropogenic effects. This paper also describes some important variations in water chemistry which had occurred by the time of the seismic event in early October 1999, particularly in the Olivella spring located on the northern flank of the volcano. At this site, a great decrease in water pH and redox potential, and increased dissolved CO 2 contents and 3 He/ 4 He ratios were observed. These changes in chemical and isotope composition support the hypothesis of an input of magma-derived helium and carbon dioxide into the aquifer feeding the Olivella spring by the time of the earthquake. ȣ 2003 Elsevier B.V. All rights reserved. Keywords: Vesuvius; volcanic surveillance; groundwater; hydro-geochemistry; oxygen-18 1. Introduction Mitigation of volcanic hazard at the volcano of Somma^Vesuvius (Southern Italy), which had been in a quiescent period since 1944, is a partic- ularly crucial topic, due to the explosive nature of its eruptions and the densely populated areas in its neighbourhood. The development of a model of groundwater circulation and chemical evolu- tion is essential in order to de¢ne strategies for geochemical monitoring of the volcano. Previous experience at other active volcanoes in Southern Italy, such as Etna (Bonfanti et al., 1996) or Vul- cano Island (Capasso et al., 1999), had revealed 0377-0273 / 03 / $ ^ see front matter ȣ 2003 Elsevier B.V. All rights reserved. doi :10.1016/S0377-0273(03)00392-5 * Corresponding author. Fax: +39-091-6809449. E-mail address: [email protected] (C. Federico). VOLGEO 3020 6-4-04 Journal of Volcanology and Geothermal Research 133 (2004) 81^104 R Available online at www.sciencedirect.com www.elsevier.com/locate/jvolgeores
-
Upload
independent -
Category
Documents
-
view
1 -
download
0
Transcript of Geochemical monitoring of groundwaters (1998–2001) at Vesuvius volcano (Italy)

Geochemical monitoring of groundwaters (1998^2001) atVesuvius volcano (Italy)
Cinzia Federico a;�, Alessandro Aiuppa b, Rocco Favara a, Sergio Gurrieri a,Mariano Valenza b
a Istituto Nazionale di Geo¢sica e Vulcanologia (INGV), Sezione di Palermo, Via La Malfa 153, 90146 Palermo, Italyb Dipartimento CFTA, Universita' di Palermo, Via Archira¢ 36, 90123 Palermo, Italy
Received 26 February 2002; accepted 14 December 2002
Abstract
This work presents the results of hydrogeochemical studies carried out at Vesuvius during the period May 1998^December 2001, mostly focusing on compositional time variations observed during this time. Based on theirchemistry, groundwater samples are distinguished into two groups, 1 and 2, representative of water circulation in thesouthern and northern sectors of the volcano, respectively. Waters from group 1 are typically more acidic, warmer,and more saline than those of group 2. They also have higher CO2 and CH4 contents, attributed to enhanced input ofdeep-rising volatiles and prolonged water^rock interactions. Time-series highlight the fairly constant chemicalcomposition of the entire aquifer. Groundwater temperature, pH, bicarbonate content and dissolved CO2 displayquite stable values in the study period, particularly in deep wells (piezometric level more than 100 m deep). Shallowerwater bodies present more evident temporal variations, related to seasonal and anthropogenic effects. This paper alsodescribes some important variations in water chemistry which had occurred by the time of the seismic event in earlyOctober 1999, particularly in the Olivella spring located on the northern flank of the volcano. At this site, a greatdecrease in water pH and redox potential, and increased dissolved CO2 contents and 3He/4He ratios were observed.These changes in chemical and isotope composition support the hypothesis of an input of magma-derived helium andcarbon dioxide into the aquifer feeding the Olivella spring by the time of the earthquake.9 2003 Elsevier B.V. All rights reserved.
Keywords: Vesuvius; volcanic surveillance; groundwater; hydro-geochemistry; oxygen-18
1. Introduction
Mitigation of volcanic hazard at the volcano ofSomma^Vesuvius (Southern Italy), which hadbeen in a quiescent period since 1944, is a partic-
ularly crucial topic, due to the explosive nature ofits eruptions and the densely populated areas inits neighbourhood. The development of a modelof groundwater circulation and chemical evolu-tion is essential in order to de¢ne strategies forgeochemical monitoring of the volcano. Previousexperience at other active volcanoes in SouthernItaly, such as Etna (Bonfanti et al., 1996) or Vul-cano Island (Capasso et al., 1999), had revealed
0377-0273 / 03 / $ ^ see front matter 9 2003 Elsevier B.V. All rights reserved.doi:10.1016/S0377-0273(03)00392-5
* Corresponding author. Fax: +39-091-6809449.E-mail address: [email protected] (C. Federico).
VOLGEO 3020 6-4-04
Journal of Volcanology and Geothermal Research 133 (2004) 81^104
R
Available online at www.sciencedirect.com
www.elsevier.com/locate/jvolgeores

that water chemistry monitoring may indeed helpin heralding renewed volcanic activity or in track-ing events of enhanced transport of volatiles fromdeep magmatic or hydrothermal reservoirs to thesurface. Hydrogeochemical studies in seismicallyactive areas have also revealed their usefulnessin detecting earthquake-related anomalies to beused as precursors (King et al., 1981; Thomas,1988; Tsunogai and Wakita, 1995; Toutain etal., 1997).
The chemistry of groundwaters at Somma^Ve-suvius has been extensively studied in the last fewyears, to provide a model of gas^water^rock in-teraction processes taking place in the shallowvolcanic aquifer (Avino et al., 1994; Caliro etal., 1998; Celico et al., 1998; Federico, 1999; Fed-erico et al., 2002). These e¡orts highlighted theexistence of clearcut relations between rising mag-matic gas, water chemistry and £ow paths, andthe main structural features of the volcano. Iso-tope geochemistry of dissolved gases (C, He) dem-onstrated that magmatic volatiles are activelytransported by groundwaters £owing along themain faults and fractures cutting the edi¢ce,namely the NW^SE- and NE^SW-trending faultsystems cutting both the volcanic cover and the
sedimentary basement (Federico et al., 2002). Pre-vious studies also showed systematic chemicalcontrasts between groundwaters £owing on thesouthern and northern sectors of the volcaniccomplex, the former being typically characterisedby higher outlet temperatures, total dissolved sol-ids and dissolved CO2 contents. Federico et al.(2002) ascribed the huge CO2 degassing in thesouthern part of Vesuvius to control exerted bythe geometry of the fractured carbonate base-ment, the top of which becomes progressivelyshallower from north to south, where it lies atonly a few hundred metres depth (Berrino et al.,1993). Instead, in the northern part of the volcanoa thick volcanoclastic^clayey pelagic rock succes-sion is interposed between the carbonate base-ment and the shallow volcanics of Somma^Vesu-vius (Ippolito et al., 1973; Aprile and Ortolani,1979; Cubellis et al., 2001), limiting the rise ofdeep gases (Celico et al., 1998).
Based on the main results of these surveys, sys-tematic hydrogeochemical surveillance started atVesuvius in May 1998. Two springs and elevenwells (Fig. 1), selected among those most clearlyshowing evidence of energy (heat) and mass (mag-matic gases) released from deep reservoirs, were
Fig. 1. Sketch-map of Mount Vesuvius area, with locations of sampling points and main villages. Structural lineaments (solidblack lines, dotted white lines) from Bianco et al. (1998). Black symbols: wells; white symbols: springs.
VOLGEO 3020 6-4-04
C. Federico et al. / Journal of Volcanology and Geothermal Research 133 (2004) 81^10482

periodically monitored. In this paper, the compo-sitional time variations recorded from May 1998to December 2001 are collected and discussed, todistinguish the various factors (volcanic-induced,man-made, or seasonal e¡ects) which may be re-sponsible for the observed changes. The de¢nitionof a baseline for temporal variations of chemicalsdissolved in groundwaters during the present stateof quiescence is crucial for a critical review of thegeochemical changes that may herald or accom-pany future reactivation of the volcano.
Particular attention is also devoted to thechemical changes which occurred at the time ofthe seismic phase which started at Vesuvius onOctober 9, 1999. The main (3.6 M) seismic eventof the whole phase, which occurred on that day at7.59 p.m., was by far the largest shock, recordedas being the highest Duration Magnitude of thelast 25 years in the area (Del Pezzo et al., 2001;Cubellis and Marturano, 2002). This earthquakehad a shallow source depth (about 6 km) and wastherefore felt by about 2 million people. The co-seismic geochemical anomalies, discussed here,highlight the relations between the dynamics ofthe volcanic system and the gas in£ux enteringthe Vesuvian aquifer.
2. Study area and analytical methods
2.1. Geological outline
Somma^Vesuvius, located 15 km south of Na-ples in Southern Italy (Fig. 1), is a polygeneticvolcanic complex composed of an old strato-vol-cano (Somma), mainly preserved on the northernsector of the edi¢ce, and the younger cone ofVesuvius. The Somma volcano mainly consistsof lava £ows (K-rich basalts and latites) and mi-nor pyroclastics (strombolian scoria fall deposits)and was active between 25 ka and 18 ka BP (San-tacroce, 1987; Ayuso et al., 1998). Four plinianeruptions between 18 ka BP to AD 79 caused thesummit to collapse and gave rise to the formationof a multi-stage summit caldera (‘Somma caldera’)(Santacroce, 1987; Andronico et al., 1995; Prin-cipe et al., 1999; De Vivo and Rolandi, 2001).The present edi¢ce of Vesuvius formed after the
AD 1631 subplinian phase and remained a semi-persistent open conduit until 1944. Intermittentlava fountains and lava £ows (K-rich trachytes)were emitted from both summit and lateral vents(Arno' et al., 1987; Rolandi et al., 1998). Since1944, Vesuvius has been dormant, displayinggradually decreasing fumarole emissions in itssummit crater and minor seismic activity. Accord-ing to Chiodini et al. (2001), the low-temperaturefumaroles currently discharged at its crater are fedby a high-salinity hydrothermal aquifer (360^440‡C) located at a depth of about 2^3 km inthe limestone basement.
According to Bianco et al. (1998), a NW^SEtrending fault system, running from the villageof Boscotrecase^Pompei to S. Sebastiano (Fig.1), is the main tectonic structure cutting boththe volcano edi¢ce and its sedimentary basement.This structural discontinuity formed in responseto the regional stress ¢eld, trending NNE^SSW.A second important fault system, recognisable bythe alignment of scoria cones, eruptive fracturesand faults, runs from the northeast (near the vil-lage of Ottaviano) to the southwestern £anks ofthe volcano (Torre del Greco area), comprisingthe 1794 and 1861 eruptive fractures and the sub-marine volcanic vents in the sea o¡ Torre delGreco (Finetti and Morelli, 1974; Rosi et al.,1987; Andronico et al., 1995).
2.2. Chemical and hydrological backgrounds
Water circulation in the Vesuvius area occurs intwo main hydrostructures (Celico et al., 1998).The ¢rst is the 3-km-thick Mesozoic carbonatesequence underlying the Quaternary volcanic for-mations and outcropping in the Apennines.Groundwaters £owing inside the carbonate moun-tains are partially discharged on the CampanianPlain, where they are hosted inside shallow sedi-mentary and volcanoclastic deposits (Celico et al.,1980, 1998; Celico, 1983). The second hydrostruc-ture is located in the fractured lavas of the Som-ma^Vesuvius complex, where water £ows radiallyslopedown from the edi¢ce. These two structures,although di¡ering signi¢cantly in chemical com-position (calcium-bicarbonate to alkali-bicarbon-ate), may locally interact and give rise to waters
VOLGEO 3020 6-4-04
C. Federico et al. / Journal of Volcanology and Geothermal Research 133 (2004) 81^104 83

with intermediate composition. This processmainly takes place in the southern £ank of Vesu-vius, where the carbonate basement is very shal-low and the vertical movements of £uids may oc-cur along faults (Caliro et al., 1998; Celico et al.,1998).
Previous studies in the area showed that thechemical composition of groundwaters on Mt.Vesuvius greatly depends on the extent of gas^water^rock interactions, driven by the supply ofacidic volcanic gases (mostly CO2) in the aquifer(Federico, 1999; Federico et al., 2002). Due to thelow temperatures at which weathering takes place,the achievement of chemical equilibrium betweenhost rocks and solution is generally prevented,leading to the formation of ‘immature’ (sensu Gig-genbach, 1988) Na^K^Mg^HCO3 waters.
Areas of marked release of volcanic £uids havebeen recognised on the southern and western£anks of Mt. Vesuvius, where CO2 ascent is con-trolled by the NE^SW trending tectonic faults. As
¢rst determined by Caliro et al. (1998), the gas-rich waters emerging in these sectors typicallyshow a carbon isotope signature of dissolvedCO2 similar to that of the crater fumaroles(N13CðCO2ÞW0x). This 13C-rich carbon isotopesignature, signi¢cantly higher than the typicalrange of MORB (34 to 38x ; Kyser, 1986),suggests either that CO2 is degassed by deepmagma bodies formed by partial melting of ametasomatised sub-continental mantle (Tedesco,1997) or the involvement of CO2 originatingfrom decarbonation reactions in Mesozoic lime-stone (Chiodini et al., 2001). However, a mag-matic origin is consistent with the high 3He/4Heratios (2.0^2.6 Ra) of dissolved He in ground-waters (Federico et al., 2002), which closely matchthose measured in crater fumaroles and £uid in-clusions in phenocrysts in some recent lavas (3He/4He= 2.7 Ra ; Graham et al., 1993; Tedesco et al.,1991).
Signi¢cant uprising of magmatic gases in some
Table 1Chemical compositions of analysed groundwaters
Date T pH Eh Na K Mg Ca Cl NO3 SO4 HCO3 TDS N18O CO2 He R/Ra
Site 15/98 ^ ^ ^ ^ ^ ^ ^ ^ ^ ^ ^ ^ ^ ^ ^ ^11/98 16.8 6.4 364 97 97 74 168 141 0.1 297 741 1614 36.0 570 n.m. n.m.1/99 16.4 6.5 343 136 109 91 222 156 0.1 156 1348 2219 36.0 420 n.m. n.m.3/99 16.8 6.6 326 151 115 87 243 150 3.0 146 1287 2183 36.1 290 n.m. n.m.5/99 16.5 6.5 5 147 106 83 249 163 0.2 179 1177 2104 36.4 380 n.m. n.m.10/99 16.2 6.4 339 133 117 76 262 143 0.2 153 1308 2192 36.3 370 n.m. n.m.11/99 16.3 6.4 333 142 112 91 250 141 0.1 147 1281 2152 36.1 450 n.m. n.m.3/00 16.4 6.4 381 139 108 91 240 144 4.7 147 1220 2158 36.1 200 n.m. n.m.5/00 16.6 6.3 42 102 103 49 189 129 1.9 266 726 1554 36.3 150 n.m. n.m.7/00 16.5 6.3 2 132 115 84 245 143 2.8 153 1324 2198 36.4 n.m. n.m. n.m.10/00 16.3 6.3 312 153 118 85 246 132 6 0.1 144 1299 2172 36.2 350 n.m. n.m.11/00 16.5 6.3 36 87 98 51 210 143 2.8 291 738 1606 36.3 410 n.m. n.m.1/01 16.1 6.4 n.m. 135 106 77 296 153 6 0.1 172 1251 2209 36.2 400 n.m. n.m.3/01 16.3 6.4 n.m. 166 118 96 227 152 6 0.1 163 1312 2226 36.3 370 n.m. n.m.4/01 16.3 6.4 369 135 111 83 235 138 2.4 152 1235 2080 36.2 n.m n.m. n.m.5/01 16.5 6.3 310 115 104 71 213 143 6 0.1 259 891 1793 36.3 250 n.m. n.m.6/01 16.3 6.4 14 143 109 89 224 150 5.0 205 1077 2002 36.4 n.m n.m. n.m.7/01 16.7 6.2 322 152 114 87 238 147 7.0 148 1318 2211 36.1 240 n.m. n.m.8/01 16.9 6.3 24 140 114 82 235 150 4.0 156 1299 2180 nm 270 n.m. n.m.9/01 16.2 6.2 102 147 111 86 233 155 4.0 165 1284 2184 36.3 250 n.m. n.m.10/01 16.2 6.3 97 155 110 89 235 138 1.0 146 1290 2164 36.3 310 n.m. n.m.11/01 16.2 6.4 22 84 94 49 214 148 6 0.1 150 842 1581 nm 310 n.m. n.m.12/01 16.4 6.3 2 153 114 89 284 146 6 0.1 154 1302 2241 36.4 n.m n.m. n.m.average 16.4 6.4 35 134 109 79 235 146 2.2 180 1161 2047 36.2 330 n.m. n.m.c 0.2 0.1 45 23 7 13 30 8 2.2 50 218 241 0.1 102 n.m. n.m.VC % 1.3 1.4 1000 17 7 17 13 5 98 28 19 12 2 31 n.m. n.m.
VOLGEO 3020 6-4-04
C. Federico et al. / Journal of Volcanology and Geothermal Research 133 (2004) 81^10484

Table 1 (Continued).
Date T pH Eh Na K Mg Ca Cl NO3 SO4 HCO3 TDS N18O CO2 He R/Ra
Site 65/98 ^ ^ ^ ^ ^ ^ ^ ^ ^ ^ ^ ^ ^ ^ ^ ^11/98 16.9 5.9 3269 142 252 83 58 209 6 0.1 36 991 1770 36.3 1061 n.m. n.m.1/99 16.8 5.9 3130 136 242 83 57 202 6 0.1 39 1013 1772 36.3 1086 n.m. n.m.3/99 16.4 6.1 390 141 258 81 57 210 0.5 39 854 1710 36.3 520 n.m. n.m.5/99 ^ ^ ^ ^ ^ ^ ^ ^ ^ ^ ^ ^ ^ n.m. n.m. n.m.10/99 16.7 5.8 3117 144 252 90 59 168 0.5 41 994 1658 36.5 1199 n.m. n.m.11/99 16.9 5.9 3280 149 243 89 64 170 0.3 34 988 1714 36.4 943 n.m. n.m.3/00 16.8 6.1 3275 146 250 84 59 168 4.3 36 988 1734 36.3 571 n.m. n.m.5/00 16.8 5.9 3200 151 259 89 56 165 1.9 31 1037 1785 36.3 992 n.m. n.m.7/00 17.1 5.8 3184 139 240 92 67 181 1.5 44 1025 1772 36.8 1226 n.m. n.m.10/00 16.7 5.7 3210 136 241 92 52 149 6 0.1 34 1000 1680 36.5 1522 n.m. n.m.11/00 16.6 5.8 3163 134 235 85 54 171 6 0.1 38 1019 1735 36.6 1235 n.m. n.m.1/01 16.5 6.0 n.m. 137 251 75 57 168 0.2 36 961 1688 36.6 738 n.m. n.m.3/01 16.6 5.9 n.m. 144 242 78 71 170 6 0.1 35 1007 1735 36.4 967 n.m. n.m.4/01 16.7 5.9 350 137 237 84 55 155 3.0 40 971 1701 36.5 950 n.m. n.m.5/01 17.1 5.7 24 134 230 88 59 148 0.2 34 1031 1770 36.6 1194 n.m. n.m.6/01 17.1 5.87 57 135 234 88 57 174 0.2 45 973 1705 n.m. 829 n.m. n.m.8/01 16.7 5.85 385 138 241 89 62 179 5 45 994 1748 36.5 n.m. n.m. n.m.9/01 16.6 5.90 60 144 243 89 66 171 4.3 46 1003 1762 36.7 n.m. n.m. n.m.10/01 16.7 5.90 334 144 239 93 66 165 3.7 47 1016 1770 36.4 848 n.m. n.m.11/01 16.6 5.78 25 143 237 90 64 169 6 0.1 35 1010 1747 36.5 450 n.m. n.m.12/01 16.7 5.97 15 134 241 84 64 160 6 0.1 33 997 1712 36.5 n.m. n.m. n.m.average 16.8 5.9 3106 140 241 87 62 178 1.9 39 986 1733 36.5 860 n.m. n.m.c 0.2 0.1 115 4 6 4 6 19 1.9 5 39 36 0.1 189 n.m. n.m.VC % 1 2 100 3 3 4 10 10 97 13 4 2 2 23 n.m. n.m.Site 135/98 22.5 6.0 390 179 328 105 188 361 20.6 242 1089 2492 36.6 n.m. n.m. n.m.11/98 23.2 6.0 3104 185 350 101 167 459 6 0.1 275 1055 2593 n.m. n.m. n.m. n.m.1/99 22.1 6.2 368 175 327 101 180 391 3.2 273 1040 2488 36.6 n.m. n.m. n.m.3/99 22.7 5.9 3113 180 330 101 174 416 0.4 262 921 2385 36.6 n.m. n.m. n.m.5/99 23.2 5.9 3256 170 333 95 166 358 0.2 256 903 2290 36.8 n.m. n.m. n.m.10/99 23.3 6.7 3110 173 342 88 164 340 3.5 231 1007 2323 36.7 n.m. n.m. n.m.11/99 23.3 6.0 3252 159 321 91 149 322 6.8 219 946 2243 36.9 n.m. n.m. n.m.3/00 22.6 6.0 3270 171 307 92 169 343 5.0 247 988 2317 36.7 n.m. n.m. n.m.5/00 23.0 6.0 3160 179 326 96 157 379 3.1 255 994 2359 36.7 n.m. n.m. n.m.7/00 23.2 6.0 359 178 324 104 186 399 3.1 268 1046 2504 36.8 n.m. n.m. n.m.10/00 23.1 6.0 3200 200 360 112 179 419 6 0.1 281 1068 2619 36.6 n.m. n.m. n.m.11/00 22.9 5.9 3178 171 306 96 180 381 1.8 274 1049 2445 36.7 n.m. n.m. n.m.1/01 22.3 6.0 n.m. 167 340 95 223 393 6 0.1 265 1037 2483 36.8 n.m. n.m. n.m.3/01 22.4 6.0 n.m. 185 325 105 191 393 6 0.1 280 1074 2558 36.7 n.m. n.m. n.m.4/01 22.8 6.0 335 177 325 107 192 390 n.m. 263 1075 2530 36.8 n.m. n.m. n.m.5/01 23.0 6.0 34 181 326 109 191 402 n.m. 282 1028 2518 36.9 n.m. n.m. n.m.6/01 22.8 5.93 44 184 335 108 186 432 5.2 293 1043 2582 36.9 n.m. n.m. n.m.7/01 23.2 5.99 3220 206 362 111 192 457 6.7 310 1104 2742 36.7 n.m. n.m. n.m.8/01 23.8 5.74 399 216 365 116 184 468 5.0 312 1101 2762 36.7 n.m. n.m. n.m.9/01 23.2 5.93 3100 215 372 117 194 491 4.3 324 1113 2827 36.9 n.m. n.m. n.m.10/01 23.3 5.93 3105 227 386 123 198 484 1.2 313 1125 2857 n.m. n.m. n.m. n.m.11/01 22.9 5.95 55 205 353 120 200 442 6 0.1 329 1122 2771 n.m. n.m. n.m. n.m.average 22.9 6.0 3114 187 335 104 183 405 4.7 276 1042 2531 36.7 n.m. n.m. n.m.c 0.4 0.2 96 17 22 10 13 48 4.8 29 62 177 0.1 n.m. n.m. n.m.VC % 2 3 84 9 7 9 7 12 104 11 6 7 1.5 n.m. n.m. n.m.
VOLGEO 3020 6-4-04
C. Federico et al. / Journal of Volcanology and Geothermal Research 133 (2004) 81^104 85

Table 1 (Continued).
Date T pH Eh Na K Mg Ca Cl NO3 SO4 HCO3 TDS N18O CO2 He R/Ra
Site 145/98 23.3 6.3 3168 533 410 763 616 2001 6 0.1 88 4060 8470 36.6 505 n.m. n.m.11/98 23.3 6.4 3260 540 415 771 621 2202 2.4 86 4340 8975 36.8 894 n.m. n.m.1/99 23.2 6.4 374 555 413 808 588 2022 7.1 88 4337 8810 n.m. 740 n.m. n.m.3/99 23.1 6.4 390 526 433 760 606 1966 0.7 82 3910 8304 36.4 1005 n.m. n.m.5/99 23.5 6.4 3260 529 413 720 586 1826 5.9 87 4081 8471 36.8 677 n.m. n.m.10/99 23.2 6.4 3150 510 429 825 553 1882 1.7 82 4294 8550 36.7 733 n.m. n.m.11/99 ^ ^ ^ ^ ^ ^ ^ ^ ^ ^ ^ ^ n.m. n.m. n.m.3/00 22.6 6.5 3197 524 420 788 410 2104 21.0 114 3819 8177 36.7 896 n.m. n.m.5/00 22.9 6.9 3251 541 414 830 400 2077 6.8 113 3770 7991 36.7 1181 n.m. n.m.7/00 23.4 6.4 3200 530 401 769 670 1976 17.0 105 4587 9121 36.6 655 n.m. n.m.10/00 23.0 6.3 3132 561 422 791 510 1875 6 0.1 77 4587 8972 36.6 1033 n.m. n.m.11/00 22.3 6.3 383 513 387 789 549 1978 6 0.1 77 4453 8857 36.7 1090 n.m. n.m.1/01 21.8 6.6 n.m. 555 352 795 727 2109 1.2 71 4288 8662 36.5 863 n.m. n.m.3/01 22.1 6.5 n.m. 525 406 783 566 1814 1.2 80 4301 8420 36.5 821 n.m. n.m.4/01 22.1 6.4 390 514 392 835 610 1855 7.3 95 4343 8642 36.5 803 n.m. n.m.5/01 22.4 6.2 380 504 392 787 570 1908 0.8 71 4618 8889 36.5 964 n.m. n.m.6/01 23.1 6.4 358 512 381 806 684 2039 5.0 84 4618 9124 36.8 1040 n.m. n.m.7/01 23.7 6.3 385 542 405 797 704 2009 32 95 4624 9177 36.7 1120 n.m. n.m.8/01 23.3 6.5 381 541 408 831 725 2019 21 85 4612 9220 36.8 1100 n.m. n.m.9/01 22.9 6.3 360 550 404 817 678 2039 20 84 4429 9000 n.m. 1057 n.m. n.m.10/01 22.9 6.3 357 553 398 809 635 2046 6.0 83 4410 8935 36.6 n.m. n.m. n.m.11/01 22.9 6.2 343 525 383 855 474 1862 6 0.1 93 4172 8365 n.m. n.m. n.m. n.m.12/01 23.1 6.1 378 549 415 808 654 2010 6 0.1 97 4435 8967 36.8 n.m. n.m. n.m.average 22.9 6.4 3125 533 400 790 625 1974 9 87 4322 8732 36.7 994 n.m. n.m.c 0.5 0.1 73 16 15 28 68 96 9 4 260 347 0.1 124 n.m. n.m.VC % 2 2 58 3 4 3 11 5 100 5 6 4 2 12 n.m. n.m.Site 195/98 ^ ^ ^ ^ ^ ^ ^ ^ ^ ^ ^ ^ ^ ^ ^ ^11/98 21.0 6.6 140 195 361 119 136 331 74 196 1205 2498 36.2 276 n.m. n.m.1/99 20.9 6.6 129 212 386 130 110 326 84 210 1132 2459 36.5 236 n.m. n.m.3/99 16.9 7.1 174 202 354 114 93 307 72 183 1089 2300 36.3 200 n.m. n.m.5/99 21.1 6.7 93 193 360 106 97 266 78 189 1019 2202 36.4 189 n.m. n.m.10/99 20.8 6.7 175 207 368 122 99 294 112 195 1153 2438 36.6 221 n.m. n.m.11/99 20.7 6.6 230 203 384 128 110 299 107 191 1144 2392 36.3 226 n.m. n.m.3/00 20.0 6.6 105 219 381 121 97 283 77 191 1165 2438 36.4 226 n.m. n.m.5/00 20.9 6.7 136 217 380 118 93 284 73 184 1165 2405 36.3 184 n.m. n.m.7/00 21.3 6.7 201 206 364 129 107 296 74 191 1229 2471 36.4 n.m. n.m. n.m.10/00 20.8 6.7 162 216 385 132 92 300 76 191 1238 2507 36.3 159 n.m. n.m.11/00 20.7 6.5 178 214 371 132 97 328 79 208 1281 2585 36.6 210 n.m. n.m.1/01 19.2 6.8 n.m. 203 414 131 120 323 71 191 1241 2573 36.5 237 n.m. n.m.3/01 20.0 6.5 n.m. 218 371 130 112 310 76 201 1232 2556 36.5 115 n.m. n.m.4/01 20.8 6.5 153 215 375 129 91 300 72 182 1226 2493 36.6 115 n.m. n.m.5/01 21.2 6.6 153 204 362 129 110 314 98 193 1251 2524 36.6 213 n.m. n.m.6/01 21.0 6.5 258 220 377 137 111 327 73 199 1251 2558 36.7 n.m. n.m. n.m.7/01 21.4 6.5 210 228 396 140 103 331 80 201 1260 2598 36.7 n.m. n.m. n.m.8/01 22.5 6.6 191 225 389 133 107 320 54 195 1293 2584 36.6 n.m. n.m. n.m.9/01 20.9 6.5 230 232 396 142 122 341 60 205 1272 2628 36.6 n.m. n.m. n.m.10/01 20.9 6.5 175 242 404 148 122 341 72 191 1275 2646 36.6 n.m. n.m. n.m.11/01 20.3 6.6 193 226 397 142 114 339 77 216 1308 2677 36.5 200 n.m. n.m.12/01 20.2 6.6 112 221 379 130 104 322 65 207 1276 2575 36.4 n.m. n.m. n.m.average 20.8 6.6 170 216 378 130 110 313 76 199 1214 2505 36.5 208 n.m. n.m.c 0.6 0.1 44 12 14 10 10 20 12 9 73 113 0.1 37 n.m. n.m.VC % 3 1 26 6 4 7 9 6 16 4 6 5 2 18 n.m. n.m.
VOLGEO 3020 6-4-04
C. Federico et al. / Journal of Volcanology and Geothermal Research 133 (2004) 81^10486
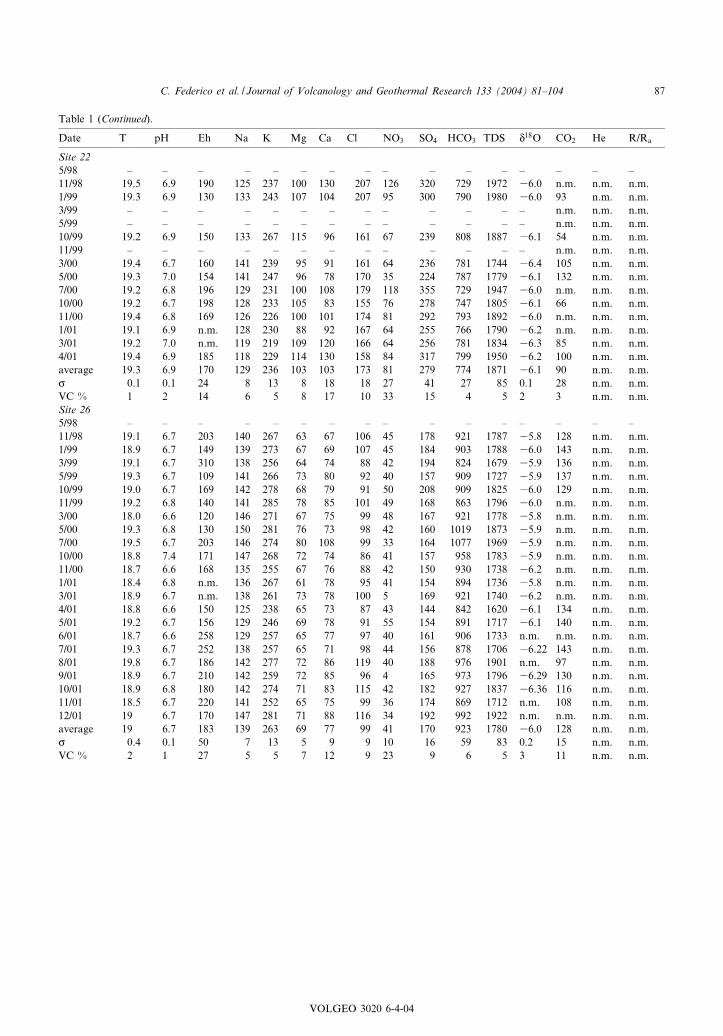
Table 1 (Continued).
Date T pH Eh Na K Mg Ca Cl NO3 SO4 HCO3 TDS N18O CO2 He R/Ra
Site 225/98 ^ ^ ^ ^ ^ ^ ^ ^ ^ ^ ^ ^ ^ ^ ^ ^11/98 19.5 6.9 190 125 237 100 130 207 126 320 729 1972 36.0 n.m. n.m. n.m.1/99 19.3 6.9 130 133 243 107 104 207 95 300 790 1980 36.0 93 n.m. n.m.3/99 ^ ^ ^ ^ ^ ^ ^ ^ ^ ^ ^ ^ ^ n.m. n.m. n.m.5/99 ^ ^ ^ ^ ^ ^ ^ ^ ^ ^ ^ ^ ^ n.m. n.m. n.m.10/99 19.2 6.9 150 133 267 115 96 161 67 239 808 1887 36.1 54 n.m. n.m.11/99 ^ ^ ^ ^ ^ ^ ^ ^ ^ ^ ^ ^ ^ n.m. n.m. n.m.3/00 19.4 6.7 160 141 239 95 91 161 64 236 781 1744 36.4 105 n.m. n.m.5/00 19.3 7.0 154 141 247 96 78 170 35 224 787 1779 36.1 132 n.m. n.m.7/00 19.2 6.8 196 129 231 100 108 179 118 355 729 1947 36.0 n.m. n.m. n.m.10/00 19.2 6.7 198 128 233 105 83 155 76 278 747 1805 36.1 66 n.m. n.m.11/00 19.4 6.8 169 126 226 100 101 174 81 292 793 1892 36.0 n.m. n.m. n.m.1/01 19.1 6.9 n.m. 128 230 88 92 167 64 255 766 1790 36.2 n.m. n.m. n.m.3/01 19.2 7.0 n.m. 119 219 109 120 166 64 256 781 1834 36.3 85 n.m. n.m.4/01 19.4 6.9 185 118 229 114 130 158 84 317 799 1950 36.2 100 n.m. n.m.average 19.3 6.9 170 129 236 103 103 173 81 279 774 1871 36.1 90 n.m. n.m.c 0.1 0.1 24 8 13 8 18 18 27 41 27 85 0.1 28 n.m. n.m.VC % 1 2 14 6 5 8 17 10 33 15 4 5 2 3 n.m. n.m.Site 265/98 ^ ^ ^ ^ ^ ^ ^ ^ ^ ^ ^ ^ ^ ^ ^ ^11/98 19.1 6.7 203 140 267 63 67 106 45 178 921 1787 35.8 128 n.m. n.m.1/99 18.9 6.7 149 139 273 67 69 107 45 184 903 1788 36.0 143 n.m. n.m.3/99 19.1 6.7 310 138 256 64 74 88 42 194 824 1679 35.9 136 n.m. n.m.5/99 19.3 6.7 109 141 266 73 80 92 40 157 909 1727 35.9 137 n.m. n.m.10/99 19.0 6.7 169 142 278 68 79 91 50 208 909 1825 36.0 129 n.m. n.m.11/99 19.2 6.8 140 141 285 78 85 101 49 168 863 1796 36.0 n.m. n.m. n.m.3/00 18.0 6.6 120 146 271 67 75 99 48 167 921 1778 35.8 n.m. n.m. n.m.5/00 19.3 6.8 130 150 281 76 73 98 42 160 1019 1873 35.9 n.m. n.m. n.m.7/00 19.5 6.7 203 146 274 80 108 99 33 164 1077 1969 35.9 n.m. n.m. n.m.10/00 18.8 7.4 171 147 268 72 74 86 41 157 958 1783 35.9 n.m. n.m. n.m.11/00 18.7 6.6 168 135 255 67 76 88 42 150 930 1738 36.2 n.m. n.m. n.m.1/01 18.4 6.8 n.m. 136 267 61 78 95 41 154 894 1736 35.8 n.m. n.m. n.m.3/01 18.9 6.7 n.m. 138 261 73 78 100 5 169 921 1740 36.2 n.m. n.m. n.m.4/01 18.8 6.6 150 125 238 65 73 87 43 144 842 1620 36.1 134 n.m. n.m.5/01 19.2 6.7 156 129 246 69 78 91 55 154 891 1717 36.1 140 n.m. n.m.6/01 18.7 6.6 258 129 257 65 77 97 40 161 906 1733 n.m. n.m. n.m. n.m.7/01 19.3 6.7 252 138 257 65 71 98 44 156 878 1706 36.22 143 n.m. n.m.8/01 19.8 6.7 186 142 277 72 86 119 40 188 976 1901 n.m. 97 n.m. n.m.9/01 18.9 6.7 210 142 259 72 85 96 4 165 973 1796 36.29 130 n.m. n.m.10/01 18.9 6.8 180 142 274 71 83 115 42 182 927 1837 36.36 116 n.m. n.m.11/01 18.5 6.7 220 141 252 65 75 99 36 174 869 1712 n.m. 108 n.m. n.m.12/01 19 6.7 170 147 281 71 88 116 34 192 992 1922 n.m. n.m. n.m. n.m.average 19 6.7 183 139 263 69 77 99 41 170 923 1780 36.0 128 n.m. n.m.c 0.4 0.1 50 7 13 5 9 9 10 16 59 83 0.2 15 n.m. n.m.VC % 2 1 27 5 5 7 12 9 23 9 6 5 3 11 n.m. n.m.
VOLGEO 3020 6-4-04
C. Federico et al. / Journal of Volcanology and Geothermal Research 133 (2004) 81^104 87

Table 1 (Continued).
Date T pH Eh Na K Mg Ca Cl NO3 SO4 HCO3 TDS N18O CO2 He R/Ra
Site 275/98 ^ ^ ^ ^ ^ ^ ^ ^ ^ ^ ^ ^ ^ ^ ^ ^11/98 18.6 6.4 141 174 350 221 153 180 10.3 137 2065 3291 36.4 602 n.m. n.m.1/99 18.7 6.5 190 177 345 234 144 213 6.8 142 2044 3305 n.m. 617 n.m. n.m.3/99 16.4 6.6 193 180 349 226 141 190 7.0 124 1879 3096 36.6 n.m. n.m. n.m.5/99 18.3 6.5 95 171 346 186 141 175 7.8 123 1815 2972 36.5 534 n.m. n.m.10/99 18.3 6.6 167 179 336 212 131 171 12.6 126 2062 3229 36.4 544 n.m. n.m.11/99 18.6 6.5 130 174 334 220 148 174 10.2 126 1952 3158 n.m. n.m. n.m. n.m.3/00 18.0 6.5 112 185 344 221 131 176 12.5 129 2111 3312 36.3 599 n.m. n.m.5/00 18.8 6.6 180 193 357 223 131 176 16.7 132 2037 3218 36.4 343 n.m. n.m.7/00 18.5 6.4 202 176 334 231 147 179 11.7 127 2162 3364 36.4 101 n.m. n.m.10/00 18.2 6.6 178 176 336 217 141 162 12.8 124 2135 3303 36.5 n.m. n.m. n.m.11/00 18.1 6.5 142 172 330 227 126 156 10.7 122 2092 3238 36.3 498 n.m. n.m.1/01 18.1 6.4 n.m. 172 363 219 156 181 6.2 121 2098 3340 36.5 426 n.m. n.m.3/01 18.4 6.4 n.m. 183 339 238 140 184 9.2 138 2123 3335 36.6 604 n.m. n.m.4/01 16.6 6.4 130 177 332 223 131 177 43.5 126 2050 3252 36.4 587 n.m. n.m.5/01 18.1 6.4 115 170 323 216 128 164 54.6 133 1967 3144 36.7 534 n.m. n.m.6/01 16.5 6.4 255 175 323 218 141 193 39.7 133 2089 3285 36.6 n.m. n.m. n.m.7/01 18.6 6.4 259 177 330 221 147 170 43.9 134 1995 3199 36.5 143 n.m. n.m.8/01 18.2 6.6 186 181 344 242 157 178 40.0 136 2077 3315 n.m. 97 n.m. n.m.9/01 18.2 6.4 140 178 327 221 149 163 4.4 130 1992 3163 36.7 130 n.m. n.m.10/01 18.2 6.5 180 177 325 230 147 163 42.2 128 1986 3197 36.5 116 n.m. n.m.11/01 18.3 6.5 205 176 322 239 143 187 36.3 145 2037 3255 36.1 108 n.m. n.m.12/01 18.2 6.2 160 177 327 212 139 108 34.0 188 2022 3219 36.1 n.m. n.m. n.m.average 18.1 6.5 168 178 337 221 144 173 13 134 2036 3236 36.5 495 n.m. n.m.c 0.7 0.1 44 4 10 10 7 20 9 14 83 92 0.1 110 n.m. n.m.VC % 4 2 26 2 3 5 5 11 67 10 4 3 2 22 n.m. n.m.Site 295/98 21.7 7.0 330 163 225 68 73 153 4.4 241 732 1660 36.4 56 n.m. n.m.11/98 21.5 7.1 364 158 229 65 68 180 2.2 248 738 1688 36.3 57 n.m. n.m.1/99 21.4 7.3 315 162 234 73 79 191 2.5 272 750 1763 n.m. 44 n.m. n.m.3/99 ^ ^ ^ ^ ^ ^ ^ ^ ^ ^ ^ ^ ^ n.m. n.m. n.m.5/99 21.5 7.4 336 151 213 69 58 148 1.4 230 628 1497 36.4 41 n.m. n.m.10/99 20.9 7.0 117 162 217 63 82 149 3.7 226 1007 1912 36.6 43 n.m. n.m.11/99 21.8 6.8 122 150 217 74 77 163 2.9 235 683 1702 36.4 60 n.m. n.m.3/00 19.7 7.1 111 160 220 67 75 154 8.5 232 702 1609 36.5 44 n.m. n.m.5/00 21.2 7.5 73 166 231 68 68 161 6.2 239 720 1565 36.4 n.m. n.m. n.m.7/00 21.4 7.2 55 151 211 70 83 164 7.5 234 732 1662 36.6 n.m. n.m. n.m.10/00 21.2 7.1 74 168 219 68 68 146 4.1 228 720 1611 36.5 67 n.m. n.m.11/00 21.3 6.9 104 156 232 70 72 165 3.8 247 744 1670 36.7 54 n.m. n.m.1/01 20.3 6.9 n.m. 155 227 65 71 166 3.1 237 723 1731 36.2 83 n.m. n.m.3/01 21.3 6.9 n.m. 166 226 74 83 176 3.8 251 781 1769 36.5 78 n.m. n.m.4/01 21.4 6.8 73 161 229 80 80 158 3.8 227 787 1706 36.3 127 n.m. n.m.5/01 21.5 7.0 91 152 213 74 79 169 2.9 250 738 1682 36.5 76 n.m. n.m.6/01 21.5 6.9 100 160 218 74 72 169 5.5 247 702 1647 36.4 n.m. n.m. n.m.7/01 21.5 6.7 149 162 223 70 73 165 9.2 241 720 1664 36.5 n.m. n.m. n.m.8/01 22.0 6.8 69 159 222 72 73 156 0.6 230 726 1639 36.5 n.m. n.m. n.m.9/01 21.5 6.9 195 166 223 75 78 172 4.3 245 741 1704 36.6 n.m. n.m. n.m.10/01 21.6 7.0 114 149 217 67 70 163 10.4 236 738 1651 36.3 70 n.m. n.m.11/01 21.5 6.8 105 162 216 70 73 170 0.2 255 711 1657 n.m. 57 n.m. n.m.12/01 21.5 6.8 96 155 214 70 78 167 5.5 252 695 1631 36.4 n.m. n.m. n.m.average 21.3 7.0 75 160 220 70 77 166 4.4 245 734 1674 36.5 64 n.m. n.m.c 0.5 0.2 65 5 8 3 5 15 3.0 15 71 81 0.1 22 n.m. n.m.VC % 2 3 87 3 4 5 7 9 61 6 10 5 2 34 n.m. n.m.
VOLGEO 3020 6-4-04
C. Federico et al. / Journal of Volcanology and Geothermal Research 133 (2004) 81^10488

Table 1 (Continued).
Date T pH Eh Na K Mg Ca Cl NO3 SO4 HCO3 TDS N18O CO2 He R/Ra
Site 315/98 19.0 7.0 390 309 285 191 141 383 5.8 173 1653 3141 n.m. 127 n.m. n.m.11/98 19.1 7.0 390 313 281 187 133 411 2.7 167 1626 3119 n.m. 171 n.m. n.m.1/99 18.4 6.9 387 300 269 178 124 448 0.0 183 1592 3095 n.m. 139 n.m. n.m.3/99 20.1 7.0 3100 310 282 183 141 456 1.2 178 1586 3136 36.3 76 n.m. n.m.5/99 20.2 7.0 3116 285 270 168 134 395 0.2 185 1379 2831 36.6 130 n.m. n.m.10/99 19.7 7.2 3110 303 277 175 128 412 0.3 177 1678 3150 36.6 117 n.m. n.m.11/99 20.7 6.8 386 297 275 184 154 378 0.2 164 1562 3071 36.4 232 n.m. n.m.3/00 20.5 7.0 392 302 277 172 135 391 8.7 177 1623 3148 36.5 n.m. n.m. n.m.5/00 20.4 6.9 380 318 289 182 141 403 1.2 176 1647 3140 36.6 169 n.m. n.m.7/00 19.8 6.8 386 290 270 186 139 382 3.2 173 1537 2980 36.6 124 n.m. n.m.10/00 18.8 6.7 3110 301 286 190 122 383 6 0.1 176 1647 3111 36.6 170 n.m. n.m.11/00 20.0 6.8 391 300 262 187 137 384 6 0.1 178 1699 3145 36.5 n.m. n.m. n.m.1/01 19.7 6.9 n.m. 288 256 177 132 383 6 0.1 165 1629 3059 36.5 n.m. n.m. n.m.3/01 19.6 6.8 n.m. 306 271 192 159 415 6 0.1 185 1647 3152 36.5 200 n.m. n.m.4/01 20.6 7.0 390 298 263 187 127 414 2.0 169 1708 3205 n.m. 175 n.m. n.m.5/01 20.4 6.8 347 281 266 189 134 412 0.8 208 1580 3073 n.m. 183 n.m. n.m.6/01 20.3 6.8 39 291 278 199 151 423 1.8 211 1583 3137 36.5 n.m. n.m. n.m.7/01 20.5 6.7 3107 309 280 200 159 432 6.7 200 1690 3276 36.5 n.m. n.m. n.m.8/01 20.7 6.9 369 287 286 200 130 381 7.3 240 1638 3169 36.5 116 n.m. n.m.9/01 19.9 6.8 350 304 271 185 148 385 4.3 175 1678 3150 36.6 116 n.m. n.m.10/01 19.8 6.8 340 282 291 194 148 408 4.3 234 1520 3082 36.4 125 n.m. n.m.11/01 19.9 6.7 358 315 281 201 141 416 6 0.1 221 1687 3263 36.5 154 n.m. n.m.12/01 20.0 6.9 371 292 259 181 139 387 6 0.1 186 1656 3100 36.6 n.m. n.m. n.m.average 19.9 6.9 380 301 275 187 140 404 3.2 189 1620 3119 36.5 153 n.m. n.m.c 0.6 0.1 27 12 9 9 10 23 3 20 71 89 0.1 35 n.m. n.m.VC % 3 2 33 4 3 5 7 6 83 11 4 3 1 23 n.m. n.m.Site 385/98 ^ ^ ^ ^ ^ ^ ^ ^ ^ ^ ^ ^ ^ ^ ^ ^11/98 17.6 7.4 48 116 160 41 190 109 315 277 461 1207 35.6 12 n.m. n.m.1/99 14.8 7.5 44 94 147 36 144 102 238 234 467 996 35.7 16 n.m. n.m.3/99 16.5 7.7 70 96 155 38 166 101 346 256 427 1157 35.8 13 n.m. n.m.5/99 ^ ^ ^ ^ ^ ^ ^ ^ ^ ^ ^ ^ ^ n.m. n.m. n.m.10/99 17.6 7.4 143 91 164 34 161 86 247 205 448 988 35.8 16 n.m. n.m.11/99 ^ ^ ^ ^ ^ ^ ^ ^ ^ ^ ^ ^ ^ n.m. n.m. n.m.3/00 15.8 7.5 115 90 137 34 147 84 226 173 445 892 36.0 36 n.m. n.m.5/00 ^ ^ ^ ^ ^ ^ ^ ^ ^ ^ ^ ^ ^ n.m. n.m. n.m.7/00 17.7 7.3 154 85 138 35 143 86 200 171 498 859 36.0 21 n.m. n.m.10/00 17.5 7.1 156 92 140 29 124 70 166 141 488 762 36.2 32 n.m. n.m.11/00 ^ ^ ^ ^ ^ ^ ^ ^ ^ ^ ^ ^ ^ n.m. n.m. n.m.1/01 ^ ^ ^ ^ ^ ^ ^ ^ ^ ^ ^ ^ ^ n.m. n.m. n.m.3/01 15.9 7.2 n.m. 86 136 36 129 84 167 140 488 778 36.0 21 n.m. n.m.average 16.8 7.4 104 94 147 35 151 90 238 200 465 955 35.9 21 n.m. n.m.c 1.1 0.2 49 10 11 3 21 13 65 52 25 164 0.2 9 n.m. n.m.VC % 7 2 47 10 8 10 14 14 27 26 5 17 3 41 n.m. n.m.Site 475/98 13.2 8.0 107 50 72 22 78 36 56 52 397 726 36.5 n.m. n.m. n.m.11/98 14.1 7.7 177 52 75 20 70 37 60 57 403 738 36.4 8 5 0.971/99 10.7 8.3 63 52 74 23 65 38 61 60 354 690 36.3 7 5 0.983/99 9.2 8.2 188 52 75 22 63 37 60 63 320 655 36.6 4 50 0.425/99 12.8 8.0 122 53 73 24 79 38 58 60 340 687 36.8 7 164 0.4510/99 13.7 6.8 3153 55 78 24 81 38 64 64 406 772 36.5 19 17 2.4511/99 12.7 8.1 240 51 80 27 68 38 64 62 366 720 36.5 3 6 0.61
VOLGEO 3020 6-4-04
C. Federico et al. / Journal of Volcanology and Geothermal Research 133 (2004) 81^104 89

Table 1 (Continued).
Date T pH Eh Na K Mg Ca Cl NO3 SO4 HCO3 TDS N18O CO2 He R/Ra
3/00 10.8 8.2 226 54 70 21 60 44 52 57 308 622 36.5 4 11 0.745/00 12.7 7.9 130 53 76 22 78 37 57 60 317 637 36.7 3 9 0.837/00 13.4 7.9 213 51 73 25 76 36 60 62 427 773 36.7 7 19 0.8410/00 13.5 7.7 156 56 78 25 72 34 56 61 412 764 36.5 7 20 0.8511/00 13.3 7.8 170 50 72 22 66 36 51 60 387 704 36.7 9 15 0.971/01 9.3 8.3 n.m. 52 60 20 61 32 42 48 354 667 36.5 2 17 1.033/01 12.2 8.1 n.m. 50 72 24 71 34 51 50 372 684 36.5 3 9 1.034/01 12.4 8.0 154 47 69 23 69 32 40 46 397 692 36.6 8 9 1.035/01 13.2 7.9 180 47 69 22 67 34 42 53 400 695 36.5 7 13 0.986/01 13.5 8.0 281 49 72 22 74 41 44 59 410 729 36.7 n.m. 6 n.m.7/01 13.7 8.0 140 54 76 23 75 37 46 53 427 754 nm n.m. 4 1.018/01 13.8 7.8 243 53 76 24 75 37 45 53 427 754 36.5 n.m. 7 n.m.9/01 13.6 7.9 230 55 76 25 74 36 49 53 433 765 36.7 5 4 0.9310/01 13.8 7.8 330 55 75 24 67 33 45 51 412 728 nm 4 4 1.0111/01 11.4 8.0 430 54 73 22 68 36 45 53 384 700 nm 5 4 n.m.12/01 7.2 7.9 245 54 68 20 68 42 47 60 366 683 36.7 n.m. n.m. n.m.average 12.4 7.9 182 52 73 23 70 37 52 57 383 710 36.6 8.8 16 0.95c 1.8 0.3 107 3 4 2 6 2 7 5 37 43 0.1 12 35 0.42VC % 15 4 59 5 5 7 9 6 14 8 10 6 2 134 213 44Site 505/98 15.4 7.2 106 53 92 33 88 72 28 93 415 875 36.5 n.m. n.m. n.m.11/98 15.4 7.2 156 52 91 31 76 74 26 98 427 875 36.7 15 n.m. n.m.1/99 ^ ^ ^ ^ ^ ^ ^ ^ ^ ^ ^ ^ ^ n.m. n.m. n.m.3/99 15.2 7.3 105 53 92 31 83 78 33 86 427 883 36.5 13 n.m. n.m.5/99 15.8 7.3 140 54 94 37 84 80 33 107 363 851 36.7 14 n.m. n.m.10/99 14.6 7.2 115 56 93 36 91 79 38 109 445 948 37.0 14 n.m. n.m.11/99 14.8 7.4 197 50 90 34 77 76 38 91 397 845 36.9 12 n.m. n.m.3/00 14.9 7.3 192 59 97 33 85 76 36 109 409 885 36.9 14 n.m. n.m.5/00 15.5 7.4 144 59 95 35 81 83 39 107 409 911 36.8 n.m. n.m. n.m.7/00 15.3 7.3 214 56 92 35 86 73 31 90 424 886 36.8 10 n.m. n.m.10/00 15.0 7.2 197 57 94 33 76 67 32 86 415 868 36.7 8 n.m. n.m.11/00 14.8 7.3 236 53 90 34 86 77 35 97 427 895 36.9 19 n.m. n.m.1/01 14.2 7.1 n.m. 52 87 33 84 74 33 87 406 908 37.0 n.m. n.m. n.m.3/01 14.6 7.4 n.m. 55 91 34 83 75 35 95 415 892 36.7 13 n.m. n.m.4/01 14.9 7.3 78 53 92 36 84 72 32 86 418 872 36.7 35 n.m. n.m.5/01 15.1 7.3 150 51 88 33 84 76 34 95 419 868 36.8 13 n.m. n.m.6/01 15.7 7.3 268 52 88 34 75 79 31 100 390 848 36.9 n.m. n.m. n.m.7/01 15.8 7.4 254 55 91 33 81 78 35 94 415 882 36.7 26 n.m. n.m.8/01 16 7.2 162 53 91 34 82 73 32 90 415 870 36.8 n.m. n.m. n.m.9/01 14.9 7.2 280 55 91 35 83 81 33 95 427 900 36.7 n.m. n.m. n.m.10/01 14.8 7.1 235 53 93 32 81 74 26 88 424 872 n.m. n.m. n.m. n.m.11/01 14.6 7.3 260 56 91 34 93 82 36 101 430 923 36.7 12 n.m. n.m.12/01 13.9 7.4 278 56 87 34 88 89 33 104 413 905 36.5 n.m. n.m. n.m.average 15.0 7.3 188 54 90 34 85 77 33 97 415 885 36.8 15 n.m. n.m.c 0.5 0.1 63 2 3 1 6 6 4 8 17 25 0.1 7 n.m. n.m.VC % 4 1 34 3 3 4 7 8 11 8 4 3 2 49
Temperature in ‡C, redox potential (Eh) in mV, major ion concentrations and total dissolved solids contents in mg/l. 18-oxygenexpressed in x with respect to V-SMOW. Dissolved CO2 concentrations in cc/l STP, He contents in 10^5 cc/l STP. R/Ra is3He/4He isotope ratio of dissolved helium normalised to air reference ratio.
VOLGEO 3020 6-4-04
C. Federico et al. / Journal of Volcanology and Geothermal Research 133 (2004) 81^10490

sites on the northern and eastern £anks of Vesu-vius has been identi¢ed by Federico et al. (2002).In particular, high contents (up to 6.5U1034 cc/lSTP) of magma-derived helium (R/Ra = 2.7) aremeasured along a NE^SW-trending fault (TorreDel Greco^Ottaviano fault; Fig. 1), near Ottavia-no. The low CO2, 13C-depleted composition ofthese waters (N13CðCO2Þ =312x) is interpreted
as the ¢nal result of fractionation a¡ecting mag-ma-derived CO2 during its uprising and partialdissolution into the aquifers. In the residualwaters, this process leads the enrichment ofpoorly soluble gases (He), paralleled by a progres-sive decrease and isotopic negativisation of CO2,highly soluble in cold water. Federico et al. (2002)also proposed that south-£owing carbonate
Fig. 2. Temporal variations in temperature in (a) southern, and (b) northern sectors of Vesuvius.
VOLGEO 3020 6-4-04
C. Federico et al. / Journal of Volcanology and Geothermal Research 133 (2004) 81^104 91

groundwaters within the carbonate hydrostruc-ture (Celico et al., 1998) play a dominant role incontrolling such a fractionation mechanism, bytrapping at depth more soluble carbon dioxidewhile being slightly ine¡ective on poorly soluble
He. This process probably ceases on the southern£ank of Vesuvius, where deep carbonate waters,warmed and gas-charged near the central con-duits, have lost their initial ability to trap risingCO2.
Fig. 3. Temporal variations in selected parameters in some study sites. Solid vertical lines: timing of October 9^11, 1999 seismicphase. (a) Site 13. (b) Site 47. Below: R/Ra values on right vertical scale, helium concentrations on left. (c) Site 22. (d) Site 38.
VOLGEO 3020 6-4-04
C. Federico et al. / Journal of Volcanology and Geothermal Research 133 (2004) 81^10492

2.3. Methods
Fig. 1 shows the location of sampling sites ; theresults of analytical determinations are listed inTable 1. Samples were collected from May 1998to December 2001 from two springs and eleven
drilled wells commonly used for irrigation. Tem-perature, pH, Eh, and alkalinity were determinedupon sampling with conventional ¢eld instrumen-tation; laboratory determinations were carriedout at INGV, Palermo, following the proceduresdescribed by Federico et al. (2002). Main dis-
Fig. 3 (Continued).
VOLGEO 3020 6-4-04
C. Federico et al. / Journal of Volcanology and Geothermal Research 133 (2004) 81^104 93
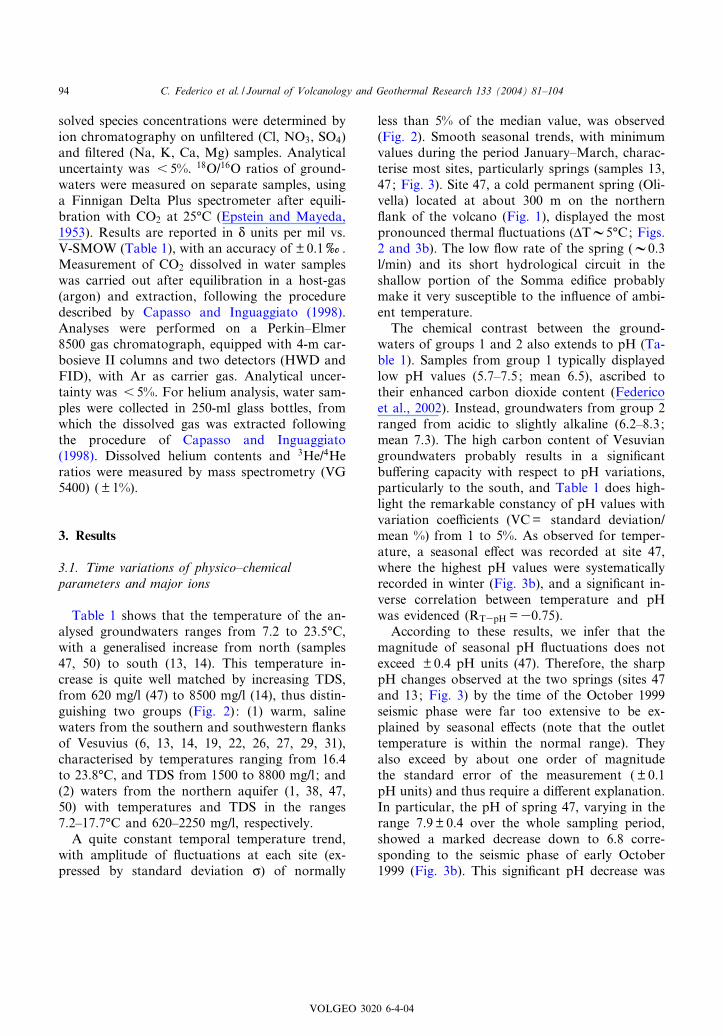
solved species concentrations were determined byion chromatography on un¢ltered (Cl, NO3, SO4)and ¢ltered (Na, K, Ca, Mg) samples. Analyticaluncertainty was 6 5%. 18O/16O ratios of ground-waters were measured on separate samples, usinga Finnigan Delta Plus spectrometer after equili-bration with CO2 at 25‡C (Epstein and Mayeda,1953). Results are reported in N units per mil vs.V-SMOW (Table 1), with an accuracy of R 0.1x.Measurement of CO2 dissolved in water sampleswas carried out after equilibration in a host-gas(argon) and extraction, following the proceduredescribed by Capasso and Inguaggiato (1998).Analyses were performed on a Perkin^Elmer8500 gas chromatograph, equipped with 4-m car-bosieve II columns and two detectors (HWD andFID), with Ar as carrier gas. Analytical uncer-tainty was 6 5%. For helium analysis, water sam-ples were collected in 250-ml glass bottles, fromwhich the dissolved gas was extracted followingthe procedure of Capasso and Inguaggiato(1998). Dissolved helium contents and 3He/4Heratios were measured by mass spectrometry (VG5400) ( R 1%).
3. Results
3.1. Time variations of physico^chemicalparameters and major ions
Table 1 shows that the temperature of the an-alysed groundwaters ranges from 7.2 to 23.5‡C,with a generalised increase from north (samples47, 50) to south (13, 14). This temperature in-crease is quite well matched by increasing TDS,from 620 mg/l (47) to 8500 mg/l (14), thus distin-guishing two groups (Fig. 2) : (1) warm, salinewaters from the southern and southwestern £anksof Vesuvius (6, 13, 14, 19, 22, 26, 27, 29, 31),characterised by temperatures ranging from 16.4to 23.8‡C, and TDS from 1500 to 8800 mg/l ; and(2) waters from the northern aquifer (1, 38, 47,50) with temperatures and TDS in the ranges7.2^17.7‡C and 620^2250 mg/l, respectively.
A quite constant temporal temperature trend,with amplitude of £uctuations at each site (ex-pressed by standard deviation c) of normally
less than 5% of the median value, was observed(Fig. 2). Smooth seasonal trends, with minimumvalues during the period January^March, charac-terise most sites, particularly springs (samples 13,47; Fig. 3). Site 47, a cold permanent spring (Oli-vella) located at about 300 m on the northern£ank of the volcano (Fig. 1), displayed the mostpronounced thermal £uctuations (vTV5‡C; Figs.2 and 3b). The low £ow rate of the spring (V0.3l/min) and its short hydrological circuit in theshallow portion of the Somma edi¢ce probablymake it very susceptible to the in£uence of ambi-ent temperature.
The chemical contrast between the ground-waters of groups 1 and 2 also extends to pH (Ta-ble 1). Samples from group 1 typically displayedlow pH values (5.7^7.5; mean 6.5), ascribed totheir enhanced carbon dioxide content (Federicoet al., 2002). Instead, groundwaters from group 2ranged from acidic to slightly alkaline (6.2^8.3;mean 7.3). The high carbon content of Vesuviangroundwaters probably results in a signi¢cantbu¡ering capacity with respect to pH variations,particularly to the south, and Table 1 does high-light the remarkable constancy of pH values withvariation coe⁄cients (VC= standard deviation/mean %) from 1 to 5%. As observed for temper-ature, a seasonal e¡ect was recorded at site 47,where the highest pH values were systematicallyrecorded in winter (Fig. 3b), and a signi¢cant in-verse correlation between temperature and pHwas evidenced (RT3pH =30.75).
According to these results, we infer that themagnitude of seasonal pH £uctuations does notexceed R 0.4 pH units (47). Therefore, the sharppH changes observed at the two springs (sites 47and 13; Fig. 3) by the time of the October 1999seismic phase were far too extensive to be ex-plained by seasonal e¡ects (note that the outlettemperature is within the normal range). Theyalso exceed by about one order of magnitudethe standard error of the measurement ( R 0.1pH units) and thus require a di¡erent explanation.In particular, the pH of spring 47, varying in therange 7.9 R 0.4 over the whole sampling period,showed a marked decrease down to 6.8 corre-sponding to the seismic phase of early October1999 (Fig. 3b). This signi¢cant pH decrease was
VOLGEO 3020 6-4-04
C. Federico et al. / Journal of Volcanology and Geothermal Research 133 (2004) 81^10494

correlated with a signi¢cant lowering of the waterredox potential, which dropped to 3150 mV inOctober 1999 (normal range: 63^240 mV; mean+141 mV). Notably, pre-seismic conditions werere-established in November 1999, and remainedsteady until December 2001. At the same time, asigni¢cant pH increase of 0.7 units was recordedduring the October 1999 survey at site 13 (Fig.3a), despite its generally constant and low values(pHV6.0). This pH increase was paralleled by adecrease in major ion concentrations (Fig. 3a),highlighting the fact that the Torre Annunziataaquifer underwent signi¢cant dilution during theOctober 1999 seismic phase (see Section 4.2).
The major ion composition of the Vesuvianaquifer did not show drastic variations duringthe study (Table 1). As regards cation species,the main observed feature was the slight variabil-ity in the relative proportions of calcium to alkali.This is demonstrated in the triangular diagram ofFig. 4a, which shows a trend from alkali-richcomposition towards Ca-rich composition at con-stant alkali/magnesium ratios at most sites. Thepresence of two di¡erent water types, one moretypically calcium-bicarbonate and the other alka-li-bicarbonate in composition and richer in chlo-ride and sulphate, mixing in variable proportions,had already been described by Federico et al.(2002). This feature is further supported by Fig.4b, demonstrating the existence of a chemicaltrend from bicarbonate to chloride^sulphate com-position. In particular, samples 22 and 38 are dis-placed towards the sulphate-rich corner, andprobably deserve a special explanation. Both siteshave in common exceptionally high nitrate con-centrations (site 22, NO3 = 34^118 mg/l ; site 38,NO3 = 140^277 mg/l) and relevant correlations be-tween nitrate and sulphate (Fig. 5), both featuresbeing commonly recognised as markers of £uidsrelated to man’s activities. In particular, sample22 has a SO4/NO3 ratio of V4, closely matchingthe characteristic S/N ratio of chemical fertilisers(N-rich calcium sulphates) widely used in the Ve-suvian area for extensive £ower cultivation. Sam-ple 38, by contrast, typically shows a NO3/SO4
ratio of about 7:1, which is distinctive of pollu-tion from urban and rural sewage, animal wasteand septic tanks (Panno et al., 2001; Pawar and
Shaikh, 1995; Steinich et al., 1998). Notably, shal-low water bodies are tapped at sites 22 and 38,which increase their susceptibility to pollutionfrom anthropogenic sources.
3.2. Dissolved gases
The carbon dioxide concentrations dissolved ingroundwaters from Somma^Vesuvius range from2 to 1200 cc/l STP (Table 1). These contents are inmost cases within R 10% of the theoretical equi-librium of CO2 computed from measured alkalin-ity at sampling T and pH.
The data of Table 1 indicate the increasing con-tribution of deep carbon dioxide to groundwaters,from north (range= 3^570 cc/l STP; mean= 95cc/l STP) to south (range = 40^1522 cc/l STP,mean= 448 cc/l STP). Also, signi¢cant time vari-ability in CO2 contents is revealed in the varioussites, as indicated by the listed standard deviationvalues (VC ranging from 20 to 40% at most sites).
The marked CO2 increase which occurred atsite 47 during the October 1999 seismic phase(from 6.6 cc/l STP in May 1999 to 53 cc/l STPon October 13 1999) clearly exceeds the magni-tude of variations normally recorded in the springduring the study period (Fig. 3b). The isotopecomposition of dissolved helium during the sameperiod (Fig. 3b), increasing from atmospheric orradiogenic values (during the seven months pre-ceding the earthquake, R/Ra = 0.5) to R/Ra = 2.5 ^a value very close to the local magmatic marker(2.7 Ra ; Graham et al., 1993) ^ clearly indicatesan input of magma-derived He during (or in re-sponse to) the seismic event. It is worth notingthat a helium anomaly was observed a fewmonths preceding the earthquake. A great in-crease in helium, enriched in radiogenic 4He (R/Ra = 0.5), was measured in March^May 1999,from values typical of air-saturated water(4.8U1035 cc/l STP) to 1.6U1033 cc/l STP. Afterthe seismic phase, typically atmospheric 3He/4Heratios were detected at this site until December2001.
3.3. N18O data
The measured N18O values of groundwaters
VOLGEO 3020 6-4-04
C. Federico et al. / Journal of Volcanology and Geothermal Research 133 (2004) 81^104 95

Fig. 4. (a) Ca^Mg^alkali triangular diagram. Temporal variability in each site is mainly ascribed to changes in Ca contents. (b)Cl^SO4^HCO3 triangular diagram. Extensive variations in anion contents at constant chloride/sulphate ratio are observed atmost sites. Samples as in Fig. 2. See text for discussion.
VOLGEO 3020 6-4-04
C. Federico et al. / Journal of Volcanology and Geothermal Research 133 (2004) 81^10496

range between 37.0x and 35.5x vs. V-SMOW,con¢rming data from previous studies (Caliro etal., 1998; Federico, 1999). The whole set of iso-tope data is plotted vs. total dissolved solidcontents in Fig. 6, showing the overlapping N
18Oisotope composition of groups 1 and 2 ground-waters.
In Fig. 6, samples from group 1 display a maintrend of increasing saline contents paralleled byconstant or slightly decreasing 18-oxygen compo-sitions. Of importance is the fact that the rangeof N
18O values, between 36.9x and 35.8x, ismore negative than the isotopic signature of pre-cipitations on the Tyrrhenian coast (35.5x), in-dicating the more continental (or higher-altitude)origin of precipitation feeding the south-£owinggroundwaters. This ¢nding supports the hypothe-sis that the high TDS of group 1 waters simplyre£ects longer £ow paths from the recharge area,resulting in more extensive water^rock interac-tions. Groundwaters from group 2 form a nar-row, vertically-oriented band on the left side ofthe diagram, which is mostly a result of the re-markable homogeneity of total salinity, paralleledby a wider range of N
18O values (from 35.6 to37.0x), the most negative values being consis-tent with the more inland location (or higher alti-tude) of the sampling sites (samples 47 and 50).The time constancy of N18O composition observedat each site, ranging from 0.3 to 0.5 N units, is afurther indication of the existence of a hugeslowly-moving water reservoir, where ground-waters may e⁄ciently mix and produce seasonalisotopic e¡ects.
Fig. 5. NO3 vs. SO4 concentrations in groundwaters. Straightline: SO4/NO3 ratio in fertilisers commonly used in Vesuviusarea (V4). Strong NO3 enrichment observed in sample 38 isattributed to pollution from urban and rural sewage, animalwaste and septic tanks.
Fig. 6. Scatter diagram plotting N18O isotope composition of groundwaters vs. total dissolved solid contents.
VOLGEO 3020 6-4-04
C. Federico et al. / Journal of Volcanology and Geothermal Research 133 (2004) 81^104 97

4. Discussion
In the previous sections, we emphasised thatsome important chemical changes recently tookplace in the aquifer. Accordingly, the followingdiscussion attempts to assess the possible in£u-ence of anthropogenic and seasonal processesand to reveal the relationships between the timingof energy release on the volcano (testi¢ed by seis-micity) and water chemistry.
4.1. Time variations induced by seasonal andanthropogenic e¡ects
Two distinct water groups can be distinguished,based on water chemistry. Groundwaters fromgroup 1, issuing on the southern and southwest-ern £anks of Vesuvius, are characterised by highertemperature, carbon dioxide contents and totaldissolved solids. The remarkable time constancyof chemistry, T, pH and oxygen isotope composi-tion is the main argument for the quite consider-able isolation of these groundwaters from the sur-face along the hydrological circuit. This ¢ndingpoints to the existence of a deep reservoir, wheregroundwaters extensively interact with the hostrocks and may e⁄ciently mix and homogenise.The long hydrological circuits of Vesuviangroundwaters in the aquifer, indicated by the oxy-gen isotope values, is consistent with their deple-tion in tritium (0^7 TU) with respect to the typ-ical contents of present meteoric recharge in thearea (15 TU) (Federico et al., 2002). Based on thegeneral hydrogeological features of the Campa-nian Plain (Celico et al., 1980, 1998), the isotopecomposition of these saline water samples, whichare among the most 18O-depleted and appear lessa¡ected by time variations in most analysed pa-rameters, may partly arise from circulation in thedeep carbonate basement, the recharge area ofwhich lies in the Apennines.
Conversely, groundwaters from group 2 are di-lute and cooler, probably the result of (1) weakinteraction with deep-rising volcanic volatiles ; (2)a shallower hydrological circuit ; or (3) both. Thepresence in the northern aquifer(s) of ‘young’ me-teoric groundwaters, rapidly £owing inside thefractured volcanics of the old Somma volcano,
is consistent with the high tritium contents (s 7TU; Federico et al., 2002), which are very similarto those of present-day precipitation (IAEA,1994). The shallow hydrological circuit of theaquifer feeding the Olivella spring is also sup-ported by its sensitivity to seasonal e¡ects, as re-vealed by the synchronous variations in temper-ature, pH and major ion contents, ascribed to thevariable meteoric input over the hydrological year(Fig. 3a). The inverse correlation between pH andtemperature (Fig. 3b) points to winter dilution ofthe aquifer by shallow meteoric waters. Duringthe cold season the normal CO2-induced acidityof groundwaters may be partly masked by theinput of meteoric waters, the latter rapidly evolv-ing upon in¢ltration to neutral pH throughwater^rock interactions. It is worth noting thatthe wide seasonal £uctuations in Olivella springalso depend on the very low £ow rate (0.3 l/min), making the site sensitive to external condi-tioning.
Special mention should be made of geochemicalvariations which may be induced by anthropogen-ic activities. As Fig. 5 shows, a few samples (22,38) contain signi¢cant concentrations of nitrateand sulphate, an association indicating the in-volvement of £uids related to man’s activities.Chemical fertilisers used for £ower cultivation inthe Vesuvian area are mostly N-rich sulphates, theS/N concentration ratio of which (V4) matchesthe ratios measured at site 22. The wide and syn-chronous variations in sulphate and nitrate con-tents (Fig. 3c) convincingly indicate that leachingof fertilisers used on cultivated land may producesigni¢cant perturbations in the water^soil envi-ronment at Vesuvius. In turn, the great enrich-ment in NO3 systematically measured at site 38indicates pollution from urban and rural sewage,animal waste and septic tanks (Panno et al., 2001;Pawar and Shaikh, 1995; Steinich et al., 1998). Inthis light, the slight time-decreasing trend ob-served for all parameters at site 38 (Fig. 3d) sug-gests tapping of progressively deeper and less pol-luted water levels. Lastly, it is noteworthy thatthis N-rich composition is found in two wells(22 and 38) on the western £anks of Vesuvius,where the land is more extensively exploited andurban settlements are more widespread; also, the
VOLGEO 3020 6-4-04
C. Federico et al. / Journal of Volcanology and Geothermal Research 133 (2004) 81^10498

shallow depth of the watertable makes the aquifermore susceptible to e¡ects induced by man.
As a main conclusion, it should be stated that,when developing geochemical volcanic monitoringnetworks in an urbanised area like Vesuvius, oneshould be aware of the probability of anthropo-genic perturbations in groundwater chemistry.
One last cause of variability in water chemistrymay be mixing between water bodies of di¡erentcompositions, a process especially important atVesuvius where small aquifers overlap. The signif-icance of mixing processes is highlighted in Fig. 4,in which a systematic shift from calcium bicar-bonate to alkali chloride^sulphate compositionat several sites is shown. Based on recent hydro-geochemical studies in the area (Caliro et al.,1998; Celico et al., 1998), variations in calciumcontent at a constant alkali/magnesium ratio(Fig. 4a) may be interpreted as a variable contri-bution from carbonate groundwaters, mostly re-producing the composition of shallow ground-waters circulating in the Campanian Plain. Thevariable mixing proportions between these twophysically and chemically distinct water typesmay be controlled by time £uctuations in the hy-drological mass budget or, to an even greater ex-tent, by local variations in permeability due torock fracturing prior to or during seismic energyrelease (see below).
4.2. Chemical variations associated with theOctober 1999 seismic phase
Signi¢cant variations in the chemistry of theOlivella spring (sample 47; Fig. 3b) were mea-sured during the October 13, 1999 survey:
(1) a great decrease in water pH values (from 8to 6.8);
(2) a corresponding fall in the redox potential(from +140 mV to 3150 mV);
(3) an increase in dissolved CO2 contents, from7 cc/l STP to 53 cc/l STP;
(4) a rise in 3He/4He ratios, from a radiogenicsignature of 0.5 R/Ra in May 1999 to R/Ra of 2.5in October 1999, a value close to that hypothe-sised for the magmatic end-member (Graham etal., 1993).
These observations support the hypothesis of
the contribution of magma-derived carbon diox-ide and helium to the aquifer feeding the spring.The presence in the ascending gas phase of reduc-ing species such as H2S, the concentration ofwhich is in the 100^800 Wmol/mol range in craterfumaroles (Chiodini et al., 2001), may in turn beresponsible for the fall in the redox potential.Considering that pre-seismic conditions were re-established before the November 1999 survey andremained steady from then onwards, the above-described chemical changes may be related torock fracturing and increased permeability associ-ated with the seismic phase. This in turn mayhave allowed the ascent of deep-rising volatilesthrough the NE^SW fault cutting the northeast-ern £ank of Somma volcano, close to the emer-gence of the spring (Fig. 1). Of importance tooare the variations in helium contents and R/Ra
ratios, suggesting the increasing contribution ofcrustal helium in the period March^May 1999,indicative of pressure build-up and increasingrock failure starting more than six months beforethe earthquake.
No appreciable changes in pH and dissolvedgas contents were recorded during the seismicphase of October 1999 in saline groundwater sam-ples from the southern and southwestern sectorsof the volcanic complex. Both pH values and CO2
contents remained in their normal range at allsites except the Torre Annunziata thermal spring(site 13), where a huge pH increase, paralleled bya decrease in major ion concentrations, was mea-sured (Fig. 3a). If we accept that this event ofuprising magmatic volatiles was not a local phe-nomenon, we must clarify why a generalised in-crease in dissolved gases ^ and a correspondingdecrease in pH ^ was not observed in the wholeVesuvian aquifer. As a matter of fact, the insen-sitivity of group 1 groundwaters to the input ofmagma-derived volatiles is neither surprising norcontradictory with observations carried out at theOlivella spring. South-£owing groundwaters, withmuch higher TDC contents, are close to equilib-rium with calcite, and normally display pH valuesclose to the H2CO3ðaÞ^HCO3
3 ðaÞ equivalencepoint. All these features point to the substantialbu¡ering capacity of these groundwaters with re-spect to external inputs of CO2. From an isotopic
VOLGEO 3020 6-4-04
C. Federico et al. / Journal of Volcanology and Geothermal Research 133 (2004) 81^104 99

point of view, the magmatic signature of both Heand CO2, characterising these groundwater sam-ples during the present quiescent state of the vol-cano (Federico et al., 2002), makes both the 3He/4He ratio and the N
13C values poor indicators ofthe possible enhancement of the deep magmaticcomponent. Lastly, we should be aware that thevery low £ow rate of the Olivella spring (0.3l/min), being up to ¢ve orders of magnitude lessthan the average out£ow of the Vesuvian aquifer(1.6 m3/s; Celico et al., 1998), represents the high-er sensitivity of this site to mass contributionsfrom deep reservoirs.
In order to explain the above arguments in amore quantitative fashion, a numerical simulationwas carried out with the PHREEQC code (Park-hurst, 1995). In the model, increasing amountsof carbon dioxide and H2S (in the proportionsobserved at crater fumaroles) were added to threeinitial groundwater samples (6, 14, 47), chosen asrepresentative of group 1 and group 2, respec-tively, covering the range of pH, TDC and TDSencountered in the Vesuvian aquifer. In the nu-merical simulation, the gas phase containing CO2
and H2S (0.0044 moles of H2S per mole of CO2)was progressively added to 1 l of solution in stepsof 0.00001 moles, and the resulting hydrogen ac-tivity and redox potential were computed at eachstep. Results are summarised in Fig. 7, where thex-axis represents the moles of supplemented car-bon dioxide and the y-axis the correspondingequilibrium pH. A similar simulation, carriedout adding a pure CO2 gas phase (data notshown), resulted in model trends for pH whichwere virtually indistinguishable from those givenin the ¢gure, which suggests that H2S is far lesse¡ective in controlling pH than CO2. The diagramhighlights the fact that the dilute Olivella spring,due to its high pH and low TDC, is sensitiveeven to very slight carbon dioxide contributions(1 millimoles per litre of solution). About twomillimoles of carbon dioxide are required to shiftthe pH of the spring from 8 to 6.8. This ¢gureclosely matches the increase in carbon dioxidecontent surveys and the corresponding pH de-crease recorded during the October 1999 surveys(Fig. 3a). It should also pointed out that, in thesimulation, the pe of the solution decreased from
2.5 to 32.9 (corresponding to EhV3170 mV) asthe H2S-bearing gas mixture was gradually dis-solved, the latter value being very similar to thatmeasured at the time of the October 1999 earth-quake. The sulphate content of the spring, con-versely, was not appreciably a¡ected by the H2Sinput.
Fig. 7 also shows that signi¢cant amounts ofcarbon dioxide (about 100 millimoles per litre ofsolution) need to be added to carbon-rich samples6 and 14 in order to a¡ect their pH appreciably.Clearly, this quantity exceeds the amount of car-bon dioxide released during the October 1999 seis-mic phase, explaining the lack of any appreciableanomalous pH signal.
Although groundwaters from the southern sec-tor of Vesuvius failed to track the minor transi-ents of gas release related to the seismic event,they did undergo slight £uctuations in the ana-lysed period. It was pointed out already that adilution trend is recognisable at site 13, corre-sponding to the 1999 seismic phase. A closerlook at the data shows that this temporal patternis a general feature common to most sites. This is
Fig. 7. Results of numerical simulation carried out usingPHREEQC code (Parkhurst, 1995). Horizontal axis: increas-ing CO2 amounts added stepwise to 1 l of three Vesuviangroundwaters (6, 14, 47): resulting changes in solution pHare plotted on vertical axis. At site 47, addition of only0.001 moles of CO2 per litre of solution drives pH fromstarting value of 8 (May 1999) to 6.8 (October 1999). Else-where, a pH change is observed only for enhanced amountof carbon dioxide (0.1 moles) introduced in solution.
VOLGEO 3020 6-4-04
C. Federico et al. / Journal of Volcanology and Geothermal Research 133 (2004) 81^104100

fairly well revealed by the time series of ground-water alkalinity, this parameter being a good in-dicator of total dissolved solid contents, due tothe overwhelming abundance of bicarbonateover other solutes. The time plots (Fig. 8) revealthe existence of synchronous variations in alkalin-ity at all sites, starting from the anomalous lowlevel recorded in the period March^May 1999.
After the seismic phase of October 1999, an in-creasing trend started, which ranged from gradual(i.e. Torre Annunziata, samples 13, 19) to steep(Torre del Greco and Ottaviano, 6, 14, 27, 29, 31,50). In all instances, pre-seismic conditions werere-established after the earthquake and remainedsteady until the present. The timing and general-ised occurrence of these time modulations in
Fig. 8. Time-plots of groundwater alkalinity, revealing existence of synchronous variations at all sites during study period. Grey¢eld: pre-seismic period, characterised by general decrease in salinity (here, exempli¢ed by alkalinity). After seismic phase of Oc-tober 1999, increasing trend ranged from gradual (e.g. Torre Annunziata, samples 13, 19) to steep (Torre del Greco and Ottavia-no, 6, 14, 27, 29, 31, 50).
VOLGEO 3020 6-4-04
C. Federico et al. / Journal of Volcanology and Geothermal Research 133 (2004) 81^104 101

groundwater chemistry suggest cause^e¡ect rela-tions with the October 1999 earthquake. In fact, itis widely recognised (e.g. Toutain et al., 1997, andreferences therein) that stress ¢eld changes preced-ing a seismic event often induce long-range per-turbations in hydrological circuits, thus causingsubstantial changes in water chemistry. At Vesu-vius, there are probably several overlapping waterbodies, with contrasting chemical compositions.Thus, in order to explain the minimal ground-water TDS measured in the pre-seismic period(March^May 1999), we suggest that water ex-changes between shallow dilute waters and under-lying saline waters were reduced at that time,probably due to a local decrease in permeability.Rock fracturing and energy release during theseismic phase allowed the pre-seismic circulationpattern of groundwaters to be re-established. Thishypothesis is supported by the increasing trend ofTDS recorded at most sites after the main event,probably as a result of enhanced mass contribu-tions from the deeper and saline water bodies.
5. Conclusions
The quite steady oxygen isotope composition ofgroundwaters, like their minor variations in waterpH, temperature and carbon dioxide contents, in-dicate that the main aquifer is not severely af-fected by seasonal £uctuations, with the exceptionof shallower water bodies, in which greater £uc-tuations of measured parameters were recordedduring the study period.
The constancy observed in groundwaters col-lected in the southern and western sectors of theaquifer indicates long £ow paths and residencetimes in this area of the volcano, consistent withrecently acquired data on tritium contents (Fed-erico et al., 2002). Agricultural activities, such asthe application of nitrogen- and sulfur-rich fertil-isers, may locally produce chemical interferenceson the composition of the aquifer, particularly onthe Tyrrhenian coast where the piezometric sur-face is shallower and human settlements morewidespread. Also, the complex geometry of theVesuvian aquifer, composed of several overlap-ping water layers, together with its mixing rela-
tions with the bicarbonate groundwaters £owingin the surrounding plain, may also introduce var-iability. In the light of geochemical monitoring tobe carried out at Vesuvius over the next few years,careful assessment of non-volcanic processes af-fecting water chemistry is crucial, to identify themagnitude and features of geochemical variationswhich are to be related to changing volcano dy-namics.
In this study, special emphasis is given to thegeochemical variations recorded at the Olivellaspring during the October 1999 earthquake. Therecording of these geochemical anomalies, as-cribed to enhanced in£ux of magma-derived vol-atiles in the aquifer due to rock fracturing andlocal increase in permeability, highlight the poten-tial of hydrogeochemical studies in the monitoringof the volcano. The peculiar features of the Oli-vella spring, its dilute and gas-poor composition,low £ow rate, and proximity to active tectonicfaults, make it sensitive even to slight variationsin the input of deep-rising £uids, and it representsa unique site for continuous geochemical monitor-ing. By contrast, the groundwaters £owing on thesouthern £ank of the volcano ^ where the ascentof magma-derived volatiles is massive and persis-tent even during non-seismic phases and the waterout£ow is more extensive ^ although not suitablefor detecting the minor transients of gas releaserelated to seismicity, may turn out to be impor-tant in identifying major variations in the state ofactivity of the volcano. The synchronous varia-tions of TDS and alkalinity, recorded during theseismic phase, are particularly indicative in thisrespect.
Acknowledgements
The authors wish to thank S. Bellomo, S. Fran-cofonte, A. Rizzo and G. Volpicelli for help in the¢eld and analytical work. This study was sup-ported by INGV.
References
Andronico, D., Calderoni, G., Cioni, R., Sbrana, A., Sulpizio,
VOLGEO 3020 6-4-04
C. Federico et al. / Journal of Volcanology and Geothermal Research 133 (2004) 81^104102

R., Santacroce, R., 1995. Geological map of Somma^Vesu-vius volcano. Per. Mineral. 64, 77^78.
Aprile, F., Ortolani, F., 1979. Sulla struttura profonda dellaPiana Campana. Boll. Soc. Nat. Napoli 88, 243^261.
Arno' , V., Principe, C., Rosi, M., Santacroce, R., Sbrana, A.,Sheridan, L.F., 1987. Somma^Vesuvius eruptive history. In:Santacroce, R. (Ed.), Somma Vesuvius. CNR Quad. Ric.Sci. 114, pp. 53^103.
Avino, R., Celico, P., Esposito, L., Ghiara, M.R., La Gioia,P., Pece, R., Piscopo, V., Stanzione, D., 1994. Caratteris-tiche idrogeologiche e idrogeochimiche del sistema Vesuvia-no. Rapporto interno del CNR^GNV.
Ayuso, R.A., De Vivo, B., Rolandi, G., Seal, R.R., II, Paone,A., 1998. Geochemical and isotopic (Nd^Pb^Sr^O) varia-tions bearing on the genesis of volcanic rocks from Vesu-vius, Italy. J. Volcanol. Geotherm. Res. 82, 53^78.
Berrino, G., Coppa, U., De Natale, G., Pingue, F., 1993. Re-cent geophysical investigation at Somma^Vesuvius volcaniccomplex. J. Volcanol. Geotherm. Res. 58, 239^262.
Bianco, F., Castellano, M., Milano, G., Ventura, G., Vilardo,G., 1998. The Somma^Vesuvius stress ¢eld induced by re-gional tectonics: Evidences from seismological and meso-structural data. J. Volcanol. Geotherm. Res. 82, 199^218.
Bonfanti, P., D’Alessandro, W., Dongarra', G., Parello, F.,Valenza, M., 1996. Medium-term anomalies in groundwatertemperature before the 1991^1993 Mt. Etna eruption.J. Volcanol. Geotherm. Res. 73, 303^306.
Caliro, S., Panichi, C., Stanzione, D., 1998. Baseline study ofthe isotopic and chemical composition of waters associatedwith the Somma^Vesuvius volcanic system. Acta Vulcanol.10, 19^25.
Capasso, G., Inguaggiato, S., 1998. A simple method for thedetermination of dissolved gases in natural waters. An ap-plication to thermal waters from Vulcano Island. Appl.Geochem. 13, 631^642.
Capasso, G., Favara, R., Francofonte, S., Inguaggiato, S.,1999. Chemical and isotopic variations in fumarolic dis-charge and thermal waters at Vulcano Island (Aeolian Is-lands, Italy) during 1996: Evidence of resumed volcanic ac-tivity. J. Volcanol. Geotherm. Res. 88, 167^175.
Celico, P., 1983. Idrogeologia dei massicci carbonatici, dellepiane quaternarie e delle aree vulcaniche dell’Italia centro-meridionale (Marche e Lazio meridionali, Abruzzo, Molise eCampania). Quad. Cassa Mezz. Roma 4, 190^194.
Celico, P., De Gennaro, M., Ferreri, M., Ghiara, M.R., Rud-do, D., Stanzione, D., Zenone, F., 1980. Il margine orientaledella Piana Campana: Indagini idrogeologiche e geochi-miche. Per. Mineral. 49, 241^270.
Celico, P., Stanzione, D., Esposito, L., Ghiara, M.R., Piscopo,V., Caliro, S., La Gioia P., 1998. Caratterizzazione idrogeo-logica e idrogeochimica dell’area Vesuviana. Boll. Soc. Geol.Ital. 117, 3^20.
Chiodini, G., Marini, L., Russo, M., 2001. Geochemical evi-dence for the existence of high-temperature hydrothermalbrines at Vesuvio volcano, Italy. Geochim. Cosmochim.Acta 65, 2129^2147.
Cubellis, E., Ferri, M., Luongo, G., Obrizzo, F., 2001. The
roots of Mt. Vesuvius deduced from gravity anomalies. Min-eral. Petrol. 73, 23^38.
Cubellis, E., Marturano, A., 2002. Mt. Vesuvius A macroseis-mic study of the earthquake of October 9 1999. J. Volcanol.Geotherm. Res. 118, 339^351.
Del Pezzo, E., Bianco, F., Castellano, M., Giudicepietro, F.,La Rocca, M., Martini, M., Milano, G., Petrosino, S., Sac-corotti, G., Vilardo., G., 2001. Mt. Vesuvius (Italy) earth-quake of 9 October, 1999. Proc. XVI EGS General Assem-bly, Nice, 25^30 March 2001.
De Vivo, B., Rolandi G., 2001 (Eds.), Mt. Somma^Vesuviusand volcanism of the Campanian Plain. Mineral. Petrol. 73,233 pp.
Epstein, S., Mayeda, T., 1953. Variation of 18O content ofwaters from natural sources. Geochim. Cosmochim. Acta4, 213^224.
Federico, C., 1999. Interaction between Magmatic Gases andthe Hydrological System at Vesuvius (Southern Italy) duringCurrent Dormancy: Evidence from Water and Gas Geo-chemistry. Ph.D. Thesis, University of Palermo.
Federico, C., Aiuppa, A., Allard, P., Bellomo, S., Jean-Bap-tiste, P., Parello, F., Valenza, M., 2002. Magma-derived gasin£ux and water-rock interactions in the volcanic aquifer ofMt. Vesuvius, Italy. Geochim. Cosmochim. Acta 66, 963^981.
Finetti, I., Morelli, C., 1974. Esplorazione di sismica a ri£es-sione dei Gol¢ di Napoli e Pozzuoli. Boll. Geof. Teor. Appl.16, 175^222.
Giggenbach, W.F., 1988. Geothermal solute equilibria. Deri-vation of Na^K^Mg^Ca geoindicators. Geochim. Cosmo-chim. Acta 52, 2749^2765.
Graham, D.W., Allard, P., Killburn, C.R.J., Spera, F.J., Lup-ton, J.E., 1993. Helium isotopes in some historical lavasfrom Mount Vesuvius. J. Volcanol. Geotherm. Res. 58,359^366.
IAEA, 1994. Environmental Isotope Data No. 10 World Sur-vey of Isotope Concentration in Precipitation (1988^1991).Technical Reports Series 371, 214 pp.
Ippolito, F., Ortolani, F., Russo, M., 1973. Struttura margin-ale tirrenica dell’Appennino Campano: Reinterpretazionedei dati di antiche ricerche di idrocarburi. Mem. Soc.Geol. Ital. 12, 27^250.
King, C.Y., Evans, W.C., Presser, T., Husk, R., 1981. Anom-alous chemical changes in well waters and possible relationto earthquakes. Geophys. Res. Lett. 8, 425^428.
Kyser, T.K., 1986. Stable isotope variations in the mantle. In:Valley, J.W., Taylor, Jr., H.P., O’Neil, J.R. (Eds.), StableIsotopes in High Temperature Geological Processes. Rev.Mineral. 16, pp. 141^164.
Panno, S.V., Hackley, K.C., Hwang, H.H., Kelly, W.R., 2001.Determination of the sources of nitrate contamination inkarst springs using isotopic and chemical indicators.Chem. Geol. 179, 113^128.
Parkhurst, D.L., 1995. PHREEQC ^ a computer program forspeciation, reaction path, advective transport, and inversegeochemical calculations. USGS Water-Resources Investiga-tions Report 95, 4227 pp.
VOLGEO 3020 6-4-04
C. Federico et al. / Journal of Volcanology and Geothermal Research 133 (2004) 81^104 103

Pawar, N.J., Shaikh, I.J., 1995. Nitrate pollution of groundwaters from shallow basaltic aquifers, Deccan Trap Hydro-logic Province, India. Environ Geo. 25, 197^204.
Principe, C., Brocchini, D., Perillo, M., 1999. The ‘Cognoli diTrocchia’ volcano and Monte Somma growth. Plinius 22,316^317.
Rolandi, G., Petrosino, P., McGeehin, J., 1998. The interpli-nian activity of Somma^Vesuvius in the last 3500 years.J. Volcanol. Geotherm. Res. 82, 19^52.
Rosi, M., Santacroce, R., Sbrana, A., 1987. Geological map ofSomma^Vesuvius volcanic complex. CNR Progetto Finaliz-zato Geodinamica.
Santacroce, R. (Ed.), 1987. Somma^Vesuvius complex. CNRQuad. Ric. Sci. 114, 251 pp.
Steinich, B., Escolero, O., Marin, L.E., 1998. Salt-water intru-sion and nitrate contamination in the Valley of Hermosilloand El Sahuaral coastal aquifers, Sonora, Mexico. Hydro-geol. J. 6, 518^526.
Tedesco, D., 1997. Systematic variations in the 3He/4He ratioand carbon of fumarolic £uids from active volcanic areas inItaly: Evidence for radiogenic 4He and crustal carbon addi-tion by the subducting African plate? Earth Planet. Sci.Lett. 151, 255^269.
Tedesco, D., Allard, P., Baubron, J.C., Maiorani, A., Miele,G., 1991. Geochemistry of present-day gas emissions fromVesuvius: Volcanological implications. Proc. Int. Conf. Ac-tive Volcanoes and Risk Mitigation, Naples, August 25^31,1991.
Thomas, D., 1988. Geochemical precursors to seismic activity.Pure Appl. Geophys. 126, 241^265.
Toutain, J.P., Munoz, M., Poitrasson, F., Lienard, A.C., 1997.Springwater chloride ion anomaly prior to a ML=5.2 Pyr-enean earthquake. Earth Planet. Sci. Lett. 149, 113^119.
Tsunogai, U., Wakita, H., 1995. Precursory chemical changesin groundwater: Kobe earthquake, Japan. Science 269, 61^63.
VOLGEO 3020 6-4-04
C. Federico et al. / Journal of Volcanology and Geothermal Research 133 (2004) 81^104104