Assessment of oil spill vulnerability of Southwest Pulau Pinang shoreline
This article appeared in a journal published by Elsevier. The attachedcopy is furnished to the author for internal non-commercial researchand education use, including for instruction at the authors institution
and sharing with colleagues.
Other uses, including reproduction and distribution, or selling orlicensing copies, or posting to personal, institutional or third party
websites are prohibited.
In most cases authors are permitted to post their version of thearticle (e.g. in Word or Tex form) to their personal website orinstitutional repository. Authors requiring further information
regarding Elsevier’s archiving and manuscript policies areencouraged to visit:
http://www.elsevier.com/authorsrights
Author's personal copy
The Oil Spill Hazard Index (OSHI) elaboration. An oil spill hazard assessmentconcerning Italian hydrocarbons maritime traffic
Davide Astiaso Garcia a,*, Daniele Bruschi a, Fabrizio Cumo b, Franco Gugliermetti a
aDepartment of Astronautical, Electrical and Energy Engineering, Faculty of Engineering, Sapienza University, Via Eudossiana 18, 00184 Rome, ItalybDepartment of Design, Architectural Technology, Territory and Environment, Faculty of Architecture, Sapienza University, Via Flaminia 72, 00196 Rome, Italy
a r t i c l e i n f o
Article history:Available online 6 April 2013
a b s t r a c t
The main purpose of this paper was to develop an Oil Spill Hazard Index (OSHI) concerning hydrocarbonmaritime traffic. The subsequent aim is to evaluate this hazard index along the whole Italian coastlineand waters.
The OSHI processing derives from the aggregation of two hazard subindices: R1 (concerning hydro-carbons handled at ports) and R2 (related to hydrocarbons in transit). In order to assess the OSHI alongthe Italian coastline (8660 km), it has been divided into 335 coastal stretches and for each of them anOSHI value was calculated, considering the amount of crude oil and petroleum products moved in theItalian ports or just passed through continental shelf waters, as well as the major Mediterranean oilroutes affecting the Italian seas.
All the results (national oil traffic database and hazard indices) were recorded in a Geographic In-formation System (GIS) database that contains a comparative spatial analysis of these records in order toachieve a critical scale of the oil spill hazard along the Italian waters and coasts.
The obtained results include computerized cartography and operational maps representing usefultools for decision-makers as well as practical guidelines for the elaboration of a national oil spill con-tingency plan, and the application of the principles of Integrated Coastal Zone Management (ICZM) bypublic administrations and local stakeholders.
� 2013 Elsevier Ltd. All rights reserved.
1. Introduction
This paper briefly describes some results of a multi-yearresearch project, aimed to elaborate a national oil spill contin-gency plan, carried out by the Department of Astronautical, Elec-trical and Energy Engineering of the Sapienza University andsupported by the General Directorate for Nature and Sea Protectionof the Italian Ministry for the Environment, Land and Sea, which isthe national competent authority for dealing with marine pollutioninvolving hydrocarbons.
One of the main goals of this research project was to develop anoil spill risk index able to compare the probability of an unforeseenspill of hydrocarbons along the whole Italian shores and waters.
Generally, the concept of risk includes different aspects, likehazard, exposure and vulnerability (Crichton, 1999; Douglas, 2007).For an exhaustive overview of the risk terminology currently used
in scientific literature or in documents published by internationalorganizations see Renn (2005).
Briefly, any risk assessment is conventionally expressed by theequation: Risk ¼ Hazard * Vulnerability (e.g. UNDHA, 1992; Blong,1996; Granger et al., 1999; Sayers et al., 2002; Wisner et al., 2004;UNDP, 2004; Smith, 2004; Kumpulainen, 2006).
According to Kumpulainen (2006), vulnerability is complemen-tary to hazards in risk research. In fact, it refers to the susceptibilityof people, communities or regions to natural or technological haz-ards. Generally, vulnerability can be defined as the degree to whichhuman and environmental systems are likely to experience harmdue to a perturbation or stress (Turner et al., 2003). According toMitchell (1989), vulnerability is broadly defined as “potential forloss”. Cutter (1993) considers vulnerability as an interactive anddynamic process that links environmental risks and society. For ageneral review of the vulnerability conceptualization, see Füssel(2007). With regard to environmental vulnerability, it can bedefined as the susceptibility of the natural environment to negativeimpacts from hazardous events (de Andrade et al., 2010). Williamsand Kapustka (2000) consider environmental vulnerability as anestimate of the inability of an ecosystem to tolerate stressors over
* Corresponding author. Tel.: þ39 3492303498; fax: þ39 06 49918646.E-mail addresses: [email protected] (D. Astiaso Garcia),
[email protected] (D. Bruschi), [email protected] (F. Cumo),[email protected] (F. Gugliermetti).
Contents lists available at SciVerse ScienceDirect
Ocean & Coastal Management
journal homepage: www.elsevier .com/locate/ocecoaman
0964-5691/$ e see front matter � 2013 Elsevier Ltd. All rights reserved.http://dx.doi.org/10.1016/j.ocecoaman.2013.03.016
Ocean & Coastal Management 80 (2013) 1e11

Author's personal copy
time. For an overview on environmental vulnerability see Villa andMcLeod (2002). In reference to coastal environments vulnerabilityto oil spills, the literature is extensive. The first studies have beendeveloped since 1978. In particular, Gundlach and Hayes (1978),proposed the “Vulnerability Index” in which the coastal environ-ments were classified on a scale of 1e10, based upon their potentialvulnerability to oil spill damage. LaBelle et al. (1982), in order todefine the sensitivity of the Gulf of Mexico shoreline by estimatingits vulnerability to spilled oil, an oil spill trajectory model couplingwith a land segment vulnerability characterization to predict therisks to the shoreline designed. Weslawski et al. (1997) have pro-posed a system for estimating a coast vulnerability to oil spills basedon geomorphologicalmaps and environmental data collected. Morerecently, the National Oceanic and Atmospheric Administration(Petersen et al., 2002) developed the Environmental Sensitivity In-dex (ESI) approach, in which not only physical features, but alsobiological information and human use of the shoreline wereconsidered. In this framework, several studies have been conducted.Fattal et al. (2007) proposed an index of global vulnerability whoidentifies the critical variables required to assess coastal vulnera-bility to oil spills. Ng et al. (2008)_ carried out an analysis of theshoreline resources vulnerability in various geomorphic and land-use types. Futhermore, taking into account the environmental andsocio-economic value of the shorelines andmodifying the NOAA ESIapproach, an oil spill vulnerability index (VI) was developed.Castanedo et al. (2009) applied an oil spill vulnerability assessmentintegrating physical, biological and socio-economical aspects on theCantabrian coast.
Starting from these theoretical premises, the first results ob-tained from the above mentioned research project concerned theelaboration of ad hoc equations and matrices for the assessment ofthe vulnerability of coastal and marine habitats to oil contamina-tion (Gugliermetti et al., 2007a; Cumo et al., 2008), as well as theirapplication on some Italian case studies (Gugliermetti et al., 2007b;Cumo et al., 2009; de Santoli et al., 2011) in order to highlight thoseareas characterized by high environmental, cultural and/or eco-nomic vulnerability.
In order to develop an oil spill risk index based on the interac-tion between hazard and vulnerability analysis, the second step ofthe research project (showed in this paper) aimed to elaborate anequation for the assessment of the hazard linked to a potential oilspills along the Italian coasts and waters.
Recently, several authors developed different modeling tools toestimate the hazard and/or the risk related to oil spills. Iakovou(2001) presents an interactive multiobjective model allowing forrisk analysis due tomaritime transportation of petroleum products.Ronza et al. (2006) propose a quantitative risk analysis of oil spill inharbor waters. Eide et al. (2007), considering four selected accidenttypes (powered grounding, fire and explosion, drift grounding andcollision), develop a risk model based on AIS technology, whichestimates the risk levels of individual crude oil tankers. Through amathematical risk model, Ulusçu et al. (2009) present a risk anal-ysis of the vessel traffic in the Strait of Istanbul, quantifying risksbased on historical data, expert judgment elicitation, and a simu-lation model of the transit vessel traffic.
Udoh (2010) provides an oil spill hazard assessment using a GIScost distance spatial analysismodeling. vanDorp andMerrick (2011)develop an of oil spill risk analysis using maritime transportationsystem (MTS) simulation. Olita et al. (2012) compute an hazard in-dex, given by the ratio between the oil concentration reaching eachpredefined coastal cell and the maximum stranded concentration.
In this paper we focused our attention on the estimation of theoil spill hazard, presenting an equation for the assessment of OSHI(Oil Spill Hazard Index) and the resulting hazard index and mapsalong the whole Italian coastline and seas.
As recently demonstrated by the environmental disaster of theDeepwaterHorizon oil rig, oil spills pose a serious threat to the entireglobe. Furthermore, despite the international crisis, in the last yearsan increase in production, trade and traffic of crude oil was recorded.The global transportation of crude oilmoves about 1500million tonsa year. The European Union and the United States together receivemore than 50%. Inparticular Europeanwaters are an obligatory routefor the transportation of crude oil to other countries. In this sense,Mediterranean Sea plays a central role. In fact, it is one of theworld’sbusiest areas for maritime activity: indeed, in the last years, overallmaritime transportation within this sea has been gradually rising.Moreover, while being less than 1% of the world surface water, theMediterranean Sea records about one third of the total oil traffic. It isestimated that around 360 million tons of oil and refined productscross the Mediterranean every year (Kluser et al., 2006).
Naturally, oil tankers are not the only vessels that couldcontaminate the sea with hydrocarbons. There are also cargo ships,offshore platforms, fishing boats, leisure craft, ferries and navalvessels that could discharge oily waste, adding more tons of hy-drocarbons into the sea, not to mention the problem of illegaldischarges from ships. In all, it is estimated that on average, thereare about 60 maritime accidents in the Mediterranean annually, ofwhich about 15 involve oil and chemical spills (EEA, 1999).
Nowadays, more than 200,000 commercial ships annually crossthe Mediterranean Sea and approximately 30% of international sea-borne volume originates from the 300 ports in the MediterraneanSea or is directed towards them (Abdulla and Linden, 2008). Hence,an enclosed sea such as the Mediterranean is particularly vulner-able to ship-associated impacts due to a high-volume of shippingroutes.
At the same time, theMediterranean Sea, bound by the Straits ofGibraltar on the west side and the Suez Canal and the BosporusStraits on the east side, is one of the 25 hotspots (Myers et al., 2000)and one of the 200 ecological regions with the highest biodiversityin the world (Olson and Dinerstein, 1998): whilst, constituting amere 0.8% of the world’s ocean area and 0.3% of its volume, it ishome to 7e8% of all known marine species (Mangos et al., 2010).Therefore, the oil pollution represents for the Mediterranean one ofthe more serious threats to its protection and integrity (UNEP/MAPe RAC/SPA, 2003). For these reasons, because of its unique envi-ronmental value and, at the same time, its vulnerability to oilpollution, the Mediterranean Sea was among the first regional seato be declared a “Special Area” by the MARPOL 73/78 Convention.
In this scenario, for its central position in the Mediterranean,Italy is involved in the forefront with regard to maritime transportof hydrocarbons. In fact, it accounts for nearly half of all crude oildischarged in the Mediterranean (REMPEC, 2008).
In addition, Italy has an important role as Europe’s largest refiningcentre, and it’s also a refined products net exporter which provides alarge share of its finished products to other countries. In particular,there are 16 refineries operating in Italy, with a total crude distilla-tion capacity of slightlymore than 2.3million barrels per day. Four ofthese refineries are located in the northernpart of the country, in thePovalley; theothers are situated along theMediterranean coast (IEA,2010). This data on theprocesses of production and transportation ofrefined products is an additional component of pressure of oil on themarine and coastal environment.
Furthermore data on oil spills occurred in the MediterraneanSea in last 30 years also confirm this risk: since 1985, more than 25accidents happened in this sea e only considering the most seriousand neglecting others e with over than 270,000 tons of hydrocar-bons spill, 162,600 of which spilled in Italian waters (Biliardo andMureddu, 2005).
Therefore, in the light of the heavy oil traffic and the relativehigh probability of an oil spill in Italian seas, the main aim of this
D. Astiaso Garcia et al. / Ocean & Coastal Management 80 (2013) 1e112
Author's personal copy
research is to propose an oil spills hazard index (OSHI) valid for thetotality of the Italian coasts andwaters, able to highlight those areascharacterized by greatest oil spill hazard.
Moreover, the OSHI values obtained along the Italian coastlineswill be implemented in a GIS databasewhich allows the elaborationof thematic maps representing a useful tool for planning a nationalContingency plan as well as for decision makers and stakeholdersinvolved in preparedness and response actions in case of oil spills.
Last but not least, according to the Marine Strategy FrameworkDirective (Directive, 2008/56/EC of the European Parliament), theassessment of oil spill impacts and risks is included in the initialassessment of the environmental impact of human activities thateach Member State should complete by 15 July 2012.
2. Methods
Theoil spills hazard index (OSHI)was calculated on thebasis of theamount of crude oil and petroleum products handled in the Italianports or just passed through Italian continental shelf waters, consid-ering the major Mediterranean oil routes affecting the Italianwaters.
The research has focused on the oil maritime transport,excluding the traffic of methane tankers and tankers specialized inliquid products other than oil, regardless of their dangerousness.
In order to assess OSHI values of thewhole Italian coastlines, thefirst methodological step of the project was to estimate the nationalmaritime traffic of hydrocarbon. To do this, our project included astudy conducted by Mureddu and Gugliermetti (2009) who esti-mated the amount of crude oil and oil products handled in Italianports or in transit during 2007 (the most recent year in which alarge amount of data was available).
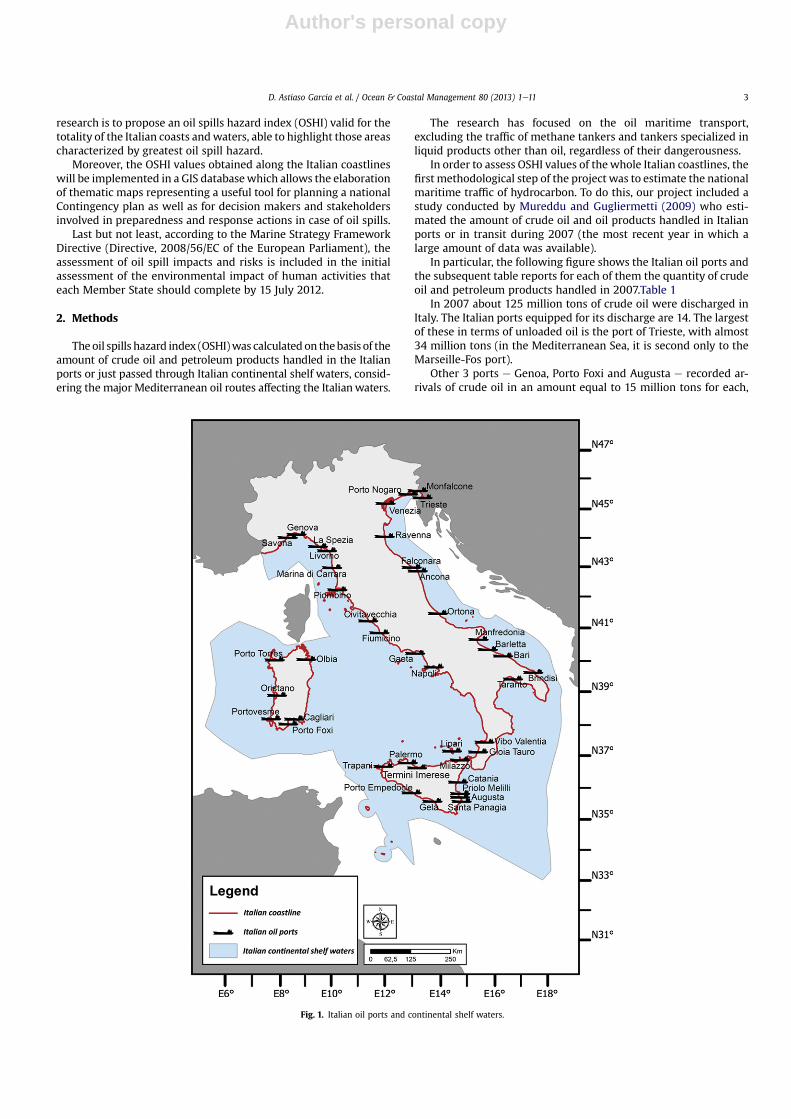
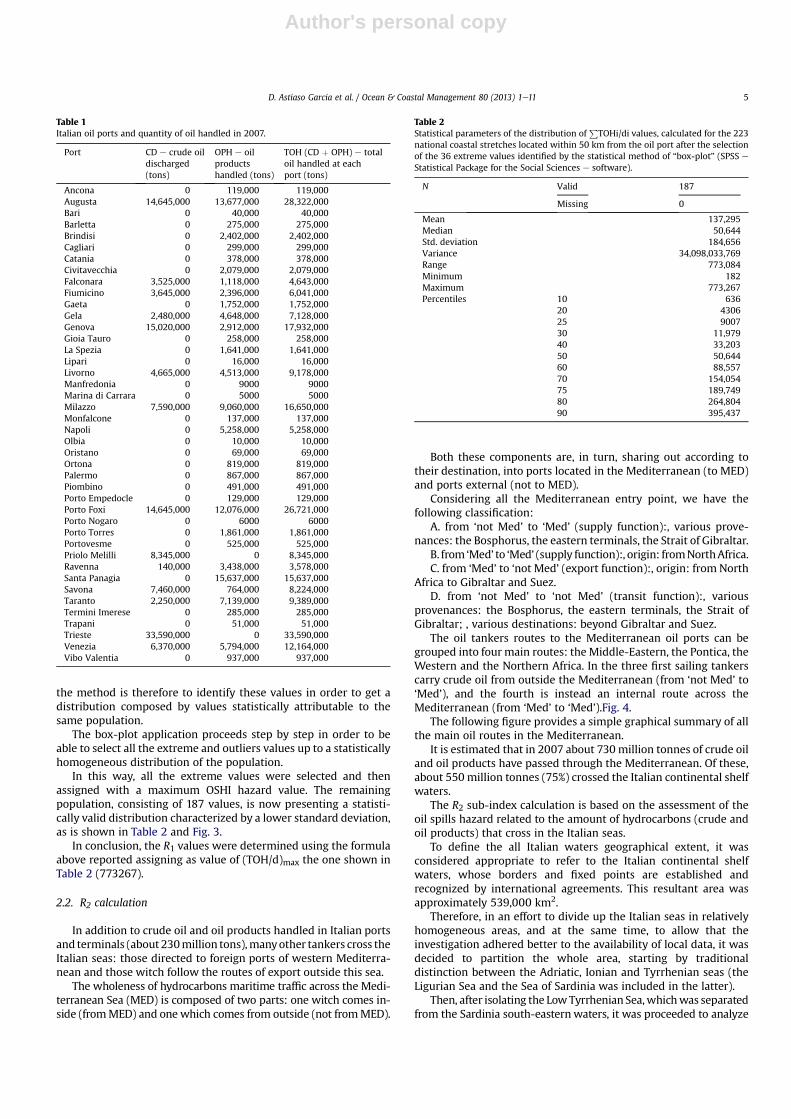
In particular, the following figure shows the Italian oil ports andthe subsequent table reports for each of them the quantity of crudeoil and petroleum products handled in 2007.Table 1
In 2007 about 125 million tons of crude oil were discharged inItaly. The Italian ports equipped for its discharge are 14. The largestof these in terms of unloaded oil is the port of Trieste, with almost34 million tons (in the Mediterranean Sea, it is second only to theMarseille-Fos port).
Other 3 ports e Genoa, Porto Foxi and Augusta e recorded ar-rivals of crude oil in an amount equal to 15 million tons for each,
Fig. 1. Italian oil ports and continental shelf waters.
D. Astiaso Garcia et al. / Ocean & Coastal Management 80 (2013) 1e11 3
Author's personal copy
which added to those of Trieste represented about 2/3 of all crudeoil discharged in Italy.
In addition to these 125million tons of crude oil, there are about105 million tons of oil products handled (OPH), for a total of 230million tons.
Indeed, Italy is the largestMediterranean refining industry: it has17 refineries localized in its territory, with a refining capacity of 2.3million barrels per day, which represents more than 1/3 of refiningcapacity installed on thewholeMediterranean. This record confirmsthe real hazard that could affect the Italian coasts and seas.
Starting from these data, the OSHI index processing derives fromthe aggregation of two hazard sub-indices: R1 concerning thewhole oil handled at Italian ports and R2 relating to the amount ofoil crossing the Italian waters.
This sub-indices calculation has been developed by analyzingdata of 2007 and generally considering the tons of oil in transit orlanding as a factor of statistical intensity, without distinguishingbetween crude oil and oil products. This consideration is acceptablebecause theprobability of occurrence of an accident does not dependon the type of treatment that affected the oil carried or landed.
The OSHI index was applied to the whole Italian shorelineanalyzing carefully all the natural coastline and artificial featuresfor a total of 8660 km.
This study area was partitioned into 335 coastal stretches ofapproximately 25 km (15.5 mile) length, and for each of them anOSHI value was calculated, supposing that in this surface the oilspill hazard could be homogeneous. These values have a compar-ative nature on national scale because they are standardized in arange from zero to hundred, with the value 100 assigned to Italiancoastlines with maximum oil spills hazard.
2.1. R1 calculation
The R1 sub-index was calculated considering the hazard asso-ciated with the discharge of crude oil and the handling (dischargeand load) of oil products in the 42 Italian oil ports (Fig. 1).
In particular, collected all the relevant information, for each ofthe 335 coastal stretches was calculated a standardized value of R1hazard on a scale from 1 to 100, corresponding to the sum of the oil
tons landed in each port, divided by the sea distance between theport analyzed and the midpoint of the examined coastal stretches:
R1 ¼ 100$Pi¼n
i¼1TOHi=diðTOH=dÞmax
where (c di < 50 km) :
� TOHi ¼ tons of crude oil and oil products annually loaded ordischarged in i-th port
� di ¼ sea distance between the i-th port and the midpoint of theexamined coastal stretches
� (TOH/d)max ¼ maximum value of TOH/d
This hazard sub-index was evaluated for each coastal stretchconsidering only ports located at a sea distance of less than 50 kmfrom the midpoint of the examined coast, since the oil dischargedin the more distant ports is considered such as oil “in transit” forthis coast and evaluated in the calculation of R2 sub-index.
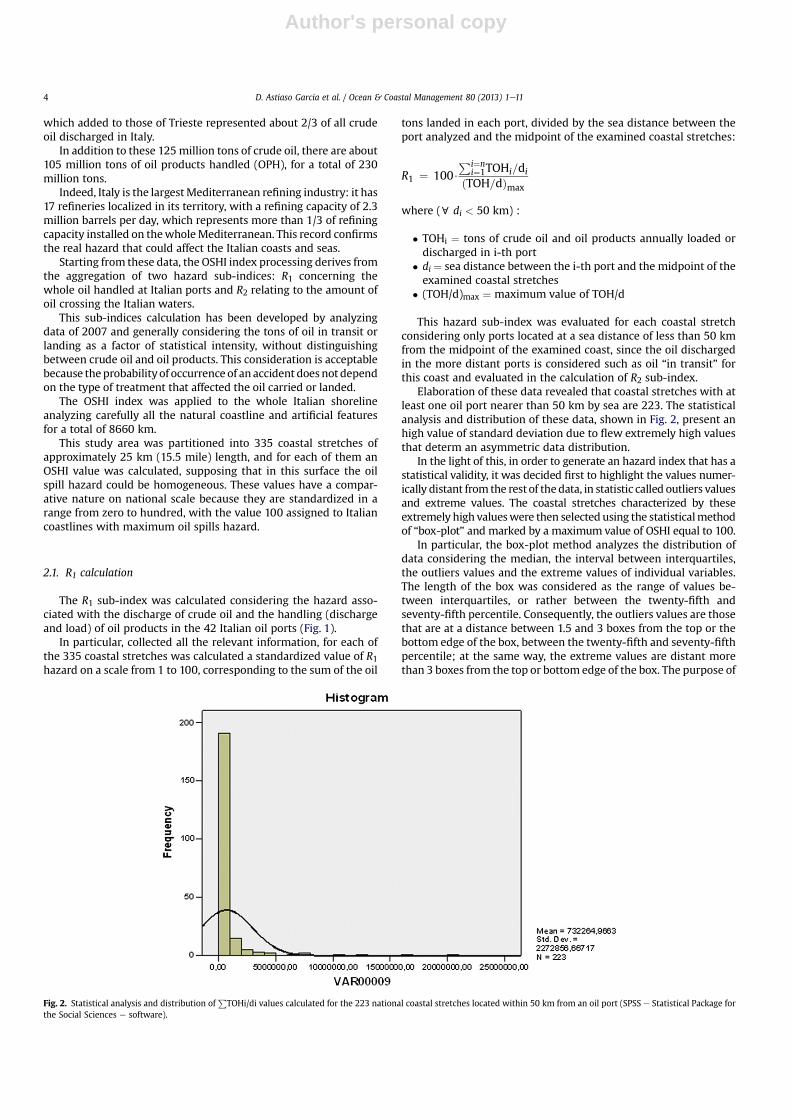
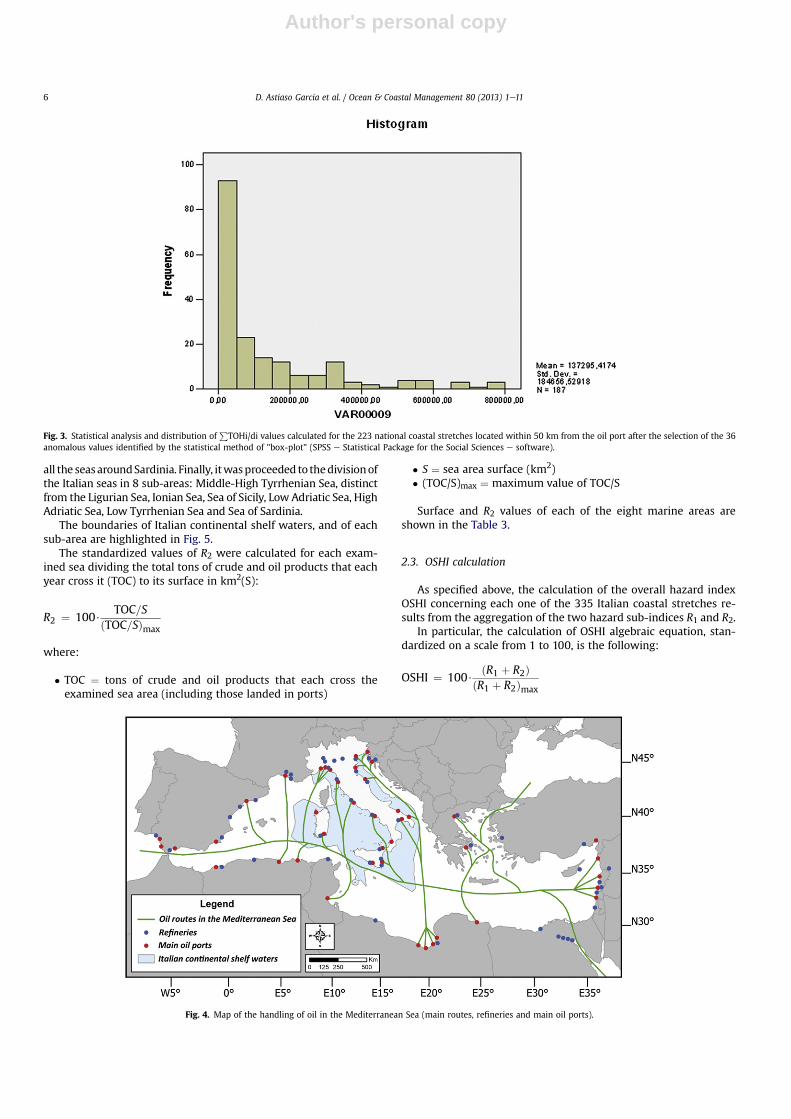
Elaboration of these data revealed that coastal stretches with atleast one oil port nearer than 50 km by sea are 223. The statisticalanalysis and distribution of these data, shown in Fig. 2, present anhigh value of standard deviation due to flew extremely high valuesthat determ an asymmetric data distribution.
In the light of this, in order to generate an hazard index that has astatistical validity, it was decided first to highlight the values numer-ically distant from the rest of thedata, in statistic called outliers valuesand extreme values. The coastal stretches characterized by theseextremely high valueswere then selected using the statisticalmethodof “box-plot” and marked by a maximum value of OSHI equal to 100.
In particular, the box-plot method analyzes the distribution ofdata considering the median, the interval between interquartiles,the outliers values and the extreme values of individual variables.The length of the box was considered as the range of values be-tween interquartiles, or rather between the twenty-fifth andseventy-fifth percentile. Consequently, the outliers values are thosethat are at a distance between 1.5 and 3 boxes from the top or thebottom edge of the box, between the twenty-fifth and seventy-fifthpercentile; at the same way, the extreme values are distant morethan 3 boxes from the top or bottom edge of the box. The purpose of
Fig. 2. Statistical analysis and distribution ofP
TOHi/di values calculated for the 223 national coastal stretches located within 50 km from an oil port (SPSS e Statistical Package forthe Social Sciences e software).
D. Astiaso Garcia et al. / Ocean & Coastal Management 80 (2013) 1e114
Author's personal copy
the method is therefore to identify these values in order to get adistribution composed by values statistically attributable to thesame population.
The box-plot application proceeds step by step in order to beable to select all the extreme and outliers values up to a statisticallyhomogeneous distribution of the population.
In this way, all the extreme values were selected and thenassigned with a maximum OSHI hazard value. The remainingpopulation, consisting of 187 values, is now presenting a statisti-cally valid distribution characterized by a lower standard deviation,as is shown in Table 2 and Fig. 3.
In conclusion, the R1 values were determined using the formulaabove reported assigning as value of (TOH/d)max the one shown inTable 2 (773267).
2.2. R2 calculation
In addition to crude oil and oil products handled in Italian portsand terminals (about 230million tons),manyother tankers cross theItalian seas: those directed to foreign ports of western Mediterra-nean and those witch follow the routes of export outside this sea.
The wholeness of hydrocarbons maritime traffic across the Medi-terranean Sea (MED) is composed of two parts: one witch comes in-side (fromMED) and one which comes from outside (not fromMED).
Both these components are, in turn, sharing out according totheir destination, into ports located in the Mediterranean (to MED)and ports external (not to MED).
Considering all the Mediterranean entry point, we have thefollowing classification:
A. from ‘not Med’ to ‘Med’ (supply function):, various prove-nances: the Bosphorus, the eastern terminals, the Strait of Gibraltar.
B. from ‘Med’ to ‘Med’ (supply function):, origin: fromNorthAfrica.C. from ‘Med’ to ‘not Med’ (export function):, origin: from North
Africa to Gibraltar and Suez.D. from ‘not Med’ to ‘not Med’ (transit function):, various
provenances: the Bosphorus, the eastern terminals, the Strait ofGibraltar; , various destinations: beyond Gibraltar and Suez.
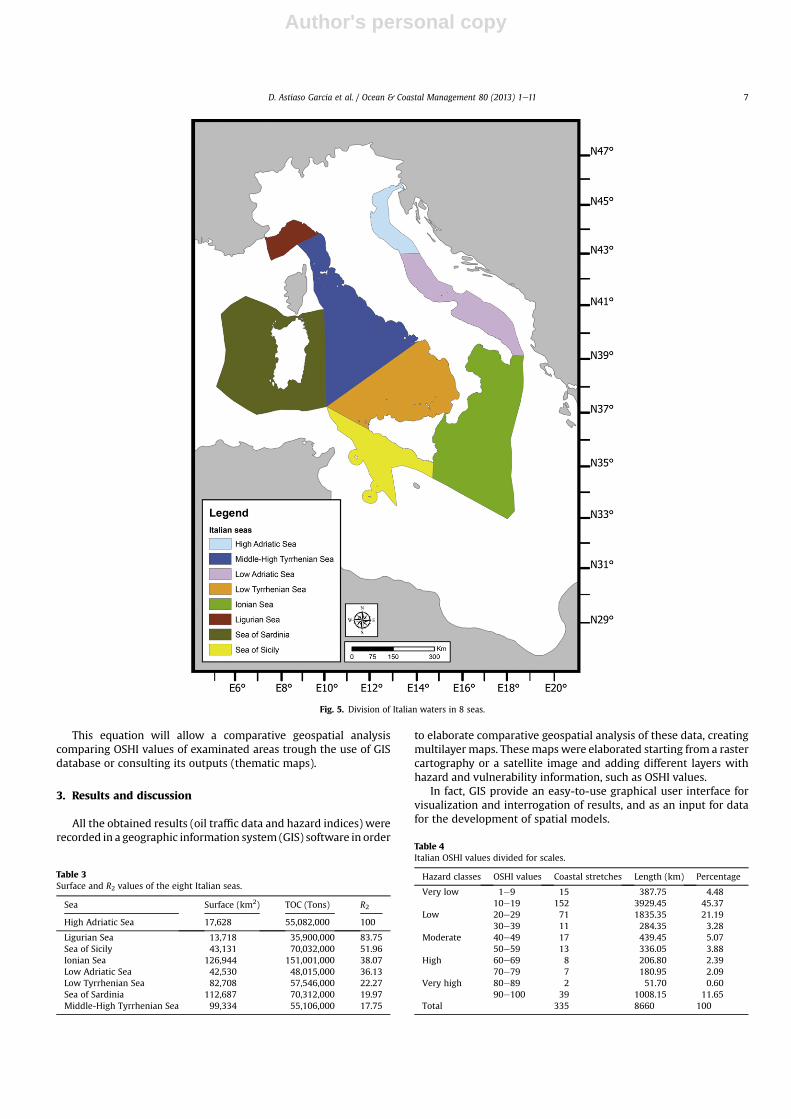
The oil tankers routes to the Mediterranean oil ports can begrouped into four main routes: the Middle-Eastern, the Pontica, theWestern and the Northern Africa. In the three first sailing tankerscarry crude oil from outside the Mediterranean (from ‘not Med’ to‘Med’), and the fourth is instead an internal route across theMediterranean (from ‘Med’ to ‘Med’).Fig. 4.
The following figure provides a simple graphical summary of allthe main oil routes in the Mediterranean.
It is estimated that in 2007 about 730 million tonnes of crude oiland oil products have passed through the Mediterranean. Of these,about 550 million tonnes (75%) crossed the Italian continental shelfwaters.
The R2 sub-index calculation is based on the assessment of theoil spills hazard related to the amount of hydrocarbons (crude andoil products) that cross in the Italian seas.
To define the all Italian waters geographical extent, it wasconsidered appropriate to refer to the Italian continental shelfwaters, whose borders and fixed points are established andrecognized by international agreements. This resultant area wasapproximately 539,000 km2.
Therefore, in an effort to divide up the Italian seas in relativelyhomogeneous areas, and at the same time, to allow that theinvestigation adhered better to the availability of local data, it wasdecided to partition the whole area, starting by traditionaldistinction between the Adriatic, Ionian and Tyrrhenian seas (theLigurian Sea and the Sea of Sardinia was included in the latter).
Then, after isolating the LowTyrrhenian Sea,whichwas separatedfrom the Sardinia south-eastern waters, it was proceeded to analyze
Table 1Italian oil ports and quantity of oil handled in 2007.
Port CD e crude oildischarged(tons)
OPH e oilproductshandled (tons)
TOH (CD þ OPH) e totaloil handled at eachport (tons)
Ancona 0 119,000 119,000Augusta 14,645,000 13,677,000 28,322,000Bari 0 40,000 40,000Barletta 0 275,000 275,000Brindisi 0 2,402,000 2,402,000Cagliari 0 299,000 299,000Catania 0 378,000 378,000Civitavecchia 0 2,079,000 2,079,000Falconara 3,525,000 1,118,000 4,643,000Fiumicino 3,645,000 2,396,000 6,041,000Gaeta 0 1,752,000 1,752,000Gela 2,480,000 4,648,000 7,128,000Genova 15,020,000 2,912,000 17,932,000Gioia Tauro 0 258,000 258,000La Spezia 0 1,641,000 1,641,000Lipari 0 16,000 16,000Livorno 4,665,000 4,513,000 9,178,000Manfredonia 0 9000 9000Marina di Carrara 0 5000 5000Milazzo 7,590,000 9,060,000 16,650,000Monfalcone 0 137,000 137,000Napoli 0 5,258,000 5,258,000Olbia 0 10,000 10,000Oristano 0 69,000 69,000Ortona 0 819,000 819,000Palermo 0 867,000 867,000Piombino 0 491,000 491,000Porto Empedocle 0 129,000 129,000Porto Foxi 14,645,000 12,076,000 26,721,000Porto Nogaro 0 6000 6000Porto Torres 0 1,861,000 1,861,000Portovesme 0 525,000 525,000Priolo Melilli 8,345,000 0 8,345,000Ravenna 140,000 3,438,000 3,578,000Santa Panagia 0 15,637,000 15,637,000Savona 7,460,000 764,000 8,224,000Taranto 2,250,000 7,139,000 9,389,000Termini Imerese 0 285,000 285,000Trapani 0 51,000 51,000Trieste 33,590,000 0 33,590,000Venezia 6,370,000 5,794,000 12,164,000Vibo Valentia 0 937,000 937,000
Table 2Statistical parameters of the distribution of
PTOHi/di values, calculated for the 223
national coastal stretches located within 50 km from the oil port after the selectionof the 36 extreme values identified by the statistical method of “box-plot” (SPSS e
Statistical Package for the Social Sciences e software).
N Valid 187
Missing 0
Mean 137,295Median 50,644Std. deviation 184,656Variance 34,098,033,769Range 773,084Minimum 182Maximum 773,267Percentiles 10 636
20 430625 900730 11,97940 33,20350 50,64460 88,55770 154,05475 189,74980 264,80490 395,437
D. Astiaso Garcia et al. / Ocean & Coastal Management 80 (2013) 1e11 5
Author's personal copy
all the seasaroundSardinia. Finally, itwasproceeded to thedivisionofthe Italian seas in 8 sub-areas: Middle-High Tyrrhenian Sea, distinctfrom the Ligurian Sea, Ionian Sea, Sea of Sicily, Low Adriatic Sea, HighAdriatic Sea, Low Tyrrhenian Sea and Sea of Sardinia.
The boundaries of Italian continental shelf waters, and of eachsub-area are highlighted in Fig. 5.
The standardized values of R2 were calculated for each exam-ined sea dividing the total tons of crude and oil products that eachyear cross it (TOC) to its surface in km2(S):
R2 ¼ 100$TOC=S
ðTOC=SÞmax
where:
� TOC ¼ tons of crude and oil products that each cross theexamined sea area (including those landed in ports)
� S ¼ sea area surface (km2)� (TOC/S)max ¼ maximum value of TOC/S
Surface and R2 values of each of the eight marine areas areshown in the Table 3.
2.3. OSHI calculation
As specified above, the calculation of the overall hazard indexOSHI concerning each one of the 335 Italian coastal stretches re-sults from the aggregation of the two hazard sub-indices R1 and R2.
In particular, the calculation of OSHI algebraic equation, stan-dardized on a scale from 1 to 100, is the following:
OSHI ¼ 100$ðR1 þ R2Þ
ðR1 þ R2Þmax
Fig. 3. Statistical analysis and distribution ofP
TOHi/di values calculated for the 223 national coastal stretches located within 50 km from the oil port after the selection of the 36anomalous values identified by the statistical method of "box-plot" (SPSS e Statistical Package for the Social Sciences e software).
Fig. 4. Map of the handling of oil in the Mediterranean Sea (main routes, refineries and main oil ports).
D. Astiaso Garcia et al. / Ocean & Coastal Management 80 (2013) 1e116
Author's personal copy
This equation will allow a comparative geospatial analysiscomparing OSHI values of examinated areas trough the use of GISdatabase or consulting its outputs (thematic maps).
3. Results and discussion
All the obtained results (oil traffic data and hazard indices) wererecorded in a geographic information system (GIS) software in order
to elaborate comparative geospatial analysis of these data, creatingmultilayer maps. Thesemaps were elaborated starting from a rastercartography or a satellite image and adding different layers withhazard and vulnerability information, such as OSHI values.
In fact, GIS provide an easy-to-use graphical user interface forvisualization and interrogation of results, and as an input for datafor the development of spatial models.
Fig. 5. Division of Italian waters in 8 seas.
Table 3Surface and R2 values of the eight Italian seas.
Sea Surface (km2) TOC (Tons) R2
High Adriatic Sea 17,628 55,082,000 100
Ligurian Sea 13,718 35,900,000 83.75Sea of Sicily 43,131 70,032,000 51.96Ionian Sea 126,944 151,001,000 38.07Low Adriatic Sea 42,530 48,015,000 36.13Low Tyrrhenian Sea 82,708 57,546,000 22.27Sea of Sardinia 112,687 70,312,000 19.97Middle-High Tyrrhenian Sea 99,334 55,106,000 17.75
Table 4Italian OSHI values divided for scales.
Hazard classes OSHI values Coastal stretches Length (km) Percentage
Very low 1e9 15 387.75 4.4810e19 152 3929.45 45.37
Low 20e29 71 1835.35 21.1930e39 11 284.35 3.28
Moderate 40e49 17 439.45 5.0750e59 13 336.05 3.88
High 60e69 8 206.80 2.3970e79 7 180.95 2.09
Very high 80e89 2 51.70 0.6090e100 39 1008.15 11.65
Total 335 8660 100
D. Astiaso Garcia et al. / Ocean & Coastal Management 80 (2013) 1e11 7
Author's personal copy
In particular, the GIS database, containing queried digital mapswith collected data and their subsequent elaboration, providesvaluable information for Integrated Coastal Zone Managementapproaches along Italian shorelines.
It was therefore possible to get a national framework of theItalian waters and coasts criticalities concerning hydrocarbonsmaritime traffic.
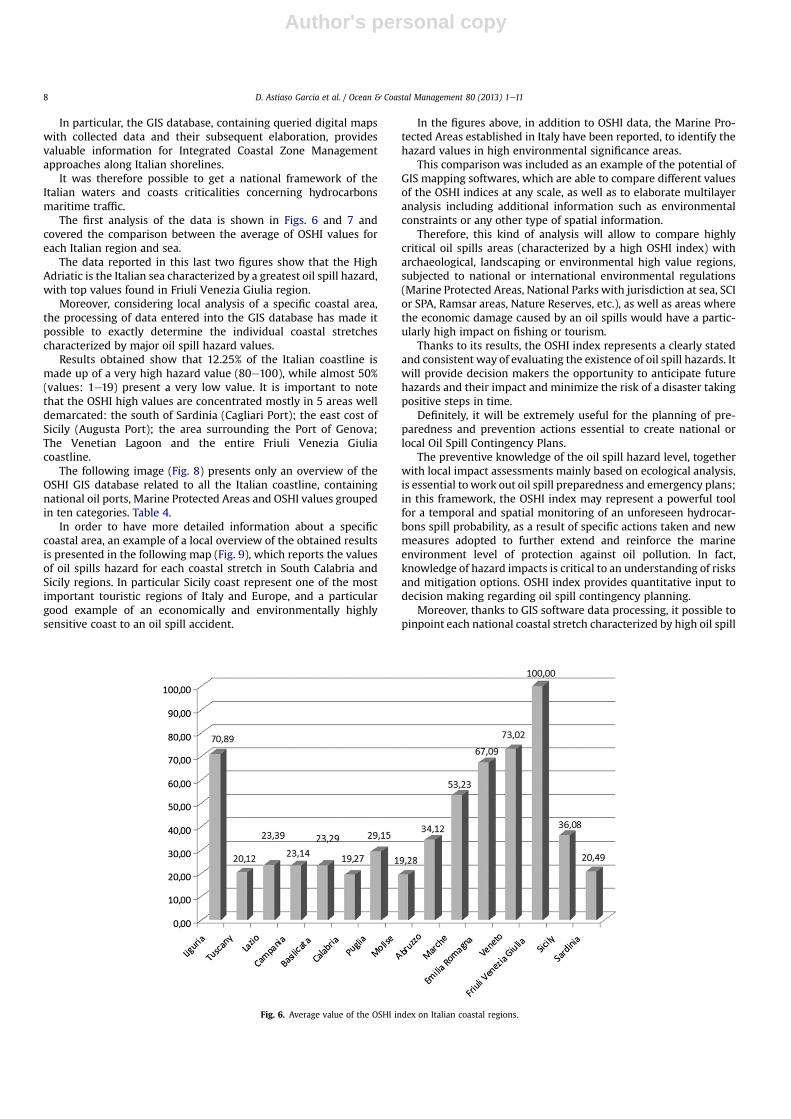
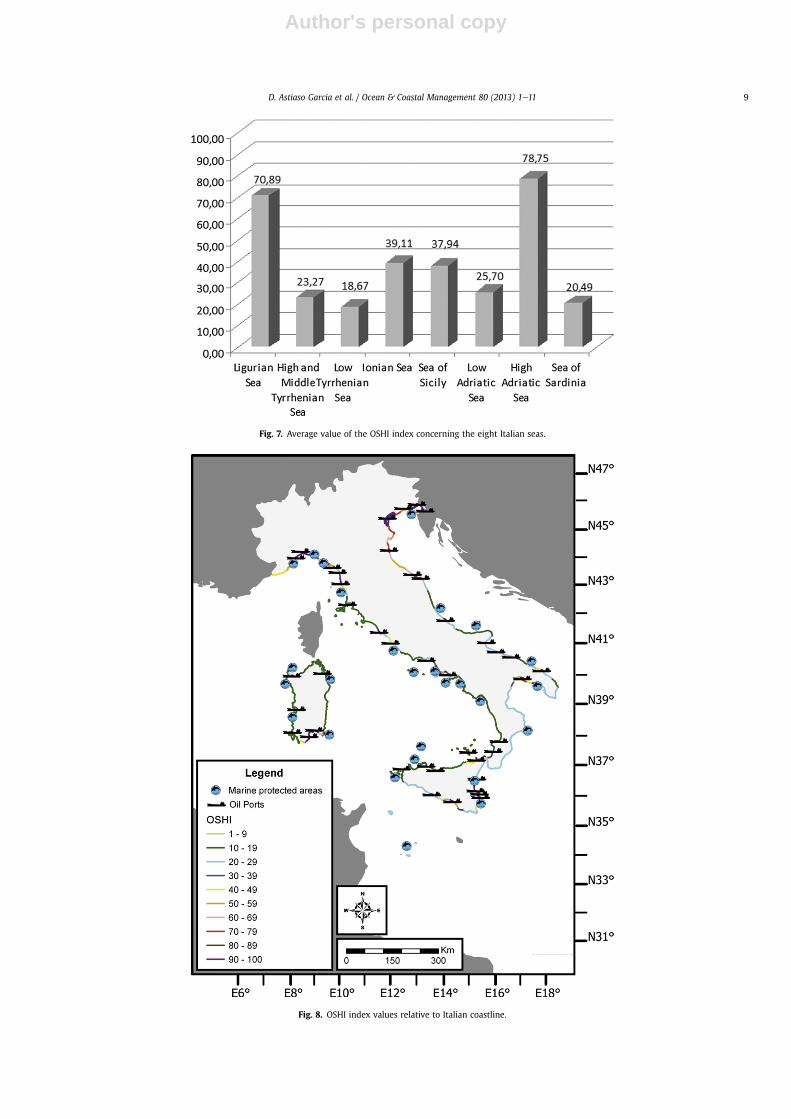
The first analysis of the data is shown in Figs. 6 and 7 andcovered the comparison between the average of OSHI values foreach Italian region and sea.
The data reported in this last two figures show that the HighAdriatic is the Italian sea characterized by a greatest oil spill hazard,with top values found in Friuli Venezia Giulia region.
Moreover, considering local analysis of a specific coastal area,the processing of data entered into the GIS database has made itpossible to exactly determine the individual coastal stretchescharacterized by major oil spill hazard values.
Results obtained show that 12.25% of the Italian coastline ismade up of a very high hazard value (80e100), while almost 50%(values: 1e19) present a very low value. It is important to notethat the OSHI high values are concentrated mostly in 5 areas welldemarcated: the south of Sardinia (Cagliari Port); the east cost ofSicily (Augusta Port); the area surrounding the Port of Genova;The Venetian Lagoon and the entire Friuli Venezia Giuliacoastline.
The following image (Fig. 8) presents only an overview of theOSHI GIS database related to all the Italian coastline, containingnational oil ports, Marine Protected Areas and OSHI values groupedin ten categories. Table 4.
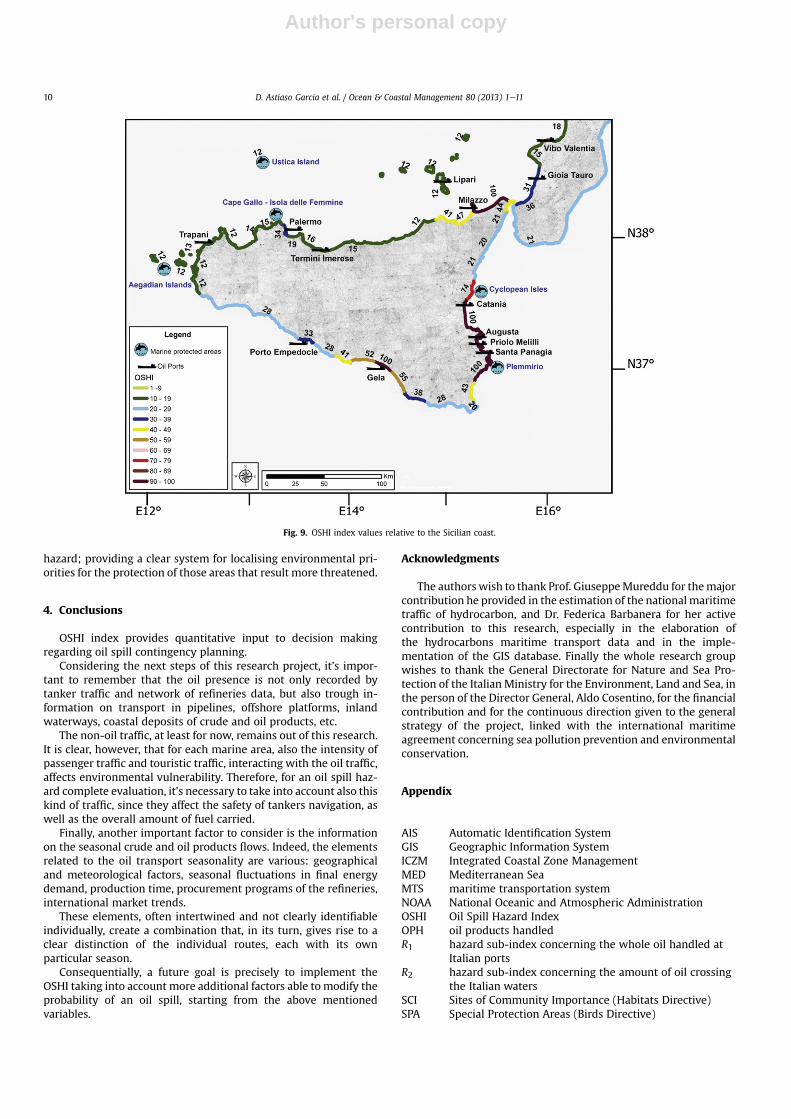
In order to have more detailed information about a specificcoastal area, an example of a local overview of the obtained resultsis presented in the following map (Fig. 9), which reports the valuesof oil spills hazard for each coastal stretch in South Calabria andSicily regions. In particular Sicily coast represent one of the mostimportant touristic regions of Italy and Europe, and a particulargood example of an economically and environmentally highlysensitive coast to an oil spill accident.
In the figures above, in addition to OSHI data, the Marine Pro-tected Areas established in Italy have been reported, to identify thehazard values in high environmental significance areas.
This comparison was included as an example of the potential ofGIS mapping softwares, which are able to compare different valuesof the OSHI indices at any scale, as well as to elaborate multilayeranalysis including additional information such as environmentalconstraints or any other type of spatial information.
Therefore, this kind of analysis will allow to compare highlycritical oil spills areas (characterized by a high OSHI index) witharchaeological, landscaping or environmental high value regions,subjected to national or international environmental regulations(Marine Protected Areas, National Parks with jurisdiction at sea, SCIor SPA, Ramsar areas, Nature Reserves, etc.), as well as areas wherethe economic damage caused by an oil spills would have a partic-ularly high impact on fishing or tourism.
Thanks to its results, the OSHI index represents a clearly statedand consistent way of evaluating the existence of oil spill hazards. Itwill provide decision makers the opportunity to anticipate futurehazards and their impact and minimize the risk of a disaster takingpositive steps in time.
Definitely, it will be extremely useful for the planning of pre-paredness and prevention actions essential to create national orlocal Oil Spill Contingency Plans.
The preventive knowledge of the oil spill hazard level, togetherwith local impact assessments mainly based on ecological analysis,is essential towork out oil spill preparedness and emergency plans;in this framework, the OSHI index may represent a powerful toolfor a temporal and spatial monitoring of an unforeseen hydrocar-bons spill probability, as a result of specific actions taken and newmeasures adopted to further extend and reinforce the marineenvironment level of protection against oil pollution. In fact,knowledge of hazard impacts is critical to an understanding of risksand mitigation options. OSHI index provides quantitative input todecision making regarding oil spill contingency planning.
Moreover, thanks to GIS software data processing, it possible topinpoint each national coastal stretch characterized by high oil spill
Fig. 6. Average value of the OSHI index on Italian coastal regions.
D. Astiaso Garcia et al. / Ocean & Coastal Management 80 (2013) 1e118
Author's personal copy
Fig. 7. Average value of the OSHI index concerning the eight Italian seas.
Fig. 8. OSHI index values relative to Italian coastline.
D. Astiaso Garcia et al. / Ocean & Coastal Management 80 (2013) 1e11 9
Author's personal copy
hazard; providing a clear system for localising environmental pri-orities for the protection of those areas that result more threatened.
4. Conclusions
OSHI index provides quantitative input to decision makingregarding oil spill contingency planning.
Considering the next steps of this research project, it’s impor-tant to remember that the oil presence is not only recorded bytanker traffic and network of refineries data, but also trough in-formation on transport in pipelines, offshore platforms, inlandwaterways, coastal deposits of crude and oil products, etc.
The non-oil traffic, at least for now, remains out of this research.It is clear, however, that for each marine area, also the intensity ofpassenger traffic and touristic traffic, interacting with the oil traffic,affects environmental vulnerability. Therefore, for an oil spill haz-ard complete evaluation, it’s necessary to take into account also thiskind of traffic, since they affect the safety of tankers navigation, aswell as the overall amount of fuel carried.
Finally, another important factor to consider is the informationon the seasonal crude and oil products flows. Indeed, the elementsrelated to the oil transport seasonality are various: geographicaland meteorological factors, seasonal fluctuations in final energydemand, production time, procurement programs of the refineries,international market trends.
These elements, often intertwined and not clearly identifiableindividually, create a combination that, in its turn, gives rise to aclear distinction of the individual routes, each with its ownparticular season.
Consequentially, a future goal is precisely to implement theOSHI taking into account more additional factors able tomodify theprobability of an oil spill, starting from the above mentionedvariables.
Acknowledgments
The authors wish to thank Prof. GiuseppeMureddu for themajorcontribution he provided in the estimation of the national maritimetraffic of hydrocarbon, and Dr. Federica Barbanera for her activecontribution to this research, especially in the elaboration ofthe hydrocarbons maritime transport data and in the imple-mentation of the GIS database. Finally the whole research groupwishes to thank the General Directorate for Nature and Sea Pro-tection of the Italian Ministry for the Environment, Land and Sea, inthe person of the Director General, Aldo Cosentino, for the financialcontribution and for the continuous direction given to the generalstrategy of the project, linked with the international maritimeagreement concerning sea pollution prevention and environmentalconservation.
Appendix
AIS Automatic Identification SystemGIS Geographic Information SystemICZM Integrated Coastal Zone ManagementMED Mediterranean SeaMTS maritime transportation systemNOAA National Oceanic and Atmospheric AdministrationOSHI Oil Spill Hazard IndexOPH oil products handledR1 hazard sub-index concerning the whole oil handled at
Italian portsR2 hazard sub-index concerning the amount of oil crossing
the Italian watersSCI Sites of Community Importance (Habitats Directive)SPA Special Protection Areas (Birds Directive)
Fig. 9. OSHI index values relative to the Sicilian coast.
D. Astiaso Garcia et al. / Ocean & Coastal Management 80 (2013) 1e1110
Author's personal copy
TOC tons of crude and oil products that each cross theexamined sea area (including those landed in ports)
TOHi tons of crude oil and oil products annually loaded ordischarged in i-th port
VI vulnerability index
References
Abdulla, A., Linden, O., 2008. Maritime Traffic Effects on Biodiversity in the Medi-terranean Sea: Volume 1-Review of Impacts, Priority Areas and MitigationMeasures. <http://data.iucn.org> (last accessed 25.07.12).
Biliardo, U., Mureddu, G., 2005. Traffico petrolifero e sostenibilità ambientale.Unione Petrolifera, Rome, Italy, p. 350.
Blong, R.J., 1996. Volcanic hazards risk assessment. In: Scarpa, R., Tilling, R.I. (Eds.),Monitoring and Mitigation of Volcano Hazards. Springer-Verlag, Berlin,pp. 676e698.
Castanedo, S., Juanes, J.A., Medina, R., Puente, A., Fernandez, F., Olabarrieta, M.,Pombo, C., 2009. Oil spill vulnerability assessment integrating physical, bio-logical and socio-economical aspects: application to the Cantabrian coast (Bayof Biscay, Spain). Journal of Environmental Management 91 (1), 149e159.
Crichton, D., 1999. The risk triangle. In: Ingleton, J. (Ed.), Natural Disaster Man-agement. Tudor Rose, London, United Kingdom, p. 336.
Cumo, F., Cinquepalmi, F., Astiaso Garcia, D., 2008. Data gathering guidelines for themapping of environmental sensitivity to oil spill of the Italian coastlines. In:Environmental Problems in Coastal Regions VII, Coastal Environment 2008: 7thInternational Conference on Environmental Problems in Coastal Regionsincluding oil and chemical spill studies. WIT Transaction on the Built Envi-ronment, vol. 99, pp. 119e125.
Cumo, F., Astiaso Garcia, D., Cinquepalmi, F., 2009. Integrated oil spill risk man-agement and response in coastal areas: a case study from Italy. In: Interspill2009 e a Key international conference and exhibition for spill prevention,preparedness, response and restoration, The 4th IMO R&D FORUM, Marseille,France, 12e14 May 2009.
Cutter, S., 1993. Living with Risk, the Geography of Technological Hazards. EdwardArnold, London, United Kingdom, p. 214.
de Andrade, M.M.N., Szlafsztein, C.F., Souza-Filho, P.W.M., Araújo, A.D.R.,Gomes, M.K.T., 2010. A socioeconomic and natural vulnerability index for oilspills in an Amazonian harbor: a case study using GIS and remote sensing.Journal of Environmental Management 91 (10), 1972e1980.
de Santoli, L., Cumo, F., Astiaso Garcia, D., Bruschi, D., 2011. Coastal and marineimpact assessment for the development of an oil spill contingency plan: thecase study of the east coast of Sicily. In: Coastal Processes II, 2nd InternationalConference on Physical Coastal Processes, Management and Engineering. WITTransaction on Ecology and the Environment, vol. 149, pp. 285e296.
Douglas, J., 2007. Physical vulnerability modelling in natural hazard risk assess-ment. Natural Hazards and Earth System Sciences 7, 283e288.
EEA, 1999. State and Pressures of the Marine and Coastal Mediterranean. No 5,Copenhagen, Denmark. In: Environmental Issues Series, p. 137.
Eide, M.S., Endresen, Ø., Brett, P.O., Ervik, J.L., Røang, K., 2007. Intelligent ship trafficmonitoring for oil spill prevention: risk based decision support building on AIS.Marine Pollution Bulletin 54 (2), 145e148.
Fattal, P., Robin, M., Pottier, P., 2007. Évaluation de la vulnérabilité côtière face auxpollutions par hydrocarbures: application à l’île de Noirmoutier. Territoire enMouvement (1), 54e69.
Füssel, H.-M., 2007. Vulnerability: a generally applicable conceptual framework forclimate change research. Global Environmental Change 17 (2), 155e167.
Granger, K., Jones, T., Leiba,M., Scott,G.,1999. CommunityRisk inCairns: aMultihazardRisk Assessment. Tech. rep.. AGSO (Australian Geological Survey Organisation)Cities Project. Department of Industry, Science and Resources, Australia, p. 13.
Gugliermetti, F., Cinquepalmi, F., Astiaso Garcia, D., 2007a. The use of environmentalsensitivity indices (ESI) maps for the evaluation of oil spill risk in Mediterraneancoastlines and coastal waters. In: Sustainable Development and Planning III, Vol.2, 3rd International Conference on Sustainable Development and Planning. WITTransaction on Ecology and the Environment, vol. 102, pp. 593e600.
Gugliermetti, F., Cumo, F., Monaco, A., 2007b. The elaboration of environmentalsensitivity indices (ESI) maps of the Marine Protected Area of Baia. In: Safetyand Security Engineering II, 2nd International Conference on Safety and Secu-rity Engineering. WIT Transactions on the Built Environment, 94, pp. 497e505.
Gundlach, E.R., Hayes, M.O., 1978. Vulnerability of coastal environments to oil spillimpacts. Marine Technology Society Journal 12 (4), 18e27.
Iakovou, E.T., 2001. An interactive multiobjective model for the strategic maritimetransportation of petroleum products: risk analysis and routing. Safety Science39 (1e2), 19e29.
IEA, 2010. Energy Policies of IEA Countries e Italy e 2009 Review. <www.iea.org>(last accessed 28.07.12).
Kluser, S., Richard, J.P., Giuliani, G., De Bono, A., Peduzzi, P., 2006. Illegal Oil Dischargein European Seas. <http://www.grid.unep.ch> (last accessed 28.07.12).
Kumpulainen, S., 2006. Vulnerability concepts in hazard and risk assessments. In:Schmidt-Thomé, P. (Ed.), Natural and Technological Hazards and Risks Affectingthe Spatial Development of European Regions. Geological Survey of Finland,pp. 65e74. Special Paper 42.
LaBelle, R.P., Rainey, G., Lanfear, K.J., 1982. An Application of a Vulnerability Index toOil Spill Modeling in the Gulf of Mexico. U.S. Geological Survey, Denver, Colo-rado, USA, p. 17.
Mangos, A., Bassino, J.P., Sauzade, D., 2010. The Economic Value of SustainableBenefits Rendered by the Mediterranean Marine Ecosystems. Plan Bleu, Val-bonne, France, p. 78.
Mitchell, J.K., 1989. Hazards research. In: Gaile, G.L., Willmott, C.J. (Eds.), Geographyin America. Merill Publishing, Columbus, Ohio, pp. 410e424.
Mureddu, G., Gugliermetti, F., 2009. Analisi statistico ambientale del traffico pet-roliero sulle rotte mediterranee, in particolare nelle acque italiane. In: WorkingPaper, DIAEE Department. Sapienza University of Rome, Rome, Italy.
Myers, N., Mittermeier, R.A., Mittermeier, C.G., da Fonseca, G.A.B., Kent, J., 2000.Biodiversity hotspots for conservation priorities. Nature 403, 853e858.
Ng, T.F., Vijayan, V.R., Chow, W.S., Sulaiman, A., 2008. Assessment of oil spillvulnerability of Southwest Pulau Pinang shoreline. Bulletin of the GeologicalSociety of Malaysia 54, 123e131.
Olita, A., Cucco, A., Simeone, S., Ribotti, A., Fazioli, L., Sorgente, B., Sorgente, R., 2012.Oil spill hazard and risk assessment for the shorelines of a Mediterraneancoastal Archipelago. Ocean & Coastal Management 57, 44e52.
Olson, D.M., Dinerstein, E., 1998. The global 200: a representation approach toconserving the Earth’s most biologically valuable ecoregions. ConservationBiology 12 (3), 502e515.
Petersen, J., Michel, J., Zengel, S., White, M., Lord, C., Park, C., 2002. EnvironmentalSensitivity Index Guidelines. Version 3.0. NOAA Technical Memorandum NOSOR & R 11. Office of Response and Restoration, National Oceanic and Atmo-spheric Administration, Seattle, p. 192. Washington, USA.
REMPEC, 2008. Study of Maritime Traffic Flows in the Mediterranean Sea e FinalReport. <http://80.33.141.76/esatdor/attachments/article/69/Maritime_Traffic_Flows.pdf> (last accessed 29.07.12).
Renn, O., 2005. Risk Governance: Towards an Integrative Approach. White Paper no.1. International Risk Governance Council, Geneva, Switzerland, p. 156.
Ronza, A., Carol, S., Espejo, V., Vílchez, J.A., Arnaldos, J., 2006. A quantitative riskanalysis approach to port hydrocarbon logistics. Journal of Hazardous Materials128 (1), 10e24.
Sayers, P., Gouldby, B., Simm, J., Meadowcroft, I., Hall, J., 2002. Risk, Performanceand Uncertainty in Flood and Coastal Defence e a Review. R&D Technical ReportFD2302/TR1, Crown Copyright. Defra/Environment Agency, London, UnitedKingdom, p. 115.
Smith, K., 2004. Environmental Hazards: Assessing Risk and Reducing Disaster,fourth ed. Routledge, London, United Kingdom, p. 324.
Turner, B.L., Kasperson, R.E., Matson, P.A., McCarthy, J.J., Corell, R.W., Christensen, L.,Eckley, N., Kasperson, J.X., Luers, A., Martello, M.L., Polsky, C., Pulsipher, A.,Schiller, A., 2003. A framework for vulnerability analysis in sustainability sci-ence. Proceedings of the National Academy of Sciences of the United States ofAmerica 100 (14), 8074e8079.
Udoh, J.C., 2010. A GIS based cost distance modelling for oil spill hazard assessmentin the coastal areas of South Eastern Nigeria. Research Journal of Applied Sci-ences 5 (4), 254e259.
Ulusçu, Ö.S., Özbas, B., Altiok, T., Or, I., 2009. Risk analysis of the vessel traffic in thestrait of Istanbul. Risk Analysis 29 (10), 1454e1472.
UNDHA (United Nations Department of Humanitarian Affairs), 1992. InternationallyAgreed Glossary of Basic Terms Related to Disaster Management. Geneva,Switzerland, p. 81.
UNDP (United Nations Development Programme) Bureau for Crisis Prevention andRecovery, 2004. In: Pelling, M., Maskrey, A., Ruiz, P., Hall, L. (Eds.), ReducingDisaster Risk: a Challenge for Development. A Global Report. John S. Swift Co,USA, p. 146.
UNEP/MAP e RAC/SPA, 2003. Strategic Action Programme for the Conservation ofBiological Diversity (SAP BIO) in the Mediterranean Region. <http://sapbio.rac-spa.org> (last accessed 23.07.12).
van Dorp, J.R., Merrick, J.R.W., 2011. On a risk management analysis of oil spill riskusing maritime transportation system simulation. Annals of OperationsResearch 187 (1), 249e277.
Villa, F., McLeod, H., 2002. Environmental vulnerability indicators for environ-mental planning and decision-making: guidelines and applications. Environ-mental Management 29 (3), 335e348.
Weslawski, J.M., Wiktor, J., Zajaczkowski, M., Futsaeter, G., Moe, K.A., 1997.Vulnerability assessment of Svalbard Intertidal Zone for oil spills. Estuarine,Coastal and Shelf Science 44 (SUPPL. A), 33e41.
Williams, L.R.R., Kapustka, L.A., 2000. Ecosystem vulnerability: a complex interfacewith technical components. Environmental Toxicology and Chemistry 19 (4 II),1055e1058.
Wisner, B., Blaikie, P., Cannon, T., Davis, I., 2004. At Risk: Natural Hazards, People’sVulnerability and Disasters, second ed. Routledge, London, United Kingdom,p. 496.
D. Astiaso Garcia et al. / Ocean & Coastal Management 80 (2013) 1e11 11
Copyright © 2022 FDOKUMEN