THE SELDOVIA BAY OIL SPILL Prepared by William D. Ernst ...
93
THE SELDOVIA BAY OIL SPILL Prepared by William D. Ernst Prepared for The National Oceanic and Atmospheric Administration Hazardous Materials Response Project 701 "C" St. Box 54 (907) 271-5134 A p ril 1979
-
Upload
khangminh22 -
Category
Documents
-
view
2 -
download
0
Transcript of THE SELDOVIA BAY OIL SPILL Prepared by William D. Ernst ...

THE SELDOVIA BAY OIL SPILL
Prepared by
William D. Ernst
Prepared for
The National Oceanic and Atmospheric AdministrationHazardous Materials Response Project
701 "C" St. Box 54(907) 271-5134
Ap ril 1979

TABLE OF CONTENTS
Page
List of Figures al
List of Appendices bl
Preface 1
Summary 2
Background on Seldovia 5
Introduction
Chronology 6The Scientific Sup port Program 9
Physical Processes
General Description of The Study Area 11
Review of Previous Investigations 12
Physical Conditions in Seldovia Bay 14
Observations and Discussion 16
Oil In Ice 18
Summation 19
Coastal Geomorphology and Oil Behavior
Prior Research on Seldovia Bay 20
Discussion Format 21
Morphology Units in Seldovia Bay 21
Summation 26
Biological Character Assessment
Pertinent Information From Selected Literature 29
Commercial and Visible Resources 30
Intertidal Habitats and Biological Assemblages 31
Discussion on Biological Priority Areas 35
The SSC Sampling Program and Summation 37
Scientific Response to Oil Spills in High Energy Environments 39
Conclussion 42
References 44
Acknowledgments 46

LIST OF FIGURES
Page(s)
1. Index Map of Lower Cook Inlet 5, 11(from Traskey, Flagg & Burbank, 1977).
2. Index Map of Seldovia Bay. 5,6,16,24
3. Wind Frequency Distribution 11(from Hayes, Brown & Michel, 1977).
Net Surface and subsurface 12Circulation in Outer KachemakBay (from Burbank, 1977).
5. Kachemak Bay Slick Observations 13(Personal communication, G. Hufford)
6. Four Typical Oil Trajectories. 15
7. Rock Type and Shore Morphology 21,35,37(composite from Hayes et al., 1977).
8. Detailed Shore Morphology and 22,24,25,26Major Sites of Shore-Oil Contact.
9. Known Biological Resources 35(from L. Flagg - ADF&G andpersonal observations).
10. Biological Sampling Stations. 37

-bl-
LIST OF APPENDICES
I Local Climatological Data Homer, Alaska;
NOAA National Weather Service.
II Excerpts from United States Coast Pilot 9,1977; NOAA National Ocean Survey.
III Physical Processes Studies performed by the
Scientific Su pport Team in Seldovia Ba y , Alaska,
IV Environmental Susceptibility Index, Applicationsto Lower Cook Inlet; from Hayes et al., 1977.
Forward to Environmental Studies of Kachemak Bay and Lower Cook Inlet; Trasky, Flaag andBurbank,-eds..
VI Biological Sampling and Observations by the
Scientific Support Team in Seldovia Bay, Alaska.
VII U.S. Fish and Wildlife report on a Marine Birdsand Marine Mammals survey conducted November,9 & 10, 1978.
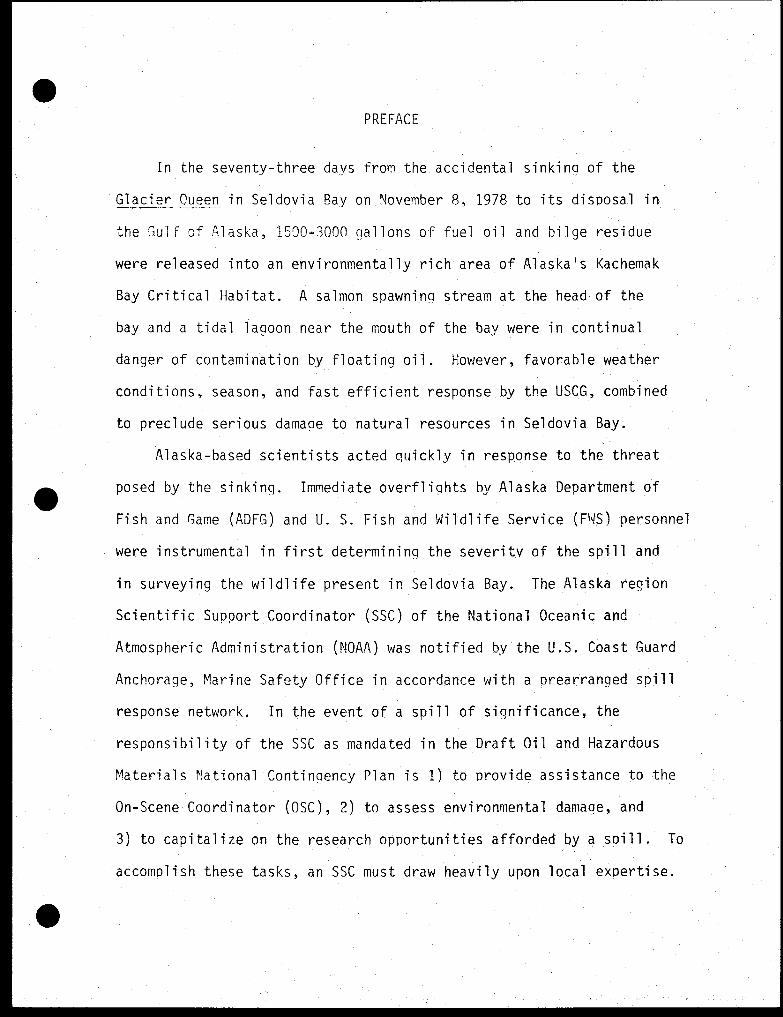
PREFACE
In the seventy-three days from the accidental sinking of the
Glacier Queen in Seldovia Bay on November 8, 1978 to its disposal in
the Gulf of Alaska, 1500-3000 gallons of fuel oil and bilge residue
were released into an environmentally rich area of Alaska's Kachemak
Bay Critical Habitat. A salmon spawning stream at the head of the
bay and a tidal lagoon near the mouth of the bay were in continual
danger of contamination by floating oil. However, favorable weather
conditions, season, and fast efficient response by the USCG, combined
to preclude serious damage to natural resources in Seldovia Bay.
Alaska-based scientists acted quickly in response to the threat
posed by the sinking. Immediate overflights by Alaska Department of
Fish and Game (ADFG) and U. S. Fish and Wildlife Service (FWS) personnel
were instrumental in first determining the severity of the spill and
in surveying the wildlife present in Seldovia Bay. The Alaska region
Scientific Support Coordinator (SSC) of the National Oceanic and
Atmospheric Administration (NOAA) was notified by the U.S. Coast Guard
Anchorage, Marine Safety Office in accordance with a prearranged spill
response network. In the event of a spill of significance, the
responsibility of the SSC as mandated in the Draft Oil and Hazardous
Materials National Contingency Plan is 1) to provide assistance to the
On-Scene Coordinator (OSC), 2) to assess environmental damage, and
3) to capitalize on the research opportunities afforded by a spill.
accomplish these tasks, an SSC must draw heavily upon local expertise.

In addition, an SSC must be prepared to alert scientists on-call through-
out the United States. Should a spill assessment require long-term
monitoring, specialists are needed to develo p a multi-discipline program.
The SSC, in cooperation with other agencies, initiated a program
of studies which provided advice for the OSC and became a foundation
for the identification and assessment of environmental impacts. This
report reviews those contributions of the science oriented govern-
mental agencies, as represented•by the Alaska region SSC, to the spill
response effort lead by the U.S. Coast Guard. Following a summary of
studies performed and generalized conclusions, a background section
briefly depicts the setting of the City of Seldovia. A cursory
scenario of events and the SSC study program are then introduced in
preparation for subsequent discussions of physical processes, geo-
morphology and oil behavior, biological character, and socioeconomic
ramifications.
SUMMARY
It is fortunate that despite the varied direct and indirect
repercussions throughout human communities, the biological trophic
structure was hampered little by the sinking of the Glacier Queen
and on occasion suffered only mild perturbation. Therefore, while
segments of society question past decisions or prepare for future
threats, the response of the ecosystem may be described and examined with
certain finality.
Visual daily monitoring of Seldovia Bay's marine and wildlife
populations indicated that life was not noticeably impaired although

some individuals of bird and crustacean groups probably perished as a
result of the pollution by oil. Eight water birds partially eaten and
frozen including one spotted with oil were collected within ten days
of the sinking. This correlated closely with the period of maximum
oil pollution and also with the period of most thorough visual obser-
vations. In one instance, a small number of helmet crabs were stranded
with oiled seaweed. These mortalities represent the only kills noted
during the initial month of scrutiny be NOAA personnel.
Planktonic, benthic, and intertidal sampling programs were established
as a first step towards damage assessment. Essentially no oil was en-
countered while sampling. In addition, life forms observed appeared
unaffected by the oil pollution. Samples were secured and will be
processed analytically if the need for a continued impact assessment
program is declared.
At the time of the spill, the physical processes within Seldovia
Bay were unknown. The dependence of boom de p loyment on familiarity
with predominent current patterns made acquisition of this information
a high priority for the SSC team. Flow predictions were initially com-
piled from observations of shore morphology, flotsam, and actual oil
and sheen transport. Tests with plastic drift cards and subsurface
current indicators supplemented this data.
As a gross generalization, surface transport of oil a p peared to
be controlled by the tidal currents except during periods of medium
to high wind velocity. Oil and debris were thoroughly flushed into
Kachemak Bay in calm weather. Wind and storm waves, however, deflected
oil and debris onto the shore. Winds through Seldovia Bay were typically
-3-

northerly or southeasterly due to effects of the surrounding tonography
Four oil trajectories were predictable depending on whether northerly
or southeasterly winds were superimposed on an ebb or flood tidal
current. Thus, for example, if a southeasterly wind occurred during
an ebb tide, floating oil would ultimately contact the western shore
of Seldovia Bay. Subsequent discussions on geomorphology consider
shore oilings due to the four combinations of the prevalent winds and
the tidal cycle.
As biological damage was slight and brief if at all, secondary
impacts to marine industries are not anticipated or credible. In
addition, inspection of vessels docked in the small boat basin noted no
oiling of craft other than those used directly in spill response. As
no comp laints have been received, it is assumed-that such damage t
property did not occur.
Undoubtedly, the most measureable consequence of the Glacier
Queen incident was the expense. Approximately 2.4 million dollars were
drawn from the National Pollution Fund, a public tax-supported emergency
cash fund. However, to understand the dollars-per-gallon ratio of this
spill, the value of the Alaskan environment must be kept in perspective.
Most of Alaska may be categorized as "pristine" and, consequently,
impacts on the environment from pollutants are far more significant
biologically as well as politically.
The response to the spill in Seldovia Bay consisted of two phases-
an initial learning phase and a subsequent o perational phase. The
learning phase which lasted a pproximately a week was essentially a trial
and error process. Many unknowns existed such as the design and cargo
-4-

of the ship as well as the tidal and current regime of Seldovia Bay.
Oil on the surface occurred in variable Quantities at unpredictable times
and locations. In the second phase during the remaining two months,
the incident resembled a salvane operation more than an oil spill.
Clean-up crews and Coast Guard personnel maintained a (holding pattern)
of minor oil pick-up along with daily monitoring, sup ply, and reporting
functions. The oil and sheen was commonly present in only trace
amounts. In fact, the small boat basin used extensively by commercial
fishin g craft, sometimes produced more of a sheen than the Glacier
Queen itself.
BACKGROUND ON SELDOVIA
Seldovia Bay is a narrow bay approximately five kilometers by one
kilometer bordered by mountainous terrain on the southwest side of
Kachemak Bay in lower Cook Inlet (Fi g ure 1). The City of Seldovia,
situated on the bay's northeastern shore (Figure 2), is accessible
only by small aircraft and boat.
Historically, Seldovia has been a prime location for commercial
fishing and trapp ing. Russian discovery followed by settlement in the
early 1800's lead to rapid exploitation and near erradication of the
local fur bearers (Becker, 1977). Fishery stocks survived and lured
American fishermen to the area after Czarist Russia sold Alaska in
1867. At the time of the 1964 earthouake, Seldovia had eighteen can-
neries and extensive wooden boardwalks built a gainst the sheer rock
waterfront (pers. comm., local resident). Complete devastation of
the town by the Good Friday earthquake necessitated construction of

Cape StarichkofWhiskey Gulch
?ANCHOR PT

Figure 2.
In aex map Seidovia.. Boy
LEGEND
C) Glazier Queen inside,
cont'aiI1 meet boom
Exclusion boom
— • — • — "Ccecui Ctleowy MI) boom
..... Abser6evt (worn
- a 3-

a new town.
Today, the tourism and timber industries are growing conspicuously
but fishing and seafood processing continue to dominate the local
economy . At the time of the spill in early November, tourism was
essentially non-existant and the population size was approximately
900. Timber clear cuts and log rafts were situated along the bay's
southeastern shore (Figure 2) and the crab fishery was pre paring for
the season's opening day on December 1, 1978.
INTRODUCTION
Chronology
The Glacier Queen sank on November 8, 1978 after approximately
one year of derelict and often mobile moorage in Seldovia Bay. The
ship was sole asset of the now bankrupt Blue Goose Corporation in
Homer, Alaska. The Glacier Queen - 253' length and 36' beam - was a
Navy Corvette class cruiser in the early 1940's. It was repeatedly
modified by several owners to serve first as a ferry and then as
a hotel-restaurant before it arrived engineless and gutted as a barge
in Kachemak Bay. It sank from unpumped rain water, hull leakage, and
wave slap into vandalized portholes. The sinking took place two weeks
after the Coast Guard had boarded the vessel and after a compliance
notice and request for action was mailed to the owner by the Alaska
Department of Environmental Conservation (ADEC).
The wreck was situated roughly parallel to the shoreline in an
upright position with only the rear third of the keel in contact with
the bottom. At a very low tide, the bow protruded four feet out of

the water while the stern was about eight feet below sea level. The
ship's bow rested in approximately thirty feet of water during the
higher tides. Stability of the vessel was questionable during the
first few days. While plugging holes which released upward streaming
ropes of oil, USCG divers detected considerable ship movement par-
ticularly at highwater. This uncertainty called for extreme caution
during operations as shifting of the vessel would threaten human
safety and perhaps cause additional pollution from the unknown quantity
of oil on the vessel. Eventually the ship was secured by sedimentation
and by settling of the shin into the substrate.
Immediate notification by the Coast Guard in Anchorage activated
many groups including their own Pacific Strike Team, a Navy salvage
expert, and the NOAA SSC. Crowley Environmental Services was contracted
to provide manpower and equipment. The Alaska Regional Response Team
(RRT) members from State and Federal agencies communicated frequently
to provide assistance and support on decisions to the USCG On-Scene
Coordinator. Remoteness - not excessive by Alaskan standards - com-
licated logistics and elevated the cost of equipment and personnel
movements. Variable weather, limited daylight, and powerful tides
often disrupted the initial containment and clean-up process.
The RRT recommended complete removal of the Glacier Queen from
Seldovia Bay for the following reasons. The designation of Kachemak
Bay as a Critical Habitat by the Alaska State Legislature in 1973
promped the State to buy back oil leases due to public concern about
the environmental sensitivity of the area. The wreck also posed a
hazard in navigable although isolated waters. Moreover, a worst-case
-7-

situation could develop if the wreck were left in Seldovia Bay. The
operation of the Pacific Pearl Cannery could have been seriously
affected and saleability of its products reduced.
Fred Devine Diving and Salvage Corporation was contracted to
refloat the sunken hulk with the aid of the Salvage Chief from
Portland, Oregon. After about five days en route, the Salvage Chief
set up operations adjacent to the hulk. Hard hat divers immediately
began sealing portholes, hatches, and other openings with a steel
plate, nut and bolt, and Neooreme rubber gasket technique that minimized
underwater welding . After seven weeks of tedious underwater operations,
approximately 40% of the main deck had been patched. Calculations
indicated at this time that air pumped into the sealed airspaces
would refloat the vessel.
During the night of January 9, 1979, raisin g of the vessel was
accomplished by pumping air into the various compartments. Numerous
air leaks were indicative of badly deteriorated hull plating. The
bow lifted first and gently pivoted on the stern. When the Glacier
Queen finally surfaced, minor oil and sheen comparable to those stirred
up by divers' activity were released. The area had been boomed so as
to minimize the impact to the environment in the event that the raising
■
broke the hull of the barge or released large volumes of oil. Due to
the extensive boomin g and thorough plannin g , therefore, work crews
were able to absorb most of the oil and only minor amounts of sheen
drifted into Kachemak Bay.
Before the raising, the Coast Guard had sought permission to
dispose of the Glacier Queen in the Gulf of Alaska. An ocean dumping
-8-

permit was granted by the U.S. Environmental Protection Agency (EPA)
to the ADEC who requested the permit for the Coast Guard. NOAA's
National Marine Fisheries Service and other RRT member agencies selected
a location in the Gulf of Alaska where sinkin g of the barge would not
threaten commercial fishery stocks of interfer with bottom fish and
crab harvesting operations.
High winds and rough seas delayed removal of the Glacier Queen
from Seldovia Bay. Finally on January 19, 1979, the Salvage Chief
towed the barge into position over an old military dump site west of
Cape St. Elias. Detonation of explosives sent the vessel to the bottom
of the Gulf of Alaska in 2,000 fathoms of water.
The Scientific Support Program
The NOAA Alaska Region SSC team reported to Seldovia on the morning
of November 9, 1978 with a chartered Cessna 206. The plane was retained
several weeks for overflights which were initially conducted at least
three times a day. A chart prepared for each fli g ht noted slick and
sheen positions, effectiveness and position of booms, and other indi-
cators of surface currents. Each chart was used by the OSC to direct
work crews to floating oil and areas of oiled shoreline. The charts
were taped in sequence to a wall at the Control Center. This series
provided a rough but effective documentation of the surface circulation
patterns in Seldovia Bay.
In addition to overflights, daily observations of the shoreline
in a Boston whaler loaned by the Alaska Department of Fish and Game
efficiently monitored the location and stranding of oil, oiled debris
and loose seaweed, and resource mortalities. Radio notification by

the NOAA field party from an oiled beach to USCG Spill Control allowed
rapid deployment of work skiffs to the freshly oiled, high priority
area. Immediate clean-up minimized beaching and subsequent spread
of pollutant by the chan g ing tide. By the third week, the daily oil
emmissions from the wreck caused primarily by divers had diminished to
two or three gallons. The morning overflight proved to be an efficient
tool for dictating which sections of bay should be inspected by the
whaler.
A major portion of the SSC study and sam p ling program was com-
pleted within the first two weeks of the spill. Samples of fresh oil
were taken from the water surface and from the ceilin g s of the ship's
boiler and en g ine rooms by USCG divers. The biological survey of
representative bay habitats and current studies were completed as
quickly as possible while the oil pollution was at its maximum level.
It became readily apparent that the most valuable information to be
collected each day for all parties concerned were: 1) aerial tracking
of the movement of oil on the water, 2) natural resource data, and
3) tidal and wind effects on surface circulation patterns. Tides and
limited visibility due to occasional had weather and less than seven
hours of daylight greatly restricted the scheduling of all scientific
activities.
Gradually, the physical and biological character of Seldovia Bay
was established. Reconnaissance of the shoreline and of the bay itself
revealed no apparent accumulation of oil. Attention was, therefore,
concentrated on an investigation of possible subsurface oil movement.
Permission was received from the Alaska Department of Fish and Game
-1 0-

(pers. comm., H. Keiser, ADEC) to deploy locally available dungeoness
crab pots in Seldovia Bay. Samples of crab body and gill tissue were
taken, but no oil in any form was observed on the surface of the crabs,
the pots, or ropes.
The Seldovia Bay scientific program along with results and specific
observations are reviewed in the following sections.
PHYSICAL PROCESSES
General Description of The Study Area
Seldovia Bay is small, lenticular, partially enclosed bay adjoining
Kachemak Bay (Figure 1). Physical oceanographic research in Alaska is
still scanning broad areas so that small secluded bays such as Seldovia
are largely unstudied except for tide table information and the nautical
chart series. Climate data is sparse as well. Synoptic wind data for
Homer (Appendix I) serves the region although local topography will
control wind conditions and often render Homer reports unrecognizable.
The steep mountains that border Seldovia Bay funnel winds along the
north - southeast axis of the bay and effectively block winds from
other directions. On one occasion during an overflight, this author
documented southeasterly winds (forming surface waves) in the valleys
east of Seldovia which were transformed by the topography of the area
to northerly winds in Seldovia Bay.
During the fall and winter at Homer, however, northeasterly winds
prevail, although there is a strong northerly comooment (Figure 3).
Winds are strongest during late summer to early fall. Tides for the
region are semi-diurnal with a pronounced diurnal inequality (Appendix


II; NOAA Coast Pilot, 1977).
Review of Previous Investigations
Several studies in Lower Cook Inlet applied current measurements,
ship movements, distribution of sediment and water properties, and
satellite imagery to plot surface circulation (Kinney, et. l., 1970;
Wright, 1970; Burbank, 1974; and Galt, 1976). These works showed that
relatively clear saline water flows from the Gulf of Alaska up the
eastern side of the Lower Inlet, while relatively fresh, silt-laden
water flows out of the inlet on the west side reflecting the effect
of coriolis forces. Burbank (1977) also conducted drogue and drift
card studies in Kachemak Bay during spring, summer and fall conditions.
This work identified two large gyres in the outer bay west of Homer
Spit (Figure 4). A clockwise gyre occures in the western half of the
bay and a counter-clockwise gyre occures in the eastern half. Figure
4 reveales that a portion of the clear saline Gulf of Alaska water turns
to the right and flows northeast along the southern shore of Kachemak
Bay. In turn, relatively fresh water containing a substantial river
sediment load, flows from the inner bay east of Homer Spit and moves
northwest or becomes incorporated in the gyres.
Burbank noted significant variations in the above described
surface circulation for outer Kachemak Bay. Apparently, the lunar tidal
cycle causes the gyres to change in size and shape, and the counter-
clockwise gyre may disappear entirely in the fall. In addition, the
surface current (7-8 cm/sec) and, consequently, the net flow associated
with the transport of Gulf of Alaska water are Proportional to the
tidal range. In other words, tides are swifter with a greater net
-12-

Figure 4
?Jet Surface and SubsurCtueareukcirion In Outer kachennalc Say
cren. Buri:G.►k

flow during Spring tides than during Neap tides.
During the first few days of the spill, the shear that forms
between the Gulf of Alaska and the turbid inland water masses was
observed running parallel to the south shore at a distance of ap-
proximately ten kilometers (Figure 5). Inshore of the shear, waters
were clear and blue; offshore waters were green in color indicating
a suspended load.
When several slicks drifted out of Seldovia Bay on November 9,
Dr. Gary Hufford - a Bureau of Land Management Outer Continental Shelf
(BLM OCS) staff member assistin g the SSC during initial spill response -
monitored transport until the slicks dissipated. According to Hufford,
a slick 50 m. by 6 m., the long axis trending north-south, was sighted
several kilometers northeast of Seldovia Bay and marked with plastic
drift cards. The marked slick was tracked revealing a net movement
of 6.5 km. in nearly 24 hours (Figure 5b). This avera ge speed of 7cm/
sec. in a northeasterly direction is in close agreement with Burbank's
measured current velocities.
In another instance, a cluster of small slicks with long axes
parallel to shore were observed near this shear about eleven kilometers
northwest of Seldovia Bay, Figure 5a shows that these slicks crossed
the shear and probably joined the clockwise gyre by drifting west about
three kilometers in approximately 24 hours with an average speed of
about 3.5 cm/sec.
The average winds recorded at the Homer Weather Station (Appendix I)
were from the southeast and the northeast at 18 to 8 miles per hour
for November 9 and 10, respectively. A general rule of thumb states
-13-

1 Flure. 5
Cool< (MLETKGelierAzdt- 13o-j stick Observations(perscmoi communt'coit;:v.,G.Huf-ford)
NoTe;KCAtEMAK 134y Eastern lire.
E---,_ 0.Ssurnin3 Rd( mode.die .---- "\
tts5 ito Nev. -- Ma
to Ow. / q Ijou.I53o *to Gi5
/4(1550
/ Slick stl,?.."
-a6-

that oil moves under the influence of the wind at about 3% of the
windspeed and, in the northern hemisphere due to the coriolis force,
at an angle 300 -60o to the right of the wind direction (Wright, 1970).
Application of this formula to the slick movements described above
indicates that the wind force had little effect on oil transport.
Apparently, the small, low relief oil patches were controlled by
normal surface circulation.
Hufford notes that these observations are in accordance with
data reported by Burbank. Behavior of the slicks indicates that both
gyres were well established at the time of the spill. Moreover, the
Glacier Queen sinking and the period of maximum oil leakage occurred
at the end of a Neap tide. Hufford speculates that the combination of
minimum current and net flow along the south shore of Kachemak Bay
initially slowed the movement of oil from and near Seldovia Bay during
the first days of the spill.
Physical Conditions in Seldovia Bay
The spill provided the opportunity to study the Kachemak Bay
system and re-examine past studies. It soon became obvious that
Seldovia Bay is a distinct system and the physical processes therein
had to be considered independently.
The processes that control water circulation also affect the
movement of oil in a similar manner. The surface currents were first
plotted from oil movement and features such as organic foam lines, the
sharp differences in water color at the shear zone in the upper bay
area, and beach morphology. As scheduling permitted, drift card studies
and two subsurface drogue investigations were performed to test and
-14-

refine the initial charting. See A ppendix III for specific details
regarding these studies.
Over two weeks, the wind and tidal forces affectina Seldovia
Bay remained fairly consistent. Predictive capabilities were based
primarily upon a matrix of the north-southeast winds expected due
to topography plus tidal currents. The four typical conditions
observed which appeared to characterize surface circulation patterns
are diagramed in Figure 6.
In 6a, northerly winds combined with a flood tide produced an
apparent gyre by Rabies Spit which resulted in oiling of the Dan's
Cove area on the southeast shore. Discharge from the Seldovia River
exerted a northward force which kept oil from the mud flats at the head
of the bay. In Figure 6b, southeasterly winds on a flood tide pushed
oil towards the western shore north of Rabies Spit. The opposing
forces of wind and tide tended to create choppy seas which accelerated
the dispersion of oil. In addition, during these conditions, Naskowhak
Lagoon was particularly susceptible to oil pollution due to the swift
flooding action occurring between the spit and the small islands at
the lagoon mouth. Conditions shown in Figure 6c, northerly winds on
an ebbing current, also produced choppy seas and a greater tendancy for
oil dissipation. Oil observed under these conditions generally approached
the north side of Rabies Spit or the area near the western tip of Powder
Island. Transport from these areas were variable and more difficult to
define. In the last case, 6d, southeasterly winds with an ebb tide,
often drove oil to the western shore where crenelated portions such as
T-boom beach concentrated the stranding oil. Ebbing currents, however,
-15-

Esture

would wash oil into Kachemak Bay if winds were not particularly strong.
Subsurface currents were not studied extensively and limited data
is available only for the area of the wreck. Based on two drogue tests
and daily observations, subsurface currents on both ebb and flood tides
appeared to be directed onshore southwest of the wreck. Once oil was
in close proximity to the shore, ebb and flood conditions transported
the oil north and south, respectively.
Observations and Discussions
USCG divers reported that oil leaving the wreck floated directly
to the surface. Although no oil was observed sinking, lateral subsurface
drifting over short distances did occur due to relatively strong sub-
surface currents. As it reached the surface, oil generally formed
pancakes no larger than 10-12 cm. in diameter. Sheen emanating from
the pancakes was easily spotted from the air whereas the small brown
oil patches were usually not visible from the air. Sheen, easily
visible from the air, was often very difficult to see from a skiff.
Despite a fairly constant emission from the wreck, there was no
accumulation of the pollutant on the water surface. Overflights
revealed successful boom containment at low tide. However, initially
during high tides, oil and sheen leaving the wreck often drifted clear
of the containment boom as the pollutant rose laterally to the surface.
Subsequent modifications of the containment boom size and placement
partially corrected this problem.
In accordance with resource protection priorities, immediate
action by the USCG concentrated on installation of the exclusion boom
(Figure 2) across the bay to limit oil transport up the bay and to
-16-

protect the mud flats and the salmon spawning stream. The exclusion
boom was in place by November 10 but on November 12, weather conditions
on an ebb tide broke and destroyed portions of the boom. The boom
was not reset immediately because adequate lengths of strong boom were
not available. When additional boom did arrive, a greater familiarity
with the general circulation and the influence of the winds led to
other priorities for deployment of the boom. In addition, it appeared
that the current from the Seldovia River kept oil away from the head
of the bay. Greater amounts of oil and different weather conditions
could have combined to impact this area, however.
The positioning of the exclusion boom subjected it to ebb currents
constricted by the projection of Rabies Spit. When the boom failed,
normal currents of 1-2 knots (pers. comm., Dr. Gary Hufford) had been
amplified by strong winds and the river outflow. It is interesting
to note that flooding waters did not appreciably stress the boom whereas
the receeding ebb tide did. This difference was due to the fact that
the bomm and the surface waters were merely elevated as the dense salt
water wedge flooded along the bottom of the estuary, displacing lighter,
less saline water while advancing inland. Bay water is largely mixed
by the time ebbing occurs. Surface waters then evacuated more quickly
by flowing downward as the earth's gravity maintains equilibrium
behind the passing tidal bulge.
Calculations with the cross-sectional area and tidal height for
the wreck position yielded a maximum tidal current in that location
of 0.5 knots, not including the forces of wind and the river outflow
(pers. comm., Dr. Jerry Galt, NOAA, Seattle). Behavior of the
-17-

containment boom around the wreck and enclosed oil indicated that this
was a fairly accurate figure. Thus, two areas within 1000 meters of
each other were observed to differ widely under similar environmental
conditions.
Oil In Ice
This section is more appropriately termed "sheen in ice" because
pollution from the wreck after the first day seldom summed to more than
several gallons a day. In any event, on several occasions, ice up to
one centimeter thick formed from the mouth of the Seldovia River
almost to Rabies Spit. Northerly winds helped to contain the ice
growing from the fresh water flowin g from the head of the bay.
As ice crystals collected and formed a slush, variable winds
herded ice around the upper bay area and helped to compact the slush
alon g shorelines where complete freezing first occured. Later, as
the tide receded, protruding rocks formed crater-like holes in the
settling ice layer. Sheen was observed to be concentrated in one of
these holes. Larger volumes of oil would also tend to seek such
openings in a similar situation.
Another feature observed was a swash-like sheen and emulsion
band which was pushed into the accumulating slush pack by the wind.
In a situation with greater volumes of spilled oil, the incorporation
of the pollutant in ice could facilitate collection of the oil by
crews positioned along the growing pack edge. Once frozen in ice of
this type, access to the oil "windrow" would still be possible by
work skiffs breaking through the thin ice.
-18-

Summation
The prevalent north and southeast winds superimposed on the tidal
ebb and flood currents identified four conditions which appeared to
typify possible surface circulation in Seldovia Bay during the late fall
of 1978. A matrix of diagrams showing the wind and tide combinations
revealed which shorelines could expect oiling. The predictive
capabilities afforded by this four-state model were fortunately not
tested under crisis conditions due to the limited amounts of pollutant
actually being released. However, experience of the first few weeks
which led to this systems description was applied in the deployment of
the U-shaped booms north and south of the wreck in preparation for the
raising of the Glacier Queen.
-19-

COASTAL l EOMORPHOLOGY AND OIL BEHAVIOR
-20-
Prior Research on Seldovia Bay Coastal Geomorphology
The advance of petroleum resource development into Lower Cook
Inlet necessitated a regional look at the inanimate processes which
regulate shoreline mor p hology. Coastal Morpholo gy and Sedimentation-
Lower Cook Inlet, Alaska by M.O. Hayes, P.J. Brown and J. Michel, 1977,
categorized the shoreline into various subclasses of erosional, neutral,
and depositional sedimentary environments. In addition, Hayes et al.
correlated previous oil spill field ex perience with shoreline types
found in Lower Cook Inlet. A one-to-ten "vulnerability" scale was
produced which ranked primarily the shore exposure to wave energy and
the susceptibility of shore morphology to oil contamination. By
this method (see Appendix IV), the least vulnerable category, (Class 1
strai g ht, rocky headlands, will quickly shed any oil that reaches it
in spite of the presence of a cushion formed by reflected wave energy.
On the other hand, the most vulnerable shorelines (Class 10), charac-
terized by protected estuarine salt marshes, will retain spilled oil
for 10 years. In this latter case, incident energy is too minimal to
aerate the deposit and dearedation must occur from unaided chemical
and biogenic processes.
Hayes et al, 1977 represents the most complete work to date which
touches upon geomorphologic conditions found in Seldovia Bay. Detail
for this specific area is understandably limited. A three person, team
investigated 1,216 km. of Lower Cook Inlet shoreline in 21 days (NOAA/
EPA, 1978). Additional increments of precision and detail would have

required disproportionately greater amounts of effort and time. The
sinking of the Glacier Queen, however, has provided the opportunity
to document in detail the reaction of a small bay environment to
minor but continual spillages of oil.
Discussion Format
The Seldovia Bay shoreline, as studied by Hayes et al 1977, is
presented below along with a more precise description of the study
area noting greater detail in the intertidal sedimentation. The pre-
dicted longevity of oil on various shores is discussed and, if necessary,
revised based upon observed examples of oil behavior.
Hayes' work is designed for the catastrophic spill that releases
massive amounts of oil adjacent to lengthy shorelines. Correlating
the Glacier Queen incident to a scale molded to fit a disaster is
admittedly precarious and misleading. This spill situation, however,
allows us to examine the applicability of the vulnerability index in
a small, contained and diverse estuarine system. The processes con-
sidered by the scale and the expected affinities of shore types to
oil were identified in Seldovia Bay. The estimated residency times
for oil on the different shore morphologies, however, had to be scaled
downward. In effect, ten or more years residency for a class 10
shore became one week or less for this spill in Seldovia Bay.
Morphologic Units in Seldovia Bay
Figure 7 is a composite of rock type and shoreline morphology
maps. Foothills of the Kenai Mountains surround the bay to the
south with variably metamorphosed Mesozoic/Paleozoic graywacke and
slate bedrock, and younger Triassic and lower Jurassic volcanics
-21-

Fi9u re 7
Rock Type cvewl Shore Mor-phoLogyC.c.oPm.pcxes; to mow, Rages 4 0_1. . 1577)
LEGEND - SWORE MORPHoLOGY(see Appetvint
Alb eros;cevLI ueeticsA scarps131a. neufrolerobalearounickinoosCd.a. deposdicroat labia far, Jetta.8 ex C2e c‘efosi-W000l iza.bolo spit
LEGEND - ROCK TYPE
Tv Lower Tomsfic.toCr olliomere.te.UMW' Tr it4.35 •COrCtOrtei eh eete tipper Triassic .agfpsoic14.1 taut..
5s I fnescsok eind Paleo3b4, • er-6-Ywo-gkscow& c.kart,timesfore,i bo.catt.

to the north. These rock types have eroded to near vertical scarps
with sand to boulder-bedrock intertidal beaches. Hayes et al. 1977,
differentiated four shoreline types which are outlined below. Refer
to Figure 8, Detailed Morphology and Sites of Oiling, during the
followin g discussion.
1) Seldovia River Delta
At the head of the bay, the Seldovia River formed extensive mud
flats. Sandy gravel channnels are visible at low tide. The river
appears to have projected narrow sand beaches and small spits along
the predominantly rocky upper bay shoreline. The Hayes study classi-
fied this portion of the bay as a depositional delta. Subclass
descriptions indicate that it is a lobate fan delta (Cla) with digitate
sediment lobes and low wave action which limits swash bar formation.
The area type was assigned a 6-8 vulnerability value but it was mapped
8-10 due probably to its sheltered position at the head of a lenticular
bay. Oil from the Glacier Queen never reached this area for reasons
given in the physical processes section.
2) East and West Shoreline Morphologies
North from the delta to the mouth of the bay, the eastern and
western shorelines were classed by Hayes as bein g neutral (stable),
embayed, and mountainous (Bla) dominated by steep valley walls with
some low erosional scarps.. Sand and gravel pocket beaches are common,
minor depositional scarps and deltas occur, and tidal flats are
abundant at very low tides. This geomorphological unit ranked an
8-10 risk classification because oil tends to stick to rough, some-
what sheltered, rocky surfaces, and deep penetration and burial in
-22-

bedrock scarpcobiste boulder
cobble, boelcier patches
sandy rave(50.44Mud Ctatshore-cai corkack
_Erre 8
erW !v_,; amore MDrph,01,01y av+4,•?•
Meijer. 5a-es oC Shore- Oa CortickeE

gravel is likely.
Secondary pollution from contaminated sediments was observed
in Seldovia Bay soon after the initial phase of the spill. The shore-
line southwest of the wreck was contacted by oil along the hightide
line on November 19. Stron g southeasterly winds on a flood tide
pushed about a half gallon of oil onto barnacled rocks. Maximum
thickness in the half-meter wide band of dark brown oil was 4-5 mm.
For a distance of approximately 120 meters to the north, a 1-2 meter
band of sheen was deposited on the sandy gravel beach. A heavy
rainfall on the 20th of November allowed the sheen to penetrate 12-15 cm,
a depth observed on the 21st. Hi g h tides during the following week
were lower than the previous week.
Subsequent visits noted no change to the oiled rocks but the
depth of penetration lessened daily, and, by the 24th, the beach sheen
had disappeared. This rapid dissipation is due to the effects of
typically low levels of humidity. Oil on the rocks was removed rapidly
after the 26th as high tides again rose higher than the strand line.
These rates of removal were observed on other shorelines receiving
trace to minor oil contact.
Sand and gravel beaches line the steep topography on the western
shore; whereas, the eastern shore consists of thickly wooded, rolling
hills and a mostly boulder-bedrock intertidal zone. This difference
in sedimentation indicates that strong currents sweep the eastern
shore, or that transported sediment never reaches the eastern shore
perhaps due to the coriolis force during flood tides and ebb tide
flushing in the main channel.
-23-

The dominant physical processes in Seldovia Bay distributed the
oil in a relatively characteristic fashion. The eastern shore, with
minor sand build-u p , was largely untouched by oil, but oil often
contacted and lingered on the western beaches. The wind-tide com-
binations described in the physical processes section a p peared to
drive oil either 1) to the rocky eastern shore south of Dan's Cove
(Figures 2 & 8) or 2) onshore west of the wreck and north of Rabies
Spit.
Oil which remained on the rocky eastern shore (case 1) after
manual pickup of oiled seaweed and debris disappeared within several
cycles of sufficiently high tides. Case 2, on the shore west of the
wreck, occurred when prevalent southeasterly winds produced relatively
persistant presence of oil blebs, 0.5 - 2.0 cm in diameter, and sheen
in the T-boom beach area (Figures 2 & 8). Oil was usually stranded
along the small crenulated segments of the western beach. The
orientation of the T-boom beach formed the greatest trap for floating
oil. This prompted deployment of an absorbent boom off the rock
point in the first days of the spill. This boom had a negative effect,
however, as it held oil and sheen against the shore instead of
letting it circle into and dissipate in open portions of the bay. That
area of beach grades from gravel sediment to bedrock cliffs (Figure 8)
indicatin g net erosion from a stacking up of water as currents flow
past the rock point.
3) Naskowhak Spit
Point Naskowhak and Naskowhak Lagoon form the western shore at
the mouth of Seldovia Bay. Mixed sand and gravel spits have connected
-24-

the Point and a lesser island outcrop to the bedrock scarps fronting
on Cook Inlet. This area, termed a tombolo spit (C2c), received a 4-6
vulnerability rating because the outer beaches face waves which build
up energy over long fetches in Cook Inlet. Burial of spilled oil
would occur but continual reworking of the sediment would lower oil
residency time to under one year. Station 37 of Hayes, Brown and
Michel's work, the station location closest to Seldovia Bay, was situated
along the outer beach southwest of Point Naskowhak. The outer beaches
of the spit were not oiled.
The lagoon and the inner shorelines were repeatedly polluted
during the first several weeks of the spill. Shoreline and substrate
types within the lagoon vary considerably. The tide floods vigorously
into the lagoon between bedrock islands and the southward projection
of the spit (Figure 8). The channel runs north along the mixed sand
and gravel spit projection, continuin g west along a broad silty sand
flat, and finally abraids in mud flats, a small salt marsh, and a
fine gravel beach on the western border. Bedrock scarps line the
south side of the lagoon.
By the above description, the lagoon is made up of several mor-
phologic units. When considering the area as a small, well protected
bay, however, the lagoon readily fits into Hayes' shoreline subclass
for tide-dominated depositional systems (C3b). This assigns to the
sensitive and biologically rich, low energy environment the 8-10
risk class signifying lon g term residency of spilled oil.
Actual oilings, however, revealed a brief residency period.
one incident, oil with sheen and emulsion washed into the lagoon on a
-25-

flood tide assisted by the easterly winds occurring during that time.
The oil, adhering to wood debris and loose seaweed, stranded quickly
on the western shore (Figure 8). The emulsion, a light brown, 2 mm
thick scum, remained floating in a small gyre in the west corner of
the lagoon. The oil, sheen, and emulsion remaining after manual
clean-up disappeared naturally within one to two days. Mild winter
weather, confined tidal flushing, and the high tides are probably
responsible for the rapid evaporation and dispersion of the oil.
Fortunately, oil transported into Naskowhak Lagoon did not impact
the marsh area found at the northern tip of intertidal shoreline.
This incident is of particular significance biologically. The
crab mortalities reported in the Summary occurred during this lagoon
oiling. Two partially eaten ducks, one with lightly oiled feathers,
were also found in the vicinity at that time. This same Naskowhak
Lagoon oiling is discussed in the Biological Observations section.
4) Northeast Shore Morphology
The area including Gray Cliff and the bedrock scarps found on the
east shore by the mouth of Seldovia Bay is the bay's fourth morphologic
unit defined by Hayes et al. (Alb). The vertical erosional shoreline
with a boulder-bedrock intertidal zone is considered to have a 2-4
vulnerability despite the possibility of oil burial by penetration.
No oil from the Glacier Queen was observed to contact this shore or
linger in the g eneral vicinity.
Summation
The classification of shore morphology and the determination of
oiling susceptability for each intertidal substrate type (Hayes et al.,
-96-
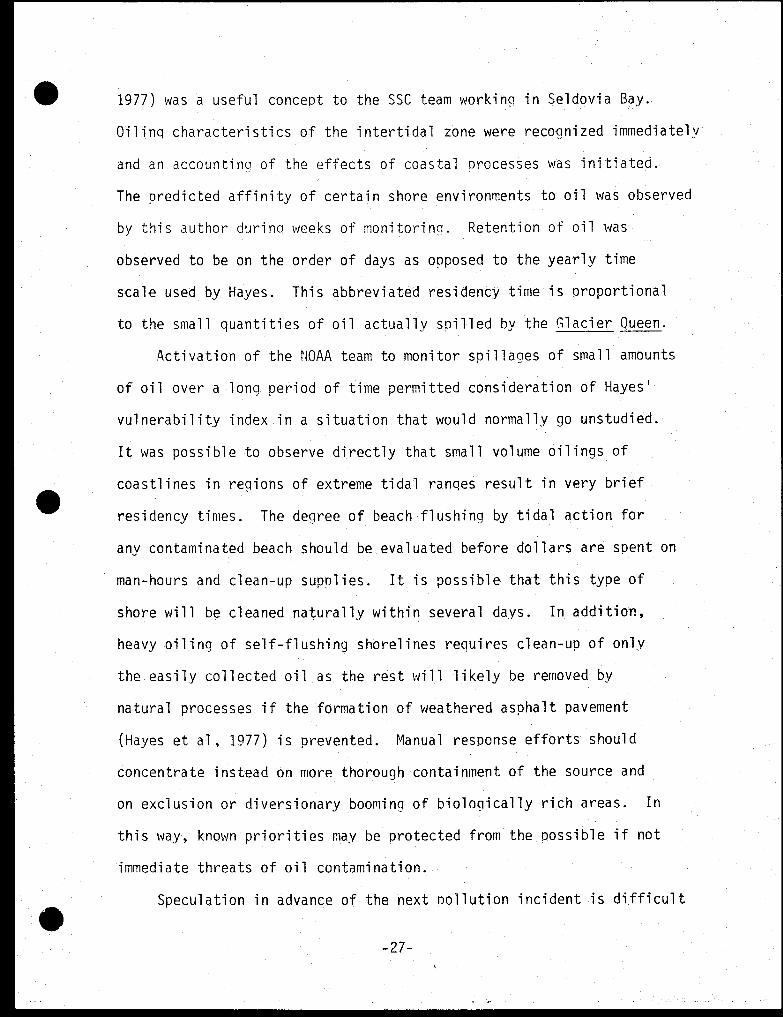
1977) was a useful concept to the SSC team working in Seldovia Bay.
Oiling characteristics of the intertidal zone were recognized immediately
and an accounting of the effects of coastal processes was initiated.
The predicted affinity of certain shore environments to oil was observed
by this author during weeks of monitoring. Retention of oil was
observed to be on the order of days as opposed to the yearly time
scale used by Hayes. This abbreviated residency time is proportional
to the small quantities of oil actually spilled by the Glacier Queen.
Activation of the NOAA team to monitor spillages of small amounts
of oil over a long period of time permitted consideration of Hayes'
vulnerability index in a situation that would normally go unstudied-.
It was possible to observe directly that small volume oilings of
coastlines in regions of extreme tidal ranges result in very brief
residency times. The degree of beach flushing by tidal action for
any contaminated beach should be evaluated before dollars are spent on
man-hours and clean-up supplies. It is possible that this type of
shore will be cleaned naturally within several days. In addition,
heavy oiling of self-flushing shorelines requires clean-up of only
the easily collected oil as the rest will likely be removed by
natural processes if the formation of weathered asphalt pavement
(Hayes et al, 1977) is prevented. Manual response efforts should
concentrate instead on more thorough containment of the source and
on exclusion or diversionary booming of biologically rich areas. In
this way, known priorities may be protected from the possible if not
immediate threats of oil contamination.
Speculation in advance of the next Pollution incident is difficult
-27-

because every spill scene requires a different strategy. The Glacier
Queen sinking, however, will hopefully provide some guidelines for the
next oil spill response in Lower Cook Inlet. While the description of
shore morphology by Hayes et al, 1977 serves an essential purpose for
the region as a whole, a site-specific assessment of coastal processes
is necessary in a spill for the OSC to direct response efforts efficient-
ly. In an area where even simple movements are logistically complicated,
accurate estimation of the self-cleaning potential of coastlines is a
money-saving asset.
-28-

BIOLOGICAL CHARACTER ASSESSMENT
Pertinent Information From Selected Literature
Studies of the ecological habitats and species distributions in
Kachemak Bay are recent additions to an otherwise limited source of
information on the area. Seldovia Bay itself has not been closely
examined and available references scarcely mention specific conditions
found within the bay. However, a review of regional generalities from
descriptive works on Kachemak Bay will present an accurate picture of
the ecological environments and assembla ges found in the spill area.
The biological assets of Seldovia Bay are only a small fraction of
the Kachemak Bay Critical Habitat.
When oil development progressed into Lower Cook Inlet during
the mid 1970's, outer Kachemak Bay was a designated lease area. In-
tensive research was initiated in many disciplines. Results of these
studies contributed to the growing awareness in Alaska of the real
value of the region's commercial and recreational amenities, and all
drilling activity was ultimately excluded from Kachemak Bay. The
Critical Habitat is considered to be exceptionally prolific and, to
date, nearly unblemished.
Environmental Studies of Kachemak Bay and Lower Cook Inlet (L.L.
Trasky, L.B. Flagg and D.C. Burbank eds. 1977) is a thorough evaluation
of the region's physical and geomorphological processes (cited above),
and also includes studies of eight significant biological components
and an intertidal hydrocarbon baseline survey (Appendix V). Volume I.
Impact of Oil on the Kachemak Bay Environment (L.L. Trasky, L.B. Flagg
and D.C. Burbank, 1977) summarizes the eleven research projects.
-2-

Volume I provided much of the information contained in the following
section.
Commercial and Visible Resources
Fisheries resources harvested by commercial fishermen in Kachemak
Bay are king, tanner and dunaeoness crab, Pandalid shrimp, five species
of Pacific salmon, halibut, and herring. Recreational fishin g also
contributes significantly to the local economy and subsistence fishing,
particularly of salmon species, is an essential way of life for many
people residing in the area. Seldovia Bay is important for moorage
and fish processing facilities which service the Kachemak Bay fisheries.
In addition, however, the Seldovia River has consistently been the
major pink salmon spawning-escapement stream in the region. The pink
salmon harvest constituted approximately 70% of the commercial salmon
catch from 1969 to 1976. Shellfish in Seldovia Bay are mostly limited
to small populations of dungeoness crab and various clam species found
abundantly in the lower intertidal flats on the western shore. These
resources attract only subsistance gatherers.
Marine birds use inner Kachemak Bay extensively for nesting,
feeding and overwintering sites. In addition, many species rest in
the area during the spring and fall seasons while migrating from
overwintering areas in temperate climates and breeding sites in interior
Alaska. The greatest concentration of birds in Kachemak Bay and Lower
Cook Inlet occurs during periods of seasonal migration. Seldovia Bay
waters are not considered to be particularly important as areas for
nesting and overwintering. However, feeding areas, especially Naskowhak
La goon and the head of the bay are known to attract large numbers of
-30-

marine birds. Bald eagles, a conspicuous predator along the bay
coastline, consume carrion of birds that succumb to disease or winter
starvation.
Marine mammals are found in moderate to high densities in Kachemak
Bay on a permanent or transient basis. Sea otters, in particular, are
attracted to the region for its abundant food supply and protected
nature. Seldovia Bay does not support concentrations of any marine
mammal although the highly mobile animals probably are present throu g h-
out the area. During the first month of the spill, only several indi-
vidual sea otters and one harbor seal were seen within the confines of
the bay. It is unlikely that these animals were affected by the
Glacier Queen spill.
Intertidal Habitats and Biological Assemblages
Detailed investigations and description of intertidal habitats
in Kachemak Bay were not undertaken until the mid- 1970's when the
Bureau of Land Management OSC- related oil development was initiated
in Lower Cook Inlet (Dames & Moore 1978). The three main biological
beach assemblages present in Kachemak Bay were identified as gravel,
sand and mud. Although Seldovia Bay itself has not been studied to
date, much can be inferred from the investigations of comparable inter-
tidal substrates in the region. A recent Dames and Moore publication,
Ecology of Unconsolidated Beaches in Lower Cook Inlet, provided most
of the information for the following discussion.
Gravel, cobble, and boulder beaches are prevalent throughout
Seldovia Bay. Cobbles and boulders also occur in patches, particularly
in the lower portion of low tidal mud flats of the gravel and sand
-31-

beaches. Concentrations of physical energy are responsible for the
distribution of the lar ger sediment sizes. Furthermore, tolerance to
energy regimes and physical conditions appears to be the major factor
controlling the resident biota. Coarse beaches, created by high
energy conditions, are normally quite impoverished. Amphipods and
isopods, the dominant organisms on coarse beach types, are most
abundant in locations where ground water pools form at the base of
the steep upper beach (Dames & Moore 1978). The cobble and boulder
patches visible on the flats exposed at MLLW support similar species
as well as barnacle and mussel populations which attach to the large,
normally stable rocks. Winter storms upset this substrate and re-
placement of annual species is typical. Predation on these organisms
is by shorebirds, mainly sandpipers, turnstones, and plovers, at low
tide and by diving duck, crab and fish species during higher water.
While the relative significance of predation in the winter season is
generally unknown, observations suggest that the dominant factor in
population control is the high energy level (Dames & Moore 1978).
Sand beaches are also subject to stresses from wave action and
temperature and salinity fluctuations. Winter conditions generally
cause a decrease in species diversity as well as abundance and biomass
which indicate winter termination of annual life cycle for most sand
beach org anisms. Dames & Moore report that sand beaches throughout
Lower Cook Inlet maintain roughly similar faunas which include primarily
polychaetes, gammarid amphipods, helmet crabs, and various clam species.
Dissimilarities between study sites reflect a strong de pendence on the
region's physical energy gradient. This gradient generally increases
-32-

from south to north due to more pronounced tidal currents, higher
turbidity, colder temperatures, lower salinities and more ice. Speci-
fically, the study found that polychaete worms decreased and the
exoskeletal crustaceans increased in importance to the north. Ex-
trapolation of this infaunal data to Seldovia Bay is not possible
without first studying Seldovia's sand beaches. Consideration of
the habitat's contribution to the regional foodweb, however, is useful
in determining the relative significance of sand beach productivity
during winter in the spill area.
According to Dames & Moore 1978, the predation cycle by shorebirds
and gulls at low tide, and by diving ducks and fish at high tide is
similar to feeding which occurs on gravel beaches. Food is thought to
be abundant to infaunal species and, therefore, competition within a
sand beach assemblage is considered secondary to physical stress in
selection. Physical stress concentrated at the sand-water boundary
results in relatively low diversity, biomass, and abundance parameters
for most surface-dwelling organisms. Fora g ing birds, thus, have
limited access to most of the infauna which is comprised primarily of
adult polychaetes. Characteristics and importance of fish and crab,
feeding on the submerged substrate are largely unknown. Scavenging
by birds, however, appears to be greatest during spring migration.
Even during spring migration, sand beaches are not extensively
utilized for the physical reasons discussed above and because of
availability of richer food sources in the mud habitats. Productivity
and, hence, usage of sand beaches, at least by birds, is further limited
in winter.
-33-

For these reasons, therefore, sandy gravel and cobble beaches in
Seldovia Bay were not considered particularly threatened during the
Glacier Queen s pill. The low volumes of oil released did not result
in damage to the food web structure because winter conditions normally
reduce the productivity in these ecosystems. A spring or summer spill
could impact one entire generation of or ganisms, reduce their abun-
dance, and consequently, produce a smaller food supply for higher
trophic levels in the following year.
Of shorelines studied thus far, it appears that soft mud sub-
strates are the most diverse and productive intertidal habitat in
Lower Cook Inlet (Dames & Moore 1978). Mud flat fauna react as do
organisms in coarser g rained beaches to changes in seasonal patterns
and weather conditions. High percentages of some populations,
especially those near surface of the mud are occasionally destroyed by
storm activity. In this environment, however, predation and competi-
tion for food and space are significant, and biological interaction
is on-going throughout the year. Spring bloom is marked by an abundance
of larval and juvenile forms, primarily Mya and Macoma, which totaled
90% of the wet biomass and dry tissue weight in the Dames & Moore study.
Organisms found to be of lesser importance included an echiurid, a
large polychaete, other clam species, crabs and barnacles. Competition
for space and food is keen among young organisms while predators
variably adapted for foraging on exposed or submerged flats continually
feed on the swollenspring populations. Selective predation by shore-
birds and divin g ducks ap pear to reduce the Mya and Macoma densities by
about 50% and 70% respectively. Other foragers, gulls and Dolly Varden
-34-

trout for example, are known to exploit prefered food supplies as well.
The importance of the mud flat assemblage to the Lower Cook Inlet
ecosystem is that it is the major food supply for many of the higher
trophic levels in the Inlet. The extent of dependence on the mud
habitat is best indicated by the intense concentration of life found
there throughout the year. Infauna appear to maintain an increase in
biomass well into the summer months (Dames & Moore 1978). Growth
then slows as winter darkness begins to limit the formation of plant
detritus. During spring and summer, birds, the most conspicuous
predators, capitalize on seasonal production. Durin g winter the birds
depend on and appear to be sustained by the mud flats. However, normal
life cycles, the effects of winter storm energy, temperature, and ice
combine to produce a nearly dormant state in the mud flat habitat.
Death by starvation and cold shock is common among bird populations.
Discussion on Biological Priority Areas
The preceding review of the region's three basic shore habitats
together with Figure 7, the detailed intertidal morphology, provide
an indication of the relative significance, of various portions of the
bay. In addition, Figure 9 shows known clam resources and areas of
observed utilization by birds.
These data indicated that several sections of the bay were
particularly biologically vulnerable. Three important features are
located at the head of the bay- the mouth of a salmon spawning stream,
a sandy mud delta which supports clam populations, and patches of
eel grass (Zostera Marina), a major source of the detritus energy
fundamental to the food web. Protection of this area from oil
-35-

LENDbirci Cee&v.5 areas
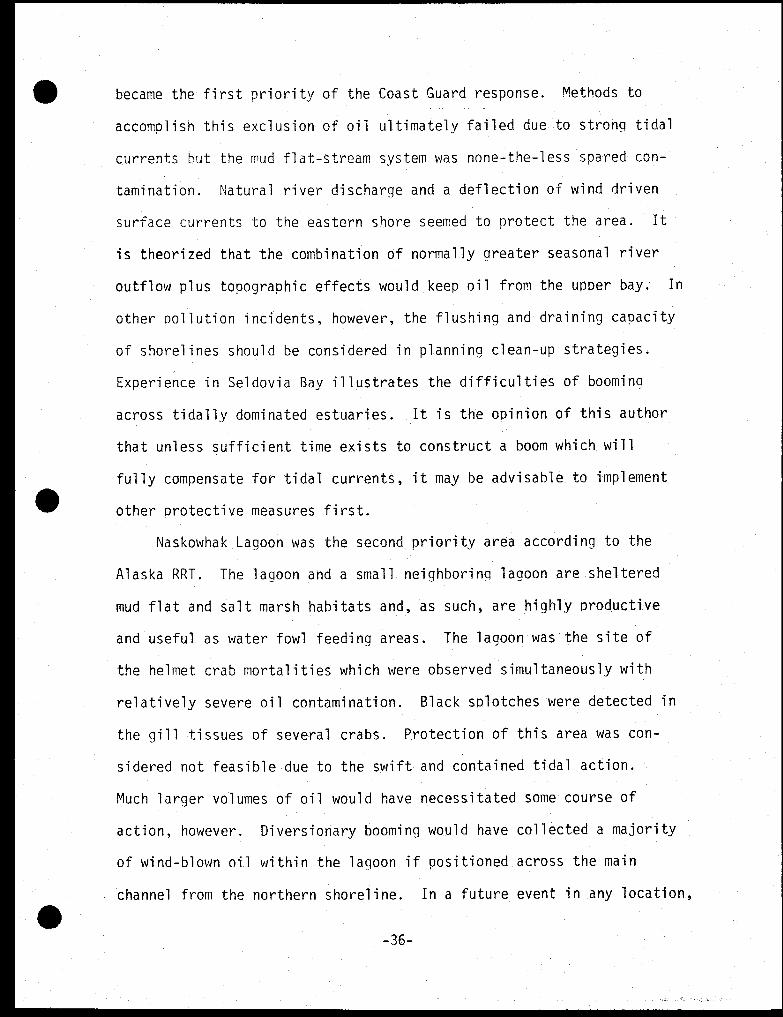
became the first priority of the Coast Guard response. Methods to
accomplish this exclusion of oil ultimately failed due to strong tidal
currents but the mud flat-stream system was none-the-less spared con-
tamination. Natural river discharge and a deflection of wind driven
surface currents to the eastern shore seemed to protect the area. It
is theorized that the combination of normally greater seasonal river
outflow plus topographic effects would keep oil from the upper bay. In
other pollution incidents, however, the flushing and draining capacity
of shorelines should be considered in planning clean-up strategies.
Experience in Seldovia Bay illustrates the difficulties of booming
across tidally dominated estuaries. It is the opinion of this author
that unless sufficient time exists to construct a boom which will
fully compensate for tidal currents, it may be advisable to implement
other protective measures first.
Naskowhak Lagoon was the second priority area according to the
Alaska RRT. The la goon and a small neighboring la goon are sheltered
mud flat and salt marsh habitats and, as such, are highly productive
and useful as water fowl feeding areas. The lagoon was the site of
the helmet crab mortalities which were observed simultaneously with
relatively severe oil contamination. Black s p lotches were detected in
the gill tissues of several crabs. Protection of this area was con-
sidered not feasible due to the swift and contained tidal action.
Much larger volumes of oil would have necessitated some course of
action, however. Diversionary booming would have collected a majority
of wind-blown oil within the lagoon if positioned across the main
channel from the northern shoreline. In a future event in any location,
-36-

placement of boom equipment in anticipation of likely wind conditions
would help prevent costly manual clean-up and preclude impacts to an
area extremely susceptible to long tern residency by oil.
The remaining sensitive habitat in Seldovia Bay is the area
along the western shore where mud flats are exposed at low water. This
substrate was found to contain very dense clam populations which
provide subsistence foods for humans as well as many important marine
species. Figure 7 indicates that this area is normally covered by
up to eight meters of water. Great volumes of oil would likely strand
on these flats but risin g tides would probably refloat much of the
oil off the typically non-oliophilic mud. Clam syphon holes however
would draw in oil, and death or fouling of these organisms would be
wide-spread. The difficulty is that the resources in this and similar
Lower Cook Inlet locations cannot be isolated by manual booming
techniques. It appears, in conclusion, that (conditions permitting)
concentrating response efforts on thorough, perhaps concentric,
containment booming of the pollution source may be the most effective
means to limiting a spreading threat of oil spills.
The SSC Sampling Program and Summation
The various studies undertaken by the NOAA Field team are pre-
sented in Appendix VI with a review of the various methods, procedures,
and observations made. Figure 10 shows the distribution of NOAA
sampling stations.
Sampling was initiated during the early stages of the spill when
oil was continually being emitted and while a sudden release of a large
volume was a real possibility. Several weeks later, it became apparent
-37-

LEGEND
beoftuC
clam sample
Ineimat crok sample
pkunkton towsCrest., oil samp(xs
-a 1 1 -
ELlcare 10
Thiotoctito-( SalmOirvi Sto:kov‘s-5scleta.ds - Appendix Ur

that the wreck emission would probably continue to be sheen and very
minor slicks stirred by the salvage operation. Since the spill damage
documented above is not significant and seasonal conditions at the
time of the spill precluded the possibility of any measurable impact.
it is unlikely that most samples taken will be analysed. Collection
of the samples was an essential act, however, in preparation for a
greater release of oil from the wreck. If that occurred, the SSC
would then have available crude but effective early baseline data for
the area. Fresh oil was sampled for the record and for "finger printing"
purposes, if necessary.
Biological sampling was conducted in areas either visibly impacted
by oil or in subsurface localities which would be affected by oil if
present. Intertidal grid sampling centered on a crenulate segment of
the western shoreline which was exposed to oil. Benthic grabs, plankton
tows, and water column samples were all positioned relative to the
apparent directions of tidal currents. Crab sampling stations also
depicted the motion of tidal currents past the Glacier Queen until
the absence of crabs redirected the deployment of pots.
Visual observations were performed daily by the NOAA SSC team
for three to four weeks. Availability of a science oriented person
on-scene, as discussed above, was a useful addition to the Coast
Guard response effort. Having a scientist present to monitor the
wildlife frequenting the bay and to watch for impacts to natural re-
sources permitted the Coast Guard to concentrate on clean-up activities.
Specific observations are discussed throughout this report. One
additional point concerns bird usage in the bay.
-38-

-39-
A complete survey of marine birds was undertaken during the first
days of the spill by ADFG and U.S. F+WS personnel (see re port in
Appendix VII). Approximately one hundred birds, predominantly white
win ged Scoters, Oldsquaw and Harlequin Ducks, were observed initially.
In the weeks that followed, NOAA and ADEC observers saw relatively few
birds. Apparently, human activity or perhaps normal overwintering
patterns reduced foragin g by birds in the area.
SCIENTIFIC RESPONSE TO OIL SPILLS IN HIGH ENERGY ENVIRONMENTS
Work by Hayes et al. in Lower Cook Inlet identified areas of
special concern based on the role of geomorphological processes during
an oil spill. That study provided the NOAA Scientific Support Team
with a valuable characterization of the physical conditions of
Seldovia Bay. The intertidal zones described and mapped by Hayes
et al., however, were found to be considerably more complex when
observed in detail during the Glacier Queen crisis. Lateral variations
and two vertical divisions - an upper and lower beach - were conspicuous.
Biological assemblages varied subtly in type and significance along
with the morphology and the physical environment. During the Seldovia
Bay spill, therefore, the geomorphological susce ptibility concept had
to be examined in detail together with known and observed biological
resource information.
Combination of the coastal morp holo g ic index and the relative
vulnerabilities of biological communities for Lower Cook Inlet is one
portion of a NOAA-funded study presently nearing completion. In
combining the disciplines of geology and biology, a new scale has been
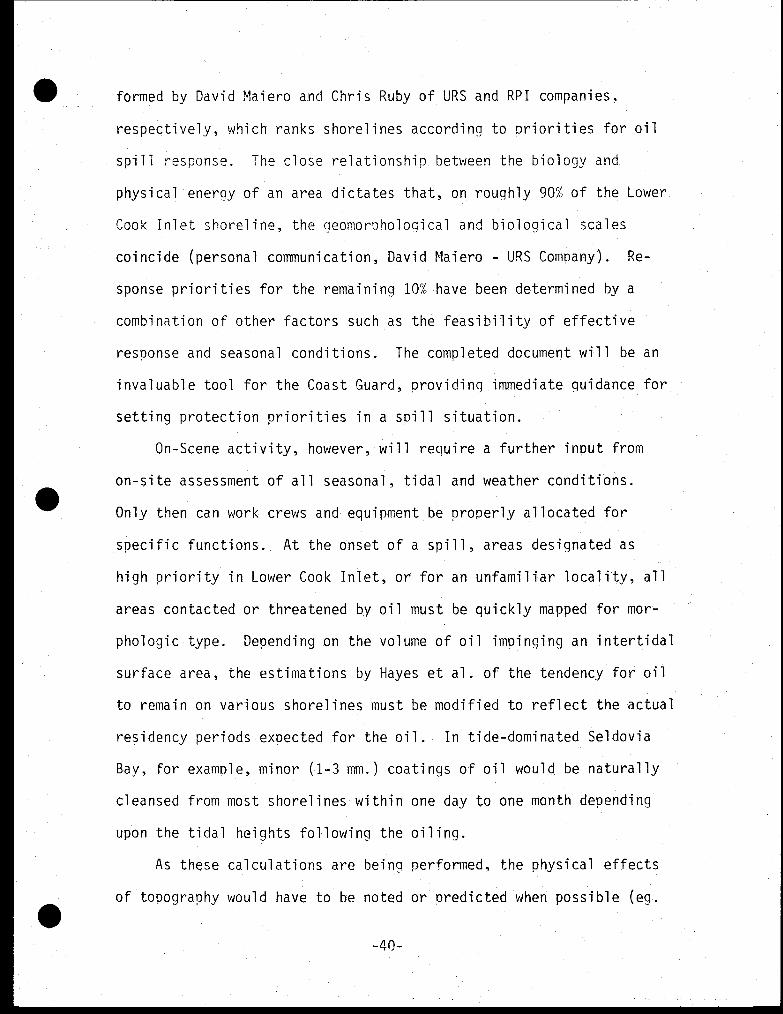
formed by David Maiero and Chris Ruby of URS and RPI companies,
respectively, which ranks shorelines according to priorities for oil
spill response. The close relationship between the biology and
physical energy of an area dictates that, on roughly 90% of the Lower
Cook Inlet shoreline, the geomorohological and biological scales
coincide (personal communication, David Maiero - URS Company). Re-
sponse priorities for the remaining 10% have been determined by a
combination of other factors such as the feasibility of effective
response and seasonal conditions. The completed document will be an
invaluable tool for the Coast Guard, providing immediate guidance for
setting protection priorities in a spill situation.
On-Scene activity, however, will require a further input from
on-site assessment of all seasonal, tidal and weather conditions.
Only then can work crews and equipment be properly allocated for
specific functions. At the onset of a spill, areas designated as
high priority in Lower Cook Inlet, or for an unfamiliar locality, all
areas contacted or threatened by oil must be quickly mapped for mor-
phologic type. Depending on the volume of oil impinging an intertidal
surface area, the estimations by Hayes et al. of the tendency for oil
to remain on various shorelines must be modified to reflect the actual
residency periods expected for the oil. In tide-dominated Seldovia
Bay, for example, minor (1-3 mm.) coatings of oil would be naturally
cleansed from most shorelines within one day to one month depending
upon the tidal heights following the oiling.
As these calculations are being performed-, the physical effects
of topography would have to be noted or predicted when possible (eg.
-40-

probable wind/tide currents or seasonal self- protection capabilities
of river flushing ). Simultaneously, the visible biological resources
would be mapped for compilation with the more generalized biological
data. Sociological implications and the locations of archaeological
sites if any may also require considerable attention.
This type of information assembled for the Coast Guard in advance,
if possible, or at the time of a s p ill allows the On-Scene Coordinator
to direct clean-up activities with full knowledge of site-specific
conditions. Expenditures of energy on low priority but lightly visible
oiled shorelines may not be necessary and could be wasteful. In Alaska,
where remoteness is apt to preclude timely mobilization, misdirected
manpower and equipment could result in inadequate protection of a high
priority biological habitat or resource. Response strategy should
first concentrate on the most significant portions of the ecosystem
to ensure that actual damages are limited and (wherever possible) that
potential "worst case" developments are anticipated and prevented.
With the cost of complete response rising continually, the day will
come when only the most significant biological resources will justify
clean-up expense and attract the attention of the Coast Guard. In
coastal regions with high levels of energy, the environment can be
left with the major role of dissipating visible concentrations of oil.
The scientific community and the Congressionally mandated response
structures must recognize and apply natural cleansing processes. The
Coast Guard can then concentrate funds on the containment and clean-up
of the source.
In order to keep oil spill clean-up costs at reasonable and publically
-41-

acceptable levels, a realistic ratio of cost and effect must be main-
tained. The scientific community can provide guidance in carrying out
cost effective clean-up operations by helping the OSC establish
environmental priorities.
CONSCLUSION
Due to quick and efficient res ponse actions by the U.S. Coast
Guard, Seldovia Bay was spared significant or even detectable damage
from spilled oil. Well placed booms and responsive clean-up crews
removed most of the oil from the environment before any detectable
impact did occur. Seasonal factors also p layed an important role in
the protection of Seldovia Ba y . November through January is known
to be a relatively dormant period for many biological species. For
example, salmon were not spawning in Seldovia River at the time of
the spill.
In a situation with greater volumes of oil spilled onto the bay,
tidal waters, to pographically controlled wind patterns, and the con
tinuous flushing action of the river would again assist with the
clean-up and protection response by the Coast Guard. Containment, the
most effective action for preventing spill damage, and cost effective
clean-up will always be challenging learning ex periences in regions
of extreme tidal ranges. The U.S. Coast Guard, assisted by the Regional
Response Team, was prepared for any situation of development that might
have occurred. Fortunately environmental conditions and a dwindling
source of pollution averted potentially disasterous p ilings of sheltered
and sensitive habitats. A combination of factors, therefore, produced
-42-

-43-
no negative socioeconomic impacts on the area.
The Glacier Queen sinking should not he considered a typical
scenario but hopefully the incident will serve to alert and prepare
policing and regulatory groups for what might happen again if pre-
vention is not emphasized in the future. As a necessary and unavailable
training exercise, the spill was an informative ex perience for the many
response organizations. Other s p ills in remote environments will incur
sizable outlays of money, and in all probability, response will be
tempered by this reality. In many situations, the energy inherent
in tidally dominated or ex posed coastlines will naturally dissipate
oil pollution, thereby, reducing governmental response efforts.
Reliance upon environmental processes is justified scientifically.
Documented observations of the Seldovia Bay incident and other spills
will help concerned and responsible government organizations. The
importance of this guidance will be future money saved during larger
spills. A rational and consistant perspective will make possible a
long lasting preservation and protection of the environment.

REFERENCES CITED
Becker, E.A., 1977. A Treasury of Alaskana. 183 0o. Bonanza Books,New York, New York.
Burbank, D.C., 1974. Suspended Sediment Transport and Deposition inAlaskan Coastal Waters. M.Sc. Ihesis, University of ATTMT---Institute of Marine Sciences.
Burbank, D.C., 1977. Circulation Studies in Kachemak Bay and LowerCook Inlet. 207 pp. Volume III, Environmental Studies ofKachemak Bay and Lower Cook Inlet. (L.L. Traskey, L.B. Flagg,and D.C. Burbank, eds. ) Alaska Department of Fish and Game.
Dames & Moore, 1978-. Ecology of Unconsolidated Beaches in LowerCook Inlet. 183 pp. Prepared for The National Oceanic andAtmospheric Administration Outer Continental Shelf EnvironmentalAssessment Project Office, Juneau, Alaska. Job no. 6797-010-20.
Galt, J., 1976. Numerical Studies of Alaska Region: Annual Report.Prepared for: The l Oceanic and Atmospheric AdministrationOuter Continental Shelf Environmental Assessment Program, RU no.140, Juneau Project Office, Juneau, Alaska.
Gundlach, E.R., and Hayes, M.O., 1978. Investigations of Beach Processes.98 pp. Prepared for: National Oceanic and Atmospheric Admin-istration/Environmental Protection Agency Special Report. TheAMOCO CADIZ Oil Spill a preliminary Scientific Report. April1978. U.S. Government Printing Office, Washin g ton D.C., 20402.
Hayes, M.O., Brown, P.J., and Michel, J., 1977. Coastal Morphologyand Sedimentation, Lower Cook Inlet, Alaska. 107 pp. Volume II,Environmental Studies of Kachemak Bay and Lower Cook Inlet, (L.L.
Traskey, L.B. Flagg, and D.C. Burbank, eds.) Alaska Departmentof Fish and Game.
Kinney, P.J., Button, D.K., Schell, D.M., Robertson, B.R., and Groves,J., 1970. Quantitative Assessment of Oil Pollution Problems inAlaska's Cook Inlet. Institute of Marine Science Report, R-169,
University of Alaska. 116 pp.
National Oceanic and Atmospheric Administration. National Ocean Survey.United States Coast Pilot 9, Eighth Edition, January 1977.
National Oceanic and Atmospheric Administration/Environmental Protection
Agency, 1978. The AMOCO CADIZ Oil Spill a preliminary ScientificReport. April 1978. U.S. Government Printing Office, WashingtonD.C., 20402.
-44-
Traskey, L.L., Flagg, L.B., and Burbank, D.C., 1977. Impact of Oil on the Kachemak Bay Environment. 123 pp. Volume I, EnvironmentalStudies of Kachemak Bay and Lower Cook Inlet, (L.L. Traskey, L.B.Fla g g, and D.C. Burbank, eds.) Alaska De partment of Fish and Game.
Wright, F.F., Sharma, G.D., and Burbank, D.C., 1973. ERTS-1 Observa-tions of Sea Surface Circulation and Sediment Transport, Cook inlet, Alaska. Prepared for: Sym posium on Significant ResultsObtained form the Earth Resources Technology Satellite -1, NASASp-327, March. 1315-1322 pp.
-45-

-1..Local Climatological Data .."-cot,
OMONTHLY SUMMARY
OEGREE DAYS HEATHER TYPES sAAN. RRU. SH• COYER
TEMPERATURE * F BASE Es. ON OATES OF ICE PRECIPITATION STATION WINO SUNSHINETENTHS
OCCURRENCEI TOG
•ot,s
PRWhir
ERRS-Nat 0
FASTESTAILS
2 vrtav v. sou3 ,ftuN0(6906H
,,, c„. HATER ,.. g
.- o.
0
r - ..• ICY PELLET,s Haft$ Otaff
GROUNDat
DRAM
EQuiva . ICE - -
LEN, (LEY. .
..' L' 2
E- _
; i6. 1s il
7 ON3TSTON.6 MAE. RAU IN.
IN IN. FEET
m.s.,. 11' ..1-,1i' 1-6 g .7, .=
9 OLOAING 5401.1
I 2 3 4 5 5 70 7E1 8 9 10 12 13 14 IN 17 18 19 20 21 22
1 29 33 25 4 33 20 1 0 .34 T 29.05 05 4.3 8.1 02 24 1 10 1
2 16 30 33 1 29 32 1 0 .25 1.1 29.45 28 5.3 7.6 12 26 1 10 2
3 36 20 28 -4 25 37 1 1 .04 T 20.54 OS 9.5 11.9 22 14 I 8 3
4 AO 32 36 4 33 29 1 1 T T 29.30 08 5.1 8.1 18 15 9 4
56
4038
3131
3635
54
3028
230 1
.0.; 28.6728.93
0426
6.311.2
8.513.2
1821
0325
11
1010
56
7 36 24 30 -1 23 35 T 29.76 02 3.0 5.5 10 03 4 7
8 31 18 25 -5 19 40 0 30.43 04 6.6 6.9 14 07 6 8
9 42 30 36 6 28 29 T 30.45 15 0.1 10.5 18 13 0 9
10 39 33 36 6 31 29 T 30.17 05 2.3 4.0 8 06 1 10 10
11 36 26 31 2 2E1 34 0 30.21 06 7.7 7.8 12 06 7 11
12 ' 39 33 36 7 33 2 30.19 04 4.0 4.0 9 05 1 10 12
13 36 26 31 2 27 34.10
30.15 05 6.9 7.5 13 08 5 13
14 32 23 28 -1 17 37 0 30.02 05 7.2 8.9 21 07 0 14
15 27 13 20 -8 7 45 O 29.06 06 9.5 10.5 17 OS 0 15
16 28 10. 19. -9 7 46 0 30.14 06 5.2 5.6 10 05 1 16
17 33 18 26 -2 19 39 0 30.45 07 10.8 11.5 16 08 1 7 17
18 40 30 35 8 28 30 T 30.59 11 6.2 9.8 16 20 1 10 18
19 42 37 40 13 25 T 30.45 18 4.1 6.9 17 18 1 10 19
20 38 33 36 9 29 .04 9 OS 1 10 20
21 45. 35 40 13 38 25 1 .60 29.66 22 4.1 8.6 21 28 1 10 21
22 41 30 36 10 31 29 0 29.58 28 2.6 6.2 21 22 5 22
23 32 21 27 1 22 30 0 29.70 04 6.2 6.5 12 07 0 23
24 30 20 25 -1 19 40 1 .03 . 29.62 04 4.1 5.2 12 02 6 24
25 42 25 34 8 30 31 1 .17 29.40 09 9.2 12.1 29 10 1 10 25
26 44 37 41. 16 35 24 1 .76 29.09 09 13.3 14.1 24 08 1 9 26
27 41 32 37 12 33 28 I .10 29.01 07 .9 7.6 1S 22 1 9 27
28 39 25 32 7 29 33 .05 29.48 21 .6 6.3 25 25 1 5 28
29 36 25 3 7 34 I' 29.75 03 1.9 3.1 9 05 9 7 29
30 38 22 30 6 26 35 1 .26 29.66 09 7.9 10.1 21 09 9 7 30
SUM SUM - TOTAL TOTA TOTAL TOTAL FOR THE MONTH, TOTAL % Sum Sum804 - 989 0
.....NUMBER OF GAYS 2 .79 1.4 29T 10 FOR 223 213
1115
AUG. , AVG. AVG. DEP. AUG. DEP. DEP. PRECIPITATION DEP. - DATE, 25 mu.. AvG. AVG.7.4 7.1
'moo.
37.2 26.8 32.0 -120 0TO DATE
; .01 INCH 13SNOW. ICE PELLETS
0.03
NURSER OF DAYSSEASON
TOTAL TOTAL 0 1.0 INCH 1 GREATEST IN 24 HOu S ANO OATES GREATEST DEPTH ON ORO NO OF OK.
maXINUM TEMP. MINIMUM TEMP. 2943 0 THUNDERSTORMS 0 PRECIPITATION SNOW. ICE PELLETS ICE PELLETS OR ICE ANO DATE
70 * - , 32 * < 32 ' 0 ' DEP . DEP. HEAVY FOG 0 .791 25-25 1.1 2 1 I 9+
0 6 23 0 -342 0 CLEAR 5 PARTLY CLOUDY 6 CLOUDY 19
CO
O
rn
• EXTREME FOR THE MONTH - LAST OCCURRENCE IFMORE THAN ONE.
T TRACE AMOUNT. ALSO ON AN EARLIER DATE. OR DATES.HEART FOOT - vISIBILITY 1/4 MILE OR LESS.FIGURES FOR WINO DIRECTIONS ARE TENS OF DE-GREES CLOCKAISE FROM TRUE AORTA. 00 CALM.DATA IN COLS. 6 AND 12-15 ARE BASED ON 7 OR
MORE OBSERVATIONS PER DRY AT 3-HOUR INTERVALS.FASTEST MILE MIND SPEEDS ARE FASTEST OBSERYEDONE-MINUTE VALUES NNE. DIRECTIONS ARE IN TENSOF DEGREES. THE / w/Tm THE DIRECTION INDICATESPEAK GUST SPEED.ANY ERRORS DETECTED MILL BE CORRECTED AROCHANGES IN SUMMARY DATA HILL BE ANNOTATED INTHE ANNUAL SUMMARY
NOVEMBER 1978
HOMER. ALASKA
NATIONAL WEATHER SERVICE OFC
MUNICIPAL AIRPORT
LATITUDE 59' 38 N LONGITUDE 151' 30 T NELEVATION !GROUND!
63E1 • STANDARD T IRE USEOT ALASKAN
WARN 925507
SUMMARY BY HOURS
AvERAGES RESULTANTMIND
TEMPERATURE ,... 0
*5 :$- ... t ....- g = -
02 6 28.74 31 30 26 80 7.2 06 2.3
05 6 29.75 32 30 26 80 8.4 06 3.3
08 7 29.77 31 29 25 78 7.8 07 3.211 8 29.79 34 32 27 76 7.0 06 4.1
14 7 29.77 36 33 20 75 9.0 08 4.217 7 29.76 33 31 27 77 9.5 09 3.6
20 7 29.76 33 31 27 80 8.5 06 5.2
23 7 29.74 32 30 27 61 7.1 06 4.2
HOURLY PRECIPITATION (WATER EQUIVALENT IN INCHES)
-- 6-HOUR ACCUMULATIONS.
w A. 71 HOUR ENDING Al A. M .HOUR ENDING AT
i 2 3 4 5 5 8 9 10 - 11 I.2 1 2 3 4 5 6 7 8 9 10 121 .02 .01 .07 T i2 .26 .18 .03 .02 2
3 .01 .02 34
4 .02 75 7 .01 5
6 .02 T T 67
78
7 8
99
10 7 T 7 T 1011
11.06 12
12 13113 .04 1414 1515 1616 171718 T 18
19 T T 19
20 1" T T 20
21 .07 .38 .12 7 21
22 .072223
23 .03 242425 T .12 25
26 .07 .02 .39 .31 26
27 .02 .02 .07 .01 27
28 .0528
29 7 29
30 7 30
SUBSCRIPTION PRICE. $2.55 PER YEAR INCLUDING ANNUAL SUMMARY. FOREIGN MAILING $1.85 E TRA. SINGLE COPY, 20 CENTS FOR MONTHLY OR ANNUAL ISSUE. THERE
IS A MINIMUM CHARGE OF $2.00 FOR EACH ORDER OF SHELF-STOCKED ISSUES OF PUBLICATIONS. MAKE CHECKS PAYABLE TO DEPARTMENT OF COmmERC . NORA. SENOPAYMENTS. ORDERS. AND INQUIRIES TO NATIONAL CLIMATIC CENTER. FEDERAL BUILDING. ASHEVILLE. NORTH CAROLINA 20801.
I CERTIFY THAT THIS IS AN OFFICIAL PUBLICATION OF THE NATIONAL OCEANIC ANO ATMOSPHERIC AOMIN/STRATION. AND IS CO mPILE0 FROM RECORDS ON FILE AT THE
NATIONAL CLIMATIC CENTER. ASHEVILLE. NORTH CAROLINA 28801.
.F6aEAL2-, 7;(4,Wnoaa NATIONAL OCEANIC AND ENVIRONMENTAL DATA AND
ATMOSPHERIC ADMINISTRATION // INFORMATION SERVICE DIRECTOR. NATIONAL CLIMATIC CENTER

10 25 1210 25 12
10 um. 3010 25 3010 SO 15
10 16 14
10 21 7
10 21 •
to 25 12
10 15 12
30150 30
100 3046 1231 12
/0 70 12
IC 33 7
/a 45 1255 20
7 UNL 30
2 QM. 30VW_ 30
0 UNL 120 UAL 12
10 55 1210 25 12
10 2E1 30
10 33 3010 30 5020 30 158 30 15
10
10 12
10 17 78 30 /2
10 15 207
301841. 30UHL 30
0 UNL 150 UPS. 20
0 UNL 12UNL 12UNL 30
303 UNL 30
3 UM. 12
0 UM. 12UNL 12
10 50 12
10 28 1210 55 3010 50 30
10 38 3010 38 1210 31 12
5 UPS. 121 US'. 127 UhL 30
00 303
20
2 UNL 123 UML 122 UNL 12
UNL 1210 30 12
6 50 2010 55 30IC 50 3010 25 12
10 20 12
10
12
10 25 12
40 16
7
1 UTIL 200 UNL 30
2 UNl 301 UML 30
5 UNL 12UNL 12
DAY 07
AY 13
AY 16
AY 18
DAY 22
AY 25
A
Ay 28
02
05
De
111417
20
23
02OS
08
1114
2023
02
0500
1114
17
20
23
02OS
0811
2023
02
0508
1114
20
23
02
OS
06111417
20
23
02OS08
Ii14
2023
0205
0811
1917
2023
02
OS013
Ii1917
20
23
02
05
0811
1720
23
•
OBSERVATIONS AT 3-HOUR INTERVALSv1St-
ilt 1/.
RATuRE ISO I'S'-bill''
16 P t ROTC 14 p RAWRE ISO
• •
C
•
DAY 02 DAY 03
361 35 33 09 09 10 8 40 /2 36 34 30 70 24 10 5 ,L 12 27 26 23 85 08 6
361 35 33 89 06 10 21 7 35 33 31 85 36 5 3 ,L 23 23 21 92 03
331 33 32 96 08 10 10 /2 SF 31 32 30 89 24 5 30 PO 20 17 86 04 6 NOTES381 36 34 86 05 6 10 28 3 SF 33 32 30 89 26 8 10 /10 30 29 27 24 82 03 4
181 37 35 89 36 • 10 7 32 30 85 28 6 10 30 30 34 30 23 64 5 16 CEILING33 31 83 03 5 10 20 7 33 32 30 89 26 /0 25 5 5 35 32 27 73 le14/
26 35 34 92 24 5 9 20 7 5 31 31 28 02 33 4 10 12 4 WSF 33 32 30 89 08 le
151 33 311 85 30 10 28 12 31 29 25 78 02 5 ID /8 2 36 35 33 99106 /0
DAY 05 041 06
36 34 3: 9227 8 la 55 12 18 36 33 82 08 6 10 50 12 31 31 30 96 27
35 34 32 6909 8 10 20 12 38 35 30 73 06 11 10 35 12 37 35 31 79 25 1 ° WEATHER23 32 31 9204 4 10 23 30 38 35 31 76 04 6 10 36 20 30 34 27 65 24 16
37 35 35 02 05 3 10 20 15 37 33 27 67 03 14 10 28 30 17 33 25 62 26 12 • TORNADO
38 37 36 93 07 9 10 30 8 37 14 29 73 05 12 /0 25 20 5 37 34 30 76 24 14 I INUNOERSTORM
32 32 30 4205 6 10 23 6 5 35 33 30 82 25 6 /0 27 12 35 31 64 24 0 SQUALL39 37 35 06 11 7 10 11 6 A 36 34 31 82 00 0 10 35 12 5 34 32 26 79 33
It RAIN42/ 361 30 68 11 11 IC 50 12 12 32 31 96 35 9 10 23 5 SF 34 32 29 82 02 4
69 RAIN 5800E65
DAY 08 DAY 09 IR FREEZING RAIN
13 12 29 85 34 4 0 UNL 12 26 24 18 72 03 5 7 150 12 12 29 22 67 04 4 L DRIZZLE
72 30 28 85 04 4 0 UNL 12 24 23 19 81 02 4 4 ,L 12 36 39 29 76 25 6 IL FREEZING DRIZZLE
32 29 22 67 13 4 2 UNL 30 21 19 12 68 08 5 9 /6L 30 3e 26 62 la 10 5 SNOw
35 30 21 57 08 5 UNL 30 30 28 17 58 05 9 7 100 30 40 35 29 65 16 12 sp 5500 PELLETS
36 32 23 59 34 7 10 200 30 31 28 20 69 05 5 10 33 30 40 35 28 62 12 12 IC ICE CRYSTALS30 20 22 72 00 0 8 UNL 12 27 25 17 68 04 5 9 90 15 38 35 29 70 17 19
SW SNOw 5404ERS2524
24al
2114 66
6535
04
6
8
10 150
10 /SO1212
DAY II
29
29
27
27
22
23
75
780305 7
4610 33
12
12
DAY 12
3817
35
35
3132
7682
13 a7
SG SNOw GRAINS
IP ICE PELLETSmAIL
37 34 29 73 ID 33 12 35 31 30 82 06 10 10 28 /2 36 33 20 76 04 F FOG
35 32 27 71 07 5 UML 12 30 29 27 89 06 6 10 70 12 35 34 32 09 03 3 IF ICE FOG
37 34 30 76 00 UHL 30 20 27 24 85 05 7 10 90 30 34 32 29 62 04 5 OF GROuND FOG
37 15 32 82 0 UNt. 30 35 32 27 73 06 4 10 BO 30 36 14 32 85 OD 0 eo OLONING DuSt
39
16
37
34
341 82 0732 s
25
2830
15
36
36
33
33
28
29
76
760507
88
10 46JO 23
30
IS
39
37
3736
3935
82
9202 303 6
ON BLUING SANDes BLUING SNOW
35 34311 82
31 85 30 28 15 35 33 30 82 04 10 20 7 36 36 35 96 5 88 8106I60 SPRAY35 39 221 89 07 5 28 12 35 31 3/ 85 07 7 10 IS 7 35 35 35 100 0 0
S OPPOSE
m NAZE
36 35 35 96 04 3 UNL /5
DAY 1423 22 16 74 36 UNL 12
DAY 1524 21 55 12 0 OUST
34 33 30 95 09 6 UKL 15 29 27 22 75 10 14 UNL 12 24 21 Oa 53 06 10
34 23 31 e9 04 7 UNL 30 23 21 15 71 03 8 NL 30 21 18 08 57 07
34 32 29 02 04 8 UNL 30 30 27 21 69 04 7 UNL 30 26 22 08 46 07 9 19160
35
303327
29
20
79
66
ae
08116
Unl
UNL
30
12
12
25
2722
20
12
61
58
0803 10
Kt
,NL
30
15
27
21
2212
06
/0 62
05 25
04 8 DIRECTIONS ARE THOSE FROm
20 25 19 69 05 6 UNL 12 24 21 11 58 01 6 NL 15 17 19 00 47 07 8 wHICH TNE wIND 81000. 1601-
27 26 22 81 01 5 UNL 20 23 21 15 36 UNL IS 14 12 03 61 36 3 CATED IN TENS OF DEGREES
FRum TRUE NORTH: I.E.. 09
DAY 17 DAY /IS FDA EAST. 18 FOR SOUTN. 27// 10 02 67 00 0 UNL 12 19 17 07 SO 04 7 ID 25 12 33 31 28 75 06 7 FOR NEST. EhTRT OF 00 IN12 10 02 69 04 UNL 12 22 20 13 68 02 10 20 12 34 31 26 73 05 ImE DIRECTION COLumN 1801-10 09 03 73 05 5 50 20 25 23 18 75 07 12 10 28 30 36 32 25 67 10 5 CATES CALM.23 20 08 52 10 8 200 30 28 26 21 75 08 13 10 38 30 38 34 20 70 06 7
27 2. 15 61 00 0 45 30 33 29 24 70 07 8 10 33 30 40 35 27 60 11SPEED IS E8PRESSE0 IN KNOTS,
23
2020
20
1718
1007
10
57
57
65
03
05
05
4
9
384595
121212
32
31
10
29
2928
23
2324
6972
78
08
0608
19
9
10 38
10 2810 25
301212
39
4039
353635
292929
676567
20 1914 la12 7
muLT/P0 EIT 1.15 TO CONvERT
TO MILES PER mOuR.
DAY 20 DAY 21
39 36 31 73 le 15 10 23 6 RF 40 38 37 89 12
39 35 28 65 10 5 10 28 12 9 42 40 38 86 17 7
39 35 29 67 19 6 10 17 /5 34 33 32 92 03 3 10 30 12 41 37 76 /8 /9
39 35 29 67 07 10 /0 15 38 37 36 93 09 4 10 25 6 RF 43 41 39 86 20 5
42 38 30 63 19 10 60 30 37 37 36 96 03 8 10 30 15 40 40 40 100 26
40 37 33 76 00 10 60 12 34 14 33 96 06 4 10 20 12 90 39 38 93 06
37 35 32 82 01 10 70 12 35 34 32 es 00 0 8 33 12 43 42 41 93 27 8
10 28 12 36 35 33 89 08 8 10 23 12 41 39 37 86 26
DAY 23 DAY 24
40 36 32 73 24 17 UNL 12 26 26 25 96 04 4 UHL 12 21 20 16 81 03 5
30 37 35 89 24 8 UHL 12 25 25 24 96 04 6 UNL 12 20 18 1/ 66 05 7
39 32 30 85 04 UNL 30 25 24 20 81 02 5 UNL 30 20 18 12 71 02
35 34 33 92 36 3 UNL 30 3/ 29 26 82 04 6 45 30 25 21 17 72 07 4
37 13 73 00 0 UNL 30 32 29 24 72 07 a 35 30 30 28 24 78 16
33 32 30 89 02 8 UNl 12 26 24 21 81 01 4 20 6 SF 28 27 24 85 04 4
35 32 29 79 35 5 UNL 12 24 22 10 78 03 8 12 SF 28 27 25 89 00 0
31 30 28 09 00 0 UNL 12 22 21 10 88 01 4 25 12 20 27 24 85 03 4
DRY 26 DAY 27
27 26 24 ee 07 3 6 50 12 38 37 36 93 04 5 10 30 12 41 37 31 68 35 6
28 27 25 89 05 6 10 33 12 42 38 32 68 10 9 10 23 12 37 38 34 89 34 3
28 27 25 89 35 10 25 12 A 43 40 36 76 09 10 28 12 37 36 35 42 06
33 31 28 82 36 4 /0 2/ 8 9 43 90 36 76 09 14 10 28 12 38 37 36 93 07
40 36 3/ 70 13 6 10 20 4 AF 40 38 36 86 10 20 10 10 4 qe 38 37 36 93 27
42 36 33 71 /0 23 10 10 4 RF 40 38 35 82 Ca 18 10 40 22 39 36 32 76 22 13
40 30 35 62 09 25 10 10 6 41 38 35 79 10 10 5 UNL IS 35 34 32 89 13 3
41 38 35 79 19 9 10 SO /2 40 37 33 76 03 5 10 30 12 33 32 30 09 06 8
DAY 29 DAY 30
36 35 13 09 04 3 7 200 12 26 26 24 92 5 UNL 12 26 25 24 92 02 3
39
383635
33
30
7973
22
23
15 10 70
10 981220
29
132031
2628
8982
0600
4
0US!.NL
12
30
24
28
2426
2124
ea85
OS 605
38 26 12 79 00 3 10 45 30 39 32 30 85 00 UNL 30 30 29 28 85 05 5
3730
3529
3227
02
89
0706 5
95
3 Uhl2012
36
33
3531
33
29
8985
00
30 4
90
60
30
12
30
38
28
34
25
27
8265
06 514 IS
20 27 25 89 01 6 0 UM. 12 25 24 21 05 06 6 15 ASP 35 34 31 es 07 15
25 25 23 02 00 0 13 4 ASP 37 35 32 82 12 13
STATION TEAR 8 NOWN
HOMER ALASKA 78 11
U.S. DEPARTMENT OF COMMERCENATIONAL CLIMATIC CENTERFEDERAL BUILDINGASHEVILLE. N.C. 28801
AN EQUAL OPPORTUNITY EMPLOTERPOSTAOC RNO PEES PAID
U.S. OEPARTMEHT OF COMMERCE
COM-210
FIRST CLASS
-b3-

TEMPERATURE • FDEGREE OATS
BASE As•
WEATHER T YPESON GATES Of
NC*.ICE P.Ec 1.1 T., ta
avG.STATION WINO SUNSHINE
SA, OVEOVERTENTHH6
OC,uRRENEE m...ov
g wAff• so.p.••Es-
SIFTa
. r
F ASTES T
TOG.V. fat'
O,,
R o._r .- CI """'""/ Pflif , S S.O NOu .u .CO l y ' f - i '''
'
`^
e._
1.
a ..
awnOustsToemSn.f • ..tfBONING SNOW
pe ,
.
,,,,,
TN
...=
IN.7
FEE,M.1 .1. ii. z .,
-
c, 6 . r
3 4 5 5 7A 79 8 9 10 II 1 2 13 14 I5 16 IT ,8 19 20 21 22
41 32 37 13 32 28 1 .37 7 29.18 09 3.0 5.6 14 09 9 10 1
2 38 33 25 12 28 29 0 I 0 .23 T 20.69 29 11.3 20.7 31 25 10 10 2
3 35 32 34 11 22 31 0 0 29.48 26 19.5 19.6 31 25 5 5 3
4 41 11 26 13 32 29 .16 T 29.96 19 .7 6.0 12 24 10 9 4
5 43 33 38 15 35 27 .09 T 30.23 03 1.8 6.0 12 19 10 10 5
6 45 36 41 18 36 24 .64 0 20.62 03 4.8 6.6 17 06 10 10 6
7 49. 40 450 22 36 20 .24 0 29.21 11 7.0 10.6 18 07 9 10 7
R 42 35 39 17 33 28 .10 0 29.21 09 5.7 6.3 14 08 10 9 8
9 38 33 36 14 31 29 1 .29 T 29.35 21 7.6 13.2 32 24 10 9 9
10 37 25 31 9 24 34 1" T 28.60 20 3.2 10.4 16 25 5 4 10
11 37 24 31 9 28 34 1 .61 .2 29.47 09 8.4 11.7 21 09 10 9 11
12 36 32 34 12 28 31 1 .13 .4 28.87 05 9.3 9.8 21 01 10 9 12
13 33 25 I 29 8 27 36 1 9 T .08 .8 28.71 28 4.7 9.4 29 27 10 9 13
14 26 B I 17 -4 11 48 9 T .02 .1 29.42 30 8.3 11.9 27 25 1 3 14
15 18 9 14 -7 2 51 1 0 29.71 03 7.4 8.1 14 01 3 3 15
16 19 9 140 -7 2 51 T 0 30.12 03 6.2 6.9 13 03 9 6 16
17 30 16 27 6 24 38 1 T .10 29.42 12 2.5 9.5 20 14 10 10 17
18 33 14 24 3 20 41 1 7 .35 3. 29.23 02 1.8 4.5 9 07 7 6 18
19 33 20 27 6 21 38 2 9 4 .35 5. 29.29 26 5.0 9.4 29 26 9 9 19
20 32 24 28 7 20 37 7 0 29.54 26 8.8 10.5 18 26 9 7 20
21 27 5. 16 -5 B 49 7 0 29.58 05 6.7 7.2 9 04 2 3 21
22 32 8 20 -1 21 A5 2 9 7 1.02 9. 29.01 04 5.2 6.9 21 04 10 8 22
23 30 20 25 5 22 40 1 9 12 .02 . 29.12 25 19.1 21.3 30 25 9 9 23
24 23 13 2 1 44 12 0 29.90 27 13.0 16.6 32 27 1 24
25 31 13 2 2 43 1 12 T 21 22 9 5 25
26 28 14 21 1 17 44 10 0 30.26 05 5.5 6.3 9 04 10 8 26
27 38 23 31 11 24 34 10 0 30.16 05 5.1 5.3 13 IC 9 9 27
28 40 34 37 17 29 20 10 1 29.98 09 7.9 9.6 25 08 10 10 28
29 41 32 37 17 32 28 10 .02 29.05 14 5.2 8.1 23 09 9 9 29
30 42 38 40 20 25 10 T 29.91 09 14.7 17.1 23 00 10 10 30
31 41 36SUM
39-
19-
25TOTAL IOTA
1TO Or TOTAL FOR THE MOAT
21MI
11TOTAL 7.
10SUM
10SUM
31
SUM1093 747 - 1088 0 NUMBER OF DA 5.00 20. 1 32 27 FOR 255 239
AVG. AVG. A G DEP. AVG. GEP• DEP. PRECIPITATION DEP. ------ - - - DATE' 24 •efillt 005Y AvG.8.2
WAG.
7.735.3 24.1 29.7 -264SEASON TO DATE
.01 INCH 19SNOW. ICE PELLETS
2.71 ------ - --I-
NUMBER OF OA YS TOTAL TOTAL • 1.0 INCH 3 GREATEST IN 24 YOU 5 AND DATES GREATEST DEPTH ON GROUND' OF SNOW.
AIINuN TEMP. MINIMUM E P 4031 0 THUNDERSTORMS 0 PRECI PI A 10 SN w. ICE P ELLE T S ICE PELLETS OR ICE AND DATE
'" ° 32 ° DEP. 0 P MLA FOG 2 1.031 22-.23 9.7 22-23 14 J 22
. 0__0 22 0 -605 0 CLEAR 4 PARTLY CLOUDY 3 CLOUD, 24
Local Climatological DataMONTHLY SUMMARY
53F1. STANDARD TIME USEOF ALASKAN WORN 425507
Q14:00 1 0 F
45
471E50
DECEMBER 1978
HOMER. ALASKA
NATIONAL WEATHER SERVICE OFC
MUNICIPAL AIRPORT
LATITUDE 59 • 38 N LONGITUDE 151. 30 r W ELEVATION IGROUNO:
3rn
• E.TREME FOR THE MONTH - LAST OCCURRENCE IFPORE THAN ONE.
T TRACE AMOUNT• ALSO. ON AN EARLIER DATE. OR DATES.elEar. FOOT - .15181/Air 1/4 MILE OR LESS.FIGURES FOR WINO DIRECTIONS ARE TENS OF DE-GREES CLOCKWISE FROM TRUE NORTH. 00 v CALM.DATA IN COLS. 6 AND 12-15 ARE BASED ON 7 OR
MORE OBSERVATIONS PER. DAY AT 3-HOUR INTERVALS.FASTEST MILE WINO SPEEDS ARE FASTEST OBSERVEDONE-MINUTE VALUES AMEN DIRECTIONS ARE IN TENSOF DEGREES. THE / WITH IRE DIRECTION INDICATESPEAK GUST SPEED.aN y ERRORS DETECTED WILL BE CORRECTED ANDCHANGES IN SUMMARY DATA WILL BE ANNOTATED INTHE ANNUAL SUMMAR.,
STATION CLOSED ON THE 24TH. 2100 LST TO THE 25TH. 0600 LOT.
NATIONAL CLIMATIC CENTER. ASHEVILLE. NORTH CAROLINA 28801.
noaa NFT/ONAL OCEANIC ANO ENVIRONMENTAL DATA AND ./ /Ale
ATHOSPAERil ADMINISTRATION / INFORMATION SERVICE DIRECTOR. NO T IONAL CLIMATIC CENTER
SUMMARY BY HOURSAvERA GES RESULTANT
WINO
TEMPERATURE
a 26 -.' .
02 29.52 29 27 23 78 9.2 35 1.2
05 29.51 31 29 24 78 9.5 36 1.4
08 29.53 30 28 23 76 9.3 36 1.5
11 29.56 32 29 25 77 10.5 17 .8
14 29.55 32 30 26 78 12.1 14 .2
17 29.57 31 29 24 78 9.8 36 1.2
20 29.58 30 27 23 76 10.3 02 1.4
23 29.55 29 27 22 76 9.8 03 1.2
HOURLY PRECIPITATION (WATER EQUIVALENT IN INCHES) 6 - HOUR ACrUMuLATIONS.
R. M HOUR ENDING AT P. m HOUR ENDING AT
I 2 3 I 4 5 6 7 8 9 10 II 12 I 2 3 4 5 5 7 8 9 10 II 8
1 .33 .20 .10 1
2 T .05 .18 T 2
3 3
4 .01 .15 T 4
5 .03 5
6 .15 .37 .05 .10 6
7 .05 .22 7
8 .02 .00 8
9 .02 .12 .15 9
10 T 10
11 .06 .41 11
12 .24 .02 1 12
13 .01 7 .03 13
11 .07 14
15 15
16 16
17 T .07 t 17
10 .06 .32 18
19 T .03 .29 19
20 .03 20
21 21
22 .01 .80 .21 22
23 .01 .01 T T 23
24 24
25 T 25
26 26
27 27
28 1 T 28
29 .02 29
30 T 30
31 11 .08 .10 T 31
SUBSCRIPTION PRICE/ 12.55 PER YEAR INCLUDING ANNUAL SUMMARY. °REIGN mAI NG •i.85 E IRA. SINGLE COPT. 20 CENTS FOR mONTHLT 00 ANNUAL ISSUE. THEREIS A MINIMUM CHARGE O F 42.00 FOR LAC. ORDER OF SHELF-STOCKED ISSUES Of PUBLICATIONS. MARE CHECn$ RATABLE. TO DEPARTMENT OF COMMERCE. NOAA. SEND
PAYMENTS. ORDERS. ANO INQUIRIES TO NATIONAL CLIMATIC CENTER. FEDERAL BUILDING. ASHEVILLE. NORTH CAROLINA 28801.
I CERTIFY THAT THIS 15 AN OFFICIAL PUBLICATION. OF THE NATIONAL OCEANIC AND ATMOSPHERIC ADMINISTRATION. AND iS COMPILED FROM RECORDS ON FILE a' 'ME

OBSERVRTIONS RT 3-HOUR INTERVRLS
CD
SILI,yE44ERA,URE 9)50 2151.
OIL1,,RAM!: 0250 r151-
91,11*
2( RAtuR ISO
° 5?rai • ,9! • 9,901 •
047 01 DAY 02 DAY 0302 10 12 7 9 38 36 33 02 13 10 15 12 36 33 29 76 04 12 3 ,62 12 33 26 27 52 252305 10 30 12 41 38 34 76 13 7 10 12 7 37 35 32 82 05 /5 25 12 33 30 24 70 26 23
oe 10 25 12 16 15 34 92 20 10 35 15 36 33 29 76 01 17 25 12 32 28 19 59 25 18 NOTES11/4
10 25IC 18
3030
3735
1634
339.
es96
2205 5
1010
12
SF95F
3434
3333
3131 es
892828
7/0
5 UNL3 UN).
2030
3333
2820
2017 552 ;2:2 1: CEI L ING
17
2010 BO10 50
3012
3332
3232
3:11
6296
0405
55
10 2510 10
1212
3535
3111
2425
6467
2626
2527
3 2NL6 30
3012
3233
2930
2125
6472
28 1527 le
982. IW102(12 .4,100
23 IC 2:3 13 22 20 82 07 10 33 12 34 31 26 73125 25 7 33 15 35 13 30 62 26 /0
040 04 DAY 05 DAY 06
02 6 80 12 34 32 30 85 10 12 33 32 30 e9 06 10 12 12 37 36 35 02 14 4
05 10 28 12 11 29 26 82 06 9 10 25 12 36 35 34 92 05 10 17 12 38 37 35 09 34 5 WEWTHERoa 10 le 15 34 32 26 73 02 9 10 28 30 37 36 35 92 30 7 19 le 12 3e 37 35 86 01 5
10 15 7 9 32 37 15 86 24 10 7C 30 30 37 36 93 05 3 10 35 30 2 39 37 35 05 00 0 • TORNADO
74 10 29 30 9 37 37 16 95 05 IC SO 20 38 37 35 89 23 7 10 38 ID 39 36 36 89 30 3 ThuNDERSToRm17 6 BO 12 40 37 33 76 20 7 10 20 12 RS 39 30 36 ea 36 5 10 40 12 3e 38 37 96 36 7 0 SQUALL2023
7 268 40
1225
4128
3826
3433
7 662100
26 70
10 1610 23
712
99
3739
3737
3634
9582
0513
66
10 4010 35
1215
9345
4041
3636
7668
07 to07 12 R RAIN
Rm 202118 5609E05
OAY 07 DAY 023 DAY 09 2R FREE2I040 RAIN
02 10 30 12 41 41 38, 93 03 /0 60 12 39 36 33 79 00 0 26 12 36 35 34 92101 6 L DRIZZLE
05OS
8 .510 25
1212
4649
4241
37 7s37 76
0717
1610
10 355 46
1210
2832
3636
3332
e276
0010
06
30 1212
3736
3535
3333
8509
09 1013 9
IL FREEZING 081111E5 54011
11 10 35 30 42 40 37 03 09 10 35 30 20 38 35 02 07 6 5 2 AS, 35 34 32 80 23 20 sp 5800 PELLETS
14 e SS 30 4] 40 36 76 10 10 19 15 42 38 34 73 09 12 22 IS 37 35 31 79 19 24 /C ICE 07151SL527 8 55 15 40 39 36 06 15 5 10 15 12 40 38 35 82 14 6 30 IS 38 35 31 76 20 12
Sw SNOw 5409E052023
10 33:0 33
/212
4242
3938
3534
7673
1815
713
10 352 Ur,
1512
3635
3433
3130
8262
0805
35NL
/212
3736
1432
282.
7062
25 924 13 SG SNOw GRaINS
IP ICE PELLETS
DAY /0 DAY 11 CAY 12 A HAIL
02 40 17 36 31 22 57 24 12 UNL 12 26 25 21 01 04 5 33 12 33 33 32 06 OS F FOG
05 ust. 12 35 30 21 57 26 12 7 90 12 31 28 23 72 06 6 SO 12 33 32 30 89 06 4 IF ICE FOG
C8 2.26L 12 35 31 23 62 20 22 ID 90 15 36 32 26 67 IS 23 12 34 32 29 02 08 OF GROuNO FOG11 9 um: 30 36 32 25 64 25 10 33 20 37 33 25 62 14 18 IC 80 20 13 31 27 79 04 10 00 ELOwING OUST
24 5 45 30 36 32 26 67 18 10 /0 10 RS; 35 14 12 es 07 14 /0 45 30 35 32 27 73 05 11 EIN SLUING SaNO17 33 12 32 31 30 92 06 5 10 10 5 R5F 34 33 32 ea Os 12 10 28 12 35 32 26 70 05 9 85 BLUING SkOw20 IS 28 27 23 82 05 10 10 12 7 9 36 35 33 89 14 ID 15 12 34 31 25 70 02 10 87 EILOwING SPRAY23 0 etc. 12 25 2. 22 88 05 10 7 3 ASF 33 33 32 96 04 10 28 7 32 29 25 75 07 13
9 5804E
02DRY 1
10 12 32 20 27 82 12 6 1 0 17 5DAY 14
55 25 29 21 85 25 24 1 NL 12DAY 15
10 09 02 70 03 6
N NstE
0 OUST05 10 38 12 20 30 28 92 08 5 10 35 12 26 25 23 08 29 21 5 50 12 15 19 07 70 01 •0011
3 UNL10 25
30 2530
2429
2320 92
0132 4
UNL3 umL
2030
2122
1818
1010
6260
3.31
5 6 506 Us).
2530
15IS
/313
0406
6167
0202 -5, WING
172023
10 2010 1210 2810 8
153 SF
5F5S
31313131
30302929
28292525
88927078
00052627
011825
0 UNL0 uNL0 uNL3
10121212
23171209
191411DB
1106OS03
60627576
32020104
8755
1 U N).3 UN'.0 UNL0 UNL
30121212
10131224
15111011
0500-02-03
57565346
01 12062 90508 S
DIRECTIONS ARE 7805E FRON
WNICm THE 14180 BLONS. 1801-
CRIED IN TENS OF DEGREES
FRON TRUE NORTN I.E.. 05
DAY 16 DAY 17 DAY 113 FOR EAST. 18 FOR SOutty . 2702 0 UNL 12 11 09 -03 53 36 5 10 40 12 19 17 08 62 06 7 10 27 3 SF 33 32 32 96 20 3 FOR HEST. E8180 OF 00 INCS 0 umL 12 /2 10 02 67 05 6 20 40 12 23 20 12 63 07 a 10 7 1 SF 32 32 31 96 6 3 THE DIRECTION COLLOIN 1NDI-0811
09 ISO
2030
1017
0815
-0105
6159
0103
511
10 1010 7
a6
SFRS
2835
2534
1731
6385
0616
6 10 1510 23
2230
2827
2725
2520
6675
32 604 5
CATES CAL,
24 10 120 30 16 14 05 62 06 7 10 25 19 AS 36 34 30 79 10 16 UN). 30 25 24 19 78 21 SPEED 15 E1288E55E0 IN KNOTS/272023
IC 10010 10010 120
121212
151615
132413
030404
595961
250307
46
10 2010 2810 23
12125 SF
363232
353031
332830
098592
253502
774
UN).0 NL0 uNL
121215
201426
191315
150907
018067
0105 600 0
NuLTIPLY 87 1.15 TO CONvERTTO SILOS PER NouR.
DAY 16 DAY 20 DAY 2102 5 UNL 12 21 21 12 63 24 8 UNL 12 25 24 21 85 24 5 1 0 35 /2 27 25 20 75 09 60508
10 700 35
1215
2825
2524 21
6305
2505
95
uNLUN).
2220
2530
2428
2122
8572
2830
712
1 0 35 1215
2214
2113
1709
0180
02 5„ 5
11 10 35 30 26 24 21 et 02 3 200 30 32 29 22 64 26 14 171. 30 12 11 00 58 061427
2510 9
293 Sr
3330
312
2928
8592
2426
1810
2126
3015 10
2827
2220
6966
2.26
1510
29 NL
3015
1510
1409
1003
8073
602 5
2023
10 2120 25
a7
2726
2525
2221 81
1034
4 7028
1515
3026
2625
1620
5678
2201
5 mL0
IS15
08 0709
0300
SO61
09OS 7
02 0 umL 12DAY 22
10 10 04 76 06 6 10 0DAY 238 5F 24 23 20 85 03 12
-DAY 2424 22 15 68 27 21
05 45 12 27 23 11 50 02 10 25 12 29 28 25 es 26 10 22 25 24 20 81 26 2208 10 11 2 5 31 28 22 72 19 /0 20 7 30 28 23 75 25 22 .6L 20 2E 23 12 55 27 1511 10 3 0 a se 30 30 29 96 05 10 10 28 14 29 28 23 78 25 24 NL 30 27 29 16 69 25 1314172023
10 410 14
15umL
0
772
12 SF 32212520
31302420
31292217
968988BEI
05010336
7664
9 301 0 15
255 25
1577
12
28272624
26252423
22212019
78787801
26242425
25202019
NL00 NL
301515
282615
252313
191406
696067
27 152706
AY 25 DAY 26 088 2702 • UNL 12 16 15 09 74 06 10 30 12 30 29 25 02 00 005 55 /2 17 13 84 02 5 10 30 12 29 28 25 05 00 000 1 0 21 12 23 21 14 se 01 5 10 200 12 /8 17 13 81 04 13 20 23 23 20 ea 06 411 10 25 15 31 29 24 75 17 5 10 75 30 20 19 16 0. 07 4 /5 27 27 25 92 05 71. 8 60 30 27 26 22 81 01 3 10 150 30 22 21 19 ee OS 7 38 20 29 20 27 92 05 8
1 12 17 16 15 92 04 3 10 20 12 23 22 19 85 04 5 /0 33 12 27 26 23 85 06 a20 3 12 23 22 18 81 34 5 9 30 12 24 23 20 85 03 6 10 28 12 29 20 26 09 36 323 0 uNL 12 20 19 15 81 00 0 10 30 12 28 26 23 e2 14 10 30 12 35 31 23 62 06 7
02DAY 28
10 33 12 34 32 29 82 01 9DAY 29
1 28 12 39 37 35 86 09 6 SO 22DAY 30
39 36 30 70 205 9 35 12 34 32 28 79 00 0 45 12 30 35 32 79 16 /0 10 45 12 41 37 32 70 09 1406 10 28 12 36 33 20 79 07 7 UNL 15 36 34 30 79 08 5 10 40 12 40 37 32 73 06 1011 10 30 30 38 34 29 70 16 3 40 30 39 35 30 70 17 10 10 35 20 42 37 31 65 09 2014 10 28 20 39 35 29 67 10 13 35 30 40 36 30 68 30 5 10 35 20 42 30 31 55 06/ 2017 10 75 12 39 35 29 67 12 7 28 30 40 36 29 65 07 5 10 23 12 41 37 29 62 09 1820 10 21 12 28 35 20 73 12 55 12 40 36 30 60 lb 8 10 /9 12 42 37 31 68 7 1521 10 23 12 38 35 30 73 De 16 60 12 39 39 37 93 13 7
AY 31020508 10 12 7 A 39 36 32 76 06 1211 10 10 7 37 35 32 82 05 ID1417
10 1010 23
2012
RS 3837
1534
3029
7373
1107
18/0 STATION TEAR 4 PIONTN
2023
10 3310 30
1212
3837
3333
2526
6065
0502
89 HOMER ALASKA 70 12
U.S. DEPARTMENT OF COMMERCE AN EQUAL OPPORTUNITY EMPLOYERfostAGE we FEES 8610
NATIONAL CLIMATIC CENTER U.S. DEPRRTNENT of cOmmERCE
mammaFEDERAL BUILDING COM-210 u•SfaluLASHEVILLE. N.C. 28801
FIRST CLASS
-b5--

APPENbik
-b6-
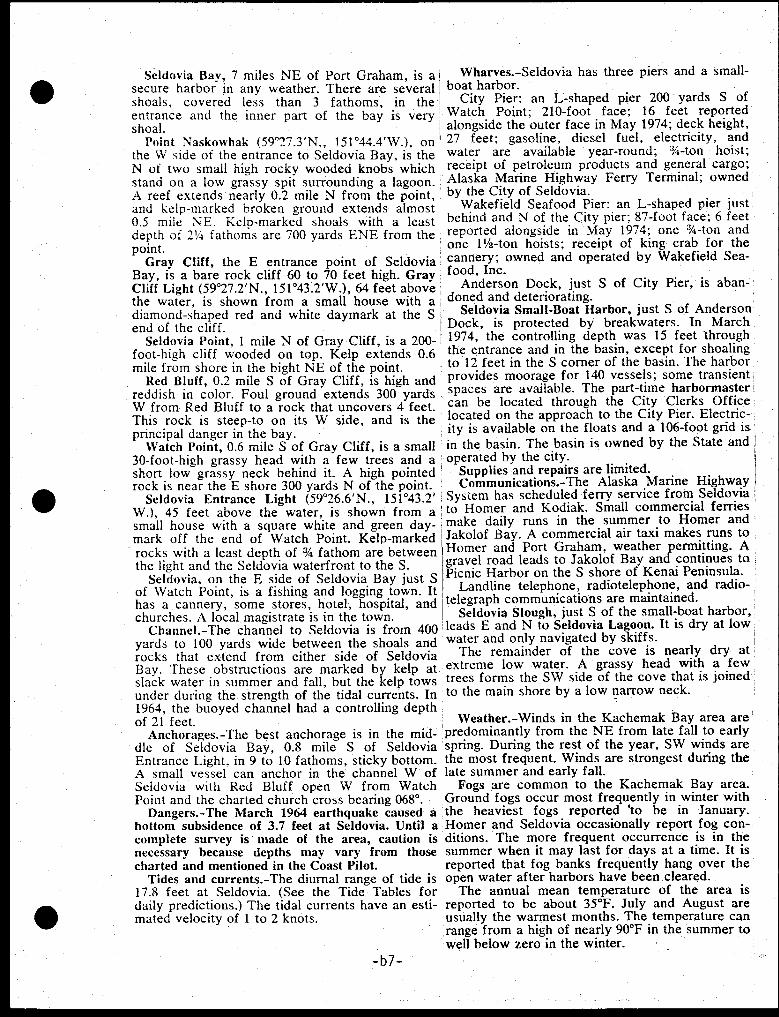
Wharves.-Seldovia has three piers and a small-boat harbor.
City Pier: an L-shaped pier 200 yards S ofWatch Point; 210-foot face; 16 feet reportedalongside the outer face in May 1974; deck height,27 feet; gasoline, diesel fuel, electricity, andwater are available year-round; %-ton hoist;receipt of petroleum products and general cargo;Alaska Marine Highway Ferry Terminal; ownedby the City of Seldovia.
Wakefield Seafood Pier: an L-shaped pier just'behind and N of the City pier; 87-foot face; 6 feetreported alongside in May 1974; one 3/4-ton andone 11/2-ton hoists; receipt of king crab for thecannery; owned and operated by Wakefield Sea-food, Inc.
Anderson Dock, just S of City Pier, is aban-doned and deteriorating.
Seldovia Small-Boat Harbor, just S of AndersonDock, is protected by breakwaters. In March1974, the controlling depth was 15 feet throughthe entrance and in the basin, except for shoalingto 12 feet in the S corner of the basin. The harborprovides moorage for 140 vessels; some transientspaces are available. The part-time harbormastercan be located through the City Clerks Office
Seldovia Bay, 7 miles NE of Port Graham, is asecure harbor in any weather. There are severalshoals, covered less than 3 fathoms, in theentrance and the inner part of the bay is veryshoal.
Point Naskowhak (59°27.3'N., 151°44.4'W.), onthe W side of the entrance to Seldovia Bay, is theN of two small high rocky wooded knobs whichstand on a low grassy spit surrounding a lagoon.A reef extends nearly 0.2 mile N from the point,and kelp-marked broken ground extends almost0.5 mile NE. Kelp-marked shoals with a leastdepth of 2 1/4 fathoms are 700 yards ENE from thepoint.
Gray Cliff, the E entrance point of SeldoviaBay, is a bare rock cliff 60 to 70 feet high. GrayCliff Light (59°27.2'N., 151°43.2'W.), 64 feet abovethe water, is shown from a small house with adiamond-shaped red and white daymark at the Send of the cliff.
Seldovia Point, 1 mile N of Gray Cliff, is a 200-foot-high cliff wooded on top. Kelp extends 0.6mile from shore in the bight NE of the point.
Red Bluff, 0.2 mile S of Gray Cliff, is high andreddish in color. Foul ground extends 300 yardsW from Red Bluff to a rock that uncovers 4 feet.This rock is steep-to on its W side, and is the located on the approach to the City Pier. Electric-principal danger in the bay. ity is available on the floats and a 106-foot grid is.
Watch Point, 0.6 mile S of Gray Cliff, is a small in the basin. The basin is owned by the State and30-foot-high grassy head with a few trees and a operated by the city.short low grassy neck behind it. A high pointed Supplies and repairs are limited.rock is near the E shore 300 yards N of the point. Communications.-The Alaska Marine Highway
Seldovia Entrance Light (59°26.6'N., 151°43.2' System has scheduled ferry service from SeldoviaW.), 45 feet above the water, is shown from a ' to Homer and Kodiak. Small commercial ferriessmall house with a square white and green day- make daily runs in the summer to Homer andmark off the end of Watch Point. Kelp-marked Jakolof Bay. A commercial air taxi makes runs to
Homer and Port Graham, weather permitting. Agravel road leads to Jakolof Bay and continues toPicnic Harbor on the S shore of Kenai Peninsula.
of Watch Point, is a fishing and logging town. It Landline telephone, radiotelephone, and radio-has a cannery, some stores, hotel, hospital, and telegraph communications are maintained.churches. A local magistrate is in the town. Seldovia Slough, just S of the small-boat harbor,
Channel.-The channel to Seldovia is from 400 leads E and N to Seldovia Lagoon. It is dry at lowyards to 100 yards wide between the shoals and water and only navigated by skiffs.rocks that extend from either side of Seldovia The remainder of the cove is nearly dry atBay. These obstructions are marked by kelp at extreme low water. A grassy head with a fewslack water in summer and fall, but the kelp tows trees forms the SW side of the cove that is joinedunder during the strength of the tidal currents. In to the main shore by a low narrow neck.1964, the buoyed channel had a controlling depthof 21 feet. Weather.-Winds in the Kachemak Bay area are'
Anchorages.-The best anchorage is in the mid-'predominantly from the NE from late fall to earlydle of Seldovia Bay, 0.8 mile S of Seldovia spring. During the rest of the year, SW winds areEntrance Light, in 9 to 10 fathoms, sticky bottom. the most frequent. Winds are strongest during theA small vessel can anchor in the channel W a late summer and early fall.Seldovia with Red Bluff open W from Watch Fogs are common to the Kachemak Bay area.Point and the charted church cross bearing 068°. Ground fogs occur most frequently in winter with
Dangers.-The March 1964 earthquake caused a the heaviest fogs reported to be in January.bottom subsidence of 3.7 feet at Seldovia. Until a Homer and Seldovia occasionally report fog con-complete survey is made of the area, caution is ditions. The more frequent occurrence is in thenecessary because depths may vary from those summer when it may last for days at a time. It ischarted and mentioned in the Coast Pilot. reported that fog banks frequently hang over the
Tides and currents.-The diurnal range of tide is open water after harbors have been cleared.17.8 feet at Seldovia. (See the Tide Tables for The annual mean temperature of the area isdaily predictions.) The tidal currents have an esti- reported to be about 35°F. July and August aremated velocity of 1 to 2 knots. usually the warmest months. The temperature can
range from a high of nearly 90°F in the summer towell below zero in the winter.
rocks with a least depth of % fathom are betweenthe light and the Seldovia waterfront to the S.
Seldovia, on the E side of Seldovia Bay just S
-b7-

APPENDI%
Drift Card Study #1 (DCS #1)
Date: November 15, 1978
Time: 0932-0940 release
Objective: To determine surface drift pattern during flood tide.
Method: One hundred cards (marked with NOAA series numbers)were divided into stacks of 25 and deployed at fourpoints.
Procedure: Cards were deployed as such:
Serial Numbers:Group I - A07801 - A07826Group II - A07827 - A07850Group III - A07851 - A07875Group IV - A07876 - A07900
First observation of where and how cards weredispersing was taken at 1100 by aerial observation.
Cards were then collected by boat at 1600 on sameday. Cards were found grou ped at two areas along
the shoreline.
-b8-

DCS #1Page
Percent Recovery as of November 17, 1978:
Group I 20%
Group II 52%Group III 75%Group IV 62%
Overall recover of cards = 54%
Aerial observation showed cards to remain in small,tight groups and not disperse. Most of the cardsrecovered were found on two small areas of shore-line opposite the wreck site (see chart). The ob-served drift path of the cards does appear to be thesame taken by drifting oil during similar tidal andwind conditions. Note: the shore areas at whichthe groups of drift cards were found were simulta-neously contaminated with oil.
Observations:

Drift Card Study #2 (DCS #2)
Date: November 16, 1978
Time: 1430-1435 release.
Objective: To determine surface drift pattern durin g ebb tide.
Method: Same as DCS #1.
Procedure: Same drop pattern as DCS #1.
Serial Numbers:
V - A07901 - A07928VI - A07929 - A07953VII - A07954 - A07978VIII - A07979 - A07999
Only one card recovered as of December 9, 1978.The drop pattern for the drift cards was in openwater and not subject to those currents moving oilonshore. Oil moving from the wreck into the openwater areas of Seldovia Bay during ebb tide seemsto be transported out of the bay to the open watersof Kachemak Bay without making contact with the
shoreline.
Observations:

Current Survey #1 (CS #1) Current Survey #2 (CS #2)
Date: November 17, 1978 Date: November 18, 1978
Time: 1050 deployment Time: 1230 deployment
Objective: To determine sub-surface current patterns primarilyto give advise to the OSC pertaining to boom con-figurations.
Method:
Current probes were constructed from base material.
Note:
Buoys were deflated until no more than two inchesfloated above the water. The purpose of this wasto reduce wind effect on the buoys. Flags wereplaced with the buoys to aid in aerial observation.Two flags trailed the surface current buoy (anchorat 3'1") and three flags trailed the deep currentbuoy (anchor at 6'8"). See chart for observations ofbuoy drift.
At approximately 1500, November 17, Crowley ac-cidentally recovered both buoys. Both buoys werethen re-deployed in the original deployment siteat approximately 1700 hours.
Procedure: Buoys for CS #1 were deployed approximately 200meters east of the wreck. Buoys for CS #2 weredeployed approximately 200 meters northwest ofthe wreck.
Observations: See text for discussion.
-bll-

Figure 59. Exposed rocky coastin northwest Spain. Arrowpoints to heavy oil-in-wateremulsion (chocolate mousse)derived from the Urquiola spill. Note how oil is keptoffshore by return currentsgenerated by reflecting wavesin the upper right hand por-tion of photograph.
APpervu x mir
Environmental Susceptibility
On the basis of the two case studies cited above, plus careful study of
the literature, a scale of environmental susceptibility to oil spill impacts
has been derived. This scale relates primarily to the longevity of oil ineach environment. The subtleties of chemical weathering of the oil withineach environment have not yet been studied in enough detail to be incorporated
into the susceptibility scale. Results of a preliminary study by Rashid (1974)411
are given in Table 7. He concluded that chemical weathering processes are more
active on high ener gy coasts than on low energy coasts, although the details
of his environmental classification are rather obscure. Also, although biO-
degradation rates are thought to be slower in cold temperatures, little docu-
mentation exists to verify that notion.
Coastal environments are listed and discussed below in order to increas-
ing susceptibility to oil spills:
1. Straight, rocky headlands:
Most areas of this type are exposed to maximum wave energy. Wavesreflect off the rocky scarps with great force, readily dispersingthe oil. In fact, waves reflecting off the scarps at high tide tendto generate a surficial return flow that keeps the oil off the rocks
(observed in Spain; Fig. 59).
2. Erodino wave-cut platforms:
These areas are also swept clean by wave erosion. All of the areasof this type at the Metula spill site had been cleaned of oil afterone year. The rate of removal of the oil would be a function of thewave climate. In general, no clean-up procedures are needed for this
type of coast.
3. Flat, fine-grained sandy beaches:
Beaches of this type are generally flat and hard-packed. Oil that isimplaced on such beaches will not penetrate the fine sand. Instead, itusually forms a thin layer on the surface that can be readily scraped
-b12-

off by a motorized elevated scraper or some other type of road machinery.
Furthermore, these types of beaches change slowly, so burial of oil bynew deposition would take place at a slow rate. There are no beaches
of this type in lower Cook Inlet.
4. Stee per, medium- to coarse-grained sandy beaches:
On these beaches, the depth of penetration would be greater than for thefine-grained beaches (though still only a few centimeters), and rates ofburial of the oil would be greatly increased. Based on earlier studies
by our group in numerous localities, it is possible for oil to be buriedas much as 50-100 cm within a period of a few days on beaches of this
class. In this type of situation, removal of the oil becomes a seriousproblem, inasmuch as it would be necessary to destroy the beach in orderto remove the oil. This was a common problem encountered during theclean up of the Arrow spill in Chedabucto Bay, Nova Scotia (Owens andRashid, 1976). Another problem is that burial of the oil preserves it
for release at a later date when the beach erodes as part of the naturalbeach cycle, thus assuring long-term pollution of the-environment. Thereare only a few beaches of this type in lower Cook Inlet, which occur off
the large arcuate-cuspage fan deltas on the western shoreline.
5. Impermeable muddy tidal flats (exposed to winds and currents):
One of the major surprises of the study of the Metula site was the dis.-covery that oil did not readily stick to the surfaces of mud flats. Al-so, penetration into the sediments was essentially non-existent. There-fore, if an oiled tidal flat is subject to winds and some currents, theoil will tend to be eventually removed, although not at the rapid rateencountered on exposed beaches. Many of the more exposed tidal flats
of lower Cook Inlet fall in this category.
Mixed sand and gravel beaches:
On beaches of this type, the oil may penetrate several centimeters,and rates of burial are quite high (a few days in Spain). Most ofthe beaches of both the Metula site and lower Cook Inlet are of this
type. The longevity of the oil at the Metula site, particularly onthe low-tide terraces and berm top areas, attests to the high suscep-
tibility of these beaches to long-term oil spill damage.
7. Gravel beaches:
Pure gravel beaches have large penetration depths (up to 45 cm in
Spain). Furthermore, rapid burial is also possible. A heavily-oiled gravel beach would be impossible to clean up without completelyremoving the gravel. Many of the beaches of lower Cook Inlet are of
this type.
8. Sheltered rocky headlands:
Our experience in Spain indicates that oil tends to stick to rough
rocky surfaces. In the absence of abrasion by wave action, oil couldremain on such areas for years, with only chemical and biological pro-cesses left to degrade it. Many miles of the sheltered embayments of
lower Cook Inlet are fringed by rocky coasts of this type.
-b13-

9. Protected estuarine tidal flats:
Once oil reaches a backwater, protected, estuarine tidal flat, chemi-cal and biogenic processes must degrade the oil if it is to be removed.Many of the upper reaches of the embayed shorelines of lower Cook In-let fall in this class.
10. Protected estuarine salt marshes:
In sheltered estuaries, oil from a spill may have long-term deleteriouseffects. We observed oil from the Metula on the salt marshes of EastEstuary, on the south shore of the Strait of Magellan, that had shownessentially no change in 11/2 years. We predict a life span of at least
10 years for that oil. The upper reaches of the embayments of lowerCook Inlet contain extensive salt marshes.
Applications to lower Cook Inlet
Oil spill susceptibility. - Utilizing a combination •of the susceptibility
classification just described and the classification of the coastal morphologyproposed in Table 4, it is possible to delineate the coastal environments oflower Cook Inlet with respect to oil spill susceptibility. As a generaliza-
tion, lower Cook Inlet is a high risk area for the occurrence of spills, be-cause so many of the environments have a high susceptibility rating. Further-more, the inaccess4bility of the area renders most normal oil spill clean-uptechniques infeasible. Of all the environments, the erosional shorelines aremost apt to be cleaned of oil spills by natural processes. The embayed ria
0 shorelines of the neutral class would be extremely high-risk areas. The de-positional coasts would be variable, depending essentially upon the amount of
wave energy expended and the grain size of the beaches. Problems of oil burialwould be much greater in this class than in any of the others. Each of the in-dividual coastal morphology classes are listed and discussed below:
Class
Ala. High
rock scarps
% ofshoreline. Discussion
Oil easily removed • by wave ero-sion; some problems in areaswhere gravel beaches•occur.
(1 - 10)Risk Classification
1-2
Alb. Lowrock scarps 28 Generally low-risk area except 2-4
where depositional berms exist;gravel and boulder low-tide ter-races subject to long-term oil-ing; burial possible on beach
faces.
Alc. Scarps 5 Same as Ala. 1-2
on dipslopes
Ala. Scarps 3 Same as Alb.inglacial
deposits
• 2-4
-b14-

Blb. Embay-
ments withhilly andlowland shores
Cla. Lobate 1.5fan deltas
Clb.Arcuate-
• cuspate fan
deltas
Clc.
Arcuate- 1
cuspate asym-metrical fan
deltas
C2a. Recurved 2
spits
C2b. Cuspate 2
spits
C2c. Tombolo 0.4spits
C2d. Flat- 1
tened pro-tuberances
C3a. Bay- 2
head beach-
• ridge plains
Class
A2b. Scarps
in deltaicdeposits
% ofshoreline Discussion
(1 - 10)Risk Classification
• Same as Alb. 2-4
8-10Bla. Embay-ments withmountaineous
shores
30 Almost all areas subject to long-term oil spill damage, especially
salt marsh areas; fewer problems
at mouth than at head of'embayment.
Same as Bla. 8-10
Low wave energy conditions and
6-8
coarse grain size would allow oilto remain for years; fresh waterplume would probably keep oil offdelta during periods of high run-
off.
Oil would probably be eroded in
4-6
6 mos. to one year; penetrationand burial possible; if buried,
would remain longer.
Lower wave energy (than Clb) and
6-8
of oil residence (11/2 years in simi-coarse grain size increase length
lar areas in Chile).
4-6Mostly mixed sand and gravel beaches;
6 mos. to one year . residence time
4-6Same as C2a.
4-6Same as C2a.
4-6Same as C2a.
Variable dependin g on composition
4-6
of beaches; gravel _beaches moresusceptible than sandy areas; oilwould tend to accumulate here be-cause of position at head of bay.
-b15-

% of
(1-10)Class shoreline- Discussion
Risk Classification
III C3b. Tide- 1 Very sensitive area because of broad 8-10
dominated expanse of salt marsh and tidal flats;
bayhead sys- lower parts of intertidal areas would
tems be flushed by tidal currents; oil maynot enter area if fresh water run-off
is high.
In summary, 45% of the shoreline of lower Cook Inlet was classified withlow risk values of 1-4 on the susceptibility scale (1-2 = 13%; 2-4 = 32%), 13.4%was classified with intermediate values of 4-6, and 41.5% was classified with
high values of 6-10 (6-8 = 2.5%; 8-10 = 39%). The distribution of these areasin lower Cook Inlet is given on the map in Figure 60. Itshould be pointed out
that wave energy is relatively low in lower Cook Inlet, and that this scale can-not be applied directly in areas with larger waves. Oil that goes ashore inareas with a rating of 1-2 could be expected to be dispersed within a few weeks.Areas with ratings of 2-4 would probably be free of oil within 6 months, and a
rating of 4-6 indicates possible pollution of up to one.year. A 6-8 ratingmeans that oil could remain in place for several years, and, based on our ex-perience with the Metula, long-term pollution of 10 years or longer can be expected in areas rated 8-10 if no clean-up procedures are initiated. Furthermore,
0 clean-up is extremely difficult in these high-risk environments. Obviously, aconcerted effort needs to be made to keep the oil away from areas with a rating
greater than 6.
Oil dispersal. - The potential dispersal of oil spills in lower Cook In-
let is discussed elsewhere (Wennekens et al., 1975). The circulation pattern
of lower Cook Inlet is such that oil would probably be selectively transportedinto the Kamishak Bay,area (Fig. 6B). Northerly and easterly winds would aug-
ment this pattern. The accumulation of tremendous' quantities of flotsam in theKamishak Bay region supports this assumption. The general pattern of oil dis-persal would be governed by the strong tidal currents with their superimposedcoriolis deflection to the east on flooding tides and to the west on ebbingtides. Wind regime at the time of oil release is another important factor.
As, part of our reconnaissance work, all indicators of longshore sedimenttransport, such as recurved spits, cuspate spits, and shoreline protuberances,were plotted on the base map in order to depict regional trends. The resultsare shown on Figure 61. These trends generally indicate alongshore transport
of sediment into most of the embayments,.in - particular Kamishak Bay and Kachemak
Bay. Thus, in places where the oil comes onshore, the part that doesn't strand
on the beach immediately will probably be caught up in the nearshore wave-generated currents and be transported toward the heads of the bays, where the
oil-spill impact would be greatest.
-b16-

I i
2- t,-, 1.%
- . 1. 'S' I- --ri-
Ia. High vertical scarps over 100 m
high; beaches coarse gravel orbedrock platforms 35.9 8
1. Ursus Head (192)2. Fortification Bluff (21)3. Contact Point (24)
b. vertical scarps generally lessthan 100 m hioh; variable bed-
rock comp osition; teaches com-plea mixes of gravel and sane;flanked in p laces on wide tidalflats or bedrock platforms 341.9 28
1. Rocky Cove (22)2. Much of the shoreline of
Kamishak Bay (26; 28; 29)
3. Cape Douglas area'(33)4. Most of Augustine island5. Outer shoreline of lower Kenai
Peninsula (36; 3716. North shore of Kacnemak Bay (44;45)7. Most of the shoreline between Homer
and Kenai (47; 48; 50; 51; 532; 54; 55)
8. Redoubt Point area (2)
I c. Rock scarps of variable heightson dip slopes; beaches coarsegravel on rock platforms; ava-lanche aebris piles common 50.8 5
I. Tilted Hills (13; 15)2. Slope Mtn.3. Chisik Island
...<1.1 4!al .. -. -It '
7, .-lb..
. •-• ..°,....5 r-
a. Low scares in glacial deposits;beaches mostly mixed sand andgravel; abundant large isolated
blocks on low-tide terrace 40.8 3
1. Much of Kalgin Island
2. Harriet Pt. area (1)3. Spring Lakes area
4. Cape Kasilof (56)
Low scarps in deltaic de-posits; beaches mixes ofsand and gravel (sand
,( ___ dominant) 16.8 1
1. Margin of Crescent River
Delta (3Z)
Iota/ shoreline . of totalshoreline
Examples station
TABLE 4. SHORELINE MORPHOLOGY - LOWER COOK INLET
A. EROSIONAL SHORELINES (450 of shoreline)
B. NEUTRAL (STABLE) SHORELINES (380 of shoreline)
,otal snoreline S of total(km) shorelineSubclass (Cescriotion)
a. Mountainous snorelines dorm- Inated by steep valley wallswith some low erosional scarps; 1pocket beaches of mixed sandand gravel common; sore minordepositional features such asrecurved salts and minor del-tas; extensive tidal flats
__:7; abundant
4 b. Lowlands and hilly shorelines;
m low scams and a few minor de-
1 positional features; generallysediment starved with widerock p latforms covered inplaces by thin tidal flatdeposits
C. DEPOSITIONAL SHORELINES (17t of snoreline)
Subclass (Description)
a. Lobate fan deltas; digitatesediment looes at river mouth;low wave action. hence no swainbar development
b. Arcuate-cus pate fan deltas;mixed sand and gravel (sanddominant); margin of deltamace up of wave-built spitsand beach ridges
Arcuate-cus p ate asymmetricalfan deltas; mixed sand andgravel (gravel dominant);usually nas one main gravelspit and a hard-packed graveldelta platform
a. Recurred spits; multiplecurving beach ridgesbuilding into deeperwater; mixed sand andgravel
='b. Cuspate spits; multiple in-
:: tersecting beach ridges pro-
ti jetting into deeper water;
al mixed sand and gravel
ol,I c. Tombola spits; mixed sand and
...I gravel spits connectin g bed-rock headlands and islands
d. Flattened protuberances of sand iand gravel (gravel dominant);spit elongated against a ore-dominantly
eroding headland '
I
--Ia. hayhead beach-ridge plains; I
...; 21 multiple beach ridges of
1 sana and gravel (sand usually 1
s g 7" , dominant); dunes coon
---:4 3common
17.;.2 7,1 ..C.7 .-1
olb. Tide dominated depositional
i;., E,1 systems: tidal sand bodies.
gl mud flats and salt marshes
Examples (station)
1. Tuxedni Bay (5)2. Chinitna Bay (11)
3. Iniskin hay (16; 17)4. Iliamna-Cottonwood Bays (18)S. Port Graham Harbor6. Port Chatham Harbor7. Seldoela hayS. Tutka 9ay (39)9. Sadie(Cove10. Halibut Cove
1. Bruin Bay (23)
2. McNeil Cave (27)3. Akumwarvik Say
100.1
1.5
1.2.3.4.
Tuxedni River DeltaOpen Creek DeltaMartin liver DeltaHungryman Creek Delta
6
1.2.3.4.
5.6.7.
Johnson River Delta (7)Red River Delta (82)Horn Creek Delta (10)Redoubt Creek DeltaDouglas River Delta (302;China Root Delta (40)Grewingk Delta (41)
31; 32)
3. 9arabara Pt. (362)4. Anchor Pt. (482)
5. Ninilchik (52)
13.4 1 6. Tuxedni Channel Delta (6)
1. Crescent River Spit (4)
2. Glacier Spit
3. Seal Spit (12)4. Aurora Spit (42)
22.8 2 5. Homer Spit (46)
1. SW corner of Augustine Islana (342)
2. NW corner of Chisik Island
3. SW corner of Kaigin island (58)21.3 •
1. Spit at Sp ring Lakes (8)2. Entrance to Seloovia Harbor
4.4 0.4 3. McDonald Spit
8.5 1. Ca pe Staricnkof2. Midpoint between Anchor Pt.
and Cape Starichkof
1. Ory Say (14)
2. Oil Bay
20.2
3. Urs
u
s Cove (20)4. gegfish Bay (252)
1 5. Amakaeaori (251
1. Head of Kacnemak Say (432)
9.3
2
366.7 30
,Total snoreline A of total
(km) shoreline Examples (Station)
18.4
74.0
1. Ursus Head DeltaCreek Delta2. East Glacier

SHORELINE TYPES
7---75-7 Ala Bla
*-7571. Alb ;;;;,;i Bib
Alc 477:7, Cla—c
Ala—b C2a—d
C3a—b 0 30
Figure 11. Areal distribution of geomorphological units described in Table

VULNERABILITYof
COASTAL ENVIRONMENTSto
OIL SPILLS
w;(10,4b/ a, j,
2 - 4 NI=areo not includedin study
- 2 lowest
fit
0km
Figure 60. Vulnerability of coastal environments to oil spills.

Figure 61. Longshore sediment transport patterns in lower Cook Inlet. Based on geomorphic evidence suchas recurved spits, cuspate spits, and beach protuberances.

APPEAmix FOREWORD
ENVIRONMENTAL STUDIES OF KACHEMAK BAYAND LOWER COOK INLET
The report "Environmental Studies of Kachemak Bay and Lower CookInlet" consists of 12 volumes. Volume I discusses the purpose of thestudy, background information on the Kachemak Bay environment, problemsassociated with petroleum development, and effects of oil pollution onthe marine organisms and environment of Kachemak Bay. Volumes II-XIIpresent the detailed results of each of the eleven environmental studiesundertaken in Kachemak Bay. The results of these studies, summarized inVolume I, are used to document conclusions presented in Volume I.
The subject of each volume is listed below:
Volume I Impact of Oil on the Kachemak Bay Environment
L. Trasky, L. Flagg and D. Burbank; AlaskaDepartment of Fish and Game.
Volume II Coastal Morphology. and Sedimentation - Lower Cook Inlet,Alaska
M. Hayes, P. Brown and J. Michel; University ofSouth Carolina.
Volume III Circulation Studies in Kachemak Bay and Lower Cook Inlet,Alaska
D. Burbank; Alaska Department of Fish and Game.
Volume IV Summary Status on the Distribution of King Crab and PandalidShrimp Larvae, Kachemak Bay - Lower Cook•Inlet, Alaska, 1976
E. Haynes; National Marine Fisheries Service.
Volume V Post-Larval King Crab . (Paralithodes camtschatica) Distri-bution and Abundance in Kachemak Bay, Lower Cook Inlet,Alaska, 1976
K. Sundberg and D. Clausen; Alaska Departmentof Fish and Game.
Volume VI Food Habits of Shrimp in Kachemak Bay, Alaska
J. Crow; Rutgers University.
-b21-
Volume VII Benthic Reconnaissance of Kachemak Bay, Alaska
W. Driskell; Alaska Department of Fish andGame/Dames and Moore.
Volume VIII Distribution, Abundance, Migration and Breeding Locations
of Marine Birds-Lower Cook Inlet, Alaska, 1976
D. Erikson; Alaska Department of Fish and Game.
Volume IX Marine Plant Community Studies, Kachemak Bay, Alaska
. Dames and Moore.
Volume X The Salt Marsh Vegetation of China Poot Bay, Alaska
J. Crow and J. Koppen; Rutgers University.
Volume XI Baseline Study of Beach Drift Composition in Lower CookInlet, Alaska, 1976
A. Cunning; Alaska Department of Fish and Game.-
Volume XII Hydrocarbons in Intertidal Environments of Lower Cook
Inlet, Alaska, 1976
D. Shaw and K. Lotspeich; University of Alaska-.
-b22-
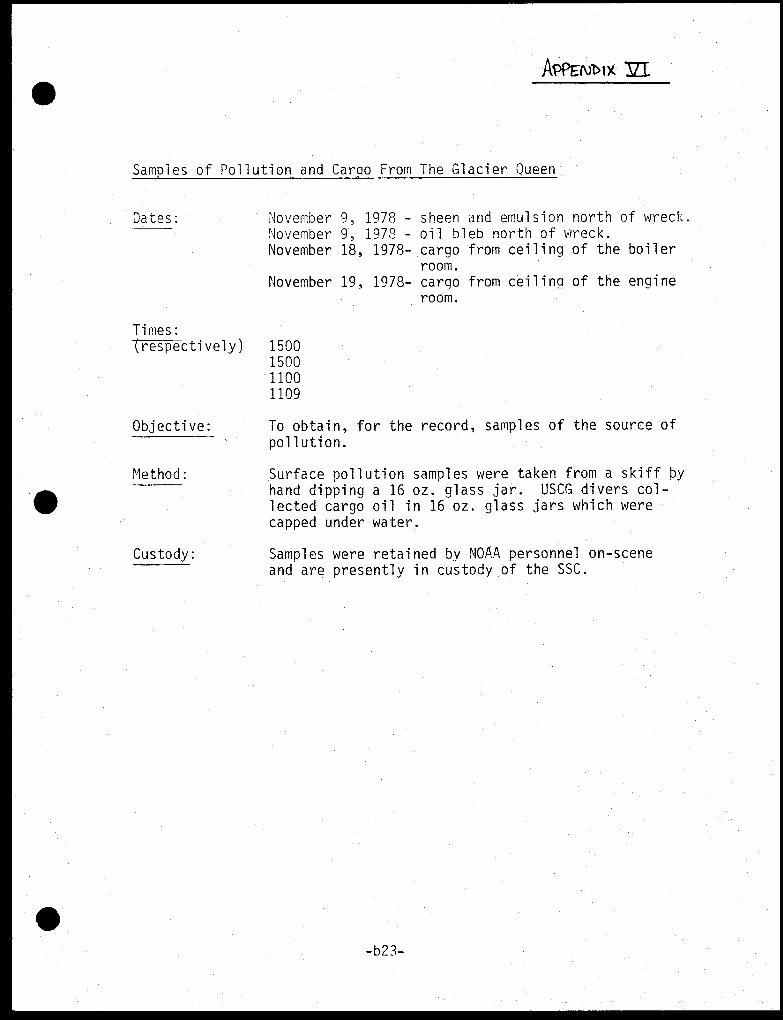
APPENN x VI
Samples of Pollution and Cargo From The Glacier Queen
Dates: November 9, 1978 - sheen and emulsion north of wreck.November 9, 1978 - oil bleb north of wreck.November 18, 1978- cargo from ceiling of the boiler
room.November 19, 1978- cargo from ceiling of the engine
room.
Times: (respectively) 1500
15001100
1109
Objective: To obtain, for the record, samples of the source of
pollution.
Surface pollution samples were taken from a skiff byhand dipping a 16 oz. glass jar. USCG divers col-lected cargo oil in 16 oz. glass jars which werecapped under water.
Method:
Custody: Samples were retained by NOAA personnel on-scene
and are presently in custody of the SSC.
-b23-

Intertidal Sample:#1 (IS #1)
Date: November 10, 1978
Time: 1700 - 1750
Objective: To determine hydrocarbon concentrations in the inter-tidal sediments (and, as a secondary objective,characterize the benthic community).
Method: A "coffee can" core sampler was used to obtain sedimentsamples. The sampler was worked into the substrateand when in place, a trench was dug around the samplersuch that the entire can was exposed and placed intodoubled-up plastic garbage bags. The samples were
tagged by placin g a marker in between the two plasticbags and the bags were individually sealed. The sampleswere deep frozen immediately after being taken.
Procedure: Samples were taken in the lower intertidal reaches ofT-Boom Beach. T-Boom Beach received a significantamount of contamination during the first and seconddays of the spill (November 9 and 10). Samples were
taken immediately followin g a low tide of 1.3 occurring
at 1613. Using a compass, a transect was taken at aheading of 30° which extended 90 yards through the ex-posed lower intertidal. The length of the transect wasmeasured using a 90 yard length of twine. The beginningand end points of the transect were triangulated usingnavigation lights on the opposite shore according tothe following figure.
°i4t4vi ports.
red la;1croon414455°
C1(6-qi0
‘1.4.eiregim tiAleft (Se)
Samples were then taken at every 15 yards along the90 yard transect and were numbered stations 1 through 7.
Custody: The samples were taken into custody on board the USCGSedge, under command by Lt. Cmd. Erlandson.
-b24-

Description of the Sampling Area:
Nwww
41-m9rxWfl ,7-r°u‘1"44icZr:we.‘ fv./.0.15. ntietpirl cocurs4cka.""ee.Slope-
1+.10-rE:%Jeri-Lea:4(yexa.55eraket3
packed stlra
0,4
cobble.-ear(prai-e_luzz."
IS #1Page 2
Dominantly gravel and packed coarse sand. Largerounded rocks occur in random patches. Fucus, Ulva and red algae present. Also some beached Nereocystis.
Observations: No smell or sight of oil present. It was sometimesdifficult to sink the core sampler into the substratebecause of coarse gravel and rocks. Seas calm. Skycloudy.
-b25-

Intertidal Sample #2 (IS #2)
Date: November 13, 1978
Time: 1540 - 1640
Objective: Same as IS #1
Method: Same as IS #1
Procedure: Samples were taken in the mid to upper intertidalreached of T-Boom Beach to complete the intertidalsampling of this area. Samples were taken during themid-ebb cycle (low @ 1830 of -2.8). The transect es-tablished during IS #1 was reestablished and 60 yardtransects were taken from stations 1, 3, 5 and 7. Thetransects were set at 900 from the original 30° NNE
transect (bearing 300° NW).
ekcue, eCrov....K6 Pe4A
tikowle
cork Ps:"11.
go 9As.
Two samples were taken along each transect at 30yard intervals. Samples were numbered OA, OB, 1A, 1B,
4A, 4B, 8A, 8B.
Custody: The samples were initially stored in the freezer of the
cannery and are now in custody of NOAA SSC.
Description of Sampling Area: Mid-intertidal samples were taken abouthalf way up the beach incline for mid-intertidalstations and at the top of the incline for the upperintertidal stations. The substrate is composed of sandand pebbles with random gravels.
Observations: Oil was not observed at the sample sites; however, somesamples had a very slight oily smell on the surfacelayer. Windrows were present containing large amountsof wood and Fucus - Sky clear. Little wave action.
-b26-

Clam Sample:
Date:
Time:
Objective:
November 14; 1978
1800 - 1830
Upon request by Loren Flagg of ADF&G, clam sampleswere taken in the event that hydrocarbon analysis ofbody tissues by the U.S. Department of Agriculturewas necessary.
Clams were dug during minus tide using a spade and
were generally taken from a depth in the sedimentcolumn of 6-8 inches. Samples were immediately frozen
in double bags.
The samples initially stored at the Wakefield CanneryFreezer, are now in custody of the NOAASSC.
of Sampling Area: Samples were collected from the lowerintertidal zone of T-boom beach in a level area of
course sand and pebbles.
Observations: No sight or odor of oil in sample area. Clams spacedevenly about every 6 inches. Very rich bed. Mostprevalent was the hard shell clam (Merceneria sp).Cockles and red neck clams were found in very low numbers.
Method:
Custody:
Description

Benthic Sam p le #1 (BS #1)
Date: November 13, 1978
Time: 1430 - 1630
Objective: To quantitatively characterize benthic communitystructure around the site of the wreck and to determine analytically the extent of bottom drift ofspilled oil (including visual presence of oil andoil smell in sediment).
Method: Samples were taken using a Ponar Grab weighing 40 lbs.
and havin g a grab area of 552 cm2 and a total volume3 -
of 6292 cm . Samples were taken in 35-40 feet of waterduring an ebb tide (low 0 1830 of 2.8). Samples werelabeled and stored in polypropylene and glass containers. Samples were preserved in 10% buffered formalin.Samples were taken from the ADF&G, 32 foot "Puffin".
Procedure: Three sampling stations were marked approOmately 100yards from the wreck at 330', 210 and 90 . Due tothe movement of clean-up boats, divers and a largenumber of bouys and lines, we were not able to per-manently mark the station. Three samp les were taken at
each station (3 reps) and marked 1A, 1B, 1C (330 ),2A, 2B, and 2C (210") and 3A, 3B (90').
Custody: Samples were taken into custody by the ADF&G by consentof Loren Flagg. The samples were transported on boardthe "Puffin" to the ADF&G warehouse in Homer for storage.
Description of Sam p ling Area: The bottom was fairly well packedsand/clay at station #1 and soft clay and shell frag-ments at stations #2 and #3. Note: divers reportedthat the sediment became looser toward shore and thattheir fins sweeping close to the bottom stirred upsediment. This corresponds with the de position pattern
from the navigational chart.
-b28-

EIS #1
Page 2
Observation: No sheen or smell of oil noticed on bottom sediment,nor globules of heavy oil noticed in sediment.Samples smell healthy -- very little H7S.
Sto*LorNS 10C-Caer4
0.9 prox.I■N% WW1100 rneiers Corn
wreck a ( pos,avi cavyr4
-b29-

Plankton Sample:
Date: November 13, 1978
Time: 1630 - 1700.
Objective: To qualitatively analyse the damage to the planktoncommunity of Seldovia Bay during the spill. Thisincluded an "eye ball" examination of samples to de-termine if any significant mortality was incurred orif motor impairment of the plankton was obvious.
Method:
Samples were taken from the ADM 32 foot "Puffin"using an ADFAG plankton trawl.
3 citOxvziec- operovv3I texvitil
Two plankton trawls were taken for five minutes each.One trawl was taken at surface and one trawl was takenat approximately two feet below the surface. Trawlswere taken at a heading of 180 0 approximately 400 yardsnorth of the wreck. The trawls were taken during aswift ebb tide. Because we were travellin g into thetide, the trawl distance was about 100 yards. Sampleswere preserved in 5% formalin.
Custody: The plankton samples were sent to the ADF&G warehousein Homer on board the "Puffin" and are presently inthe custody of the ADFAG.
Description of Sampling Area: No surface waves -- little wind, openwater, depth of 6-8 fathoms.
Observations: No sight or smell of oil or sheen in sample area.Samples were rich with plankton which seemed to heswimming actively and strongly. Co pepods made up the
majority of the sample. Also present were a few larvalfish, larval shrimp and ctenophorans.
-b30-

Water Column Samples
Dates: November 19, 1978.
Time:
#1 1430 due west of wreck 20 meters.#2 1500 due east of wreck 150 meters.#3 1525 due north of wreck 1000 meters.
Objective: To sample dissolved and/or particulate hydrocarbonsin the water column.
Method: Field Chemistry Procedure of NOAA/USCG Spilled OilResearch Team.Because the General Oceanics Butterfly Sam pler hadbroken on scene the samples were taken in hexane-rinsed quart glass jars. The jars were opened 6"below the surface of the water and then cap ped atthat de p th. The samples were immediately "fixed"with hexane according to the NOAA SOR Team method.The fixed samples were stored in pre-cleaned 20 ml.vials were marked in accordance with chain-of-costodyprocedures and are presently in the custody of theNOAA Alaska SSC.
Costody: Samples are in custody of the NOAA SSC.
-b31-

Dunneoness Crab Sampling
Dates: November 24, 1978 to December 7, 1978
Objective: To search for subsurface movements of oil and to samplea valuable bay resource that is likely to contact andretain spilled oil. Deployment of crab pots and ropesalso exposed retrievalbe objects to subsurface oilin an area too congested to investigate such a possibilityin an y other way.
Method: Six pots measuring ap proximately 4 feet by 1 foot wereborrowed from alocal fisherman and positioned as shownin figure a.
Procedure: No crabs were caug ht in first positioning nor was oilseen. Pots were then continually shifted according topractice common to crab fishermen until crabs werelocated as shown in figure b.
Custody: Whole crabs were immediately frozen in a sealed container.Gill tissue was preserved in 5% formalin in 16 oz. glassjars and refrigerated immediately. Samples are now incustody of the NOAA SSC.
Observation: Crab populations were found to be extremely localizedand a lengthy distance from the wreck. No oil in anyform was observed by this method.
-b32-

APperobtx $z[r U.S. Vis%- 4 WI' tiCe SzeviCe
Preliminary Assessment of the Seldovia Oil Spill on MarineBirds and Marine Mammals
Anthony R. DeGange 13 November, 1978
-b33-
On 9 November, 1978, Pat Wennekins, Tom Turner and myself flew toSeldovia to assess the impact of the recent oil spill on wildlife. Thespill began, when a barge moored in Seldovia Bay, sank. The oil beganleaking on 8 November when the barge sank, and continues to do so atthis writing.
The oil from the barge is of two consistencies: a fuel oil whichleft a thin sheen over much of Seldovia Bay, and oil residues from thebilge which were very viscous and tar-like. The latter was concentratedin the near shore zone and beaches across from the town of Seldovia.
During the night of the 8th, the Coast Guard deployed a boomhalfway across the upper 1/3 of the bay to protect the salmon streams.This barrier was completed on the morning of the 10th when additionalequipment arrived. At this time, a boom was also placed around thestill leaking barge, and a section of absorbent boom was placed in thepath of the drifting oil on the shore opposite Seldovia. In addition asmall section of boom was placed across the mouth of a lagoon to keepadditional oil away from this potentially important clamming and wild-life area. The cleanup of oil undertaken by Crowley Maritime began on10 November.
Large portions of Seldovia Bay, save the head of the bay, wereaffected by the oil. A thin sheen of oil was present over much of thearea on 10 November. The most heavily impacted area was the westernside of the Bay directly across from the town of Seldovia. Not only wasa thin layer of oil present on the water surface and beach, but alsoglobs of thick, black bilge residues were floating and washing up onthose beaches. The slick of thin oil was also evident approximately 2-3km out into Kachemak Bay.
An aerial survey, using an amphibious goose, was taken on themornings of the 9th and 10th to assess the extent of the spill and thewildlife associated with the spill. Two beached bird surveys werecompleted on hthe afternoon of 9 November (See Figure). Part of theSeldovia Bay was surveyed by small boat at this time. On the afternoonof 10 November, a small boat survey was taken of most of Seldovia Bay.
Kachemak Bay and the smaller bays associated with it are importantwintering areas for scoters, Oldsquaw, murres and marbled murrelets.Other species using these areas during the winter include Arctic andCommon Loons, Red-necked and Horned Grebes and Glaucous-winged Gulls.It was my impression that large numbers of seaducks and alcids have yetto move into Kachemak Bay at the time of this oil spill. Nevertheless,small numbers of the above mentioned species, except for the marbledmurrelet, were observed in the spill area.

During the aerial survey on 9 November only one male surf scoterand one unidentified cormorant were observed in the oil slick outside ofSeldovia Bay. However, approximately 35 white-winged scoters and 5Oldsquaw were swimming in water directly adjacent to the slick. Anadditional 15 unidentified scoters and 25 white-winged scoters wereobserved near a thin slick in Seldovia Bay.
Surveys by small boat and by foot along the beach, revealed thatmore birds were utilizing the area than the survey by the fast flyinggoose led us to believe. A group of 40 01s4quaw were observed in thebay directly in front of the small boat harbor. Other birds observedalong the west shore of Seldovia Bay while conducting beached birdsurveys include 1 Artic Loon, 1 Red-necked Grebe, 3 Horned Grebes, 20Pelagic Cormorants, 24 Black Scoters, 22 Harlequin Ducks and Glaucouswinged Gulls. All these birds were observed in or close to water coveredby a thin sheen of oil. The only marine mammal I observed near thespill area but not in oiled water was a Sea Otter in a kelp bed alongthe outer beach. The lagoon on the west side of Seldovia Bay may beimportant for birds during the low tide. Approximately 40 dabblingducks, probably mallards, and 20 Glaucous-winged Gulls were using thelagoon at this time.
Only one oiled bird was observed by me during the entire day. ThisCommon Loon was completely covered by dark oil and spent a considerableamount of time preening. In addition, Howard Kaiser (pers. comm.)reported seeing one oiled Glaucous-winged Gull.
Only one bird was found on the beached bird surveys. The wings ofa freshly killed murre were found along with many plucked feathers andbird droppings. This was probably attributable to a Bald Eagle whichare numerous in the area. Eagles may be affected by oil in these areasby frequenting oiled beaches and feeding on oiled birds and carrion.
During the night of the 9 November, the oil spread considerablybefore the barge was contained by a boom. An aerial survey revealedthat the oil had spread further into Kachemak Bay. A group of 200loosely aggregated Glaucous-winged Gulls were observed near the oilslick approximately 2 km. offshore. Two Sea Otters were seen not morethan 10m from the oil. Most of the ducks observed from the air- 2 in and
outside of the bay (approx.60) were in non-oiled areas.By far the most complete survey of the wildlife in Seldovia Bay at
the time of the spill was taken by Loren Flagg and myself during anebbing tide at 1300 on 10 November. Observed in the outer portion of
the bay were approximately 60 white-winged Scoters and 30 Oldsquaw. As
a thin coating of oil .was found in an irregular pattern over much ofthis area,some birds were undoubtly swimming in light oil. FifteenOldsquaw were observed in a lightly oiled area just off the Seldoviaboat harbor. Other birds observed in oiled areas, primarily on the west
A'ge- of the bay across from town include 1 Common Loon, 1 Red-neckedGrebe, 5 Harlequin Ducks and 4 Glaucous-winged Gulls. Birds observed incleaner portions of Seldovia Bay, primarily near Powder Island, include 1
Pelagic Cormorant, 5 Black Scoters, 8 Surf Scoters, 32 white-wingedScoters, 15 Oldsquaw and 1 Pigeon Guillemot. On the ebbing tide in thelagoon, 58 Harlequin Ducks and 4 Glaucous-winged Gulls were seen. TwoHarbor Seals were seen in Seldovia Bay during the survey.

•
Three oiled birds were observed during the survey: One CommonMurre, lightly oiled on the breast was observed in the small boatharbor. An immature Glaucous-winged Gull, lightly oiled on breast, anda Red-necked Grebe were seen on the west side of Seldovia Bay.
At this point, it appears that the Seldovia oil spill has had a 1,,YAit
impact on birds and mammals. Undoubt, some birds will die from thespill but at this time it is too early to predict the magnitude of thekill, other than its being small.
Oil is still leaking from the barge and will continue to do sountil the oil is gone or the barge removed. Bird population in the areawill continue to increase through the late fall and early winter.Efforts must be continued to keep oil from spreading l and the beachesopposite Seldovia must be cleaned so as not to act as reservtkors. Thelagoon which is of importance to Harlequin Ducks, Dabbling Ducks andgulls must also be protected from further fouling by oil.
At this writing no fouled or dead birds have been found. However,I suggest that at the end of this week, the weekend, or early next weeka biologist, preferably me j be sent to Seldovia to re-examine the beachesand the neighboring waters. If the ADF&G whaler is not available inSeldovia, then I suggest we utilize the USFWS Monarch already in Homer.
ti
-b35-