The East Greenland Spill Jet*
17
The East Greenland Spill Jet* ROBERT S. PICKART,DANIEL J. TORRES, AND PAULA S. FRATANTONI Woods Hole Oceanographic Institution, Woods Hole, Massachusetts (Manuscript received 6 July 2004, in final form 3 November 2004) ABSTRACT High-resolution hydrographic and velocity measurements across the East Greenland shelf break south of Denmark Strait have revealed an intense, narrow current banked against the upper continental slope. This is believed to be the result of dense water cascading over the shelf edge and entraining ambient water. The current has been named the East Greenland Spill Jet. It resides beneath the East Greenland/Irminger Current and transports roughly 2 Sverdrups of water equatorward. Strong vertical mixing occurs during the spilling, although the entrainment farther downstream is minimal. A vorticity analysis reveals that the increase in cyclonic relative vorticity within the jet is partly balanced by tilting vorticity, resulting in a sharp front in potential vorticity reminiscent of the Gulf Stream. The other components of the Irminger Sea boundary current system are described, including a presentation of absolute transports. 1. Introduction The first detailed study of the circulation and water masses south of Denmark Strait was carried out in the mid-nineteenth century by the Danish Admiral Carl Ludvig Christian Irminger, after whom the sea is named (Fiedler 2003). Among other things, Irminger determined that Atlantic-origin water flowed north- ward into the strait west of Iceland, while cold Arctic- origin water flowed equatorward along the continental boundary of Greenland. Not long after this, Hamberg (1884) noted that warm and salty Atlantic water also resided below and offshore of the polar water. Using measurements from the 1895–96 Ingolf expeditions, Knudsen (1899) then deduced that the northward- flowing Irminger Current bifurcated south of Denmark Strait, with much of the Atlantic water recirculating to join the “East Greenland Polar Current.” 1 Hence, more than a century ago there existed a rudimentary upper- layer circulation scheme for the Irminger Sea boundary current system—one that is remarkably accurate even by today’s standards (see Fig. 1). Since these early measurements there have been nu- merous field programs that have focused on the hy- drography and circulation of the East Greenland shelf and slope. This was driven originally, in part, by the unique topography of the shelf, which contains a series of deep basins and associated banks, making it an im- portant location for trawling of deep-sea fish (e.g., Die- trich 1964). One particularly impressive program was the German expedition on the R/V Meteor in 1933 and 1935, which consisted of a set of “spoke wheel” sections around the southern tip of Greenland. From these data Defant (1936) mapped out the path of the East Green- land/Irminger hydrographic front as it progressed around Cape Farewell, more or less trapped to the shelf break. Earlier, Defant (1930) had noted that intrusions of warm and salty Irminger water were regularly found onshore of the front, likely because of eddy formation. Such meandering of the East Greenland/Irminger Cur- rent was also discussed by Dietrich (1957a,b) and Blindheim (1968); Lee (1968a) noted significant amounts of Irminger water on the shelf as well. Dietrich (1957a) hypothesized that pumping of nutrients would occur because of the frontal secondary circulation, with ramifications for the distribution of plankton and fish populations. Dietrich (1957a) rightly realized the need for more closely spaced stations to investigate this phe- nomenon properly. Other major initiatives investigating the East Green- land/Irminger Current were the IGY program in 1957– 58 (Dietrich 1964), the NORWESTLANT program in 1963 (Lee 1968a), the extensive Norwegian study from 1 This current has also been referred to historically as the East Greenland stream, cold stream, polar stream, Arctic current, and polar current. Today it is referred to as the East Greenland Cur- rent. * Woods Hole Oceanographic Institution Contribution Num- ber 11260. Corresponding author address: Dr. Robert S. Pickart, Woods Hole Oceanographic Institution, Department of Physical Ocean- ography, Mail Stop #21, Woods Hole, MA 02543. E-mail: [email protected] JUNE 2005 PICKART ET AL. 1037 © 2005 American Meteorological Society JPO2734
-
Upload
independent -
Category
Documents
-
view
5 -
download
0
Transcript of The East Greenland Spill Jet*

The East Greenland Spill Jet*
ROBERT S. PICKART, DANIEL J. TORRES, AND PAULA S. FRATANTONI
Woods Hole Oceanographic Institution, Woods Hole, Massachusetts
(Manuscript received 6 July 2004, in final form 3 November 2004)
ABSTRACT
High-resolution hydrographic and velocity measurements across the East Greenland shelf break south ofDenmark Strait have revealed an intense, narrow current banked against the upper continental slope. Thisis believed to be the result of dense water cascading over the shelf edge and entraining ambient water. Thecurrent has been named the East Greenland Spill Jet. It resides beneath the East Greenland/IrmingerCurrent and transports roughly 2 Sverdrups of water equatorward. Strong vertical mixing occurs during thespilling, although the entrainment farther downstream is minimal. A vorticity analysis reveals that theincrease in cyclonic relative vorticity within the jet is partly balanced by tilting vorticity, resulting in a sharpfront in potential vorticity reminiscent of the Gulf Stream. The other components of the Irminger Seaboundary current system are described, including a presentation of absolute transports.
1. Introduction
The first detailed study of the circulation and watermasses south of Denmark Strait was carried out in themid-nineteenth century by the Danish Admiral CarlLudvig Christian Irminger, after whom the sea isnamed (Fiedler 2003). Among other things, Irmingerdetermined that Atlantic-origin water flowed north-ward into the strait west of Iceland, while cold Arctic-origin water flowed equatorward along the continentalboundary of Greenland. Not long after this, Hamberg(1884) noted that warm and salty Atlantic water alsoresided below and offshore of the polar water. Usingmeasurements from the 1895–96 Ingolf expeditions,Knudsen (1899) then deduced that the northward-flowing Irminger Current bifurcated south of DenmarkStrait, with much of the Atlantic water recirculating tojoin the “East Greenland Polar Current.”1 Hence, morethan a century ago there existed a rudimentary upper-layer circulation scheme for the Irminger Sea boundary
current system—one that is remarkably accurate evenby today’s standards (see Fig. 1).
Since these early measurements there have been nu-merous field programs that have focused on the hy-drography and circulation of the East Greenland shelfand slope. This was driven originally, in part, by theunique topography of the shelf, which contains a seriesof deep basins and associated banks, making it an im-portant location for trawling of deep-sea fish (e.g., Die-trich 1964). One particularly impressive program wasthe German expedition on the R/V Meteor in 1933 and1935, which consisted of a set of “spoke wheel” sectionsaround the southern tip of Greenland. From these dataDefant (1936) mapped out the path of the East Green-land/Irminger hydrographic front as it progressedaround Cape Farewell, more or less trapped to the shelfbreak. Earlier, Defant (1930) had noted that intrusionsof warm and salty Irminger water were regularly foundonshore of the front, likely because of eddy formation.Such meandering of the East Greenland/Irminger Cur-rent was also discussed by Dietrich (1957a,b) andBlindheim (1968); Lee (1968a) noted significantamounts of Irminger water on the shelf as well. Dietrich(1957a) hypothesized that pumping of nutrients wouldoccur because of the frontal secondary circulation, withramifications for the distribution of plankton and fishpopulations. Dietrich (1957a) rightly realized the needfor more closely spaced stations to investigate this phe-nomenon properly.
Other major initiatives investigating the East Green-land/Irminger Current were the IGY program in 1957–58 (Dietrich 1964), the NORWESTLANT program in1963 (Lee 1968a), the extensive Norwegian study from
1 This current has also been referred to historically as the EastGreenland stream, cold stream, polar stream, Arctic current, andpolar current. Today it is referred to as the East Greenland Cur-rent.
* Woods Hole Oceanographic Institution Contribution Num-ber 11260.
Corresponding author address: Dr. Robert S. Pickart, WoodsHole Oceanographic Institution, Department of Physical Ocean-ography, Mail Stop #21, Woods Hole, MA 02543.E-mail: [email protected]
JUNE 2005 P I C K A R T E T A L . 1037
© 2005 American Meteorological Society
JPO2734

1959–64 (Blindheim 1968), and the Irminger Sea Proj-ect in 1963–65 (Malmberg et al. 1967). The seasonalcoverage and spatial extent of these surveys varied, butlike the early Meteor cruises noted above, the pattern ofhydrographic stations generally provided good along-stream coverage of the current system. The Norwegianstudy is noteworthy because it contained repeated sur-veys over several years. Among other things this re-vealed that the volume of Atlantic water that flows intothe sea via the Irminger Current on the western flank ofthe Reykjanes Ridge fluctuates on interannual timescales, presumably because of winds. Blindheim (1968)suggested that this, rather than changes in the bi-furcation of the current at Denmark Strait, wouldimpact the amount of Irminger water flowing south-ward with the East Greenland/Irminger Current. TheNORWESTLANT program concentrated on the sea-sonal transition from spring to summer and sampled thecurrent system from late March to early August (Lee1968b). One of the findings showed that there was a
general decrease in salinity of the upper-layer flow asthe season progressed, presumably because of ice meltand increased precipitation (Lee 1968a).
In addition to the combined flow of the East Green-land/Irminger Current in the vicinity of the shelf break(Fig. 1), there is an additional branch of the upper-layerIrminger Sea boundary current system located on theinner part of the shelf. This has recently been namedthe East Greenland Coastal Current by Bacon et al.(2002), although its existence has been known for manyyears. For example, Malmberg et al. (1967) measuredthis branch with near-shore current meters (they re-ferred to it as simply the East Greenland Current). Ba-con et al. (2002) argue that this branch is driven pre-dominantly by local runoff and ice melt. Recently, thetwo branches have been distinguished by trajectories ofdrifters drogued at both 100 m (Krauss 1995) and 15 m(Fratantoni 2001; Reverdin et al. 2003; Jakobsen et al.2003). It must be remembered, however, that ice coveron the Greenland shelf prohibits the launching of drift-
FIG. 1. Schematic of the boundary currents of the Irminger Sea. Red (blue) indicates a warm(cold) upper-layer current. The northward-flowing Irminger Current (IC) on the western flankof the Reykjanes Ridge is fed by two branches of warm water: one recirculating from theeastern flank of the ridge and another from farther south (see Bower et al. 2002; Jakobsen etal. 2003; Pollard et al. 2004). Near Denmark Strait the Irminger Current bifurcates; its north-ward extension is called the Icelandic Irminger Current (Jonsson and Briem 2003), and therecirculating component merges with the cold East Greenland Current (EGC). We refer tothis combined flow—which is associated with a sharp hydrographic front—as the East Green-land/Irminger Current or shelfbreak jet. A separate southward-flowing band of cold waterresides on the inner shelf, which Bacon et al. (2002) called the East Greenland Coastal Current(EGCC); we adopt this terminology as well. The deep western boundary current (DWBC)carrying Denmark Strait overflow water is indicated by the gray line (the contribution fromthe Gibbs Fracture zone is not shown). The bathymetric contours are 500, 1000, 2000, and3000 m.
1038 J O U R N A L O F P H Y S I C A L O C E A N O G R A P H Y VOLUME 35
Fig 1 live 4/C

ers north of Denmark Strait. In Jakobsen’s et al. studymost of the drifters in the East Greenland Coastal Cur-rent originated from the Icelandic slope and shelf (M.Ribergaard 2002, personal communication), likelytransported there by wind or eddies in the vicinity ofDenmark Strait. Because of the general inaccessibilityof the Greenland shelf to in situ measurements, theprecise origin and seasonality of the East GreenlandCoastal Current are still unknown.
Based on the number of programs over the years,one might think that the kinematics and dynamics ofthe East Greenland/Irminger Current are well under-stood at this point. This is not the case, however. Invirtually all of the field programs to date the cross-stream resolution of stations has been deficient to re-solve properly the detailed structure of the hydro-graphic front and its associated jet, which, like manyother frontal systems around the World Ocean, is com-plex and time varying. This is partly due to the harshenvironment of this region. In addition to the ice cover,which is present on the shelf most of the year, theweather is notoriously nasty (even in summer). Conse-quently, the majority of historical hydrographic surveyshave contained only a few stations in the vicinity of theshelf break, and moored measurements to date havebeen limited.
In summer 2001 a hydrographic survey was con-ducted that measured the upper-layer boundary flow ofthe western Irminger Sea at high resolution (stationspacing �5 km). This detailed view revealed a hereto-fore undetected component of the boundary currentsystem located at, and just seaward of, the shelf break—beneath the well-known East Greenland/Irminger Cur-rent. The feature results from the spilling of dense wa-ter over the shelf edge south of Denmark Strait, whichforms a narrow gravity current flowing equatorward onthe upper continental slope (so narrow that it wasmissed in previous surveys).2 In some ways this is akinto the sinking of dense water through Denmark Straititself. However, the cascading shelf water is not asdense as the Denmark Strait overflow water (see alsoRudels et al. 1999), and the mechanisms leading to thespilling have not yet been determined. We have namedthis current the East Greenland Spill Jet. The samefeature was measured as well in our subsequent surveyin 2003.
The purpose of this paper is to introduce and de-scribe the East Greenland Spill Jet using our measure-ments in 2001, and put this current in context with theEast Greenland/Irminger current as well as the deeperflow of Denmark Strait overflow water downstream ofthe sill. In addition to water property measurements,our field program included vessel-mounted acoustic
Doppler current profiler (ADCP) data obtained at highhorizontal resolution. Together with the hydrography,this allows us to compute fields of absolute geostrophicvelocity and potential vorticity. After discussing theproperties, kinematics, and transport of the differentboundary current components in the western IrmingerSea, we focus on the vorticity structure of the spill jet,as well as the entrainment that occurs during its initialadjustment.
2. Field program
a. Hydrographic variables
The hydrographic survey considered here was carriedout in August 2001, and included four high-resolutioncrossings of the East Greenland shelf break (Fig. 2).The intention was to cross the entire shelf on each line,but ice constraints made this impossible since our re-search vessel was not strengthened for ice breaking.The exception to this was section 3, which coincidedwith the A1E line of the World Ocean Circulation Ex-periment (WOCE). On this line we were able to crossmost of the shelf, including the East Greenland CoastalCurrent. However, the focus of this paper is on the twonorthern lines (sections 1 and 2, Fig. 2) where the EastGreenland Spill Jet is first formed.
A Seabird 9� conductivity/temperature/depth(CTD) system, with dissolved oxygen, was used on a24 � 4 L rosette. Water samples were taken for salinityand oxygen. Based on laboratory calibration of thetemperature sensors and in situ calibration of the con-ductivity sensors, the accuracies were 0.001°C and 0.002(practical salinity scale). In the vicinity of the shelfbreak the rosette was lowered to less than 2 m abovethe bottom, and the data were pressure averaged to aresolution of 1 dbar. Gridded fields of the hydrographicvariables were constructed for each section usingLaplacian–spline interpolation, with a grid spacing of1–2 km in the horizontal and 5 m in the vertical direc-tions. The basic fields were potential temperature (�),salinity (S), and potential density referenced to the seasurface (��). The bottom topography was measured us-ing a 12-kHz Knudsen unit.
b. Velocity
Because absolute velocity information in theIrminger Sea boundary current system is relatively rare,especially in the vicinity of the shelf break, high prioritywas placed on the collection and processing of the ves-sel-mounted ADCP data.
1) ADCP DATA COLLECTION AND PROCESSING
R/V Oceanus was equipped with a hull-mounted RDInstruments 150-kHz narrow-band ADCP for measur-ing ship relative velocities. For this cruise the instru-ment was configured to collect 64 8-m bins. Accounting
2 Rudels et al. (1999, 2002) surmised that such a current shouldexist, but their hydrographic measurements were of insufficientresolution to capture the phenomenon.
JUNE 2005 P I C K A R T E T A L . 1039

for blanking near the surface and the hull depth, thecenter of the first bin was 17 m. The software used fordata collection integrated the GPS data, gyro data, andPC clock information (no Ashtech heading correctionwas available). Following collection of the data, theCommon Ocean Data Access System (CODAS) soft-ware package was used for converting the ship relativevelocities into absolute velocities. Next, a series ofsemiautomated programs were used to edit bad pointsand profiles individually from the dataset. Once thesedata were removed, calibration calculations were re-done to determine if our initial transducer misalign-ment angle was correct. The amplitude and phase cor-
rections were found to be 0.999° and �0.0087°, whichmeant no further calibration was necessary.
2) ADCP DE-TIDING
In an effort to remove the barotropic tidal compo-nent from the ADCP velocities, we used the OregonState University (OSU) Ocean Topography Experi-ment (TOPEX)/Poseidon Cross-Over Global InverseSolution (Egbert et al. 1994). The version implementedwas the 1⁄2° North Atlantic model, which solved for theeight tidal constituents M2, S2, N2, K2, K1, O1, P1, andQ1. The model was evaluated at each time/location as-sociated with the 5-min ensemble ADCP profiles. Com-
FIG. 2. (a) Study area in the Irminger Sea. (b) The hydrographic survey in summer 2001. CTD stationsare marked by the crosses. Section numbers are labeled in boldface lettering, and selected stationnumbers are indicated in smaller lettering. The bathymetric contours are 500, 1000, 2000, and 3000 m.
1040 J O U R N A L O F P H Y S I C A L O C E A N O G R A P H Y VOLUME 35

parisons of tidal velocities derived from the OSU modeland those calculated from harmonic analysis of mooredADCP data have generally shown good agreement inthe western North Atlantic (Torres and Mauritzen2002). Nonetheless, because of the complex bathymetryof the East Greenland shelf and slope, we compared theSmith and Sandwell bathymetry used in the model withthe Knudsen data collected on the cruise and foundsignificant differences in a few regions (mainly aroundCape Farewell). An interpolation method was devel-oped for recalculating the tidal correction in the areaswhere the bathymetry was inaccurate.
3) STREAM COORDINATE ROTATION
After the de-tiding was complete, the ADCP profileswere rotated into a streamwise coordinate system fol-lowing the methods of Fratantoni et al. (2001). Theapproach is designed to ensure that comparisons be-tween ADCP velocity sections along the path of theboundary current are not biased by changes in the cur-rent’s orientation relative to the survey lines. In therotated coordinate system, the major axis is alignedparallel to the downstream direction of the dominantupper-layer flow. The along-stream direction was de-fined by the mean transport vector calculated over theupper 250 m of the water column (encompassing thelargest velocities in the vicinity of the shelf break) andaveraged over the e-folding width of the current. In thisapproach, we assume that the structure of the currentremains largely the same over the along-stream dis-tance sampled in a single section. This distance, andhence the error, is dependent on the width of the cur-rent and the angle at which it intersects the survey line.In the two ADCP sections considered here (sections 1and 2), the survey lines were oriented nearly perpen-dicular to the dominant flow; hence any error associ-ated with this assumption is small.
4) ABSOLUTE GEOSTROPHIC VELOCITY
To investigate the flow in the deeper part of the wa-ter column (i.e., deeper than the penetration depth ofthe vessel-mounted ADCP) we computed geostrophicvelocities and referenced them using the de-tided,stream-coordinate ADCP data. This was done as fol-lows. First the gridded vertical sections of temperatureand salinity were used to calculate the dynamic heightfrom which the relative geostrophic velocity was com-puted. This was then regridded onto the standard gridalong with the ADCP along-stream velocity. Theformer was then referenced by matching the verticallyaveraged velocity over the depth range of the ADCPdata at each horizontal grid location. Although theADCP velocity field contains ageostrophic contribu-tions (other than the barotropic tide which was re-moved), these contributions are generally small in com-parison with the boundary current flow. This can beseen by noting the good agreement between the vessel-
mounted ADCP velocity and the absolute geostrophicvelocity (see next section). We define x, u as the along-stream distance, velocity (positive for shallow water onthe right), and y, � as the cross-stream distance, velocity(positive offshore). The depth z is defined as positiveupward.
3. Components of the Irminger Sea boundarycurrent system
a. Upper layer
As schematicized in Fig. 1, the cold East Greenlandcurrent flows southward through Denmark Strait andmeets the warm, retroflected branch of the IrmingerCurrent. This results in a sharp hydrographic front nearthe shelf break, separating the cold, fresh shelf waterfrom the warm, salty slope water. This front occurs be-tween stations 23 and 24 on our first crossing (Figs.3a,b). Note that there is a lens of warm, salty slopewaterlocated on the shelf inshore of the main front. A similarlens was found on the second hydrographic section (notshown). This is not unexpected since the meandering ofthis front and the formation of such lenses has longbeen documented (e.g., Defant 1930; Dietrich 1957a,b;Blindheim 1968; Lee 1968a).
Coincident with the hydrographic front is a sharpchange in isopycnal slope, with density surfaces de-scending as much as 250 m from the outer shelf to theupper slope. This feature has been discussed previouslyand is thought to be the manifestation of dense watercascading over the shelf break (Rudels et al. 1999; Ru-dels et al. 2002). Such a process has been documentedat numerous other locations around the World Ocean(Ivanov et al. 2004). Rudels et al. (1999) surmised thatoff of east Greenland this resulted in a shallower,lighter version of the Denmark Strait overflow waterflowing southward (perhaps at times merging with thedeep overflow). Rudels et al. (2002) reiterated this andspeculated that the upper core underwent more intenseentrainment than the dense overflow passing throughthe strait. Neither of these studies had fine enough sta-tion spacing to resolve the feature fully, and there wasno direct velocity information. Our more detaileddataset verifies the assertions of Rudels et al. (1999;2002) and documents the existence of this upper core,which we call the East Greenland Spill Jet. Interest-ingly, Malmberg et al. (1967) noted increased south-ward flow with depth at the outer shelf in this region,which was likely the same feature.
The vertical section of de-tided velocity from the ves-sel-mounted ADCP clearly reveals the spill jet (Fig.4a). One sees the enhanced equatorward flow, greaterthan 60 cm s�1, banked against the upper continentalslope. The absolute geostrophic velocity, referenced us-ing the ADCP data (Fig. 4b), shows the relationship ofthe spill jet to the East Greenland/Irminger current.The strongest velocities in the latter are associated with
JUNE 2005 P I C K A R T E T A L . 1041

the warm Irminger water, located shallower and off-shore of the spill jet. At this northern location, the ret-roflecting Irminger Current is still in the process ofmerging with the East Greenland Current. Although itis common to depict these two flows side by side alongthe entire shelf break (as in Fig. 1 and many otherschematics), the two are not separable in terms of ve-locity, which is why we refer to the composite feature asthe East Greenland/Irminger Current. Farther down-stream the merged velocity signal is located closer tothe shelf break.
Note that the spill jet extends from the outer shelf tothe upper slope, almost to 1000 m (Fig. 4b). However,the property sections (Fig. 3) show an isolated core ofcold, fresh, newly ventilated water confined to the slopenear 600–800 m. Did this anomalous water emanatefrom the shelf, as we assert, or is it instead simply thetop of the Denmark Strait overflow core? To shed lighton this we computed the vertical section of Richardsonnumber, R � [N(x, z)/uz(x, z)]2, using the gridded fieldsof buoyancy frequency (N) and along-stream velocity(u). This reveals an area of small R near the shelf break
and upper slope, which suggests that strong verticalmixing is taking place at that location (Fig. 5). Ourinterpretation is that entrainment with ambient slopewater is occurring as the dense water first spills over theshelf and that this modifies the properties of the shelfwater, making it warmer, saltier, and lower in oxygen.By contrast, we surmise that the deeper portion of thespill jet, where the stratification is weaker, did not en-train as rigorously where it spilled over farther up-stream. This would explain why the lower portion of thespill jet has more shelflike properties as seen in Fig. 3.A similar contrast in properties is found between theupper and lower portions of the Denmark Strait over-flow at the base of the continental slope (see below).
To demonstrate further that turbulent mixing is tak-ing place near the shelf break, we considered individualvertical profiles of N and u. This was motivated by thefact that a certain amount of smoothing occurs whenconstructing the gridded fields so that the vertical sec-tion of R in Fig. 5 is, in fact, a low-passed view. The rawvertical profiles of velocity (from the vessel-mountedADCP) and buoyancy frequency squared (from the
FIG. 3. Vertical sections of hydrographic properties (in color)overlaid on potential density (kg m�3) at the western end ofsection 1. CTD station numbers are indicated at the top. (a)Potential temperature, (b) salinity, and (c) dissolved oxygen. Wa-ter sample locations are indicated by the open circles.
1042 J O U R N A L O F P H Y S I C A L O C E A N O G R A P H Y VOLUME 35
Fig 3 live 4/C

CTD) are shown in Figs. 6a and 6b for the site closestto the shelf break. One sees that there is elevated ver-tical shear in the velocity deeper than 200 m (i.e., thespill jet), which is accompanied by small values of strati-fication. Together, these result in local values of theRichardson number that fall below the critical value of1/4 (Fig. 6c), indicating that turbulent entrainment isindeed active in the upper portion of the spill jet.
b. Deep layer
A full water-column view of the along-stream veloc-ity (Fig. 7a) reveals the complete Irminger Sea bound-ary current system (minus the East Greenland Coastal
Current). Beneath the East Greenland/Irminger Cur-rent and the spill jet is the bottom-intensified flow ofDenmark Strait overflow water. One sees that the coreof highest velocity is situated near 1400-m depth, flow-ing greater than 55 cm s�1. A broad region of weakerflow extends offshore down to the base of the conti-nental slope. The vertical section of oxygen (Fig. 7b)shows that this long tail contains the highest oxygenconcentrations, whereas the high-speed core has amarkedly reduced signal. This is analogous to the spilljet in that the greatest entrainment—and hence thestrongest modification of properties—occurs in theswiftest part of the jet, while the denser, slower com-ponent contains the purest form of the water mass.
We note that, in terms of velocity, there is not a hugedistinction between the base of the upper-layer compo-nents of flow (the spill jet and the East Greenland/Irminger Current) and the top of the overflow. Thevelocity minimum separating these components isgreater than 35 cm s�1. Also note the strong lateralshear in velocity at the edge of the composite boundarycurrent, near station 18. This shear would not havebeen evident from the thermal wind alone, and furtherdemonstrates the importance of the vessel-mountedADCP data in referencing the geostrophic velocity.The isopycnal that separates the upper-shelfbreak sys-tem from the deeper Denmark Strait overflow water is�� � 27.76 kg m�3. This is smaller than the value typi-cally used to delineate the overflow (27.8 kg m�3; seeDickson and Brown 1994) and may be a reflection ofinterannual variability (e.g., Bacon 1998).
4. Transports
Despite the fact that there have been numerous sur-veys of the western Irminger Sea boundary current sys-tem over the years, very few absolute transport esti-
FIG. 4. (a) Along-stream velocity from the vessel-mountedADCP at the western end of section 1. Positive velocities areequatorward. The area not sampled by the ADCP is blanked bygray shading. CTD station numbers are indicated at the top, andthe cross-stream locations of the ADCP ensemble bins are de-noted by black circles. (b) Absolute geostrophic velocity refer-enced using the information in (a) (see text), overlaid on potentialdensity (kg m�3). The thick gray line is the zero velocity contour.The white rectangle is the region used to calculate the volumetransport of the spill jet.
FIG. 5. Vertical section of Richardson number (color) overlaidon potential density (kg m�3) at the western end of section 1.
JUNE 2005 P I C K A R T E T A L . 1043
Fig 4 and 5 live 4/C

mates exist because there is a lack of direct velocitymeasurements. One notable exception is the study byClarke (1984), who used current-meter data from short-term deployments to reference a hydrographic sectionoff of Cape Farewell (the offshore part of the sectionwas referenced subjectively, however). A second excep-tion is the investigation of Dickson and Brown (1994),who presented a rigorous calculation of the down-stream evolution in transport of the Denmark Straitoverflow layer (although the East Greenland/IrmingerCurrent was not sampled by the current-meter arrays).Our survey offers the best opportunity to date in termsof lateral coverage (with absolute velocity), but oneneeds to keep in mind that this is a synoptic snapshot,subject to inherent mesoscale variability.
Some of the historical transport calculations considerthe East Greenland/Irminger current as a single entity(e.g., Bacon 1997), while others resolve the two com-ponents (e.g., Dietrich et al. 1980). To separate the twoparts it is necessary to define a watermass boundarybetween the East Greenland Current water and theIrminger Water, which is not straightforward. For ex-ample, both Blindheim (1968) and Clarke (1984) usedthe 34.5 isohaline as the boundary, but in some ofBlindheim’s sections this is closer to the dividing linebetween the East Greenland Current and the EastGreenland Coastal Current. This is true for our real-ization as well. Clearly this division is subject to inter-annual variability, and for our 2001 data we chose S �34.9 psu as the dividing isohaline between the cold,fresh East Greenland Current water and the warm,salty Irminger Current water (see Fig. 3b). As for theother components of the flow, the chosen limits of thespill jet are shown in Fig. 4, and, as noted above, thelayer from �� � 27.76 kg m�3 to the bottom is taken asthe Denmark Strait overflow water.
Two of the hydrographic sections in our survey ex-tended to the Reykjanes Ridge (Fig. 2), and on bothsections we sampled the northward-flowing IrmingerCurrent situated over the western flank of the ridge.This was evident both in the vessel-mounted ADCPdata and in the hydrography (a transition into saltierwater over the ridge). At the northern section theADCP velocity vectors indicate that the current washeading north-northwestward, and hence we crossed itat an oblique angle. For this reason we used the south-ern crossing to compute the northward transport of thecurrent. Figure 8 shows this cross section of the current,which has a similar structure to the Gulf Stream fromwhich it derives—albeit smaller and weaker. A pro-nounced salinity front shows the transition to subtropi-cal waters, and the associated density front supports acurrent that is greater than 40 cm s�1. For the transportwe used �� � 27.76 kg m�3 as the lower boundary of theflow (to be consistent with the western boundary), andthe lateral domain was taken to be 530–605 km (Fig. 8).
A geographical view of the transport distribution ofthe boundary current system is shown in Fig. 9a. In thefigure the directly computed transport values appear inthe yellow squares. It is seen that the East Greenlandportion of the combined East Greenland/Irminger Cur-rent is 0.7 Sv (Sv � 106 m3 s�1), while the Irmingerportion is 12.9 Sv. Note that the latter includes the spilljet, which is 1.9 Sv. Farther to the south we were able tocross the East Greenland Coastal Current (near CapeFarewell, where ice was not a problem), which is trans-porting 2.0 Sv. We have no direct measure of the Ice-landic Irminger Current flowing northward into the Ice-land Sea nor have we measured the cold outflow of theEast Greenland Current prior to joining the IrmingerCurrent. To put our synoptic transport scheme intocontext with the transport budget of the Nordic seas as
FIG. 6. (a) Unsmoothed ADCP along-stream velocity profile at the bin location closest to CTD station 22. Positive velocities areequatorward. (b) Vertical profile of buoyancy frequency squared at CTD station 22 (the data have been subsampled for presentation).(c) Richardson number calculated from (a) and (b). The gray shading denotes values less than the critical number of 1/4.
1044 J O U R N A L O F P H Y S I C A L O C E A N O G R A P H Y VOLUME 35

FIG. 7. Full-water column vertical sections. (a) Absolute geostrophic velocity (color) overlaid on potential density (kg m�3) at thewestern end of section 1. Positive velocities are equatorward. The thick gray line is the zero velocity contour. (b) Dissolved oxygen(color) overlaid on potential density. Water sample locations are indicated by the open circles.
JUNE 2005 P I C K A R T E T A L . 1045
Fig 7 live 4/C

a whole, it is desirable to estimate these values. We doso as follows.
Figure 10 shows the Nordic seas transport budgetfrom Hansen and Osterhus (2000), which they argue isaccurate to within 1 Sv. In their scheme, 7 Sv of Atlanticwater enter the basin in the east and 1 Sv enters in thewest, comprising the Icelandic Irminger Current. If wetake this value for the Icelandic Irminger Current in oursurvey, it means that 12.7 Sv of the northward-flowing
Irminger Current recirculates south of Denmark Strait.This in turn implies that the spill jet would consist ofnearly all recirculated Atlantic water, which is clearlynot the case. In the other extreme, if we assume 3 Sv ofwater flow northward in the Icelandic Irminger Cur-rent, this implies that no recirculated Irminger Currentwater would be in the spill jet, which is also unlikely.We therefore assign an intermediate value of 2 Sv tothe Icelandic Irminger Current. For the East GreenlandCurrent emanating from the Iceland Sea we have nocompelling reason not to use the value of 1.3 Sv quotedby Hansen and Osterhus (2000). This in turn impliesthat in our scheme the spill jet is composed of roughly0.7 Sv of recirculating Irminger Current water, 0.6 Sv ofpure East Greenland Current water, and 0.6 Sv due toentrainment of additional ambient water adjacent tothe shelf. While this scenario is of course speculative, itis nonetheless plausible in light of the evidence pre-sented above for significant entrainment at the shelfbreak as the spill jet forms. It is also consistent with thetemperature–salinity distribution of the water compris-ing the spill jet, which is shown in Fig. 11. One sees aspread of T–S values ranging from the extreme of EastGreenland Current water to the opposite extreme ofpure Irminger water.
Our estimated values of inflow and outflow from theIceland Sea are included in Fig. 9a (shown in cyancircles, since they are not directly calculated), whichthen gives a complete scheme for the transport of theIrminger Sea boundary current system. These transportestimates are compared with historically calculated val-ues in Fig. 9b, and also listed in Table 1. Summarizingour scheme, nearly 14 Sv of warm, salty Irminger waterapproaches Denmark Strait from the south, androughly 85% of this retroflects to the southwest. Ourvalue of 2 Sv for the Icelandic Irminger Current issomewhat large (although it falls within the range ofvalues presented in Table 1), but one should keep inmind that the degree of retroflection is thought to varyin time. For example, one of the influencing factors isthe local winds (Steffansson 1962; Blindheim 1968),which can enhance the Atlantic inflow when blowingfrom the south. Regarding the cold outflow, the EastGreenland Current is transporting 1.3 Sv of water outof Denmark Strait. Nearly half of this cascades over theshelf and entrains ambient water—including some ofthe retroflected Irminger Current water—to form thespill jet carrying 1.9 Sv. We also calculate 2 Sv for theEast Greenland Coastal Current on the inner shelf,which is significantly larger than Bacon et al.’s (2002)estimate at the same location (0.8 Sv).3 Regarding thedeep flow, the transport of Denmark Strait overflow
3 We note that Bacon et al. (2002) show drifter-derived surfacecurrents 100 cm s�1 in the East Greenland Coastal current, sug-gesting a greater transport than that derived from their ADCPdata.
FIG. 8. (a) Salinity (color) overlaid on potential density (kg m�3)at the eastern end of section 3, over the western flank of theReykjanes Ridge. (b) Absolute geostrophic velocity (color) over-laid on potential density. Positive velocities are poleward. Thethick gray line is the zero velocity contour.
1046 J O U R N A L O F P H Y S I C A L O C E A N O G R A P H Y VOLUME 35
Fig 8 live 4/C

FIG. 9. Transport of thedifferent components of theIrminger Sea boundary cur-rent system. (a) Plan viewof the transport estimatesfrom this study. Directlycalculated values are shownin the yellow squares, andsubjective estimates are inthe cyan circles (see text forjustification of the subjec-tive estimates). The bathy-metric contours are 500,1000, 2000, and 3000 m. (b)Transport values from thisstudy (boldface symbols)compared with historical es-timates. See Table 1 for de-tails of the historical esti-mates.
JUNE 2005 P I C K A R T E T A L . 1047
Fig 9 live 4/C

water at section 1 is 6.0 Sv, in line with what Dicksonand Brown (1994) present for this location (5.2 Sv).
Does our synoptic scheme make sense in terms of theoverall balance for the Nordic seas? Comparing Figs. 9aand 10 it is seen that we have more warm inflow (1 Svmore) as well as more cold surface outflow (2 Sv more)than in the budget presented by Hansen and Osterhus(2000) (we assume that the deep outflows and the east-ern Atlantic inflow are the same in both schemes, alongwith the Bering Strait and Canadian Arctic Archi-pelago contributions). This difference could be due tothe fact that our scheme is an instantaneous snapshot,whereas Hansen and Osterhus’ (2000) budget is basedon long-term measurements. Nonetheless, our schemebalances the Nordic seas inflow/outflow to within 1 Sv,which is the uncertainty quoted by Hansen and Oster-hus (2000). The imbalance of excess outflow in Fig. 9abecomes smaller when one considers that some of the
East Greenland Coastal Current at Cape Farewell islikely due to runoff emanating from south of DenmarkStrait. In any event, even though our survey is synoptic,it suggests that a significant amount of the cold, freshoutflow of the Nordic seas occurs in the East GreenlandCoastal Current.
Last, we address the total western boundary currenttransport exiting the Irminger Sea to the south. As de-picted in Dickson and Brown (1994), the deep-layertransport increases downstream of Denmark Strait, pri-marily because of the addition of the Iceland–Scotlandoverflow water from the Gibbs Fracture Zone. If weassume the same enhancement to the south, which in-creases the deep transport to 13.3 Sv at Cape Farewell,and assume that the spill jet does not increase its trans-port significantly further (see below), this gives a totalequatorward volume flux of 28.9 Sv at 60°N. This isfairly close to the other directly referenced estimates atthis location—Clarke’s (1984) range of 27–33 Sv andBacon’s (1997) value of 26–27 Sv based on inverse con-straints. It is also in line with the mean estimate of 28.5Sv that Pickart and Spall (2004) obtained for the north-ward-directed total transport on the west side of Green-land (at the WOCE AR7W line). This latter agreementmay be fortuitous, however. The Lagrangian results ofLavender et al. (2000) and others have suggested thatthere are local deep recirculations in both the Irmingerand Labrador Seas. Pickart and Spall’s (2004) estimateexcludes the recirculating component, whereas ourIrminger Sea calculation (and that of Clarke 1984 andBacon 1997) does not attempt to separate throughputfrom recirculation. Furthermore, Pickart and Spall’s(2004) mean section does not include the full contribu-tion from the West Greenland Current. More refine-ment will be required to pin down the precise boundarycurrent throughput in this region of the subpolar gyre.
5. Vorticity structure of the spill jet
To understand better the character of the spill jet andthe possible nature of its spatial and temporal variabil-ity, we considered the cross-stream structure in vortic-ity. In particular, we constructed vertical sections of thedifferent components of the Ertel potential vorticity,
� ��f
�0
���
�z�
1�0
�u
�y
���
�z�
g
�02 f����
�y �2
, 1�
where f is the (constant) Coriolis parameter (1.31 �10�4 s�1), �0 is the reference density (1.031 � 103
kg m�3), and g is the gravitational acceleration. Thefirst term on the right-hand side of (1) is the verticalstretching term, while the second term is the relativevorticity, which is dominated by the cross-stream shearin equatorward velocity. The third term is a nonquasi-geostrophic contribution to the vorticity known as thetilting term [see Hall (1994) for a derivation of thisterm]. In large-scale relatively weak flows, the stretch-
FIG. 10. Schematic of the water balance in the Nordic seas,from Hansen and Osterhus (2000).
FIG. 11. The T–S scatterplot for the water comprising the spilljet, computed from those parts of stations 21–24 that fall withinthe white box shown in Fig. 4b; IW denotes the Irminger Waterend member, whose bounds were computed from stations 68–69using data between 100 and 600 m (Fig. 8).
1048 J O U R N A L O F P H Y S I C A L O C E A N O G R A P H Y VOLUME 35

TA
BL
E1.
His
tori
cal
tran
spor
tes
tim
ates
(Sv)
ofth
eIr
min
ger
Sea
boun
dary
curr
ent
syst
em.
Stud
y
Nor
thw
ard-
flow
ing
Irm
inge
rC
urre
nt
Sout
hwar
d-fl
owin
gIr
min
ger
Cur
rent
Icel
andi
cIr
min
ger
Cur
rent
Eas
tG
reen
land
Cur
rent
Com
bine
dE
ast
Gre
enla
ndan
dso
uthw
ard-
flow
ing
Irm
inge
rC
urre
nt
Eas
tG
reen
land
Coa
stal
Cur
rent
Tot
alw
este
rnbo
unda
rycu
rren
tof
fso
uthe
rnG
reen
land
Abs
olut
ere
fere
nce
Com
men
t
Lee
(196
8a)
3.0
2.9
No
Ave
rage
ofIn
tern
atio
nal
Ice
Pat
rol
repe
athy
drog
raph
yfr
om19
50–6
3.D
ietr
ich
(195
7b)
7.4
3.0
No
Wor
thin
gton
(197
0)3.
0N
oM
alm
berg
etal
.(19
67)
1.6
Yes
Ref
eren
ced
usin
gm
oori
ngs.
Lee
(196
8b)
7.8
2.4
No
Rel
ativ
eto
1000
m.N
OR
WE
STL
AN
T2.
Die
tric
het
al.(
1980
)2.
02.
0N
oC
lark
e(1
984)
11.0
3.0
27–3
3.5
Yes
Shor
ewar
dpa
rtof
sect
ion
refe
renc
edus
ing
shor
t-te
rmm
oori
ngs.
Rei
d(1
994)
3.0
No
Schm
itz
and
McC
artn
ey(1
993)
36N
o
Kra
uss
(199
5)9.
66.
23.
4Y
es/n
oO
nly
the
sout
hwar
d-fl
owin
gIr
min
ger
curr
ent
valu
eis
refe
renc
edus
ing
floa
tda
ta.T
heIc
elan
dic
Irm
inge
rcu
rren
tes
tim
ate
isa
resi
dual
.B
acon
(199
7)9.
015
.026
–27
Yes
Ref
eren
ced
usin
gve
ssel
-mou
nted
AD
CP
,in
vers
eca
lcul
atio
n.B
acon
etal
.(20
02)
0.8
No
Cal
cula
ted
usin
ghy
drog
raph
yan
dm
odel
.Jo
nsso
nan
dB
riem
(200
3)0.
95Y
esC
alcu
late
dus
ing
long
-ter
mm
oori
ngs.
S.Jo
nsso
n(2
004,
pers
onal
com
mun
icat
ion)
2Y
esC
alcu
late
dus
ing
vess
el-m
ount
edA
DC
Pda
ta.
Pol
lard
etal
.(20
04)
9.0 –
13.0
7.0
No
Rel
ativ
eto
1400
mor
bott
om.
Thi
sst
udy
13.7
12.9
2.0
0.7
13.6
2.0
28.9
Yes
The
Icel
andi
cIr
min
ger
curr
ent
valu
eis
subj
ecti
ve;a
llot
her
valu
esar
edi
rect
lyca
lcul
ated
.The
tota
ltr
ansp
ort
valu
eas
sum
esen
hanc
emen
tof
deep
laye
rtr
ansp
ort
acco
rdin
gto
Cla
rke
(198
4;se
ete
xt).
JUNE 2005 P I C K A R T E T A L . 1049

ing term dominates (e.g., Talley and McCartney1982), but in strong jets like the Gulf Stream all threeterms can contribute (Hall 1994). The tilting vorticitybecomes significant in regions of strongly sloped isopy-cnals, so we would expect this term to be important inthe spill jet because of the strong density front at theshelf break (Fig. 3).
The ratio of the relative vorticity and the tilting vor-ticity to the stretching term (Fig. 12) reveals that allthree components of are significant in the spill jet.Strong cyclonic vorticity, exceeding 0.5f, is found adja-cent to the upper slope (Fig. 12a). This suggests that thecurrent may be barotropically unstable. This has re-cently been purported for the boundary current on thewest side of Greenland because of the strong lateralvelocity shear adjacent to the boundary (Eden andBöning 2002), as well as for various other boundarycurrent systems around the World Ocean (e.g., in thewestern Arctic shelfbreak jet; Paquette and Bourke
1974). The relative vorticity is likely even stronger inthe narrow spill jet than it is on the west side of Green-land. The tilting vorticity is also strong in the spilljet, greater than 0.4f in the vicinity of the shelf break(Fig. 12b).
To elucidate further the cross-stream vorticity struc-ture we computed a depth-layer average (300–500 m) ofthe terms in , which is displayed in Fig. 13. The regionof the spill jet is shaded in the figure, and one sees thatthe cyclonic relative vorticity increases markedly to-ward the boundary. Note however that, since the tiltingvorticity has the opposite trend, these two terms par-tially cancel each other. The net effect on is tosharpen the transition from a low value of potentialvorticity offshore to a high, generally uniform value inthe spill jet. Such a potential vorticity front is reminis-
FIG. 12. (a) Vertical section of the ratio of relative vorticity tostretching vorticity [see Eq. (1)] at the western end of section 1.Solid contours are cyclonic vorticity, and dashed contours areanticyclonic. (b) Ratio of tilting vorticity to stretching vorticity.
FIG. 13. (a) Terms of the Ertel vorticity at the western end ofsection 1, averaged over the depth layer 300–500 m. The shadedregion denotes the spill jet. (b) Average along-stream velocity inthe same depth layer.
1050 J O U R N A L O F P H Y S I C A L O C E A N O G R A P H Y VOLUME 35
cent of the Gulf Stream (Hall 1985) and is believed toinfluence the turbulent behavior of that current. Prattand Stern (1986) modeled a jet, located adjacent to asidewall, with this same potential vorticity structure.They found that meanders in the current’s path devel-oped at finite amplitude, and eddies were subsequentlyformed. This could be happening in the spill jet as well,whereby an initial disturbance (resulting say from baro-tropic instability) would grow to finite amplitude andultimately lead to cross-frontal exchange. This is in-triguing because it suggests that the process of transfer-ring dense water from the shelf to the interior basinmay involve two steps: First, the spilling process formsthe intense jet flowing along the upper slope, then theunstable character of the jet leads to lateral exchange ofmass and properties.
6. Discussion
While our measurements have offered a first glimpseof the nature, transport, and structure of the EastGreenland Spill Jet, a host of issues remain to be sortedout. These include determining the formation mecha-nism, the seasonality, and the fate of the jet, as well asits role in shelf–basin exchange in the Irminger Sea.Some of these issues can be addressed with future fieldprograms, while some will require high-resolution mod-eling. Using our present dataset we can make a fewgeneral statements, and a few speculations.
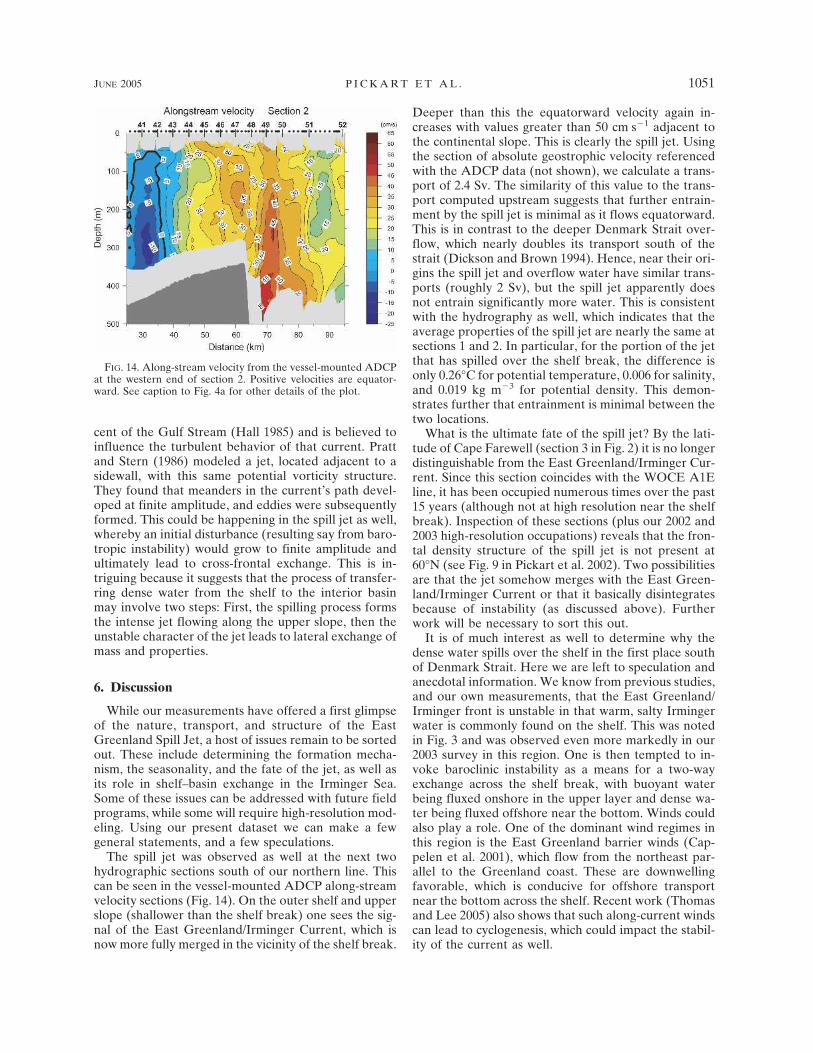
The spill jet was observed as well at the next twohydrographic sections south of our northern line. Thiscan be seen in the vessel-mounted ADCP along-streamvelocity sections (Fig. 14). On the outer shelf and upperslope (shallower than the shelf break) one sees the sig-nal of the East Greenland/Irminger Current, which isnow more fully merged in the vicinity of the shelf break.
Deeper than this the equatorward velocity again in-creases with values greater than 50 cm s�1 adjacent tothe continental slope. This is clearly the spill jet. Usingthe section of absolute geostrophic velocity referencedwith the ADCP data (not shown), we calculate a trans-port of 2.4 Sv. The similarity of this value to the trans-port computed upstream suggests that further entrain-ment by the spill jet is minimal as it flows equatorward.This is in contrast to the deeper Denmark Strait over-flow, which nearly doubles its transport south of thestrait (Dickson and Brown 1994). Hence, near their ori-gins the spill jet and overflow water have similar trans-ports (roughly 2 Sv), but the spill jet apparently doesnot entrain significantly more water. This is consistentwith the hydrography as well, which indicates that theaverage properties of the spill jet are nearly the same atsections 1 and 2. In particular, for the portion of the jetthat has spilled over the shelf break, the difference isonly 0.26°C for potential temperature, 0.006 for salinity,and 0.019 kg m�3 for potential density. This demon-strates further that entrainment is minimal between thetwo locations.
What is the ultimate fate of the spill jet? By the lati-tude of Cape Farewell (section 3 in Fig. 2) it is no longerdistinguishable from the East Greenland/Irminger Cur-rent. Since this section coincides with the WOCE A1Eline, it has been occupied numerous times over the past15 years (although not at high resolution near the shelfbreak). Inspection of these sections (plus our 2002 and2003 high-resolution occupations) reveals that the fron-tal density structure of the spill jet is not present at60°N (see Fig. 9 in Pickart et al. 2002). Two possibilitiesare that the jet somehow merges with the East Green-land/Irminger Current or that it basically disintegratesbecause of instability (as discussed above). Furtherwork will be necessary to sort this out.
It is of much interest as well to determine why thedense water spills over the shelf in the first place southof Denmark Strait. Here we are left to speculation andanecdotal information. We know from previous studies,and our own measurements, that the East Greenland/Irminger front is unstable in that warm, salty Irmingerwater is commonly found on the shelf. This was notedin Fig. 3 and was observed even more markedly in our2003 survey in this region. One is then tempted to in-voke baroclinic instability as a means for a two-wayexchange across the shelf break, with buoyant waterbeing fluxed onshore in the upper layer and dense wa-ter being fluxed offshore near the bottom. Winds couldalso play a role. One of the dominant wind regimes inthis region is the East Greenland barrier winds (Cap-pelen et al. 2001), which flow from the northeast par-allel to the Greenland coast. These are downwellingfavorable, which is conducive for offshore transportnear the bottom across the shelf. Recent work (Thomasand Lee 2005) also shows that such along-current windscan lead to cyclogenesis, which could impact the stabil-ity of the current as well.
FIG. 14. Along-stream velocity from the vessel-mounted ADCPat the western end of section 2. Positive velocities are equator-ward. See caption to Fig. 4a for other details of the plot.
JUNE 2005 P I C K A R T E T A L . 1051
Fig 14 live 4/C

Last, one wonders about the origin of the dense wa-ter in the spill jet. Has it formed locally (and has thus inturn facilitated the spilling) or has it been advectedremotely from north of Denmark Strait (as implied inour earlier discussion on transports)? The strong strati-fication on the shelf in Fig. 3 suggests the latter, but onemust keep in mind the strong wintertime buoyancyforcing in this region. The air–sea heat flux due to thebarrier winds is quite strong (see Pickart et al. 2003),and brine formation may lead to overturning. Convec-tion near the outer shelf can also be enhanced by sur-face Ekman flux of dense, salty water from offshore dueto the northerly winds (Straneo et al. 2001). On theother hand, there are a variety of water masses beingadvected southward in the East Greenland Currentnorth of Denmark Strait, which could be supplying thesource waters of the spill jet. Inspection of the propertysections in Rudels et al. (2002) suggest that the spill jetmay be composed of modified Polar Intermediate Wa-ter. Clearly, more investigation is needed to begin sort-ing out this issue, as well as the other spill jet issuesraised above. A hydrographic survey completed in sum-mer 2004 was a first step toward this.
Acknowledgments. We are grateful to Captain A.Mello and the crew of the R/V Oceanus for their dili-gent efforts in collecting these data. During the cruisewe also received assistance from the Danish Meteoro-logical Institute in the way of weather and ice informa-tion. We are especially grateful to E. Buch, M. Riber-gaard, and K. Hansen for their help with the field pro-gram. The CTD data processing was carried out by T.McKee. D. Sutherland provided one of the figures. Wewould also like to acknowledge P. Ehrenbrink, whotranslated several old German articles into English.This project was funded by the National Science Foun-dation under Grant OCE 00-02492.
REFERENCES
Bacon, S., 1997: Circulation and fluxes in the North Atlantic be-tween Greenland and Ireland. J. Phys. Oceanogr., 27, 1420–1435.
——, 1998: Decadal variability in the outflow from the NordicSeas to the deep Atlantic Ocean. Nature, 394, 871–874.
——, G. Reverdin, I. G. Rigor, and H. M. Snaith, 2002: A fresh-water jet on the east Greenland shelf. J. Geophys. Res., 107,3068, doi:10.1029/2001JC000935.
Blindheim, J., 1968: Hydrographic investigations in the IrmingerSea in the years 1954–1964. FiskDir. Skr. Ser. HavUnders., 14,72–97.
Bower, A. S., and Coauthors, 2002: Directly measured mid-depthcirculation in the northeastern North Atlantic Ocean. Nature,419, 603–607.
Cappelen, J., B. V. Jorgensen, E. V. Laursen, L. S. Stannius, andR. S. Thomsen, 2001: The observed climate of Greenland,1958–99, with climatological standard normals, 1961–90.Danish Meteorological Institute Tech. Rep. 00–18, 149 pp.
Clarke, R. A., 1984: Transport through the Cape Farewell–Flemish Cap section. Rapp. P.-V. Reun.-Cons. Int. Explor.Mer., 185, 120–130.
Defant, A., 1930: Bericht uber die ozeanographischen Untersu-
chungen des Vermessungsschiffes “Meteor” in der Dane-markstrasse und in der Imingersee. Preuss. Akad. Wiss., Sitz.,Phys. Math. Klasse, XVI, 230–235.
——, 1936: Bericht uber die ozeanographischen Untersuchungendes Vermessungsschiffes “Meteor” in der Danemarkstrasseund in der Imingersee. Preuss. Akad. Wiss., Sitz., Phys. Math.Klasse, XIX, 232–242.
Dickson, R. R., and J. Brown, 1994: The production of NorthAtlantic deep water: Sources, rates, and pathways. J. Geo-phys. Res., 99, 12 319–12 341.
Dietrich, G., 1957a: Ozeanographische probeme der deutschenForschungsfahrten im Internationalen GeophysikalischenJahr 1957/58. Deutsche Hydrographische Zeitschrift, 2, 39–61.
——, 1957b: Schichtung und Zirkulation de Irminger See in Juni1955. Berichte der Deutsche Wissenschaftlichen Kommissionfur Meeresforschung, Neue Folge, 14, 255–312.
——, 1964: Oceanic polar front survey in the North Atlantic. Res.Geophys., 2, 291–308.
——, K. Kalle, W. Krauss, and G. Siedler, 1980: General Ocean-ography: An Introduction. 2d ed. John Wiley and Sons, 626pp.
Eden, C., and C. Böning, 2002: Sources of eddy kinetic energy inthe Labrador Sea. J. Phys. Oceanogr., 32, 3346–3363.
Egbert, G. D., A. F. Bennett, and M. G. G. Foreman, 1994:TOPEX/POSEIDON tides estimated using a global inversemodel. J. Geophys. Res., 99, 24 821–24 852.
Fiedler, A., 2003: Om Irminger Havets og Irminger Strommensnavn. Sovoernsorientering, 1, 1–3.
Fratantoni, D. M., 2001: North Atlantic surface circulation duringthe 1990’s observed with satellite-tracked drifters. J. Geo-phys. Res., 106, 22 067–22 093.
——, R. S. Pickart, D. J. Torres, and A. Scotti, 2001: Mean struc-ture and dynamics of the shelfbreak jet in the Middle AtlanticBight during fall and winter. J. Phys. Oceanogr., 31, 2135–2156.
Hall, M. M., 1985: Horizontal and vertical structure of velocity,potential vorticity, and energy in the Gulf Stream. Ph.D. the-sis, Massachusetts Institute of Technology, 165 pp.
——, 1994: Synthesizing the Gulf Stream thermal structure fromXBT data. J. Phys. Oceanogr., 24, 2278–2287.
Hamberg, A., 1884: Hydrographic observations of the Norden-skiold Expedition to Greenland, 1883. Proceedings Royal So-ciety, London.
Hansen, B., and S. Osterhus, 2000: North Atlantic–Nordic Seasexchanges. Progress in Oceanography, Vol. 45, Pergamon,109–208.
Ivanov, V. V., G. I. Shapiro, J. M. Huthnance, D. L. Aleynik, andP. N. Golovin, 2004: Cascades of dense water around theworld ocean. Progress in Oceanography, Vol. 60, Pergamon,47–98.
Jakobsen, P. K., M. H. Ribergaard, D. Quadfasel, T. Schmith,C. W. Hughes, 2003: Near-surface circulation in the northernNorth Atlantic as inferred from Lagrangian drifters: Variabil-ity from the mesoscale to interannual. J. Geophys. Res., 108,3251, doi:10.1029/2002JC001554.
Jonsson, S., and J. Briem, 2003: Flow of Atlantic water west ofIceland and onto the north Icelandic shelf. ICES Mar. Sci.Symp., 219, 326–328.
Knudsen, M., 1899: Hydrography. Danish Ingolf Expedition, Bd.I, No. 2, Kopenhagen.
Krauss, W., 1995: Currents and mixing in the Irminger Sea and inthe Iceland Basin. J. Geophys. Res., 100, 10 851–10 871.
Lavender, K. L., R. E. Davis, and W. B. Owens, 2000: Mid-depthrecirculation observed in the interior Labrador and IrmingerSeas by direct velocity measurements. Nature, 407, 66–69.
Lee, A. J., 1968a: NORWESTLANT Surveys: Physical Oceanog-raphy. ICNAF Special Publication, Environmental Surveys,Vol. 7, Part I, 31–54.
——, 1968b: NORWESTLANT Surveys: Physical Oceanography.
1052 J O U R N A L O F P H Y S I C A L O C E A N O G R A P H Y VOLUME 35

ICNAF Special Publication, Environmental Surveys, Vol. 7,Part II, 38–159.
Malmberg, S-A., H. G. Gade, H. E. Sweers, 1967: Report on thesecond joint Icelandic-Norwegian expedition to the area be-tween Iceland and Greenland in August–September 1965.NATO Subcommittee on Oceanographic Research Tech.Rep. 41, Irminger Sea Project, 44 pp.
Paquette, R. G., and R. H. Bourke, 1974: Observations on thecoastal current of Arctic Alaska. J. Mar. Res., 32, 195–207.
Pickart, R. S., and M. A. Spall, 2004: Heat transport in the Lab-rador Sea. Geophys. Res. Abs., 6, EGU04-A-03974.
——, D. J. Torres, and R. A. Clarke, 2002: Hydrography of theLabrador Sea during active convection. J. Phys. Oceanogr.,32, 428–457.
——, F. Straneo, and G. W. K. Moore, 2003: Is Labrador SeaWater formed in the Irminger Basin? Deep-Sea Res., 50A,23–52.
Pollard, R. T., J. F. Read, and N. P. Holliday, 2004: Water massesand circulation pathways through the Iceland Basin duringVivaldi 1996. J. Geophys. Res., 109, C04004, doi:10.1029/2003JC002067.
Pratt, L. J., and M. E. Stern, 1986: Dynamics of potential vorticityfronts and eddy detachment. J. Phys. Oceanogr., 16, 1101–1120.
Reid, J. L., 1994: On the total geostrophic circulation of the NorthAtlantic Ocean: Flow patterns, tracers, and transports. Prog-ress in Oceanography, Vol. 33, Pergamon, 1–92.
Reverdin, G., P. P. Niiler, and H. Valdimarsson, 2003: North
Atlantic Ocean surface currents. J. Geophys. Res., 108, 3002,doi:10.1029/2001JC001020.
Rudels, B., P. Eriksson, H. Gronvall, R. Hietala, and J. Launi-ainen, 1999: Hydrographic observations in Denmark Strait infall 1997, and their implications for the entrainment into theoverflow plume. Geophys. Res. Lett., 26, 1325–1328.
——, E. Fahrbach, J. Meincke, G. Budeus, and P. Eriksson, 2002:The East Greenland Current and its contribution to the Den-mark Strait overflow. ICES J. Mar. Sci., 59, 1133–1154.
Schmitz, W. J., and M. S. McCartney, 1993: On the North Atlanticcirculation. Rev. Geophys., 31, 29–49.
Steffansson, U., 1962: North Icelandic waters. Rit. Fiskideild., 3,1–269.
Straneo, F., M. Kawase, and R. S. Pickart, 2001: Effect of wind onconvection in strongly and weakly baroclinic flows with ap-plication to the Labrador Sea. J. Phys. Oceanogr., 32, 2603–2618.
Talley, L. D., and M. S. McCartney, 1982: Distribution and circu-lation of Labrador Sea Water. J. Phys. Oceanogr., 12, 1189–1205.
Thomas, L., and C. M. Lee, 2005: Intensification of ocean frontsby down-front winds. J. Phys. Oceanogr., 35, 1086–1102.
Torres, D. J., and C. Mauritzen, 2002: Using a global tidal modelfor removing tides from direct velocity measurements in theFaroe Bank Channel. Amer. Geophys. Union, 82, OS32F-197.
Worthington, L. V., 1970: The Norwegian Sea as a Mediterraneanbasin. Deep-Sea Res., 17, 77–84.
JUNE 2005 P I C K A R T E T A L . 1053