Greenland Minerals A/S - Naalakkersuisut.gl
331
Greenland Minerals A/S Kvanefjeld Project Environmental Impact Assessment The 13 th of December 2020
-
Upload
khangminh22 -
Category
Documents
-
view
0 -
download
0
Transcript of Greenland Minerals A/S - Naalakkersuisut.gl

Greenland Minerals A/S
Kvanefjeld Project
Environmental Impact Assessment
The 13th of December 2020

Greenland Minerals Ltd – Kvanefjeld Project EIA | i
Table of contents
1. Introduction ................................................................................................................................... 1
1.1 Project overview ............................................................................................................................ 1
1.2 Environmental Impact Assessment process .................................................................................. 3
1.2.1 Study Area ...................................................................................................................... 3
1.3 Report preparation ........................................................................................................................ 3
1.4 Argumentation for Appendices...................................................................................................... 3
2. Non-Technical Summary ................................................................................................................ 6
2.1 Project description ......................................................................................................................... 6
2.2 Environmental Impact Assessment process .................................................................................. 8
2.3 Consultation completed to date .................................................................................................. 10
2.4 Alternatives considered ............................................................................................................... 11
2.5 Assessment of impacts................................................................................................................. 14
2.5.1 Physical Environment ................................................................................................... 14
2.5.2 Atmospheric impacts .................................................................................................... 20
2.5.3 Radiological impacts ..................................................................................................... 21
2.5.4 Water environment ...................................................................................................... 24
2.5.5 Waste management ..................................................................................................... 29
2.5.6 Biodiversity ................................................................................................................... 30
2.5.7 Local use and cultural heritage..................................................................................... 34
2.5.8 Cumulative Impact Assessment ................................................................................... 35
2.6 Closure and decommissioning objectives .................................................................................... 36
2.7 Environmental Risk Assessment .................................................................................................. 36
3. Project Description....................................................................................................................... 48
3.1 Project setting .............................................................................................................................. 48
3.1.1 History of mineral exploration ..................................................................................... 48
3.1.2 What is being mined and why ...................................................................................... 49
3.1.3 Local community .......................................................................................................... 49
3.2 Overview of operations ............................................................................................................... 50
3.3 Project phases .............................................................................................................................. 52
3.4 The Mine ...................................................................................................................................... 52
3.5 Waste rock stockpile (WRS) ......................................................................................................... 54
3.6 Concentrator and refinery ........................................................................................................... 54
Greenland Minerals Ltd – Kvanefjeld Project EIA | ii
3.6.1 Sulphuric Acid Plant ...................................................................................................... 56
3.6.2 Chlor-Alkali Plant .......................................................................................................... 58
3.6.3 Tailings Storage Facility (TSF) - Overview ..................................................................... 60
3.6.4 TSF - Operation ............................................................................................................. 62
3.6.5 Flotation tailings ........................................................................................................... 65
3.6.6 Refinery tailings ............................................................................................................ 66
3.6.7 Chemical and radiological properties of the tailings .................................................... 67
3.7 Port facility ................................................................................................................................... 67
3.8 Handling of radioactive material ................................................................................................. 68
3.8.1 Overall management .................................................................................................... 68
3.9 Water Management ..................................................................................................................... 69
3.9.1 Water balance .............................................................................................................. 69
3.9.2 Surface water management ......................................................................................... 70
3.9.3 Water discharge ........................................................................................................... 71
3.10 Support Infrastructure ................................................................................................................. 71
3.10.1 Administration and accommodation ............................................................................ 71
3.10.2 Transport Facilities ....................................................................................................... 72
3.10.3 Electricity and Fuel Supply ............................................................................................ 73
3.10.4 Domestic and industrial waste handling ...................................................................... 73
3.10.5 Hazardous material handling ........................................................................................ 73
3.10.6 Fencing.......................................................................................................................... 73
3.10.7 Dangerous Goods Storage and Handling ...................................................................... 74
3.10.8 Security of nuclear products......................................................................................... 74
3.10.9 Pipelines ....................................................................................................................... 74
3.11 Use of reagents ............................................................................................................................ 75
3.12 Labour and services ..................................................................................................................... 79
3.13 Project footprint .......................................................................................................................... 79
3.14 Decommissioning, closure and rehabilitation ............................................................................. 79
4. Regulatory Framework................................................................................................................. 81
4.1 Introduction ................................................................................................................................. 81
4.2 Legislation concerning Greenland ............................................................................................... 81
4.2.1 The Mineral Resource Act ............................................................................................ 83
4.2.2 National Guidelines ...................................................................................................... 83
4.3 International obligations .............................................................................................................. 84

Greenland Minerals Ltd – Kvanefjeld Project EIA | iii
4.4 Shipping regulations .................................................................................................................... 85
4.5 International Security Obligations ............................................................................................... 85
5. Project Alternatives...................................................................................................................... 87
5.1 Not proceeding with Project ........................................................................................................ 87
5.2 Processing Alternatives ................................................................................................................ 87
5.2.1 Scenario 1: Concentrator only ...................................................................................... 87
5.2.2 Scenario 2: Mechanical (concentrator) and chemical processing (refinery) ................ 88
5.2.3 Scenario 3: Greenland Separation Plant ....................................................................... 88
5.3 Alternative facility locations ........................................................................................................ 88
5.4 Alternative port locations ............................................................................................................ 90
5.5 Accommodation facilities ............................................................................................................ 90
5.6 Tailings management alternatives ............................................................................................... 91
5.6.1 Evaluation of Options ................................................................................................... 92
5.7 Energy alternatives .................................................................................................................... 104
6. Environmental impact assessment methodology...................................................................... 105
6.1 Introduction ............................................................................................................................... 105
6.2 Impact assessment methodology and structure ....................................................................... 106
6.3 Potential impacts ....................................................................................................................... 108
6.4 Assessment of impact significance ............................................................................................ 109
6.5 Risk Assessment Methodology .................................................................................................. 110
7. Physical environment ................................................................................................................. 111
7.1 Existing environment ................................................................................................................. 111
7.1.1 Climate ........................................................................................................................ 111
7.1.2 Topography ................................................................................................................. 112
7.1.3 Geology and soils ........................................................................................................ 112
7.1.4 Seismicity .................................................................................................................... 114
7.2 Potential impacts ....................................................................................................................... 115
7.3 Assessment of impacts............................................................................................................... 115
7.3.1 Physical alteration of the landscape and reduced visual amenity ............................. 115
7.3.2 Erosion ........................................................................................................................ 116
7.3.3 Noise and vibration .................................................................................................... 116
7.3.4 Light emissions ........................................................................................................... 120
7.3.5 Physical alteration of the landscape resulting from a seismic event ......................... 120
7.4 Mitigations ................................................................................................................................. 121

Greenland Minerals Ltd – Kvanefjeld Project EIA | iv
7.5 Predicted outcome..................................................................................................................... 122
8. Atmospheric setting ................................................................................................................... 124
8.1 Existing environment ................................................................................................................. 124
8.2 Potential impacts ....................................................................................................................... 125
8.3 Assessment of impacts............................................................................................................... 125
8.3.1 Dust ............................................................................................................................. 125
8.3.2 Gaseous Emissions ...................................................................................................... 135
8.3.3 Greenhouse Gases ...................................................................................................... 137
8.4 Mitigation Measures .................................................................................................................. 138
8.5 Predicted outcome..................................................................................................................... 139
9. Radiological emissions ............................................................................................................... 140
9.1 Existing environment ................................................................................................................. 140
9.2 Potential impacts ....................................................................................................................... 144
9.3 Assessment of impacts............................................................................................................... 144
9.3.1 Release to air, land and water .................................................................................... 144
9.3.2 Spills to land or water ................................................................................................. 152
9.3.3 Release resulting from TSF failure .............................................................................. 154
9.3.4 Release from TSF aerosol spray .................................................................................. 175
9.4 Mitigations ................................................................................................................................. 177
9.5 Predicted outcome..................................................................................................................... 177
10. Water environment ................................................................................................................... 179
10.1 Existing environment ................................................................................................................. 179
10.1.1 Surface water.............................................................................................................. 179
10.1.2 Marine environment .................................................................................................. 183
10.1.3 Groundwater .............................................................................................................. 185
10.2 Potential impacts ....................................................................................................................... 187
10.3 Assessment of impacts............................................................................................................... 187
10.3.1 Modification of hydrological processes ...................................................................... 187
10.3.2 Operation of the TSF................................................................................................... 189
10.3.3 TSF Embankment failure............................................................................................. 195
10.3.4 Aerosol spray from TSF ............................................................................................... 202
10.3.5 Impact on Narsaq drinking water supply ................................................................... 205
10.3.6 Excess water management ......................................................................................... 206
10.3.7 Waste rock runoff ....................................................................................................... 212
Greenland Minerals Ltd – Kvanefjeld Project EIA | v
10.3.8 Closure Mine Pit Water .............................................................................................. 213
10.3.9 Hydrocarbon and Chemical Spills ............................................................................... 213
10.3.10 Risk of process water spills ......................................................................................... 215
10.4 Mitigations ................................................................................................................................. 216
10.5 Predicted outcome..................................................................................................................... 218
11. Waste management ................................................................................................................... 220
11.1 Existing environment ................................................................................................................. 220
11.2 Potential impacts ....................................................................................................................... 220
11.3 Assessment of impacts............................................................................................................... 220
11.3.1 Waste management ................................................................................................... 220
11.4 Mitigations ................................................................................................................................. 221
11.5 Predicted outcome..................................................................................................................... 221
12. Biodiversity ................................................................................................................................ 222
12.1 Existing environment ................................................................................................................. 222
12.1.1 Vegetation .................................................................................................................. 222
12.1.2 Fauna .......................................................................................................................... 223
12.1.3 Threatened species and significant communities ...................................................... 232
12.2 Potential impacts ....................................................................................................................... 235
12.3 Assessment of impacts............................................................................................................... 235
12.3.1 Disturbance of habitat for terrestrial fauna and flora ................................................ 235
12.3.2 Disturbance of habitat for freshwater species ........................................................... 237
12.3.3 Disturbance of habitat for marine fauna .................................................................... 237
12.3.4 Contamination of terrestrial fauna and flora habitat ................................................. 238
12.3.5 Contamination of freshwater habitats ....................................................................... 240
12.3.6 Contamination of marine habitats ............................................................................. 242
12.3.7 Increased vehicle strikes of terrestrial fauna ............................................................. 243
12.3.8 Invasive non-indigenous marine species .................................................................... 244
12.4 Mitigations ................................................................................................................................. 244
12.5 Predicted outcome..................................................................................................................... 244
13. Local use and cultural heritage .................................................................................................. 247
13.1 Existing environment ................................................................................................................. 247
13.1.1 Archaeology and cultural heritage ............................................................................. 248
13.2 Potential impacts ....................................................................................................................... 249
13.2.1 Restriction in local use ................................................................................................ 249

Greenland Minerals Ltd – Kvanefjeld Project EIA | vi
13.2.2 Disturbance of heritage sites ...................................................................................... 250
13.3 Mitigations ................................................................................................................................. 251
13.4 Predicted outcome..................................................................................................................... 251
14. Cumulative Impact Assessment ................................................................................................. 253
14.1 Introduction ............................................................................................................................... 253
14.2 Spatial and Temporal Boundaries .............................................................................................. 253
14.3 Other Activities and Social and Environmental Stressors .......................................................... 254
14.4 Baseline Status of the VECs ........................................................................................................ 258
14.5 Cumulative Impacts on VECs...................................................................................................... 261
14.6 Summary of Potential Cumulative Impacts per EIA Section ...................................................... 264
15. Environmental Risk Assessment ................................................................................................ 271
15.1 Risk Identification ...................................................................................................................... 271
15.2 Risk analysis and evaluation ...................................................................................................... 272
15.3 Results ........................................................................................................................................ 275
16. References ................................................................................................................................. 285
Appendices .................................................................................................................................... 292

Greenland Minerals Ltd – Kvanefjeld Project EIA | i
Table index
Table 1 Project summary .................................................................................................................. 7
Table 2 Key Stakeholders ............................................................................................................... 10
Table 3 Summary of environmental impacts assessed .................................................................. 37
Table 4 Project phases .................................................................................................................... 52
Table 5 Summary of SAP tail gas composition ............................................................................... 57
Table 6 Tailings production ............................................................................................................ 61
Table 7 Chemical and radiological properties of tailings ............................................................... 67
Table 8 Summary of reagents used ................................................................................................ 76
Table 9 Project footprint ................................................................................................................ 79
Table 10 Orders on occupational health and safety relevant to the Project and safety ................. 82
Table 11 Greenland Government guidelines for environmental impact assessments .................... 83
Table 12 International uranium related conventions and treaties .................................................. 84
Table 13 Assessment of impact by criteria by option ...................................................................... 96
Table 14 Cover options comparison assessment – Closure Objectives ([77] – Table 3.1) ............. 102
Table 15 Factored ratings for “Wet” vs “Dry” cover options comparison ([77] – Table 3.5)
......................................................................................................................................... 103
Table 16 Potential impacts ............................................................................................................. 108
Table 17 Kvanefjeld TSF PGA Design parameters based on Mean Hazard Deaggregation
([92] – Table E.2) .............................................................................................................. 114
Table 18 Deformation estimates – TSF embankments – MCE ([75] – Table 7-5) .......................... 121
Table 19 Predicted outcomes for physical environment ............................................................... 122
Table 20 Annualised PM10 emissions by Project phase ([19] – Tables 2-22, 2-23) ........................ 126
Table 21 Summary of Greenland’s air quality impact assessment criteria [19] ............................. 128
Table 22 Summary of EIA air quality impact assessment criteria ([19] – Table 1-9) ...................... 128
Table 23 Estimated annual quantity of dust generated by major mining activities ([19] –
Tables 2-3, 2-4) ................................................................................................................ 129
Table 24 Maximum 24 -hour dust levels (in isolation) – Predicted compared to
assessment criteria ([19] – ES-1) ..................................................................................... 129
Table 25 Maximum concentrations of metals in emitted dust – By source of dust ...................... 134
Table 26 Comparison of maximum metal deposition loads to Greenland limit values [45] .......... 134
Table 27 Cumulative sulphur compound emissions – Predicted compared to assessment
criteria ([19] – Table ES-2) ............................................................................................... 136
Table 28 Cumulative nitrogen compound emissions – Predicted compared to assessment
criteria ([19] – Table ES-2) ............................................................................................... 136
Table 29 IPCC emission factors ([20] – IPCC 2006) ......................................................................... 137
Table 30 Predicted outcomes for the atmospheric setting ............................................................ 139
Greenland Minerals Ltd – Kvanefjeld Project EIA | ii
Table 31 Concentrations of radioactive elements in dust particles (ambient air PM10) ([5]
– Table 21) ....................................................................................................................... 141
Table 32 Summary of terrestrial gamma exposure rates in the Project Area and
surrounding areas ([5] – Table 23) .................................................................................. 142
Table 33 Background radioactivity measurements - Soil and sediment from the Study
Area ([5] – Tables I-12, I-14) ............................................................................................ 142
Table 34 Radionuclide concentrations in water in the Study Area ([5] – Table 26) ....................... 143
Table 35 Radioactivity measurements - Snow lichens and grass from the Narsaq valley
and reference station ([5] – Table I-15) ........................................................................... 144
Table 36 Radon emission rates - Project activities ([6] – Table 5-1) .............................................. 146
Table 37 Radon emission rates for Operations ([6] – Table 5-3) ................................................... 147
Table 38 Modelled cumulative concentrations of COPCs in lichen in the Study Area ([5] -
Table 56) .......................................................................................................................... 148
Table 39 Modelled cumulative (background and Project related) concentrations of COPCs
in mammals and birds in the Study Area ([5] - Table 63) ................................................ 148
Table 40 Estimated aggregate dose (mGy/d) for snow lichen, a selection of plant groups,
mammals and marine fish ([5] - Calculated from Table 66) ........................................... 149
Table 41 Reference dose limits used in the EIA ([5] – Table 19) .................................................... 150
Table 42 SIVs for marine animals and plants ([5] – Table 43) ....................................................... 151
Table 43 SIVs for terrestrial mammals and plants ([5] – Table 44b) .............................................. 151
Table 44 SIVs for birds ([5] – Table 63) ........................................................................................... 151
Table 45 Transport accidents with dangerous goods per million tonne kilometres - North
American statistics ([3] – Table 14) ................................................................................ 154
Table 46 Predicted U, Th, Ra-228 concentrations in FTSF water ([110] - Table 4.1) ...................... 160
Table 47 Radionuclide concentrations in Narsap Ilua during an overtopping event ..................... 160
Table 48 Water Concentration used in Dose Calculations – Piping Failure ([110] – Table
4.3) ................................................................................................................................... 162
Table 49 Radionuclide concentrations in FTSF tailings solids used for dose calculations
([110] - Table 4.4) ............................................................................................................ 163
Table 50 Estimated Dose from consuming fish from Narsap Ilua ([110] - Table 4.5) .................... 164
Table 51 Contaminated Zone Parameters ([110] - Table 4.6) ........................................................ 167
Table 52 Occupancy, inhalation, and external gamma data ([110] - Table 4.7) ............................ 168
Table 53 Total dose for casual access by contaminated zone thickness, area ([110] - Table
4.8) ................................................................................................................................... 168
Table 54 Pathway dose for casual access by contaminated zone thickness, area ([110] -
Table 4.9) ......................................................................................................................... 169
Table 55 Significant nuclide external pathway dose for casual access by contaminated
zone thickness, area ([110] - Table 4.10) ......................................................................... 169
Table 56 Concentrations used in sensitivity calculation ([110] - Table 4.11) ................................. 171

Greenland Minerals Ltd – Kvanefjeld Project EIA | iii
Table 57 Summary of results of radiological exposure to accidental release scenarios
([110] - Table 4.13) .......................................................................................................... 172
Table 58 Estimated deposition of uranium (kg/year) in the Narsaq drinking water
catchment ([59] – Table 7.7) ........................................................................................... 176
Table 59 Predicted outcomes for radiological emissions ............................................................... 177
Table 60 Characteristic discharges at selected sites in the Narsaq river catchment ([51] –
Table 3.6) [1] .................................................................................................................... 180
Table 61 An example of surface water fluoride concentrations – August 2009 - mg/L ([53
– Table 4-5) ...................................................................................................................... 181
Table 62 Description of Threshold Fjords ([17] – Table 4.1) .......................................................... 183
Table 63 Timeline and milestones in the tailings facilities management ...................................... 190
Table 64 IDEAS® results - Yrs 49, 59 and 93 - Downstream of Control Point C ([53] – Table
5-3) ................................................................................................................................... 193
Table 65 Comparison of PNEC criteria for reagents and modelled concentrations at
Control Point C ([53] – Table 5-5) .................................................................................... 194
Table 66 Summary of tailings pore water, supernatant and river water qualities ([126] –
Table 2.4) ......................................................................................................................... 198
Table 67 Summary of modelled cases ([126] – Table 3.1) ............................................................. 198
Table 68 Case 1: Summary of end-of-operation model input and results (mg/L) ([126] –
Table 3.2) ......................................................................................................................... 199
Table 69 Case 2: Summary of wet post-closure model input and results (mg/L) ([126] –
Table 3.3) ......................................................................................................................... 200
Table 70 Case 3: Summary of dry post-closure model input and results (mg/L) ([126] –
Table 3.4) ......................................................................................................................... 200
Table 71 Summary of radionuclides assessed during failure scenario (end of operation) ............ 201
Table 72 Estimated deposition of fluoride (kg/year) in the Narsaq drinking water
catchment ([59] – Table 7.6) ........................................................................................... 203
Table 73 Peak concentrations of elements at the Control Point C from aerosol deposition
during foehn events ([59] – Tables 7-3 and 7-4) ............................................................. 204
Table 74 Peak concentrations of reagents at the Control Point C from aerosol deposition
during foehn events ([59] – Tables 7-3 and 7-4) ............................................................. 204
Table 75 Greenland (and Canadian*) water guidelines and baseline concentrations in
Nordre Sermilik ................................................................................................................ 208
Table 76 PNEC for selection of chemical species and required dilution to meet PNEC limit
([17] – Appendix C, Table 7-4) ......................................................................................... 209
Table 77 Predicted outcomes for water environment ................................................................... 218
Table 78 Predicted outcomes for waste management .................................................................. 221
Table 79 Vegetation communities [57] .......................................................................................... 222
Table 80 Bird species potentially occurring [57] ............................................................................ 225
Table 81 Marine species potentially occurring [57] ....................................................................... 228
Table 82 Threatened species recorded from Erik Aappalaartup Nunaa [57] ................................. 233

Greenland Minerals Ltd – Kvanefjeld Project EIA | iv
Table 83 Predicted outcome for biodiversity ................................................................................. 245
Table 84 Predicted outcome on local use and cultural heritage .................................................... 252
Table 85 VECs and Spatial Boundaries ........................................................................................... 254
Table 86 Other Stressors and Activities ......................................................................................... 254
Table 87 Resilience of the VEC ....................................................................................................... 259
Table 88 Magnitude of Cumulative Impacts .................................................................................. 262
Table 89 Impact Significance .......................................................................................................... 264
Table 90 The potential cumulative impacts associated with biodiversity ..................................... 269
Table 91 Consequence Classification ............................................................................................. 273
Table 92 Likelihood Classification................................................................................................... 275
Table 93 Risk Classification Matrix ................................................................................................. 275
Table 94 Risk Assessment ............................................................................................................... 276
Figure index
Figure 1 Project locality ..................................................................................................................... 2
Figure 2 Study Area............................................................................................................................ 5
Figure 3 Map of Kommune Kualleq showing towns and settlements (Source:
www.kujalleq.gl) .................................................................................................................. 6
Figure 4 Location East ...................................................................................................................... 12
Figure 5 Location West .................................................................................................................... 12
Figure 6 Project locality ................................................................................................................... 15
Figure 7 Study Area.......................................................................................................................... 16
Figure 8 View of the developed Project from Narsaq town (Google Earth 2018) .......................... 16
Figure 9 Calculated total noise load in and around the Port during the operations phase ............ 19
Figure 10 Water catchments ............................................................................................................. 25
Figure 11 Project layout ..................................................................................................................... 51
Figure 12 Mine layout at Maximum Footprint (Yr 37) ....................................................................... 53
Figure 13 3D Drawing of the Plant site location ................................................................................ 54
Figure 14 Main process plant steps ................................................................................................... 56
Figure 15 The TSF ............................................................................................................................... 61
Figure 16 Cross-section of embankment at the CRSF (above) and FTSF (below) at year 37 ............. 62
Figure 17 Operations phase schematic ............................................................................................. 63
Figure 18 Closure phase schematic ................................................................................................... 64
Figure 19 End of Closure phase schematic ........................................................................................ 64
Figure 20 Post- closure phase schematic .......................................................................................... 65
Greenland Minerals Ltd – Kvanefjeld Project EIA | v
Figure 21 Flowchart of concentrator water treatment ..................................................................... 66
Figure 22 Port layout ......................................................................................................................... 68
Figure 23 Water balance.................................................................................................................... 70
Figure 24 Location of the Village and the temporary construction worker’s camp .......................... 72
Figure 25 Fencing ............................................................................................................................... 74
Figure 26 Post closure landform ........................................................................................................ 80
Figure 27 Location East ...................................................................................................................... 89
Figure 28 Location West .................................................................................................................... 89
Figure 29 Alternative Port locations .................................................................................................. 90
Figure 30 3D view of alternative tailings facility sites ....................................................................... 93
Figure 31 Alternative tailings facility sites ......................................................................................... 93
Figure 32 Dry Tailings Disposal design ............................................................................................... 97
Figure 33 Wet Tailings Deposition design ......................................................................................... 99
Figure 34 Section view of dry TSF capping ...................................................................................... 101
Figure 35 Wind directions and speed recorded from Kvanefjeld weather station ......................... 111
Figure 36 Elevation and contours .................................................................................................... 112
Figure 37 Outline of the Ilimaussaq Complex .................................................................................. 113
Figure 38 Lujvarite (dark grey) outcrop ........................................................................................... 113
Figure 39 View of the developed Project from the Narsaq (Google Earth 2018) ........................... 115
Figure 40 Calculated total noise levels for Mine Plants areas during operation ............................. 118
Figure 41 Calculated total noise levels along Port-Mine Road and in the Port area ....................... 119
Figure 42 Calculated total noise levels in and around the Port during the operations .................. 119
Figure 43 Location of emission monitoring stations ....................................................................... 124
Figure 44 The maximum 24-hours TSP concentrations in µg/m3 (cumulative) ............................... 130
Figure 45 The maximum 24-hours PM10 concentrations in µg/m3 .................................................. 131
Figure 46 The maximum 24-hours PM2.5 concentrations in µg/m3 ................................................. 132
Figure 47 Maximum 1-hour deposition of dust – cumulative (g/m2/month) ................................. 133
Figure 48 Potential Failure Discharge Pathway from the FTSF to the Fjord .................................... 154
Figure 49 Embankment – Upstream Liner ([1] – Drawing 002-1020) ............................................. 155
Figure 50 Theoretical Piping Failure ([110] – Figure 3.2) ................................................................ 156
Figure 51 Maximum depth - Based on the Rico et al. (2008) and Froehlich (2008) Breach
Parameters ([110] – Figure 3.5) ....................................................................................... 158
Figure 52 Maximum velocity - Based on the Rico et al. (2008) and Froehlich (2008) Breach
Parameters ([110] – Figure 3.8) ....................................................................................... 159
Figure 53 Location of Control Point C .............................................................................................. 175
Figure 54 Taseq river and Napasup-Kuua catchment areas ............................................................ 179
Figure 55 Location of water quality monitoring sites ...................................................................... 181

Greenland Minerals Ltd – Kvanefjeld Project EIA | vi
Figure 56 Fluoride levels across the catchment ([53] – Fig 4.8) ...................................................... 182
Figure 57 Marine environment ........................................................................................................ 184
Figure 58 Location of Raw Water Dam ............................................................................................ 188
Figure 59 Culvert type ..................................................................................................................... 188
Figure 60 Uranium concentration in the FTSF and CRSF over Project life – as predicted by
GoldSim ............................................................................................................................ 192
Figure 61 Fluoride concentration in the FTSF and CRSF over Project life – as predicted by
GoldSim ............................................................................................................................ 192
Figure 62 Foehn event duration of fluoride buffer load at 10 % deposition ([59] - Fig 7-6) ........... 203
Figure 63 Narsaq drinking water sources ........................................................................................ 205
Figure 64 50th percentile dilution factors at an insertion depth of -40 m for summer (the
winter plume is slightly smaller) ([16] – Figure 7-1e) ...................................................... 210
Figure 65 Vertical profile of 50th percentile dilution factors at discharge depth of -40 m for
summer ([16] – Figure 7-2e,f) .......................................................................................... 211
Figure 66 Dilution requirements for elements to meet background levels or PNEC values
([31] – Fig. 17) .................................................................................................................. 212
Figure 67 Important areas for wintering sea birds off south Greenland and in neighbouring
fjords ................................................................................................................................ 227
Figure 68 Distribution of Arctic char in rivers, streams and lakes on Erik Aappalaartup
Nunaa ............................................................................................................................... 230
Figure 69 Rare flora in the Project Area .......................................................................................... 234
Figure 70 Ecological protected areas in south Greenland ............................................................... 235
Figure 71 Archaeological sites at Narsaq/Kvanefjeld (Source: http://nunniffiit.natmus.gl) ........... 248
Figure 72 Kujaata UNESCO World Heritage Sites (UNESCO, 2017) ................................................. 249
Figure 73 Archaeological sites ......................................................................................................... 251
Figure 74 Location of TANBREEZ project relative to Narsaq (Source: TANBREEZ EIA (2013) ......... 256
Figure 75 The Ilimaussaq Complex (www.ggg.gl) ............................................................................ 257
Figure 76 Local Use Study Areas ...................................................................................................... 261
Figure 77 Significance of Impacts on VECs ...................................................................................... 264
Figure 78 AS/NZS 31000:2009 Risk Management – Principles and Guidelines ............................... 271
Appendices
Appendix A - Environmental Management Plan ................................................................................. 293
Appendix B - Conceptual Closure and Decommissioning Plan for the Project .................................... 300
Appendix C - Conceptual Environmental Monitoring Program for the Project ................................... 305

Greenland Minerals Ltd – Kvanefjeld Project EIA |
List of Abbreviations and Acronyms
Acronym /
Abbreviation Description
$ / USD United States Dollars
A/S Aktieselskab, Danish name for a stock-based corporation
AIDS Acquired Immune Deficiency Syndrome
ALARA As low as reasonably achievable
ANCOLD Australian National Committee on Large Dams
ASDSO Association of Dam Safety Officials
BAT Best Available Technology
BCL Barren Chloride Liquor
BFS Bankable Feasibility Study
Bn Billion
Bq Becquerel, Unit of radioactivity
BREF Best Available Techniques (BAT) Reference Document
BWM International Convention for the Control and Management of Ships’ Ballast Water
and Sediments
C Celsius
C.E. Common Era (also referred to as Anno Domini (AD))
CALPUFF An industry standard model designated by the United States Environmental Protection Authority (USEPA) as a preferred model for air quality modelling
CAP Chlor-Alkali Plant
Capex Capital Expenditure
COD Chemical Oxygen Demand
COPC Contaminants of Potential Concern
CRSF Chemical Residue Storage Facility
dB Decibels
dB(A) Decibel Average
DCE Danish Centre of Environment and Energy
DCP Dust Control Plan
DHI DHI Water and Environment
DKK Danish Kroner
DMA Danish Maritime Authority
Greenland Minerals Ltd – Kvanefjeld Project EIA | i
Acronym /
Abbreviation Description
DMP Dust Management Plan
DWT Dead Weight Tonnage
EAMRA The Environmental Agency for Mineral Resource Activities
EBRD European Bank for Reconstruction and Development
EC European Community
EIA Environmental Impact Assessment
EL Exploration License
EMP Environmental Management Plan
ERA Environmental Risk Assessment
ERM ERM Ltd
et al. Et alii (and others)
EU European Union
FASSET Framework for Assessment of Environmental Impact
FIFO Fly-In Fly-Out
FoS Factor of Safety
FS Feasibility Study
FTSF Flotation Tailings Storage Facility
GA Employers’ Association of Greenland
GE Greenland Business Association
GEUS Geological Survey of Greenland and Denmark
GHD GHD Pty Ltd
GHG Greenhouse Gas
GINR Greenland Institute of Natural Resources
GMAS Greenland Minerals A/S
GML Greenland Minerals Limited
GoG Government of Greenland / Naalakkersuisut
GRAIN Synthesis Report for Greenland Agricultural Initiative
GWQC Greenland Water Quality Criteria
ha Hectare

Greenland Minerals Ltd – Kvanefjeld Project EIA | ii
Acronym /
Abbreviation Description
HDPE High Density Poly-ethylene
HFO Heavy Fuel Oil
HVAS High Volume Air Sampler
IAEA International Atomic Energy Agency
ICCM International Council on Mining and Metals
ICOLD International Convention on Large Dams
ICRP International Commission for Radiological Protection
IFC International Finance Corporation
IMDG International Maritime Dangerous Goods
IMO International Maritime Organisation
INTAKE Model developed for use in simulating environmental transfer, uptake and risk due to exposure to radionuclides, stable metals and inorganic species released to the environment (e.g. air, water, groundwater, soil).
IPCC Intergovernmental Panel on Climate Change
ISPS International Ship and Port Facility Security
IUCN International Union for Conservation of Nature
JORC Joint Ore Reserves Committee
km Kilometre
km2 Square Kilometre
L Litre
LCD Liquid Crystal Display
LTIFR Lost Time Injury Frequency Rate
M Million
m2 Metres Squared
m3 Cubic Metres
MARPOL International Convention for the Prevention of Pollution From Ships
MCE Maximum Credible Earthquake
MCP Mine Closure Plan
MEND Mine Environment Neutral Drainage
MFA Danish Ministry of Foreign Affairs

Greenland Minerals Ltd – Kvanefjeld Project EIA | iii
Acronym /
Abbreviation Description
MLSA Mineral License and Safety Authority
mm Millimetre
Mm3 Million Cubic Metres
mps Metres Per Second
MRA Mineral Resources Act
mRL Metres Relative Level
mSv milliSievert, Unit of Radiation Dose
Mt Million Tonnes
Mtpa Million Tonnes Per Annum
MW MegaWatt
MWEI Management of Waste from Extractive Industries
NAAQO National Ambient Air Quality Objectives
NCA Nuclear Co-operation Agreement
NEA Nuclear Energy Agency
NKA Greenland National Museum and Archives
NPV (NNV) Net Present Value
NSIS Navigational Safety Investigation Study
OBE Operating Basis Earthquake
OCE Operating Cost Estimate
OECD Organisation for Economic Co-operation and Development
OPRC International Convention on Oil Pollution Preparedness, Response and Co-
operation
OSPAR Oslo/Paris convention (for the Protection of the Marine Environment of the
North-East Atlantic
PAH Polycyclic Aromatic Hydrocarbons
PBT Persistent Bio-accumulative Toxic
PEL Pacific Environment Limited
PM Particulate Matter
PNEC Predicted No Effet Concentration
ppm Parts Per Million
PSHA Probabilistic Seismic Hazard Assessment

Greenland Minerals Ltd – Kvanefjeld Project EIA | iv
Acronym /
Abbreviation Description
REE(s) Rare Earths or Rare Earth Element(s)
REMC Rare Earth Mineral Concentrate
REO Rare Earth Oxide
RoM Run of Mine
SAP Sulphuric Acid Plant
SEE Safety Evaluation Earthquake
SIA Social Impact Assessment
SIK Greenland Labour Union
SIV Screening Index Value
Sv Sievert
t Tonne
tCO2e Tonnes of Carbon Dioxide Equivalent
TDS Total Dissolved Solids
ToR Terms of Reference
tpd Tonnes Per Day
TSF Tailings Storage Facility
TSP Total Suspended Particulates
TWP Treated Water Placement
UK United Kingdom
UNESCO United Nations Educational, Scientific and Cultural Organisation
UNSCEAR United Nations Scientific Committee on the Effects of Atomic Radiation
USEPA United States Environmental Protection Agency
VEC Valued Environmental and Social Components
vPvB Very Persistent Very Bio-accumulative
VSB Social Impact Assessment
VVM Environmental Impact Assessment
WHO World Health Organisation
WNA World Nuclear Association
WRS Waste Rock Stockpile

Greenland Minerals Ltd – Kvanefjeld Project EIA | 1
1. Introduction
Purpose and scope of document
Greenland Minerals Limited (GML) is proposing to develop the Kvanefjeld rare earth (REE) project (the
Project) in Greenland. The Project includes integrated mine, processing plant and port facilities.
This document provides an assessment of the potential environmental impacts of the Project and
describes the environmental management practices that will be in place during the Project’s
construction, operations, closure and post-closure phases.
1.1 Project overview
GML is an Australian mining company based in Perth and listed on the Australian Securities Exchange.
Greenland Minerals A/S (GMAS) is the Greenlandic subsidiary of GML and is headquartered in Narsaq.
GML acquired a majority stake in GMAS, the holder of the license, to explore the Project, in 2007. In
2011 GML acquired the outstanding shares in GMAS and thereby assumed 100% ownership and
control of the Project.
The Project is located in the Arctic region within Kommune Kujalleq (the Municipality of southern
Greenland) approximately 8 km to the north of the town of Narsaq and 40km to the southwest of the
international airport and settlement of Narsarsuaq (Figure 1).
The primary mineralisation is located at an elevation of approximately 600 m above sea level.
The Kvanefjeld site has unique geological and environmental features:
The resource is comprised of highly alkaline rocks that are enriched in REEs, lithium,
beryllium, uranium, niobium and tantalum (see Section 7)
The results of the seismic hazard assessment indicate that the Project is in a region of low
seismicity (see Section 7)
Natural occurring radionuclides, such as uranium and thorium, are present in all soils and
rocks. The Kvanefjeld ore contains approximately 300 ppm uranium and 800 ppm thorium.
Over time natural processes, such as glaciation and wind and water erosion, have dispersed
uranium and thorium into the surrounding environment, including the Narsaq valley (see
Section 9)
The resource contains high levels of the water-soluble mineral villiaumite (NaF). This has
given rise to naturally-elevated fluoride levels in surrounding waterbodies including the
Narsaq and Taseq rivers and the Taseq lake (see Section 10)
The harsh conditions have generated an environment characterised by low fauna and flora
diversity (see Section 12).
Mining operations will involve conventional open pit mining with blasting followed by truck/shovel
haulage. Broken ore will be transported to a concentrator to produce a REE mineral concentrate
(REMC), a zinc concentrate and fluorspar. The REMC will be further processed in the refinery to
produce REE products and uranium oxide. All saleable products will be transported to a purpose-built
port and exported.
While the ore in Kvanefjeld deposit comprises multiple elements with commercial value, REEs are the
primary value products and the zinc, fluorspar and uranium are by-products that provide additional
revenues to strengthen project economics.

Greenland Minerals Ltd – Kvanefjeld Project EIA | 2
Figure 1 Project locality
Greenland Minerals Ltd – Kvanefjeld Project EIA | 3
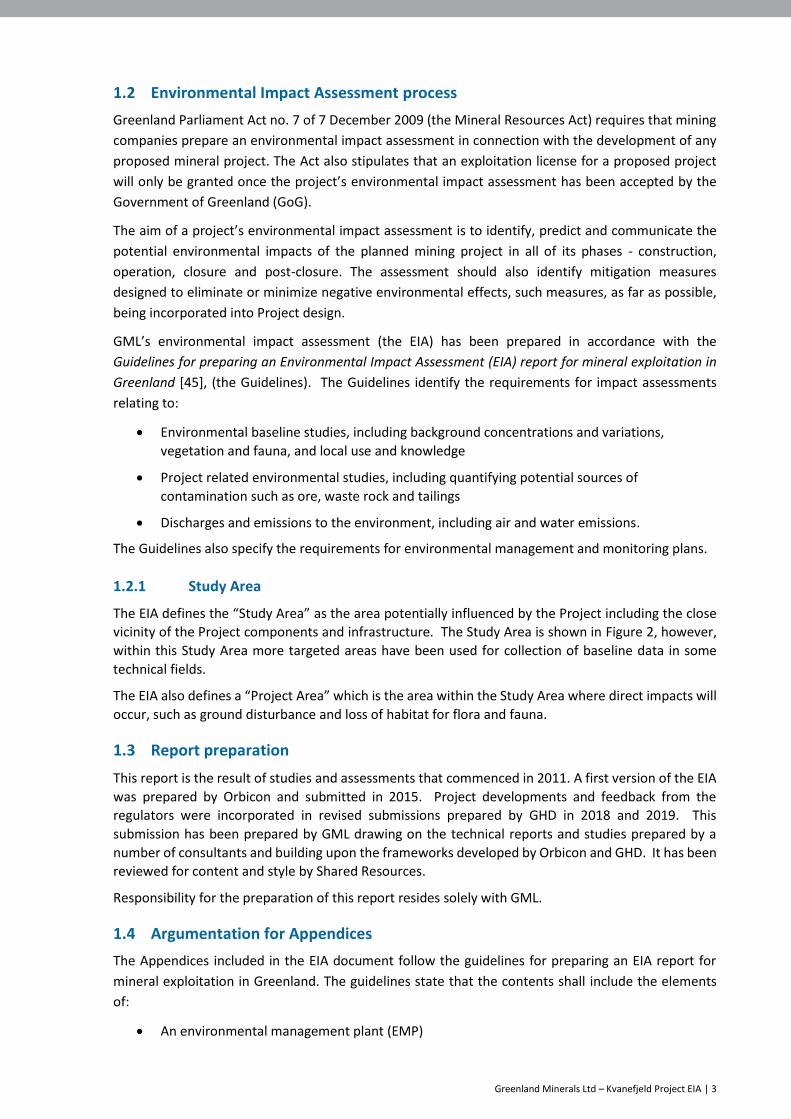
1.2 Environmental Impact Assessment process
Greenland Parliament Act no. 7 of 7 December 2009 (the Mineral Resources Act) requires that mining
companies prepare an environmental impact assessment in connection with the development of any
proposed mineral project. The Act also stipulates that an exploitation license for a proposed project
will only be granted once the project’s environmental impact assessment has been accepted by the
Government of Greenland (GoG).
The aim of a project’s environmental impact assessment is to identify, predict and communicate the
potential environmental impacts of the planned mining project in all of its phases - construction,
operation, closure and post-closure. The assessment should also identify mitigation measures
designed to eliminate or minimize negative environmental effects, such measures, as far as possible,
being incorporated into Project design.
GML’s environmental impact assessment (the EIA) has been prepared in accordance with the
Guidelines for preparing an Environmental Impact Assessment (EIA) report for mineral exploitation in
Greenland [45], (the Guidelines). The Guidelines identify the requirements for impact assessments
relating to:
Environmental baseline studies, including background concentrations and variations,
vegetation and fauna, and local use and knowledge
Project related environmental studies, including quantifying potential sources of
contamination such as ore, waste rock and tailings
Discharges and emissions to the environment, including air and water emissions.
The Guidelines also specify the requirements for environmental management and monitoring plans.
1.2.1 Study Area
The EIA defines the “Study Area” as the area potentially influenced by the Project including the close
vicinity of the Project components and infrastructure. The Study Area is shown in Figure 2, however,
within this Study Area more targeted areas have been used for collection of baseline data in some
technical fields.
The EIA also defines a “Project Area” which is the area within the Study Area where direct impacts will
occur, such as ground disturbance and loss of habitat for flora and fauna.
1.3 Report preparation
This report is the result of studies and assessments that commenced in 2011. A first version of the EIA
was prepared by Orbicon and submitted in 2015. Project developments and feedback from the
regulators were incorporated in revised submissions prepared by GHD in 2018 and 2019. This
submission has been prepared by GML drawing on the technical reports and studies prepared by a
number of consultants and building upon the frameworks developed by Orbicon and GHD. It has been
reviewed for content and style by Shared Resources.
Responsibility for the preparation of this report resides solely with GML.
1.4 Argumentation for Appendices
The Appendices included in the EIA document follow the guidelines for preparing an EIA report for
mineral exploitation in Greenland. The guidelines state that the contents shall include the elements
of:
An environmental management plant (EMP)

Greenland Minerals Ltd – Kvanefjeld Project EIA | 4
An environmental monitoring plan
As assessment of environmental impacts related to a closure plan.
These three documents are included as appendices to this EIA and have been translated into English,
Danish and Greenlandic.
The EIA and the Appendices are based on a number of technical reports and baseline data. These
reports are highly technical in content and not designed for layperson reading and investigation, but
have been investigated by the scientific advisors of the EAMRA. The contents of the references are
included in the EIA in summary form. The EIA contains a referencing system which allows for the
identification of the source technical study. References and baseline information will be made
available on GML’s website. The refences are provided in English.

Greenland Minerals Ltd – Kvanefjeld Project EIA | 5
Figure 2 Study Area

Greenland Minerals Ltd – Kvanefjeld Project EIA | 6
2. Non-Technical Summary
2.1 Project description
GML is an Australian mining company based in Perth and listed on the Australian Securities Exchange.
Greenland Minerals A/S (GMAS) is the Greenlandic subsidiary of GML and is headquartered in Narsaq.
GML acquired a majority stake in GMAS, the holder of the license to explore the Kvanefjeld REE project
(the Project), in 2007. In 2011 GML acquired the outstanding shares of GMAS and thereby assumed
100% ownership of the Project.
GML proposes to develop a mine and integrated minerals processing facility at Kvanefjeld. In addition
to producing significant quantities of REE products, the Project will also produce, as by-products, small
but commercially valuable quantities of uranium, zinc concentrates and fluorspar.
The Project is located within the Kommune Kujalleq, the Municipality of southern Greenland (Figure
3). The mine (the Mine) and processing plant (the Plant) will be located approximately 8 km to the
north of the town of Narsaq with a new port facility (the Port) to be developed for the Project
approximately 1 km to the west of Narsaq.
Figure 3 Map of Kommune Kualleq showing towns and settlements (Source: www.kujalleq.gl)
Mining operations will involve conventional open pit mining – blasting, loading and hauling. Blasting
will produce broken ore which will be transported by truck to a concentrator where a rare earth
mineral concentrate (REMC) will be produced together with zinc concentrate and fluorspar. The REMC
will be further processed in the refinery to produce REE products and uranium oxide.
Two streams of tailings (waste produced during processing activities) will be generated: a flotation
residue and a chemical residue. Both will be stored in tailings storage facilities (TSF) to be located in
the Taseq basin. The tailings in the TSF will be covered with a water cap throughout operations. The
Project design also maintains a water cap over the tailings after operations have ceased.
Greenland Minerals Ltd – Kvanefjeld Project EIA | 7
There will be a dedicated road between the Plant and the Port on the shore of Narsap Ilua. The road
will be used to transport goods and personnel between Project facilities. Saleable products will be
transported by truck to the Port where they will be stored until export in vessels chartered by the
Project.
Permanent accommodation (the Village) for employees working on the Project will be constructed
adjacent to the town of Narsaq.
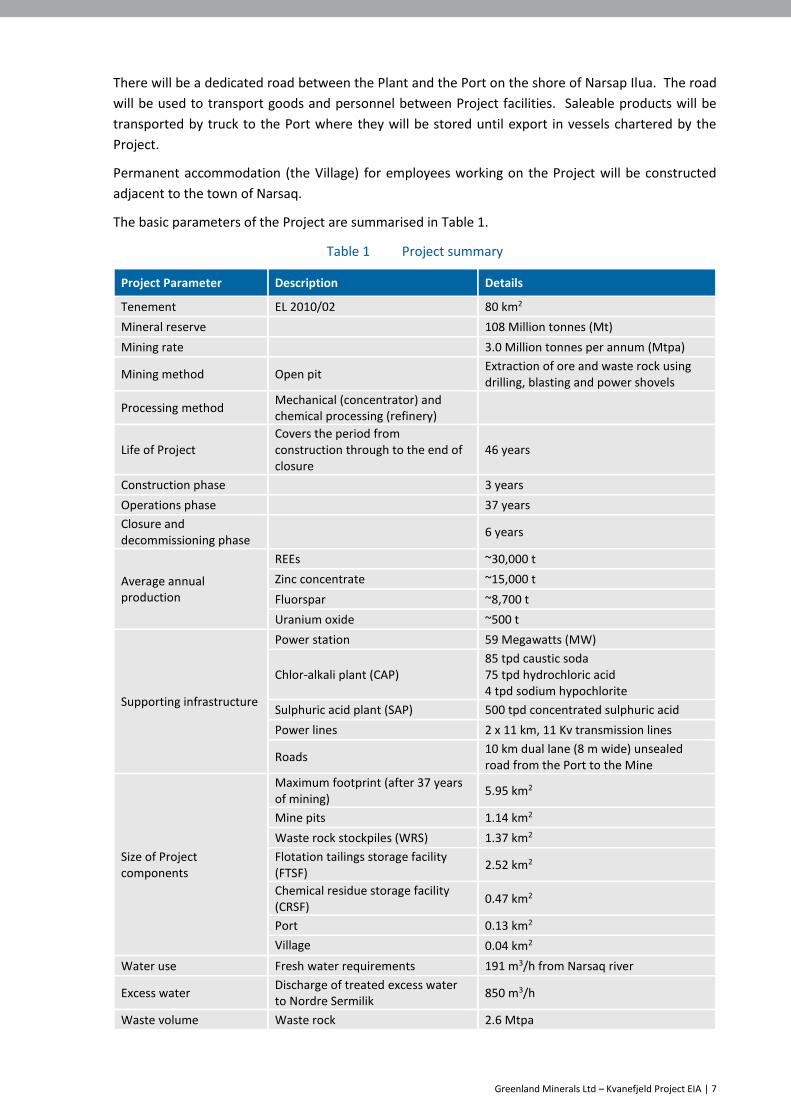
The basic parameters of the Project are summarised in Table 1.
Table 1 Project summary
Project Parameter Description Details
Tenement EL 2010/02 80 km2
Mineral reserve 108 Million tonnes (Mt)
Mining rate 3.0 Million tonnes per annum (Mtpa)
Mining method Open pit Extraction of ore and waste rock using drilling, blasting and power shovels
Processing method Mechanical (concentrator) and chemical processing (refinery)
Life of Project Covers the period from construction through to the end of closure
46 years
Construction phase 3 years
Operations phase 37 years
Closure and decommissioning phase
6 years
Average annual production
REEs ~30,000 t
Zinc concentrate ~15,000 t
Fluorspar ~8,700 t
Uranium oxide ~500 t
Supporting infrastructure
Power station 59 Megawatts (MW)
Chlor-alkali plant (CAP) 85 tpd caustic soda 75 tpd hydrochloric acid 4 tpd sodium hypochlorite
Sulphuric acid plant (SAP) 500 tpd concentrated sulphuric acid
Power lines 2 x 11 km, 11 Kv transmission lines
Roads 10 km dual lane (8 m wide) unsealed road from the Port to the Mine
Size of Project components
Maximum footprint (after 37 years of mining)
5.95 km2
Mine pits 1.14 km2
Waste rock stockpiles (WRS) 1.37 km2
Flotation tailings storage facility (FTSF)
2.52 km2
Chemical residue storage facility (CRSF)
0.47 km2
Port 0.13 km2
Village 0.04 km2
Water use Fresh water requirements 191 m3/h from Narsaq river
Excess water Discharge of treated excess water to Nordre Sermilik
850 m3/h
Waste volume Waste rock 2.6 Mtpa

Greenland Minerals Ltd – Kvanefjeld Project EIA | 8
Project Parameter Description Details
Tailings volume Flotation 122 m3/h of solids
Chemical residue 11.4 m3/h of solids
Vessel movements ~30 per year Handy-Max vessel - 40,000 Dead Weight Tonnes (DWT)
Employee transport Airport Narsarsuaq (or Qaqartoq if new airport proceeds)
Employees
Construction 200 Greenlandic, 971 foreign
Operations 328 Greenlandic, 387 foreign
Closure 41 Greenlandic, 7 foreign
2.2 Environmental Impact Assessment process
In 2009, Naalakkersuisut (the Government of Greenland, GoG) assumed responsibility for the
administration of Greenland’s mineral resources from Denmark. Responsibilities assumed included
the administration of environmental issues in relation to mining projects. The Mineral Resources Act
(MRA) came into force on 1 January 2010 and, as amended, is the backbone of the legislative regulation
of the sector, regulating all matters concerning mineral resource activities, including environmental
issues (such as pollution and nature protection).
As noted in explanatory notes to the MRA (Section 74 (3)), “the Bureau of Minerals and Petroleum’s
‘Guidelines for Preparing an Environmental Impact Assessment (EIA) Report for Mineral Exploitation
in Greenland’ issued on 13 March 2007 serve as a basis for assessment of environmental impacts and
for the preparation of EIA reports”. These guidelines were updated and re-issued in 2015 by the
Mineral Resources Authority.
In order to conduct mining activities in Greenland, a licensee must first apply for and obtain an
exploitation licence for the area that it proposes to mine. An exploitation licence is granted pursuant
to the MRA. To apply for an exploitation licence for the Project, the following documents must be
submitted to the relevant authorities:
An application for an exploitation license
A bankable feasibility study
An environmental impact assessment
A social impact assessment
A navigational safety investigation study.
GML submitted a draft of its EIA to the GoG in November 2015. Feedback received during an extensive
period of consultation with GoG agencies and advisers, and comments received on subsequent draft
EIAs have been incorporated in this revised document which comprises the Company’s EIA for the
Project.
The EIA has been prepared in parallel with the Project’s social impact assessment (the SIA) to ensure
that the interplay between the environmental and social impacts of the Project is properly captured.
The EIA has been prepared in accordance with the Guidelines which state that the aims of the EIA are:
“To estimate and describe the surrounding nature and the environment, as well as the
possible environmental impacts of the proposed project
To provide a basis for the consideration of the proposed project for Naalakkersuisut
To provide a basis for public participation in the decision-making process

Greenland Minerals Ltd – Kvanefjeld Project EIA | 9
To give the authorities all information necessary to determine the conditions of permission
and approval of a proposed project”.
In order to best present the environmental baseline data and the assessment of potential
environmental impacts, this report has been structured to consider Project impacts associated with
each of the environmental factors set out below:
Physical environment
Atmospheric setting
Radiological emissions
Water environment
Waste management
Biodiversity
Local use and local knowledge
Cumulative Impact Assessment.
For each of the factors listed above the report describes:
Baseline description
Potential Project impacts on the environment
The assessment of impacts
Mitigation measures
Predicted outcomes.
The assessment of the predicted outcomes considers, as appropriate for each factor, the spatial scale
of the impact, the duration of the impact, and the significance of the impact related to key outcomes.
An impact assessment is essentially a prediction of anticipated impacts resulting from the
implementation of a Project. The impacts assessed in this EIA have been assessed using scientific
models where appropriate, however within a process of prediction, some level of uncertainty can be
present. Three different mechanisms to classify and then address uncertainty have been applied:
Uncertainty related to data – Comprehensive baseline data has been collected to inform the
impact assessment and is considered sufficient to inform the scale and nature of the
predicted impacts. In a few cases the need for additional data collection has been identified
to further reduce the uncertainty of the assessment, but the additional data is not expected
to change the outcome of the assessment;
Uncertainty related to consequence – Wherever possible, models used to assess impacts
have been applied conservatively;
Uncertainty related to likelihood - The impacts considered in an impact assessment are
typically those with a high likelihood. However, in this impact assessment, some low
likelihood impacts have also been considered (e.g. the potential failure of the FTSF and its
impact on various environmental values) where the impacts are considered of significant
stakeholder concern or interest. The methodology applied in this impact assessment
assumes impacts are going to occur, making it challenging to assess variable likelihood
impacts in this context. To address this, the Project has also analysed potential
environmental risks associated with the development of the Project. Risks are events which
may or may not occur and for which there is a probability of a certain consequence
eventuating. As such, the assessment of risks is particularly suited to the assessment of
uncertain events / effects. Impacts with variable likelihood are effectively reported on twice
in this impact assessment: once in the relevant impact assessment chapter, where details of

Greenland Minerals Ltd – Kvanefjeld Project EIA | 10
the assessment provided, and again in the risk assessment Section, where the likelihood and
consequence of the risk are reported.
2.3 Consultation completed to date
In 2010 GML prepared an initial feasibility study (FS) for the Project.
At the same time, to initiate activity to satisfy the requirements for obtaining an exploitation license
for the Project, work on the “scoping phase” of an EIA was also commenced.
During the scoping phase, several workshops were conducted to present the Project to stakeholders
and to receive feedback on topics to be covered in the Project’s EIA. In July 2011, after extensive
consultation, GML drafted the first version of the Terms of Reference (ToR) for the EIA.
Subsequent changes to the Project design and an amendment to the MRA in 2014 prompted the
development of an updated ToR. Public consultation in respect of the updated ToR occurred in the
period August – October 2014, with comments from the consultation process consolidated in a
subsequent White Paper.
In the first half of 2015 GML prepared a further revision of the ToR based on comments collated in the
White Paper. The 2015 version of the ToR was approved by the GoG in late 2015. The EIA has been
developed in accordance with this ToR which is available on www.naalakkersuisut.gl.
The EIA has been developed with the involvement of stakeholders as much and as effectively as
possible at all stages of its development. Table 2 summarises the key stakeholders the Company has
engaged with in relation to the development of the Project and the preparation of the ToR for the EIA.
Table 2 Key Stakeholders
Regulators and Ministries Community Other
Ministry of Science and Environment Residents of Narsaq Danish Centre for Environment and Energy (DCE) Aarhus University
Mineral Licence and Safety Authority, Administration (MLSA)
Residents of Sisimiut Greenland Institute of Natural Resources (GINR)
The Environmental Agency for Mineral Resource Activities (EAMRA)
Residents of Qaqortoq Air Greenland, Nuuk
Danish Foreign Ministry Residents of Aasiaat Arctic Business Network
Municipality of Kujalleq Mineral Manager
Residents of Ilulissat Businesses in Qaqortoq
Ministry of Mineral Resources (MMR) Residents of Kangaamiut Greenland Labour Union (SIK)
Residents of Maniitsoq Employers Association of Greenland (GE)
Residents of Nuuk Local Hunter and Fisher Association Narsaq
Residents of Qasigiannguit Mineral Resources Committee
Residents of Qeqertarsuaq Transparency Greenland
Municipality of Sermersooq WWF Copenhagen
Municipality of Kujalleq
Mayor of Municipality of Kujalleq
Info Group Narsaq

Greenland Minerals Ltd – Kvanefjeld Project EIA | 11
2.4 Alternatives considered
In order to identify the most appropriate design for the Project, a number of alternatives for aspects
of Project design have been identified and assessed. As per the MRA (Sections 51-54) the Project has
sought to apply Best Available Technology (BAT) and Best Environmental Practice (BEP) where this is
technically, practically and financially possible. A summary of the major alternatives considered is
provided below.
Alternative 1 Not proceeding with the Project
Not proceeding is an alternative in a commercial environment subject to volatile commodity prices
and increasing processing costs. However, the Project has the potential to provide significant short
and long term social and economic benefits to Greenland, in particular, to the Narsaq region.
The Project anticipates paying an average of approximately DKK 1.52 Bn per annum in nominal/current
prices in company tax, royalties and direct labour income taxes and anticipates generating
approximately 715 jobs during the operations phase of which approximately 328 could be Greenlandic
jobs
Alternative 2 Utilising different processing methods
Three alternative processing scenarios were examined:
i. mechanical concentrator only
ii. mechanical concentrator and chemical processing or
iii. mechanical concentrator, chemical processing and REE separation (referred to as the
Greenland separation plant).
The concentrator scenario, (i), would represent the lowest possible level of domestic processing. It
was not pursued as the processing method for the Project because it failed to adequately align with
the priority of the GoG to ensure that, as much as practically possible, processing of mineral products
takes place within Greenland.
The Greenland separation plant scenario, (iii), was considered from two perspectives: the option to
develop a Greenland separation plant, and the option to operate such a plant in-house. In-house
operation of a Greenland separation plant was not pursued because of the need to apply proprietary
extraction technology, which is not available for purchase or licensing as it is a key commercial
advantage for its current holders. The development of a Greenland separation plant was not included
as part of the current Project design due to the significant additional capital expenditure, and the lack
of expertise and experience available in Greenland to operate and maintain such a plant. However, it
is important to note that a decision to not pursue a Greenland separation plant at Project
commencement does not mean that it cannot be considered subsequently as the Project matures and
market conditions allow.
The mechanical (concentrator) and chemical processing (refinery) scenario, (ii), was selected as the
processing method for the Project. This method involves some downstream processing of REEs in
Greenland and the production of several saleable by-products and is therefore aligned with GoG
priorities.
Alternative 3 Alternative facility locations
Two potential locations for each of the concentrator, refinery, Port and accommodation facilities were
considered: Location East and Location West.

Greenland Minerals Ltd – Kvanefjeld Project EIA | 12
Figure 4 Location East
Figure 5 Location West
Public consultation indicated a preference for Location West, and subsequent Project development
has focused on Location West where facilities and activities would be located in the Narsaq valley.
Alternative 4 Alternative Port locations
Two potential Port locations were considered within Narsap Ilua. The selected site on the Tunu
peninsula required less dredging and avoided impacts to a Norse farm ruin (Dyrnaes).

Greenland Minerals Ltd – Kvanefjeld Project EIA | 13
Alternative 5 Alternative accommodation locations
Two primary accommodation options suitable for a predominantly fly-in fly-out (FIFO) workforce were
considered. These included the integration of new housing into the town of Narsaq, and the building
of a new security-controlled workers’ village on the north-west boundary of Narsaq. The security-
controlled workers’ village was selected as it provides the best balance between impacts to Narsaq
and the workforce. The SIA provides a detailed description of the considerations which informed this
choice [69].
Alternative 6 Alternative sources of energy for the Project
The use of hydropower for the Project was evaluated as an option because of the existence of a
potentially suitable water source 55 km to the north of the Project, at Johan Dahl Land. For this option
to be implemented however, a hydropower scheme of sufficient scale to support the Project would
need to be developed.
Based on construction requirements this option was not considered feasible for the first stage of
development of the Project. Power generation using heavy fuel oil (HFO) was also considered but later
rejected because of the level of sulphur emissions which would be produced.
A 59 MW diesel fired combined heat and power station will be built adjacent to the concentrator to
provide power for Project activities.
Alternative 7 Tailings management
Alternatives for the three key tailings management issues: how and where to deposit tailings, and how
to cover them after operations cease were considered.
The selection of BAT for tailings management depends on the technical characteristics of the tailings
facility, its geographic location and the local environment conditions [99]. The Best Available
Techniques Reference Document for the Management of Waste from Extractive Industries [100] does
not prescribe any specific technique or specific technology for the management of tailings, but requires
BAT to be defined based on the three conditions identified above.
A number of options for the location of the TSF were investigated including potential sites outside the
Company’s current license boundaries. Based on topographical analysis, seven potential sites were
identified including locations on the Kvanefjeld plateau and in the Taseq basin. Placement of tailings
in the mined out open pit was also considered but rejected due to the practical challenge of disposing
of tailings into the same area as an active open pit mine. A co-disposal option, where tailings and
waste rock would be disposed together was also considered. However, the potential environment
impacts from dust and radon associated with this deposition approach, combined with increased
material handling at the Plant and WRS made this option unsuitable for the Project also.
The relative merit of each of the seven sites was ranked by reference to potential environmental, social
and technical risks. Factors considered in the ranking included: catchment / water supply; footprint;
vegetation; settlement impacts / current land use; visual impact; local ecology and recreation;
geotechnical setting and geology; and technical viability. Comparative costs for the various options
were not assessed as part of this ranking, however economic and technical viability considerations
informed the final selection. After consideration of each of these factors for all sites, the Taseq basin
was selected as the preferred location for the storage of Project tailings. A number of the benefits of
the Taseq site are summarised below:
It is an impermeable basin

Greenland Minerals Ltd – Kvanefjeld Project EIA | 14
There is no competing land use
Taseq lake is of low biodiversity value
There is no direct linkage to drinking water supply
It allows for water cover to prevent dust emissions
It is located on the intrusion, so the area already displays elevated radioactivity
It is not visible from fjord marine traffic
It requires the lowest embankment walls.
Three methods for the deposition of tailings in the Taseq basin were also considered: dry (filter cake)
disposal; and two forms of wet disposal (thickened tailings / paste and conventional slurry). After
analysis it was concluded that a naturally wet environment (such as Taseq basin) creates a difficult
environment in which to store dry tailings. The properties of the Project’s tailings also challenge the
viability of producing a high-density tailings product required for a thickened paste. Slurry deposition
is a standard technique, widely used around the world, which suits the material characteristics of the
Project’s tailings. Conventional slurry can be deposited either sub-aerially or sub-aqueously. In order
to attenuate radiation exposure, and reduce dust emissions, sub-aqueous deposition was selected.
Upon closure, a long-term cover will be required for the deposited tailings. Two options were
considered: a wet cover where the tailings are contained by a permanent water cap; and a dry cover
where the tailings are covered by an engineered fill cover.
The closure cover options were evaluated against the closure principles defined for the Project,
namely: physical stability, chemical stability, minimised radiological impact, and minimal significant
change to baseline landforms.
These core principles are consistent with the International Atomic Energy Agency (IAEA) TECDOC-1403
[107] on uranium mill tailings which notes that the objectives of covers should be to “minimise radon
and dust emission, shield the environment from gamma radiation, reduce water and oxygen
infiltration, control erosion, and to form an aesthetically acceptable landscape that fulfils these
technical objectives”. Using multi-criteria analysis techniques, it was determined that while wet and
dry closure cover options present different strengths and weaknesses, they are expected to achieve
these objectives, in aggregate, to a similar level. The wet and dry closure cover options would both be
designed in accordance with best international practice in terms of health, safety and environmental
protection. The Project has been developed assuming a wet cover design at closure, however given
the likely evolution of technology over time, this alternatives assessment will be re-visited closer to
the time of closure. The ultimate selection of wet or dry tailings closure will reflect the preferences of
the environmental authorities of the Greenland Government and the proven technology at the time.
2.5 Assessment of impacts
The assessment has been structured into seven environmental categories. For each category, a brief
description of the relevant baseline condition is provided prior to a summary of the relevant impacts.
The assessment studied 36 impacts of which 8 were evaluated to be very low, 25 low and 3 medium
post mitigation.
2.5.1 Physical Environment
Situated only 40 km from the open ocean, weather in the Project area is influenced by the ocean,
resulting in cool summers and relatively mild winters. The area can experience foehn winds, which are
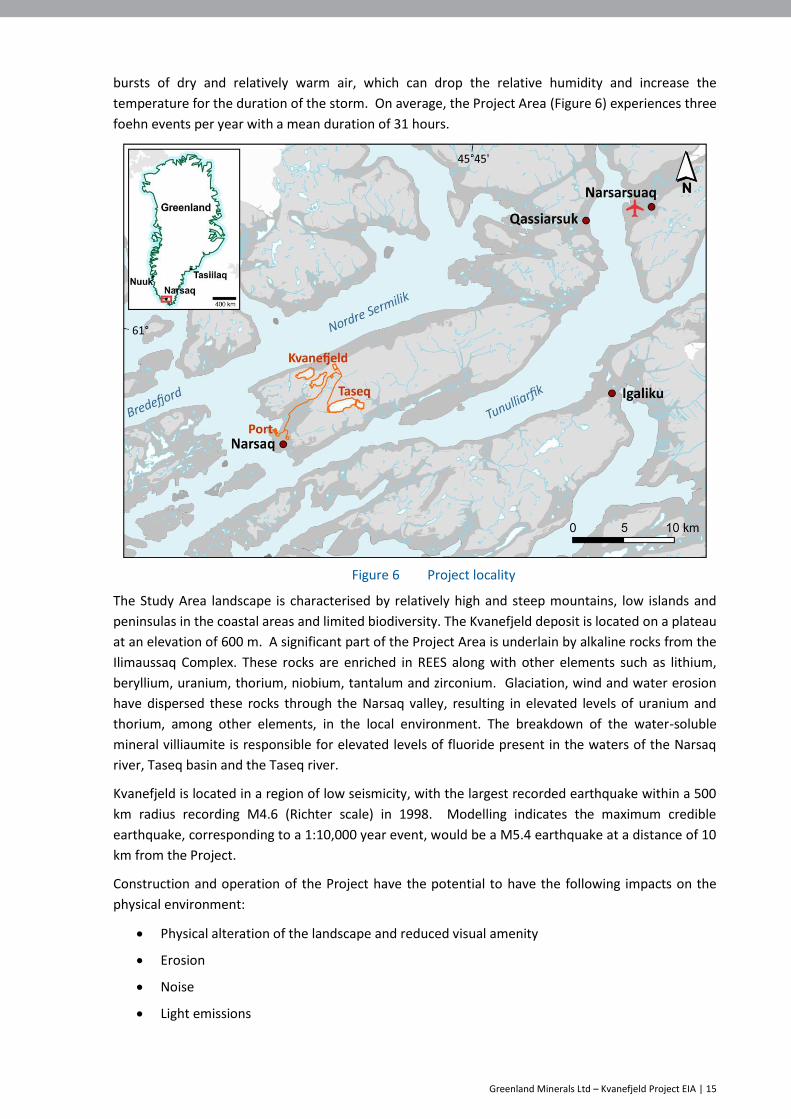
Greenland Minerals Ltd – Kvanefjeld Project EIA | 15
bursts of dry and relatively warm air, which can drop the relative humidity and increase the
temperature for the duration of the storm. On average, the Project Area (Figure 6) experiences three
foehn events per year with a mean duration of 31 hours.
Figure 6 Project locality
The Study Area landscape is characterised by relatively high and steep mountains, low islands and
peninsulas in the coastal areas and limited biodiversity. The Kvanefjeld deposit is located on a plateau
at an elevation of 600 m. A significant part of the Project Area is underlain by alkaline rocks from the
Ilimaussaq Complex. These rocks are enriched in REES along with other elements such as lithium,
beryllium, uranium, thorium, niobium, tantalum and zirconium. Glaciation, wind and water erosion
have dispersed these rocks through the Narsaq valley, resulting in elevated levels of uranium and
thorium, among other elements, in the local environment. The breakdown of the water-soluble
mineral villiaumite is responsible for elevated levels of fluoride present in the waters of the Narsaq
river, Taseq basin and the Taseq river.
Kvanefjeld is located in a region of low seismicity, with the largest recorded earthquake within a 500
km radius recording M4.6 (Richter scale) in 1998. Modelling indicates the maximum credible
earthquake, corresponding to a 1:10,000 year event, would be a M5.4 earthquake at a distance of 10
km from the Project.
Construction and operation of the Project have the potential to have the following impacts on the
physical environment:
Physical alteration of the landscape and reduced visual amenity
Erosion
Noise
Light emissions

Greenland Minerals Ltd – Kvanefjeld Project EIA | 16
Physical alteration of the landscape generated by a seismic event.
Visual Amenity
Visual impact on the landscape is an unavoidable part of an open pit mining project and cannot be
completely eliminated by mitigation measures.
The development and operation of the Project will result in landscape alterations which will be
localized within the Study Area (as indicated in Figure 7) but will be visible to varying degrees from
various vantage points. Some of the alterations will be permanent while others will be removed or
ameliorated during the Project’s closure phase.
Figure 7 Study Area
A view of the developed Project from Narsaq town is indicated in Figure 8.
Figure 8 View of the developed Project from Narsaq town (Google Earth 2018)
Greenland Minerals Ltd – Kvanefjeld Project EIA | 17
The most significant alterations will be development and construction of:
The Mine and associated haul roads
Stockpiles for material that is mined but not processed, the WRS
The Plant, located in the vicinity of the open pit
The TSF in the Taseq basin
The new Port on the shore of Narsap Ilua
A road from the Port to the Mine and Plant (the Port-Mine Road)
Permanent employee accommodation in the Village adjacent to the town of Narsaq.
During the operating life of the Project a number of these physical features will be visible, some only
partly, from Narsaq or from the Narsaq valley.
Structures at the Port will be visible from Narsaq
The Port-Mine Road will be visible from Narsaq
The Plant will be visible in the Narsaq valley, but not from the town of Narsaq
The Mine will be visible from the highest part of the Narsaq valley but not from the alluvial
fan zone or the town of Narsaq
Embankments for the TSF will be visible from the highest part of the Narsaq valley but not
from the alluvial fan zone or the town of Narsaq
The Village which will be built on the outskirts of Narsaq will be visible from parts of the
town.
During the Project’s closure phase, the structures that are no longer required will be removed and
other physical features of the Project will be remediated.
Erosion
Most construction works will take place in areas with consolidated rock, and there are very limited
soils or clays within the Project Area. As a result, limited erosion is anticipated from the Project’s
earthworks and construction activities. To further minimise the risk of erosion and sediment transport
associated with the development of the WRS, all direct precipitation will be captured and diverted into
an artificial pond.
Noise
Wind speed is an important parameter affecting natural background sound levels. With an average
wind speed of 2-5 m/s occurring more than a third of the time, this corresponds to a minimum natural
background noise level of 30 dB(A) in the Project Area. The Project will create additional noise in the
Project Area. The level of noise will vary according to the phase of the Project.
Construction Phase
Significant noise sources during the construction phase will include:
Drilling and blasting at the Mine and Port
Pre-stripping of the pit area
Grading will take place in all key locations to prepare level surfaces
The Port-Mine Road will be constructed in stages gradually progressing from the Port to the
Mine and Plant areas
Greenland Minerals Ltd – Kvanefjeld Project EIA | 18
Vessel traffic associated with construction.
Overall, the noise impact during construction is predicted to be at or below noise levels that have been
calculated and modelled for the Project’s operations phase. For this reason, the modelling focused on
the operations phase rather than the construction phase.
Of specific relevance to the town of Narsaq, as a result of low vessel speed and the distance between
the Port and Narsaq, the average noise level resulting from vessel movements will be below the 35
dB(A) Danish guideline for night time noise in residential areas.
Operations Phase
Activities during the Project’s operations phase will result in an increase in the ambient noise level near
several Project facilities. Noise arising from Project activities that exceeds the existing baseline
acoustical environment (defined to be 30 dB(A)) is defined as the Project’s Noise Footprint.
The most significant sources of noise during Project operations will be:
The Mine, Plant and power station
The Port-Mine Road, and
The Port area.
Noise modelling was undertaken using SoundPlan software, and conservative assumptions were used
to represent maximum continuous noise source strengths. Modelled noise level distribution indicates
that the areas where the noise levels will exceed 30 dB(A) will be limited to the Mine/Plant areas, the
upper parts of the Narsaq valley, the Port and, depending on the terrain, for between 800 and 1,200
m on both sides of the Port-Mine Road.
Modelling results also assessed the noise level anticipated at noise sensitive receptors located in the
Narsaq valley and town. These included locations such as the summer houses and the farm in the
valley and the residential houses in Narsaq closest to Project activities.
The Project-related traffic noise levels calculated for the houses closest to the Port-Mine road are
approximately 38 dB(A). The levels are below the Danish limit for daytime noise for summer housing
(40 dB(A)) but above the evening and night limit (35 dB(A)).
The calculated noise level for the Port will exceed 70 dB(A) in a small area where containers are
unloaded. The area where the average noise level exceeds the 30 dB(A) background level extends
approximately 1,800 m from the centre of the Port and can be seen in Figure 9.
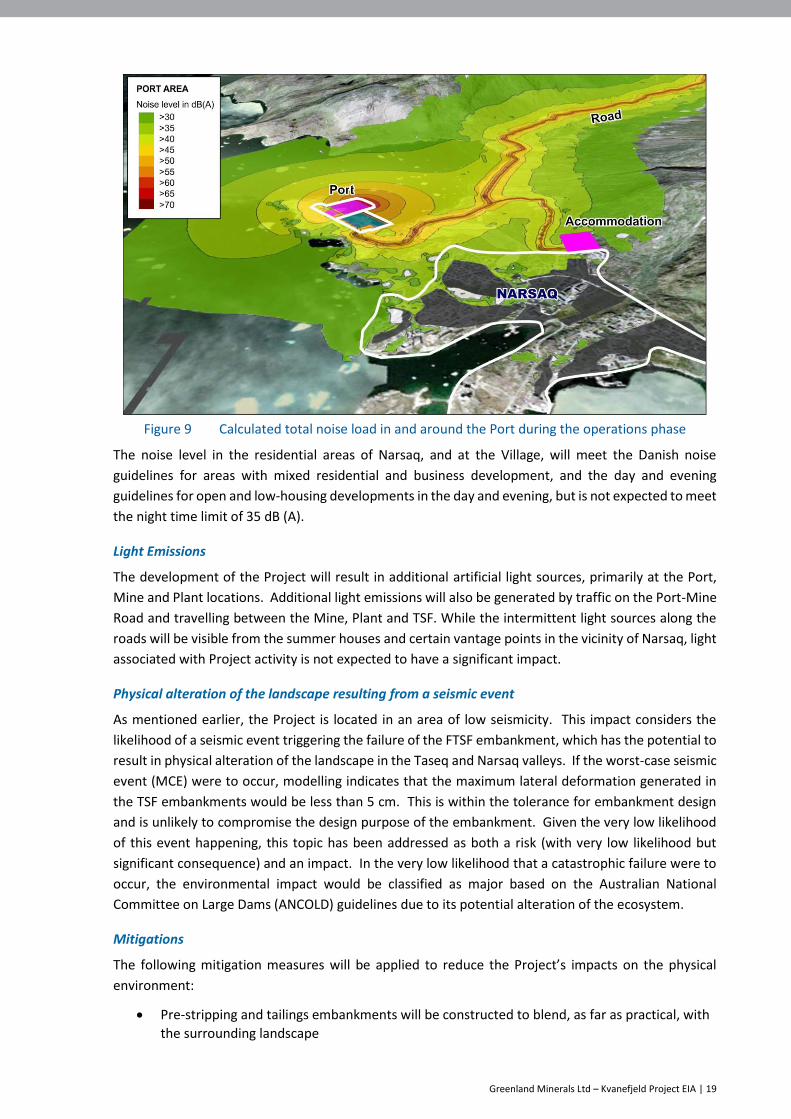
Greenland Minerals Ltd – Kvanefjeld Project EIA | 19
Figure 9 Calculated total noise load in and around the Port during the operations phase
The noise level in the residential areas of Narsaq, and at the Village, will meet the Danish noise
guidelines for areas with mixed residential and business development, and the day and evening
guidelines for open and low-housing developments in the day and evening, but is not expected to meet
the night time limit of 35 dB (A).
Light Emissions
The development of the Project will result in additional artificial light sources, primarily at the Port,
Mine and Plant locations. Additional light emissions will also be generated by traffic on the Port-Mine
Road and travelling between the Mine, Plant and TSF. While the intermittent light sources along the
roads will be visible from the summer houses and certain vantage points in the vicinity of Narsaq, light
associated with Project activity is not expected to have a significant impact.
Physical alteration of the landscape resulting from a seismic event
As mentioned earlier, the Project is located in an area of low seismicity. This impact considers the
likelihood of a seismic event triggering the failure of the FTSF embankment, which has the potential to
result in physical alteration of the landscape in the Taseq and Narsaq valleys. If the worst-case seismic
event (MCE) were to occur, modelling indicates that the maximum lateral deformation generated in
the TSF embankments would be less than 5 cm. This is within the tolerance for embankment design
and is unlikely to compromise the design purpose of the embankment. Given the very low likelihood
of this event happening, this topic has been addressed as both a risk (with very low likelihood but
significant consequence) and an impact. In the very low likelihood that a catastrophic failure were to
occur, the environmental impact would be classified as major based on the Australian National
Committee on Large Dams (ANCOLD) guidelines due to its potential alteration of the ecosystem.
Mitigations
The following mitigation measures will be applied to reduce the Project’s impacts on the physical
environment:
Pre-stripping and tailings embankments will be constructed to blend, as far as practical, with
the surrounding landscape

Greenland Minerals Ltd – Kvanefjeld Project EIA | 20
Topsoil will be stockpiled, where possible, to support revegetation post closure
Roads will be constructed to minimize impacts on the surrounding landscape
Embankments and diversion channels will be covered with local materials (rock and gravel)
Blasting will be undertaken only between 8am and 6pm to minimise noise and vibration
impacts
Vehicular traffic along the Port-Mine road and around the Port will be minimised between
10pm -7am
The TSF facility has been designed to meet international standards (International Convention
on Large Dams, ICOLD) and includes the use of rock fill in the embankment design and the
keying of the embankment into surrounding competent rock.
2.5.2 Atmospheric impacts
Baseline monitoring of air quality (dust and gaseous emissions) has been undertaken in the Study Area.
Monitoring stations are located at the farm in Narsaq valley, in Narsaq town and to the south of Narsaq.
The development of the Project has the potential to generate three types of atmospheric impacts:
dust, gaseous emissions and GHG.
Air quality modelling was undertaken using CALPUFF, an industry standard model designated by the
United States Environmental Protection Authority (USEPA) as a preferred model for such purposes.
The Project’s dust and gaseous emissions are predicted to be greatest during the Operations phase.
Modelled ground level concentrations of key pollutants (TSP, PM2.5, PM10, SOX, NOX, black carbon and
PAHs) were compared to ambient air quality assessment criteria to determine the potential impact to
the physical environment and human health. In addition, TSP dust fall rates were modelled and metal
loads estimated.
Dust
Fugitive dust will be created by a number of Project activities including blasting and excavation in the
Mine, materials handling and transport on unpaved roads. Modelling results indicate that the
predicted ground level concentrations for TSP, PM2.5, PM10 and dust deposition will not exceed relevant
assessment criteria at any sensitive receptor locations, either in isolation or cumulatively. The highest
dust levels are anticipated in the Mine area close to the pit.
All particulate concentrations will be less than 20 % (Project emissions in isolation) and 40 %
(cumulative, including background emissions) of their respective assessment criteria. Therefore, the
impact of particulate emissions from the Project is assessed to be low.
Gaseous Emissions
Air emissions will be produced from diesel powered machinery and trucks, equipment used for power
generation and heating, acid plants and vessels at the Port. Emissions from the combustion of diesel
will include solid particles, NOX (nitrous oxides), SOX (oxides of sulphur), black carbon and PAHs.
The results of modelling cumulative impacts indicate that the predicted ground level concentrations
for nitrogen, NO2, H2S, SO2 and SO4 will not exceed the relevant limit criteria at the receptor locations.
The impact of gaseous emissions from the Project is assessed to be low. The potential impact of black
carbon and PAHs from the Project has also been assessed to be low.
Greenland Minerals Ltd – Kvanefjeld Project EIA | 21
Greenhouse Gas Emissions
The greenhouse gas emissions (GHG) evaluated for the Project include carbon dioxide, nitrous oxide
and methane. The GHG emissions have been estimated using methods outlined in the 2006
Intergovernmental Panel on Climate Change (IPCC) guidelines for national greenhouse gas inventories
[12]. Estimates are based on conservative assumptions and as such, they represent the maximum
expected emissions for the activities identified in this assessment.
During all phases of the Project, diesel machinery, power generation, heating, road and ship transport
will generate GHG emissions. Considering mobile and stationary combustion emissions and emissions
from the Plant (including the acid plants), a total of 0.24 million tonnes of GHG emissions per year is
estimated for the Project, of which methane and nitrous oxide contribute 2,360 tonnes. Due to the
current scale of Greenland’s GHG emissions, the Project will increase Greenland’s CO2 emissions by 45
%. By way of comparison, with the inclusion of the Project emissions, Greenland will contribute 2 % of
the annual Danish GHG emissions.
Mitigations
The following mitigation measures will be applied to reduce the Project’s impacts on air quality.
GML has developed a dust control plan (DCP) which describes dust suppression activities that will be
implemented during operations.
Mitigation measures in the DCP include:
Dust containment and wetting of materials and areas prone to dusting
Vehicle speed limits, regular road grading and maintenance
Vehicle washing systems at the exit point of the Mine (to minimize dispersal of dust along
roads).
Additional mitigations will include:
Using vehicles and equipment with energy efficient technologies to minimize emission rates
Maintaining the power plant, vehicles and other fuel powered equipment in accordance with
manufacturer specifications to minimize emissions.
2.5.3 Radiological impacts
Radiation is energy that is transmitted in the form of waves or streams of particles. A source of
radiation is naturally occurring radionuclides which are present in all soils and rocks thereby creating
a natural background radiation level in every location.
Uranium and thorium are two of a number of natural occurring radionuclide elements that are widely
distributed on earth. Kvanefjeld ore contains elevated concentrations of uranium and thorium and,
over time, natural processes such as glaciation and wind and water erosion have dispersed
radionuclides into the Narsaq valley and Narsaq. As a result, baseline radionuclide concentrations
around the Project Area are elevated when compared to global average values. For residents of
Narsaq, the natural baseline exposure through food ingestion and radon / thoron inhalation was
calculated to be between 8.5-10.5 mSv/year.
Project activities, predominantly Mine operations, will release radioactivity to the air and water. This
radioactivity, if absorbed in significant quantities, has the potential to cause harm to humans, flora and
fauna. Radiation impacts from both Project generated dust, radon and thoron were assessed. In
addition to the release of radionuclides associated with planned Project activities, three risk scenarios

Greenland Minerals Ltd – Kvanefjeld Project EIA | 22
were also considered: radioactivity from spills; radioactivity released in the unlikely event of a TSF
embankment failure; and radioactivity released from aerosol spray from the TSF.
Radioactivity from Dust
A radiological assessment was conducted for the Project using the INTAKE model to assess the
potential for radiological contamination as a result of the Project. The INTAKE model has been applied
to several uranium mining projects in Northern Canada to simulate radiological and non-radiological
constituent fate and transport in the environment and the subsequent evaluation of exposures to
ecological species and humans.
Potential radiological releases from the Mine and Plant were estimated and the radiological
contaminants of concern were identified. Estimates of releases were combined with data on air and
water dispersion to estimate radionuclide concentrations which will occur as a result of Project
activities. These estimates were calculated for different locations within the Study Area. These
concentrations were used, together with “behaviour characteristics” (e.g. what and how much is eaten
by animals and people) and natural background radiation, to estimate radiological doses for selected
flora, fauna and humans.
The potential for effects on the health of humans and fauna is determined by comparing the total
calculated radiological dose for the various receptors (the sum of the natural background dose and the
dose arising from Project activities) to the International Commission on Radiological Protection (ICRP)
benchmark dose limits. The final step in the assessment was to calculate screening index values (SIVs),
where an SIV of less than 1 indicates that the calculated dose is below the reference dose limit and
therefore the threshold for the potential for radiological effects on the population at large will not
have been reached. The SIVs calculated for all species were well below 1 indicating that the Project is
not expected to result in an adverse effect or significant harm to plants, animals or humans either
living in or visiting the area. The analysis specifically included consideration of sheep and their SIVs
were also found to be well below 1 (0.017 at Ipuitaq farm).
Radioactivity from Radon
During each phase of the Project, activities will take place which have the potential to produce radon
and thoron emissions, including exposure of surfaces of uranium bearing material (waste and ore), in-
pit releases from mine pore water, handling of broken ore, ore processing and storage, mill process
vessels, and tailings facilities. Radon generation is likely to be greatest during the operations phase.
To understand the impact of mining related radon to residents of Narsaq, the incremental level of
radon arising from mining activities was estimated by combining the estimated radon sources with
atmospheric dilution factors to predict radon levels in the town of Narsaq. These levels were then
compared to measured background levels. Based on the worst-case emission rate , the Project will
increase background radon concentrations in Narsaq by a maximum of 3 %. The majority of the
additional radon exposure will come from radon (and a small amount of thoron) released from the
open pit mining operations. As these incremental exposure levels are within the natural variation of
background, the consequences of incremental exposure are negligible.
Radioactivity from spills
The transport and handling of uranium oxide will be in accordance with the applicable IAEA Safety
Standards and the International Maritime Dangerous Goods (IMDG) Code. Uranium oxide will be
packaged in 200 litre steel drums which will be sealed at the Plant, packed in sea containers and
transported to the Port. A specific uranium transport assessment has been carried out for the Project.
The assessment identified the potential for a:

Greenland Minerals Ltd – Kvanefjeld Project EIA | 23
Spill of uranium oxide into rivers or Narsap Ilua
Spill of uranium oxide on land.
Should a spill into water occur there may be an immediate and short-term impact on aquatic life. In
the long term, released material should be contained and the affected area remediated. The long-
term quality of sediment in the area of the spill may be adversely affected with the result that biota
may be exposed to contaminated water and sediments.
Based on experience from Arctic Canada the risk of a spill into water is calculated to be extremely low.
In case of an accident involving the release of uranium oxide on land, flora and fauna and members of
the public (and workers) could be exposed to gamma radiation as well as inhalation of airborne
particles. Modelling indicates that workers involved in a clean-up process for a period of 10 hours
would receive a maximum dose of 0.26 mSv, which is well under the annual public health dose of 1
mSv, which in turn is well below the prescribed worker dose limit of an average of 20 mSv per year
over 5 years. A review of road transportation accident statistics for Canada and the U.S. confirmed
that the probability of an accident and release of uranium oxide into the environment is extremely
low.
Radioactivity release from a TSF embankment failure
The FTSF and CRSF embankments have been designed to meet international standards (ICOLD) and are
predicted to withstand even worst-case seismic events. They also incorporate a number of safety
features, such as being keyed into competent rock, and using downstream construction techniques to
further strengthen the facilities. Notwithstanding the very low likelihood of a failure, three different
scenarios of a potential failure have been assessed to determine the impact of a failure on the
environment. The three hypothetical failure modes which were modelled are described below:
Overtopping – Where water cover over the tailings would be accidentally released into the
river
Piping failure – Where embankment materials would be eroded out by flowing water,
resulting in the release of both water cover and a proportion of tailings solids into the river;
Catastrophic failure – Where all tailings water and a significant proportion of the tailings
solids would be released into the river.
Under all three failure scenarios, the discharge would be expected to follow the current surface water
discharge pathway down the Taseq river, through the Narsaq river to the sea at Narsap Ilua. Detailed
analyses of the radiological impacts of each of these scenarios have been undertaken. The failure
scenarios were modelled for two different points in time – the end of operations (when the tailings
volume will reach an operational peak) and the post closure period (illustrated by Year 49 which is
representative of the maximum supernatant (water cover over the tailings) volume).
In an overtopping scenario, where only supernatanttailings water is released into the Taseq and Narsaq
rivers in the post closure period, the potential radiological impact in the post-closure period is assessed
to be very low with no expected effect on human health. In the event of an operational overtopping
failure, a potential short-term effect on phytoplankton (microscopic plants) was identified with no
other species expected to be affected and no impacts to human health. This is primarily because the
water quality in the TSF in the post closure period will have met the Greenland water quality guidelines
(GWQC) for all elements excluding fluoride.

Greenland Minerals Ltd – Kvanefjeld Project EIA | 24
In a piping failure scenario, physical (rather than radiological) factors are likely to have a greater
influence on the freshwater environment in the short-term, and some longer term radiological effects
might be experienced by freshwater biota but these are not expected to be severe. Some quickly
reproducing freshwater organisms (for example, zooplankton) would be likely to experience low-level
short-term radiological effects. Within the marine environment, phytoplankton could experience
short-term significant radiological effects, but these effects would be expected to decline after the
conclusion of the event. In the longer-term, FTSF tailings may comprise a new sediment layer in Narsap
Ilua, however this is not expected to present concerns from a radiological exposure perspective.
Human health impacts have been assessed using dose consumption data for fish and it was determined
that Narsaq residents would be able to source up to 20 % of their annual fish consumption from Narsap
Ilua without exceeding the public health dose limit.
In a worst-case catastrophic embankment failure scenario, the radiological exposures would be similar
to those described for the piping case. The larger footprint of a catastrophic failure would result in a
greater area of inundation and sediment deposition on land. Modelling indicates that some marine
species (phytoplankton) may experience significant short-term radiological effects but these effects
would be expected to rapidly decline. The RESRAD ONSITE model was used to determine human health
impacts, and concluded that direct exposure to tailings deposited on land is not likely to be a health
concern. Similarly, dust generated from the desiccation of deposited tailings is not expected to be a
concern from a radiological perspective.
Radioactivity release from TSF aerosol spray
Aerosols originating from the TSF are a potential source of uranium airborne dispersion for the Taseq
and Narsaq rivers. However, given prevailing wind directions (easterly and north easterly), local
topography and the marked mountain ridge separating Taseq valley from the area used for abstraction
of raw water to Narsaq water supply, (the ridge south of the valley is more than 200 m above Taseq
lake), modelling indicates that deposition of aerosols from the TSF into the catchment for Narsaq’s
drinking water will be limited. Modelling of foehn wind events demonstrates that the quantity of
uranium potentially deposited in the Narsaq drinking water catchment will remain well below World
Health Organization (WHO) drinking water quality guidelines even under extreme conditions.
Mitigations
The following mitigation measures will be applied to reduce the Project’s radiological impacts
Management of dust through the DCP
The Plant will be engineered to minimise radiation emissions
The transportation and packaging of uranium oxide will be in accordance with IAEA safety
standards and the IMDG Code
During and after operations, tailings solids will be stored under water to prevent dust and
radon emissions.
2.5.4 Water environment
The hydrology of the Project Area is characterized by a 30 km2 precipitation dominated catchment
area, most of which is without vegetation and as a result, has a rapid runoff rate. The two major
tributaries to the Narsaq river, the Taseq river and the Kvane river, are influenced by the lake in the
Taseq basin and by Kvane lake, respectively. Figure 10 illustrates the Taseq catchment area and the
Napasup-Kuua catchment area (the source of Narsaq’s drinking water).

Greenland Minerals Ltd – Kvanefjeld Project EIA | 25
Figure 10 Water catchments
Due to the significant quantity of the water-soluble mineral villiaumite (NaF) in the geological
environment, the Narsaq and Taseq rivers and water in the Taseq basin have elevated natural
concentrations of fluoride. Background fluoride levels in the Narsaq river exceed international
guidelines for freshwater environments including the WHO drinking water quality guidelines. The level
of uranium is below international guidelines.
Basement geology underlying Taseq basin (and the proposed TSF) is characterized by crystalline rock
with minimal weathering. The rock types beneath the Taseq basin are expected to demonstrate similar
characteristics to the surrounding geology and are likely to be impermeable with limited interaction
with groundwater systems. The limited hydrogeological studies undertaken to date suggest that there
is little or no connectivity between Taseq lake and the Napasup-Kuua catchment area.
Narsaq is situated in the middle of two threshold fjords connected by a passage. These fjords are
generally deep, with maximum water depth up to 700 m.
Eleven potential impacts to the water environment have been assessed:
Modification of hydrological process
Operation of tailings dam
Release of tailings water and solids from TSF embankment failure
Narsaq drinking water quality impacts from aerosol spray from TSF
Narsaq drinking water quality impacts from seepage from the TSF
Discharge of water to Nordre Sermilik (operations)

Greenland Minerals Ltd – Kvanefjeld Project EIA | 26
Discharge of water to Nordre Sermlik (closure)
Waste rock run-off
Mine pit water
Hydrocarbon and chemical spills
Process related spills.
Some of these impacts have been grouped together in the description provided below.
Modification of hydrological process (1 impact)
The Project will cause changes to the hydrology of the Study Area primarily by interrupting the flow of
the Taseq and Kvane rivers in the catchment and by extracting water from the Narsaq river. Narsaq
river flow varies between 40 and 4,000 m3/h through the year. Approximately 191 m3/h of freshwater
will be sourced from Narsaq river for the Plant. With an average flow of 1,200 m3/h at the extraction
site and 4,100 m3/h downstream near the outlet into Narsap Ilua, the impact on flow during the
majority of the year will be limited. No water will be extracted during periods of low flow.
The changes to the hydrology of rivers and lakes will have limited impact on the overall hydrology of
the area but will have a significant impact on the Kvane and Taseq rivers, with reduced flow in their
upper sections.
Operation of the tailings dam (1 impact)
The FTSF and CRSF will utilize the natural topography of the valley of the Taseq basin. Two
embankments will be constructed within the basin, one for the FTSF and one for the CRSF. The height
of each embankment will be increased in stages to cater for the increasing requirements for tailings
storage capacity during the Project’s operations phase.
Inflow from the catchment area to the TSF will be reduced by constructing diversion channels prior to
the commencement of processing operations. The channels will partly divert the run-off (non-contact
water) to the Taseq river downstream of the FTSF embankment.
There will be no discharge from the FTSF and the CRSF to the Taseq river during the operations or
closure and decommissioning phases. Post-closure, when the water covering the FTSF and the CRSF
meets GWQC (expected to be within six years), water will be allowed to overflow the embankment
into the Taseq river.
Monitoring of streams, rivers and potential seeps will be undertaken to ensure water quality is not
being influenced by the tailings facilities. In the event that changes to water quality are identified as a
result of the tailings facilities (either from aerosol sprays or seepage from the facility) water treatment
could be introduced to improve water quality before being discharged into the TSF.
Tailings water will be re-used as process water in the Plant and any excess water will be treated prior
to being placed into Nordre Sermilik.
Embankments for both the FTSF and CRSF will be constructed to withstand extreme inflows of water,
due, for example, to exceptional snow melt under foehn wind conditions. A minimum of 6 m freeboard
will be maintained for both facilities, with operating freeboard ranges extending between 6-13 m. The
capacity of the facilities has also been designed to comfortably accommodate a 1 in 10,000 year rainfall
event.

Greenland Minerals Ltd – Kvanefjeld Project EIA | 27
Release of tailings water and solids from TSF embankment failure (1 impact)
As described earlier, three hypothetical modes of failure were assessed to determine the impact on
the environment if such an unlikely event were to occur:
Overtopping – The primary impact of a post closure overtopping event on the water
environment would be a large and extended flow, which could temporarily flood the grass
field of the alluvial fan zone. If the failure were to occur in the post closure period, the
quality of the overtopping water would meet the GWQCs (with the exception of fluoride) and
as such, would not be expected to have an impact on downstream water quality. If the
failure were to occur during operations, short term water quality exceedances could be
anticipated but these would be rapidly diluted.
Piping failure – Assuming that all surface water (13.7 Mm3 in the operations phase and 32.9
Mm3 in the post-closure phase and 25 % of flotation tailings stored above the saddle (15
Mm3) were lost in this type of failure, the slurry flow would be expected to be in the order of
42,000 m3/h (11.7 m3/s). Given the Narsaq river’s average natural flow of 1.15 m3/s, it would
be unlikely to provide much dilution for the released tailings. A piping failure would be
expected to result in the flooding of the grass field of the fan zone for the duration of the
failure event.
Catastrophic embankment failure – Breach scenarios were assessed using 3D modelling
techniques. The worst-case operational breach case would result in an estimated 43 Mm3 of
tailings (surface water and tailings material) being released (and ~60 Mm3 for a post-closure
phase), and approximately 80 % of this material would be expected to reach Narsap Ilua.
Immediately after failure, temporary exceedance of GWQCs for several elements in Taseq
and Narsaq rivers would be expected in both an operational and post-closure failure event.
However the most significant immediate effect would be the physical impact of a sudden
release of high velocity fluid and solids. Immediately after failure, the water quality in the
river would be likely to be similar to that of the tailings. Within two years, constituent
concentrations would approximate baseline conditions in the Narsaq river for all bar fluoride.
Fluoride concentrations would meet the winter water quality criteria after two years, and the
summer water quality criteria after 10 – 20 years (depending on the timing of the failure
event). River water flowing into Narsap Ilua would meet all except the fluoride guideline
values [126].
Narsaq town is outside the flow path of all modelled scenarios, and as such, neither inundation nor
tailings deposition would be expected to occur in the town of Narsaq.
The impacts to the water environment from the worst case TSF embankment failure would be high,
however due to the very low likelihood of this event, the impact has been assessed to be low.
Narsaq drinking water quality impacts from aerosol spray or seepage from the TSF (2 impacts)
Narsaq is supplied with water from the Napasup Kuua, Kuukasik and Landnamselven rivers in the
Napasup Kuua catchment. An assessment of water aerosols spray from the TSF was conducted to
determine the potential impact of aerosols on Narsaq drinking water. As noted above, given the
pronounced ridge separating Taseq and the catchment and the prevailing wind direction during foehn
events, it is unlikely that aerosols from the TSF will affect the town’s drinking water.
Studies indicate that there is limited surface and underground water connectivity between the Taseq
basin area and the Napasup Kuua catchment areas. The risk of seepage from the tailings area is
considered low. These studies are supported by the existence of a lake in the Taseq basin, indicating a
competent geological structure.

Greenland Minerals Ltd – Kvanefjeld Project EIA | 28
In the unlikely event that fluoride in tailings dam water impacts the water supply to Narsaq, either as
a result of seepage, overflows or aerosol deposition, water treatment on site can be applied as an
immediate mitigation.
Discharge of water to Nordre Sermilik (2 impacts)
During operations, excess water streams will be released to the environment when it is not possible to
recycle water any further for use in the Plant. Two streams of excess water from the Plant will be
placed into Nordre Sermilik; a treated water placement containing excess concentrator process water
and excess refinery water; and a barren chloride liquor. The water will be treated prior to discharge.
A hydro-dynamic model was developed to assess the quality and quantity of all major contaminants in
terms of temperature, concentration and flow.
The extent of spreading of chemical species contained in the treated water introduced to Nordre
Sermilik was modelled for summer and winter, and the optimal position in terms of dilution for
submerged discharge was identified to be 40 m below the water surface level. The plume developing
from the water placement is expected to cover an area of 3 km2, extending 700 m from the coast at
depths between -20 to -50 m. Beyond this distance, the water quality is below the predicted no effect
concentration (PNEC) level for all contaminants. Toxicological testing was carried out to determine if
the discharge water would be acute or chronically toxic to algae, copepods or fish. Testing indicated
that algae and fish appeared to be unaffected by the effluent, even at high concentrations however,
under certain high concentrations, the effluent may impact copepods.
It was concluded that the placement of water in Nordre Sermilik is unlikely to significantly affect water
quality or the marine environment in the operations phase.
During the six year closure phase, water in the TSF will be pumped to a water treatment plant and,
once treated to meet the GWQCs, it will be discharged to Nordre Sermilik. TSF water will be gradually
replenished by precipitation and run off from the catchment area which will result in steady
improvement to the quality of the water in the TSF. When the water in the TSF meets Greenlandic and
International water quality criteria, water treatment will cease. The water level in the Taseq basin will
be allowed to rise naturally and will eventually overflow via a spillway into the Taseq river.
Waste rock runoff and mine pit lake (2 impacts)
Waste rock will be mined together with ore during the operations phase. This waste rock will be
stockpiled near the mine in the WRS. Material in the WRS is significantly less susceptible to weathering
than lujavrite which is the host-rock for the Project’s orebody. It also contains significantly lower
concentrations of uranium, thorium, and fluorine.
Water shedding off the WRS will be captured for use during the Project’s operations phase in order to
reduce consumption of water from the Narsaq river. During the closure phase water from the WRS
will be diverted to a natural waterway where it will be diluted with local catchment before flowing into
Nordre Sermilik.
Culverts will be constructed as required, including one across the Narsaq river. These will be designed
to minimise flow restrictions in the river. During culvert construction, water flow will be maintained
by pumping water around the culvert construction area. This will have the added benefit of ensuring
a dry construction zone.
The mining of the open pit will cease after 37 years based on the current mine reserve. During closure
the pit will gradually fill with water and contribute an additional stream to the southwest lake. The
Greenland Minerals Ltd – Kvanefjeld Project EIA | 29
mine pit water is expected to be low in salts and provide an additional source of dilution to the waste
rock run-off collected in the lake.
Hydrocarbon and chemical spills (2 impacts)
During the Project’s operations phase, chemicals and hydrocarbons will be shipped to Greenland and
transported to the Project location where they will be stored prior to use. During transportation and
use there is the potential for spills.
The environmental impacts of chemical or fuel spills on land are confined to parts of the Study Area,
or more particularly to a narrow corridor of a few kilometres around the Project activities. If no
mitigating measures are in place, spills affecting the Narsaq river (or other watercourses) during
periods of high flows might spread downstream of the spill location and reach the fjord.
There is the potential for the accidental placement of untreated process water into the fjord due to a
technical fault. Should this occur, water placement would immediately cease and untreated process
water would be directed to the TSF. With appropriate mitigations in place any release would be minor
and the impact low.
Mitigations
The following mitigation measures will be applied to minimise Project impacts on the water
environment:
Local rivers, fjords, seeps and town water supplies will be monitored for possible
contamination from the Project, with results being publicly reported on a regular basis.
TSF embankments will be constructed in accordance with BAT
Diversion channels will be maintained during the operations phase
Treated excess water will be placed into the fjord 40 m below the surface via a specially
designed diffuser which will facilitate rapid dilution
No discharge to the Taseq river will take place in the Project’s operations or closure phases
If seepage from the TSF with elevated fluoride levels is observed through monitoring, water
treatment prior to tailings discharge can be implemented to reduce fluoride levels
Low speed limits will be mandated to avoid transport accidents
Navigational safety protocols will be in place to reduce the risk of spills in the fjords.
2.5.5 Waste management
Qaqortoq is the municipality’s waste collection centre and waste suitable for incineration is collected
and transported from Narsaq to Qaqortoq for treatment. Putrescible waste, including food waste and
animal carcasses, are deposited in a Narsaq landfill located on the site of the proposed Port.
Waste produced during the Project’s construction and operations phases will include domestic waste,
construction waste, iron and scrap metal, tyres from mobile equipment and various types of hazardous
waste (hydrocarbon waste, chemical waste and batteries).
All combustible solid waste will be shipped to Qaqortoq for incineration. This includes all putrescible
waste and the Project does not intend to contribute any waste to the Narsaq landfill.
Sewage from all buildings in the Port, the Village, Mine, Plant and vessels alongside the wharf will be
treated in a package sewage treatment facility located adjacent to the Port. The sewage plant will
apply mechanical, biological and chemical treatment processes to the waste to render it safe for
Greenland Minerals Ltd – Kvanefjeld Project EIA | 30
permanent disposal. Treated effluent will be discharged to the fjord at the north end of the Tunu
peninsula, consistent with current practice in Narsaq [69]. An environmental monitoring point will be
established proximate to this location to monitor water quality impacts.
Hazardous waste will be registered, handled and shipped to Denmark for treatment and disposal in
compliance with Danish and EU requirements.
As waste handling will be managed in accordance with BEP, with recycling where applicable, the impact
of waste production on the environment is assessed to be of low significance.
Solid waste produced by the sulphuric acid plant and hydrochloric acid plant will be blended with other
process plant waste for storage in the TSF. Both acid plant solid wastes, which will comprise only a
small portion of the total tailings, will be benign and compatible with other tailings materials.
Mitigations
The following mitigation measures will be applied to reduce the impact of the Project’s waste on the
local environment:
Development of waste handling procedures and a waste management plan
Installation of a sewage treatment plant
Remediation of any contamination arising from Project activities.
2.5.6 Biodiversity
The vegetation in the Study Area is dominated by terrestrial habitats and plant species which are
common and widespread in south Greenland. Native vegetation in south Greenland is largely
determined by temperature and precipitation, both of which follow oceanic-inland/continental and
altitude gradients.
Three vegetation communities were identified in a field assessment undertaken in 2014:
Narsap Ilua and the lower Narsaq valley (0 – c. 200 m altitude)
The higher reaches of the Narsaq valley and the Kvanefjeld plateau (c. 200 – 680 m altitude)
The upper northern slopes of the Narsaq valley and surrounding the Taseq basin (c. 350 –
650 m altitude).
The botanic study identified several rare species and unusual vegetation communities in the Study
Area:
One rare plant species, autumn gentian, (Gentiana Amarella (Groenlands Roedliste (the Red
List [10]) "Vulnerable")), was recorded on the northern side of the mouth of the Narsaq river.
Autumn gentian is rare in Greenland and 50 individual plants were counted at this location.
The round-leaved orchid (Amerorchis rotundifolia), Greenland’s rarest orchid, has previously
been recorded between the gravel road and a location just to south of the “test piles” at c.
300 m altitude. No observations of the orchid were made during the 2014 survey.
One observation of bog rosemary (Andromeda polifola) (Red Listed ”Vulnerable”) was made on the
Kvanefjeld plateau
The mountain side of the lowland stretch of the road has a small fen that is dominated by
mountain bog sedge (Carex rariflora), single-spike sedge (Carex scirpoidea) and carnation
sedge (Carex panacea). The latter is a rare species in Greenland.

Greenland Minerals Ltd – Kvanefjeld Project EIA | 31
The northern green orchid (Platanthera hyperborean) is growing along the streams in the
lowland areas and around Taseq lake.
The Arctic fox and the Arctic hare are the only terrestrial mammals in the area. Both usually habituate
well to human activities but are likely to avoid the Project facilities.
The terrestrial and freshwater bird fauna in South Greenland is relatively species poor in comparison
to other Arctic regions. Five species of passerine birds were identified, all of which are common and
widespread. The coastal and offshore waters of southwest Greenland are internationally important
winter quarters for seabirds. Most of the wintering sea birds remain offshore but some have been
observed coming into Erik Aappalaartup Nunaa.
The only freshwater fish species present in the Project Area is the Arctic Char (Char), which has a
significant presence in the lower Narsaq river.
17 species of marine mammals, mainly whales and seals are present in the south-eastern David Strait.
Of these, eight species are likely to be found in the waters around the Project Area, namely: ringed
seal, hooded seal, harp seal, bearded seal, minke whale, fin whale, humpback whale and harbour
porpoise.
Of the animals and plants recorded from Erik Aappalaartup Nunaa, four species of birds, five plant
species and one mammal species are listed as Vulnerable or Near Threatened in the Red List.
The construction and operation of the Project:
Will result in the disturbance of habitat for terrestrial fauna and flora, habitat for freshwater
fauna and habitat for marine fauna
Has the potential to contaminate terrestrial flora and fauna habitat, freshwater habitats and
marine habitats
Will increase vehicular traffic
Will increase seaborne traffic.
Disturbance of habitat
Where construction works take place in the vicinity of rare plants or vegetation communities the
extent of disturbance resulting from Project related activities is expected to be small compared to the
distribution of similar habitat in south Greenland. Typically, low densities of animals occur in the Study
Area (Arctic fox and Arctic hare) and neither of these species are rare or threatened in Greenland. The
significance of lost terrestrial habitat due to the Project is assessed to be very low.
The noise disturbance from machines and blasting will be similar during the construction and
operations phases. Noise and visual disturbance during operations will cause only localised disturbance
of terrestrial birds and mammals. Since no breeding sites are known for the white-tailed eagle inside
or close to the Study Area, the disturbance impact of terrestrial mammals and birds is assessed as low.
Construction works in connection with culverts across the Narsaq river and the building of
embankments on the Taseq river may cause increases in turbidity. Any increase in turbidity would be
expected to be short-term. At certain times of the year the Project will extract water from the Narsaq
river, reducing the downstream flow. The scale of the flow reduction is not expected to exceed 15%
of the average flow and as such is not expected to have a significant impact on the breeding success
of the Char population in the Narsaq river.
Construction works at the Port will cause temporary underwater noise from blasting and ramming and
increased turbidity of the nearby sea water. Vessels bringing machinery and materials to the Port
Greenland Minerals Ltd – Kvanefjeld Project EIA | 32
during construction will generate noise both above and below water and visual disturbance above
water. In addition to the construction works, marine habitats could be impacted by the treated water
placement in Nordre Sermilik. However, given the maximum extent of the plume is anticipated to be
3 km2 (I.e. the dilution zone required to meet PNEC levels), impacts to marine habitat and fauna at a
population level would not occur. Toxicological studies were undertaken to assess the impact of the
placement of treated water in Nordre Sermilik on individual marine species. The results indicate a
limited impact on copepods and a low impact on all other species.
Wintering common eiders that rest and forage in the fjords might be temporarily disturbed by vessels
calling at the Port, however this disturbance is likely to be slight due to the low number of vessel
movements (1 or 2 per week). Seals are common in the fjords around Narsaq, however severe
disturbance from blasting and ramming is considered unlikely as seals in general display considerable
tolerance to underwater noise.
Contamination of terrestrial fauna and flora habitat
Potential causes of contamination include spills and contamination as a result of the failure of the TSF
embankment.
The likelihood of a spill occurring is very low, however in the event that a spill did occur, the
environmental impacts of hydrocarbon or chemical spills on land were assessed to be confined to the
Project Area and would result in low impact to terrestrial habitats.
Impacts to terrestrial flora and fauna were assessed for each of three hypothetical embankment failure
scenarios. Only the results of the worst-case scenario are described in this summary. A catastrophic
failure would result in the inundation of approximately 1.84 km2, to various depths, along the discharge
pathway from the TSF to Narsap Ilua. Under such a scenario, it is assumed that the terrestrial biota
within this inundation zone would be smothered and species would need to recolonize. The terrestrial
fauna present in the affected area are common throughout southern Greenland and their conservation
is not dependent on the local population. In a catastrophic failure scenario, impacts to terrestrial flora
and fauna would be expected at an individual level, but population level effects would not be
anticipated.
Contamination of freshwater habitats
Potential causes of contamination include spills, use of Taseq lake for the storage of tailings, and
contamination as a result of the failure of the TSF embankment.
An oil spill in fresh water could potentially affect the spawning migration, spawning area and feeding
of young Char in Narsaq river. The likelihood of a major spill occurring on land or into fresh water
sources is not high. Spills would not be expected to cause significant impact on the species at a
population level.
The use of Taseq basin for storage of tailings is expected to have limited consequence due to the
absence of fish in the lake. Invertebrates present in the lake would be likely lost however they are
neither unique nor of population importance.
Impacts to freshwater fauna and habitats were assessed for each of three hypothetical embankment
failure scenarios. Only the results of the worst case scenario are described in this summary. The flow
from a catastrophic failure would be expected to overwhelm the natural river flow. There would be
significant scouring and local fish populations would be swept away. Aquatic life would be further
compromised by high levels of sediment clogging fish gills and preventing freshwater plant
photosynthesis in the short-term. Short-term radiological effects upon zooplankton and some plant

Greenland Minerals Ltd – Kvanefjeld Project EIA | 33
species could be expected under this failure scenario, however given that these are quickly
reproducing organisms the effect would be of limited duration. In the longer-term, once particles had
settled, biota would be exposed to radioactivity due to the presence of uranium and thorium in the
tailings particles. Radiological assessments indicate that molluscs and zooplankton may experience an
elevated risk, but fish were identified as not at risk.
Contamination of marine habitats
Potential causes of contamination include spills and contamination as a result of the failure of the TSF
embankment.
The consequences of a large oil spill caused by a shipping accident could be very high. An assessment
of the potential impact [55] concluded that, while hydrocarbon spills in Arctic ecosystems can have
large impacts which are long lasting when compared with temperate ecosystems, if appropriate
mitigation strategies are implemented the overall risk of large-scale ecological impacts is low.
These mitigations include undertaking detailed contingency planning, setting navigational speed
restrictions, imposing compulsory pilotage for vessels and ensuring that appropriate equipment and
materials are available for emergency response in the event of a spill.
A navigational safety study has also been prepared for this Project to address navigation risks. The
likelihood of such a spill occurring is significantly reduced through the application of maritime
regulations, and has been termed “improbable” by navigation specialists.
Impacts to marine fauna and habitats were assessed for each of three hypothetical embankment
failure scenarios. Only the results of the worst-case scenario are described in this summary. In a
catastrophic failure scenario, it is anticipated some of the tailings material would flow beyond Narsap
Ilua into the fjord. This is a very high energy environment and tailings would then be mixed and
dispersed over a larger area. In the short-term, biota in Narsap Ilua would likely experience significant
physical and radiological impacts, however radioactivity levels would be expected to quickly decline to
close to baseline levels. Longer-term radiological impacts to biota in Narsap Ilua and the fjord would
not be expected.
Increased vehicle strikes
The movement of trucks and other vehicles represents a risk for animals, however given the limited
presence of terrestrial fauna in the Project Area, this is unlikely to present a major threat to wildlife.
Invasive non-indigenous marine species
Vessels berthing at the Port will discharge ballast water before loading cargo. All vessels will be
expected to adhere to the Ballast Water Management (BWM) Convention, reducing the risk of
introducing invasive species to marine habitats.
Mitigations
The following mitigation measures will be applied to reduce the Project’s impacts on biodiversity.
Minimizing the disturbance footprint of the Project Area
Restricting the movement of staff members outside the Project Area to minimize the general
disturbance of wildlife
Maintaining a minimum environmental flow in the Narsaq river in periods of low flow
Mandating low vessel speeds while in fjords

Greenland Minerals Ltd – Kvanefjeld Project EIA | 34
Operating in accordance with navigational safety requirements and BWM convention
Responding quickly to any reported spills.
2.5.7 Local use and cultural heritage
Local use baseline studies identified hunting and fishing as livelihood activities in the Narsaq area,
providing an important source of income and subsistence to many households. Most local fishing
activity takes the form of small-scale operations in the fjords around Narsaq, however a small number
of people also hold commercial fishing licenses. Seal hunting is also an important source of income
and subsistence in Narsaq. Seals are typically hunted in the fjords around Narsaq, particularly in
Bredefjord and Nordre Sermilik. In winter ptarmigan and hare hunting are popular activities in the
mountains to the north-east of Narsaq. Berry picking in autumn and hiking in the mountains around
Narsaq are both popular activities.
Gemstone fossicking takes place throughout the Study Area, with the semi-precious tugtupit the most
popular target and primarily located on the Kvanefjeld plateau. Tourism in and around Narsaq is
relatively limited, and mostly linked to fjord kayaking or town visits.
A number of archaeological sites are located along the shore of Erik Aappalaartup Nunaa, the majority
of which are Inuit remains from the Thule culture (1300 C.E.). The remains of a settlement from the
Norse period (985 – 1450 C.E.) is located at Narsap Ilua /Dyrnaes just north of the Narsaq river mouth.
In 2017, five areas representing sub-Arctic farming landscapes in Greenland, collectively referred to as
Kujaata, were admitted to the UNESCO World Heritage List. The areas are located in the fjord system
around the Tunulliarfik and Igaliku fjords and comprise:
Area 1 – Qassiarsuk
Area 2 – Igaliku
Area 3 – Sissarluttoq
Area 4 – Tasikuluulik
Area 5 – Qaqortukulooq.
The five parts of Kujataa together represent the demographic and administrative core of two farming
cultures, a Norse Greenlandic culture from the late-10th to the mid-15th century and an Inuit culture
from the 1780s to the present. Area 5 is the closest to the Project, at a distance of approximately 18
km from the boundary of the Project Area.
Restrictions in Local Use
With the exceptions listed hereunder, access to the Study Area for Narsaq residents and visitors will
not be interrupted during the operation of the Project. The exceptions are:
Access to the Mine and Plant areas will not be permitted for security and safety reasons,
which will limit access to some tugtupit fossicking areas
A “no hunting” security zone around the Project Area will be determined in coordination with
local authorities to ensure community safety is maintained. This will restrict hunting activity
in the vicinity of the Project
A no-hunting and no-fishing zone around the Port in Narsap Ilua and around the treated
water discharge point in Nordre Sermilik will be implemented. The zone will be limited to
the area necessary to prevent access to waters where dilution of discharges to PNEC
concentrations is taking place (an area of approximately 0.03km2 [17]

Greenland Minerals Ltd – Kvanefjeld Project EIA | 35
The public will have limited access to the Port-Mine Road.
Disturbance of Cultural Heritage Sites
Construction activities associated with the development of the Project will result in the loss of two low
significance heritage sites, a rock shelter along the shore of Taseq and a tent foundation and shooting
blind situated on the tip of the Tunu peninsula close to the location of the Port. The rock shelter at
Taseq will be flooded, while the shooting blind will be demolished.
Prior to the commencement of any construction activities, these sites, together with any additional
sites that may be have been identified during preparation for Project activities, will be recorded and
registered by the Greenland National Museum and Archives.
With the closest UNESCO World Heritage listed site 18 km away, the Project will have no impact on
any protected areas.
Mitigations
The following mitigation measures will be applied to reduce the impact of the Project on local land use
and cultural heritage:
Additional archeological surveys and investigation will be undertaken in consultation with the
NKA in advance of construction
During the construction and operations phases appropriate “no hunting and no fishing”
safety zones will be established
“Chance finds” procedures will be established to manage any heritage discoveries made
during the construction phase.
2.5.8 Cumulative Impact Assessment
A desk-based cumulative impact was conducted to assess any impacts that result from the incremental
impact of a project when added to other existing, planned and / or reasonably predictable future
projects and developments. The impact assessment was conducted in accordance with the IFC
Guidance on cumulative impact assessment [132] and focussed on those impacts generally recognised
as important on the basis of scientific concerns and / or concerns from affected communities.
Potential impacts to five different “valued environmental and social components (VECs)” were
assessed, namely: impacts to the marine environment through increased shipping; impacts to marine,
terrestrial and freshwater species and habitats associated with increased greenhouse gas emissions;
impacts to areas available for foraging; impacts to kayaking based tourism; and impacts to farming
activities. The other activities of stressors which were evaluated (to the extent possible with available
data) included: global climate change; TANBREEZ Mining project; expansion of tourism activities;
expansion of the Kvanefjeld Project, and changes to the scale of farming activity.
The baseline status of each VEC was considered as well as its resilience. Using this baseline
understanding, cumulative impacts (associated with the identified stressors and other activities) were
assessed for each VEC. After considering the magnitude of the potential cumulative impact and the
VEC’s resilience, it was concluded that for two VECs (marine environment, and foraging for berries)
any anticipated impacts were “not significant”, and for the remaining three VECs (greenhouse gas
emissions, kayaking and farming), “potential significant” cumulative impacts could exist. While the
Project’s national contribution to GHGs is potentially significant; the Project will also at a global level,

Greenland Minerals Ltd – Kvanefjeld Project EIA | 36
generate a positive contribution through the role it’s products will play in the substitution of fossil fuels
in engine technology.
In addition to the approach described above, potential cumulative impacts across each of the topics
addressed in the EIA were also considered. The cumulative effects address the key parameters which
are central to in the environmental impact assessment from a cumulative aspect. The cumulative effect
focuses on the overall effects of the individual components included in the environmental impact
assessment, including the physical environment, atmospheric environment, radiological emissions,
aquatic environment, waste management, biodiversity – ie. all the important parameters where
environment, nature and climate impact have been assessed in the EIA.
In addition, it is assessed whether there are impacts on the basis of other stressful factors and activities
that may lead to a cumulative impact.
The outcome of this assessment indicated that the scale of cumulative impacts is not expected to
significantly alter the assessment of impacts for the Project in isolation.
2.6 Closure and decommissioning objectives
The overall closure goal is to return the Project Area to viable and, wherever practicable, self-sustaining
ecosystems that are compatible with a healthy environment and human activities and consistent with
the ecosystem services pre-Project.
In order to achieve this, the following core closure principles will be adopted:
Physical Stability
All Project components remaining after closure will be physically stable for humans and wildlife.
Chemical Stability
Any Project components (including associated wastes) remaining after closure will be chemically stable
and non-polluting or contaminating. Any deposits remaining on the surface or in lakes will not release
substances at a concentration that would significantly harm the environment.
Minimized radiological impact
Long-term radiation exposure of the public due to any radiological contamination of the Mine area will
be kept “as low as reasonably achievable” (ALARA).
Minimal Significant Change to Baseline Landforms
Landforms and land use will be returned to visual amenity and geography similar to baseline conditions
where practical.
2.7 Environmental Risk Assessment
An environmental risk assessment has been carried out to re-analyse impacts which have potentially
significant consequences but low likelihoods of occurring. Ten hazards were assessed, resulting in 35
different consequences. Of the 35 assessed risks, 27 were assessed to have low residual risk post
mitigation, and eight were identified as presenting a medium residual risk.

Greenland Minerals Ltd – Kvanefjeld Project EIA | 37
Table 3 Summary of environmental impacts assessed
Physical Environment
Impact Project Phase Spatial extent Duration Significance
Physical Alteration to Landscape and Changes to Visual Amenity
Construction
Operation
Closure
Project footprint Permanent Medium
Mitigation
Pre-stripping will be planned to blend as far as practical with the existing landscape.
Tailings embankments will be planned to blend as far as practical with the existing landscape.
Roads will be planned to minimize impacts on the existing landscape.
Decant barges will be removed at Mine closure.
Embankments and diversion channels will be covered with local materials (rock and gravel). Over time the embankments will also revegetate which will also reduce visual impact.
Following Mine closure disturbed areas will revegetate reducing visual impact.
Assessment
Several of the facilities will be visible in the Narsaq valley although the footprint of the Project is relatively small. Buildings will be demolished upon closure.
Limited natural revegetation may occur over time.
Erosion Construction
Operation Project footprint Permanent Low
Mitigation
Rock and gravel materials will be used where possible for construction.
Assessment
Construction methods and routing of infrastructure alignments will be designed to limit erosion to the point that no significant erosion is expected.
Noise and Vibration
Construction
Operation Project footprint Life of mine Low
Mitigation
Blasting to be undertaken between 8am and 6pm.
Assessment
Noise increases in Narsaq will meet the Danish guideline for areas of mixed residential and business development, but will exceed the guidelines levels for residential areas for open and low housing development. Traffic noise will exceed the Danish evening and night limit of 35 dB(A) for summer houses by up to 3.7 dB(A) at two cottages in Narsaq valley.
No known sensitive wildlife areas will be impacted by noise during the Project’s operations phase.

Greenland Minerals Ltd – Kvanefjeld Project EIA | 38
Impact Project Phase Spatial extent Duration Significance
Light Emissions Construction
Operation Project footprint Life of mine Low
Mitigation
No mitigation required.
Assessment
Intermittent light associated with vehicle movements on the Port-Mine Road close to the Port will be visible from Narsaq during hours of darkness.
Artificial light will mainly be needed during the winter months, at this time almost no bird migration takes place. Therefore this is unlikely to be an issue of ecological concern.
Physical alteration of landscape due to earthquake induced TSF failure
Operations
Closure Study Area Permanent Low
Mitigation
No mitigation required.
Assessment
A probabilistic seismic hazard assessment has been conducted for the Project and the stability of the TSF has been assessed against the resultant design ground motion parameters. The TSF embankments meet or exceed the minimum factor of safety under all conditions, including the maximum credible earthquake (MCE). The likelihood of this risk occurring is very low, however the consequence could be “high” if it were to eventuate. This risk is considered further in Section 14.
Atmospheric impacts
Impact Project Phase Spatial extent Duration Significance
Dust Construction
Operation Study area Life of Mine Low
Mitigation
Wetting of rock stockpiles, concentrates and waste materials with water sprinkler systems (summer).
Wetting of haul roads with water spray trucks (summer).
Salting of haul roads to melt ice and snow.
Low vehicle speed limits.
Regular grading and maintenance of unsealed roads.
Drilling dust containment procedures.
Wetting down blast areas and activating “fog cannon” which generates fine water mist towards the blasting region (summer).
Vehicle wash system at the exit point of the mining area to minimize dispersal of dust along roads outside Mine area.
Assessment

Greenland Minerals Ltd – Kvanefjeld Project EIA | 39
Impact Project Phase Spatial extent Duration Significance
The modelling shows that high concentrations of dust in the air are only recorded close to the haul roads in the mine area. Outside the mine area, the concentrations are well below Greenland guideline values and other relevant international standards. It is predicted that most dust will be deposited on Kvanefjeld and on the mountainous plateau to the south-west of the mine. Outside this area deposition levels are well below Greenland guidelines.
Gaseous Emissions
Construction
Operation
Closure
Study area Life of Mine Low
Mitigation
Using vehicles and equipment with energy efficiency technologies to minimize emissions
rates
Maintaining power plant, vehicles and other fuel powered equipment in accordance with manufacture’s specifications to minimize emissions.
Assessment
The impact of gaseous emissions (including NOx, SOx, black carbon and PAHs) from the Project were assessed to be low
Greenhouse gas
Construction
Operation National Life of Mine Low
Mitigation
Using vehicles and equipment with energy efficiency technologies to minimize emissions rates.
Maintaining power plant, vehicles and other fuel powered equipment in accordance with manufacture’s specifications to minimize on emissions.
Assessment
The Project will increase Greenland’s CO2 emissions by 45 %.
The existing CO2 emission from Greenland is approximately 1 % of Denmark emissions. During the operations phase of the Project, this will increase to 2%.
Radiological impacts
Impact Project Phase Spatial extent Duration Significance
Radioactivity from dust
Operation Study area Life of mine Very Low
Mitigation
Implement the dust control measures in GMLs DCP.
Assessment
The radiological impacts on plants and animals in marine, freshwater and terrestrial habitats in the Studies Area as well as residents and visitors of Narsaq and Ipiutaq are very low. The estimated dose to all these receptors is well below benchmark values.
Radioactivity from radon
Construction
Operation Study Area Life of Mine Very Low

Greenland Minerals Ltd – Kvanefjeld Project EIA | 40
Closure
Mitigation
During and after operations tailings solids will be stored underwater to minimise dust and
radon emissions.
The Plant will be designed to minimise radiation emissions.
Assessment
Development of the Project is predicted to increase the background level of radon in Narsaq by a maximum of 3 %.
Radioactivity from spills
Operation Study area Life of mine Very Low
Mitigation
Transport of uranium oxide in accordance with international best practice requirements.
Assessment
Transport and packaging of the uranium oxide will be in accordance with IAEA Safety Standards.
Release of radioactivity from TSF embankment failure
Operations
Post-closure
Study area Long term Low
Mitigation
The tailings embankments for the Project will be constructed in accordance with ICOLD criteria and BAT.
Rock fill and a conservative wall design will be used.
Monitoring of TSF embankments in accordance with ANCOLD requirements.
Clean-up would be undertaken however significant effects would remain.
Assessment
The risk of TSF embankment failure in both operations and post-closure phases is considered very unlikely. In the very unlikely event of a catastrophic failure occurring, major environmental impacts would occur under the worst case scenario (catastrophic failure). In the short-term these would be primarily caused by the physical effects of the flow of solids. In the event of a catastrophic failure In the short-term, significant effects would be expected on biota in marine and freshwater environments. In the longer-term, some species would be expected to experience some effects from exposure to radiation, but these effects are not predicted to be severe. After the release period, levels of radionuclides will decline and dose levels decrease.
The only significant difference between an operational phase failure and a post-closure phase failure would be seen in the case of an overtopping event, where potential short-term radiological effects could be experienced by phytoplankton in the marine environment in an operational failure, but not in a post-closure failure.
This impact is considered low due to the low likelihood. This is assessed further as a risk in Section 14.
Radioactivity from aerosol release from TSF
Operation
Closure Study area Long term Very Low
Mitigation
Radon emissions will be regularly monitored.
If necessary, water sourcing from certain sources can be suspended until conditions improve.
Assessment
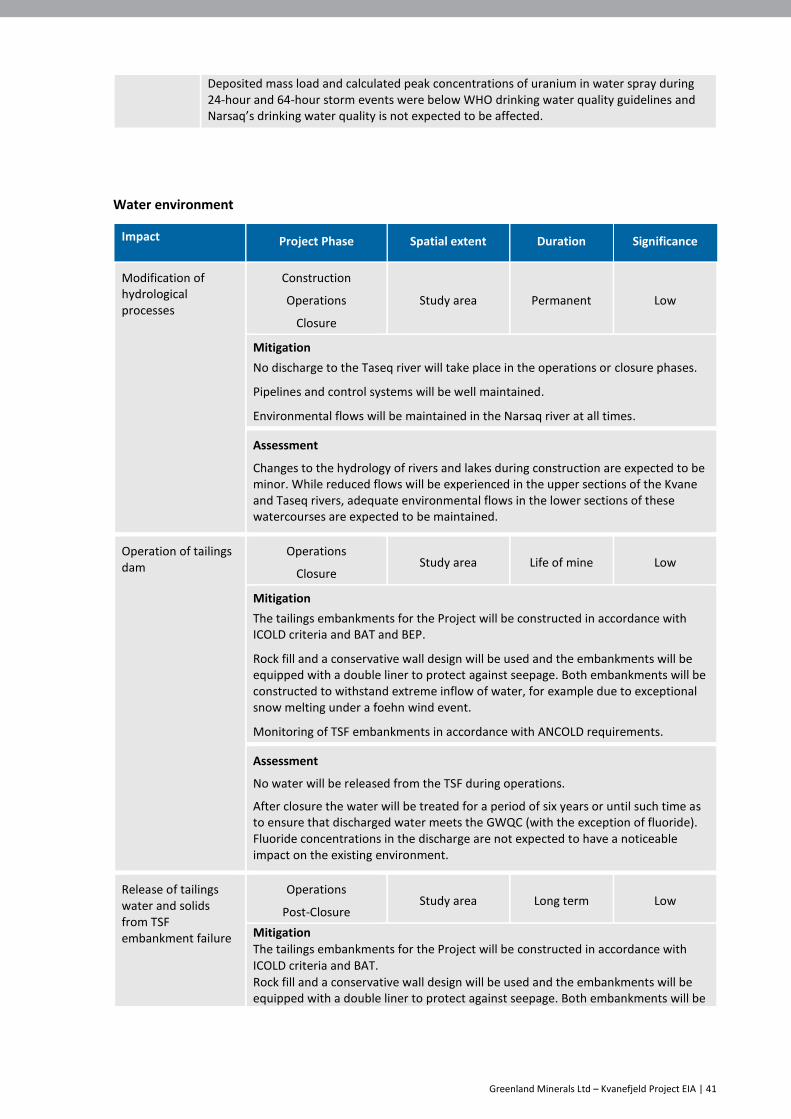
Greenland Minerals Ltd – Kvanefjeld Project EIA | 41
Water environment
Deposited mass load and calculated peak concentrations of uranium in water spray during 24-hour and 64-hour storm events were below WHO drinking water quality guidelines and Narsaq’s drinking water quality is not expected to be affected.
Impact Project Phase Spatial extent Duration Significance
Modification of hydrological processes
Construction
Operations
Closure
Study area Permanent Low
Mitigation
No discharge to the Taseq river will take place in the operations or closure phases.
Pipelines and control systems will be well maintained.
Environmental flows will be maintained in the Narsaq river at all times.
Assessment
Changes to the hydrology of rivers and lakes during construction are expected to be minor. While reduced flows will be experienced in the upper sections of the Kvane and Taseq rivers, adequate environmental flows in the lower sections of these watercourses are expected to be maintained.
Operation of tailings dam
Operations
Closure Study area Life of mine Low
Mitigation
The tailings embankments for the Project will be constructed in accordance with ICOLD criteria and BAT and BEP.
Rock fill and a conservative wall design will be used and the embankments will be equipped with a double liner to protect against seepage. Both embankments will be constructed to withstand extreme inflow of water, for example due to exceptional snow melting under a foehn wind event.
Monitoring of TSF embankments in accordance with ANCOLD requirements.
Assessment
No water will be released from the TSF during operations.
After closure the water will be treated for a period of six years or until such time as to ensure that discharged water meets the GWQC (with the exception of fluoride). Fluoride concentrations in the discharge are not expected to have a noticeable impact on the existing environment.
Release of tailings water and solids from TSF embankment failure
Operations
Post-Closure Study area Long term Low
Mitigation
The tailings embankments for the Project will be constructed in accordance with ICOLD criteria and BAT.
Rock fill and a conservative wall design will be used and the embankments will be equipped with a double liner to protect against seepage. Both embankments will be

Greenland Minerals Ltd – Kvanefjeld Project EIA | 42
constructed to withstand extreme inflow of water, for example due to exceptional snow melting under a foehn wind event.
Removal of deposited tailings and precipitates from alongside the river channels would be undertaken where possible to minimise risk of remobilisation.
Monitoring of TSF embankments in accordance with ANCOLD requirements.
Assessment
The likelihood of this event occurring is very low, but the short-term consequences of a modelled catastrophic FTSF embankment failure would be high due to the inability to achieve GWQCs in the short-term aftermath of the event, . However, within two years, the majority of non-radiological elements will be in compliance with the GWQCs. A period of between 10-20 years (depending on the time and nature of the failure) may be required before fluoride levels would meet the summer water quality for the river. In the event of an embankment failure, sediment and precipitates would be removed from alongside the river channel, where possible, to minimise the risk of remobilisation of constituents.
Narsaq drinking water quality impacts from aerosol spray from TSF
Operations
Closure Study area Long term Low
Mitigation
Regular monitoring of the quality of Narsaq drinking water.
Water extraction from the Napasup Kuua, Kuukasik and Landnamselven rivers can be temporarily interrupted during foehn events.
In the event of significant seepage being identified with elevated fluoride levels, the Project could introduce water treatment prior to the discharge of liquid into the TSF.
Assessment
Impact to the water catchment area is low due to prevailing wind directions, topography and low rate of deposition.
Narsaq drinking water quality impacts from seepage from TSF
Operations
Closure Study Area Long-term Low
Mitigation
Embankments will be equipped with a double liner to protect against seepage.
Regular monitoring of the quality of Narsaq drinking water.
Water extraction from the Napasup Kuua, Kuukasik and Landnamselven rivers can be temporarily interrupted during foehn events.
Assessment
It is not anticipated that potential seepage from the TSF would interact with the Napasup Kuua catchment area.
Discharge of excess water to Nordre Sermilik
Operations Study area Life of mine Low
Mitigation
Excess water will be treated for fluoride reduction prior to discharge to the fjord.
If the treatment plant fails during the operations or closure phase, production will be stopped immediately.
Optimization of diffusor outlet for fjord dilution.
Waste rock runoff water will be used in the concentrator as process water.
Assessment
A dilution factor of ~ 1,600 will be required to obtain PNEC levels for the most critical parameters including safety margins. The required dilution can be obtained
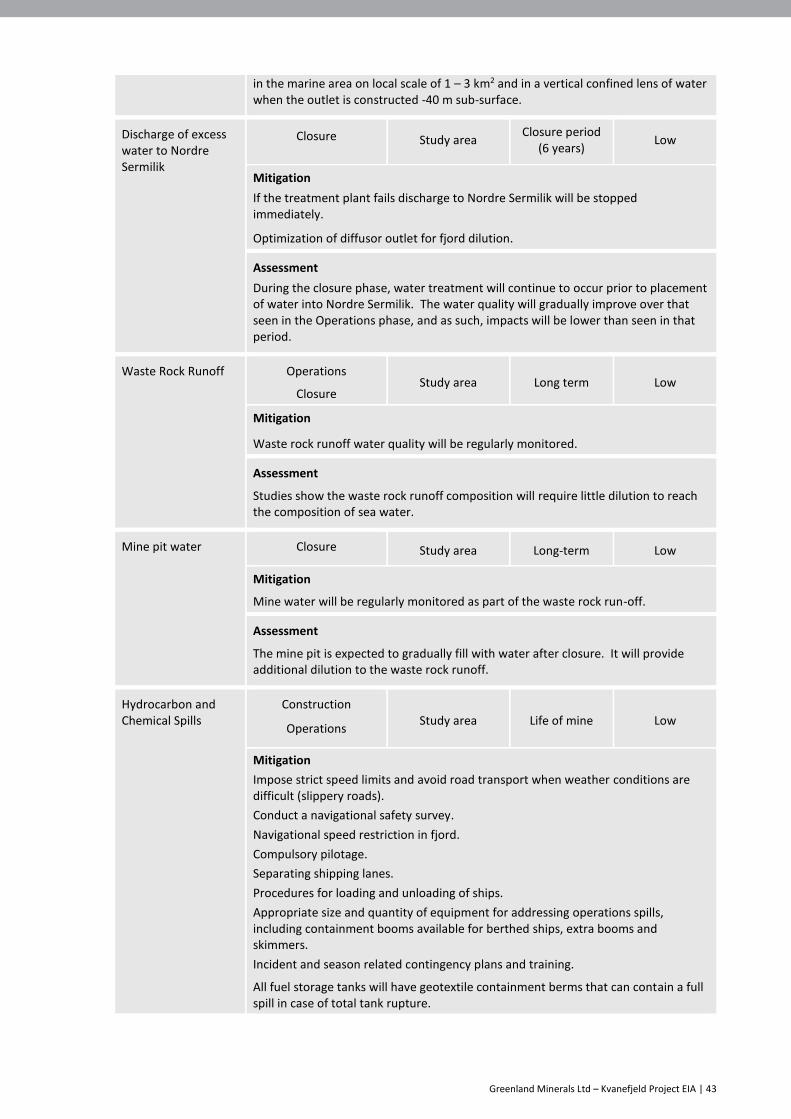
Greenland Minerals Ltd – Kvanefjeld Project EIA | 43
in the marine area on local scale of 1 – 3 km2 and in a vertical confined lens of water when the outlet is constructed -40 m sub-surface.
Discharge of excess water to Nordre Sermilik
Closure Study area Closure period
(6 years) Low
Mitigation
If the treatment plant fails discharge to Nordre Sermilik will be stopped immediately.
Optimization of diffusor outlet for fjord dilution.
Assessment
During the closure phase, water treatment will continue to occur prior to placement of water into Nordre Sermilik. The water quality will gradually improve over that seen in the Operations phase, and as such, impacts will be lower than seen in that period.
Waste Rock Runoff Operations
Closure Study area Long term Low
Mitigation
Waste rock runoff water quality will be regularly monitored.
Assessment
Studies show the waste rock runoff composition will require little dilution to reach the composition of sea water.
Mine pit water Closure Study area Long-term Low
Mitigation
Mine water will be regularly monitored as part of the waste rock run-off.
Assessment
The mine pit is expected to gradually fill with water after closure. It will provide additional dilution to the waste rock runoff.
Hydrocarbon and Chemical Spills
Construction
Operations Study area Life of mine Low
Mitigation
Impose strict speed limits and avoid road transport when weather conditions are difficult (slippery roads).
Conduct a navigational safety survey.
Navigational speed restriction in fjord.
Compulsory pilotage.
Separating shipping lanes.
Procedures for loading and unloading of ships.
Appropriate size and quantity of equipment for addressing operations spills, including containment booms available for berthed ships, extra booms and skimmers.
Incident and season related contingency plans and training.
All fuel storage tanks will have geotextile containment berms that can contain a full spill in case of total tank rupture.

Greenland Minerals Ltd – Kvanefjeld Project EIA | 44
Waste management
Impact Project Phase Spatial extent Duration Significance
Contamination resulting from waste
Construction
Operation
Closure
Municipality Life of mine Low
Mitigation
Waste handling procedures.
Remediation of contamination.
Assessment
With proper waste handling procedures in place, the impact of waste production to the environment is assessed to be low.
Biodiversity
Impact Project Phase Spatial extent Duration Significance
Disturbance of terrestrial fauna and flora habitat
Construction
Operation
Closure
Study area Life of mine Low
Mitigation
Restrict the movement of staff members outside the Mine area during spring and summer to minimize the general disturbance of wildlife.
Minimize the area to be disturbed by planning infrastructure to have as small a footprint as possible.
Assessment
Noise and visual disturbance during operations will only cause localised disturbance of terrestrial birds and mammals.
As no breeding sites of the disturbance sensitive white-tailed eagles are known inside or close to the Study Areas, the disturbance impact of terrestrial mammals and birds is assessed as low.
Assessment
The impact of spills is expected to be limited based on the application of BEP and BAT.
Process related spills Operations Study area Life of mine Low
Mitigation
The project will undertake Hazops assessments during the construction period to minimise the risk of safety and environmental hazards within the Process.
Any spills would be cleaned up and remediated immediately.
Assessment
Emergency procedures can be enacted to stop discharge in the event of a process failure.

Greenland Minerals Ltd – Kvanefjeld Project EIA | 45
Impact Project Phase Spatial extent Duration Significance
Disturbance of freshwater species habitat
Construction
Operation
Closure
Study area Life of mine Low
Mitigation
Minimise disturbance of the water in Narsaq river and Taseq river when building culverts and embankments by keeping the construction period as short as practically possible.
Assessment
The changes to hydrology because of the Project will be minimal. During winter no Project related flow reduction is expected for any freshwater sources.
Disturbance of habitat for marine fauna
Construction
Operation
Closure
Study area Life of mine Low
Mitigation
Low speed while in fjords.
Distance restrictions to flocks of wintering sea birds (when possible).
Assessment
The impact on marine fauna and habitat is expected to be limited based on the application of international best practice standards.
Contamination of terrestrial fauna habitat
Construction
Operation
Post-Closure
Study area Life of mine Low
Mitigation
Emergency Response Plans.
Assessment
The potential loss or depletion of terrestrial habitat as a result of a spill is considered low.
In the low likelihood of a catastrophic FTSF failure , terrestrial flora and fauna would be significantly impacted, at an individual level, but no population level effects would be expected. Short-term radiological effects would potentially impact vascular plants and zooplankton, while long-term impacts could affect birds, but neither impact would be expected to be severe. Due to the low likelihood of this occurring, this has been considered a low impact.
Contamination of freshwater habitats
Construction
Operation
Post-Closure
Study area Life of mine Medium
Mitigation
Enforcement of waste handling procedures.
Emergency Response Plans.
Assessment
The potential loss or depletion of freshwater habitat as a result of a spill is considered medium due to the ability for the spill to spread through the water course.
The use of Taseq lake for storage of tailings is not expected to have significant freshwater habitat impacts due to the species poor environment of the lake.

Greenland Minerals Ltd – Kvanefjeld Project EIA | 46
Impact Project Phase Spatial extent Duration Significance
In the low likelihood of a catastrophic FTSF failure, freshwater species and habitats would be significantly impacted, at an individual level, and potentially at a population level. Short-term radiological effects would potentially impact vascular plants and zooplankton, while long-term impacts could affect birds, molluscs and zooplankton but neither impact would be expected to be severe. Due to the low likelihood of this occurring, this high consequence risk has been considered a medium impact.
Contamination of marine habitats
Construction
Operation
Post-Closure
Study area Life of mine Medium
Mitigation
Public health messages would be presented to the town of Narsaq to ensure residents are aware of the condition of Narsap Ilua, the effects on marine habitats and fauna and any health consequences these may have for residents.
Assessment
The potential loss or depletion of marine species and / or habitat as a result of a spill is considered low.
In the low likelihood of a catastrophic FTSF failure marine species and habitats would be significantly impacted in the short-term due to sediment and associated radiological impacts on biota. In the longer-term individual impacts would be anticipated but population level effects should be limited. Due to the low likelihood of this occurring, this high consequence risk has been considered a medium impact.
Increased vehicle strikes of terrestrial fauna
Construction
Operation
Closure
Study area Life of mine Very Low
Mitigation
Speed limits and restrictions on site.
Assessment
The impact on terrestrial fauna and habitat is expected to be limited based due to the limited number of vehicles and the low density of terrestrial fauna.
Invasive non-indigenous marine species
Construction
Operation
Closure
Study area Life of mine Very Low
Mitigation
Ballast Water and Sediments Management Plan.
Assessment
The impact on marine fauna and habitat is expected to be limited based on the application of international best practice standards.
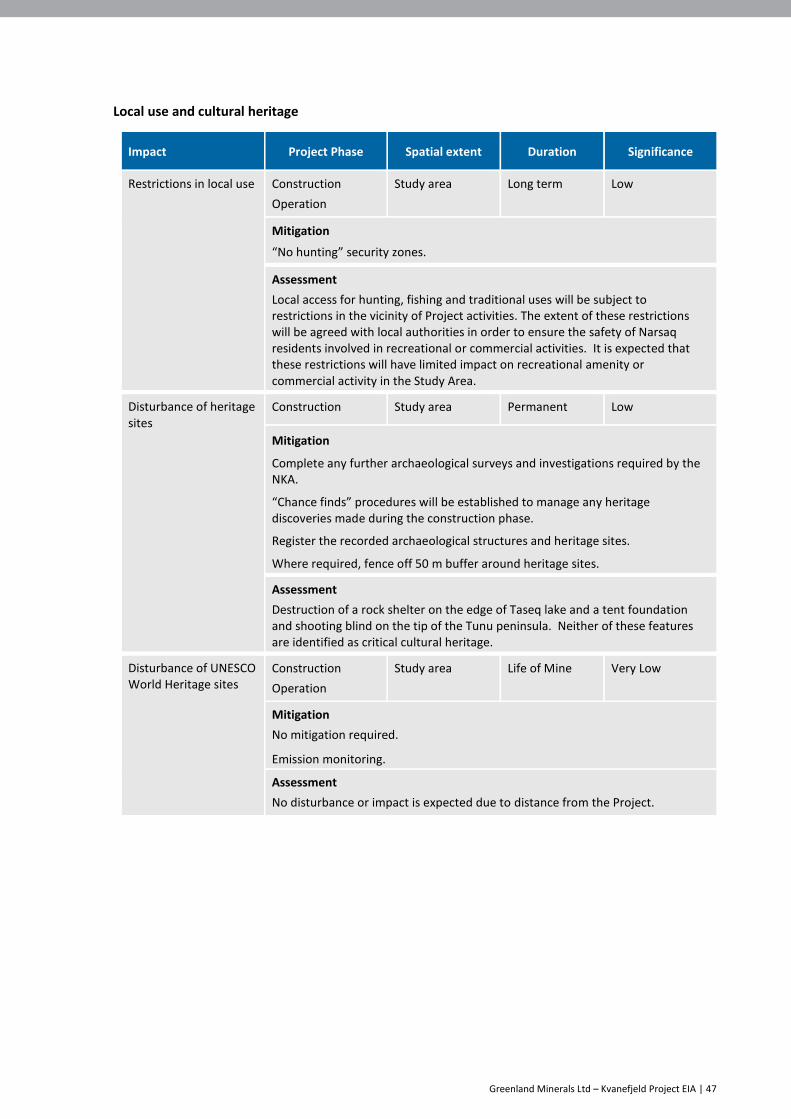
Greenland Minerals Ltd – Kvanefjeld Project EIA | 47
Local use and cultural heritage
Impact Project Phase Spatial extent Duration Significance
Restrictions in local use Construction
Operation
Study area Long term Low
Mitigation
“No hunting” security zones.
Assessment
Local access for hunting, fishing and traditional uses will be subject to restrictions in the vicinity of Project activities. The extent of these restrictions will be agreed with local authorities in order to ensure the safety of Narsaq residents involved in recreational or commercial activities. It is expected that these restrictions will have limited impact on recreational amenity or commercial activity in the Study Area.
Disturbance of heritage sites
Construction Study area Permanent Low
Mitigation
Complete any further archaeological surveys and investigations required by the NKA.
“Chance finds” procedures will be established to manage any heritage discoveries made during the construction phase.
Register the recorded archaeological structures and heritage sites.
Where required, fence off 50 m buffer around heritage sites.
Assessment
Destruction of a rock shelter on the edge of Taseq lake and a tent foundation and shooting blind on the tip of the Tunu peninsula. Neither of these features are identified as critical cultural heritage.
Disturbance of UNESCO World Heritage sites
Construction
Operation
Study area Life of Mine Very Low
Mitigation
No mitigation required.
Emission monitoring.
Assessment
No disturbance or impact is expected due to distance from the Project.

Greenland Minerals Ltd – Kvanefjeld Project EIA | 48
3. Project Description
3.1 Project setting
A significant part of the Project Area is underlain by the unusual alkaline rocks of the Ilimaussaq
Complex. These rocks are enriched in REEs, along with other elements such as lithium, beryllium,
uranium, thorium, niobium, tantalum and zirconium. Owing to the rugged topography, these rocks
have been, and continue to be dispersed by glaciation, water, and wind, and contribute significantly
to the talus, scree and soils that line slopes and fill valleys. This dispersion results in naturally elevated
levels of REEs, uranium and thorium in the local environment. This is particularly prevalent in the
Narsaq valley, Taseq basin, and on the slopes to adjacent fjords.
Lujavrite is the host-rock to REE ore that will be mined and processed and is one of a series of rock
types in the Ilimaussaq Complex. Lujavrite contains approximately 1.4 % REEs, 0.25 % zinc, 0.03 %
uranium, and is enriched in other rare elements. Lujavrite outcrops extensively on the Kvanefjeld
plateau and adjacent slopes. Extensive talus and scree comprised of broken-down lujavrite line the
slopes to Tunulliarfik fjord at the southern end of the Project Area.
Elevated levels of fluoride are naturally present in waters in the Narsaq river, Taseq basin and the
Taseq river. This is due to the breakdown of the water-soluble mineral villiaumite in rocks of the
Ilimaussaq Complex.
The Project Area has a limited range of biodiversity, with common fauna species recorded and only
three vegetation communities identified. Ten Red Listed species (four birds, one mammal and five
plant species) have been identified in the Study Area.
3.1.1 History of mineral exploration
The Kvanefjeld deposit is geologically located inside the northwest margin of the Ilimaussaq Complex.
The area represents a lujavrite-rich zone that has been exposed by erosion. The Kvanefjeld deposit is
characterised by thick, mostly sub-horizontal slabs of lujavrite. Other rock types that outcrop include
basalt, gabbro and sandstone of the Eriksfjord Formation, and augite syenite and naujaite [29].
The Danish Atomic Energy Commission identified the Kvanefjeld deposit in 1955. Over the next 30
years Narsaq was regularly the base for technical studies of the deposit.
GML is an Australian mining company based in Perth and listed on the Australian Securities Exchange.
GMAS is the Greenlandic subsidiary of GML and is headquartered in Narsaq. GML acquired a majority
stake in GMAS, the holder of the license to explore the Kvanefjeld REE project (Project), in 2007. In
2011 GML acquired the outstanding shares of GMAS and thereby assumed 100% ownership of the
Project. Since then, GML has undertaken extensive geological exploration of the area and has collected
environmental data for the purpose of supporting the development of the deposit.
In January 2010, the GoG assumed responsibility for the administration of mineral resources.
Drilling results identified that the highest metal grades occur near the surface, with grades of REEs,
uranium and zinc decreasing with depth. Steenstrupine is a rare phosphorous and silicate alkaline
mineral and is the dominant mineral containing REEs and uranium. Other important minerals
containing REEs include the phosphate mineral vitusite, and to a lesser extent, cerite and monazite.
Aside from steenstrupine, uranium is also contained in unusual sodic silicate minerals that are rich in
yttrium, heavy REEs, zirconium and tin. Sphalerite is the dominant zinc mineralisation.
Greenland Minerals Ltd – Kvanefjeld Project EIA | 49
3.1.2 What is being mined and why
The Project involves the mining and processing of ore from the Kvanefjeld deposit to produce four REE
products together with a number of by-products. While the ore in the deposit contains a number of
elements with commercial value, the REEs are the primary products, and zinc, fluorspar and uranium
are by-products.
The mining rate will be approximately of 3.0 million tonnes of ore per annum (Mtpa), at which rate the
Project would be expected to produce:
Rare earth products (~30,000 tpa)
Zinc metal (~5,000 tpa)
Fluorspar (~8,700 tpa)
Uranium oxide (~500 tpa).
The total Proven and Probable Mine Reserve [39] for the Kvanefjeld deposit is 108 million tonnes (Mt)
@ 362 ppm U3O8, 1.43 % REO and 0.26 % zinc [101]. The Mine Reserve represents approximately 10
% of the established Mineral Resource Estimate [39], and therefore, it is anticipated that additional
reserves will be confirmed with further drilling, potentially extending the life of the Project.
REEs are a group of specialty metals with unique physical, chemical and light-emitting properties.
Many electrical products are dependent on these unique properties - for example wind turbines,
hybrid vehicles, rechargeable batteries, mobile (cell) phones, plasma and LCD screens, laptop
computers and catalytic converters. As a result of the widespread use of REEs global consumption is
increasing substantially and is outstripping global supply.
The majority of the global production of REEs is in China which is a leader in REE processing technology.
With only a relatively small proportion available for export there is a global demand for a reliable
source of REEs outside China to meet growing demand for REEs, particularly in the production of
emerging technologies.
The Kvanefjeld deposit is one of the largest deposits of REEs in the world. Kvanefjeld has the potential
to meet the world’s rapidly growing demand for REEs and in doing so, can become a major contributor
to the Greenland economy for decades to come. Once in production Kvanefjeld is forecast to produce
approximately 10 % of the world’s REEs.
The Project will be a minor uranium producer, producing less than 1 % of total global uranium
production.
3.1.3 Local community
The Project is situated approximately 8 km to the north of the town of Narsaq in south Greenland
(Kommune Kujalleq) and approximately 40km to the south-west of Narsarsuaq where the nearest
airport is located.
The town of Narsaq was originally settled in the 1830s. The establishment of a landing site in the bay
adjacent to the settlement in the 1880s stimulated scientific activity in the vicinity and by the 1900s
geological mapping of the area had indicated the presence of radioactive minerals.
Agriculture in the form of sheep farming was introduced in the early 1900s, however some farms have
converted to cattle and reindeer farming in recent years.
The first major expansion of economic/industrial activity took place shortly after the end of World War
II when people came from all over Greenland to work at the slaughterhouse and cod processing plant

Greenland Minerals Ltd – Kvanefjeld Project EIA | 50
in Narsaq. Today the primary occupations in Narsaq include public administration, fishing and
wholesale activities, with farming activities continuing across the Kommune. A detailed description of
the socio-economic context for the Project is provided in the SIA [69].
Narsaq was granted civic status in 1959. In 2017, the district of Narsaq had an estimated population
of approximately 1,600, of whom approximately 1,400 live in the town of Narsaq with the remainder
in the surrounding settlements of Narsarsuaq, Qassiarsuk and Igaliku, or on one of the farms in the
area.
3.2 Overview of operations
The mining operation will involve conventional open pit mining via blasting followed by truck/shovel
haulage. Ore will be transported to a concentrator to produce REMC, zinc concentrate and fluorspar.
The zinc concentrate and fluorspar will be sold and the REMC further processed in a refinery to produce
REE products and uranium oxide. All saleable products will be transported to the Port and exported.
Overburden from the Mine will be placed in a waste rock stockpile (WRS). Tailings from the
concentrator and refinery will be placed within a tailings storage facility (TSF).
The layout of the Project is shown in Figure 11 and described in further detail below.

Greenland Minerals Ltd – Kvanefjeld Project EIA | 51
Figure 11 Project layout

Greenland Minerals Ltd – Kvanefjeld Project EIA | 52
3.3 Project phases
The phases of the Project are described in Table 4. The closure and decommissioning is described in
Section 3.14.
Table 4 Project phases
Phase Timing Description
Construction 3 years Construction primarily involves FIFO personnel plus local employees and local subcontractors.
Prior to the construction of the Port, a temporary off-loading facility will be used for beaching barges.
Packaged equipment will arrive on site and be installed by specialist construction workers. Large buildings will be erected to provide protection against weather events. There will be continuous deliveries of plant components and equipment to the Mine and Plant.
The Port and the Village will be constructed at this time. Once the temporary facilities and basic infrastructure are established, construction of the Plant, TSF and other facilities will follow a schedule for completion within the three-year construction period.
Operations 37 years Once operations commence the Mine and Plant will gradually ramp up operations until steady state operation is achieved.
Closure 6 years Plant and utilities will be removed while water treatment continues in the TSF.
Mine pits will be fenced off to prevent pedestrian, livestock and animal access.
Post-closure Perpetuity Overflow from Taseq resumes once GWQC criteria have been achieved.
Annual water monitoring will be maintained for an agreed period.
3.4 The Mine
The Mine has been designed taking into consideration its environmental setting. The Kvanefjeld
deposit is located on the plateau at an elevation of 600 m above sea level, with the orebody
outcropping at the surface, and the highest-grade material occurring in the upper zones.
The Mine will have an open pit design with 10 m wide benches. Mining will be a standard drill-blast-
truck-shovel operation. This configuration has been identified as the mining method with the lowest
operational risk, both in terms of cost and productivity. Ore will initially be hauled to the run of mine
(RoM) pad located adjacent to the pit where it will be arranged in stockpiles. Ore selected from
individual piles will be blended by a front-end loader and the blended ore will be hauled in mine trucks
to the plant site, an average haul distance of 1.5 km. The trucks will dump directly into the primary
crusher.
The active mining fleet will initially include three 150 t mining trucks and one excavator. As the pit
deepens and haul distances increase, truck numbers will increase to a maximum of six trucks.
The Mine will operate 24 hours per day and 365 days per year.
Water diversions will be used to minimise the water ingress into the open pit mine.

Greenland Minerals Ltd – Kvanefjeld Project EIA | 53
Figure 12 Mine layout at Maximum Footprint (Yr 37)
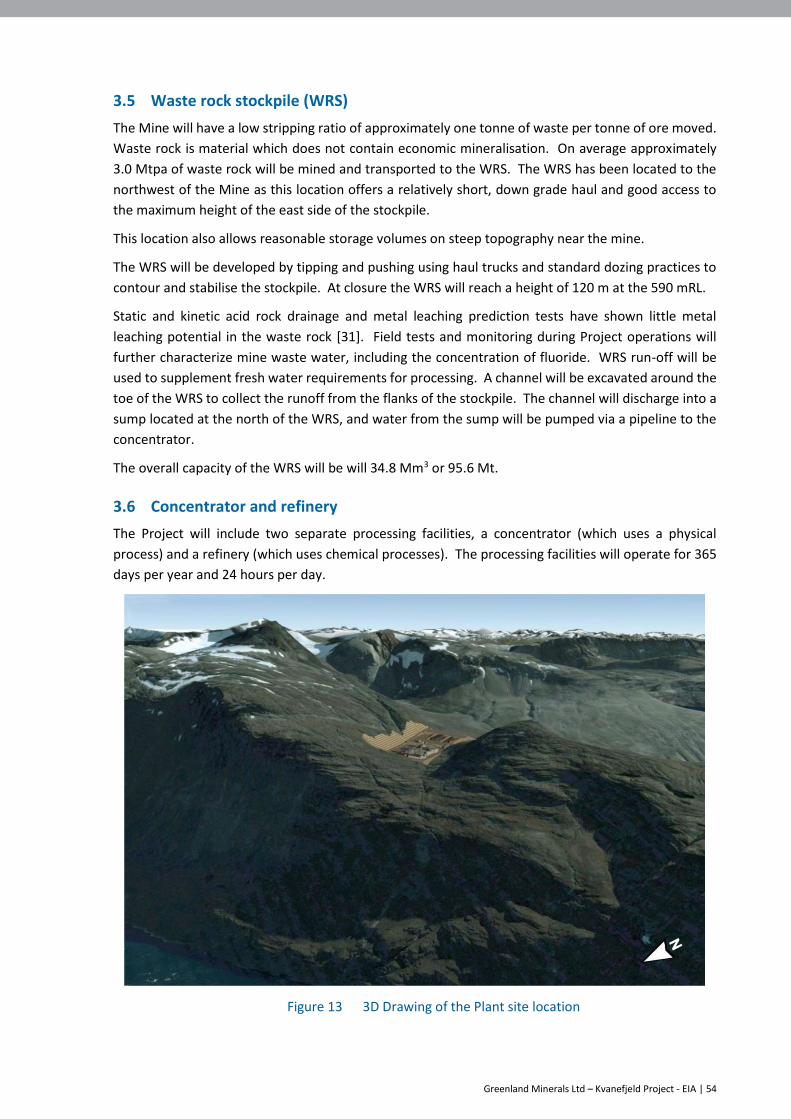
Greenland Minerals Ltd – Kvanefjeld Project - EIA | 54
3.5 Waste rock stockpile (WRS)
The Mine will have a low stripping ratio of approximately one tonne of waste per tonne of ore moved.
Waste rock is material which does not contain economic mineralisation. On average approximately
3.0 Mtpa of waste rock will be mined and transported to the WRS. The WRS has been located to the
northwest of the Mine as this location offers a relatively short, down grade haul and good access to
the maximum height of the east side of the stockpile.
This location also allows reasonable storage volumes on steep topography near the mine.
The WRS will be developed by tipping and pushing using haul trucks and standard dozing practices to
contour and stabilise the stockpile. At closure the WRS will reach a height of 120 m at the 590 mRL.
Static and kinetic acid rock drainage and metal leaching prediction tests have shown little metal
leaching potential in the waste rock [31]. Field tests and monitoring during Project operations will
further characterize mine waste water, including the concentration of fluoride. WRS run-off will be
used to supplement fresh water requirements for processing. A channel will be excavated around the
toe of the WRS to collect the runoff from the flanks of the stockpile. The channel will discharge into a
sump located at the north of the WRS, and water from the sump will be pumped via a pipeline to the
concentrator.
The overall capacity of the WRS will be will 34.8 Mm3 or 95.6 Mt.
3.6 Concentrator and refinery
The Project will include two separate processing facilities, a concentrator (which uses a physical
process) and a refinery (which uses chemical processes). The processing facilities will operate for 365
days per year and 24 hours per day.
Figure 13 3D Drawing of the Plant site location

Greenland Minerals Ltd – Kvanefjeld Project - EIA | 55
The concentrator will use froth flotation (Flotation) to concentrate the ore. Flotation involves the use
of minor quantities of benign reagents to separate minerals and is a standard processing technique.
Prior to Flotation, ore will pass through a crushing and milling circuit in which the ore particles will be
reduced in size to the consistency of fine sand (80 % passing 75 microns). This size optimises the
efficiency at which valuable mineral particles are liberated from the ore.
The concentrator will produce two saleable products, zinc concentrate and fluorspar, and will produce
REMC, which will be pumped to the refinery for further processing. Approximately 80% of the REEs
will be recovered into the REMC. From the initial 3.0 Mtpa that is delivered to the crusher, the
concentrator will typically produce:
~233,000 tpa of REMC (containing REEs and uranium)
~15,000 tpa of zinc concentrate
~8,700 tpa of fluorspar
2.8 Mtpa of Flotation tailings.
REMC from the concentrator will be pumped via a pipeline to the adjacent refinery. The refinery will
comprise three sections:
acid leaching
uranium recovery
REE recovery.
Acid leaching will dissolve the REE and uranium bearing minerals making REE and uranium available
for recovery in subsequent processing steps. The refinery will produce four REE products via solvent
extraction (SX). These are:
lanthanum oxide
cerium hydroxide
a mixed lanthanum cerium oxide, and
a mixed REO.
The 233,000 tpa of REMC that is fed into the refinery will produce approximately:
30,000 tpa of REE products
500 tpa uranium oxide
270,000 tpa of chemical residue tailings.
All REE products will be exported.
A uranium by-product will be produced from the leach solutions via SX. The final product will be
uranium peroxide UO4, which is directly saleable to power utilities.
The processing facilities will also include water treatment facilities (described in Section 3.6.5) and two
acid plants (described below). The process requires the use of two different types of acid for leaching
purposes - sulphuric and hydrochloric acid. Sulphuric acid will be used in the primary atmospheric
leaching process to dissolve the rare earth mineral concentrate. Hydrochloric acid will be used in the
refinery, as the secondary leaching agent, to produce a rare earth chloride solution suitable for the
recovery of rare earth products.

Greenland Minerals Ltd – Kvanefjeld Project - EIA | 56
Figure 14 Main process plant steps
3.6.1 Sulphuric Acid Plant
Sulphuric acid will be produced in a sulphuric acid plant (SAP) located at the refinery. Acid will be
produced by the oxidation of elemental sulphur. Sulphur will be imported as a solid and will be
delivered to site by truck. The capacity of the plant will be 500 tpd of concentrated sulphuric acid,
however the acid plant will be operated to achieve 370 tpd (75 % capacity) [79]. The process will
generate heat which will be converted into power by an electrical turbo generator set (2.3 MW).
The SAP will be skid mounted and compact. The SAP has been designed in Germany by the global
engineering company Outotec and utilises commercially proven best available technology (BAT). The
SAP uses a multiple contact process to recover > 99.5% of the sulphur in the sulphuric acid. Mist
eliminators are included in the design to remove mist from the tail gas stream. A stack 37.5 m high
will be constructed.
The SAP will utilise double absorption, which is considered the BAT for new sulphuric acid production
facilities [102]. A double absorption design removes the requirement for a gas scrubbing stage,
thereby eliminating a waste product stream from the flowsheet.
A review of the relevant environmental aspects of the SAP was conducted, with the following results:
1. Transportation of sulphur from the Port to the Plant
Elemental sulphur will be transported from the Port to the Plant by truck. Between 16 - 41,000
t/annum of elemental sulphur will be required by the Project. Impacts associated with the noise, the release of carbon dioxide and potential spills generated by this transport are
captured in the Project noise assessment [52], GHG study [20] and spills study [55].
2. Transportation of minor reagents including filter aid (120 tpa), water treatment chemicals (120 tpa) and catalysts (vanadium pentoxide and caesium oxide ~1 tpa)
These will be transported to the Plant in sea containers on trucks. Spent catalysts will be
returned to the supplier for recycling. Impacts associated with the noise, the release of carbon

Greenland Minerals Ltd – Kvanefjeld Project - EIA | 57
dioxide and potential spills generated by this transport are captured in the Project noise
assessment [52], GHG study [20] and spills study [55].
3. Water Use
There will be an intermittent stream of blow down water from the waste heat boiler which will
be directed to the refinery and will not be released directly to the environment.
The SAP will be designed to minimise the use of fresh water and maximise reuse of treated
water. Acid production technology has now reached a point where water discharges are
negligible [114]
3.34 m3/hour of demineralised water will be supplied from the raw water treatment plant in
the refinery. Cooling water will be used for various cooling duties and will be cycled around
the cooling plant. All water consumption has been considered in the design of the plant water
management system, which has informed the EIA.
4. Tail gas (exhaust) will be released from the stack after treatment
The tail gas emission (18,000 m3 per hour) will contain the following [114].
Table 5 Summary of SAP tail gas composition
Component Units Value Baseline Values
SO3 mg/m3 <30 <1
SO2 ppm 200 <1
O2 % v/v 0.02 21
N2 % v/v 5.81 78
H2O % humidity 94 5
Temperature °C 80 0
TSP and PM 2.5 negligible 18 and 3.3
All values at Standard Temperature and Pressure (0°C and 1,103 mbar)
SO2 will be the most significant gaseous component of SAP emissions. Sulphur emissions for
the Project are produced by the power plant and the SAP. ERM’s CALPUFF modelling included
emissions from both sources. Based on ERM’s Project level air quality modelling [19], the 24-
hour maximum concentration of SO2 is predicted to be 5 % of the Greenland air quality criteria
(125 μg/m3 ) and the highest annual average concentration of SO2 emissions is predicted to be
2 % of the Canadian NAAQO limit (30 μg/m3). The highest one-hour concentration is predicted
to be 19 % of the EU Directive limit (350 μg/m3).
In the event that sulphur levels in the tail gas need to be further reduced, a caesium doped
V2O5 catalyst can be used to facilitate this process. The caesium catalyst drives greater
efficiency of conversion to the SO3 form in a larger concentration range.
These gas emissions have been included in the Project’s air quality assessment [19].
5. The SAP will generate noise during standard operations
Noise generated from the acid plants is included in the noise assessment for the entirity of
the Plant. “Maximum noise source strengths in the Plant area were uniformly estimated to be
85 dB(A) at the exterior walls of all process and service buildings and other facilities. Actual
noise source strengths are likely to be less at some of these facilities” [52].

Greenland Minerals Ltd – Kvanefjeld Project - EIA | 58
6. Solid wastes generated from the SAP
Sulphur sludge, mostly diatomaceous earth, a filtration aid, will be generated from the
filtration of molten sulphur after melting. Filtration removes low levels of impurities contained
within the elemental sulphur. The sulphur sludge will be mixed with the concentrator tailings
stream and deposited into the FTSF. The volume of filtration residue is expected to total 200
tpa. This represents a small additional volume to ~2.7 Mt of flotation tailings deposited on an
annual basis [58] [114].
7. Acid handling and storage
There are no air pollution issues with sulphuric acid as it is stable in air, a result of its very low
vapour pressure. The acid storage area will be fully bunded to contain a full tank of acid
spillage. Neutralisation chemicals are available (limestone) as part of the standard refinery
usage in the rare case of severe spillage.
8. Power Consumption
The SAP will be a net producer of electrical energy. With the exception of some heating at
start-up, no additional electrical power will be required to run the SAP.
Emissions control systems will be installed on all environmental contact points to meet EU emission
standards.
Upon closure, the SAP will be dismantled and removed from site in accordance with the Mine Closure
Plan (MCP). Site remediation to address any contamination will be undertaken in accordance with
Greenland requirements and best practice.
3.6.2 Chlor-Alkali Plant
Hydrochloric acid will be produced from an acid plant (CAP) using chlor-alkali cell technology. The
chlor-alkali cell will also produce caustic soda (a concentrated solution of sodium hydroxide) as a by-
product which will be used as a reagent in the refinery. CAP technology is commercially proven with
over 60 years of global operating experience.
The main feedstock for the chlor-alkali cell will be high purity standard salt (sodium chloride). The
chlor-alkali cell process electrolyses a brine which splits the salts in solution. Electrolysis is an energy
intensive process.
The CAP will have the capacity to produce 85 tpd of caustic soda and 75 tpd of hydrochloric acid. In
addition, four tpd of sodium hypochlorite will be produced as a commercial by-product.
The CAP will be housed within a building and will incorporate environmental controls for all emissions
in accordance with European standards for air quality. All releases from the chlor-alkali plant have
been included in the air quality modelling [19].
A review of the relevant environmental aspects of the CAP was conducted, with the following results:
1. Transportation of salt from the Port to the Plant
Salt will be transported from the Port to the Plant by truck. Approximately 45,000 tpa of
sodium chloride will be required by the Project. Impacts associated with the noise, the release
of carbon dioxide and potential spills generated by this transport are captured in the project
noise assessment [52], GHG study [20] and spills study [55]. Note that a spill of salt (sodium
chloride) will have a modest impact on the environment.
Greenland Minerals Ltd – Kvanefjeld Project - EIA | 59
2. Transportation of minor reagents including filter aid (alpha cellulose), water treatment
chemicals (sodium sulphide and barium chloride) and flocculants used elsewhere in the
refinery
These reagents will be transported to the Plant in sea containers on trucks. Impacts associated
with the noise, the release of carbon dioxide and potential spills generated by this transport
are captured in the project noise assessment [52], GHG study [20] and spills study [55].
3. Production of gaseous emissions
The CAP operates to capture gaseous emissions and use them in the production of
concentrated acid. Anticipated stack emissions have been used in the CALPUFF air quality
model. Sodium hypochlorite unit vent gas with an emission rate of 4.17 mg of Cl2 per second
is a potential source of Cl2. A caustic scrubber will be applied, absorbing the chlorine gas into
the caustic spray to form sodium hypochlorite liquid. Sodium hypochlorite is produced and
sold as a by-product. The caustic scrubber design will produce a resulting air emission of <1
mg/m3 of Cl2. This is less than the lowest observed health effect level of 1.2 mg/m3 [115]. The
exit gases are then extensively diluted with the atmospheric environment from the stack
release to achieve acceptable ambient working levels.
Hydrochloric acid cell vent gas with an emission rate of 321 mg of HCl per second is a potential
source of acid mist. A water scrubber will be used to clean the acid mist. After passing through
the gas scrubbing systems, air from the exhaust stack is designed to be <30 mg of HCl per m3
of air. The lowest observable health effect concentration for HCl mist is 15 mg/m3 of air [116].
The acid mist was modelled by ERM in CAPLUFF at 50 % higher than the design limit of 30 mg
of HCL per m3 of air for conservatism (45 mg of HCl per cubic meter of air). The HCl mist is
diluted by releasing with an elevated tower stack which dilutes the acid mist to acceptable
ambient working levels of <0.02 mg/m3.
The exhaust gases emitted by the CAP stacks have been included in the CALPUFF model which
informed the Project’s air quality assessment [19]. Dispersion modelling demonstrates that
the aggregate emissions from all CAP emissions results in acceptable ambient levels of HCl and
Cl2. Chlorine gas emissions are considered negligible as the concentrations released are at very
low levels even if they are notionally increased by 50 % for conservatism. Therefore, chlorine
gas was not directly included in the CALPUFF modelling [19].
4. The CAP will generate noise during standard operations
Noise generated from the acid plants is included in the noise assessment for the entirity of the
Plant. “Maximum noise source strengths in the Plant area were uniformly estimated to be 85
dB(A) at the exterior walls of all process and service buildings and other facilities. Actual noise
source strengths are likely to be less at some of these facilities” [52].
5. Solid wastes generated from the CAP
Purification of the salt used to feed the chlor-alkali plant produces a solid residue. This solid residue is a filter cake which will be precipitated during impurity removal. It is expected that approximately 15 tpd will be produced [117]. The filter cake will comprise metal hydroxides
precipitated from the brine solution using alkaline precipitants. The main components are
found in high quality salt and consist of:
Calcium carbonate, CaCO3
Magnesium hydroxide, Mg(OH)2
Sodium Carbonate, Na2CO3
Barium Sulphate, BaSO4 – A highly insoluble compound
Cellulose – Inert filter aid used to bind fine particles into the filter cake.

Greenland Minerals Ltd – Kvanefjeld Project - EIA | 60
The filter cake will be benign and would be acceptable as suburban landfill [117]. For
Kvanefjeld, the filter cake will be blended with the refinery tailings and disposed in the CRSF.
The CRSF will already contain the same hydroxide compounds as those found in the filter cake which will make up 1.5 % of the total CRSF tailings solids flow by mass [117] .
6. Acid handling and storage
Hydrochloric acid will be stored in sealed and vented fibreglass tanks which are specifically
designed to store hydrochloric acid. These tanks are commercially proven and in common use.
7. Water Use
5m3/hour of demineralised water will be supplied from the raw water treatment plant in the
refinery. Cooling water will be used for various cooling duties and will be cycled around the
cooling plant. All water consumption has been considered in the design of the plant water
management system, which has informed the EIA.
8. Power consumption
Approximately 14 MW of electrical energy will be required to operate the CAP to produce 85
tpd of caustic soda and 75 tpd of hydrochloric acid. There will be GHG emissions and other
exhaust gases from the diesel fired power plant generating this power. The GHG emissions and
other exhaust gases have been included in the Project air quality assessment performed by
ERM [19] [20]. GHG emissions from the CAP are estimated to be 62,000 tCO2e/year.
In the event of an emergency where the plant is shutdown under uncontrolled conditions there will be
an emergency absorption system which will absorb the full capacity of chlorine production for 10
minutes to allow for emergency responses. The emergency absorption system will be expected to
stand idle for most of the operation and is included as a contingency.
Upon closure, the SAP will be dismantled and removed from site in accordance with the MCP. Site
remediation to address any contamination will be undertaken in accordance with Greenland
requirements and best practice.
3.6.3 Tailings Storage Facility (TSF) - Overview
Once the economic minerals have been extracted from the ore, the balance of the processed material,
comprising a large majority of the volume, will be removed from the Plant and stored as tailings.
The concentrator and the refinery will produce two distinct tailings streams that will be handled and
stored separately.
Both tailings streams will be in the form of very fine solids (silt) suspended in water and will be pumped
to and discharged in the TSF. The TSF will be located within the Taseq basin to allow sub-aqueous
(placement under water) tailings disposal. Embankments will be constructed to form two discrete
tailings storage areas within the Taseq basin - one to receive tailings from the concentrator (FTSF) and
the other to receive tailings from the refinery (CRSF) (Figure 15).
The design and construction of the FTSF and the CRSF will be done in accordance with international
best practice (ICOLD) and with consideration of Canadian dam classification as defined by the
Association of Dam Safety Officials (ASDSO), which has been adopted/used by the Canadian Dam
Association (CDA) and other associations (CDA 2007) [78].
Embankments will be constructed using a downstream design. The embankments will be lined with
geosynthetic membranes to minimise seepage from the TSF. The embankments will be constructed
with rock-fill and will be keyed into solid, competent rock [1].

Greenland Minerals Ltd – Kvanefjeld Project - EIA | 61
Over time the embankments will be sequentially raised to increase the volume of the storage facilities.
The embankments will be raised five times over the life of the Project to eventually reach heights of
45 m and 46 m above the original ground level for the FTSF and CRSF respectively (Figure 16). The
maximum thickness of deposited tailings will be 68 m in the middle of the FTSF and 40 m in the CRSF.
As a result of the bowl shape of the floor of the Taseq basin, the rate of increase in the depth of tailings
is at its greatest in the early years of the Project. The rate of increase gradually declines over the
Project life with a freeboard height of at least 6m being maintained throughout operations. During
operations, the tailings facilities will be managed to ensure a minimum of 5 m up to a maximum of 22
m of water coverage over the tailings.
On closure, two cover options have been identified for the TSF: a wet cover and a dry cover. The FS
for the Project, and this EIA, have assumed a wet cover will be applied, and this is the option which has
been assessed in this document. A feasibility study to confirm the most appropriate technology will
be conducted closer to the time of closure. Both options are currently believed to present
environmentally appropriate alternatives at closure.
The concentrator will produce 2.8 Mtpa of solid tailings and the refinery will produce a further 0.3
Mtpa. The combined cumulative total of tailings production over the life of the Mine will be 110,7 Mt,
consisting of 100 Mt from the concentrator and 10,7 Mt from the refinery (Table 6).
Table 6 Tailings production
Year Flotations Tailings Chemical Residue
1- 36 2.8 Mtpa 0.3 Mtpa
37 1.4 Mtpa 1.5 Mtpa
LoM Total 100.0 Mt 10.7 Mt
Figure 15 The TSF

Greenland Minerals Ltd – Kvanefjeld Project - EIA | 62
Figure 16 Cross-section of embankment at the CRSF (above) and FTSF (below) at year 37
The TSF walls are designed to be permanent embankments capable of withstanding anticipated local
seismic and weather events. Stability modelling, using data from probabilistic seismic hazards
assessments, demonstrates that the TSF walls will remain stable under a maximum credible
earthquake [1] [75] [92]. The tailings dams have also been designed with sufficient capacity to
accommodate a one in 10,000 year rainfall event while at all times retaining a freeboard ranging
between 6 and 13 m.
The embankments will be constructed using a downstream design. There is significant precedent for
the design and location type of the Kvanefjeld tailings facilities. There are many similar designs used
in equivalent settings. To date, there is no record of catastrophic failure of equivalent dams built to
the design standards which are being used for the Kvanefjeld facilities [78].
3.6.4 TSF - Operation
Operations phase
The Flotation tailings will be covered by a minimum of 5 m of water at all times. In the Project’s
operations phase tailings slurries will be discharged below the water surface into the respective
storage facilities. The supernatant (the liquid covering the tailings solids in the TSF) will be re-circulated
to the Plant (Figure 17).
The key advantages of subaqueous tailings storage are the prevention of radon gas release and the
elimination of stored tailings as a potential source of dust [1].

Greenland Minerals Ltd – Kvanefjeld Project - EIA | 63
Figure 17 Operations phase schematic
The tailings dams have also been designed with sufficient capacity to accommodate a 1 in 10,000 year
rainfall event while at all times retaining at least a 5 m freeboard [23].
To minimize the inflow of water from rain and snow that falls on the slopes surrounding Taseq,
diversion channels and embankments will be constructed on both sides of the basin to divert some
rain and snow melt. Most of this water will be directed towards the Taseq river that currently drains
the lake in order to ensure that it avoids contact with the TSF (see Figure 15).
Narsaq is supplied with drinking water from the Napasup Kuua, Kuukasik and Landnamselven rivers.
Potential Project related impacts to Narsaq’s drinking water are assessed in Section 10.3.1 [58].
Closure phase
Two methods were investigated for closure of the TSF using current technology (wet cover and dry
cover) [77]. The wet closure method, which was selected for the Project’s FS, is the method assessed
in this EIA. The wet closure method was selected as it leaves the environment closer to its original state
than dry closure. The life of the Project (at least 37 years) means that it is not possible to identify, at
this stage of the development, what might constitute BAT for closure of tailings facilities when closure
will be required. At an appropriate time interval in advance of the completion of operations, further
technical studies and impact assessments, environmental and social, will be undertaken to identify the
most appropriate, incorporating current BAT, long term solution for closure of the TSF.
Under the wet closure method, supernatant water in the TSF will be treated at the processing plant
site over a period of six years (the closure period) to remove contaminants and produce water suitable
for discharge to Nordre Sermilik fjord.
The water depth above the tailings will typically be up to 10 m in the FTSF and 8 m in the CRSF
throughout the closure period.
In addition to impact of treatment at the processing site, the supernatant will be steadily diluted by
water from precipitation and run-off from the catchment area. The combined impact of these two
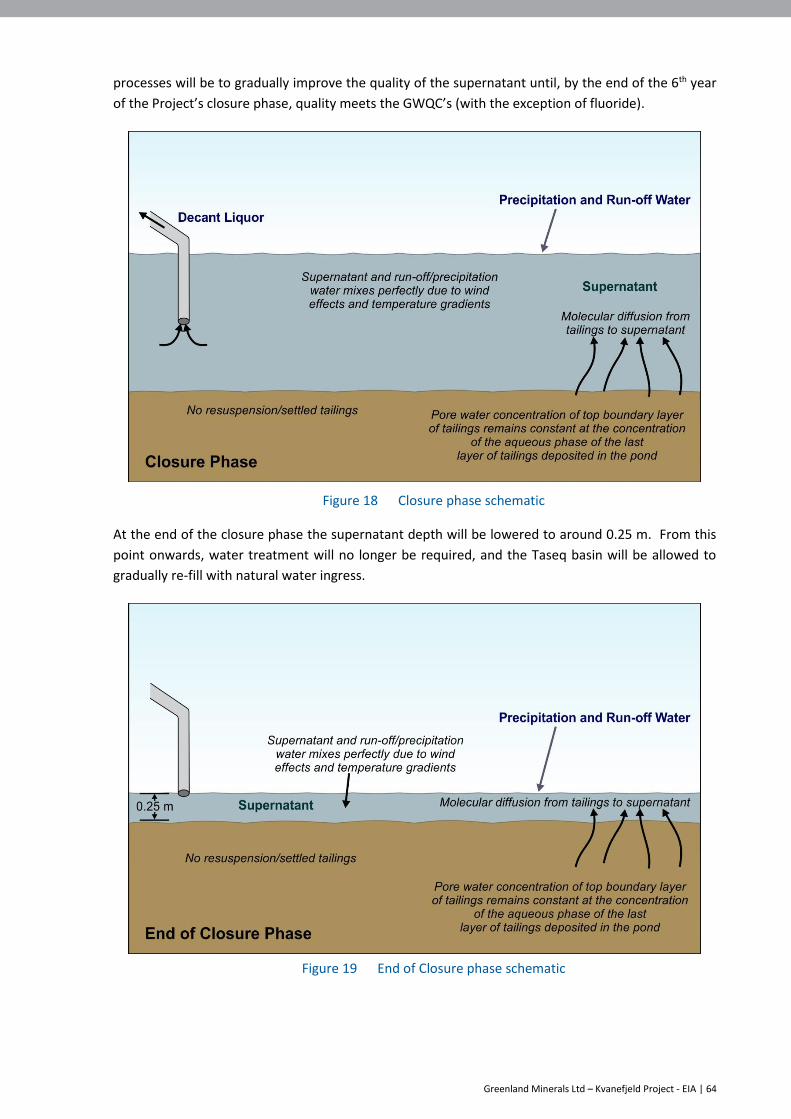
Greenland Minerals Ltd – Kvanefjeld Project - EIA | 64
processes will be to gradually improve the quality of the supernatant until, by the end of the 6th year
of the Project’s closure phase, quality meets the GWQC’s (with the exception of fluoride).
Figure 18 Closure phase schematic
At the end of the closure phase the supernatant depth will be lowered to around 0.25 m. From this
point onwards, water treatment will no longer be required, and the Taseq basin will be allowed to
gradually re-fill with natural water ingress.
Figure 19 End of Closure phase schematic

Greenland Minerals Ltd – Kvanefjeld Project - EIA | 65
Post-closure phase
The water level in the TSF will increase gradually post closure eventually reaching the crest level of the
embankment at which point water will start to overflow into the Taseq river/Narsaq river system via a
specifically designed and dedicated spillway.
The effectiveness of the diversion channels, which will be constructed to minimise water inflow to the
TSF during operations, will gradually deteriorate over time as a result of natural erosion and the in-fill
of soil and gravel.
The hydrology in the Taseq valley will, in broad terms, return to the existing conditions before mining
operations commenced [58].
Figure 20 Post- closure phase schematic
3.6.5 Flotation tailings
Flotation tailings will be stored in the FTSF located at the western end of the Taseq lake, approximately
three km to the south of the refinery. The embankment of the FTSF will be sealed with a double
composite geosynthetic liner.
Flotation tailings represent approximately 90 % of tailings production. These tailings consist of a slurry
of finely ground rock left after the physical removal of zinc, uranium and REEs in the concentrator.
There is no chemical change to the ore during the concentration process and Flotation tailings do not
require treatment prior to storage in the FTSF as they are chemically stable.
Filter solids from the sulphur filtration stage of the sulphuric acid plant will also be added to the
Flotation tailings prior to pumping to the FTSF. These filter solids will only represent a small proportion
of tailings volume.
Flotation tailings will be pumped to the FTSF as a slurry with a solids percentage of 60 %. The water
used to form the slurry will contain soluble natural fluoride ions and will be isolated from the
environment and returned back to the concentrator for re-use.

Greenland Minerals Ltd – Kvanefjeld Project - EIA | 66
Prior to excess water being discharged to the fjord, the fluoride is precipitated from solution with the
addition of calcium chloride salt (process summarised in Figure 21). A thickener, filter and clarifier will
be installed to ensure the fluoride solids are captured and the treated water meets required water
quality conditions before release [29]. This method is standard technology for fluoride removal.
The removed fluoride forms a calcium fluoride, which is a commercial grade fluorspar that will be sold.
Figure 21 Flowchart of concentrator water treatment
3.6.6 Refinery tailings
The tailings produced by the refinery will be a mixture of finely crushed inert rock, neutralised chemical
precipitates and water from which the uranium and REEs will have been removed. This tailing stream
represents approximately 10 % of the total tailings volume. The associated water will contain chloride
and sulphate salts in solution and will, therefore, be isolated from the environment and stored in a
double lined tailings dam. The refinery tailings slurry will have a solids percentage of 43 % or greater
at the bottom of the tailings pond.
In the refinery a number of contaminants will be precipitated from solution as stable solid particles
prior to reporting to the refinery tailings stream. Such contaminants include low concentration
radionuclides such as polonium, lead, bismuth and radium. Solids from the hydrochloric acid plant will
also report to the refinery tailings stream but will only comprise a small proportion of the tailings
deposited in the CRSF.
Water treatment circuits have also been included to remove organic contaminants from released
water. Water treatment solids are mixed with refinery tailings removing the requirement for a
separate solids or “sludge” solid liquid separation system.
Refinery tailings will be neutralized with hydrated lime prior to pumping to the CRSF. In this process
the pH level of the tailings will be reduced to a neutral level at which point many potentially deleterious
elements, including actinium, will precipitate from solution [29]. Potential migration of these
deleterious elements is severely curtailed once they have been precipitated. The neutralisation
precipitates are mixed with the refinery solids prior to pumping to the CRSF.
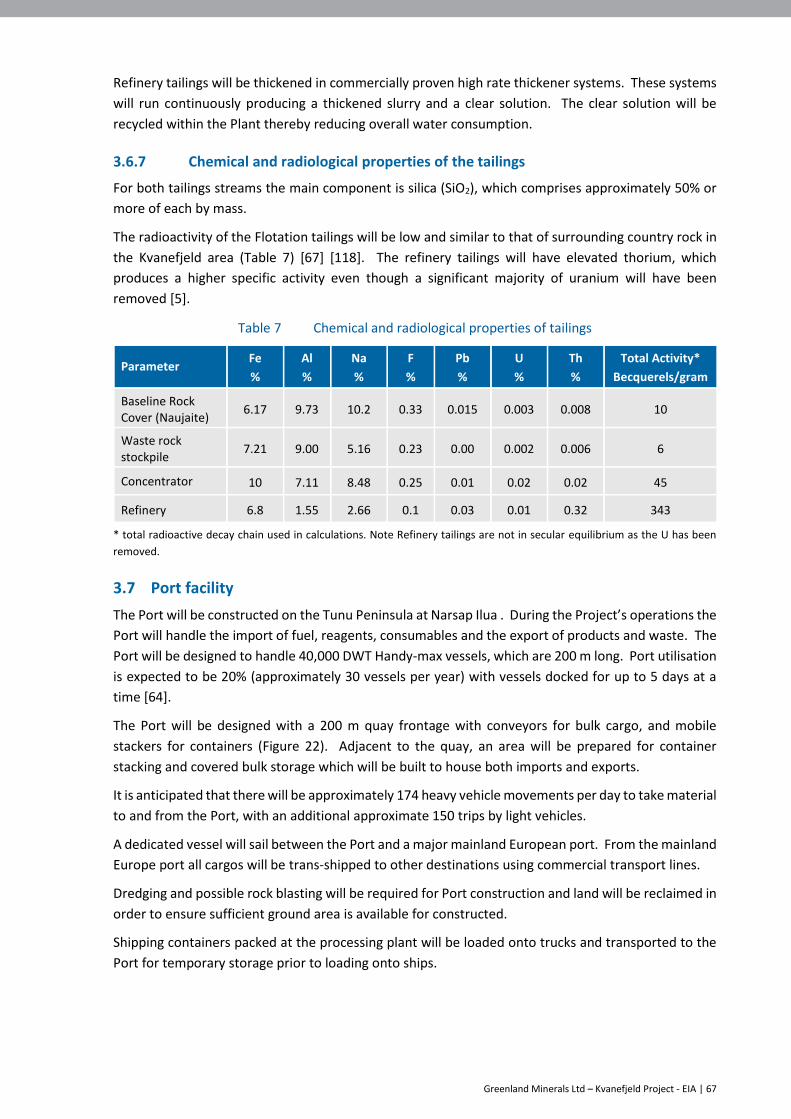
Greenland Minerals Ltd – Kvanefjeld Project - EIA | 67
Refinery tailings will be thickened in commercially proven high rate thickener systems. These systems
will run continuously producing a thickened slurry and a clear solution. The clear solution will be
recycled within the Plant thereby reducing overall water consumption.
3.6.7 Chemical and radiological properties of the tailings
For both tailings streams the main component is silica (SiO2), which comprises approximately 50% or
more of each by mass.
The radioactivity of the Flotation tailings will be low and similar to that of surrounding country rock in
the Kvanefjeld area (Table 7) [67] [118]. The refinery tailings will have elevated thorium, which
produces a higher specific activity even though a significant majority of uranium will have been
removed [5].
Table 7 Chemical and radiological properties of tailings
Parameter Fe
%
Al
%
Na
%
F
%
Pb
%
U
%
Th
%
Total Activity*
Becquerels/gram
Baseline Rock Cover (Naujaite)
6.17 9.73 10.2 0.33 0.015 0.003 0.008 10
Waste rock stockpile
7.21 9.00 5.16 0.23 0.00 0.002 0.006 6
Concentrator 10 7.11 8.48 0.25 0.01 0.02 0.02 45
Refinery 6.8 1.55 2.66 0.1 0.03 0.01 0.32 343
* total radioactive decay chain used in calculations. Note Refinery tailings are not in secular equilibrium as the U has been
removed.
3.7 Port facility
The Port will be constructed on the Tunu Peninsula at Narsap Ilua . During the Project’s operations the
Port will handle the import of fuel, reagents, consumables and the export of products and waste. The
Port will be designed to handle 40,000 DWT Handy-max vessels, which are 200 m long. Port utilisation
is expected to be 20% (approximately 30 vessels per year) with vessels docked for up to 5 days at a
time [64].
The Port will be designed with a 200 m quay frontage with conveyors for bulk cargo, and mobile
stackers for containers (Figure 22). Adjacent to the quay, an area will be prepared for container
stacking and covered bulk storage which will be built to house both imports and exports.
It is anticipated that there will be approximately 174 heavy vehicle movements per day to take material
to and from the Port, with an additional approximate 150 trips by light vehicles.
A dedicated vessel will sail between the Port and a major mainland European port. From the mainland
Europe port all cargos will be trans-shipped to other destinations using commercial transport lines.
Dredging and possible rock blasting will be required for Port construction and land will be reclaimed in
order to ensure sufficient ground area is available for constructed.
Shipping containers packed at the processing plant will be loaded onto trucks and transported to the
Port for temporary storage prior to loading onto ships.
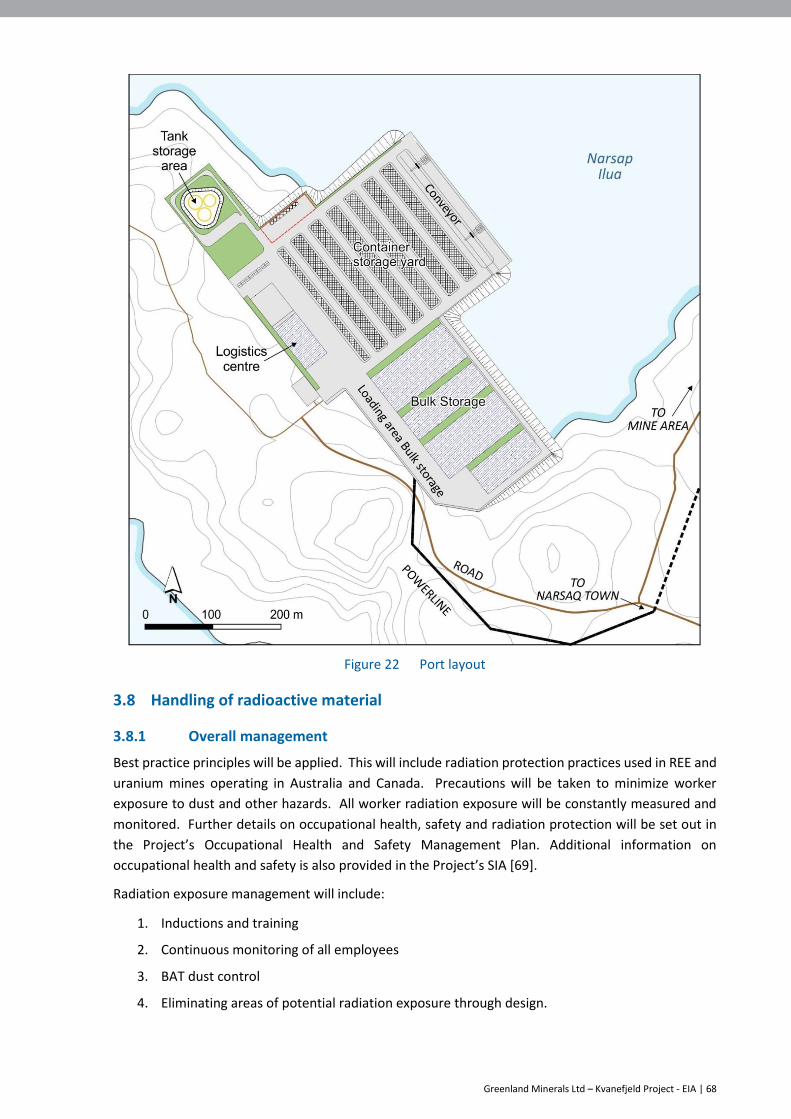
Greenland Minerals Ltd – Kvanefjeld Project - EIA | 68
Figure 22 Port layout
3.8 Handling of radioactive material
3.8.1 Overall management
Best practice principles will be applied. This will include radiation protection practices used in REE and
uranium mines operating in Australia and Canada. Precautions will be taken to minimize worker
exposure to dust and other hazards. All worker radiation exposure will be constantly measured and
monitored. Further details on occupational health, safety and radiation protection will be set out in
the Project’s Occupational Health and Safety Management Plan. Additional information on
occupational health and safety is also provided in the Project’s SIA [69].
Radiation exposure management will include:
1. Inductions and training
2. Continuous monitoring of all employees
3. BAT dust control
4. Eliminating areas of potential radiation exposure through design.

Greenland Minerals Ltd – Kvanefjeld Project - EIA | 69
All vehicles leaving the Mine area will pass through a wash down facility. The facility will operate
automatically and operators will not be required to leave the cabins of their vehicles during the wash
down. Radiation clearance control will be used to ensure that contaminated vehicles do not leave the
Mine area [28].
3.9 Water Management
3.9.1 Water balance
Water for Plant operations will be supplied from the following sources:
The Narsaq river
Recycled water from the TSF
Recycled water from the Plant in times of low flow in the Narsaq river
Mine water and run off from the WRS.
The TSF will serve as a water reservoir in addition to being a site for tailings retention.
A minimum of 5 m of water cover will be maintained in the TSF to ensure effective subaqueous disposal
of tailings. Maintaining this water level will be managed through the control of the amount of decant
water which is recycled back to the Plant.
The water in the TSF and the surrounding waterways will be monitored continuously for contaminant
loads. A monitoring programme will also be implemented to identify any seeps in proximity to the TSF
and monitor their water quality, to confirm the integrated water model developed for the Project.
Fluoride limits of 5 ppm in summer and 30 ppm in winter at Control Point C will be applicable. In the
unlikely case of contamination of surface waters with fluoride (either as aerosol spray from the TSF or
through potential seepage pathways), water treatment of tailings water from the concentrator can
commence to reduce fluoride concentrations [76].
The decant water is pumped from the TSF to the concentrator and refinery in pipelines adjacent to the
pipes that transport the tailings to the TSF.
Recycled decant water will be filtered to remove grit and other debris.
The conceptual water balance is shown in Figure 23.
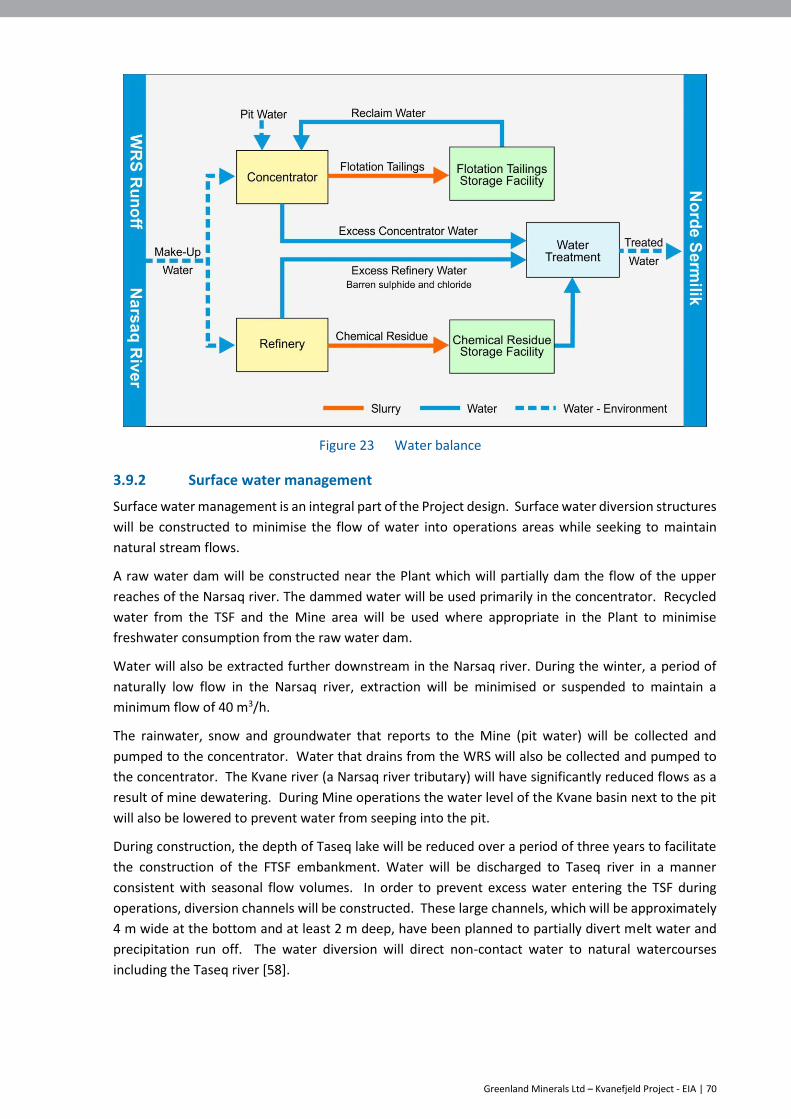
Greenland Minerals Ltd – Kvanefjeld Project - EIA | 70
Figure 23 Water balance
3.9.2 Surface water management
Surface water management is an integral part of the Project design. Surface water diversion structures
will be constructed to minimise the flow of water into operations areas while seeking to maintain
natural stream flows.
A raw water dam will be constructed near the Plant which will partially dam the flow of the upper
reaches of the Narsaq river. The dammed water will be used primarily in the concentrator. Recycled
water from the TSF and the Mine area will be used where appropriate in the Plant to minimise
freshwater consumption from the raw water dam.
Water will also be extracted further downstream in the Narsaq river. During the winter, a period of
naturally low flow in the Narsaq river, extraction will be minimised or suspended to maintain a
minimum flow of 40 m3/h.
The rainwater, snow and groundwater that reports to the Mine (pit water) will be collected and
pumped to the concentrator. Water that drains from the WRS will also be collected and pumped to
the concentrator. The Kvane river (a Narsaq river tributary) will have significantly reduced flows as a
result of mine dewatering. During Mine operations the water level of the Kvane basin next to the pit
will also be lowered to prevent water from seeping into the pit.
During construction, the depth of Taseq lake will be reduced over a period of three years to facilitate
the construction of the FTSF embankment. Water will be discharged to Taseq river in a manner
consistent with seasonal flow volumes. In order to prevent excess water entering the TSF during
operations, diversion channels will be constructed. These large channels, which will be approximately
4 m wide at the bottom and at least 2 m deep, have been planned to partially divert melt water and
precipitation run off. The water diversion will direct non-contact water to natural watercourses
including the Taseq river [58].
Greenland Minerals Ltd – Kvanefjeld Project - EIA | 71
3.9.3 Water discharge
Excess water from concentrator will be treated to remove dissolved fluoride and solids and excess
water from the refinery including the barren chloride liquor will be neutralised and treated to remove
organic material and radionuclides [58].
Treated water will be placed into Nordre Sermilik via a single underwater diffuser located 40m below
the surface water level to achieve optimal dilution [17].
3.10 Support Infrastructure
3.10.1 Administration and accommodation
During the construction phase, a peak workforce of over 1,100 employees is anticipated. Of these,
approximately 200 are expected to be Greenlandic citizens who will commute on a rotational basis to
the Project. The remaining foreign workforce will be accommodated in a temporary construction
workers’ camp which will be constructed in proximity to the concentrator. Temporary accommodation
for construction workers will be also be provided locally in Narsaq and Narsarsuaq. Potential overflow
accommodation utilizing a marine vessel (cruise ship style) may also be provided in the Narsaq harbour
for peak periods.
During Project operations, with an average workforce of over 700 of which more than 300 are expected
to be Greenlandic. Non-local employees will be accommodated in the Village to be constructed on the
outskirts of the town of Narsaq. The location of both the temporary construction workers’ camp and
the permanent Village are illustrated in Figure 24. Additional detail on the labour and workforce
accommodation plans for the Project can be found in the SIA [69].
There will be a road providing access from the Village to the Port-Mine Road. The Village will be
supplied with power from the Project’s power station. Sewage from the Village will be treated prior to
discharge. Village will include recreation facilities, meeting rooms, canteen, laundry and
communication facilities [29].

Greenland Minerals Ltd – Kvanefjeld Project - EIA | 72
Figure 24 Location of the Village and the temporary construction worker’s camp
3.10.2 Transport Facilities
The Project will not require the construction of an airport and GML will rely on Narsarsuaq airport (or
Qaqortoq as plans for the new airport develop) for the transport of its FIFO workforce.
A ferry will be used to transfer workers from the airport to Narsaq.
An extension to existing passenger facilities will be required at the Narsaq heliport but the airport at
Narsarsuaq (or the new proposed airport at Qaqortoq) is considered to be adequate to handle
additional passenger loads resulting from Project construction and operation. Additional commercial
and chartered flights between Narsarsuaq / Qaqortoq and Nuuk, Reykjavik, Copenhagen and the UK
may be necessary for the increased volume of passengers.
The Port-Mine Road will be seven meters wide and approximately 13 km long. It will follow an existing
gravel road along the Narsaq river. The Port-Mine Road will cater for all transport between the Port,
the Plant and the Mine. Specialised fuel trucks will transport fuels from the Port to the Project’s power
station at the site of the concentrator. Personnel will generally commute by bus between the Village
and work sites at the Mine and Plant.
Port utilisation will be approximately 20 % per year. In a typical year, there will be in excess of 30
vessel arrivals at the Port [64] [104]. It is expected that, each year, the Port will dock:
22 Handy-Max vessels (40,000 DWT) for containerized and bulk cargo
10 tankers carrying fuel.

Greenland Minerals Ltd – Kvanefjeld Project - EIA | 73
3.10.3 Electricity and Fuel Supply
A 59 MW diesel fired combined heat and power station will be built adjacent to the concentrator. This
power station will service the Plant, the Port and the Village. The power station will have a waste heat
recovery system which will generate hot water that will be used for process heating in the
concentrator, as well as heating of buildings in the Plant [1].
Fuel for the power station will be stored at the Port and transported in road tankers as required. The
tankers will discharge the fuel into day tanks adjacent to the power station.
An 11 kV overhead power line will deliver power to the Port and Village.
3.10.4 Domestic and industrial waste handling
All combustible solid waste will be pressed into bales and shipped to Qaqortoq for incineration. In the
event that an incinerator were to be constructed in Narsaq, this facility would be used instead.
Accumulators, batteries, electronic devices, glass, etc. will be stored in temporary containers and
periodically handed over to the Qaqortoq waste handling facility for further disposal according to
regulations and after mutual agreement.
Independently of the project, a national waste solution is being implemented.
3.10.5 Hazardous material handling
Hazardous waste will be handled in accordance with the Kommune Kujalleq regulation concerning
hazardous waste [26]. In general, hazardous waste will be shipped to Denmark and handled in
compliance with a comprehensive EU initiated legal framework. Hazardous waste will be registered
and traced using code standards (EC waste list / EAK koder (Europæiske Affalds Koder)).
3.10.6 Fencing
Fencing around the Project’s operations will be constructed for safety and security. Due to the steep
topography of the area complete fencing is not required. Vehicle and fauna access will be restricted
by the proposed fencing plan. As shown on Figure 25, the fencing will restrict access to the Mine, Plant
and explosives magazine. During operations and closure, there is the potential to restrict access to the
CRSF and FTSF through the installation of additional fencing if required.

Greenland Minerals Ltd – Kvanefjeld Project - EIA | 74
Figure 25 Fencing
3.10.7 Dangerous Goods Storage and Handling
Dangerous goods will be stored at the Plant in accordance with EU requirements. Dangerous good
include reagents such as acids (described in Section 3.11).
The explosives magazine will be located away from the infrastructure at the south end of the Mine and
will be accessed by a gravel road (see Figure 25). Access will be restricted with security fencing and
continuous surveillance. The explosives and detonators will be stored separately in an approved
explosives magazine building [68].
3.10.8 Security of nuclear products
Uranium oxide will be packed in sealed 200 L steel drums at the refinery which will then be loaded into
standard shipping containers, also sealed, before being transported to the Port on trucks. Annual
production of uranium will fill fewer than 40 freight containers. The containers will remain sealed to
the final point of delivery.
Containers will be unloaded at the Port and moved to a dedicated storage area. The storage area will
have a gate and security that meets/exceeds the requirements of International Ship and Port Security
Codes [3].
The uranium oxide will be packaged and transported in compliance with IAEA Safety Standards SSR-6:
Regulations for the Safe Transport of Radioactive Material (2018) [38] and relevant international and
national codes and regulations for the transport of radioactive material.
3.10.9 Pipelines
Tailings will be pumped to the TSF as a slurry through pipework located in above ground piping
corridors, mounted on supports and insulated to prevent freezing.
Recycled water from the TSF will be pumped to the Plant via the tailings piping corridor in pipework
mounted on supports, insulated and heat traced to prevent the return waters freezing [1].

Greenland Minerals Ltd – Kvanefjeld Project - EIA | 75
Treated excess Plant water will be pumped from the concentrator to Nordre Sermilik, where possible,
above ground in a mounted and insulated piping corridor.
3.11 Use of reagents
A variety of reagents will be used in the Plant. Table 8 lists the reagents to be used in the Plant together
with an annual consumption estimate.

Greenland Minerals Ltd – Kvanefjeld Project EIA | 76
Table 8 Summary of reagents used
Reagent
Function Used for Purpose
Annual
consumption Tonnes
Zetag 8140 *
Concentrator Flocculant
Zinc flotation Thickener flocculant for zinc sulphide concentrate - to promote particle sedimentation to enable recovery of zinc product from process.
1.2 - 3.0
SNF FO4800H
Concentrator Flocculant
REMC flotation Thickener flocculant for REMC - to promote particle sedimentation to enable recovery of REMC from process.
150 - 400
Magnafloc 155
Refinery Flocculant (Anonic)
Impurity removal - Refinery
Thickener flocculant for anionic impurities - to promote particle sedimentation to enable removal of impurities in the refinery circuit.
75 - 180
Magnfloc 430 *
Refinery Flocculant (Cationic)
Impurity removal and product recovery - Refinery
Thickener flocculant for cationic impurities and cationic products - to promote particle sedimentation to enable removal of impurities, and recovery of products in the refinery circuit.
20 - 60
RM1250 *
Refinery Coagulant
Silica agglomeration
Thickener agglomerate for silica impurities - to promote agglomeration of fine silica particles to enable their removal from uranium product liquor.
60 - 160
Sodium iso-butyl xanthate (SIBX)
Flotation Collector
Zinc flotation To float the zinc sulphides, thereby separating these from the ore. 125 - 320
Copper sulphate (CuSO4.5H2O)
Flotation Activator
Zinc flotation To activate the surface of the zinc sulphide particles thereby improving the efficiency of their flotation. 25 - 60
Aero 6494
Flotation Collector
REMC flotation To float the RE-bearing minerals, thereby separating these from the non-value mineral tailings. 1,000 - 2,700

Greenland Minerals Ltd – Kvanefjeld Project EIA | 77
Reagent
Function Used for Purpose
Annual
consumption Tonnes
Sodium Silicate
Flotation Depressant
Zinc and REMC flotation
Depressant - prevents the flotation of the non-value mineral tailings. 2,300 - 5,800
Polyfroth W22C
Flotation Frother
Zinc and REMC flotation
To reduce the bubble size and increase froth stability in the flotation process. 110 - 280
Sodium Carbonate
REE product precipitation
To precipitate REE intermediate products from process liquors in the refinery circuit. 12,000 - 30,000
Sulphur Sulphuric acid (H2SO4) production
To produce sulphuric acid, used to leach REEs and uranium from the REMC in the refinery circuit. 16,000 - 41,000
Sodium Chloride
Hydrochloric acid (HCl) and caustic soda (NaOH) production
To produce hydrochloric acid and caustic soda, used to respectively to leach REEs and to raise pH of process liquors (for product precipitation and impurity removal) in the refinery circuit.
35,000 - 87,000
Limestone Impurity removal
To raise pH of process liquors in the refinery circuit. 30,000 - 77,000
Caustic Flake (NaOH)
Product precipitation and impurity removal
To precipitate cerium product, and to raise pH of process liquors in the refinery circuit. 1,400 - 5,000
Calcium Chloride Water treatment
To precipitate fluoride from the treated water placement stream entering Nordre Sermilik. 6,900 - 17,500
Pyrolusite REE leaching To oxidise REE species during acid leaching process to improve REE recovery. 300 - 750
Haematite REE leaching To precipitate phosphate species during acid leaching process to improve REE recovery. 0 - 15,000
Hydrogen Peroxide
Product precipitation and Impurity removal
To precipitate uranium oxide, and to precipitate impurities from refinery process liquors. 125 - 300

Greenland Minerals Ltd – Kvanefjeld Project EIA | 78
Reagent
Function Used for Purpose
Annual
consumption Tonnes
Lime Impurity removal
To raise pH of process liquors in the refinery circuit. 3,800 - 9,500
Barium Chloride Impurity removal
To precipitate impurities from refinery process liquors. 1,800 - 4,500
Sodium Hydrosulphide
Impurity removal
To precipitate impurities from refinery process liquors. 60 - 200
Alamine 336 *
SX Extractant Uranium SX
To extract uranium species from process liquors in the refinery circuit, thereby removing these from impurities and enabling production of pure uranium oxide.
2.5 - 10
Isodecanol *
SX Phase Modifier Uranium SX
To improve the solubility of the extractant in the organic diluent, thereby ensuring effective removal of uranium from the liquor phase.
1.0 - 5.0
PC-88A or Ionquest 801 *
SX Extractant
REE SX To extract REE species from process liquors in the refinery circuit, thereby removing these from impurities and enabling production of pure REE products.
70 - 175
Shellsol D70 *
SX Diluent REE SX
To provide the organic phase needed to carry the extractant, thereby ensuring effective removal of REEs from the liquor phase.
160 - 500
Uranium IX Resin
CleanTeQ R603B
Impurity removal
To remove uranium impurities from the REE process liquor stream in the refinery circuit. 0.1 – 1.0
Accepta 2827/2302 Cooling Water Biocide
Cooling water treatment
To prevent the growth and build-up of microbiological organisms in the cooling water system, thereby ensuring optimum performance of process plant cooling systems.
140 - 500
Accepta 2319
Cooling Water Inhibitor
Cooling water treatment
To prevent the formation of rust in equipment associated with the cooling water system, thereby ensuring optimum performance of process plant cooling systems.
5 -30

Greenland Minerals Ltd – Kvanefjeld Project EIA | 79
3.12 Labour and services
The Project will seek to maximise employment for Greenlandic people. Suitably qualified workers will
be offered employment and other potential employees will be offered opportunities to train to fill
vacant positions.
The Project is expected to employ over 1,100 and 700 people during the construction and operations
phases of the Project respectively.
It is anticipated that the existing Greenlandic labour force will not be able to initially meet all of the
labour required for the Project. A proportion of employees will therefore have to be sourced from
outside Greenland. GML’s commitment remains that where a suitably skilled employee can be sourced
from within Greenland, that Greenlander will be given preference over a foreign worker. Further detail
on labour and services is discussed in the Project’s SIA.
3.13 Project footprint
The Project footprint is described in Table 9.
Table 9 Project footprint
Element Area (ha)
Mine 115
WRS 130
TSF 310
Plant 15
Port 15
Other (Village, offices etc.) 30
Roads and infrastructure 16
Total 631
3.14 Decommissioning, closure and rehabilitation
The closure and reclamation goal is to return the Mine site and affected areas to viable and, wherever
practicable, self-sustained ecosystems that are compatible with a healthy environment and with
human activities and consistent with the ecosystem services pre-Project.
In order to achieve this, the following core closure principles will be followed:
Physical Stability
All Project components remaining after closure will be physically stable to humans and wildlife;
Chemical Stability
Any Project components (including associated wastes) remaining after closure will be chemically stable
and non-polluting or contaminating. Any deposits remaining on the surface or in lakes will not release
substances at a concentration that would significantly harm the environment;
Minimized radiological impact
Long-term radiation exposure of the public due to any radiological contamination of the Project Area
will be kept “as low as reasonably achievable” (ALARA);
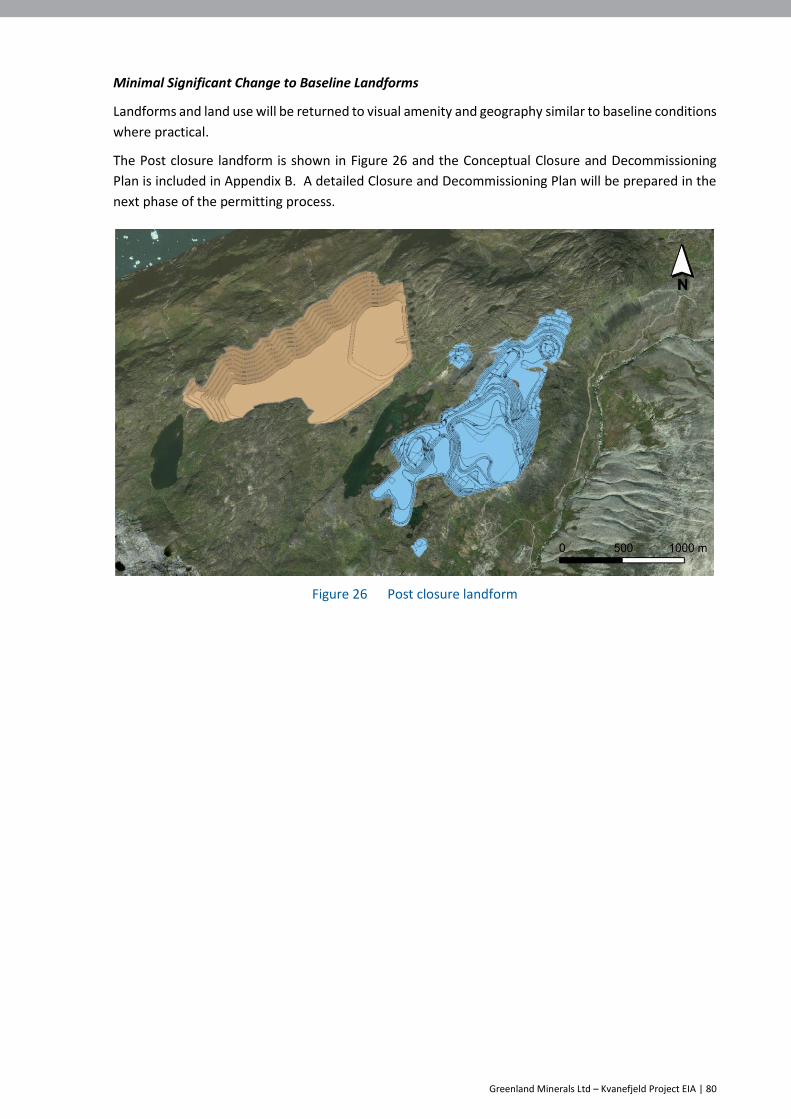
Greenland Minerals Ltd – Kvanefjeld Project EIA | 80
Minimal Significant Change to Baseline Landforms
Landforms and land use will be returned to visual amenity and geography similar to baseline conditions
where practical.
The Post closure landform is shown in Figure 26 and the Conceptual Closure and Decommissioning
Plan is included in Appendix B. A detailed Closure and Decommissioning Plan will be prepared in the
next phase of the permitting process.
Figure 26 Post closure landform

Greenland Minerals Ltd – Kvanefjeld Project EIA | 81
4. Regulatory Framework
4.1 Introduction
Greenland is part of the Kingdom of Denmark. Autonomous local governance was introduced to
Greenland in 1979 followed in 2009 by a new Act of Greenland Self Government, which formalised the
assumption by Greenland of the administration of natural resources including the administration of
environmental issues in relation to mine projects.
The Environmental Agency of the Mineral Resources Activities (EAMRA) is Greenland’s administrative
authority for environmental matters relating to mineral resources activities, including protection of
the environment and nature, environmental liability and environmental impact assessments.
The Mineral Licence and Safety Authority - MLSA is the administrative authority for licences and is the
authority for safety matters including supervision and inspections.
In addition to the requirements relating to the preparation of this EIA, the Project will also comply with
all other applicable Greenlandic and Danish legislation, including conventions to which Greenland is a
signatory.
4.2 Legislation concerning Greenland
Subsequent to the assumption by Greenland of responsibility for regulation and management of the
mineral sector, the Mineral Resource Act (MRA) came into force on 1 January 2010 (Greenland
Parliament Act no. 7 - 7 December 2009). A number of amendments have subsequently been made
to the legislation, the most recent in late 2019 with effect from 1 January, 2020.
The MRA is the backbone of the legislative regulation of the minerals sector, regulating all matters
concerning mineral resource activities, including environmental issues (such as pollution) and nature
protection.
Two authorities are responsible for the administration of mineral resources:
MLSA – an agency within the Ministry of Mineral Resources(MMR)
EAMRA – an agency within the Ministry of Research and Environment.
Under this structure, the MMR and the MLSA are responsible for mining licence administration and for
technical and geological matters.
The following legislation passed by the Greenlandic parliament is relevant to the development of the
Project:
Mineral Resources Act (Greenland Parliament Act No. 7 of 7 December 2009 (as amended))
Greenland Parliament Act No. 4 of June 4, 2012 on Greenland Oil Spill Response A/S (as
amended)
Greenlandic Parliament Act No. 33 of December 9, 2015 regarding Ionizing Radiation and
Protection Against Radiation
Greenland Parliament Act No. 25 of 18 December 2012 on building and construction work for
large scale projects (as amended).
Orders on Health and Safety:

Greenland Minerals Ltd – Kvanefjeld Project EIA | 82
Table 10 Orders on occupational health and safety relevant to the Project and safety
Order Year
Order no. 32 of 23 January 2006, rest periods and off-time in Greenland 2006
Order no. 155 of 18 April 1972, Pressure contained on land 1972
Order no. 133 of 5 February 2010, Asbestos 2010
Order no. 302 of 26 March 2015, Work in Relation with Extraction and Exploration for
the Extraction of Mineral Materials in Greenland
2015
Order no. 395 of 24 June 1986, Order on the performance of work 1986
Order no. 396 of 25 June, 1986, Work with substances and materials (chemicals) 1986
Order no. 399 of 24 June 1986, Layout/design of the Workplace 1986
Order no. 401 of 24 June 1986, Reporting of Work Related Injuries 1986
Order no. 656 of 12 May 2015, Technical Equipment 2015
Order no. 914 of 26 June 2013, Mandatory Education on Occupational Health and Safety 2013
Order no. 1168 of 8 October 2007, Work place assessment in Greenland 2007
Order no. 1344 of 15 December 2005, Duties of the Developer 2005
Order no. 1346 of 15 December 2005, Occupational health and safety work in Greenland, with amendment in Order no. 364 of 6 April 2010
2005, 2010
Order no. 1347 of 15 December 2005, Order on the construction owner’s obligations
and responsibility
2005
Order no. 1348 of 15 December 205, Arrangement of construction sites and similar work
places in Greenland
2005
An Executive Order from the Danish Working Environment Authority on Ionizing Radiation and working
environment in Greenland is pending.
The following legislation passed by the Danish parliament is relevant to the development of the
Project:
Act on working environment in Greenland cf. Statutory Order No. 1048 of 26 October 2005
(as amended)
Danish Act No. 621 of 8 June 2016 on the Control of Peaceful use of Nuclear Material in
Greenland
Act No. 616 of 8 June 2016 and Executive Order No. 67 of 22 January 2018 on the Control of
Exports of Dual Use Items in Greenland.
Due to the importance of the MRA, it is further described in the next section.
Greenland Minerals Ltd – Kvanefjeld Project EIA | 83
4.2.1 The Mineral Resource Act
The MRA stipulates the conditions which need to be met in order to conduct mining activities in
Greenland. Initially, a licensee must apply for and obtain an exploitation license for the area, which
can be granted pursuant to Section 16 of the MRA upon submission to the authorities of the following
documents:
An application with key information on the proposed mining project;
A bankable feasibility study
A navigational safety investigation study
An environmental impact assessment, and
A social impact assessment.
In accordance with the Guidelines, the aims of an environmental impact assessment are:
To estimate and describe the surrounding nature and the environment, as well as the
possible environmental impacts of the proposed project
To provide a basis for the consideration of the proposed project for Naalakkersuisut
To provide a basis for public participation in the decision-making process
To give the authorities all the information necessary to determine the conditions of
permission and approval of a proposed project.
An environmental impact assessment should have regard to:
§ 52 - The best available techniques must be used, including less polluting facilities,
machinery, equipment, processes and technologies should be applied
§ 53 - Planning and selection of all activities and construction must take place in a manner to
cause the least possible pollution, disturbance or other environmental impacts
§ 56 - Impairment or negative impacts on the climate must be avoided
§ 60 - Impairment of nature and the habitats of species in designated national and
international nature conservation areas and species must be avoided.
A licensee must also apply for and obtain approval of an exploitation plan for the Project, (Section 19
of the MRA) and a Project closure plan, (Section 43 of the MRA). Provided Section 19 and 43 approvals
are granted, specific constructions, processes, vehicles, devices etc must be approved in detail under
Section 86 of the Act.
GML submitted a draft of its EIA to the GoG in November 2015. Feedback received during an extensive
period of consultation with GoG agencies and advisers, and comments received on subsequent draft
EIAs have been incorporated in this revised document which comprises the Company’s EIA for the
Project.
4.2.2 National Guidelines
Table 11 sets out the Greenlandic national guidelines relevant to the environmental impact assessment
for the Project.
Table 11 Greenland Government guidelines for environmental impact assessments
Guidelines Year
Guidelines for preparing an Environmental Impact Assessment (EIA) report for mineral exploitation in Greenland
2015
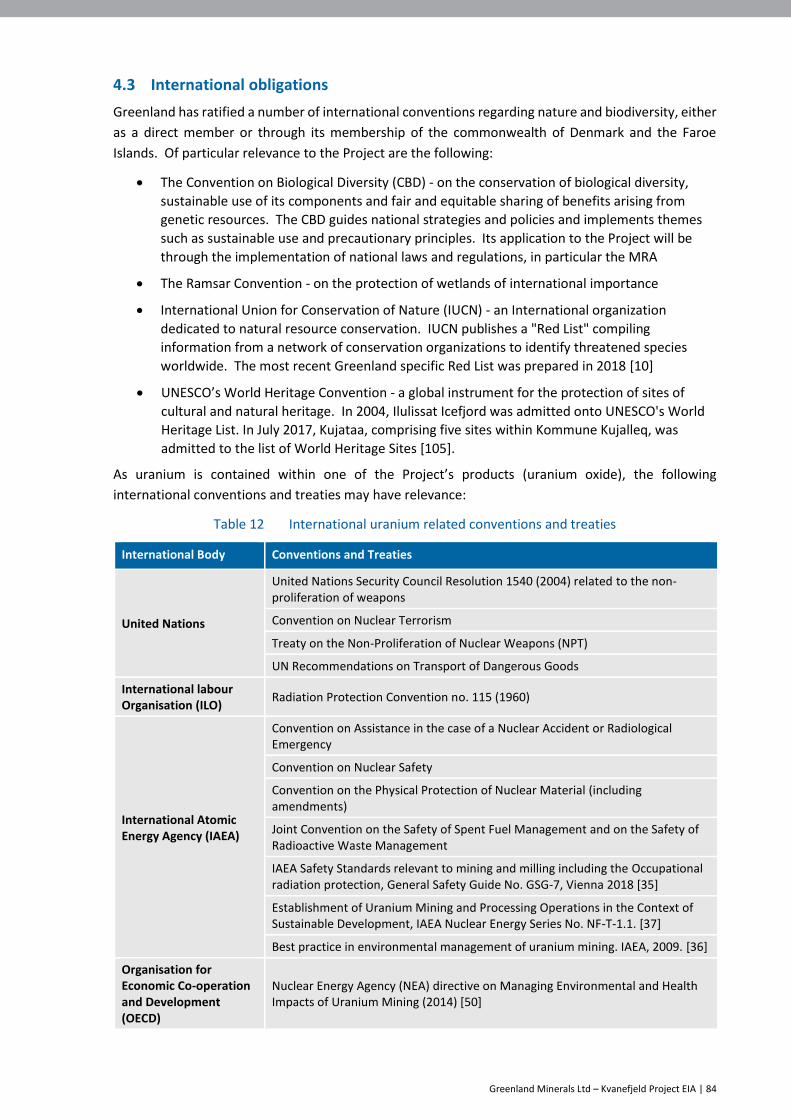
Greenland Minerals Ltd – Kvanefjeld Project EIA | 84
4.3 International obligations
Greenland has ratified a number of international conventions regarding nature and biodiversity, either
as a direct member or through its membership of the commonwealth of Denmark and the Faroe
Islands. Of particular relevance to the Project are the following:
The Convention on Biological Diversity (CBD) - on the conservation of biological diversity,
sustainable use of its components and fair and equitable sharing of benefits arising from
genetic resources. The CBD guides national strategies and policies and implements themes
such as sustainable use and precautionary principles. Its application to the Project will be
through the implementation of national laws and regulations, in particular the MRA
The Ramsar Convention - on the protection of wetlands of international importance
International Union for Conservation of Nature (IUCN) - an International organization
dedicated to natural resource conservation. IUCN publishes a "Red List" compiling
information from a network of conservation organizations to identify threatened species
worldwide. The most recent Greenland specific Red List was prepared in 2018 [10]
UNESCO’s World Heritage Convention - a global instrument for the protection of sites of
cultural and natural heritage. In 2004, Ilulissat Icefjord was admitted onto UNESCO's World
Heritage List. In July 2017, Kujataa, comprising five sites within Kommune Kujalleq, was
admitted to the list of World Heritage Sites [105].
As uranium is contained within one of the Project’s products (uranium oxide), the following
international conventions and treaties may have relevance:
Table 12 International uranium related conventions and treaties
International Body Conventions and Treaties
United Nations
United Nations Security Council Resolution 1540 (2004) related to the non-proliferation of weapons
Convention on Nuclear Terrorism
Treaty on the Non-Proliferation of Nuclear Weapons (NPT)
UN Recommendations on Transport of Dangerous Goods
International labour Organisation (ILO)
Radiation Protection Convention no. 115 (1960)
International Atomic Energy Agency (IAEA)
Convention on Assistance in the case of a Nuclear Accident or Radiological Emergency
Convention on Nuclear Safety
Convention on the Physical Protection of Nuclear Material (including amendments)
Joint Convention on the Safety of Spent Fuel Management and on the Safety of Radioactive Waste Management
IAEA Safety Standards relevant to mining and milling including the Occupational radiation protection, General Safety Guide No. GSG-7, Vienna 2018 [35]
Establishment of Uranium Mining and Processing Operations in the Context of Sustainable Development, IAEA Nuclear Energy Series No. NF-T-1.1. [37]
Best practice in environmental management of uranium mining. IAEA, 2009. [36]
Organisation for Economic Co-operation and Development (OECD)
Nuclear Energy Agency (NEA) directive on Managing Environmental and Health Impacts of Uranium Mining (2014) [50]

Greenland Minerals Ltd – Kvanefjeld Project EIA | 85
4.4 Shipping regulations
Maritime regulations in Greenland comprise the equivalent Danish regulations which have been
supplemented with specific regulations for navigation in Arctic regions. In addition, regulations and
codes administered by the International Maritime Organization (IMO), together with international
conventions adopted by Denmark, apply in Greenland.
A number of international maritime conventions and standards focus on environmental issues. These
include:
The MARPOL convention and the annexes (1973/78 International Convention for the
Prevention of Pollution From Ships) [42]
The BWM convention (2004 - International Convention for the Control and Management of
Ships’ Ballast Water and Sediments) [43]
The OPRC convention (1990 - International Convention on Oil Pollution Preparedness,
Response and Co-operation) [44]
2020 International Maritime Organisation Fuel Sulphur Regulation (IMO2020)
International Maritime Organisation’s International Code for Ships Operating in Polar Waters
(Polar Code, 2014)
The International Maritime Dangerous Goods Code (IMDG Code), 2018 Edition.
As a result of the special navigational conditions pertaining to Greenland waters, a safety package
relating specifically to Greenland topics has been issued by the Danish Maritime Authorities (DMA).
The safety package includes the following orders and recommendations relevant for the Project:
DMA Order no. 417 of 28 May 2009 [14]:
“Order on technical regulation on safety of navigation in Greenland territorial waters”
IMO recommendation A.1024 (26) [41]
“Guidelines for ships operating in polar waters”.
A special agreement has been entered into by the MLSA and the DMA regarding a “Guideline on
investigation of navigational safety issues in connection with mineral exploitation Projects in
Greenland as basis for navigation in the operations phase”. The guideline specifies the contents of a
navigational safety investigation to be carried out prior to starting the exploitation activities.
Blue Water Shipping has completed a Navigational Safety Investigation Study (NSIS) for the cargo
requirements for the Project [104]. This study has been reviewed and was accepted for use by the
DMA in October 2017 and will be available for review as part of the public consultation process for the
Project.
4.5 International Security Obligations
Uranium oxide produced at the Project will be sold to commercial electricity utilities for use as fuel in
nuclear power plants. All uranium oxide sales will be governed by export control and nuclear
safeguards laws enacted by Greenland and Denmark in 2016:
”Tunisassianik marloqiusamik atorneqartartunik avammut annissuinermik nakkutiginninneq pillugu Kalaallit Nunaannut inatsit”
”Atomip nukinganik atortussiat sorsunnerunngitsumut atornissaannik nakkutilliineq pillugu Kalaallit Nunaannut anatsit”
”Lov for Grønland om kontrol med eksport af produkter med dobbelt anvendelse (Nr. 616 2016)”

Greenland Minerals Ltd – Kvanefjeld Project EIA | 86
”Lov for Grønland om kontrol med den fredelige udnyttelse af nukleart material (Nr. 621 2016)”.

Greenland Minerals Ltd – Kvanefjeld Project EIA | 87
5. Project Alternatives
In order to identify the most appropriate design for the Project, a number of alternatives for aspects
of Project design have been identified and assessed. As per the MRA (Sections 51-54) the Project has
sought to apply Best Available Technology (BAT) and Best Environmental Practice (BEP) where this is
technically, practically and financially possible. A summary of the major alternatives considered is
provided below.
5.1 Not proceeding with Project
Not proceeding with the Project is an alternative in an economic environment characterised by volatile
commodity prices and increasing processing costs. Should the Project not proceed there would be no
Project related social, environmental or economic impacts, both beneficial and adverse.
The Project has the potential to provide significant short and long term social and economic benefits
to Greenland and in particular the Narsaq region including:
Over 1,100 direct construction jobs
More than 700 direct operations jobs
Capital expenditure of approximately USD 1.2Bn for the construction of the Project
Operational expenditure of approximately USD 260M per annum over the 37 year life of the
Project
Business opportunities for local and national suppliers to provide goods and services during
construction, operations and closure
Education and training opportunities
Revenue for Greenland in the form of production royalties, personal and company taxes
totalling in excess of ~ DKK 1,52 Bn pr annum (USD 242 M per annum) in nominal prices.
5.2 Processing Alternatives
Three alternative processing scenarios were examined in detail:
1. Concentrator only scenario
2. Mechanical (concentrator) and chemical processing (refinery) scenario
3. Greenland separation plant scenario.
Each of these options is discussed below.
5.2.1 Scenario 1: Concentrator only
The concentrator only scenario involves the separation of minerals using physical separation methods
only. This scenario would produce three products:
1. A REE and uranium bearing mineral concentrate
2. A zinc mineral concentrate
3. A chemical precipitate - fluorspar.
This scenario would produce the simplest form of REE product which would require further processing
outside Greenland and it avoids the high cost of building and operating a chemical processing facility
in Greenland.
Greenland Minerals Ltd – Kvanefjeld Project EIA | 88
5.2.2 Scenario 2: Mechanical (concentrator) and chemical processing (refinery)
This scenario allows REE and uranium bearing mineral concentrate to be treated to produce value
added products in Greenland. The treatment of the mineral concentrate produces the following
products:
Lanthanum oxide
Mixed lanthanum and cerium oxide
Cerium hydroxide
Mixed REE Oxide
Uranium Oxide
A zinc mineral concentrate
A chemical precipitate - fluorspar.
This scenario is aligned with the policy of the GoG to ensure that, as much as practically possible,
processing of mineral products takes place within Greenland. As such GML has selected this as its
preferred scenario. Under this scenario some of the REE products will require further processing
outside Greenland.
5.2.3 Scenario 3: Greenland Separation Plant
This scenario involves the construction of a REE separation complex in Greenland to produce 15
separated REE oxides. The metallurgical processing of REEs is one of the most complicated processes
in the mining and chemical industry. This scenario was considered from two perspectives: the
development of a Greenland separation plant; and the option to operate such a plant in-house.
It requires:
1. Proprietary extraction technology. This technology is not available for purchase or licensing as
it is a key commercial advantage for its current holders.
2. Significant additional capital expenditure which will increase the capital hurdle rate required
for Project financing.
3. Expertise and experience in the operation of separation plants neither of which are available
in Greenland and are globally scarce skills.
4. Support services for maintenance and materials supplies which are not currently available in
Greenland.
Other issues include: the fact that developing a REE separation process involves significant technical
risk; and being located far from customers and markets will increase transportation costs significantly.
For these reasons GML has concluded to that the development of in-house REE separation technology
is not feasible. However, it is important to note that a decision to not pursue a Greenland separation
plant at Project commencement does not mean that it cannot be considered subsequently as the
Project matures.
5.3 Alternative facility locations
Two potential locations for the concentrator, refinery, port and accommodation facilities were
considered:
1. Location East - where the processing plant and accommodation facilities would be located at
Ipiutaq and the port at Illunnguaq opposite Nunarsarnaq, 15 to 20 km northeast of Narsaq.
The ore would be transported by haul trucks through a tunnel from the pit at Kvanefjeld. This

Greenland Minerals Ltd – Kvanefjeld Project EIA | 89
scenario requires that the waste rock and tailings be deposited near the Ipiutaq area (see
Figure 27).
2. Location West - where all mine facilities would be situated in the Narsaq valley and near
surroundings, and with the port at Narsap Ilua (see Figure 28).
The proposed locations are identified in the SIA including details of the public consultation undertaken,
which resulted in Location West being identified as the preferred alternative.
Figure 27 Location East
Figure 28 Location West

Greenland Minerals Ltd – Kvanefjeld Project EIA | 90
5.4 Alternative port locations
Two potential port locations were considered within Narsap Ilua. The two locations can be seen on
Figure 29.
Figure 29 Alternative Port locations
Site 1 (on the Tunu Peninsula) offers good access for vessels and requires less dredging. Site 2 would
have been closer to the Project Area. Site 2 was rejected due to its proximity to a Norse farm ruin
(Dymaes) and the requirement for large-scale blasting to create space for container stacking and the
storage of bulk cargo.
5.5 Accommodation facilities
A number of options were considered for the accommodation of employees during the operations
phase of the Project. The choice of a primarily FIFO workforce means that whichever accommodation
option was selected, significant and regular turnover of residents would be expected as employees
travel on and off roster.
The two primary accommodation options which were assessed were:
Integrating new housing for the Greenlandic and foreign workforce into the town of
Narsaq, and
Building a security-controlled workers’ village on the north-west boundary of Narsaq.
The accommodation strategy needs to balance the benefits brought to Narsaq through revitalisation
of town facilities and houses with the long-term cost of maintaining any new facilities constructed to
support the Project. The strategy also needs to weigh the social change associated with integrating a
large foreign workforce into a small town against the reduced potential income for the town associated
with a closed accommodation option. The SIA provides more detail on this topic [69]. Taking account

Greenland Minerals Ltd – Kvanefjeld Project EIA | 91
of all these considerations, building a security-controlled workers’ village on the north-west boundary
of Narsaq was seen to present a better balance for Narsaq and the workforce. The location of the
Village will utilise currently vacant land. The development of a connecting road between the Port-
Mine Road and the Village will minimise traffic impacts in the town of Narsaq.
5.6 Tailings management alternatives
Tailings are typically discharged from a processing plant in the form of a slurry and are transported
from the process plant to a final storage area commonly known as a tailings storage facility [1] [72].
The selection of BAT for tailings management depends on the technical characteristics of the waste
facility, its geographic location and the local environmental conditions [37] [80] [99]. The Best
Available Techniques Reference Document for the Management of Waste from Extractive Industries
[100] does not prescribe any technique or specific technology for the management of waste, but
requires BAT to be defined based on the conditions outlined above. Directive 2008/1/EC of 17 January
2008 [106] concerning integrated pollution prevention and control provides the following definition of
BAT:
‘best available techniques’ means the most effective and advanced stage in the development of
activities and their methods of operation which indicate the practical suitability of particular techniques
for providing in principle the basis for emission limit values designed to prevent and, where that is not
practicable, generally to reduce emissions and the impact on the environment as a whole:
(a) ‘techniques’ shall include both the technology used and the way in which the installation is
designed, built, maintained, operated and decommissioned;
(b) ‘available techniques’ means those developed on a scale which allows implementation in the
relevant industrial sector, under economically and technically viable conditions, taking into
consideration the costs and advantages, whether or not the techniques are used or produced
inside the Member State in question, as long as they are reasonably accessible to the
operator;
(c) ‘best’ means most effective in achieving a high general. level of protection of the environment
as a whole’
Under the OSPAR Convention [98], Best Environmental Practice (BEP) is defined as “the application of
the most appropriate combination of environmental control measures and strategies”. Furthermore,
it is noted that BEP for a particular source will change with time in the light of technological advances,
economic and social factors, as well as changes in scientific knowledge and understanding.
There are a range of proven approaches and emerging technologies to manage the disposal of tailings
[2]. Factors which influence the selection of the tailings disposal method and location include:
ore types and geochemistry
the volume of tailings produced
the metallurgical process producing the tailings
the quality of process water
reagents used in the metallurgical process, and
the environment (both physical and social) in which the tailings storage facility is situated.

Greenland Minerals Ltd – Kvanefjeld Project EIA | 92
Various designs and operating philosophies for tailings management exist; however, the vast majority
of tailings are deposited in land-based extractive waste facilities. The most common methods include
[100]:
Deposition of slurried waste in pond type facilities with or without dams
Deposition of thickened or paste extractive waste into sub-aerial extractive waste facilities
Dry stacking of wet or dry filter cakes of extractive waste to extractive waste facilities
Deposition of dry extractive waste onto heap-type or hillside extractive waste facilities.
The selected approach to managing and storing tailings must address 3 important, and closely
interrelated questions:
Where to locate the long-term tailings storage facility?
Considering site-specific factors including proximity to settlements and houses, hydrology,
topography, climate, geochemistry and land use
In what form will the tailings be deposited in the tailings storage facility and how will they
be covered during the Project’s operations phase?
A range of options from slurry to filter cake, with either dry or wet cover
How to manage the tailings storage facility after mining activities have ceased?
Whether to place a dry or wet permanent cover on the tailings storage facility
5.6.1 Evaluation of Options
The evaluation of options for the location, disposal method and closure of the TSF was conducted in
the steps summarized below
Based on topographical analysis, seven sites were identified as potential locations for the tailings
storage facility for the Project. The assessment was not limited to locations within the Company’s
current license boundaries [1] [2] The seven sites identified by the desktop assessment were:
A. Taseq basin area
B. South of the open pit, north east of the town of Narsaq
C. Central valley site, east of the Nakkaalaaq range
D. Natural basin, east of the Nakkaalaaq range
E. Valley site, west of Mt Naajarsuit
F. Sarfannguit Fjord, northwest of Ipiutaq
G. Valley site, east of the Nakkaalaaq range.
These sites are shown on the two images below.

Greenland Minerals Ltd – Kvanefjeld Project EIA | 93
Figure 30 3D view of alternative tailings facility sites
Figure 31 Alternative tailings facility sites
Placement of tailings into the mined out open pit mine was considered as an option for assessment.
However, as the single open pit is active for the duration of operations it was not considered practical
to dispose tailings into the same area as an active mine [83]. There are also significant environmental
risks and costs relating to the potential for seepage, the release of salts and the impact on pit wall
stability associated with returning tailings to the open pit at the end of mine life.
A further alternative, tailings and waste rock co-disposal, was also assessed. Under this approach,
dewatered tailings are stored with waste rock after physically blending up to 10% tailings per unit of
waste rock and placing the remaining product into a "void" formed within the WRS. The void is then
sequentially covered with rock. As a result of the potential environmental impacts from dust and
radon/thoron exhalation from desiccated tailings, together with the requirement for further materials
Greenland Minerals Ltd – Kvanefjeld Project EIA | 94
handling at the Plant and transportation to the WRS, co-disposal was considered unsuitable for the
Project.
The relative merit of each of the seven sites was ranked by reference to potential environmental, social
and technical risks. Comparative costs for the various options were not assessed as part of this ranking,
however economic and technical viability considerations informed the final selection
In order to facilitate the development of a method to rank the seven sites, a range of criteria
(environmental, social and technical) were identified.
The factors considered in the ranking were:
Catchment/water supply
Footprint
Vegetation
Settlements impact/land use
Visual impact
Local ecology and recreation
Geotech/geology
Technical viability.
The scores reflect the likelihood of impact from the development based on each factor. The costs
necessary to mitigate issues are also reflected in the scores.
A score of 1 is given to minor potential impacts whereas a score of 2 or 3 is used to highlight differences
between a minimal effect and more adverse impacts.
Scoring a 3 on any criteria identifies a potentially unacceptable impact to the use of that location as a
TSF.
1. Water Catchment
Potential impacts to water catchment areas were assessed based on site geology, community water
supply abstraction points and surface water sources.
Score 1 No impact to community water supply or surface water sources. Area is
downstream of water source
Score 2 Potential impact to community water supply or surface water sources
Score 3 Impacts community water supply.
2. Footprint
The amount of land disturbance was based on the immediate footprint required for each facility and
its associated supporting infrastructure, including pipelines and roads required to connect the TSF to
the plant location (ranked smallest to largest).
Score 1 Relatively small footprint
Score 2 Of intermediate scale
Score 3 Relatively large footprint.

Greenland Minerals Ltd – Kvanefjeld Project EIA | 95
3. Biodiversity
Impact on biodiversity was assessed based on presence of vegetation, and the intrinsic value of the
vegetation and fauna habitat.
Score 1 Area is barren rock or has no particular habitat value
Score 2 Vegetation is evident but common. Habitat value is low
Score 3 Vegetation is evident, potentially rare or has commercial value. Habitat value is
high.
4. Settlement impact
Impact was assessed by reference to the proximity to local population or communities
Score 1 Relatively distant from any human habitation
Score 2 Located within 4-8 km of human habitation
Score 3 Located closer than 4km to human habitation.
5. Visual impact
Impact was assessed by reference to the proximity to local population or communities
Score 1 Unlikely to be visible from vantage points
Score 2 Visible from at least 1 vantage point
Score 3 Visible from a number of potential vantage points.
6. Ecosystem services and recreation
The Project has the potential to generate impacts to the benefits people derive from ecosystems
(referred to as ecosystem services) through the disruption of the existing ecosystem as a result of its
activities. Types of potential impact include: impacts to recreational use of areas, impacts to water
sources and landform stability (e.g. erosion protection), and impacts to cultural areas (e.g. heritage
sites).
Score 1 Limited or no impact to ecosystem services
Score 2 Moderate impact
Score 3 Significant impact from land clearing, noise, dust, access restriction etc.
7. Geotech/geology
The level of porosity in the geological substrate that underlies the potential sites
Score 1 Underlain by non-porous crystalline igneous rock with low permeability
Score 2 Underlain by layers of differing levels of porosity
Score 3 Underlain by medium to coarse grained sandstones.
8. Technical viability
The technical viability of a potential site considers the physical distance between the site and Plant,
the elevation changes between the two sites and the relative ease of construction of the infrastructure
corridor between the two facilities (referred to in the descriptors below as topography). The lower the
practical accessibility, the greater the environmental impact anticipated from developing and
operating the infrastructure corridor.

Greenland Minerals Ltd – Kvanefjeld Project EIA | 96
Score 1 Short distances, storage facilities at similar or lower RLs, benign impact of
topography
Score 2 At least one of the three factors identified above having a significantly negative
impact
Score 3 Longer distances, storage facilities at higher RLs or requiring traversing of an
infrastructure corridor with higher RLs, negative impact of topography.
The assessment of the impact of each of the criteria has been tabulated below.
Table 13 Assessment of impact by criteria by option
Criteria TSF Site Option
A B C D E F G
Catchment / Water Supply 2 2 3 2 2 3 2
Footprint 2 1 2 2 2 3 3
Biodiversity 1 3 2 2 1 3 1
Settlements Impact/land use/ownership 2 3 2 1 1 3 1
Visual Impact 2 3 2 2 2 3 3
Local ecology and recreation 2 3 2 2 2 2 3
Geotech / Geology* 1 2 2 2 2 2 3
Technical viability 1 1 3 2 3 3 3
Total Score 13 18 18 15 15 22 19
*As noted in Section 10, further hydrogeological drilling is planned for Taseq basin. Based on current knowledge, the
geology / geotech rating is evaluated to be a 1, however even if this were to change to a 2, Site A would still remain the
lowest scoring site.
After consideration of all factors the preferred site was A – the Taseq basin area. It scored the lowest
overall ranking and no criteria was assessed with a 3 thereby avoiding the risk of an unacceptable
impact associated with the location.
After a qualitative assessment considering these 8 criteria, the Taseq basin (referred to as Taseq)
emerged as the preferred location for the TSF [1].
It is an impermeable basin
There is no competing land use
Taseq lake is of low biodiversity value
There is no direct linkage to drinking water systems
It is at a safe pumping distance and height from the Plant
It allows for water cover to prevent dust emissions
It is located on the intrusion so the area already displays elevated radioactivity
It is not visible from fjord marine traffic
It requires the lowest embankment walls.
Having identified Taseq as the preferred location for the TSF, three forms of tailings were considered:
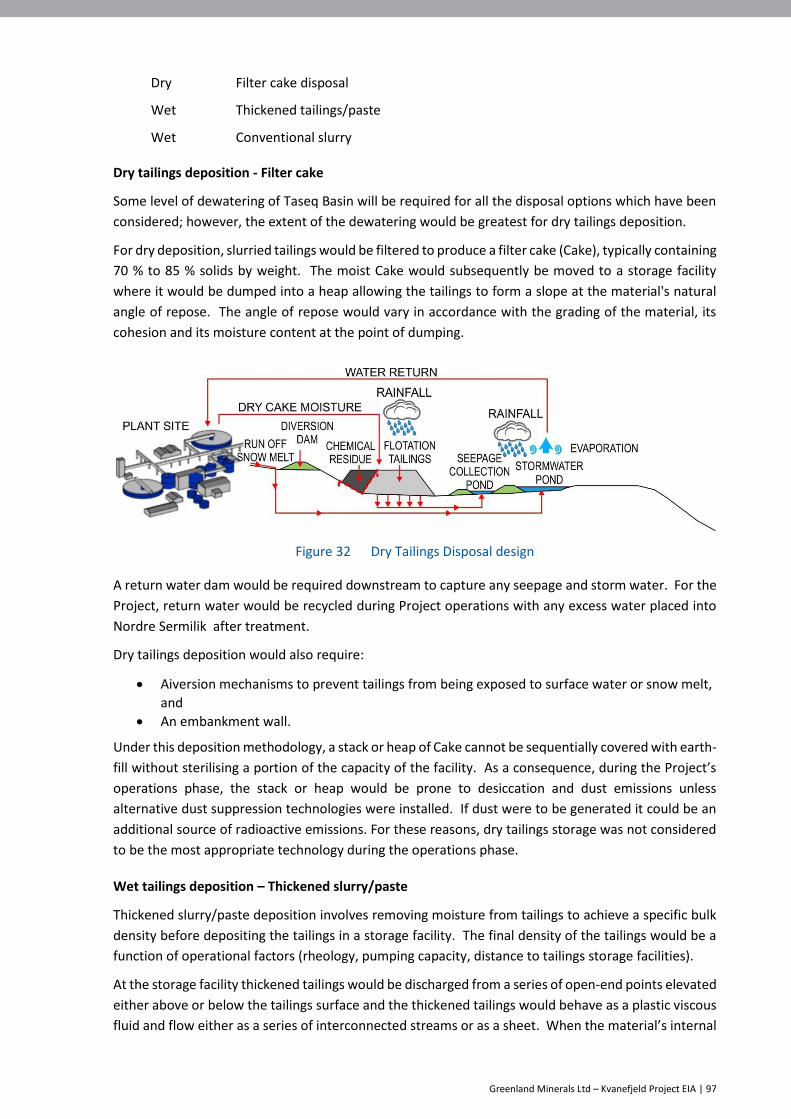
Greenland Minerals Ltd – Kvanefjeld Project EIA | 97
Dry Filter cake disposal
Wet Thickened tailings/paste
Wet Conventional slurry
Dry tailings deposition - Filter cake
Some level of dewatering of Taseq Basin will be required for all the disposal options which have been
considered; however, the extent of the dewatering would be greatest for dry tailings deposition.
For dry deposition, slurried tailings would be filtered to produce a filter cake (Cake), typically containing
70 % to 85 % solids by weight. The moist Cake would subsequently be moved to a storage facility
where it would be dumped into a heap allowing the tailings to form a slope at the material's natural
angle of repose. The angle of repose would vary in accordance with the grading of the material, its
cohesion and its moisture content at the point of dumping.
Figure 32 Dry Tailings Disposal design
A return water dam would be required downstream to capture any seepage and storm water. For the
Project, return water would be recycled during Project operations with any excess water placed into
Nordre Sermilik after treatment.
Dry tailings deposition would also require:
Aiversion mechanisms to prevent tailings from being exposed to surface water or snow melt,
and
An embankment wall.
Under this deposition methodology, a stack or heap of Cake cannot be sequentially covered with earth-
fill without sterilising a portion of the capacity of the facility. As a consequence, during the Project’s
operations phase, the stack or heap would be prone to desiccation and dust emissions unless
alternative dust suppression technologies were installed. If dust were to be generated it could be an
additional source of radioactive emissions. For these reasons, dry tailings storage was not considered
to be the most appropriate technology during the operations phase.
Wet tailings deposition – Thickened slurry/paste
Thickened slurry/paste deposition involves removing moisture from tailings to achieve a specific bulk
density before depositing the tailings in a storage facility. The final density of the tailings would be a
function of operational factors (rheology, pumping capacity, distance to tailings storage facilities).
At the storage facility thickened tailings would be discharged from a series of open-end points elevated
either above or below the tailings surface and the thickened tailings would behave as a plastic viscous
fluid and flow either as a series of interconnected streams or as a sheet. When the material’s internal

Greenland Minerals Ltd – Kvanefjeld Project EIA | 98
friction exceeds the forces causing it to flow, the stream would stop moving and both coarse and fine
particles would settle out together liberating the interstitial free water.
The resultant beach surface usually comprises in excess of 95 % of the discharged solids and is relatively
erosion resistant under normal conditions.
Resultant supernatant typically would be treated and recycled.
Paste thickened tailings disposal is generally considered suitable for tailings which exhibit a particle
size grading of at least 15 % below 20 μm. As this profile is not consistent with the profile of Project’s
tailings stream this method of tailings deposition was not considered to be appropriate for the Project.
Wet tailings deposition – Traditional Slurry
Slurry disposal of tailings is used extensively in the mining industry.
Slurried tailings can be deposited into a storage facility sub-aqueously or sub-aerially.
a) Sub-aerial (above water) deposition
Slurry is pumped via pipeline from source to deposition points (spigots, cyclones, open pipes)
located above the disposal area within the storage facility.
Early separation of interstitial water from the mass is encouraged by sequentially discharging
the tailings onto the upstream beach in small layers. Gently sloping beaches of settled material
form at the outlets.
The discharge points are regularly moved and recently deposited layers dry. After an
appropriate period, a new layer of tailings is then placed over the dried area.
A sub aerial slurry tailings storage facility cannot be sequentially covered with earth-fill without
sterilising a portion of capacity of the facility. As a consequence, during the operations phase of
a project, as material dries it can be prone to desiccation and dust emissions and can be an
additional source of radioactive emissions.
Given the potential for dust and the associated radon risk, sub-aerial deposition of tailings is not
considered appropriate for the Project.
b) Sub-aqueous (below water) deposition
Tailings storage facilities containing tailings with the potential to produce acid mine drainage
are typically covered with water to prevent oxidation. The Project’s orebody is not characterized
by sulfide mineralization. However, the Project’s tailings are radioactive and a water cover
provides an effective barrier to this level of radioactivity.
Slurry would be pumped via pipeline from the source to open-ended pipe deposition points
located below the surface of water covering the tailings storage facility. A floating barge could
also be utilised to assist in the distribution of tailings.
The sequential hydraulic deposition of tailings sub-aqueously encourages natural separation
with coarse material being deposited on a steep sub-aqueous beach adjacent to the point of
deposition and the finer material being transported further into the supernatant pond where,
depending on the time of retention, it will settle out and consolidate.

Greenland Minerals Ltd – Kvanefjeld Project EIA | 99
Figure 33 Wet Tailings Deposition design
Due to the potential for high colloidal levels within the supernatant water, direct discharge of excess
supernatant to the environment is not typically possible and return water would be recycled.
In summary, a naturally wet environment (such as Taseq basin) limits the practicality of storing a dry
tailings product for deposition during the Project’s operations. The physical properties of the Project’s
tailings also challenge the viability of producing a high-density tailings product required for thickened
paste [72]. Slurry deposition is a standard technique, widely used around the world, which suits the
material characteristics of the tailings from Kvanefjeld.
Tailings in a slurried form can be deposited either sub-aqueously or sub-aerially. A water cover
maintained during sub-aqueous deposition will attenuate radiation exposure, desiccation and dust
during Project operations and sub-aqueous deposition [2].
On this basis, conventional slurry with sub-aqueous deposition has been selected as the preferred form
of tailings.
While sub-aqueous tailings deposition was identified as the preferred option for the Project, in January
2018, an environmental risk assessment (ERA) on tailings disposal options in the Taseq basin was
prepared by Wood plc (previously known as Amec Foster Wheeler) [72] to review this decision.
The ERA assumed that the TSF in the Taseq basin would be designed, operated and maintained utilising
BAT and BEP having regard to guidelines and recommendations from the IAEA, the Mine Environment
Neutral Drainage (MEND) Program, the Mining Association of Canada and international best practice,
including that of the European Commission.
The 2 options for tailings deposition reviewed in the ERA were: dry stacking of Cake and sub aqueous
deposition of conventional slurry tailings.
For the review of the dry deposition it was assumed that tailings would be filtered at the Plant and
trucked and deposited into a dewatered Taseq basin. It was further assumed that a seepage return
water pond would be constructed downstream to capture any seepage and storm water and excess
water would be recycled.
The ERA concluded:
“The environmental risks associated with wet vs dry deposition during operation are very similar.
Twelve risks were identified with the wet deposition of which four are moderate and ten risks with dry
deposition of which four are also moderate and the rest low”.
The 4 material risks for dry deposition that were ranked as moderate were:
Major slope failure of dry stack
Need to release untreated water to Nordre Sermilik
Greenland Minerals Ltd – Kvanefjeld Project EIA | 100
Transport of contaminated particulate matter as dust into the valley from the TSF
Spillage of return water between TSF and the water treatment plant during transportation.
Mitigation measures for these risks were considered in the ERA but have not been further discussed
in this EIA as dry tailings deposition was not selected for the Project.
The 4 material risks for sub-aqueous wet tailings deposition that were ranked as moderate were:
Full failure of embankment
Partial embankment failure
Spillage of return water during transportation
Need to release untreated water into Nordre Sermilik.
These risks would be managed utilizing a suite of mitigation measures including:
Designing the embankment in accordance with international best practice and International Commission on Large Dams (ICOLD) design criteria and guidelines including designing embankments to maintain stability during a maximum credible earthquake (MCE).
Utilisation of best practice for tailings emplacement
Monitoring of the integrity of the facility, potential seepage, water quality and return water pipelines
Emergency retention ponds along the pipeline route
Insulated pump housings to avoid freezing
An emergency response plan making provision for potential spillage
TSF capacity designed to accommodate a 1:10,000 storm event.
The findings from the ERA reinforced the understanding that wet and dry tailings disposal options
present different risks, however in aggregate they are considered to present a similar environmental
risk profile. This was considered to validate the original choice of sub-aqueous deposition of slurry
tailings for the operations phase of the Project.
Closure Tailings Cover Options
Upon closure, a long-term cover will be required for the tailings facility. The two options for closure
of the TSF which were assessed with the goal of achieving long-term containment of the TSF were:
A “wet” cover where the tailings are contained by a permanent water cap, and
A “dry” cover where the tailings are contained by an engineered fill cover.
The “wet” and “dry” cover options which were assessed represent opposite ends of a closure
spectrum, and additional alternative options which lie somewhere between these two options have
not been assessed.
1. “Wet” Closure Cover
Wet cover would involve retaining a layer (minimum of 1.5 m) of water on top of the tailings to avoid
exposure of the tailings to the atmosphere. If required, a thin layer of shallow, inert sand would be
applied sub-aqueously on top of tailings to prevent re-suspension.
Supernatant water would be treated for a minimum of 6 years after the end of mining and processing
activities in order to meet water quality criteria at which point surface water will be allowed to return
to the basin.
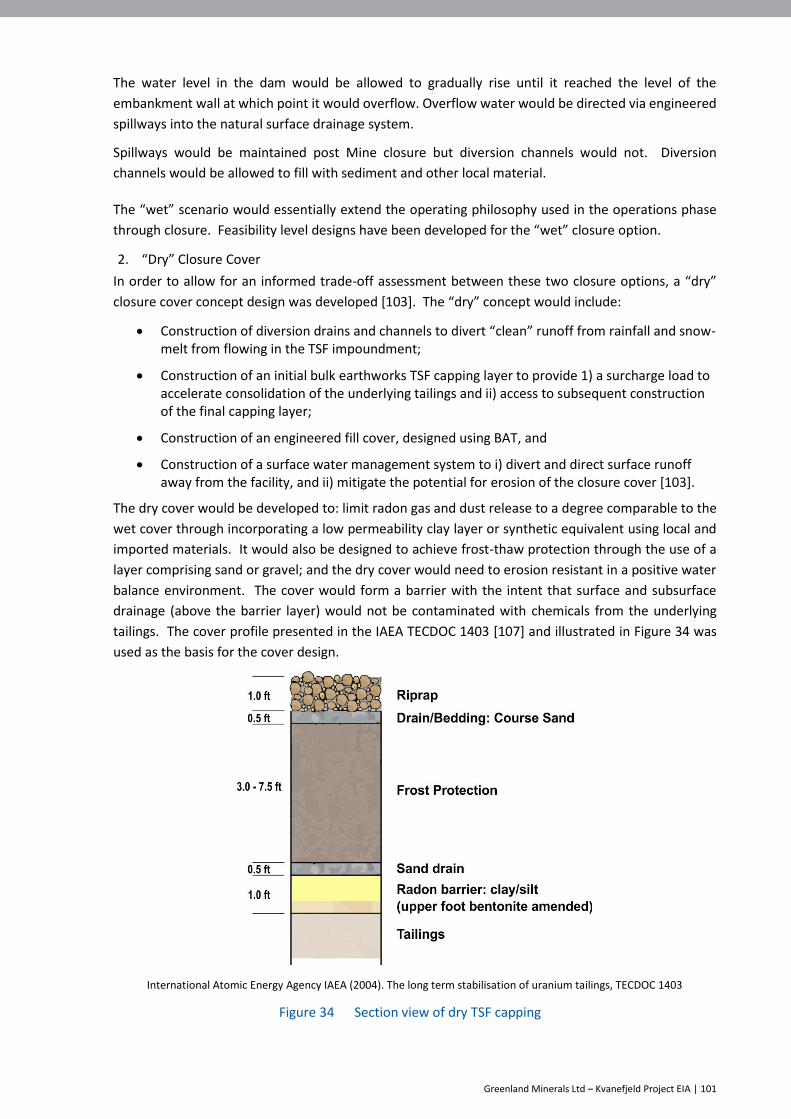
Greenland Minerals Ltd – Kvanefjeld Project EIA | 101
The water level in the dam would be allowed to gradually rise until it reached the level of the
embankment wall at which point it would overflow. Overflow water would be directed via engineered
spillways into the natural surface drainage system.
Spillways would be maintained post Mine closure but diversion channels would not. Diversion
channels would be allowed to fill with sediment and other local material.
The “wet” scenario would essentially extend the operating philosophy used in the operations phase
through closure. Feasibility level designs have been developed for the “wet” closure option.
2. “Dry” Closure Cover
In order to allow for an informed trade-off assessment between these two closure options, a “dry”
closure cover concept design was developed [103]. The “dry” concept would include:
Construction of diversion drains and channels to divert “clean” runoff from rainfall and snow-melt from flowing in the TSF impoundment;
Construction of an initial bulk earthworks TSF capping layer to provide 1) a surcharge load to accelerate consolidation of the underlying tailings and ii) access to subsequent construction of the final capping layer;
Construction of an engineered fill cover, designed using BAT, and
Construction of a surface water management system to i) divert and direct surface runoff away from the facility, and ii) mitigate the potential for erosion of the closure cover [103].
The dry cover would be developed to: limit radon gas and dust release to a degree comparable to the
wet cover through incorporating a low permeability clay layer or synthetic equivalent using local and
imported materials. It would also be designed to achieve frost-thaw protection through the use of a
layer comprising sand or gravel; and the dry cover would need to erosion resistant in a positive water
balance environment. The cover would form a barrier with the intent that surface and subsurface
drainage (above the barrier layer) would not be contaminated with chemicals from the underlying
tailings. The cover profile presented in the IAEA TECDOC 1403 [107] and illustrated in Figure 34 was
used as the basis for the cover design.
International Atomic Energy Agency IAEA (2004). The long term stabilisation of uranium tailings, TECDOC 1403
Figure 34 Section view of dry TSF capping

Greenland Minerals Ltd – Kvanefjeld Project EIA | 102
Assessment of Closure Cover Options
The long-term closure options for the TSF have been the subject of a number of assessments [1] [2]
[72] [77]. The most recent trade-off study, conducted in 2020, compared the design concepts for “wet”
and “dry” cover in terms of their ability to meet the closure principles of the Project. Notably the
closure principles (physical stability, chemical stability, minimized radiological impact; and minimal
significant change to baseline landforms) were developed drawing on the Integrated Mine Closure
Good Practice Guide from the International Council on Mining and Metals (ICMM).
Each of the closure principles was expanded to define twelve closure objectives, against which the
performance of the two cover options could be assessed. These objectives are shown in Table 14.
Table 14 Cover options comparison assessment – Closure Objectives ([77] – Table 3.1)
Core Closure Principles
Cover Options Closure Objectives Phase Relative
Importance
Physical Stability
Option mitigates potential magnitude of failure during post-closure phase
Post-Closure High (5)
Option mitigates potential for erosion and sedimentation of covers during post-closure
Post-Closure Moderate (3)
Option minimises requirement for maintenance during post-closure phase
Post-Closure High (5)
Option can be implemented primarily using mine waste materials
Implementation Moderate (3)
Chemical Stability
Option mitigates risk of tailing re-mobilisation during post-closure phase
Post-Closure High (5)
Option reduces potential for seepage during post-closure phase
Post-Closure Moderate (3)
Option mitigates potential post-closure requirement for water collection and treatment
Post-Closure Moderate (3))
Minimized Radiological Impact
Option mitigates risk of cover functionality loss due to climatic events
Post-Closure High (5)
Option can be implemented within reasonable timeframe (< 10 years)
Implementation Moderate (3)
Option reduces potential for dust generation (Radon exposure) during implementation
Implementation Moderate (3)
No Significant Change to Baseline Lanforms
Option can achieve end land-use analogous to existing land-use (lake)
Post-Closure Low (1)
Option will require limited additional disturbance to implement (borrow sources)
Implementation Low (1)
Note: (1) Importance rated as either 1 (Low), 3 (Moderate), or 5 (High)
The relative importance of each objective was also assessed, and rated as indicated in same table. A
multi-criteria comparison assessment was undertaken whereby each closure cover option was
assessed independently against the criteria in Table 14 in terms of the independent consultant’s
confidence in the option achieving the objective. Each objective was the factored based on the
perceived uncertainty in the assessment. The uncertainty considers the background information
available and the analysis completed to date for the “wet” and “dry” cover options. A higher
uncertainty resulted in a reduction of the rating [77].
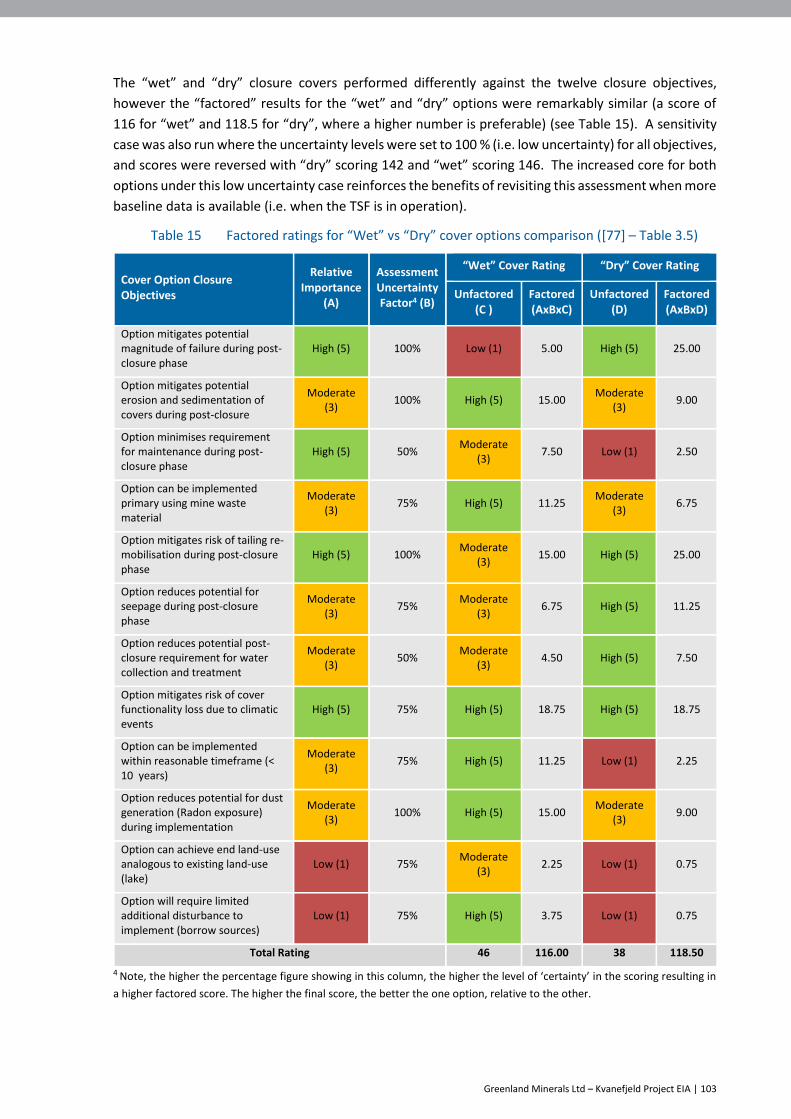
Greenland Minerals Ltd – Kvanefjeld Project EIA | 103
The “wet” and “dry” closure covers performed differently against the twelve closure objectives,
however the “factored” results for the “wet” and “dry” options were remarkably similar (a score of
116 for “wet” and 118.5 for “dry”, where a higher number is preferable) (see Table 15). A sensitivity
case was also run where the uncertainty levels were set to 100 % (i.e. low uncertainty) for all objectives,
and scores were reversed with “dry” scoring 142 and “wet” scoring 146. The increased core for both
options under this low uncertainty case reinforces the benefits of revisiting this assessment when more
baseline data is available (i.e. when the TSF is in operation).
Table 15 Factored ratings for “Wet” vs “Dry” cover options comparison ([77] – Table 3.5)
Cover Option Closure Objectives
Relative Importance
(A)
Assessment Uncertainty Factor4 (B)
“Wet” Cover Rating “Dry” Cover Rating
Unfactored (C )
Factored (AxBxC)
Unfactored (D)
Factored (AxBxD)
Option mitigates potential magnitude of failure during post-closure phase
High (5) 100% Low (1) 5.00 High (5) 25.00
Option mitigates potential erosion and sedimentation of covers during post-closure
Moderate (3)
100% High (5) 15.00 Moderate
(3) 9.00
Option minimises requirement for maintenance during post-closure phase
High (5) 50% Moderate
(3) 7.50 Low (1) 2.50
Option can be implemented primary using mine waste material
Moderate (3)
75% High (5) 11.25 Moderate
(3) 6.75
Option mitigates risk of tailing re-mobilisation during post-closure phase
High (5) 100% Moderate
(3) 15.00 High (5) 25.00
Option reduces potential for seepage during post-closure phase
Moderate (3)
75% Moderate
(3) 6.75 High (5) 11.25
Option reduces potential post-closure requirement for water collection and treatment
Moderate (3)
50% Moderate
(3) 4.50 High (5) 7.50
Option mitigates risk of cover functionality loss due to climatic events
High (5) 75% High (5) 18.75 High (5) 18.75
Option can be implemented within reasonable timeframe (< 10 years)
Moderate (3)
75% High (5) 11.25 Low (1) 2.25
Option reduces potential for dust generation (Radon exposure) during implementation
Moderate (3)
100% High (5) 15.00 Moderate
(3) 9.00
Option can achieve end land-use analogous to existing land-use (lake)
Low (1) 75% Moderate
(3) 2.25 Low (1) 0.75
Option will require limited additional disturbance to implement (borrow sources)
Low (1) 75% High (5) 3.75 Low (1) 0.75
Total Rating 46 116.00 38 118.50
4 Note, the higher the percentage figure showing in this column, the higher the level of ‘certainty’ in the scoring resulting in
a higher factored score. The higher the final score, the better the one option, relative to the other.

Greenland Minerals Ltd – Kvanefjeld Project EIA | 104
Two more sensitivity cases were also undertaken to assess the effect of bias towards implementation
risk mitigation versus post-closure risk mitigation. Under the post-closure risk mitigation case, “dry”
closure outperformed “wet” closure (a score of 128 to 117.5 respectively). However, in the
implementation risk case, “wet” closure significantly outperformed “dry” closure (a score of 101.5 to
58). The scale of the gap between the “wet” and “dry” score for the implementation risk is
representative of the complexity of achieving the “dry” closure cover compared to the “wet” cover.
The results of this trade-off study demonstrate the different merits of the two options, while also
indicating than at an aggregate level, they deliver a similar “factored” outcome against the closure
objectives. Given the relative aggregate equivalence of the performance of the two cover options, the
Project design has selected a “wet” cover for closure as it represents a simpler implementation option.
However, with the evolution of time, technology is likely to develop and greater certainty around the
operational performance of the TSF will have been achieved. For these reasons, a feasibility study will
be conducted in advance of closure to revisit this options assessment to ensure the most appropriate
design is applied at the time of closure.
5.7 Energy alternatives
Diesel
The original Project design included the installation of a 59 MW HFO-fired combined heat and power
station which produces significantly higher levels of sulphur emissions than the generation of
equivalent levels of electricity from diesel combustion. On this basis, the Project fuel source was
changed from HFO to diesel in 2018. The Project emissions reported in this EIA reflect the use of diesel
as primary fuel source for power generation [19].
Hydroelectricity
The use of hydropower for the Project was first studied by Risø in the 1980s [108]. Johan Dahl Land,
located approximately 55 km away, was identified as a potentially suitable source for hydropower.
The Project commissioned experienced hydropower plant specialists to determine the feasibility of
supplying hydropower to the Project [51] [51a]. This study identified that to provide the hydropower
energy to meet the electrical power requirements (approximately 35 MW) for treating 3 Mtpa of ore
would require the damming and diversion of three elevated lakes in the Johan Dahl area. This would
also require the construction of a diversion tunnel to be built that feeds lake water to hydro turbines
for electricity production. The electricity would then need to be transmitted to the Project site from
John Dahl Land by an above ground 55 km power line [29].
On the basis of the substantial infrastructure construction required this option was not considered
feasible for the first stage of Project development. Future expansion options will reconsider the use
of hydropower as a source of electricity.

Greenland Minerals Ltd – Kvanefjeld Project EIA | 105
6. Environmental impact assessment methodology
6.1 Introduction
The Project’s EIA takes into account a number of factors as summarised in Section 6.2.
This impact assessment was undertaken in compliance with the MRA and identifies potential
environmental impacts associated with construction, operations and closure of the Project, as well as
proposed mitigation measures.
Studies performed by independent consultants include, amongst others, the following:
Physical
Noise Assessment (Orbicon) [52]
Hydrology and Climate Report (Orbicon) [51] [51a]
Probabilistic Seismic Hazard Assessment (KCB) [92].
Atmospheric
Air Quality Assessment (ERM) [19]
Greenhouse Gas Assessment (ERM) [20].
Radiological emissions
Radiological assessment (ARCADIS Canada) [5]
Uranium Product Transportation Assessment (ARCADIS Canada) [3]
Radiation Monitoring Plan Outline (ARCADIS Canada) [4]
Radon and Thoron Releases (ARCADIS Canada) [6]
Radiological Consequence Report Rev 2 (Arcadis) [110]
Risk Assessment Transportation (SENES) [65] [66]
Wind Dispersion (Orbicon) [59]
Air Quality Addendum for Dam Failure Scenarios (ERM) [90]
Seismic Stability Assessment of FTSF and CRSF (KCB) [75]
Dam Failure Report (KCB) [74]
Closure Cover Options Comparison Assessment (KCB) [77]
Dry Closure Concept Design (KCB) [103].
Water
Hydrology and Climate (Orbicon) [51]
Tailings and Waste Rock Stockpile (Orbicon) [53]
Hydrocarbon and Chemical Spill Report (Orbicon) [55]
Natural Environment of the Study Area (Orbicon) [57]
Preliminary Groundwater Impact Assessment from Tailings Facilities (GHD, Orbicon) [24]
Water Quality Assessment of Tailings Water and Waste Rock Run off (Orbicon) [58]

Greenland Minerals Ltd – Kvanefjeld Project EIA | 106
Marine Discharges and Fjord Dynamics - Modelling and Interpretation of Ecotoxicology
Studies (DHI) [17]
Life of Mine Modelling (Water, Fluoride and Uranium - GoldSim) (GHD) [23]
Wind Dispersion (Orbicon) [59]
Taseq Basin Groundwater Hydrology (Orbicon) [60]
Fluoride Levels in Taseq Tailings Dam (Orbicon) [61]
Woods / AMEC (2017) TSF Environmental Risk Assessment [72]
Dam Failure Report (KCB) [74]
Seismic Stability Assessment of FTSF and CRSF (KCB) [75]
Seepage Technical Memorandum (Orbicon) [88]
Air Quality Addendum for Dam Failure Scenarios (ERM) [90]
Geochemical assessment of river water quality changes resulting from dam failure (KCB)
[126].
Waste
Geochemical/Environmental test work (SGS Lakefield Oretest) [67].
AMEC (2011) Project Tailings Management Options [2]
SRK (2015) Kvanefjeld Project Mining Study [68]
Biodiversity
Marine Discharge Ecotoxicity Test (DHI) [15]
Botanical Investigations Kvanefjeld (Simondsen) [21]
Hydrocarbon and Chemical Spill Report (Orbicon) [55]
The Natural Environment of the Study Area (Orbicon) [57]
Dam Failure Report (KCB) [74]
Radiological Consequence Report (Arcadis) [110].
Local Use and heritage
Local Use Study (Orbicon) [54]
Archaeological surveys (Kapel H) [40]
Archaeological surveys (Greenland National Museum and Archives) [48]
SIA (Shared Resources) [69].
6.2 Impact assessment methodology and structure
Consistent with the Guidelines [45] and in order to best present the environmental baseline data and
the assessment of potential environmental impacts, this report has been structured to consider Project
impacts associated with each of the environmental factors set out below:
Physical environment Section 7
Atmospheric setting Section 8
Radiological emissions Section 9
Greenland Minerals Ltd – Kvanefjeld Project EIA | 107
Water environment Section 10
Waste management Section 11
Biodiversity Section 12
Local use and local knowledge Section 13
Cumulative Impact Assessment Section 14
For each of the environmental factors the assessment has been structured to consider:
Baseline description
Potential impacts
Assessment of impacts
Mitigation measures
Predicted outcomes.
An impact assessment is essentially a prediction of anticipated impacts resulting from the
implementation of a Project. Within a process of prediction, some level of uncertainty can be present.
The three different mechanisms to classify and then address uncertainty have been applied in this
impact assessment and are described below:
Uncertainty related to data – Comprehensive baseline data has been collected to inform the
impact assessment and is considered sufficient to inform the scale and nature of the
predicted impacts. In a few cases additional data collection is recommended to refine the
assessment of impacts, and this future data collection is indicated in the text of the impact
assessment. Importantly, the additional data collection will reduce the uncertainty of the
assessment, but is not expected to change the outcome of the assessment.
Uncertainty related to consequence – Many of the predicted impacts have been assessed
using outputs from internationally recognised models or formulas. Wherever possible, the
models have been applied conservatively. In some cases, this has meant impacts have been
modelled assuming no control measures are in place (e.g. dust assessment modelling and
pollution modelling for the treated water placement). The application of the described
control measures will “improve” the outcomes for impacts in this context, however the
results reported in the impact assessment are conservative in these cases. In other cases,
sensitivity ranges have been applied to models, to check that predicted outcomes remain
within the predicted scale even if inputs are changed (e.g. chemical and radiological analyses
of tailings failure scenarios). Descriptions of the models used to inform the impact
assessment identify conservative assumptions or approaches where they have been applied.
Uncertainty related to likelihood – The impacts considered in an impact assessment are
typically those with a high likelihood. However, in this impact assessment, some low
likelihood impacts have also been considered (e.g. the potential failure of the FTSF and its
impact on various environmental values). The impact assessment methodology applied in
this impact assessment assumes impacts are going to occur, making it challenging to assess
variable likelihood impacts in this context. To address this, the Project has also analysed
potential environmental risks associated with the development of the Project in Section 14.
Risks are events which may or may not occur and for which there is a probability of a certain
consequence eventuating. As such, the assessment of risks is particularly suited to the
assessment of uncertain events / effects. Impacts with variable likelihood are effectively
reported on twice in this impact assessment: once in the relevant impact assessment Section,

Greenland Minerals Ltd – Kvanefjeld Project EIA | 108
where details of the assessment provided, and again in the risk assessment Section, where
the likelihood and consequence of the risk are reported.
6.3 Potential impacts
The potential impacts that are assessed for each environmental factor in this report are summarised
in Table 16.
Table 16 Potential impacts
Factor Impact Section
Physical Environment
Construction, operation and closure of the Project have the potential to result in physical alteration of the landscape and changes to visual amenity.
7.3.1
Construction and operation of the Project has the potential to result in erosion.
7.3.2
Construction and operation of the Project will increase noise emissions and vibration.
7.3.3
Construction and operation of the Project will increase light emissions and has the potential to result in reduced amenity as a consequence.
7.3.4
Operation and closure of the Project has the potential to physically alter the landscape if an earthquake were to induce the collapse of the TSF embankment
7.3.5
Atmospheric Setting
Construction and operation of the Project will generate dust, which has the potential to result in reduced air quality and produce secondary impacts associated with the physical or chemical composition of the dust.
8.3.1
During the construction, operations and closure phases, the Project will generate gaseous air emissions (oxides of nitrogen, oxides of sulphur, black carbon and polycyclic aromatic hydrocarbons (PAH)) which have the potential to reduce air quality
8.3.2
Construction and operation of the Project will result in increased GHG. 8.3.3
Radiological emissions
Construction and operation of the Project will release radioactivity through dust, which has the potential to result in contamination of the environment and affect human health.
9.3.1
Construction, operation and closure of the Project will release radioactivity through radon emissions, which has the potential to result in contamination of the environment and affect human health
9.3.1
There is the risk of accidents or spills during the construction and operations of the Project that may result in the discharge of radioactivity into the atmosphere, soil and water.
9.3.2
Failure of TSF embankment has the potential to result in the release of tailings water and solids to land and water bodies downstream of the TSF and associated radiological exposure
9.3.3
Release of aerosols from the TSF has the potential to result in contamination of land and release of radioactivity downwind of the TSF
9.3.4
Water Environment
Construction and operation of the Project will modify the hydrological processes which will potentially affect water quality.
10.3.1
Construction, operation and closure of TSF has the potential to create contamination outside the TSF as a result of spills, damage to the TSF or wind.
10.3.2
Release of tailings water and solids in the event of an FTSF embankment failure
10.3.3
Release of aerosols from the TSF has the potential to result in contamination of Narsaq’s drinking water
10.3.4

Greenland Minerals Ltd – Kvanefjeld Project EIA | 109
Factor Impact Section
Seepage from the TSF could have the potential to affect Narsaq’s drinking water
10.3.5
Discharge of water from the Project has the potential to affect the water quality of the Nordre Sermilik
10.3.6 and 10.3.7
Discharge of water from waste rock stockpile run-off 10.3.8
Formation of a mine pit lake post closure 10.3.8
There is the risk of accidents during the construction and operations of the Project that may result in the discharge of chemicals (i.e. oil spills) into the environment.
10.3.9
There is the risk of accidents during the operations of the Project that may result in the discharge of process water into the environment.
10.3.10
Waste Management
Waste generated during construction and operations has the potential to result in environmental impacts if not appropriately managed.
11.3.1
Biodiversity Construction, operation and closure of the Project will result in disturbance of terrestrial fauna habitats.
12.3.1
Construction and operation of the Project will result in disturbance of habitats for freshwater species.
12.3.2
Construction, operation and closure of the Project will result in disturbance of marine fauna habitat.
12.3.3
Construction and operation of the Project has the potential to result in contamination of terrestrial fauna habitats.
12.3.4
Construction and operation of the Project has the potential to result in contamination of freshwater habitats.
12.3.5
Construction and operation of the Project has the potential to result in contamination of marine habitats.
12.3.6
Construction and operation of the Project will involve increased vehicle traffic which has the potential to result in fauna mortality.
12.3.7
Construction and operation of the Project will involve increased marine traffic which has the potential to introduce invasive non-indigenous species in ballast water.
12.3.8
Local Use and Cultural Heritage
Construction and operation of the Project will restrict local use of the Study Area.
13.2.1
Construction and operation of the Project has the potential to affect cultural heritage sites.
13.2.2
6.4 Assessment of impact significance
The predicted outcome of each impact is summarised for each environmental factor. The predicted
outcome is assessed after consideration of mitigation measures.
The assessment of the predicted outcomes considers, for each, the spatial scale of the impact, the
duration of the impact and the significance of the impact.
Spatial scale of the impact
Project Area Direct disturbance by the Project, i.e. confined to the activities, the
infrastructure itself and the very close vicinity of the Project (as defined in
Figure 2)
Study Area Defined as per Figure 2
Greenland Minerals Ltd – Kvanefjeld Project EIA | 110
Regional Activities occurring within Kommune Kujalleq
National Activities affecting areas in Greenland beyond Kommune Kujalleq.
Duration (reversibility):
Duration means the time horizon for the impact.
Duration also incorporates the degree of reversibility of the impact, i.e. to what extent the impact is
reversible, ranging from completely reversible to irreversible.
Short term The impact will last for a short period without any irreversible effects
Medium Term The impact will last for a period of months or years but without
permanent effects or irreversible effects
Life of Project The impact will last for the life of the Project (46 years)
Long term The impact will potentially go beyond the life of the Project and
potentially irreversible effects may result
Permanent The impact will continue in perpetuity.
Significance of the impact:
Very low Very small/brief elevation of non-toxic contaminants in local
air/terrestrial/freshwater/marine environments (when concerning emissions)
and decline/displacement of a few (non-key) animal and plant species from
the sites of Project related activities and/or loss of habitat at the sites of
Project related activities (when concerning disturbance)
Low Small elevation of non-toxic contaminants in local air/terrestrial/freshwater/
marine environments and/or very small temporary elevations of toxic
contaminants (when concerning emissions) and decline/displacement of key
animal and/or plant species and/or loss of habitat at the sites of Project
related activities (when concerning disturbance)
Medium Some elevation (above baseline, national or international guidelines) of
contaminants, including toxic substances, in local or regional air/terrestrial/
freshwater/marine environments or decline/ displacement of key animal
and/or plant species and/or loss of habitat in the Study Area
High Significant elevation of contaminants, including toxic substances, (above
baseline, national or international guidelines) in local and regional
air/terrestrial/freshwater/marine environments or decline/displacement of
key animal and/or plant species and/or loss of habitat at regional level.
6.5 Risk Assessment Methodology
The risk assessment process has been undertaken using a systematic approach consistent with the
AS/NZS 31000:2009 Risk Management – Principles and Guidelines. A detailed description of the
methodology is provided in Section 14.

Greenland Minerals Ltd – Kvanefjeld Project EIA | 111
7. Physical environment
7.1 Existing environment
7.1.1 Climate
The climate in south Greenland is influenced by the North American continent and the North Atlantic
Ocean, together with Greenland’s inland ice and low sea surface temperatures. Average summer
temperatures are below 10 °C.
Situated only 40 km from the open ocean, weather in the local area is influenced by the ocean resulting
in cool summers and relatively mild winters. Long-term weather station data is available from weather
stations in nearby towns providing average monthly temperatures throughout the year. Qaqortoq,
located 30 km south of the Project and closer to the ocean, has an average temperature of -5.5 °C in
January and 7.2 °C in August and July. Narsarsuaq, located 40 km east of the Project and further inland,
has an average temperature of -6.8 °C in January and 10.3 °C in July. Narsaq is located between these
two towns. The mine site is at higher elevation than Narsaq and therefore experiences lower
temperatures.
Annual average precipitation in Qaqortoq is 858 mm and in Narsarsuaq 615 mm. The precipitation
pattern in the Project Area is more similar to Qaqortoq, with a precipitation increase of 3 % per 100m
of altitude. Snow depth is typically highest in February, where an average of 20 cm has been recorded
in Narsarsuaq and 41 cm in Qaqortoq [51].
Figure 35 displays the wind speed and direction recorded by the weather station at Kvanefjeld between
2010 and 2014. The predominant wind directions are from the north east and the south east. Most
strong winds are recorded as blowing from the north east direction.
Figure 35 Wind directions and speed recorded from Kvanefjeld weather station

Greenland Minerals Ltd – Kvanefjeld Project EIA | 112
Foehn winds are bursts of dry and relatively warm air and are common in south Greenland and in the
area of the Project. Foehns arise as a result of adiabatic compression of air sweeping down from the
inland ice cap. When the foehn blows, within an hour the relative humidity drops to 30-40 % and the
temperature rises by up to 15-20 °C and can remain elevated for up to two days. The effect of the
foehn is particularly marked in winter, when it can result in rapid melting of snow.
7.1.2 Topography
The landscape in south Greenland is characterised by relatively high and steep mountains and by low
islands and peninsulas in the coastal areas. This landscape has been largely formed through glaciation,
which has carved long, narrow and deep fjords.
The Kvanefjeld deposit is located on a plateau at an elevation of 600 m, with the orebody outcropping
at surface and with the highest grade material occurring in the upper zones. The deposit is situated
on the Erik Aappalaartup Nunaa peninsula close to Narsaq (Figure 36). South of the Kvanefjeld deposit
are the Narsaq valley and the Narsaq river which drains into the valley and then to the fjord at Narsap
Ilua.
Figure 36 Elevation and contours
7.1.3 Geology and soils
A significant part of the Project area is underlain by the unusual alkaline rocks of the Ilimaussaq
Complex. These rocks are enriched in REEs, along with other elements such as lithium, beryllium,
uranium, thorium, niobium, tantalum and zirconium. Owing to the rugged topography, these rocks
have been, and continue to be, dispersed by glaciation, water, and wind, and contribute significantly
to the talus, scree and soils that line slopes and fill valleys. This dispersion results in naturally elevated
levels of rare elements, including uranium and thorium, in the local environment. This is particularly
prevalent in the Narsaq valley, the Taseq basin and on the slopes leading to adjacent fjords.

Greenland Minerals Ltd – Kvanefjeld Project EIA | 113
Figure 37 Outline of the Ilimaussaq Complex
Lujavrite hosts the REE ore that will be mined and processed and is one of a series of rock types in the
Ilumaussaq Complex. Lujavrite ore contains approximately 1.4 % REEs, 0.25 % zinc, 0.03 % uranium.
Lujavrite outcrops extensively on the Kvanefjeld plateau and adjacent slopes. Extensive talus and scree,
comprised of broken-down lujavrite, line the slopes to Tunulliarfik fjord at the southern end of the
Project Area.
The lujavrite outcrop is depicted in Figure 38 below. It is identifiable below the dashed line on the
slope immediately south of Taseq basin. Active erosion results in the break-up of lujavrite into scree
and sand that lines the slopes.
Figure 38 Lujvarite (dark grey) outcrop

Greenland Minerals Ltd – Kvanefjeld Project EIA | 114
Elevated levels of fluoride are naturally present in waters in the Narsaq river, Taseq basin and the
Taseq river. This is due to the breakdown of the water-soluble mineral villiaumite in rocks of the
Ilimaussaq Complex.
The Project Area is also notable for its low biodiversity, with common fauna species recorded and only
three vegetation communities identified [57] [120]. Some rare flora were located in the area but will
be avoided by Project activities.
7.1.4 Seismicity
Seismic conditions for the Project have been reviewed three times [1] [75] [81]. In order to ensure
that the EIA reflects the current state of understanding with respect to these conditions, the latest
seismic information from the Geological Survey of Greenland and Denmark (GEUS) was used in the
most recent review [75].
Earthquakes occur along faults in the earth crust. The highest density of faults occurs along tectonic
plate boundaries. The Project area is located approximately 800 km from the nearest active plate
boundary. Intra-continental plate settings are considered geologically stable in contrast to plate
boundary regions where interaction between adjacent tectonic produces a higher frequency and
magnitude of earthquakes.
There may be numerous small, local and regional faults around the Project. However, there are no
known active, capable or potentially active faults delineated within 250 km of the site.
The largest recorded earthquake within a 500 km radius of the Project was a magnitude (M) 4.6
(Richter scale) quake in 1998 which had an epicentre 102 km to the south-east of Kvanefjeld. The
largest earthquake recorded closest to Kvanefjeld was a M3.6 event in 2001 with its epicentre 18 km
to the north-east. Earthquakes which have a magnitude of 5 or below are classed as light.
A seismic hazard assessment of the Project Area was undertaken in order to estimate parameters to
be used in an evaluation of the capacity of the TSF to withstand ground motions resulting from
potential earthquake events [75]. The ground motion parameters considered for each of the
earthquake design events for Kvanefjeld are indicated in Table 17.
Table 17 Kvanefjeld TSF PGA Design parameters based on Mean Hazard Deaggregation ([92] –
Table E.2)
Design Event Return period
(years) Amplitude
(%g) Primary Mode
M D (km)
Operating Basis Earthquake (OBE) 500 7 5.4 25
OBE Alternate 1,000 11 5.4 18.5
Safety Evaluation Earthquake (SEE) 2,500 17 5.4 12.5
Maximum Credible Earthquake (MCE) 10,000 45 5.4 10
The assessment determined a maximum credible earthquake, drawing on a range of seismological,
geological and physiographic inputs. In areas of moderate seismicity [75], of which the Project Area is
one, a maximum credible earthquake may correspond to a one in 10,000-year event or longer. The
study estimated the magnitude (M) of such an event to be M5.4 at a distance of 10km from the TSF.
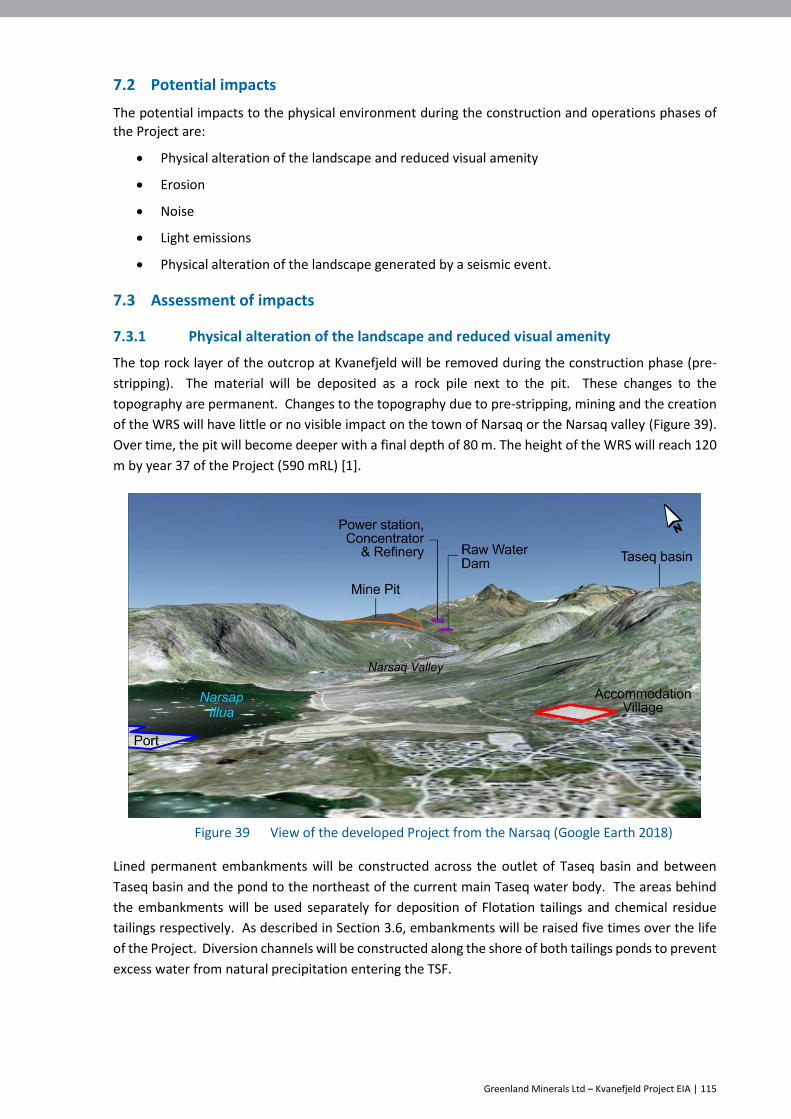
Greenland Minerals Ltd – Kvanefjeld Project EIA | 115
7.2 Potential impacts
The potential impacts to the physical environment during the construction and operations phases of
the Project are:
Physical alteration of the landscape and reduced visual amenity
Erosion
Noise
Light emissions
Physical alteration of the landscape generated by a seismic event.
7.3 Assessment of impacts
7.3.1 Physical alteration of the landscape and reduced visual amenity
The top rock layer of the outcrop at Kvanefjeld will be removed during the construction phase (pre-
stripping). The material will be deposited as a rock pile next to the pit. These changes to the
topography are permanent. Changes to the topography due to pre-stripping, mining and the creation
of the WRS will have little or no visible impact on the town of Narsaq or the Narsaq valley (Figure 39).
Over time, the pit will become deeper with a final depth of 80 m. The height of the WRS will reach 120
m by year 37 of the Project (590 mRL) [1].
Figure 39 View of the developed Project from the Narsaq (Google Earth 2018)
Lined permanent embankments will be constructed across the outlet of Taseq basin and between
Taseq basin and the pond to the northeast of the current main Taseq water body. The areas behind
the embankments will be used separately for deposition of Flotation tailings and chemical residue
tailings respectively. As described in Section 3.6, embankments will be raised five times over the life
of the Project. Diversion channels will be constructed along the shore of both tailings ponds to prevent
excess water from natural precipitation entering the TSF.

Greenland Minerals Ltd – Kvanefjeld Project EIA | 116
Floating decant barges and a laydown area will be constructed at the edge of the TSF. The changes to
Taseq basin and the upstream pond are permanent while the decant barges will be removed at mine
closure [1]. An assessment of the impacts on surface water bodies is included in Section 10.
Situated high in a narrow valley behind Talut Mountain, Taseq basin is not visible from Narsaq or from
most of the valley. After construction of the embankments, the tailings facilities will have little or no
visual impact on the town or valley. The embankments and the diversion channels will be visible in
the near field but since they will be covered by local materials (rock and gravel), the visible impact is
limited.
The construction of other Project facilities and related infrastructure will require some re-profiling of
the landscape. The most important re-profiling will occur where the Plant, the Port and the Port-Mine
Road will be constructed. Aa service road will connect the TSF with the Plant. Two pipelines will also
connect the Plant with the TSF.
Some of the Project’s components, for example the Plant, will be widely visible from the Narsaq valley
and the fjord but will not be visible from Narsaq. The Port and the Port-Mine Road will be visible from
the valley but only to a very limited degree from Narsaq The accommodation Village which will be
built on the outskirts of Narsaq will be visible from parts of the town. Following the decommissioning
of buildings and machines at mine closure there is the potential for limited natural re-growth of
vegetation.
7.3.2 Erosion
In this context erosion is defined as transport of soil, sand and gravel by the forces of water, ice or
wind. A number of construction activities have the potential to lead to erosion. These include:
Preparation of construction sites
Construction of the Port-Mine Road
Pipeline alignments
Pre-stripping of the mine pit
Redirection of drainage
Blasting to provide granular material for construction – e.g. for tailings embankments
Construction of the Port.
Generally, erosion is not expected to be an issue for the Project as most construction works will take
place in areas with consolidated rock. There are very limited clay or soils in the Project area as a result
of the local geology. Limited local erosion could potentially take place at the Plant and along the Port-
Mine road during construction.
To minimise the risk of erosion and sediment transport associated with the development of the WRS
during Project operations, the WRS has been designed to capture all direct precipitation and divert the
runoff into an artificial pond. The water from this pond will be pumped to a central mine area water
storage dam before being pumped to the processing plant [29]. Activities during the Project’s
operations are not expected to cause significant erosion.
7.3.3 Noise and vibration
The perception of noise from a particular source depends, in part, on the level of background sounds
in an area. Wind speed is an important parameter affecting natural background sound levels, and
sound levels rapidly increase with increasing wind speed. In the Kvanefjeld area, the most common

Greenland Minerals Ltd – Kvanefjeld Project EIA | 117
10-min average wind speed is between 2-5 m/sec which occurs 35 % of the time. This wind speed
range corresponds to a minimum natural background noise level of 30 dB(A).
Construction
During the construction phase significant noise will be generated by:
Mobile equipment used in connection with excavation and construction of:
- the Port
- the Port-Mine Road
- other roads
- pipelines
- the Plant
- the Mine and associated facilities
Pre-stripping of the pit area
Drilling and blasting in the Port and Mine
Transport of supplies and machinery from the Port to the Plant and Mine
Vessel movements.
Seaborne traffic associated with construction will increase noise levels in Narsaq. However, due to the
low speed of vessels and the distance between the Port and Narsaq, the average incremental noise
contribution from vessel movements will not cause the overall noise level to exceed the 35 dB(A)
guideline for night time noise in residential areas.
Blasting will take place in the Mine. Grading will take place to prepare level surfaces for lay down
areas, access roads and during construction of haul roads. The Port-Mine Road will be constructed in
stages gradually progressing from the Port to the Mine and Plant areas.
Blasted rock from Port construction activities on the Tunu Peninsula and blasted material from the
mining area will be used as material for land reclamation and revetments. Impacts of noise and
vibration on fauna species are discussed in Section 12.3.1.
Overall, the noise levels in the Project’s construction phase are expected to be at or below the noise
levels which have been calculated and modelled for the Project’s operations phase which are discussed
below [52].
Operations
Activities during the operations phase of the Project will result in an increase in the ambient noise level
near several Project facilities [52]. The noise assessment for the Project used 30 dB(A) as the ambient
noise level that characterizes the existing baseline acoustical environment [52]. Project activities
during operations that will generate noise that exceeds this value were classified as the “noise
footprint” for the Project.
The noise assessment identified the following activity areas as the potentially most significant noise
sources during operations:
The Mine area (pit, haul roads, Plant and power station)
The Port – Mine Road
The Port area.

Greenland Minerals Ltd – Kvanefjeld Project EIA | 118
Noise levels for each of these areas were calculated using SoundPlan software. Conservative
assumptions have been used which are expected to represent maximum continuous noise source
strengths [52]. The limit for noise levels in industrial areas in Danish guidelines is 70 dB(A). This limit
was used to assess the noise impact of the Project’s operations. The 70 dB(A) limit applies at the
property boundary of an enterprise (fence line). Since the Project has no clear boundary line (there
will be fenced areas for safety and security), the spatial pattern of noise loads was calculated and
described for the entire working area for identified noise sources and the area that surrounds them.
The modelled total noise level distribution generated by the Project’s operations in the open pit area,
along the haul roads and at the two plant sites is highlighted in Figure 40.
The area where total noise levels will exceed the 30 dB(A) background level is limited to the vicinity of
sites of significant Project activity and the upper parts of the Narsaq valley.
Figure 40 Calculated total noise levels for Mine Plants areas during operation
The noise footprint created by trucks, buses and other vehicles travelling on the Port-Mine Road and
at the Port is shown in Figure 41. Noise levels above the 30 dB(A) background level extend for 800-
1,200 meters on either side of the road, depending on the terrain. Traffic on the Port-Mine Road will
have limited impact on the total noise level in Narsaq. town.
The noise-sensitive locations closest to the Port-Mine Road are nine summerhouses situated just north
of Narsaq in the Narsaq valley. These summer houses are typically occupied for only a limited period
each year. The Project related traffic noise level calculated for the houses closest to the road increases
to 38.0 dB(A) during the day, 38.3 dB(A) during the evening and 38.7 dB(A) at night, only slightly above
the natural background levels [52]. Compared to Danish noise limits for summer housing during day,
evening and night, the calculated noise levels are below the daytime limit (40 dB(A)), but exceed the
35 dB (A) limit for the evening and night.

Greenland Minerals Ltd – Kvanefjeld Project EIA | 119
Figure 41 Calculated total noise levels along Port-Mine Road and in the Port area
The noise footprint for the Project’s operations at the Port is shown in Figure 42. The calculated noise
level will exceed 70 dB(A) in a small area where containers are unloaded [52]. The area where the
average noise level exceeds the 30 dB(A) background level extends approximately 1,800 m from the
centre of the Port.
Figure 42 Calculated total noise levels in and around the Port during the operations
The noise level in the residential areas of Narsaq, and at the proposed location of the Village, will be
less than 40 dB(A) which will meet Danish noise guidelines for noise levels in areas with mixed
residential and business development, but is not expected to meet the 35dB(A) night-time Danish

Greenland Minerals Ltd – Kvanefjeld Project EIA | 120
guideline for residential areas for open and low housing development. The Government of Greenland
has not formally adopted guidelines or regulations on noise from industries.
Blasts in the open pit are expected to occur every two days with the potential for multiple shots to be
fired simultaneously.
The nature and magnitude of noise from blasting operations in the pit area will depend on the blasting
regime chosen, the nature of the rock to be blasted, the size and depth of the charge, the type of
explosive, the local topography and the detonation sequence. These details are not known at this
time, so noise and vibration from blasting has not been calculated. The short duration of this noise
source means that it will have only a small to negligible contribution to the average noise levels which
are calculated.
The modelled noise level distribution generated by Project operations shows that the area of the 70
dB(A) industrial footprint is small and limited to the Mine, the Plant, a narrow corridor along the Port-
Mine Road and the Port.
The predicted noise levels associated with the Project will be well below Danish guideline limits in
residential areas in Narsaq. Traffic noise will exceed the Danish evening and night limit of 35 dB(A) for
summer houses by up to 3.7 dB(A) at two cottages in Narsaq valley. No known sensitive wildlife areas
will be impacted by operations noise [52].
7.3.4 Light emissions
Construction activities will take place day and night, year-round, as will activities during the Project’s
operations phase at the Mine, Plant and Port. In periods of darkness, the construction areas will be
illuminated. The consequences of such “ecological light pollution” where artificial light alters the
natural light regimes in ecosystems are generally not well known.
During hours of darkness and semi-darkness light from the Plant and from vehicle movements on the
Port-Mine Road will be visible from the summer houses and from certain vantage points in the vicinity
of Narsaq. Intermittent light associated with vehicle movements on the Port-Mine Road close to the
Port will be visible from Narsaq as will light associated with Port activities and the Village. Light
associated with Project activities is however not expected to have a significant impact and the overall
impact is assessed to be low.
The serious consequences of light in otherwise dark areas, such as the attraction of migratory birds
and the risk of collisions with tall-lighted structures are well described [9]; however, since artificial light
will mainly be required during the winter months when almost no bird migration takes place, this is
not expected to be a significant impact of Project activities.
7.3.5 Physical alteration of the landscape resulting from a seismic event
As described earlier in this Section, the Project is located in an area of low seismicity. The operating
basis earthquake (OBE), safety evaluation earthquake (SEE) and maximum credible earthquake (MCE)
have been assessed for the Project and were indicated in Table 17. This impact considers the risk of
physical alteration of the landscape resulting from a seismic event causing the embankment of the
FTSF to fail. In order to assess this risk, the effect of an SEE earthquake and an MCE earthquake (a
M5.4 earthquake at a distance of 12.5 km and 10 km from FTSF respectively) on the stability of the TSF
embankments has been evaluated. The results of the pseudo-static stability analysis show that, under
the assumed conditions, the factor of safety (FoS) criteria are expected to be met for both
embankments for both the SEE and the MCE [75]. To further assess the scale of any potential impact,

Greenland Minerals Ltd – Kvanefjeld Project EIA | 121
the amount of deformation which might result from a MCE event was estimated by KCB. A summary
of the deformation estimates for the FTSF and CRSF embankments under the MCE (1:10,000 AEP
earthquake) are shown in Table 18.
Table 18 Deformation estimates – TSF embankments – MCE ([75] – Table 7-5)
Embankment Seismic Loading case Estimated Lateral Deformation
(95th Percentile)
FTSF MCE (1:10,000 AEP) 4.1 cm
CRSF MCE (1:10,000 AEP) 4.5 cm
The results of the seismic deformation estimates show that, under the assumed conditions, the
estimated deformation is ≤5 cm for both the FTSF and the CRSF. The design embankment crest and
pond levels allow for 5 m to 6 m of freeboard and a deformation of 5 cm (≤1 %) is unlikely to
compromise the design intent [75]. Therefore, the seismic performance (as assessed by seismic
deformation estimates) is expected to be within the tolerance for the embankment design. The TSF
embankments will be built into solid rock and will be constructed using the “downstream” method
which is recognised as the construction method which produces the most stable embankments [25].
On this basis the risk of a seismic event causing a failure of the TSF and resulting in physical alteration
of the landscape is assessed to be low.
In the event that the FTSF were to fail, physical alteration of the landscape downstream of the FTSF
would be anticipated. Modelling of potential failure modes for the FTSF has assessed the likely
physical, ecological and radiological impacts associated with a dam failure scenario, and these impacts
are discussed in Sections 9, 10 and 12 of this EIA. Based on that analysis, scouring and gouging of the
Taseq valley, downstream of the FTSF, would be anticipated. In addition, there would be deposition
of some sediment along the alluvial zone of the Narsaq river and temporary inundation. The majority
of sediment would report to Narsap Ilua. The environmental impact in the case of a catastrophic
embankment failure would be classified as major based on the definition in ANCOLD referencing a
significantly altered ecosystem, however the risk of this occurring is very low [74]. This risk is assessed
again in Section 14.
7.4 Mitigations
The following mitigation measures will be applied to reduce the Project’s impacts on the physical
environment:
Pre-stripping will be planned to blend, as far as practical, with the surrounding landscape
Topsoil, where available, will be stockpiled to assist with revegetation at closure or
progressive rehabilitation where practical
Tailings embankments will be planned to blend, as far as practical, with the surrounding
landscape
Roads will be planned to minimize impacts on the surrounding landscape
Decant barges will be removed at Mine closure
Embankments and diversion channels will be covered with local materials (rock and gravel).
Over time natural revegetation may occur further blending these features into the natural
environment
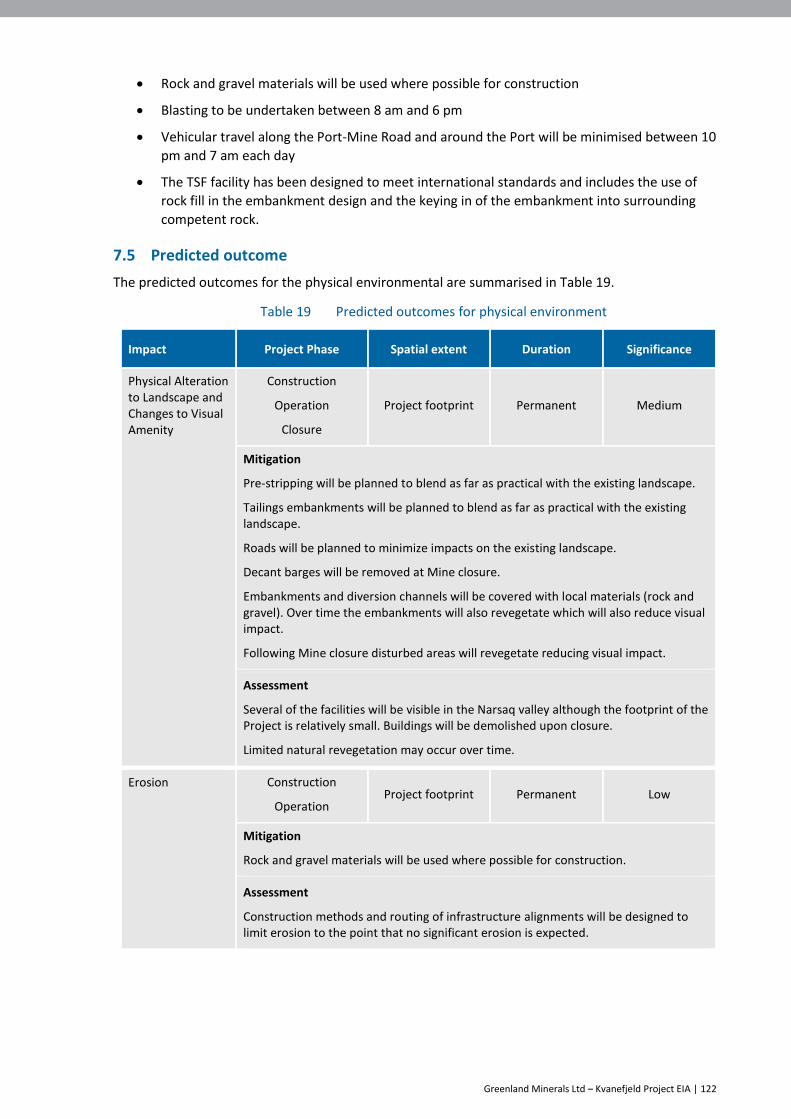
Greenland Minerals Ltd – Kvanefjeld Project EIA | 122
Rock and gravel materials will be used where possible for construction
Blasting to be undertaken between 8 am and 6 pm
Vehicular travel along the Port-Mine Road and around the Port will be minimised between 10
pm and 7 am each day
The TSF facility has been designed to meet international standards and includes the use of
rock fill in the embankment design and the keying in of the embankment into surrounding
competent rock.
7.5 Predicted outcome
The predicted outcomes for the physical environmental are summarised in Table 19.
Table 19 Predicted outcomes for physical environment
Impact Project Phase Spatial extent Duration Significance
Physical Alteration to Landscape and Changes to Visual Amenity
Construction
Operation
Closure
Project footprint Permanent Medium
Mitigation
Pre-stripping will be planned to blend as far as practical with the existing landscape.
Tailings embankments will be planned to blend as far as practical with the existing landscape.
Roads will be planned to minimize impacts on the existing landscape.
Decant barges will be removed at Mine closure.
Embankments and diversion channels will be covered with local materials (rock and gravel). Over time the embankments will also revegetate which will also reduce visual impact.
Following Mine closure disturbed areas will revegetate reducing visual impact.
Assessment
Several of the facilities will be visible in the Narsaq valley although the footprint of the Project is relatively small. Buildings will be demolished upon closure.
Limited natural revegetation may occur over time.
Erosion Construction
Operation Project footprint Permanent Low
Mitigation
Rock and gravel materials will be used where possible for construction.
Assessment
Construction methods and routing of infrastructure alignments will be designed to limit erosion to the point that no significant erosion is expected.
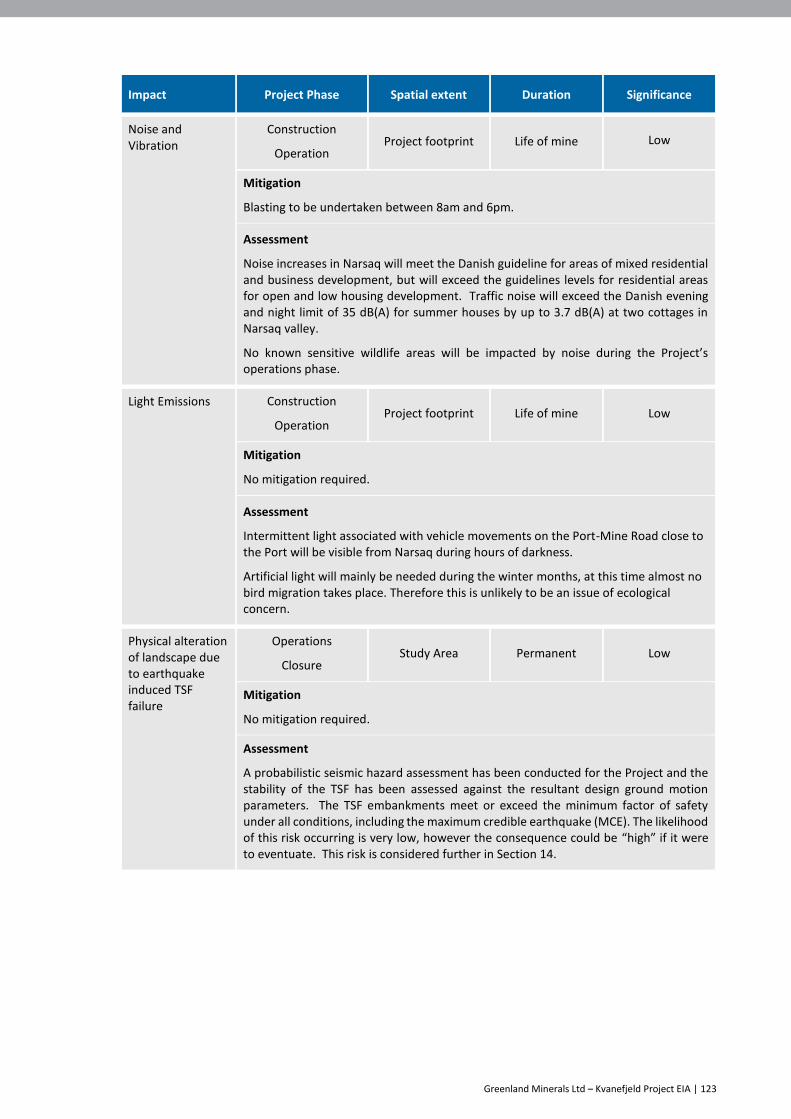
Greenland Minerals Ltd – Kvanefjeld Project EIA | 123
Impact Project Phase Spatial extent Duration Significance
Noise and Vibration
Construction
Operation Project footprint Life of mine Low
Mitigation
Blasting to be undertaken between 8am and 6pm.
Assessment
Noise increases in Narsaq will meet the Danish guideline for areas of mixed residential and business development, but will exceed the guidelines levels for residential areas for open and low housing development. Traffic noise will exceed the Danish evening and night limit of 35 dB(A) for summer houses by up to 3.7 dB(A) at two cottages in Narsaq valley.
No known sensitive wildlife areas will be impacted by noise during the Project’s operations phase.
Light Emissions Construction
Operation Project footprint Life of mine Low
Mitigation
No mitigation required.
Assessment
Intermittent light associated with vehicle movements on the Port-Mine Road close to the Port will be visible from Narsaq during hours of darkness.
Artificial light will mainly be needed during the winter months, at this time almost no bird migration takes place. Therefore this is unlikely to be an issue of ecological concern.
Physical alteration of landscape due to earthquake induced TSF failure
Operations
Closure Study Area Permanent Low
Mitigation
No mitigation required.
Assessment
A probabilistic seismic hazard assessment has been conducted for the Project and the stability of the TSF has been assessed against the resultant design ground motion parameters. The TSF embankments meet or exceed the minimum factor of safety under all conditions, including the maximum credible earthquake (MCE). The likelihood of this risk occurring is very low, however the consequence could be “high” if it were to eventuate. This risk is considered further in Section 14.
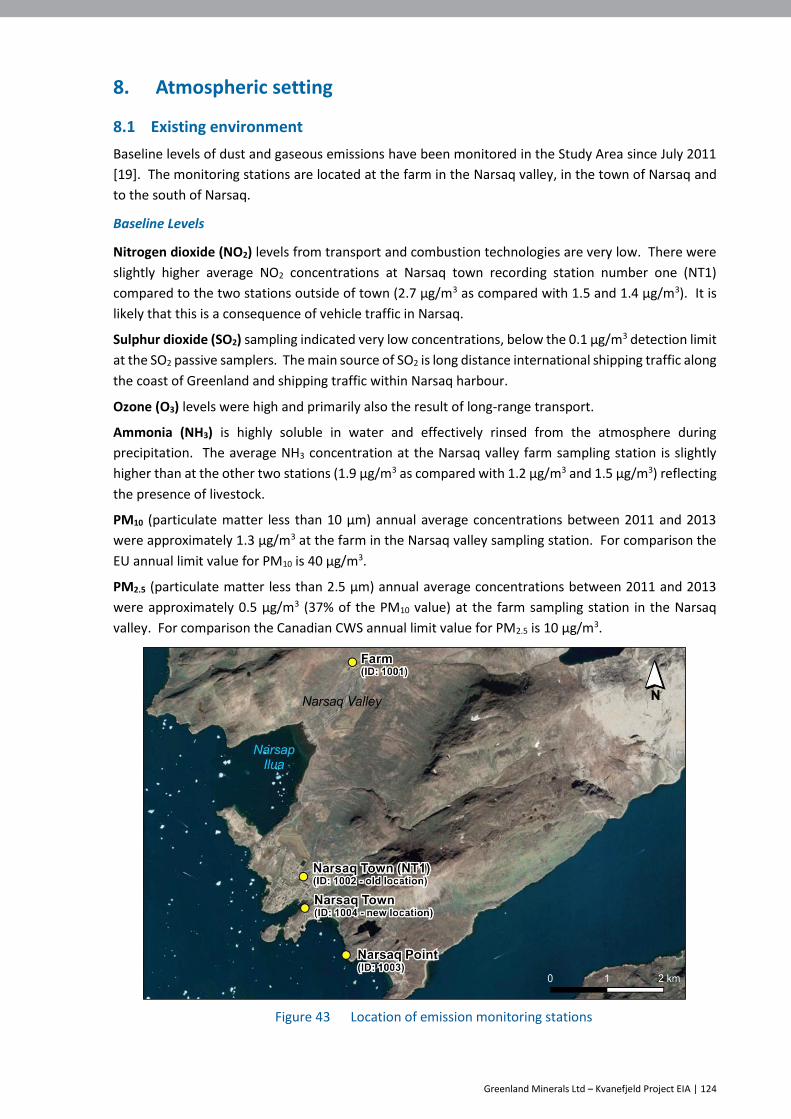
Greenland Minerals Ltd – Kvanefjeld Project EIA | 124
8. Atmospheric setting
8.1 Existing environment
Baseline levels of dust and gaseous emissions have been monitored in the Study Area since July 2011
[19]. The monitoring stations are located at the farm in the Narsaq valley, in the town of Narsaq and
to the south of Narsaq.
Baseline Levels
Nitrogen dioxide (NO2) levels from transport and combustion technologies are very low. There were
slightly higher average NO2 concentrations at Narsaq town recording station number one (NT1)
compared to the two stations outside of town (2.7 μg/m3 as compared with 1.5 and 1.4 μg/m3). It is
likely that this is a consequence of vehicle traffic in Narsaq.
Sulphur dioxide (SO2) sampling indicated very low concentrations, below the 0.1 μg/m3 detection limit
at the SO2 passive samplers. The main source of SO2 is long distance international shipping traffic along
the coast of Greenland and shipping traffic within Narsaq harbour.
Ozone (O3) levels were high and primarily also the result of long-range transport.
Ammonia (NH3) is highly soluble in water and effectively rinsed from the atmosphere during
precipitation. The average NH3 concentration at the Narsaq valley farm sampling station is slightly
higher than at the other two stations (1.9 μg/m3 as compared with 1.2 μg/m3 and 1.5 μg/m3) reflecting
the presence of livestock.
PM10 (particulate matter less than 10 µm) annual average concentrations between 2011 and 2013
were approximately 1.3 μg/m3 at the farm in the Narsaq valley sampling station. For comparison the
EU annual limit value for PM10 is 40 μg/m3.
PM2.5 (particulate matter less than 2.5 µm) annual average concentrations between 2011 and 2013
were approximately 0.5 μg/m3 (37% of the PM10 value) at the farm sampling station in the Narsaq
valley. For comparison the Canadian CWS annual limit value for PM2.5 is 10 μg/m3.
Figure 43 Location of emission monitoring stations

Greenland Minerals Ltd – Kvanefjeld Project EIA | 125
8.2 Potential impacts
The Project’s potential impacts during the construction, operations and closure phases to ambient
atmosphere are:
The Project will generate dust which has the potential to result in reduced air quality and has
the potential, because of the physical or chemical composition of the dust, to result in
secondary impacts associated with dust deposition
The Project will generate gaseous air emissions (oxides of nitrogen, oxides of sulphur, black
carbon and polycyclic aromatic hydrocarbons (PAH)) which have the potential to reduce air
quality
The Project will produce greenhouse gas (GHG) emissions from the combustion of diesel in
mobile equipment and at the power station.
8.3 Assessment of impacts
8.3.1 Dust
Background
The Project has the potential to generate dust during all its phases primarily through material handling
and vehicle movements. Particulates have the potential to affect both the environment and human
health.
The dust in the atmosphere is referred to as particulate matter (PM). PM is categorized according to
size:
PM2.5 Particulate matter from combustion, typically which is less than 2.5 microns
in diameter
PM10 Mechanically generated dust from material handling and road dust, is coarser
with particles typically between 2.5 microns and 10 microns in diameter
TSP (Total Suspended Particulates)
The combination of all particles up to approximately 30 microns in diameter.
Construction
In the construction phase, particulate matter will be generated during site preparation for mining and
associated activities, including land clearing, topsoil removal, road grading, material loading, hauling,
travelling on unpaved roads and wind erosion from exposed areas.
Emissions from construction activities will be limited to the three-year construction period.
Operations
In the Project’s operations phase various mining and processing related activities will produce dust.
The key emission sources for the operations phase of the Project are identified as:
Mining operations
Plant operations (concentrator, refinery and acid plants)
On-site power generation
Port operations (including berthing ships).
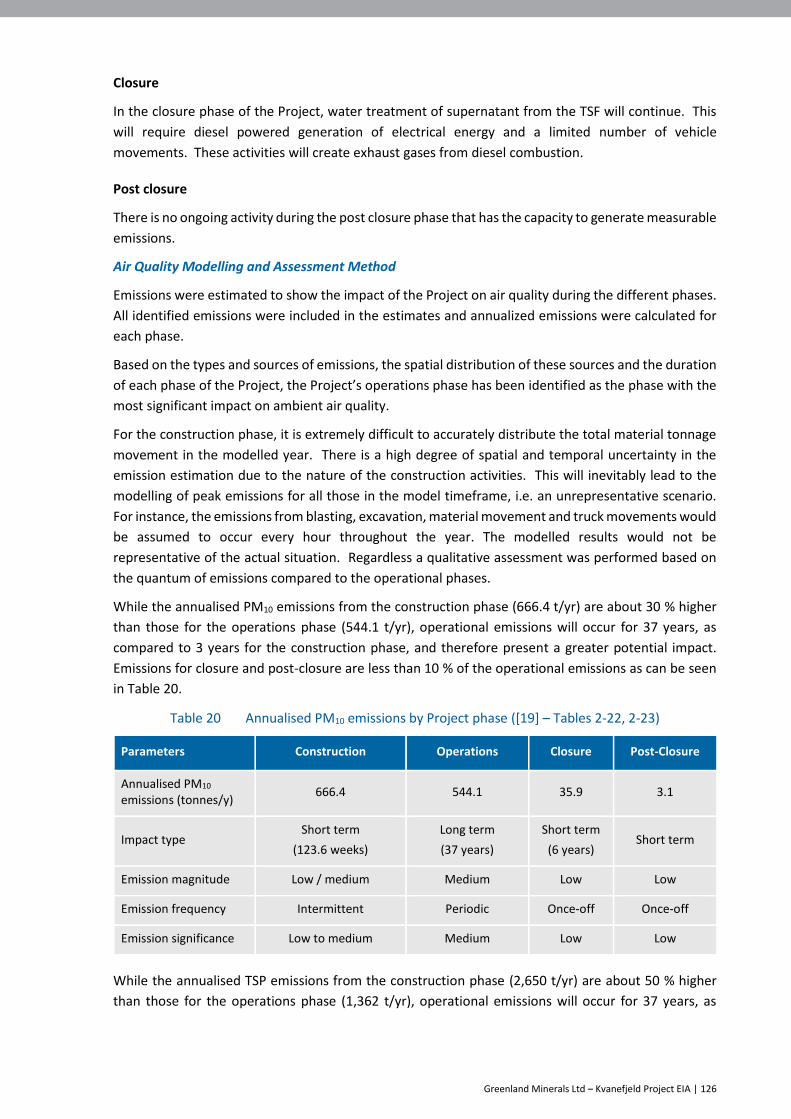
Greenland Minerals Ltd – Kvanefjeld Project EIA | 126
Closure
In the closure phase of the Project, water treatment of supernatant from the TSF will continue. This
will require diesel powered generation of electrical energy and a limited number of vehicle
movements. These activities will create exhaust gases from diesel combustion.
Post closure
There is no ongoing activity during the post closure phase that has the capacity to generate measurable
emissions.
Air Quality Modelling and Assessment Method
Emissions were estimated to show the impact of the Project on air quality during the different phases.
All identified emissions were included in the estimates and annualized emissions were calculated for
each phase.
Based on the types and sources of emissions, the spatial distribution of these sources and the duration
of each phase of the Project, the Project’s operations phase has been identified as the phase with the
most significant impact on ambient air quality.
For the construction phase, it is extremely difficult to accurately distribute the total material tonnage
movement in the modelled year. There is a high degree of spatial and temporal uncertainty in the
emission estimation due to the nature of the construction activities. This will inevitably lead to the
modelling of peak emissions for all those in the model timeframe, i.e. an unrepresentative scenario.
For instance, the emissions from blasting, excavation, material movement and truck movements would
be assumed to occur every hour throughout the year. The modelled results would not be
representative of the actual situation. Regardless a qualitative assessment was performed based on
the quantum of emissions compared to the operational phases.
While the annualised PM10 emissions from the construction phase (666.4 t/yr) are about 30 % higher
than those for the operations phase (544.1 t/yr), operational emissions will occur for 37 years, as
compared to 3 years for the construction phase, and therefore present a greater potential impact.
Emissions for closure and post-closure are less than 10 % of the operational emissions as can be seen
in Table 20.
Table 20 Annualised PM10 emissions by Project phase ([19] – Tables 2-22, 2-23)
Parameters Construction Operations Closure Post-Closure
Annualised PM10
emissions (tonnes/y) 666.4 544.1 35.9 3.1
Impact type Short term
(123.6 weeks)
Long term
(37 years)
Short term
(6 years) Short term
Emission magnitude Low / medium Medium Low Low
Emission frequency Intermittent Periodic Once-off Once-off
Emission significance Low to medium Medium Low Low
While the annualised TSP emissions from the construction phase (2,650 t/yr) are about 50 % higher
than those for the operations phase (1,362 t/yr), operational emissions will occur for 37 years, as

Greenland Minerals Ltd – Kvanefjeld Project EIA | 127
compared to 3 years for the construction phase, and therefore present a greater potential impact.
Emissions for closure and post-closure are less than 10% of the operational emissions.
Detailed emissions calculations were made for each phase of the Project. In addition, the Project’s
operations phase was subjected to extensive modelling using industry standard methods [1] [19].
Detailed emissions from the construction, closure and post-closure phases of the Project have been
estimated for pollutants including TSP, PM10, PM2.5, NOX, SO2, black carbon and PAHs. These detailed
estimates can be found in ERM’s Air Quality Report [19].
Air quality modelling focused on the Study Area. Sources of significant air emissions were identified,
emission rates from these sources were estimated and dispersion modelling was undertaken. Air
emissions from all sources were included in the models, including the crushing circuit [19] and acid
plants at the process plant site [79].
Modelled ground level concentrations for the key pollutants (TSP, PM2.5, PM10, SOX, NOX, black carbon
and PAHs) were compared to ambient air quality assessment criteria to determine the potential impact
to the physical environment and human health. In addition, TSP dust fall rates were modelled and
metal loads estimated.
The assessment considered the potential impacts attributable to the Project in isolation and the
cumulative impact of the Project’s emissions and existing emission sources in the Study Area.
Air quality emissions were modelled using CALPUFF, an industry standard model designated by the
USEPA as a “preferred model” in their Guideline on Air Quality Models.
For modelling it was conservatively assumed that no dust controls were in place at the Project in order
to ensure that the maximum potential emission profile was assessed. It is estimated that, were dust
control measures accounted for in the modelling, dust emissions would be 63 % lower.
Sensitive Receptor Locations
In addition to ground level concentrations of dust and combustion products, concentrations were
calculated for 58 sensitive receptor locations which were identified as being representative of
protective values. These locations included:
Four locations in Narsaq
The Narsaq valley farm
Five summer houses in the Narsaq valley
The site of the Village
45 archaeological sites, and
The location of the vulnerable round leaf orchid (Amerorchis rotundifolia).
Air Quality Assessment Criteria
Greenland has developed air quality criteria to be applied to mining operations.

Greenland Minerals Ltd – Kvanefjeld Project EIA | 128
Table 21 Summary of Greenland’s air quality impact assessment criteria [19]
Pollution Parameter Criteria Value Time Period for Assessment
PM2.5 30 μg/m3 24 hour
PM10 50 μg/m3 24 hour
TSP (Total Suspended Particles) 4 g/m2 Month
SO2 125 μg/m3 24 hour
NO2 100 μg/m3 24 hour
The Guidelines [45] recommend consulting other jurisdictions, such as Canada or Denmark (for
consistency with European Union guidelines), for relevant standards where appropriate Greenlandic
criteria are not available. A broader review of assessment criteria was undertaken to identify criteria
suitable for determining the potential impact on all values considered important for the Project (i.e.
the physical environment, the living environment and land-use, conservation and heritage).
A summary of the assessment criteria adopted for use in the assessment is shown in Table 22.
Table 22 Summary of EIA air quality impact assessment criteria ([19] – Table 1-9)
Parameter Limit criteria source Limit
criteria Units Averaging period
TSP Canada NAAQOs 60 μg/m2 Annual Average
120 μg/m2 24-hr Maximum
PM10 EU Directive 2008/50/EC 40 μg/m3 Annual Average
50 μg/m3 24-hr Maximum
PM2.5 Canada CWS 10 μg/m3 Annual Average
Canada NAAQOs 15 μg/m3 24-hr Maximum
TSP (Dust Deposition)
Germany 0.35 g/m2/d Annual Average
Norway 5 g/m2/m Monthly Maximum
NO2 Greenland 100 μg/m3 24-hr Maximum
NO2 EU Directive 2008/50/EC1 40 μg/m3 Annual Average
200 μg/m3 1-hr Maximum
H2S Total Reduced Sulphur
Canada B.C. PCO 7 μg/m3 24-hr Maximum
3 μg/m3 1-hr Maximum
SO2
Canada NAAQOs 30 μg/m3 Annual Average
450 μg/m3 1-hr Maximum
Greenland 125 μg/m3 24-hr Maximum
EU Directive 2008/50/EC2 20 μg/m3 Winter Average
SO4 Australia NSW DEC Sulfuric
Acid (H2SO4) 18 μg/m3 1-hr Maximum
Nitrogen deposition
WHO Guidelines for Europe 5 kg ha-1 yr-1 Annual

Greenland Minerals Ltd – Kvanefjeld Project EIA | 129
Particulate Matter (Dust)
The modelling results indicate that the predicted ground level concentrations for TSP, PM10, PM2.5and
dust deposition do not exceed the relevant assessment criteria at the sensitive receptor locations (in
isolation and cumulatively). Results from the modelling are inherently conservative as they present
outputs generated in the absence of applicable control measures (it is estimated that, were dust
control measures accounted for in the modelling, dust emissions could be reduced by as much as 63
%).
The highest overall dust emissions are expected in the Mine area close to the pit. Material handling,
haulage and blasting are the mining activities which are expected to have the greatest impact on dust
emissions.
Estimates of annual emissions from the various mining activities are based on data compiled by the US
EPA and are shown in Table 23. The Table identifies that the haulage of ore and waste rock is the key
source of dust generation.
Table 23 Estimated annual quantity of dust generated by major mining activities ([19] – Tables 2-3,
2-4)
Mining activity PM10 TSP PM2.5
(kg/year)
Material handling 29,056 86,844 8,543
Haulage 257,074 1,046,235 75,580
Blasting 2,090 4,018 614
The highest annual average concentration of PM2.5 emissions predicted at key sensitive receptors, (in
isolation of background sources) is 5 % of the respective assessment criteria. The annual average
concentration of PM2.5 in isolation was 0.5 µg/m3 compared to updated limit criteria of 8.8 µg/m3
(effective as of January 2020 in Canada) [19].
The highest 24-hour maximum concentration of TSP, PM10, PM2.5 and TSP dust deposition predicted at
key sensitive receptors are highlighted in the Table 24 below.
Table 24 Maximum 24 -hour dust levels (in isolation) – Predicted compared to assessment criteria
([19] – ES-1)
TSP PM10 PM2.5 TSP Dust
Deposition
Max 24 hr Concentration Predicted
of Project in isolation 8.7 µg/m3 7.4 µg/m3 4.4 µg/m3
0.007
g/m2/month
Canadian (NAAQO) and CWS 120 µg/m3 15 µg/m3
EU Directive (2008/50) 40 µg/m3 5g/m2/month
Greenland Standard 50 µg/m3 30 µg/m3 4 g/m2/month
For all types of particulates, the highest annual average and 24-hour maximum concentrations and
depositions were estimated at the Narsaq valley farm. The farm is located close to the Port-Mine Road
and is the closest sensitive receptor to the Mine and Plant.

Greenland Minerals Ltd – Kvanefjeld Project EIA | 130
All particulate emission estimations at the key receptor locations were below the respective
assessment criteria [19].
The results presented above considered the contribution of the Project to air quality parameters in
isolation. The results presented in the following sections consider the cumulative impact on air quality
parameters, where background levels and Project contributions are assessed together.
TSP
Contours of predicted TSP cumulative ground level concentrations (24-hour maximum) are shown in
Figure 44. The contours show the greatest concentrations close to the Mine area, with concentrations
decreasing rapidly as distance from the Mine increases. Greenland’s air quality guidelines do not
include a limit for TSP in a 24-hour period. However, Canada’s NAAQO has a 120 µg/m3 standard for
maximum acceptable level during a 24-hour period. The modelling study shows that this standard is
not exceeded outside the Mine area.
Figure 44 The maximum 24-hours TSP concentrations in µg/m3 (cumulative)
The highest 24-hour TSP concentration was at the Narsaq valley farm at 27 µg/m3. This is well below
the assessment limit criterion of 120 µg/m3. Of the three sensitive receptor locations modelled in
Narsaq, Narsaq Town 1 (NT1) (Figure 43) is predicted to have the highest 24-hour concentration at
22.5 µg/m3.
PM10
The highest maximum 24-hour concentration of PM10, 16.5 µg/m3, is predicted to be at the Narsaq
valley farm. At NT1 the concentration is 12.7 g/m3, of which 9 µg/m3 is background dust – that is the
existing dust level in the town which is primarily the result of dust from traffic movements on unsealed

Greenland Minerals Ltd – Kvanefjeld Project EIA | 131
roads. The predicted 24-hour maximum concentration for all receptors does not exceed the EU
Directive assessment limit criterion of 40 µg/m3.
Figure 45 shows the maximum concentration of PM10 during a 24-hour period.
Figure 45 The maximum 24-hours PM10 concentrations in µg/m3
PM2.5
The distribution of PM2.5 is predicted to be very similar to the distribution PM10 (although at lower
concentrations) with the highest values recorded close to the Mine (Figure 46).
The highest maximum 24-hour concentration, 7.9 µg/m3, is predicted at the Narsaq valley farm. At
NT1 the concentration is 5.4 µg/m3. The predicted highest maximum 24-hour concentration does not
exceed the Canadian assessment limit criterion of 15 µg/m3.

Greenland Minerals Ltd – Kvanefjeld Project EIA | 132
Figure 46 The maximum 24-hours PM2.5 concentrations in µg/m3
It is predicted that most of the dust generated by the Project will be deposited on the Project area
itself and on the mountainous plateau to the south-west of the open pit. Forecasts of dust deposition
are based on several factors including wind speed and direction. The calculated dust figures are
determined from predicted maximum 1-hour values and show the deposition in grams per square
meter if this maximum 1-hour value persisted for an entire month.
Figure 47 illustrates the predicted deposition of dust generated by the Project. The highest TSP dust
deposition concentration, 0.11 g/m2/month, is at the Narsaq valley farm. At NT1 (and at all other
receptors) the deposition concentration is 0.1 g/m2/month. The predicted TSP annual average and
monthly maximum concentrations do not exceed the Greenland guideline value of 4 g/m2/month [45].
Dust deposition from mining and unpaved roads can have an impact on tundra vegetation via the
coating of leaves with dust [8] [47]. Dust deposited on vegetation might also have an impact on
mammals and birds that feed on the affected vegetation.
Researchers in northern Canada have observed a reduction of 50 to 75% in caribou density where
calculated dust deposition exceeded about 20 kg/ha/year (5.5 mg/m2/day) [11]. Caribou density rose
quickly to normal frequency at lower dust levels. Caribou are not found in the Study Area, but
observations from Canada suggests a dust deposition threshold on the order of 0.16 g/m2/month
might also be relevant for Arctic hare, sheep and birds such as the ptarmigan which feed on vegetation.
The modelling has shown that the area with dust deposition above 0.16 g/m2/month extends less than
a few hundred meters from the Mine’s open pit and haul roads. For all sensitive receptor locations
dust deposition is below 0.11 g/m2/month. The potential dust deposition impact on vegetation and
mammals (including sheep) and birds is assessed as low.

Greenland Minerals Ltd – Kvanefjeld Project EIA | 133
All particulate concentrations are less than 20 % (Project emissions in isolation) and 40 % (cumulative,
including background emissions) of the assessment criteria. Therefore, the impact of particulate
emissions from the Project is assessed to be low [1] [19].
Figure 47 Maximum 1-hour deposition of dust – cumulative (g/m2/month)
Dust Composition
The composition of deposited dust will reflect the composition of the material from which dust is
generated. The largest source of dust is the unsealed haul roads which account for approximately 92
% of all dust. The haul roads will be constructed from locally sourced gravel and mined waste rock.
The composition of the dust particles will model the road construction material. Dust emanating from
ore is not expected to contribute significantly to the haul road dust load.
Dust particles from other mining activities at the mine site will be generated from waste rock and ore.
It has been assumed that dust generated will align with the movement of material in the pit. With an
average stripping ratio of 1:1, it is assumed that waste rock and ore will contribute to dust emissions
equally, each contributing 50 %.
To estimate metal deposition load from dust from the Mine the maximum metal concentrations (dust
from ore and dust from waste) set out in Table 25 were used. These concentrations were derived from
laboratory testing [67].
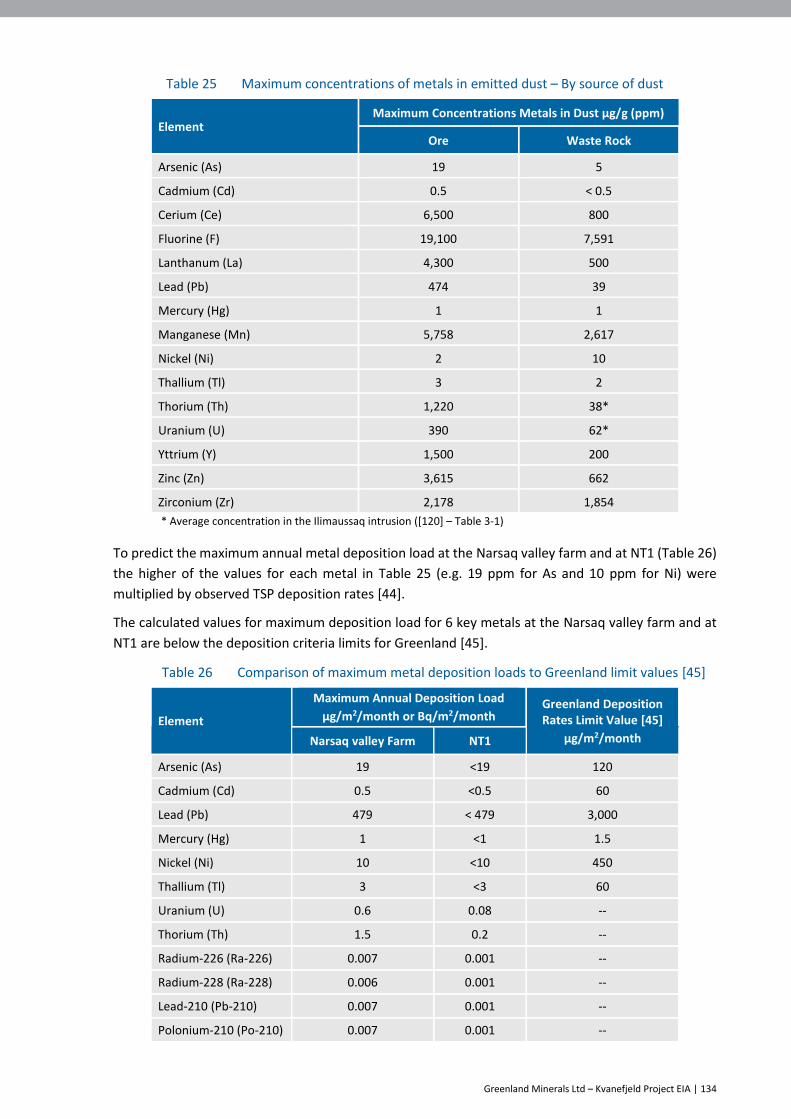
Greenland Minerals Ltd – Kvanefjeld Project EIA | 134
Table 25 Maximum concentrations of metals in emitted dust – By source of dust
Element Maximum Concentrations Metals in Dust µg/g (ppm)
Ore Waste Rock
Arsenic (As) 19 5
Cadmium (Cd) 0.5 < 0.5
Cerium (Ce) 6,500 800
Fluorine (F) 19,100 7,591
Lanthanum (La) 4,300 500
Lead (Pb) 474 39
Mercury (Hg) 1 1
Manganese (Mn) 5,758 2,617
Nickel (Ni) 2 10
Thallium (Tl) 3 2
Thorium (Th) 1,220 38*
Uranium (U) 390 62*
Yttrium (Y) 1,500 200
Zinc (Zn) 3,615 662
Zirconium (Zr) 2,178 1,854
* Average concentration in the Ilimaussaq intrusion ([120] – Table 3-1)
To predict the maximum annual metal deposition load at the Narsaq valley farm and at NT1 (Table 26)
the higher of the values for each metal in Table 25 (e.g. 19 ppm for As and 10 ppm for Ni) were
multiplied by observed TSP deposition rates [44].
The calculated values for maximum deposition load for 6 key metals at the Narsaq valley farm and at
NT1 are below the deposition criteria limits for Greenland [45].
Table 26 Comparison of maximum metal deposition loads to Greenland limit values [45]
Element
Maximum Annual Deposition Load
µg/m2/month or Bq/m2/month Greenland Deposition Rates Limit Value [45]
µg/m2/month Narsaq valley Farm NT1
Arsenic (As) 19 <19 120
Cadmium (Cd) 0.5 <0.5 60
Lead (Pb) 479 < 479 3,000
Mercury (Hg) 1 <1 1.5
Nickel (Ni) 10 <10 450
Thallium (Tl) 3 <3 60
Uranium (U) 0.6 0.08 --
Thorium (Th) 1.5 0.2 --
Radium-226 (Ra-226) 0.007 0.001 --
Radium-228 (Ra-228) 0.006 0.001 --
Lead-210 (Pb-210) 0.007 0.001 --
Polonium-210 (Po-210) 0.007 0.001 --

Greenland Minerals Ltd – Kvanefjeld Project EIA | 135
8.3.2 Gaseous Emissions
Gaseous emissions resulting from combustion associated with the power station and mobile
equipment and produced by the acid plants include:
NOX Primarily nitrogen dioxide (NO2)
SOX Primarily sulphur dioxide (SO2) and hydrogen sulfide (H2S)
Cl2 Chloride Gas
Black carbon A component of soot emitted because of the incomplete combustion of fuel
PAH Organic compounds produced during combustion.
Construction
Diesel powered mobile equipment and stationary power generation will produce gaseous emissions.
Emissions from construction activities will be limited to the three-year construction period.
Operations
In the Project’s operations phase various mining and processing related activities will produce gaseous
emissions. The key emission sources for the operations phase of the Project are identified as:
Mining operations
Plant operations (concentrator, refinery and acid plants)
On-site power generation
Port operations (including berthing ships).
Emissions of zinc sulfide, calcium fluoride, hydrochloric acid mist and chlorine gas from the Plant will
be low and below guidelines [19] [79]. Therefore, these emissions were not further evaluated.
Closure
In the closure phase of the Project, water treatment of supernatant from the TSF will continue. This
will require diesel powered generation of electrical energy and a limited number of vehicle
movements. These activities will create exhaust gases from diesel combustion.
Post closure
There is no ongoing activity during the post closure phase that has the capacity to generate measurable
emissions.
The air quality modelling described in Section 8.3.1 was also used to model gaseous emissions.
As described below, the cumulative modelling results indicate that the predicted ground level
concentrations for deposition of nitrogen, NO2, H2S, SO2 and SO4 do not exceed the relevant limit
criteria at the receptor locations. The impact of gaseous emissions from the Project is assessed to be
low [19].
The Project’s gaseous emissions were assessed against guideline criteria, as defined in Table 27.
SOx
For all sulphur compounds, the highest predicted concentration is the 1-hour maximum for SO2 at 66
µg/m3 at the Village (Table 27). This is 19 % of the respective limit criteria.

Greenland Minerals Ltd – Kvanefjeld Project EIA | 136
The modelled concentrations of sulphur are all below assessment limit criteria. The potential impact
from the emission of sulphur compounds from the Project has been assessed as low.
Table 27 Cumulative sulphur compound emissions – Predicted compared to assessment criteria
([19] – Table ES-2)
Compound Criteria Source Limit
Criteria Units
Averaging period
Highest Av or Max
% of limit
criteria Receptor
H2S Canada B.C.
PCO
7 µg/m3 24-hr
Maximum >0.001 >1 % Farm
3 µg/m3 1-hr
Maximum >0.001 >1 %
Summer house 4
SO2
Canada NAAQOs
30 µg/m3 Annual
Average 0.48 2 % Farm
450 µg/m3 1-hr
Maximum 66 19 % Village
Greenland 125 µg/m3 24-hr
Maximum 6.2 5 % Farm
SO4 Australia NSW Sulfuric Acid
(H2SO4) 18 µg/m3
1-hr Maximum
0.007 >1 % Summer house 4
NOx
For NO2 and nitrogen deposition, the highest predicted concentration is the 1-hour maximum for NO2
at 192 µg/m3 at the Village (Table 28). This is 96 % of the respective limit criteria.
The modelled concentrations of nitrous oxides are all below assessment limit criteria. The potential
impact from the emission of nitrous oxides compounds from the Project has been assessed as low.
Table 28 Cumulative nitrogen compound emissions – Predicted compared to assessment criteria
([19] – Table ES-2)
Compound Criteria Source Limit
Criteria Units
Averaging period
Highest Av or Max
% of limit criteria
Receptor
NO2
EU Directive 2008/50/EC
40 µg/m3 Annual
Average 6.3 16 % Farm
200 µg/m3 1-hr
Maximum 192 96 % Village
Greenland 100 µg/m3 24-hr
Maximum 58.3 58 % Farm
Nitrogen deposition
WHO 5 kg/ha/yr Annual 1.011 20 % Farm
Black Carbon and Polycyclic Aromatic Hydrocarbons (PAHs)
Black carbon and PAHs are produced during the incomplete combustion of diesel fuel. The main
sources of black carbon and PAHs are the power station and diesel engines in stationary and mobile
equipment.
A qualitative assessment of PAHs has been undertaken based on the dispersion modelling predictions
for black carbon. As is the case with PAHs, the emissions of black carbon are dominantly from
combustion sources. For black carbon, the highest annual average and maximum 24-hour
concentrations, are predicted to be 0.09 µg/m3 and 0.664 µg/m3 respectively. At the Narsaq valley
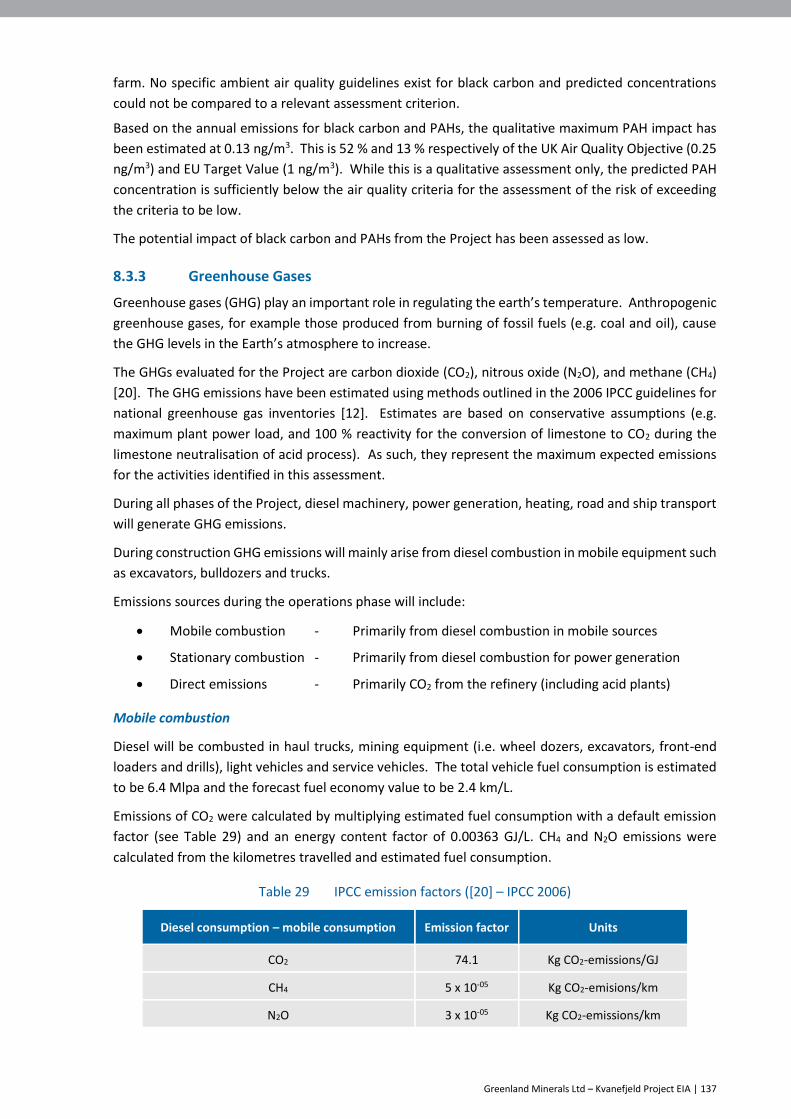
Greenland Minerals Ltd – Kvanefjeld Project EIA | 137
farm. No specific ambient air quality guidelines exist for black carbon and predicted concentrations
could not be compared to a relevant assessment criterion.
Based on the annual emissions for black carbon and PAHs, the qualitative maximum PAH impact has
been estimated at 0.13 ng/m3. This is 52 % and 13 % respectively of the UK Air Quality Objective (0.25
ng/m3) and EU Target Value (1 ng/m3). While this is a qualitative assessment only, the predicted PAH
concentration is sufficiently below the air quality criteria for the assessment of the risk of exceeding
the criteria to be low.
The potential impact of black carbon and PAHs from the Project has been assessed as low.
8.3.3 Greenhouse Gases
Greenhouse gases (GHG) play an important role in regulating the earth’s temperature. Anthropogenic
greenhouse gases, for example those produced from burning of fossil fuels (e.g. coal and oil), cause
the GHG levels in the Earth’s atmosphere to increase.
The GHGs evaluated for the Project are carbon dioxide (CO2), nitrous oxide (N2O), and methane (CH4)
[20]. The GHG emissions have been estimated using methods outlined in the 2006 IPCC guidelines for
national greenhouse gas inventories [12]. Estimates are based on conservative assumptions (e.g.
maximum plant power load, and 100 % reactivity for the conversion of limestone to CO2 during the
limestone neutralisation of acid process). As such, they represent the maximum expected emissions
for the activities identified in this assessment.
During all phases of the Project, diesel machinery, power generation, heating, road and ship transport
will generate GHG emissions.
During construction GHG emissions will mainly arise from diesel combustion in mobile equipment such
as excavators, bulldozers and trucks.
Emissions sources during the operations phase will include:
Mobile combustion - Primarily from diesel combustion in mobile sources
Stationary combustion - Primarily from diesel combustion for power generation
Direct emissions - Primarily CO2 from the refinery (including acid plants)
Mobile combustion
Diesel will be combusted in haul trucks, mining equipment (i.e. wheel dozers, excavators, front-end
loaders and drills), light vehicles and service vehicles. The total vehicle fuel consumption is estimated
to be 6.4 Mlpa and the forecast fuel economy value to be 2.4 km/L.
Emissions of CO2 were calculated by multiplying estimated fuel consumption with a default emission
factor (see Table 29) and an energy content factor of 0.00363 GJ/L. CH4 and N2O emissions were
calculated from the kilometres travelled and estimated fuel consumption.
Table 29 IPCC emission factors ([20] – IPCC 2006)
Diesel consumption – mobile consumption Emission factor Units
CO2 74.1 Kg CO2-emissions/GJ
CH4 5 x 10-05 Kg CO2-emisions/km
N2O 3 x 10-05 Kg CO2-emissions/km

Greenland Minerals Ltd – Kvanefjeld Project EIA | 138
Total GHG emissions arising from fuel combustion in mobile sources during operations is estimated to
be 18,346 tonnes per year of which 99 % are CO2 emissions [20]. Construction and closure emissions
are a combined 56,475 tonnes per year the majority of which is generated by the construction phase.
Stationary combustion
GHG emissions from the power station were calculated using 2006 IPCC guidelines. For operations, a
total of 175,313 tonnes of GHG emissions per year was estimated [20]. For closure, emissions were
estimated at 16,572 tonnes per year [20]. More than 99 % of the GHG’s are CO2.
Emissions from the refinery
The refinery will produce emissions of CO2 and CH4 and N2O. Assuming the refinery is operating 24
hours a day and 365 days a year, the estimated GHG emissions will 33,014 tonnes of GHG per year. (of
which 32,986 tonnes is CO2).
Total GHG emissions
A total of 0.24 million tonnes of GHG emissions per year is estimated for the Project. The combined
CH4 and N2O emissions are 2,360 tonnes GHG per year.
The annual CO2 emissions in Greenland were 0.53 million tonnes in 2016 [34]. The Project will increase
Greenland’s CO2 emissions by 45 %.
The population of Greenland is small and any new energy intensive industries will alter per capita
emission levels significantly. In the Project’s operations phase, CO2 emissions in Greenland will
increase from the current level, approximately 9.7 t CO2 per capita per year, to 13.9 t CO2 per capita
per year [34].
By way of comparison, the annual Danish CO2 emissions (2015) from energy consumption are
approximately 49 Mt CO2. The current level of CO2 emissions in Greenland is approximately 1% of that
in Denmark. In the operations phase of the Project, this will increase this to approximately 2%
(assuming all other quantities remain constant).
The ~500 tonnes of uranium oxide produced by the Project annually will be used to produce electricity
at nuclear power plants outside Greenland. This will lead to a global displacement in CO2 emissions of
approximately 7 Mtpa (when compared to an average European fossil fuel power station) [27].
8.4 Mitigation Measures
GML has developed a DCP [28] which describes dust suppression activities that will be implemented
during operations.
Mitigation measures in the DCP include recommendations contained in the ERM Air Quality report [19]
and those indicated below:
Wetting of rock stockpiles, concentrates and waste materials with water sprinkler systems
(summer) using excess water which has been captured through recycling
Wetting of haul roads with water spray trucks (summer)
Salting of haul roads in the winter to melt ice and snow from the roads. The salt can also
increase surface moisture by drawing moisture from the atmosphere
Vehicle speed limits, regular road grading and maintenance
Drilling dust containment (capturing dust generated during drilling operations)

Greenland Minerals Ltd – Kvanefjeld Project EIA | 139
Blasting dust mitigations (wetting down the blasting area, the use of a “fog cannon” which
generates fine water mist in the blasting region (summer)
Vehicle washing systems at the exit point of the mining area (to minimize dispersal of dust
along roads outside mine area).
It is expected that the mitigation measures proposed will significantly reduce the dust generation from
mining activities. As it was assumed for the purposes of modelling that there were no dust control
measures in place, the actual level of dust concentration and deposition is expected to be significantly
lower than the modelled values.
Air quality and GHG mitigation measures include:
Using vehicles and equipment with energy efficiency technologies to minimize emission rates
Maintaining power plant, vehicles and other fuel powered equipment in accordance with
manufacturer’s specifications to minimize emissions.
8.5 Predicted outcome
The predicted outcomes for atmospheric setting are summarised in Table 30.
Table 30 Predicted outcomes for the atmospheric setting
Impact Project Phase Spatial extent Duration Significance
Dust Construction
Operation Study area Life of Mine Low
Assessment
The modelling shows that high concentrations of dust in the air are only recorded close to the haul roads in the mine area. Outside the mine area, the concentrations are well below Greenland guideline values and other relevant international standards. It is predicted that most dust will be deposited on Kvanefjeld and on the mountainous plateau to the south-west of the mine. Outside this area deposition levels are well below Greenland guidelines.
Gaseous Emissions
Construction
Operation
Closure
Study area Life of Mine Low
Assessment
The impact of gaseous emissions (including NOx, SOx, black carbon and PAHs) from the Project were assessed to be low
Greenhouse gas
Construction
Operation National Life of Mine Low
Assessment
The Project will increase Greenland’s CO2 emissions by 45 %.
The existing CO2 emission from Greenland is approximately 1 % of Denmark emissions. During the operations phase of the Project, this will increase to 2%.
Greenland Minerals Ltd – Kvanefjeld Project EIA | 140
9. Radiological emissions
9.1 Existing environment
Radiation is energy that is transmitted in the form of waves or streams of particles. It is present
everywhere in our environment. A source of radiation is naturally occurring radionuclides, which are
present in all soils and rocks thereby creating a natural background radiation level in every location on
the planet. Worldwide, the normal range of natural background radiation has been reported to range
between 1 and 13 mSv/year with an average of 2.4 mSv/year [70].
Radiation can be divided into two broad types: ionizing and non-ionizing. Ionizing radiation includes
the radiation that comes from naturalas well as man-made radioactive sources such as cosmic rays,
nuclear power plants, and x-ray machines. Non-ionizing radiation is a lower energy radiation that
includes radiowaves, ultraviolet rays, microwaves, and sunlight. This form of radiation does not carry
enough energy to ionize atoms or molecules. The focus of this assessment is on the ionizing radiation
associated with the Project.
Elements that emit ionizing radiation are called radionuclides. As it decays, a radionuclide transforms
into a different atom - a decay product. The atoms keep transforming to new decay products until they
reach a stable state and are no longer radioactive. The majority of radionuclides only decay once
before becoming stable. Those that decay in more than one step are called series radionuclides. The
series of decay products created to reach this balance is called the decay chain.
Each series has its own unique decay chain. The decay products within the chain are always radioactive.
Only the final, stable atom in the chain is not radioactive. Some decay products are a different chemical
element. Every radionuclide has a specific decay rate, which is measured in terms of half-life, or the
time required for half of the radioactive atoms present to decay or transform [122].
Uranium and thorium are two of a number of naturally occurring radioactive elements that are widely
distributed on earth. Kvanefjeld ore contains elevated concentrations of uranium and thorium,
approximately 300 and 800 ppm respectively.
Mining, processing and waste management activities associated with uranium and thorium rich ores
release radon to the atmosphere. Radon is a chemically inert noble gas and as such can travel
significant distances from the radioactive source material. Its most common isotope is radon-222
(radon), which arises from the radioactive decay chain of uranium-238 (U-238). The term “radon” is
commonly used to mean radon‑222 (Rn-222). However, there are other isotopes of radon, notably,
“thoron” (Rn-220) which is an isotope of radon, and is also an inert noble gas. Thoron is an element in
the radioactive decay chain of naturally occurring thorium-232 (Th-232). Since radon and thoron are
members of different decay chains, the ratio between radon and thoron (or between the decay
products of radon and thoron) will depend in part on the ratio of uranium to thorium in local soils and
rocks. In addition, as discussed in the UNSCEAR 2000 Report, the radioactive half-lives of radon and
thoron and their respective decay products are very important in determining their behaviour in the
environment and subsequently the corresponding exposures to people in workplaces or homes. Since
thoron has a much shorter half-life (t½ = 55 sec) than radon (t½ = 3.82 days), the distance it can travel
before undergoing radioactive decay is very much shorter than the distance radon can travel in the
same medium, and therefore its expression in the environment is quite different from that of radon.
Radon escapes easily from the ground into the air, where it decays and produces further radioactive
particles. Through respiration, the particles are deposited on the cells lining the airways, where they
can damage DNA and potentially cause lung cancer.

Greenland Minerals Ltd – Kvanefjeld Project EIA | 141
Outdoors, radon quickly dilutes to very low concentrations and is generally not a problem. The average
outdoor radon level varies between 5–15 Bq/m3. However, indoors, radon concentrations can be
higher, with highest levels found in places like mines, caves and water treatment facilities [121].
Baseline radon and thoron concentrations at locations through Narsaq and the Project Area were
surveyed using two different instruments [6]. The baseline results show indicate mean concentrations
of radon and thoron of 20 Bq/m3 and 16.1 Bq/m3 respectively in Narsaq.
Near the proposed Mine mean radon levels of 341 Bq/m3 have been recorded, however these values
have a with wide variation [6]. Additional radon baseline measurements are planned prior to the
commencement of construction.
Over time, natural processes such as glaciation and wind and water erosion have dispersed
radionuclides into the Narsaq valley and Narsaq. Radionuclide concentrations in the Project Area are
higher than global average soil concentrations [5] as a result of this shedding from the Kvanefjeld ore.
The baseline concentrations in dust, soils and sediments and biota in the Study Area are discussed
below.
Naturally occurring radionuclides are found in dust. Dust in the Narsaq valley and other areas
surrounding the Project is likely to contain naturally elevated levels of radioactive particles. Ambient
PM10 dust concentrations at four locations in and around Narsaq were monitored and tested for a
number of radioactive elements [5]. Concentrations of these elements in ambient air are set out in
Table 31. To strengthen the baseline, further data collection will be conducted for concentrations of
radioactive elements in TSP. The Project also intends to install a high-volume air sampler (HVAS) close
to the mining area to reduce the variability within dust data from this location.
Table 31 Concentrations of radioactive elements in dust particles (ambient air PM10) ([5] – Table
21)
Location Uranium (ng/m3)
U-238 (µBq/m3)
Thorium (ng/m3)
Th-232 (µBq/m3)
Narsaq Farm (2012) 0.021 0.26 0.142 0.58
Narsaq Town (2012) 0.005 0.06 0.098 0.40
Narsaq Point (2012) 0.006 0.07 0.068 0.28
Narsaq Town (2014) 0.033 0.41 0.11 0.45
Narsaq Town (2015) 0.019 0.24 0.071 0.29
Average 0.017 0.21 0.098 0.4
Note: 1 g Uranium = 12,350 Bq of U-238 and 1 g Thorium = 4,100 Bq of Th-232
The presence of naturally occurring radionuclides in the ground can result in external gamma radiation
exposure. To quantify the gamma radiation level in the Project area, in the Narsaq valley and in Narsaq,
a survey was carried out in 2014 [5]. The survey found that gamma radiation levels in the town of
Narsaq were low but levels tended to be higher near some sections of the track leading up the valley
towards the proposed site of the Plant. Gravel used for road fill, landfill and house foundation concrete
in Narsaq includes material from the Narsaq river that has been transported from the Kvanefjeld
Plateau and is naturally elevated in uranium and thorium content.
The coastal areas show slightly higher gamma radiation levels than in Narsaq. Gamma radiation tends
to increase in the Narsaq valley area primarily as a result of the movement of mineralized material

Greenland Minerals Ltd – Kvanefjeld Project EIA | 142
from higher elevations. The highest gamma radiation levels in the valley tend to be adjacent to the
Narsaq river.
Gamma radiation levels in the Project Area are generally higher than in the surrounding area, reflecting
the radionuclide content of the deposit, as seen in Table 32.
Table 32 Summary of terrestrial gamma exposure rates in the Project Area and surrounding areas
([5] – Table 23)
Study Area Infrastructure Mean
(μGy/h) Max
(μGy/h)
Nasarsuaq N/A 0.1 0.13
Qaqortoq N/A 0.11 0.15
Town of Narsaq
GMEL workshop 0.11 0.38
None 0.11 0.29
All 0.11 0.38
Coastal Plain
Port 0.05 0.07
Accommodation 0.1 0.17
None 0.12 0.27
All 0.12 0.27
Valley All 0.44 1
Soils in the Narsaq valley, marine sediment from Narsap Ilua and sediment from the Narsaq river
display, relative to typical background levels, elevated combined thorium and uranium levels of
between 2 and 15 ppm. The ratio of thorium to uranium in the Kvanefjeld deposit ranges between 2.5
and 2.7, and this is consistent with what is seen in the soils and sediments.
This indicates some influence of the Kvanefjeld resource possibly resulting from erosion (Table 33).
Table 33 Background radioactivity measurements - Soil and sediment from the Study Area ([5] –
Tables I-12, I-14)
Parameter Unit Soil Marine
sediment Freshwater sediment
Lower Narsaq river
Freshwater sediment Upper Narsaq river close to
Kvanefjeld
Thorium (Th) ppm 78 30 61 190
Uranium (U) ppm 29.5 9.5 30 56
Uranium-238 (a) Bq/g 0.36 0.12 0.37 0.69
Radium-226 Bq/g 0.44 - 0.23 -
Lead-210 Bq/g - - 0.24 -
Polonium-210 Bq/g - - 0.23 -
Thorium-232 (b) Bq/g 0.32 0.12 0.25 0.78
Radium-228 Bq/g - 0.099 0.34 0.61
Note: (a) 1 g U = 12,350 Bq of U-238; (b) 1 g Th = 4,100 Bq of Th-232; all wet weight basis

Greenland Minerals Ltd – Kvanefjeld Project EIA | 143
Radioactivity measurements in water showed low concentrations of uranium in freshwater and
seawater, with averages of 0.003 mg/L and 0.002 mg/L, respectively. Thorium was consistently below
detection limits. The only detectable measurement of thorium was in the Narsaq river at 0.002 mg/L.
Radium-226 and lead-210 concentrations in rivers and fjords in the Study Area were lower than the
Canadian drinking water guidelines, (Radium-226 - 0.5 Bq/L and Lead-210 – 6 Bq/L) [123], as indicated
in Table 34.
Table 34 Radionuclide concentrations in water in the Study Area ([5] – Table 26)
Location Uranium (mg/L)
Thorium (mg/L)
Radium-226 (Bq/L)
Lead-210 (Bq/L)
Radium-228 (Bq/L)
Port 0.0011 <0.0005 <0.043 0.10 ± 0.13 <0.011
First Bridge 0.0014 <0.0005 <0.048 <0.22 <0.12
Kvanefjeld Stream 0.0082 0.0017 0.047 ± 0.022 0.16 ± 0.08 <0.10
Old Bridge 0.00082 <0.0005 <0.057 0.20 ± 0.07 <0.12
Accommodation Area <0.0005 <0.0005 0.048 ± 0.028 0.11 ± 0.07 <0.12
Waste Area <0.0005 <0.0005 <0.055 0.08 ± 0.13 <0.12
Waste Area <0.0005 <0.0005 <0.046 <0.27 <0.10
River from glacier 0.0032 <0.0005 <0.043 0.16 ± 0.11 <0.11
River coming down from lake
0.00092 <0.0005 0.022 ± 0.020 0.11 ± 0.13 <0.12
Samples of lichen, plants, seaweed, mussels, fish and seals were analysed to determine the natural
background concentrations of radionuclides in representative species of the resident flora and fauna.
Despite the elevated levels of uranium and thorium in soils and sediments near the Kvanefjeld deposit,
there is little evidence of accumulation in organic samples.
With the exception of snow lichens, thorium was not found in any of the organic samples. Snow lichens
from Narsaq valley show the potential for accumulation of radionuclides, likely the result of dust
dispersion from exposed rock and soils in the Narsaq valley. This is more evident in samples from the
upper Narsaq valley closer to the Kvanefjeld orebody. Lichens collected close to the fjord showed a
lower value (Table 35). Lichens from a reference station 28 km south southwest of Kvanefjeld showed
very low values.
Analyses of Arctic char from the Narsaq river as well as marine fish and ringed seals from the fjords
around Narsaq indicated no significant concentration of radionuclides.
Radionuclides, with one exception, are also below detection levels in ringed seals from Nordre Sermilik.
The exception, polonium-210, was found in seal meat (0.040 Bq/g) and seal liver (0.16 Bq/g). Polonium
is known to biomagnify through the aquatic food chain and higher trophic level animals that consume
fish (such as seals) are known to have elevated levels of polonium. This is particularly the case for
sedentary seal species living in an area with slightly elevated concentrations of radionuclides, such as
ringed seal in the fjords around Kvanefjeld. For comparison, Polonium-210 levels in a (migratory) harp
seal from the Bylot Sound at Thule were found to be 0.008 Bq/g fresh weight in flesh and 0.043 Bq/g
fresh weight in liver [49].

Greenland Minerals Ltd – Kvanefjeld Project EIA | 144
Table 35 Radioactivity measurements - Snow lichens and grass from the Narsaq valley and
reference station ([5] – Table I-15)
Parameters Unit
Snow lichen Snow lichen reference
station
Grass
Lower Narsaq valley
Lower Narsaq valley
Upper Narsaq valley
Thorium ppm 1.2 4.7 <0.1 <0.1
Uranium ppm 0.6 1.6 <0.1 0.53
Uranium-238 (a) Bq/g 0.007 0.020 <0.0012 0.0065
Radium-226 Bq/g 0.029 0.088 <0.01 0.01
Lead-210 Bq/g 0.26 - - -
Polonium-210 Bq/g 0.21 0.45 0.26 <0.01
Thorium-232 (b) Bq/g 0.005 0.019 <0.0004 <0.0004
Radium-228 Bq/g <0.05 - - -
Note: (a) 1 g U = 12,350 Bq of U-238; (b) 1 g Th = 4,100 Bq of Th-232; all wet weight basis
9.2 Potential impacts
The release of radionuclides from Project activities has the potential to impact the environment and
human health. In addition to the release of radionuclides associated with the planned Project
activities, risk scenarios resulting in further contribution to radiation levels have been considered.
Impacts and risks considered include:
Uranium oxide spills during Project operations which may result in additional radiological
emissions
Failure of TSF embankments with the potential to release tailings water and solids containing
radionuclides to land and water bodies downstream of the TSF thereby elevating the
radiological exposure
Release of aerosols from the TSF with the potential to result in contamination of land and
release of radioactivity downwind of the TSF
Dispersal of radionuclides via groundwater seepage
Dispersal of radionuclides via dust dispersal.
9.3 Assessment of impacts
9.3.1 Release to air, land and water
Some Project activities may result in the release of radioactivity to the air, land and water that
potentially may be harmful to animals, plants and humans.
Radioactive releases from the Project will primarily take the form of radon emissions and the
dispersion of radioactive dust.
In radiological studies undertaken by Arcadis [5], the potential for radiological contamination was
assessed. Project-related radionuclide concentrations in receptors (soil, water, plants and animals) at
different locations within the Study Area modelled using radiation data from laboratory tests [6].
Potential impacts to key animal species and plants as well as human health were considered including
the assessment of a range of habitats and potential contaminants across the food chain.

Greenland Minerals Ltd – Kvanefjeld Project EIA | 145
Effects on the health of plants and animals were determined by comparing the total dose (natural
background dose plus the dose arising from Project activities) to a selected protective dose limit. If
the dose received was below the protective dose limit, then it can be concluded that the health of the
species is not at risk.
Arcadis used the INTAKE pathways model, a proprietary model. INTAKE was developed for use in
simulating environmental transfer, uptake and risk due to exposure to radionuclides, stable metals and
inorganic species released to the environment (e.g. air, water, groundwater, soil). The model has an
extensive history of development and quality assurance. It can be run in a deterministic mode or in a
probabilistic framework to facilitate uncertainty and sensitivity analyses.
The model includes both ecological (non-human biota) and human receptors. Input parameters used
in the pathways model are as follows:
Dietary characteristics
Baseline concentrations
Project concentrations
Transfer factors and
Dose coefficients.
The INTAKE model has been applied to several uranium mining projects in northern Saskatchewan to
simulate radiological and non-radiological constituent fate and transport in the environment and the
subsequent evaluation of exposures to ecological species and humans.
The Kvanefjeld resource contains significant concentrations of uranium and thorium. Therefore, the
assessment of contaminants of potential concern (COPC) includes the long-lived radionuclides in the
uranium decay chain including uranium-238 (U-238) as well as thorium-230 (Th-230), radium-226 (Ra-
226), lead-210 (Pb-210) and polonium-210 (Po-210) as well as the thorium-232 (Th-232) series, which
includes radium-228 (Ra-228) and thorium-228 (Th-228). In addition, radon-222 and radon-220
(thoron) are considered in the atmospheric environment. Community and occupational health aspects
of radiological exposure are assessed in the Project’s SIA.
Radon
During each phase of the Project, activities will take place which have the potential to produce radon
emissions. The following activities were identified as having the potential to release radon and thoron
[6]:
Exposed surfaces of uranium bearing material (ore and waste rock) in the mine and from the
associated ore and waste rock stockpiles
In-pit releases from mine water pore water
Handling of broken ore in the pit
Ore processing and storage (primary crushing, and grinding assumed to be negligible based
on assumed limited ore storage time after primary crushing)
Mill process vessels (concentrator and refinery) due to an inventory of radium (process
vessels located in the Plant, and
Tailings facilities (assumed to be negligible due to constant water cover during operations
phase, while during post-closure, treatment of supernatant water will be completed and the
FTSF and CRSF will be allowed to fill with precipitation and water runoff).
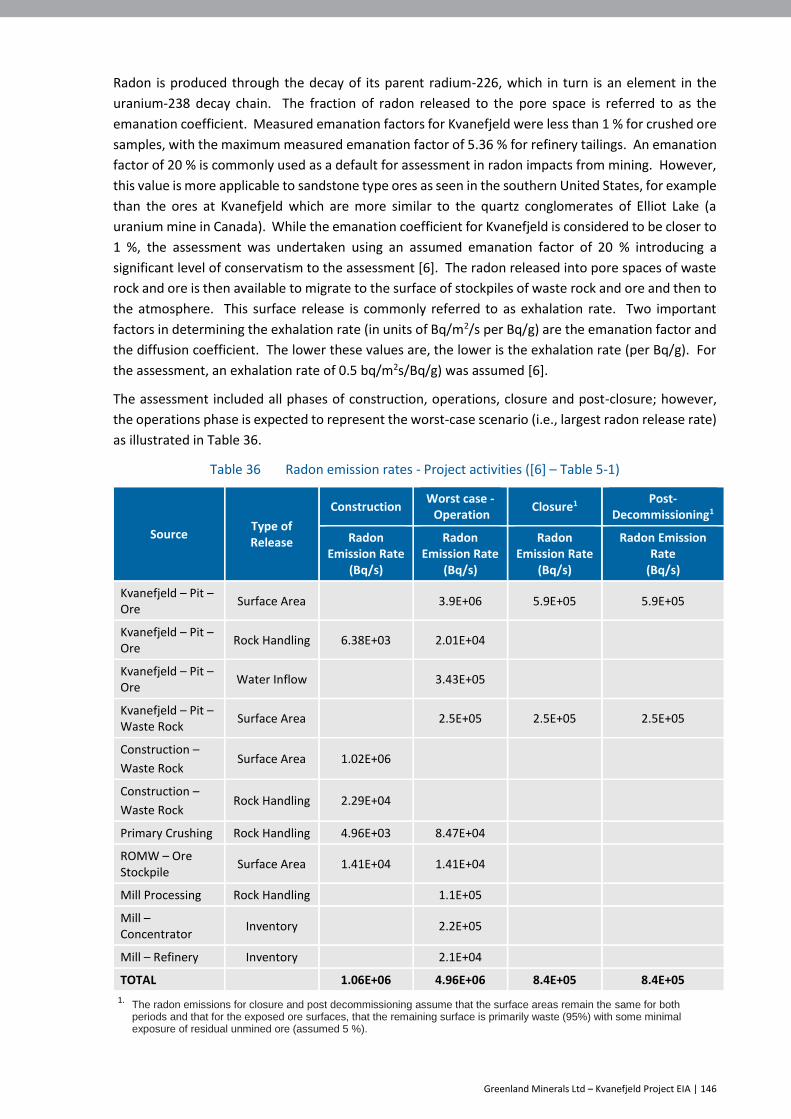
Greenland Minerals Ltd – Kvanefjeld Project EIA | 146
Radon is produced through the decay of its parent radium-226, which in turn is an element in the
uranium-238 decay chain. The fraction of radon released to the pore space is referred to as the
emanation coefficient. Measured emanation factors for Kvanefjeld were less than 1 % for crushed ore
samples, with the maximum measured emanation factor of 5.36 % for refinery tailings. An emanation
factor of 20 % is commonly used as a default for assessment in radon impacts from mining. However,
this value is more applicable to sandstone type ores as seen in the southern United States, for example
than the ores at Kvanefjeld which are more similar to the quartz conglomerates of Elliot Lake (a
uranium mine in Canada). While the emanation coefficient for Kvanefjeld is considered to be closer to
1 %, the assessment was undertaken using an assumed emanation factor of 20 % introducing a
significant level of conservatism to the assessment [6]. The radon released into pore spaces of waste
rock and ore is then available to migrate to the surface of stockpiles of waste rock and ore and then to
the atmosphere. This surface release is commonly referred to as exhalation rate. Two important
factors in determining the exhalation rate (in units of Bq/m2/s per Bq/g) are the emanation factor and
the diffusion coefficient. The lower these values are, the lower is the exhalation rate (per Bq/g). For
the assessment, an exhalation rate of 0.5 bq/m2s/Bq/g) was assumed [6].
The assessment included all phases of construction, operations, closure and post-closure; however,
the operations phase is expected to represent the worst-case scenario (i.e., largest radon release rate)
as illustrated in Table 36.
Table 36 Radon emission rates - Project activities ([6] – Table 5-1)
Source Type of Release
Construction Worst case - Operation
Closure1 Post-Decommissioning1
Radon Emission Rate
(Bq/s)
Radon Emission Rate
(Bq/s)
Radon Emission Rate
(Bq/s)
Radon Emission Rate
(Bq/s)
Kvanefjeld – Pit – Ore
Surface Area 3.9E+06 5.9E+05 5.9E+05
Kvanefjeld – Pit – Ore
Rock Handling 6.38E+03 2.01E+04
Kvanefjeld – Pit – Ore
Water Inflow 3.43E+05
Kvanefjeld – Pit – Waste Rock
Surface Area 2.5E+05 2.5E+05 2.5E+05
Construction –
Waste Rock Surface Area 1.02E+06
Construction –
Waste Rock Rock Handling 2.29E+04
Primary Crushing Rock Handling 4.96E+03 8.47E+04
ROMW – Ore Stockpile
Surface Area 1.41E+04 1.41E+04
Mill Processing Rock Handling 1.1E+05
Mill – Concentrator
Inventory 2.2E+05
Mill – Refinery Inventory 2.1E+04
TOTAL 1.06E+06 4.96E+06 8.4E+05 8.4E+05
1. The radon emissions for closure and post decommissioning assume that the surface areas remain the same for both periods and that for the exposed ore surfaces, that the remaining surface is primarily waste (95%) with some minimal exposure of residual unmined ore (assumed 5 %).

Greenland Minerals Ltd – Kvanefjeld Project EIA | 147
In addition to radon releases, thoron releases have also been estimated to assess the worst-case
scenario. The mechanisms for the release of thoron to the pore space and subsequent diffusion to the
atmosphere are similar to those for radon, but given radon's very much larger half-life, radon is able
to diffuse from greater depths within the source material of soil. The thoron emanation factor is about
1/10 that of radon, affecting the potential release of thoron to pore space and hence, the amount of
thoron potentially available for release to the atmosphere. Table 37 summarises the worst-case
emission rates (as per the Operations period).
Table 37 Radon emission rates for Operations ([6] – Table 5-3)
Source Type of Release
Worst case - Operation
Thoron Emission Rate (Bq/s)
Radon Emission Rate (Bq/s)
Kvanefjeld – Pit – Ore Surface Area 1.7E+05 3.9E+06
Kvanefjeld – Pit – Ore Rock Handling 6.29E+03 2.01E+04
Kvanefjeld – Pit – Ore Water Inflow nil 3.43E+05
Kvanefjeld – Pit – Waste Rock Surface Area 7.14E+03 2.5E+05
Construction – Waste Rock Surface Area
Construction – Waste Rock Rock Handling
Primary Crushing Rock Handling 2.65E+04 8.47E+04
ROMW – Ore Stockpile Surface Area 6.30E+02 1.41E+04
Mill Processing Rock Handling 3.44E+0.4 1.1E+05
Mill – Concentrator Inventory 6.88E+04 2.2E+05
Mill – Refinery Inventory 6.57E+03 2.1E+04
TOTAL 3.25E+05 4.96E+06
To understand the impact of mining related radon and thoron to residents of Narsaq, the incremental
level of radon and thoron arising from mining activities (as indicated in Table 36) was estimated by
combining the estimated sources with atmospheric dilution factors to predict levels in the town of
Narsaq and these levels were then compared to background levels. Based on the worst-case emission
rate of 4.96E+06 Bq/s for radon and 3.25E+05 for thoron, the Project will increase background radon
concentrations in Narsaq by a maximum of 3 %. The majority of the additional radon exposure will
come from radon released from the open pit mining operations. As these incremental radon levels are
within the natural variation of background radon, the consequences of incremental radon exposure
are negligible [6].
Dust
The modelling of dust dispersion identified the sources of dust during the Project’s operations and
estimated the concentrations at different locations within the Study Area. Using dust deposition
modelling and data on the content of uranium and thorium in the source material of the dust,
concentrations of COPC at different locations in the Study Area were estimated.
The predicted levels of COPC in Project dust were then used to predict the change in concentrations
of radionuclides in receptors as a result of the deposition of Project related dust.

Greenland Minerals Ltd – Kvanefjeld Project EIA | 148
As an example, the estimated concentration of COPC in lichens at different locations in and around the
Study area is shown in Table 38. Estimated concentrations in the Table are the sum of the background
level and the predicted Project dust-related impact.
Table 38 Modelled cumulative concentrations of COPCs in lichen in the Study Area ([5] - Table 56)
COPC Unit Narsaq valley Taseq Narsaq Tuttutooq
Uranium µg/g 2.06 1.21 1.18 1.18
Uranium-238 Bq/g 0.026 0.015 0.015 0.015
Thorium-230 Bq/g 0.026 0.015 0.015 0.015
Radium-226 Bq/g 0.026 0.015 0.015 0.015
Lead-210 Bq/g 0.60 0.59 0.59 0.59
Polonium-210 Bq/g 0.15 0.14 0.14 0.14
Thorium µg/g 6.9 4.6 4.5 4.5
Thorium-232 Bq/g 0.028 0.019 0.018 0.018
Radium-228 Bq/g 0.028 0.019 0.018 0.018
Thorium-228 Bq/g 0.028 0.019 0.018 0.018
Based on the predicted cumulative concentrations of COPC in soil and plants (i.e. background and
Project-related), the predicted concentrations in selected animals that inhabit the various terrestrial
habitats of the Study Area were determined. The calculation of the concentration of COPC in each
species was determined by considering the species’ diet, the time spent in the Study Area and the
estimated concentrations of radionuclides in the diet.
Modelled concentrations for selected terrestrial birds and mammals at a number of locations within
the Study Area is shown in Table 39. The concentrations are all low and are at or below levels of
detection (for example, the detection limit for Ra-226 in tissue is approximately 0.01 Bq/g). As
discussed above, the concentrations are estimated using transfer factors along with other
assumptions. The transfer factors, taken from literature sources, are variable depending on the food
items. They can be difficult to determine due to the detection limits and the difference in
concentrations shown in the table below are not expected to be as significant as shown.
Table 39 Modelled cumulative (background and Project related) concentrations of COPCs in
mammals and birds in the Study Area ([5] - Table 63)
COPC Unit
Narsaq valley Ipiutaq Narsaq town
Ptarmigan Arctic fox White-tailed
eagle Sheep
Glaucous gull
Uranium µg/g 0.049 0.001 0.10 0.009 0.009
Uranium-238 Bq/g 6.1x10⁻⁴ 1.6x10⁻⁵ 1.2x10⁻³ 1.2x10⁻⁴ 1.1x10⁻⁴
Thorium-230 Bq/g 6.9x10⁻⁶ 1.2x10⁻⁵ 3.7x10⁻⁵ 5.7x10⁻⁵ 6.1x10⁻⁷
Radium-226 Bq/g 2.3x10⁻⁵ 1.0x10⁻⁴ 7.4x10⁻⁵ 0.003 6.9x10⁻⁶
Lead-210 Bq/g 0.003 2.3x10⁻⁵ 0.003 6.3x10⁻⁴ 3.2x10⁻⁴
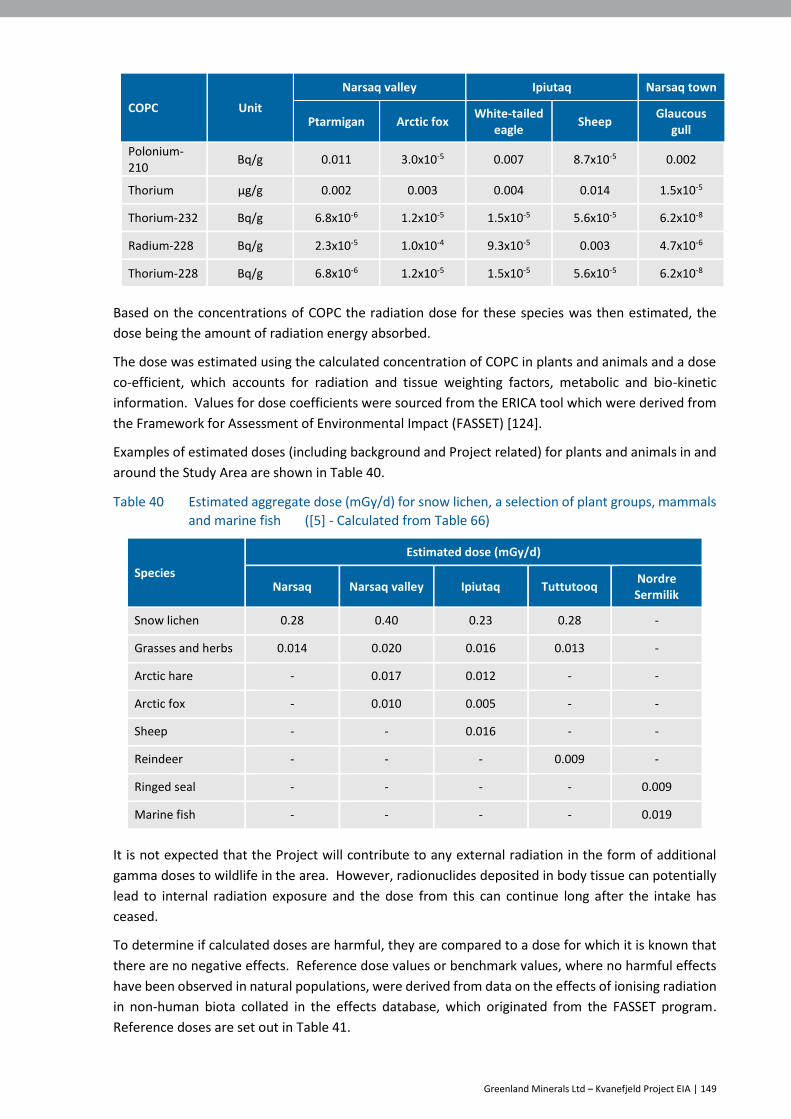
Greenland Minerals Ltd – Kvanefjeld Project EIA | 149
COPC Unit
Narsaq valley Ipiutaq Narsaq town
Ptarmigan Arctic fox White-tailed
eagle Sheep
Glaucous gull
Polonium-210
Bq/g 0.011 3.0x10⁻⁵ 0.007 8.7x10⁻⁵ 0.002
Thorium µg/g 0.002 0.003 0.004 0.014 1.5x10⁻⁵
Thorium-232 Bq/g 6.8x10⁻⁶ 1.2x10⁻⁵ 1.5x10⁻⁵ 5.6x10⁻⁵ 6.2x10⁻⁸
Radium-228 Bq/g 2.3x10⁻⁵ 1.0x10⁻⁴ 9.3x10⁻⁵ 0.003 4.7x10⁻⁶
Thorium-228 Bq/g 6.8x10⁻⁶ 1.2x10⁻⁵ 1.5x10⁻⁵ 5.6x10⁻⁵ 6.2x10⁻⁸
Based on the concentrations of COPC the radiation dose for these species was then estimated, the
dose being the amount of radiation energy absorbed.
The dose was estimated using the calculated concentration of COPC in plants and animals and a dose
co-efficient, which accounts for radiation and tissue weighting factors, metabolic and bio-kinetic
information. Values for dose coefficients were sourced from the ERICA tool which were derived from
the Framework for Assessment of Environmental Impact (FASSET) [124].
Examples of estimated doses (including background and Project related) for plants and animals in and
around the Study Area are shown in Table 40.
Table 40 Estimated aggregate dose (mGy/d) for snow lichen, a selection of plant groups, mammals
and marine fish ([5] - Calculated from Table 66)
Species
Estimated dose (mGy/d)
Narsaq Narsaq valley Ipiutaq Tuttutooq Nordre Sermilik
Snow lichen 0.28 0.40 0.23 0.28 -
Grasses and herbs 0.014 0.020 0.016 0.013 -
Arctic hare - 0.017 0.012 - -
Arctic fox - 0.010 0.005 - -
Sheep - - 0.016 - -
Reindeer - - - 0.009 -
Ringed seal - - - - 0.009
Marine fish - - - - 0.019
It is not expected that the Project will contribute to any external radiation in the form of additional
gamma doses to wildlife in the area. However, radionuclides deposited in body tissue can potentially
lead to internal radiation exposure and the dose from this can continue long after the intake has
ceased.
To determine if calculated doses are harmful, they are compared to a dose for which it is known that
there are no negative effects. Reference dose values or benchmark values, where no harmful effects
have been observed in natural populations, were derived from data on the effects of ionising radiation
in non-human biota collated in the effects database, which originated from the FASSET program.
Reference doses are set out in Table 41.

Greenland Minerals Ltd – Kvanefjeld Project EIA | 150
ERICA uses a screening incremental dose rate of 10 µGy/h for chronic exposure for all biota (Beresford
et al. 2007). This value was derived from data on the effects of ionising radiation in non-human biota
collated in the effects database, which originated from the Framework for Assessment of
Environmental Impact (FASSET) program. It is noted that the screening dose rate lies within the dose
range resulting in minor effects, which are not expected to be important at higher organizational levels
such as the structure and functioning of ecosystems (Beresford et al. 2007). The ERICA tool allows for
the dose benchmark to be modified to a user input value or the default value of 40 µGy/h for terrestrial
animals and birds and 400 µGy/h for plants and aquatic species.
The International Commission on Radiological Protection (ICRP 2014) has developed Derived
Consideration Reference Levels (DCRLs). These are bands of dose rates that can be used in making
decisions on scenarios that require further evaluation. Under normal operations, ICRP indicates that
the lower boundary of the relevant DCRL band should be used as the appropriate reference point. For
the aquatic environment, the DCRLs are in the range of 40-400 µGy/h. For the terrestrial environment,
the doses are in the range of 4-40 µGy/h for pine trees, birds and mammals and 40-400 µGy/h for grass
and higher invertebrates. In emergency exposure situations, the diagram shown in Figure 4.1 from
ICRP 124 (2014) can be used as a guide. The severe-effect reference levels are approximately
equivalent to a band of doses two orders of magnitude above the DCRL band. This information can be
used to determine the potential and severity of any potential impacts.
The United Nations Scientific Committee on the Effects of Atomic Radiation (UNSCEAR 2008, Annex E)
reviewed the available information on dose rates. They found that reproductive effects are the more
sensitive indicator of radiation response. Overall, they concluded that chronic irradiation at dose rates
up to 400 µGy/h to a small proportion of the individuals in an aquatic population would not have any
detrimental effects at the population level. For terrestrial communities, they concluded that a chronic
dose rate of less than 100 µGy/h to the most highly exposed individuals would be unlikely to have
significant effects on most terrestrial communities.
For the evaluation of effects, the dose limits of 40 µGy/h (0.96 mGy/d) for terrestrial animals and birds
and 400 µGy/h (9.6 mGy/d) for plants and aquatic species, which is one of the defaults available in the
ERICA tool, were used. It is noted that this is a cautious approach as the dose limit for the terrestrial
environment is lower than suggested by UNSCEAR [5].
For human receptors doses should be kept below the dose limits but also at all times as low as
reasonably achievable (ALARA). The radiation dose limit for a member of public is 1 mSv/y,
incremental to natural background and medical exposures.
The reference dose values used for this assessment are shown in Table 41. The values differ between
animals and plants associated with aquatic and terrestrial environments.
Table 41 Reference dose limits used in the EIA ([5] – Table 19)
Value Units
Aquatic biota (background + Project) 9.6 mGy/d
Terrestrial biota (background + Project) 0.96 mGy/d
The final step in this radiological assessment is the calculation of the screening index value (SIV). This
is calculated by dividing the total dose rate (background plus Project) received by a receptor (for
example a bird) by the relevant reference dose limits from Table 41. If the SIV is below 1, the calculated

Greenland Minerals Ltd – Kvanefjeld Project EIA | 151
dose is below the reference dose limit and, therefore, the threshold for the potential for significant
effects on the population at large will not have been reached.
Table 42 shows the SIVs for marine animals and plants at points in Nordre Sermilik. The SIVs for all
receptors are well below 1. In other fjords, the values are even lower.
Table 42 SIVs for marine animals and plants ([5] – Table 43)
Species Stream run off Treated Water Placement Nordre Sermilik
Benthic fish 0.002 0.002 0.002
Pelagic fish 0.002 0.002 0.002
Benthic/crustacean 0.003 0.005 0.004
Vascular plant 0.001 0.002 0.001
Ringed seal - - 0.001
Humpback whale - - 0.001
SIVs for terrestrial plants and animals are given in Table 43. As the values for all receptors are well
below 1, it can be seen that the Project will have little effect on the exposure and dose to terrestrial
biota [5].
Table 43 SIVs for terrestrial mammals and plants ([5] – Table 44b)
Species
SIV Compared to 0.96 mGy/d
Narsaq Narsaq valley Ipiutaq Tuttutooq Island
Snow lichen 0.29 0.42 0.24 0.29
Grasses and herb 0.015 0.022 0.017 0.014
Arctic hare - 0.018 0.013 -
Arctic fox - 0.010 0.005 -
Sheep - - 0.017 -
Reindeer - - - 0.009
SIVs are shown for a selection of birds in Table 44. The values for all species are well below 1 and are
lower outside the Study Area.
Table 44 SIVs for birds ([5] – Table 63)
Species SIV Compared to 0.96 mGy/d
Narsaq Narsaq valley Ipiutaq Nordre Sermilik
Brünnichs guillemot - - - 0.011
Common eider - - - 0.013
Purple sandpiper - - - 0.02
Ptarmigan - 0.019 0.012 --
Snow bunting - 0.028 0.021 -
White-tailed eagle - - 0.011 -
Glaucous gull 0.008 - 0.008 0.02
Peregrine falcon - 0.023 - -

Greenland Minerals Ltd – Kvanefjeld Project EIA | 152
The Project is expected to release only small amounts of additional radioactivity to the environment
and is not expected to result in an adverse effect, or significant harm, to plants, animals or humans
either living in or visiting the area. The potential radiological impacts of the Project on plants and
animals in marine, freshwater and terrestrial habitats are assessed as very low. The estimated dose to
all these receptors is below benchmark values as seen in the SIVs.
9.3.2 Spills to land or water
The Plant will be fully bunded and as such, if a process spill were to occur, it would be captured by the
bund, and recovered to avoid environmental damage. As such, process spills to land or water have not
been further addressed.
The uranium oxide product will be packaged in 200-litre steel drums which will be sealed at the Plant.
The drums will be packed into standard ISO shipping containers which will be sealed before being
transported to the Port as per IAEA Safety Standards and the IMDG Code. The containers will be
unloaded at the Port and moved to a specified storage area. The storage area will have a gate and a
standard of security that meets/exceeds the requirements of International Ship and Port Security
Code. The containers will be moved around the Port with a reach stacker and then will be loaded into
a vessel using a ship mounted crane minimising human interaction with the containers.
The containers will remain sealed throughout the journey from the Plant to final destination for the
uranium oxide.
Approximately 500 tpa of uranium oxide of will be transported with approximately 18 t in each
standard container. Approximately 40 containers of drummed yellow cake will be transported from
the Plant to the Port each year.
A specific uranium transport assessment has been carried out for the Project by Arcadis [3]. This
assessment was conducted for a higher level of uranium oxide production (557 tonnes per year),
however the findings from the report remain valid for use in this impact assessment. The assessment
identified the following potential scenarios for transportation incidents involving uranium oxide:
Spill of uranium oxide into rivers or harbour
Spill of uranium oxide on land and associated gamma radiation exposure.
While site clean-up would occur within a short time after any accident, it is unlikely that recovery
efforts would recover 100 % of the spilled material, especially in the event of a spill into water.
Spill to water
In the event of a traffic accident (rollover or crash) containers and drums could potentially be breached
and uranium oxide spilled into rivers. An accident in connection with the handling and loading of
containers onto ships could lead to a spill into the marine environment. The amount of the spill
depends on the amount of force applied to the container and the ability of the container and drums
to withstand the force.
Two comprehensive risk assessments of release into surface waters (rivers, lakes, and fjords) and land
during transportation across Arctic Canada were completed by ARCADIS-SENES Canada in 2014 [65]
[66]. The studies considered similar potential receptors as would occur in the Study Area.
The potential impact on water quality (freshwater and the marine environment) as a result of the
release of uranium oxide was assessed using fate and transport modelling of the released material as
well as exposure pathway modelling and risk characterization for various receptors. The assessment
Greenland Minerals Ltd – Kvanefjeld Project EIA | 153
assumed that a major clean-up effort would remove the majority (> 90 %) of the released materials.
Both assessments included the release of uranium oxide on sites that are similar to southern Greenland
with respect to meteorology and winter conditions.
Based on the results of the radiological assessment from the Arctic region of Canada for similar
radioactive material, it can be inferred that a spill of uranium oxide into the Narsaq river or Narsap Ilua
may, when not frozen, have short-term and long-term implications.
In the short-term the affected water may have an impact on aquatic life. In this context short-term for
water quality is defined as the time between spill and the point that the affected water is diluted
sufficiently to meet the water quality guidelines for uranium. This period varies between water bodies
but is usually in the order of days or weeks.
In the long term, the released material should be contained and the area remediated. Depending on
the effectiveness of the response to the spill, the long-term quality of sediment in the area of the spill
may be adversely affected with the result that biota may be exposed to contaminated water and
sediments.
In order to assess the risk of a spill of uranium oxide impacting the environment, Arcadis [3] considered
both the likelihood an accident resulting in a spill and the consequence of the potential spill. Primarily
due to the low likelihood of an accident due to the limited and closely managed logistics of the
transport from Plant to Port. the risk of a spill into water is calculated to be extremely low (less than a
one in 50 million event per year) [3].
Spill on land
A traffic accident (rollover or crash) could result in a spill on land from a container or drum breach.
Part of the spilled product could become airborne due to the impact of the accident. If the accident is
followed by fire, the buoyant effect of fire could contribute to the airborne release of uranium oxide
particles.
In case of an accident involving the release of uranium oxide on land, both flora and fauna and
members of the public (and workers) could be exposed to external gamma radiation as well as
inhalation of airborne particles.
Arcadis [3] modelled a vehicle accident where half of the transported uranium oxide was spilled onto
the ground. If workers were exposed to gamma radiation from the uranium oxide during 10 hours of
clean-up, the maximum dose received would be 0.026 mSv, which is well below the incremental dose
benchmark of one mSv (over natural background level) [3].
An accident could also potentially lead to uranium oxide dust being suspended in air as an aerosol or
gas. Assuming an accident where half of the transported uranium oxide was dispersed in a hemisphere
with a radius of 10 m for 30 seconds, the immediate and very short duration concentration in the air
near the accident area would be 63 mg/m3. If a person was exposed to this dust concentration, the
total inhalation dose will be 0.164 mSv. This dose is well below the recommended radiation dose limit
for the public of 1 mSv per year (over natural background level) which in turn is well below the
prescribed worker dose limit of an average of 20 mSv per year over 5 years.
The likelihood of an accident involving dangerous goods was assessed by Arcadis, using accident
statistics from North America (see Table 45).

Greenland Minerals Ltd – Kvanefjeld Project EIA | 154
Table 45 Transport accidents with dangerous goods per million tonne kilometres - North American
statistics ([3] – Table 14)
Jurisdiction All accidents Roll-over Head-on Collision
Canada 0.005 3.16 x 10⁻⁴ 3.55 x 10⁻⁴
USA 0.0021 4.6 x 10⁻⁴ 5.6 x 10⁻⁴
Saskatchewan 0.0045 2 x 10⁻⁴ 2 x 10⁻⁴
Applying the length of the transportation route (13 km) and referencing the Canadian accident
statistics, the frequency of accidents was determined to be 0.0087 accidents per million tonnes.
Considering the production of ~500 tonnes of uranium oxide per annum, the frequency of a rollover
or crash along the route is calculated to be 4.4 x 10⁻⁶ per year. Applying a conditional probability of
damage to the containment when the accident occurred (as defined by IAEA (2003)), the probability
of an accident and release of uranium oxide into the environment is extremely unlikely (a one in 4.3
million event per year) and the probability of fire after a spill of uranium oxide is even lower (a one in
25 million event in a year).
9.3.3 Release resulting from TSF failure
Three different scenarios for a potential failure of the FTSF embankment have been assessed to
determine the impact of a failure on the environment [110]. The failure scenarios were modelled for
two different time periods – the end of operations (when the tailings volume will reach an operational
peak) and the post closure period (represented by Year 49 which is the year of maximum supernatant
(pond water) volume).
In the event of any unplanned discharge of tailings or tailings water from the FTSF, it can be expected
to follow the current surface water discharge pathway to the sea. This pathway can be described as
being composed of three distinct zones as shown in Figure 48.
Figure 48 Potential Failure Discharge Pathway from the FTSF to the Fjord

Greenland Minerals Ltd – Kvanefjeld Project EIA | 155
The three failure modes which were assessed include: overtopping; piping; and catastrophic failure.
Each of these failure modes and their potential consequences are described below.
Overtopping
Overtopping could be caused by a multi-year ice-derived degradation of the upper gravel protection,
geofabric, high density polyethylene (HDPE) and clay liner (Figure 49). This failure assessment
considered both the operational phase and the post-closure phase. In both cases, some of the water
cover would be lost. For the assessment it was assumed that the discharge would occur over a period
of 3 months at any time of the year with no loss of tailings solids. During the operational phase,
approximately 15 Mm3 of water was assumed to be discharged at an average rate of 6,900 m3 per hour.
In post-closure the amount of water released could range up to double that of the operational
scenario. While supernatant water quality during operations is reflective of mining and milling
operations, post-closure supernatant water quality is generally similar to background water quality.
Figure 49 Embankment – Upstream Liner ([1] – Drawing 002-1020)
Potential Consequence of Overtopping
In addition to public concern about a loss of containment in a tailings facility, the major impact of an
overtopping event could be a large and extended flow which could be expected to flood the grass fields
in the fan zone during the period of the event (assuming to be three months). The flooding could be
accentuated by ice-induced flow blockages if the containment failure were to occur in winter
conditions.
During operations, the uranium concentrations in the supernatant may reach a peak of 76 µg/L,
however radium-226 and thorium will be similar to background (Orbicon 2018).
Post closure, when discharge from the FTSF starts to overflow into the Taseq River in Year 49,
concentration levels are predicted to be below GWQC for all elements except fluoride.
Piping Failure
A piping failure is an internal tunnel erosion in an embankment that progressively erodes embankment
soils and rocks. Piping failure is considered a (remote) possibility which could potentially result from
deterioration of the sealed diversion conduit that was constructed before the FTSF embankment
construction was initiated (e.g. Omai, Guyana, 1995). This type of embankment failure is shown in
Figure 50. Embankment materials can be eroded out by flowing water and this kind of erosion could

Greenland Minerals Ltd – Kvanefjeld Project EIA | 156
result in the loss of all of the FTSF water cover and a significant quantity of tailings to the Taseq and
Narsaq rivers.
For this scenario it was assumed that all of the surface water (13.7 Mm3 during operations and 32.9
Mm3 post closure) and 25 % of the flotation tailings stored above the original Taseq lake saddle (15
Mt) would be lost over a period of 1 month during operations and 2 months during post-closure. The
discharge is assumed to start with tailings only (at 60 % solids) which quickly changes to a lower
percentage solids condition as the surface water is mixed in.
Figure 50 Theoretical Piping Failure ([110] – Figure 3.2)
It should be noted that the AMEC Foster Wheeler design includes provisions that substantially diminish
the potential for piping failure – including multiple seepage barriers, a filter zone and coarse rock fill
that would diffuse any small leakage and prevent the formation of a major conduit or pipe.
In the event of piping failure, the tailings solids would contain some uranium and thorium-based
radioactivity. Example tests conducted at SGS on flotation tails indicated U-238 and Th-232 contents
to be 2.2 Bq/g (about 179 ppm) and 1.6 Bq/g (about 404 ppm), respectively. The tailings pore water at
60% solids was measured to contain 2.15 mg/L uranium and 0.037 mg/L thorium (average
concentration from the Cold Water Storage test results conducted in 2015). During operations, the
uranium concentrations in the supernatant may reach a peak of 76 µg/L, however radium-226 and
thorium will be similar to background (Orbicon 2018).
By Year 49, the theoretical time of the modelled piping failure, the tailings pond water is predicted to
contain less than 1 µg/L uranium and practically no thorium. If the tailings at 60 % solids is fully mixed
on a 1:1 basis with the surface water, the concentration of dissolved uranium and thorium will decline
to 0.6-0.7 mg/L and 0.01 mg/L in a released slurry that contains, on average, approximately 37 %
solids.
Assuming 37% solids, the total volume of tailings solids released in the event of a failure at the end of
operations and during post-closure would be 5.55 Mm3, which would be distributed as follows: 65%
(3.61 Mm3) would be deposited in the river system and its alluvial fan, about 35% (1.94 Mm3) would
flush through the river system and reach Narsap Ilua where 30 % (1.66 Mm3) would settle out and 5%
(0.28 Mm3) would be carried beyond.
The slurry flow is calculated to be very large at an average 42,000 m3/h (11.7 m3/s), which can be
expected to result in some disruption of the rock fill of the embankment as well as distribution of solid
tailings along the current pathway of the Taseq and Narsaq Rivers.

Greenland Minerals Ltd – Kvanefjeld Project EIA | 157
Potential Consequence of Piping Failure
Under this scenario, significant impacts could result from a large flow at the end of operations and
during post closure, which could be expected to flood the grass fields of the fan zone. With a reported
average natural flow of 1.15 m3/s (GHD 2019), the Narsaq River would not provide much dilution for
the released tailings.
The tailings released in this scenario could deposit along the rivers and in the fjord. In the area
immediately downstream of the hypothetical release (Segment 1 of the release path indicated in
Figure 50), the steep slope, low depth, and high velocity combined with the rough river bed create a
highly turbulent flow, which would prevent settling of tailings solids in these areas. Except for some
small recessed pockets where the flow could slow-down, little deposition would occur in the upper
steep slopes. Similarly, in Segment 2 of the release path, while slightly less steep, it would also have
high velocities that would limit the quantities of materials that settle along this stretch. On reaching
the Narsaq River, slopes flatten and the river fans out as it approaches the Narsap Ilua. In this area, the
river has many channels with some combined channels visible. With a slope of about 3 % and wide
flow channels, the flow velocity would be much slower and some deposition of more of the tailings
could occur. The Narsap Ilua bay is about 2 km across and the first 200 m from the mouth of the Ilua is
relatively shallow.
Based on Arcadis’ experience and modelling a significant portion (60 to 70%) of tailings particles,
particularly coarser particles, are expected to settle in the lower stretch of the Narsaq River.
Approximately 30 to 40% of the tailings solids are expected to settle in Narsap Ilua and only a small
portion of solids (less than 5%) leave Narsaq Ilua and enter the fjord.
Catastrophic Dam Failure
Two catastrophic operational failure scenarios have been modelled, representing a low- and a high-
volume case. The nature and extent of the potential release of solids and fluids from a catastrophic
tailings dam failure were first modelled by Arcadis in 2018 using a 2D model for an assumed breach
width of 100 m, a tailings depth of 30 m and a water cover of 5 m (equivalent to a water volume of
15Mm3) at the time of failure. In April 2020, [110] a second assessment was completed by KCB using
a 3D release flood and inundation model for an assumed breach width of 95 m, a tailings depth of 34
m and an operating water cover volume of 13.7 Mm3.
These operational breach value calculations provided a bounding range of release volumes from 21
Mm3 in Arcadis [110] to 43.5 Mm3 in KCB [74] arrived at using the Rico et al. (2008) method. For these
bounding conditions, KCB carried out a hydraulic assessment of potential failure impacts using the
Flo2D Pro Model Build No: 18.12.20; a finite volume conservation flood routing model that is capable
of modelling unconfined mud/sediment flows over complex topography and roughness.
For the catastrophic operational embankment failure KCB [74] estimated a maximum release of about
30.0 Mm3 total tailings comprised of 13.8 Mm3 tailings solids and 16.2 Mm3 porewater, along with 13.5
Mm3 pond water. The 3D model of the operational catastrophic failure shows that the release flow
would inundate an area of approximately ~1.84 km2 to various thicknesses along the discharge path
from the tailings dam to the Narsap Ilua. It was estimated that approximately 80 % of the tailings solids
(~11 Mm3) would reach the Narsap Ilua.
The key differences between an operational and post-closure catastrophic failure are the volume of
supernatant and the water quality of the supernatant :
Operational failure assumed to have 13.7 Mm3 of untreated supernatant

Greenland Minerals Ltd – Kvanefjeld Project EIA | 158
Post closure failure assumed to have 32.9 Mm3 of treated supernatant.
In a post-closure catastrophic embankment failure scenario, the extent of the inundation would be
expected to be similar to that modelled for the operational failure, and as such, no additional 3-D
modelling was undertaken for this event. The larger supernatant volume associated with a post-
closure failure would be likely to transport a greater proportion of the solid tailings into Narsap Ilua
and as such an operational failure likely represents the worst case scenario for solids tailings deposition
on land.
Potential Consequences of Catastrophic Dam Failure
Both the low and the high-volume operational cases were modelled, and while there is a significant
difference in potential breach volumes, only a small difference was seen in the inundation extent
(~1.84 km2) as the inundation is largely constrained by the Taseq and Narsaq valleys. The deepest flow
would occur in the narrow valley in the first one-third of the breach path (Stream Segment 1), which
could exceed 25 m in depth. In the wider valley and alluvial fan, the flow depth would reduce to
approximately 5 m, while some areas could reach up to 10 m. The inundation extent would be
approximately 510 m wide on the alluvial fan, with a maximum width of approximately 640 m at the
mouth of Narsap Ilua. Figure 51 illustrates the maximum depth and inundation extent for the "high
volume” breach volume (43 Mm3).
Figure 51 Maximum depth - Based on the Rico et al. (2008) and Froehlich (2008) Breach Parameters
([110] – Figure 3.5)
The highest velocity anticipated in a catastrophic scenario would be expected to occur approximately
750 m downstream of the breach, in a narrow and steep section, where the velocity could exceed 25
m/s. The remainder of the narrow valley would be expected to experience flow velocities of between
10 and 25 m/s before reaching the wide alluvial fan section where the velocity could reduce to 2 to 5
m/s. The maximum velocity is illustrated in Figure 52.

Greenland Minerals Ltd – Kvanefjeld Project EIA | 159
Figure 52 Maximum velocity - Based on the Rico et al. (2008) and Froehlich (2008) Breach
Parameters ([110] – Figure 3.8)
The estimated median runout distance is approximately 50 km, while the distance from the FTSF to
Narsap Ilua is only 5 km. For this situation, the dam failure flood wave and post-failure recession flow
indicate that both transport, sedimentation of tailings material, and erosion of the riverbed would
occur along the Narsaq River and into Narsap Ilua as the maximum erosion and transport velocities
greatly exceed the settling velocities. As the post-failure recession flow dissipates, the remaining
tailings would be deposited in the slower flowing areas, particularly the alluvial fan, and lastly in the
main river channel.
In this section of the impact assessment, the radiological impacts associated with three failure modes
at both the end of operations and during post-closure) are discussed. Using the same failure scenarios,
Section 10.3.3 describes the potential water quality impacts associated with TSF failure. Section 12.3
describes the potential ecological impacts associated with TSF failure.
The modelling which has been undertaken by Arcadis assumed that the tailings affected under each of
the failure modes is sourced from the FTSF. For each of the modelled scenarios, predictions of water
quality and dose concentrations in solids were undertaken to inform the analysis of potential impacts.
Each failure mode and its associated radiological consequences is addressed below.
The ERICA model provides a risk quotient, which is the estimated radiological dose to an organism
compared to the selected dose limit. The risk quotient is not an estimate of the probability of ecological
impact. Rather, the index values are positively correlated with the potential of an effect, i.e. higher
index values imply greater potential of an effect. When the risk quotient is below a value of 1, the
potential risk is minimal. A risk quotient above 1 indicates that there is a greater potential for an
adverse effect. As discussed above, severe effects are expected when doses are two orders of
magnitude above the dose limit (i.e., risk quotients of 100).

Greenland Minerals Ltd – Kvanefjeld Project EIA | 160
Overtopping - Radiological Impact Assessment
Risks to Aquatic Species
Freshwater
In an operational overtopping event, uranium can reach concentrations of 76 µg/L in the water cover
(Orbicon 2018). Table 46 summarizes the water concentrations that may be released during an
overtopping event. To evaluate the radiological impact for short-term exposure for a release during
operations, a screening level calculation was completed using the ERICA model. The maximum
estimated risk quotient during operations is 0.7 for vascular plants.
Post closure, when discharge from the FTSF starts to overflow into the Taseq river in Year 49,
concentration levels in the FTSF are predicted to be below ambient water quality for uranium and
radium-226; although there are no criteria for thorium, the concentrations are low [110]. In the post-
closure phase, the water quality results are not substantially different from baseline. This indicates
that there is not expected to be a concern in the freshwater environment with respect to the release
of radionuclides during an overtopping event.
Marine
The flow from the tailings pond during an overtopping event was estimated at 6,900 m3 per hour. The
concentrations in the FTSF tailings water were estimated over time and are summarized in Table 46.
Under the modelled scenarios, elevated uranium concentrations are expected to be present during an
operational failure, and during post-closure when discharge from the FTSF starts to overflow into the
Taseq river in Year 49, concentrations are predicted to be low.
Table 46 Predicted U, Th, Ra-228 concentrations in FTSF water ([110] - Table 4.1)
Element Year 37 – End of
Operations Start of overflow to Taseq
River (Year 49) Year 59 Year 93
U (µg/L) 76 2.47 1.78 1.43
Th (µg/L) 0 1.15E-04 1.72E-04 1.32E-04
Ra-226 (Bq/L) 0 0 0 0
Table 47 summarizes the water concentrations that would be expected to be present in Narsap Ilua
during an overtopping event.
Table 47 Radionuclide concentrations in Narsap Ilua during an overtopping event
([110] - Table 4.2)
Element Concentration (Bq/L)
Comment During Operations Post-Closure
U-238 0.94 0.031 Based on the predicted water quality.
Th-230 0.083 0.003
No information – estimated based on relative activity of Th-230 and U‑238 in pore water. Post-closure value is lower than baseline, thus Th-230 value was set to baseline in the calculations.
Ra-226 0 0 Predicted concentrations are low , set to baseline.
Pb-210 0.029 9.5E-04
No information – estimated concentration based on relative activity of Pb-210 and U‑238 in pore water. These values are lower than baseline in freshwater, thus Pb-210 value was set to baseline in the calculations.
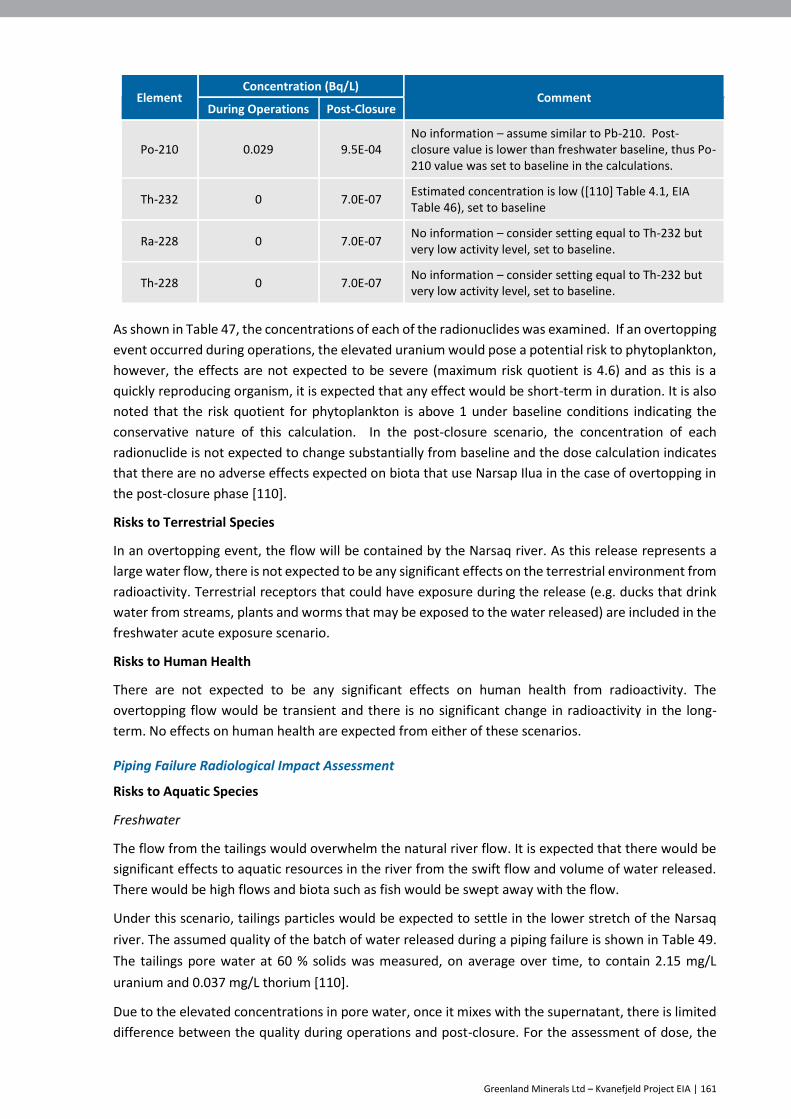
Greenland Minerals Ltd – Kvanefjeld Project EIA | 161
Element Concentration (Bq/L)
Comment During Operations Post-Closure
Po-210 0.029 9.5E-04 No information – assume similar to Pb-210. Post-closure value is lower than freshwater baseline, thus Po-210 value was set to baseline in the calculations.
Th-232 0 7.0E-07 Estimated concentration is low ([110] Table 4.1, EIA Table 46), set to baseline
Ra-228 0 7.0E-07 No information – consider setting equal to Th-232 but very low activity level, set to baseline.
Th-228 0 7.0E-07 No information – consider setting equal to Th-232 but very low activity level, set to baseline.
As shown in Table 47, the concentrations of each of the radionuclides was examined. If an overtopping
event occurred during operations, the elevated uranium would pose a potential risk to phytoplankton,
however, the effects are not expected to be severe (maximum risk quotient is 4.6) and as this is a
quickly reproducing organism, it is expected that any effect would be short-term in duration. It is also
noted that the risk quotient for phytoplankton is above 1 under baseline conditions indicating the
conservative nature of this calculation. In the post-closure scenario, the concentration of each
radionuclide is not expected to change substantially from baseline and the dose calculation indicates
that there are no adverse effects expected on biota that use Narsap Ilua in the case of overtopping in
the post-closure phase [110].
Risks to Terrestrial Species
In an overtopping event, the flow will be contained by the Narsaq river. As this release represents a
large water flow, there is not expected to be any significant effects on the terrestrial environment from
radioactivity. Terrestrial receptors that could have exposure during the release (e.g. ducks that drink
water from streams, plants and worms that may be exposed to the water released) are included in the
freshwater acute exposure scenario.
Risks to Human Health
There are not expected to be any significant effects on human health from radioactivity. The
overtopping flow would be transient and there is no significant change in radioactivity in the long-
term. No effects on human health are expected from either of these scenarios.
Piping Failure Radiological Impact Assessment
Risks to Aquatic Species
Freshwater
The flow from the tailings would overwhelm the natural river flow. It is expected that there would be
significant effects to aquatic resources in the river from the swift flow and volume of water released.
There would be high flows and biota such as fish would be swept away with the flow.
Under this scenario, tailings particles would be expected to settle in the lower stretch of the Narsaq
river. The assumed quality of the batch of water released during a piping failure is shown in Table 49.
The tailings pore water at 60 % solids was measured, on average over time, to contain 2.15 mg/L
uranium and 0.037 mg/L thorium [110].
Due to the elevated concentrations in pore water, once it mixes with the supernatant, there is limited
difference between the quality during operations and post-closure. For the assessment of dose, the
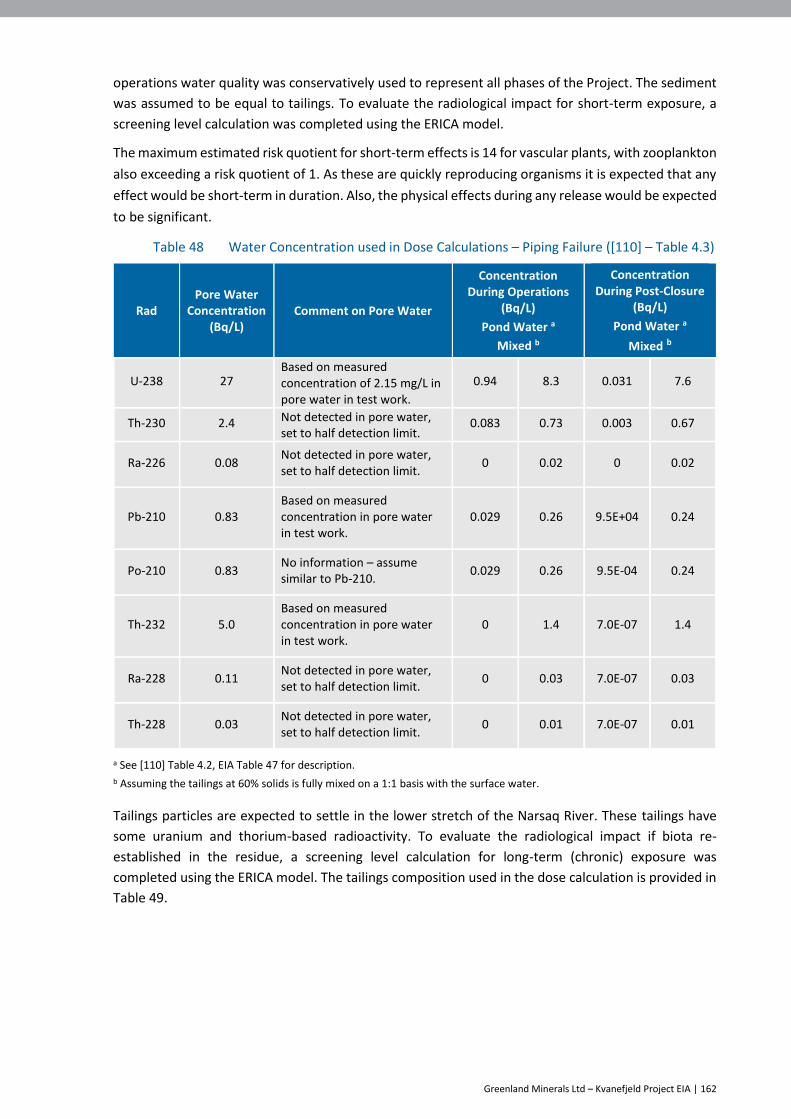
Greenland Minerals Ltd – Kvanefjeld Project EIA | 162
operations water quality was conservatively used to represent all phases of the Project. The sediment
was assumed to be equal to tailings. To evaluate the radiological impact for short-term exposure, a
screening level calculation was completed using the ERICA model.
The maximum estimated risk quotient for short-term effects is 14 for vascular plants, with zooplankton
also exceeding a risk quotient of 1. As these are quickly reproducing organisms it is expected that any
effect would be short-term in duration. Also, the physical effects during any release would be expected
to be significant.
Table 48 Water Concentration used in Dose Calculations – Piping Failure ([110] – Table 4.3)
Rad Pore Water
Concentration (Bq/L)
Comment on Pore Water
Concentration During Operations
(Bq/L)
Pond Water a
Mixed b
Concentration During Post-Closure
(Bq/L)
Pond Water a
Mixed b
U-238 27 Based on measured concentration of 2.15 mg/L in pore water in test work.
0.94 8.3 0.031 7.6
Th-230 2.4 Not detected in pore water, set to half detection limit.
0.083 0.73 0.003 0.67
Ra-226 0.08 Not detected in pore water, set to half detection limit.
0 0.02 0 0.02
Pb-210 0.83 Based on measured concentration in pore water in test work.
0.029 0.26 9.5E+04 0.24
Po-210 0.83 No information – assume similar to Pb-210.
0.029 0.26 9.5E-04 0.24
Th-232 5.0 Based on measured concentration in pore water in test work.
0 1.4 7.0E-07 1.4
Ra-228 0.11 Not detected in pore water, set to half detection limit.
0 0.03 7.0E-07 0.03
Th-228 0.03 Not detected in pore water, set to half detection limit.
0 0.01 7.0E-07 0.01
a See [110] Table 4.2, EIA Table 47 for description.
b Assuming the tailings at 60% solids is fully mixed on a 1:1 basis with the surface water.
Tailings particles are expected to settle in the lower stretch of the Narsaq River. These tailings have
some uranium and thorium-based radioactivity. To evaluate the radiological impact if biota re-
established in the residue, a screening level calculation for long-term (chronic) exposure was
completed using the ERICA model. The tailings composition used in the dose calculation is provided in
Table 49.
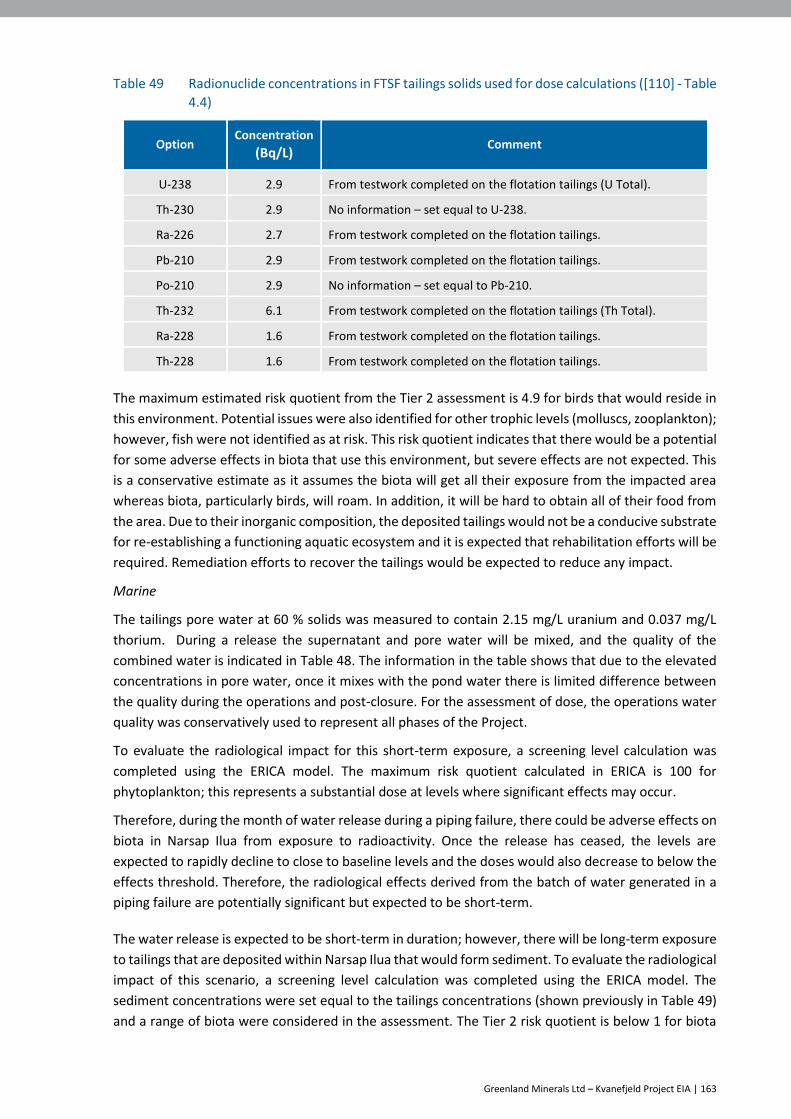
Greenland Minerals Ltd – Kvanefjeld Project EIA | 163
Table 49 Radionuclide concentrations in FTSF tailings solids used for dose calculations ([110] - Table
4.4)
Option Concentration
(Bq/L) Comment
U-238 2.9 From testwork completed on the flotation tailings (U Total).
Th-230 2.9 No information – set equal to U-238.
Ra-226 2.7 From testwork completed on the flotation tailings.
Pb-210 2.9 From testwork completed on the flotation tailings.
Po-210 2.9 No information – set equal to Pb-210.
Th-232 6.1 From testwork completed on the flotation tailings (Th Total).
Ra-228 1.6 From testwork completed on the flotation tailings.
Th-228 1.6 From testwork completed on the flotation tailings.
The maximum estimated risk quotient from the Tier 2 assessment is 4.9 for birds that would reside in
this environment. Potential issues were also identified for other trophic levels (molluscs, zooplankton);
however, fish were not identified as at risk. This risk quotient indicates that there would be a potential
for some adverse effects in biota that use this environment, but severe effects are not expected. This
is a conservative estimate as it assumes the biota will get all their exposure from the impacted area
whereas biota, particularly birds, will roam. In addition, it will be hard to obtain all of their food from
the area. Due to their inorganic composition, the deposited tailings would not be a conducive substrate
for re-establishing a functioning aquatic ecosystem and it is expected that rehabilitation efforts will be
required. Remediation efforts to recover the tailings would be expected to reduce any impact.
Marine
The tailings pore water at 60 % solids was measured to contain 2.15 mg/L uranium and 0.037 mg/L
thorium. During a release the supernatant and pore water will be mixed, and the quality of the
combined water is indicated in Table 48. The information in the table shows that due to the elevated
concentrations in pore water, once it mixes with the pond water there is limited difference between
the quality during the operations and post-closure. For the assessment of dose, the operations water
quality was conservatively used to represent all phases of the Project.
To evaluate the radiological impact for this short-term exposure, a screening level calculation was
completed using the ERICA model. The maximum risk quotient calculated in ERICA is 100 for
phytoplankton; this represents a substantial dose at levels where significant effects may occur.
Therefore, during the month of water release during a piping failure, there could be adverse effects on
biota in Narsap Ilua from exposure to radioactivity. Once the release has ceased, the levels are
expected to rapidly decline to close to baseline levels and the doses would also decrease to below the
effects threshold. Therefore, the radiological effects derived from the batch of water generated in a
piping failure are potentially significant but expected to be short-term.
The water release is expected to be short-term in duration; however, there will be long-term exposure
to tailings that are deposited within Narsap Ilua that would form sediment. To evaluate the radiological
impact of this scenario, a screening level calculation was completed using the ERICA model. The
sediment concentrations were set equal to the tailings concentrations (shown previously in Table 49)
and a range of biota were considered in the assessment. The Tier 2 risk quotient is below 1 for biota

Greenland Minerals Ltd – Kvanefjeld Project EIA | 164
that would re-establish in the sediment that comprises Flotation tailings. This indicates that there are
not expected to be any long-term effects on biota from exposure to radioactivity within Narsap Ilua.
However, it is noted that that the tailings will smother the existing biota and the species will need to
re-colonize, which could be difficult.
Risks to Terrestrial Species
In the case of a piping failure there may be scouring and the river would be substantially altered.
Tailings are expected to be deposited primarily within the existing Narsaq river channel, therefore
effects on terrestrial species are not expected. If there were areas of tailings deposited on land, this
would be no worse than the impact for the catastrophic dam embankment failure scenario discussed
below.
Terrestrial receptors that could have exposure during the water release (e.g. ducks that drink water
from streams, plants and worms that may be exposed to the water released) are included in the
freshwater acute exposure scenario.
Risks to Human Health
In the event of a piping failure, the tailings deposited in Narsap Ilua could result in increased
concentrations of radionuclides in fish that could be consumed locally. A screening level calculation
was undertaken using the predicted fish concentrations from the ERICA model and the expected fish
consumption rate for the local population. The calculation approach, fish consumption rate and dose
coefficients were taken from the Radiological Pathways Assessment (Arcadis 2019). However, it is
noted that the fish concentration is the total concentration, not just the increment from the Project.
Based on this information, a person could obtain approximately 20 % of their fish in any year from
Narsap Ilua and remain below the dose of 1 mSv. Table 50 provides the estimated dose for the 20%
consumption scenario. This is a conservative assessment assuming that the fish consumed reside
entirely within Narsap Ilua. Moreover, this is a high energy marine environment and elevated levels of
radioactivity will decline over time. There is uncertainty in the estimate of the fish concentration and
in the event of an unexpected release, periodic monitoring would be conducted to confirm the
concentrations in fish.
Table 50 Estimated Dose from consuming fish from Narsap Ilua ([110] - Table 4.5)
Radionuclide
Fish
Concentration
(Bq/kg fw)
Estimated Dose (mSv/y)
Adult Child Toddler
U-238 2.9 1.8E-02 2.6E-02 2.9E-02
Th-230 0.58 1.5E-03 2.6E-03 3.5E-03
Ra-226 135 1.7E-01 1.7E-01 1.8E-01
Pb-210 5.8 2.4E-01 5.5E-01 6.3E-01
Po-210 0.29 1.0E-04 1.4E-04 1.6E-04
Th-232 1.2 5.3E-04 3.6E-04 3.3E-04
Ra-228 80 1.2E-03 8.7E-04 7.6E-04
Th-228 0.32 1.2E-03 1.0E-03 1.0E-03
Total 0.4 0.8 0.8
Note: Dose based on consuming 20 % of the annual fish consumption (e.g., 21,900 g/y for an adult) from Narsap Ilua. The
dose was calculated consistent with the approach and assumptions provided in Arcadis (2019).

Greenland Minerals Ltd – Kvanefjeld Project EIA | 165
Catastrophic Embankment Failure Radiological Impact Assessment
KCB [74] assessed a potential embankment wall failure with water and tailings solids released due to
a “major” failure mode. In the case of a tailings dam failure, the material would be released rapidly. As
the bulk of the tailings would be transported at velocities greater than the deposition velocities, most
of the tailings would be deposited in Narsap Ilua. As the post-failure recession flow dissipates, the
remaining tailings would be deposited in the slower flowing areas, particularly the alluvial fan, and
lastly in the main river channel. The inundation extent would be approximately 510 m wide on the
alluvial fan, with a maximum width of approximately 640 m at the mouth of Narsap Ilua.
Risks to Aquatic Species
Freshwater
The flow from the tailings would overwhelm the natural river flow. It is expected that there would be
significant effects to aquatic resources in the river from the swift flow and volume of water released.
There would be significant scouring and biota such as fish would be swept away with the flow. KCB
[74] indicate that the environmental impacts that could be expected include destruction of riparian
vegetation and significant fish mortality (due to being buried in slurry or clogged gills; turbidity that
prevents light penetration and photosynthesis from occurring; and altered acidity and temperature of
the water). The dose from radionuclides in the water during the short-term event was examined in
the piping failure. It was determined that there is the potential for a risk to vascular plants and
zooplankton. As these are quickly reproducing organisms it is expected that any effect would be short-
term in duration.
Tailings particles are expected to settle in the lower stretch of the Narsaq River. These tailings have
some uranium and thorium-based radioactivity. To evaluate the radiological impact if biota re-
established in the residue, a screening level calculation was completed using the ERICA model (as
described in Section 9.3.1). The tailings composition used in the dose calculation is provided in Table
49.
The maximum estimated risk quotient from the Tier 2 assessment is 4.9 for birds that would reside in
this environment. Potential issues were also identified for other trophic levels (molluscs, zooplankton);
however, fish were not identified as at risk. This is the same result as the piping failure scenario as in
both cases it was assumed that the entire area would be covered by tailings with a sufficient depth
that the radiological doses would not depend on this factor. This risk quotient indicates that there
would be potential for some adverse effects in biota that use this environment, but severe effects are
not expected. This is a conservative estimate as it assumes the biota will get all their exposure from
the impacted area whereas biota, particularly birds, will roam. In addition, it will be hard to obtain all
of their food from the area. As noted, in the discussion above, the deposited tailings would not be a
conducive substrate for re-establishing a functioning aquatic ecosystem and it is expected that
rehabilitation efforts would be required. Remediation efforts to recover the tailings would be expected
to reduce any radiological impact; however, such remedial actions have potential to generate impacts
arising from the performance of the remedial actions themselves (e.g. dredging of sediment containing
tailings can cause a short-term increase in the turbidity and can remobilize a portion of the
contamination in the sediment).
Marine
The water released during the dam embankment failure was assumed to be a mix of porewater and
pondwater, similar to that shown in Table 48. During the period of release, it was assumed that the

Greenland Minerals Ltd – Kvanefjeld Project EIA | 166
biota in Narsap Ilua could be exposed to radionuclide levels at the concentrations shown in the Table.
As it would be such a short-term release, only rapidly reproducing biota (phytoplankton, zooplankton,
algae) were included in the calculation. The maximum risk quotient calculated in ERICA is 100 for
phytoplankton; this represents a substantial dose at levels where significant effects may occur.
Therefore, during the period of water release, there could be adverse effects on biota in Narsap Ilua
from exposure to radioactivity. However, it should be noted that there would be other stressors on
the biota. For example, turbidity would prevent light penetration and photosynthesis, which would
affect phytoplankton.
Once the release had ceased, the radioactivity levels would be expected to rapidly decline to close to
baseline levels and the doses would also decrease to below the effects threshold. Therefore, the
effects of radiation and radioactivity would be significant but expected to be short-term.
The water release would be expected to be short-term in duration; however, there would be long-
term exposure to sediments that were deposited within Narsap Ilua. To evaluate the radiological
impact of this scenario, a screening level calculation was completed using the ERICA model. The
sediment concentrations were set equal to the tailings concentrations (shown previously in Table 49)
and a range of biota were considered in the assessment. This is the same result as the piping failure
scenario as in both cases it is assumed that the entire area is covered by tailings with a sufficient depth
that the radiological doses would not depend on this factor. The Tier 2 risk quotient is below 1 for biota
that would re-establish in the sediment that comprises Flotation tailings. This indicates that long-term
effects on biota from exposure to radioactivity within Narsap Ilua would not be expected. However, it
is noted that that the tailings would smother the existing biota and the species would need to re-
colonize, which could be difficult.
Due to the large volume of tailings that would be released in this scenario, it is expected that the extent
of physical effects in Narsap Ilua would be greater than in the piping failure case and that tailings would
enter Ikerasaa/Narsaq Sound. This is a very high energy environment and these tailings would then be
mixed and dispersed over a larger area.
Risks to Terrestrial Species
Terrestrial receptors that could have exposure from radionuclides in the water during the short-term
event (e.g. ducks that drink water from streams, plants and worms that may be exposed to the water
released) are included in the freshwater acute exposure scenario.
The dose to terrestrial receptors that were assumed to re-establish in areas where tailings were
deposited was estimated using the ERICA model. However, it is noted that the tailings would smother
the existing biota and the species would need to re-colonize, which could be difficult. The tailings
concentration shown in Table 49 was used as “soil” in ERICA, which represents the terrestrial sections
of the 1.84 km2 inundation area [74]. The maximum risk quotient in the Tier 2 assessment was
estimated to be 1.9 for lichen and bryophytes, while other receptor groups were below 1. Therefore,
although there could be some areas with impact, the overall population of terrestrial receptors would
not be expected to be affected by residual radionuclides.
There is also the potential for dust from the exposed tailings to be deposited over a larger area. As
there were not expected to be significant effects for biota directly in tailings, exposure due to dust
would be lower and therefore, no wide-spread effects are expected.

Greenland Minerals Ltd – Kvanefjeld Project EIA | 167
Risks to Human Health
The Argonne National Laboratory’s RESRAD-ONSITE family of codes [112] were used to assess potential
human radiation exposure arising from tailings deposited in the inundation area.
RESRAD
To estimate dose consequences for dam embankment failure, external gamma, (dust) inhalation, soil
ingestion, and radon pathways were considered. The external gamma pathway applies correction
factors to an infinite contaminated zone, which for the assessment would be the areal extent and
thickness of the deposited tailings. The inhalation pathway estimates the intake of dust from the
tailings, accounting for release from the soil, areal extent, occupancy and inhalation rate. The ingestion
of soil is estimated from a standard rate and correction for occupancy. The radon model estimates
doses due to radon decay products released from the tailings, accounting for radon diffusion from the
tailings, areal extent, wind, occupancy and inhalation rate.
The activity concentrations were assumed from Table 49. Table 51 shows how the contaminated zone
areas and thicknesses varied over 12 hypothetical cases.
Table 51 Contaminated Zone Parameters ([110] - Table 4.6)
Parameter Variation Value Unit Rationale
Area of contaminated zone
1 1
ha range variation 2 10
3 100
Thickness of contamated zone
A 1
cm range variation B 5
C 10
D 100
Length parallel to aquifer flow NA
Contaminated fraction below water
table NA
Default values for occupancy were adjusted to reflect 100 % outdoor occupancy at the contaminated
site. Input parameters used in the model are summarized in Table 52. The RESRAD-ONSITE default
value for soil ingestion is 36.5 g/y (ANL 2016).
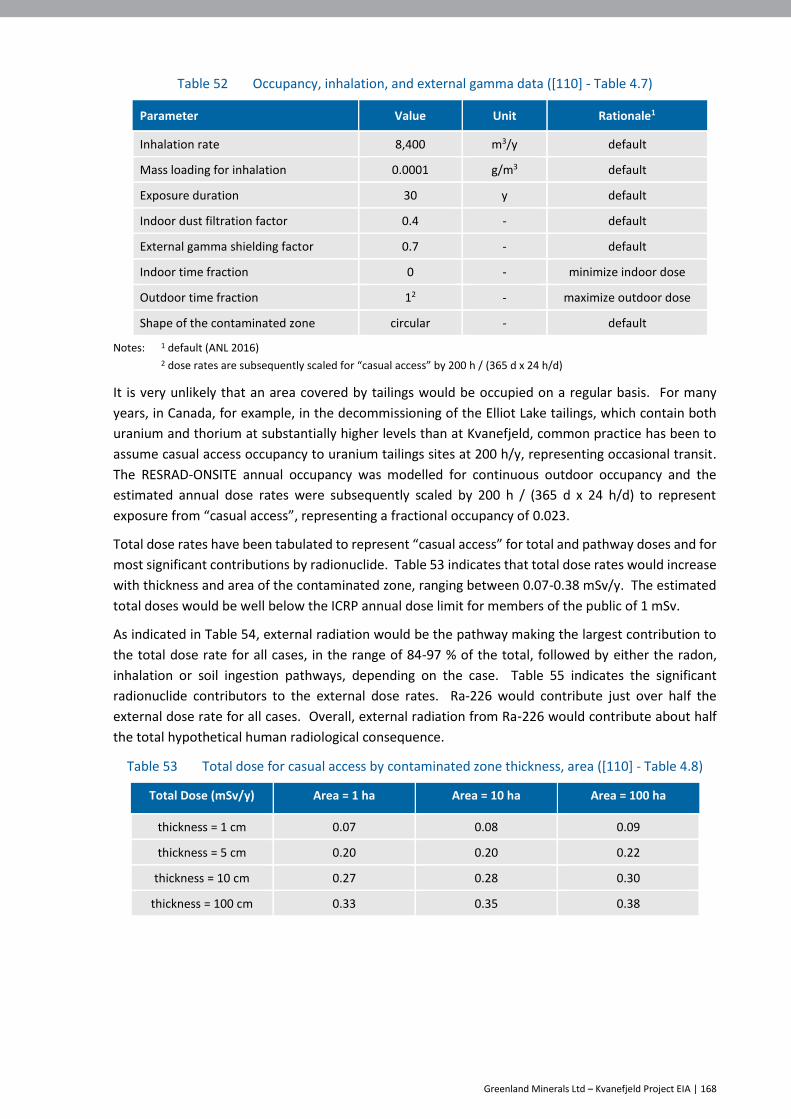
Greenland Minerals Ltd – Kvanefjeld Project EIA | 168
Table 52 Occupancy, inhalation, and external gamma data ([110] - Table 4.7)
Parameter Value Unit Rationale1
Inhalation rate 8,400 m3/y default
Mass loading for inhalation 0.0001 g/m3 default
Exposure duration 30 y default
Indoor dust filtration factor 0.4 - default
External gamma shielding factor 0.7 - default
Indoor time fraction 0 - minimize indoor dose
Outdoor time fraction 12 - maximize outdoor dose
Shape of the contaminated zone circular - default
Notes: 1 default (ANL 2016)
2 dose rates are subsequently scaled for “casual access” by 200 h / (365 d x 24 h/d)
It is very unlikely that an area covered by tailings would be occupied on a regular basis. For many
years, in Canada, for example, in the decommissioning of the Elliot Lake tailings, which contain both
uranium and thorium at substantially higher levels than at Kvanefjeld, common practice has been to
assume casual access occupancy to uranium tailings sites at 200 h/y, representing occasional transit.
The RESRAD-ONSITE annual occupancy was modelled for continuous outdoor occupancy and the
estimated annual dose rates were subsequently scaled by 200 h / (365 d x 24 h/d) to represent
exposure from “casual access”, representing a fractional occupancy of 0.023.
Total dose rates have been tabulated to represent “casual access” for total and pathway doses and for
most significant contributions by radionuclide. Table 53 indicates that total dose rates would increase
with thickness and area of the contaminated zone, ranging between 0.07-0.38 mSv/y. The estimated
total doses would be well below the ICRP annual dose limit for members of the public of 1 mSv.
As indicated in Table 54, external radiation would be the pathway making the largest contribution to
the total dose rate for all cases, in the range of 84-97 % of the total, followed by either the radon,
inhalation or soil ingestion pathways, depending on the case. Table 55 indicates the significant
radionuclide contributors to the external dose rates. Ra-226 would contribute just over half the
external dose rate for all cases. Overall, external radiation from Ra‑226 would contribute about half
the total hypothetical human radiological consequence.
Table 53 Total dose for casual access by contaminated zone thickness, area ([110] - Table 4.8)
Total Dose (mSv/y) Area = 1 ha Area = 10 ha Area = 100 ha
thickness = 1 cm 0.07 0.08 0.09
thickness = 5 cm 0.20 0.20 0.22
thickness = 10 cm 0.27 0.28 0.30
thickness = 100 cm 0.33 0.35 0.38
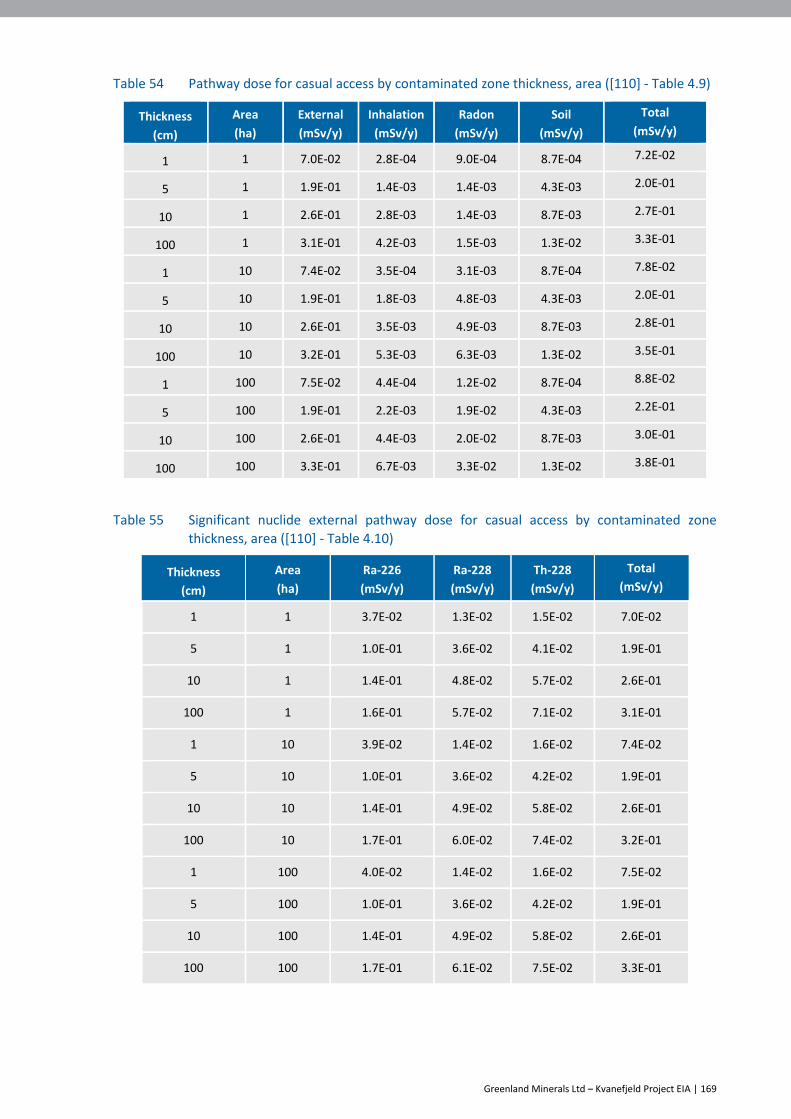
Greenland Minerals Ltd – Kvanefjeld Project EIA | 169
Table 54 Pathway dose for casual access by contaminated zone thickness, area ([110] - Table 4.9)
Thickness
(cm)
Area
(ha)
External
(mSv/y)
Inhalation
(mSv/y)
Radon
(mSv/y)
Soil
(mSv/y)
Total
(mSv/y)
1 1 7.0E-02 2.8E-04 9.0E-04 8.7E-04 7.2E-02
5 1 1.9E-01 1.4E-03 1.4E-03 4.3E-03 2.0E-01
10 1 2.6E-01 2.8E-03 1.4E-03 8.7E-03 2.7E-01
100 1 3.1E-01 4.2E-03 1.5E-03 1.3E-02 3.3E-01
1 10 7.4E-02 3.5E-04 3.1E-03 8.7E-04 7.8E-02
5 10 1.9E-01 1.8E-03 4.8E-03 4.3E-03 2.0E-01
10 10 2.6E-01 3.5E-03 4.9E-03 8.7E-03 2.8E-01
100 10 3.2E-01 5.3E-03 6.3E-03 1.3E-02 3.5E-01
1 100 7.5E-02 4.4E-04 1.2E-02 8.7E-04 8.8E-02
5 100 1.9E-01 2.2E-03 1.9E-02 4.3E-03 2.2E-01
10 100 2.6E-01 4.4E-03 2.0E-02 8.7E-03 3.0E-01
100 100 3.3E-01 6.7E-03 3.3E-02 1.3E-02 3.8E-01
Table 55 Significant nuclide external pathway dose for casual access by contaminated zone
thickness, area ([110] - Table 4.10)
Thickness
(cm)
Area
(ha)
Ra-226
(mSv/y)
Ra-228
(mSv/y)
Th-228
(mSv/y)
Total
(mSv/y)
1 1 3.7E-02 1.3E-02 1.5E-02 7.0E-02
5 1 1.0E-01 3.6E-02 4.1E-02 1.9E-01
10 1 1.4E-01 4.8E-02 5.7E-02 2.6E-01
100 1 1.6E-01 5.7E-02 7.1E-02 3.1E-01
1 10 3.9E-02 1.4E-02 1.6E-02 7.4E-02
5 10 1.0E-01 3.6E-02 4.2E-02 1.9E-01
10 10 1.4E-01 4.9E-02 5.8E-02 2.6E-01
100 10 1.7E-01 6.0E-02 7.4E-02 3.2E-01
1 100 4.0E-02 1.4E-02 1.6E-02 7.5E-02
5 100 1.0E-01 3.6E-02 4.2E-02 1.9E-01
10 100 1.4E-01 4.9E-02 5.8E-02 2.6E-01
100 100 1.7E-01 6.1E-02 7.5E-02 3.3E-01

Greenland Minerals Ltd – Kvanefjeld Project EIA | 170
Consumption of Food
The tailings deposited in Narsap Ilua could result in increased concentrations of radionuclides in fish
that could be consumed locally. Modelling determined that a person could obtain approximately 20 %
of their fish in any year from Narsap Ilua and remain below the dose of 1 mSv. There is uncertainty in
the estimate of the fish concentration and in the event of an unexpected release, periodic monitoring
would be conducted to confirm the concentrations in fish.
Erosion of Deposited Tailings
There would also the potential for dust from the exposed tailings to be deposited over a larger area.
ERM [19] [90] examined the potential for deposition of the tailings at several key locations. This
information was used to estimate the potential increase in soil concentration. The predicted soil
concentrations were used to estimate doses to human receptors. Doses to human receptors from air
deposited tailings assuming short-term exposure at locations outside the town (200 hours) and long-
term exposure at residential locations within the town (4 hours per day, every day) were very low and
well below the annual ICRP dose limit for members of the public of 1 mSv.
In addition to dust dispersion resulting from release events, dusting may also occur from the dried out
FTSF tailings surface. With a surface area of approximately 2.6 km2, potential dusting from the FTSF
tailings surface would be in the same order of magnitude as modelled for the maximum release event
(1.84 km2).
Sensitivity Case
The failure scenarios were developed to assess the potential nature and impacts of these events in
association with failure of the FTSF. No failure scenarios were considered for the CRSF as this facility is
built to BAT and is also immediately upstream of the FTSF. As such, should the CRSF dam embankment
fail, the release would flow into the FTSF and be contained within the FTSF.
However, a screening-level sensitivity case was carried out to assess the impact of the release of CRSF
tailings along with FTSF tailings.
Table 56 summarizes the radiological content of the FTSF and CRSF tailings. These numbers were taken
from testwork completed on the tailings material and it can be seen that the CRSF tailings have an
elevated radionuclide content. It is assumed that the ratio release from the FTSF and CRSF is the same
as the ratio of placement (i.e. CRSF makes up 10 % of the tailings mass).

Greenland Minerals Ltd – Kvanefjeld Project EIA | 171
Table 56 Concentrations used in sensitivity calculation ([110] - Table 4.11)
Option FTSF Tailings
(Bq/g)
CRSF Tailings
(Bq/g) Mixed Tailingsa
U-238 2.9 2 2.8
Th-230 2.9 11 3.7
Ra-226 2.7 11 3.5
Pb-210 2.9 7.5 3.4
Po-210 2.9 7.5 3.4
Th-232 6.1 31 8.6
Ra-228 1.6 14 2.8
Th-228 1.6 14 2.8
Note: Radionuclide content based on testwork completed on a sample of tailings. a Mixed concentration is based on CRSF comprising 10% of the total
ERICA calculations were completed using the mixed concentration of the tailings for different
environments and the following was noted:
If these tailings formed the sediment in a freshwater environment there is the potential for
effects in many organisms, with the highest risk quotient (6) for birds
If these tailings formed the sediment in the marine environment (Narsap Ilua), there is the
potential for effects on phytoplankton and birds that are exposed to these levels. None of
the long-term risk quotients indicated a severe effect
In the terrestrial environment, exposure of biota to these radionuclides at these levels
indicate a potential for effects for lichen. None of the other biota were identified as a
potential risk and none of the risk quotients indicated a severe effect.
Overall, the conclusions are similar to the results of the release of tailings from the FTSF only with the
dose estimates being approximately 20-30 % higher.

Greenland Minerals Ltd – Kvanefjeld Project EIA | 172
Table 57 Summary of results of radiological exposure to accidental release scenarios ([110] - Table 4.13)
Scenario
Non-Human Biota
Human Health Freshwater Aquatic
(Narsaq River) Terrestrial
Marine
(Narsap Ilua)
Overtopping
(Release of 13.7 Mm3 of water cover during operations and 32.9 Mm3 during post-closure from FTSF over 3 months)
Modelling (short-term): Slug of water considered for both operations and post-closure scenarios.
Modelling: Not applicable. Modelling (short-term): Slug of water considered for both operations and post-closure scenarios.
Modelling: Not applicable.
Operations: No effects expected.
Post-closure: No effects expected, water released is near baseline and meets guidelines.
Terrestrial receptors that could have exposure during water release (e.g. ducks that drink water from streams, plants and worms that may be exposed to the water released) were included in the freshwater acute (short-term) exposure scenario, which showed no effects.
Operations: Potential effect on phytoplankton identified. Expected to be a short-term effect (during release).
Post-closure: No effects expected, water released is near baseline.
No effects expected. There would be minimal exposure during the short-term release.
Piping Failure
(Release of 13.7 Mm3 of water and 15 Mm3 of flotation tailings over a period of 1 month during operations and 32.9 Mm3 of water and 15 Mm3 of flotation
Modelling (short-term): Slug of water considered (mix of pond water and pore water, applicable to all Project phases)
Modelling (long-term): Using solids concentrations from [110] Table 4.4. (EIA Table 49).
Modelling: Not applicable Modelling (short-term): Slug of water over 1 month. Mix of pond water and pore water.
Modelling (long-term): Using solids concentrations from[110] Table 4.4. (EIA Table 49).
Modelling (long-term): Dose calculations from consumption of fish.
Short-term: Effects on biota, primarily quickly reproducing organisms, are possible, but
Short-term: Terrestrial receptors that could have exposure during water release
Short-term: During the short-term release of water, significant effects on biota may occur. This is expected to
People may consume approximately 20% of their fish from Narsap Ilua and
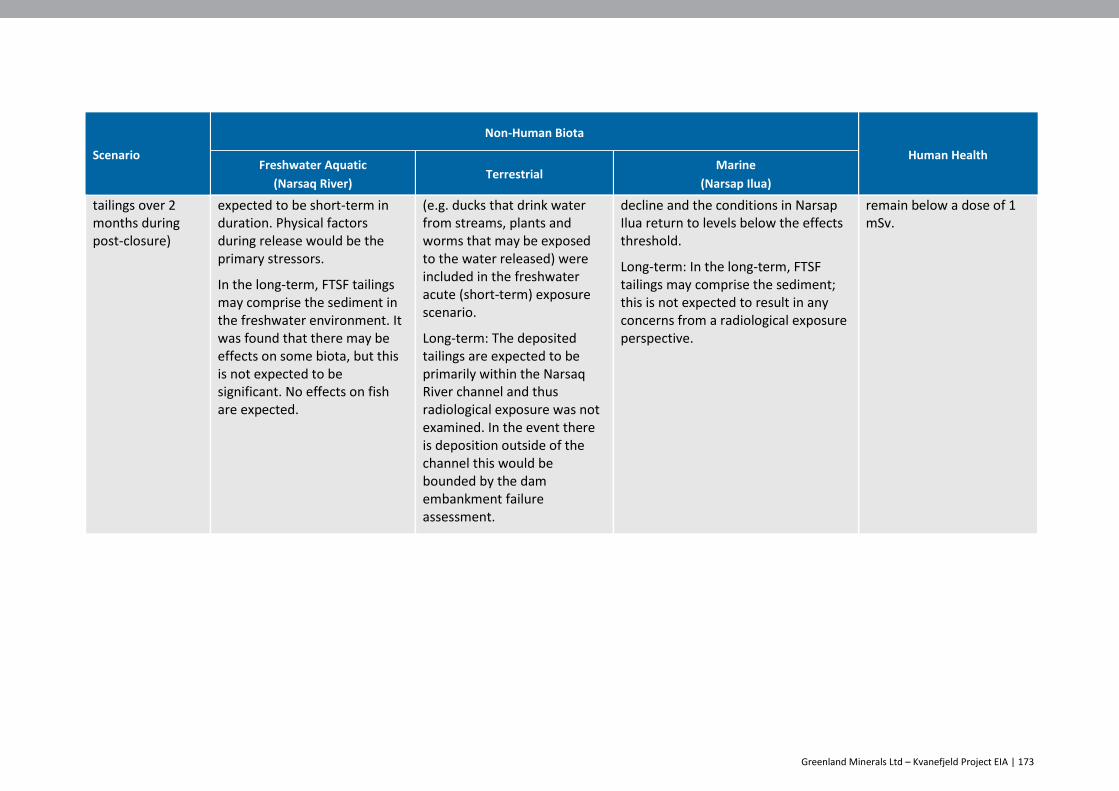
Greenland Minerals Ltd – Kvanefjeld Project EIA | 173
Scenario
Non-Human Biota
Human Health Freshwater Aquatic
(Narsaq River) Terrestrial
Marine
(Narsap Ilua)
tailings over 2 months during post-closure)
expected to be short-term in duration. Physical factors during release would be the primary stressors.
In the long-term, FTSF tailings may comprise the sediment in the freshwater environment. It was found that there may be effects on some biota, but this is not expected to be significant. No effects on fish are expected.
(e.g. ducks that drink water from streams, plants and worms that may be exposed to the water released) were included in the freshwater acute (short-term) exposure scenario.
Long-term: The deposited tailings are expected to be primarily within the Narsaq River channel and thus radiological exposure was not examined. In the event there is deposition outside of the channel this would be bounded by the dam embankment failure assessment.
decline and the conditions in Narsap Ilua return to levels below the effects threshold.
Long-term: In the long-term, FTSF tailings may comprise the sediment; this is not expected to result in any concerns from a radiological exposure perspective.
remain below a dose of 1 mSv.
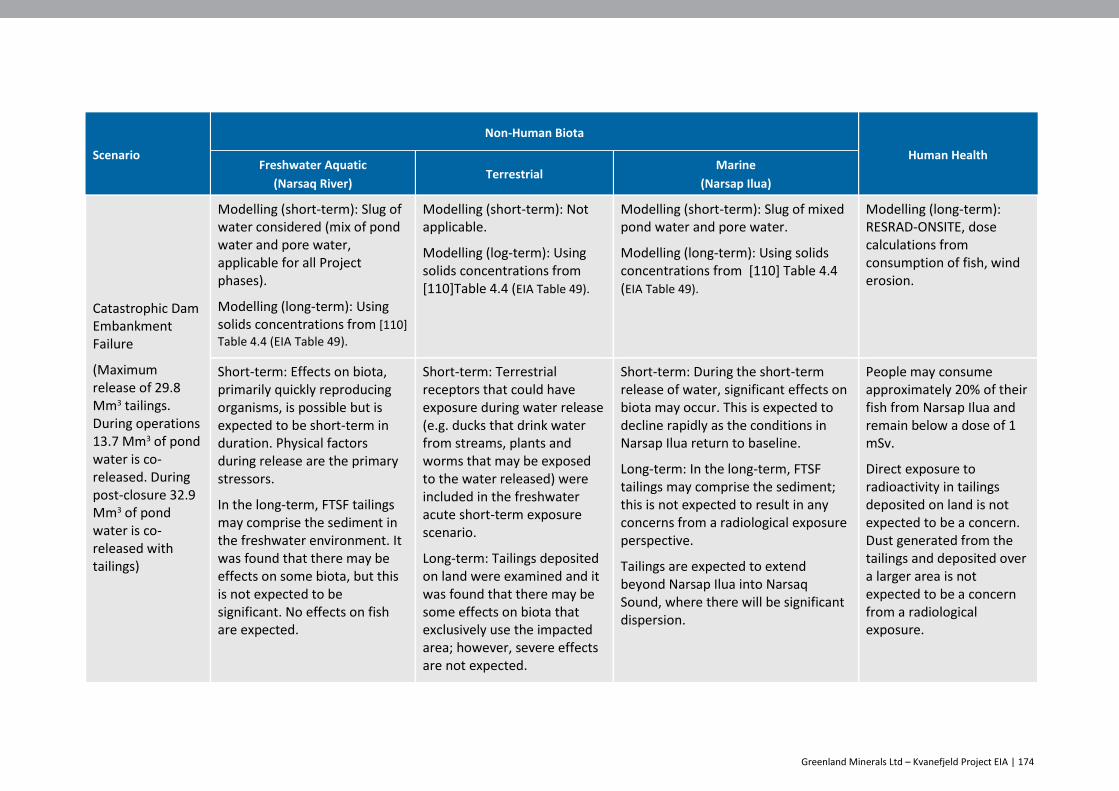
Greenland Minerals Ltd – Kvanefjeld Project EIA | 174
Scenario
Non-Human Biota
Human Health Freshwater Aquatic
(Narsaq River) Terrestrial
Marine
(Narsap Ilua)
Catastrophic Dam Embankment Failure
(Maximum release of 29.8 Mm3 tailings. During operations 13.7 Mm3 of pond water is co-released. During post-closure 32.9 Mm3 of pond water is co-released with tailings)
Modelling (short-term): Slug of water considered (mix of pond water and pore water, applicable for all Project phases).
Modelling (long-term): Using solids concentrations from [110]
Table 4.4 (EIA Table 49).
Modelling (short-term): Not applicable.
Modelling (log-term): Using solids concentrations from [110]Table 4.4 (EIA Table 49).
Modelling (short-term): Slug of mixed pond water and pore water.
Modelling (long-term): Using solids concentrations from [110] Table 4.4 (EIA Table 49).
Modelling (long-term): RESRAD-ONSITE, dose calculations from consumption of fish, wind erosion.
Short-term: Effects on biota, primarily quickly reproducing organisms, is possible but is expected to be short-term in duration. Physical factors during release are the primary stressors.
In the long-term, FTSF tailings may comprise the sediment in the freshwater environment. It was found that there may be effects on some biota, but this is not expected to be significant. No effects on fish are expected.
Short-term: Terrestrial receptors that could have exposure during water release (e.g. ducks that drink water from streams, plants and worms that may be exposed to the water released) were included in the freshwater acute short-term exposure scenario.
Long-term: Tailings deposited on land were examined and it was found that there may be some effects on biota that exclusively use the impacted area; however, severe effects are not expected.
Short-term: During the short-term release of water, significant effects on biota may occur. This is expected to decline rapidly as the conditions in Narsap Ilua return to baseline.
Long-term: In the long-term, FTSF tailings may comprise the sediment; this is not expected to result in any concerns from a radiological exposure perspective.
Tailings are expected to extend beyond Narsap Ilua into Narsaq Sound, where there will be significant dispersion.
People may consume approximately 20% of their fish from Narsap Ilua and remain below a dose of 1 mSv.
Direct exposure to radioactivity in tailings deposited on land is not expected to be a concern. Dust generated from the tailings and deposited over a larger area is not expected to be a concern from a radiological exposure.

Greenland Minerals Ltd – Kvanefjeld Project EIA | 175
The potential radiological impact to the natural environment if the TSF embankment were to fail has
been assessed as high. However, given that there is an extremely low risk of a TSF embankment failure
the overall impact has been assessed as low [25] [110]. These events are also considered in the risk
assessment in chapter 14.
9.3.4 Release from TSF aerosol spray
As noted in Section 7.1.1, the Study Area can experience strong foehn winds. Given the strength of
these winds, stakeholders have expressed concerns regarding the potential for aerosol sprays from the
TSF to impact the Narsaq drinking water supply. An assessment of the impact of spray from TSF was
conducted to determine the likely concentration of pollutants in the Taseq and Narsaq rivers arising
from aerosol deposition [59].
The assessment considered the following:
Quantities of liquid lost from the TSF under strong wind conditions
Concentrations of selected elements and reagents in the aerosols lost from the TSF
The fate of elements and reagents if the aerosols are deposited
Areas likely to be affected, including an assessment of the Narsaq water supply.
Figure 53 Location of Control Point C
Concentrations were estimated at Control Point C (Figure 53) downstream of the TSF. This will be the
control point for future water quality compliance monitoring in the Narsaq river. This point was
selected for compliance monitoring as it is located downstream of the junction at which water from
the various sub-catchments combine into a single water course.
The Narsaq river control point is the first point downstream of the TSF at which wildlife, recreational
activities or farming could be affected by a possible increase over baseline concentrations arising from
discharge from the TSF during the Project’s post-closure phase.

Greenland Minerals Ltd – Kvanefjeld Project EIA | 176
Local topography and wind directions during storms will largely determine the deposition areas and
the potential influence on the water supply catchment area.
Wind direction data indicate that strong foehn winds blow from the east and the northeast.
Consequently, the focal point for potential deposition of aerosols was downstream in the Taseq and
Narsaq valleys.
Based on meteorological data for southern Greenland, over a 7 year period (2010 – 2016) there were
an average of 3 foehn events each year in the ice-free months (May – November). These events lasted
between 17 and 64 hours [59].
For the purpose of the analysis two potential scenarios were assessed to determine the drawdown in
surface water (net loss of aerosols) from the TSF when the average wind speed exceeds 32 m/s for any
ten-minute period within the defined storm event:
A 24-hour storm event- 4 mm water loss
A 64-hour storm event- 13 mm water loss.
The impact of uranium is discussed in this section. Discussion of the potential impact of other
pollutants is described in Section 10.3.4.
Water for the town of Narsaq is sourced from three rivers (combined annual flow 6 Mm3)
approximately 5km away from the Project area [84]. At this flow rate the estimated annual baseline
mass transport of uranium is 1 kg. Using this volume of water flow, WHO drinking water quality
guidelines [71] define a critical load of uranium to be 180 kg/year. This denotes a margin of 179 kg/year
as a maximum “buffer load”, i.e. the safety margin between the background limit and the critical limit.
An average of 3 foehn events per year have occurred in southern Greenland between 2010 and 2016.
The duration of these events lasted between 17 and 64 hours. 31 hours was the mean duration [59].
The estimates of deposition of uranium in the Narsaq drinking water catchment, assuming that 1 %
and 10 % of the released aerosols will be blown from the tailing ponds onto the catchment, are set out
in Table 58. They indicate that the maximum buffer load will not be exceeded in any of the modelled
scenarios.
Table 58 Estimated deposition of uranium (kg/year) in the Narsaq drinking water catchment ([59]
– Table 7.7)
Foehn Events Drawdown Deposition of Uranium (kg/year)
1 % 10 %
1 event/year 3.7 mm/year 0.02 0.24
3 events/year 12 mm/year 0.08 0.8
6 events/year 41 mm/year 0.29 2.9
Even assuming an unrealistic scenario of 100 % of the aerosol landing within the water catchment zone
and that all wind directions are towards the catchment for at least 6 foehn events, the critical load
would not be exceeded [59].
The topography and wind direction during storms will, to a large extent, determine where water spray
is deposited and, therefore, the potential influence on the water supply catchment area for town
drinking water.

Greenland Minerals Ltd – Kvanefjeld Project EIA | 177
Given prevailing wind directions (east and north-east), topography and the marked mountain ridge
separating Taseq valley from the area used for abstraction of raw water to Narsaq water supply (the
ridge south of the valley is more than 200 m above Taseq lake), deposition of uranium bearing aerosols
from the TSF is considered to be unlikely.
Peak concentrations for uranium were calculated for the raw water intake of the Narsaq water plant
and compared with WHO [71] drinking water quality guidelines. The highest estimated concentration
of uranium from the TSF which will occur in Year 37 was applied. The estimated peak concentration
of uranium in raw water after a 24-hr storm event at 10 % deposition was 1.58 µg/L and for a 64-hour
event the concentration was 4.15 µg/L. Both concentrations are below the WHO drinking water quality
guideline limit of 30 µg/L [59] [71].
It is considered unlikely that even under foehn conditions, contamination of Narsaq drinking water
with uranium from the TSF beyond WHO drinking water quality guidelines limits, would occur.
9.4 Mitigations
Mitigation measures include:
Management of dust through the DCP
The transportation and packaging of the uranium oxide will be in accordance with IAEA
Safety Standards and the IMDG Code
During and after operations tailings solids will be stored underwater to minimise dust and
radon emissions
The Plant will be designed to minimise radiation emissions
Implementation of radiation monitoring systems for both occupational and
community/environment exposures
Annual reports detailing results of radiation monitoring.
9.5 Predicted outcome
The predicted outcomes resulting from radiological emissions are summarised in Table 59.
Table 59 Predicted outcomes for radiological emissions
Impact Project Phase Spatial extent Duration Significance
Radioactivity from dust
Operation Study area Life of mine Very Low
Assessment
The radiological impacts on plants and animals in marine, freshwater and terrestrial habitats in the Studies Area as well as residents and visitors of Narsaq and Ipiutaq are very low. The estimated dose to all these receptors is well below benchmark values.
Radioactivity from radon
Construction
Operation
Closure
Study Area Life of Mine Very Low
Assessment
Development of the Project is predicted to increase the background level of radon in Narsaq by a maximum of 3 %.
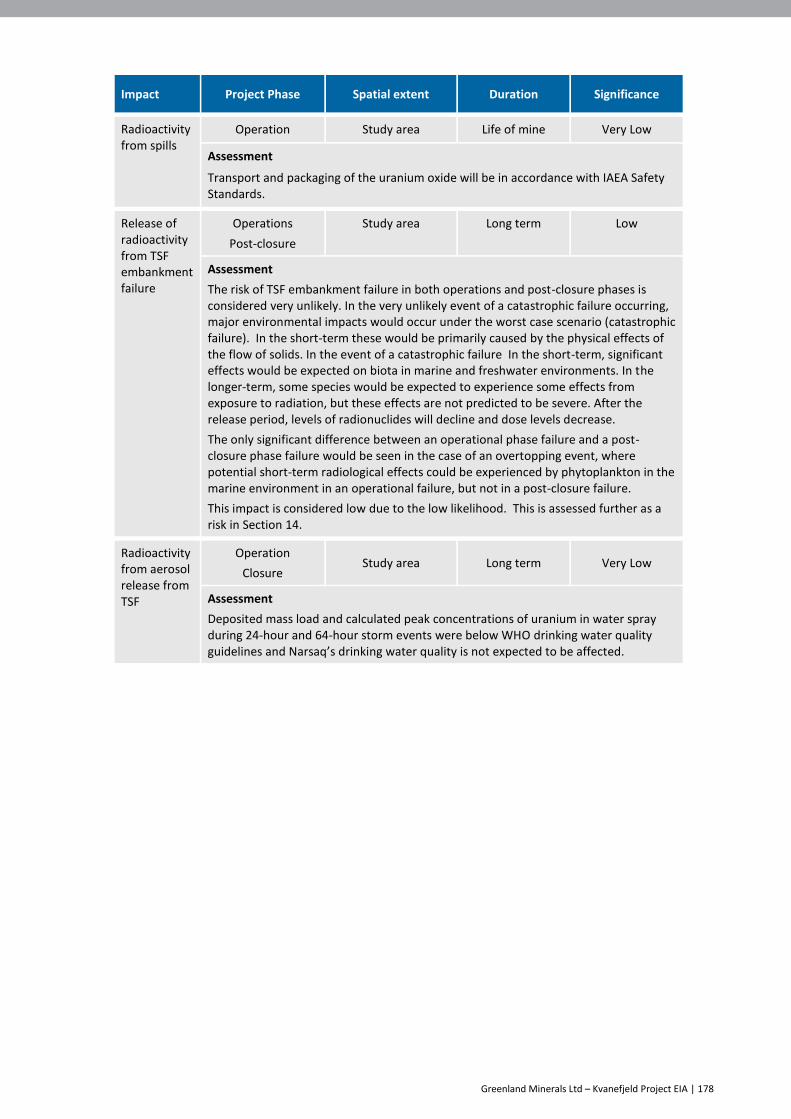
Greenland Minerals Ltd – Kvanefjeld Project EIA | 178
Impact Project Phase Spatial extent Duration Significance
Radioactivity from spills
Operation Study area Life of mine Very Low
Assessment
Transport and packaging of the uranium oxide will be in accordance with IAEA Safety Standards.
Release of radioactivity from TSF embankment failure
Operations
Post-closure
Study area Long term Low
Assessment
The risk of TSF embankment failure in both operations and post-closure phases is considered very unlikely. In the very unlikely event of a catastrophic failure occurring, major environmental impacts would occur under the worst case scenario (catastrophic failure). In the short-term these would be primarily caused by the physical effects of the flow of solids. In the event of a catastrophic failure In the short-term, significant effects would be expected on biota in marine and freshwater environments. In the longer-term, some species would be expected to experience some effects from exposure to radiation, but these effects are not predicted to be severe. After the release period, levels of radionuclides will decline and dose levels decrease.
The only significant difference between an operational phase failure and a post-closure phase failure would be seen in the case of an overtopping event, where potential short-term radiological effects could be experienced by phytoplankton in the marine environment in an operational failure, but not in a post-closure failure.
This impact is considered low due to the low likelihood. This is assessed further as a risk in Section 14.
Radioactivity from aerosol release from TSF
Operation
Closure Study area Long term Very Low
Assessment
Deposited mass load and calculated peak concentrations of uranium in water spray during 24-hour and 64-hour storm events were below WHO drinking water quality guidelines and Narsaq’s drinking water quality is not expected to be affected.
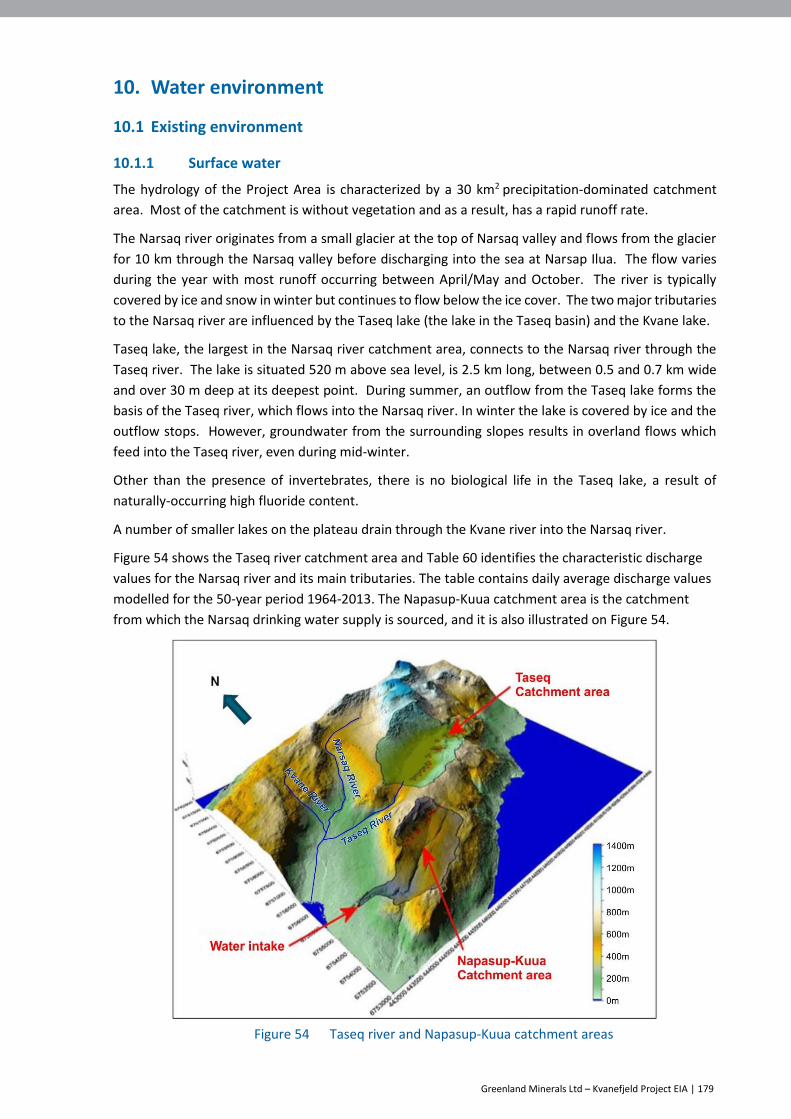
Greenland Minerals Ltd – Kvanefjeld Project EIA | 179
10. Water environment
10.1 Existing environment
10.1.1 Surface water
The hydrology of the Project Area is characterized by a 30 km2 precipitation-dominated catchment
area. Most of the catchment is without vegetation and as a result, has a rapid runoff rate.
The Narsaq river originates from a small glacier at the top of Narsaq valley and flows from the glacier
for 10 km through the Narsaq valley before discharging into the sea at Narsap Ilua. The flow varies
during the year with most runoff occurring between April/May and October. The river is typically
covered by ice and snow in winter but continues to flow below the ice cover. The two major tributaries
to the Narsaq river are influenced by the Taseq lake (the lake in the Taseq basin) and the Kvane lake.
Taseq lake, the largest in the Narsaq river catchment area, connects to the Narsaq river through the
Taseq river. The lake is situated 520 m above sea level, is 2.5 km long, between 0.5 and 0.7 km wide
and over 30 m deep at its deepest point. During summer, an outflow from the Taseq lake forms the
basis of the Taseq river, which flows into the Narsaq river. In winter the lake is covered by ice and the
outflow stops. However, groundwater from the surrounding slopes results in overland flows which
feed into the Taseq river, even during mid-winter.
Other than the presence of invertebrates, there is no biological life in the Taseq lake, a result of
naturally-occurring high fluoride content.
A number of smaller lakes on the plateau drain through the Kvane river into the Narsaq river.
Figure 54 shows the Taseq river catchment area and Table 60 identifies the characteristic discharge
values for the Narsaq river and its main tributaries. The table contains daily average discharge values
modelled for the 50-year period 1964-2013. The Napasup-Kuua catchment area is the catchment
from which the Narsaq drinking water supply is sourced, and it is also illustrated on Figure 54.
Figure 54 Taseq river and Napasup-Kuua catchment areas
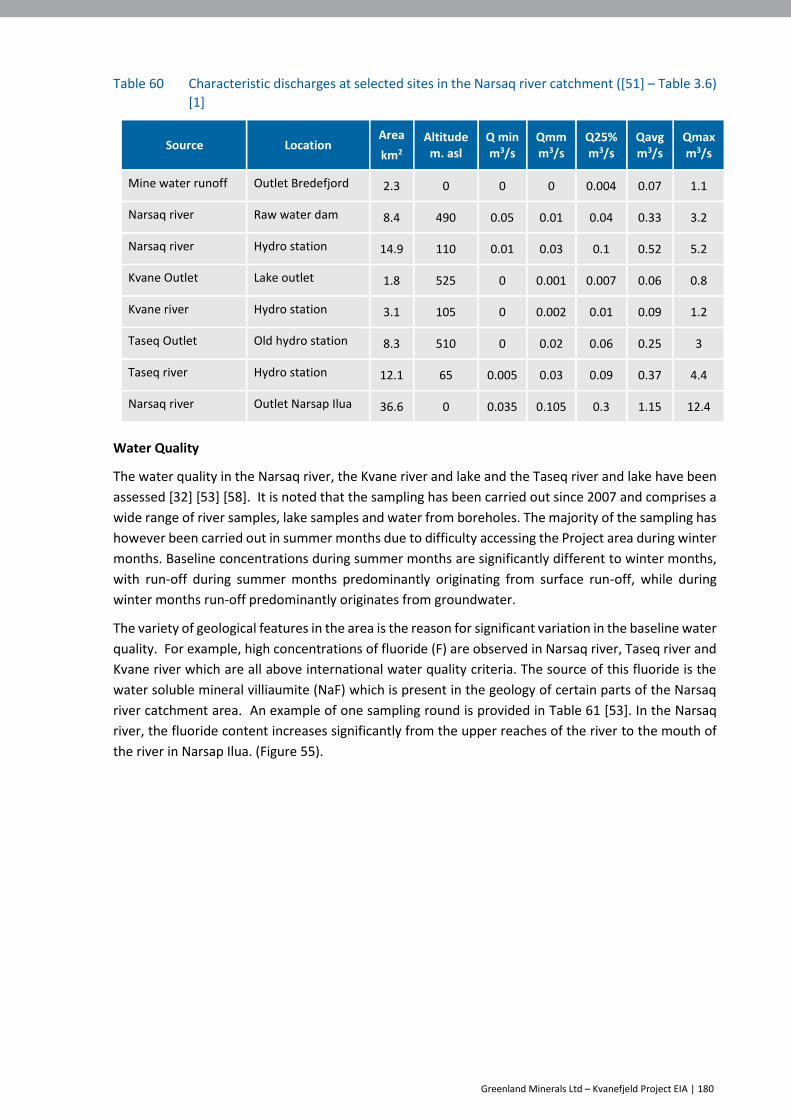
Greenland Minerals Ltd – Kvanefjeld Project EIA | 180
Table 60 Characteristic discharges at selected sites in the Narsaq river catchment ([51] – Table 3.6)
[1]
Source Location Area
km2 Altitude
m. asl Q min m3/s
Qmm m3/s
Q25% m3/s
Qavg m3/s
Qmax m3/s
Mine water runoff Outlet Bredefjord 2.3 0 0 0 0.004 0.07 1.1
Narsaq river Raw water dam 8.4 490 0.05 0.01 0.04 0.33 3.2
Narsaq river Hydro station 14.9 110 0.01 0.03 0.1 0.52 5.2
Kvane Outlet Lake outlet 1.8 525 0 0.001 0.007 0.06 0.8
Kvane river Hydro station 3.1 105 0 0.002 0.01 0.09 1.2
Taseq Outlet Old hydro station 8.3 510 0 0.02 0.06 0.25 3
Taseq river Hydro station 12.1 65 0.005 0.03 0.09 0.37 4.4
Narsaq river Outlet Narsap Ilua 36.6 0 0.035 0.105 0.3 1.15 12.4
Water Quality
The water quality in the Narsaq river, the Kvane river and lake and the Taseq river and lake have been
assessed [32] [53] [58]. It is noted that the sampling has been carried out since 2007 and comprises a
wide range of river samples, lake samples and water from boreholes. The majority of the sampling has
however been carried out in summer months due to difficulty accessing the Project area during winter
months. Baseline concentrations during summer months are significantly different to winter months,
with run-off during summer months predominantly originating from surface run-off, while during
winter months run-off predominantly originates from groundwater.
The variety of geological features in the area is the reason for significant variation in the baseline water
quality. For example, high concentrations of fluoride (F) are observed in Narsaq river, Taseq river and
Kvane river which are all above international water quality criteria. The source of this fluoride is the
water soluble mineral villiaumite (NaF) which is present in the geology of certain parts of the Narsaq
river catchment area. An example of one sampling round is provided in Table 61 [53]. In the Narsaq
river, the fluoride content increases significantly from the upper reaches of the river to the mouth of
the river in Narsap Ilua. (Figure 55).

Greenland Minerals Ltd – Kvanefjeld Project EIA | 181
Figure 55 Location of water quality monitoring sites
Table 61 An example of surface water fluoride concentrations – August 2009 - mg/L ([53 –
Table 4-5)
Locality Fluoride (F)
mg/L
Narsaq river site 1 0.58
Narsaq river site 2 0.88
Narsaq river site 3 2.7
Narsaq river site 4 2.9
Narsaq river site 5 2.9
Narsaq river site 6 3.0
Taseq basin 2.0
Taseq river 1.7
Kvane lake 0.83
Kvane river 5.6
Canada Freshwater Quality Criteria 2015 0.12
WHO Drinking Water Standard 1993 1.5
In addition to the above example from 2009, a general impression of the baseline water quality
variability can be derived from the graphical presentations of the results of selected WQ parameters
and selected sites from the period 2007 – 2014. For example, a graphical presentation of the fluoride
levels is presented in Figure 56, illustrating significant variability across the water catchment. The sites
of Narsaq River (downstream near the outlet), Narsaq River upstream of Kvane River, Narsaq River
near the proposed dam site for the raw water intake, Kvane Lake, and Taseq Lake were selected for
analysis [53].
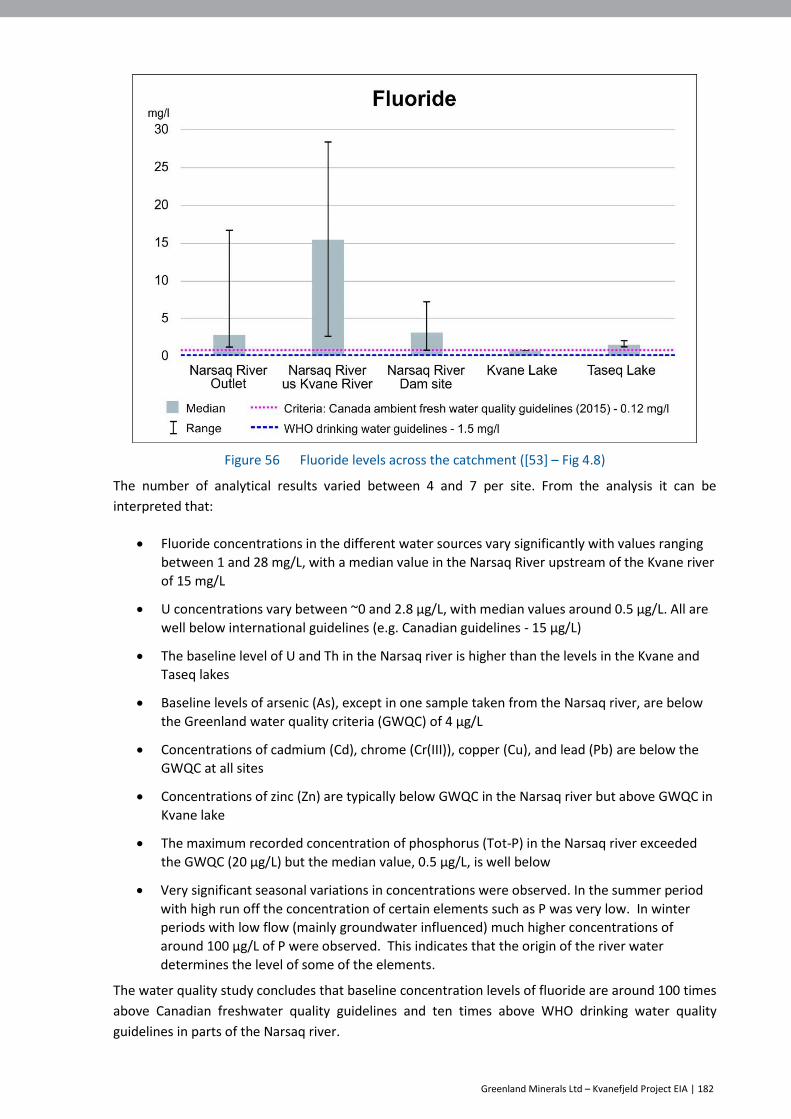
Greenland Minerals Ltd – Kvanefjeld Project EIA | 182
Figure 56 Fluoride levels across the catchment ([53] – Fig 4.8)
The number of analytical results varied between 4 and 7 per site. From the analysis it can be
interpreted that:
Fluoride concentrations in the different water sources vary significantly with values ranging
between 1 and 28 mg/L, with a median value in the Narsaq River upstream of the Kvane river
of 15 mg/L
U concentrations vary between ~0 and 2.8 µg/L, with median values around 0.5 µg/L. All are
well below international guidelines (e.g. Canadian guidelines - 15 µg/L)
The baseline level of U and Th in the Narsaq river is higher than the levels in the Kvane and
Taseq lakes
Baseline levels of arsenic (As), except in one sample taken from the Narsaq river, are below
the Greenland water quality criteria (GWQC) of 4 µg/L
Concentrations of cadmium (Cd), chrome (Cr(III)), copper (Cu), and lead (Pb) are below the
GWQC at all sites
Concentrations of zinc (Zn) are typically below GWQC in the Narsaq river but above GWQC in
Kvane lake
The maximum recorded concentration of phosphorus (Tot-P) in the Narsaq river exceeded
the GWQC (20 µg/L) but the median value, 0.5 µg/L, is well below
Very significant seasonal variations in concentrations were observed. In the summer period
with high run off the concentration of certain elements such as P was very low. In winter
periods with low flow (mainly groundwater influenced) much higher concentrations of
around 100 µg/L of P were observed. This indicates that the origin of the river water
determines the level of some of the elements.
The water quality study concludes that baseline concentration levels of fluoride are around 100 times
above Canadian freshwater quality guidelines and ten times above WHO drinking water quality
guidelines in parts of the Narsaq river.

Greenland Minerals Ltd – Kvanefjeld Project EIA | 183
All sampling sites in the Narsaq river, Kvane lake and Taseq lake have median fluoride concentration
values that exceed the ambient water quality criteria by at least a factor of five. From time to time
baseline concentrations of As, Zn, and P at some locations exceeded ambient water quality criteria
[58]. The variations might be explained by the heterogenic geological features of Kvanefjeld and
seasonal differences between summer and winter runoff sources.
In Greenland drinking water is primarily supplied from lakes and rivers. Narsaq is supplied with water
from the Napasup Kuua, Kuukasik and Landnamselven rivers, which collectively form the Napasup
Kuua catchment area. Currently the supply of water for Narsaq comes almost exclusively from the
Landnamselven river. Total annual consumption is approximately 80,000 m3. Water is collected in a
town reservoir with a capacity of 280,000 m3. The water is filtered and treated with chlorine. The
supply of drinking water to Narsaq is managed by Nukissiorfiit. See Figure 54 for a map which shows
the catchment area for the drinking water (orange) being separate to that of the Taseq river.
10.1.2 Marine environment
Narsaq is situated in the middle of two threshold fjords connected by a passage. The fjords are shaped
like the letter H with Narsaq placed in the middle bar. The overall characteristics of the two threshold
fjords are found in [17].
Table 62 Description of Threshold Fjords ([17] – Table 4.1)
Description
Bredefjord Ikerssuaq (outer part) or Isa Fjord (inner part) and Nordre
Sermilik (innermost part)
Tunugdliarfik Skovfjord (outer part) and Erik’s Fjord
(inner part)
Sill depth isolating the fjords from David Strait
140 m 70 m
Depth of Narsaq Sound between the two fjords
80 m 80 m
Estimated average depth 450 m 200 m
Maximum known depth 700 m 410 m
Length 130 km 110 km
Area 660 km2 420 km2
Approximate volume 300 km3 85 km3
The seas off south and west Greenland, north to 65-67° N, are ice-free throughout the year. This open
water area is primarily a result of the relatively warm north or northwest flowing West Greenland
Current. However, three types of sea ice can occur in the marine area surrounding Erik Aappalaartup
Nunaa (Figure 57):
Short-lived fast-moving ice may occur in the inner part of the fjords during winter. This type
of ice cover is extremely variable both within each winter period and between winters
In recent years, fast ice has mostly been limited to the heads of the fjords, with the
remaining parts of the fjords otherwise ice-free during winter
Icebergs and growlers originating from glaciers in the Ikersuaq/Bredefjord – Sermilik and
Tunulliarfik/Eriks Fjord systems are common all year
During summer, icebergs and growlers can cover large parts of Nordre Sermilik and
sometimes Ikersuaq/Bredefjord

Greenland Minerals Ltd – Kvanefjeld Project EIA | 184
Multi-year sea ice/drift ice (Storis), flowing with the East Greenland Current, moves
southwards along the east coast of Greenland, turns westwards at Cape Farewell and then
northward along the south-west coast of Greenland
In some years, wind and waves cause “Storis” to fill up the mouths of the larger fjords of
south Greenland including Ikersuaq/Bredefjord and Narlunaq/Skovfjord during spring.
Like most fjords in south and west Greenland, the three fjords in the area surrounding the Project are
old glacial valleys (Ikersuaq/Bredefjord, Nordre Sermilik and Narlunaq/Skovfjord, shown in (Figure 57).
These fjords are generally deep, with maximum water depths up to 700 m.
Figure 57 Marine environment
Ikersuaq/Bredefjord and Narlunaq/Skovfjord are also “sill fjords” where shallow water depths at the
mouth of the fjord prevent the free ingress of oceanic water. At the mouth of the Ikersuaq/Bredefjord
the depth is 140 m, while depth at the mouth of Narlunaq/Skovfjord is only 70 m. As the sill strongly
limits the exchange of water between the deeper parts of the fjords and the open sea, large-scale
circulation of water in the fjords mostly depends on the supply of freshwater. The freshwater input
comes mainly from rivers, such as the Narsaq river, but also from icebergs that have calved from
glaciers.
In these sill fjords, the inflow of freshwater forms a brackish surface layer of water that causes a higher
water level in the fjords than outside [46]. This difference in water level forces the brackish surface
water out of the fjords. As the water flows towards the mouth of the fjord, the brackish water becomes
increasingly saline due to the surface water mixing with the underlying water. In order to replace the
saline water entrained by the surface current, an undercurrent of more saline water flows into the
fjords at intermediate depths [46].
Greenland Minerals Ltd – Kvanefjeld Project EIA | 185
During winter, the fresh water inflow to the fjords is reduced, because lakes and rivers freeze and the
precipitation on land falls as snow rather than rainfall. The reduced inflows of fresh water cause the
surface salinity in the fjord to increase to the levels found in the coastal waters outside the fjord. The
reduced difference in salinity decreases circulation within the fjord to a minimum.
As a result of the reduced exchange of salt water with the ocean, sill fjords are dynamic marine
ecosystems [46]. In addition, the quantity and quality of freshwater inflow from rivers are of particular
importance to the marine flora and fauna, as these water sources are one of the main drivers of the
water exchange in these fjords [51] [51a].
The main characteristics of the threshold fjords are summarised below [17]:
The fjords are stratified. Salinity differences between 30-34 % are the main cause of the
stratification
Vertical differences in salinity and temperature are three orders of magnitude larger than
horizontal gradients in the fjords. Water movements are mainly horizontal driven by
freshwater run-off primarily from glaciers and rivers
Both threshold fjords contain highly saline (34.5 %) and slightly warmer water (up to four degrees C) in their deeper basins originating from oceanic seawater ingress over the sills occurring regularly in late autumn
Oxygen content is normally high with levels of seven mg/L even in the deeper areas
The surface water near shore may, in the inner parts, contain pockets of very low salinity due to the influence of melting ice and freshwater runoff.
10.1.3 Groundwater
Existing groundwater hydrology data for the Taseq basin and surrounds was assessed to determine the
likely presence of water in the groundwater systems and the potential for seepage from the TSF into
these systems [24] [58].
The potential for groundwater storage in the Taseq basin is understood to be limited as a result of
steep slopes, bare rock and limited layers of soil and sediments, with most groundwater tending to be
pushed into the Taseq lake.
Geology
Tectonic activities can result in open fractures. In the Taseq catchment, tectonic activity was
associated with magmatic activities which creates relatively few open fractures.
The basement rocks underlying the bases of the FTSF and the CRSF are composed of the Ilimaussaq
naujaite [24] and, to a lesser extent, Gardar basalts to the southwest of the outlet from the Taseq
basin. Naujaite is a crystalline igneous rock that is more broadly classified as a syenite. While there
has been no targeted hydrogeological drilling or hydraulic testing done in this area, shallow
geotechnical drilling (six holes ranging from 17-33 m) at the outlet of the basin suggests that the degree
of weathering would be considered low and consequently the permeabilities associated with the host
rock are also considered to be low. A continuous drill core from a 500 m exploratory hole (DDH-V001)
drilled from adjacent to the Taseq lake further demonstrates that naujaite continues for 233 m below
current water levels, with minimal weathering and fractures. Below 233 m downhole, lenses of
lujavrite occur between the naujaite.
Since the matrix permeability is likely to be negligible, the transmissivity would be of secondary nature
driven by the fracture sets. Hydraulic testing from the future mining area at Kvanefjeld suggests low
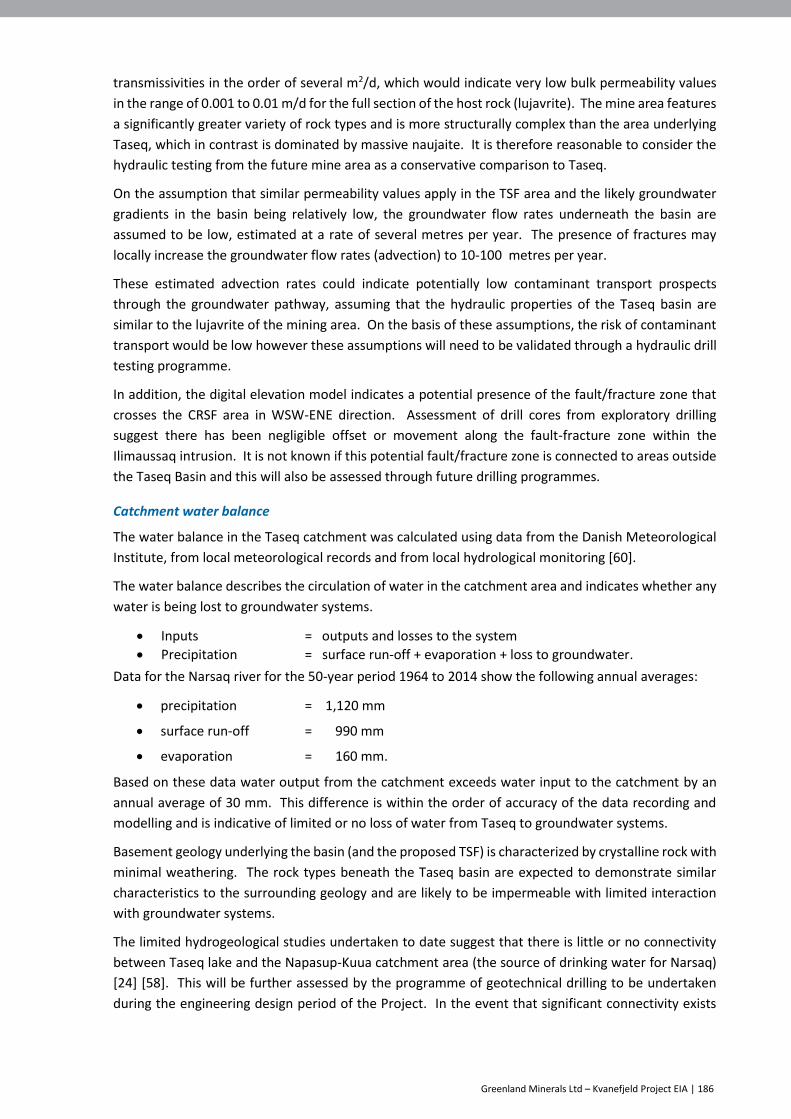
Greenland Minerals Ltd – Kvanefjeld Project EIA | 186
transmissivities in the order of several m2/d, which would indicate very low bulk permeability values
in the range of 0.001 to 0.01 m/d for the full section of the host rock (lujavrite). The mine area features
a significantly greater variety of rock types and is more structurally complex than the area underlying
Taseq, which in contrast is dominated by massive naujaite. It is therefore reasonable to consider the
hydraulic testing from the future mine area as a conservative comparison to Taseq.
On the assumption that similar permeability values apply in the TSF area and the likely groundwater
gradients in the basin being relatively low, the groundwater flow rates underneath the basin are
assumed to be low, estimated at a rate of several metres per year. The presence of fractures may
locally increase the groundwater flow rates (advection) to 10-100 metres per year.
These estimated advection rates could indicate potentially low contaminant transport prospects
through the groundwater pathway, assuming that the hydraulic properties of the Taseq basin are
similar to the lujavrite of the mining area. On the basis of these assumptions, the risk of contaminant
transport would be low however these assumptions will need to be validated through a hydraulic drill
testing programme.
In addition, the digital elevation model indicates a potential presence of the fault/fracture zone that
crosses the CRSF area in WSW-ENE direction. Assessment of drill cores from exploratory drilling
suggest there has been negligible offset or movement along the fault-fracture zone within the
Ilimaussaq intrusion. It is not known if this potential fault/fracture zone is connected to areas outside
the Taseq Basin and this will also be assessed through future drilling programmes.
Catchment water balance
The water balance in the Taseq catchment was calculated using data from the Danish Meteorological
Institute, from local meteorological records and from local hydrological monitoring [60].
The water balance describes the circulation of water in the catchment area and indicates whether any
water is being lost to groundwater systems.
Inputs = outputs and losses to the system
Precipitation = surface run-off + evaporation + loss to groundwater.
Data for the Narsaq river for the 50-year period 1964 to 2014 show the following annual averages:
precipitation = 1,120 mm
surface run-off = 990 mm
evaporation = 160 mm.
Based on these data water output from the catchment exceeds water input to the catchment by an
annual average of 30 mm. This difference is within the order of accuracy of the data recording and
modelling and is indicative of limited or no loss of water from Taseq to groundwater systems.
Basement geology underlying the basin (and the proposed TSF) is characterized by crystalline rock with
minimal weathering. The rock types beneath the Taseq basin are expected to demonstrate similar
characteristics to the surrounding geology and are likely to be impermeable with limited interaction
with groundwater systems.
The limited hydrogeological studies undertaken to date suggest that there is little or no connectivity
between Taseq lake and the Napasup-Kuua catchment area (the source of drinking water for Narsaq)
[24] [58]. This will be further assessed by the programme of geotechnical drilling to be undertaken
during the engineering design period of the Project. In the event that significant connectivity exists

Greenland Minerals Ltd – Kvanefjeld Project EIA | 187
between Taseq and Napasup-Kuua a number of mitigations are available which can be built into Project
design. These mitigations are discussed further later in this Section.
While the risk of significant seepage from the proposed TSF is considered to be low [24] [60] the
programme of geotechnical drilling to be undertaken during Project development will test this
assumption.
10.2 Potential impacts
The potential impacts to the water environment are:
Construction and operation of the Project will modify hydrological processes, potentially
affecting water quality
Operation of the TSF has the potential to result in contamination outside the TSF
Failure of the FTSF has the potential to result in contamination of the water environment
Release of aerosols from the TSF has the potential to result in contamination of water,
downwind of the TSF
Narsaq’s drinking water quality could potentially be affected by the Project due to aerosol
spray or seepage from the TSF or in the event of FTSF failure
Discharge of treated excess water from the Project has the potential to affect water quality
in the Nordre Sermilik
Waste rock stockpile runoff
Post closure mine pit water quality
Risks of accidents which result in the discharge of hydrocarbons and chemicals
Risks of accidents which result in the discharge of Project process water.
10.3 Assessment of impacts
10.3.1 Modification of hydrological processes
The major hydrological changes that the Project will cause are:
Outflow from the Taseq basin will be blocked by embankments constructed for the TSF
Water that enters the basin will be pumped through a pipeline to the Plant. This water will be
recycled and treated (to remove fluoride) prior to placement of a proportion of it into Nordre
Sermilik
Diversion channels will be constructed to direct rainwater and water from melting snow
away from the TSF. Some of this water will be directed to the Taseq river
The depth of Taseq lake will be reduced over a period of three years to facilitate the
construction of the embankment. Water will be discharged to Taseq river in a manner
consistent with seasonal flow volumes.
The flow of Kvane river will be gradually reduced and will no longer report to the Narsaq river
Water from the Kvane river will pass through mine dewatering and be pumped through a
pipeline to the Plant
Culverts will be installed across the lower sections of Narsaq river
An embankment with a sluice will be built across the Narsaq river at the raw water dam site
to create a raw water storage source for the Project.
The reduced flow of the Kvane river into the Narsaq river will have only a limited impact on the flow in
the Narsaq river because the Kvane contributes only 5 % of the average annual flow in the Narsaq river
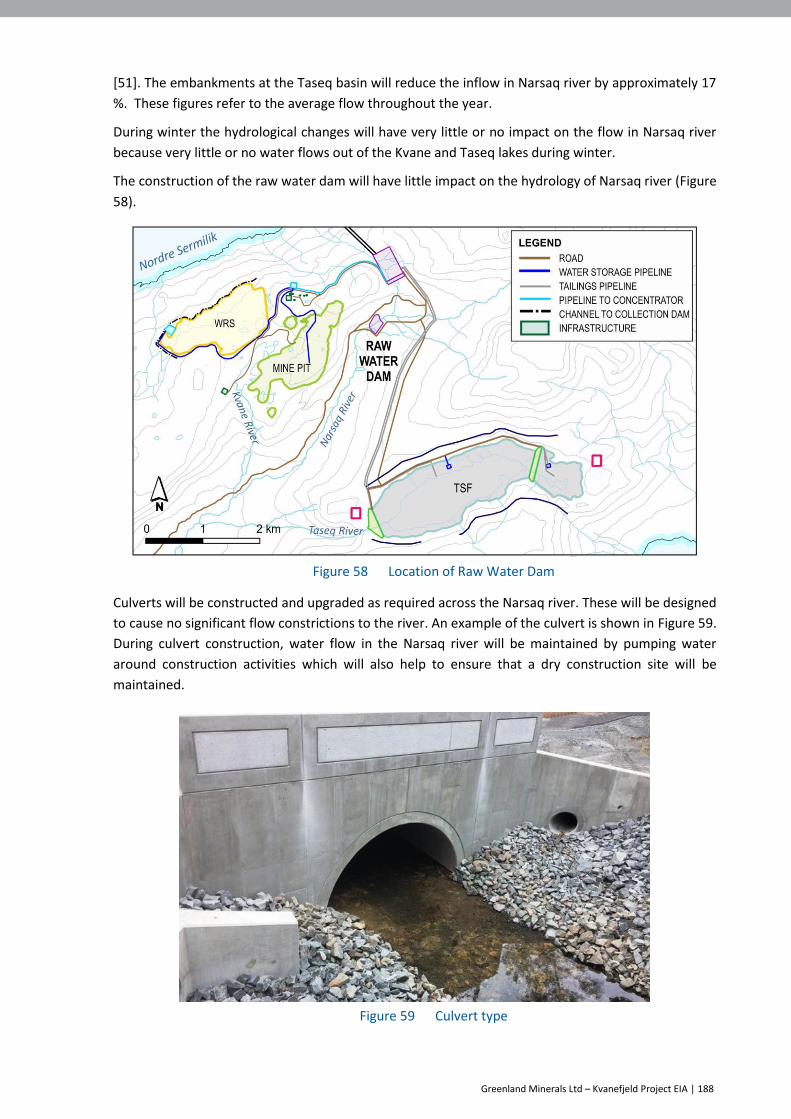
Greenland Minerals Ltd – Kvanefjeld Project EIA | 188
[51]. The embankments at the Taseq basin will reduce the inflow in Narsaq river by approximately 17
%. These figures refer to the average flow throughout the year.
During winter the hydrological changes will have very little or no impact on the flow in Narsaq river
because very little or no water flows out of the Kvane and Taseq lakes during winter.
The construction of the raw water dam will have little impact on the hydrology of Narsaq river (Figure
58).
Figure 58 Location of Raw Water Dam
Culverts will be constructed and upgraded as required across the Narsaq river. These will be designed
to cause no significant flow constrictions to the river. An example of the culvert is shown in Figure 59.
During culvert construction, water flow in the Narsaq river will be maintained by pumping water
around construction activities which will also help to ensure that a dry construction site will be
maintained.
Figure 59 Culvert type

Greenland Minerals Ltd – Kvanefjeld Project EIA | 189
Narsaq river flow varies between 40 and 4,000 m3/h through the year. Approximately 191 m3/h of
freshwater will be sourced from Narsaq river for the Plant. With an average flow of 1,200 m3/h at the
extraction site and 4,100 m3/h downstream near the outlet into Narsap Ilua, the impact on flow during
the majority of the year will be limited. No water will be extracted during periods of low flow.
In general, the changes to the hydrology of rivers and lakes will have limited impact on the overall
hydrology of the area but will have a significant impact on the Kvane and Taseq rivers, which will have
reduced flow in their upper sections.
10.3.2 Operation of the TSF
The design and the operations of the TSF comprising the FTSF and the CRSF are detailed in Section
3.6.3. Water quality issues related to the deposition of tailings during the lifespan of the Project have
been modelled and detailed in technical reports covering the Project’s operations (year 1 - 37), closure
(years 38 - 44) and post-closure (beyond year 44) phases [23] [53] [58].
The majority of the tailings produced in the Project’s operations phase will originate from the physical
extraction of zinc, uranium and REE (~90 % of total tailings) from the ore. These tailings will be
deposited as a wet slurry in the FTSF. The balance of the tailings is the residue remaining after
extracting the REEs and uranium which will be deposited in the CRSF. Both tailings streams will be
deposited subaqueously.
The FTSF and CRSF utilize the natural topography of the valley of the Taseq basin. Two embankments
will be constructed within the basin, one for the FTSF and one for the CRSF. The height of each
embankment will be increased in stages to cater for the increasing requirements for tailings storage
capacity during the Project’s operations phase.
Inflow from the catchment area to the TSF will be reduced by constructing diversion channels prior to
the commencement of processing operations. The channels will partly divert the run-off (non-contact
water) to the Taseq river downstream of the FTSF embankment.
There will be no discharge from the FTSF and the CRSF to the Taseq river during the operations or
closure and decommissioning phases. Post-closure, when the water covering the FTSF and the CRSF
meets GWQC, water will be allowed to overflow the embankment into the Taseq river.
Due to precipitation and natural run-off, water levels in the FTSF and the CRSF will increase at the
beginning of the Project’s post-closure phase. The level in the FTSF will continue to increase until water
starts to flow over the embankment spillway into the Taseq river.
The water quality in the Taseq river downstream of the tailings facilities will have to comply with GWQC
at Control Point C downstream of the mixing zone of the junction between the Taseq and Narsaq rivers.
From a practical point of view, the control point in the river will be easily accessible for future
monitoring.
Water quality in the FTSF and CRSF has been extensively modelled and validated to identify:
The concentration and flows in the facilities and their interactions with the Plant during the
Project’s operations phase
The concentration and flows of the discharge to the freshwater bodies of the Taseq and
Narsaq rivers during the post-closure phase.
A dynamic process simulation model has been developed for this purpose using IDEAS® software [53]
[58]. The software has simulated three Project phases through a lifespan of almost 100 years.

Greenland Minerals Ltd – Kvanefjeld Project EIA | 190
The sequences and milestones in the phases are summarized in Table 63.
The IDEAS® model has been validated twice with check calculations performed by independent
Consultants Orbicon [58] using Excel and by GHD [23] using the GoldSim® modelling package. Good
agreement was found between all three modelling methods, giving confidence in the use of each
model [73]. Results presented in this section are drawn from all three modelling methods.
Table 63 Timeline and milestones in the tailings facilities management
Phase Mining Year Remarks
Construction -3 - 0 Water level reduction of the Taseq lake
Operations - 37 years
1 Start of operations phase.
1 – 37 Tailings stored continuously in FTSF and CRSF. Excess water (supernatant) decanted and re-used in Plant. No discharge to Taseq river. Tailings volume capacity and height of embankments increased several times.
37 End of operations phase. Tailings production ceases.
Closure - 6 years 38 Start of closure phase.
38 – 43 Water in the FTSF and CRSF decanted to the Plant and treated to remove fluoride and discharged to Nordre Sermilik following treatment. No discharge to Taseq river. Water level in ponds gradually lowered. Precipitation and run off will partly compensate decanted water volume. Water quality gradually improved.
43 End of closure phase.
Post – closure (>44 years)
44 Start of post-closure phase.
44 – 48 Precipitation and run-off to the FTSF and CRSF will increase the water level. Maintenance of diversion channels has stopped and as a result run off to the FTSF and CRSF gradually increased. The effect of diversion channels in model has been terminated in 2073.
48 Water from CRSF starts overflow the rim of the embankment to FTSF. No discharge to Taseq river.
49 Modelling indicates that water quality criteria will be met. Water from FTSF starts overflow the embankment to the Taseq river. Post-closure phase completed.
59 Water quality results presented 10 years after commencement of the discharge to Taseq river.
93 Time horizon for model runs of IDEAS®.
Specific information from geochemical assays of the tailings slurries, from chemical processes in the
Plant, and the hydrological development of the TSF have been used to develop the site hydrology
models [53].
The IDEAS® model predicts the behaviour of different chemical species and elements through the
flotation and refinery processes, including the REEs, uranium, thorium, reagents and impurities.
Specific attention has been devoted to the elements included in the GWQC. In addition to elements
found in the Study Area with elevated concentrations relative to continental crustal average, this also
includes elements identified as of “environmental concern”.
In respect of identification of reagents/consumables for modelling, the following criteria were used:
the fate of the reagents in the process
eco-toxicity properties

Greenland Minerals Ltd – Kvanefjeld Project EIA | 191
bio-accumulating properties and quantities.
In total 46 elements and 15 reagents and consumables used in the processes have been modelled.
Baseline concentrations from the rivers and lakes were also included in the model. Measured baseline
concentrations obtained from the Narsaq, Taseq and Kvane rivers and from Kvane lake and Taseq lake
since 2007 indicate persistent high levels of fluoride exceeding international ambient water quality
guidelines by up to a factor of 100 (international standards were applied in this case due to the absence
of a fluoride limit in the GWQC).
Natural background concentrations of arsenic, zinc and phosphorous also regularly exceed GWQC. The
natural geological features within Narsaq valley are the likely cause of the variations and the elevated
concentrations of rare elements in water. The origin of run-off (surface near run-off or groundwater)
and the geological variation within the individual sub-catchments determine baseline water quality
[51]. Existing baseline water quality will be a factor for consideration when future water quality is
assessed against water quality guidelines.
The concentration of certain elements and reagents present in the FTSF and CRSF during the
operations phase will exceed ambient water quality criteria. However, during operations the FTSF and
CRSF will be operated as a closed system, with no releases to the natural environment. Monitoring of
streams, rivers and potential seeps will be undertaken to ensure water quality is not being influenced
by the tailings facilities. In the event that changes to water quality were identified as a result of the
tailings facilities (either from aerosol sprays or seepage from the facility) water treatment could be
introduced to improve water quality before being discharged into the TSF. Tailings water will be re-
used as process water in the Plant and any excess water will be pumped to the water treatment facility
in the Plant for treatment prior to being placed into the Nordre Sermilik.
During the Project’s closure phase, the concentrations of all elements and reagents in the FTSF and
CRSF supernatants will be significantly reduced by water treatment and dilution resulting from
precipitation and runoff to the FTSF and CRSF. It is anticipated that a period of six years (defined as
the closure period) will be required to achieve reductions in the concentrations of almost all elements
and reagents to below ambient water quality criteria or PNEC. Once these levels have been achieved,
water treatment will cease, and the water level within the tailings facilities will increase due to
continued run-off. During the post closure phase, the water level will rise above the embankment to
re-establish flow in Taseq river.
Examples of the concentration of uranium and fluoride in the tailings dam water are presented in
Figure 60 and Figure 61. Figure 60 details the uranium concentration pattern in the CRSF with
fluctuations in the first five years (due to the low volume of material in the CRSF) together with the
quarterly values that have been used for the hydrological input in the first five modelling years [23].
In the early tears of the Project’s operations phase there will be a steady increase in the concentration
levels of fluoride in the FTSF (see Figure 61) as a result of constant deposition of tailings slurry. This
rise in concentration plateaus before it will fall dramatically during the closure phase.
In the CRSF, concentrations of uranium and fluoride will be lower than in the FTSF, however the
concentration of sulphate and chloride salts will be elevated. To minimise seepage of the CRSF’s salty
water, the CRSF will be double lined with clay and plastic.
In the Project’s closure phase, there is a significant decrease in the concentrations of dissolved salts in
the CRSF. This occurs because the water-soluble metal from the tailings slurry is no longer entering

Greenland Minerals Ltd – Kvanefjeld Project EIA | 192
the CRSF and because of the recycling of supernatant water to the water treatment facility at the Plant.
The water also becomes more diluted from run-off and precipitation.
Figure 60 Uranium concentration in the FTSF and CRSF over Project life – as predicted by GoldSim
Figure 61 Fluoride concentration in the FTSF and CRSF over Project life – as predicted by GoldSim
During the Project’s operations phase, the concentration of flotation reagents in the FTSF increases
sharply initially, and then gradually levels out over time. During the closure period there is a sharp
decrease in the concentration of these reagents with the decline in concentration continuing in the
post closure period [58].
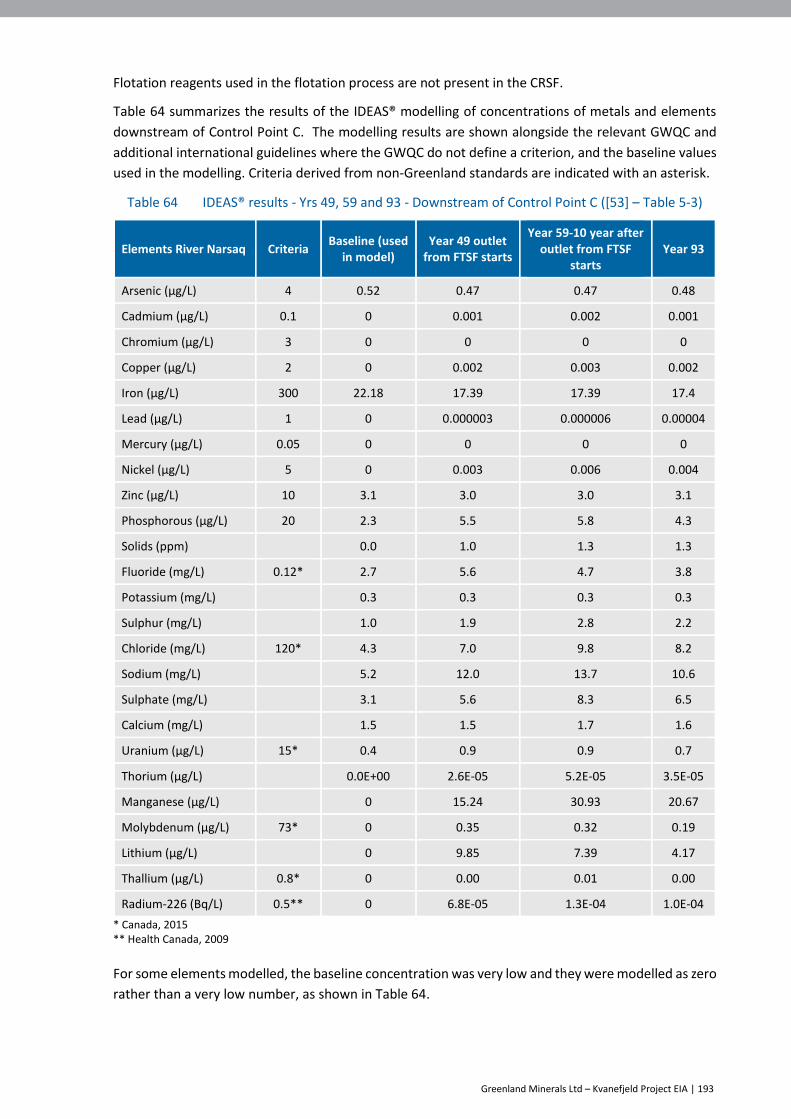
Greenland Minerals Ltd – Kvanefjeld Project EIA | 193
Flotation reagents used in the flotation process are not present in the CRSF.
Table 64 summarizes the results of the IDEAS® modelling of concentrations of metals and elements
downstream of Control Point C. The modelling results are shown alongside the relevant GWQC and
additional international guidelines where the GWQC do not define a criterion, and the baseline values
used in the modelling. Criteria derived from non-Greenland standards are indicated with an asterisk.
Table 64 IDEAS® results - Yrs 49, 59 and 93 - Downstream of Control Point C ([53] – Table 5-3)
Elements River Narsaq Criteria Baseline (used
in model) Year 49 outlet
from FTSF starts
Year 59-10 year after outlet from FTSF
starts Year 93
Arsenic (µg/L) 4 0.52 0.47 0.47 0.48
Cadmium (µg/L) 0.1 0 0.001 0.002 0.001
Chromium (µg/L) 3 0 0 0 0
Copper (µg/L) 2 0 0.002 0.003 0.002
Iron (µg/L) 300 22.18 17.39 17.39 17.4
Lead (µg/L) 1 0 0.000003 0.000006 0.00004
Mercury (µg/L) 0.05 0 0 0 0
Nickel (µg/L) 5 0 0.003 0.006 0.004
Zinc (µg/L) 10 3.1 3.0 3.0 3.1
Phosphorous (µg/L) 20 2.3 5.5 5.8 4.3
Solids (ppm) 0.0 1.0 1.3 1.3
Fluoride (mg/L) 0.12* 2.7 5.6 4.7 3.8
Potassium (mg/L) 0.3 0.3 0.3 0.3
Sulphur (mg/L) 1.0 1.9 2.8 2.2
Chloride (mg/L) 120* 4.3 7.0 9.8 8.2
Sodium (mg/L) 5.2 12.0 13.7 10.6
Sulphate (mg/L) 3.1 5.6 8.3 6.5
Calcium (mg/L) 1.5 1.5 1.7 1.6
Uranium (µg/L) 15* 0.4 0.9 0.9 0.7
Thorium (µg/L) 0.0E+00 2.6E-05 5.2E-05 3.5E-05
Manganese (µg/L) 0 15.24 30.93 20.67
Molybdenum (µg/L) 73* 0 0.35 0.32 0.19
Lithium (µg/L) 0 9.85 7.39 4.17
Thallium (µg/L) 0.8* 0 0.00 0.01 0.00
Radium-226 (Bq/L) 0.5** 0 6.8E-05 1.3E-04 1.0E-04
* Canada, 2015 ** Health Canada, 2009
For some elements modelled, the baseline concentration was very low and they were modelled as zero
rather than a very low number, as shown in Table 64.

Greenland Minerals Ltd – Kvanefjeld Project EIA | 194
The baseline values are defined for the control point C, i.e. after the merge point of Narsaq river and
Taseq river.
Chemical oxygen demand (COD) measurements were made by SGS Oretest on pilot plant samples of
tailings water. The solution measured 73 mg/L COD which is below the GWQC of <75 mg/L. Most of
the oxidation of reagents occurs during the processing due to elevated temperatures and air
entrainment.
Table 65 Comparison of PNEC criteria for reagents and modelled concentrations at Control Point C
([53] – Table 5-5)
Reagents river Narsaq Criteria PNEC
Year 49 outlet from FTSF starts
Year 59 – 10 year after start of outlet
Year 93
Total Flocculant (μg/L) 10 0.00 0.00 0.00
SIBX (μg/L) 268 0.08 0.01 0.00
Copper Sulphate (μg/L) 0.1 0.00 0.01 0.01
Aero 6494 (μg/L) 0.33 0.03 0.00 0.00
Sodium Silicate (μg/L) 2,470 774 396 324
Frother (μg/L) 0.24 0.06 0.01 0.00
Barium Chloride (μg/L) 220 0.00 0.00 0.00
NaHS (μg/L) 10 0.01 0.01 0.01
Alamine 336 (μg/L) 0.014 0.00004 0.00002 0.00001
Isodecanol (μg/L) 10 0.00 0.00 0.00
PC88A (μg/L) 4.2 0.01 0.00 0.00
Shellsol Diluent (μg/L) 2 0.01 0.00 0.00
CW Biocide (μg/L) 0.2 0.00 0.00 0.00
In general, the modelled concentration patterns over time for reagents and elements at Control Point
C can be summarized as follows:
Concentrations for all elements included in the GWQC are well below criteria values
Uranium is not included in the GWQC. As an alternative criterion, the Canadian guideline
[123] concentration of 15 µg/L has been used. The calculated concentration is 1/16 of the
Canadian guideline criterion
The concentration of fluoride exceeds the Canadian Guidelines of 0.12 mg/L by a factor of
nearly 50.
The baseline fluoride concentration already exceeds this guideline value by a factor of 22,
hence the Canadian Guidelines are not applicable to the Study Area.
When compared to typical variations in the baseline fluoride concentration in Narsaq river
upstream of control point C, between 1 and 28 mg/L, the expected peak fluoride level at
control point C during Year 49 of 5.6 mg/L is well within baseline range of conditions for this
site.
The Project, in terms of fluoride concentration, is not expected to have a noticeable impact
on the existing environment
Reagent concentrations are well below PNEC values for all reagents.

Greenland Minerals Ltd – Kvanefjeld Project EIA | 195
The content of fluoride in TSF water will reach a peak concentration of 300 mg/L during the Project’s
operations. At these concentrations no impact on the environment is observable even in the event of
seepage or aerosol spray from the TSF [61]. This concentration will be reduced significantly by the
water treatment circuit during the closure phase. Fluorspar, a commercial product, will be reclaimed
from this circuit [73].
During the Project’s closure phase, the concentrations of all elements and reagents in the outlet to the
fjord will be less than during operations as no additional flotation and refining tailings will have been
added after year 37.
The potential impact in the marine environment in the 6-year closure phase will consequently be lower
than the operations phase.
Tailings supernatant overflow
Embankments for both the FTSF and the CRSF will be constructed to withstand extreme inflows of
water, for example due to exceptional snow melting under foehn wind events. Minimum of 6 m
freeboard has been designed for both tailings facilities, with operating ranges extending between 6-
13 m. Large diversion channels will be constructed to capture water ingress to the Taseq lake and lead
it away from the TSF. These channels will significantly reduce the likelihood of the TSF embankment
overflowing.
The capacity of the TSF has been designed to cater for a range of extreme weather scenarios, such as
a 1 in 10,000-year rainfall event. In the case of a 1 in 10,000-year event the water level in the FTSF will
increase by approximately 0.5 meters which is well within the minimum freeboard [23].
An overflow of the CRSF embankment into the FTSF would have no immediate consequences.
Supernatant water from the CRSF would be contained in the FTSF. The FTSF embankment freeboard
is designed to accommodate a major inflow of water from the CRSF or from the surrounding
environment.
In the unlikely event of the FTSF overtopping, water would overflow the FTSF embankment at the
designated spillway point. Water would first flow into the Taseq river and then into the lower part of
Narsaq rivers before reaching the fjord at Narsap Ilua.
The impact of an overflow on the freshwater biota and marine life will depend on the amount and
quality of water that overflows the FTSF embankment. The consequence of a major overflow event
(an overtopping) are discussed in the next section.
If the supernatant overflow were to result from extreme rainfall or snow melt, the supernatant will be
diluted prior to overflowing and as a result the impact would be significantly lower than that
anticipated under the overtopping scenario.
The impact on the Taseq and Narsaq rivers would most likely be short term, lasting days or weeks. The
impact of an overflow on marine life is likely to be local only (limited to Narsap Ilua).
To minimize the risk of an overflow event it is essential that the diversion channels are well maintained
during the operations and closure phases.
10.3.3 TSF Embankment failure
Three different scenarios for a potential failure (complete or partial) of the TSF embankment were
assessed to determine the impact of a failure on the environment in the operations and post-closure
phases [110]. During these phases the volume of tailings would be at its maximum with the key

Greenland Minerals Ltd – Kvanefjeld Project EIA | 196
difference relating to the volume and water quality of the supernatant. Industry standard 3D modelling
of catastrophic failures of the FTSF embankment was performed to visually display the area of
inundation [74]. These failure modes are described in detail in Section 9.3.3. and the descriptions are
not repeated here. This section reports on the analysis of potential impacts to the water environment
under each of the failure scenarios. The geochemical assessment on water quality resulting from an
embankment failure was only conducted for the worst-case scenario of a catastrophic failure. The
geochemical water quality impacts associated with overtopping and piping failures would be less
significant than those described for the catastrophic failure case.
Overtopping
In this case, some of the water cover could be lost, however no solids are assumed to be released. In
the event of a failure during the operations phase, approximately 15 Mm3 of water would be lost at an
average rate of 6,900 m3 per hour (this is expected to continue for a period of three months). For
perspective, it is noted that the discharge rate of 6,900 m3 per hour is about three and 1.7 times the
mean annual flows of 1,300 and 4,150 m3 per hour for the Taseq river and the Narsaq river (below
Control Point C), respectively, and significantly less than the typical high flowrates of about 12,000 and
31,800 m3 per hour for the Taseq river and the Narsaq river (beyond Control Point C), respectively.
At post-closure the amount of water released could range up to double that of the operational phase
scenario. While supernatant water quality during operations is reflective of mining and milling
operations, post-closure supernatant water quality is generally similar to background water quality.
In addition to public concern about a loss of containment in a tailings facility, the major impact from
an overtopping event could be a large and extended flow, which could temporarily flood the grass
fields of the fan zone during the period of the event (assumed to be three months in this case) [110].
If an overtopping event were to occur in the operations phase, management actions could be taken to
minimise the impact and improve the water quality of the supernatant. While a model has not been
developed to assess the non-radiological effects on water quality associated with an operations phase
overtopping event, the effects would significantly be lower than those described for an operations
phase piping or catastrophic failure event (described below).
If the failure were to occur in the post closure period, the quality of the water which would overflow
would meet the GWQC’s (with the exception of fluoride) and as such, would not be expected to have
an impact on downstream water quality.
Piping failure - Containment failure resulting from a partial breach of the embankment.
Under this scenario, embankment materials could be eroded out by flowing water, and this type of
erosion can progress and create an open path for flow or a pipe/tunnel. This could result in the loss of
100 % of the FTSF water cover and a significant quantity of tailings. .
It is assumed that all of the surface water (13.7 Mm3 in the operations phase and 32.9 Mm3 in the post-
closure phase)and 25 % of the Flotation tailings stored above the original Taseq lake saddle (15 Mm3
for both phases) would be released over a period of 1 month during the last year of operations and over
a 2 month period during post-closure.
The discharge is assumed to start with tailings only discharge at 60 % solids which quickly changed to
a lower percentage solids as the supernatant is mixed in.

Greenland Minerals Ltd – Kvanefjeld Project EIA | 197
The slurry flow resulting from a failure of this nature would be expected to be in the order of 42,000
m3/h (11.7 m3/s). This would likely result in some disruption of the rock fill of the embankment as well
as distribution of solid tailings along the current pathways of the Taseq and Narsaq rivers.
A significant portion (60 to 70 %) of tailings particles, particularly coarser particles, would be expected
to settle in the lower stretches of the Narsaq river. Approximately 30-40% of the tailings solids would
be expected to settle in Narsap Ilua and only a small portion of solids (less than 5%) leave Narsap Ilua
and enter the fjord.
A piping failure could be expected to result to the flooding of the grass fields of the fan zone for the
duration of the event. With a reported average natural flow of 1.15 m3/s, the Narsaq river would be
unlikely to provide much dilution for the released tailings [110].
Catastrophic embankment failure - Containment failure resulting from a full breach of the
embankment.
Low and high operational breach volumes were assessed to provide a range of potential consequences
using 3D modelling techniques. The low breach volume assumed 21 Mm3 of tailings released and the
high breach assumed a tailings volume of 43 Mm3. It has been estimated that approximately 80% of
the tailings solids (~11 Mm3) would reach Narsap Ilua.
Both operational scenarios have a similar maximum velocity and inundation area. The highest velocity
is observed 750 m downstream of the breach in a narrow section of the Taseq river where speeds of
25 metres per second (mps) are expected. The remainder of the narrow valley would experience
velocities of 10-25 mps before slowing down at the river delta to 2-5 mps. The overall area of
inundation for both high and low scenarios is similar.
The most obvious effect of a TSF embankment failure is the deposition of tailings solids and dam
material over a wide area downstream of the breach. The deepest flow would be expected to occur in
the narrow valley in the first one-third of the breach path, which could exceed 25 m in depth and a
width of 110 m. After reaching the wider valley and alluvial fan, the flow depth would be expected to
be approximately 5 m, rising to 10 m in some areas. The inundation extent would be expected to be
510 m wide on the alluvial fan with a maximum width of ~640 m at the mouth of Narsap Ilua.
The total area impacted would cover 1.84 km2.
A catastrophic embankment failure scenario was considered during both the operational and post-
closure periods. In a post-closure catastrophic embankment failure scenario, the extent of the
inundation would be expected to be similar to that modelled for the operational failure, and as such,
no additional 3-D embankment break modelling was undertaken for this event. The larger supernatant
volume associated with a post-closure wet cover failure would be likely to transport a greater
proportion of the solid tailings into Narsap Ilua and as such an operational failure likely represents the
worst case scenario for solids tailings deposition on land.
In order to assess the water quality impacts from non-radiological elements of a catastrophic
embankment failure, KCB [126] modelled three cases. These cases cover a failure at the end of
operations (Year 37), the time at which the supernatant height will reach its peak in post-closure in a
wet closure cover case (Year 49) and the same year (Year 49) for a dry cover closure case.
The assumptions which informed the three cases are summarised in Table 67.

Greenland Minerals Ltd – Kvanefjeld Project EIA | 198
Table 66 Summary of tailings pore water, supernatant and river water qualities ([126] – Table 2.4)
Parameter a
(mg/L)
Supernatant Water End of Production
Supernatant Water after
Closure
Tailings Pore Water
Narsaq River
Aug2009
(Site 6 b)
Taseq River
Aug 2009
Calcium 0.590 1.560 0.413 2.432 3.316
Sodium 378 37.9 2,427 6.599 5.411
Potassium 2.8 0.36 17.4 0.356 0.374
Sulphate 23.2 14.4 144 1.12 1.53
Chloride 3.56 16.9 0.264 2.30 3.80
Fluoride 279 17.3 1,799 3.00 1.70
Iron 0 0 10 0.021 0.004
Manganese 0.0126 0.0683 0.081 0.000128 0.000110
Arsenic 0.0002 0.00028 0.014c 0.000531 0.000465
Thorium 0 0.0001 0.001 0.000023 0.00001
Uranium 0.076 0.00247 0.492 0.000793 0.000553
Zinc 0.00192 0.00267 0.500 0.00223 0.00155
Table in Orbicon A/S, 2018
(Year 37) Table 5.3
(Year 49) Table 5.3
Annex 1 (Site 6)
Table 4.5-4.6 Table 4.5-4.6
a No pH or alkalinity was reported for these samples. The audit report (DCE & GINR, 2019) however reported a neutral pH for the river water. Kinetic leach test results indicate that the pH of the tailings water will be slightly alkaline. b Site 6 is situated at the river mouth. c The maximum arsenic in additional assay results of shake flask tests performed by SGS (SGS Lakefield, 2013)
Table 67 Summary of modelled cases ([126] – Table 3.1)
Cases Description Volume Pore
Water (Mm3)
Volume Supernatant Water (Mm3)
Supernatant Water
Cover (m)
Case 1 End of operation 16.1 13.7 5
Case 2 End of closure (wet) 16.1 32.9 11.6
Case 3 End of closure (dry) 16.1 0 0
In the very unlikely event of a failure of the FTSF, there would be short- and long-term impacts to the
environment. A geochemical reaction path model was developed to model the expected change in
river water after the breach for each Case. Attention was given to the FTSF water quality, residue
tailings chemical load rate and the through flowing river water.
The assessments indicated that conservative constituents (i.e. those which do not readily precipitate
to form minerals) would stay in solution and be diluted by the natural river flow. Conservative
chemicals include sodium, fluoride and sulphate. Directly after a breach, the concentration of these
ions in the river water would initially be at levels based on the mixing ratio between the tailings pore
water and the supernatant water. Given the conservative nature of these chemicals, dilution is the
primary mechanism by which their concentrations will decrease. Because of the rapid flow of the river,
the concentrations of the chemicals will significantly decrease over time. Table 68, Table 69 and Table
70 summarise the results for Cases 1, 2 and 3 respectively.
After about 1-2 years, in all three modelled Cases, the fluoride is simulated to reach a value of <30
mg/L in the river water which is below the guideline set for fluoride in the river during winter months.

Greenland Minerals Ltd – Kvanefjeld Project EIA | 199
It is close to the summer months river guideline set for fluoride (5 mg/L) after about 15, 10 and 20
years for Cases 1 (operational failure), 2 (post-closure wet cover failure) and 3 (post closure dry cover
failure) respectively. The timeline for dilution of fluoride is extended by the presence of a background
fluoride level of 3 mg/L in Narsaq river.
More reactive constituents (especially metals such as iron and manganese) showed an immediate
decrease in concentration in all Cases as they could precipitate on the river sediments, allowing for
subsequent remobilisation after concentrations were diluted through upstream river water. For all
three Cases, the modelled iron concentration was below the Greenland freshwater guideline of 0.3
mg/L. The uranium concentration, without allowing precipitation in the model, was below the
Canadian guideline of 0.015 mg/L in all three Cases within two model years. [126].
The model assumed that the river would be in full contact with the residue tailings. An inherent
model limitation is that tailings deposited on the fringes of the Narsaq valley may not be in full
contact with the river flow. It may take some time before snowmelt washes tailings towards the
river. Therefore, some heterogeneity would be present in the Narsaq valley in terms of the water
quality and the models attempted to estimate only the changes in the average river water quality.
Of the three Cases which have been modelled, the most significant impacts to water quality would
be associated with a post closure dry cover failure due to the absence of a supernatant which
provides dilution capabilities.
Table 68 Case 1: Summary of end-of-operation model input and results (mg/L) ([126] – Table 3.2)
Parameter (units mg/L
or as indicated in
brackets)
Model Input:
Tailings Pore Water
Model Input:
Supernatant Water End Operation
Model Input: Narsaq River
Aug 2009
Modelled River Water
Quality after Breach
Modelled River Water
Quality after 2 Years
Modelled River Water
Quality after 10
Years
Water Quality
Guidelines
Seawater Guideline/ Reference
pH (value) 9.40* 8.00* 7.00** 9.10 7.80 7.50
Calcium 0.413 0.590 2.43 0.49 2.5 2.5 422d
Sodium 2,427 378 6.60 1,488 25 10 11,020d
Potassium 17.4 2.8 0.356 10.7 0.5 0.4 408d
Sulphate 144 23.2 1.12 88.7 2.3 1.4 2775d
Chloride 0.264 3.56 2.30 1.77 2.3 2.3 120c 19,805d
Fluoride 1,799 279 3.00 1103 17 5.8 5 summer 30 wintera
1.4d
Iron 10 0 0.021 5.42 0.028 0.028 0.300b 0.030b
Manganese 0.081 0.0126 0.00013 0.050 0.001 <0.0001 0.0002d
Arsenic 0.014 0.0002 0.00053 0.008 <0.001 <0.001 0.004b 0.005b
Uranium 0.492 0.076 0.000793 0.301 <0.001 to 0.005***
<0.001 to 0.002***
0.015c
Zinc 0.500 0.00192 0.0022 0.272 0.006 0.003 0.010b 0.010b
Blue = modelled concentrations
*Estimated from column leach test. **Adopted from DCE audit report (DCE & GINR, 2019). ***<0.001 mg/L when allowed to precipitate. a Guideline from DCE (DCE & GINR, 2018) b Freshwater and seawater guidelines from BMP (BMP, 2015) c Canadian guidelines (CCME, 2020) d Typical seawater composition (Nordstrom et al., 1979)

Greenland Minerals Ltd – Kvanefjeld Project EIA | 200
Table 69 Case 2: Summary of wet post-closure model input and results (mg/L) ([126] – Table 3.3)
Parameter (units mg/L
or as indicated in
brackets)
Model Input:
Tailings Pore Water
Model Input:
Supernatant Water End Operation
Model Input: Narsaq River
Aug 2009
Modelled River Water
Quality after Breach
Modelled River Water
Quality after 2 Years
Modelled River Water
Quality after 10
Years
Water Quality
Guidelines
Seawater Guideline/ Reference
pH (value) 9.40* 8.00* 7.00** 9.10 7.60 7.40
Calcium 0.413 1.560 2.43 1.18 2.5 2.5 422d
Sodium 2,427 37.9 6.60 826 17 9 11,020d
Potassium 17.4 0.36 0.356 5.98 0.4 0.4 408d
Sulphate 144 14.4 1.12 57.2 2 1.3 2775d
Chloride 0.264 16.9 2.30 11.4 2.4 2.3 120c 19,805d
Fluoride 1,799 17.3 3.00 605 10.6 4.6 5 summer 30 wintera
1.4d
Iron 10 0 0.021 3.30 0.028 0.028 0.300b 0.030b
Manganese 0.081 0.0683 0.00013 0.072 <0.001 <0.0001 0.0002d
Arsenic 0.014 0.0003 0.00053 0.008 <0.001 <0.001 0.004b 0.005b
Uranium 0.492 0.025 0.000793 0.164 <0.001 to 0.0035***
<0.001 to 0.0015***
0.015c
Zinc 0.500 0.00267 0.0022 0.272 0.004 0.003 0.010b 0.010b
Blue = modelled concentrations
*Estimated from column leach test. **Adopted from DCE audit report (DCE & GINR, 2019). ***<0.001 mg/L when allowed to precipitate. a Guideline from DCE (DCE & GINR, 2018) b Freshwater and seawater guidelines from BMP (BMP, 2015) c Canadian guidelines (CCME, 2020) d Typical seawater composition (Nordstrom et al., 1979)
Table 70 Case 3: Summary of dry post-closure model input and results (mg/L) ([126] – Table 3.4)
Parameter (units mg/L
or as indicated in
brackets)
Model Input:
Tailings Pore Water
Model Input:
Supernatant Water End Operation
Model Input: Narsaq River
Aug 2009
Modelled River Water
Quality after Breach
Modelled River Water
Quality after 2 Years
Modelled River Water
Quality after 10
Years
Water Quality
Guidelines
Seawater Guideline/ Reference
pH (value) 9.40* N/A 7.00** 9.10 7.60 7.40
Calcium 0.413 N/A 2.43 0.413 2.5 2.5 422d
Sodium 2,427 N/A 6.60 2427 37 13 11,020d
Potassium 17.4 N/A 0.356 17.4 0.6 0.4 408d
Sulphate 144 N/A 1.12 144 3 1.5 2,775d
Chloride 0.264 N/A 2.30 0.264 2.4 2.3 120c 19,805d
Fluoride 1,799 N/A 3.00 1799 26 7.6 5 summer 30 wintera
1.4d
Iron 10 N/A 0.021 10 0.028 0.028 0.300b 0.030b
Manganese 0.081 N/A 0.00013 0.081 <0.0001 <0.0001 0.0002d
Arsenic 0.014 N/A 0.00053 0.014 <0.001 <0.001 0.004b 0.005b
Uranium 0.492 N/A 0.000793 0.492 <0.001 to 0.007***
<0.001 to 0.002***
0.015c
Zinc 0.500 N/A 0.0022 0.500 0.0085 0.0035 0.010b 0.010b

Greenland Minerals Ltd – Kvanefjeld Project EIA | 201
Blue = modelled concentrations
*Estimated from column leach test. **Adopted from DCE audit report (DCE & GINR, 2019). ***<0.001 mg/L when allowed to precipitate. a Guideline from DCE (DCE & GINR, 2018) b Freshwater and seawater guidelines from BMP (BMP, 2015) c Canadian guidelines (CCME, 2020) d Typical seawater composition (Nordstrom et al., 1979)
In the unlikely event of a failure, river water flowing into Narsap Ilua under all Cases would be below
the average seawater composition for the modelled major chemicals except for fluoride. Most
metal(loid)s (e.g. iron, manganese, zinc, arsenic and uranium) would precipitate and be below sea
water composition within 1-2 years after an embankment failure event.
Narsaq town is outside of the flow path of all of the modelled scenarios, and as such, neither
inundation nor tailings deposition would be expected to occur in the town of Narsaq.
An assessment was performed to determine if the residual solids from a catastrophic failure of the
FTSF would result in contamination of Narsaq drinking water or other sensitive receptors. The
evaluation modelled the impact with the CALPUFF model used for the air quality assessments while
incorporating laboratory geochemical testwork. The results show any contamination of Narsaq
drinking water, after an embankment failure, is likely to be negligible [90). The potential impact of the
radioactivity in the tailings solids and water was also assessed (Arcadis 2020b). The source term was
determined from the 2015 cold water storage test results (Table 71). It was found that there may be
some short-term effects from an embankment failure; however, no long-term chronic exposure from
the presence of radioactivity would be expected.
Table 71 Summary of radionuclides assessed during failure scenario (end of operation)
Parameter (units Bq/L)
Tailings Pore Water
Supernatant Water End Operation
Narsaq River Aug 2009
River Water Quality after
Breach Water Quality Guidelines a
U-238e 27 0.94 0.014 8.3 3
Th-230 e 2.4 0.083 0.014 0.73 0.6
Ra-226 e 0.08 0 0.025 0.02 0.5
Pb-210 e 0.83 0.029 0.14 0.26 0.2
Po-210 e 0.83 0.029 0.025 0.26 0.1
Th-232 e 5.0 0 0.001 1.4 0.6
Ra-228 e 0.11 0 0.04 0.03 0.2
Th-228 e 0.03 0 0.001 0.01 2
Details provided in Arcadis 2020b a Canadian guidelines - radionuclide drinking water guidelines from Health Canada (2009)
In the very unlikely event of a catastrophic dam failure, the freshwater environment of the Narsaq
River would be overwhelmed by suspended solids and contaminants from tailings porewater.
Freshwater surges in the springtime will erode stream embankments composed of tailings and in the
river channel zones. The tailings in the Fan Zone would be susceptible to stream meandering and the
formation of oxbow stagnant water ponds during the surge of the spring snow melt. Unchecked, this
phenomenon could continue for decades. Various remedial actions could be contemplated such as
those outlined below but some consideration would need to be given to the possibility that the
environmental effects of remedial actions might be larger than those arising from natural restoration.
Greenland Minerals Ltd – Kvanefjeld Project EIA | 202
In broad terms, remedial action to restore the freshwater environment could in general be one of two
options:
i. Recover all of the tailings from all channel zones, contaminated soil and gravel by mechanical
means – similar to the Aznacollar reclamation in southern Spain. The natural stream banks in
the upper two zones are rock. Hydraulic cleaning could be considered. A location to deposit
this material would need to be selected or developed. Restore the natural channels with clean
gravel.
ii. Recover tailings from upper zones and create artificially lined, meander-resistant channels in
the Fan Zone.
The selection of either option would be dependent on detailed surveying, weather conditions and
reclamation objectives and as previously noted, the potential that active reclamation might lead to
larger environmental effects than natural remediation.
Pipeline rupture and plant failure
Tailings mixed with water will be transported as slurry through a pipeline from the Plant to the TSF. A
pipeline rupture will lead to a localised spill of slurry containing tailings or process water. Pressure
sensors and block valves will be installed on all pipelines to detect spills. Emergency procedures and
programmed interlocks will be activated to minimize the leak or rupture.
The water treatment plant will continue operating during the 6-year closure and decommissioning
phase. The water in the FTSF and the CRF will be pumped to the Plant as was the case in the operations
phase. The treated water will be placed in Nordre Sermilik via the use of a specially engineered pipeline
and diffuser. If the treatment plant fails during the operations or closure phases, production will stop
immediately and water disposal into Nordre Sermilik fjord will cease. There is significant water storage
capacity in the TSF and at the Plant site. A large volume of untreated water can be contained in the
event of a water treatment plant failure.
In the post-closure phase, no wastewater from the tailings ponds or the treatment plant is discharged
to the fjord.
10.3.4 Aerosol spray from TSF
As noted in Section 7.1.1, the Study Area can experience strong foehn winds. Given the strength of
these winds, stakeholders have expressed concerns regarding the potential for aerosol sprays from the
TSF to impact the Narsaq drinking water supply. An assessment of the impact of spray from the TSF
was conducted to determine the likely concentration of pollutants in the Taseq and Narsaq rivers
arising from aerosol deposition [59].
A description of the modelling conducted to assess these impacts is provided in Section 9.3.3 and is
not repeated here. The assessment of radiological impacts from the deposition is discussed in Section
9.3.4. This section addresses those impacts related to non-radioactive elements.
Concentrations were sampled at Control Point C (Figure 53) downstream of the TSF. This is important
when the variation in baseline levels of fluoride from specific sub-catchments is taken into
consideration. Natural levels of fluoride are significantly higher in the Narsaq river compared to the
Taseq river.
Four elements (fluoride, cadmium, phosphorus and chloride) and seven reagents have been estimated
to have concentrations in the TSF water exceeding the GWQC and relevant international water quality

Greenland Minerals Ltd – Kvanefjeld Project EIA | 203
criteria. These were included in screening level calculations and compared to baseline concentrations
and PNEC (for the reagents only).
Water for the town of Narsaq is sourced from three rivers with a combined maximum annual flow of
6 Mm3. At this flow rate the estimated annual baseline mass transport of fluoride (i.e. the mass
transported annually in the 3 rivers) is 4,500 kg/year. WHO drinking water quality guidelines [71] have
a critical load of fluoride of 1.5 g/m3, which corresponds to 9,000 kg/year. There is a margin of 4,500
kg/year as a maximum “buffer load”, i.e. the safety margin between the baseline load and the critical
limit.
The aerosol dispersion model assesses the estimated deposition of fluoride if 1% or 10% of TSF aerosols
were to be blown from the tailing ponds onto the Narsaq drinking water catchment. Summary results
are set out in Table 72.
Table 72 Estimated deposition of fluoride (kg/year) in the Narsaq drinking water catchment ([59] –
Table 7.6)
Foehn Events Drawdown Deposition of fluoride (kg/year)
1% 10%
1 event/ year 3.7 mm/year 31 309
3 event/ year 12 mm/year 100 1,000
6 event/ year 41 mm/year 346 3,460
If 10% of the released aerosols from the FTSF and CRSF is deposited in the 6 km2 drinking water
catchment area, the maximum buffer load of 4,500 kg/year will only be exceeded if the foehn events
last for more than 335 hours (see Figure 62).
Figure 62 Foehn event duration of fluoride buffer load at 10 % deposition ([59] - Fig 7-6)

Greenland Minerals Ltd – Kvanefjeld Project EIA | 204
The results for the 24- and 64-hour storm events indicate that peak incremental concentrations of
fluoride are within the baseline levels at Control Point C (Table 73). Chloride is slightly above the
baseline concentration (but within the GWQC of 120mg/L).
Table 73 Peak concentrations of elements at the Control Point C from aerosol deposition during
foehn events ([59] – Tables 7-3 and 7-4)
Element Baseline concentration Narsaq and Taseq river
conflux (range) Storm Event duration Control Point C
Fluoride (mg/L) 2 - 40 24 hour 7.5
64 hour 24
Cadmium (mg/L) <0.001 24 hour 0.0014
64 hour 0.004
Phosphorus (ug/L) 1 - 13 24 hour 8
64 hour 26
Chloride (mg/L) 0.9 - 6.4 24 hour 2.2
64 hour 7.1
Table 74 Peak concentrations of reagents at the Control Point C from aerosol deposition during
foehn events ([59] – Tables 7-3 and 7-4)
Reagent (ug/L) PNEC (ug/L) Storm Event duration Control Point C
Copper sulphate 0.1 24 hour 0.0093
64 hour 0.030
Alamine 336 0.014 24 hour 0.0103
64 hour 0.033
PC88A 4.2 24 hour 1.4
64 hour 4.5
Shellsol 2 24 hour 1.5
64 hour 4.9
Aero 6494 0.33 24 hour 1.9
64 hour 6.1
Sodium silicate 2470 24 hour 2,023
64 hour 644
Frothers 0.24 24 hour 4.4
64 hour 14.1
In view of the conservative setting for the modelling in respect of the assumed rate of aerosol
deposition (1-10 %) within the drinking water catchment, the results indicate that the potential impact
of pollutants from aerosol spray on the drinking water of Narsaq is low.

Greenland Minerals Ltd – Kvanefjeld Project EIA | 205
10.3.5 Impact on Narsaq drinking water supply
Water for the town of Narsaq is sourced from the Napasup-Kuua catchment area primarily from the
Landnamselven river (Figure 63). A 2 km gravity feed pipeline connects the various potential water
extraction points with the water works in Narsaq. Water from Kuukasik is sourced from an artificial
pond next to the water works. The water system also includes a large water reservoir south of Narsaq.
Water from the Landnamselven river is fed directly into the reservoir.
The overall capacity of the catchment areas of Narsaq water supply is between 3 and 6 million m³/year
depending on the rainfall of that year.
Figure 63 Narsaq drinking water sources
At the water works, raw water is passed through a sand filter, it is disinfected by UV illumination and
the addition of chlorine. Lime and soda ash are added to control the pH of the water. Water is pumped
from the water works to a water tower. Excess water is pumped to the reservoir for use during dry
periods and, in particular, during winter when flow in the rivers is low. During winter when most water
is sourced from the reservoir, the raw water also passes through an aeration facility in the water works
building.
Three pathways for potential impacts to Narsaq drinking water sources have been identified and
assessed:
Airborne contamination from aerosol spray from the TSF (see above)
Contamination via seepage from the TSF
Catastrophic TSF dam failure.
This analysis draws on the technical assessment presented in the earlier sections of this Section. The
remaining two pathways are discussed in turn below.

Greenland Minerals Ltd – Kvanefjeld Project EIA | 206
Contamination via seepage from the TSF
The assessment of existing limited hydrogeological data indicates that the potential for groundwater
storage and movement is low. Basement geology underlying the basin (and the proposed TSF) is
characterized by crystalline rock with minimal weathering. The rock types beneath the Taseq basin
demonstrate similar characteristics to the surrounding geology and are likely to be impermeable with
limited interaction with groundwater systems. As such, it is not anticipated that potential seepage
from the TSF will interact with the Napasup Kuua catchment area and impact the drinking water supply
[85].
Tailings Dam Failure Assessment
The impact of a catastrophic tailings dam failure on the quality of Narsaq drinking water was also
assessed. For the purposes of the analysis it was assumed that both solids and water would be
released, with modelling conducted for low and high volume cases [74]. 3D modelling of the failure
scenarios indicates a flow path which would not affect the town of Narsaq directly and would not be
expected to impact the Narsaq drinking water catchment areas.
A further assessment was conducted to investigate the potential, following a dam failure, for wind
erosion of desiccated tailings to impact Narsaq drinking water quality. The dust and associated metals
dispersion and deposition were modelled using CALPUFF and the impact to water quality was assumed
based on the annual amount of deposited metals being dissolved in the annual rainfall. The analysis
predicted no exceedances of the annual average dust deposition criteria, nor the monthly maximum
lead deposition criteria. It is predicted that at locations very close to the inundation area, the monthly
dust deposition criteria will be exceeded. Using this dust deposition data, the water quality assessment
indicates that the only GWQC criteria to be exceeded is likely to be iron. Due to the conservative
nature of the assessment (i.e. that there is no further dilution once the rainfall reaches the reservoir)
the risk to water quality in the reservoir is considered to be very low.
The conclusion of the assessment [90] indicates that the worst case embankment failure does not pose
a significant risk to dust deposition amenity, air quality, human health and catchment area water
quality.
Drinking Water Mitigations
In the unlikely event that drinking water quality is affected by the Project, for whatever reason,
mitigation measures are available which can be immediately implemented. Narsaq drinking water
quality is regularly monitored at several points to ensure that the water meets GWQC. Water
extraction from the Napasup Kuua, Kuukasik and Landnamselven rivers can be interrupted at any time
should water monitoring at any of those points reveal that the water quality does not meet the criteria.
Water extraction can also be temporarily interrupted during foehn events.
Total annual water consumption in Narsaq is approximately 80,000 m3. Even with additional demand
from the work force population resident in the Village accommodation, the town reservoir capacity of
280,000 m3 is sufficient to support a temporary restriction of water extraction from the catchment
area should this prove to be necessary.
10.3.6 Excess water management
Excess water streams will be released to the environment when it is not possible to recycle water any
further for use in the Plant. Two streams of excess water from the Plant will be placed into Nordre
Sermilik:

Greenland Minerals Ltd – Kvanefjeld Project EIA | 207
Treated Water Placement (TWP) which consists of:
Excess concentrator process water, after water treatment has removed the fluoride.
This stream is a saline water containing sodium chloride. It is less salty than sea water
with an average flow of 446 m3/hour.
Excess refinery water, after water treatment to remove organic materials and
radionuclides.
This is a barren sodium and calcium sulphate bearing water which has been neutralized.
The average flow for this stream is 301 m3/hour.
Barren chloride liquor (BCL) - Barren chloride solution after REEs have been recovered in the
refinery. This is a saline solution containing other contaminants. This water is neutralized and
treated to remove contaminants, in particular organic contaminants [32]. The average flow
for this stream is 103.05 m3/hour.
The TWP and the BCL will be piped in separate pipes from the Plant to a common discharge point in
Nordre Sermilik. The potential impacts of the discharge are:
Risk to the marine pelagic environment
Impact on sediment dwelling organisms (marine benthic community)
Accumulation in the food web.
To assess these potential impacts the Danish Hydraulic Institute [15] [17] developed a hydro-dynamic
model for the local fjord system and modelled the quality and quantity of all major contaminants in
the streams in terms of temperature, concentration and flow. Initially, the contaminants from the
effluent were reviewed and ranked according to the required dilution in order to obtain concentrations
in the marine environment below PNEC levels. This is the highest concentration in the marine
environment at which no effects on the pelagic environment are expected. The PNEC-values were
derived by DHI based on the eco-toxicity of the individual contaminants.
All chemical species in the effluent were assessed to determine if they are persistent bio accumulative
toxic (PBT) or very persistent very bio accumulative (vPvB). To complete the understanding of the
effluents, ecotoxicology testing was carried out using acute and chronic testing of algae, copepods and
fish [16] [17].
The estimated concentrations of contaminants were then compared to Greenland’s marine and
freshwater guidelines. Table 75 shows the Greenland marine and freshwater guidelines and
information on the baseline concentrations in the fjord water. Where no Greenland guidelines are
available, Canadian guidelines are included (these have been marked with an *).
The composition of the excess water streams is shown in Table 75 with the total weighted average
composition of all mixed streams. These streams once combined represent the only environmental
discharge from the Plant.
Prior to discharge the water will be treated to ensure it meets GWQC making it compatible for
placement into the fjord.

Greenland Minerals Ltd – Kvanefjeld Project EIA | 208
Table 75 Greenland (and Canadian*) water guidelines and baseline concentrations in Nordre
Sermilik
Elements Freshwater
Criteria Marine Criteria
Nordre Sermilik Water
Excess concentrator
Water (a)
Excess refinery Sulphate Water (b)
Barren Chloride Solution
(c)
Weighted Average a, b, c
μg/L
Arsenic 4 5 2.6 1 1 1 1
Cadmium 0.1 0.2 0.11 0.1 0.1 0.1 0.1
Chromium 3 3 0.2 <1 <1 <1 0.5
Copper 2 2 1 1 1 1 1
Iron 300 30 3.4 <5 <5 <5 2.5
Lead 1 2 5 <1 <1 <1 0.5
Mercury 0.05 0.05 0.3 <0.5 0.05 <0.5 0.170
Nickel 5 5 0.5 5 <1 <1 3
Zinc 10 10 14 <5 <5 <5 3
Phosphorus 20 88 <50 <50 1600 175
Mg/L
Fluoride 0.12* 1.3 24 12 0.2 17
Potassium 392 11 180 139 84
Sulphur 884 30 13,000 17 4,662
Chloride 120* 18,980 1,840 397 40,400 4,995
Sodium 10,561 1,290 16,900 19,400 8,590
Bq/L
U238 7.76 10.4 8.1
Th230 2.6 3.6 2.7
Ra226 0.1 2.9 0.4
Pb210 0.44 0.65 0.5
Po210 0.1 0.1 0.1
Th232 2.5 2.5 2.5
Ra228 0.1 3.1 0.5
Th228 0.1 0.1 0.1
PNEC values
PNEC values for the low concentration chemical species in the effluent process water were derived
from relevant official publications. This is an accepted methodology which is used within the European
Union [18]. The PNEC values and the required dilution are shown in Table 76 for the chemical species
in the process water that require the highest dilution.
The elements that require high dilution factors are reagents essential to producing suitable quality
products. The reagent caprylic acid requires the highest dilution (876) to reach PNEC [17]. Caprylic
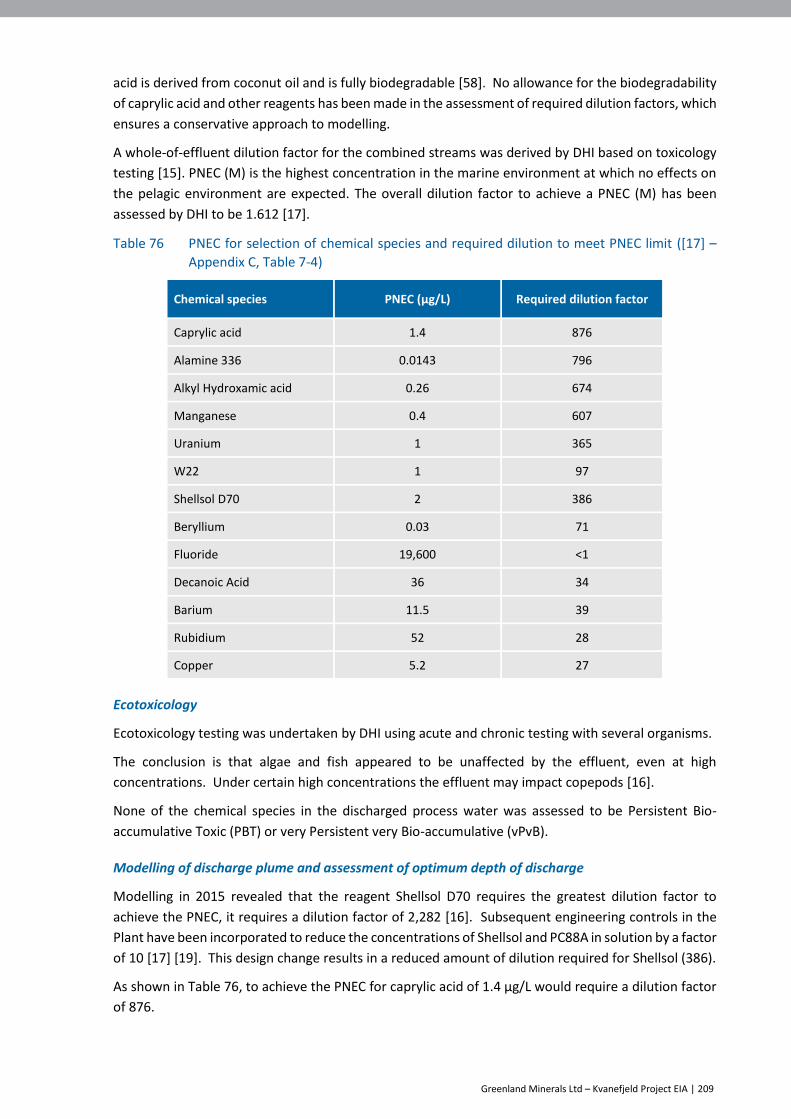
Greenland Minerals Ltd – Kvanefjeld Project EIA | 209
acid is derived from coconut oil and is fully biodegradable [58]. No allowance for the biodegradability
of caprylic acid and other reagents has been made in the assessment of required dilution factors, which
ensures a conservative approach to modelling.
A whole-of-effluent dilution factor for the combined streams was derived by DHI based on toxicology
testing [15]. PNEC (M) is the highest concentration in the marine environment at which no effects on
the pelagic environment are expected. The overall dilution factor to achieve a PNEC (M) has been
assessed by DHI to be 1.612 [17].
Table 76 PNEC for selection of chemical species and required dilution to meet PNEC limit ([17] –
Appendix C, Table 7-4)
Chemical species PNEC (µg/L) Required dilution factor
Caprylic acid 1.4 876
Alamine 336 0.0143 796
Alkyl Hydroxamic acid 0.26 674
Manganese 0.4 607
Uranium 1 365
W22 1 97
Shellsol D70 2 386
Beryllium 0.03 71
Fluoride 19,600 <1
Decanoic Acid 36 34
Barium 11.5 39
Rubidium 52 28
Copper 5.2 27
Ecotoxicology
Ecotoxicology testing was undertaken by DHI using acute and chronic testing with several organisms.
The conclusion is that algae and fish appeared to be unaffected by the effluent, even at high
concentrations. Under certain high concentrations the effluent may impact copepods [16].
None of the chemical species in the discharged process water was assessed to be Persistent Bio-
accumulative Toxic (PBT) or very Persistent very Bio-accumulative (vPvB).
Modelling of discharge plume and assessment of optimum depth of discharge
Modelling in 2015 revealed that the reagent Shellsol D70 requires the greatest dilution factor to
achieve the PNEC, it requires a dilution factor of 2,282 [16]. Subsequent engineering controls in the
Plant have been incorporated to reduce the concentrations of Shellsol and PC88A in solution by a factor
of 10 [17] [19]. This design change results in a reduced amount of dilution required for Shellsol (386).
As shown in Table 76, to achieve the PNEC for caprylic acid of 1.4 µg/L would require a dilution factor
of 876.

Greenland Minerals Ltd – Kvanefjeld Project EIA | 210
The modelling results were produced prior to the reduction in the concentration of Shellsol and PC88A
in the Plant. As such, the modelling has been designed to show where a dilution factor of 2,500 is
achieved. This now represents an overly conservative plot given the PNEC (M) is 1,612.
The fate and the extent of spreading of chemical species contained in the treated water introduced to
the fjord was modelled for summer and winter. The modelling investigated the optimal position for
the submerged discharge, and, after evaluating a range of insertion depths (surface, -10 m, -20 m, -30
m and -40 m), identified that the discharge of treated water below 40 m would achieve the greatest
mixing and therefore most rapid dilution.
In Figure 64 the discharge plume spreads in a narrow band westward along the coast. The modelling
shows that a dilution of 2,500 times is achieved over a relatively short distance from the discharge
point. The plume covers an area of approximately 3 km2 , extending up to 700 m from the coast at
depths between – 20 and – 50 m. The green area denotes the approximate extent of the area for PNEC
for all contaminants (in Figure 64 and Figure 65). Beyond this the water quality is below PNEC for all
contaminants.
Figure 64 50th percentile dilution factors at an insertion depth of -40 m for summer (the winter
plume is slightly smaller) ([16] – Figure 7-1e)
The vertical distribution is shown in Figure 65, and demonstrates that the plume remains between –
20 and – 40 m depth in summer. During the winter the band is narrower and ranges between – 35 and
– 45 m depth.
The area affected by the thermal plume (12 oC) was negligible and little or no impact on marine life in
the fjord is expected [17]. The modelled temperature differences were around 0.5 oC within a radius
of approximately 250 m from the release point.

Greenland Minerals Ltd – Kvanefjeld Project EIA | 211
Figure 65 Vertical profile of 50th percentile dilution factors at discharge depth of -40 m for summer
([16] – Figure 7-2e,f)
Assessment of marine impacts
Based on the modelling DHI [15] assessed the potential marine impacts of the discharge and concluded
the following:
Regarding bioaccumulation and bio-magnification, it is assessed that:
- Lanthanum and Yttrium may bio-magnify to a small degree in the food-webs
- Manganese will bio-magnify in the food-web and an excess manganese concentration in
the food-web is expected arising from the discharge
The potential impact on the primary production of phytoplankton in fjords in south
Greenland and potential impact on fish is expected to be very limited
The copepods/crustaceans are likely to be the most sensitive to the release of these chemical
species but with the modelled dilution regimes no acute and no chronic effects should be
expected
The copepod Calanus finmarchicus, which is an important component of the marine
ecosystem, is assessed only to have very limited contact with the chemical in the effluents as
it migrates vertically in the broader water column (50 - 600 m)
The pelagic commercially relevant species of deep-sea shrimp (Pandalus borealis) are also
assessed to have only limited contact with the chemical species in the effluent

Greenland Minerals Ltd – Kvanefjeld Project EIA | 212
Locally, larvae from the female red deep-sea shrimp may come into contact with
thechemicals species in the effluent
Based on the fjord model, it is not expected that the spreading of sediments will have
significant impact on the marine life, and the amount of sediment discharged is relatively low
compared to the natural sediment loads of the glacier-fed Bredefjord.
On the basis of this modelling, the placement of the water in the Nordre Sermilik fjord is unlikely to
significantly affect water quality or the marine ecosystem.
10.3.7 Waste rock runoff
The composition of run‐off from the WRS was calculated from 50 samples using the assessment
method described in reference [31]. Results show the mine area run‐off water composition requires
little dilution to reach the composition of sea water. Waste rock run-off will be diverted to the Plant
during the Project life. All waste rock run-off will be transported to the processing plant during
operations. During construction and closure the waste rock run-off will be diverted to the SW Lake
where it will be diluted with natural catchment. The contents of the SW Lake will then flow into the
fjord via a natural watercourse (pre-existing baseline flow) where water flow will be further diluted
with sea water from the fjord. For each of the elements of interest, an analysis was performed where
the number of dilutions in sea water required to reach either sea water concentration or the PNEC was
calculated. The results of this analysis are shown in Figure 66 and indicate that with the exception of
Fe which requires a dilution of 30 times, modest dilutions of less than ten are required for the elements
to have no impact on the environment. Studies by DHI [16] [17] show this point will be reached within
30 meters. A dilution requirement of >500 times is required for an element to be detectable in fjord
water based on the DHI modelling [31].
Figure 66 Dilution requirements for elements to meet background levels or PNEC values ([31] – Fig.
17)
Greenland Minerals Ltd – Kvanefjeld Project EIA | 213
10.3.8 Closure Mine Pit Water
The mining of the open pit will cease after 37 years based on the current mine reserve. Further
exploration drilling will occur during operations, which has the potential to extend the life of the mine
considerably [29]. During closure the mine pit will gradually fill with water and contribute an additional
stream to the SW Lake. Mine pit water will be diverted to the SW Lake via a fabricated water course
which encompassed natural topography. The mine pit water has been assessed and found to be very
low in dissolved salts [30] and therefore provides additional dilution to the waste rock run-off. Figures
67 and 68 show the amount of dilution required to reach pollution no effect concentrations in the
fjord. The water source is from the SW Lake and includes the following:
1. SW Lake Catchment
2. Waste Rock Run-off
3. Mine Pit Water.
[30] [32].
10.3.9 Hydrocarbon and Chemical Spills
During the Project’s operations, chemicals and hydrocarbons will be used for processing. These
products will be shipped to Greenland and then transported by truck to the Mine and Plant where they
will be stored and used.
The saleable mine products will be transported by truck to the Port where they will be stored before
shipment.
During operations the following activities/events have the potential to result in spills of chemicals and
hydrocarbons.
Shipping in the fjords
Unloading from ships to land based storage
Rupturing or leakage of fuel storage tanks
Spills of chemicals and hydrocarbons during land transport
Leaks from pipelines
Spills during fuelling of mobile equipment at tank farms.
Spills at the Port
Oil storage tanks for diesel are located on the western boundary of the Port, at a safe distance from
Port facilities and administrative buildings [64].
Approximately 56,000 m3 of organic fuel will arrive at the Port each year in tankers. In addition,
approximately 270,000 tons of chemicals will arrive at the Port annually and 71,000 tons of mine
products will be exported [64].
Fuelling of mobile equipment will take place at the fuel farm in the Port.
A major shipping accident such as a vessel collision or grounding could give rise to spills of oil, chemicals
or mine products. If a fuel tanker were involved in an accident a significant spill could result. Due to
currents in the fjords, oil leaked to the marine environment would be transported over long distances

Greenland Minerals Ltd – Kvanefjeld Project EIA | 214
quickly, and the narrow fjords make shoreline contamination likely. Potential impacts of these spills
include marine and shoreline fouling.
The consequences of an oil spill to the marine life, including birds may be significant. Birds are
extremely vulnerable to oil spills. Most fatalities typically result from the oiling of a bird’s plumage but
many birds also die from intoxication. Marine mammals are generally less sensitive to oiling.
Only a few small bird colonies are located near the shipping routes to the Port while quite large
numbers of sea duck (eiders) winter in the fjords making them vulnerable to oil spills [57]. Wave action
can clean away spill residue, wave-exposed shores are less sensitive to oil spills. However, sheltered
rocky shores will be in contact with spills for longer, and effects on the invertebrate fauna can
potentially affect the ecology of the shore. Most of the fjords close to Narsaq have rocky shorelines.
Large spills of chemicals can also have adverse effects, depending on the toxicity and bioaccumulation
of the spilled chemicals. However, the quantities potentially released will likely be quite small, and the
large volume of the fjords would mean that dilution and dispersal would likely mitigate the effects of
the spill.
Shipping though the fjords to and from the Port creates potential hazards. These hazards are,
however, not different from other shipping routes in Arctic coastal areas, including routes to other
Greenlandic towns and settlements. If all maritime regulations are followed, and shipping lanes are
well placed, the likelihood of a significant incident of this nature occurring during Project operations is
considered to be low [46].
Fuel arriving to the port will be pumped from the tankers through underground fuel pipelines to the
storage tank farm at the port. The fuel storage in the port area consists of two main diesel oil tanks
(total capacity 10,417 m3) and one smaller diesel oil tank (2,065 m3). Smaller fuel storage tanks are
also located at Plant and in the Mine area [29].
Chemicals will also arrive by sea. Reagents transported in containers or ISO tanks will be unloaded
onto the wharf using spreaders and moved to the container storage yard for stacking. Chemicals
transported as bulk cargo (sodium chloride, limestone, sulphur and sodium carbonate) will be
unloaded using clamshell bulk grabs and transferred to one of four bulk storage buildings at the Port.
Most spills from tankers result from routine operations in connection with loading, discharging and
bunkering. Spills of this type are typically small and localised. The impact on marine life would be local
and could be managed using the oil spill equipment available at the Port.
All fuel storage tanks will have geotextile containment berms that can contain a 110 % of a full spill in
case of total tank rupture. The containment berms eliminate the potential spread of an oil spill [55]
[64].
Full details of the maritime safety plan are included in the NSIS undertaken by Blue Water Shipping
[104]. This document forms part of the public consultation documentation.
Traffic accident resulting in spill
Traffic accidents involving fuel tankers and flatbed trucks transporting containers containing chemicals
and mine product have been identified as a potential hazard. The relatively small number of individual
tank trucks and containers will limit the number of potential spills and hence the impacts of accidents
during truck haulage.
Greenland Minerals Ltd – Kvanefjeld Project EIA | 215
Most chemicals and the mine products are transported in dry form, reducing the consequences of
spills. Spills of fuel products and liquid chemicals will typically not affect large areas, unless seepage
into nearby waterways occurs, or steep slopes at the spill site causes the spill to spread downhill.
Effects of oil spills on the Arctic vegetation will likely be localised, but as Arctic flora has very slow
growth rates, effects can be long lasting, stretching into decades. As terrestrial spills likely only will
affect relatively small areas, it will be possible to largely prevent terrestrial mammals being exposed
to the spills. It is unlikely that terrestrial bird populations will be significantly affected. Spills into
freshwater ecosystems can cause an impact on diversity and abundance of invertebrates, plants and
fish.
The likelihood of an accidental spill during land transport is low. In case of a spill it is most likely that
it can be limited to affecting terrestrial habitats [55].
Mine and Plant spills
The areas of the highest spill probability are adjacent to the Plant due to rehandling of reagents and
chemicals. In this controlled area, immediate action can be taken to mitigate the effects of any spill.
The likelihood of a major accidental spill occurring at the Mine (limited fuel or chemical storage) or
into local fresh water courses (due to distance from the Plant) is low.
Spills on land would be managed by mechanical removal, possibly in combination with either natural
or accelerated in situ degradation (of oil).
Mobile equipment at the mine site (mine trucks, excavators, etc.) will be refuelled at the Mine tank
farm. A spill associated with refuelling and handling of fuel in the Mine area generally would be small
and the impact on the environment limited.
The environmental impacts of chemical or fuel spills on land are confined to the Study Area or to a
narrow corridor of a few km around the Project activities. Spills affecting Narsaq river (or other
watercourses) in summer periods with high flows might spread downstream of the spill location and
reach the fjord, if no mitigating measures are in place [55].
10.3.10 Risk of process water spills
During the Project’s operations phase excess water that cannot be recycled is treated before being
discharged into Nordre Sermilik. In the event of a treatment plant malfunction during operations,
water can be stored before being discharged reducing the risk of untreated water being placed in
Nordre Sermilik. During the closure phase water from the TSF will be pumped to the treatment plant
before discharge into Nordre Sermilik. A malfunction or overflow of the treatment plant could
potentially lead to a minor release of untreated water into the fjord. The release of untreated water
could potentially have an impact on marine life near the discharge point in Nordre Sermilik.
In case of a malfunction of the treatment plant during the closure phase, the discharge of water will
immediately be stopped, preventing untreated water from the TSF from being released to the fjord. It
is unlikely that significant quantities of untreated process water or water from the TSF would be
discharged to the fjord. Since the discharge of water into Nordre Sermilik will be immediately stopped
in case of a malfunction of the treatment plant, exposure of the fjord to untreated water is unlikely
[55] [58].

Greenland Minerals Ltd – Kvanefjeld Project EIA | 216
10.4 Mitigations
The following mitigation measures will be applied to minimise the risk and consequence to the water
environment:
Tailings embankments will be constructed in accordance with BAT and BEP
Rock fill and a conservative embankment design will be used in the tailings facilities, with
embankments equipped with a double liner to protect against seepage
Both embankments will be constructed to withstand extreme inflow of water, for example
due to exceptional snow melting under a foehn wind event
To minimise the risk of unplanned TSF overflow, diversion channels will be maintained during
the operations and closure phases
A cut-off trench and leak detection also form part of BAT to identify and manage seepage
from the TSF [1]
In the unlikely event of an embankment failure, repair work would be initiated immediately
No discharge to the Taseq river will take place in the operations or closure phases
To keep the surface of the tailings wet (to avoid wind dispersal of solids) water cannons will
be used
If the water treatment plant fails during operations or closure phases the refinery production
would be stopped immediately
Pipelines and control systems will be well maintained
Low speed limits will be mandated to avoid transport accidents
To reduce the risk of spills of fuel and chemicals in the fjords during operations the following
mitigating measures will be implemented:
- Impose navigational speed restrictions
- Compulsory pilotage
- Separation of shipping lanes
- Procedures for loading and unloading of ships
- At the Port
o Appropriate equipment for addressing operational spills, including containment
booms available for berthed ships, extra booms and skimmers
o Oil spill equipment will always be available and fully stocked
o Contingency plans and procedures for detecting and addressing operations spills,
including procedures for operations spills in sea ice
o Incident and season related contingency plans and training
o Prepare contingency plans with authorities for managing large scale spills
o All fuel storage tanks will have geotextile containment berms that can contain 110%
of total tank volume in case of complete tank rupture
o The containment berms reduce the potential spread of an oil spill
o The geotextile containment berms must be inspected regularly to ensure that they
are intact

Greenland Minerals Ltd – Kvanefjeld Project EIA | 217
o Water flow will be maintained utilising generators during the Narsaq river culvert
construction, with water taken from one side and returned to the other side to
ensure a dry construction zone.
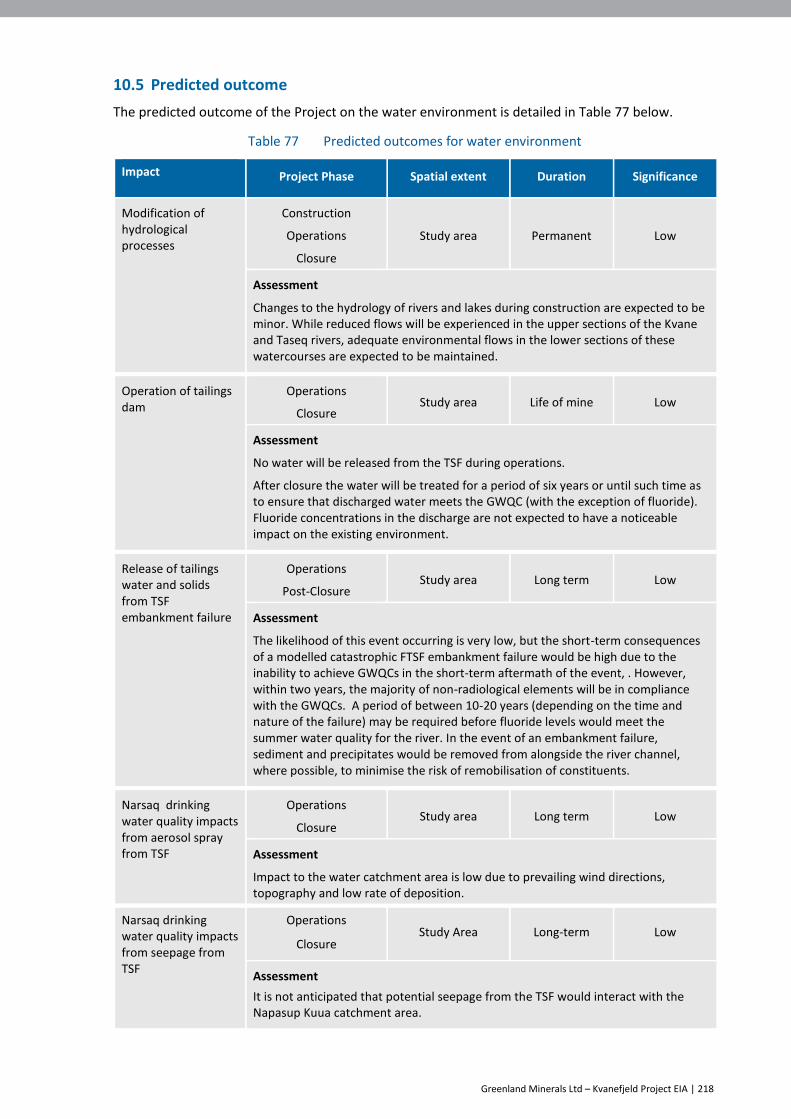
Greenland Minerals Ltd – Kvanefjeld Project EIA | 218
10.5 Predicted outcome
The predicted outcome of the Project on the water environment is detailed in Table 77 below.
Table 77 Predicted outcomes for water environment
Impact Project Phase Spatial extent Duration Significance
Modification of hydrological processes
Construction
Operations
Closure
Study area Permanent Low
Assessment
Changes to the hydrology of rivers and lakes during construction are expected to be minor. While reduced flows will be experienced in the upper sections of the Kvane and Taseq rivers, adequate environmental flows in the lower sections of these watercourses are expected to be maintained.
Operation of tailings dam
Operations
Closure Study area Life of mine Low
Assessment
No water will be released from the TSF during operations.
After closure the water will be treated for a period of six years or until such time as to ensure that discharged water meets the GWQC (with the exception of fluoride). Fluoride concentrations in the discharge are not expected to have a noticeable impact on the existing environment.
Release of tailings water and solids from TSF embankment failure
Operations
Post-Closure Study area Long term Low
Assessment
The likelihood of this event occurring is very low, but the short-term consequences of a modelled catastrophic FTSF embankment failure would be high due to the inability to achieve GWQCs in the short-term aftermath of the event, . However, within two years, the majority of non-radiological elements will be in compliance with the GWQCs. A period of between 10-20 years (depending on the time and nature of the failure) may be required before fluoride levels would meet the summer water quality for the river. In the event of an embankment failure, sediment and precipitates would be removed from alongside the river channel, where possible, to minimise the risk of remobilisation of constituents.
Narsaq drinking water quality impacts from aerosol spray from TSF
Operations
Closure Study area Long term Low
Assessment
Impact to the water catchment area is low due to prevailing wind directions, topography and low rate of deposition.
Narsaq drinking water quality impacts from seepage from TSF
Operations
Closure Study Area Long-term Low
Assessment
It is not anticipated that potential seepage from the TSF would interact with the Napasup Kuua catchment area.

Greenland Minerals Ltd – Kvanefjeld Project EIA | 219
Impact Project Phase Spatial extent Duration Significance
Discharge of excess water to Nordre Sermilik
Operations Study area Life of mine Low
Assessment
A dilution factor of ~ 1,600 will be required to obtain PNEC levels for the most critical parameters including safety margins. The required dilution can be obtained in the marine area on local scale of 1 – 3 km2 and in a vertical confined lens of water when the outlet is constructed -40 m sub-surface.
Discharge of excess water to Nordre Sermilik
Closure Study area Closure period
(6 years) Low
Assessment
During the closure phase, water treatment will continue to occur prior to placement of water into Nordre Sermilik. The water quality will gradually improve over that seen in the Operations phase, and as such, impacts will be lower than seen in that period.
Waste Rock Runoff Operations
Closure Study area Long term Low
Assessment
Studies show the waste rock runoff composition will require little dilution to reach the composition of sea water.
Mine pit water Closure Study area Long-term Low
Assessment
The mine pit is expected to gradually fill with water after closure. It will provide additional dilution to the waste rock runoff.
Hydrocarbon and Chemical Spills
Construction
Operations Study area Life of mine Low
Assessment
The impact of spills is expected to be limited based on the application of BEP and BAT.
Process related spills Operations Study area Life of mine Low
Assessment
Emergency procedures can be enacted to stop discharge in the event of a process failure.

Greenland Minerals Ltd – Kvanefjeld Project EIA | 220
11. Waste management
11.1 Existing environment
In Narsaq, waste suitable for incineration is collected and transported to Qaqortoq for treatment at
the incinerator. Qaqortoq is the Commune’s waste collection centre. All hazardous waste and scrap
metal is subsequently forwarded from Qaqortoq to Denmark.
Putrescible waste, including food waste and animal carcasses, is deposited in a Narsaq landfill. The
landfill has no drainage collection system for waste streams and outfall from the landfill is understood
to flow to the ocean. Under certain wind conditions, the landfill can be smelled in Narsaq, creating an
unpleasant environment.
The Narsaq landfill is located on the proposed site of the Port. Development of the Port will
compromise aspects of the existing waste management site in Narsaq.
11.2 Potential impacts
Waste generated during construction and operations has the potential to result in environmental
impacts if not appropriately managed.
11.3 Assessment of impacts
11.3.1 Waste management
During its construction and operations phases the Project will produce:
domestic waste and sewage
used tyres from mobile equipment, and
various types of hazardous waste, for example hydrocarbon waste, chemical waste and
batteries.
Waste, in particular waste classified as hazardous, has the potential to lead to significant
contamination of the environment.
Sewage from all buildings in the Port, the Village, Mine, Plant and vessels alongside the wharf will be
treated in a sewage treatment facility which will be located adjacent to the Port [69]. Tanker trucks
will be used to transport wastewater and sewage from holding tanks in the Mine and the Plant for
treatment and disposal at the sewage plant.
The sewage plant will apply mechanical, biological and chemical treatment processes to the waste to
render it safe for permanent disposal. Treated effluent will be discharged to the fjord at the north end
of the Tunu peninsula.
All combustible solid waste will be pressed into bales and shipped to Qaqortoq for incineration. This
includes all putrescible waste and the Project does not intend to contribute any waste to the Narsaq
landfill. Hazardous waste will be handled according to the Kommune Kujalleq regulations regulating
management of hazardous waste [26]. Hazardous waste in the municipality is shipped to Denmark
and handled in compliance with the EU initiated legal framework.
Accumulators, batteries, electronic devices, glass, etc. will be temporarily stored in containers and
periodically forwarded to the Qaqortoq waste handling facility for further disposal according to
regulations and, where appropriate, after agreement with relevant authorities.

Greenland Minerals Ltd – Kvanefjeld Project EIA | 221
In the event that current waste management systems and processes in Kommune Kujalleq do not have
the capacity to process the quantity of waste that will be produced by the Project, in consultation with
Kommune Kujalleq, capacity to manage and process combustible, hazardous and other forms of waste
will be designed into the Project.
Specialist consumables such as spent acid plant catalyst will be returned to their original manufacturer
for refurbishment.
The impact of waste on the environment is assessed to be low.
11.4 Mitigations
Development of waste handling procedures and a waste management manual
Installation of a sewage treatment plant
Remediation of any contamination arising from Project activities.
11.5 Predicted outcome
The predicted outcome of the Project resulting from waste is detailed below.
Table 78 Predicted outcomes for waste management
Impact Project Phase Spatial extent Duration Significance
Contamination resulting from waste
Construction
Operation
Closure
Municipality Life of mine Low
Assessment
With proper waste handling procedures in place, the impact of waste production to the environment is assessed to be low.

Greenland Minerals Ltd – Kvanefjeld Project EIA | 222
12. Biodiversity
12.1 Existing environment
12.1.1 Vegetation
The presence and distribution of native vegetation in south Greenland is largely determined by
temperature and precipitation, both of which follow oceanic-inland/continental and altitude
gradients. Such gradients are obvious when moving inland through long narrow fjords towards Narsaq.
In the outer fjord area, vegetation growth is inhibited by cold ocean currents, drift ice, salt spray and
wind. Dense birch and willow scrub are common below 200 m altitude on south-facing exposures at
the head of the fjords and inland [57].
In the Narsaq valley – Kvanefjeld area, the length of snow cover, water supply, temperature, soil type
and wind exposure further limit the distribution of plant communities.
Field surveys conducted by Ernberg Simonsen [21] in August 2013 and September 2014 identified three
vegetation communities (Table 79).
Table 79 Vegetation communities [57]
Community Description
Narsap Ilua and
lower Narsaq valley
(0 – c. 200 m
altitude)
The dominant vegetation type in this lowland was dwarf-shrub heath made up
mainly by bog bilberry, crowberry, glandular birch and northern willow and with
patches of mosses, grasses and sedges. On some southern exposure slopes,
more species rich plant communities were present, with species such as
common harebell and alpine meadow-rue. Northern green orchid grows
commonly along most of the streams in the lowland.
An unusual vegetation community was found close to the Narsaq river mouth,
which included rarely recorded species such as autumn gentian, golden gentian,
alpine gentian and common butterwort. Autumn gentian is rare in Greenland,
know only from three sites and is listed as Vulnerable in the Red List.
Higher reaches of
Narsaq valley and
the Kvanefjeld
plateau (c. 200 –
680 m altitude)
With increasing altitude, different types of dwarf-shrub and lichen-grass-sedge
heaths dominated, but open rocky terrain, snow beds and smaller fens were also
widespread. Herb slopes with high plant species diversity grew along some of
the streams.
The dwarf-shrub heath at medium altitude was dominated by crowberry,
glandular birch, bog bilberry and northern willow with stiff sedge, northern bent
grass, and alpine club moss in the lower vegetation layer. Mosses and lichens
also covered large areas. One individual of Red List “Vulnerable” species bog
rosemary (Andromeda polifolia) was found on the Kvanefjeld plateau. This
species is very rare in Greenland with only two previous records from south
Greenland.
On some north facing slopes a snow bed plant community occurred, dominated
by dwarf-willow, hare’s-foot sedge, starwort mouse-ear, starry saxifrage and
pigmy buttercup. The aquatic plant common mare’s-tail was found in some of
the ponds and smaller lakes on the Kvanefjeld plateau.
The round-leaved orchid - Greenland’s rarest orchid - has previously been
recorded between the existing gravel road and the Narsaq river at c. 300 m
altitude. However, it was not recorded during the survey in 2014.

Greenland Minerals Ltd – Kvanefjeld Project EIA | 223
Community Description
Upper northern
slopes of Narsaq
valley and Lake
Taseq (c. 350 – 650
m altitude)
At high altitude on the north facing slope of Narsaq valley much of the ground
is covered with loose stones and rock. This area has very limited plant cover
with the most common species being three-leaved rush, moss campion, trailing
azalea, purple saxifrage and stiff sedge. Locally, northern green orchid and
small white orchid grow close to streams.
The slopes surrounding Taseq were mostly without vegetation and have very
few species of vascular plants. In a few places with more even terrain, higher
plant diversity was found. To the northeast of Taseq the terrain increases
gradually in height creating a smooth south facing slope without scree. This
area was covered by grasses and sedges as well as many species of herbs, such
as alpine lady’s-mantle, alpine meadow-rue, dandelions and procumbent
sibbaldia.
12.1.2 Fauna
Terrestrial fauna
A survey undertaken by Orbicon [57] identified the Arctic fox (Alopex lagopus) and the Arctic hare
(Lepus Arcticus) as the only wild terrestrial mammals in the Study Area.
The Arctic fox is the only terrestrial carnivore in south Greenland and has previously been recorded in
the Kvanefjeld area. The Arctic Fox is widespread and generally common throughout Greenland. It is
an opportunistic feeder, eating birds in summer and fish found along the shore of the fjord in winter.
Arctic Hare (Lepus arcticus) is distributed in most of Greenland, absent only from the southeast.
Numbers fluctuate from year to year, mostly due to winter conditions. They are most common in
northeast Greenland. Probably due to intensive hunting in south Greenland, the hare is mostly
confined to mountainous areas in this part of the country and is usually very shy. Arctic hare is generally
protected in May – July but hunting can be permitted locally all year.
Sedges, grasses and rushes, as well as willow, are the primary food sources of the Arctic hare in
Greenland.
During the field study, a few hares were observed near Kvanefjeld, and it is believed that the species
occurs throughout the study area in small numbers.
The terrestrial and freshwater bird fauna in south Greenland is relatively species poor in comparison
to other Arctic regions. There are only five species of passerine birds, all of which are common and
widespread.
The seas and coastal areas have a richer bird fauna, both with respect to species numbers and the
numbers of individuals. Bird fauna includes birds that breed in Greenland and also large numbers of
birds from other breeding sites in the northern Atlantic, that overwinter off the coast of west and south
Greenland. Most seabirds in Greenland are colonial breeders, but no large colonies are known to
breed between Ivituut and Nanortalik, which includes the Study Area, and neighbouring waters.
Summary
The coastal and offshore waters of southwest Greenland are internationally important winter quarters
for seabirds [9]. Most of the wintering sea birds remain off shore, but some move into the fjords and
have been recorded surrounding Erik Aappalaartup Nunaa (Figure 67).

Greenland Minerals Ltd – Kvanefjeld Project EIA | 224
The birds entering the fjords in the greatest numbers are the common eider and Brünnich’s guillemot.
A few small sea bird colonies are found in the glacier fjords at Akullit Nunaat, to the north of the central
part of Bredefjord. The sea birds breeding at these colonies are black guillemot and various gull species
[9]. A few of these birds may occasionally forage in the fjords that surround Erik Aappalaartup Nunaa.
Boertmann et al. (2004) identified an important wintering area for harlequin duck, common eider, and
Brünnicks guillemot off south Greenland (Figure 67). Since harlequin ducks winter and molt along
exposed rocky coasts, they were recorded only along the coast of the open sea of the important
wintering area [9] [111] not in the fjords. While both the common eider and Brunnich’s guillemot have
been seen in the vicinity of the Project, Harlequin ducks have never been recorded during field work
in connection with this Project. Due to the large field effort in the Narsaq valley over several years, a
breeding population is unlikely to be overlooked on Narsaq River or other rivers in the valley.
Table 80 summarises the bird species that may be found regularly on and around Erik Aappalaartup
Nunaa (breeding and/or wintering). Other than where specifically noted otherwise, all the species are
listed as being of “Least Concern” on the Red List [10].
In addition, snow bunting, common wheatear, redpoll and Lapland bunting are common breeders in
the Narsaq valley and at Kvanefjeld. These birds are common and widespread throughout south and
west Greenland. The raven (Corvus corax) which occurs in almost all habitats is probably also breeding
in small numbers in the area but no definite information is available.

Greenland Minerals Ltd – Kvanefjeld Project EIA | 225
Table 80 Bird species potentially occurring [57]
Species Distribution
Mallard The only dabbling duck that regularly breeds in south Greenland. It is a widespread and relatively common breeding bird at lakes and shallow coasts. In south Greenland, the mallard is mainly sedentary, but moves to the outer coast in winter. Mallards are regularly observed throughout Erik Aappalaartup Nunaa, mostly along the coast. It is likely that a few mallards breed at wetlands in the Study Area.
Common eider A widespread and common breeder in Greenland. It typically breeds on small islets and skerries along the coast. No breeding colonies of eiders are known along the shore of Erik Aappalaartup Nunaa but very large numbers winter off south Greenland. In addition, several hundred eiders regularly spend winter on the fjords at Erik Aappalaartup Nunaa. Usually, most are seen in Tunulliarfik/ Skovfjord south of the peninsula, where they feed on mussels.
The west Greenland population of common eider is listed as “Least Concern” in the Red List. Its numbers have declined dramatically over the last 50-100 years due to intensive, non-sustainable harvesting. In recent years there have been signs of a recovery of the population in some areas.
Red-breasted merganser A rather common species along the Greenland south and west coasts and part of the east coast. It breeds at lakes and shallow fjords and bays and feeds primarily on fish. Small flocks are quite common in the fjords around Erik Aappalaartup Nunaa and on Lake Ilua. It is likely that a few breed along the shores of the peninsula – particularly in the Ilua area, but definite proof is not available.
Ptarmigan Widespread and common throughout Greenland, but it is subject to marked annual fluctuations in numbers. On Erik Aappalaartup Nunaa, it mainly occurs in upland areas where it feeds on plant material.
White-tailed eagle Confined to Greenland’s south and west coasts north to Upernavik. In recent years the population has increased and now numbers 150-200 pairs. But since the breeding population is still relatively small it is listed as Vulnerable on the Red List.
White-tailed eagles are mainly found in coastal areas where they feed on fish. The nest is typically placed on ledges on steep cliffs. The adults normally remain within the breeding areas throughout the year while the young birds move to the outer coastal areas during winter. Breeding white-tailed eagles nest from around March to early September. Egg laying typically takes place at the beginning of April. During the breeding period, eagles are known to be very sensitive to disturbance.
White-tailed eagles are commonly observed at Erik Aappalaartup Nunaa, most frequently along the coast. No breeding sites are known from this area, but several pairs undoubtedly breed in the region.
Peregrine falcon Quite common in south Greenland where it typically nests on ledges on steep cliffs inland. One pair regularly breeds on a ledge on a steep mountainside near the mouth of the Narsaq river, and peregrines are a common sight throughout Erik Aappalaartup Nunaa. Peregrines feed mainly on medium-size birds. The falcon is a migrant that arrives in May and departs August-November.
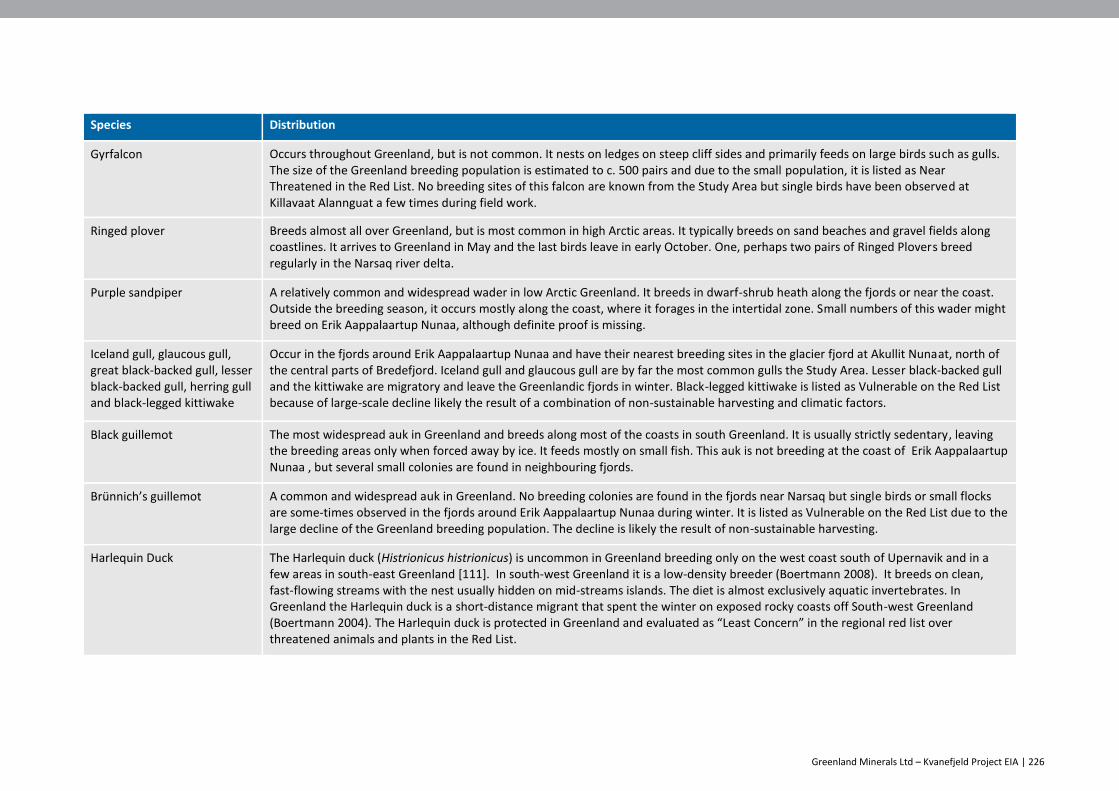
Greenland Minerals Ltd – Kvanefjeld Project EIA | 226
Species Distribution
Gyrfalcon Occurs throughout Greenland, but is not common. It nests on ledges on steep cliff sides and primarily feeds on large birds such as gulls. The size of the Greenland breeding population is estimated to c. 500 pairs and due to the small population, it is listed as Near Threatened in the Red List. No breeding sites of this falcon are known from the Study Area but single birds have been observed at Killavaat Alannguat a few times during field work.
Ringed plover Breeds almost all over Greenland, but is most common in high Arctic areas. It typically breeds on sand beaches and gravel fields along coastlines. It arrives to Greenland in May and the last birds leave in early October. One, perhaps two pairs of Ringed Plovers breed regularly in the Narsaq river delta.
Purple sandpiper A relatively common and widespread wader in low Arctic Greenland. It breeds in dwarf-shrub heath along the fjords or near the coast. Outside the breeding season, it occurs mostly along the coast, where it forages in the intertidal zone. Small numbers of this wader might breed on Erik Aappalaartup Nunaa, although definite proof is missing.
Iceland gull, glaucous gull, great black-backed gull, lesser black-backed gull, herring gull and black-legged kittiwake
Occur in the fjords around Erik Aappalaartup Nunaa and have their nearest breeding sites in the glacier fjord at Akullit Nunaat, north of the central parts of Bredefjord. Iceland gull and glaucous gull are by far the most common gulls the Study Area. Lesser black-backed gull and the kittiwake are migratory and leave the Greenlandic fjords in winter. Black-legged kittiwake is listed as Vulnerable on the Red List because of large-scale decline likely the result of a combination of non-sustainable harvesting and climatic factors.
Black guillemot The most widespread auk in Greenland and breeds along most of the coasts in south Greenland. It is usually strictly sedentary, leaving the breeding areas only when forced away by ice. It feeds mostly on small fish. This auk is not breeding at the coast of Erik Aappalaartup Nunaa , but several small colonies are found in neighbouring fjords.
Brünnich’s guillemot A common and widespread auk in Greenland. No breeding colonies are found in the fjords near Narsaq but single birds or small flocks are some-times observed in the fjords around Erik Aappalaartup Nunaa during winter. It is listed as Vulnerable on the Red List due to the large decline of the Greenland breeding population. The decline is likely the result of non-sustainable harvesting.
Harlequin Duck The Harlequin duck (Histrionicus histrionicus) is uncommon in Greenland breeding only on the west coast south of Upernavik and in a few areas in south-east Greenland [111]. In south-west Greenland it is a low-density breeder (Boertmann 2008). It breeds on clean, fast-flowing streams with the nest usually hidden on mid-streams islands. The diet is almost exclusively aquatic invertebrates. In Greenland the Harlequin duck is a short-distance migrant that spent the winter on exposed rocky coasts off South-west Greenland (Boertmann 2004). The Harlequin duck is protected in Greenland and evaluated as “Least Concern” in the regional red list over threatened animals and plants in the Red List.
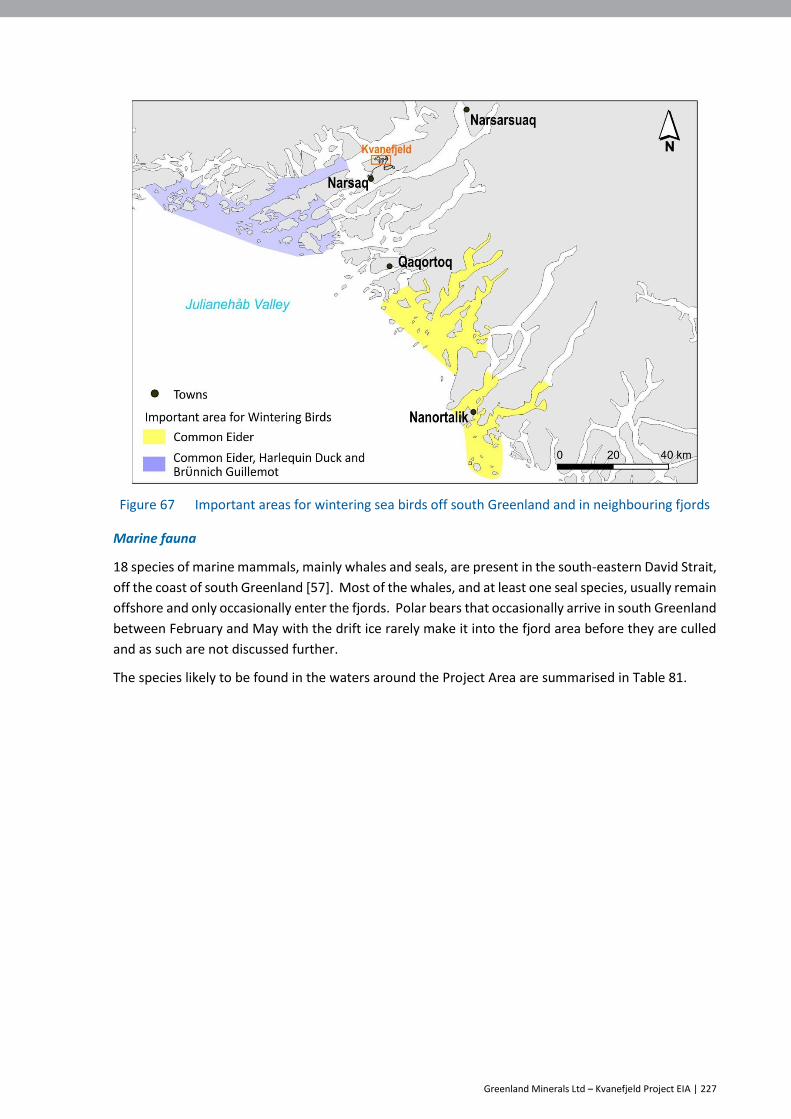
Greenland Minerals Ltd – Kvanefjeld Project EIA | 227
Figure 67 Important areas for wintering sea birds off south Greenland and in neighbouring fjords
Marine fauna
18 species of marine mammals, mainly whales and seals, are present in the south-eastern David Strait,
off the coast of south Greenland [57]. Most of the whales, and at least one seal species, usually remain
offshore and only occasionally enter the fjords. Polar bears that occasionally arrive in south Greenland
between February and May with the drift ice rarely make it into the fjord area before they are culled
and as such are not discussed further.
The species likely to be found in the waters around the Project Area are summarised in Table 81.

Greenland Minerals Ltd – Kvanefjeld Project EIA | 228
Table 81 Marine species potentially occurring [57]
Species Distribution IUCN or Red List Classification
Ringed seal Generally common in Greenland waters, but less so along the south-western coastline. It is believed to be mainly stationary in south Greenland, where it favours fjords with ice. Ringed seal haul-out and moult on fast-ice and drift ice, and they maintain several breathing holes in ice during winter. Ringed seals typically breed at the head of fjords, where fast ice forms during winter. The pups are born in snow dens on the sea ice in March/April. It feeds on a broad range of prey, including fish and crustaceans. Ringed seals are common in the fjords around Erik Aappalaartup Nunaa, particularly in Nordre Sermilik north of the peninsula, where they probably also breed.
Ringed seals are subject to large-scale unregulated hunting and are regularly on sale at the local market “Brættet” in Narsaq.
Least Concern (Red List)
Hooded seal A large seal. During the summer months, small numbers of hooded seals are regularly encountered in the fjords at Erik Aappalaartup Nunaa where they feed mainly on larger fish, such as Atlantic cod, Greenland halibut and in particular redfish caught at large depths (down to 800 m or even deeper). Hunting of Hooded seal is unregulated in Greenland
Vulnerable (Red List)
Harp seal A common non-breeding visitor to Greenland fjords during the summer months. In late autumn – early winter, the harp seals leave Green-land waters again and return to the breeding grounds.
The harp seal is the most numerous seal species in south Greenland fjords during summer, when it penetrates deep into the fjords. During this time of the year, harp seals typically form feeding groups of 5 – 20 animals, which mostly forage on capelin. It is also common in the fjords at Erik Aappalaartup Nunaa from May until autumn. It is regularly on sale at the local market “Brættet” in Narsaq. The hunting in Greenland is unregulated.
Least Concern (Red List)
Bearded seal A large seal which occurs in small numbers throughout Greenland waters. It is usually associated with sea ice but in particular young seals often remain in the fjords in south Greenland during summer. Bearded seal hunting in Greenland is unregulated. Little is known about the status of this seal in Greenland and it is listed as “Data deficient” on the Red List [10] but globally it is considered “not threatened”.
Data Deficient (Red List)
Minke whale Common along Greenland’s south and west coasts. It arrives at south Greenland in spring and early summer, from wintering grounds in the Atlantic Ocean and leaves Greenland waters in November.
It is a regular visitor to the fjords of southern Greenland and within the Study Area. Minke whales sometimes occur at the Qaqortup Ikera/Julianehåbsfjorden and in Qaqortup Imaa where they are hunted. The hunting of minke whales in Greenland waters is regulated by a quota system.
Least Concern (Red List)

Greenland Minerals Ltd – Kvanefjeld Project EIA | 229
Species Distribution IUCN or Red List Classification
Fin whales Summer and autumn visitors to south Greenland typically between June and October. They usually remain offshore, along edges of banks, where they feed on krill and small schooling fish. However, they are also a regular visitor to the fjords of south Greenland, and within the Study Area. Fin whales sometimes occur at the Qaqortup Ikera/Julianehåbsfjord and occasionally even in Qaqortup Imaa where they are hunted. The hunting of fin whales in Greenland waters is regulated by a quota system.
Least Concern (Red List)
Humpback whale
In recent years the population of humpback whales in Greenland waters has increased significantly. It is now quite common in some fjords of west Greenland during summer where it feeds on krill and small fish e.g. capelin and sand eels. In south Greenland it is less numerous but in some years small numbers appear in the fjord. In 2008 at least three different animals were observed at Narsaq. Subsistence harvest has recently been permitted again in Greenland, which follows an annual quota system
Least Concern (Red List)
Harbour porpoise
A small toothed whale that occurs throughout the year in the waters of south Greenland. It is generally quite common in Greenland waters, but most porpoises remain offshore, with only few penetrating into the fjords. Harbour porpoises feed on fish in the upper water layers. Hunting in Greenland of the species is unregulated. I. Little exact knowledge is available about its status in the fjords around Erik Aappalaartup Nunaa, but it is probably a relatively common visitor in small numbers.
Least Concern (Red List)

Greenland Minerals Ltd – Kvanefjeld Project EIA | 230
No baseline data on benthic flora and fauna has been collected to date, however a baseline assessment
will be conducted prior to the construction of the Port. The Project is not expected to have significant
impacts on benthic flora and fauna.
Fish species
A large number of fish species occur in the Greenland fjords, but generally, little is known about species
which are not utilized commercially or in connection with local subsistence fishing [57]. The discussion
in this section is therefore limited to those species.
Arctic char (Char)
The Char is a habitat generalist found in streams, at sea and in all habitats of oligotrophic lakes
throughout Greenland. Char lifecycles are highly variable, both within and between localities. and Char
population in Greenland rivers typically consists of resident fish (non-anadromous) and anadromous
fish that migrate to the sea during summer when they have reached a certain age.
The distribution and general biology of the Narsaq river population of Char was studied in 1981 [33].
In 2018 Orbicon [57] assessed the distribution in the Narsaq and Ilua rivers by means of electrofishing.
Char are very common in the lower part of the Narsaq river but are absent from the lakes connected
to the river including Taseq lake. There is also a Char population in the Ilua river system (Figure 68).
The results of surveys undertaken by Orbicon [57] suggest that Char is absent from the other streams
and lakes on Erik Aappalaartup Nunaa.
The Char populations in the Narsaq and Ilua rivers are believed to be mainly anadromous with these
sea going populations co-existing with resident non-anadromous populations.
The Narsaq river’s anadromous Char begin to migrate into the fjords at about 4 years of age when
they are approximately 15 cm long. The seaward migration probably starts as the river ice begins to
break up with the fish returning from the fjords towards the end of July.
Figure 68 Distribution of Arctic char in rivers, streams and lakes on Erik Aappalaartup Nunaa

Greenland Minerals Ltd – Kvanefjeld Project EIA | 231
Char in the Narsaq river typically reach sexual maturity when they are around 5 years old i.e. after their
first sea run. Spawning in the Narsaq river occurs from late August to the beginning of October. Most
Char spawn in the main stream in places that are 30 to 35 cm deep, have a gravel bed and are subject
to currents that are not too strong. Females create a depression in the river bed into which eggs are
laid. Once the eggs are fertilised the female uses its tail to cover the eggs with gravel. The eggs hatch
the following spring.
During winter, when most of Greenland’s rivers are covered by thick ice and the water flow is
significantly restricted, Char are found in pools in the larger rivers. In the Narsaq river, the Char are
likely to winter near the outlet to Narsap Ilua where the deepest sections of the river occur. In spring,
the fish spread out to utilize all water-covered areas below the rapids which are located approximately
5 km upstream.
Smaller fish in the Narsaq river mainly eat chironomid (non-biting midges) larvae while the larger fish
mostly feed on chironomid pupae and adults. It is also likely that some cannibalisation takes place
[33].
While in rivers where the main food is insect larvae, Char generally have a very slow growth rate. Non-
anadromous fish will typically grow less than 2 cm per year and reach a maximum length of around 25
cm.
Anadromous Char, which feed on marine planktonic amphipods, copepods and fish during the
summer, grow larger. The 1981 study [33] found that the average length of seagoing Char was 23 cm,
28 cm and 33 cm for 4, 5 and 6-year old fish, respectively.
As part of the same study an attempt was made to assess the number of Char in the Narsaq river [33].
At this time (October) some of the shallow parts of Narsaq river were dry and the Char population was
limited to the main stream in an area covering 20,800 m2. The Char population was estimated at
31,000 of which 8,300 were 3 years old or older i.e. potentially seagoing. The stock of anadromous
Char in August was estimated to be 1,200.
The Char is the only fish known to occur in freshwater in the Narsaq – Kvanefjeld area. This contrasts
with the fjord where many fish species occur.
Other species
Atlantic cod (Gadus morhua)is currently quite common in fjords around Erik Aappalaartup Nunaa but
throughout the 20th century, its numbers and distribution have fluctuated widely, possibly as a result
of climatic changes.
The lumpsucker (Cyclopterus lumpus) is a common and widespread species that spends most of the
year in deep offshore waters. However, in the late winter, the mature part of the stock migrates to
very shallow water to spawn and it is then common along the coasts of the fjords in the Narsaq area.
In recent years lumpsucker fisheries has become important in the fjords at Narsaq. It is mainly the
females, which are fished for the roe.
Greenland cod (Gadus ogac) or uvak occurs along the coasts and fjords north to Upernavik and is
common in the fjords around Erik Aappalaartup Nunaa. In commercial fisheries the Greenland cod is
considered inferior to the Atlantic cod however it has significance for subsistence fishing.
Spotted wolffish (Anarhichas minor) has a wide distribution across the west and east coasts of
Greenland and probably occurs in all deep parts of the fjords around Erik Aappalaartup Nunaa. Its
numbers have decreased in recent years but it still has considerable importance for subsistence fishing.
Greenland Minerals Ltd – Kvanefjeld Project EIA | 232
Atlantic salmon (Salmo salar) occurs along Greenland’s coast from August to about November during
foraging migration from the American and European continents. In some years the Atlantic salmon is
quite common in Narlunaq Skovfjord, and in Qaqortup Ikera/Julianehåbfjord and small numbers
probably also enter the fjords around Erik Aappalaartup Nunaa
Capelin (Mallotus vilosus) is a key ecological species because of its role as an important food resource
for larger fish, seabirds and marine mammals. It is also exploited both commercially and for
subsistence purposes. There are indications that individual fjord systems contain separate capelin
populations. Capelin is believed to be common along the shore of Erik Aappalaartup Nunaa although
no precise data is available.
Redfish (Sebastes spp.) are quite common in the deep parts of the fjords that surround Erik
Aappalaartup Nunaa although no precise data is available.
Three-spined stickleback (Gasterosteus aculeleatus) are anadromous fish which are commonly present
in both marine and freshwater environments in Greenland. This is a species of IUCN “least concern”
at a global level.
12.1.3 Threatened species and significant communities
Of the animals and plants recorded from Erik Aappalaartup Nunaa four species of birds, five plant
species and one mammal species are listed as “Vulnerable” or “Near threatened” on the Red List [10].
These species were targeted in the fieldwork surveys conducted in 2013 and 2014 [57] and the
significance of the survey area to the threatened species was assessed, based on known distribution
and preferred habitat (Table 82).
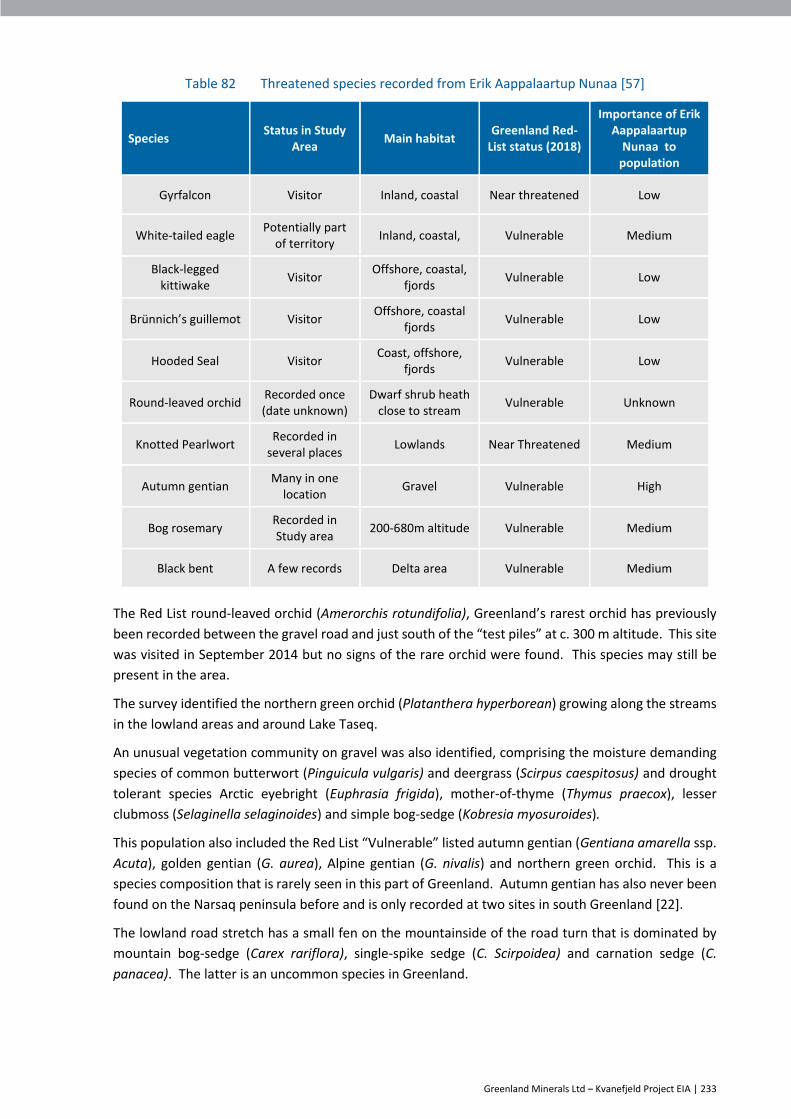
Greenland Minerals Ltd – Kvanefjeld Project EIA | 233
Table 82 Threatened species recorded from Erik Aappalaartup Nunaa [57]
Species Status in Study
Area Main habitat
Greenland Red-List status (2018)
Importance of Erik Aappalaartup
Nunaa to population
Gyrfalcon Visitor Inland, coastal Near threatened Low
White-tailed eagle Potentially part
of territory Inland, coastal, Vulnerable Medium
Black-legged kittiwake
Visitor Offshore, coastal,
fjords Vulnerable Low
Brünnich’s guillemot Visitor Offshore, coastal
fjords Vulnerable Low
Hooded Seal Visitor Coast, offshore,
fjords Vulnerable Low
Round-leaved orchid Recorded once (date unknown)
Dwarf shrub heath close to stream
Vulnerable Unknown
Knotted Pearlwort Recorded in
several places Lowlands Near Threatened Medium
Autumn gentian Many in one
location Gravel Vulnerable High
Bog rosemary Recorded in Study area
200-680m altitude Vulnerable Medium
Black bent A few records Delta area Vulnerable Medium
The Red List round-leaved orchid (Amerorchis rotundifolia), Greenland’s rarest orchid has previously
been recorded between the gravel road and just south of the “test piles” at c. 300 m altitude. This site
was visited in September 2014 but no signs of the rare orchid were found. This species may still be
present in the area.
The survey identified the northern green orchid (Platanthera hyperborean) growing along the streams
in the lowland areas and around Lake Taseq.
An unusual vegetation community on gravel was also identified, comprising the moisture demanding
species of common butterwort (Pinguicula vulgaris) and deergrass (Scirpus caespitosus) and drought
tolerant species Arctic eyebright (Euphrasia frigida), mother-of-thyme (Thymus praecox), lesser
clubmoss (Selaginella selaginoides) and simple bog-sedge (Kobresia myosuroides).
This population also included the Red List “Vulnerable” listed autumn gentian (Gentiana amarella ssp.
Acuta), golden gentian (G. aurea), Alpine gentian (G. nivalis) and northern green orchid. This is a
species composition that is rarely seen in this part of Greenland. Autumn gentian has also never been
found on the Narsaq peninsula before and is only recorded at two sites in south Greenland [22].
The lowland road stretch has a small fen on the mountainside of the road turn that is dominated by
mountain bog-sedge (Carex rariflora), single-spike sedge (C. Scirpoidea) and carnation sedge (C.
panacea). The latter is an uncommon species in Greenland.
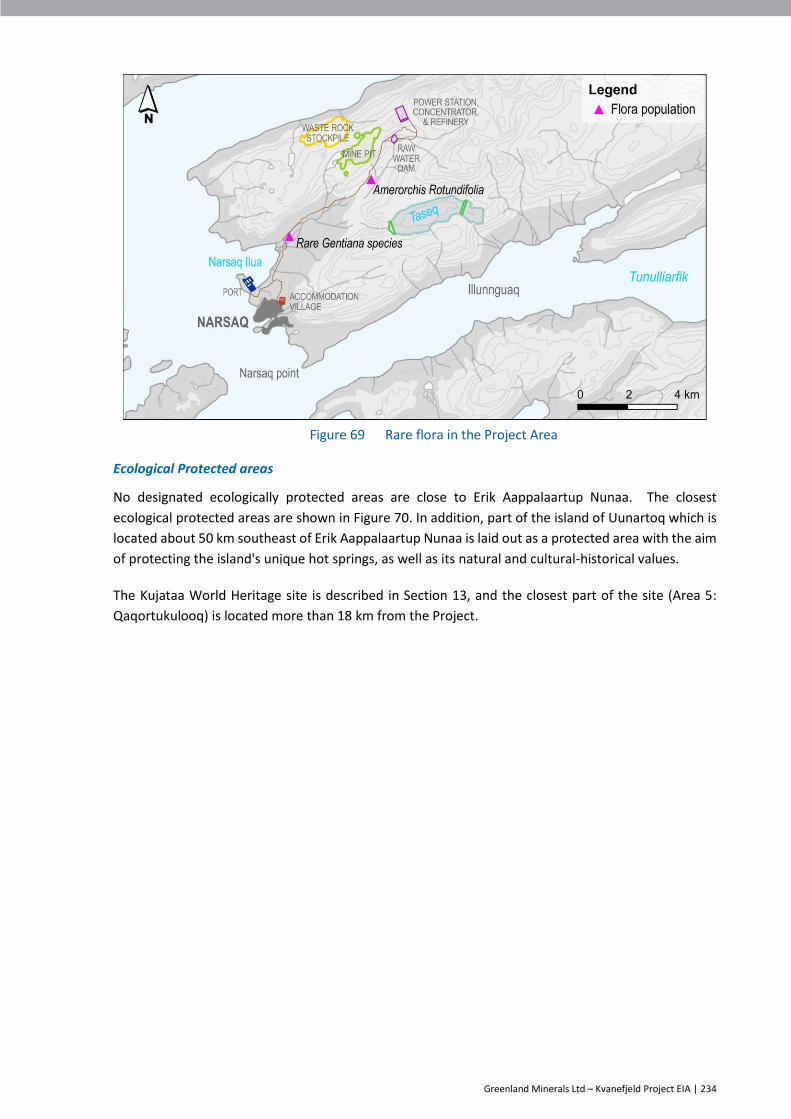
Greenland Minerals Ltd – Kvanefjeld Project EIA | 234
Figure 69 Rare flora in the Project Area
Ecological Protected areas
No designated ecologically protected areas are close to Erik Aappalaartup Nunaa. The closest
ecological protected areas are shown in Figure 70. In addition, part of the island of Uunartoq which is
located about 50 km southeast of Erik Aappalaartup Nunaa is laid out as a protected area with the aim
of protecting the island's unique hot springs, as well as its natural and cultural-historical values.
The Kujataa World Heritage site is described in Section 13, and the closest part of the site (Area 5:
Qaqortukulooq) is located more than 18 km from the Project.

Greenland Minerals Ltd – Kvanefjeld Project EIA | 235
Figure 70 Ecological protected areas in south Greenland
12.2 Potential impacts
Construction and operation of the Project:
Will result in the disturbance of:
- habitat for terrestrial fauna and flora
- habitat for freshwater fauna
- habitat for marine fauna
Has the potential to
- contaminate terrestrial fauna and flora habitat
- contaminate freshwater habitats
- contaminate marine habitats
Will increase vehicular traffic which has the potential to result in fauna mortalities
Will increase seaborne traffic which has the potential to result in the introduction of invasive
non-indigenous species in ballast water and fauna collision.
12.3 Assessment of impacts
12.3.1 Disturbance of habitat for terrestrial fauna and flora
Several construction activities can potentially disturb animals, particularly mammals and birds:

Greenland Minerals Ltd – Kvanefjeld Project EIA | 236
Noise and vibration, in particular the intermittent blasting noise from the mine has the
potential of startling mammals and birds
Visual disturbances from personnel, vehicles, buildings and other Project structures which
might cause mammals and birds to avoid habitats in the Mine area.
Bird and mammal species react very differently to noise and visual disturbances. The white-tailed
eagle is known to be affected by disturbances close to its nest during the breeding season. The white-
tailed eagle is commonly observed in the Study Area and nesting sites are anticipated to exist in this
area.
The raven is known to be sensitive to noise or visual disturbance. Ravens will therefore probably avoid
breeding within 1 to 2 km of the Mine and Plant areas. Ravens are generally low-density breeding
birds in Greenland and the Project is not expected to lead to a significant reduction in the population
of nesting pairs in the region.
Two terrestrial mammals occur in the Kvanefjeld area, the Arctic fox and the Arctic hare. These animals
usually adapt well to human activities in locations where they are not hunted. As hunting pressure in
south Greenland is generally high, foxes and hares will most likely avoid Project facilities and activities.
Rock movements required for construction of the Port, the Plant, roads and associated infrastructure
and to prepare the Mine for operations, will lead to a loss of natural vegetation and will displace most
terrestrial animals from the mine area.
The vegetation in the Study Area is mostly dominated by species which are common and widespread
in south Greenland.
A botanic study was performed in 2013 - 14 [57] which identified:
One plant species found on the northern side of the mouth of the Narsaq river, Gentiana
Amarella, is rare in Greenland. 50 individual plants have been counted at this location. An
unusual vegetation community was also recorded at this location.
Round-leaved orchid, Amerorchis rotundifolia, Greenland’s rarest orchid has previously been
recorded between the gravel road and just south of the “test piles” at c. 300 m altitude. This
site was visited in September 2014 but no signs of the rare orchid were found. Seed for this
species may still be present in the area.
The lowland road stretch had a small fen on the mountainside of the road turn in the
lowlands that is dominated by mountain bog-sedge (Carex rariflora), single-spike sedge (C.
scirpoidea) and carnation sedge (C. panacea). The latter is a rare species in Greenland.
The protected northern green orchid (Platanthera hyperborean) growing along the streams
in the lowland areas and around Taseq lake.
Where construction works will take place in the areas of rare plants or vegetation communities, the
overall footprint of the mine infrastructure is expected to be small compared to the distribution of
similar habitat in south Greenland.
Typically, low densities of animals occur in the Study Area (Arctic fox and Arctic hare) and neither of
the known species are rare or threatened in Greenland. The significance of lost terrestrial habitat due
to the Project is assessed to be low.
The noise disturbance from machines and blasting will be similar in the construction and operations
phases.

Greenland Minerals Ltd – Kvanefjeld Project EIA | 237
Noise and visual disturbance during operations will cause only localised disturbance of terrestrial birds
and mammals. Based on the results of the baseline surveys, the disturbance impact of terrestrial
mammals and birds is assessed as low.
12.3.2 Disturbance of habitat for freshwater species
A significant population of Char lives in the Narsaq river where they spawn in autumn in sections of
the main stream of the river with gravel river beds. In summer, many of the Char leave the river to
feed in the fjords, but during winter the entire population is present in the lower section of the river.
In years with long periods of sub-zero temperatures the water flow in Narsaq river is significantly
reduced and a further reduction in the flow due to Project related changes to the hydrology could
impact the survival of the wintering Char.
Construction works in connection with the culverts across the Narsaq river and the building of
embankments at Taseq may cause short-term increases in the turbidity in the Narsaq and Taseq rivers.
This could disturb freshwater organisms including Char in the Narsaq river. Most construction will take
place in the summer months when a significant proportion of the Char leave the Narsaq river for the
fjords. Any rise in turbidity due to these construction works will be temporary (and short term) during
summer. As such the disturbance of the Char and the freshwater ecosystem due to turbidity is
considered to be of low significance.
At certain times of the year Project activities will reduce the flow in the Narsaq river. Water to be used
in the Plant will be taken from the Narsaq river during times of high flow. The flows in the Taseq and
Kvane rivers will either be stopped or significantly reduced during operations.
The Project related changes to the flow patterns of Kvane and Taseq rivers will lead to an average
reduction of the flow in the main spawning area in the Narsaq river by about 18 % [29] [51]. The scale
of this flow reduction is not expected to have a significant impact on the breeding success of the Char
population in the Narsaq river.
Water will only be extracted from the Narsaq river for the Project in the non-winter periods (at a rate
of 191 m3/h). Baseline data indicates a minimum flow of 40 m3/h occurs year-round.
Due to the restriction of water extraction to non-winter periods (I.e. to non-low-flow periods), Project-
related changes to the hydrology of the Narsaq river and its tributaries are not expected to have a
significant impact on the population of Char in the Narsaq river.
12.3.3 Disturbance of habitat for marine fauna
Construction works at the Port will cause temporary underwater noise from blasting and ramming and
increased turbidity of the nearby sea water. Vessels bringing machinery and materials to the Port
during construction will generate noise both above and below water and visual disturbance above
water. In addition to the construction works, marine habitats could be impacted by the water
treatment placement in Nordre Sermilik. Both of these activities could potentially result in
disturbances for and displacements of marine mammals, sea birds and fish.
Significant marine species which could be affected include:
Ringed seals all year and harp seals during summer
Sea bird colonies at Akullit Nunaat
Flocks of wintering eider duck
Arctic char during summer.

Greenland Minerals Ltd – Kvanefjeld Project EIA | 238
Baseline studies indicate that three species of seal and four whale species are either resident in the
study area or are believed to be regular visitors [57]. Limited baseline data has been collected on the
marine fauna within Narsap Ilua specifically.
Flocks of sea birds, mainly the common eider, winter in the fjords around Narsaq, including in
Narlunaq/Skovfjord and Narsaq Ikerasaa. Wintering common eiders that rest and forage in the fjords
might be temporarily disturbed by vessels calling at the Port. However, this disturbance is considered
insignificant due to the low number of expected vessel arrivals and departures (1 or 2 per week).
If vessels traverse the Bredefjord, as an alternative to the more regularly used Skovfjord, they have the
potential to disturb sea bird colonies. Char that migrate through Narsap Ilua to the surrounding fjords
during summer to feed may also be disturbed. Vessels moving to and from the Port using Bredefjord,
as opposed to Skovfjord, will pass several small sea bird colonies at Akullit Nunaat at a distance of a
few kilometres. This is unlikely to disturb the sea birds breeding since experience from other parts of
Greenland has shown that breeding seabirds are only disturbed if a vessel is within a few hundred
meters of the colony [13].
Seals are common in the fjords at Narsaq. However, severe disturbance from blasting and ramming is
considered unlikely, as seals in general display considerable tolerance to underwater noise [13].
Char migrating from Narsaq river into the fjords in spring and back in late summer-autumn pass close
to the Port. Noise and increased turbidity in Narsap Ilua during Port construction could potentially
disturb migrating Char. Since the construction works are temporary with infrequent blasting and
ramming and with increased turbidity limited to a small area, the disturbance to migrating Char during
the construction period is considered to be low.
Due to the low number of vessels serving the Project during construction (and operation) disturbance
from shipping in the fjords is considered low.
The Port will require reprofiling of a section of the shore. The re-profiling will be permanent. This will
lead to the loss of some intertidal habitat and could potentially impact populations of marine animals
and plants. The species potentially affected include Char from the Narsaq river population that
migrates into the fjord during the summer months. Little specific knowledge exists about the marine
flora and fauna of Narsap Ilua. Observations during the ecological baseline sampling [57] suggest that
no marine mammals or sea birds are specifically associated with this part of the fjord. The loss of
foraging ground for Char due to the construction of the Port is expected to be low due to the close
proximity of large areas of similar habitat are common along the fjords in the region.
During the operations phase, approximately thirty vessels are expected to berth annually.
The placement of treated water into Nordre Sermilik is required to dispose of excess water from the
processing plants during operations and closure. A detailed description of the water treatment
placement is provided in Section 10.3.5. Toxicology studies were conducted to assess the impacts of
this water placement on indigenous marine species [15]. The results indicate an anticipated low impact
on all species and limited impact on copepods.
12.3.4 Contamination of terrestrial fauna and flora habitat
Project activities which can potentially cause direct contamination of terrestrial habitats include:
Accidents in connection with transport, storage and handling of hazardous materials such as
hydrocarbons and chemicals
Failure of the TSF embankment resulting in water and tailings material released onto land.
Greenland Minerals Ltd – Kvanefjeld Project EIA | 239
Spills of chemicals or hydrocarbons
All transport of fuel and chemicals will be by trucks from the Port to the Mine and Plant. Fuels will be
transported in special fuel trucks whereas all liquid chemicals will be transported in small volumes (25L
drums, 250 L drums or one m3 isotainers), except the flotation collector (Aero 6494) which is
transported in 20 m3 isotainers. Isotainers are specifically designed to improve safety when
transporting chemicals. Furthermore, 19 out of the 30 chemicals used in the Project will be transported
in dry form, which, unless spillage is into local waterways, will reduce the spread of spills [55].
Subsequently, the most likely contamination of terrestrial habitats would result from a hydrocarbon
spill. Contamination of the surface soil and vegetation by hydrocarbons or other hazardous materials
potentially poses a risk to animals, plants and their habitats.
Due to their organic nature, small spills of hydrocarbons are generally broken down by bacteria in the
soil; however, this process is much slower in the Arctic climate and even small oil spills can kill the
vegetation which subsequently requires decades to re-establish.
The risk of a major spill occurring on land is primarily a function of the likelihood of a transport accident
occurring. Traffic into and out of the Project facilities will be closely monitored, driver training will be
mandatory, and strict speed limits will be enforced. Small spills may be more likely to occur, but the
effects would be localized and comparatively easy to remediate.
The environmental impacts of fuel and chemical spills on land are assessed to be confined to the
Project Area. The potential loss or depletion of terrestrial habitat due to contamination from spills is
considered low [55].
Tailings embankment failure
In the highly unlikely event of a tailings embankment failure (overtopping, piping or catastrophic)
terrestrial ecosystems in the Narsaq valley would be impacted [110]. The potential TSF failure
scenarios are described in Section 9.3.3.
Overtopping of the water in the FTSF would result in a large and extended flow temporarily flooding
the grass fields of the fan zone during the period of the event. Assuming that the overtopping event
were to occur in the post-closure period, the water quality of the released liquid would meet the
GWQCs for all criteria excluding fluoride. An overtopping event which occurred in the operational
phase would be expected to cause a short-term exceedance of the GWQCs, however this effect would
be expected to diminish rapidly due to dilution.
As such, the impact to terrestrial fauna and flora from water quality changes, caused by an overtopping
event during post-closure, would be expected to be minor. In an operational overtopping scenario,
radiological exposure for terrestrial receptors that could have exposure during water release (e.g.
ducks that drink water from the streams, plants and worms) was assessed and concluded that no
effects would be anticipated. An impact to terrestrial fauna and flora due to the increased flow of the
river may be caused by some limited scouring.
An FTSF piping failure would be expected to flood the grass fields of the fan zone and result in the
deposition of most tailings solids (60-70 %) within the lower reaches of the Narsaq river. In the case
of a piping failure there may be scouring and the river would be substantially altered. Tailings would
be expected to be deposited primarily within the existing Narsaq river channel, therefore effects on
terrestrial species would not be expected [110]. The primary influence for radiological exposure
associated with a piping failure would be the presence of pore water, and as such, the exposure
scenarios for operational and post-closure piping failures are largely equivalent. In the longer-term,
Greenland Minerals Ltd – Kvanefjeld Project EIA | 240
the tailings would likely smother the existing biota to some degree and some species would need to
re-colonize.
Radiological dose estimates resulting from a piping failure have been determined for a variety of
species [110]. The maximum estimated short-term risk quotient identified in the radiological analysis
was recorded for vascular plants (risk quotient of 14) and zooplankton (risk quotient exceeding 1). As
these are quickly reproducing organisms it would be expected that any effect would be short-term in
duration.
The maximum estimated risk quotient for longer-term exposure is 4.9 for birds that reside in the local
environment. This indicates the potential for some adverse effects in biota using this environment, but
severe effects would not be expected. This assessment is also conservative, as it assumes the birds will
get all of their exposure from the impacted area, whereas most species, and particularly birds, will
roam [110].
A catastrophic failure of the FTSF embankment would result in the inundation of an area of ~1.84 km2
to various depths along the discharge path from the tailings dam to Narsap Ilua. It was estimated that
approximately 20 % of the tailings solids would remain on land. In those areas in which tailings solids
are deposited, it is anticipated that the existing biota would be smothered and species would need to
recolonize. The impacts to birds are predicted to be similar to those modelled for the piping failure.
The terrestrial fauna present in the affected area are common throughout southern Greenland and
their conservation is not dependent on local populations. In a catastrophic embankment failure
scenario under both operational and post-closure failure scenarios, impacts to species on a local level
would be expected, however population level effects are not anticipated due to the comparatively
small area of habitat affected by the failure.
The assessed impact to terrestrial biota in the event of a piping failure or a catastrophic embankment
failure is considered high. However, when combined with the extremely low risk of an embankment
failure, the overall potential impact to biota is considered low [110].
12.3.5 Contamination of freshwater habitats
Project activities which will or potentially could cause direct contamination of freshwater habitats
include:
Accidents in connection with transport, storage and handling of hazardous materials such as
hydrocarbons and chemicals
Use of Taseq lake for the storage of tailings material
Failure of the TSF embankment resulting in the release of water and tailings material.
Spills of chemicals or hydrocarbons
The impacts assessed in this section rely on the same analysis as that presented in Section 12.3.4, and
as such, it is not discussed further here. Char is the only fresh-water fish in the Project area and a large
population is present in the lower part of the Narsaq river. An oil spill in fresh water could potentially
affect the spawning migration, spawning area and feeding of the young Char.
The likelihood of a major spill occurring on land or into local fresh water resources is not high. Lesser operational spills are more likely to occur, but the effects are likely to be localised, and comparatively easy to combat.
Spills affecting river courses in summer periods with high flows have the potential to spread downstream and increase size of the affected area if no mitigating measures are in place.

Greenland Minerals Ltd – Kvanefjeld Project EIA | 241
Effects of spills on freshwater habitats would be observed and some effects might be of long term or
medium term duration before full or partial recovery is obtained. The effect will not, or only to a minor
extent, impact species on population level.
Use of Taseq lake for storage of tailings
Taseq lake will be used for the storage of two streams of tailings from the Project: flotation tailings and
chemical residue tailings. Taseq lake does not host a fish population [120]. A small number of
invertebrates are reported to be resident in the Taseq freshwater environment. The introduction of
tailings to Taseq lake is expected to result in the loss of the existing invertebrate population. During
the operations period, wildlife access to the tailings facility is expected to be limited due to operational
activity and disturbance. Long-term security and safety for human and wildlife access to Taseq lake
will be one of the issues addressed in the Closure Plan.
Tailings embankment failure
In the highly unlikely event of a tailings embankment failure (overtopping, piping or catastrophic)
impacts to freshwater habitats in the Project area would be expected [110]. The potential TSF failure
scenarios are described in Section 9.3.3.
Overtopping of the water in the FTSF would result in a large and extended flow temporarily flooding
the grass fields of the fan zone during the period of the event. Assuming that the overtopping event
were to occur in the post-closure period, the water quality of the released liquid would meet the
GWQCs for all criteria excluding fluoride. An overtopping event which occurred in the operational
phase would be expected to cause a short-term exceedance of the GWQCs, however this effect would
be expected to diminish rapidly due to dilution. No radiological effects to freshwater habitats would
be anticipated from an overtopping failure in either an operational or post-closure event.
The flow volume anticipated during an overtopping remains below the peak flow experienced in the
Narsaq and Taseq rivers, and as such, scouring and gouging impacts on freshwater habitats are likely
to be of a similar scale to those experienced naturally.
An FTSF piping failure would be expected to flood the grass fields of the fan zone and result in the
deposition of most tailings solids (60-70 %) within the lower reaches of the Narsaq river. The flow from
the tailings would be expected to overwhelm the natural river flow, and would be likely to result in
biota such as fish being swept away with the flow. In the short-term, the physical effects of the release
would be the primary cause of impacts to freshwater habitats. Once tailings particles had settled in
the lower stretch of the Narsaq river, biota would be exposed to radioactivity due to the presence of
uranium and thorium in the tailings particles. The maximum estimated short-term risk quotient
identified in the radiological analysis was recorded for zooplankton (risk quotient exceeding 1). As
these are quickly reproducing organisms it would be expected that any effect would be short-term in
duration. To evaluate the radiological impact if biota re-established in the residue, a screening level
calculation for long-term (chronic) exposure was completed using the ERICA model. Potential issues
were identified for molluscs and zooplankton, however fish were not identified as being at risk. The
risk quotients indicated some adverse effects however severe effects were not anticipated.
Water quality in Narsaq river is expected to achieve compliance with the GWQCs (with the exception
of fluoride) within two years of the failure.
A catastrophic failure of the FTSF embankment would result in the inundation of an area of ~1.84 km2
to various depths along the discharge path from the tailings dam to Narsap Ilua. It is estimated that
approximately 20 % of the tailings solids would remain on land. The flow from the tailings would be
Greenland Minerals Ltd – Kvanefjeld Project EIA | 242
expected to overwhelm the natural river flow. There would be significant scouring and biota such as
fish would be swept away with the flow. Aquatic life would be expected to be affected through a
number of mechanisms: being buried in slurry or clogged gills; turbidity that prevents light penetration
and photosynthesis from occurring; and altered acidity and temperature of the water. These impacts
would be expected to overwhelm any radiological exposure in the short-term The radiological
exposure described for a piping failure is equally applicable to this scenario.
12.3.6 Contamination of marine habitats
Project activities which potentially could cause direct contamination of marine habitats include:
Accidents in connection with transport, storage and handling of hazardous materials such as
hydrocarbons and chemicals
Failure of the TSF embankment resulting in the release of water and tailings material.
Spills of chemicals or hydrocarbons
The impacts assessed in this section rely on the same analysis as that presented in Section 12.3.4, and
as such, it is not discussed further here.
The consequences of a large oil spill caused by a shipping accident can be very high, particularly if a
tanker spills a large quantity of AGO diesel or if a large bulk carrier spills a large portion of its bunker
oil. In respect to the latter, it should be noted that ships will not arrive with fuel quantities equal to
their full bunker capacity, as they will already have consumed parts in transit to the Port [55].
If all maritime regulations are followed, and shipping lanes are well placed, the likelihood of a full-scale
accident happening is deemed to be very low and phrased as “improbable”. In contrast to spills caused
by ship accidents, the likelihood of spills caused by operational events is higher, although the quantities
of spilled oil are usually smaller than in spills caused by shipping accidents. The causes can be human
failures, malfunctions of valves, rupture of hoses, etc. This calls for mitigating measures targeting
operational spills [55].
In general, effects of oil spills on seabirds and marine mammals are well documented. In Bredefjord
and Skovfjord, a few seabird species are assessed to be particular vulnerable to spills due to low
reproductive capacity (e.g. black guillemot and common eider). These species are however common
in many Greenlandic waters and not exclusively seen in this area. Marine mammals (seals and whales)
are common in Bredefjord and Skovfjord, but the fjord system is not specifically considered a focal
area of these species [55].
Tailings embankment failure
A tailings embankment failure (overtopping, piping or catastrophic) would be expected to impact
marine habitats in the Project area [110]. The potential TSF failure scenarios are described in Section
9.3.3.
Overtopping of the water in the FTSF would result in a large and extended flow temporarily flooding
the grass fields of the fan zone during the period of the event and eventually reporting into Narsap
Ilua. The predicted concentrations of radionuclides in Narsap Ilua as a result of the overtopping during
post-closure were evaluated and levels would not be expected to change from baseline. The impact of
a post-closure overtopping event on the marine habitat would be expected to be very low.

Greenland Minerals Ltd – Kvanefjeld Project EIA | 243
If an overtopping event occurred during operations, elevated uranium levels could pose a potential
risk to phytoplankton. The effect would not be expected to severe (maximum risk quotient of 4.6) and
would be expected to be short-term in duration.
An FTSF piping failure would be expected to flood the grass fields of the fan zone and result in the
deposition of some tailings solids (30-40 %) in Narsap Ilua. Of these, 5 % would be expected to continue
into the fjord. A piping failure has the potential generate radiological impacts from both the water lost
as part of the failure and the deposition of solids. The primary influence for radiological exposure
associated with a piping failure would be the presence of pore water, and as such, the exposure
scenarios for operational and post-closure piping failures are largely equivalent.
During the period of water release, there could be adverse short-term radiological effects on biota in
Narsap Ilua (as indicated by a risk quotient of 100 for phytoplankton) from exposure to radioactivity
from the batch of released water. This represents a substantial dose where significant effects may
occur. After the release ceases, the levels of radioactivity would be expected to decline to close to
baseline levels, with doses decreasing to below the effects level. The radiological effects derived from
the batch of water generated by a piping failure would be potentially significant but short-term.
Longer-term effects from exposure to the tailings solids deposited in Narsap Ilua would also be
expected. Modelling has been undertaken assuming that the tailings solids would constitute a new
sediment layer in Narsap Ilua. The results from this modelling indicate there are not expected to be
any long-term radiological impact on biota that would re-establish in the sediment that comprises
flotation tailings. However, it is noted that the tailings would smother the existing biota and species
would need to re-colonize.
A catastrophic failure of the FTSF embankment would result in the inundation of an area of ~1.84 km2
to various depths along the discharge path from the tailings dam to Narsap Ilua. It was estimated that
approximately 80% of the tailings solids would settle in Narsap Ilua or beyond. The radiological impacts
to marine habitats are expected to be in line with those reported above for the piping failure, and as
such are not further discussed here. The physical impacts of a catastrophic embankment failure on
the marine environment would be expected to be greater than in the piping failure case due to the
larger volume of tailings released. Some of the tailings would be expected to enter the Narsaq sound,
however this is a very high energy environment and tailings would then be mixed and dispersed over
a larger area. Most of the whales, and at least one seal species, usually remain offshore and only
occasionally enter the fjords, minimising their exposure to the deposited tailings [110].
12.3.7 Increased vehicle strikes of terrestrial fauna
The Project could potentially lead to increased direct mortality among animals and birds due to traffic
collisions.
The movement of trucks and other vehicles along the haul and service roads represents a risk for
animals. However, given the limited presence of terrestrial fauna in the Study Area this is unlikely to
be a major danger for wildlife.
The movement of vehicles between habitats of different quality can risk the introduction of invasive
alien species. The presence of invasive alien species has not been identified as an issue of particular
concern in the Study Area, and as such, the use of vehicle transport from the Port to the Mine and
Plant areas is not expected to present a significant risk of alien species introduction to terrestrial
habitats.

Greenland Minerals Ltd – Kvanefjeld Project EIA | 244
12.3.8 Invasive non-indigenous marine species
Vessels berthing at the Port will discharge ballast water before loading cargo. The ballast water can
contain non-indigenous species that could potentially establish themselves in the south Greenland
fjords. When introduced in new areas, these species could thrive and become a threat to indigenous
species and the local ecosystem.
The Ballast Water Management (BWM) Convention aims to prevent the potentially devastating effects
of spreading harmful aquatic organisms carried by ships' ballast water. The BWM requires all ships to
implement a Ballast Water and Sediments Management Plan. All ships are required to carry out ballast
water management procedures to a given standard. To minimize a potential introduction of non-
indigenous species, regulations of the BWM Convention will be followed by the Project.
Provided vessels that berth at the Port follow the BWM regulations, the risk of introducing invasive
non-indigenous species with ballast water is unlikely.
12.4 Mitigations
Restrict the movement of staff members outside the Project Area during spring and summer
to minimize the general disturbance of wildlife
Minimise the disturbance of the water in the Narsaq and Taseq rivers when building culverts
and embankments by keeping construction as short as practically possible
Maintain a minimum Narsaq river flow during winter (40m3/h)
This will require additional water recycling of Plant water in the winter to reduce fresh water
consumption
Mandate low vessel speeds while in fjords
Vessels to maintain good distance to flocks of wintering sea birds (when possible)
Minimize the area to be disturbed, infrastructure to have as small a footprint as possible
Prepare spill contingency plans in collaboration with appropriate authorities.
Spill equipment to be appropriate to spill risk and readily available
Develop waste handling procedures and a waste management manual
Mandate and enforce speed limits across the Project
Report fauna strikes
Develop a Ballast Water and Sediments Management Plan.
12.5 Predicted outcome
The predicted outcome of the Project on biodiversity is detailed in Table 83.

Greenland Minerals Ltd – Kvanefjeld Project EIA | 245
Table 83 Predicted outcome for biodiversity
Impact Project Phase Spatial extent Duration Significance
Disturbance of terrestrial fauna and flora habitat
Construction
Operation
Closure
Study area Life of mine Low
Assessment
Noise and visual disturbance during operations will only cause localised disturbance of terrestrial birds and mammals.
As no breeding sites of the disturbance sensitive white-tailed eagles are known inside or close to the Study Areas, the disturbance impact of terrestrial mammals and birds is assessed as low.
Disturbance of freshwater species habitat
Construction
Operation
Closure
Study area Life of mine Low
Assessment
The changes to hydrology because of the Project will be minimal. During winter no Project related flow reduction is expected for any freshwater sources.
Disturbance of habitat for marine fauna
Construction
Operation
Closure
Study area Life of mine Low
Assessment
The impact on marine fauna and habitat is expected to be limited based on the application of international best practice standards.
Contamination of terrestrial fauna habitat
Construction
Operation
Post-Closure
Study area Life of mine Low
Assessment
The potential loss or depletion of terrestrial habitat as a result of a spill is considered low.
In the low likelihood of a catastrophic FTSF failure , terrestrial flora and fauna would be significantly impacted, at an individual level, but no population level effects would be expected. Short-term radiological effects would potentially impact vascular plants and zooplankton, while long-term impacts could affect birds, but neither impact would be expected to be severe. Due to the low likelihood of this occurring, this has been considered a low impact.
Contamination of freshwater habitats
Construction
Operation
Post-Closure
Study area Life of mine Medium
Assessment
The potential loss or depletion of freshwater habitat as a result of a spill is considered medium due to the ability for the spill to spread through the water course.
The use of Taseq lake for storage of tailings is not expected to have significant freshwater habitat impacts due to the species poor environment of the lake.
In the low likelihood of a catastrophic FTSF failure, freshwater species and habitats would be significantly impacted, at an individual level, and potentially at a population level. Short-term radiological effects would potentially impact vascular plants and zooplankton, while long-term impacts could affect birds, molluscs and zooplankton but neither impact would be expected to be severe. Due to the low likelihood of this occurring, this high consequence risk has been considered a medium impact.

Greenland Minerals Ltd – Kvanefjeld Project EIA | 246
Impact Project Phase Spatial extent Duration Significance
Contamination of marine habitats
Construction
Operation
Post-Closure
Study area Life of mine Medium
Assessment
The potential loss or depletion of marine species and / or habitat as a result of a spill is considered low.
In the low likelihood of a catastrophic FTSF failure marine species and habitats would be significantly impacted in the short-term due to sediment and associated radiological impacts on biota. In the longer-term individual impacts would be anticipated but population level effects should be limited. Due to the low likelihood of this occurring, this high consequence risk has been considered a medium impact.
Increased vehicle strikes of terrestrial fauna
Construction
Operation
Closure
Study area Life of mine Very Low
Assessment
The impact on terrestrial fauna and habitat is expected to be limited based due to the limited number of vehicles and the low density of terrestrial fauna.
Invasive non-indigenous marine species
Construction
Operation
Closure
Study area Life of mine Very Low
Assessment
The impact on marine fauna and habitat is expected to be limited based on the application of international best practice standards.
Greenland Minerals Ltd – Kvanefjeld Project EIA | 247
13. Local use and cultural heritage
13.1 Existing environment
With more than 40,000 km of coastline, Greenland is the largest island in the world. The combination
of difficult climatic and physical conditions mean that Greenland is sparsely populated with the current
population estimated to be 57,000 [69].
There is no private right of land ownership in Greenland. Land is considered “commons” which is to
be shared responsibly by all Greenlandic people. Where access to land is required by a specific group,
for example sheep farmers, the Government requires the group to be jointly responsible for agreeing
to the terms of the right to use the land. Where individuals build houses, they can own the building
but may only rent the land upon which it is built.
Most of Greenland is covered by an ice cap and it is estimated only 0.6 % of Greenland’s landmass is
used for agriculture. The majority of Greenland’s agricultural activity occurs in Kommune Kujalleq. In
2017, of the 37 farms operating in Kommune Kujalleq, 34 were sheep farms, with two reindeer farms
and one cattle farm.
The Kvanefjeld deposit is located approximately 8 km north of Narsaq which is located at the southern
tip of the Erik Aappalaartup Nunaa peninsula. Narsaq, which has ~1,400 residents [69] is the town
nearest to the Project. Qaqortoq (~3,000 residents) is the administrative centre of Kommune Kujalleq
and is located 28 km south south-east of the Project on an adjacent peninsula.
Other settlements in the vicinity of the Project include the cattle farm and summerhouses in the lower
part of the Narsaq valley.
Local use studies were undertaken in 2011 and 2015 by Orbicon [54]. Orbicon identified hunting and
fishing as livelihood activities in the Narsaq area, providing an important source of income and
subsistence to many families. Most local fishing activity takes the form of small-scale operations in the
fjords around Narsaq. Around 30 persons in Narsaq identified fishing as their primary source of
income. In addition, a small number of people hold commercial fishing licences and sell their catch. In
most years Atlantic cod, redfish, Arctic char and wolfish are the most significant commercial fish
species. In late winter and spring fishing for roe is important.
Although less significant as a commercial activity, seal hunting is an important source of income via
the private sale and distribution of seal meat. Seal hunting is also important for subsistence for many
families in Narsaq. Seals are hunted in the fjords around Narsaq, particularly in Bredefjord and Nordre
Sermilik. The most important species is the ringed seal, but during the summer months, many harp
seals are also hunted.
During winter ptarmigan and hare hunting is popular with many residents of Narsaq. This is primarily
recreational hunting that takes place high in the mountains to the north-east of Narsaq.
Gemstone fossicking, primarily for commercial jewellery or personal souvenirs, takes place throughout
the Study Area. The semi-precious stone tugtupit is by far the most popular target for fossickers and
it is predominantly found on the Kuannersuit. Three individuals hold licences for small-scale mining of
tugtupit, although in 2017 only one was active [69]. An additional 4 to 5 people sell stones, either
polished into jewellery or “as found” collected elsewhere in the area.
Tourism in and around Narsaq is relatively limited. Most tourists usually arrive at Narsaq as part of a
south Greenland tour, and the focus of the visit is activities within the town or kayaking in the fjords.
However, some tourists come on their own, stay at the small hotel in town and visit the Narsaq valley.
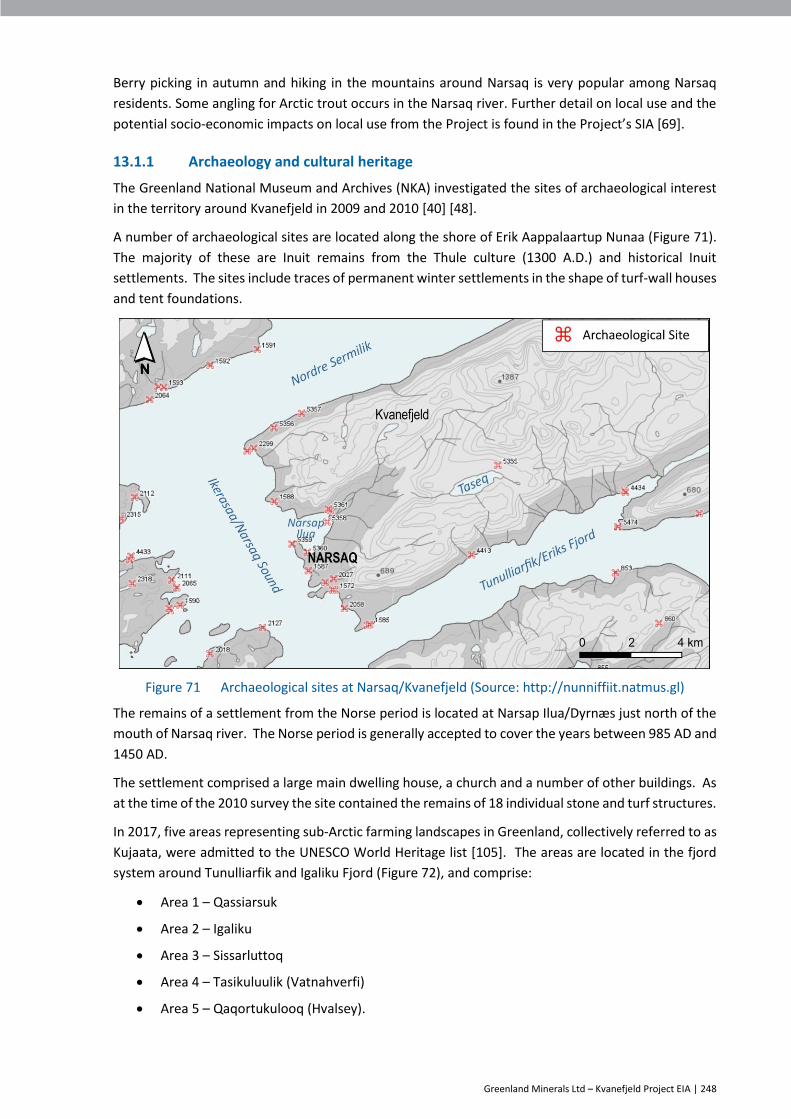
Greenland Minerals Ltd – Kvanefjeld Project EIA | 248
Berry picking in autumn and hiking in the mountains around Narsaq is very popular among Narsaq
residents. Some angling for Arctic trout occurs in the Narsaq river. Further detail on local use and the
potential socio-economic impacts on local use from the Project is found in the Project’s SIA [69].
13.1.1 Archaeology and cultural heritage
The Greenland National Museum and Archives (NKA) investigated the sites of archaeological interest
in the territory around Kvanefjeld in 2009 and 2010 [40] [48].
A number of archaeological sites are located along the shore of Erik Aappalaartup Nunaa (Figure 71).
The majority of these are Inuit remains from the Thule culture (1300 A.D.) and historical Inuit
settlements. The sites include traces of permanent winter settlements in the shape of turf-wall houses
and tent foundations.
Figure 71 Archaeological sites at Narsaq/Kvanefjeld (Source: http://nunniffiit.natmus.gl)
The remains of a settlement from the Norse period is located at Narsap Ilua/Dyrnæs just north of the
mouth of Narsaq river. The Norse period is generally accepted to cover the years between 985 AD and
1450 AD.
The settlement comprised a large main dwelling house, a church and a number of other buildings. As
at the time of the 2010 survey the site contained the remains of 18 individual stone and turf structures.
In 2017, five areas representing sub-Arctic farming landscapes in Greenland, collectively referred to as
Kujaata, were admitted to the UNESCO World Heritage list [105]. The areas are located in the fjord
system around Tunulliarfik and Igaliku Fjord (Figure 72), and comprise:
Area 1 – Qassiarsuk
Area 2 – Igaliku
Area 3 – Sissarluttoq
Area 4 – Tasikuluulik (Vatnahverfi)
Area 5 – Qaqortukulooq (Hvalsey).

Greenland Minerals Ltd – Kvanefjeld Project EIA | 249
The five parts of Kujataa together represent the demographic and administrative core of two farming
cultures, a Norse Greenlandic culture from the late 10th to the mid 15th century AD and an Inuit
culture from the 1780s to the present. Area 5 is the closest to the Project, approximately 18 km from
the boundary of the area to the Project.
Figure 72 Kujaata UNESCO World Heritage Sites (UNESCO, 2017)
13.2 Potential impacts
The potential impacts on local use and cultural heritage are:
Construction and operation of the Project will restrict local use of the area
Construction and operation of the Project will affect some cultural heritage sites.
The Project’s social impacts are assessed in detail in the Project’s SIA [69].
13.2.1 Restriction in local use
A large proportion of the inhabitants in Narsaq make use of the Study Area for recreational [54]. While
there will be access restrictions in the immediate vicinity of Project activities, most of the valley and
the waters around Erik Aappalaartup Nunaa will remain available to residents of Narsaq for
recreational use.
While some hare and ptarmigan hunting takes place in the Study Area, the majority of hunting takes
place in the mountains further away from Narsaq. From the commencement of construction a “no
hunting” security zone will be established around the Project Area to avoid shooting accidents. The
extent of the security zone will be agreed with relevant local authorities prior to the commencement
of construction. At the end of the Project’s post closure phase, the requirement for, and extent of, any
Greenland Minerals Ltd – Kvanefjeld Project EIA | 250
remaining safety zone will be determined with local authorities to ensure community safety is
maintained.
Residents of Narsaq (mostly women) pick crowberries and bilberries in late summer and autumn. The
favoured sites are southeast of Narsaq and on the hills to the north. Some also pick berries in the lower
parts of Narsaq valley. Except within the working area of the Port-Mine Road, Project activities will
have a limited direct impact on berry picking activities in the valley.
For security reasons access to the Mine and Plant area will not be permitted during the construction
and operations phases of the Project and this will limit access to some tugtupit fossicking areas. There
are other locations in the area where these semi-precious gemstones are found, and arrangements
will be made to allow fossicking in affected areas prior to restrictions being put in place.
Seal hunting takes place in Nordre Sermilik and in some parts of the other fjords around Narsaq. No
significant restrictions in seal hunting are expected with the exception of two “no hunting” security
zones, one in Narsap Ilua and the other in the immediate vicinity of the point where treated Plant
water is placed in Nordre Sermilik. The extent of these zones will be agreed with relevant local
authorities. The impact of imposing these marine safety zones has been assessed as low as these
particular areas represent a small reduction in the seal hunting area available to the Narsaq
community.
Some professional and recreational fishing takes place in the fjords around Narsaq [54]. Char fishing
in the lower parts of Narsaq river is popular among Narsaq residents. Only very locally, close to the
Port, will fishing not be possible. There will also be a “no-fishing” zone around the discharge point of
treated Plant water in Nordre Sermilik. This will probably have no impact as fishing in this area is
difficult due to the high density of icebergs. Char fishing in the Narsaq river may continue during the
construction period.
Walking, running, hiking and, to a lesser extent, driving are currently popular recreational uses of
Narsaq valley among Narsaq residents and tourists. For safety reasons driving and hiking on the Port-
Mine Road will not be permitted. The Mine and Plant area and a zone around the various Project
facilities, including the TSF, will also be closed for the public.
Kayaking is also a popular activity, particularly amongst tourists. With Port utilisation not expected to
exceed 20 %, impacts to kayaking safety are not expected to be significant, however an alternative
“put-in” point may need to be located for aesthetic reasons.
There are two farms in the Study Area, a cattle farm in the Narsaq valley and a sheep farm at Ipiutaq.
The Ipiutaq farm also operates as a guest house and a gourmet kitchen. Ipiutaq is relatively isolated
from the Project and Project related activities are expected to have a limited impact on farming
activities.
The Project and the owner of the Narsaq valley cattle farm have conducted informal discussions in the
past. Once the Project obtains an exploitation permit, steps regarding a negotiation between the
Company and the owner of the farm regarding a possible acquisition of the farm can take place. It must
be emphasized that at present no agreement has been made.
13.2.2 Disturbance of heritage sites
The NKA have identified several heritage sites within the Study Area including the Norse farm, Dyrnæs,
on the shore of Narsap Ilua and several Inuit settlements and burial sites [40] [48]. The Port location
was chosen, in part, to limit the Project’s impact on the Norse farm.

Greenland Minerals Ltd – Kvanefjeld Project EIA | 251
One identified heritage site will be destroyed by Project construction: A rock shelter along the shore
of the Taseq lake (reference: Taseq 60V2-0IV-071) will be flooded. Additional heritage sites that may
be disturbed by the project include a tent foundation and shooting blind situated on the tip of the Tunu
peninsula (reference: Nuugaarmiut 60V1-00I-169) close to the location of the Port [48] (Figure 73)
and features close to the road from the Port to the mine (reference: Illunnguaq 60V1-00I-168 and no-
name 60V1-00I-170).
Figure 73 Archaeological sites
In consultation with the Greenland National Museum and Archives (NKA) further archaeological
surveys will be undertaken where it is proposed that certain elements of Project infrastructure be
constructed. These surveys will be undertaken prior to any ground disturbance.
If required, more detailed archaeological investigations of already identified heritage sites , and any
new heritage sites identified through additional surveys, will be undertaken.
The closest part of the UNESCO World Heritage site, Qaqortukulooq, is located 18 km from the Project.
The Project is expected to have no impact on this or any of the other UNESCO-locations.
13.3 Mitigations
Additional archaeological surveys and investigations will be undertaken in consultation with
the NKA
During the construction and operations phases a “no hunting” safety zone will be established
During the construction and operations phases a “no fishing / hunting” safety zone in Narsap
Ilua and around the Plant treated water discharge point in Nordre Sermilik will be established
“Chance finds” procedures will be established to manage any heritage discoveries made
during the construction phase.
13.4 Predicted outcome
The predicted outcome of the Project on land use and cultural heritage is detailed in the Table 84.

Greenland Minerals Ltd – Kvanefjeld Project EIA | 252
Table 84 Predicted outcome on local use and cultural heritage
Impact Project Phase Spatial extent Duration Significance
Restrictions in local use Construction
Operation
Study area Long term Low
Assessment
Local access for hunting, fishing and traditional uses will be subject to restrictions in the vicinity of Project activities. The extent of these restrictions will be agreed with local authorities in order to ensure the safety of Narsaq residents involved in recreational or commercial activities. It is expected that these restrictions will have limited impact on recreational amenity or commercial activity in the Study Area.
Disturbance of heritage sites
Construction Study area Permanent Low
Assessment
Destruction of a rock shelter on the edge of Taseq lake and a tent foundation and shooting blind on the tip of the Tunu peninsula. Neither of these features are identified as critical cultural heritage.
Disturbance of UNESCO World Heritage sites
Construction
Operation
Study area Life of Mine Very Low
Assessment
No disturbance or impact is expected due to distance from the Project.

Greenland Minerals Ltd – Kvanefjeld Project EIA | 253
14. Cumulative Impact Assessment
14.1 Introduction
“Cumulative impacts are those that result from the incremental impact of a project when added to
other existing, planned and / or reasonably predictable future projects and developments”1.
Cumulative impact assessments are typically limited to those impacts generally recognised as
important on the basis of scientific concerns and / or concerns from affected communities2.
This chapter has been developed in line with the guidance provided in the IFC’s “Good Practice
Handbook: Cumulative Impact Assessment and Management: Guidance for the Private Sector in
Emerging Markets” (2013) [131].
Step 1 – Determination of spatial and temporal boundaries
Step 2 – Identification of Valued Environmental and Social Components (VECs) and
identification of all developments and external natural and social stressors affecting the VECs
Step 3 – Assessment of present condition of VECs
Steps 4 and 5 – Assessment of cumulative impacts and their significance over VECs predicted
future conditions
Step 6 – Definition of management strategies to address impacts
This assessment has been conducted as a desk-based evaluation, however it has drawn on the
experience and expertise of specialists as communicated through their sections of the EIA, and through
understanding of priority VECs within local communities gained through consultation.
In addition to the procedure described above, and under the guidance of DCE/GINR an additional
assessment of potential cumulative impacts across each of the topics addressed in this EIA were
conducted.
The cumulative effects address the core parameters that are central to the EIA report in a cumulative
aspect. The cumulative effect focuses on the combined effects of the individual components that are
included in the individual environmental impact assessments, including the physical environment,
atmospheric environment, radiological emissions, aquatic environment, waste management,
biodiversity – in other words all the essential parameters where environment, nature and climate
impact have been assessed in the EIA.
In addition, it is assessed whether there has been an impact on the basis of other stressful factors and
activities that may lead to and cumulative impact.
The result of this assessment indicated that the extent of cumulative impacts in isolation was not
expected to significantly change the assessment of impacts for the project (see section 14.6).
14.2 Spatial and Temporal Boundaries
For this assessment, the temporal boundary has been set as the life of the project (including
construction, operations, closure and 6 years of post-closure), which is a total of 46 years. The spatial
boundary varies with each VEC considered. The VECs identified below are all components that the
1 US Council on Environmental Quality (1997)
2 IFC (2012) Performance Standard 1 – Assessment and management of Environmental and Social Risks and Impacts,
http://www.ifc.org/wps/wcm/connect/3be1a68049a78dc8b7e4f7a8c6a8312a/PS1_English_2012.pdf?MOD=AJPERES

Greenland Minerals Ltd – Kvanefjeld Project EIA | 254
Kvanefjeld Project is either expected to affect or there is a perception that it could affect. A spatial
boundary is provided for each VEC listed in Table 85.
Table 85 VECs and Spatial Boundaries3
Valued Environmental and Social Components (VECs) Spatial Boundary
Category (VEC) Description (Focus area)
Physical Features and Natural environment
Marine environment (safety and risk of spills) Study Area
Atmospheric Setting incl. greenhouse gas emissions National
Disturbance of habitat for terrestrial fauna and flora
Disturbance of habitat for freshwater fauna
Disturbance of habitat for marine fauna
Contamination of terrestrial fauna and flora habitat
Contamination of freshwater habitats
Contamination of marine habitats
Increased Vehicular traffic
Seaborne traffic
Water environment including fresh, drinking and marine water
National and regional
Albedo impact from dust deposition on snow and ice National and regional
Ecosystem Services, Tourism, recreational activities and cultural herritage
Foraging and gathering of berries Study Area
Kayaking, hiking and camping etc. Study Area
Farming industry including sheep farming, vegetable and aminal feed farming
National
UNESCO World Heritage sites and other Heritage sites Regional
14.3 Other Activities and Social and Environmental Stressors
In order to understand the potential for cumulative impacts it is necessary to identify existing and
expected future planned projects that could influence the conclusions of the EIA. In developing this
list, consideration was given to past developments whose impacts persist, existing developments and
foreseeable future developments as well as any relevant environmental drivers.
Table 86 Other Stressors and Activities
Other Activities and Stressors Potential Impact to VECs
Global climate change Marine, terrestrial and freshwater species, albedo impact
TANBREEZ Mining Project Marine safety and risk of spills
Greenhouse gas emissions, dust deposition etc.
Establishment of a hydropower plant
3 Some of the cumulative effect of the descriptions (focus areas) in the table are concluded in section
14.5 and others in section 14.6.
Greenland Minerals Ltd – Kvanefjeld Project EIA | 255
Expansion of the Kvanefjeld Project Greenhouse gas emissions
Radiological emissions
Water environment
Atmospheric setting
Waste management
Sheep farming
Terrestrial species
Foraging and gathering of berries
Tourism expansion Kayaking, hiking and camping etc.
Changes to scale of farming activity Sheep farming
A brief description of each activity or stressor is provided below:
Global climate change
Greenland is frequently referenced in discussions related to climate change due to the presence of the
Greenland Ice Sheet (Ice Sheet) which contains approximately 10 % of global freshwater reserves,
sufficient to raise sea levels by an average of 7m should It melt completely [127]. In Greenland the
reflection of sunlight, the so-called albedo, by ice and snow has been decreasing since the beginning
of satellite observations in 19814. While numerous climate change models have been developed,
recent analysis of scientific data on the melting of the Ice Sheet indicates a global sea level rise of 10c
m by the end of the 21st century if global warming trends continue [129]. Further to this, Greenland is
expected to warm between 4-6.6 deg C by the year 2100 (ibid) under a “business as usual” scenario.
The impacts of climate change are likely to be significant both at an environmental and social level.
For example, farmers in southern Greenland reported benefiting from warmer summers due
expanding grazing lands a decade ago, however, this benefit appears to have been lost more recently
with greater variability in harvest and reduced harvests due to warmer summers [130].
From an environmental perspective, the risk is that climate change will place additional pressure upon
endangered or critically endangered species, as their habitat is either impacted or lost.
TANBREEZ Mining Project
If developed, the TANBREEZ Project (TANBREEZ) will extract, process and export mineral concentrates
containing zirconium, yttrium, niobium, hafnium, tantalum and REEs. It is located at Killavaat
Alannguat (Kringlerne) on the Kangerluarsuk fjord in south Greenland. It is located approxiantely 20k
m north-east of Qaqartoq and 12 km southwest of Narsaq. As described in the TANBREEZ EIA (2012),
TANBREEZ is expected to extract 0.5 Mtpa of ore from two open pits, over a 10 year mine life. Figure
74 illustrates the location of in relation to Narsaq.
4 PROMICE Programme for Monitoring of the Greenland Ice Sheet www.promice.org/DarkeningIce.html

Greenland Minerals Ltd – Kvanefjeld Project EIA | 256
Figure 74 Location of TANBREEZ project relative to Narsaq (Source: TANBREEZ EIA (2013)
Of relevance for the identified VECs:
TANBREEZ anticipates using three diesel generators to provide power for the Project,
consuming approximately 7.8 million litres per year. The GHG contribution from the project
(based on fuel consumption) has been estimated to be 20,881 tons of CO2 per year.
The TANBREEZ anticipates requiring six 57,000 DWT bulk carriers to visit a port at
Kangerluarsuk fjord per annum. In addition, 15,000 DWT Arctic line vessels will visit the port
a few times a year with supplies. Fuel will be supplied four times a year via a 2,300 DWT
tanker.
Expansion of the Kvanefjeld Project
The Project is located in a geologically prospective region (the Ilimaussaq Complex), with mineral
resources estimates prepared for three locations: Kvanefjeld (the focus of this EIA), Sørensen, and Zone
3 (as illustrated in Figure 75).

Greenland Minerals Ltd – Kvanefjeld Project EIA | 257
Figure 75 The Ilimaussaq Complex (www.ggg.gl)
The mining of these additional resources can be considered an expected future activity, and additional
exploration may identify further resources in the same complex. Any additional mining activities would
be subject to the same environmental and social regulatory approval processes as have been
undertaken for the Kvanefjeld Project.
Tourism Expansion
Tourism has been a key component of the Narsaq economy for many years (as described in the
Project’s SIA). The existing tourism activities are focussed on outdoor recreation, including hiking,
kayaking, visiting sites of cultural heritage and trips to the ice shelf. Tourists include both independent
travellers and package and / or cruise tourists. Recent years have seen a significant increase in the
number of cruise passengers coming to Greenland in summer (from 13,594 in 2014 to 33,809 in 2019),
however only a small proportion of these passengers travel to Narsaq. With most visiting the Disko
Bay area [131].
There are no known plans for specific tourism expansion programmes, however it can be assumed that
increased transport availability to Narsaq may present opportunities for increased recreational tourism
in the area.
As mentioned in section 13 in this EIA five UNESCO world heritage sites have been identified. These
sites primarily cover areas with historical norse ruins with present agricultural and sheep farming
activities which could lead to future opportunities for increased tourism.
Changes to the scale of Farming Activities
Almost all of the farming (sheep/cattle/reindeer) undertaken in Greenland occurs in Kommune
Kujalleq. Farming was first introduced to the Narsaq area in the 1900s [69]. Of the 37 farms operating
in Kommune Kujalleq in 2017, 34 were sheep farms, with two reindeer farms and one cattle farm. Of
the arable land in Greenland, 68 % is near Narsaq, 17% if near Nanortalik and 13% is near Qaqartoq
Greenland Minerals Ltd – Kvanefjeld Project EIA | 258
[128]. Farming is considered an activity of cultural significance in Greenland, and despite challenging
economics, it receives considerable support from the government in the form of subsidies and other
grants.
In recent decades, sheep farms have tended to become fewer in number but larger in size, with
multiple generations joining forces to run a farm in some instances [131]. Sheep numbers have
reportedly dropped by more than 10% from 2009 to 2019 (from 20,439 in 2009 to 17,785 in 2019)
[131]. The only livestock which has seen an increase in population size between 2009 and 2019 are
cows (from 56 to 300).
14.4 Baseline Status of the VECs
The baseline status of the VECs identified in Table 85 has been presented throughout this EIA (with
additional information captured in the SIA for some topics). For the purposes of this cumulative impact
assessment chapter, a brief summary of the status of some of the VECs, and their sensitivity to change
and potential indicators to assess their condition are provided in Table 87. The rest is described in
section 14.6.

Greenland Minerals Ltd – Kvanefjeld Project EIA | 259
Table 87 Resilience of the VEC
VEC Baseline Condition Resilience to Stress Indicators to assess condition
Marine Environment
Narsaq is situated in the middle of two threshold fjords connected by a passage. The seas off south and west Greenland are ice-free throughout the year. The largest container storage area is in the municipality capital, Qaqortoq, however Narsaq has a fishing and a ship harbour, and Nanortalik has a combined fishing and shipping harbour. GoG owned, Royal Arctic Line, is the primary cargo carrier servicing these towns.
High – this is due to the large mass of water which provides powerful dilution capacity for any spills or disturbance impacts to species.
The relatively low volume of shipping activity in the Project also provides capacity for an increase in shipping volume with limited safety risk.
Key marine species monitoring (to be defined in the monitoring plan) in the Fjords and within the Port area.
Marine safety records (spills and safety incidents).
Greenhouse Gas Emissions
In 2016, Greenland reported 0.5 Mt CO2 emissions (representing approximately 2 % of Denmark’s annual emissions).
Low – While Greenland itself is a small producer of CO2 emissions it is highly vulnerable to changes in global emissions and their subsequent impacts on climate change.
Annual CO2 emissions in Greenland and CO2 emissions from Greenland as a proportion of Denmark’s emissions.
Foraging for berries
The Narsaq valley is commonly used as foraging source of blueberries and other herbs and products during warmer months. Foraging activity tends to be influenced by distance from residences, with grasslands closer to communities being accessed more regularly. The local use study identified Areas 3 and 4 (see Figure 76) as being most important for foraging.
High – The berries and other items sourced in the Project Area are not unique to that area, and many foraging zones close to the town of Narsaq will be unaffected by the Project. The estimated combined area of Areas 3 and 4 is approximately 35 km2.
Social practices as described by focus group surveys.
Kayaking Kayaking tourism is conducted from Narsaq, having maintained a regular presence in the town for a number of years. Kayaking trips typically travel from Narsaq to the Ice Sheet. The current scale of kayaking tourism is well within the capacity of the town and environment to accommodate.
Medium – The launching point for kayaking trips will likely need to change when the Project is developed to avoid interactions with the port and sea-going vessels. Much of the appeal of the tourist industry in Narsaq is its remoteness which may be compromised by the development of a mining project (see SIA for further analysis of this topic). If kayaking tourism were to significantly increase, new launching points and potentially additional accommodation would need to be identified in Narsaq.
Number of tourists coming to Narsaq to participate in kayaking tourism.

Greenland Minerals Ltd – Kvanefjeld Project EIA | 260
VEC Baseline Condition Resilience to Stress Indicators to assess condition
Farming Sheep farming across Greenland has been experiencing a decline in the number of farms, and a decline in the total number of sheep being farmed across the country. This is understood to be in part a response to climate change impacts as well as the challenging economics of sheep farming activities. The establishment of the Kujaata World Heritage Area in 2017 provides protection for five different sub-Arctic farming landscapes and reinforces the importance of farming to Greenland (and international) culture.
Medium – The area of arable land is a constraint at a national level, however climate change is expected to provide opportunities for increased agricultural productivity in southern Greenland [128], while also increasing the variability in weather conditions with periods of drought, thawing and excessive winter rainfall.
Number of operating sheep farms
Number of hectares of permanent pasture
Number of livestock
Financial reports on farming activities in Greenland.

Greenland Minerals Ltd – Kvanefjeld Project EIA | 261
Figure 76 Local Use Study Areas
14.5 Cumulative Impacts on VECs
The approach taken to evaluate cumulative impacts in this chapter is desk-based and the results are
captured in Table 88.

Greenland Minerals Ltd – Kvanefjeld Project EIA | 262
Table 88 Magnitude of Cumulative Impacts
VECs Cumulative Impacts Impact to sustainability or viability of VEC Actions Proposed
Marine environment
During mining operations, Kvanefjeld anticipates handling 30 vessels per year of approximately 40,000 DWT. If TANBREEZ is also developed, that Project will add another 6 large vessels per annum to the main fjord environment. Port utilisation at Narsaq is expected to be around 20%, with more than sufficient capacity for other port users to berth ships as necessary. While the additional shipping requirements needed to support the Kvanefjeld Project are significant, they are not expected to present significant additional risk of shipping collisions or spills. Marine safety has been specifically addressed in the NSIS
Low – the Project’s impact on the marine environment associated with shipping has been evaluated to be low (associated with risk of spills) and this risk remains low when considered in the context of cumulative impacts.
Operate in accordance with the NSIS.
Greenhouse gas emissions
The Kvanefjeld project will generate approximately 0.24 Mt CO2 equivalent per annum, representing 45 % of Greenland’s current national CO2 emissions. If the emissions from the TANBREEZ project (20,881 t CO2) are also considered, the CO2 contribution from the two projects combined will rise to 0.26Mt per annum. This will represent slightly more than 50% of Greenland’s current national emissions. While a significant increase at a Greenland level, even including this increase Greenland’s emissions will contribute 2 % of the annual Danish GHG emissions.
Upon further development of mining activities on both TANBREEZ and Kvanefjeldet the need for energy will increase.
On a global scale the Kvanefjeld project will produce 6,000 tonnes rare earth magnet metals corresponding to approx. 15 % of world demand. Rare earth magnet metals are central to the conversion of combustion engine automobiles into EVs and to the development of the international wind turbine energy sector etc.
Low – the scale of GHG emission increases is not expected to cause any significant impact to marine, freshwater or terrestrial habitats or species.
Upon further development of mining activities on both TANBREEZ and Kvanefjeldet the need for energy will increase.
At a global level, the products generated by the Project will support the substitution of fossil fuels in egine technology, representing a positive contribution to the management of this impact.
Annual reporting of GHG
Further investigation of opportunities to develop renewable energy, such as hydropower solutions during the life of the Project.
To partner with the EU Commissions raw material alliance in relation to critical raw materials not least REEs.
Foraging for berries
Berries grow in much of the landscape surrounding Narsaq and upon which Kvanefjeld will be developed (with the exception of Taseq which is largely barren scree). The footprint of the project (excluding the TSF at Taseq) is 3.43 km2. If it were conservatively assumed that all of these areas were currently available for berry harvesting (which is not the case as some of these areas are already disturbed (e.g. the road), this would represent a loss of approximately 10 % of the berry foraging area within Areas 3 and 4.
Low - The project’s impact on foraging activities. even if combined with an increased population in Narsaq, potentially increasing demand for foraging activities, is not expected to add significant additional pressure to the availability or accessibility of berry foraging areas.
Minimisation of Project footprint where possible during all phases of the Project

Greenland Minerals Ltd – Kvanefjeld Project EIA | 263
VECs Cumulative Impacts Impact to sustainability or viability of VEC Actions Proposed
Kayaking Development of the Project will increase the number of ships in the Narsaq fjord and development of the Port will likely impact the current launching point for kayaking tourism. The Port is only expected to be utilised 20% of the year, leaving many opportunities for kayaking to proceed without interference, however the sense of “nature” may be diminished. If kayaking tourism were to maintain or increase, alternative launching locations would need to be identified and supported.
Low – The existing tourism operators appear to have significant flexibility in where and how they launch their tours and accommodate their guests.
Support the tourism operators to understand the potential impacts to kayaking from the Project and identify solutions to impacts as necessary.
Farming The Project and the owner of the Narsaq valley cattle farm have conducted informal discussions in the past. Once the Project obtains an exploitation permit, steps regarding a negotiation between the Company and the owner of the farm regarding a possible acquisition of the farm can take place. It must be emphasized that at present no agreement has been made.
If such an acquisition were to occur, this would potentially reduce the number of farms within Greenland by approximately 3%. Additional farm closures due to either consolidation or challenged economics (independent of the Project’s activities) may also occur.
If the Zone 3 or Sørensen deposits were to be developed they could potentially impact additional farming land. Any development would be subject to social and environmental approval processes.
Low – Considerable work has been commissioned to better understand how to protect and promote Greenlandic farming, including changing practices and additional research. Significant opportunities appear to exist for farming improvements, however the economics of the industry remain challenging in some years.
Impacts to farming are discussed in the SIA.
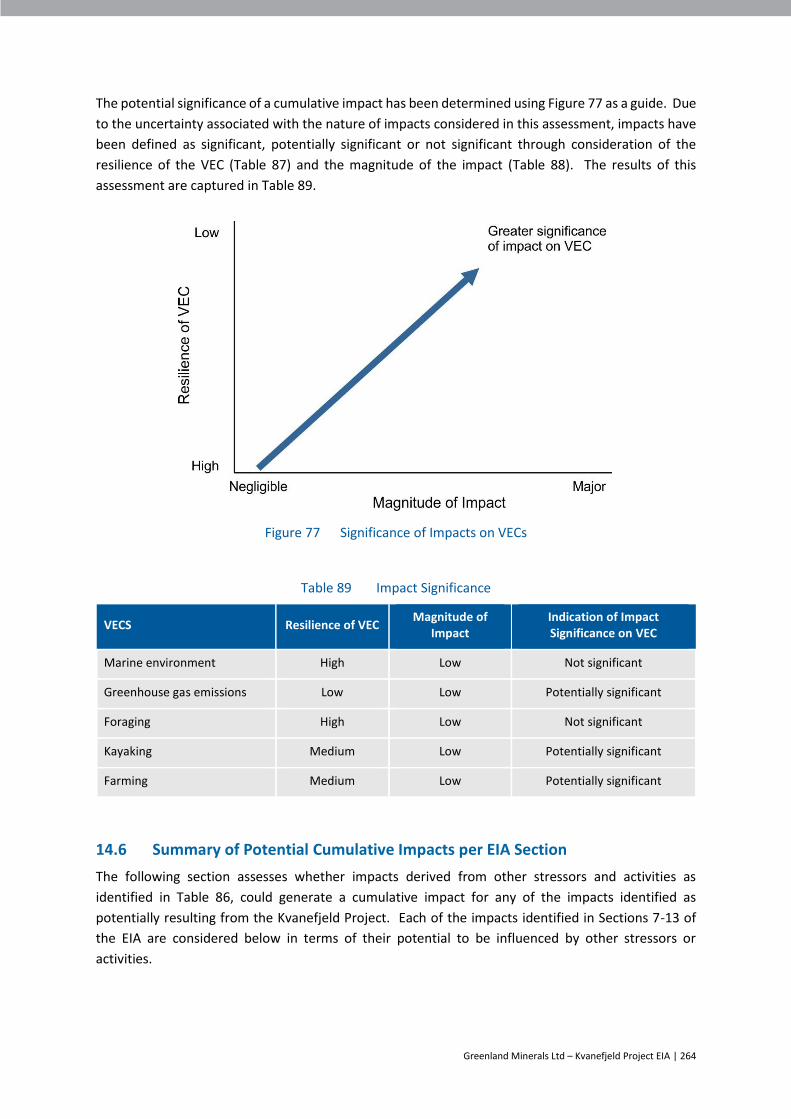
Greenland Minerals Ltd – Kvanefjeld Project EIA | 264
The potential significance of a cumulative impact has been determined using Figure 77 as a guide. Due
to the uncertainty associated with the nature of impacts considered in this assessment, impacts have
been defined as significant, potentially significant or not significant through consideration of the
resilience of the VEC (Table 87) and the magnitude of the impact (Table 88). The results of this
assessment are captured in Table 89.
Figure 77 Significance of Impacts on VECs
Table 89 Impact Significance
VECS Resilience of VEC Magnitude of
Impact Indication of Impact Significance on VEC
Marine environment High Low Not significant
Greenhouse gas emissions Low Low Potentially significant
Foraging High Low Not significant
Kayaking Medium Low Potentially significant
Farming Medium Low Potentially significant
14.6 Summary of Potential Cumulative Impacts per EIA Section
The following section assesses whether impacts derived from other stressors and activities as
identified in Table 86, could generate a cumulative impact for any of the impacts identified as
potentially resulting from the Kvanefjeld Project. Each of the impacts identified in Sections 7-13 of
the EIA are considered below in terms of their potential to be influenced by other stressors or
activities.
Greenland Minerals Ltd – Kvanefjeld Project EIA | 265
Section 7 – Physical Environment
The potential impacts to the physical environment during the construction and operations phases of
the Project have been defined as:
Physical alteration of the landscape and reduced visual amenity
Erosion
Noise
Light emissions
Physical alteration of the landscape generated by a seismic event.
Of these impacts, only “physical alteration of the landscape and reduced visual amenity” is considered
likely to be impacted by other stressors and activities, and this would be associated with a potential
expansion of the Kvanefjeld Project. While the TANBREEZ Project may generate similar impacts in its
Project location, these impacts will occur in different geographic locations and will not both be visible
or experienced from any single vantage point.
The area identified for potential expansion of the Kvanefjeld Project is not expected to be visible from
Narsaq and as such, would not be expected to significantly alter the assessment of this impact (the
impact has been assessed to have Medium significance for the Project in isolation). Any proposed
expansion of the Kvanefjeld Project would also be subject to the same robust environmental
permitting process which has been undertaken for Kvanefjeld.
Section 8 – Atmospheric Setting
The Project’s potential impacts during the construction, operations and closure phases to ambient
atmosphere have been identified as:
Generation of dust which has the potential to result in reduced air quality and has the
potential, because of the physical or chemical composition of the dust, to result in secondary
impacts associated with dust deposition on the snow and ice during winter operations in the
vicinity of Kvanefjeld
Generation of gaseous air emissions (oxides of nitrogen, oxides of sulphur, black carbon and
polycyclic aromatic hydrocarbons (PAH)) which have the potential to reduce air quality
Generation of greenhouse gas (GHG) emissions from the combustion of diesel in mobile
equipment and at the power station.
Expansion of the Kvanefjeld Project is the only stressor or other activity which is considered likely to
potentially generate a cumulative dust and air quality impact in the Project’s airshed. The other
identified stressors or other activities would either be unlikely to generate such emissions or are
located outside of the Project’s airshed. Any proposed expansion of the Kvanefjeld Project would be
subject to the same robust environmental permitting process which has been undertaken for
Kvanefjeld and would be designed to operate in compliance with air quality regulations. As such, this
is not considered a potentially significant cumulative impact.
The generation of GHG emissions is considered likely to be potentially significantly impacted by
other stressors or activities, due to a combination of the potential expansion of the Kvanefjeld
Project and the development of the TANBREEZ Mining Project. This will represent slightly more than
50% of Greenland’s current national emissions. While a significant increase at a Greenland level,

Greenland Minerals Ltd – Kvanefjeld Project EIA | 266
even including this increase Greenland’s emissions it will contribute 2% of the annual Danish GHG
emissions.
A cumulative effect of the development of both the Kvanefjeld an the Tanbreez project could be that
the establishment of a hydropower plant for energy supply will be relevant. The environmental
effects hereof would be an increased impact of GHG emissions in the construction phase, however
this would be offset by a reduction in the GHG emissions in the operations phase by 50 % compared
to the base scenanrios for both projects (the suggested solution for both projects is that energy is
provided by an diesel generator facility).
On a global scale the Kvanefjeld project will produce 6,000 tonnes rare earth magnet metals
corresponding to approx. 15 % of world demand. Rare earth magnet metals are central to the
conversion of combustion engine automobiles into EVs and to the development of the international
wind turbine energy sector etc.
At a global level, the products generated by the Project will support the substitution of fossil fuels in
engine technology, representing a positive contribution to the management of this impact.
The ice reflectivity (a.k.a. albedo) exhibits a strong control on the melting of the ice sheet. However,
Greenland ice albedo has been decreasing since the beginning of satellite observations in 1981.
The ice sheet albedo is impacted amongst others by global warming, dust, transported from close by
and far away, particles released into the atmosphere by increasing amounts of wild fires in North
America, pollen, and industrial emissions, such as those by ships taking a northerly route. The
Cumulative effects of the Kvanefeld and the Tanbreez projects would have a negative impact on on
the ice sheet albedo.
The cumulative impacts on GHG emissions and their resultant impact on marine, terrestrial and
freshwater habitats and species are discussed and assessed in Table 88, which concluded that the
cumulative impact was potentially significant but of low magnitude.
Section 9 – Radiological Emissions
The release of radionuclides from Project activities has the potential to impact the environment and
human health. Impacts and risks which were assessed include:
Uranium oxide spills during Project operations which may result in additional radiological
emissions
Failure of TSF embankments with the potential to release tailings water and solids
containing radionuclides to land and water bodies downstream of the TSF thereby elevating
the radiological exposure
Release of aerosols from the TSF with the potential to result in contamination of land and
release of radioactivity downwind of the TSF
Dispersal of radionuclides via groundwater seepage
Dispersal of radionuclides via dust dispersal.
The majority of the identified stressors or other activities would not be expected to influence any of
these potential impacts. An exception would be the potential expansion of the Kvanefjeld Project,
which would increase the total volume of tailings which would need to be stored and the volume of
uranium oxide to be transported over the life of the Project. Any proposed expansion of the
Kvanefjeld Project would be subject to the same robust environmental permitting process which has

Greenland Minerals Ltd – Kvanefjeld Project EIA | 267
been undertaken for Kvanefjeld. Given the absence of any specific future development plans, it is
premature to predict how best these impacts could be managed, however, consistent with
Greenlandic regulatory requirements, BAT and BEP technology would be applied for any future
expansions.
Section 10 – Water Environment
The potential impacts to the water environment which have been identified include:
Modification of hydrological processes, potentially affecting water quality
Operation of the TSF has the potential to result in contamination outside the TSF
Failure of the FTSF has the potential to result in contamination of the water environment
Release of aerosols from the TSF has the potential to result in contamination of water,
downwind of the TSF
Narsaq’s drinking water quality could potentially be affected by the Project due to aerosol
spray or seepage from the TSF or in the event of FTSF failure
Discharge of treated excess water from the Project has the potential to affect water quality
in the Nordre Sermilik
Waste rock stockpile runoff
Post closure mine pit water quality
Risks of accidents which result in the discharge of hydrocarbons and chemicals
Risks of accidents which result in the discharge of Project process water
The majority of the identified stressors or other activities would not be expected to influence any of
these potential impacts. An exception would be the potential expansion of the Kvanefjeld Project,
which would increase the total volume of material mined, processed, and tailings produced which
would need to be stored as well as the volume of reagents and product which would need to be
transported. It may also have the potential to expand the number of open pits and waste rock
stockpiles in a closure scenario. Any proposed expansion of the Kvanefjeld Project would be subject
to the same robust environmental permitting process which has been undertaken for Kvanefjeld.
Given the absence of any specific future development plans, it is premature to predict how best these
impacts could be managed, however, consistent with Greenlandic regulatory requirements, BAT and
BEP technology would be applied for any future expansions.
The development of the TANBREEZ Mining Project, and an expansion of tourism in Kommune Kujalleq
could also both increase the level of marine traffic. The cumulative impact of changes to marine traffic
associated with the development of the TANBREEZ Mining Project is discussed in Table 88. Both
TANBREEZ and Kvanefjeld projects have undertaken an NSIS which specifically considers the risk of
marine spills and accidents. The recent trend for increased cruise ship tourism in Kommune Kujalleq
could also contribute to this impact, however the relative increase in shipping volumes is still
considered low in magnitude and “not significant” due to the vast areas and high resilience of the
marine environment.
Section 11 – Waste Management
During its construction and operations phases the Project will produce:
Domestic waste and sewage

Greenland Minerals Ltd – Kvanefjeld Project EIA | 268
Used tyres from mobile equipment, and
Various types of hazardous waste, for example hydrocarbon waste, chemical waste and
batteries.
The capacity of the Narsaq domestic waste and sewage systems to accommodate an increase in waste
associated with the Project have been assessed in the SIA [91]. The tourism expansion which is
occurring appears to be focussed on cruise ship tourism, with limited overnight stays in Narsaq itself,
limiting its effect on waste management in the town. No potentially significant cumulative impacts
have been identified for waste management.
Section 12 – Biodiversity
Construction and operation of the Project:
Will result in the disturbance of;
- habitat for terrestrial fauna and flora
- habitat for freshwater fauna
- habitat for marine fauna
Has the potential to;
- contaminate terrestrial fauna and flora habitat
- contaminate freshwater habitats
- contaminate marine habitats
Will increase vehicular traffic which has the potential to result in fauna mortalities
Will increase seaborne traffic which has the potential to result in the introduction of invasive
non-indigenous species in ballast water and fauna collision.
Given the number of specific impacts associated with biodiversity, the potential cumulative impacts
are summarised in Table 90.
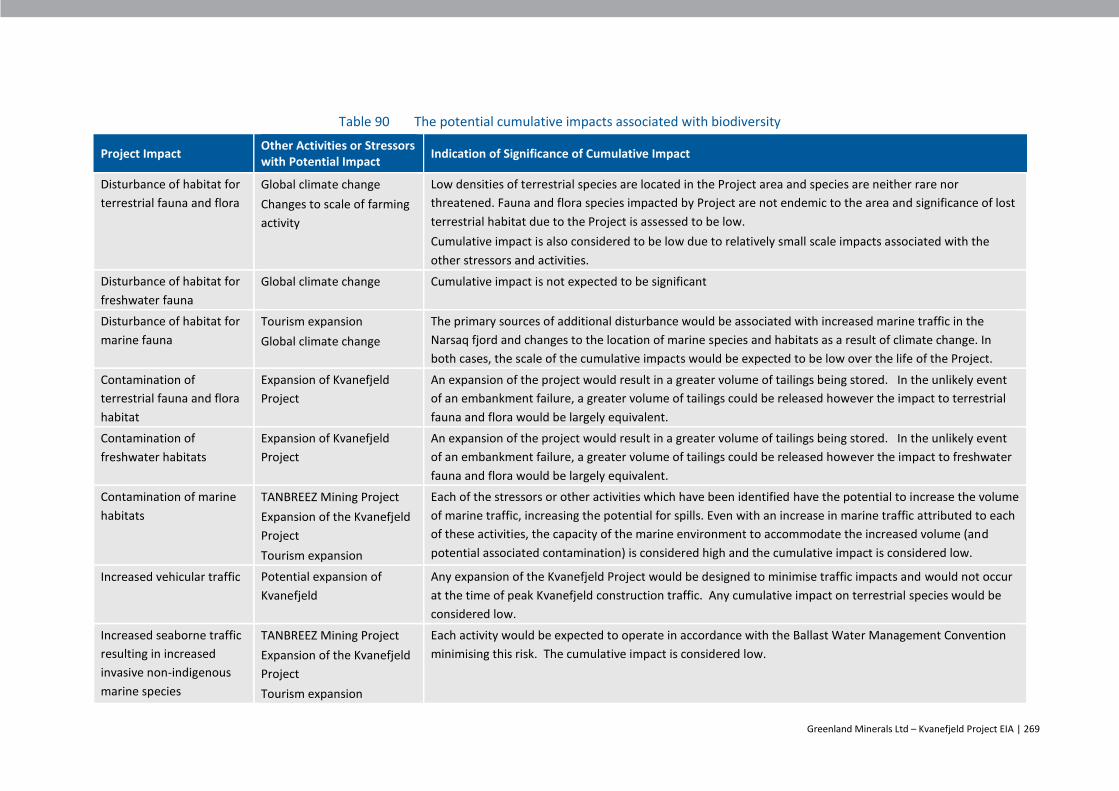
Greenland Minerals Ltd – Kvanefjeld Project EIA | 269
Table 90 The potential cumulative impacts associated with biodiversity
Project Impact Other Activities or Stressors with Potential Impact
Indication of Significance of Cumulative Impact
Disturbance of habitat for
terrestrial fauna and flora
Global climate change
Changes to scale of farming
activity
Low densities of terrestrial species are located in the Project area and species are neither rare nor
threatened. Fauna and flora species impacted by Project are not endemic to the area and significance of lost
terrestrial habitat due to the Project is assessed to be low.
Cumulative impact is also considered to be low due to relatively small scale impacts associated with the
other stressors and activities.
Disturbance of habitat for
freshwater fauna
Global climate change Cumulative impact is not expected to be significant
Disturbance of habitat for
marine fauna
Tourism expansion
Global climate change
The primary sources of additional disturbance would be associated with increased marine traffic in the
Narsaq fjord and changes to the location of marine species and habitats as a result of climate change. In
both cases, the scale of the cumulative impacts would be expected to be low over the life of the Project.
Contamination of
terrestrial fauna and flora
habitat
Expansion of Kvanefjeld
Project
An expansion of the project would result in a greater volume of tailings being stored. In the unlikely event
of an embankment failure, a greater volume of tailings could be released however the impact to terrestrial
fauna and flora would be largely equivalent.
Contamination of
freshwater habitats
Expansion of Kvanefjeld
Project
An expansion of the project would result in a greater volume of tailings being stored. In the unlikely event
of an embankment failure, a greater volume of tailings could be released however the impact to freshwater
fauna and flora would be largely equivalent.
Contamination of marine
habitats
TANBREEZ Mining Project
Expansion of the Kvanefjeld
Project
Tourism expansion
Each of the stressors or other activities which have been identified have the potential to increase the volume
of marine traffic, increasing the potential for spills. Even with an increase in marine traffic attributed to each
of these activities, the capacity of the marine environment to accommodate the increased volume (and
potential associated contamination) is considered high and the cumulative impact is considered low.
Increased vehicular traffic Potential expansion of
Kvanefjeld
Any expansion of the Kvanefjeld Project would be designed to minimise traffic impacts and would not occur
at the time of peak Kvanefjeld construction traffic. Any cumulative impact on terrestrial species would be
considered low.
Increased seaborne traffic
resulting in increased
invasive non-indigenous
marine species
TANBREEZ Mining Project
Expansion of the Kvanefjeld
Project
Tourism expansion
Each activity would be expected to operate in accordance with the Ballast Water Management Convention
minimising this risk. The cumulative impact is considered low.

Greenland Minerals Ltd – Kvanefjeld Project EIA | 270
Section 13 – Local use and cultural heritage
The Project’s potential impacts on local use and cultural heritage are:
Construction and operation of the Project will restrict local use of the area
Construction and operation of the Project will affect some cultural heritage sites.
The other activities and stressors identified in Table 86 are not expected to impact cultural heritage
sites. They may however generate some impact on the local use of the area, in the following ways:
Increased tourism could increase the number of people seeking to make use of the local area
including visiting the UNESCO world heritage sites;
Changes to the scale of farming activity could impact (either positively or negatively) the
access to and availability of areas for local use;
Global climate change could alter the availability and location of berries and other items
which are the current focus of terrestrial foraging activities and the availability and location
of freshwater and marine species which are the subject of fishing activities.
The potential cumulative impacts to foraging for berries, kayaking and farming are specifically
addressed in Table 88. The cumulative impacts on kayaking and farming activities were considered
potentially significant.

Greenland Minerals Ltd – Kvanefjeld Project EIA | 271
15. Environmental Risk Assessment
The Guidelines for preparing an Environmental Impact Assessment (EIA) report for mineral exploitation
in Greenland (2015) notes that the “EIA shall identify, predict, describe, assess and communicate
potential environmental impacts of a proposed mining project in all its phases”. The preceding
Sections of this EIA present all of the predicted potential impacts from the Kvanefjeld mining project,
regardless of their likelihood.
In this risk assessment Section, those environmental effects which “may or may not occur” (i.e. for
which there is a likelihood of occurrence or non-occurrence) are re-assessed in a risk format. Risk
assessments evaluate the likelihood and consequence of an environmental effect occurring as a result
of the Project. The risk assessment process has been undertaken using a systematic approach
consistent with the AS/NZS 31000:2009 Risk Management – Principles and Guidelines, and illustrated
in Figure 78.
Figure 78 AS/NZS 31000:2009 Risk Management – Principles and Guidelines
15.1 Risk Identification
For the purposes of this impact assessment, the risk identification process was informed by the analysis
undertaken in the impact assessment Sections and reported upon in the supporting technical reports.
The risks considered in this assessment represent environmental effects which “may or may not”
occur, as distinct from the majority of impacts assessed in this impact assessment for which there is a
reasonable confidence that they will occur. It is not the intention of the risk assessment to present
new information, but rather to present a subset of the information contained in the impact
assessments chapters in a risk format. The broad criteria for inclusion in the risk assessment are
summarised below:

Greenland Minerals Ltd – Kvanefjeld Project EIA | 272
Risks which have been highlighted as of being of public concern or interest in public
consultations
Real or perceived high consequence, low likelihood events
Unplanned events (e.g. accidents or spills).
Notably, low likelihood and low consequence events have not been assessed except where the issue
is of specific public concern. The decision to exclude low consequence, low likelihood events was made
to ensure the risk register focused on issues of significance, be it either risk significance or public
significance.
15.2 Risk analysis and evaluation
The risk assessment has been prepared using hazards as a starting point, where hazards are defined as
events which can cause harm, and the risk is the probability of that hazard causing a defined level of
harm. For each line in the risk register, a hazard has been defined and a cause associated with that
hazard. Multiple causes may generate a similar hazard.
The harm generated by a hazard (referred to as the consequence) might occur across a range of
environmental receptors. As such, risk consequences have been assessed for each of the relevant
environmental receptors for the same hazard in some instances. The environmental receptors against
which risks were assessed include:
Ecology
Air quality
Surface water
Groundwater
Soil and ground conditions
Landscape and visual impact
Community health.
Risk ratings were determined based on the risk assessments contained in the specialists reports which
inform this EIA. The specialist reports utilise a variety of risk ratings, and as such, a common basis for
the assessment of risk needed to be defined against which all risks could be assessed. The resulting
consequence and likelihood tables against which the risks have been assessed are included as Table
91 and Table 92 respectively. Table 93 illustrates the risk classification matrix which has been applied.
Risks were evaluated at two points: inherent risk and residual risk. The inherent risk measures the
likelihood and consequence of the risk event using the Project design but in the absence of planned
controls. Key references used to inform the risk assessment are noted in the risk table as appropriate.
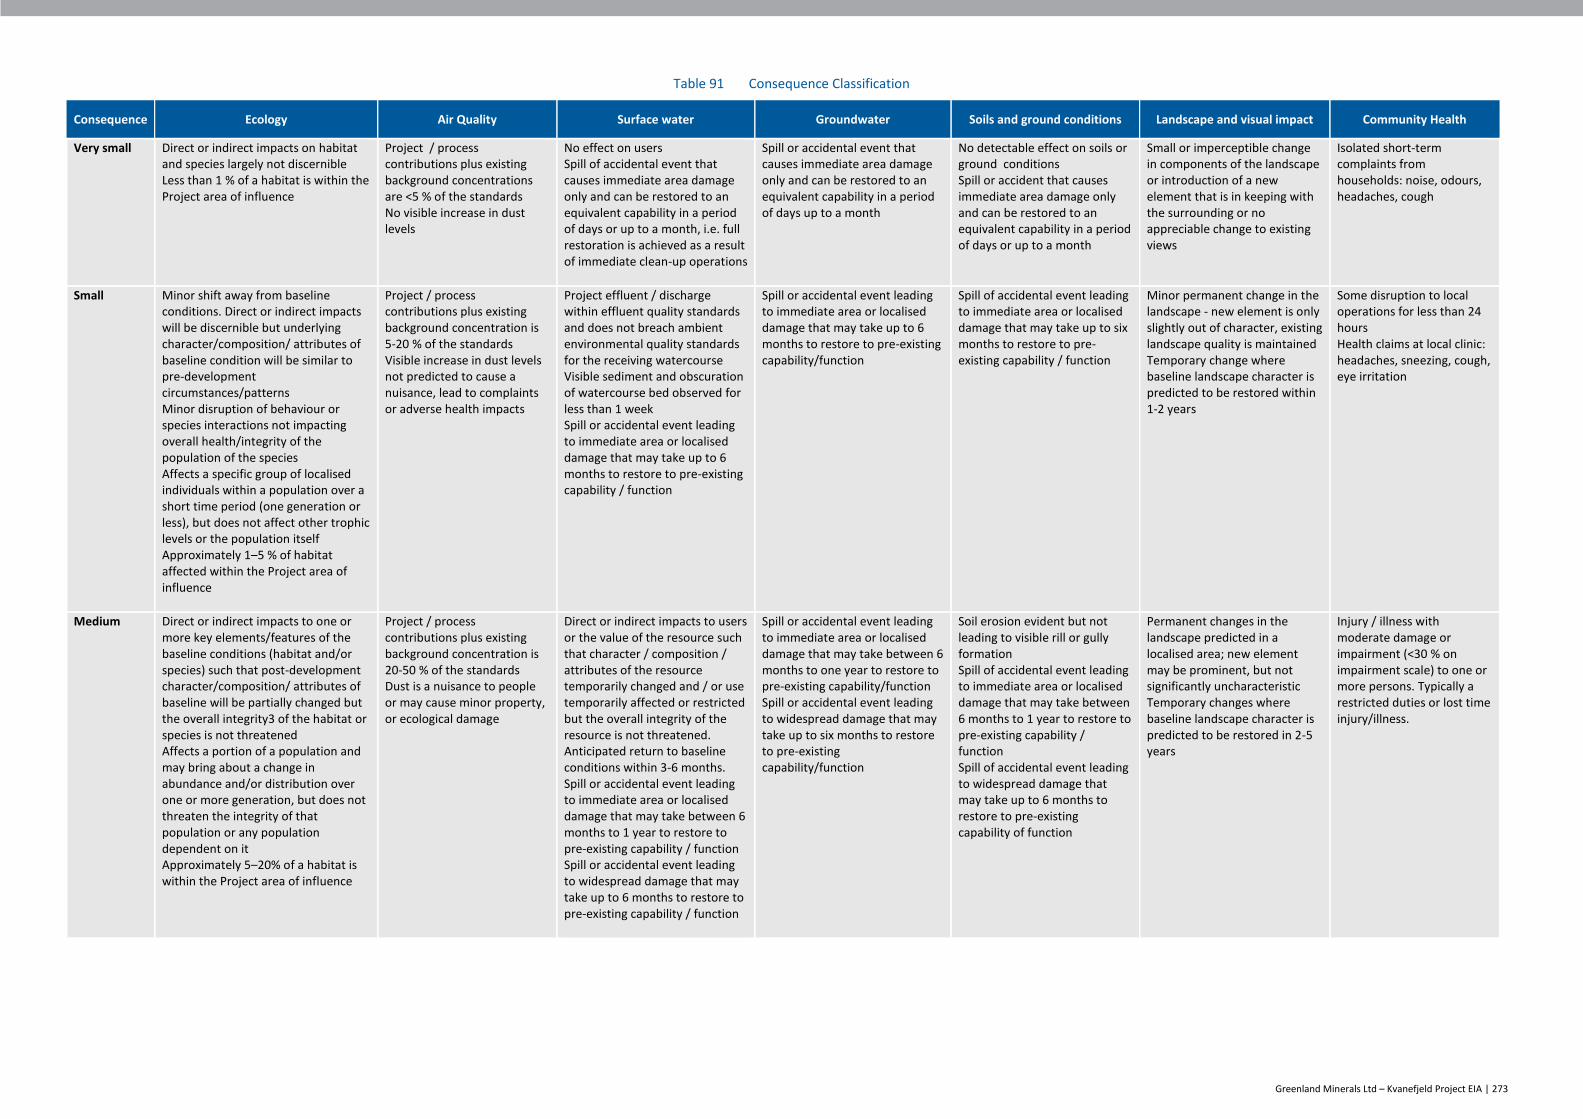
Greenland Minerals Ltd – Kvanefjeld Project EIA | 273
Table 91 Consequence Classification
Consequence Ecology Air Quality Surface water Groundwater Soils and ground conditions Landscape and visual impact Community Health
Very small Direct or indirect impacts on habitat and species largely not discernible Less than 1 % of a habitat is within the Project area of influence
Project / process contributions plus existing background concentrations are <5 % of the standards No visible increase in dust levels
No effect on users Spill of accidental event that causes immediate area damage only and can be restored to an equivalent capability in a period of days or up to a month, i.e. full restoration is achieved as a result of immediate clean-up operations
Spill or accidental event that causes immediate area damage only and can be restored to an equivalent capability in a period of days up to a month
No detectable effect on soils or ground conditions Spill or accident that causes immediate area damage only and can be restored to an equivalent capability in a period of days or up to a month
Small or imperceptible change in components of the landscape or introduction of a new element that is in keeping with the surrounding or no appreciable change to existing views
Isolated short-term complaints from households: noise, odours, headaches, cough
Small Minor shift away from baseline conditions. Direct or indirect impacts will be discernible but underlying character/composition/ attributes of baseline condition will be similar to pre-development circumstances/patterns Minor disruption of behaviour or species interactions not impacting overall health/integrity of the population of the species Affects a specific group of localised individuals within a population over a short time period (one generation or less), but does not affect other trophic levels or the population itself Approximately 1–5 % of habitat affected within the Project area of influence
Project / process contributions plus existing background concentration is 5-20 % of the standards Visible increase in dust levels not predicted to cause a nuisance, lead to complaints or adverse health impacts
Project effluent / discharge within effluent quality standards and does not breach ambient environmental quality standards for the receiving watercourse Visible sediment and obscuration of watercourse bed observed for less than 1 week Spill or accidental event leading to immediate area or localised damage that may take up to 6 months to restore to pre-existing capability / function
Spill or accidental event leading to immediate area or localised damage that may take up to 6 months to restore to pre-existing capability/function
Spill of accidental event leading to immediate area or localised damage that may take up to six months to restore to pre-existing capability / function
Minor permanent change in the landscape - new element is only slightly out of character, existing landscape quality is maintained Temporary change where baseline landscape character is predicted to be restored within 1-2 years
Some disruption to local operations for less than 24 hours Health claims at local clinic: headaches, sneezing, cough, eye irritation
Medium Direct or indirect impacts to one or more key elements/features of the baseline conditions (habitat and/or species) such that post-development character/composition/ attributes of baseline will be partially changed but the overall integrity3 of the habitat or species is not threatened Affects a portion of a population and may bring about a change in abundance and/or distribution over one or more generation, but does not threaten the integrity of that population or any population dependent on it Approximately 5–20% of a habitat is within the Project area of influence
Project / process contributions plus existing background concentration is 20-50 % of the standards Dust is a nuisance to people or may cause minor property, or ecological damage
Direct or indirect impacts to users or the value of the resource such that character / composition / attributes of the resource temporarily changed and / or use temporarily affected or restricted but the overall integrity of the resource is not threatened. Anticipated return to baseline conditions within 3-6 months. Spill or accidental event leading to immediate area or localised damage that may take between 6 months to 1 year to restore to pre-existing capability / function Spill or accidental event leading to widespread damage that may take up to 6 months to restore to pre-existing capability / function
Spill or accidental event leading to immediate area or localised damage that may take between 6 months to one year to restore to pre-existing capability/function Spill or accidental event leading to widespread damage that may take up to six months to restore to pre-existing capability/function
Soil erosion evident but not leading to visible rill or gully formation Spill of accidental event leading to immediate area or localised damage that may take between 6 months to 1 year to restore to pre-existing capability / function Spill of accidental event leading to widespread damage that may take up to 6 months to restore to pre-existing capability of function
Permanent changes in the landscape predicted in a localised area; new element may be prominent, but not significantly uncharacteristic Temporary changes where baseline landscape character is predicted to be restored in 2-5 years
Injury / illness with moderate damage or impairment (<30 % on impairment scale) to one or more persons. Typically a restricted duties or lost time injury/illness.

Greenland Minerals Ltd – Kvanefjeld Project EIA | 274
Consequence Ecology Air Quality Surface water Groundwater Soils and ground conditions Landscape and visual impact Community Health
Large Major direct or indirect impacts to key elements/features of the baseline conditions such that post-development character/composition/attributes will be fundamentally changed and the overall integrity of the habitat or species is threatened Affects an entire population or species in sufficient magnitude to cause a decline in abundance and/or change in distribution beyond which natural recruitment (reproduction, immigration from unaffected areas) would not return that population or species, or any population or species dependent upon it, to its former level within several generations Approximately 20–80% of a habitat is within the Project area of influence Introduction of alien invasive species
Project / process contributions plus existing background concentration is >50 % of the standards Dust is a significant nuisance to people or will cause measurable but not significant health effects, or moderate property or ecological damage
Project effluent / discharge breaches effluent quality standards or ambient environmental quality standard for the receiving water body but rapidly diluted Project causes temporary flooding over a small area Direct or indirect impacts to other users or the value of the resource such that character/ composition/ attributes of the resource post development are changed, threatening the overall integrity of the resource, or use by others significantly restricted on a temporary basis. Guide timescale for return to baseline conditions: 6-12 months Spill or accidental event leading to localised damage that cannot be restored to pre-existing capability/function within one year Spill or accidental event leading to widespread damage that may take six months to one year to restore to pre-existing capability/ function
Direct or indirect impacts to other users or the value of the resource such that character/composition/attributes of the resource such that post development character/composition/attributes changed or use by others significantly restricted on a temporary basis Spill or accidental event leading to localised damage that cannot be restored to pre-existing capability/function within one year Spill or accidental event leading to widespread damage that may take six months to one year to restore to pre-existing capability/ function
Soil erosion predicted to lead to visible rill or gully formation Spill of accidental event leading to localised damage that cannot be restored to pre-existing capability / function within one year Spill or accidental event leading to widespread damage that may take 6 months to 1 year to restore to pre-existing capability / function
Permanent changes over an extensive area and / or new development that will result in significant negative change to the existing landscape character Temporary changes where baseline landscape character is predicted to be restored in 5-10 years
Single fatality or severe permanent impairment to a person (>30 %) e.g. loss of hand or lower limb (at knee), paraplegia
Very large Total loss or very major alteration to key elements/ features of the baseline habitat or a species such that post-development character/composition/ attributes will be fundamentally changed and may be lost altogether Affects an entire population or species in sufficient magnitude to cause a permanent decline in abundance and/or change in distribution >80% of a habitat is within the Project area of influence
Project / process contributions plus existing background concentration is >70% of the standards Dust is a very significant nuisance to people or will cause significant health effects, or significant damage to property.
Project effluent / discharge breaches effluent quality standards or ambient environmental quality standard for the receiving water body and receiving water body has poor pollution capacity Project causes temporary flooding over a large area Total loss or very major alteration to key elements / features of watercourse such that post dement character / composition / attributed will be fundamentally changes and may be lost altogether or use by others permanently impacted. Spill or accidental event leading to widespread damage that cannot be restored to pre-existing capability / function within one year
Total loss or very major alteration to key elements/features of watercourse or aquifer such that post development character/ composition/attributes will be fundamentally changed and may be lost altogether or use by others permanently impacted Spill or accidental event leading to widespread damage that cannot be restored to pre-existing capability/function within one year
Rill or gully formation predicted to be extensive Spill or accidental event leading to widespread damage that cannot be restored to pre-existing capability / function within 1 year
Permanent change over an extensive area and / or introduction of elements that will fundamentally change the landscape character Temporary changes where restoration of baseline landscape character is predicted to take longer than 10 years
Multiple fatalities or severe permanent impairment to multiple people (<5 people).
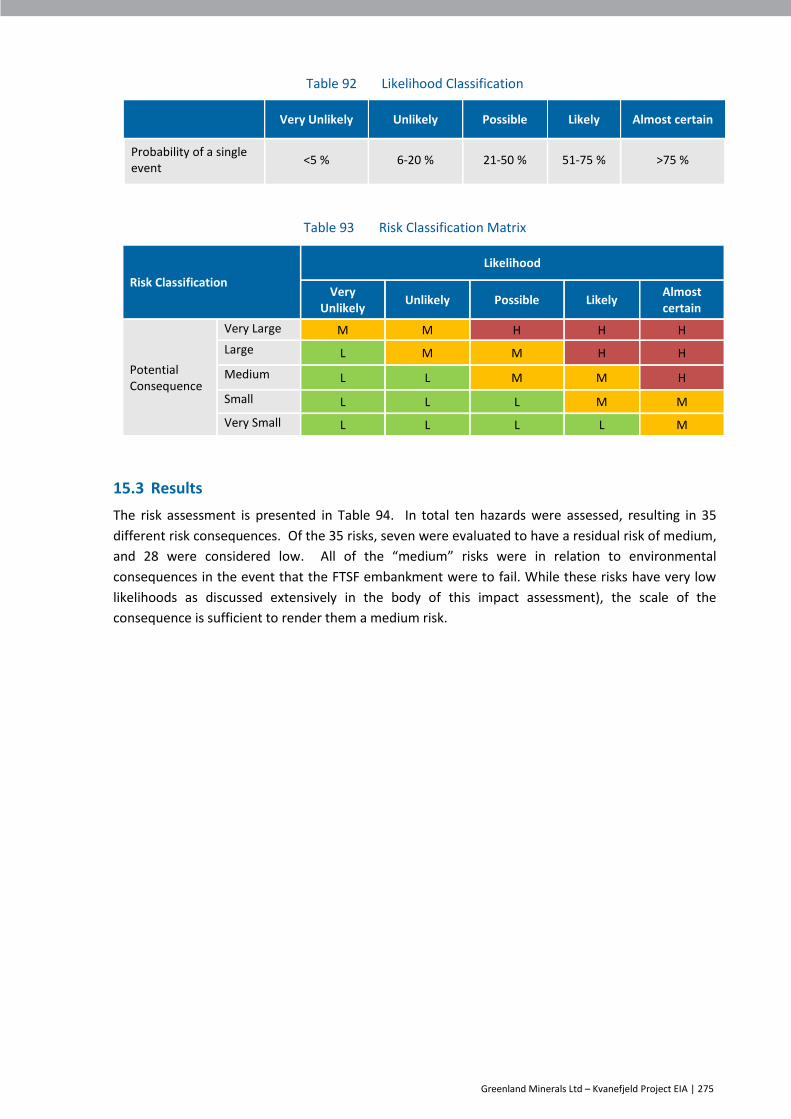
Greenland Minerals Ltd – Kvanefjeld Project EIA | 275
Table 92 Likelihood Classification
Very Unlikely Unlikely Possible Likely Almost certain
Probability of a single event
<5 % 6-20 % 21-50 % 51-75 % >75 %
Table 93 Risk Classification Matrix
Risk Classification
Likelihood
Very Unlikely
Unlikely Possible Likely Almost certain
Potential Consequence
Very Large M M H H H
Large L M M H H
Medium L L M M H
Small L L L M M
Very Small L L L L M
15.3 Results
The risk assessment is presented in Table 94. In total ten hazards were assessed, resulting in 35
different risk consequences. Of the 35 risks, seven were evaluated to have a residual risk of medium,
and 28 were considered low. All of the “medium” risks were in relation to environmental
consequences in the event that the FTSF embankment were to fail. While these risks have very low
likelihoods as discussed extensively in the body of this impact assessment), the scale of the
consequence is sufficient to render them a medium risk.

Greenland Minerals Ltd – Kvanefjeld Project EIA | 276
Table 94 Risk Assessment
Hazard Risk Description Inherent Risk Risk
Rating Reasoning for Assessment Mitigation controls
Residual Risk Risk Rating Cause Consequence Likelihood Consequence Likelihood Consequence
Failure of FTSF and / or CRSF due to a seismic event
Maximum Credible Earthquake (MCE) occurs (M5.4 at 10 km distance from the TSF)
Deformation of the FTSF and / or CRSF embankments as a result of the seismic event, resulting in failure of the tailings facilities
Very Unlikely
Large Low MCE event is a 1:10,000 AEP. MCE event is predicted to cause <5cm of deformation of FTSF and CRSF. Such a level of deformation is not expected to be sufficient to weaken the stability of the embankments. Factor of safety (FoS) for structures remains at 1.1 or higher under MCE circumstances. Embankments will be constructed using BAT, to ICOLD standards. They will be rock-filled and the FTSF embankment will be keyed into competent rock.
No further mitigation measures
Very Unlikely
Large Low
Supernatant discharge from FTSF in operational and post closure phases
Excessive precipitation event or ice blockage causing over-topping (assumed to occur in year 37 for operational failure and after year 49 for post-closure failure) causing supernatant to flow down the Taseq valley, joining the Taseq and Narsaq rivers and reporting to Narsap Ilua. Inundation would be expected in the fan zones of the alluvial area during the period of the event.
Loss of terrestrial flora and fauna / impacts to terrestrial habitats due to water quality, water flow or radiological impacts
Unlikely Small Low In an overtopping event the flow would be contained by the Narsaq river. The release would represent a large water flow (6,900m3/h compared to mean annual flows of 1,300m3/h and 4,150m3/h for the Taseq river and the Narsaq river (at Control Point C) with no anticipated significant effects tothe environment from radioactivity [110]. In a post-closure failure, water quality would be expected to be meet all GWQCs, with the exception of fluoride, at Control point C. In an operational failure, a short-term exceedance of the GWQCs would be expected. Impact to terrestrial habitats on the basis of water quality would be expected to minor. Physical impacts to the terrestrial environment are expected to include a temporary inundation of the grass fields in the alluvial zone during overtopping event. Once the overtopping ceases, the terrestrial habitat is expected to drain into the Narsaq river, with no significant long-term effects [126]. The terrestrial habitats would be expected experience minor scouring and return to pre-event conditions.
No further mitigation measures
Unlikely Small Low
Loss of freshwater flora and fauna / impacts to fresh water habitats due to water quality, water flow or radiological impacts
Unlikely Very small Low Water quality impacts would be expected to be limited and the flow volume would be expected to remain below the peak flow in the Taseq and Narsaq rivers. Minimal impacts to freshwater habitats would be expected for both operational and post-closure failures [110].
No further mitigation measures
Unlikely Very small Low
Loss of marine flora and fauna / impacts to marine habitat due to water quality, water flow or radiological impacts
Unlikely Very small Low The predicted level of radionuclides in Narsap Ilua as a result of an overtopping event were evaluated and in a post-closure failure, levels would not be expected to change from baseline conditions. If an overtopping event occurred during operations, elevated uranium levels could pose a potential risk to phytoplankton. The effect would not be expected to severe (maximum risk quotient of 4.6) and would be expected to be short-term in duration. The impact of an overtopping event on marine habitats would be expected to be low [110].
No further mitigation measures
Unlikely Very small Low

Greenland Minerals Ltd – Kvanefjeld Project EIA | 277
Hazard Risk Description Inherent Risk Risk
Rating Reasoning for Assessment Mitigation controls
Residual Risk Risk Rating Cause Consequence Likelihood Consequence Likelihood Consequence
Radiation impacts to human health associated with supernatant flow
Unlikely Very small Low No impact on human health would be anticipated as the water in the supernatant flow would meet all GWQC with the exception of fluoride in the post closure phase. Radiological dose would not be affected by this failure [110].
During the period of the event, the alluvial fan zone could be temporarily inundated. This would be expected to drain away naturally once the flow ceased. Any areas where water was retained due to surface topography could be manually drained if necessary.
Unlikely Very small Low
Impacts to drinking water in Narsaq
Unlikely Very small Low No impact to Narsaq drinking water is anticipated under this scenario due to a combination of the quality of the water which would be discharged (meeting all GWQCs except for fluoride) and the location of the anticipated temporary inundation zone which would not affect the catchment areas of the Narsaq drinking water supply [110].
No additional mitigation controls required
Unlikely Very small Low
Supernatant and solids loss (partial failure) from FTSF after closure
Piping failure in embankment causing supernatant (liquid above solid tailings deposition) and some solids to flow down the Taseq valley, joining the Taseq and Narsaq rivers and discharging into Narsap Ilua
Loss of terrestrial flora and fauna / impacts to terrestrial habitats due to water quality, water flow or radiological impacts
Unlikely Small Low Under this scenario, embankment materials could be eroded by flowing water, opening a pipe / tunnel for further erosion in the embankment. This could result in 100 % loss of the water cover of the FTSF (13.7 Mm3
during operations and 32.9 Mm3 in a post closure failure and 25 % of flotation tailings solids (15Mm3). 60-70 % of solids would be expected to settle in the lower stretches of the Narsaq river, 30-40 % would settle in Narsap Ilua and less than 5 % would progress through to the fjord [126]. Tailings would be expected to overwhelm the natural river flow in the short-term. Scouring of the river channel would be expected and the river would be significantly altered. Tailings would be expected to primarily be deposited in the existing river channel, reducing impacts on terrestrial species, however some biota would be smothered and would need to re-colonize. The primary influence for radiological exposure associated with a piping failure would be the presence of pore water, and as such, the exposure scenarios for operational and post-closure piping failures are largely equivalent. The maximum estimated short-term risk quotient identified in the radiological analysis was recorded for vascular plants (risk quotient of 14) and zooplankton (risk quotient exceeding 1). As these are quickly reproducing organisms it would be expected that any effect would be short-term in duration. The maximum estimated risk quotient for longer-term exposure is 4.9 for birds that reside in the local environment. This is a conservative assessment [110].
Immediately after the failure, remediation activities would commence to reduce the level of contamination in the environment.
Unlikely Small Low
Loss of freshwater flora and fauna /
Unlikely Large Medium Flow from a piping failure would be expected to overwhelm the natural river flow and would be likely to
No further mitigation measures
Unlikely Large Medium

Greenland Minerals Ltd – Kvanefjeld Project EIA | 278
Hazard Risk Description Inherent Risk Risk
Rating Reasoning for Assessment Mitigation controls
Residual Risk Risk Rating Cause Consequence Likelihood Consequence Likelihood Consequence
impacts to fresh water habitats due to water quality, water flow or radiological impacts
result in biota such as fish being swept out with the flow. In the short-term, the physical effects of the piping failure would the primary cause of impacts to freshwater habitats. The maximum estimated short-term risk quotient identified in the radiological analysis was recorded for zooplankton (risk quotient exceeding 1). As these are quickly reproducing organisms it would be expected that any effect would be short-term in duration. . Radiological assessments indicate that molluscs and zooplankton may experience an elevated risk of radiological impact in the longer-term, however fish were not identified as at risk, and severe effects were not anticipated [110].
Loss of marine flora and fauna / impacts to marine habitat due to water quality, water flow or radiological impacts
Unlikely Large Medium A piping failure has the potential to generate radiological impacts from both the water lost as part of the failure and the deposition of solids. During the period of release, there could be adverse short-term radiological effects on biota in Narsap Ilua (risk quotient for phytoplankton of 100) due to the released water. After the event ceases, radioactivity levels would be expected to decline to close to baseline levels with doses decreasing to below effects levels. The radiological impacts from the batch of water would be significant but short-lived. Longer-term effects from exposure to the tailings solids deposited in Narsap Ilua would also be expected. The tailings would form a new sediment layer in Narsap Ilua, and results indicate there are not expected to be any long-term radiological impacts on biota in Narsap Ilua. However, tailings would smother biota and species would need to recolonize which could take some time [110].
Comprehensive biota monitoring established. Advisory health notices provided to community regarding fish consumption after the event.
Unlikely Large Medium
Radiation impacts to human health associated with supernatant flow
Unlikely Medium Low Pathways assessments of exposure to radiological impacts were completed for the piping scenario, indicating residents of Narsaq could secure up to 20 % of their fish supply from Narsap Ilua without exceeding the public health value of 1mSv/y over background levels per year.
Comprehensive biota monitoring established. Advisory health notices provided to community regarding fish consumption after the event.
Unlikely Medium Low
Embankment failure of FTSF after closure
Catastrophic failure of the embankment generating solids and liquid which travel down Taseq river, through Narsaq valley, discharging in Narsap Ilua, with some flow continuing to the fjord
Loss of terrestrial flora and fauna / impacts to terrestrial habitats due to water quality, water flow or radiological impacts
Unlikely Large Medium A low and a high volume breach scenario have been modelled for the embankment failure. This risk assessment is in relation to the worst case, "high" volume scenario under which 43 Mm3 of material would be lost in the failure if it were to occur in operations and 63Mm3 if it were to occur in the post-closure phase. A catastrophic embankment failure would result in deposition of tailings solids and dam material over a wide area downstream of the breach. Deepest flow would be in the first 1/3 of the breach path, with depths exceeding 25 m and widths of 110 m. After reaching the alluvial fan, flow depth would be approximately 5m (some areas up to 10m) and maximum width of ~640m at the mouth of Narsap Ilua. The total land area impacted would cover 1.84 km2. In the short-term, the primary cause of impact to all habitats will be as a consequence of the deposition of a
Immediately after the failure, remediation activities would commence to reduce the level of contamination in the environment.
Unlikely Large Medium

Greenland Minerals Ltd – Kvanefjeld Project EIA | 279
Hazard Risk Description Inherent Risk Risk
Rating Reasoning for Assessment Mitigation controls
Residual Risk Risk Rating Cause Consequence Likelihood Consequence Likelihood Consequence
large volume of solids and very high flows of liquid. In the areas where tailings would be deposited it would be anticipated that the existing biota would be smothered and species would need to recolonize. The maximum estimated short-term risk quotient
identified in the radiological analysis was recorded for
vascular plants (risk quotient of 14) and zooplankton (risk
quotient exceeding 1). As these are quickly reproducing
organisms it would be expected that any effect would be
short-term in duration.
The maximum estimated risk quotient for longer-term exposure is 4.9 for birds that reside in the local environment. This is a conservative assessment. [110] The terrestrial fauna present in the affected area are common throughout southern Greenland and their conservation is not dependent on local populations. In a catastrophic embankment failure scenario under both operational and post-closure failure scenarios, impacts to species on a local level would be expected, however population level effects are not anticipated due to the comparatively small area of habitat affected by the failure.
Loss of freshwater flora and fauna / impacts to fresh water habitats due to water quality, water flow or radiological impacts
Unlikely Large Medium Significant scouring would be expected and biota such as fish would be swept away with the flow. Aquatic life would be expected to be affected through a number of mechanisms: being buried in slurry or clogging of gills; turbidity that prevents light penetration and photosynthesis from occurring; and altered acidity and temperatures of the water. In the short-term these impacts would overwhelm any radiological exposure impacts. The maximum estimated short-term risk quotient identified in the radiological analysis was recorded for zooplankton (risk quotient exceeding 1). As these are quickly reproducing organisms it would be expected that any effect would be short-term in duration. Radiological assessments indicate that molluscs and zooplankton may experience an elevated risk of radiological impact in the longer-term, however fish were not identified as at risk, and severe effects were not anticipated [110]. Water quality in Narsaq river is expected to achieve compliance with the GWQCs (with the exception of fluoride) within two years of the failure.
Immediately after the failure, remediation activities would commence to reduce the level of contamination in the environment.
Unlikely Large Medium
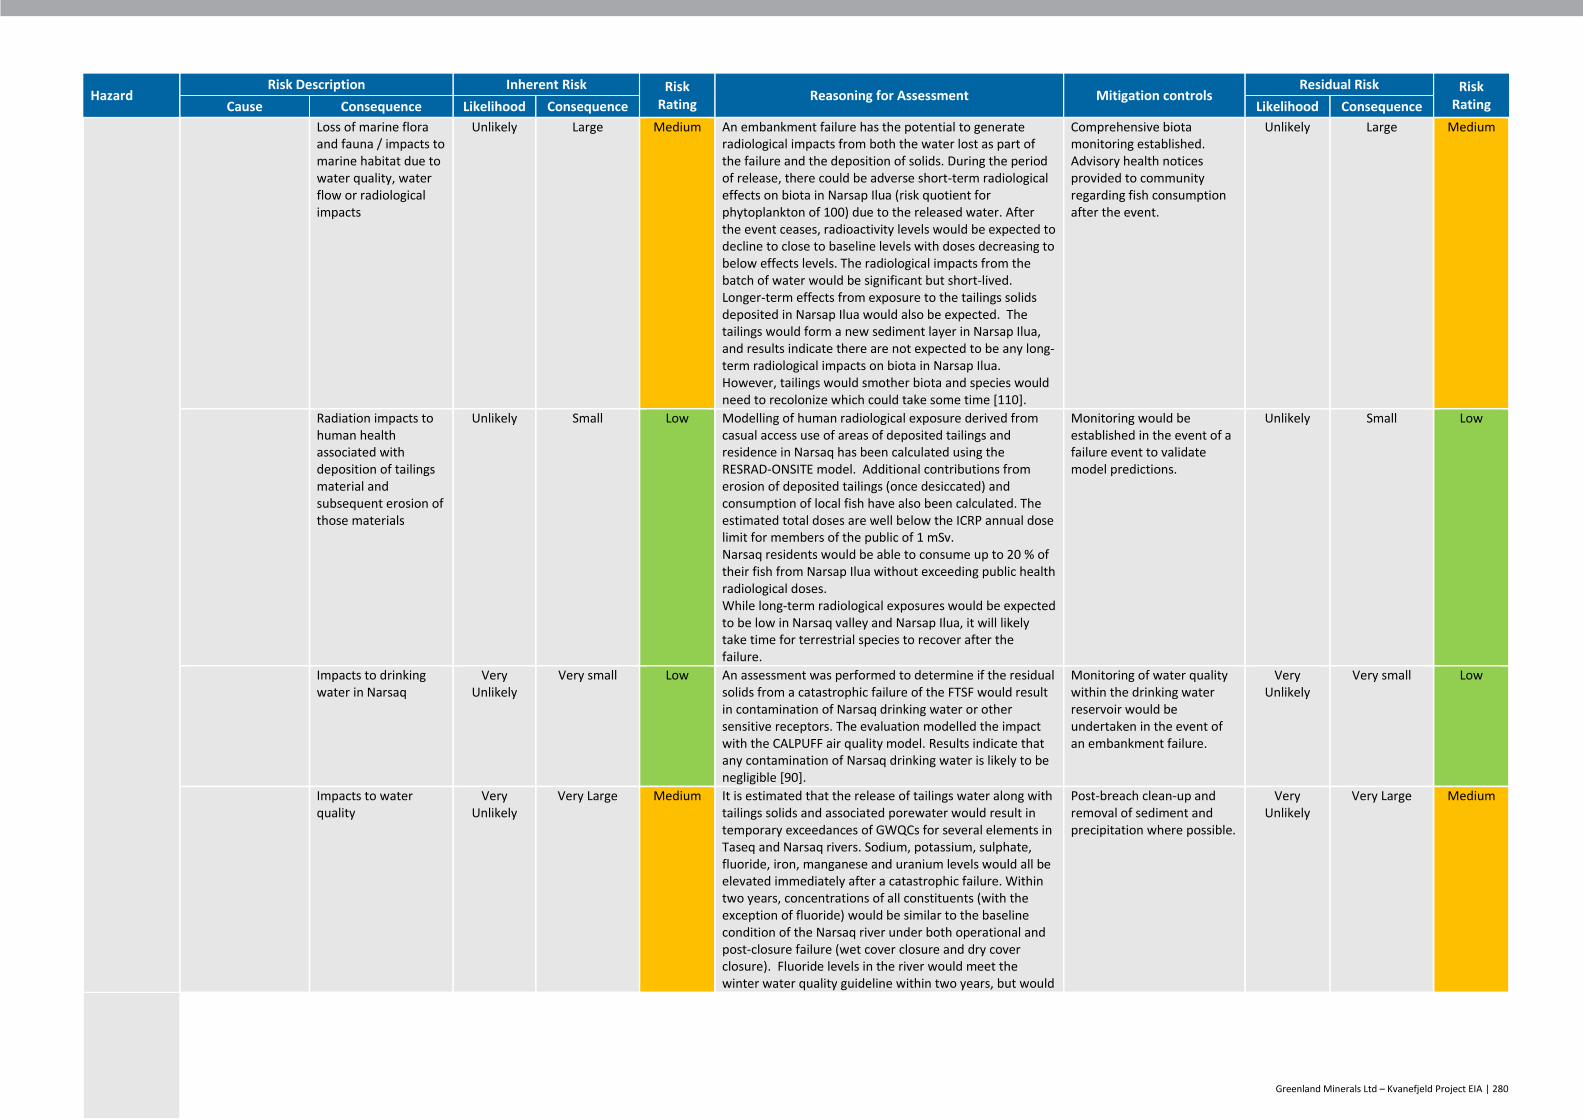
Greenland Minerals Ltd – Kvanefjeld Project EIA | 280
Hazard Risk Description Inherent Risk Risk
Rating Reasoning for Assessment Mitigation controls
Residual Risk Risk Rating Cause Consequence Likelihood Consequence Likelihood Consequence
Loss of marine flora and fauna / impacts to marine habitat due to water quality, water flow or radiological impacts
Unlikely Large Medium An embankment failure has the potential to generate radiological impacts from both the water lost as part of the failure and the deposition of solids. During the period of release, there could be adverse short-term radiological effects on biota in Narsap Ilua (risk quotient for phytoplankton of 100) due to the released water. After the event ceases, radioactivity levels would be expected to decline to close to baseline levels with doses decreasing to below effects levels. The radiological impacts from the batch of water would be significant but short-lived. Longer-term effects from exposure to the tailings solids deposited in Narsap Ilua would also be expected. The tailings would form a new sediment layer in Narsap Ilua, and results indicate there are not expected to be any long-term radiological impacts on biota in Narsap Ilua. However, tailings would smother biota and species would need to recolonize which could take some time [110].
Comprehensive biota monitoring established. Advisory health notices provided to community regarding fish consumption after the event.
Unlikely Large Medium
Radiation impacts to human health associated with deposition of tailings material and subsequent erosion of those materials
Unlikely Small Low Modelling of human radiological exposure derived from casual access use of areas of deposited tailings and residence in Narsaq has been calculated using the RESRAD-ONSITE model. Additional contributions from erosion of deposited tailings (once desiccated) and consumption of local fish have also been calculated. The estimated total doses are well below the ICRP annual dose limit for members of the public of 1 mSv. Narsaq residents would be able to consume up to 20 % of their fish from Narsap Ilua without exceeding public health radiological doses. While long-term radiological exposures would be expected to be low in Narsaq valley and Narsap Ilua, it will likely take time for terrestrial species to recover after the failure.
Monitoring would be established in the event of a failure event to validate model predictions.
Unlikely Small Low
Impacts to drinking water in Narsaq
Very Unlikely
Very small Low An assessment was performed to determine if the residual solids from a catastrophic failure of the FTSF would result in contamination of Narsaq drinking water or other sensitive receptors. The evaluation modelled the impact with the CALPUFF air quality model. Results indicate that any contamination of Narsaq drinking water is likely to be negligible [90].
Monitoring of water quality within the drinking water reservoir would be undertaken in the event of an embankment failure.
Very Unlikely
Very small Low
Impacts to water quality
Very Unlikely
Very Large Medium It is estimated that the release of tailings water along with tailings solids and associated porewater would result in temporary exceedances of GWQCs for several elements in Taseq and Narsaq rivers. Sodium, potassium, sulphate, fluoride, iron, manganese and uranium levels would all be elevated immediately after a catastrophic failure. Within two years, concentrations of all constituents (with the exception of fluoride) would be similar to the baseline condition of the Narsaq river under both operational and post-closure failure (wet cover closure and dry cover closure). Fluoride levels in the river would meet the winter water quality guideline within two years, but would
Post-breach clean-up and removal of sediment and precipitation where possible.
Very Unlikely
Very Large Medium

Greenland Minerals Ltd – Kvanefjeld Project EIA | 281
Hazard Risk Description Inherent Risk Risk
Rating Reasoning for Assessment Mitigation controls
Residual Risk Risk Rating Cause Consequence Likelihood Consequence Likelihood Consequence
only achieve the summer water quality guideline between 10-20 years later depending on the Project phase when failure to occurred.
Potential loss of life due to embankment failure
Very Unlikely
Very Large Medium The "population at risk" (PAR) includes all people who would be directly exposed to flood waters assuming they take no action to evacuate. In the post closure phase the number of people who may be in this environment is not likely to be high as it is only used for recreation on an occasional basis. A PAR of between 1-10 has been estimated for this context. In the event that the embankment failed, and individuals were downstream of the facility at the time of the failure, the speed of the failure could result in a loss of life.
Installation of alarms to warn of changes in the stress regime within the FTSF Monitoring of TSF embankment in accordance with ANCOLD requirements.
Very Unlikely
Very Large Medium
Impacts to the town of Narsaq
Very Unlikely
Small Low The town of Narsaq is outside of the flow path of all modelled scenarios and as such, neither inundation nor tailings deposition would be expected to affect the town of Narsaq. Radiological exposure levels for residents of Narsaq and casual users of the Narsaq valley would not exceed public health exposure levels in a post breach embankment failure scenario.
Community safety training would be conducted on a regular basis to inform Narsaq residents of risks and emergency preparedness measures.
Very Unlikely
Small Low
Embankment failure of FTSF and CRSF in post closure phase
An event which causes both the CRSF and FTSF to fail releasing tailingsdown Taseq river, through Narsaq valley, discharging in Narsap Ilua, with some flow continuing to the fjord
Radiological impacts to terrestrial, marine and freshwater species due to the combined tailings flow
Unlikely Medium Low CRSF and FTSF are both built to BAT. Failure of the FTSF in isolation is not predicted to have the potential to cause the failure of the CRSF. In the event both failed, a sensitivity analysis was conducted to determine the radiological consequences of the tailings on the environment [5]. Risk quotients for freshwater species were predicted to be higher (6 compared to 4.9 for birds) however remain well below the level associated with severe effects in the long-term. Potential for impacts to phytoplankton in the marine environment and lichen in the terrestrial environment were also noted, however in all cases, risk quotients did not indicate a severe effect. The sensitivity analysis concluded that the combined release of the CRSF and FTSF would generate dose estimates approximately 20-30 % higher than those recorded for the failure of the FTSF in isolation.
Immediately after the failure, remediation activities would commence to reduce the level of contamination in the environment. The primary initial impact of the failure would be physical, as described in the next risk. None of the longer-term radiological effects to species are expected to have severe effects, however, some species may time take to re-colonize areas due to loss sustained from the physical impacts of the failure.
Unlikely Medium Low
Physical impacts to terrestrial, marine and freshwater species due to the combined tailings flow
Unlikely Large Medium CRSF and FTSF are both built to BAT. Failure of the FTSF in isolation is not predicted to have the potential to cause the failure of the CRSF. In the event that both embankments failed, the volume of tailings would be expected to increase by 10 % (proportional to the size of the two facilities). While a significant increase, this additional volume would not be expected to reach any environmental tipping points generating demonstrably different physical impacts from those anticipated under the FTSF failure scenario.
Immediately after the failure, remediation activities would commence to reduce the level of contamination in the environment.
Unlikely Large Medium

Greenland Minerals Ltd – Kvanefjeld Project EIA | 282
Hazard Risk Description Inherent Risk Risk
Rating Reasoning for Assessment Mitigation controls
Residual Risk Risk Rating Cause Consequence Likelihood Consequence Likelihood Consequence
Uncontrolled seepage from the TSF
Insufficient characterisation of groundwater connectivity results in significant seepage from the TSF to seeps
Impacts to surface water quality
Possible Small Low Connectivity between groundwater and surface water is understood to be limited, making this risk unlikely. In the event that some seepage is identified, volumes would not be expected to be significant given the stability of the Taseq lake water level.
In the event of significant seepage being identified with elevated fluoride levels, the Project could implement a water treatment plant prior to the discharge of liquid into the TSF
Possible Small Low
Impacts to drinking water in Narsaq
Possible Small Low Connectivity between groundwater and surface water is understood to be limited.
In the event of seepage occurring, the risk of impacts to the Narsaq drinking water supply are limited due to the dilution effects which would occur and if necessary, potentially affected drinking water sources could be suspended in an extreme event.
Possible Very small Low
Aerosol spray generated from surface of TSF
High winds (foehn conditions) generate aerosol spray on the TSF with deposition beyond the confines of the TSF facility
Impacts to the Narsaq drinking water catchment and supply
Unlikely Small Low An aerosol dispersion model estimated the deposition of fluoride if 1 % and 10 % of aerosol spray from the TSF under foehn conditions landed in the Narsaq drinking water catchment. If 10 % is considered (the maximum case) to land in the 6 km2 area of the Narsaq drinking water catchment, the maximum buffer load of 4,500 kg/y (considering WHO Guidelines for drinking water quality and baseline fluoride levels) would only be exceeded if foehn events lasted for more than 335 hours. Deposition of aerosols in Narsaq drinking water catchment is considered unlikely due to wind direction, topography and mountain ridge separating Taseq valley with the area used for abstraction of raw water to Narsaq water supply. Critical load assessments indicate that potential impacts to Narsaq water quality are considered low. [59].
In the event that foehn winds were shown to be generating changes in the water quality for Narsaq, additional water treatment could be implemented at the TSF to improve water quality in the supernatant prior to discharge. Environmental monitoring will be undertaken at Point C control point (Narsaq river just after confluence with Taseq river), allowing early identification of changes in water quality requiring intervention.
Unlikely Very small Low
Impacts to flora and fauna in the Ilua Valley
Unlikely Very small Low Deposition of aerosol spray could potentially cover an area of 10km2. This would predominantly cover the Narsaq Valley. Spray could desiccate and remain on land for an extended period, however concentrations would remain low with no significant impact on flora and fauna anticipated.
In the event that environmental impacts were identified as a result of aerosol spray dispersion, options to improve water quality at the TSF could be advanced.
Unlikely Very small Low
Impacts to surface water quality
Unlikely Large Low Short-term exceedance of ambient water quality guidelines anticipated.
In the event that environmental impacts were identified as a result of aerosol spray dispersion, options to improve water quality at the TSF could be advanced.
Unlikely Large Low

Greenland Minerals Ltd – Kvanefjeld Project EIA | 283
Hazard Risk Description Inherent Risk Risk
Rating Reasoning for Assessment Mitigation controls
Residual Risk Risk Rating Cause Consequence Likelihood Consequence Likelihood Consequence
Accidental spill of tailings slurry
Pipeline rupture and / or water treatment plant failure
Impacts to water quality
Possible Medium Medium If the water treatment plant were to fail during the operations or 6 year closure phases, production would cease and as would placement of water in Nordre Sermilik. Significant water storage is available in the TSF and at the Plant site to retain volumes until the equipment is repaired.
Pressure sensors and block values will be installed on slurry pipelines to detect spills Emergency procedures and programme interlocks would be activated to minimise the leak or rupture
Unlikely Medium Low
Accidental spill of uranium oxide in Narsaq valley
Truck roll-over in Narsaq valley spilling uranium oxide being transported to the Port
Impacts to human health due to radiation exposure (worker exposure to gamma radiation)
Very Unlikely
very small Low The likelihood of a rollover accident involving a truck transporting uranium oxide has been calculated to be 4.4 x 10⁻⁶ per year. Applying conditional probabilities to the likelihood of that accident resulting in the release of uranium oxide, renders the probability of release of uranium oxide in the environments very unlikely (a 1 in 4.3 million event per year). Uranium oxide will be packed in sealed 200-litre drums at the refinery and loaded into containers and transported to the Port on flatbed trucks in accordance with IAEA Safety Standards. Approximately 40 containers of drummed uranium oxide will be transported from the refinery to the Port each year Specific uranium transport assessment has been carried out for the Project. Assuming maximum 10 hour clean-up exposure, maximum dose received would be 0.026 mSv per accident (compared to ICRP recommended radiation dose limit for member pf public of 1mSv per annum over natural background levels) [3].
PPE would be worn by workers during spill clean-up Likelihood of accident is very low, and driver training will further minimise risk of accident.
Very Unlikely
very small Low
Impacts to human health due to radiation exposure (worker inhalation)
Very Unlikely
Very small Low Modelling indicates a dose exposure for a driver or worker present at the time of the accident and involved in cleaning up a spill to be 0.164 mSv, which is considerably lower than the regulatory dose limit (1 mSv/yr). No overall adverse health effects are expected for the driver exposed to the dust following an accident.
PPE would be worn by workers during clean-up. Likelihood of accident is very low, and driver training will further minimise risk of accident.
Very Unlikely
Very small Low
Air quality impact for public following an accident
Very Unlikely
Very small Low The public are not anticipated to be closer than 100 m from an accident. Any dust generated by the event would be expected to settle in close proximity, resulting in a lower radiation exposure than that modelled for workers - making it well below dose limits.
Driver training will further minimise risk of accident. In the event of an accident, restrictions would be put in place to avoid public access to the site in the short-term
Very Unlikely
Very small Low
Impacts to fauna and flora due to spill
Very Unlikely
Medium Low Impacts to fauna and flora present on a small terrestrial area. Individuals could be affected but impacts would not affect significant population of species or proportion of habitat [3].
Comprehensive clean-up would be undertaken to remove as much spilled material as possible immediately after the spill
Very Unlikely
Small Low
Impacts to surface water quality
Very Unlikely
Small Low Short-term impacts to surface water quality could result from drainage from spill location, however impacts would be lower than risk assessed for spill directly into harbour or river (see below).
Comprehensive clean-up would be undertaken to remove as much spilled material as possible immediately after the spill
Very Unlikely
Small Low

Greenland Minerals Ltd – Kvanefjeld Project EIA | 284
Hazard Risk Description Inherent Risk Risk
Rating Reasoning for Assessment Mitigation controls
Residual Risk Risk Rating Cause Consequence Likelihood Consequence Likelihood Consequence
Impacts to soil quality and sediment
Very Unlikely
Small Low Impacts to soil quality and sediment in immediate vicinity of spill [3].
Comprehensive clean-up would be undertaken to remove as much spilled material as possible immediately after the spill
Very Unlikely
Small Low
Accidental spill of uranium oxide in harbour or into rivers
Handling error when transporting uranium oxide in Port area
Impacts to human health due to radiation exposure (workers)
Very Unlikely
Very small Low Exposure of workers would be limited dur to use of mechanical equipment at Port and immediate water cover over any lost uranium oxide. Impacts would be significantly lower than those predicted for spills on land.
Risk of accident is minimised by use of mechanical equipment for moving containers where possible, reducing interaction between workers and containers. PPE would be worn by workers during clean-up. Comprehensive clean-up would be undertaken to remove as much spilled material as possible immediately after the spill Impact would be lower in winter due to solid state of some water courses.
Very Unlikely
Very small Low
Impacts to surface water quality
Very Unlikely
Small Low Short-term impacts on water quality (exceeding drinking water standards if water were sourced from downstream of spill) could occur for a period of a few weeks.
Comprehensive clean-up would be undertaken to remove as much spilled material as possible immediately after the spill Impact would be lower in winter due to solid state of some water courses.
Very Unlikely
Small Low
Impacts to aquatic species in the harbour
Very Unlikely
Medium Low Short-term impacts to individual species could occur but population level effects on biota would not be expected. In the long-term the released material would need to be contained, removed and the area remediated. Fate and transport modelling and exposure pathway modelling indicates that a major clean-up effort would remove >90% of released materials. In the longer-term the quality of sediment may be impacted resulting in undesirable exposure of benthic invertebrates and other biota exposed to contaminated water and sediments.
Comprehensive clean-up would be undertaken to remove as much spilled material as possible immediately after the spill Impact would be lower in winter due to solid state of some water courses.
Very Unlikely
Small Low

Greenland Mineral Ltd – Kvanefjeld Project EIA | 285
16. References
[1] Amec Foster Wheeler Earth & Environmental UK Ltd. 2017. Flotation Tailings and Chemical
Residue Storage Facilities Feasibility Study, Kvanefjeld Rare Earth and Uranium Project,
Greenland. 256 pp.
[2] AMEC Minproc. 2011. Kvanefjeld Multi Element Project Tailings Management Options,
Presentation. 26 pp.
[3] ARCADIS. 2015. Uranium Product Transportation Assessment, Kvanefjeld Multi-Element
Project, Narsaq Area, Greenland. 35 pp.
[4] ARCADIS. 2015. Radiation Monitoring Plan Outline, Kvanefjeld Multi-Element Project, Narsaq
Area, Greenland. 7 pp.
[5] ARCADIS. 2019. Radiological Assessment for the Kvanefjeld Multi-element Project, Narsaq
Area, Greenland. 453 pp.
[6] ARCADIS. 2020. Rev 1 Radon and Thoron Releases – Mining the Kvanefjeld Rare Element
Resource, Narsaq Area, Greenland. 64 pp.
[8] Auerbach, N. A., M. D. Walker & D. A. Walker, 1997. Effects of roadside disturbance on soil
and vegetation properties in Arctic tundra. Ecological Applications, 7: 218–235.
[9] Boertmann, D., Lungs, P., Merkel, F.R. and Mosbech, A. 2004. The significance of Southwest
Greenland as winter quarters for seabirds. Bird Conservation International, 14: 87-112.
[10] Boertmann, D., Bay, C. Grønlands Rødliste, 2018. -Aarhus University, Department of
Bioscience - http://www.natur.gl/en/roedliste/.
[11] Boulanger, J., K.G. Poole, A. Gunn and J. Wierzchowski, 2012. Estimating the zone of in-fluence
of industrial developments on wildlife: a migratory caribou Rangifer tarandus groenlandicus
and diamond mine case study. Wildlife Biology 18(2): 164-179.
[12] Rypdal, K. et al. (2006) IPCC Guidelines for National Greenhouse Gas Inventories - Volume 1
General Guidance and Reporting - Introduction. 12 pp.
[13] Christensen, T., Falk, K., Boye, T., Ugarte, F., Boertmann, D. & Mosbech, A. 2012. Identifi kation
af sårbare marine områder i den grønlandske/danske del af Arktis. Aarhus Universitet, DCE –
Nationalt Center for Miljø og Energi. 72 pp.
[14] Danish Maritime Authority Order no. 417 of 28 May 2009: “Order on technical regulation on
safety of navigation in Greenland territorial waters.” 4 pp.
[15] DHI. 2015. Kvanefjeld Marine Discharges and Fjord Dynamics – Ecotoxicity test of the mixture
of TWP and Barren Chloride. 54 pp.
[16] DHI. 2015. Kvanefjeld Marine Discharges and Fjord Dynamics – Modelling and Interpretation
of Ecotoxicology Studies. 104 pp.
[17] DHI. 2019. Kvanefjeld Marine Discharges and Fjord Dynamics - Modelling and Interpretation
of Ecotoxicology Studies – Final Report. 93pp.

Greenland Minerals Ltd – Kvanefjeld Project EIA | 286
[18] ECHA 2008. Guidance on information requirements and chemical safety assessment. Chapter
R.10: Characterisation of dose [concentration]-response for environment.
[19] ERM. 2020. Air Quality Assessment – Project. 232 pp.
[20] ERM. 2019. Final Report - Greenhouse Gas Assessment – Kvanefjeld Uranium Mine Project. 43
pp.
[21] Enrberg Simonsen, C. 2014. Botanical investigations concerning the GME mining Project at
Kvanefjeld in south Greenland 2013-14. 42 pp.
[22] Feilberg, J. 1984. A phytogeographical study of South Greenland: Vascular plants. Meddelelser
om Grønland, Bioscience 15. 72 pp. - https://www.mtp.dk/details.asp?eln=201491
[23] GHD. 2018. Kvanefjeld Rare Earth Element Mine: GoldSim Life of Mine Modelling (Water). 46
pp.
[24] GHD. 2018. Kvanefjeld Multi-Element Project: Preliminary Groundwater Impact Assessment
from Tailings. 52 pp.
[25] GHD. 2019. Letter. Discussion of downstream construction of tailings storage facilities. 6 pp.
[26] Kommune Kujalleq 2015. Regulations for disposal of hazardous waste (Regulativ for
bortskaffelse af miljøfarligt affald).
[27] GML. 2015. CO2 reduction from Uranium production. 5 pp.
[28] GML. 2015. Project – Dust Control Plan. 50 pp.
[29] GML. 2016. Feasibility Study Update. 501 pp.
[30] GML. 2019. Pit Water Composition at 37 years. 15 pp.
[31] GML. 2019. DCE Waste Rock Run-off Calculation using Humidity Cell Test Results. 27 pp.
[32] GML. 2019. Narsaq Water Requirements and Mine Water. 13 pp.
[33] Grønlands Fiskeriundersøgelser. 1982. Fjeldørredundersøgelser i Narsaq Elv, 1981. 39 pp.
[34] Grønlands Statistic. 2019. Greenland in Figures 2019. 40 pp.
[35] International Atomic Energy Agency Safety Standards. 2018. Occupational Radiation
Protection. General Safety Guide No. GSG-7, Vienna 2018. 320 pp.
[36] International Atomic Energy Agency. 2009. Best practice in environmental management of
uranium mining. Series No. NF-T-1.2 47, Vienna 2009. 47 pp.
[37] International Atomic Energy Agency. 2009. NF-T-1.1: Establishment of Uranium Mining and
Processing Operations in the Context of Sustainable Development. Vienna, 2009. 80 pp.
[38] International Atomic Energy Agency. 2018. SSR-6: Regulation for the Safe Transport of
Radioactive Material. Specific Safety Requirements No. SSR-6 (Rev. 1). Vienna, 2018. 190pp.
[39] Joint Ore Reserves Committee (JORC). 2012. Australasian Code for reporting of exploration
results, mineral resources and ore reserves, 2012 edition. 44pp.
Greenland Minerals Ltd – Kvanefjeld Project EIA | 287
[40] Kapel, H. 2009. Archaeological interests in the area around Kvanefjeld, Narsaq. Preliminary
evaluation of the vulnerability of ancient, protected monuments. Nunatta Katersugaasivia
Allagaateqarfialu. Greenland National Museum and Archives. 9 pp.
[41] International Maritime Organisation (IMO). 2009. Resolution A.1024 (26). Guidelines for Ships
Operating in Polar Waters. 35 pp.
[42] International Maritime Organisation (IMO). 1973. (IMO). International Convention for the
Prevention of Pollution from Ships (MARPOL),
http://www.imo.org/en/About/Conventions/ListOfConventions/Pages/International-
Convention-for-the-Prevention-of-Pollution-from-Ships-(MARPOL).aspx Accessed May 2020.
[43] International Maritime Organisation 2004. International Convention for the Control and
Management of Ships' Ballast Water and Sediments (BWM),
http://www.imo.org/en/About/Conventions/ListOfConventions/Pages/International-
Convention-for-the-Control-and-Management-of-Ships'-Ballast-Water-and-Sediments-
(BWM).aspx. Accessed May 2020.
[44] International Maritime Organisation 1990. International Convention on Oil Pollution
Preparedness, Response and Co-operation (OPRC),
http://www.imo.org/en/About/Conventions/ListOfConventions/Pages/International-
Convention-on-Oil-Pollution-Preparedness,-Response-and-Co-operation-(OPRC).aspx
Accessed May 2020
[45] Mineral Resources Authority. 2015. Guidelines for preparing an Environmental Impact
Assessment (EIA) report for mineral exploitation in Greenland. 24 pp.
[46] Mosbech, A., Boertmann, D., Olsen, B.Ø., Olsvig, S., von Platen, F., Buch, E., Hansen, K.Q., Rash,
M., Nielsen, N., Møller, H.S., Potter, S., Andreasen, C., Berglund, J. & Myrup, M. 2004.
Environmental Oil Spill Sensivity Atlas for south Greenland Coastal Zone. National
Environmental Research Institute, Denmark. 341 pp. - NERI Technical Report No. 493.
[47] Myers-Smith, I.H., B,K. Arnesen, R.M. Thompson and F.S. Chapin III, 2006. Cumulative impacts
on Alaskan Arctic tundra of a quarter century of road dust. Ecoscience 13(4): pp 503-510.
[48] Myrup, M. 2010. Archaeological survey Narsaq 2010. Nunatta Katersugaasivia
Allagaateqarfialu. Greenland National Museum and Archives. 18 pp.
[49] Nielsen, S.P. 2005. Radionuclides in seal flesh and liver. In Proceedings of the Summary
Seminar within the NKS-B Programme 2002-2005. 24-25 October 2005, Tartu, Estonia. pp 89-
93.
[50] OECD Nuclear Energy Agency (NEA). 2014. Managing Environmental and Health Impacts of
Uranium Mining. NEA No. 7062. 144 pp
[51] Orbicon. 2014. Kvanefjeld Hydrology. 41 pp.
[51a] Orbicon. 2014. Kvanefjeld Hydrology - Annexes 1 and 2. 74 pp.
[52] Orbicon. 2015. Kvanefjeld Multi-Element Project – Technical Report: Noise Assessment. 41 pp.
[53] Orbicon. 2015. Kvanefjeld Multi-Element Project – Technical Report: Water Quality
Assessment of Tailings - Water and Waste Rock Run off. 97 pp.

Greenland Minerals Ltd – Kvanefjeld Project EIA | 288
[54] Orbicon. 2015. Local Use Study Kvanefjeld. 35 pp.
[55] Orbicon. 2015d. Greenland Mining and Energy Limited - Technical report: Oil and chemicals
and assessment of potential impacts of spills. 53 pp.
[56] Orbicon. 2017. Kvanefjeld Hydrology, Water and Mass Balance. 28 pp.
[57] Orbicon. 2018. The Natural Environment of the Study Area. 67 pp.
[58] Orbicon. 2018. Kvanefjeld Multi-Element Project – Technical Report: Water Quality
Assessment of Tailings - Water and Waste Rock Run off. 402 pp.
[59] Orbicon. 2018. Note on Wind Dispersion of Polluted Water from Taseq. 66 pp.
[60] Orbicon. 2018. Taseq Basin – Groundwater Hydrology.
[61] Orbicon. 2019. Safe Fluoride Levels in Taseq Tailings Dam. Technical Report. May 2019. 12 pp.
[64] Rambøll Danmark. 2014. Kvanefjeld Port Feasibility Study, Part II – Conceptual Design. 79pp.
[65] SENES Consultants (an ARCADIS Company). 2011. Kiggavik Project Transportation Risk
Assessment, Prepared for: AREVA Resources Canada Inc. 106 pp.
[66] SENES Consultants (an ARCADIS Company). 2014. Risk Assessment of Transportation of
Uranium Ore Concentrate (UOC) in Canada, Prepared for: AREVA Resources Canada Inc. 236
pp.
[67] SGS Lakefield Oretest Pty Ltd. 2013. Geochemical/Environmental Testwork on Kvanefjeld
Materials. 45 pp.
[68] SRK Consulting. 2015. Kvanefjeld Project Mining Study. 74 pp.
[69] Shared Resources Pty Ltd. 2018. Greenland Minerals Kvanefjeld Project Social Impact
Asssessment. 304 pp.
[70] UNSCEAR. 2008. Sources and Effects of Ionizing Radiation - Volume II, Scientific Annexes C, D
and E. 179 pp.
[71] World Health Organisation. 2017. Guidelines for Drinking-Water Quality. 4th Ed. 631 pp.
[72] Wood Group. 2018. Kvanefjeld Project - TSF Environmental Risk Assessment - Tailings Disposal
and Closure Cover Options Document No. L157-18-R2429. 62pp.
[73] GML. 2019. Production of Fluoride and Mass Balance. 8 pp.
[74] Klohn Crippen Berger. 2020. Taseq Lake FTSF Dam Failure Report - Final. 37 pp.
[75] Klohn Crippen Berger. 2020. Kvanefjeld Multi-Element Project - Seismic Stability Assessment
of FTSF and CRSF Dams - Revision 3. 14 pp.
[76] GML. 2019. Hydrology Summary Key Points. 14 pp.
[77] Klohn Crippen Berger. 2020. Kvanefjeld Rare Earths Project - Closure Cover Options
Comparison Assessment - Revision 2. 18 pp.

Greenland Minerals Ltd – Kvanefjeld Project EIA | 289
[78] Arcadis. 2020. Kvanefjeld Tailings dam State of the Art Review and Comparison. (Addendum
1 to Consequence Assessment of Tailings Dam Failure for the Kvanefjeld Project). 64pp.
[79] GML. 2020. Review of the Environmental Impact of the Sulphuric and Chlor-Alkalai Plants.
19pp.
[80] International Atomic Energy Agency Safety. 2002. Management of Radioactive Waste from
the Mining and Milling of Ores. Series, WS-G-1-1.2. 48pp.
[81] AMEC. 2014. Technical Note – Kvanefjeld Project RSF Feasibility Study Seismic Hazard. 8 PP.
[82] DTU. 2017. Predicted Radiation Exposure from Mining at Kvanefjeld. 48 pp.
[83] GML. 2016. Returning Tailings to the Kvanefjeld Pit from Taseq. 10 pp.
[84] Orbicon. 2012. Narsaq Drinking Water System. 31 pp.
[85] Orbicon. 2012. Taseq Risk Assessment. 42 pp.
[88] Orbicon. 2018. Seepage from the FTSE to the Taseq River. 4 pp.
[90] ERM. 2020. Addendum – Air Quality Assessment. 11 pp.
[92] Klohn Crippen Berger. 2020. Probabilistic Seismic Hazard Assessment - Kvanefjeld Rare Earth
Project, Greenland - Revision 2. 70 pp.
[98] OSPAR Convention. 1992. The Convention for the Protection of the Marine Environment of
the North East Atlantic. 33 pp.
[99] EU. 2010. Directive 2010/75/EU of the European Parliament and of the Council of 24
November 2010 on industrial emissions (integrated pollution prevention and control). 103 pp.
[100] EC. 2018. Best Available Techniques (BAT) Reference Document for the Management of Waste
from Extractive Industries. 722 pp.
[101] SRK. 2015. Kvanefjeld Project Ore Reserve Estimation. 27 pp.
[102] Fertilizers Europe. 2000. Best Available Techniques for Pollution Prevention and Control in the
European Sulphuric Acid and Fertilizer Industries. 68 pp.
[103] Klohn Crippen Berger. 2020. Taseq TSF Review, Kvanefjeld Rare Earth Project, Greenland - Dry
Closure Cover Concept Design (Rev 2). 94 pp.
[104] Blue Water Shipping. 2017. Navigational Safety Investigation Study. 68 pp.
[105] UNESCO. 2017. World Heritage Lisdting – Kujataa. 19 pp.
[107] International Atomic Energy Agency. 2004. The long term stabilization of uranium mill tailings.
309 pp.
[108] RISØ. 1981. Evaluation of alternative energy supply options from hydropower and CHP
stations. 45 pp.
[110] ARCADIS. 2020. Consequence Assessment of Tailings Dam Failure for the Kvanefjeld Project –
Revision 2. 220 pp.

Greenland Minerals Ltd – Kvanefjeld Project EIA | 290
[111] NERI. 2003. Seabird colonies and moulting harlequin ducks in South Greenland. 36 pp.
[112] USDoE. 2007. Resrad-Offsite - A Tool for Evaluating Radiation Doses and Risks to Humans. 4
pp.
[114] Outotec. 2014. SKID 250- Sulfuric Acid Plant. 9 pp.
[115] USEPA. 2000. Chlorine. 4 pp.
[116] USEPA. 2000. Hydrochloric Acid (Hydrogen Chloride). 4 pp.
[117] Thyssen-Krupp. 2014. Kvanefjeld Chloralkalai Plant Estimating Services. 93 pp.
[118] GML. 2018. Waste Rock Samples. 9 pp.
[119] DCE-GINR. 2016. Recommendations for tailings, waste rock and water management for
Kvanefjeld Multielement Project. 25 pp.
[120] RISØ. 1990. Preliminary Environmental Impact Statement for the Kvanefjeld Uranium Mine.
138 pp.
[121] World Health Organisation. 2016. Radon Key Facts https://www.who.int/news-room/fact-
sheets/detail/radon-and-health Accessed May 2020.
[122] USEPA. Radioactive Decay. https://www.epa.gov/radiation/radioactive-decay Accessed May
2020
[123] Health Canada. 2014. Guidelines for Canadian Drinking Water Quality. 25 pp.
[124] EU. 2003. Framework for Assessment of Environmental Impact – Deliverable 1- 6 including
No. 3 - Dosimetric models and data for assessing radiation exposures to biota
[125] World Health Organisation. 2016. Radon Information Sheet. 7 pp.
[126] KCB. 2020. A geochemical assessment of river water quality changes upon a tailings dam break.
25pp.
[127] Boberg, F., Langen, P.L., Mottram, R.H., Christensen, J.H, and Olesen, M. (2018) 21st Century
climate change around Kangerlussuaq, west Greenland: From the ice sheet to the shores of
the Davis Strait, Arctic, Antarctic and Alpine Research, Vol 50, Issue 1
[128] GRAIN (2019) Agriculture in Greenland – possibilities and needs for future development and
research, Synthesis Report for Greenland Agricultural Initiative (GRAIN) in Cooperation with
Greenland Perspective, https://natur.gl/wp-content/uploads/2020/03/ENG-Synthesis-
Report-on-Agriculture-in-GL.pdf
[129] Hanna, E., Cappelen, J., Fettweis, X., Mernild, S.H., Mote, T.L., Mottram, R., Steffen, K.,
Ballinger, T.J., and Hall, R. (2020) Greenland surface air temperature changes from 1981 to
2019 and implications for ice-sheet melt and mass-balance change, International Journal of
Climatology
[130] Merrild Hansen, A. and Brown Burkins , M. (2020) Melting and Mining in Greenland:
Understanding Arctic Climate Change Through Dialogue with Locals, Georgetown Journal of

Greenland Minerals Ltd – Kvanefjeld Project EIA | 291
International Affairs, https://gjia.georgetown.edu/2020/05/29/greenland-understanding-
climatechange-through-localdialogue/
[131] Statistics Greenland (2020) Greenland in Figures 2020,
https://stat.gl/publ/en/GF/2020/pdf/Greenland%20in%20Figures%202020.pdf
[132] IFC (2013) Good Practice Handbook: Cumulative Impact Assessment and Management:
Guidance for the Private Sector in Emerging Markets. 102 pp.

Greenland Mineral Ltd – Kvanefjeld Project EIA | 292
Appendices

Greenland Minerals Ltd – Kvanefjeld Project EIA| 293
Appendix A - Environmental Management Plan
Introduction
An environmental management plan for a Project describes how the Project proponent intends to
manage the environmental issues identified in the proponents environmental impact assessment. The
EMP also identifies who is responsible for each commitment.
Kvanefjeld Environmental Management Plan
The Project’s environmental management plan (EMP) includes commitments and management
measures that GML will implement to ensure the Project environmental risks are managed to an
acceptable level.
The EMP outlines for each Project phase as relevant:
The management objectives under each category of impact identified in the EIA
The potential impacts to the environment
The mitigation measures for each impact
The person responsible for each commitment.
The commitments outlined in the EMP aim to provide a basis for which environmental performance
and compliance can be measured for the duration of the Project.
The EMP and work procedures will be periodically reviewed and updated over the life of the Project.
Environmental management commitments detailed in the EMP will be included in relevant contract
documents and technical specifications prepared for the Project. All GML’s employees, contractors and
other personnel employed on the Project will be made aware of the EMP through the site induction
process. During all phases of the Project, compliance with environmental management measures will
be regularly monitored, any non-compliances addressed and improvement actions will be
implemented.
The EMP presented below is a framework and comprises:
A management program that specifies the activities to be performed in order to minimize
disturbance of the natural environment and prevent or minimize all forms of pollution
A definition of the roles, responsibilities and authority to implement the management
program.
The EMP framework has been tabulated below. The Table includes information related to:
Project activity
The activity associated with the Project which has been identified as having the potential to
have an impact on or pose a risk to environment.
Environmental impact
A description of the impact of the activity (such as pollution or disturbance of natural
environment)
Action
The mitigating measure or actions identified to prevent or minimize the adverse
environmental impact, and
Responsibility
The party or parties responsible for ensuring the mitigation is put in place.

Greenland Minerals Ltd – Kvanefjeld Project EIA | 294
Responsibility for meeting some of the management commitments in the tables will be transferred to
GML’s contractors. Through the development of a code of responsible environmental practice which
will be included in all tender documents and contracts, GML will commit the contractors to meeting
the relevant management responsibilities.
GML understands that this will not be absolved from those management responsibilities by securing
the relevant commitments from contractors. Ultimate responsibility for meeting all commitments lies
with the relevant GML staff member, typically be the resident mine manager and/or the company
environmental manager.
Specific radiation management plans and a radioactive waste management plan will be developed as
the Project proceeds through the Greenlandic permitting process.
GML’s Environmental Management System
Prior to the commencement of operations GML is committed to developing and implementing an
Environmental Management System (EMS) consistent with the International Organization of
Standardization’s ISO 14001 guidelines for managing an EMS.
The purpose of an EMS is to formalize procedures for managing and reducing environmental impacts
from a project. The EMS will assist GML to maintain compliance with Greenland’s environmental
regulations, lower environmental impacts, reduce risks, develop indicators of impact and improve
environmental performance.
The ISO 14001 (2004) is based on the methodology - Plan-Do-Check-Act:
Plan
Establish the objectives and processes necessary to deliver results in accordance with the
organization's environmental policy
Do
Implement the processes
Check
Monitor and measure processes against environmental policy, objectives, targets, legal and
other requirements, and report the results
Act
Take actions to continually improve performance of the environmental management system.
GML’s EMS will ensure that the environmental obligations associated with the Project are managed in
a manner that is planned, controlled, monitored, recorded and audited. Environmental incidents will
be reported, investigated, analyzed and documented. Information gathered from the incident
investigations will be analyzed to monitor trends and to develop prevention programs, which include
corrective and preventative actions taken to eliminate the causes of incidents. All employees,
contractors and sub-contractors will be required to adhere to the EMS and the non-conformance and
corrective action system in place at Kvanefjeld.

Greenland Minerals Ltd – Kvanefjeld Project EIA| 295
EMP - Construction Phase
Ref. no.
Project activity Environmental Impact Action Responsibility
8.1.1 Stripping of the mine pit area The mining activities can have aesthetic impact
Plan the pre-stripping to blend as far as practical with the surrounding landscape
Project Manager
8.1.2 The use of Taseq and adjacent pond for tailings deposition
The mining activities can have aesthetic impact
Plan the tailings embankments to blend as far as practical with the surrounding landscape
Project Manager
8.1.3 Re-profiling of landscape for other mine facilities and infrastructure construction
Re-profiling of terrain for infrastructure can have aesthetic impact
Plan roads to blend as far as practicable with the surrounding landscape
Project Manager
8.1.4 Construction activities could cause erosion
Loss of soil, sand and gravel by the forces of water, ice or wind
Take erosion into account when selecting construction methods and routing of the alignments
Project Manager
8.1.5 Mobile equipment, drilling and blasting, land transport and shipping make noise
Increased noise load could disturb wildlife and people
Plan noise activities such as blasting to take place when noise impact is least
Project Manager
8.1.6 In dark periods the construction areas will be illuminated
“Ecological light pollution” can distract wildlife, in particular migrating birds
No action required since problem is negligible Project Manager
8.2.1 Blasting, excavation and shipping in fjords generate dust and air emissions
Potential pollution of water and land Plan construction works to minimize dust generation and air pollution
Project Manager
8.2.2
Mobile equipment such as excavators, bulldozers and trucks generate greenhouse gasses
Climate change Limit the amount of fuel combusted as much as practical possible
Project Manager
8.3.1
Construction works will lead to changes of natural flow pattern and capacity of freshwater resources
Impact freshwater ecology including fish population
Limit mitigation possible except minimizing the impact as much as practically possible
Project Manager

Greenland Minerals Ltd – Kvanefjeld Project EIA | 296
Ref. no.
Project activity Environmental Impact Action Responsibility
8.4.1
Noise and visual disturbances from personnel
Disturbance of terrestrial mammals and birds Restrict the movement of staff members outside the construction areas
Mine Manager
8.4.2 Construction works at port and shipping in fjords
Disturbance of marine mammals and birds Low speed while in fjords and keep good distance to flocks of wintering sea birds (when possible)
Project Manager
8.4.3 Construction of bridges and embankments
Disturbance of freshwater organisms including fish
Minimise the disturbance of the water in when building new bridges and embankments by keeping the construction period as short as practically possible
Project Manager
8.4.4 Re-profiling to accommodate buildings
Loss of terrestrial habitat Minimize the area to be disturbed by planning infrastructure to have as small a footprint as possible
Project Manager
8.4.5 Deposition of tailings in Taseq Loss of freshwater habitat No mitigating possible Mine Manager
8.4.6 Re-profiling for shore to accommodate port
Loss of marine habitat Minimize the area to be disturbed Project Manager
8.4.7 Accidents can lead to spill of oil and chemicals on land
Impact on terrestrial habitats and biota Prepare contingency plans for oil and chemical spills including efficient spill readiness training
Mine Manager
8.4.8 Accidents can lead to spill of oil and chemicals
Impact of freshwater and marine habitats and biota
Prepare contingency plans for oil and chemical spills including efficient spill readiness training
Mine Manager
8.5 Contamination of environment from domestic and industrial waste
Waste – and in particular hazardous waste - can lead to significant contamination of the environment
Handle waste according to procedure detailed in waste management manual and according to good environmental practice, with high degree of re-use and re-cycling
Mine Manager
8.5.1 Traffic along haul- and service roads
Road kills of animals Ensure speed limits are enforced and that all staff are aware of animal hazards
Mine Manager

Greenland Minerals Ltd – Kvanefjeld Project EIA | 297
Ref. no.
Project activity Environmental Impact Action Responsibility
8.5.2 Shipping in the fjord Introduction of invasive alien species with ballast water
Follow regulations of the International Convention for the Control and Management of Ships’ ballast water and Sediments
Project Manager
8.6.1 Safety regulations at mine area Hindrance of traditional land use Keep the area closed to the public and the no-hunting zone as small as possible
Mine Manager
8.6.2 The new road between the port and the mine area will be closed for the public
Limit recreational use and tourism No mitigation possible. Roads will be available for emergency use and planned special occasions.
Mine Manager
8.6.3 Construction work at port and Taseq
Disturbance of heritage site Contact staff member of the Greenland National Museum and Archives
Project Manager
EMP covering the Operational Phase
Ref. no. Project activity Environmental Impact Action Responsibility
9.1.1 Landscape alterations at pit and embankments
Aesthetic impact Plan the activities to blend as far as possible with surrounding landscape
Project Manager
9.1.3 Noise from Project operations, blasting at pit
Disturbance of wildlife and people Avoid blasting during evenings and at night Mine Manager
9.2.1 Mine activities cause air emissions
Increased air emissions (concentration and deposition of dust, NOx, SOx & Black carbon)
Minimize dust generation by implementing GML’s Dust Control Plan
Choose vehicles and other equipment based on energy efficiency technologies to optimize emissions rates
Maintain power plant, vehicles and other fuel powered equipment in accordance with manufacture’s specifications to minimize on emissions
Mine Manager

Greenland Minerals Ltd – Kvanefjeld Project EIA | 298
Ref. no. Project activity Environmental Impact Action Responsibility
9.2.2 Mobile and stationary fuel combustion generates GHG
Climate change Choose vehicles and other equipment based on energy efficiency technologies to optimize emissions rates
Maintain power plant, vehicles and other fuel powered equipment in accordance with manufacture’s specifications to minimize on emissions
Mine Manager
9.3 Some mine activities cause release of radioactivity
Radiological emissions Minimize dust generation (which can be radioactivity bearing) by implement GML’s Dust Control Plan
Project Manager
9.5.1 People and machines work at mine area
Visual (and noise) disturbance of terrestrial animals
Restrict the movement of staff members outside the Project area during spring and summer to minimize the general disturbance of wildlife
Project Manager
9.5.2 Discharge of water from mine operations to the fjord
Pollution of marine environment Optimization of diffusor outlet (possible engineering challenge as it shall be implemented 40 m below sea level)
Project Manager
9.5.3 Mine activities change hydrology Impact on fish population in Narsaq river No mitigation needed Project Manager
9.5.4 Accidents can lead to spill of oil and chemicals
Pollution of terrestrial, freshwater and marine habitats
Prepare contingency plans for oil and chemical spills including efficient spill readiness training
Project Manager
9.5.5 Traffic along haul- and service roads
Increased mortality among terrestrial animals Ensure speed limits are enforced and that all staff are aware of animal hazards
Project Manager
9.5.6 Shipping in the fjord Introduction of invasive alien species with ballast water
Follow regulations of the International Convention for the Control and Management of Ships’ ballast water and Sediments
Project manager
9.6 Many Project activities generates waste
Contamination of environment Strict enforcement of waste handling procedures; and Continue updating waste management manual.
Project manager

Greenland Minerals Ltd – Kvanefjeld Project EIA | 299
Ref. no. Project activity Environmental Impact Action Responsibility
9.7 Access to mine area not possible and no hunting security zone introduced
Restrict local peoples (and visitors) traditional use of area
Minimize no go and no hunting zones as much as possible Project manager
EMP covering the Closure and Post Closure Phases
Ref. no. Project activity Environmental Impact Action Responsibility
10.1. Discharge of water from mine operations to the fjord
Pollution of marine environment None, except continuous monitoring of effluent Project Manager

Greenland Minerals Ltd – Kvanefjeld Project EIA| 300
Appendix B - Conceptual Closure and Decommissioning Plan
for the Project
Introduction
The closure and the post-closure phases are integral parts of a mining project and the environmental
management of a mining project. This part of the EIA summarizes the legal framework for project
closure and describes broadly how each individual component of the Project will be decommissioned.
Since this conceptual plan has been prepared before Mine operations have started the plan will be
expanded and refined during the Project’s operations phase.
Closure obligations
The Mineral Resources Act of 2009 (amended in 2012 and 2014) specifies that a closure plan (the Plan)
shall be prepared and approved before exploitation begins (Part 10, section 43).
In the Act it is stipulated that: “the licensee must submit a plan for steps to be taken on cessation of
activities in respect of facilities, etc. established by the licensee, and how the affected areas will be left
(Plan). If the licensee plans to leave facilities, etc. in the area that for environmental, health or safety
reasons will require maintenance or other measures after the closure, the Plan must include plans for
the maintenance or the measures and monitoring thereof”.
The Kvanefjeld Project Closure and Reclamation Plan
The Plan is based on the current open pit mine configuration and production rates and assumes that
mining operations will cease after 37 years, at which stage mine closure activities will commence.
However, temporary suspension and possibly premature closure may be required if the operations
become unviable due to a change in Project economics or other difficulties.
Since the Plan will be prepared before the mine is constructed it contains broadly identified tasks of
closure activities which will be refined and expanded before the closure date for mining and processing
operations.
The Plan covers the closure phase, which is estimated to take approximately six years. During this
phase the decommissioning of equipment, buildings and other structures will take place. Throughout
the closure phase the TWP will continue to operate to treat water from the TSF prior to discharge into
the fjord.
Post-closure follows decommissioning and rehabilitation and is a monitoring phase. During post-
closure, no active care will be required except minor maintenance of gravel roads and TSF spillways.
Access to the Mine and TSF will be maintained to ensure access for inspections and monitoring
activities.
Post-closure is managed through a monitoring plan and with liaison with the authorities. Towards the
end of the life of the Project, the post closure objectives will be refined to accommodate the site
conditions prevailing at the time.
Purpose and Scope of the Closure and Reclamation Plan
The overall closure and reclamation goal is to return the mine site and affected areas to viable and,
wherever practicable, self-sustained ecosystems that are compatible with a healthy environment and
with human activities.

Greenland Minerals Ltd – Kvanefjeld Project EIA | 301
In order to achieve this, the following core closure principles will be followed:
Physical Stability
All project components that remain after closure will be physically stable to humans and wildlife;
Chemical Stability
Any project components (including associated wastes) that remain after closure will be chemically
stable and non-polluting or contaminating meaning that any deposits remaining on the surface or in
lakes will not release substances at a concentration that would significantly harm the environment;
Minimized radiological impact
It will be ensured that the long-term radiation exposure of the public due to any radiological
contamination of mine area is kept “as low as reasonably achievable” (ALARA); and
Minimal Significant Change to Baseline Landforms
Baseline landforms and land use prior to the mining operations will be returned to similar visual
amenity and geography where possible.
Closure implementation
The closure works e.g. how each individual project component will be decommissioned is broadly
described below. As mentioned above, the Plan is at this early stage conceptual and it will be expanded
and refined during the Project’s operations phase.
Open pit mine workings
The open pit will be fenced off to restrict access for humans, livestock and wildlife (for safety reasons).
The pit will be allowed to fill naturally from precipitation. When the pit is full, water will flow through
water courses into a lake to the south west of the Mine. Here the water will be diluted in the natural
catchment before flowing naturally into Nordre Sermilik.
Waste rock stockpile
During the operations phase, the WRS will be constructed and managed in such a way that it will
remain physically and geo-technically stable in the long-term. Any risk from erosion, thaw settlement,
slope failure or collapse after mine closure is expected to be negligible.
The geochemical test work that has already been undertaken shows that following the six-year closure
phase, no significant acid rock drainage or metal leaching will occur from the WRS or surface runoff.
The water quality of seepage from the pile will be similar to baseline conditions for the Mine area river
flows. WRS run-off will be diverted into natural water courses which flow into the lake to the south
west of the Mine. Here the waste rock run-off will be significantly diluted with precipitation catchment
before naturally flowing into Nordre Sermilik.
Water management systems
This incorporates embankments and diversion channels at the TSF, embankment and diversion channel
on Kvanefjeld, the TWP pipelines and the raw water dam at the Refinery.
The TSF embankments and diversion channels are retained. After six years, water treatment of water
covering the TSF ceases, the return water pipelines are removed and the TSF are left to fill naturally
with water from groundwater inflows and precipitation. Water will initially overflow from the CRSF
into the FTSF and, when the FTSF fills, will eventually overflow into the Taseq river. Water discharge
into Nordre Sermilik, from the water treatment plant, will cease at this point.
Greenland Minerals Ltd – Kvanefjeld Project EIA | 302
The embankment of the raw water dam is left as a bridge across Narsaq river, to permit future
inspections and monitoring activities at Taseq. The natural flow of the river is re-established.
Tailings Closure
The TSF will be closed as wet lakes contained within the Taseq basin by the embankment walls and
natural rock features. This will be a permanent structure designed to the highest standards using BAT.
A layer of water will be retained on top of the tailings to avoid dust generation and eliminate radiation
exposure. The water layer will be deep enough to prevent tailings solids from being exposed under all
circumstances.
The tailings solids will remain as a compacted layer of fine solids at the bottom of the tailings lake.
These solids will act as a liner, as they are practically impermeable, obviating seepage issues.
Buildings and equipment
Including the crusher facility, concentrator plant, refinery, acid plant, power plant, fuel tanks,
maintenance shops, offices, warehouses, accommodation village, reagent and explosive storage,
mobile equipment and tailings and return water pipelines.
Except for the Village at Narsaq, all buildings and major structures will be dismantled and removed.
Where possible foundations will be removed otherwise covered by natural materials to blend into the
natural surroundings.
On the assumption that the local authorities require it, the Village will be left as constructed.
For aesthetic reasons, and because a cover of vegetation will help control erosion and dust dispersal
together with providing food and shelter for wildlife, an active re-vegetation program will be
considered once the buildings and mine facilities are removed. However, this will not be focused on
the rapid establishment of a green cover on disturbed areas, for example by seeding grasses. These
measures sometimes meet the short-term expectations for aesthetic improvement and sometimes
erosion and dust control, but do not address the longer-sighted requirements for habitat restoration.
Instead, the species selected for re-vegetation will reflect the site’s ecological variables, as well as the
nature of the mining-related disturbances and will follow the principle; “the best species for planting
on a mine site are the ones that can be found growing nearby” (Withers 1999).
Mine infrastructure
Including on-site roads, electrical power supply system (including power lines to the port), bridges,
culverts and the Port.
The haul roads will be reclaimed as soon as the mining operations no longer require them. The roads
will be ripped to encourage re-vegetation (see above).
The power line connecting the on-site plant with the port area will removed and any culverts that could
potentially act as hydraulic conduits at closure will be removed.
The Port-Mine road (including the bridges across Narsaq river) as well as the track between the Mine
and Taseq will be left intact to facilitate future inspections and monitoring activities.
The Port will be left as constructed (if agreed with the Greenland authorities) and will be offered for
use for the local community and industry.

Greenland Minerals Ltd – Kvanefjeld Project EIA | 303
Possible contaminated materials/areas at the mine site
Given the comprehensive monitoring that will be take place throughout operations Project’s phase it
is unlikely that a significant contamination of soil, rock or groundwater in and around the mine area
will remain undetected until the remediation phase during mine closure.
Furthermore, because of the uranium production, procedures will be introduced for controlling any
contamination of equipment, buildings and the surroundings. In addition all plant and equipment will
be contained within a bunded building area minimizing the risk of soil contamination outside the
facilities. It is therefore very unlikely that there will be a need to remove or isolate contaminated soil,
rock, equipment or building materials at the end of operations. However, if such a need should arise,
at any time, the contaminated material will be isolated in the tailings facility.
Identification and management of closure issues
To insure that the closure and post-closure phases of the Project will meet the principles listed in
section 2.6 each project domain has been analysed carefully to identify if there are issues for specific
attention. This assessment identified the following:
Potential acid rock drainage and metal leaching from waste rock pile
Acid rock drainage and metal leaching from the weathering of undisturbed waste rock is a potential
issue in connection with mine closure. Although the low temperatures in Greenland will slow the
chemical weathering processes during a large part of the year, there is potentially a seasonal flush of
accumulated contaminants during spring melt.
Static and kinetic acid rock drainage and metal leaching prediction tests have shown little metal release
and no acid release. However, during the first years of the closure phase some leaching of fluoride is
expected. Field tests and monitoring on site will further characterize the mine waste water including
the concentration of fluoride. To prevent Narsaq river exposure to seepages (mainly fluoride) from the
waste rock water, ditches and berms will be constructed to divert the waste rock water away from the
Narsaq river.
Potential radiological contamination of mine area
It is an objective of the Plan to ensure that there is no unacceptable radiological health risk to people,
livestock and wildlife after Project closure. This will be achieved by managing radiation in compliance
with the “as low as reasonably achievable” or ALARA principle and the “Best practicable technology”
principle.
The mine components potentially associated with elevated radiation following mine closure are
identified as the Mine area and the TSF.
From the Mine area, there may still be releases of radon and dust (from any waste barren rock piles
deposits that are uncovered). These releases are expected to be very small and will not result in any
measurable change in the receiving environment.
The tailings deposited in the TSF will contain uranium and thorium and their decay products. The
tailings will emit radiation. To ensure that none of this radiation will be of any health risk to humans,
livestock or wildlife the tailings will remain deposited under permanent water cover. This will ensure
no radiation release.
In the post-closure phase of the Project there will be some small amount of radioactivity released to
the freshwater environment, however concentrations will be low and exposure will be low, close to

Greenland Minerals Ltd – Kvanefjeld Project EIA | 304
background levels. Overall, it is not expected that there will be any radiation issues associated with
tailings.
Iteration of the hydrology and flow of surface water (Narsaq river)
All modifications to the hydrology of the Narsaq river and its tributaries, which are required during
mining, will be reversed at the end of the mine closure phase. This will include the controls imposed in
the upper reaches of Narsaq river to supply water to the raw water dam and the moderating of outflow
from the Taseq basin during the Project’s operations and closure phases.
The water that overflows the pit 50 years after mine closure will be lead to Nordre Sermilik.
References
Withers, S.P. 1999. Natural Vegetation Succession and Sustainable Reclamation at Yukon Mine and
Mineral Exploration Sites. Mining Environment Research Group (MERG). 67 pp.
Greenland Minerals Ltd – Kvanefjeld Project EIA | 305
Appendix C - Conceptual Environmental Monitoring Program for
the Project
Introduction
GML will develop and implement an Environmental Monitoring Program (EMP) in accordance with
Greenlandic guidelines to monitor the predicted residual environmental effects of the Project and the
effectiveness of implemented mitigation measures. The EMP will encompass all phases of the Project
(construction, operation, closure and post-closure) and will identify any variances from predictions
that occur and whether such variances require action, including any additional mitigation measures.
Content of GML’s Environmental Monitoring Program
The Project’s EMP will be a best practice, multiple lines of evidence approach comprising grab sampling
of water, air, soil, lichens, plants, mussels, fish and seals from numerous locations in and around the
Mine and tested to confirm that environmental protection systems are effective. The monitoring
results will be submitted to regulatory authorities for review.
The EMP for the Kvanefjeld Project will cover:
1. Air quality (including Greenhouse gases) and dust
2. Sea and freshwater
3. Soil and terrestrial biota
4. Tailings Facility
5. Meteorological, and
6. Narsaq Drinking Water.
Each of the program elements will include:
Description of design and objectives
Specific monitoring stations
Schedules for monitoring activities
Sampling procedures, sample preservation requirements, and analytical methods, as
applicable
Procedures for comparison of monitoring results against baseline data, environmental
standards and environmental quality objectives
Actions to be implemented when requirements set out in regulations or permits have not
been met
Procedures for reporting results to Greenlandic authorities
Roles and responsibilities of key staff, for internal and external reporting of monitoring
activities and results, as well as management of the EMP
Quality assurance and quality control processes, and
Procedures for reviewing and updating the monitoring program.
Greenland Minerals Ltd – Kvanefjeld Project EIA | 306
As uranium is a by-product of the Project the MSP will include radiological as well as non-radiological
parameters5. For this conceptual MSP, Arcadis has prepared a specific Radiation Monitoring Plan
Outline (Arcadis 2015), which proposes the environmental media to be measured or sampled. The
Arcadis outline follows the principles defined by the Canadian Standards Association (CSA) /2010/ that
the media to be monitored will:
Provide information to assess the dose
Be close to the receptor
Consider the expected fate in the environment, and
Recognize the variability of the media.
The EMP will be developed and updated throughout the mine life.
Conceptual Monitoring Program
Prior to Project operations, a more detailed study design will be developed for each of the EMP’s
elements. This will be undertaken in co-operation with Greenlandic authorities. Set out below are
descriptions of the proposed approach for each element of the EMP. In addition to the studies outlined
below, supplementary studies may be conducted for specific, well-defined objectives and are not
expected to continue throughout the program (e.g. indoor radon monitoring).
1. Air Quality and Dust Monitoring
Air quality and dust monitoring will continue at established stations in the town of Narsaq and in the
Narsaq valley using high-volume samplers and dust fall jars and/or stack sampling. Mill stacks will have
scrubbers to remove particulate matter and contaminants from the air stream before discharge. The
results will be compared to baseline values as well as applicable guidelines to determine if there has
been a change as a result of mine activities. The parameters to be monitored will be agreed with the
Greenlandic authorities but are expected to include:
Dust deposition
The monthly collection of samples at the baseline stations and along a gradient relatively
close to the source. Depending on the deposition results, selected dust fall jars may be
provided for analysis of radiological parameters;
Concentration levels of Particulate Matter (PM10 and PM2.5)
Radionuclide content of dust
Collection of samples from an area close to the operations as well as other locations such as
Narsaq town site and a reference location. Quarterly composite samples will be sent for
analysis of radionuclides. If sufficient mass for obtaining low detection limits is not available
then chemical analysis will be conducted and secular equilibrium will be assumed.
Radon, thoron and relevant decay product
Monitoring (integrated semi-annual sampling) at locations near the mine area boundary and
at other specific locations such as the Narsaq town site, within the Narsaq Valley, Ipiutaq and
a reference location.
Gamma detectors will be deployed at the same locations as the radon and thoron monitors.
Nitrogen oxides (NOx) from a selection of stations.
5 The monitoring should include Actinium (227Ac)

Greenland Minerals Ltd – Kvanefjeld Project EIA | 307
Greenhouse gasses
Estimating emissions from a variety of activities such as burning fossil fuels and energy
production.
The sampling periods, the trace elements, major ions and radioisotopes to be analyzed and reporting
requirements are to be agreed with the Greenlandic authorities.
2. Sea and Freshwater Monitoring
Water quality
Baseline water quality has been characterized from a large number of stations in the fjords at Narsaq
and in watercourses, lakes and ponds on the Kvanefjeld plateau, Narsaq Valley, at Taseq lake and a
reference area. Sediment samples have also been collected and analyzed from the rivers and lakes in
and around Narsaq Valley.
Monitoring of water quality and sediment will continue at the same sites during all phases of the
Project. This will include at least one monitoring site upstream of Control Point C (Figure 53). The
sampling frequency, reporting requirements, parameters to be monitored will be defined both for field
monitoring activities and laboratory activities in co-operation with the Greenlandic authorities.
It is expected that the water and sediment sampling will include radiological as well as non-radiological
parameters. Also the radionuclide content of supernatant of tailings pond water will be monitored to
confirm modelled predictions.
When Project operations commence effluent monitoring (chemistry) will be carried out at the
discharge point into Nordre Sermilik. Monitoring of the mine water runoff from the WRS and pit that
discharges to Nordre Sermilik will be performed.
Results of the monitoring will be compared to baseline values as well as applicable guidelines to
determine if there has been a change in water quality as a result of Project. Detailed quality assurance
procedures will be provided, and will include calibration and validation of field measurement
equipment as well as sampling measures. Data will be reviewed to update loading assumptions in the
site water balance and verify water quality models.
Marine and freshwater biota
The marine and freshwater biota component of the EMP will provide detailed information regarding
metal and radioisotope concentrations in selected key plant and animal species.
Since 2007 samples of indicator plant and animal species have been collected from a large number of
stations to determine the background level of metals. Stations were located in the vicinity of the fjords
that surround Narsaq, the Narsaq river and references areas. The target species were ringed seal,
short-spined sea scorpion, Arctic char, blue mussels and bladder wrack seaweed.
It is proposed to continue monitoring of fish and seal samples on an annual basis and analyze for
radionuclides. In addition, select or composite samples of blue mussels and seaweed will be provided
for analysis on a periodic basis.
Monitoring of these species will continue at the same sites during all phases of the Project and the
metal loads compared to baseline values to determine if there has been a change as a result of Project
activities.
Monitoring of water quality will also be conducted in proximity to the sewage discharge point off Tunu
Peninsula.

Greenland Minerals Ltd – Kvanefjeld Project EIA | 308
Hydrology
Surface water flow monitoring will be maintained at established stations in the Study Area (Narsaq,
Taseq and Kvane rivers) to:
Monitor seasonal and annual flow patterns
Support water management measures
Refine the water balance, and
Inform water quality modeling.
Water levels will be recorded continuously with a pressure transducer at automated stations, with
calibration discharge measurements conducted at a range of flows during scheduled site visits.
3. Soil and Terrestrial Biota Monitoring
To establish background concentrations of metals and radioisotopes in terrestrial habitats, samples of
soil, lichens, grass and leaves of bushes have been collected since 2007 from stations at Kvanefjeld,
Narsaq Valley and in a reference area.
Monitoring will continue at the locations identified in the baseline study and include soil, snow lichen,
grass and leaves of dwarf shrubs including Northern Willow (e.g. once every 3 years). This frequency is
consistent with the approach adopted at uranium mining operations in Canada for these types of
media where any changes would be expected to be gradual.
The results will compared to baseline values to determine if there has been change as a result of Project
activities.
4. Tailings Facility Monitoring
The objective of the TSF monitoring is to provide on-going characterization of water quality in the TSF
during the Project’s operations, closure and post-closure phases in order to confirm the predicted
concentrations of metals in the TSF.
TSF monitoring will include radiological as well as non-radiological parameters.
The monitoring will also cover the embankments including seepage.
5. Meteorological Monitoring
Collection of meteorological data will continue at an established weather station on Kvanefjeld
plateau. Ongoing meteorological data collection is required to verify design assumptions for water
management systems and dust dispersal modelling.
Reporting of meteorological monitoring will include a summary of the measured parameters, including
temperature, precipitation and wind.
The collected data will be compared with the predictions for extreme events or for performance
predictions; results will be used to revise operations procedures as necessary. The results will also be
used in the air quality monitoring.
6. Narsaq Drinking Water
Drinking water quality in Narsaq is already monitored by the Greenland authorities. It is recommended
that this be extended to include relevant radiological parameters, total organic carbon, phosphorus
and a number of bacteria.

Greenland Minerals Ltd – Kvanefjeld Project EIA | 309
References
Arcadis. 2015. Radiation Monitoring Plan Outline, Kvanefjeld Multi-Element Project, Narsaq Area,
Greenland. 7 pp
Canadian Standards Association (CSA). 2010. Environmental monitoring programs at Class I nuclear
facilities and uranium mines and mills. N288.4-10.
The tables below show a framework for the monitoring parameters and sampling locations proposed.
The suggested sampling frequency for each parameter will ensure validity of actual environmental
conditions at the Project site and surroundings. Defined monitoring durations identify which phases of
the mining project will generate the potential impact that requires sampling and monitoring. Where
relevant the programme includes control sites where no expected Project impacts are likely to be
experienced.
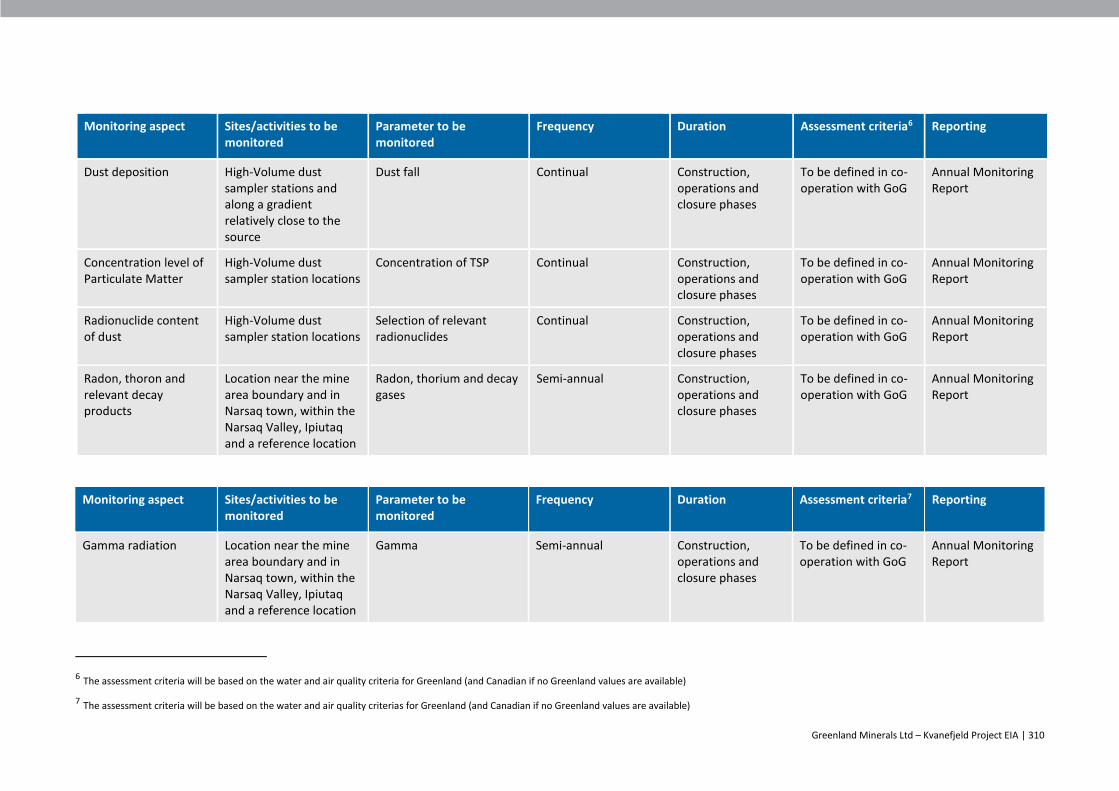
Greenland Minerals Ltd – Kvanefjeld Project EIA | 310
Monitoring aspect Sites/activities to be monitored
Parameter to be monitored
Frequency Duration Assessment criteria6 Reporting
Dust deposition High-Volume dust sampler stations and along a gradient relatively close to the source
Dust fall Continual Construction, operations and closure phases
To be defined in co-operation with GoG
Annual Monitoring Report
Concentration level of Particulate Matter
High-Volume dust sampler station locations
Concentration of TSP Continual Construction, operations and closure phases
To be defined in co-operation with GoG
Annual Monitoring Report
Radionuclide content of dust
High-Volume dust sampler station locations
Selection of relevant radionuclides
Continual Construction, operations and closure phases
To be defined in co-operation with GoG
Annual Monitoring Report
Radon, thoron and relevant decay products
Location near the mine area boundary and in Narsaq town, within the Narsaq Valley, Ipiutaq and a reference location
Radon, thorium and decay gases
Semi-annual Construction, operations and closure phases
To be defined in co-operation with GoG
Annual Monitoring Report
Monitoring aspect Sites/activities to be monitored
Parameter to be monitored
Frequency Duration Assessment criteria7 Reporting
Gamma radiation Location near the mine area boundary and in Narsaq town, within the Narsaq Valley, Ipiutaq and a reference location
Gamma Semi-annual Construction, operations and closure phases
To be defined in co-operation with GoG
Annual Monitoring Report
6 The assessment criteria will be based on the water and air quality criteria for Greenland (and Canadian if no Greenland values are available)
7 The assessment criteria will be based on the water and air quality criterias for Greenland (and Canadian if no Greenland values are available)

Greenland Minerals Ltd – Kvanefjeld Project EIA | 311
Monitoring aspect Sites/activities to be monitored
Parameter to be monitored
Frequency Duration Assessment criteria7 Reporting
Nitrogen oxides High-Volume dust sampler stations
NOx concentration Semi-annual Construction, operations and closure phases
To be defined in co-operation with GoG
Annual Monitoring Report
Metal incl. radionuclide concentrations in rivers
Narsaq, Taseq and Kvane rivers (at baseline stations)
Metals incl. radionuclides in water
Monthly
Semi-annual in post closure
Construction, operations, closure and post closure phases
To be defined in co-operation with GoG
Annual Monitoring Report
Metal incl. radionuclide concentrations in rivers
Narsaq, Taseq and Kvane rivers (at baseline stations)
Metals incl. radionuclides in sediment
Annually (August) Construction, operations, closure and post closure phases
To be defined in co-operation with GoG
Annual Monitoring Report
Monitoring aspect Sites/activities to be monitored
Parameter to be monitored
Frequency Duration Assessment criteria8 Reporting
Supernatant of tailings ponds
Water of FTSF & CRSF Relevant elements, reagents and radionuclide concentrations
Continual during operations and closure phases
Semi-annual in post closure phase
Operations, closure phases and post-closure
To be defined in co-operation with GoG
Weekly in operations and closure phases. Annual Monitoring Report in post-closure phase
Treatment Water Placement
TWP Relevant elements and radionuclide concentrations
Continual Operations and closure phases
To be defined in co-operation with GoG
Weekly and annual Monitoring Report
8 The assessment criteria will be based on the water and air quality criteria for Greenland (and Canadian if no Greenland values are available)
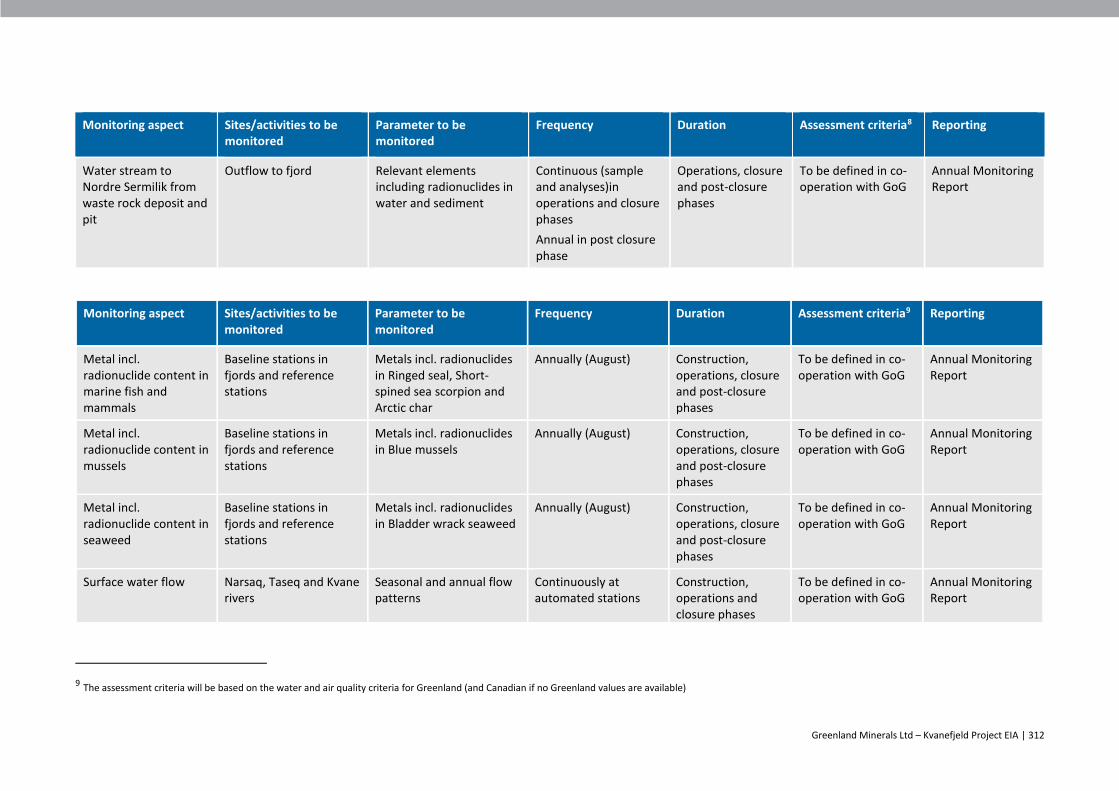
Greenland Minerals Ltd – Kvanefjeld Project EIA | 312
Monitoring aspect Sites/activities to be monitored
Parameter to be monitored
Frequency Duration Assessment criteria8 Reporting
Water stream to Nordre Sermilik from waste rock deposit and pit
Outflow to fjord Relevant elements including radionuclides in water and sediment
Continuous (sample and analyses)in operations and closure phases
Annual in post closure phase
Operations, closure and post-closure phases
To be defined in co-operation with GoG
Annual Monitoring Report
Monitoring aspect Sites/activities to be monitored
Parameter to be monitored
Frequency Duration Assessment criteria9 Reporting
Metal incl. radionuclide content in marine fish and mammals
Baseline stations in fjords and reference stations
Metals incl. radionuclides in Ringed seal, Short-spined sea scorpion and Arctic char
Annually (August) Construction, operations, closure and post-closure phases
To be defined in co-operation with GoG
Annual Monitoring Report
Metal incl. radionuclide content in mussels
Baseline stations in fjords and reference stations
Metals incl. radionuclides in Blue mussels
Annually (August) Construction, operations, closure and post-closure phases
To be defined in co-operation with GoG
Annual Monitoring Report
Metal incl. radionuclide content in seaweed
Baseline stations in fjords and reference stations
Metals incl. radionuclides in Bladder wrack seaweed
Annually (August) Construction, operations, closure and post-closure phases
To be defined in co-operation with GoG
Annual Monitoring Report
Surface water flow Narsaq, Taseq and Kvane rivers
Seasonal and annual flow patterns
Continuously at automated stations
Construction, operations and closure phases
To be defined in co-operation with GoG
Annual Monitoring Report
9 The assessment criteria will be based on the water and air quality criteria for Greenland (and Canadian if no Greenland values are available)
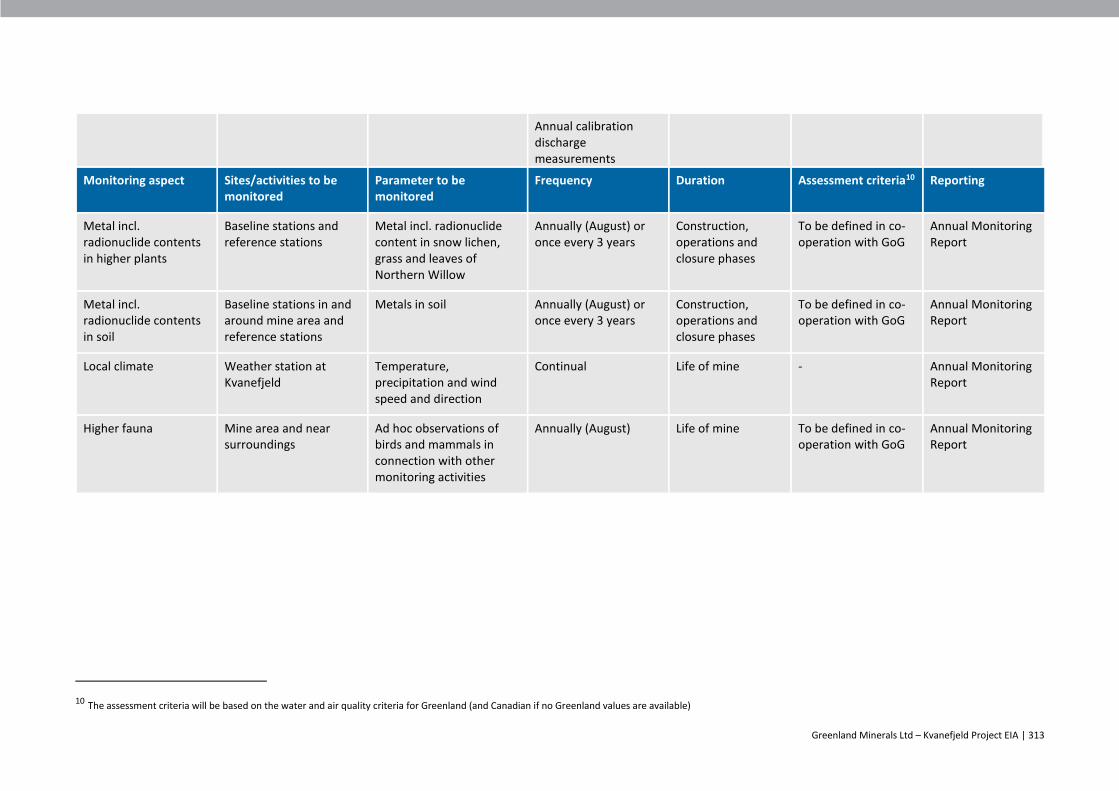
Greenland Minerals Ltd – Kvanefjeld Project EIA | 313
Annual calibration discharge measurements
Monitoring aspect Sites/activities to be monitored
Parameter to be monitored
Frequency Duration Assessment criteria10 Reporting
Metal incl. radionuclide contents in higher plants
Baseline stations and reference stations
Metal incl. radionuclide content in snow lichen, grass and leaves of Northern Willow
Annually (August) or once every 3 years
Construction, operations and closure phases
To be defined in co-operation with GoG
Annual Monitoring Report
Metal incl. radionuclide contents in soil
Baseline stations in and around mine area and reference stations
Metals in soil Annually (August) or once every 3 years
Construction, operations and closure phases
To be defined in co-operation with GoG
Annual Monitoring Report
Local climate Weather station at Kvanefjeld
Temperature, precipitation and wind speed and direction
Continual Life of mine - Annual Monitoring Report
Higher fauna Mine area and near surroundings
Ad hoc observations of birds and mammals in connection with other monitoring activities
Annually (August) Life of mine To be defined in co-operation with GoG
Annual Monitoring Report
10 The assessment criteria will be based on the water and air quality criteria for Greenland (and Canadian if no Greenland values are available)