
Pacifico Minerals Ltd (PMY) - Boab Metals
23
Shaw and Partners PMY – Equity Report current as at –01/10/2020–Pg. 1 Pacifico Minerals Ltd (PMY) Rating: Buy | Risk: High | Price Target: $0.037 Take a ride in my silver machine – Initiation of Coverage Andrew Hines | Head of Research +61 3 9268 1178 [email protected] Michael Clark | Analyst +61 3 9268 1148 [email protected] Event We initiate coverage on Pacifico Minerals (PMY) with a Buy recommendation and A$0.037ps price target. Pacifico Minerals is developing the Sorby Hills Lead-Silver Project in the Kimberley Region of Western Australia. Pacifico holds a 75% interest in the Sorby Hills JV with China’s largest lead smelting and silver producer Henan Yuguang holding 25%. Highlights • In August 2020, Pacifico released the results of a Sorby Hills Pre-Feasibility Study (PFS). The PFS outlined a A$183m project mining 1.5Mtpa of ore and producing 78ktpa of a lead/silver concentrate over a 10 year mine life. The annual production of contained metals is expected to be ~50ktpa of lead and 1.5Mozpa of silver. • The PFS resulted in an estimated pre-tax NPV of A$303M (at an 8% discount rate) and an IRR of 46% (assuming 10-year historical average prices of US$0.95/lb lead and US$21/oz silver). Our post-tax NPV of A$189m is lower than the PFS, mainly due to a higher WACC assumption of 10%. • Pacifico is progressing to a Definitive Feasibility Study (DFS) and is conducting additional exploration and Resource definition drilling in anticipation of a Final Investment Decision in late 2021, a 12-18-month construction period and first production in mid-2023. • The Sorby Hills Reserve currently stands at 13.6Mt at 3.6% Pb for 490kt of lead and at 40g/t Ag for 18 Moz of silver. There is likely to be Reserve upside given; 1. ~5Mt of Resource has been excluded from the PFS to ensure the Project does not step outside the existing Environmental Protection Authority (EPA) approved development zones. 2. Pacifico has commenced a 68-hole (5,200m) drilling campaign that will include in-fill drilling of high-grade zones and target shallow extensions to presently defined mineralisation. 3. Exploration upside in a license 100% held by Pacifico immediately to the south of the JV Project. • We model a further A$150m of capital requirements to fund Pacifico’s 75% share of pre-production capex, working capital and ongoing exploration. We expect PMY to split the funding roughly A$50m/A$100m equity/debt. We forecast gearing to peak at 44% in FY23. • Pacifico’s Sorby Hills Lead-Silver project is comparable to Galena’s (ASX: G1A) Abra Lead-Silver Project. Compared to Abra, Sorby Hills is a shallow Resource suitable for open cut mining (Abra is underground), has a better-defined Resource and Mine Plan, is higher silver grade and is closer to export facilities. • Sorby Hills has successfully passed the Strategic Assessment Stage of the Federal Government’s Northern Australia Infrastructure Facility (NAIF) funding assessment process. Recommendation We initiate coverage on Pacifico Minerals (PMY) with a Buy recommendation and A$0.037ps price target. There are limited opportunities to gain exposure to silver on the ASX and Pacifico is an attractive option. We have set our price target at a fully diluted DCF valuation. Catalysts for the stock to reach our price target include; • Further Resource upgrades post ongoing drilling programs. • Delivery of the Sorby Hills Project through the course of FY21/22. • Resolution of financing options. Key Information Current Price ($ps) 0.016 12m Target Price ($ps) 0.037 52 Week Range ($ps) 0.00-0.03 Target Price Upside (%) 131% TSR (%) 131% Reporting Currency AUD Market Cap ($m) 61 Sector Materials Avg Daily Volume (m) 22.1 ASX 200 Weight (%) 0
-
Upload
khangminh22 -
Category
Documents
-
view
1 -
download
0
Transcript of Pacifico Minerals Ltd (PMY) - Boab Metals

Shaw and Partners
0.01600 0000 000
PMY – Equity Report current as at –01/10/2020–Pg. 1
Pacifico Minerals Ltd (PMY) Rating: Buy | Risk: High | Price Target: $0.037
Take a ride in my silver machine – Initiation of Coverage
Andrew Hines | Head of Research
+61 3 9268 1178 [email protected]
Michael Clark | Analyst
+61 3 9268 1148 [email protected]
Event We initiate coverage on Pacifico Minerals (PMY) with a Buy recommendation and A$0.037ps
price target. Pacifico Minerals is developing the Sorby Hills Lead-Silver Project in the
Kimberley Region of Western Australia. Pacifico holds a 75% interest in the Sorby Hills JV
with China’s largest lead smelting and silver producer Henan Yuguang holding 25%.
Highlights • In August 2020, Pacifico released the results of a Sorby Hills Pre-Feasibility Study
(PFS). The PFS outlined a A$183m project mining 1.5Mtpa of ore and producing 78ktpa of a lead/silver concentrate over a 10 year mine life. The annual production of contained metals is expected to be ~50ktpa of lead and 1.5Mozpa of silver.
• The PFS resulted in an estimated pre-tax NPV of A$303M (at an 8% discount rate) and an IRR of 46% (assuming 10-year historical average prices of US$0.95/lb lead and US$21/oz silver). Our post-tax NPV of A$189m is lower than the PFS, mainly due to a higher WACC assumption of 10%.
• Pacifico is progressing to a Definitive Feasibility Study (DFS) and is conducting additional exploration and Resource definition drilling in anticipation of a Final Investment Decision in late 2021, a 12-18-month construction period and first production in mid-2023.
• The Sorby Hills Reserve currently stands at 13.6Mt at 3.6% Pb for 490kt of lead and at 40g/t Ag for 18 Moz of silver. There is likely to be Reserve upside given;
1. ~5Mt of Resource has been excluded from the PFS to ensure the Project does not step outside the existing Environmental Protection Authority (EPA) approved development zones.
2. Pacifico has commenced a 68-hole (5,200m) drilling campaign that will include in-fill drilling of high-grade zones and target shallow extensions to presently defined mineralisation.
3. Exploration upside in a license 100% held by Pacifico immediately to the south of the JV Project.
• We model a further A$150m of capital requirements to fund Pacifico’s 75% share of pre-production capex, working capital and ongoing exploration. We expect PMY to split the funding roughly A$50m/A$100m equity/debt. We forecast gearing to peak at 44% in FY23.
• Pacifico’s Sorby Hills Lead-Silver project is comparable to Galena’s (ASX: G1A) Abra Lead-Silver Project. Compared to Abra, Sorby Hills is a shallow Resource suitable for open cut mining (Abra is underground), has a better-defined Resource and Mine Plan, is higher silver grade and is closer to export facilities.
• Sorby Hills has successfully passed the Strategic Assessment Stage of the Federal Government’s Northern Australia Infrastructure Facility (NAIF) funding assessment process.
Recommendation We initiate coverage on Pacifico Minerals (PMY) with a Buy recommendation and A$0.037ps price target. There are limited opportunities to gain exposure to silver on the ASX and Pacifico is an attractive option. We have set our price target at a fully diluted DCF valuation.
Catalysts for the stock to reach our price target include;
• Further Resource upgrades post ongoing drilling programs.
• Delivery of the Sorby Hills Project through the course of FY21/22.
• Resolution of financing options.
Key InformationCurrent Price ($ps) 0.016
12m Target Price ($ps) 0.037
52 Week Range ($ps) 0.00- 0.03
Target Price Upside (%) 131%
TSR (%) 131%
Reporting Currency AUD
Market Cap ($m) 61
Sector Materials
Avg Daily Volume (m) 22.1
ASX 200 Weight (%) 0

Shaw and Partners PMY – Equity Report current as at –01/10/2020–Pg. 2
Pacifico Minerals Limited is a base metal exploration and development company, primarily focused on its flagship Sorby Hills Project in Kununurra, Western Australia. The flagship Project is the largest undeveloped, near surface lead-silver-zinc deposit in Australia. Sorby Hills is 75%-owned by Pacifico and 25% owned by Henan-Yuguang - China’s largest lead smelting / silver producer.
MaterialsMaterials
Key Items DataRecommendation BUY
Risk HIGH
Price ($ps) 0.016
Target Price ($ps) 0.037
52 Week Range ($ps) 0.00-0.03Shares on Issue (m) 3,463
Market Cap ($m) 61
Enterprise Value ($m) 48
TSR (%) 131%
Company Description
Pacifico Minerals Ltd
FactSet: PMY-AU / Bloomberg: PMY AU
Shaw and Partners PMY – Equity Report current as at –01/10/2020–Pg. 3
Table of Contents
Pacifico Minerals key financials 4
Pacifico Minerals overview 5
Sorby Hills Resource and exploration upside 6
Sorby Hills Pre-Feasibility Study (PFS) 10
Water Management 12
Comparison to Galena’s Abra project 12
Commodity analysis
Silver 101 and price forecast 14
Lead 101 and price forecast 16
Pacifico P&L 17
Financing – balance sheet and cash flow 18
Valuation and price target 19
Key risks 20
Appendix: Key personnel 21

Shaw and Partners PMY – Equity Report current as at –01/10/2020–Pg. 4
Pacifico Minerals Key financials
Profit & Loss FY18 FY19 FY20 FY21f FY22f Company Information
Revenue 0.0 0.0 0.0 0.0 0.0 Financial Year End Date 30 June
Expenses -1.6 -3.4 -3.2 -4.0 -4.0 Share Price 0.016
Underlying EBITDA -1.6 -3.4 -3.2 -4.0 -4.0 Market Capitalisation 61
Depreciation & Amort 0.0 0.0 0.0 0.0 0.0 Valuation 0.037
Underlying EBIT -1.6 -3.4 -3.2 -4.0 -4.0 Recommendation Buy
Net Interest 0.0 0.0 0.0 -0.7 -1.9
Profit Before Tax -1.6 -3.3 -3.1 -4.7 -5.9 Per Share Data (c) FY18 FY19 FY20 FY21f FY22f
Tax 0.0 0.0 0.0 0.0 0.0 Shares (m) 893 2,313 2,888 3,841 5,582
NPAT (Underlying) -1.6 -3.3 -3.1 -4.7 -5.9 Normalised EPS -0.2 -0.2 -0.1 -0.1 -0.1
Exceptional items 0.0 0.0 0.0 0.0 0.0 Dividends 0.0 0.0 0.0 0.0 0.0
NPAT (reported) -1.6 -3.3 -3.1 -4.7 -5.9 Dividend Yield (%) 0.0% 0.0% 0.0% 0.0% 0.0%
Book Value 0.00 0.00 0.00 0.01 0.02
Balance Sheet FY18 FY19 FY20 FY21f FY22f P/E (x) -5.1 -2.9 -7.5 -11.5 -12.9
Cash 0.8 2.0 2.9 3.7 82.0 EV/EBITDA (x) -3.8 -3.3 -7.3 -14.7 -21.6
Net Receivables 0.0 0.4 0.2 0.2 0.2
Other 0.0 0.0 0.0 0.0 0.0 Valuation - fully diluted for $50m equity raise A$m A$ps
Current Assets 0.8 2.4 3.1 3.9 82.2 Sorby Hills (75%) 141 0.025
Property, Plant & Equipment 0.0 0.0 0.0 10.0 95.0 Net cash 13 0.002
Other 1.3 5.2 5.4 7.4 9.4 Exploration 10 0.002
Non Current Assets 1.3 5.3 5.4 17.4 104.4 Cash from options + raise 57 0.010
Total Assets 2.1 7.6 8.5 21.3 186.6 Corporate costs -15 -0.003
Total Valuation 206 0.037
Trade Creditors 0.1 0.7 0.5 0.5 0.5
Borrow ings 0.0 0.3 0.1 0.1 0.1 Assumptions FY18 FY19 FY20 FY21f FY22f
Other 0.0 0.1 0.1 0.1 0.1 Prices
Current Liabilities 0.1 1.1 0.6 0.6 0.6 A$/US$ 0.77 0.71 0.67 0.70 0.73
Borrow ings 0.0 0.0 0.0 0.0 100.0 Lead (USc/lb) 110 91 87 90 102
Other 0.2 0.2 0.2 0.2 0.2 Silver (US$/oz) 17 15 17 26 36
Non Current Liabilities 0.2 0.2 0.2 0.2 100.2 Zinc (USc/lb) 144 119 100 97 112
Net Assets 1.8 6.3 7.6 20.4 85.7
Operating Metrics FY18 FY19 FY20 FY21f FY22f
Shareholder Capital 20.9 28.7 33.0 47.9 97.9 Ore processed (ktpa) 0 0 0 0 0
Retained earnings -20.5 -23.8 -27.0 -31.6 -37.5 Lead concentrate (kt) 0 0 0 0 0
Minorities/others 1.4 1.5 1.6 4.1 25.4 Payable lead (kt) 0 0 0 0 0
Total Equity 1.8 6.3 7.6 20.4 85.7 Payable silver (Moz) 0 0 0 0 0
Cash Flow FY18 FY19 FY20 FY21f FY22f Average price (A$/t) 0 0 0 0 0
Receipts 0.0 0.0 0.0 0.0 0.0 Average cost (A$/t) 0 0 0 0 0
Payments -0.7 -0.9 -0.9 -4.0 -4.0 Average margin (A$/t) 0 0 0 0 0
Other Operating Cash Flow -0.7 -1.9 -2.3 0.0 0.1
Operating Cash Flow -1.4 -2.8 -3.3 -4.0 -3.9 Financial metrics (%) FY18 FY19 FY20 FY21f FY22f
Capex 0.0 0.0 0.0 -10.0 -85.0 EBITDA margin 0.0% 0.0% 0.0% 0.0% 0.0%
Other Investing Cash Flow -0.1 -3.3 -0.1 0.5 19.3 EBIT margin 0.0% 0.0% 0.0% 0.0% 0.0%
Investing Cash Flow -0.1 -3.3 -0.1 -9.5 -65.8 ROIC 0.0% 0.0% 0.0% 0.0% 0.0%
Dividends Paid 0.0 0.0 0.0 0.0 0.0 Return on Assets -76.0% -68.9% -38.9% -31.4% -5.6%
Net Borrow ings 0.0 0.0 0.0 0.0 100.0 Return on Equity -89.2% -82.3% -44.9% -33.4% -11.0%
Share capital raised 0.8 7.9 4.6 15.7 50.0
Other 0.0 -0.6 -0.3 -1.4 -2.0 Balance sheet metrics FY18 FY19 FY20 FY21f FY22f
Financing Cash flow 0.7 7.3 4.3 14.3 148.0 Net Debt (m) -1 -2 -3 -4 18
Total Cash Change -0.8 1.2 0.9 0.8 78.3 ND / ND+E 0.0% 0.0% 0.0% 0.0% 17.4%

Shaw and Partners PMY – Equity Report current as at –01/10/2020–Pg. 5
Pacifico Minerals overview Pacifico Minerals Limited (ASX:PMY) owns 75% of the Sorby Hills Lead-Silver Project. The
25% JV partner is Henan Yuguang Gold and Lead Co. Ltd. Henan Yuguang is China's largest
lead smelting enterprise and silver producer.
Sorby Hills is located 50km from the regional centre of Kununurra in the East Kimberley and
is 150km from Wyndham Port via a sealed road.
In August 2020, Pacifico released the results of an updated Sorby Hills Pre-Feasibility Study
(PFS). The PFS outlined a A$183m project mining 1.5Mtpa of ore and producing 78ktpa of a
lead/silver concentrate over an initial 10 year mine life. The annual production of contained
metals is expected to be approximately 50ktpa of lead and 1.5Mozpa of silver.
The PFS resulted in an in an estimated NPV of A$303M (at an 8% discount rate) and an IRR
of 46% (assuming 10-year historical average prices of US$0.95/lb lead and US$21/oz silver).
Pacifico has progressed immediately to a Definitive Feasibility Study (DFS) and is conducting
additional exploration and Resource definition drilling in anticipation of a Final Investment
Decision in late 2021, a 12-18-month construction period and first production in FY24.
Figure 1: Sorby Hills Project location
Source: Pacifico presentation September 2020

Shaw and Partners PMY – Equity Report current as at –01/10/2020–Pg. 6
Sorby Hills - Resource and exploration upside The Sorby Hills Resource is spread over six main deposits named Alpha, Beta, Norton,
Omega, A and B. The Alpha and Beta deposits are on a granted mining permit that sits
outside the EPA approved development zone and have been excluded from the PFS. The
incorporation of these deposits in the Mine Plan represents additional upside once the
project is in operation.
Figure 2: Sorby Hills Project – main deposits
Source: Pacifico presentation September 2020
Figure 3: Sorby Hills main deposits cross section
c
Source: Pacifico presentation September 2020

Shaw and Partners PMY – Equity Report current as at –01/10/2020–Pg. 7
Pacifico has a total Resource base of 44.1Mt at 3.3% Pb and 38 g/t Ag. 53% of the Resource
is in the Inferred category which has largely been excluded from the Mine Plan. The Reserve
that was included in the PFS totals 13.6Mt at 3.6% Pb and 40.2g/t silver.
It is interesting to note that the silver grade is higher in the Measured Resource category
than the Inferred category. This suggests that additional drilling could result in an
improvement in the silver grade and hence the project economics.
Figure 4: Pacifico Resources
Source: Pacifico presentation September 2020
Figure 5: Pacifico Reserves
Source: Pacifico presentation September 2020
Pacifico acquired the project in March 2018 from the administrators of KBL Mining and since
acquisition has completed 193 drill holes for over 14,500m of drilling in three phases. The
Resource base has increased by around 50% in the past two years with the growth largely
in the Measured and Indicated category.
Figure 6: Sorby Hills Resource growth since March 2018
Source: Pacifico presentation September 2020

Shaw and Partners PMY – Equity Report current as at –01/10/2020–Pg. 8
Recent drilling has increased the confidence in the Resource base and the following
diagrams outline a number of notable drill intercepts.
Figure 7: Sorby Hills Resource growth since March 2018
Source: Pacifico presentation September 2020
Figure 8: Sorby Hills resource growth since March 2018
Source: Pacifico presentation September 2020

Shaw and Partners PMY – Equity Report current as at –01/10/2020–Pg. 9
A new phase of drilling commenced in September 2020 with Pacifico intending to drill a
further 68 drill holes for a 5,200m drilling program. Around half of the drilling is for
metallurgical and sterilisation test work with the balance targeting;
▪ Extensions of the mineralisation between Norton and Omega deposits;
▪ The continuity of high-grade zones of mineralisation;
▪ Verification of RC drilling results in the Wildcat target area;
▪ Follow up of high-grade historic intercepts south of the known deposits identified in a recent project data review;
▪ Near pit opportunities to expand shallow mineralisation; and
▪ Follow-up drilling where high-grade silver mineralisation has been intersected previously.
Pacifico will also be conducting a gravity survey over the northern deposits.
Figure 9: Exploration upside
Source: Pacifico presentation September 2020

Shaw and Partners PMY – Equity Report current as at –01/10/2020–Pg. 10
Sorby Hills Pre- Feasibility Study (PFS) The Sorby Hills PFS was released in August 2020. The key operating and financial parameters
from the PFS are outlined in the tables below. The key features of the PFS include;
▪ A pre-tax NPV(8%) of A$303m, IRR of 46% and payback of 1.6yrs from first concentrate production.
▪ Total ore mined of 14.8Mt at 3.6% Pb and 39.5g/t Ag.
▪ Annual processing ~1.5Mtpa of ore to produce around 50ktpa of lead and 1.5Mozpa of silver.
▪ C1 cash costs at 40 USc/lb, and All-in-sustaining-cost (AISC) at 47c USc/lb.
▪ The capital cost is expected to be A$183m to first production.
▪ A Decision to Mine is expected by year end 2021 with first production in mid-2023.
Figure 10: Life of Mine metrics Figure 11: Life of mine metrics
Source: Pacifico PFS August 2020 Source: Pacifico PFS August 2020
Figure 12: Capital cost estimates Figure 13: Operating cost estimates
Source: Pacifico PFS August 2020 Source: Pacifico PFS August 2020

Shaw and Partners PMY – Equity Report current as at –01/10/2020–Pg. 11
The PFS considered two processing options;
▪ Whole Ore (“WO”) Option: Where all of the ore reports directly from the primary crusher to the milling and flotation circuit without beneficiation; and
▪ Dense Media Separation (“DMS”) Option: Where the high-grade ore reports from primary crushing directly to the flotation circuit, and the low-grade ore is beneficiated via parallel DMS circuit to produce a product that supplements the high-grade direct flotation feed.
The base case for the PFS is the Whole Ore option and we have based our financial model
on this option. The potential advantage of the DMS option is that the processing facility
could economically treat lower grade material allowing for additional current Resource
tonnes and future low-grade discoveries to be incorporated into the Mine Plan.
The technical and economic aspects of the DMS option will be further considered during
the DFS phase of the project.
Figure 14: Process flow sheet (inclusive of additional optional DMS circuit – dashed box)
Source: Pacifico presentation September 2020

Shaw and Partners PMY – Equity Report current as at –01/10/2020–Pg. 12
Water management The Sorby Hills Project is set in a complex hydrogeological system, especially given the
region is prone to flooding. In the Kimberley region, almost 90% of the annual rainfall occurs
during the Wet Season. The most extreme storms are often associated with cyclone events.
As such, a key risk for the project is water management.
The Pacifico management team have attempted to manage this risk by engaging technical
geoscience consultants Pennington Scott (P-S) for contribution to the PFS. We make note
of the following from P-S’s hydrogeological study:
▪ A comprehensive Conceptual Site Model (CSM) – benchmarked against historical (1979-2011) and new test pumping data – has been built to simulate regional groundwater systems across the life of the Sorby Hills Project. This has significantly improved estimates of pit dewatering requirements and the overall site water balance.
▪ The revised methods have derived hydraulic properties that are about one order of magnitude lower than determined by previous technical consultants in the 1980s.
▪ P-S has evaluated the effectiveness of several dewatering techniques, including dewatering bores and in-pit sump pumping. In-pit sump pumping has been selected as the preferred disposal option in conjunction with aquifer reinjection and seasonal discharge into nearby rivers. The final water disposal option will be selected after consultation with regulators during the DFS study phase.
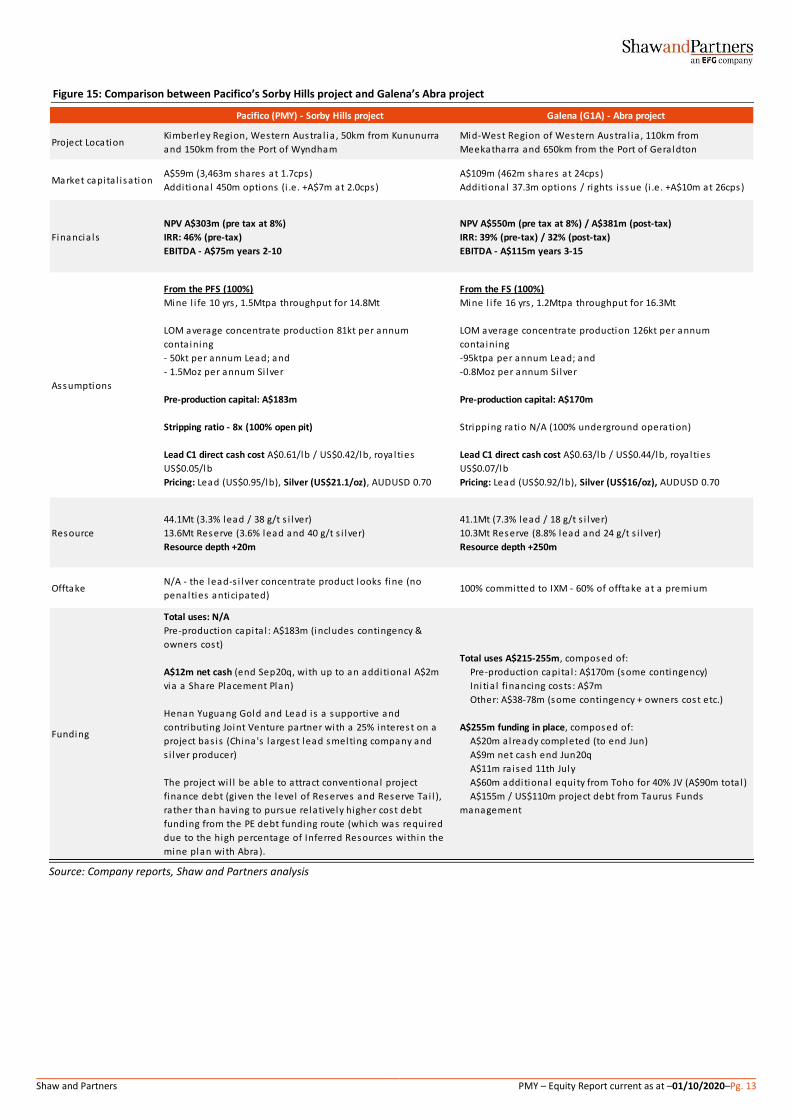
Sorby Hills comparison to Abra Pacifico’s Sorby Hills Lead-Silver project is comparable to Galena’s Abra lead/silver project
with the added benefit of being a low-risk open-pit proposition with significant upside
potential between this point in time and project construction. The broad differences stem
from the respective Project Deposits and Mine Plans:
▪ Sorby Hills begins 20m from surface and is 100% open pitable, whereas the Abra lies +250m below the surface and will be a 100% underground operation.
▪ Sorby Hills comprises a 44Mt Resource of which 16% falls into the Measured (most confident) classification, Abra is yet to report a Resource at the Measured level.
▪ Whilst the Abra Mine Plan spans 16 years versus the current 10-year life of Sorby Hills, the Sorby Hills Mine Plan incorporates 92% Reserves (of which 50% are considered Proved), whereas Abra comprises 67% Reserves, none of which is considered Proved as this point in time.
▪ Being shallow, the opportunity to efficiently and effectively expand and further upgrade the Sorby Hills Resource and Mine Life is significant as highlighted by previous drilling programs which have almost doubled the Resource size over the past 2 years.
▪ Pacifico has commenced a 68-hole (5,200m) drilling campaign that will include in-fill drilling of high-grade zones and target shallow extensions to presently defined mineralisation.
▪ Sorby Hills contains less Lead but approximately double the silver of Abra. Furthermore, the Pre-Feasibility Study has demonstrated that the Sorby Hill deposit is amendable to further grade enhancement via conventional beneficiation processes.
Shaw and Partners PMY – Equity Report current as at –01/10/2020–Pg. 13
Figure 15: Comparison between Pacifico’s Sorby Hills project and Galena’s Abra project
Source: Company reports, Shaw and Partners analysis
Pacifico (PMY) - Sorby Hills project Galena (G1A) - Abra project
Project LocationKimberley Region, Western Austra l ia , 50km from Kununurra
and 150km from the Port of Wyndham
Mid-West Region of Western Austra l ia , 110km from
Meekatharra and 650km from the Port of Gera ldton
Market capita l i sation A$59m (3,463m shares at 1.7cps)
Additional 450m options (i .e. +A$7m at 2.0cps)
A$109m (462m shares at 24cps)
Additional 37.3m options / rights i ssue (i .e. +A$10m at 26cps)
Financia ls
NPV A$303m (pre tax at 8%)
IRR: 46% (pre-tax)
EBITDA - A$75m years 2-10
NPV A$550m (pre tax at 8%) / A$381m (post-tax)
IRR: 39% (pre-tax) / 32% (post-tax)
EBITDA - A$115m years 3-15
Assumptions
From the PFS (100%)
Mine l i fe 10 yrs , 1.5Mtpa throughput for 14.8Mt
LOM average concentrate production 81kt per annum
conta ining
- 50kt per annum Lead; and
- 1.5Moz per annum Si lver
Pre-production capital: A$183m
Stripping ratio - 8x (100% open pit)
Lead C1 direct cash cost A$0.61/lb / US$0.42/lb, royal ties
US$0.05/lb
Pricing: Lead (US$0.95/lb), Silver (US$21.1/oz), AUDUSD 0.70
From the FS (100%)
Mine l i fe 16 yrs , 1.2Mtpa throughput for 16.3Mt
LOM average concentrate production 126kt per annum
conta ining
-95ktpa per annum Lead; and
-0.8Moz per annum Si lver
Pre-production capital: A$170m
Stripping ratio N/A (100% underground operation)
Lead C1 direct cash cost A$0.63/lb / US$0.44/lb, royal ties
US$0.07/lb
Pricing: Lead (US$0.92/lb), Silver (US$16/oz), AUDUSD 0.70
Resource
44.1Mt (3.3% lead / 38 g/t s i lver)
13.6Mt Reserve (3.6% lead and 40 g/t s i lver)
Resource depth +20m
41.1Mt (7.3% lead / 18 g/t s i lver)
10.3Mt Reserve (8.8% lead and 24 g/t s i lver)
Resource depth +250m
OfftakeN/A - the lead-s i lver concentrate product looks fine (no
penalties anticipated)100% committed to IXM - 60% of offtake at a premium
Funding
Total uses: N/A
Pre-production capita l : A$183m (includes contingency &
owners cost)
A$12m net cash (end Sep20q, with up to an additional A$2m
via a Share Placement Plan)
Henan Yuguang Gold and Lead is a supportive and
contributing Joint Venture partner with a 25% interest on a
project bas is (China 's largest lead smelting company and
s i lver producer)
The project wi l l be able to attract conventional project
finance debt (given the level of Reserves and Reserve Ta i l ),
rather than having to pursue relatively higher cost debt
funding from the PE debt funding route (which was required
due to the high percentage of Inferred Resources within the
mine plan with Abra).
Total uses A$215-255m, composed of:
Pre-production capita l : A$170m (some contingency)
Ini tia l financing costs : A$7m
Other: A$38-78m (some contingency + owners cost etc.)
A$255m funding in place, composed of:
A$20m already completed (to end Jun)
A$9m net cash end Jun20q
A$11m ra ised 11th July
A$60m additional equity from Toho for 40% JV (A$90m tota l )
A$155m / US$110m project debt from Taurus Funds
management

Shaw and Partners PMY – Equity Report current as at –01/10/2020–Pg. 14
Commodity analysis
Silver 101 Silver is a soft and lustrous metallic element that is unique as a commodity and currency.
Of all metals, it has the highest electrical and thermal conductance and optical reflectivity.
Throughout history it has been used as a white metal in jewellery or coins; as with other
precious metals, a protection against inflation. More recently it is being used for industrial
purposes. Solar panels are now ~9% of total silver demand. Its extensive industrial use is
somewhat regulated by silver’s higher relative cost to other metals (figure 16).
Figure 16: Relative electrical and thermal conductance of metals Figure 17: Silver – demand by end use (2019)
Source: TIBTECH innovations, LME, Factset, Shaw and Partners Source: Statista, Shaw and Partners
Silver supply is different from gold supply, in that it increases as base metals production
increases. Primary gold supply tends to remain relatively stable (between the range of 90-
115Moz since 2010). A relatively small percentage of silver production comes from primary
silver mines, but the majority comes as a by-product from base metal mines. This is an
important feature because rising silver prices may not necessarily drive new mine supply
investments (this year's ~170Moz estimated market deficit is mainly driven by increased
ETF inflows – figures 19, 22). Mine production is dominated by the major producers Mexico,
China and Peru.
Figure 18: Silver supply (Moz) Figure 19: Silver demand (Moz)
Source: GFMS, CRU, Shaw and Partners Source: GFMS, CRU, Shaw and Partners
Price (US$/t)
Si lver 727,583
Copper 6,530
Gold 59,704,852
Aluminium 1,710
Molybdenum 22,855
Zinc 2,36528
100 100
95
75
56
33
94
71
59
30
27
Electrical conductivity
relative to silver
Thermal conductivity
relative to silver
Jewellery, 18%
Phys ical investment (coins
/ bars ), 19%
Si lverware, 5%
Industrial, 46%
Industrial - PV,
9%
Photography, 3%
200
400
600
800
1,000
1,200
2013 2014 2015 2016 2017 2018 2019 2020f
Mine production Silver Scrap
-200
200
400
600
800
1,000
1,200
2013 2014 2015 2016 2017 2018 2019 2020f
Other Applications Jewellery / Silverware, Coins, Medals
Brazing Alloys and Solders Photography
Electronics Change in ETF Holdings

Shaw and Partners PMY – Equity Report current as at –01/10/2020–Pg. 15
Silver price forecast
Silver is traded on many exchanges around the globe and in many forms (i.e. silver paper,
bullion, coins and fabricated items). Its price has been historically highly dependent on the
gold price direction. Comparatively, silver is much cheaper than gold, and consequently, it
is more accessible to investors and prices more volatile.
The long-run gold: silver price ratio is ~68:1, which is used to determine the optimal times
to buy and sell precious metal. Generally, when the ratio is higher than long-run averages
(as it is now, ~80), silver is favoured. Conversely a low ratio tends to favour the purchase of
gold.
We use a long-run silver price of US$19/oz, which is based on a gold : silver ratio converging
from current levels to a long run value of 65 by the start of 2022, and a long run gold price
of US$1,250/oz (2025+). We expect the recent gold price strength – driven by negative real
interest rates - to continue for 2-3 years. We expect gold to peak at US$2,500/oz in late
2022, before reducing to long-run levels in 2025.
Figure 20: Shaw and Partners – silver price forecast (US$/oz)
Source: Bloomberg, LBMA, Factset, Shaw and Partners analysis
Figure 21: Silver price forecast (US$/oz) Figure 22: Silver's total ETF holdings worldwide (Moz)
Source: World Bank, Bloomberg, Shaw and Partners Source: Bloomberg, Shaw and Partners
Figure 23: silver ratio (since 2000) Figure 24: Gold : silver ratio (2020)
Source: World Bank, Bloomberg, Shaw and Partners Source: Bloomberg, Shaw and Partners
CY commodity prices 2015 2016 2017 2018 2019 2020f 2021f 2022f 2023f LT Real Spot
Silver US$/oz 15.7 17.1 17.1 15.7 16.5 21.0 30.6 37.9 32.7 19.3 23.0
Gold US$/oz 1,160 1,248 1,259 1,269 1,425 1,812 2,250 2,463 2,125 1,251 1,815
Gold : silver ratio 74 73 74 81 86 86 74 65 65 65 79
AU$/US$ 0.74 0.75 0.77 0.73 0.70 0.67 0.72 0.74 0.74 0.75 0.70
0
5
10
15
20
25
30
35
40
45
19
90
19
92
19
94
19
96
19
98
20
00
20
02
20
04
20
06
20
08
20
10
20
12
20
14
20
16
20
18
20
20
20
22
20
24
20
26
0
100
200
300
400
500
600
700
800
900
1000
2006
2007
2008
2009
2010
2011
2012
2013
2014
2015
2016
2017
2018
2019
2020
0
20
40
60
80
100
120
140
2000
2002
2004
2006
2008
2010
2012
2014
2016
2018
2020

Shaw and Partners PMY – Equity Report current as at –01/10/2020–Pg. 16
Lead 101 and price forecast Humans have used lead for at least 7,000 years mainly because deposits containing lead are
widespread and it is easy to extract and work with. Properties of the metal responsible for
its variety of uses include its malleability, ductility, low melting point, high density, ability to
absorb radiation, and high resistance to corrosion.
Due to its various health hazards, lead use is now dominated by lead-acid batteries for
combustion engines in transportation. This is approximately 80% of the globe’s ~12Mtpa
market. China has become the dominant producer (~50%) and consumer (~45%).
There are two types of lead supply - primary and secondary (figure 28). Primary lead is
mined, separated from ore, and refined into various products. Zinc, silver and copper is
usually extracted together with lead. Secondary lead is recovered from used objects (i.e.
lead-acid batteries) for reuse in other products. We note that the lead industry is not a
concentrated market, with the 10 largest company suppliers of lead being responsible for
only ~30% of global mined supply.
We use a relatively stable long-run lead price outlook at ~US$2,200/t or USc98/lb (2020
Real). Accelerating competition from lithium ion batteries in the longer term is likely to keep
lead's demand growth rate suppressed (N.B. Electric vehicles use a separate lead battery to
run their battery management and safety systems, however EVs use lead batteries that are
~60% smaller than regular ICE vehicles). On the supply side, declining primary mine supply
is partially balance by secondary supply – the glob’s swing factor - which keeps prices stable.
Figure 25: Shaw and Partners – lead price forecast (US$/oz)
Source: Bloomberg, LME, Factset, Shaw and Partners analysis
Figure 26: Lead price forecast (US$/t) Figure 27: Lead – demand by end use (2015-20)
Source: LME, Factset, Shaw and Partners Source: ILZSG, Shaw and Partners
Figure 28: Refined lead supply (Mt) Figure 29: Refined lead demand (Mt)
Source: ILZSG, Shaw and Partners Source: ILZSG, Shaw and Partners
CY commodity prices 2015 2016 2017 2018 2019 2020f 2021f 2022f 2023f LT Real Spot
Lead USc/lb 81 85 105 102 90 82 101 103 106 98 82
Lead US$/t 1,787 1,867 2,314 2,241 1,989 1,810 2,225 2,278 2,333 2,164 1,805
0
500
1000
1500
2000
2500
3000
3500
19
90
19
92
19
94
19
96
19
98
20
00
20
02
20
04
20
06
20
08
20
10
20
12
20
14
20
16
20
18
20
20
20
22
20
24
20
26
Batteries, 80%
Cable sheathing, 1%
Rolled and extrudedproducts, 6%Shot/ Ammuniition, 3%
Alloys, 2%
Pigments and othercompounds, 5%Miscellaneous, 3%
.0
2.0
4.0
6.0
8.0
10.0
12.0
14.0
2015 2016 2017 2018 2019 2020f
Primary refined production Secondary refined production
.0
2.0
4.0
6.0
8.0
10.0
12.0
14.0
2015 2016 2017 2018 2019 2020f
China Brazil, Russia, India USA Europe ROW

Shaw and Partners PMY – Equity Report current as at –01/10/2020–Pg. 17
Pacifico P&L Sorby Hills will be Pacifico’s only producing asset, and so 75% of the Group P&L (to account
for Henan Yuguang Gold & Lead’s 25% project equity) will look very similar to the asset P&L
– just additional corporate overheads and financing costs.
We model first production from Sorby Hills in FY24, and a full ramp-up by FY25. This is
slightly delayed to the company’s PFS schedule, which uses a May-23 date for first
production.
Once in production, the main driver of profitability will be movements in the lead and sliver
prices. In figure 32 we show our forecast of NPAT to percentage movements in commodity
prices away from our base case forecast. Every 10% move in the price is worth around
A$11m to NPAT in 2025.
Figure 30: Pacifico Minerals P&L (A$m)
Source: Company reports, Shaw and Partners analysis
Figure 31: NPAT (A$m) Figure 32: Pacifico NPAT sensitivity to commodity prices (A$m)
Source: Company reports, Shaw and Partners analysis Source: Company reports, Shaw and Partners analysis
Profit & Loss (A$m) 2018 2019 2020f 2021f 2022f 2023f 2024f 2025f 2026f 2027f 2028f 2029f 2030f
Ore processed (kt) 0 0 0 0 0 0 1,200 1,500 1,500 1,500 1,500 1,500 1,500
Lead concentrate (kt) 0 0 0 0 0 0 63 78 78 78 78 78 78
Payable lead (kt) 0.0 0.0 0.0 0.0 0.0 0.0 40.8 51.0 51.0 51.0 51.0 51.0 51.0
Revenue 0 0 0 0 0 0 182 217 219 224 229 234 240
Total cost of sa les 0 0 0 0 0 0 -102 -129 -132 -135 -138 -141 -144
Admin & other expenses -2 -3 -4 -4 -4 -2 -2 -2 -2 -2 -2 -2 -2
Total costs -2 -3 -4 -4 -4 -2 -104 -131 -134 -137 -140 -143 -146
EBITDA -2 -3 -4 -4 -4 -2 79 86 85 87 89 91 93
Depreciation & Amortisation 0 0 0 0 0 0 -12 -14 -14 -14 -14 -14 -6
EBIT -2 -3 -4 -4 -4 -2 67 71 71 73 75 77 88
Net Finance Expense 0 0 0 -1 -3 -1 -3 -1 1 2 4 5 6
Profit before tax -2 -3 -4 -5 -7 -3 64 71 72 75 78 82 94
Income tax (expense)/benefi t 0 0 0 0 0 0 -19 -21 -22 -23 -23 -25 -28
Minori ties 0 0 0 0 0 0 -11 -12 -13 -13 -14 -14 -16
Reported NPAT -2 -3 -4 -5 -7 -3 34 37 38 39 41 43 49
-20
-10
0
10
20
30
40
50
60
20
18
20
19
2020
f
2021
f
2022
f
2023
f
2024
f
2025
f
20
26
f
20
27
f
20
28
f
2029
f
2030
f
-20
-10
0
10
20
30
40
50
60
70
80
2018 2019 2020f 2021f 2022f 2023f 2024f 2025f 2026f
+30%
+20%
+10%
basecase
-10%
-20%
-30%

Shaw and Partners PMY – Equity Report current as at –01/10/2020–Pg. 18
Financing - balance sheet and cash flow We estimate that Pacifico will need to raise around A$150m of new capital to fund its 75%
share of the pre-production capex, working capital and to maintain an active ~$4mpa
exploration program. Peak cash outflow will occur in 2HFY22, post a Sorby Hills Final
Investment Decision (end 1HFY22 / CY21).
Pacifico raised $10m of equity capital in September 2020 (with up to an additional A$2m
via a Share Placement Plan) to fund ongoing exploration and the DFS. We anticipate a
further A$50m equity raise in FY22 along with an $100m debt finance package. We expect
the debt finance package to be in two tranches, a consortium of commercial banks (tranche
A) and NAIF (Northern Australia Infrastructure Facility, tranche B).
At peak funding, this would leave Pacifico with a gearing level of 44% which appears
manageable given the strong free cash flow expected post start-up and ongoing support
from project partner Henan Yuguang Gold & Lead. Our base case forecast has the company
back in a net cash position by FY25.
Figure 33: Pacifico Cash flow (A$m)
Source: Company reports, Shaw and Partners analysis
Figure 34: Pacifico Balance Sheet (A$m)
Source: Company reports, Shaw and Partners analysis
CASH FLOW (AS$m) 2019 2020 2021f 2022f 2023f 2024f 2025f 2026f 2027f 2028f 2029f 2030f
Operating activities
Receipts from customers 0 0 0 0 0 182 217 219 224 229 234 240
Payments to suppl iers and employees -1 -1 -4 -4 -2 -104 -131 -134 -137 -140 -143 -146
Income taxes paid 0 0 0 0 0 0 -19 -21 -22 -23 -24 -25
Working capita l movement 0 0 0 0 0 0 0 0 0 0 0 0
Other -2 -2 0 0 2 1 2 2 3 4 5 6
Net cash flow from operating activities -3 -3 -4 -4 0 79 68 66 68 70 73 75
Investing activities
Payments for PPE 0 0 -10 -85 -76 -22 -4 -4 -4 -4 -4 -4
Other -3 0 1 19 18 4 0 0 0 0 0 0
Net cash flow from investing activities -3 0 -10 -66 -58 -17 -4 -4 -4 -4 -4 -4
Free cash flow -6 -3 -14 -89 -76 57 65 63 64 66 69 71
Financing activities
Net proceeds from issue of shares 8 5 16 50 0 0 0 0 0 0 0 0
Proceeds from borrowings 0 0 0 100 0 0 0 0 0 0 0 0
Repayments of borrowings 0 0 0 0 0 -25 -30 -30 -15 0 0 0
Dividends paid 0 0 0 0 0 0 -7 -19 -19 -20 -21 -23
Other -1 0 -1 -2 -4 -3 -2 -1 0 0 0 0
Net cash flow from financing activities 7 4 14 148 -4 -28 -39 -50 -34 -20 -21 -23
Net increase/(decrease) in cash 1 1 1 78 -61 33 26 13 30 46 48 49
BALANCE SHEET (A$m) 2019 2020 2021f 2022f 2023f 2024f 2025f 2026f 2027f 2028f 2029f 2030f
Cash and cash equiva lents 2 3 4 82 21 54 80 92 122 169 216 265
Trade and other receivables 0 0 0 0 0 0 0 0 0 0 0 0
Other 0 0 0 0 0 0 0 0 0 0 0 0
Total current assets 2 3 4 82 21 54 80 92 122 169 216 265
Property, plant and equipment 0 0 10 95 171 181 171 160 149 139 129 127
Exploration and evaluation 5 5 7 9 10 11 12 13 14 15 16 17
Total non-current assets 5 5 17 104 181 193 183 173 164 154 145 144
TOTAL ASSETS 8 8 21 187 202 247 263 266 286 323 361 409
Trade and other payables 1 0 0 0 0 0 0 0 0 0 0 0
Total current liabilities 1 1 1 1 1 0 0 0 0 0 0 0
Deferred tax 0 0 0 0 0 19 21 22 23 24 25 28
Borrowings 0 0 0 100 100 75 45 15 0 0 0 0
Total non-current liabilities 0 0 0 100 100 95 66 37 23 24 25 28
TOTAL LIABILITIES 1 1 1 101 101 95 67 37 23 24 25 29
NET ASSETS 6 8 20 86 101 152 196 229 263 299 336 381
Net debt -2 -3 -4 18 79 21 -34 -77 -122 -168 -216 -265
Gearing (ND/ND+E %) 0% 0% 0% 17% 44% 12% 0% 0% 0% 0% 0% 0%
Shaw and Partners PMY – Equity Report current as at –01/10/2020–Pg. 19
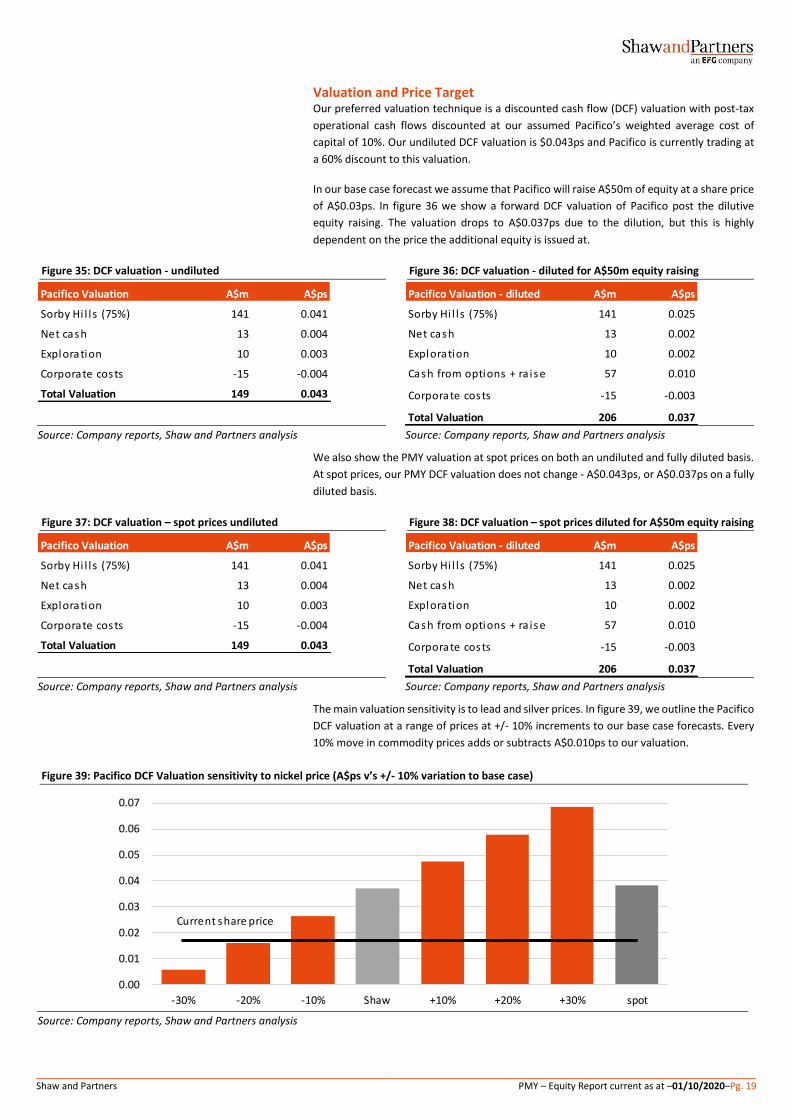
Valuation and Price Target Our preferred valuation technique is a discounted cash flow (DCF) valuation with post-tax
operational cash flows discounted at our assumed Pacifico’s weighted average cost of
capital of 10%. Our undiluted DCF valuation is $0.043ps and Pacifico is currently trading at
a 60% discount to this valuation.
In our base case forecast we assume that Pacifico will raise A$50m of equity at a share price
of A$0.03ps. In figure 36 we show a forward DCF valuation of Pacifico post the dilutive
equity raising. The valuation drops to A$0.037ps due to the dilution, but this is highly
dependent on the price the additional equity is issued at.
Figure 35: DCF valuation - undiluted Figure 36: DCF valuation - diluted for A$50m equity raising
Source: Company reports, Shaw and Partners analysis Source: Company reports, Shaw and Partners analysis
We also show the PMY valuation at spot prices on both an undiluted and fully diluted basis.
At spot prices, our PMY DCF valuation does not change - A$0.043ps, or A$0.037ps on a fully
diluted basis.
Figure 37: DCF valuation – spot prices undiluted Figure 38: DCF valuation – spot prices diluted for A$50m equity raising
Source: Company reports, Shaw and Partners analysis Source: Company reports, Shaw and Partners analysis
The main valuation sensitivity is to lead and silver prices. In figure 39, we outline the Pacifico
DCF valuation at a range of prices at +/- 10% increments to our base case forecasts. Every
10% move in commodity prices adds or subtracts A$0.010ps to our valuation.
Figure 39: Pacifico DCF Valuation sensitivity to nickel price (A$ps v’s +/- 10% variation to base case)
Source: Company reports, Shaw and Partners analysis
Pacifico Valuation A$m A$ps
Sorby Hi l l s (75%) 141 0.041
Net cash 13 0.004
Exploration 10 0.003
Corporate costs -15 -0.004
Total Valuation 149 0.043
Pacifico Valuation - diluted A$m A$ps
Sorby Hi l l s (75%) 141 0.025
Net cash 13 0.002
Exploration 10 0.002
Cash from options + ra ise 57 0.010
Corporate costs -15 -0.003
Total Valuation 206 0.037
0.00
0.01
0.02
0.03
0.04
0.05
0.06
0.07
0.08
-30% -20% -10% Shaw +10% +20% +30% spot
Current share price

Shaw and Partners PMY – Equity Report current as at –01/10/2020–Pg. 20
Key risks As a small mining company with exposure to lead and silver and a single asset we consider
an investment in Pacifico Minerals to be high risk. The key risks include;
▪ The prices of silver and lead are volatile and difficult to forecast. The actual prices may differ substantially from our forecasts.
▪ The Sorby Hills project is not yet producing and there is a risk that Pacifico is unable to bring the operation in to production. The project may cost more than expected to build and may not operate as expected.
▪ Pacifico requires around $150m of new capital to finance its 75% share of the Sorby Hills Project. There is a risk that capital markets are not willing to fund the project.
▪ Forecasting future operating costs has considerable uncertainty. Our forecasts may prove to be too optimistic. If Pacifico Resource’s costs are higher than we expect then our cash flow forecasts will be too high.
▪ Smaller companies carry more significant ‘key personnel’ risk than larger organisations. If senior management depart the company, then it could delay projects or exacerbate operational risks.

Shaw and Partners PMY – Equity Report current as at –01/10/2020–Pg. 21
Appendix: Key Personnel
Gary Comb | Executive Chairman
Gary is an engineer with over 30 years' experience in the Australian mining industry, with a
strong track record in successfully commissioning and operating base metal mines. Gary
was Chairman of Finders Resources Limited from 2013 until its takeover in 2018, and was
previously the Managing Director of Jabiru Metals Limited and the CEO of BGC Contracting
Pty Ltd.
Simon Noon | Managing Director
Simon is an experienced executive having spent the past 10 years’ managing listed
resources companies. Simon has a strong background in strategic management, business
planning, finance and capital raising, and experience with a variety of commodities.
Simon's career highlights include managing Groote Resources Limited from a market
capitalisation of less than $5M, to market highs in excess of $100M as the Executive
Director. After leaving Groote, Simon co-founded West Rock Resources Limited where he
held the position of Managing Director until the company was acquired by Pacifico in 2013.
While managing West Rock, Simon secured and operated joint ventures and strategic
alliances with mid and top tier miners.
As the Managing Director at Pacifico, Simon has led the company from a greenfields
explorer to a company that has the potential to become a significant global lead and silver
producer.
Simon is a passionate member of the WA resources industry, a member of the Australian
Institute of Company Directors and an Associate Fellow of the Australian Institute of
Management.
Richard Monti | Non-Executive Director
Richard is a geologist with over thirty years' experience in many facets of the exploration
and mining industry including technical, commercial, marketing, and finance. Prior to joining
Pacifico, Richard held roles at several international and Australian companies including
Anaconda Nickel, Azimuth Resources Limited, The North Group, Normandy Group, and RTZ
Exploration. Richard gained extensive business experience through founding and working
at Ventnor Capital Pty Ltd, a boutique consultancy firm providing corporate advisory and
investment banking services to junior and mid cap listed resource companies.
Richard is currently a director at Black Dragon Gold Limited.
Andrew Parker | Non-Executive Director
Andrew is a lawyer with significant experience in the exploration and mining industry and a
wealth of expertise in corporate advisory, strategic consultancy and capital raisings. Before
Andrew joined Pacifico, he co-founded Trident Capital Pty Ltd, a corporate advisory and
venture capital firm where he held the position of Managing Director until 2008.
Kevin Reynolds | Project Manager
Experienced metallurgist and project development manager of 30 years, covering mining
and metallurgical operations, project development, process development, feasibility
studies and project execution.
Simon Dorling | Project Manager
Geologist with more than 26 years' experience in exploration, development and the mining
of base metals, precious metals, energy minerals and industrial minerals.

Shaw and Partners PMY – Equity Report current as at –01/10/2020–Pg. 22
Rating Classification
Buy Expected to outperform the overall market
Hold Expected to perform in line with the overall market
Sell Expected to underperform the overall market
Not Rated Shaw has issued a factual note on the company but does not have a recommendation
Risk Rating
High Higher risk than the overall market – investors should be aware this stock may be speculative
Medium Risk broadly in line with the overall market
Low Lower risk than the overall market
RISK STATEMENT: Where a company is designated as ‘High’ risk, this means that the analyst has determined that the risk profile for this company is
significantly higher than for the market as a whole, and so may not suit all investors. Clients should make an assessment as to whether this stock
and its potential price volatility is compatible with their financial objectives. Clients should discuss this stock with their Shaw adviser before making
any investment decision.

Shaw and Partners PMY – Equity Report current as at –01/10/2020–Pg. 23
Disclaimer
Shaw and Partners Limited ABN 24 003 221 583 (“Shaw”) is a Participant of ASX Limited, Chi-X Australia Pty Limited and the holder of Australian Financial Services Licence number 236048. ANALYST CERTIFICATION: The Research Analyst who prepared this report hereby certifies that the views expressed in this document accurately reflect the analyst's personal views about the Company and its financial products. Neither Shaw nor its Research Analysts received any direct financial or non-financial benefits from the company for the production of this document. However, Shaw Research Analysts may receive assistance from the company in preparing their research which can include attending site visits and/or meetings hosted by the company. In some instances, the costs of such site visits or meetings may be met in part or in whole by the company if Shaw considers it is reasonable given the specific circumstances relating to the site visit or meeting. As at the date of this report, the Research Analyst does not hold, either directly or through a controlled entity, securities in the Company that is the subject of this report. Shaw restricts Research Analysts from trading in securities outside of the ASX/S&P100 for which they write research. Other Shaw employees may hold interests in the company. DISCLAIMER: This report is published by Shaw to its clients by way of general, as opposed to personal, advice. This means it has been prepared for multiple distribution without consideration of your investment objectives, financial situation and needs (“Personal Circumstances”). Accordingly, the advice given is not a recommendation that a particular course of action is suitable for you and the advice is therefore not to be acted on as investment advice. You must assess whether or not the advice is appropriate for your Personal Circumstances before making any investment decisions. You can either make this assessment yourself, or if you require a personal recommendation, you can seek the assistance of your Shaw client adviser. This report is provided to you on the condition that it not be copied, either in whole or in part, distributed to or disclosed to any other person. If you are not the intended recipient, you should destroy the report and advise Shaw that you have done so. This report is published by Shaw in good faith based on the facts known to it at the time of its preparation and does not purport to contain all relevant information with respect to the financial products to which it relates. The research report is current as at the date of publication until it is replaced, updated or withdrawn. Although the report is based on information obtained from sources believed to be reliable, Shaw does not make any representation or warranty that it is accurate, complete or up to date and Shaw accepts no obligation to correct or update the information or opinions in it. If you rely on this report, you do so at your own risk. Any projections are indicative estimates only and may not be realised in the future. Such projections are contingent on matters outside the control of Shaw (including but not limited to market volatility, economic conditions and company-specific fundamentals) and therefore may not be realised in the future. Past performance is not a reliable indicator of future performance. Except to the extent that liability under any law cannot be excluded, Shaw disclaims liability for all loss or damage arising as a result of any opinion, advice, recommendation, representation or information expressly or impliedly published in or in relation to this report notwithstanding any error or omission including negligence. DISCLOSURE: Shaw will charge commission in relation to client transactions in financial products and Shaw client advisers will receive a share of that commission. Shaw, its authorised representatives, its associates and their respective officers and employees may have earned previously or may in the future earn fees and commission from dealing in the Company's financial products. Shaw acted for the company in a corporate capacity within the past 12 months for which it received a fee. RESEARCH TEAM: For analyst qualifications and experience, refer to our website at http://www.shawandpartners.com.au/about/our-
people/research
RESEARCH POLICY: For an overview of our Research policy, refer to our website at https://www.shawandpartners.com.au/media/1267/
researchpolicy.pdf
If you no longer wish to receive Shaw research, please contact your Financial Adviser to unsubscribe.