unit 10 minerals (micro minerals): iron, zinc, copper, selenium ...
Upload
khangminh22Category
view
0download
0
TSX: ALS
Renewable Energy | Clean Steel | Potash | Copper | Lithium | Nickel | Cobalt
2021 Global Metals & Mining Conference
|2TSX: ALS | OTCQX: ATUSFTSX: ALS | OTCQX: ATUSF
FORWARD- LOOKING STATEMENT
This document includes certain statements that constitute “forward-looking statements” and “forward-looking information” within themeaning of applicable securities laws (collectively, “forward-lookingstatements”). Forward-looking statements include statementsregarding Altius Minerals Corporation’s (“Altius”) intent, or the beliefsor current expectations of Altius’ officers and directors. Such forward-looking statements are typically identified by words such as “believe”,“anticipate”, “estimate”, “project”, “intend”, “expect”, “may”, “will”,“plan”, “should”, “would”, “contemplate”, “possible”, “attempts”,“seeks” and similar expressions. Forward-looking statements mayrelate to future outlook and anticipated events or results.
By their very nature, forward-looking statements involve numerousassumptions, inherent risks and uncertainties, both general andspecific, and the risk that predictions and other forward-lookingstatements will not prove to be accurate. Do not unduly rely onforward-looking statements, as a number of important factors, manyof which are beyond Altius’ control, could cause actual results to differmaterially from the estimates and intentions expressed in suchforward-looking statements.
Forward-looking statements speak only as of the date thosestatements are made. Except as required by applicable law, Altius doesnot assume any obligation to update, or to publicly announce theresults of any change to, any forward-looking statement containedherein to reflect actual results, future events or developments,changes in assumptions or changes in other factors affecting theforward-looking statements.
Non-IFRS MeasuresAttributable revenue, adjusted EBITDA and adjusted operating cashflow is intended to provide additional information only and do nothave any standardized meaning prescribed under IFRS and should notbe considered in isolation or as a substitute for measures ofperformance prepared in accordance with IFRS. Other companies maycalculate these measures differently. For a reconciliation of thesemeasures to various IFRS measures, please refer to our ManagementDiscussion and Analysis.
|3TSX: ALS | OTCQX: ATUSFTSX: ALS | OTCQX: ATUSF
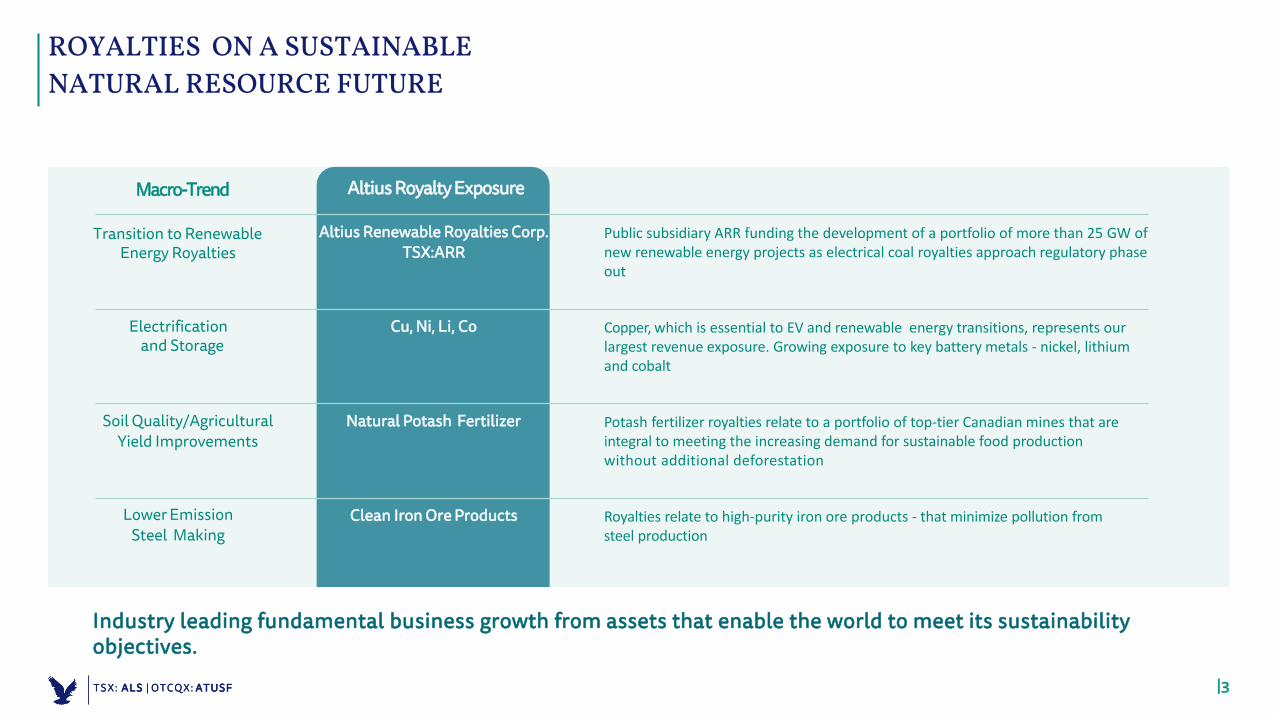
ROYALTIES ON A SUSTAINABLE NATURAL RESOURCE FUTURE
Public subsidiary ARR funding the development of a portfolio of more than 25 GW of new renewable energy projects as electrical coal royalties approach regulatory phase out
Macro-Trend
Transition to Renewable Energy Royalties
Electrification and Storage
Soil Quality/AgriculturalYield Improvements
Lower EmissionSteel Making
Altius Royalty Exposure
Altius Renewable Royalties Corp.TSX:ARR
Cu, Ni, Li, Co
Natural Potash Fertilizer
Clean Iron Ore Products
Copper, which is essential to EV and renewable energy transitions, represents our largest revenue exposure. Growing exposure to key battery metals - nickel, lithium and cobalt
Potash fertilizer royalties relate to a portfolio of top-tier Canadian mines that are integral to meeting the increasing demand for sustainable food productionwithout additional deforestation
Royalties relate to high-purity iron ore products - that minimize pollution from steel production
Industry leading fundamental business growth from assets that enable the world to meet its sustainabilityobjectives.
|4TSX: ALS | OTCQX: ATUSFTSX: ALS | OTCQX: ATUSF
3Electricity
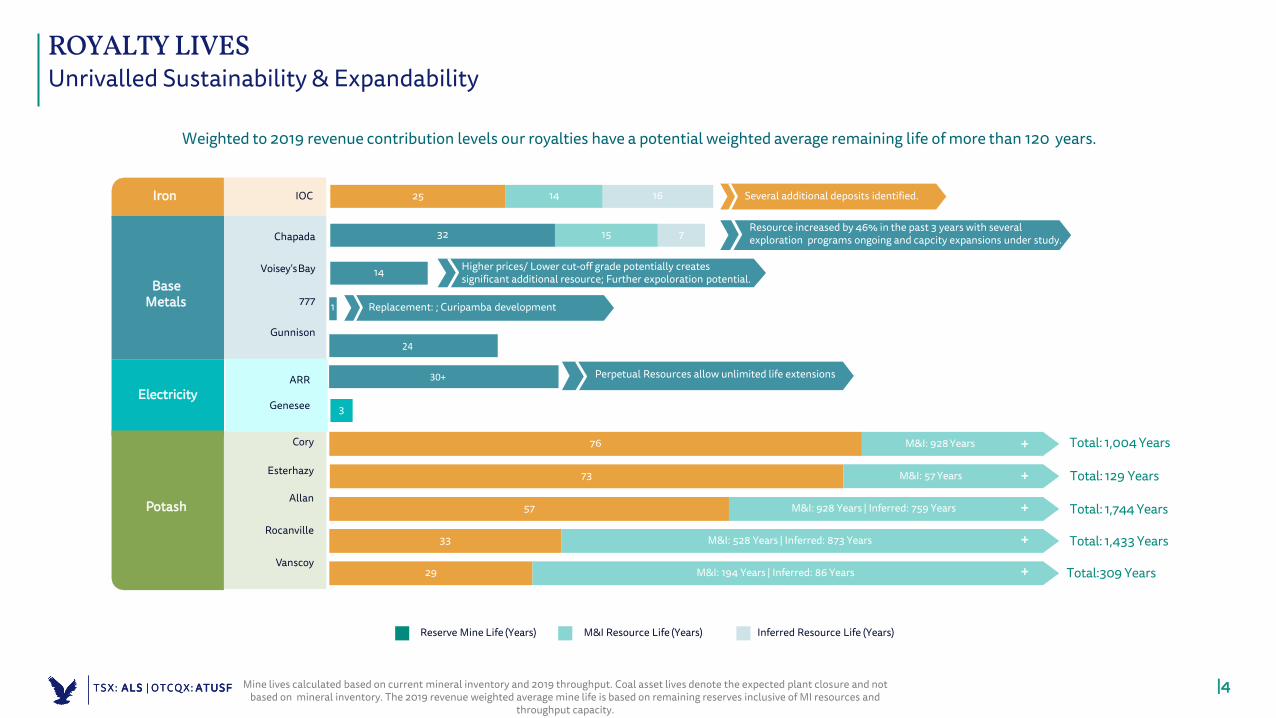
ROYALTY LIVES Unrivalled Sustainability & Expandability
Weighted to 2019 revenue contribution levels our royalties have a potential weighted average remaining life of more than 120 years.
Mine lives calculated based on current mineral inventory and 2019 throughput. Coal asset lives denote the expected plant closure and not based on mineral inventory. The 2019 revenue weighted average mine life is based on remaining reserves inclusive of MI resources and
throughput capacity.
Reserve Mine Life (Years) M&I Resource Life (Years) Inferred Resource Life (Years)
Chapada
Voisey’sBay
777
Gunnison
Cory
Esterhazy
Allan
Rocanville
Vanscoy
25IOC
32
14
1
76
57
33
29
14
15
73
16
7
Total: 1,004 Years
Total: 129 Years
Total: 1,744 Years
Total: 1,433 Years
Total:309 Years
Several additional deposits identified.Iron
Base Metals
Potash
+
+
+
+
+
M&I: 928 Years
M&I: 57 Years
M&I: 928 Years | Inferred: 759 Years
M&I: 528 Years | Inferred: 873 Years
M&I: 194 Years | Inferred: 86 Years
Resource increased by 46% in the past 3 years with several exploration programs ongoing and capcity expansions under study.
Higher prices/ Lower cut-off grade potentially creates significant additional resource; Further expoloration potential.
Replacement: ; Curipamba development
Perpetual Resources allow unlimited life extensions30+
24
ARR
Genesee
|5TSX: ALS | OTCQX: ATUSFTSX: ALS | OTCQX: ATUSF
Revenues
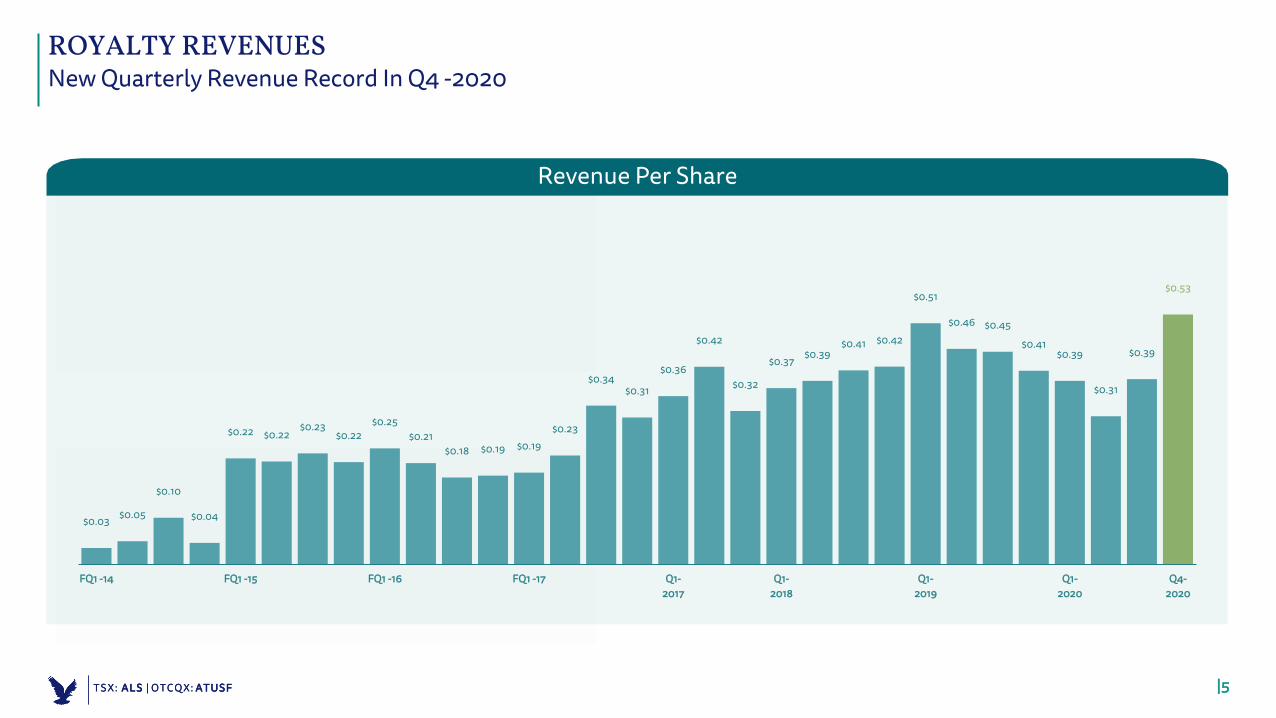
ROYALTY REVENUESNew Quarterly Revenue Record In Q4 -2020
Revenue Per Share
$0.03 $0.05
$0.10
$0.04
$0.22 $0.22$0.23
$0.22$0.25
$0.21$0.18 $0.19 $0.19
$0.23
$0.34$0.31
$0.36
$0.42
$0.32
$0.37 $0.39$0.41 $0.42
$0.51
$0.46 $0.45
$0.41$0.39
$0.31
$0.39
$0.53
FQ1 -14 FQ1 -15 FQ1 -16 FQ1 -17 Q1-2017
Q1-2018
Q1-2019
Q1-2020
Q4-2020
|6TSX: ALS | OTCQX: ATUSFTSX: ALS | OTCQX: ATUSF
Renewable Energy
LithiumRenewable
Energy
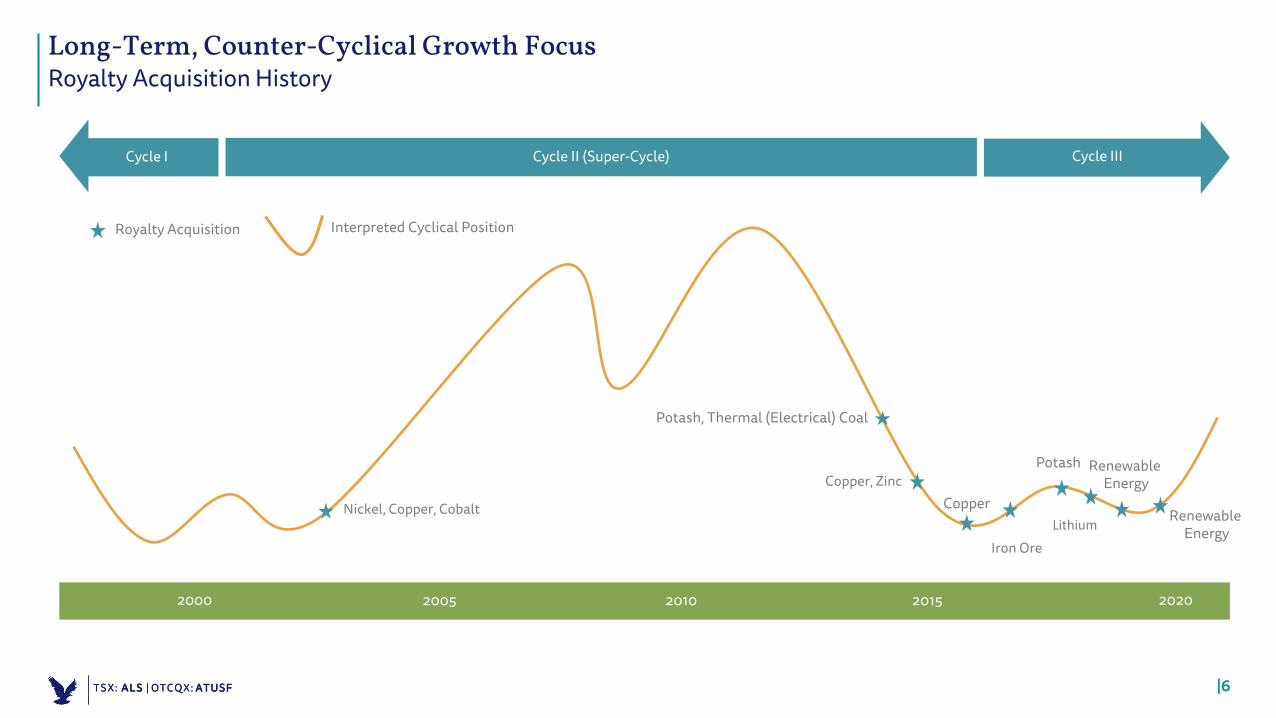
Long-Term, Counter-Cyclical Growth FocusRoyalty Acquisition History
Interpreted Cyclical PositionRoyalty Acquisition
20052000 2010 2015 2020
Nickel, Copper, Cobalt
Potash, Thermal (Electrical) Coal
Copper, ZincCopper
Iron Ore
Potash
Cycle II (Super-Cycle)Cycle I Cycle III
|7TSX: ALS | OTCQX: ATUSF
$50
$100
$150
$200
$250
Iron Ore 65% Fe Fines CFR Qingdao
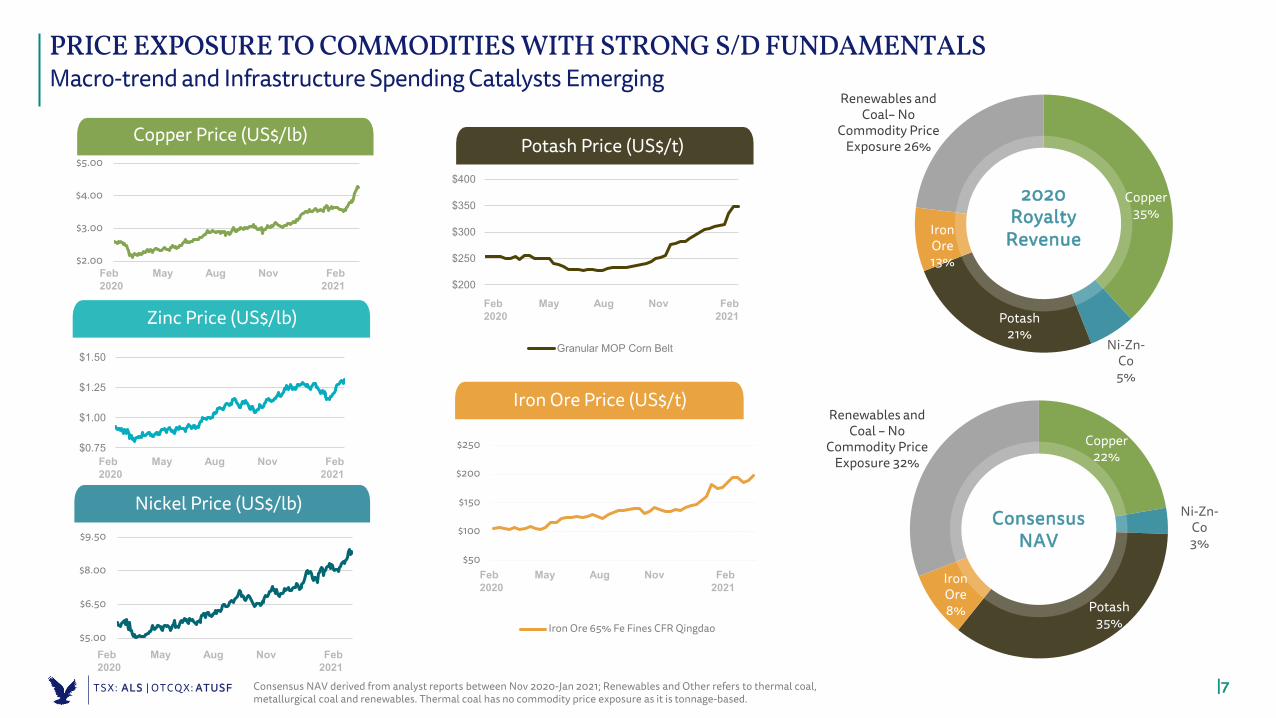
PRICE EXPOSURE TO COMMODITIES WITH STRONG S/D FUNDAMENTALS Macro-trend and Infrastructure Spending Catalysts Emerging
Potash Price (US$/t)
Iron Ore Price (US$/t)
Consensus NAV
Copper 22%
Potash35%
Iron Ore8%
Ni-Zn-Co3%
2020Royalty
Revenue
Copper 35%
Potash21%
Iron Ore13%
Ni-Zn-Co5%
Renewables and Coal– No
Commodity Price Exposure 26%
Copper Price (US$/lb)
Zinc Price (US$/lb)
Nickel Price (US$/lb)
Feb
2020
May Aug Nov Feb
2021
Feb
2020
May Aug Nov Feb
2021
Feb
2020
May Aug Nov Feb
2021
$200
$250
$300
$350
$400
Granular MOP Corn Belt
Feb
2020
May Aug Nov Feb
2021
Feb
2020
May Aug Nov Feb
2021
Renewables and Coal – No
Commodity Price Exposure 32%
Consensus NAV derived from analyst reports between Nov 2020-Jan 2021; Renewables and Other refers to thermal coal, metallurgical coal and renewables. Thermal coal has no commodity price exposure as it is tonnage-based.
$2.00
$3.00
$4.00
$5.00
$0.75
$1.00
$1.25
$1.50
$5.00
$6.50
$8.00
$9.50
|8TSX: ALS | OTCQX: ATUSFTSX: ALS | OTCQX: ATUSF
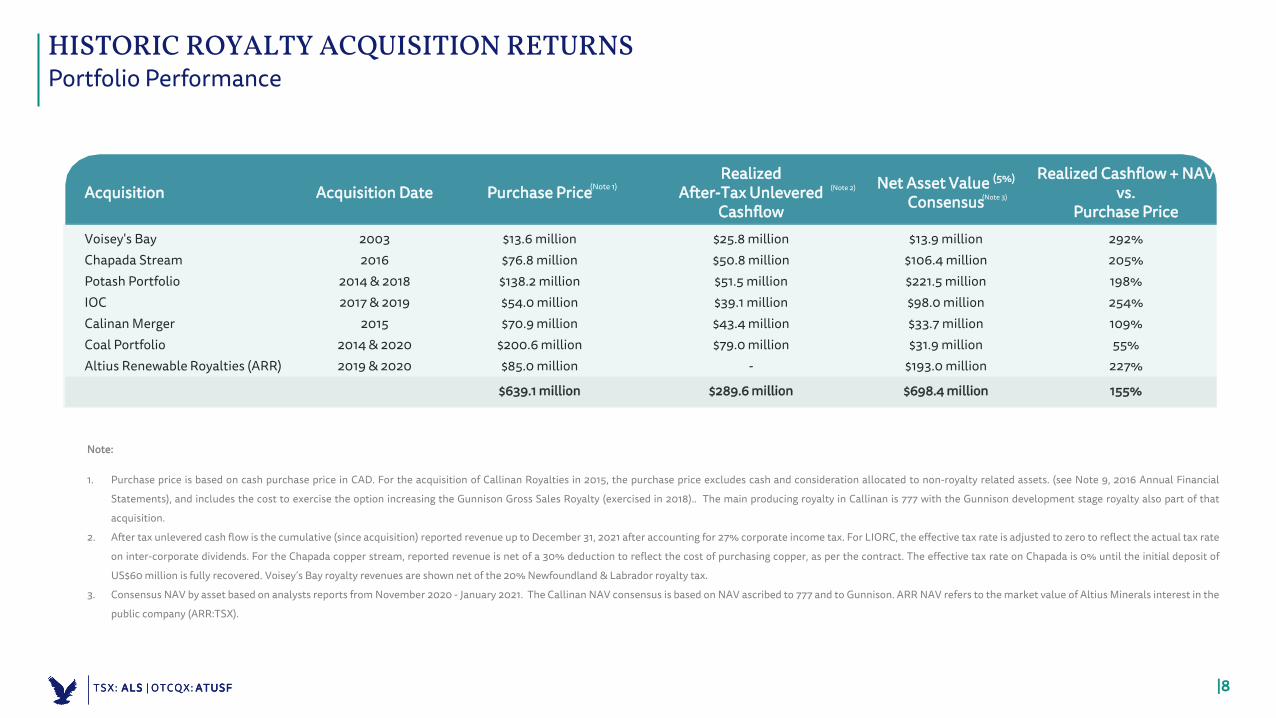
Acquisition Acquisition Date Purchase PriceRealized
After-Tax Unlevered Cashflow
Net Asset Value (5%)
Consensus
Realized Cashflow + NAVvs.
Purchase PriceVoisey's Bay 2003 $13.6 million $25.8 million $13.9 million 292%Chapada Stream 2016 $76.8 million $50.8 million $106.4 million 205%Potash Portfolio 2014 & 2018 $138.2 million $51.5 million $221.5 million 198%IOC 2017 & 2019 $54.0 million $39.1 million $98.0 million 254%Calinan Merger 2015 $70.9 million $43.4 million $33.7 million 109%Coal Portfolio 2014 & 2020 $200.6 million $79.0 million $31.9 million 55%Altius Renewable Royalties (ARR) 2019 & 2020 $85.0 million - $193.0 million 227%
$639.1 million $289.6 million $698.4 million 155%
HISTORIC ROYALTY ACQUISITION RETURNSPortfolio Performance
Note:
1. Purchase price is based on cash purchase price in CAD. For the acquisition of Callinan Royalties in 2015, the purchase price excludes cash and consideration allocated to non-royalty related assets. (see Note 9, 2016 Annual Financial
Statements), and includes the cost to exercise the option increasing the Gunnison Gross Sales Royalty (exercised in 2018).. The main producing royalty in Callinan is 777 with the Gunnison development stage royalty also part of that
acquisition.
2. After tax unlevered cash flow is the cumulative (since acquisition) reported revenue up to December 31, 2021 after accounting for 27% corporate income tax. For LIORC, the effective tax rate is adjusted to zero to reflect the actual tax rate
on inter-corporate dividends. For the Chapada copper stream, reported revenue is net of a 30% deduction to reflect the cost of purchasing copper, as per the contract. The effective tax rate on Chapada is 0% until the initial deposit of
US$60 million is fully recovered. Voisey’s Bay royalty revenues are shown net of the 20% Newfoundland & Labrador royalty tax.
3. Consensus NAV by asset based on analysts reports from November 2020 - January 2021. The Callinan NAV consensus is based on NAV ascribed to 777 and to Gunnison. ARR NAV refers to the market value of Altius Minerals interest in the
public company (ARR:TSX).
(Note 1) (Note 2)(Note 3)
|9TSX: ALS | OTCQX: ATUSFTSX: ALS | OTCQX: ATUSF
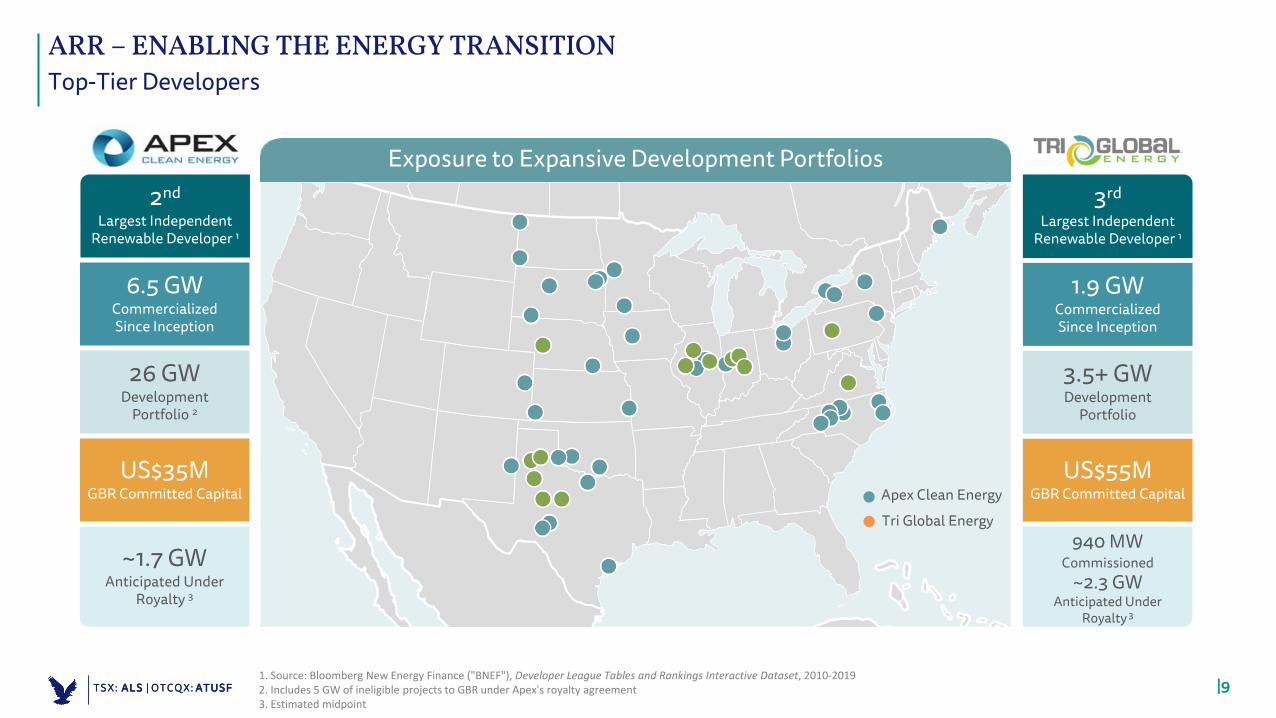
2nd
Largest Independent Renewable Developer 1
6.5 GWCommercializedSince Inception
Exposure to Expansive Development Portfolios
1.9 GWCommercializedSince Inception
940 MWCommissioned
~2.3 GW Anticipated Under
Royalty 3
3.5+ GW Development
Portfolio
US$55M GBR Committed Capital
~1.7 GWAnticipated Under
Royalty 3
26 GWDevelopment
Portfolio 2
US$35M GBR Committed Capital
3rd
Largest Independent Renewable Developer 1
Apex Clean Energy
Tri Global Energy
1. Source: Bloomberg New Energy Finance ("BNEF"), Developer League Tables and Rankings Interactive Dataset, 2010-20192. Includes 5 GW of ineligible projects to GBR under Apex's royalty agreement3. Estimated midpoint
ARR –ENABLING THE ENERGY TRANSITIONTop-Tier Developers
|10TSX: ALS | OTCQX: ATUSFTSX: ALS | OTCQX: ATUSF
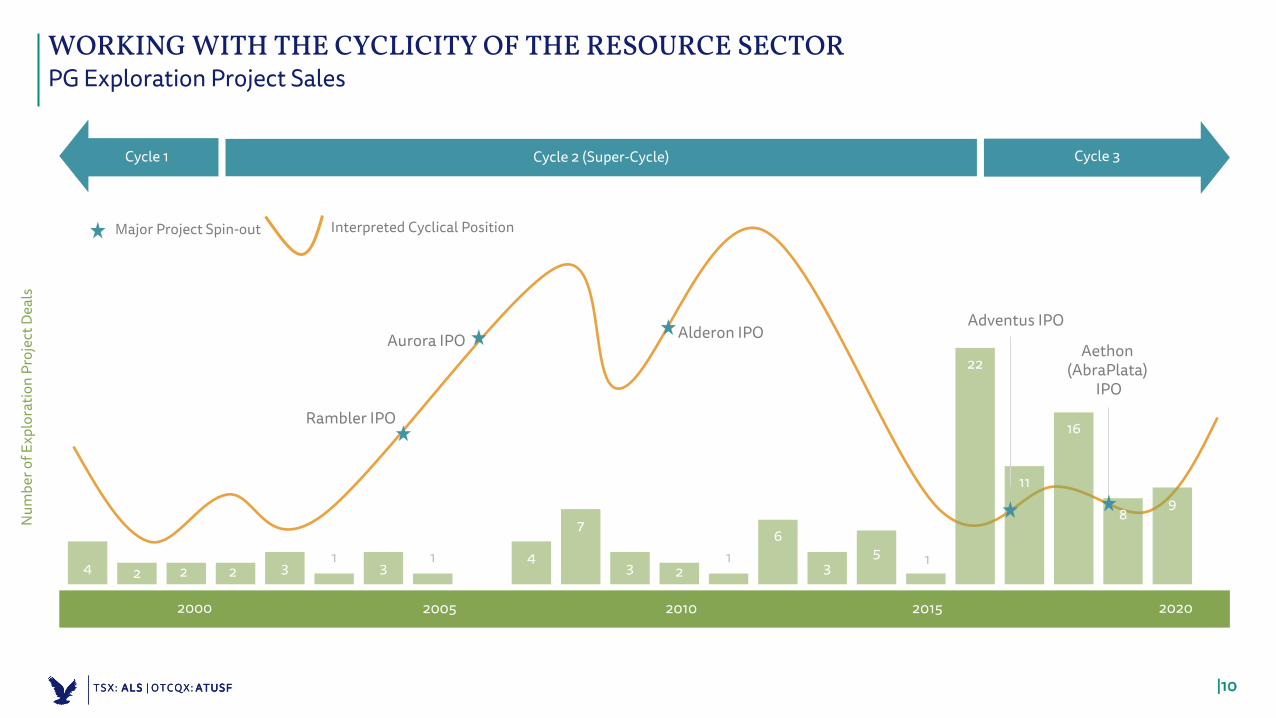
4 2 2 2 31
31 4
7
3 21
6
35 1
22
11
16
89
0
Rambler IPO
Aurora IPO Alderon IPO
WORKING WITH THE CYCLICITY OF THE RESOURCE SECTORPG Exploration Project Sales
Num
ber o
f Exp
lora
tion
Proj
ect D
eals
Adventus IPO
Aethon(AbraPlata)
IPO
Interpreted Cyclical PositionMajor Project Spin-out
20052000 2010 2015 2020
Cycle 2 (Super-Cycle)Cycle 1 Cycle 3
|11TSX: ALS | OTCQX: ATUSF
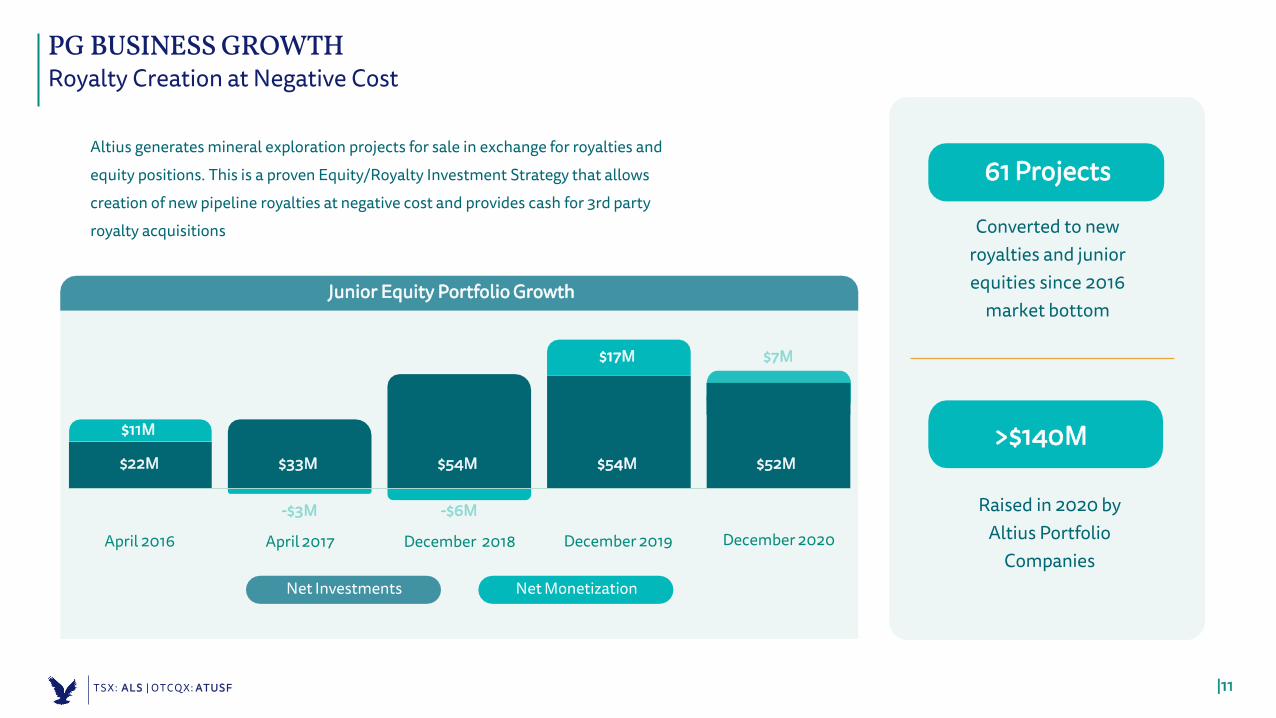
PG BUSINESS GROWTHRoyalty Creation at Negative Cost
61 Projects
Converted to new royalties and junior equities since 2016
market bottom
Raised in 2020 by Altius Portfolio
Companies
Altius generates mineral exploration projects for sale in exchange for royalties and
equity positions. This is a proven Equity/Royalty Investment Strategy that allows
creation of new pipeline royalties at negative cost and provides cash for 3rd party
royalty acquisitions
Net Investments Net Monetization
April 2016 December 2019
$33M
-$3M
April 2017
-$6M
December 2018
$7M
$54M $54M
$17M
$11M
$22M $52M
Junior Equity Portfolio Growth
>$140M
December 2020
|12TSX: ALS | OTCQX: ATUSFTSX: ALS | OTCQX: ATUSF
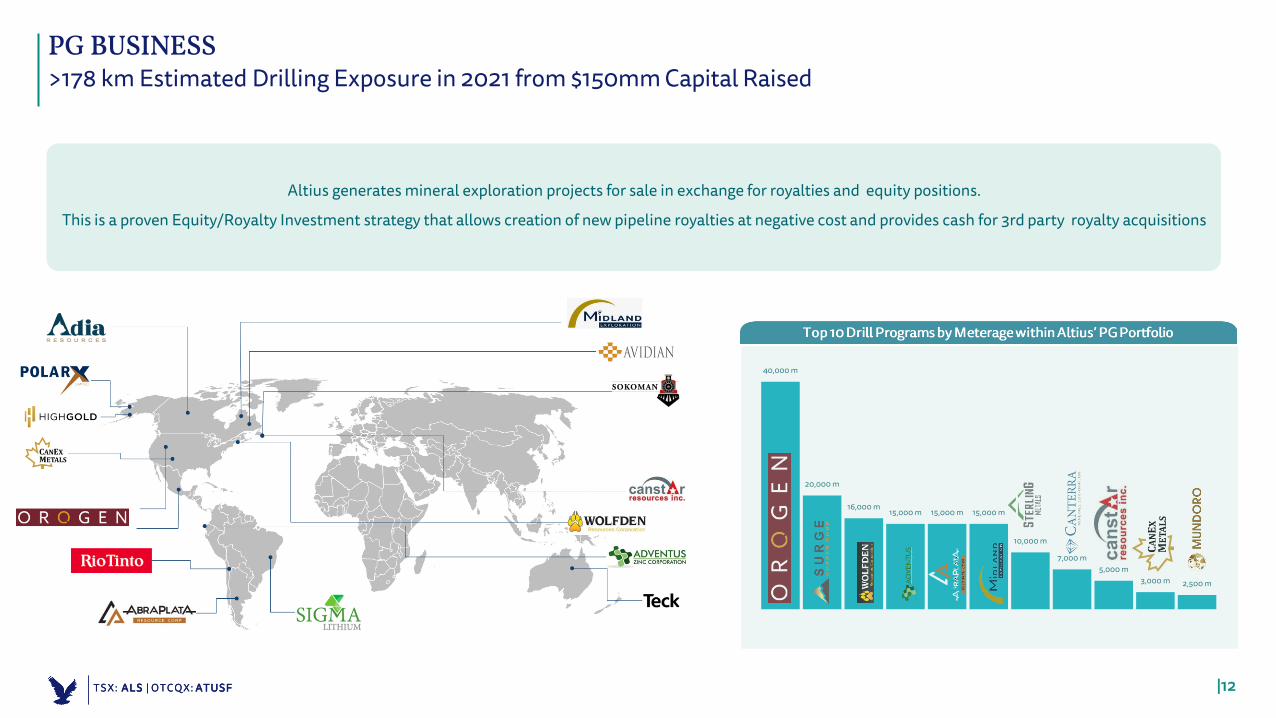
40,000 m
20,000 m
16,000 m15,000 m 15,000 m 15,000 m
10,000 m
7,000 m5,000 m
3,000 m 2,500 m
PG BUSINESS>178 km Estimated Drilling Exposure in 2021 from $150mm Capital Raised
Altius generates mineral exploration projects for sale in exchange for royalties and equity positions.
This is a proven Equity/Royalty Investment strategy that allows creation of new pipeline royalties at negative cost and provides cash for 3rd party royalty acquisitions
|13TSX: ALS | OTCQX: ATUSFTSX: ALS | OTCQX: ATUSF
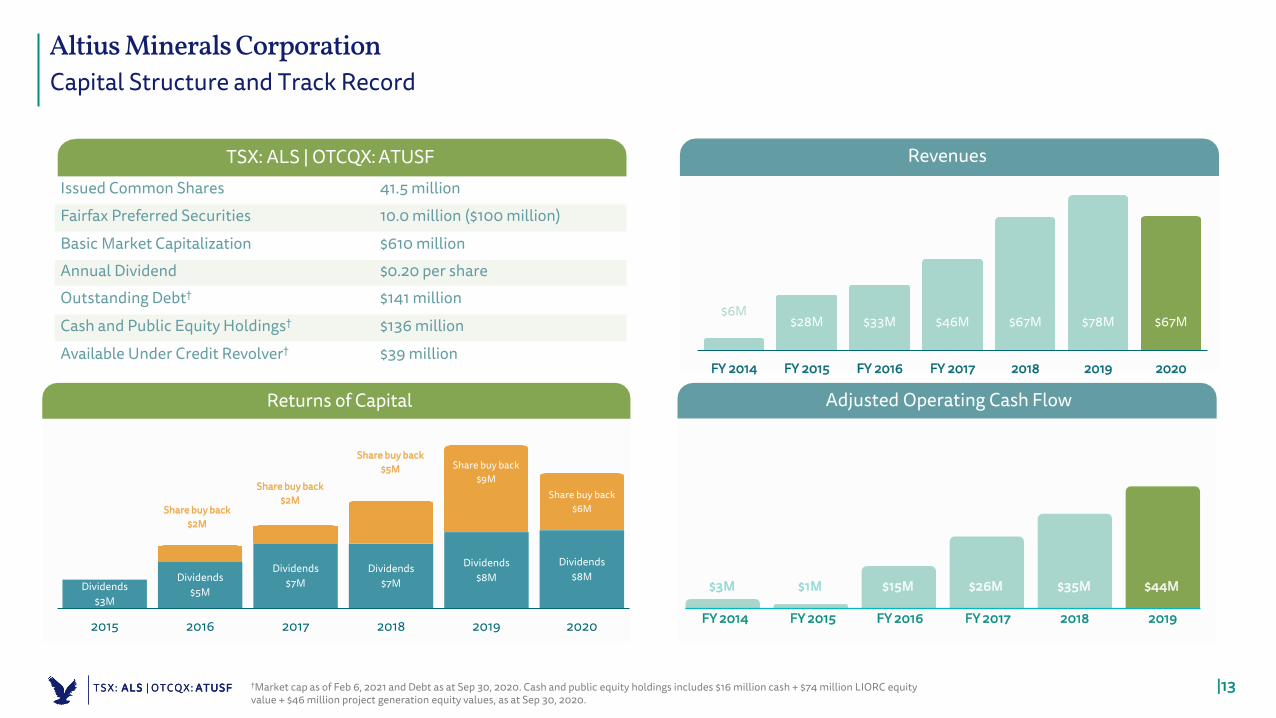
Issued Common Shares 41.5 millionFairfax Preferred Securities 10.0 million ($100 million)
Basic Market Capitalization $610 millionAnnual Dividend $0.20 per shareOutstanding Debt† $141 million
Cash and Public Equity Holdings† $136 million
Available Under Credit Revolver† $39 million
TSX: ALS | OTCQX: ATUSF
FY 2014 FY 2015 FY 2016 FY 2017 2018 2019
$3M $1M $15M $26M $35M $44M
Revenues
Adjusted Operating Cash FlowReturns of Capital
†Market cap as of Feb 6, 2021 and Debt as at Sep 30, 2020. Cash and public equity holdings includes $16 million cash + $74 million LIORC equity value + $46 million project generation equity values, as at Sep 30, 2020.
Capital Structure and Track RecordAltius Minerals Corporation
$6M$28M $33M $46M $67M $78M $67M
FY 2014 FY 2015 FY 2016 FY 2017 2018 2019 2020
Dividends$3M
Dividends$5M
Dividends$7M
Dividends$7M
Dividends$8M
Dividends$8M
Share buy back$2M
Share buy back$2M
Share buy back$5M Share buy back
$9MShare buy back
$6M
2015 2016 2017 2018 2019 2020
|14TSX: ALS | OTCQX: ATUSFTSX: ALS | OTCQX: ATUSF
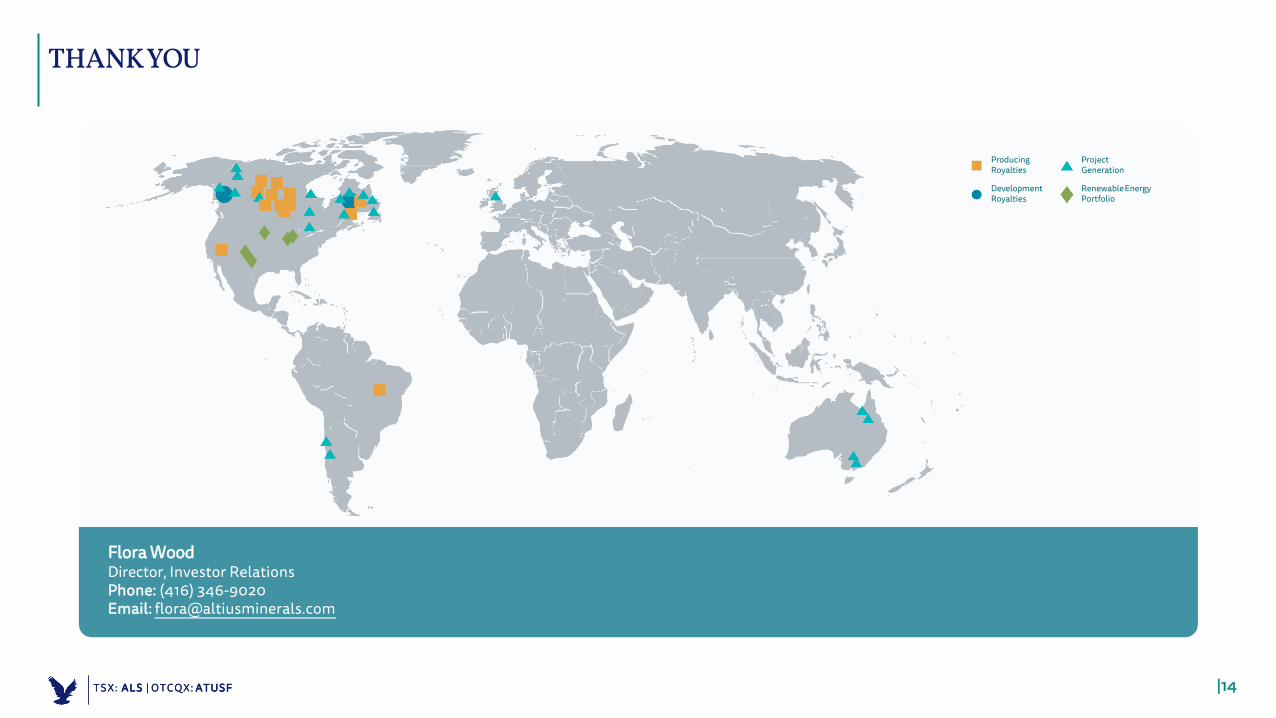
THANKYOU
Flora WoodDirector, Investor RelationsPhone: (416) 346-9020Email: [email protected]
Producing Royalties
Development Royalties
Project Generation
RenewableEnergy Portfolio
Copyright © 2022 FDOKUMEN