Applying the rasch rating scale model to gain insights into students’ conceptualisation of quality...
16
2006, Vol. 18, No. 2, 11-26 Mathematics Education Research Journal Applying the Rasch Rating Scale Model to Gain Insights into Students’ Conceptualisation of Quality Mathematics Instruction Kelly Bradley, Shannon Sampson and Kenneth Royal University of Kentucky Teacher quality has become a national policy concern in the US, especially in mathematics. This study provides insights into the conceptualisation of high quality mathematics teaching from the perspective of approximately 750 students in grades nine through twelve. Results from Rasch analysis yield information about the quality of the Mathematics Quality Survey constructed for this study and the hierarchy of items representing varying levels of quality as perceived by the students. Group interviews with teachers and open-ended responses from students are used to support the findings. This study lays the groundwork for understanding the difference between being qualified and being a quality teacher. Teacher quality has become a policy concern internationally. Researchers (e.g., Brown, 2002) have argued that “teacher quality is emerging as the most important ingredient in students’ achievement” (p. 4). Before teacher quality can be assessed or evaluated, it must be operationalised. Arguably, the process should begin with those who know the classroom best – the teachers and the students. This year-long study of mathematics education was undertaken at a south eastern, United States public high school (grades 9 – 12). It emphasised the importance of the affective domain: specifically, what characteristics and qualities students associate with quality mathematics instruction. After all “students and their learning should become the focus of everything we do … from the instruction that we provide, to the intellectual climate that we create, to the policy decisions that we make” (Cross, 1998, cited in Frye, 2005, sec. 2, para. 1). Surveys are the most common method of collecting self-reported data and continue to be one of the most popular research methodologies for graduate studies and published papers in education (Babbie, 1992; Gay, 1981; Nardi, 2006). Even so, within the field of education, the development of instruments to assess affective domain constructs has been problematic (Aiken, 1996). Bond and Fox (2001) write, Operationalizing and then measuring variables are two of the necessary first steps in the empirical research process. Statistical analysis, as a tool for investigating relations among the measures, then follows. Thus, interpretation of analyses can only be as good as the quality of the measures (p. xvi). Quality of the measurement tool—here a survey instrument—should play a fundamental role in the analysis of the data it produces; however, this element is often overlooked. This study addresses that concern through the use of a Rasch rating scale model to operationalise quality mathematics
-
Upload
independent -
Category
Documents
-
view
3 -
download
0
Transcript of Applying the rasch rating scale model to gain insights into students’ conceptualisation of quality...

2006, Vol. 18, No. 2, 11-26Mathematics Education Research Journal
Applying the Rasch Rating Scale Model to GainInsights into Students’ Conceptualisation of
Quality Mathematics InstructionKelly Bradley, Shannon Sampson and Kenneth Royal
University of Kentucky
Teacher quality has become a national policy concern in the US, especially in mathematics. This study provides insights into the conceptualisation of high quality mathematics teaching from the perspective of approximately 750 students ingrades nine through twelve. Results from Rasch analysis yield information about thequality of the Mathematics Quality Survey constructed for this study and the hierarchy of items representing varying levels of quality as perceived by the students.Group interviews with teachers and open-ended responses from students are used to support the findings. This study lays the groundwork for understanding the difference between being qualified and being a quality teacher.Teacher quality has become a policy concern internationally. Researchers
(e.g., Brown, 2002) have argued that “teacher quality is emerging as the mostimportant ingredient in students’ achievement” (p. 4). Before teacher qualitycan be assessed or evaluated, it must be operationalised. Arguably, theprocess should begin with those who know the classroom best – the teachersand the students. This year-long study of mathematics education was undertaken at a south eastern, United States public high school (grades 9 –12). It emphasised the importance of the affective domain: specifically, whatcharacteristics and qualities students associate with quality mathematicsinstruction. After all “students and their learning should become the focus ofeverything we do … from the instruction that we provide, to the intellectualclimate that we create, to the policy decisions that we make” (Cross, 1998,cited in Frye, 2005, sec. 2, para. 1).
Surveys are the most common method of collecting self-reported dataand continue to be one of the most popular research methodologies for graduate studies and published papers in education (Babbie, 1992; Gay, 1981;Nardi, 2006). Even so, within the field of education, the development ofinstruments to assess affective domain constructs has been problematic(Aiken, 1996). Bond and Fox (2001) write,
Operationalizing and then measuring variables are two of the necessary first steps in the empirical research process. Statisticalanalysis, as a tool for investigating relations among the measures,then follows. Thus, interpretation of analyses can only be as good asthe quality of the measures (p. xvi). Quality of the measurement tool—here a survey instrument—should
play a fundamental role in the analysis of the data it produces; however, thiselement is often overlooked. This study addresses that concern through theuse of a Rasch rating scale model to operationalise quality mathematics
instruction as perceived by students. It thereby demonstrates a practicalapplication of an emerging methodological tool. Defining and Measuring ‘Quality’
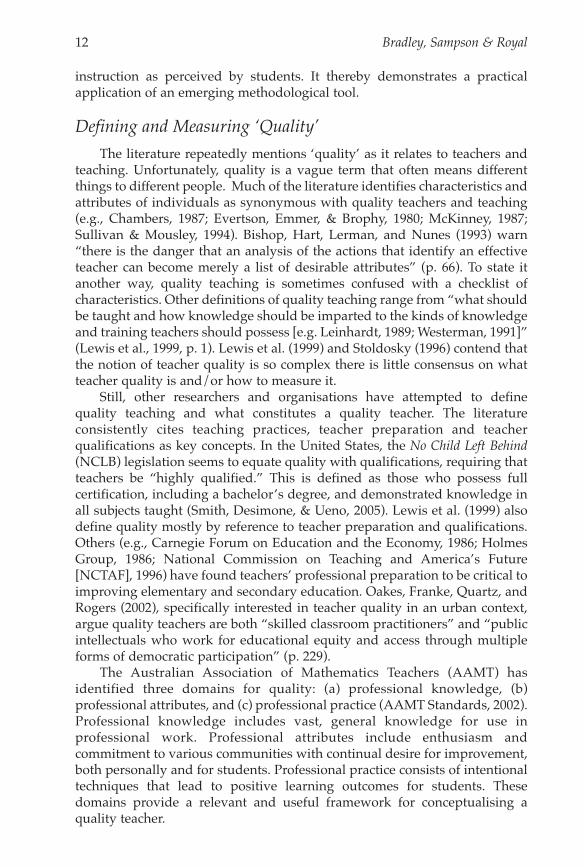
The literature repeatedly mentions ‘quality’ as it relates to teachers andteaching. Unfortunately, quality is a vague term that often means differentthings to different people. Much of the literature identifies characteristics andattributes of individuals as synonymous with quality teachers and teaching(e.g., Chambers, 1987; Evertson, Emmer, & Brophy, 1980; McKinney, 1987;Sullivan & Mousley, 1994). Bishop, Hart, Lerman, and Nunes (1993) warn“there is the danger that an analysis of the actions that identify an effectiveteacher can become merely a list of desirable attributes” (p. 66). To state itanother way, quality teaching is sometimes confused with a checklist of characteristics. Other definitions of quality teaching range from “what shouldbe taught and how knowledge should be imparted to the kinds of knowledgeand training teachers should possess [e.g. Leinhardt, 1989; Westerman, 1991]”(Lewis et al., 1999, p. 1). Lewis et al. (1999) and Stoldosky (1996) contend thatthe notion of teacher quality is so complex there is little consensus on whatteacher quality is and/or how to measure it.
Still, other researchers and organisations have attempted to define quality teaching and what constitutes a quality teacher. The literature consistently cites teaching practices, teacher preparation and teacher qualifications as key concepts. In the United States, the No Child Left Behind(NCLB) legislation seems to equate quality with qualifications, requiring thatteachers be “highly qualified.” This is defined as those who possess full certification, including a bachelor’s degree, and demonstrated knowledge inall subjects taught (Smith, Desimone, & Ueno, 2005). Lewis et al. (1999) alsodefine quality mostly by reference to teacher preparation and qualifications.Others (e.g., Carnegie Forum on Education and the Economy, 1986; HolmesGroup, 1986; National Commission on Teaching and America’s Future[NCTAF], 1996) have found teachers’ professional preparation to be critical toimproving elementary and secondary education. Oakes, Franke, Quartz, andRogers (2002), specifically interested in teacher quality in an urban context,argue quality teachers are both “skilled classroom practitioners” and “publicintellectuals who work for educational equity and access through multipleforms of democratic participation” (p. 229).
The Australian Association of Mathematics Teachers (AAMT) has identified three domains for quality: (a) professional knowledge, (b) professional attributes, and (c) professional practice (AAMT Standards, 2002).Professional knowledge includes vast, general knowledge for use in professional work. Professional attributes include enthusiasm and commitment to various communities with continual desire for improvement,both personally and for students. Professional practice consists of intentionaltechniques that lead to positive learning outcomes for students. Thesedomains provide a relevant and useful framework for conceptualising a quality teacher.
Bradley, Sampson & Royal12

There is a great deal of overlap between the aforementioned definitions.Each provides insights as to what a teacher should aspire, both personallyand professionally, and what a teacher should be both intrinsically and extrinsically. It is within this framework that the researchers investigatedquality as it relates to teachers and teaching.
Measuring ‘quality’ is perhaps as wide-open a task as defining it. Lewiset al. (1999) suggest there are four types of approaches to measuring teacherquality: (a) classroom observations of teacher practices; (b) written examinations intended to measure teacher content knowledge, literacy andpedagogy; (c) student scores as performance measures; and (d) surveys ofteachers’ attitudes, perceptions, practices, and qualifications. Simon (2004)notes most research in this field consists of qualitative methodologies.According to Xin, Xu, and Tatsuoka (2004), a number of the quantitative studies pertaining to teacher quality face problems with measurement. Content Knowledge and Pedagogy
The literature consistently presents content knowledge as critical to quality teaching. In studies with high achieving students in challengingmathematics courses, research suggests the teacher’s content knowledge is amajor factor (Ma, 1999; The Education Trust, 1998). Olson (2000) found “students whose teachers know their subjects perform better than studentswhose teachers lack subject-matter preparation” (p. 5). Numerous studieshave corroborated the importance of content knowledge (Eisenhart et al.,1993; Johnson, 1995; Lee, Meadows, & Lee, 2003; Liekin & Winicki-Landman,2001; Manouchehri, 1998; Manouchehri & Goodman, 1998.)
Lappan (2000) stresses content knowledge is not simply knowing one’sacademic discipline. In her research, she identified 12 domains of knowledgeand experience that are essential for good teaching and teacher educationprograms. She argues: “It is not just the amount of engagement with contentthat matters. [It is also] the quality of the experience, the ways in which teachers know what they know, [that] matter” (p. 323). She goes on to sayteachers must develop a sense of self efficacy (both a sense of self-worth andsuccess) because research (e.g., Ashton & Webb, 1986; Woolfolk, Rosoff, &Hoy, 1990) has shown teachers with high levels of self efficacy produce higher performing students, demonstrate more patience for struggling students, and are generally more responsive to students.
Koency and Swanson (2000) add that content knowledge is only onepiece of the puzzle. Numerous studies have identified the importance ofteachers’ understanding of mathematical pedagogy (Eisenhart et al., 1993;Johnson, 1995; Lee, Meadows, & Lee, 2003; Manouchehri & Goodman, 1998;Swafford, Jones, & Thorton, 1997; Swafford, Jones, Thorton, Stump, & Miller,1999). Lee, Meadows, and Lee (2003) argue content knowledge and pedagogyare not necessarily mutually exclusive, as they found the combination of thetwo, which they termed pedagogical content knowledge, to be a strong predictor of teaching practices in mathematics. The research of Lockheed andKomenan (1989) supported this, finding teaching practices to be more
13Insights into Students’ Conceptualisation of Quality Mathematics Instruction
important than a teacher’s education, experience and certification in Nigeriaand Swaziland. Consequences for student learning connected to quality teaching/teachers
A substantial body of research pertains to the relationship betweenteacher preparation and experience and student learning and student attitudes toward mathematics. Fetler (2001) and Darling-Hammond (2000)found a positive relationship between teacher preparation and studentachievement. According to Brown (2002), the number of years an individualhas been teaching is associated with an increase in teacher quality. The U.S.Department of Education (2000) suggests students learn more from experienced teachers. Darling-Hammond’s research corroborates this findingand adds that new teachers are generally less effective teachers than thosewho have been teaching for at least five years. This suggests it is imperativeto train and encourage young teachers to maximise their teaching potential.
Teachers play a fundamental role in shaping student attitudes towardmathematics. According to the Australian Education Council (1991), “children come to school enthusiastic and eager to learn mathematics andleave school with quite negative attitudes” (p. 31). Willoughby (2000) concursmathematics typically is taught in a way that makes students dislike bothmathematics and the process of learning it. Numerous articles stress theimportance of professional development and its impact on improving students’ attitudes and achievement, not to mention improving teacher quality. Wenglinsky (2000) found “in math, students whose teachers havereceived professional development in working with special populations outperform their peers by more than a full grade level” (p. 7). Moreover, “students whose teachers have received professional development in higherorder thinking skills outperform their peers by 40% of a grade level” (p. 7).
Another important finding regarding student learning and quality teachers and teaching includes the fact that American states with the highestperforming students also have the highest percentage of well-qualified teachers (Darling-Hammond, 2000; Provasnik & Young, 2003). Provasnik andStearns (2003) point out the importance of having a high-quality mathematicsteacher in the 8th grade. They found a correlation between the quality of the teacher and increased student opportunity to be in a high quality learningenvironment, even after controlling for such factors as student background andability level. Similar to Darling-Hammond’s concept of qualified, high qualityis identified by certification, degree, experience, exposure to key mathematicsconcepts and self-confidence in regard to teaching.
ObjectivesThe purpose of this study was twofold: to inquire about students’
specific perceptions of quality high school (grades 9 – 12) mathematics
Bradley, Sampson & Royal14
instruction and to evaluate the measurement properties of the MathematicsQuality Survey constructed for that inquiry. The study demonstrates how theRasch rating scale model effectively addresses these purposes. Research wasguided by the overarching research question: What factors do students perceive to be associated with high quality mathematics teaching?
MethodResponse Frame
The study was conducted at a public high school, consisting of studentsin enrolled in grades 9 – 12, in the southeast United States. The school wasselected for a number of reasons. Two of the most important criteria were the student demographic variables and results from state mathematicsassessments. These provided reasonable evidence that those students withinthe school represented a wide range of mathematics ability. The students inthe school were 76% white, 13% African-American, 6% Hispanic, 2% Asian,less than 1% Native American, and 2% other ethnicities. Twenty six percentof the students received federal aid to help pay lunch fees, and 7% of studentswere classified as having limited English proficiency.
All mathematics teachers in the school were invited to participate in thestudy and six of the thirteen opted to do so. The participating teachers agreedto administer the student survey to their classes following the research protocol which included anonymity of the students, meaning teachers couldnot review their individual responses. Instruments
A Math Teacher Quality survey, originally constructed in 2002 (Bradley &Loadman, 2005) was revised by the researchers after a thorough review of theliterature and current teacher evaluation tools utilised within the school system. The pencil-and-paper questionnaire was a selected response survey.The instrument included the following sections: introduction, demographicsand qualities of good teachers. The survey instrument contained 32 short statements for which respondents provided their level of agreement utilisinga 4-point Likert-type scale where 1 = strongly disagree, 2 = disagree, 3 = agree and4 = strongly agree. There were also open-ended questions for respondents toprovide additional feedback. For example, students were asked to list the twoqualities they felt were most associated with the best mathematics teachersand were also asked to describe the best mathematics teacher they knew.
The introduction explained the goal of the survey and informed respondents that only the researchers would review their individual responsesand that only aggregate information would be reported. Finally, the surveyincluded directions for how to submit the survey upon completion and a note of appreciation for participants’ time. The demographic variables wereselected in response to the literature review and to gain an overall picture of the
15Insights into Students’ Conceptualisation of Quality Mathematics Instruction
response sample. Specific variables of interest included: typical mathematicsperformance, sex, current academic rank, and ethnicity and enrolment inEnglish language development courses. All demographic variables were self-reported.
The original instrument on qualities of the best teachers were addressedin statements related to the research and studies of Black and Howard-Jones(2000), Murphy (1990), and Tamblyn (2000), as utilised in Bradley andLoadman (2005). The researchers updated the instrument to include currentliterature and measures used by the school system to evaluate new teachers(Kentucky Education Professional Standards Board, 2004). In order to addressthe variable of interest and for added opportunity to assess the validity of thehierarchy, students were asked to identify qualities they associated with thebest teachers they know.
The questionnaire concluded by thanking the respondents for their time.Respondents were also asked to provide any additional comments related totheir responses to the survey. The updated scannable, pencil-and-paper survey was created using eListen survey and data collection software(Scantron, 2005). eListen software allows researchers to create custom surveysand to deploy them to the World Wide Web, e-mail, hand-held devicesand/or paper, and it provides the infrastructure to collect and store the datafrom completed surveys in a database. In this study, the researchers deployedthe survey to paper and collected data by scanning completed surveys.
Procedure Teachers completed the questionnaire in the fall of 2004 and administered
it to their students in February of 2005. Data were entered into eListen software utilizing the data pump option, were exported into Excel for clean-up prior to analysis, and entered into WINSTEPS software (Linacre,2005) to conduct a Rasch analysis. After ensuring the data acceptably fit theRasch model, the researchers produced item hierarchy maps for the students.The researchers presented the results to the teachers in a focus group in thespring. In the focus groups, one researcher led the discussion, beginning witha set of questions, and expanded the discussion through follow-up questionsand probing. The second researcher took detailed notes of the discussion.Teachers discussed their expectations for the hierarchy, their reactions to theresults, and their speculations as to why some of the results differed fromtheir expectations.
Teachers participated in two focus groups during the school year, one inFebruary and one in May. In February teachers discussed their ideas aboutwhat quality teaching entails and their thoughts about how quality is evaluated. In May, the teachers discussed the results from the questionnairesand the assessment. Data Analysis
The self-administered survey was completed by 729 mathematics
Bradley, Sampson & Royal16

students in grades 9 – 12 from among 6 teachers of mathematics. Data wereanalysed using WINSTEPS (Version 3.57) (Linacre, 2005) adopting the polytomous “Rating Scale” model.
Fit of the data to the model, the rating scale structure and the quality ofthe individual items were examined. Survey items and students identified asnot fitting the model through an investigation of rater (student) and item fitstatistics were identified to determine if certain items should be removed toproduce a teacher quality measurement instrument that could be used infuture studies. Following this, the researchers examined the item hierarchy.To support this examination, the research team reviewed notes from thesefocus groups as well as open-ended responses to the survey to identify common themes as well as ideas that were both convergent and divergent tothe quantitative analysis.
ResultsGiven careful attention to the instrument, a preliminary review of the
Rasch results was conducted prior to interpreting the findings in response tothe research question and stated objectives. Review of the Mathematics Quality Survey
WINSTEPS software produces diagnostic information about the use ofthe categories in the rating scale. It is expected that category measuresincrease as the category labels increase from disagreement to agreement.Furthermore, in this study, items were selected because the literature suggested they were indicators of teacher quality. Thus, students shouldagree with the items.
By summing observed counts across categories, Table 1 shows that students selected either category 3, agree, or 4, strongly agree, at a rate of 80%.Students were much less likely to disagree or strongly disagree with statements,only selecting category 1 and 2 at a rate of 17%. While the tendency to disagreeis outside of the expectation of response pattern and warrants further investigation, the expectation of the model for category measures to increaseis satisfied.Table 1Category Measures
Category Category Label Observed Count Percent Category Measure1 Strongly Disagree 620 3 -3.042 Disagree 3214 14 -1.123 Agree 10704 47 0.964 Strongly Agree 7550 33 3.33
The analysis moved to an examination of the raw scores, measures, andmean square fit statistics for the survey items. Only one item fell outside the
17Insights into Students’ Conceptualisation of Quality Mathematics Instruction

reasonable range, with an outfit mean square value of 2.59: (15) The best mathematics teachers I know assign homework on a regular basis. Table 2 displays thestudent responses to this item that differed from the Rasch model’s expectations. The fourth column, Standardised Residual, indicates the degreeto which it differed. Many of the students who were very likely to agree withthe survey items in general disagreed with this item. This item was notremoved from the scale for this study, but the related results were interpretedwith caution.Table 2Most Unexpected Responses for Item 15
Student Response Expected Response Standardised Residual145 1 3.93 -11.27379 1 3.88 -8.64302 1 3.65 -5.26719 2 3.82 -4.68688 1 3.53 -4.60599 1 3.43 -4.25183 1 3.40 -4.15467 1 3.40 -4.1450 1 3.37 -4.06
486 2 3.77 -4.0685 2 3.77 -4.0640 1 3.34 -3.9721 1 3.34 -3.97
475 1 3.33 -3.94692 1 3.31 -3.89326 2 3.74 -3.82602 1 3.28 -3.81460 1 3.25 -3.74277 1 3.25 -3.74
Mathematics Teacher Quality Hierarchy
Figure 1 displays the hierarchy of qualities as rated by the students. Thequalities at the top were least associated with the best mathematics teachersand those at the bottom were most associated.
The items easiest to endorse included: (26) knowledgeable in mathematics; (2)recognise every student has the right to be educated; (6) provide a safe atmosphere for students; (16) have the ability to communicate with all students, regardless of ethnicity or heritage; (7) are honest; (3) practise fairness to all students; and (1) havehigh expectations for students. The hardest to endorse for students were: (11) useresources beyond the textbook, (14) emphasise the importance of mathematics in reallife, (13) individualise instruction, (20) sponsor extracurricular activities, (31) use student results on state assessments to guide planning and instruction, (25) have aquiet classroom, and (12) incorporate technology in their instruction on a regular basis.
Bradley, Sampson & Royal18

Figure 1. Hierarchy of qualities of the best mathematics teachers.Open-ended Responses
In addition to the Likert-type questions, the survey also contained questions that requested open responses. These responses were reviewed tosupport the quantitative analysis. Students were asked to finish the sentence,“I would describe the best math[ematics] teachers I know as …”. Of the over750 anonymous student responses, there were only 15 students who did notcomplete the statement. Also, of the students responding to the prompt andchoosing not to do so, there was a mix of students who reported that theyenjoyed and did not enjoy mathematics. In accordance with the Rasch hierarchy, the students generally reported the best mathematics teachers they
19Insights into Students’ Conceptualisation of Quality Mathematics Instruction

knew as being competent at the job and having good rapport with students.More than half of the responding students referenced teacher knowledge inmathematics when describing the best teachers they knew; with this, manyspecifically referenced the importance of having a mathematics degree andcontinually learning how to improve mathematics teaching. Other themesincluded enjoyment of teaching, high expectations coupled with a dedicationto assist students in reaching those expectations, good organisation, andstrong communication skills. A few students listed a specific teacher, some ofwhom were their current teachers and others from as far back as primary school.
Under the umbrella of good rapport with students, students mentionedqualities such as sense of humour, patience, approachability, honesty, compassion, and good listening skills. One female student wrote, I woulddescribe the best math[ematics] teacher I know as “a teacher that wants tohelp you succeed that teaches you in a fun sort of manner. I seem to learn better when I am having fun in the classroom. These teachers are very brightand want to help you become a better student and be all that you can be.”Similarly, another student described the best math[ematics] teacher as“Patient. Math[ematics] is difficult. If the teacher is patient and understanding of a student’s problems and willing to go over the lessonagain the student won’t get frustrated as easily. They will be more willing tolearn the material and ultimately like math[ematics] better because they getit.” Others value “motivational instructors who teach encouragingly andwhose priority is teaching the material successfully rather than finishing thebook or material on time” and “someone who will listen to their students’questions and be able to help them.”
Supporting high expectations, students noted that the best teachers dowhat it takes to help students learn. From the students’ perspective thisincludes motivating students to learn, being hands-on, being willing to workwith students outside of class, varying teaching methods, using real-worldactivities, assigning homework and utilising technology. One studentdescribed the best mathematics teachers as “compassionate, though notpushovers, who require kids to pass; strongly gifted in mathematics yet constantly pushing to expand their understanding; giving yet not requiringhomework; enjoyable and humorous but still capable of flunking when necessary.”
Within the theme of good organisation, students commented the bestteachers are well-planned, sometimes strict, deliver lessons and curriculumthat have been well thought-out, but are also flexible enough to adapt lessonsand curriculum as necessary. “The best math[ematics] teachers I know alwayshave a planned and organised use of class time. They explain the materialclearly and regularly review it so students don’t forget it. They follow a pattern for how class time is spent so students know what to expect.”
Many students commented on the importance of strong communicationskills, writing that the best teachers clearly explain mathematics conceptsusing multiple approaches. Some students noted the importance of teachersenjoying their work; one student described the best math[ematics] teacher as“a fun person who enjoys their job enough to make their students enjoy italso.” The summary of comments mirrors the Rasch hierarchy, reiterating the
Bradley, Sampson & Royal20

significance of the teacher-student relationship and the importance of theteacher’s care for the individual student.
DiscussionQuality of the Scale
The only item with unacceptable fit to the Rasch model was (15) The bestmathematics teachers I know assign homework on a regular basis. In determiningwhy this item might not fit the expectations of the Rasch model, theresearchers found that over 60% of students who were agreeable to mostitems either disagreed or strongly disagreed with this item. The researchersdetermined that homework is often not popular among students regardlessof their opinions about the teacher assigning it, so this item may be less related to qualities of teachers and more related to student preferences. Forfuture use of the instrument, this item would be removed.Student Perceptions
Consistent with the emphasis on teacher preparation in the literature,students valued teacher knowledge of mathematics as the most importantquality of the best mathematics teachers. Students gave the most importanceto qualities associated with teachers’ interaction with them. It seems thatquality instruction is viewed within the spectrum of teachers’ caring aboutthe students, making the effort to connect with them as individuals and treating all students fairly. The Oakes, Franke, Quartz, and Rogers (2002)finding that individuals working for educational equity and access are typically quality teachers as well as the AAMT (2002) emphasis on teachers’commitment to various communities reiterates this.
Students appear to be less interested in teaching practices that might beviewed as being tangential to their learning, such as use of technology [for technology’s sake], use of assessment results to drive instruction andsponsoring extracurricular events. Still considered important, but among theless valued qualities among the students is the emphasis of mathematics inreal life. This may be explained with Lappan’s (2000) finding that teacher useof what they know is what matters most. Students seem to care that the mathematics they are learning is meaningful and important for future successin school and beyond. Students do not directly equate that concept to real life examples.
Teacher Reactions
When asked to reflect on the empirical hierarchy in the May focus group,the teachers’ responses reflected the lack of consensus in the literature regarding the definition of teacher quality and how to measure it. Teacherssaid, “We know being a highly qualified teacher is important, but it’s not well
21Insights into Students’ Conceptualisation of Quality Mathematics Instruction

defined. It’s vague”, and “It seems like we’re usually evaluated on the qualities that are easiest to quantify, especially in a short period of time.” Inreviewing the students’ item hierarchies of teacher quality, the teachers generally agreed with their students’ perceptions of quality. They were surprised to find that students rated use of technology lowest on the scale, eventhough they also ranked it among the least important indicators of quality ina parallel survey they had completed. In the May teacher interview group,the teachers surmised this may be a matter of different understandings ofwhat technology is. Teachers stated that technology is not a consistent construct, so while one individual views using an overhead projector as technology, another may view handheld calculators as technology and evenothers may only view computer-based activities as technology. These multiple interpretations may have contributed to the low ranking of technology in defining high quality teachers.
Teachers observed that administrators place a great deal of importanceon outcomes that are easily quantified such as state test scores and behaviours that they can observe quickly. The teachers noted the administrators spent only a few minutes in their classrooms, and that use oftechnology was typically mentioned in their reviews. Many of the behavioursthe teachers and students considered to make high quality teachers are noteasily quantified, especially in a short amount of time, so they commentedthey do not place very much weight in the evaluations conducted by theiradministrators when considering their own quality as teachers.
In discussing how they discern their quality as educators, the teachers allindicated they considered their personal judgments to be most important, followed closely by the opinions of their peers. This discussion led to conversations about policy implications and hypotheses to explore in futurestudies. The researchers developed two testable hypotheses for further investigation:
(H1) Satisfying one’s own expectations is the most important aspect ofassessing quality, followed closely by those of one’s peers (other teachers).
(H2) Hierarchy maps related to factors associated with quality teachingwill not align across the K – 16 mathematics community.
ConclusionResearch in the area of quality mathematics instruction sheds light on the
issues pervading mathematics classrooms and curriculum today. The information presented can support mathematics teachers and school administrators, as well as the educational research community. High qualitymathematics education impacts children within and beyond the classroom,preparing them for employment, higher education and the challenges ofdaily life.
This study works to conceptualise and operationalise quality mathematics instruction and effective learning at the high school level. Theresearchers in this study value research communities, with specific emphasison the growing network of faculty, teachers, students and administrators.
Bradley, Sampson & Royal22

Thus, they sought to engage the teachers in the study as members of theresearch team instead of simply paid participants. The study presents a fundamental argument for the need to include classroom teachers and students in the policy-making process. Often the best sources leading to data-driven policy decisions are overlooked or not respected.
While colleges and universities often use student evaluations to measureteacher quality, student insights are rarely considered in evaluating qualityteaching in grades K - 12. The scale developed through this study lays thegroundwork for student evaluations of the quality of their teachers. Using itin reference to individual teachers would provide information about howtheir conceptualisations compare with student conceptualisations of theirbest teachers.
As quoted in No Dream Denied: The ability to create and maintain a strong professional learning community in a school is limited not by teacher supply, but by highturnover among the teachers who are already there—turnover that is only aggravated by hiring unqualified or under prepared individuals to replace those who leave (National Commission onTeaching and America’s Future, 2003, p. 8). To ensure that every student has the opportunity to learn from experts, or
highly qualified teachers, it is important for educational researchers to continue to identify areas of need and for educational institutions and educational policy makers to implement changes to address them.
AcknowledgmentThis research was supported by a Kentucky Education Professional
Standards Board Teacher Quality Grant.References
Aiken, L. (1996). Rating scales and checklists: Evaluating behaviour, personality, and attitudes. New York: John Wiley.
Aston, P. T., & Webb, R. B. (1986). Making a difference: Teachers’ sense of efficacy and student achievement. New York: Longman.
Australian Association of Mathematics Teachers. (2002). Standards for excellence inteaching mathematics in Australian schools. [Online]. Retrieved on February 22, 2006from http://www.aamt.edu.au/
Australian Education Council. (1991). A national statement on mathematics for Australianschools. Melbourne: Australian Education Council and Curriculum Corporation.
Babbie, E. (1992). The practice of social research (6th ed). Belmont, CA: Wadsworth.Bishop, A. J., Hart, K., Lerman, S., & Nunes, T. (1993). Significant influences on children’s
learning of mathematics. (ERIC Document Reproduction Service No. ED368552).Black, R., & Howard-Jones, A. (2000). Reflections on best and worst teachers: An
experiential perspective of teaching. Journal of Research and Development inEducation, 34(1), 1—13.
23Insights into Students’ Conceptualisation of Quality Mathematics Instruction
Bond, T. G., & Fox, C. M. (2001). Applying the Rasch model: Fundamental measurement inthe human sciences. Mahwah, NJ: Lawrence Erlbaum.
Bradley, K. D., & Loadman, W. E. (2005). A view of the teaching profession through theeyes of secondary urban educators: A study of factors related to recruitment andretention. NASSP Bulletin 89(644), 2—28.
Brown, K. S. (2002). Instructional personnel: Trends and issues (Revised). (ERICDocument Reproduction Service No. ED472993).
Carnegie Forum on Education and the Economy. (1986). Task force on teaching as a profession. A nation prepared: Teachers for the 21st century. New York, CarnegieCorporation.
Chambers, D. (1987). Effective teaching of mathematics (Bulletin No. 7447). Madison, WI:Wisconsin State Department of Public Instruction.
Cross, K. P. (1998). What do we know about students’ learning and how do we know it?Retrieved October 21, 2001, from the American Association for Higher EducationWeb site: http://www.aahe.org/nche/cross_lecture.htm
Darling-Hammond, L. (2000). Teacher quality and student achievement. Education PolicyAnalysis Archives, 8(1). Retrieved February 22, 2006 from http://epaa.asu.edu/epaa/v8nl
Eisenhart, M., Borko, H., Underhill, R., Brown, C., Jones, D., & Agard, P. (1993). Conceptualknowledge falls through the cracks: Complexities of learning to teach mathematicsfor understanding. Journal for Research in Mathematics Education, 24, 8-40.
Evertson, C., Emmer, E., & Brophy, J. (1980). Predictors of effective teaching in juniorhigh mathematics classrooms. Journal for Research in Mathematics Education, 11(3),167-178.
Fetler, M. (2001). Student mathematics achievement test scores, dropout rates, andteacher characteristics. Teacher Education Quarterly, 28(1), 151-168.
Frye, R. (1999). Assessment, accountability and student outcomes. (Dialogue). RetrievedJuly 8, 2005, from http://www.ac.wwu.edu/~dialogue/issue2.html
Gay, L. R. (1981). Educational research: Competencies for analysis and application.Columbus, OH: Charles E. Merrill.
Hays, W . L. (1988). Statistics (4th ed.). Fort Worth: Holt, Rinehart & Winston.Holmes Group. (1986). Tomorrow’s teachers. East Lansing, MI: Author.Johnson, L. (1995). Extending the National Council of Teachers of Mathematics’
“Recognizing and recording reform in mathematics education: Documentation projectthrough cross-case analysis”. Unpublished doctoral dissertation, University of NewHampshire.
Kentucky Education Professional Standards Board. (2004). Kentucky teacher internshipprogram intern performance record. Retrieved September 15, 2004, fromhttp://www.kyepsb.net/documents/Intern/IPR.pdf.
Koency, G., & Swanson, J. (2000). The special case of mathematics: Insufficient contentknowledge a major obstacle to reform. Paper presented at the American EducationalResearch Association Conference (AERA), New Orleans, LO.
Lappan, G. (2000). A vision of learning to teach for the 21st century. School Science &Mathematics, 100(6), 319—326.
Lee, J., Meadows, M., & Lee, J. O. (2003). What causes teachers to implement high-qualitymathematics education more frequently: Focusing on teachers’ pedagogical contentknowledge. Paper presented at the Association for Childhood EducationInternational (ACEI) International Annual Conference, Phoenix, AZ.
Leinhardt, G. (1989). Math Lessons: A contrast of novice and expert competence.Journal for Research in Mathematics Education, 20(1), 52—75.
Lewis, L., Parsad, B., Carey, N., Bartfai, N., Farris, E., & Smerdon, B. (1999). Teacherquality: A report on the preparation and qualifications of public school teachers.Washington, DC: National Centre for Educational Statistics.
Bradley, Sampson & Royal24
Liekin, R., & Winicki-Landman, G. (2001). Defining as a vehicle for professional development of secondary school mathematics teachers. Mathematics TeacherEducation and Development, 3, 62—73.
Linacre, J. M. (2005). WINSTEPS Rasch measurement computer program (Version3.57) [Computer software]. Chicago: Winsteps.com.
Lockheed, M. E., & Komenan, A. (1989). Teaching quality and student achievement inAfrica: The case of Nigeria and Swaziland. Teaching and Teacher Education, 5(2),93—113.
Ma, L. (1999). Knowing and teaching elementary mathematics: Teachers’ understanding offundamental mathematics in China and the United States. Mahwah, NJ. LawrenceErlbaum.
Manouchehri, A. (1998). Mathematics curriculum reform and teachers: What are thedilemmas? Journal of Teacher Education, 49, 276—286.
Manouchehri, A., & Goodman, T. (1998). Mathematics curriculum reform and teachers: Understanding the connections. Journal of Educational Research, 92(1),27—41.
McKinney, K. (1987). Effective teaching of mathematics (Bulletin No. 7447). Madison, WI:Wisconsin State Department of Public Instruction.
Murphy, I. (1990). Characteristics of a good teacher. The Delta Kappa Gamma Bulletin,57, 39—45.
National Commission on Teaching and America’s Future. (1996). What matters most:Teaching for America’s future. New York: Author.
National Commission on Teaching and America’s Future. (2003). No dream denied: Apledge to America’s children. New York: Author.
Nardi, P. M. (2006). Doing survey research: A guide to quantitative methods (2nd ed.).Boston: Allyn & Bacon.
Oakes, J., Franke, M. L., Quartz, K. H., & Rogers, J. (2002). Research for high-qualityurban teaching: Defining it, developing it, assessing it. Journal of Teacher Education,53(3), 228—234.
Olson, L. (2000). Teacher quality: Finding and keeping competent teachers. [Editorial]Projects in Education 1(18), 12-16. Retrieved 18 August 2006 fromhttp://counts.edweek.org/sreports/qc00/templates/article.cfm?slug=intro.html
Provasnik, S. J., & Stearns, C. K. (2003). Teacher quality and student educational attainment: Findings from the National Educational Longitudinal Study (1988-2000).Paper presented at the American Educational Research Association (AERA)Annual Conference, Chicago, IL.
Provasnik, S. J., & Young, B. O. (2003). The relationship of teacher quality to student mathematics achievement at the 8th grade: Findings from the National Assessment ofEducation Progress (2000). Paper presented at the American Educational ResearchAssociation (AERA) Annual Conference, Chicago, IL.
Scantron. (2005). eListen (Version 4.8) [Computer software]. Irvine, CA: ScantronCorp.
Smith, T. M., Desimone, L. M., & Ueno, K. (2005). Highly qualified to do what? Therelationship between NCLB Teacher Quality mandates and the use of reform-oriented instruction in middle school mathematics. Educational Evaluation andPolicy Analysis, 27(1), 75—109.
Simon, M. A. (2004). Raising issues of quality in mathematics education research.Journal of Research in Mathematics Education, 35(3), 157—163.
Stoldosky, S. S. (1996). Should SASS measure instructional processes and teacher effectiveness? The schools and staffing survey: Recommendations for the future.Washington, DC: National Centre for Educational Statistics.
25Insights into Students’ Conceptualisation of Quality Mathematics Instruction

Sullivan, P., & Mousley, J. (1994). Quality mathematics teaching: Describing some keycomponents. Mathematics Education Research Journal, 6(1), 4—22.
Swafford, J., Jones, G., & Thorton, C. (1997). Increased knowledge in geometry andinstructional practice. Journal for Research in Mathematics Education, 28, 467—482.
Swafford, J., Jones, G., Thorton, C., Stump, S., & Miller, D. (1999). The impact oninstructional practice of a teacher change model. Journal of Research andDevelopment in Education, 32(2), 69—82.
Tamblyn, P. (2000). Qualities of success: lessons from a teaching career. EducationCanada, 40(1), 16—19.
The Education Trust. (1998). Good teaching matters. Thinking K-16, 3(2), 1—16. U.S. Department of Education. (2000). Monitoring school quality: An indicators report.
(Statistical Analysis Report EA 030 894). Washing, DC: Office of EducationalResearch and Improvement, National Centre for Educational Statistics.
Wenglinsky, H. (2000). How teaching matters: Bringing the classroom back into discussionsof teacher quality. (ERIC Document Reproduction Service No. ED447128).
Westerman, D. A. (1991). Expert and novice teacher decision making. Journal of TeacherEducation, 42(4), 292—305.
Willoughby, S. (2000). Perspectives on mathematics education. In M. Burke & F. Curcio(Eds.), Learning mathematics for a new century (pp. 1-15). Reston, VA: NationalCouncil of Teachers of Mathematics.
Woolfolk, A.E., Rosoff, B., & Hoy, W. K. (1990). Teachers’ sense of efficacy and theirbeliefs about managing students. Teaching and Teacher Education, 6, 137—148.
Xin, T. Xu, Z. & Tatsuoka, K. (2004). Linkage between teacher quality, student achievement, and cognitive skills: A rule-space model. Studies in EducationalEvaluation, 30(4), 205—223.
Authors
Kelly D. Bradley, Department of Educational Policy Studies and Evaluation, 131Taylor Education Building, University of Kentucky, Lexington, KY 40506-0001,USA. Email: <[email protected]>
Shannon O. Sampson, Department of Educational Policy Studies and Evaluation, 131Taylor Education Building, University of Kentucky, Lexington, KY 40506-0001,USA. Email: <[email protected]>
Kenneth D. Royal, Department of Educational Policy Studies and Evaluation, 131Taylor Education Building, University of Kentucky, Lexington, KY 40506-0001,USA. Email: <[email protected]>
Bradley, Sampson & Royal26