Exact evaluation of bias in Rasch model residuals
23
Exact evaluation of bias in Rasch model residuals Svend Kreiner Karl Bang Christensen Research Report 07/2 Department of Biostatistics University of Copenhagen
Transcript of Exact evaluation of bias in Rasch model residuals

Exact evaluation of bias in Rasch model residuals
Svend Kreiner Karl Bang Christensen
Research Report 07/2
Department of Biostatistics University of Copenhagen
Exact evaluation of bias in Rasch model residuals
Svend Kreiner*
Department of Biostatistics, University of Copenhagen
Karl Bang Christensen
National Institute of Occupational Health, Denmark
Abstract
This paper compares conventional Rasch model residuals and mean squared outfit statistics to
residuals and outfit statistics based either on conditional probabilities of item responses given the
total person score, or on exact conditional probabilities given both item margins and person scores.
Exact residuals are asymptotically unbiased, but residuals and outfit statistics based on
unconditional probabilities are biased to a degree that may influence analysis of fit. The bias
appears to depend mainly on the dispersion of item parameters, sample size and targeting of items
have little effect on the bias. Very little bias is found for residuals based on conditional probabilities
of item responses given person scores.
Keywords: Rasch models, residuals, mean squared residuals, outfit statistics, Markov Chain Monte
Carlo methods.
1 Introduction Let pv i= P(Yvi=1) be the probability that a person, v, responds positively to an item, i, according to
the Rasch model for dichotomous items. Response residuals, Yvi- , compare observed responses
estimates to estimates of the probabilities. Outfit statistics (Wright, 1977 and Smith, 2004) summar-
ize squared standardized response residuals over persons and/or items. Outfit statistics defined in
this way are useful for item analysis where they are used in different ways in several programs to
test the fit of item responses to Rasch models (Linacre and Wright, 2000, Andrich et.al.,2000 and
Wu et al, 1998). The inherent possibilities in statistical analyses of response residuals are, however,
vip̂
* Corresponding author Svend Kreiner, Department of Biostatistics, University of Copenhagen, Øster Farimagsgade 5,B, P.O.B. 2099, DK-1014 Copenhagen K, email [email protected]
1

offset by the fact that the results concerning the distributions of these statistics are based on
heuristic arguments that are easily shown to be wrong. The degree to which this is a problem in
practical applications and what to do about it will be addressed in this paper.
Outline of the paper
The Rasch model is briefly described in Section 2. Response residuals and outfit statistics are also
defined in this section. The distribution of residuals depends on the frame of inference (FOI)
adapted for the statistical analysis. Three FOIs for item analysis by Rasch models are defined in
Section 3: the unconditional FOI, the conditional FOI and the exact FOI. It is argued that the exact
FOI is the proper one for analysis of residuals. Markov Chain Monte Carlo methods for analysis in
the exact FOI are also described in Section 3. The bias of unconditional and conditional residuals
and outfit statistics is discussed in Section 4 and investigated in Sections 5 and 6 by means of
analyses of real and simulated data.
2 The Rasch model Let Y= (Yvi) be the matrix of responses of n subjects to k dichotomous items with responses coded
0 and 1. The vectors of person scores, S = (S1,..,Sn), and item margins, M = (M1,..,Mk), are given by
and v viS =∑ iY vii v
M Y=∑ . A = (Asi) is the (k+1)×k matrix with elements Asi equal to the number
of persons with Sv = s and Yvi = 1. Under the Rasch model (Rasch, 1960) the probabilities
v ivi v i
v i
exp( )P(Y 1) ( , )1 exp( )
θ −β= = φ θ β =
+ θ −β (1)
of positive responses on items depend on item parameters, β = (β1,…, βk) and person parameters, θ
= (θ1,…, θn).
The vectors of person scores and item margins, (S,M), are minimal sufficient statistics for (θ,β).
The conditional probability that the response of person v on item i is positive given that Sv = s is
i
i
j s 1 1,.., j 1, j 1,..,rvi v i
s
exp( ) ( )P(Y 1| S s) (s, )
( )− − +−β γ β
= = = ϕ β =γ β
(2)
2
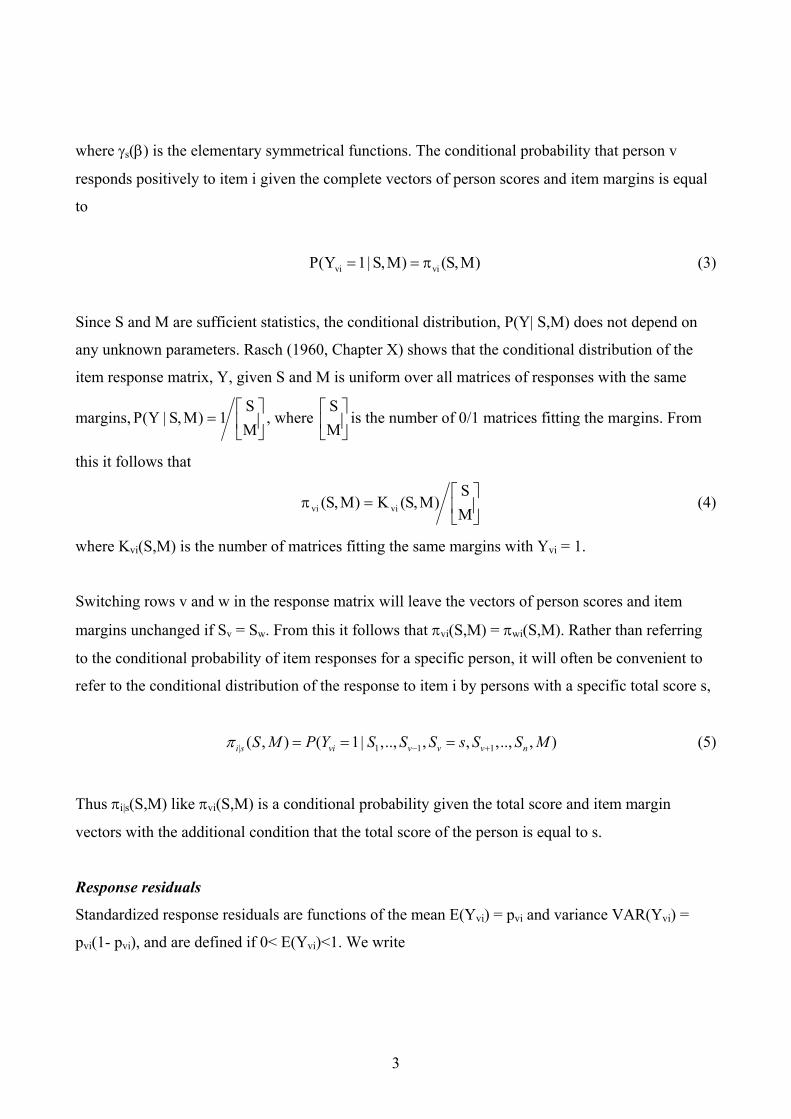
where γs(β) is the elementary symmetrical functions. The conditional probability that person v
responds positively to item i given the complete vectors of person scores and item margins is equal
to
vi viP(Y 1| S,M) (S,M)= = π (3)
Since S and M are sufficient statistics, the conditional distribution, P(Y| S,M) does not depend on
any unknown parameters. Rasch (1960, Chapter X) shows that the conditional distribution of the
item response matrix, Y, given S and M is uniform over all matrices of responses with the same
margins,
=
MS
1)M,S|Y(P , where is the number of 0/1 matrices fitting the margins. From
this it follows that
MS
=π
MS
)M,S(K)M,S( vivi (4)
where Kvi(S,M) is the number of matrices fitting the same margins with Yvi = 1.
Switching rows v and w in the response matrix will leave the vectors of person scores and item
margins unchanged if Sv = Sw. From this it follows that πvi(S,M) = πwi(S,M). Rather than referring
to the conditional probability of item responses for a specific person, it will often be convenient to
refer to the conditional distribution of the response to item i by persons with a specific total score s,
| 1 1 1( , ) ( 1| ,.., , , ,.., , )i s vi v v v nS M P Y S S S s S S Mπ − += = = (5)
Thus πi|s(S,M) like πvi(S,M) is a conditional probability given the total score and item margin
vectors with the additional condition that the total score of the person is equal to s.
Response residuals
Standardized response residuals are functions of the mean E(Yvi) = pvi and variance VAR(Yvi) =
pvi(1- pvi), and are defined if 0< E(Yvi)<1. We write
3

( )( )
,1
vi vivi vi vi
vi vi
Y pZ Y pp p
−=
− (6)
All three probabilities (1) – (3) can be used in (6). Residuals are called unconditional, conditional,
and exact when expected values are based on (1), (2), and (3) respectively:
( ) ( , )( , ( , ))( , )(1 ( , ))
u vi v ivi vi vi v i
v i v i
YZ Z Y φ θ βφ θ βφ θ β φ θ β
−= =
− (7)
(c) vi i vvi vi vi i v
i v i v
Y (S , )Z Z (Y , (S , ))(S , )(1 (S , ))
−ϕ β= ϕ β =
ϕ β −ϕ β (8)
( ) ( , )( , ( , ))( , )(1 ( , ))
e vi vivi vi vi vi
vi vi
Y S MZ Z Y S MS M S M
πππ π
−= =
− (9)
Dimitrov and Smith (2006) refer to (8) as adjusted residuals in the context of Person-Fit statistics.
Unconditional and conditional residuals, (7) and (8), are theoretical residuals that are functions of
unknown parameters. Residuals where expected values are calculated using estimated parameters
are called estimated residuals. Conventional statistical analyses of estimated residuals assume that
parameter estimates are consistent; therefore, they use the distribution of the theoretical residuals as
approximations to the distributions of estimated residuals. One of the problems with Rasch model
response residuals is that this assumption is not justified, since some item parameter estimates and
all conventional person parameter estimates are inconsistent.
Outfit statistics
The means of squared residuals (MSR) summarized over persons and/or items, are sometimes
referred to as outfit statistics (Smith, 2004). Item outfit statistics are given by
2i viv
1MSR (Y,P) Z (Y ,p )n
= ∑ vi vi (10)
and the total outfit statistic by
∑=i i )P,Y(MSR
k1)P,Y(MSR (11)
4

Person outfit statistics defined by summarizing residuals over items can also be considered. These
are, however, not discussed in this paper.
Zvi(pvi) is a conventional standardized residual, but the squared residual has somewhat atypical
properties, because it relates to a Bernoulli variable. Assume that outcomes on Yvi are coded 0 and
1. From this it follows that and therefore that is a linear function of Yvi2vi YY = )p(Z vi
2vi vi,
2
2 vi vi vi vi vi vivi vi vi vi
vi vi vi vi vi
Y 2p Y p p 1 2pZ (Y ,p ) Yp (1 p ) (1 p ) p (1 p )− + −
= = +− − −
(12)
It follows from (12) that 2vi vi viE(Z (Y ,p )) 1= , ( ) 2
vi2vi vi vi
vi vi
1 2pVAR(Y , Z (p ))
p (1 p )−
= − , =1, and
VAR( )=0. VAR( ) is very large when E(Y
)5.0(Z2vi
)5.0(Z2vi )p(Z2
vi vi) is close to 0 and 1.
Estimated outfit statistics
In practice, outfit statistics are always estimated, summarizing estimated rather than theoretical
residuals. There is a one-to-one relationship between all conventional person parameter estimates
and the sufficient person scores. Estimates of the unconditional probabilities (1) therefore share the
property that all persons with the same score have the same probability, written pi|s, with the
conditional and exact response probabilities. For this reason, we may regard estimated outfit
statistics as functions of data summarized in the matrix A = (Asi), where Asi is the number of
persons with positive response on item i and total score s, and the matrix P(c) = (pi|s) of conditional
probabilities. Expected item responses in conditional and exact residuals are the same for all
persons with score s and (10) can thus be written
( )k 1
i|s i|s(c)i s
s 1 i|s i|s i|s
ˆ ˆp 1 2p1ˆMSR A,P n Aˆ ˆ ˆn (1 p ) p (1 p )
−
=
−= + − − ∑ si (13)
Persons with extreme scores are not included, since standardized residuals are not defined for these
persons. From (13) it follows not only that the expected value ( )( )(c)i
ˆE MSR A, P | S, M =1 when
5

s|ip̂ is a consistent estimate, but also that ( )(c)i
ˆMSR A,P =1 when there is a perfect model fit in the
sense that |ˆ=si s i sA n p
π̂
.Depending on the choice of residual (7), (8), or (9), we define unconditional,
conditional and exact outfit statistics
MSRMSR )u(i =
MSRMSR )c(i =
MSRMSR )e(i =
(i|s
expˆ
1 expφ =
+
)ˆ,A(i φ (14)
)ˆ,A(i ϕ (15)
)ˆ,A(i π (16)
where ϕ and are the (k-1)×k matrices with estimates of the probabilities given by (2) and (5),
and φ is the (k-1)×k matrix with elements
ˆ
ˆ ( ) )( )( )
i
i
ˆ ˆsˆ ˆs
θ −β
θ −β where ( )ˆ sθ is the estimate of
the parameter for persons with a total score equal to s.
Finally, it must be noted that (13) applies to unconditional residuals, if they assign infinite person
parameter estimates to persons with extreme scores. If finite person parameter estimates are
assigned to extreme scores, we have to exclude the extreme score groups form (13) in order to avoid
systematic bias. This problem does not occur for conditional and exact outfit statistics.
3 Frames of inference for analysis of response residuals The three probabilities (1) – (3) define different frames of inference with different probability
estimates and different outfit distribution.
The unconditional frame of inference
The unconditional FOI is given by the unconditional distribution P(Y;θ,β). The probabilities in this
inference frame are given by (1). Maximum likelihood estimates in this framework are referred to
as joint parameter estimates. Conventional wisdom has it that standardized unconditional residuals
“are distributed as approximate unit normals”, that summarizing squared standardized residuals
over items and/or persons “results in a chi-square” (Smith, 2004), and that a Wilson-Hilferty cube
root transformation,
6

( )3
)outfit(VAR)outfit(VAR
31outfitt 3 +−= (17)
(Wilson & Hilferty, 1931) produces a transformed statistics with a distribution that is close to a
standardized normal distribution (Smith, 1991).
Standardizing response residuals does not, however, change the fact that response residuals are
dichotomous variables. All of the above statements are therefore obviously erroneous, and whether
the distribution of the Wilson-Hilferty transformed outfit statistic may be approximated by the
standardized normal distribution is open for discussion.
The situation complicates considerably when unconditional outfit statistics are calculated with
estimated rather than known parameters, because estimates from the unconditional FOI are
asymptotically biased (Neyman & Scott, 1948; Andersen, 1980, p.244). In addition to the bias
imposed by the joint estimates, we also notice that the standard error of person parameter estimates
cannot approach zero as n → ∞ if the number of items is fixed. In order to see this, one must notice
that there is one person parameter, , for every possible score such that the probabilities of the
distribution of the person parameter estimate given the true person and item parameters are equal to
the probabilities of the total score,
sθ̂
( )βθ ,; vsθ̂P = ( )βθ=∑ ,;sYP vi vi . These probabilities do not
depend on the number of persons in the sample. The standard errors of the person parameter
estimates and the standard error of the estimates of the unconditional probabilities will therefore
never approach zero. Standardized response residuals based on these estimates may therefore both
be biased and have standard deviations larger than 1.
The conditional frame of inference
The conditional FOI is defined by the conditional distribution of the item responses given the
person scores, P(Y|S;β), with response probabilities given by (2). Formula (12) shows that outfit
statistics are linear functions (12). The central limit theorem therefore suggests that the distribution
of the conditional item outfit may be approximated by a normal distribution with mean equal to 1
and variance equal to
7

( )( )
2k 1is
i 2s 1 i i
1 2 (s, )nVAR(MSR (Y, ))n (s, ) 1 (s, )
−
=
− ϕ βϕ =
ϕ β −ϕ β ∑
(18)
since all persons within a specific score group have the same conditional probability of a positive
response. In the conditional framework, we therefore evaluate the significance of the item outfit by
comparison of
( )
i
k 1i
ss 1 i i
n(MSR (Y, ) 1)t1 2 (s, )n
(s, ) 1 (s, )
−
=
ϕ −=
− ϕ β ϕ β −ϕ β
∑ (19)
to a standardized normal distribution.
Analysis of response residuals in the conditional FOI requires item parameter estimates. The
maximum likelihood item parameter estimates in this framework are the conditional maximum
likelihood (CML) estimates of Andersen (1970). These are known to be both consistent and
asymptotically unbiased. Probability estimates using CML item parameter estimates instead of the
unknown item parameters in (2) will therefore also be consistent and asymptotically unbiased.
The exact frame of inference
The exact FOI is given by the conditional distribution, P(Y|S,M). There are no unknown parameters
in this framework, where residuals are calculated relative to (3) and where significance is always
assessed relative to the exact distribution of fit statistics. The Markov Chain Monte Carlo procedure
first described by Besag and Clifford (1989) and later extended to cover item response matrices
with missing responses by Holst (1994) provides consistent estimates of both response probabilities
and p-values of fit statistics.
To estimate the probability πi|s(S,M) that a person with a total score equal to s answers positively on
an item in the exact conditional frame of inference, we generate NSIM random item response
matrices as described above and calculate the number of different responses on items in different
score groups, ( ) k,..1i,k,..,0s)j(
si)j( AA === for j=1,..,NSIM. Given these tables, unbiased estimates of
πi|s(S,M) are given by
8

∑=⋅
=πNSIM
1j
)j(si
ss|i A
nNSIM1ˆ (17)
These estimates are used in (9) and (16) to calculate exact residuals and outfit statistics. The
evaluation of the significance of the exact outfit then requires a second MCMC sample similar to
the one used to estimate response probabilities. Let MSR be the observed outfit statistic, while
(MSR1,..,MSRNSIM) is the MCMC sample of outfit statistics. Li = 1 if MSRi ≤ MSR and 0 otherwise.
Hi = 1 if MSRi ≥ MSR and 0 otherwise. The MCMC estimate of the one-sided p-values are then
estimated by
∑=
=NSIM
1iilow L
NSIM1p̂ (18)
and
∑=
=NSIM
1iihigh H
NSIM1p̂ (19)
The precision of MCMC estimates depends on NSIM and on the degree of dependence between the
sampled item response matrices. For each of the analyses presented in this paper 5,100,000,000
item response matrices were generated, but only every 100,000th of these were actually sampled.
This reduced the correlation between consecutive values of the outfit statistic (all were between -
0.02 and +0.02). The MCMC samples thus function as conventional Monte Carlo samples. In order
to reduce dependency of sampled matrices and the observed item responses, the first 100 sampled
matrices were discarded. Each MCMC sample thus consisted of 5000 random item response
matrices.
4 Exact evaluation of bias The frame of inference of estimated residuals and outfit statistics
It follows from the one-to-one relationship between the sufficient margins and the person and item
parameter estimates that estimates of unconditional and conditional response probabilities are
functions of (S,M). The unconditional and conditional inference frames, P(Y; ) and P(Y|S;ˆ ˆ,θ β β̂ ),
with estimates instead of known parameters are consequently equal to the exact FOI. As a result, the
exact FOI is therefore the proper frame of inference for an analysis of the bias of estimated
9

residuals and outfit statistics. Discussing the use of residuals for tests of fit of the Rasch model,
Smith (2004) appears to take the same stance arguing that the “issue of fit … can be reduced to a
single question. How well do the marginals, translated through the estimated item and person
parameters, reproduce the actual data?”.
Standardized residuals should have expectation equal to zero. The bias of unconditional and
conditional residuals is ( )vi viˆE Z ( ) | S,Mφ and ( )vi viˆE Z ( ) | S,Mϕ respectively, both of which may be
estimated by the MCMC procedure discussed above. The bias of the unconditional and conditional
outfit statistics is evaluated by comparison to the expected value of 1 for the exact outfit statistics.
The outfit statistics are linear functions of the item-by-score matrix (13). The bias of the
unconditional and conditional outfit statistics is therefore equal to MSR and
, where E = (e
1)ˆ,E(i −φ
1)ˆ,E(MSR i −ϕ si) is the matrix of expected numbers of positive item responses in
different score groups in the exact FOI, esi = E(Asi|S,M). These may also be estimated by the
MCMC procedure.
In the following, two examples are used to illustrate the analysis of residuals by MCMC methods:
(i) a well-known small-sample example with 35 persons and 18 items, and (ii) simulated data
generated to get a better idea about the behaviour of residuals and outfit statistics under different
conditions.
Both examples use conditional maximum likelihood estimates of item parameters and maximum
likelihood estimates of person parameters. Unconditional and conditional outfit test statistics are
then compared to MCMC estimates of expected outfit statistics in the exact frame of inference.
5 Exact evaluation of bias for Knox Cube test data Analysis of data from the Knox Cube Test is described in Wright and Stone (1979). The data is also
included as one of the standard examples for the WINSTEPS program (Linacre and Wright, 2000).
A total of 35 students responded to 18 items. All students gave the same response to items 1, 2, 3,
and 18. These items are not included in the analysis. In what follows, data from the 34 persons with
non-trivial scores on the remaining 14 items is considered.
10
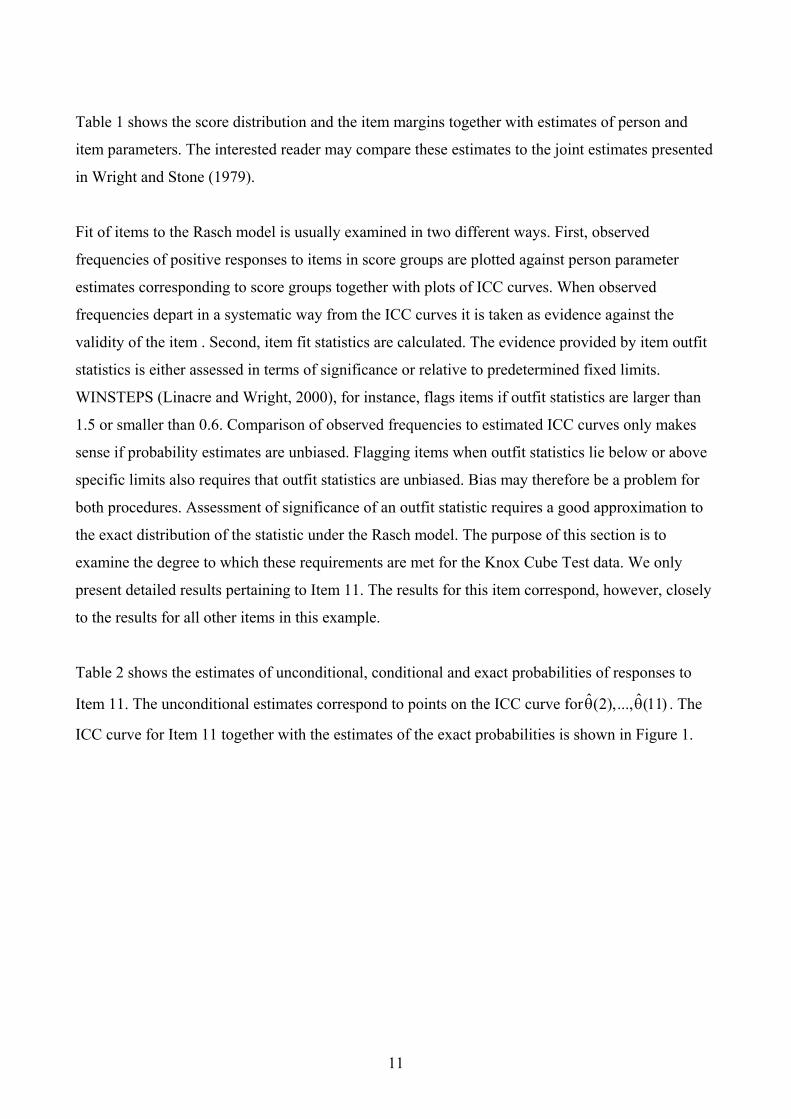
Table 1 shows the score distribution and the item margins together with estimates of person and
item parameters. The interested reader may compare these estimates to the joint estimates presented
in Wright and Stone (1979).
Fit of items to the Rasch model is usually examined in two different ways. First, observed
frequencies of positive responses to items in score groups are plotted against person parameter
estimates corresponding to score groups together with plots of ICC curves. When observed
frequencies depart in a systematic way from the ICC curves it is taken as evidence against the
validity of the item . Second, item fit statistics are calculated. The evidence provided by item outfit
statistics is either assessed in terms of significance or relative to predetermined fixed limits.
WINSTEPS (Linacre and Wright, 2000), for instance, flags items if outfit statistics are larger than
1.5 or smaller than 0.6. Comparison of observed frequencies to estimated ICC curves only makes
sense if probability estimates are unbiased. Flagging items when outfit statistics lie below or above
specific limits also requires that outfit statistics are unbiased. Bias may therefore be a problem for
both procedures. Assessment of significance of an outfit statistic requires a good approximation to
the exact distribution of the statistic under the Rasch model. The purpose of this section is to
examine the degree to which these requirements are met for the Knox Cube Test data. We only
present detailed results pertaining to Item 11. The results for this item correspond, however, closely
to the results for all other items in this example.
Table 2 shows the estimates of unconditional, conditional and exact probabilities of responses to
Item 11. The unconditional estimates correspond to points on the ICC curve forθ . The
ICC curve for Item 11 together with the estimates of the exact probabilities is shown in Figure 1.
ˆ ˆ(2),..., (11)θ
11

Table 1. Score distribution, maximum likelihood estimates of person parameters, item margins and conditional maximum likelihood estimates of item parameters
Score s
Score distribution
ns
Person parameter
)s(θ̂
Item
i
Item margin
Mi
Item parameter
iβ̂ 2 1 -3.909 4 32 -3.778 3 2 -3.215 5 31 -3.365 4 2 -2.574 6 30 -2.956 5 2 -1.900 7 31 -3.365 6 3 -1.124 8 27 -2.004 7 12 -0.202 9 30 -2.956 8 5 0.770 10 24 -1.281 9 4 1.665 11 12 0.638 10 1 2.496 12 6 1.913 11 2 3.304 13 7 1.658 14 3 2.946
Mean 6.7 15 1 4.216 s.d. 2.4 16 1 4.216
17 1 4.216
Table 2. Estimated probabilities and observed frequencies of positive responses on Item 11 in different score groups. The CML estimate of the item parameter is equal toβ = 0.638 11
ˆ
Score s
Unconditional probability
)ˆˆexp(1)ˆˆexp(
1111
1111
β−θ+
β−θ
Conditional Probability
11 s 1 1..10,12,..14
s
ˆ ˆexp( ) ( )ˆ( )
−−β γ β
γ β
Exact Probability
s|11π̂
2 0.0105 0.0084 0.0112 3 0.0208 0.0161 0.0177 4 0.0387 0.0287 0.0314 5 0.0732 0.0515 0.0533 6 0.1466 0.0990 0.1019 7 0.3016 0.2164 0.2148 8 0.5330 0.5864 0.5901 9 0.7364 0.7912 0.7913 10 0.8650 0.9013 0.8960 11 0.9350 0.9541 0.9448
12

Figure 1. The item characteristic curve of Item 11 together with the exact probabilities, π11|s, plotted against the person parameter estimates in each score group.
6,004,002,000,00-2,00-4,00-6,00
1,0
0,8
0,6
0,4
0,2
0,0
In each score group, the observed frequency of positive responses should be compared to estimates
of the conditional probabilities πi|s, rather than to unconditional probabilities, because the estimated
person parameters are the same for all persons with the same score. In this case, the difference
between unconditional and exact probabilities results in evidence of too high item discrimination
when frequencies of correct response in each score group are compared to the unconditional ICC
curve.
The difference between unconditional and exact probabilities will also influence standardized
residuals and outfit statistics. Table 3 shows the bias of the unconditional and conditional residuals
for Item 11. Unconditional residuals are more biased than conditional residuals. The bias in this
example is particular pronounced in score groups with large numbers of cases.
Table 3. Expected unconditional and conditional standardized response residuals for Item 11. Score
Sv = s
Unconditional standardized residuals( )(u) (e)
v,11 v,11E Z Z | S,M− Conditional standardized residuals
( )(c) (e)v,11 v,11E Z Z | S,M−
2 0.007 0.031 3 -0.022 0.013 4 -0.038 0.016 5 -0.077 0.008 6 -0.126 0.010 7 -0.189 -0.004 8 0.115 0.008 9 0.124 0.000 10 0.091 -0.018 11 0.040 -0.044
13

Expected values of unconditional and conditional outfit statistics are shown in Table 4 for all items
(Exact residuals always have expectation equal to 1). Unconditional outfit statistics are
systematically biased and diminish evidence of ill-fitting items, whereas the bias of the conditional
outfit statistics is unsystematic and less pronounced. The significance of the departure of outfit
statistics from what one should expect under the Rasch model may be assessed by MCMC estimates
of exact conditional p-values. If these methods are unavailable, one will have to rely on
approximations by chi squared or normal distributions based on tentative and less than convincing
arguments.
Table 4. Expected values of the item outfit statistics. Item
i Expected unconditional outfit ( )(u)
iE MSR | S,MExpected conditional
outfit ( )(c)iE MSR | S,M
4 0.686 0.990 5 0.715 1.008 6 0.724 0.998 7 0.704 0.987 8 0.779 1.025 9 0.732 1.014 10 0.822 1.029 11 0.856 1.036 12 0.893 1.040 13 0.793 1.023 14 0.699 0.984 15 0.696 1.026 16 0.709 1.052 17 0.705 1.044
Total 0.744 1.018
Figure 2 shows the distribution of the Wilson-Hilferty transformed unconditional item outfit for
Item 11. Being skewed with expected value equal to -0.25 and standard deviation equal to 0.80, The
distribution is far from a standardized normal distribution. The 95 % confidence region is equal to [-
1.30, 1.82].
14

Figure 2. Distribution of the Wilson-Hilferty transformed unconditional outfit statistics for Item 11
5,004,003,002,001,000,00-1,00-2,00
700
600
500
400
300
200
100
0
Frequency
Table 5 shows observed conditional and unconditional outfit statistics for all items together with
MCMC estimates of 95 % confidence regions. Eight unconditional and seven conditional outfit
values are below 0.6, while one unconditional and two conditional outfit statistics are larger than
1.5. The outfit statistics are, however, only marginally significant for three items.
Table 5. Outfit statistics with exact 95% confidence regions. Unconditional
outfit Conditional
outfit
Item
Observed value
95% confidence
region
95 % confidence region.W-H transformed
outfit statistics
Observed value
95% confidence
region
95 % confidence region. W-H transformed
outfit statistics
4 0.308 0.14 – 3.21 0.04 – 1.38 0.351 0.14 – 5.27 0.34 – 1.72 5 0.460 0.15 – 2.75 -0.30 – 1.28 0.540 0.14 – 4.46 -0.02 – 1.63 6 0.758 0.18 – 3.24 -0.53 – 1.52 1.078 0.16 – 4.84 -0.27 – 1.80 7 1.523 0.15 – 2.67 -0.30 – 1.25 2.490 0.14 – 4.36 -0.02 – 1.61 8 0.395 0.28 – 1.94 -1.00 – 1.18 0.470 0.25 – 2.83 -0.75 – 1.56 9 0.220 0.18 – 3.24 -0.53 – 1.52 0.206 0.16 – 4.84 -0.27 – 1.80
10 0.766 0.38 – 2.05 -1.28 – 1.62 0.914 0.36 – 2.89 -1.00 – 2.04 11 0.736 0.42 – 2.11 -1.30 – 1.82 0.897 0.37 – 2.69 -1.17 – 2.13 12 0.840 0.26 – 3.13 -0.80 – 1.76 1.205 0.23 – 4.24 -0.65 – 2.01 13 0.385 0.32 – 2.56 -0.82 – 1.59 0.382 0.30 – 3.41 -0.67 – 1.85 14 1.049 0.15 – 2.12 -0.30 – 1.07 1.636 0.14 – 3.32 -0.11 – 1.40 15 0.109 0.11 – 2.49 0.54 – 1.38 0.119 0.12 – 4.41 0.81 – 1.74 16 0.109 0.11 – 2.49 0.54 – 1.38 0.119 0.12 – 4.41 0.81 – 1.74 17 0.109 0.11 – 2.49 0.54 – 1.39 0.119 0.12 – 4.41 0.81 – 1.74
15

6 Exact evaluation of bias for simulated data There are at least three reasons why unconditional and conditional outfit may be biased: (i) the
probabilities (1) and (2) are poor approximations of exact probabilities, (ii) person parameter
estimates are inconsistent, and (iii) the error associated with person and item parameter estimates in
small sample studies. This section presents the results of a simulation study with sample sizes 50,
100, 200, 500, and 1000. In the latter of these, the error of the item parameter estimates should be
considerably reduced. We simulated responses to 21 items from a Rasch model where item
parameter values were equidistant ranging from -2.5 to +2.5 and person parameters came from
standard normal distribution. In order to investigate the effect of scale length and of the targeting of
items to the population, analyses were performed for nine subsets of items (cf. Table 6). The last
subset was added after analysis of the first eight subsets in order to best illustrate the conclusions.
Table 6 shows the expected value of total unconditional outfit statistics, MSR(u), for all sample sizes
and for the total conditional outfit statistics, MSR(u), for n= 50 and 1000. Conditional outfit statistics
are virtually unbiased, while unconditional outfit statistics are systematically biased with
E(MSR(u)|S,M) < 1. The only factor that appears to have a profound effect on the bias of the
unconditional outfit is the dispersion of the items. Item set 4, and in particular item set 8, are item
sets with highly dispersed item and a strong degree of bias. The analysis of item set 9 (added after
analysis of the first eight sets) underscore this finding. Compared to the effect of item dispersion,
the number of items has less of an effect. Targeting of items and sample size has virtually no effect
at all.
Item outfit statistics for selected items from Item Set 1 are shown in Table 7. The bias of the
unconditional outfit statistics is easily seen, as is the fact that conditional outfit statistics provide
close approximations of exact outfit statistics. Despite the bias of the unconditional outfit statistics,
there is virtually no difference between conditional and unconditional outfit statistics if exact p-
values are used. Finally, the asymptotic p-values of the conditional outfit statistics based on the
approximate normal distribution of the standardized outfit defined by formula (17) appear to
provide reasonable close to the exact p-values when sample sizes are moderate. In small sample
studies with n = 50 and 100, the asymptotic p-values are conservative.
16

Table 6. Item parameters and item sets together with MCMC estimates of expected total outfit statistics
Item no.
Item parameters
Item set 1
Item set 2
Item set 3
Item set 4
Item set 5
Item set 6
Item set 7
Item set 8
Item set 9
1 -2.50 + + + + + 2 -2.25 + + + + 3 -2.00 + + + + + + + 4 -1.75 + + + 5 -1.50 + + + + + 6 -1.25 + + + 7 -1.00 + + + + + + 8 -0.75 + + + 9 -0.50 + + + + + + 10 -0.25 + + + + 11 0.00 + + + + + + + 12 0.25 + + + 13 0.50 + + + + 14 0.75 + + 15 1.00 + + + + 16 1.25 + + 17 1.50 + + 18 1.75 + 19 2.00 + + + + 20 2.25 + + 21 2.50 + + +
Outfit statistics
n Expected outfit statistics
MSR(u) 50 0.945 0.968 0.958 0.863 0.934 0.973 0.967 0.757 0.599 100 0.946 0.965 0.952 0.881 0.953 0.946 0.967 0.776 0.659 200 0.948 0.959 0.965 0.889 0.964 0.935 0.976 0.804 0.614 500 0.949 0.963 0.965 0.891 0.971 0.933 0.979 0.784 0.613 1000 0.947 0.962 0.965 0.889 0.977 0.929 0.978 0.784 0.602
MSR(c) 50 1.004 1.001 1.002 1.002 1.000 0.999 1.000 1.003 0.999 1000 1.000 1.000 1.000 1.000 1.000 1.000 1.000 1.000 0.999
17

Table 7 Outfit statistics1 and 1-sided p-values2 for items 1, 6 and 11 in Item set 1.
Exact Conditional Unconditional n Item )e(
iMSR )c(iMSR pexact pasymptotic )u(
iMSR pexact
50 1 1.047 1.021 0.344 0.492 0.873 0.344 6 1.056 1.054 0.348 0.432 0.956 0.346 11 1.109 1.115 0.261 0.299 1.075 0.261
100 1 1.258 1.239 0.233 0.380 1.094 0.233 6 0.842 0.841 0.184 0.220 0.815 0.188 11 0.988 1.003 0.471 0.488 0.967 0.483
200 1 0.790 0.791 0.320 0.335 0.706 0.319 6 0.919 0.919 0.277 0.289 0.891 0.289 11 0.964 0.964 0.411 0.376 0.942 0.403
500 1 1.536 1.511 0.031 0.030 1.355 0.031 6 0.987 0.986 0.477 0.448 0.947 0.488 11 0.927 0.927 0.139 0.147 0.909 0.139
1000 1 1.102 1.097 0.211 0.285 0.993 0.213 6 0.984 0.985 0.440 0.426 0.942 0.448 11 1.018 1.019 0.336 0.357 0.990 0.337
1: Outfit statistics are defined in (14), (15) and (16). 2: Exact p-values are defined in (18) and (19). The asymptotic p values of the conditional outfit is defined by (17)
7 Discussion Unconditional response residuals are used in several widely used computer programs for evaluation
of item fit in the Rasch model. Items are flagged as potentially flawed if outfit statistics are either
larger than 1.5 or smaller than 0.6 and/or if they depart significantly from 1. Two recent
publications assessing fit of items to the Rasch model report nothing but outfit statistics and/or infit
statistics (Chen et. al. 2006; Conrad et. al. 2006). Both papers appear to disregard outfit and infit
statistics that are smaller than 1, thereby ignoring evidence that might suggest that a 2-parameter
IRT model might provide a better description of the data than the Rasch model.
The results of this paper suggest that unconditional outfit statistics are systematically biased with
expected outfit statistics smaller than 1. Outfit statistics will therefore both tend to overlook
misfitting items and indicate that perfect items are too good to be true because they have stronger
item discrimination than assumed by the Rasch model. Evaluation of significance based on the
18

19
assumption that the distribution of Wilson-Hilferty transformed outfit statistics can be approximated
by a standardized normal distribution is also shown to be erroneous. Based on these results, we
suspect many published results relying exclusively on out- and infits to be mistaken concerning the
fit of the Rasch model.
This paper points out that these problems can be avoided if inference is performed in the exact
frame of inference defined by the conditional distribution of item responses given both person
scores and item margins. According to Rasch (1960) this is the natural frame of inference for
analysis of fit of item responses to Rasch models. In this framework, it is possible to assess the
significance of unconditional, conditional and exact outfit statistics in a way that is not influenced
by the bias of the outfit statistics. Because of this bias, flagging items due to the size of
unconditional outfit statistics appears to be unwise and should be avoided, but conditional outfit
statistics are unbiased and may be used instead.
Weighted means of standardized residuals referred to as infit statistics are also used. These statistics
were also looked into during this study, yielding similar results. Unconditional infit statistics are
biased, and conditional infit statistics are unbiased. The Wilson-Hilferty transformation does not
work, because infit statistics are not approximately chi squared distributed, but significance may be
assessed in the exact frame of inference.
The significance of conditional outfit statistics may also be assessed in the conditional frame of
inference, using the transformation (15). The transformation is based on the central limit theorem
and should only be carefully applied. We did not use this transformation in the analysis of the Knox
Cube Test example where it would have been completely inappropriate due to the presence of score
groups with too few persons.
References Andersen, E. B. (1970). Asymptotic properties of conditional maximum likelihood estimators. Journal of the Royal Statistical Society B, 32, 283-301.

20
Andersen, E. B. (1980). Discrete Statistical Models with Social Science Applications. Amsterdam:
North-Holland.
Andrich, D., Lyne, A., Sheridan, B. & Luo, G. (2000). RUMM2010 Computer Program. Perth :
Rumm Laboratory Pty, Ltd.
Besag, J. & Clifford. P. (1989). Generalized Monte Carlo Significance Tests. Biometrika, 76, 633-
642
Chen, S-P. C., Bezrucko, N. and Ryan-Henry, S. (2006) Rasch Analysis of a New Construct:
Functional Caregiving for Adult Children with Intellectual Disabilities. Journal of
Applied Measurement, 7, 141-159
Conrad, K. J., Matters, M. D., Luchins, D. J., Hanrahan, P., Quasius, D. L. and Lutz, G. (2006).
Development of a Money Mismanagement Measure and Cross-Validation Due to
Suspected Range Restriction. Journal of Applied Measurement, 7, 206-224
Dimitrov, D. M. and Smith, R. M. (2006) Adjusted Rasch Person-Fit Statistics. Journal of Applied
measurement, 7, 170-183
Holst, C. (1994) Item response Theory. Copenhagen: The Danish national Institute for Educational
Research.
Linacre, J.M. and Wright, B. D. (2000) A user’s guide to WINSTEPS Chicago: MESA Press
Neyman, J. & Scott, E. L. (1948). Consistent estimates based on partially consistent observations.
Econometrika, vol.16, p. 1-32
Rasch, G. (1960). Probabilistic Models for Some Intelligence and Attainment Tests. Copenhagen:
Nielsen & Lydiche.
Smith, R. M. (1991). The Distribution Properties of Rasch Item Fit Statistics. Educational and

21
Psychological Measurement, 51, 541-565
Smith, R. M. (2004) Fit Analysis in latent Trait Measurement Models. In Smith, E.V and Smith,
R.M. (eds.) Introduction to Rasch measurement. Maple Grove, Minnesota: JAM
Press, 73 - 92
Wright, B. D. and Stone, M. H. (1979). Best Test Design. Chicago: MESA Press
Wilson, E. B. and Hilferty, M. M. (1931). The distribution of chi-square. Proceedings Of The
National Academy Of Sciences Of The United States Of America-Physical
Sciences, 17, 684-688
Wu, M., Adams, R. J. & Wilson, M. R. (1998). ACER Conquest: Generalised Item Response
Modelling Software. Australian Council for Educational Research.

Research Reports available from Department of Biostatistics http://www.pubhealth.ku.dk/bs/publikationer ________________________________________________________________________________ Department of Biostatistics University of Copenhagen Øster Farimagsgade 5 P.O. Box 2099 1014 Copenhagen K Denmark 06/1 Carstensen, B. Demography and epidemiology: Age-Period-Cohort models in the computer
age. 06/2 Carstensen, B. Demography and epidemiology: Practical use of the Lexis diagram in the
computer age or: who needs the Cox-model anyway? 06/3 Christensen, K.B., Andersen, P.K., Smith-Hansen, L., Nielsen, M.L., Kristensen, T.S.
Analyzing sickness absence using statistical models for survival data. 06/4 Christensen, K.B. & Kreiner, S. A Monte Carlo approach to unidimensionality testing in
polytomous Rasch models. 06/5 Keiding, N. Event history analysis and the cross-section. 06/6 Ditlevsen, S.D. & Lansky, P. Estimation of the input parameters in the Feller neuronal
model. 06/7 Kvist, K., Andersen, P.K. & Kessing, L.V. Repeated events and total time on test. 06/8 Ditlevsen, S.D. & Ditlevsen, O. Parameter estimation from observations of first-passage
times of the Ornstein-Uhlenbeck process and the Feller Process. 06/9 Budtz-Jørgensen, E. Estimation of the benchmark dose by structural equation models. 06/10 Christensen, K.B., Feveille, H., Kreiner, S. & Bjorner, J.B. Adjusting for mode of
administration effect in surveys using mailed questionnaire and telephone interview data. 06/11 Dalgaard, P. New R functions for multivariate analysis. 06/12 Picchini, U., Gaetano, A.D. & Ditlevsen, S. Parameter Estimation in Stochastic Differential
Mixed-Effects Models. 06/13 Kvist, K., Harhoff, M.G., Andersen, P.K. & Kessing, L.V. Non-parametric estimation and
model checking procedures for marginal gap time distributions for recurrent events. 07/1 Meira-Machado, L., de Uña-Álvarez, Cardarso-Suárez, C. & Andersen, P.K. Multi-state
models for the analysis of time to event data. 07/2 Kreiner, S. & Christensen, K.B. Exact evaluation of bias in Rasch model residuals.