Assessment of Architecture Design using Rasch Measurement Model
12
Transcript of Assessment of Architecture Design using Rasch Measurement Model


PeKA’12
Mengilham Harapan, Mencipta Masa Depan
Prosiding
Seminar Pendidikan Kejuruteraan dan Alam Bina 2012
Dianjurkan Oleh
Pusat Penyelidikan Pendidikan Kejuruteraan,
Fakulti Kejuruteraan dan Alam Bina
Universiti Kebangsaan Malaysia
Disunting Oleh
Siti Rozaimah Sheikh Abdullah
Adi Irfan Che Ani
Hafizah Husain
Siti Aminah Osman
Norngainy Mohd. Tawil
Nor Kamaliana Khamis
Zulkifli Mohd Nopiah
Afida Ayob
Nizaroyani Saibani
Roszilah Hamid
Mohd Shahbudin Mastar@Masdar
Noorhisham Tan Kofli
Nur Arzilah Ismail
FAKULTI KEJURUTERAAN DAN ALAM BINA
UNIVERSITI KEBANGSAAN MALAYSIA
BANGI 2012

Cetakan Pertama 2012
Hak cipta Fakulti Kejuruteraan dan Alam Bina
Universiti Kebangsaan Malaysia, 2012
Hak cipta terpelihara. Tiada bahagian daripada terbitan ini boleh diterbitkan semula,
disimpan untuk pengeluaran atau ditukarkan ke dalam sebarang bentuk atau dengan
sebarang alat juga pun, sama dengan cara elektronik, gambar serta rakaman dan
sebagainya tanpa kebenaran bertulis dari Fakulti Kejuruteraan dan Alam Bina,
Universiti Kebangsaan Malaysia
Diterbitkan di Malaysia oleh
FAKULTI KEJURUTERAAN DAN ALAM BINA
UNIVERSITI KEBANGSAAN MALAYSIA
43600 UKM Bangi, Selangor Darul Ehsan
Malaysia
Dicetak di Malaysia oleh
Penerbit UKM
Universiti Kebangsaan Malaysia
x
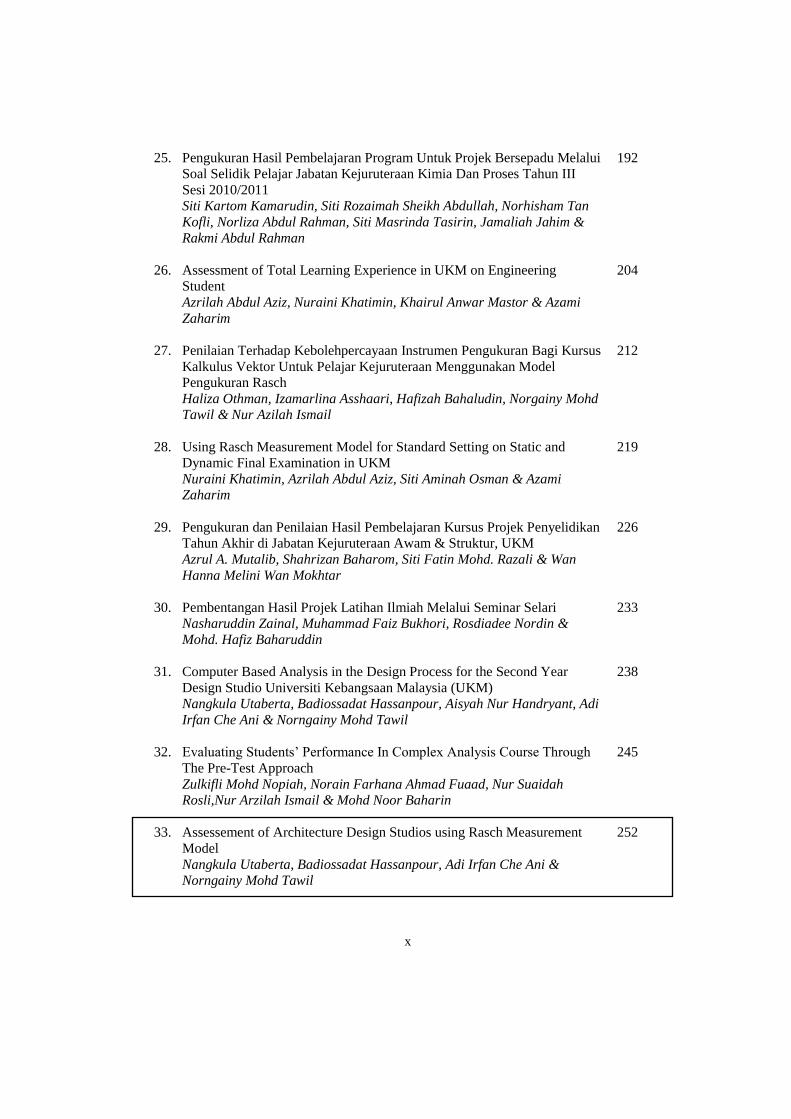
25. Pengukuran Hasil Pembelajaran Program Untuk Projek Bersepadu Melalui
Soal Selidik Pelajar Jabatan Kejuruteraan Kimia Dan Proses Tahun III
Sesi 2010/2011
Siti Kartom Kamarudin, Siti Rozaimah Sheikh Abdullah, Norhisham Tan
Kofli, Norliza Abdul Rahman, Siti Masrinda Tasirin, Jamaliah Jahim &
Rakmi Abdul Rahman
192
26. Assessment of Total Learning Experience in UKM on Engineering
Student
Azrilah Abdul Aziz, Nuraini Khatimin, Khairul Anwar Mastor & Azami
Zaharim
204
27. Penilaian Terhadap Kebolehpercayaan Instrumen Pengukuran Bagi Kursus
Kalkulus Vektor Untuk Pelajar Kejuruteraan Menggunakan Model
Pengukuran Rasch
Haliza Othman, Izamarlina Asshaari, Hafizah Bahaludin, Norgainy Mohd Tawil & Nur Azilah Ismail
212
28. Using Rasch Measurement Model for Standard Setting on Static and
Dynamic Final Examination in UKM
Nuraini Khatimin, Azrilah Abdul Aziz, Siti Aminah Osman & Azami Zaharim
219
29. Pengukuran dan Penilaian Hasil Pembelajaran Kursus Projek Penyelidikan
Tahun Akhir di Jabatan Kejuruteraan Awam & Struktur, UKM
Azrul A. Mutalib, Shahrizan Baharom, Siti Fatin Mohd. Razali & Wan
Hanna Melini Wan Mokhtar
226
30. Pembentangan Hasil Projek Latihan Ilmiah Melalui Seminar Selari
Nasharuddin Zainal, Muhammad Faiz Bukhori, Rosdiadee Nordin &
Mohd. Hafiz Baharuddin
233
31. Computer Based Analysis in the Design Process for the Second Year
Design Studio Universiti Kebangsaan Malaysia (UKM)
Nangkula Utaberta, Badiossadat Hassanpour, Aisyah Nur Handryant, Adi
Irfan Che Ani & Norngainy Mohd Tawil
238
32. Evaluating Students’ Performance In Complex Analysis Course Through
The Pre-Test Approach
Zulkifli Mohd Nopiah, Norain Farhana Ahmad Fuaad, Nur Suaidah Rosli,Nur Arzilah Ismail & Mohd Noor Baharin
245
33. Assessement of Architecture Design Studios using Rasch Measurement
Model
Nangkula Utaberta, Badiossadat Hassanpour, Adi Irfan Che Ani & Norngainy Mohd Tawil
252

Seminar Pendidikan Kejuruteraan dan Alam Bina 2012
Kongres Pengajaran & Pembelajaran
UKM2012 15 – 18 Disember 2012
http://www.ukm.my/kongres2012
252
Assessement of Architecture Design Studios using
Rasch Measurement Model
Nangkula Utabertaa, Badiossadat Hassanpour
b, Adi Irfan Che Ani
b
& Norngainy Mohd Tawilb
aArchitecture Department
Universiti Putra Malaysia
43400 UPM Serdang, Selangor, Malaysia bArchitecture Department
Faculty of Engineering & Built Environment
Universiti Kebangsaan Malaysia
43600, Bangi, Selangor, Malaysia
Abstract
Architecture as a multidisciplinary filed has a close relation with other fields like art and because of this nature, its education system is completely different with scientific majors. Students expose themselves to critique and evaluation in each session and in this way by gaining experience they try to upgrade their problem solving skills. Definitely such an education system needs different
evaluation and assessment model. Essentially different models and methods are currently implementing in universities and architecture departments all around the world with minimum variations. Unfortunately, despite of its considerable, minimum studies have been conducted and reported in literature. So in order to promote an open discussion and improve the assessment in architecture education, rasch measurement model and mini facet software have been used for the first time to assess the evaluation system at the current architecture studio. This research has been choosing Malaysia (as a model of developing multicultural country) for the study and select Universiti Kebangsaan Malaysia especially architecture department as case study. Keywords: architecture assessment; critique sessions; education; Rasch measurement model.
1. Introduction
There are different assessment methods and grading models that are designed and
implemented by pioneer universities in architecture education and followed by other
universities around the world. By gradually improving the definition of education and
assessment, these models have been upgraded and evaluated. One of the systems is
Nangkula Utaberta et al. / Prosiding - Seminar Pendidikan Kejuruteraan dan Alam Bina 2012
253
comparative method. In this appraisal model the student’s projects will be compared with
each other.
In fact jurors or the related tutors that are going to give marks in submission day,
judge the quality of projects holistically then they rank the projects. Grades follow in
descending form best project to worth one. Comparing students with each other is unfair,
because students are from different backgrounds and talents (Salama 2007). Students
deserve to be graded on the basis of the quality of their work alone, uncontaminated by
reference to how other students in the studio perform on the same or equivalent tasks, and
without regard to each student’s previous level of performance (Sadler 2005). In
comparative system, the holistically attitude to the projects judgment leads to neglect
student’s creativity and abilities in some contexts.
Students cannot be aware of their weak and strong points and by this way they cannot
do any effort to increase their marks and just lucky students who are skillful in graphic
design are able to impact jurors for better grades. On the other hand making pair-wise
comparisons just among small set of students submissions is possible but it will be very
difficult in large amount of projects and students.
In recent years, universities have made explicit overtures towards criteria-based
grading and reporting. Under these models, grades are required to evaluate student’s
achievement in fulfilling juror’s expectations. These expectations can be explain in
different form. We name these expectations as course objectives. The objectives are
assumed to provide the basis for the criteria, but exactly what the criteria are is in essence
left undefined (Sadler 2005).
These objectives should be known by instructors, students and especially external
jurors. Because invited jurors have their certain tendency and assumed objectives that
would be the base of their grading. This incoherency may lead to variant in given marks
by different instructors and students dissatisfaction. One of the implemented methods
under this way is grading system base on marking forms.
These grading criteria sheets (Montgomery 2002) typically do not map in any simple
way into course objectives. They are scoring rubrics which shows some tasks and their
marks portion. These tasks outline some of the knowledge and skills students ideally
should be able to exhibit by the end of the course. For instance, 3D model and executive
details, boards, oral presentation as tasks and 5 mark for each of them.
The given mark is based on the quality of presented documentation. This holistic
method cannot explain the expected details in each task and will leave the doors open to
enter the personal opinions and subjective decisions in evaluation. An underlying
difficulty is that the quality of performance in a course, judged holistically on the basis of
the quality of work submitted, may not be determinable well with the attainment of
course objectives.
Since the purpose of this study is evaluation of current appraisal model and
improvement of current framework to achieve better critique sessions and assessment
model, second year design studio students selected as critical stage in architecture
education for this study.
Therefore to demonstrate the proposed framework, we used Rasch measurement
model and Mini Facet Software to use the software’s prediction and estimation ability
besides evaluating the efficiency and quality of proposed and implemented model. The
main target of this research is to evaluate the implemented assessment and grading model

Nangkula Utaberta et al. / Prosiding - Seminar Pendidikan Kejuruteraan dan Alam Bina 2012
254
in Universiti Kebangsaan Malaysia and evaluate the efficiency and reliability of used
grading model.
2. Findings and Discussions
This research used assessment and grading sheet in second year design studio based on
the main framework and specification of criteria based assessment (Hassanpour, 2012). It
was designed based on the expected objectives of the course and each objective was
clearly defined and expanded by number of tasks. The rubrics of this evaluation sheet are
named as follows:
1. Critical Explanation
2. Logical Development
3. Proposal and recommendation
4. Oral and Graphic Presentation
On the other hand each of these tasks had different percentage mark based on the
importance of each and their priority to the objectives. Also the given marks were defined
into five different levels from fail, poor, average, good and excellent and their definition
to make the ranking as easy and fast as possible for the jurors.
To test this evaluation sheet, Rasch measurement model and mini facet software has
used.
Figure 1 shows Criteria measurement report. Item reliability is >0.7 given as 0.96 to
indicate that the items have a good spread of item difficulties to measure the design
progress of students’ project.
The difficulty level ranges from the maximum logit at 2.43 to the minimum logit (least
difficult) at -1.18logit with a standard deviation of (S.D.) 1.22.
Figure 1. Criteria Measurement Report

Nangkula Utaberta et al. / Prosiding - Seminar Pendidikan Kejuruteraan dan Alam Bina 2012
255
The item separation of 4.87, which can be round of to 5 is different levels of item
difficulty. The most difficult criteria is, M=Model, all the M items are located way above
the rest of the items, Highest at 2.43 logit and lowest at 2.16. Mean for M=7.02/3=2.34.
Where else, the oral and graphic presentation is mediocre, Mean for O= -1.37/3= -0.46
Design development is the easiest with the lowest mean value, Mean for D=-5.64/8=-0.71. Raw variance explained shown in figure 2, by measures is at 65.26%
higher than 40% gives an indication that the instrument is measuring one dimension (uni-
dimensionality) or in other words, measuring what is supposed to measure.
Figure 2. Measurable Data Summary.
To monitor tutors’ performance, statistical analysis has been done and the results are
revealed in figures 3 and 4. Figure 4 shows that teacher3 is the strictest assessor among
the other teachers since Teacher3 logit measure is at 3.17 logit.
And the next logit measure is only at 1.39 logit, a difference of 1.78 logit. Teacher4 is
the most lenient among them all with logit at 0.96 measures.
However further scrutiny reveals that Teacher4 has Z-Std or high negative residual.
Teacher4 under-rate easy criteria, and over-rate on difficult criteria.
Figure 3. Tutors’ Measurement Report
Nangkula Utaberta et al. / Prosiding - Seminar Pendidikan Kejuruteraan dan Alam Bina 2012
256
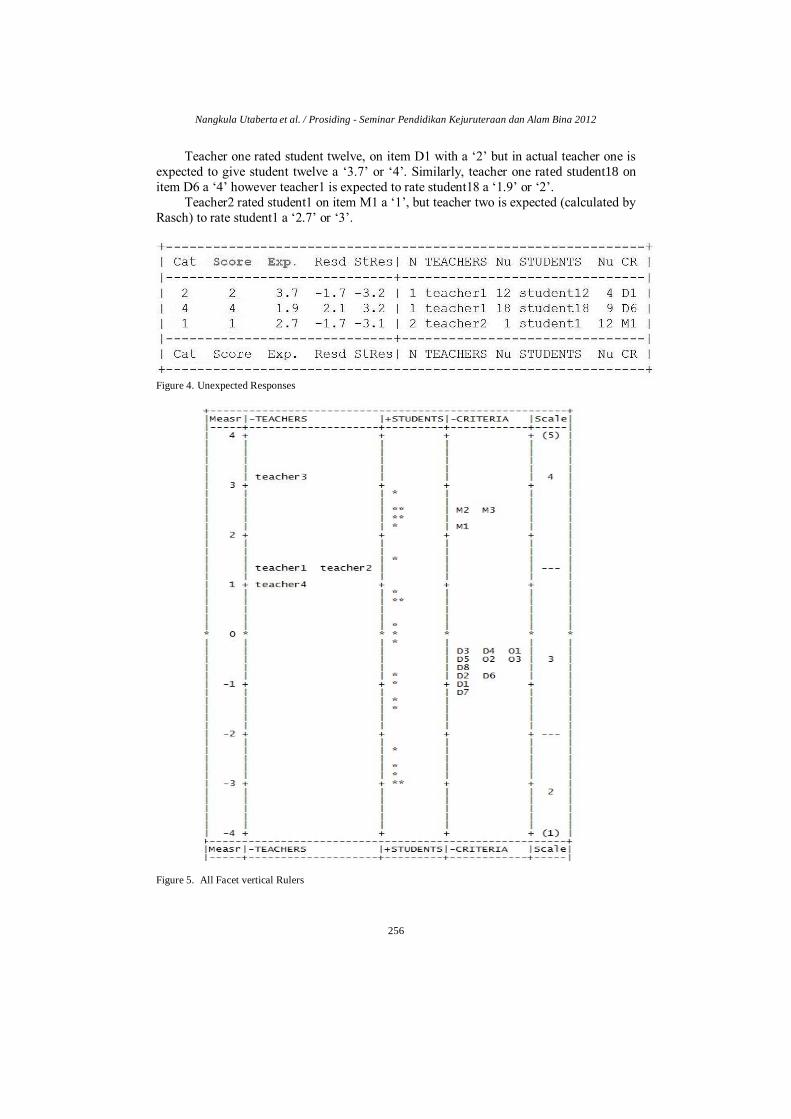
Teacher one rated student twelve, on item D1 with a ‘2’ but in actual teacher one is
expected to give student twelve a ‘3.7’ or ‘4’. Similarly, teacher one rated student18 on
item D6 a ‘4’ however teacher1 is expected to rate student18 a ‘1.9’ or ‘2’.
Teacher2 rated student1 on item M1 a ‘1’, but teacher two is expected (calculated by
Rasch) to rate student1 a ‘2.7’ or ‘3’.
Figure 4. Unexpected Responses
Figure 5. All Facet vertical Rulers

Nangkula Utaberta et al. / Prosiding - Seminar Pendidikan Kejuruteraan dan Alam Bina 2012
257
Figure 6. Probabilities of Grades
Figure 5 shows the results of all facet vertical rulers. The first column includes
measurement values which have calculated by the software. The next columns include
teachers, students, criteria and scales, respectively. Distributions of students in getting
marks in different criteria by different teachers are shown by the star icons.
It is observable that the measurement values of the teacher 1, teacher 2 and teacher 4
are close to each other while the measurement value of the teacher 3 is more than other
teachers.
Giving criteria in brief would have an important influence on the form of questioning,
but in tutors’ and jurors’ responses their first consideration was the strength and weakness
of the students’ design. The tutors and members of jury have their own preference and
priorities, and would tend to bias their questioning to accommodate these personal
interests.
Obtained data and analysis have shown that defined criteria for that specific sample
does fit properly and as Figure 6 reveals in any probabilty and any students’ measurement
all of marks could be in the range.
Based on this curve, we can expect that for even large sample of students and teachers
the criteria would work and easily we can predict or expect marks. In the tutor performance Rasch also confirms the concerns. As Figure 7 shows teacher
three with minimum experience and degree among other tutors has more unexpected
marks and teacher number two which was the studio master with degree and experience
has no unexpected marks and judgment.
Figure 7. Most Unexpected Responses

Nangkula Utaberta et al. / Prosiding - Seminar Pendidikan Kejuruteraan dan Alam Bina 2012
258
All these make the idea of tutor training, having more discussion session among
invited jurors before holding submission session and explain the jurors about the
objectives and expectations. Teacher4 under-rate easy criteria, and over-rate on difficult
criteria. Maybe the distance of tutors from practice world with ageing profile of untrained
instructors may cause the problem in evaluation and assessment process.
In proposed assessment model in this research the existence of objectives and different
portion of importance for each and informing this to students helped students to have
their best probability of mark for each task. Rasch also proved that each student obtained
his maximum rank of mark due to his effort and ability.
To make this understandable the average of three submission sessions which were held
on before the specific session which measured by Rasch were compared to the obtained
grade on the chosen session.
It is notable that in all three sessions the evaluation sheet were used but students were
not aware of details and also jurors used the evaluation sheet but the form of marking
were holistic, they just given the percentage for each of criteria-Based on obtained result
by Rasch which discussed in chapter four, student number 16 is the most performed
student and the least performed student is student 20.
The investigation as figure 8 reveals shows that student number four and number
twenty has maximum progress and student number 7 and 18 have regressed. But the
reason their regress seems to be lack of time for preparation in submission day. In their
evaluation sheet for instance jurors have mentioned that the unfinished 3D model or
absence of one or two elevations.
In most performed students group also we have some small progress, especially for
student number 12 and 16. In total, summations of progresses were more than regresses.
The summations of marks are the evidence of this claim. Summations of marks from
1204 unit go to 1261 unit. This means 4.73 percent progress. We chose 6 students. Six
because of the separation number given by Rasch and then would do the investigation on
the process of progress and the given marks in interim submissions.
Figure 8. Improvement of marks after using proposed model

Nangkula Utaberta et al. / Prosiding - Seminar Pendidikan Kejuruteraan dan Alam Bina 2012
259
3. Recommendations and Conclusion
The results from Rasch shown that criteria based assessment model and defined
criteria for course and assignment objectives worked well and was designed properly.
About tutor performance, Rasch shown that experience has an important role that can
affect the judgment. In summary, Rasch also confirmed the necessity of implementing
some recommendation like holding workshops for tutors, clarification in objectives and
criteria for teachers and students.
In fact, inviting part time teachers with practice base can help to have more effective
evaluation and assessment process but in the case they do not see their teaching as an
escape from the constraint of office life that d like to follow the strategic approach to
embedding in professional skills.
All these make the idea of tutor training, having more discussion session among
invited jurors before holding submission session and explain the jurors about the
objectives and expectations. In case of time, the most spent time goes to students’
presentation and giving comments which would be same in all architecture assessment
models. For grading time why there is no need for tutors to calculate the total mark or
transfer the chosen level of satisfaction between fail to excellent, this will decrease the
consuming time and leads to dedicate maximum time to measure the satisfaction level of
each task and criteria.
Rasch also can help to transfer qualitative evaluation like our case to accurate
interpretation of numbers. The results of this research imply that students are learning
from the tool of criticism in the design studio. The expectations are merely components
of a design studio, which allow for crit sessions to be an effective didactic situation.
References
Hassanpour, B., Utaberta, N. & Zaharim, A. (2012). Critical Analysis of Criteria-Based Assessment and
Grading in Architecture Education (Universiti Kebangsaan Malaysia as Case Study). Research Journal of
Applied Sciences, Engineering and Technology 4(14), 2046-2054.
Salama, A.M., & Wilkinson, N. (2007). Design Studio Pedagogy: Horizons for the Future. In A. M. Salama and
N. Wilkinson (Eds.). Gateshead, United Kingdom.: The Urban International Press.
Sadler, D.R , (2005). Interpretations of criteria-based assessment and grading in higher education. Assessment
and education in higher education 30(2), 175-193.
Masodi, S. & Gulman. (2008). Application of Rasch-based ESPEGS model in measuring generic skills of
engineering students. WSEAS TRANSACTIONS on Advances in Engineering Education 8(5), 591-602.
Sadler, D.R , 2005. Interpretations of criteria-based assessment and grading in higher education. Assessment and
education in higher education 30(2), 175-193.
Sudin, W.P. (2003). Architecture education in Malaysia: an historical overview. Architecture forum. Kuala
Lumpur. Malaysia.
.