
A CONCEPTUALISATION OF SUPPLY CHAIN ... - e-space
302
A CONCEPTUALISATION OF SUPPLY CHAIN EFFECTIVENESS Scott F Bambrick PhD Thesis 2016
-
Upload
khangminh22 -
Category
Documents
-
view
0 -
download
0
Transcript of A CONCEPTUALISATION OF SUPPLY CHAIN ... - e-space
A CONCEPTUALISATION OF
SUPPLY CHAIN EFFECTIVENESS
Scott F Bambrick
PhD Thesis
2016

A conceptualisation of supply chain
effectiveness
Scott Francis Bambrick
A thesis submitted in partial fulfilment of the requirements of the
Manchester Metropolitan University for the degree Doctor of Philosophy
Department of Marketing, Operations and Digital Business
2016

Abstract
With globalisation leading to increased competition within their markets, businesses
face new challenges. One of these is the management and subsequent efficiency of
their supply chains. Through carefully considered and implemented supply chain
management, businesses can attain a competitive advantage over their competitors.
However, there is evidence to suggest that in practice, success factors attributed to
efficiency of supply chains are not being addressed. This is of concern, as more
businesses are now competing supply chain vs supply chain rather than directly as
business vs business. This study investigates the success factors related to the
management of successful supply chains.
The research methodology of this study utilised a quantitative survey instrument
informed by qualitative information. It encapsulates structured themes within a
conceptual framework and encompasses the associated critical success factors of
each theme. Responses from 307 supply chain decision makers, have enabled both
exploratory and confirmatory factor analysis to take place.
Through an exploratory factor analysis (EFA) the findings firstly identified 48 variables
as critical factors directly attributed to supply chain efficiency. A confirmatory factor
analysis offered the plausibility of a model fit of a 7V conceptual framework when
addressing supply chain efficiency. The research contributes to the relatively new field
research area of supply chain management and specifically critical success factors. It
develops a conceptual framework that can assist organisations when planning and
managing their supply chains. In doing so it also identifies critical success factors that
if managed can improve supply chain efficiency and assist organisations in attaining a
competitive advantage.

Declaration
No portion of the work referred to in this thesis has been submitted in support of an
application for another degree or qualification at this or any other university or institute
of learning.
Signed
Scott Francis Bambrick
Date

Acknowledgements
I would firstly like to thank my Director of Studies Professor Anthony Hines who started
me on this journey and saw it through with me to its conclusion. His guidance and
advice over the past 6 years has proven to be invaluable on countless occasions. Next,
I would like to acknowledge the rest of my supervisory team by thanking Professor
Gillian Wright for her hard work and dedication. She has on many occasions gone
above and beyond what would normally be expected, she along with Prof Hines have
helped develop me as an academic and I have learnt so much from them both. I would
also like to thank Dr Sai Nudurupati who has helped immensely when I struggled to
see a light at the end of the tunnel.
I would also like to thank my friends, family and especially my loving wife Joanne who
has been and continues to be my rock. Finally, I would like to dedicate this thesis to
my late grandfather Francis Bambrick.

5 | P a g e
Table of Contents
Abstract .......................................................................................................................................... ii
Declaration .................................................................................................................................... iii
Acknowledgements ....................................................................................................................... iv
Table of Contents ........................................................................................................................... 5
List of Figures ................................................................................................................................. 8
List of Tables .................................................................................................................................. 9
Chapter 1 – Introduction ............................................................................................................ 11
1.1 Background of the research ......................................................................................... 11
1.1.1 Drivers for Research ............................................................................................ 13
1.2 Knowledge gap ............................................................................................................ 17
1.3 Contribution to knowledge ............................................................................................ 19
1.4 Research aim and objectives ....................................................................................... 20
1.5 Structure of the thesis .................................................................................................. 24
Chapter 2 – Review of supply chain literature .......................................................................... 26
2.1 Literature study............................................................................................................. 26
2.2 Definition and Challenges ............................................................................................ 30
2.3 Contextualising the 7V Framework .............................................................................. 34
2.3.1 Value .................................................................................................................... 35
2.3.2 Volume-Volatility................................................................................................... 40
2.3.3 Velocity ................................................................................................................. 45
2.3.4 Variability .............................................................................................................. 48
2.3.5 Variety .................................................................................................................. 52
2.3.6 Visibility ................................................................................................................ 58
2.3.7 Virtuality ................................................................................................................ 62
2.3.8 In Conclusion – Contextualisation of themes ....................................................... 66
2.4 Existing relationships - 7V Themes .............................................................................. 67
2.4.1 In Conclusion ........................................................................................................ 73
2.5 Contextualising CSFs within SCM ............................................................................... 74
2.5.1 CSFs associated to Value .................................................................................... 75
2.5.2 CSFs associated to Volume-Volatility .................................................................. 79

6 | P a g e
2.5.3 CSFs associated to Velocity ................................................................................ 82
2.5.4 CSFs associated to Variety .................................................................................. 84
2.5.5 CSFs associated to Variability ............................................................................. 87
2.5.6 CSFs associated to Visibility ................................................................................ 89
2.5.7 CSFs associated to Virtuality ............................................................................... 92
2.5.8 In Conclusion – CSFs .......................................................................................... 94
2.6 Summary of Literature .................................................................................................. 97
Chapter 3 Methodology and Method ......................................................................................... 99
3.1 Methodology ................................................................................................................. 99
3.2 Discussion surrounding epistemology ......................................................................... 99
3.3 Method ....................................................................................................................... 105
3.3.1 Phase 1 – Qualitative data collection ................................................................. 107
3.3.2 Phase 2 – Quantitative research – Data Collection ........................................... 111
3.3.3 Phase 3 - Data Collection and Analysis ............................................................. 125
3.4 Reliability and validity of the research design ............................................................ 134
3.5 Summary .................................................................................................................... 137
Chapter 4 Findings ..................................................................................................................... 139
4.1 Exploratory Factor Analysis ....................................................................................... 139
4.1.1 In Conclusion - EFA and Descriptive statistics .................................................. 156
4.2 Confirmatory Factor Analysis ..................................................................................... 158
4.2.1 In Conclusion - Confirmatory Factor Analysis .................................................... 162
4.3 Summary .................................................................................................................... 162
Chapter 5 - Discussion ............................................................................................................... 163
5.1 Objective 1: Identification of CSFs influencing Supply Chains .................................. 163
5.2 Objective 2: Analyse findings confirming or disconfirming CSFs ............................... 165
5.3 Objective 3: Development of the 7V conceptual framework incorporating CSFs ...... 176
5.4 Objective 4: Reconceptualise effective SCS on the evidence from the study ........... 185
5.5 Objective 5: Evaluate implications for supply chain strategy practice ....................... 191
Chapter 6 Conclusions ............................................................................................................ 198
6.1 Contributions to Theory .............................................................................................. 199
6.1.1 Confirmation of CSFs ......................................................................................... 200
6.1.2 Validation of 7V Conceptual Framework ............................................................ 207
7 | P a g e
6.2 Contribution to Practice .............................................................................................. 207
6.3 Limitations .................................................................................................................. 208
6.4 Further Research ....................................................................................................... 210
6.5 In Conclusion.............................................................................................................. 211
6.6 Personal Reflection .................................................................................................... 212
6.6.1 Reflecting on the trigger ..................................................................................... 212
6.6.2 Reflections of the research process ................................................................... 213
References ................................................................................................................................. 215
Appendix .................................................................................................................................... 243
Appendix A: Example cover letter and questionnaire ............................................................ 244
Appendix B: Descriptive statistics........................................................................................... 254
Appendix C: Model 2 Confirmatory Factor Analysis AMOS ....................................................... 242
Appendix D: Population Sample break down ……………………………………………………252
Appendix E: SPSS Outputs Initial Exploratory Factor Analysis ……………………………….254
Appendix F: SPSS Output final Exploratory Factor Analysis ………………………………….270
Appendix G: Model 1 Confirmatory Factor Analysis AMOS ……………………………………277
8 | P a g e
List of Figures
Figure 1.1: Lamberts Model ……………………………………………………………………………21
Figure 2.1: The lead-time gap ..................................................................................................... 41
Figure 2.4: Traditional supply chain model ................................................................................. 69
Figure 2.5: Suggested relationship between Variety, Volume, Variability and Virtuality ............ 73
Figure 2.6: Over specification of product ................................................................................... 76
Figure 3.1: Engaged Scholarship Diamond Model ................................................................... 108
Figure 3.2: Research design decision route ............................................................................. 112
Figure: 3.3: Extract from questionnaire – questions related to Volume .................................... 116
Figure 3.4: Sampling framework ............................................................................................... 120
Figure 4.1: Scree plot ................................................................................................................ 140
Figure 4.2: Confirmatory factor analysis - model 2 ................................................................... 161
Figure 5.1: Implementing the 7V Framework in a Supply Chain Process ................................ 186
Figure 5.2: Implementing the 7V Framework onto a Dairy Supply Chain ................................. 192
Figure 5.3: Implementing the 7V Framework onto a Car Manufacturing Supply Chain ........... 195
9 | P a g e
List of Tables
Table 2.0: Phases of literature search ………………………………………………………............25
Table 2.1: The 7Vs themes - Definitions, Concepts and Business Challenges ……………...….34
Table 2.2: Evidence of discussion – Value …………………………………………………………..39
Table 2.3: Evidence of discussion – Volume Volatility ................................................................ 44
Table 2.4: Evidence of discussion - Velocity............................................................................... 47
Table 2.5: Evidence of discussion - Variability............................................................................ 51
Table 2.6: Evidence of discussion - Variety ................................................................................ 57
Table 2.7: Evidence of discussion - Visibility .............................................................................. 61
Table 2.8: Evidence of discussion - Virtuality ............................................................................. 65
Table 2.9: Evidence of relationships between themes ……………………………………………..68
Table 2.10: CSFs associated to the theme Value....................................................................... 78
Table 2.11: CSFs associated to the theme Volume-Volatility ..................................................... 81
Table 2.12: CSFs associated to the theme Velocity ................................................................... 84
Table 2.13: CSFs associated to the theme Variety .................................................................... 86
Table 2.14: CSFs associated to the theme Variability ................................................................ 88
Table 2.15: CSFs associated to the theme Visibility ................................................................... 91
Table 2.16: CSFs associated to the theme Virtuality .................................................................. 94
Table 2.17: Literature Breakdown identifying CSFs ................................................................... 95
Table 2.18: Total CSFs associated to the 7V themes ................................................................ 97
Table 3.1: The four phases of the research ………………………………………………………..106
Table 3.2: CSFs post round table discussions.......................................................................... 110
Table 3.3: Extract from code book related to the theme Volume ………………………………..115
Table 3.4: Organisational title and breakdown of sample targeted........................................... 122
Table 3.5: Advantages and disadvantages of postal survey design ......................................... 124
Table 4.1: Factor Analysis - Rotated component matrix ………………………………………….141
Table 4.2: Component 1-analysis findings …………………………………………………………144
Table 4.3: Component 2-analysis findings ................................................................................ 146
Table 4.4: Component 3 - analysis findings .............................................................................. 148
Table 4.5: Component 4 - analysis findings .............................................................................. 150
Table 4.6: Component 5 - analysis findings .............................................................................. 152
10 | P a g e
Table 4.7: Component 6 - analysis findings .............................................................................. 154
Table 4.8: Component 7 - analysis findings .............................................................................. 155
Table 4.9: Breakdown of CSFS pre and post exploratory factor analysis ................................ 156
Table 4.10: Confirmatory factor analysis - 3 model fit results ................................................... 158
Table 5.1: Confirmed CSFs associated to visibility ................................................................... 165
Table 5.2: Confirmed CSFs associated with Virtuality .............................................................. 167
Table 5.3: Confirmed CSFs associated with Variability ............................................................ 169
Table 5.4: Confirmed CSFs associated with Value .................................................................. 171
Table 5.5: Confirmed CSFs associated to Variety .................................................................... 173
Table 5.6: Confirmed CSFs associated to Velocity .................................................................. 174
Table 5.7: Confirmed CSFs associated to Volume ................................................................... 175
Table 5.8 7V Framework ........................................................................................................... 178
Table 5.9: Extract from 7V Framework ..................................................................................... 190
11 | P a g e
Chapter 1 – Introduction
It is the purpose of this chapter to offer an overall understanding of the thesis.
Firstly, it will give the context and background of the research area. Secondly, the
chapter will highlight the knowledge gap that the research will address. Thirdly,
the contribution to knowledge the thesis will offer will be discussed. Fourthly, the
chapter will explore the aims and objectives of the research. Fifthly and finally,
the structure of the thesis will be explained to assist the reader.
1.1 Background of the research
Supply chain management (SCM) is viewed within practice and academic
domains as an emergent field (Burgess, Singh et al. 2006). In both instances, it
is yet to fully mature. It is suggested that in order for either to progress, both
domains will need to be intrinsically linked to each other (Storey, Edberson et al.
2006). The conceptualisation of the term supply chain management was first
phrased in the early 1980s (Oliver 1982). Throughout the 1990s SCM research
and practice became more prominent. In part this was due to the increased
globalisation of markets that organisations were operating within (Li and Liu 2006,
Thoo, Huam et al. 2011). An underlying issue with SCM research is the narrow
functional areas from which it draws its knowledge. Although a broader
organisational perspective has been sought, SCM research is in the main eclectic
with little in the way of consensus in relation to its conceptualisation (Burgess,
Singh et al. 2006). There is a clear need for organisations undertaking supply
chain initiatives to develop core competencies and be aware of what and where
things can go wrong. The proper management of supply chains when issues arise
helps to lower costs and in turn make organisations more competitive (Rao,
Phillips et al. 2006).
12 | P a g e
Globalisation of markets, increased competition, increased emphasis on
customer needs and the seeking of competitive advantage are all seen as
prominent in the increased interest in supply chain management (Gunasekaran,
Patel et al. 2001, Webster, Sugdern et al. 2004, Shepherd and Gunter 2006).
Therefore, organisations should look to improve efficiency where it is possible to
do so. Efficiency in supply chains has always had its place. History has shown
the importance of supply chains in relation to successful delivery of organisational
objectives and in turn achieving a competitive advantage over ones rivals (Chen,
Lin et al. 2006). Supply chains are key to organisational profit and success and
are continually dealing with logistical problems related to goods and services
(Power 2005). These problems, are noted as among the most complex
operational issues that supply chain managers need to address (Aykagan 2014).
The well-planned and strategically managed supply chain, will lead to improved
performance in relation to controlling demand. Additionally this could also assist
in ensuring a consistency when it comes to quality products and services (Rao,
Phillips et al. 2006).
Historically, focus from organisations was inward as they addressed issues
surrounding procurement of supplies, management of their inventories and
subsequent deliveries to their customers (Hines 2013). This operational
perspective was considered inadequate and more focus began to be given to the
externalities associated to managing supplies, such as external suppliers and in
turn their suppliers and so on (Christopher 1992).
Although, this study starts with the premise that all organisations have supply
chains of sorts. It is also acknowledged that supply chains have many tiers of
suppliers and relationships between suppliers and customers can at times
overlap and lack clarity.
13 | P a g e
1.1.1 Drivers for Research
Current Practice
Issues arise in the management of supply chains, such as transportation which,
within the literature is focused upon physical logistics, others include
communication; tariffs and planning (Christopher 2011). In the context of the
current business environment, one may ask why the management of supply
chains is so important. In the first instance, it is the increased level of customer
choice; failure of a supplier to deliver could lead to the customer looking
elsewhere for either a similar or substitute product.
Secondly, focus should be given to an organisation’s internal balance sheet, for
example, a common occurrence is that 50 per cent of a retailers total value of
assets is located within its inventories (Hines 2013). The key point here is that
keeping inventories as low as possible should improve upon cash flow.
Thirdly looking at the external environment, in 2013 the world investment report
stated “60 per cent of global trade, which today amounts to more than $20 trillion,
consists of trade in intermediate goods and services that are incorporated at
various stages in the production process of goods and services for final
consumption" (Taylor 2013). This point is not lost on organisational strategic
decision makers. A recent survey of 400 retail CEOs highlighted that over 50 per
cent believed that supply chains can be the difference between success and
failure. Interestingly, in the same survey 87 per cent highlighted that their own
supply chains were not at optimal levels of efficiency (Reporter 2014). Seminal
research continues to highlight that successful implementation of SCM is key to
an organisations competing in a global market place (Gonzalez-Loureiri, Dabic et
al. 2014).
14 | P a g e
Existing SCM Discussions
SCM theoretical boundaries are not always clearly delineated (Tan, Lyman et al.
2002). There are also suggestions that in practice there are generic issues arising
around the implementation and management of supply chains (Power 2005). To
address such issues organisations are bestowing more decision-making authority
onto their supply chain executives in an attempt to increase efficiency and gain
competitive advantage (Douglas 2011). This increased authority has supply chain
decision makers managing processes from the initial design, through to the raw
material and eventually delivering to the end user. However, even with this
management focus on supply chain processes there continues to be issues in
practice surrounding efficiency. Hines (2004) suggests that the implementation
of supply chain strategies can be assisted through careful consideration of
success factors that in turn, can assist in attaining the efficiency organisations
seek.
In practice, organisations are going to great lengths to ensure that their supply
chains are as efficient as possible (Hines 2004, Rao, Phillips et al. 2006). For
example, Apple has its own distinctive supply chain model which is structured to
allow maximum control of product design and production. By investing in the
manufacturing of key component parts, they have sought to strengthen control
over their supply chains by controlling every part possible. To increase efficiency,
they have actively recruited supply chain managers who they believe will speed
up operations in key areas (Williams 2014). However, a discussion has arisen
that Apple is over controlling and this is starting to affect levels of flexibility within
their supply chain. Improvements to competitors supply chains and increased
flexibility is enabling them to bring their products to market quicker (Williams
2014).
15 | P a g e
Due to the increase in globalisation organisations need to be better equipped to
deal with issues surrounding the management and expansion of their supply
chains (Lambert and Cooper 2000, Li and Liu 2006). With these changes, new
challenges to businesses will continue to occur in relation to their supply chains
(Power 2005, Christopher 2011). This means that they need to establish delivery
systems that add value and in turn are more responsive to constantly changing
demands placed upon them from their markets (Christopher 2011). To offer more
effective responsiveness and efficiency, organisations need no longer act as
stand-alone separate entities but rather as part of a larger integrated supply chain
(Lambert and Cooper 2000, Chen and Paulraj 2004). Integration and cooperation
between supply chain members is not a new idea and was previously highlighted
by Cooper and Ellram (1993) as being key to success. More recently Chen, Lin
et al. (2006) suggested that firms within supply chains should stop seeking to be
single autonomous units and come together with a view to helping each other to
improve the overall competitiveness. Historically, rather than collaboration to gain
a competitive advantage, organisations would instead rely upon aggressive
selling of strong brand products and the utilisation of large advertising budgets.
Over time, in order for organisations to compete they have looked inward to their
own capabilities and competences (Lambert and Cooper 2000, Hines 2004, Li
and Liu 2006). Primarily organisations need to address and improve their core
processes. These core processes are that of product and supplier development;
order fulfilment and customer management (Christopher 2011).
Another suggestion, that their supply chains need to be more agile and structured
in a manner that they can be both proactive and reactive to changes in demand
(Gattorna 2010). It is important to note that in today’s product based markets, life
cycles are shortening. In turn, this leads to customers demanding just-in-time

16 | P a g e
supply attitudes, as clearly buyers are becoming increasingly more demanding.
With increased pressure on delivery of products, it is fundamental that
organisations have the ability to identify issues within their supply chain to ensure
demand is met (Hines 2004). This assists in a competitive advantage being
maintained and/or profit being achieved. Christopher (2011) suggests that there
is a fine line between profit and loss for an individual product, the extent of which
is related to how a supply chain is optimised. In essence, if the costs involved in
production are high, then for a company to achieve a competitive advantage they
must continually develop and manage their supply chains. Further to this, they
must do so in a manner that minimises disruption and offers maximum efficiency.
The research contained in this thesis is concerned with the development and
management of supply chains, specifically factors that affect the successful
management of supply chains. This research focussed on the critical success
factors (CSFs) associated with the management of supply chains. It sought to
add clarity to a research area that does not take a holistic view of all supply chains
and critical factors associated to them. This research investigated the
conceptualization offered up by Hines (2004) 7V framework. This framework
identified seven themes: value, volume, velocity, variety, variability, visibility and
virtuality. The understanding and management of these themes could be critical
to the efficiency of supply chains.
The ability of organisations to successfully manage their supply chains is crucial.
However, in order for this to happen organisations must be in a position to fully
understand the critical factors that need to be addressed to ensure delivery of
their product/service through their respective supply chains (Power, Sohal et al.
2001). By focusing on the themes associated to the 7V Framework, this study
17 | P a g e
attempted to identify the CSFs attributed to each of them in order to gain a greater
understanding of them from both a theoretical and operational perspective.
1.2 Knowledge gap
Two clear knowledge gaps have been identified, which will be addressed
throughout this research. Firstly, there is acknowledgement that businesses face
challenges in developing their supply chain strategy in a manner that will continue
to give them competitive advantages (Hines 2004, Power 2005, Fawcett, Magnan
et al. 2008). The importance of supply chains to organisations is clearly
highlighted in the literature, especially in helping them to gain a competitive
advantage (Ayers 1999, Fawcett, Magnan et al. 2008). This means the efficient
manner in which organisations plan a supply chain in conjunction with the speed
that they implement changes has never been more critical. This planning and
subsequent management must be responsive to the customer’s needs,
especially in the changing face of business environments (Hines 2004). It is not
only of interest to supply chain scholars to know how, when and why supply
chains fail but also practitioners who have to manage the daily tasks associated
with them (Fawcett, Magnan et al. 2008).
There is a surge of interest in SCM research, in part this is due to the savings
that can be made through efficiency (Shepherd and Gunter 2006). It is also noted
that research in this area is still developing (Wang, Huang et al. 2004). As the
area is still developing, there are few models that focus on the critical factors that
need addressed when planning and managing supply chains. Although
conceptualizations have moved from integration and synthesis of earlier
informing disciplines towards a strategic systems view, limited frameworks are
apparent (Gunasekaran, Patel et al. 2003).
18 | P a g e
Evidence would suggest there is no framework which brings together the
extended seven themed areas, suggested by Hines (2004) as being key to the
strategic delivery of supply chains.
An additional gap leading on from the above mentioned leads on from the first.
Although, SCM literature relating to CSFs has increased in recent years. It still
falls short of offering a framework to address potential CSFs with supply chains.
At present, research into the identification of CSFs within supply chains is more
prominent than at any time previously, as researchers and practitioners examine
ways to better understand them. However, current research is focusing on
specific operational and organisational areas. These include Humanitarian Aid
(Pettit and Beresford 2009); Sustainable foods (Grimm, Hofstetter et al. 2014);
National Health Service (Cullen and Taylor 2009); Enterprise implementation
(Koh, Gunasekaran et al. 2011); Sustainable supply chains (Kim and Rhee 2011,
Wittstruck and Teuteberg 2012, Jabbour, Neto et al. 2015); Manufacturing
(Routroy and Pradhan 2011, Thoo, Huam et al. 2011, Patil and Kany 2014);
Fashion and Clothing (Thomassey 2010, Castelli and Sianesi 2015).
Unfortunately, with such eclectic research into CSFs there is a lack of
generalisability within the area. Very few researchers have taken a holistic view
of supply chains when identifying CSFs. This offers an opportunity for new
research. The research in this thesis intentionally takes a more holistic view of
supply chains. It develops a framework that can be utilised in differing types of
supply chains and offers a clear contribution to knowledge in this area as will be
discussed in the following section.
19 | P a g e
1.3 Contribution to knowledge
This research contributes to the existing knowledge in the field of SCM in relation
to theory and empirical research. It also has a clear potential contribution to
practice as well as to the knowledge of this discipline. Firstly, in relation to theory
this study contributes to the understanding of the individual themes located within
the 7Vs conceptual framework. In addition, the research develops the framework
through the findings of its empirical research. It is the understanding of the
themes and the identification of the CSFs associated to them that is the second
contribution to theory.
The CSFs attributed to the developed framework, could assist operational
decision-making in the field of practice. This study supports offers evidence that
themes within the 7V framework have potential relationships, as previously
highlighted in the extant literature. Prior to this research the main focus of these
relationships were discussed as single relationships such as virtuality and
visibility (Lancioni, Smith et al. 2003) or in smaller clusters such as variety,
volume and variability when discussing Agile type supply chains (Christopher
2011). At most, themes are grouped into four themes such as variety, virtuality,
variability and volume (Christopher 2000, Reichart and Holweg 2007). The
current study offers a plausible model that validates seven themes that can be
brought together. Up until this point no research identified within the literature,
brings together all of the 7V themes within Hines (2004) 7V conceptual
framework. Therefore, a further contribution offered is in the development the 7Vs
conceptual framework. In turn, the framework will include CSFs associated to the
successful delivery of supply chains. These contributions in their entirety offer a
contribution to practice, in that SCM decision makers will be able to utilise the
framework to better plan and manage their supply.

20 | P a g e
1.4 Research aim and objectives
There is not any evidence within the literature of frameworks that have been
utilised to identify and bracket factors critical to the effective delivery of supply
chains. It is believed that it would be possible to utilise Hines (2004) 7V
Conceptual Framework in the identification and managing of critical factors that
are suggested will make supply chains more effective.
The more efficiency of supply chains will contribute to their effectiveness at
gaining organisations a competitive advantage. There is clear evidence that
organisations see a competitive advantage being gained through the improved
operational effectiveness of their supply chains (Lambert and Cooper 2000,
Power 2005, Li and Liu 2006, Patnayakuni, Ral et al. 2006, Sengupta, Heiser et
al. 2006). Discussions surrounding supply chain management quite often brings
the terms ‘efficiency of supply chains’ and ‘effectiveness of supply chains’
together, when highlighting factors that focus on supply chain operations. In order
for a supply chain to be as effective in it delivery, it must in turn be efficient in its
processes.
The aim of this study is to gain a greater understanding of key factors related to
the effective delivery of supply chains through the development of the 7V
Conceptual Framework.
From this overall aim, five research objectives emerge, which are:-
1. Identify critical success factors (CSFs) influencing supply chain
effectiveness.
2. Analyse findings from the empirical study with a view to confirming
or disconfirming CSFs.
3. Incorporate CSFs into the 7V conceptual framework
21 | P a g e
4. Reconceptualise how supply chains can be more effective on the
evidence from the study.
5. Evaluate implications for supply chain practice.
Other models were considered in relation to the research objectives of this study.
The first of which was the Supply Chain Operations Reference Model (SCOR).
Developed by the Supply Chain Council, this cross-industry framework assists
organisations in better understanding both the performance of and areas to
improve within their supply chains (Harrison and Hoek, 2011). It is utilised by
organisations worldwide and can describe both simple and complex supply
chains by using what is noted as common sets of definitions. The current iteration
of the SCOR model has six overlapping management processes of ‘Plan, Source,
Make, Deliver, Return and Enable’ (APICS, 2016). According to the Supply Chain
Council, the SCOR Model covers aspects from customer interaction, physical
material transaction and market interactions. Focusing on three process levels
(Harrison and Hoek, 2011), the model offers support to various supply chains
across many industries (APIC, 2016). Although the SCOR Model does support
areas such as, information management, forecasting and risk amongst other
practices, it does not include the operational themes or business challenges
highlighted within the 7V Conceptual Framework.
Through the implementation of the SCOR model process, consideration is given
to a wide range of factors. However, factors critical to their success are not offered
in any real depth. Although risk is discussed under the ‘Enable’ management
process, it does not give direction on what risks should be considered in relation
to what supply chain operation is being assessed. From a theoretical perspective,
assumptions are made through the implementation of the SCOR model. This
22 | P a g e
leads to questions being raised and gaps identified that the objectives of this
research seeks to fill specifically around the area of Critical Success Factors.
For example, issues such as Information Technology (Virtuality) within the supply
chain. In relation to supplier’s capabilities, what are they? Do the downstream
suppliers have the same level of IT capabilities as upstream suppliers, thus
allowing for visibility throughout the supply chain, reducing blockages and in turn
allowing the supply chain to be managed and coordinated effectively?
Furthermore, what are the critical factors that need to be addressed when
considering issues related to IT? SCOR does not offer clarity around such
operational issues.
If the aim and objectives of this study are met, the 7V Conceptual Framework
could contribute knowledge and complement the SCOR model in its management
process of ‘Enable’, specifically when it focuses on the ‘Manages Supply Chain
Risk’ section. This would be possible, if risk identification was to take into
consideration the themed areas of the conceptual framework and the CSFs
associated to them.
Another model to be considered in relation to the aims and objectives of this
research is Lamberts (1998). This model focuses on ‘Customer and Supplier
Relationship Management’ and aims to improve upon cross-functional integration
of suppliers within any particular supply chain as shown in figure 1.1.
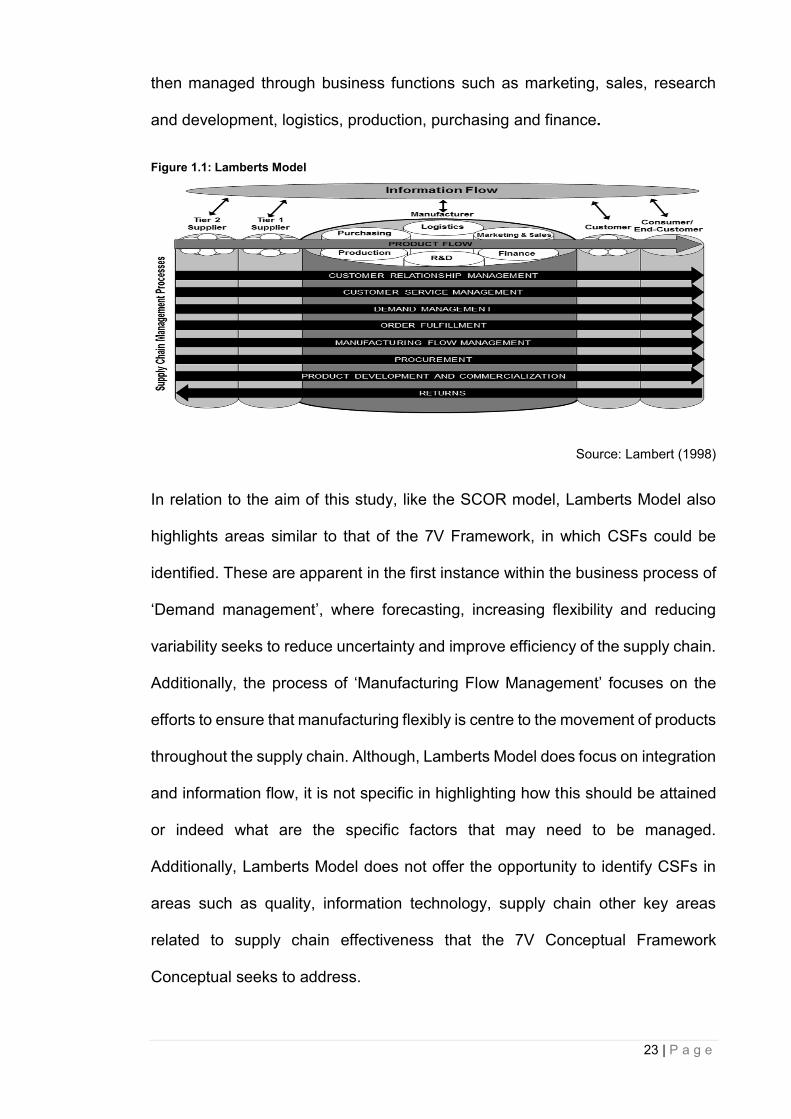
In addition to focusing on these relationships, the model offers six further
business related processes of customer service management; demand
management; order fulfilment; manufacturing flow management; product
development and commercialisation; and finally returns management as part of
the supply chain management process. These business related processes are
23 | P a g e
then managed through business functions such as marketing, sales, research
and development, logistics, production, purchasing and finance.
Figure 1.1: Lamberts Model
Source: Lambert (1998)
In relation to the aim of this study, like the SCOR model, Lamberts Model also
highlights areas similar to that of the 7V Framework, in which CSFs could be
identified. These are apparent in the first instance within the business process of
‘Demand management’, where forecasting, increasing flexibility and reducing
variability seeks to reduce uncertainty and improve efficiency of the supply chain.
Additionally, the process of ‘Manufacturing Flow Management’ focuses on the
efforts to ensure that manufacturing flexibly is centre to the movement of products
throughout the supply chain. Although, Lamberts Model does focus on integration
and information flow, it is not specific in highlighting how this should be attained
or indeed what are the specific factors that may need to be managed.
Additionally, Lamberts Model does not offer the opportunity to identify CSFs in
areas such as quality, information technology, supply chain other key areas
related to supply chain effectiveness that the 7V Conceptual Framework
Conceptual seeks to address.
24 | P a g e
Based on the stated research aim and objectives, it is the purpose of this research
to identify the underlying factors that need to be addressed in order to
successfully manage supply chains. The focus of the research will be the
identification of these factors and the categorisation of them within the 7V
conceptual framework.
1.5 Structure of the thesis
From this point forward, this thesis will discuss and reflect upon the literature
surrounding each individual theme within the 7V conceptual framework and the
identification of associated CSFs. It will follow this by rationalising the research
design, highlighting the findings of the empirical research and a discussion
surrounding the interpretation of the findings.
Chapter 2 provides a comprehensive review of the literature in the selected field.
It will firstly seek to define effective SCM. Secondly, it will contextualise the 7
individual themes from the framework. Thirdly, it will identify existing relationships
between themes, as suggested by the literature. Finally, it will identify CSFs
attributed to of the themes within the framework. This will initiate the research
process and assist in attaining research objective 1.
Chapter 3 describes the methodology and the individual phases of the research
process. The chapter explains how the survey instrument was structured around
the 7Vs conceptual framework and discusses the philosophical grounding of this
research, as well as the research design and strategy. The chapter then justifies
the sampling strategy and data collection method undertaken and finally
introduces in detail the data analysis technique, response rates to the survey
instrument and data treatment.
25 | P a g e
Chapter 4 focuses on the results of the data analysis and sets the foundations for
the attainment of research objectives 2 and 3. Firstly, in relation to research
objective 2 it presents the results from the analysis of the exploratory factor
analysis (EFA) with a view to confirming or disconfirming CSFs. Secondly, the
chapter investigates the plausibility of Model-Fit of the 7Vs conceptual
framework. This assists in identifying specific CSFs influencing supply chains
whilst applying a 7V conceptual framework for the purpose of its development in
research objective 3.
Chapter 5 presents the initial discussion of the results of the empirical study. In
the first instance it focuses on how research objectives 1-3 have been met. The
chapter then reconceptualises effective supply chain strategies on the evidence
from the study (objective 4). The chapter also discusses and interprets the results
from the analysis along with its theoretical contribution and empirical implications.
Finally an evaluation of the implications for supply chain strategy in practice is
presented (objective 5).
Chapter 6 links the contribution of the study back to the overall aim of the research
and presents the conclusions of the research. Potential areas for further research
that were identified in this study are discussed. The chapter also discusses the
limitations of this research study and offers reflections on the process.

26 | P a g e
Chapter 2 – Review of supply chain literature
The review of supply chain literature conceptualises the themes within the 7V
framework. The chapter confirms the existence of the themes associated to the
framework within the body of literature. The chapter takes the first step in the
attainment of research objective 1, in that it allows the researcher to identify from
the extant literature possible critical success factors (CSFs) influencing supply
chain operations.
The chapter highlights possible relationships between themes within the
framework. In addition, the chapter contextualises and identifies specific CSFs
related to the successful management of supply chains.
2.1 Literature study
The rationale of the strategic management of supply chains is to remove
communication barriers in order to coordinate, monitor and control the process of
supply goods (Power 2005). Hines (2004) emphasises the importance of supply
chains being efficient with the ability to satisfy the demands of the customer and
its markets. Within the literature, aspects of SCM are discussed as stand-alone
individual factors such as ‘technology’ (Simatupang, Wright et al. 2002);
‘flexibility’ (Ketchen Jr, Thomas et al. 2007) and ‘forecasting’ (Saeed 2008).
Historically, a number of authors conceptualise supply chains differently (Brown
and Hendry 1997, Harland 1997, Christopher 2000, Mentzer, DeWitt et al. 2001).
These conceptualisations fall into definable clusters with a thematic focus, for
example on logistics (Ellram 1990, Cooper and Ellram 1993, Christopher 2000),
operations (Lamming 1996, Harland 1997), marketing and strategy (Mentzer,
DeWitt et al. 2001, Hines 2004).
27 | P a g e
These boundaries have historically informed debates within this field. However,
the field around the understanding of CSFs is eclectic and at times lacks
generalizable views across differing supply chains. In turn, the themes contained
within the framework are mostly discussed in isolation or in small groups. To gain
clarity around this area, the review of the literature will seek to address the
following questions:
i) How are the 7V themes conceptualised within the literature?
ii) Is there evidence of relationships between any of the 7V themes?
iii) What are the factors critical to the successful delivery of supply chains?
iv) Can the 7V themes can assist in identifying and bracketing CSF?
The themes discussed within this chapter relate directly to operational
effectiveness of supply chains in achieving a competitive advantage. The
discussion within the chapter focuses primarily on the 7 themes within Hines
(2004) conceptual framework (value, volume, velocity, variety, variability, visibility
and virtuality). As supply chains are evident across many industries, sectors, and
countries, the literature pertaining to differing types of supply chains is included.
Although, supply chains can effectively be sub-divided into categories such as:
agile supply chains (ASC), lean supply chains (LSC) and hybrid supply chains
(HSC) this review takes a holistic view of all literature when identifying possible
CSF’s.
Literature Search
The purpose of the literature search was to gain an understanding of current
issues and discussions surrounding supply chain literature. Additionally, it served
to contextualise the 7V Themes within the framework and identify critical success
factors associated to each theme. The contextualisation of the themes from the
28 | P a g e
literature was important, as it would justify the grounding of the research and offer
evidence that the themes existed outside the conceptual framework offered by
Hines (2004). It is the identification of these Critical Success Factors attributed to
the themes, that would contribute to the attainment of research objective 1 and
offer a grounding from which to develop the study.
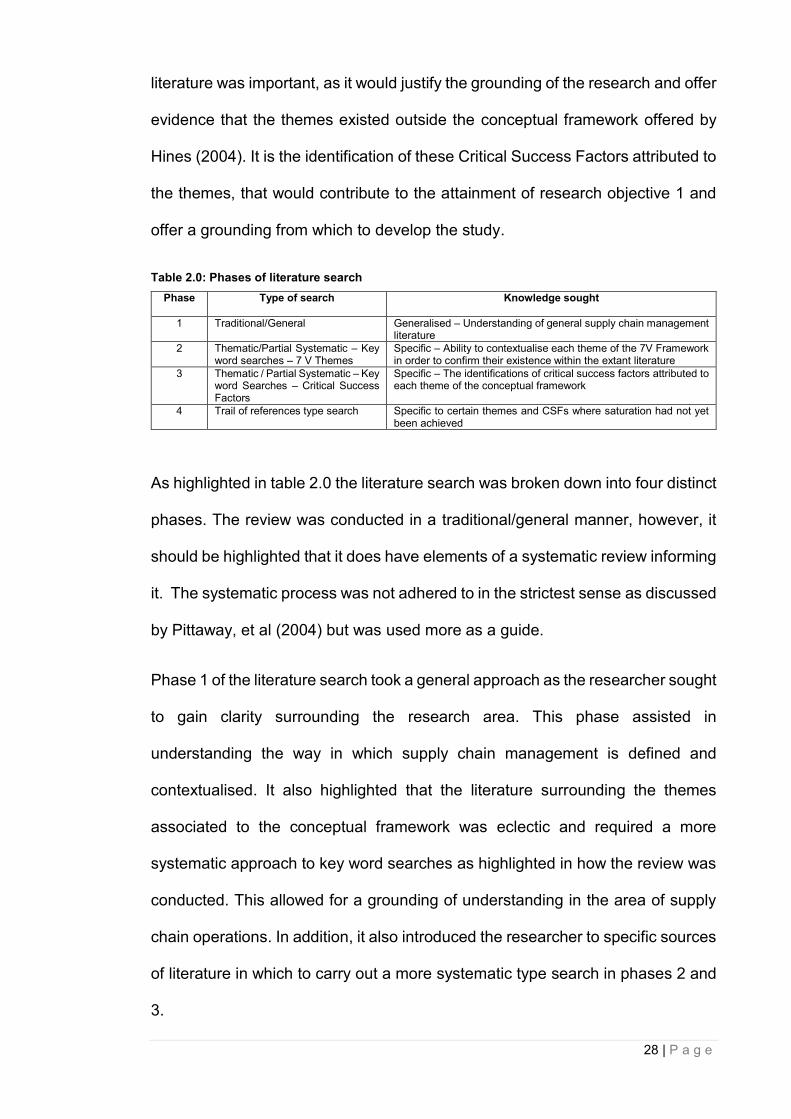
Table 2.0: Phases of literature search
Phase Type of search Knowledge sought
1 Traditional/General Generalised – Understanding of general supply chain management literature
2 Thematic/Partial Systematic – Key word searches – 7 V Themes
Specific – Ability to contextualise each theme of the 7V Framework in order to confirm their existence within the extant literature
3 Thematic / Partial Systematic – Key word Searches – Critical Success Factors
Specific – The identifications of critical success factors attributed to each theme of the conceptual framework
4 Trail of references type search Specific to certain themes and CSFs where saturation had not yet been achieved
As highlighted in table 2.0 the literature search was broken down into four distinct
phases. The review was conducted in a traditional/general manner, however, it
should be highlighted that it does have elements of a systematic review informing
it. The systematic process was not adhered to in the strictest sense as discussed
by Pittaway, et al (2004) but was used more as a guide.
Phase 1 of the literature search took a general approach as the researcher sought
to gain clarity surrounding the research area. This phase assisted in
understanding the way in which supply chain management is defined and
contextualised. It also highlighted that the literature surrounding the themes
associated to the conceptual framework was eclectic and required a more
systematic approach to key word searches as highlighted in how the review was
conducted. This allowed for a grounding of understanding in the area of supply
chain operations. In addition, it also introduced the researcher to specific sources
of literature in which to carry out a more systematic type search in phases 2 and
3.
29 | P a g e
The literature search was conducted by:
1. The use of key words in searching general supply chain management
books, academic journals and online sources
2. Throughout the phase 2 and 3 the literature search utilised keywords in
various combinations such as:
i. Supply Chain Management (SCM) and/or Effective SCM
ii. SCM and/or logistics
iii. SCM and/or logistics and Critical Success Factors (CSFs)
iv. SCM and Individual themes from framework:
Virtuality
Value
Velocity
Variety
Variability
Visibility
Volume
v. Themes from framework together in various combinations for example;
Value and/or Variety and or Volume
Velocity and/or Volume and or Virtuality
vi. CSF and individual themes from framework for example;
CSF and Virtuality
CSF and Value
vii. CSF and SCM and key words associated to each theme for example;
CSF and SCM and Information Technology (virtuality)
CSF and SCM and Quality (Variability)
Principle Sources searched were:
MMU Library electronic databases by title
Web if knowledge
Web of science
Online aggregate website – Google Scholar
MMU Library catalogue of academic books (both online and hard
copies)
In phase 4, the researcher followed a trail of references from relevant journal
articles in order to expand the search. Due to a lack of sources related to certain
themes and CSFs, this final phase assisted in targeting specific themes to

30 | P a g e
support their contextualisation. Not all literature identified was utilised, for
example, if the research had been superseded by more recent studies. A clear
theme that focused on more recent literature was that of virtuality, the changing
nature of Information Technology meant that all but two seminal papers pre-2001
were discarded. In analysing, the literature related to the themes of the
framework, when it was apparent that there was enough evidence to support
Hines (2004) contextualisation’s of a particular theme then the next theme was
addressed.
In relation to the search of the literature associated to CSFs, it was of primary
importance to the study that these variables were identified. Lists of CSFs
associated to each theme were compiled and tabulated, where possible multiple
sources were identified as a way to support the existence of each CSF. Both the
contextualisation of the themes and identified CSFs came from reputable
academic sources.
2.2 Definition and Challenges
Before this chapter goes onto contextualise themes and identify possible critical
factors, this section will firstly attempt to define SCM and highlight supply chain
challenges.
Defining Supply Chain Management
Fieldman and Muller (2003) suggest that there is no universally agreed definition
of SCM. Whilst Burgess, Singh et al. (2006) agree there is a lack of consensus
on what the term ‘supply chain management’ actually means. Others such as
Mentzer, DeWitt et al. (2001) state that due to the poor way in which SCM has
been defined it has led to varying views as to what it actually consists of.
31 | P a g e
However some clarity has been offered. The Global Supply Chain Forum (GSCF)
defines SCM as “the integration of key business processes from end user through
original suppliers that provides a product, services and information that add value
for customers and other stakeholders” (Lambert and Cooper 2000). In turn the
Council of Logistic Management (CLM) sees SCM as the coordination of
traditional business strategies across the entirety of the organisation’s functions.
Focusing this effort between businesses in a manner, that improves the long-term
performance of the organisation and the supply chain is imperative to attaining
success (Management 2000). Others state that the main goal of SCM is to
integrate material and information seamlessly between all members of the supply
chain as a way to create a competitive weapon (Li, Ragu-Nathan et al. 2004).
A clear and succinct definition is offered by Hines (2013), who states that the
management of a supply chain incorporates all activities that move and transform
products and services (goods). This occurs throughout the design stage,
procurement of raw materials and finally ends up with the end user. It also takes
into account additional activities such as the flow of cash and information which
form part of the management of supply chains. Hines (2013) sees supply chains
as service systems that deliver value to consumers and customers and in turn
contribute value to suppliers, producers and distributors.
The Supply Chain Challenges
Although definitions may vary, it is clear that organisations which are developing
supply chain strategies face challenges. These challenges consist of ensuring
that they are able to identify and manage critical factors as a way to ensure a
successful outcome. Historically, senior managers were at times oblivious to the
importance of SCM to their organisations competitive advantage. However,
32 | P a g e
Leach (2013) states organisations have now realised that a well-run supply chain
can be critical in giving them a competitive advantage, especially in new and
emerging markets. Taylor (2013) highlights the importance of which can be seen
in economic terms; since the turn of the 21st century, there has been a rise of 10
per cent of goods sold worldwide that are derived from purchased materials.
Further to this, the research of Degun (2013) offers an opinion that 70 per cent of
business leaders believe supplier risk will become more complex as
organisations expand into new global markets. To address this perceived risk,
organisations have been focusing more on their capabilities of being able to build
relationships through networks of suppliers and business, as a way to survive in
a competitive market (Drucker 2011). This recognised high level of supplier risk,
highlights the importance of a well-run supply chain to organisations.
The importance of gaining a competitive advantage through a supply chain is
highlighted throughout the literature as being key to organisational strategy
(Porter 1985, Ayers 1999, Reichart and Holweg 2007).
It has also been suggested that it is not companies that compete but rather supply
chains (Christopher and Towill 2000). Gaining a competitive advantage through
the relationships with suppliers may force organisations to constantly seek cost
reductions; with little or no care for the consequences.
Christopher (2011) stated that historically suppliers were kept at a distance and
this minimised the opportunities for competitive advantage through the speeding
up of the processes through improved lead times. Now it seems more focus is
given to collaboration and sharing of resources and information as all members
seek to make the supply chain as competitive as possible (Benavides 2013). This
is in contrast to earlier practices, when organisations tended to focus their efforts
33 | P a g e
on making internal business functions as effective and efficient as possible
(Shepherd and Gunter 2006). It is in this attempt to be efficient that organisations
are thinking strategically when it comes to their supply chains (Burgess, Singh et
al. 2006).
Ayers (1999) suggested that managers have the same core concerns regarding
supply chains at the turn of the 20th century as they did over the 50 years
beforehand. These include products, people operations, finance and markets.
More recently these concerns have become more focused on specific issues
related to the increased globalisation of their markets. Hines (2004) is not alone
in suggesting that organisations face challenges from the external environment
in which they operate.
These challenges come from continuous incremental changes or from even
breakthrough-innovations better known as discontinuous change (Zammuto
2008). This means that managers are continually dealing with impacts upon their
supply chain operations (Fawcett, Magnan et al. 2008). These impacts can be
due to changes in their organisations, markets they operate within, industrial
change through competition, individuals, and innovations. All these can have an
influence on the way that supply chain decision makers plan and implement
strategies. So much that changes within key areas will influence the way that
organisations structure their supply chains to increase efficiency (Gattorna 2010).
It is this drive for the efficiency of supply chains in practice, which leads to a
competitive advantage and subsequent customer satisfaction that has seen a
recent increase in research into CSFs throughout supply chain management
literature.

34 | P a g e
2.3 Contextualising the 7V Framework
The 7V conceptual framework offers a tool that could be utilised to help ‘identify’
and ‘bracket’ factors that are critical to the effectiveness of supply chains. The
themes highlighted within the framework are that of value, variability, variety,
velocity, volume (volatility) visibility and virtuality. The definitions of the 7V themes
are highlighted in table 2.1 and should be seen as “a useful conceptual framework
from which organisations can examine their own potential to meet complex
challenges of developing appropriate supply chain strategies” (Hines, 2004, p.
361).
Table 2.1: The 7Vs themes - Definitions, Concepts and Business Challenges
Theme Definition Concepts 7Vs – Business challenges
Value The relationship between what the customers want and expects against what the supplier can offer
Reduce cost, meeting customer expectations, continuous improvement, Value chain, Value streams, Reduce risks, Economic value, Value for all parties
Offer value for money to customers based on what they want. Value not just at point of exchange by through time and use
Volume (Volatility)
Ensuring that customers have the flexibility to increase decrease volume as their demands dictate
Flexibility to adjust demand, Bullwhips identified, Lead time gap addressed, Forecasting accuracy based on real time data, SC competence, dynamic systems
Customers want to order as late as possible to ensure they have ‘best forecast’ of demand. Reduced likelihood of standard orders in many sectors. Requirement to facilitate changes in order quantities
Velocity The ability for customers to utilise speed through their supply chain as a competitive advantage
Speed of delivery, Proactive practices, Time-based competition, Adapting to changes in the market
The speed of response in adapting to change in areas such as demand conditions, market structures, production technology and suppliers capabilities
Variety The ability to customise or standardise a product as per consumer demands or even in anticipation of changes in demand
Local Customisation, Product/Service variety increasing over varying sectors, Increased outsourcing, Shorter product life cycles, Reduced complexity of customisation
Being able to customize the product/service offered. This may mean moving from economies of scale to economies of scope or economies of value to customer
Variability The products/services have no varying levels of quality and that they are delivered in a manner that is of a level that is acceptable to the customers
Value adding process, Quality of product/service to end user, Total Quality Management
The business must be able to reduce variability and offer standard quality.
Visibility Ensure that the supply chain is transparent and all parties are able to see and avoid blockages and issues surrounding bottom heavy inventories
Transparency between members, Bullwhip reduced, IT systems communicate, Information sharing, Pipeline visible to members, reduction in transaction risk
Enabling all parts of the supply chain to be transparent and avoid blockages, ‘ice berg’ inventories and hidden costs; keeping the customer informed.
Virtuality The ability to manage and coordinate the supply chain using information technology
Multi-dimensional systems, improved communication
Coordinating of both intangible and tangible assets within SC. Facilitated by ICT give customer confidence and ensure dependability.
Source: Adapted from (Hines 2004)
35 | P a g e
It is the inclusion of the concepts and challenges to business in table 2.1, that
highlights the additional outputs that are required to ensure the 7V framework can
assist in delivering what the customer wants. The following subsections will take
the definitions of each theme within the 7V framework and conceptualise them
within the extant literature. It is important that there is a clear understanding of
the definitions, concepts and overall conceptualisations of each theme prior to
the identification of relevant CSFs. This is to ensure that each CSF identified is
located within the correct theme within the framework.
2.3.1 Value
‘The relationship between what the customers want and expects against what the supplier can offer’
It is imperative that if organisations want to develop strategic capabilities in areas
related to the effectiveness of their supply chains, they must address ongoing
specific issues. In essence when it comes to supply chains, organisations must
learn to ‘work smarter, not harder’ (Christopher 2011). As shown in table 2.1, the
challenges that business’s face in ensuring customers gain value for money, is
not just focused at the point of sale but through time and use (Hines 2004).
Sengupta, Heiser et al. (2006) states that customers are demanding value and
it is essential that organisations ensure that this is delivered throughout the
product and/or services lifetime. It is the challenge to compete in today’s markets
that organisations anticipate what the customer accepts as value in relation to
products and/or services. What is clear is that value can change over time and
Tracy and Tan (2001) suggest that this can be due to external influences;
therefore, it is crucial that organisations are aware of what their customers see
as value.
36 | P a g e
Power, Sohal et al. (2001) support the view that, value is likely to be found within
the relationship between benefits and cost to the end user. Value in this context
is linked to ‘customer expectations’ and encompasses in part literature related to
Total Quality Management (TQM). What can be derived from this is the notion of
continuous improvement. Meaning that organisations must seek to understand
‘what are their customer value expectations’. Within supply chain literature, it is
easy to get confused between the terminology value and quality. The concept of
quality is found within the 7V framework and is conceptualised as the theme
variability. Within the Framework value, takes a more holistic view as a concept
as it focuses reducing costs, meeting the customers’ expectations reducing risks
and ensuring value for all parties (Hines 2004).
Bowersox and Calantone (1998) book highlighted the importance of a continuous
improvement philosophy being crucial to organisations. They also suggest that
continued monitoring is crucial. The reasoning they give is that what may have
satisfied a customer one year ago might not be seen as acceptable to them a
year later. When attempting to conceptualise the theme value using supply chain
literature, is important to acknowledge how it is linked to various theoretical and
operational buzzwords.
These variations include ‘value streams’ and ‘value chain management’ (Soon
and Udin 2013); ‘value chain segmentation’ and ‘supply value chain’ (Lee, So et
al. 2000, Kayakutlu and Buyukozkan 2011); ‘value creation’ (Hoyt and Huq 2000,
Gunasekaran, Patel et al. 2003).
This study suggests that a definitive definition of the theme ‘value’ within SCM
literature is one that is difficult to capture. The reason for this is firstly in part due
to the subjective nature of the term, in that value to one party in a transaction

37 | P a g e
does not necessitate that the other party believes value has been obtained for
them. Secondly as previously mentioned within SCM literature, it is used to
describe various phenomenon. Value could simply be termed, as ‘what one
believes is an acceptable outcome or agreement between certain parties at the
completion of a transaction of sorts’. Within the 7vs conceptual framework, it is
simply suggested that value is ‘the relationship between what the customer wants
and expects against what the supplier can offer.
Additionally, Hines (2004) highlights a clear focus in relation to supplier strategy
in seeking value is the ability to reduce costs and risk whilst meeting customer
demands. In turn, this offers value to the customer based on their preferences
not only in initial exchange but also through time and use. Whilst the main
customer driver for suppliers strategy relating to value is to attain the right
customer focus (Hines 1994, Narasimham and Das 2000, Kumar 2001). Although
a precise contextualisation of theme value within the literature is in part
problematic, there is clear evidence of its existence in the delivery of what
customer’s expectation are against what suppliers can deliver. With that in mind,
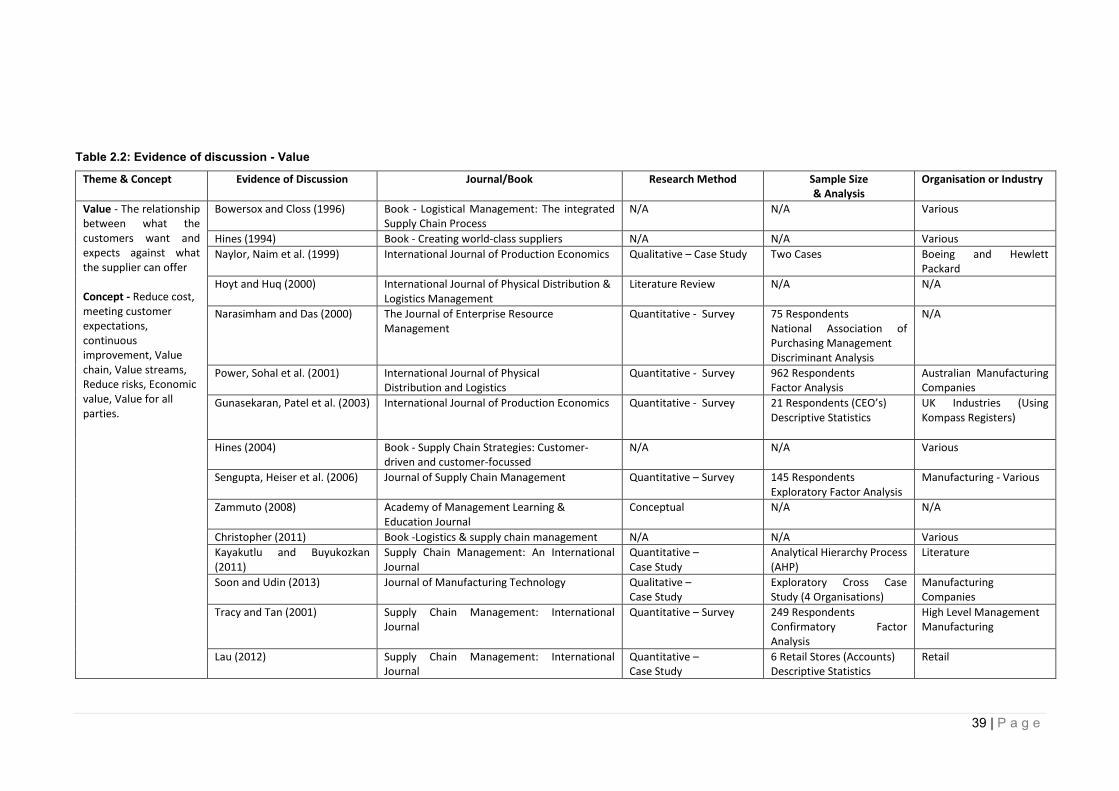
the literature surrounding the theme value has been highlighted in table 2.2.
Table 2.2 is not an exhaustive list of the literature in which the theme value is
apparent within discussions. However, it is indicative of the types of research that
has been carried out and utilised to contextualise the theme. There is evidence
to suggest that qualitative research methods are common in this area. Due to the
term value being associated to many operational areas, it can also be shown that
research is not just restricted to supply chain management. However, in most
cases the common denominator is that the focus of the research is encompassed
in different types of manufacturing processes.
38 | P a g e
In summary, the literature highlights that the expectations of customers is a key
element to achieving a competitive advantage. Although, the term value is seen
throughout the literature in differing form and is clearly subjective in nature. It has
still been possible to contextualise this theme as it is constructed by Hines (2004)
but not without difficulty. In contextualising the theme value, it was crucial that it
was not confused with the literature surrounding variability. Importantly, the
theme variability focuses on the quality of delivery and is conceptualised clearly
as the quality of the end product delivered. This differs somewhat from the theme
value in that it is clearer to define it as the actual end product.
39 | P a g e
Table 2.2: Evidence of discussion - Value
Theme & Concept Evidence of Discussion Journal/Book Research Method Sample Size & Analysis
Organisation or Industry
Value - The relationship between what the customers want and expects against what the supplier can offer Concept - Reduce cost, meeting customer expectations, continuous improvement, Value chain, Value streams, Reduce risks, Economic value, Value for all parties.
Bowersox and Closs (1996) Book - Logistical Management: The integrated Supply Chain Process
N/A N/A Various
Hines (1994) Book - Creating world-class suppliers N/A N/A Various
Naylor, Naim et al. (1999) International Journal of Production Economics Qualitative – Case Study Two Cases Boeing and Hewlett Packard
Hoyt and Huq (2000) International Journal of Physical Distribution & Logistics Management
Literature Review N/A N/A
Narasimham and Das (2000) The Journal of Enterprise Resource Management
Quantitative - Survey 75 Respondents National Association of Purchasing Management Discriminant Analysis
N/A
Power, Sohal et al. (2001) International Journal of Physical Distribution and Logistics
Quantitative - Survey 962 Respondents Factor Analysis
Australian Manufacturing Companies
Gunasekaran, Patel et al. (2003) International Journal of Production Economics Quantitative - Survey 21 Respondents (CEO’s) Descriptive Statistics
UK Industries (Using Kompass Registers)
Hines (2004) Book - Supply Chain Strategies: Customer-driven and customer-focussed
N/A N/A Various
Sengupta, Heiser et al. (2006) Journal of Supply Chain Management Quantitative – Survey 145 Respondents Exploratory Factor Analysis
Manufacturing - Various
Zammuto (2008) Academy of Management Learning & Education Journal
Conceptual N/A N/A
Christopher (2011) Book -Logistics & supply chain management N/A N/A Various
Kayakutlu and Buyukozkan (2011)
Supply Chain Management: An International Journal
Quantitative – Case Study
Analytical Hierarchy Process (AHP)
Literature
Soon and Udin (2013) Journal of Manufacturing Technology Qualitative – Case Study
Exploratory Cross Case Study (4 Organisations)
Manufacturing Companies
Tracy and Tan (2001) Supply Chain Management: International Journal
Quantitative – Survey 249 Respondents Confirmatory Factor Analysis
High Level Management Manufacturing
Lau (2012) Supply Chain Management: International Journal
Quantitative – Case Study
6 Retail Stores (Accounts) Descriptive Statistics
Retail
40 | P a g e
2.3.2 Volume-Volatility
‘Ensuring that customers have the flexibility to increase decrease volume as their demands dictate’
The second theme of volume-volatility occurs, as customers place specific
demands on their downstream suppliers. The challenge that is set, is the flexibility
customers have to increase and lower their demand in relation to their own
customer demands. It is suggested that in today’s business environment
customers are less likely to purchase the maximum quantities the suppliers can
offer, more specifically at a time and delivery schedule dictated by those
downstream (associated to mass production runs) (Hines 2004). It is highlighted
that customers wish to do this without incurring additional costs. Both Christopher
(2011) and Harrison and Hoek (2011) published works agree that this is the
challenge that downstream suppliers need to address in relation to volume –
volatility. Historically suppliers keeping high levels of inventory would be seen as
the way this would be addressed. However, due to the operational and financial
pressures associated to this option, it is proving to be less popular course of
action in recent times.
Christopher (2011) states that at its very basic core principle, the primary goal of
SCM is to attempt to match supply with demand. However, with the external
uncertainties organisation face in practice, this not always easy. Gattorna (2010)
suggests that volume is managed easier when there is stability within markets
and in turn is more difficult to manage with fluctuations in demand. Christopher,
Tatham et al. (2011) reaffirms this by highlighting issues suppliers are constantly
addressing. These include the time that is used to procure, produce and deliver
a product to a customer is usually much longer than a customer would be
prepared to wait.
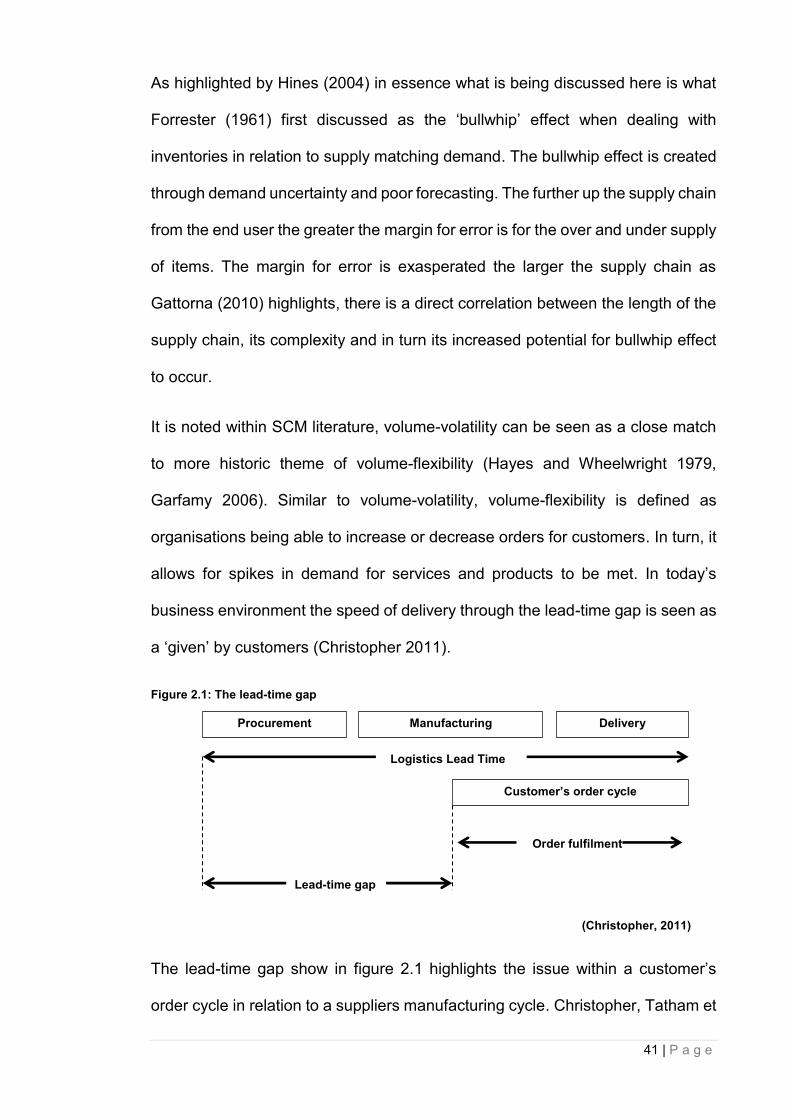
41 | P a g e
As highlighted by Hines (2004) in essence what is being discussed here is what
Forrester (1961) first discussed as the ‘bullwhip’ effect when dealing with
inventories in relation to supply matching demand. The bullwhip effect is created
through demand uncertainty and poor forecasting. The further up the supply chain
from the end user the greater the margin for error is for the over and under supply
of items. The margin for error is exasperated the larger the supply chain as
Gattorna (2010) highlights, there is a direct correlation between the length of the
supply chain, its complexity and in turn its increased potential for bullwhip effect
to occur.
It is noted within SCM literature, volume-volatility can be seen as a close match
to more historic theme of volume-flexibility (Hayes and Wheelwright 1979,
Garfamy 2006). Similar to volume-volatility, volume-flexibility is defined as
organisations being able to increase or decrease orders for customers. In turn, it
allows for spikes in demand for services and products to be met. In today’s
business environment the speed of delivery through the lead-time gap is seen as
a ‘given’ by customers (Christopher 2011).
Figure 2.1: The lead-time gap
Logistics Lead Time
Order fulfilment
Lead-time gap
(Christopher, 2011)
The lead-time gap show in figure 2.1 highlights the issue within a customer’s
order cycle in relation to a suppliers manufacturing cycle. Christopher, Tatham et
Procurement Manufacturing Delivery
Customer’s order cycle

42 | P a g e
al. (2011) state that this is the time that a customer is prepared to wait from the
moment their order is placed. In certain cases some, if not all the product is part
way through production. Lau (2012) discusses that in a conventional organisation
the only way to address the gap between lead-time and the customer’s order
cycle is for them to carry inventory. This suggests that organisations need to
forecast in a manner that calculates market/clients requirements, thus allowing
inventory to be sourced ahead of fluctuations in demand. This in itself causes
issues, as forecasting is not always accurate and mistakes will happen (Fisher,
Hammond et al. 1994, Elmuti 2002, Christopher 2011).
Constant improvement in forecasting accuracy is always sought. It may be that
the answer lies more in the reduction of the lead-time gap and in addressing the
critical factors within this period of the process. Lau (2012) suggest that visibility
of real demand (final market place demand) is a problem that organisations
continually face. This demand is different from the ‘derived’ demand that is
passed upstream through the individual supply chain members.
The challenge to organisations in relation to volume volatility is to ascertain a way
in which they can identify the customer’s requirements. More specifically this
must be done at the earliest opportunity and thus reduce the lead-time gap.
Gattorna (2010) suggests that this can be managed in part with close
collaboration between customer and supplier.
Table 2.3 highlights the literature in which there was evidence of a discussion
related to volume-volitility. The theme in essence is an attempt to address the
‘bullwhip’ affect, first highlighted by Forrester (1961) and is discussed in many
books and conceptual papers since its conception. In summary, volume focuses
on the sub-themes of flexibility, just in time, bullwhip forecasting, real-time
43 | P a g e
information and the importance of accurate demand forecasts. The value to
customer is in essence flexibility. This has a customer driver of ‘right product right
service’. With a holistic view of volatility Hines (2013) offers three key themes of
system volatility, which focuses on external factors. Demand volatility which
concerns itself with market conditions and which effects volume. Finally,
disruptive technologies related to innovation and a series of risks factors are the
sub-themes that conceptualise volatility. In essence the value propositions for a
customer whose supplier addresses volatility are reliability, trustworthiness and
continuity of service with the overriding customer driver in relation to volatility is
the right quantity (Hines 2013).
In summary, whilst the flexibility offered to customers through volume-volatility
allows organisations to assist customers in addressing their own demand issues
(Gattorna 2010). It is clear that the management of ongoing supply and demand
issues related to volatile markets is key to achieving a competitive advantage
(Christopher 2011). Encompassed within the theme velocity is the opportunity for
demand issues raised within the to be addressed through the management of the
lead time gap (Harrison and Hoek 2011). However, in dealing with volume-
volatility issues through velocity can restrict an organisations ability to offer variety
and gain a subsequent competitive advantage in this manner (Lee, Ha et al.
2001). The literature highlights clearly that the ability to customise and offer
variety is key for some organisations and in part this can be addressed through
local customisation, however, this is not an option available on all products
(Christopher 2000).
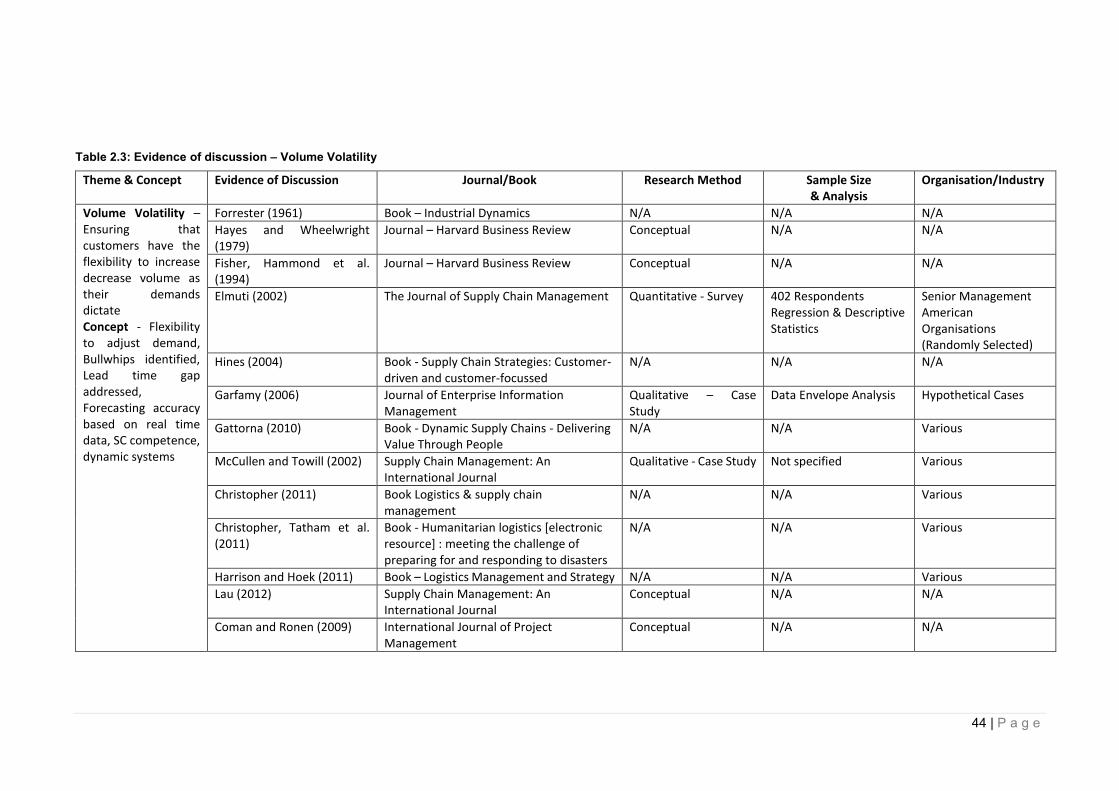
44 | P a g e
Table 2.3: Evidence of discussion – Volume Volatility
Theme & Concept Evidence of Discussion Journal/Book Research Method Sample Size & Analysis
Organisation/Industry
Volume Volatility – Ensuring that customers have the flexibility to increase decrease volume as their demands dictate Concept - Flexibility to adjust demand, Bullwhips identified, Lead time gap addressed, Forecasting accuracy based on real time data, SC competence, dynamic systems
Forrester (1961) Book – Industrial Dynamics N/A N/A N/A
Hayes and Wheelwright (1979)
Journal – Harvard Business Review Conceptual N/A N/A
Fisher, Hammond et al. (1994)
Journal – Harvard Business Review Conceptual N/A N/A
Elmuti (2002) The Journal of Supply Chain Management Quantitative - Survey 402 Respondents Regression & Descriptive Statistics
Senior Management American Organisations (Randomly Selected)
Hines (2004) Book - Supply Chain Strategies: Customer-driven and customer-focussed
N/A N/A N/A
Garfamy (2006) Journal of Enterprise Information Management
Qualitative – Case Study
Data Envelope Analysis Hypothetical Cases
Gattorna (2010) Book - Dynamic Supply Chains - Delivering Value Through People
N/A N/A Various
McCullen and Towill (2002) Supply Chain Management: An International Journal
Qualitative - Case Study Not specified Various
Christopher (2011) Book Logistics & supply chain management
N/A N/A Various
Christopher, Tatham et al. (2011)
Book - Humanitarian logistics [electronic resource] : meeting the challenge of preparing for and responding to disasters
N/A N/A Various
Harrison and Hoek (2011) Book – Logistics Management and Strategy N/A N/A Various
Lau (2012) Supply Chain Management: An International Journal
Conceptual N/A N/A
Coman and Ronen (2009) International Journal of Project Management
Conceptual N/A N/A
45 | P a g e
There is a sizable body of research and literature associated to the theme
volume-volatility but it could be argued as being eclectic. This could be due to the
theme definition, which covers key issues such as bullwhip (McCullen and Towill
2002); flexibility (Tachizawa and Thomsen 2007, Stevenson and Spring 2009);
responsiveness (Holweg 2005) and forecasting (Oke 2003, Saeed 2008). These
issues all come under the theme definition of volume-variability and each in their
own right has a sizable body of literature within supply chain management
research. It should be acknowledged, that the grounding of the literature is
focused upon earlier research surrounding the previously discussed bullwhip
effect. There is no lack of research within these specific areas and it is the
bringing together of these areas that assisted in the conceptualisation of the
theme volume-volatility.
2.3.3 Velocity
‘Enabling the customer to utilise speed as a competitive advantage, by ensuring prompt delivery’
The third theme to be contextualised is that of velocity which is defined as
‘enabling the customer to utilise speed as a competitive advantage, by ensuring
prompt delivery’ (Hines 2004). The ability of an organisation or manufacturing
system to adapt to changes in the marketplace through responsiveness is
according to Holweg (2005) a constant, as they seek a competitive advantage.
Harrison and Hoek (2011) state that in relation to customers, increased
responsiveness is a fundamental reason why organisations are investing in new
approaches to enhance performance within supply chains. Reichart and Holweg
(2007) go further and suggest that the concept of responsiveness is now a key
theme within supply chain research.
46 | P a g e
This responsiveness/speed of delivery from suppliers to customers is clearly
defined as velocity within SCM literature (Christopher 2000, Hines 2004, Power
2005). Customers are continually placing demands on suppliers as they look for
ways to improve upon speed of delivery. Li, Ragu-Nathan et al. (2004) highlight
the pressure is increasing to assist in getting products to market. According to
Harrison and Hoek (2011) this is linked to the enhanced possibility of competitive
advantage being achieved through velocity. It should be noted that there are
increased risks associated to practices related to velocity, these are mostly born
by the supplier and not the customer (Hines 2013). T
he importance for downstream suppliers to achieve velocity for their upstream
customers should not be underestimated. The reasoning is that upstream
customers that have responsive suppliers regarding speed of delivery, are in turn
loyal to that supplier Harrison and Hoek (2011).
In essence, they become locked into the service that is provided as they can then
pass these short lead times onto their clients and so forth. This increases the
competitiveness of the supply chain. Min and Mentzer (2000) suggests that this
is possible through a process of increasing stock levels and reduced order cycle
times. However, as previously stated with volume-volatility this can bring its own
problem with increased inventory levels that can effect supplier’s cash flows.
In conceptualising velocity Hines (2013) suggests that the main sub-themes are
that of responsiveness, anticipation and time-based competition. Further to this
there is a clear agreement with Christopher and Towill (2000) that the value
proposition offered to a customer from a supplier, who addresses velocity, is a
heightened level of responsiveness known as either quick response (QR) or
efficient consumer response (ECR).
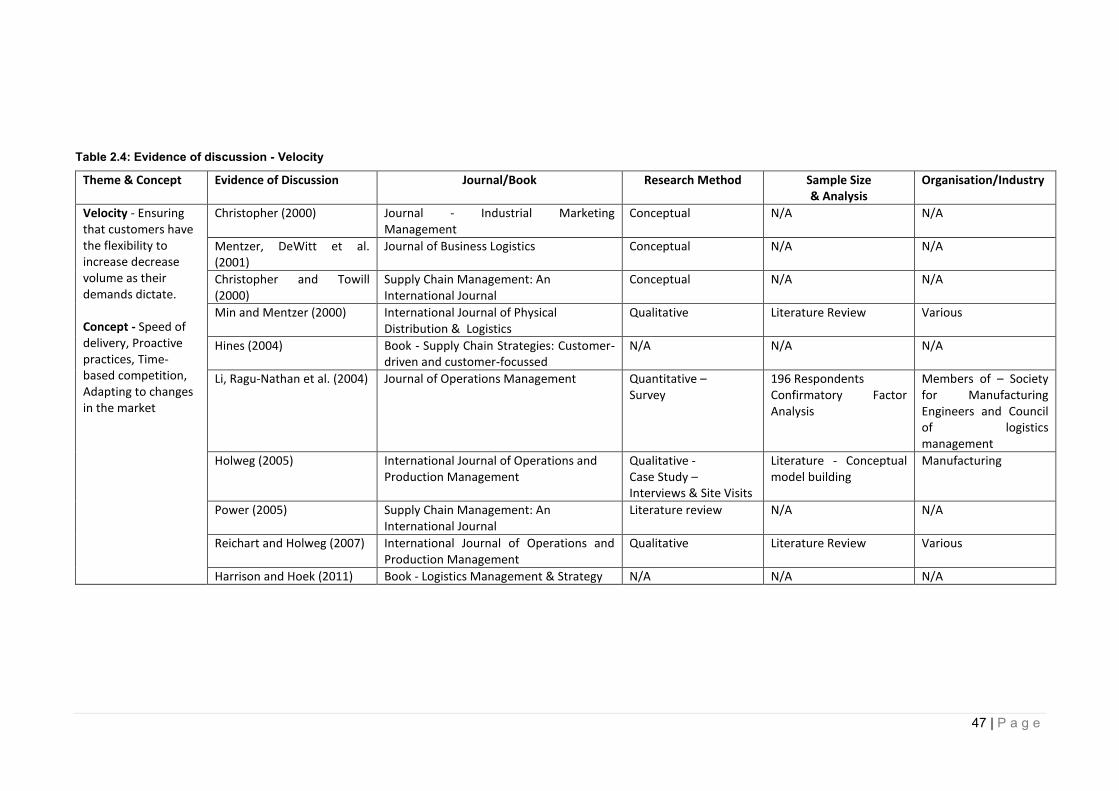
47 | P a g e
Table 2.4: Evidence of discussion - Velocity
Theme & Concept Evidence of Discussion Journal/Book Research Method Sample Size & Analysis
Organisation/Industry
Velocity - Ensuring that customers have the flexibility to increase decrease volume as their demands dictate. Concept - Speed of delivery, Proactive practices, Time-based competition, Adapting to changes in the market
Christopher (2000) Journal - Industrial Marketing Management
Conceptual N/A N/A
Mentzer, DeWitt et al. (2001)
Journal of Business Logistics Conceptual N/A N/A
Christopher and Towill (2000)
Supply Chain Management: An International Journal
Conceptual N/A N/A
Min and Mentzer (2000) International Journal of Physical Distribution & Logistics
Qualitative Literature Review Various
Hines (2004) Book - Supply Chain Strategies: Customer-driven and customer-focussed
N/A N/A N/A
Li, Ragu-Nathan et al. (2004) Journal of Operations Management Quantitative – Survey
196 Respondents Confirmatory Factor Analysis
Members of – Society for Manufacturing Engineers and Council of logistics management
Holweg (2005) International Journal of Operations and Production Management
Qualitative - Case Study – Interviews & Site Visits
Literature - Conceptual model building
Manufacturing
Power (2005) Supply Chain Management: An International Journal
Literature review N/A N/A
Reichart and Holweg (2007) International Journal of Operations and Production Management
Qualitative Literature Review Various
Harrison and Hoek (2011) Book - Logistics Management & Strategy N/A N/A N/A
48 | P a g e
Table 2.4 highlights a body of literature where a discussion related to theme
velocity is evident. What is clear in relation to this theme, is that there is a
prominence of conceptual papers, although there are key seminal papers such
as Li, Ragu-Nathan et al. (2004) that have quantitative methodologies. The
amount of conceptual works could lead to an argument of a gap in empirical
research directly attributed to this theme. However, it could also highlight that
similar to the other themes within the 7V Framework the literature is not always
predominantly focused on the actual theme.
2.3.4 Variability
‘The products/services have no varying levels of quality and that they are delivered in a manner that is of a level that is acceptable to the customers’
Quality is a crucial factor in the value-adding process attributed to the delivery of
products throughout a supply chain (Sila, Ebrahhimpour et al. 2006). The
importance of quality in this context will go a long way to ascertaining the length
of relationship between customer and supplier. Kannan and Tan (2007) research
highlighted the need for organisations to address issues regarding quality and
ensure that goods and services meet standardised quality levels that are
acceptable to a customer. Within the 7Vs Framework, the quality challenge is
defined as the theme variability. It is discussed by Hines (2004), as the challenge
for management to ensure that the quality of a service or product is delivered to
the required standard. Gattorna (2010) highlights the importance of quality within
supply chains as it is emphasised as being the most visible aspect of supply chain
performance. With quality, being of such a subjective nature it is key, that
organisations do everything they can to understand their customers’
requirements concerning acceptable standards.

49 | P a g e
Within the literature pertaining to SCM, it is clear that when discussing quality,
Total Quality Management (TQM) is closely linked (Forker, Mendez et al. 1997,
Siddiqui, Haleem et al. 2009, Talib and Rahman 2011). It is suggested that both
TQM along with SCM are considered to be the most important strategies to be
implemented to assist manufacturers in attaining global success (Talib, Rahman
et al. 2011). The importance of the role of quality control when supply differing
markets should not be overlooked (Croom, Romano et al. 2000).
The link between the theme variability and quality control is clear in that, the later
can be defined as ‘a function which measures and looks to improve the
production, marketing processes and information flow’ (Hazen, Boone et al.
2014). Within SCM literature quality is also encompassed in phrases such as
quality performance and quality of service (Gattorna 2010). This issue was
clearly identified by the research of Sila, Ebrahhimpour et al. (2006). They state
that manufacturing companies use both supply chain management and total
quality management as tools to achieve competitive advantages. However, a
main outcome of their research highlights that although manufacturers will
include customers in quality initiatives, this is not always the case with their
suppliers.
In the conceptualisation of the theme variability, it is clear from the literature that
the customer is the deciding factor on acceptable levels of quality. According to
Silvestro (2001) all quality levels should be based on customer requirements.
What is apparent is that companies need to focus upon the quality they receive
from their suppliers, in order to pass on an acceptable level to their customers.
However, there is a view by Kannan and Tan (2007) that the research around
quality in a supply chain context is somewhat limited. They argue that although
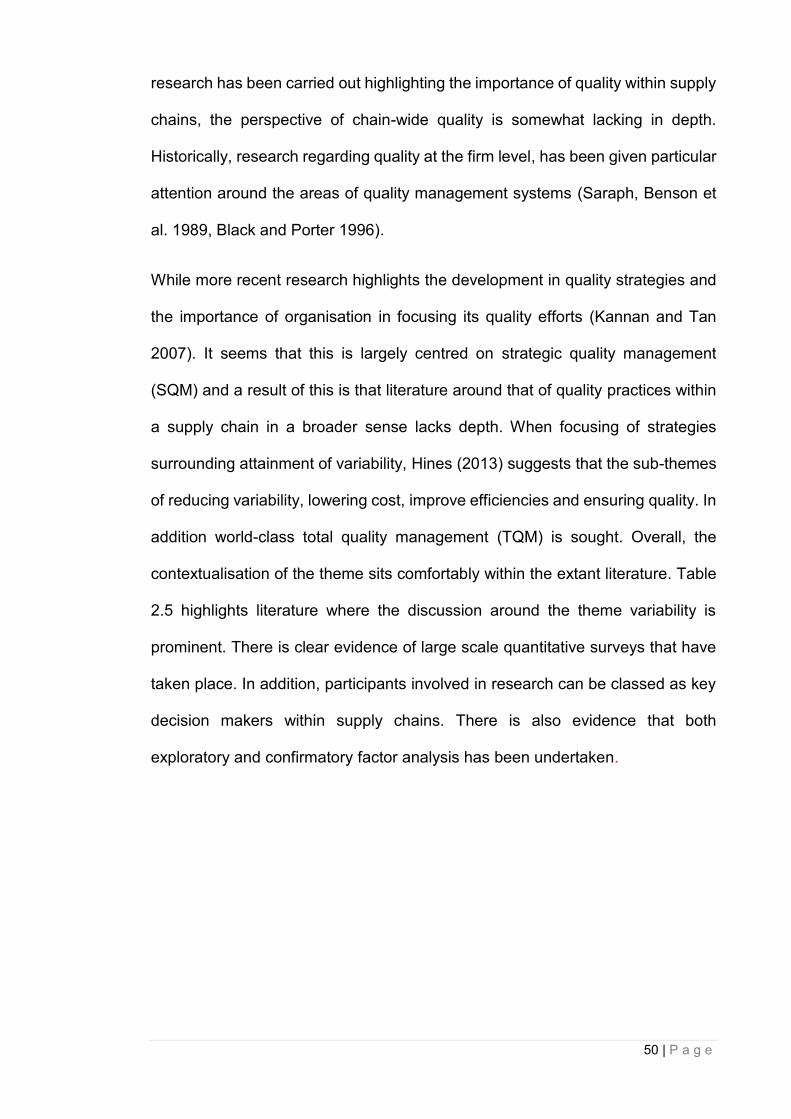
50 | P a g e
research has been carried out highlighting the importance of quality within supply
chains, the perspective of chain-wide quality is somewhat lacking in depth.
Historically, research regarding quality at the firm level, has been given particular
attention around the areas of quality management systems (Saraph, Benson et
al. 1989, Black and Porter 1996).
While more recent research highlights the development in quality strategies and
the importance of organisation in focusing its quality efforts (Kannan and Tan
2007). It seems that this is largely centred on strategic quality management
(SQM) and a result of this is that literature around that of quality practices within
a supply chain in a broader sense lacks depth. When focusing of strategies
surrounding attainment of variability, Hines (2013) suggests that the sub-themes
of reducing variability, lowering cost, improve efficiencies and ensuring quality. In
addition world-class total quality management (TQM) is sought. Overall, the
contextualisation of the theme sits comfortably within the extant literature. Table
2.5 highlights literature where the discussion around the theme variability is
prominent. There is clear evidence of large scale quantitative surveys that have
taken place. In addition, participants involved in research can be classed as key
decision makers within supply chains. There is also evidence that both
exploratory and confirmatory factor analysis has been undertaken.
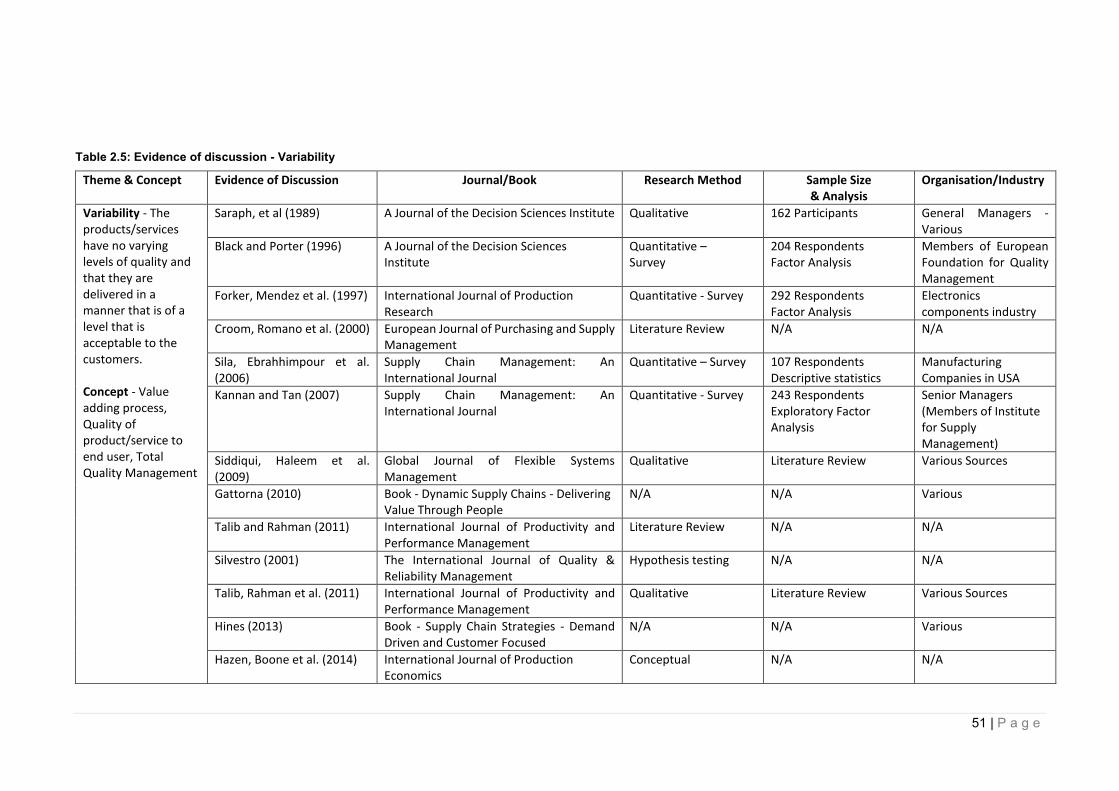
51 | P a g e
Table 2.5: Evidence of discussion - Variability
Theme & Concept Evidence of Discussion Journal/Book Research Method Sample Size & Analysis
Organisation/Industry
Variability - The products/services have no varying levels of quality and that they are delivered in a manner that is of a level that is acceptable to the customers. Concept - Value adding process, Quality of product/service to end user, Total Quality Management
Saraph, et al (1989) A Journal of the Decision Sciences Institute Qualitative 162 Participants General Managers - Various
Black and Porter (1996) A Journal of the Decision Sciences Institute
Quantitative – Survey
204 Respondents Factor Analysis
Members of European Foundation for Quality Management
Forker, Mendez et al. (1997) International Journal of Production Research
Quantitative - Survey 292 Respondents Factor Analysis
Electronics components industry
Croom, Romano et al. (2000) European Journal of Purchasing and Supply Management
Literature Review N/A N/A
Sila, Ebrahhimpour et al. (2006)
Supply Chain Management: An International Journal
Quantitative – Survey 107 Respondents Descriptive statistics
Manufacturing Companies in USA
Kannan and Tan (2007) Supply Chain Management: An International Journal
Quantitative - Survey 243 Respondents Exploratory Factor Analysis
Senior Managers (Members of Institute for Supply Management)
Siddiqui, Haleem et al. (2009)
Global Journal of Flexible Systems Management
Qualitative Literature Review Various Sources
Gattorna (2010) Book - Dynamic Supply Chains - Delivering Value Through People
N/A N/A Various
Talib and Rahman (2011) International Journal of Productivity and Performance Management
Literature Review N/A N/A
Silvestro (2001) The International Journal of Quality & Reliability Management
Hypothesis testing N/A N/A
Talib, Rahman et al. (2011) International Journal of Productivity and Performance Management
Qualitative Literature Review Various Sources
Hines (2013) Book - Supply Chain Strategies - Demand Driven and Customer Focused
N/A N/A Various
Hazen, Boone et al. (2014) International Journal of Production Economics
Conceptual N/A N/A

52 | P a g e
2.3.5 Variety
‘The ability to customise or standardise a product as per consumer demands or even in anticipation of changes in demand’
Within the modern consumer environment, it is becoming increasingly common
for products and services to be customised. Harrison and Hoek (2011) state
suppliers will attempt to drive customers demand through the introduction of new
products and or services. Literature surrounding the theme variety suggests that
the same suppliers must be ready to customize products on the basis that
customer requirements may vary. This has led to organisations finding innovative
ways to increase product variety and more customer-adapted products (Lee, So
et al. 2000). It is clear that with the customization of products, managers face
complex and challenging tasks. Lee, Ha et al. (2001) suggest this is in part due
to the ongoing trend of offering product variety, in conjunction with increased
outsourcing and shorter product life cycles. There is prominent research where
investigations have focused upon the relationship between variety, product
design and how these influence supply chain operations (Fisher 1997, Randall
and Ulrich 2001). It is the understanding of these relationships that are crucial to
operations. According to Pero, Abdelkafi et al. (2010) their research offers two
main points to focus upon. Firstly, changes in design creates changes to supply
chain processes, which can increase cost. Secondly, the extent in which supply
chains are effected, will depend upon the implementation of supply chain
practices, such as structure, supply choice and production sites.
The challenge of achieving this variety is for organisations to stay competitive.
Bennett and Klug (2012) state that manufacturing organisations find themselves
needing to ensure they continuously seek ways of updating their products.
Believing that this will assist them in attaining the required customer satisfaction
and in turn loyalty. However, the manner and speed in which the ever-increasing
53 | P a g e
innovations and changes to products are being produced, means that managers
are faced with issues surrounding the delivery of these products through their
supply chains whilst ensuring a competitive advantage.
Literature also highlights that organisations offering product variety are increasing
across varying sectors. In an operational context, being able to offer product
variety in conjunction with the availability of customised products, can again be
utilised to enhance the probability of providing a competitive advantage that can
assist or lead to gaining customers (Helo 2004, Scarvarda, Reichhart et al. 2010,
Bennett and Klug 2012).
In defining the theme variety Hines (2004), suggests it is when organisations vary
what they offer to suit the customer in accordance with their demands in relation
to the customization of products. Within SCM literature variety focuses upon the
prefix of what is on offer to customers in relation to the range of products and
services. Scarvarda, Reichhart et al. (2010) research into car manufacturing
highlights the issue that any form of variety to a final product, will in some way
add complexity to a supply chain’s operations. Their case study research focused
upon attaining variety to products in emerging and developed markets, with the
findings highlighting the inability to attain parity in what is offered to clients in
different markets. This should be seen as an important focus due to the previously
mentioned globalisation of markets. Organisations need to be aware that levels
of variety offered on identical products may change depending on the market.
The consequence of this is that suppliers are required to reduce the amount in
which this complexity will negatively affect the delivery of products. In turn, this
will determine their operational efficiency (Harrison and Hoek 2011). There are
key elements highlighted in relation to ensuring the theme variety can be
54 | P a g e
operationally achieved. For example, the correct match between product design
and the operational supply chain is crucial (Fisher 1997, Randall and Ulrich 2001,
Pero, Abdelkafi et al. 2010). This relationship and the importance of
understanding it from an operational perspective cannot be underestimated,
especially when it comes to cost efficiency. Randall and Ulrich (2001) suggest
that a large portion of supply chain costs are decided at the design stage. This is
due to decisions being made as to where products are sourced; manufactured
and distributed throughout the supply chain process. Whilst Pero, Abdelkafi et al.
(2010) highlight supply chains operational decision making will be influenced by
design in that outsourcing of materials, processes, location of manufacturing and
storage facilities. This in turn affects the overall supply chain structure and issues
will need to be considered when addressing the implementation of product design
changes.
In practice, Hines (2013) states that a particular product design needs to be
paired to a correct supply chain process, thus ensuring a higher level of
operational performance that can lead to a competitive advantage. Changes in
what a supply chain can offer needs to be achievable, or the supply chain may
not operate at the efficiency levels it was designed to achieve. When supply chain
processes are discussed within the literature, the overlapping with logistics is
apparent. This is evidenced within the research of Soosay, Hyland et al. (2008).
The focus of their research is centred around collaboration between supply chain
members that assists in increasing capabilities for continuous innovation.
Although their research does focus upon collaboration and innovation between
suppliers, it should be considered important to the attainment of variety. The
reason for this is that it is taking an operational perspective of how to deliver the
changes to products that come through variety.
55 | P a g e
These types of operations lead us to the literature associated to agile
manufacturing, which is the process and/or ability of maintaining good levels of
productivity in face of market uncertainty (Gattorna 2010). This uncertainty can
be the external environment, but also changes in customer demand in relation to
what they want from the product. According to Gunasekaran, Patel et al. (2003)
and (Helo 2004) it is how an organisation reacts to uncertainty and more
importantly prospers from this type of environment is again crucial to attaining a
competitive advantage. With specific reference to this type of environment the
theme variety comes into prominence. It is accepted that supply chain agility can
be achieved if an organisation can successfully offer a broad range of products
that are low costing but of high quality and delivered within a quick timescale.
Vokurka and Fliedner (1998) support the notion that products need to be available
in varying lot sizes and must provide value and variety for the customer. However,
Coman and Ronen (2009) note that concern is growing in certain sectors that the
increased levels of variety in products has a detrimental on supply chain
performance. This particular concern is related to the situation when supply lead-
time is long and demand has a level of uncertainty coupled together with product
variety being high which result in increased flow times (Christopher 2011). Supply
chain performance is impacted the greatest when critical materials cannot be
sourced earlier in the production process.
Within the literature there is clear evidence that variety in products or service can
lead to complexity of operations. This is apparent within the logistic process as a
supply chain becomes more complex, the more difficult it is to manage. Examples
of variety driving complexity are all too common. According to Harrison and Hoek
(2011) organisations are warned that the variety of a product should only be
increased if it adds value. Gattorna (2010) concludes that adding variety may

56 | P a g e
inevitably increase costs both directly and indirectly, whilst also bring additional
factors that need to be managed through strategic decision-making. In making
strategic decisions in relation to variety Harrison and Hoek (2011) highlights the
need for organisation to be able to manage external variety (the choice offered to
the customer) and internal variety (converts external variety into changes within
the supply chain) as a key process. The underlying themes highlighted by Hines
(2013) in relation to suppliers strategies being able to implement variety consists
of the considering phenomenon such as; cost implications, inventory holding,
modular manufacturing, complexity reduction, customization and co-creation.
This means that the value proposition to customers are aligned with being able
to offer a variety, range and choice of product. Table 2.6 has highlighted literature
where there is evidence of discussions related to the theme variety. This list is
not exhaustive and is drawn from various operational backgrounds to assist in
the conceptualisation of the theme.
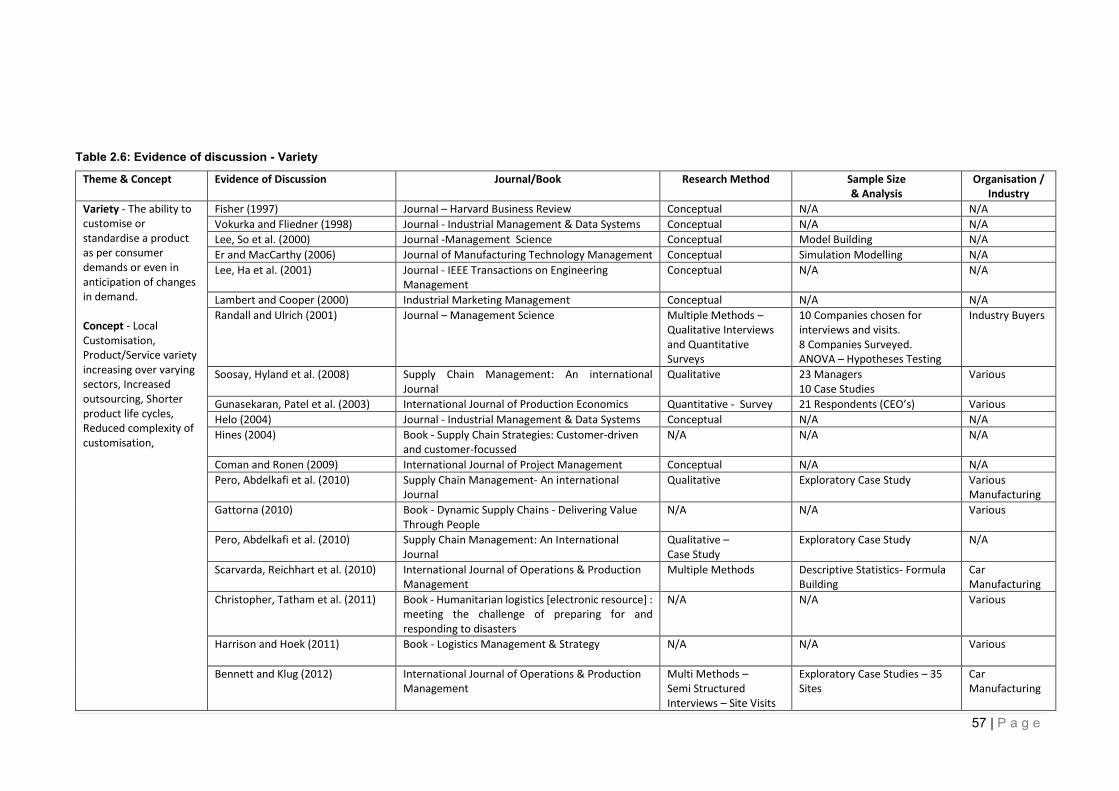
57 | P a g e
Table 2.6: Evidence of discussion - Variety
Theme & Concept Evidence of Discussion Journal/Book Research Method Sample Size & Analysis
Organisation / Industry
Variety - The ability to customise or standardise a product as per consumer demands or even in anticipation of changes in demand. Concept - Local Customisation, Product/Service variety increasing over varying sectors, Increased outsourcing, Shorter product life cycles, Reduced complexity of customisation,
Fisher (1997) Journal – Harvard Business Review Conceptual N/A N/A
Vokurka and Fliedner (1998) Journal - Industrial Management & Data Systems Conceptual N/A N/A
Lee, So et al. (2000) Journal -Management Science Conceptual Model Building N/A
Er and MacCarthy (2006) Journal of Manufacturing Technology Management Conceptual Simulation Modelling N/A
Lee, Ha et al. (2001) Journal - IEEE Transactions on Engineering Management
Conceptual N/A N/A
Lambert and Cooper (2000) Industrial Marketing Management Conceptual N/A N/A
Randall and Ulrich (2001) Journal – Management Science Multiple Methods – Qualitative Interviews and Quantitative Surveys
10 Companies chosen for interviews and visits. 8 Companies Surveyed. ANOVA – Hypotheses Testing
Industry Buyers
Soosay, Hyland et al. (2008) Supply Chain Management: An international Journal
Qualitative 23 Managers 10 Case Studies
Various
Gunasekaran, Patel et al. (2003) International Journal of Production Economics Quantitative - Survey 21 Respondents (CEO’s) Various
Helo (2004) Journal - Industrial Management & Data Systems Conceptual N/A N/A
Hines (2004) Book - Supply Chain Strategies: Customer-driven and customer-focussed
N/A N/A N/A
Coman and Ronen (2009) International Journal of Project Management Conceptual N/A N/A
Pero, Abdelkafi et al. (2010) Supply Chain Management- An international Journal
Qualitative Exploratory Case Study Various Manufacturing
Gattorna (2010) Book - Dynamic Supply Chains - Delivering Value Through People
N/A N/A Various
Pero, Abdelkafi et al. (2010) Supply Chain Management: An International Journal
Qualitative – Case Study
Exploratory Case Study N/A
Scarvarda, Reichhart et al. (2010) International Journal of Operations & Production Management
Multiple Methods Descriptive Statistics- Formula Building
Car Manufacturing
Christopher, Tatham et al. (2011) Book - Humanitarian logistics [electronic resource] : meeting the challenge of preparing for and responding to disasters
N/A N/A Various
Harrison and Hoek (2011) Book - Logistics Management & Strategy
N/A N/A Various
Bennett and Klug (2012) International Journal of Operations & Production Management
Multi Methods – Semi Structured Interviews – Site Visits
Exploratory Case Studies – 35 Sites
Car Manufacturing
58 | P a g e
2.3.6 Visibility
‘Ensure that the supply chain is transparent and all parties are able to see and avoid blockages and issues surrounding bottom heavy inventories’
The final two themes to be conceptualised are visibility and virtuality. These two
themes are closely linked within the extant literature. As highlighted in table 2.1
the concept of visibility requires transparency between members thus reducing
bullwhip. In turn, the utilisation of IT systems in communicating information is
crucial. In addition, information sharing ensures the pipeline is visible to all supply
chain members this will assist in the reduction of transaction risk. The following
section discusses these issues and introduces supporting literature that will allow
the conceptualisation of the theme.
The relationship between visibility and virtuality will be discussed in section 2.4,
however, to highlight the overlapping between these themes Gattorna (2010)
suggests that this visibility of information within a virtual setting is vital when
attempting to remove blockages (bullwhip) and excessive build-up of inventories.
The reasoning is that, systems are not just based with the customer
organisations, but also rather integrated throughout the supply chain (Christopher
2011). Thus ensuring visibility and sharing tangible information between all
supply chain members. Hines (2004) states the importance of organisations
focusing their efforts to assure that they have supply chains that are market-
driven informed through information sharing.
In essence, it is the requirements of customers that must be the focus of
developing strategies and delivery products in a speedy manner delivering quality
and utilising standard systems. Whilst visibility in supply chains is not a new
phenomenon or discussion within the literature, Caridi, Perego et al. (2013)
suggest that a single definition is yet to be agreed upon. A simplistic view by
59 | P a g e
Lamming (1996) is that visibility is the ability to access and share information
throughout the supply chain. In a similar manner Hines (2004) defines visibility
by the capability of all the stakeholders associated to the supply chain being in a
position to see the pipeline. More importantly from an operational sense he also
defines visibility as being able to ensure that the supply chain is transparent and
all parties are able to see and avoid any blockages and issues surrounding
bottom heavy inventories. For this to be possible Li and Liu (2006) emphasise
that levels of information sharing is crucial and that that two key aspects are
present ‘quality’ and ‘quantity’. This sharing of information and its link to visibility
is prominent with supply chain literature.
It is suggested that in order to gain a competitive advantage it is crucial that
supply chains ensure undistorted (and up to date) information is available
throughout the process and is widely accepted (Turner 1993, Novack, Langley Jr
et al. 1995, Balsmerier and Voisin 1996, Towill 1997, Jones 1998, Childerhouse
and Towill 2003). The flow of information between supply chain managers has
become a critical factor in the success of supply chains (Power 2005).
Traditionally supply chain members would work in the dark with lack of
information and information sharing between each party and according to
Patnayakuni, Ral et al. (2006), this increased transaction risk. It would also
ensure a greater chance of operational issues and unnecessary costs, which
could be avoided if resources had been pulled. In operational terms the
information key to ensuring visibility is available includes stock/inventory, events,
dates, outcomes, delivery schedules, shipping data. This information should be
available to supply chain members. When in place it allows for a coordinated
effort that in itself will assist in achieving performance improvements throughout
the process (Patnayakuni, Ral et al. 2006).
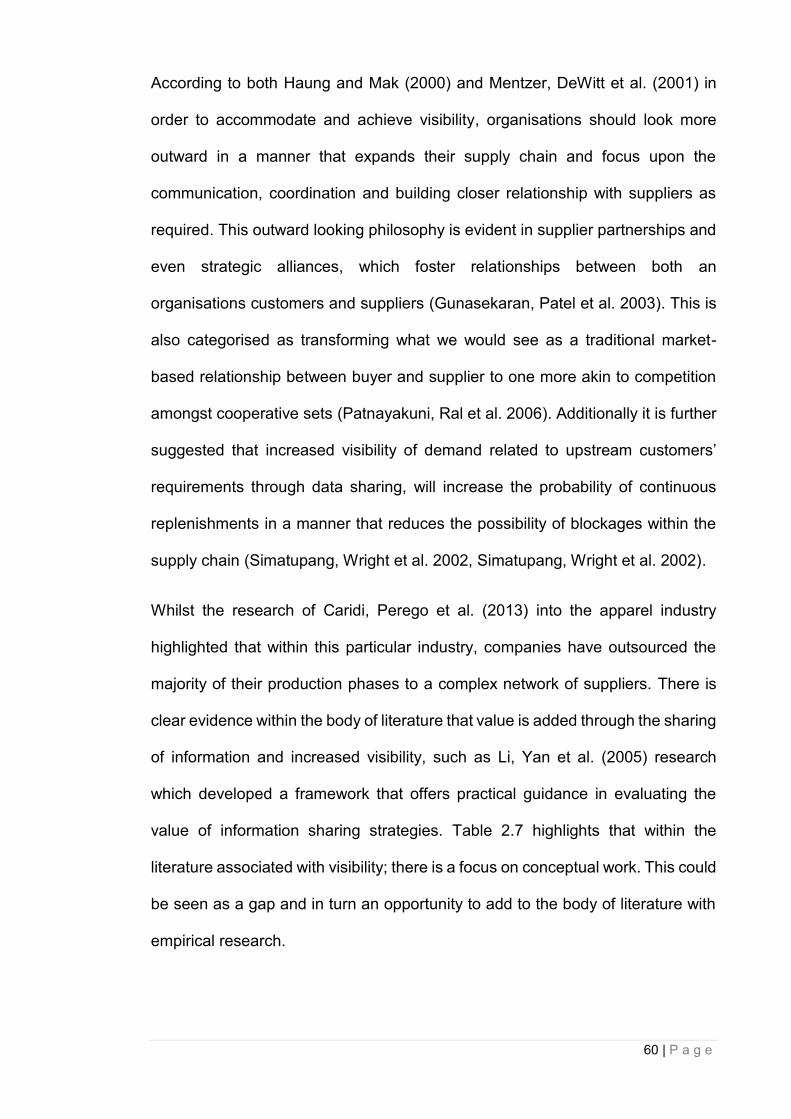
60 | P a g e
According to both Haung and Mak (2000) and Mentzer, DeWitt et al. (2001) in
order to accommodate and achieve visibility, organisations should look more
outward in a manner that expands their supply chain and focus upon the
communication, coordination and building closer relationship with suppliers as
required. This outward looking philosophy is evident in supplier partnerships and
even strategic alliances, which foster relationships between both an
organisations customers and suppliers (Gunasekaran, Patel et al. 2003). This is
also categorised as transforming what we would see as a traditional market-
based relationship between buyer and supplier to one more akin to competition
amongst cooperative sets (Patnayakuni, Ral et al. 2006). Additionally it is further
suggested that increased visibility of demand related to upstream customers’
requirements through data sharing, will increase the probability of continuous
replenishments in a manner that reduces the possibility of blockages within the
supply chain (Simatupang, Wright et al. 2002, Simatupang, Wright et al. 2002).
Whilst the research of Caridi, Perego et al. (2013) into the apparel industry
highlighted that within this particular industry, companies have outsourced the
majority of their production phases to a complex network of suppliers. There is
clear evidence within the body of literature that value is added through the sharing
of information and increased visibility, such as Li, Yan et al. (2005) research
which developed a framework that offers practical guidance in evaluating the
value of information sharing strategies. Table 2.7 highlights that within the
literature associated with visibility; there is a focus on conceptual work. This could
be seen as a gap and in turn an opportunity to add to the body of literature with
empirical research.
61 | P a g e
Table 2.7: Evidence of discussion - Visibility
Theme & Concept Evidence of Discussion Journal / Book Research Method Sample Size & Analysis
Organisation / Industry
Visibility - Ensure that the supply chain is transparent and all parties are able to see and avoid blockages and issues surrounding bottom heavy inventories. Transparency -between members, Bullwhip reduced, IT systems communicate, Information sharing.
Novack, Langley Jr et al. (1995)
Book - Council of Logistics Management N/A N/A N/A
Balsmerier and Voisin (1996)
Journal – Industrial Management Conceptual N/A N/A
Lamming (1996) International Journal of Operations and Production Management
Conceptual N/A N/A
Towill (1997) International Journal of the Techniques of Manufacturing Conceptual N/A N/A
Jones (1998) Journal – Logistics Focus Conceptual N/A N/A
Caridi, Perego et al. (2013)
Bench Marking: An International Journal Qualitative – Case Study 11 Case Studies Apparel Industry
Lee, So et al. (2000) Management Science Conceptual – Model Building N/A N/A
Haung and Mak (2000) Robotics and Computer-Integrated Manufacturing Conceptual N/A N/A
Mentzer, DeWitt et al. (2001)
Journal of Business Logistics Conceptual Paper N/A N/A
Simatupang, Wright et al. (2002)
Business Process Management Journal Conceptual N/A N/A
Childerhouse and Towill (2003)
OMEGA The International Journal of Science Multiple Methods -Qualitative – Interviews & Site visits Quantitative – Survey
32 Participants – Interviews & Questionnaires Analysis – Correlation – ANOVA
N/A
Li, Ragu-Nathan et al. (2004)
OMEGA The International Journal of Science Conceptual – Methods Approaches
Crosses multiple themes N/A
Gunasekaran, Patel et al. (2003)
International journal of production economics Quantitative - Survey
Descriptive Statistics – CEO
Various
Hines (2004) Book - Supply Chain Strategies: Customer-driven and customer-focussed
N/A N/A N/A
Simatupang, Wright et al. (2002)
Supply Chain Management: An international Journal Conceptual N/A N/A
Li and Liu (2006) International Journal of Production Economics Conceptual N/A N/A
Power (2005) Supply Chain Management: An International Journal Literature Review N/A N/A
Patnayakuni, Ral et al. (2006)
Journal of Management Information Systems Quantitative - Survey
110 Respondents Factor Analysis and Descriptive statistics
Manufacturing and Retail Organisations
Gattorna (2010) Book - Dynamic Supply Chains - Delivering Value Through People
N/A N/A N/A
Christopher (2011) Book Logistics & supply chain management N/A N/A N/A
62 | P a g e
2.3.7 Virtuality
‘The ability to manage and coordinate the supply chain using information technology’
Virtuality is defined by Hines (2004) as the ability to manage and coordinate the
supply chain using information technology. The system goals within an
operational supply chains that are attributed to virtuality and are expected to be
multi-dimensional, seek to minimise cost, improve service, enhance
communication between members and essentially increase flexibility in relation
to delivery and response time (Lancioni, Smith et al. 2000). According to Wu,
Yenigurt et al. (2006) the ability to manage the supply chains through the use of
information technology, has come to prominence in the corporate world. There
are also suggestions by Radjou (2003) that U.S manufacturers see the benefits
of IT as improving supply chain agility, higher efficiency, improved cycle time and
faster delivery of products to customers.
Bremer, Michilini et al. (2001) suggest that virtuality can be seen as an enterprise
having the ability to deliver upstream customers a service or product in which the
said enterprise would only have small amount of propriety competencies. Up until
the 1980s this was not easily achieved. This was mainly due to the reluctance of
supply chain partners to share databases (as suggested in attaining visibility) due
to their concerns of sensitive information being shared or misused by competitors
and handing them a competitive advantage. However, these attitudes have
changed and it is acknowledged within the literature with the implementation of
such systems as just-in-time (JIT) and point of sale data sharing programmes
and increasing use of the term virtuality (Simatupang, Wright et al. 2002,
Lancioni, Smith et al. 2003, Christopher 2011).

63 | P a g e
Ranganathan, Dhaliwal et al. (2004) suggest the impact of information technology
in relation to supply chain performance has become a focal point of interest since
the turn of the 20th century. There was evidence during that time of increased
investment by organisations in relation to their al IT capabilities, that led directly
to improved performance (Devaraj and Kohli 2003). With this increased
development of information communication technology (ICT) it has become
possible for companies to access real time reports related to all aspects of supply
chain logistics (Hines 2004).
Organisations taking advantage of integrated supply chains has increased as the
information and technology has become more easily accessible (Bowersox and
Calantone 1998, Williamson, Harrison et al. 2004). Further to this, Hines (2004)
suggests that in operational terms virtuality means that inventory can be replaced
with information by the creation of digital supply chains which are supported by
IT. According to Christopher (2011) due to the increase in information
technologies (IT) organisations now have the tools to gain an overview in real
time of the entire supply chain. In turn, this assists in the objective of meeting
clients demands and with such use can assist in changing cost and value
equation of a supply chain. Further to this, the increased use of IT as a tool to
share information and data between all members of the supply chain, is in
essence creating what is called a virtual supply chain (Harrison and Hoek 2011).
The levels of virtuality within organisational supply chains differ from one to
another, however, the extent of how much importance they put on it can be
measured against how much they embrace the concept of a networked value
chain (Webster, Sugdern et al. 2004). The research by Hadaya (2009) is one of
the few papers that focuses on the use of internet based IOISs to assist in the
integration of supply chain members processes.

64 | P a g e
Within supply chain literature, it seems as though it is as much about the
distributing of information as it is a physical product. In today’s competitive market
the use of the internet and again it is widely accepted that information systems
are an essential part of this business practice (Lancioni, Smith et al. 2003,
Christopher, Tatham et al. 2011). However, the research in this area is not
evolving as fast as the technology systems currently being utilised within supply
chains.
However, what can be taken from the literature is that the use of modern IT
systems, it makes the contacting and collaborating of suppliers around the world
more probable and allows new members to join the supply chain as and when
required (Kumar 2001). The benefits of such use seems to be the reduction in
supply chain costs, inventory and an improved speed of delivery and of course to
be able to share information in real time within a virtual supply chain paradigm
(Lee, So et al. 2000, Power, Sohal et al. 2001). The conceptualisation of the
theme virtuality sits comfortable within extant literature. Table 2.9 highlights from
the extant literature evidence of a discussion of virtuality. As shown there a solid
grounding of work.
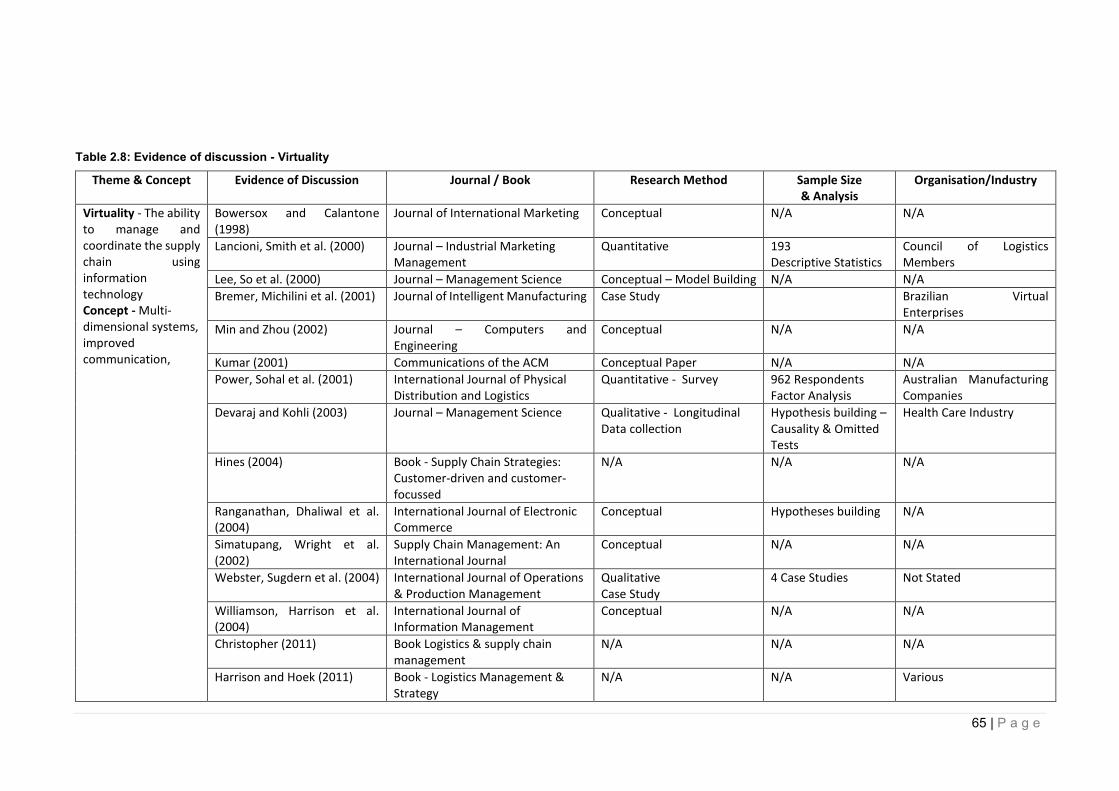
65 | P a g e
Table 2.8: Evidence of discussion - Virtuality
Theme & Concept Evidence of Discussion Journal / Book Research Method Sample Size & Analysis
Organisation/Industry
Virtuality - The ability to manage and coordinate the supply chain using information technology Concept - Multi-dimensional systems, improved communication,
Bowersox and Calantone (1998)
Journal of International Marketing Conceptual N/A N/A
Lancioni, Smith et al. (2000) Journal – Industrial Marketing Management
Quantitative 193 Descriptive Statistics
Council of Logistics Members
Lee, So et al. (2000) Journal – Management Science Conceptual – Model Building N/A N/A
Bremer, Michilini et al. (2001) Journal of Intelligent Manufacturing Case Study Brazilian Virtual Enterprises
Min and Zhou (2002) Journal – Computers and Engineering
Conceptual N/A N/A
Kumar (2001) Communications of the ACM Conceptual Paper N/A N/A
Power, Sohal et al. (2001) International Journal of Physical Distribution and Logistics
Quantitative - Survey 962 Respondents Factor Analysis
Australian Manufacturing Companies
Devaraj and Kohli (2003) Journal – Management Science Qualitative - Longitudinal Data collection
Hypothesis building – Causality & Omitted Tests
Health Care Industry
Hines (2004) Book - Supply Chain Strategies: Customer-driven and customer-focussed
N/A N/A N/A
Ranganathan, Dhaliwal et al. (2004)
International Journal of Electronic Commerce
Conceptual Hypotheses building N/A
Simatupang, Wright et al. (2002)
Supply Chain Management: An International Journal
Conceptual N/A N/A
Webster, Sugdern et al. (2004) International Journal of Operations & Production Management
Qualitative Case Study
4 Case Studies Not Stated
Williamson, Harrison et al. (2004)
International Journal of Information Management
Conceptual N/A N/A
Christopher (2011) Book Logistics & supply chain management
N/A N/A N/A
Harrison and Hoek (2011) Book - Logistics Management & Strategy
N/A N/A Various
66 | P a g e
2.3.8 In Conclusion – Contextualisation of themes
The literature in the previous section has been drawn from various sources, with
the main premise of a supply chain background and offering clarity on the
conceptualisation of themes within the framework. The literature embodying each
of the themes is not identical and is at times drawn from differing operational
perspectives. For example, volume-volatility literature is very much embedded
within supply chain management literature. Contrary to that although the theme
virtually is evidenced in supply chain literature, understanding has been gained
from management sciences and computing literature.
Interestingly, Caridi, Perego et al. (2013) within their research associated to
visibility that, although the theme has been studied by many authors, a single
definition has yet to be provided. This point could be attributed to all of the themes
within the framework. The literature surrounding certain themes is eclectic and
open to interpretation, specifically in regards to how much it relates to each
theme. By focusing on the definitions offered by Hines (2013), section 2.3 was
able to identify key literature that support the conceptualisation of each theme.
The tables within the section have highlighted a sample of the research
publication in which each theme is evidenced as being grounded within the extant
literature. This allows the study to accept the existence of individual themes
associated to the 7V Conceptual Framework. The first question sought from the
literature has been addressed in that these themes do exist outside the context
of the 7V Framework. This will allow the literature study to now seek clarity
regarding the identification of potential relationships between themes and then
identify potential CSFs. This in part will assist in the attainment of research
objective 1.

67 | P a g e
2.4 Existing relationships - 7V Themes
This section identifies potential relationships between themes of the 7V
Framework as is discussed within the extant literature. The purpose being that
assumptions could be made of the plausibility of all themes within the framework
being connected. Evidence of such relationships could offer testing the
relationship between all themes in their entirety justifiable.
In searching for relationships between themes, certain questions were asked. For
example, does a supply chains level of virtuality, increase the possibility of its
visibility? Alternatively, does velocity depended upon the supply chains virtuality
and visibility of its members? After a search of the extant literature, Table 2.9
was created to highlight where possible relationships have been identified. This
list is not exhaustive, but as previously highlighted offers evidence that
relationships are plausible. So what is it that facilitates this information flow and
visibility between organisations working within the supply chain?
In short, it is Information Technology (Virtuality) in addition to real time
communication (Visibility). Min and Zhou (2002) highlighted the clear link
between both these themes when suggesting the partnerships between supply
chain members cannot be fully utilised without sharing information through digital
means. This philosophy of information sharing is supported by Mentzer, DeWitt
et al. (2001) who state that information flows to each supply chain member
facilitated by IT, will have a positive effect on production and overall outputs.
The first of these plausible relationships is that of virtuality and visibility. Hines
(2013) highlights a clear link between the two in that transparency is required
within the supply chain and that information technology platforms can
communicate visibility to supply chain partners.
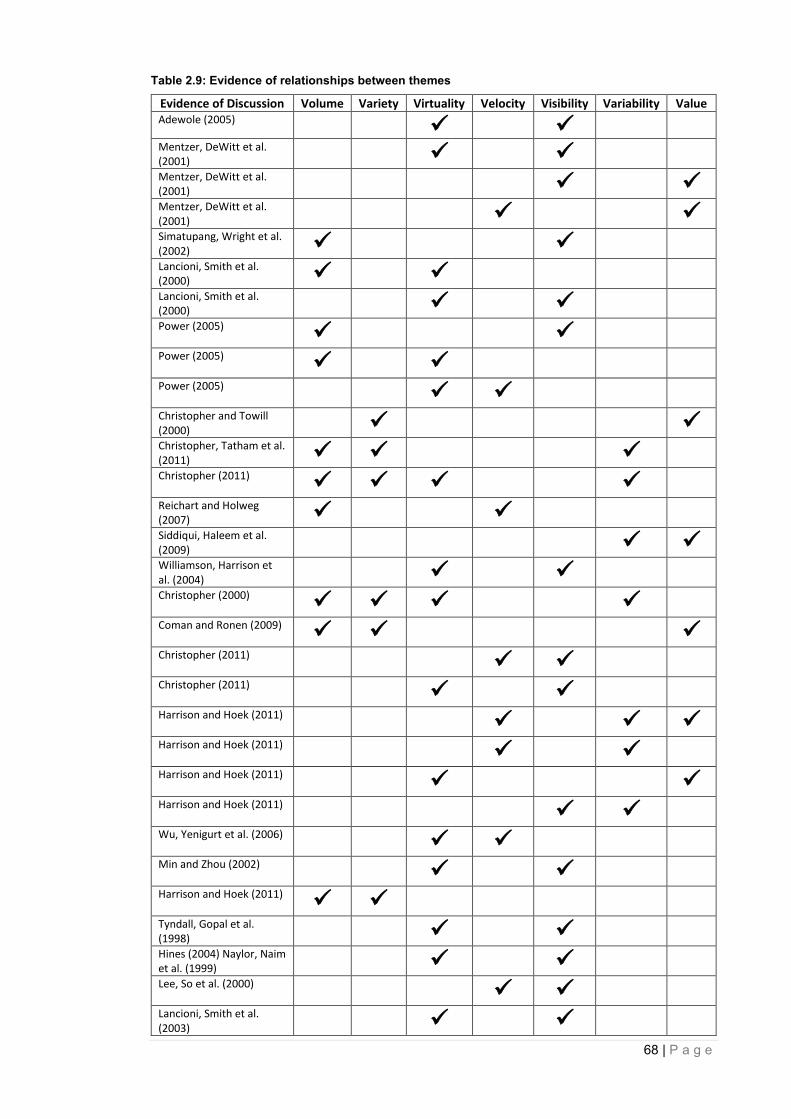
68 | P a g e
Table 2.9: Evidence of relationships between themes
Evidence of Discussion Volume Variety Virtuality Velocity Visibility Variability Value Adewole (2005)
Mentzer, DeWitt et al. (2001)
Mentzer, DeWitt et al. (2001)
Mentzer, DeWitt et al. (2001)
Simatupang, Wright et al. (2002)
Lancioni, Smith et al. (2000)
Lancioni, Smith et al. (2000)
Power (2005)
Power (2005)
Power (2005)
Christopher and Towill (2000)
Christopher, Tatham et al. (2011)
Christopher (2011)
Reichart and Holweg (2007)
Siddiqui, Haleem et al. (2009)
Williamson, Harrison et al. (2004)
Christopher (2000)
Coman and Ronen (2009)
Christopher (2011)
Christopher (2011)
Harrison and Hoek (2011)
Harrison and Hoek (2011)
Harrison and Hoek (2011)
Harrison and Hoek (2011)
Wu, Yenigurt et al. (2006)
Min and Zhou (2002)
Harrison and Hoek (2011)
Tyndall, Gopal et al. (1998)
Hines (2004) Naylor, Naim et al. (1999)
Lee, So et al. (2000)
Lancioni, Smith et al. (2003)
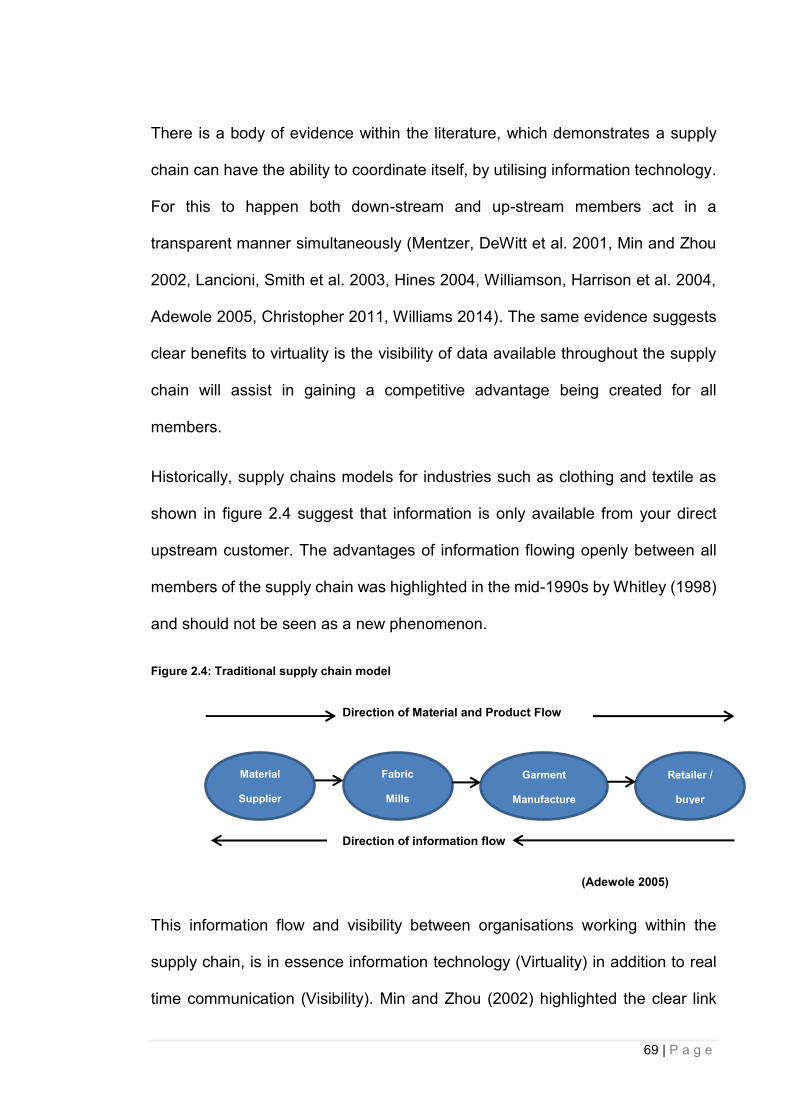
69 | P a g e
There is a body of evidence within the literature, which demonstrates a supply
chain can have the ability to coordinate itself, by utilising information technology.
For this to happen both down-stream and up-stream members act in a
transparent manner simultaneously (Mentzer, DeWitt et al. 2001, Min and Zhou
2002, Lancioni, Smith et al. 2003, Hines 2004, Williamson, Harrison et al. 2004,
Adewole 2005, Christopher 2011, Williams 2014). The same evidence suggests
clear benefits to virtuality is the visibility of data available throughout the supply
chain will assist in gaining a competitive advantage being created for all
members.
Historically, supply chains models for industries such as clothing and textile as
shown in figure 2.4 suggest that information is only available from your direct
upstream customer. The advantages of information flowing openly between all
members of the supply chain was highlighted in the mid-1990s by Whitley (1998)
and should not be seen as a new phenomenon.
Figure 2.4: Traditional supply chain model
Direction of Material and Product Flow
Direction of information flow
(Adewole 2005)
This information flow and visibility between organisations working within the
supply chain, is in essence information technology (Virtuality) in addition to real
time communication (Visibility). Min and Zhou (2002) highlighted the clear link
Retailer /
buyer
Garment
Manufacture
Fabric
Mills
Material
Supplier
70 | P a g e
between both these themes. They suggested partnerships between supply chain
members cannot be fully utilised without sharing information through digital
means. Information sharing is supported by Mentzer, DeWitt et al. (2001). They
state information that flows to each supply chain member facilitated by IT, will
have a positive effect on production and overall outputs.
Another theme proposed to have a direct relationship with virtuality is that of
velocity. Both Power (2005) and Lancioni, Smith et al. (2000) discuss the speed
in which products are delivered up the supply chain with the assistance of
technology can gain a competitive advantage to upstream customers if utilised
correctly. Whilst, Wu, Yenigurt et al. (2006) agrees virtuality capabilities can
increase velocity in which products move throughout the supply chain, they warn
of restrictions, especially if technology between supply chain members is not
compatible. This suggests that speed and efficiency of product movement
throughout the supply chain has a direct correlation with the technology available
between supply chain members.
With this probable relationship between velocity and virtuality in evidence, it is
justified to assume the apparent close connection between virtuality and volume
volatility. In turn, this relationship suggests a customer can take advantage of the
use of volume volatility management if they have access to a virtual management
system. Again both Christopher (2000) and Lancioni (2000) are in agreement
when suggesting volume demand can be addressed through virtual supply chain
information in real time. In addition, Power (2005) highlighted a clear link between
how volume can be managed through the use of information technology.
However, it should be noted that Scarvarda, Reichhart et al. (2010) warned speed
of delivery can in certain instances restrict the ability of customers taking
71 | P a g e
advantage of volume flexibility. This is prevalent if downstream suppliers are not
able to attain or hold the required inventory within restricted time periods. The
ability for customers to service demand for finished products, by identifying issues
within the supply chain, suggests the relationship between volume volatility and
visibility is possible.
The importance of this has been emphasized by both Simatupang, Wright et al.
(2002) and Power (2005) who see the identification of issues and knowledge
regarding capacity within the supply chain as being crucial for upstream
customers to understand how they can best meet the demands of their clients.
Helo (2004) and Scarvarda, Reichhart et al. (2010) suggest that in order to attain
value in an ever changing and competitive market, organisations are having to
differentiated products in smaller batches and reduce delivery times for their
customers. This highlights a possible relationship between the two themes of
variety and value. However, Christopher (2000) states the relationship between
value and variety has restrictions, in that the latter does not always guarantee the
former. In part Harrison and Hoek (2011) lend weight to the suggesting of a
possible relationship between these two themes, when stating that variety should
only be increased when leading to attainment of value.
It is a basic requirement of ‘Just in Time’ (JIT) delivery that quality of a product
should not be affected, even if the speed of delivery is increased. Mentzer, DeWitt
et al. (2001) support the notion that although speed is seen as a competitive
advantage it is only accepted if a product is delivered defect free.
Continuing from variability, Harrison and Hoek (2011) suggest that in order to
control variability, then velocity must be addressed as increased speed may affect
the quality being delivered. The theme of variability is also seen as having a
72 | P a g e
relationship with visibility as discussed by Wu, Yenigurt et al. (2006). This
suggests that by having transparency within the supply chain and reacting to the
issues highlighted causing delays, this will in turn help reduce quality defects in
a product. The final paired relationship examines how it is possible to increase
velocity and utilise it as a competitive advantage. There is clear evidence of the
necessity to have visibility within the supply chain (Hines 2004). Christopher
(2000) states that the relationship between velocity and visibility is crucial and
relates directly to the ability of suppliers to improve responsiveness. Whilst Lee,
So et al. (2000) highlight that the information sharing associated with visibility will
assist in the lead-time delivery linked to velocity. Having highlighted single
relationships thus far, next the focus turns towards suggested multiple
relationships between themes. The first multiple relationship is between that of
variety, variability and volume. Within the literature this relationship is discussed
around agile and lean SCM (Christopher 2011, Harrison and Hoek 2011).
Organisational supply chains are responding to uncertain volatility of demand.
This uncertainty means that the three themes of variety, variability and volume
are becoming increasingly intertwined. It is accepted that agile supply chains face
challenges such as turbulence in the market place whilst, ensuring that demand
for reduced lead times are met for low volume products. In essence, this type of
chain can rightly be seen as a pragmatic approach of suppliers focusing their
capabilities on what the demand may be from a customer (Harrison and Hoek
2011). These relationships may only be directly attributed agile supply chains, as
with specific reference to product variety is more likely to seen at a higher level
within this type of supply chain and in turn lower in a lean supply chain. In addition,
volume volatility would be less likely an issue within a lean supply chain with long
product life cycle usually associated to commodity type products that frequent
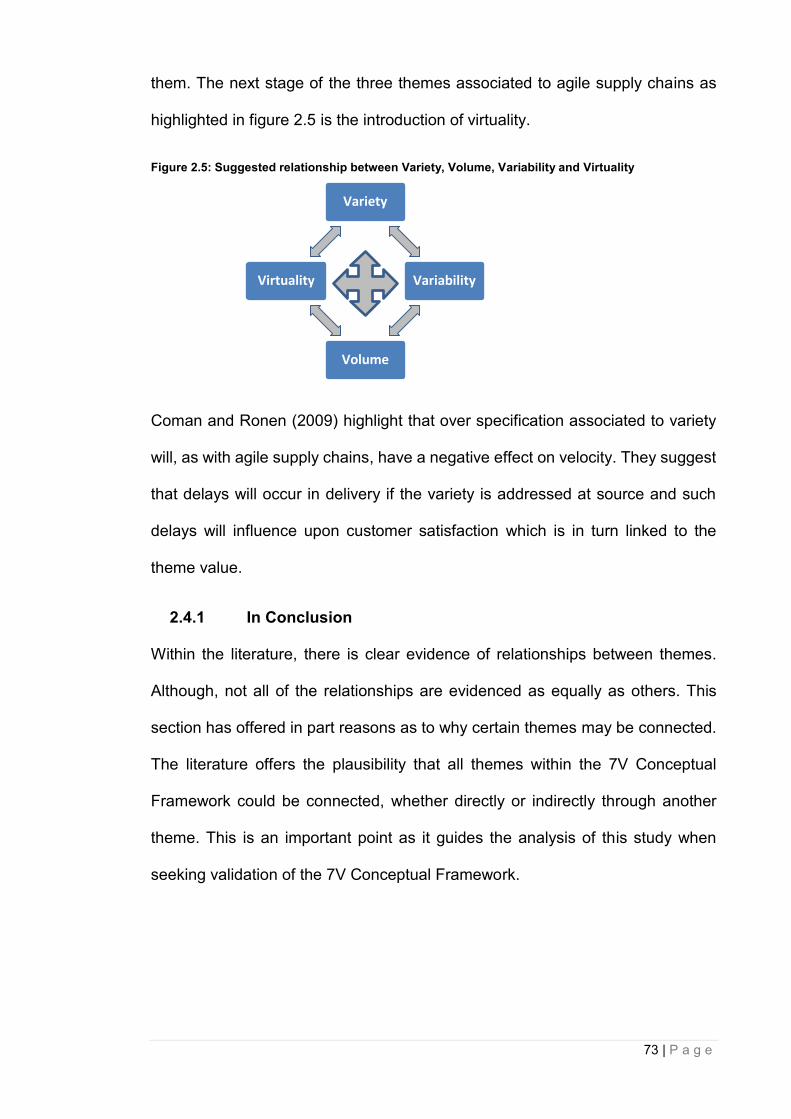
73 | P a g e
them. The next stage of the three themes associated to agile supply chains as
highlighted in figure 2.5 is the introduction of virtuality.
Figure 2.5: Suggested relationship between Variety, Volume, Variability and Virtuality
Coman and Ronen (2009) highlight that over specification associated to variety
will, as with agile supply chains, have a negative effect on velocity. They suggest
that delays will occur in delivery if the variety is addressed at source and such
delays will influence upon customer satisfaction which is in turn linked to the
theme value.
2.4.1 In Conclusion
Within the literature, there is clear evidence of relationships between themes.
Although, not all of the relationships are evidenced as equally as others. This
section has offered in part reasons as to why certain themes may be connected.
The literature offers the plausibility that all themes within the 7V Conceptual
Framework could be connected, whether directly or indirectly through another
theme. This is an important point as it guides the analysis of this study when
seeking validation of the 7V Conceptual Framework.
Variety
Variability
Volume
Virtuality
74 | P a g e
2.5 Contextualising CSFs within SCM
The term critical success factors (CSFs) is widely used throughout operational
literature to describe key variables that are crucial to the outcome of an event.
Within the project management field, researchers such as Bellasi and Tukel
(1996) have undertaken seminal work in identifying which CSFs are critical to a
project successful delivery. Since then a pattern has emerged where researchers
have continually produced individual lists of CSFs, associated to different facets
of project management (Chua, Kog et al. 1999, Fortune and White 2006, Bryde
2008, Pinto and Slevin 1988).
Within strategic management literature, CSFs such as planning, good leadership,
communication, product innovation, Total Quality Management (TQM) and
marketing are seen as critical issues that need addressing to ensure the overall
organisational objectives are met (Black and Porter 1996, Mazzarol 1998,
Appelbaum 2000, Cooper 2003).
There are difficulties in defining CSFs. The reasoning is that CSFs can be
different or similar from industry to industry, project to project and in the context
of this research supply chain to supply chain. At this point it is important to give
contextualisation of what a CSF actually encompasses. Throughout the literature
CSFs are not always described in the same manner or even discussed using the
term. Although the language used can be seen as being similar, some
interpretation of the literature is required. Therefore, for the purpose of this study,
a ‘CSF is a variable that if not managed will affect the outcome of an event or
process within a supply chain’. Historically, research undertaken within the SCM
directly attributed to CSFs is still developing.
75 | P a g e
Elmuti (2002) seminal research is a rare attempt to bring some clarity to the area
with SCM. Similar to the way that Bellasi and Tukel (1996) created a list of CSF
in relation to project management research, Elmuti (2002) identified a list of
fourteen factors attributed to the success and failure of supply chains operations.
These CSFs will be discussed in relation to specific themes later in this chapter.
Within the literature CSFs are discussed from varying operational perspectives
such as agile and lean supply chains (Power, Sohal et al. 2001) and TQM (Talib
and Rahman 2011). These discussions are also focused around specific
industries as differing case studies have been utilised for researched purposes.
For example Weightman (2004) highlighted success factors in fresh produce
supply chains, good staff, customer relationship, and communication as being
key to the successful outcome. Similarly, Thoo, Huam et al. (2011) quantitative
research within the Malaysian manufacturing industry highlighted generic CSFs
such as customer relationships; Information Technology; Corporate culture and
material flow management. When identifying CSFs it takes a level of
interpretation from the literature. Not all CSFs are labelled as such and efforts are
made to justify their inclusion. The following sub-sections identify possible CSFs
associated to each of the themes within the 7V Framework. This focuses on
addressing the third question asked of the literature, which was ‘what are the
factors critical to the successful management of supply chains’?
2.5.1 CSFs associated to Value
When defining value in relation to the 7Vs conceptual framework, Hines (2004)
relates value throughout the products life cycle. This allows the study to identify
CSFs beyond the point of sale and ascertain if further CSFs can be identified
within the literature post-delivery. This is supported by Kumar (2001) who
suggests supply chains do not terminate once the goods or services are
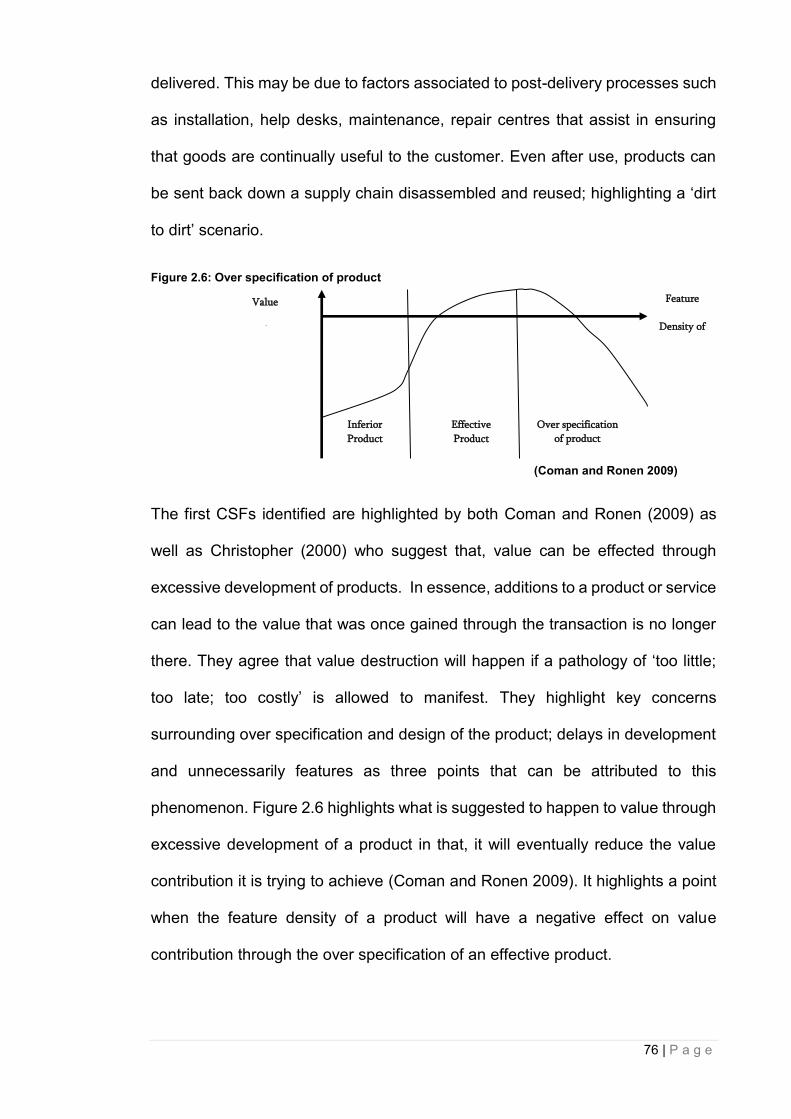
76 | P a g e
delivered. This may be due to factors associated to post-delivery processes such
as installation, help desks, maintenance, repair centres that assist in ensuring
that goods are continually useful to the customer. Even after use, products can
be sent back down a supply chain disassembled and reused; highlighting a ‘dirt
to dirt’ scenario.
Figure 2.6: Over specification of product
(Coman and Ronen 2009)
The first CSFs identified are highlighted by both Coman and Ronen (2009) as
well as Christopher (2000) who suggest that, value can be effected through
excessive development of products. In essence, additions to a product or service
can lead to the value that was once gained through the transaction is no longer
there. They agree that value destruction will happen if a pathology of ‘too little;
too late; too costly’ is allowed to manifest. They highlight key concerns
surrounding over specification and design of the product; delays in development
and unnecessarily features as three points that can be attributed to this
phenomenon. Figure 2.6 highlights what is suggested to happen to value through
excessive development of a product in that, it will eventually reduce the value
contribution it is trying to achieve (Coman and Ronen 2009). It highlights a point
when the feature density of a product will have a negative effect on value
contribution through the over specification of an effective product.
Value
Contribution
Inferior
Product
Effective
Product
Over specification
of product
Feature
Density of
product
77 | P a g e
Heikkila (2002) also warns that over development of product specification or
customisation needs to be treated as a balancing act. Thus suggesting that if
organisations go too far with customisation, then they run the risk of ruining
efficiency. In turn, an approach that is too rigid and not offering any customisation
could in fact affect the outcome of customer satisfaction. With value being a term
that is widely used throughout SCM literature, there is at time overlaps with some
of the other themes discussed. For example, value’s importance in relation to the
theme velocity in that competitive advantage is not just gained by speed of
delivery but also with a reliable defect free product (Mentzer, DeWitt et al. 2001).
In essence, customers seek value in products delivered at speed and on time
and undamaged highlighting, that to attain value more than one variable must be
present (Heikkila 2002).
It is clear that with this ever-changing business environment, more is demanded
from supply chain members and as such, they must be flexible to customers’
requirements in order to deliver the value required. It may be possible for
customer’s satisfaction to be met if a supplier can achieve the value levels that
these customers demand. Therefore, focusing on the improvement of customer
satisfaction can benefit an organisations competitive advantage and assist in the
continual relationship between these parties (Giunipero and Brand 1996). The
importance of this is that the value a firm creates, will assist in attaining the
competitive advantage it seeks (Porter 1985). Key factors for supply chain
strategies to be successful and attain value for customers, requires organisations
at times to look beyond their own operations. These organisations need to focus
upon a supply chain strategy that champions cooperation and collaboration
between partners in a manner that fosters integration. This will be possible
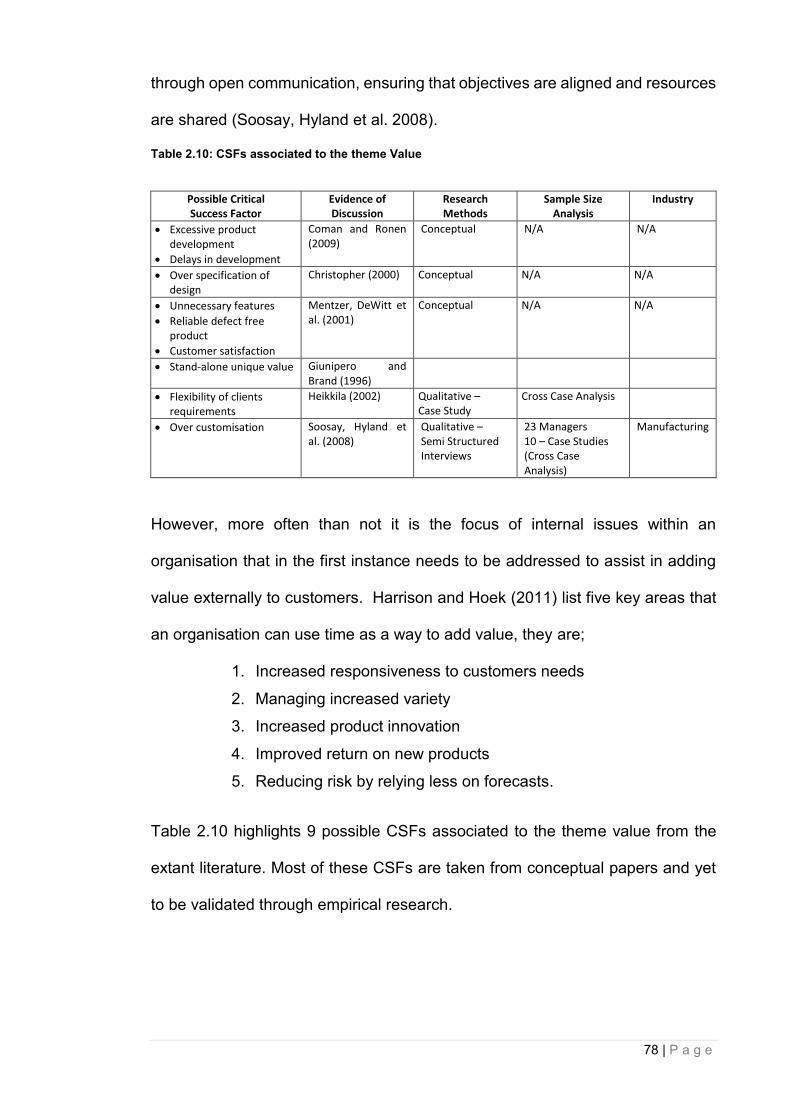
78 | P a g e
through open communication, ensuring that objectives are aligned and resources
are shared (Soosay, Hyland et al. 2008).
Table 2.10: CSFs associated to the theme Value
Possible Critical Success Factor
Evidence of Discussion
Research Methods
Sample Size Analysis
Industry
Excessive product development
Delays in development
Coman and Ronen (2009)
Conceptual N/A N/A
Over specification of design
Christopher (2000) Conceptual N/A N/A
Unnecessary features
Reliable defect free product
Customer satisfaction
Mentzer, DeWitt et al. (2001)
Conceptual N/A N/A
Stand-alone unique value Giunipero and Brand (1996)
Flexibility of clients requirements
Heikkila (2002) Qualitative – Case Study
Cross Case Analysis
Over customisation Soosay, Hyland et al. (2008)
Qualitative – Semi Structured Interviews
23 Managers 10 – Case Studies (Cross Case Analysis)
Manufacturing
However, more often than not it is the focus of internal issues within an
organisation that in the first instance needs to be addressed to assist in adding
value externally to customers. Harrison and Hoek (2011) list five key areas that
an organisation can use time as a way to add value, they are;
1. Increased responsiveness to customers needs
2. Managing increased variety
3. Increased product innovation
4. Improved return on new products
5. Reducing risk by relying less on forecasts.
Table 2.10 highlights 9 possible CSFs associated to the theme value from the
extant literature. Most of these CSFs are taken from conceptual papers and yet
to be validated through empirical research.
79 | P a g e
2.5.2 CSFs associated to Volume-Volatility
Scarvarda, Reichhart et al. (2010) discuss the characteristics of volume-volatility
when using the term volume-flexibility. They see volume-flexibility as the supply
chains ability to adjust and alter predetermined delivery agreements. Further to
this they suggest that part of being flexible is the ability to change the location of
the final output of a supply chain as and when required. This notion offers
customers the flexibility to manage their own businesses in markets that may be
more volatile and reduce their own risk.
The importance of this needs to be emphasized as a factor critical to a supply
chains success. The reason being that subsequent changes in market conditions
need to be managed as these will lead to rapid changes in demand (Narasimham
and Das 2000, Power, Sohal et al. 2001). To meet these changes in demand
Christopher (2000) suggests supply chains must ensure that they are
synchronised to meet any peaks or troughs. Further highlighting the need for
economies of scales that are volume oriented. Others, such as Fisher (1997)
suggest pro-active risk avoidance strategy as a CSF, suggesting that companies
employ accurate forecasting. Alternatively, Power (2005) states it is possible to
mitigate potential risk, if organisations take care of the basics during the planning
stage instead of hoping for the ‘silver bullet’ solution. The importance of correct
decisions at the planning stage of the supply chain in relation to volume is critical
as is data accuracy being supply chain members (Fieldman and Muller 2003).
There is a general opinion that a practicality of delivering volume is that of
choosing the most reliable suppliers, also known as vendor selection (Wang,
Huang et al. 2004, Power 2005). In order to manage this process, it is key to have
selection criteria for suppliers in place before they are included in the supply
80 | P a g e
chain. According to Christopher (2000) this seems to be a critical factor as one’s
own supply chain can only be as flexible and manoeuvrable as its suppliers will
allow it to be. Narasimham and Das (2000) are in agreement with both
Christopher (2000) and Power (2005) when suggesting if manufacturers
themselves require rapid changes in supply, they need to have suppliers with
such capabilities.
Worryingly for organisations, research by Simpson (2007) highlights that less
than half have suitable evaluation processes in place to choose such suppliers.
Further to this Moller (2002) warns that clear alignment of the requirements and
what the system can deliver known as ‘system functionality’ is crucial. Due to the
constant changing of the business environment, the need for organisations to
become more responsive to clients’ needs is critical. Power (2005) argues that
organisations must look to be less lean and more agile in order to respond to
customer demands. According to Naylor, Naim et al. (1999), in a volatile market
an organisation that is agile and has market knowledge can take advantage and
can exploit more opportunities that are profitable. This is primarily due to agile
manufacturing being best placed to deal with fluctuations in demand, most
notable concerning volume and variety (Harrison and Hoek 2011).
In addition, organisations that respond to specific changes in demand related to
‘volume and variety’ can quickly be seen as agile, which can be more beneficial
to customers (Christopher 2000). Contrary to this, leanness is more akin to
specifically eliminating all waste, including improving on time to develop a value
stream and ensure a level schedule, which is more beneficial to the organisation
(Naylor, Naim et al. 1999).
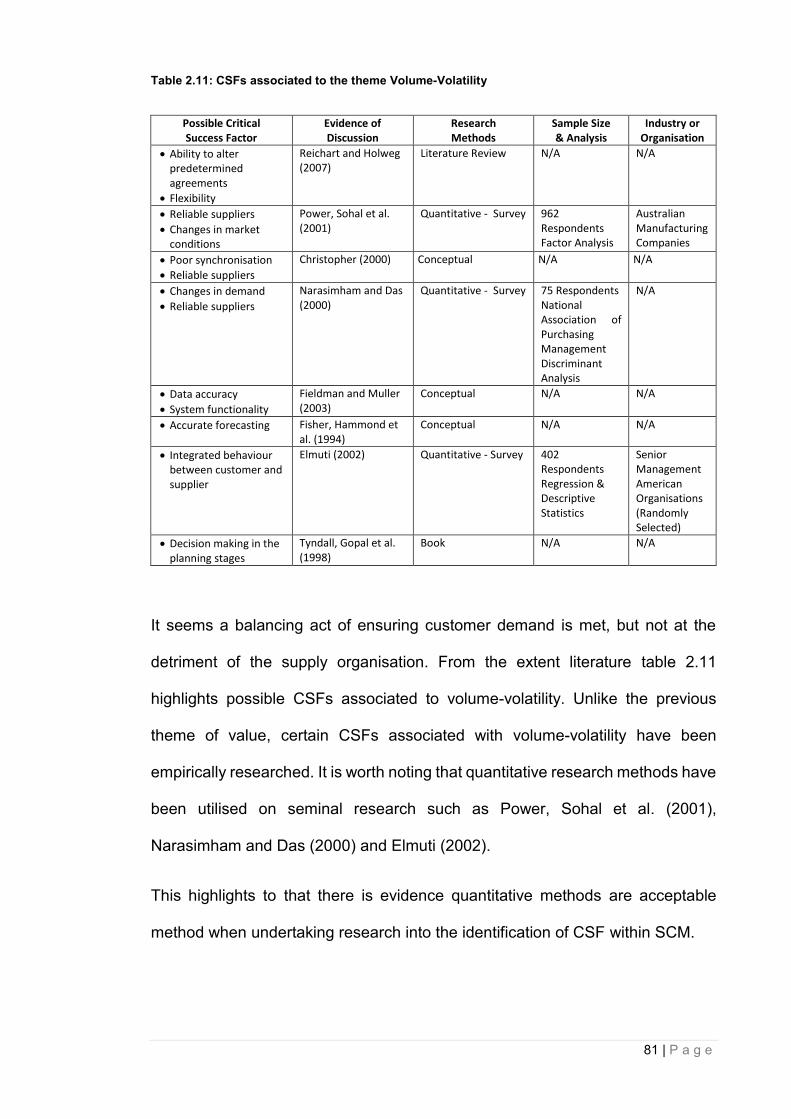
81 | P a g e
Table 2.11: CSFs associated to the theme Volume-Volatility
Possible Critical Success Factor
Evidence of Discussion
Research Methods
Sample Size & Analysis
Industry or Organisation
Ability to alter predetermined agreements
Flexibility
Reichart and Holweg (2007)
Literature Review N/A N/A
Reliable suppliers
Changes in market conditions
Power, Sohal et al. (2001)
Quantitative - Survey 962 Respondents Factor Analysis
Australian Manufacturing Companies
Poor synchronisation
Reliable suppliers
Christopher (2000) Conceptual N/A N/A
Changes in demand
Reliable suppliers
Narasimham and Das (2000)
Quantitative - Survey 75 Respondents National Association of Purchasing Management Discriminant Analysis
N/A
Data accuracy
System functionality
Fieldman and Muller (2003)
Conceptual N/A N/A
Accurate forecasting Fisher, Hammond et al. (1994)
Conceptual N/A N/A
Integrated behaviour between customer and supplier
Elmuti (2002) Quantitative - Survey 402 Respondents Regression & Descriptive Statistics
Senior Management American Organisations (Randomly Selected)
Decision making in the planning stages
Tyndall, Gopal et al. (1998)
Book N/A N/A
It seems a balancing act of ensuring customer demand is met, but not at the
detriment of the supply organisation. From the extent literature table 2.11
highlights possible CSFs associated to volume-volatility. Unlike the previous
theme of value, certain CSFs associated with volume-volatility have been
empirically researched. It is worth noting that quantitative research methods have
been utilised on seminal research such as Power, Sohal et al. (2001),
Narasimham and Das (2000) and Elmuti (2002).
This highlights to that there is evidence quantitative methods are acceptable
method when undertaking research into the identification of CSF within SCM.
82 | P a g e
2.5.3 CSFs associated to Velocity
The following subsection identifies possible CSFs associated with the theme
velocity. Scarvarda, Reichhart et al. (2010) research highlighted that with an ever-
increasing demand on products, it is critical for organisations to respond in a
timely manner to gain them that sought after competitive advantage. Tyndall,
Gopal et al. (1998), state that although speed of delivery may be important it is
critical that organisations put in place practicable timeframes for delivery and do
not over sell what can be achieved.
Historically, reduced competition meant that it was possible for manufacturers to
offer longer lead times. Due to the increasing competitive environment
consumers can now demand individualised well designed products delivered
promptly and directly to them. Kumar (2001) suggest additional pressure is put
on supply chains to achieve speed of delivery due to the regular changes in
customer tastes and demands.
According to Power (2005), the key critical factor in an organisation achieving a
competitive advantage through velocity lies with the reliability of its suppliers. This
suggests that a supply chain is only as fast as its slowest supplier, in the same
way that a relay team is as fast as its slowest man. Both Narasimham and Das
(2000) and (Power 2005) suggest that a critical issue is that the abilities of trading
partners are taken into account when judging what speed of delivery can be
achieved.
Within the literature, there is a clear relation between the discussion about
velocity and that of physical logistics (Bowersox and Calantone 1998, Handfield
and Nichols 1999, Power 2005). The management of physical inventories
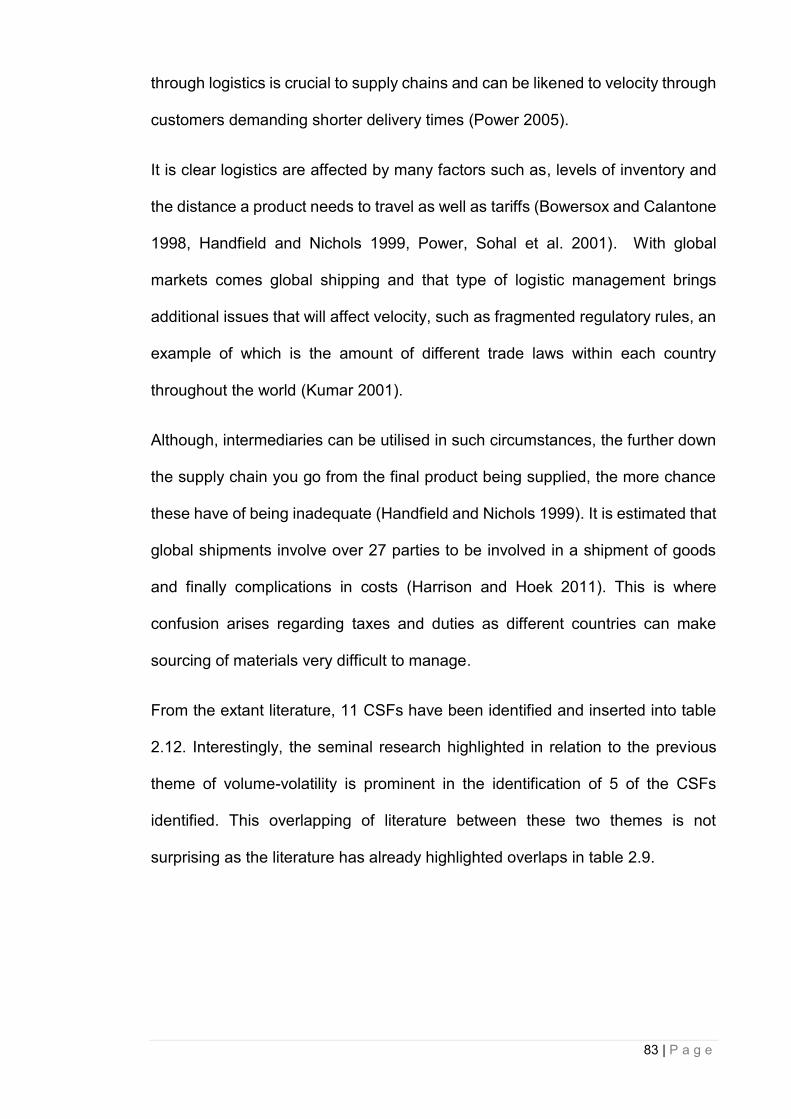
83 | P a g e
through logistics is crucial to supply chains and can be likened to velocity through
customers demanding shorter delivery times (Power 2005).
It is clear logistics are affected by many factors such as, levels of inventory and
the distance a product needs to travel as well as tariffs (Bowersox and Calantone
1998, Handfield and Nichols 1999, Power, Sohal et al. 2001). With global
markets comes global shipping and that type of logistic management brings
additional issues that will affect velocity, such as fragmented regulatory rules, an
example of which is the amount of different trade laws within each country
throughout the world (Kumar 2001).
Although, intermediaries can be utilised in such circumstances, the further down
the supply chain you go from the final product being supplied, the more chance
these have of being inadequate (Handfield and Nichols 1999). It is estimated that
global shipments involve over 27 parties to be involved in a shipment of goods
and finally complications in costs (Harrison and Hoek 2011). This is where
confusion arises regarding taxes and duties as different countries can make
sourcing of materials very difficult to manage.
From the extant literature, 11 CSFs have been identified and inserted into table
2.12. Interestingly, the seminal research highlighted in relation to the previous
theme of volume-volatility is prominent in the identification of 5 of the CSFs
identified. This overlapping of literature between these two themes is not
surprising as the literature has already highlighted overlaps in table 2.9.
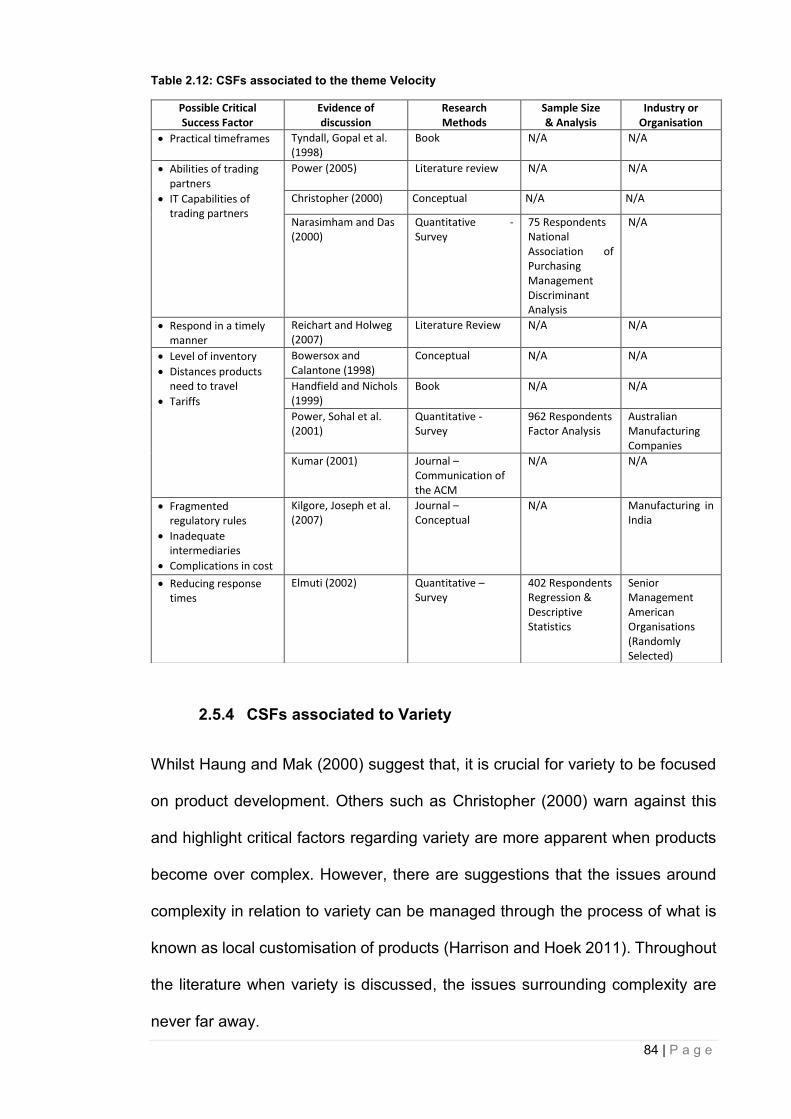
84 | P a g e
Table 2.12: CSFs associated to the theme Velocity
2.5.4 CSFs associated to Variety
Whilst Haung and Mak (2000) suggest that, it is crucial for variety to be focused
on product development. Others such as Christopher (2000) warn against this
and highlight critical factors regarding variety are more apparent when products
become over complex. However, there are suggestions that the issues around
complexity in relation to variety can be managed through the process of what is
known as local customisation of products (Harrison and Hoek 2011). Throughout
the literature when variety is discussed, the issues surrounding complexity are
never far away.
Possible Critical Success Factor
Evidence of discussion
Research Methods
Sample Size & Analysis
Industry or Organisation
Practical timeframes Tyndall, Gopal et al. (1998)
Book N/A N/A
Abilities of trading partners
IT Capabilities of trading partners
Power (2005)
Literature review N/A N/A
Christopher (2000) Conceptual N/A N/A
Narasimham and Das (2000)
Quantitative - Survey
75 Respondents National Association of Purchasing Management Discriminant Analysis
N/A
Respond in a timely manner
Reichart and Holweg (2007)
Literature Review N/A N/A
Level of inventory
Distances products need to travel
Tariffs
Bowersox and Calantone (1998)
Conceptual N/A N/A
Handfield and Nichols (1999)
Book N/A N/A
Power, Sohal et al. (2001)
Quantitative - Survey
962 Respondents Factor Analysis
Australian Manufacturing Companies
Kumar (2001) Journal – Communication of the ACM
N/A N/A
Fragmented regulatory rules
Inadequate intermediaries
Complications in cost
Kilgore, Joseph et al. (2007)
Journal – Conceptual
N/A Manufacturing in India
Reducing response times
Elmuti (2002) Quantitative – Survey
402 Respondents Regression & Descriptive Statistics
Senior Management American Organisations (Randomly Selected)
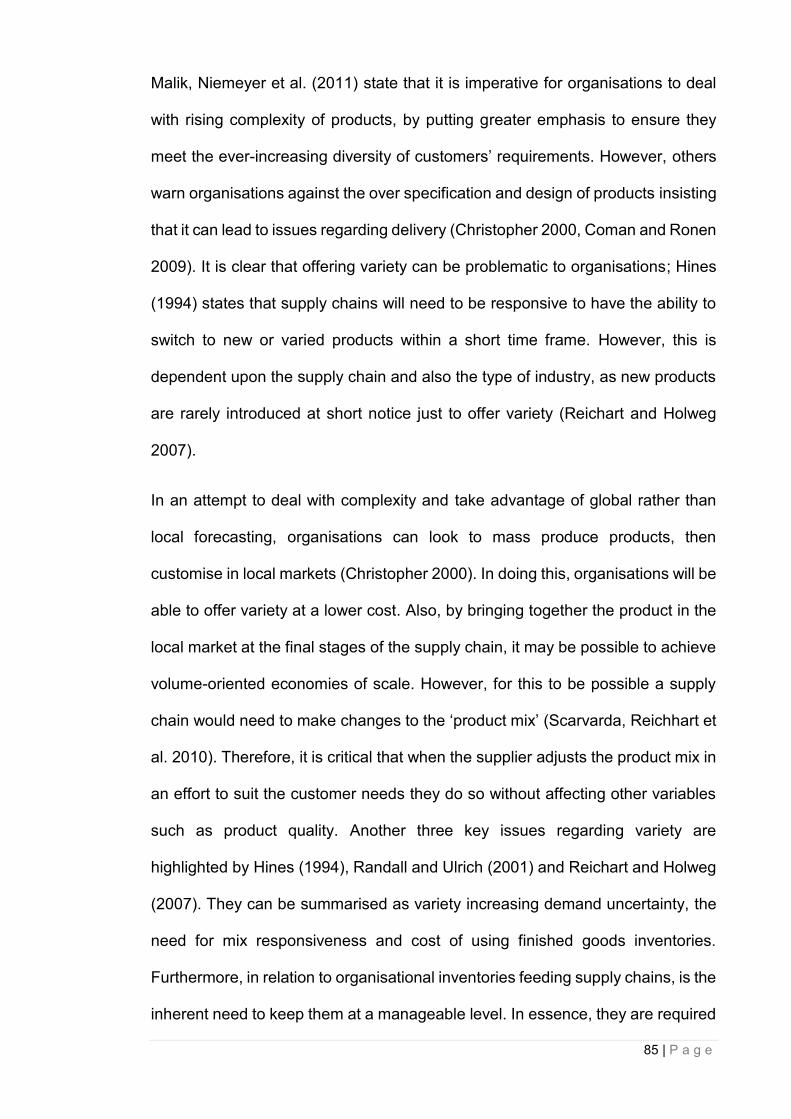
85 | P a g e
Malik, Niemeyer et al. (2011) state that it is imperative for organisations to deal
with rising complexity of products, by putting greater emphasis to ensure they
meet the ever-increasing diversity of customers’ requirements. However, others
warn organisations against the over specification and design of products insisting
that it can lead to issues regarding delivery (Christopher 2000, Coman and Ronen
2009). It is clear that offering variety can be problematic to organisations; Hines
(1994) states that supply chains will need to be responsive to have the ability to
switch to new or varied products within a short time frame. However, this is
dependent upon the supply chain and also the type of industry, as new products
are rarely introduced at short notice just to offer variety (Reichart and Holweg
2007).
In an attempt to deal with complexity and take advantage of global rather than
local forecasting, organisations can look to mass produce products, then
customise in local markets (Christopher 2000). In doing this, organisations will be
able to offer variety at a lower cost. Also, by bringing together the product in the
local market at the final stages of the supply chain, it may be possible to achieve
volume-oriented economies of scale. However, for this to be possible a supply
chain would need to make changes to the ‘product mix’ (Scarvarda, Reichhart et
al. 2010). Therefore, it is critical that when the supplier adjusts the product mix in
an effort to suit the customer needs they do so without affecting other variables
such as product quality. Another three key issues regarding variety are
highlighted by Hines (1994), Randall and Ulrich (2001) and Reichart and Holweg
(2007). They can be summarised as variety increasing demand uncertainty, the
need for mix responsiveness and cost of using finished goods inventories.
Furthermore, in relation to organisational inventories feeding supply chains, is the
inherent need to keep them at a manageable level. In essence, they are required
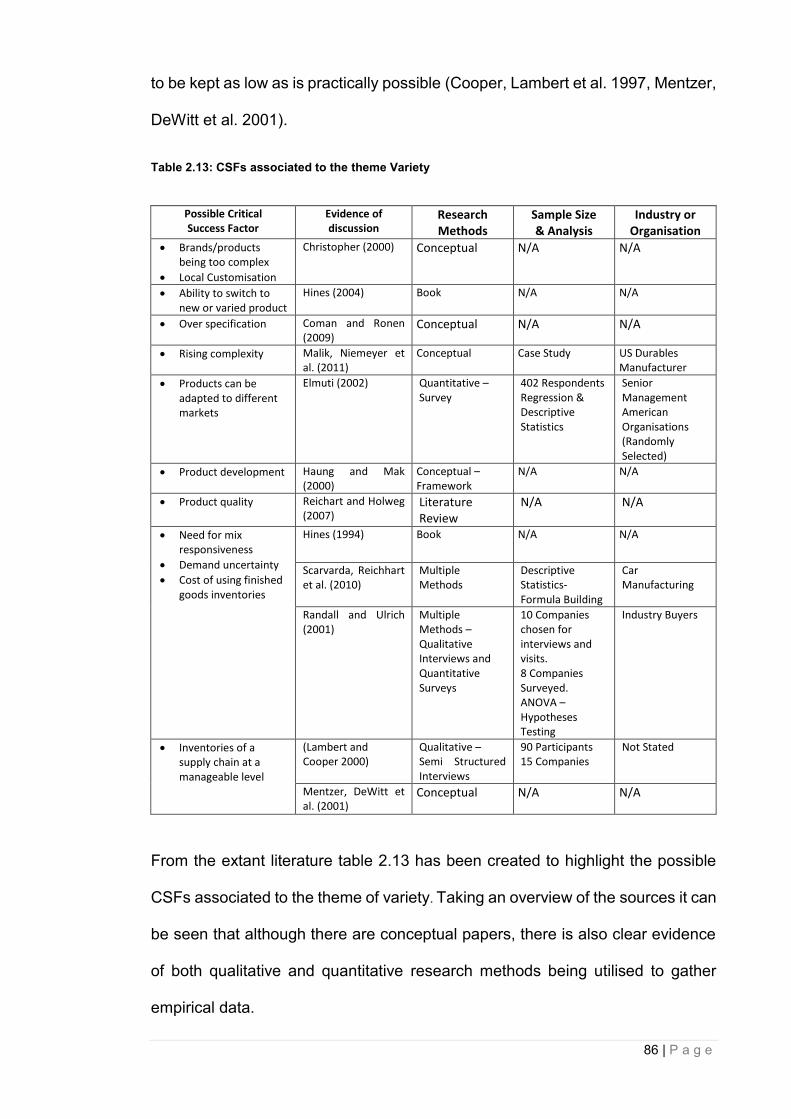
86 | P a g e
to be kept as low as is practically possible (Cooper, Lambert et al. 1997, Mentzer,
DeWitt et al. 2001).
Table 2.13: CSFs associated to the theme Variety
Possible Critical Success Factor
Evidence of discussion
Research Methods
Sample Size & Analysis
Industry or Organisation
Brands/products being too complex
Local Customisation
Christopher (2000) Conceptual N/A N/A
Ability to switch to new or varied product
Hines (2004) Book N/A N/A
Over specification Coman and Ronen (2009)
Conceptual N/A N/A
Rising complexity Malik, Niemeyer et al. (2011)
Conceptual Case Study US Durables Manufacturer
Products can be adapted to different markets
Elmuti (2002) Quantitative – Survey
402 Respondents Regression & Descriptive Statistics
Senior Management American Organisations (Randomly Selected)
Product development Haung and Mak (2000)
Conceptual – Framework
N/A N/A
Product quality Reichart and Holweg (2007)
Literature Review
N/A N/A
Need for mix responsiveness
Demand uncertainty
Cost of using finished goods inventories
Hines (1994)
Book N/A N/A
Scarvarda, Reichhart et al. (2010)
Multiple Methods
Descriptive Statistics- Formula Building
Car Manufacturing
Randall and Ulrich (2001)
Multiple Methods – Qualitative Interviews and Quantitative Surveys
10 Companies chosen for interviews and visits. 8 Companies Surveyed. ANOVA – Hypotheses Testing
Industry Buyers
Inventories of a supply chain at a manageable level
(Lambert and Cooper 2000)
Qualitative – Semi Structured Interviews
90 Participants 15 Companies
Not Stated
Mentzer, DeWitt et al. (2001)
Conceptual N/A N/A
From the extant literature table 2.13 has been created to highlight the possible
CSFs associated to the theme of variety. Taking an overview of the sources it can
be seen that although there are conceptual papers, there is also clear evidence
of both qualitative and quantitative research methods being utilised to gather
empirical data.
87 | P a g e
2.5.5 CSFs associated to Variability
According to Forker, Mendez et al. (1997), a specific CSF relating to quality is the
procurement of defect-free components. They also suggest that internal
operational practices and the relationship between customers and suppliers are
a factor that must be considered. Looking historically, Feigenbaum (1956)
suggests quality of design, incoming materials and shop-floor management are
to be considered as critical to achieve standards required. Moving forward in time,
management leadership, employee involvement and increased communications
have been seen as potential factors in attaining quality (Crosby 1979).
Before the turn of the 20th century, it was noted that organisations should
streamline supply bases when choosing suppliers. In essence, that focus should
not be on getting the cheapest deal but rather the best quality of supply (Deming
1986, Garvin 1998). Since the turn of the 20th century, additional CSF relating to
variability have become apparent within the literature. These include top
management support; leadership; benchmarking; employee training; teamwork;
technical systems; human resource management and finally customer
satisfaction orientation (Brah, Wong et al. 2000, Saravanan and Rao 2004,
Lakhel, Pasin et al. 2006, Samat, Ramayah et al. 2006, Al-Marri, Ahmed et al.
2007, Ueno 2008, Fotopoulos and Psomas 2009, Christopher 2011). From the
literature, it has been possible to extract the possible CSFs associated to the
theme variability and these are highlighted in table 2.14. The research that
encompasses the literature is loaded towards quantitative methods. Key research
such as Forker, Mendez et al. (1997), Ueno (2008), Brah, Wong et al. (2000) and
Fotopoulos and Psomas (2009) have utilised both exploratory and confirmatory
factor analysis. This would give justification to the use of such methods in the
confirmation of CSFs.
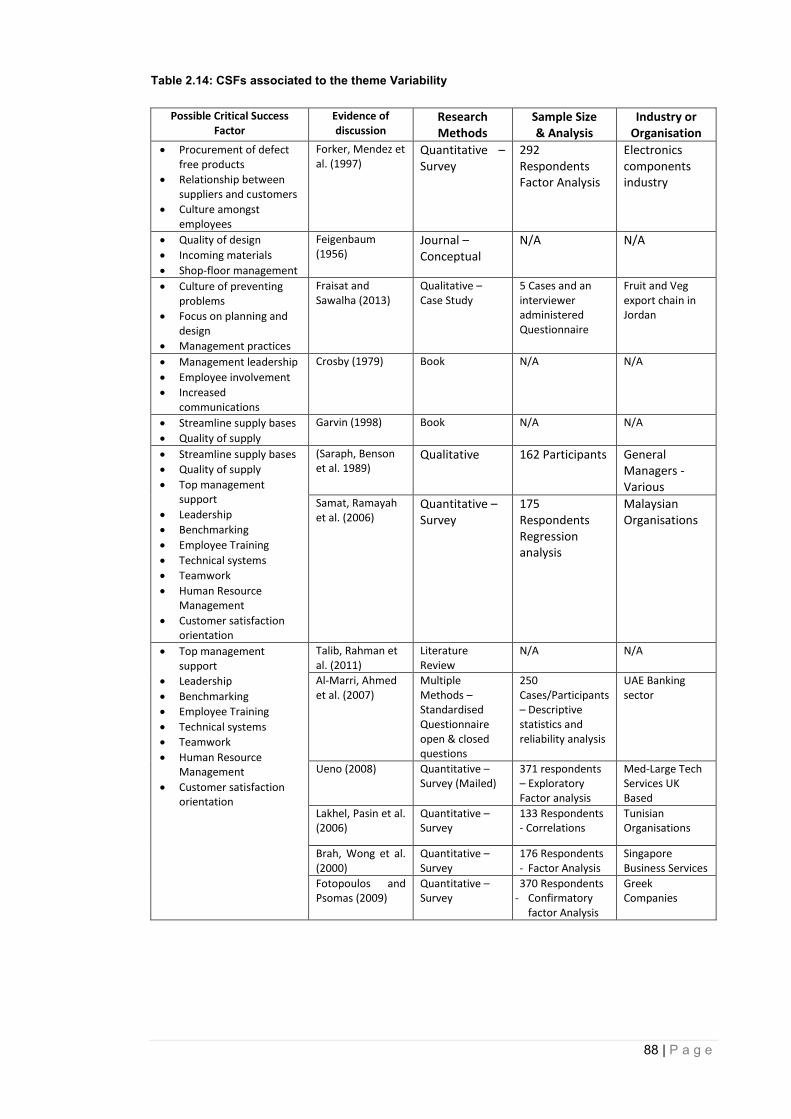
88 | P a g e
Table 2.14: CSFs associated to the theme Variability
Possible Critical Success Factor
Evidence of discussion
Research Methods
Sample Size & Analysis
Industry or Organisation
Procurement of defect free products
Relationship between suppliers and customers
Culture amongst employees
Forker, Mendez et al. (1997)
Quantitative – Survey
292 Respondents Factor Analysis
Electronics components industry
Quality of design
Incoming materials
Shop-floor management
Feigenbaum (1956)
Journal – Conceptual
N/A N/A
Culture of preventing problems
Focus on planning and design
Management practices
Fraisat and Sawalha (2013)
Qualitative – Case Study
5 Cases and an interviewer administered Questionnaire
Fruit and Veg export chain in Jordan
Management leadership
Employee involvement
Increased communications
Crosby (1979) Book N/A N/A
Streamline supply bases
Quality of supply
Garvin (1998)
Book N/A N/A
Streamline supply bases
Quality of supply
Top management support
Leadership
Benchmarking
Employee Training
Technical systems
Teamwork
Human Resource Management
Customer satisfaction orientation
(Saraph, Benson et al. 1989)
Qualitative 162 Participants General Managers - Various
Samat, Ramayah et al. (2006)
Quantitative – Survey
175 Respondents Regression analysis
Malaysian Organisations
Top management support
Leadership
Benchmarking
Employee Training
Technical systems
Teamwork
Human Resource Management
Customer satisfaction orientation
Talib, Rahman et al. (2011)
Literature Review
N/A N/A
Al-Marri, Ahmed et al. (2007)
Multiple Methods – Standardised Questionnaire open & closed questions
250 Cases/Participants – Descriptive statistics and reliability analysis
UAE Banking sector
Ueno (2008) Quantitative – Survey (Mailed)
371 respondents – Exploratory Factor analysis
Med-Large Tech Services UK Based
Lakhel, Pasin et al. (2006)
Quantitative – Survey
133 Respondents - - Correlations
Tunisian Organisations
Brah, Wong et al. (2000)
Quantitative – Survey
176 Respondents - Factor Analysis
Singapore Business Services
Fotopoulos and Psomas (2009)
Quantitative – Survey
370 Respondents - Confirmatory
factor Analysis
Greek Companies
89 | P a g e
2.5.6 CSFs associated to Visibility
The following section will investigate the CSFs suggested as being related to the
theme visibility. A key component related to visibility is that of relationships
between supply chain members. Towill (1997) suggests organisational
boundaries need to be overcome, even broken down in a manner that creates
one organisation as a way to increase transparency. The importance of
transparency is highlighted by Patnayakuni, Ral et al. (2006) who stress that poor
information visibility, will attribute to ‘bullwhip’ as far as supply and demand is
concerned. This is supported by Lee, So et al. (2000) suggested that ‘bullwhip’
may be overcome by increased transparency, in turn this would enable suppliers
to be more aware of the visibility of demand.
To accomplish visibility there are those that suggest, organisations must evolve
a culture of integration that encompasses both customers and suppliers
(Bowersox and Closs 1996, Mentzer, DeWitt et al. 2001). Chen, Lin et al. (2006)
discuss the positive side of integration; when a supplier is integrated into a well-
managed supply chain, the relationship built up will contribute to the
competitiveness of the supply chain in its entirety. It is clear within the literature
that visibility, integration and coordination overlap, however, they all point to the
same discussion. Cooper (2003) calls for the need for cooperation between
management not just at the point of sale but also throughout the full supply chain.
It is this cooperation that is seen as key to supply chain success and should begin
with the joint planning of the supply chain through to the way that the performance
of the supply chain is evaluated (Cooper, Lambert et al. 1997, Mentzer, DeWitt
et al. 2001).
There is further belief that relationships between suppliers that have been built
up over time, should be treated as a factor critical to success (Chen, Lin et al.
90 | P a g e
2006). Research by Mentzer, DeWitt et al. (2001) focusing on visibility, highlights
supply chain members having same goal and same focus; integration of key
processes; partners building and maintaining long-term relationships; strategic
alliances; information sharing; shared risks and rewards; organisational
compatibility; commitment from members; top management support as being key
to achieving visibility. Whilst Patnayakuni, Ral et al. (2006) research suggests
that the focus on collaboration of real time information between members is seen
as being imperative to the delivery of effective supply chains.
Although this phenomenon is a visibility issue, it is also related to that of volume
volatility, as this will allow suppliers to match supply with demand. Lee, So et al.
(2000) summarise the type of relationship needed between members of the
supply chain when discussing the need for ‘connectivity’. They also suggest that
this should not be restricted only to information relating to demand for a product
or levels of inventory, but also the interaction of multiple and collaborative working
relationships between each organisation. Froehlich, Hoover et al. (1999) highlight
further possible CSFs related to visibility in that certain organisations may have
entrenched business practices where employees may not be used to working in
such a manner.
This reiterates the stance taken by Power (2005); the ability of trading partners
to interact is a CSF. In essence, it seems that the willingness of partners to openly
share information that will dictate the possibility of visibility being utilised.
Therefore, research by Chen, Lin et al. (2006) indicates factors when choosing
supply chain partners such as close relationship, technological capacity, conflict
resolution, and profitability of supplier and conformance quality should also be
seen as a CSFs.
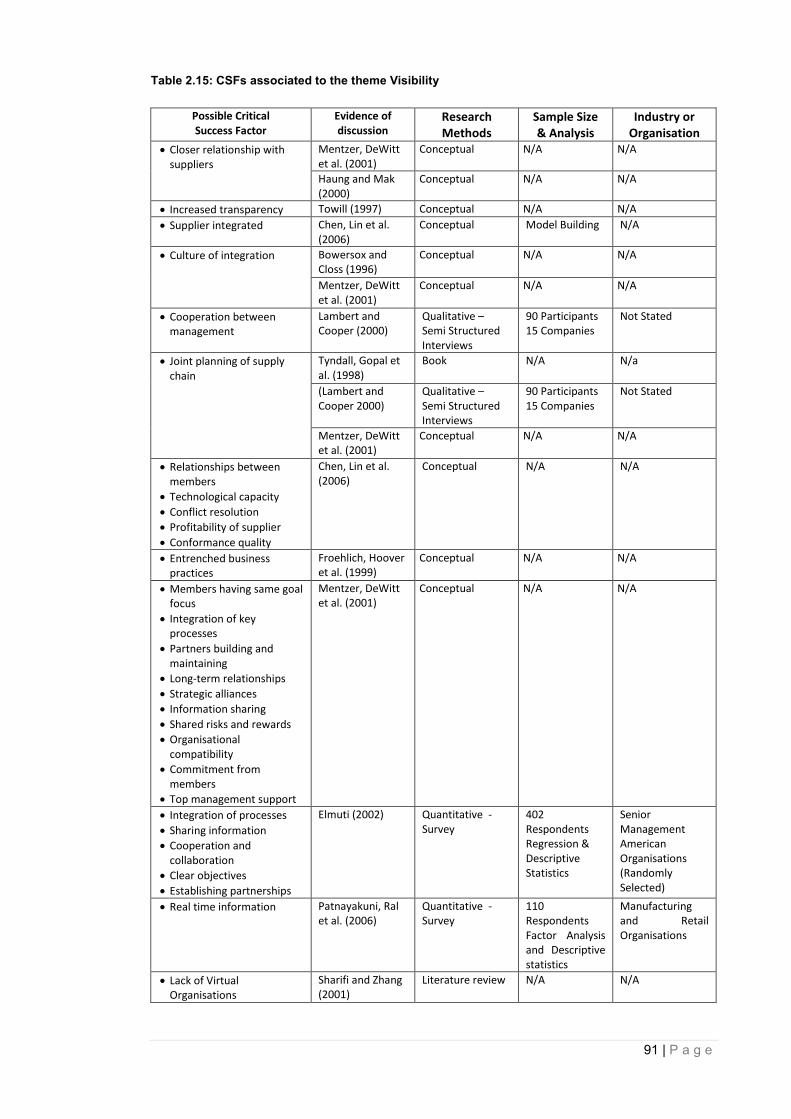
91 | P a g e
Table 2.15: CSFs associated to the theme Visibility
Possible Critical Success Factor
Evidence of discussion
Research Methods
Sample Size & Analysis
Industry or Organisation
Closer relationship with suppliers
Mentzer, DeWitt et al. (2001)
Conceptual N/A N/A
Haung and Mak (2000)
Conceptual N/A N/A
Increased transparency Towill (1997) Conceptual N/A N/A
Supplier integrated Chen, Lin et al. (2006)
Conceptual Model Building N/A
Culture of integration Bowersox and Closs (1996)
Conceptual N/A N/A
Mentzer, DeWitt et al. (2001)
Conceptual N/A N/A
Cooperation between management
Lambert and Cooper (2000)
Qualitative – Semi Structured Interviews
90 Participants 15 Companies
Not Stated
Joint planning of supply chain
Tyndall, Gopal et al. (1998)
Book N/A N/a
(Lambert and Cooper 2000)
Qualitative – Semi Structured Interviews
90 Participants 15 Companies
Not Stated
Mentzer, DeWitt et al. (2001)
Conceptual N/A N/A
Relationships between members
Technological capacity
Conflict resolution
Profitability of supplier
Conformance quality
Chen, Lin et al. (2006)
Conceptual N/A N/A
Entrenched business practices
Froehlich, Hoover et al. (1999)
Conceptual N/A N/A
Members having same goal focus
Integration of key processes
Partners building and maintaining
Long-term relationships
Strategic alliances
Information sharing
Shared risks and rewards
Organisational compatibility
Commitment from members
Top management support
Mentzer, DeWitt et al. (2001)
Conceptual N/A N/A
Integration of processes
Sharing information
Cooperation and collaboration
Clear objectives
Establishing partnerships
Elmuti (2002) Quantitative - Survey
402 Respondents Regression & Descriptive Statistics
Senior Management American Organisations (Randomly Selected)
Real time information Patnayakuni, Ral et al. (2006)
Quantitative - Survey
110 Respondents Factor Analysis and Descriptive statistics
Manufacturing and Retail Organisations
Lack of Virtual Organisations
Sharifi and Zhang (2001)
Literature review N/A N/A
92 | P a g e
From the literature it has been possible to identify 28 potential CSFs associated
with the theme visibility as shown in table 2.15. Within this literature there is a
body of conceptual work that is yet to be empirically researched.
2.5.7 CSFs associated to Virtuality
The following section identifies the CSFs related to the theme virtuality.
Previously, Naylor, Naim et al. (1999) discussed virtual supply chains in the form
of virtual co-operation. Lancioni, Smith et al. (2003) then stated managing vendor
relations as being critical to ensuring a smooth flow of information. At the turn of
the 20th century it was clear that critical issues relating to virtuality were focused
around the lack of partners having the virtual capacity (Sharifi and Zhang 2001).
It would be prudent when discussing virtuality to highlight that the research by
Sharifi and Zhang (2001) was undertaken in the late 90s, during which time it
could be argued that certain IT systems were in their infancy. However, this
research are still relevant today especially when we discuss supply chains in the
context of a global network with markets. It is possible that organisations in less
developed countries and more likely further down the supply chain, would have
varying levels of IT available to them. This is supported impart by both
Christopher (2000) and Gunasekaran, Patel et al. (2001) who state that the
specific issue relating to the integration of technological capabilities between
organisations is key to virtuality. In addition to this Christopher (2000) further
suggested that a joint strategy determination between supply team members and
transparency of information is critical to implementing virtual supply chains. It is
also clear within the literature that an organisation’s own technology may already
be in place before the IT requirements to join a new supply chain are known. This
means that existing IT might not be compatible or indeed advanced enough to be
integrated (Froehlich, Hoover et al. 1999). Williamson, Harrison et al. (2004)
93 | P a g e
suggest that this factor is important for organisations to be aware of in relation to
the time and cost of integration of IT systems and processes. It could lead to
supply chain members’ inability to produce accurate data that can be utilised
within a virtual supply chain. This in turn would highlight trustworthiness of
information as being a problem which other members would have to manage
(Froehlich, Hoover et al. 1999). It should be noted that, it is not only
trustworthiness of information that is a concern between supply chain members,
as Williamson, Harrison et al. (2004) highlight, but also the obvious security risks
associated to opening up of internal systems to external partners that worries
supply chain members.
The research by Williamson, Harrison et al. (2004) in this area primarily focuses
on the increased use of electronic data interchange (EDI) that incorporates a
value added network (VAN). The use of EDI systems is supplemented with other
processes such as TQM and ‘just in time’ (JIT) as a way to continually improve
the service that a customer receives. However, this process is not without its own
problems as it can be argued as being costly for smaller suppliers to implement
such technologies and processes. This leads to what they call an infrastructure
mismatch and more worryingly for a supplier, when connected to such a system
it can restrict their flexibility, especially when trying to deal with more than one
customer. This is mainly due to their inability and capacity to support specific
information technologies for each individual customer. Williamson, Harrison et
al. (2004) highlight, a survey by IBM of 33,000 companies worldwide which found
that less than 5 per cent of them could integrate their information systems with
external partners. They suggest the main reasons for such a statistic could be
issues surrounding contrasting or different IT operating systems and/or
applications. Mills (2001) then re-iterates the point that a comprehensive
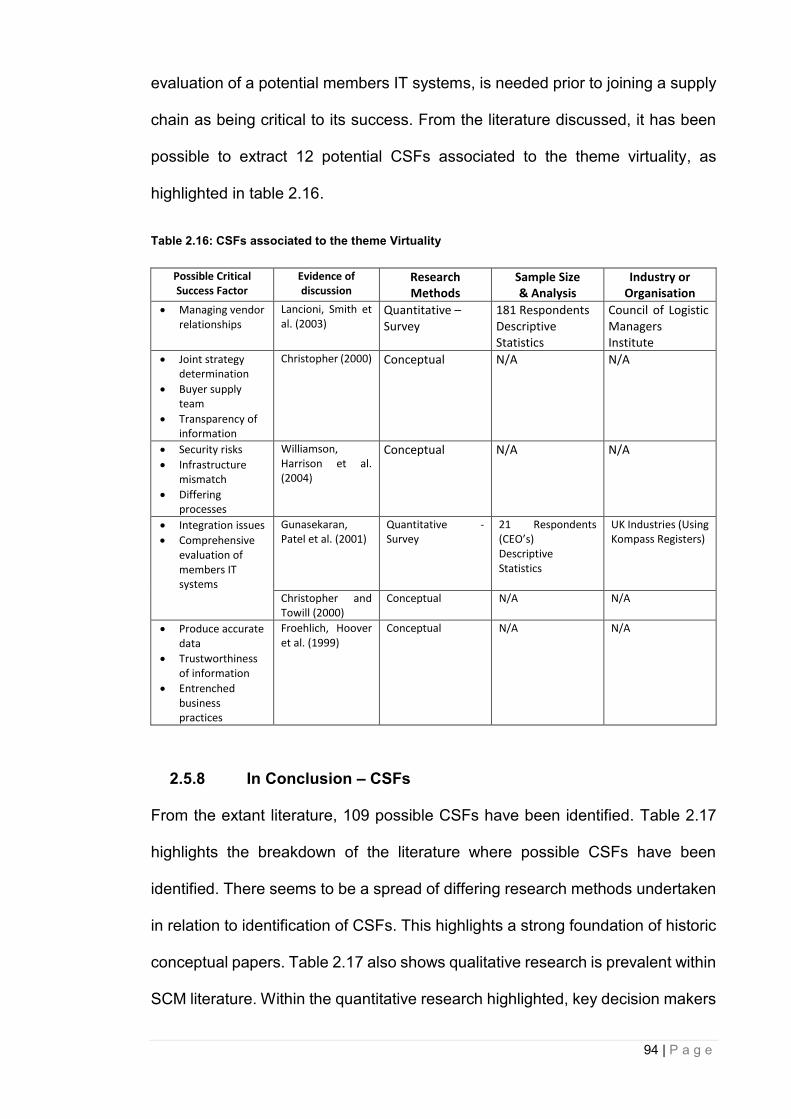
94 | P a g e
evaluation of a potential members IT systems, is needed prior to joining a supply
chain as being critical to its success. From the literature discussed, it has been
possible to extract 12 potential CSFs associated to the theme virtuality, as
highlighted in table 2.16.
Table 2.16: CSFs associated to the theme Virtuality
Possible Critical Success Factor
Evidence of discussion
Research Methods
Sample Size & Analysis
Industry or Organisation
Managing vendor relationships
Lancioni, Smith et al. (2003)
Quantitative – Survey
181 Respondents Descriptive Statistics
Council of Logistic Managers Institute
Joint strategy determination
Buyer supply team
Transparency of information
Christopher (2000) Conceptual N/A N/A
Security risks
Infrastructure mismatch
Differing processes
Williamson, Harrison et al. (2004)
Conceptual N/A N/A
Integration issues
Comprehensive evaluation of members IT systems
Gunasekaran, Patel et al. (2001)
Quantitative - Survey
21 Respondents (CEO’s) Descriptive Statistics
UK Industries (Using Kompass Registers)
Christopher and Towill (2000)
Conceptual N/A N/A
Produce accurate data
Trustworthiness of information
Entrenched business practices
Froehlich, Hoover et al. (1999)
Conceptual N/A N/A
2.5.8 In Conclusion – CSFs
From the extant literature, 109 possible CSFs have been identified. Table 2.17
highlights the breakdown of the literature where possible CSFs have been
identified. There seems to be a spread of differing research methods undertaken
in relation to identification of CSFs. This highlights a strong foundation of historic
conceptual papers. Table 2.17 also shows qualitative research is prevalent within
SCM literature. Within the quantitative research highlighted, key decision makers
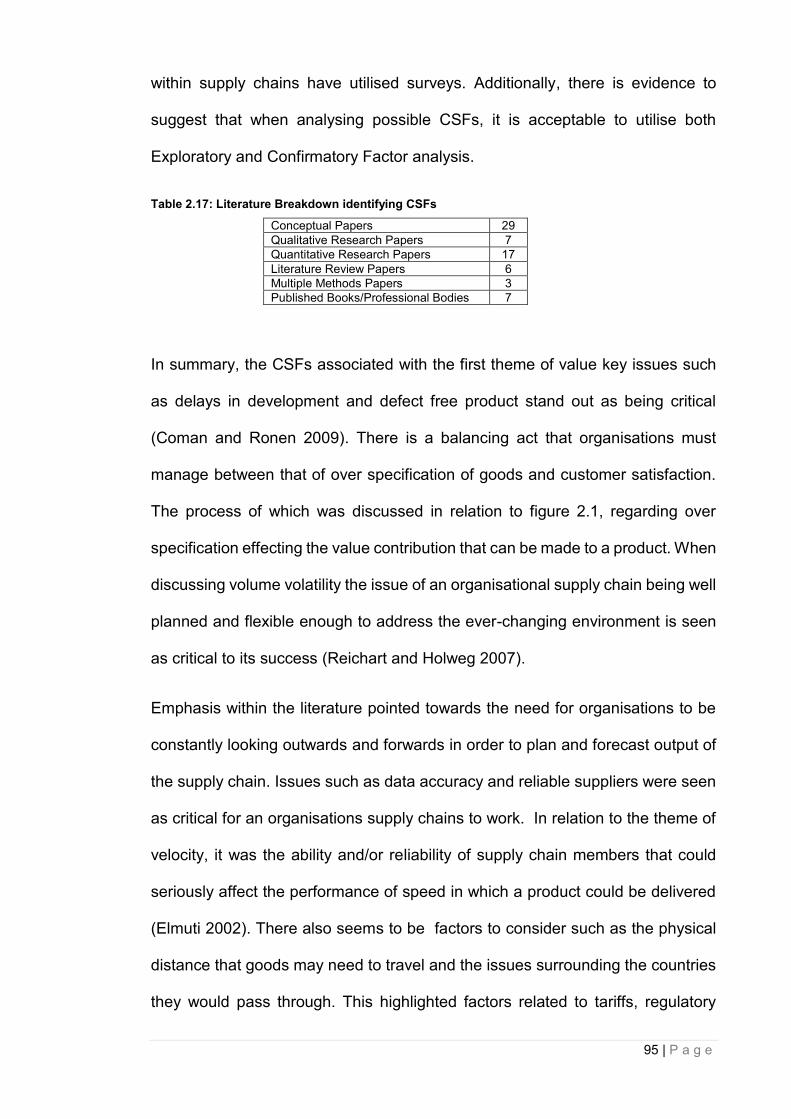
95 | P a g e
within supply chains have utilised surveys. Additionally, there is evidence to
suggest that when analysing possible CSFs, it is acceptable to utilise both
Exploratory and Confirmatory Factor analysis.
Table 2.17: Literature Breakdown identifying CSFs
Conceptual Papers 29
Qualitative Research Papers 7
Quantitative Research Papers 17
Literature Review Papers 6
Multiple Methods Papers 3
Published Books/Professional Bodies 7
In summary, the CSFs associated with the first theme of value key issues such
as delays in development and defect free product stand out as being critical
(Coman and Ronen 2009). There is a balancing act that organisations must
manage between that of over specification of goods and customer satisfaction.
The process of which was discussed in relation to figure 2.1, regarding over
specification effecting the value contribution that can be made to a product. When
discussing volume volatility the issue of an organisational supply chain being well
planned and flexible enough to address the ever-changing environment is seen
as critical to its success (Reichart and Holweg 2007).
Emphasis within the literature pointed towards the need for organisations to be
constantly looking outwards and forwards in order to plan and forecast output of
the supply chain. Issues such as data accuracy and reliable suppliers were seen
as critical for an organisations supply chains to work. In relation to the theme of
velocity, it was the ability and/or reliability of supply chain members that could
seriously affect the performance of speed in which a product could be delivered
(Elmuti 2002). There also seems to be factors to consider such as the physical
distance that goods may need to travel and the issues surrounding the countries
they would pass through. This highlighted factors related to tariffs, regulatory

96 | P a g e
rules and complications in cost. There were also warnings that organisations
should not over sell and give practicable time frames for delivery, whilst at the
same time managing their inventory levels to their advantage.
The theme variety, similar to value, highlighted the issues surrounding a product
having a high specification (Coman and Ronen 2009). However, unlike value
more emphasis was placed on overcoming issues such as complexity with
processes such as local customisation and making a product easier to adapt to
local markets. There is clear evidence within the literature that product
development is crucial to attaining value and the balance between this and
demand uncertainty needs constant monitoring. The literature also warns that
with variety comes the risk of unused inventories and that in itself is a serious
consideration to organisations along with them being able to switch to new or
varied products to suit demand. With variability, the literature clearly puts
emphasis of quality onto management procedures (TQM) and their individual
philosophy’s. It highlights management issues such as organisational culture,
leadership and communication as core areas critical to a supply chains success.
It further suggests that similar to volume volatility, planning is crucial along with
the training of employees and the procurement of quality defect free components.
The latter brings the reliability of suppliers into question in the same way that
other themes seem to do. In addressing visibility, once again culture is seen as
critical, whether it is regarding integration of supply chains, relationships between
members or even criticising an organisation’s entrenched business practices. It
seems that for visibility to be possible supply chain members need to be open
regarding information and trust in other members, even if these members are not
directly part of the parent organisation. Finally, virtuality focuses around ICT and
the supply chain member’s ability to be integrated into a virtual network. With this
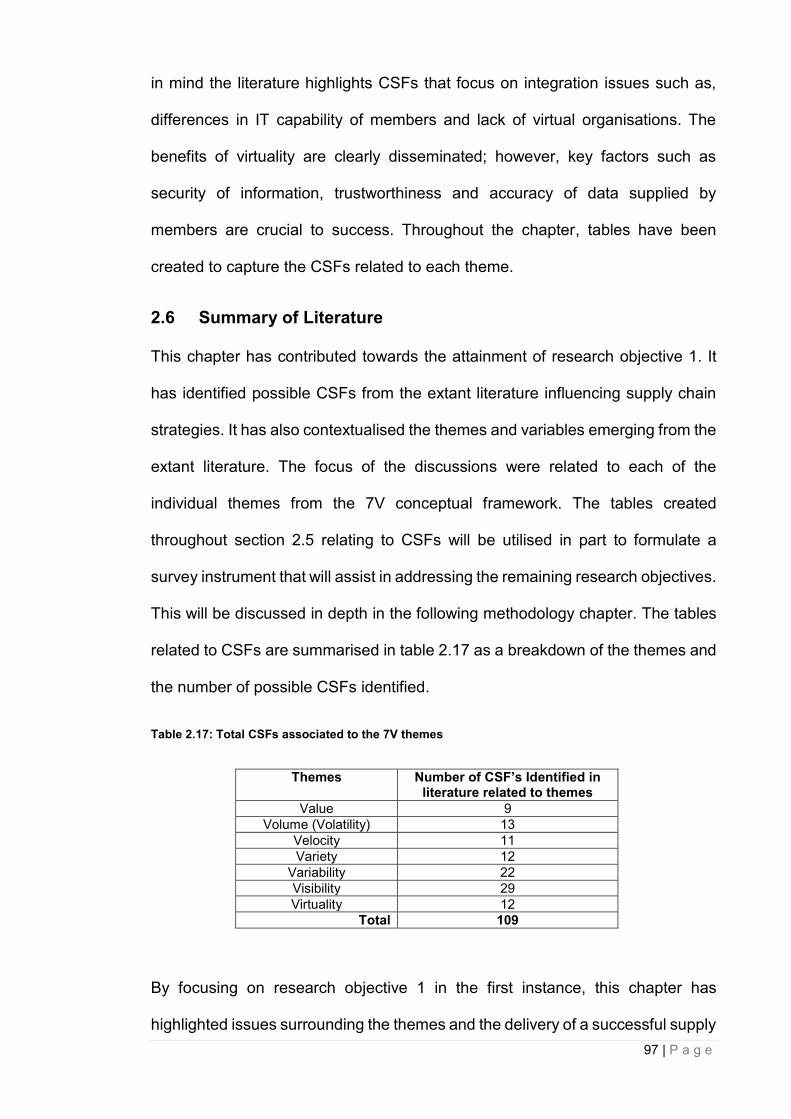
97 | P a g e
in mind the literature highlights CSFs that focus on integration issues such as,
differences in IT capability of members and lack of virtual organisations. The
benefits of virtuality are clearly disseminated; however, key factors such as
security of information, trustworthiness and accuracy of data supplied by
members are crucial to success. Throughout the chapter, tables have been
created to capture the CSFs related to each theme.
2.6 Summary of Literature
This chapter has contributed towards the attainment of research objective 1. It
has identified possible CSFs from the extant literature influencing supply chain
strategies. It has also contextualised the themes and variables emerging from the
extant literature. The focus of the discussions were related to each of the
individual themes from the 7V conceptual framework. The tables created
throughout section 2.5 relating to CSFs will be utilised in part to formulate a
survey instrument that will assist in addressing the remaining research objectives.
This will be discussed in depth in the following methodology chapter. The tables
related to CSFs are summarised in table 2.17 as a breakdown of the themes and
the number of possible CSFs identified.
Table 2.17: Total CSFs associated to the 7V themes
Themes
Number of CSF’s Identified in literature related to themes
Value 9
Volume (Volatility) 13
Velocity 11
Variety 12
Variability 22
Visibility 29
Virtuality 12
Total 109
By focusing on research objective 1 in the first instance, this chapter has
highlighted issues surrounding the themes and the delivery of a successful supply

98 | P a g e
chain. In turn, this process has identified and bracketed CSFs against the 7Vs
themes. In total, 109 individual CSFs have been extracted from the extant
literature and this has enabled a greater understanding of what the restrictions
are to the successful delivery of supply chains. These CSFs are shown
throughout the review, summarised in tables and will be used to assist in the
designing of the survey instrument during phase 2 of the PhD thesis. Finally, the
literature has identified plausible relationships between themes that justify further
investigation when carrying out the data analysis.

99 | P a g e
Chapter 3 Methodology and Method
3.1 Methodology
This chapter highlights the research approach and provides a justification for the
chosen methods. It addresses the issue that scientific methodology needs to be
seen for what it truly is, which is in essence a way of preventing the researcher
deceiving themselves.
This research is designed is based on the problem under investigation, the
theoretical framework of the study, and the overall purpose of the study (Black
2009). This chapter presents detailed information that allows the reader, to
replicate the research undertaken in this thesis if so required. The research
process is justified in detail and in turn assists the reader in understanding the
methods undertaken that will serve to support the reliability and validity of the
study. For the study to achieve its overall aim and to enable confidence in its
findings there should be no ambiguity regarding the stages and process it has it
has employed. Therefore, this chapter provides a narrative that demonstrates
consistency between the research objectives, extant literature and the methods
applied throughout the study.
3.2 Discussion surrounding epistemology
This research was conducted through a process that advances the understanding
of Critical Success Factors (CSFs) associated to the delivery of supply chains. It
is clear that the planning and managing of supply chains is a participatory
endeavour. This means that a level of involvement from key informants is
required in order to gain an understanding of the phenomena and make
suggested changes to it. In the case of the current research the overall aim was
100 | P a g e
to identify and understand how CSFs influenced supply chains. In doing so, it
investigated the suitability of a conceptual framework in relation to acceptable
knowledge in the field of research. Most new researchers would consider
themselves more as a practitioner than a philosopher. The considerations given
to epistemology or paradigms may at best me minimal. However, the
understanding of philosophy will assist the researcher in what they can say about
the findings of the studies.
Epistemology
Of all of the epistemological views that this study considered, the two most
prominent were those of ‘objectivism’ and ‘constructivism’. These views framed
how the current study looked at knowledge and where it comes from was key to
understanding its philosophical position. Knowledge be a seen as ‘a priori’ which
is encapsulated in philosophical beliefs that proceed and is independent of sense
experience or ‘a posteriori’ which comes after from what is known from a sense
experience (Richardson and Bowden 1983). This study sought knowledge related
to the solving of a practical problem and utilised the experience of key decision
makers within supply chains to answer questions previously created from the
literature and developed by practitioners. These practitioners were crucial to the
development of the survey instruments as they had the ‘a priori’ knowledge that
was utilised to form the instrument to conduct this investigation.
If considering ‘objectivism’ as the underpinning of a study it requires the
assumption that, reality exists independent of consciousness (Crotty 1998). In
essence the person (researcher) and reality are separate (Webber 2004).
‘Constructivism’ on the other hand, is an epistemological view that argues that
there is no absolute truth (Crotty 1998). This epistemic paradigm argues that
101 | P a g e
knowledge is not an insight into an objective reality, instead it is constructed by
humans in part through social interactions and therefore the knower and the
known become interactive and inseparable (Teddie and Tashakkori 2009). In the
case of this research it is the social interactions that are the key to the creation of
the conceptual framework. Constructivism does not seek a universal set of laws
underpinning reality (Guba and Lincoln 1989). Constructivism is a view that
knowledge, and in turn reality is reliant upon human practices between other
humans and their worlds being constructed, developed and transmitted within a
social context (Crotty 1998). In relation to this study, constructionism sits more
comfortably than objectivism. The reasoning is that, unlike the view seen in
objectivism, constructionists do not believe that the world is out there to be
discovered. They believe that meaning is constructed; it is not found in the object,
waiting for someone to come across it. They (constructionists) will rather attempt
to understand the individual formation of intangible constructions or perspectives
of others rather than evaluate whether constructions are true or false.
Positivism - Considered
Positivism builds knowledge in the form of building blocks of a reality that exists
beyond what we see as the human mind (Benton 2001, Denzin and Lincoln 2005,
Blanche, Blanche et al. 2006, Goldman 2010). In doing so it suggests that a
humans lived experience of its world will reflect an objective independent reality,
and in such a paradigm the researcher and this reality provides the foundation
for human knowledge (Webber 2004). Contrary to this, one of the most influential
philosophers of the 20th century Kuhn (1970), suggests that interpretivist
researchers believe qualities they give to objects are socially constructed.
102 | P a g e
Positivism could be seen as a sensible theoretical perspective for this research
study. Especially as this study incorporates a questionnaire as a research tool,
which will be used to inform a statistical data analysis technique. This research
method is widely accepted as a standard research tool for quantitative
researchers and links through to positivism (Webber 2004). Within a positivist
framework, knowledge quality is determined by scientific rigor, benchmarks of
which include internal and external validity in addition to the reliability of the
research (discussed later in this chapter).
Interpretivisim Considered
The widely accepted theoretical perspective in direct opposition to positivism is
interpretivisim (Crotty 1998). If the current study took an interpretivist stance, it
would be acknowledging that humans build their knowledge as a reflection of their
own experiences, through their interaction with the world around them. In
essence, they are attempting to make sense of the world. In doing so they are
acting as active agents in which they construct sensible events that bring a
structure to the unknown (Weick 1995). In other words, interpretivists make sense
of their world “recognizing that their sense-making activities occur within the
framework of their life-worlds and the particular goals they have for their work”
(Webber 2004). This can be seen as them building knowledge through social
construction of their world and is a theoretical perspective that is linked
comfortably to constructivism (Crotty 1998). In relation to the philosophical
underpinnings of this study, it could be argued that objectivism and the paradigm
of positivism are attractive offerings. From a simplistic viewpoint it could be
argued the philosophical underpinnings of this study are suited to objectivism and
the paradigm of positivism. It is commonly accepted that this paradigm sits
comfortably with a quantitative survey and generalisations regarding knowledge.
103 | P a g e
Quantitative purists (positivists) would argue social science should be objective
and this study will objectively analyse the data collected. They consider
generalisation as desirable and possible and that outcomes of social science can
be determined both reliably and with validity. On the other side of the argument,
qualitative purists (constructivists and interpretivist) support the notion of multiple-
constructed realities. However, they argue that time and context free
generalisations are not possible or even desirable and they reject the notion of
objective positivism (Guba and Lincoln 1989). The research undertaken in this
thesis cannot dismiss the constructivist viewpoint. This research used the 7V
conceptual framework as its starting point. It does not accept that this framework
has been discovered, as would be the case if one was taking a purely objectivist
view but that it has been constructed through social interactions.
In the case of this study, the philosophical underpinning does look in part towards
social constructionism, which in turn raises issues surrounding the acceptance of
generalised findings. However, the research is based on the themes of a
conceptual framework in which neither they nor the framework created to include
were discovered, but rather socially constructed within the world of organisational
supply chains created by an individual with ‘a priori’ experience within this area.
By utilising a quantitative research method of collecting primary data supported
through qualitative opinion that structures themes that are socially constructed,
this opens the possibility that questions and confusion could arise regarding its
epistemic grounding.
Pragmatism
Pragmatism is seen as a theory of meaning, knowledge, truth or even value,
which, it is suggested, takes as its reason or yardstick the success of practical
104 | P a g e
consequence (Harrison-Barbet 1990). Born out of the work of William James who,
through a series of lectures on ‘Pragmatism: A New Name for an Old way of
Thinking’ (James 2014) set the conversation to address what he saw as the
dilemma in philosophy. James openly challenged the historic fundamental clash
between two historic dualisms and in doing so stated that pragmatism was able
to overcome this dilemma (Hookway 2013). By stating the philosophical position
of pragmatism, the researcher looked for a more moderate and common sense
versions of philosophical dualisms basing requirements on solving problems.
Importantly for this study Pragmatism can also be seen as endorsing eclecticism
and pluralism in that they see different and even conflicting perspectives and
theories as being useful and moreover experience, experiments and observation
are all acceptable ways to gain understanding of people and the world (Johnson
and Onwuegbuzie 2004).
Pragmatism also offers the middle ground between philosophical dogmatisms
and scepticism and more importantly for this researcher, ‘to find a workable
solution’. In addition, the pragmatic views of philosophy denotes that its logic of
inquiry includes the use of induction (or discovery of patterns), deduction (testing
theories), and abduction for uncovering and relying on the best set of
explanations for understanding results (Johnson and Onwuegbuzie 2004).
Others such as Hookway (2013) lend weight to the argument that pragmatism
and in turn, pragmatists will incorporate a methodology, which uses different
types of research methods employed in differing sciences. Importantly for this
research study, they suggest they do this without being, restricted by historic
dualisms that might contradict otherwise. In relation to this study, accepting such
a stance is in essence due to pragmatism’s flexible views related to the
understanding of knowledge and the acceptance of other types methods and its
105 | P a g e
freedom to not be constrained to the traditional dualisms. This then allows the
researcher the opinion that such a philosophical underpinning, which attempts to
put aside any apparent metaphysical disputes and allows the use socially
constructed themes and generalize findings from a quantitative research method
without fear of contradiction that lends weight to this study confirming such a
stance.
3.3 Method
The following section explains how the research method undertaken in this study
assists in attaining its overall aim, which is to gain a greater understanding of key
factors related to the efficient delivery of supply chains through the development
of the 7V Conceptual Framework. From this overall aim, five research objectives
that have emerged are-
1. Identify potential Critical Success Factors, which could influence
supply chains.
2. Analyse findings from the empirical study with a view to confirming
or disconfirming CSFs.
3. Incorporate CSFs into the 7V conceptual framework
4. Reconceptualise effective supply chain strategies on the evidence
from the study.
5. Evaluate implications for supply chain management practice.
In order to attain these objectives this study primarily utilised a quantitative data
collection tool in the form of a survey instrument. The instrument was designed
with the assistance of key supply chain decision makers. These included group
and individual discussions, as well as the previously discussed literature review
to gather information attaining to possible CSFs. The process undertaken and
subsequent information gathered assisted in designing the questionnaire for the
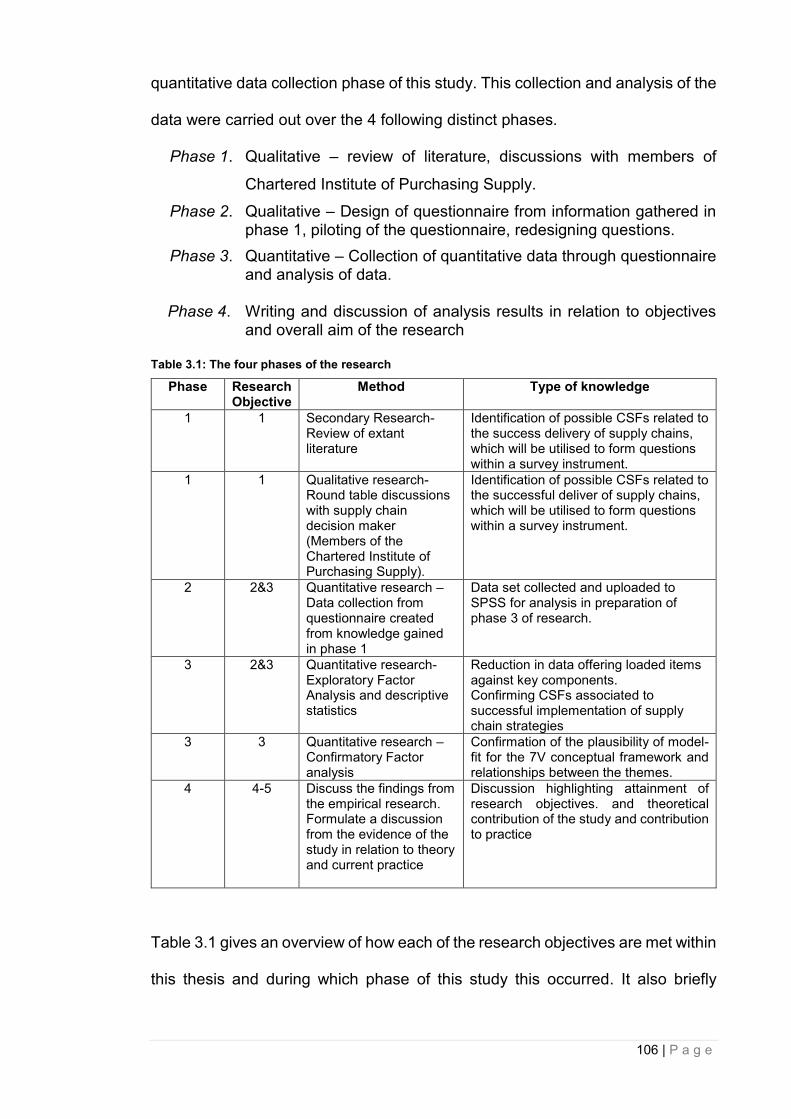
106 | P a g e
quantitative data collection phase of this study. This collection and analysis of the
data were carried out over the 4 following distinct phases.
Phase 1. Qualitative – review of literature, discussions with members of
Chartered Institute of Purchasing Supply.
Phase 2. Qualitative – Design of questionnaire from information gathered in phase 1, piloting of the questionnaire, redesigning questions.
Phase 3. Quantitative – Collection of quantitative data through questionnaire and analysis of data.
Phase 4. Writing and discussion of analysis results in relation to objectives and overall aim of the research
Table 3.1: The four phases of the research
Phase Research Objective
Method Type of knowledge
1 1 Secondary Research- Review of extant literature
Identification of possible CSFs related to the success delivery of supply chains, which will be utilised to form questions within a survey instrument.
1 1 Qualitative research- Round table discussions with supply chain decision maker (Members of the Chartered Institute of Purchasing Supply).
Identification of possible CSFs related to the successful deliver of supply chains, which will be utilised to form questions within a survey instrument.
2 2&3 Quantitative research – Data collection from questionnaire created from knowledge gained in phase 1
Data set collected and uploaded to SPSS for analysis in preparation of phase 3 of research.
3 2&3 Quantitative research- Exploratory Factor Analysis and descriptive statistics
Reduction in data offering loaded items against key components. Confirming CSFs associated to successful implementation of supply chain strategies
3 3 Quantitative research –Confirmatory Factor analysis
Confirmation of the plausibility of model-fit for the 7V conceptual framework and relationships between the themes.
4
4-5
Discuss the findings from the empirical research. Formulate a discussion from the evidence of the study in relation to theory and current practice
Discussion highlighting attainment of research objectives. and theoretical contribution of the study and contribution to practice
Table 3.1 gives an overview of how each of the research objectives are met within
this thesis and during which phase of this study this occurred. It also briefly
107 | P a g e
describes the method for achieving the objective and the types of knowledge
their attainment offers.
3.3.1 Phase 1 – Qualitative data collection
Aim – Attainment of research objective 1, which was to identify potential critical
success factors, which could influence supply chains.
3.3.1.1 Approach
This research took a deductive approach and incorporated theory testing.
Although the following section highlights that during the early phases of the
research, knowledge was gained in a manner that sought to clarify themes
suggested within the 7V Framework, it should not be misconstrued as theory
building. According to Colquitt and Zapata-Phelan (2007) in order for theory
testing to offer a high level of theoretical contribution, it is important that any
conceptualisations that it is built upon needs to be validated. In the case of this
study, this was achieved through phase 1 of the research.
Phase 1 of the study involved a review of supply chain literature to identify
possible CSFs from the extant literature as shown in chapter 2. From this review
109 possible CSFs had been identified as was highlighted in section 2.6. Once a
review of the literature was undertaken, initial contact was made with the
Chartered Institute of Procurement & Supply. This organisation is considered to
be “the premier global organisation serving the procurement and supply
profession” (CIPS 2015).
The members of the CIPS are in the most part practitioners within the field of
supply chain management. Informal round table discussion with members were
set up. The focus of these discussions was based around their understanding of
the themes associated to the 7Vs framework and CSFs associated to each theme
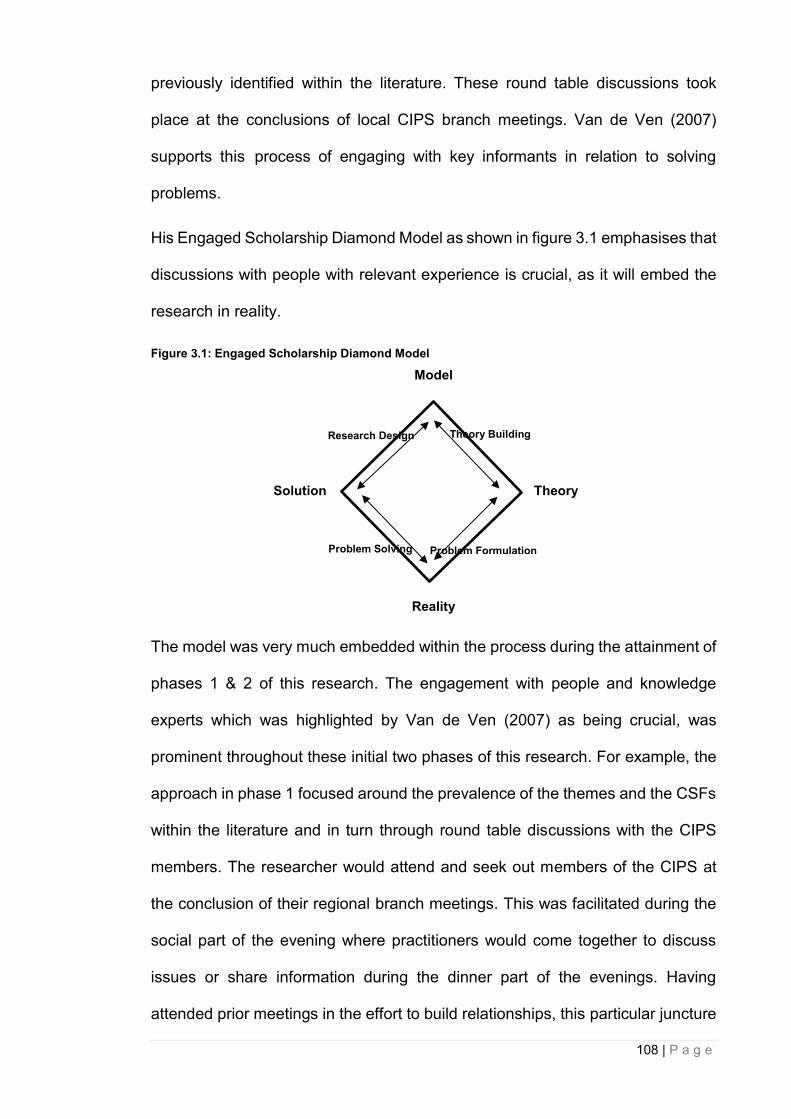
108 | P a g e
previously identified within the literature. These round table discussions took
place at the conclusions of local CIPS branch meetings. Van de Ven (2007)
supports this process of engaging with key informants in relation to solving
problems.
His Engaged Scholarship Diamond Model as shown in figure 3.1 emphasises that
discussions with people with relevant experience is crucial, as it will embed the
research in reality.
Figure 3.1: Engaged Scholarship Diamond Model
Model
Solution Theory
Reality
The model was very much embedded within the process during the attainment of
phases 1 & 2 of this research. The engagement with people and knowledge
experts which was highlighted by Van de Ven (2007) as being crucial, was
prominent throughout these initial two phases of this research. For example, the
approach in phase 1 focused around the prevalence of the themes and the CSFs
within the literature and in turn through round table discussions with the CIPS
members. The researcher would attend and seek out members of the CIPS at
the conclusion of their regional branch meetings. This was facilitated during the
social part of the evening where practitioners would come together to discuss
issues or share information during the dinner part of the evenings. Having
attended prior meetings in the effort to build relationships, this particular juncture
Problem Formulation Problem Solving
Research Design Theory Building
109 | P a g e
of the meetings was identified as an excellent way to join conversations with
practitioners. This allowed the researcher to seek assistance with understanding
and development of CSFs identified within the literature. In the context of the
Engaged Scholarship Model this process works towards theory building through
initially addressing problem formulation. This meant utilising the knowledge of the
people at the round table discussions to develop the operational understanding
of the literature. In essence, this is what Van de Ven (2007) highlights as the
‘problem formulation’ and insists that grounding the problem or issue in reality is
crucial in any research study. The round table discussions undertaken should not
be mistaken for focus groups. The reason being is that these discussions were
less structured and more informal than what may be expected from focus groups.
In some instances, people at the table would seek out other members in
attendance at the wider CIPS meeting who had more specialised knowledge, to
join the discussions. In addition, unlike focus groups the process was not seeking
to somehow collect data and analyse what the members were discussing. The
members were embedded in the process of theory development; they were part
of the research design, rather than part of the actual data collection during phase
1 of the research. In essence, this was purely part of a process that assisted in
moving initial CSFs identified within the literature towards a practical
understanding that could be interpreted by practitioners during phase 2 of the
research.
3.3.1.2 Instrument design
The design of phase 1 of this study was structured to focus upon the attainment
of research objective 1. Having identified the 109 possible CSFs from within the
literature, it was then essential they were examined from an operational
perspective before moving to phase 2 of the research. Through the round table
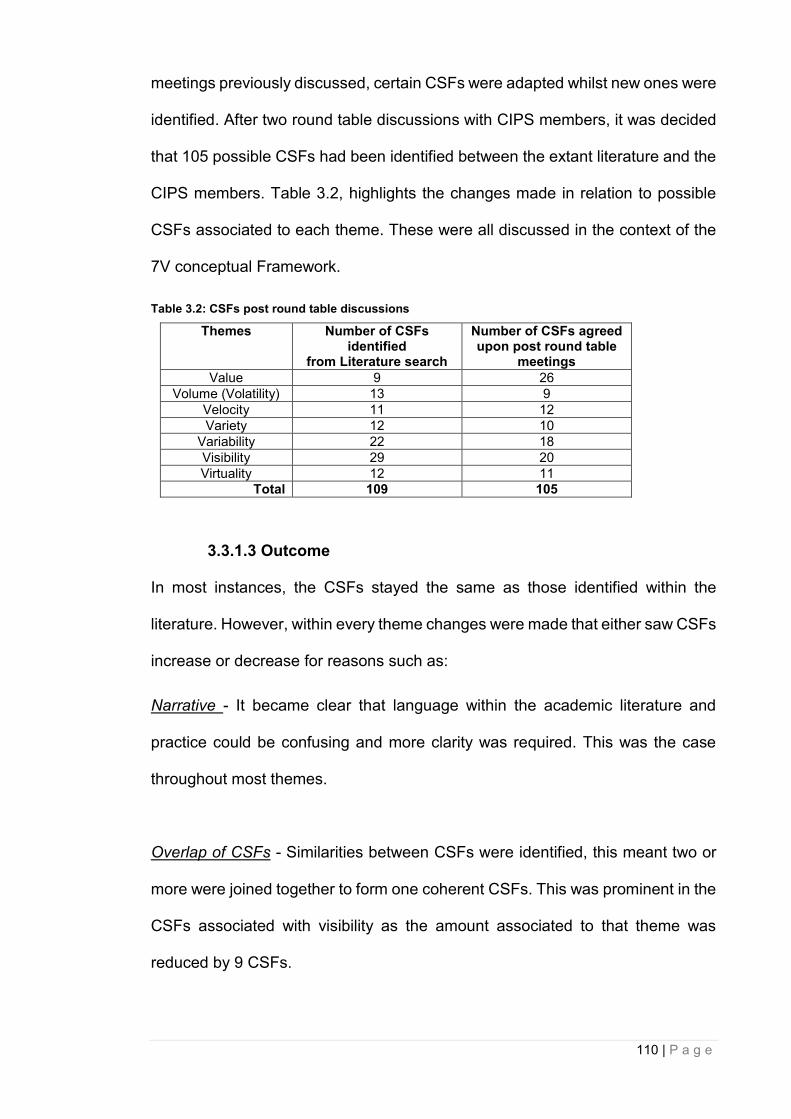
110 | P a g e
meetings previously discussed, certain CSFs were adapted whilst new ones were
identified. After two round table discussions with CIPS members, it was decided
that 105 possible CSFs had been identified between the extant literature and the
CIPS members. Table 3.2, highlights the changes made in relation to possible
CSFs associated to each theme. These were all discussed in the context of the
7V conceptual Framework.
Table 3.2: CSFs post round table discussions
Themes
Number of CSFs identified
from Literature search
Number of CSFs agreed upon post round table
meetings
Value 9 26
Volume (Volatility) 13 9
Velocity 11 12
Variety 12 10
Variability 22 18
Visibility 29 20
Virtuality 12 11
Total 109 105
3.3.1.3 Outcome
In most instances, the CSFs stayed the same as those identified within the
literature. However, within every theme changes were made that either saw CSFs
increase or decrease for reasons such as:
Narrative - It became clear that language within the academic literature and
practice could be confusing and more clarity was required. This was the case
throughout most themes.
Overlap of CSFs - Similarities between CSFs were identified, this meant two or
more were joined together to form one coherent CSFs. This was prominent in the
CSFs associated with visibility as the amount associated to that theme was
reduced by 9 CSFs.
111 | P a g e
Increase in understanding - There was an increase of 17 CSFs associated with
the theme value. This happened during the first round table discussion. There
was a consensus that the attainment of value highlighted more potential CSFs.
Due to the input of the practitioners it was decided that it would be beneficial to
validity of the study that additional CSFs identified through these discussion
would be included in phase 2 of the research. The final 105 possible CSFs
identified in phase 1 would be utilised in the design of the survey instrument for
the primary data collection. On the conclusion of phase 1 and thus the attainment
of research objective 1, the research study then moved onto phase 2 the
quantitative data collection stage.
3.3.2 Phase 2 – Quantitative research – Data Collection
Aim – Design and dissemination of the survey instrument to lay grounding for
attainment of research objectives 2&3
3.3.2.1 Approach
Phase 2 of the study involved the design of the survey instrument, which included
three phases of piloting. The design of the questionnaire was structured around
the 7V themes and the 105 CSFs identified through the completion of phase one
of the study. Phase 2 primarily focused on the design of the survey instrument
through to its dissemination to the designated sample. This phase was crucial for
the attainment of research objectives 2 and 3 when the study moved onto phase
3. During phase 2 the population was identified from which the study sample was
acquired. 3050 questionnaires were sent to supply chain decision makers within
the United Kingdom. The aim was to gain a 10% sample from the chosen
population in order to carry out the chosen analysis method in phase 3.
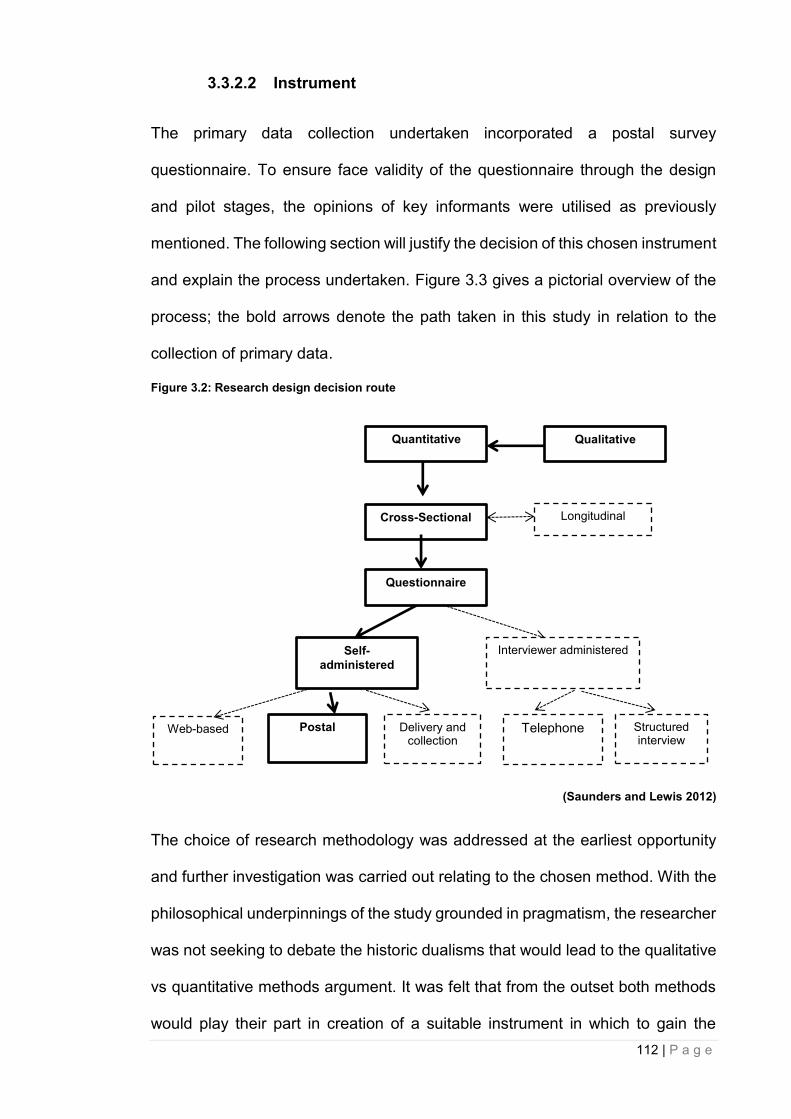
112 | P a g e
3.3.2.2 Instrument
The primary data collection undertaken incorporated a postal survey
questionnaire. To ensure face validity of the questionnaire through the design
and pilot stages, the opinions of key informants were utilised as previously
mentioned. The following section will justify the decision of this chosen instrument
and explain the process undertaken. Figure 3.3 gives a pictorial overview of the
process; the bold arrows denote the path taken in this study in relation to the
collection of primary data.
Figure 3.2: Research design decision route
(Saunders and Lewis 2012)
The choice of research methodology was addressed at the earliest opportunity
and further investigation was carried out relating to the chosen method. With the
philosophical underpinnings of the study grounded in pragmatism, the researcher
was not seeking to debate the historic dualisms that would lead to the qualitative
vs quantitative methods argument. It was felt that from the outset both methods
would play their part in creation of a suitable instrument in which to gain the
Self-
administered
Quantitative
Cross-Sectional
Questionnaire
Longitudinal
Interviewer administered
Postal Delivery and collection
Telephone
Qualitative
Web-based Structured interview
113 | P a g e
greatest opportunity to attain the overall aim of this study. Even though the
research has a pragmatic approach it still fully accepts the importance of structure
within the study
3.3.2.3 Justification of research tool
This study also gave due consideration to accepted methodological practices
within the field of SCM, specifically around the research area pertaining to the
themes of the 7V conceptual framework. Seminal papers that utilise a qualitative
approach when focusing on the themes are Mentzer, DeWitt et al. (2001)
Visibility; Coman and Ronen (2009) Variety & Value; Chen and Paulraj (2004)
Velocity; Williamson, Harrison et al. (2004) Virtuality; Reichart and Holweg (2007)
Volume and Siddiqui, Haleem et al. (2009) Variability.
However, quantitative methods are also an accepted practice within this research
area. They are also located around the themes that are being researched by this
study. Quantitative research within this field such as; Lancioni, Smith et al. (2000)
Virtuality; Elmuti (2002) Volume & Velocity; Simpson (2007) and the more historic
Forker, Mendez et al. (1997) Variability; Sengupta, Heiser et al. (2006) Value; Li,
Ragu-Mathan et al. (2004) Visibility and (Simpson 2007) Variety lends additional
support to the justification of such a method being utilised. From the SCM
literature it was highlighted that in relation to CSF conceptual papers had earlier
prominence. However, since the turn of the 20th century more quantitative papers
have been published that highlight the use of survey instruments. These include
Power, Sohal et al. (2001) Volume- Volatility; Elmuti (2002) Velocity & Variety;
Samat, Ramayah et al. (2006) Variability; Patnayakuni, Ral et al. (2006) Visibility
and Gunasekaran, Patel et al. (2001) Virtuality.
114 | P a g e
Further to that, research into CSFs within project management as discussed in
section 2.1.1 highlights a clear precedence that has been set in using quantitative
research methods in the gathering and understanding of this particular
phenomena.
3.3.2.4 Question Design
It was crucial that the respondent’s responses produced meaningful data in
relation to the aim and objectives of the study. Using closed questions offered the
opportunity to present questions quickly and clearly to participants, allowed for
the comparison of responses and provided an opportunity to assess the
representativeness of the findings to the wider population. (Appendix A). This is
supported by Black (2009) who states closed questions are preferred for testing
the generalizability of views to a larger population. Importantly, that is what this
study achieves from the chosen population in relation to the 7V themes within the
conceptual framework. Closed questions simplifies the collection of data into a
quantifiable set for analysis, particularly when pre-coded which makes data
management easier (Bryman and Bell 2003).
Although the variables addressed in closed questions were focused it assisted in
giving them their operational definitions. In turn this assisted in confirming
construct validity. In order to maximise the efficiency of the use of closed
questions for this study the survey instrument utilised a 7-point Likert-Scale.
There was an option of using a 5-point Likert-Scale instrument; however, a 7-
point spread would give a clearer representation of views. The spread of the scale
as is shown in figure 3.7 gave the respondent the choice of either ‘strongly
disagreeing, disagreeing, slightly disagreeing, having no opinion or slightly
agreeing to agreeing or strongly agreeing. There is no doubt ambiguity and
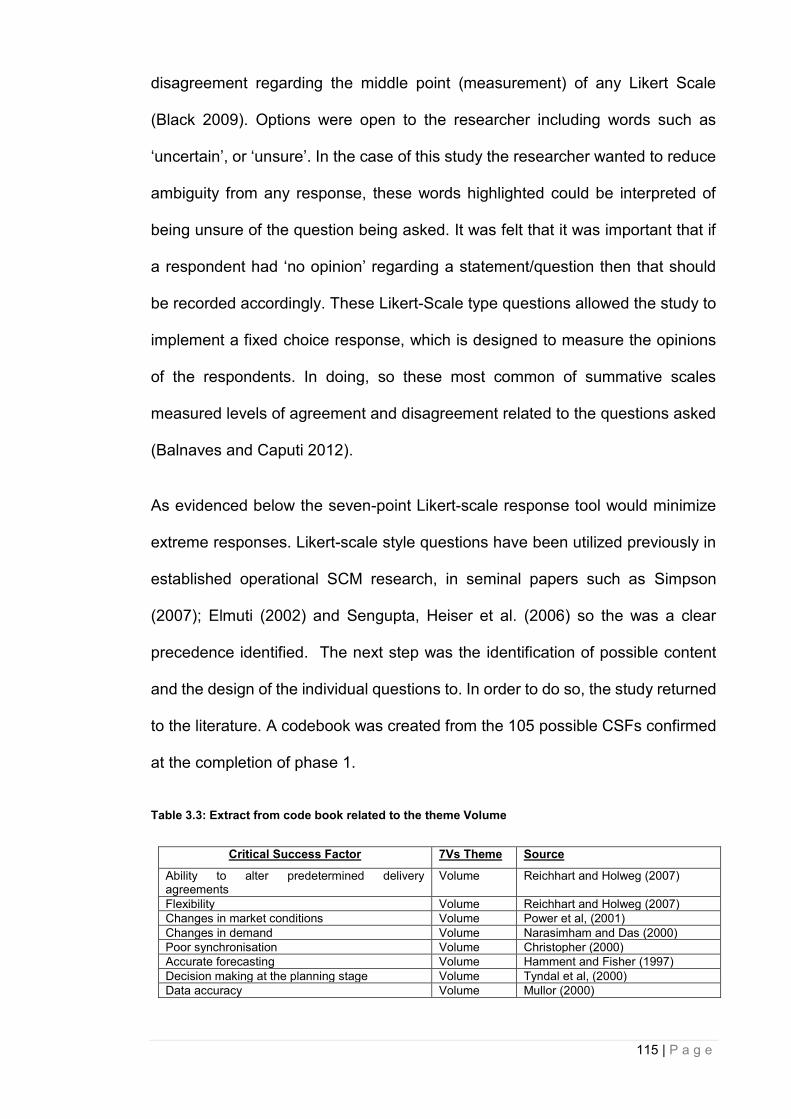
115 | P a g e
disagreement regarding the middle point (measurement) of any Likert Scale
(Black 2009). Options were open to the researcher including words such as
‘uncertain’, or ‘unsure’. In the case of this study the researcher wanted to reduce
ambiguity from any response, these words highlighted could be interpreted of
being unsure of the question being asked. It was felt that it was important that if
a respondent had ‘no opinion’ regarding a statement/question then that should
be recorded accordingly. These Likert-Scale type questions allowed the study to
implement a fixed choice response, which is designed to measure the opinions
of the respondents. In doing, so these most common of summative scales
measured levels of agreement and disagreement related to the questions asked
(Balnaves and Caputi 2012).
As evidenced below the seven-point Likert-scale response tool would minimize
extreme responses. Likert-scale style questions have been utilized previously in
established operational SCM research, in seminal papers such as Simpson
(2007); Elmuti (2002) and Sengupta, Heiser et al. (2006) so the was a clear
precedence identified. The next step was the identification of possible content
and the design of the individual questions to. In order to do so, the study returned
to the literature. A codebook was created from the 105 possible CSFs confirmed
at the completion of phase 1.
Table 3.3: Extract from code book related to the theme Volume
Critical Success Factor 7Vs Theme Source
Ability to alter predetermined delivery agreements
Volume Reichhart and Holweg (2007)
Flexibility Volume Reichhart and Holweg (2007)
Changes in market conditions Volume Power et al, (2001)
Changes in demand Volume Narasimham and Das (2000)
Poor synchronisation Volume Christopher (2000)
Accurate forecasting Volume Hamment and Fisher (1997)
Decision making at the planning stage Volume Tyndal et al, (2000)
Data accuracy Volume Mullor (2000)

116 | P a g e
An extract from the codebook is shown in Table 3.2. This highlights the starting
point for the development of the questions. Once the individual CSFs relating to
each theme had been identified from the literature, the researcher then moved
onto the next stage of question design. As Black (2009) suggests, at this stage
of the question design, if the survey instrument was going to be reliable, it was
crucial that its respondents would interpret the questions being asked in a similar
manner.
Figure: 3.3: Extract from questionnaire – questions related to Volume
Volume: ‘Ensuring that customers have the flexibility to increase and decrease
volume as their demands dictate’
With that in mind the CSFs identified were developed to include a narrative that
made operational sense, ensuring that respondents would understand what was
being asked. In order to accomplish this before each question was asked, a short
definition was given prior to the main questions confirming operational meaning
of the theme being investigated, as can be seen in figure 3.7. Once the
operational definition of the theme was articulated, the next stage was to lay out
the question that encompassed a main question in conjunction with the Likert
scale being utilised and the individual CSFs. As can be seen from figure 3.7 this
To ensure that volume flexibility can be offered to customers, it is important that…
Strongly disagree
Disagree
Slightly disagree
No opinion
Slightly agree
Agree
Strongly agree
…the supply chain has the ability to alter pre-determined delivery dates
…the supplier understands the customers market conditions
…the suppliers are able to anticipate changes in demand
… forecasting is accurate
…the supply chain has reliable suppliers
…data being used throughout the chain is accurate
…decisions at the planning stage are correct
…the behaviour of everyone in the supply chain is integrated
…the supply chain is flexible enough to deal with sudden changes in demand
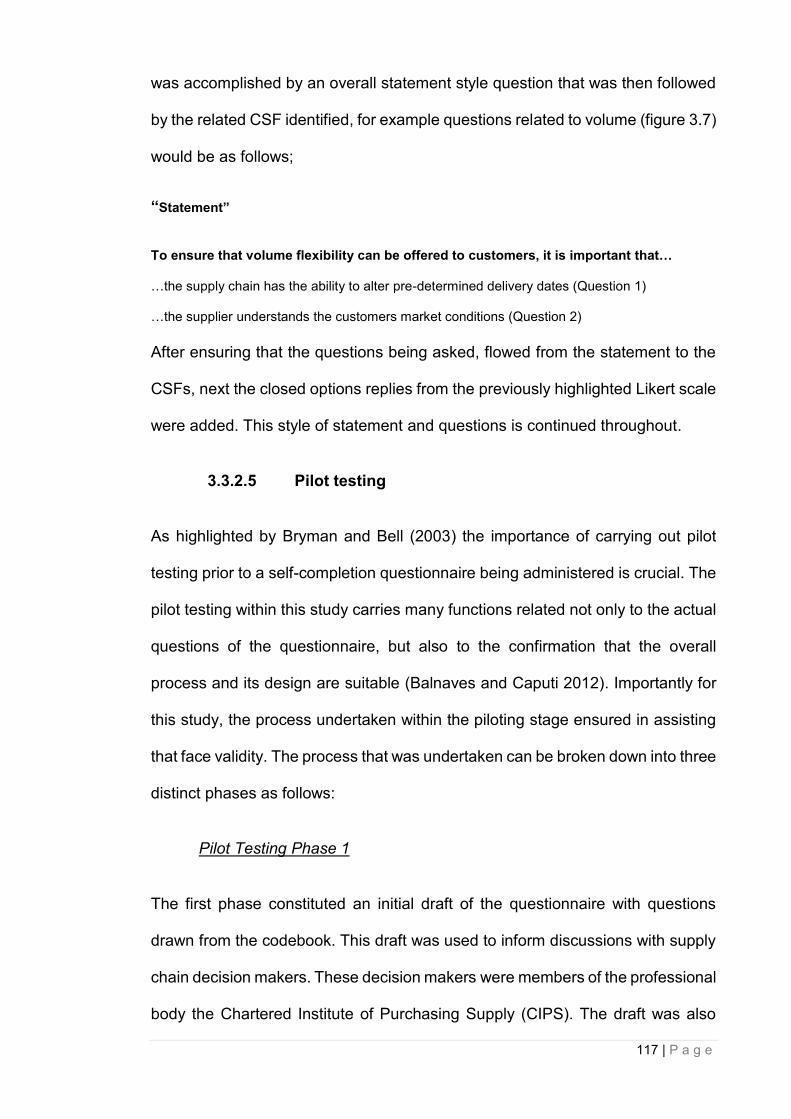
117 | P a g e
was accomplished by an overall statement style question that was then followed
by the related CSF identified, for example questions related to volume (figure 3.7)
would be as follows;
“Statement”
To ensure that volume flexibility can be offered to customers, it is important that… …the supply chain has the ability to alter pre-determined delivery dates (Question 1) …the supplier understands the customers market conditions (Question 2)
After ensuring that the questions being asked, flowed from the statement to the
CSFs, next the closed options replies from the previously highlighted Likert scale
were added. This style of statement and questions is continued throughout.
3.3.2.5 Pilot testing
As highlighted by Bryman and Bell (2003) the importance of carrying out pilot
testing prior to a self-completion questionnaire being administered is crucial. The
pilot testing within this study carries many functions related not only to the actual
questions of the questionnaire, but also to the confirmation that the overall
process and its design are suitable (Balnaves and Caputi 2012). Importantly for
this study, the process undertaken within the piloting stage ensured in assisting
that face validity. The process that was undertaken can be broken down into three
distinct phases as follows:
Pilot Testing Phase 1
The first phase constituted an initial draft of the questionnaire with questions
drawn from the codebook. This draft was used to inform discussions with supply
chain decision makers. These decision makers were members of the professional
body the Chartered Institute of Purchasing Supply (CIPS). The draft was also
118 | P a g e
discussed in depth with senior academic members of Manchester Metropolitan
Business School. These academics have extensive knowledge of both the area
of research and this particular method of collecting data. At this point, the focus
of the initial pilot testing and meeting with CIPS members focused on construct
validity and operational definitions of the 7V themes. It also concerned itself with
the operational understanding of the questions, language being used and the
relationship the questions had to the research objectives. Through this initial
stage of piloting, specific changes were made to questions that the members of
the CIPS felt were too academic in their wording. They felt that the interpretation
of these questions could prove problematic. Therefore, wording and narrative
were adjusted accordingly before phase 2 testing began.
Pilot Testing Phase 2
Following phase one, the changes were made to the questionnaire and the
second phase of the pilot testing encompassed face to face round table meetings
with 8 members from the CIPS. During this phase, focus was set around each
individual question and the language used. At this point, questions requiring
adapting and restructuring were amended during the meeting. This was a crucial
part of the process as it allowed the researcher the opportunity to better
understand, how potential participants within the larger sample would react to
certain questions. In addition, a key change to the questionnaire at this point was
to the structure; each of the themes was given their own subsection. Due to
subsequent discussions that took place at the meeting, the researcher inserted a
short definition of each theme prior to the subsequent question being asked as
highlighted in figure 3.7.
119 | P a g e
Pilot Testing Phase 3
The third phase of the pilot testing involved the researcher utilising the supply
chain network built up during the life cycle of the study. This particular network
consisted of individuals met through meetings with CIPS members and
subsequent introductions made by them through ‘LinkedIn’. The researcher
considered all members of this sample group (30 members) to be decision
makers who operated within operational supply chains. This phase of the pilot
testing was facilitated by a previous agreement with the participants. This enabled
a 100 per cent response rate by directly emailing each individual a copy of the
questionnaire that had previously gone through two phases of piloting.
Respondents were requested to complete the questionnaire and comment upon
its structure and language etc. This phase again proved valuable to the study as
issues surrounding understanding the themes, enabled the researcher to re-
address the short definition before each section.
From this final pilot test, minimal changes were made to the final questionnaire.
In addition, from the returned questionnaires an initial database was created on
SPSS and descriptive analysis was undertaken. This allowed for the
identification of any issues that may have arisen from the transferring of data from
the questionnaires to a digital format. On completion of the pilot test, all
subsequent changes had been made and the questionnaire was considered
ready for dissemination to the population as discussed in the following section.
3.3.2.6 Population and sampling strategy
Within social science research, Balnaves and Caputi (2012) explain that
‘sampling’ is seen as a technique for selecting a subset of units for the purpose
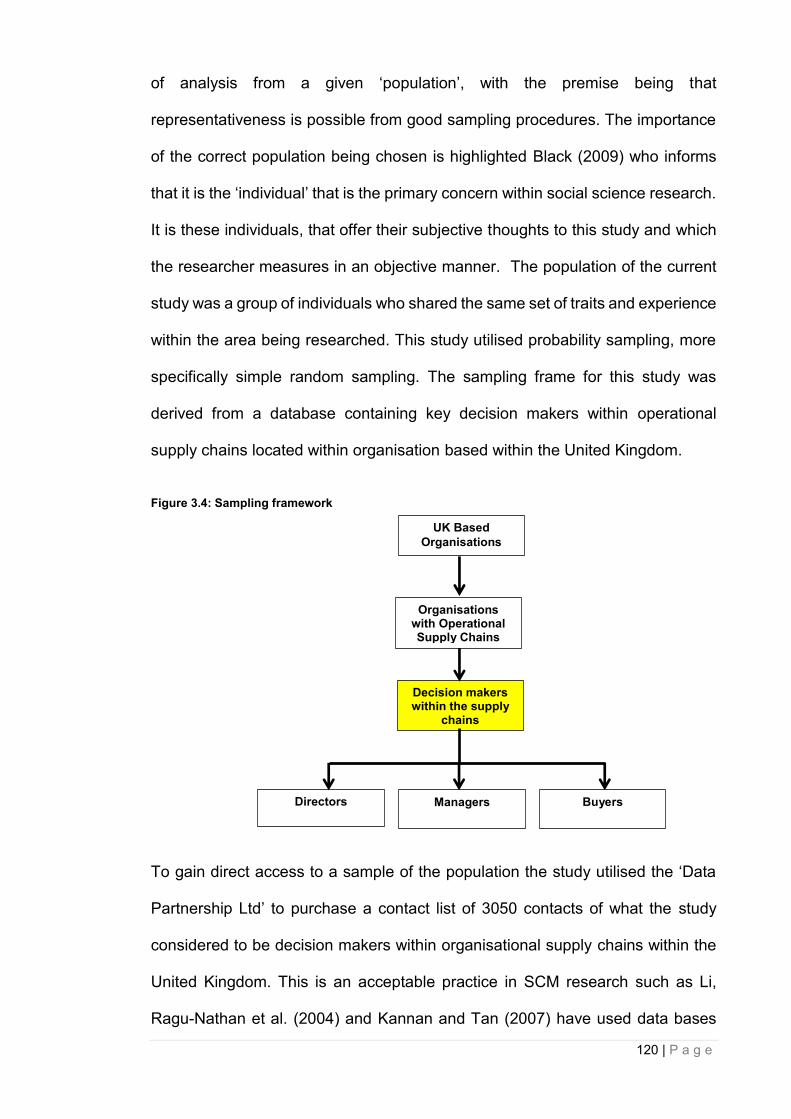
120 | P a g e
of analysis from a given ‘population’, with the premise being that
representativeness is possible from good sampling procedures. The importance
of the correct population being chosen is highlighted Black (2009) who informs
that it is the ‘individual’ that is the primary concern within social science research.
It is these individuals, that offer their subjective thoughts to this study and which
the researcher measures in an objective manner. The population of the current
study was a group of individuals who shared the same set of traits and experience
within the area being researched. This study utilised probability sampling, more
specifically simple random sampling. The sampling frame for this study was
derived from a database containing key decision makers within operational
supply chains located within organisation based within the United Kingdom.
Figure 3.4: Sampling framework
To gain direct access to a sample of the population the study utilised the ‘Data
Partnership Ltd’ to purchase a contact list of 3050 contacts of what the study
considered to be decision makers within organisational supply chains within the
United Kingdom. This is an acceptable practice in SCM research such as Li,
Ragu-Nathan et al. (2004) and Kannan and Tan (2007) have used data bases
Organisations with Operational Supply Chains
Directors
UK Based
Organisations
Managers Buyers
Decision makers within the supply
chains
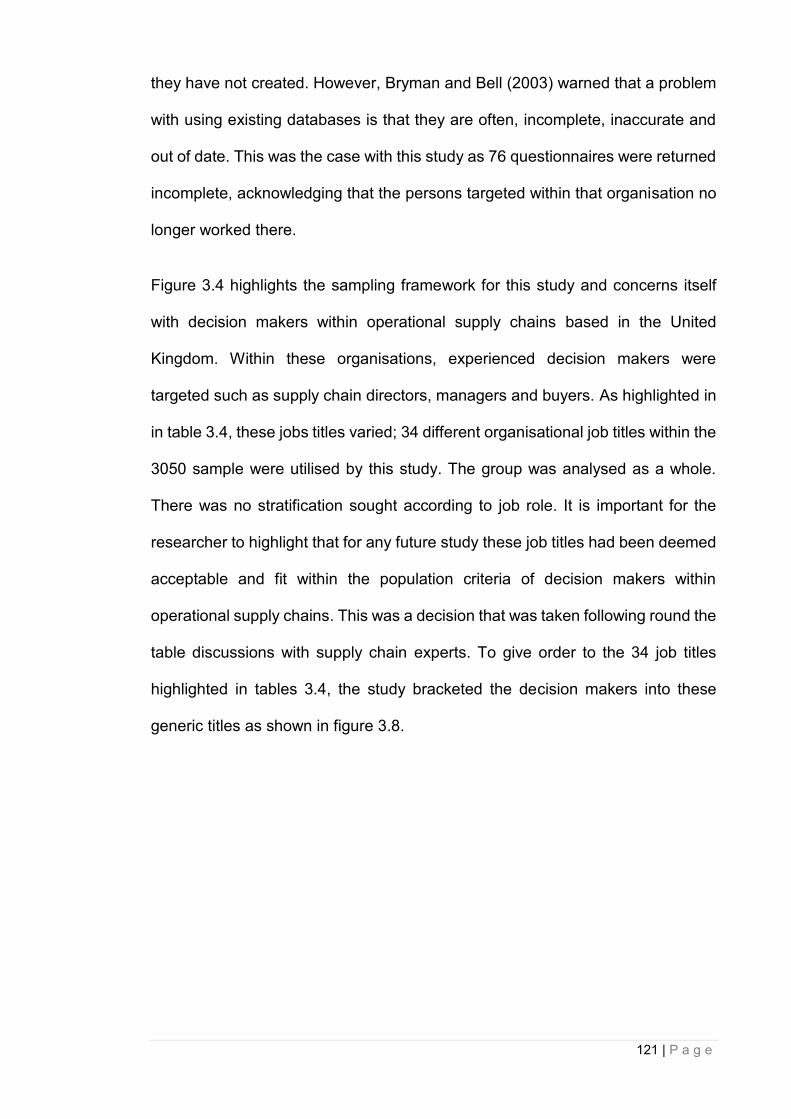
121 | P a g e
they have not created. However, Bryman and Bell (2003) warned that a problem
with using existing databases is that they are often, incomplete, inaccurate and
out of date. This was the case with this study as 76 questionnaires were returned
incomplete, acknowledging that the persons targeted within that organisation no
longer worked there.
Figure 3.4 highlights the sampling framework for this study and concerns itself
with decision makers within operational supply chains based in the United
Kingdom. Within these organisations, experienced decision makers were
targeted such as supply chain directors, managers and buyers. As highlighted in
in table 3.4, these jobs titles varied; 34 different organisational job titles within the
3050 sample were utilised by this study. The group was analysed as a whole.
There was no stratification sought according to job role. It is important for the
researcher to highlight that for any future study these job titles had been deemed
acceptable and fit within the population criteria of decision makers within
operational supply chains. This was a decision that was taken following round the
table discussions with supply chain experts. To give order to the 34 job titles
highlighted in tables 3.4, the study bracketed the decision makers into these
generic titles as shown in figure 3.8.
122 | P a g e
Table 3.4: Organisational title and breakdown of population targeted
Organisational Tile Participants in Sample
Buying Director 17
Buying Manager 6
Chief Buyer 40
Chief Procurement/Purchasing Officer 7
Chief Supply Chain Officer 1
Director of Purchasing 3
Director of Supply Chain Services 2
Group Buyer 1
Group Procurement/Purchasing Director 6
Group Purchasing Manager 11
Head Buyer 10
Head of Group Procurement 1
Head of Procurement 21
Head of Purchasing 72
Head of Supplies 1
Head of Supply Chain Management 2
Procurement Director 10
Procurement Manager 95
Purchasing Controller 5
Purchasing Coordinator 57
Purchasing Director 110
Purchasing Manager 2414
Purchasing Supervisor 2
Senior Buyers 31
Senior Procurement Managers 2
Senior Purchaser 1
Senior Purchasing Managers 2
Supplier Manager 1
Supplies Coordinator 2
Supplies Manager 39
Supplies Officer 9
Supply Chain Coordinator 1
Supply Chain Director 8
Supply Chain Manager 64
TOTAL 3050
As an additional way to show rigor of the data collection, it was not presumed that
the job titles supplied by the contact list were wholly accurate. In order to
ascertain if the respondents could be categorised as supply chain decision
makers, a survey question asked directly for each job title within a categorisation
of Director, Manager and Buyer. The responses from the survey question related
to job role, are shown in appendix F and figure 3.5. They highlight that from the
sample of 303 participants, 197 classified themselves as managers, 60 as buyers
and 46 as directors. It should be reiterated that no stratification was sought and
the main reason for the question being asked was to confirm that the respondents
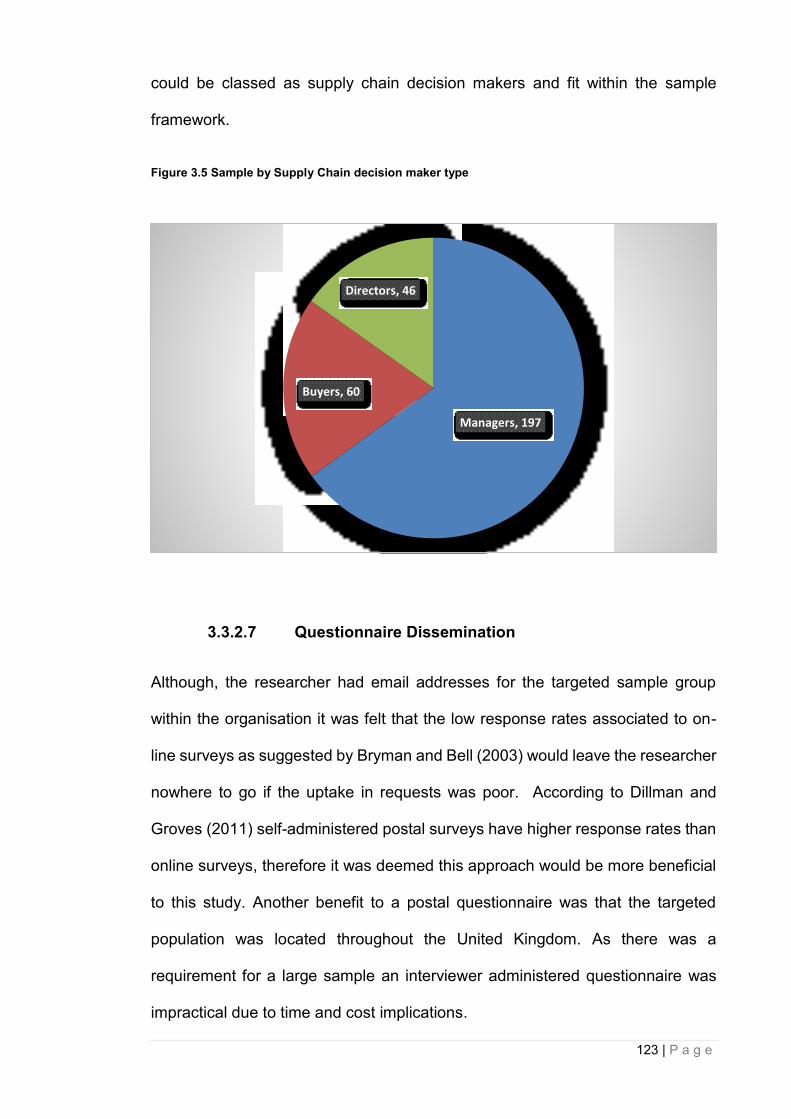
123 | P a g e
could be classed as supply chain decision makers and fit within the sample
framework.
Figure 3.5 Sample by Supply Chain decision maker type
3.3.2.7 Questionnaire Dissemination
Although, the researcher had email addresses for the targeted sample group
within the organisation it was felt that the low response rates associated to on-
line surveys as suggested by Bryman and Bell (2003) would leave the researcher
nowhere to go if the uptake in requests was poor. According to Dillman and
Groves (2011) self-administered postal surveys have higher response rates than
online surveys, therefore it was deemed this approach would be more beneficial
to this study. Another benefit to a postal questionnaire was that the targeted
population was located throughout the United Kingdom. As there was a
requirement for a large sample an interviewer administered questionnaire was
impractical due to time and cost implications.
Managers, 197
Buyers, 60
Directors, 46
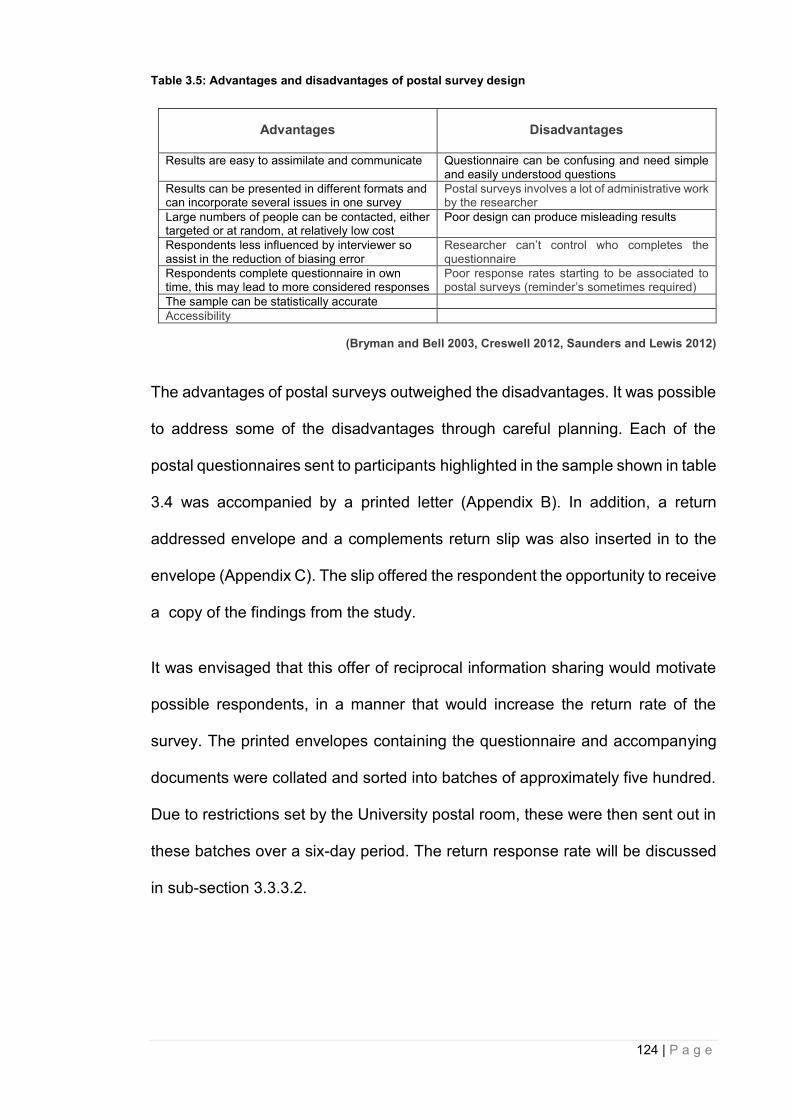
124 | P a g e
Table 3.5: Advantages and disadvantages of postal survey design
Advantages Disadvantages
Results are easy to assimilate and communicate Questionnaire can be confusing and need simple and easily understood questions
Results can be presented in different formats and can incorporate several issues in one survey
Postal surveys involves a lot of administrative work by the researcher
Large numbers of people can be contacted, either targeted or at random, at relatively low cost
Poor design can produce misleading results
Respondents less influenced by interviewer so assist in the reduction of biasing error
Researcher can’t control who completes the questionnaire
Respondents complete questionnaire in own time, this may lead to more considered responses
Poor response rates starting to be associated to postal surveys (reminder’s sometimes required)
The sample can be statistically accurate
Accessibility
(Bryman and Bell 2003, Creswell 2012, Saunders and Lewis 2012)
The advantages of postal surveys outweighed the disadvantages. It was possible
to address some of the disadvantages through careful planning. Each of the
postal questionnaires sent to participants highlighted in the sample shown in table
3.4 was accompanied by a printed letter (Appendix B). In addition, a return
addressed envelope and a complements return slip was also inserted in to the
envelope (Appendix C). The slip offered the respondent the opportunity to receive
a copy of the findings from the study.
It was envisaged that this offer of reciprocal information sharing would motivate
possible respondents, in a manner that would increase the return rate of the
survey. The printed envelopes containing the questionnaire and accompanying
documents were collated and sorted into batches of approximately five hundred.
Due to restrictions set by the University postal room, these were then sent out in
these batches over a six-day period. The return response rate will be discussed
in sub-section 3.3.3.2.
125 | P a g e
3.3.3 Phase 3 - Data Collection and Analysis
Aim – Collection of quantitative data and analysis in attainment of research
objective 2 & 3
3.3.3.1 Approach
Phase 3 of this study focused primarily upon the attainment of research objectives
2 & 3. An SPSS data file was created from the responses that took place from
the survey instrument disseminated on conclusion of phase 2. During this phase,
research objective 2 was first to be addressed. This took the form of an
Exploratory Factor Analysis (Principal Component) that was carried out to
facilitate the identification of heavily loaded items.
Next step in phase 3 to was to address objective 3. This focused upon the
confirmation of the plausibility of model-fit for the 7V conceptual framework and
the identification of relationships between the themes. By carrying out a
Confirmatory Factor Analysis (CFA), objective 3 was achieved. On conclusion of
phase 3, the study had at this point attained research objectives 1-3. This gave
a grounding for the subsequent discussion to take place in phase 4 and where
the attainment of the final 2 research objectives 4 & 5 would be the focus.
3.3.3.2 Postal response and data treatment
The response rate was 303 completed questionnaires from 3050 distributed. By
extracting the 76 questionnaires that are known to not have reached their
intended recipient’s, it can be confirmed that the overall response rate from the
postal survey was 10.3 per cent. Data treatment was of prime importance to
assist in the reliability of the study (Black 2009). Within this study, the researcher
was proactive in preparation of the returned questionnaires. Each returned
126 | P a g e
questionnaire was numbered, dated and then filed into folders. This quality
process was put in place in case of possible mistakes when inputting data, such
as missed data input on the SPSS file. The researcher then had the ability to
return to the numerically filed questionnaires, to track back to the exact question
answered and find the missing data. The returned complements slips from the
respondents requesting a copy of the initial research findings were logged for
future reference. Before the information from the questionnaires could be
analysed, it was uploaded to an SPSS file. The researcher created the SPSS file
prior to the questionnaires being returned. This was necessary due to the pilot
testing stages as discussed in section 3.4.5. and allowed the researcher to
develop; design and test data file in conjunction with the questionnaire going
through the piloting stages.
3.3.3.3 Data Analysis – Statistical Tool
This section focuses on the specific attainment of research objectives 2 & 3 whilst
offering a foundation for discussion related to objectives 4 & 5. Stage 1 of the
data analysis focused on the data collected from the survey being analysed using
Exploratory Factor Analysis (EFA) to assist in the confirmation of CSFs which
assisted the specific attainment of research objective 2. As there are differing
options open to a researcher when undertaking EFA, this section also clarifies
the process undertaken during this study. In the first instance, this was possible
by justifying the study’s use of EFA and the parameters that were set during the
analysis.
Stage 2 of the analysis sought ‘model fit’ by undertaking a Confirmatory Factor
Analysis (CFA). The findings from this analysis assisted the attainment of
research objective 3 which was to reconceptualise effective supply chain
127 | P a g e
strategies on the evidence from the study. In utilising these forms of analysis, the
study agrees with Bagozzi (1983) suggestion that EFA and CFA approaches can
be seen as specific ends on a continuum. EFA is a technique for reducing data
thus offering a structure to the CSF’s associated to each of the 7Vs themes within
the conceptual framework, whilst the CFA will allow a form of testing the
structured that has been created and offer a theoretical contribution from its
findings.
3.3.3.4 Exploratory Factor Analysis
Exploratory Factor Analysis (EFA) is a widely used statistical technique utilised
within the social sciences (Floyd 1995, Costello and Osborne 2005). The
literature discussed in chapter 2 highlights that it is also prominent in relation to
the research associated to CSFs in SCM (Forker, Mendez et al. 1997, Power,
Sohal et al. 2001, Elmuti 2002, Ueno 2008).
Other types of analysis techniques were considered for this study. From the
literature, tables highlighted throughout chapter 2 that Regression Analysis and
Descriptive statistics as well as EFA were the most common forms of analysis
within academic studies into this research area. This study accepted that
descriptive statistics would be able to highlight key issues in relation to the study,
but would not be enough on their own to confirm CSFs, nor would it be suitable
to see if the 7V Framework could be validated as a model. Regression Analysis,
did offer a process for estimating relationships between variables and had the
capacity of analysing several variables at once (Field, 2009). The drawback to
the utilisation of regression was what it would actually be analysing. With
regression, the focus is on a relationship between a dependent and one or more
independent variables. Further to this, it also focuses on the strength of the

128 | P a g e
relationship between variables. There is evidence of regression analysis being
utilised in the area of CSFs in SCM studies such as Elmuti (2002). However, the
focus of that particular study was to investigate integrated behaviour between
customer and suppliers and the strength of such relationships. When identifying
operational CSFs in supply chains the actual relationship or strength of
relationship is not of prime importance. In the case of this study, it was the ability
of EFA to reduce data that specifically links to the attainment of research objective
2; ‘analyse findings from the empirical study with a view to confirming or
disconfirming CSFs’ which influenced the decision of it being chosen as a
research method. As a multivariate statistical method, EFA seeks to clarify the
structure of interrelationships found within a large set of variables (Hair, Black et
al. 2006). The reason that this study utilizes EFA rather than regression is that as
a data analysis technique, it seeks to identify variables (CSFs) that load heavily
onto key factors/components (Themes). Further justification for the use of EFA
comes from the research field of SCM and its CSFs. Power, Sohal et al. (2001)
seminal paper on ‘critical success factors in agile supply chain management’, has
informed key research throughout the field of SCM. Their data collection
instrument of questionnaires sent to key decision makers within manufacturing
industries in Australia draws clear comparisons with this study.
It is important to note that EFA has few absolute guidelines (Field 2009). EFA
offers varying options, which leads to complexity. In the simplest cases, these
varying options that lack definition that can be linked by basic terminology which
can be identified between the differing software packages available to carry out
such analysis, such as SPSS and SAS. There are varying options open to a
researcher during the analysis (Field 2009). It is also crucial to ensure replicability
and that the options taken within research are well documented and justified. In
129 | P a g e
this study, the variables are the CSFs previously identified which informed the
survey instrument. The study uses EFA to identify the separate dimensions
(factors), which are individual Vs of the conceptual framework. In doing so, the
factor analysis allowed the researcher to ascertain how each variable was
attributed to the dimensions/components (Individual Vs). EFA assists the
researcher in identifying the variables/items (CSFs) associated to each of the
individual themes.
In undertaking the EFA, the study utilised ‘principle component analysis’ (PCA)
rather than component analysis. The reasoning for this is that PCA unlike
component analysis does not discriminate between shared and unique variance
(Costello and Osborne 2005). In the strictest sense there are arguments that PCA
is not factor analysis in the purest sense; however, as highlighted by Field (2009)
the two approaches more often than not produce similar results. PCA is an
analysis technique for identifying groups or clusters of variables and serves three
main purposes. The first assists in the understanding of the structure within a set
of variables (The CSFs in this research). Secondly, it measures the underlying
variables within the questionnaire and finally it reduces the data set so that it is
easier to manage (Field 2009). As this study sought to reduce the number of
variables/items (CSFs) within the data file, the utilisation of PCA was suitable.
When undertaking PCA, it is necessary to test the adequacy of the sample size
being utilised in relation to the analysis undertaken.
A general rule of thumb has been ‘the more participants the better’ with subject-
to-variable ratios of 5:1 being an accepted norm (Floyd 1995, Hair, Black et al.
2006). Others such as Gorsuch (1990) state that as well as the 5:1 ratio, there is
also a requirement for a minimum of 200 within the sample size, which is, double

130 | P a g e
the amount that is suggested by Streiner (1994). This study utilised Kaiser-Meyer-
Oklin (KMO) and Bartlett’s Test of Sphericity. KMO and Bartlett’s tests play a
crucial part in the confirmation of sampling adequacy of this study. KMO ranges
between 0 to 1. Accepted levels for sampling adequacy are those above 0.5
(Field 2009). If the KMO for the factor analysis in this study had been valued at 0
then that would have indicated the amount of partial correlations was high when
compared to the overall amount of actual correlations. This would in turn indicate
diffusion and would highlight the inappropriateness of using factor analysis with
the sample available (Field 2009).
Likewise if the test in this study yielded a value closer to 1, then that would
suggest that correlations and patterns associated to them can be seen as
compact and therefor the factor analysis will produce factors that are reliable and
acceptable. It is also beneficial to highlight the varying levels of KMO values and
consideration should be given to these acceptance levels; 0.5 - 0.7 is classed as
mediocre, 0.7 – 0.8 good and 0.8 - 0.9 great whilst values above 0.9 are classed
as superb (Hair, Black et al. 2006, Field 2009). In addition, Bartlett’s Test of
Sphericity relates directly to the overall significance and measures validity and
suitability of the responses to the actual problem being addressed within the
study. In measuring the suitability of Bartlett’s, this study seeks a significance
value of less than 0.05. Field (2009) suggests that in order for factor analysis to
work there is a requirement for some relationships to be evident, meaning that by
carrying out the significance test it will inform the researcher of the r-matrix that
could be an identity matrix is in fact not, then there are the required relationships
and therefore factor analysis is deemed appropriate. The next step addressed
the extraction method undertaken; in essence which rotation the researcher
should use. Field (2009) suggests that through rotation, the interpretability of
131 | P a g e
certain factors is improved. In utilising rotation, it allowed the analysis to maximise
the loading of the variables (CSFs) onto the individual factors (Themes) whilst at
the same time attempting to minimise the variables loading over more than one
factor. In selecting ‘Varimax rotation’, it is accepted that an orthogonal rotation
instead of oblique rotations such as Promax was the preferred. In doing so, the
study is accepting that at this point the factors are independent off each other.
As the current study did not seek correlations between factor scores it utilised the
method proposed by Anderson-Rubin test instead of regression (Field 2009).
Bartlett’s test produces unbiased scores that only correlate with their own factors.
However, Field (2009) states that the Anderson-Rubin test although similar to
Bartlett’s test generates factors scores that are standardised and uncorrelated.
The study reduced a large set of data into smaller subsets. Field (2009) suggests
this analysis ensures that the coefficient display format will sort the variables by
size so that it is easier to interpret the factors. Stevens (2002) suggests that for a
sample size over 300, supressing smaller loadings at less than 0.298 is
acceptable but the variance in the variable is then considered low. However, the
significance of this loading gives little in the way and that a factor loading of
greater than 0.4, which accounts for 16% of variance within the variable. It is from
that level that this study used as a starting point. Once the descriptive, extraction,
rotation, scores and options were addressed then the analysis was run. The EFA
and the subsequent outputs associated to it will be discussed further chapter 4.
3.3.3.5 Confirmatory Factor Analysis
Once the EFA was completed and identified which variables/items (CSF) loaded
heavily against specific components, the next stage of the analysis undertaken
was to carry out a Confirmatory Factor Analysis (CFA). The study has highlighted
132 | P a g e
literature that has utilised CFA in relation to themes from the 7V Framework (Li,
Ragu-Mathan et al. 2004) and CSFs associated to themes (Fotopoulos and
Psomas 2009). As highlighted by Schreiber (2006) the confirmatory technique
CFA is theory driven, meaning the planning of the analysis is driven by the
theoretical relationships among the observed and unobserved variables (the
themes and the CSFs). The CFA was undertaken using a specific model.
Primarily CFA was undertaken to achieve research objective 3, which was to
‘examine CSFs influencing supply chain strategies applying a 7V conceptual
framework’ and to assist in attaining research objectives 4-5.
Up to this point the researcher has limited control over which variable loads onto
which factor (Hoyle 2000). As discussed by Hair, Black et al. (2006) CFA gives
control back to the researcher in that they can seek to establish a goodness of fit
(model fit), which was not possible with the previously discussed EFA when
utilising principle component. CFA is also seen as a validation technique in
relation to the measurement of specific constructs (Hair, Black et al. 2006). As
highlighted by Diana (2014) by undertaking a CFA it was possible to validate the
relationship between unobserved constructs and observed variables. In essence,
the study uses CFA to see if the 7Vs conceptual framework is plausible. In doing
so, it is important to note that in using CFA the study evaluates the plausibility of
model-fit between themes within the 7V conceptual framework, it does not, seek
the causal nature between factors and variables. The findings from the CFA like
the previously discussed EFA assist the researcher in attaining research
objective 4 for this study. As with EFA the study ensures that, the CFA outputs
generated from the SPSS-Amos statistical tests were evaluated, in a manner that
offered validity to the findings. Unlike most statistical data analysis techniques,
CFA utilises multiple tests in an effort to determine the plausibility of model fit.
133 | P a g e
Schermelleh-Engel (2003) state that this means that a good model fit merely
gives an indication that the model is plausible, it will not explain large proportion
of covariance nor will it even confirm that the model is correct. It is noted that in
relation to model fit indices many have developed, this can lead to confusion and
conflicting conclusions as to the extent to which a model is plausible
(Schermelleh-Engel 2003). In choosing specific model fit indices this study gives
a polarised view by utilising indices that may be conflicting. This ensured it was
reported in an unbiased manner. In order to achieve this the analysis initially
focuses on Chi Square. To supplement Chi Square, Bollen (1989) suggests
further Goodness of Fit Indices (GFI) should considered. With that in mind the
findings also report on Baseline Comparison such as the commonly used
Comparative Fit Index (CFI) as discussed by Bentler (1990), which suggests that
a good model fit can be measured with an output close to .900. Whilst, Bollen
(1989) offers Incremental Fit Index (IFI) as an alternative Baseline Comparison
where values of close to .950 also offer the suggestion of good fit. Mulaik, James
et al. (1989) state that a balanced approach to the analysis is necessary to ensure
that compensation is made for the possibility of artificial fit from eliminating more
parameters associated to baseline comparisons. They suggest by simply freeing
parameters goodness-of-fit can be achieved, however, this would dilute the
model. To overcome this issue, the parsimony of the model-fit is measured
through PRATIO and the Parsimonious Normed-fit index (PNFI); the analysis
sought scores of >0.900 and >0.600 respectively (Mulaik, James et al. 1989). The
final index reported in an attempt to highlight the plausibility of model fit is the root
mean square error of approximation (RMSEA). Brown and Cudeck (1992)
discuss the subjective manner in which RMSEA should be interpreted,
highlighting that 0.05 should be regarded as a close fit, but that this figure is not
134 | P a g e
infallible. They further suggest that a score of 0.1 would indicate a reasonable
error for approximation and would not recommended that as a close fit. Others
such as Bentler and Hu (1999) suggest a score of 0.06 the plausibility of model
fit.
3.4 Reliability and validity of the research design
There is little doubt that validity and reliability issues can be the main factors that
can weaken the power of a research study (Black 2009). Maximising both
construct and internal validity within this study reduces any bias in its conclusion;
however, as highlighted as an issue by Balnaves and Caputi (2012), validity
should not be achieved at the cost of reliability.
Reliability
The reliability of this study is linked to the extent in which other researchers would
arrive at similar results, if studying the same case, data collected and following
identical analytic procedures as the original researcher (Field 2009, Saunders,
Lewis et al. 2012).
Achieving reliability was not a simple process. An example of a threat to reliability
in this study was that of ‘participant error’; if a participant incorrectly completed a
questionnaire i.e. rushing through due to how busy they are. Another threat was
‘participant bias’, in which a false response i.e. a participant given false positive
answers to make themselves come across as having more importance than their
role would suggest. The issue surrounding researcher error was another threat
to reliability during this study. The researcher undertook over 63,000 individual
data inputs from the questions answered related to the questionnaire returned
onto a SPSS file. This task was managed in a manner that the researcher
135 | P a g e
minimised errors through a quality check in place throughout the inputting
process. Finally, there was the potential for an issue surrounding ‘researcher
bias’, which Saunders, Lewis et al. (2012) suggests as being linked to the
researcher using their own subjective opinion when recording or interpreting
responses from participants.
As this study collected data from a structured questionnaire, this issue is
minimised but not eradicated. The researcher ensured that all data inputs were
correct and any ambiguity with responses i.e. two or more responses to the same
Likert-scale question, then the response is was not recorded. The most
appropriate way to deal with the threats highlighted in relation to reliability was
ensuring this study is transparent which allows others to judge its reliability if they
wish to replicate the study (Saunders and Lewis 2012).
However, the researcher notes Balnaves and Caputi (2012) warning that
reliability cannot in itself be deemed sufficient enough to guarantee a high
standard of research. For this to be possible the study also considered validity
and its various forms. The study clearly addresses the issues surrounding
construct, external and face validity which will now be discussed. However, it will
not focus upon internal validity. The justification for this is that, internal validity is
seen as to what extent the design of your research study will allow the researcher
to justify conclusions related to potential relationships between variables (Black
2009, Balnaves and Caputi 2012, Saunders, Lewis et al. 2012). In essence,
internal validity focuses on ‘causality’ related to potential relationships of
variables. Although this study will attempt to identify and confirm relationships
136 | P a g e
between the identified themes it will not seek causality so will therefore not seek
to guarantee its presence within the process.
Construct validity
This study confirms construct validity by ensuring that the data collection
instrument measured what it is supposed to. In doing this the researcher asked,
can the constructs be operationalised? (Field 2009, Balnaves and Caputi 2012)
This specific issue was addressed early within the study’s life cycle. The
importance in doing so is highlighted by Black (2009) who states that issues
related to research outcomes are more likely to be traced back to the how the
construct was defined rather than the instrument that has been put in place to
measure it.
Within this study, themes are operational constructs that have been built upon
existing theories and literature highlighted in chapter 2. It was accepted that these
constructs could have been fundamentally flawed and if not checked the study
would be attempting to analyse themes that should not be measured and offer no
validity. To overcome this potential issue this study established that each of the
seven themes constitute a valid operational definition of the constructs, as can
be seen throughout section 2.3.
External Validity
The study addressed external validity which relates to the findings of this study
being able to be generalised beyond the specific context of the research
(Saunders and Lewis 2012). It is stated that the selection of the participants within
the population is critical and should be noted as a key issue for quantitative
researchers who seek to produce representative samples (Bryman and Bell

137 | P a g e
2003). The sample and the conditions of this study are “representative of the
situations and time to which the results are to apply” (Black 2009). To ensure
validity of this, studies results can be applied to the selected sample, the
researcher ensured any issues around planning, design and execution were
addressed at each stage of the process. Within this study external validity was
addressed by the way in which the population was identified and the sample was
gathered. This is clearly articulated in section 3.3.26.
Face Validity
Although similar to construct validity, face validity was considered and actioned
upon. Face validity is seen as, the extent in which a test is viewed by its
participants. In essence similar to construct validity in how closely it measures
what it is meant to (Holden 2010). In the case of this research it asks the question
‘will the participants see the questionnaire and what is being asked as valid. In
order to for Face validity to be achieved the researcher worked closely with
professional members of the Chartered Institute of Purchasing Supply (CIPS)
when designing the questionnaire. Initial group meetings focused around the
meaning and understanding of the individual 7V themes. There was a clear
attempt to ensure that the themes constructed within the literature would translate
to an operational sense. Through the initial piloting stages the 7 themes were
closely investigated to ensure face validity as were the questions being asked
within the survey tool.
3.5 Summary
This chapter outlined the first three phases of the research. It highlighted the key
elements of the instrument applied to this study, and these were explained and
justified. The following chapter will now highlight the findings of the thesis as it

138 | P a g e
moves into phase 3 of the study, which is post collection of quantitative data
through the survey instrument and subsequent analysis of data.
139 | P a g e
Chapter 4 Findings
This chapter reports the results of the findings from phase 3 of the study. The
Descriptive statistics, Exploratory Factor Analysis (EFA) and Confirmatory Factor
Analysis (CFA) findings are highlighted. All analysis was conducted using SPSS
and AMOS software. As previously stated the purpose of the EFA was to achieve
research objective 2, which was to analyse findings from the empirical study with
a view to confirming or disconfirming CSFs. The EFA is complemented by the
inclusion of descriptive statistics. The chapter then states the findings of the CFA
and highlights the plausibility of model fit, which in turns initiates the process of
validating the 7V Framework. The results of the CFA lay the foundations for
seeking clarification on the issues surrounding research objective 3 which was to
examine CSFs influencing supply chains applying a 7V conceptual framework.
4.1 Exploratory Factor Analysis
The EFA (principal component) utilising varimax rotation was carried out to
validate the 106 possible CSFs highlighted during phase 1 of the research. In
conjunction with the factor extraction, specific tests relating to sampling adequacy
and overall significance such as Bartlett’s Test of Sphericity were undertaken.
Kaiser-Meyer-Olkin (KMO) measurement of sampling adequacy highlights a
0.898, which is classed as great and above the commonly recommended
measurement of 0.6. Bartlett’s Test of Sphericity revealed a level of 0.000 which
suggested the strength of the relationships between the variables was strong. In
addition to both KMO and Bartlett’s it was also found that the commonalities were
all above 0.3, this lends weight to the assumption that each item shares in part
some common variance with other items. By focusing on these three initial
indicators, it was decided that proceeding with EFA was justifiable. As discussed
by Field (2009) the initial stage of factor extraction is to determine the linear
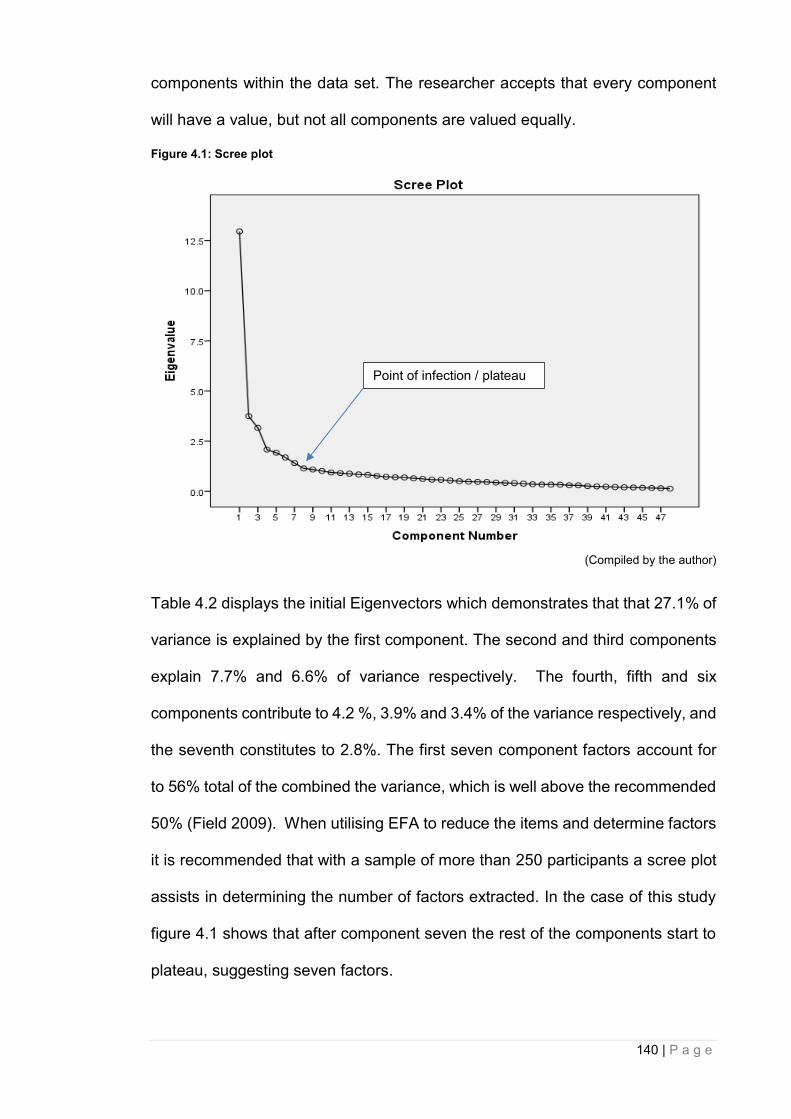
140 | P a g e
components within the data set. The researcher accepts that every component
will have a value, but not all components are valued equally.
Figure 4.1: Scree plot
(Compiled by the author)
Table 4.2 displays the initial Eigenvectors which demonstrates that that 27.1% of
variance is explained by the first component. The second and third components
explain 7.7% and 6.6% of variance respectively. The fourth, fifth and six
components contribute to 4.2 %, 3.9% and 3.4% of the variance respectively, and
the seventh constitutes to 2.8%. The first seven component factors account for
to 56% total of the combined the variance, which is well above the recommended
50% (Field 2009). When utilising EFA to reduce the items and determine factors
it is recommended that with a sample of more than 250 participants a scree plot
assists in determining the number of factors extracted. In the case of this study
figure 4.1 shows that after component seven the rest of the components start to
plateau, suggesting seven factors.
Point of infection / plateau
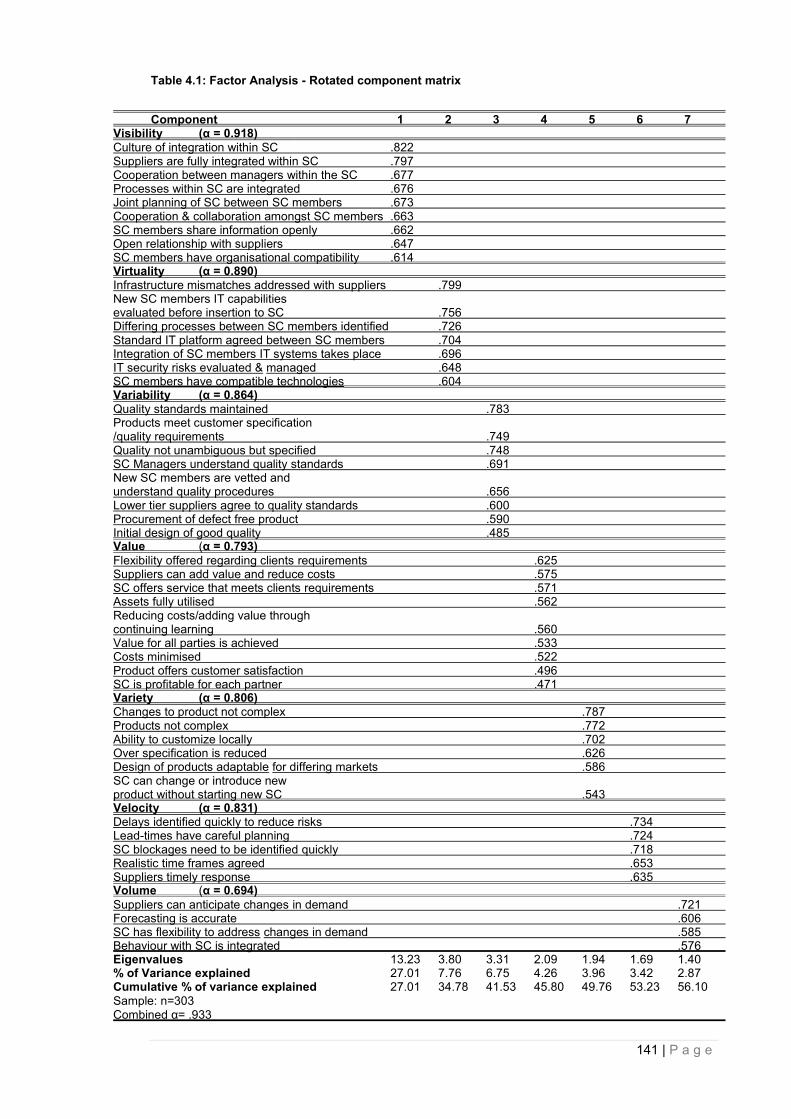
141 | P a g e
Table 4.1: Factor Analysis - Rotated component matrix
Component 1 2 3 4 5 6 7 Visibility (α = 0.918)
Culture of integration within SC .822 Suppliers are fully integrated within SC .797 Cooperation between managers within the SC .677 Processes within SC are integrated .676 Joint planning of SC between SC members .673 Cooperation & collaboration amongst SC members .663 SC members share information openly .662 Open relationship with suppliers .647 SC members have organisational compatibility .614 Virtuality (α = 0.890)
Infrastructure mismatches addressed with suppliers .799 New SC members IT capabilities evaluated before insertion to SC .756 Differing processes between SC members identified .726 Standard IT platform agreed between SC members .704 Integration of SC members IT systems takes place .696 IT security risks evaluated & managed .648 SC members have compatible technologies .604 Variability (α = 0.864)
Quality standards maintained .783 Products meet customer specification /quality requirements .749 Quality not unambiguous but specified .748 SC Managers understand quality standards .691 New SC members are vetted and understand quality procedures .656 Lower tier suppliers agree to quality standards .600 Procurement of defect free product .590 Initial design of good quality .485 Value (α = 0.793)
Flexibility offered regarding clients requirements .625 Suppliers can add value and reduce costs .575 SC offers service that meets clients requirements .571 Assets fully utilised .562 Reducing costs/adding value through continuing learning .560 Value for all parties is achieved .533 Costs minimised .522 Product offers customer satisfaction .496 SC is profitable for each partner .471 Variety (α = 0.806)
Changes to product not complex .787 Products not complex .772 Ability to customize locally .702 Over specification is reduced .626 Design of products adaptable for differing markets .586 SC can change or introduce new product without starting new SC .543 Velocity (α = 0.831)
Delays identified quickly to reduce risks .734 Lead-times have careful planning .724 SC blockages need to be identified quickly .718 Realistic time frames agreed .653 Suppliers timely response .635 Volume (α = 0.694)
Suppliers can anticipate changes in demand .721 Forecasting is accurate .606 SC has flexibility to address changes in demand .585 Behaviour with SC is integrated .576 Eigenvalues 13.23 3.80 3.31 2.09 1.94 1.69 1.40 % of Variance explained 27.01 7.76 6.75 4.26 3.96 3.42 2.87 Cumulative % of variance explained 27.01 34.78 41.53 45.80 49.76 53.23 56.10
Sample: n=303 Combined α= .933
142 | P a g e
Coefficients of less than 0.4 were suppressed. The rotated component matrix
utilised Varimax rotation with Kaiser Normalization.
As can be seen in the rotated component analysis in Table 4.1 the decision to
load the items onto seven principal components (themes) was justified and the
rotation converged was set in 7 iterations. As part of the process of undertaking
exploratory factor analysis, the reduction of items needed careful consideration.
As shown in appendix E, the initial exploratory factor analysis (EFA) highlights all
106 items within the rotated competent matrix. This EFA shows items that were
loaded onto multiple components and others that loaded with less than the 0.45
factor loading sought (highlighted in section 3.3.3.4). The first attempt at
reduction, focused on extracting the items with a value of less than 0.45. The next
run of the EFA reduced the items from 106 to 73 within the rotated component
matrix.
The researcher then focused on items that loaded heavily onto more than one
principal component. An item was considered to have a duel loading if it scored
more than 0.45 on one component. This process then went back and forth
reducing and then re-running the factor analysis until no items loaded onto
multiple components and all had a factor loading of more than 0.45 until only 48
items met this criterion.
The final rotated component matrix is show in Table 4.1 and appendix E (full EFA
data statistics). It highlights 48 items loading onto the 7 principal components
each named after their relevant themes.
Cronbach’s Alpha = α was also applied to each individual factor to determine the
interrelatedness between items. Field (2009) suggests lower scores below 0.6
are considered heterogeneous with little correlation to other items. Options have
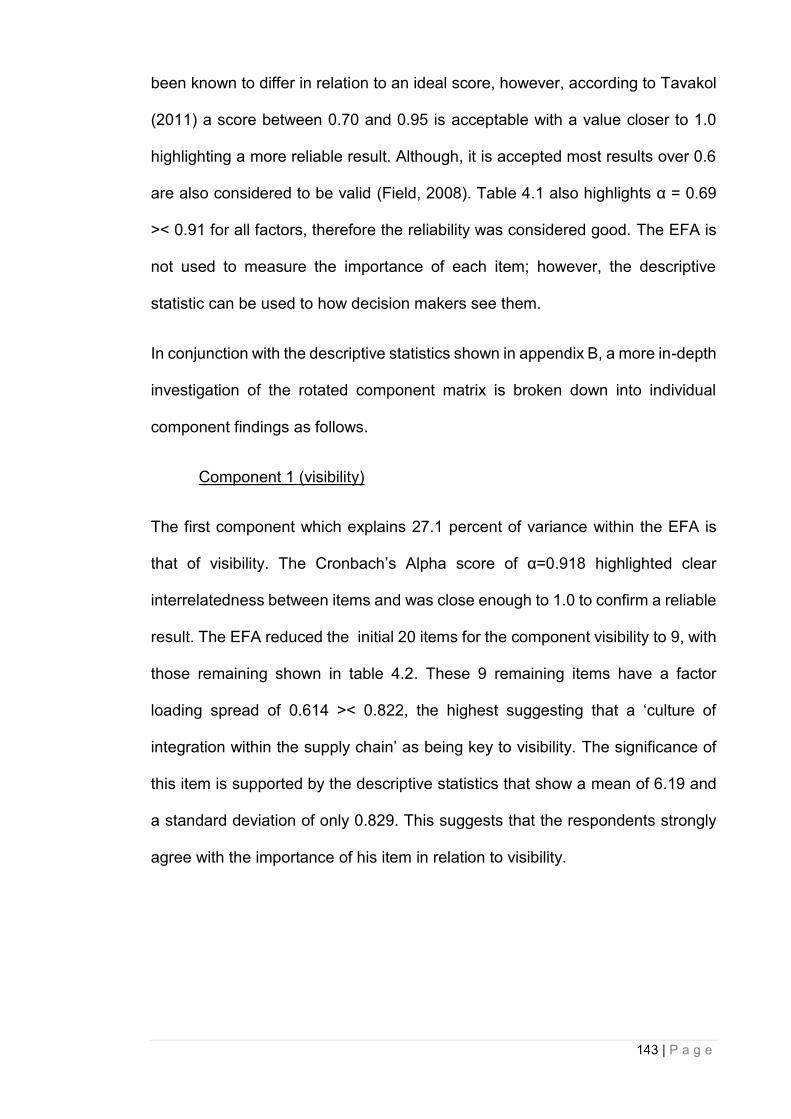
143 | P a g e
been known to differ in relation to an ideal score, however, according to Tavakol
(2011) a score between 0.70 and 0.95 is acceptable with a value closer to 1.0
highlighting a more reliable result. Although, it is accepted most results over 0.6
are also considered to be valid (Field, 2008). Table 4.1 also highlights α = 0.69
>< 0.91 for all factors, therefore the reliability was considered good. The EFA is
not used to measure the importance of each item; however, the descriptive
statistic can be used to how decision makers see them.
In conjunction with the descriptive statistics shown in appendix B, a more in-depth
investigation of the rotated component matrix is broken down into individual
component findings as follows.
Component 1 (visibility)
The first component which explains 27.1 percent of variance within the EFA is
that of visibility. The Cronbach’s Alpha score of α=0.918 highlighted clear
interrelatedness between items and was close enough to 1.0 to confirm a reliable
result. The EFA reduced the initial 20 items for the component visibility to 9, with
those remaining shown in table 4.2. These 9 remaining items have a factor
loading spread of 0.614 >< 0.822, the highest suggesting that a ‘culture of
integration within the supply chain’ as being key to visibility. The significance of
this item is supported by the descriptive statistics that show a mean of 6.19 and
a standard deviation of only 0.829. This suggests that the respondents strongly
agree with the importance of his item in relation to visibility.
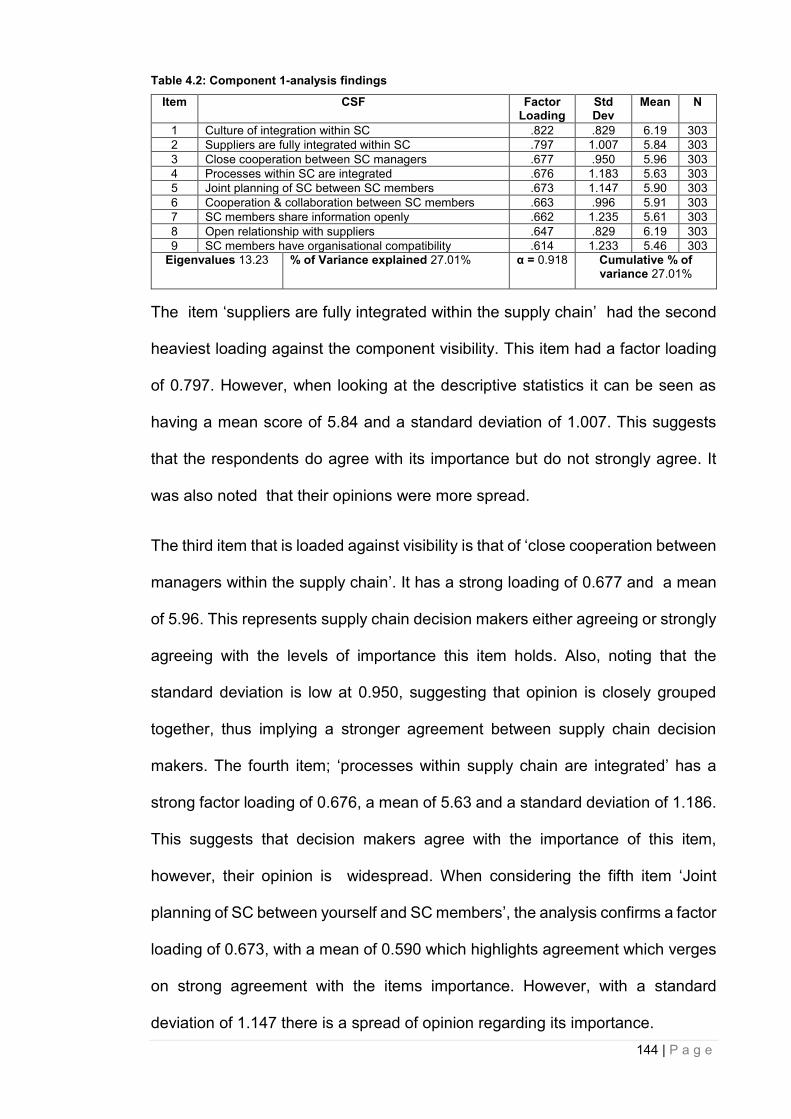
144 | P a g e
Table 4.2: Component 1-analysis findings
Item CSF Factor Loading
Std Dev
Mean N
1 Culture of integration within SC .822 .829 6.19 303
2 Suppliers are fully integrated within SC .797 1.007 5.84 303
3 Close cooperation between SC managers .677 .950 5.96 303
4 Processes within SC are integrated .676 1.183 5.63 303
5 Joint planning of SC between SC members .673 1.147 5.90 303
6 Cooperation & collaboration between SC members .663 .996 5.91 303
7 SC members share information openly .662 1.235 5.61 303
8 Open relationship with suppliers .647 .829 6.19 303
9 SC members have organisational compatibility .614 1.233 5.46 303
Eigenvalues 13.23 % of Variance explained 27.01% α = 0.918 Cumulative % of variance 27.01%
The item ‘suppliers are fully integrated within the supply chain’ had the second
heaviest loading against the component visibility. This item had a factor loading
of 0.797. However, when looking at the descriptive statistics it can be seen as
having a mean score of 5.84 and a standard deviation of 1.007. This suggests
that the respondents do agree with its importance but do not strongly agree. It
was also noted that their opinions were more spread.
The third item that is loaded against visibility is that of ‘close cooperation between
managers within the supply chain’. It has a strong loading of 0.677 and a mean
of 5.96. This represents supply chain decision makers either agreeing or strongly
agreeing with the levels of importance this item holds. Also, noting that the
standard deviation is low at 0.950, suggesting that opinion is closely grouped
together, thus implying a stronger agreement between supply chain decision
makers. The fourth item; ‘processes within supply chain are integrated’ has a
strong factor loading of 0.676, a mean of 5.63 and a standard deviation of 1.186.
This suggests that decision makers agree with the importance of this item,
however, their opinion is widespread. When considering the fifth item ‘Joint
planning of SC between yourself and SC members’, the analysis confirms a factor
loading of 0.673, with a mean of 0.590 which highlights agreement which verges
on strong agreement with the items importance. However, with a standard
deviation of 1.147 there is a spread of opinion regarding its importance.
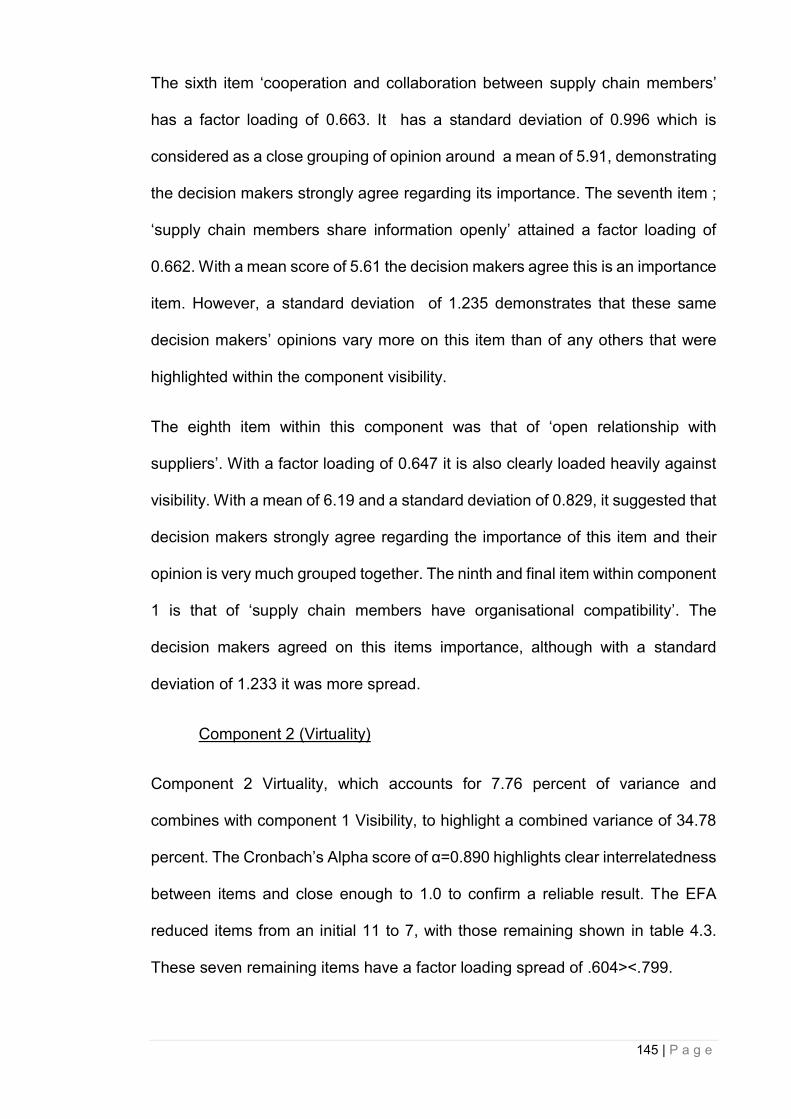
145 | P a g e
The sixth item ‘cooperation and collaboration between supply chain members’
has a factor loading of 0.663. It has a standard deviation of 0.996 which is
considered as a close grouping of opinion around a mean of 5.91, demonstrating
the decision makers strongly agree regarding its importance. The seventh item ;
‘supply chain members share information openly’ attained a factor loading of
0.662. With a mean score of 5.61 the decision makers agree this is an importance
item. However, a standard deviation of 1.235 demonstrates that these same
decision makers’ opinions vary more on this item than of any others that were
highlighted within the component visibility.
The eighth item within this component was that of ‘open relationship with
suppliers’. With a factor loading of 0.647 it is also clearly loaded heavily against
visibility. With a mean of 6.19 and a standard deviation of 0.829, it suggested that
decision makers strongly agree regarding the importance of this item and their
opinion is very much grouped together. The ninth and final item within component
1 is that of ‘supply chain members have organisational compatibility’. The
decision makers agreed on this items importance, although with a standard
deviation of 1.233 it was more spread.
Component 2 (Virtuality)
Component 2 Virtuality, which accounts for 7.76 percent of variance and
combines with component 1 Visibility, to highlight a combined variance of 34.78
percent. The Cronbach’s Alpha score of α=0.890 highlights clear interrelatedness
between items and close enough to 1.0 to confirm a reliable result. The EFA
reduced items from an initial 11 to 7, with those remaining shown in table 4.3.
These seven remaining items have a factor loading spread of .604><.799.
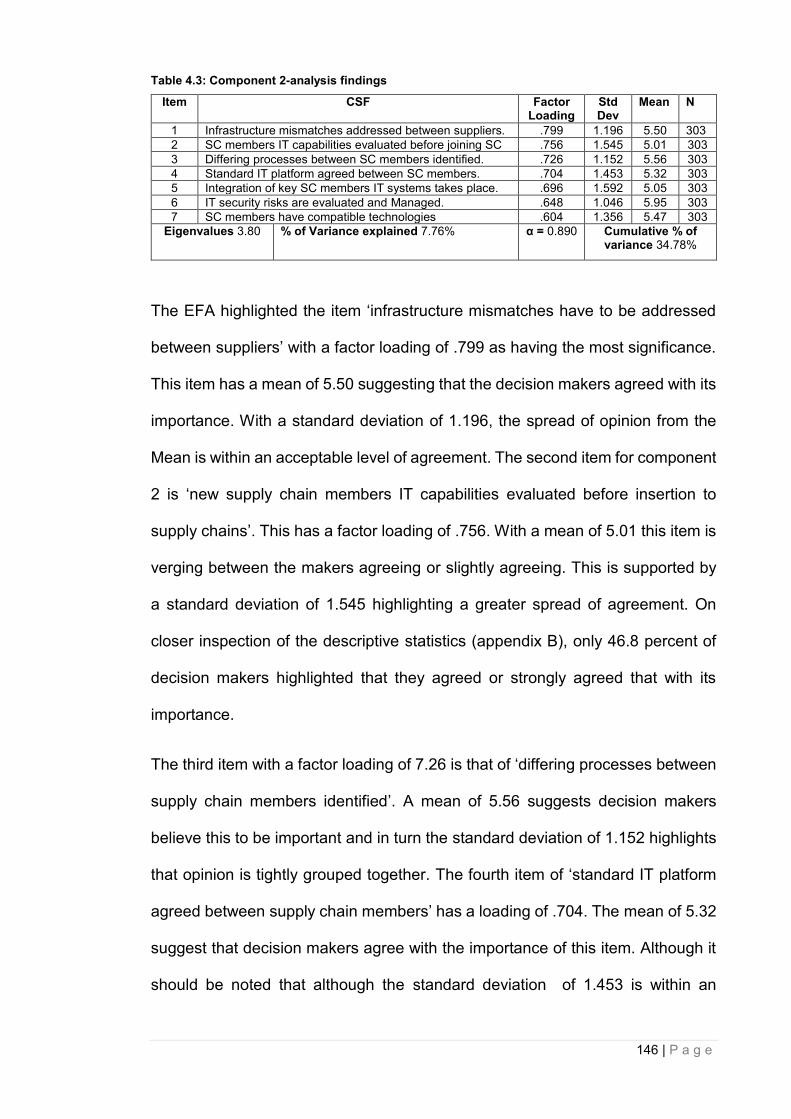
146 | P a g e
Table 4.3: Component 2-analysis findings
Item CSF Factor Loading
Std Dev
Mean N
1 Infrastructure mismatches addressed between suppliers. .799 1.196 5.50 303
2 SC members IT capabilities evaluated before joining SC .756 1.545 5.01 303
3 Differing processes between SC members identified. .726 1.152 5.56 303
4 Standard IT platform agreed between SC members. .704 1.453 5.32 303
5 Integration of key SC members IT systems takes place. .696 1.592 5.05 303
6 IT security risks are evaluated and Managed. .648 1.046 5.95 303
7 SC members have compatible technologies .604 1.356 5.47 303
Eigenvalues 3.80 % of Variance explained 7.76% α = 0.890 Cumulative % of variance 34.78%
The EFA highlighted the item ‘infrastructure mismatches have to be addressed
between suppliers’ with a factor loading of .799 as having the most significance.
This item has a mean of 5.50 suggesting that the decision makers agreed with its
importance. With a standard deviation of 1.196, the spread of opinion from the
Mean is within an acceptable level of agreement. The second item for component
2 is ‘new supply chain members IT capabilities evaluated before insertion to
supply chains’. This has a factor loading of .756. With a mean of 5.01 this item is
verging between the makers agreeing or slightly agreeing. This is supported by
a standard deviation of 1.545 highlighting a greater spread of agreement. On
closer inspection of the descriptive statistics (appendix B), only 46.8 percent of
decision makers highlighted that they agreed or strongly agreed that with its
importance.
The third item with a factor loading of 7.26 is that of ‘differing processes between
supply chain members identified’. A mean of 5.56 suggests decision makers
believe this to be important and in turn the standard deviation of 1.152 highlights
that opinion is tightly grouped together. The fourth item of ‘standard IT platform
agreed between supply chain members’ has a loading of .704. The mean of 5.32
suggest that decision makers agree with the importance of this item. Although it
should be noted that although the standard deviation of 1.453 is within an
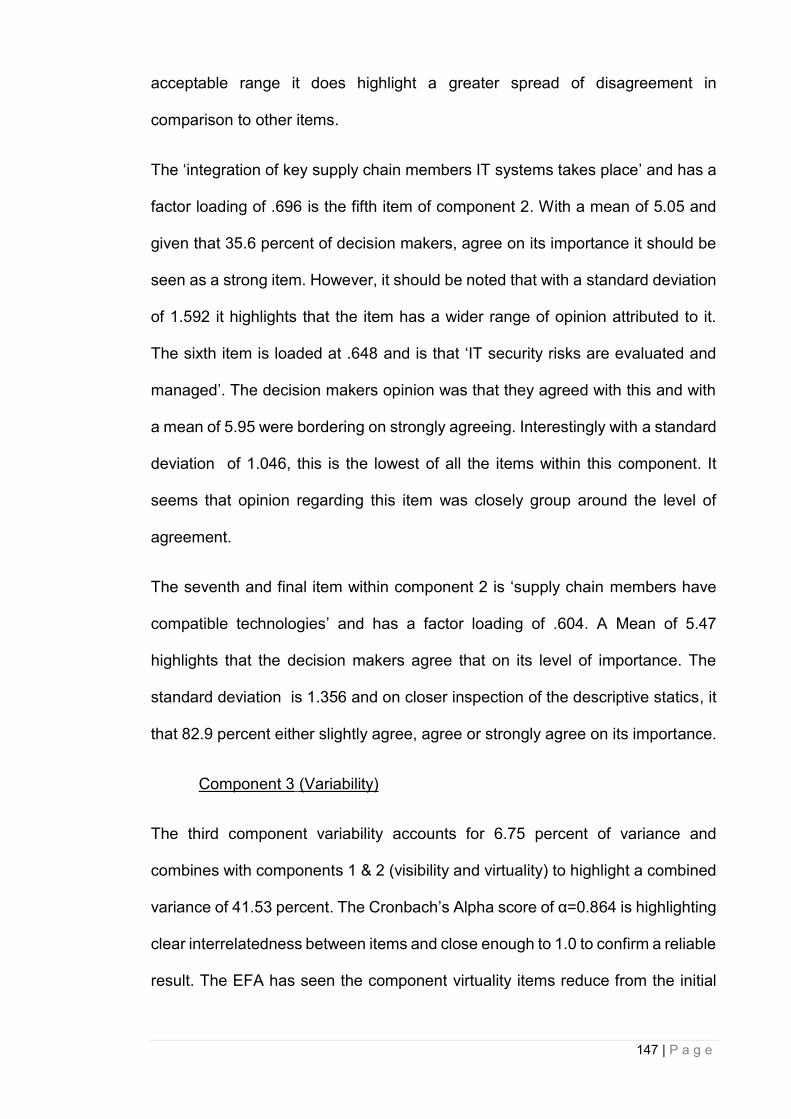
147 | P a g e
acceptable range it does highlight a greater spread of disagreement in
comparison to other items.
The ‘integration of key supply chain members IT systems takes place’ and has a
factor loading of .696 is the fifth item of component 2. With a mean of 5.05 and
given that 35.6 percent of decision makers, agree on its importance it should be
seen as a strong item. However, it should be noted that with a standard deviation
of 1.592 it highlights that the item has a wider range of opinion attributed to it.
The sixth item is loaded at .648 and is that ‘IT security risks are evaluated and
managed’. The decision makers opinion was that they agreed with this and with
a mean of 5.95 were bordering on strongly agreeing. Interestingly with a standard
deviation of 1.046, this is the lowest of all the items within this component. It
seems that opinion regarding this item was closely group around the level of
agreement.
The seventh and final item within component 2 is ‘supply chain members have
compatible technologies’ and has a factor loading of .604. A Mean of 5.47
highlights that the decision makers agree that on its level of importance. The
standard deviation is 1.356 and on closer inspection of the descriptive statics, it
that 82.9 percent either slightly agree, agree or strongly agree on its importance.
Component 3 (Variability)
The third component variability accounts for 6.75 percent of variance and
combines with components 1 & 2 (visibility and virtuality) to highlight a combined
variance of 41.53 percent. The Cronbach’s Alpha score of α=0.864 is highlighting
clear interrelatedness between items and close enough to 1.0 to confirm a reliable
result. The EFA has seen the component virtuality items reduce from the initial
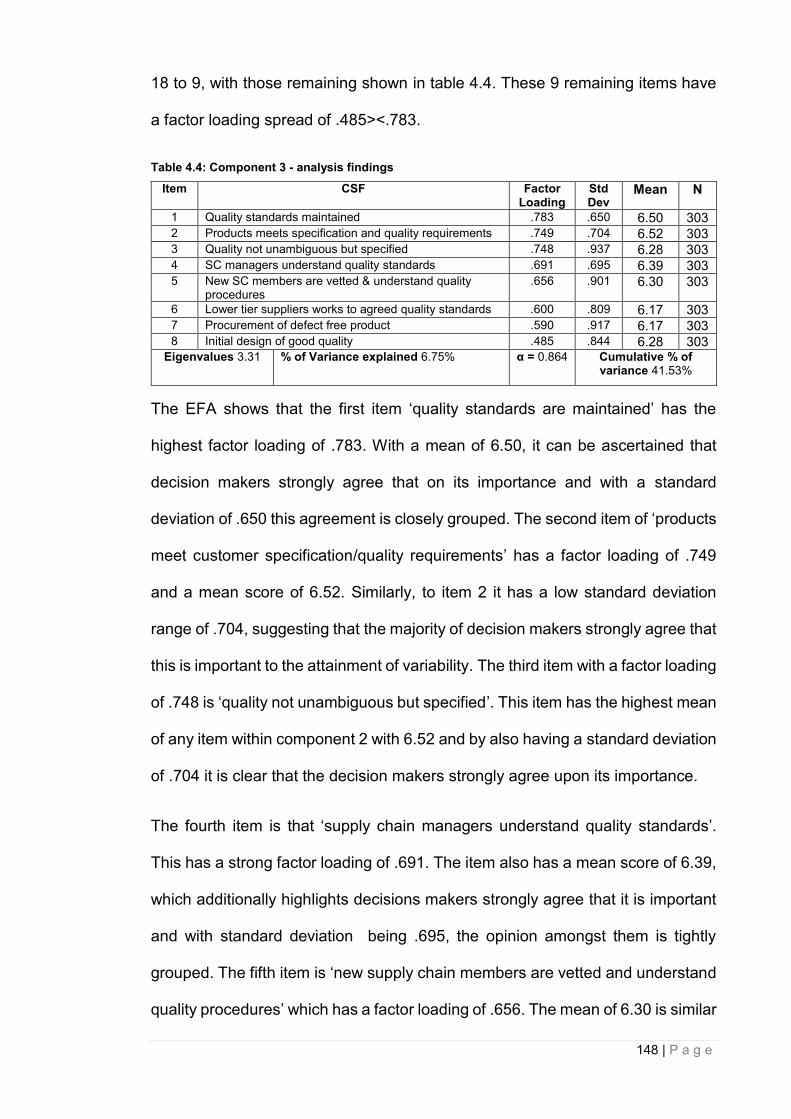
148 | P a g e
18 to 9, with those remaining shown in table 4.4. These 9 remaining items have
a factor loading spread of .485><.783.
Table 4.4: Component 3 - analysis findings
Item CSF Factor Loading
Std Dev
Mean N
1 Quality standards maintained .783 .650 6.50 303 2 Products meets specification and quality requirements .749 .704 6.52 303 3 Quality not unambiguous but specified .748 .937 6.28 303 4 SC managers understand quality standards .691 .695 6.39 303 5 New SC members are vetted & understand quality
procedures .656 .901 6.30 303
6 Lower tier suppliers works to agreed quality standards .600 .809 6.17 303 7 Procurement of defect free product .590 .917 6.17 303 8 Initial design of good quality .485 .844 6.28 303
Eigenvalues 3.31 % of Variance explained 6.75% α = 0.864 Cumulative % of variance 41.53%
The EFA shows that the first item ‘quality standards are maintained’ has the
highest factor loading of .783. With a mean of 6.50, it can be ascertained that
decision makers strongly agree that on its importance and with a standard
deviation of .650 this agreement is closely grouped. The second item of ‘products
meet customer specification/quality requirements’ has a factor loading of .749
and a mean score of 6.52. Similarly, to item 2 it has a low standard deviation
range of .704, suggesting that the majority of decision makers strongly agree that
this is important to the attainment of variability. The third item with a factor loading
of .748 is ‘quality not unambiguous but specified’. This item has the highest mean
of any item within component 2 with 6.52 and by also having a standard deviation
of .704 it is clear that the decision makers strongly agree upon its importance.
The fourth item is that ‘supply chain managers understand quality standards’.
This has a strong factor loading of .691. The item also has a mean score of 6.39,
which additionally highlights decisions makers strongly agree that it is important
and with standard deviation being .695, the opinion amongst them is tightly
grouped. The fifth item is ‘new supply chain members are vetted and understand
quality procedures’ which has a factor loading of .656. The mean of 6.30 is similar

149 | P a g e
to all component 3 items in that decision makers strongly agree with its
importance in relation to variability. With the standard deviation being .901, it
shows that opinion is tightly grouped. On further inspection of the descriptive
statistics it confirms 88.4 percent of decision makers agree or strongly agree with
its importance in relation to variability.
The sixth item is loaded at .600 and is ‘lower tier suppliers works to agreed quality
standards’. This item has a mean of 6.17 and standard deviation of .809. Next,
the seventh item suggests that ‘procurement of defect free product’ with a factor
loading of 5.90 is linked to variability. This is the first item from the first three
component that scores under .600. However, it is still considered acceptable and
with a mean score of 6.17, decision makers strongly agree on its importance.
Finally, the eighth item loaded onto component 3 is that of the ‘initial design of
good quality’ ad score at .485. This is the first item within the EFA that scores
between .400 and .500. With a high, mean score of 6.28 it shows that decision
makers strongly agree with its importance towards variability. In addition, the
standard deviation of .844 also suggests that their agreement is closely grouped
together.
Component 4 (value)
The forth component of value accounts for 4.26 percent of variance and combines
with components 1-3 (visibility, virtuality and variability) to highlight a combined
variance of 45.80 percent. The Cronbach’s Alpha score of α=0.793 is highlighting
clear interrelatedness between items and close enough to 1.0 to confirm a reliable
result. The EFA significantly reduced the initial 26 items identified to 9, these are
highlighted in table 4.5. The nine remaining items have a factor loading spread of
.471><.625.

150 | P a g e
Table 4.5: Component 4 - analysis findings
Item ITEM/CSF Factor Loading
Std Dev
Mean N
1 Flexibility offered regarding clients requirements .625 .952 6.01 303
2 Suppliers can add value and reduce costs .575 .927 6.08 303
3 SC offers service that meets clients requirements .571 .665 6.38 303
4 Assets fully utilised .562 1.258 5.62 303
5 Reducing costs/adding value through continuing learning .560 .895 6.06 303
6 Value for all parties is achieved .533 .797 6.01 303
7 Costs minimised .522 .893 6.01 303
8 Product offers customer satisfaction .496 .865 6.36 303
9 SC is profitable for each partner .471 .898 6.16 303
Eigenvalues 2.09 % of Variance explained 4.26 α = 0.793 Cumulative % of variance 45.80%
The EFA identifies item 1, the ‘flexibility offered regarding clients requirements’
has a factor loading of 0.625 as the highest loaded item in relation to value. With
a mean of 6.1, the decision makers see this as being very important in the
attainment achieving value. With a standard deviation of .952 it is also shown that
opinion is closely grouped together. In comparison to the items from other
components, the items attributed to value have a lower loading with only item
above.600. However, all but one of the items has a mean lower that .600
highlighting their individual importance in attaining value. Item 2 has a factor
loading of .575 as is that ‘suppliers can add value and reduce costs’, with a Mean
of 6.08 and a standard deviation of .927 suggesting that decision makers strongly
agree on its importance to the attainment value. Item 3 with a factor loading of
.571 is that a ‘supply chain offers service that meets clients requirements’. Within
component 4 this item has the highest Mean of 6.38 with the lowest standard
deviation of .665. This suggests that item 3, should be seen as being very
important in attaining value by decision makers.
Item 4 with a factor loading of .562 suggests that ‘assets are fully utilised’ to
enable value to be achieved. A mean score of 5.62 with a standard deviation of
1.258 suggesting a wider spread of opinion between decision markets as to its
importance. However, closer inspection of the descriptive statistics it highlights
only 6.3 percent that have no opinion or disagree on the importance of this CSF.
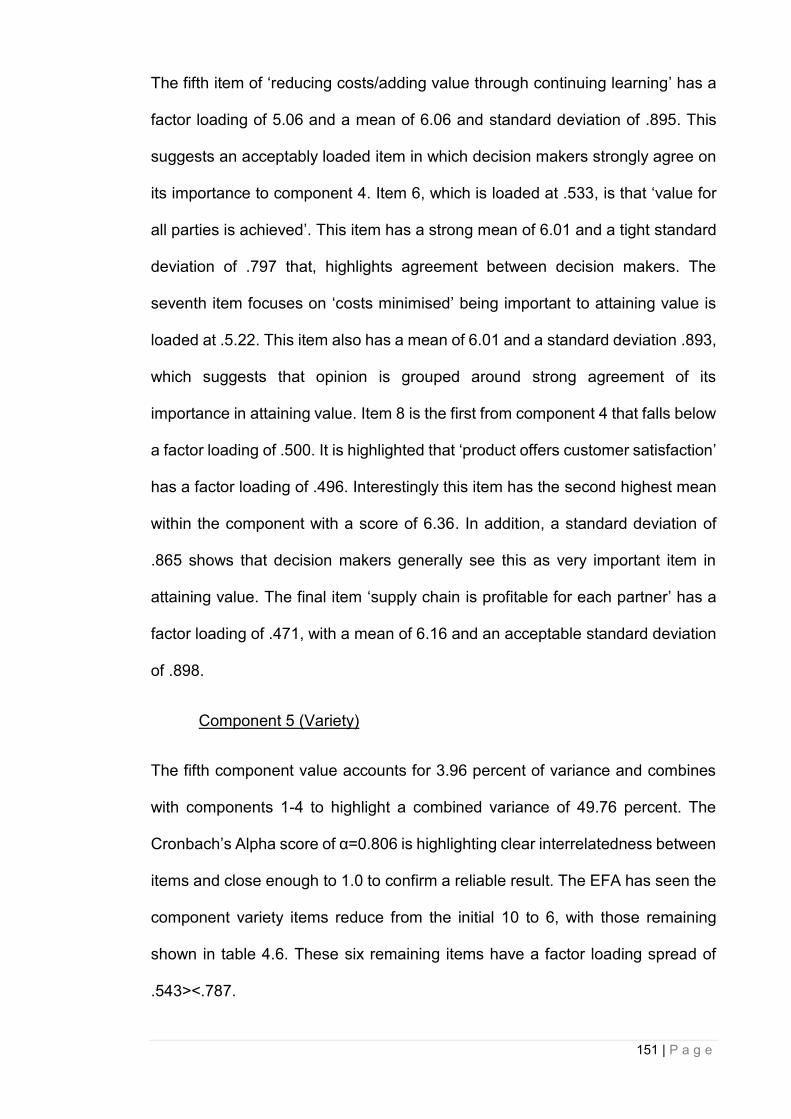
151 | P a g e
The fifth item of ‘reducing costs/adding value through continuing learning’ has a
factor loading of 5.06 and a mean of 6.06 and standard deviation of .895. This
suggests an acceptably loaded item in which decision makers strongly agree on
its importance to component 4. Item 6, which is loaded at .533, is that ‘value for
all parties is achieved’. This item has a strong mean of 6.01 and a tight standard
deviation of .797 that, highlights agreement between decision makers. The
seventh item focuses on ‘costs minimised’ being important to attaining value is
loaded at .5.22. This item also has a mean of 6.01 and a standard deviation .893,
which suggests that opinion is grouped around strong agreement of its
importance in attaining value. Item 8 is the first from component 4 that falls below
a factor loading of .500. It is highlighted that ‘product offers customer satisfaction’
has a factor loading of .496. Interestingly this item has the second highest mean
within the component with a score of 6.36. In addition, a standard deviation of
.865 shows that decision makers generally see this as very important item in
attaining value. The final item ‘supply chain is profitable for each partner’ has a
factor loading of .471, with a mean of 6.16 and an acceptable standard deviation
of .898.
Component 5 (Variety)
The fifth component value accounts for 3.96 percent of variance and combines
with components 1-4 to highlight a combined variance of 49.76 percent. The
Cronbach’s Alpha score of α=0.806 is highlighting clear interrelatedness between
items and close enough to 1.0 to confirm a reliable result. The EFA has seen the
component variety items reduce from the initial 10 to 6, with those remaining
shown in table 4.6. These six remaining items have a factor loading spread of
.543><.787.

152 | P a g e
Table 4.6: Component 5 - analysis findings
Item ITEM/CSF Factor Loading
Std Dev
Mean N
1 Changes to product not complex .787 1.558 5.11 303
2 Products are not complex .772 1.785 4.39 303
3 Ability to customize locally .702 1.670 4.75 303
4 Over specification is reduced .626 1.249 5.55 303
5 Design of products adaptable for differing markets .586 1.313 5.56 303
6 SC can change or introduce new product without starting new SC
.543 1.254 5.46 303
Eigenvalues 1.94 % of Variance explained 3.96% α = 0.806 Cumulative % of variance 49.76%
The EFA highlights that the heaviest loaded factor on component 5 is ‘changes
to product not complex’ with a loading of .787. In relation to the mean score of
5.11 it suggests that decision makers agree on its importance. However, the
standard deviation of 1.558 suggests that opinion is spread. On closer inspection
of the descriptive statistics, it can be seen that 70.3 percent of decision makers
either slightly agree, agree or strongly agree. This suggests that although opinion
is spread, it still leans heavily to an agreement that the item is important between
decision makers. Item 2 has a factor loading of .772 and in relation to variety it
seeks that ‘products are not complex’. This item has the lowest mean score 4.39
for not only this component, but also the previous four. This suggests that
decision makers only slightly agree of its importance in relation to variety. The
standard deviation has a spread of 1.785 which this highest for this or any other
component up to this point. On closer inspection of the descriptive statistics, it
can be seen that 51.2 percent slightly agree, agree or strongly agree with its
importance. In turn 32.4 percent slightly disagree, disagree or strongly disagree,
with 15.5 percent having no opinion.
The third item is the ‘ability to customize locally’ and has a strong factor loading
of .702. The mean of 5.11 shows that there is agreement that the item is important
between decision makers, however, the standard deviation of 1.670 again
suggests that it is spread. On closer inspection of the descriptive statistics, it can
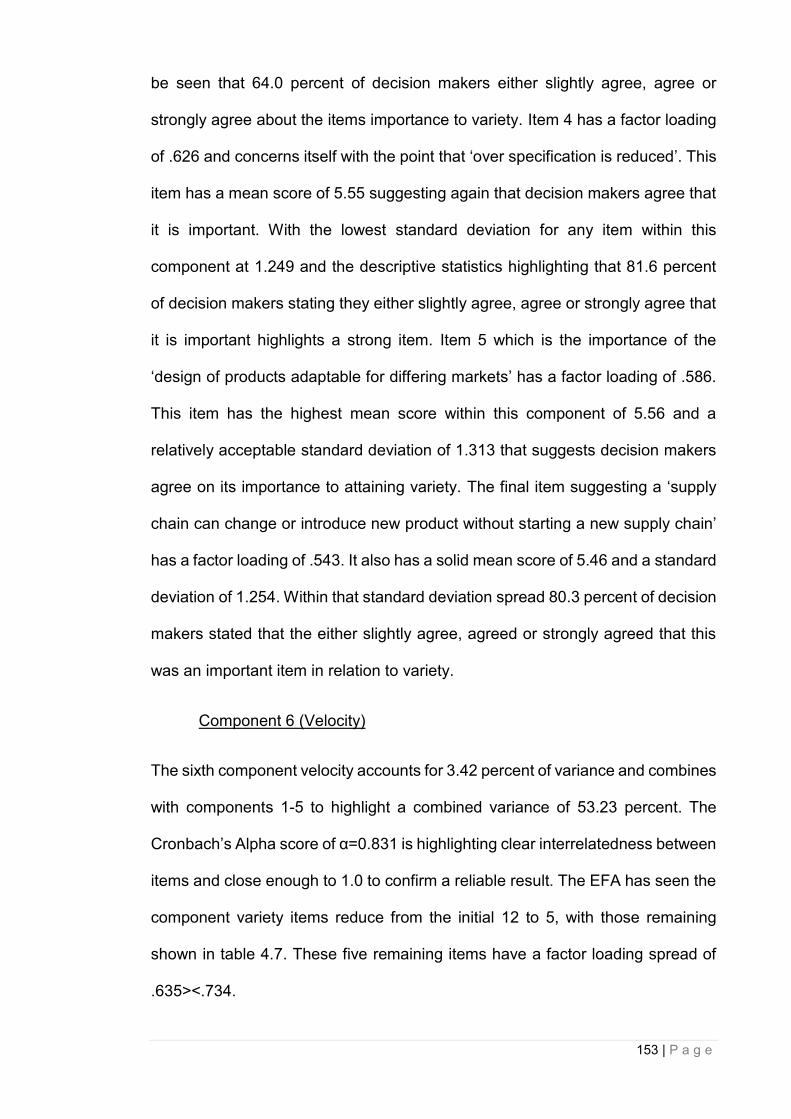
153 | P a g e
be seen that 64.0 percent of decision makers either slightly agree, agree or
strongly agree about the items importance to variety. Item 4 has a factor loading
of .626 and concerns itself with the point that ‘over specification is reduced’. This
item has a mean score of 5.55 suggesting again that decision makers agree that
it is important. With the lowest standard deviation for any item within this
component at 1.249 and the descriptive statistics highlighting that 81.6 percent
of decision makers stating they either slightly agree, agree or strongly agree that
it is important highlights a strong item. Item 5 which is the importance of the
‘design of products adaptable for differing markets’ has a factor loading of .586.
This item has the highest mean score within this component of 5.56 and a
relatively acceptable standard deviation of 1.313 that suggests decision makers
agree on its importance to attaining variety. The final item suggesting a ‘supply
chain can change or introduce new product without starting a new supply chain’
has a factor loading of .543. It also has a solid mean score of 5.46 and a standard
deviation of 1.254. Within that standard deviation spread 80.3 percent of decision
makers stated that the either slightly agree, agreed or strongly agreed that this
was an important item in relation to variety.
Component 6 (Velocity)
The sixth component velocity accounts for 3.42 percent of variance and combines
with components 1-5 to highlight a combined variance of 53.23 percent. The
Cronbach’s Alpha score of α=0.831 is highlighting clear interrelatedness between
items and close enough to 1.0 to confirm a reliable result. The EFA has seen the
component variety items reduce from the initial 12 to 5, with those remaining
shown in table 4.7. These five remaining items have a factor loading spread of
.635><.734.
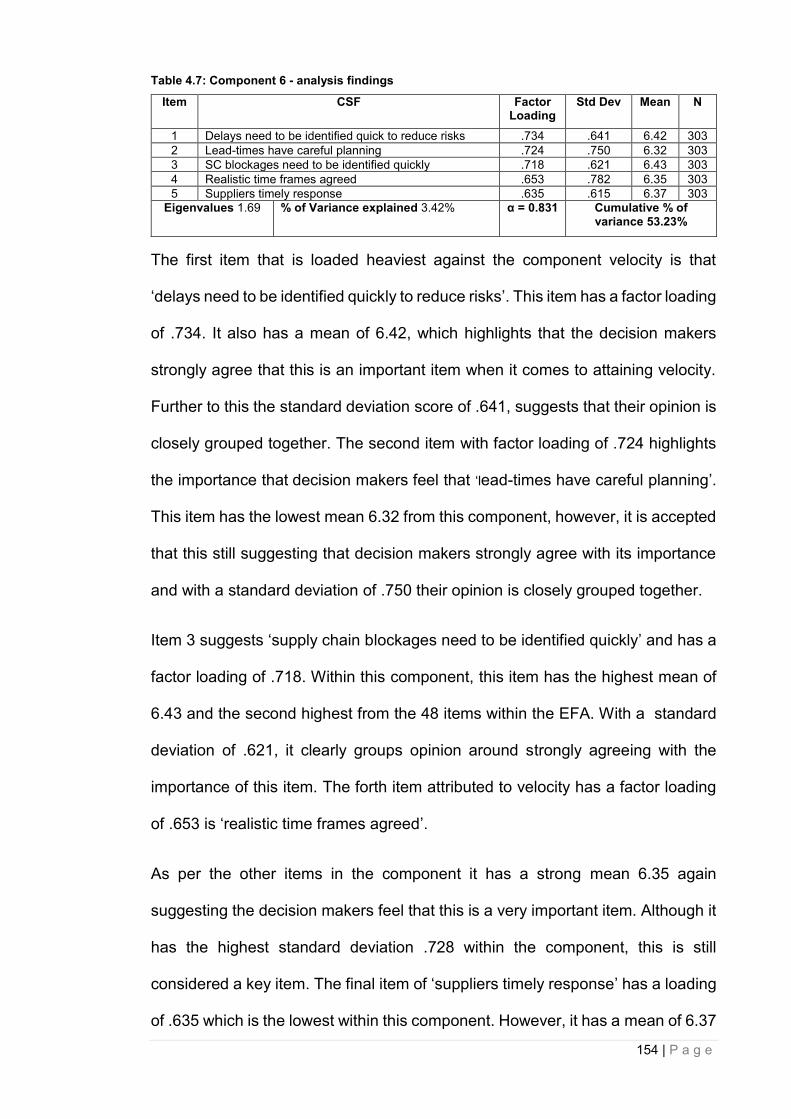
154 | P a g e
Table 4.7: Component 6 - analysis findings
Item CSF Factor Loading
Std Dev Mean N
1 Delays need to be identified quick to reduce risks .734 .641 6.42 303
2 Lead-times have careful planning .724 .750 6.32 303
3 SC blockages need to be identified quickly .718 .621 6.43 303
4 Realistic time frames agreed .653 .782 6.35 303
5 Suppliers timely response .635 .615 6.37 303
Eigenvalues 1.69 % of Variance explained 3.42% α = 0.831 Cumulative % of variance 53.23%
The first item that is loaded heaviest against the component velocity is that
‘delays need to be identified quickly to reduce risks’. This item has a factor loading
of .734. It also has a mean of 6.42, which highlights that the decision makers
strongly agree that this is an important item when it comes to attaining velocity.
Further to this the standard deviation score of .641, suggests that their opinion is
closely grouped together. The second item with factor loading of .724 highlights
the importance that decision makers feel that ‘lead-times have careful planning’.
This item has the lowest mean 6.32 from this component, however, it is accepted
that this still suggesting that decision makers strongly agree with its importance
and with a standard deviation of .750 their opinion is closely grouped together.
Item 3 suggests ‘supply chain blockages need to be identified quickly’ and has a
factor loading of .718. Within this component, this item has the highest mean of
6.43 and the second highest from the 48 items within the EFA. With a standard
deviation of .621, it clearly groups opinion around strongly agreeing with the
importance of this item. The forth item attributed to velocity has a factor loading
of .653 is ‘realistic time frames agreed’.
As per the other items in the component it has a strong mean 6.35 again
suggesting the decision makers feel that this is a very important item. Although it
has the highest standard deviation .728 within the component, this is still
considered a key item. The final item of ‘suppliers timely response’ has a loading
of .635 which is the lowest within this component. However, it has a mean of 6.37
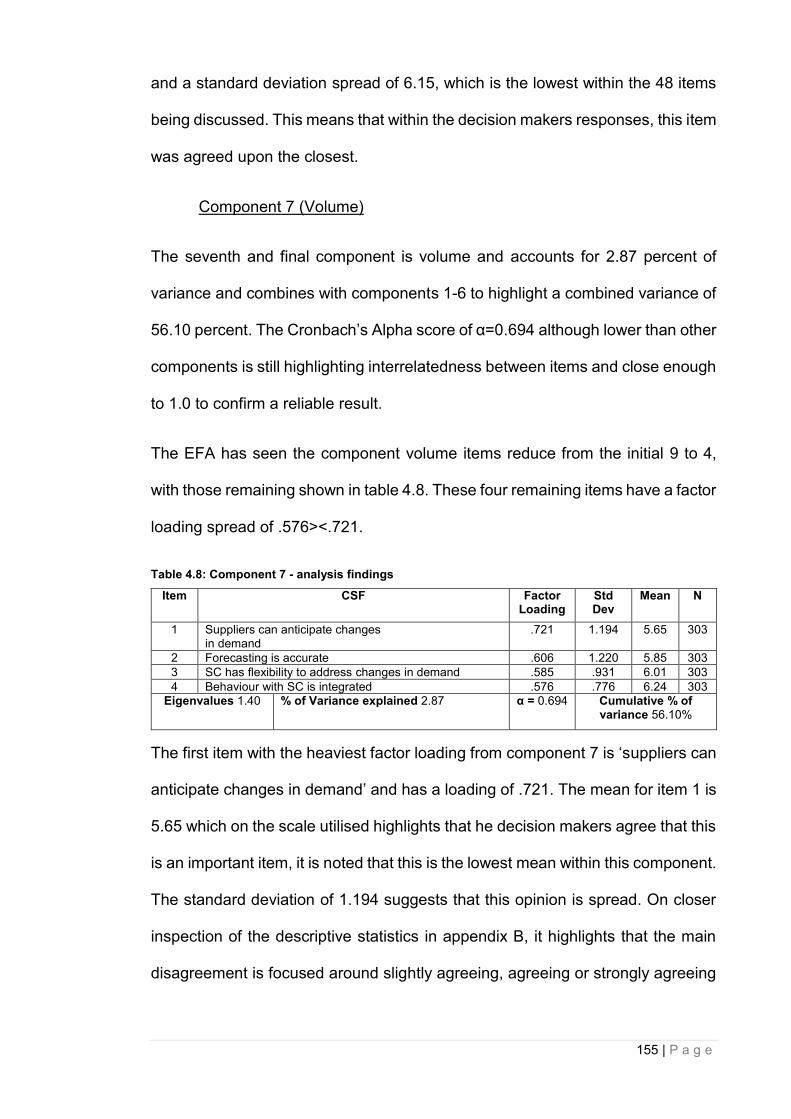
155 | P a g e
and a standard deviation spread of 6.15, which is the lowest within the 48 items
being discussed. This means that within the decision makers responses, this item
was agreed upon the closest.
Component 7 (Volume)
The seventh and final component is volume and accounts for 2.87 percent of
variance and combines with components 1-6 to highlight a combined variance of
56.10 percent. The Cronbach’s Alpha score of α=0.694 although lower than other
components is still highlighting interrelatedness between items and close enough
to 1.0 to confirm a reliable result.
The EFA has seen the component volume items reduce from the initial 9 to 4,
with those remaining shown in table 4.8. These four remaining items have a factor
loading spread of .576><.721.
Table 4.8: Component 7 - analysis findings
Item CSF Factor Loading
Std Dev
Mean N
1 Suppliers can anticipate changes in demand
.721 1.194 5.65 303
2 Forecasting is accurate .606 1.220 5.85 303
3 SC has flexibility to address changes in demand .585 .931 6.01 303
4 Behaviour with SC is integrated .576 .776 6.24 303
Eigenvalues 1.40 % of Variance explained 2.87 α = 0.694 Cumulative % of variance 56.10%
The first item with the heaviest factor loading from component 7 is ‘suppliers can
anticipate changes in demand’ and has a loading of .721. The mean for item 1 is
5.65 which on the scale utilised highlights that he decision makers agree that this
is an important item, it is noted that this is the lowest mean within this component.
The standard deviation of 1.194 suggests that this opinion is spread. On closer
inspection of the descriptive statistics in appendix B, it highlights that the main
disagreement is focused around slightly agreeing, agreeing or strongly agreeing
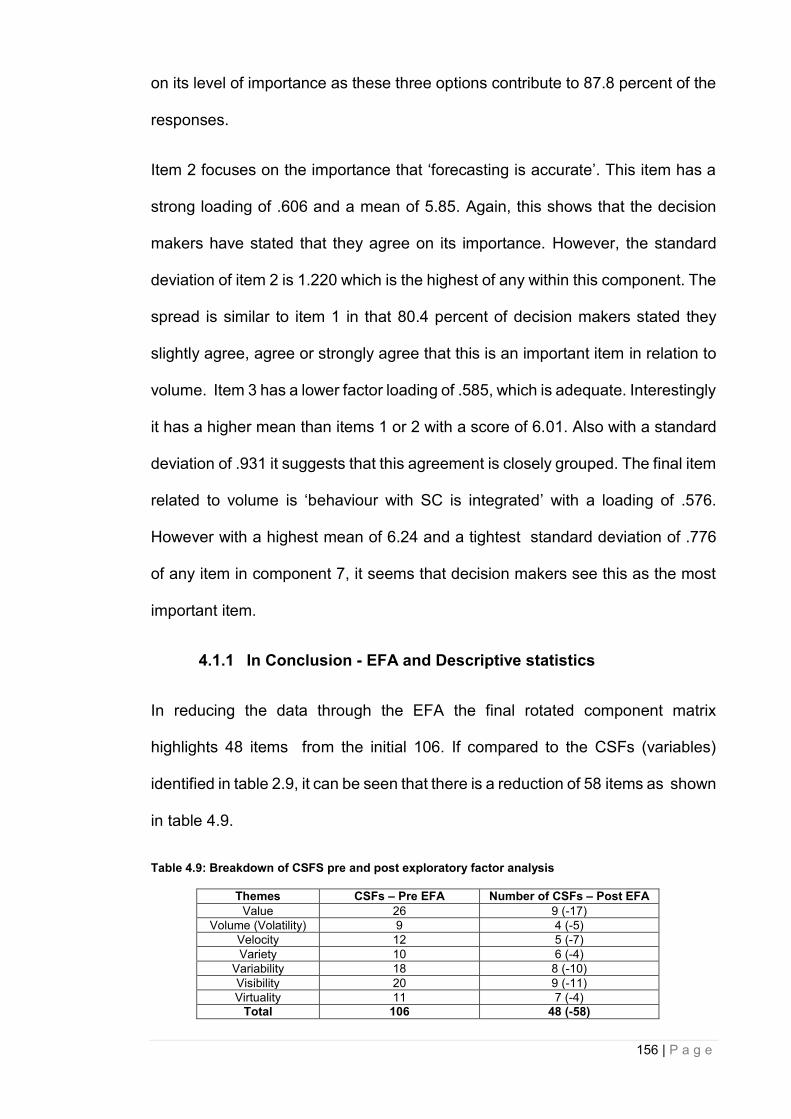
156 | P a g e
on its level of importance as these three options contribute to 87.8 percent of the
responses.
Item 2 focuses on the importance that ‘forecasting is accurate’. This item has a
strong loading of .606 and a mean of 5.85. Again, this shows that the decision
makers have stated that they agree on its importance. However, the standard
deviation of item 2 is 1.220 which is the highest of any within this component. The
spread is similar to item 1 in that 80.4 percent of decision makers stated they
slightly agree, agree or strongly agree that this is an important item in relation to
volume. Item 3 has a lower factor loading of .585, which is adequate. Interestingly
it has a higher mean than items 1 or 2 with a score of 6.01. Also with a standard
deviation of .931 it suggests that this agreement is closely grouped. The final item
related to volume is ‘behaviour with SC is integrated’ with a loading of .576.
However with a highest mean of 6.24 and a tightest standard deviation of .776
of any item in component 7, it seems that decision makers see this as the most
important item.
4.1.1 In Conclusion - EFA and Descriptive statistics
In reducing the data through the EFA the final rotated component matrix
highlights 48 items from the initial 106. If compared to the CSFs (variables)
identified in table 2.9, it can be seen that there is a reduction of 58 items as shown
in table 4.9.
Table 4.9: Breakdown of CSFS pre and post exploratory factor analysis
Themes CSFs – Pre EFA Number of CSFs – Post EFA
Value 26 9 (-17)
Volume (Volatility) 9 4 (-5)
Velocity 12 5 (-7)
Variety 10 6 (-4)
Variability 18 8 (-10)
Visibility 20 9 (-11)
Virtuality 11 7 (-4)
Total 106 48 (-58)
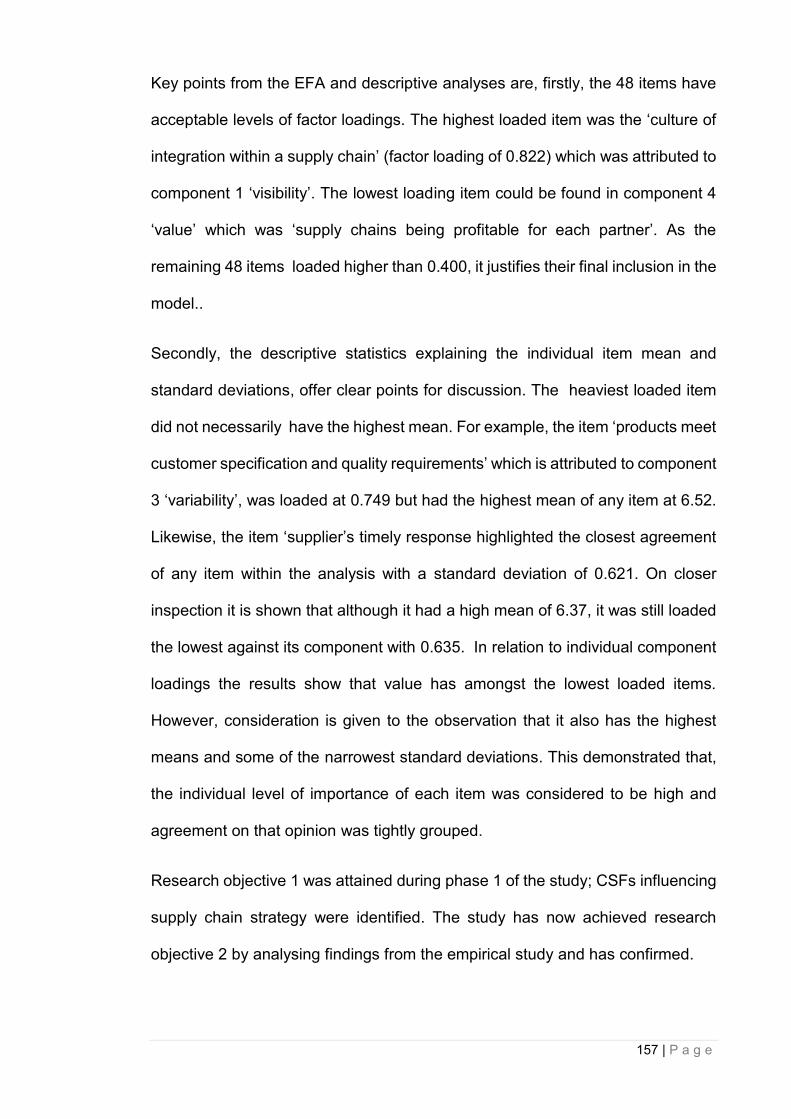
157 | P a g e
Key points from the EFA and descriptive analyses are, firstly, the 48 items have
acceptable levels of factor loadings. The highest loaded item was the ‘culture of
integration within a supply chain’ (factor loading of 0.822) which was attributed to
component 1 ‘visibility’. The lowest loading item could be found in component 4
‘value’ which was ‘supply chains being profitable for each partner’. As the
remaining 48 items loaded higher than 0.400, it justifies their final inclusion in the
model..
Secondly, the descriptive statistics explaining the individual item mean and
standard deviations, offer clear points for discussion. The heaviest loaded item
did not necessarily have the highest mean. For example, the item ‘products meet
customer specification and quality requirements’ which is attributed to component
3 ‘variability’, was loaded at 0.749 but had the highest mean of any item at 6.52.
Likewise, the item ‘supplier’s timely response highlighted the closest agreement
of any item within the analysis with a standard deviation of 0.621. On closer
inspection it is shown that although it had a high mean of 6.37, it was still loaded
the lowest against its component with 0.635. In relation to individual component
loadings the results show that value has amongst the lowest loaded items.
However, consideration is given to the observation that it also has the highest
means and some of the narrowest standard deviations. This demonstrated that,
the individual level of importance of each item was considered to be high and
agreement on that opinion was tightly grouped.
Research objective 1 was attained during phase 1 of the study; CSFs influencing
supply chain strategy were identified. The study has now achieved research
objective 2 by analysing findings from the empirical study and has confirmed.
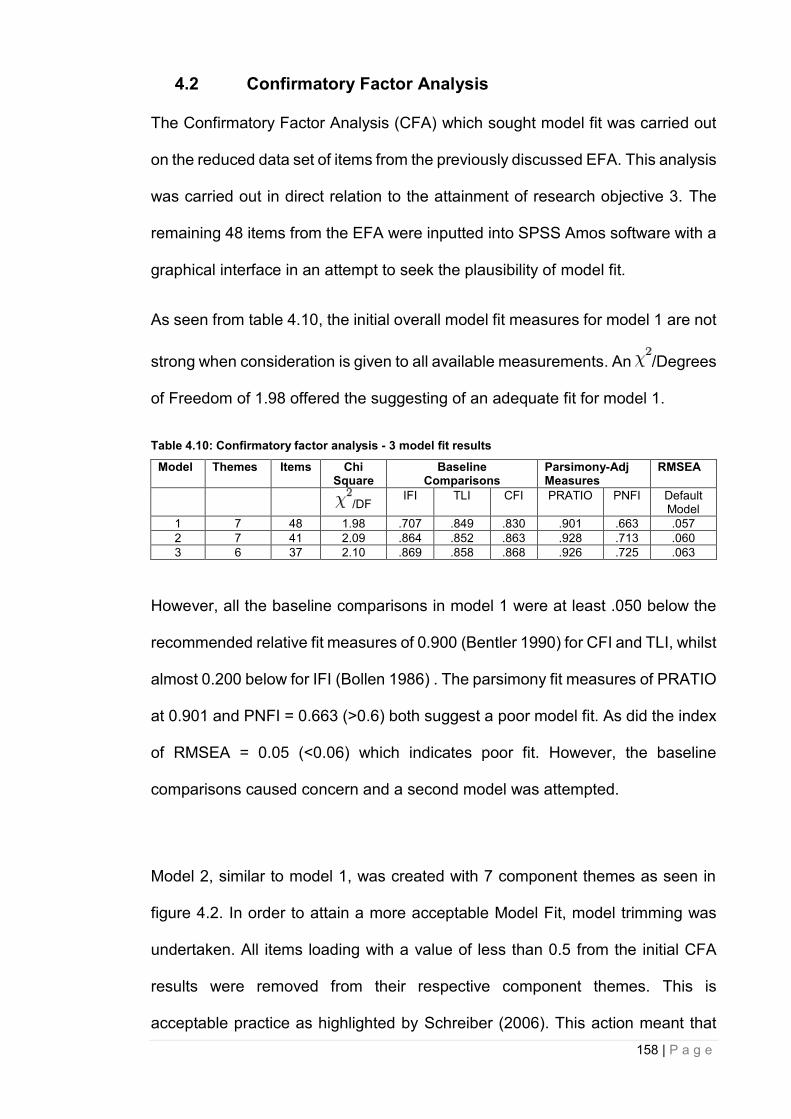
158 | P a g e
4.2 Confirmatory Factor Analysis
The Confirmatory Factor Analysis (CFA) which sought model fit was carried out
on the reduced data set of items from the previously discussed EFA. This analysis
was carried out in direct relation to the attainment of research objective 3. The
remaining 48 items from the EFA were inputted into SPSS Amos software with a
graphical interface in an attempt to seek the plausibility of model fit.
As seen from table 4.10, the initial overall model fit measures for model 1 are not
strong when consideration is given to all available measurements. An /Degrees
of Freedom of 1.98 offered the suggesting of an adequate fit for model 1.
Table 4.10: Confirmatory factor analysis - 3 model fit results
Model Themes Items Chi Square
Baseline Comparisons
Parsimony-Adj Measures
RMSEA
/DF
IFI TLI CFI PRATIO PNFI Default Model
1 7 48 1.98 .707 .849 .830 .901 .663 .057
2 7 41 2.09 .864 .852 .863 .928 .713 .060
3 6 37 2.10 .869 .858 .868 .926 .725 .063
However, all the baseline comparisons in model 1 were at least .050 below the
recommended relative fit measures of 0.900 (Bentler 1990) for CFI and TLI, whilst
almost 0.200 below for IFI (Bollen 1986) . The parsimony fit measures of PRATIO
at 0.901 and PNFI = 0.663 (>0.6) both suggest a poor model fit. As did the index
of RMSEA = 0.05 (<0.06) which indicates poor fit. However, the baseline
comparisons caused concern and a second model was attempted.
Model 2, similar to model 1, was created with 7 component themes as seen in
figure 4.2. In order to attain a more acceptable Model Fit, model trimming was
undertaken. All items loading with a value of less than 0.5 from the initial CFA
results were removed from their respective component themes. This is
acceptable practice as highlighted by Schreiber (2006). This action meant that

159 | P a g e
the component theme value was reduced from 9 to 4 items. The removed items
from the component value were:
Flexibility offered regarding clients requirements
Supply chain offers service that meets the clients requirements
Costs minimised
Product offers customer satisfaction
Supply chain is profitable for each partner
The component variability had 1 item removed; ‘initial design is of good quality’.
As can be seen in table 4.10, when re-running the CFA with the items removed,
the plausibility of the model fit increased substantially on all indices. The baseline
comparisons TFI 0.852 and CFI 0.863 were then lower than 0.050, whilst the IFI
of 0.864 was only 0.080 from an ideal model fit. From these baseline comparison
indices, the plausibility of model fit was now within an acceptable margin of error.
In addition, the parsimony fit measures of PRATIO improved to 0.928 as had
PNFI = 0.713 (>0.6) both suggesting that the removal of the items had not
weakened the model. In addition the RMSEA was still within the acceptable
margin at 0.60. as was /DF at 2.09.
A third model was also tested. As an improvement of the model fit indices was
achieved in part by removing all 5 items from the theme value. It was envisaged
that removing value as a themed component and rerunning the analysis might
offer a more ideal model fit overall. Having done this, the results shown in table
4.10 demonstrate that the Baseline Line comparisons have all improved but no
more than 0.006. The parsimony fit measure of PRATIO reduced slightly to 0.926,
however, the PNFI improved slightly to 0.725. The RMSEA model fit index
exceeded the minimum at score of 0.063. Overall, it could be argued that the
analysis suggests a slight improvement to model 3 from model 2 however; it is

160 | P a g e
argued this is only slight. Therefore, it was decided to utilise model 2 rather than
fall into the trap of chasing model fit at the cost of the model quality itself.
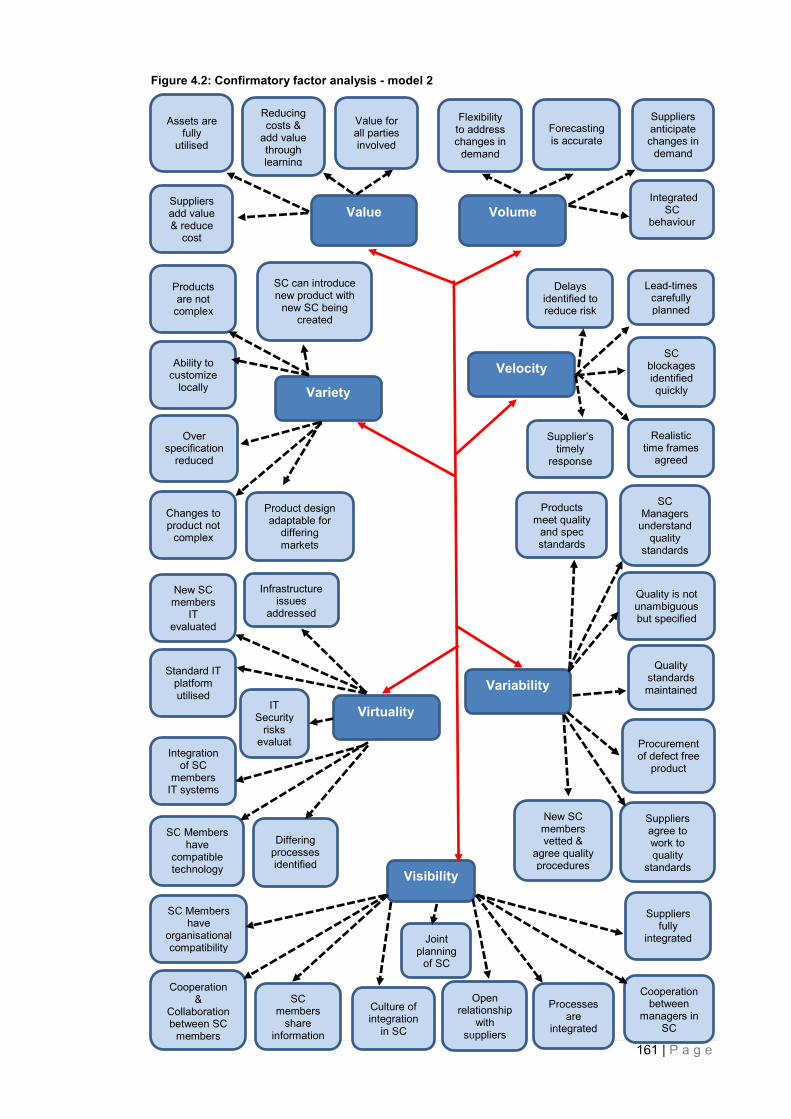
161 | P a g e
Figure 4.2: Confirmatory factor analysis - model 2
Value
Variety
Virtuality
Volume
Visibility
Velocity
Variability
Forecasting is accurate
Flexibility to address changes in
demand
Integrated SC
behaviour
Suppliers anticipate changes in
demand
Assets are fully
utilised
Reducing costs &
add value through learning
Suppliers add value & reduce
cost
Value for all parties involved
Delays identified to reduce risk
Lead-times carefully planned
SC blockages identified quickly
Realistic time frames
agreed
Supplier’s timely
response
Quality standards maintained
Products meet quality
and spec standards
Quality is not unambiguous but specified
SC Managers
understand quality
standards
New SC members vetted &
agree quality procedures
Suppliers agree to work to quality
standards
Procurement of defect free
product
Culture of integration
in SC
Cooperation between
managers in SC
Processes are
integrated
Joint planning
of SC
Cooperation &
Collaboration between SC
members
SC members
share information
Open relationship
with suppliers
SC Members have
organisational compatibility
Changes to product not
complex
Products are not
complex
Ability to customize
locally
Over specification
reduced
Product design adaptable for
differing markets
SC can introduce new product with
new SC being created
New SC members
IT evaluated
Infrastructure issues
addressed
Standard IT platform utilised
Integration of SC
members IT systems
Differing processes identified
IT Security
risks evaluat
ed
Suppliers fully
integrated
SC Members have
compatible technology
162 | P a g e
4.2.1 In Conclusion - Confirmatory Factor Analysis
The purpose of the CFA was to ascertain the plausibility of model fit from the
findings of the EFA in relation to both the confirmed CSFs and the individual
component themes. This has been achieved and the 7V Framework has been
validated. Through the process of CFA and subsequent validation of the 7V
Framework the CSFs were reduced from 48 post EFA, and then further reduced
to 42 post CFA. This reduction and subsequent model fit assisted in the overall
attainment of research objective 3; discussed further in section 5.3.
4.3 Summary
Phase 3 of the study focused on the attainment of research objectives 2 and 3 as
highlighted in table 3.1. EFA and CFA were undertaken in order to complete
objectives 2 & 3. Phase 1 of the research identified variables (CSFs) that could
contribute to the effectiveness of supply chains. Through the analysis of these
variables, the findings of the EFA confirmed 48 specific CSFs were considered
by the sample to contribute to supply chain effectiveness. From the findings of
the descriptive statistics, the varying levels of importance of the 48 individual
CSFs in relation to supply chain effectiveness has confirmed. The completion of
the CFA has progressed the EFA a stage further by confirming Model Fit and in
turn takes the 7V Framework from being conceptual model to a validated model.
This process and eventual validation supports the strength of the relationship
between the 7V Framework and supply chain effectiveness.
163 | P a g e
Chapter 5 - Discussion
Chapter 4 presented the results from the statistical analysis carried out in relation
to the primary data collected for this study. Phases 1-3 primarily involved data
collection and analysis. The study now moves onto phase 4 which formulates a
discussion from the study evidence in relation to theory and current practice. To
assist in clarity, the chapter discusses the results of the findings of the study and
each objective individually.
5.1 Objective 1: Identification of CSFs influencing Supply
Chains
In order to attain research objectives 2-5 it was crucial that research objective 1
was met and formed a solid grounding on which the subsequent objectives could
be achieved. The importance of this is highlighted within the study as it was
treated as an individual phase of the research (phase 1).
The initial starting point was the search within the literature that focused upon the
‘identification of possible CSFs attributed to the delivery of supply chains’. To
assist the study the parameters of the 7V Conceptual framework were utilised.
This allowed for a more focused search and identification of initial CSFs. The
review of CSFs within the SCM literature highlighted the eclectic nature of the
research area. The identification of possible CSFs within certain themes was
facilitated by the existence of seminal research in the area (REFs). However,
within themes such as value, the identification was problematic and more
interpretation of the literature was required. During the review of the literature, it
was also confirmed that empirical research methods into CSFs had a solid
grounding within quantitative methods and the use of EFA and CFA.
Subsequently, this assisted decision-making regarding the subsequent research

164 | P a g e
design. As highlighted in the literature, 109 possible CSFs were identified as
shown in table 2.17. By focusing the literature search around the themes within
the 7V conceptual framework, it was also possible to identify CSFs that
specifically influenced decision makers when considering SCM. The need for
face validity and the ability to operationalise these CSFs became apparent.
Relying solely on the researcher interpretations of the literature may not be
acceptable. This was addressed through informal round table discussions with
members of the Chartered Institute Purchase and Supply. The discussions
enabled the interpretation and operationalisation and subsequent early stages of
the survey instrument to be created. These discussions were the final key to the
attainment of research objective 1. The discussions examined the CSFs identified
within the literature and reworked them from a decision maker with SCM
perspective. In addition CSFs previously unknown to the researcher that were not
identified within the literature were highlighted. This was a key element of the
study; had the round table discussions not taken place, or had the experience of
the CIPs members not been utilised, the validity of the study could have been
open to criticism. Through this process the study has clearly shown validity in the
attainment of research objective 1. In turn, this laid a solid grounding for the
remaining research objectives to be attained.
To summarise, in achieving research objective 1 and phase 1 of the study, the
following took place;
1. A review of the extant literature resulting in identification of 109 possible
CSFs.
2. Round table discussions with members of the CIPS focusing on the initial
109 CSFs. Through these discussion CSFs were adapted and
subsequently reduced to 105 possible CSFs.
3. Through this process the grounding was laid for the creation of a survey
instrument and the start of phase 2 of the research.
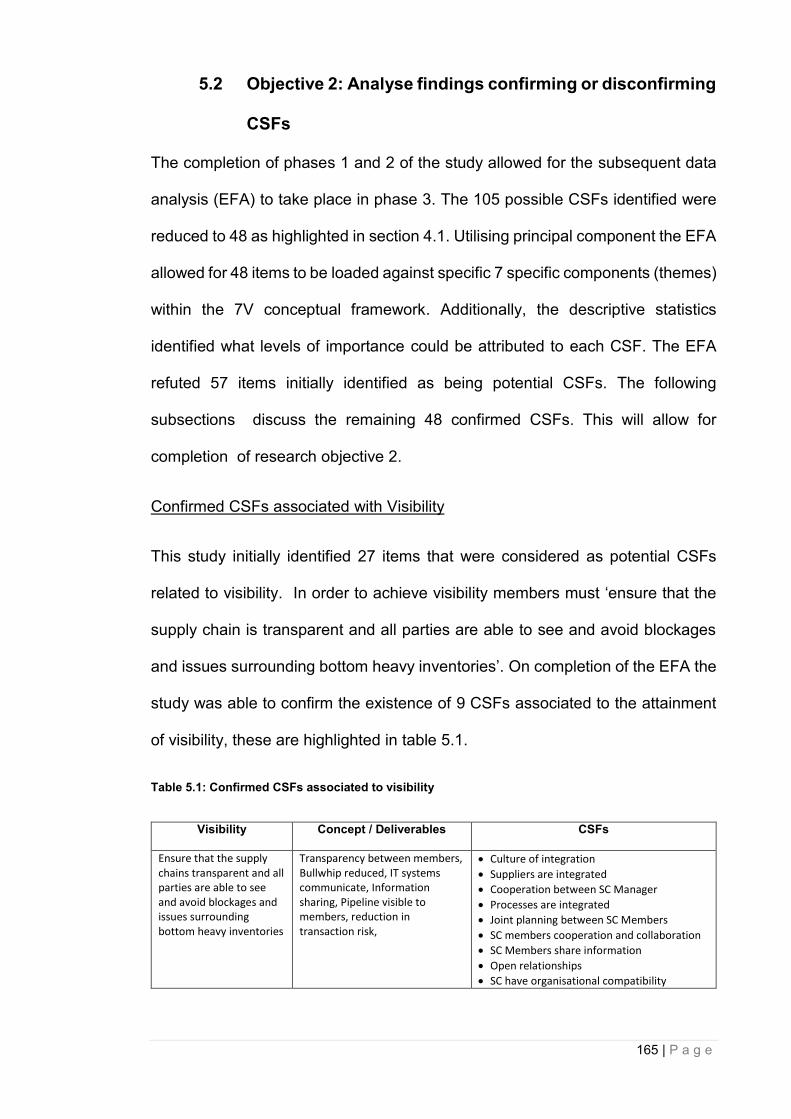
165 | P a g e
5.2 Objective 2: Analyse findings confirming or disconfirming
CSFs
The completion of phases 1 and 2 of the study allowed for the subsequent data
analysis (EFA) to take place in phase 3. The 105 possible CSFs identified were
reduced to 48 as highlighted in section 4.1. Utilising principal component the EFA
allowed for 48 items to be loaded against specific 7 specific components (themes)
within the 7V conceptual framework. Additionally, the descriptive statistics
identified what levels of importance could be attributed to each CSF. The EFA
refuted 57 items initially identified as being potential CSFs. The following
subsections discuss the remaining 48 confirmed CSFs. This will allow for
completion of research objective 2.
Confirmed CSFs associated with Visibility
This study initially identified 27 items that were considered as potential CSFs
related to visibility. In order to achieve visibility members must ‘ensure that the
supply chain is transparent and all parties are able to see and avoid blockages
and issues surrounding bottom heavy inventories’. On completion of the EFA the
study was able to confirm the existence of 9 CSFs associated to the attainment
of visibility, these are highlighted in table 5.1.
Table 5.1: Confirmed CSFs associated to visibility
Visibility Concept / Deliverables CSFs
Ensure that the supply chains transparent and all parties are able to see and avoid blockages and issues surrounding bottom heavy inventories
Transparency between members, Bullwhip reduced, IT systems communicate, Information sharing, Pipeline visible to members, reduction in transaction risk,
Culture of integration
Suppliers are integrated
Cooperation between SC Manager
Processes are integrated
Joint planning between SC Members
SC members cooperation and collaboration
SC Members share information
Open relationships
SC have organisational compatibility
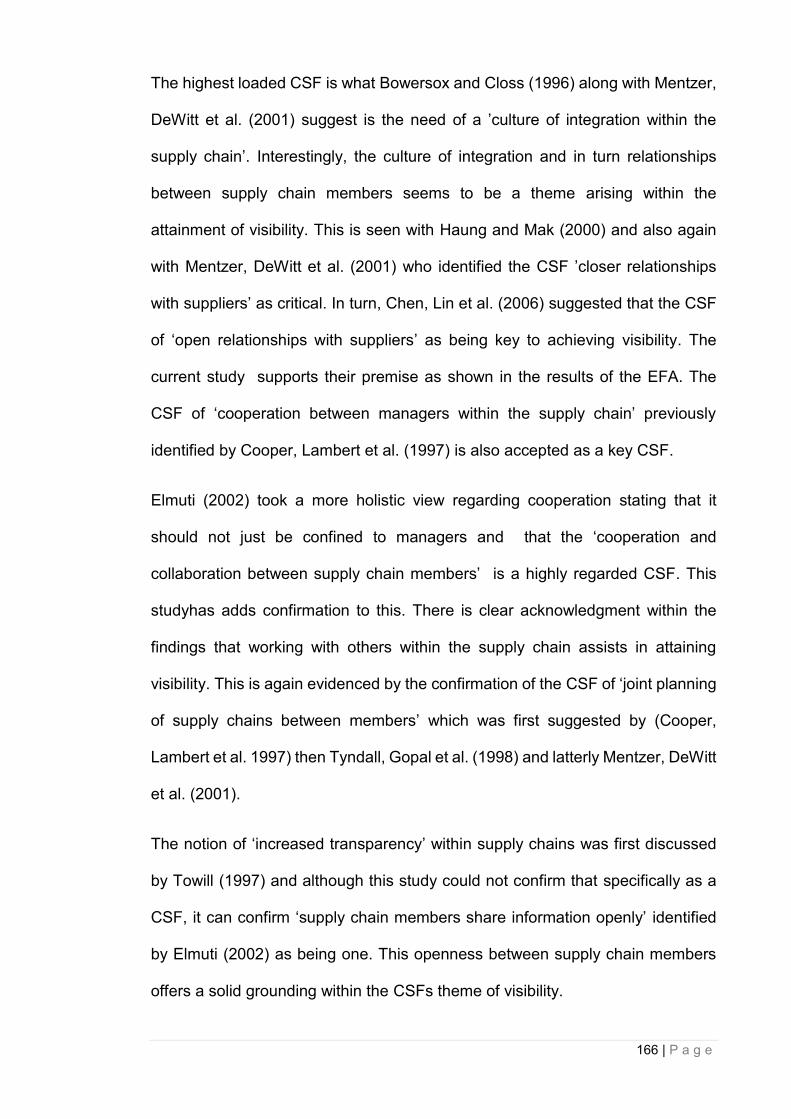
166 | P a g e
The highest loaded CSF is what Bowersox and Closs (1996) along with Mentzer,
DeWitt et al. (2001) suggest is the need of a ’culture of integration within the
supply chain’. Interestingly, the culture of integration and in turn relationships
between supply chain members seems to be a theme arising within the
attainment of visibility. This is seen with Haung and Mak (2000) and also again
with Mentzer, DeWitt et al. (2001) who identified the CSF ’closer relationships
with suppliers’ as critical. In turn, Chen, Lin et al. (2006) suggested that the CSF
of ‘open relationships with suppliers’ as being key to achieving visibility. The
current study supports their premise as shown in the results of the EFA. The
CSF of ‘cooperation between managers within the supply chain’ previously
identified by Cooper, Lambert et al. (1997) is also accepted as a key CSF.
Elmuti (2002) took a more holistic view regarding cooperation stating that it
should not just be confined to managers and that the ‘cooperation and
collaboration between supply chain members’ is a highly regarded CSF. This
studyhas adds confirmation to this. There is clear acknowledgment within the
findings that working with others within the supply chain assists in attaining
visibility. This is again evidenced by the confirmation of the CSF of ‘joint planning
of supply chains between members’ which was first suggested by (Cooper,
Lambert et al. 1997) then Tyndall, Gopal et al. (1998) and latterly Mentzer, DeWitt
et al. (2001).
The notion of ‘increased transparency’ within supply chains was first discussed
by Towill (1997) and although this study could not confirm that specifically as a
CSF, it can confirm ‘supply chain members share information openly’ identified
by Elmuti (2002) as being one. This openness between supply chain members
offers a solid grounding within the CSFs theme of visibility.
167 | P a g e
According to Chen, Lin et al. (2006) it is important that ‘suppliers are fully
integrated with the supply chain’, similarly Elmuti (2002) suggests that ‘processes
within the supply chain are integrated’. The study also confirmed that both of
these items are CSFs. The final CSF identified relates to the integration of supply
chains in that ‘supply chain members have organisational compatibility’ which
was first highlighted by Mentzer, DeWitt et al. (2001). There is clear evidence
from the findings of the analysis that the current study can offer nine specific
CSFs attributed to the theme of visibility.
Confirmed CSFs associated with Virtuality
A total of 13 possible items were identified in relation to virtuality in section 2.3.7
prior to the EFA. In identifying these CSFs the research focused upon what is
critical in the ‘ability to manage and coordinate the supply chain using information
technology’. On completion of the EFA the study was able to confirm the
existence of 7 CSFs associated to the attainment of virtuality, these are
highlighted in table 5.2.
Table 5.2: Confirmed CSFs associated with Virtuality
Virtuality Concept / Deliverables CSFs
The ability to manage and coordinate the supply chain Using information technology
Multi-dimensional systems, improved communication
Infrastructure mismatches addressed
New SC members IT evaluated
Differing processes between SC members identified
Standardised IT platforms agreed between members
Integration of SC members IT systems
It security risks evaluated
SC members have compatible technologies
The heaviest loading CSF in relation to the attainment of virtuality was that
‘infrastructure mismatches have been addressed between suppliers’. This was
first suggested by Williamson, Harrison et al. (2004) who also proposed ‘differing
processes between supplied chain members are identified’ as a CSF. This was
also confirmed through the EFA undertaken in the current study. With these two
168 | P a g e
CSFs in mind the study also asked how important it was that ‘standard IT
platforms are agreed between supply chain members’. The findings suggest that
this too can also be confirmed as a CSF.
Interestingly the first two CSF do not focus upon IT capabilities, but more on the
procedures that take place. However, there is a clear need for IT capabilities to
be considered as is shown in the remaining CSFs associated with virtuality. This
is supported as the need for ‘new supply chain members IT capabilities to be
evaluated before insertion to supply chain’ was previously suggested by Mills
(2001) and confirmed in the findings of the EFA. In addition to technologies being
evaluated, Christopher (2000) and Gunasekaran, Patel et al. (2001) suggest that
‘integration of key supply chain members IT systems take place’, This was also
confirmed in the current study. The study also identified the importance of ‘supply
chain members having compatible technologies’ as a CSF. It is clear that in
relation to the CSFs associated with virtuality that integration, process and IT
capabilities are seen as an underlying theme amongst the CSFs identified. In
addition, Williamson, Harrison et al. (2004) suggestions on the issue of ‘IT
security risks being evaluated and managed’ have been confirmed within the
results of this study as also being a CSF associated with virtuality.
The CSFs associated with the theme virtuality, are grouped around processes
and IT capabilities. With the physical distances that supply chains can now cover
and the varying amount of members within a supply chain, it seems that CSFs
associated with virtuality focus upon reducing the impact of both of these
variables. The standardisation of IT capabilities reduces the amount of miss-
information within the supply chain which in theory should improve efficiency.
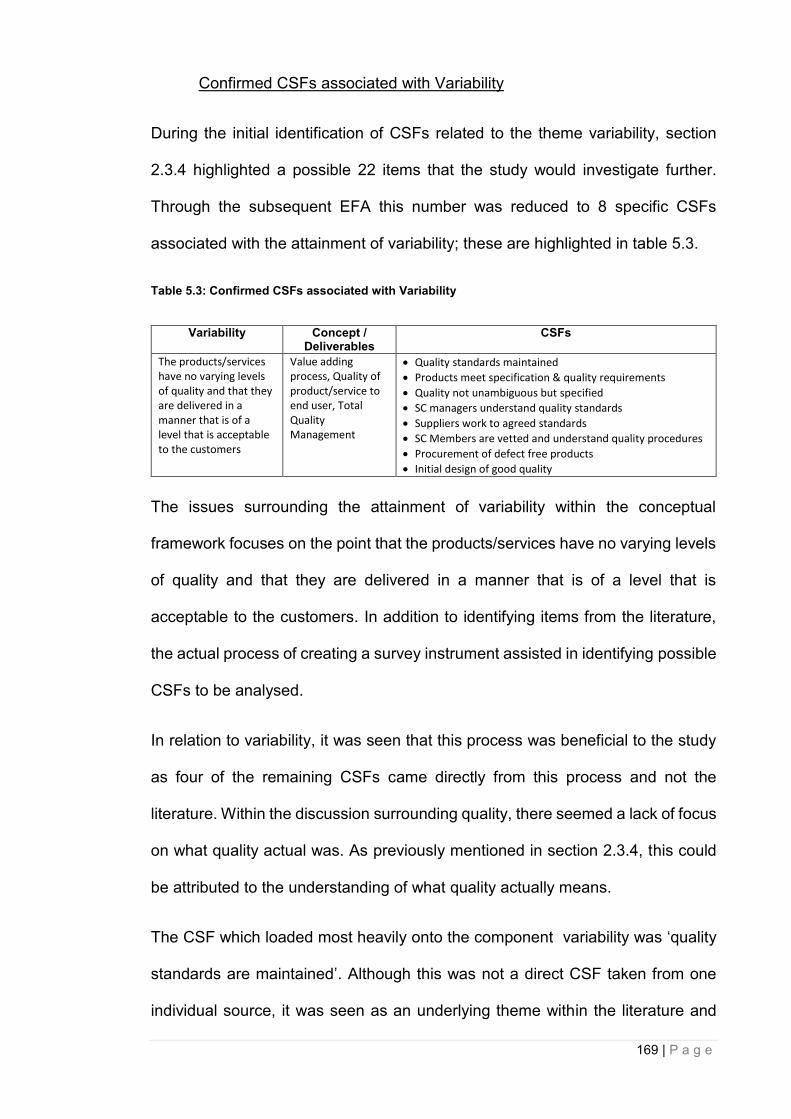
169 | P a g e
Confirmed CSFs associated with Variability
During the initial identification of CSFs related to the theme variability, section
2.3.4 highlighted a possible 22 items that the study would investigate further.
Through the subsequent EFA this number was reduced to 8 specific CSFs
associated with the attainment of variability; these are highlighted in table 5.3.
Table 5.3: Confirmed CSFs associated with Variability
Variability Concept / Deliverables
CSFs
The products/services have no varying levels of quality and that they are delivered in a manner that is of a level that is acceptable to the customers
Value adding process, Quality of product/service to end user, Total Quality Management
Quality standards maintained
Products meet specification & quality requirements
Quality not unambiguous but specified
SC managers understand quality standards
Suppliers work to agreed standards
SC Members are vetted and understand quality procedures
Procurement of defect free products
Initial design of good quality
The issues surrounding the attainment of variability within the conceptual
framework focuses on the point that the products/services have no varying levels
of quality and that they are delivered in a manner that is of a level that is
acceptable to the customers. In addition to identifying items from the literature,
the actual process of creating a survey instrument assisted in identifying possible
CSFs to be analysed.
In relation to variability, it was seen that this process was beneficial to the study
as four of the remaining CSFs came directly from this process and not the
literature. Within the discussion surrounding quality, there seemed a lack of focus
on what quality actual was. As previously mentioned in section 2.3.4, this could
be attributed to the understanding of what quality actually means.
The CSF which loaded most heavily onto the component variability was ‘quality
standards are maintained’. Although this was not a direct CSF taken from one
individual source, it was seen as an underlying theme within the literature and
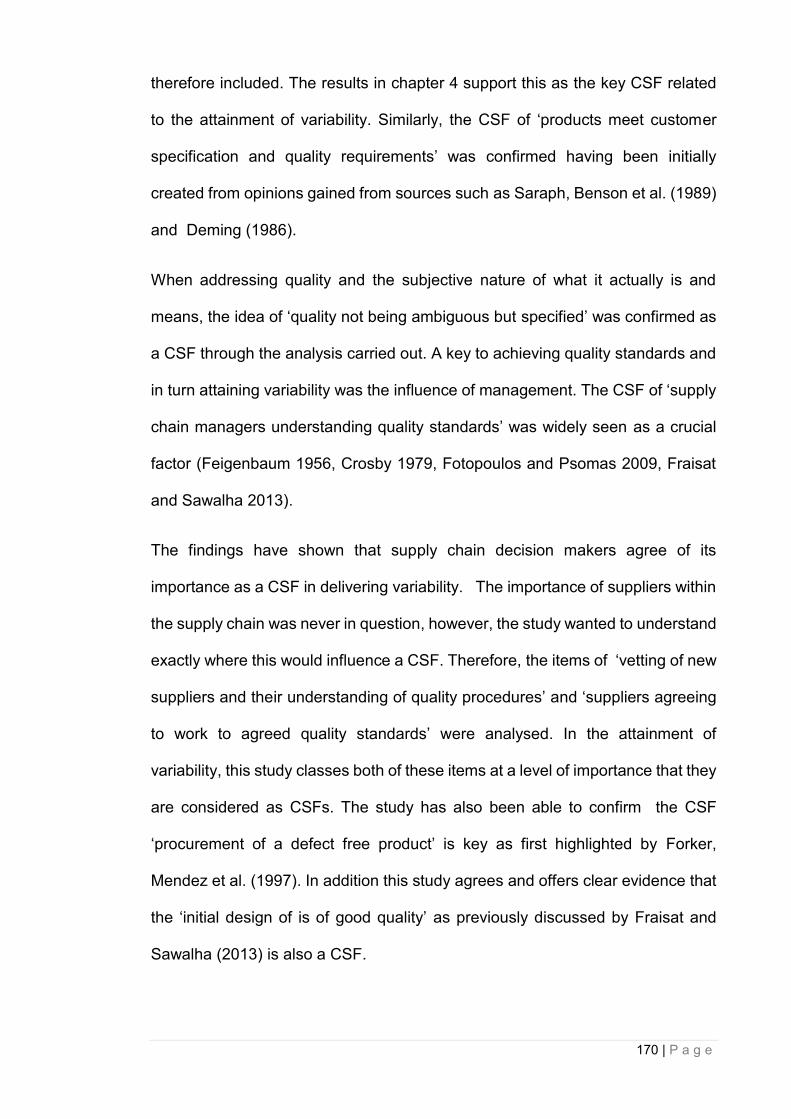
170 | P a g e
therefore included. The results in chapter 4 support this as the key CSF related
to the attainment of variability. Similarly, the CSF of ‘products meet customer
specification and quality requirements’ was confirmed having been initially
created from opinions gained from sources such as Saraph, Benson et al. (1989)
and Deming (1986).
When addressing quality and the subjective nature of what it actually is and
means, the idea of ‘quality not being ambiguous but specified’ was confirmed as
a CSF through the analysis carried out. A key to achieving quality standards and
in turn attaining variability was the influence of management. The CSF of ‘supply
chain managers understanding quality standards’ was widely seen as a crucial
factor (Feigenbaum 1956, Crosby 1979, Fotopoulos and Psomas 2009, Fraisat
and Sawalha 2013).
The findings have shown that supply chain decision makers agree of its
importance as a CSF in delivering variability. The importance of suppliers within
the supply chain was never in question, however, the study wanted to understand
exactly where this would influence a CSF. Therefore, the items of ‘vetting of new
suppliers and their understanding of quality procedures’ and ‘suppliers agreeing
to work to agreed quality standards’ were analysed. In the attainment of
variability, this study classes both of these items at a level of importance that they
are considered as CSFs. The study has also been able to confirm the CSF
‘procurement of a defect free product’ is key as first highlighted by Forker,
Mendez et al. (1997). In addition this study agrees and offers clear evidence that
the ‘initial design of is of good quality’ as previously discussed by Fraisat and
Sawalha (2013) is also a CSF.
171 | P a g e
Confirmed CSFs associated with Value
This study originally identified 26 possible CSFs related to the theme value.
Through the EFA this number was reduced to 9 CSFs that loaded heavily enough
to be considered as key items. In defining the theme value within the conceptual
framework, the focus was set against ‘the relationship between what the
customers want and expects against what the supplier can offer’. These 9 CSFs
confirmed as being associated to the attainment of value, are shown in table 5.4.
Table 5.4: Confirmed CSFs associated with Value
Value Concept / Deliverables CSFs
The products/services have no varying levels of quality and that they are delivered in a manner that is of a level that is acceptable to the customers
Value adding process, Quality of product/service to end user, Total Quality Management
Flexibility offered to clients
Suppliers ass value and reduce costs
SC offers service that meets clients requirements
Assets fully utilised
Continual learning to add value and reduce costs
Value for all parties is achieved
Costs minimised
Products offer customer satisfaction
SC Is profitable for each partner
As Sengupta, Heiser et al. (2006) has stated, customers are demanding value
and it is essential that organisations ensure it is delivered. The challenge for
suppliers is how they can achieve this value for their customers and what the
CSFs are that must be considered to attain this. Within the findings chapter it was
shown that, supply chain decision makers strongly agreed that each of the CSFs
identified were very important to the attainment of value. The highest loaded CSF;
‘flexibility is offered regarding clients requirements’ was originally suggested
within the literature by Heikkila (2002) . The CSF of ‘suppliers can add value and
at the same time reduce costs’ was also seen as a key item amongst decision
makers in the attainment of value. Although, it is not confirmed how this value
could be added, an argument exists that suggests that addressing other CSFs
may help to achieve this.. For example, the CSF of the ‘supply chain offers a
172 | P a g e
service that meets the clients requirements’ may go some way to assist the
attainment of value. It is also suggested that the CSF of ‘assets being fully utilised’
meaning that where possible everything is being done to achieve value with the
tools that the decision makers have at their disposal.
Although, not highlighted directly from
the literature but rather through an interpretation of it in conjunction with the
piloting that took place, it seems costs attribute to the attainment of value. The
second CSF to mention costs focuses on ‘reducing costs and adding value
through continuing learning’ as being crucial in the attainment of value. Whilst the
third CSF highlighting costs simply states ‘costs must be minimised’. It is clear
that decision makers see cost and cost savings as a way of appeasing customers
and assisting in achieving value. Interestingly the final two CSFs identified take a
holistic view and suggest benefits for all parties within the supply chain must be
sought when seeking value. The first states that ‘value is achieved for all parties’
whilst the final CSF suggests that the ‘supply chain is profitable for each partner’.
Both these CSFs were identified during the round table discussions with
members of the CIPS who this study has highlighted as being supply chain
decision makers.
Confirmed CSFs associated with Variety
Hines (2004) states that in order to attain variety suppliers must have; ‘the ability
to customise or standardise a product as per consumer demands or even in
anticipation of changes in demand’. This study initially identified 12 possible CSFs
related to the theme variety, after piloting these formed 10 questions. The results
of the EFA show that 6 CSFs were confirmed as being directly attributed to variety
and are highlighted in table 5.5.
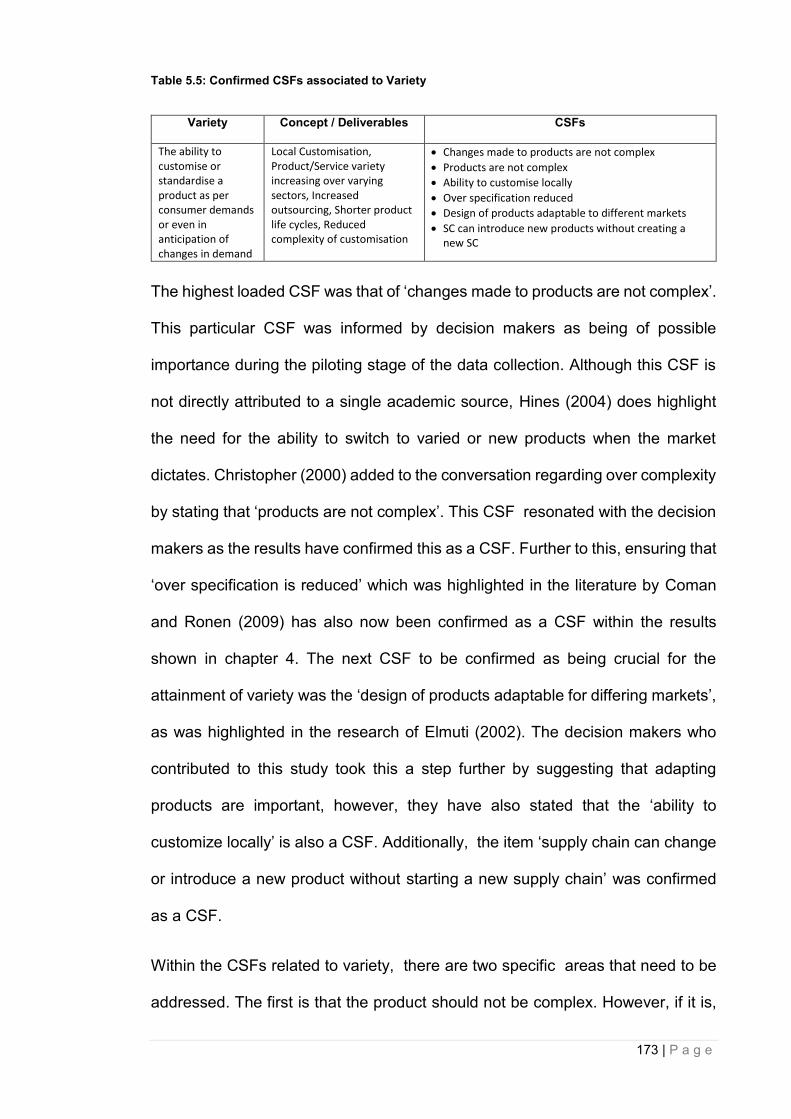
173 | P a g e
Table 5.5: Confirmed CSFs associated to Variety
Variety Concept / Deliverables CSFs
The ability to customise or standardise a product as per consumer demands or even in anticipation of changes in demand
Local Customisation, Product/Service variety increasing over varying sectors, Increased outsourcing, Shorter product life cycles, Reduced complexity of customisation
Changes made to products are not complex
Products are not complex
Ability to customise locally
Over specification reduced
Design of products adaptable to different markets
SC can introduce new products without creating a new SC
The highest loaded CSF was that of ‘changes made to products are not complex’.
This particular CSF was informed by decision makers as being of possible
importance during the piloting stage of the data collection. Although this CSF is
not directly attributed to a single academic source, Hines (2004) does highlight
the need for the ability to switch to varied or new products when the market
dictates. Christopher (2000) added to the conversation regarding over complexity
by stating that ‘products are not complex’. This CSF resonated with the decision
makers as the results have confirmed this as a CSF. Further to this, ensuring that
‘over specification is reduced’ which was highlighted in the literature by Coman
and Ronen (2009) has also now been confirmed as a CSF within the results
shown in chapter 4. The next CSF to be confirmed as being crucial for the
attainment of variety was the ‘design of products adaptable for differing markets’,
as was highlighted in the research of Elmuti (2002). The decision makers who
contributed to this study took this a step further by suggesting that adapting
products are important, however, they have also stated that the ‘ability to
customize locally’ is also a CSF. Additionally, the item ‘supply chain can change
or introduce a new product without starting a new supply chain’ was confirmed
as a CSF.
Within the CSFs related to variety, there are two specific areas that need to be
addressed. The first is that the product should not be complex. However, if it is,

174 | P a g e
it should be possible to adjust it as required. Secondly, the ability to customize
products as and when is required is also seen as being important in the
attainment of variety.
Confirmed CSFs associated with Velocity
The theme velocity focuses on ‘enabling the customer to utilise speed as a
competitive advantage, by ensuring prompt delivery’. It is clear that the speed of
delivery is a competitive advantage suppliers will seek to offer customers, when
and where possible. In order to ascertain how to achieve velocity this study
initially identified 12 possible CSFs which was r reduced to 5 confirmed CSFs.
These CSFs are highlighted in table 5.6, the first of which focuses on the issues
that ‘delays need to be identified quickly to reduce risks’. This focuses on
communication of information and links closely back to visibility in that the
transparency of the supply chain can be an issue that needs to be addressed.
Table 5.6: Confirmed CSFs associated to Velocity
Velocity Concept / Deliverables CSFs
Enabling the customer to utilise speed as a competitive advantage, by ensuring prompt delivery
Speed of delivery, Proactive practices, Time-based competition, Adapting to changes in the market
Delays identified quickly to reduce risks
Lead-time carefully planned
SC blockages identified quickly
Realistic time frames
Suppliers response times
In addition, it was seen as crucial that ‘supply chain blockages need to be
identified quickly’. As shown in the results, decision makers agreed that this was
the most important CSF in attaining velocity. Reichart and Holweg (2007)
highlighted that ‘suppliers must offer a timely response’ if velocity is to be
achieved. This study confirmed this was a CSF.. In addition, the importance of
‘realistic time frames being agreed’ between supply chain members was also
seen as crucial. This was originally identified by Elmuti (2002). Similarly, decision
makers offered the idea that ‘lead-times have careful planning’. This planning can
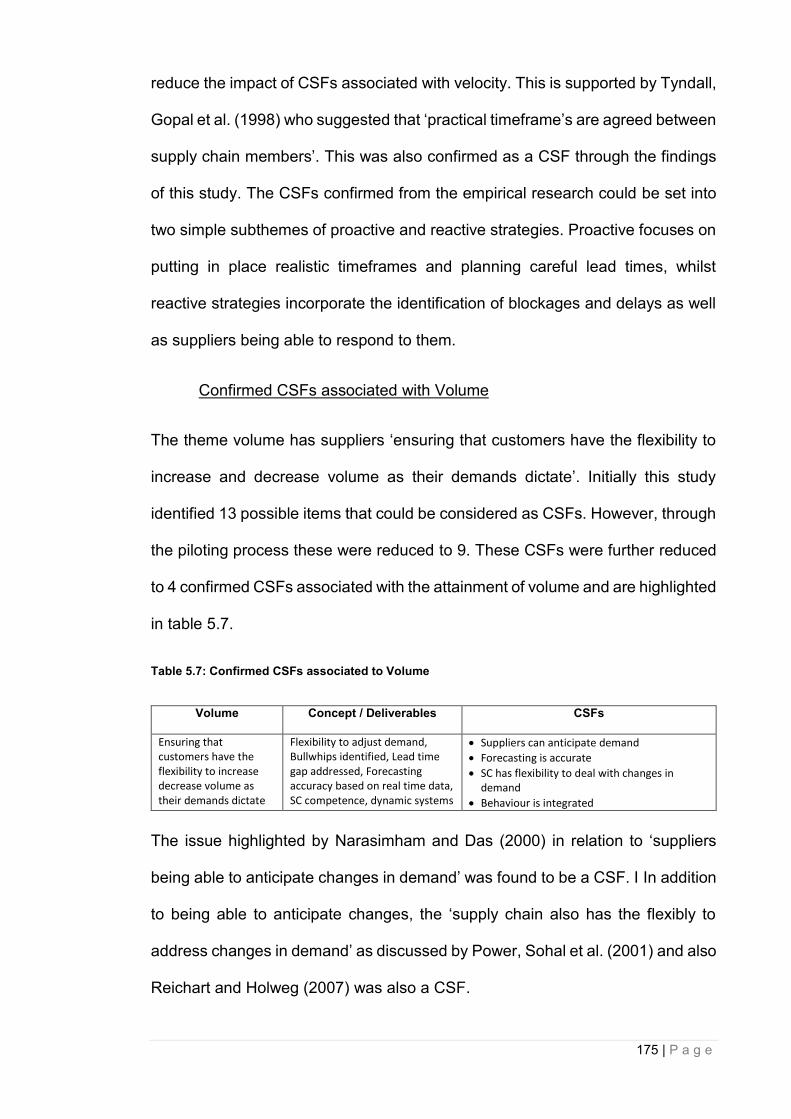
175 | P a g e
reduce the impact of CSFs associated with velocity. This is supported by Tyndall,
Gopal et al. (1998) who suggested that ‘practical timeframe’s are agreed between
supply chain members’. This was also confirmed as a CSF through the findings
of this study. The CSFs confirmed from the empirical research could be set into
two simple subthemes of proactive and reactive strategies. Proactive focuses on
putting in place realistic timeframes and planning careful lead times, whilst
reactive strategies incorporate the identification of blockages and delays as well
as suppliers being able to respond to them.
Confirmed CSFs associated with Volume
The theme volume has suppliers ‘ensuring that customers have the flexibility to
increase and decrease volume as their demands dictate’. Initially this study
identified 13 possible items that could be considered as CSFs. However, through
the piloting process these were reduced to 9. These CSFs were further reduced
to 4 confirmed CSFs associated with the attainment of volume and are highlighted
in table 5.7.
Table 5.7: Confirmed CSFs associated to Volume
Volume Concept / Deliverables CSFs
Ensuring that customers have the flexibility to increase decrease volume as their demands dictate
Flexibility to adjust demand, Bullwhips identified, Lead time gap addressed, Forecasting accuracy based on real time data, SC competence, dynamic systems
Suppliers can anticipate demand
Forecasting is accurate
SC has flexibility to deal with changes in demand
Behaviour is integrated
The issue highlighted by Narasimham and Das (2000) in relation to ‘suppliers
being able to anticipate changes in demand’ was found to be a CSF. I In addition
to being able to anticipate changes, the ‘supply chain also has the flexibly to
address changes in demand’ as discussed by Power, Sohal et al. (2001) and also
Reichart and Holweg (2007) was also a CSF.

176 | P a g e
In order to achieve this knowledge Elmuti (2002) suggested that the ‘behaviour
within the supply change is integrated’, the results of this study identified that this
was also a CSF. The final CSF associated with volume was ‘forecasting is
accurate’ (Fisher, Hammond et al. 1994). Two themes could be identified from
the CSFs associated with volume, the first was supplier related. This takes into
account suppliers throughout the supply chain being able to anticipate changes
in demand. The second theme was the supply chains capabilities/capacity to
deal with change.
In conclusion - Research Objective 2
The focus of research objective 2 was to confirm or refute CSFs. This chapter
described and discussed the CSFs associated with each theme. Through the
research process the study has confirmed the existence of 48 CSFs associated
with the themes of the 7V conceptual framework. Each of the CSFs identified was
loaded heavily enough against each theme to suggest that they are relevant. In
addition, the importance of each CSF to that theme was highlighted through the
descriptive statistics. These 48 loaded items produced by the EFA, were utilised
when seeking to attain research objective 3. This objective is discussed in the
following section.
5.3 Objective 3: Development of the 7V conceptual framework
incorporating CSFs
This section considers both the development of the 7V conceptual framework and
the incorporation of CSFs. This is achieved through the incorporation of the
confirmed CSFs into the existing 7V framework. This starts to build a specific
contribution to theory that will be fully developed in section 5.4. In addition, this
section also discusses the validation of the 7V framework in order to ensure its
177 | P a g e
relevance and usefulness in maximising the efficiency of supply chain processes.
The first two research objectives focussed on the existence of CSFs and their
relationship with individual themes within the 7V framework. Research objective
2 utilised the EFA that identified 48 CSFs related to themes within the framework.
Research objective 3 utilised the findings of the CFA. Through the process of
attaining the plausibility of model fit, certain CSFs were extracted from the ones
produced by the EFA. The relevance of this is that through the process of
attaining model fit and validation the plausibility of the model, the number of CSFs
was reduced to 42. The subsequent analysis of the CSFs identified from the EFA
by the undertaking of a CFA was highlighted in section 4.2.
Up until this point, the 7V Framework has been justifiably developed to include
themes, concepts and business challenges as has been described in previous
chapters. As seen in table 5.8 the 7V conceptual framework has now been
developed to include the CSFs attributed to each theme. These were first
highlighted in figure 4.2 and can also be seen in appendix C. The framework has
matured to a point where, it can be utilised to assist supply chain decision makers.
This will be discussed further in section 5.4 when research objective 4 will be
addressed. Through the EFA and the CFA it has been possible to focus on 42
CSFs associated the validated model.
Up until this point this study has;
Conceptualised the themes from the 7V framework as summarised in
table 2.2.
Confirmed the existence of CSFs, through the findings of the EFA in
section 4.12.
Confirmed the 7V themes within the framework are related through the
findings of the CFA and the attainment of model fit as highlighted in
section 4.2.

178 | P a g e
Table 5.8 7V Framework Source: Developed from Hines 2004
Theme Concept/Deliverables Business Challenges Critical Success Factors Value - The relationship between what the customers want and expects against what the supplier can offer
Reduce cost, meeting customer expectations, continuous improvement, Value chain, Value streams, Reduce risks, Economic value, Value for all parties
Offer value for money to customers based on what they want. Value not just at point of exchange by through time and use
Suppliers add value at reduced costs
Assets are fully utilised
Reducing costs and adding value through learning
Value for all parties involved
Volume - Ensuring that customers have the flexibility to increase decrease volume as their demands dictate
Flexibility to adjust demand, Bullwhips identified, Lead time gap addressed, Forecasting accuracy based on real time data, SC competence, dynamic systems
Customers want to order as late as possible to ensure they have ‘best forecast’ of demand. Reduced likelihood of standard orders in many sectors. Requirement to facilitate changes in order quantities
Flexibility to address changes in demand
Forecasting is accurate
Suppliers can anticipate changes in demand
Integrated SC behaviour
Velocity - Enabling the customer to utilise speed as a competitive advantage, by ensuring prompt delivery
Speed of delivery, Proactive practices, Time-based competition, Adapting to changes in the market
The speed of response in adapting to change in areas such as demand conditions, market structures, production technology and suppliers capabilities
Delays identified to reduce risk
Lead-times carefully planned
SC blockages identified quickly
Realistic time frames agreed
Suppliers timely response
Variety - The ability to customise or standardise a product as per consumer demands or even in anticipation of changes in demand
Local Customisation, Product/Service variety increasing over varying sectors, Increased outsourcing, Shorter product life cycles, Reduced complexity of customisation
Being able to customize the product/service offered. This may mean moving from economies of scale to economies of scope or economies of value to customer
SC introduces product without new SC being created
Products not complex
Ability to customise locally
Over specification reduced
Changes to products not complex
Product design adaptable for differing markets
Variability - The products/services have no varying levels of quality and that they are delivered in a manner that is of a level that is acceptable to the customers
Value adding process, Quality of product/service to end user, Total Quality Management
The business must be able to reduce variability and offer standard quality.
Products meet quality and spec standards
SC Managers understand quality standards
Quality not unambiguous but specified
Quality standard maintained
Procurement of defect free product
Suppliers agree to work to quality standards
New SC members vetted and agree quality procedures
Visibility - Ensure that the supply chain is transparent and all parties are able to see and avoid blockages and issues surrounding bottom heavy inventories
Transparency between members, Bullwhip reduced, IT systems communicate, Information sharing, Pipeline visible to members, reduction in transaction risk
Enabling all parts of the supply chain to be transparent and avoid blockages, ‘ice berg’ inventories and hidden costs; keeping the customer informed.
SC members have organisational compatibility
Cooperation and collaboration between SC members
SC members share information
Culture of integration in SC
Joint planning of supply chain
Open relationship with suppliers
Processes are integrated
Cooperation between managers in SC
Suppliers fully integrated
Virtuality - The ability to manage and coordinate the supply chain Using information technology
Multi-dimensional systems, improved communication
Coordinating of both intangible and tangible assets within SC. Facilitated by ICT give customer confidence and ensure dependability.
Infrastructure issues addressed
New SC members IT evaluated
Standard IT platforms utilised
IT Security risks evaluated
Integration of SC members IT systems
SC members have compatible IT systems
Differing processes identified

179 | P a g e
The final model identifies specific CSFs that are related to each theme (shown in
figure 4.2). These CSFs were inserted into the 7V Framework as highlighted in
table 5.8. Through each of the stages undertaken and the utilisation of EFA and
subsequent CFA, this research validated the 7V conceptual framework model.
In doing so, this research offers a direct contribution in the field of supply chain
management.
Previous SCM research has highlighted a clear link between the themes variety,
variability and volume, specifically when discussing agile and lean supply chains
(Christopher 2000). Evidence also suggested that virtuality could be added to
the three themes (Coman and Ronen 2009). The literature also highlighted the
possibility of other individual relationships between the themes within the
framework (section 2.4). In addition, there was evidence for the plausibility that
certain themes had an operational impact on each other. This was important
discovery for the development of the study as it warranted the assumption that
all themes could be brought together (Hines 2004).
The findings from the CFA, and the creation of figure 4.2 confirms that having
utilised the CSFs highlighted from the EFA, the CFA offers a plausible model that
suggests relationships exist. This is a clear contribution to knowledge as
previously, no evidence confirmed a relationship between all of the seven themes
within this conceptual framework.
In relation to the themes within the framework, value involves the expectations of
the customer and the supplier’s ability to manage them. The model has 4 CSFs
associated to the theme value. The first is attributed to ensuring that all assets
are fully utilised. The study suggests that this focus might come from supply chain
decision makers’ desire to attain value with what they had at their disposal.

180 | P a g e
However, fully utilising assets could also be interpreted as decision makers not
wanting to waste assets that they do not fully utilise. The reason could simply be
unnecessary fixed costs, raising overall costs that in turn could increase the
customer’s expectations.
The attainment of value for all parties involved focuses on the expectations of
both the supplier and the customer. The meeting of such expectations regarding
the variable value within a practice setting should be seen as key to all parties
within the supply chain. All members should be satisfied with the workings and
outputs of the supply chain to ensure continued cooperation.
The reduction of costs could be seen as key within the variables associated with
value. In the first instance, focus is placed on suppliers to ensure they add value
and reduce costs. The second instance focuses on reducing costs whilst at the
same time adding value. According to the CSFs identified this can be achieved
through continual learning of the processes undertaken.
Volume-volatility ensures that customers have the flexibly to increase and
decrease volume as their demands dictate. In essence, customers place specific
demands on their downstream suppliers as a way to ease the demands on
themselves (Hines 2013). Within the framework 4 key CSFs have been identified
related to the theme. The CSF, ‘flexibility to address the changes in demand’ is
key as previously highlighted (Christopher 2000, Narasimham and Das 2000,
Power, Sohal et al. 2001). This flexibility needs to be examined from two
perspectives. Firstly, the ability to be flexible for the customer so that they benefit
is no doubt a competitive advantage that a supplier can offer. However, it is also
crucial that the supplier reduces the risk to themselves of the Bullwhip effect as
previously discussed in chapter 2 (Forrester 1961). The CSFs identified suggest
181 | P a g e
that forecasting accuracy and suppliers ability to anticipate changes in demand
will assist in the attainment of volume-volatility. However, it seems that for this to
happen the supply chain and its members require to behave in an integrated
manner as previously suggested by Elmuti (2002).
Velocity enables the customer to utilise speed as a competitive advantage by
ensuring prompt delivery. Within the framework 5 CSFs were inserted against
this theme. From these, two sub-themes of planning and proactive practices
emerged. Firstly, the issues around planning are concerned with the variables
(CSFs) of realistic time-frames being agreed and lead-times being carefully
planned (Tyndall, Gopal et al. 1998). Interestingly these CSFs were originally
suggested by practitioners during the round table discussions when creating the
survey instrument. Enabling the customer to utilise speed as a competitive
advantage, by ensuring prompt delivery is the very definition of velocity. CSFs
related to velocity can be seen as having two sub-themes; proactive and reactive
practises. Proactive practices are attributed to issues that decision makers should
address during the planning stages of the supply chain process. The CSF of ‘lead
times being carefully planned’, is also seen as a key operational issue for supply
chains and can also be seen as an item that can be addressed during the
planning stages of supply chain operations. Likewise, the CSF of ‘realistic time-
frames being agreed between supply chain partners’ are negotiated either prior
to the start of initial operations or before a supplier is integrated into a supply
chain. The second sub-theme identified is that of reactive practices. This is seen
as supply chain decision makers changing strategies in reaction to issues
occurring within a supply chain. The first variable attributed to this is the
identification of delays to reduce risk. Secondly, supply chain blockages are
182 | P a g e
identified quickly and suppliers response is timely as previously discussed by
Elmuti (2002) .
Variability focuses on the products/services having no varying levels of quality
and being at a level that is acceptable to the customers. As shown in table 2.9,
there were originally 22 possible CSFs identified from extant literature. Through
the CFA this was reduced to 7 CSFs. As discussed in section 2.3.4, the
importance of quality cannot be underestimated and will in part affect the length
of relationships between supplier and customer. The loading of these CSFs onto
the themes does not highlight their importance however, the descriptive statistics
do show that each one is seen as being either ‘ important’ or ‘very important’ by
decision makers. As highlighted in section 4.2, the CSFs of ‘quality standards
are maintained’ and ‘products meet customer specifications/quality
requirements’, can be ranked as the two most important. However, these are both
closely followed by the other 7 CSFs associated to variability. The theme
variability brings into play a subjective measurement in regards to an individuals’
understanding of value. It could be argued that there is a need for the CSF of
quality not being ambiguous, will assist in managers/decision maker
understanding these requirements.
As first highlighted by Forker, Mendez et al. (1997) the CSF of ‘the procurement
of a defect free product’ is important to the attainment of variability. The last two
CSFs focus upon the suppliers and what they must do before becoming part of a
supply chain. Firstly, they must agree to work to quality standards and before
they are even considered, new supply chain members must be vetted. The CSFs
surrounding variability came under the most scrutiny when undertaking the round
table discussions with the supply chain decision makers. Their opinions did not
always align with the literature and this meant that new CSFs were created for

183 | P a g e
insertion into the survey instrument. In addition, others were adapted to be more
operationally defined.
As shown in in table 2.7, 30 possible CSFs were highlighted for consideration in
relation to the theme visibility. Through the stages undertaken in the development
of the survey instrument and subsequent EFA and CFA, this has been reduced
to 9 CSFs. Interestingly, the EFA shows that the theme visibility is the component
that makes up 27% of the variance, the most from any of the themes in the
framework. All CSFs were seen as important from the decision-makers
perspective. Unlike the previous theme of value, the CSFs associated with
visibility linked closely to the extant literature. The CSF suggesting the culture of
integration within the supply chain, which had a factor loading of 0.822 and open
relationships with suppliers, were both seen as important by decision-makers in
the attainment of visibility. This openness and integration between members is
highlighted previously by Bowersox and Closs (1996) and Mentzer, DeWitt et al.
(2001) . The next CSF within the framework associated with visibility goes further
by suggesting suppliers should fully integrate within the supply chain and was
taken from Chen, Lin et al. (2006). This importance of integration in relation to
the attainment of visibility is key, even going to the extent of processes being fully
integrated as shown in table 4.4. The remaining CSFs focus upon collaboration,
cooperation and organisational capability which all have a clear grounding within
the extant literature (Cooper, Lambert et al. 1997, Tyndall, Gopal et al. 1998,
Mentzer, DeWitt et al. 2001). It is evidenced in section 2.4 that, throughout the
growing body of SCM literature the theme of visibility is closely linked to that of
final theme virtuality (Christopher 2011, Harrison and Hoek 2011, Williams 2014).
Virtuality is also linked to the themes variability, volume and variety as highlighted
in figure 2.5. As IT systems are improving and becoming more accessible, the

184 | P a g e
theme virtuality is becoming more prominent within supply chain operations.
Further to the literature search and round table discussions, 11 potential CSFs
were identified. After the EFA and subsequent CFA were undertaken this was
reduced to 7 confirmed CSFs. As shown in table 4.4 all of the 7 CSFs loaded
against virtuality were seen as important by SCM decision makers. All 7 CSFs
loaded heavily against the component theme. The research has shown that the
CSFs first highlighted by Williamson, Harrison et al. (2004);‘infrastructure
mismatches addressed between suppliers’, ‘differing processes between supply
chain members’ and ‘IT security risks being evaluated and managed’, are all key
to the attainment of virtuality. In addition Mills (2001) ascertain that supply chain
members IT platforms are compatible is essential.
In conclusion - Research objective 3
Through the processes undertaken that led to the inclusion of the CSFs into the
7V conceptual framework on the completion of the CFA, the framework can now
be seen as validated. This staged process has shown that key CSFs can be
attributed to individual themes and that through the attainment of Model Fit, the
themes within the framework can be seen as related to each other. The
attainment of research objective 3 is seen as a contribution to theory. The model
that considers all themes within the framework has been validated.. It also
considers the CSFs associated with each theme. The attainment of research
objective 3 and the validation of the 7V Framework, allows research objective 4
to be addressed. This will be possible as the research looks to reconceptualise
effective SCS on the evidence of from the study thus far. The research now
moves onto phase 4 of the study.
185 | P a g e
5.4 Objective 4: Reconceptualise effective SCS on the
evidence from the study
Having attained research objectives 1-3 during phases 1-3 of the study, focus
turned to the development of the 7V Framework. This section utilised the now
validated 7V Framework to reconceptualise effective supply chain strategies. To
show the attainment of research objective 4, the study looked at how the 7V
Framework highlighted in 5.8 can be interpreted within a supply chain process.
Figure 5.1 will be used to explain how the 7V Framework can be used in practice.
The section will also discuss the versatility and implementation of the Framework
in different supply chains.
In addition, figure 5.1 highlights the 7V Framework giving specific consideration
to issues at each stage of the supply chain process. At this point, it is again stated
that no two supply chain processes are identical. However, this study would argue
that most go through a linear development that starts with the planning stages,
through to the eventual point where the customer receives the product or service.
It is appreciated that supply chains are more complicated than that being
suggested in figures 5.1 5.2 and 5.3, with many more tasks and sub-networks in
operation. However, the processes outlined are realistic and give a clear pictorial
view of the Framework.
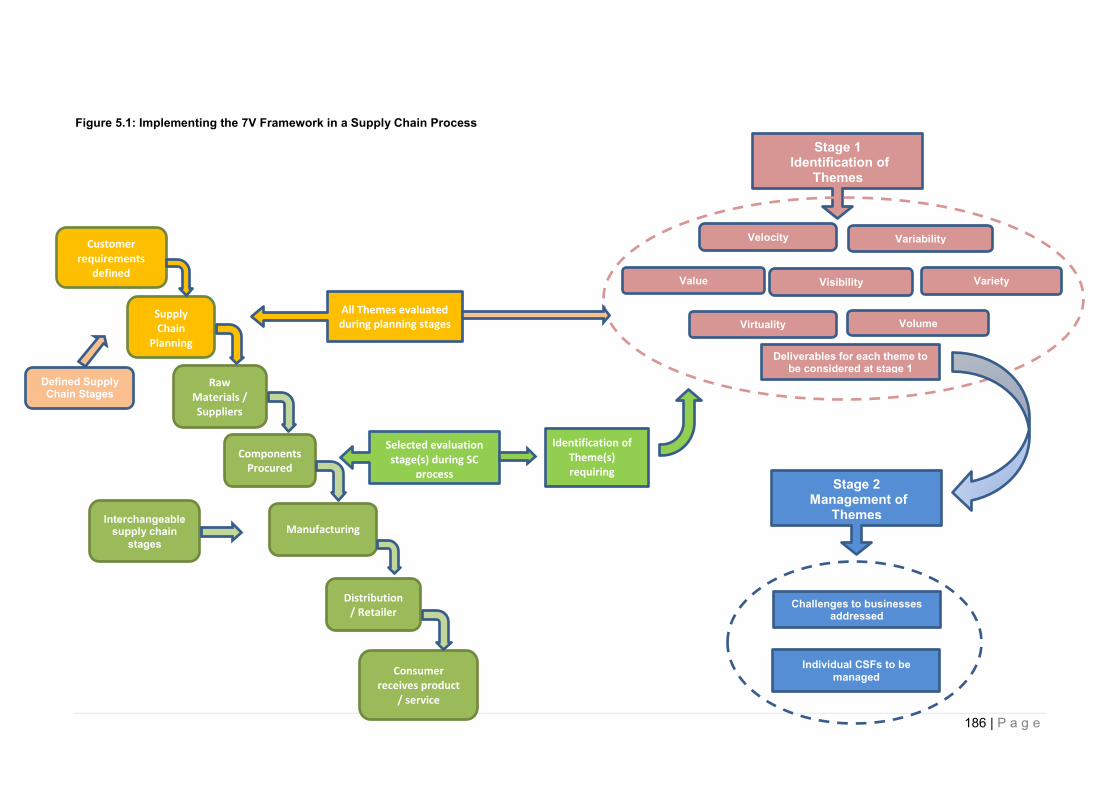
186 | P a g e
Figure 5.1: Implementing the 7V Framework in a Supply Chain Process
Customer requirements
defined
Distribution / Retailer
Manufacturing
Components Procured
Raw Materials / Suppliers Sourced
Supply Chain
Planning Design
Consumer receives product
/ service
Selected evaluation stage(s) during SC
process
Identification of Theme(s) requiring
evaluating
Deliverables for each theme to be considered at stage 1
Challenges to businesses addressed
Individual CSFs to be
managed
Stage 1 Identification of
Themes
Defined Supply Chain Stages
Interchangeable supply chain
stages
All Themes evaluated during planning stages
Value
Virtuality Volume
Visibility
Variability
Variety
Velocity
Stage 2 Management of
Themes
187 | P a g e
It is accepted that when planning organisations will firstly decide upon the supply
chain stages and process required. Figure 5.1 highlights an example of a generic
supply chain process. Elements of this supply chain is interchangeable at differing
stages. It begins with an organisation understanding the customer requirements,
before then moving onto the planning stage and design stage of the supply chain.
These two stages are described as defined stages within the context of figure 5.1
(highlighted yellow). It could be argued that these points are generic starting
points for most supply chains.
Next, the process moves on to the interchangeable supply chain stages
highlighted in the example supply chain process shown in figure 5.1. These
stages are ‘raw materials being sourced’, ‘components produced’, ‘manufacturing
takes place’ and ‘distribution hands the product or service on to the final
customers’ (highlighted in green). The reason these stages are seen as
interchangeable is that different products and services may need different stages
and in turn strategies. An example would be the difference between clothing
manufacturing and fresh food supply chains. The basic stages of a clothing
supply chain may look similar to the one shown in figure 5.1; however, a fresh
food supply chain may have fewer stages to consider. The reason for this is
newer techniques which have suppliers picking and packaging vegetables in the
fields then sending direct to the retailer, which results in produce being on the
shelves within hours. It is reasonable to suggest that the first two stages would
be similar (interchangeable stages). However, the type of product or service
would have a direct influence on the stages later in the supply chain. This will be
discussed in more depth in section 5.5, when the research objective 5 ‘evaluate
implications for supply chain strategy practice’ is addressed.

188 | P a g e
Having highlighted the supply chain process, the next step was to integrate the
two-stage implementation of the 7V framework onto the process.
Stage 1 – Implementing the 7V Framework
Stage 1 of the 7V Framework is the ‘identification of key themes’ associated with
each point within the supply chain process. This stage progresses from the initial
defined stages to the interchangeable stages. During the planning stage
highlighted in figure 5.1, all themes within the 7V Framework need to be
considered by supply chain decision makers. They should then be evaluated
specifically in the context of the deliverables as highlighted in the 7V Framework
(table 5.8). This will assist in giving supply chain decisions makers an opportunity
to take a holistic view of deliverables and strategically plan in accordance with
the information attained. The business challenges must be fully understood. In
addition, all CSFs must be fully considered. Some CSFs may require that action
is taken during the planning stage to ensure issues do not arise or flexibility is
available to decision makers later in the supply chain process. For example, in
relation to the theme variety it is essential that in order to achieve certain levels
of customisation, both an ‘ability to customise locally’ and ‘over specification is
reduced’ must be achieved. CSFs such as these may be better addressed during
the planning stage of the supply chain process, where specific strategies can be
put in place to deal with such matters.
Key themes requiring specific consideration during the interchangeable stages of
the supply chain process would be identified during planning. Once the supply
chain is in operation (interchangeable stages), the focus may centre on specific
themes as they take prominence over other themes within the framework. All
themes should be managed accordingly at each stage of the supply chain
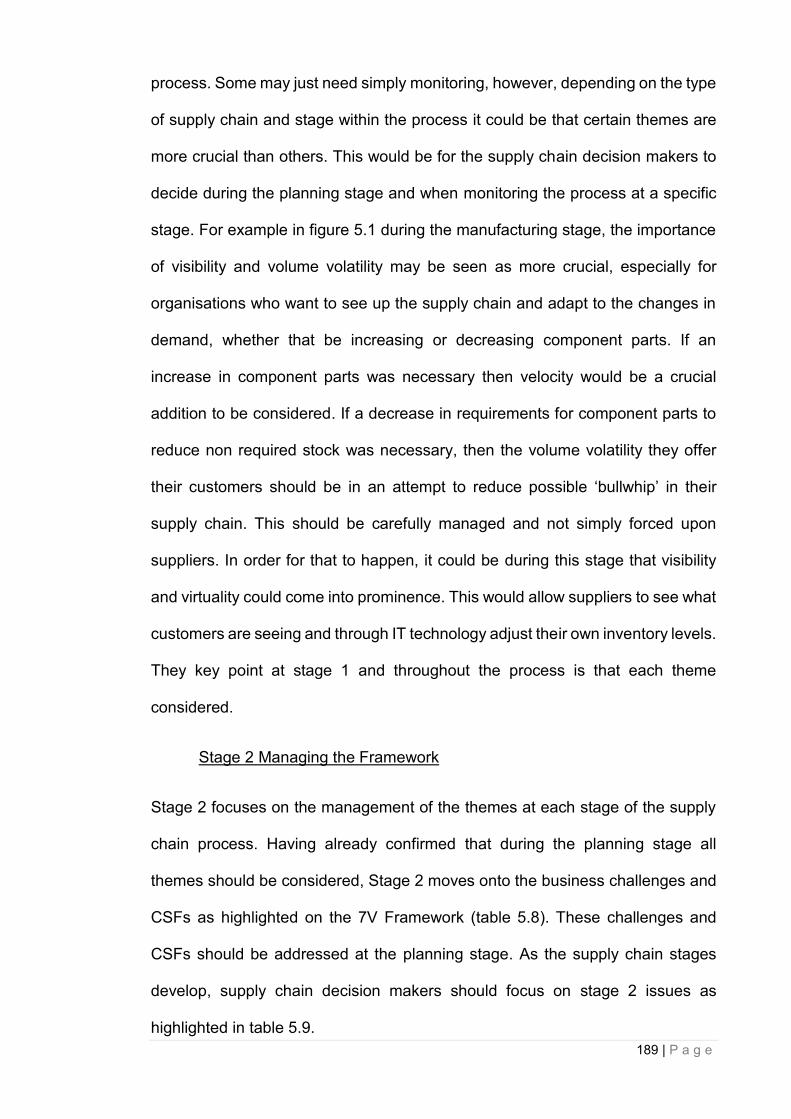
189 | P a g e
process. Some may just need simply monitoring, however, depending on the type
of supply chain and stage within the process it could be that certain themes are
more crucial than others. This would be for the supply chain decision makers to
decide during the planning stage and when monitoring the process at a specific
stage. For example in figure 5.1 during the manufacturing stage, the importance
of visibility and volume volatility may be seen as more crucial, especially for
organisations who want to see up the supply chain and adapt to the changes in
demand, whether that be increasing or decreasing component parts. If an
increase in component parts was necessary then velocity would be a crucial
addition to be considered. If a decrease in requirements for component parts to
reduce non required stock was necessary, then the volume volatility they offer
their customers should be in an attempt to reduce possible ‘bullwhip’ in their
supply chain. This should be carefully managed and not simply forced upon
suppliers. In order for that to happen, it could be during this stage that visibility
and virtuality could come into prominence. This would allow suppliers to see what
customers are seeing and through IT technology adjust their own inventory levels.
They key point at stage 1 and throughout the process is that each theme
considered.
Stage 2 Managing the Framework
Stage 2 focuses on the management of the themes at each stage of the supply
chain process. Having already confirmed that during the planning stage all
themes should be considered, Stage 2 moves onto the business challenges and
CSFs as highlighted on the 7V Framework (table 5.8). These challenges and
CSFs should be addressed at the planning stage. As the supply chain stages
develop, supply chain decision makers should focus on stage 2 issues as
highlighted in table 5.9.

190 | P a g e
Table 5.9: Extract from 7V Framework
Theme Concept / Deliverables
Business Challenges
Critical Success Factors (1st Tier)
Variety - The ability to customise or standardise a product as per consumer demands or even in anticipation of changes in demand
Local Customisation, Product/Service variety increasing over varying sectors, Increased outsourcing, Shorter product life cycles, Reduced complexity of customisation
Being able to customize the product/service offered. This may mean moving from economies of scale to economies of scope or economies of value to customer
SC introduces product without new SC being created
Products not complex
Ability to customise locally
Over specification reduced
Changes to products not complex
Product design adaptable for differing markets
Stage 1 Stage 2
The prominent operational issues in the attainment of the theme are that the
consideration of CSFs should be key in the deliberations of the decision makers.
Table 5.9 extracts the theme variety from the 7V Framework. Key issues need
addressing when focusing upon this theme during the retailer distribution of the
supply chain process. As previously highlighted, the theme variety seeks to
address the standardisation or customisation of a product. The business
challenges at that particular point in the supply chain process are challenging. By
addressing the CSFs associated with the theme at this stage of the process (and
previously during the planning stage), it is suggested that this theme can be
attained and a competitive advantage could be achieved.
In conclusion - Research Objective 4
Research objective 4 focused on the possibility of the supply chain strategies
being reconceptualised by utilising the 7 V Framework. The Framework should
not be used in isolation but rather as a management tool. The key point is that
the 7V Framework will assist decision makers in planning and operating and will
help to identify specific risks in supply chains.
191 | P a g e
5.5 Objective 5: Evaluate implications for supply chain strategy
practice
The fifth and final objective focuses on the contribution to practice from the
research study. It is important to note that the 7V framework is not to be seen in
isolation as the one stop shop. The 7V Framework should be seen as offering
focus to key areas regarding the planning and managing of supply chains. If the
7V Framework was to be utilised during the stages highlighted it would offer
decision makers guidance on what key areas should be examined.
There is no doubt that companies need to take a long term view when adopting
SCM initiatives; the focus should be right across the supply chain from dirt to end
user (Rao, Phillips et al. 2006). The literature states that competition in many
industries will revolve around the development of supply chains (Narasimham
and Das 2000). Therefore, the 7V Framework should be seen as an opportunity
for organisations to make marginal gains in the improvement of their operations.
It could assist in giving them focus around specific areas of operations as
highlighted in section 5.4.
As can be seen in figure 5.2 the 7Vs Framework has been inserted onto a dairy
supply chain. This type of supply chain deals with a product that has a specific
time restraints placed upon it due to consumption date. Products must be with
the retailer in enough time for them to sell it and for the customers to have enough
time to store prior to consumption.
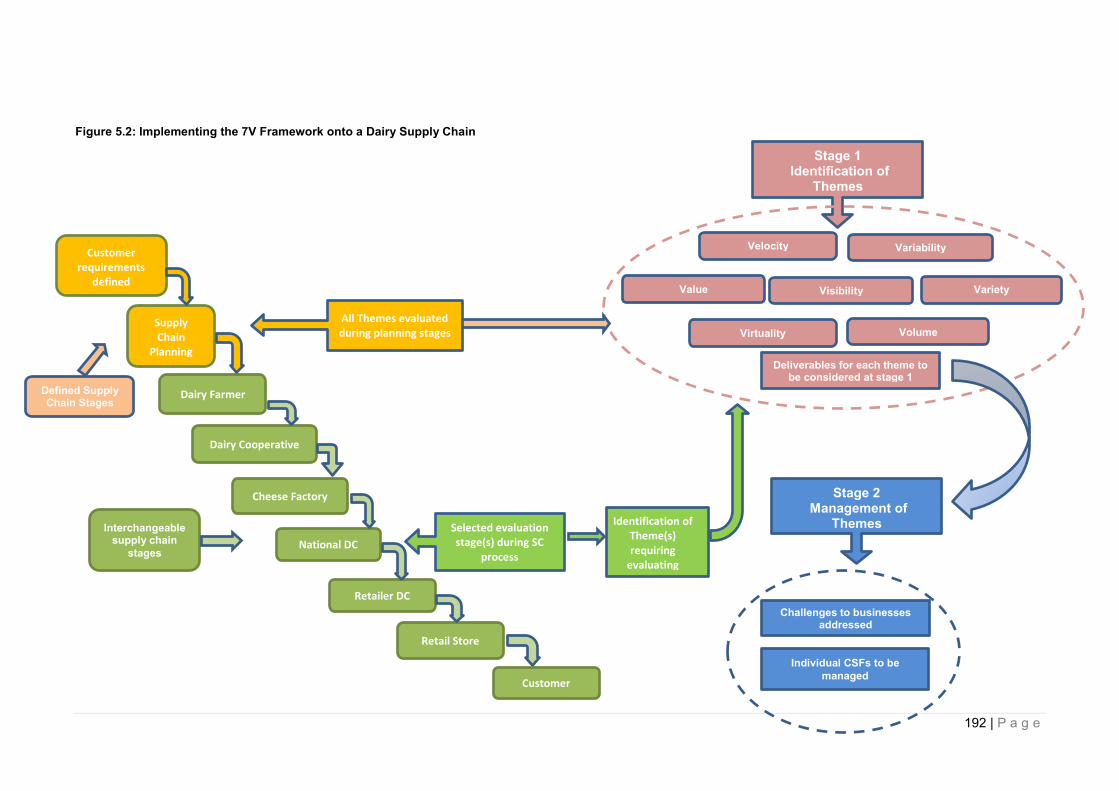
192 | P a g e
Figure 5.2: Implementing the 7V Framework onto a Dairy Supply Chain
Customer requirements
defined
National DC
Cheese Factory
Dairy Cooperative
Dairy Farmer
Supply Chain
Planning Design
Retailer DC
Selected evaluation stage(s) during SC
process
Identification of Theme(s) requiring
evaluating
Deliverables for each theme to be considered at stage 1
Challenges to businesses addressed
Individual CSFs to be
managed
Stage 1 Identification of
Themes
Defined Supply Chain Stages
Interchangeable supply chain
stages
All Themes evaluated during planning stages
Value
Virtuality Volume
Visibility
Variability
Variety
Velocity
Stage 2 Management of
Themes
Retail Store
Customer
193 | P a g e
The sustainable issues surrounding waste and products not being fit for market are
key with such supply chains. As per the previously highlighted stage 1, the
organisation would have considered the framework in its entirety during planning.
If consideration is given to CSFs within the framework during planning, then
potential issues can be identified and addressed at the earliest stage. For example,
during planning stages of the diary supply chain (figure 5.2), the theme volume
could raise significant issues to be addressed.
The theme volume ensures customers have the flexibility to increase volume as
their demands dictate. In relation to a dairy supply chain this would be a key issue
in reducing waste, as suppliers could not simply place unwanted stock into storage.
The CSFs identified highlight that forecasting would need to be accurate, suppliers
would need to anticipate changes in demand, there would need to be flexibility to
make changes due to demand and finally the supply chain would have to act in an
integrated manner. The latter being key in that all members would be looking to
work together to control the flow of products. If the focus then went on to the supply
chain being in operation then other themes may become more prominent at certain
stages. An example of this is shown again in figure 5.2. Within this supply chain,
the point of the national distribution centre is key as it is at this point where all
products come together. The visibility of the supply chain both back to the
downstream suppliers and up to the retail store would be at its most crucial as to
ensure that demand can be matched. This would enable the reduction of potential
bullwhip effect. Within the framework key issues such as integration of and joint
planning have already been addressed at the planning stage. However, at this
point the national distribution centre, would be interested in ensuring that other

194 | P a g e
CSFs within the framework related to visibility are being addressed. These could
be that supply chain members share information, all suppliers at that point are fully
integrated, and there are continued open relationships between suppliers. The key
business challenges here are that the supply chain is transparent and that
blockages are avoided, all in an effort to keep the upstream customer informed.
The 7V Framework is not designed to be rigid and should be seen as adaptable
from supply chain to supply chain. In some instances at differing points on
subsequent supply chains, themes and CSFs will be more prominent in relation to
importance. This is acceptable and fully expected. It is the ability of the Framework
to be adaptable that allows it to be used in such a holistic manner and in turn be
used for different types of supply chains. For example, figure 5.3 highlights a car
manufacturing supply chain. As previously stated all themes would be considered
during planning. In this case, during operation the supply chain may be more
focused on specific themes such as Virtuality and Variety. Within figure 5.3 the
focus is at the auto manufacturer assembly stage. During this stage, all parts and
components are brought together. All downstream suppliers are controlled through
IT systems as is communication upstream. The business challenge here is to
coordinate tangible and intangible assets within the supply chain facilitated by IT.
In turn this should give customers confidence and ensure dependability (Hines
2004). The CSFs associated with virtuality at this time would have, in the most
part, been addressed as the supply chain was designed or as new suppliers
entered the process. However, the key thing in a supply chain like this is stability.
Suppliers must be integrated through IT systems and standard IT platforms should
continue to be used.

195 | P a g e
Figure 5.3: Implementing the 7V Framework onto a Car Manufacturing Supply Chain
Customer requirements
defined
Auto Manufacturer -
Assembly
Subassembly
Components
Raw Material
Supply Chain
Planning Design
Marketing Channels Dealer Network
Selected evaluation stage(s) during SC
process
Identification of Theme(s) requiring
evaluating
Deliverables for each theme to
be considered at stage 1
Challenges to businesses addressed
Individual CSFs to be
managed
Stage 1 Identification of
Themes
Defined Supply Chain Stages
Interchangeable supply chain
stages
All Themes evaluated during planning stages
Value
Virtuality Volume
Visibility
Variability
Variety
Velocity
Stage 2 Management of
Themes
Customer

196 | P a g e
Likewise, all IT security risks are evaluated and differing processes are identified.
At this point in the supply chain IT systems would be crucial to the achievement of
the theme variety. With customers wishing to customise products, in this case cars,
the systems used by the marketing channels would need to feedback downstream
through to the manufacturing assembly stage. Long gone are the days of Henry
Ford’s philosophy of you can have it in any colour as long as that colour is black.
This clearly shows the link again between virtuality and variety. The ability to
customise or standardise a product as per customer demand is key within the
marketing and dealer network of the car manufacturing industry. This type of
supply chain would already ensure it had the ability to customise locally without
starting a new supply chain as has been highlighted as two CSFs. Also, product
design would be adaptable to differing markets, this could be differing engine sizes
or simply seat fabrics.
It is this ability to deliver a standardised product that at the same time has been
specified to the customers’ requirements that is key here especially when
addressing the CSF ‘changes to product are not complex’. Most car models will
come with a wide range of options from sound systems to alloy wheels. These are
either fitted towards the end of the production line or locally once at the dealers. It
is the ability to offer the customer variety, whilst at the same time addressing the
CSFs identified that is key to this being a possibility.
In Conclusion
Research objective 5 focussed on the implications for supply chain practice
through the implementation of the framework. It is important that with supply
197 | P a g e
chains constantly changing, organisations find the external environment that they
are operating in constantly changing through the face of economic and political
uncertainty. It is therefore important that where possible they are utilising what
information they have to their full advantage. Being able to identify key areas of
operation and subsequent CSFs will be vital to organisations being best placed to
achieve the competitive advantage they seek. The 7V Framework, offers
organisations the opportunity to identify and manage CSFs associated with 7 key
areas in delivering a successful supply chain.
198 | P a g e
Chapter 6 Conclusions
The overall aim of this research was to gain a greater understanding of key factors
related to the effective delivery of supply chains.
This research identified specific CSFs believed to be associated with the
successful delivery of supply chains. Additionally, the research offered evidence of
the suitability of the 7Vs conceptual framework as an organisational tool for better
understanding and managing these CSFs. The main findings of the research are:
• Firstly, the themes within the 7Vs conceptual framework have been
conceptualised from the literature and validated through the empirical
research
• Secondly, the identification of CSFs attributed to the successful delivery of
supply chains has been achieved. Through the research process, 48 CSFs
were identified as being related to specific themes within the conceptual
framework that were directly attributed to the successful delivery of supply
chains.
• Thirdly, the validation of the 7Vs conceptual framework through the
achievement of model fit has contributed to theory.
• Finally, the research is able to draw implications for the practices of SCM.
To conclude this thesis, the following chapter will now reiterate both the
contributions to theory and practice. The chapter will highlight the limitations of
the research and discuss further areas of possible research suggested by this
199 | P a g e
study. Finally, a personal reflection is offered by the researcher on the research
process undertaken.
6.1 Contributions to Theory
Two clear contributions to theory can be taken from the findings of this study, the
first being the confirmation of CSFs and secondly the validation of the 7Vs
Framework. The attainment of these are discussed further in this chapter and can
be seen as stand-alone contributions. Firstly, no other research can be found that
confirms 48 CSFs related to the effective delivery of supply chains. Likewise no
research been identified that has previously tested and in turn validated the 7V
Framework.
As the aim and objectives of this study have been met, the contributions made
should be discussed in relation to existing SCM models. Previously, the SCOR
and Lamberts (1998) Models were highlighted as having been considered for the
attainment of the aim and objectives of this study. Although, neither was deemed
suitable for the identification of CSFs in SCM, it is believed that through its
validation, the 7V Framework could now be utilised in conjunction with the SCOR
model. It was previously highlighted, that it may be possible in what SCOR calls
its management process of ‘Enable’. This is where SCOR ‘Manages Supply
Chain Risk’. The 7 themed areas of the Framework along with the 48 CSFs offers
specific guidance to supply chain decision makers that could assist in the area of
risk identification. As this area is non prescriptive within the SCOR Model, the 7V
Framework could be utilised by supply chain decision makers to assist
organisations in what SCOR process highlights as designing and maintaining
supply chains.
200 | P a g e
In relation to Lamberts (1998) Model, similar to the SCOR there are specific areas
that do overlap and would add more depth of understanding. These would include
what Lamberts (1998) model calls ‘Demand Management’ where forecasting and
supply chain capabilities would be considered. However, unlike the SCOR model
it does not offer a specific area in which the CSFs associated to the supply chain
could be considered. Additionally, due to the Lambert (199) Models prescriptive
structure it would be problematic for the 7V Framework to be added or run in
conjunction with it.
6.1.1 Confirmation of CSFs
The identification of potential CSFs associated with the delivery was discussed
in depth within section 2.5. It is noted, the extant literature associated to CSFs is
growing as this research area develops. As supply chains are continually evolving
they bring new factors that need consideration.
The premise set was that CSFs are in essence crucial to the outcome of an event
or in this case the delivery of a theme. This allowed for a comfortable link to the
7V framework. The CSFs this research has confirmed as being associated with
each theme has allowed for clarity in a research area that at present in still
evolving.
To date, no other SCM research has been identified that gives such focus to
CSFs in relation to the collective amount confirmed within this study. The
confirmation of 48 CSFs from a possible 106 original analysed assisted in the
attainment of research objective 2. The 48 CSFs confirmed following the EFA
(table 4.2) reflected a direct contribution to theory. The research contributes to a
201 | P a g e
deeper understanding of CSFs associated with supply chain management.
Although the validation of the model post CFA reduces the number of CSFs
associated with the framework in its entirety to 42 CSFs, if examining the themes
individually then it would be prudent to focus on the findings of the EFA.
The extent in which the CSFs identified effect or impact supply chain
management has not been measured and could be a possible avenue for future
research; however, the implications of each CSF in relation to the individual
themes within the framework has been discussed in depth within section 5.2.
Each individual theme offers clear areas in which CSFs should be focused upon
and considered by supply chain decision makers.
Visibility
The study has contributed to the identification and confirmation of 9 CSFs that
need to be considered in ensuring that a supply chain is transparent, blockages
can be identified and issues surrounding bottom heavy inventories can be
addressed. These are:
Culture of integration between supply within supply chain
Suppliers are fully integrated within supply chain
Cooperation between managers within supply chain
Joint planning of supply chain between members
Processes within supply chain are integrated
Cooperation and collaboration between supply chain members
Supply chain members share information openly
Open relationships with suppliers
Supply chain members has organisational compatibility
There are clear themes surrounding the CSFs related to Visibility of integration,
cooperation and openness between suppliers. This suggests that where and
202 | P a g e
when possible, physical and cultural barriers within supply chains and between
participating members need to be addressed in order to achieve the challenges
associated with the attainment of visibility.
Virtuality
This study contributed to the identification and confirmation of 7 CSFs that need
be considered in ensuring that a supply chain is able to manage and coordinate
itself using information technology. These are:
Infrastructure mismatches are addressed with suppliers
New supply chain members IT capabilities evaluated
Differing processes between supply chain members identified
Standard IT platforms agreed between members
Integration of supply chain members
IT security risks are evaluated and managed
Supply chain members have compatible technologies
Section 2.6 identified 13 possible CSFs (see table 2.9) associated with the theme
of virtuality. The development of the questionnaire reduced these to 11 prior to
data collection. It first highlighted that there is a clear link between the themes
virtuality and visibility (section 2.4). This suggests that the use of IT systems to
manage and coordinate supply chains will assist in the transparency and ability
of supply chains to identify potential blockages. It is clear that with advancements
in technology supply chains will benefit, however, there is an argument that this
technology must have compatibility with all supply chain members.
Variability
203 | P a g e
This study contributed to the identification and confirmation of 8 CSFs that need
to be considered when ensuring that products/services quality has standard
levels of delivery. In addition to that, delivery of products/services is at an
acceptable level to the customer, in doing so the following CSFs were highlighted:
Quality standards are maintained
Products meet customer specification/quality requirements
Quality not unambiguous but specified
SC Managers understand quality standards
New SC members vetted and understand quality procedures
Lower tier suppliers agree to quality standards
Procurement of defect free product
Initial design of good quality.
The issue regarding attainment of quality is well noted within operational literature
as discussed in section 2.3.4 and is a crucial value adding process (Sila,
Ebrahhimpour et al. 2006). It is also suggested that it is the most visible aspect
of supply chain performance (Gattorna 2010). The CSFs associated with the
attainment of variability suggest a subtheme; that there needs to be an
understanding of what quality actually means throughout the supply chain. This
suggests that quality levels are given precedence throughout the supply chain.
This is highlighted from the initial design, to the procurement of defect free
products and right through to the final product meeting customer requirements.
Value
The study contributed to the identification and confirmation of 9 CSFs in relation
to the attainment of what a customers expect against what the supplier can offer.
The expectations related to the theme value are discussed within section 2.3.1.
The attainment of value is problematic as highlighted within the literature for
204 | P a g e
varying reasons. This is emphasized by the fact that initially the study had
identified 26 potential CSFs from the literature and discussions with supply chain
decision makers.
Issues such as value changing over time and more specifically the ability to fully
understand expectations has been well articulated (Tracy and Tan 2001). From
the process undertaken the study has been able to focus the attainment of value
to the following:
Flexibility offered regarding clients requirements
Suppliers ability to add value and reduce costs
Supply chain offers a service that meets clients requirements
Assets fully utilised
Reducing costs and adding value through continual learning
Value for all parties is achieved
Costs minimised
Product offers customer satisfaction
Supply chain is profitable for each partner
The ability for organisations to be able to anticipate what is acceptable to
customers in today’s markets is no doubt challenging (Sengupta, Heiser et al.
2006). The focus on value is difficult particularly due to the inability to directly
measure it.
Although reduction of costs is seen as a key way to attain value as highlighted in
the CSFs, it is seen more in a reduction of costs and value for all within the supply
chain. Within this theme the CSFs remaining after the initial EFA was carried out
were the ones created through the discussions with the supply chain decision
makers and not the literature.
205 | P a g e
This supports the previous suggestion made in section 2.5.1 that the literature
surrounding value is widely used and fragmented. The main contribution here
was that the majority of CSFs identified in association with value were new and
created from a purely operational perspective.
Variety
This study contributed to the identification and confirmation of 6 CSFs in relation
to the ability to customise or standardise a product either through demand or due
to anticipation of changes to demand. With products and services ever changing
and adapting, the ability for supply chains to offer such flexibility is clear. To assist
in this the following were highlighted as being key:
Changes to products not complex
Product not complex
Ability to customise locally
Over specification is reduced
Design of products adaptable to differing markets
SC can change or introduce new product without starting new SC
This is a clear indication that in order for organisations to offer variety, changes
must be possible within the supply chain. New supply chains should not need to
be started in order to implement changes to products or services. Decision
makers must ensure products are not over complex, are adaptable to changes
within the supply chain and have ability to customise locally.
Velocity
The speed in which an organisation can get products to market is widely accepted
as an area where competitive advantage can be achieved as discussed in section

206 | P a g e
2.3.3. Enabling a customer to utilise this competitive advantage through the
speed and prompt delivery forms the foundations of the theme velocity. This study
has contributed to the research area through the identification and confirmation
of 5 CSFs associated to the attainment of this theme, they are:
Delays identified quickly to reduce risks
Lead times have careful planning
SC blockages need identified quickly
Realistic time frames agreed
Suppliers timely response to issues
As stated previously, the importance of velocity and improved responsiveness is
a fundamental reason why organisations are investing in new approaches to
enhance performance (Harrison and Hoek 2011). These CSFs identified can
assist in the design of these new approaches.
Volume-Volatility
The ability for customers to have the flexibility to adjust demands on downstream
suppliers in relation to demand from their own customers is the basis of volume-
volatility. Literature highlighted that historically, this would be addressed by down-
stream suppliers keeping high levels of inventory (Christopher 2011). Clearly, this
would be impractical and costly. The focus should be to ensure the reduction in
the ‘bull whip’ effect that is created through demand uncertainty. To that end, the
study contributed to knowledge by confirming 4 CSFs attributed to attaining
volume-volatility:
Suppliers can anticipate changes in demand
Forecasting is accurate
Supply chain has flexibility to address changes in demand
Behaviour within the supply chain is integrated
207 | P a g e
It could be argued that the management of volume-volatility needs to be
addressed early in the planning stages and once the supply chain is operational
as the CSFs would suggest.
6.1.2 Validation of 7V Conceptual Framework
Through the research undertaken it has been possible to validate the 7V
conceptual framework. The framework is a step forward in the understanding of
how decision makers see factors affecting supply chains. The framework has
highlighted key issues that need managing in relation to CSFs associated with
each theme. It has also contributed to knowledge in that it offers the premise that
all themes within the framework are related. This is an important point as it
confirms previous research, as highlighted in section 2.4. Earlier research
focused on relationships between only three or four themes. Specifically around
the discussions of lean and/or agile supply chain literature such as variety,
variability and volume (Christopher 2011). However, this research is able to offer
the plausibility that as a model the four additional themes of virtuality, value,
visibility and virtuality can be included as confirmed in section 4.2.
This allows the researcher to suggest that the framework in its entirety may be
utilised to give a clearer understanding to the factors affecting the successful
delivery of supply chains.
6.2 Contribution to Practice
The practice of successful planning and managing of supply chains is becoming
more crucial in a world where political economic and geographical borders are
208 | P a g e
constantly shifting. This study makes a direct contribution to practice in the
validation and development of the 7V Framework. The study has highlighted the
importance organisations place on their supply chains. In certain cases,
organisations are competing directly through their supply chains as they seek
competitive advantages where possible.
This study offers a framework, which practitioners can use to identify and address
CSFs at key points throughout the supply chain life cycle. Unlike previous
research into CFSs, this framework is not focused on individual industries or
organisations. This framework offers the ability to take a more holistic view of any
supply chain, therefore its findings can be applied to different industries and
organisations as highlighted in section 5.5. Practitioners can adapt the framework
and in turn create checklists more aligned with their own organisations.
6.3 Limitations
The scope of the study highlights certain limitations. In relation to the findings,
the scope of the 7V Framework focused on specific areas related to supply chain
effectiveness. However, it is acknowledged throughout the study that these areas
take a holistic view of all supply chains. Therefore, in its attempt to be non-
prescriptive the model cannot cover all issues related to all supply chains. For
example, if a supply chain has a focus on sustainability, then the model would
need to be adapted to include a theme that could identify CSFs in that area.
Furthermore, due to the snap shot in time, that this type of research study offers,
certain CSFs may arise that had not been included and others may become less
relevant.
209 | P a g e
Additionally, the scope of this study made the possibility of acquiring a
representative sample of supply chain decision makers difficult, given the amount
of people operating in supply chains. However, the sample size of 303 attained
during the data collection offered a diverse range of opinion from key informants.
Phase 1 of the study contributed to the identification of 105 possible CSFs. This
was taken from both the extant literature and from discussions with supply chain
decision makers. Efforts were made to have a diverse range of decision makers
(from different supply chain backgrounds) at each round table discussion through
the identification of CSFs and piloting of the survey instrument. However, this was
not always possible due to the restrictions of only having access to one branch
of the Chartered Institute of Procurement and Supply. One of the difficulties in
carrying out research in this area is the job titles that are given to decision makers
within supply chains. The population sought was that of supply chain decision
makers. This is clearly a wide scope of roles and positions within organisations
as shown in table 3.4. All recipients were required to highlight their job roles. No
guarantee can be made that through the postal survey respondents accurately
reflected these roles.
The survey instrument utilised a 7-point Likert scale so that a clearer
representation of views would be achieved. Although the Likert scale provided a
spread from 1 (Strongly disagree) to 7 (Strongly agree) most respondents
answered either slightly agreeing, agreeing or strongly agreeing. This was
highlighted in the mean scores and standard deviation. During piloting, no
concerns were raised about the use of the 7-point Likert scale and it is noted that
on responses to some questions, a wider spread of answers was achieved. This
210 | P a g e
gives the researcher confidence that the layout of the questionnaires in part
allowed for more thought being put into responses.
6.4 Further Research
Continued globalisation and the inherent need for organisational supply chains to
become more competitive, has in part led to an increase in research within the
area of CSFs. At the time of writing this thesis, supply chain research in the area
of CSFs, is more organisation or industry focused and any holistic views of supply
chains are limited. This lends weight to the argument that existing research is not
transferrable between organisations and in turn industries.
The findings of the current study offer a framework that can be utilised to assist
in the management of supply chains. This should be seen as a starting point as
the framework can and will be developed further post completion of the PhD. It is
envisaged that the next stage of this research is to take the 7V framework out
into industry and assess its practical implementation within supply chains.
The current study has given clarity to the phenomena surrounding CSFs within
supply chain management. The 7V Framework will assist decision makers during
both planning and operations of supply chain management as stated. At present
this is restricted to the 7V themed areas of the Framework as it stands. However,
due to the non-prescriptive nature of the Framework it also offers flexibility to add
in other themes through future research. For example, this could be in the
growing research area of sustainability. By creating new themes and identifying
potential deliverables, business challenges and CSFs the Framework could
expand to include many areas related to the delivery of supply chains. As no
211 | P a g e
causality between the themes or CSFs was sought during this study, future
research could focus on the strengths of relationships between the themes.
Additionally, with current political and economic issues surrounding Briexit having
organisations with supply chains scrambling for answers new avenues for
research into CSFs arise. At the point of writing, ‘Article 50’ has not yet been
invoked. Even when this happens, it will be at least two year of ambiguity through
political negotiations, with some saying that it could take as long as 10 years for
processes to truly completed. This offers the supply chain research community
opportunities to focus on issues related to CSFs post Brexit supply chains for
both British and European organisation. Organisations will be looking to
understand what opportunities and challenges exist. With the potential risk of
lower economic growth and possible tariffs, barriers to entry and restrictions on
migration of labour, new areas of research have arisen.
6.5 In Conclusion
Supply chain management practice, research and literature continue to develop.
It is time to reassess the issues that affect its successful outcome. Failures to
address key issues in the delivery of supply chains could be catastrophic for
organisations. As highlighted, organisations are competing more and more
through supply chain efficiency. Knowledge gained through the better
understanding and management of these supply chains could go a long way to
attaining the competitive advantage organisations. Marginal gains can be
achieved through better planning and focus on key areas during operations. The
research around CSFs within supply chain management is nowhere nearing
212 | P a g e
maturity, in part due to the changing face of the business environment. However,
this offers an opportunity to further develop research in this field.
6.6 Personal Reflection
To conclude this thesis, the following section will reflect upon the journey I have
taken over the past 6 years, from a Construction Project Manager trying to better
understand his working environment to submitting the PhD. This will be structured
by focusing on the reflection of the trigger and the research process.
6.6.1 Reflecting on the trigger
This study has no doubt taken me on a journey in relation to the processes it
undertook and the research method it utilised. I have gone from a practicing
construction project manager who undertook a part-time master’s degree through
a process that has developed me into an early career researcher. Previously my
early research focused on the area of CSFs within the construction industry. As
a project manager I had experience of what could go wrong and what needed to
be managed. This focus was very much needs based. I wanted to understand
how and what can go wrong and improve processes within the industry I worked.
I had very little knowledge regarding supply chain management other than it was
crucial in the delivery of successful projects. Being a project manager I was
considered the end user for many supply chains that feed into the construction
projects. My initial research focused on project failure and specifically the
identification of CSFs related to project management. From an operational
perspective, the relationship between suppliers and a project had a profound
effect on a project being delivered successfully. Delays were common and
213 | P a g e
directly related to a supply chains inability to adapt or change to the programme
requirements due to time restrictions and changes in the environment.
In practice, decisions relating to the choice suppliers make are often in direct
response to the specification demanded from the client or external influences.
Supply chains had pre-determined parameters in relation to distance and time. In
essence, if these parameters do not reflect the needs of the overall project
outcomes, experience suggests that it leads to issues surrounding project failure.
Although my initial research findings identified numerous CSFs within project
management (PM) literature as being key to project success, one that linked to
suppliers was that of SCM. Within PM literature, the individual CSF of SCM was
limited and gave no depth as to why it was critical or what the variables were that
influenced this process (Bellasi and Tukel 1996, Fortune and White 2006). Project
management literature identified SCM as an individual CSF related to its own
successful delivery. It did not give any depth to this CSF, giving little in the way
of explanation as to what causes such a factor to arise. Further investigation
highlighted that SCM had in turn the potential of having many CSFs that could
lead it its own failure. It became apparent that this could be a gap and an
opportunity to enhance the knowledge gained through my previous research into
CSFs, by focusing solely on the CSFs related directly to SCM.
6.6.2 Reflections of the research process
My early research outputs focused on qualitative research for both my MSc and
MRes dissertations. Whilst undertaking both my MSc and MRes both the
research studies utilised qualitative research methods. I also co-authored a

214 | P a g e
conference paper on how to undertake Thematic Analysis in business research.
However, my PhD research took me out of my comfort zone of qualitative
research methods. This was due to the necessity in achieving the aims and
objectives of the research study. Due to the requirement to make generalisations
from my findings, it set me on a path of gaining a deeper understanding of
quantitative research methods. Having not undertaken any quantitative research
methods previously, I found this a very difficult proposition. However, through the
guidance of my supervision team and courses available at the university I was
able to navigate my way through the quantitative research methods undertaken.
I believe that this will be greatly beneficial to me both in my future academic
teaching and research.
The creation of the survey instrument and the subsequent piloting was an
enjoyable process and I took confidence from this. Through the development and
piloting the instrument matured and became more focused and professional
looking. The management of the data collection through the sending out of over
3000 postal questionnaires was a difficult task. The easier method would have
been to undertake an online survey. However, response rates were a concern
and the decision makers from the CIPs who helped me develop the
questionnaires advised against such methods as their personal preference would
be to receive a letter rather than something that could be treated as a spam email.
The most difficult and arduous task was the inputting of the data from the returned
questionnaires. This process took over 25 days of inputting data into an SPSS
spreadsheet. However, it was also a rewarding task as I learnt about the use of
the software and I could start to practice and run analysis as the data set was
215 | P a g e
growing. Overall, I am satisfied with the quantitative research methods that I
undertook. I believe that having undertaken this process I have become a more
rounded early career researcher. I feel that I have a skill set which allows me to
not be restricted in the type of research I am willing to carry out. In relation to the
overall methodology I spent time struggling with the understanding of the
philosophy and paradigms behind the approaches available to me. My thoughts
had me looking at the study and assuming that through seeking generalisations
that a positivist standpoint was required. This in turn gave me conflicting thoughts
as I also saw the themes that I was looking to utilise within the framework, as
being a social constructs. At that point, I looked at what I was trying to achieve,
what I wanted to be able to say about the findings, I looked at myself, my back
ground and the way that supply chain decision makers operate. In doing so it was
clear that the philosophical approach of pragmatism fitted well. Research into
Supply Chain Management and specifically CSFs is growing views from
operational decision makers will be key to its continued development. I believe
that the work I have undertaken has seen me grown from an at best novice
student of research who didn’t quite realise what he did not know and how far this
journey would mature his outlook. I now see myself as a practitioner who now
knows what he still has to learn and has the ability to develop the skills required
for future studies.
References
216 | P a g e
Adewole, A. (2005). "Developing a strategic framework for efficient and effective
optimisation of information in the supply chains of the UK clothing manufacture
industry." Supply Chain Management: An International Journal 10(5): 9.
Al-Marri, K., et al. (2007). "Excellence in service: an emprical study of UAE
banking sector." International Journal of quality and Reliability Management
24(2).
Appelbaum, S., H. Everard, A. Hung, L, T, S. (2000). "Straegic Downsizing:
critical success factors." Managemenet Decisions 37(7): 17.
Ayers, J. (1999). "Supply Chain Strategies." Information Systems
Management(Spring): 1.
Aykagan, A. (2014). "Variability: a wildcard in todays supply chain equations."
from http://logisticsviewpoints.com/2014/06/17/variability-wildcard-todays-
supply-chain-equations/.
Bagozzi, R., P. (1983). "A Holistic Methodolgy for Modeling Consumer REsponce
to Innovation." OPerations Research 31(1): 48.
Balnaves, M. and P. Caputi (2012). Introduction to Quantitative Research
Methods: An Investigative Approach. London, SAGE.
Balsmerier, P., W. and W. Voisin (1996). "Supply chain management: a time-
based strategy." Industrial Management 38(5): 17.
217 | P a g e
Bellasi, W. and O. Tukel, I. (1996). " A new framework for determining critical
success/failure factors in projects." International Journal of Project Management
14(3).
Benavides, L. E., V. Swan, D (2013). "Six steps to successful supply chain
collaboration." CSCMP's Supply Chain Quarterly. Retrieved 9th May 2014, from
http://www.supplychainquarterly.com/topics/Strategy/20120622-six-steps-to-
successful-supply-chain-collaboration/.
Bennett, D. and F. Klug (2012). "Logistics supplier integration in the automotive
industry." International Journal of Operations & Production Management 33(11):
24.
Bentler, P., M. (1990). "Comparative Fix Indexes in Structural Models."
Quantitative Methods in Phychology 107(2): 18.
Bentler, P., M. and L. Hu (1999). "Cutoff criteria for fit indexes in converiance
structure analysis: Conventional criteria versus new alternatives." Structural
Equation Modeling 6(1): 55.
Benton, T. (2001). "Philosophy of social science: The philosophical foundations
of social thought."
Black, S., A. and L. Porter, J. (1996). ""Identifications of the critical factors of
TQM"." Decision Sciences 27(1): 22.
Black, T., R. (2009). Doing Quantitative Research in the Social Sciences: An
Integrated Approach to Research Design, Measurement and Statistics. London,
Sage.
218 | P a g e
Blanche, M. J. T., et al. (2006). Research in practice: Applied methods for the
social sciences, Juta and Company Ltd.
Bollen, A. (1986). "Sample Size and Bentler and Bonett's Nonnormed Fit Index."
Psychometrika 51(3): 3.
Bollen, K., A. (1989). "A NEw Incremental Fit Index for General Structural
Equation Models." Sociological Methods & Research 17(3): 13.
Bowersox, D. J. and R. J. Calantone (1998). "Executive insights: global logistics."
Journal of International Marketing 6(4): 83-93.
Bowersox, D. J. and D. C. Closs (1996). Logistical Management: The integrated
Supply Chain Process. New York, McGraw-Hill.
Brah, S. A., et al. (2000). "TQM and business performance in the service sector:
a Singapore study, International." Journal of Operations and Production
Management 20(11): 1293-1312.
Bremer, C., F. , et al. (2001). "VIRTEC: an example of a Brazilian virtual
organisation." Journal of Intelligent Manufacturing 12(7): 1268.
Brown, J., E. and C. Hendry (1997). "Industrial districts and supply chains as
vehicles for managerial and organisational learning." International Studies of
Management and Organization 27(4): 127-157.

219 | P a g e
Brown, M., W. and R. Cudeck (1992). "Alternative Ways of Assessing Model Fit."
Sociological Methods & Research 21(2): 258.
Bryde, D. (2008). "Perceptions of the impact of project sponsorship practices on
project success." International Journal of Project Management 26(8).
Bryman, A. and E. Bell (2003). Business Research Methods. Oxford, Oxford
University Press.
Burgess, K., et al. (2006). "Supply chain management: a structured literature
review and implications for future research." International Journal of Operations
& Production Management 26(7): 26.
Caridi, M., et al. (2013). "Measuring supply chain visibility in the apparel industry."
Benchmarking: An International Journal 20(1): 19.
Castelli, C., M. and A. Sianesi (2015). "Supply chain strategy for companies in
the luxury-fashion market." International Journal of Retial & Distribution
Management 43(10): 26.
Chen, C.-T., et al. (2006). "A fuzzy approach for supplier evaluation and selection
in supply chain management." International journal of production economics 102:
289-301.
Chen, I., J. and A. Paulraj (2004). "Understanding supply chain management:
critical research and a theoretical framework." International Journal of Production
Research 42(1): 131-163.
220 | P a g e
Childerhouse, P. and D. Towill, R. (2003). "Simplified material flow holds the key
to supply chain integration." OMEGA 31(1): 10.
Christopher, M. (2000). "Agile Supply Chain: Competing in Volatile Markets."
Industrial Marketing Management 29(1): 37-44.
Christopher, M. (2011). Logistics & supply chain management. Harlow, Financial
Times Prentice Hall.
Christopher, M. (2011). Logistics & supply chain management [electronic
resource] : creating value-adding networks. Harlow, Essex ; New York, NY,
Financial Times Prentice Hall.
Christopher, M., G. (1992). Logistics and Supply Chain Management-Strategies
for Reducing Costs and Inmproving Services. London, Financial Times/Pitman
Publishing.
Christopher, M., et al. (2011). Humanitarian logistics [electronic resource] :
meeting the challenge of preparing for and responding to disasters. London,
Kogan Page.
Christopher, M. and D. Towill, R. (2000). "Developing Market Specific Supply
Chain Strategies`." International Journal of Logistics Management 13(1): 14.
Chua, D., K,H., et al. (1999). "Critical success factors for different project
objectives." Journal of construction engineering and management 125(3).
CIPS (2015). Chartered Institute of Procurement and Supply
221 | P a g e
Colquitt, J, A., and Zapata-Phelan, C, P., (2007) Trends in Theory Building and
Theory Testing: A Five-Decade Study of the Academy of Management Journal.
Academy of Management Journal 50 (6) 1281-1303.
Coman, A. and B. Ronen (2009). "Icarus predicament: Managing the pathologies
of over specification and over design." International Journal of Project
Management 28: 237-244.
Cooper, M., C. and L. Ellram, M. (1993). "Characteristics of Supply Chain
Management and the implications for Purchasing and Logistic Strategy." The
International Journal of Logistics Management 4(2): 13-24.
Cooper, M. C., et al. (1997). "Supply Chain Management: More than a new name
for logistics." The International Journal of Logistics Management 8(1): 1-14.
Cooper, R., G. Kleinschmidt, E, J. (2003). "Benchmarking the firms Critical
Success Factors in new product development." Journal of Product Innovation
Management 12(5): 17.
Costello, A., B and J. Osborne, W. (2005). "Best Practices in Explority Factor
Analysis: Four recomendations for getting the most from your analysis." Practical
Asessment, Research & Evaluation 10(July): 9.
Creswell, J., W. (2012). Qualitative inquiry and research design: Choosing
amoung five approuches. London, Sage Publications
Croom, S., et al. (2000). "Supply chain management: an analytical framework for
critcal literature review." European Journal of Purchasing and Supply
Management 6: 67-83.
222 | P a g e
Crosby, P., B. (1979). Quality is free: The art of making quality certain. New York,
McGraw-Hill.
Crotty, M. (1998). The Foundation of Social Research: Meaning and perspective
in the research process. London, SAGE Publications.
Cullen, A., J. and M. Taylor (2009). "Critical success factors for B2B e-commerce
use within the UK NHS pharmaceutical supply chain." International Journal of
Operations & Production Management 29(11): 29.
Degun, G. (2013). "Global supply chains increase complexity of supplier risk
analysis." Supply Management. from
http://www.supplymanagement.com/news/2013/global-supply-chains-increase-
complexity-of-supplier-risk-analysis.
Deming, W. E. (1986). Out of the Crisis. MA: MIT Centre for Advanced
Engineering. Cambridge.
Denzin, N., K. and Y. Lincoln, S. (2005). The Sage handbook of Qualitative
Research. California., Sage.
Devaraj, S. and R. Kohli (2003). "Information technology payoff paradox and
system use: is actual usage the missing link?" Management Science 49(3): 16.
Diana, T. (2014). "Validating delay constructs: An application of confirmatory
factor analysis." Journal of Air Transport Management 35(MArch): 4.
223 | P a g e
Dillman, D. and B. Groves (2011). "Internet, mail and Mixed-Mode Surveys: The
Tailored Design Method 3 rd ed." Survey Research 34(833): 635.
Douglas, M. (2011). "The Rise of the Supply Chain Executive." from
http://www.inboundlogistics.com/cms/article/the-rise-of-the-supply-chain-
executive/.
Drucker, P. F. (2011). Managements new Paradigms. Forbes Magazine: 152-
177.
Ellram, L., M. (1990). "The supplier selection decision in strategic partner-ships."
International Journal of Purchasing and Materials Management 26(4): 8-14.
Elmuti, D. (2002). "The perceived impact of supply chain management on
organisational effectiveness,." The Journal of supply chain management: A
Global review of purchasing and supply: 49-57.
Er, M. and B. MacCarthy (2006). "Journal of Manufacturing Technology
Management." Managing product variety in multinational corporation supply
chains: A simulation study 17(8): 21.
Fawcett, S., E., et al. (2008). "Benefits, barriers, and bridges to effective supply
chain management." Supply Chain Managemenet: An International Journal
13(1): 13.
Feigenbaum, A. V. (1956). "Total Quality Control." Harvard Business Review: 93-
101.
224 | P a g e
Field, A. (2009). Discovering Statistics Using SPSS. London, Sage.
Fieldman, M. and S. Muller (2003). "An incentive scheme for true information
providing in supply chains." OMEGA 31(2): 63-73.
Fisher, M. (1997). "What is the right supply chain for your product? ." Harvard
Business Review: 105-116.
Fisher, M. L., et al. (1994). "Making supply meet demand in an uncertain world."
Harvard Business Review 72(3): 83-93.
Floyd, F., J. Widaman, K, F. (1995). "Factor Analysis in the development and
refinement of clinical assessment instruments." Psychological Assessment 7(3):
23.
Forker, L. B., et al. (1997). "Total Quality Management in the supply chain: what
is its impact on performance?" International Journal of Production Research
35(6): 1681-1701.
Forrester, J. W. (1961). Industrial Dynamics, Cambridge: MIT Press.
Fortune, J. and D. White (2006). "Framing of project critical success factors
by a systems model." International Journal of Project Management 24(1).
Fotopoulos, C. B. and E. L. Psomas (2009). "The impact of soft and hard TQM
elements on Quality management results,." International Journal of quality and
Reliability Management 26( 2): 150-163.

225 | P a g e
Fraisat, L., E. and I. Sawalha, H. (2013). "Quality control and supply chain
managemenet: a contextual perspective and a case study." Supply Chain
Managemenet: An International Journal 18(2): 13.
Froehlich, G., et al. (1999). "Application framework issues when evolving
business applications for electronic commerce." Information Systems 24(6): 454-
473.
Garfamy, M. (2006). "A data envelopment analysis approach based on total cost
of ownership for supplier selection." Journal of Enterprise Information
Management 9(6): 16.
Garvin, D. A. (1998). "Managing Quality." New York, Free Press.
Gattorna, J. (2010). Dynamic Supply Chains - Delivering Value Through People.
Harlwow, Pearson.
Giunipero, L. C. and R. R. Brand (1996). "Purchasing’s Role in Supply Chain
Management." The International Journal of Logistics Management 7(1): 29-37.
Goldman, A. (2010). "Social Epistemology." The Stanford Encylopedia of
Philosophy Summer Edition.
Gonzalez-Loureiri, M., et al. (2014). "Supply chain management as the key to a
firm's strategy in the global marketplace." International Journal of Physical
Distribution & Logistics Management 45(1): 13.
226 | P a g e
Gorsuch (1990). "Common Factor-Analysis Versus Compenent Analysis - Some
well and little known facts." Multivariate Behavioral Research 25(1): 6.
Grimm, J., H., et al. (2014). "Critical Factors for sub-suppliers management: A
sustainable food supply chain perspective." International journal of production
economics 152: 14.
Guba, E. G. and Y. S. Lincoln (1989). Fourth Generation Evaluation. Newbury
Park, Sage.
Gunasekaran, A., et al. (2003). "A framework for supply chain performance
measurement." International journal of production economics 87: 333-347.
Gunasekaran, A., et al. (2001). "Performance measures and metrics in a supply
chain environment." International Journal of Operations and Production
Management 21(1): 71-87.
Hadaya, P. (2009). "Benchmarking firms' operational performance according to
their use of internet-based interorganizational systems." Benchmarking: An
International Journal 16(5): 18.
Hair, J., F., et al. (2006). Multivariate Data Analysis. New Jersey, Pearson Pentice
Hall.
Handfield, R. B. and E. L. Nichols (1999). Introduction to supply chain
management. Englewood Cliffs, NJ, Prentice Hall.
227 | P a g e
Harland, C. (1997). "Supply chain operational perfornace roles." Integrated
Manufacturing Systems 8(2): 70-78.
Harrison-Barbet, A. (1990). Mastering Philosophy. London, MacMillan.
Harrison, A. and R. Hoek, V. (2011). Logistics Management & Startegy, Pearson.
Haung, G. Q. and K. L. Mak (2000). "“We-Bid: a web-based framework to support
early supplier involvement in new product development"." Robotics and
Computer-Integrated Manufacturing 16(2/3): 169-179.
Hayes, R., H. and S. Wheelwright, C. (1979). "Link manufacturing process and
product life cycles." Harvard Business Review 57(1): 8.
Hazen, B., T. , et al. (2014). "Data quality for data science, predictive analytics,
and big data in supply chain management: An introduction to the problem and
suggestions for research and applications." International journal of production
economics 154(August): 80.
Heikkila, J. (2002). "From supply to demand chain management efficiency and
customer satisfaction." Journal of Operations Management 20: 747-767.
Helo, P. (2004). "Managing agaility and productivity in the electrics industry."
Industrial Managemenet & Data Systems 104(7): 10.
Hines, P. (1994). Creating World Class Suppliers. London, Pitmans.

228 | P a g e
Hines, T. (2004). Supply Chain Stragtegies: Customer-driven and customer-
focussed. Oxford, Elsevie Butterworth-Heinemann.
Hines, T. (2013). Supply Chain Strategies - Demand Driven and Customer
Focused. London, Routledge.
Holden, R. R. (2010). "Face validity." Corsini Encyclopedia of Psychology.
Holweg, M. (2005). "An investigation into supplier responsiveness - empiricak
evidence from the automotive industry." International Journal of Logistics
Management 16(1): 23.
Hookway, C. (2013). Quine, John Wiley & Sons.
Hoyle, R., H. (2000). Handbook of Applied Multivariate Statistics and
Methematical Modelling. London, Elsevier.
Hoyt, J. and F. Huq (2000). "From arms-length to collaborative relationships in
the supply chain: An evolutionary process." International Journal of Physical
Distribution & Logistics Management 30(9): 14.
Jabbour, C., J, C., et al. (2015). "Eco innovations in more sustanable supply
chains for low-carbon economy: A multiple case study of human critical success
factors in Brazillian leading companies." International Journal for Economics 164:
12.
James, W. (2014). Pragmatism, Cambridge University Press.
229 | P a g e
Johnson, R. B. and A. Onwuegbuzie (2004). "Mixed Method Research: A
Research Paradigm whose time has come." Educational researcher 33(7): 12.
Jones, C. (1998). "Moving beyond ERP: making the missing link." Logistics Focus
6(7): 2-7.
Kannan, V., R. and K. Tan, C. (2007). "The impact of operational quality: a supply
chain view." Supply Chain Managemenet: An International Journal 12(1): 5.
Kayakutlu, G. and G. Buyukozkan (2011). "Assessing performance factors for a
3PL in a value chain." International journal of production economics 131(2): 11.
Ketchen Jr, D., J., et al. (2007). "Bridging organization theory and supply chain
management: The case of best value supply chains." Journal of Operations
Management 25: 573-580.
Kilgore, M., et al. (2007). "The Logistical Challenges of Doing." Supply Chain
Management Review: 37.
Kim, J. and J. Rhee (2011). "An empirical study on the impact of critical success
factors on the balanced scorecard performance in Korean grenn supply chain
management enterprises." International Journal of Production Research 50(9):
18.
Koh, S., C, L., et al. (2011). "Drivers, barriers and critical factors for ERPII
implementation in supply chains: A critical analysis." Journal of Strategic
Infomation Systems 20: 17.

230 | P a g e
Kuhn, S., T. (1970). The structure of Scientific Revolutions. Chicago, University
of Chicago Press.
Kumar, K. (2001). "Technology for supporting supply chain management."
Communications of the ACM 44(6): 58-61.
Lakhel, L., et al. (2006). "Quality management practices and their impact on
performance." International Journal of quality and Reliability Management 23(6):
625-646.
Lambert, D., M. and M. Cooper, C. (2000). "Issues in Supply Chain
Management." Industrial Marketing Management 39: 65-83.
Lamming, R. (1996). "Squaring lean supply with supply chain management."
International Journal of Operations and Production Management 16(2): 183-196.
Lancioni, R., A. (2000). "New Developments in Supply Chain Management for
the Millennium." Industrial Marketing Management 29(1): 1-6.
Lancioni, R., A., et al. (2000). "The Role of the Internet in Supply Chain
Management." Industrial Marketing Management 29(1): 46-52.
Lancioni, R., A., et al. (2003). "Startegic Internet application trends in supply chain
management." Industrial Marketing Management 32: 211-217.
Lau, K., H. (2012). "Demand management in downstream wholesdale and retail
distribution: a case study." Supply Chain Managemenet: An International Journal
17(6): 16.

231 | P a g e
Leach, A. (2013). "Supply chain key to growth in emerging markets." Retrieved
09/07/2014, from http://www.supplymanagement.com/news/2013/supply-chain-
key-to-growth-in-emerging-markets.
Lee, E.-K., et al. (2001). "Supplier Selection and Management System
Considering Relationships in Supply Chain Management." IEEE Transactions on
Engineering Management 48(3): 307-318.
Lee, H., L., et al. (2000). "The Value of Information Sharing in a Two-Level Supply
Chain." Management Science 46(5): 626-643.
Li, G., et al. (2005). "Comparative analysis on value of infromantion sharing in
supply chains." Supply Chain Management: An International Journal 10(1): 12.
Li, J. K. and L. Liu (2006). "Supply chain coordination with quantity discount
policy " International Journal of Production Economics 101(1): 89-98.
Li, S., et al. (2004). "The impact of supply chain management practices on
competitative advantage and organizational performance." Omega The
International Journal of Management Science 34: 107-124.
Li, S., et al. (2004). "Development and validation of a measurement for studying
supply chain management practices." Journal of Operations Management 23:
618-641.
Malik, Y., et al. (2011). "Building the supply chain of the future." Operations
practice: 1-10.
232 | P a g e
Management, C. o. L. (2000). What it’s all about?
Mazzarol, T. (1998). "Critical Success Factors for International Education
Marketing." International Journal for Education Management 12(4): 12.
McCullen, P. and D. Towill (2002). "Diagnosis and reduction of bullwhip in supply
chains." Supply Chain Managemenet: An International Journal 7(3): 15.
Mentzer, J., T., et al. (2001). "Defining Supply Chain Management." Journal of
Business Logistics 22(2): 1-25.
Mills, S. A. (2001). Real potential on the net: companies need more than to reap
benefits from e-commerce. Financial Times. London: 18.
Min, H. and G. Zhou (2002). "Supply chain modeling: past, present and future."
Computers & Industrial Engineering 43(1): 18.
Min, S. and J. Mentzer, T. (2000). "The role of marketing in supply chain
management." International Journal of Physical Distribution and Logistics 30(9):
765-787.
Moller, C. (2002). "SCM in the extended enterprise: implementation of APS
systems." The Journal of Enterprise Resource Management 4(4): 29-35.
Mulaik, S., A. , et al. (1989). "Evaluation of Goodness-of-Fit indices for Structural
Equation Models." Quantitative Methods in Psychology 105(3): 15.

233 | P a g e
Narasimham, R. and A. Das (2000). "Manufacturing agility and supply chain
management practices." The Journal of Enterprise Resource Management 3(3):
11-17.
Naylor, B., J., et al. (1999). "Leagility: Integrating the lean and agile manufacturing
paradigms in the total supply chain." International journal of production
economics 62: 107-118.
Novack, R., A. , et al. (1995). Creating logistics value: themes for the future.
Illinois, Oak Brook.
Oke, A. (2003). "Drivers of volume flexibility requirements in manufacturing
plants." International Journal of Operations & Production Management 23(12):
15.
Oliver, R., K. Webber, M,D,U. (1982). Supply Chain Management: Logistics
catches up with strategy, Outlook.
Patil, K. and R. Kany (2014). "Knowledge management in a supply chain."
Journal of Modelling in Management 9(2): 18.
Patnayakuni, R., et al. (2006). "Relational Antecedents if information flow
integration for supply chain coordination." Journal of Management information
Systems 23(1): 13-49.
Pero, M., et al. (2010). "A framework for the alignment of new product
development and supply chains." Supply Chain Management: An International
Journal 15(2): 18.
234 | P a g e
Pettit, S. and A. Beresford (2009). "Critical success factors in the context of
humanitarian aid supply chains." International Journal of Physical Distribution &
Logistics Management 39(6): 16.
Pinto, J. and D. Slevin, P. ( 1988). "Critical success factors across the project life
cycle." Project Management Journal 19(3): 67-75.
Pittaway, L. Robertson, M., Munir, K., Denyer, D. & Neely, A. (2004) "Networking
and innovation: a systematic review of the evidence". International Journal of
Management Reviews.
Porter, M. E. (1985). "Competitive Strategy: Techniques for Analysing Industries
and Competitors." New York, The Free Press.
Power, D. (2005). "Supply chain management integration and implementation: a
literature review." Supply Chain Management: An International Journal 10(4):
252-263.
Power, J., P. , et al. (2001). "Critical sucess factors in agile supply chain
management: An empirical study." International Journal of Physical
Distribution and Logistics 31(4): 247-265.
Radjou, N. (2003). "U.S. manufacturers supply chain mandate." World Trade
16(12): 4.
Randall, T. and K. Ulrich (2001). "Product variety supply chain structure and firm
performance: analysis of the US bicycle industry." Management Science 47(12):
1588-1604.
235 | P a g e
Ranganathan, C., et al. (2004). "Assimilation and diffusion of web technologies
in supply chain management: an examination of key drivers and performance
impacts." International Journal of Electronic Commerce 9(1): 34.
Rao, T., V, M., et al. (2006). "Assessing supply chain management success
factors: a case study." Supply Chain Management: An International Journal 11(2): 13.
Reichart, A. and M. Holweg (2007). "Creating the customer-responsive supply
chain: a reconciliation of concepts." International Journal of Operations and
Production Management 27(11): 1144-1172.
Reporter, B. (2014). "83% of global retail CEOs belive supply chains not optimal."
from http://www.business-standard.com/article/companies/83-of-global-retail-
ceos-believe-their-supply-chain-not-optimal-114061700314_1.html.
Routroy, S. and S. Pradhan, K. (2011). "Evaluating the critical sucess factors of
suppliers development: a case study." Benchmarking: An International Journal
20(3): 19.
Saeed, K. (2008). "Trend forecasting for stability in supply chains." Journal of
Business Research 61: 1113-1124.
Samat, N., et al. (2006). "TQM practices, service quality and market orientation-
some empirical evidence from a developing country." Management Research
News 29(11): 713-728.
236 | P a g e
Saraph, J., et al. (1989). "An instrument for measuring the critical factors of quality
management." Decision Sciences 20: 810-829.
Saravanan, R. and K. S. P. Rao (2004). An instrument for measuring total quality
management implementation in service-business units in India. Proceedings of
the International Conference on Manufacturing and Management, Tamil Nadu,
India.
Saunders, M. and P. Lewis (2012). Doing Business Research in Business &
Management: An Essntial Guide to Planning Your Project. Harlow, England.,
Prentiice Hall, Pearson.
Saunders, M., et al. (2012). Research Methods for Business Students. Harlow,
Pearson.
Scarvarda, L. F., et al. (2010). "Managing product variety in emerging markets."
International Journal of Operations & Production Management 30(2): 19.
Schermelleh-Engel, K. M., H. Muller, H. (2003). "Evaluating the fit of structural
equation models: Tests of Significance and Descriptive Goodness-of-Fit
Measures." Methods of Psychological Research 8(2): 49.
Schreiber, J., B. Stage, F, K. King, J. Nora, A. Barlow, E, A. (2006). "Reporting
Structural Equation Modeling and Confirmatory Factor Analysis Results: A
Review." The Journal of Educational Research 99(6): 15.
Sengupta, K., et al. (2006). "Manufacturing and Service Supply Chain
Performance: A Comparative Analysis." The Journal of Supply Chain
Management.
237 | P a g e
Sharifi, H. and Z. Zhang (2001). "Agile manufacturing in practice - Application of
a methodology." International Journal of Operations & Production Management
21(5/6): 22.
Shepherd, C. and H. Gunter (2006). "Measuring supply chain performance:
current research and future directions." International Journal of Productiivty and
Performance Management 55(3): 16.
Siddiqui, F., et al. (2009). "Role of supply chain management in Context of Total
Quality Management in Flexible Systems: A State of the Art Literature Review."
Global Journal of Flexible Systems Management 10(3): 1-14.
Sila, I., et al. (2006). "Quality in supply chains: an empirical analysis." Supply
Chain Management: An International Journal 11(6): 21.
Silvestro, R. (2001). "Towards a contigency theory of TQM in services: how
implementation varies on the basis of volume and variety." The International
Journal of Quality & Reliability Management 18(3): 34.
Simatupang, T., M. , et al. (2002). "Applying the theory of constraints to supply
chain collaboration." Supply Chain Management: An interntional Journal 9(1): 57-
70.
Simatupang, T., M., et al. (2002). "The knowledge of coordination for supply chain
integration." Business Process Management Journal 8(3): 289-308.
Simatupang, T., M., et al. (2002). "The Knowledge of coordination for supply
chain integration." Business Process Management Journal 8(3): 19.
238 | P a g e
Simpson, D. P., D. Samson, D. (2007). "Greening the automotive supply chain: a
relationship perspective." International Journal of Operations & Production
Management 27(1): 20.
Soon, Q., H. and Z. Udin, M. (2013). "Supply chain management from the
perspective of value chain flexibility: an exploratory study." Journal of
Manufacturing Technology Management 22(4): 20.
Soosay, C., A. , et al. (2008). "Supply chain collaboration:capabilities for
continuous innovation." Supply Chain Management: An International Journal
12(2): 9.
Stevens, J., P. (2002). Applied multivariate statistics for the social sciences.
NJ:Erlbaun, Hillsdale.
Stevenson, M. and M. Spring (2009). "Supply chain flexibility: an inter-firm
empirical study." International Journal of Operations & Production Management
29(9): 25.
Storey, J., et al. (2006). "Supply chain Management: theory, practice and future
challenges." International Journal of Operations & Production Management
26(7): 20.
Streiner, D., L. (1994). "SAMPLE-SIZE FORMULAE FOR PARAMETER
ESTIMATION." Perceptual and Motor Skills 78: 9.
239 | P a g e
Tachizawa, E., M. and C. Thomsen, G. (2007). "Drivers and sources of supply
flexibility: an explority study." International Journal of Operations & Production
Management 27(10): 19.
Talib, F. and Z. Rahman (2011). "Critical success factors for TQM in service
organizations: a proposed model." Service Marketing Quarterly 31(3): 363-380.
Talib, F., et al. (2011). "A study of total quality management and supply chain
management practices." International Journal of Productivity and Performance
Management 60(3): 268-288.
Tan, K., C., et al. (2002). ""Supply chain amangement : a strategic perspective"."
International Journal of Operations & Production Management 22(6): 16.
Tavakol, M., D. (2011). "Making sense of Cronbach's alpha." International Journal
of Medical Education 2(53).
Taylor, T. (2013). "Global Supply Chains and the Changing Nature of
International Trade." Retrieved 23rd June 2014, from
http://conversableeconomist.blogspot.co.uk/2013/09/global-supply-chains-and-
changing.html.
Teddie, C. and A. Tashakkori (2009). Foundations of Mixed MethodsResearch:
Integrating Quantitative and Qualitative Approuches in the social and behavioral
Sciences. Sage, Thousand Oaks.
Thomassey, S. (2010). "Sales forecastsin clothing industry: The key success
factor of the supply chain management." International Journal or Production
Economics 128: 13.
240 | P a g e
Thoo, A., C., et al. (2011). "Supply Chain management: success factors from the
Malaysian manufacturer's perspective." African Journal of Business Management
5(17): 7.
Towill, D. R. (1997). "The seamless supply chain: the predator’s strategic
advantage." International Journal of the Techniques of Manufacturing 13( 1): 37-
56.
Tracy, M. and C. Tan, L. (2001). "Empirical Analysis of supplier selection and
involvement, customer satisfaction and firm performance." Supply Chain
Management: An International Journal 6(4): 14.
Turner, J., R. (1993). "Integrated supply chain management: what's wrong with
this picture." Industrial Engineering 31(6): 7.
Tyndall, G., et al. (1998). Supercharging supply chains: New ways to incraese
value through global operational excellence. Hoboken, NJ, John Wiley & Sons.
Ueno, A. (2008). "Which managerial practices are contributory to service quality."
International Journal of quality and Reliability Management 25(6): 585-603.
Van de Ven, A., H. (2007). Engaged Scholarship: A Guide for Organizational and
Social Research. Oxford, OUP.
Vokurka, R., J. and G. Fliedner (1998). "The Journey Towards Agility." Industrial
Managemenet & Data Systems 4(6).
241 | P a g e
Wang, G., et al. (2004). "Product-driven supply chain selection using integrated
multi-criteria decision-making methodology." International journal of production
economics 91: 1-15.
Webber (2004). "The Rhetoric of Positivism Versus Interpretivisim: A Personal
View." MIS Quarterly 28(1): 10.
Webster, M., et al. (2004). "The measurement of manufacturing virtuality."
International Journal of Operations & Production Management 24(7): 21.
Weick, K., E. (1995). Sensemaking in Organizations. London, Sage, Thousand
Oaks.
Weightman, P., W, H. Bourlajis, M, A. (2004). Food supply chain management,
Blackwell.
Whitley, R. (1998). "East-Asian and Anglo-American Business Systems."
Economic Dynamism in the Asia-Pacific: 213-249.
Williams, R. (2014). Apples Supply Chain Trouble? The Telegraph.
Williamson, E., A. , et al. (2004). "Information systems development within supply
chain management." International Journal of Information Management 24: 10.
Williamson, E., A., et al. (2004). "Information systems development within supply
chain management." International Journal of Information Management 24: 375-
385.
242 | P a g e
Wittstruck, D. and F. Teuteberg (2012). "Understanding the Success Factors of
Sustainable Supply Chain Management: Emprical Evidence from Electrics and
Electronics Industry." Corporate Social and Responsibility and Environmental
Management 19: 17.
Wu, F., et al. (2006). "The impact of information technology on supply chain
capabilities and firm performance: A resource-based view." Industrial Marketing
Management 35(4): 11.
Zammuto, R. F. (2008). "Accreditation and the globalization of business."
Academy of Management Learning & Education 7(2): 256-268.

243 | P a g e
Appendix

244 | P a g e
Appendix A: Example cover letter and questionnaire
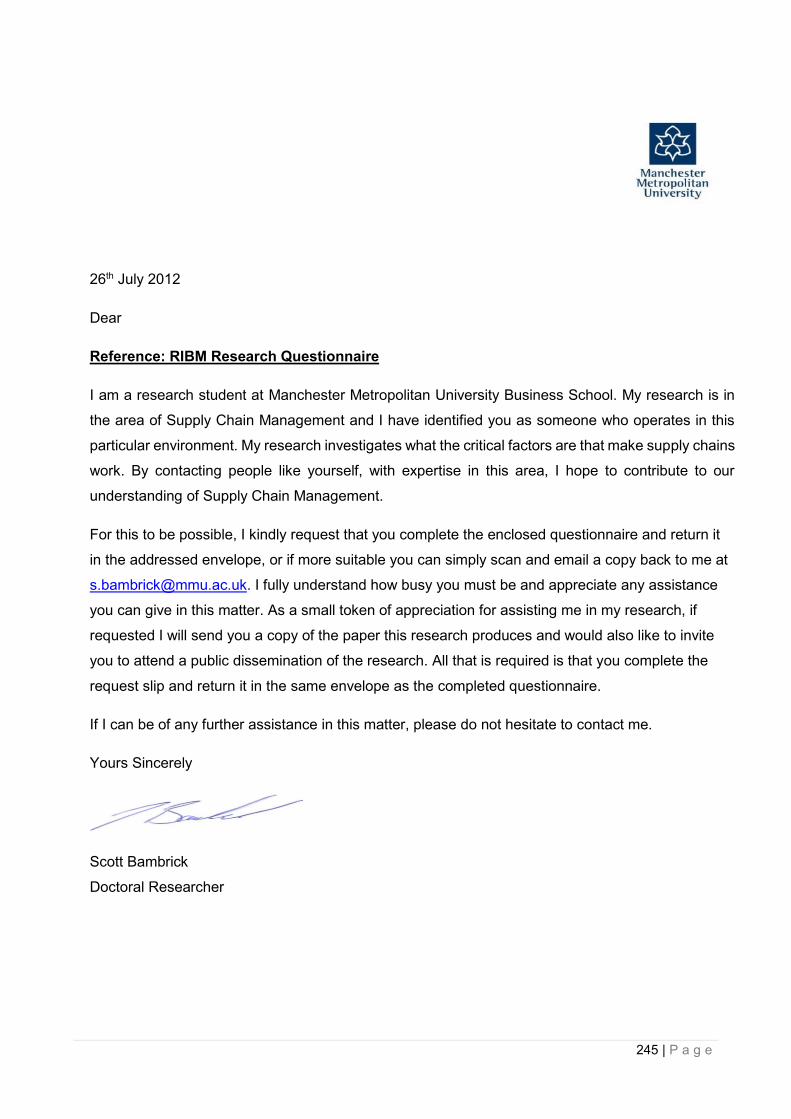
245 | P a g e
26th July 2012
Dear
Reference: RIBM Research Questionnaire
I am a research student at Manchester Metropolitan University Business School. My research is in
the area of Supply Chain Management and I have identified you as someone who operates in this
particular environment. My research investigates what the critical factors are that make supply chains
work. By contacting people like yourself, with expertise in this area, I hope to contribute to our
understanding of Supply Chain Management.
For this to be possible, I kindly request that you complete the enclosed questionnaire and return it
in the addressed envelope, or if more suitable you can simply scan and email a copy back to me at
[email protected]. I fully understand how busy you must be and appreciate any assistance
you can give in this matter. As a small token of appreciation for assisting me in my research, if
requested I will send you a copy of the paper this research produces and would also like to invite
you to attend a public dissemination of the research. All that is required is that you complete the
request slip and return it in the same envelope as the completed questionnaire.
If I can be of any further assistance in this matter, please do not hesitate to contact me.
Yours Sincerely
Scott Bambrick
Doctoral Researcher

246 | P a g e
RIBM Small Grant Project
Supply chain success factors
Your views and experience
Please
will you help
us understand
effective supply chain
management, by spending
30 minutes completing the survey?
Your replies are completely confidential

247 | P a g e
Your answers to the following questions will help us understand success factors in managing supply chains. We have identified and defined themes which appear before each question associated to them. Please answer the following questions with your own organisation/department in mind. To answer the questions, please mark ‘x’ in the most appropriate box that represents your own opinion.
About You
Your organisation
With specific relation to the current organisation, you work within, approximately…
0-20
21-40
41-60
61-80
81-100
100+
…up to how many individual suppliers do they use
…up to how many staff do they have
…up to how many subcontractors do they use
…up to how many different clients/projects do they manage
…up to how many different individual components can be used in the final product
With specific relation to your current organisation, where do you believe them to be located within their clients overall supply chain (if multiple clients then more than one answer is acceptable)…
Yes
No
…at the raw material stage (i.e. supplier for small component manufacturer)
…at component pre-assembly stage (supplier for larger manufacturer)
…at final manufacturing stage (prior to delivery to client/final user)
…as a installation/service provider
…other
We are asking you for these details so that we can compare different groups of respondents. We will not use them to reveal your individual responses.
What is your job title ……………….…………………............(Director, Manager, Buyer, Technician, etc)
What industry/sector is your organisation located ...............................................(Manufacturing, Electronics etc)
How long have you worked within supply chains organisations ..……………….(Years)
x
x
x
x
x
x
x
x
x
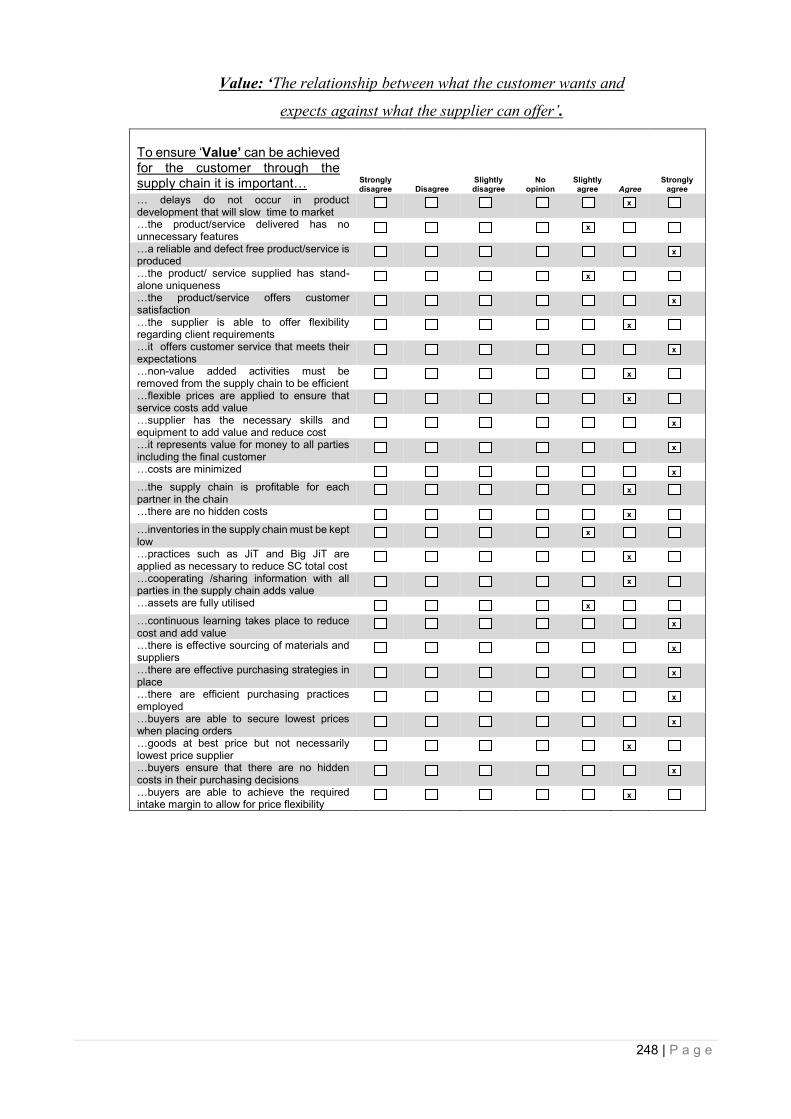
248 | P a g e
Value: ‘The relationship between what the customer wants and
expects against what the supplier can offer’.
To ensure ‘Value’ can be achieved for the customer through the supply chain it is important…
Strongly disagree
Disagree
Slightly disagree
No opinion
Slightly agree
Agree
Strongly agree
… delays do not occur in product development that will slow time to market
…the product/service delivered has no unnecessary features
…a reliable and defect free product/service is produced
…the product/ service supplied has stand-alone uniqueness
…the product/service offers customer satisfaction
…the supplier is able to offer flexibility regarding client requirements
…it offers customer service that meets their expectations
…non-value added activities must be removed from the supply chain to be efficient
…flexible prices are applied to ensure that service costs add value
…supplier has the necessary skills and equipment to add value and reduce cost
…it represents value for money to all parties including the final customer
…costs are minimized
…the supply chain is profitable for each partner in the chain
…there are no hidden costs
…inventories in the supply chain must be kept low
…practices such as JiT and Big JiT are applied as necessary to reduce SC total cost
…cooperating /sharing information with all parties in the supply chain adds value
…assets are fully utilised
…continuous learning takes place to reduce cost and add value
…there is effective sourcing of materials and suppliers
…there are effective purchasing strategies in place
…there are efficient purchasing practices employed
…buyers are able to secure lowest prices when placing orders
…goods at best price but not necessarily lowest price supplier
…buyers ensure that there are no hidden costs in their purchasing decisions
…buyers are able to achieve the required intake margin to allow for price flexibility
x
x
x
x
x
x
x
x
x
x
x
x
x
x
x
x
x
x
x
x
x
x
x
x
x
x
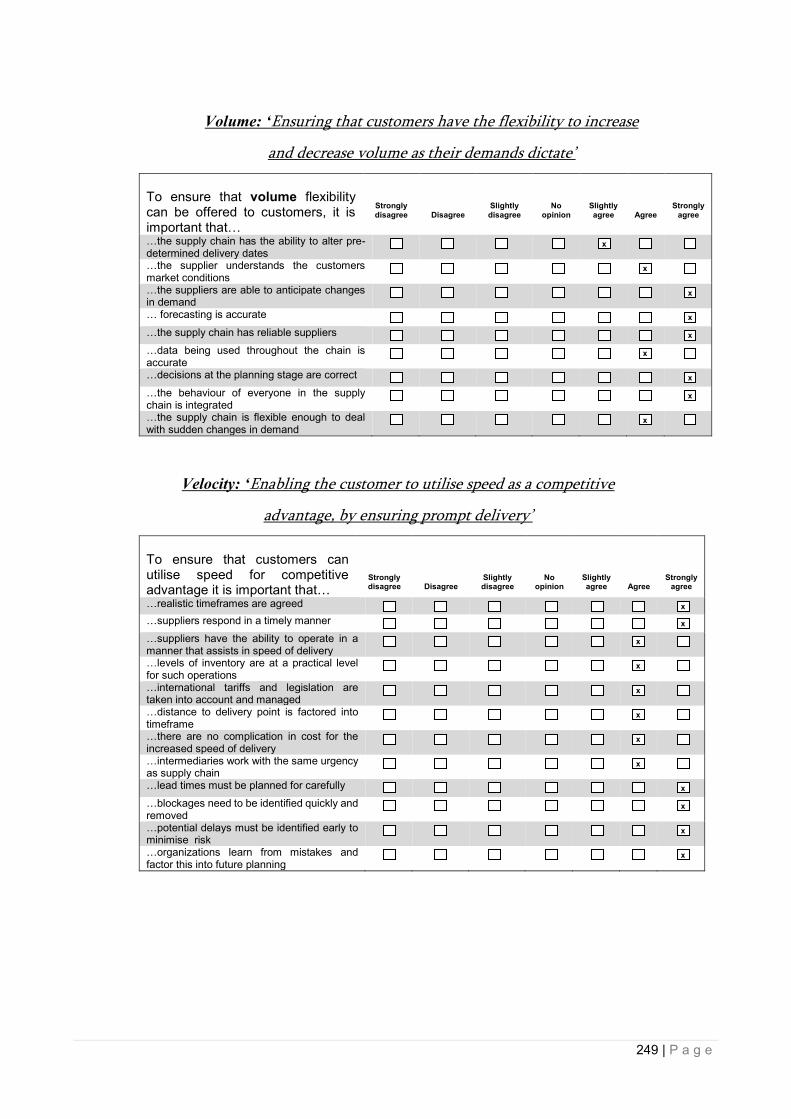
249 | P a g e
Volume: ‘Ensuring that customers have the flexibility to increase
and decrease volume as their demands dictate’
To ensure that volume flexibility can be offered to customers, it is important that…
Strongly disagree
Disagree
Slightly disagree
No opinion
Slightly agree
Agree
Strongly agree
…the supply chain has the ability to alter pre-determined delivery dates
…the supplier understands the customers market conditions
…the suppliers are able to anticipate changes in demand
… forecasting is accurate
…the supply chain has reliable suppliers
…data being used throughout the chain is accurate
…decisions at the planning stage are correct
…the behaviour of everyone in the supply chain is integrated
…the supply chain is flexible enough to deal with sudden changes in demand
Velocity: ‘Enabling the customer to utilise speed as a competitive
advantage, by ensuring prompt delivery’
To ensure that customers can utilise speed for competitive advantage it is important that…
Strongly disagree
Disagree
Slightly disagree
No opinion
Slightly agree
Agree
Strongly agree
…realistic timeframes are agreed
…suppliers respond in a timely manner
…suppliers have the ability to operate in a manner that assists in speed of delivery
…levels of inventory are at a practical level for such operations
…international tariffs and legislation are taken into account and managed
…distance to delivery point is factored into timeframe
…there are no complication in cost for the increased speed of delivery
…intermediaries work with the same urgency as supply chain
…lead times must be planned for carefully
…blockages need to be identified quickly and removed
…potential delays must be identified early to minimise risk
…organizations learn from mistakes and factor this into future planning
x
x
x
x
x
x
x
x
x
x
x
x
x
x
x
x
x
x
x
x
x
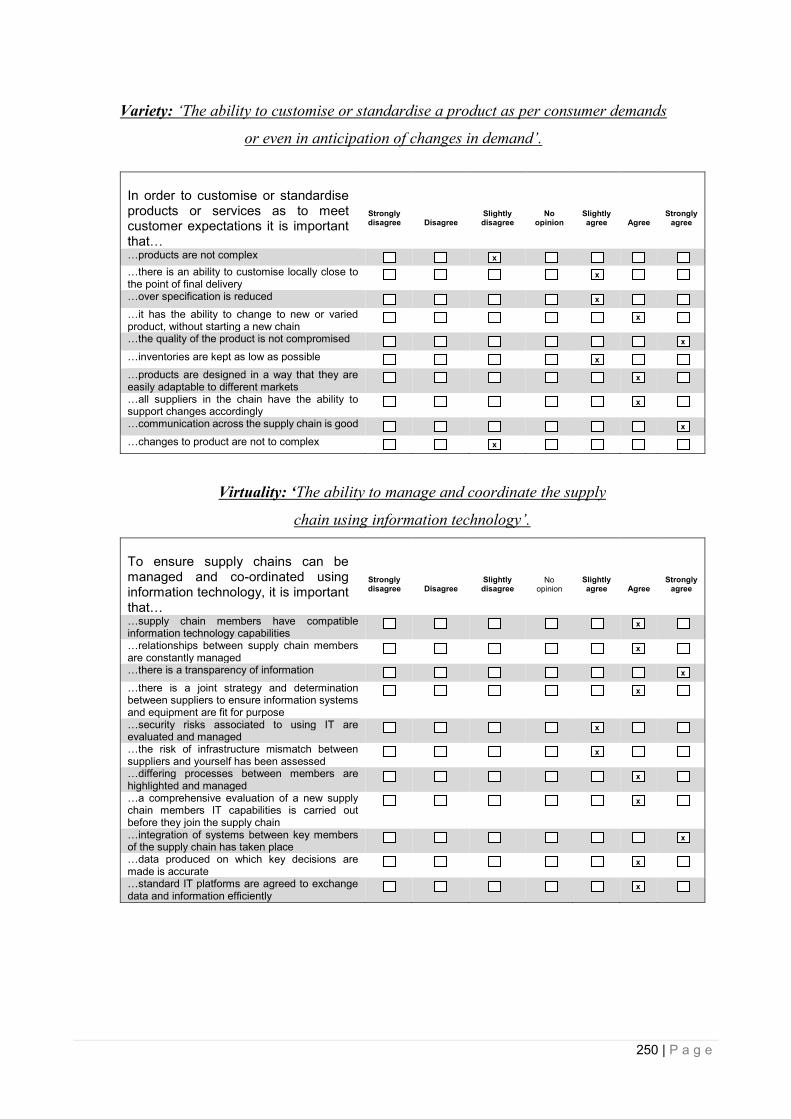
250 | P a g e
Variety: ‘The ability to customise or standardise a product as per consumer demands
or even in anticipation of changes in demand’.
In order to customise or standardise products or services as to meet customer expectations it is important that…
Strongly disagree
Disagree
Slightly disagree
No opinion
Slightly agree
Agree
Strongly agree
…products are not complex
…there is an ability to customise locally close to the point of final delivery
…over specification is reduced
…it has the ability to change to new or varied product, without starting a new chain
…the quality of the product is not compromised
…inventories are kept as low as possible
…products are designed in a way that they are easily adaptable to different markets
…all suppliers in the chain have the ability to support changes accordingly
…communication across the supply chain is good
…changes to product are not to complex
Virtuality: ‘The ability to manage and coordinate the supply
chain using information technology’.
To ensure supply chains can be managed and co-ordinated using information technology, it is important that…
Strongly disagree
Disagree
Slightly disagree
No opinion
Slightly agree
Agree
Strongly agree
…supply chain members have compatible information technology capabilities
…relationships between supply chain members are constantly managed
…there is a transparency of information
…there is a joint strategy and determination between suppliers to ensure information systems and equipment are fit for purpose
…security risks associated to using IT are evaluated and managed
…the risk of infrastructure mismatch between suppliers and yourself has been assessed
…differing processes between members are highlighted and managed
…a comprehensive evaluation of a new supply chain members IT capabilities is carried out before they join the supply chain
…integration of systems between key members of the supply chain has taken place
…data produced on which key decisions are made is accurate
…standard IT platforms are agreed to exchange data and information efficiently
x
x
x
x
x
x
x
x
x
x
x
x
x
x
x
x
x
x
x
x
x

251 | P a g e
Variability: ‘The products/services have no varying levels of quality and
that they are delivered in a manner that is of a level that is acceptable to the customer’.
In order to ensure that the supply chain produces consistent levels of quality, it is important that…
Strongly disagree
Disagree
Slightly disagree
No opinion
Slightly agree
Agree
Strongly agree
…there is a focus on planning and design of the supply chain
…management practices are of a high standard across the supply chain
…there is a culture of preventing problems by all members of the supply chain
…there is procurement of a defect free product
…there are good relationships between customer and suppliers
…the initial design of the product is of good quality
…there is good communication between all members of the supply chain
…products meet customer specifications and achieve consistent quality
…all managers within the supply chain understand the importance quality standards
…quality standards are unambiguous and specified in processes
…quality standards are maintained
…continuous improvement is embedded in the supply chain processes
…SC partners have appropriate accreditations to international standards (e.g. ISO 9000, 9001, 9002)
…component suppliers and lower tier suppliers all work to agreed quality standards
…new suppliers are subject to vetting procedures and understand quality standards
…appropriate training is offered to improve/ maintain quality standards
…regular compliance checks are made across the supply chain
x
…regular compliance checks with outsourced or offshore supplies
x
x
x
x
x
x
x
x
x
x
x
x
x
x
x
x
x
x
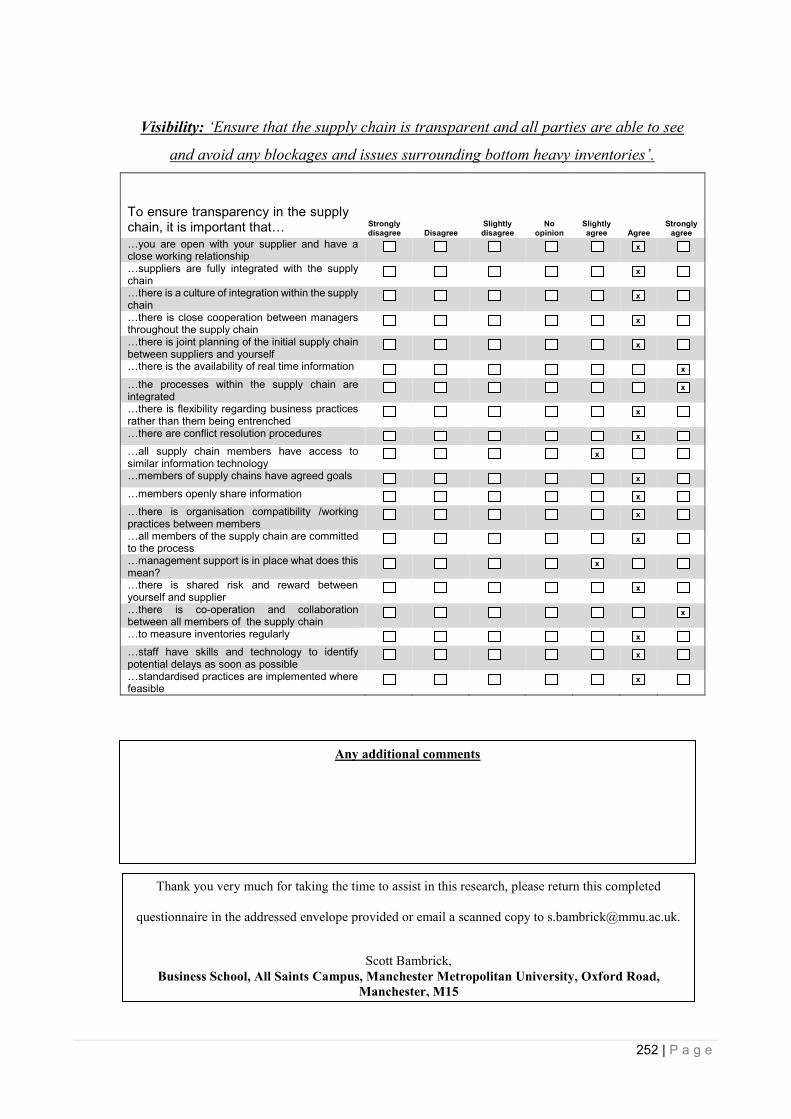
252 | P a g e
Visibility: ‘Ensure that the supply chain is transparent and all parties are able to see
and avoid any blockages and issues surrounding bottom heavy inventories’.
To ensure transparency in the supply chain, it is important that…
Strongly disagree
Disagree
Slightly disagree
No opinion
Slightly agree
Agree
Strongly agree
…you are open with your supplier and have a close working relationship
…suppliers are fully integrated with the supply chain
…there is a culture of integration within the supply chain
…there is close cooperation between managers throughout the supply chain
…there is joint planning of the initial supply chain between suppliers and yourself
…there is the availability of real time information
…the processes within the supply chain are integrated
…there is flexibility regarding business practices rather than them being entrenched
…there are conflict resolution procedures
…all supply chain members have access to similar information technology
…members of supply chains have agreed goals
…members openly share information
…there is organisation compatibility /working practices between members
…all members of the supply chain are committed to the process
…management support is in place what does this mean?
x
…there is shared risk and reward between yourself and supplier
…there is co-operation and collaboration between all members of the supply chain
…to measure inventories regularly
…staff have skills and technology to identify potential delays as soon as possible
…standardised practices are implemented where feasible
x
x
x
x
x
x
x
x
x
x
x
x
x
x
x
x
x
x
x
x
Any additional comments
Thank you very much for taking the time to assist in this research, please return this completed
questionnaire in the addressed envelope provided or email a scanned copy to [email protected].
Scott Bambrick,
Business School, All Saints Campus, Manchester Metropolitan University, Oxford Road,
Manchester, M15

253 | P a g e

254 | P a g e
Appendix B: Descriptive statistics
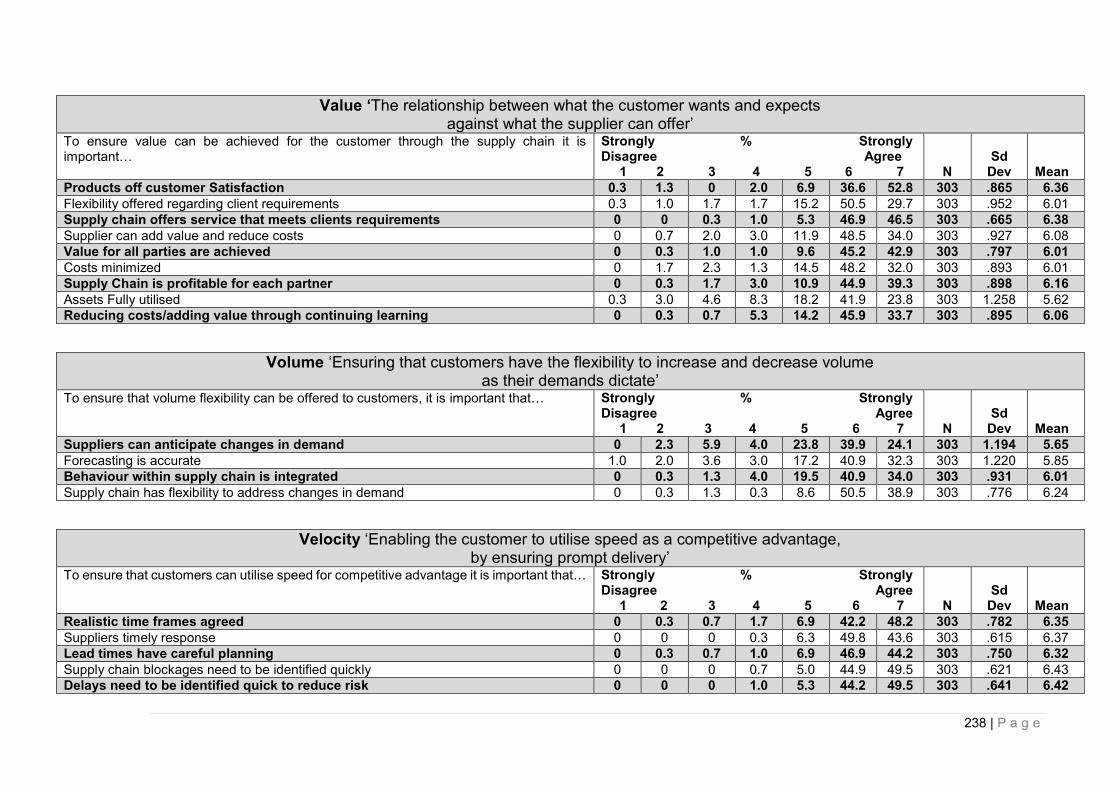
238 | P a g e
Value ‘The relationship between what the customer wants and expects against what the supplier can offer’
To ensure value can be achieved for the customer through the supply chain it is important…
Strongly % Strongly Disagree Agree 1 2 3 4 5 6 7
N
Sd
Dev
Mean
Products off customer Satisfaction 0.3 1.3 0 2.0 6.9 36.6 52.8 303 .865 6.36
Flexibility offered regarding client requirements 0.3 1.0 1.7 1.7 15.2 50.5 29.7 303 .952 6.01
Supply chain offers service that meets clients requirements 0 0 0.3 1.0 5.3 46.9 46.5 303 .665 6.38
Supplier can add value and reduce costs 0 0.7 2.0 3.0 11.9 48.5 34.0 303 .927 6.08
Value for all parties are achieved 0 0.3 1.0 1.0 9.6 45.2 42.9 303 .797 6.01
Costs minimized 0 1.7 2.3 1.3 14.5 48.2 32.0 303 .893 6.01
Supply Chain is profitable for each partner 0 0.3 1.7 3.0 10.9 44.9 39.3 303 .898 6.16
Assets Fully utilised 0.3 3.0 4.6 8.3 18.2 41.9 23.8 303 1.258 5.62
Reducing costs/adding value through continuing learning 0 0.3 0.7 5.3 14.2 45.9 33.7 303 .895 6.06
Volume ‘Ensuring that customers have the flexibility to increase and decrease volume as their demands dictate’
To ensure that volume flexibility can be offered to customers, it is important that… Strongly % Strongly Disagree Agree 1 2 3 4 5 6 7
N
Sd
Dev
Mean
Suppliers can anticipate changes in demand 0 2.3 5.9 4.0 23.8 39.9 24.1 303 1.194 5.65
Forecasting is accurate 1.0 2.0 3.6 3.0 17.2 40.9 32.3 303 1.220 5.85
Behaviour within supply chain is integrated 0 0.3 1.3 4.0 19.5 40.9 34.0 303 .931 6.01
Supply chain has flexibility to address changes in demand 0 0.3 1.3 0.3 8.6 50.5 38.9 303 .776 6.24
Velocity ‘Enabling the customer to utilise speed as a competitive advantage, by ensuring prompt delivery’
To ensure that customers can utilise speed for competitive advantage it is important that… Strongly % Strongly Disagree Agree 1 2 3 4 5 6 7
N
Sd
Dev
Mean
Realistic time frames agreed 0 0.3 0.7 1.7 6.9 42.2 48.2 303 .782 6.35
Suppliers timely response 0 0 0 0.3 6.3 49.8 43.6 303 .615 6.37
Lead times have careful planning 0 0.3 0.7 1.0 6.9 46.9 44.2 303 .750 6.32
Supply chain blockages need to be identified quickly 0 0 0 0.7 5.0 44.9 49.5 303 .621 6.43
Delays need to be identified quick to reduce risk 0 0 0 1.0 5.3 44.2 49.5 303 .641 6.42
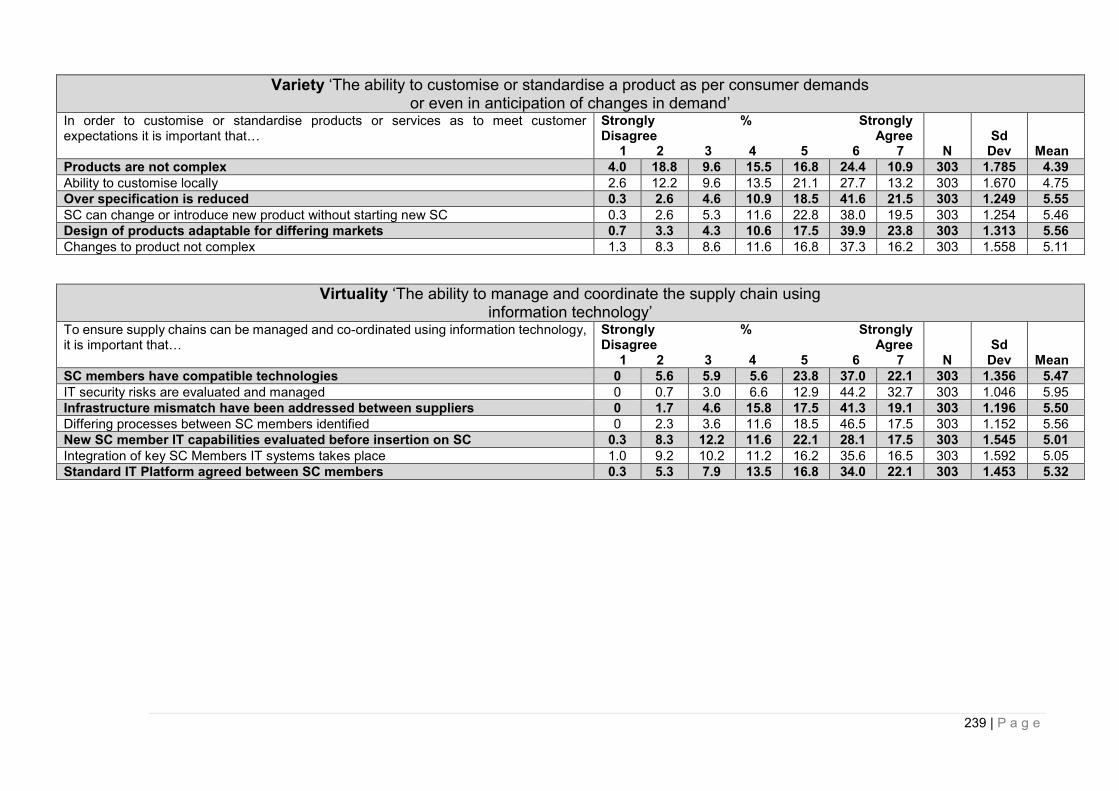
239 | P a g e
Variety ‘The ability to customise or standardise a product as per consumer demands or even in anticipation of changes in demand’
In order to customise or standardise products or services as to meet customer expectations it is important that…
Strongly % Strongly Disagree Agree 1 2 3 4 5 6 7
N
Sd
Dev
Mean
Products are not complex 4.0 18.8 9.6 15.5 16.8 24.4 10.9 303 1.785 4.39
Ability to customise locally 2.6 12.2 9.6 13.5 21.1 27.7 13.2 303 1.670 4.75
Over specification is reduced 0.3 2.6 4.6 10.9 18.5 41.6 21.5 303 1.249 5.55
SC can change or introduce new product without starting new SC 0.3 2.6 5.3 11.6 22.8 38.0 19.5 303 1.254 5.46
Design of products adaptable for differing markets 0.7 3.3 4.3 10.6 17.5 39.9 23.8 303 1.313 5.56
Changes to product not complex 1.3 8.3 8.6 11.6 16.8 37.3 16.2 303 1.558 5.11
Virtuality ‘The ability to manage and coordinate the supply chain using information technology’
To ensure supply chains can be managed and co-ordinated using information technology, it is important that…
Strongly % Strongly Disagree Agree 1 2 3 4 5 6 7
N
Sd
Dev
Mean
SC members have compatible technologies 0 5.6 5.9 5.6 23.8 37.0 22.1 303 1.356 5.47
IT security risks are evaluated and managed 0 0.7 3.0 6.6 12.9 44.2 32.7 303 1.046 5.95
Infrastructure mismatch have been addressed between suppliers 0 1.7 4.6 15.8 17.5 41.3 19.1 303 1.196 5.50
Differing processes between SC members identified 0 2.3 3.6 11.6 18.5 46.5 17.5 303 1.152 5.56
New SC member IT capabilities evaluated before insertion on SC 0.3 8.3 12.2 11.6 22.1 28.1 17.5 303 1.545 5.01
Integration of key SC Members IT systems takes place 1.0 9.2 10.2 11.2 16.2 35.6 16.5 303 1.592 5.05
Standard IT Platform agreed between SC members 0.3 5.3 7.9 13.5 16.8 34.0 22.1 303 1.453 5.32
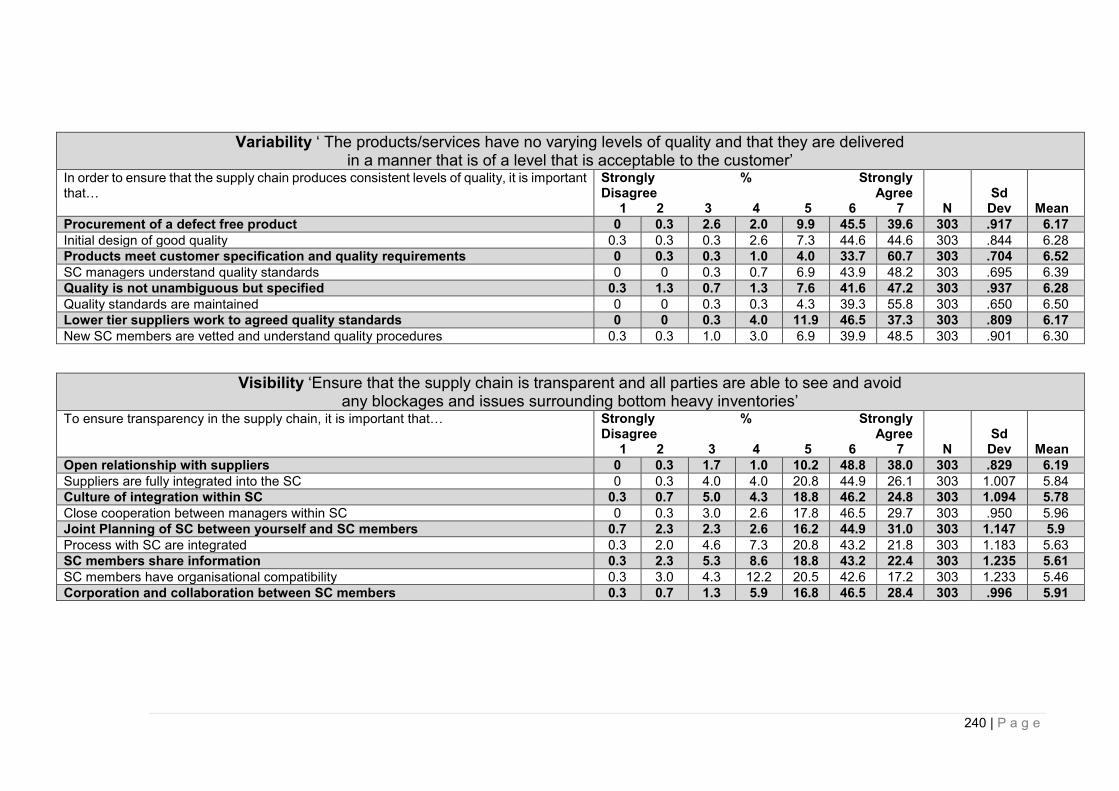
240 | P a g e
Variability ‘ The products/services have no varying levels of quality and that they are delivered in a manner that is of a level that is acceptable to the customer’
In order to ensure that the supply chain produces consistent levels of quality, it is important that…
Strongly % Strongly Disagree Agree 1 2 3 4 5 6 7
N
Sd
Dev
Mean
Procurement of a defect free product 0 0.3 2.6 2.0 9.9 45.5 39.6 303 .917 6.17
Initial design of good quality 0.3 0.3 0.3 2.6 7.3 44.6 44.6 303 .844 6.28
Products meet customer specification and quality requirements 0 0.3 0.3 1.0 4.0 33.7 60.7 303 .704 6.52
SC managers understand quality standards 0 0 0.3 0.7 6.9 43.9 48.2 303 .695 6.39
Quality is not unambiguous but specified 0.3 1.3 0.7 1.3 7.6 41.6 47.2 303 .937 6.28
Quality standards are maintained 0 0 0.3 0.3 4.3 39.3 55.8 303 .650 6.50
Lower tier suppliers work to agreed quality standards 0 0 0.3 4.0 11.9 46.5 37.3 303 .809 6.17
New SC members are vetted and understand quality procedures 0.3 0.3 1.0 3.0 6.9 39.9 48.5 303 .901 6.30
Visibility ‘Ensure that the supply chain is transparent and all parties are able to see and avoid any blockages and issues surrounding bottom heavy inventories’
To ensure transparency in the supply chain, it is important that… Strongly % Strongly Disagree Agree 1 2 3 4 5 6 7
N
Sd
Dev
Mean
Open relationship with suppliers 0 0.3 1.7 1.0 10.2 48.8 38.0 303 .829 6.19
Suppliers are fully integrated into the SC 0 0.3 4.0 4.0 20.8 44.9 26.1 303 1.007 5.84
Culture of integration within SC 0.3 0.7 5.0 4.3 18.8 46.2 24.8 303 1.094 5.78
Close cooperation between managers within SC 0 0.3 3.0 2.6 17.8 46.5 29.7 303 .950 5.96
Joint Planning of SC between yourself and SC members 0.7 2.3 2.3 2.6 16.2 44.9 31.0 303 1.147 5.9
Process with SC are integrated 0.3 2.0 4.6 7.3 20.8 43.2 21.8 303 1.183 5.63
SC members share information 0.3 2.3 5.3 8.6 18.8 43.2 22.4 303 1.235 5.61
SC members have organisational compatibility 0.3 3.0 4.3 12.2 20.5 42.6 17.2 303 1.233 5.46
Corporation and collaboration between SC members 0.3 0.7 1.3 5.9 16.8 46.5 28.4 303 .996 5.91

242 | P a g e
Appendix C: Model 2 Confirmatory Factor Analysis AMOS
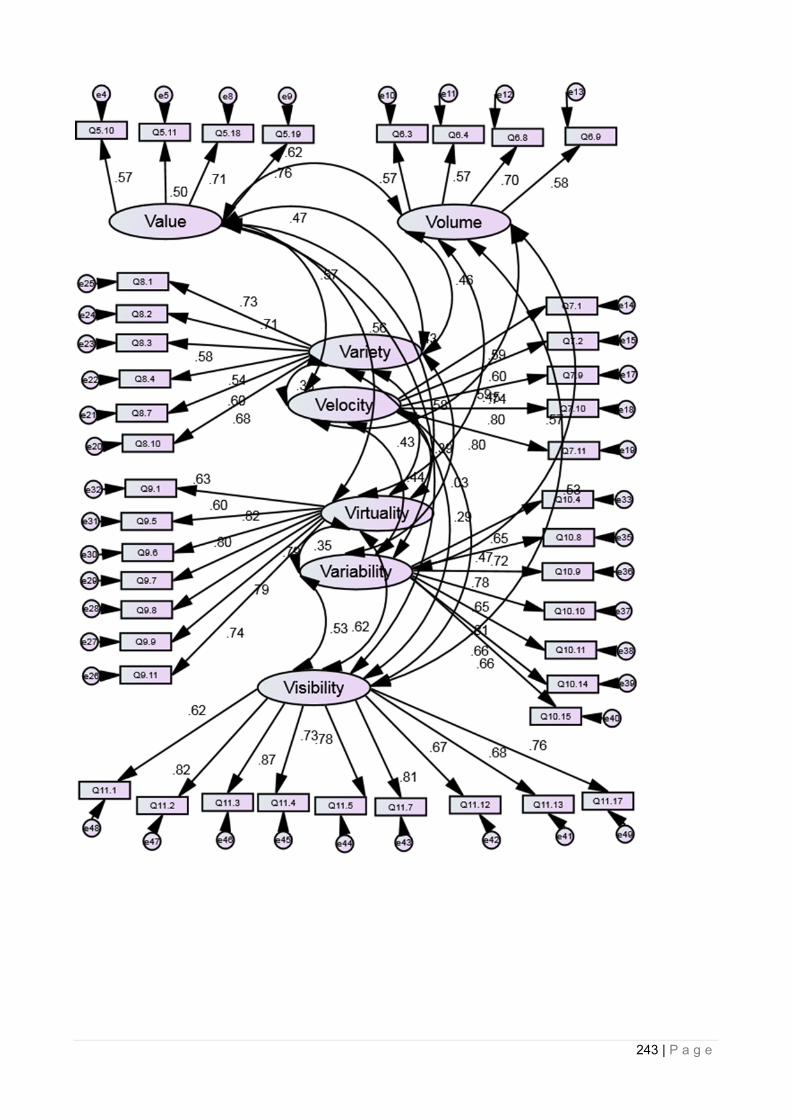
243 | P a g e

244 | P a g e
Model Fit – Model 2 Summary
CMIN
Model NPAR CMIN DF P CMIN/DF
Default model 146 1674.690 799 .000 2.096
Saturated model 945 .000 0
Independence model 84 7232.332 861 .000 8.400
Baseline Comparisons
Model NFI
Delta1
RFI
rho1
IFI
Delta2
TLI
rho2 CFI
Default model .768 .750 .864 .852 .863
Saturated model 1.000 1.000 1.000
Independence model .000 .000 .000 .000 .000
Parsimony-Adjusted Measures
Model PRATIO PNFI PCFI
Default model .928 .713 .800
Saturated model .000 .000 .000
Independence model 1.000 .000 .000
NCP
Model NCP LO 90 HI 90
Default model 875.690 762.045 997.064
Saturated model .000 .000 .000
Independence model 6371.332 6103.302 6645.906
FMIN
Model FMIN F0 LO 90 HI 90
Default model 5.545 2.900 2.523 3.302
Saturated model .000 .000 .000 .000
Independence model 23.948 21.097 20.210 22.006
RMSEA
Model RMSEA LO 90 HI 90 PCLOSE
Default model .060 .056 .064 .000
Independence model .157 .153 .160 .000
AIC
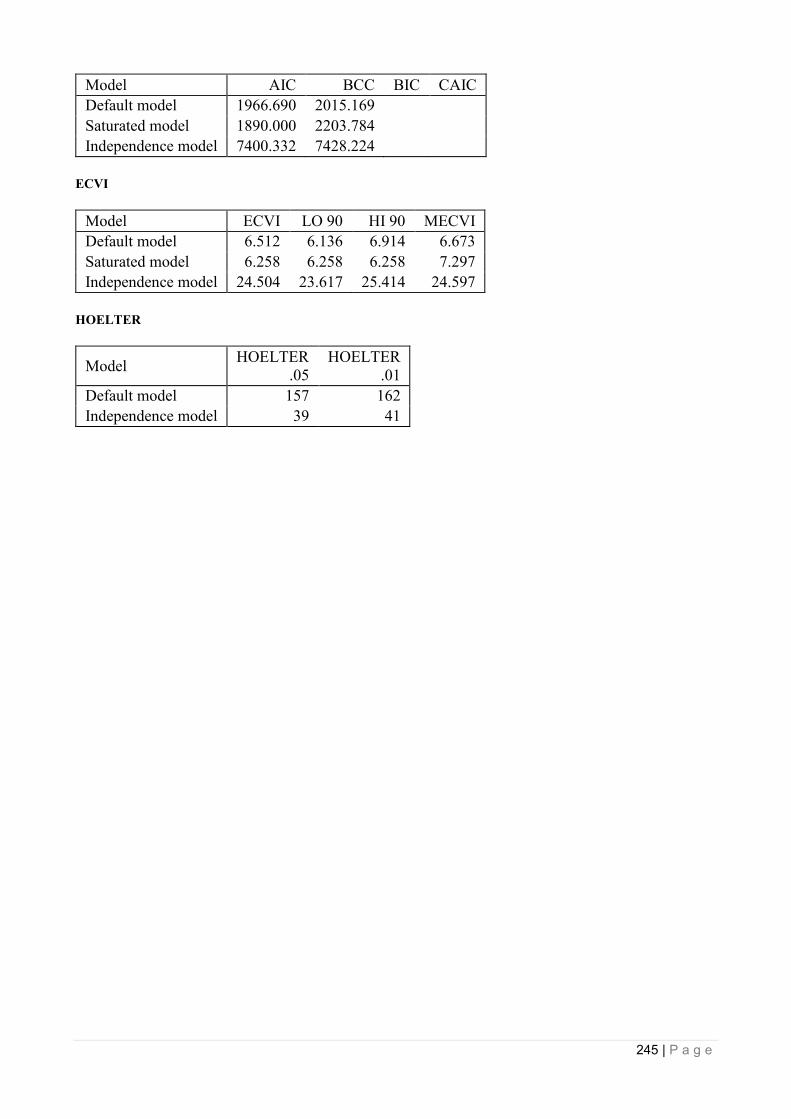
245 | P a g e
Model AIC BCC BIC CAIC
Default model 1966.690 2015.169
Saturated model 1890.000 2203.784
Independence model 7400.332 7428.224
ECVI
Model ECVI LO 90 HI 90 MECVI
Default model 6.512 6.136 6.914 6.673
Saturated model 6.258 6.258 6.258 7.297
Independence model 24.504 23.617 25.414 24.597
HOELTER
Model HOELTER
.05
HOELTER
.01
Default model 157 162
Independence model 39 41
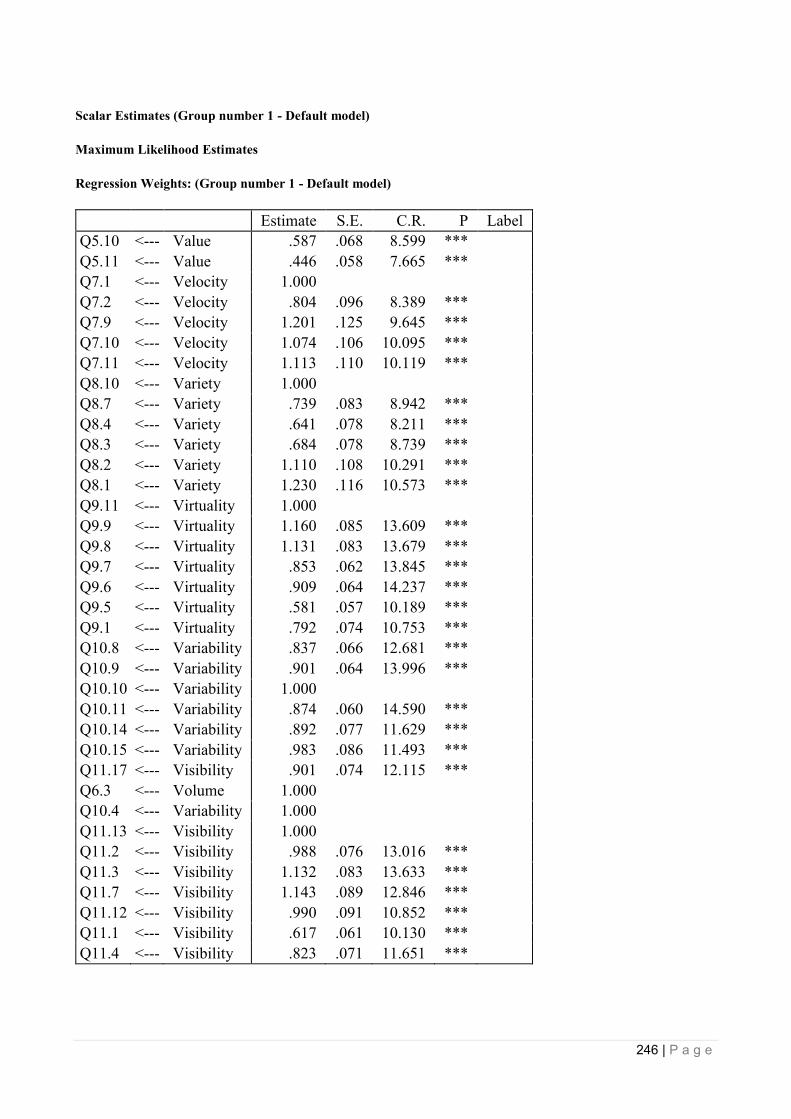
246 | P a g e
Scalar Estimates (Group number 1 - Default model)
Maximum Likelihood Estimates
Regression Weights: (Group number 1 - Default model)
Estimate S.E. C.R. P Label
Q5.10 <--- Value .587 .068 8.599 ***
Q5.11 <--- Value .446 .058 7.665 ***
Q7.1 <--- Velocity 1.000
Q7.2 <--- Velocity .804 .096 8.389 ***
Q7.9 <--- Velocity 1.201 .125 9.645 ***
Q7.10 <--- Velocity 1.074 .106 10.095 ***
Q7.11 <--- Velocity 1.113 .110 10.119 ***
Q8.10 <--- Variety 1.000
Q8.7 <--- Variety .739 .083 8.942 ***
Q8.4 <--- Variety .641 .078 8.211 ***
Q8.3 <--- Variety .684 .078 8.739 ***
Q8.2 <--- Variety 1.110 .108 10.291 ***
Q8.1 <--- Variety 1.230 .116 10.573 ***
Q9.11 <--- Virtuality 1.000
Q9.9 <--- Virtuality 1.160 .085 13.609 ***
Q9.8 <--- Virtuality 1.131 .083 13.679 ***
Q9.7 <--- Virtuality .853 .062 13.845 ***
Q9.6 <--- Virtuality .909 .064 14.237 ***
Q9.5 <--- Virtuality .581 .057 10.189 ***
Q9.1 <--- Virtuality .792 .074 10.753 ***
Q10.8 <--- Variability .837 .066 12.681 ***
Q10.9 <--- Variability .901 .064 13.996 ***
Q10.10 <--- Variability 1.000
Q10.11 <--- Variability .874 .060 14.590 ***
Q10.14 <--- Variability .892 .077 11.629 ***
Q10.15 <--- Variability .983 .086 11.493 ***
Q11.17 <--- Visibility .901 .074 12.115 ***
Q6.3 <--- Volume 1.000
Q10.4 <--- Variability 1.000
Q11.13 <--- Visibility 1.000
Q11.2 <--- Visibility .988 .076 13.016 ***
Q11.3 <--- Visibility 1.132 .083 13.633 ***
Q11.7 <--- Visibility 1.143 .089 12.846 ***
Q11.12 <--- Visibility .990 .091 10.852 ***
Q11.1 <--- Visibility .617 .061 10.130 ***
Q11.4 <--- Visibility .823 .071 11.651 ***
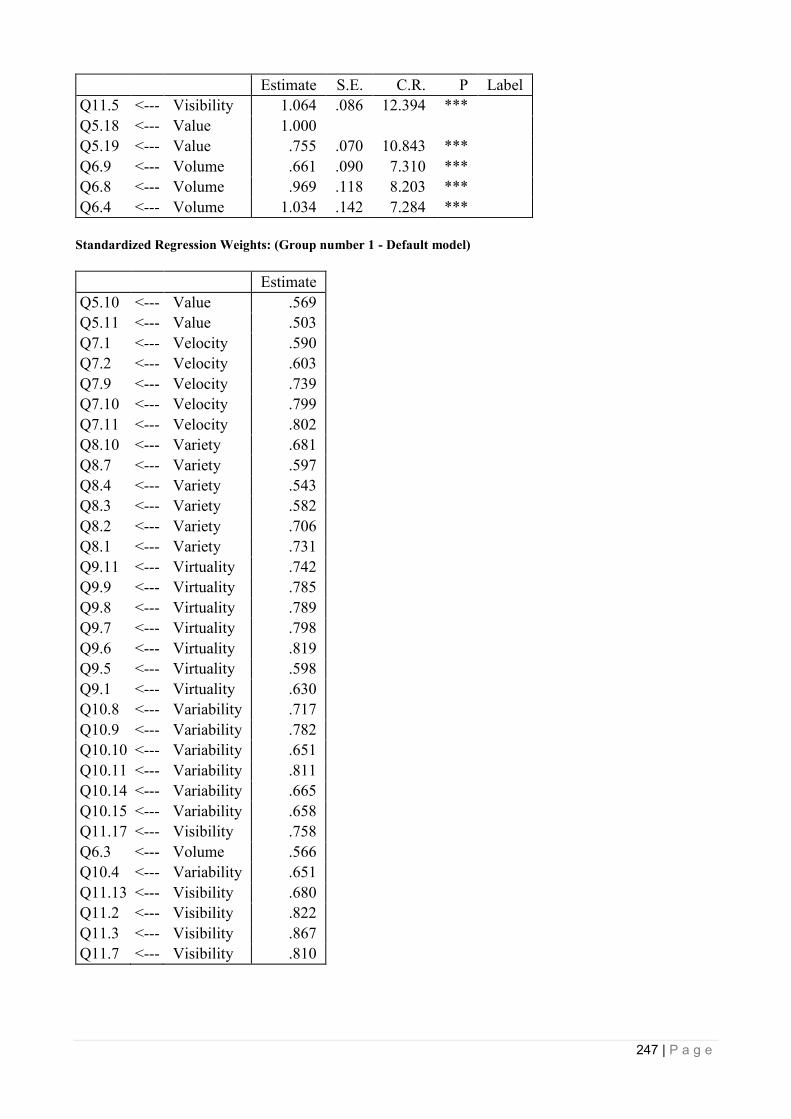
247 | P a g e
Estimate S.E. C.R. P Label
Q11.5 <--- Visibility 1.064 .086 12.394 ***
Q5.18 <--- Value 1.000
Q5.19 <--- Value .755 .070 10.843 ***
Q6.9 <--- Volume .661 .090 7.310 ***
Q6.8 <--- Volume .969 .118 8.203 ***
Q6.4 <--- Volume 1.034 .142 7.284 ***
Standardized Regression Weights: (Group number 1 - Default model)
Estimate
Q5.10 <--- Value .569
Q5.11 <--- Value .503
Q7.1 <--- Velocity .590
Q7.2 <--- Velocity .603
Q7.9 <--- Velocity .739
Q7.10 <--- Velocity .799
Q7.11 <--- Velocity .802
Q8.10 <--- Variety .681
Q8.7 <--- Variety .597
Q8.4 <--- Variety .543
Q8.3 <--- Variety .582
Q8.2 <--- Variety .706
Q8.1 <--- Variety .731
Q9.11 <--- Virtuality .742
Q9.9 <--- Virtuality .785
Q9.8 <--- Virtuality .789
Q9.7 <--- Virtuality .798
Q9.6 <--- Virtuality .819
Q9.5 <--- Virtuality .598
Q9.1 <--- Virtuality .630
Q10.8 <--- Variability .717
Q10.9 <--- Variability .782
Q10.10 <--- Variability .651
Q10.11 <--- Variability .811
Q10.14 <--- Variability .665
Q10.15 <--- Variability .658
Q11.17 <--- Visibility .758
Q6.3 <--- Volume .566
Q10.4 <--- Variability .651
Q11.13 <--- Visibility .680
Q11.2 <--- Visibility .822
Q11.3 <--- Visibility .867
Q11.7 <--- Visibility .810
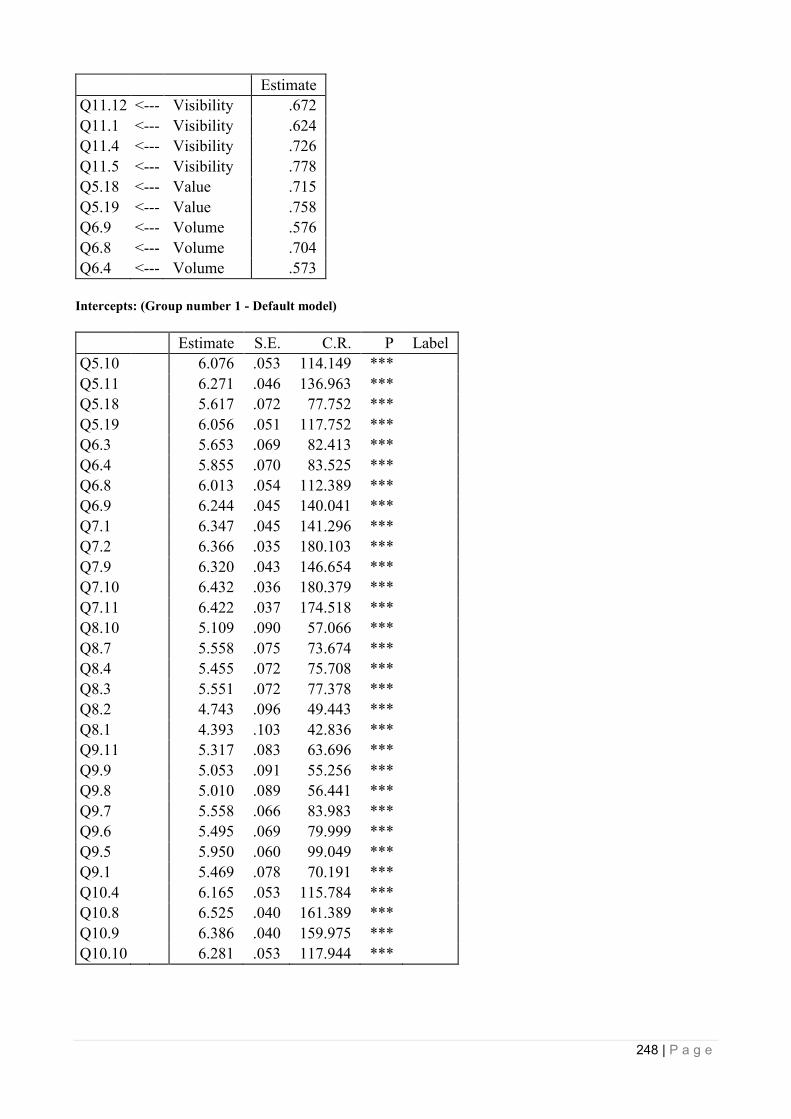
248 | P a g e
Estimate
Q11.12 <--- Visibility .672
Q11.1 <--- Visibility .624
Q11.4 <--- Visibility .726
Q11.5 <--- Visibility .778
Q5.18 <--- Value .715
Q5.19 <--- Value .758
Q6.9 <--- Volume .576
Q6.8 <--- Volume .704
Q6.4 <--- Volume .573
Intercepts: (Group number 1 - Default model)
Estimate S.E. C.R. P Label
Q5.10 6.076 .053 114.149 ***
Q5.11 6.271 .046 136.963 ***
Q5.18 5.617 .072 77.752 ***
Q5.19 6.056 .051 117.752 ***
Q6.3 5.653 .069 82.413 ***
Q6.4 5.855 .070 83.525 ***
Q6.8 6.013 .054 112.389 ***
Q6.9 6.244 .045 140.041 ***
Q7.1 6.347 .045 141.296 ***
Q7.2 6.366 .035 180.103 ***
Q7.9 6.320 .043 146.654 ***
Q7.10 6.432 .036 180.379 ***
Q7.11 6.422 .037 174.518 ***
Q8.10 5.109 .090 57.066 ***
Q8.7 5.558 .075 73.674 ***
Q8.4 5.455 .072 75.708 ***
Q8.3 5.551 .072 77.378 ***
Q8.2 4.743 .096 49.443 ***
Q8.1 4.393 .103 42.836 ***
Q9.11 5.317 .083 63.696 ***
Q9.9 5.053 .091 55.256 ***
Q9.8 5.010 .089 56.441 ***
Q9.7 5.558 .066 83.983 ***
Q9.6 5.495 .069 79.999 ***
Q9.5 5.950 .060 99.049 ***
Q9.1 5.469 .078 70.191 ***
Q10.4 6.165 .053 115.784 ***
Q10.8 6.525 .040 161.389 ***
Q10.9 6.386 .040 159.975 ***
Q10.10 6.281 .053 117.944 ***
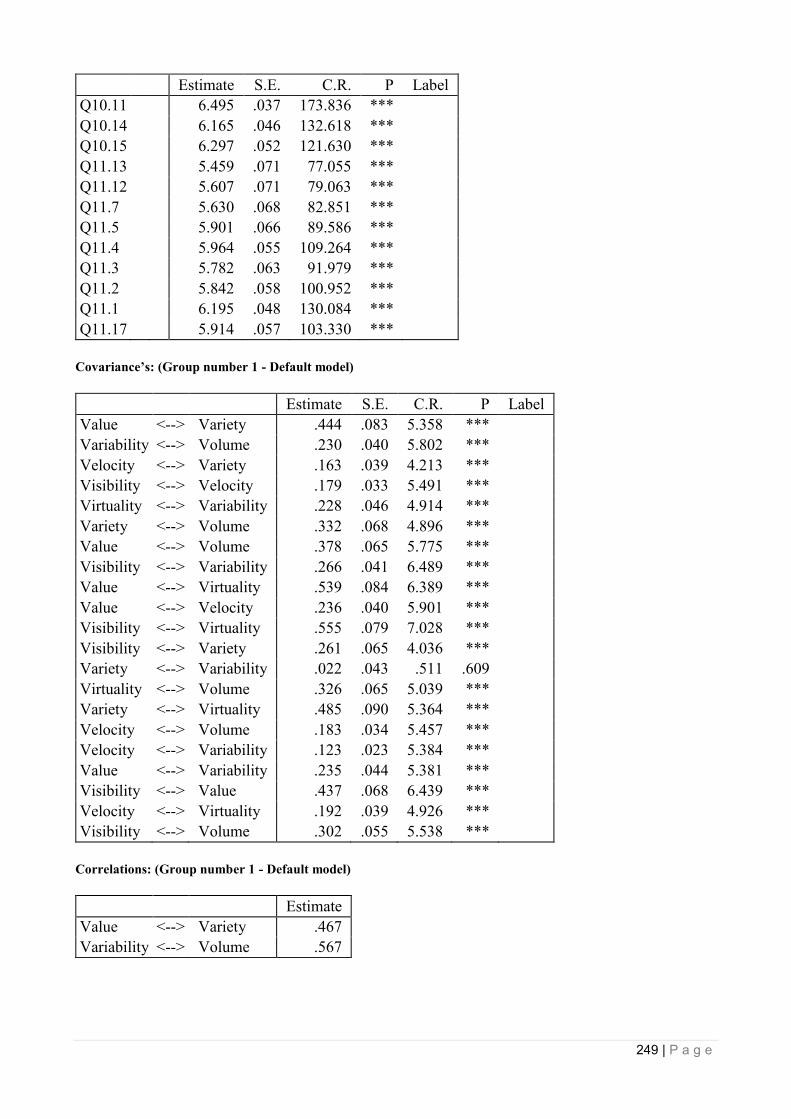
249 | P a g e
Estimate S.E. C.R. P Label
Q10.11 6.495 .037 173.836 ***
Q10.14 6.165 .046 132.618 ***
Q10.15 6.297 .052 121.630 ***
Q11.13 5.459 .071 77.055 ***
Q11.12 5.607 .071 79.063 ***
Q11.7 5.630 .068 82.851 ***
Q11.5 5.901 .066 89.586 ***
Q11.4 5.964 .055 109.264 ***
Q11.3 5.782 .063 91.979 ***
Q11.2 5.842 .058 100.952 ***
Q11.1 6.195 .048 130.084 ***
Q11.17 5.914 .057 103.330 ***
Covariance’s: (Group number 1 - Default model)
Estimate S.E. C.R. P Label
Value <--> Variety .444 .083 5.358 ***
Variability <--> Volume .230 .040 5.802 ***
Velocity <--> Variety .163 .039 4.213 ***
Visibility <--> Velocity .179 .033 5.491 ***
Virtuality <--> Variability .228 .046 4.914 ***
Variety <--> Volume .332 .068 4.896 ***
Value <--> Volume .378 .065 5.775 ***
Visibility <--> Variability .266 .041 6.489 ***
Value <--> Virtuality .539 .084 6.389 ***
Value <--> Velocity .236 .040 5.901 ***
Visibility <--> Virtuality .555 .079 7.028 ***
Visibility <--> Variety .261 .065 4.036 ***
Variety <--> Variability .022 .043 .511 .609
Virtuality <--> Volume .326 .065 5.039 ***
Variety <--> Virtuality .485 .090 5.364 ***
Velocity <--> Volume .183 .034 5.457 ***
Velocity <--> Variability .123 .023 5.384 ***
Value <--> Variability .235 .044 5.381 ***
Visibility <--> Value .437 .068 6.439 ***
Velocity <--> Virtuality .192 .039 4.926 ***
Visibility <--> Volume .302 .055 5.538 ***
Correlations: (Group number 1 - Default model)
Estimate
Value <--> Variety .467
Variability <--> Volume .567
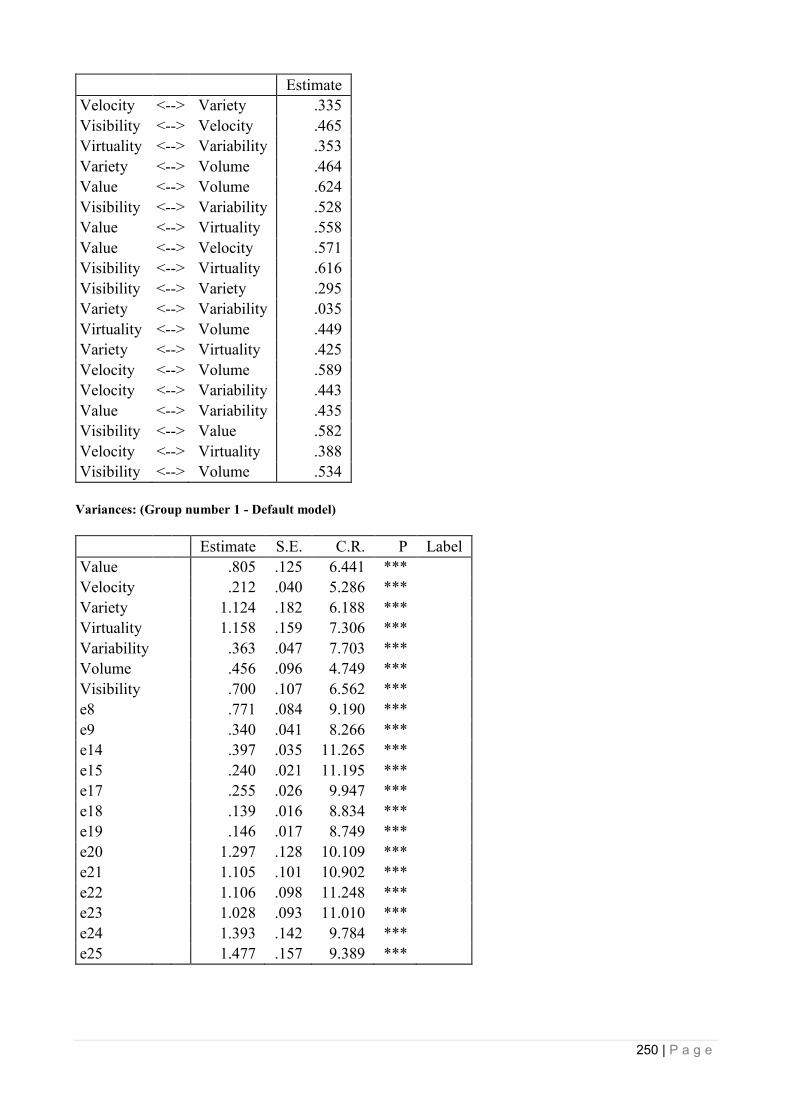
250 | P a g e
Estimate
Velocity <--> Variety .335
Visibility <--> Velocity .465
Virtuality <--> Variability .353
Variety <--> Volume .464
Value <--> Volume .624
Visibility <--> Variability .528
Value <--> Virtuality .558
Value <--> Velocity .571
Visibility <--> Virtuality .616
Visibility <--> Variety .295
Variety <--> Variability .035
Virtuality <--> Volume .449
Variety <--> Virtuality .425
Velocity <--> Volume .589
Velocity <--> Variability .443
Value <--> Variability .435
Visibility <--> Value .582
Velocity <--> Virtuality .388
Visibility <--> Volume .534
Variances: (Group number 1 - Default model)
Estimate S.E. C.R. P Label
Value .805 .125 6.441 ***
Velocity .212 .040 5.286 ***
Variety 1.124 .182 6.188 ***
Virtuality 1.158 .159 7.306 ***
Variability .363 .047 7.703 ***
Volume .456 .096 4.749 ***
Visibility .700 .107 6.562 ***
e8 .771 .084 9.190 ***
e9 .340 .041 8.266 ***
e14 .397 .035 11.265 ***
e15 .240 .021 11.195 ***
e17 .255 .026 9.947 ***
e18 .139 .016 8.834 ***
e19 .146 .017 8.749 ***
e20 1.297 .128 10.109 ***
e21 1.105 .101 10.902 ***
e22 1.106 .098 11.248 ***
e23 1.028 .093 11.010 ***
e24 1.393 .142 9.784 ***
e25 1.477 .157 9.389 ***
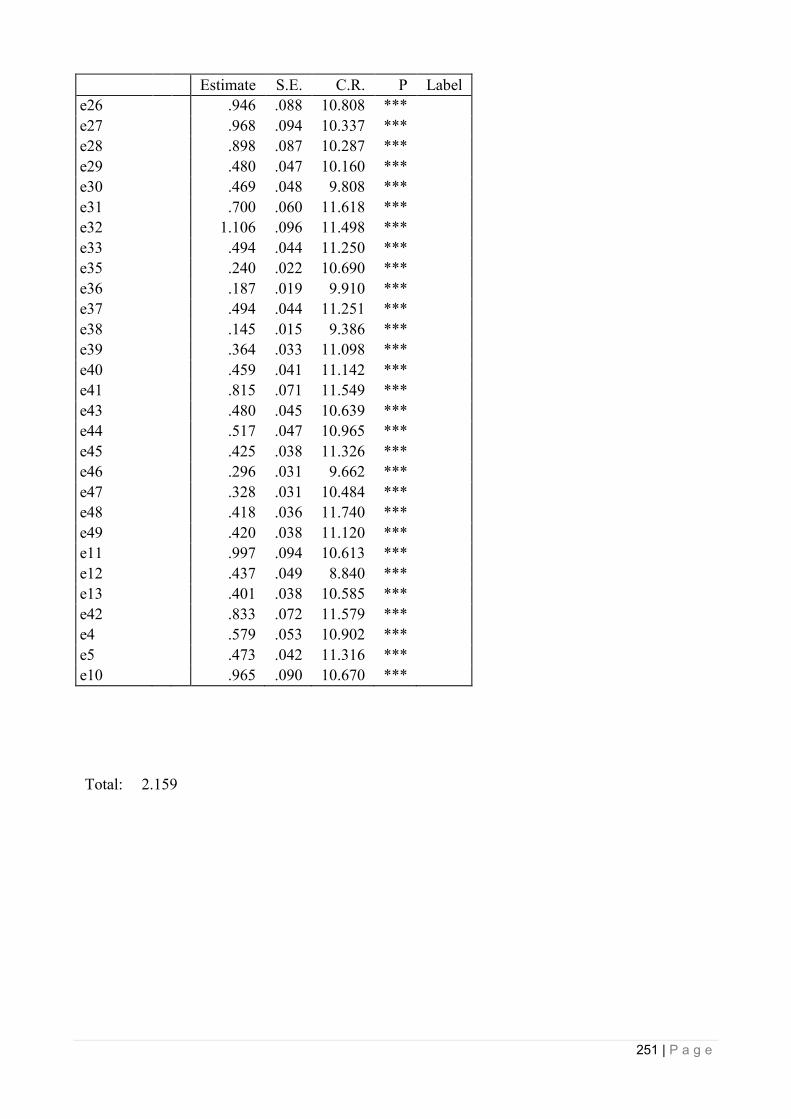
251 | P a g e
Estimate S.E. C.R. P Label
e26 .946 .088 10.808 ***
e27 .968 .094 10.337 ***
e28 .898 .087 10.287 ***
e29 .480 .047 10.160 ***
e30 .469 .048 9.808 ***
e31 .700 .060 11.618 ***
e32 1.106 .096 11.498 ***
e33 .494 .044 11.250 ***
e35 .240 .022 10.690 ***
e36 .187 .019 9.910 ***
e37 .494 .044 11.251 ***
e38 .145 .015 9.386 ***
e39 .364 .033 11.098 ***
e40 .459 .041 11.142 ***
e41 .815 .071 11.549 ***
e43 .480 .045 10.639 ***
e44 .517 .047 10.965 ***
e45 .425 .038 11.326 ***
e46 .296 .031 9.662 ***
e47 .328 .031 10.484 ***
e48 .418 .036 11.740 ***
e49 .420 .038 11.120 ***
e11 .997 .094 10.613 ***
e12 .437 .049 8.840 ***
e13 .401 .038 10.585 ***
e42 .833 .072 11.579 ***
e4 .579 .053 10.902 ***
e5 .473 .042 11.316 ***
e10 .965 .090 10.670 ***
Total: 2.159

252 | P a g e
Appendix D Sample from Population Statistics
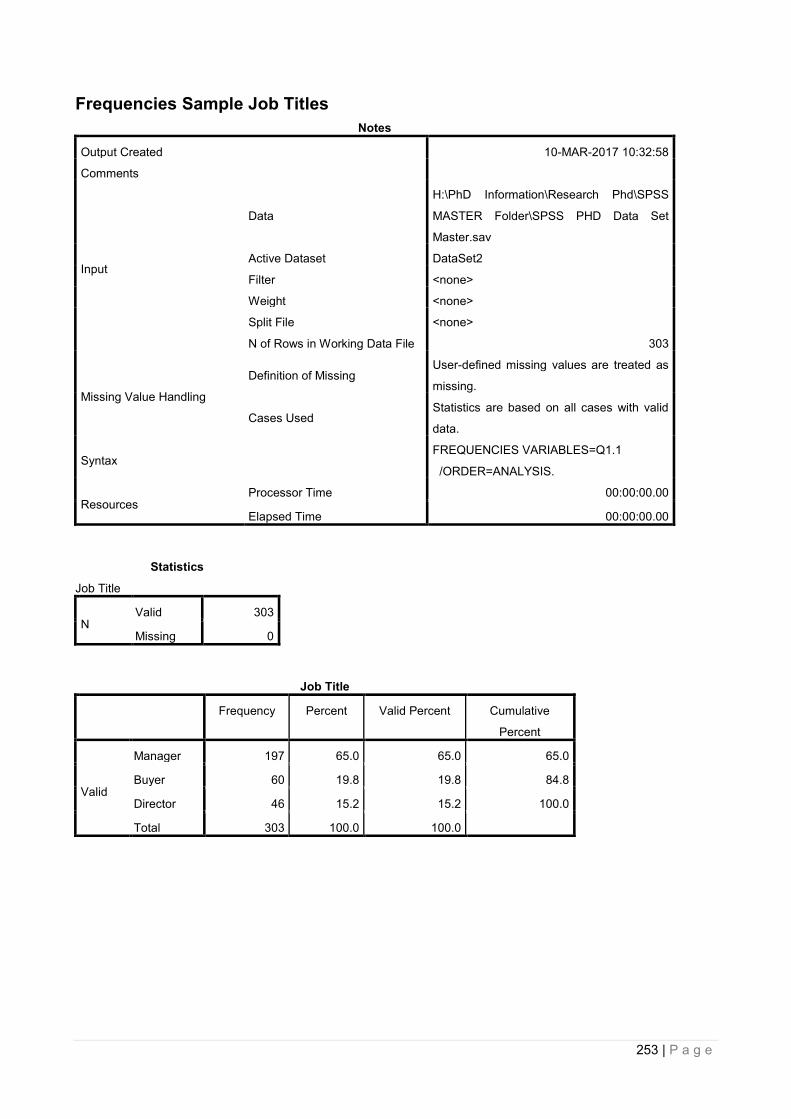
253 | P a g e
Frequencies Sample Job Titles
Notes
Output Created 10-MAR-2017 10:32:58
Comments
Input
Data
H:\PhD Information\Research Phd\SPSS
MASTER Folder\SPSS PHD Data Set
Master.sav
Active Dataset DataSet2
Filter <none>
Weight <none>
Split File <none>
N of Rows in Working Data File 303
Missing Value Handling
Definition of Missing User-defined missing values are treated as
missing.
Cases Used Statistics are based on all cases with valid
data.
Syntax FREQUENCIES VARIABLES=Q1.1
/ORDER=ANALYSIS.
Resources Processor Time 00:00:00.00
Elapsed Time 00:00:00.00
Statistics
Job Title
N Valid 303
Missing 0
Job Title
Frequency Percent Valid Percent Cumulative
Percent
Valid
Manager 197 65.0 65.0 65.0
Buyer 60 19.8 19.8 84.8
Director 46 15.2 15.2 100.0
Total 303 100.0 100.0

254 | P a g e
Appendix E Exploratory Factor Analysis 1st Iteration
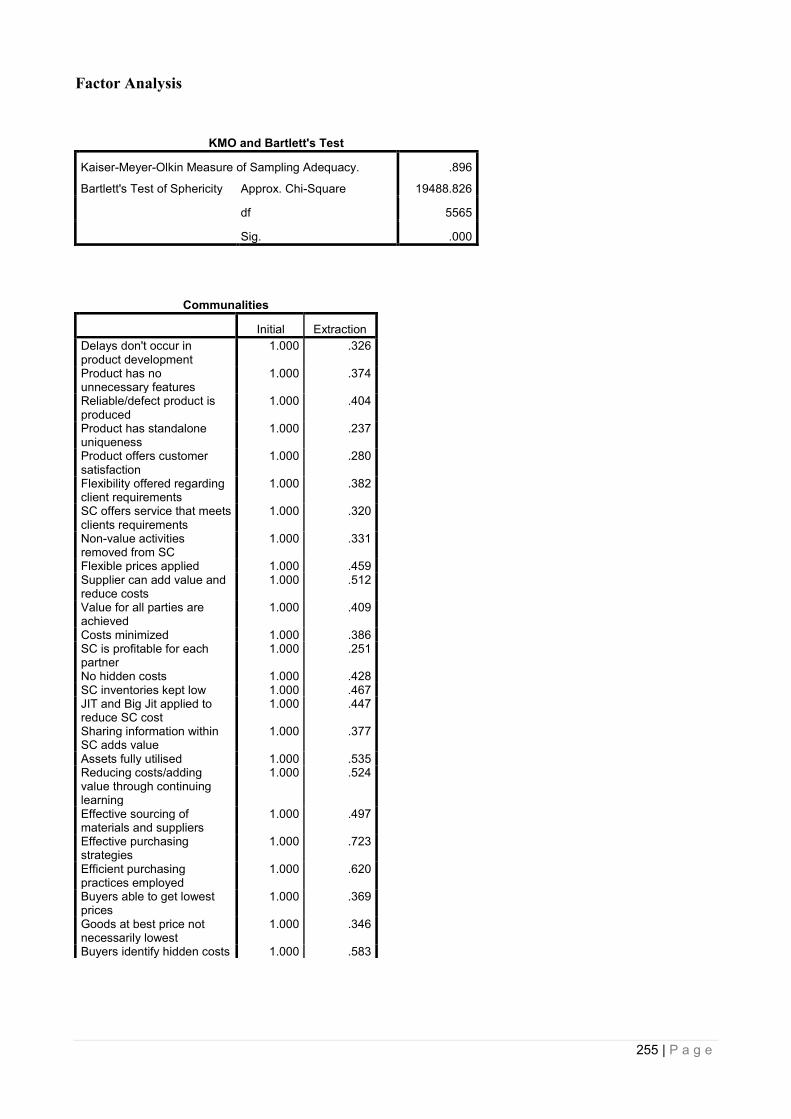
255 | P a g e
Factor Analysis
KMO and Bartlett's Test
Kaiser-Meyer-Olkin Measure of Sampling Adequacy. .896
Bartlett's Test of Sphericity Approx. Chi-Square 19488.826
df 5565
Sig. .000
Communalities
Initial Extraction
Delays don't occur in product development
1.000 .326
Product has no unnecessary features
1.000 .374
Reliable/defect product is produced
1.000 .404
Product has standalone uniqueness
1.000 .237
Product offers customer satisfaction
1.000 .280
Flexibility offered regarding client requirements
1.000 .382
SC offers service that meets clients requirements
1.000 .320
Non-value activities removed from SC
1.000 .331
Flexible prices applied 1.000 .459 Supplier can add value and reduce costs
1.000 .512
Value for all parties are achieved
1.000 .409
Costs minimized 1.000 .386 SC is profitable for each partner
1.000 .251
No hidden costs 1.000 .428 SC inventories kept low 1.000 .467 JIT and Big Jit applied to reduce SC cost
1.000 .447
Sharing information within SC adds value
1.000 .377
Assets fully utilised 1.000 .535 Reducing costs/adding value through continuing learning
1.000 .524
Effective sourcing of materials and suppliers
1.000 .497
Effective purchasing strategies
1.000 .723
Efficient purchasing practices employed
1.000 .620
Buyers able to get lowest prices
1.000 .369
Goods at best price not necessarily lowest
1.000 .346
Buyers identify hidden costs 1.000 .583
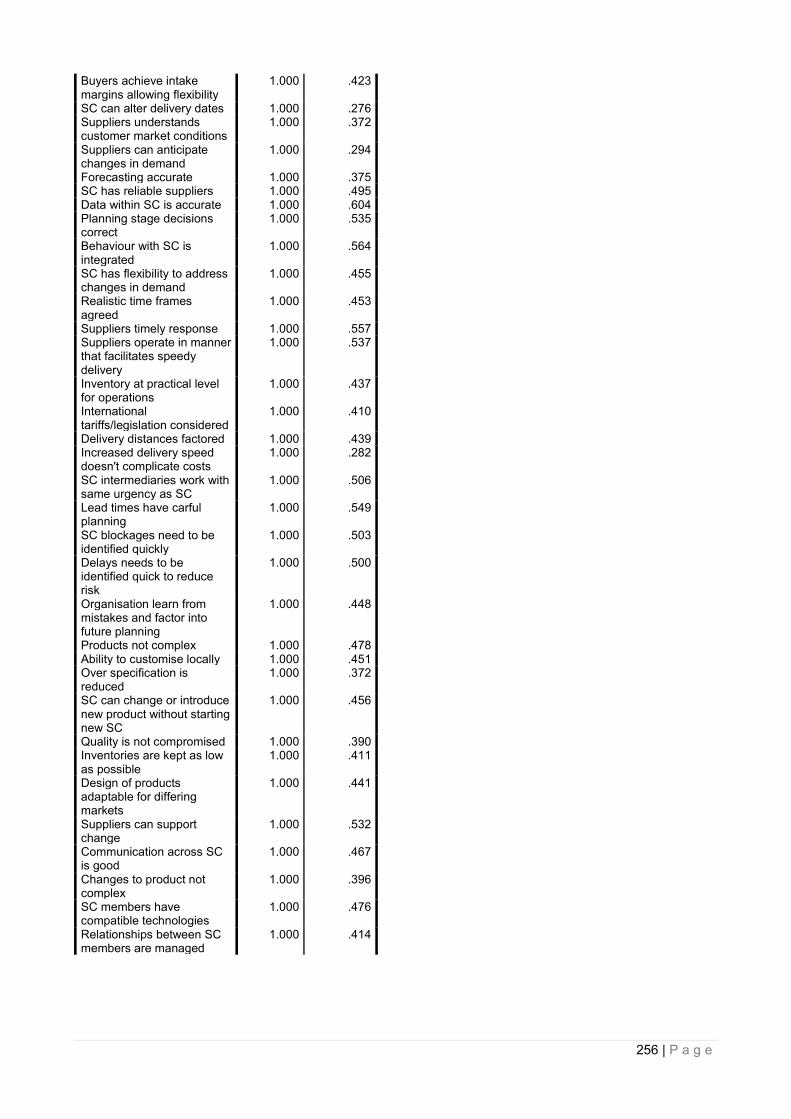
256 | P a g e
Buyers achieve intake margins allowing flexibility
1.000 .423
SC can alter delivery dates 1.000 .276 Suppliers understands customer market conditions
1.000 .372
Suppliers can anticipate changes in demand
1.000 .294
Forecasting accurate 1.000 .375 SC has reliable suppliers 1.000 .495 Data within SC is accurate 1.000 .604 Planning stage decisions correct
1.000 .535
Behaviour with SC is integrated
1.000 .564
SC has flexibility to address changes in demand
1.000 .455
Realistic time frames agreed
1.000 .453
Suppliers timely response 1.000 .557 Suppliers operate in manner that facilitates speedy delivery
1.000 .537
Inventory at practical level for operations
1.000 .437
International tariffs/legislation considered
1.000 .410
Delivery distances factored 1.000 .439 Increased delivery speed doesn't complicate costs
1.000 .282
SC intermediaries work with same urgency as SC
1.000 .506
Lead times have carful planning
1.000 .549
SC blockages need to be identified quickly
1.000 .503
Delays needs to be identified quick to reduce risk
1.000 .500
Organisation learn from mistakes and factor into future planning
1.000 .448
Products not complex 1.000 .478 Ability to customise locally 1.000 .451 Over specification is reduced
1.000 .372
SC can change or introduce new product without starting new SC
1.000 .456
Quality is not compromised 1.000 .390 Inventories are kept as low as possible
1.000 .411
Design of products adaptable for differing markets
1.000 .441
Suppliers can support change
1.000 .532
Communication across SC is good
1.000 .467
Changes to product not complex
1.000 .396
SC members have compatible technologies
1.000 .476
Relationships between SC members are managed
1.000 .414
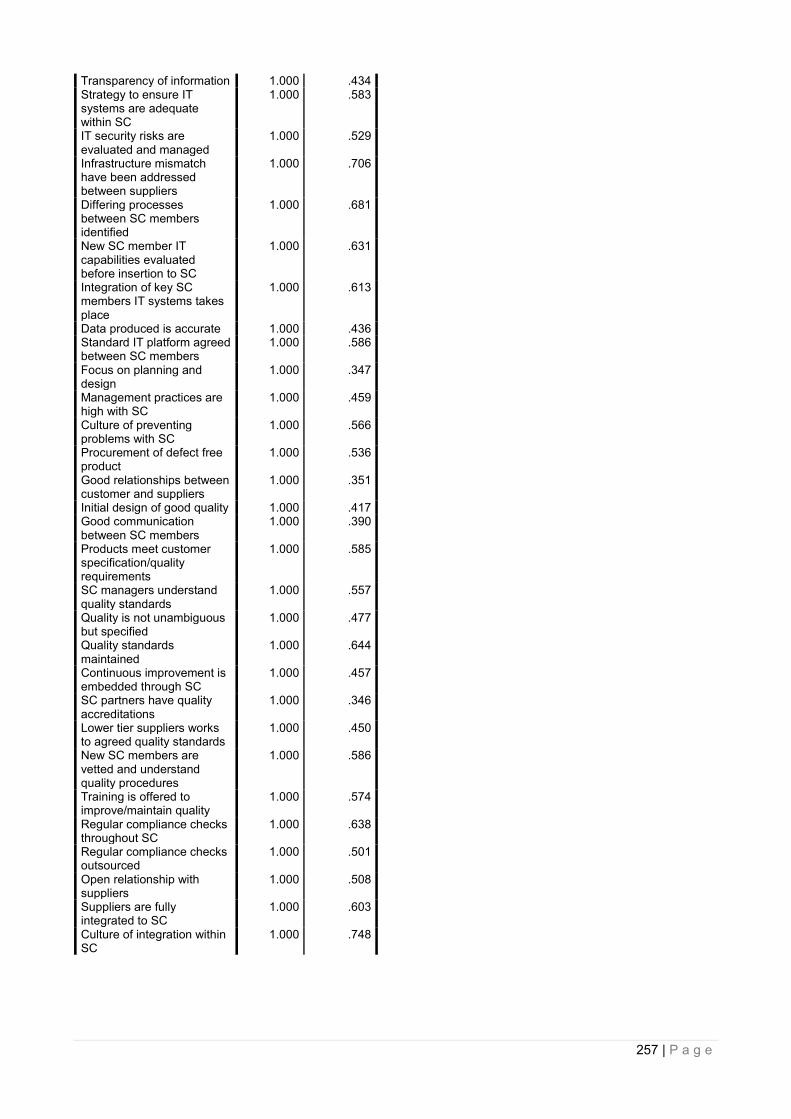
257 | P a g e
Transparency of information 1.000 .434 Strategy to ensure IT systems are adequate within SC
1.000 .583
IT security risks are evaluated and managed
1.000 .529
Infrastructure mismatch have been addressed between suppliers
1.000 .706
Differing processes between SC members identified
1.000 .681
New SC member IT capabilities evaluated before insertion to SC
1.000 .631
Integration of key SC members IT systems takes place
1.000 .613
Data produced is accurate 1.000 .436 Standard IT platform agreed between SC members
1.000 .586
Focus on planning and design
1.000 .347
Management practices are high with SC
1.000 .459
Culture of preventing problems with SC
1.000 .566
Procurement of defect free product
1.000 .536
Good relationships between customer and suppliers
1.000 .351
Initial design of good quality 1.000 .417 Good communication between SC members
1.000 .390
Products meet customer specification/quality requirements
1.000 .585
SC managers understand quality standards
1.000 .557
Quality is not unambiguous but specified
1.000 .477
Quality standards maintained
1.000 .644
Continuous improvement is embedded through SC
1.000 .457
SC partners have quality accreditations
1.000 .346
Lower tier suppliers works to agreed quality standards
1.000 .450
New SC members are vetted and understand quality procedures
1.000 .586
Training is offered to improve/maintain quality
1.000 .574
Regular compliance checks throughout SC
1.000 .638
Regular compliance checks outsourced
1.000 .501
Open relationship with suppliers
1.000 .508
Suppliers are fully integrated to SC
1.000 .603
Culture of integration within SC
1.000 .748
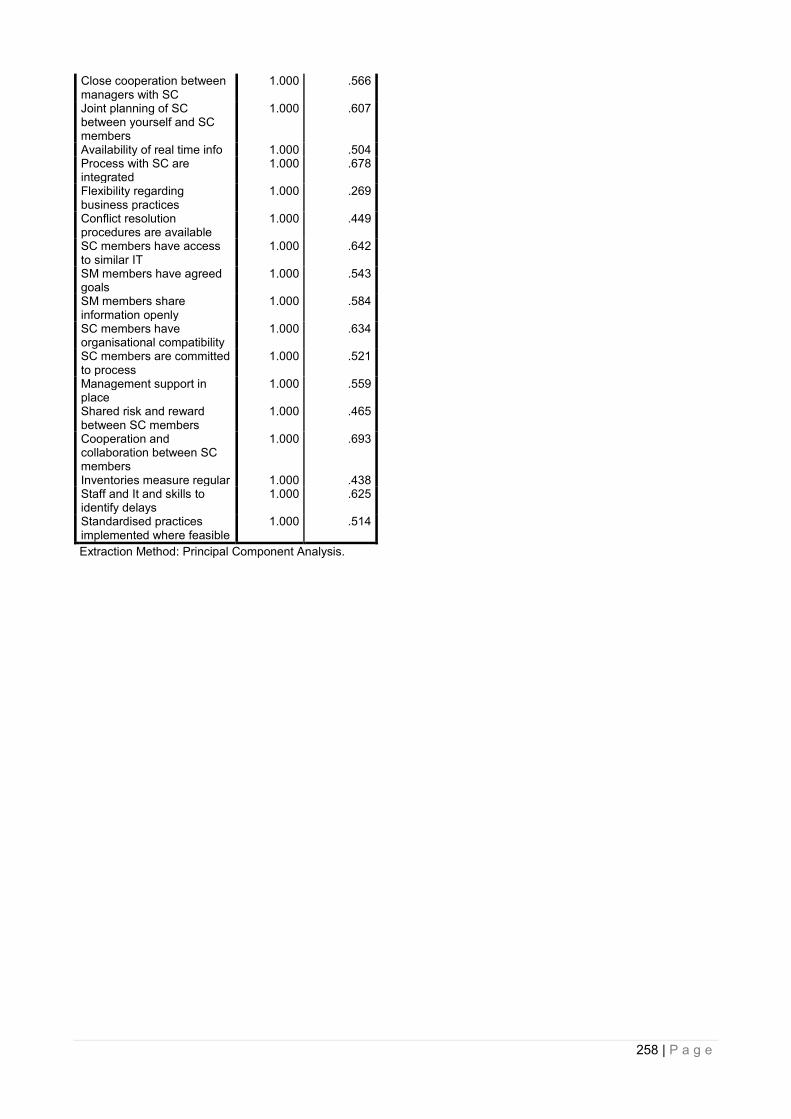
258 | P a g e
Close cooperation between managers with SC
1.000 .566
Joint planning of SC between yourself and SC members
1.000 .607
Availability of real time info 1.000 .504 Process with SC are integrated
1.000 .678
Flexibility regarding business practices
1.000 .269
Conflict resolution procedures are available
1.000 .449
SC members have access to similar IT
1.000 .642
SM members have agreed goals
1.000 .543
SM members share information openly
1.000 .584
SC members have organisational compatibility
1.000 .634
SC members are committed to process
1.000 .521
Management support in place
1.000 .559
Shared risk and reward between SC members
1.000 .465
Cooperation and collaboration between SC members
1.000 .693
Inventories measure regular 1.000 .438 Staff and It and skills to identify delays
1.000 .625
Standardised practices implemented where feasible
1.000 .514
Extraction Method: Principal Component Analysis.
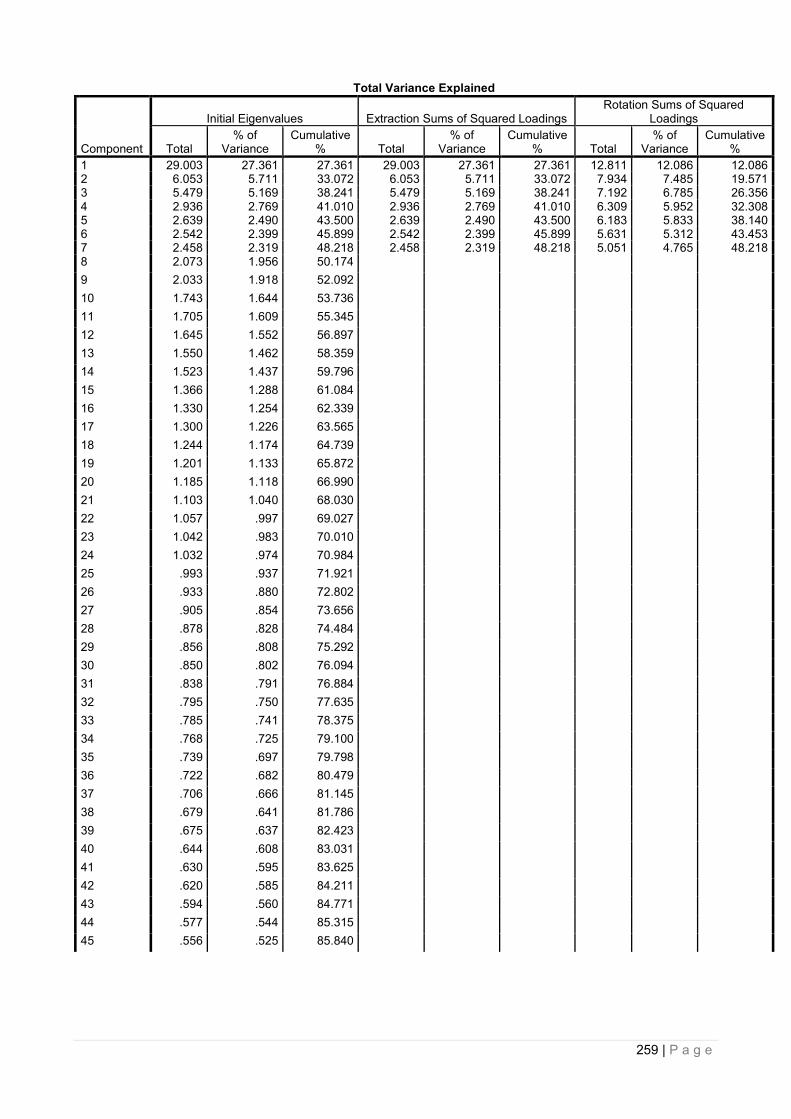
259 | P a g e
Total Variance Explained
Component
Initial Eigenvalues Extraction Sums of Squared Loadings Rotation Sums of Squared
Loadings
Total % of
Variance Cumulative
% Total % of
Variance Cumulative
% Total % of
Variance Cumulative
%
1 29.003 27.361 27.361 29.003 27.361 27.361 12.811 12.086 12.086 2 6.053 5.711 33.072 6.053 5.711 33.072 7.934 7.485 19.571 3 5.479 5.169 38.241 5.479 5.169 38.241 7.192 6.785 26.356 4 2.936 2.769 41.010 2.936 2.769 41.010 6.309 5.952 32.308 5 2.639 2.490 43.500 2.639 2.490 43.500 6.183 5.833 38.140 6 2.542 2.399 45.899 2.542 2.399 45.899 5.631 5.312 43.453 7 2.458 2.319 48.218 2.458 2.319 48.218 5.051 4.765 48.218 8 2.073 1.956 50.174 9 2.033 1.918 52.092 10 1.743 1.644 53.736 11 1.705 1.609 55.345 12 1.645 1.552 56.897 13 1.550 1.462 58.359 14 1.523 1.437 59.796 15 1.366 1.288 61.084 16 1.330 1.254 62.339 17 1.300 1.226 63.565 18 1.244 1.174 64.739 19 1.201 1.133 65.872 20 1.185 1.118 66.990 21 1.103 1.040 68.030 22 1.057 .997 69.027 23 1.042 .983 70.010 24 1.032 .974 70.984 25 .993 .937 71.921 26 .933 .880 72.802 27 .905 .854 73.656 28 .878 .828 74.484 29 .856 .808 75.292 30 .850 .802 76.094 31 .838 .791 76.884 32 .795 .750 77.635 33 .785 .741 78.375 34 .768 .725 79.100 35 .739 .697 79.798 36 .722 .682 80.479 37 .706 .666 81.145 38 .679 .641 81.786 39 .675 .637 82.423 40 .644 .608 83.031 41 .630 .595 83.625 42 .620 .585 84.211 43 .594 .560 84.771 44 .577 .544 85.315 45 .556 .525 85.840

260 | P a g e
46 .538 .508 86.348 47 .528 .499 86.846 48 .522 .493 87.339 49 .501 .472 87.812 50 .479 .452 88.263 51 .473 .446 88.709 52 .457 .431 89.140 53 .448 .422 89.563 54 .440 .415 89.978 55 .420 .396 90.374 56 .414 .391 90.765 57 .394 .372 91.137 58 .388 .366 91.503 59 .375 .354 91.857 60 .365 .344 92.201 61 .352 .332 92.533 62 .340 .321 92.854 63 .333 .314 93.168 64 .313 .296 93.464 65 .311 .293 93.757 66 .298 .281 94.038 67 .289 .273 94.310 68 .284 .268 94.578 69 .276 .261 94.839 70 .263 .248 95.087 71 .259 .245 95.331 72 .251 .236 95.568 73 .243 .230 95.797 74 .238 .224 96.022 75 .229 .216 96.237 76 .220 .208 96.445 77 .207 .196 96.640 78 .204 .192 96.833 79 .195 .184 97.017 80 .190 .179 97.196 81 .182 .171 97.367 82 .172 .163 97.530 83 .169 .160 97.690 84 .165 .156 97.846 85 .155 .147 97.992 86 .151 .143 98.135 87 .149 .141 98.276 88 .141 .133 98.408 89 .135 .127 98.536 90 .131 .124 98.660 91 .127 .119 98.779 92 .117 .110 98.889 93 .116 .110 98.999
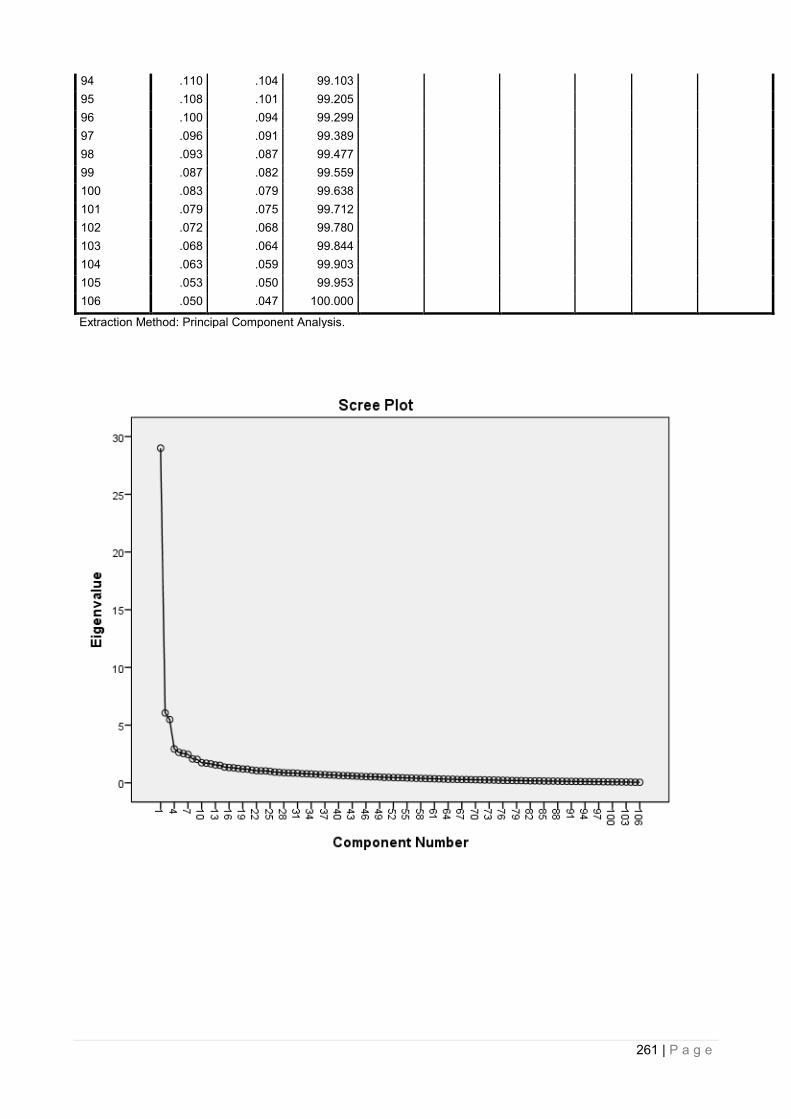
261 | P a g e
94 .110 .104 99.103 95 .108 .101 99.205 96 .100 .094 99.299 97 .096 .091 99.389 98 .093 .087 99.477 99 .087 .082 99.559 100 .083 .079 99.638 101 .079 .075 99.712 102 .072 .068 99.780 103 .068 .064 99.844 104 .063 .059 99.903 105 .053 .050 99.953 106 .050 .047 100.000 Extraction Method: Principal Component Analysis.

262 | P a g e
Component Matrixa
Component
1 2 3 4 5 6 7
Delays don't occur in product development
.407 .188 .234 .106 .018 -.081 .229
Product has no unnecessary features
.357 .246 .323 .231 .050 .125 .102
Reliable/defect product is produced
.454 -.170 .170 -.021 .303 .179 .122
Product has standalone uniqueness
.243 .314 .205 .122 .033 .105 .097
Product offers customer satisfaction
.388 -.070 .142 -.090 .259 .025 -.168
Flexibility offered regarding client requirements
.378 .020 .320 .132 .325 -.045 -.104
SC offers service that meets clients requirements
.396 -.162 .216 -.057 .239 .073 -.157
Non-value activities removed from SC
.244 .052 .359 .179 .207 .088 .240
Flexible prices applied .478 .254 .311 .183 .161 .025 .097
Supplier can add value and reduce costs
.563 -.029 .278 .109 .295 .110 -.072
Value for all parties are achieved
.478 .021 .119 -.059 .283 .211 -.196
Costs minimized .397 .062 .264 .354 .167 .023 .030
SC is profitable for each partner
.378 .016 .173 .135 .192 -.067 -.137
No hidden costs .481 -.082 .245 .287 .003 -.027 -.216
SC inventories kept low .313 .274 .188 .455 -.016 .051 .220
JIT and Big Jit applied to reduce SC cost
.483 .301 .073 .281 -.038 -.046 .187
Sharing information within SC adds value
.427 .337 .116 .062 .118 -.175 -.139
Assets fully utilised .562 .276 .191 .096 .191 -.021 -.245
Reducing costs/adding value through continuing learning
.607 .188 .212 .012 .165 -.112 -.188
Effective sourcing of materials and suppliers
.556 -.186 .201 .066 .180 .120 -.248
Effective purchasing strategies
.673 -.336 .129 .217 -.053 .033 -.298
Efficient purchasing practices employed
.606 -.321 .159 .263 -.081 .035 -.218
Buyers able to get lowest prices
.295 .136 .223 .370 .152 .218 .082
Goods at best price not necessarily lowest
.391 -.149 .308 .062 -.243 .053 -.106
Buyers identify hidden costs .562 -.386 .241 .152 -.107 .036 -.156
Buyers achieve intake margins allowing flexibility
.522 .126 .218 .171 -.081 -.038 -.223
SC can alter delivery dates .379 .067 .317 .085 -.123 -.021 -.061
Suppliers understands customer market conditions
.499 .092 .173 -.020 -.075 .013 -.281
Suppliers can anticipate changes in demand
.448 .091 .056 -.023 -.273 .076 .030
Forecasting accurate .489 -.113 .161 -.011 -.281 .131 -.035
SC has reliable suppliers .443 -.495 .101 -.159 -.001 .129 -.048
Data within SC is accurate .606 -.392 .152 -.083 -.151 .146 -.099
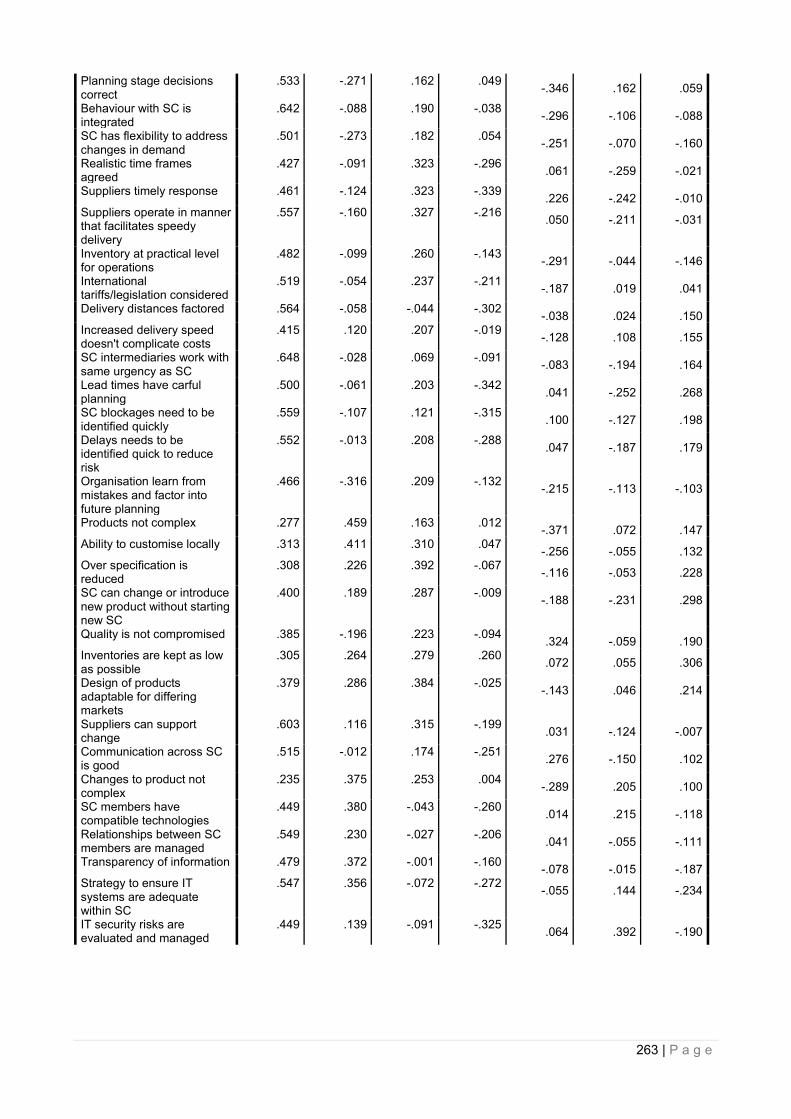
263 | P a g e
Planning stage decisions correct
.533 -.271 .162 .049 -.346 .162 .059
Behaviour with SC is integrated
.642 -.088 .190 -.038 -.296 -.106 -.088
SC has flexibility to address changes in demand
.501 -.273 .182 .054 -.251 -.070 -.160
Realistic time frames agreed
.427 -.091 .323 -.296 .061 -.259 -.021
Suppliers timely response .461 -.124 .323 -.339 .226 -.242 -.010
Suppliers operate in manner that facilitates speedy delivery
.557 -.160 .327 -.216 .050 -.211 -.031
Inventory at practical level for operations
.482 -.099 .260 -.143 -.291 -.044 -.146
International tariffs/legislation considered
.519 -.054 .237 -.211 -.187 .019 .041
Delivery distances factored .564 -.058 -.044 -.302 -.038 .024 .150
Increased delivery speed doesn't complicate costs
.415 .120 .207 -.019 -.128 .108 .155
SC intermediaries work with same urgency as SC
.648 -.028 .069 -.091 -.083 -.194 .164
Lead times have carful planning
.500 -.061 .203 -.342 .041 -.252 .268
SC blockages need to be identified quickly
.559 -.107 .121 -.315 .100 -.127 .198
Delays needs to be identified quick to reduce risk
.552 -.013 .208 -.288 .047 -.187 .179
Organisation learn from mistakes and factor into future planning
.466 -.316 .209 -.132 -.215 -.113 -.103
Products not complex .277 .459 .163 .012 -.371 .072 .147
Ability to customise locally .313 .411 .310 .047 -.256 -.055 .132
Over specification is reduced
.308 .226 .392 -.067 -.116 -.053 .228
SC can change or introduce new product without starting new SC
.400 .189 .287 -.009 -.188 -.231 .298
Quality is not compromised .385 -.196 .223 -.094 .324 -.059 .190
Inventories are kept as low as possible
.305 .264 .279 .260 .072 .055 .306
Design of products adaptable for differing markets
.379 .286 .384 -.025 -.143 .046 .214
Suppliers can support change
.603 .116 .315 -.199 .031 -.124 -.007
Communication across SC is good
.515 -.012 .174 -.251 .276 -.150 .102
Changes to product not complex
.235 .375 .253 .004 -.289 .205 .100
SC members have compatible technologies
.449 .380 -.043 -.260 .014 .215 -.118
Relationships between SC members are managed
.549 .230 -.027 -.206 .041 -.055 -.111
Transparency of information .479 .372 -.001 -.160 -.078 -.015 -.187
Strategy to ensure IT systems are adequate within SC
.547 .356 -.072 -.272 -.055 .144 -.234
IT security risks are evaluated and managed
.449 .139 -.091 -.325 .064 .392 -.190
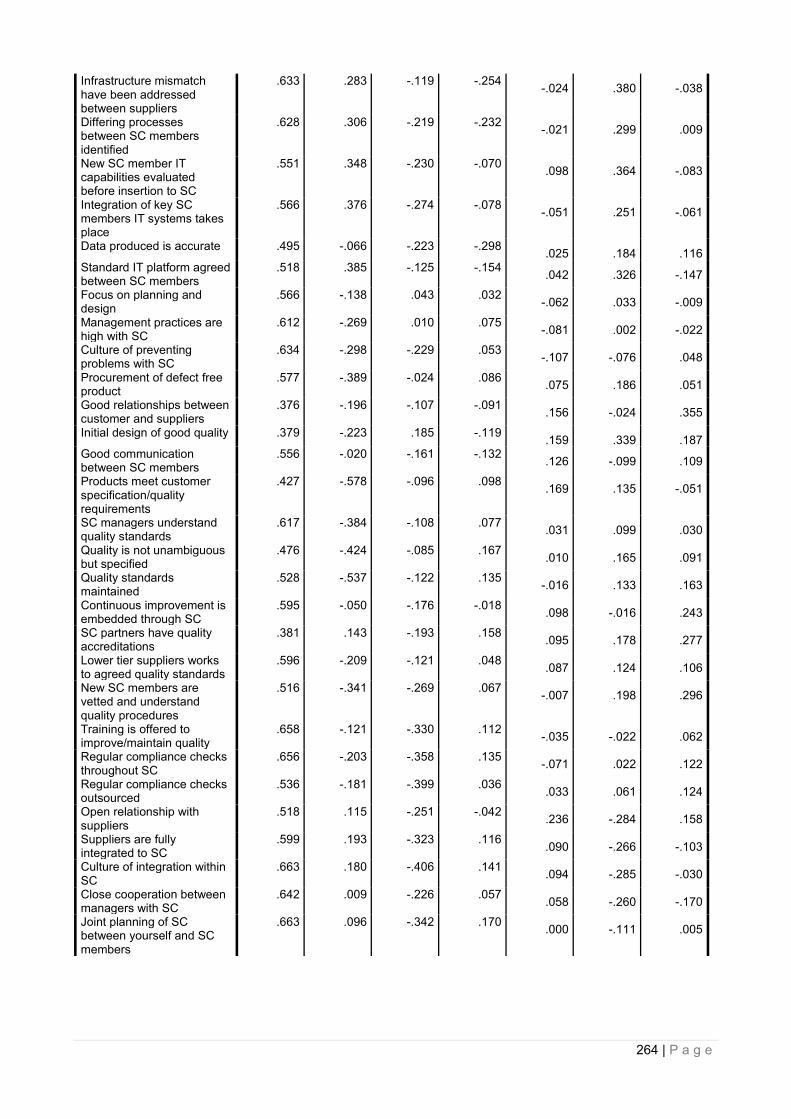
264 | P a g e
Infrastructure mismatch have been addressed between suppliers
.633 .283 -.119 -.254 -.024 .380 -.038
Differing processes between SC members identified
.628 .306 -.219 -.232 -.021 .299 .009
New SC member IT capabilities evaluated before insertion to SC
.551 .348 -.230 -.070 .098 .364 -.083
Integration of key SC members IT systems takes place
.566 .376 -.274 -.078 -.051 .251 -.061
Data produced is accurate .495 -.066 -.223 -.298 .025 .184 .116
Standard IT platform agreed between SC members
.518 .385 -.125 -.154 .042 .326 -.147
Focus on planning and design
.566 -.138 .043 .032 -.062 .033 -.009
Management practices are high with SC
.612 -.269 .010 .075 -.081 .002 -.022
Culture of preventing problems with SC
.634 -.298 -.229 .053 -.107 -.076 .048
Procurement of defect free product
.577 -.389 -.024 .086 .075 .186 .051
Good relationships between customer and suppliers
.376 -.196 -.107 -.091 .156 -.024 .355
Initial design of good quality .379 -.223 .185 -.119 .159 .339 .187
Good communication between SC members
.556 -.020 -.161 -.132 .126 -.099 .109
Products meet customer specification/quality requirements
.427 -.578 -.096 .098 .169 .135 -.051
SC managers understand quality standards
.617 -.384 -.108 .077 .031 .099 .030
Quality is not unambiguous but specified
.476 -.424 -.085 .167 .010 .165 .091
Quality standards maintained
.528 -.537 -.122 .135 -.016 .133 .163
Continuous improvement is embedded through SC
.595 -.050 -.176 -.018 .098 -.016 .243
SC partners have quality accreditations
.381 .143 -.193 .158 .095 .178 .277
Lower tier suppliers works to agreed quality standards
.596 -.209 -.121 .048 .087 .124 .106
New SC members are vetted and understand quality procedures
.516 -.341 -.269 .067 -.007 .198 .296
Training is offered to improve/maintain quality
.658 -.121 -.330 .112 -.035 -.022 .062
Regular compliance checks throughout SC
.656 -.203 -.358 .135 -.071 .022 .122
Regular compliance checks outsourced
.536 -.181 -.399 .036 .033 .061 .124
Open relationship with suppliers
.518 .115 -.251 -.042 .236 -.284 .158
Suppliers are fully integrated to SC
.599 .193 -.323 .116 .090 -.266 -.103
Culture of integration within SC
.663 .180 -.406 .141 .094 -.285 -.030
Close cooperation between managers with SC
.642 .009 -.226 .057 .058 -.260 -.170
Joint planning of SC between yourself and SC members
.663 .096 -.342 .170 .000 -.111 .005
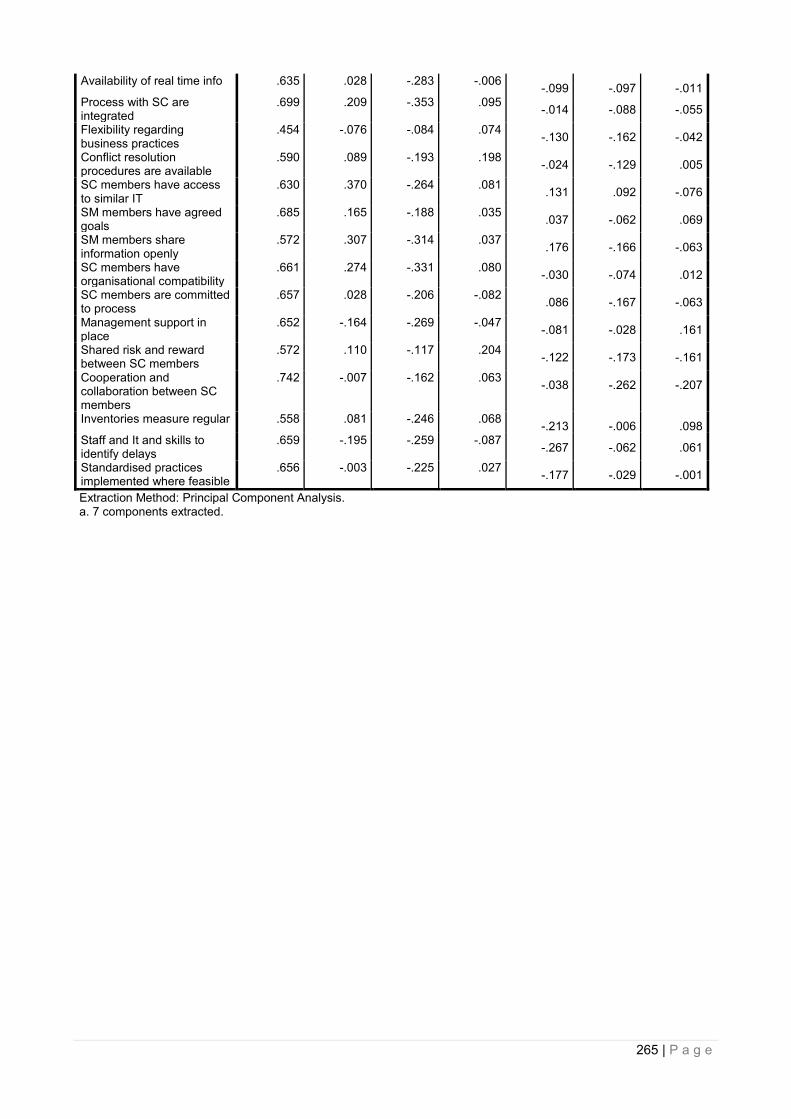
265 | P a g e
Availability of real time info .635 .028 -.283 -.006 -.099 -.097 -.011
Process with SC are integrated
.699 .209 -.353 .095 -.014 -.088 -.055
Flexibility regarding business practices
.454 -.076 -.084 .074 -.130 -.162 -.042
Conflict resolution procedures are available
.590 .089 -.193 .198 -.024 -.129 .005
SC members have access to similar IT
.630 .370 -.264 .081 .131 .092 -.076
SM members have agreed goals
.685 .165 -.188 .035 .037 -.062 .069
SM members share information openly
.572 .307 -.314 .037 .176 -.166 -.063
SC members have organisational compatibility
.661 .274 -.331 .080 -.030 -.074 .012
SC members are committed to process
.657 .028 -.206 -.082 .086 -.167 -.063
Management support in place
.652 -.164 -.269 -.047 -.081 -.028 .161
Shared risk and reward between SC members
.572 .110 -.117 .204 -.122 -.173 -.161
Cooperation and collaboration between SC members
.742 -.007 -.162 .063 -.038 -.262 -.207
Inventories measure regular .558 .081 -.246 .068 -.213 -.006 .098
Staff and It and skills to identify delays
.659 -.195 -.259 -.087 -.267 -.062 .061
Standardised practices implemented where feasible
.656 -.003 -.225 .027 -.177 -.029 -.001
Extraction Method: Principal Component Analysis. a. 7 components extracted.

266 | P a g e
Rotated Component Matrixa
Component
1 2 3 4 5 6 7
Delays don't occur in product development
.183 .084 .066 .466 .024 .227 .108
Product has no unnecessary features
.056 .101 .048 .533 .113 .026 .247
Reliable/defect product is produced
.035 .061 .419 .160 .128 .241 .351
Product has standalone uniqueness
.058 -.003 -.034 .431 .168 .024 .131
Product offers customer satisfaction
.101 .126 .119 -.005 .164 .222 .404
Flexibility offered regarding client requirements
.084 .090 .055 .230 .005 .183 .526
SC offers service that meets clients requirements
.028 .198 .189 .014 .126 .210 .429
Non-value activities removed from SC
-.076 -.018 .188 .443 -.050 .142 .266
Flexible prices applied .167 .073 .055 .519 .118 .156 .339 Supplier can add value and reduce costs
.133 .175 .238 .265 .149 .181 .531
Value for all parties are achieved
.112 .115 .180 .073 .342 .127 .461
Costs minimized .153 .122 .135 .413 -.057 -.003 .393 SC is profitable for each partner
.186 .142 .039 .156 .022 .108 .398
No hidden costs .205 .404 .080 .223 -.026 -.012 .407 SC inventories kept low .196 .033 .074 .620 -.050 -.128 .136 JIT and Big Jit applied to reduce SC cost
.375 .077 .061 .531 .070 .032 .094
Sharing information within SC adds value
.346 .071 -.195 .270 .162 .163 .297
Assets fully utilised .311 .167 -.090 .285 .267 .123 .484 Reducing costs/adding value through continuing learning
.325 .218 -.052 .249 .213 .261 .438
Effective sourcing of materials and suppliers
.138 .345 .242 .060 .161 .114 .508
Effective purchasing strategies
.298 .603 .297 .039 .034 .014 .423
Efficient purchasing practices employed
.249 .570 .296 .103 -.025 -.011 .367
Buyers able to get lowest prices
.048 .027 .177 .458 .049 -.139 .321
Goods at best price not necessarily lowest
.010 .522 .100 .194 .048 .085 .128
Buyers identify hidden costs .131 .592 .318 .085 -.039 .094 .310 Buyers achieve intake margins allowing flexibility
.267 .388 -.058 .284 .140 .041 .310
SC can alter delivery dates .076 .347 -.024 .312 .068 .124 .178 Suppliers understands customer market conditions
.210 .385 -.057 .137 .262 .111 .276
Suppliers can anticipate changes in demand
.208 .336 .090 .248 .237 .088 -.068
Forecasting accurate .109 .494 .200 .188 .186 .095 .025 SC has reliable suppliers .005 .413 .453 -.148 .077 .243 .179 Data within SC is accurate .105 .580 .402 .001 .157 .198 .176 Planning stage decisions correct
.097 .580 .361 .203 .100 .083 -.027
Behaviour with SC is integrated
.287 .590 .094 .195 .124 .256 .075

267 | P a g e
SC has flexibility to address changes in demand
.181 .599 .155 .060 -.011 .132 .138
Realistic time frames agreed
.082 .281 -.008 .061 .040 .566 .205
Suppliers timely response .076 .193 .062 .024 .061 .637 .316 Suppliers operate in manner that facilitates speedy delivery
.139 .375 .101 .101 .044 .533 .267
Inventory at practical level for operations
.100 .565 .021 .113 .160 .255 .063
International tariffs/legislation considered
.091 .414 .141 .193 .221 .352 .027
Delivery distances factored .256 .196 .290 .067 .294 .399 -.031 Increased delivery speed doesn't complicate costs
.082 .219 .130 .374 .199 .173 .015
SC intermediaries work with same urgency as SC
.388 .293 .195 .235 .078 .410 .038
Lead times have carful planning
.176 .160 .156 .165 .056 .661 .014
SC blockages need to be identified quickly
.205 .161 .259 .104 .145 .572 .092
Delays needs to be identified quick to reduce risk
.201 .196 .139 .192 .127 .583 .091
Organisation learn from mistakes and factor into future planning
.107 .558 .158 -.017 .006 .303 .087
Products not complex .124 .184 -.173 .518 .284 .035 -.220 Ability to customise locally .110 .200 -.204 .554 .157 .148 -.064 Over specification is reduced
-.014 .163 -.051 .481 .092 .320 -.004
SC can change or introduce new product without starting new SC
.185 .204 -.031 .485 -.030 .367 -.090
Quality is not compromised .042 .021 .318 .126 -.040 .420 .304 Inventories are kept as low as possible
.083 -.033 .099 .608 .005 .073 .135
Design of products adaptable for differing markets
.012 .190 -.022 .553 .186 .253 .012
Suppliers can support change
.194 .290 .005 .278 .223 .475 .240
Communication across SC is good
.194 .050 .157 .120 .136 .541 .277
Changes to product not complex
-.031 .192 -.103 .487 .313 .004 -.112
SC members have compatible technologies
.217 .053 -.039 .158 .609 .143 .095
Relationships between SC members are managed
.366 .141 -.028 .109 .378 .283 .157
Transparency of information .336 .176 -.178 .174 .437 .163 .105 Strategy to ensure IT systems are adequate within SC
.322 .183 -.085 .098 .625 .157 .117
IT security risks are evaluated and managed
.107 .117 .166 -.034 .664 .098 .155
Infrastructure mismatch have been addressed between suppliers
.275 .132 .207 .190 .717 .123 .069
Differing processes between SC members identified
.376 .070 .200 .175 .670 .123 .013
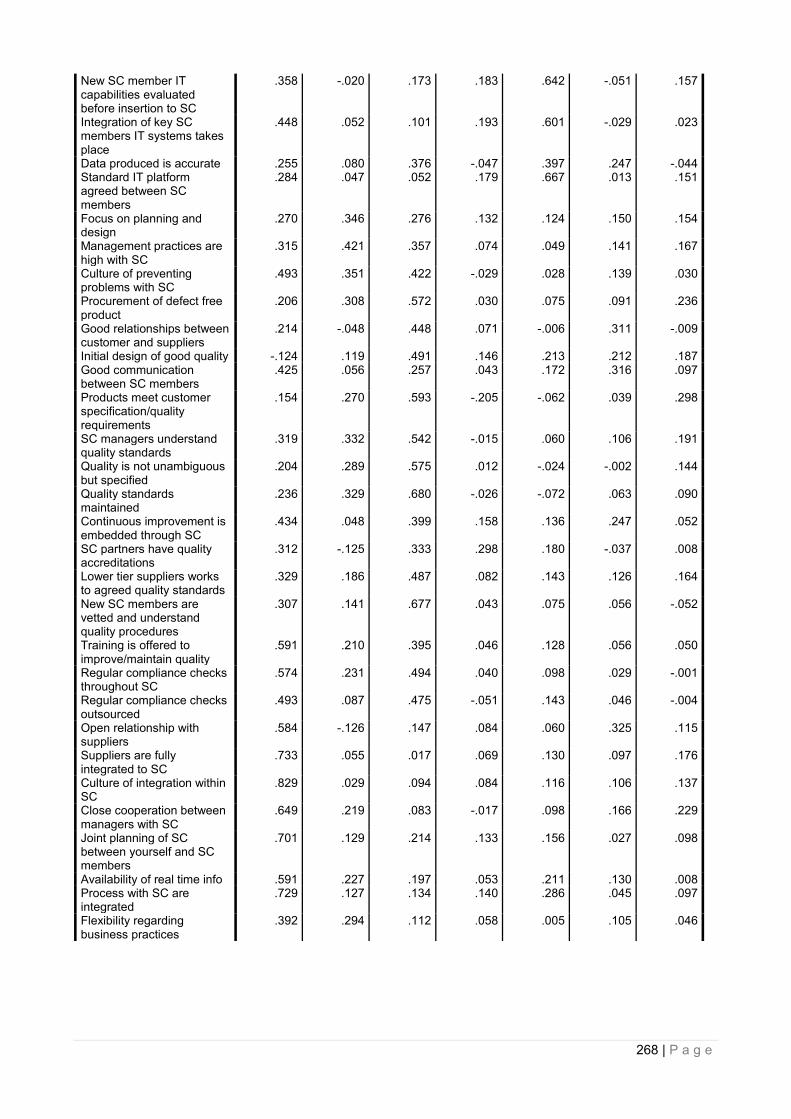
268 | P a g e
New SC member IT capabilities evaluated before insertion to SC
.358 -.020 .173 .183 .642 -.051 .157
Integration of key SC members IT systems takes place
.448 .052 .101 .193 .601 -.029 .023
Data produced is accurate .255 .080 .376 -.047 .397 .247 -.044 Standard IT platform agreed between SC members
.284 .047 .052 .179 .667 .013 .151
Focus on planning and design
.270 .346 .276 .132 .124 .150 .154
Management practices are high with SC
.315 .421 .357 .074 .049 .141 .167
Culture of preventing problems with SC
.493 .351 .422 -.029 .028 .139 .030
Procurement of defect free product
.206 .308 .572 .030 .075 .091 .236
Good relationships between customer and suppliers
.214 -.048 .448 .071 -.006 .311 -.009
Initial design of good quality -.124 .119 .491 .146 .213 .212 .187 Good communication between SC members
.425 .056 .257 .043 .172 .316 .097
Products meet customer specification/quality requirements
.154 .270 .593 -.205 -.062 .039 .298
SC managers understand quality standards
.319 .332 .542 -.015 .060 .106 .191
Quality is not unambiguous but specified
.204 .289 .575 .012 -.024 -.002 .144
Quality standards maintained
.236 .329 .680 -.026 -.072 .063 .090
Continuous improvement is embedded through SC
.434 .048 .399 .158 .136 .247 .052
SC partners have quality accreditations
.312 -.125 .333 .298 .180 -.037 .008
Lower tier suppliers works to agreed quality standards
.329 .186 .487 .082 .143 .126 .164
New SC members are vetted and understand quality procedures
.307 .141 .677 .043 .075 .056 -.052
Training is offered to improve/maintain quality
.591 .210 .395 .046 .128 .056 .050
Regular compliance checks throughout SC
.574 .231 .494 .040 .098 .029 -.001
Regular compliance checks outsourced
.493 .087 .475 -.051 .143 .046 -.004
Open relationship with suppliers
.584 -.126 .147 .084 .060 .325 .115
Suppliers are fully integrated to SC
.733 .055 .017 .069 .130 .097 .176
Culture of integration within SC
.829 .029 .094 .084 .116 .106 .137
Close cooperation between managers with SC
.649 .219 .083 -.017 .098 .166 .229
Joint planning of SC between yourself and SC members
.701 .129 .214 .133 .156 .027 .098
Availability of real time info .591 .227 .197 .053 .211 .130 .008 Process with SC are integrated
.729 .127 .134 .140 .286 .045 .097
Flexibility regarding business practices
.392 .294 .112 .058 .005 .105 .046
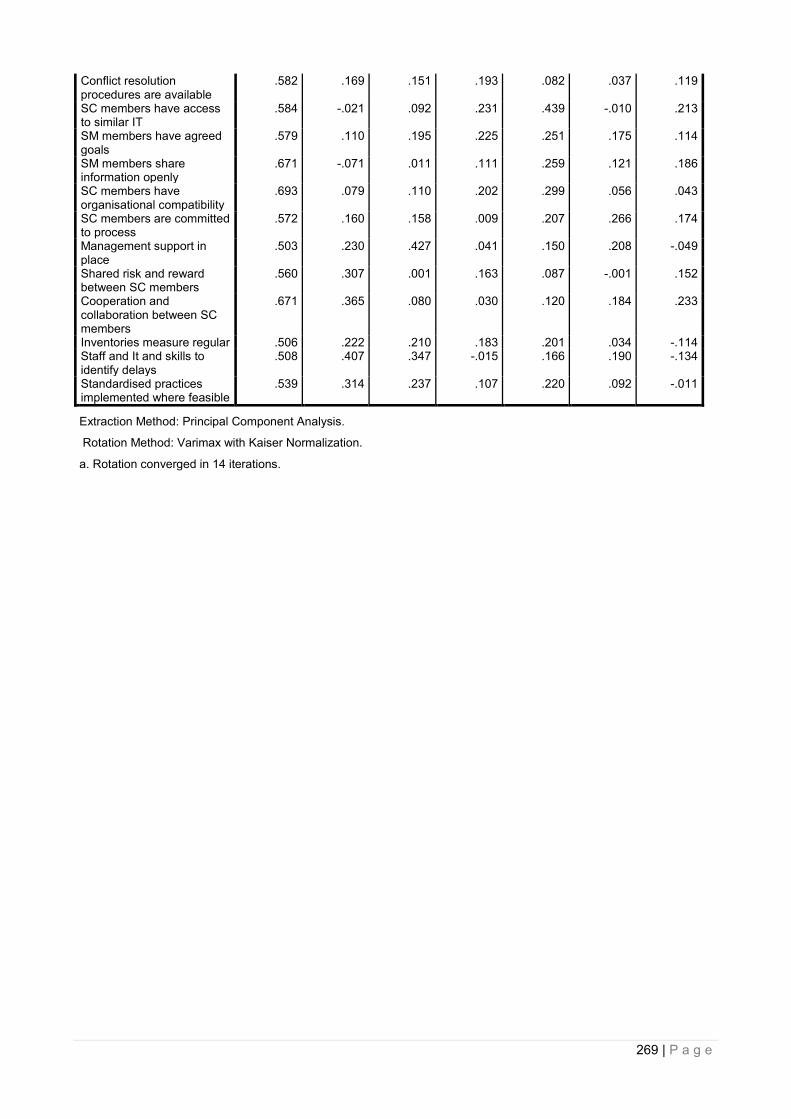
269 | P a g e
Conflict resolution procedures are available
.582 .169 .151 .193 .082 .037 .119
SC members have access to similar IT
.584 -.021 .092 .231 .439 -.010 .213
SM members have agreed goals
.579 .110 .195 .225 .251 .175 .114
SM members share information openly
.671 -.071 .011 .111 .259 .121 .186
SC members have organisational compatibility
.693 .079 .110 .202 .299 .056 .043
SC members are committed to process
.572 .160 .158 .009 .207 .266 .174
Management support in place
.503 .230 .427 .041 .150 .208 -.049
Shared risk and reward between SC members
.560 .307 .001 .163 .087 -.001 .152
Cooperation and collaboration between SC members
.671 .365 .080 .030 .120 .184 .233
Inventories measure regular .506 .222 .210 .183 .201 .034 -.114 Staff and It and skills to identify delays
.508 .407 .347 -.015 .166 .190 -.134
Standardised practices implemented where feasible
.539 .314 .237 .107 .220 .092 -.011
Extraction Method: Principal Component Analysis.
Rotation Method: Varimax with Kaiser Normalization.
a. Rotation converged in 14 iterations.

270 | P a g e
Appendix F Exploratory Factor Analysis – Final Iteration
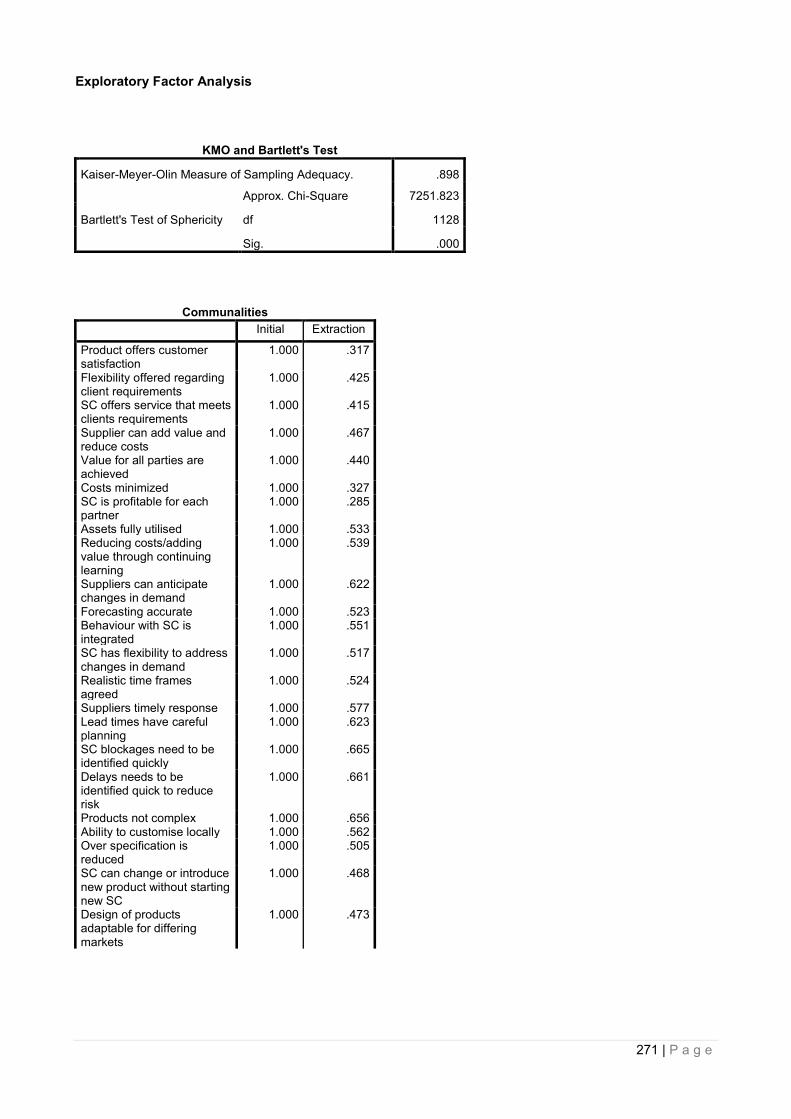
271 | P a g e
Exploratory Factor Analysis
KMO and Bartlett's Test
Kaiser-Meyer-Olin Measure of Sampling Adequacy. .898
Bartlett's Test of Sphericity
Approx. Chi-Square 7251.823
df 1128
Sig. .000
Communalities
Initial Extraction
Product offers customer satisfaction
1.000 .317
Flexibility offered regarding client requirements
1.000 .425
SC offers service that meets clients requirements
1.000 .415
Supplier can add value and reduce costs
1.000 .467
Value for all parties are achieved
1.000 .440
Costs minimized 1.000 .327 SC is profitable for each partner
1.000 .285
Assets fully utilised 1.000 .533 Reducing costs/adding value through continuing learning
1.000 .539
Suppliers can anticipate changes in demand
1.000 .622
Forecasting accurate 1.000 .523 Behaviour with SC is integrated
1.000 .551
SC has flexibility to address changes in demand
1.000 .517
Realistic time frames agreed
1.000 .524
Suppliers timely response 1.000 .577 Lead times have careful planning
1.000 .623
SC blockages need to be identified quickly
1.000 .665
Delays needs to be identified quick to reduce risk
1.000 .661
Products not complex 1.000 .656 Ability to customise locally 1.000 .562 Over specification is reduced
1.000 .505
SC can change or introduce new product without starting new SC
1.000 .468
Design of products adaptable for differing markets
1.000 .473
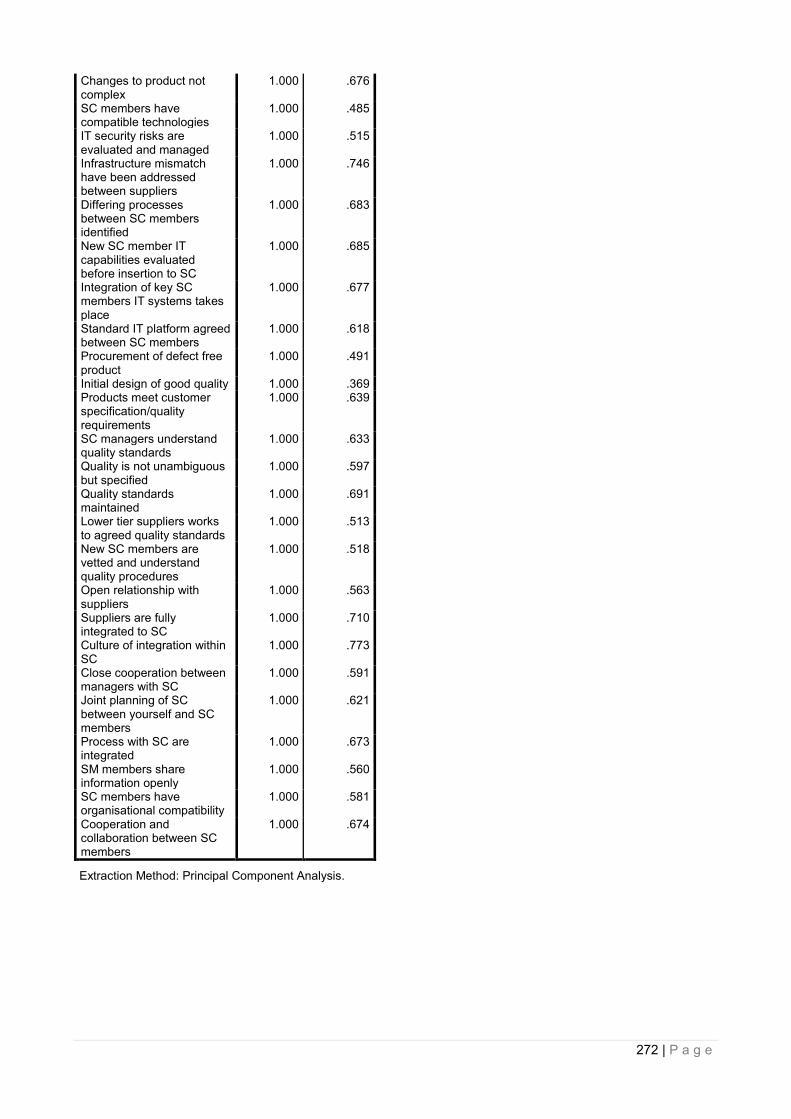
272 | P a g e
Changes to product not complex
1.000 .676
SC members have compatible technologies
1.000 .485
IT security risks are evaluated and managed
1.000 .515
Infrastructure mismatch have been addressed between suppliers
1.000 .746
Differing processes between SC members identified
1.000 .683
New SC member IT capabilities evaluated before insertion to SC
1.000 .685
Integration of key SC members IT systems takes place
1.000 .677
Standard IT platform agreed between SC members
1.000 .618
Procurement of defect free product
1.000 .491
Initial design of good quality 1.000 .369 Products meet customer specification/quality requirements
1.000 .639
SC managers understand quality standards
1.000 .633
Quality is not unambiguous but specified
1.000 .597
Quality standards maintained
1.000 .691
Lower tier suppliers works to agreed quality standards
1.000 .513
New SC members are vetted and understand quality procedures
1.000 .518
Open relationship with suppliers
1.000 .563
Suppliers are fully integrated to SC
1.000 .710
Culture of integration within SC
1.000 .773
Close cooperation between managers with SC
1.000 .591
Joint planning of SC between yourself and SC members
1.000 .621
Process with SC are integrated
1.000 .673
SM members share information openly
1.000 .560
SC members have organisational compatibility
1.000 .581
Cooperation and collaboration between SC members
1.000 .674
Extraction Method: Principal Component Analysis.
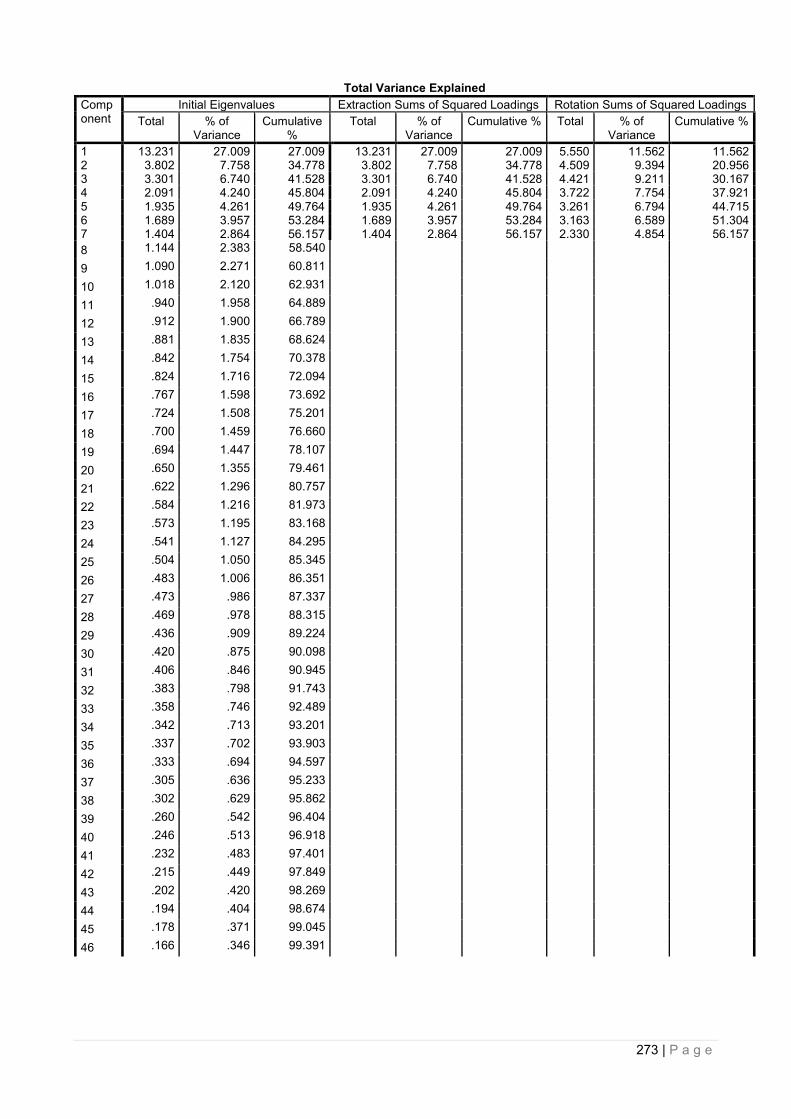
273 | P a g e
Total Variance Explained
Component
Initial Eigenvalues Extraction Sums of Squared Loadings Rotation Sums of Squared Loadings
Total % of Variance
Cumulative %
Total % of Variance
Cumulative % Total % of Variance
Cumulative %
1 13.231 27.009 27.009 13.231 27.009 27.009 5.550 11.562 11.562 2 3.802 7.758 34.778 3.802 7.758 34.778 4.509 9.394 20.956 3 3.301 6.740 41.528 3.301 6.740 41.528 4.421 9.211 30.167 4 2.091 4.240 45.804 2.091 4.240 45.804 3.722 7.754 37.921 5 1.935 4.261 49.764 1.935 4.261 49.764 3.261 6.794 44.715 6 1.689 3.957 53.284 1.689 3.957 53.284 3.163 6.589 51.304 7 1.404 2.864 56.157 1.404 2.864 56.157 2.330 4.854 56.157
8 1.144 2.383 58.540 9 1.090 2.271 60.811 10 1.018 2.120 62.931 11 .940 1.958 64.889 12 .912 1.900 66.789 13 .881 1.835 68.624 14 .842 1.754 70.378 15 .824 1.716 72.094 16 .767 1.598 73.692 17 .724 1.508 75.201 18 .700 1.459 76.660 19 .694 1.447 78.107 20 .650 1.355 79.461 21 .622 1.296 80.757 22 .584 1.216 81.973 23 .573 1.195 83.168 24 .541 1.127 84.295 25 .504 1.050 85.345 26 .483 1.006 86.351 27 .473 .986 87.337 28 .469 .978 88.315 29 .436 .909 89.224 30 .420 .875 90.098 31 .406 .846 90.945 32 .383 .798 91.743 33 .358 .746 92.489 34 .342 .713 93.201 35 .337 .702 93.903 36 .333 .694 94.597 37 .305 .636 95.233 38 .302 .629 95.862 39 .260 .542 96.404 40 .246 .513 96.918 41 .232 .483 97.401 42 .215 .449 97.849 43 .202 .420 98.269 44 .194 .404 98.674 45 .178 .371 99.045 46 .166 .346 99.391
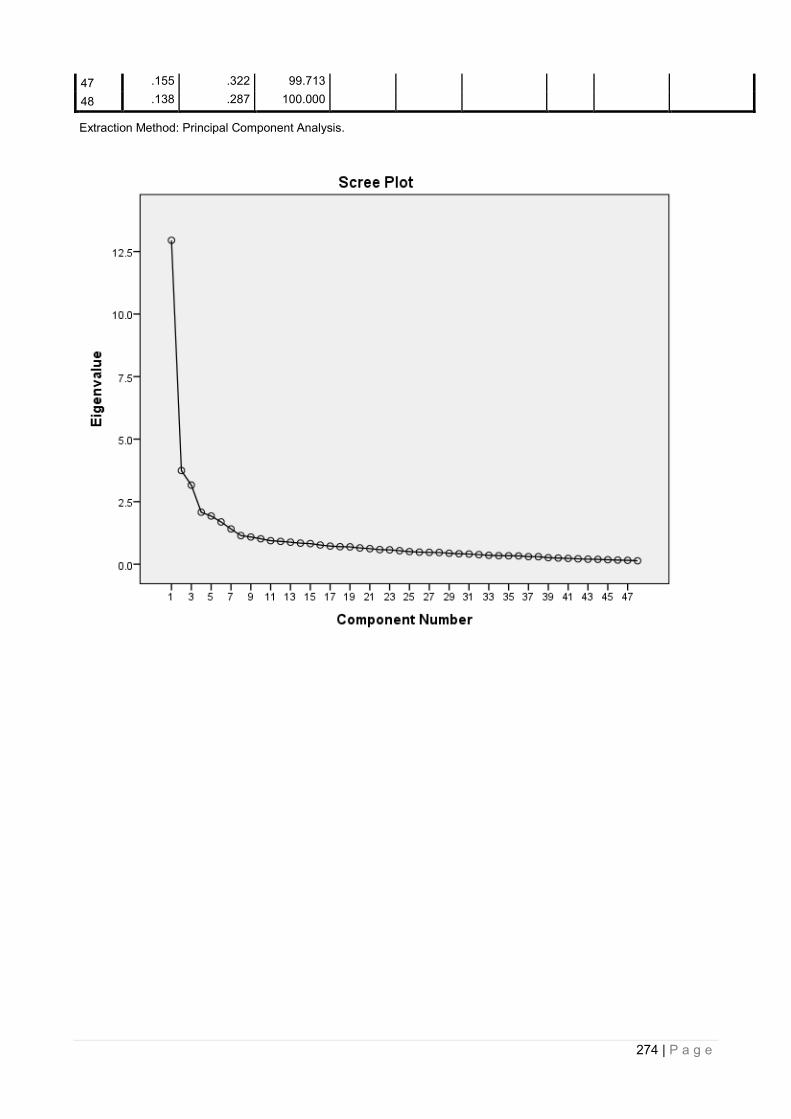
274 | P a g e
47 .155 .322 99.713 48 .138 .287 100.000
Extraction Method: Principal Component Analysis.

275 | P a g e
Rotated Component Matrixa
Component
1 2 3 4 5 6 7
Product offers customer satisfaction
.496
Flexibility offered regarding client requirements
.625
SC offers service that meets clients requirements
.571
Supplier can add value and reduce costs
.597
Value for all parties are achieved
.533
Costs minimized .522 SC is profitable for each partner
.471
Assets fully utilised .562 Reducing costs/adding value through continuing learning
.560
Suppliers can anticipate changes in demand
.721
Forecasting accurate .606
Behaviour with SC is integrated
.576
SC has flexibility to address changes in demand
.585
Realistic time frames agreed .653 Suppliers timely response .635 Lead times have careful planning
.724
SC blockages need to be identified quickly
.718
Delays needs to be identified quick to reduce risk
.734
Products not complex .772 Ability to customise locally .702 Over specification is reduced
.626
SC can change or introduce new product without starting new SC
.543
Design of products adaptable for differing markets
.586
Changes to product not complex
.787
SC members have compatible technologies
.604
IT security risks are evaluated and managed
.648
Infrastructure mismatch have been addressed between suppliers
.779
Differing processes between SC members identified
.726
New SC member IT capabilities evaluated before insertion to SC
.756

276 | P a g e
Integration of key SC members IT systems takes place
.696
Standard IT platform agreed between SC members
.704
Procurement of defect free product
.590
Initial design of good quality .485 Products meet customer specification/quality requirements
.749
SC managers understand quality standards
.691
Quality is not unambiguous but specified
.748
Quality standards maintained
.783
Lower tier suppliers works to agreed quality standards
.600
New SC members are vetted and understand quality procedures
.656
Open relationship with suppliers
.647
Suppliers are fully integrated to SC
.797
Culture of integration within SC
.822
Close cooperation between managers with SC
.677
Joint planning of SC between yourself and SC members
.673
Process with SC are integrated
.676
SM members share information openly
.662
SC members have organisational compatibility
.614
Cooperation and collaboration between SC members
.663
Extraction Method: Principal Component Analysis. Rotation Method: Varma with Kaiser Normalization. a. Rotation converged in 7 iterations.

277 | P a g e
Appendix G Model 1 Confirmatory Factor Analysis Amos
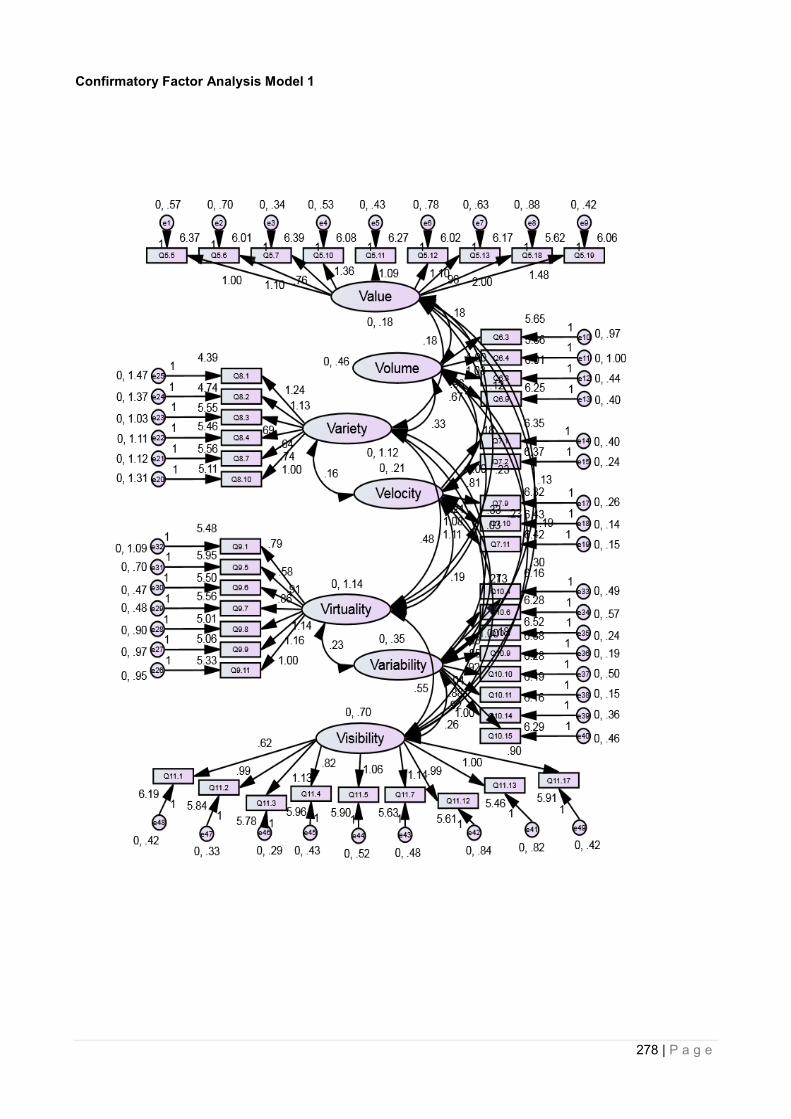
278 | P a g e
Confirmatory Factor Analysis Model 1
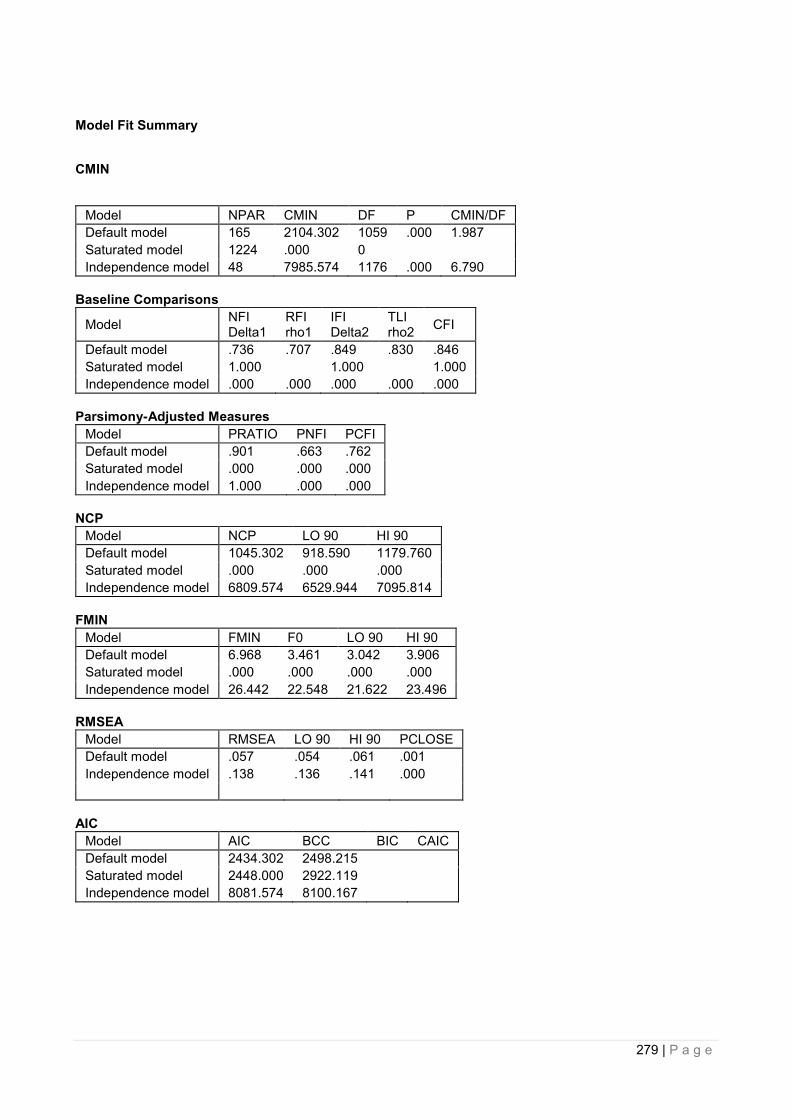
279 | P a g e
Model Fit Summary
CMIN
Model NPAR CMIN DF P CMIN/DF
Default model 165 2104.302 1059 .000 1.987
Saturated model 1224 .000 0
Independence model 48 7985.574 1176 .000 6.790
Baseline Comparisons
Model NFI Delta1
RFI rho1
IFI Delta2
TLI rho2
CFI
Default model .736 .707 .849 .830 .846
Saturated model 1.000 1.000 1.000
Independence model .000 .000 .000 .000 .000
Parsimony-Adjusted Measures
Model PRATIO PNFI PCFI
Default model .901 .663 .762
Saturated model .000 .000 .000
Independence model 1.000 .000 .000
NCP
Model NCP LO 90 HI 90
Default model 1045.302 918.590 1179.760
Saturated model .000 .000 .000
Independence model 6809.574 6529.944 7095.814
FMIN
Model FMIN F0 LO 90 HI 90
Default model 6.968 3.461 3.042 3.906
Saturated model .000 .000 .000 .000
Independence model 26.442 22.548 21.622 23.496
RMSEA
Model RMSEA LO 90 HI 90 PCLOSE
Default model .057 .054 .061 .001
Independence model .138 .136 .141 .000
AIC
Model AIC BCC BIC CAIC
Default model 2434.302 2498.215
Saturated model 2448.000 2922.119
Independence model 8081.574 8100.167

280 | P a g e
ECVI
Model ECVI LO 90 HI 90 MECVI
Default model 8.061 7.641 8.506 8.272
Saturated model 8.106 8.106 8.106 9.676
Independence model 26.760 25.834 27.708 26.822
HOELTER
Model HOELTER .05
HOELTER .01
Default model 164 168
Independence model 48 49
Scalar Estimates (Group number 1 - Default model) Maximum Likelihood Estimates Regression Weights: (Group number 1 - Default model)
Estimate S.E. C.R. P Label
Q5.6 <--- Value 1.103 .179 6.179 ***
Q5.7 <--- Value .757 .124 6.113 ***
Q5.10 <--- Value 1.360 .192 7.089 ***
Q5.11 <--- Value 1.093 .160 6.833 ***
Q5.12 <--- Value 1.101 .184 5.997 ***
Q5.13 <--- Value .962 .163 5.903 ***
Q5.18 <--- Value 1.996 .271 7.370 ***
Q5.19 <--- Value 1.485 .198 7.511 ***
Q6.3 <--- Volume 1.000
Q6.4 <--- Volume 1.032 .142 7.265 ***
Q6.8 <--- Volume .964 .118 8.173 ***
Q6.9 <--- Volume .666 .091 7.331 ***
Q7.1 <--- Velocity 1.000
Q7.2 <--- Velocity .809 .096 8.403 ***
Q7.9 <--- Velocity 1.211 .126 9.626 ***
Q7.10 <--- Velocity 1.084 .107 10.115 ***
Q7.11 <--- Velocity 1.110 .110 10.070 ***
Q8.10 <--- Variety 1.000
Q8.7 <--- Variety .741 .084 8.838 ***
Q8.4 <--- Variety .643 .079 8.158 ***
Q8.3 <--- Variety .687 .079 8.675 ***
Q8.2 <--- Variety 1.127 .110 10.275 ***
Q8.1 <--- Variety 1.238 .118 10.494 ***
Q9.11 <--- Virtuality 1.000
Q9.9 <--- Virtuality 1.163 .086 13.477 ***
Q9.8 <--- Virtuality 1.138 .084 13.567 ***
Q9.7 <--- Virtuality .863 .063 13.805 ***
Q9.6 <--- Virtuality .914 .065 14.138 ***
Q9.5 <--- Virtuality .585 .058 10.134 ***
Q9.1 <--- Virtuality .791 .074 10.695 ***
Q10.4 <--- Variability 1.000
Q10.6 <--- Variability .634 .091 6.987 ***
Q10.8 <--- Variability .850 .080 10.571 ***
Q10.9 <--- Variability .915 .081 11.326 ***
Q10.10 <--- Variability 1.039 .105 9.858 ***
Q10.11 <--- Variability .883 .076 11.576 ***
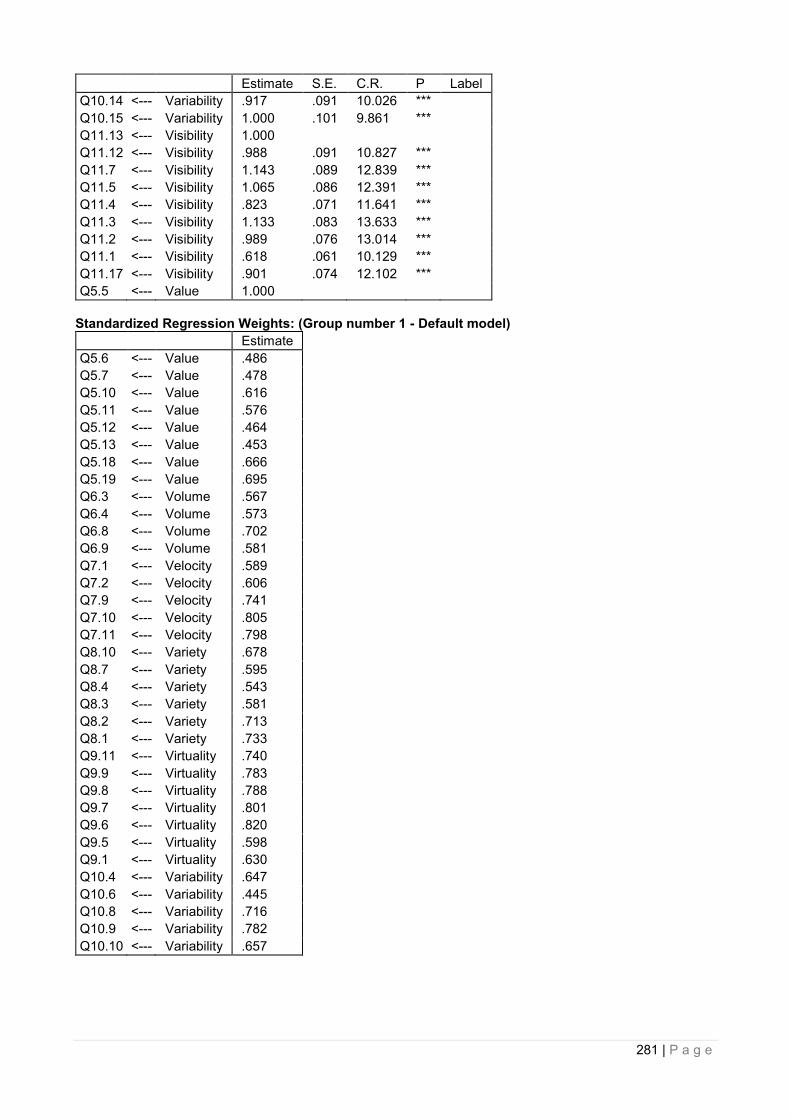
281 | P a g e
Estimate S.E. C.R. P Label
Q10.14 <--- Variability .917 .091 10.026 ***
Q10.15 <--- Variability 1.000 .101 9.861 ***
Q11.13 <--- Visibility 1.000
Q11.12 <--- Visibility .988 .091 10.827 ***
Q11.7 <--- Visibility 1.143 .089 12.839 ***
Q11.5 <--- Visibility 1.065 .086 12.391 ***
Q11.4 <--- Visibility .823 .071 11.641 ***
Q11.3 <--- Visibility 1.133 .083 13.633 ***
Q11.2 <--- Visibility .989 .076 13.014 ***
Q11.1 <--- Visibility .618 .061 10.129 ***
Q11.17 <--- Visibility .901 .074 12.102 ***
Q5.5 <--- Value 1.000
Standardized Regression Weights: (Group number 1 - Default model)
Estimate
Q5.6 <--- Value .486
Q5.7 <--- Value .478
Q5.10 <--- Value .616
Q5.11 <--- Value .576
Q5.12 <--- Value .464
Q5.13 <--- Value .453
Q5.18 <--- Value .666
Q5.19 <--- Value .695
Q6.3 <--- Volume .567
Q6.4 <--- Volume .573
Q6.8 <--- Volume .702
Q6.9 <--- Volume .581
Q7.1 <--- Velocity .589
Q7.2 <--- Velocity .606
Q7.9 <--- Velocity .741
Q7.10 <--- Velocity .805
Q7.11 <--- Velocity .798
Q8.10 <--- Variety .678
Q8.7 <--- Variety .595
Q8.4 <--- Variety .543
Q8.3 <--- Variety .581
Q8.2 <--- Variety .713
Q8.1 <--- Variety .733
Q9.11 <--- Virtuality .740
Q9.9 <--- Virtuality .783
Q9.8 <--- Virtuality .788
Q9.7 <--- Virtuality .801
Q9.6 <--- Virtuality .820
Q9.5 <--- Virtuality .598
Q9.1 <--- Virtuality .630
Q10.4 <--- Variability .647
Q10.6 <--- Variability .445
Q10.8 <--- Variability .716
Q10.9 <--- Variability .782
Q10.10 <--- Variability .657
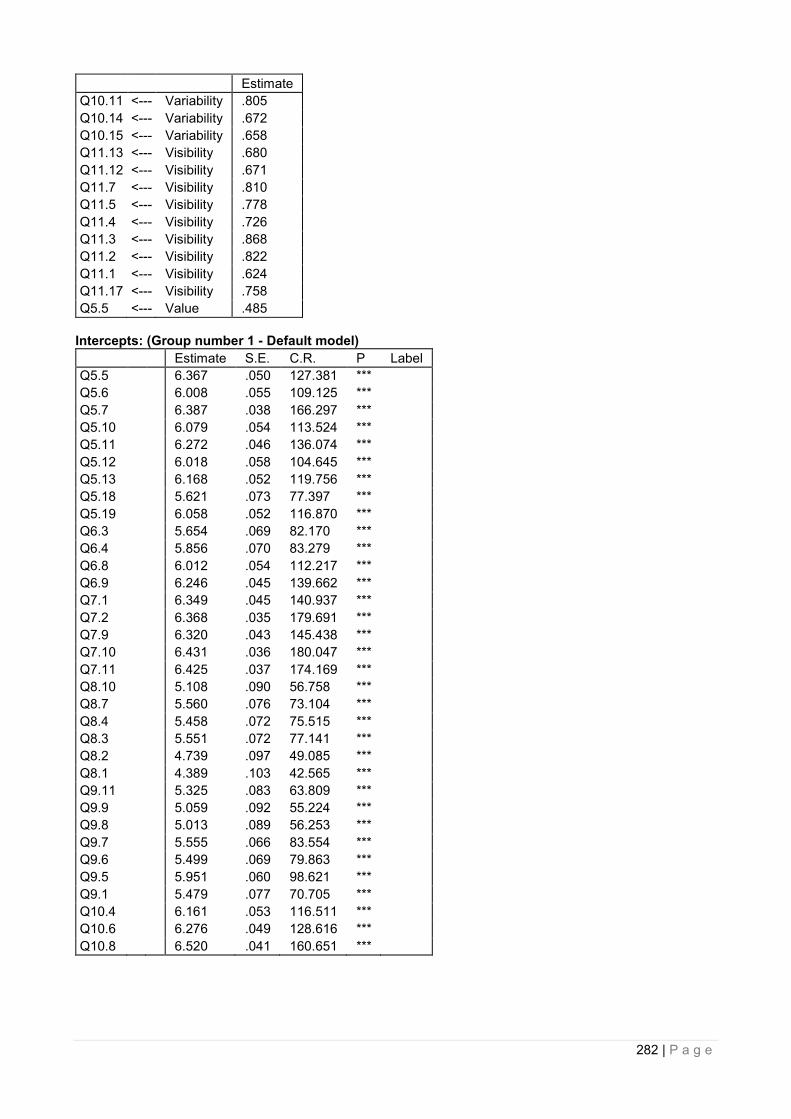
282 | P a g e
Estimate
Q10.11 <--- Variability .805
Q10.14 <--- Variability .672
Q10.15 <--- Variability .658
Q11.13 <--- Visibility .680
Q11.12 <--- Visibility .671
Q11.7 <--- Visibility .810
Q11.5 <--- Visibility .778
Q11.4 <--- Visibility .726
Q11.3 <--- Visibility .868
Q11.2 <--- Visibility .822
Q11.1 <--- Visibility .624
Q11.17 <--- Visibility .758
Q5.5 <--- Value .485
Intercepts: (Group number 1 - Default model)
Estimate S.E. C.R. P Label
Q5.5 6.367 .050 127.381 ***
Q5.6 6.008 .055 109.125 ***
Q5.7 6.387 .038 166.297 ***
Q5.10 6.079 .054 113.524 ***
Q5.11 6.272 .046 136.074 ***
Q5.12 6.018 .058 104.645 ***
Q5.13 6.168 .052 119.756 ***
Q5.18 5.621 .073 77.397 ***
Q5.19 6.058 .052 116.870 ***
Q6.3 5.654 .069 82.170 ***
Q6.4 5.856 .070 83.279 ***
Q6.8 6.012 .054 112.217 ***
Q6.9 6.246 .045 139.662 ***
Q7.1 6.349 .045 140.937 ***
Q7.2 6.368 .035 179.691 ***
Q7.9 6.320 .043 145.438 ***
Q7.10 6.431 .036 180.047 ***
Q7.11 6.425 .037 174.169 ***
Q8.10 5.108 .090 56.758 ***
Q8.7 5.560 .076 73.104 ***
Q8.4 5.458 .072 75.515 ***
Q8.3 5.551 .072 77.141 ***
Q8.2 4.739 .097 49.085 ***
Q8.1 4.389 .103 42.565 ***
Q9.11 5.325 .083 63.809 ***
Q9.9 5.059 .092 55.224 ***
Q9.8 5.013 .089 56.253 ***
Q9.7 5.555 .066 83.554 ***
Q9.6 5.499 .069 79.863 ***
Q9.5 5.951 .060 98.621 ***
Q9.1 5.479 .077 70.705 ***
Q10.4 6.161 .053 116.511 ***
Q10.6 6.276 .049 128.616 ***
Q10.8 6.520 .041 160.651 ***
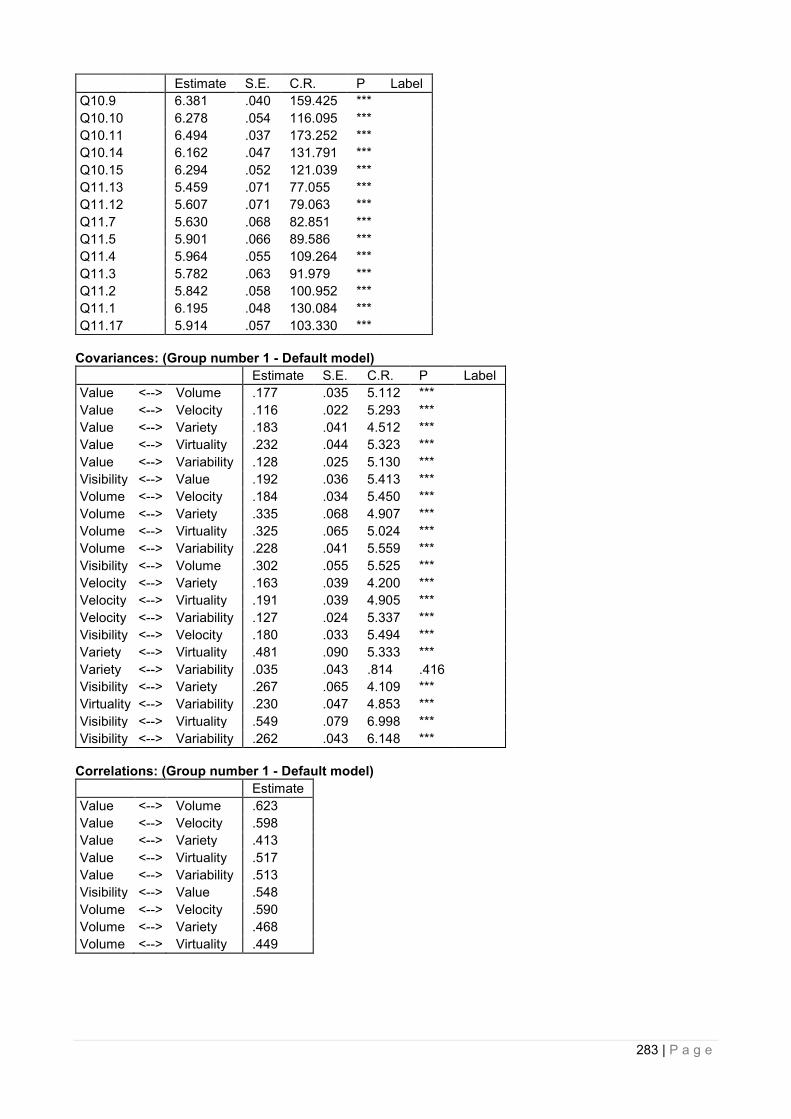
283 | P a g e
Estimate S.E. C.R. P Label
Q10.9 6.381 .040 159.425 ***
Q10.10 6.278 .054 116.095 ***
Q10.11 6.494 .037 173.252 ***
Q10.14 6.162 .047 131.791 ***
Q10.15 6.294 .052 121.039 ***
Q11.13 5.459 .071 77.055 ***
Q11.12 5.607 .071 79.063 ***
Q11.7 5.630 .068 82.851 ***
Q11.5 5.901 .066 89.586 ***
Q11.4 5.964 .055 109.264 ***
Q11.3 5.782 .063 91.979 ***
Q11.2 5.842 .058 100.952 ***
Q11.1 6.195 .048 130.084 ***
Q11.17 5.914 .057 103.330 ***
Covariances: (Group number 1 - Default model)
Estimate S.E. C.R. P Label
Value <--> Volume .177 .035 5.112 ***
Value <--> Velocity .116 .022 5.293 ***
Value <--> Variety .183 .041 4.512 ***
Value <--> Virtuality .232 .044 5.323 ***
Value <--> Variability .128 .025 5.130 ***
Visibility <--> Value .192 .036 5.413 ***
Volume <--> Velocity .184 .034 5.450 ***
Volume <--> Variety .335 .068 4.907 ***
Volume <--> Virtuality .325 .065 5.024 ***
Volume <--> Variability .228 .041 5.559 ***
Visibility <--> Volume .302 .055 5.525 ***
Velocity <--> Variety .163 .039 4.200 ***
Velocity <--> Virtuality .191 .039 4.905 ***
Velocity <--> Variability .127 .024 5.337 ***
Visibility <--> Velocity .180 .033 5.494 ***
Variety <--> Virtuality .481 .090 5.333 ***
Variety <--> Variability .035 .043 .814 .416
Visibility <--> Variety .267 .065 4.109 ***
Virtuality <--> Variability .230 .047 4.853 ***
Visibility <--> Virtuality .549 .079 6.998 ***
Visibility <--> Variability .262 .043 6.148 ***
Correlations: (Group number 1 - Default model)
Estimate
Value <--> Volume .623
Value <--> Velocity .598
Value <--> Variety .413
Value <--> Virtuality .517
Value <--> Variability .513
Visibility <--> Value .548
Volume <--> Velocity .590
Volume <--> Variety .468
Volume <--> Virtuality .449
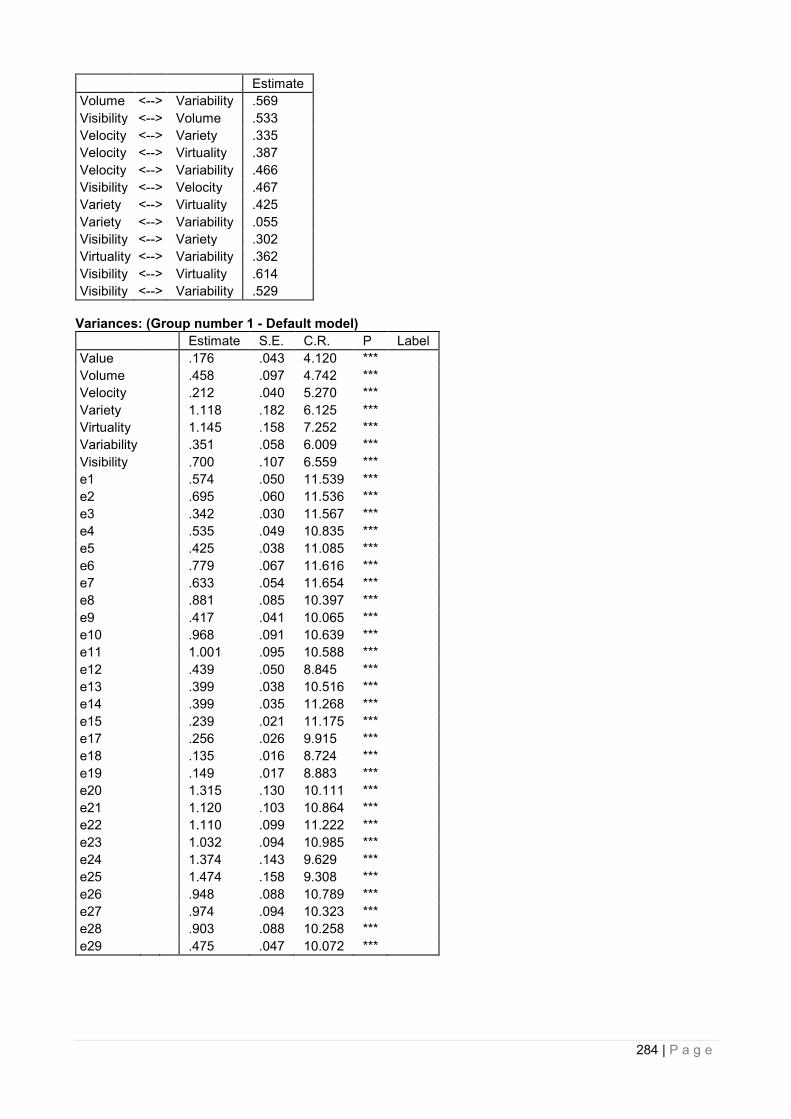
284 | P a g e
Estimate
Volume <--> Variability .569
Visibility <--> Volume .533
Velocity <--> Variety .335
Velocity <--> Virtuality .387
Velocity <--> Variability .466
Visibility <--> Velocity .467
Variety <--> Virtuality .425
Variety <--> Variability .055
Visibility <--> Variety .302
Virtuality <--> Variability .362
Visibility <--> Virtuality .614
Visibility <--> Variability .529
Variances: (Group number 1 - Default model)
Estimate S.E. C.R. P Label
Value .176 .043 4.120 ***
Volume .458 .097 4.742 ***
Velocity .212 .040 5.270 ***
Variety 1.118 .182 6.125 ***
Virtuality 1.145 .158 7.252 ***
Variability .351 .058 6.009 ***
Visibility .700 .107 6.559 ***
e1 .574 .050 11.539 ***
e2 .695 .060 11.536 ***
e3 .342 .030 11.567 ***
e4 .535 .049 10.835 ***
e5 .425 .038 11.085 ***
e6 .779 .067 11.616 ***
e7 .633 .054 11.654 ***
e8 .881 .085 10.397 ***
e9 .417 .041 10.065 ***
e10 .968 .091 10.639 ***
e11 1.001 .095 10.588 ***
e12 .439 .050 8.845 ***
e13 .399 .038 10.516 ***
e14 .399 .035 11.268 ***
e15 .239 .021 11.175 ***
e17 .256 .026 9.915 ***
e18 .135 .016 8.724 ***
e19 .149 .017 8.883 ***
e20 1.315 .130 10.111 ***
e21 1.120 .103 10.864 ***
e22 1.110 .099 11.222 ***
e23 1.032 .094 10.985 ***
e24 1.374 .143 9.629 ***
e25 1.474 .158 9.308 ***
e26 .948 .088 10.789 ***
e27 .974 .094 10.323 ***
e28 .903 .088 10.258 ***
e29 .475 .047 10.072 ***
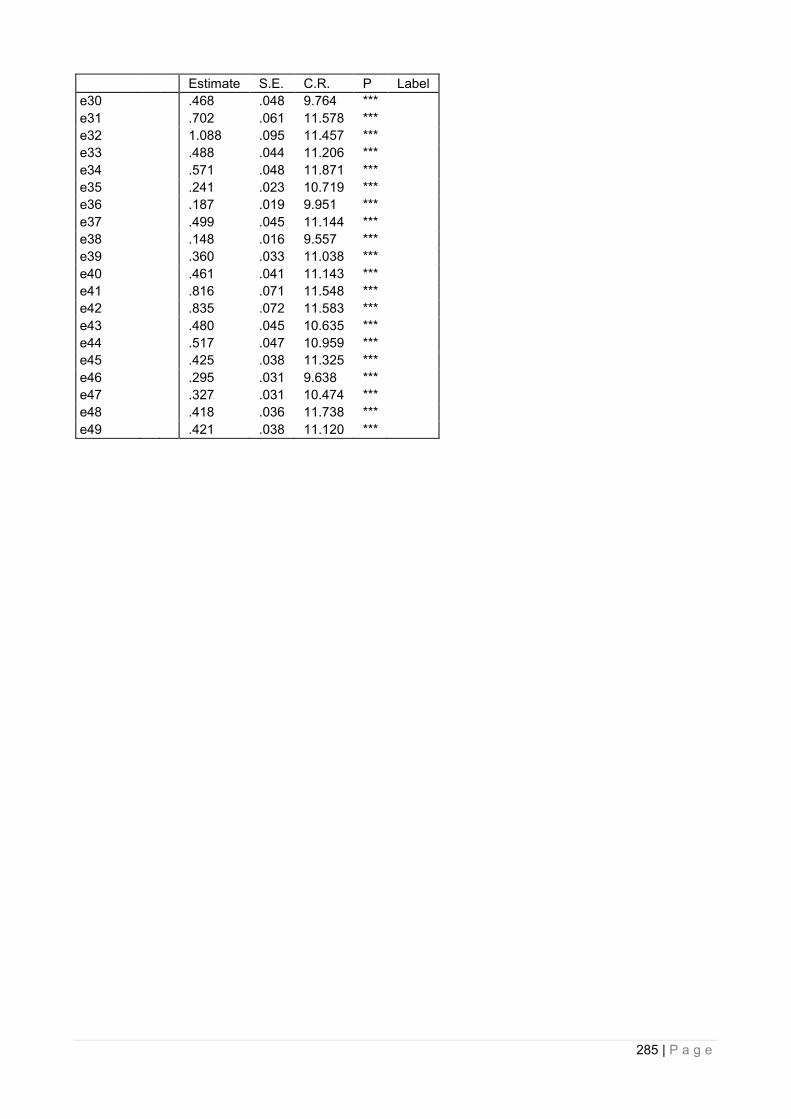
285 | P a g e
Estimate S.E. C.R. P Label
e30 .468 .048 9.764 ***
e31 .702 .061 11.578 ***
e32 1.088 .095 11.457 ***
e33 .488 .044 11.206 ***
e34 .571 .048 11.871 ***
e35 .241 .023 10.719 ***
e36 .187 .019 9.951 ***
e37 .499 .045 11.144 ***
e38 .148 .016 9.557 ***
e39 .360 .033 11.038 ***
e40 .461 .041 11.143 ***
e41 .816 .071 11.548 ***
e42 .835 .072 11.583 ***
e43 .480 .045 10.635 ***
e44 .517 .047 10.959 ***
e45 .425 .038 11.325 ***
e46 .295 .031 9.638 ***
e47 .327 .031 10.474 ***
e48 .418 .036 11.738 ***
e49 .421 .038 11.120 ***