Development of Math Anxiety Rating Scale
27
Math Anxiety Rating Scale Development of Math Anxiety Rating Scale Draper, Shaira Liwanag, Anette L. Serafico, Monique Anne Villafuerte, Arianne Joie St. Paul University Manila
Transcript of Development of Math Anxiety Rating Scale

Math Anxiety Rating Scale
Development of Math Anxiety Rating Scale
Draper, Shaira
Liwanag, Anette L.
Serafico, Monique Anne
Villafuerte, Arianne Joie
St. Paul University Manila
Math Anxiety Rating Scale
Abstract
Math Anxiety is the main subject of this scale development paper. A group of researchers have
come up to develop a Math Anxiety Rating Scale because of the gaps they have found on the
past researches about the Math Anxiety Test. A test consisting of 30 items were constructed by
the researchers through following and understanding underlying constructs and theories that
cover Math Anxiety. Therewith, two main dimensions that serve as the factors of encountering
Math Anxiety, those are the Cognitive dimension and the Affective Dimension. From the past
researches, there have been arguments on what really are the factors that cover Math Anxiety.
That was the gap that the researchers were trying to answer in. Samples of 291 non-math major
college students were the respondents of the Math Anxiety Rating Scale. The test was conducted
with two different approaches. Data gathering was simultaneously done through (1) Direct
Approach; paper-and-pencil-test wherein they and (2) through online testing. The data were
encoded to IBM software called SPSS. This tool was able to help the researchers find out the
result on the different statistical techniques. Relevant results from the SPSS made the researchers
to go back again to their test and observe if there must be items to be eliminated. Statistical
results such, Cronbach Alpha .970, suggested a good internal consistency estimate of items.
KMO Measure, .963 suggesting an acceptable sampling adequacy, Bartlett’s Test of Spherecity
as 0.000. As a conclusion, this current study can still be developed and improved. There were
evident conflicts between the theoretical basis of the researchers and the results given by the
SPSS.

Math Anxiety Rating Scale
Development of Math Anxiety Rating Scale
A group of college students have come up with scale development paper that focuses the
anxiety of (also) college students towards Math in Academic setting. As defined, Mathematics,
either can be a major subject or a minor subject to college students significantly gives anxiety
especially in school (academic setting) when doing activities such as homeworks, boardworks in
a class discussion and seatworks after a series of lessons in Mathematics. Mathematics is a
subject which elicits many different attitudes and feelings.
Among these attitudes are general feelings towards the subject, such as liking or
enjoyment, and more specific attitudes such as confidence and anxiety. There is a considerable
body of studies which examines attitudes towards mathematics, one of the earliest reviews being
that by Feierabend (1960, in Aiken, 1970) A marked increase in the number of articles and
dissertations in the ten years following Feierabend's report provided the stimulus for a
reappraisal by Aiken (1970). As anxiety and mathematics have been combined to for a one
construct which what we call Math Anxiety, we can simply define that this math anxiety often
leads to avoidance of math by those who experience it and it is noticeable that students who are
anxious, bored and fearful towards math or who do not comprehend the importance of math in
professional and personal life are the once most likely to avoid the study of math.
In this present study of the researchers, they have found the two main constructs that
cover Math Anxiety. A multidimensional rating scale is developed to find out if really is these
two factors affect anxiety towards Mathematics and these two dimensions are the Cognitive
Factor and the Affective Factor.

Math Anxiety Rating Scale
A lot of scales were developed and constructed to measure an individual’s math anxiety.
In this research paper, a Math Anxiety Scale is being developed. Through underlying theories
that make up this Math Anxiety Scale and definitions of constructs, the researchers will be able
to construct and even more, develop a Math Anxiety Scale with multi-dimensions.
Construct and Construct Definition
Math Anxiety is found to have no single underlying theory. There is a noticeable lack of
any clear theoretical basis for mathematics anxiety, in either the research or the treatment
literature. Parallel to this, there also no single and fixed definition that could describe Math
Anxiety. However, there were authors and theorists that gave Math Anxiety specific definitions
despite of it, being a wide range of study. Math Anxiety was not only described through a single
dimension or a factor. Since there were theoretical considerations, researchers found that there
are number of theories which might be applicable, these being general anxiety theories and
theories taken from the field of test anxiety.
Considerations to these many applicable theories lead the researchers to define Math
Anxiety with two dimensions; Cognitive and Affect.
Mathematics
Mathematics is a subject which elicits many different attitudes and feelings. Among these
attitudes are general feelings towards the subject, such as liking or enjoyment, and more
specific attitudes such as confidence and anxiety. Feierabend (1960, in Aiken, 1970
Math Anxiety

Math Anxiety Rating Scale
Feelings of tension and anxiety that interefere with the manipulation of numbers and
the solving of mathematical problems in a wide variety of ordinary life and academic
situations (Richardson and Suinn, 1972).
Affective Anxiety
Refers to the emotional component of anxiety, feelings of nervousness, tension, dread,
fear, and unpleasant physiological reactions to testing situaions
Cognitive Anxiety
Refers to the worry component of anxiety, which often displayed through negative
expectation, preoccupation with and self-deprecatory thoughts about an anxiety-causing
situation.
Review of Literature
Mathematics. Mathematics is the science of quantity. It is the classification and study of
all possible patterns (Sawyer, 1995). Mathematics is also a gateway to engineering, scientific and
technological fields (Mahmood, 2011). Mathematics, either can be a major subject or a minor
subject to college students significantly gives anxiety especially in school (academic setting)
when doing activities such as home works, board works in a class discussion and seat works after
a series of lessons in Mathematics. Mathematics is a subject which elicits many different
attitudes and feelings. Among these attitudes are general feelings towards the subject, such as
liking or enjoyment, and more specific attitudes such as confidence and anxiety. There is a
considerable body of studies which examines attitudes towards mathematics, one of the earliest
reviews being that by Feierabend (1960, in Aiken, 1970) A marked increase in the number of
articles and dissertations in the ten years following Feierabend's report provided the stimulus for

Math Anxiety Rating Scale
reappraisal by Aiken (1970). As anxiety and mathematics have been combined to for a one
construct which what we call Math Anxiety, we can simply define that this math anxiety often
leads to avoidance of math by those who experience it and it is noticeable that students who are
anxious, bored and fearful towards math or who do not comprehend the importance of math in
professional and personal life are the once most likely to avoid the study of math. A lot of scales
were developed and constructed to measure an individual’s math anxiety. In this research paper,
a Math Anxiety Scale is being developed. Through underlying theories that make up this Math
Anxiety Scale and definitions of constructs, the researchers will be able to construct and even
more, develop a Math Anxiety Scale with multi-dimensions. Math Anxiety is found to have a no
single underlying theory. There is a noticeable lack of any clear theoretical basis for mathematics
anxiety, in either the research or the treatment literature. Parallel to this, there also no single and
fixed definition that could describe Math Anxiety. However, there were authors and theorists that
gave Math Anxiety specific definitions despite of it, being a wide range of study. Math Anxiety
was not only described through a single dimension or a factor. Since there were theoretical
considerations, researchers found that there are number of theories which might be applicable,
these being general anxiety theories and theories taken from the field of test anxiety.
Considerations to these many applicable theories lead the researchers to define Math Anxiety
with two dimensions; Cognitive and Affect. Test anxiety and mathematics anxiety were among
the different types of anxiety being studied in the 1950's and since that time mathematics anxiety
research has grown in parallel with, although lagging slightly behind, research in the field of test
anxiety. In spite of an apparently close relationship between mathematics anxiety and test
anxiety there has been less cross-fertilization between these two fields than would be expected.
Of the many researchers into test anxiety only Suinn (1970, 1971, 1972, 1982, 1988) and
Math Anxiety Rating Scale
Richardson (1972, 1973, 1980) appear to have shown a consistent interest in mathematics
anxiety. Other theory of test anxiety involves its dimensionality. Where areas test anxiety was
originally seen as a unidimensional construct. Libert and Morris (1967) were first to propose a
two-factor model of test anxiety that distinguished between an affective “emotionality” and a
cognitive worry dimension of test anxiety. More recently, Deffenbacher has noted that
emotionality may relate more to the degree of awareness or attention paid to affective-
autonomic arousal rather than to the level of arousal per se (1980, p. 123). According to
Richadson and Suinn (1972), feelings of tension and anxiety interfere with the manipulation of
numbers and the solving of mathematical problems in a wide variety of ordinary life and
academic situations. Liebert and Morris (1967) distinguished two components of math anxiety;
affective and cognitive. Affective Anxiety refers to the emotional component of anxiety, feelings
of nervousness, tension, dread, fear, and unpleasant physiological reactions to testing situations.
Cognitive Anxiety refers to the worry component of anxiety, which often displayed through
negative expectation, preoccupation with and self-deprecatory thoughts about an anxiety-causing
situation.
Measurement and Dimensionality of Mathematics Anxiety
By: James B. Rounds, Jr., and Darwin D. Hendel
The purpose of this study was to examine the dimensionality of one such measure of
mathematics anxiety, the Mathematics Anxiety Rating Scale (MARS). The results of the study
indicated that contrary to previous statements (Richardson & Suinn, 1972), mathematics anxiety
as measured by the MARS is not a unidimensional construct. Two factors were identified and
labeled Mathematics Test Anxiety and Numerical Anxiety. The results of this study suggest that

Math Anxiety Rating Scale
for the female sample, the domain of mathematics anxiety as measured by the MARS is best
described not as anxiety about everyday numerical manipulation, but primarily as test anxiety
and secondarily as anxiety associated with mathematics courses. The data indicate that the
female participants were relatively unconcerned about numerical manipulation in the context of
daily activities. The distribution of the Mathematics Test Anxiety Scale and Numerical Anxiety
Scale scores indicate that anxiety about mathematics is situationally specific and not Tran
situational. Also, the article suggests that the usefulness of present instrumentation of
mathematics anxiety is hampered by the lack of an adequate definition of mathematics. Results
also said that mathematics anxiety as conceptualized by Richardson and Suinn (1972) can be
measured with the factor-derived scales. Compared to the 98-item MARS, these two 15-item
factor-derived scales will take less time to complete. Since the assessment of a client's status
with multifactorial rather than uni-factorial measures may mask changes, Bergin and Lambert
(1978) have recommended the development of indices that are more situation specific than the
presently used global-improvement indices. Another assessment tool that may be helpful for
participants in mathematics anxiety treatment programs is a measure of test anxiety. Results from
the present study also showed that the participants were almost as apprehensive about tests in
general as tests in particular (i.e., mathematics tests). The MARS factor-derived scales provide
descriptive information; they do not provide explanations of anxiety about mathematics.
Attention to the client's background data can be useful in exploring possible explanations, as for
example, in the present study in which a mean of 16.5 years had elapsed since the participants
had had formal mathematics training. It is a reasonable assumption that anxiety about
mathematics can occur when future career and educational goals in part depend on success in
mathematics courses for which an individual feels inadequately prepared and insufficiently

Math Anxiety Rating Scale
experienced. Until more is known about the characteristics of individuals who elect to enter
mathematics-anxiety treatment programs, counselors may want to supplement the MARS factor-
derived scales with other types of measures (e.g., mathematics attitude scales, mathematics skill
tests) to aid in the description of individual constellations of mathematics difficulties. The
application of multimodal treatment plans (see Mathison, Note 1) emphasizing some
combination of remediation or math-skills building, mathematics curricular intervention (e.g.,
math labs, individualized instruction), and psychological intervention seems to be sound strategy
for counselors involved in mathematics-anxiety treatment programs. In terms of psychological
intervention, it should be noted that the cognitive and self-control treatments as presented by
Suinn and Richardson (1971) and Hendel and Davis (1978) seem more effective in reducing
mathematics anxiety than do insight-oriented counseling and systematic desensitization.
Mathematics anxiety has been postulated—especially for women—to affect enrollment in
mathematics courses, learning of mathematics, and mathematics performance, thereby affecting
a student's educational and career goals. These results and the results from this study suggest that
the concept and/or measures of mathematics anxiety may need revision to be of sufficient value
to enrich our understanding of mathematics learning and performance.
www.researchgate.net/...Rounds/.../0912f5123d9e6bd134000000.pdf
The Affective and Cognitive Dimensions of Math Anxiety: A Cross-National Study
By: Hsiu-Zu Ho, Deniz Senturk, Amy G. Lam, Jules M. Zimmer, Sehee Hong, and Yukari
Okamoto

Math Anxiety Rating Scale
This study focuses on math anxiety, comparing its dimensions, levels, and relationship with
mathematics achievement across samples of 6th-grade students from China, Taiwan, and the
United States. First, the study fills in research gaps showing that the heuristic distinction between
affective and cognitive dimensions of math anxiety found in the United States is also relevant for
samples in other nations, specifically China and Taiwan. Second, the findings also generalize the
negative effect of math anxiety, specifically the affective factor, on mathematics achievements in
samples in China and Taiwan. Given the possibility that the high-achieving Asian students may
not experience debilitating math anxiety, the finding that affective math anxiety was also a
debilitating factor in mathematics performance in Asian samples is significant. The distinction
between affective and cognitive effects on performance has important implications for
intervention strategies. The study cannot presume that the etiology of math anxiety is the same
across the three cultures; hence further research would be needed to examine the effectiveness of
such interventions in reducing math anxiety in Asian students. Although the desirability of
facilitative tensions in learning situations is recognized, environments that provoke nervousness,
dread, and fear are not in the best interest of students.
http://mina.education.ucsb.edu/ho/documents/%2338.pdf
Current Study
According to Bergin and Lambert (1978), the development of indices that are more
situation specific than the presently used global-improvement indices would be more useful. This
gap was not filled by further scale developments made so the researchers came to a decision to
make a scale about specific setting: academic. Mathematics, either can be a major subject or a
minor subject to college students significantly gives anxiety especially in school (academic

Math Anxiety Rating Scale
setting) when doing activities such as home works, board works in a class discussion and seat
works after a series of lessons in Mathematics. Tertiary students have been chosen due to lack of
thorough studies about Math Anxiety which particularly concentrates on them. In the previous
studies, lack of attention towards the clients’ backgrounds has been suggested to be given more
focus. Clients’ backgrounds can be useful in providing sufficient explanations as to why these
people have this anxiety towards math. In line with this, future researches can be made by
finding these explanations that would lead to the advancements of solutions and treatments that
could alleviate math difficulties/anxieties. With this gap, the researchers have chosen non-math
major college students as their primary source of data and subjects. Non-math major college
students might be helpful in providing more concrete explanations as to why they are anxious
towards math (e.g. think they lack of advanced mathematical training). Another gap observed is
the clarification of the potential distinction between cognitive anxiety that serves as a facilitator
and cognitive anxiety that is a debilitator but the researchers have not focused on this particular
opening.
The researchers have observed research gaps to fill in the course of the Math Anxiety
Scale history. A lot of scales were developed and constructed to measure an individual’s math
anxiety. Through underlying theories that make up this Math Anxiety Scale and definitions of
constructs, the researchers will be able to construct and even more, develop a Math Anxiety
Scale with multi-dimensions: affective and cognitive. The main purpose of this scale
development is to develop a scale which is directed to measure Math Anxiety of Non-math major
tertiary students. In the hope of promoting further research that will advance understanding of
the relationship between anxiety of students towards math and their goal/career orientation.
Math Anxiety Rating Scale
Item Writing
The researchers have conducted a thorough study about Math Anxiety in educational setting,
brought up relevant data about the construct, review of related literature, defining the construct
Math Anxiety as feelings of tension and anxiety that interfere with the manipulation of numbers
and the solving of mathematical problems in a wide variety of ordinary life and academic
situations. (Richardson and Suinn, 1972) With the gathered theory, the items are brought up by
the following manifestations and attitudes when anxiety arises. We have come up of two
proponents from our definition and construct by the following:
1. Affective Anxiety refers to the emotional component of anxiety, feelings of nervousness,
tension, dread, fear, and unpleasant physiological reactions to testing situations. (Liebert
and Morris, 1967)
2. Cognitive Anxiety refers to the worry component of anxiety, which often displayed
through negative expectation, preoccupation with and self-deprecatory thoughts about an
anxiety-causing situation. . (Liebert and Morris, 1967)
The researchers formed the test questionnaires that can be an indicator of the two proponents
when solving mathematical equations in educational setting, such as seatwork, board work, class
recitation and homework. Initial item inventory consisted of 30 items. The following proponents:
affective anxiety comprised of 15 items and cognitive component also comprised of 15 items.
(See Appendix A. 1) Expert Validation however revisions were suggested to indicate the
following manifestations as before onset of encountering and solving mathematical equations,
avoid test questionnaires that rather assess self-efficacy, avoid double-negative propositions,
correct grammatical errors and expound ideas. The revised item inventory however remained
consisting of 30 items; Factor 1 (Cognitive) still comprised of 15 items and Factor 2 (Affective)
Math Anxiety Rating Scale
consisted of 15 items. The two dimensions were developed, revised and reviewed carefully
designed in order to avoid overlapping of the formulated definitions and constructs (See
Appendix A. 2)
Method
The researchers made the data gathering possible through two different approaches. First, is by
going room-to-room on different universities and colleges to encourage respondents who are non-math
majors to be part of their study and second, by online testing.
Participants
The data was gathered from 291 Non-math Major College Students, ranging from First to
Senior Year, either private or public of different universities. The sample ranged in age 17-20 to
years. 156 Male (53.61%) and 135 Female (46.39%). The sample was chosen through criterion-
based sampling. The key characteristic needed must be a non-math major undergraduate college
student. They have been picked due to their availability.
Instrument
A group of third year psychology students developed a scale which attempts to measure
anxiety of non-math major college students towards Math. The scale is a two-dimensional tool
which measures the affective and cognitive aspects of math anxiety in academic settings. The
affective dimension asked questions about the emotional component of anxiety while the
cognitive dimensions are questions that referred to the worry component of anxiety which occurs
because of math.
Statements are presented in a negative manner which of consists of the negative behavior,
emotion and attitude they manifests when encountered a Math problem or a question primarily

Math Anxiety Rating Scale
happening inside school, classroom/ class discussions which may applies into doing board
works, recitations and answering seatwork.
In total, there are 30 items and the response format used is the Likert-Type Scale. The
range captures the intensity of the participants’ response: Strongly Disagree, Disagree,
Somewhat Disagree, Somewhat Agree, Agree, and Strongly Agree.
Data Gathering Procedures
An indirect or questionnaire approach consisting of 30 items was used to explore the
following depth dimensions of the study. The data was gathered through online forms and paper-
and-pencil tests. The examiners asked if the participant is a non-math major college student
before he or she could partake into the study. The examiners explained to each participant that he
or she would answer a math anxiety test and all data collected would be given with outmost
confidentiality. The test only took about fifteen minutes or less of the participants’ time. None of
the participants was paid for participating and they partook voluntarily.
All responses collected in the online forms are encoded automatically through Microsoft Excel
Worksheets while the paper-and-pencil tests data were encoded manually.
Data Analysis
An IBM tool called SPSS was used to determine different statistical elements or to
present statistical analysis. This consists of the discussion of the different descriptive statistical
techniques used to compute for the Mean, Standard Deviation Skewness and Kurtosis.
Math Anxiety Rating Scale
The Mean is the arithmetic mean across the observations. It is the most widely used
measure of central tendency. On getting the mean, it does not only gives you the total summation
mean of all the items rather each mean of the 30 items of the Math Anxiety Rating Scale. On the
other hand, Standard Deviation is the square root of the variance. It measures the spread of a set
of observations. The larger the standard deviation is, the more spread out the observations are.
We define Skewness as the measure of the degree and direction of asymmetry. A symmetric
distribution such as a normal distribution has a skewness of 0, and a distribution that is skewed to
the left, e.g. when the mean is less than the median, has a negative skewness. Related to
Skewness is another technique known as Kurtosis. Kurtosis on the other is
In determining the number of factors the researchers still chose their conceptualization
and the theory of constructs they have researched although it can be also be distinguished
through a scree plot on which on the result they got from SPSS is only one (1) factor. The elbow
of the scree plot falls on one (1) which means there is only one factor. Promax, on the other way
around which is a good method for the items of the rating scale which is a Multidimensional with
highly correlated factors. Based also on the conceptualization of the researchers, the Cognitive
Factor and the Affective factor which are the two dimensions of the test show a high correlation.
Theoretically speaking, there are only few distinguishable differences from these two factors.
Nevertheless, they still differ psychologically. On developing a rating scale, sample is very
relevant. A method called Kaiser-Meyer-Olkin was used to determine if the sample was
adequate. Note that the value of KMO must be greater than .05 (>.0.5) to prove that the sample
was adequate. After identifying and knowing if the sample was adequate, it is important also to
know if there really is enough correlation among the items. The researchers used the Bartlett’s
Test of Sphericity. KMO & Bartlett’s Test of Sphericity is a measure of sampling adequacy that

Math Anxiety Rating Scale
is recommended to check the case to variable ratio for the analysis being conducted. In most
academic and business studies, KMO & Bartlett’s test play an important role for accepting the
sample adequacy. While the KMO ranges from 0 to 1, the world-over accepted index is over 0.6.
Also, the Bartlett’s Test of Sphericity relates to the significance of the study and thereby shows
the validity and suitability of the responses collected to the problem being addressed through the
study. For Factor Analysis to be recommended suitable, the Bartlett’s Test of Sphericity must be
less than 0.05. An Exploratory Factor analysis was done by the reaserchers to find out and see
the results of the different techniques on in descriptive statistics (mean, sd, Skewness and
Kutosis). EFA may require many different analyses involving different numbers of factors,
different types of rotation, and different sets of items that made the researchers look over again
on their test items because there might be problem on determining the factors of the test. CFA or
Confirmatory Factor Analysis on the other hand is used to test whether measures of a construct
are consistent with a researcher's understanding of the nature of that construct (or factor). The
goal of EFA is to identify factors based on data and to maximize the amount of variance
explained. The researcher is not required to have any specific hypotheses about how many
factors will emerge, and what items or variables these factors will comprise. If these hypotheses
exist, they are not incorporated into and do not affect the results of the statistical analyses. By
contrast, CFA evaluates a priori hypotheses and is largely driven by theory. CFA analyses
require the researcher to hypothesize, in advance, the number of factors, whether or not these
factors are correlated, and which items/measures load onto and reflect which factors. As such, in
contrast to exploratory factor analysis, where all loadings are free to vary, CFA allows for the
explicit constraint of certain loadings to be zero. The EFA does not only gives the descriptive
part, it also aids the researchers for the reduction of items and the rotation. The type of rotation

Math Anxiety Rating Scale
used in the development of the scale is Promax. This was used since the researchers constructed
the scale with two dimensional, or a multidimensional scale with highly correlated factors.
The Cronbach’s Alpha reliability test was used to determine if the established internal
consistency is as good as what the rule stated. Cronbach's alpha is a measure of internal
consistency, that is, how closely related a set of items are as a group. It is considered to be a
measure of scale reliability. A "high" value for alpha does not imply that the measure is
unidimensional. If, in addition to measuring internal consistency, you wish to provide evidence
that the scale in question is unidimensional, additional analyses can be performed. Exploratory
factor analysis is one method of checking dimensionality. Technically speaking, Cronbach's
alpha is not a statistical test - it is a coefficient of reliability (or consistency). A good and
acceptable internal consistency for the factors must be greater than .5 ( n>.5 ).
Results
Descriptive Statistics.
Four Descriptive Statistical techniques were used by the researchers to know the average,
square root of variance and the normality of distribution of the test items (See Appendix B, Table
1). For the mean, the average of the test items range from 2.96- 4.02, considering estimations,
we can say the mean range from 3.00-4.02. This means that from the average score or the mean
of the test items, mostly the answers of the respondents were between “Somewhat disagree” (3)
and “Somewhat agree”(4) following the 6-point Likert Scale in the scale. As for the standard
deviation, the square root of the variance show it ranges from 1.30-1.54, this is the range
measurement of the spread of a set of observations. The larger the standard deviation is, the

Math Anxiety Rating Scale
more spread out the observations are. In Skewness, the highest score gathered from the items is
.408 which falls on the positive skew. Positive skew means that the right tail is longer; the mass
of the distribution is concentrated on the left of the figure. The distribution is said to be right-
skewed, right-tailed, or skewed to the right. Also, a positive skew means that the mode and
median are both higher than the mean (2-4). For Kurtosis, all items resulted a negative kurtosis
the values for asymmetry and kurtosis between -2 and +2 are considered acceptable in order to
prove normal univariate distribution (George & Mallery, 2010).
Factor structure.
For Factor structure, it is important to know if the sample size is enough for the scale
development. Initially, when the researchers entered only a few number of respondents which
mean a small sample size, there were only 89 number of respondents they have encoded KMO
resulted with a saying that it is not yet enough to continue with a series of factor analysis tests
and methods. Until finally they have reached and encoded 291 respondents, KMO result now is
.963. For Kaiser-Meyer-Olkin Measure of Sampling Adequacy, it is already a good and
acceptable score. On the other hand, Bartlett’s Test of Sphericity score is highly significant. The
researchers got a score of 0.000 which is basically lower than 0.001 ( p < 0.001).
For the Keirser criterion, there is a noticeable result if it is compared from the theoretical
framework and constructs of the researchers. The scree plot has shown only one factor. This can
be identified on the elbow of the scree plot, which for this scale falls on one which means that
there must be really one factor. Apparently, there might be switch of conclusions for this because
of the conflict between the factor shown by the Keirser criterion and the proposed number of
factors.
Math Anxiety Rating Scale
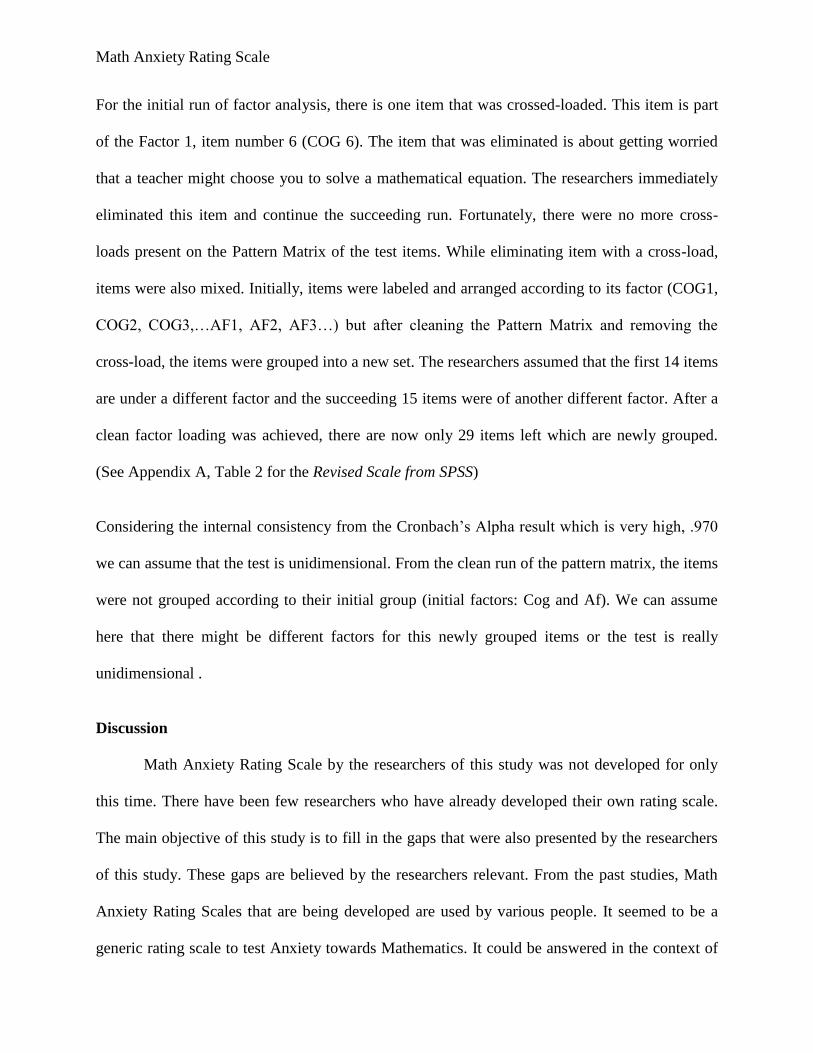
For the initial run of factor analysis, there is one item that was crossed-loaded. This item is part
of the Factor 1, item number 6 (COG 6). The item that was eliminated is about getting worried
that a teacher might choose you to solve a mathematical equation. The researchers immediately
eliminated this item and continue the succeeding run. Fortunately, there were no more cross-
loads present on the Pattern Matrix of the test items. While eliminating item with a cross-load,
items were also mixed. Initially, items were labeled and arranged according to its factor (COG1,
COG2, COG3,…AF1, AF2, AF3…) but after cleaning the Pattern Matrix and removing the
cross-load, the items were grouped into a new set. The researchers assumed that the first 14 items
are under a different factor and the succeeding 15 items were of another different factor. After a
clean factor loading was achieved, there are now only 29 items left which are newly grouped.
(See Appendix A, Table 2 for the Revised Scale from SPSS)
Considering the internal consistency from the Cronbach’s Alpha result which is very high, .970
we can assume that the test is unidimensional. From the clean run of the pattern matrix, the items
were not grouped according to their initial group (initial factors: Cog and Af). We can assume
here that there might be different factors for this newly grouped items or the test is really
unidimensional .
Discussion
Math Anxiety Rating Scale by the researchers of this study was not developed for only
this time. There have been few researchers who have already developed their own rating scale.
The main objective of this study is to fill in the gaps that were also presented by the researchers
of this study. These gaps are believed by the researchers relevant. From the past studies, Math
Anxiety Rating Scales that are being developed are used by various people. It seemed to be a
generic rating scale to test Anxiety towards Mathematics. It could be answered in the context of
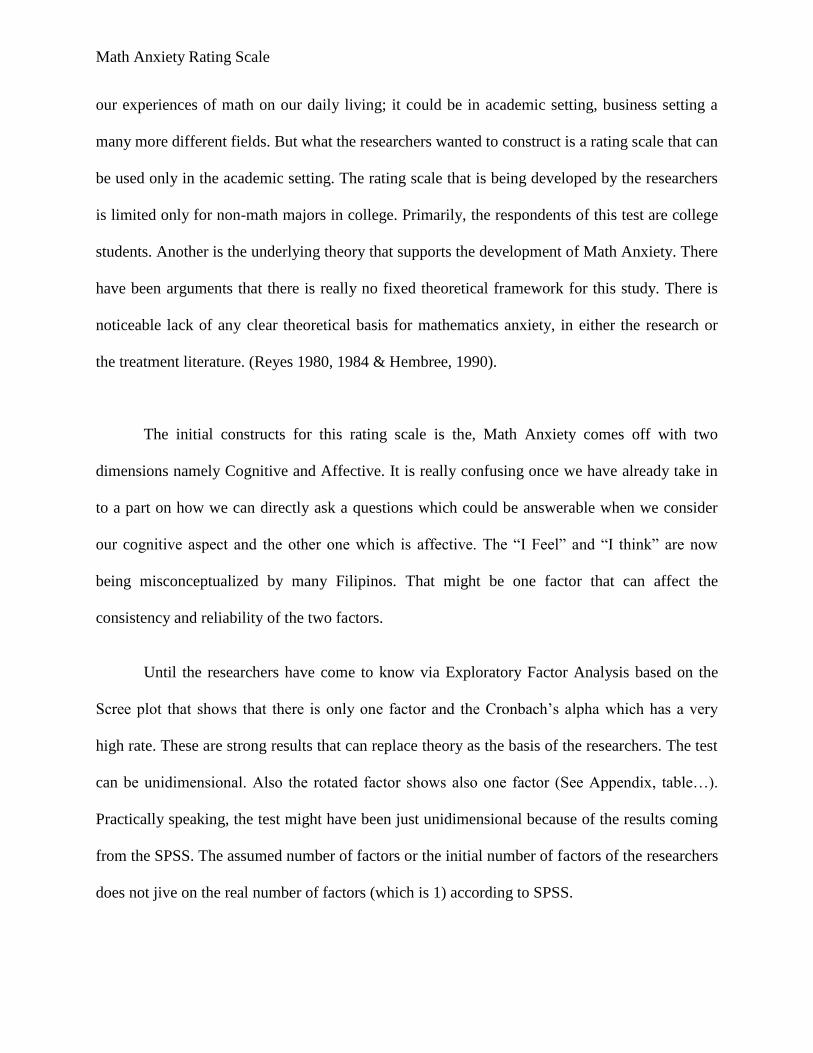
Math Anxiety Rating Scale
our experiences of math on our daily living; it could be in academic setting, business setting a
many more different fields. But what the researchers wanted to construct is a rating scale that can
be used only in the academic setting. The rating scale that is being developed by the researchers
is limited only for non-math majors in college. Primarily, the respondents of this test are college
students. Another is the underlying theory that supports the development of Math Anxiety. There
have been arguments that there is really no fixed theoretical framework for this study. There is
noticeable lack of any clear theoretical basis for mathematics anxiety, in either the research or
the treatment literature. (Reyes 1980, 1984 & Hembree, 1990).
The initial constructs for this rating scale is the, Math Anxiety comes off with two
dimensions namely Cognitive and Affective. It is really confusing once we have already take in
to a part on how we can directly ask a questions which could be answerable when we consider
our cognitive aspect and the other one which is affective. The “I Feel” and “I think” are now
being misconceptualized by many Filipinos. That might be one factor that can affect the
consistency and reliability of the two factors.
Until the researchers have come to know via Exploratory Factor Analysis based on the
Scree plot that shows that there is only one factor and the Cronbach’s alpha which has a very
high rate. These are strong results that can replace theory as the basis of the researchers. The test
can be unidimensional. Also the rotated factor shows also one factor (See Appendix, table…).
Practically speaking, the test might have been just unidimensional because of the results coming
from the SPSS. The assumed number of factors or the initial number of factors of the researchers
does not jive on the real number of factors (which is 1) according to SPSS.

Math Anxiety Rating Scale
Appendix A
Table 1. Math Anxiety Rating Scale Item no.
Factor 1
Item 01
I feel nervous knowing that I will encounter math questions in a class.
Item 02 I am scared of answering any math problem.
Item 03 I feel nervous when my teacher calls me to answer a math problem.
Item 04 I panic the moment I am faced with math equations.
Item 05 I start to get nervous before I present my answers in Math class.
Item 06 I am afraid of attending math classes.
Item 07 I feel uncomfortable when my classmate/s is/are asking me my math answer/s.
Item 08 I feel distressed when I show my math solutions on the board.
Item 09 I feel tension when I am the only who is not yet done answering a math question.
Item 10 I am ashamed of presenting and sharing my answers on a math problem.
Item 11 I am afraid and nervous when I enter a math class.
Item 12 I easily panic when I encounter a math problem that I cannot answer.
Item 13 I feel inflexible before solving math seat works when I am alone.
Item 14 I am apprehensive when the teacher presents a lot of math equations on the board.
Item 15 The thought of answering future math problems frightens me.
Factor 2
Item 16 I feel nervous knowing that I will encounter math questions in a class.
Item 17 I am scared of answering any math problem.
Item 18 I feel nervous when my teacher calls me to answer a math problem.
Item 19 I panic the moment I am faced with math equations.
Item 20 I start to get nervous before I present my answers in Math class.
Item 21 I am afraid of attending math classes.
Item 22 I feel uncomfortable when my classmate/s is/are asking me my math answer/s.
Item 23 I feel distressed when I show my math solutions on the board.
Item 24 I feel tension when I am the only who is not yet done answering a math question.
Item 25 I am ashamed of presenting and sharing my answers on a math problem.
Item 26 I am afraid and nervous when I enter a math class.
Item 27 I easily panic when I encounter a math problem that I cannot answer.
Item 28 I feel inflexible before solving math seat works when I am alone.
Item 29 I am apprehensive when the teacher presents a lot of math equations on the board.
Item 30 The thought of answering future math problems frightens me.
Math Anxiety Rating Scale
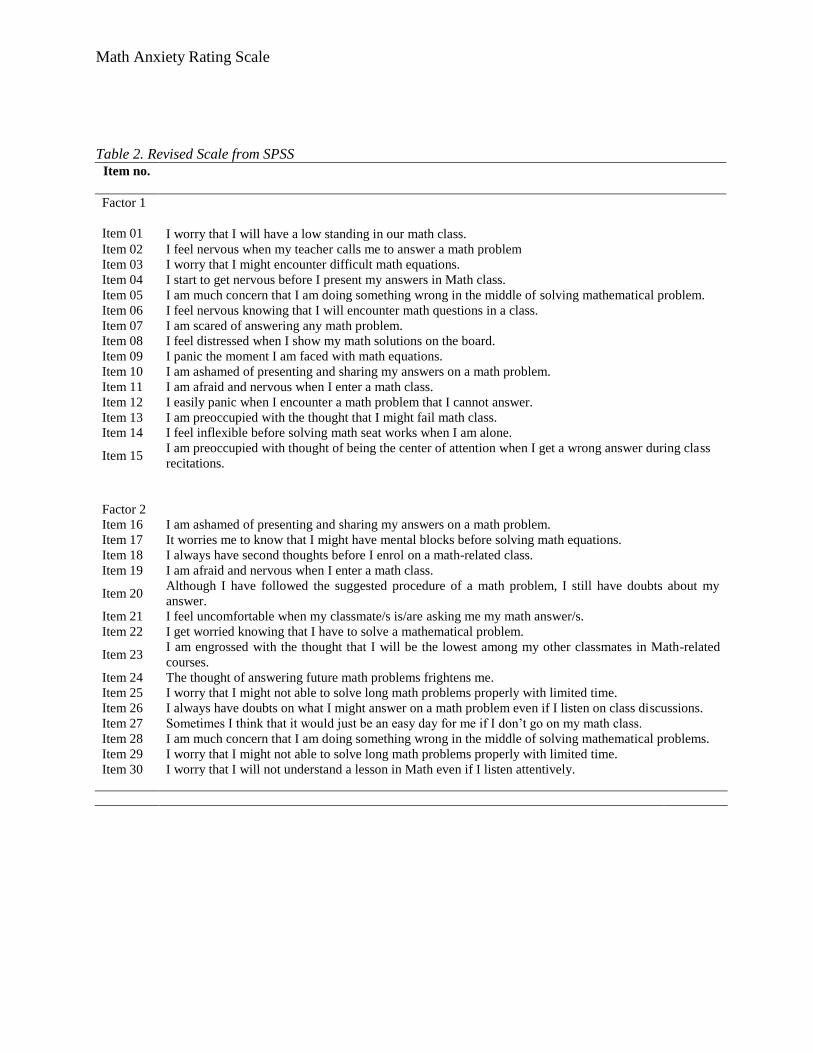
Table 2. Revised Scale from SPSS Item no.
Factor 1
Item 01
I worry that I will have a low standing in our math class.
Item 02 I feel nervous when my teacher calls me to answer a math problem
Item 03 I worry that I might encounter difficult math equations.
Item 04 I start to get nervous before I present my answers in Math class.
Item 05 I am much concern that I am doing something wrong in the middle of solving mathematical problem.
Item 06 I feel nervous knowing that I will encounter math questions in a class.
Item 07 I am scared of answering any math problem.
Item 08 I feel distressed when I show my math solutions on the board.
Item 09 I panic the moment I am faced with math equations.
Item 10 I am ashamed of presenting and sharing my answers on a math problem.
Item 11 I am afraid and nervous when I enter a math class.
Item 12 I easily panic when I encounter a math problem that I cannot answer.
Item 13 I am preoccupied with the thought that I might fail math class.
Item 14 I feel inflexible before solving math seat works when I am alone.
Item 15 I am preoccupied with thought of being the center of attention when I get a wrong answer during class
recitations.
Factor 2
Item 16 I am ashamed of presenting and sharing my answers on a math problem.
Item 17 It worries me to know that I might have mental blocks before solving math equations.
Item 18 I always have second thoughts before I enrol on a math-related class.
Item 19 I am afraid and nervous when I enter a math class.
Item 20 Although I have followed the suggested procedure of a math problem, I still have doubts about my
answer.
Item 21 I feel uncomfortable when my classmate/s is/are asking me my math answer/s.
Item 22 I get worried knowing that I have to solve a mathematical problem.
Item 23 I am engrossed with the thought that I will be the lowest among my other classmates in Math-related
courses.
Item 24 The thought of answering future math problems frightens me.
Item 25 I worry that I might not able to solve long math problems properly with limited time.
Item 26 I always have doubts on what I might answer on a math problem even if I listen on class discussions.
Item 27 Sometimes I think that it would just be an easy day for me if I don’t go on my math class.
Item 28 I am much concern that I am doing something wrong in the middle of solving mathematical problems.
Item 29 I worry that I might not able to solve long math problems properly with limited time.
Item 30 I worry that I will not understand a lesson in Math even if I listen attentively.

Math Anxiety Rating Scale
Appendix B
Table 2. Means, SDs, Skewness, and Kurotsis of Each of the Revised Set of Items
Mean Std. Deviation Skewness Kurtosis
Item1 3.91 1.348 -.370 -.642
Item2 3.95 1.430 -.238 -.931
Item3 3.90 1.423 -.070 -.896
Item4 3.88 1.409 -.163 -.940
Item5 4.02 1.335 -.408 -.537
Item6 3.65 1.390 -.215 -.785
Item7 3.36 1.426 .065 -.768
Item8 3.95 1.312 -.224 -.684
Item9 3.90 1.304 -.212 -.442
Item10 3.88 1.455 -.250 -.798
Item11 3.60 1.433 .003 -.890
Item12 3.51 1.461 .107 -.924
Item13 3.87 1.491 -.246 -.987
Item14 3.41 1.355 .189 -.727
Item15 3.47 1.393 .042 -.924
Item16 3.86 1.349 -.286 -.555
Item17 3.77 1.414 -.250 -.741
Item18 3.79 1.451 -.196 -.900
Item19 3.41 1.458 .131 -.878
Item20 3.67 1.511 -.146 -.920
Item21 3.69 1.448 -.113 -.856
Item22 3.46 1.429 .088 -.830
Item23 3.47 1.453 .167 -.899
Item24 2.96 1.539 .435 -.819
Item25 3.36 1.384 .151 -.759
Item26 3.21 1.482 .141 -1.101
Item27 3.47 1.388 .104 -.830
Item28 3.63 1.344 -.053 -.601
Item29 3.46 1.402 .010 -.836

Math Anxiety Rating Scale
Item FACTOR
No. College Adaptation Statements 1 2
Item 01 My study habits are efficient. 0.774
Item 03 I have developed an effective study skill. 0.717
Item 02 I am able to get sufficient information about matters related to my studies. 0.666
Item 05 I feel competent with my school performance. 0.665
Item 04 I am satisfied with my school’s ambiance. 0.662
Item 08 I perform well in classroom activities. 0.624
Item 06 I could explain what I have learned from class. 0.62
Item 07 I am satisfied with my college experience in general. 0.591
Item 09 I ask my professor when I have not fully understood the lesson. 0.549
Item 10 I get along very well with my classmates.
0.71
Item 11 I have no trouble making friends inside the campus.
0.696
Item 12 I feel confident introducing myself to others.
0.669
Item 16 I am happy with my friends in school.
0.66
Item 13 I have no trouble making friends inside the campus.
0.651
Item 14 I can communicate with my fellow students easily.
0.639
Item 17 I am comfortable interacting with the opposite sex.
0.638
Item 15 I spend some time with my friends after class.
0.613
Item 18 I have been able to make friends with others who are from a different degree
program. 0.598
Item 19 I can approach my classmates easily.
0.571
Item 20 I have genuine friends in the campus.
0.536
Item 21 I handle stress from school efficiently.
Item 22 I remain calm despite numerous school works.
Item 23 I remain calm during class presentations
Item 24 I always think positively about my school requirements.
Item 25 I find time to relax from school works.
Item 26 I feel energized in school.
Item 29 I can easily cope up with stress in school.
Item 27 I can control my emotions even during stressful events in school.
Item 28 I manage to eat regularly despite workloads from school.
Item 30 I feel healthy and fit despite having stress from school.
Item 32 I wouldn’t want to be in another university.
Item 31 I made the right decision in choosing this school.
Item 33 I am satisfied with my college experience in general.

Math Anxiety Rating Scale

Math Anxiety Rating Scale
References
Adams, J., & Corbett, A (2010). Experiences of Traditional and Non-Traditional College
Students. Retrieved from: www.cola.uhn.edu/site/cola.unh.edu
Advisory Committee on Student Financial Assistance (2012). Pathways to Success: Integrating
Learning with Life and Work to Increase National College Completion. Washington DC
: US Department of Education
Atkinson, J. W. (1966). Motivational determinants of risk taking behavior. In J. W. Atkinson &
N. T. Feather (1966), A Theory of Achievement Motivation (pp. 1 l-31). New York:
Wiley.
Bauman, S. S. M., Wang, N., DeLeon, C. W., Kafentsiz, J., Zavala-Lopez, M. A., & Lindsey, M.
S. (2004). Nontraditional students’ service need and social support resources: A pilot
Study. Journal of College Counseling, 7(10), 12-17.
Bean, J., & B. Metzner. 1985. A conceptual model of nontraditional student attrition. Review of
Educational Research, 55, 485-540.
Chao, R., & Good, G. E. (2004). Nontradional students perspective on education: A qualitative
Study. Journal of College Counseling, 7, 5-7.
Choy, S. 2002. Nontraditional Undergraduates. Washington DC: National Center for Education
Statistics.
Cross, K. P. 1981. Adults as Learners: Increasing Participation and Facilitating Learning. San
Francisco: Jossey-Bass.
Dasinger, J. A. (2013). Casual attributions of student success in developmental mathematics.
Journal of Developmental Education, 36(3), 2-12.

Math Anxiety Rating Scale