Deriving utility scores from the SF36 health instrument using Rasch analysis
Upload
khangminh22Category
view
0download
0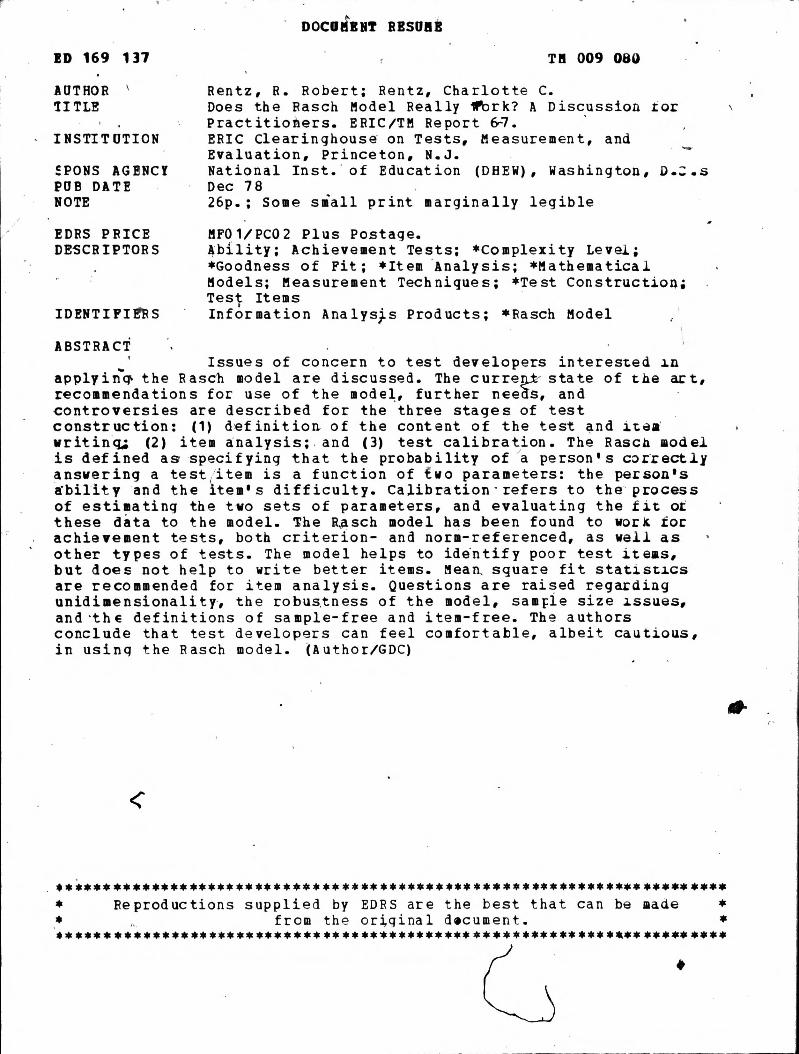
DOCO!lBNT MORE
ED 169 137 T!! 009 080
AUTHOR ` Rentz, R. Robert; Rentz, Charlotte C. TITLE Does the Rasch Model Really Work? A Discussion for
Practitiohers. ERIC/TM Report 64. INSTITUTION ERIC Clearinghouse on Tests, Measurement, and
Evaluation, Princeton, N.J. SPONS AGENCY National Inst. of Education (DHEW) , Washington, D.C.S.PUB DATE Dec 78 NOTE 26p.; Some small print marginally legible
EDRS PRICE MF01/PCO2 Plus Postage. DESCRIPTORS Ability; Achievement Tests; *Complexity Level;
*Goodness of Fit; *Item Analysis; *Mathematical Models; Measurement Techniques; *Test Construction; Test Items
IDENTIFIERS Information Analys}.s Products; *Rasch Model
ABSTRACT Issues of concern to test developers interested in
applying the Rasch model are discussed. The current state of the art, recommendations for use of the model, further needs, and controversies are described for the three stages of test construction: (1) definition of the content of the test and item writing,; (2) item analysis; . and (3) test calibration. The Rasch model is defined as specifying that the probability of a person's correctly answering a test item is a function of two parameters: the person'sability and the item's difficulty. Calibration • refers to the process of estimating the two sets of parameters, and evaluating the fit of these data to the model. The Rasch model has been found to worK for achievement tests, both criterion- and norm-referenced, as well as • other types of tests. The model helps to identify poor test items, but does not help to write better items. Mean, square fit statistics are recommended for item analysis. Questions are raised regarding unidimensionality, the robustness of the model, sample size issues, and the definitions of sample-free and item-free. The authors conclude that test developers can feel comfortable, albeit cautious, in using the Rasch model. (Author/GDC)
E R IC REPORT 67
DOES THERASCH MODEL REALLY WORK?
A DISCUSSION FOR PRACTITIONERS
by R. Robert Rentz and
Charlotte C. Rentz
ERIC CLEARINGHOUSE ON TESTS, MEASUREMENT, & EVALUATION EDUCATIONAL TESTING SERVICE, PRINCETON. NEW JERSEY 08541
The material in this publication was prepared pursuant to a contract with the National Institute of Education,
U.S. Department of Health, Education and Welfare Contractors undertalving such projects under government sponsorship are encouraged to express freely their Judgment in professional and technical matters. Prior to pub-
lication, the manuscript was submitted to qualified professionals for critical review and determination of pro-' fessional competence. This publication has met such standards. Points of view or opinions, however, do not nec-essarily represent the official view or opinions of either these reviewers or the National Institute of Education.
ERIC Clearinghouse on Tests, Measurement, and Evaluation Educational Testing tiers ice
Princeton, NJ 08541
December 1978
INTRODUCTION
To attempt a state-of-the-art review of research related to the Rasch Model is a formidable task. We have an out-of-date listing (nine months old at this writ-ing) of references related to Rasch Modèl topics numbering over 400. This list does not include much of the work being done in Europe and published in non-English sources. We have no intention of conducting a comprehensive review of this rapidly increasing body of literature; rather, our intent is to address ourselves to a few specific issues that might be of concern to those measure-ment practitioners who are interested in applying the Rasch Model.
We intend to take the perspective of a person seeking guidelines for applying the Rasch Model to test-development activities. The paper is organized around certain stages in the test-construction or test-development process, and we will assume the reader is interested in applying the model to that process. These stages are: (I) defining the content of the test and writing the test items; (2) item analysis; and (3) calibrating the test. For each stage we will deal with the current state of knowledge as we see it, offer some recommendations from the literature and our own experience, point out areas where clarification is needed, and call attention to areas of controversy.
A PERSPECTIVE ON THE RASCH MODEL
In this paper, we shall not spend time discussing what the Rasch Model is; there are other sources that treat that topic. In fact, in recent years some por-tion of most articles on the subject has been devoted to a description of the model. A good single source is the summer 1977 special issue of the Journal of Educational Measurement, an issue devoted entirely to latent trait theory,• within which the Rasch Model can be seen as one of several measurement mod-els'. Another general source, available through ERIC, is a monograph pre-pared by Hambleton and his associates for a 1977 AERA symposium. Of course, the considerable work of Benjamin Wright is invaluable for learning what the model is, how model parameters are estimated, how item analysis proceeds, and how tests are designed. We will return to some of Wright's work later. Finally, Georg Rasch's (1960) original hook (now out of print but avail-able in many libraries) should at some point he absorbed 'by the serious stu-dent. Rasch provides some insights into measurement that have not been con-veyed quite the same way since.
The way in which we will deal with the Rasch Model involves the distinction made by Rentz and Bashaw (1977) between test analysis and test construction. Our orientation is that the Rasch Model is primarily a test construction model; that is, it provides a specific theory about those test items'that ought to be used in putting tests together, as well as what the consequences will be in terms of the resulting measurements. Procedures used in Rasch Model item analysis tell the test developer when ¡he model is not working; that is, when there is lack of model-data fit. During test construction, one is' free to discard nonfitting items with the obvious result that the items that are left do, in fact, fit the model. In test construction applications, the model becomes fixed and data are in effect "fitted" to it.
Applications that involve the relationship of the model to existing tests (rather than tests deliberately constructed to fit the model) can be classified as test analysis applications. While we do not intend to deal directly with issues of test analysis, many comments will be related to the question of the robustness of the model, a concept central to application of the model with existing tests, wherein the issue is how well the model works, in spite of violations of the assumptions of the model. Robustness issues are really issues related to the de-gree of model-data fit necessary for application of the model.
The language used by psychometricians when discussing latent trait models in general can be quite confusing to the practitioner new to this area. For this reason, we will define a few terms that will be used throughout this paper.
The Rasch Model specifies that the probability of a person's correctly an-swering a test item is a function of only two'characteristics (parameters)—one for the person and one for the item. The person's characteristic is a variable of interest in a particular measurement application. The person parameter is usually called abilitj', although that term is. rather arbitrary. It could be called achievement, for an achievement test, or aptitude, for an aptitude test. Ability refers to the amount of a particular characteristic the person possesses that enables him or her to answer questions like the ones that comprise the partic-ular test. ' The item's characteristic may be called difficulty. Difficulty is defined as the point on the ability scale at which an examinee has a 50 percent chance of an-swering the item correctly. Thus, items and persons are measured on the same scale.
The processes of estimating two sets of parameters and evaluating fit to the model are referred to as calibration. Item calibration consists of evaluating the fit of items to the model and estimating the difficulty parameter value for each item. Test calibration involves determining the ability scores to be assigned to persons taking the test. For the Rasch Model, this is done by estimating the ability parameter corresponding to each test score (the simple, unweighted, number-right score) rather than estimating a parameter for each individual
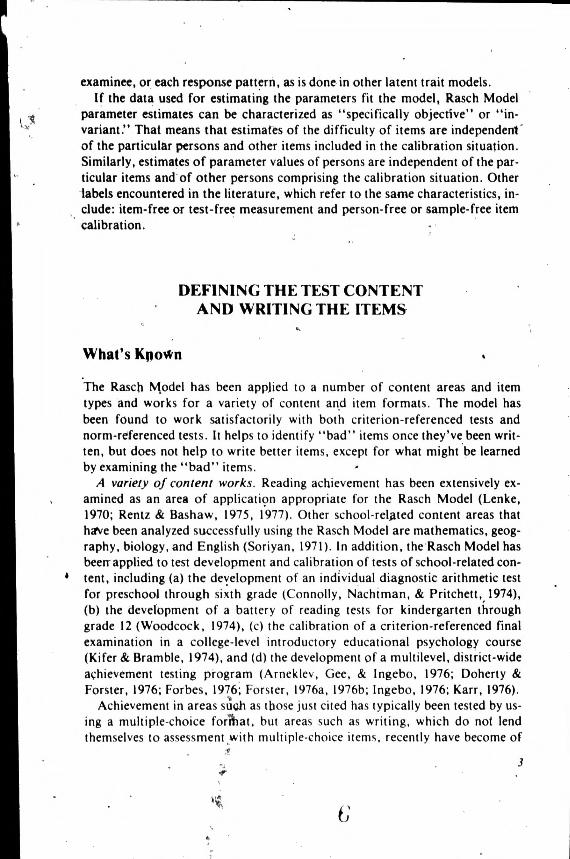
examinee, or each response pattern, as is done in other latent trait models. If the data used for estimating the parameters fit the model, Rasch Model
parameter estimates can be characterized as "specifically objective" or "in-variant." That means that estimates of the difficulty of items are independentof the particular persons and other items included in the calibration situation. Similarly, estimates of parameter values of persons are independent of the par-ticular items and of other persons comprising the calibration situation. Other labels encountered in the literature, which refer to the same characteristics, in-clude: item-free or test-free measurement and person-free or sample-free item calibration.
DEFINING THE TEST CONTENT AND WRITING THE ITEMS
What's Known
The Rasch Model has been applied to a number of content areas and item types and works for a variety of content and item formats. The model has been found to work satisfactorily with both criterion-referenced tests and norm-referenced tests. It helps to identify "bad" items once they've been writ-ten, but does not help to write better items, except for what might be learned by examining the "bad" items.
A variety of content works. Reading achievement has been extensively ex-amined as an area of application appropriate for the Rasch Model (Lenke, 1970; Rentz & Bashaw, 1975, 1977). Other school-related content areas that have been analyzed successfully using the Rasch Model are mathematics, geog-raphy, biology, and English (Soriyan, 1971). In addition, the Rasch Model has been• applied to test development and calibration of tests of school-related con-tent, including (a) the development of an individual diagnostic arithmetic test for preschool through sixth grade (Connolly, Nachtman, & Pritchett, 1974), (b) the development of a battery of reading tests for kindergarten through grade 12 (Woodcock, 1974), (c) the calibration of a criterion-referenced final examination in a college-level introductory educational psychology course (Kifer & Bramble, 1974), and (d) the development of a multilevel, district-wide achievement testing program (Arneklev, Gee, & Ingebo, 1976; Doherty & Forster, 1976; Forbes, 1976; Forster, 1976a, 1976b; Ingebo, 1976; Karr, 1976).
Achievement in areas such as those just cited has typically been tested by us-ing a multiple-choice format, but areas such as writing, which do not lend themselves to assessment with multiple-choice items, recently have become of
some concern to professional educators and the lay public. The Rasch Model has been applied successfully to the assessment of writing ability by several authors (Andrich, 1973; Hake, 1973; R. Rentz, 1971; Wells, 1973) who have developed and/or analyzed essay tests using the Rasch Model. Andrich (1973) presented the mathematical development and estimation procedures for using the Rasch Model tó calibrate raters. Hake (1973) has a working system based on these procedures in which raters are calibrated using standard calibrated essays. The raters can then grade a number of essays, and the scores on the essays can be adjusted for differences in the harshness of the individual raters. The evidence suggests that whenever a complex task can be dichotomized (con-sidered pass or fail), there is the possibility the model will fit.
Other content areas for which there is reason to expect the Rasch Model to work include: Civil Service tests (Durovic, 1970); nurses' exams (Passmore, 1974); environmental perception (Uhl & Briley, 1970); and dental anatomy (Haladyna & Roid, 1976). Garrison, Cohen, and Linden (1977) found the model useful with measures needed for longitudinal 'research on change in affective behaviors of children.
Intelligence or aptitude tests have been found to provide adequate fit to the Rasch Model. Anderson, Kearney, and Everett (1968) found this to be the case for a "spiral omnibus intelligence tesi for military recruits." Brooks (1964) found theRasch Model useful with a multilevel intelligence test at the eighth and tenth grades. The appropriateness of the model for verbal analogy tests has been investigated (with mixed interpretations) by Tinsley (1971), Whitely (1977), Whitely & Dawis (1974), and Wright (1977a).
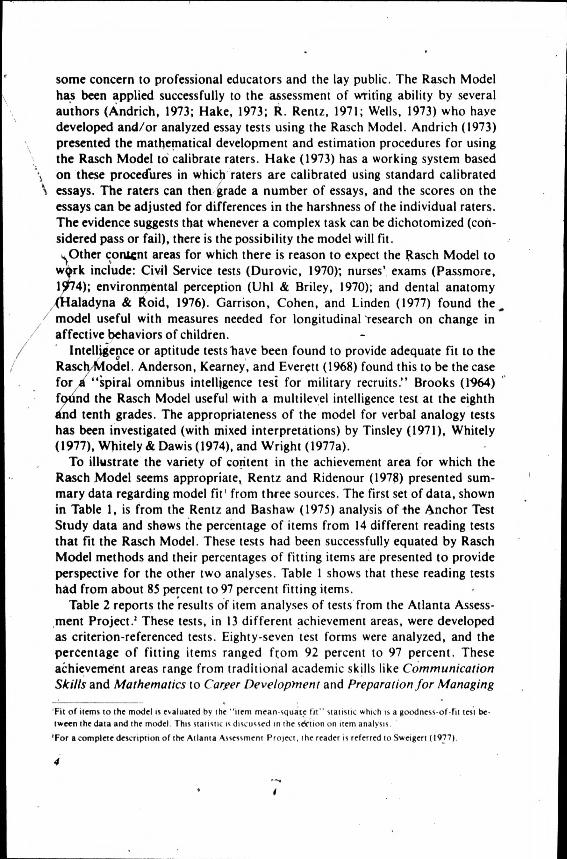
To illustrate the variety of content in the achievement area for which the Rasch Model seems appropriate, Rentz and Ridenour (1978) presented sum-mary data regarding model fit' from three sources. The first set of data, shown in Table 1, is from the Rentz and Bashaw (1975) analysis of the Anchor Test Study data and shows the percentage of items from 14 different reading tests that fit the Rasch Model. These tests had been successfully equated by Rasch Model methods and their percentages of fitting items are presented to provide perspective for the other two analyses. Table 1 shows that these reading tests had from about 85 percent to 97 percent fitting items.
Table 2 reports the results of item analyses of tests from the Atlanta Assess-ment Project.' These tests, in 13 different achievement areas, were developed as criterion-referenced tests. Eighty-seven test forms were analyzed, and the percentage of fitting items ranged from 92 percent to 97 percent. These achievement areas range from traditional academic skills like Communication Skills and Mathematics to Carper Development and Preparation for Managing
'Fit of items to the model is evaluated by the "item mean-squate tn" statistic which is a goodness-of-fit test be-
tween the data and the model. This statistic is discussed in the section on item analysis
'For a complete description of the Atlanta Assessment Project, the reader is referred to Sweigert (1977).

Personal Finance. The tests were all administered to high school seniors. Thé third set of data, shown in Table 3, is from the national standardization
sample of the 1973 edition of the Stanford Achievement Tests. Six levels repre-senting grades 1 through 8, with up to nine subtests per level, were analyzed. Most of the tests (42 of 47) had in excess of 85 percent fitting items; only two
tests fell below 80 percent: Prirpary 1, Vocabulary (78.4 percent) and Primary
III, Spelling (67.4 percent).
Table 1
Item Fit for ATS TestsSecondary Forms—Total Reading
Test Name Calibration Sample Size Number of Items
Percentage of Fitting Items*
California Achievement Tests 3-B 3,809 82 92.7 California Achievement Tests 4-8 1,926 85 88.2 Comprehensive Tests of Basic Skills 2-R 3,289 85 91.8 Comprehensive Tests of Basic Skills 3-R 1,548 85 90.6 Iowa Tests of Basic Skills 10.6 2,095 106 90.6 Iowa Tests of Basic Skills 11.6 2,195 117 94.0 Iowa Tests of Basic Skills 12-6 2,178 122 95.9 Metropolitan Achievement Tests E-G 1,619 95 84.2 Metropolitan Achievement Tests I-G 3,252 95 94.7 Sequential Tests of Educational Progress 4-B 4,637 60 91.7 SRA Achievement Sertes B-F 3,270 90 92.2 SRA Achievement Series G-F 1,467 90 84.4 Stanford Achievement Tests Intermediate I-X 1,261 98 $5.7 Stanford Achievement Tests Intermediate II-X 2,803 112 97.3
••Percentage of items with ti1S• < 2 0, MS• - MS) 1.500 N)
Both criterion-referenced tests and norm-referenced tests have been found to work satisfactorily using the Rasch Model. In addition to the Rentz and Ridenour study previously cited, the literature reports numerous studies of the applicability of the model in development and analysis of both kinds of tests. Because of the way criterion-referenced tests (CRTs) are typically built, one could expect the Rasch Model to work even better with CRTs than with norm-referenced tests (NRTs). The broad range of content and the broad range of ability, which represent the target in an NRT, are likely to affect fit. Fit should be best if the content is relatively homogeneous and the items are relatively easy for examinees; this situation is more typical of CRTs in contrast with survey tests covering several grades.
The model does •not help to write better items. The examination or evalua-tion of fit between the Rasch Model and the,item-analysis data provides the mechanism for identifying items that are bad (do not fit) and, need to be modi-
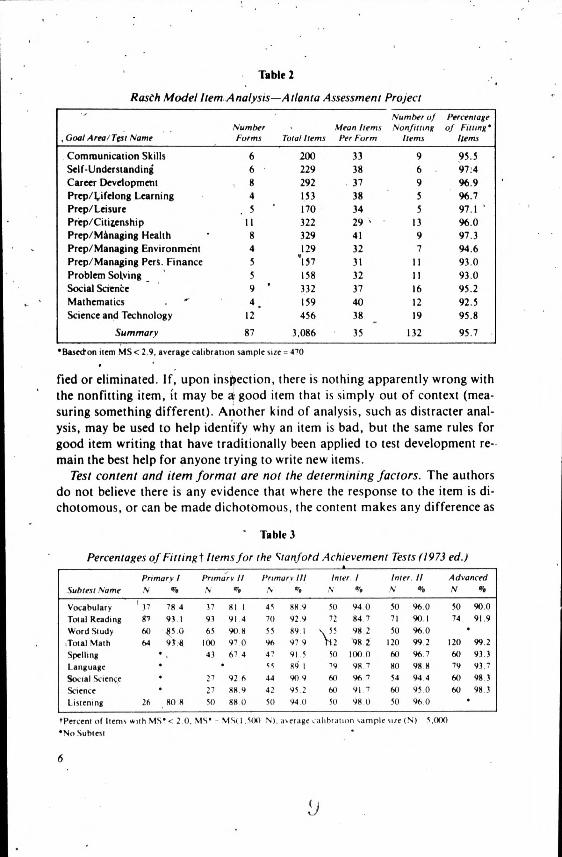
Table 2
Rasch Model Item Analysis-Atlanta Assessment Project
Number of Percentage
,Goal Area/Test Name Number Forms
Mean Items Nonfuting of Fining• Total Items Per Form Items Items
Communication Skills 6 200 33 9 95.5 Self-Understanding 6 229 38 6 97:4 Career Development 8 292 37 9 96.9 Prep/Lifelong Learning 4 153 38 5 96.7 Prep/Leisure 5 170 34 5 97.1 Prep/Citizenship 11 322 29 13 96.0 Prep/Managing Health 8 329 41 9 97.3 Prep/Managing Environment 4 129 32 7 94.6 Prep/Managing Pers. Finance 5 157 31 11 93.0 Problem Solving 5 158 32 11 93.0 Social Science 9 332 37 16 95.2 Mathematics 4 159 40 12 92.5 Science and Technology 12 456 38 19 95.8
Summary 87 3,086 35 132 95.7
•Basedon item MS< 2.9, average calibration sample size = 470
fled or eliminated. lf, upon inspection, there is nothing apparently wrong with the nonfitting item, it may be a. good item that is simply out of context (mea-suring something different). Another kind of analysis, such as distracter anal-ysis, may be used to help identify why an item is bad, but the same rules for good item writing that have traditionally been applied to test development re main the best help for anyone trying to write new items.
Test content and item format are not the determining factors. The authors do not believe there is any evidence that where the response to the item is di-chotomous, or can be made dichotomous, the content makes any difference as
Table 3
Percentages of Fitting Items for the Stanford Achievement Tests (1973 ed.)
Subtest Name Primary I N %
Primare II N 4
Primary III N we
Inter. I N W
Inter. II N %
Advanced N %
Vocabulary Total Reading Word Study Total Math Spelling Language Social Science Science Listening
37 87 60 64
26
78.4 93.1 45.0 93.8
• • • •
808
37 81 1 91 91 4 65 90.8
100 97 0 43 67 4
27 92 6 27 88.9 50 88 0
45 70 55 96 47 55 44 42 50
88 9 92 9 89.1 97 9 91.5 841 90 9 95 2 94.0
50 94.0 72 84.7 55 98.2
112 98.2 50 100.0 79 98.7 60 96 7 60 91 7 50 98.0
50 96.0 71 90.1 50 96.0
120 99.2 60 96.7 80 988 54 94.4 60 95.0 50 96.0
50 90.0 74 91.9
120 99.2 6O 93.3 79 93.7 60 98.3 60 98.3
(Percent of Items with MS• < 2.0. 51S• MS(1,5(8) N), aserage eahbratton sample sue IN) 5.000 •No Subtest
far as fit is concerned. That is, many areas of content have been found to fit the model. What one does find is that individual items do not fit. This is the same kind of situation one finds with traditional item analysis: Some items areidentified as good; some aré identified as bad.
Similarly, neither the item format nor the inferred mental process (cognitiveor affective) seems to make a difference as far as fit is concerned. In the Rentz and Ridenour study of the Atlanta Assessment Project data, multiple-choice, open-ended, and Likert-type (attitudinal) items were calibrated together within the same content area. The model assumes unidimensionality; that is, the items in the tests can be arranged according to degree of difficulty along a single con-tinuum, and a person's performance can be represented by a single score plac-ing that person on the same continuum as the items. Some of the test content cited in studies reported here has all the appearance of heterogeneous, multi-dimensional content; yet such sets of items apparently function quite well under the assumption that the content is unidimensional.
Recommendations
There are no separate tests of the unidimensionality assumption that are really adequate; do not waste time with tests prior to calibration. Apparent homoge-neity of content may be sufficient but not necessary; the question of what kinds of content fit is an empirical question. There is no efvidence that any par-ticular kind of content will not fit the model.
Testing the unidimensionality assumption. There are no separate adequate tests of the unidimensionality assumption. The most direct test of the unidi-mensionality assumption is the test of fit to the model that is part of the cali-bration process. Factor analysis does not clarify the dimensionality because factor analysis is itself a model (or a number of models) with several, some-times conflicting, concepts of dimensionality. There is no clear definition of unidimensionality when you go beyond the mathematical defipition.
In general, if the item content is relatively homogeneous, the test developer is satisfied that the measurement can be represented as a single total score, and the items can be answered right or wrong, then the test of fit to the model will tell whether the specific assumptions of the model have been met. What can you do to maximize the chances of success during item analysis? The following guidelines may be helpful: (a) the tighter the definition of the content, the bet-ter off you are; (b) the easier the items, the better off you are since guessing is likely to be minimal with easy items; and (c) in general, the more care you take in writing items (using traditional guidelines for good item writing), the better off you are.
Highly homogeneous content may be sufficient for fit, but that homogenei-
ty may not be necessary. If you look at a set of items and on the surface they all appear to measure algebra, you would expect reasonable fit. 1f you look at a set in which some items appear to measure algebra and some appear to mea-sure arithmetic, you may still get good fit. Fit to the model is a matter of em-pirical determination, not armchair speculation.
Empirical evaluation of whether the trait measured by the items is unidimen-sional involves consideration of the item-analysis sample. The test developer should be careful when using a pool of items representing several traits that may become integrated into a single trait over time or developmental stages, or that during progression through school become compound traits. An example of a compound trait might be mathematical ability and might be composed of arithmetic and algebraic competence. Do not take "person-free item analysis" too literally. 1f you are going to calibrate arithmetic and algebra items together, you must have a calibration sample that has had the opportunity to learn both arithmetic and algebra. Rasch's "frame-of-reference" (1973) re-quires joint applicability of persons and items. These concerns apply equally to developmental traits not assessed by achievement tests (for example, measures of Piagetian constructs).
Clarification Needed
Prior evaluation (prior to calibration) of unidimensionality and prior notions of likely fit would contribute to efficiency in using Rasch Model methodology. What are the important variables in specifying or recognizing unidimensional content? What are the significant variables that determine fit? What is the la-tent trait for multilevel achievement tests? Are there areas where multilevel tests and multilevel assessment of a single trait would not apply? Can different kinds of item types be calibrated together?
Specification or recognition of unidimensional content prior to calibration would contribute to efficiency in using Rasch Model methodology. Here effi-ciency rather than effectiveness is the concern. If we knew the important vari-ables regarding unidimensionality, and could recognize them beforehand, fewer items would need to be discarded during item analysis. There is evidence (although skimpy) that differentiating traits as cognitive or affective is not nec-essary; together, they sometimes function unidimensionally provided they are related to the same content. The central issue is how to decide whether the items in a test measure only one trait or more than one trait. The important vat;iables seem to have more to do with content homogeneity than with levels of skills or item types.
What are the significant variables that determine fit? Are the variables more likely to be content-related, process-related, or related to mode of response? Certainly items that differ greatly from one another in their discriminating
power will not fit the model, ribr will the model fit when guessing is pro-nounced. Guessing is probably related to item difficulty in that it is likely to be most noticeable when the items are hard relative to the persons being mea-sured. While we can sometimes recognize when items differ in discrimination, we do not know very much about why they differ.
What is the latent trait for multilevel achievement tests? Are arithmetic con-cepts at the first grade the same as arithmetic concepts at the seventh grade? The concepts themselves would seem to be different, but do they represent lo-cations along some definable dimension? Is there a conceptualization that makes that dimension a single latent trait? We know that many people want to interpret test scores on a growth scale from grades 1 to 12. There has to be some theoretical defense for such a scale and such a practice.
Are there areas where multilevel tests and multilevel assessment of a single trait would not apply? Science and social studies are content areas in which multilevel measurement of achievement seems to be different from areas like reading and mathematics. The content in science and social studies seems much more categorized than in reading and mathematics, where subdivision of the content may simply represent a higher level of performance. The Rentz and Ridenour analysis of the Stanford Achievement Tests suggests that for test levels where multiple grades are spanned, science and social studies items dem-onstrate good fit to the Rasch Model. Whether or not scales spanning grades 1 through 12 can be developed remains to be seen.
Can different kinds of item types be calibrated together? Can multiple-choice items, completion items, essays, and other types of items be calibrated together? Some evidence suggests an affirmative answer. R. Rentz (1971) and Wells (1973) found adequate fit when they calibrated essays and multiple-choice items together. Clarification in this area is needed because mode of re-sponse may be one of the variables causing lack of model-data fit.
Controversy
Controversial issues related to test content, the writing of test items, and the Rasch Model are centered around three questions regarding unidimensional-ity: What constitutes unidimensionality? Do we need a prior test of it? How much should we be concerned about it? Although the first two questions are important and have been pointed out earlier as requiring clarification, the real controversy is centered around the third question. The question is really one of the robustness of the model.
ITEM ANALYSIS
What's Known
Bad items detected by the Rasch Model are not too different from those identi-fied using traditional or classical procedures. The purpose of item analysis is to calibrate items; that is, estimate item easiness and evaluate fit. Rasch Model . literature suggests it is not necessary to recalibrate items after performing the item-analysis process of deleting bad items. The sample size required for cali-bration depends on the application and the desired precision of item calibra-tion. Estimation procedures are known, and several computer programs are available for use in estimating Rasch Model parameters and evaluating fit. Ex-cept for correcting obvious defects, we do not know how to fix a misfitting item.
Bad items detected by Rasch Model vs. those detected by traditional means. Research studies comparing procedures for detecting bad items (fit to Rasch Model vs. other procedures) suggest that items identified as bad by Rasch Model criteria are also bad by whatever traditional standard one uses. Occa-sionally items will misbehave, according to Rasch Model criteria, for specific reasons. For example, if in a mathematics test there is an item tIlat is predomi-nately a reading item, it may show up.as a misfit. When the item is placed somewhere else (in a reading test) the problem may be eliminated.
Studies that have compared Rasch procedures with other item-analysis cri-teria include Tinsley (1971), Tinsley and Dawis (1972), Mandeville and Smarr (1976), Haladyna and Roid (1976), and Ryan (1977). Rasch procedures and traditional procedures are less likely to select/delete the same items when there is a wide range of item discriminations. Rasch procedures would indicate mis-fit for items at both extremes (high discrimination and low discrimination); traditional procedures would identify as bad only tow-discriminating items. In general, however, the results are similar because there are few instances where there ate large numbers of very highly discriminating items. The initial item-analysis distribution of discriminations is likely to be skewed with most of the "bad" items, which are deleted, appearing at the lower end. Since Rasch pro-cedures involve deleting extremes, and typically there are more low extremes than high exttemes, Rasch procedures would delete only a few items retained by traditional procedures.
flow many items can one expect to losê during item analysis? Does the Rasch Model produce a significantly larger number of bad items than tradi-tional item-analysis procedures? Tables 1, 2, and 3 show that after traditional item-selection procedures have been used, 5 percent to 10 percent of the items in a test would be rejected by Rasch Model criteria. However, as Table I indi-
cates, the presence of such a degree of nonfitting items does not disturb such applications as test equating.
Rasch Model item-analysis procedures do not require examining distracters, but they do not prohibit it. In traditional item analysis, one does a distracter analysis, particularly when trying to fix bad items, and such an analysis might help detect reasons for misfit to the Rasch Model. Rasch Model item-analysis procedures involve obtaining initial estimates of the item parameters and then evaluating item-fit to the model. In -traditional item analysis, bad items are deleted or fixed, and the same is true for Rasch Model procedures. The pur-pose of item analysis, regardless of method, is to detect bad items, discard them or fix them, and then use the information to build tests with desirable characteristics.
Purpose of item analysis and necessity of recalibration. The purpose of tra-ditional item Analysis is to obtain item calibrations in order to construct tests with certain properties. Means, variances, reliability, and validity can be esti-mated from the item analysis. In traditional item analysis, if items are deleted or modified, the test developer must recalibrate (see Cureton, 1950). The prob-lem is that the estimates of those test parameters are dependent on the original item statistics, and the original item statistics ate not invariant with respect to the collection of items in which they are included. One might expect a similar situation when usiñg the Rasch Model, but a number of studies reported in the literature indicate recalibration is not necessary. (See Anderson et al., 1968; Brooks, 1964; C. Rentz, 1975, 1976; Tinsley, 1971; Wilmott & Fowles, 1973.)
The purposes or objectives of Rasch Model and traditional item analyses are not always the same. For the Rasch Model, the purpose is to calibrate items; that is, to estimate the difficulty of items and to evaluate fit (which detects bad items). In traditional item analysis, the objective is to detect bad items and to obtain item parameters (such as difficulty, correlation with a criterion, corre-lation with the total test) which can be used to estimate test characteristics such as means, variances, reliability, and validity. The test developer who uses the Rasch Model is not concerned about parallel forms. The various forms are automatically equated, and the concept of reliability is replaced by standard error of measurement (Wright, 1977b).
Sample size depends on the application and desired precision of item esti-mates. Sample sizes relate to accuracy in calibration; accuracy in calibrating items (the concern here) has little to do with calibrating a test. If one is trying to calibrate items that will appear in several places (for example, in various test forms drawn from an item bank), then one wants to be sure the estimates are stable. Sample sizes of 500 to 1,000 would be preferred in this case. Forster (1976) actually found samples of 200 to be sufficient to produce stable calibra-tions. With a sample size of more than 1,000, not much is'gained in stability relative to the investment it takes in additional data.
Such sample sizes are desirable if one wants to obtain' calibrations for items, but smaller sample sizes may be used f6r applications like equating when items have been calibrated on a previous occasion. Rentz and Bashaw (1975) studied sample size and stability of parameter estimates. They found that as sample size increased, stability (over repeated samples) increased rapidly at first (that is, with sample sizes of 500 to 1,000) but leveled off and increased at a less rapid rate with samples of 2,000 and 4,000. Brigman (1976) studied the effect of sample sizes of 125, 250, and 500 on estimating equating constants. She found that sample sizes of 125 and 250 gave virtually the same equating con-stants as sample sizes of 500. One should note that the equating constant is the mean of a set of item difficulties, and the size of the resulting error is similar to errors associated with averages. The stability of the mean difficulty is deter-mined by averaging over items and people; therefore, it is not just the number of people that is important to consider, but also the number of items.
In test construction, the more good items there are to offset any bad ones, the better the test will be. In this kind of situation, many items less well-estimated (as when estimates are based on small samples) probably work as well as only a few items that are well-estimated. The effect of bad items is to reduce efficiency. Hambleton (1969) suggests that with 15 percent nonfitting items, lengthening the test by IS percent will give equivalent measurement (in the sense of equal measurement errors).
Estimation procedures are known. We know the mathematics of procedures to estimate parameters. Parameter-estimation procedures for the Rasch Model have been described and discussed by Moonan and Covher (1972), Rasch (1960), Wright and Panchapakesan (1969), Andersen (1970, 1973a), and Wright (1977a, 1977b). Several computer programs are availáble to estimate parameters (Wright and Mead, 1977), and Wright (1977b) describes approxi-mate procedures that may be used to do the calculations by hand or with a pocket calculator.
Except for obvious problems, we do not know how to fix a misfitting item. If an item is detected as non fitting and if, upon inspection, we cannot tell what is wrong, we do not know how to fix the item. The flaws in a bad item ire usually obvious, but sometimes the test developer cannot tell on the face of it what to do to make the item better. If the item is too bad (that is, nonfitting) and the content is important, try to write another item. If the item is not too bad, leave it in; all the item will do is detract from efficiency and will not dis-turb the model's consequences too much. In test-equating applications, for ex-ample, the presence of a few nonfitting items does no serious damage.
Recommendations
The standard recommendation is to. use mean square (MS) fit statistics in eval-uating the fit and quality of items. Slope values (estimates of the slope of the item characteristic curve) can be used if their estimates are good. Comparisons of high- and low-score§plits of the calibration sample are also useful in evalu-ating fit. If one considers relative fit, the test develóper may approach the problem from either a select-the-best or reject-the-worst perspective.
Use of MS fit statistics. Fit of items to the model is usually evaluated by some variation of a chi-square-related statistic presented 1?y Wright and Panchaiiakesan (1969) that is usually called the "mean-square fit." This statistic is essentially a comparison of the data with what is expected, given the model. The procedure given by Wright and,Panchapakesan involves comput-ing this MS for each item over score groups (that is, 'groups with the same raw score) for which the sample size is greater than some specified number. (We usually use 15.) Sometimes the score groups are themselves grouped into a smaller number, and the statistic is computed over this smaller number of groups. Sometimes the statistic is standardized (divided by some appropriate standard error). Mead (1976) suggests another method of evaluating fit that has a number of advantages. This method is used in the most current versions of the BICAL computer program. The various methods of computing the MS fit values cause some confusion when the practitioner either is trying to select some critical value to use for a cutoff or is changing computer programs, since different programs may use different methods. The particular method used in-fluences the size of these values and makes recommendations regarding specif-ic values very much method-dependent.
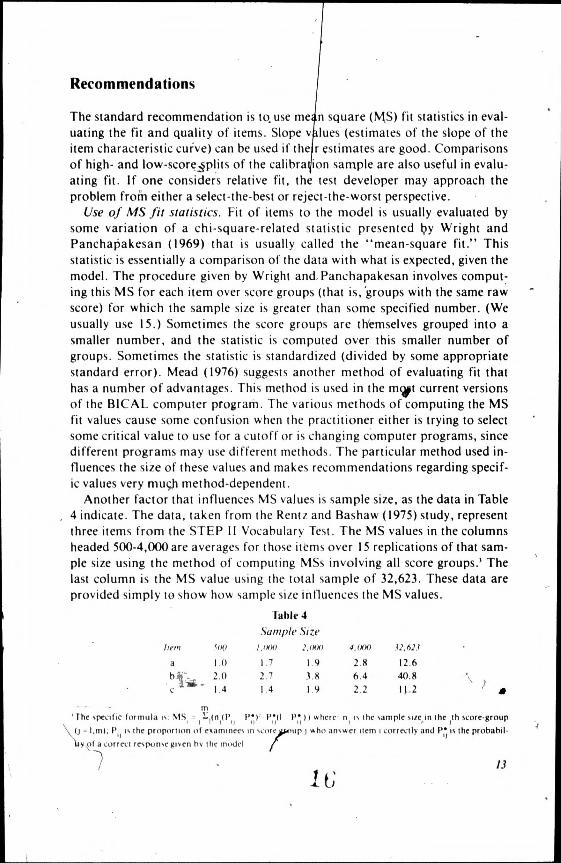
Another factor that influences MS values is sample size, as the data in Table 4 indicate. The data, taken from the Rentz and Bashaw (1975) study, represent three items from the STEP II Vocabulary Test. The MS values in the columns headed 500-4,000 are averages for those items over 15 replications of that sam-ple size using the method of computing MSs involving all score groups.' The last column is the MS value using the total sample of 32,623. These data are provided simply to show how sample size influences the MS values.
Table 4 Sample Size
Item 500 1.000 2,0(X) 4,0(X) 32,623
a 1.0 1.7 1.9 2.8 12.6
b c 2.0
1.4
2.7
1.4
3.8
1.9
6.4
2.2
40.8
1J .2
mt y'The specific formula is: MS. = tln tlP t P Y. P7,0 P.', 11 where: nt is the sample size in the ,th score-group
IA); P., is the proportion of examinees in score group i who answer item t correctly and Pi', is the probabil•
ity of a correct response given by the model
Our conclusion from the factors discussed, the data shown, and several years' experience in using the MS values in test-construction projects is that while the MS values can be very useful, the practitioner should be careful. Our recommendations are: Be cautious—look for outliers; look for relative sizes instead of absolute numbers like 2.0 or 3.0 (values as high as 9.0 or 10.0 may indicate a satisfactorily fitting item if samples are very large). In general, the smaller the MS values, the better-fitting is the item. Interpretation of the MS statistic suffers from the same flaw as any statistical test of significance: Given a large enough sample size, any. hypothesis (or model) can.be rejected.
One other word of caution: Some versions of the item-analysis program also compute probability values corresponding to the MSs. These numbers are quite misleading and simply should be disregarded; with samples of sufficient size to estimate the parameters, the probabilities will almost always be less than the magic .05.
Slope values.. Rasch used thecriterion of parallel slopes when looking at the regression of a log-odds transformation of the item score on ability. Unit slope is the criterion for fit. If slopes are adequately estimated, deviation from slope= l is a good criterion to use. It is likely that the BICAL (Wright and Mead, 1977a) estimate is pretty good. If the procedure uses all score groups, there is probably not enough stability in the extreme score groups to get a good estimate. The BICAL procedures of grouping data should provide enough stability.
High vs. low splits of the calibrdtion sample. Comparing the calibration re-sults from a high vs. low split of the calibration sample is a technique that can help you judge fit. There is the problem, however, of what the criterion should be: How much departure from a unit slope line must you•have in order to de-fine items as nonfitting? What we need are empirical studies that deal with dif-ferent applications of the model and illustrate how different proportions of misfitting items and the amount of misfit influence these consequences. Mea-surements of fit will be made and judged against the achievement of the conse-quence of specific objectivity in those applications. It is an oversimplification to take a statistical test of fit and apply it routinely.
Select the best or reject the worst. If faced with a limited number of items in the item-analysis pool and the need to select a high proportion of the items for the desired test length, throw away/reject the worst items and keep the re-mainder. When there is a large number of items in the itèm-analysis pool and a small proportion is required for meeting the desired test length, select the best items. In these situations, as well as in others, a combination of the MS and slope criteria may be useful.
Clarifications
Does necessity for cross-validation depend on the number of fitting items? How should fit be evaluated? How much misfit is too much? What does it mean to be "sample-free" and "item-free"; how careful must we be?
Cross-validation and the number of fitting items. We know from previous studies that we do not have to recalibràte items after item analysis if there are only a few misfitting items, but what if the number of misfitting items is large? What is the line of demarcation? Is it necessary to cross-validate sometimes, and what percentage of misfitting items provides a criterion?
Evaluation of fit. There are no clear guidelines for fit. We have a statistical test for fit of the whole set of items to the model (Andersen, 1973b) and vari-ous versions for individual items. The problem is that the test is sensitive to sample size. It suffers from the same problem as any other statistical test of significance: With a large enough sample size, the test will reject anything as nonfittirig! Different versions of computer programs used to estimate Rasch parameters may give different estimates of MS fit, depending on the methodsused for computation.
We must know more about the interpretation of the sizes of MSs and slopes. In applied work, the senior author of this paper uses the following guidelines. If sample sizes are 500-1,500, discard any item with an MS (from formula in footnote 3) over 3.0 unless other considerations take priority. if the MS = 2.0 to'3.0, try to rewrite the item and include it in the next item analysis. If the MS = 2.0 to 3.0 and one is unable to rewrite the item, mark it and monitor it as additional data are available. If the MS = 3.0 to 4.0, leave it in, marked for monitoring, if it is part of a small cluster of items needed for content complete-ness (that is, clusters of items that measure the same Objective or refer to the same reading passage).
We need better and more thorough studies of robustness. We need studies where departure from fit is well-described and the consequence being judged is well-defined (equating, tailored testing, for example). •
Meaning of "sample free" and "item-free." One should regard "sample-free" and "item-free" with a little discretion. Items cannot be given to just any group; the sample must be comprised of appropriate people. We cannot calibrate algebra problems on second graders; whether we can calibrate them on eighth graders depends on the experiences of the eighth graders. Items with which you intend to measure ninth graders should he calibrated on people with ninth-grade experiences. While we do not have to pay particular attention to representativeness of the sample in any kind of strict sampling way, we do have to exercise good judgment to make sure the sample is appropriate. There is usually no reason why one can't get a sample thát is reasonably representa-tive. If, in general, the group is appropriate in terms of the people for whom

the test is designed, then the particular sample does not matter. Similar arguments hold for using good sense in applying the notion of
"item-free person measurement" Certainly we cannot measure an individual with just any collection of items. A second grader's mathematics performance could not be assessed with a calculus test unless he or she were a remarkable second grader. The items must be appropriate.
Controversy
Controversy with respect to item analysis using the Rasch Model focuses on two issues: sample size and fit. Wright (1977a) vs. Whitely (1977) represents the only sample-size controversy to have emerged in the literature. Wright argues from a viewpoint of precision of calibration of items and concludes that sample sizes of 500 are sufficient and that useful data can be obtained with samples of 100. Whitely argues that precision of calibration is not the issue; rather, the issue is testing the fit of the model, and her arguments revolve around considerations of statistical power. She recommends a sample size of at least 800to provide sufficient power to detect "sizable differences" between the data and the model. She further concludes, "the choice of sample size should be guided by the degree of departure from the model that the test devel-oper wishes to detect" (p. 231). Unfortunately, Whitely does not tell us the consequences, for application, of various "degrees of departure" of the data from the model. Thus we are left with neither recommendation nor resolution of the problem. The questions remain: What is the minimum sample size needed (1) to estimate item difficulty, and (2) to evaluate model-data fit? And on what criteria should that decision be based?
At the practical level there will be some uncertainty in applying the statistical tests of fit until some of the theoretical issues are resolved; however, our own feeling is that this should not deter the careful practitioner. He has three fac-tors he can rely on: (I) A little experience in doing item analysis and examining presumed nonfitting items will give him workable guidelines; (2) there are usu-ally just a few nonfitting items in a set of well-constructed items and these are usually clearly indicated by fit statistics that are quite noticeable; and (3) if there are doubtful items, the test developer can either eliminate them or keep them, relying.on the observation that the model seems to be able to tolerate the presence of a few misfitting items.
CALIBRATING TIIE TEST
General Comments
Test calibration ís the process of selecting a set of previously calibrated items and estimating the ability parameters or the latent trait score for individual ex-aminees. The ability-scale score expressed in„natural logarithm units (called logics) has been discussed at length by Rentz and Bashaw (1977) who provided various ways of interpreting that type of score. The important question for test calibration involves which items to choose.
Little applied work has been published in this area, but there have been some theoretical results coming primarily from computer simulations. We know of a number of practitioners in this country and abroad who are building tests with items calibrated by the Rasch Model. Some investigators have pub-lished findings related to other aspects of using the Rasch Model, and we have noted them elsewhere. liisofar as test design is concernèd, out best recommen-dation at the moment is to refer readers, to the work of Wright and his col-leagues on "best-test design” (Wright, 1977b; Wright and Douglas, 1975; Wright and Stone, 1978). It is likely that a number of papers will be published within the next two years or so describing the test-design experiences of those engaged in test-development work.
We can speculate as to the direction research is likely to take in the area of test design in the near future. Four interrelated directions seem to be promis-ing. Tailored testing, an area particularly suited to latent trait theory, is al-read ,.atttacting a good deal of attention. Usually implemented via a com-puterized system, tailored testing involves selecting a particular set of items that best measure an individual examinee. Thus examinees may take unique tests (sets 'of items) with their scores reported on a common scale. Another direction test design is likely to take is the development of multilevel test bat-teries, with the various•levels keyed to a common reference scale. Such bat-teries would provide much-desired growth scales for describing school achieve-ment. While multilevel batteries are commonly used, a single level is likely to cover one, two, or in some cases, three grades. These tests are typically quite long, which is necessary to cover such broad ranges of ability. It is likely that equivalent measurement can be achieved with much shorter tests covering much narrower ranges of ability—say, three or four levels per grade.
A third direction that is likely to be productive is the combining of testing for program-assessment purposes with testing designed to measure individual examinees. Educational assessment programs are usually designed to gather information about programs: Has this school, this district, or this state achiev-ed these objectives? Such questions do not require administering the same test
to all students; multiple-matrix sampling is commonly used in such situations. But if all items to be administered in a given area (or for a given objective) were part of a calibrated item pool, then examinees who took different forms could be measured on a comnion scale and individual scores could be reported.
A final area that seems particularly exciting involves detecting test bias by identifying "nonfitting" examinees (Mead, 1976; Wright and Mead, 1977b). Just as certain items may not fit the model, certain examinees may not fit the model. Based on a particular examinee's test score and"corresponding ability estimate, the Rasch Model specifies a probability of correctly answering each item to which that examinee has responded. If that examinee's pattern of re-sponses fails to conform to the model's expectations (probabilities), we may legitimately conclude that the measurement is inadequate, unfair, or biased. For example, an examinee who answers too many very hard items correctly may be guessing a great deal. Or a high-ability examinee may miss several easy items that contain culture-specific vocabulary. Both can be detected as nonfit-ting examinees. In both cases, the measurement was inadequate or invalid for those examinees. Such individual examinee validity indexes could make the use and interpretation of tests more rational.
CONCLUDING COMMENTS
In this paper, we have tried to synthesize the literature related to applications of the Rasch Model as it relates to test-development activities. We have delib-erately avoided a number of areas such as the analysis of existing tests and the comparison .of the Rasch Model with other models except as these other areas affect test-development activities. Based on our evaluation of the research lit-erature and our own experiences using the model, we believe that the test de-veloper can feel comfortable (albeit cautious) in using the Rasch Model for constructing tests.
REFERENCES*
Andersen, E. B. Asymptotic properties of conditional maximum likelihood estimators. Journal of the Royal Statistical Society, Series B, 1970, 32, 283-301.
Andersen, E. B. Conditional inference for multiple-choice questionnaires. British Journal of Mathematical and Statistical Psychology, 1973, 26, 3I-44.(a)
Andersen, E. B. A goodness of fit test for the Rasch Model. Psychbmetrika, 1973, 38, 123-140.(b)
Andersen, J., Kearney, G. E., & Everett, A. V. An evaluation of Rasch's structural model for test items. British Journal of Mathematical and Statistical Psychology, 1968, 2!, 231-238.
Andrich, D. Latent trait psychometric theory in the measurement and evaluation of writing ability. Unpublished doctoral dissertation, University of Chicago, 1973.
Arneklev, B., Gee, D., & Ingebo, G. Optimum range of difficulty for linking items. In C. Karr (Chair), Exploring the Rasch test scaling procedure. Symposium presented at the meeting of the American Educational Research Associatioh, San Francisco, 1976.
Brigman, S. L. Rasch Model test equating with three multiple test equating designs. (Doctoral dissertation, University of Georgia, 1976). Dissertation Abstracts Interna-tional, 37(06-A), 3570. (University Microfilms N6. 76-28862)
Brooks, R. D. An empirical investigation of the Rasch ratio-scale model for item-difficulty indexes (Doctoral dissertation, State University of Iowa, 1964). Disserta-tion Abstracts International, 26(04), 2047. (University Microfilms No. 65-00434)
Connolly, A. J., Nachtman, W., & Pritchett, E. M. Key Math diagnostic arithmetic test. Circle Pines, Minn.: American Guidance Service, 1974.
Cureton, E. E. Validity, reliability, and baloney. Educational and Psychological Mea-surement, 1950, 10, 94-96.
Doherty, V. W., & Forster, F. Can Rasch scaled scores be prédicted from a calibrated item pool? In C. Karr (Chair), Exploring the Rasch test scaling procedure. Sympos-ium presented at the meeting of the American Educational Research Association; San Francisco, 1976.
Durovic, J. Application of the Rasch' Model to civil service testing. Paper presented at the meeting of the Northeastern Educational Research Association, Grossingers, New York, November 1970. ED 049 305.
'Items followed by an ED number (for example ED 049 305) are available from the ERIC Document Reproduc-
tion Service (FORS). See a recent issue of Resnurces in Education for the address and ordering information.
Forbes;-D. W. The use of Rasch logistic scaling procedures in.the developrhent of short multilevel arithmetic achievement tests for public school measurement. In C. Karr (Chair), Exploring the Rasch test scaling procedure. Symposium presented at the meeting of the American Educational Research Association, San Francisco, 1976. ED 128 400.
Forster, F. The Rasch item characteristic curve and actual item performance. In C. Karr (Chair), Exploring the Rasch test scaling procedure. Symposium presented at the meeting of the American Educational Research Association, San Francisco, 1976. ED 129 840. (a)
Forster, F. Sample size and stable calibrations. In C. Karr (Chair), Exploring the Rasch test scaling procedure. Symposium presented at the meeting of the American Educa-tional Research Association, San Francisco, 1976. (b)
Garrison, W. M., Cohen„ A. S., & Linden. K. W. The use of the Rasch measurement model in developmental analyses of children's self-concept. Paper presented at the meeting of the American Educational Research Association, New York, April 1977.
Hake, R. Composition theory in the identifying and evaluating of essay writing ability. Unpublished doctoral dissertation, University of Chicago, 1973.
Haladyna, T. M., & Roid, G. H. The quality of domain-referenced test items.' Paper presented at the meeting of the American Educational Research Association, San Francisco, April 1976.
Hambleton, B. K. An empirical investigation of the Rasch test theory model (Doctoral dissertation, University of Toronto, 1969). Dissertation Abstracts International, 1971, 31 (08-A), 4035 (Available from author, University of Massachusetts, School of Education, Amherst, Mass. 01002)
Hambleton, R. K., Swaminathan, H., Cook, L. L., Eignor, D. R., & Gifford, J. A. Developments in latent trait theory: A review of models, technical issues, and appli-cation. Paper presented at the joint meeting of the National Council on Measure-ment in Education and the American Educational Research Association, New York, April 1977. ED 137 364.
Ingebo, G. S. Item pool linking procedures. In C. Karr (Chair), Exploring the Rasch test scaling procedure. Symposium presented at the meeting of the American Educa-tional Research Association, San Francisco, 1976.
Karr, C. Research report on the Rasch Model of test development. In C, Karr (Chair), Exploring the Rasch test scaling procedure. Symposium presented at the meeting of the American Educational Research Association, San Francisco, 1976.
Kifer, E., & Bramble, W. The calibration of a criterion-referenced test. Paper pre-sented at the annual meeting of the American Educational Research Association, Chicago, 1974. ED 091 434.
Lenke, J. M. The application of the Rasch Model to achievement test data. Paper pre-sented at the meeting of the Northeastern Educational Research Association, Gros-singers, New York, November 1970.
Mandeville, G. K., & Smarr, A. Rasch Model analysis of three types of cognitive test data. In J. P. Ryan (Chair), Critical perspectives on the Rasch latent trait model. Symposium presented at the meeting of the American Educational Research Associ-ation, San Francisco, 1976.
Mead, R. J. Assessing the fit of data to the Rasch Model through analysis of residuals. Doctoral dissertation, University of Chicago, 1976.
Moonan, W. J., & Covher, M. MAXCO: Maximum likelihood estimations of abilities corresponding to raw scores of tests (FACT Document No. 24). San Diego, Calif.: Naval Personnel and paining Research Laboratory, December 1972.
Passmore, D. L. An application of the Rasch one parameter logistic measurement model to the National League for Nursing Achievement Test in Normal Nutrition (Doctoral dissertation, University of Minnesota, 1974). Dissertation Abstracts Inter-national, 35(02-A), 963. (University Microfilms No. 74-17271)
Rasch, G. Probabilistic models for some intelligence and attainment tests. Copen-hagen: Danish Institute for Educational Research, 1960.
Rasch, G. Lectures at the University of Georgia, Athens, Georgia, March 1973.
Rentz, C. C. An investigation of the invariance properties of the Rasch Model parame-ter (Doctoral dissertation, University of Georgia, 1975) Dissertation Abstracts Inter- • national, 36(08-B), 4139. (University Microfilms No. 76-02258)
Rentz, C. C. Rasch Model invariance as a function of the shape of the sample distribu-tion and degree of model-data fit. Paper presented at the meeting of the Florida Edu-cational Research Association, Orlando, Florida, January 1976.
Rentz, R. R. Applications of the Rasch Model: Test equating and interpretation. In-vited address at the Conference on thf Rasch-Wright Model, Indiana University, Bloomington, Indiana, November 1971.
Rentz, R. R. & Bashaw, W. L. Equating reading tests with the Rasch Model, Volume 1 Final Report, Volume 11 Technical Reference Tables. Athens, Ga.: University of Georgia, Educational Research Laboratory, 1975. ED 127 330 through ED 127 331.
Rentz, R. R., & Bashaw, W. L. The national reference scale for reading: An applica-tion of the Rasch Model. Journal of Educational Measurement, 1977, 14, 161-179.
Rentz, R. R., & Ridenour, S. E. The fit of the Rasch Model to achievement tests. Paper presented at the meeting of the Eastern Educational Research Association, Williams-burg, Va., March 1978.
Ryan, J. P. Comparing classical and latent trait analyses of attitudinal data. Paper pre-sented at the Southeastern Invitational Conference on Measurement in Education, Virginia Polytechnic Institute and State. University, Blacksburg, Virginia, December 1977.

Soriyan, M. A. Measurement of thkgoodness-of-fit of Rasch's probabilistic model of item analysis to objective achievement test of the West African Certificate Examina-tion. Doctoral dissertation, University of Pittsburgh, 1971). Dissertation Abstracts International, University Microfilms No. 72-7895, 1971.
Sweigert, Jr., R. L. Assessing learner needs with criterion-referenced tests: a working approach. Educational Technology, 1977, 28-35,
Tinsley, H. E. A. An investigation of the Rasch simple logistic model for tests of intel-ligence or attainment (Doctoral dissertation, University of Minnesota, 1971). Disser-tation Abstracts International, 1972, 32(11-8), 6629. (University Microfilms No. 72-14387)
Tinsley, H. E. A., & Dawis, R. V. A comparison of the Rasch item probability with three common item characteristics as criteria for item selection (Technical Report No. 3003), January, 1972, Project No. NR151-323, Personnel and Training Research Programs, Office of Naval Research. ED 068 516.
Uhl, N. P., Briley, T. S. Application of the Rasch Model to a measure of environmental perception. Paper presented at the meeting of the Northeastern Educational Re-search Association, Grossingers, New York, November 1970.
Wells, R. A. The probabilistic interpretation of test scores calibrated by the Rasch . Model (Doctoral dissertation, University of Georgia, 1973). Dissertation Abstracts
International, 1974, 34(07-A), 4012. (University Microfilms No. 73-31977)
Whitely, S. E. Models, meanings, and misunderstandings: Some issues in applying Rasch's theory. Journal of Educational Measurement, 1977, 14, 227-235.
Whitely, S. E. & Dawis, R. V. The nature of objectivity with the Rasch Model. Journal of Educational Measurement, 1974, 11 (3), 163178.
Willmott. A. S., & Fowles, D. E. The objective interpretation of test performance: The Rasch Model applied. National Foundation for Educational Research report for Schools Council, London, March 197.3.
Woodcock, R. W. Woodcock reading mastery tests, Circle Pinas, Minn.: American Guidance Service, 1974.
Wright, B. D. Misunderstanding the Rasch Model. Jou'?nal of Educational Measure-ment, 1977, 14, 219-225. (a)
Wright, B. D. Solving measurement problems with the Rasch Model. Journal of Edua-tional Measurement, 1977, 14, 97-116. (b)
Wright, B. D., Douglas, G. A. Best test design and self-tailored testing. Research Memorandum No. 19, Chicago: The University of Chicago, Department of Educa-tion, Statistical Laboratory, June 1975.
Wright, B. D., & Mead, R. J. BICAL: Calibrating rating scales with the Rasch Model.Research Memorandum No. 23A, Chicago: The University of Chicago, Department of Education, Statistical Laboratory, 1977.
Wright, B. D. & Mead, R. J. The use of measurement models in the definition and application of social science variables (Grant DAHC19-76-G-0011, Final Report). U.S. Army Research Institute for the Behavioral and Social Sciences, Arlington,Va., June 1977.
Wright, B. D., & Panchapakesan, N. A procedure for sample-free item analysis. Edu-cational and Psychological Measurement, 1969, 29, 23-48.
Wright, B.D., & Stone, M.H. Best test design: A handbook for Rasch measurement. Palo Alto: Scientific Press, 1978.
Copyright © 2022 FDOKUMEN