Common-Person Equating with the Rasch Model - Digital ...
10
73 Common-Person Equating with the Rasch Model Geofferey N. Masters University of Melbourne Two procedures, one based on item difficulties, the other based on person abilities, were used to equate 14 forms of a reading comprehension test using the Rasch model. These forms had no items in common. For practical purposes, the two procedures produced equivalent results. An advantage of common-person equating for testing the unidimensionality assumption is pointed out, and the need for caution in interpreting tests of common-item invariance is stressed. The traditional approach to equating two test forms X and Y is to administer both forms to the same group of persons and to define as &dquo;’equivalent’’ two scores corresponding to the same percentile rank in that group (Angoff, 1971). Recently, a number of researchers have drawn attention to shortcomings of traditional procedures such as equipereentile equating, particularly for vertical equating tasks, and have investigated equating procedures based on latent trait theory methods (e.g., Divgi, 1981; Guskey, 1981; Holmes, 1982; Lord, 1975; Loyd & Hoover, 1980; Slinde & Linn, 1978, 1979a, 1979b; Wight, 1977). A simple and effective latent trait method for equating scores on two psychological tests X and Y is to include in each test a set of items that can be calibrated in each form separately. These shared items provide a link between the two forms and so permit their relative difficulties to be estimated. &dquo;’Common- item&dquo; equating is especially useful when there are no constraints on the way in which items can be selected and combined to construct different test forms; however, for a variety of equating tasks shared items are either impractical or inconvenient. Two standardized intelligence tests, or two reading com- prehension tests based on different passages of writing, for example, would not usually contain shared items. In these situations, alternative methods must be used. This paper describes and compares two latent trait methods for equating tests that do not contain shared items. Both methods depend on a group of persons who have taken both tests. The first method, Method A, uses the responses of this linking group to calibrate all L, + Ly items simultaneously. The shift needed to equate the forms is then estimated as where d.x is the mean item difficulty estimate for Form X and d.y is the mean for Form Y. Downloaded from the Digital Conservancy at the University of Minnesota, http://purl.umn.edu/93227 . May be reproduced with no cost by students and faculty for academic use. Non-academic reproduction requires payment of royalties through the Copyright Clearance Center, http://www.copyright.com/
-
Upload
khangminh22 -
Category
Documents
-
view
0 -
download
0
Transcript of Common-Person Equating with the Rasch Model - Digital ...

73
Common-Person Equatingwith the Rasch Model
Geofferey N. MastersUniversity of Melbourne
Two procedures, one based on item difficulties, theother based on person abilities, were used to equate 14forms of a reading comprehension test using the Raschmodel. These forms had no items in common. For
practical purposes, the two procedures produced
equivalent results. An advantage of common-personequating for testing the unidimensionality assumptionis pointed out, and the need for caution in interpretingtests of common-item invariance is stressed.
The traditional approach to equating two test forms X and Y is to administer both forms to the samegroup of persons and to define as &dquo;’equivalent’’ two scores corresponding to the same percentile rank inthat group (Angoff, 1971). Recently, a number of researchers have drawn attention to shortcomings oftraditional procedures such as equipereentile equating, particularly for vertical equating tasks, and haveinvestigated equating procedures based on latent trait theory methods (e.g., Divgi, 1981; Guskey, 1981;Holmes, 1982; Lord, 1975; Loyd & Hoover, 1980; Slinde & Linn, 1978, 1979a, 1979b; Wight, 1977).
A simple and effective latent trait method for equating scores on two psychological tests X and Yis to include in each test a set of items that can be calibrated in each form separately. These shared itemsprovide a link between the two forms and so permit their relative difficulties to be estimated. &dquo;’Common-item&dquo; equating is especially useful when there are no constraints on the way in which items can beselected and combined to construct different test forms; however, for a variety of equating tasks shareditems are either impractical or inconvenient. Two standardized intelligence tests, or two reading com-prehension tests based on different passages of writing, for example, would not usually contain shareditems. In these situations, alternative methods must be used.
This paper describes and compares two latent trait methods for equating tests that do not containshared items. Both methods depend on a group of persons who have taken both tests. The first method,Method A, uses the responses of this linking group to calibrate all L, + Ly items simultaneously. Theshift needed to equate the forms is then estimated as
where d.x is the mean item difficulty estimate for Form X and d.y is the mean for Form Y.
Downloaded from the Digital Conservancy at the University of Minnesota, http://purl.umn.edu/93227. May be reproduced with no cost by students and faculty for academic use. Non-academic reproduction
requires payment of royalties through the Copyright Clearance Center, http://www.copyright.com/

74
The second method, Method B, first calibrates the items in each form using all available responsesto that form. For each person n in the X-Y link, two ability estimates bnX and bnY are obtained from theseparate calibrations of Forms X and Y. The shift needed to equate Forms X and Y is then estimated as
tXy = b.Y - b. x , (2)where b.~; and b.y are the mean ability estimates for persons in the X-Y link.
When data conform to the Rasch model, these two methods should produce equivalent results. Ifthey do not, then it will be important to understand where they differ and why. If they do lead to thesame conclusions, then it would be useful to know whether there are advantages or disadvantages toeither method or circumstances under which one method is to be preferred to the other. The purpose ofthis study was to investigate the equivalence of these two methods in practice. Methods A and B wereused to equate 14 forms of a reading comprehension test through 25 different common-person links. Theresults of these two equatings are then compared, and their relative merits discussed.
Method and Results
The 25 common-person links used in this study were part of a linking design developed for thecalibration and equating of 14 Tests of Reading Comprehension (Education Department of WesternAustralia, 1983). These tests were constructed for use with students in their third to tenth years of school.Each test consists of a passage of writing approximately two pages in length accompanied by a ’retelling’ ’of this passage in different words. This retelling contains gaps corresponding to details contained in theoriginal passage. Readers who understand the passage should be able to fill in these gaps using one ormore of their own words. Each insertion is then scored either correct or incorrect.
The linking design is shown in Figure 1. The 14 forms are labeled A to N; the easier forms are onthe left, the more difficult, on the right. Each line segment connecting a pair of forms represents a groupof students who took that pair of forms. The tests were administered to 2,698 third- to tenth-grade studentsin Western Australia in November 1982. Most students took 2 of the 14 test forms.
The first step in the equating was to calibrate each form separately using the responses of all 300(approximately) students who took that form. Misfitting items were identified and removed, reducing theaverage test length from 25 to 22 items. Of particular concern in the fit analysis were possible violationsof the assumption of local independence. It had been recognized during test development that becauseall items in each form related to the same passage, special care would be needed to minimize possibledependencies among items. A statistical test of fit based on an analysis of responses to pairs of itemsand related to the statistic described by van den Wollenberg (1982) and Molenaar (1983) was used totest for violations of local independence.
The second step was to consider each pair of linked test forms X and Y, and to recalibrate the~X + Ly items in these two forms simultaneously using the responses of students who took both forms.The mean item difficulties d.X and cl.Y were then used to estimate the relative difficulties of Forms X
Figure 1The Linking Structure
Downloaded from the Digital Conservancy at the University of Minnesota, http://purl.umn.edu/93227. May be reproduced with no cost by students and faculty for academic use. Non-academic reproduction
requires payment of royalties through the Copyright Clearance Center, http://www.copyright.com/

75
and Y. This was done for each of the 25 links, and the results are shown on the left of Table 1. Mostof the d.Y - c~.X differences are positive, indicating that the test forms on the left of Figure 1 tend to beeasier than the forms to their right, as intended. The exceptions are Form A, which was estimated to besomewhat more difficult than Forms B and C; Form I, which is more difficult than Form J; and Form K,which is slightly more difficult than Form L.
The shift needed to equate each pair of linked test forms X and Y was next estimated using Method B.The earlier calibration of each of the 14 tests provided two ability estimates bnx and bny for each person~c with nonperfect scores on both forms. The number of persons used in each link is shown in the middleof Table 1, and the estimated shift b.x - b.Y is shown towards the right of the table.
An inspection of the values of d.Y - d.~ and ~.x ― b.y for each of the 25 common-person linksshows that they differ on average by less than one-tenth of a logit. In other words, Methods A and Bagree to within one-tenth of a logit on the amount that must be added to each Form Y ability estimateto bring it to the same scale as the Form X abilities. For comparison, the minimum standard error of theability estimates themselves is in the vicinity of .5 logits. The 25 shifts estimated by Methods A and Bappear to produce equivalent estimates of the shifts needed to equate these 14 test forms.
Nevertheless, there is one important difference between Methods A and B. The recalibration ofForms X and Y using the responses of the X-Y link group does not provide a particularly powerful check
Table 1Shifts Estimated by Methods A and B
and Internal Consistency
Downloaded from the Digital Conservancy at the University of Minnesota, http://purl.umn.edu/93227. May be reproduced with no cost by students and faculty for academic use. Non-academic reproduction
requires payment of royalties through the Copyright Clearance Center, http://www.copyright.com/

76
Figure2Shifts Estimated by Methods A and B
on the extent to which these two forms define the same latent variable. This is especially true for testssuch as these which are intended to measure the same latent variable and which have been constructed
to fit the Rasch model individually. Additional global or item tests of fit at this stage are unlikely toreveal subtle differences between forms. Method B, on the other hand, provides an obvious and explicitcheck on the unidimensionality assumption underlying the attempt to equate these 14 forms. Becauseeach person n in the X-Y link has two ability estimates the set of ~,,x ― b,,y differences provides a basisfor assessing the extent to which Forms X and Y define the same latent variable.
For each of the 25 common-person links, abilities measured on Form X were plotted against abilitiesmeasured on Form Y. Figure 3 is a typical plot and provides a graphic check on the internal consistencyof link J-L. The diagonal line in Figure 3 has been shifted 1.06 logits to the right of the identity line-the shift estimated for link J-L in Table I-and a 95% confidence band based on the estimated errors of
measurement has been added. Several students are outside this band, indicating that significantly differentestimates of their reading abilities have been obtained on Forms J and L.
A statistical check on the internal consistency of each common-person link can be carried out usingthe observed and modeled variances of the ~x ~ bnY differences. The observed variance of this differenceis calculated as
Downloaded from the Digital Conservancy at the University of Minnesota, http://purl.umn.edu/93227. May be reproduced with no cost by students and faculty for academic use. Non-academic reproduction
requires payment of royalties through the Copyright Clearance Center, http://www.copyright.com/

77
Figure3Abilities Estimated on Form J and Form Lfor Students Taking This Pair of Forms
where W,,xy = s§x + S2, gives more weight to more precisely estimated differences, ~~ and s,, are theerrors of measurement associated with b,,x and baY, and N is the number of persons in the X-Y link. Themodeled variance of this difference is calculated as
The ratio of the observed variance S2 to modeled variance V can then be inspected for each common-person link to assess the internal consistency of that link. This internal consistency index is shown onthe far right of Table 1 for each of the 25 links.
Values of this index are consistently greater than their expected value of i , indicating that theobserved bnx - b&dquo;Y differences are consistently more dispersed about their expected value, 0, than hasbeen modeled. During the construction of these tests, items that displayed poor fit to the model whereeither removed or revised. This should have resulted in greater item homogeneity within each form.However, because each test is based on a different passage of writing, and because these tests coverdifferent levels and types of writing, the question of unidimensionality across tests is especially relevant.Values of the internal consistency index suggest that these 14 tests do not define exactly the same readingcomprehension variable.
An inspection of the plots for each of the X-Y links reveals a number of students with very discrepantability estimates on the two forms that they took. These students performed significantly better, on one
Downloaded from the Digital Conservancy at the University of Minnesota, http://purl.umn.edu/93227. May be reproduced with no cost by students and faculty for academic use. Non-academic reproduction
requires payment of royalties through the Copyright Clearance Center, http://www.copyright.com/
78
reading test than on the other. Their very discrepant performances may be a reflection of their differentinterests in these topics, their different approaches to different types of writing (e.g., informative, narrative)or, more likely perhaps, to their motivation on the day of the test (the two tests were administered onconsecutive days). Whatever the reason, their very different levels of performance on the two tests makea meaningful estimate of their reading ability impossible.
The removal of students with particularly implausible test performances improved the internal con-sistency of each link. In most cases, the removal of two or three outliers resulted in an index very closeto its expected value of one. Even for link A-C, the removal of the four most extreme outliers reducedthe internal consistency index from 2.26 to 1.36. Although the removal of outliers to achieve better fitmay be a questionable activity, it does make clear that much of the misfit evident from the large valuesof the internal consistency index can be traced to a few individuals with highly improbable test perfor-mances.
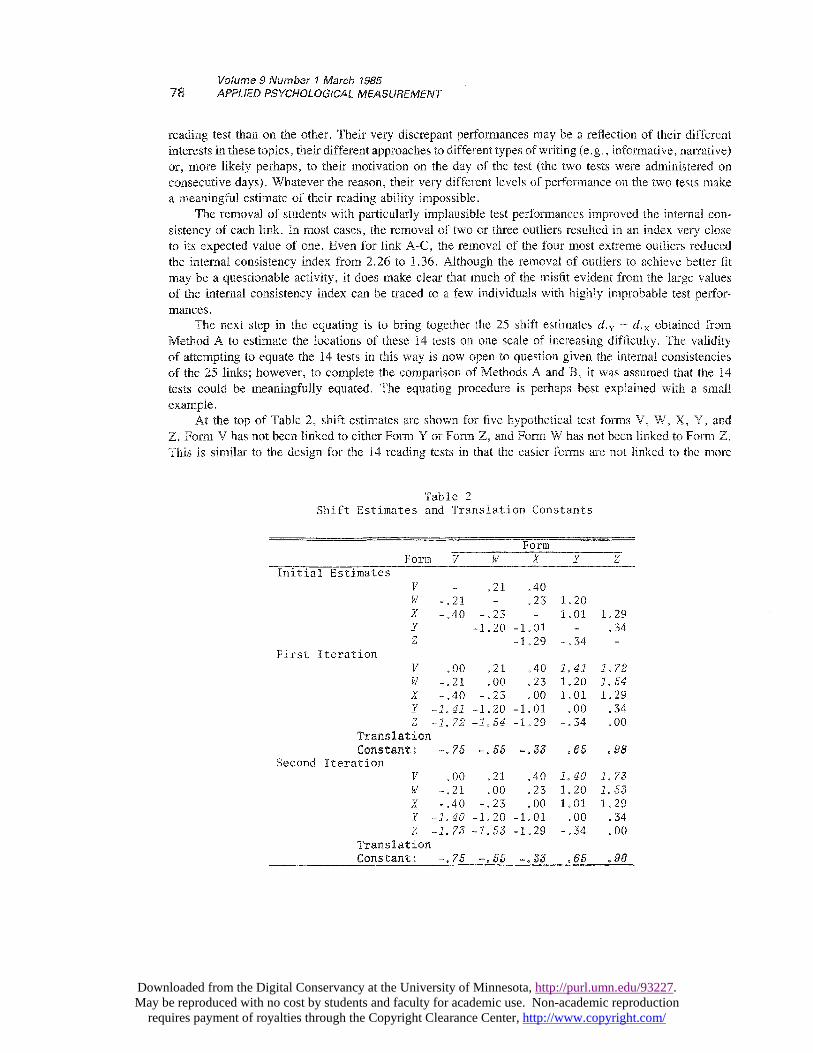
The next step in the equating is to bring together the 25 shift estimates d.Y - d.x obtained fromMethod A to estimate the locations of these 14 tests on one scale of increasing difficulty. The validityof attempting to equate the 14 tests in this way is now open to question given the internal consistenciesof the 25 links; however, to complete the comparison of Methods A and ~, it was assumed that the 14tests could be meaningfully equated. The equating procedure is perhaps best explained with a smallexample.
At the top of Table 2, shift estimates are shown for five hypothetical test forms V, W, X, Y, andZ. Form V has not been linked to either Form Y or Form Z, and Form W has not been linked to Form Z.This is similar to the design for the 14 reading tests in that the easier forms are not linked to the more
Table 2
Shift Estimates and Translation Constants
Downloaded from the Digital Conservancy at the University of Minnesota, http://purl.umn.edu/93227. May be reproduced with no cost by students and faculty for academic use. Non-academic reproduction
requires payment of royalties through the Copyright Clearance Center, http://www.copyright.com/

79
difficult forms. The difference is that in the shift matrix for the reading tests there are many more missinglinks.
Initial estimates are now obtained for the missing links. From the available links, Form W is estimatedto be .21 logits more difficult than Form V, and Form Y is estimated to be 1.20 logits more difficultthan Form W. An initial estimate for the V-Y link is .21 + 1.20 = 1.41 logits. This has been insertedinto the updated (first iteration) shift matrix in the middle of Table 2. Similarly, initial estimates havebeen obtained for missing links V-Z and W-Z. The mean of the five estimates in each column of thismatrix is now obtained and provides the first set of form difficulty estimates (translation constants) Tv,Tw, ..., Tz. Form V is estimated to be the easiest of these five forms with difficulty Tv = -.75 logits,and Form Z the most difficult with difficulty Tz = .98 logits. The five form difficulty estimates areautomatically centered on zero.
These five estimates are now used to improve the estimates for the three missing links. The estimatefor link V-Y, for example, is calculated as TY - 7~ = .65 - ( - .75) = 1.40. This improved estimatehas been inserted into the revised (second iteration) matrix at the bottom of Table 2 together with similarlyimproved estimates for links V-Z and W-Z. The five estimates in each column are averaged again toobtain a new set of form difficulty estimates. This process is continued until values of the form difficulties~’v9 ~’w9 ..., ~’z become stable to two decimal places. In this example, because the invented shift estimatesat the top of Table 2 are reasonably consistent with one another, convergence has already occurred.
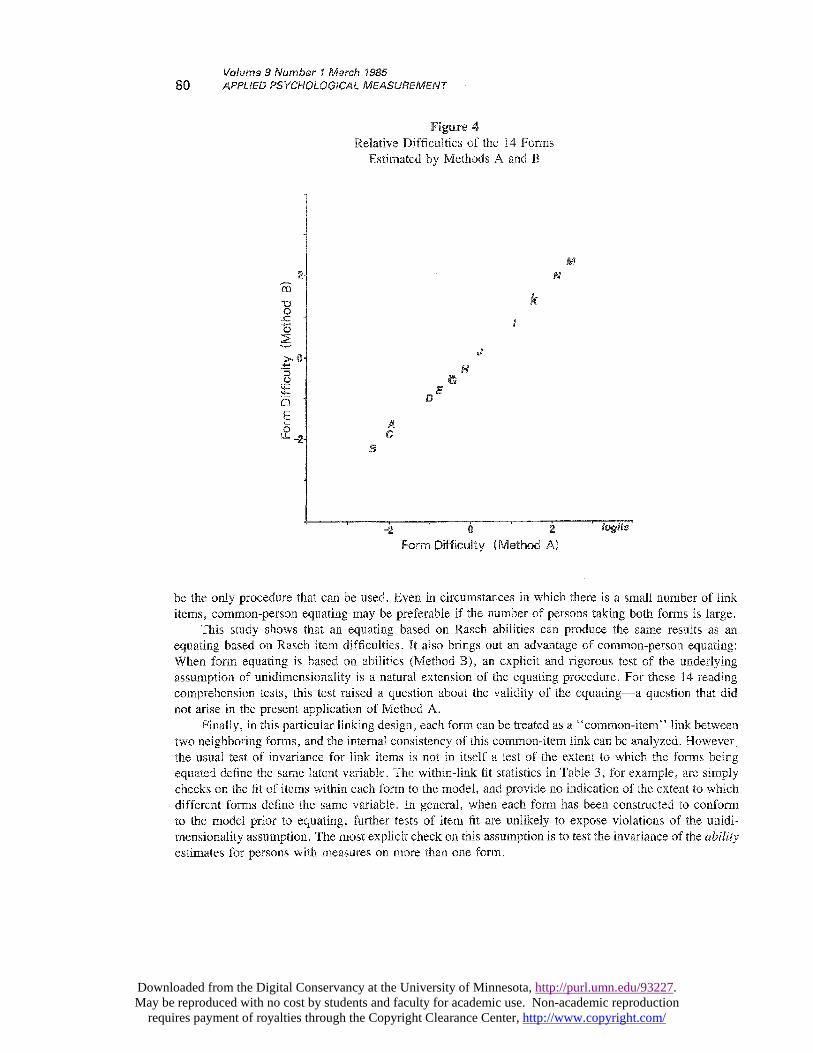
This iterative procedure was carried out on the 14 x 14 matrix of shifts (c~.Y - d.x) to estimate aform difficulty for each of the 14 Tests of Reading Comprehension. The entire procedure was thenrepeated, this time using the matrix of shifts (b.X - b.y) from Method B. This provides a second set ofform difficulty estimates for the 14 reading tests. These two sets of estimates are plotted against eachother in Figure 4.
It is clear from Figure 4 that, for practical purposes, Methods A and B produce equivalent estimatesof the difficulties of these 14 reading tests. This is the result that is expected when data conform to themodel. For these data, it seems not to matter whether the equating is performed using the difficulties(Method A) or using the abilities (Method B). Although there is still a doubt about the extent to whichthese 14 forms can be equated meaningfully, the observation that Methods A and B have produced moreor less equivalent estimates of their form difficulties is encouraging.
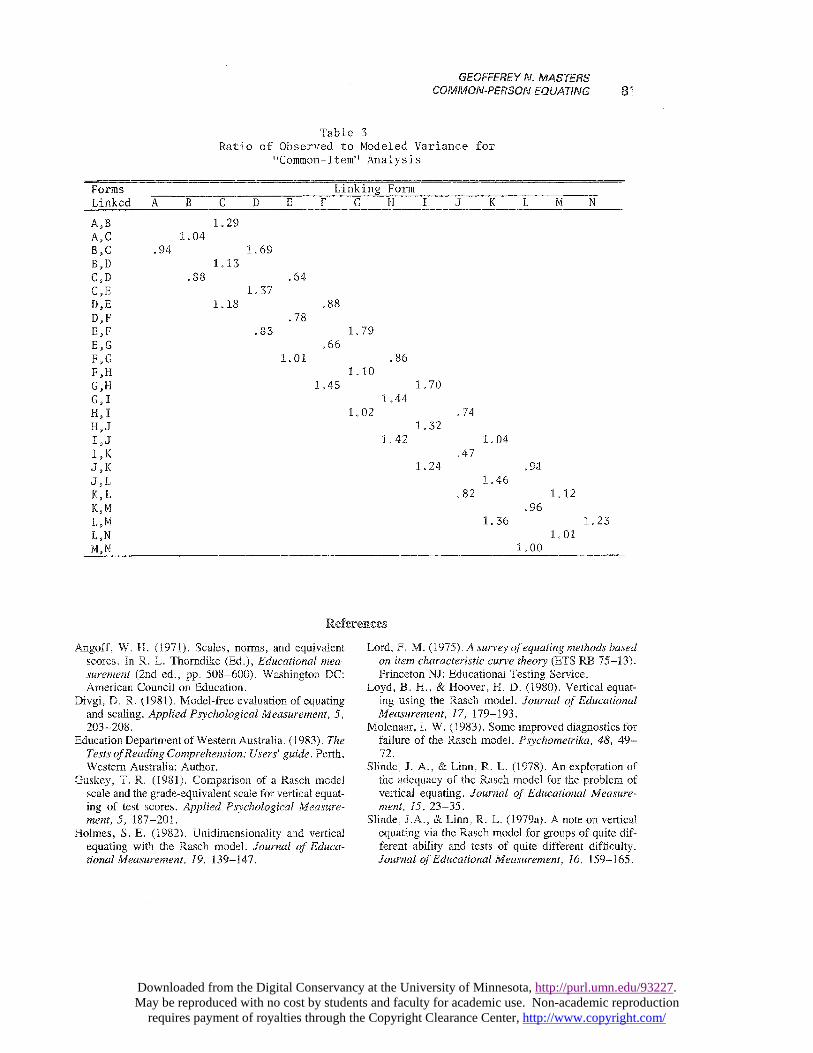
Finally, because the items in Form B have been calibrated on link group A-B and also on link groupB-C, Form B can be thought of as a common-item link between Forms A and C. The two difficultyestimates obtained for each item in Form B from these separate calibrations can be subtracted and theratio of the observed to modeled variance of this difference can be used to check on the internal consistencyof this common-item link. This has been done for each of the links in this design, and the results areshown in Table 3. Values of this ratio are approximately centered on their expected value of 1. Abouthalf the values in Table 3 are below their expected value, indicating that for these links, the two sets ofdifficulty estimates are more similar than has been modeled.
Discussion
The observation that, for practical purposes, Methods A and B produce equivalent estimates of thedifficulties of these 14 test forms is significant. Equating procedures based on latent trait methods usuallywork with item difficulties rather than with person abilities because, in general, difficulties are moreprecisely estimated. However, common-item equating is not always possible or practical. Often, the testsbeing equated include one or more existing standardized tests; sometimes, responses to individual itemshave been lost and only total test scores are available. In these situations, common-person equating may
Downloaded from the Digital Conservancy at the University of Minnesota, http://purl.umn.edu/93227. May be reproduced with no cost by students and faculty for academic use. Non-academic reproduction
requires payment of royalties through the Copyright Clearance Center, http://www.copyright.com/
80
Figure 4Relative Difficulties of the 14 Forms
Estimated by Methods A and B
be the only procedure that can be used. Even in circumstances in which there is a small number of linkitems, common-person equating may be preferable if the number of persons taking both forms is large.
This study shows that an equating based on Rasch abilities can produce the same results as anequating based on Rasch item difficulties. It also brings out an advantage of common-person equating:When form equating is based on abilities (Method B), an explicit and rigorous test of the underlyingassumption of unidimensionality is a natural extension of the equating procedure. For these 14 readingcomprehension tests, this test raised a question about the validity of the equating-a question that didnot arise in the present application of Method A.
Finally, in this particular linking design, each form can be treated as a &dquo;common-item&dquo; link betweentwo neighboring forms, and the internal consistency of this common-item link can be analyzed. However,the usual test of invariance for link items is not in itself a test of the extent to which the forms beingequated define the same latent variable. The within-link fit statistics in Table 3, for example, are simplychecks on the fit of items within each form to the model, and provide no indication of the extent to whichdifferent forms define the same variable. In general, when each form has been constructed to conformto the model prior to equating, further tests of item fit are unlikely to expose violations of the unidi-mensionality assumption. The most explicit check on this assumption is to test the invariance of the abilityestimates for persons with measures on more than one form.
Downloaded from the Digital Conservancy at the University of Minnesota, http://purl.umn.edu/93227. May be reproduced with no cost by students and faculty for academic use. Non-academic reproduction
requires payment of royalties through the Copyright Clearance Center, http://www.copyright.com/
81
Table 3
Ratio of Observed to Modeled Variance for&dquo;Common-Item&dquo; Analysis
References
Angoff, W. H. (1971). Scales, norms, and equivalentscores. In R. L. Thorndike (Ed.), Educational mea-surement (2nd ed., pp. 508-600). Washington DC:American Council on Education.
Divgi, D. R. (1981). Model-free evaluation of equatingand scaling. Applied Psychological Measurement, 5,203-208.
Education Department of Western Australia. (1983). TheTests of Reading Comprehension: Users’ guide. Perth,Western Australia: Author.
Guskey, T. R. (1981). Comparison of a Rasch modelscale and the grade-equivalent scale for vertical equat-ing of test scores. Applied Psychological Measure-ment, 5, 187-201.
Holmes, S. E. (1982). Unidimensionality and verticalequating with the Rasch model. Journal of Educa-tional Measurement, 19, 139-147.
Lord, F. M. (1975). A survey of equating methods basedon item characteristic curve theory (ETS RB 75-13).Princeton NJ: Educational Testing Service.
Loyd, B. H., & Hoover, H. D. (1950). Vertical equat-ing using the Rasch model. Journal of EducationalMeasurement, 17, 179-193.
Molenaar, I. W. (1983). Some improved diagnostics forfailure of the Rasch model. Psychometrika, 48, 49-72.
Slinde, J. A., & Linn, R. L. (1978). An exploration ofthe adequacy of the Rasch model for the problem ofvertical equating. Journal of Educational Measure-ment, 15, 23-35.
Slinde, J.A., & Linn, R. L. (1979a). A note on verticalequating via the Rasch model for groups of quite dif-ferent ability and tests of quite different difficulty.Journal of Educational Measurement, 16, 159-165.
Downloaded from the Digital Conservancy at the University of Minnesota, http://purl.umn.edu/93227. May be reproduced with no cost by students and faculty for academic use. Non-academic reproduction
requires payment of royalties through the Copyright Clearance Center, http://www.copyright.com/

82
Slinde, J. A., & Linn, R. L. (1979b). The Rasch model,objective measurement, equating and robustness. Ap-plied Psychological Measurement, 3, 437-452.
van den Wollenberg, A. L. (1982). A simple and ef-fective method to test the dimensionality axiom of theRasch model. Applied Psychological Measurement,6, 83-91.
Wright, B. D. (1977). Solving measurement problemswith the Rasch model. Journal of Educational Mea-surement, 14, 97-116.
Acknowledgment
The author thanks Peter Hill, Research Branch, Edu-cation Department of Western Australia, for his assis-tance in this project.
Author’s Address
Send requests for reprints or further information to Geof-ferey Masters, Centre for the Study of Higher Education,University of Melbourne, Parkville, Victoria, Australia3052.
Downloaded from the Digital Conservancy at the University of Minnesota, http://purl.umn.edu/93227. May be reproduced with no cost by students and faculty for academic use. Non-academic reproduction
requires payment of royalties through the Copyright Clearance Center, http://www.copyright.com/