BEST'S RATING REPORT BEST'S RATING REPORT
18
SINCE 1899 Page 1 of 18 Printed October 1, 2020 BEST’S RATING REPORT A M BEST A Excellent Financial Strength Rating THE INDEPENDENT ORDER OF FORESTERS Domiciliary Address: 789 Don Mills Road, Toronto, Ontario M3C 1T9 Canada AMB #: 067409 NAIC #: N/A FEIN #: N/A Phone: 415-429-3000 Fax: 416-467-2526 Website: www.foresters.com THE INDEPENDENT ORDER OF FORESTERS A Domiciliary Address: 789 Don Mills Road, Toronto, Ontario M3C 1T9 Canada AMB #: 060132 NAIC #: N/A AIIN#: AA-1560109 Phone: 416-429-3000 Fax: 416-467-2526 Website: www.foresters.com
-
Upload
khangminh22 -
Category
Documents
-
view
0 -
download
0
Transcript of BEST'S RATING REPORT BEST'S RATING REPORT
BEST’S RATING REPORT
SINCE 1899
Page 1 of 18 Printed October 1, 2020
BEST’S RATING REPORTBEST’S RATING REPORT
AM BEST
A Excellent
Financial Strength Rating
THE INDEPENDENT ORDER OF FORESTERSDomiciliary Address: 789 Don Mills Road, Toronto, Ontario M3C 1T9 CanadaAMB #: 067409 NAIC #: N/A FEIN #: N/APhone: 415-429-3000 Fax: 416-467-2526 Website: www.foresters.com
THE INDEPENDENT ORDER OF FORESTERS ADomiciliary Address: 789 Don Mills Road, Toronto, Ontario M3C 1T9 CanadaAMB #: 060132 NAIC #: N/A AIIN#: AA-1560109Phone: 416-429-3000 Fax: 416-467-2526 Website: www.foresters.com
SINCE 1899
Page 2 of 18 Printed October 1, 2020
BEST’S RATING REPORT
Best's Credit Rating Effective DateAugust 05, 2020
Analytical ContactsFrank WalkoFinancial [email protected]+1(908) 439-2200 Ext. 5072
Edward [email protected]+1(908) 439-2200 Ext. 5664
InformationBest's Credit Rating Methodology
Understanding Best's Credit Ratings
Market Segment Outlooks
Financial Data PresentedFinancial data in this report: (i) includesdata of affiliated entities that are not ratingunit members where analytics benefit frominclusion; and/or (ii) excludes data of ratingunit member entities if they operate indifferent segments or geographic areas thanthe Rating Unit generally. See list ofcompanies for details of rating unitmembers and any such included and/orexcluded entities.The financial data in this report reflects themost current data available to the AnalyticalTeam at the time of the rating. Updates tothe financial exhibits in this report areavailable here: Best's Financial Report.
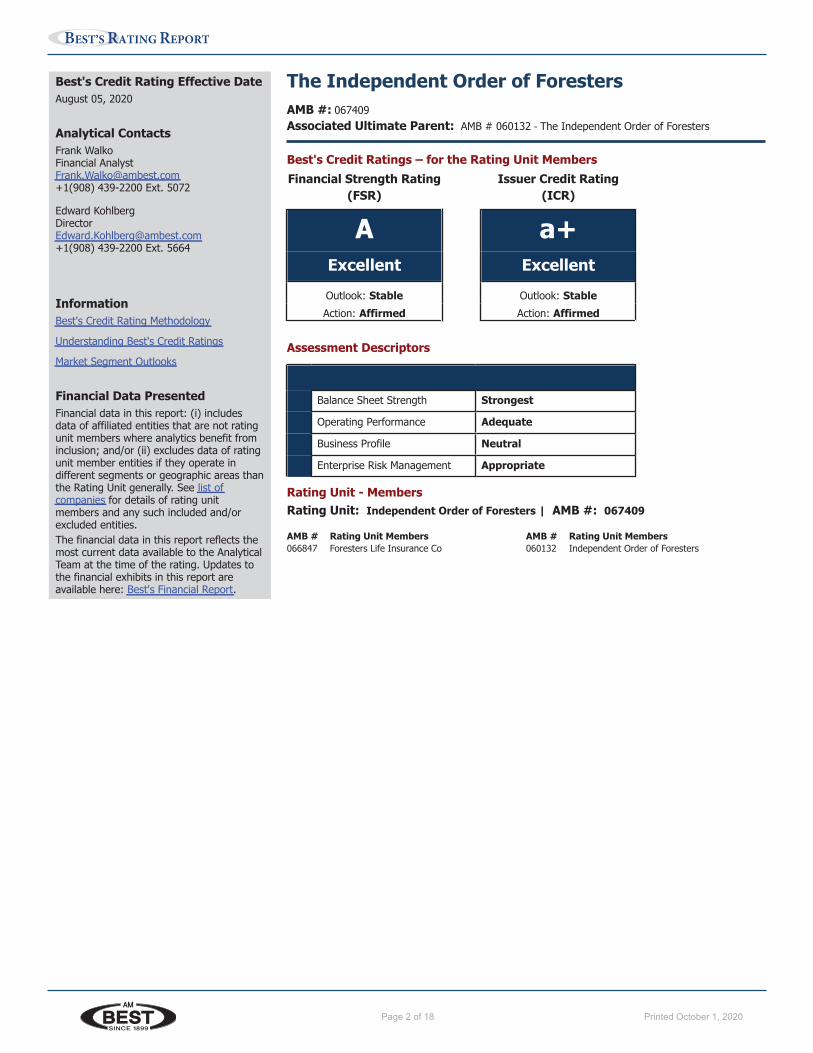
The Independent Order of ForestersAMB #: 067409Associated Ultimate Parent: AMB # 060132 - The Independent Order of Foresters
Best's Credit Ratings – for the Rating Unit Members
Financial Strength Rating Issuer Credit Rating(FSR) (ICR)
A a+Excellent Excellent
Outlook: Stable Outlook: Stable
Action: Affirmed Action: Affirmed
Assessment Descriptors
Balance Sheet Strength Strongest
Operating Performance Adequate
Business Profile Neutral
Enterprise Risk Management Appropriate
Rating Unit - MembersRating Unit: Independent Order of Foresters | AMB #: 067409
AMB # Rating Unit Members066847 Foresters Life Insurance Co
AMB # Rating Unit Members060132 Independent Order of Foresters
www.ambest.com Page 2Printed for Bcrs on August 13, 2020
SINCE 1899
Page 3 of 18 Printed October 1, 2020
BEST’S RATING REPORT
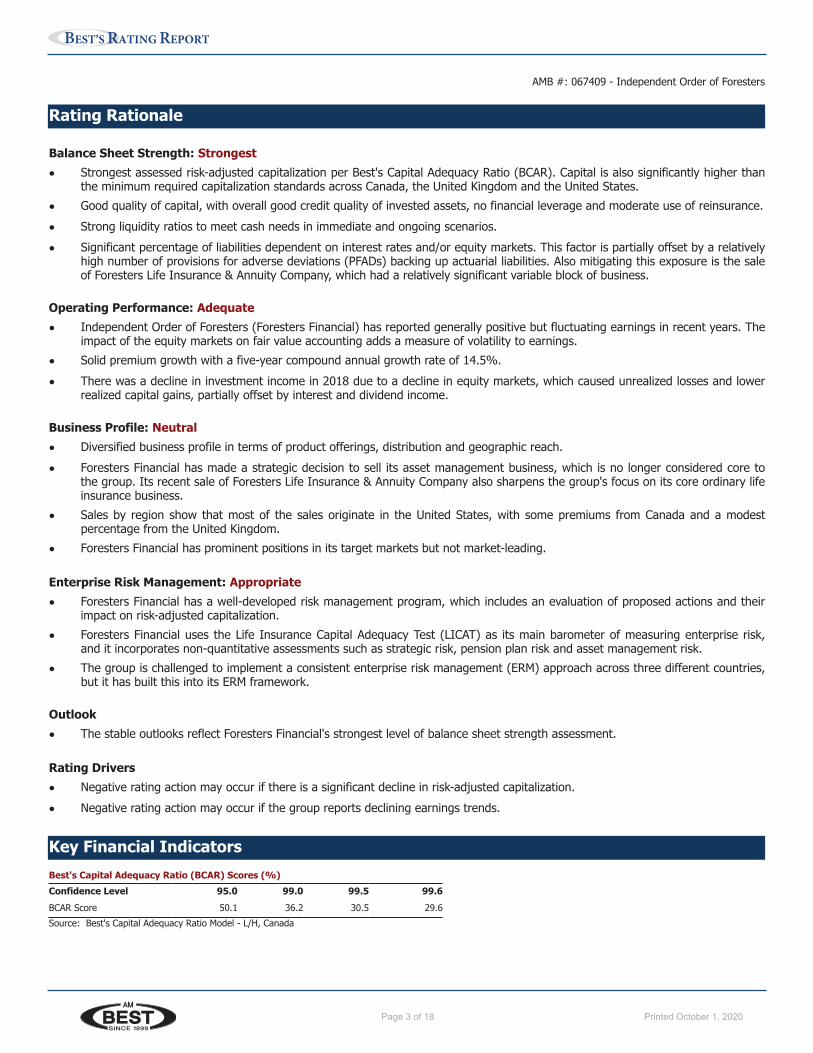
Rating Rationale
Balance Sheet Strength: Strongest
• Strongest assessed risk-adjusted capitalization per Best's Capital Adequacy Ratio (BCAR). Capital is also significantly higher thanthe minimum required capitalization standards across Canada, the United Kingdom and the United States.
• Good quality of capital, with overall good credit quality of invested assets, no financial leverage and moderate use of reinsurance.
• Strong liquidity ratios to meet cash needs in immediate and ongoing scenarios.
• Significant percentage of liabilities dependent on interest rates and/or equity markets. This factor is partially offset by a relativelyhigh number of provisions for adverse deviations (PFADs) backing up actuarial liabilities. Also mitigating this exposure is the saleof Foresters Life Insurance & Annuity Company, which had a relatively significant variable block of business.
Operating Performance: Adequate
• Independent Order of Foresters (Foresters Financial) has reported generally positive but fluctuating earnings in recent years. Theimpact of the equity markets on fair value accounting adds a measure of volatility to earnings.
• Solid premium growth with a five-year compound annual growth rate of 14.5%.
• There was a decline in investment income in 2018 due to a decline in equity markets, which caused unrealized losses and lowerrealized capital gains, partially offset by interest and dividend income.
Business Profile: Neutral
• Diversified business profile in terms of product offerings, distribution and geographic reach.
• Foresters Financial has made a strategic decision to sell its asset management business, which is no longer considered core tothe group. Its recent sale of Foresters Life Insurance & Annuity Company also sharpens the group's focus on its core ordinary lifeinsurance business.
• Sales by region show that most of the sales originate in the United States, with some premiums from Canada and a modestpercentage from the United Kingdom.
• Foresters Financial has prominent positions in its target markets but not market-leading.
Enterprise Risk Management: Appropriate
• Foresters Financial has a well-developed risk management program, which includes an evaluation of proposed actions and theirimpact on risk-adjusted capitalization.
• Foresters Financial uses the Life Insurance Capital Adequacy Test (LICAT) as its main barometer of measuring enterprise risk,and it incorporates non-quantitative assessments such as strategic risk, pension plan risk and asset management risk.
• The group is challenged to implement a consistent enterprise risk management (ERM) approach across three different countries,but it has built this into its ERM framework.
Outlook
• The stable outlooks reflect Foresters Financial's strongest level of balance sheet strength assessment.
Rating Drivers
• Negative rating action may occur if there is a significant decline in risk-adjusted capitalization.
• Negative rating action may occur if the group reports declining earnings trends.
Key Financial Indicators
Best's Capital Adequacy Ratio (BCAR) Scores (%)
Confidence Level 95.0 99.0 99.5 99.6
BCAR Score 50.1 36.2 30.5 29.6
Source: Best's Capital Adequacy Ratio Model - L/H, Canada
AMB #: 067409 - Independent Order of Foresters
www.ambest.com Page 3Printed for Bcrs on August 13, 2020
SINCE 1899
Page 4 of 18 Printed October 1, 2020
BEST’S RATING REPORT
Year End - December 31
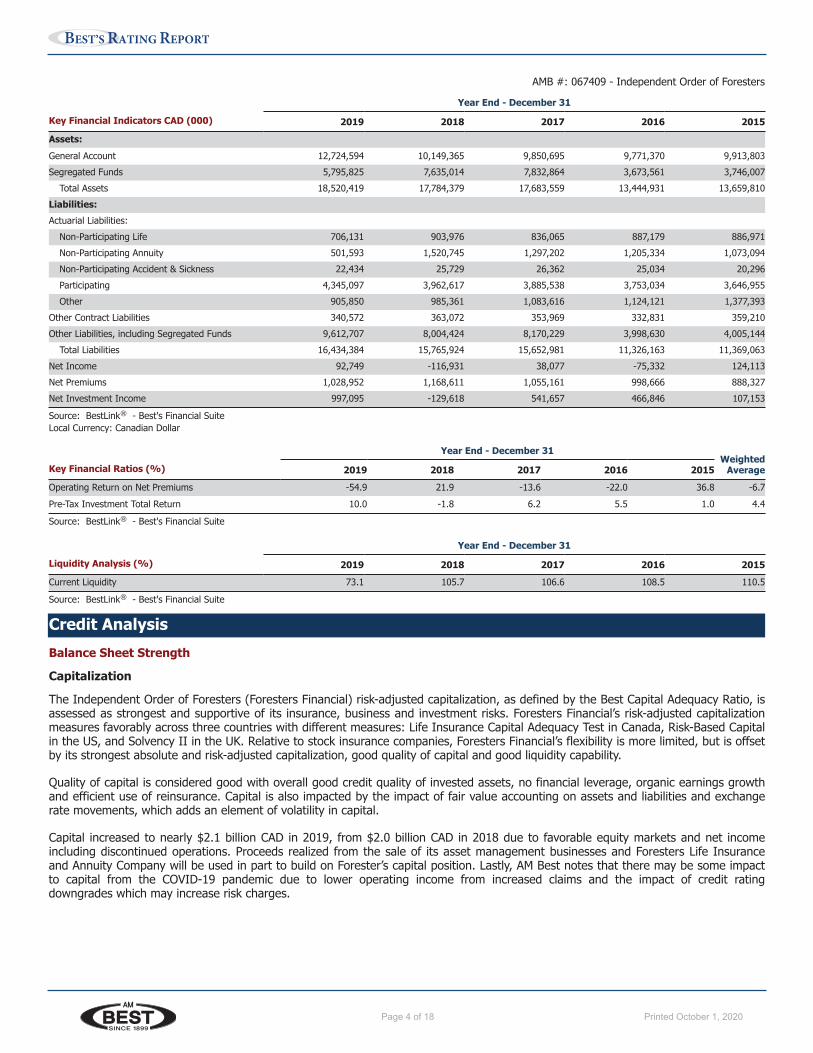
Key Financial Indicators CAD (000) 2019 2018 2017 2016 2015
Assets:
General Account 12,724,594 10,149,365 9,850,695 9,771,370 9,913,803
Segregated Funds 5,795,825 7,635,014 7,832,864 3,673,561 3,746,007
Total Assets 18,520,419 17,784,379 17,683,559 13,444,931 13,659,810
Liabilities:
Actuarial Liabilities:
Non-Participating Life 706,131 903,976 836,065 887,179 886,971
Non-Participating Annuity 501,593 1,520,745 1,297,202 1,205,334 1,073,094
Non-Participating Accident & Sickness 22,434 25,729 26,362 25,034 20,296
Participating 4,345,097 3,962,617 3,885,538 3,753,034 3,646,955
Other 905,850 985,361 1,083,616 1,124,121 1,377,393
Other Contract Liabilities 340,572 363,072 353,969 332,831 359,210
Other Liabilities, including Segregated Funds 9,612,707 8,004,424 8,170,229 3,998,630 4,005,144
Total Liabilities 16,434,384 15,765,924 15,652,981 11,326,163 11,369,063
Net Income 92,749 -116,931 38,077 -75,332 124,113
Net Premiums 1,028,952 1,168,611 1,055,161 998,666 888,327
Net Investment Income 997,095 -129,618 541,657 466,846 107,153
Source: BestLink ® - Best's Financial SuiteLocal Currency: Canadian Dollar
Year End - December 31Weighted
AverageKey Financial Ratios (%) 2019 2018 2017 2016 2015
Operating Return on Net Premiums -54.9 21.9 -13.6 -22.0 36.8 -6.7
Pre-Tax Investment Total Return 10.0 -1.8 6.2 5.5 1.0 4.4
Source: BestLink ® - Best's Financial Suite
Year End - December 31
Liquidity Analysis (%) 2019 2018 2017 2016 2015
Current Liquidity 73.1 105.7 106.6 108.5 110.5
Source: BestLink ® - Best's Financial Suite
Credit Analysis
Balance Sheet Strength
Capitalization
The Independent Order of Foresters (Foresters Financial) risk-adjusted capitalization, as defined by the Best Capital Adequacy Ratio, isassessed as strongest and supportive of its insurance, business and investment risks. Foresters Financial’s risk-adjusted capitalizationmeasures favorably across three countries with different measures: Life Insurance Capital Adequacy Test in Canada, Risk-Based Capitalin the US, and Solvency II in the UK. Relative to stock insurance companies, Foresters Financial’s flexibility is more limited, but is offsetby its strongest absolute and risk-adjusted capitalization, good quality of capital and good liquidity capability.
Quality of capital is considered good with overall good credit quality of invested assets, no financial leverage, organic earnings growthand efficient use of reinsurance. Capital is also impacted by the impact of fair value accounting on assets and liabilities and exchangerate movements, which adds an element of volatility in capital.
Capital increased to nearly $2.1 billion CAD in 2019, from $2.0 billion CAD in 2018 due to favorable equity markets and net incomeincluding discontinued operations. Proceeds realized from the sale of its asset management businesses and Foresters Life Insuranceand Annuity Company will be used in part to build on Forester’s capital position. Lastly, AM Best notes that there may be some impactto capital from the COVID-19 pandemic due to lower operating income from increased claims and the impact of credit ratingdowngrades which may increase risk charges.
AMB #: 067409 - Independent Order of Foresters
www.ambest.com Page 4Printed for Bcrs on August 13, 2020
SINCE 1899
Page 5 of 18 Printed October 1, 2020
BEST’S RATING REPORT
Balance Sheet Strength (Continued...)
Year End - December 31
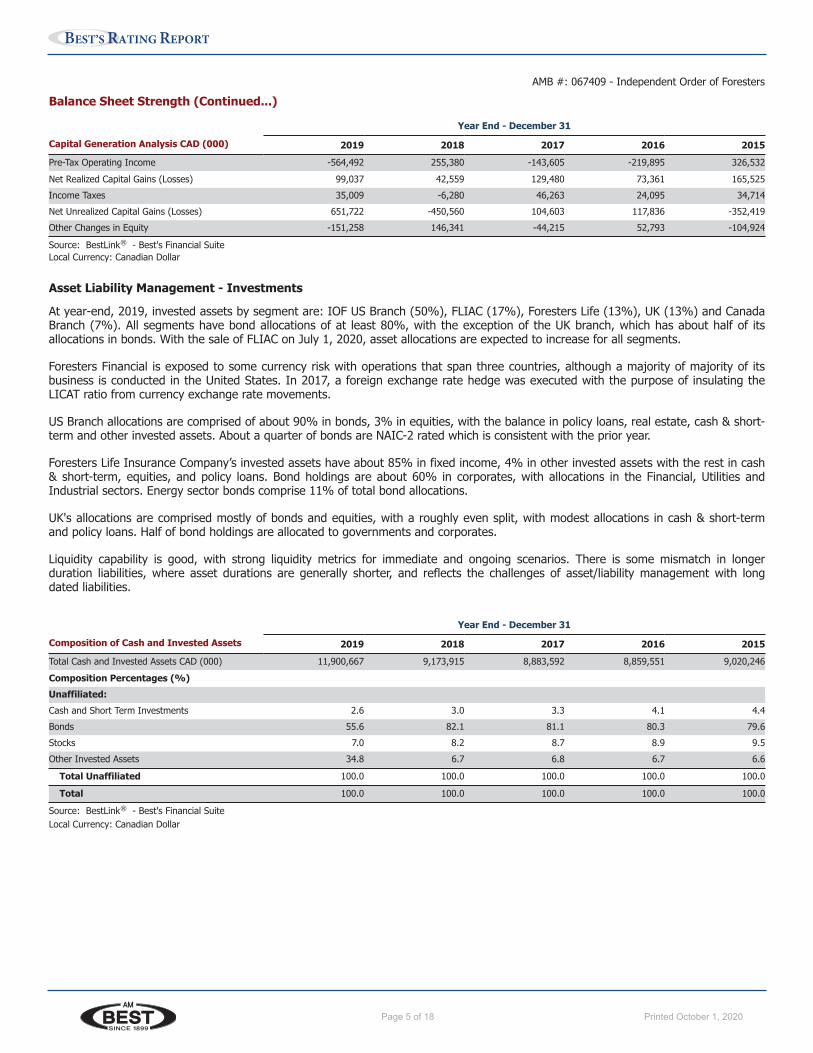
Capital Generation Analysis CAD (000) 2019 2018 2017 2016 2015
Pre-Tax Operating Income -564,492 255,380 -143,605 -219,895 326,532
Net Realized Capital Gains (Losses) 99,037 42,559 129,480 73,361 165,525
Income Taxes 35,009 -6,280 46,263 24,095 34,714
Net Unrealized Capital Gains (Losses) 651,722 -450,560 104,603 117,836 -352,419
Other Changes in Equity -151,258 146,341 -44,215 52,793 -104,924
Source: BestLink ® - Best's Financial SuiteLocal Currency: Canadian Dollar
Asset Liability Management - Investments
At year-end, 2019, invested assets by segment are: IOF US Branch (50%), FLIAC (17%), Foresters Life (13%), UK (13%) and CanadaBranch (7%). All segments have bond allocations of at least 80%, with the exception of the UK branch, which has about half of itsallocations in bonds. With the sale of FLIAC on July 1, 2020, asset allocations are expected to increase for all segments.
Foresters Financial is exposed to some currency risk with operations that span three countries, although a majority of majority of itsbusiness is conducted in the United States. In 2017, a foreign exchange rate hedge was executed with the purpose of insulating theLICAT ratio from currency exchange rate movements.
US Branch allocations are comprised of about 90% in bonds, 3% in equities, with the balance in policy loans, real estate, cash & short-term and other invested assets. About a quarter of bonds are NAIC-2 rated which is consistent with the prior year.
Foresters Life Insurance Company’s invested assets have about 85% in fixed income, 4% in other invested assets with the rest in cash& short-term, equities, and policy loans. Bond holdings are about 60% in corporates, with allocations in the Financial, Utilities andIndustrial sectors. Energy sector bonds comprise 11% of total bond allocations.
UK's allocations are comprised mostly of bonds and equities, with a roughly even split, with modest allocations in cash & short-termand policy loans. Half of bond holdings are allocated to governments and corporates.
Liquidity capability is good, with strong liquidity metrics for immediate and ongoing scenarios. There is some mismatch in longerduration liabilities, where asset durations are generally shorter, and reflects the challenges of asset/liability management with longdated liabilities.
Year End - December 31
Composition of Cash and Invested Assets 2019 2018 2017 2016 2015
Total Cash and Invested Assets CAD (000) 11,900,667 9,173,915 8,883,592 8,859,551 9,020,246
Composition Percentages (%)
Unaffiliated:
Cash and Short Term Investments 2.6 3.0 3.3 4.1 4.4
Bonds 55.6 82.1 81.1 80.3 79.6
Stocks 7.0 8.2 8.7 8.9 9.5
Other Invested Assets 34.8 6.7 6.8 6.7 6.6
Total Unaffiliated 100.0 100.0 100.0 100.0 100.0
Total 100.0 100.0 100.0 100.0 100.0
Source: BestLink ® - Best's Financial SuiteLocal Currency: Canadian Dollar
AMB #: 067409 - Independent Order of Foresters
www.ambest.com Page 5Printed for Bcrs on August 13, 2020
SINCE 1899
Page 6 of 18 Printed October 1, 2020
BEST’S RATING REPORT
Balance Sheet Strength (Continued...)
Year End - December 31
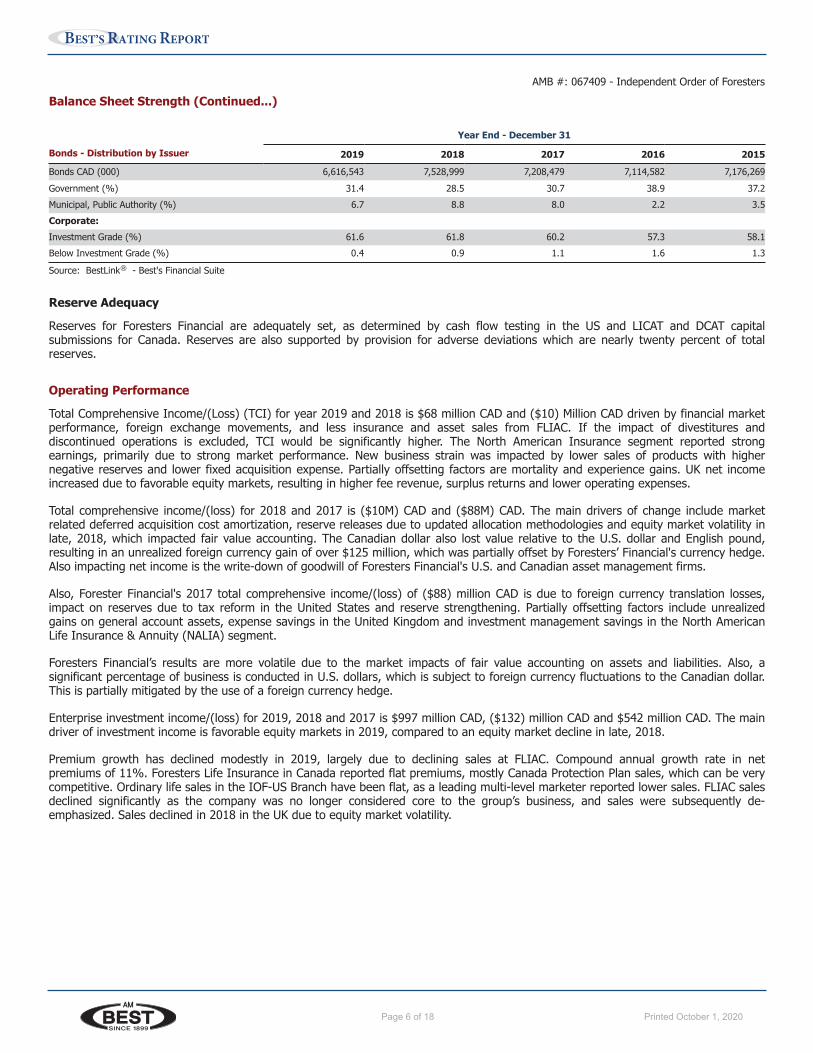
Bonds - Distribution by Issuer 2019 2018 2017 2016 2015
Bonds CAD (000) 6,616,543 7,528,999 7,208,479 7,114,582 7,176,269
Government (%) 31.4 28.5 30.7 38.9 37.2
Municipal, Public Authority (%) 6.7 8.8 8.0 2.2 3.5
Corporate:
Investment Grade (%) 61.6 61.8 60.2 57.3 58.1
Below Investment Grade (%) 0.4 0.9 1.1 1.6 1.3
Source: BestLink ® - Best's Financial Suite
Reserve Adequacy
Reserves for Foresters Financial are adequately set, as determined by cash flow testing in the US and LICAT and DCAT capitalsubmissions for Canada. Reserves are also supported by provision for adverse deviations which are nearly twenty percent of totalreserves.
Operating Performance
Total Comprehensive Income/(Loss) (TCI) for year 2019 and 2018 is $68 million CAD and ($10) Million CAD driven by financial marketperformance, foreign exchange movements, and less insurance and asset sales from FLIAC. If the impact of divestitures anddiscontinued operations is excluded, TCI would be significantly higher. The North American Insurance segment reported strongearnings, primarily due to strong market performance. New business strain was impacted by lower sales of products with highernegative reserves and lower fixed acquisition expense. Partially offsetting factors are mortality and experience gains. UK net incomeincreased due to favorable equity markets, resulting in higher fee revenue, surplus returns and lower operating expenses.
Total comprehensive income/(loss) for 2018 and 2017 is ($10M) CAD and ($88M) CAD. The main drivers of change include marketrelated deferred acquisition cost amortization, reserve releases due to updated allocation methodologies and equity market volatility inlate, 2018, which impacted fair value accounting. The Canadian dollar also lost value relative to the U.S. dollar and English pound,resulting in an unrealized foreign currency gain of over $125 million, which was partially offset by Foresters’ Financial's currency hedge.Also impacting net income is the write-down of goodwill of Foresters Financial's U.S. and Canadian asset management firms.
Also, Forester Financial's 2017 total comprehensive income/(loss) of ($88) million CAD is due to foreign currency translation losses,impact on reserves due to tax reform in the United States and reserve strengthening. Partially offsetting factors include unrealizedgains on general account assets, expense savings in the United Kingdom and investment management savings in the North AmericanLife Insurance & Annuity (NALIA) segment.
Foresters Financial’s results are more volatile due to the market impacts of fair value accounting on assets and liabilities. Also, asignificant percentage of business is conducted in U.S. dollars, which is subject to foreign currency fluctuations to the Canadian dollar.This is partially mitigated by the use of a foreign currency hedge.
Enterprise investment income/(loss) for 2019, 2018 and 2017 is $997 million CAD, ($132) million CAD and $542 million CAD. The maindriver of investment income is favorable equity markets in 2019, compared to an equity market decline in late, 2018.
Premium growth has declined modestly in 2019, largely due to declining sales at FLIAC. Compound annual growth rate in netpremiums of 11%. Foresters Life Insurance in Canada reported flat premiums, mostly Canada Protection Plan sales, which can be verycompetitive. Ordinary life sales in the IOF-US Branch have been flat, as a leading multi-level marketer reported lower sales. FLIAC salesdeclined significantly as the company was no longer considered core to the group’s business, and sales were subsequently de-emphasized. Sales declined in 2018 in the UK due to equity market volatility.
AMB #: 067409 - Independent Order of Foresters
www.ambest.com Page 6Printed for Bcrs on August 13, 2020
SINCE 1899
Page 7 of 18 Printed October 1, 2020
BEST’S RATING REPORT
Operating Performance (Continued...)
Year End - December 31
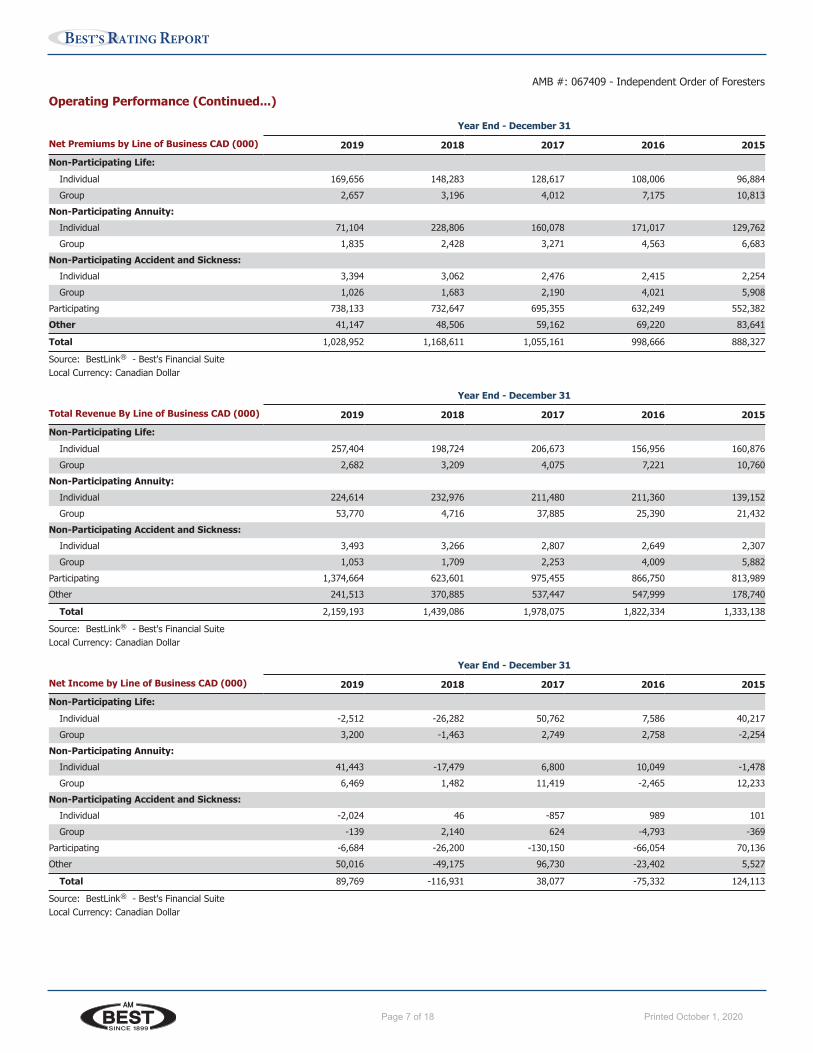
Net Premiums by Line of Business CAD (000) 2019 2018 2017 2016 2015
Non-Participating Life:
Individual 169,656 148,283 128,617 108,006 96,884
Group 2,657 3,196 4,012 7,175 10,813
Non-Participating Annuity:
Individual 71,104 228,806 160,078 171,017 129,762
Group 1,835 2,428 3,271 4,563 6,683
Non-Participating Accident and Sickness:
Individual 3,394 3,062 2,476 2,415 2,254
Group 1,026 1,683 2,190 4,021 5,908
Participating 738,133 732,647 695,355 632,249 552,382
Other 41,147 48,506 59,162 69,220 83,641
Total 1,028,952 1,168,611 1,055,161 998,666 888,327
Source: BestLink ® - Best's Financial SuiteLocal Currency: Canadian Dollar
Year End - December 31
Total Revenue By Line of Business CAD (000) 2019 2018 2017 2016 2015
Non-Participating Life:
Individual 257,404 198,724 206,673 156,956 160,876
Group 2,682 3,209 4,075 7,221 10,760
Non-Participating Annuity:
Individual 224,614 232,976 211,480 211,360 139,152
Group 53,770 4,716 37,885 25,390 21,432
Non-Participating Accident and Sickness:
Individual 3,493 3,266 2,807 2,649 2,307
Group 1,053 1,709 2,253 4,009 5,882
Participating 1,374,664 623,601 975,455 866,750 813,989
Other 241,513 370,885 537,447 547,999 178,740
Total 2,159,193 1,439,086 1,978,075 1,822,334 1,333,138
Source: BestLink ® - Best's Financial SuiteLocal Currency: Canadian Dollar
Year End - December 31
Net Income by Line of Business CAD (000) 2019 2018 2017 2016 2015
Non-Participating Life:
Individual -2,512 -26,282 50,762 7,586 40,217
Group 3,200 -1,463 2,749 2,758 -2,254
Non-Participating Annuity:
Individual 41,443 -17,479 6,800 10,049 -1,478
Group 6,469 1,482 11,419 -2,465 12,233
Non-Participating Accident and Sickness:
Individual -2,024 46 -857 989 101
Group -139 2,140 624 -4,793 -369
Participating -6,684 -26,200 -130,150 -66,054 70,136
Other 50,016 -49,175 96,730 -23,402 5,527
Total 89,769 -116,931 38,077 -75,332 124,113
Source: BestLink ® - Best's Financial SuiteLocal Currency: Canadian Dollar
AMB #: 067409 - Independent Order of Foresters
www.ambest.com Page 7Printed for Bcrs on August 13, 2020
SINCE 1899
Page 8 of 18 Printed October 1, 2020
BEST’S RATING REPORT
Business Profile
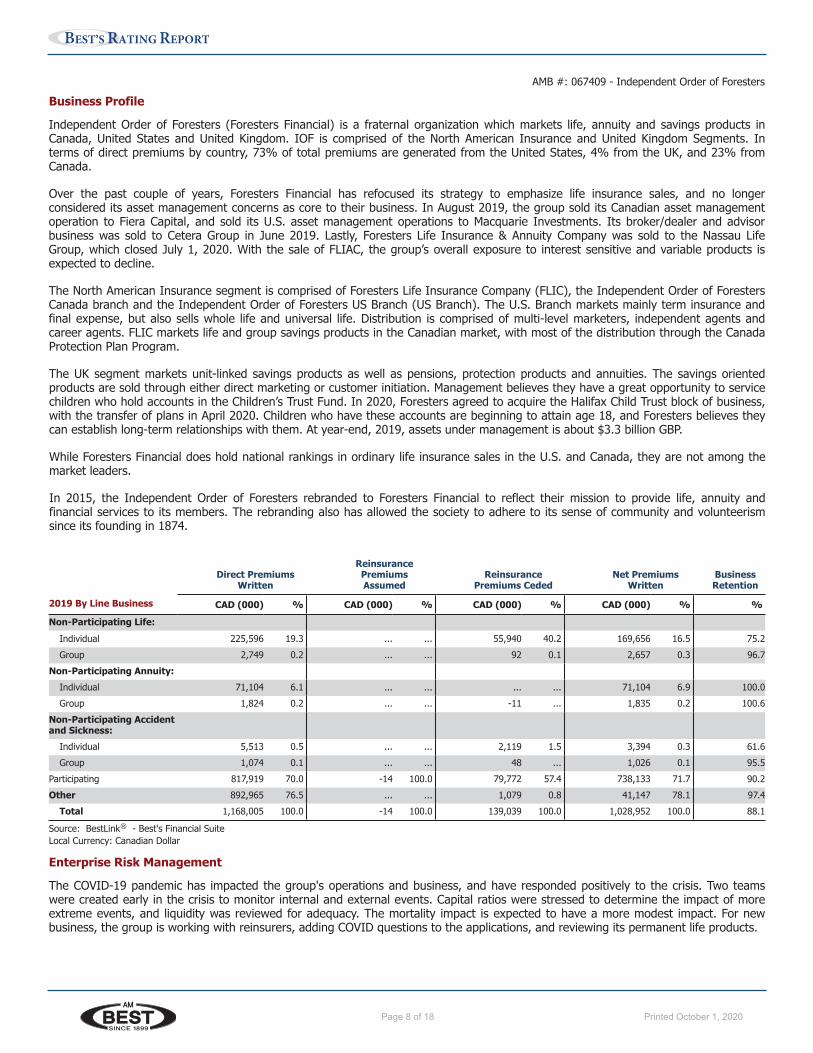
Independent Order of Foresters (Foresters Financial) is a fraternal organization which markets life, annuity and savings products inCanada, United States and United Kingdom. IOF is comprised of the North American Insurance and United Kingdom Segments. Interms of direct premiums by country, 73% of total premiums are generated from the United States, 4% from the UK, and 23% fromCanada.
Over the past couple of years, Foresters Financial has refocused its strategy to emphasize life insurance sales, and no longerconsidered its asset management concerns as core to their business. In August 2019, the group sold its Canadian asset managementoperation to Fiera Capital, and sold its U.S. asset management operations to Macquarie Investments. Its broker/dealer and advisorbusiness was sold to Cetera Group in June 2019. Lastly, Foresters Life Insurance & Annuity Company was sold to the Nassau LifeGroup, which closed July 1, 2020. With the sale of FLIAC, the group’s overall exposure to interest sensitive and variable products isexpected to decline.
The North American Insurance segment is comprised of Foresters Life Insurance Company (FLIC), the Independent Order of ForestersCanada branch and the Independent Order of Foresters US Branch (US Branch). The U.S. Branch markets mainly term insurance andfinal expense, but also sells whole life and universal life. Distribution is comprised of multi-level marketers, independent agents andcareer agents. FLIC markets life and group savings products in the Canadian market, with most of the distribution through the CanadaProtection Plan Program.
The UK segment markets unit-linked savings products as well as pensions, protection products and annuities. The savings orientedproducts are sold through either direct marketing or customer initiation. Management believes they have a great opportunity to servicechildren who hold accounts in the Children’s Trust Fund. In 2020, Foresters agreed to acquire the Halifax Child Trust block of business,with the transfer of plans in April 2020. Children who have these accounts are beginning to attain age 18, and Foresters believes theycan establish long-term relationships with them. At year-end, 2019, assets under management is about $3.3 billion GBP.
While Foresters Financial does hold national rankings in ordinary life insurance sales in the U.S. and Canada, they are not among themarket leaders.
In 2015, the Independent Order of Foresters rebranded to Foresters Financial to reflect their mission to provide life, annuity andfinancial services to its members. The rebranding also has allowed the society to adhere to its sense of community and volunteerismsince its founding in 1874.
Direct PremiumsWritten
ReinsurancePremiumsAssumed
ReinsurancePremiums Ceded
Net PremiumsWritten
BusinessRetention
2019 By Line Business CAD (000) % CAD (000) % CAD (000) % CAD (000) % %
Non-Participating Life:
Individual 225,596 19.3 ... ... 55,940 40.2 169,656 16.5 75.2
Group 2,749 0.2 ... ... 92 0.1 2,657 0.3 96.7
Non-Participating Annuity:
Individual 71,104 6.1 ... ... ... ... 71,104 6.9 100.0
Group 1,824 0.2 ... ... -11 ... 1,835 0.2 100.6
Non-Participating Accidentand Sickness:
Individual 5,513 0.5 ... ... 2,119 1.5 3,394 0.3 61.6
Group 1,074 0.1 ... ... 48 ... 1,026 0.1 95.5
Participating 817,919 70.0 -14 100.0 79,772 57.4 738,133 71.7 90.2
Other 892,965 76.5 ... ... 1,079 0.8 41,147 78.1 97.4
Total 1,168,005 100.0 -14 100.0 139,039 100.0 1,028,952 100.0 88.1
Source: BestLink ® - Best's Financial SuiteLocal Currency: Canadian Dollar
Enterprise Risk Management
The COVID-19 pandemic has impacted the group's operations and business, and have responded positively to the crisis. Two teamswere created early in the crisis to monitor internal and external events. Capital ratios were stressed to determine the impact of moreextreme events, and liquidity was reviewed for adequacy. The mortality impact is expected to have a more modest impact. For newbusiness, the group is working with reinsurers, adding COVID questions to the applications, and reviewing its permanent life products.
AMB #: 067409 - Independent Order of Foresters
www.ambest.com Page 8Printed for Bcrs on August 13, 2020
SINCE 1899
Page 9 of 18 Printed October 1, 2020
BEST’S RATING REPORT
Enterprise Risk Management (Continued...)
Foresters Financial has developed their enterprise risk management program as their organization structure has grown. They facechallenges in making their ERM program consistent across three different countries, given the different product mix and with eachjurisdiction having their own economic, legal, regulatory and judicial environments.
Foresters Financial has been able to foster good diversification in its business model, which included products, geography, distribution,sales and investments.
The Foresters Financial management team has remained intact in recent years, and is expected to develop continuity in future years.Foresters Financial has developed a new five-year plan which will emphasize its core life business and promote earnings growth tocoincide with its 150 years of existence in 2024.
Foresters Financial has created the position of Chief Actuary, who would also assume the duties as Chief Risk Officer (CRO). Each ofthe CROs of each segment will report to this individual. The ERMC and CRO are overseen by the Board's Risk and InvestmentCommittee (RIC). The Board approves the Risk Management Policy annually which outlines Foresters Financial Risk Appetite andTolerances, as well as the risk management governance structure, including the Board's and Management's responsibilities in managingrisks and the ERMC mandate.
The risk management framework works to identify risk areas and establish clear accountability for risk management. Primary riskcategories include Strategic, Financial, Operational, and Compliance Risk. Individual risks are identified, measured, mitigated andmonitored at the divisional or operational level. The risk management function, as the next level of defense, oversees risk managementand reports to the ERMC monthly and RIC quarterly on the organization’s overall risk profile, including any areas of concern formanagement to monitor.
The primary means for evaluating the impact risk on capital and surplus is the LICAT, which is also adjusted for other factors such asstrategic risk, pension risk, concentration risk and reinsurance. Sensitivity analysis is also performed in the group's DCAT submission.
Risk-adjusted capitalization is monitored by Corporate Capital Management on a quarterly basis, using the Best Capital Adequacy Ratio,Risk Based Capital Ratio, Life Insurance Capital Adequacy Test and the U.K. Solvency II requirements. Actual results are compared toprior year and plan, and variances are researched and addressed as they arise. Currency hedges are also used to manage the impactof exchange rates relative to the Canadian dollar. Foresters Financial continually seeks ways to diversify its organization by product,geography and distribution. Spreads and asset/liability management is done monthly. Scenario and stress testing is done at leastannually and per regulations.
Reinsurance Summary
Foresters Financial does not extensively use reinsurance. Retention is $500 thousand or lower depending on age and ratings. Inforcereinsurance is mostly yearly renewable term designed not to exceed retention. Most prominent reinsurers include SwissRe, RGA andMunich Re. In 2016, Foresters Financial completed a modified coinsurance transaction on certain U.S. Branch inforce universal life andterm life policies. Foresters Financial reviews its reinsurance needs and reinsurers on a regular basis and addresses any issues as theyarise.
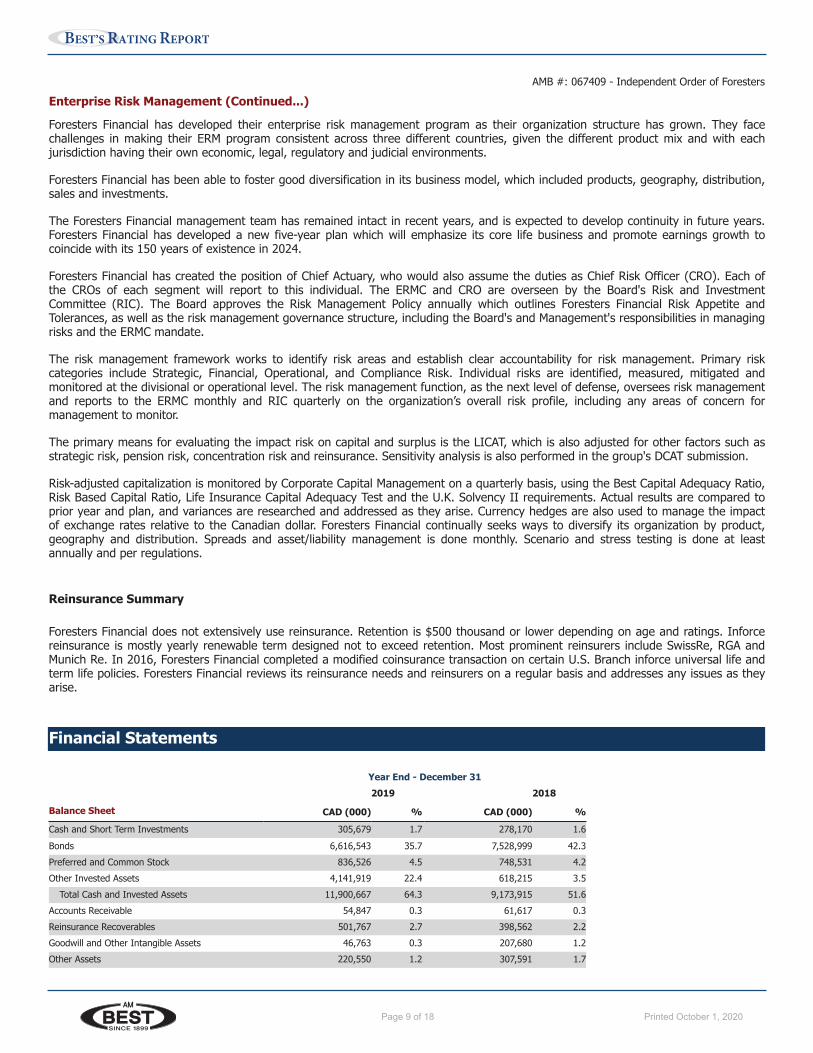
Financial Statements
Year End - December 31
2019 2018
Balance Sheet CAD (000) % CAD (000) %
Cash and Short Term Investments 305,679 1.7 278,170 1.6
Bonds 6,616,543 35.7 7,528,999 42.3
Preferred and Common Stock 836,526 4.5 748,531 4.2
Other Invested Assets 4,141,919 22.4 618,215 3.5
Total Cash and Invested Assets 11,900,667 64.3 9,173,915 51.6
Accounts Receivable 54,847 0.3 61,617 0.3
Reinsurance Recoverables 501,767 2.7 398,562 2.2
Goodwill and Other Intangible Assets 46,763 0.3 207,680 1.2
Other Assets 220,550 1.2 307,591 1.7
AMB #: 067409 - Independent Order of Foresters
www.ambest.com Page 9Printed for Bcrs on August 13, 2020
SINCE 1899
Page 10 of 18 Printed October 1, 2020
BEST’S RATING REPORT
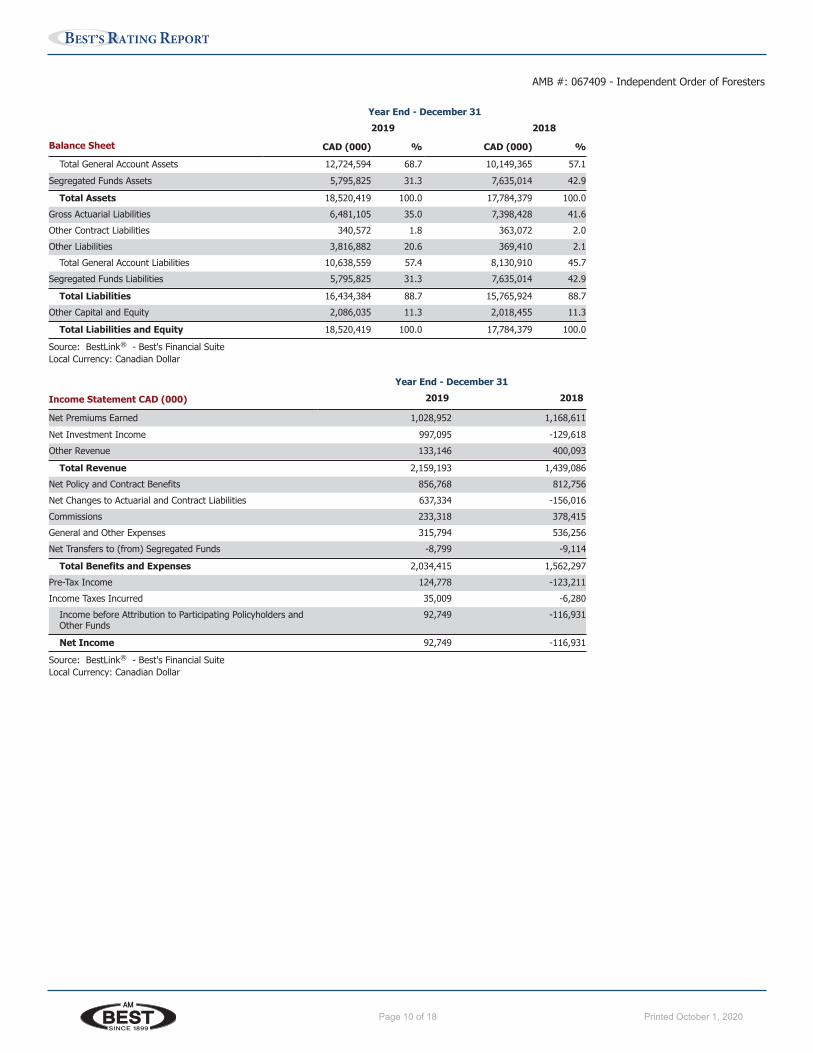
Year End - December 31
2019 2018
Balance Sheet CAD (000) % CAD (000) %
Total General Account Assets 12,724,594 68.7 10,149,365 57.1
Segregated Funds Assets 5,795,825 31.3 7,635,014 42.9
Total Assets 18,520,419 100.0 17,784,379 100.0
Gross Actuarial Liabilities 6,481,105 35.0 7,398,428 41.6
Other Contract Liabilities 340,572 1.8 363,072 2.0
Other Liabilities 3,816,882 20.6 369,410 2.1
Total General Account Liabilities 10,638,559 57.4 8,130,910 45.7
Segregated Funds Liabilities 5,795,825 31.3 7,635,014 42.9
Total Liabilities 16,434,384 88.7 15,765,924 88.7
Other Capital and Equity 2,086,035 11.3 2,018,455 11.3
Total Liabilities and Equity 18,520,419 100.0 17,784,379 100.0
Source: BestLink ® - Best's Financial SuiteLocal Currency: Canadian Dollar
Year End - December 31
Income Statement CAD (000) 2019 2018
Net Premiums Earned 1,028,952 1,168,611
Net Investment Income 997,095 -129,618
Other Revenue 133,146 400,093
Total Revenue 2,159,193 1,439,086
Net Policy and Contract Benefits 856,768 812,756
Net Changes to Actuarial and Contract Liabilities 637,334 -156,016
Commissions 233,318 378,415
General and Other Expenses 315,794 536,256
Net Transfers to (from) Segregated Funds -8,799 -9,114
Total Benefits and Expenses 2,034,415 1,562,297
Pre-Tax Income 124,778 -123,211
Income Taxes Incurred 35,009 -6,280
Income before Attribution to Participating Policyholders andOther Funds
92,749 -116,931
Net Income 92,749 -116,931
Source: BestLink ® - Best's Financial SuiteLocal Currency: Canadian Dollar
AMB #: 067409 - Independent Order of Foresters
www.ambest.com Page 10Printed for Bcrs on August 13, 2020
SINCE 1899
Page 11 of 18 Printed October 1, 2020
BEST’S RATING REPORT
Last UpdateAugust 05, 2020
IdentifiersAMB #: 067409
Contact Information
Domiciliary Address:789 Don Mills Road, Toronto,Ontario M3C 1T9Canada
Web: www.foresters.comPhone: 415-429-3000Fax: 416-467-2526
Financial Data Presented
The financial data in this reportreflects the most current dataavailable at the time the report wasprinted.
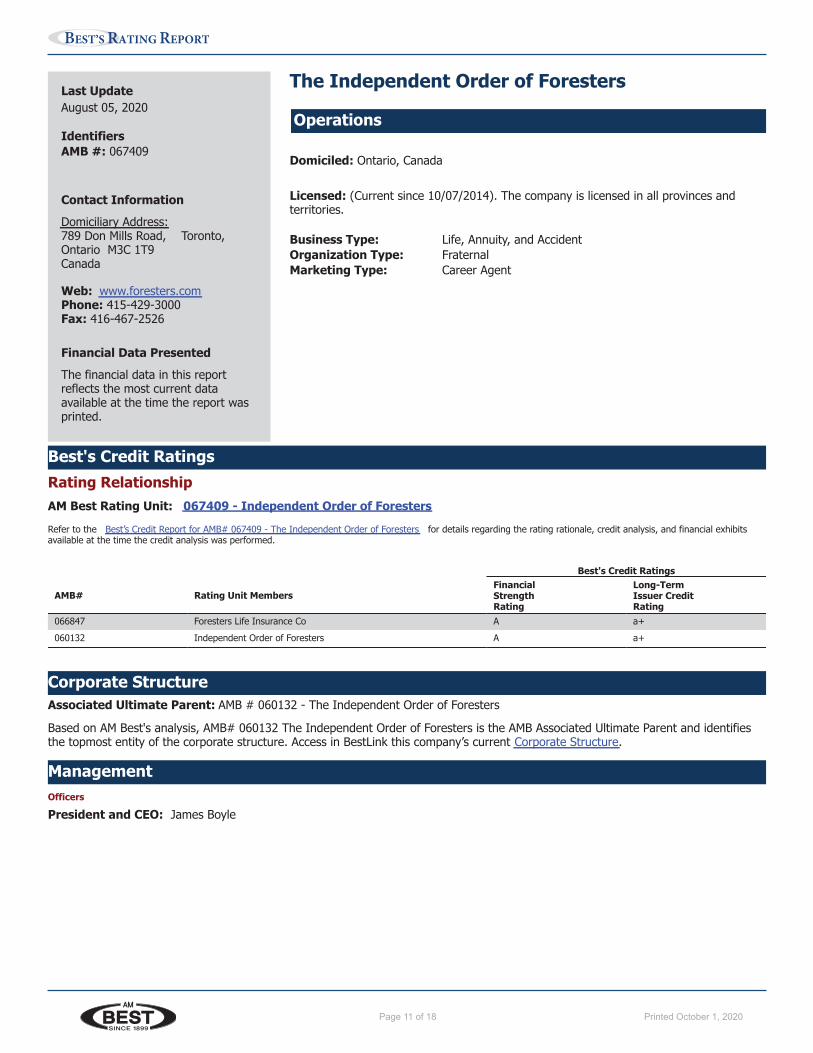
The Independent Order of Foresters
Operations
Domiciled: Ontario, Canada
Licensed: (Current since 10/07/2014). The company is licensed in all provinces andterritories.
Business Type: Life, Annuity, and AccidentOrganization Type: FraternalMarketing Type: Career Agent
Best's Credit RatingsRating RelationshipAM Best Rating Unit: 067409 - Independent Order of Foresters
Refer to the Best’s Credit Report for AMB# 067409 - The Independent Order of Foresters for details regarding the rating rationale, credit analysis, and financial exhibitsavailable at the time the credit analysis was performed.
Best's Credit Ratings
AMB# Rating Unit MembersFinancialStrengthRating
Long-TermIssuer CreditRating
066847 Foresters Life Insurance Co A a+
060132 Independent Order of Foresters A a+
Corporate StructureAssociated Ultimate Parent: AMB # 060132 - The Independent Order of Foresters
Based on AM Best's analysis, AMB# 060132 The Independent Order of Foresters is the AMB Associated Ultimate Parent and identifiesthe topmost entity of the corporate structure. Access in BestLink this company’s current Corporate Structure.
ManagementOfficers
President and CEO: James Boyle
www.ambest.com Page 11Printed for Bcrs on October 01, 2020
SINCE 1899
Page 12 of 18 Printed October 1, 2020
BEST’S RATING REPORT
Last UpdateSeptember 14, 2020
IdentifiersAMB #: 060132AIIN #: AA-1560109LEI #: 54930076M746H2DBTP84
Contact Information
Domiciliary Address:789 Don Mills Road, Toronto,Ontario M3C 1T9Canada
Web: www.foresters.comPhone: 416-429-3000Fax: 416-467-2526
Financial Data Presented
The financial data in this reportreflects the most current dataavailable at the time the report wasprinted.
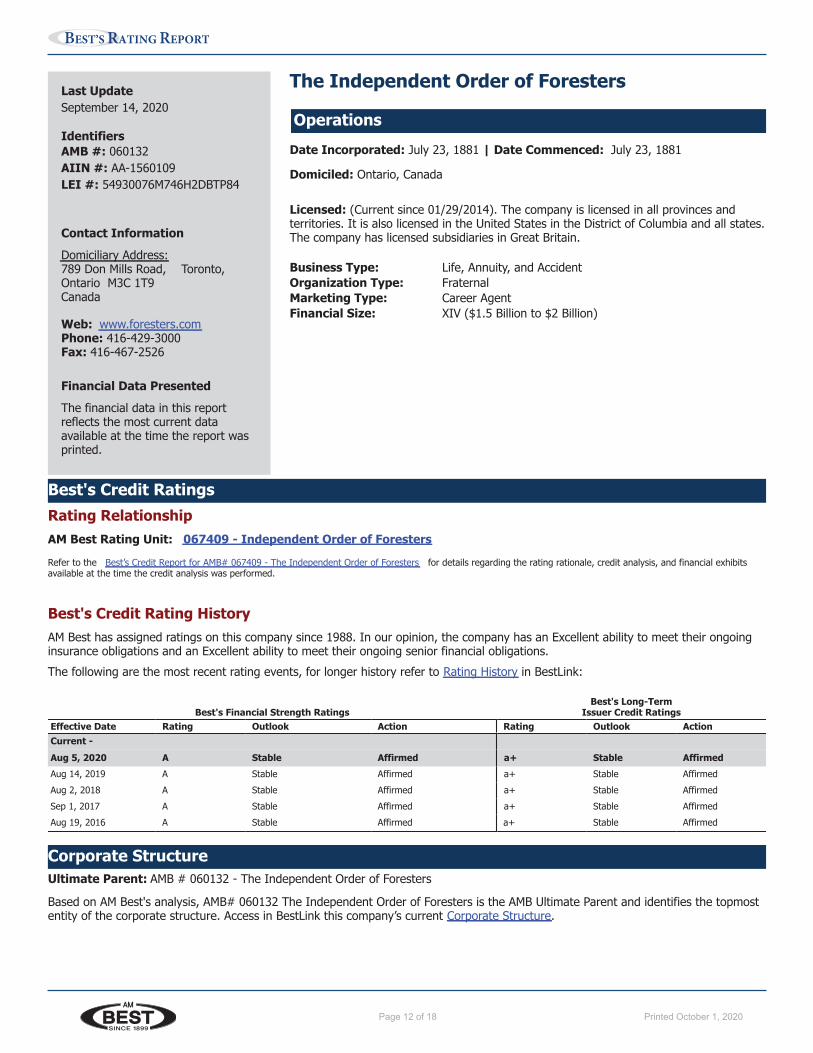
The Independent Order of Foresters
Operations
Date Incorporated: July 23, 1881 | Date Commenced: July 23, 1881
Domiciled: Ontario, Canada
Licensed: (Current since 01/29/2014). The company is licensed in all provinces andterritories. It is also licensed in the United States in the District of Columbia and all states.The company has licensed subsidiaries in Great Britain.
Business Type: Life, Annuity, and AccidentOrganization Type: FraternalMarketing Type: Career AgentFinancial Size: XIV ($1.5 Billion to $2 Billion)
Best's Credit RatingsRating RelationshipAM Best Rating Unit: 067409 - Independent Order of Foresters
Refer to the Best’s Credit Report for AMB# 067409 - The Independent Order of Foresters for details regarding the rating rationale, credit analysis, and financial exhibitsavailable at the time the credit analysis was performed.
Best's Credit Rating HistoryAM Best has assigned ratings on this company since 1988. In our opinion, the company has an Excellent ability to meet their ongoinginsurance obligations and an Excellent ability to meet their ongoing senior financial obligations.
The following are the most recent rating events, for longer history refer to Rating History in BestLink:
Best's FinancialBest's Financial Strength Ratings
Best's Long-TermIssuer Credit Ratings
Effective Date Rating Outlook Action Rating Outlook ActionCurrent -
Aug 5, 2020 A Stable Affirmed a+ Stable Affirmed
Aug 14, 2019 A Stable Affirmed a+ Stable Affirmed
Aug 2, 2018 A Stable Affirmed a+ Stable Affirmed
Sep 1, 2017 A Stable Affirmed a+ Stable Affirmed
Aug 19, 2016 A Stable Affirmed a+ Stable Affirmed
Corporate StructureUltimate Parent: AMB # 060132 - The Independent Order of Foresters
Based on AM Best's analysis, AMB# 060132 The Independent Order of Foresters is the AMB Ultimate Parent and identifies the topmostentity of the corporate structure. Access in BestLink this company’s current Corporate Structure.
www.ambest.com Page 12Printed for Bcrs on September 29, 2020
SINCE 1899
Page 13 of 18 Printed October 1, 2020
BEST’S RATING REPORT
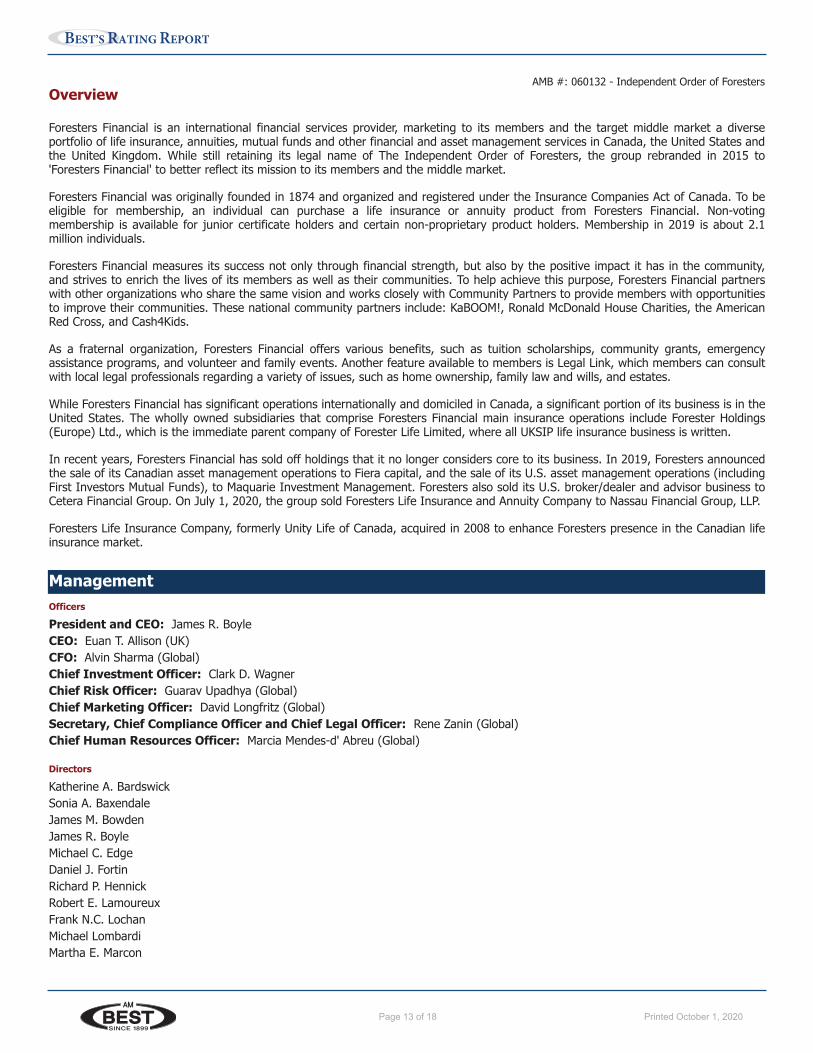
Overview
Foresters Financial is an international financial services provider, marketing to its members and the target middle market a diverseportfolio of life insurance, annuities, mutual funds and other financial and asset management services in Canada, the United States andthe United Kingdom. While still retaining its legal name of The Independent Order of Foresters, the group rebranded in 2015 to'Foresters Financial' to better reflect its mission to its members and the middle market.
Foresters Financial was originally founded in 1874 and organized and registered under the Insurance Companies Act of Canada. To beeligible for membership, an individual can purchase a life insurance or annuity product from Foresters Financial. Non-votingmembership is available for junior certificate holders and certain non-proprietary product holders. Membership in 2019 is about 2.1million individuals.
Foresters Financial measures its success not only through financial strength, but also by the positive impact it has in the community,and strives to enrich the lives of its members as well as their communities. To help achieve this purpose, Foresters Financial partnerswith other organizations who share the same vision and works closely with Community Partners to provide members with opportunitiesto improve their communities. These national community partners include: KaBOOM!, Ronald McDonald House Charities, the AmericanRed Cross, and Cash4Kids.
As a fraternal organization, Foresters Financial offers various benefits, such as tuition scholarships, community grants, emergencyassistance programs, and volunteer and family events. Another feature available to members is Legal Link, which members can consultwith local legal professionals regarding a variety of issues, such as home ownership, family law and wills, and estates.
While Foresters Financial has significant operations internationally and domiciled in Canada, a significant portion of its business is in theUnited States. The wholly owned subsidiaries that comprise Foresters Financial main insurance operations include Forester Holdings(Europe) Ltd., which is the immediate parent company of Forester Life Limited, where all UKSIP life insurance business is written.
In recent years, Foresters Financial has sold off holdings that it no longer considers core to its business. In 2019, Foresters announcedthe sale of its Canadian asset management operations to Fiera capital, and the sale of its U.S. asset management operations (includingFirst Investors Mutual Funds), to Maquarie Investment Management. Foresters also sold its U.S. broker/dealer and advisor business toCetera Financial Group. On July 1, 2020, the group sold Foresters Life Insurance and Annuity Company to Nassau Financial Group, LLP.
Foresters Life Insurance Company, formerly Unity Life of Canada, acquired in 2008 to enhance Foresters presence in the Canadian lifeinsurance market.
ManagementOfficers
President and CEO: James R. BoyleCEO: Euan T. Allison (UK)CFO: Alvin Sharma (Global)Chief Investment Officer: Clark D. WagnerChief Risk Officer: Guarav Upadhya (Global)Chief Marketing Officer: David Longfritz (Global)Secretary, Chief Compliance Officer and Chief Legal Officer: Rene Zanin (Global)Chief Human Resources Officer: Marcia Mendes-d' Abreu (Global)
Directors
Katherine A. BardswickSonia A. BaxendaleJames M. BowdenJames R. BoyleMichael C. EdgeDaniel J. FortinRichard P. HennickRobert E. LamoureuxFrank N.C. LochanMichael LombardiMartha E. Marcon
AMB #: 060132 - Independent Order of Foresters
www.ambest.com Page 13Printed for Bcrs on September 29, 2020
SINCE 1899
Page 14 of 18 Printed October 1, 2020
BEST’S RATING REPORT
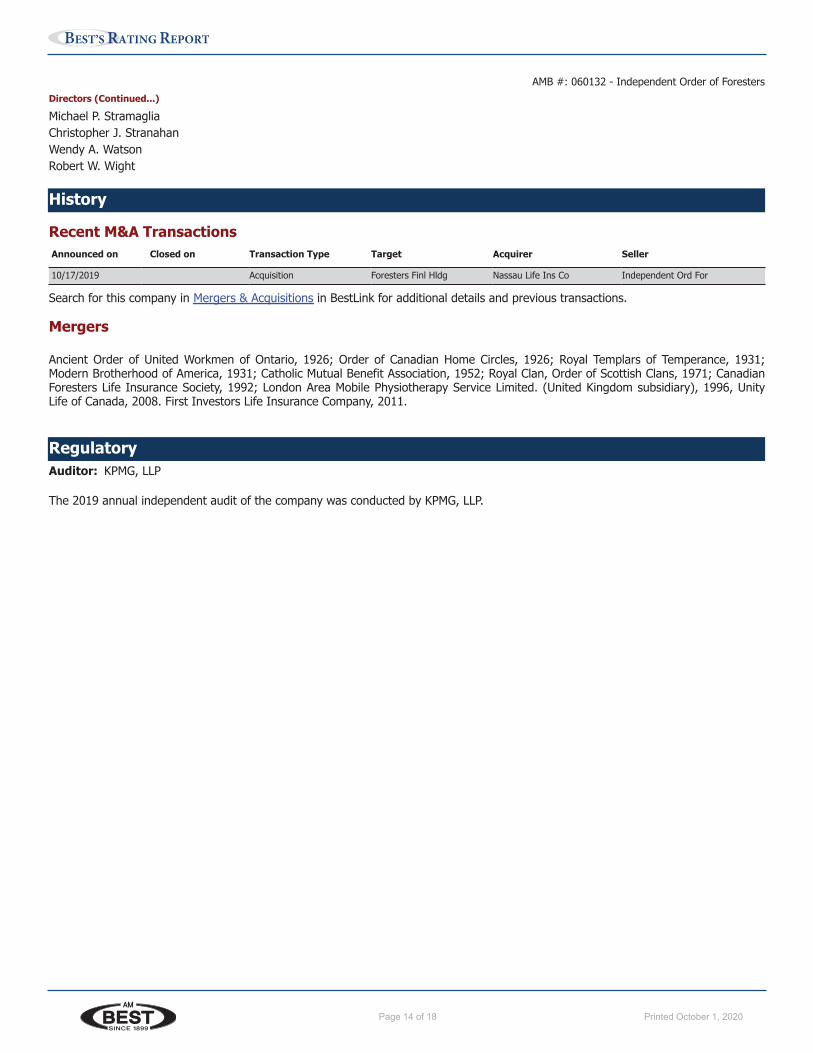
Directors (Continued...)
Michael P. StramagliaChristopher J. StranahanWendy A. WatsonRobert W. Wight
History
Recent M&A TransactionsAnnounced on Closed on Transaction Type Target Acquirer Seller
10/17/2019 Acquisition Foresters Finl Hldg Nassau Life Ins Co Independent Ord For
Search for this company in Mergers & Acquisitions in BestLink for additional details and previous transactions.
Mergers
Ancient Order of United Workmen of Ontario, 1926; Order of Canadian Home Circles, 1926; Royal Templars of Temperance, 1931;Modern Brotherhood of America, 1931; Catholic Mutual Benefit Association, 1952; Royal Clan, Order of Scottish Clans, 1971; CanadianForesters Life Insurance Society, 1992; London Area Mobile Physiotherapy Service Limited. (United Kingdom subsidiary), 1996, UnityLife of Canada, 2008. First Investors Life Insurance Company, 2011.
RegulatoryAuditor: KPMG, LLP
The 2019 annual independent audit of the company was conducted by KPMG, LLP.
AMB #: 060132 - Independent Order of Foresters
www.ambest.com Page 14Printed for Bcrs on September 29, 2020
SINCE 1899
Page 15 of 18 Printed October 1, 2020
BEST’S RATING REPORT
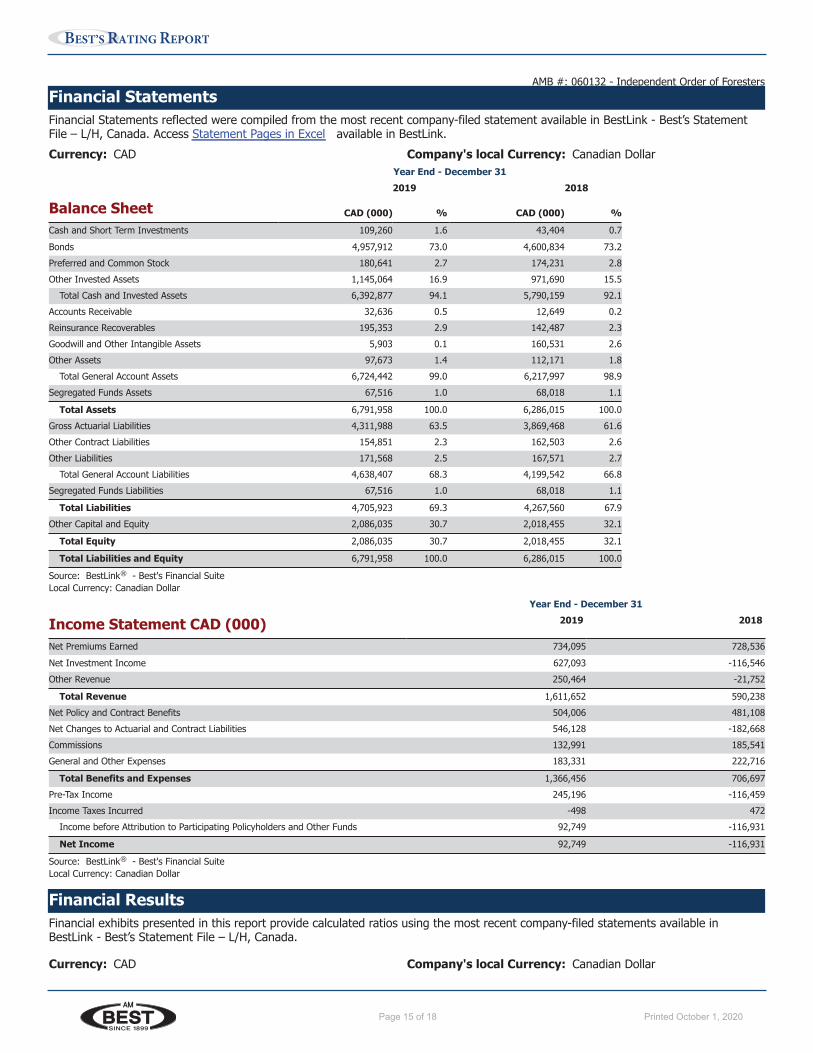
Financial StatementsFinancial Statements reflected were compiled from the most recent company-filed statement available in BestLink - Best’s StatementFile – L/H, Canada. Access Statement Pages in Excel available in BestLink.
Currency: CAD Company's local Currency: Canadian DollarYear End - December 31
2019 2018
Balance Sheet CAD (000) % CAD (000) %
Cash and Short Term Investments 109,260 1.6 43,404 0.7
Bonds 4,957,912 73.0 4,600,834 73.2
Preferred and Common Stock 180,641 2.7 174,231 2.8
Other Invested Assets 1,145,064 16.9 971,690 15.5
Total Cash and Invested Assets 6,392,877 94.1 5,790,159 92.1
Accounts Receivable 32,636 0.5 12,649 0.2
Reinsurance Recoverables 195,353 2.9 142,487 2.3
Goodwill and Other Intangible Assets 5,903 0.1 160,531 2.6
Other Assets 97,673 1.4 112,171 1.8
Total General Account Assets 6,724,442 99.0 6,217,997 98.9
Segregated Funds Assets 67,516 1.0 68,018 1.1
Total Assets 6,791,958 100.0 6,286,015 100.0
Gross Actuarial Liabilities 4,311,988 63.5 3,869,468 61.6
Other Contract Liabilities 154,851 2.3 162,503 2.6
Other Liabilities 171,568 2.5 167,571 2.7
Total General Account Liabilities 4,638,407 68.3 4,199,542 66.8
Segregated Funds Liabilities 67,516 1.0 68,018 1.1
Total Liabilities 4,705,923 69.3 4,267,560 67.9
Other Capital and Equity 2,086,035 30.7 2,018,455 32.1
Total Equity 2,086,035 30.7 2,018,455 32.1
Total Liabilities and Equity 6,791,958 100.0 6,286,015 100.0
Source: BestLink ® - Best's Financial SuiteLocal Currency: Canadian Dollar
Year End - December 31
Income Statement CAD (000) 2019 2018
Net Premiums Earned 734,095 728,536
Net Investment Income 627,093 -116,546
Other Revenue 250,464 -21,752
Total Revenue 1,611,652 590,238
Net Policy and Contract Benefits 504,006 481,108
Net Changes to Actuarial and Contract Liabilities 546,128 -182,668
Commissions 132,991 185,541
General and Other Expenses 183,331 222,716
Total Benefits and Expenses 1,366,456 706,697
Pre-Tax Income 245,196 -116,459
Income Taxes Incurred -498 472
Income before Attribution to Participating Policyholders and Other Funds 92,749 -116,931
Net Income 92,749 -116,931
Source: BestLink ® - Best's Financial SuiteLocal Currency: Canadian Dollar
Financial ResultsFinancial exhibits presented in this report provide calculated ratios using the most recent company-filed statements available inBestLink - Best’s Statement File – L/H, Canada.
Currency: CAD Company's local Currency: Canadian Dollar
AMB #: 060132 - Independent Order of Foresters
www.ambest.com Page 15Printed for Bcrs on September 29, 2020

SINCE 1899
Page 16 of 18 Printed October 1, 2020
BEST’S RATING REPORT
Key Financial Indicators
Year End - December 31
Key Financial Indicators CAD(000) 2019 2018 2017 2016 2015
Assets:
General Account 6,724,442 6,217,997 6,105,894 6,054,717 6,108,632
Segregated Funds 67,516 68,018 80,056 79,701 76,618
Total Assets 6,791,958 6,286,015 6,185,950 6,134,418 6,185,250
Liabilities:
Actuarial Liabilities:
Participating 704,670 611,361 608,679 578,881 560,093
Total Canada 704,670 611,361 608,679 578,881 560,093
Out of Canada 3,607,318 3,258,107 3,165,923 3,062,653 2,982,171
Other Contract Liabilities 154,851 162,503 145,925 143,778 158,827
Other Liabilities, including Segregated Funds 239,084 235,589 234,845 230,338 193,412
Total Liabilities 4,705,923 4,267,560 4,155,372 4,015,650 3,894,503
Equity 2,086,035 2,018,455 2,030,578 2,118,768 2,290,747
Net Income 92,749 -116,931 38,077 -75,332 124,113
Net Premiums 734,095 728,536 691,170 627,836 548,009
Net Investment Income 627,093 -116,546 344,557 224,816 45,411
Source: BestLink ® - Best's Financial SuiteLocal Currency: Canadian Dollar
Year End - December 31WeightedAverageKey Financial Ratios (%) 2019 2018 2017 2016 2015
Operating Return on Net Premiums 12.6 -16.1 5.5 -12.0 22.6 1.9
Operating Return on Equity 4.5 -5.8 1.8 -3.4 5.9 0.6
Pre-Tax Investment Total Return 10.3 -2.0 6.1 4.0 0.8 4.0
Leverage
General Account Liabilities to Equity 2.2 2.1 2.0 1.9 1.7 ...
Liquidity Analysis
Current Liquidity 114.0 115.4 115.8 120.7 125.3 ...
Source: BestLink ® - Best's Financial Suite
Balance Sheet Highlights
Year End - December 31
Capital Generation Analysis CAD(000) 2019 2018 2017 2016 2015
Beginning Equity 2,018,455 2,030,578 2,118,768 2,290,747 1,905,546
Net Income 92,749 -116,931 38,077 -75,332 124,113
Net Unrealized Capital Gains (Losses) in AOCI 51,536 -26,110 7,260 12,841 -18,233
Other Changes in Equity -77,122 133,191 -134,527 -109,488 279,321
Net Change in Equity 67,580 -12,123 -88,190 -171,979 385,201
Ending Equity 2,086,035 2,018,455 2,030,578 2,118,768 2,290,747
Net Change in Equity (%) 3.3 -0.6 -4.2 -7.5 20.2
Net Change in Equity (5 Yr CAGR) 1.8 ... ... ... ...
Source: BestLink ® - Best's Financial SuiteLocal Currency: Canadian Dollar
AMB #: 060132 - Independent Order of Foresters
www.ambest.com Page 16Printed for Bcrs on September 29, 2020
SINCE 1899
Page 17 of 18 Printed October 1, 2020
BEST’S RATING REPORT
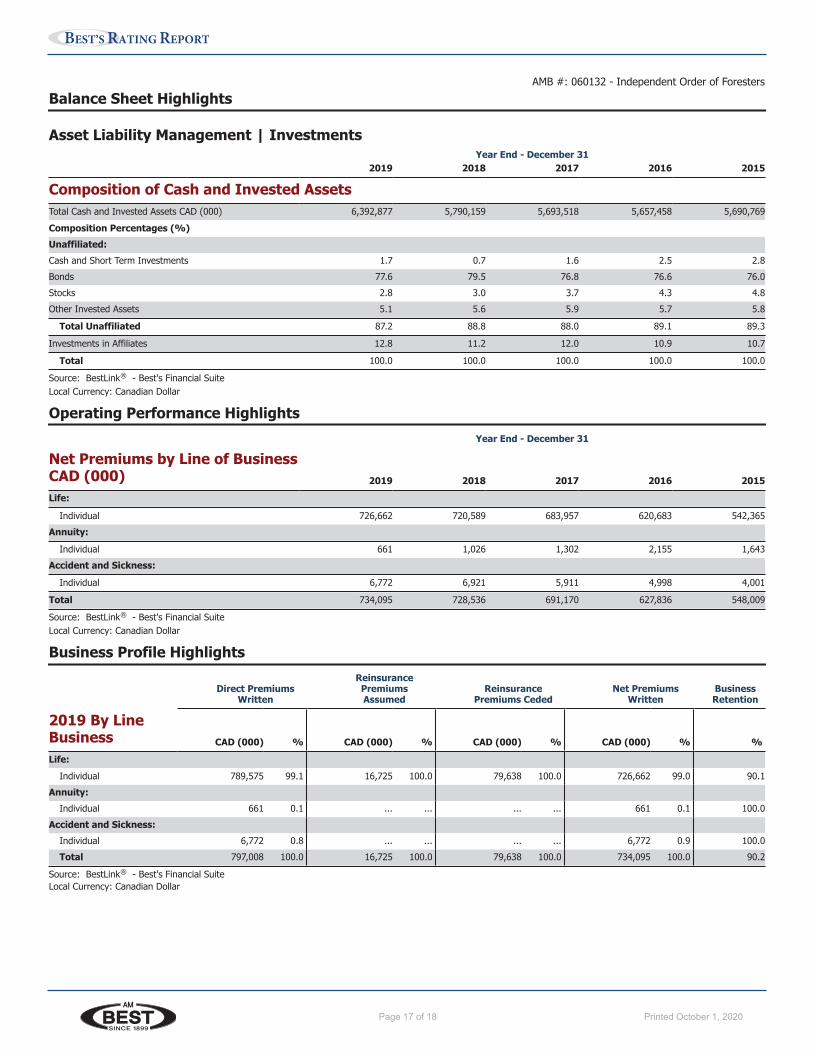
Balance Sheet Highlights
Asset Liability Management | InvestmentsYear End - December 31
2019 2018 2017 2016 2015
Composition of Cash and Invested AssetsTotal Cash and Invested Assets CAD (000) 6,392,877 5,790,159 5,693,518 5,657,458 5,690,769
Composition Percentages (%)
Unaffiliated:
Cash and Short Term Investments 1.7 0.7 1.6 2.5 2.8
Bonds 77.6 79.5 76.8 76.6 76.0
Stocks 2.8 3.0 3.7 4.3 4.8
Other Invested Assets 5.1 5.6 5.9 5.7 5.8
Total Unaffiliated 87.2 88.8 88.0 89.1 89.3
Investments in Affiliates 12.8 11.2 12.0 10.9 10.7
Total 100.0 100.0 100.0 100.0 100.0
Source: BestLink ® - Best's Financial SuiteLocal Currency: Canadian Dollar
Operating Performance Highlights
Year End - December 31
Net Premiums by Line of BusinessCAD (000) 2019 2018 2017 2016 2015
Life:
Individual 726,662 720,589 683,957 620,683 542,365
Annuity:
Individual 661 1,026 1,302 2,155 1,643
Accident and Sickness:
Individual 6,772 6,921 5,911 4,998 4,001
Total 734,095 728,536 691,170 627,836 548,009
Source: BestLink ® - Best's Financial SuiteLocal Currency: Canadian Dollar
Business Profile Highlights
Direct PremiumsWritten
ReinsurancePremiumsAssumed
ReinsurancePremiums Ceded
Net PremiumsWritten
BusinessRetention
2019 By LineBusiness CAD (000) % CAD (000) % CAD (000) % CAD (000) % %
Life:
Individual 789,575 99.1 16,725 100.0 79,638 100.0 726,662 99.0 90.1
Annuity:
Individual 661 0.1 ... ... ... ... 661 0.1 100.0
Accident and Sickness:
Individual 6,772 0.8 ... ... ... ... 6,772 0.9 100.0
Total 797,008 100.0 16,725 100.0 79,638 100.0 734,095 100.0 90.2
Source: BestLink ® - Best's Financial SuiteLocal Currency: Canadian Dollar
AMB #: 060132 - Independent Order of Foresters
www.ambest.com Page 17Printed for Bcrs on September 29, 2020
BEST’S RATING REPORT
SINCE 1899
Page 18 of 18 Printed October 1, 2020
Copyright © 2020 A.M. Best Company, Inc. and/or its affiliates. All rights reserved.No portion of this content may be reproduced, distributed, or stored in a database or retrieval system, or transmitted in any form or by any means without the prior written permis-sion of AM Best. While the content was obtained from sources believed to be reliable, its accuracy is not guaranteed. For additional details, refer to our Terms of Use available at AM Best website: www.ambest.com/terms.
Best’s Credit Rating Methodology | Disclaimer | Best’s Credit Rating Guide
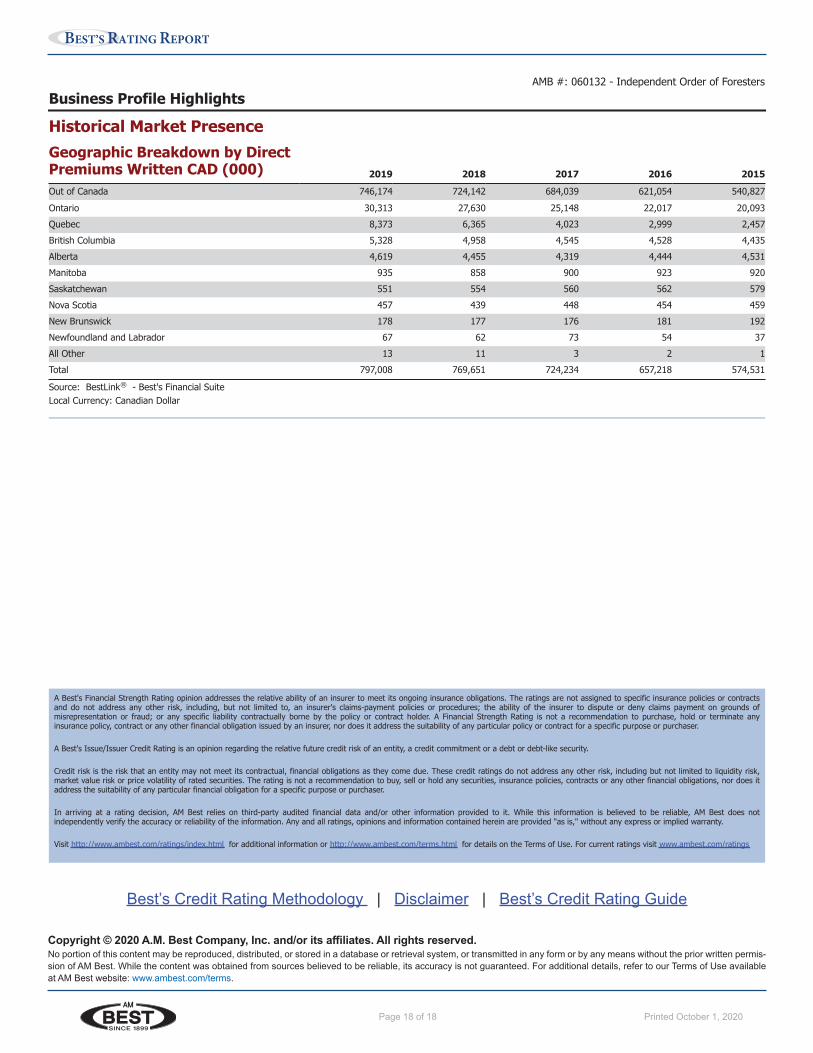
Business Profile Highlights
Historical Market PresenceGeographic Breakdown by DirectPremiums Written CAD (000) 2019 2018 2017 2016 2015
Out of Canada 746,174 724,142 684,039 621,054 540,827
Ontario 30,313 27,630 25,148 22,017 20,093
Quebec 8,373 6,365 4,023 2,999 2,457
British Columbia 5,328 4,958 4,545 4,528 4,435
Alberta 4,619 4,455 4,319 4,444 4,531
Manitoba 935 858 900 923 920
Saskatchewan 551 554 560 562 579
Nova Scotia 457 439 448 454 459
New Brunswick 178 177 176 181 192
Newfoundland and Labrador 67 62 73 54 37
All Other 13 11 3 2 1
Total 797,008 769,651 724,234 657,218 574,531
Source: BestLink ® - Best's Financial SuiteLocal Currency: Canadian Dollar
A Best's Financial Strength Rating opinion addresses the relative ability of an insurer to meet its ongoing insurance obligations. The ratings are not assigned to specific insurance policies or contractsand do not address any other risk, including, but not limited to, an insurer's claims-payment policies or procedures; the ability of the insurer to dispute or deny claims payment on grounds ofmisrepresentation or fraud; or any specific liability contractually borne by the policy or contract holder. A Financial Strength Rating is not a recommendation to purchase, hold or terminate anyinsurance policy, contract or any other financial obligation issued by an insurer, nor does it address the suitability of any particular policy or contract for a specific purpose or purchaser.
A Best's Issue/Issuer Credit Rating is an opinion regarding the relative future credit risk of an entity, a credit commitment or a debt or debt-like security.
Credit risk is the risk that an entity may not meet its contractual, financial obligations as they come due. These credit ratings do not address any other risk, including but not limited to liquidity risk,market value risk or price volatility of rated securities. The rating is not a recommendation to buy, sell or hold any securities, insurance policies, contracts or any other financial obligations, nor does itaddress the suitability of any particular financial obligation for a specific purpose or purchaser.
In arriving at a rating decision, AM Best relies on third-party audited financial data and/or other information provided to it. While this information is believed to be reliable, AM Best does notindependently verify the accuracy or reliability of the information. Any and all ratings, opinions and information contained herein are provided "as is," without any express or implied warranty.
Visit http://www.ambest.com/ratings/index.html for additional information or http://www.ambest.com/terms.html for details on the Terms of Use. For current ratings visit www.ambest.com/ratings
AMB #: 060132 - Independent Order of Foresters
www.ambest.com Page 18Printed for Bcrs on September 29, 2020
Copyright © 2020 A.M. Best Company, Inc. and/or its affiliates. All rights reserved.No portion of this content may be reproduced, distributed, or stored in a database or retrieval system, or transmitted in any form or by any means without the prior written permis-sion of AM Best. While the content was obtained from sources believed to be reliable, its accuracy is not guaranteed. For additional details, refer to our Terms of Use available at AM Best website: www.ambest.com/terms.