Crescent Bahuman Limited - VIS Credit Rating
12
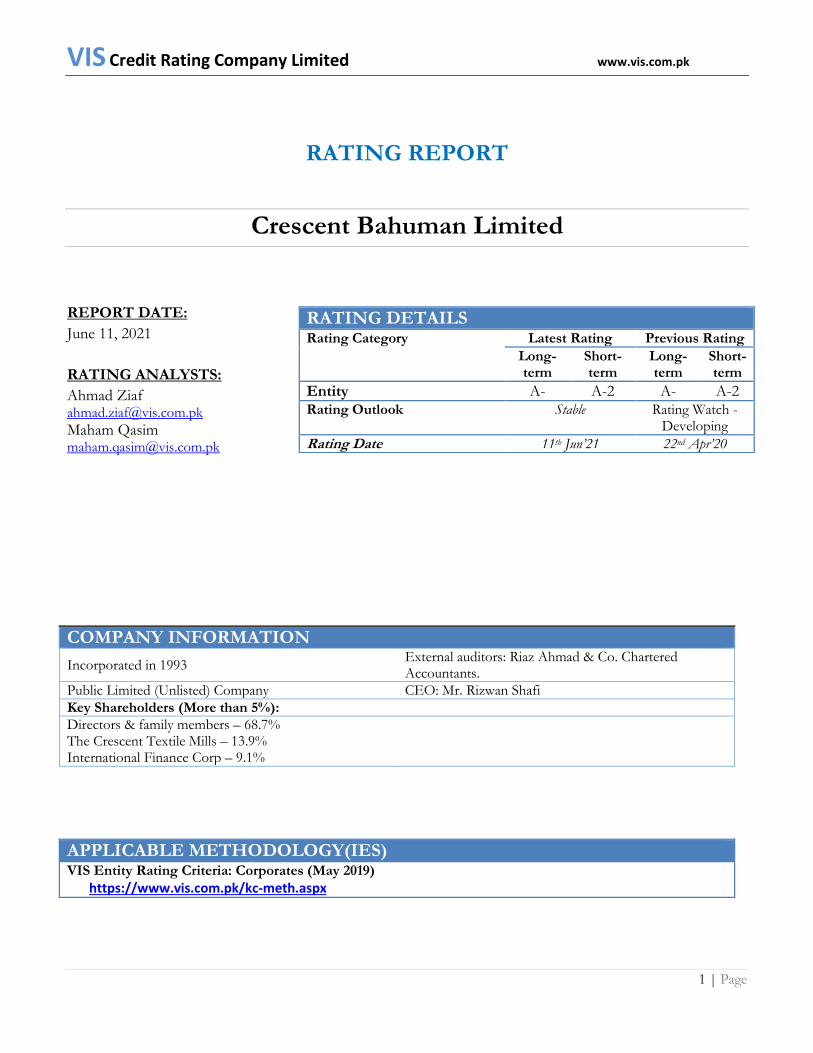
VIS Credit Rating Company Limited www.vis.com.pk 1 | Page RATING REPORT Crescent Bahuman Limited REPORT DATE: June 11, 2021 RATING ANALYSTS: Ahmad Ziaf [email protected] Maham Qasim [email protected] COMPANY INFORMATION Incorporated in 1993 External auditors: Riaz Ahmad & Co. Chartered Accountants. Public Limited (Unlisted) Company CEO: Mr. Rizwan Shafi Key Shareholders (More than 5%): Directors & family members – 68.7% The Crescent Textile Mills – 13.9% International Finance Corp – 9.1% APPLICABLE METHODOLOGY(IES) VIS Entity Rating Criteria: Corporates (May 2019) https://www.vis.com.pk/kc-meth.aspx RATING DETAILS Rating Category Latest Rating Previous Rating Long- term Short- term Long- term Short- term Entity A- A-2 A- A-2 Rating Outlook Stable Rating Watch - Developing Rating Date 11 th Jun’21 22 nd Apr’20
-
Upload
khangminh22 -
Category
Documents
-
view
2 -
download
0
Transcript of Crescent Bahuman Limited - VIS Credit Rating
VIS Credit Rating Company Limited www.vis.com.pk
1 | Page
RATING REPORT
Crescent Bahuman Limited
REPORT DATE:
June 11, 2021
RATING ANALYSTS:
Ahmad Ziaf [email protected]
Maham Qasim [email protected]
COMPANY INFORMATION
Incorporated in 1993 External auditors: Riaz Ahmad & Co. Chartered Accountants.
Public Limited (Unlisted) Company CEO: Mr. Rizwan Shafi
Key Shareholders (More than 5%):
Directors & family members – 68.7% The Crescent Textile Mills – 13.9% International Finance Corp – 9.1%
APPLICABLE METHODOLOGY(IES) VIS Entity Rating Criteria: Corporates (May 2019) https://www.vis.com.pk/kc-meth.aspx
RATING DETAILS Rating Category Latest Rating Previous Rating
Long-term
Short-term
Long-term
Short-term
Entity A- A-2 A- A-2 Rating Outlook Stable Rating Watch -
Developing
Rating Date 11th Jun’21 22nd Apr’20

VIS Credit Rating Company Limited www.vis.com.pk
2 | Page
Crescent Bahuman Limited
OVERVIEW OF THE INSTITUTION RATING RATIONALE
Crescent Bahuman Limited (CBL) was incorporated in
1993 under the repealed Companies Ordinance, 1984 (now Companies Act, 2017). The principal activity of the company is manufacturing and export of denim fabric
and garments. The production facility is located
at Sargodha Road, Pindi Bhattian and head office is
located at 45-A Zafar Ali Road, Gulberg-V Lahore.
Profile of the CEO
Mr. Rizwan Shafi holds a Bachelor’s degree in
Engineering from USA. He has been serving on the
Board of Directors of Crescent Bahuman Ltd since
2001.
Financial Snapshot
Total Equity: end-HY21: Rs. 5.8b; end-FY20: Rs. 5.6b; end-FY19: Rs.5.4b; end-
FY18: Rs. 2.80b
Assets: end-HY21: Rs. 13.4b; end-FY20: Rs. 12.8b; end-
FY19: Rs. 12.7b; end-FY18: Rs. 11.8b
Profit After Tax: HY21: Rs. 255.3m; end-FY20: Rs. 182.9; FY19: Rs. 571.9m; FY18: Rs.
599.5m
The ratings assigned to Crescent Bahuman Limited (CBL) take into account moderate risk
profile of the company underpinned by its presence in the export oriented value-added
textile segment, fully integrated denim jeans production unit giving complete control on
quality maintenance, geographical diversification and continued investment in supply chain
automation and research & development coupled with efficiency enhancements through
capex in waste management and solar energy systems. Ratings reflect the company’s
established market position as one of the leading exporters of denim products along with
long-standing business relationships with leading international brands. Ratings also
incorporate sound financial risk manifested by rescued margins, positive momentum in
profitability, manageable gearing indicators and comfortable debt service coverages. Further,
owing to reduction in benchmark rates, the financing cost for the company has reduced,
reflecting positively on the bottom line.
Given improvement in the company’s operational performance owing to pandemic led
boom in textile sector during the period under review, the outlook assigned to CBL’s ratings
has been revised to ‘Stable’. Even though concerns of a successive waves of Covid-19 are
present, strong order book of the industry for the ongoing year along with vaccine rollout
has largely subsided business risk concerns. With plan of equity injection, leverage indicators
are projected to improve further during the rating horizon. The ratings are dependent on
maintenance of margins, realization of projected targets, sustenance of long-term customer
relations and incremental cash flow generation from recent capital expenditure coupled with
evolution of sector dynamics post ongoing pandemic.
Local Textile Sector performance during COVID-19: The coronavirus pandemic led to
3% drop in global trade volumes in the 1QFY20 according to United Nations conference
on Trade and Development forecasts. Industries whose operations were more globalized
(particularly those who relied on Chinese inputs for production) were highly exposed to
initial supply side disruptions. However, given most of the textile companies in Pakistan are
heavily reliant on local cotton produce; the supply side risk was largely curtailed. In addition,
the lockdown in China at the initial stage turned advantageous as the orders got shifted to
Pakistan. Prior to onslaught of the pandemic, the European buyers were attracted by
repetitive rupee weakening since 4QFY18, as unit prices fell only for Pakistan in 9MFY20
vis-à-vis its competitors. The price effect was further enforced by duty-free/quota free
access under the GSP Plus agreement. Bangladesh and Pakistan have been able to increase
their exports to the bloc as they enjoy preferential trade treatment within EU. Moreover,
US-China trade war with USA applying additional tariffs on Chinese apparel imports since
Sep’19 has aided low cost suppliers including Pakistan in capturing the untapped share. So
after global onslaught of corona virus European and American retailers, the two main
destination markets for this sector, cancelled their orders causing serious concerns in many
sourcing countries. With only a few buyers honoring their import commitments with local
manufactures, exports declined during April’20. Exports of readymade garments dipped by

VIS Credit Rating Company Limited www.vis.com.pk
3 | Page
69% in April’20 compared to same month ln the preceding year.
The country’s textile industry has scaled up production to pre-Covid level of full-capacity as
a significant improvement in containment of the pandemic in the country led the world
buyers to partially divert their orders to domestic manufacturers. The growth in production
is backed by a big jump in the import of basic raw materials – cotton and man-made yarn –
after the recent heavy rainfall and pest attack damaged notable portion of cotton crops in
the fields to a multi-year low. Secondly, the industry recovered on a fast pace with the
government's support in the shape of rationalizing energy price to a regional competitive
level, the same included continued supply of raw material and subsidized financing for the
expansion of production and setting up new units. Further, the textile exports have also
largely recovered from the Covid-19 pandemic shocks and are still growing both in terms of
their quantity and dollar value. The textile shipments have surged by 3.8% to $4.8 billion
between July and October from $4.6bn in the corresponding period last year. The rise in the
textile and clothing group has been slightly faster than the 0.6% growth in the overall
export. The export recovery is most prominent in the knitwear, home textiles and denim
segments.
Business Model:
As per the company’s business model, it procures a range of raw materials from both local
and foreign suppliers. Cotton for yarn spinning is procured from multiple local vendors on
a credit period of 60 days; CBL maintains one-month buffer stock for production. During
FY20, entire cotton requirement was met locally. As per normal practice, the company
meets nearly 60% of its yarn requirement from in-house production and procures the
remaining 40% from the local and foreign spinning mills, including Crescent Textile Mills
Ltd, Naveena Exports Ltd, Sapphire Fibers Ltd, DSM Dyneema BV and Changzhou
Texhong Textile Co Ltd, on a credit period ranging from 45 days to 90 days. Total yarn
purchases amounted to Rs. 450.0m (FY20: Rs. 1.7b; FY19: Rs. 1.4b) during 1QFY21.
Revenue model of the company encompasses denim garments (FY20: 80%, FY19: 86%),
denim fabric (FY20: 17%, FY19: 9%), retail (FY20: 2%, FY19: 4%) and yarn sales (FY20:
1% FY19: 1%), with exports accounting for 96% of total revenue during FY20 (FY19: 93%,
FY18: 90%). The contribution of local sales has declined over the past three years due to
gradual closure of Stoneage branded retail outlets.
Denim garment sales are made to multinational retail chains, including Levi Strauss & Co.
(LEVI), Express LLC, Realteks Tekstil, and Dressmann, whereas nominated denim fabric
sales are made to local and regional garment manufacturers. Top 10 customers nearly
constitute 90% of total revenue, resulting in high concentration risk. The three largest
customers are Levi Strauss, Express, and Realteks Tekstil, accounting for 47%, 13% and 8%
of total revenue during FY20. CBL faces a risk of limited pricing power due to large sized
customers and strong competition for denim exports from the local textile industry. Top-10
customers are tabulated below:
Customer (FY20) Qty Rs. million % of Net Revenue
LEVI STRAUSS & CO. 4,204,366 6,296 47%

VIS Credit Rating Company Limited www.vis.com.pk
4 | Page
EXPRESS LLC, 952,988 1,681 13%
Realteks Tekstil* 2,823,211 1,003 8%
Dressmann AS 442,319 730 5%
Ananta Denim 1,063,001 527 4%
Jeans Collection 313,515 485 4%
Bluezone Denim LLC* 1,287,159 455 3%
Bestseller A/S 280,334 384 3%
Aero Opco LLC 187,700 326 2%
Grotto SPA 132,465 206 2%
Total 11,687,068 12,093 90%
CBL has had long-term business relationship with Levi Strauss since FY95; meanwhile,
business with Express was secured in FY16 which has grown substantially since then. As
per the management, established customer relations, high customer satisfaction
underpinned by focus on quality and sustainability and fairly cumbersome supplier
switching process help mitigate the intensity of concentration risk. CBL makes 95% sales on
open account payment terms with a credit receivables period ranging from 30 days to 110
days for denim garment customers and up to 170 days for denim fabric customers. Levi
Strauss makes payments normally within two months.
Production Update:
CBL follows a build to order approach where products are produced when confirmed
orders are received. Customer normally shares a tentative annual sales plan, however, the
average duration of confirmed orders are around three months in advance and production is
scheduled accordingly. In response to increasing denim demand, CBL has enhanced denim
fabric and garment production capacities during the past four years. Installed capacities and
actual production are tabulated below;
FY19 FY20 1QFY21
Installed Capacity ('000 lbs')
Ring Yarn Spinning 10,500 9,725 2,625
Open End Yarn Spinning 8,050 7,456 2,013
Actual Production ('000 lbs')
Ring Yarn Spinning 6,306 6,495 1,580
Open End Yarn Spinning 4,234 4,490 1,437
Installed Capacity ('000 meters')
Fabric Weaving 16,500 15,283 4,125
Fabric Finishing 16,500 15,283 4,125
Actual Production ('000 meters')
Fabric Weaving 12,812 15,062 3,601
Fabric Finishing 10,992 12,811 3,175
Installed Capacity ('000 garments')
Garment Cutting 9,600 8,892 2,400
Garment Stitching 9,600 8,892 2,400
Garment Wet Processing/Washing 9,600 8,892 2,400

VIS Credit Rating Company Limited www.vis.com.pk
5 | Page
Actual Production ('000 garments')
Garment Cutting 9,163 7,564 1,702
Garment Stitching 9,156 7,710 1,659
Garment Wet Processing/Washing 9,002 7,547 1,694
Topline and profitability took a hit during FY20; however, both picked pace during
the ongoing year: Given the onslaught of COVID pandemic and subsequent depressed
economic indicators, the company fell short of its last year revenue by 4.8% at Rs. 13.4b
(FY19:Rs. 14.0b) during FY20; the decline was primarily an outcome of complete halt to
order placement, reception of shipments and delay in payments from the export originating
countries. However, despite the unprecedented situation the dip in the revenues was not
alarming and was only manifested in local sales which were recorded lower at Rs. 537.9m
(FY19: Rs. 964.6m) in FY20. The company was able to maintain the exports at prior year’s
level despite decrease in the number of orders processed due to the pandemic owing to tilt
of consumer preferences towards premium products along with increase in average price.
On the other hand, margins declined from to 14.3% (FY19:15.5%) in FY20 on account of
increase in cost of sales in line with higher salary expense incurred due to outsourcing of
Cut, Make and Trim (CMT) processes in the production process along with increase in
processing charges without proportionate increase in revenues. Moreover, the increase in
cost of cotton to Rs. 255/kg (FY19: Rs. 234/kg) during the outgoing year has also resulted
in decline in margins. The Research and development cost also increased to Rs. 224.6m in
FY20 (FY19: Rs. 195.3m) in line with management’s endeavors to focus on process
refinement.
Further, distribution expenses were reported lower at Rs. 680.0m (FY19: Rs. 744.2m) due to
decline in salary expense, rent and taxes in line with reduced scale of operations.
Administrative expenses on the other hand increased on a timeline basis owing to increase
in legal and professional charges to Rs. 86.4m (FY19: Rs.40.0m) during FY20; legal charges
include consultancy fees of trainers hired to improve the quality standard of the products
offered. The employee related expenses also increased to Rs. 166.3m (FY19: 149.2m) in line
with inflationary pressure on salaries as the average head count was recorded lower at 7,607
(FY19:8,323) at end-FY20. Further, other expenses stood higher at Rs. 185.5m (FY19: Rs.
110.5m) on account of increase in allowance for expected credit loss of Rs. 116m in FY20
(FY19: Rs. 12.4m) coupled with a loss on disposal of property, plant and equipment of Rs.
13.0m (FY19: nil) in FY20. The other income was recorded significantly lower to Rs.
135.3m (FY19: Rs. 312.7m) as a result of reduced exchange gain reaped during the year
amounting to Rs. 106.1m (FY19: 297.2m) in line with relatively stable forex position. The
finance cost related to commercial borrowings increased slightly to Rs. 166.7m during FY20
as opposed to Rs.164.4m in preceding year owing to higher utilization of short-term
borrowings; the same was largely marginalized on account of significant reduction in
benchmark rates in 4QFY20 by SBP to support depressed economic indicators amid
ongoing pandemic. Other components of finance cost including bank charges, bills
discounting and interest paid on non-voting cumulative participatory preference shares
aggregated to Rs. 294.4m (FY19: 384.3m); the decrease was manifested in interest paid on
preference shares in line with conversion of aforementioned into non-voting ordinary

VIS Credit Rating Company Limited www.vis.com.pk
6 | Page
shares at par value during FY20. Subsequently, with decline in scale of operations, margins
and other income along with increase administrative expenses, CBL reported a bottom line
of Rs. 182.9m during FY20 as compared to Rs. 571.9m in the preceding year.
The declining trend in quantum sales was rescued during the ongoing year with the
company’s operations back at full capacity. CBL’s topline was recorded higher at Rs. 8.0b
during HY21 as opposed to Rs.7.6b in the corresponding period last year owing to a
combined impact of increase in export quantum coupled with higher average prices in line
with positive momentum in demand of premium fabric denims. The increased demand of
domestic products is underpinned by capitalizing of marketing gap as production units in
competing countries are not operating at full potential owing to COVID-19 related
lockdowns. In addition, the power subsidy announced by the government for the sector has
made the prices even more competitive globally, therefore positively resulted in the off-take
of local products. Subsequently, with increase in retail prices and no major increase in input
cost the margins have reverted back to the pre-COVID level of around 15.5% in HY21.
The total operating expenses were recorded slightly higher at Rs. 704.8m (HY20: Rs.
668.2m) during HY21; however the same if annualized is largely in sync with increase in
scale of operations. On the other hand, the finance cost was rationalized owing to sharp dip
in benchmark interest rates despite increase in total borrowings of the company during the
period under review. As a result of positive trajectory of revenues, improved margins and
curtailment of interest expense, CBL reported profit of Rs. 255.3m (HY20: Rs.103.0m)
during HYFY21. Going forward, the management projects to close FY21 with a topline of
Rs.15.6b and profit of Rs. 380.0m; the projected target is realistic and expected to be
materialized given positive prospects for the sector.
Adequate liquidity profile as evident from healthy cash flows in relation to
outstanding obligations and sound debt service ability: Liquidity profile of the
company is considered sound in view of sizable cash flows in relation to long-term
outstanding obligations and adequate debt service capacity. As an outcome of dip in
revenues and margins, both translating into subdued profitability indicators, Funds from
Operations (FFO) declined and were recorded lower at Rs. 590.2m (FY19: Rs. 873.1m)
during FY20. However, with the plant operational at full capacity and improvement in
industry dynamics during the ongoing year, FFO amounted to Rs. 556.9m during HY21.
On the other hand, there was an increase in the total borrowings due to higher utilization of
short term debt during the outgoing year; therefore, FFO in terms of outstanding
obligations had a significant dip in FY20 as it was recorded lower at 0.14x (FY19: 0.24x); the
same improved to 0.23x during HY21. On the other hand, FFO to long-term debt declined
on a timeline basis in line with CBL obtaining long-term debt of Rs. 593.9m under SBP’s
refinance scheme for payment of salaries and wages. However, debt service coverage and
remained sizeable at 2.21x during FY20 (FY19: 2.70x) in line relatively low reliance on long-
term debt. With the plant operational at full capacity and improvement in industry
dynamics, FFO were recorded at Rs. 556.9m during HY21. Going forward, cash flows are
expected to improve on account of increase in sales supported by incremental revenue from
capacity expansion of stitching unit along with cost efficiencies projected to be derived from
increased reliance on solar energy generation.

VIS Credit Rating Company Limited www.vis.com.pk
7 | Page
The stock position has remained relatively stable over the rating review period and majorly
comprises work in process inventory and finished goods. In addition, trade receivables also
declined on a timeline basis; the aging of receivables is considered satisfactory since less
than 8% of the total receivables were due for more than six months while none is overdue
for more than nine months. Trade debts due from other than related parties amounting to
Rs. 796.2m (FY19: RS. 627.0m) were overdue for more than one month; however the same
were not impaired. These receivables pertain to independent clients with no history of
default. Receivables amounting to Rs. 176.4m (FY19: nil) were written off during FY20; the
same were overdue for more than year. Loan and advances amounting to Rs. 112.1m (FY19:
Rs. 118.5m) pertained to advances extended to employees and suppliers at end-FY20. Other
receivables were sizable at Rs. 1.3b (FY19: Rs. 1.4b) majorly comprises sales tax recoverable
and duty drawback amounting to Rs. 674.9m (FY19: 195.9m) and Rs. 458.6m (FY19:
949.3m) respectively at end-FY20. On the other hand, trade and other payables decreased
on timeline basis primarily on account of sizable decline in payable to employees provident
fund trust amounting to 13.1m during FY20 in comparison to payable of Rs. 609.0m in the
preceding year. As a result the current ratio from improved to 1.43x (FY20: 1.24x; FY19:
1.20x) in HY21.
The company is currently in the process of transforming its energy generation source from
conventional thermal sources to solar energy generation. CBL’s total power requirement is
5MW out of which 1.3MW has been transferred to solar using the SBP financing during
FY20; total capex incurred on the projected amounted to Rs. 110m. Going forward, the
company plans to increase the solar generation capacity to 4MW by end-FY22; the
estimated cost of transfer ranges between Rs. 200-225m and is planned to be funded by
central bank’s long term financing facility (LTFF).
Moderately leveraged capital structure: The equity base of the company has steadily
improved on the back decrease in accumulated loss reserve with healthy internal capital
generation over the years. The debt profile of the company comprises a mix of short-term
and long-term debt, though the proportion of former is higher. CBL procured long-term
debt amounting to Rs. 593.3m during FY20 under SBP refinance scheme for payment of
salaries and wages at subsidized rate of borrowing during HY21. The loan has a tenor of
two years out of which two quarterly payments have already been made so the entire loan
will be paid off in the next 18 months. Further, for all the other existing long-term facilities
banks have deferred the loan installments for the period of one year under SBP directive as
a relief to the company during COVID-19 pandemic. The outstanding balance of short-
term borrowings stood lower at end-HY21; these short term finances are obtained under
markup agreements with the rates ranging from 9.3% to 16.2% per annum during the year
on the balance outstanding and are secured against first and second pari passu charge and
raking hypothecation charge on all present and future current and fixed assets of the
company. The short term finances also include export refinancing availed amounting to Rs.
3.4b (FY19: Rs. 3.1b) in FY20 at SBP’s concessionary rate of 3% markup rate.
Subsequently, in line with higher quantum of total borrowings owing to procurement of
long-term debt, gearing increased on a timeline basis to 0.98x (FY20: 0.94x; FY19: 0.84x) at

VIS Credit Rating Company Limited www.vis.com.pk
8 | Page
end-HY21. On the other hand, in line with decline in trade payables along with
augmentation in equity base the debt leverage improved to 1.56x (FY20:1.58x; FY19: 1.66x)
at end-HY21.
The company also plans to enhance the capacity of sewing and washing unit along with
installation of water recycling plants by end-FY22; the capex on both is expected to be
around Rs. 500.0m. The capex is expected to be largely financed through SBP’s
concessionary schemes as equity contribution is to be capped at Rs.50m. The specifications
of capital investment include laser machines (Rs. 135m), steam dryers for washing
(Rs.135m), pocket setters and auto loop machines (Rs.117m) and water recycling plant (Rs.
70m. Going forward, CBL also plans to inject equity amounting to Rs. 500-600m in the
ongoing year therefore leverage indicators are expected to scale down during the rating
horizon.

VIS Credit Rating Company Limited www.vis.com.pk
9 | Page
Crescent Bahuman Limited Appendix I
FINANCIAL SUMMARY (amounts in PKR millions)
BALANCE SHEET June 30, 2019 June 30, 2020 Dec 31, 2020
Non-Current Assets 4,232.9 4,175.9 4,135.4
Stock-in-Trade 4,363.2 4,828.6 4,815.2
Trade Debts 1,696.8 1,571.1 1,170.4
Cash & Bank Balances 305.6 267.6 779.5
Total Assets 12,650.8 12,815.8 13,379.6
Trade and Other Payables 3,531.2 2,855.2 2,739.3
Short Term Borrowings 3,324.9 4,026.6 3,627.5
Long Term Borrowings 372.5 310.4 1,135.9
Total Debt 3,697.4 4,337.0 4,763.4
Total Liabilities 7,297.9 7,255.4 7,563.9
Paid Up Capital 4,053.1 5,265.1 5,265,1
Tier 1 Equity 4,395.1 4,602.6 4,858.0
Total Equity 5,352.9 5,560.4 5,815.8
INCOME STATEMENT June 30, 2019 June 30, 2020 Dec 31, 2020 Net Sales 14,046.6 13,375.9 7,981.0
Gross Profit 2,130.4 1,918.9 1,237.9
Operating Profit 1,255.4 776.7 551.6
Profit Before Tax 706.6 315.6 334.8
Profit After Tax 571.9 182.9 255.3
FFO 873.1 590.2 556.9
RATIO ANALYSIS June 30, 2019 June 30, 2020 Dec 31, 2020
Gross Margin (%) 15.2 14.3 15.5
Current Ratio (x) 1.20 1.24 1.43
FFO to Total Debt (x) 0.24 0.14 0.23
FFO to Long Term Debt (x) 2.34 1.90 0.98
Debt Service Coverage Ratio (x) 2.70 2.21 3.54
ROAA (%) 4.7 1.4 3.9
ROAE (%) 14.0 3.4 9.0
Gearing (x) 0.84 0.94 0.98
Debt Leverage (x) 1.66 1.58 1.56
Stock+ Trade debts/ Short-term Borrowings (x)
1.82 1.59 1.65

VIS Credit Rating Company Limited www.vis.com.pk
10 | Page
Crescent Bahuman Limited Appendix II
BALANCE SHEET Projections (Millions)
June 30, 2021 June 30, 2022 June 30, 2023
Non-Current Assets 4,551 4.619 4,680
Stock-in-Trade 5,018 5,107 4,662
Trade Debts 1,799 2.340 2,366
Cash & Bank Balances 496 358 477
Total Assets 13,660 14,503 14,179
Trade and Other Payables 2,565 3,162 2,650
Short Term Borrowings 3,586 3,586 3,386
Long Term Borrowings 984 550 252
Total Liabilities 7,149 7,317 6,305
Paid Up Capital 5,836 5,836 5,836
Tier 1 Equity 5,554 6,228 6,915
Total Equity 6,512 7,186 7,873
INCOME STATEMENT June 30,2021 June 30, 2021 June 30, 2022 Net Sales 15,635 20,332 20,559
Gross Profit 2,069 2,578 2,648
Operating Profit 1,061 1,405 1,401
Profit Before Tax 568 928 944
Profit After Tax 380 674 687
FFO 617 908 925
RATIO ANALYSIS June 30,2021 June 30, 2021 June 30, 2022
Gross Margin (%) 13.2 12.7 12.9
Current Ratio (x) 1.38 1.41 1.55
FFO to Total Debt (x) 0.14 0.22 0.25
FFO to Long Term Debt (x) 0.63 1.65 3.67
Debt Service Coverage Ratio (x)
2.16 1.52 2.33
ROAA (%) 2.9 4.8 4.8
ROAE (%) 6.3 9.8 9.1
Gearing (x) 0.82 0.66 0.53
Debt Leverage (x) 1.29 1.17 0.91
Stock+ Trade debts/ Short-term Borrowings (x)
1.90 2.08 2.08
VIS Credit Rating Company Limited www.vis.com.pk
11 | Page
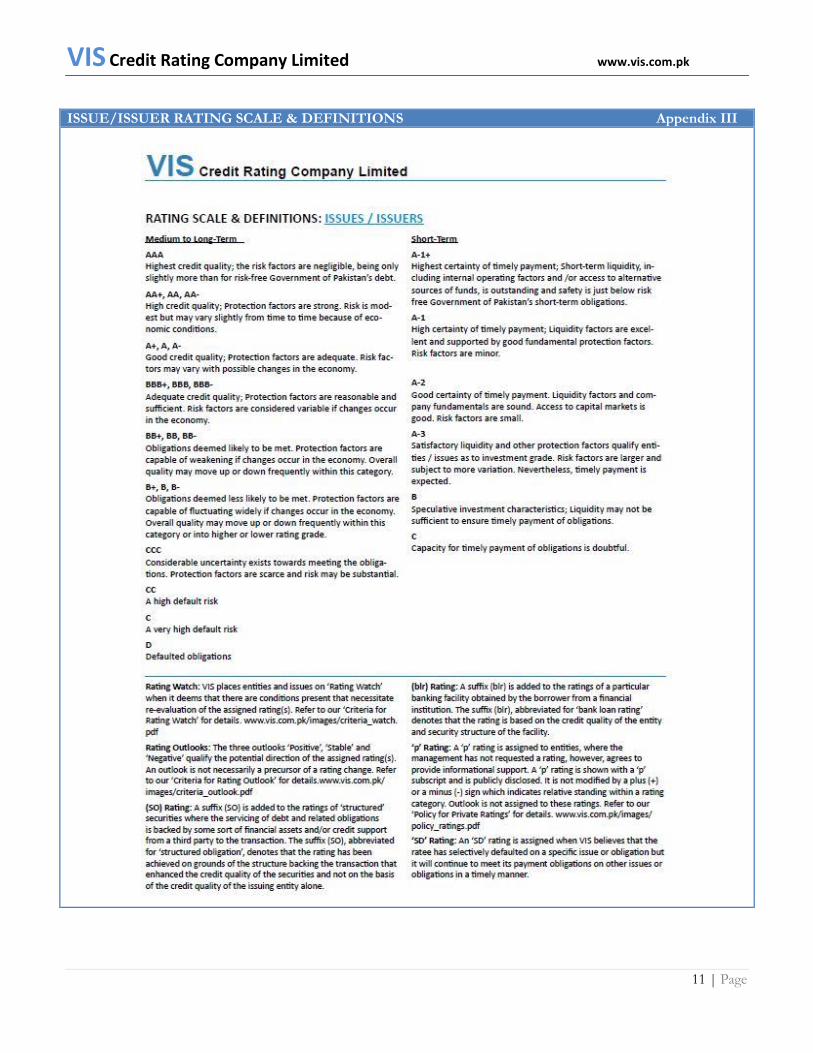
ISSUE/ISSUER RATING SCALE & DEFINITIONS Appendix III
VIS Credit Rating Company Limited www.vis.com.pk
12 | Page
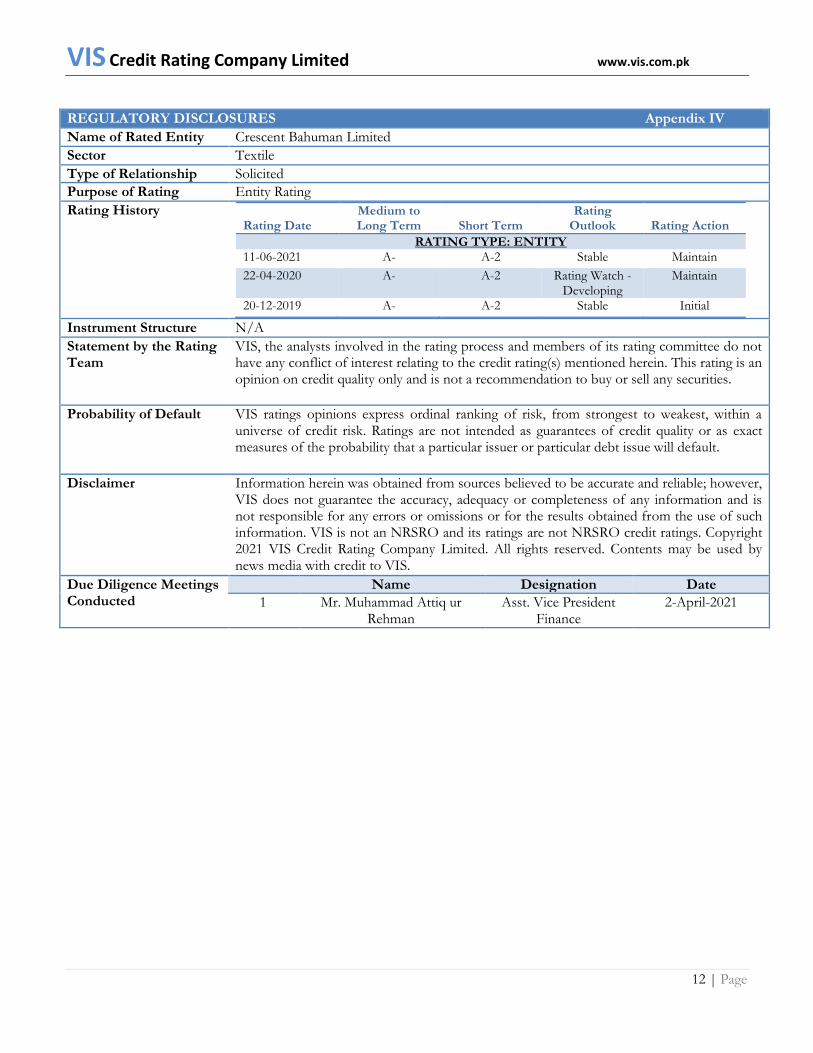
REGULATORY DISCLOSURES Appendix IV
Name of Rated Entity Crescent Bahuman Limited
Sector Textile
Type of Relationship Solicited
Purpose of Rating Entity Rating
Rating History Rating Date
Medium to Long Term Short Term
Rating Outlook Rating Action
RATING TYPE: ENTITY 11-06-2021 A- A-2 Stable Maintain
22-04-2020 A- A-2 Rating Watch - Developing
Maintain
20-12-2019 A- A-2 Stable Initial
Instrument Structure N/A
Statement by the Rating Team
VIS, the analysts involved in the rating process and members of its rating committee do not have any conflict of interest relating to the credit rating(s) mentioned herein. This rating is an opinion on credit quality only and is not a recommendation to buy or sell any securities.
Probability of Default VIS ratings opinions express ordinal ranking of risk, from strongest to weakest, within a universe of credit risk. Ratings are not intended as guarantees of credit quality or as exact measures of the probability that a particular issuer or particular debt issue will default.
Disclaimer Information herein was obtained from sources believed to be accurate and reliable; however, VIS does not guarantee the accuracy, adequacy or completeness of any information and is not responsible for any errors or omissions or for the results obtained from the use of such information. VIS is not an NRSRO and its ratings are not NRSRO credit ratings. Copyright 2021 VIS Credit Rating Company Limited. All rights reserved. Contents may be used by news media with credit to VIS.
Due Diligence Meetings Conducted
Name Designation Date
1 Mr. Muhammad Attiq ur Rehman
Asst. Vice President Finance
2-April-2021