Shakarganj Food Products Limited - VIS Credit Rating
13
VIS Credit Rating Company Limited www.vis.com.pk RATING REPORT Shakarganj Food Products Limited REPORT DATE: January 04, 2021 RATING ANALYSTS: Maham Qasim [email protected] COMPANY INFORMATION Incorporated in 2001 External auditors: EY Ford Rhodes, Chartered Accountants Chairman of the Board: Mr. Anjum M. Saleem Chief Executive Officer: Mr. Anjum M. Saleem Public Limited (Unlisted) Company Key Shareholders (with stake 5% or more): Shakarganj Limited- 52.4% Bank Islami Pakistan Limited- 36.4% Crescent Steel and Allied Products Limited – 8.4% APPLICABLE METHODOLOGY VIS Entity Rating Criteria: Corporates (August 2021) & Rating The Issue (November 2021) https://docs.vis.com.pk/docs/CorporateMethodology202108.pdf https://docs.vis.com.pk/docs/Notchingtheissue202007nov.pdf RATING DETAILS Rating Category Latest Rating Previous Rating Long-term Short-term Long-term Short-term Entity BBB+ A-3 BBB+ A-3 Rating Outlook Stable Negative Rating Date 04 Jan’22 23 Nov’20 Sukuk BBB+ BBB+ Rating Outlook Stable Negative Rating Date 04 Jan’22 23 Nov’20
-
Upload
khangminh22 -
Category
Documents
-
view
0 -
download
0
Transcript of Shakarganj Food Products Limited - VIS Credit Rating

VIS Credit Rating Company Limited www.vis.com.pk
RATING REPORT
Shakarganj Food Products Limited
REPORT DATE: January 04, 2021
RATING ANALYSTS: Maham Qasim [email protected]
COMPANY INFORMATION Incorporated in 2001 External auditors: EY Ford Rhodes, Chartered
Accountants
Chairman of the Board: Mr. Anjum M. Saleem Chief Executive Officer: Mr. Anjum M. Saleem
Public Limited (Unlisted) Company
Key Shareholders (with stake 5% or more):
Shakarganj Limited- 52.4% Bank Islami Pakistan Limited- 36.4%
Crescent Steel and Allied Products Limited – 8.4%
APPLICABLE METHODOLOGY VIS Entity Rating Criteria: Corporates (August 2021) & Rating The Issue (November 2021) https://docs.vis.com.pk/docs/CorporateMethodology202108.pdf https://docs.vis.com.pk/docs/Notchingtheissue202007nov.pdf
RATING DETAILS
Rating Category
Latest Rating Previous Rating
Long-term Short-term Long-term Short-term
Entity BBB+ A-3 BBB+ A-3 Rating Outlook Stable Negative Rating Date 04 Jan’22 23 Nov’20
Sukuk BBB+ BBB+
Rating Outlook Stable Negative Rating Date 04 Jan’22 23 Nov’20

VIS Credit Rating Company Limited www.vis.com.pk
Shakarganj Food Products Limited
OVERVIEW OF THE
INSTITUTION
RATING RATIONALE
Shakarganj Food Products Limited is
an unlisted public limited company setup by initially
acquiring a fruit juice concentrate plant
from A.M. Fruits in 2005 and later
acquiring a dairy facility from Dairy
Crest Limited in 2006. Principal
activity of SFPL involves
manufacturing, processing and sale
of food products including dairy, fruit
pulps, and
concentrate juices.
Profile of Chairman/CEO:
Mr. Anjum A. Saleem is the
Chairman/CEO of SFPL and carries over 30 years of
international and local corporate
management experience. Mr.
Anjum is a qualified Chartered
Accountant from ICAEW (Institute of
Chartered Accountants,
England & Wales) and also serves as
CEO of Shakarganj Limited.
The ratings assigned to Shakarganj Food Products Limited (SFPL) take into account strong sponsor profile, comprising renowned business concerns including Sharkarganj Limited, Bank-Islami Pakistan Limited and Crescent Steel & Allied Products Limited. The ratings incorporate moderate business risk environment underpinned by presence of the company in fast moving consumer goods segment coupled with positive demand prospects of dairy products in line with population growth & higher per capita consumption. On the other hand, heightened competition in value-added dairy and challenging operating environment of the organized segment leaves limited room for price maneuvering leading to pressure on margins. In addition, owing to presence of two strong market players, constituting around 90% market share of the documented dairy segment, reaping incremental share of the pie is considered an uphill task. Moreover, the industry margins remain sensitive to exchange rate risk and price risk pertaining to imported skimmed milk powder and edible oils. The ratings incorporate recovery of financial indicators; growth in revenues was manifested in line with improved market penetration and reception of company’s products resulting from segmentation of business areas where distributors were given targets for separate business segments as opposed to aggregate sale target for the company itself. The margins also exhibited positive trajectory owing to increase in retail prices of entire product portfolio, shift in revenue mix and reduction in skimmed milk price (SMP) during the rating review period. However, the ratings remain sensitive to SFPL’s nominal net margins on account of significant promotional expenses; the same remains an integral part of company’s presence in fast moving consumer goods (FMCG) sector. Moreover, the ratings reflect improvement in liquidity profile with adequate debt service coverage coupled with healthy funds flow from operations (FFO); the latter is considered adequate in terms outstanding obligations. Further with the company’s bottom reverting back to positive, gearing and leverage indicators improved slightly given there was no noticeable increase in debt utilization. However, debt leverage still remains on a higher side on account of sizable trade payables. Further, current ratio also continues to remain low on account of high trade payables. Going forward, the ratings are dependent on improvement of market penetration and new market development leading to revenue growth, mitigation of margin volatility, maintenance of leverage indicators at around current levels and materialization of projected targets.
Rating Drivers
Dairy Industry Dynamics: Pakistan is the fourth largest milk producing country in the world with estimated gross milk production of 61.7m tonnes, approximately 62b liters, during FY20. Cows and buffalos produced the major chunk with 22.5m tonnes and 37.3m tonnes respectively while the remaining was produced by sheep, goats and camels. However, milk available for human consumption was recorded lower around 50.0m tonnes; the 20% haircut applied pertained to subtraction of 15% for faulty transportation and a lack of chilling facilities and 5% for suckling calf nourishment. Unfortunately, the sector has not developed to its maximum potential as currently livestock and dairy constitute around 3.1% country’s total exports amounting to mere USD $0.7m in FY20. The underutilization of the sector is attributable to multiple reasons including low productivity, seasonality in milk supply, patchy distribution system, absence of cold chains

VIS Credit Rating Company Limited www.vis.com.pk
and unhygienic handling at farm and middleman level leading to poor milk quality and the inability to meet international standards. Another major barrier is that most farmers in the country have low yielding animals; even though Pakistan has more milk-producing animals than the US, its milk production is far lower. If the untapped potential is utilized trough rectification of animal rearing practices and infrastructure issues, the dairy sector can contribute around USD $30b to economy through exports.
The country’s milk sector is categorized into two distinct value chains for the post-farmgate supply of milk to consumers; fresh loose milk and packaged milk & dairy products. Loose milk is the raw milk collected from the animals without any further processing and accounts for 90% of total milk available for human consumption. Organized sector processes remaining 10% milk by employing Ultra-High Temperature (UHT) where milk is heated above 135°C for 2 to 5 seconds and High-Temperature/Short-Time (HTST) pasteurization where milk is heated to 72°C for at least 15 seconds. In the packaged milk business, tea whitener is considered the leading category in terms of retail volumes, followed by UHT milk, and pasteurized milk. Consistently growing population and prevalence of high malnutrition rate indicate that there is significant growth potential in Pakistan’s milk industry. As per the Food and Agriculture Organization’s (FAO) agricultural outlook 2020-2029, fresh dairy consumption in Pakistan is projected to increase by 5kg/capita to 40kg/capita by FY29. Moreover, as per the same source it is expected that India and Pakistan will contribute more than half of the growth in world milk production over the next decade, and will account for more than 30% of world’s production in FY29. Penetration of packaged milk in Pakistan is low vis-à-vis regional peers and its growth potential is hindered mainly by considerable price premium over loose milk due to additional cost of transportation, processing and distributor margin.
According to statistics of Dun and Bradstreet, Nestle Pakistan and FrieslandCampina Engro have the largest presence in the UHT-treated milk segment with a collective market share of 90%. Remaining market share is divided among SFPL, Haleeb Foods Limited, Dairyland (Pvt) Limited and Fauji Foods Limited. Growth potential of packaged milk is restricted on account of national regulations which mandate different requirements of Milk Fat and Non-Fat Milk Solids for different types of liquid packaged milk. The demand of tea whiteners has declined considerably in the last three years due to enforcement of tighter quality regulations on the dairy industry by Pakistan Standards and Quality Control Authority (PSQCA) and labeling of the same as non-dairy product by Punjab Food Authority (PFA).
Quantum of loss declined during the ongoing year owing to change in product mix entailing higher margins: SPFL’s net revenue took a plunge during FY20 declining to Rs. 15.4b in comparison to Rs. 16.6b in the preceding year primarily as a continued impact of classification of tea whiteners, constituting 54% of the revenue mix, as non-dairy products by FDA. The remaining product mix includes milk, flavored milk, fruit juices, pulp and fat products (butter, cream & desi ghee). Tea whiteners in respect to other product lines are the lowest grossing product in terms of margins therefore, on account of revenue mix being dominated by the same historically, margins shrunk to 8.0% (FY19: 12.5%) during FY20. Further, despite increase in cost of production, the management was unable to exercise transfer pricing strategy for tea-whiteners for most part of the previous year owing to negative connotation attached with the product in terms of its categorization. Subsequently on account stunted margins, SPFL recorded sizable negative bottom line of Rs. 885.6m during FY20 as opposed to profit of Rs. 105.1m in the preceding year. However, the downward trend in revenues was rescued with significant increase to Rs. 13.3b during 9MFY21 in line with improved market penetration through segmentation of

VIS Credit Rating Company Limited www.vis.com.pk
business areas where retailers/distributors were given targets for separate business divisions like milk, tea whitener, juices, etc. as compared to holistic sale target for the company itself. The change in the aforementioned strategy has primarily resulted in uptick of juices sales therefore slight change in the product revenue mix was witnessed during the ongoing year with increased contribution of 12% (FY20: 10%) from the juices sub-segment during 9MFY21. In addition, the company has also set up a small pulp processing unit to build in end-to end synergies in the business processes; the results of the same on cost efficiencies will be ascertained over time. The breakdown of revenue mix in terms of product categories is presented in the table below:
FY20 9MFY21
Category Gross Revenue (Rs. in m)
Share Mix Gross Revenue (Rs. in m)
Share Mix
Juices 1,777 10% 1,828 12%
Milk 6,305 36% 5,428 35%
Pulp 99 <1% 154 1%
Tea Creamer 9,506 54% 7,999 52%
Gross Revenue 17,687 100% 15,409 100%
In terms of product volumes an increase was manifested in quantum sales of Joose, Refresh, Thanda and Gulpy, all pertaining to juices category, along with flavored milk, Oolala. On the other hand, annualized volumetric sales of largest revenue contributor, tea whitener Qudrat, were recorded largely at prior year’s level. Along with management’s increased focus towards juices and milk categories, volumetric sales of tea whiteners were also impacted by the supply chain disruption and closure of offices, schools, colleges, tourist spots, and dhabas owing to the outbreak of COVID-19. Volumetric sales of major products are tabulated below:
FY20 9MFY21
Product Name Volume (in liters)
Avg Selling Price/ liter
Volume (in liters)
Avg Selling Price/ liter
Anytime 1,279,740 101 828,454 108
Chaika 16,043,419 90 12,250,180 95
Dairy Pure 14,905,040 94 11,327,092 101
Good Milk 36,145,119 124 25,561,688 139
Joose 15,735,306 55 12,893,484 56
Gulpy - - 305,424 86
Oolala 1,306,386 137 2,127,893 132
Qudrat 89,277,898 90 66,228,938 95
Refresh 11,940,293 65 12,216,334 66
Thanda 140,700 51 622,628 53
Goodmilk Cream 77,362 385 105,019 385
Moreover, positive trajectory was also witnessed in margins with noteworthy increase to 13.2% (FY20: 8.0%) during the period under review owing to slight intentional structural shift in the revenue mix along with increase in retail price of the entire product range. As per the management, the contribution margin of tea whiteners increased to Rs. 3-4/pack (FY20: Rs. 1-2/pack) due to relatively reduced reliance of the company on imported powder at 60% (FY20: 70%) with increased focus on local milk procurement during abundance season starting from January to April for drying during 9MFY21. As per the management, SFPL is making continuous investment into research & development (R&D) to improvise on recipes in order to reap better margins; the same was implemented for using easily available and less costly loose liquid milk for production of tea-creamers,

VIS Credit Rating Company Limited www.vis.com.pk
Qudrat and Chaika. In addition, the reduction in average procurement price of skimmed milk powder (SMP) to Rs. 13,087/bag (FY20: Rs. 15,343/bag) on account of locking in orders while the pricing was favorable in the international market has also resulted in improved contribution margin of tea creamers during 9MFY21. Going forward, the company plans on tapering off proportion of tea whiteners to 45% against increase in contribution of milk to 40% followed by juices at 15% by end-FY22. In line with strategic vision, despite highest gross margins reaped under juices category, the company would continue to keep its prime focus on improving distribution of milk as element of brand equity is vested with ‘Good Milk’. The contribution margin of main products is tabularized below:
Average Contribution per pack in Rs.
Product Name FY20 9MFY21
Anytime 7.60 12.84
Chaika 2.08 4.08
Dairy Pure 9.08 7.48
Good Milk 8.10 13.62
Joose 0.56 0.15
Gulpy - 6.18
Oolala 3.82 5.11
Qudrat 1.34 3.78
Refresh 1.90 2.90
The selling and distribution expenses were recorded lower at Rs. 1.2b during 9MFY21 in comparison to Rs. 1.4b in the corresponding period last year owing to reduced road shows and promotions carried out due to covid-19 related lockdowns. Moreover, administrative expenses were also curtailed at Rs. 110.7m (9MFY20: Rs. 113.5m) owing to decrease in employee related expenses as the average number of employees were reported lower during the rating review period. Further, other expenses stood higher at Rs. 11.3m (9MFY20: Rs. 0.4m) during 9MFY21 on account of increased contribution to workers’ participation fund. The company booked other income amounting to Rs. 17.3m (9MFY20: Rs. 26.3m) given reduced profit on bank placements owing to low policy rate scenario prevalent during 9MFY21. SFPL’s finance cost was rationalized and recorded lower at Rs. 244.0m (9MFY20: 340.4m) owing to a sharp dip in the benchmark rates during the review period. As a combined impact of positive trajectory of revenues, notable recovery of margins and rationalized finance cost, the company recorded profit after tax of Rs. 94.2m during 9MFY21 as compared to a loss of Rs. 666.7m in the corresponding period last year. Despite recovery from FY20’s indicators, net margin of the company remained low at 0.7% during the review period owing sizable distribution & selling expenses; the same is in impact of company’s presence in FMCG sector where heavy promotional expense has to keep brand loyalty intact. As per the management, the company has closed FY21 at a net revenue of Rs. 18.0b. Revenue is projected to increase by 43% to Rs. 23.4b during FY22 with increased focus on juices and milk sub-segments coupled with new market development through export of juices to Africa, UAE and Central Asia. The company has already obtained certifications in that regard; moreover, the management is well versed with operations of the aforementioned export markets as SFPL’s fruit concentrates are already exported to them. Specifically, the revenue growth is projected to be driven by volumetric increase of 25% in Refresh & Minis Joose, 20% in Good Milk Cream and Good Milk Ghee, 15% increase in Dairy Pure, Good Milk, Oolala and loose cream and 7% increase in Chaika and Qudrat product lines. Volumetric sale of its Refresh juice brand is projected to grow to 25m liters in FY22 (FY21: 16m liters; FY20: 12m liters) and Joose volumes to 28m liters (FY21: 17m liters; FY20: 16m liters). The restoration of pulp orders from Nestle and PepsiCo, which

VIS Credit Rating Company Limited www.vis.com.pk
were cancelled during the COVID-19, is also expected to positively impact the top-line during FY22. In addition, the setup of additional pulp production line during the outgoing year will also provide impetus to revenues. The projected growth of revenues also takes into account increase in price of the entire product portfolio ranging between 5-9% during FY22. From FY22 onwards, the price increase is estimated around 3-5% for the next two fiscal years. Gross profit is estimated to improve and range between 15.4-16% during the next three fiscal years; the increase is projected on the back of shift in revenue mix, continued execution of economical buying of SMP and increased reliance on local loose milk for drying. Despite slight increase in debt utilization, financial charges are largely projected at FY21’s level of Rs. 325.6m; however, the same might require upward adjustment in line with increasing trend witnessed in the market benchmark rates from Sep’21 onwards. SPFL as a result of improved scale of operations and margins has projected a bottom line of Rs. 457.4m for FY22.
Liquidity position slightly improved during the rating review period; the same has been a function of profitability indicators: Liquidity profile of the company could not present a stable position during FY20 on account of incurrence of net loss resulting in negative funds flow from operations (FFO). Subsequently, FFO to total debt was also reported negative. The trend in liquidity indicators is a replication of profitability metrics. Therefore, with the enhancement in scale of operations and improvement in margins, SFPL’s reported healthy FFO amounting to Rs. 466.2m during 9MFY21. As a result, the company’s FFO to outstanding debt obligations reverted back to positive; FFO to total debt and FFO to long-term debt were recorded at 0.33x and 0.41x respectively at end-9MFY21. In addition, debt service coverage ratio (DSCR) was also recorded adequate at 1.74x at end-9MFY21; the same indicates that the company is comfortably placed in meeting the obligations falling due. Going forward, cash flow generation is expected to improve on account of higher business volumes. Despite increase in scale of operations, stock in trade was maintained at prior’s year’s level at Rs. 1.2b (end-FY20: Rs. 1.2b) at end-9MFY21; the same is an outcome of better turnaround time of finished goods as per company’s plan for reducing unnecessary carrying costs materialized. The slight increase in trade debts to Rs. 123.9m (end-FY20: Rs. 119.9m) was in sync with growth in scale of operations. The aging of receivables is satisfactory as only less than 10% of the receivables pertained to more than four-months overdue bracket. As per the management, the milk sales payment is made within two weeks therefore the company does not face any cash-flow stress; the company operates under fast-moving consumer goods segment which is a cash rich sector therefore hardly any liquidity crunch is faced. These along with high quantum of payables are the reason for the company’s low reliance on short-term funding. Loans and advances were recorded higher at Rs. 230.4m (end-FY20: 142.0m) at end-9MFY21 on account of higher advance payments for imported raw material; the same is an outcome of increase in scale of operations. Further, liquidity of the company is slightly impacted due to sizable sales tax refunds amounting to Rs. 676.0m (end-FY20: Rs. 745.3m) due from government during the rating review period; the company is unable to rectify the situation given it is an exogenous factor and inbuilt in the operating business dynamics. Trade and other payables were recorded lower at Rs. 3.9b (end-FY20: Rs. 4.1b) on account of reduced inventory levels. Payable to gratuity was recorded higher at Rs. 195.6m (end-FY20: Rs. 175.6m) at end-9MFY21 on account of higher contribution payable based on actuarial assumptions. Current ratio also remained low at 0.5x at end-9MFY21 (FY20: 0.5x) on account of continued delayed payments to Tetra Pak as agreed by both parties. Inventory plus trade receivables to short-term borrowings remained unchanged at 3.9x
VIS Credit Rating Company Limited www.vis.com.pk
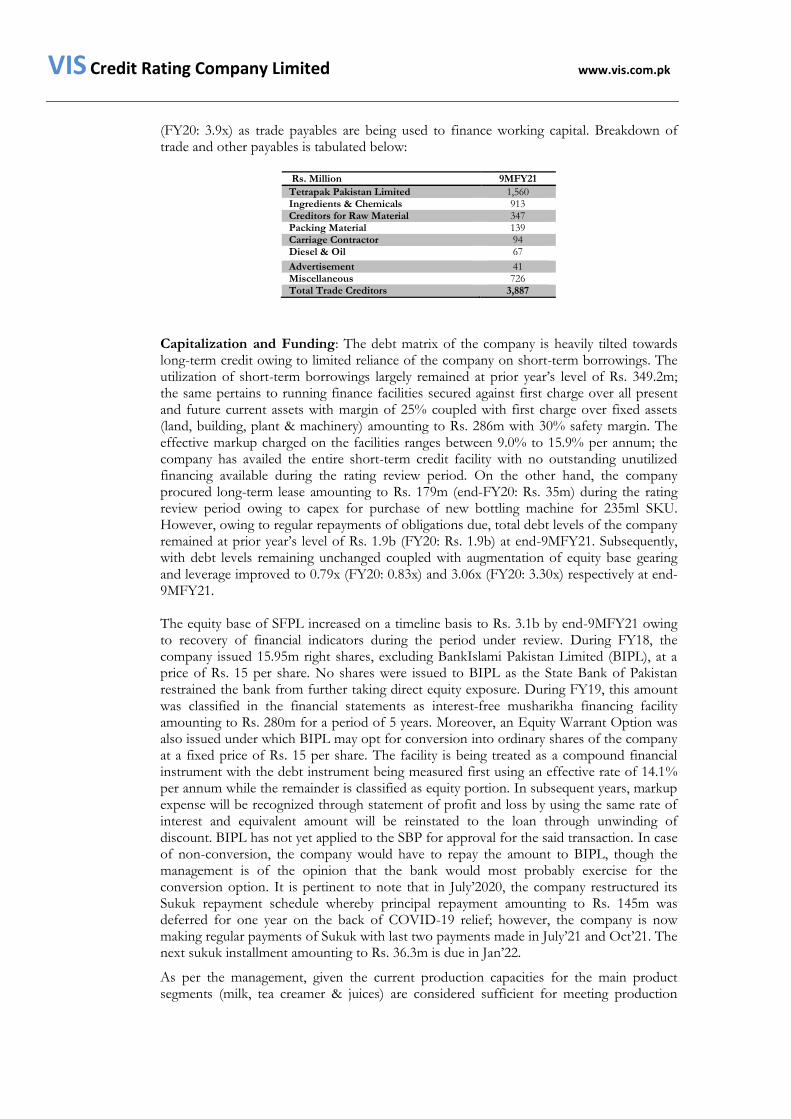
(FY20: 3.9x) as trade payables are being used to finance working capital. Breakdown of trade and other payables is tabulated below:
Rs. Million 9MFY21
Tetrapak Pakistan Limited 1,560 Ingredients & Chemicals 913 Creditors for Raw Material 347 Packing Material 139 Carriage Contractor 94 Diesel & Oil 67
Advertisement 41 Miscellaneous 726 Total Trade Creditors 3,887
Capitalization and Funding: The debt matrix of the company is heavily tilted towards long-term credit owing to limited reliance of the company on short-term borrowings. The utilization of short-term borrowings largely remained at prior year’s level of Rs. 349.2m; the same pertains to running finance facilities secured against first charge over all present and future current assets with margin of 25% coupled with first charge over fixed assets (land, building, plant & machinery) amounting to Rs. 286m with 30% safety margin. The effective markup charged on the facilities ranges between 9.0% to 15.9% per annum; the company has availed the entire short-term credit facility with no outstanding unutilized financing available during the rating review period. On the other hand, the company procured long-term lease amounting to Rs. 179m (end-FY20: Rs. 35m) during the rating review period owing to capex for purchase of new bottling machine for 235ml SKU. However, owing to regular repayments of obligations due, total debt levels of the company remained at prior year’s level of Rs. 1.9b (FY20: Rs. 1.9b) at end-9MFY21. Subsequently, with debt levels remaining unchanged coupled with augmentation of equity base gearing and leverage improved to 0.79x (FY20: 0.83x) and 3.06x (FY20: 3.30x) respectively at end-9MFY21. The equity base of SFPL increased on a timeline basis to Rs. 3.1b by end-9MFY21 owing to recovery of financial indicators during the period under review. During FY18, the company issued 15.95m right shares, excluding BankIslami Pakistan Limited (BIPL), at a price of Rs. 15 per share. No shares were issued to BIPL as the State Bank of Pakistan restrained the bank from further taking direct equity exposure. During FY19, this amount was classified in the financial statements as interest-free musharikha financing facility amounting to Rs. 280m for a period of 5 years. Moreover, an Equity Warrant Option was also issued under which BIPL may opt for conversion into ordinary shares of the company at a fixed price of Rs. 15 per share. The facility is being treated as a compound financial instrument with the debt instrument being measured first using an effective rate of 14.1% per annum while the remainder is classified as equity portion. In subsequent years, markup expense will be recognized through statement of profit and loss by using the same rate of interest and equivalent amount will be reinstated to the loan through unwinding of discount. BIPL has not yet applied to the SBP for approval for the said transaction. In case of non-conversion, the company would have to repay the amount to BIPL, though the management is of the opinion that the bank would most probably exercise for the conversion option. It is pertinent to note that in July’2020, the company restructured its Sukuk repayment schedule whereby principal repayment amounting to Rs. 145m was deferred for one year on the back of COVID-19 relief; however, the company is now making regular payments of Sukuk with last two payments made in July’21 and Oct’21. The next sukuk installment amounting to Rs. 36.3m is due in Jan’22.
As per the management, given the current production capacities for the main product segments (milk, tea creamer & juices) are considered sufficient for meeting production

VIS Credit Rating Company Limited www.vis.com.pk
requirements, the company does not foresee procurement of additional long-term debt for capital expansion for the same in the next 3-4years. However, for value-added products involving product line extensions (biscuits) and capacity enhancement of fat products (ghee & cream), SFPL plans to procure long-term funding amounting to Rs. 300m in FY22 and around Rs. 500m in long-term lease during FY23. Meanwhile, the management plans to completely eliminate the utilization of short-term borrowings by FY24. On the other hand, equity injection of Rs. 179m is expected through right share issue during FY22. Therefore, with healthy internal capital generation, timely repayment of long-term obligations and zero reliance on short-term credit gearing and leverage indicators are projected to improve on a timeline basis during the rating horizon. However, debt leverage will still remain a higher side owing to no significant decline in trade payables.

VIS Credit Rating Company Limited www.vis.com.pk
Shakarganj Food Products Limited Annexure I
Financial Statement (Amount in Million)
BALANCE SHEET FY18 FY19 FY20 9MFY21*
Fixed Assets 3,720 7,837 7,834 7,842
Store and Spare Parts 187 213 196 214
Stock in Trade 1,175 1,407 1,224 1,224
Trade Debts 99 120 124 142
Loans and Advances 1,059 227 142 230
Income and Sales Tax 624 691 745 676
Cash & Bank Balances 316 431 322 295
Other Assets 16 46 20 8
Total Assets 7,196 10,972 10,607 10,631
Trade and Other Payables 2,203 3,147 4,149 3,887
Short Term Borrowings 341 299 349 349
Long-Term Borrowings (Inc. current matur) 1,430 1,840 1,516 1,526
Total Borrowings 1,771 2,140 1,865 1,875
Retirement Benefit 174 246 280 342
Contract Liabilities - 794 663 722
Other Liabilities 384 577 432 475
Total Liabilities 4,532 6,903 7,389 7,301
Tier-1 Equity 2,664 3,042 2,238 2,385
Total Equity 2,664 4,069 3,217 3,330
Paid-Up Capital 1,676 1,676 1,676 1,676
INCOME STATEMENT FY18 FY19 FY20 9MFY21*
Net Sales 15,776 16,588 15,383 13,306
Gross Profit 2,861 2,071 1,230 1,750
Operating Profit/(Loss) 705 192 (612) 473
Profit/(Loss) Before Tax 594 10 (1,028) 229
Profit/(Loss) After Tax 418 105 (886) 94
FFO 634 149 (709) 466
RATIO ANALYSIS FY18 FY19 FY20 9MFY21*
Gross Margin (%) 18.1 12.5 8.0 13.2
Net Margin (%) 2.6 0.6 -5.8 0.7
FFO to Long-Term Debt 0.44 0.08 (0.38) 0.41
FFO to Total Debt 0.36 0.07 (0.47) 0.33
Debt Servicing Coverage Ratio (x) 1.05 0.6 (0.38) 1.74
Gearing (x) 0.66 0.70 0.83 0.79
Debt Leverage (x) 1.70 2.27 3.30 3.06
Current Ratio 1.1 0.6 0.5 0.5
Inventory + Receivables/Short-term Borrowings
3.7 5.1 3.9 3.9
* 9-month numbers are for period ended-June’21

VIS Credit Rating Company Limited www.vis.com.pk
Shakarganj Food Products Limited Annexure II
Financial Projections (Amount in Million)
BALANCE SHEET FY22 FY23 FY24
Fixed Assets 7,484 7,557 7,646
Store and Spare Parts 236 279 329
Stock in Trade 1,710 1,885 2,200
Trade Debts 150 176 208
Loans and Advances 443 512 597
Income and Sales Tax 1,118 962 946
Cash & Bank Balances 50 50 121
Total Assets 11,624 12,000 12,527
Trade and Other Payables 3,937 3,827 3,754
Short Term Borrowings 285 194 -
Long-Term Borrowings (Inc. current matur) 1,831 1,893 1,941
Total Borrowings 2,116 2,087 1,941
Retirement Benefit 386 440 512
Contract Liabilities 693 728 808
Total Liabilities 7,587 7,413 7,343
Tier-1 Equity 3,146 3,736 4,373
Total Equity 4,037 4,587 5,185
Paid-Up Capital 1,795 1,795 1,795
INCOME STATEMENT FY22 FY23 FY24
Net Sales 23,428 27,519 32,459
Gross Profit 3,743 4,239 5,053
Operating Profit/(Loss) 970 1,058 1,410
Profit/(Loss) Before Tax 645 728 1,103
Profit/(Loss) After Tax 457 516 580
FFO 772 740 1,177
RATIO ANALYSIS FY22 FY23 FY24
Gross Margin (%) 16.0 15.4 15.6
Net Margin (%) 2.0 1.9 1.8
FFO to Long-Term Debt 0.42 0.39 0.61
FFO to Total Debt 0.37 0.35 0.61
Debt Servicing Coverage Ratio (x) 1.5 1.3 1.8
Gearing (x) 0.67 0.56 0.44
Debt Leverage (x) 2.41 1.98 1.68
Current Ratio 0.7 0.8 0.9
Inventory + Receivables/Short-term Borrowings
6.5 10.6 -

VIS Credit Rating Company Limited www.vis.com.pk
ISSUE/ISSUER RATING SCALE & DEFINITIONS Annexure II

VIS Credit Rating Company Limited www.vis.com.pk
REGULATORY DISCLOSURES Annexure III
Name of Rated Entity Shakarganj Food Products Limited
Sector Consumer Goods
Type of Relationship Solicited
Purpose of Rating Entity Ratings
Rating History Rating Date Medium to Long Term
Short Term Rating Outlook
Rating Action
RATING TYPE: ENTITY Jan 04, ‘20 BBB+ A-3 Stable Maintained Nov 23, ‘20 BBB+ A-3 Negative Downgrade July 18, ‘19 A- A-2 Stable Reaffirmed Mar 20, ‘18 A- A-2 Stable Initial RATING: SUKUK Jan 04, ‘20 BBB+ Stable Maintained Nov 23, ‘20 BBB+ Negative Downgrade July 18, ‘19 A Stable Final Mar 20,’18 A Stable Preliminary
Instrument Structure Sukuk is of amount Rs. 725m.Tenor of the Sukuk will be 6 years including 1-year grace period. Principal will be repaid in 20 quarterly installments starting from 15th month from the date of issuance. The facility shall be secured by first pari passu charge over moveable & immoveable fixed assets of the company with 25% margin plus any other security mutually agreed or as advised by the legal counsel. Moreover, the company will maintain a Debt Service Account (DSA) with accounts bank, which will be held under exclusive lien of investment agent/trustee (for the benefit of the sukuk investors). The company shall ensure that during each month (and in any case not later than the fifteenth (15th) day of each month), it shall deposit the amount equivalent to the 1/3rd of the upcoming installment amount (principal + profit/rental) into DSA so that the aggregate amount in the DSA on the due date is equal to the installment amount of the relevant period due for payment.
Statement by the Rating Team VIS, the analysts involved in the rating process and members of its rating committee do not have any conflict of interest relating to the credit rating(s) mentioned herein. This rating is an opinion on credit quality only and is not a recommendation to buy or sell any securities.
Probability of Default VIS’ ratings opinions express ordinal ranking of risk, from strongest to weakest, within a universe of credit risk. Ratings are not intended as guarantees of credit quality or as exact measures of the probability that a particular issuer or particular debt issue will default.

VIS Credit Rating Company Limited www.vis.com.pk
Disclaimer Information herein was obtained from sources believed to be accurate and
reliable; however, VIS does not guarantee the accuracy, adequacy or completeness of any information and is not responsible for any errors or omissions or for the results obtained from the use of such information. For conducting this assignment, analyst did not deem necessary to contact external auditors or creditors given the unqualified nature of audited accounts and diversified creditor profile. Copyright 2021 VIS Credit Rating Company Limited. All rights reserved. Contents may be used by news media with credit to VIS.
Due Diligence Meetings Conducted
Name Designation Date
Mr. Naguib Saigal CFO December 9, 2021
Mr. Nasir Ismail Senior Financial Analyst December 9, 2021