Annual Budget - City of Prescott
307
Annual Budget Fiscal Year 2018
-
Upload
khangminh22 -
Category
Documents
-
view
0 -
download
0
Transcript of Annual Budget - City of Prescott
Annual BudgetFiscal Year 2018
City of Prescott, Arizona Annual Budget
Fiscal Year 2018 July 1, 2017 – June 30, 2018
City Council
Harry Oberg, Mayor
Billie Orr
Greg Lazzell
Jean Wilcox
Jim Lamerson
Steve Sischka
Steve Blair
Administrative Staff
Michael Lamar City Manager
Mark Woodfill Finance Director
Lars Johnson Budget Manager
Table of Contents
Budget Award ........................................................................................................................................ 1
City Leadership and Community Overview ........................................................................................ 4 Mayor and City Council ...................................................................................................................... 5 Community Profile ............................................................................................................................ 12 City of Prescott Demographics ......................................................................................................... 16
Organizational Structure, Goals, and Policies ................................................................................. 20 Organizational Values ...................................................................................................................... 21 City Organizational Chart ................................................................................................................. 22 Employees by Department and Ten-Year Trend ............................................................................. 23 Budget Policy ................................................................................................................................... 24 Debt Policy ....................................................................................................................................... 28 Investment Policy ............................................................................................................................. 31 Budget Preparation Process Overview ............................................................................................ 35
Budget Preparation Calendar ..................................................................................................... 37 Budget Basis and Budget Amendments ..................................................................................... 38
Fund Summaries ................................................................................................................................. 40 Fund Structure .................................................................................................................................. 42 Overall City Budget Summary .......................................................................................................... 45 General Fund ................................................................................................................................... 50 Special Revenue Funds ................................................................................................................... 57 Debt Service Fund ............................................................................................................................ 63 Enterprise Funds .............................................................................................................................. 64 Internal Service Funds ..................................................................................................................... 78 City Debt Summary .......................................................................................................................... 80
Department Operational Plans ........................................................................................................... 84 Department Operational Plans Overview ......................................................................................... 86 City Expenditure Budget by Department and Fund ......................................................................... 88 City Expenditure Budget by Department and Category ................................................................... 89 Airport ............................................................................................................................................... 90 Budget and Finance ......................................................................................................................... 94 City Clerk ........................................................................................................................................ 103 City Council .................................................................................................................................... 107 City Court ........................................................................................................................................ 110 City Manager .................................................................................................................................. 115 Community Development ............................................................................................................... 132 Fire ................................................................................................................................................. 141 Legal ............................................................................................................................................... 155
City of Prescott, Arizona Annual Budget FY2018
City Manager's Budget Message ......................................................................................................... 2

Table of Contents
Police .............................................................................................................................................. 167 Public Works................................................................................................................................... 179 Recreation Services ....................................................................................................................... 201 Regional Communications ............................................................................................................. 216
Capital Budget ................................................................................................................................... 220 Capital Budget Overview ................................................................................................................ 222 Capital Budget Categories and Funding Sources .......................................................................... 224 Capital Budget Listing .................................................................................................................... 225 Capital Budget and Project Descriptions ........................................................................................ 228 Five-Year Capital Improvement Plan Summary ............................................................................. 266
Appendix ............................................................................................................................................ 270 Budget Resolutions ........................................................................................................................ 272 Auditor General Schedules ............................................................................................................ 276 Authorized Position Listing ............................................................................................................. 288 Authorized Pay Grade Ranges....................................................................................................... 296 Glossary of Terms .......................................................................................................................... 297
City of Prescott, Arizona Annual Budget FY2018
Library ............................................................................................................................................. 159
Budget Award
The Government Finance Officers Association of the United States and Canada (GFOA) presented a Distinguished Budget Presentation Award to the City of Prescott, Arizona for its annual budget for the fiscal year beginning July 1, 2016 (FY2017). In order to receive this award, a governmental unit must publish a budget document that meets program criteria as a policy document, as an operations guide, as a financial plan, and as a communications device. This award is valid for a period of one year only. We believe our current budget continues to conform to program requirements, and we are submitting it to GFOA to determine its eligibility for another award.
City of Prescott, Arizona 1 Annual Budget FY2018

City Manager’s Budget Message
Dear Citizens and Council – For the creation of the Fiscal Year 2018 (FY18) budget I determined several priorities to focus on that would drive the budget process and reflect the desires of the Council. They are the following:
1. Implement the Council’s Strategic Plan 2. Continue to work on innovation and efficiency in city operations 3. Start moving the city to a budgeting for outcomes model 4. Address the city’s Public Safety Personnel Retirement System (PSPRS) unfunded liability and
the increasing burden on the General Fund 5. Continue the market-based compensation plan the Council implemented in FY 2017
The City Council’s Strategic Plan was created in August 2016. The city made great progress on the goals outlined in that plan, which were: Stabilize the General Fund, Economic Development, Quality of Life, and Service-Oriented Culture. This budget contains elements that will further the accomplishments made on the Strategic Plan. To help stabilize the General Fund and move towards a solution for the PSPRS unfunded liability, the budget creates a new Special Revenue Fund to use the potential revenue generated if Proposition 443 is approved by the voters of Prescott. The Council will have the option of using this new dedicated tax, reserves, and submitting the regular payment to PSPRS as well. In addition, no new personnel have been added and overall department operations have been closely examined for operational efficiency. The Field and Facilities Department was dissolved, Tourism/Economic Development was reorganized, Code Enforcement was moved to Community Development, and Fire/Safety Inspection function was moved from the Fire Department to Community Development. To name a few more innovations and efficiencies, we have eliminated four high-level employees saving $575,000 annually and will be providing community policing within the existing budget. Additionally, we are carrying out the reorganization of fire hydrant maintenance and working with ERAU to make public their OctoberWest alumni event. These changes have streamlined services and created greater efficiency and effectiveness. This budget also provides for the ability to continue our economic development efforts of attracting a variety of businesses and industries, especially from technology and cyber security. Quality of life through our excellent recreational amenities, streets, and other services will continue to be provided as well. The city provided a specific customer service training to all employees and will maintain its focus on improved customer service throughout this new fiscal year. We have begun moving in the direction of outcome-based budgeting by asking departments to identify and focus on key efficiency and effectiveness performance measures as well as the outcomes they want to achieve. This method allocates funds based on what the Council wants the departments to achieve and will be improved upon as time goes on. The table below shows the overall changes between the FY17 and FY18 budgets. The total adopted budget for FY18 is $188.8 million. The operating component is $84.9 million which is a 2.8% increase from last fiscal year. The increase in operating budget reflects increases in the contribution rate for the Public Safety Personnel Retirement System, adjustments in personnel compensation with the market compensation plan, and cost increases necessary to continue to provide city services at equal or better levels. The capital component of the budget is $73.3 million, which is roughly the same in FY18 as it was in FY17. The capital budget is a robust plan for infrastructure improvements for utility and streets projects as well as other one time expenditures for purchase or projects. City of Prescott, Arizona 2 Annual Budget FY2018

City Manager’s Budget Message
Internal services are budgeted at $9.9 million, and include a debt refunding for the fleet maintenance facility. These are now separated out of operating costs to provide a better picture of the operating budget for the city. Internal charges for services are already budgeted in the departments that are receiving the services and the $9.9 million represents expenditures out of the Fleet, Facilities, Engineering, and Risk Management funds. The remaining component is a $20.7 million contingency, consisting of $6 million for a ballot proposition of a dedicated tax to pay down a pension liability, $11 million for a lump sum payment using General Fund balance to pay down a pension liability, $1.2 million for a court case regarding refunding of pension contributions, and $2.5 for the expenditure of possible grant awards. These items, especially grants, have been separated from department operating budgets to better reflect the true cost of providing the service if the grants or other costs are not obtained or expended.
We look forward to continuing to be fiscally responsible while carrying out the goals and plans of the Council and to ensure that Prescott remains a great place to live, learn, work, and play. Sincerely, Michael Lamar City Manager
City of Prescott, Arizona 3 Annual Budget FY2018
City Leadership and Community Overview
Mayor and City Council ...................................................................................................................... 5 Community Profile ............................................................................................................................ 12 City of Prescott Demographics ......................................................................................................... 16
City of Prescott, Arizona 4 Annual Budget FY2018

City Leadership & Community Overview
Mayor and City Council Profiles
Harry Oberg, Mayor Term: November 2015 – November 2017 The Mayor services as the chair of the City Council and presides over Council meetings. He is recognized as the head of the city government for all ceremonial purposes and is responsible for governing the city during times of crisis, such as natural disasters. To reach the Mayor’s office, call 777-1270. Harry Oberg is a longtime native of Prescott whose father (Nils) came to Prescott in 1929. His father worked in ranching until the early 1950’s. Harry was born in Laramie, Wyoming in 1947 when his father was in the process of moving his mother from South Dakota to Arizona after their joint service in World War II. Harry grew up in Prescott attending Lincoln School, Prescott Junior High School (where the Sheriff’s Office is today), and graduated from Prescott High School in 1965 (where the middle school is currently). Harry attended Arizona State College until drafted on 6 November, 1966. Harry completed two tours in Vietnam as an Army helicopter pilot. During his first tour he received a combat wound which required several months of hospitalization between tours. His combat decorations include 2-Distinguished Flying Crosses, 2-Bronze Stars, the Purple Heart, 34-Air Medals (one with Valor Device), and numerous Vietnam campaign and service awards. After extensive service with Army Aviation, Harry pursued his Army career as an Armor Officer until retirement at the rank of Colonel in April, 2000. During this time, he was given assignments of increasing responsibility in Cavalry, Mechanized Infantry and Armor units. His non-combat awards include the Legion of Merit, 5-Meritorius Service medals, and other service achievement awards. In addition, he was awarded the Saint George Medallion for his distinguished contributions to the U.S Army Armor Corps. During his 33-year career in the U.S. Army and Army National Guard, Harry had assignments in several nations in Southwest Asia, Germany and the United Kingdom. In addition, he served in the National Guard for the States of Arizona, Alaska, California, Illinois, Iowa, and Nevada. While serving with the Iowa Army National Guard, Harry was promoted to Brigadier General. Beside his command and staff assignments at the Company, Battalion and Brigade levels, he has also served as an Inspector General. Harry received an Undergraduate Degree in Accounting from Northern Arizona University, a Master’s Degree in International Relations from Salva Regina University, and is a graduate of the U.S. Army War College. In the last nine years before he retired, Harry was assigned to the Pentagon where he was responsible for a $1.5B budget providing equipment and supplies to Army National Guard units deploying to Afghanistan and Iraq. In 2007, he and his wife Jeanna both retired and returned to Prescott, Arizona. In August, 2015, Harry was elected Mayor of Prescott for a two-year term, starting 24 November, 2015. City of Prescott, Arizona 5 Annual Budget FY2018

City Leadership & Community Overview
Mayor and City Council Profiles
Billie Orr, Council Member Term: November 2015 – November 2019
Dr. Billie Orr has been an advocate for public education and school choice for decades. She taught in Maison School District and was the principal of Kiva School in Scottsdale, Arizona. Billie was the Vice President of Human Resources for Continental Bank in Phoenix and returned to her education career due to her disappointment in her own son's public school. Dr. Orr was active in public education for over twenty-five years in Arizona, ultimately becoming the Associate Superintendent of Public Instruction. Under her leadership, Arizona implemented the most vigorous charter school program in the country and created state academic standards that were ranked among the best in the nation. Billie was the Chairwoman of the Gallatin County Republican Party, as well as Vice President of the Gallatin County Republican Women in Montana. She is the immediate past President of Republican Women of Prescott. She is active in her church, an Ambassador for Free Wheelchair Mission, and a member of SunUp Rotary in Prescott. Billie and Bob Orr have been married for 43 years and have a son, daughter-in-law, and two granddaughters in Boston, where their son is attending MIT. City of Prescott, Arizona 6 Annual Budget FY2018
City Leadership & Community Overview
Mayor and City Council Profiles
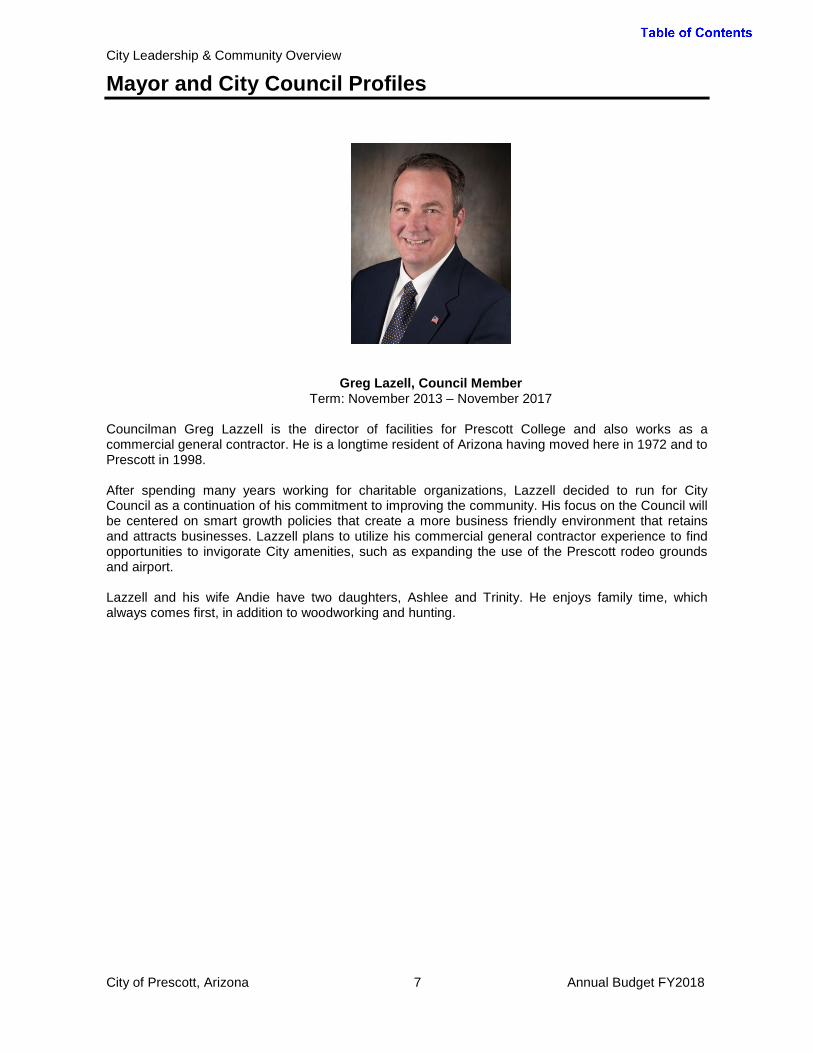
Greg Lazell, Council Member Term: November 2013 – November 2017
Councilman Greg Lazzell is the director of facilities for Prescott College and also works as a commercial general contractor. He is a longtime resident of Arizona having moved here in 1972 and to Prescott in 1998. After spending many years working for charitable organizations, Lazzell decided to run for City Council as a continuation of his commitment to improving the community. His focus on the Council will be centered on smart growth policies that create a more business friendly environment that retains and attracts businesses. Lazzell plans to utilize his commercial general contractor experience to find opportunities to invigorate City amenities, such as expanding the use of the Prescott rodeo grounds and airport. Lazzell and his wife Andie have two daughters, Ashlee and Trinity. He enjoys family time, which always comes first, in addition to woodworking and hunting. City of Prescott, Arizona 7 Annual Budget FY2018
City Leadership & Community Overview
Mayor and City Council Profiles
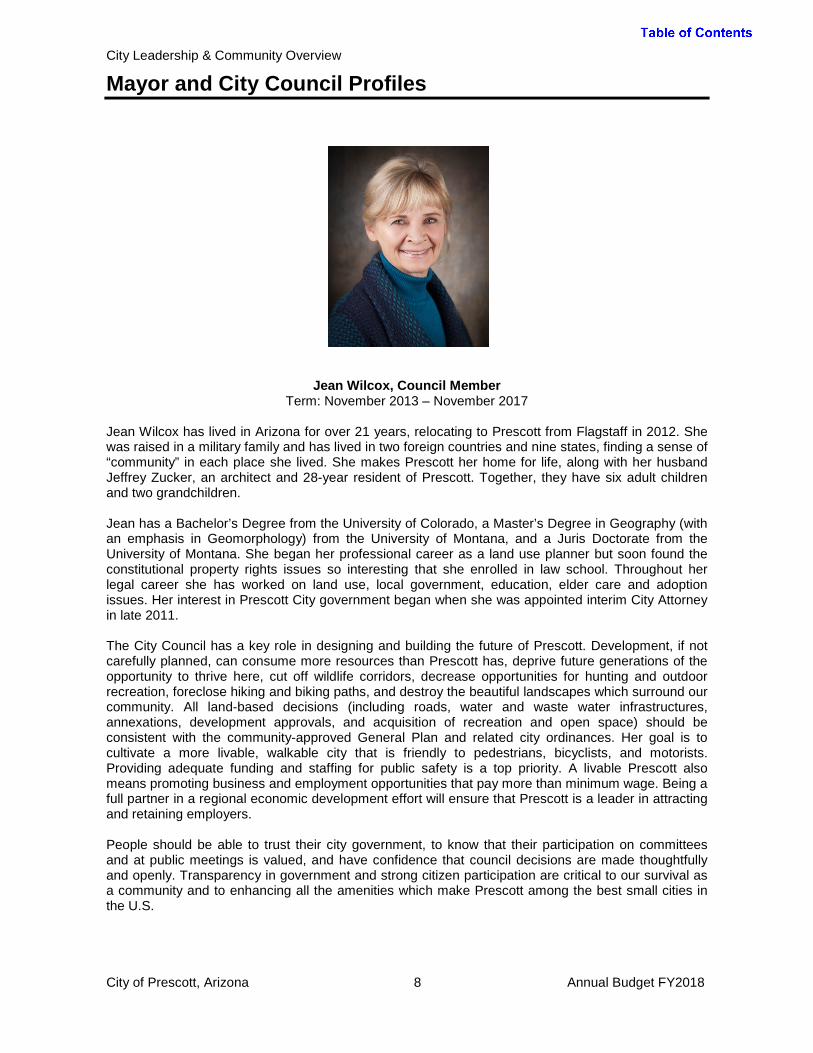
Jean Wilcox, Council Member Term: November 2013 – November 2017
Jean Wilcox has lived in Arizona for over 21 years, relocating to Prescott from Flagstaff in 2012. She was raised in a military family and has lived in two foreign countries and nine states, finding a sense of “community” in each place she lived. She makes Prescott her home for life, along with her husband Jeffrey Zucker, an architect and 28-year resident of Prescott. Together, they have six adult children and two grandchildren. Jean has a Bachelor’s Degree from the University of Colorado, a Master’s Degree in Geography (with an emphasis in Geomorphology) from the University of Montana, and a Juris Doctorate from the University of Montana. She began her professional career as a land use planner but soon found the constitutional property rights issues so interesting that she enrolled in law school. Throughout her legal career she has worked on land use, local government, education, elder care and adoption issues. Her interest in Prescott City government began when she was appointed interim City Attorney in late 2011. The City Council has a key role in designing and building the future of Prescott. Development, if not carefully planned, can consume more resources than Prescott has, deprive future generations of the opportunity to thrive here, cut off wildlife corridors, decrease opportunities for hunting and outdoor recreation, foreclose hiking and biking paths, and destroy the beautiful landscapes which surround our community. All land-based decisions (including roads, water and waste water infrastructures, annexations, development approvals, and acquisition of recreation and open space) should be consistent with the community-approved General Plan and related city ordinances. Her goal is to cultivate a more livable, walkable city that is friendly to pedestrians, bicyclists, and motorists. Providing adequate funding and staffing for public safety is a top priority. A livable Prescott also means promoting business and employment opportunities that pay more than minimum wage. Being a full partner in a regional economic development effort will ensure that Prescott is a leader in attracting and retaining employers. People should be able to trust their city government, to know that their participation on committees and at public meetings is valued, and have confidence that council decisions are made thoughtfully and openly. Transparency in government and strong citizen participation are critical to our survival as a community and to enhancing all the amenities which make Prescott among the best small cities in the U.S.
City of Prescott, Arizona 8 Annual Budget FY2018

City Leadership & Community Overview
Mayor and City Council Profiles
Jim Lamerson, Council Member Term: November 2015 – November 2019
With a well-worn copy of the Constitution of the United States in his shirt pocket and a personal commitment to the moral tenants of the Ten Commandments, Jim Lamerson is dedicated to his responsibility as a City Council member because, in his own words, “It’s the right thing to do.” Lamerson, a long-time resident and local jeweler, was driven to serve the community in a decision-making capacity. He and his wife, Anne, have lived in Prescott since 1979. Serving on the Prescott City Council exemplifies Lamerson's intense desire for public service. He has served on various city boards and commissions, is a past Rotary Club of Prescott president and a two-term board member. He served on the Prescott General Plan Committee, is a past chairman of the Prescott Downtown Commission and is a two-term former board chairman of the Prescott Chamber of Commerce, among other civic posts. Lamerson's focus includes providing high quality services to Prescott taxpayers. He is an advocate for public safety, maintaining the infrastructure necessary for basic services, and decreasing government involvement in private property issues and the free-market system. Lamerson supports private sector development of workforce housing by eliminating governmental barriers which prevent equal opportunity for a wide variety of housing to exist in Prescott. Expansion of the city limits and advancing intergovernmental relationships necessary to promote Prescott's interests are also very important goals for Lamerson. "I like a lot of non-essential things. My priorities however, will always elevate those things that impact peoples' safety and life essentials first. I don't know how I could serve the community any better than that." City of Prescott, Arizona 9 Annual Budget FY2018
City Leadership & Community Overview
Mayor and City Council Profiles
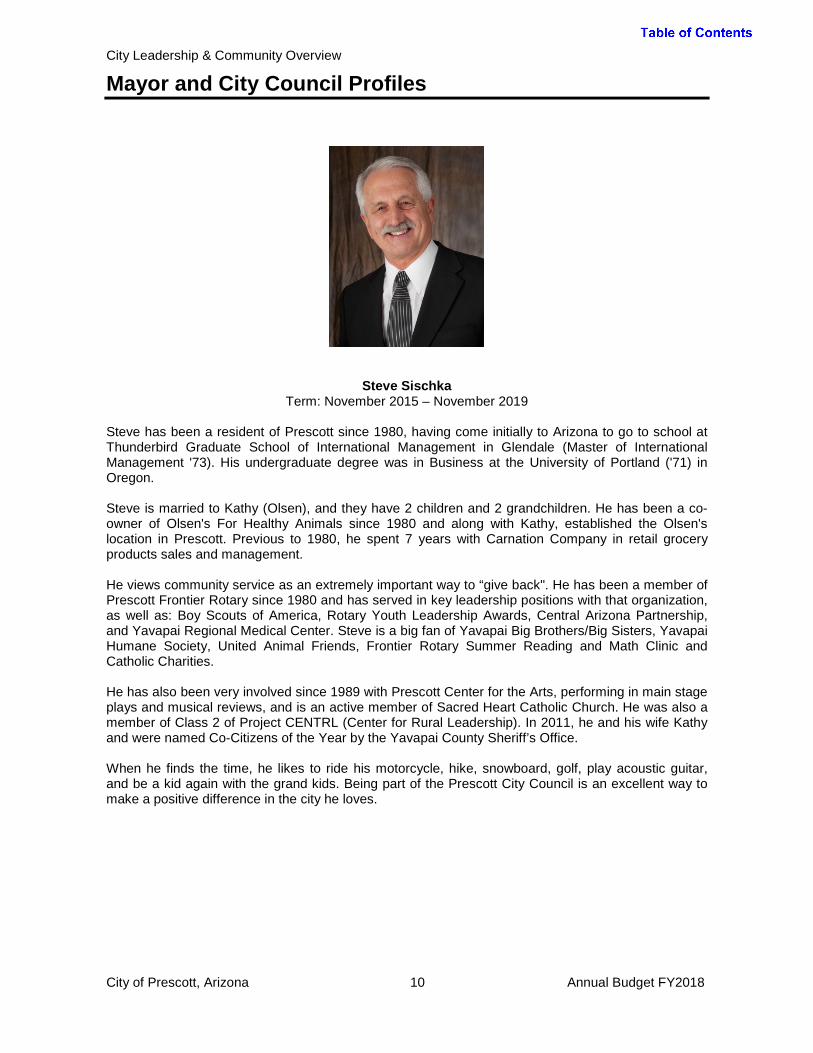
Steve Sischka Term: November 2015 – November 2019
Steve has been a resident of Prescott since 1980, having come initially to Arizona to go to school at Thunderbird Graduate School of International Management in Glendale (Master of International Management '73). His undergraduate degree was in Business at the University of Portland ('71) in Oregon. Steve is married to Kathy (Olsen), and they have 2 children and 2 grandchildren. He has been a co-owner of Olsen's For Healthy Animals since 1980 and along with Kathy, established the Olsen's location in Prescott. Previous to 1980, he spent 7 years with Carnation Company in retail grocery products sales and management. He views community service as an extremely important way to “give back". He has been a member of Prescott Frontier Rotary since 1980 and has served in key leadership positions with that organization, as well as: Boy Scouts of America, Rotary Youth Leadership Awards, Central Arizona Partnership, and Yavapai Regional Medical Center. Steve is a big fan of Yavapai Big Brothers/Big Sisters, Yavapai Humane Society, United Animal Friends, Frontier Rotary Summer Reading and Math Clinic and Catholic Charities. He has also been very involved since 1989 with Prescott Center for the Arts, performing in main stage plays and musical reviews, and is an active member of Sacred Heart Catholic Church. He was also a member of Class 2 of Project CENTRL (Center for Rural Leadership). In 2011, he and his wife Kathy and were named Co-Citizens of the Year by the Yavapai County Sheriff’s Office. When he finds the time, he likes to ride his motorcycle, hike, snowboard, golf, play acoustic guitar, and be a kid again with the grand kids. Being part of the Prescott City Council is an excellent way to make a positive difference in the city he loves.
City of Prescott, Arizona 10 Annual Budget FY2018
City Leadership & Community Overview
Mayor and City Council Profiles
Steve Blair, Council Member Term: November 2013 to November 2017
Steve has been in Prescott for 57 years. He is a graduate of Prescott High School, received an A.A. degree from Yavapai College and a B.S. degree from Arizona State University. Steve was the owner/operator of Blair Distributing LLC/Holsum Bakery for 44 years as well as owner/operator of Blind Brothers Window Coverings for 28 years. Steve has a long record of service to the community. He served on the City of Prescott Charter Review Committee in 1977, is a member of the Parks and Recreation/Library Advisory Board, served four years on the Planning & Zoning Commission and 12 years on the City Council. In addition, he has twice been appointed to special committees by Arizona Senate Past President Ken Bennett. Among his accomplishments on behalf of the community, Steve cites retaining the “World’s Oldest Rodeo” here in Prescott and securing the Rodeo Grounds from Yavapai County; developing a sound, fiscal water policy; encouraging the development of a community skate park; helping achieve the Library restoration; and ensuring that the Fire and Police Departments have the equipment they need to serve our citizens and businesses.
City of Prescott, Arizona 11 Annual Budget FY2018

City Leadership and Community Overview
Community Profile
History
Prescott was founded in 1863 and incorporated in 1883. During the late 1800s, Prescott twice served as the territorial capital, and the Governor’s Mansion is now preserved at the Sharlot Hall Museum. In 1864, the town site of Prescott was surveyed and laid out along Granite Creek where gold had been panned. The town was designated the capital of the new territory of Arizona after Arizona was separated from New Mexico. President Lincoln wanted the territorial capital in the northern part of the territory, far away from the Confederate sympathizing cities to the south. Lincoln also decided to populate this new capital with Northerners and Mid-westerners and this decision resulted in Prescott being the most Mid-western looking city in Arizona. Victorian homes and peaked roof homes were built, a far cry from the adobe structures that were more common in the Southwest. The early economy of the area centered on cattle ranching and mining. In July of 1900, a fire destroyed much of Prescott’s commercial district. Within hours, make-shift shelters were erected on the Courthouse Plaza and business began rebuilding. Following the fire, most buildings in the downtown area were reconstructed of brick, providing today’s rich architectural heritage. Dubbed “Everybody’s Hometown”, Prescott is culturally diverse from its downtown Courthouse Plaza, famous Whiskey row, preservation emphasis with 809 buildings on the National Register of Historic Places, World’s Oldest Rodeo, Prescott Fine Arts Association, Sharlot Hall Museum, Phippen Art Museum, Folk Arts Fair, Frontier Days, and Territorial Days to its official designation by the State of Arizona as “Arizona’s Christmas City”.
City of Prescott, Arizona 12 Annual Budget FY2018

City Leadership and Community Overview
Community Profile
Location Located in the mountains of north central Arizona approximately 90 miles northwest of Phoenix and 90 miles southwest of Flagstaff, the City borders the Prescott National Forest to the south and west. The average elevation is 5,400 feet. The local climate is mild, with average high temperatures ranging from fifty degrees to ninety degrees F and the average precipitation recorded at 19.8 inches, most of which is rain. Prescott and the nearby towns of Chino Valley, Prescott Valley and the newly incorporated Dewey-Humboldt form what is known locally as the Quad-City area.
City Government The council-manager form of government was adopted in 1958. The Mayor is elected on a nonpartisan ballot to represent the entire City for a two-year term. The six members of Council are elected at large for four year terms on a nonpartisan ballot. Three of the six positions and the Mayor’s position are up for reelection at the same time. Under the provisions of the City Charter, the Council appoints a City Manager who is responsible for carrying out its established policies and administering operations.
City of Prescott, Arizona 13 Annual Budget FY2018

City Leadership and Community Overview
Community Profile
City Services The City of Prescott is a full service city. The municipal government provides police, fire, library recreation, parks, trails, golf, wastewater, water, street improvements and maintenance, solid waste, municipal airport, planning and building, and economic development services.
Taxes Prescott and all Arizona municipalities are highly dependent on sales tax and state-shared revenues for their General Fund. Property taxes account for less than 5 percent of City’s tax revenues. The total 2016 property tax rate (primary and secondary) for residents in the City is 8.3454 per $100 assessed value. The City of Prescott’s 2016 rate is only 0.3025 per $100 assessed value, or 3.6% of the total property tax for residents. The remaining property tax is levied by Yavapai County (32%), Prescott Unified School District (25%), Yavapai College (29%), State Legislature (9%), and Mountain Institute (1%). The combined Privilege and Use Tax (sales tax) rate in the City of Prescott for most taxable activities is 8.35%. The combined rate consists of 5.6% for the State of Arizona, 0.75% for Yavapai County and 2% for the City of Prescott. The City’s sales tax and property tax rates are the lowest in the Greater Prescott area.
City of Prescott, Arizona 14 Annual Budget FY2018
City Leadership and Community Overview
Community Profile
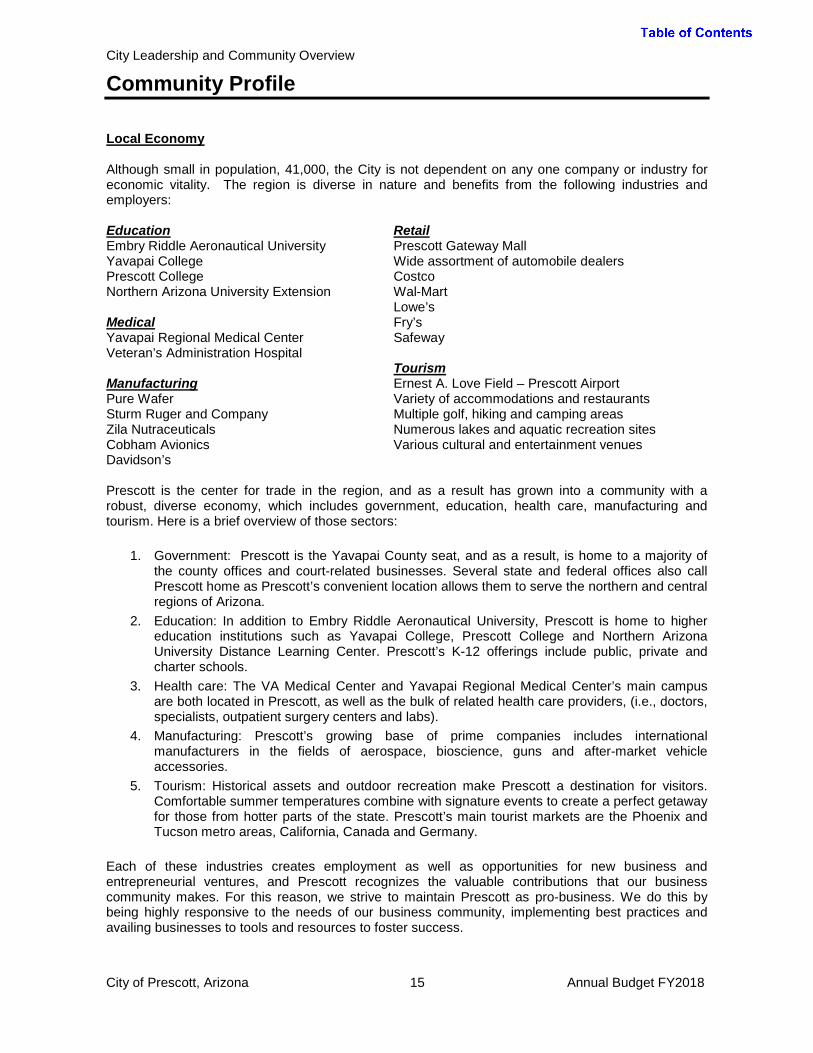
Local Economy Although small in population, 41,000, the City is not dependent on any one company or industry for economic vitality. The region is diverse in nature and benefits from the following industries and employers: Education Retail Embry Riddle Aeronautical University Prescott Gateway Mall Yavapai College Wide assortment of automobile dealers Prescott College Costco Northern Arizona University Extension Wal-Mart
Lowe’s Medical Fry’s Yavapai Regional Medical Center Safeway Veteran’s Administration Hospital Tourism Manufacturing Ernest A. Love Field – Prescott Airport Pure Wafer Variety of accommodations and restaurants Sturm Ruger and Company Multiple golf, hiking and camping areas Zila Nutraceuticals Numerous lakes and aquatic recreation sites Cobham Avionics Various cultural and entertainment venues Davidson’s Prescott is the center for trade in the region, and as a result has grown into a community with a robust, diverse economy, which includes government, education, health care, manufacturing and tourism. Here is a brief overview of those sectors:
1. Government: Prescott is the Yavapai County seat, and as a result, is home to a majority of the county offices and court-related businesses. Several state and federal offices also call Prescott home as Prescott’s convenient location allows them to serve the northern and central regions of Arizona.
2. Education: In addition to Embry Riddle Aeronautical University, Prescott is home to higher education institutions such as Yavapai College, Prescott College and Northern Arizona University Distance Learning Center. Prescott’s K-12 offerings include public, private and charter schools.
3. Health care: The VA Medical Center and Yavapai Regional Medical Center’s main campus are both located in Prescott, as well as the bulk of related health care providers, (i.e., doctors, specialists, outpatient surgery centers and labs).
4. Manufacturing: Prescott’s growing base of prime companies includes international manufacturers in the fields of aerospace, bioscience, guns and after-market vehicle accessories.
5. Tourism: Historical assets and outdoor recreation make Prescott a destination for visitors. Comfortable summer temperatures combine with signature events to create a perfect getaway for those from hotter parts of the state. Prescott’s main tourist markets are the Phoenix and Tucson metro areas, California, Canada and Germany.
Each of these industries creates employment as well as opportunities for new business and entrepreneurial ventures, and Prescott recognizes the valuable contributions that our business community makes. For this reason, we strive to maintain Prescott as pro-business. We do this by being highly responsive to the needs of our business community, implementing best practices and availing businesses to tools and resources to foster success.
City of Prescott, Arizona 15 Annual Budget FY2018

City Leadership and Community Overview
City of Prescott Demographics
City of Prescott Population Demographics
Source: Population Estimates from Office of Employment & Population Statistics, Arizona Department of Administration
Year Population Yavapai County
Population as % of County Land Area
2007 40,371 211,137 19.1% 40.00 square miles2008 40,041 212,137 18.9% 40.80 square miles2009 39,932 212,585 18.8% 40.85 square miles2010 39,771 210,899 18.9% 41.50 square miles2011 39,873 211,247 18.9% 41.50 square miles2012 39,865 211,583 18.8% 41.50 square miles2013 39,888 213,294 18.7% 42.67 square miles2014 40,520 215,357 18.8% 42.67 square miles2015 40,989 217,778 18.8% 45.25 square miles2016 41,238 220,730 18.7% 45.25 square miles
2017 proj 41,006 224,018 18.3% 45.25 square miles2021 proj 40,986 238,271 17.2% 45.25 square miles
Population and Area
City of Prescott, Arizona 16 Annual Budget FY2018

City Leadership and Community Overview
City of Prescott Demographics
Source: U.S. Census Bureau, 2011-2015 American Community Survey 5-Year Estimates, Unemployment Source: Arizona Office of Employment and Population Statistics
Source: 2010 US Census Data
Population Statistics 2010
Prescott 2015
Prescott
2015 Yavapai County
2015 Arizona
Gender distributionPercent Male 49.2% 48.3% 48.9% 49.2%Percent Female 50.8% 51.7% 51.1% 50.8%
Age distribution24 and under 21.3% 22.2% 24.6% 33.1%25 to 44 17.9% 16.1% 18.0% 26.3%45 to 64 30.4% 27.5% 30.2% 26.3%65 and over 30.8% 34.2% 27.2% 14.3%
Median Age (years) 53.4 55.6 51.3 37.6
Income/employmentHousehold Median Income $44,278 $44,846 $44,748 $53,482Household Average Income $63,300 $60,095 $58,003 $74,596
Unemployment 10.7% 6.2% 5.6% 5.9%
City of Prescott, Arizona 17 Annual Budget FY2018
Racial/Ethnic Composition 2010White, Non-Hispanic 87.10%Hispanic 8.60%Black 0.70%Other 3.60%
$200,000 or more 4.00%150,000 to 199,999 3.00%100,000 to 149,999 5.00%75,000 to 99,999 8.00%50,000 to 74,999 16.00%35,000 to 49,999 13.00%25,000 to 34,999 17.00%15,000 to 24,999 17.00%10,000 to 14,999 10.00%under 10,000 9.00%
Households by Income, 2010
City Leadership and Community Overview
City of Prescott Demographics
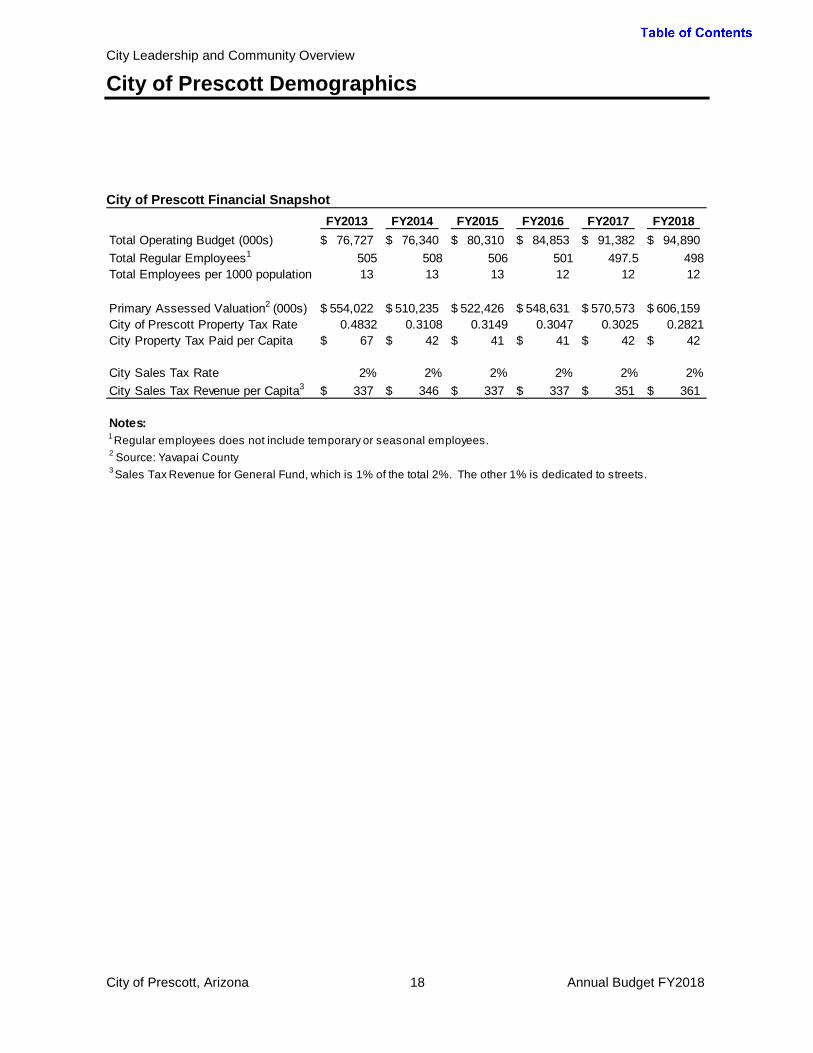
City of Prescott Financial Snapshot
FY2013 FY2014 FY2015 FY2016 FY2017 FY2018Total Operating Budget (000s) 76,727$ 76,340$ 80,310$ 84,853$ 91,382$ 94,890$ Total Regular Employees1 505 508 506 501 497.5 498Total Employees per 1000 population 13 13 13 12 12 12
Primary Assessed Valuation2 (000s) 554,022$ 510,235$ 522,426$ 548,631$ 570,573$ 606,159$ City of Prescott Property Tax Rate 0.4832 0.3108 0.3149 0.3047 0.3025 0.2821City Property Tax Paid per Capita 67$ 42$ 41$ 41$ 42$ 42$
City Sales Tax Rate 2% 2% 2% 2% 2% 2%City Sales Tax Revenue per Capita3 337$ 346$ 337$ 337$ 351$ 361$
Notes:1 Regular employees does not include temporary or seasonal employees.2 Source: Yavapai County3 Sales Tax Revenue for General Fund, which is 1% of the total 2%. The other 1% is dedicated to streets.
City of Prescott, Arizona 18 Annual Budget FY2018
City Leadership and Community Overview
City of Prescott Demographics
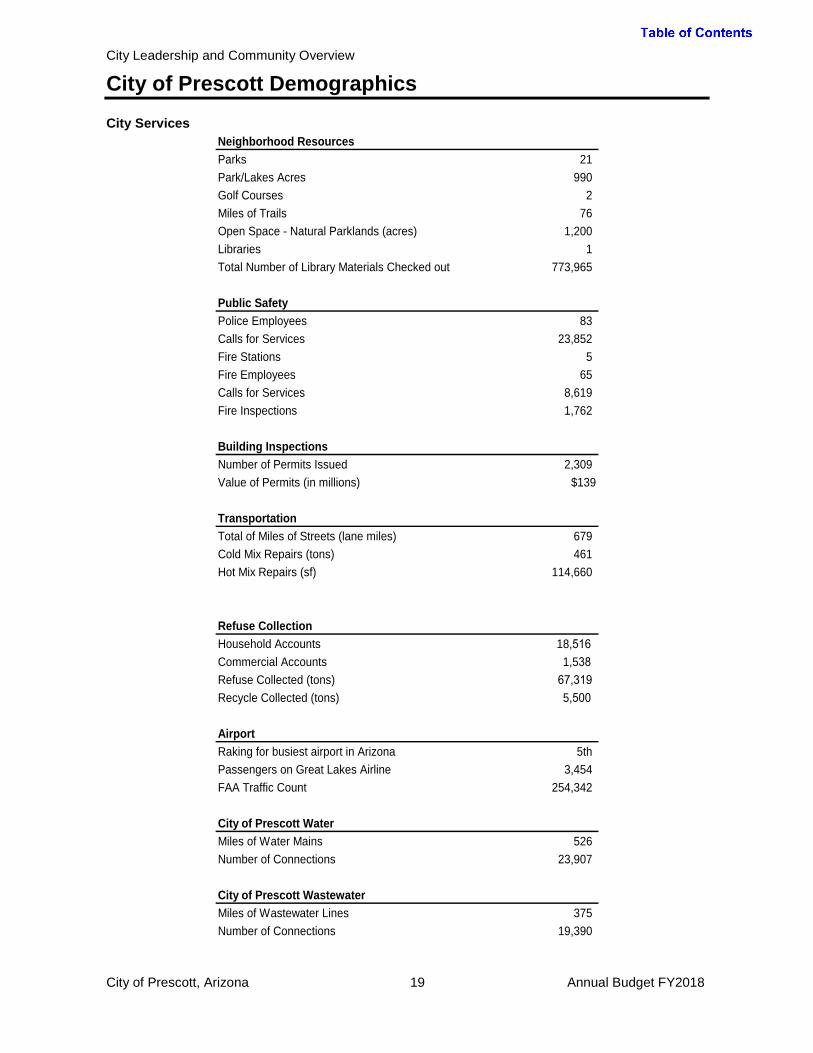
City Services Neighborhood ResourcesParks 21 Park/Lakes Acres 990 Golf Courses 2 Miles of Trails 76 Open Space - Natural Parklands (acres) 1,200 Libraries 1 Total Number of Library Materials Checked out 773,965
Public SafetyPolice Employees 83 Calls for Services 23,852 Fire Stations 5 Fire Employees 65 Calls for Services 8,619 Fire Inspections 1,762
Building InspectionsNumber of Permits Issued 2,309 Value of Permits (in millions) $139
TransportationTotal of Miles of Streets (lane miles) 679 Cold Mix Repairs (tons) 461 Hot Mix Repairs (sf) 114,660
Refuse CollectionHousehold Accounts 18,516Commercial Accounts 1,538Refuse Collected (tons) 67,319Recycle Collected (tons) 5,500
AirportRaking for busiest airport in Arizona 5thPassengers on Great Lakes Airline 3,454 FAA Traffic Count 254,342
City of Prescott WaterMiles of Water Mains 526 Number of Connections 23,907
City of Prescott WastewaterMiles of Wastewater Lines 375 Number of Connections 19,390
City of Prescott, Arizona 19 Annual Budget FY2018
Organizational Structure, Goals, and Policies
Organizational Values ...................................................................................................................... 21 City Organizational Chart ................................................................................................................. 22 Employees by Department and Ten-Year Trend ............................................................................. 23 Budget Policy ................................................................................................................................... 24 Debt Policy ....................................................................................................................................... 28 Investment Policy ............................................................................................................................. 31 Budget Preparation Process Overview ............................................................................................ 35
Budget Preparation Calendar ..................................................................................................... 37 Budget Basis and Budget Amendments ..................................................................................... 38
City of Prescott, Arizona 20 Annual Budget FY2018

Organizational Structure, Goals, and Policies
Organizational Values
PRESCOTT VISION Prescott is a beautiful, growing city that has a vibrant historic downtown, is the regional economic center for the Tri-Cities and is a 1st class tourist destination. Prescott is a livable, dynamic community where there is a range of housing choices for all, where residents and guests enjoy an active lifestyle with great recreation and leisure amenities, where people have quality living, where the community acts as a responsible environmental steward and where there is pride in our hometown. The Gem of Arizona.
CITY OF PRESCOTT MISSION STATEMENT
The mission of the City of Prescott is to provide superior city services, to create a financially sustainable city and serve as the leader of the region.
CITY OF PRESCOTT CORE BELIEFS
We believe in:
• Acting with integrity • Having personal commitment and loyalty • Working as a team • Solving problems • Taking pride in excellent results • High level of productivity • Being nice
City of Prescott, Arizona 21 Annual Budget FY2018
Organizational Structure, Goals, and Policies
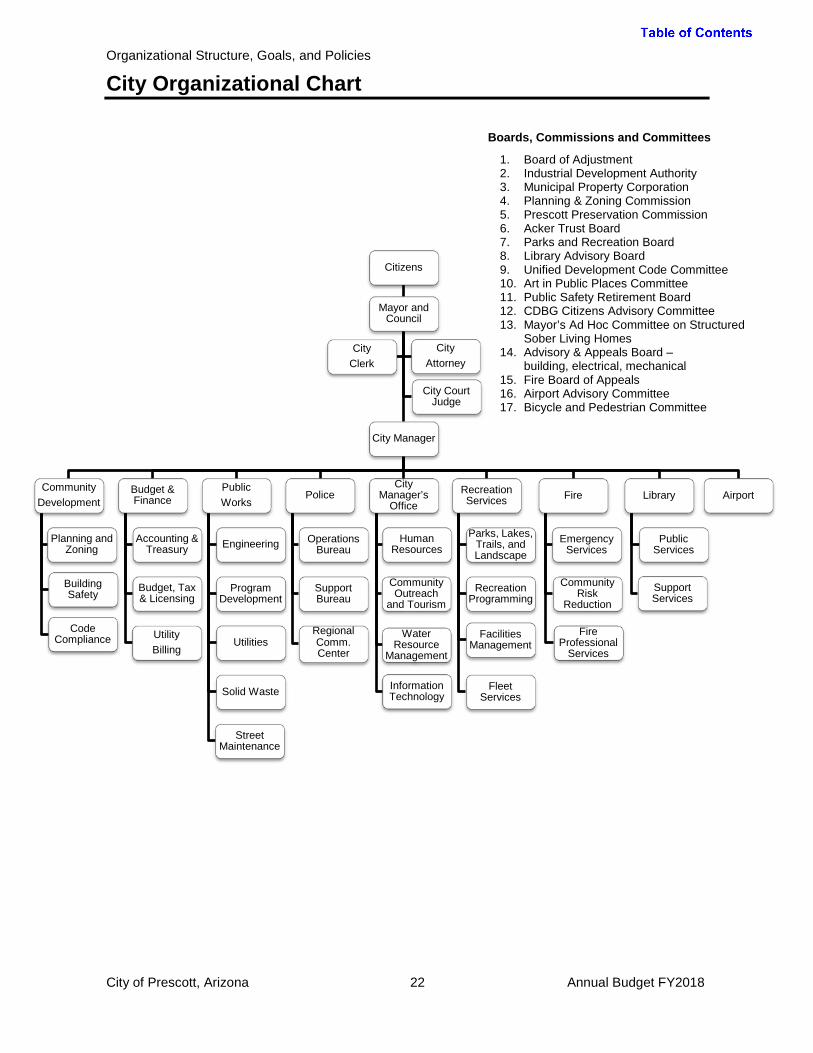
City Organizational Chart
Boards, Commissions and Committees
1. Board of Adjustment 2. Industrial Development Authority 3. Municipal Property Corporation 4. Planning & Zoning Commission 5. Prescott Preservation Commission 6. Acker Trust Board 7. Parks and Recreation Board 8. Library Advisory Board 9. Unified Development Code Committee 10. Art in Public Places Committee 11. Public Safety Retirement Board 12. CDBG Citizens Advisory Committee 13. Mayor’s Ad Hoc Committee on Structured
Sober Living Homes 14. Advisory & Appeals Board –
building, electrical, mechanical 15. Fire Board of Appeals 16. Airport Advisory Committee 17. Bicycle and Pedestrian Committee
Citizens
Mayor and Council
City Manager
Community Development
Planning and Zoning
Code Compliance
Building Safety
Budget & Finance
Accounting & Treasury
Budget, Tax & Licensing
Utility Billing
Public Works
Engineering
Program Development
Utilities
Solid Waste
Street Maintenance
Police
Operations Bureau
Support Bureau
Regional Comm. Center
City Manager’s
Office
Human Resources
Community Outreach
and Tourism
Water Resource
Management
Information Technology
Recreation Services
Parks, Lakes, Trails, and Landscape
Recreation Programming
Facilities Management
Fleet Services
Fire
Emergency Services
Community Risk
Reduction
Fire Professional
Services
Library
Public Services
Support Services
Airport
City Clerk
City Attorney
City Court Judge
City of Prescott, Arizona 22 Annual Budget FY2018

Organizational Structure, Goals, and Policies
Employees by Department and Ten-Year Trend
City of Prescott Total Full Time Equivalent Positions – 10 year trend
Department FY16 FY17 FY18
Airport 8.25 9.25 9.00
Budget & Finance 14.75 14.75 15.75 City Clerk 2.75 3.25 2.75 City Council 7.00 7.00 7.00 City Court 6.00 6.00 6.00 City Manager 31.85 30.85 28.50 Community Development 12.50 12.50 16.50 Fire 68.00 68.00 65.00 Legal 8.50 8.50 8.00 Library 22.00 21.50 21.50 Police 89.00 83.10 83.00 Public Works 154.60 155.60 154.00 Recreation Services 45.80 46.80 47.00 Regional Communications 30.00 30.40 30.00
City Total 501.00 497.50 494.00
FTEs
1Full time equivalents (FTEs) include only permanent employees. In addition, the City employs temporary and seasonal employees estimated at 47.25 FTEs.
1
City of Prescott, Arizona 23 Annual Budget FY2018

Organizational Structure, Goals, and Policies
Budget Policy
City of Prescott Budget Policy
(Resolution No. 4336-1545) Background The focus of the City's budget policy is the process by which a budget is formulated from departmental requests to adoption by the Mayor and Council. A budget policy addresses authorization levels for approval of the annual budget and adjustments thereto, applicable to the revenues and expenditures of all funds. Laws and Standards The following laws and standards apply to budget formation and reporting:
• Generally accepted accounting principles (GAAP) • Government Finance Officers Association’s (GFOA) Criteria for Distinguished Budget Award • Government Finance Officers Association’s (GFOA) Best Practices • Constitution of the State of Arizona • Arizona Revised Statutes (ARS) • Prescott City Code • City of Prescott Charter
Budget Objectives The Mayor and Council annually set City priorities, and the budget objectives shall be consistent with such priorities. The budget objectives provide policy direction for drafting of the City budget, within the overall budget schedule extending from initial preparation through adoption. The following considerations shall be applied to development of the budget: • Funding available for operations and capital needs. • Employee compensation, including merit-based pay and maintaining market-competitiveness, to
ensure that the City retains and attracts outstanding personnel. • Compliance with financial policies and maintenance of bond ratings. The following items will be considered in conjunction with the budget preparation and adoption process unless it has been determined that they must be addressed more expeditiously: • Ordinance changes for fees or rates • Personnel and/or other resources required to implement and administer fees and rates • Requests for long-term financing Balanced Budget, Revenue and Expenditure Policies The operating budget is to be balanced, with expenditures less than or equal to revenues. Fund balances should be used only for one-time expenditures, such as capital equipment and improvements. Development fees will be used for development-related one-time capital expenditures.
City of Prescott, Arizona 24 Annual Budget FY2018

Organizational Structure, Goals, and Policies
Budget Policy
The City will strive to maintain a diversified and stable revenue system, to ensure the fiscal health of the community. User fees for all operations will be examined on a regular basis to ensure that the fees cover direct and indirect costs of service as much as practicable. Fund Balance Sound financial policy requires the establishment of appropriate fund balance levels to maintain adequate cash flow, and a reserve to cover unanticipated expenditures and revenue shortfalls. The following General Fund balances will be maintained through the budgeting process: • Reserve of amounts for inventories, advances to other funds, or other uses for which an
appropriation could not be made or foreseen. • Designation of amounts re-appropriated from unencumbered balances for the completion of
projects in subsequent periods. • An unreserved and undesignated balance for each fund equal to 20% of the operating revenues:
10% to be used for the cash flow need due to timing differences between receipts and disbursements during the fiscal year, and 10% to only be used upon approval of the City Council to cover unanticipated expenditures or revenue shortfalls.
All other fund balances will be maintained to meet the objectives of the fund. Internal Cost Allocation In order to present the full cost of providing facilities, services, and other necessary support (collectively referred to as the “services”), it is necessary that all indirect costs be allocated corresponding to the services provided, and at the associated levels of such services. General fund internal support and administrative costs will be allocated to the Enterprise Funds, Internal Service Funds, and Special Revenue Funds that benefit from the services provided. The internal support and administrative departments below will be allocated based upon the following factors: • A method that allocates costs in proportion to the support or benefit received • A method that is clearly understandable and straightforward to explain • A measure that is readily available and can be easily applied The net impact (proposed budget less projected program revenues) of each of the following administrative departments will be allocated to other City operating units outside the General Fund on the basis identified:
Administrative Department Allocation Basis City Council Proportion of Budget City Clerk Proportion of Budget City Manager Proportion of Budget Legal Proportion of Budget Budget and Finance Proportion of Budget
The following administrative departments will be allocated to all City operating units on the basis identified:
Administrative Department Allocation Basis Information Technology Proportion of Budget Human Resources Proportion of Positions
Allocation Basis
• Proportion of Budget – prior year adopted budget of the operating unit as a percentage of the total budget, less grants and outsourced operations.
• Proportion of Positions – positions identified in the prior year adopted City roster for the operating unit as a percentage of total positions.
City of Prescott, Arizona 25 Annual Budget FY2018

Organizational Structure, Goals, and Policies
Budget Policy
The internal costs will be allocated on a monthly recurring charge based on adopted departmental budgets. At the close of each fiscal year, the total amount allocated will be adjusted based on actual expenditures as of June 30 of that fiscal year. Internal Service Funds will set internal charges based upon rates necessary for full operating cost recovery and necessary capital improvements. Capital Budget and Five-Year Capital Improvement Plan (CIP) The capital budget is separated into the three categories defined below: Capital Budget Category Definition
Capital Improvement Plan (CIP) A project that is more than $100,000 for a new infrastructure asset or to increase the capacity, efficiency, or expected life span of an existing infrastructure asset. This consists of infrastructure projects such as streets, utilities, and airport projects as well as major renovations to or additional City buildings or facilities.
Vehicle Replacements and Additions
Requests regarding fleet additions or replacements.
Operating Capital All other capital requests not in the above categories, such as information technology infrastructure, major tools, and equipment purchases of any cost over $5,000. Projects otherwise matching the CIP definition but for which the cost is between $5,000 and $100,000 will be categorized as operating capital.
Each department shall, when planning capital projects, estimate the impact on the City’s operating budget over the subsequent five years. The operating impact includes personnel, operating expenditures, capital outlay, and debt service, as applicable. Financing of capital expenditures from available funds, known as pay-as-you-go-funding, is the least costly and most beneficial method to cover capital expenditures. Every effort will be made in the CIP to accumulate funds to allow this method of funding to be used. Necessary capital expenditures, which are unable to be funded from available resources, will follow financing options and methods outlined in the Debt Management Policy. Utility projects will be primarily funded by user fees, as resources are available. Compliance with debt and fund balance policies shall be maintained for each year of the Plan. Budget Preparation The Finance Department and City Manager will establish a budget schedule specifying key milestones within the budget preparation period. All departments will submit their budget requests to the Finance Department in accordance with the budget preparation schedule. Budget requests will include, but not be limited to, operational plans, budget requests for personnel, operating and capital requests, including a Five-year Capital Improvement Plan. The Planning and Zoning Commission will review the City Manager’s Proposed Five-year Capital Improvement Plan (CIP). City of Prescott, Arizona 26 Annual Budget FY2018

Organizational Structure, Goals, and Policies
Budget Policy
Budget Adoption The budget is prepared and adopted in accordance with requirements of the City Charter and Arizona Revised Statutes. The budget is legally enacted through adoption of an appropriations resolution for all governmental and proprietary fund types, which places legal restrictions on expenditures at the department level. For all funds, the level of control is at the department level as established by the City of Prescott Charter. Although legal limits on expenditures are established at the department level, effective administrative control over expenditures is enabled by establishment of a detailed line-item budget. All appropriations and encumbrances unexpended at year-end lapse, and are not available in the following year. Included with the budget resolutions is approval for the re-appropriation of all encumbered balances. All new positions and reclassifications approved in the budget will be effective July 1 of the new fiscal year, unless presented differently to the Mayor and Council. Budget Amendments The City Manager may transfer any unencumbered appropriation between divisions within a department. Only the Council may transfer an unencumbered appropriation balance or portion thereof from one department to another. During a fiscal year, if a fund deficit is anticipated, recommended spending reductions will be proposed by the City Manager to the Mayor and Council in a timely manner, in order to sufficiently offset the deficit.
City of Prescott, Arizona 27 Annual Budget FY2018

Organizational Structure, Goals, and Policies
Debt Policy
City of Prescott Debt Policy
Background
A debt policy addresses the level of indebtedness the City of Prescott can reasonably expect to incur without jeopardizing its existing financial position and to ensure the efficient and effective operation of the City.
The debt policy shall conform to Federal and State Regulations.
A debt policy also addresses the purposes for the types of debt that will be issued.
The debt policy is to be used in conjunction with the Adopted Budget, the Capital Improvement Program and other financial policies as directed by Mayor and Council.
Planning and Performance
The planning, issuance and review of outstanding and proposed debt issuances will ensure that compliance with the debt policy is maintained.
The City may issue debt for the purpose of acquiring or constructing capital projects including buildings, machinery, equipment, furniture and fixtures.
Debt issuances will be pooled together when feasible to minimize issuance costs.
The City will prepare and adopt annually a Five-year Capital Improvement Program to identify and establish an orderly plan to meet the City’s infrastructure needs with all debt-related projects and the debt service impact upon operations identified, appropriately adjusted by inflation to properly reflect costs incurred in the applicable future fiscal year.
All issuance subject to arbitrage constraints shall be monitored by the applicable personnel and have arbitrage liability calculations performed in a timely manner.
Investment of bond proceeds shall at all times be in compliance with the City’s Investment Policy and meet all requirements of bond proceeds covenants.
Debt shall be within statutory and sound financial management limits.
Types of Debt
Interfund Borrowing is the borrowing by one fund from another is an acceptable means of meeting cash flow needs. • Short-term interfund borrowing, defined as paid back in less than one year, will occur due to
occasional cash shortages in a fund. All funds borrowing from the City’s available cash pool on a short-term basis should be charged an interest rate equivalent to the State Treasurers Pool for the prior month.
• Long-term borrowing, defined as paid back in more than one year, must come from a specific fundand be established by Council action. This action would include the fund borrowing the cash, fund lending the cash, terms (length of repayment period and amount of payments) of loan, and interest rate to be paid.
Lease Purchase Financing – It is legal to use lease purchasing for any lawful or necessary short-term or long-term projects; however, it is the objective not to use lease purchase financing on future equipment replacements, additions or building acquisitions. It is recognized that future events such as
City of Prescott, Arizona 28 Annual Budget FY2018
Organizational Structure, Goals, and Policies
Debt Policy
new services of unfunded legal mandates may require the City to provide unanticipated services or programs and that this financing technique may have to be utilized to fund start-up capital costs of such new services or programs. If this is the case, the City can first look to its own cash pool to ascertain if a fund would have sufficient moneys to lend, with interest, over the desired term of the needed financing. General Obligation Bonds may be used for any lawful project approved by the voters. Pursuant to Arizona Constitution, principal outstanding may not exceed: • 20% of net secondary assessed value for water, wastewater, lighting, parks, open spaces and
recreational purposes; or • 6% of net secondary assessed value for all other purposes. • This type of debt issuance is generally the lowest cost financing approach since the debt
repayment is backed by property taxes. However, it is the policy of this Council that if general obligation debt is issued for a project with a revenue stream (i.e., water/wastewater project), that revenues from the appropriate enterprise fund be used to pay for the debt repayment and not property taxes. Debt repayment for non-revenue supported projects such as park improvements would have to be repaid through property taxes.
Utility Revenue Bonds – These voter-approved bonds may be used for acquiring, constructing or improving “utility undertakings” including water, wastewater, gas, electric light or power, airport buildings or facilities, and garbage disposal systems. Utility revenue bonds are not a general or full faith and credit obligation of the City and are secured by revenues of the applicable utility undertaking. Debt repayment is from revenues from the appropriate enterprise. A limitation on these bonds is that the prior year’s net revenues must exceed maximum annual debt service by a specific factor. These bonds would be appropriate to use if the City wanted to preserve general obligation capacity for future needs. Municipal Property Corporation Bonds – These non-voter approved bonds are for all city-approved projects. In essence, the City makes annual payments equal to debt service under a lease-purchase or loan agreement with the Municipal Property Corporation. City payments may be guaranteed by pledge of excise taxes, enterprise revenues or annual appropriations. After the debt is retired, the City receives ownership of the financed project. The Municipal Property Corporation bonds are appropriate to use for 91) mandated projects that the City has no choice, but to complete, (2) projects that are a matter of public safety and welfare which can be backed by a sufficient revenue stream to allow retirement of the debt, or (3) projects which meet a stated economic development goal of the City. Examples of mandates include a required upgrade of a wastewater treatment plant or a landfill closure. Current City of Prescott limitations on this financing technique is that the prior year’s excise tax revenues must exceed maximum annual debt service by two times. Examples of public safety and welfare projects include water storage tanks, water transmission and distribution lines, sewer plant expansions and sewer collection system. Street and Highway Revenue Bonds (HURF Bonds) are voter-approved bonds that can be used for improving, constructing or maintaining City streets and highways as well as for acquisition of necessary rights of way for street projects. Debt repayment is through use of HURF revenues. The legal limit on the amount of bonds that can be issued is government by the amount of HURF receipts in that the maximum annual debt service may not exceed two-thirds (three times coverage) of the most recent year’s receipts as long as the bonds are rated “A” or above. If the bonds are rated below “A”, the maximum annual debt service may not exceed 50% of the most recent year’s receipts (two times coverage). Recommendation for issuance of these bonds should be carefully considered since if the maximum allowable were issued (approximately $15 million); there would not be sufficient yearly revenues available after debt repayment to operate the streets department. Improvement District Bonds are issued for numerous governmental purposes including financing streets, curbs, gutters, sidewalks, streetlights, wastewater systems, etc. Although the bonds are not subject to voter authorization, they may be rejected by a majority of property owners within the
City of Prescott, Arizona 29 Annual Budget FY2018
Organizational Structure, Goals, and Policies
Debt Policy
boundaries of the designated district. The debt repayment is through assessments levied against property located within the district and the debt is backed by a contingent liability of the City’s general fund. One restriction is that the improvements to be made cannot be of general benefit to the City as a whole. These bonds are recommended to be issued to bring unpaved streets to a paved status and installing wastewater systems within neighborhoods.
City of Prescott, Arizona 30 Annual Budget FY2018
Organizational Structure, Goals, and Policies
Investment Policy
City of Prescott Investment Policy
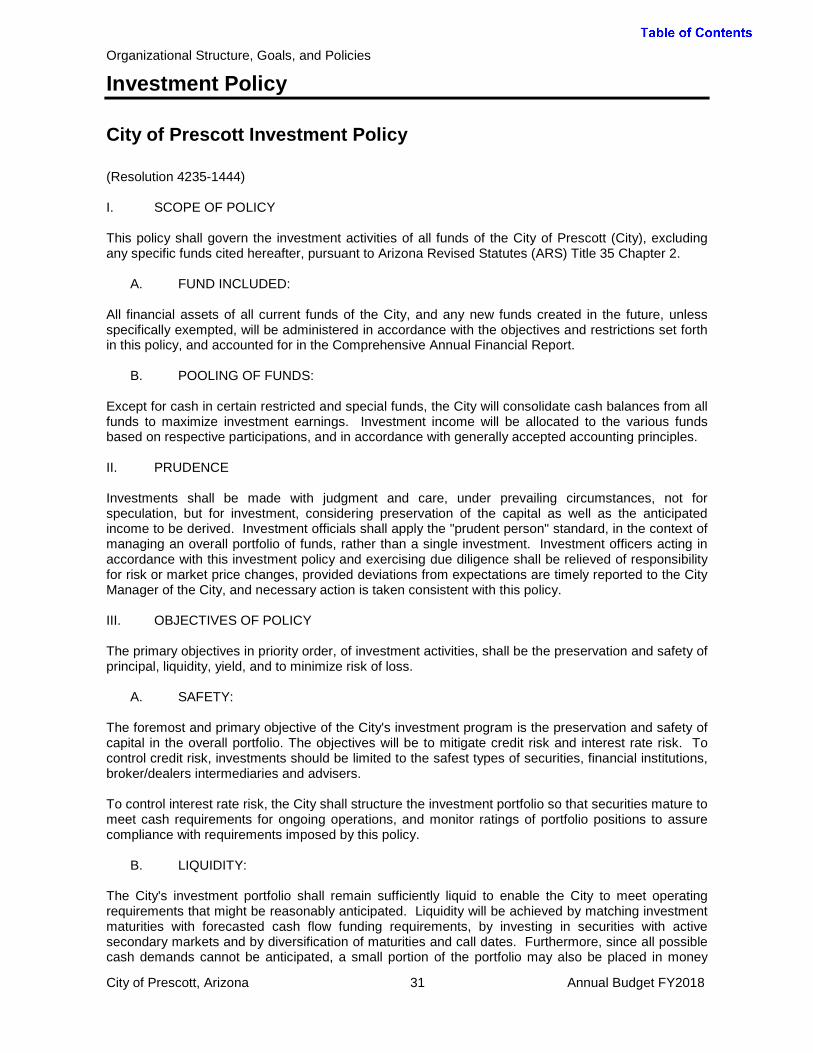
(Resolution 4235-1444) I. SCOPE OF POLICY This policy shall govern the investment activities of all funds of the City of Prescott (City), excluding any specific funds cited hereafter, pursuant to Arizona Revised Statutes (ARS) Title 35 Chapter 2.
A. FUND INCLUDED: All financial assets of all current funds of the City, and any new funds created in the future, unless specifically exempted, will be administered in accordance with the objectives and restrictions set forth in this policy, and accounted for in the Comprehensive Annual Financial Report.
B. POOLING OF FUNDS: Except for cash in certain restricted and special funds, the City will consolidate cash balances from all funds to maximize investment earnings. Investment income will be allocated to the various funds based on respective participations, and in accordance with generally accepted accounting principles. II. PRUDENCE Investments shall be made with judgment and care, under prevailing circumstances, not for speculation, but for investment, considering preservation of the capital as well as the anticipated income to be derived. Investment officials shall apply the "prudent person" standard, in the context of managing an overall portfolio of funds, rather than a single investment. Investment officers acting in accordance with this investment policy and exercising due diligence shall be relieved of responsibility for risk or market price changes, provided deviations from expectations are timely reported to the City Manager of the City, and necessary action is taken consistent with this policy. III. OBJECTIVES OF POLICY The primary objectives in priority order, of investment activities, shall be the preservation and safety of principal, liquidity, yield, and to minimize risk of loss.
A. SAFETY: The foremost and primary objective of the City's investment program is the preservation and safety of capital in the overall portfolio. The objectives will be to mitigate credit risk and interest rate risk. To control credit risk, investments should be limited to the safest types of securities, financial institutions, broker/dealers intermediaries and advisers. To control interest rate risk, the City shall structure the investment portfolio so that securities mature to meet cash requirements for ongoing operations, and monitor ratings of portfolio positions to assure compliance with requirements imposed by this policy.
B. LIQUIDITY: The City's investment portfolio shall remain sufficiently liquid to enable the City to meet operating requirements that might be reasonably anticipated. Liquidity will be achieved by matching investment maturities with forecasted cash flow funding requirements, by investing in securities with active secondary markets and by diversification of maturities and call dates. Furthermore, since all possible cash demands cannot be anticipated, a small portion of the portfolio may also be placed in money
City of Prescott, Arizona 31 Annual Budget FY2018

Organizational Structure, Goals, and Policies
Investment Policy
market mutual funds or local government investment pools which offer same day liquidity for short term funds.
C. YIELD: The City's investment portfolio shall be designed with the objective of regularly exceeding the average rate of return on three month U.S. Treasury Bills. The investment program will seek to augment returns above this threshold consistent with risk constraints identified herein, cash flow characteristics of the portfolio and prudent investment principles. The core of investments is limited to relatively low risk securities in anticipation of earning a fair return relative to the risk being assumed. Securities shall not be sold prior to maturity with the following exceptions:
1. A security swap that would improve the quality, yield or target duration in the portfolio. 2. Liquidity needs of the portfolio require that the security be sold. 3. If market conditions present an opportunity for the City to benefit from the sale.
D. RISK OF LOSS:
All participants in the investment process shall seek to act responsibly as custodians of the public trust. Investment officials shall avoid any transactions that might impair public confidence in the City's ability to govern effectively. The governing body recognizes that in a diversified portfolio, occasional measured losses due to market volatility are inevitable, and must be considered within the context of the overall portfolio's investment return, provided that adequate diversification has been implemented. IV. INVESTMENT STRATEGY The City intends to pursue an active portfolio management philosophy. Active management means that the financial markets will be monitored by investment officials and investments will be purchased and sold based on the City's parameters for liquidity and market conditions. All marketable securities purchased by the City shall have active secondary markets, unless a specific cash outflow is being matched with an investment that will be held to maturity to meet that obligation. Securities may be purchased as a new issue or in the secondary markets. Securities may be sold before they mature if market conditions present an opportunity for the city to benefit from the trade, or if changes in the market warrant the sale of securities to avoid future losses. Securities may be purchased with the intent from the beginning, to sell them prior to maturity or with the expectation that the security would likely be called prior to maturity under the analyzed market scenario. Market and credit risk shall be minimized by diversification. Diversification by market sector and security types, as well as maturity shall be used to protect the city from credit and market risk in order to meet liquidity requirements. The portfolio shall be structured to benefit from anticipated market conditions and to achieve a reasonable return. Relative value between asset groups shall be analyzed and pursued as part of the active investment program within the restrictions set forth by this policy. V. RESPONSIBILITY AND CONTROL
A. DELEGATION: Management and oversight of the investment program have been delegated to the Finance Director, who has the authority to delegate authority to persons responsible for the daily cash management operation, the execution of investment transactions, overall portfolio management and investment reporting in a manner consistent with this investment policy.
B. SUBORDINATES:
All persons involved in investment activities shall be referred to as "investment officials". No person shall engage in an investment transaction except as provided under the terms of this policy as
City of Prescott, Arizona 32 Annual Budget FY2018
Organizational Structure, Goals, and Policies
Investment Policy
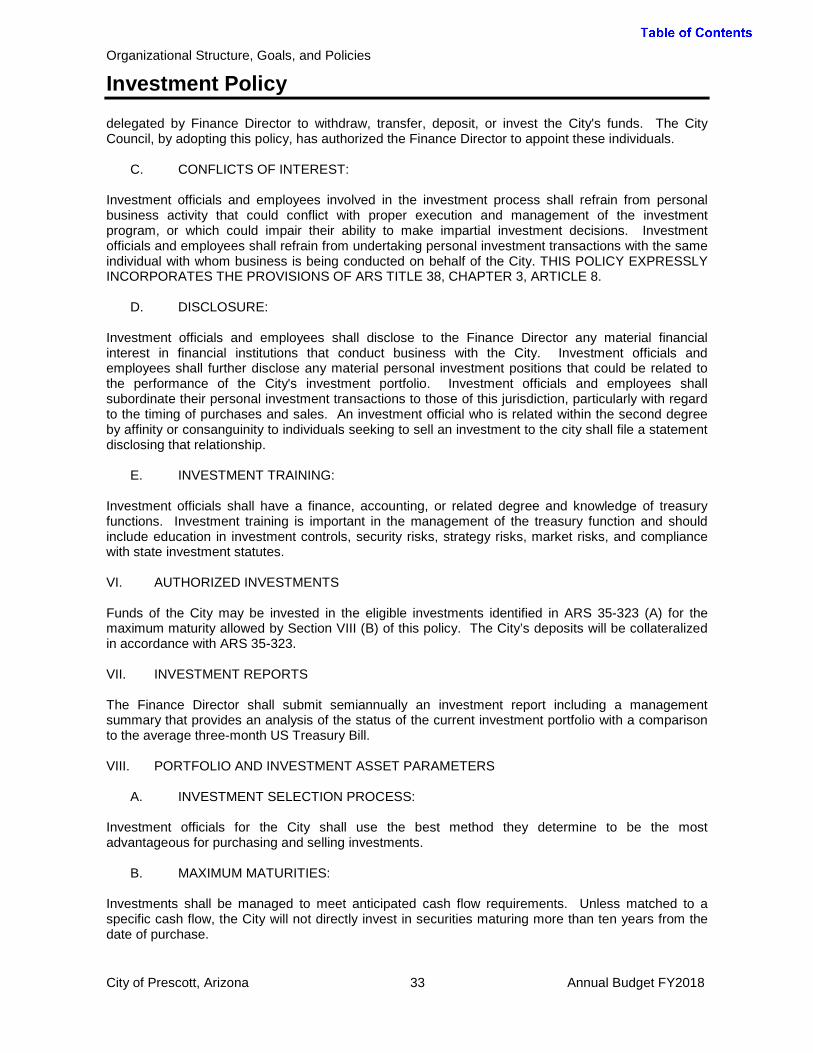
delegated by Finance Director to withdraw, transfer, deposit, or invest the City's funds. The City Council, by adopting this policy, has authorized the Finance Director to appoint these individuals.
C. CONFLICTS OF INTEREST: Investment officials and employees involved in the investment process shall refrain from personal business activity that could conflict with proper execution and management of the investment program, or which could impair their ability to make impartial investment decisions. Investment officials and employees shall refrain from undertaking personal investment transactions with the same individual with whom business is being conducted on behalf of the City. THIS POLICY EXPRESSLY INCORPORATES THE PROVISIONS OF ARS TITLE 38, CHAPTER 3, ARTICLE 8.
D. DISCLOSURE: Investment officials and employees shall disclose to the Finance Director any material financial interest in financial institutions that conduct business with the City. Investment officials and employees shall further disclose any material personal investment positions that could be related to the performance of the City's investment portfolio. Investment officials and employees shall subordinate their personal investment transactions to those of this jurisdiction, particularly with regard to the timing of purchases and sales. An investment official who is related within the second degree by affinity or consanguinity to individuals seeking to sell an investment to the city shall file a statement disclosing that relationship.
E. INVESTMENT TRAINING: Investment officials shall have a finance, accounting, or related degree and knowledge of treasury functions. Investment training is important in the management of the treasury function and should include education in investment controls, security risks, strategy risks, market risks, and compliance with state investment statutes.
VI. AUTHORIZED INVESTMENTS Funds of the City may be invested in the eligible investments identified in ARS 35-323 (A) for the maximum maturity allowed by Section VIII (B) of this policy. The City’s deposits will be collateralized in accordance with ARS 35-323. VII. INVESTMENT REPORTS The Finance Director shall submit semiannually an investment report including a management summary that provides an analysis of the status of the current investment portfolio with a comparison to the average three-month US Treasury Bill. VIII. PORTFOLIO AND INVESTMENT ASSET PARAMETERS
A. INVESTMENT SELECTION PROCESS: Investment officials for the City shall use the best method they determine to be the most advantageous for purchasing and selling investments.
B. MAXIMUM MATURITIES: Investments shall be managed to meet anticipated cash flow requirements. Unless matched to a specific cash flow, the City will not directly invest in securities maturing more than ten years from the date of purchase. City of Prescott, Arizona 33 Annual Budget FY2018

Organizational Structure, Goals, and Policies
Investment Policy
C. TARGET DOLLAR-WEIGHTED AVERAGE MATURITY:
Under most market conditions, the composite portfolio will be managed to target a three year dollar-weighted average maturity. However, under certain market conditions, investment officials may need to shorten or lengthen the average life or duration of the portfolio to best serve the City’s finances. IX. SELECTION OF DEPOSITORY, FINANCIAL INSTITUTIONS AND BROKER/DEALERS
A. BIDDING PROCESS: Depositories shall be selected through the City's banking services procurement process, which shall include a formal request for proposal (RFP). In selecting depositories, the credit worthiness of institutions shall be considered, and the Finance Director shall conduct a comprehensive review of the prospective depository’s credit characteristics and financial history. No public deposit shall be made except in a qualified public depository as established by state depository laws. The depository bank bid will not include bids for investment rates on certificates of deposit. Certificate of deposit rates will be shopped competitively among qualified financial institutions.
B. INSURABILITY: Banks and Savings and Loan Associations seeking to establish eligibility for the City's competitive certificate of deposit purchase program, shall submit financial statements, evidence of federal insurance and other information as required by the investment officials of the City. X. SAFEKEEPING AND CUSTODY OF INVESTMENT ASSETS All security transactions entered into by the City shall be conducted using the delivery vs. payment (DVP) basis. That is, funds shall not be wired or paid until verification has been made that the safekeeping bank received the correct security. The safekeeping, or custody, bank is responsible for matching instructions from the City's investment officials on an investment settlement, with what is wired from the broker/dealer, prior to releasing the City's designated funds for a given purchase. The security shall be held in the name of the City, or held on behalf of the City in a bank nominee name. A third party custodian designated by the Chief Financial Office and evidenced by safekeeping receipts will hold securities. The safekeeping bank's records shall assure the notation of the City's ownership of, or explicit claim on, the securities. The original copy of all safekeeping receipts shall be delivered to the City. A safekeeping agreement that clearly defines the responsibilities of the safekeeping bank must be in place.
City of Prescott, Arizona 34 Annual Budget FY2018

Organizational Structure, Goals, and Policies
Budget Preparation Process Overview
Each year, using a modified zero-based budgeting process, the City of Prescott’s budget is developed by the Budget and Finance Department in conjunction with the individual departments, the City Manager, the Mayor and Council, citizen advisory groups, and citizen input. Purpose of the Budget The fundamental purpose of the City’s budget is to link what we want to accomplish for the community with the resources necessary to do so. The budget process does this by setting City goals and objectives, establishing reasonable timeframes and organizational responsibility for achieving them, and allocating resources for programs and projects. To this end, the budget serves four roles: • Policy Document. Sets forth goals and objectives to be accomplished and the fundamental fiscal
principles upon which the budget is prepared. • Fiscal Plan. Identifies and appropriates the resources necessary to accomplish objectives and
deliver services and ensures that the City’s fiscal health is maintained. • Operational Plan. Describes the organizational units and activities of the City. The City is made
up of departments and departments’ subunits are called divisions. The budget describes each department and division, including a mission, description of services, goals/objectives, performance measurement.
• Communications Tool. Provides the public with a blueprint of how public resources are being
used and how these allocations were made. Major City Goals Linking important objectives with necessary resources requires a process that identifies key goals at the very beginning of the budget preparation. The City begins this process with Mayor and City Council meetings and setting the goals that guide the departments in their budget preparation. City staff then prepares the proposed budget based on the Council’s policy guidance. Financial Plan Policies Formally articulated budget and fiscal policies provide the foundation for preparing and implementing the budget while assuring the City’s long-term fiscal health. Included in this budget document, these policies include budget, debt and investment policies. Preparation and Review Process The budget development is directed by the City Manager, Finance Director and Budget Manager along with the City’s department heads. The following discusses the general approach under the City’s budget process: The Budget and Finance Department provides department/division heads, supervisors, and budget coordinators with instructions and guidance in developing and submitting their budgets. This includes instructions and information regarding the preparation of the Five-Year Capital Improvement Plan. Base budgets (the costs associated with providing current levels of service for the following year) are submitted by the departments to the Budget and Finance Department. Additional decision packages submitted include requests for new positions, organizational structure changes, capital outlay and projects. Payroll forecasts are prepared by the Human Resources Division. Input was provided by the departments concerning temporary/seasonal employment needs as well as overtime
City of Prescott, Arizona 35 Annual Budget FY2018
Organizational Structure, Goals, and Policies
Budget Preparation Process Overview
requirements. Lists of capital outlay and projects budgeted for the prior fiscal year but not expected to be received are provided budget for the next fiscal year. Meetings with each department, the City Manager, and the Budget and Finance Department for the purpose of internal review of base budgets, additional decision packages, and any issues that may affect the budget are held. During these meetings the Five-Year Capital Improvement plan and any management changes to the department’s budget requests are initially discussed. After these meetings are completed, a proposed balanced budget is prepared for submittal to the Council and public at workshops. The official budget adoption occurs after these workshops with the following milestones:
• Expenditure Limit Hearing: The City currently operates under the Home Rule Option which has been approved by the voters. As part of that process, a public hearing is mandatory. The public hearing time and location is set at Tentative Budget adoption.
• Tentative Adoption: Council adopts a tentative budget and sets the date for the public hearing
on the final budget, expenditure limitation, and tax levy for next fiscal year. The tentative budget is the estimated amounts required to meet the public expense for the City of Prescott. Adopting a tentative budget is required by City Charter and State Law (adoption required on or before the 3rd Monday in July of each Fiscal year). Once the tentative budget is adopted, the expenditures may not increase upon final adoption, but may be decreased.
• Truth and Taxation: In compliance with section 42-17107, Arizona revised statutes; the City
of Prescott notifies its property taxpayers of the city of Prescott’s intention to raise its primary property taxes over last year’s level.
• Final Budget Adoption, Adoption of the Five-Year Capital Improvement Plan, Adoption of City
Job Roster, Establishment of Expenditure Limitation: The final budget is adopted along with the five-year capital improvement plan and the city job roster. The expenditure limitation is established along with the department and fund level appropriations.
• Property Tax Levy: Adoption of the property tax levy ordinance follows not less than fourteen
days later than the final budget adoption, in accordance with State law. Interim Financial and Project Status Reports The Budget and Finance Director presents a mid-year budget report to the Mayor and Council at a public workshop either January or February. Throughout the year, real time access to financial information is provided to staff throughout the organization’s financial system. Administration As set forth in the City Charter, the control of the budget is with the department. The City Manager may transfer any unencumbered appropriation between divisions within a department. Only the Council may transfer an unencumbered appropriation balance or portion thereof from one department to another or between funds. Any revisions that alter the total expenditures of any fund must be approved by the City Council. The legal level at which expenditures may not legally exceed appropriations is the department and fund level. Budget Preparation Calendar A calendar is prepared for the annual budget development. This budget year’s budget calendar for budget preparation is presented on the next page.
City of Prescott, Arizona 36 Annual Budget FY2018

Organizational Structure, Goals, and Policies
Budget Preparation Calendar
Date Description
January 27, 2017 Budget “Kick-off” meeting for departments
February 3, 2017 Department missions, division missions, goals, performance measures, and organizational charts due
February 10, 2017 Supplemental personnel requests for temporary personnel and overtime for next fiscal year, estimated endings for current fiscal year due
February 24, 2017 Base budgets due – next fiscal year requests, current fiscal year estimated endings
March 3, 2017 New personnel and reclassifications of existing personnel request
March 10, 2017 Capital requests for next fiscal year and Five Year Capital Improvement Plan due Anticipated applications for next fiscal year grants and current fiscal year grant estimated endings due
April 20-28, 2017 City Manager meetings with departments to review budget, decision packages, and department operational plans.
May 24, 2017 Annual Council Workshop (public invited) – Part 1 (Police, Fire, Recreation Services, Library, Community Development, General Government)
May 25, 2017 Annual Council Workshop (public invited) – Part 2 (Public Works, Airport, Internal Service)
May 26, 2017 List of prior year key results and outcomes due
June 13, 2017 Set public hearing on expenditure limitation and tentative adoption
June 27, 2017 Official public hearing on budget and adoption of budget
July 11, 2017 Adoption of tax levy
City of Prescott, Arizona 37 Annual Budget FY2018

Organizational Structure, Goals, and Policies
Budget Basis of Accounting and Budget Amendments
Budget Basis of Accounting The basis of budgeting is the method used to determine when revenues and expenditures are recognized for budgetary purposes. Fund statements in the Comprehensive Annual Financial Report (CAFR) are presented on the basis of “generally accepted accounting principles” (GAAP). GAAP dictates that Governmental Funds use the modified accrual basis of accounting. Revenues are recognized when they become measurable and available to finance City operations. “Available” means “collectible” within the current period or soon enough thereafter to be used to pay liabilities of the current period. Expenditures are generally recognized when the related fund liability is incurred. The accrual basis of accounting is used for Proprietary Funds. Revenues are recognized in the accounting period in which they are earned and become measureable. Expenditures are recognized when they are incurred. The City of Prescott Budget is prepared and presented substantially consistent with generally accepted accounting principles (GAAP). The major differences between accrual basis accounting for Proprietary Funds and the budget basis of accounting are:
1. Accrued compensated absences are not recognized as expenditures for budgetary purposes, for GAAP they reported as expenses and accrued liabilities.
2. Debt service principal payments are treated as expenditures in budgetary accounting, in GAAP accounting they would be applied to outstanding liabilities.
3. Capital grants are budgeted as revenues, for GAAP as non-operating contributions. 4. Depreciation is not considered expenditure in budgetary accounting, on a GAAP basis for
depreciation expense is recorded. 5. Capital outlay is treated as expenditures in budgetary accounting and an asset in GAAP.
Amending the Budget Control of each legally adopted annual budget, according to City Charter, is at the department level. The City Manager may at any time transfer any unencumbered appropriation balance or portion thereof between general classifications of expenditure (object codes) within an office, department or agency. The City Manager generally gives authority to department heads to exceed one line item as long as other line items are reduced by a like amount. These arrangements are usually made directly between the requesting department and the Budget and Finance Department. At the request of the City Manager, the Council may transfer any unencumbered appropriation balance or portion thereof between funds. City of Prescott, Arizona 38 Annual Budget FY2018

Organizational Structure, Goals, and Policies
Budget Basis of Accounting and Budget Amendments
THIS PAGE LEFT BLANK INTENTIONALLY
City of Prescott, Arizona 39 Annual Budget FY2018

Fund Summaries
Fund Structure .................................................................................................................................. 42 Overall City Budget Summary .......................................................................................................... 45 General Fund ................................................................................................................................... 50 Special Revenue Funds ................................................................................................................... 57 Debt Service Funds .......................................................................................................................... 63 Enterprise Funds .............................................................................................................................. 64 Internal Service Funds ..................................................................................................................... 78 City Debt Summary .......................................................................................................................... 80
City of Prescott, Arizona 40 Annual Budget FY2018

Fund Summaries
THIS PAGE LEFT BLANK INTENTIONALLY
City of Prescott, Arizona 41 Annual Budget FY2018

Fund Summaries
Fund Structure
The accounts of the City are organized on the basis of funds or account groups, each of which is considered a separate accounting entity. Governmental resources are allocated to and accounted for in individual funds based upon the purposes for which they are to be spent and the means by which spending activities are controlled. The City of Prescott uses the following funds in its budget process:
The General Fund is established for the revenue and expenditures necessary to carry out basic governmental activities of the City such as police protection, recreation, planning, legal services, administrative services, etc. General Fund expenditures are made primarily for current day-to-day operating expenses and operating equipment. Capital expenditures for large-scale public improvements such as parks or streets are accounted for elsewhere in the Special Revenue Funds, Capital Project Funds, or Enterprise Funds. Special Revenue Funds are used to account for revenues derived from specific taxes or other earmarked revenue sources. These funds are usually required by statute, charter provision or ordinance to finance particular functions or activities. The Special Revenue funds listed below are used by the City of Prescott.
All Funds Total FY18 Budget
$188.8 M
Governmental Funds
$95.9 M
General Fund $49.6 M
Special Revenue Funds
$46.3 M
Streets $33.9M
Governmental Impact Fees
$0.2 M
Trust Funds $0.2 M
Transient Occupancy
$1.3 M
Grants $4.7 M
PSPRS Dedicated Tax
$6.0 M
Debt Service Funds $0.0 M
Proprietary Funds $92.9 M
Enterprise Funds $82.2 M
Water $39.8 M
Wastewater $23.7 M
Solid Waste $9.1 M
Airport $5.4 M
Golf Course $4.2 M
Internal Service Funds
$10.7 M
Fleet Maintenance
$6.0 M
Risk Management $1.1 M
Engineering $2.1 M
Facilities Maintenance
$1.5
City of Prescott, Arizona 42 Annual Budget FY2018

Fund Summaries
Fund Structure
Streets– 1% Additional Tax and Highway User Revenues – Revenue for this fund is provided by the voter approved additional transaction privilege tax and City’s share of State gasoline taxes (Highway User Revenue Funds), both restricted for maintaining and constructing streets. The accumulation and expenditure of these funds are accounted for in this area. Impact Fee Funds (Governmental) – These funds represent accounts to expend impact fees received to offset the cost of growth related projects. These fees are no longer collected as of August 1, 2014. Some fund balance remains will be used when projects are identified. Trust Funds - Gifts and Donations Fund and Acker Trust Fund – The Gift and Donations Fund provide an account to track any contributions for miscellaneous gifts which the City may receive as well as the expenditures made. The Acker Trust Fund accounts for the assets willed to the City by J.S. Acker. Revenue from investments and land sales are to be expended for cultural and recreational purposes only. Transient Occupancy Tax Fund – In 1987 the voters established a two percent (2%) transient occupancy (hotel/bed) tax. It was increased to three (3%) percent in 2007. By ballot provision, these revenues can only be used for tourism promotion and development of recreational facilities. Grants Fund – This represents grant reimbursed expenditures for various projects. Grant funds must be used for the stated purpose of the grant and must meet grantor expenditure guidelines.
Debt Service Funds are established to account for the accumulation of resources for, and the payment of, general long-term debt principal and interest. The City of Prescott’s Debt Service Fund was established during FY1999 to pay for the principal and interest of general obligation debt for the police station construction and the Watson and Willow Lakes water rights and land purchase as well as improvement district bond payments. The general obligations are paid in full after FY2017. Remaining will be debt service on a few small wastewater special assessment districts. Enterprise Funds are established to account for operations that (1) are financed and operated in a manner similar to private business operations where the intent of the City is that the costs (expenses, including depreciation) of providing goods or services to the general public on a continuing basis be financed or recovered primarily through user charges or (2) where the governing body has decided that periodic determination of revenues earned, expenses incurred, and/or net income is appropriate for capital maintenance, public policy, management control, accountability or other purposes. The City of Prescott has five enterprise funds as follows:
Water Fund – To account for the provision of water services to the residents of the City and some residents of the County. All activities necessary to provide for water services are accounted for in this fund. Wastewater Fund – Previously this fund was combined with the Water Fund. However, beginning in FY1994 this fund accounts for the provision of wastewater services to the residents of the City. All activities necessary to provide for wastewater services are accounted for in this fund. Solid Waste Fund – To account for solid waste services provided to City residents along with the operations of the City’s transfer station facility that opened in September, 1991. All activities necessary to provide these services are accounted for in this fund. Airport Fund – To account for the provision of airport services to the general aviation and commercial flying public. Services include fueling, hangar and tie down rentals, etc.
City of Prescott, Arizona 43 Annual Budget FY2018

Fund Summaries
Fund Structure
Golf Course Fund – To account for the provision of year-around golf to the residents of the City, County and visitors to the area. On April 8, 2014, the city Council approved a five-year management agreement beginning May 1, 2014. Billy Casper Golf will operate golf-related activities, including the pro shop, driving range, carts, cart barn and restaurant at the 36-hole facility, while the City will continue to be responsible for golf-course maintenance and capital improvements. The public-private partnership with Billy Casper Golf is designed to bring a new approach to the management of Antelope Hills. The company will utilize its purchasing efficiencies, lower operating costs, marketing strength, and customer-service training to assure enjoyable guest experiences.
Internal Service Funds are used to account for services and commodities furnished by one department to other departments of the City on a cost-reimbursement basis.
Fleet Maintenance – To account for the cost of operating a maintenance facility for automotive and other equipment used by various departments. These costs are billed to the various using departments. The various user departments who acquire automotive and other equipment are responsible for replacement costs. Risk Management – To account for the costs, both direct and indirect, of maintaining comprehensive property damage and general liability and workers’ compensation insurance coverage. Revenue to this fund is derived from charges to City departments. Engineering Services – To account for the direct and indirect costs of the Engineering Division of Public Works, which provides engineering services for the capital projects and other departments of the City. Revenue to this fund is derived from charges to City departments and projects based on the work performed. Facilities Maintenance – To provide maintenance and custodial service to all city owned facilities.
City of Prescott, Arizona 44 Annual Budget FY2018

Fund Summaries
Overall City Budget Summary
The Fiscal Year 2018 (FY2018) Budget consists of four components – operating budget, capital budget, internal service and contingency.
The operating budget is $84,918,474 representing a 2.8% increase from FY2017. The operating budget is comprised of the costs to continue operations from year to year without any capital expenditures. It encompasses all the basic services provided to Prescott’s residents: police and fire protection; recreation services; library services; water; wastewater; solid waste collection including recycling; streets maintenance; planning and zoning; building inspection; economic development; and administrative services. The increase in operating budget increase reflects increases in the contribution rate for Public Safety Personnel Retirement System, adjustments in personnel compensation with the market compensation plan, and cost increases necessary to continue to provide City Services at equal or better levels. Below is a chart that depicts the operating budget by department.
FY17Budget
FY18 Budget
% Budget Change
Operating 82,621,876$ 84,918,974$ 2.8%Capital 73,766,026 73,266,495 -0.7%Internal Service 7,470,859 9,971,379 33.5%Contingency 3,430,000 20,696,403 503.4%
Total 167,288,761$ 188,853,251$ 12.9%
General Government
6%
Library 2%
Community Development
2% Fire 13%
Police 15%
Public Works 44%
Recreation Services
13% Regional Comm.
2% Non-
departmental 3%
FY2018 Operating Budget by Department
City of Prescott, Arizona 45 Annual Budget FY2018

Fund Summaries
Overall City Budget Summary
The second component, the capital budget, is $73,266,495, a 0.7% decrease from FY2017. Capital expenditures are non-routine, one time expenditures for purchase or projects with a value over $5,000 and estimated useful life over one year, mainly infrastructure improvements for utility and streets projects in the Five-Year Capital Improvement Plan. Capital budgets tend to rise and fall each year depending on the timing of projects – especially as Prescott is primarily on a “pay-as-you-go” program. The other components include internal service and contingency. The internal service budget includes Facilities, Fleet, Risk Management, and Engineering. These services are provided internally and internal charges are included in the budget of each department. The increase in FY2018 is related to bond refunding for the fleet maintenance facility. Contingency includes several items: $6,000,000 for a ballot proposition for a dedicated tax to pay down a pension liability, $11,000,000 for a lump sum payment using general fund balance to pay down a pension liability, and $1,215,250 for a court case regarding refunding of pension contributions, and $2,481,153 for the expenditure of possible grant awards. The total budget for FY2018 is $188,853,251, including all funds. The proportionate share of each fund type is displayed in the pie chart below:
General Fund 26.3%
Special Revenue
Funds 24.5%
Debt Service Fund 0.0%
Enterprise Funds 43.5%
Internal Service Funds 5.7%
FY2018 Total Budget by Fund
City of Prescott, Arizona 46 Annual Budget FY2018

Fund Summaries
Overall City Budget Summary
The City of Prescott’s budget is funded through multiple sources. The three main sources are of revenue are charges for services, taxes, and intergovernmental revenues. Some of these sources are restricted and can only be used for certain types of expenditures while others are not restricted and can be used for general operations. Except for the General Fund, which pays for police, fire, recreation, and library services, all other City revenues are restricted by purpose. Enterprise funds such as water, sewer, golf course, and airport charges can only be used to provide services directly related to the rates and fees paid. Special Revenue funds such as the Streets Fund and Bed Tax Fund are also restricted to a specific purpose. The categories below include all funds and revenues will be discussed in more detail on the fund level.
City-wide Funding Sources
Funding Source Category FY17
Budget FY18
Budget FY18 % of Total
Charges for Services 54,614,110$ 55,719,618$ 29.5%Taxes 33,378,903 40,452,475 21.4%Intergovernmental Revenues 16,994,745 16,687,613 8.8%Grants 8,760,332 7,236,070 3.8%Proceeds from Debt 6,156,286 11,936,713 6.3%
Use of Fund Balance* 44,235,493 54,176,876 28.7%
OtherMiscellaneous 1,501,392 1,213,636 0.6%Licenses and Permits 1,171,000 966,850 0.5%Fines and Forfeitures 476,500 463,400 0.2%
Total Funding Sources 167,288,761$ 188,853,251$
*One time expenditures such as capital and payments towards unfunded pension liability
Charges for Services
30%
Use of Fund Balance
29%
Taxes 21% Intergovernmental
Revenues 9% Grants
4% Proceeds from
Debt 6%
Other 1%
City of Prescott, Arizona 47 Annual Budget FY2018
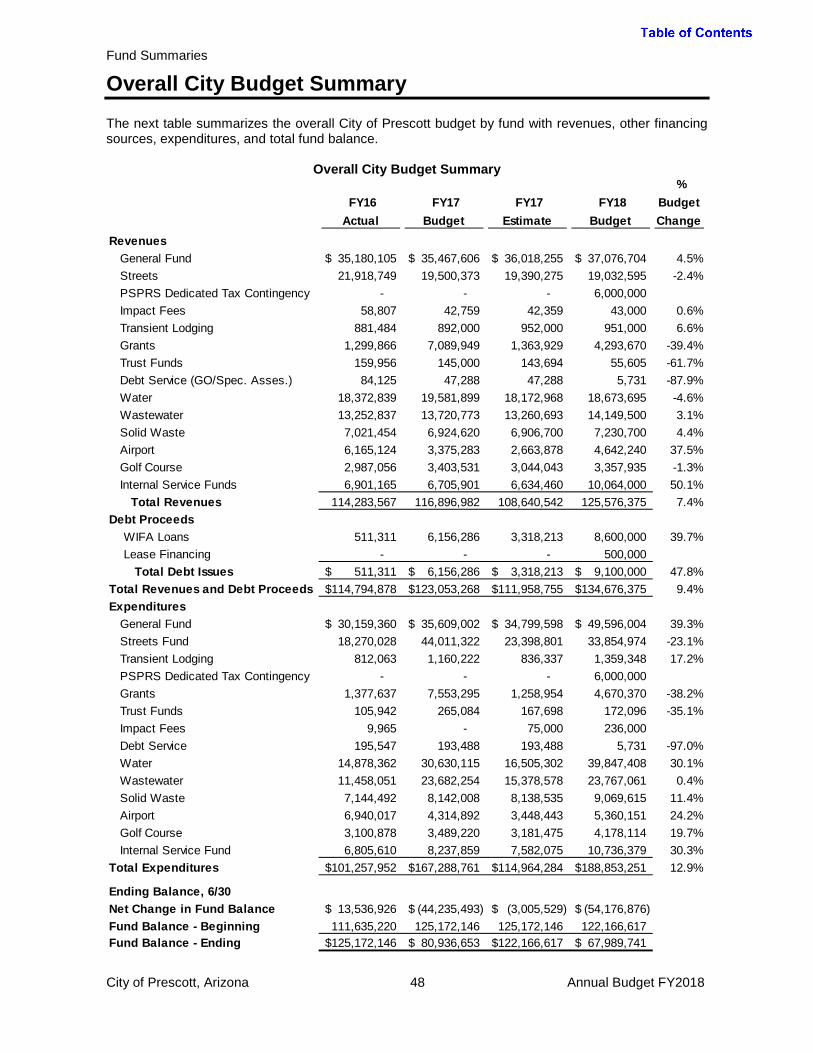
Fund Summaries
Overall City Budget Summary
The next table summarizes the overall City of Prescott budget by fund with revenues, other financing sources, expenditures, and total fund balance.
Overall City Budget Summary
FY16 Actual
FY17Budget
FY17 Estimate
FY18 Budget
% Budget Change
RevenuesGeneral Fund 35,180,105$ 35,467,606$ 36,018,255$ 37,076,704$ 4.5%Streets 21,918,749 19,500,373 19,390,275 19,032,595 -2.4%PSPRS Dedicated Tax Contingency - - - 6,000,000 Impact Fees 58,807 42,759 42,359 43,000 0.6%Transient Lodging 881,484 892,000 952,000 951,000 6.6%Grants 1,299,866 7,089,949 1,363,929 4,293,670 -39.4%Trust Funds 159,956 145,000 143,694 55,605 -61.7%Debt Service (GO/Spec. Asses.) 84,125 47,288 47,288 5,731 -87.9%Water 18,372,839 19,581,899 18,172,968 18,673,695 -4.6%Wastewater 13,252,837 13,720,773 13,260,693 14,149,500 3.1%Solid Waste 7,021,454 6,924,620 6,906,700 7,230,700 4.4%Airport 6,165,124 3,375,283 2,663,878 4,642,240 37.5%Golf Course 2,987,056 3,403,531 3,044,043 3,357,935 -1.3%Internal Service Funds 6,901,165 6,705,901 6,634,460 10,064,000 50.1%
Total Revenues 114,283,567 116,896,982 108,640,542 125,576,375 7.4%Debt Proceeds
WIFA Loans 511,311 6,156,286 3,318,213 8,600,000 39.7% Lease Financing - - - 500,000
Total Debt Issues 511,311$ 6,156,286$ 3,318,213$ 9,100,000$ 47.8%Total Revenues and Debt Proceeds 114,794,878$ 123,053,268$ 111,958,755$ 134,676,375$ 9.4%Expenditures
General Fund 30,159,360$ 35,609,002$ 34,799,598$ 49,596,004$ 39.3%Streets Fund 18,270,028 44,011,322 23,398,801 33,854,974 -23.1%Transient Lodging 812,063 1,160,222 836,337 1,359,348 17.2%PSPRS Dedicated Tax Contingency - - - 6,000,000 Grants 1,377,637 7,553,295 1,258,954 4,670,370 -38.2%Trust Funds 105,942 265,084 167,698 172,096 -35.1%Impact Fees 9,965 - 75,000 236,000 Debt Service 195,547 193,488 193,488 5,731 -97.0%Water 14,878,362 30,630,115 16,505,302 39,847,408 30.1%Wastewater 11,458,051 23,682,254 15,378,578 23,767,061 0.4%Solid Waste 7,144,492 8,142,008 8,138,535 9,069,615 11.4%Airport 6,940,017 4,314,892 3,448,443 5,360,151 24.2%Golf Course 3,100,878 3,489,220 3,181,475 4,178,114 19.7%Internal Service Fund 6,805,610 8,237,859 7,582,075 10,736,379 30.3%
Total Expenditures 101,257,952$ 167,288,761$ 114,964,284$ 188,853,251$ 12.9%
Ending Balance, 6/30Net Change in Fund Balance 13,536,926$ (44,235,493)$ (3,005,529)$ (54,176,876)$ Fund Balance - Beginning 111,635,220 125,172,146 125,172,146 122,166,617 Fund Balance - Ending 125,172,146$ 80,936,653$ 122,166,617$ 67,989,741$
City of Prescott, Arizona 48 Annual Budget FY2018
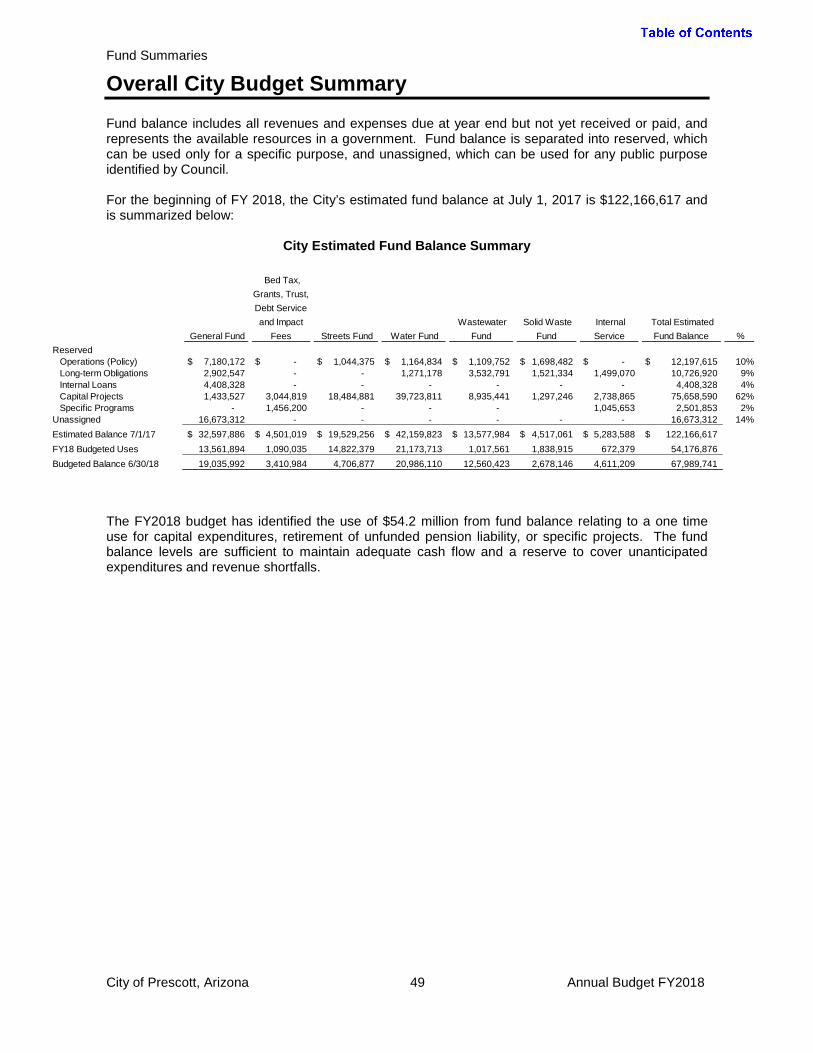
Fund Summaries
Overall City Budget Summary
Fund balance includes all revenues and expenses due at year end but not yet received or paid, and represents the available resources in a government. Fund balance is separated into reserved, which can be used only for a specific purpose, and unassigned, which can be used for any public purpose identified by Council. For the beginning of FY 2018, the City’s estimated fund balance at July 1, 2017 is $122,166,617 and is summarized below:
City Estimated Fund Balance Summary
The FY2018 budget has identified the use of $54.2 million from fund balance relating to a one time use for capital expenditures, retirement of unfunded pension liability, or specific projects. The fund balance levels are sufficient to maintain adequate cash flow and a reserve to cover unanticipated expenditures and revenue shortfalls.
City of Prescott, Arizona 49 Annual Budget FY2018
General Fund
Bed Tax, Grants, Trust, Debt Service and Impact
Fees Streets Fund Water Fund Wastewater
Fund Solid Waste
Fund Internal Service
Total EstimatedFund Balance %
ReservedOperations (Policy) 7,180,172$ -$ 1,044,375$ 1,164,834$ 1,109,752$ 1,698,482$ -$ 12,197,615$ 10%Long-term Obligations 2,902,547 - - 1,271,178 3,532,791 1,521,334 1,499,070 10,726,920 9%Internal Loans 4,408,328 - - - - - - 4,408,328 4%Capital Projects 1,433,527 3,044,819 18,484,881 39,723,811 8,935,441 1,297,246 2,738,865 75,658,590 62%Specific Programs - 1,456,200 - - - 1,045,653 2,501,853 2%
Unassigned 16,673,312 - - - - - - 16,673,312 14%Estimated Balance 7/1/17 32,597,886$ 4,501,019$ 19,529,256$ 42,159,823$ 13,577,984$ 4,517,061$ 5,283,588$ 122,166,617$ FY18 Budgeted Uses 13,561,894 1,090,035 14,822,379 21,173,713 1,017,561 1,838,915 672,379 54,176,876 Budgeted Balance 6/30/18 19,035,992 3,410,984 4,706,877 20,986,110 12,560,423 2,678,146 4,611,209 67,989,741

Fund Summaries
General Fund
The General Fund is the chief operating fund of the City. The fund provides for basic governmental services including administration, legal, council, finance, police, fire, library, recreation services, and community development. This section describes revenues and expenditures and identifies trends. Revenue and Trends The General Fund source of revenues is primarily (86%) City and state-assessed taxes which have no correlation to service demand. These taxes include the local 1% transaction privilege tax, primary property tax, intergovernmental (state shared) revenues, and franchise taxes. Service charges, licenses and permits, fines, and miscellaneous revenues total 14% of the General Fund revenues. The proportionate share of revenues for the general fund is depicted below. The next chart depicts revenue trends on an aggregate basis. During the recession, tax revenues decreased as the economy slowed and taxable activity declined. In FY18, we are projecting the total revenues to exceed the previous peak level in FY07. City of Prescott, Arizona 50 Annual Budget FY2018
Taxes 52%
Intergovernmental Revenues
34% Licenses and
Permits 2%
Service Charges 10%
Fines & Forfeitures
1%
Miscellaneous 1%
General Fund Revenues

Fund Summaries
General Fund
General Fund Revenue Trends
Taxes Transaction Privilege (Sales) Tax Arizona’s cities and towns have authority granted by the State to establish certain taxes or revenue purposes. The local transaction privilege tax, commonly referred to as sales tax, is one of the main sources of local taxes. City of Prescott’s Charter (Article VI, Section 7) authorizes the City to levy a local sales tax and requires voter approval for a local rate in excess of 1%. The combined sales tax rate in the City of Prescott for all taxable activities is 8.35%. The combined rate consists of 5.6% for the State of Arizona, 0.75% for Yavapai County and 2% for the City of Prescott. Of the City’s 2% rate, 1% is dedicated for Streets (effective January 1, 2016) and the other 1% is for the General Fund. Transaction privilege tax is far more extensive than retail sales. It includes taxation of residential and commercial rentals, utilities, communications, construction activities, and restaurant and bars to name a few. The chart below depicts the proportionate share of taxable activity reporting categories. As the economy recovers, the City has seen increased reporting of taxable sales. For FY18, a 3.4% increase, or $500,000, is budgeted for privilege tax revenue in the General Fund. The challenges in the revenue category are subjectivity to economic activity, increased regional competition, and state law reforms that decrease taxable activities.
City of Prescott, Arizona 51 Annual Budget FY2018

Fund Summaries
General Fund
Sales Tax Reporting Categories
Property Tax State law (A.R.S. §42-17151(A)) allows a municipality to levy a property tax. There are two types of property tax in the State of Arizona, primary and secondary. Primary property tax can be used for any general City operations. A secondary property tax may be levied to service voter-approved General Obligation bonds. The secondary property tax is revenue for the Debt Service fund and primary property tax is a General Fund source of revenue. The primary property tax levy provides less than 5% of General Fund revenue. Minimal annual increases to this levy are allowed per state law. Of the total property tax that residents in the City of Prescott contribute, 4% is collected for the City of Prescott and the remaining tax collections go Yavapai County and public schools such as Yavapai College and Prescott Unified School District. The City of Prescott’s primary property tax rate for FY18 is 0.2821 per $100 of assessed value. Franchise Taxes Franchise taxes are derived from utility franchise agreements. Unisource Gas and Arizona Public Service are the voter-approved sole providers of gas and electric services in the City and the franchise fee rates are 2% of gross revenues. The Cable TV license for the City of Prescott is held by Cable One and the contract negotiated franchise fee rate is 5.0% of gross revenues. Intergovernmental Revenues State Shared Revenues State shared revenues that are collected by the State of Arizona and distributed to incorporated cities and towns, including income tax (urban revenue sharing), transaction privilege tax (state shared sales tax), state gasoline tax (Highway User Revenue Fund (HURF)), and vehicle license tax (VLT). Of these revenues, all are General Fund revenue except HURF which is restricted for transportation and is in the Streets Fund. State shared revenues are subject to fluctuations in economic activity as well as changes in Prescott’s population relative to the population in the County and State. Since the City of Prescott is growing slower than other communities; the City’s proportional share of State Shared
Retail 61% Construction
10%
Restaurants & Bars
7%
Utilities 5%
Residential Rental
4%
Commercial Rental
4%
All Others 9%
City of Prescott, Arizona 52 Annual Budget FY2018

Fund Summaries
General Fund
Revenue is decreasing. Although the City’s share is decreasing, statewide economic activity has provided an increase for FY18 at a combined rate of 3.4% in these revenues. State Sales Tax (Transaction Privilege Tax): Citizens and visitors of Prescott, through collection by local businesses, pay the State 5.6% on taxable activity. A portion of that sales tax is returned to the City based on the relation of Prescott’s population to the total population of all incorporated cities and towns in the State.
State Income Tax: The State of Arizona collects income taxes and shares that revenue with incorporated cities and towns based on population. The portion of the State income tax which will be distributed to cities and towns in represents individual and corporate income tax collections by the State two years ago.
Vehicle License Tax (Auto Lieu Tax): Twenty-five percent of the net revenues collected for the licensing of motor vehicles by the State in a particular county are distributed back to incorporated cities and towns within that county based on its population in relation to the total incorporated population of the county. Library District The Yavapai County Free Library District is a Special District established by the Yavapai County Board of Supervisors in 1987 and is funded by a County levied property tax. The district funds the Yavapai Library Network, consisting of 18 public, academies, school, and museum libraries and allows for the countywide resource sharing of library materials among all member libraries. An annual direct contribution to the libraries provides supplemental funding for library operations. The Prescott Public Library is estimated to receive $562,207 in direct contribution and other direct and indirect services. Other Revenues Licenses and Permits: This revenue category consists mainly of building permit fees. Other revenues in this are transaction privilege tax license fees, dog license, blasting permits, and film Permits. Significant increases to building permit and plan review fees were implemented for FY17. Also, the City has adopted a business license ordinance requiring an annual license fee effective January 1, 2017. Service Charges: These revenues include partner contributions to the Regional Communications Center (joint dispatch) center, a contract with Yavapai Prescott Indian Tribe to provide fire protection services, facility rental, and recreation fees for parking and programs. The major increase is for partner contributions for a public safety software upgrade at the Regional Communications center. Fines and Forfeitures: This category covers fees paid to the City of Prescott for fines assessed by the Police Department, City Court, Legal Department, and Library. Miscellaneous: The main revenue source in this area is interest earned on fund balance. City of Prescott, Arizona 53 Annual Budget FY2018

Fund Summaries
General Fund
Expenditures and Trends In FY18, personnel costs make up 83% of the total operating budget in the General Fund, which include all employer costs related to the compensation for City employees in the General Fund. Costs for personnel in the General Fund have steadily increased. Since FY08, there has been a reduction of 79.5 full time equivalent employees in the General Fund, but the personnel expenditures have increased steadily. The majority of increases in General Fund personnel expenditures in recent years is attributable to steep escalation of state-mandated and determined Public Safety Personnel Retirement System (PSPRS) costs. PSPRS is a defined benefit pension which means retirement benefits are based on a formula which includes years of service and salary. It is organized as an agent multiple-employer plan which means all 256 agencies in the State that are part of PSPRS are administered by the retirement system, but accounted for individually. Prescott is not alone in this dilemma; it affects all agencies state-wide at varied levels of severity. The retirement system calculates actuarially determined contribution rates, which the City pays each year as a “percentage of salary”. Employees also contribute to the retirement system, but their rates are capped per State law at 7.65% in FY18. City employer contribution rates for FY18 are 91.61% for Fire and 85.43% for Police. A ten-year history of contribution rates is depicted in the graph below. The Arizona State Retirement System (ASRS) is the retirement system for all other employees in the City and has maintained a stable rate for both the employee and employer.
State-Run Pension Systems – Employer Contribution Rates
The rising pension contribution rates relate to a decline in the funded status of the pension plans. The current PSPRS actuarial valuation shows unfunded liability as of June 30, 2016 of approximately $78.4 million and funding ratios of 24% for Police and 35% for Fire. The total PSPRS contribution in FY18 is $7.8 million dollars. About 16% of the total contribution costs relate to normal retirement costs (benefits earned by employees this current year) and the remaining 84% pays for the amortization of unfunded liabilities. There have been many factors which lead to the decline in the funded status, including investment losses and pension reform legal battles.
City of Prescott, Arizona 54 Annual Budget FY2018

Fund Summaries
General Fund
During the legislative session in 2016, a pension reform was successfully passed along with a voter initiative. Among the major changes, the law will allow for new hires to be placed into a reformed pension plan, and removes permanent benefit increase by replacing it with a cost of living increase based on the consumer price index capped at 2%. These are positive changes for the future, but are not expected to affect the current unfunded liability. A second major increase in personnel costs for is the market compensation plan implemented starting in FY17 with the purpose of recruiting and retaining talented, high-performing employees, providing regular performance-based adjustments using an established and competitive pay plan, and encouraging career growth at the City. The maintenance cost for the plan in the General Fund is $0.5 million in FY18. Changes in departmental operating budgets will be discussed in the Department Operational Plans section of this document. Balancing the budget Each year the ongoing operating expenditures are aligned to expected revenues. The City has taken many actions to increase revenue and reduce expenditures including, establishing user fees, pursuing entrepreneurial initiatives and public-private partnerships, eliminated programs, and reducing personnel. Overall, the FY18 General Fund revenues are budgeted to be up by $1.6 million and operating expenditures are $1.8 million over FY17 budget. Adjustments in expenditures and revenue enhancements enabled the City to balance the General Fund budget while accomplishing key goals and maintain service levels. Fund Balance The General Fund balance is expected to decrease significantly as a result of budgeting for a possible $11 million lump sum payment towards the unfunded PSPRS pension liability. An authorized use of fund balance is budgeted at $13.6 million in FY18 for one time expenditures. If the full lump sum payment is made in FY18, the budgetary reserve (unassigned fund balance plus the operating reserve) would be $11.9 million, which equates to approximately 4 months of operating expenditures. This is greater than the Government Finance Officers Association (GFOA) best practice recommendation of maintaining at least 2 months of regular operating expenditures.
General Fund Balances
FY16Actual
FY17Budget
FY17Estimate
FY18Budget
Net Change in Fund Balance 4,149,980 (1,456,134) 471,550 (13,561,894) Ending Balance - Detail
Reserved for:Operations (Policy) 7,046,420$ 7,105,737$ 7,180,172$ 7,267,846$ Long-term obligations 3,284,975 2,927,922 2,902,547 2,386,407 Internal Loan 4,408,328 4,408,328 4,408,328 4,408,328 Capital Projects 2,229,249 853,431 1,433,527 345,933
Unassigned 15,157,364 15,374,784 16,673,312 4,627,478
Total Ending Fund Balance 32,126,336$ 30,670,202$ 32,597,886$ 19,035,992$
City of Prescott, Arizona 55 Annual Budget FY2018

Fund Summaries
General Fund
General Fund
FY16 Actual
FY17Budget
FY17 Estimate
FY18 Budget
% Budget Change
RevenuesTaxes
Privilege/Use Tax 15,312,068$ 14,900,000$ 15,400,000$ 15,400,000$ 3.4%Franchise Taxes 1,670,671 1,630,000 1,640,000 1,660,000 1.8%Primary Property Tax 1,591,378 1,684,903 1,684,903 1,709,975 1.5%
Total Local Taxes 18,574,117 18,214,903 18,724,903 18,769,975 3.0%Intergovernmental Revenues
State Sales Tax 3,765,409 3,945,830 3,945,830 3,982,437 0.9%State Income Tax 4,797,092 5,128,724 5,128,724 5,258,814 2.5%State Vehicle License Tax 2,510,907 2,499,006 2,499,006 2,725,555 9.1%Yavapai County Library District 568,393 565,856 565,856 562,207 -0.6%
Total Intergovernmental Revenues 11,641,801 12,139,416 12,139,416 12,529,013 3.2%Licenses and Permits 691,461 1,063,600 855,150 854,250 -19.7%Service Charges 3,406,540 3,402,487 3,792,386 4,322,766 27.0%Fines & Forfeitures 411,391 415,900 395,100 418,400 0.6%Miscellaneous 454,796 231,300 111,300 182,300 -21.2%
Total General Fund Revenue 35,180,105 35,467,606 36,018,255 37,076,704 4.5%Other Sources
Transfers In 51,996 61,080 45,000 45,000 Total Revenues and Other Sources 35,232,101$ 35,528,686$ 36,063,255$ 37,121,704$ 4.5%
Operating Expenditures by DepartmentsBudget & Finance 361,474$ 733,301$ 381,286$ 481,344$ -34.4%City Clerk 114,476 111,261 95,398 133,404 19.9%City Council 40,122 47,343 46,334 43,166 -8.8%City Court 538,339 609,675 517,925 637,197 4.5%City Manager 597,446 557,950 403,537 348,386 -37.6%Community Development 1,076,225 1,232,038 1,098,101 1,661,394 34.8%Rodeo, Parking Garage 98,271 221,739 104,237 125,301 -43.5%Fire 8,756,025 9,586,268 10,065,180 10,642,528 11.0%Legal 274,809 299,589 284,214 245,393 -18.1%Library 2,290,589 2,231,555 2,162,911 2,219,351 -0.5%Police 11,295,955 12,828,765 12,527,600 13,304,472 3.7%Recreation Services 2,867,749 3,041,608 2,996,046 3,256,245 7.1%Regional Communications 1,254,102 1,392,182 1,378,241 1,409,348 1.2%Governmental Operating Grant Match 47,398 248,514 39,745 389,683 56.8%Airport Operating Transfer 116,585 308,445 258,067 375,786 21.8%
Total Operating Expenditures 29,729,565 33,450,233 32,358,822 35,272,998 5.4%Capital and Contingencies
Capital Projects and Transfers 1,159,271 3,152,159 2,850,455 2,679,210 -15.0%Contingencies Using Fund Reserves 193,285 382,428 382,428 12,731,390 3229.1%
Total Expenditures and Transfers 31,082,121$ 36,984,820$ 35,591,705$ 50,683,598$ 37.0%
Ending Balance, 6/30Net Change in Fund Balance 4,149,980$ (1,456,134)$ 471,550$ (13,561,894)$ Fund Balance - Beginning 27,976,356 32,126,336 32,126,336 32,597,886 Fund Balance - Ending 32,126,336$ 30,670,202$ 32,597,886$ 19,035,992$
City of Prescott, Arizona 56 Annual Budget FY2018

Fund Summaries
Special Revenue Funds
Streets
A special revenue fund accounts for revenues and expenditures that are legally restricted by purpose. The City’s most significant special revenue fund is the Streets Fund. The main sources of revenue for this fund are from the 1% additional sales tax rate and HURF State shared revenue. The 1% tax was restored by voters effective January 1, 2016, establishing the 1% tax for Streets only. Previously, voters approved the 1% tax for both streets and open space acquisitions. These revenues provide the funding for street construction and maintenance. On June 7th 2016, council committed $3.8 million of the fund balance remaining at January 1, 2016, when the streets and open space tax sunset, for open space acquisitions.
Streets Fund
Revenue and Trends Transaction Privilege (Sales) Tax: Voters have approved various options for additional dedicated transaction privilege tax. The history of the voter approved sales tax is below. The latest ballot was August 2015, when voters repealed the ¾% tax expected to begin January 1, 2016 and replaced it with a 1% streets only tax.
FY16 Actual
FY17Budget
FY17Estimate
FY18 Budget
%Change
RevenuesSales Tax 14,787,422$ 14,300,000$ 14,800,000$ 14,800,000$ 3.5%Highway Users Revenue 3,236,992 3,349,275 3,349,275 3,461,595 3.4%Partnering 3,055,674 1,170,000 720,000 250,000 -78.6%Street Light Fee 229,436 230,000 230,000 230,000 0.0%Miscellaneous/Interest Earnings 609,225 451,098 291,000 291,000 -35.5%
Total Revenues 21,918,749$ 19,500,373$ 19,390,275$ 19,032,595$ -2.4%
ExpendituresRecreation Services 128,127 172,493 170,239 179,825 Public Works 5,924,902 7,704,636 7,230,687 8,049,464 4.5%Debt Service 2,249,868 2,230,106 2,230,106 2,214,460 -0.7%
Total Operations 8,302,897 10,107,235 9,631,032 10,443,749 3.3%Open Space Capital Outlay - 3,800,000 - 3,800,000 0.0%Streets Capital Outlay 9,967,131 30,104,087 13,767,769 19,611,225 -34.9%
Total Expenditures 18,270,028$ 44,011,322$ 23,398,801$ 33,854,974$ -23.1%
Ending Fund Balance, 6/30Net Change in Fund Balance 3,648,721$ (24,510,949)$ (4,008,526)$ (14,822,379)$ Fund Balance - Beginning 7/1 19,889,061 23,537,782 23,537,782 19,529,256 Fund Balance - Ending 6/30 23,537,782$ (973,167)$ 19,529,256$ 4,706,877$
Rate Begins Ends1% September 1995, streets only 1/1/1996 12/31/20051% May 2000, extend 10 year, includes open space 1/1/2006 12/31/2015
3/4% September 2009, streets only 1/1/2016 12/31/20351% August 2015, repeals prior and adopts 1% streets only 1/1/2016 12/31/2035
Streets Tax Votes
City of Prescott, Arizona 57 Annual Budget FY2018
Fund Summaries
Special Revenue Funds
The 3.5% increase in the FY18 budget shows increased taxable sales activity is occurring as the economy improves. Highways Users Revenue: The revenue estimate of $3,461,595 is provided by the State and is higher than the FY17 estimate by 3.4%. This revenue source is commonly referred to as the gasoline tax; however, there are a number of additional transportation related fees including a portion of vehicle license taxes that are placed in the highway user revenue fund. The distribution formula is adopted by the state legislature. Currently 27.5% of total State HURF collections is distributed to incorporated cities and towns on the basis of (a) one-half based on the city’s population relative to statewide population of incorporated cities and towns and (b) one-half, first, on the basis of county origin of sales of motor vehicle fuel, and secondly, on the basis of the city’s population relative to county-wide population of incorporated cities. Intergovernmental/Partnering: Intergovernmental Partnering revenues included in this fund relate to contributions from Yavapai County for major street and related drainage projects. Street Light Fee: This fee, which was implemented during FY1995, is projected to bring in $230,000. The fee is based on $.75 per residence or commercial unit and $.75 per unit for multi-family structures. The purpose of this fee is to help offset electrical and maintenance costs for street lights located throughout the City of Prescott and is collected on utility bills. Miscellaneous Revenues: Miscellaneous revenues include interest earned on fund balance and the interest rebates through the issuance of Build America Bonds for the MPC 2010 bond which was used to construct the SR89A/Side Road Interchange project in FY2010. For accounting purposes, the reduction in interest costs on the bonds is being recorded as revenue. Expenditures Operating expenditures include street maintenance and ongoing costs related to capital program development, handled jointly by the Recreation Services and Public Works Departments. Changes in departmental operating budgets will be discussed in the Department Operational Plans section of this document. The capital projects budget decreases with capital plan that is balanced for available funding. Fund Balance Although the fund balance is projected to decrease, based on trends, the City does not expect all capital projects to be accomplished or the opens space balance to be spent.
City of Prescott, Arizona 58 Annual Budget FY2018
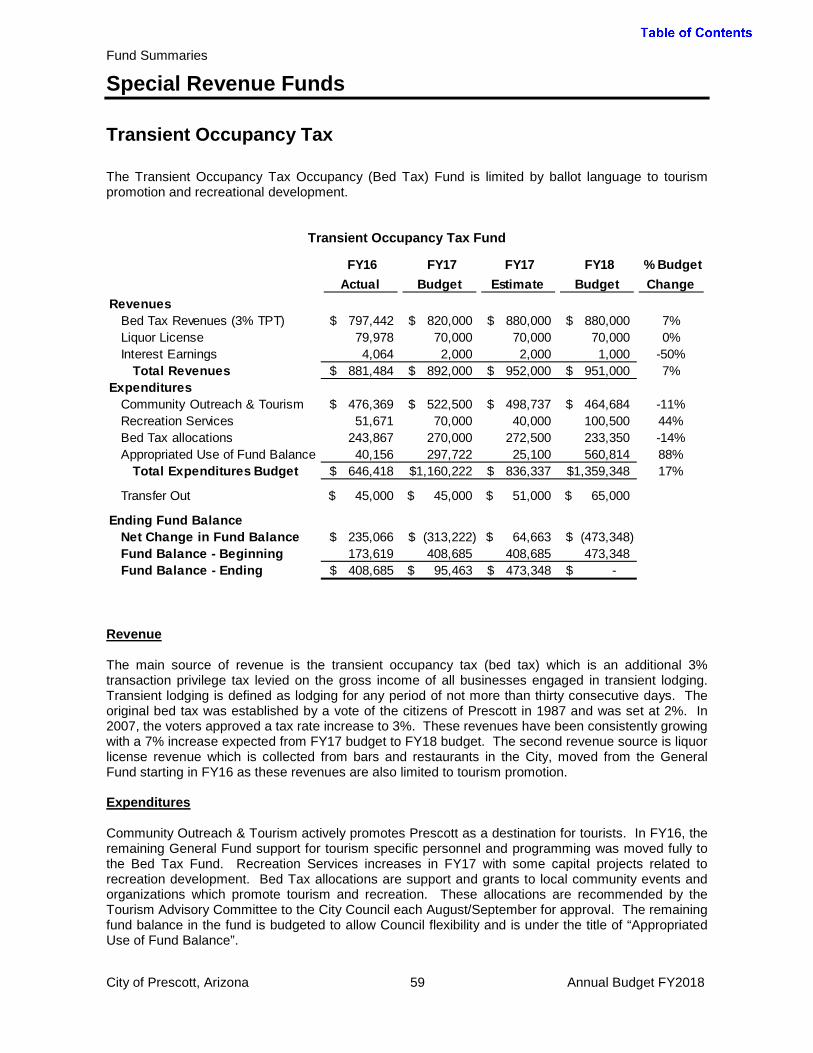
Fund Summaries
Special Revenue Funds
Transient Occupancy Tax
The Transient Occupancy Tax Occupancy (Bed Tax) Fund is limited by ballot language to tourism promotion and recreational development.
Transient Occupancy Tax Fund
Revenue The main source of revenue is the transient occupancy tax (bed tax) which is an additional 3% transaction privilege tax levied on the gross income of all businesses engaged in transient lodging. Transient lodging is defined as lodging for any period of not more than thirty consecutive days. The original bed tax was established by a vote of the citizens of Prescott in 1987 and was set at 2%. In 2007, the voters approved a tax rate increase to 3%. These revenues have been consistently growing with a 7% increase expected from FY17 budget to FY18 budget. The second revenue source is liquor license revenue which is collected from bars and restaurants in the City, moved from the General Fund starting in FY16 as these revenues are also limited to tourism promotion. Expenditures Community Outreach & Tourism actively promotes Prescott as a destination for tourists. In FY16, the remaining General Fund support for tourism specific personnel and programming was moved fully to the Bed Tax Fund. Recreation Services increases in FY17 with some capital projects related to recreation development. Bed Tax allocations are support and grants to local community events and organizations which promote tourism and recreation. These allocations are recommended by the Tourism Advisory Committee to the City Council each August/September for approval. The remaining fund balance in the fund is budgeted to allow Council flexibility and is under the title of “Appropriated Use of Fund Balance”.
FY16 Actual
FY17Budget
FY17Estimate
FY18 Budget
% Budget Change
RevenuesBed Tax Revenues (3% TPT) 797,442$ 820,000$ 880,000$ 880,000$ 7%Liquor License 79,978 70,000 70,000 70,000 0%Interest Earnings 4,064 2,000 2,000 1,000 -50%
Total Revenues 881,484$ 892,000$ 952,000$ 951,000$ 7%Expenditures
Community Outreach & Tourism 476,369$ 522,500$ 498,737$ 464,684$ -11%Recreation Services 51,671 70,000 40,000 100,500 44%Bed Tax allocations 243,867 270,000 272,500 233,350 -14%Appropriated Use of Fund Balance 40,156 297,722 25,100 560,814 88%
Total Expenditures Budget 646,418$ 1,160,222$ 836,337$ 1,359,348$ 17%
Transfer Out 45,000$ 45,000$ 51,000$ 65,000$
Ending Fund BalanceNet Change in Fund Balance 235,066$ (313,222)$ 64,663$ (473,348)$ Fund Balance - Beginning 173,619 408,685 408,685 473,348 Fund Balance - Ending 408,685$ 95,463$ 473,348$ -$
City of Prescott, Arizona 59 Annual Budget FY2018
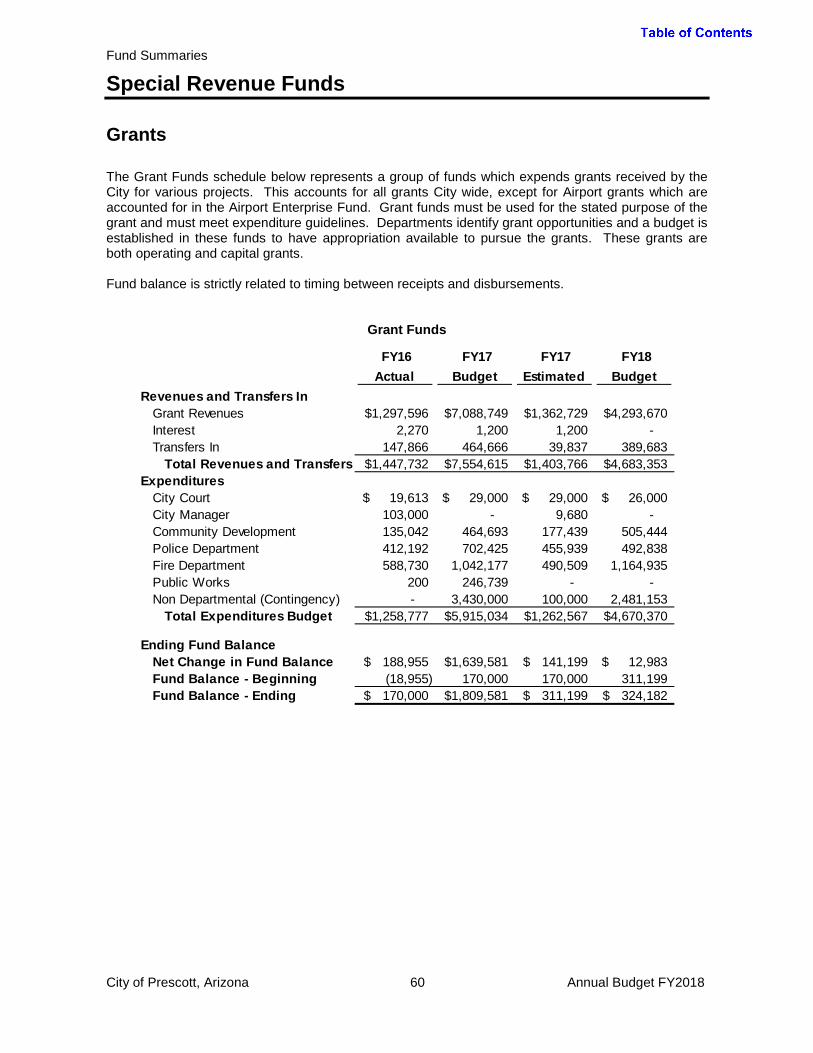
Fund Summaries
Special Revenue Funds
Grants
The Grant Funds schedule below represents a group of funds which expends grants received by the City for various projects. This accounts for all grants City wide, except for Airport grants which are accounted for in the Airport Enterprise Fund. Grant funds must be used for the stated purpose of the grant and must meet expenditure guidelines. Departments identify grant opportunities and a budget is established in these funds to have appropriation available to pursue the grants. These grants are both operating and capital grants. Fund balance is strictly related to timing between receipts and disbursements.
Grant Funds
FY16 Actual
FY17 Budget
FY17 Estimated
FY18 Budget
Revenues and Transfers InGrant Revenues 1,297,596$ 7,088,749$ 1,362,729$ 4,293,670$ Interest 2,270 1,200 1,200 - Transfers In 147,866 464,666 39,837 389,683
Total Revenues and Transfers 1,447,732$ 7,554,615$ 1,403,766$ 4,683,353$ Expenditures
City Court 19,613$ 29,000$ 29,000$ 26,000$ City Manager 103,000 - 9,680 - Community Development 135,042 464,693 177,439 505,444 Police Department 412,192 702,425 455,939 492,838 Fire Department 588,730 1,042,177 490,509 1,164,935 Public Works 200 246,739 - - Non Departmental (Contingency) - 3,430,000 100,000 2,481,153
Total Expenditures Budget 1,258,777$ 5,915,034$ 1,262,567$ 4,670,370$
Ending Fund BalanceNet Change in Fund Balance 188,955$ 1,639,581$ 141,199$ 12,983$ Fund Balance - Beginning (18,955) 170,000 170,000 311,199 Fund Balance - Ending 170,000$ 1,809,581$ 311,199$ 324,182$
City of Prescott, Arizona 60 Annual Budget FY2018
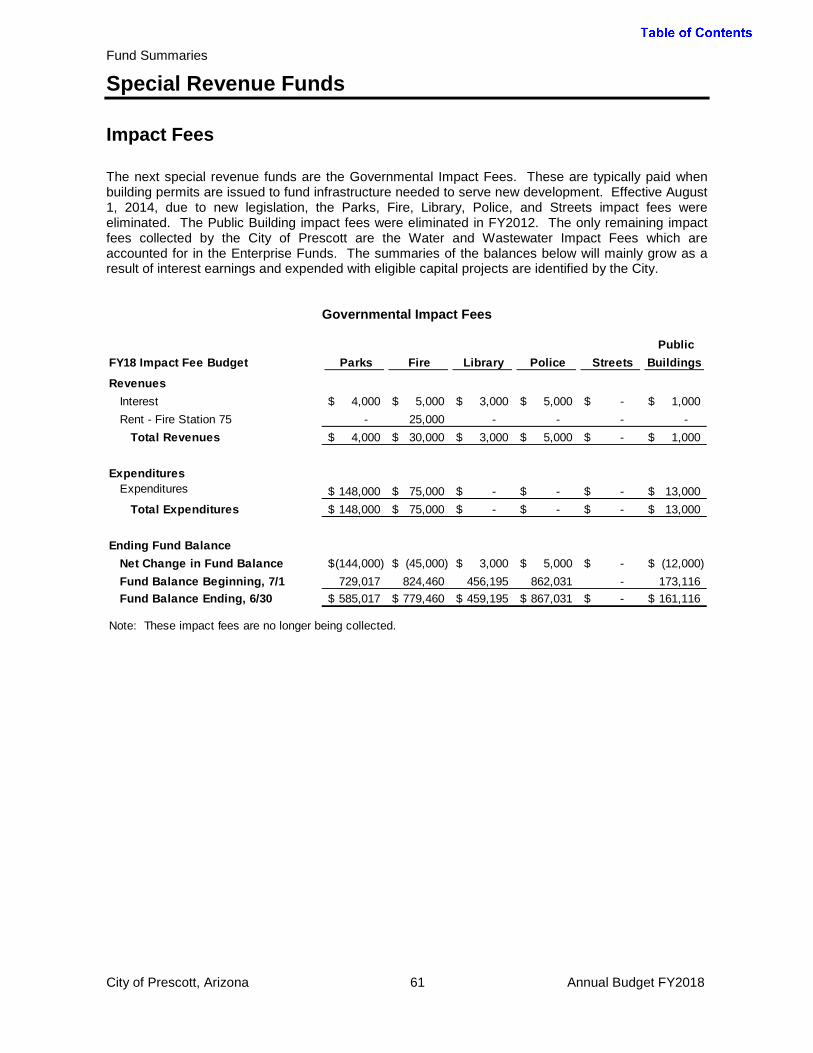
Fund Summaries
Special Revenue Funds
Impact Fees
The next special revenue funds are the Governmental Impact Fees. These are typically paid when building permits are issued to fund infrastructure needed to serve new development. Effective August 1, 2014, due to new legislation, the Parks, Fire, Library, Police, and Streets impact fees were eliminated. The Public Building impact fees were eliminated in FY2012. The only remaining impact fees collected by the City of Prescott are the Water and Wastewater Impact Fees which are accounted for in the Enterprise Funds. The summaries of the balances below will mainly grow as a result of interest earnings and expended with eligible capital projects are identified by the City.
Governmental Impact Fees
FY18 Impact Fee Budget Parks Fire Library Police Streets Public
Buildings
RevenuesInterest 4,000$ 5,000$ 3,000$ 5,000$ -$ 1,000$ Rent - Fire Station 75 - 25,000 - - - -
Total Revenues 4,000$ 30,000$ 3,000$ 5,000$ -$ 1,000$
ExpendituresExpenditures 148,000$ 75,000$ -$ -$ -$ 13,000$
Total Expenditures 148,000$ 75,000$ -$ -$ -$ 13,000$
Ending Fund BalanceNet Change in Fund Balance (144,000)$ (45,000)$ 3,000$ 5,000$ -$ (12,000)$ Fund Balance Beginning, 7/1 729,017 824,460 456,195 862,031 - 173,116 Fund Balance Ending, 6/30 585,017$ 779,460$ 459,195$ 867,031$ -$ 161,116$
Note: These impact fees are no longer being collected.
City of Prescott, Arizona 61 Annual Budget FY2018
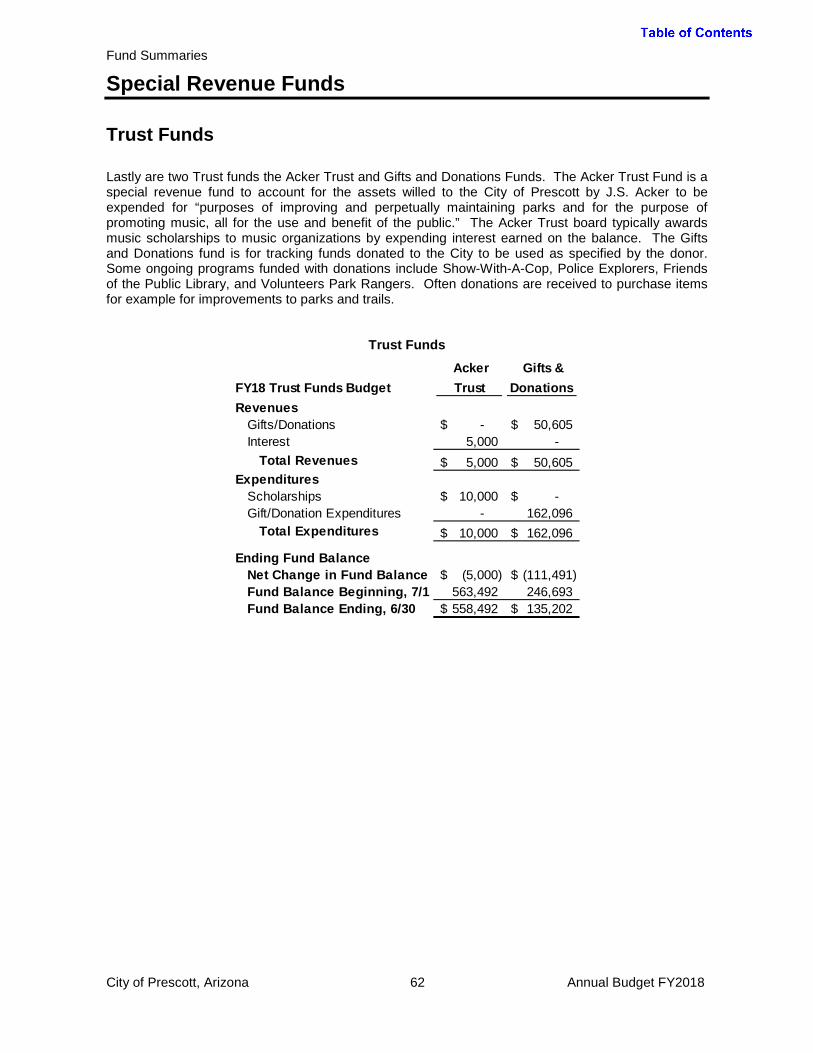
Fund Summaries
Special Revenue Funds
Trust Funds
Lastly are two Trust funds the Acker Trust and Gifts and Donations Funds. The Acker Trust Fund is a special revenue fund to account for the assets willed to the City of Prescott by J.S. Acker to be expended for “purposes of improving and perpetually maintaining parks and for the purpose of promoting music, all for the use and benefit of the public.” The Acker Trust board typically awards music scholarships to music organizations by expending interest earned on the balance. The Gifts and Donations fund is for tracking funds donated to the City to be used as specified by the donor. Some ongoing programs funded with donations include Show-With-A-Cop, Police Explorers, Friends of the Public Library, and Volunteers Park Rangers. Often donations are received to purchase items for example for improvements to parks and trails.
Trust Funds
FY18 Trust Funds Budget AckerTrust
Gifts & Donations
RevenuesGifts/Donations -$ 50,605$ Interest 5,000 -
Total Revenues 5,000$ 50,605$ Expenditures
Scholarships 10,000$ -$ Gift/Donation Expenditures - 162,096
Total Expenditures 10,000$ 162,096$
Ending Fund BalanceNet Change in Fund Balance (5,000)$ (111,491)$ Fund Balance Beginning, 7/1 563,492 246,693 Fund Balance Ending, 6/30 558,492$ 135,202$
City of Prescott, Arizona 62 Annual Budget FY2018

Fund Summaries
Debt Service Fund
The Debt Service Fund was created during FY1999 primarily as the result of the voter-approved general obligation issue for the purchase of Watson and Willow Lakes in September, 1998. Added to the debt service payments for the aforementioned project are the debt service for the Police Station building approved by the voters in 1989 and special assessment payments for improvement districts previously issued and to be issued in the future. As part of the issuance of the bonds for the purchase of Watson and Willow Lakes, the remainder of the debt for the Police Station was also refunded without extending the life of the debt service (final payment was made in FY2009). The bonds for the lakes was paid in full during FY17 and the only remaining debt service will be for a small sanitary improvement district.
Debt Service Fund
Revenue Secondary property taxes are levied to service General Obligation bonds. Special assessment billings relates to the collection of payments for a small sanitary improvement district. Fund Balance The fund balance is decreasing as a result of managing the cash flow for the final year of servicing the general obligation bonds for the purchase of the lakes.
FY16Actual
FY17Budget
FY17Estimate
FY18Budget
% Budget Change
RevenuesSecondary Property Taxes 75,684$ 41,000$ 41,000$ -$ -100%Special Assessments Billings 5,044 5,045 5,045 5,045 0%Interest 3,397 1,243 1,243 686 -45%
Total Revenues 84,125$ 47,288 47,288 5,731 -88%
ExpendituresGO Bonds 189,624$ 187,700$ 187,700$ -$ -100%Special Assessment Bonds 5,923 5,788 5,788 5,731 -1%
Total Expenditures 195,547$ 193,488 193,488 5,731 -97%
Ending Fund BalanceNet Change in Fund Balance (111,422) (146,200) (146,200) - Fund Balance Beginning, 7/1 260,805 149,383 149,383 3,183 Fund Balance Ending, 6/30 149,383$ 3,183$ 3,183$ 3,183$
City of Prescott, Arizona 63 Annual Budget FY2018

Fund Summaries
Enterprise Funds
Water
The purpose of the Water Fund is to insure a safe and reliable supply of water to the City’s customer base through the protection of existing supplies, the acquisition of new supplies, and the continued maintenance and upgrade of the existing water delivery infrastructure. All activities necessary to provide this service are accounted for in this fund. The capital program will replace deficient infrastructure as standalone projects or in conjunction with street projects. The operations annual work program is focused on providing continuous service without disruption by performing preventative maintenance on existing infrastructure.
Revenue and Trends Current water rates and impact fees can be found at www.prescott-az.gov. Water Sales: During FY2014 and FY2015 the City contracted with Raftelis Financial Consultants on a utility rate update. The rate changes continue to encourage conservation through an inverted pyramid rate structure. Water sales are projected at $14,000,000 in FY2018 compared to an estimated $15,000,000 for FY2017 representing a 6.7% decrease. The City used the rate study’s projection for FY17 which we found was not accurate so we had to revise the estimate for FY18 downward. This revenue is very weather sensitive; although trends are indicating consumption is decreasing. The population estimate for 2017 presented in the demographics section of this document shows the population in Prescott is back to 2007 levels, but the total consumption is down significantly.
FY16 Actual
FY17Budget
FY17 Estimate
FY18 Budget
% Budget Change
RevenuesWater Sales 12,989,334$ 15,000,000$ 13,660,000$ 14,000,000$ -6.7%Alt Water Source Fees 1,623,647 1,785,000 1,785,000 1,785,000 0.0%Water Connection Fees 205,171 205,000 255,000 255,000 24.4%Aquifer Protection Fee 248,400 267,000 255,000 255,000 -4.5%Water Resource Development Fee 632,906 641,284 641,284 650,000 1.4%Water System Impact Fee 1,061,681 1,085,381 995,000 1,076,990 -0.8%Miscellaneous/Interest Earnings 627,545 216,640 204,860 256,500 18.4%
Total Revenues 17,388,684 19,200,305 17,796,144 18,278,490 -4.8%Other Sources
Bond Proceeds - WIFA Draws 448,588 - - - Water Resource Partnering 982,041 376,734 376,824 395,205 4.9%
Total Revenues and Other Sources 18,819,313$ 19,577,039$ 18,172,968$ 18,673,695$ -4.6%
ExpendituresCity Manager Department 567,950 874,975 714,574 915,279 Budget & Finance 210,915 198,703 195,109 219,761 10.6%Public Works 6,105,117 7,826,317 7,081,972 8,020,367 2.5%Debt Service 2,338,720 2,388,030 2,388,030 2,492,930 4.4%
Subtotal Operations 9,222,702 11,288,025 10,379,685 11,648,337 3.2%Water System Capital Projects 3,211,445 13,598,400 4,308,143 16,972,402 24.8%Aquifer Protection Capital Projects 46,506 442,000 81,300 746,700 68.9%Alt Water Sources Capital Projects 318,244 824,681 528,874 2,280,169 176.5%Water System Impact Capital Projects 2,079,465 4,477,009 1,207,300 8,199,800 83.2%
Total Expenditures 14,878,362$ 30,630,115$ 16,505,302$ 39,847,408$ 30.1%
Ending Balance, 6/30Net Change in Fund Balance 3,940,951$ (11,053,076)$ 1,667,666$ (21,173,713)$ Fund Balance - Beginning 36,551,206 40,492,157 40,492,157 42,159,823 Fund Balance - Ending 40,492,157$ 29,439,081$ 42,159,823$ 20,986,110$
City of Prescott, Arizona 64 Annual Budget FY2018
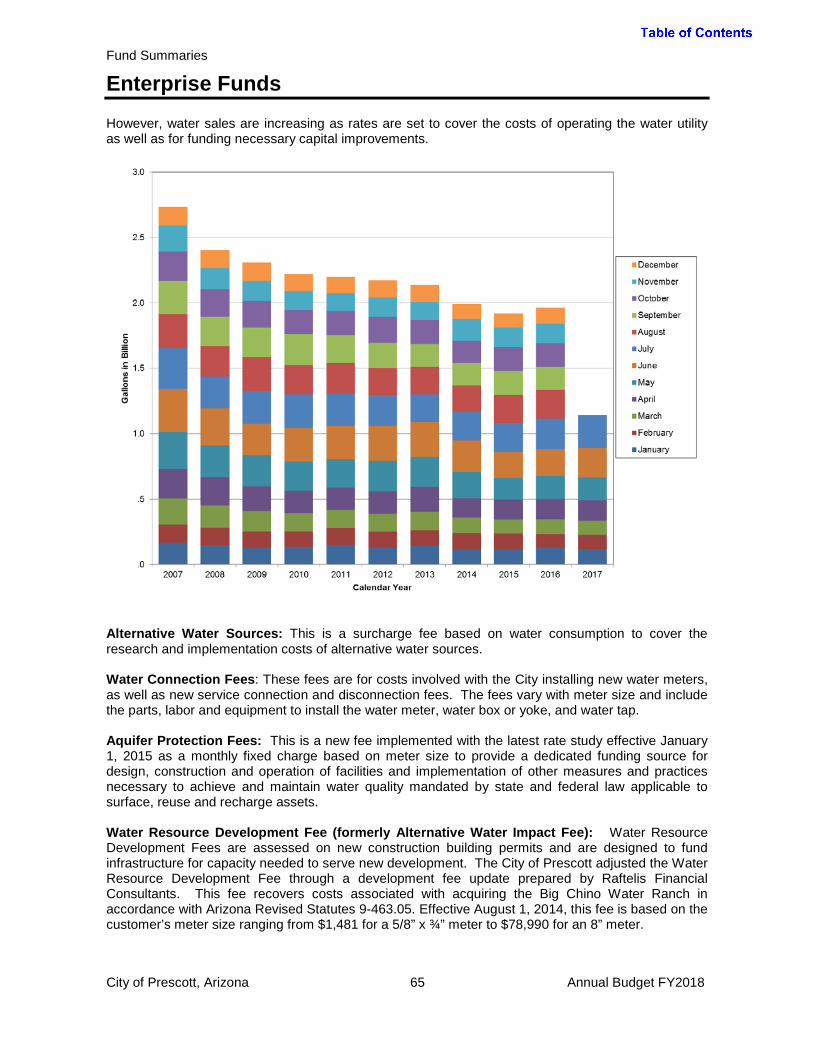
Fund Summaries
Enterprise Funds
However, water sales are increasing as rates are set to cover the costs of operating the water utility as well as for funding necessary capital improvements.
Alternative Water Sources: This is a surcharge fee based on water consumption to cover the research and implementation costs of alternative water sources. Water Connection Fees: These fees are for costs involved with the City installing new water meters, as well as new service connection and disconnection fees. The fees vary with meter size and include the parts, labor and equipment to install the water meter, water box or yoke, and water tap. Aquifer Protection Fees: This is a new fee implemented with the latest rate study effective January 1, 2015 as a monthly fixed charge based on meter size to provide a dedicated funding source for design, construction and operation of facilities and implementation of other measures and practices necessary to achieve and maintain water quality mandated by state and federal law applicable to surface, reuse and recharge assets. Water Resource Development Fee (formerly Alternative Water Impact Fee): Water Resource Development Fees are assessed on new construction building permits and are designed to fund infrastructure for capacity needed to serve new development. The City of Prescott adjusted the Water Resource Development Fee through a development fee update prepared by Raftelis Financial Consultants. This fee recovers costs associated with acquiring the Big Chino Water Ranch in accordance with Arizona Revised Statutes 9-463.05. Effective August 1, 2014, this fee is based on the customer’s meter size ranging from $1,481 for a 5/8” x ¾” meter to $78,990 for an 8” meter.
City of Prescott, Arizona 65 Annual Budget FY2018
Fund Summaries
Enterprise Funds
Water System Impact Fee: Water Resource Development Fees are assessed on new construction building permits based on location of development (service area) and meter size and are designed to fund infrastructure for capacity needed to serve new development. Water system impact fees were adjusted during FY2014 in conjunction with Raftelis Financial Consultants. This fee is assessed during the building permit process and is based on location of development (service area) and meter size. The FY2014 fee study set forth a fee schedule that ranges from $827 for a 5/8” x ¾” meter in service area A to $218,116 for an 8” meter in service area E. This adjustment was predicated upon growth related projects, derived from the City’s hydraulic utility models, needed in future years in conjunction with Arizona Revised Statutes 9-463.05. Miscellaneous/Interest earnings: Miscellaneous income encompasses NSF charges, sales tax accounting allowance and other minor fees that may be collected by this fund throughout the year. Interest earnings are monies earned on the available cash in the Water Fund. Bond Proceeds – WIFA draws: These are bonds for capital projects through the Water Infrastructure Finance Authority (WIFA) of Arizona. WIFA is an independent agency of the State of Arizona and is authorized to finance the construction, rehabilitation and/or improvement of drinking water, wastewater, wastewater reclamation, and other water quality facilities/projects. Generally, WIFA offers borrowers below market interest rates on loans. Water Resource Partnering: This category is for reimbursements made to the City of Prescott by the Town of Prescott Valley and Salt River Project pursuant to the Comprehensive Agreement #1 related to the Big Chino Aquifer. Expenditures Operating expenditures are for the Utilities Division of Public Works, the Utility Billing Division of Budget and Finance, and the Water Resource Management Division of the City Manager’s Department. Capital Projects are significant to maintain and improve aging infrastructure in the City of Prescott. Fund Balance The Water Fund has a healthy fund balance which has allowed the City to mainly fund capital through a “pay-as-you-go” program. This means the City typically finances capital with cash on hand rather than borrow.
City of Prescott, Arizona 66 Annual Budget FY2018
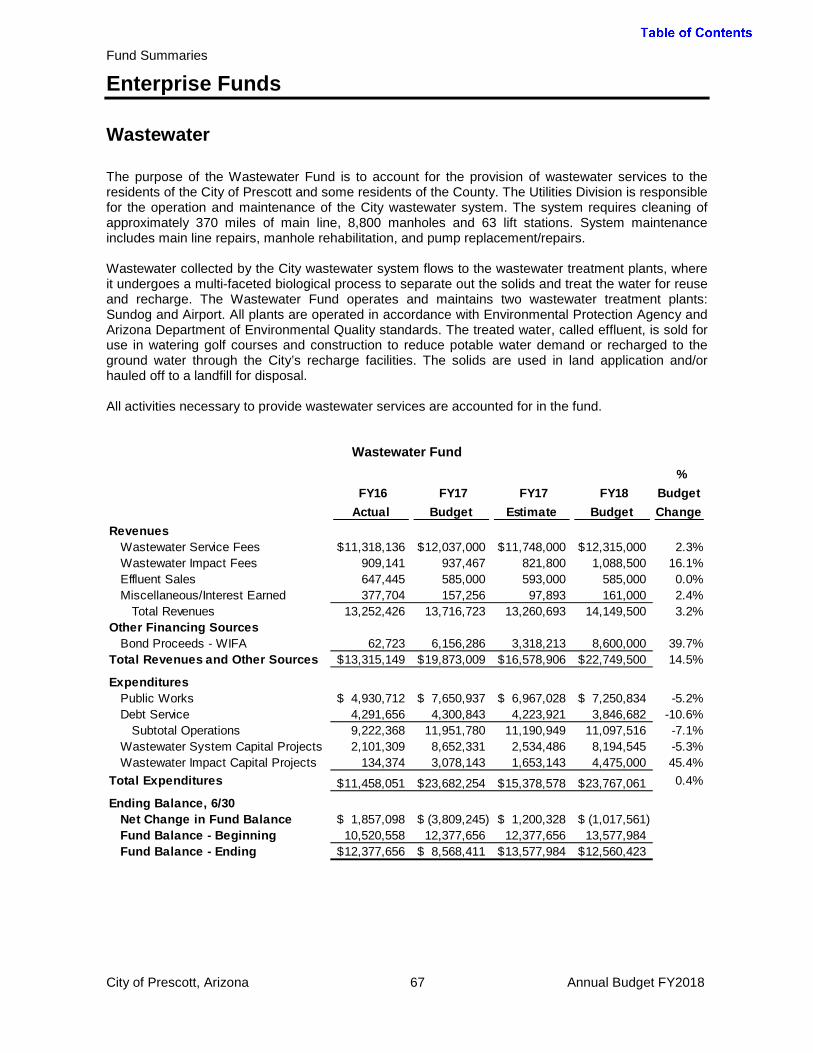
Fund Summaries
Enterprise Funds
Wastewater
The purpose of the Wastewater Fund is to account for the provision of wastewater services to the residents of the City of Prescott and some residents of the County. The Utilities Division is responsible for the operation and maintenance of the City wastewater system. The system requires cleaning of approximately 370 miles of main line, 8,800 manholes and 63 lift stations. System maintenance includes main line repairs, manhole rehabilitation, and pump replacement/repairs. Wastewater collected by the City wastewater system flows to the wastewater treatment plants, where it undergoes a multi-faceted biological process to separate out the solids and treat the water for reuse and recharge. The Wastewater Fund operates and maintains two wastewater treatment plants: Sundog and Airport. All plants are operated in accordance with Environmental Protection Agency and Arizona Department of Environmental Quality standards. The treated water, called effluent, is sold for use in watering golf courses and construction to reduce potable water demand or recharged to the ground water through the City’s recharge facilities. The solids are used in land application and/or hauled off to a landfill for disposal. All activities necessary to provide wastewater services are accounted for in the fund.
Wastewater Fund
FY16 Actual
FY17Budget
FY17 Estimate
FY18 Budget
% BudgetChange
RevenuesWastewater Service Fees 11,318,136$ 12,037,000$ 11,748,000$ 12,315,000$ 2.3%Wastewater Impact Fees 909,141 937,467 821,800 1,088,500 16.1%Effluent Sales 647,445 585,000 593,000 585,000 0.0%Miscellaneous/Interest Earned 377,704 157,256 97,893 161,000 2.4%
Total Revenues 13,252,426 13,716,723 13,260,693 14,149,500 3.2%Other Financing Sources
Bond Proceeds - WIFA 62,723 6,156,286 3,318,213 8,600,000 39.7%Total Revenues and Other Sources 13,315,149$ 19,873,009$ 16,578,906$ 22,749,500$ 14.5%
ExpendituresPublic Works 4,930,712$ 7,650,937$ 6,967,028$ 7,250,834$ -5.2%Debt Service 4,291,656 4,300,843 4,223,921 3,846,682 -10.6%
Subtotal Operations 9,222,368 11,951,780 11,190,949 11,097,516 -7.1%Wastewater System Capital Projects 2,101,309 8,652,331 2,534,486 8,194,545 -5.3%Wastewater Impact Capital Projects 134,374 3,078,143 1,653,143 4,475,000 45.4%
Total Expenditures 11,458,051$ 23,682,254$ 15,378,578$ 23,767,061$ 0.4%
Ending Balance, 6/30Net Change in Fund Balance 1,857,098$ (3,809,245)$ 1,200,328$ (1,017,561)$ Fund Balance - Beginning 10,520,558 12,377,656 12,377,656 13,577,984 Fund Balance - Ending 12,377,656$ 8,568,411$ 13,577,984$ 12,560,423$
City of Prescott, Arizona 67 Annual Budget FY2018

Fund Summaries
Enterprise Funds
Revenues Current wastewater rates and impact fees can be found at www.prescott-az.gov. Wastewater Service Fees: Wastewater fees were evaluated during the FY15 utility rate update prepared by Raftelis Financial Consultants. Wastewater revenues have increased steadily over the last ten years as rates are set to fund increased operating and capital improvement costs to service the City’s complex wastewater system.
Wastewater Revenue Trend
Wastewater Impact Fees: Wastewater system impact fees are assessed on new construction building permits based on location of development (service area) and meter size. The FY2014 fee study modified the service unit (fixtures to meter size) which yielded fees ranging from $193 for a 5/8” x ¾” meter in service area A to $189,980 for an 8” meter in service area G. This adjustment was predicated upon growth related projects, derived from the City’s hydraulic utility models, needed in future years in conjunction with Arizona Revised Statutes 9-463.05. Effluent Sales: The City of Prescott charges for the sale of effluent. This revenue category reflects the sale of effluent to externally to the Hassayampa and Prescott Lakes golf courses, as well as internally to the City owned Antelope Hills Golf Course. It is also used by vendors in the construction industry such as Hanson Concrete. The fees for the effluent are based on existing contract agreements with these users. Miscellaneous/Interest Earned: Miscellaneous revenues include interest earned, private lift station charges, septage disposal fees, plan reviews and inspection fees, and wastewater connections. Septage disposal fees are collected at the wastewater treatment plant from septic pumpers and private recreational vehicles. Plan Review Fees are collected to cover costs for Public Works staff to review infrastructure plans to ensure compliance with codes. Inspection Fees are to cover the costs for inspection of new development infrastructure to ensure the work is in compliance with the approved plans, specifications, and codes. Finally, wastewater connections are the charges to customers when tapping to the existing wastewater mains. Bonds Proceeds - WIFA: These are bonds for capital projects through the Water Infrastructure Finance Authority of Arizona. WIFA is an independent agency of the State of Arizona and is authorized to finance the construction, rehabilitation and/or improvement of drinking water, wastewater, wastewater reclamation, and other water quality facilities/projects. Generally, WIFA offers
City of Prescott, Arizona 68 Annual Budget FY2018

Fund Summaries
Enterprise Funds
borrowers below market interest rates on loans. Draws are made on approved bonds as the capital projects progress. Expenditures Operating expenditures are for the Utilities Division of Public Works. Changes in departmental operating budgets will be discussed in the Department Operational Plans section of this document. Fund Balance The Fund balance is expected to increase from FY17 Budget to FY18 Budget as a result of capital expenditures significantly less than budgeted. The Wastewater Fund has less funds available than the Water fund for capital projects, thus debt financing is used more frequently. City of Prescott, Arizona 69 Annual Budget FY2018

Fund Summaries
Enterprise Funds
Solid Waste
The Solid Waste Division manages municipal solid waste City-wide. The Division provides solid waste and recycling collection services to all City residents and contracted commercial customers; operates a 250 ton-per-day transfer station; and monitors a closed landfill. The Division educates residents regarding acceptable recycling materials in order to increase participation in the City’s recycling program and divert recyclable materials from the waste stream. The purpose of the Solid Waste Fund, an enterprise fund, is to account for the financial activities of solid waste and recycling collection, disposal and other related services provided to the citizens of Prescott. Costs are fully recovered through fees charged to customers. The City is responsible for providing solid waste collection services to its residents according to Arizona State law and City Ordinance. Collection is provided weekly for residential customers, and collection for commercial customers ranges from once per week to six times per week depending on the individual commercial customer’s needs. During FY1992, the landfill was officially closed to residential and commercial customers with the exception of continuing to accept construction debris from City accounts and private contractors. The partial closure was necessary because the landfill had almost reached capacity. The collected solid waste and recyclables are now taken to the City’s Transfer Station and then hauled by a contracted firm to a private disposal site. Voluntary curbside recycling began in 1992, following a very successful pilot program. Recyclables are collected on a weekly basis with the City providing the containers to the customers. In June 1996, the City added plastics to items collected for recycling purposes. During FY1999, the City mailed a survey along with the utility bills asking the public their opinions on expanding the residential recycling program. As a result of the favorable responses, Council approved expanding and automating the program to enable collection and transportation of commingled recyclable materials. The new program commenced in spring of FY2000. During FY1992, the Sundog Transfer Station was constructed in partnership with Yavapai County. The partnership was subsequently dissolved in 2009. All vehicles, including the City’s solid waste trucks, are weighed at the station and are charged accordingly. This fund accounts for the payments of tipping fees and hauling costs to private companies for the transporting and disposal of solid waste and recyclables and accounts for tipping fees paid by individuals, contractors and private collection companies opting to use the Transfer Station.
City of Prescott, Arizona 70 Annual Budget FY2018
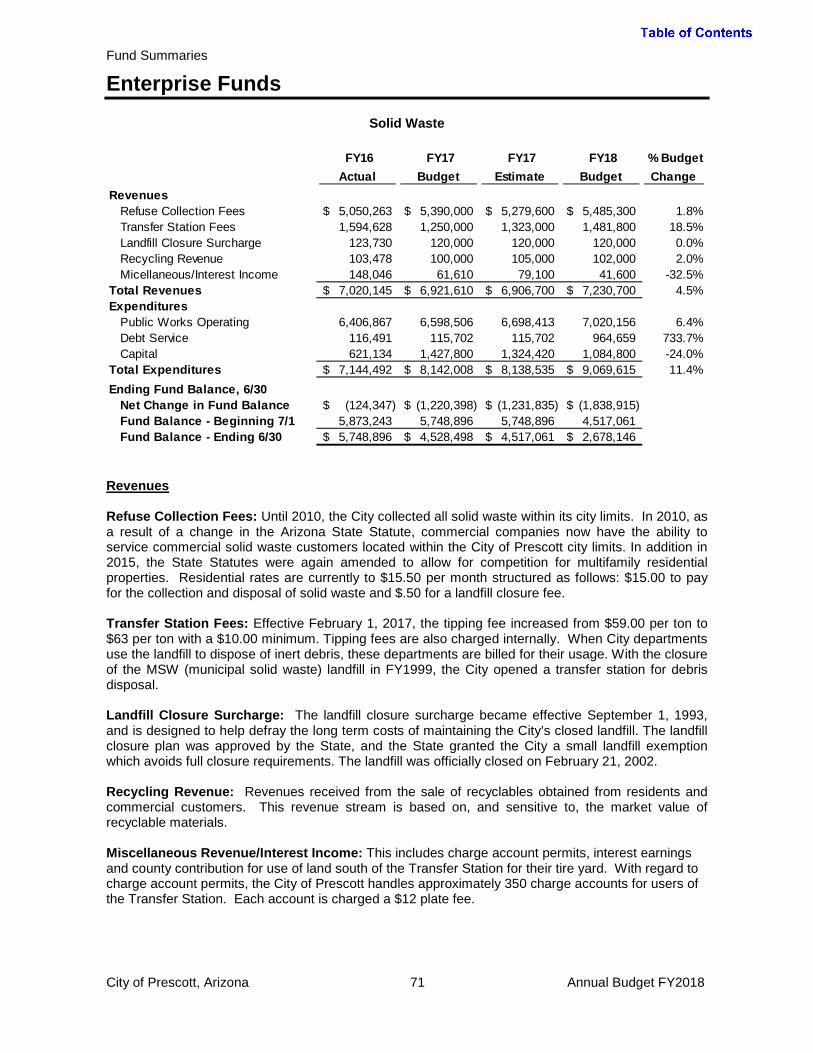
Fund Summaries
Enterprise Funds
Solid Waste
Revenues Refuse Collection Fees: Until 2010, the City collected all solid waste within its city limits. In 2010, as a result of a change in the Arizona State Statute, commercial companies now have the ability to service commercial solid waste customers located within the City of Prescott city limits. In addition in 2015, the State Statutes were again amended to allow for competition for multifamily residential properties. Residential rates are currently to $15.50 per month structured as follows: $15.00 to pay for the collection and disposal of solid waste and $.50 for a landfill closure fee. Transfer Station Fees: Effective February 1, 2017, the tipping fee increased from $59.00 per ton to $63 per ton with a $10.00 minimum. Tipping fees are also charged internally. When City departments use the landfill to dispose of inert debris, these departments are billed for their usage. With the closure of the MSW (municipal solid waste) landfill in FY1999, the City opened a transfer station for debris disposal. Landfill Closure Surcharge: The landfill closure surcharge became effective September 1, 1993, and is designed to help defray the long term costs of maintaining the City’s closed landfill. The landfill closure plan was approved by the State, and the State granted the City a small landfill exemption which avoids full closure requirements. The landfill was officially closed on February 21, 2002. Recycling Revenue: Revenues received from the sale of recyclables obtained from residents and commercial customers. This revenue stream is based on, and sensitive to, the market value of recyclable materials. Miscellaneous Revenue/Interest Income: This includes charge account permits, interest earnings and county contribution for use of land south of the Transfer Station for their tire yard. With regard to charge account permits, the City of Prescott handles approximately 350 charge accounts for users of the Transfer Station. Each account is charged a $12 plate fee.
FY16Actual
FY17Budget
FY17 Estimate
FY18 Budget
% BudgetChange
RevenuesRefuse Collection Fees 5,050,263$ 5,390,000$ 5,279,600$ 5,485,300$ 1.8%Transfer Station Fees 1,594,628 1,250,000 1,323,000 1,481,800 18.5%Landfill Closure Surcharge 123,730 120,000 120,000 120,000 0.0%Recycling Revenue 103,478 100,000 105,000 102,000 2.0%Micellaneous/Interest Income 148,046 61,610 79,100 41,600 -32.5%
Total Revenues 7,020,145$ 6,921,610$ 6,906,700$ 7,230,700$ 4.5%Expenditures
Public Works Operating 6,406,867 6,598,506 6,698,413 7,020,156 6.4%Debt Service 116,491 115,702 115,702 964,659 733.7%Capital 621,134 1,427,800 1,324,420 1,084,800 -24.0%
Total Expenditures 7,144,492$ 8,142,008$ 8,138,535$ 9,069,615$ 11.4%Ending Fund Balance, 6/30
Net Change in Fund Balance (124,347)$ (1,220,398)$ (1,231,835)$ (1,838,915)$ Fund Balance - Beginning 7/1 5,873,243 5,748,896 5,748,896 4,517,061 Fund Balance - Ending 6/30 5,748,896$ 4,528,498$ 4,517,061$ 2,678,146$
City of Prescott, Arizona 71 Annual Budget FY2018
Fund Summaries
Enterprise Funds
Expenditures The expenditures account for the Solid Waste Division of the Public Works Department. The changes in expenditures will be discussed in the “Department Operational Plans” section in this document. Fund Balance Fund balance is decreasing with ongoing capital expenditures. Ongoing rate adjustments will help maintain sufficient funds to operate the waste collection and transfer station for City residents.
City of Prescott, Arizona 72 Annual Budget FY2018

Fund Summaries
Enterprise Funds
Golf Course
The purpose of the Golf Course Fund is to account for the financial activities of Antelope North and South Golf Courses. It is the mission of the Golf Course to provide a positive golf experience and an enjoyable atmosphere for our customers while assuring revenues are more than sufficient to cover operating expenses, capital investments and debt payments. Antelope Hills North Golf Course is a championship 18-hole course located on Highway 89 at the intersection of Highway 89 and Willow Creek Road. The PGA-sanctioned course, which surrounds the City of Prescott’s municipal airport, is open to the public year-round. Antelope Hills South Golf Course was completed during FY1992. This 18 hole, par 72 course was opened for play July 1, 1992. The scenic landscaped course has views of Mingus Mountain, Granite Dells, Granite Mountain and a 100 mile view of the San Francisco Peaks, the highest point in Arizona. The South course is state of the art and includes a computerized irrigation system, multi-tees, bent grass greens and three lakes. Seventy-seven homes sites were developed surrounding the course and all sites have been sold. The clubhouse on Perkins Drive was built in 1993 and contains a restaurant, bar and full-line golf shop. The restaurant, Manzanita Grille, is currently operated by the City and is open daily to serve the public. Golfers are able to start on either course from the clubhouse. Wastewater effluent from the City’s wastewater treatment plant is used to irrigate the golf course turf on both courses. A well-organized golf maintenance and development program is carried out including daily upkeep of golf course greens, fairways, tees and rough. In April 2014, Council approved a five-year agreement with Billy Casper Golf to manage Antelope Hills Golf Courses beginning May 1, 2014. Billy Casper Golf will operate golf-related activities, including the pro shop, driving range, carts, cart barn and restaurant at the 36-hole facility, while the City will continue to be responsible for golf-course maintenance and capital improvements. The partnership with Billy Casper Golf is designed to bring a new approach to the management of Antelope Hills. The company will utilize its purchasing efficiencies, lower operating costs, marketing strength, and customer-service training to assure enjoyable guest experiences and improved fiscal outlook.
City of Prescott, Arizona 73 Annual Budget FY2018
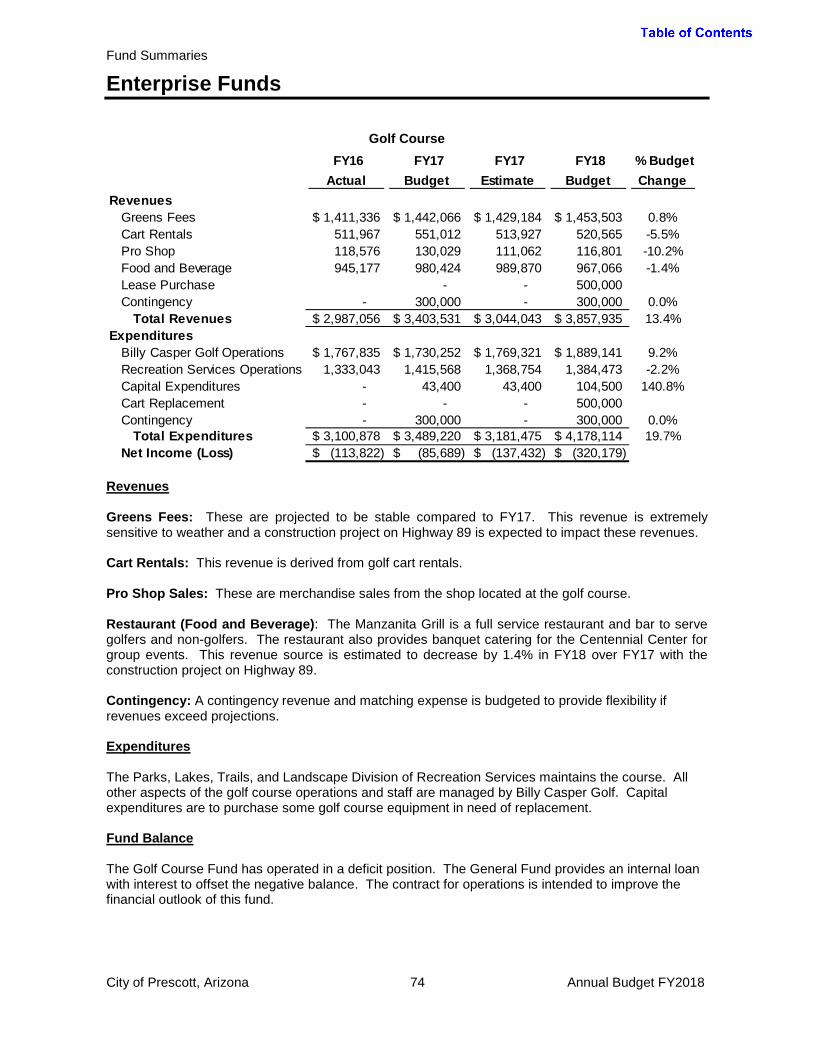
Fund Summaries
Enterprise Funds
Golf Course
Revenues Greens Fees: These are projected to be stable compared to FY17. This revenue is extremely sensitive to weather and a construction project on Highway 89 is expected to impact these revenues. Cart Rentals: This revenue is derived from golf cart rentals. Pro Shop Sales: These are merchandise sales from the shop located at the golf course. Restaurant (Food and Beverage): The Manzanita Grill is a full service restaurant and bar to serve golfers and non-golfers. The restaurant also provides banquet catering for the Centennial Center for group events. This revenue source is estimated to decrease by 1.4% in FY18 over FY17 with the construction project on Highway 89. Contingency: A contingency revenue and matching expense is budgeted to provide flexibility if revenues exceed projections. Expenditures The Parks, Lakes, Trails, and Landscape Division of Recreation Services maintains the course. All other aspects of the golf course operations and staff are managed by Billy Casper Golf. Capital expenditures are to purchase some golf course equipment in need of replacement. Fund Balance The Golf Course Fund has operated in a deficit position. The General Fund provides an internal loan with interest to offset the negative balance. The contract for operations is intended to improve the financial outlook of this fund.
FY16 Actual
FY17Budget
FY17 Estimate
FY18Budget
% BudgetChange
RevenuesGreens Fees 1,411,336$ 1,442,066$ 1,429,184$ 1,453,503$ 0.8%Cart Rentals 511,967 551,012 513,927 520,565 -5.5%Pro Shop 118,576 130,029 111,062 116,801 -10.2%Food and Beverage 945,177 980,424 989,870 967,066 -1.4%Lease Purchase - - 500,000 Contingency - 300,000 - 300,000 0.0%
Total Revenues 2,987,056$ 3,403,531$ 3,044,043$ 3,857,935$ 13.4%Expenditures
Billy Casper Golf Operations 1,767,835$ 1,730,252$ 1,769,321$ 1,889,141$ 9.2%Recreation Services Operations 1,333,043 1,415,568 1,368,754 1,384,473 -2.2%Capital Expenditures - 43,400 43,400 104,500 140.8%Cart Replacement - - - 500,000 Contingency - 300,000 - 300,000 0.0%
Total Expenditures 3,100,878$ 3,489,220$ 3,181,475$ 4,178,114$ 19.7%Net Income (Loss) (113,822)$ (85,689)$ (137,432)$ (320,179)$
City of Prescott, Arizona 74 Annual Budget FY2018
Fund Summaries
Enterprise Funds
Airport
The Airport is classified by the Federal Aviation Administration as a non-primary commercial service airport (between 2,500 and 10,000 passenger enplanements annually) and is used by a wide range of activities to include scheduled airline service, recreational aviation, corporate aviation, aircraft maintenance, flight training, aerial firefighting operations, military aviation, medical flights, and aviation education activities. The Airport Enterprise Fund accounts for the financial activities for the operation, maintenance and development of Ernest A. Love Field/Prescott Municipal Airport. The airport opened in 1926 and re-named in 1928 to honor Prescott native Ernest A. Love who died while serving as a fighter pilot in the U.S. Army Air Service during World War I. Over time, the airport has evolved into a facility comprised of approximately 760 acres of land with three runways, an airport terminal, FAA air traffic control tower, fixed base operation. Services provided include aviation fuel, aircraft services, and aircraft storage (hangar and tie-downs) to accommodate approximately 350 airplanes and helicopters in addition to transient aircraft. Embry-Riddle Aeronautical University (ERAU), the world’s only accredited 100% aviation-oriented university, has conducted flight training operations at Love Field since 1977. The university opened their western campus in Prescott in 1978 and currently hosts over 1,500 students annually. In addition to ERAU, several other companies conduct fixed wing and helicopter flight training operations. Guidance Aviation conducts helicopter training through partnership with Yavapai College; North-Aire Aviation conducts fixed wing training through partnership with Yavapai College; and Universal Helicopters conducts helicopter training through partnership with ERAU. Legend Aviation currently operates as the sole fixed-base operation (FBO) providing aviation fuel services and customer support services to include assisting customers with arranging for ground transportation, lodging and catering. The City of Prescott operated the FBO until privatizing the operation in 2008. The United States Forest Service (USFS) established an aerial firefighting base at Prescott in 1962. In May 1992, the USFS dedicated a new facility, the Prescott Fire Center and Henry Y.H. Kim Aviation Facility, to support firefighting operations. With its aviation, communications and coordination capabilities, the Center can dispatch aircraft/helicopters, supplies, equipment, and crews to assist with emergency incidents throughout Southwest.
City of Prescott, Arizona 75 Annual Budget FY2018

Fund Summaries
Enterprise Funds
Airport
Revenue Tie Down and Hangar Rentals: Monthly rental of city-operated aircraft hangars, shades, open tie-downs and storage units. Rental fees are evaluated on an annual basis. Ground Rentals: Rental of vacant property as well as existing ground leases based on fair market appraisals. Facilities Rentals: Represent facility lease and license agreement charges for commercial tenants operating in the terminal building and other leased facilities. Fuel Flowage Fee: A fuel flowage fee is a specified charge per gallon of fuel pumped and paid to the airport by the entity pumping the fuel (retail sale or bulk self-service non-retail). Landing Fees: These are fees assessed to all air carriers, cargo carriers, and chartered flights/large commercial aircraft above 12,500 pounds gross landing weight using the airport per landing. Miscellaneous/Interest Earnings: Miscellaneous revenues consist of other revenue items that do not occur on a regular basis or are minor in total revenues received. This includes transient aircraft overnight parking fees, facility transfer fees, aviation self-fuel permits, vehicles storage permits, vending concessions, fingerprinting, and advertising concessions.
FY16 Actual
FY17Budget
FY17Estimate
FY18Budget
% BudgetChange
Operating RevenuesTie Down and Hangar Rentals 654,587$ 664,000$ 660,000$ 661,370$ -0.4%Ground Rentals 486,355 482,000 486,361 506,116 5.0%Facilities Rentals 200,737 186,810 187,265 172,624 -7.6%Fuel Flowage Fee 81,597 86,240 76,500 86,500 0.3%Landing Fees 26,744 18,700 17,080 18,500 -1.1%Miscellaneous/Interest Earnings 78,920 52,830 66,137 69,430 31.4%
Total Revenues 1,528,940$ 1,490,580$ 1,493,343$ 1,514,540$ 1.6%Operating Expenditures
Fire Department - ARFF 327,286$ 504,993$ 501,557$ 588,393$ 16.5%Airport Operations 1,277,246 1,295,267 1,255,453 1,321,933 2.1%
Total Operating Expenditures 1,604,532$ 1,800,260$ 1,757,010$ 1,910,326$ 6.1%Operating Profit (Loss) (75,592)$ (309,680)$ (263,667)$ (395,786)$ 27.8%
Capital Outlay/ProjectsFAA/ADOT Grant Revenue 4,636,184$ 1,885,938$ 1,195,735$ 3,127,700$ 65.8%Capital Outlay/Projects 5,335,485 2,514,632 1,691,433 3,449,825 37.2%
City Share of Projects (699,301)$ (628,694)$ (495,698)$ (322,125)$ -48.8%
Total General Fund Transfer In (774,893)$ (938,374)$ (759,365)$ (717,911)$ -23.5%
City of Prescott, Arizona 76 Annual Budget FY2018

Fund Summaries
Enterprise Funds
Expenditures Operations at the airport are managed by the Airport Department. The Fire Department staffs and manages the Aircraft Rescue and Firefighting (ARFF) service, which is charged to the Airport Fund. The changes in expenditures will be discussed in the “Department Operational Plans” section in this document. The capital budget consists of three types of funding structures:
1. For federally-eligible projects, the Federal Aviation Administration (FAA) provides grant funding for 95% of eligible project costs, with the Arizona Department of Transportation Aeronautics Division contributing 2.5% of eligible project costs through the State Aviation Fund. The City contributes the remaining 2.5%.
2. For state-eligible projects, the Arizona Department of Transportation (ADOT) Aeronautics Division provides State Aviation Funds for 90% of eligible project costs with the City contributing the remaining 10%.
3. For local-only projects, the City provides 100% of all project costs. The total City share for capital is a combination of the city grant match and the local only projects. The capital program at the Airport is largely funded through grants. General Fund Transfer In Per Council policy, to the extent airport revenues do not cover operations or capital expenditures, non-airport revenues are used to fund these requirements. This General Fund support does not constitute an internal loan.
City of Prescott, Arizona 77 Annual Budget FY2018

Fund Summaries
Internal Service Funds
The City of Prescott’s internal service funds are used to account for services provided to other City funds on a cost-reimbursement basis and are accounted for separately. These include the Engineering, Facilities Maintenance, Fleet Maintenance, and Risk Management Funds.
Internal Service Funds
Revenue Revenues represent charges to other City operating units on a cost reimbursement basis. Engineering services are mainly charged on an hour per worked basis to capital projects. Facilities charges each City facility it maintains a cost per square foot. Fleet charges an hourly shop rate for labor and recovers the costs of the parts by charging for all vehicle maintenance and repairs. Risk Management recovers the cost of the City’s liability policy on a proportion of budget basis. Expenditures Engineering operates as a division of Public Works, Fleet and Facilities are in the Recreation Services Department, and Risk Management is managed by the Legal Department. Capital expenditures for fleet maintenance relate to vehicle purchases for General Fund departments and shop equipment when needed.
FY16 Actual
FY17Budget
FY17Estimate
FY18 Budget
% BudgetChange
RevenuesEngineering 1,924,684$ 2,304,658$ 1,950,315$ 2,071,499$ -10.1%Facililities Maintenance 1,550,634 1,541,243 1,541,243 1,667,024 8.2%Fleet Maintenance 2,459,006 1,900,000 2,182,902 5,355,477 181.9%Risk Management 966,841 960,000 960,000 970,000 1.0%
Total Revenues 6,901,165$ 6,705,901$ 6,634,460$ 10,064,000$ 50.1%
Operating ExpendituresEngineering 2,060,570$ 2,235,658$ 1,881,315$ 2,046,499$ -8.5%Facilities Maintenance 1,347,475 1,473,893 1,663,217 1,479,303 0.4%Fleet Maintenance 2,586,866 2,496,208 2,487,593 5,355,477 114.5%Risk Management 739,505 1,265,100 1,142,320 1,090,100 -13.8%
Total Operating 6,734,416$ 7,470,859$ 7,174,445$ 9,971,379$ 33.5%Capital Expenditures
Engineering 26,554$ 69,000$ 69,000$ 25,000$ -63.8%Facilities Maintenance 9,774 160,000 160,000 30,000 -81.3%Fleet Maintenance 34,866 538,000 178,630 710,000 32.0%
Total Capital 71,194$ 767,000$ 407,630$ 765,000$ -0.3%Total Expenditures 6,805,610$ 8,237,859$ 7,582,075$ 10,736,379$ 30.3%
Ending Fund Balance 6/30Engineering 1,210,555$ 1,210,555$ 1,210,555$ 1,210,555$ Facilities Maintenance 416,856 324,206 134,882 292,603 Fleet Maintenance 3,222,186 2,087,978 2,738,865 2,028,865 Risk Management 1,381,606 1,076,506 1,199,286 1,079,186
City of Prescott, Arizona 78 Annual Budget FY2018

Fund Summaries
Internal Service Funds
Fund Balance The fund balance for internal service funds is accumulated for capital items. Fleet Maintenance fund balance is decreasing as vehicles are purchased and a vehicle replacement recovery has not been in place during the recession. This will be addressed in FY18. The Risk Management fund balance decrease is intentional to utilize the funds that were accumulated during the times when the City was self-insured. Effective June 2013, the City of Prescott is insured by the Arizona Municipal Risk Retention Pool.
City of Prescott, Arizona 79 Annual Budget FY2018
Fund Summaries
City Debt Summary
The following summaries are intended to provide general information on City-wide debt obligations. The debt service payments for all other debt besides the General Obligation bonds are accounted for in their respective funds. General obligation bonds are perhaps the most common method used to raise revenues for large scale municipal projects. The bonds are referred to as general obligation or full faith and credit bonds because they are guaranteed by the full taxing power of the city or town. These bonds are retired from secondary property tax funds. The amount of indebtedness that a city or town can incur through the issuance of general obligation bonds is limited in the state constitution. The constitution states that for general municipal purposes a municipality cannot incur a debt exceeding 6 percent of the assessed valuation of taxable property in the city or town. Additional bonds amounting to 20 percent of the assessed valuation of taxable property can be issued for supplying such specific city and town projects as water, artificial light, sewers, and for the acquisition and development of land for open space preserves, parks, playgrounds and recreational facilities. The issuance of general obligation bonds must be submitted to the voters for approval. The City currently has no outstanding general obligation bonds and the total bonding capacity is depicted below:
All Others6%
Water & Sewer20%
Legal Debt LimitationAssessed Valuation - $606,159,290 36,369,557$ 121,231,858$
Outstanding DebtNo outstanding GO Bond Debt - -
Total outstanding debt - - Total margin available 36,369,557$ 121,231,858$
Total debt applicable to the limit as a percentage 0.0% 0.0%
General Obligation Bonds
City of Prescott, Arizona 80 Annual Budget FY2018

Fund Summaries
City Debt Summary
City-wide, the debts are mostly obligations of Enterprise funds, which are repaid by charges for services. The governmental debt is for municipal property corporation bonds issued for the State Route 89A/Granite Dells Parkway Interchange and is repaid by the 1% sales tax dedicated to streets. Outstanding debt principal city-wide can be observed in the charts on the following:
City of Prescott, Arizona 81 Annual Budget FY2018
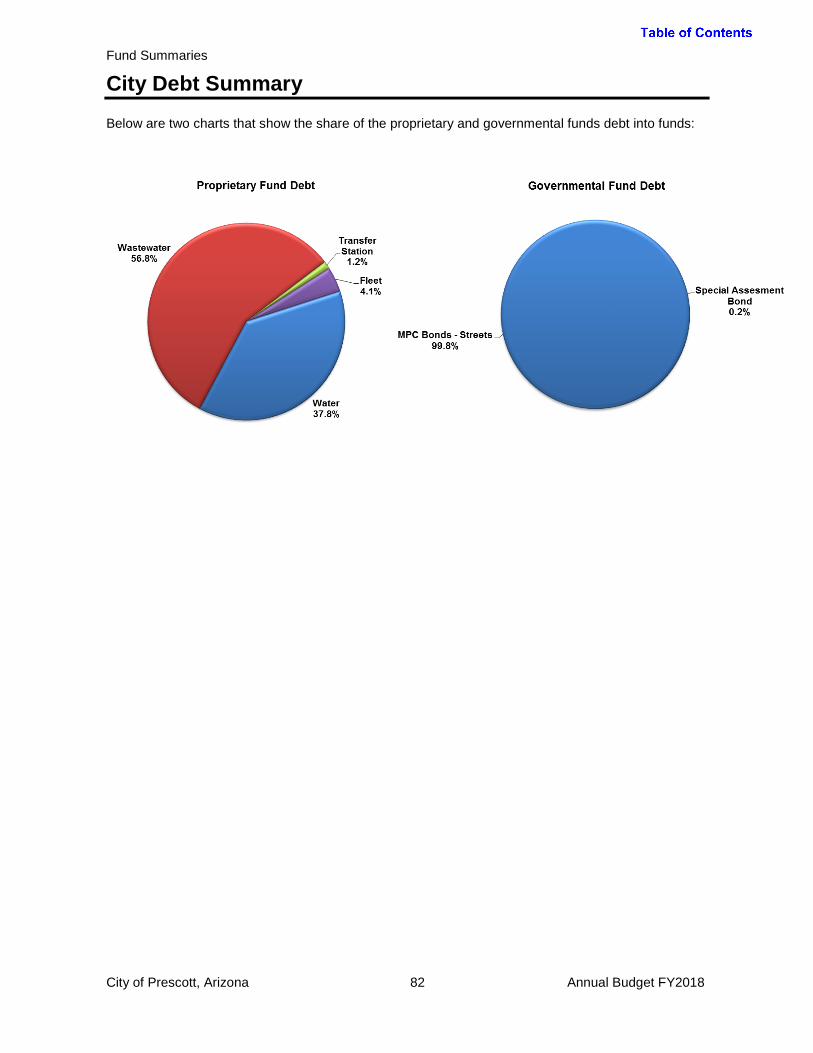
Fund Summaries
City Debt Summary
Below are two charts that show the share of the proprietary and governmental funds debt into funds:
City of Prescott, Arizona 82 Annual Budget FY2018

Fund Summaries
City Debt Summary
THIS PAGE LEFT BLANK INTENTIONALLY
City of Prescott, Arizona 83 Annual Budget FY2018
Department Operational Plans
Departmental Operational Plans Overview ...................................................................................... 86 City Expenditure Budget by Department and Fund ......................................................................... 88 City Expenditure Budget by Department and Category ................................................................... 89 Airport ............................................................................................................................................... 90 Budget and Finance ......................................................................................................................... 94 City Clerk ........................................................................................................................................ 103 City Council .................................................................................................................................... 107 City Court ........................................................................................................................................ 110 City Manager .................................................................................................................................. 115 Community Development ............................................................................................................... 132 Fire ................................................................................................................................................. 141 Legal ............................................................................................................................................... 155 Library ............................................................................................................................................. 159 Police .............................................................................................................................................. 167 Public Works................................................................................................................................... 179 Recreation Services ....................................................................................................................... 201 Regional Communications ............................................................................................................. 216
City of Prescott, Arizona 84 Annual Budget FY2018
Department Operational Plans
THIS PAGE LEFT BLANK INTENTIONALLY
City of Prescott, Arizona 85 Annual Budget FY2018

Department Operational Plans
Department Operational Plans Overview
In formulating the budget each year, the City’s departments translate high-level strategic direction of the City Council into action plans. Council’s strategic goals are summarized below: Goal #1 Stabilizing the General Fund, continually supporting the market compensation plan, and providing adequate and stable funding and flexibility to maintain a balanced budget as required by the Charter
Objectives:
1. Stabilize General Fund
2. Retire unfunded liability of by .
3. Legislative relief (impact fees) and revenue/expense flexibility
Goal #2 Economic Development – providing an environment to enable prosperity and job creation by providing great services. Drivers: tourism, medical, government, education, growth, and supply chain industries.
Objectives:
1. Regionalize the airport by building a destination passenger terminal and other amenities such as a restaurant and conference meeting space, lengthen the runways, and improve commercial air service.
Goal #3 Quality of Life – A clean and safe city that provides superior essential services and enhances opportunities that allow for retention and attraction of people who want to live, learn, work, and play in Prescott
Objectives:
1. Natural Resource Preservation and Conservation – Engage in cooperative efforts with political entities, subdivisions, and private property owners to work to assure the preservation and conservation of our natural resources
2. Highly-Rated City Services: Perceived as and are (measurably) delivering efficient and effective services including transportation with improved flow, well-maintained streets, public safety, code enforcement, water and wastewater services among many other things
Goal #4 Service-Oriented Culture – Promote an accountable organizational culture of excellent/superior/solutions-driven service
Objectives:
1. Measurably promote excellent service delivery based on trustworthy, timely, problem- solving, engaging, valuable, accessible, actionable, fair, consistent, and common-sense service as permitted by existing resources and by effective use of those resources. Other notes: culture of enforcement changed to culture of service (attitude)
2. Promote continuous process improvement which fosters better processes and procedures to improve customer service and provide quality services at the lowest possible cost to taxpayers.
City of Prescott, Arizona 86 Annual Budget FY2018
Department Operational Plans
Department Operational Plans Overview
A summary of each department and the divisions are presented in this section of this budget document. Each department and division section includes a mission and a description of the services it provides. On the division level, the main goals are presented with strategies of how the goals will be accomplished. The goals are linked to the Council’s strategic goals. Each strategy includes performance measures to evaluate progress toward and achievement of the desired outcomes. Divisions also provide key results and outcomes for the prior fiscal year. The financial and staffing resources allocated to each department are summarized in schedules. The budgeted expenditures for the fiscal year will be compared to the two prior fiscal years.
City of Prescott, Arizona 87 Annual Budget FY2018
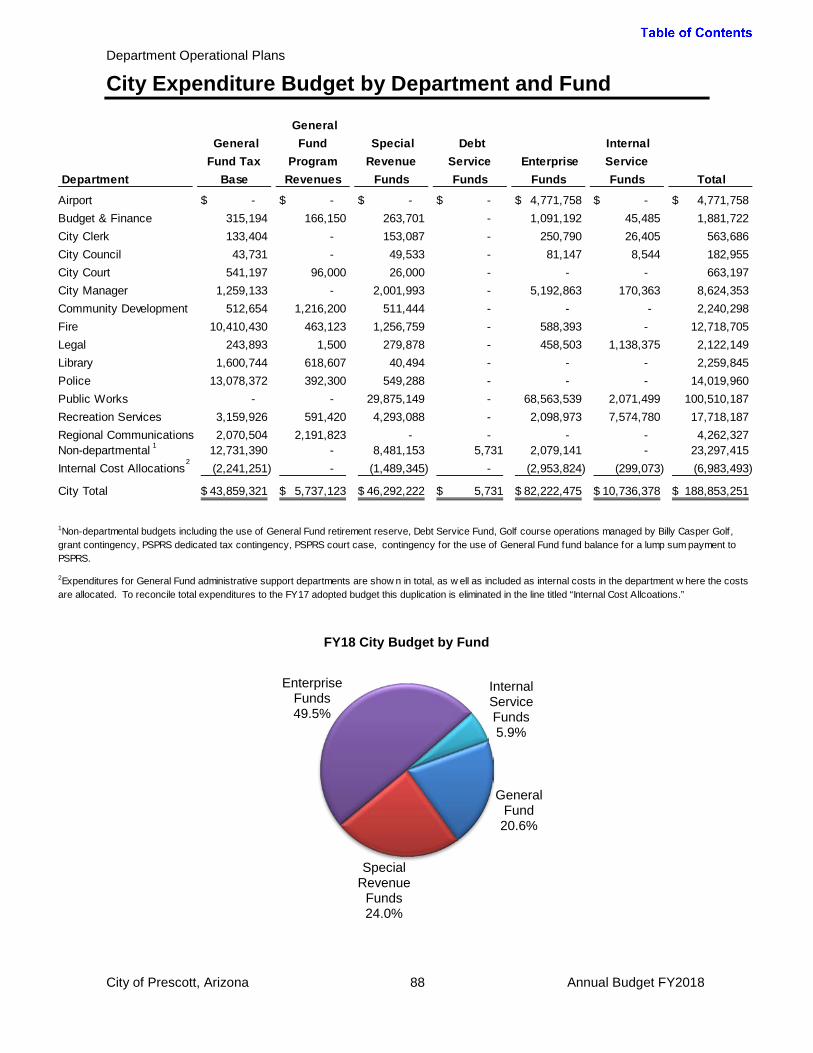
Department Operational Plans
City Expenditure Budget by Department and Fund
City of Prescott, Arizona 88 Annual Budget FY2018
Department
General Fund Tax
Base
General Fund
Program Revenues
Special Revenue
Funds
Debt Service Funds
Enterprise Funds
Internal Service Funds Total
Airport -$ -$ -$ -$ 4,771,758$ -$ 4,771,758$ Budget & Finance 315,194 166,150 263,701 - 1,091,192 45,485 1,881,722 City Clerk 133,404 - 153,087 - 250,790 26,405 563,686 City Council 43,731 - 49,533 - 81,147 8,544 182,955 City Court 541,197 96,000 26,000 - - - 663,197 City Manager 1,259,133 - 2,001,993 - 5,192,863 170,363 8,624,353 Community Development 512,654 1,216,200 511,444 - - - 2,240,298 Fire 10,410,430 463,123 1,256,759 - 588,393 - 12,718,705 Legal 243,893 1,500 279,878 - 458,503 1,138,375 2,122,149 Library 1,600,744 618,607 40,494 - - - 2,259,845 Police 13,078,372 392,300 549,288 - - - 14,019,960 Public Works - - 29,875,149 - 68,563,539 2,071,499 100,510,187 Recreation Services 3,159,926 591,420 4,293,088 - 2,098,973 7,574,780 17,718,187 Regional Communications 2,070,504 2,191,823 - - - - 4,262,327 Non-departmental 12,731,390 - 8,481,153 5,731 2,079,141 - 23,297,415 Internal Cost Allocations (2,241,251) - (1,489,345) - (2,953,824) (299,073) (6,983,493)
City Total 43,859,321$ 5,737,123$ 46,292,222$ 5,731$ 82,222,475$ 10,736,378$ 188,853,251$
2Expenditures for General Fund administrative support departments are show n in total, as w ell as included as internal costs in the department w here the costs are allocated. To reconcile total expenditures to the FY17 adopted budget this duplication is eliminated in the line titled “Internal Cost Allcoations.”
1Non-departmental budgets including the use of General Fund retirement reserve, Debt Service Fund, Golf course operations managed by Billy Casper Golf, grant contingency, PSPRS dedicated tax contingency, PSPRS court case, contingency for the use of General Fund fund balance for a lump sum payment to PSPRS.
1
2
General Fund 20.6%
Special Revenue
Funds 24.0%
Enterprise Funds 49.5%
Internal Service Funds 5.9%
FY18 City Budget by Fund

Department Operational Plans
City Expenditure Budget by Department and Category
City of Prescott, Arizona 89 Annual Budget FY2018
Personnel 59.1%
Supplies 5.9%
Internal Charges
4.9%
Other Supplies & Services
19.0%
Debt Service 11.1%
FY18 City Operating Budget by Type
Department FTEs Personnel Supplies Internal Charges
Other Supplies & Services
Debt Service Capital Total
Airport 9.00 694,841$ 127,450$ 243,967$ 255,675$ -$ 3,449,825$ 4,771,758$ Budget & Finance 15.75 1,202,955 9,300 78,637 590,830 - - 1,881,722 City Clerk 2.75 235,058 6,825 31,853 289,950 - - 563,686 City Council 7.00 49,788 2,800 34,304 96,063 - - 182,955 City Court 6.00 432,339 9,000 11,458 210,400 - - 663,197 City Manager 28.50 2,727,604 363,250 217,560 2,330,434 705,336 2,280,169 8,624,353 Community Development 16.50 1,344,327 57,500 104,192 162,875 - 571,404 2,240,298 Fire 65.00 10,494,208 427,409 1,016,642 549,421 - 231,025 12,718,705 Legal 8.00 826,582 9,600 37,567 1,248,400 - - 2,122,149 Library 21.50 1,530,167 228,180 208,790 292,708 - - 2,259,845 Police 83.00 10,843,461 660,480 1,883,521 466,298 - 166,200 14,019,960 Public Works 154.00 12,073,695 2,503,700 7,531,236 10,278,689 8,813,395 59,309,472 100,510,187 Recreation Services 47.00 4,023,879 1,621,283 914,685 2,086,673 3,335,867 5,735,800 17,718,187 Regional Communications 30.00 2,270,300 18,350 254,177 196,900 - 1,522,600 4,262,327 Non-departmental - 19,585,728 800,492 37,073 2,868,391 5,731 - 23,297,415 Internal Cost Allocations - - - (6,983,493) - - - (6,983,493)
City Total 494.00 68,334,932$ 6,845,619$ 5,622,169$ 21,923,707$ 12,860,329$ 73,266,495$ 188,853,251$
3Full time equivalents (FTEs) include only permanent employees. In addition, the City employs temporary employees estimated at 61 FTEs.
2Expenditures for General Fund administrative support departments are show n in total, as w ell as included as internal costs in the department w here the costs are allocated. To reconcile total expenditures to the FY18 adopted budget this duplication is eliminated in the line titled “Internal Cost Allcoations.”
1Non-departmental budgets including the use of General Fund retirement reserve, Debt Service Fund, Golf course operations managed by Billy Casper Golf, grant contingency, PSPRS dedicated tax contingency, PSPRS court case, contingency for the use of General Fund fund balance for a lump sum payment to PSPRS.
3
1
2
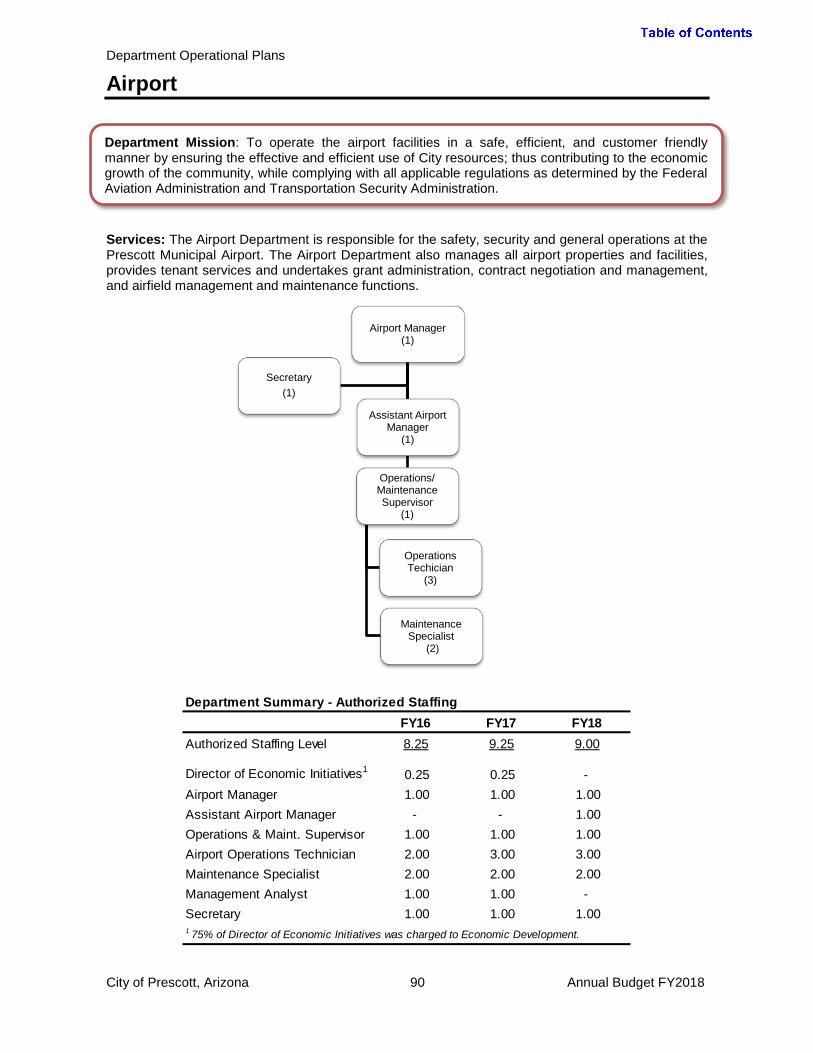
Department Operational Plans
Airport
Services: The Airport Department is responsible for the safety, security and general operations at the Prescott Municipal Airport. The Airport Department also manages all airport properties and facilities, provides tenant services and undertakes grant administration, contract negotiation and management, and airfield management and maintenance functions.
Department Summary - Authorized StaffingFY16 FY17 FY18
Authorized Staffing Level 8.25 9.25 9.00
Director of Economic Initiatives1 0.25 0.25 -Airport Manager 1.00 1.00 1.00Assistant Airport Manager - - 1.00Operations & Maint. Supervisor 1.00 1.00 1.00Airport Operations Technician 2.00 3.00 3.00Maintenance Specialist 2.00 2.00 2.00Management Analyst 1.00 1.00 -Secretary 1.00 1.00 1.001 75% of Director of Economic Initiatives was charged to Economic Development.
Department Mission: To operate the airport facilities in a safe, efficient, and customer friendly manner by ensuring the effective and efficient use of City resources; thus contributing to the economic growth of the community, while complying with all applicable regulations as determined by the Federal Aviation Administration and Transportation Security Administration.
City of Prescott, Arizona 90 Annual Budget FY2018
Airport Manager (1)
Operations/ Maintenance Supervisor
(1)
Operations Techician
(3)
Maintenance Specialist
(2)
Assistant Airport Manager
(1)
Secretary (1)
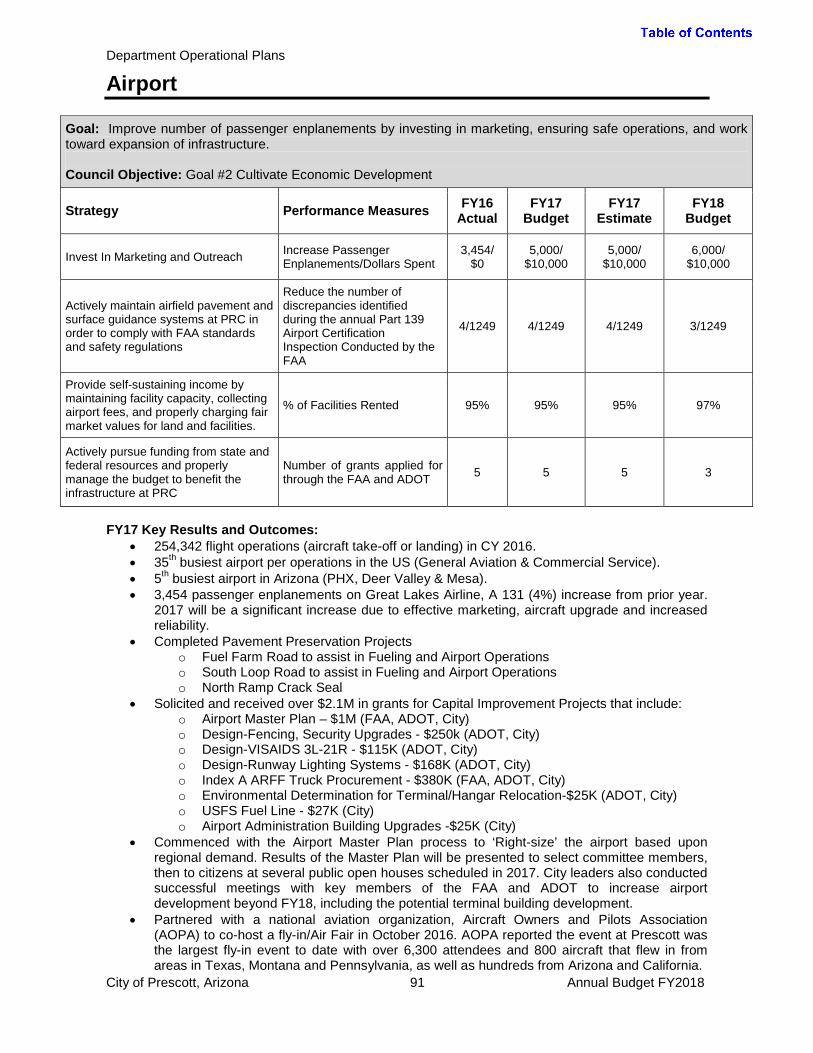
Department Operational Plans
Airport
Goal: Improve number of passenger enplanements by investing in marketing, ensuring safe operations, and work toward expansion of infrastructure. Council Objective: Goal #2 Cultivate Economic Development
Strategy Performance Measures FY16 Actual
FY17 Budget
FY17 Estimate
FY18 Budget
Invest In Marketing and Outreach Increase Passenger Enplanements/Dollars Spent
3,454/ $0
5,000/ $10,000
5,000/ $10,000
6,000/ $10,000
Actively maintain airfield pavement and surface guidance systems at PRC in order to comply with FAA standards and safety regulations
Reduce the number of discrepancies identified during the annual Part 139 Airport Certification Inspection Conducted by the FAA
4/1249 4/1249 4/1249 3/1249
Provide self-sustaining income by maintaining facility capacity, collecting airport fees, and properly charging fair market values for land and facilities.
% of Facilities Rented 95% 95% 95% 97%
Actively pursue funding from state and federal resources and properly manage the budget to benefit the infrastructure at PRC
Number of grants applied for through the FAA and ADOT 5 5 5 3
FY17 Key Results and Outcomes:
• 254,342 flight operations (aircraft take-off or landing) in CY 2016. • 35th busiest airport per operations in the US (General Aviation & Commercial Service). • 5th busiest airport in Arizona (PHX, Deer Valley & Mesa). • 3,454 passenger enplanements on Great Lakes Airline, A 131 (4%) increase from prior year.
2017 will be a significant increase due to effective marketing, aircraft upgrade and increased reliability.
• Completed Pavement Preservation Projects o Fuel Farm Road to assist in Fueling and Airport Operations o South Loop Road to assist in Fueling and Airport Operations o North Ramp Crack Seal
• Solicited and received over $2.1M in grants for Capital Improvement Projects that include: o Airport Master Plan – $1M (FAA, ADOT, City) o Design-Fencing, Security Upgrades - $250k (ADOT, City) o Design-VISAIDS 3L-21R - $115K (ADOT, City) o Design-Runway Lighting Systems - $168K (ADOT, City) o Index A ARFF Truck Procurement - $380K (FAA, ADOT, City) o Environmental Determination for Terminal/Hangar Relocation-$25K (ADOT, City) o USFS Fuel Line - $27K (City) o Airport Administration Building Upgrades -$25K (City)
• Commenced with the Airport Master Plan process to ‘Right-size’ the airport based upon regional demand. Results of the Master Plan will be presented to select committee members, then to citizens at several public open houses scheduled in 2017. City leaders also conducted successful meetings with key members of the FAA and ADOT to increase airport development beyond FY18, including the potential terminal building development.
• Partnered with a national aviation organization, Aircraft Owners and Pilots Association (AOPA) to co-host a fly-in/Air Fair in October 2016. AOPA reported the event at Prescott was the largest fly-in event to date with over 6,300 attendees and 800 aircraft that flew in from areas in Texas, Montana and Pennsylvania, as well as hundreds from Arizona and California.
City of Prescott, Arizona 91 Annual Budget FY2018
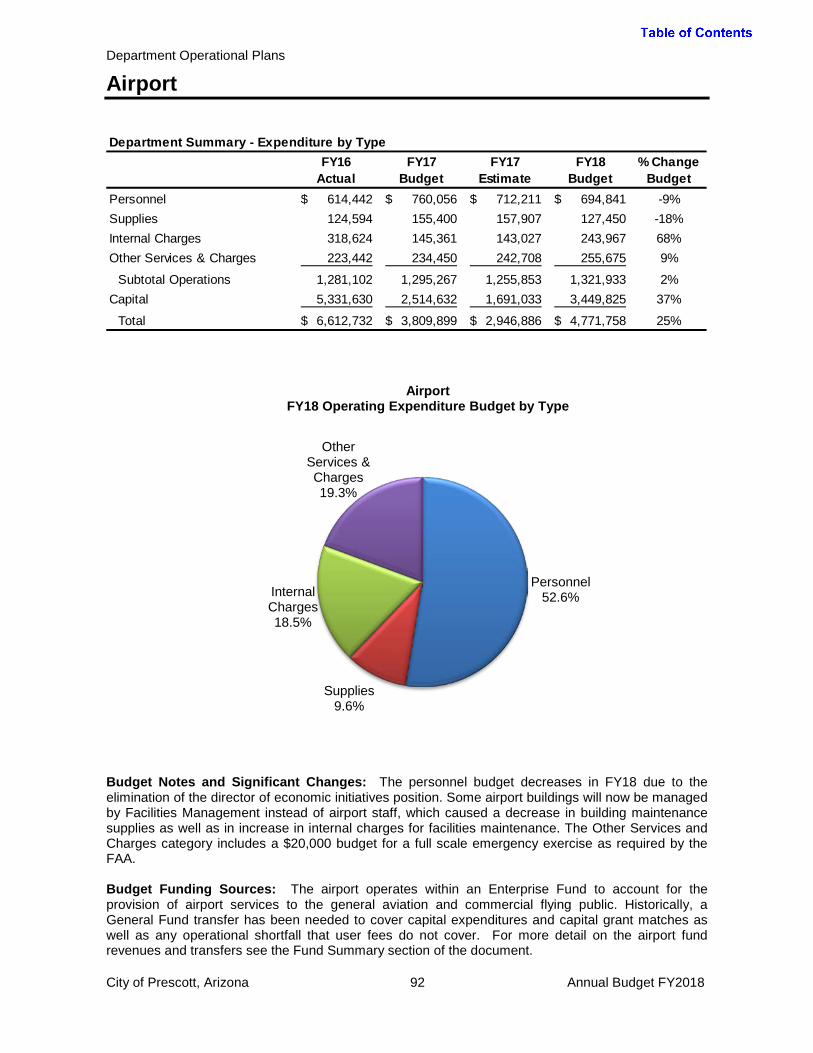
Department Operational Plans
Airport
Budget Notes and Significant Changes: The personnel budget decreases in FY18 due to the elimination of the director of economic initiatives position. Some airport buildings will now be managed by Facilities Management instead of airport staff, which caused a decrease in building maintenance supplies as well as in increase in internal charges for facilities maintenance. The Other Services and Charges category includes a $20,000 budget for a full scale emergency exercise as required by the FAA. Budget Funding Sources: The airport operates within an Enterprise Fund to account for the provision of airport services to the general aviation and commercial flying public. Historically, a General Fund transfer has been needed to cover capital expenditures and capital grant matches as well as any operational shortfall that user fees do not cover. For more detail on the airport fund revenues and transfers see the Fund Summary section of the document.
Department Summary - Expenditure by TypeFY16
ActualFY17
BudgetFY17
EstimateFY18
Budget% Change
BudgetPersonnel 614,442$ 760,056$ 712,211$ 694,841$ -9%Supplies 124,594 155,400 157,907 127,450 -18%Internal Charges 318,624 145,361 143,027 243,967 68%Other Services & Charges 223,442 234,450 242,708 255,675 9%
Subtotal Operations 1,281,102 1,295,267 1,255,853 1,321,933 2%Capital 5,331,630 2,514,632 1,691,033 3,449,825 37%
Total 6,612,732$ 3,809,899$ 2,946,886$ 4,771,758$ 25%
Personnel 52.6%
Supplies 9.6%
Internal Charges 18.5%
Other Services & Charges 19.3%
Airport FY18 Operating Expenditure Budget by Type
City of Prescott, Arizona 92 Annual Budget FY2018

Department Operational Plans
Airport
Capital Budget Notes: The airport capital projects have significant grant funding through the Federal Aviation Administration (FAA) and the Arizona Department of Transportation (ADOT). See the Capital Budget Section of this document for descriptions of each project as well as the Five-Year Capital Plan.
Description FY18
Budget Federal
Grant State Grant City Share
Funded by City Only
Airport Pavement Preservation Program - City 100,000$ -$ -$ 100,000$
Economic Impact Study 50,000 - - 50,000
FAA Tech Operations Facility - Building Upgrades 50,000 - - 50,000
Subtotal, City Only 200,000 - - 200,000 Grant Funded Projects
Security Upgrades 2,000,000 1,900,000 50,000 50,000
Airport Master Plan 520,000 494,000 13,000 13,000
Airport Pavement Maintenance Program - ADOT 350,000 - 315,000 35,000
RWY 3L PAPI and 21R PAPI Both Ends 195,000 - 175,500 19,500
New Equipment - Snow Broom 184,825 175,575 4,625 4,625
Subtotal, Grant Projects 3,249,825 2,569,575 558,125 122,125
Total, All Projects 3,449,825$ 2,569,575$ 558,125$ 322,125$
Airport Capital Outlay/Projects Detail
City of Prescott, Arizona 93 Annual Budget FY2018
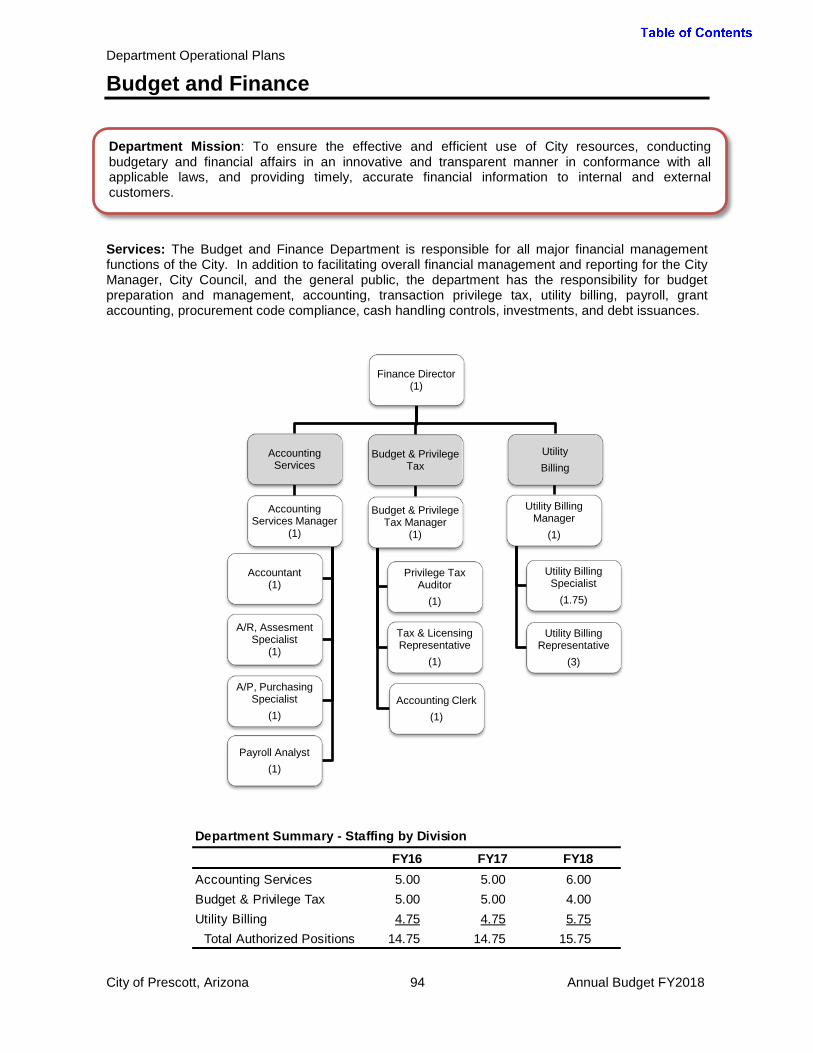
Department Operational Plans
Budget and Finance
Services: The Budget and Finance Department is responsible for all major financial management functions of the City. In addition to facilitating overall financial management and reporting for the City Manager, City Council, and the general public, the department has the responsibility for budget preparation and management, accounting, transaction privilege tax, utility billing, payroll, grant accounting, procurement code compliance, cash handling controls, investments, and debt issuances.
Department Summary - Staffing by Division
FY16 FY17 FY18Accounting Services 5.00 5.00 6.00Budget & Privilege Tax 5.00 5.00 4.00Utility Billing 4.75 4.75 5.75
Total Authorized Positions 14.75 14.75 15.75
Department Mission: To ensure the effective and efficient use of City resources, conducting budgetary and financial affairs in an innovative and transparent manner in conformance with all applicable laws, and providing timely, accurate financial information to internal and external customers.
City of Prescott, Arizona 94 Annual Budget FY2018
Finance Director (1)
Accounting Services
Accounting Services Manager
(1)
Accountant (1)
A/R, Assesment Specialist
(1)
A/P, Purchasing Specialist
(1)
Payroll Analyst (1)
Budget & Privilege Tax
Budget & Privilege Tax Manager
(1)
Privilege Tax Auditor
(1)
Tax & Licensing Representative
(1)
Accounting Clerk (1)
Utility Billing
Utility Billing Manager
(1)
Utility Billing Specialist
(1.75)
Utility Billing Representative
(3)

Department Operational Plans
Budget and Finance
Department Summary - Expenditure by TypeFY16
ActualFY17
BudgetFY17
EstimateFY18
Budget% Change
BudgetPersonnel 1,012,457$ 1,101,045$ 1,150,732$ 1,202,955$ 9%Supplies 9,745 9,600 9,644 9,300 -3%Internal Charges 166,079 77,649 74,547 78,637 1%Other Services & Charges 506,510 743,628 527,610 590,830 -21%
Total Operations 1,694,791 1,931,922 1,762,533 1,881,722 -3%
Department Summary - Operations Expenditure by DivisionFY16
ActualFY17
BudgetFY17
EstimateFY18
Budget% Change
BudgetAccounting Services 626,797$ 591,006$ 660,332$ 703,883$ 19%Budget & Privilege Tax 517,333 745,499 515,596 518,648 -30%Utility Billing 550,661 595,417 586,605 659,191 11%
Total 1,694,791$ 1,931,922$ 1,762,533$ 1,881,722$ -3%
City of Prescott, Arizona 95 Annual Budget FY2018
Personnel 63.9% Supplies
8.9%
Internal Charges
3.7%
Other Services & Charges 23.4%
Budget and Finance FY18 Operating Expenditure Budget by Type

Department Operational Plans
Budget and Finance
Department Funding Sources: The Budget and Finance Department is funded through multiple funds. Per budget policy and to present the full cost of providing services, general fund internal support is allocated to Enterprise Funds, Internal Service Funds and Special Revenue Funds that benefit from the services being provided. For the Accounting Services and Budget and Privilege Tax Divisions, the General Fund net impact (proposed budget less projected program revenues) is allocated to other City operating units outside the General Fund on the proportion of budget basis. For Utility Billing, one third of operating costs are allocated to the Wastewater Fund, one third to the Solid Waste fund, and one third remains in the Water Fund. Licenses and Permits revenues decrease in FY18 with a more realistic estimate of the newly adopted business fees. Charges for services decrease as a result of lowering the City’s transaction privilege tax license fee from $25 to $5.
Department Summary - Funding SourcesFY16
ActualFY17
BudgetFY17
EstimateFY18
Budget% Change
BudgetGeneral Fund Source of Funds
Tax Base 323,011$ 325,801$ 189,936$ 315,194$ -3%Licenses & Permits 34,206 377,000 168,650 150,650 -60%Charges for Services 34,065 30,500 25,500 15,500 -49%
General Fund Budget 391,282 733,301 384,086 481,344 -34%Special Revenue Funds 216,808 199,397 261,752 263,701 32%Enterprise Funds 1,047,570 955,517 1,059,320 1,091,192 14%Internal Service Funds 39,131 43,707 57,375 45,485 4%
Total 1,694,791$ 1,931,922$ 1,762,533$ 1,881,722$ -3%
General Fund Tax Base
16.8% General Fund Program
Revenues 8.8%
Special Revenue Funds 14.0%
Enterprise Funds 58.0%
Internal Service Funds 2.4%
Budget & Finance Funding Sources FY18 Budget
City of Prescott, Arizona 96 Annual Budget FY2018

Department Operational Plans
Budget and Finance
Accounting Services
Services: The Accounting Services Division provides support services in the areas of Internal Control, Fixed Assets, Accounts Payable, General Revenues, Purchasing, Payroll, Treasury Management, Debt Financing, Grant Management, and Financial Reporting per Federal and State Standards. Goal: Goal: Apply innovative financial solutions to deliver efficient, effective, and economic accounting support. Council Objective: Goal #4 Maintain and Promote a Customer Service Culture
Strategy Performance Measures FY16 Actual
FY17 Budget
FY17 Estimate
FY18 Budget
Provide effective and efficient accounting and financial support through the use of innovative and creative approaches
Purchases paid by credit card with a corresponding decreasing use of check or wire payments.
• Volume • % of Volume Total • % of Dollar Total
14,722 50.5% 3.9%
16,200 56.8% 5.0%
13,930 51.2% 3.7%
15,000 52.6% 4.5%
Goal: Provide sound financial management Council Objective: Goal #1 Stabilize the General Fund
Strategy Performance Measures FY16 Actual
FY17 Budget
FY17 Estimate
FY18 Budget
Maintain strong financial policies and management practices to safeguard the City’s financial position and minimize borrowing cost.
Bond rating General Obligation / Excise tax bonds Standard & Poor’s Moody’s Fitch
AA/AA Aa2/Aa3 AA/AA
Maintain strong rating
AA/AA Aa2/Aa3 AA/AA
Maintain strong rating
Manage the City’s investments in accordance with the investment policy while obtaining high yields
Investment earnings rate over investment policy bench mark (BM) Citywide earnings rate 3 mo. US Treasury rate (BM)
1.30% 0.25%
1.50% NA
1.00% 0.50%
1.00% NA
Division Mission: Maintain the City's overall financial stability through sound financial planning and management. We are committed to the highest standards of accountability, accuracy, timeliness, and professionalism and innovation in providing financial services that not only meet but exceed the expectations of those we serve.
City of Prescott, Arizona 97 Annual Budget FY2018

Department Operational Plans
Budget and Finance
FY17 Key Results and Outcomes:
• Received the Government Finance Officers Association (GFOA) of the United States and Canada Distinguished Budget Presentation Award (highest form of recognition) for the fifteenth year in a row.
• Received the Certificate of Achievement for Excellence in Financial Reporting from the Government Finance Officers Association (GFOA) of the United States and Canada for the City’s Comprehensive Annual Financial Report for the thirty-fifth year in a row.
Budget Notes and Significant Changes: The payroll function moved to this division midyear FY 17. This increased both the Personnel with the movement of a position, and other services and charges with the movement of software costs. .
Accounting ServicesExpenditure Summary
FY16 Actual
FY17 Budget
FY17 Estimate
FY18 Budget
% Change Budget
Personnel 441,273$ 458,542$ 531,697$ 544,920$ 19%Supplies 4,843 3,000 2,700 2,600 -13%Internal Charges 77,284 21,464 20,629 20,113 -6%Other Services & Charges 103,397 108,000 105,306 136,250 26%
Total, Operations 626,797$ 591,006$ 660,332$ 703,883$ 19%
Authorized Staffing SummaryFY16 FY17 FY18
Authorized Staffing Level 5.00 5.00 6.00
Finance Director 1.00 1.00 1.00Accounting Services Manager 1.00 1.00 1.00Accountant 1.00 1.00 1.00AP/Purchasing Specialist 1.00 1.00 1.00AR/Assessment Specialist 1.00 1.00 1.00Payroll Analyst - - 1.00
Goal: Prepare financial documents in accordance with the best-recognized principles and standards to achieve distinction in reporting. Council Objective: Goal #4 Maintain and Promote a Customer Service Culture
Strategy Performance Measures FY16 Actual
FY17 Budget
FY17 Estimate
FY18 Budget
Coordinate the annual financial audit maintaining accuracy, consistency and integrity
Maintain unqualified audit opinion and award of GFOA Certificate of Achievement in Financial Reporting
Yes Year 35
Yes Year 36
Yes Year 36
Yes Year 37
City of Prescott, Arizona 98 Annual Budget FY2018

Department Operational Plans
Budget and Finance
Budget & Privilege Tax
Services: The Budget and Privilege Tax Division provides taxpayer assistance and education on City Tax Code and reporting to the Arizona Department of Revenue (ADOR), analyzes ADOR provided data for taxability trends and compliance, and performs compliance audits. Also, the division is responsible for City business license compliance and issuance. Additional duties include the City-wide switchboard, receptionist support in City Hall, and the centralized mail room. Finally, the Division facilitates the annual budget preparation process by assisting departments with budget requests, compiling budget workshop materials, analyzing budget changes, assisting with revenue forecasts, and assembling the annual budget document. Goal: Produce a comprehensive, user-friendly budget document that meets the criteria prescribed by the Government Finance Officers Association (GFOA). Council Objective: Goal #4 Maintain and Promote a Customer Service Culture
Strategy Performance Measures FY16 Actual
FY17 Budget
FY17 Estimate
FY18 Budget
Follow the guidelines and best practices established by the GFOA.
Receive the GFOA annual budget award
Yes Year 14
Yes Year 15
Yes Year 15
Yes Year 16
Goal: Increase the number of businesses complying with the new City of Prescott business license requirement. Council Objective: Goal #4 Maintain and Promote a Customer Service Culture
Strategy Performance Measures FY16 Actual
FY17 Budget
FY17 Estimate
FY18 Budget
Educate business owners on the new requirement through mailings, media outreach, and canvassing
Number of Business License: In City limits licenses Out of City limit licenses Total licenses
*N/A *N/A 2,000 1,000 3,000
5,000 1,500 6,500
*New measure, the business license requirement was new effective January 1, 2017
Division Mission: To promote voluntary tax and license compliance through systematic programs designed to educate the community in a fair, equitable, and cost-effective manner. To facilitate the internal budget preparation process, ensure compliance with applicable laws, and produce a high quality budget document.
City of Prescott, Arizona 99 Annual Budget FY2018
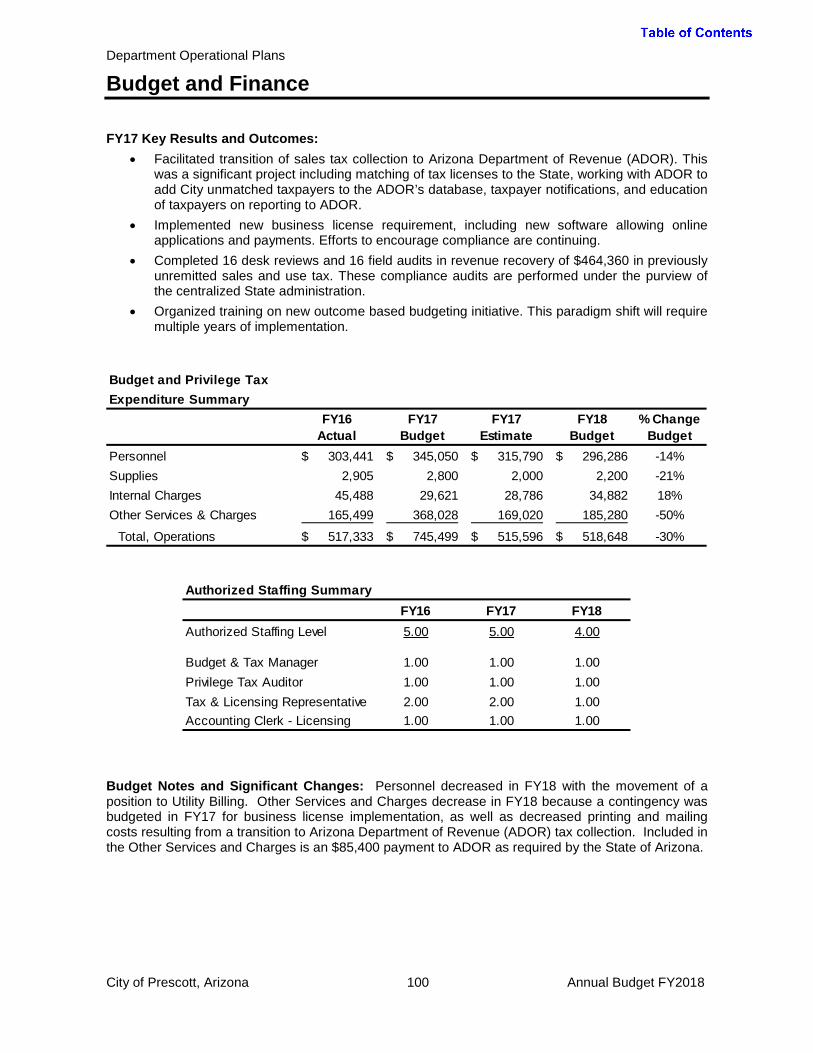
Department Operational Plans
Budget and Finance
FY17 Key Results and Outcomes:
• Facilitated transition of sales tax collection to Arizona Department of Revenue (ADOR). This was a significant project including matching of tax licenses to the State, working with ADOR to add City unmatched taxpayers to the ADOR’s database, taxpayer notifications, and education of taxpayers on reporting to ADOR.
• Implemented new business license requirement, including new software allowing online applications and payments. Efforts to encourage compliance are continuing.
• Completed 16 desk reviews and 16 field audits in revenue recovery of $464,360 in previously unremitted sales and use tax. These compliance audits are performed under the purview of the centralized State administration.
• Organized training on new outcome based budgeting initiative. This paradigm shift will require multiple years of implementation.
Budget Notes and Significant Changes: Personnel decreased in FY18 with the movement of a position to Utility Billing. Other Services and Charges decrease in FY18 because a contingency was budgeted in FY17 for business license implementation, as well as decreased printing and mailing costs resulting from a transition to Arizona Department of Revenue (ADOR) tax collection. Included in the Other Services and Charges is an $85,400 payment to ADOR as required by the State of Arizona.
Budget and Privilege Tax Expenditure Summary
FY16 Actual
FY17 Budget
FY17 Estimate
FY18 Budget
% Change Budget
Personnel 303,441$ 345,050$ 315,790$ 296,286$ -14%Supplies 2,905 2,800 2,000 2,200 -21%Internal Charges 45,488 29,621 28,786 34,882 18%Other Services & Charges 165,499 368,028 169,020 185,280 -50%
Total, Operations 517,333$ 745,499$ 515,596$ 518,648$ -30%
Authorized Staffing SummaryFY16 FY17 FY18
Authorized Staffing Level 5.00 5.00 4.00
Budget & Tax Manager 1.00 1.00 1.00Privilege Tax Auditor 1.00 1.00 1.00Tax & Licensing Representative 2.00 2.00 1.00Accounting Clerk - Licensing 1.00 1.00 1.00
City of Prescott, Arizona 100 Annual Budget FY2018

Department Operational Plans
Budget and Finance
Utility Billing
Services: The Utility Billing Division administers the billing and collection process for the City’s 24,000+ water, wastewater and solid waste accounts. In addition to billing, the Division processes service requests, changes to services, payments and pursues the collection of delinquent accounts. The Division is also responsible for managing the City’s cash handling and cashiering functions which processing all cash receipts received by the City. Goal: Produce monthly utility bills with an accurate assessment of user charges and standard billing cycle. Council Objective: Goal #4 Maintain and Promote a Customer Service Culture
Strategy Performance Measures FY16 Actual
FY17 Budget
FY17 Estimate
FY18 Budget
Prepare and monitor a read schedule for the meter readers
Average bill cycle between 28-32 days 31 30 31 31
Effectively managing the errors during the billing process through reviewing significant usage fluctuations
Keeping adjustments due to billing errors below 1% Yes Yes Yes Yes
Goal: Provide excellent customer service through cost-effective convenient payment options. Council Objective: Goal #4 Maintain and Promote a Customer Service Culture
Strategy Performance Measures FY16 Actual
FY17 Budget
FY17 Estimate
FY18 Budget
Effectively offer payment options through all points of customer contact.
Percentage of customers enrolled in auto pay 26.4% 26% 27% 29%
Percentage using online bill pay 8.2% 10% 11% 13%
Percentage of customers enrolled in email option 13.25% 9% 10% 15%
Division Mission: Provide excellent service to the City’s utility customers through accurate assessment of user charges, timely billing, and convenient payment options while protecting the City’s financial interest through assertive collection processes and appropriate controls over cash.
City of Prescott, Arizona 101 Annual Budget FY2018

Department Operational Plans
Budget and Finance
FY17 Key Results and Outcomes:
• Increased enrollment in auto pay by 7%. Currently, 6,675 customers are utilizing the service which is 27.7% of our customer base.
• Customers enrolled and using our online bill pay increased by 8%. • Customer enrollment in email program increased by 60%. • Increased account base by 324 accounts.
Budget Notes and Significant Changes: Personnel increased with the movement of a position from Budget & Privilege Tax. The position is needed because of increasing customer base as well as an increased role in processing billing for Solid Waste services.
Utility BillingExpenditure Summary
FY16 Actual
FY17 Budget
FY17 Estimate
FY18 Budget
% Change Budget
Personnel 267,743$ 297,453$ 303,245$ 361,749$ 22%Supplies 1,997 3,800 4,944 4,500 18%Internal Charges 43,307 26,564 25,132 23,614 -11%Other Services & Charges 237,614 267,600 253,284 269,300 1%
Total, Operations 550,661$ 595,417$ 586,605$ 659,163$ 11%
Authorized Staffing SummaryFY16 FY17 FY18
Authorized Staffing Level 4.75 4.75 5.75
Utility Billing Manager 1.00 1.00 1.00Utillity Billing Specialist 1.75 1.75 1.75Utility Billing Representative 2.00 2.00 3.00
City of Prescott, Arizona 102 Annual Budget FY2018

Department Operational Plans
City Clerk
Services: The primary function of the City Clerk’s Office is to provide administrative support to the Council by supplying accurate, accessible, and timely legislative information; coordinate and administer records management throughout the city; and conduct regular and special municipal elections in conformance with federal, state, and city laws and procedures.
Department Summary - StaffingFY16 FY17 FY18
Authorized Staffing Level 2.75 3.25 2.75
City Clerk 1.00 1.00 1.00Deputy City Clerk 1.00 1.00 1.00Administrative Specialist - 0.75 0.75Secretary 0.75 0.50 -
Department Mission: The mission of the City Clerk’s Office is to enable the public to fully participate in the governmental process, by providing accurate information and services in a professional manner, enabling the public to make informed decisions affecting the quality of their lives.
City of Prescott, Arizona 103 Annual Budget FY2018
City Clerk (1)
Deputy City Clerk (1)
Administrative Specialist
(0.75)
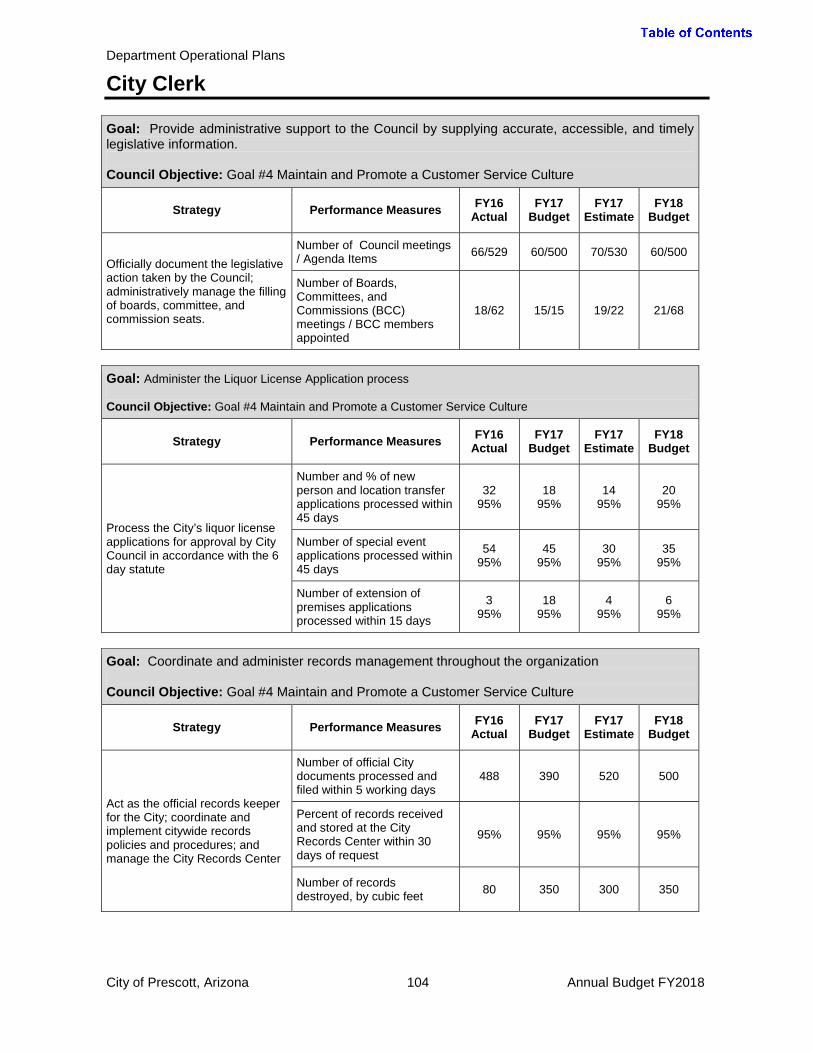
Department Operational Plans
City Clerk
Goal: Provide administrative support to the Council by supplying accurate, accessible, and timely legislative information. Council Objective: Goal #4 Maintain and Promote a Customer Service Culture
Strategy Performance Measures FY16 Actual
FY17 Budget
FY17 Estimate
FY18 Budget
Officially document the legislative action taken by the Council; administratively manage the filling of boards, committee, and commission seats.
Number of Council meetings / Agenda Items 66/529 60/500 70/530 60/500
Number of Boards, Committees, and Commissions (BCC) meetings / BCC members appointed
18/62 15/15 19/22 21/68
Goal: Administer the Liquor License Application process Council Objective: Goal #4 Maintain and Promote a Customer Service Culture
Strategy Performance Measures FY16 Actual
FY17 Budget
FY17 Estimate
FY18 Budget
Process the City’s liquor license applications for approval by City Council in accordance with the 6 day statute
Number and % of new person and location transfer applications processed within 45 days
32 95%
18 95%
14 95%
20 95%
Number of special event applications processed within 45 days
54 95%
45 95%
30 95%
35 95%
Number of extension of premises applications processed within 15 days
3 95%
18 95%
4 95%
6 95%
Goal: Coordinate and administer records management throughout the organization Council Objective: Goal #4 Maintain and Promote a Customer Service Culture
Strategy Performance Measures FY16 Actual
FY17 Budget
FY17 Estimate
FY18 Budget
Act as the official records keeper for the City; coordinate and implement citywide records policies and procedures; and manage the City Records Center
Number of official City documents processed and filed within 5 working days
488 390 520 500
Percent of records received and stored at the City Records Center within 30 days of request
95% 95% 95% 95%
Number of records destroyed, by cubic feet 80 350 300 350
City of Prescott, Arizona 104 Annual Budget FY2018

Department Operational Plans
City Clerk
FY17 Key Results and Outcomes:
• Administratively managed the City’s elections for elective offices and measures.
Budget Notes and Significant Changes: The personnel budget has decreased in FY18 as a result of personnel moving the secretary position into the City Manager’s Office. Other Services - Elections fluctuate depending on whether the City anticipates or schedules a municipal election through the Yavapai County Elections Department.
Department Summary - Expenditure by TypeFY16
ActualFY17
BudgetFY17
EstimateFY18
Budget% Change
BudgetPersonnel 206,923$ 244,980$ 219,953$ 235,058$ -4%Supplies 11,893 6,575 7,000 6,825 4%Internal Charges 46,991 32,805 32,345 31,853 -3%Other Services & Charges 55,257 63,042 69,540 67,950 8%Other Services - Elections 106,004 85,000 7,000 222,000 161%
Total Operations 427,068 432,402 335,838 563,686 30%
Personnel 41.7%
Supplies 1.2% Internal
Charges 5.7%
Other Services & Charges 12.1%
Other Services - Elections
39.4%
City Clerk FY18 Operating Expenditure Budget by Type
City of Prescott, Arizona 105 Annual Budget FY2018

Department Operational Plans
City Clerk
Department Funding Sources: The City Clerk Department is funded through multiple funds. Per budget policy and to present the full cost of providing services, general fund internal support is allocated to Enterprise Funds, Internal Service Funds and Special Revenue Funds that benefit from the services being provided. The General Fund net impact (proposed budget less projected program revenues) is allocated to other City operating units outside the General Fund on the proportion of budget basis.
Department Summary - Funding SourcesFY16
ActualFY17
BudgetFY17
EstimateFY18
Budget% Change
BudgetGeneral Fund 114,476$ 111,261$ 95,398$ 133,404$ 20%Special Revenue Funds 90,021 106,156 79,480 153,087 44%Enterprise Funds 206,327 191,716 143,538 250,790 31%Internal Service Funds 16,244 23,269 17,423 26,405 13%
Total 427,068$ 432,402$ 335,839$ 563,686$ 30%
General Fund 23.7%
Special Revenue
Funds 27.2%
Enterprise Funds 44.5%
Internal Service Funds
4.7%
City Clerk Operations Funding Sources FY18 Budget
City of Prescott, Arizona 106 Annual Budget FY2018

Department Operational Plans
City Council
Services: City Council activities include responding to citizens’ questions, concerns, and comments; preparing for Council and committee meetings; and attending civic dedications and fundraisers. City Council members also are called to chair or serve on various citizen committees; represent the City on boards or committees of County, State or intergovernmental associations; and speak to community service organizations, neighborhood associations, and the Chamber of Commerce. The City Council consists of elected officials, a mayor and six council members. In order for the Council to further carry out the Strategic Plan, it has and will focus on the following items (as well as others) according to the Strategic Plan goals:
• Goal #1 Stabilize the General Fund, provide adequate and stable funding to maintain balanced budget
o Through a vetting of many options to stabilize the General Fund, Council placed Proposition 443 on the August 2017 ballot for citizens to determine whether or not to pass a .75% sales tax increase to pay down PSPRS in 10 years or less. This will be done in conjunction with reduced spending, selling of surplus properties, and other actions as determined by Council.
• Goal #2 Economic Development
o With the help of an economic development professional, the City will have 2 economic development conferences in FY18, which will bring many leaders of technology and the cyber security industries to Prescott.
o The City is pursuing the development of a business incubator space in the downtown area as well as in partnership with ERAU and other colleges/universities.
• Goal #3 Quality of Life
o Develop at least 1 initiative per year to attract new visitors. FY18 will focus on the development of the AZ Heritage Tour in Prescott.
o Revamp tourism and economic development initiatives o Assist in the development of Pickleball courts at Pioneer Park and bring tournaments
to the area
• Goal #4 Service-Oriented Culture o Implement customer service training to the entire organization to improve service both
externally to citizens and internally between departments.
Department Mission: To serve as the legislative and policy-making body of the municipal government and have responsibility for enacting City ordinances, appropriating funds to conduct City business, and providing policy direction to the administrative staff.
City of Prescott, Arizona 107 Annual Budget FY2018
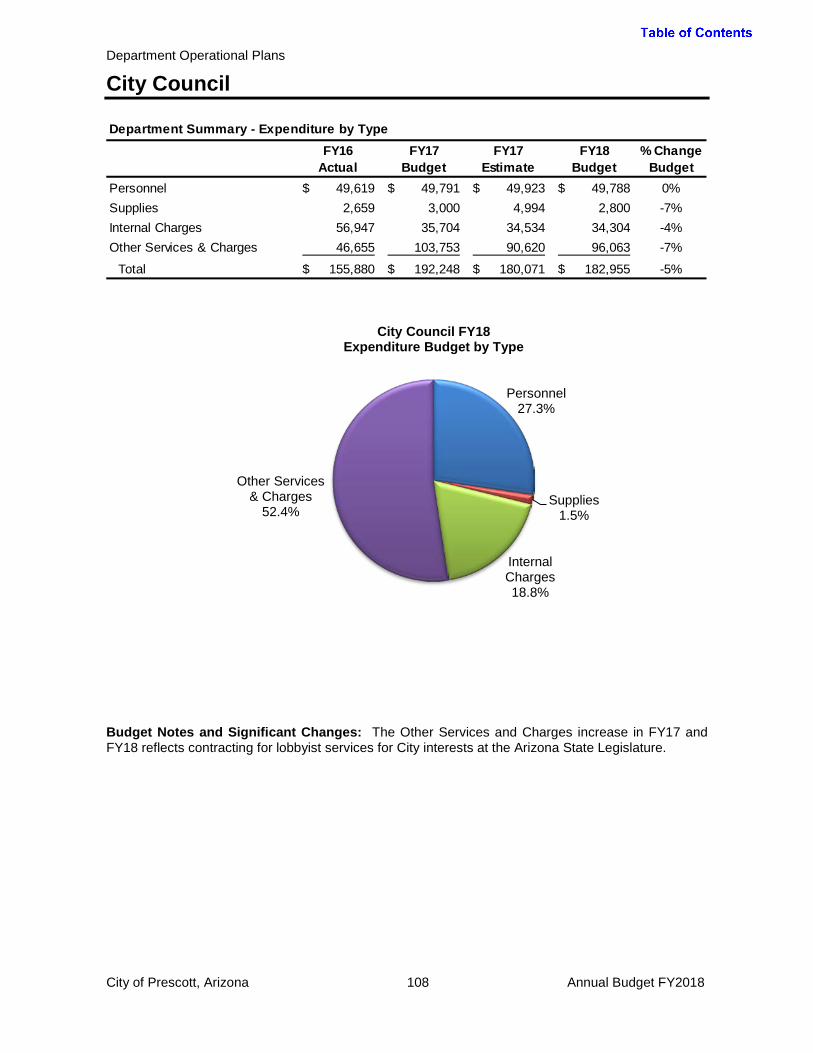
Department Operational Plans
City Council
Budget Notes and Significant Changes: The Other Services and Charges increase in FY17 and FY18 reflects contracting for lobbyist services for City interests at the Arizona State Legislature.
Department Summary - Expenditure by TypeFY16
ActualFY17
BudgetFY17
EstimateFY18
Budget% Change
BudgetPersonnel 49,619$ 49,791$ 49,923$ 49,788$ 0%Supplies 2,659 3,000 4,994 2,800 -7%Internal Charges 56,947 35,704 34,534 34,304 -4%Other Services & Charges 46,655 103,753 90,620 96,063 -7%
Total 155,880$ 192,248$ 180,071$ 182,955$ -5%
Personnel 27.3%
Supplies 1.5%
Internal Charges 18.8%
Other Services & Charges
52.4%
City Council FY18 Expenditure Budget by Type
City of Prescott, Arizona 108 Annual Budget FY2018
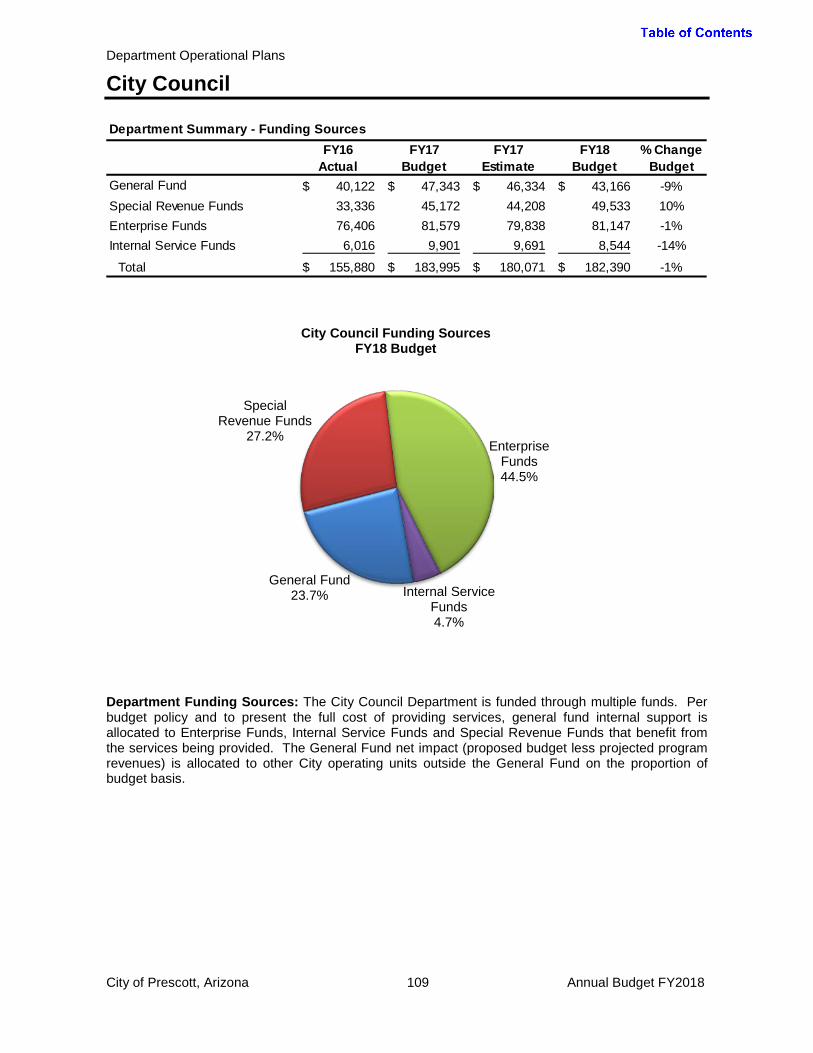
Department Operational Plans
City Council
Department Funding Sources: The City Council Department is funded through multiple funds. Per budget policy and to present the full cost of providing services, general fund internal support is allocated to Enterprise Funds, Internal Service Funds and Special Revenue Funds that benefit from the services being provided. The General Fund net impact (proposed budget less projected program revenues) is allocated to other City operating units outside the General Fund on the proportion of budget basis.
Department Summary - Funding SourcesFY16
ActualFY17
BudgetFY17
EstimateFY18
Budget% Change
BudgetGeneral Fund 40,122$ 47,343$ 46,334$ 43,166$ -9%Special Revenue Funds 33,336 45,172 44,208 49,533 10%Enterprise Funds 76,406 81,579 79,838 81,147 -1%Internal Service Funds 6,016 9,901 9,691 8,544 -14%
Total 155,880$ 183,995$ 180,071$ 182,390$ -1%
General Fund 23.7%
Special Revenue Funds
27.2% Enterprise
Funds 44.5%
Internal Service Funds 4.7%
City Council Funding Sources FY18 Budget
City of Prescott, Arizona 109 Annual Budget FY2018
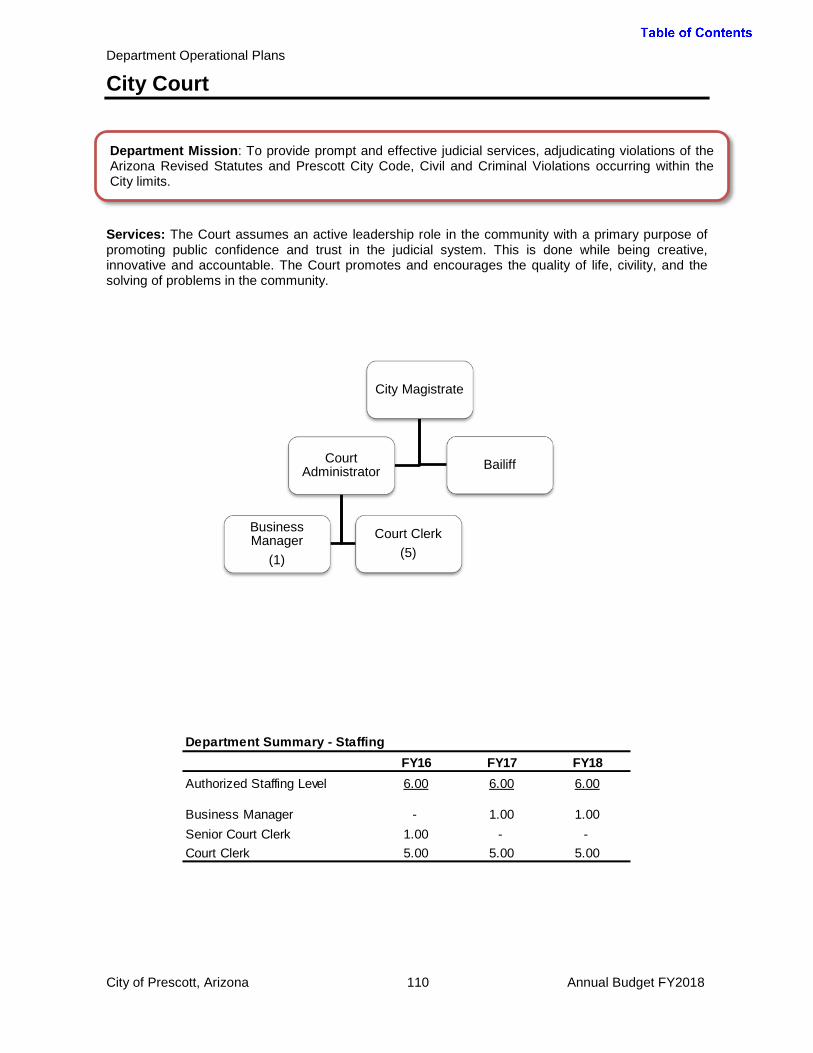
Department Operational Plans
City Court
Services: The Court assumes an active leadership role in the community with a primary purpose of promoting public confidence and trust in the judicial system. This is done while being creative, innovative and accountable. The Court promotes and encourages the quality of life, civility, and the solving of problems in the community.
Department Summary - StaffingFY16 FY17 FY18
Authorized Staffing Level 6.00 6.00 6.00
Business Manager - 1.00 1.00Senior Court Clerk 1.00 - -Court Clerk 5.00 5.00 5.00
Department Mission: To provide prompt and effective judicial services, adjudicating violations of the Arizona Revised Statutes and Prescott City Code, Civil and Criminal Violations occurring within the City limits.
City of Prescott, Arizona 110 Annual Budget FY2018
City Magistrate
Court Administrator
Business Manager
(1)
Court Clerk (5)
Bailiff

Department Operational Plans
City Court
Goal: Utilize aggressive, court-driven case management to decrease litigant time and costs. Council Objective: Goal #4 Maintain and Promote a Customer Service Culture
Strategy Performance Measures FY16 Actual
FY17 Budget
FY17 Estimate
FY18 Budget
Manage the processing of cases from inception to completion and monitor case progress to assume control of scheduling specific events from filing to disposition.
Case Closure Rates (Cases both filed and paid in full during FY)
70% *N/A *N/A 73%
Utilize case management system to identify problems and monitor caseload status.
Case Disposition Rate (Calendar Year) 94% *N/A *N/A 96%
Conduct trial management conferences on each jury trial to minimize last-minute delays.
Trial Rate (3-10% rate nationwide) 1% *N/A *N/A 1%
*Note – New CMS AJACS unable to yet create reports on those stats. Goal: Emphasize enforcement of court orders and collection efforts. Council Objective: Goal #4 Maintain and Promote a Customer Service Culture
Strategy Performance Measures FY16 Actual
FY17 Budget
FY17 Estimate
FY18 Budget
Serve victims through court-ordered restitution.
Restitution money collected by the Court for crime victims $32,500 $32,000 $32,000 $32,000
Use a collection agency on previously uncollectible accounts.
Money collected by the collection agency for old and uncollectible accounts
$93,850 $95,500 $95,500 $100,000
Goal: Continue project to reconnect court to local community. Council Objective: Goal #4 Maintain and Promote a Customer Service Culture
Strategy Performance Measures FY16 Actual
FY17 Budget
FY17 Estimate
FY18 Budget
Expand restorative justice concept by aggressive assignment of community restitution in lieu of jail.
Defendant’s assigned 940 1110 1025 1055
Restitution hours completed 10,024 13,462 13,000 13,500
Minimum wage value $85,743 $134,620 $130,000 $135,000
Incarceration savings at $70 per day $185,950 $190,500 $188,000 $195,800
City of Prescott, Arizona 111 Annual Budget FY2018
Department Operational Plans
City Court
FY17 Key Results and Outcomes: • Successfully worked with the AOC/Supreme Court to implement a new on-line payment
system option for fine and fee payments that works with the new CMS AJACS, which provides and greatly improves the convenience and customer service aspects for both the clerks and the clients.
• Continued to successfully work the process to phase out (1 year remaining) the existing legacy database program and the successful implementation of the new case management system AJACS database program that is designed for limited jurisdiction courts.
• Continued maintenance of the website link for Turbo Court which aids civil clients with on-line court forms.
• Continued successful use of a Home Detention and Alcohol Monitoring Program for the Prescott Consolidated Court.
• Continued utilization of volunteers for Civil Traffic Hearing Officers and City Council Chambers for hearings. There are currently four fully trained and active hearing officers. This program has received very positive comments from area officer in terms of professionalism and time efficiency.
• Continued use of the extremely successful Arizona Tax Interception Program that collects for city court ordered restitution and fine payment through state tax refunds.
• Updated and modernized the remaining back office of the Courts with new carpeting, paint and cubicles. Updated the break room for the clerks with a new sink, flooring, paint, cabinets and chairs.
City of Prescott, Arizona 112 Annual Budget FY2018
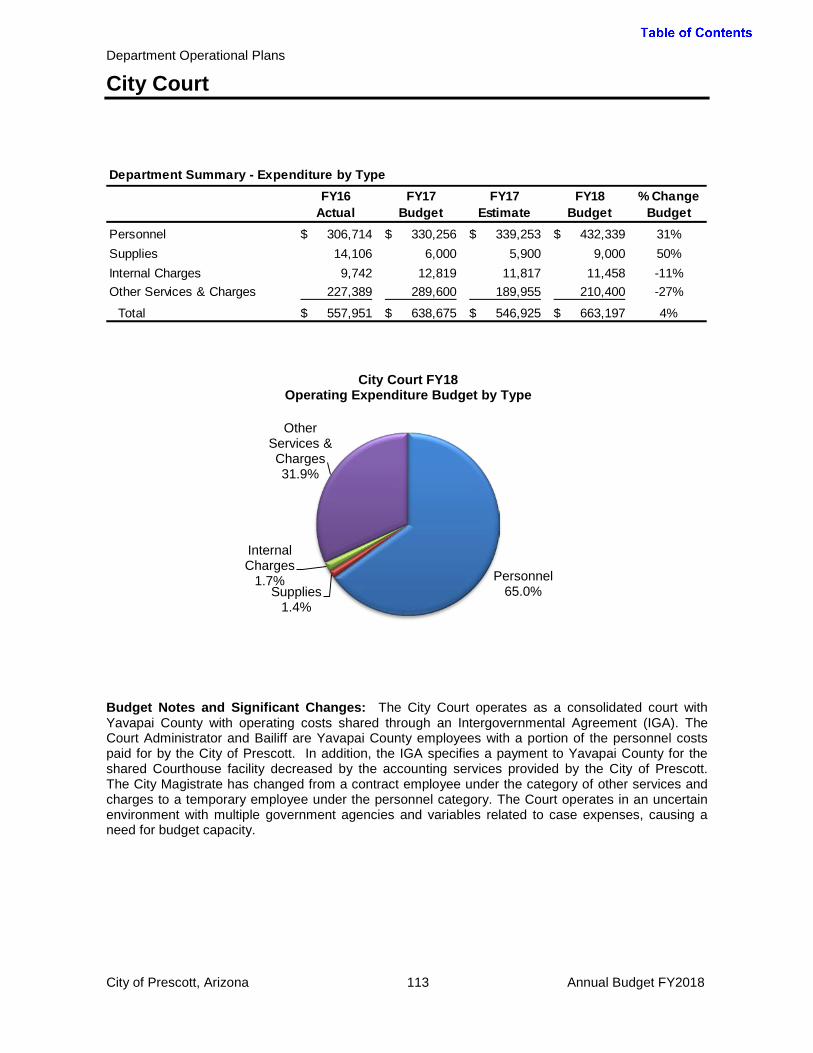
Department Operational Plans
City Court
Budget Notes and Significant Changes: The City Court operates as a consolidated court with Yavapai County with operating costs shared through an Intergovernmental Agreement (IGA). The Court Administrator and Bailiff are Yavapai County employees with a portion of the personnel costs paid for by the City of Prescott. In addition, the IGA specifies a payment to Yavapai County for the shared Courthouse facility decreased by the accounting services provided by the City of Prescott. The City Magistrate has changed from a contract employee under the category of other services and charges to a temporary employee under the personnel category. The Court operates in an uncertain environment with multiple government agencies and variables related to case expenses, causing a need for budget capacity.
Department Summary - Expenditure by TypeFY16
ActualFY17
BudgetFY17
EstimateFY18
Budget% Change
BudgetPersonnel 306,714$ 330,256$ 339,253$ 432,339$ 31%Supplies 14,106 6,000 5,900 9,000 50%Internal Charges 9,742 12,819 11,817 11,458 -11%Other Services & Charges 227,389 289,600 189,955 210,400 -27%
Total 557,951$ 638,675$ 546,925$ 663,197$ 4%
Personnel 65.0% Supplies
1.4%
Internal Charges
1.7%
Other Services & Charges 31.9%
City Court FY18 Operating Expenditure Budget by Type
City of Prescott, Arizona 113 Annual Budget FY2018
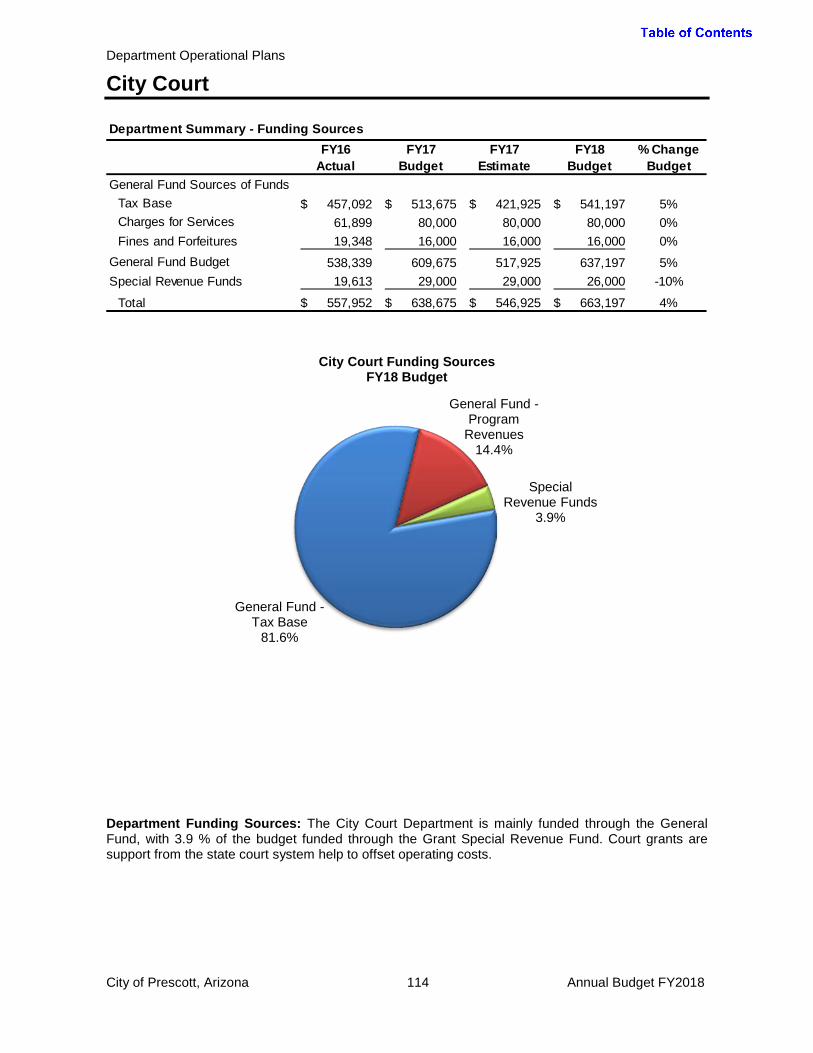
Department Operational Plans
City Court
Department Funding Sources: The City Court Department is mainly funded through the General Fund, with 3.9 % of the budget funded through the Grant Special Revenue Fund. Court grants are support from the state court system help to offset operating costs.
Department Summary - Funding SourcesFY16
ActualFY17
BudgetFY17
EstimateFY18
Budget% Change
BudgetGeneral Fund Sources of Funds
Tax Base 457,092$ 513,675$ 421,925$ 541,197$ 5%Charges for Services 61,899 80,000 80,000 80,000 0%Fines and Forfeitures 19,348 16,000 16,000 16,000 0%
General Fund Budget 538,339 609,675 517,925 637,197 5%Special Revenue Funds 19,613 29,000 29,000 26,000 -10%
Total 557,952$ 638,675$ 546,925$ 663,197$ 4%
General Fund - Tax Base
81.6%
General Fund - Program
Revenues 14.4%
Special Revenue Funds
3.9%
City Court Funding Sources FY18 Budget
City of Prescott, Arizona 114 Annual Budget FY2018
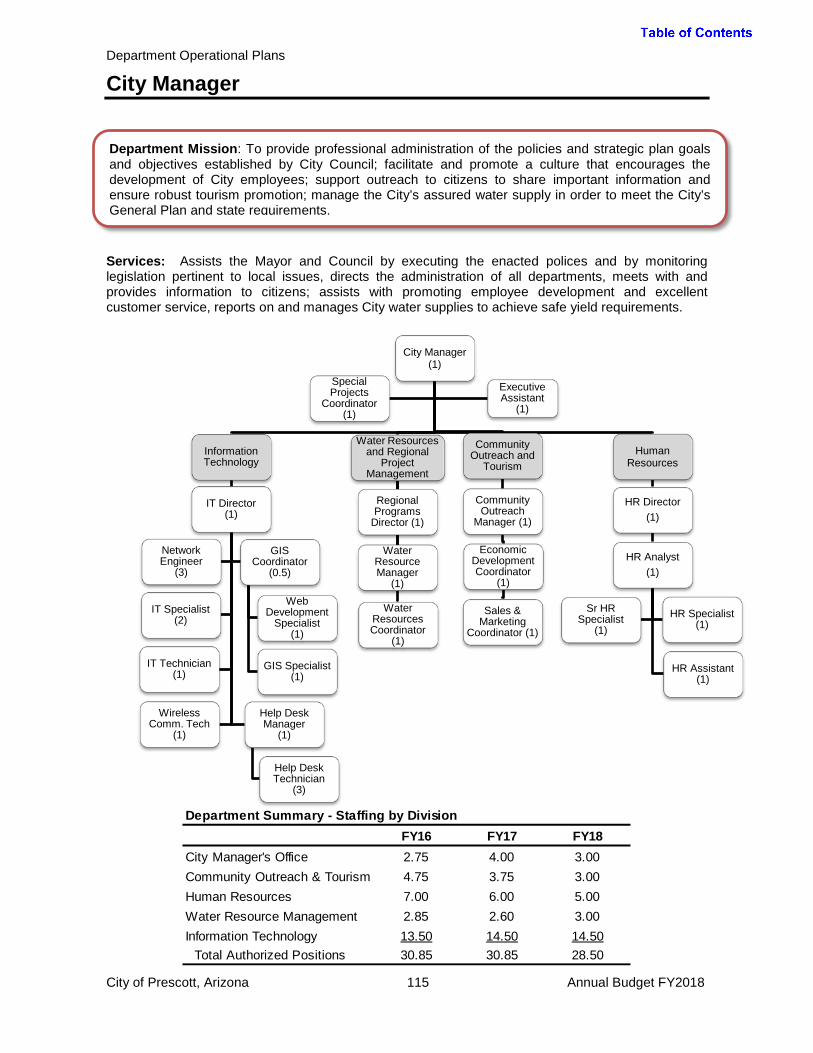
Department Operational Plans
City Manager
Services: Assists the Mayor and Council by executing the enacted polices and by monitoring legislation pertinent to local issues, directs the administration of all departments, meets with and provides information to citizens; assists with promoting employee development and excellent customer service, reports on and manages City water supplies to achieve safe yield requirements.
Department Summary - Staffing by DivisionFY16 FY17 FY18
City Manager's Office 2.75 4.00 3.00Community Outreach & Tourism 4.75 3.75 3.00Human Resources 7.00 6.00 5.00Water Resource Management 2.85 2.60 3.00Information Technology 13.50 14.50 14.50
Total Authorized Positions 30.85 30.85 28.50
Department Mission: To provide professional administration of the policies and strategic plan goals and objectives established by City Council; facilitate and promote a culture that encourages the development of City employees; support outreach to citizens to share important information and ensure robust tourism promotion; manage the City’s assured water supply in order to meet the City’s General Plan and state requirements.
City of Prescott, Arizona 115 Annual Budget FY2018
City Manager (1)
Water Resources and Regional
Project Management
Water Resource Manager
(1)
Water Resources Coordinator
(1)
Regional Programs
Director (1)
Information Technology
IT Director (1)
Network Engineer
(3)
GIS Coordinator
(0.5)
Web Development
Specialist (1)
GIS Specialist (1)
IT Specialist (2)
IT Technician (1)
Wireless Comm. Tech
(1)
Help Desk Manager
(1)
Help Desk Technician
(3)
Community Outreach and
Tourism
Community Outreach
Manager (1)
Economic Development Coordinator
(1)
Sales & Marketing
Coordinator (1)
Human Resources
HR Director (1)
HR Analyst (1)
HR Specialist (1)
Sr HR Specialist
(1)
HR Assistant (1)
Special Projects
Coordinator (1)
Executive Assistant
(1)

Department Operational Plans
City Manager
Department Summary - Expenditure by TypeFY16
ActualFY17
BudgetFY17
EstimateFY18
Budget% Change
BudgetPersonnel 2,671,337$ 3,070,690$ 2,755,264$ 2,727,604$ -11%Supplies 250,155 356,600 331,228 363,250 2%Internal Charges 326,857 215,242 225,975 217,560 1%Other Services & Charges 1,503,969 2,095,561 1,595,832 2,330,434 11%Debt Service 380,709 465,368 465,368 705,336 52%
Subtotal Operations 5,133,027 6,203,461 5,373,667 6,344,184 2%Capital 655,220 876,181 528,874 2,280,169 160%
Total 5,788,247$ 7,079,642$ 5,902,541$ 8,624,353$ 22%
Personnel 43.0%
Supplies 5.7%
Internal Charges
3.4%
Other Services & Charges 36.7%
Debt Service 11.1%
City Manager Department FY18 Operating Expenditure Budget by Type
Department Summary - Operations Expenditure by Division and CapitalFY16
ActualFY17
BudgetFY17
EstimateFY18
Budget% Change
BudgetCity Manager's Office 475,375$ 621,035$ 438,406$ 405,349$ -35%Community Outreach & Tourism 1,240,661 1,595,254 1,191,027 1,681,331 5%Human Resources 685,698 699,622 617,085 613,114 -12%
Water Resource Management 948,659 1,340,343 1,179,942 1,620,615 21%Information Technology 1,782,634 1,947,207 1,947,207 2,023,775 4%
Subtotal Operations 5,133,027 6,203,461 5,373,667 6,344,184 2%Capital 655,220 876,181 528,874 2,280,169 160%
Total 5,788,247$ 7,079,642$ 5,902,541$ 8,624,353$ 22%
City of Prescott, Arizona 116 Annual Budget FY2018

Department Operational Plans
City Manager
Department Funding Sources: The City Manager Department is funded through multiple funds. The Water Resource Management is funded fully by Enterprise Funds. Community Outreach & Tourism is funded from both general fund and the bed tax fund. Per budget policy and in order to present the full cost of providing a service, the Department’s other divisions’ costs are allocated internally. The City Manager’s Office and Information Technology is allocated to Enterprise Funds, Special Revenue and Internal Service Funds on a proportion of budget basis. Human Resources is allocated based on a cost per employee in each division throughout the City.
Department Summary - Funding SourcesFY16
ActualFY17
BudgetFY17
EstimateFY18
Budget% Change
BudgetGeneral Fund 2,215,297$ 1,595,103$ 1,342,574$ 1,259,133$ -21%Special Revenue Funds 1,008,284 1,788,320 1,447,819 2,001,993 12%Enterprise Funds 2,361,480 3,498,783 2,932,292 5,192,863 48%Internal Service Funds 203,186 197,436 179,856 170,363 -14%
Total 5,788,247$ 7,079,642$ 5,902,541$ 8,624,353$ 22%
General Fund 19.8%
Special Revenue Funds 31.6%
Enterprise Funds 45.9%
Internal Service Funds 2.7%
City Manager Operating Funding Sources FY18 Budget
City of Prescott, Arizona 117 Annual Budget FY2018

Department Operational Plans
City Manager
City Manager’s Office
Services: The City Manager’s Office assists the Mayor and Council by monitoring legislation pertinent to local issues, assisting departments in delivery of quality municipal services to internal and external customers, meeting with citizen groups, and providing information to citizens, among many other tasks. Goal: Continuously Improve Customer Service Council Objective: Goal #4 Maintain and Promote a Customer Service Culture
Strategy Performance Measures FY16 Actual
FY17 Budget
FY17 Estimate
FY18 Budget
Implement city-wide customer service training
Number of city employees receiving training N/A* N/A* 500** 50
ongoing
*New measure ** Professional training received in January 2017 to a group of 20 employees. City-wide training of all employees occurred May 2017. Goal: Be Responsive to the Council and Citizens Council Objective: Goal #4 Maintain and Promote a Customer Service Culture
Strategy Performance Measures FY15 Actual
FY16 Budget
FY16 Estimate
FY17 Budget
Quickly address Council requests for information
Fulfill 90% of requests within 3 business days N/A N/A N/A* 90%
Quickly address Citizen inquiries Fulfill 90% of inquiries within 2 business days N/A N/A N/A* 90%
*New measure FY17 Key Results and Outcomes:
• Assisted in the City Council strategic planning process • Facilitated in the discussion among the Strategic Planning Committee and City Council about
PSPRS to place a measure on the ballot to stabilize the General Fund. • Enhanced economic development efforts by contracting with a professional to leverage
existing assets in the community and continue the process of attracting jobs and businesses. • Reorganized several city services and departments to run more efficiently and effectively. • Brought about city-wide customer service training. • Enhanced code enforcement services without adding personnel.
Division Mission: To provide professional administration of the policies and objectives established by the City Council; develop alternative solutions to community problems for Council consideration; and plan programs that meet the future needs of the City.
City of Prescott, Arizona 118 Annual Budget FY2018
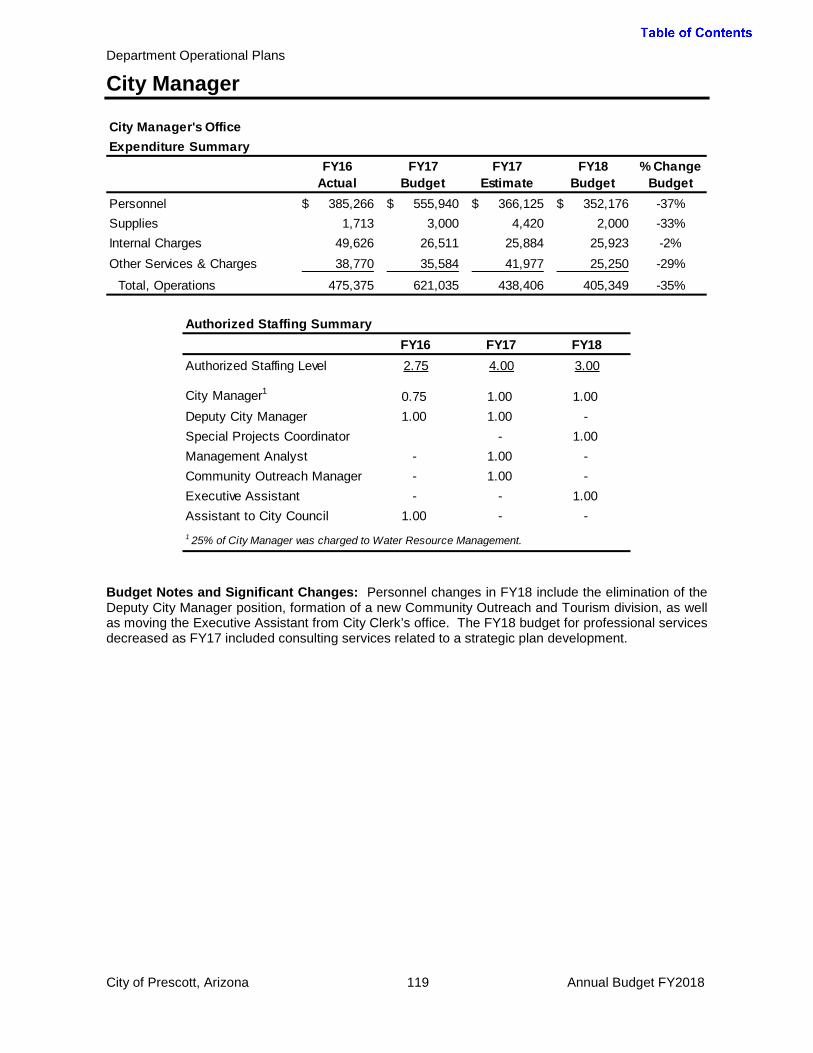
Department Operational Plans
City Manager
Budget Notes and Significant Changes: Personnel changes in FY18 include the elimination of the Deputy City Manager position, formation of a new Community Outreach and Tourism division, as well as moving the Executive Assistant from City Clerk’s office. The FY18 budget for professional services decreased as FY17 included consulting services related to a strategic plan development.
City Manager's OfficeExpenditure Summary
FY16 Actual
FY17 Budget
FY17 Estimate
FY18 Budget
% Change Budget
Personnel 385,266$ 555,940$ 366,125$ 352,176$ -37%Supplies 1,713 3,000 4,420 2,000 -33%Internal Charges 49,626 26,511 25,884 25,923 -2%Other Services & Charges 38,770 35,584 41,977 25,250 -29%
Total, Operations 475,375 621,035 438,406 405,349 -35%
Authorized Staffing SummaryFY16 FY17 FY18
Authorized Staffing Level 2.75 4.00 3.00
City Manager1 0.75 1.00 1.00Deputy City Manager 1.00 1.00 -Special Projects Coordinator - 1.00Management Analyst - 1.00 -Community Outreach Manager - 1.00 -Executive Assistant - - 1.00Assistant to City Council 1.00 - -1 25% of City Manager was charged to Water Resource Management.
City of Prescott, Arizona 119 Annual Budget FY2018
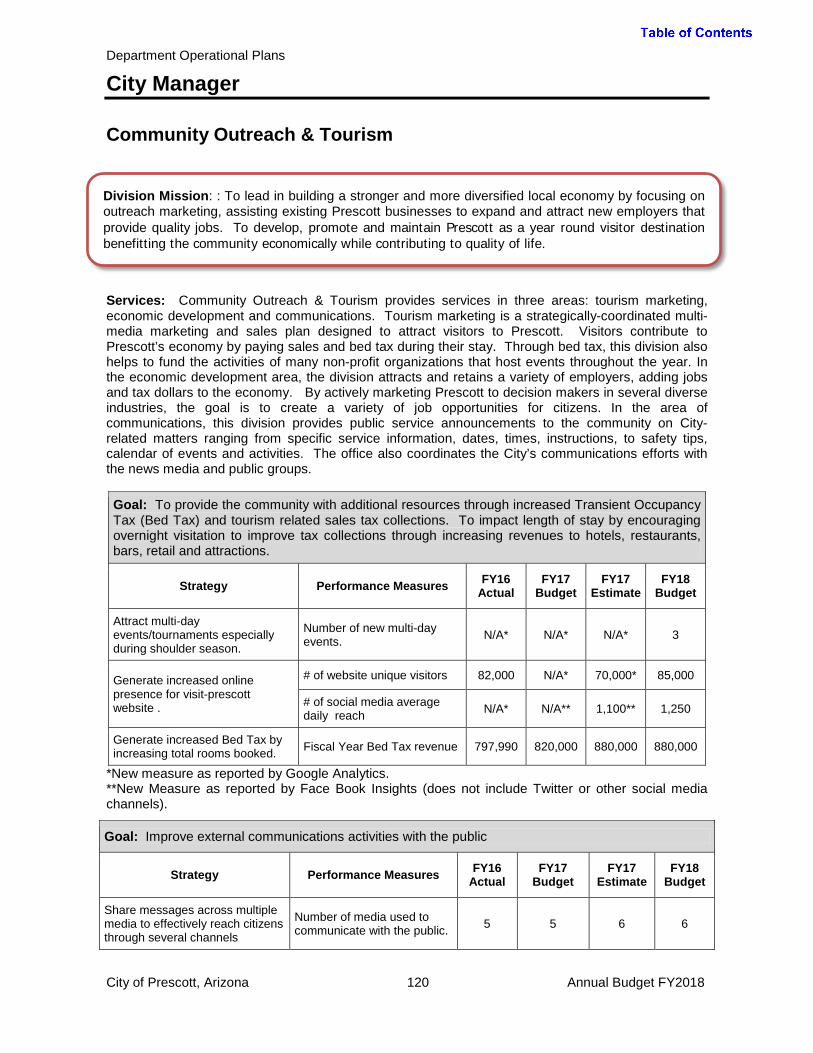
Department Operational Plans
City Manager
Community Outreach & Tourism
Services: Community Outreach & Tourism provides services in three areas: tourism marketing, economic development and communications. Tourism marketing is a strategically-coordinated multi-media marketing and sales plan designed to attract visitors to Prescott. Visitors contribute to Prescott’s economy by paying sales and bed tax during their stay. Through bed tax, this division also helps to fund the activities of many non-profit organizations that host events throughout the year. In the economic development area, the division attracts and retains a variety of employers, adding jobs and tax dollars to the economy. By actively marketing Prescott to decision makers in several diverse industries, the goal is to create a variety of job opportunities for citizens. In the area of communications, this division provides public service announcements to the community on City-related matters ranging from specific service information, dates, times, instructions, to safety tips, calendar of events and activities. The office also coordinates the City’s communications efforts with the news media and public groups. Goal: To provide the community with additional resources through increased Transient Occupancy Tax (Bed Tax) and tourism related sales tax collections. To impact length of stay by encouraging overnight visitation to improve tax collections through increasing revenues to hotels, restaurants, bars, retail and attractions.
Strategy Performance Measures FY16 Actual
FY17 Budget
FY17 Estimate
FY18 Budget
Attract multi-day events/tournaments especially during shoulder season.
Number of new multi-day events. N/A* N/A* N/A* 3
Generate increased online presence for visit-prescott website .
# of website unique visitors 82,000 N/A* 70,000* 85,000
# of social media average daily reach N/A* N/A** 1,100** 1,250
Generate increased Bed Tax by increasing total rooms booked. Fiscal Year Bed Tax revenue 797,990 820,000 880,000 880,000
*New measure as reported by Google Analytics. **New Measure as reported by Face Book Insights (does not include Twitter or other social media channels).
Goal: Improve external communications activities with the public
Strategy Performance Measures FY16 Actual
FY17 Budget
FY17 Estimate
FY18 Budget
Share messages across multiple media to effectively reach citizens through several channels
Number of media used to communicate with the public. 5 5 6 6
Division Mission: : To lead in building a stronger and more diversified local economy by focusing on outreach marketing, assisting existing Prescott businesses to expand and attract new employers that provide quality jobs. To develop, promote and maintain Prescott as a year round visitor destination benefitting the community economically while contributing to quality of life.
City of Prescott, Arizona 120 Annual Budget FY2018

Department Operational Plans
City Manager
Goal: Enhance the City’s financial health through sales tax generating businesses
Strategy Performance Measures FY16 Actual
FY17 Budget
FY17 Estimate
FY18 Budget
Market Prescott to new retailers including destination retailers
Number of companies/retailers/brokers/ developers receiving Prescott marketing information
3 4 25 30
Participate in events/ conferences geared to retailers Leads generated 1 2 3 5
Retain and assist existing retailers
Number of Business Retention/Expansion visits to retailers
N/A* N/A* 5 10
*New measure
Goal: Attract and retain quality jobs
Strategy Performance Measures FY16 Actual
FY17 Budget
FY17 Estimate
FY18 Budget
Increase Prescott’s visibility to CEOs and decisions makers, especially in venture capital and high tech firms
Number of CEO summits/conferences hosted N/A* N/A* 1 3
Market real estate opportunities to new and expanding companies
Number of companies receiving site information N/A* 6 10 12
Retain and assist existing prime/base industry employers
Number of business retention/expansion visits to employers
N/A* N/A* 5 10
*New measure FY17 Key Results and Outcomes:
• Increased online presence for Visit-Prescott Website by 10%. • Increased social media impressions for Visit Prescott Facebook Page by 10%. • Increased number of multi-day events by 2. • Increased outreach to CEO groups by 10. • Buxton retail and Tourism Data reported, and retail attraction program implemented. • Retention of Wildflower Bread Company. • Retention of Merit Saw. • Facilitated 15 television and commercial productions resulting in local spend in hotels,
retailers and restaurants. • Visited 30 hotel properties to share information for Tourism and Travel Week. • Visited 10 retailers/restaurants for retention purposes.
City of Prescott, Arizona 121 Annual Budget FY2018

Department Operational Plans
City Manager
Budget Notes and Significant Changes: This division has is new under the City Manager as a result of restructuring. Two previous were combined, Economic Development and Tourism, as well as expenditures relating to community outreach were moved out of the City Manager’s office division to this newly formed division. The personnel decrease is a result of two eliminated positions. Bed Tax Allocations are the community grants and support provided from the transient lodging additional sales tax and significantly increases as a result of an increasing appropriated use of fund balance.
Community Outreach & TourismExpenditure Summary
FY16 Actual
FY17 Budget
FY17 Estimate
FY18 Budget
% Change Budget
Personnel 449,799$ 393,456$ 369,007$ 260,186$ -34%Supplies 1,711 2,750 1,200 1,800 -35%Internal Charges 38,369 35,276 34,290 20,581 -42%Other Services & Charges 466,759 596,050 488,930 604,600 1%
Total, Operations 956,638 1,027,532 893,427 887,167 -14%Other, Bed Tax Allocations 284,023 567,722 297,600 794,164 40%
Total 1,240,661$ 1,595,254$ 1,191,027$ 1,681,331$ 5%
Authorized Staffing SummaryFY16 FY17 FY18
Authorized Staffing Level 5.75 3.75 3.00
Director of Economic Initiatives 0.75 0.75 -Community Outreach Manager - - 1.00Tourism Director 1.00 - -Tourism Manager - 1.00 -Sales & Marketing Coordinator - - 1.00Tourism Sales Manager 1.00 1.00 -
Economic Develop. Coordinator 1.00 1.00 1.00
Special Events Manager 1.00 - -
Comm. & Public Affairs Mngr 1.00 - -
City of Prescott, Arizona 122 Annual Budget FY2018

Department Operational Plans
City Manager
Human Resources
Services: The Human Resources Division assists with City-wide hiring processes, performance reviews, training, new hire orientation, classification and compensation review, implementation and administration, public safety local boards, employee relations, employee handbook and policy updates, educational assistance, benefits administration including life and health insurance, retirement, Family Medical Leave, deferred compensation and disability.
*New measure
Goal: To maintain sustainable employment levels to ensure consistent and quality delivery of services to the employees of the City of Prescott and for the citizens of Prescott. Council Objective: Goal #4 Maintain and Promote a Customer Service Culture
Strategy Performance Measures FY16 Actual
FY17 Budget
FY17 Estimate
FY18 Budget
Maintain market competitive pay and benefits, in order to recruit and retain qualified employees.
Recruitments 102 110 110 105
Number of Applications Processed 3735 4000 4000 3800
Turnover Rate (FT Turnover/FT Budgeted Employees)
17.8% 14% 14% 13%
Number of Employment Grievances/Claims/Lawsuits 1 1 1 1
Achieve a customer service rating of at least 4 out of 5 on the annual employee survey
Overall Rating N/A* N/A* N/A* 4
Division Mission: Provides services which are responsive to the individual employee and the City’s mission, vision, and core values; foster a culture which encourages the development of the City’s most valuable asset, its employees.
City of Prescott, Arizona 123 Annual Budget FY2018

Department Operational Plans
City Manager
Goal: Develop and present training Citywide to enhance the skills and development of City employees. Council Objective: Goal #4 Maintain and Promote a Customer Service Culture
Strategy Performance Measures FY16 Actual
FY17 Budget
FY17 Estimate
FY18 Budget
Provide training to all employees to improve both external and internal relations.
Number of trainings 2
trainings
15 classes
15 classes
15 classes
Provide training to supervisors to develop skills and improve accountability for employees.
Number of trainings N/A* 6 classes 6 classes 6 classes
*New measure FY17 Key Results and Outcomes:
• Implemented market competitive compensation plan. • Implemented Fair Wages and Health Families Initiative (Prop 206). • Developed, coordinated, and tracked a City wide Customer Service Training. • Continued quarterly supervisor trainings as part of new employee orientation. • Completed Successful high level recruitments for Police Chief and City Manager. • Transitioned payroll functions from Human Resources to Finance. • Implemented an online new hire and onboarding process through seamless docs. • Continued tracking of hours for Affordable Care Act reporting. • Continued tracking ASRS enrollment for variable hour employees. • On-going work with departmental supervisors to resolve employee relation issues.
City of Prescott, Arizona 124 Annual Budget FY2018
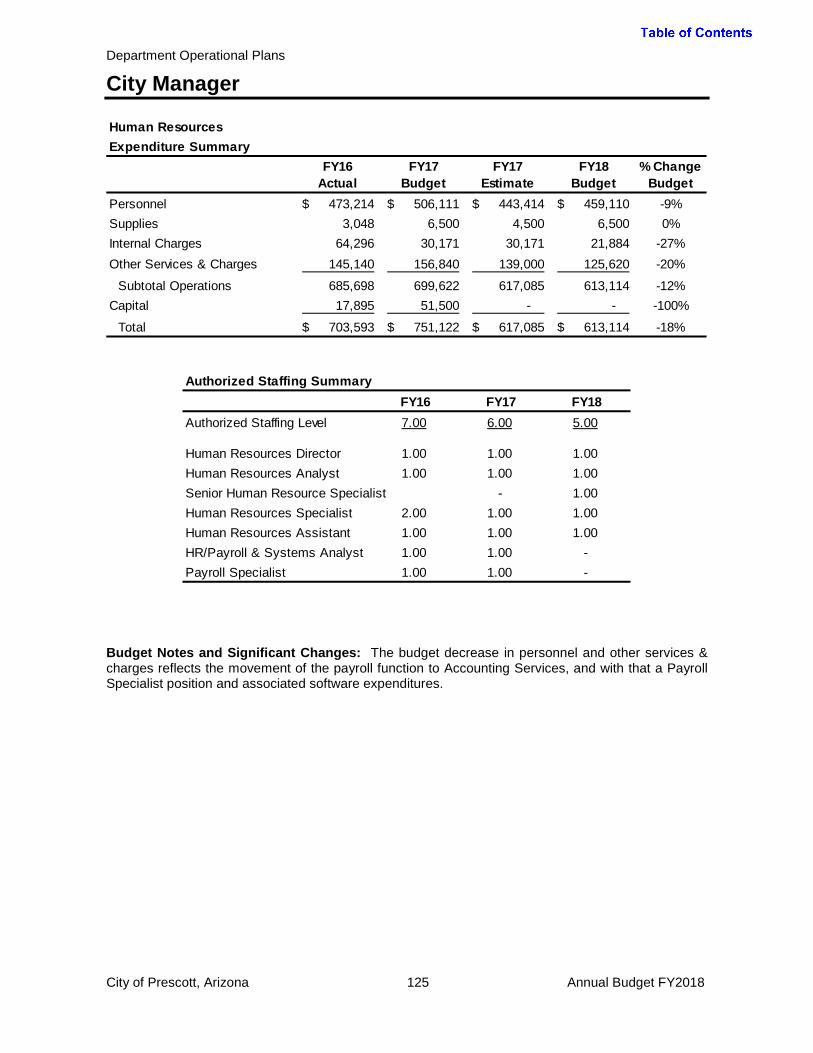
Department Operational Plans
City Manager
Budget Notes and Significant Changes: The budget decrease in personnel and other services & charges reflects the movement of the payroll function to Accounting Services, and with that a Payroll Specialist position and associated software expenditures.
Human ResourcesExpenditure Summary
FY16 Actual
FY17 Budget
FY17 Estimate
FY18 Budget
% Change Budget
Personnel 473,214$ 506,111$ 443,414$ 459,110$ -9%Supplies 3,048 6,500 4,500 6,500 0%Internal Charges 64,296 30,171 30,171 21,884 -27%Other Services & Charges 145,140 156,840 139,000 125,620 -20%
Subtotal Operations 685,698 699,622 617,085 613,114 -12%Capital 17,895 51,500 - - -100%
Total 703,593$ 751,122$ 617,085$ 613,114$ -18%
Authorized Staffing SummaryFY16 FY17 FY18
Authorized Staffing Level 7.00 6.00 5.00
Human Resources Director 1.00 1.00 1.00Human Resources Analyst 1.00 1.00 1.00Senior Human Resource Specialist - 1.00Human Resources Specialist 2.00 1.00 1.00Human Resources Assistant 1.00 1.00 1.00HR/Payroll & Systems Analyst 1.00 1.00 -Payroll Specialist 1.00 1.00 -
City of Prescott, Arizona 125 Annual Budget FY2018
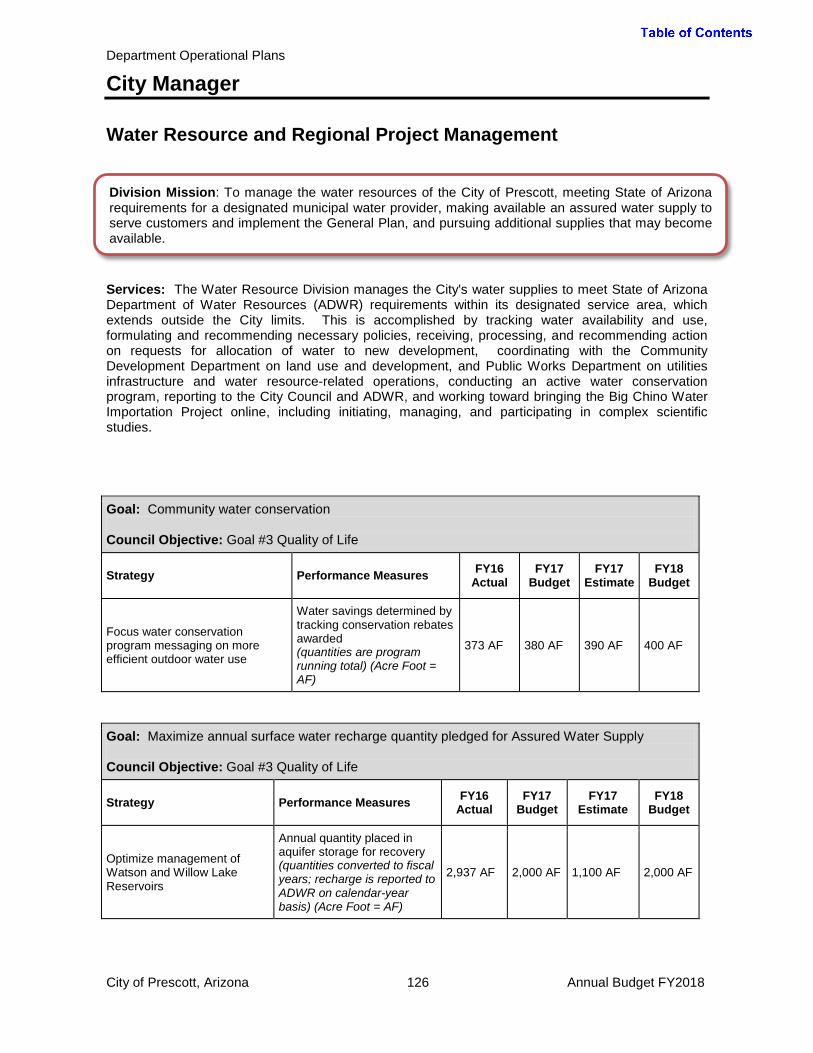
Department Operational Plans
City Manager
Water Resource and Regional Project Management
Services: The Water Resource Division manages the City's water supplies to meet State of Arizona Department of Water Resources (ADWR) requirements within its designated service area, which extends outside the City limits. This is accomplished by tracking water availability and use, formulating and recommending necessary policies, receiving, processing, and recommending action on requests for allocation of water to new development, coordinating with the Community Development Department on land use and development, and Public Works Department on utilities infrastructure and water resource-related operations, conducting an active water conservation program, reporting to the City Council and ADWR, and working toward bringing the Big Chino Water Importation Project online, including initiating, managing, and participating in complex scientific studies. Goal: Community water conservation Council Objective: Goal #3 Quality of Life
Strategy Performance Measures FY16 Actual
FY17 Budget
FY17 Estimate
FY18 Budget
Focus water conservation program messaging on more efficient outdoor water use
Water savings determined by tracking conservation rebates awarded (quantities are program running total) (Acre Foot = AF)
373 AF 380 AF 390 AF 400 AF
Goal: Maximize annual surface water recharge quantity pledged for Assured Water Supply Council Objective: Goal #3 Quality of Life
Strategy Performance Measures FY16 Actual
FY17 Budget
FY17 Estimate
FY18 Budget
Optimize management of Watson and Willow Lake Reservoirs
Annual quantity placed in aquifer storage for recovery (quantities converted to fiscal years; recharge is reported to ADWR on calendar-year basis) (Acre Foot = AF)
2,937 AF 2,000 AF 1,100 AF 2,000 AF
Division Mission: To manage the water resources of the City of Prescott, meeting State of Arizona requirements for a designated municipal water provider, making available an assured water supply to serve customers and implement the General Plan, and pursuing additional supplies that may become available.
City of Prescott, Arizona 126 Annual Budget FY2018

Department Operational Plans
City Manager
Goal: Seek Arizona Department of Water Resources (ADWR) recognition of all groundwater eligible for grandfathered status Council Objective: Goal #3 Quality of Life
Strategy Performance Measures FY16 Actual
FY17 Budget
FY17 Estimate
FY18 Budget
Audit of properties eligible for grandfathered groundwater, provision to and recognition by ADWR
Total quantity of recognized grandfathered groundwater (quantities are running total) (Acre Foot = AF)
960 AF -- 960 AF 1,060 AF
FY17 Key Results and Outcomes:
• Water Resource Management and Calendar Year 2017 Alternative Water Allocation Policy, effective 1/1/2017.
• Water Resource Management and Calendar Year 2017 Alternative Water Allocation Policy, Amendment 1, effective 5/9/2017.
• Executed City Contract No. 2017-246, Big Chino Groundwater Flow Model. • Investment in AIQUEOUS (Water Conservation rebate program database software); fully
operational and in use by City water customers.
City of Prescott, Arizona 127 Annual Budget FY2018
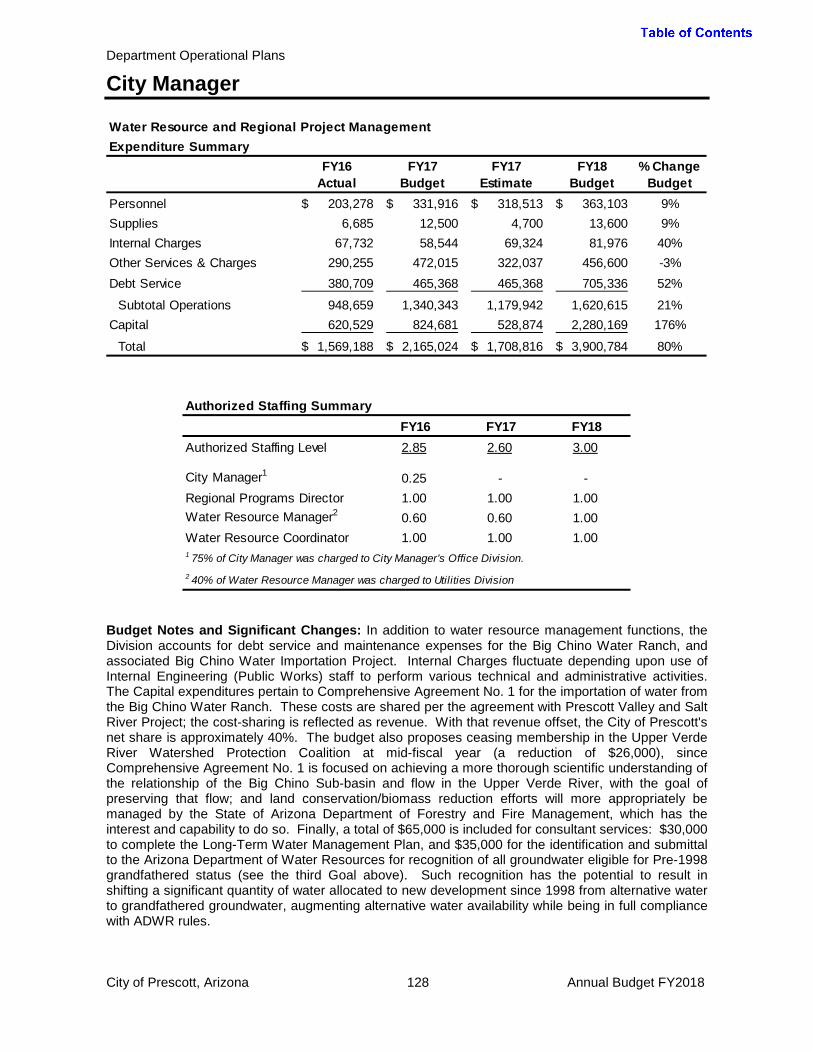
Department Operational Plans
City Manager
Budget Notes and Significant Changes: In addition to water resource management functions, the Division accounts for debt service and maintenance expenses for the Big Chino Water Ranch, and associated Big Chino Water Importation Project. Internal Charges fluctuate depending upon use of Internal Engineering (Public Works) staff to perform various technical and administrative activities. The Capital expenditures pertain to Comprehensive Agreement No. 1 for the importation of water from the Big Chino Water Ranch. These costs are shared per the agreement with Prescott Valley and Salt River Project; the cost-sharing is reflected as revenue. With that revenue offset, the City of Prescott's net share is approximately 40%. The budget also proposes ceasing membership in the Upper Verde River Watershed Protection Coalition at mid-fiscal year (a reduction of $26,000), since Comprehensive Agreement No. 1 is focused on achieving a more thorough scientific understanding of the relationship of the Big Chino Sub-basin and flow in the Upper Verde River, with the goal of preserving that flow; and land conservation/biomass reduction efforts will more appropriately be managed by the State of Arizona Department of Forestry and Fire Management, which has the interest and capability to do so. Finally, a total of $65,000 is included for consultant services: $30,000 to complete the Long-Term Water Management Plan, and $35,000 for the identification and submittal to the Arizona Department of Water Resources for recognition of all groundwater eligible for Pre-1998 grandfathered status (see the third Goal above). Such recognition has the potential to result in shifting a significant quantity of water allocated to new development since 1998 from alternative water to grandfathered groundwater, augmenting alternative water availability while being in full compliance with ADWR rules.
Water Resource and Regional Project ManagementExpenditure Summary
FY16 Actual
FY17 Budget
FY17 Estimate
FY18 Budget
% Change Budget
Personnel 203,278$ 331,916$ 318,513$ 363,103$ 9%Supplies 6,685 12,500 4,700 13,600 9%Internal Charges 67,732 58,544 69,324 81,976 40%Other Services & Charges 290,255 472,015 322,037 456,600 -3%Debt Service 380,709 465,368 465,368 705,336 52%
Subtotal Operations 948,659 1,340,343 1,179,942 1,620,615 21%Capital 620,529 824,681 528,874 2,280,169 176%
Total 1,569,188$ 2,165,024$ 1,708,816$ 3,900,784$ 80%
Authorized Staffing SummaryFY16 FY17 FY18
Authorized Staffing Level 2.85 2.60 3.00
City Manager1 0.25 - -Regional Programs Director 1.00 1.00 1.00Water Resource Manager2 0.60 0.60 1.00Water Resource Coordinator 1.00 1.00 1.001 75% of City Manager was charged to City Manager's Office Division. 2 40% of Water Resource Manager was charged to Utilities Division
City of Prescott, Arizona 128 Annual Budget FY2018
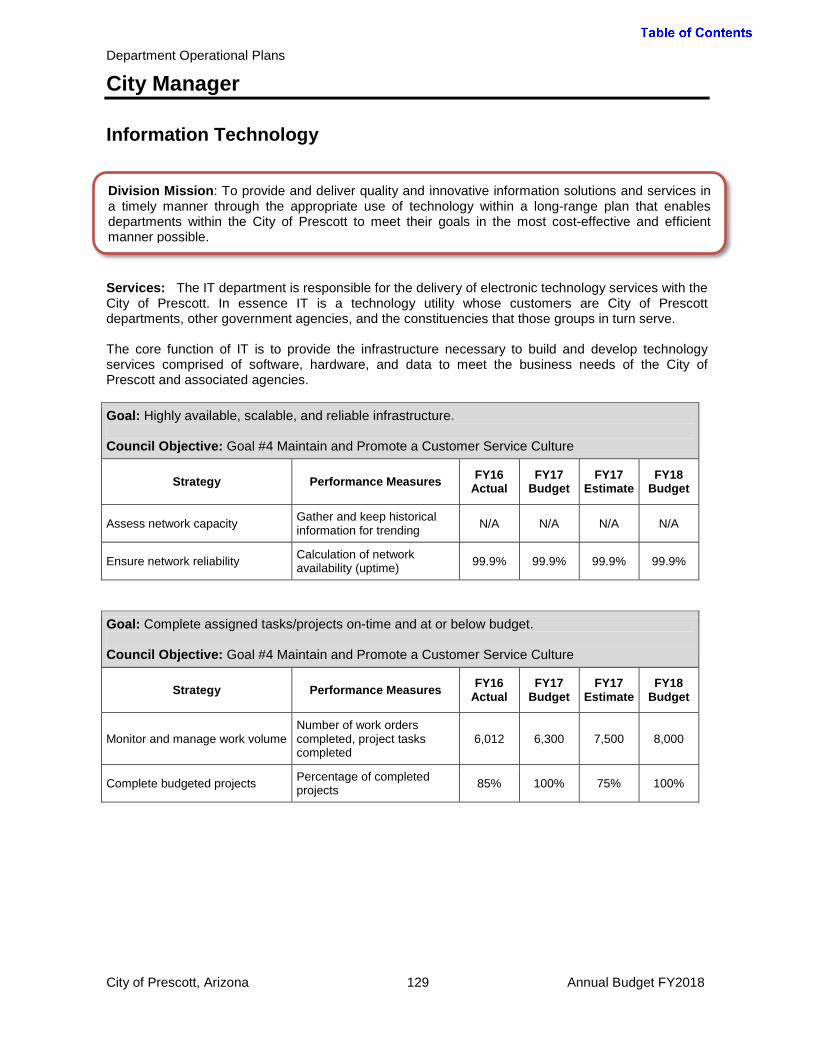
Department Operational Plans
City Manager
Information Technology
Services: The IT department is responsible for the delivery of electronic technology services with the City of Prescott. In essence IT is a technology utility whose customers are City of Prescott departments, other government agencies, and the constituencies that those groups in turn serve. The core function of IT is to provide the infrastructure necessary to build and develop technology services comprised of software, hardware, and data to meet the business needs of the City of Prescott and associated agencies. Goal: Highly available, scalable, and reliable infrastructure. Council Objective: Goal #4 Maintain and Promote a Customer Service Culture
Strategy Performance Measures FY16 Actual
FY17 Budget
FY17 Estimate
FY18 Budget
Assess network capacity Gather and keep historical information for trending N/A N/A N/A N/A
Ensure network reliability Calculation of network availability (uptime) 99.9% 99.9% 99.9% 99.9%
Goal: Complete assigned tasks/projects on-time and at or below budget. Council Objective: Goal #4 Maintain and Promote a Customer Service Culture
Strategy Performance Measures FY16 Actual
FY17 Budget
FY17 Estimate
FY18 Budget
Monitor and manage work volume Number of work orders completed, project tasks completed
6,012 6,300 7,500 8,000
Complete budgeted projects Percentage of completed projects 85% 100% 75% 100%
Division Mission: To provide and deliver quality and innovative information solutions and services in a timely manner through the appropriate use of technology within a long-range plan that enables departments within the City of Prescott to meet their goals in the most cost-effective and efficient manner possible.
City of Prescott, Arizona 129 Annual Budget FY2018
Department Operational Plans
City Manager
FY17 Key Results and Outcomes:
• Tasks completed o Staff completed 5,856 tickets submitted by our customers. This is a 2.6% decrease over
FY16, not accounting for project related tasks. • Network Uptime
o The goal of 99.9% uptime, which means less than 8 hours of unplanned network and server outages, was met in FY17. This is commendable given the number of network sites IT maintains (close to 50 currently and to expand to 170 by the end of FY18).
• Network Security o Zero network security events were detected in FY17. This includes network and server
hacks/penetrations, virus or malware infestations, etc. Given the amount of significant and serious outbreaks in FY17, this number is commendable.
• Web Server Traffic o IT web servers provided information to 1,052,559 unique visitors (30% increase over
FY16) and served over 9,000,000 pages to visitors (32% increase over FY16). This indicates that the City of Prescott is providing useful web content through the 21 different web sites we host, and that the infrastructure needed to support this delivery is working as designed.
• Projects – For FY17 IT has been engaged in large scale software projects: new public safety software system, water and wastewater command and control system, new business license and permitting system. This involves realigning, redesigning, and overhauling some fundamental IT infrastructure elements to provide additional features and functionality, and to reduce the overall cost of ownership by being simpler to manage and maintain.
City of Prescott, Arizona 130 Annual Budget FY2018

Department Operational Plans
City Manager
Budget Notes and Significant Changes: Other Services and Charges reflect increasing network and new software maintenance costs.
Information TechnologyExpenditure Summary
FY16 Actual
FY17 Budget
FY17 Estimate
FY18 Budget
% Change Budget
Personnel 1,159,780$ 1,283,267$ 1,258,205$ 1,293,029$ 1%Supplies 241,504 331,850 316,408 339,350 2%Internal Charges 106,834 64,740 66,306 67,196 4%Other Services & Charges 279,022 267,350 306,288 324,200 21%
Subtotal Operations 1,787,140 1,947,207 1,947,207 2,023,775 4%Capital 16,796 - - -
Total 1,803,936$ 1,947,207$ 1,947,207$ 2,023,775$ 4%
Authorized Staffing SummaryFY16 FY17 FY18
Authorized Staffing Level 13.50 14.50 14.50
Director of IT 1.00 1.00 1.00GIS Coord\Historic Pres.1 0.50 0.50 0.50Network Engineer 2.00 3.00 3.00Help Desk Manager 1.00 1.00 1.00Wireless Communication Tech. 1.00 1.00 1.00Web Development Specialist 1.00 1.00 1.00IT Specialist 2.00 2.00 2.00IT Technician 1.00 1.00 1.00GIS Specialist 1.00 1.00 1.00Help Desk Technician 3.00 3.00 3.001 50% of GIS/Historic Preservation Coordinator charged to Planning and Zoning.
City of Prescott, Arizona 131 Annual Budget FY2018

Department Operational Plans
Community Development
Services: Community Development Services provides project and permit review, application processing and field inspection services to the development community. The Planning and Zoning Division processes requests for subdivision plats, zoning amendments, General Plan amendments and various land use permits. The Building Safety Division processes applications for building permits, provides plan reviews, and conducts inspections of construction work in progress to assure Building Code compliance.
Department Summary - Staffing by Division
FY16 FY17 FY18Planning & Zoning 4.00 4.00 4.00Building Safety 6.50 7.50 10.50Code Compliance 2.00 1.00 2.00
Total Authorized Positions 12.50 12.50 16.50
Department Mission: To provide residents, builders and developers with quality customer service, useful information, and efficient processing of projects and permits to facilitate quality development in the City. The department monitors and reviews land use and building codes to eliminate unnecessary or overly burdensome regulations while protecting the health, safety, and welfare of the community.
City of Prescott, Arizona 132 Annual Budget FY2018
Community Development
Director (1)
Planning & Zoning
Planning Manager (1)
Planner (1)
Historic Preservation Coordinator
(0.5)
Building Safety
Chief Building Official
(1)
Plans Examiner/ Inspector
(3)
Inspector (3)
Plans Examiner/Building Fire Inspector (1)
Permit Technician (2)
Code Compliance
Chief Code Compliance
Officer (1)
Secretary (1)
Administrative Specialist
(1)

Department Operational Plans
Community Development
Department Summary - Expenditure by TypeFY16
ActualFY17
BudgetFY17
EstimateFY18
Budget% Change
BudgetPersonnel 1,030,460$ 1,136,876$ 1,057,851$ 1,344,327$ 18%Supplies 14,072 21,750 14,309 57,500 164%Internal Charges 155,319 87,054 83,800 104,192 20%Other Services & Charges 38,993 91,759 43,078 162,875 78%
Subtotal Operations 1,238,844 1,337,439 1,199,038 1,668,894 25%Capital 135,042 588,943 494,229 571,404 -3%
Total 1,373,886$ 1,926,382$ 1,693,267$ 2,240,298$ 16%
Personnel 80.8% Supplies
3.4%
Internal Charges
6.2%
Other Services & Charges
9.6%
Community Development FY18 Operating Expenditure Budget by Type
Department Summary - Operations Expenditure by Division and CapitalFY16
ActualFY17
BudgetFY17
EstimateFY18
Budget% Change
BudgetPlanning & Zoning 521,109$ 479,678$ 474,650$ 510,976$ 7%Building Safety 562,679 758,394 629,201 1,013,229 34%Code Compliance 155,056 99,367 95,187 144,689 46%
Subtotal Operations 1,238,844 1,337,439 1,199,038 1,668,894 25%Capital 135,042 588,943 494,229 571,404 -3%
Total 1,373,886$ 1,926,382$ 1,693,267$ 2,240,298$ 16%
City of Prescott, Arizona 133 Annual Budget FY2018
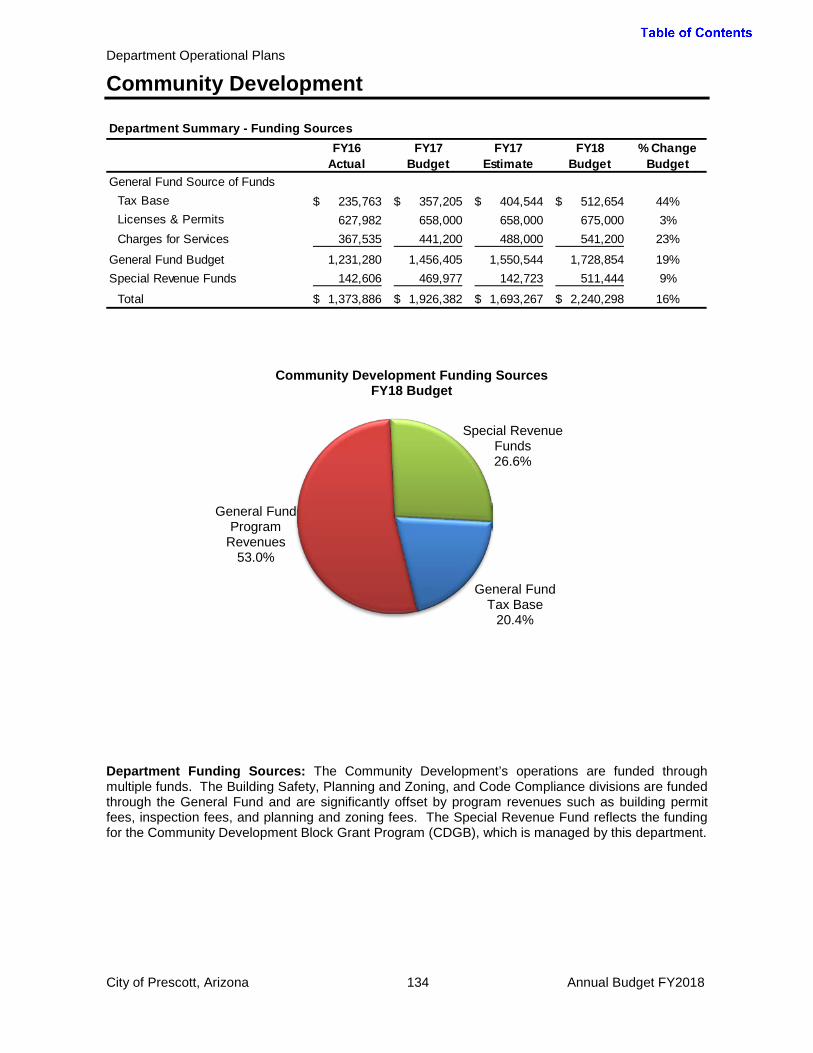
Department Operational Plans
Community Development
Department Funding Sources: The Community Development’s operations are funded through multiple funds. The Building Safety, Planning and Zoning, and Code Compliance divisions are funded through the General Fund and are significantly offset by program revenues such as building permit fees, inspection fees, and planning and zoning fees. The Special Revenue Fund reflects the funding for the Community Development Block Grant Program (CDGB), which is managed by this department.
Department Summary - Funding SourcesFY16
ActualFY17
BudgetFY17
EstimateFY18
Budget% Change
BudgetGeneral Fund Source of Funds
Tax Base 235,763$ 357,205$ 404,544$ 512,654$ 44%Licenses & Permits 627,982 658,000 658,000 675,000 3%Charges for Services 367,535 441,200 488,000 541,200 23%
General Fund Budget 1,231,280 1,456,405 1,550,544 1,728,854 19%Special Revenue Funds 142,606 469,977 142,723 511,444 9%
Total 1,373,886$ 1,926,382$ 1,693,267$ 2,240,298$ 16%
General Fund Tax Base
26.7%
General Fund Program
Revenues 72.9%
Special Revenue Funds 0.4%
Community Development Operating Funding Sources FY18 Budget
City of Prescott, Arizona 134 Annual Budget FY2018
General Fund Tax Base
20.4%
General Fund Program
Revenues 53.0%
Special Revenue Funds 26.6%
Community Development Funding Sources FY18 Budget
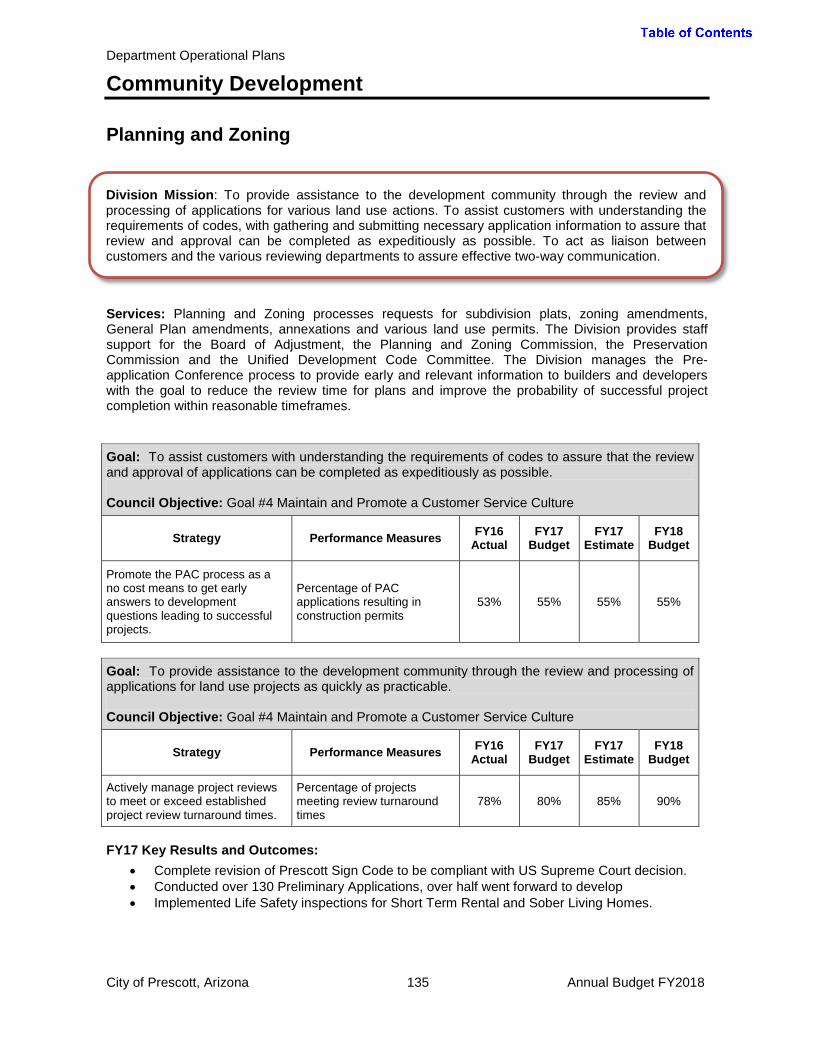
Department Operational Plans
Community Development
Planning and Zoning
Services: Planning and Zoning processes requests for subdivision plats, zoning amendments, General Plan amendments, annexations and various land use permits. The Division provides staff support for the Board of Adjustment, the Planning and Zoning Commission, the Preservation Commission and the Unified Development Code Committee. The Division manages the Pre-application Conference process to provide early and relevant information to builders and developers with the goal to reduce the review time for plans and improve the probability of successful project completion within reasonable timeframes. Goal: To assist customers with understanding the requirements of codes to assure that the review and approval of applications can be completed as expeditiously as possible. Council Objective: Goal #4 Maintain and Promote a Customer Service Culture
Strategy Performance Measures FY16 Actual
FY17 Budget
FY17 Estimate
FY18 Budget
Promote the PAC process as a no cost means to get early answers to development questions leading to successful projects.
Percentage of PAC applications resulting in construction permits
53% 55% 55% 55%
Goal: To provide assistance to the development community through the review and processing of applications for land use projects as quickly as practicable. Council Objective: Goal #4 Maintain and Promote a Customer Service Culture
Strategy Performance Measures FY16 Actual
FY17 Budget
FY17 Estimate
FY18 Budget
Actively manage project reviews to meet or exceed established project review turnaround times.
Percentage of projects meeting review turnaround times
78% 80% 85% 90%
FY17 Key Results and Outcomes:
• Complete revision of Prescott Sign Code to be compliant with US Supreme Court decision. • Conducted over 130 Preliminary Applications, over half went forward to develop • Implemented Life Safety inspections for Short Term Rental and Sober Living Homes.
Division Mission: To provide assistance to the development community through the review and processing of applications for various land use actions. To assist customers with understanding the requirements of codes, with gathering and submitting necessary application information to assure that review and approval can be completed as expeditiously as possible. To act as liaison between customers and the various reviewing departments to assure effective two-way communication.
City of Prescott, Arizona 135 Annual Budget FY2018
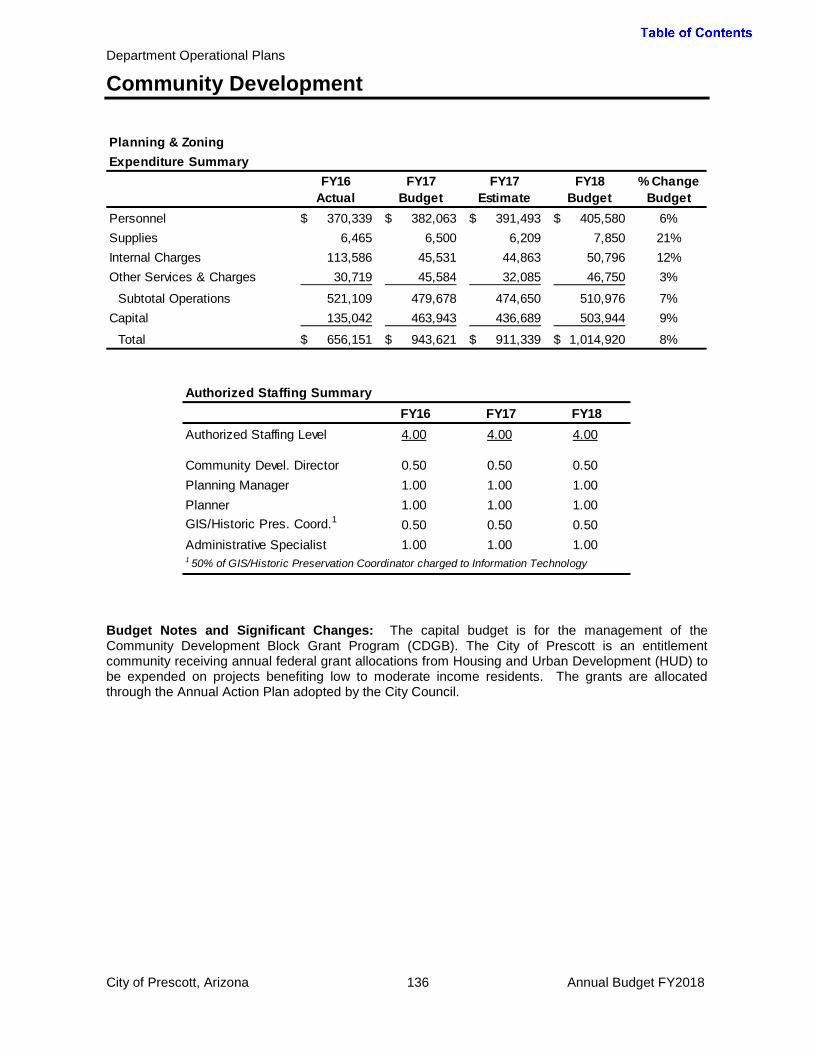
Department Operational Plans
Community Development
Budget Notes and Significant Changes: The capital budget is for the management of the Community Development Block Grant Program (CDGB). The City of Prescott is an entitlement community receiving annual federal grant allocations from Housing and Urban Development (HUD) to be expended on projects benefiting low to moderate income residents. The grants are allocated through the Annual Action Plan adopted by the City Council.
Planning & ZoningExpenditure Summary
FY16 Actual
FY17 Budget
FY17 Estimate
FY18 Budget
% Change Budget
Personnel 370,339$ 382,063$ 391,493$ 405,580$ 6%Supplies 6,465 6,500 6,209 7,850 21%Internal Charges 113,586 45,531 44,863 50,796 12%Other Services & Charges 30,719 45,584 32,085 46,750 3%
Subtotal Operations 521,109 479,678 474,650 510,976 7%Capital 135,042 463,943 436,689 503,944 9%
Total 656,151$ 943,621$ 911,339$ 1,014,920$ 8%
Authorized Staffing SummaryFY16 FY17 FY18
Authorized Staffing Level 4.00 4.00 4.00
Community Devel. Director 0.50 0.50 0.50Planning Manager 1.00 1.00 1.00Planner 1.00 1.00 1.00GIS/Historic Pres. Coord.1 0.50 0.50 0.50Administrative Specialist 1.00 1.00 1.001 50% of GIS/Historic Preservation Coordinator charged to Information Technology
City of Prescott, Arizona 136 Annual Budget FY2018

Department Operational Plans
Community Development
Building Safety
Services: The Building Safety Division applies local, national, and international construction codes to ensure minimum requirements are met that safeguard the public health, safety, and welfare, including from fire and other hazards occurring in the built environment and safety of emergency responders during emergency operations. The Division’s primary areas of focus are structural strength, means of egress, stability, sanitation, adequate light and ventilation, and energy conservation.
FY17 Key Results and Outcomes:
• Consolidated Public Works environmental (grading, drainage and SWTPP) into Building Safety Inspections.
• Held several Lunch ‘n Learns with Yavapai Contractors Association and the building community.
• All staff currently certified. Four currently pursuing additional certifications. • Partnership with Yavapai Building Safety for training and process improvements.
Goal: Provide efficient and complete plan review services thru contractor education at local contractors meetings and meeting stated plan review time frames. Council Objective: Goal #4 Maintain and Promote a Customer Service Culture
Strategy Performance Measures FY16 Actual
FY17 Budget
FY17 Estimate
FY18 Budget
Provide efficient and complete plan review services thru contractor’s education at local contractors meeting and meeting stated plan review time frames.
Contractors’ Meetings 4 4 5 4
Plan reviews performed 1500 1500 1700 1600
Reviews completed within stated 3-week time frame
90% 90% 95% 95%
Goal: Provide quality, efficient, friendly, and code compliant field inspections. Have minimum re-inspections and help facilitate increased permits. Council Objective: Goal #4 Maintain and Promote a Customer Service Culture
Strategy Performance Measures FY16 Actual
FY17 Budget
FY17 Estimate
FY18 Budget
Have certified, well trained inspectors, able to help and answers questions of developers, contractors, and clients in the field.
Total number of field inspections 19,500 19,737 22,000 22,300
Percentage of re-inspections 15% 15% 15% 13%
New single family permits issued 240 300 240 350
Division Mission: To provide quality customer service through timely plan review and inspection services to facilitate successful completion of development projects and ensure requirements are met to safeguard the public health, safety and welfare.
City of Prescott, Arizona 137 Annual Budget FY2018
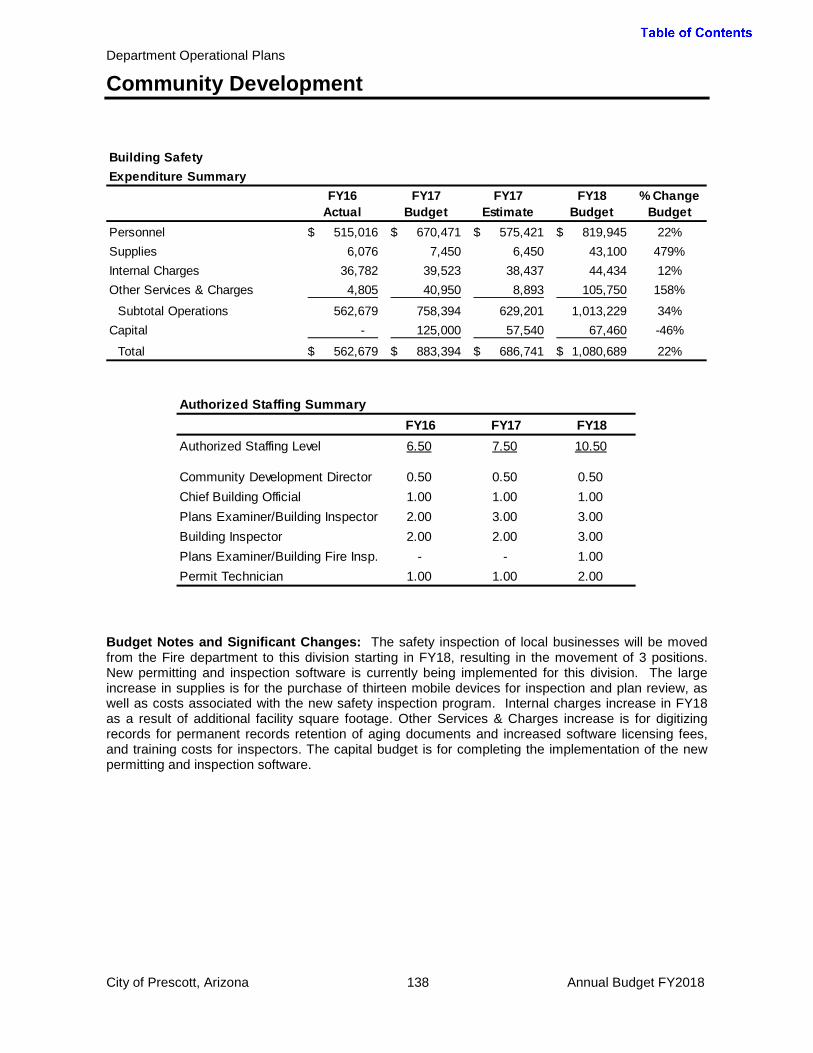
Department Operational Plans
Community Development
Budget Notes and Significant Changes: The safety inspection of local businesses will be moved from the Fire department to this division starting in FY18, resulting in the movement of 3 positions. New permitting and inspection software is currently being implemented for this division. The large increase in supplies is for the purchase of thirteen mobile devices for inspection and plan review, as well as costs associated with the new safety inspection program. Internal charges increase in FY18 as a result of additional facility square footage. Other Services & Charges increase is for digitizing records for permanent records retention of aging documents and increased software licensing fees, and training costs for inspectors. The capital budget is for completing the implementation of the new permitting and inspection software.
Building SafetyExpenditure Summary
FY16 Actual
FY17 Budget
FY17 Estimate
FY18 Budget
% Change Budget
Personnel 515,016$ 670,471$ 575,421$ 819,945$ 22%Supplies 6,076 7,450 6,450 43,100 479%Internal Charges 36,782 39,523 38,437 44,434 12%Other Services & Charges 4,805 40,950 8,893 105,750 158%
Subtotal Operations 562,679 758,394 629,201 1,013,229 34%Capital - 125,000 57,540 67,460 -46%
Total 562,679$ 883,394$ 686,741$ 1,080,689$ 22%
Authorized Staffing SummaryFY16 FY17 FY18
Authorized Staffing Level 6.50 7.50 10.50
Community Development Director 0.50 0.50 0.50Chief Building Official 1.00 1.00 1.00Plans Examiner/Building Inspector 2.00 3.00 3.00Building Inspector 2.00 2.00 3.00Plans Examiner/Building Fire Insp. - - 1.00Permit Technician 1.00 1.00 2.00
City of Prescott, Arizona 138 Annual Budget FY2018
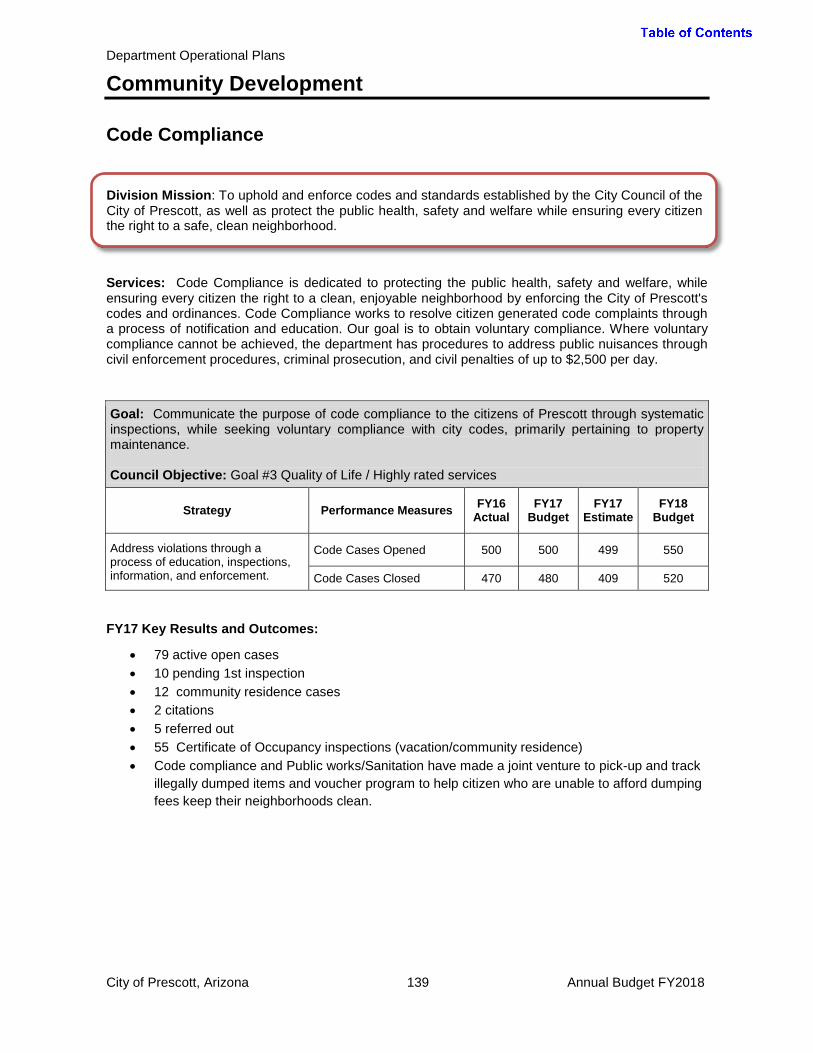
Department Operational Plans
Community Development
Code Compliance
Services: Code Compliance is dedicated to protecting the public health, safety and welfare, while ensuring every citizen the right to a clean, enjoyable neighborhood by enforcing the City of Prescott's codes and ordinances. Code Compliance works to resolve citizen generated code complaints through a process of notification and education. Our goal is to obtain voluntary compliance. Where voluntary compliance cannot be achieved, the department has procedures to address public nuisances through civil enforcement procedures, criminal prosecution, and civil penalties of up to $2,500 per day.
FY17 Key Results and Outcomes:
• 79 active open cases • 10 pending 1st inspection • 12 community residence cases • 2 citations • 5 referred out • 55 Certificate of Occupancy inspections (vacation/community residence) • Code compliance and Public works/Sanitation have made a joint venture to pick-up and track
illegally dumped items and voucher program to help citizen who are unable to afford dumping fees keep their neighborhoods clean.
Goal: Communicate the purpose of code compliance to the citizens of Prescott through systematic inspections, while seeking voluntary compliance with city codes, primarily pertaining to property maintenance. Council Objective: Goal #3 Quality of Life / Highly rated services
Strategy Performance Measures FY16 Actual
FY17 Budget
FY17 Estimate
FY18 Budget
Address violations through a process of education, inspections, information, and enforcement.
Code Cases Opened 500 500 499 550
Code Cases Closed 470 480 409 520
Division Mission: To uphold and enforce codes and standards established by the City Council of the City of Prescott, as well as protect the public health, safety and welfare while ensuring every citizen the right to a safe, clean neighborhood.
City of Prescott, Arizona 139 Annual Budget FY2018
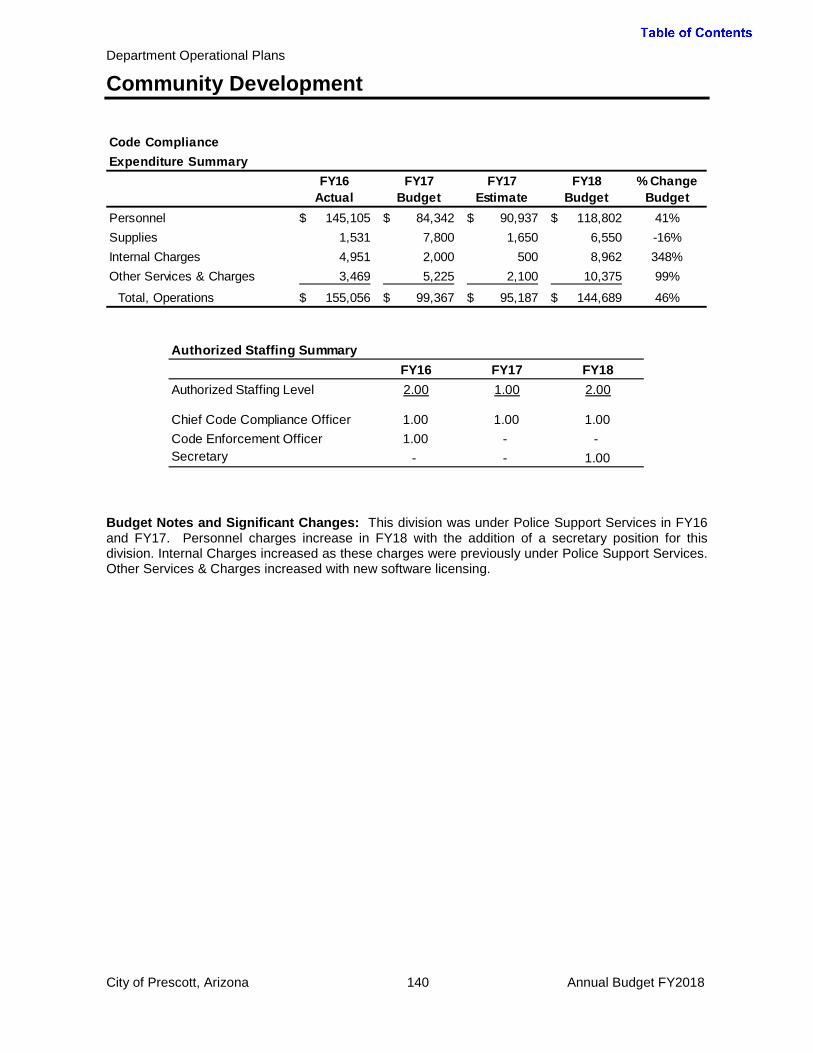
Department Operational Plans
Community Development
Budget Notes and Significant Changes: This division was under Police Support Services in FY16 and FY17. Personnel charges increase in FY18 with the addition of a secretary position for this division. Internal Charges increased as these charges were previously under Police Support Services. Other Services & Charges increased with new software licensing.
Code ComplianceExpenditure Summary
FY16 Actual
FY17 Budget
FY17 Estimate
FY18 Budget
% Change Budget
Personnel 145,105$ 84,342$ 90,937$ 118,802$ 41%Supplies 1,531 7,800 1,650 6,550 -16%Internal Charges 4,951 2,000 500 8,962 348%Other Services & Charges 3,469 5,225 2,100 10,375 99%
Total, Operations 155,056$ 99,367$ 95,187$ 144,689$ 46%
Authorized Staffing SummaryFY16 FY17 FY18
Authorized Staffing Level 2.00 1.00 2.00
Chief Code Compliance Officer 1.00 1.00 1.00Code Enforcement Officer 1.00 - -Secretary - - 1.00
City of Prescott, Arizona 140 Annual Budget FY2018
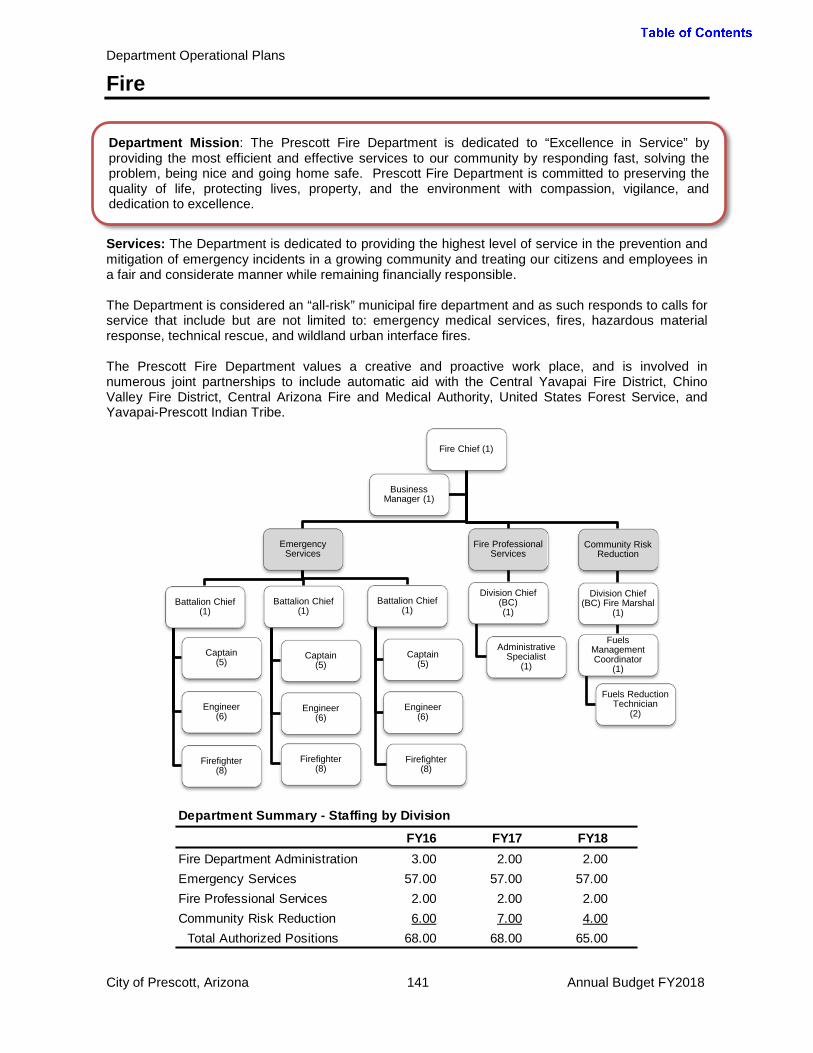
Department Operational Plans
Fire
Services: The Department is dedicated to providing the highest level of service in the prevention and mitigation of emergency incidents in a growing community and treating our citizens and employees in a fair and considerate manner while remaining financially responsible. The Department is considered an “all-risk” municipal fire department and as such responds to calls for service that include but are not limited to: emergency medical services, fires, hazardous material response, technical rescue, and wildland urban interface fires. The Prescott Fire Department values a creative and proactive work place, and is involved in numerous joint partnerships to include automatic aid with the Central Yavapai Fire District, Chino Valley Fire District, Central Arizona Fire and Medical Authority, United States Forest Service, and Yavapai-Prescott Indian Tribe.
Department Summary - Staffing by Division
FY16 FY17 FY18Fire Department Administration 3.00 2.00 2.00Emergency Services 57.00 57.00 57.00Fire Professional Services 2.00 2.00 2.00Community Risk Reduction 6.00 7.00 4.00
Total Authorized Positions 68.00 68.00 65.00
Department Mission: The Prescott Fire Department is dedicated to “Excellence in Service” by providing the most efficient and effective services to our community by responding fast, solving the problem, being nice and going home safe. Prescott Fire Department is committed to preserving the quality of life, protecting lives, property, and the environment with compassion, vigilance, and dedication to excellence.
City of Prescott, Arizona 141 Annual Budget FY2018
Fire Chief (1)
Emergency Services
Battalion Chief (1)
Captain (5)
Engineer (6)
Firefighter (8)
Battalion Chief (1)
Captain (5)
Engineer (6)
Firefighter (8)
Battalion Chief (1)
Captain (5)
Engineer (6)
Firefighter (8)
Fire Professional Services
Division Chief (BC) (1)
Administrative Specialist
(1)
Community Risk Reduction
Division Chief (BC) Fire Marshal
(1)
Fuels Management Coordinator
(1)
Fuels Reduction Technician
(2)
Business Manager (1)
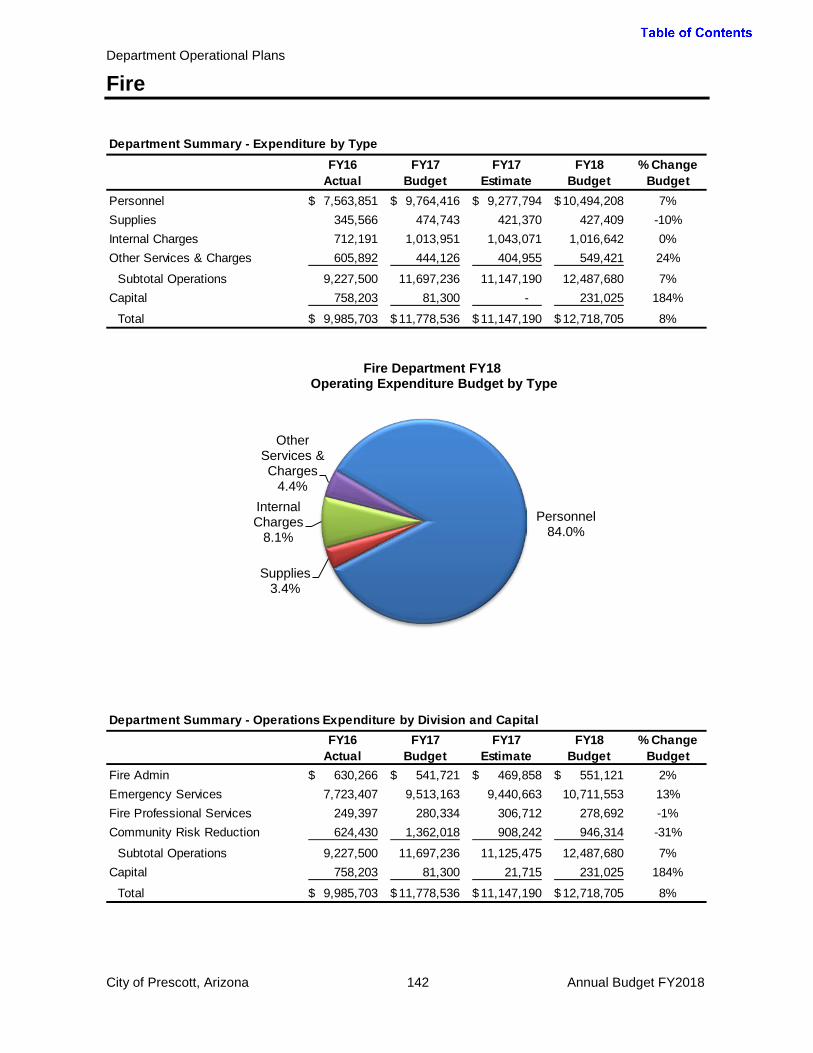
Department Operational Plans
Fire
Department Summary - Expenditure by TypeFY16
ActualFY17
BudgetFY17
EstimateFY18
Budget% Change
BudgetPersonnel 7,563,851$ 9,764,416$ 9,277,794$ 10,494,208$ 7%Supplies 345,566 474,743 421,370 427,409 -10%Internal Charges 712,191 1,013,951 1,043,071 1,016,642 0%Other Services & Charges 605,892 444,126 404,955 549,421 24%
Subtotal Operations 9,227,500 11,697,236 11,147,190 12,487,680 7%Capital 758,203 81,300 - 231,025 184%
Total 9,985,703$ 11,778,536$ 11,147,190$ 12,718,705$ 8%
Personnel 84.0%
Supplies 3.4%
Internal Charges
8.1%
Other Services & Charges
4.4%
Fire Department FY18 Operating Expenditure Budget by Type
Department Summary - Operations Expenditure by Division and CapitalFY16
ActualFY17
BudgetFY17
EstimateFY18
Budget% Change
BudgetFire Admin 630,266$ 541,721$ 469,858$ 551,121$ 2%Emergency Services 7,723,407 9,513,163 9,440,663 10,711,553 13%Fire Professional Services 249,397 280,334 306,712 278,692 -1%Community Risk Reduction 624,430 1,362,018 908,242 946,314 -31%
Subtotal Operations 9,227,500 11,697,236 11,125,475 12,487,680 7%Capital 758,203 81,300 21,715 231,025 184%
Total 9,985,703$ 11,778,536$ 11,147,190$ 12,718,705$ 8%
City of Prescott, Arizona 142 Annual Budget FY2018

Department Operational Plans
Fire
Department Funding Sources: In most years, the Fire Department is largely funded by the General Fund. The Enterprise Fund relates to the Aircraft Rescue and Firefighting (ARFF) staffing which is sourced to the Airport fund. Grants are reflected in the Special Revenue Funds. For FY17 and FY18, the Fire Department has received the Staffing for Adequate Fire and Emergency Response grant (SAFER), which funds up to 9 firefighter positions. This grant is offered through the US Department of Homeland Security and is intended to provide funding directly to fire departments to help them increase or maintain the number of trained “front line” firefighters available in their communities. In addition to SAFER, the Fire Department is budgeting for many other operating type grants such as for fuel mitigation projects.
Department Summary - Funding SourcesFY16
ActualFY17
BudgetFY17
EstimateFY18
Budget% Change
BudgetGeneral Fund Source of Funds
Tax Base 8,596,323$ 9,654,645$ 9,552,580$ 10,410,430$ 8%Licenses and Permits 1,270 500 150 500 0%Charges for Services 468,166 473,123 512,450 462,623 -2%
General Fund Budget 9,065,759 10,128,268 10,065,180 10,873,553 7%Special Revenue Funds 592,658 1,145,275 580,453 1,256,759 10%Enterprise Funds 327,286 504,993 501,557 588,393 17%
Total 9,985,703$ 11,778,536$ 11,147,190$ 12,718,705$ 8%
General Fund Tax Base
81.9%
General Fund Program
Revenues 3.6%
Special Revenue Funds 9.9%
Enterprise Funds 4.6%
Fire Department Operations Funding Sources FY18 Budget
City of Prescott, Arizona 143 Annual Budget FY2018

Department Operational Plans
Fire
Fire Department Administration
Services: The Administrative Division serves as the primary point for oversight of the three primary operating divisions and provides for the needed budget development and cost-monitoring needs to ensure efficiencies are recognized. Services provided by way of Fire Administration include: records management, purchasing and expenditure review, personnel action needs, public point of contact for complaints or compliance concerns, aid in the direction of city wide emergency management needs, Arizona Wildfire and Incident Management Academy support services, and support for disaster preparedness efforts. Goal: To provide leadership, guidance, and administrative oversight directed towards providing all-risks services that are fiscally responsible, effective, and efficient. Council Objective: Goal #3 Quality of Life
Strategy Performance Measures FY16 Actual
FY17 Budget
FY17 Estimate
FY18 Budget
Our level of service will stay in stride with the provision of services desired and asked of us by the community.
Conduction of a community survey instrument for those citizens in which we provide emergent or non-emergency services twice annually.
N/A* 100 50 100
Tabulate results from the survey instruments in order to enhance our overall efficiency as it relates to all-risk responses. Pursue those areas that our citizens determine as “being in need of improvement and work towards attaining a rating of exception in key indicator areas surveyed.
N/A* 4-5 4-5 4-5
*No previous data
Division Mission: To administer and ensure the essential functions of the Fire Department are accomplished, and to support the organization in carrying out its mission.
City of Prescott, Arizona 144 Annual Budget FY2018

Department Operational Plans
Fire
Goal: To provide state of the art training via a one-week intensive wildfire training academy. Council Objective: Goal #3 Quality of Life
Strategy Performance Measures FY16 Actual
FY17 Budget
FY17 Estimate
FY18 Budget
Provide support via the Prescott Fire department towards facilitation of the local wildfire academy for our employees and regional partners.
Academy participants 930 1,000 880 1,000
Classes being offered 51 50 44 50
Goal: To provide a platform for community engagement for which input is received in regards to process improvement for departmental efforts. Council Objective: Goal #3 Quality of Life
Strategy Performance Measures FY16 Actual
FY17 Budget
FY17 Estimate
FY18 Budget
Increase the number of connections we have with community organizations and initiatives and help strengthen the fabric of our community any way we can.
The number of organizations interacted with and the number of community initiatives of which we are a part. Prescott Area Shelter Services, Meals on Wheels, etc.
N/A* 8 10 8
*No previous data FY17 Key Results and Outcomes:
• Conducted Chief’s facilities and apparatus inspections at 8 locations • Initiated and successfully completed the inaugural Citizens Fire Academy. Over the course of
five weeks we provided requisite awareness to 14 community members to the inner workings of the Prescott Fire Department.
• Remained actively engaged with the AZ Fire Services Institute, AZ Fire Chief’s Association, Yavapai County Emergency Management Advisory Council and Western Yavapai Fire Chief’s Association.
• Provided for the recognition of personnel through the twice annual ceremonies that coincide with Fire Prevention and EMS Week. We recognized 11 new hires, 7 promotions, and 7 special Chief’s awards.
City of Prescott, Arizona 145 Annual Budget FY2018

Department Operational Plans
Fire
Budget Notes and Significant Changes: The Secretary position was moved to the Community Risk Reduction Division resulting in a decrease for the personnel budget in FY17. Budgeting for the expenditure of donated funds is included in the Supplies category.
Fire Department AdministrationExpenditure Summary
FY16 Actual
FY17 Budget
FY17 Estimate
FY18 Budget
% Change Budget
Personnel 289,361$ 321,569$ 315,036$ 343,122$ 7%Supplies 45,286 34,713 29,578 33,469 -4%Internal Charges 182,719 40,196 43,494 18,478 -54%Other Services & Charges 112,900 145,243 81,750 156,052 7%
Subtotal Operations 630,266 541,721 469,858 551,121 2%Capital 303,719 42,000 - - -100%
Total 933,985$ 583,721$ 469,858$ 551,121$ -6%
Authorized Staffing SummaryFY16 FY17 FY18
Authorized Staffing Level 3.00 2.00 2.00
Fire Chief 1.00 1.00 1.00Business Manager 1.00 1.00 1.00Secretary 1.00 - -
City of Prescott, Arizona 146 Annual Budget FY2018
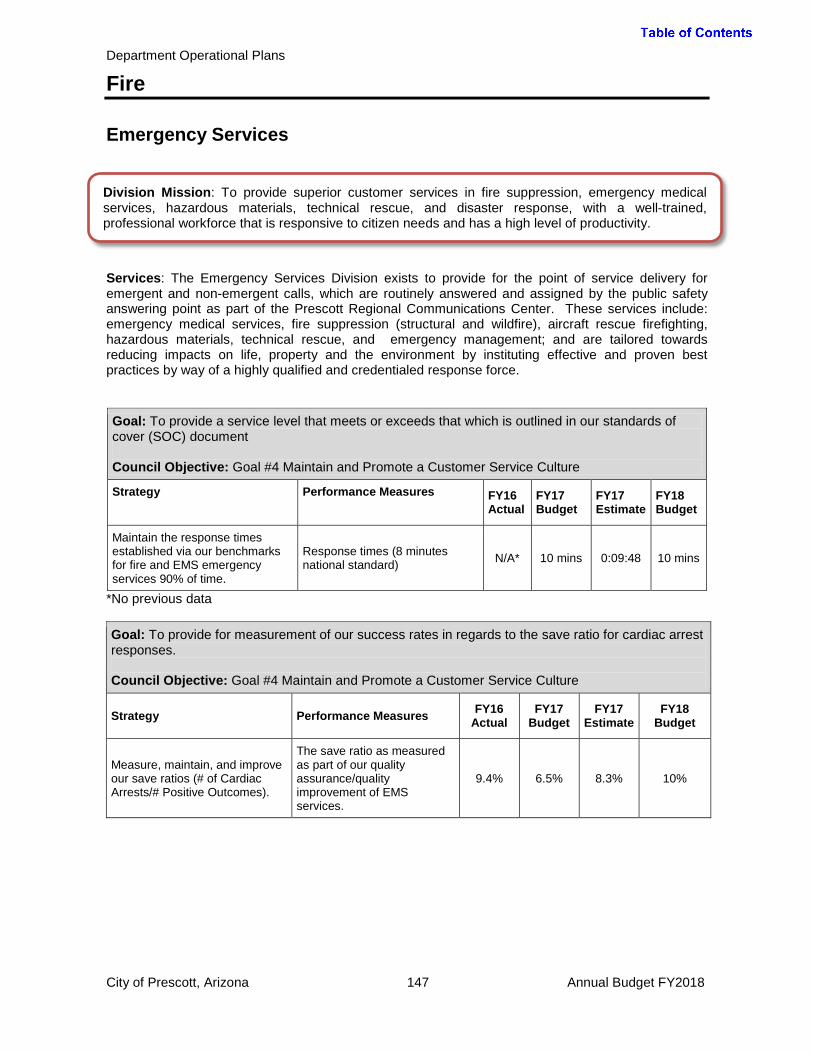
Department Operational Plans
Fire
Emergency Services
Services: The Emergency Services Division exists to provide for the point of service delivery for emergent and non-emergent calls, which are routinely answered and assigned by the public safety answering point as part of the Prescott Regional Communications Center. These services include: emergency medical services, fire suppression (structural and wildfire), aircraft rescue firefighting, hazardous materials, technical rescue, and emergency management; and are tailored towards reducing impacts on life, property and the environment by instituting effective and proven best practices by way of a highly qualified and credentialed response force. Goal: To provide a service level that meets or exceeds that which is outlined in our standards of cover (SOC) document Council Objective: Goal #4 Maintain and Promote a Customer Service Culture
Strategy Performance Measures FY16 Actual
FY17 Budget
FY17 Estimate
FY18 Budget
Maintain the response times established via our benchmarks for fire and EMS emergency services 90% of time.
Response times (8 minutes national standard) N/A* 10 mins 0:09:48 10 mins
*No previous data Goal: To provide for measurement of our success rates in regards to the save ratio for cardiac arrest responses. Council Objective: Goal #4 Maintain and Promote a Customer Service Culture
Strategy Performance Measures FY16 Actual
FY17 Budget
FY17 Estimate
FY18 Budget
Measure, maintain, and improve our save ratios (# of Cardiac Arrests/# Positive Outcomes).
The save ratio as measured as part of our quality assurance/quality improvement of EMS services.
9.4% 6.5% 8.3% 10%
Division Mission: To provide superior customer services in fire suppression, emergency medical services, hazardous materials, technical rescue, and disaster response, with a well-trained, professional workforce that is responsive to citizen needs and has a high level of productivity.
City of Prescott, Arizona 147 Annual Budget FY2018

Department Operational Plans
Fire
Goal: To deploy the closest, most appropriate unit to emergent events and deliver the most effective mitigation efforts in line with national best practices Council Objective: Goal #4 Maintain and Promote a Customer Service Culture
Strategy Performance Measures FY16 Actual
FY17 Budget
FY17 Estimate
FY18 Budget
Assess the reliability of units to maintain a reliability for the unit being dispatched greater than or equal to 70%
Percentage of time in which the first due unit comes from within the same service area for which an emergent event occurs. Station 71 Station 72 Station 73 Station 74 Station 75
80.50% 76.68% 89.15% 74.97% 82.43%
80.50% 76.68% 89.15% 74.97% 82.43%
76.69% 71.99% 69.61% 74.74% 78.51%
80.00% 78.00% 81.00% 75.00% 74.00%
FY17 Key Results and Outcomes:
• Responded to 8,619 emergency calls (averaging 23.61 responses per day). • Conducted 135 engine company inspections. • Participated in a number of “off-district” responses to include participation of single resources
as part of the Type II Regional Incident Management Team and assignments as part of the Goodwin Fire that had indirect impacts to our community.
• Heavily engaged in many community events which include but were not limited to: July 4th Parade, Rodeo Week, Veteran’s Day Parade, Holiday Parades, Sheriff’s Posse Emergency Awareness Activities, and Prescott High School Graduation night.
• Completed 16,054 hours of training in support of our all-risk response model.
City of Prescott, Arizona 148 Annual Budget FY2018
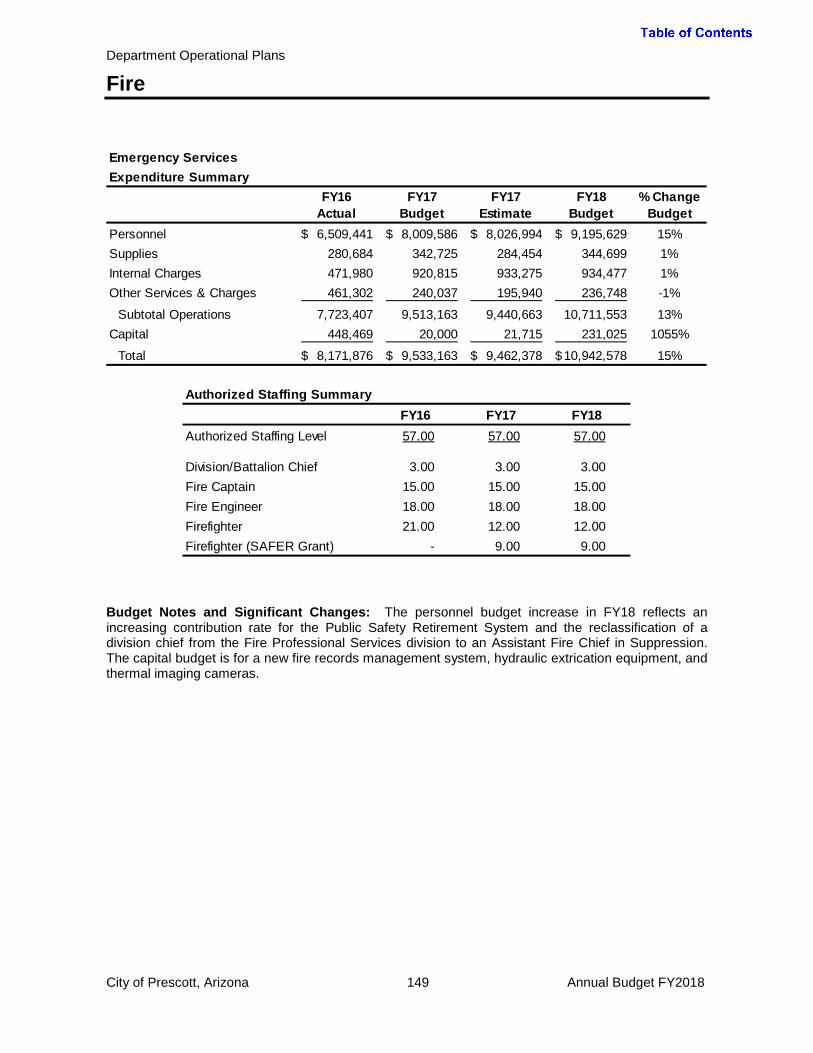
Department Operational Plans
Fire
Budget Notes and Significant Changes: The personnel budget increase in FY18 reflects an increasing contribution rate for the Public Safety Retirement System and the reclassification of a division chief from the Fire Professional Services division to an Assistant Fire Chief in Suppression. The capital budget is for a new fire records management system, hydraulic extrication equipment, and thermal imaging cameras.
Emergency ServicesExpenditure Summary
FY16 Actual
FY17 Budget
FY17 Estimate
FY18 Budget
% Change Budget
Personnel 6,509,441$ 8,009,586$ 8,026,994$ 9,195,629$ 15%Supplies 280,684 342,725 284,454 344,699 1%Internal Charges 471,980 920,815 933,275 934,477 1%Other Services & Charges 461,302 240,037 195,940 236,748 -1%
Subtotal Operations 7,723,407 9,513,163 9,440,663 10,711,553 13%Capital 448,469 20,000 21,715 231,025 1055%
Total 8,171,876$ 9,533,163$ 9,462,378$ 10,942,578$ 15%
Authorized Staffing SummaryFY16 FY17 FY18
Authorized Staffing Level 57.00 57.00 57.00
Division/Battalion Chief 3.00 3.00 3.00Fire Captain 15.00 15.00 15.00Fire Engineer 18.00 18.00 18.00Firefighter 21.00 12.00 12.00Firefighter (SAFER Grant) - 9.00 9.00
City of Prescott, Arizona 149 Annual Budget FY2018
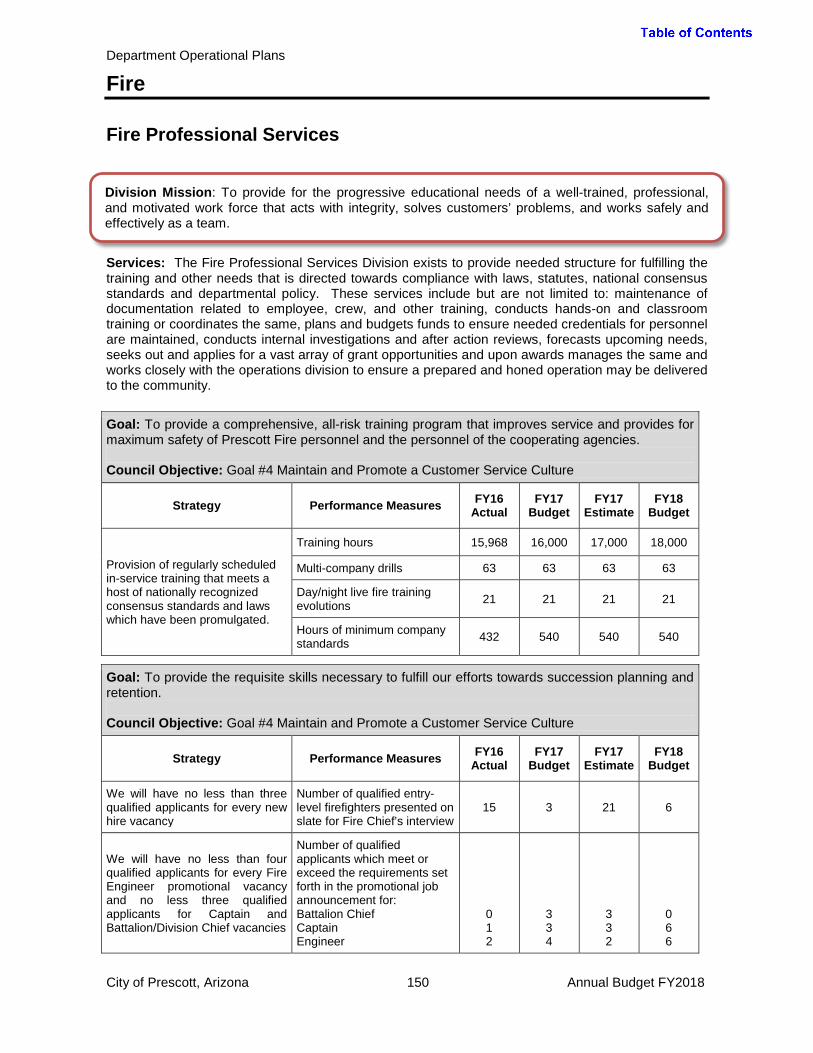
Department Operational Plans
Fire
Fire Professional Services
Services: The Fire Professional Services Division exists to provide needed structure for fulfilling the training and other needs that is directed towards compliance with laws, statutes, national consensus standards and departmental policy. These services include but are not limited to: maintenance of documentation related to employee, crew, and other training, conducts hands-on and classroom training or coordinates the same, plans and budgets funds to ensure needed credentials for personnel are maintained, conducts internal investigations and after action reviews, forecasts upcoming needs, seeks out and applies for a vast array of grant opportunities and upon awards manages the same and works closely with the operations division to ensure a prepared and honed operation may be delivered to the community.
Goal: To provide a comprehensive, all-risk training program that improves service and provides for maximum safety of Prescott Fire personnel and the personnel of the cooperating agencies. Council Objective: Goal #4 Maintain and Promote a Customer Service Culture
Strategy Performance Measures FY16 Actual
FY17 Budget
FY17 Estimate
FY18 Budget
Provision of regularly scheduled in-service training that meets a host of nationally recognized consensus standards and laws which have been promulgated.
Training hours 15,968 16,000 17,000 18,000
Multi-company drills 63 63 63 63
Day/night live fire training evolutions 21 21 21 21
Hours of minimum company standards 432 540 540 540
Goal: To provide the requisite skills necessary to fulfill our efforts towards succession planning and retention. Council Objective: Goal #4 Maintain and Promote a Customer Service Culture
Strategy Performance Measures FY16 Actual
FY17 Budget
FY17 Estimate
FY18 Budget
We will have no less than three qualified applicants for every new hire vacancy
Number of qualified entry-level firefighters presented on slate for Fire Chief’s interview
15 3 21 6
We will have no less than four qualified applicants for every Fire Engineer promotional vacancy and no less three qualified applicants for Captain and Battalion/Division Chief vacancies
Number of qualified applicants which meet or exceed the requirements set forth in the promotional job announcement for: Battalion Chief Captain Engineer
0 1 2
3 3 4
3 3 2
0 6 6
Division Mission: To provide for the progressive educational needs of a well-trained, professional, and motivated work force that acts with integrity, solves customers’ problems, and works safely and effectively as a team.
City of Prescott, Arizona 150 Annual Budget FY2018

Department Operational Plans
Fire
FY17 Key Results and Outcomes:
• Completed entry level hiring resulting in the successful hiring of 7 new positions in addition to promotional testing for Fire Engineer, Captain, and Battalion Chief. Goal of having three persons available for each vacant position was achieved.
• Renewed and refreshed efforts towards assuring after-action reviews of critical “all-risk responses” were conducted to aid in further learning with the end goal of outlining and fixing any weaknesses revealed.
• Successfully coordinated and graduated three members through the 200 hour technical rescue technician course.
• Conducted 5 formal and technical “internal affairs” investigations and made suggestions towards process improvements where appropriate to minimize risk and exposure while building a healthy and transparent learning environment.
Budget Notes and Significant Changes: No significant changes.
Fire Professional ServicesExpenditure Summary
FY16 Actual
FY17 Budget
FY17 Estimate
FY18 Budget
% Change Budget
Personnel 222,789$ 223,647$ 261,508$ 223,593$ 0%Supplies 3,669 14,360 8,375 15,410 7%Internal Charges 4,096 9,303 9,469 8,945 -4%Other Services & Charges 18,843 33,024 27,360 30,744 -7%
Subtotal Operations 249,397 280,334 306,712 278,692 -1%Capital 6,015 - - -
Total 255,412$ 280,334$ 306,712$ 278,692$ -1%
Authorized Staffing SummaryFY16 FY17 FY18
Authorized Staffing Level 2.00 2.00 2.00
Division/Battalion Chief 1.00 1.00 1.00Administrative Specialist 1.00 1.00 1.00
City of Prescott, Arizona 151 Annual Budget FY2018
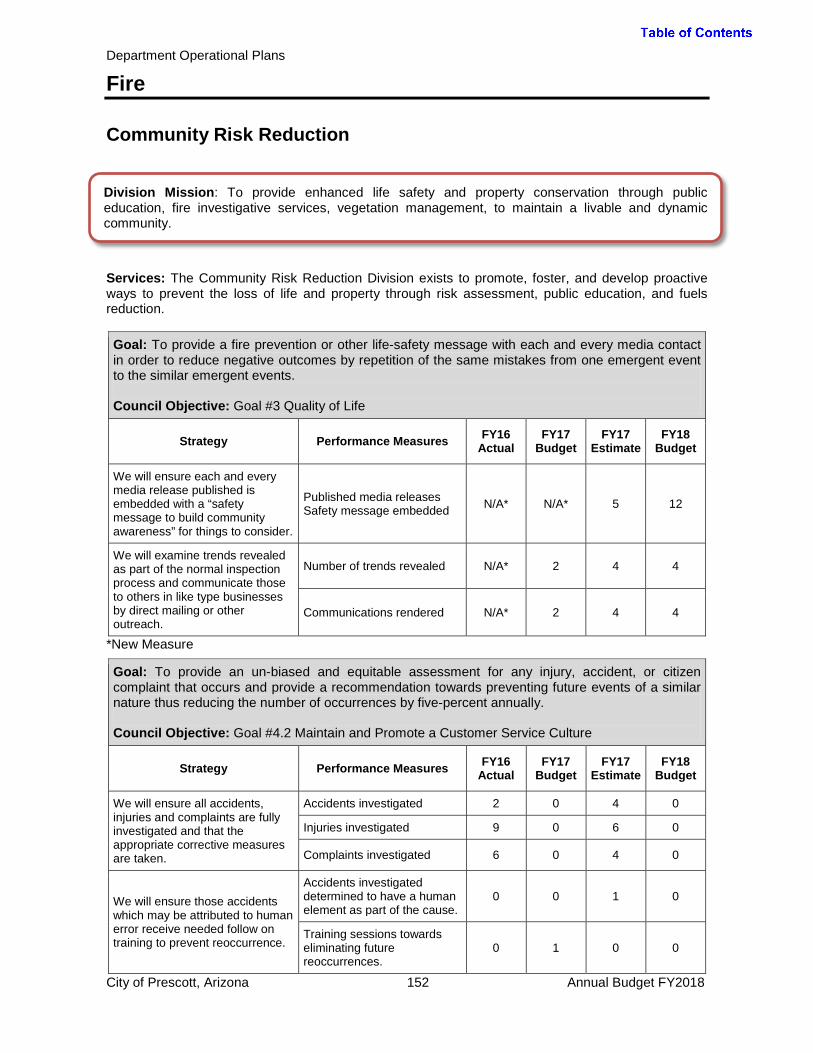
Department Operational Plans
Fire
Community Risk Reduction
Services: The Community Risk Reduction Division exists to promote, foster, and develop proactive ways to prevent the loss of life and property through risk assessment, public education, and fuels reduction. Goal: To provide a fire prevention or other life-safety message with each and every media contact in order to reduce negative outcomes by repetition of the same mistakes from one emergent event to the similar emergent events. Council Objective: Goal #3 Quality of Life
Strategy Performance Measures FY16 Actual
FY17 Budget
FY17 Estimate
FY18 Budget
We will ensure each and every media release published is embedded with a “safety message to build community awareness” for things to consider.
Published media releases Safety message embedded N/A* N/A* 5 12
We will examine trends revealed as part of the normal inspection process and communicate those to others in like type businesses by direct mailing or other outreach.
Number of trends revealed N/A* 2 4 4
Communications rendered N/A* 2 4 4
*New Measure
Goal: To provide an un-biased and equitable assessment for any injury, accident, or citizen complaint that occurs and provide a recommendation towards preventing future events of a similar nature thus reducing the number of occurrences by five-percent annually. Council Objective: Goal #4.2 Maintain and Promote a Customer Service Culture
Strategy Performance Measures FY16 Actual
FY17 Budget
FY17 Estimate
FY18 Budget
We will ensure all accidents, injuries and complaints are fully investigated and that the appropriate corrective measures are taken.
Accidents investigated 2 0 4 0
Injuries investigated 9 0 6 0
Complaints investigated 6 0 4 0
We will ensure those accidents which may be attributed to human error receive needed follow on training to prevent reoccurrence.
Accidents investigated determined to have a human element as part of the cause.
0 0 1 0
Training sessions towards eliminating future reoccurrences.
0 1 0 0
Division Mission: To provide enhanced life safety and property conservation through public education, fire investigative services, vegetation management, to maintain a livable and dynamic community.
City of Prescott, Arizona 152 Annual Budget FY2018
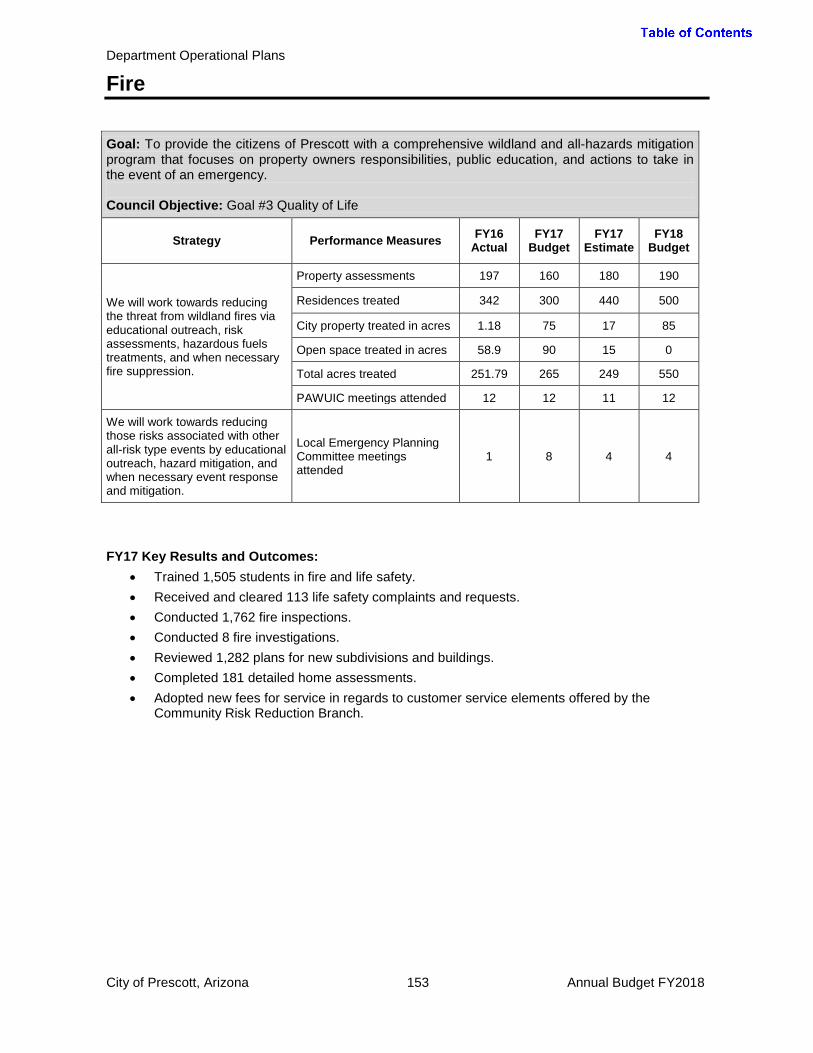
Department Operational Plans
Fire
Goal: To provide the citizens of Prescott with a comprehensive wildland and all-hazards mitigation program that focuses on property owners responsibilities, public education, and actions to take in the event of an emergency. Council Objective: Goal #3 Quality of Life
Strategy Performance Measures FY16 Actual
FY17 Budget
FY17 Estimate
FY18 Budget
We will work towards reducing the threat from wildland fires via educational outreach, risk assessments, hazardous fuels treatments, and when necessary fire suppression.
Property assessments 197 160 180 190
Residences treated 342 300 440 500
City property treated in acres 1.18 75 17 85
Open space treated in acres 58.9 90 15 0
Total acres treated 251.79 265 249 550
PAWUIC meetings attended 12 12 11 12
We will work towards reducing those risks associated with other all-risk type events by educational outreach, hazard mitigation, and when necessary event response and mitigation.
Local Emergency Planning Committee meetings attended
1 8 4 4
FY17 Key Results and Outcomes:
• Trained 1,505 students in fire and life safety. • Received and cleared 113 life safety complaints and requests. • Conducted 1,762 fire inspections. • Conducted 8 fire investigations. • Reviewed 1,282 plans for new subdivisions and buildings. • Completed 181 detailed home assessments. • Adopted new fees for service in regards to customer service elements offered by the
Community Risk Reduction Branch.
City of Prescott, Arizona 153 Annual Budget FY2018
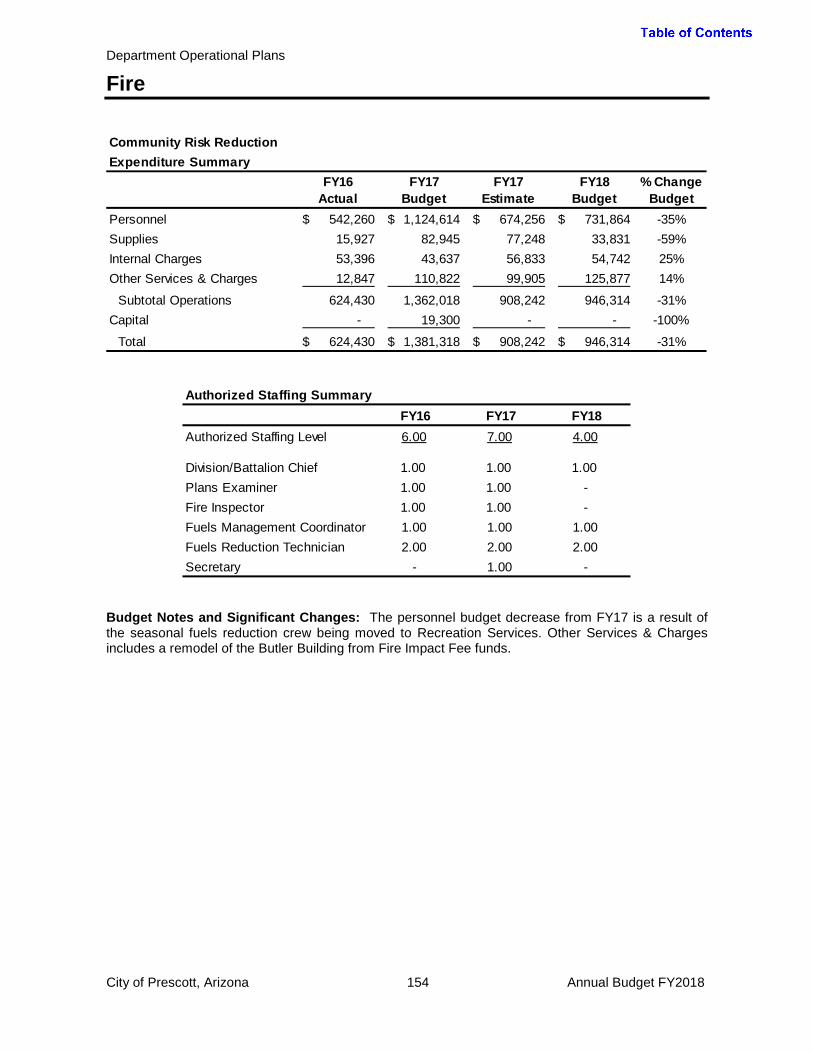
Department Operational Plans
Fire
Budget Notes and Significant Changes: The personnel budget decrease from FY17 is a result of the seasonal fuels reduction crew being moved to Recreation Services. Other Services & Charges includes a remodel of the Butler Building from Fire Impact Fee funds.
Community Risk ReductionExpenditure Summary
FY16 Actual
FY17 Budget
FY17 Estimate
FY18 Budget
% Change Budget
Personnel 542,260$ 1,124,614$ 674,256$ 731,864$ -35%Supplies 15,927 82,945 77,248 33,831 -59%Internal Charges 53,396 43,637 56,833 54,742 25%Other Services & Charges 12,847 110,822 99,905 125,877 14%
Subtotal Operations 624,430 1,362,018 908,242 946,314 -31%Capital - 19,300 - - -100%
Total 624,430$ 1,381,318$ 908,242$ 946,314$ -31%
Authorized Staffing SummaryFY16 FY17 FY18
Authorized Staffing Level 6.00 7.00 4.00
Division/Battalion Chief 1.00 1.00 1.00Plans Examiner 1.00 1.00 -Fire Inspector 1.00 1.00 -Fuels Management Coordinator 1.00 1.00 1.00Fuels Reduction Technician 2.00 2.00 2.00Secretary - 1.00 -
City of Prescott, Arizona 154 Annual Budget FY2018

Department Operational Plans
Legal
Services: Prosecute violations of the City Code and misdemeanor violations of state law in an ethical manner to assure that justice is done. Perform risk mitigation and risk management to all City departments in an effort to reduce potential claims and/or lawsuits.
Department Summary - StaffingFY16 FY17 FY18
Authorized Staffing Level 8.50 8.50 8.00
City Attorney 1.00 1.00 1.00Deputy City Attorney - 1.00 1.00Senior Assistant City Attorney - - 1.00Assistant City Attorney 3.00 2.00 1.00Paralegal - - 1.00Legal Services Administrator 1.00 1.00 -Legal Secretary 1.50 2.50 2.00Risk Management Technician 1.00 1.00 1.00Legal Assistant 1.00 - -
Department Mission: Continue to provide the highest caliber of legal service to the City, its officials and City departments by adhering to professional standards, garnering strong understanding of City operations and incorporating all relevant information into providing legal advice and guidance.
City Attorney (1)
Deptuy City Attorney (1)
Legal Secretary (2)
Risk Management Technician
(1)
Senior Asisstant City Attorney
(1)
Assistant City Attorney
(1)
Paralegal (1)
City of Prescott, Arizona 155 Annual Budget FY2018
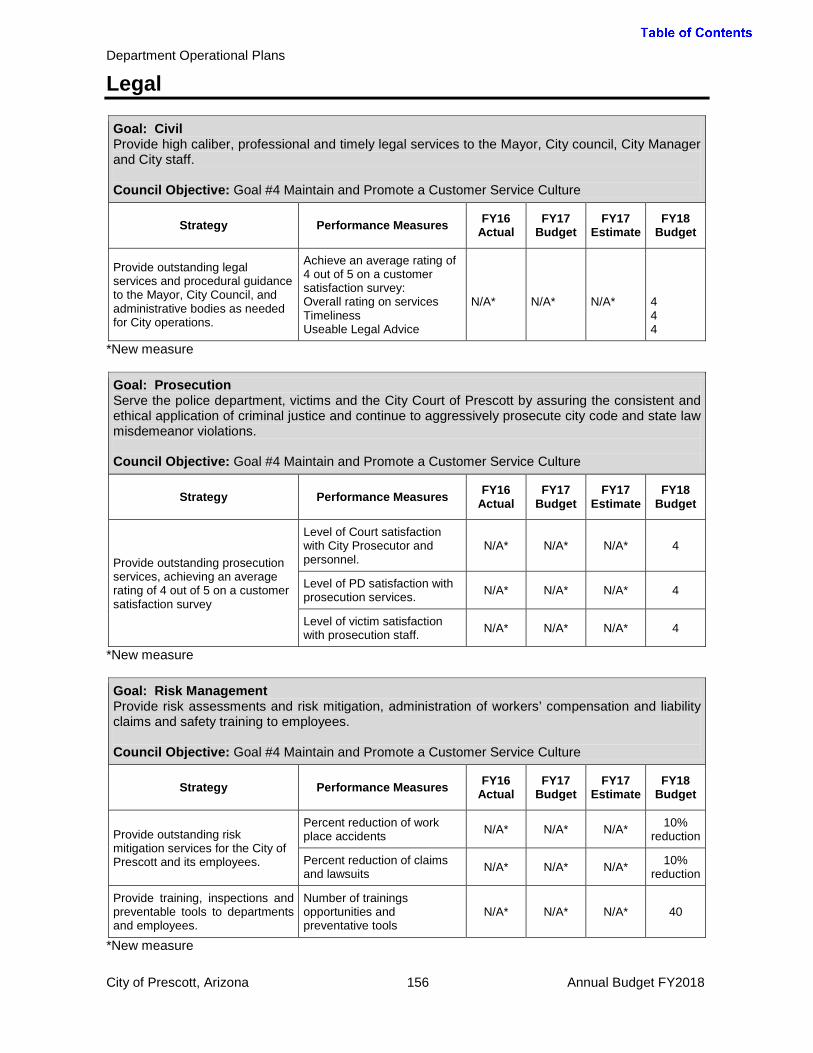
Department Operational Plans
Legal
Goal: Civil Provide high caliber, professional and timely legal services to the Mayor, City council, City Manager and City staff. Council Objective: Goal #4 Maintain and Promote a Customer Service Culture
Strategy Performance Measures FY16 Actual
FY17 Budget
FY17 Estimate
FY18 Budget
Provide outstanding legal services and procedural guidance to the Mayor, City Council, and administrative bodies as needed for City operations.
Achieve an average rating of 4 out of 5 on a customer satisfaction survey: Overall rating on services Timeliness Useable Legal Advice
N/A*
N/A*
N/A*
4 4 4
*New measure Goal: Prosecution Serve the police department, victims and the City Court of Prescott by assuring the consistent and ethical application of criminal justice and continue to aggressively prosecute city code and state law misdemeanor violations. Council Objective: Goal #4 Maintain and Promote a Customer Service Culture
Strategy Performance Measures FY16 Actual
FY17 Budget
FY17 Estimate
FY18 Budget
Provide outstanding prosecution services, achieving an average rating of 4 out of 5 on a customer satisfaction survey
Level of Court satisfaction with City Prosecutor and personnel.
N/A* N/A* N/A* 4
Level of PD satisfaction with prosecution services. N/A* N/A* N/A* 4
Level of victim satisfaction with prosecution staff. N/A* N/A* N/A* 4
*New measure Goal: Risk Management Provide risk assessments and risk mitigation, administration of workers’ compensation and liability claims and safety training to employees. Council Objective: Goal #4 Maintain and Promote a Customer Service Culture
Strategy Performance Measures FY16 Actual
FY17 Budget
FY17 Estimate
FY18 Budget
Provide outstanding risk mitigation services for the City of Prescott and its employees.
Percent reduction of work place accidents N/A* N/A* N/A* 10%
reduction
Percent reduction of claims and lawsuits N/A* N/A* N/A* 10%
reduction
Provide training, inspections and preventable tools to departments and employees.
Number of trainings opportunities and preventative tools
N/A* N/A* N/A* 40
*New measure City of Prescott, Arizona 156 Annual Budget FY2018
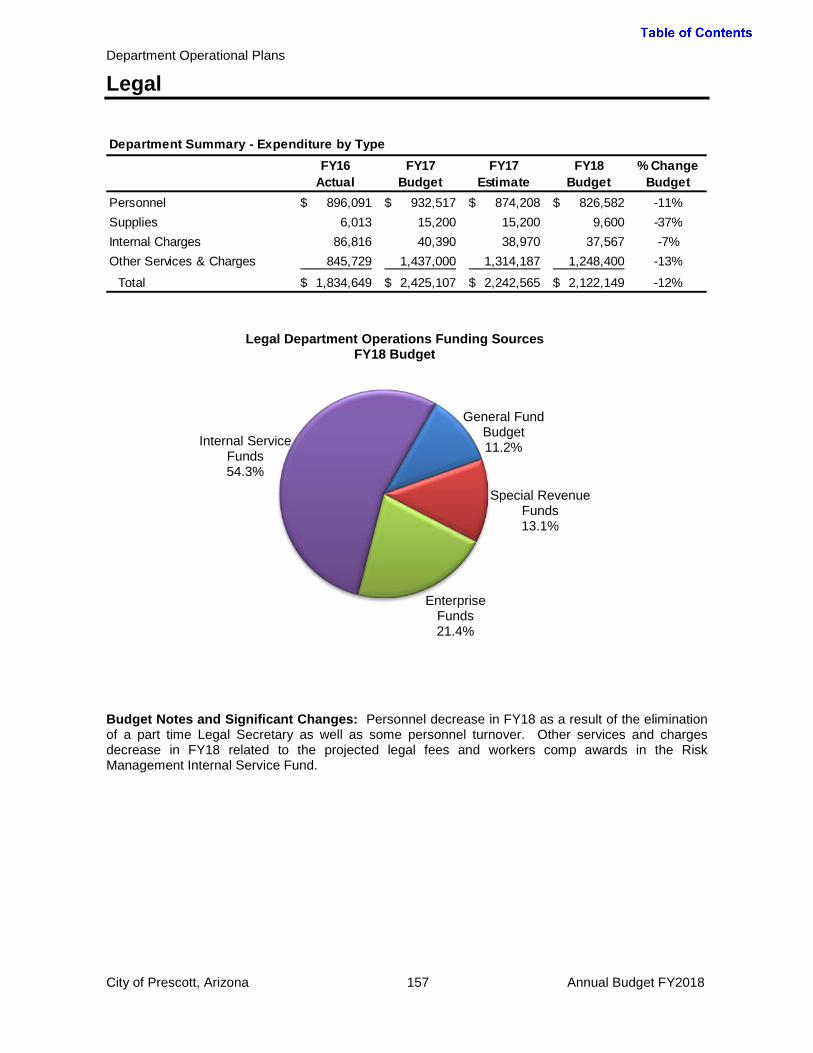
Department Operational Plans
Legal
Budget Notes and Significant Changes: Personnel decrease in FY18 as a result of the elimination of a part time Legal Secretary as well as some personnel turnover. Other services and charges decrease in FY18 related to the projected legal fees and workers comp awards in the Risk Management Internal Service Fund.
Department Summary - Expenditure by TypeFY16
ActualFY17
BudgetFY17
EstimateFY18
Budget% Change
BudgetPersonnel 896,091$ 932,517$ 874,208$ 826,582$ -11%Supplies 6,013 15,200 15,200 9,600 -37%Internal Charges 86,816 40,390 38,970 37,567 -7%Other Services & Charges 845,729 1,437,000 1,314,187 1,248,400 -13%
Total 1,834,649$ 2,425,107$ 2,242,565$ 2,122,149$ -12%
General Fund Budget 11.2%
Special Revenue Funds 13.1%
Enterprise Funds 21.4%
Internal Service Funds 54.3%
Legal Department Operations Funding Sources FY18 Budget
City of Prescott, Arizona 157 Annual Budget FY2018
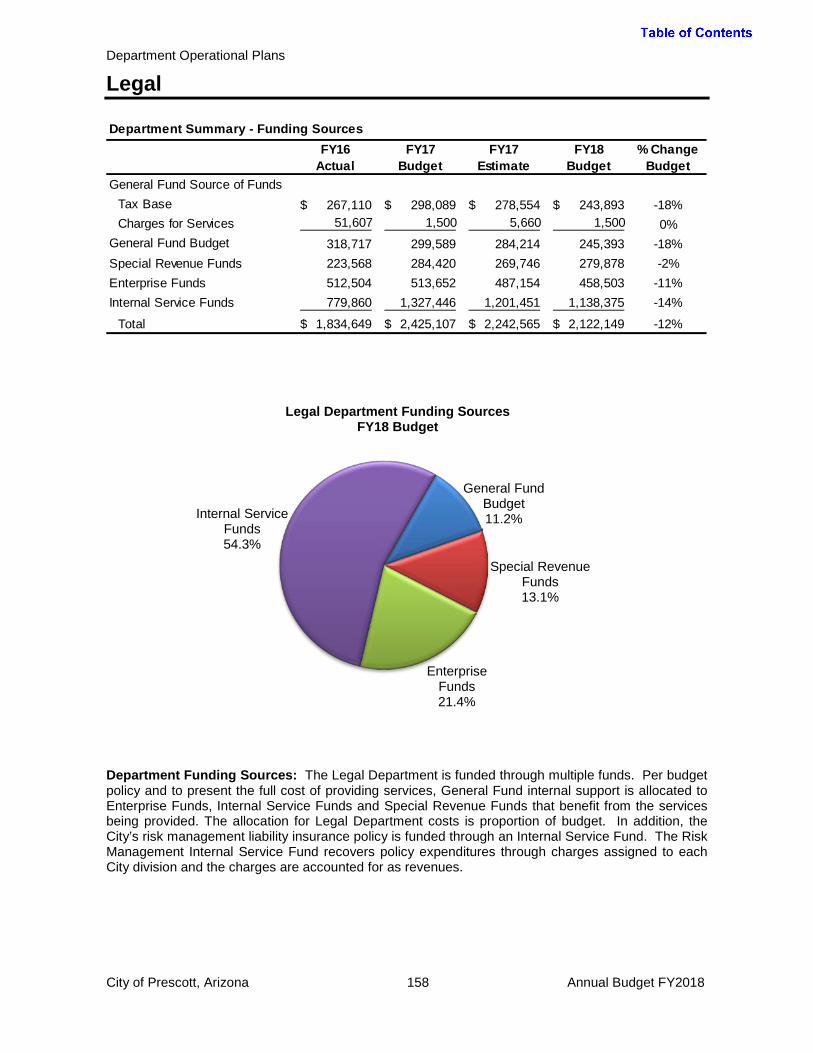
Department Operational Plans
Legal
Department Funding Sources: The Legal Department is funded through multiple funds. Per budget policy and to present the full cost of providing services, General Fund internal support is allocated to Enterprise Funds, Internal Service Funds and Special Revenue Funds that benefit from the services being provided. The allocation for Legal Department costs is proportion of budget. In addition, the City’s risk management liability insurance policy is funded through an Internal Service Fund. The Risk Management Internal Service Fund recovers policy expenditures through charges assigned to each City division and the charges are accounted for as revenues.
Department Summary - Funding SourcesFY16
ActualFY17
BudgetFY17
EstimateFY18
Budget% Change
BudgetGeneral Fund Source of Funds
Tax Base 267,110$ 298,089$ 278,554$ 243,893$ -18%Charges for Services 51,607 1,500 5,660 1,500 0%
General Fund Budget 318,717 299,589 284,214 245,393 -18%Special Revenue Funds 223,568 284,420 269,746 279,878 -2%Enterprise Funds 512,504 513,652 487,154 458,503 -11%Internal Service Funds 779,860 1,327,446 1,201,451 1,138,375 -14%
Total 1,834,649$ 2,425,107$ 2,242,565$ 2,122,149$ -12%
General Fund Budget 11.2%
Special Revenue Funds 13.1%
Enterprise Funds 21.4%
Internal Service Funds 54.3%
Legal Department Funding Sources FY18 Budget
City of Prescott, Arizona 158 Annual Budget FY2018

Department Operational Plans
Library
Services: The Library focuses on community driven needs by providing information in a variety of formats including print and non-print materials, providing access to and assistance with public computers and electronic information as well as providing answers to reference and reader’s advisory questions by phone, email and in person. The Library promotes lifelong learning through library programs and outreach programs in the community. Also, the Library efficiently maintains the physical facilities of the library to provide an attractive gathering place and meeting facilities for the community and a safe environment for both public and staff. The Library is fiscally responsible in ordering and preparing library materials for public use by utilizing volunteer workers in non-professional roles in order to more efficiently provide service to the community and leveraging membership in the Yavapai Library Network to provide more materials and services to our community than would be possible to provide as a single public library.
Department Summary - Staffing by Division
FY16 FY17 FY18Public Services 16.00 15.50 15.50Support Services 6.00 6.00 6.00
Total Authorized Positions 22.00 21.50 21.50
Department Mission: To connect community members with innovative, value-added services to increase the quality of life and strengthen the fabric of our community.
City of Prescott, Arizona 159 Annual Budget FY2018
Library Director (1)
Public Services
Public Services Manager
(1)
Lead Librarian (2)
Librarian Trainee (1)
Librarian (4)
Library Assistant (4.5)
Library Specialist (2)
Support Services
Support Services Manager
(1)
Library Assistant (2)
Librarian (1)
Maintenance Technician
(1)
Custodian (1)
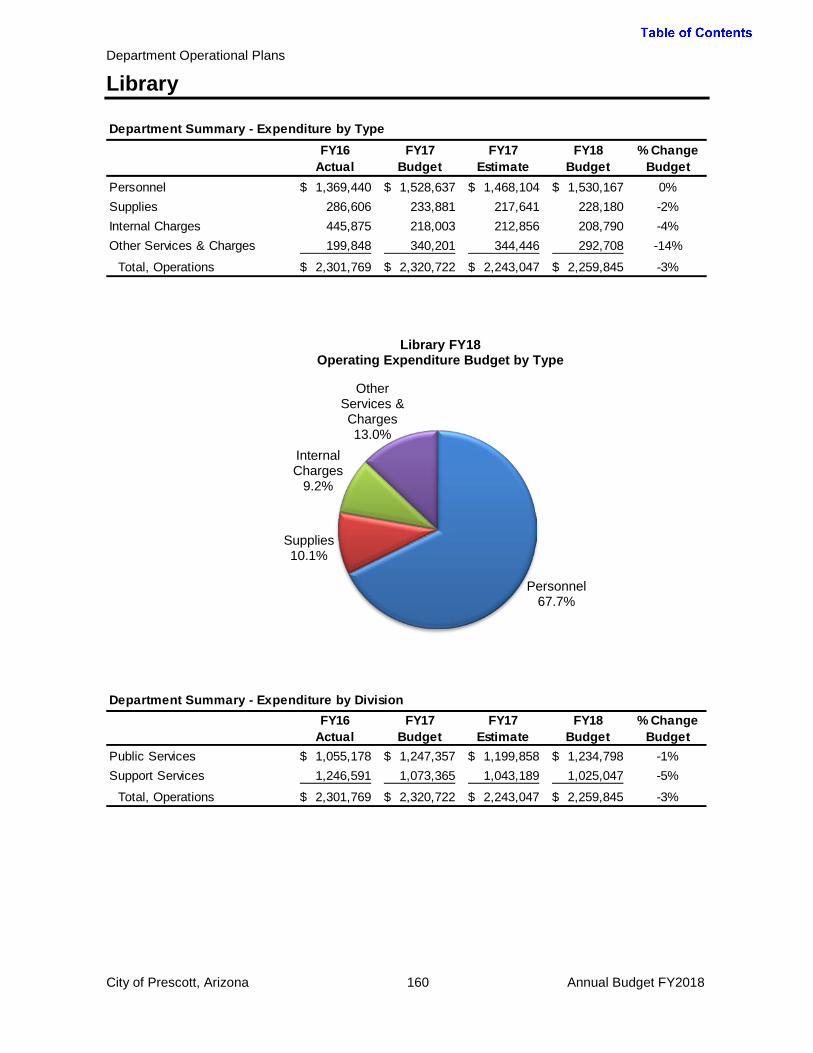
Department Operational Plans
Library
Department Summary - Expenditure by TypeFY16
ActualFY17
BudgetFY17
EstimateFY18
Budget% Change
BudgetPersonnel 1,369,440$ 1,528,637$ 1,468,104$ 1,530,167$ 0%Supplies 286,606 233,881 217,641 228,180 -2%Internal Charges 445,875 218,003 212,856 208,790 -4%Other Services & Charges 199,848 340,201 344,446 292,708 -14%
Total, Operations 2,301,769$ 2,320,722$ 2,243,047$ 2,259,845$ -3%
Personnel 67.7%
Supplies 10.1%
Internal Charges
9.2%
Other Services & Charges 13.0%
Library FY18 Operating Expenditure Budget by Type
Department Summary - Expenditure by DivisionFY16
ActualFY17
BudgetFY17
EstimateFY18
Budget% Change
BudgetPublic Services 1,055,178$ 1,247,357$ 1,199,858$ 1,234,798$ -1%Support Services 1,246,591 1,073,365 1,043,189 1,025,047 -5%
Total, Operations 2,301,769$ 2,320,722$ 2,243,047$ 2,259,845$ -3%
City of Prescott, Arizona 160 Annual Budget FY2018

Department Operational Plans
Library
Department Funding Sources: The Library receives significant funding from the Yavapai County Library District shown as intergovernmental revenues. Special Revenue funds account for grants and donations to support the library.
Department Summary - Funding SourcesFY16
ActualFY17
BudgetFY17
EstimateFY18
Budget% Change
BudgetGeneral Fund Funding Sources
Tax Base 1,668,474$ 1,583,999$ 1,544,405$ 1,600,744$ 1%Intergovernmental Revenues 568,393 565,856 565,856 562,207 -1%Charges for Services 16,428 34,800 17,950 19,300 -45%Fines and Forfeitures 39,819 46,900 34,700 37,100 -21%
General Fund Budget 2,293,114 2,231,555 2,162,911 2,219,351 -1%Special Revenue Funds 8,655 89,167 80,136 40,494 -55%
Total 2,301,769$ 2,320,722$ 2,243,047$ 2,259,845$ -3%
General Fund Tax Base
70.8%
General Fund Program
Revenues 27.4%
Special Revenue
Funds 1.8%
Library Operations Funding Sources FY18 Budget
City of Prescott, Arizona 161 Annual Budget FY2018

Department Operational Plans
Library
Public Services
Services: The Public Services Division provides materials in a variety of formats: print and electronic versions of books, magazines and reference sources, audio and visual media, and additional innovative materials such as early learning tablets for children. The Division provides expertise to assist library users with early literacy skills, knowledge of literature for youth and adults, knowledge of electronic and print resources and skills in assisting with and teaching technology and job-seeking skills. The Division staff provides a broad range of library programs and outreach to address the educational, cultural and recreational needs of community members. Goal: To provide cost-effective, convenient, accessible resources to people in the community. Council Objective: Goal #4 Maintain and Promote a Customer Service Culture
Strategy Performance Measures FY16 Actual
FY17 Budget
FY17 Estimate
FY18 Budget
Provide tools and training to access and use digital information
Percent of responders agree/strongly agree with customer satisfaction survey statements through Project Outcome. *
N/A* N/A* N/A* 75%
Utilize Yavapai Library Network to access over 1.3 million items from over 40 libraries
Items borrowed from network libraries 66,434 67,675 66,100 65,800
As percentage of items checked out 9.56% 10.0% 9.83% 10.0%
Items loaned to network libraries 61,860 62,700 61,312 60,700
Provide access to electronic information
Wireless use w/in library N/A* N/A* 47,000 50,000
Computer use w/in library 72,319 55,000 65,860 60,000
Website pageviews 463,975 465,000 464,000 465,000
Select print and non-print materials to meet community needs
Total circulation 772,629 765,500 739,000 730,000
Circulation per capita 18.97 18.70 18.00 17.82
Percent of responders agree/strongly agree with Annual Customer Satisfaction survey statements about materials available to them. *
N/A* N/A* N/A* 75%
*New measure
Division Mission: To provide opportunities for work, learning and play through resources, expertise and programs delivered with exemplary customer service.
City of Prescott, Arizona 162 Annual Budget FY2018
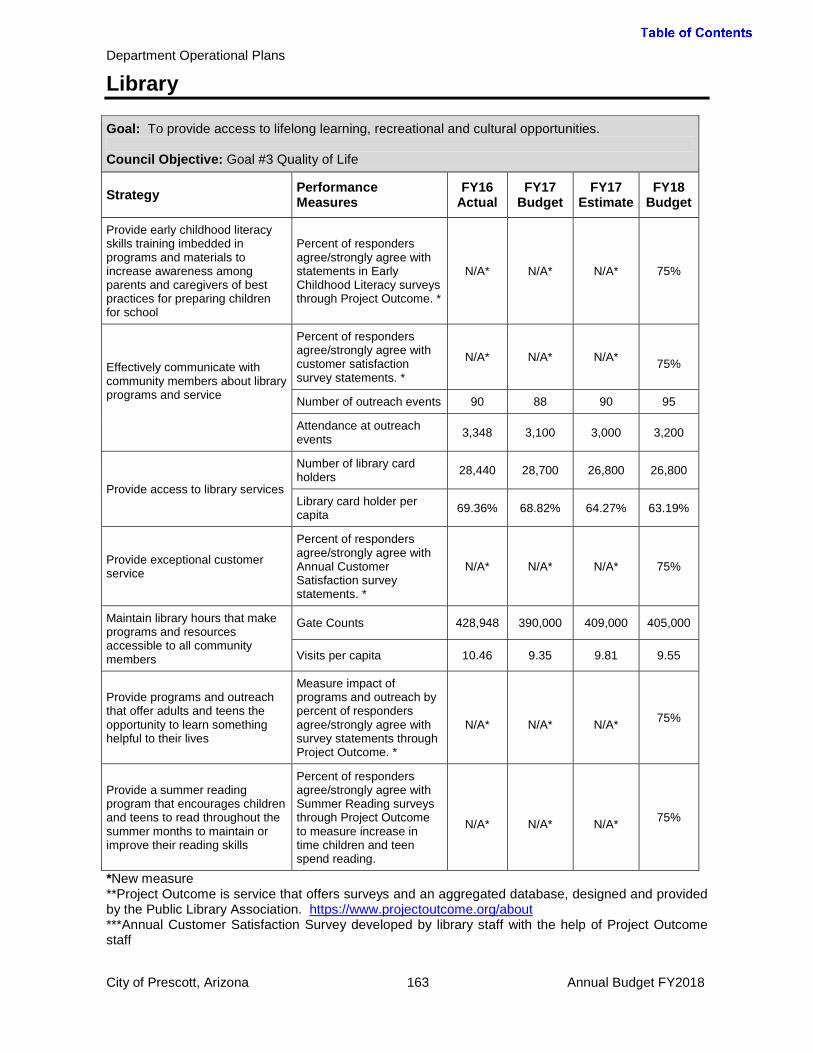
Department Operational Plans
Library
Goal: To provide access to lifelong learning, recreational and cultural opportunities. Council Objective: Goal #3 Quality of Life
Strategy Performance Measures
FY16 Actual
FY17 Budget
FY17 Estimate
FY18 Budget
Provide early childhood literacy skills training imbedded in programs and materials to increase awareness among parents and caregivers of best practices for preparing children for school
Percent of responders agree/strongly agree with statements in Early Childhood Literacy surveys through Project Outcome. *
N/A* N/A* N/A* 75%
Effectively communicate with community members about library programs and service
Percent of responders agree/strongly agree with customer satisfaction survey statements. *
N/A* N/A* N/A* 75%
Number of outreach events 90 88 90 95
Attendance at outreach events 3,348 3,100 3,000 3,200
Provide access to library services
Number of library card holders 28,440 28,700 26,800 26,800
Library card holder per capita 69.36% 68.82% 64.27% 63.19%
Provide exceptional customer service
Percent of responders agree/strongly agree with Annual Customer Satisfaction survey statements. *
N/A* N/A* N/A* 75%
Maintain library hours that make programs and resources accessible to all community members
Gate Counts 428,948 390,000 409,000 405,000
Visits per capita 10.46 9.35 9.81 9.55
Provide programs and outreach that offer adults and teens the opportunity to learn something helpful to their lives
Measure impact of programs and outreach by percent of responders agree/strongly agree with survey statements through Project Outcome. *
N/A*
N/A*
N/A* 75%
Provide a summer reading program that encourages children and teens to read throughout the summer months to maintain or improve their reading skills
Percent of responders agree/strongly agree with Summer Reading surveys through Project Outcome to measure increase in time children and teen spend reading.
N/A*
N/A*
N/A* 75%
*New measure **Project Outcome is service that offers surveys and an aggregated database, designed and provided by the Public Library Association. https://www.projectoutcome.org/about ***Annual Customer Satisfaction Survey developed by library staff with the help of Project Outcome staff
City of Prescott, Arizona 163 Annual Budget FY2018

Department Operational Plans
Library
FY17 Key Results and Outcomes:
• Provided library services to 410,000 library users. • Established a relationship with Prescott Unified School District to encourage children to take
part in summer reading program. • Was a pilot site for an Arizona State Library program to provide Open eBooks popular
children’s books to Prescott area children. • Took campaign to PUSD schools to encourage students to sign up for library cards. • Spearheaded county-wide eMaterials committee to work towards equitable purchase and
cost-effective sharing of eBooks.
Budget Notes and Significant Changes: No significant changes.
Public ServicesExpenditure Summary
FY16 Actual
FY17 Budget
FY17 Estimate
FY18 Budget
% Change Budget
Personnel 1,025,732$ 1,134,518$ 1,089,692$ 1,122,548$ -1%Internal Charges 29,446 112,839 110,166 112,250 -1%
Total 1,055,178$ 1,247,357$ 1,199,858$ 1,234,798$ -1%
Authorized Staffing SummaryFY16 FY17 FY18
Authorized Staffing Level 16.00 15.50 15.50
Library Director 1.00 1.00 1.00Manager, Public Services 1.00 1.00 1.00Lead Librarian 2.00 2.00 2.00Librarian 5.00 5.00 4.00Librarian - Trainee - - 1.00Library Specialist 2.00 2.00 2.00Library Assistant 5.00 4.50 4.50
City of Prescott, Arizona 164 Annual Budget FY2018
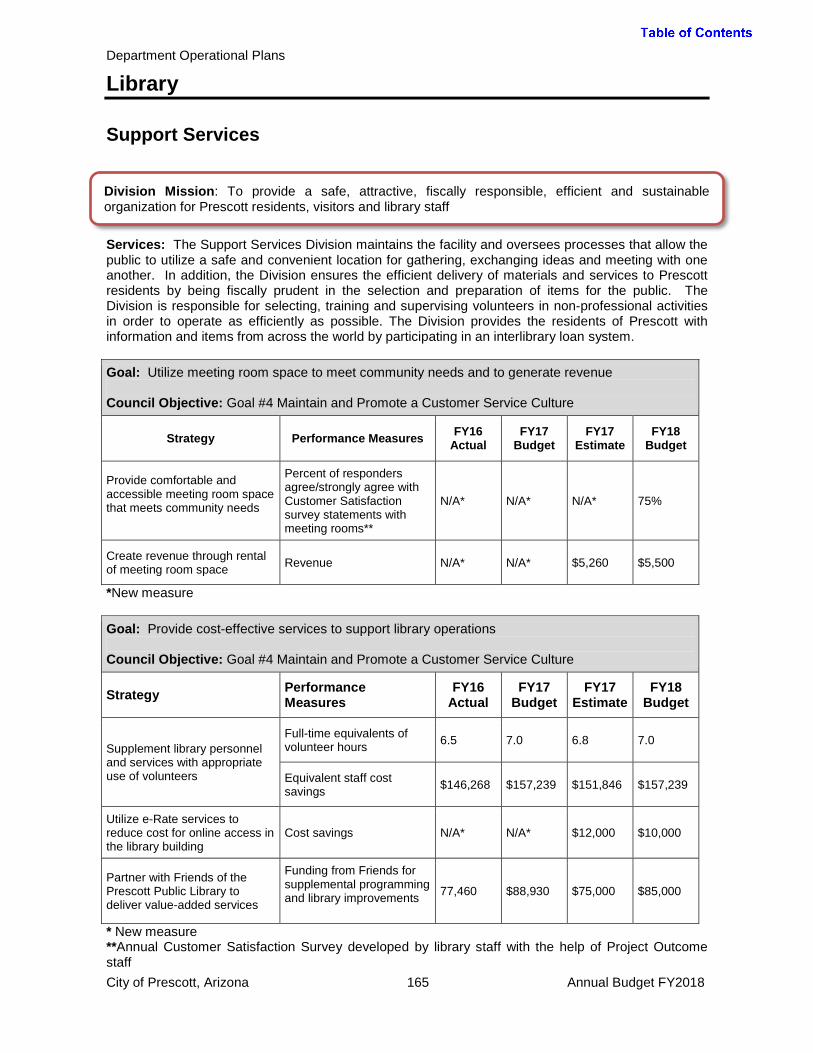
Department Operational Plans
Library
Support Services
Services: The Support Services Division maintains the facility and oversees processes that allow the public to utilize a safe and convenient location for gathering, exchanging ideas and meeting with one another. In addition, the Division ensures the efficient delivery of materials and services to Prescott residents by being fiscally prudent in the selection and preparation of items for the public. The Division is responsible for selecting, training and supervising volunteers in non-professional activities in order to operate as efficiently as possible. The Division provides the residents of Prescott with information and items from across the world by participating in an interlibrary loan system. Goal: Utilize meeting room space to meet community needs and to generate revenue Council Objective: Goal #4 Maintain and Promote a Customer Service Culture
Strategy Performance Measures FY16 Actual
FY17 Budget
FY17 Estimate
FY18 Budget
Provide comfortable and accessible meeting room space that meets community needs
Percent of responders agree/strongly agree with Customer Satisfaction survey statements with meeting rooms**
N/A* N/A* N/A* 75%
Create revenue through rental of meeting room space Revenue N/A* N/A* $5,260 $5,500
*New measure Goal: Provide cost-effective services to support library operations Council Objective: Goal #4 Maintain and Promote a Customer Service Culture
Strategy Performance Measures
FY16 Actual
FY17 Budget
FY17 Estimate
FY18 Budget
Supplement library personnel and services with appropriate use of volunteers
Full-time equivalents of volunteer hours 6.5 7.0 6.8 7.0
Equivalent staff cost savings $146,268 $157,239 $151,846 $157,239
Utilize e-Rate services to reduce cost for online access in the library building
Cost savings N/A* N/A* $12,000 $10,000
Partner with Friends of the Prescott Public Library to deliver value-added services
Funding from Friends for supplemental programming and library improvements
77,460 $88,930 $75,000 $85,000
* New measure **Annual Customer Satisfaction Survey developed by library staff with the help of Project Outcome staff
Division Mission: To provide a safe, attractive, fiscally responsible, efficient and sustainable organization for Prescott residents, visitors and library staff
City of Prescott, Arizona 165 Annual Budget FY2018
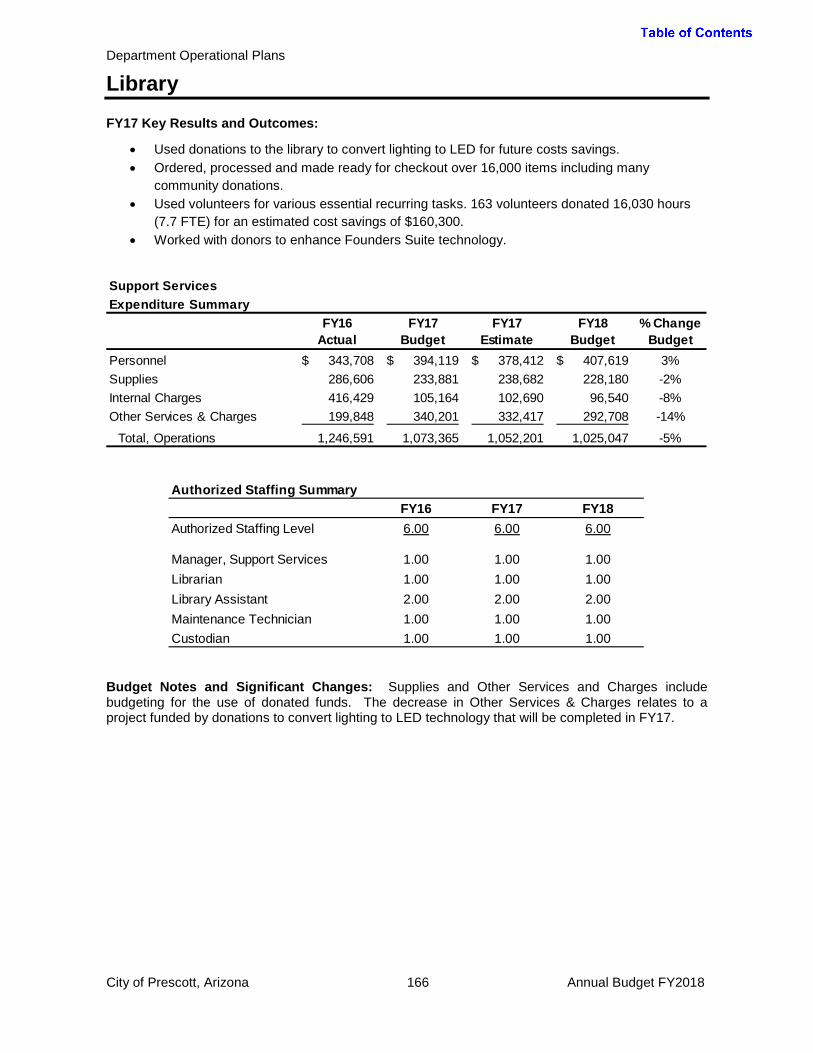
Department Operational Plans
Library
FY17 Key Results and Outcomes:
• Used donations to the library to convert lighting to LED for future costs savings. • Ordered, processed and made ready for checkout over 16,000 items including many
community donations. • Used volunteers for various essential recurring tasks. 163 volunteers donated 16,030 hours
(7.7 FTE) for an estimated cost savings of $160,300. • Worked with donors to enhance Founders Suite technology.
Budget Notes and Significant Changes: Supplies and Other Services and Charges include budgeting for the use of donated funds. The decrease in Other Services & Charges relates to a project funded by donations to convert lighting to LED technology that will be completed in FY17.
Support ServicesExpenditure Summary
FY16 Actual
FY17 Budget
FY17 Estimate
FY18 Budget
% Change Budget
Personnel 343,708$ 394,119$ 378,412$ 407,619$ 3%Supplies 286,606 233,881 238,682 228,180 -2%Internal Charges 416,429 105,164 102,690 96,540 -8%Other Services & Charges 199,848 340,201 332,417 292,708 -14%
Total, Operations 1,246,591 1,073,365 1,052,201 1,025,047 -5%
Authorized Staffing SummaryFY16 FY17 FY18
Authorized Staffing Level 6.00 6.00 6.00
Manager, Support Services 1.00 1.00 1.00Librarian 1.00 1.00 1.00Library Assistant 2.00 2.00 2.00Maintenance Technician 1.00 1.00 1.00Custodian 1.00 1.00 1.00
City of Prescott, Arizona 166 Annual Budget FY2018
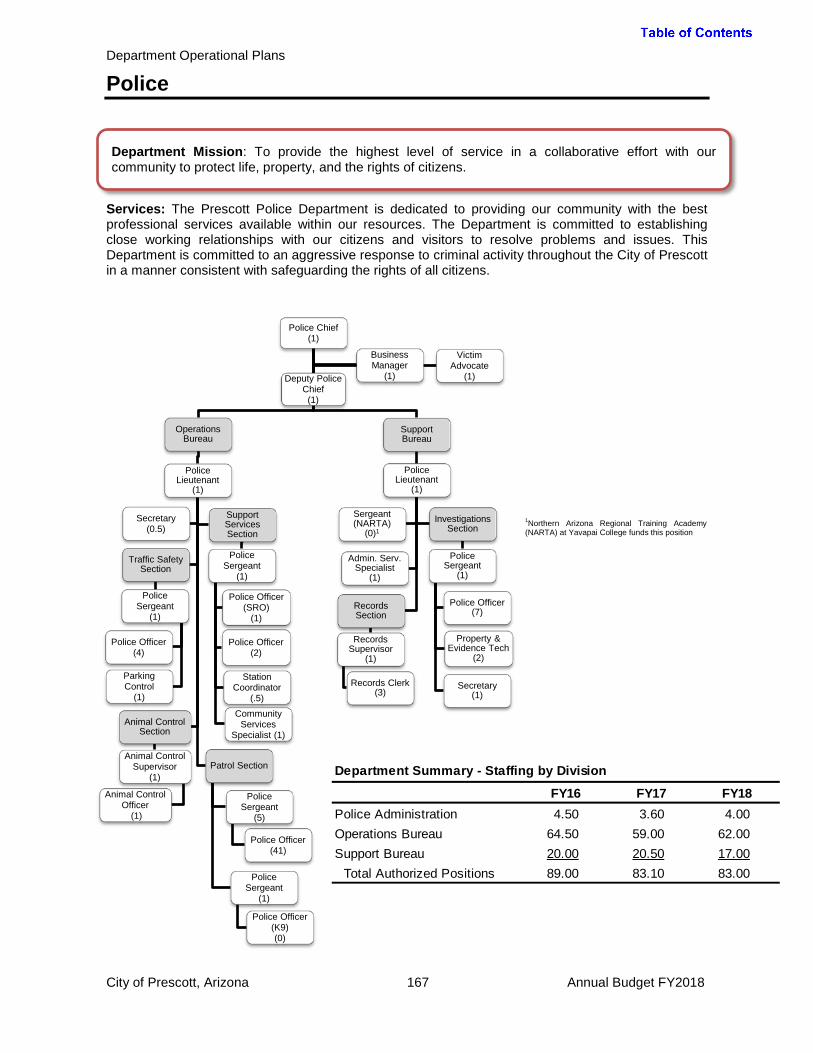
Department Operational Plans
Police
Services: The Prescott Police Department is dedicated to providing our community with the best professional services available within our resources. The Department is committed to establishing close working relationships with our citizens and visitors to resolve problems and issues. This Department is committed to an aggressive response to criminal activity throughout the City of Prescott in a manner consistent with safeguarding the rights of all citizens.
Department Mission: To provide the highest level of service in a collaborative effort with our community to protect life, property, and the rights of citizens.
1Northern Arizona Regional Training Academy (NARTA) at Yavapai College funds this position
Department Summary - Staffing by Division
FY16 FY17 FY18Police Administration 4.50 3.60 4.00Operations Bureau 64.50 59.00 62.00Support Bureau 20.00 20.50 17.00
Total Authorized Positions 89.00 83.10 83.00
City of Prescott, Arizona 167 Annual Budget FY2018
Police Chief (1)
Support Bureau
Police Lieutenant
(1)
Investigations Section
Police Sergeant
(1)
Property & Evidence Tech
(2)
Police Officer (7)
Secretary (1)
Admin. Serv. Specialist
(1)
Sergeant (NARTA)
(0)1
Records Section
Records Supervisor
(1)
Records Clerk (3)
Operations Bureau
Police Lieutenant
(1)
Patrol Section
Police Sergeant
(5)
Police Officer (41)
Police Sergeant
(1)
Police Officer (K9) (0)
Animal Control Section
Animal Control Supervisor
(1)
Animal Control Officer
(1)
Traffic Safety Section
Police Sergeant
(1)
Police Officer (4)
Parking Control
(1)
Support Services Section
Police Sergeant
(1)
Police Officer (2)
Police Officer (SRO)
(1)
Station Coordinator
(.5)
Community Services
Specialist (1)
Secretary (0.5)
Deputy Police Chief (1)
Business Manager
(1)
Victim Advocate
(1)
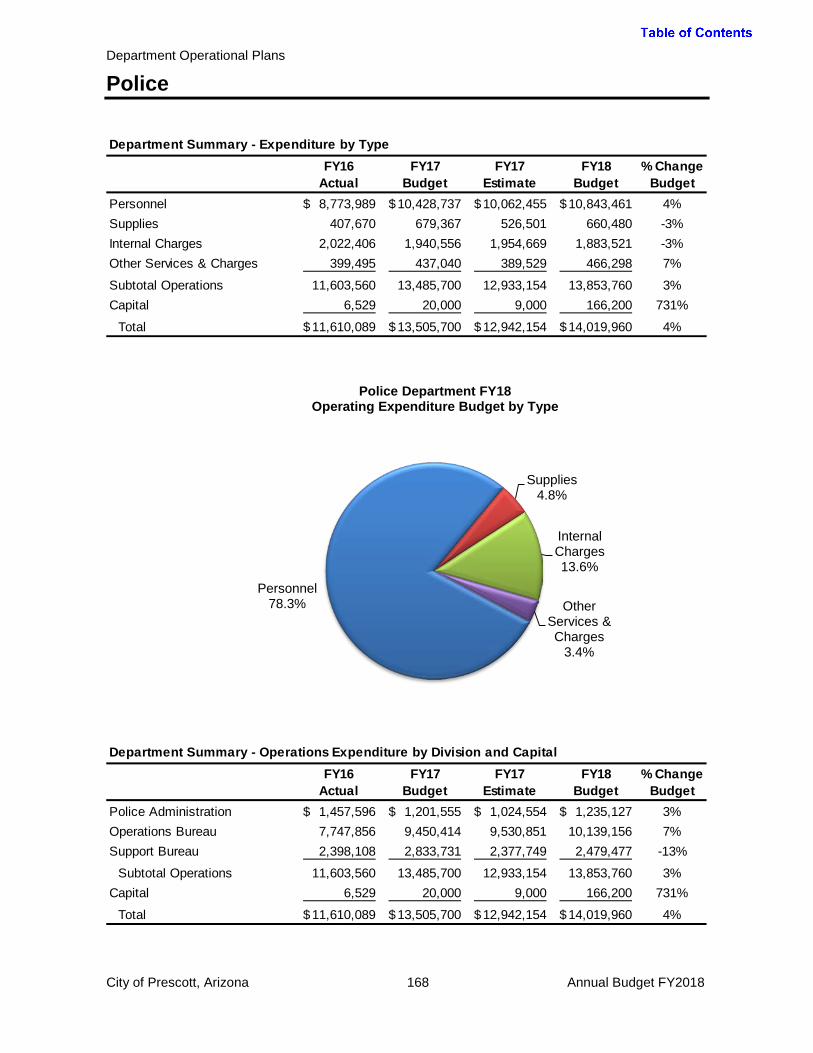
Department Operational Plans
Police
Department Summary - Expenditure by TypeFY16
ActualFY17
BudgetFY17
EstimateFY18
Budget% Change
BudgetPersonnel 8,773,989$ 10,428,737$ 10,062,455$ 10,843,461$ 4%Supplies 407,670 679,367 526,501 660,480 -3%Internal Charges 2,022,406 1,940,556 1,954,669 1,883,521 -3%Other Services & Charges 399,495 437,040 389,529 466,298 7%
Subtotal Operations 11,603,560 13,485,700 12,933,154 13,853,760 3%Capital 6,529 20,000 9,000 166,200 731%
Total 11,610,089$ 13,505,700$ 12,942,154$ 14,019,960$ 4%
Personnel 78.3%
Supplies 4.8%
Internal Charges 13.6%
Other Services & Charges
3.4%
Police Department FY18 Operating Expenditure Budget by Type
Department Summary - Operations Expenditure by Division and CapitalFY16
ActualFY17
BudgetFY17
EstimateFY18
Budget% Change
BudgetPolice Administration 1,457,596$ 1,201,555$ 1,024,554$ 1,235,127$ 3%Operations Bureau 7,747,856 9,450,414 9,530,851 10,139,156 7%Support Bureau 2,398,108 2,833,731 2,377,749 2,479,477 -13%
Subtotal Operations 11,603,560 13,485,700 12,933,154 13,853,760 3%Capital 6,529 20,000 9,000 166,200 731%
Total 11,610,089$ 13,505,700$ 12,942,154$ 14,019,960$ 4%
City of Prescott, Arizona 168 Annual Budget FY2018
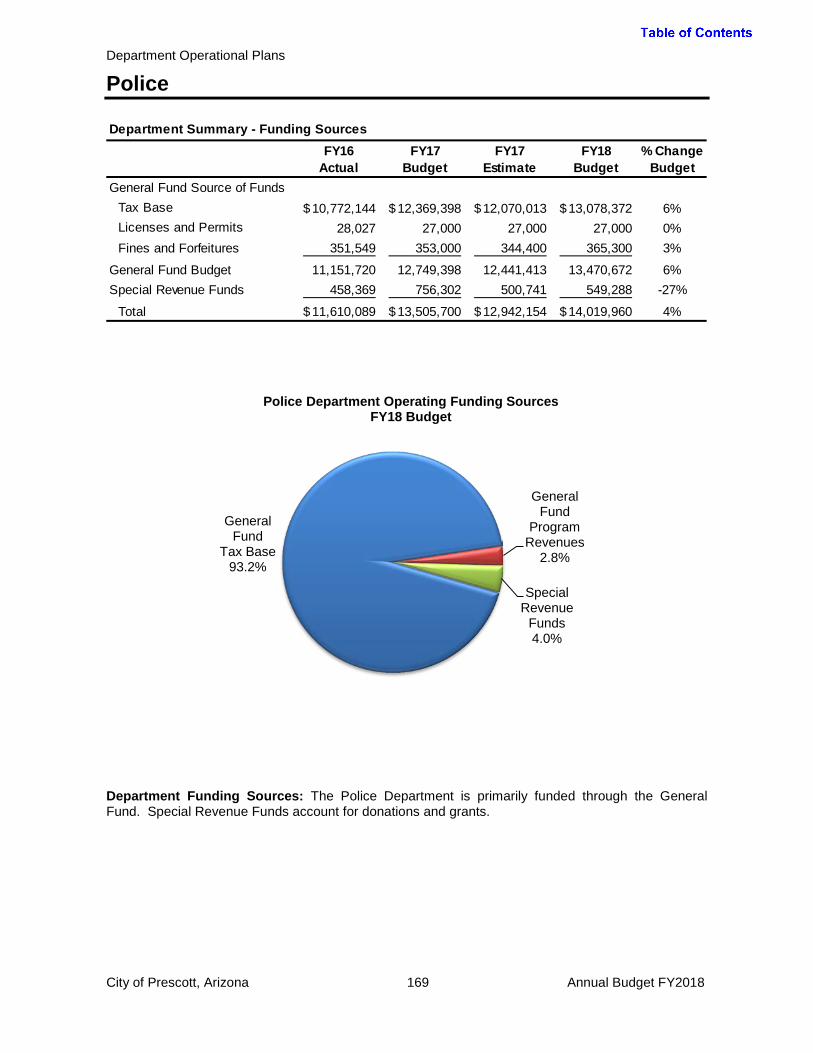
Department Operational Plans
Police
Department Funding Sources: The Police Department is primarily funded through the General Fund. Special Revenue Funds account for donations and grants.
Department Summary - Funding SourcesFY16
ActualFY17
BudgetFY17
EstimateFY18
Budget% Change
BudgetGeneral Fund Source of Funds
Tax Base 10,772,144$ 12,369,398$ 12,070,013$ 13,078,372$ 6%Licenses and Permits 28,027 27,000 27,000 27,000 0%Fines and Forfeitures 351,549 353,000 344,400 365,300 3%
General Fund Budget 11,151,720 12,749,398 12,441,413 13,470,672 6%Special Revenue Funds 458,369 756,302 500,741 549,288 -27%
Total 11,610,089$ 13,505,700$ 12,942,154$ 14,019,960$ 4%
General Fund
Tax Base 93.2%
General Fund
Program Revenues
2.8%
Special Revenue
Funds 4.0%
Police Department Operating Funding Sources FY18 Budget
City of Prescott, Arizona 169 Annual Budget FY2018
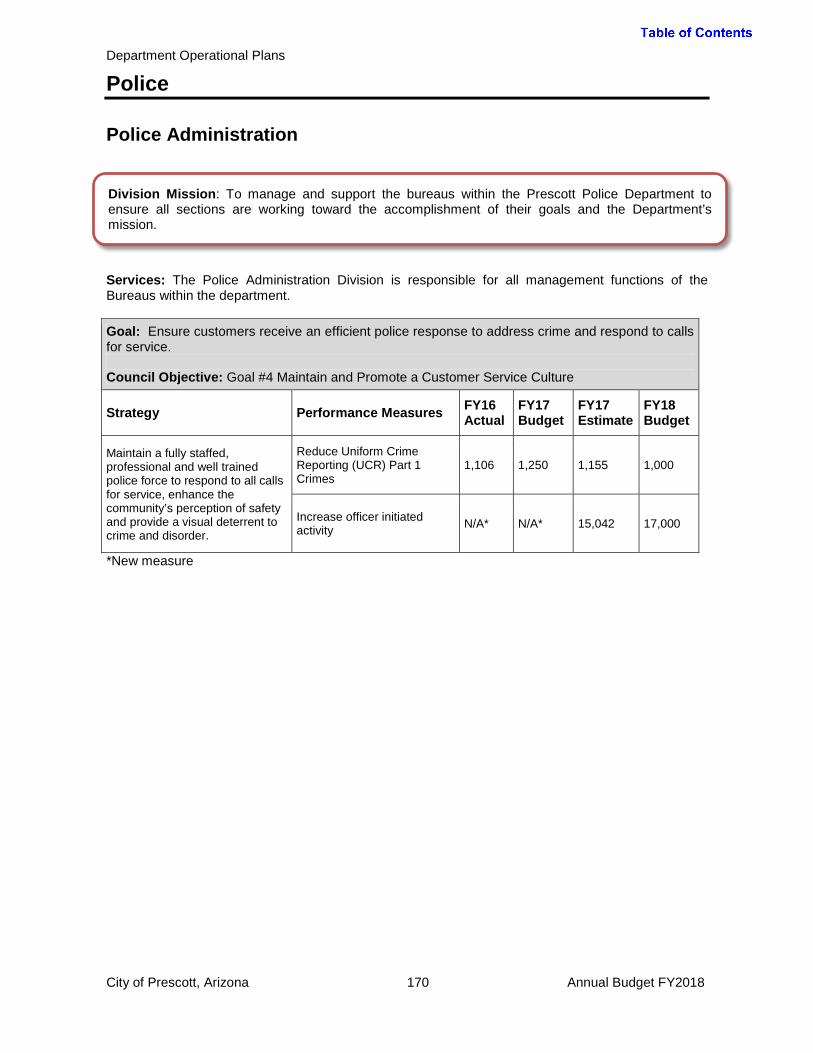
Department Operational Plans
Police
Police Administration
Services: The Police Administration Division is responsible for all management functions of the Bureaus within the department. Goal: Ensure customers receive an efficient police response to address crime and respond to calls for service. Council Objective: Goal #4 Maintain and Promote a Customer Service Culture
Strategy Performance Measures FY16 Actual
FY17 Budget
FY17 Estimate
FY18 Budget
Maintain a fully staffed, professional and well trained police force to respond to all calls for service, enhance the community’s perception of safety and provide a visual deterrent to crime and disorder.
Reduce Uniform Crime Reporting (UCR) Part 1 Crimes
1,106 1,250 1,155 1,000
Increase officer initiated activity N/A* N/A* 15,042 17,000
*New measure
Division Mission: To manage and support the bureaus within the Prescott Police Department to ensure all sections are working toward the accomplishment of their goals and the Department’s mission.
City of Prescott, Arizona 170 Annual Budget FY2018

Department Operational Plans
Police
Budget Notes and Significant Changes: Personnel changes in FY18 include adding a Police Lieutenant position to Regional Communications in place of 40% of the Deputy Chief position and an increasing contribution rate for the Public Safety Retirement System. An internal charge increase represents a facilities maintenance cost recovery rate increase for the Police Station.
Police AdministrationExpenditure Summary
FY16 Actual
FY17 Budget
FY17 Estimate
FY18 Budget
% Change Budget
Personnel 645,166$ 663,854$ 621,525$ 685,035$ 3%Supplies 125,330 239,422 150,543 247,508 3%Internal Charges 542,286 93,114 93,897 124,481 34%Other Services & Charges 144,814 205,165 158,589 178,103 -13%
Subtotal Operations 1,457,596 1,201,555 1,024,554 1,235,127 3%Capital 6,529 - - -
Total 1,464,125$ 1,201,555$ 1,024,554$ 1,235,127$ 3%
Authorized Staffing SummaryFY16 FY17 FY18
Authorized Staffing Level 4.50 3.60 4.00
Police Chief 1.00 1.00 1.00Deputy Police Chief1 1.00 0.60 1.00Business Manager 1.00 1.00 1.00Victim Advocate - 1.00 1.00Public Safety Specialist 0.50 - -Admin Services Specialist 1.00 - -1 40% of Deputy Chief was charged to Regional Communications
City of Prescott, Arizona 171 Annual Budget FY2018

Department Operational Plans
Police
Operations Bureau
Services: The Police Department Operation Bureau consists of 4 Sections: The Patrol Section consists of uniformed Patrol Officers and Sergeants staff five, 24/7 Patrol Teams with assistance from dedicated K9 Teams. These Patrol Teams provide city wide coverage responding to calls for service from our citizens and visitors. Traffic Safety Section performs proactive enforcement of traffic laws, investigates death/serious injury crashes and coordinates and participates in numerous Special Events within the city that showcase our community. The Support Services Section provides a School Resource Officer to Prescott High School and provides visibility in the downtown area to promote communication between our business community and the visitors frequenting these locations. The Support Services Section provides numerous training sessions throughout the community on subjects such as Alzheimer’s, Work Place Safety, Green Zone Anti Bullying and Red Ribbon Anti-Drug training to our elementary schools. The Animal Control Section team provides services consisting of dog licensing, animal impounds, bite investigations and educational classes to various groups. Goal: Promote safe and efficient travel on the roadways within the city. Council Objective: Goal #3 Quality of Life
Strategy Performance Measures FY16 Actual
FY17 Budget
FY17 Estimate
FY18 Budget
Proactive enforcement of traffic laws by the use of speed enforcement, saturation patrols DUI Task Force and extra patrols in citizen complaint areas.
Citations and warnings issued by the Traffic Safety Section.
8,909 7,800 7,800 8,200
Reduce collisions through education, enforcement and community outreach
Traffic crash investigations, non-injury, injury and fatality. 1,075 1,100 950
950
Division Mission: To protect life, fight crime, provide services to victims, provide safe and efficient travel on the roadways within the city, provide education through proactive community policing activities and protect the health and welfare of domestic animals within the city.
City of Prescott, Arizona 172 Annual Budget FY2018

Department Operational Plans
Police
Goal: Reduce crime through effective patrol, education and public engagement campaigns Council Objective: Goal #3 Quality of Life
Strategy Performance Measures FY16 Actual
FY17 Budget
FY17 Estimate
FY18 Budget
Increase participation in crime prevention programs such as Block Watch and Business Watch.
Number of dedicated Block Watch and Business Watch groups currently participating with the Police Department.
259 275 275 300
Increase visible bicycle and foot patrols in the downtown area and public spaces.
Provide daily uniformed presence in the downtown area.
N/A* N/A* 100 300
*New measure FY17 Key Results and Outcomes: Patrol
• Responded to 39,429 incidents; 23,852 were calls for service with the remaining 15,577 self-initiated in nature.
• Citizens on Patrol provided their services for the Whiskey Row Off-Road race, the Whiskey Row Marathon and the 4th of July festivities, including the rodeo and fireworks in the downtown area. They also assisted with the City Christmas holiday events and the Halloween detail on Mt. Vernon Street. They continued to provide public safety services throughout the year with regular patrols, abandoned vehicles, money runs, evidence runs, property watches, drug burns, critical incident call-outs, vehicle maintenance runs and traffic control for accidents.
Traffic Safety • Provided traffic control and a police presence at 25 different races, parades and various
community special events. • Submitted for and received grant funding through the Governor’s Office of Highway Safety
(GOHS); $35,000 for DUI and speed and aggressive driver enforcement and $3,000 for seatbelt enforcement. Through grant funding received, the Traffic Safety Section administered:
o 13 DUI taskforce details including saturation patrols and joint command post operations
o 2 week enforcement wave of “Click it or Ticket” National Campaign o 9 speed and aggressive driver enforcement details o Know your Limit campaign, providing information to the public regarding alcohol and
its effects • Received advanced training to continue proficiency in numerous specialty areas such as:
o Phlebotomist re-certification training o Advanced accident investigation class on line (IPTM) o AZPOST Police Supervision class o FTO school o AZPOST firearms instructor school
• Officers of the Traffic Safety Section: o Wrote 1,500 traffic citations and warnings o Investigated 522 traffic crashes o Made 32 DUI arrests o Wrote 2,700 parking citations and warnings
City of Prescott, Arizona 173 Annual Budget FY2018
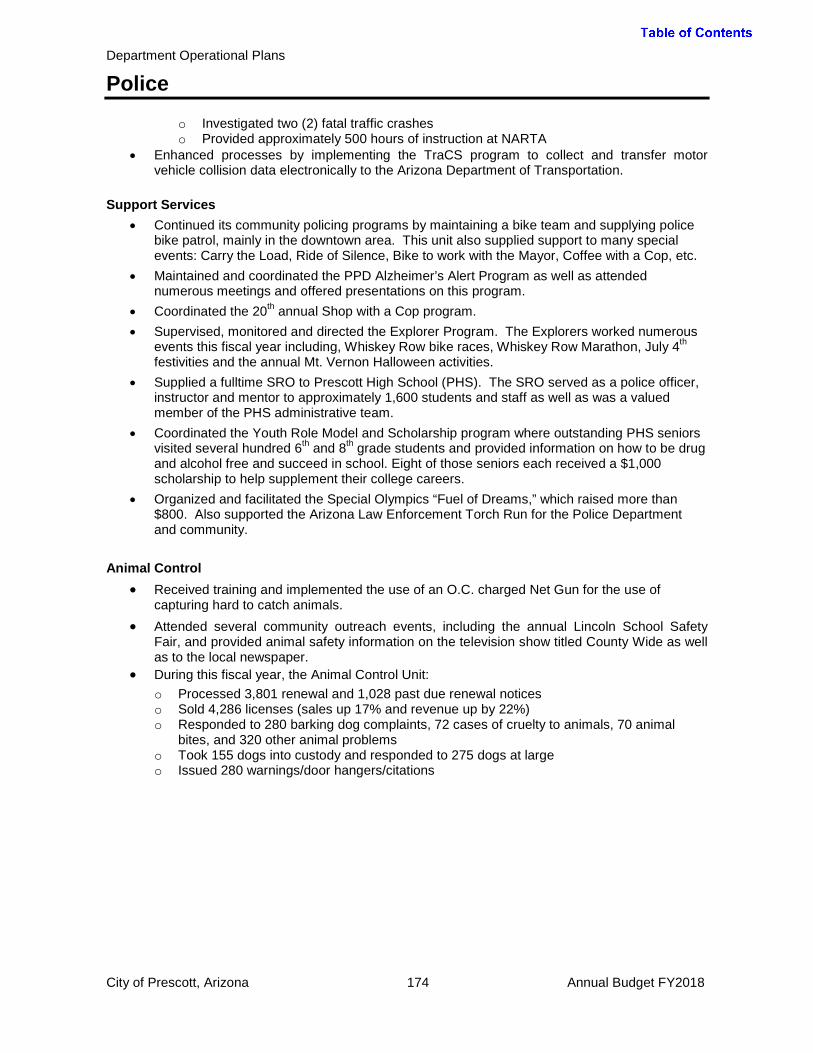
Department Operational Plans
Police
o Investigated two (2) fatal traffic crashes o Provided approximately 500 hours of instruction at NARTA
• Enhanced processes by implementing the TraCS program to collect and transfer motor vehicle collision data electronically to the Arizona Department of Transportation.
Support Services
• Continued its community policing programs by maintaining a bike team and supplying police bike patrol, mainly in the downtown area. This unit also supplied support to many special events: Carry the Load, Ride of Silence, Bike to work with the Mayor, Coffee with a Cop, etc.
• Maintained and coordinated the PPD Alzheimer’s Alert Program as well as attended numerous meetings and offered presentations on this program.
• Coordinated the 20th annual Shop with a Cop program. • Supervised, monitored and directed the Explorer Program. The Explorers worked numerous
events this fiscal year including, Whiskey Row bike races, Whiskey Row Marathon, July 4th
festivities and the annual Mt. Vernon Halloween activities. • Supplied a fulltime SRO to Prescott High School (PHS). The SRO served as a police officer,
instructor and mentor to approximately 1,600 students and staff as well as was a valued member of the PHS administrative team.
• Coordinated the Youth Role Model and Scholarship program where outstanding PHS seniors visited several hundred 6th and 8th grade students and provided information on how to be drug and alcohol free and succeed in school. Eight of those seniors each received a $1,000 scholarship to help supplement their college careers.
• Organized and facilitated the Special Olympics “Fuel of Dreams,” which raised more than $800. Also supported the Arizona Law Enforcement Torch Run for the Police Department and community.
Animal Control • Received training and implemented the use of an O.C. charged Net Gun for the use of
capturing hard to catch animals. • Attended several community outreach events, including the annual Lincoln School Safety
Fair, and provided animal safety information on the television show titled County Wide as well as to the local newspaper.
• During this fiscal year, the Animal Control Unit: o Processed 3,801 renewal and 1,028 past due renewal notices o Sold 4,286 licenses (sales up 17% and revenue up by 22%) o Responded to 280 barking dog complaints, 72 cases of cruelty to animals, 70 animal
bites, and 320 other animal problems o Took 155 dogs into custody and responded to 275 dogs at large o Issued 280 warnings/door hangers/citations
City of Prescott, Arizona 174 Annual Budget FY2018

Department Operational Plans
Police
Budget Notes and Significant Changes: Changes to personnel in FY18 include moving 2 Police Officers and Community Services Specialist from the Support Bureau. The FY18 personnel budget also increases with rising Public Safety Personnel Retirement System (PSPRS) contributions.
Operations BureauExpenditure Summary
FY16 Actual
FY17 Budget
FY17 Estimate
FY18 Budget
% Change Budget
Personnel 6,043,915$ 7,365,713$ 7,522,276$ 8,133,212$ 10%Supplies 209,552 342,700 285,700 319,100 -7%Internal Charges 1,345,051 1,592,886 1,592,891 1,541,129 -3%Other Services & Charges 149,338 149,115 129,984 145,715 -2%
Subtotal Operations 7,747,856 9,450,414 9,530,851 10,139,156 7%Capital - - - 166,200
Total 7,747,856$ 9,450,414$ 9,530,851$ 10,305,356$ 9%
Authorized Staffing SummaryFY16 FY17 FY18
Authorized Staffing Level 64.50 59.00 62.00
Police Lieutenant 1.00 1.00 1.00Police Sergeant 8.00 8.00 8.00Police Officer 49.00 46.00 48.00Parking Control Monitor 1.00 1.00 1.00Animal Control Supervisor 1.00 1.00 1.00Animal Control Officer 2.00 1.00 1.00Station Coordinator 0.50 0.50 0.50Secretary 1.00 0.50 0.50Community Services Specialist - - 1.00Crime Prevention Specialist 1.00 - -
City of Prescott, Arizona 175 Annual Budget FY2018
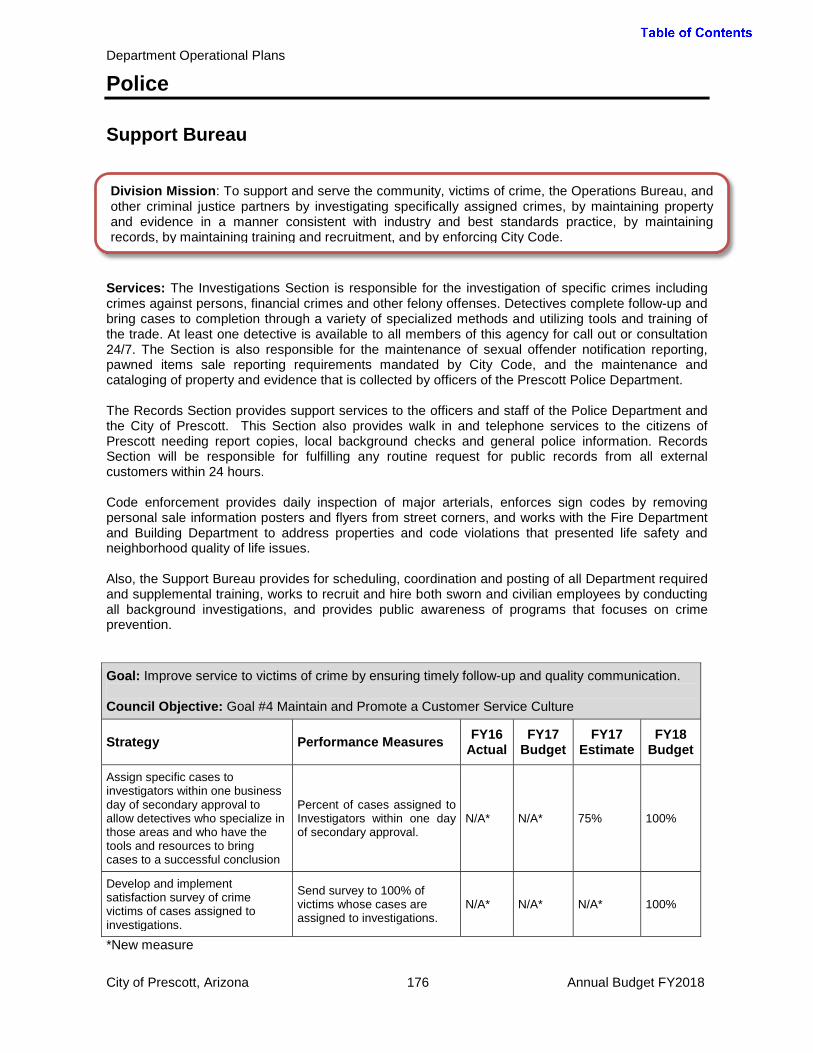
Department Operational Plans
Police
Support Bureau
Services: The Investigations Section is responsible for the investigation of specific crimes including crimes against persons, financial crimes and other felony offenses. Detectives complete follow-up and bring cases to completion through a variety of specialized methods and utilizing tools and training of the trade. At least one detective is available to all members of this agency for call out or consultation 24/7. The Section is also responsible for the maintenance of sexual offender notification reporting, pawned items sale reporting requirements mandated by City Code, and the maintenance and cataloging of property and evidence that is collected by officers of the Prescott Police Department. The Records Section provides support services to the officers and staff of the Police Department and the City of Prescott. This Section also provides walk in and telephone services to the citizens of Prescott needing report copies, local background checks and general police information. Records Section will be responsible for fulfilling any routine request for public records from all external customers within 24 hours. Code enforcement provides daily inspection of major arterials, enforces sign codes by removing personal sale information posters and flyers from street corners, and works with the Fire Department and Building Department to address properties and code violations that presented life safety and neighborhood quality of life issues. Also, the Support Bureau provides for scheduling, coordination and posting of all Department required and supplemental training, works to recruit and hire both sworn and civilian employees by conducting all background investigations, and provides public awareness of programs that focuses on crime prevention. Goal: Improve service to victims of crime by ensuring timely follow-up and quality communication. Council Objective: Goal #4 Maintain and Promote a Customer Service Culture
Strategy Performance Measures FY16 Actual
FY17 Budget
FY17 Estimate
FY18 Budget
Assign specific cases to investigators within one business day of secondary approval to allow detectives who specialize in those areas and who have the tools and resources to bring cases to a successful conclusion
Percent of cases assigned to Investigators within one day of secondary approval.
N/A* N/A* 75% 100%
Develop and implement satisfaction survey of crime victims of cases assigned to investigations.
Send survey to 100% of victims whose cases are assigned to investigations.
N/A* N/A* N/A* 100%
*New measure
Division Mission: To support and serve the community, victims of crime, the Operations Bureau, and other criminal justice partners by investigating specifically assigned crimes, by maintaining property and evidence in a manner consistent with industry and best standards practice, by maintaining records, by maintaining training and recruitment, and by enforcing City Code.
City of Prescott, Arizona 176 Annual Budget FY2018

Department Operational Plans
Police
FY17 Key Results and Outcomes: Investigations
• Secured a conviction of Jerry Lee Wells for the 2015 triple homicide of his mother and two roommates.
• Responded to and supported the Department of Public Safety Special Investigations Unit in the April 2017 Hope Street officer involved shooting.
• Created processes and procedures and implemented the Sex Offender Accountability Program.
• Out of a total of 374 cases assigned from Patrol, investigated and cleared 115 cases. Records
• In collaboration with the Investigations Section and the City’s IT Department, developed a process and established a secure email address to securely route appropriate reports to the Yavapai County Attorney’s Office, saving time and resources and reducing the reproduction of hard copy reports.
• Reduced the processing time and streamlined the entry and transfer of traffic accidents to the Arizona Department of Transportation with the use of the new TraCS program.
Property and Evidence • A total of 6,100 items of evidence were impounded, 750 property items released, and 1,250
pounds of drugs destroyed. • 44 scenes were investigated by the Crime Scene Technician for Patrol and the Investigations
Section.
Swat • The SWAT team was activated three (3) times during FY17: one (1) high risk warrant service
for the Investigations Section and two (2) for barricaded subjects patrol officers had initially responded to. Additionally, two (2) members of the SWAT team assisted YCSO SWAT with a warrant service by providing an armored vehicle as theirs was not operational at the time of the operation.
• In conjunction with the Prescott Valley Police Department SWAT team, the SWAT team provided dignitary protection for President Trump when he flew into the Prescott airport for a campaign event in Prescott Valley.
• The SWAT team trained one hundred ninety hours (190) over the past year and attended the Arizona Tactical Officer’s Association (ATOA) Conference as well as TAC OPS where tactical operators attended leadership classes and specialized instructor certification courses.
• Participated in several community outreach events as a way to educate its citizens about tactical teams and their purpose. Events included a fundraising event hosted by NARTA to raise money for the child of a local officer, the annual Lincoln School Safety Fair and a men’s expo held at Prescott High School.
City of Prescott, Arizona 177 Annual Budget FY2018
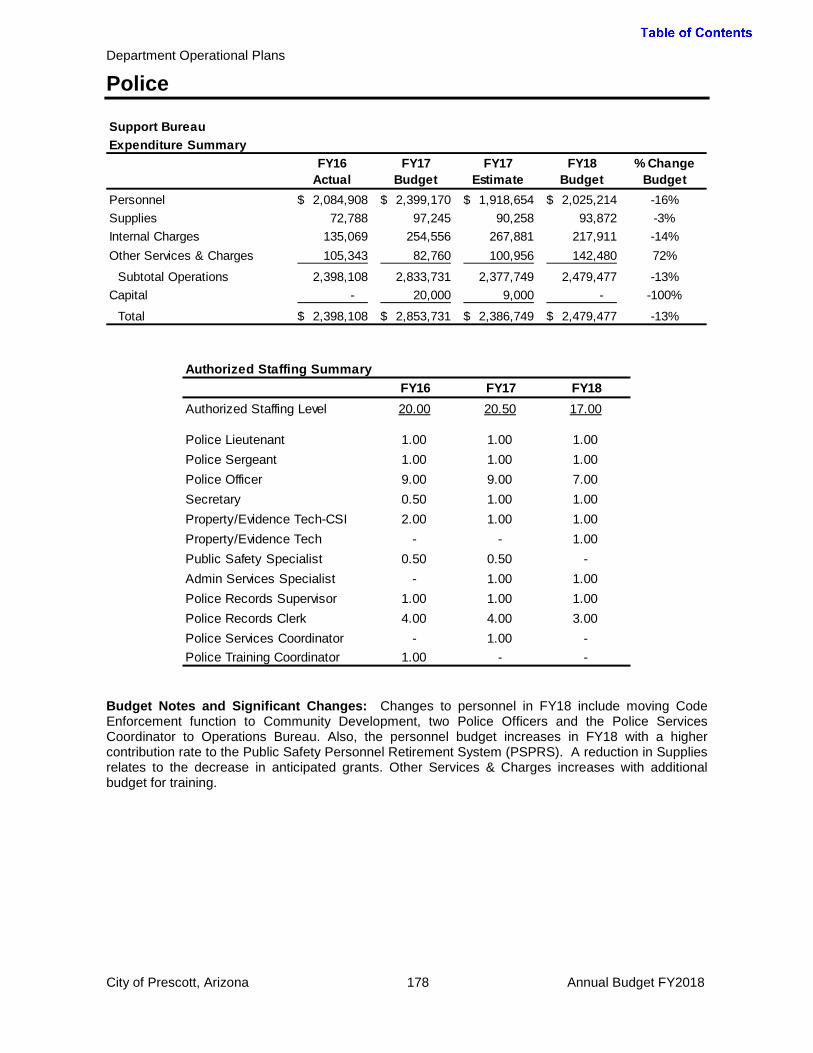
Department Operational Plans
Police
Budget Notes and Significant Changes: Changes to personnel in FY18 include moving Code Enforcement function to Community Development, two Police Officers and the Police Services Coordinator to Operations Bureau. Also, the personnel budget increases in FY18 with a higher contribution rate to the Public Safety Personnel Retirement System (PSPRS). A reduction in Supplies relates to the decrease in anticipated grants. Other Services & Charges increases with additional budget for training.
Support BureauExpenditure Summary
FY16 Actual
FY17 Budget
FY17 Estimate
FY18 Budget
% Change Budget
Personnel 2,084,908$ 2,399,170$ 1,918,654$ 2,025,214$ -16%Supplies 72,788 97,245 90,258 93,872 -3%Internal Charges 135,069 254,556 267,881 217,911 -14%Other Services & Charges 105,343 82,760 100,956 142,480 72%
Subtotal Operations 2,398,108 2,833,731 2,377,749 2,479,477 -13%Capital - 20,000 9,000 - -100%
Total 2,398,108$ 2,853,731$ 2,386,749$ 2,479,477$ -13%
Authorized Staffing SummaryFY16 FY17 FY18
Authorized Staffing Level 20.00 20.50 17.00
Police Lieutenant 1.00 1.00 1.00Police Sergeant 1.00 1.00 1.00Police Officer 9.00 9.00 7.00Secretary 0.50 1.00 1.00Property/Evidence Tech-CSI 2.00 1.00 1.00Property/Evidence Tech - - 1.00Public Safety Specialist 0.50 0.50 -Admin Services Specialist - 1.00 1.00Police Records Supervisor 1.00 1.00 1.00Police Records Clerk 4.00 4.00 3.00Police Services Coordinator - 1.00 -Police Training Coordinator 1.00 - -
City of Prescott, Arizona 178 Annual Budget FY2018
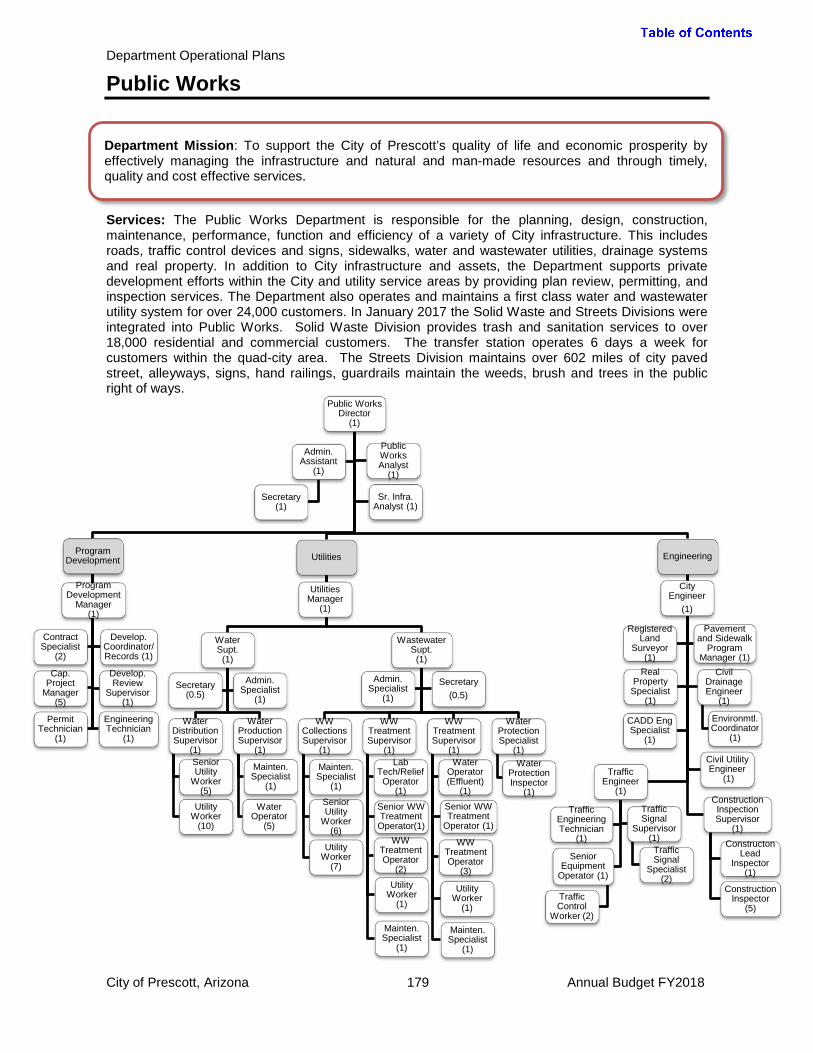
Department Operational Plans
Public Works
Services: The Public Works Department is responsible for the planning, design, construction, maintenance, performance, function and efficiency of a variety of City infrastructure. This includes roads, traffic control devices and signs, sidewalks, water and wastewater utilities, drainage systems and real property. In addition to City infrastructure and assets, the Department supports private development efforts within the City and utility service areas by providing plan review, permitting, and inspection services. The Department also operates and maintains a first class water and wastewater utility system for over 24,000 customers. In January 2017 the Solid Waste and Streets Divisions were integrated into Public Works. Solid Waste Division provides trash and sanitation services to over 18,000 residential and commercial customers. The transfer station operates 6 days a week for customers within the quad-city area. The Streets Division maintains over 602 miles of city paved street, alleyways, signs, hand railings, guardrails maintain the weeds, brush and trees in the public right of ways.
Department Mission: To support the City of Prescott’s quality of life and economic prosperity by effectively managing the infrastructure and natural and man-made resources and through timely, quality and cost effective services.
City of Prescott, Arizona 179 Annual Budget FY2018
Public Works Director
(1)
Program Development
Develop. Coordinator/ Records (1)
Develop. Review
Supervisor (1)
Engineering Technician
(1)
Permit Technician
(1)
Cap. Project
Manager (5)
Contract Specialist
(2)
Utilities
Water Supt.
(1)
Water Distribution Supervisor
(1) Senior Utility
Worker (5)
Utility Worker
(10)
Water Production Supervisor
(1)
Mainten. Specialist
(1)
Water Operator
(5)
Secretary (0.5)
Admin. Specialist
(1)
Wastewater Supt.
(1)
WW Collections Supervisor
(1)
Mainten. Specialist
(1)
Senior Utility
Worker (6)
Utility Worker
(7)
WW Treatment Supervisor
(1) Lab
Tech/Relief Operator
(1)
Utility Worker
(1)
Mainten. Specialist
(1)
Senior WW Treatment Operator(1)
WW Treatment Operator
(2)
WW Treatment Supervisor
(1) Water
Operator (Effluent)
(1)
WW Treatment Operator
(3)
Utility Worker
(1)
Mainten. Specialist
(1)
Senior WW Treatment
Operator (1)
Water Protection Specialist
(1) Water
Protection Inspector
(1)
Admin. Specialist
(1)
Secretary (0.5)
Engineering
Registered Land
Surveyor (1)
Civil Drainage Engineer
(1)
Environmtl. Coordinator
(1)
Real Property Specialist
(1)
Civil Utility Engineer
(1) Traffic
Engineer (1)
Traffic Engineering Technician
(1)
Traffic Signal
Supervisor (1) Traffic Signal
Specialist (2)
Senior Equipment
Operator (1)
Traffic Control
Worker (2)
Construction Inspection Supervisor
(1) Constructon
Lead Inspector
(1)
Construction Inspector
(5)
CADD Eng Specialist
(1)
Admin. Assistant
(1)
Secretary (1)
Public Works Analyst
(1)
Sr. Infra. Analyst (1)
Program Development
Manager (1)
Utilities Manager
(1)
City Engineer
(1)
Pavement and Sidewalk
Program Manager (1)

Department Operational Plans
Public Works
Department Summary - Staffing by Division
FY16 FY17 FY18Program Development 11.90 11.10 10.20Utilities 67.10 68.60 66.30Engineering 18.40 17.70 21.70Solid Waste 27.30 28.20 28.70Street Maintenance 29.90 30.00 27.10
Total Authorized Positions 154.60 155.60 154.00
City of Prescott, Arizona 180 Annual Budget FY2018
Public Works Director (cont.)
Solid Waste
Solid Waste Superintendent
(1)
Solid Waste Supervisor
(1)
Senior Equipment Operator
(1)
Equipment Operator
(12)
Solid Waste Supervisor
(1)
Senior Equipment Operator
(2)
Equipment Operator
(1)
Equipment Service
Technician (1)
Maintenance Worker
(5)
Business Manager
(0.5)
Accounting Clerk
(2)
Street Maintenance
Street Maintenance
Superintendent (1)
Street Maintenance Supervisor
(1)
Senior Equipment Operator
(1)
Equipment Operator
(7)
Street Maintenance Supervisor
(1)
Senior Equipment Operator
(1)
Equipment Operator
(5)
Maintenance Worker
(2)
Equipment Operator
(3)
Equipment Service
Technician (2)
Business Manager
(0.5)
Accounting Clerk
(1)
Public Works Analyst (cont.)
Sr. Util Ops Infra. Analyst
(cont.)
Admin Assistant (cont.)
Secretary (cont.)

Department Operational Plans
Public Works
Department Summary - Expenditure by TypeFY16
ActualFY17
BudgetFY17
EstimateFY18
Budget% Change
BudgetPersonnel 10,637,219$ 12,302,286$ 11,592,708$ 12,073,695$ -2%Supplies 2,033,913 2,851,815 2,125,798 2,503,700 -12%Internal Charges 6,225,351 7,157,575 6,794,407 7,531,236 5%Other Services & Charges 6,519,160 9,704,378 9,346,495 10,278,689 6%Debt Service 8,616,025 8,569,313 8,492,391 8,813,395 3%
Subtotal Operations 34,031,668 40,585,367 38,351,799 41,200,715 2%Capital 18,162,780 62,095,509 24,945,568 59,309,472 -4%
Total 52,194,448$ 102,680,876$ 63,297,367$ 100,510,187$ -2%
Department Summary - Operating Expenditures by Division and CapitalFY16
ActualFY17
BudgetFY17
EstimateFY18
Budget% Change
BudgetProgram Development 5,033,899$ 6,388,178$ 5,423,078$ 6,416,485$ 0%Utilities 16,963,745 21,112,742 19,893,517 20,328,887 -4%Engineering 2,285,804 2,527,213 2,440,616 2,610,238 3%
Solid Waste 6,523,356 6,714,208 6,814,116 7,984,815 19%
Street Maintenance 3,224,864 3,843,026 3,780,472 3,860,290 0%
Subtotal Operations 34,031,668 40,585,367 38,351,799 41,200,715 2%Capital 18,162,780 62,095,509 24,945,568 59,309,472 -4%
Total 52,194,448$ 102,680,876$ 63,297,367$ 100,510,187$ -2%
City of Prescott, Arizona 181 Annual Budget FY2018
Personnel 29.3%
Supplies 6.1%
Internal Charges 18.3%
Other Services & Charges 24.9%
Debt Service 21.4%
Public Works FY18 Operating Expenditure Budget by Type
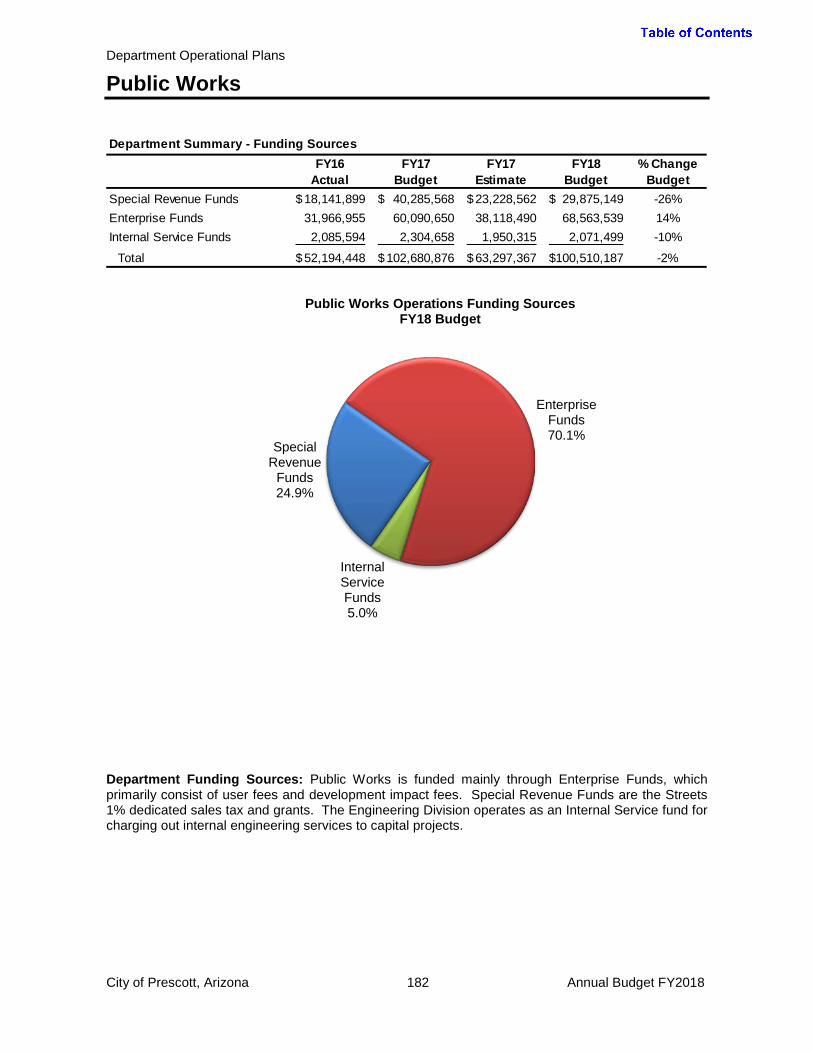
Department Operational Plans
Public Works
Department Funding Sources: Public Works is funded mainly through Enterprise Funds, which primarily consist of user fees and development impact fees. Special Revenue Funds are the Streets 1% dedicated sales tax and grants. The Engineering Division operates as an Internal Service fund for charging out internal engineering services to capital projects.
Department Summary - Funding SourcesFY16
ActualFY17
BudgetFY17
EstimateFY18
Budget% Change
BudgetSpecial Revenue Funds 18,141,899$ 40,285,568$ 23,228,562$ 29,875,149$ -26%Enterprise Funds 31,966,955 60,090,650 38,118,490 68,563,539 14%Internal Service Funds 2,085,594 2,304,658 1,950,315 2,071,499 -10%
Total 52,194,448$ 102,680,876$ 63,297,367$ 100,510,187$ -2%
Special Revenue
Funds 24.9%
Enterprise Funds 70.1%
Internal Service Funds 5.0%
Public Works Operations Funding Sources FY18 Budget
City of Prescott, Arizona 182 Annual Budget FY2018

Department Operational Plans
Public Works
Program Development
Services: Within the Program Development Division, the permit center is responsible for providing building permit plan review of Public Works engineering elements, engineering permit plan review/permits, right of way permit plan review/permits, and pre-application conference reviews of Public Works engineering elements. Also within the Program Development Division, the capital improvement program management team is responsible for implementing water system and wastewater system upgrades, roadway pavement system preservation, rehabilitation and reconstruction, drainage system improvements, and transportation system enhancements and improvements. Goal: Streamline plan review process to meet or exceed established plan review turnaround times. Council Objectives: Goal #4 Maintain and Promote a Customer Service Culture
Strategy Performance Measures FY16 Actual
FY17 Target
FY17 Estimate
FY18 Target
Cross train personnel to assist when workloads or staff availability fluctuates. Develop team approaches to plan reviews.
Percentage of plan reviews meeting established deadlines
N/A* 90% 75% 90%
*New measure Goal: Work closely with other Public Works Divisions in order to improve or maintain the quality of life for the residents and visitors by providing a safe and reliable water, wastewater, drainage, transportation system by delivering the Capital Improvement Program. Council Objectives: Goal #3 Quality of Life
Strategy Performance Measures FY16 Actual
FY17 Target
FY17 Estimate
FY18 Target
Complete 80% of Capital Improvement Program Projects scheduled in Fiscal Year.
Completed projects out of total projects N/A* 42/53 21/53 56/70
Develop pavement and sidewalk preservation, rehabilitation and reconstruction program to improve quality of roadways.
Roadway System Pavement Quality Index (PQI) 75 100 to 70 – Good Needs Preservation 40 to 70 - Fair Needs Rehabilitation 40 and Below – Poor Needs Reconstruction
66.4 67 67 68
*New measure
Division Mission: Support the City’s quality of life by providing superior customer service through clear, consistent and responsible communication to all internal and external customers. Promote economic prosperity through timely and efficient plan review and permitting activities for private development and capital improvement projects. Work with all stakeholders in a cooperative manner to “Get to Yes” and to expedite the permitting process. Improve the operation, longevity and reliability of public infrastructure to the users of these systems.
City of Prescott, Arizona 183 Annual Budget FY2018
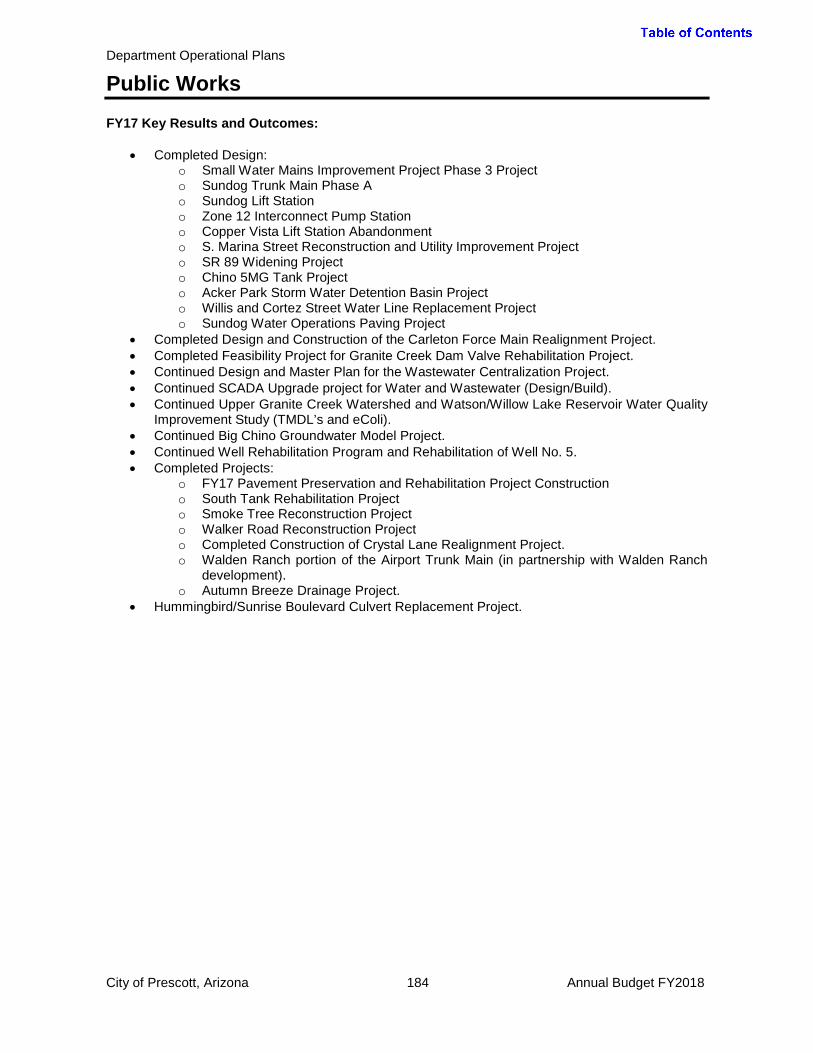
Department Operational Plans
Public Works
FY17 Key Results and Outcomes:
• Completed Design: o Small Water Mains Improvement Project Phase 3 Project o Sundog Trunk Main Phase A o Sundog Lift Station o Zone 12 Interconnect Pump Station o Copper Vista Lift Station Abandonment o S. Marina Street Reconstruction and Utility Improvement Project o SR 89 Widening Project o Chino 5MG Tank Project o Acker Park Storm Water Detention Basin Project o Willis and Cortez Street Water Line Replacement Project o Sundog Water Operations Paving Project
• Completed Design and Construction of the Carleton Force Main Realignment Project. • Completed Feasibility Project for Granite Creek Dam Valve Rehabilitation Project. • Continued Design and Master Plan for the Wastewater Centralization Project. • Continued SCADA Upgrade project for Water and Wastewater (Design/Build). • Continued Upper Granite Creek Watershed and Watson/Willow Lake Reservoir Water Quality
Improvement Study (TMDL’s and eColi). • Continued Big Chino Groundwater Model Project. • Continued Well Rehabilitation Program and Rehabilitation of Well No. 5. • Completed Projects:
o FY17 Pavement Preservation and Rehabilitation Project Construction o South Tank Rehabilitation Project o Smoke Tree Reconstruction Project o Walker Road Reconstruction Project o Completed Construction of Crystal Lane Realignment Project. o Walden Ranch portion of the Airport Trunk Main (in partnership with Walden Ranch
development). o Autumn Breeze Drainage Project.
• Hummingbird/Sunrise Boulevard Culvert Replacement Project.
City of Prescott, Arizona 184 Annual Budget FY2018

Department Operational Plans
Public Works
Budget Notes and Significant Changes: No significant changes.
Program DevelopmentExpenditure Summary
FY16 Actual
FY17 Budget
FY17 Estimate
FY18 Budget
% Change Budget
Personnel 1,097,516$ 1,131,401$ 976,393$ 1,083,367$ -4%Supplies 10,545 17,000 15,150 15,500 -9%Internal Charges 1,423,930 2,153,937 1,834,503 2,275,547 6%Other Services & Charges 252,040 855,734 366,926 827,611 -3%Debt Service 2,249,868 2,230,106 2,230,106 2,214,460 -1%
Subtotal Operations 5,033,899 6,388,178 5,423,078 6,416,485 0%Capital 16,799,295 57,619,607 21,573,480 55,145,472 -4%
Total 21,833,194$ 64,007,785$ 26,996,558$ 61,561,957$ -4%
Authorized Staffing SummaryFY16 FY17 FY18
Authorized Staffing Level 11.90 11.10 10.20
Public Works Director1 0.30 0.30 0.16Public Works Analyst2 0.20 0.20 0.20Administrative Assistant1 0.20 0.40 0.16Secretary1 0.20 0.20 0.16Contract Specialist1 2.00 0.80 0.32Program Development Manager - 0.40 0.40City Engineer - 0.70 0.70Capital Project Manager 5.00 5.00 5.00Develop. Coord./Records Control 1.00 0.10 0.10Development Review Supervisor 1.00 1.00 1.00Engineering Technician 1.00 1.00 1.00Permit Technician 1.00 1.00 1.001 Public Works Admin personnel charged 28% Streets Maintenance, 20% Solid Waste, 36% Utilities, and 16% Program Development2 Public Works Analyst charged 20% to Program Development, 20% Utilities, 20% Solid Waste, 20% Streets Maintenance.
City of Prescott, Arizona 185 Annual Budget FY2018
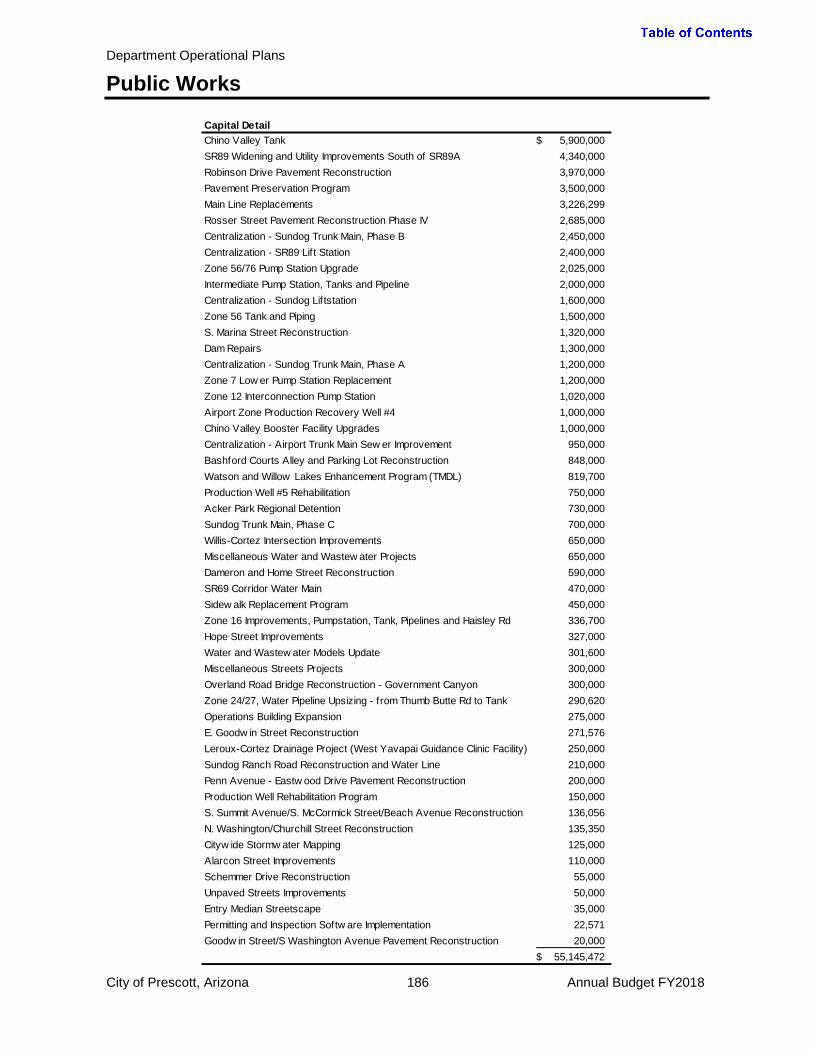
Department Operational Plans
Public Works
Capital DetailChino Valley Tank 5,900,000$ SR89 Widening and Utility Improvements South of SR89A 4,340,000 Robinson Drive Pavement Reconstruction 3,970,000 Pavement Preservation Program 3,500,000 Main Line Replacements 3,226,299 Rosser Street Pavement Reconstruction Phase IV 2,685,000 Centralization - Sundog Trunk Main, Phase B 2,450,000 Centralization - SR89 Lift Station 2,400,000 Zone 56/76 Pump Station Upgrade 2,025,000 Intermediate Pump Station, Tanks and Pipeline 2,000,000 Centralization - Sundog Liftstation 1,600,000 Zone 56 Tank and Piping 1,500,000 S. Marina Street Reconstruction 1,320,000 Dam Repairs 1,300,000 Centralization - Sundog Trunk Main, Phase A 1,200,000 Zone 7 Low er Pump Station Replacement 1,200,000 Zone 12 Interconnection Pump Station 1,020,000 Airport Zone Production Recovery Well #4 1,000,000 Chino Valley Booster Facility Upgrades 1,000,000 Centralization - Airport Trunk Main Sew er Improvement 950,000 Bashford Courts Alley and Parking Lot Reconstruction 848,000 Watson and Willow Lakes Enhancement Program (TMDL) 819,700 Production Well #5 Rehabilitation 750,000 Acker Park Regional Detention 730,000 Sundog Trunk Main, Phase C 700,000 Willis-Cortez Intersection Improvements 650,000 Miscellaneous Water and Wastew ater Projects 650,000 Dameron and Home Street Reconstruction 590,000 SR69 Corridor Water Main 470,000 Sidew alk Replacement Program 450,000 Zone 16 Improvements, Pumpstation, Tank, Pipelines and Haisley Rd 336,700 Hope Street Improvements 327,000 Water and Wastew ater Models Update 301,600 Miscellaneous Streets Projects 300,000 Overland Road Bridge Reconstruction - Government Canyon 300,000 Zone 24/27, Water Pipeline Upsizing - from Thumb Butte Rd to Tank 290,620 Operations Building Expansion 275,000 E. Goodw in Street Reconstruction 271,576 Leroux-Cortez Drainage Project (West Yavapai Guidance Clinic Facility) 250,000 Sundog Ranch Road Reconstruction and Water Line 210,000 Penn Avenue - Eastw ood Drive Pavement Reconstruction 200,000 Production Well Rehabilitation Program 150,000 S. Summit Avenue/S. McCormick Street/Beach Avenue Reconstruction 136,056 N. Washington/Churchill Street Reconstruction 135,350 Cityw ide Stormw ater Mapping 125,000 Alarcon Street Improvements 110,000 Schemmer Drive Reconstruction 55,000 Unpaved Streets Improvements 50,000 Entry Median Streetscape 35,000 Permitting and Inspection Softw are Implementation 22,571 Goodw in Street/S Washington Avenue Pavement Reconstruction 20,000
55,145,472$
City of Prescott, Arizona 186 Annual Budget FY2018

Department Operational Plans
Public Works
Utilities
Services: The Utilities Division is responsible for providing water and wastewater services to City customers. Drinking water is produced from wells, treated as necessary to comply with all Federal and State Drinking Water Standards, before entering the water distribution system. Water from the distribution system is metered for delivery to customers with metering information subsequently supplied to the Utility Billing Division. Wastewater collection and treatment is another part of the Utilities Division, including conveyance to the City treatment facilities. The treated flow is reused either as irrigation water or for recharge of the groundwater aquifer. The Division is also responsible for compliance with Federal and State backflow and pretreatment regulations to ensure the safety of the systems. All utility systems are maintained to support the City’s goals of having a first class utility system. This involves not only routine maintenance but also planning for the future through the implementation of the capital improvement program, and replacement of systems and equipment that have reached the end of their service life.
Goal: Operate and maintain the water and wastewater infrastructure in a manner to reduce the City’s liability, minimize sanitary sewer overflows and reduce water leaks. Council Objective: Goal #3 Quality of Life
Strategy Performance Measures FY16 Actual
FY17 Budget
FY17 Estimate
FY18 Budget
Effectively manage the structured cleaning program to reduce sanitary sewer overflows.
Percentage of wastewater collection system cleaned per year
62% 65% 68% 70%
Reduce the total number of sanitary sewer overflows 26 25 24 20
Review water leak history records to effectively plan and perform leak detection on high risk areas and old infrastructure.
Perform water main leak detection on a minimum of 25 miles of the water system per year
19 Miles 25 Miles 35 Miles 25 Miles
Division Mission: Support the City of Prescott’s quality of life and economic prosperity by providing high quality, cost effect management of the City’s utility system. Provide utility related services that meet or exceed all State and Federal regulations through compliance, communication and outstanding customer service. Maintain the utility systems to protect the environment and assure that every resource is managed in a sustainable manner.
City of Prescott, Arizona 187 Annual Budget FY2018
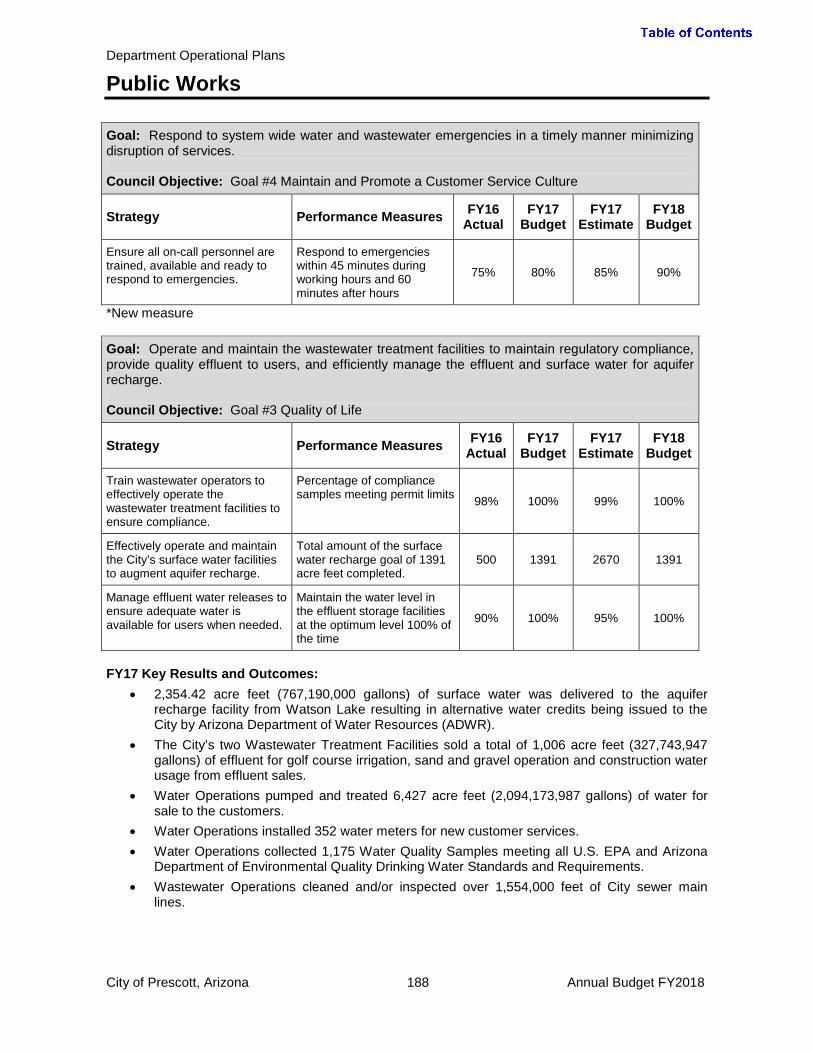
Department Operational Plans
Public Works
*New measure Goal: Operate and maintain the wastewater treatment facilities to maintain regulatory compliance, provide quality effluent to users, and efficiently manage the effluent and surface water for aquifer recharge. Council Objective: Goal #3 Quality of Life
Strategy Performance Measures FY16 Actual
FY17 Budget
FY17 Estimate
FY18 Budget
Train wastewater operators to effectively operate the wastewater treatment facilities to ensure compliance.
Percentage of compliance samples meeting permit limits
98% 100% 99% 100%
Effectively operate and maintain the City’s surface water facilities to augment aquifer recharge.
Total amount of the surface water recharge goal of 1391 acre feet completed.
500 1391 2670 1391
Manage effluent water releases to ensure adequate water is available for users when needed.
Maintain the water level in the effluent storage facilities at the optimum level 100% of the time
90% 100% 95% 100%
FY17 Key Results and Outcomes:
• 2,354.42 acre feet (767,190,000 gallons) of surface water was delivered to the aquifer recharge facility from Watson Lake resulting in alternative water credits being issued to the City by Arizona Department of Water Resources (ADWR).
• The City’s two Wastewater Treatment Facilities sold a total of 1,006 acre feet (327,743,947 gallons) of effluent for golf course irrigation, sand and gravel operation and construction water usage from effluent sales.
• Water Operations pumped and treated 6,427 acre feet (2,094,173,987 gallons) of water for sale to the customers.
• Water Operations installed 352 water meters for new customer services. • Water Operations collected 1,175 Water Quality Samples meeting all U.S. EPA and Arizona
Department of Environmental Quality Drinking Water Standards and Requirements. • Wastewater Operations cleaned and/or inspected over 1,554,000 feet of City sewer main
lines.
Goal: Respond to system wide water and wastewater emergencies in a timely manner minimizing disruption of services. Council Objective: Goal #4 Maintain and Promote a Customer Service Culture
Strategy Performance Measures FY16 Actual
FY17 Budget
FY17 Estimate
FY18 Budget
Ensure all on-call personnel are trained, available and ready to respond to emergencies.
Respond to emergencies within 45 minutes during working hours and 60 minutes after hours
75% 80% 85% 90%
City of Prescott, Arizona 188 Annual Budget FY2018

Department Operational Plans
Public Works
Budget Notes and Significant Changes: Supplies budget decreases in FY18 to align with historical trends.
UtilitiesExpenditure Summary
FY16 Actual
FY17 Budget
FY17 Estimate
FY18 Budget
% Change Budget
Personnel 4,499,587$ 5,375,747$ 4,911,355$ 4,990,744$ -7%Supplies 1,023,420 1,535,510 1,008,771 1,308,670 -15%Internal Charges 2,407,664 2,818,060 2,696,971 2,895,078 3%Other Services & Charges 2,783,407 5,159,920 5,129,837 5,500,119 7%Debt Service 6,249,667 6,223,505 6,146,583 5,634,276 -9%
Subtotal Operations 16,963,745 21,112,742 19,893,517 20,328,887 -4%Capital 455,153 1,623,000 873,000 2,290,000 41%
Total 17,418,898$ 22,735,742$ 20,766,517$ 22,618,887$ -1%
Capital DetailSCADA System Installation and Upgrade 2,000,000$ Vehicle Replacements - Public Works 225,000 Emergency Wastewater Bypass Pump 65,000
2,290,000$
City of Prescott, Arizona 189 Annual Budget FY2018

Department Operational Plans
Public Works
Authorized Staffing SummaryFY16 FY17 FY18
Authorized Staffing Level 67.10 68.60 66.30
Public Works Director1 0.70 0.70 0.36Public Works Analyst2 0.80 0.80 0.40Administrative Assistant1 0.80 0.60 0.36Secretary1 0.80 0.80 0.36Contract Specialist1 - 1.20 0.72City Engineer - 0.30 0.30Civil Utility Engineer 1.00 1.00 1.00Program Development Manager 0.60 0.60 0.60Utilities Manager 1.00 1.00 1.00Water Resource Manager 0.40 0.40 -Sr. Infrastructure Analyst 1.00 1.00 1.00Develop. Coord./Records Control - 0.20 0.20Administrative Specialist 2.00 2.00 2.00Secretary 1.00 1.00 1.00Water Superintendent 1.00 1.00 1.00Water Distribution Supervisor 1.00 1.00 1.00Water Production Supervisor 1.00 1.00 1.00Wastewater Superintendent 1.00 1.00 1.00WW Collections Supervisor 1.00 1.00 1.00WW Treatment Supervisor 2.00 2.00 2.00Sr. WW Treatement Operator - 1.00 2.00Wastewater Treatment Operator 9.00 8.00 5.00Lab Technician/Relief Operator 1.00 1.00 1.00Senior Utility Worker 11.00 11.00 11.00Utility Worker 17.00 17.00 19.00Water Operator 6.00 6.00 6.00Maintenance Specialist 4.00 4.00 4.00Water Protection Specialist 1.00 1.00 1.00Water Protection Inspector 1.00 1.00 1.001 Public Works Admin personnel charged 28% Streets Maintenance, 20% Solid Waste, 36% Utilities, and 16% Program Development2 Public Works Analyst charged 20% to Program Development, 20% Utilities, 20% Solid Waste, 20% Streets Maintenance.
City of Prescott, Arizona 190 Annual Budget FY2018
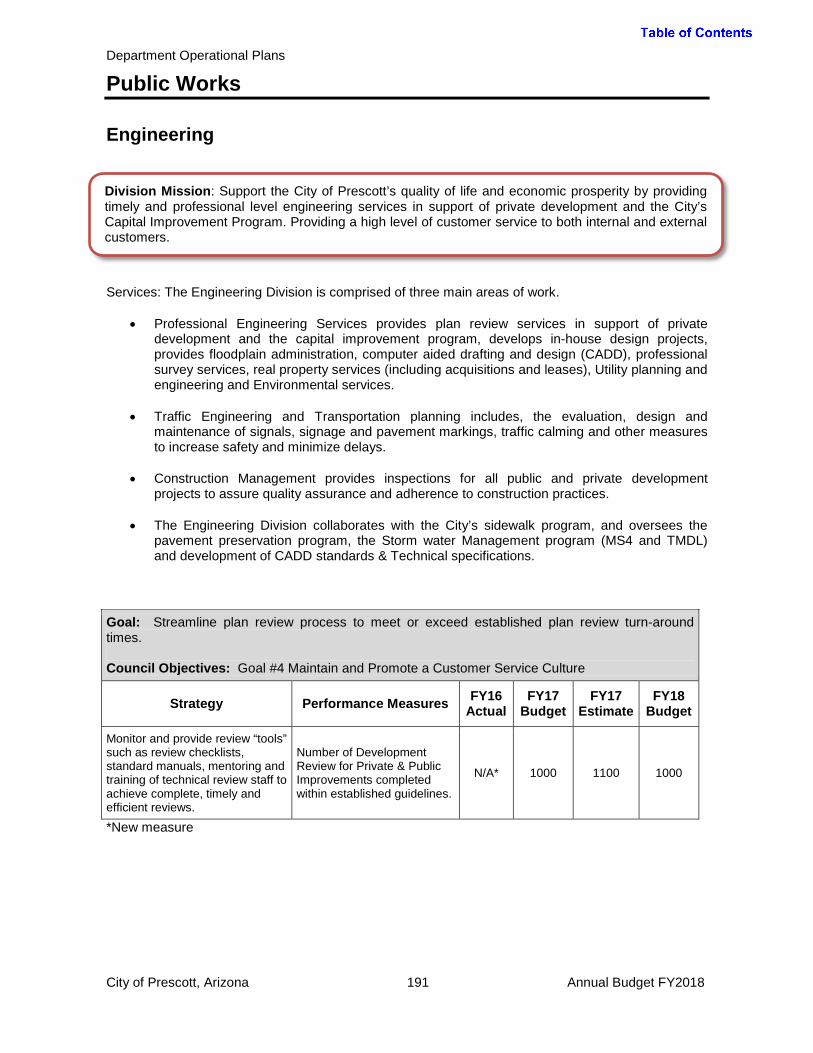
Department Operational Plans
Public Works
Engineering
Services: The Engineering Division is comprised of three main areas of work.
• Professional Engineering Services provides plan review services in support of private development and the capital improvement program, develops in-house design projects, provides floodplain administration, computer aided drafting and design (CADD), professional survey services, real property services (including acquisitions and leases), Utility planning and engineering and Environmental services.
• Traffic Engineering and Transportation planning includes, the evaluation, design and maintenance of signals, signage and pavement markings, traffic calming and other measures to increase safety and minimize delays.
• Construction Management provides inspections for all public and private development projects to assure quality assurance and adherence to construction practices.
• The Engineering Division collaborates with the City’s sidewalk program, and oversees the pavement preservation program, the Storm water Management program (MS4 and TMDL) and development of CADD standards & Technical specifications.
Goal: Streamline plan review process to meet or exceed established plan review turn-around times. Council Objectives: Goal #4 Maintain and Promote a Customer Service Culture
Strategy Performance Measures FY16 Actual
FY17 Budget
FY17 Estimate
FY18 Budget
Monitor and provide review “tools” such as review checklists, standard manuals, mentoring and training of technical review staff to achieve complete, timely and efficient reviews.
Number of Development Review for Private & Public Improvements completed within established guidelines.
N/A* 1000 1100 1000
*New measure
Division Mission: Support the City of Prescott’s quality of life and economic prosperity by providing timely and professional level engineering services in support of private development and the City’s Capital Improvement Program. Providing a high level of customer service to both internal and external customers.
City of Prescott, Arizona 191 Annual Budget FY2018

Department Operational Plans
Public Works
Goal: Improve the quality of private development and capital improvement projects within the City by reviewing and implementing construction standard documents that exceed the guidelines for readability, constructability and are change-order free. Council Objective: Goal #4 Maintain and Promote a Customer Service Culture
Strategy Performance Measures FY16 Actual
FY17 Budget
FY17 Estimate
FY18 Budget
Provide professional level engineering services through design in-house projects
Annual Cost Savings to City N/A* $250K $280K $300K
Provide professional level inspection services
Number of Private Development inspections performed per year.
N/A* 5200 5250 5300
Number of Public Capital Improvement Project inspections performed per year.
N/A* 3400 3200 3200
*New measure Goal: Improve traffic safety, minimize delay and reduce City liability through a modern well maintained traffic control system and high quality pavement markings. Council Objective: Goal #3 Quality of Life
Strategy Performance Measures FY16 Actual
FY17 Budget
FY17 Estimate
FY18 Budget
Effectively maintain the City’s traffic signal and roundabout intersections to ensure proper operation.
Traffic signal and roundabout call-out maintenance/repairs made within 4 hours of notification.1
N/A* 85% 80% 85%
Manage the traffic requests to maximize productivity and provide a request resolution rate greater than 90%.
Traffic request is resolved within 2 weeks of initial citizen contact.
N/A* 94% 90% 94%
*New measure 1Some traffic signal maintenance requires traffic control or repair parts that may not be available the same day. The 85% target allows for 15% of the requests to be of this type. FY17 Key Results and Outcomes:
• Provided In-House design, project management, construction management, and inspection for the Alarcon roadway improvement project (Alarcon to Sheldon).
• Provided In-House design for the Sundog Paving improvement project. • Provided In-House design, project management, construction management, and inspection
for the Hassayampa Force main Improvement project (Carleton at Granite Creek). • Improved efficiency in the public works organization by moving the traffic sign group to the
traffic engineering division. • Completed the LED tunnel lighting conversion of the Peavine Trail under SR89A resulting in a
savings to the City of $3,000 annually in electricity cost, and a onetime APS rebate of $2,000.
City of Prescott, Arizona 192 Annual Budget FY2018

Department Operational Plans
Public Works
• Installed new solar powered changeable radar sign assemblies on Willow Creek Road near the curve at Deep Well Ranch Road.
• Design begins on the Safe Route to School infrastructure Grant Projects at Mile High Middle School, Mountain Oak School, and on Coronado Avenue near Lincoln School, which the City received a federal grant for $1.06 million dollars.
• Completed the first in a series of Historic traffic signal cabinet wraps at the intersection of Goodwin Street at Cortez Street.
EngineeringExpenditure Summary
FY16 Actual
FY17 Budget
FY17 Estimate
FY18 Budget
% Change Budget
Personnel 1,451,143$ 1,601,191$ 1,574,178$ 1,583,113$ -1%Supplies 157,111 214,325 120,725 141,250 -34%Internal Charges 330,009 214,737 222,213 217,646 1%Other Services & Charges 347,541 496,960 523,500 668,229 34%
Subtotal Operations 2,285,804 2,527,213 2,440,616 2,610,238 3%Capital 75,157 314,000 314,000 325,000 4%
Total 2,360,961$ 2,841,213$ 2,754,616$ 2,935,238$ 3%
Capital DetailIntersection Signalization Project 200,000$ Street Light (Intersection) LED Conversion Project 100,000 Large Scale Printer/Scanner 25,000
325,000$
City of Prescott, Arizona 193 Annual Budget FY2018

Department Operational Plans
Public Works
Budget Notes and Significant Changes: The increases other services and charges relate to bridge evaluation and repair, as well as new software licensing.
Authorized Staffing SummaryFY16 FY17 FY18
Authorized Staffing Level 18.40 17.70 21.70
City Engineer 1.00 - -Civil Drainage Engineer 1.00 1.00 1.00Pavement & Sidewalk Prog. Manager - 1.00Program Development Manager 0.40 - -Construction Inspection Supv. 1.00 1.00 1.00Construction Lead Inspector - 1.00 1.00Construction Inspector 6.00 5.00 5.00Environmental Coordinator 1.00 1.00 1.00CADD Engineering Specialist 1.00 1.00 1.00Real Property Specialist 1.00 1.00 1.00Registered Land Surveyor 1.00 1.00 1.00Traffic Engineer 1.00 1.00 1.00Traffic Engineering Technician 1.00 1.00 1.00Traffic Signal Supervisor 1.00 1.00 1.00Traffic Signal Specialist 2.00 2.00 2.00Senior Equipment Operator - - 1.00Traffic Control Worker - - 2.00Develop. Coord./Records Control - 0.70 0.70
City of Prescott, Arizona 194 Annual Budget FY2018

Department Operational Plans
Public Works
Solid Waste
Services: The Solid Waste Division manages municipal solid waste City-wide. The Division provides solid waste and recycling collection services to all City residents and contracted commercial customers; operates a 250 ton-per-day transfer station; and monitors a closed landfill. The Division educates residents regarding acceptable recycling materials in order to increase participation in the City’s recycling program and divert recyclable materials from the waste stream. Goal: Increase the overall diversion rate for the Solid Waste Division to exceed the national average of 34.6% of material diverted from the landfill. Council Objective: Goal #3 Quality of Life
Strategy Performance Measures
FY16 Actual
FY17 Target
FY17 Estimate
FY18 Target
Proactively recover recyclables from received solid waste
Tons of Metal Diverted 206 240 250 255
Tons of Inert Debris Diverted 8,337 6,500 9,000 9,000
Tons of Green Waste Diverted 3,976 4,000 3,650 4,000
Increase co-mingled residential recyclables through educational outreach
Tons of Co-mingled Recycle Diverted 4,284 4,400 5,000 5,000
Through the efforts above, increase the overall diversion rate Overall diversion rate 29.16% 30.0% 30.0% 31.0%
FY17 Key Results and Outcomes:
• Completed the review and updates to the City Code, Chapter 2-13 and 7-4. • The first fee increase was approved by Council in over 10 years for Solid Waste services. • Successfully diverted 26% of the material coming into the Transfer Station from going to the
landfill. • Rerouted Commercial Front-load routes to eliminate the need for 4 trucks on a Monday. • Completed the Annual Clean Up and removed over 180 tons of debris from Prescott
neighborhoods. • Improved the delivery of carts, bins and roll-offs by rescheduling to zones which increased
efficiencies and improved customer service. • The Lighting Project at the Transfer Station will be completed by June 30, 2017. • The Floor and Scale replacement project will be completed by June 12, 2017.
Division Mission: Support the City of Prescott’s quality of life and economic prosperity by providing solid waste services in an environmentally, fiscally responsible and customer service oriented manner. Educate and encourage recycling practices, including inert and composting materials within the Community to reduce recyclable materials from permanent landfills.
City of Prescott, Arizona 195 Annual Budget FY2018
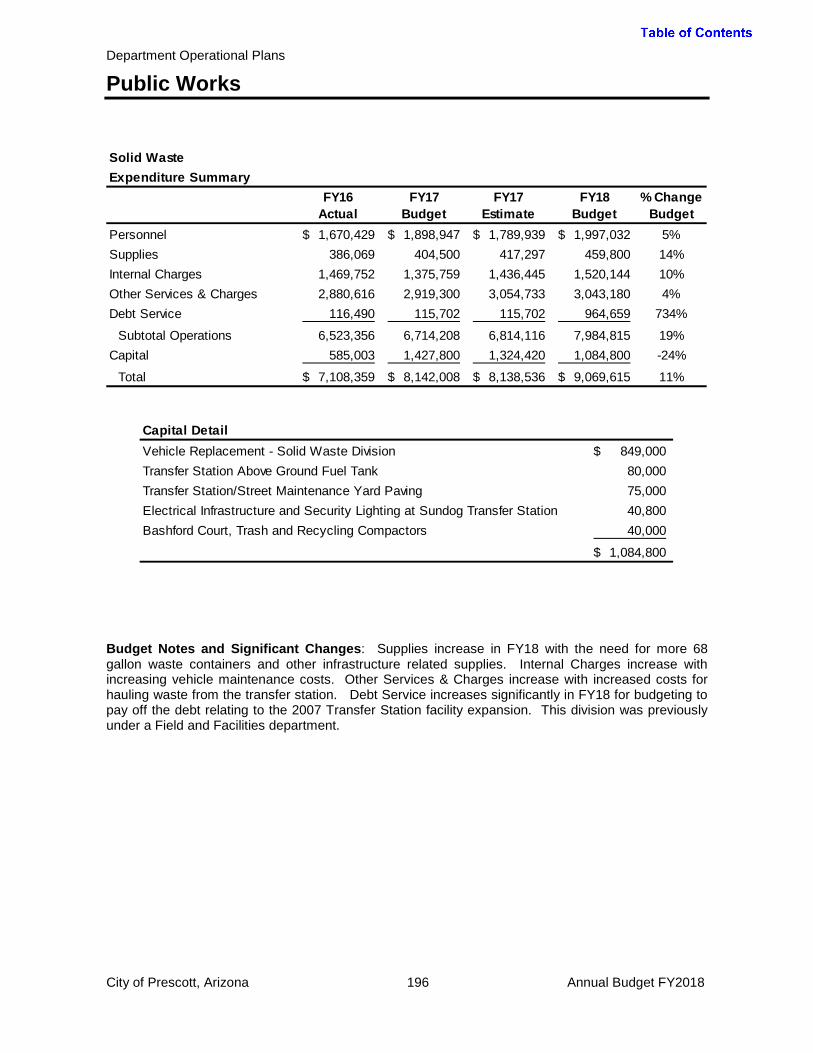
Department Operational Plans
Public Works
Budget Notes and Significant Changes: Supplies increase in FY18 with the need for more 68 gallon waste containers and other infrastructure related supplies. Internal Charges increase with increasing vehicle maintenance costs. Other Services & Charges increase with increased costs for hauling waste from the transfer station. Debt Service increases significantly in FY18 for budgeting to pay off the debt relating to the 2007 Transfer Station facility expansion. This division was previously under a Field and Facilities department.
Solid WasteExpenditure Summary
FY16 Actual
FY17 Budget
FY17 Estimate
FY18 Budget
% Change Budget
Personnel 1,670,429$ 1,898,947$ 1,789,939$ 1,997,032$ 5%Supplies 386,069 404,500 417,297 459,800 14%Internal Charges 1,469,752 1,375,759 1,436,445 1,520,144 10%Other Services & Charges 2,880,616 2,919,300 3,054,733 3,043,180 4%Debt Service 116,490 115,702 115,702 964,659 734%
Subtotal Operations 6,523,356 6,714,208 6,814,116 7,984,815 19%Capital 585,003 1,427,800 1,324,420 1,084,800 -24%
Total 7,108,359$ 8,142,008$ 8,138,536$ 9,069,615$ 11%
Capital DetailVehicle Replacement - Solid Waste Division 849,000$ Transfer Station Above Ground Fuel Tank 80,000 Transfer Station/Street Maintenance Yard Paving 75,000 Electrical Infrastructure and Security Lighting at Sundog Transfer Station 40,800 Bashford Court, Trash and Recycling Compactors 40,000
1,084,800$
City of Prescott, Arizona 196 Annual Budget FY2018
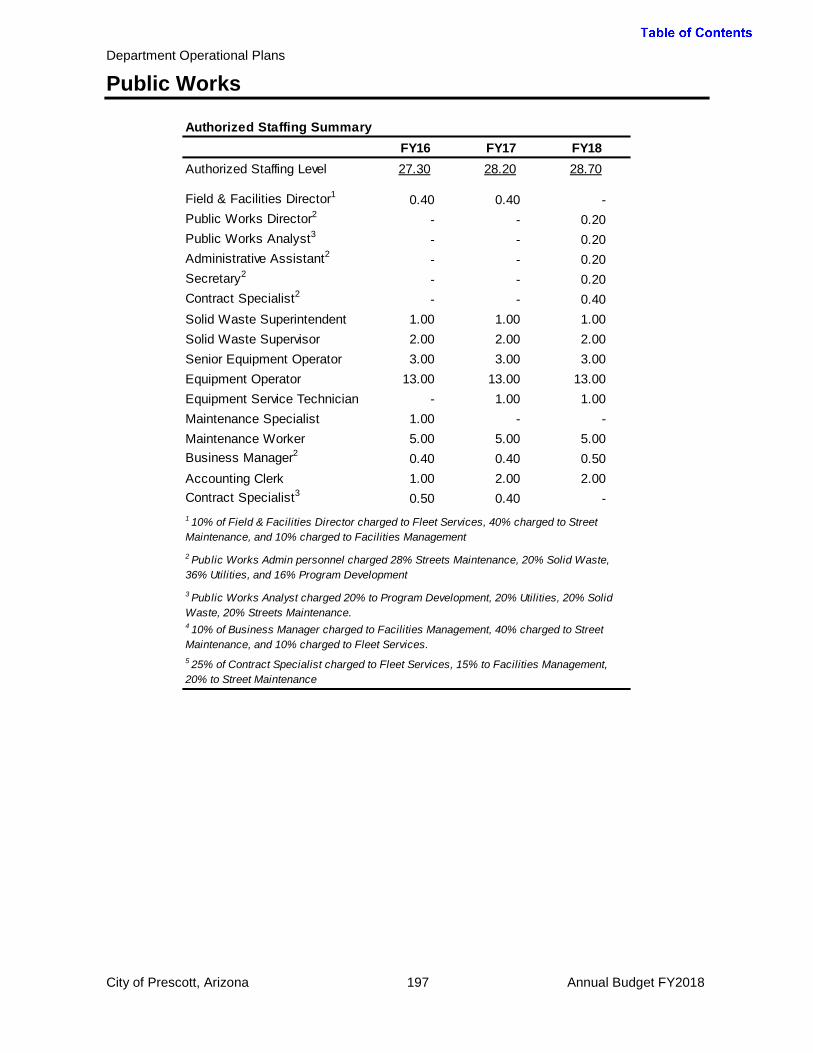
Department Operational Plans
Public Works
Authorized Staffing SummaryFY16 FY17 FY18
Authorized Staffing Level 27.30 28.20 28.70
Field & Facilities Director1 0.40 0.40 -Public Works Director2 - - 0.20Public Works Analyst3 - - 0.20Administrative Assistant2 - - 0.20Secretary2 - - 0.20Contract Specialist2 - - 0.40Solid Waste Superintendent 1.00 1.00 1.00Solid Waste Supervisor 2.00 2.00 2.00Senior Equipment Operator 3.00 3.00 3.00Equipment Operator 13.00 13.00 13.00Equipment Service Technician - 1.00 1.00Maintenance Specialist 1.00 - -Maintenance Worker 5.00 5.00 5.00Business Manager2 0.40 0.40 0.50Accounting Clerk 1.00 2.00 2.00Contract Specialist3 0.50 0.40 -1 10% of Field & Facilities Director charged to Fleet Services, 40% charged to Street Maintenance, and 10% charged to Facilities Management
4 10% of Business Manager charged to Facilities Management, 40% charged to Street Maintenance, and 10% charged to Fleet Services.5 25% of Contract Specialist charged to Fleet Services, 15% to Facilities Management, 20% to Street Maintenance
2 Public Works Admin personnel charged 28% Streets Maintenance, 20% Solid Waste, 36% Utilities, and 16% Program Development3 Public Works Analyst charged 20% to Program Development, 20% Utilities, 20% Solid Waste, 20% Streets Maintenance.
City of Prescott, Arizona 197 Annual Budget FY2018

Department Operational Plans
Public Works
Street Maintenance
Services: The Street Maintenance Division performs pavement and concrete maintenance and repair, including preventive measures such as crack sealing, street sweeping and pothole repair. The division also maintains designated rights-of-way by removing weeds, brush and nuisance trees for aesthetic purposes, and for sight-distance issues City-wide. The City’s drainage infrastructure, signage, traffic and pedestrian safety devices, such as hand rail and guard rail, are maintained by the Street Maintenance Division. The Division also responds year-round to rain and snow storms, including the ensuing clean-up requirements. Goal: Improve the longevity, quality and safety of public right of way within the City. Council Objectives: Goal #3 Quality of Life
Strategy Performance Measures FY16 Actual
FY17 Target
FY17 Estimate
FY18 Target
Develop a maintenance plan and implement preventive maintenance practices
Miles of crack sealing completed 22 22 18 22
Sweep entire City 3 times Yes Yes Yes Yes
Percentage of stop signs replaced within 8 hours 100% 100% 100% 100%
Inspect and replace 12.5 % of over 10,000 signs per year 1,708 1,250 1,000 1,250
Response time from Police Department activation of snow response until plows are deployed
N/A* N/A* 2 hours 2 hours
Inspect drainage ways and structures 2 times annually 100% 100% 100% 100%
*New measure FY17 Key Results and Outcomes:
• Successfully converted the Maintenance Management System from CitiTech to Lucity to produce a performance-based budget.
• Replaced two undersized dump trucks with plows and spreaders for maintenance work and snow plowing.
• Continued inventory and replacement of unserviceable signs throughout the City and began inventory conversion to Lucity.
• Employed dedicated drainage crew and equipment in inspecting all drainage ways and structures twice and cleaning over 6,500 lf of drainage ditches and culverts
• Cleaned the downtown 208 times. Painted over 6,200 feet of curb in the downtown area.
Division Mission: Maintain serviceable, environmentally safe, accessible streets; an effective storm water drainage system; informative signage; and aesthetically pleasing rights-of-way for residents and visitors in the City of Prescott.
City of Prescott, Arizona 198 Annual Budget FY2018

Department Operational Plans
Public Works
• Placed over 114,660 sf of hot mix asphalt and over 461 tons of cold mix in patches and potholes within 5 days of notification.
• Mowed and manually removed weeds from over 271 acres.
Budget Notes and Significant Changes: Budgets for Supplies and Other Services & Charges decreased to align more with actual needs. Two Traffic Control Workers and a Senior Equipment operator were moved to Engineering under the Traffic Engineer to supervise existing sign maintenance. This division was previously under a Field and Facilities department.
Street MaintenanceExpenditure Summary
FY16 Actual
FY17 Budget
FY17 Estimate
FY18 Budget
% Change Budget
Personnel 1,918,544$ 2,295,000$ 2,340,843$ 2,419,439$ 5%Supplies 456,768 680,480 563,855 578,480 -15%Internal Charges 593,996 595,082 604,275 622,821 5%Other Services & Charges 255,556 272,464 271,499 239,550 -12%
Subtotal Operations 3,224,864 3,843,026 3,780,472 3,860,290 0%Capital 248,172 1,111,102 860,668 464,200 -58%
Total 3,473,036$ 4,954,128$ 4,641,140$ 4,324,490$ -13%
Capital DetailVehicle Replacements -Street Maintenance 270,000$ Transfer Station Above Ground Fuel Tank 80,000 Transfer Station/Street Maintenance Yard Paving 75,000 Electrical Infrastructure and Security Lighting at Sundog Transfer Station 39,200
464,200$
City of Prescott, Arizona 199 Annual Budget FY2018
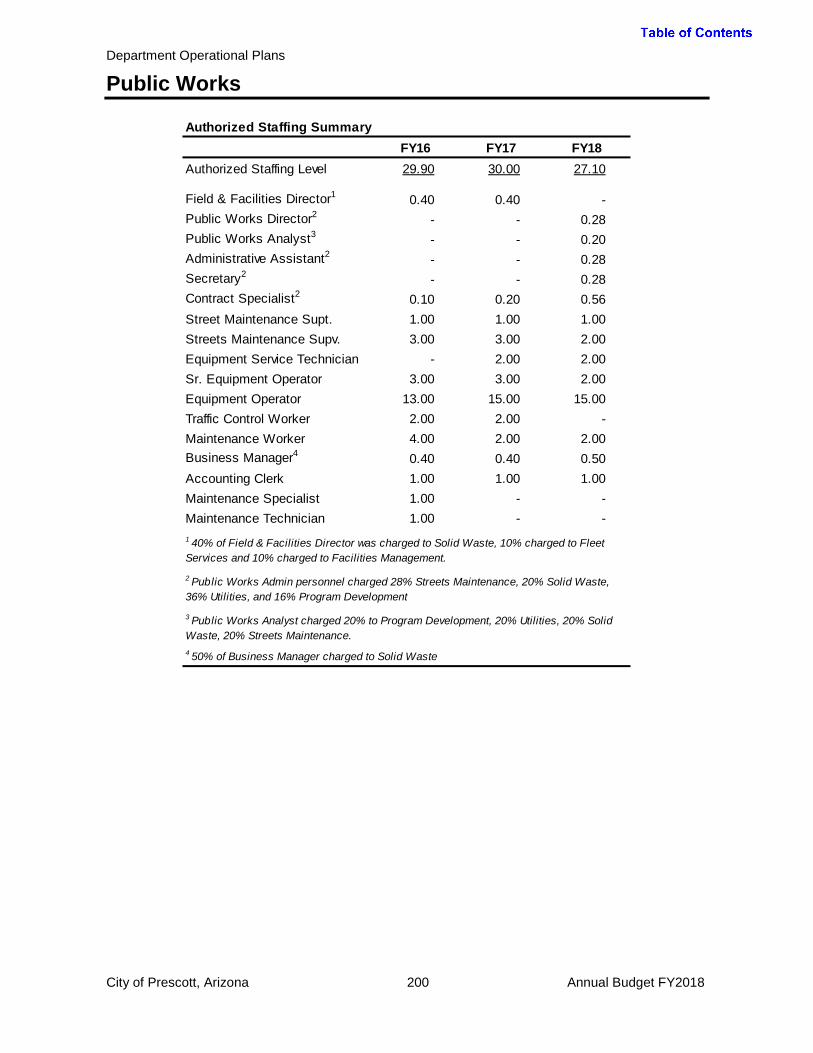
Department Operational Plans
Public Works
Authorized Staffing SummaryFY16 FY17 FY18
Authorized Staffing Level 29.90 30.00 27.10
Field & Facilities Director1 0.40 0.40 -Public Works Director2 - - 0.28Public Works Analyst3 - - 0.20Administrative Assistant2 - - 0.28Secretary2 - - 0.28Contract Specialist2 0.10 0.20 0.56Street Maintenance Supt. 1.00 1.00 1.00Streets Maintenance Supv. 3.00 3.00 2.00Equipment Service Technician - 2.00 2.00Sr. Equipment Operator 3.00 3.00 2.00Equipment Operator 13.00 15.00 15.00Traffic Control Worker 2.00 2.00 -Maintenance Worker 4.00 2.00 2.00Business Manager4 0.40 0.40 0.50Accounting Clerk 1.00 1.00 1.00Maintenance Specialist 1.00 - -Maintenance Technician 1.00 - -1 40% of Field & Facilities Director was charged to Solid Waste, 10% charged to Fleet Services and 10% charged to Facilities Management.
4 50% of Business Manager charged to Solid Waste
2 Public Works Admin personnel charged 28% Streets Maintenance, 20% Solid Waste, 36% Utilities, and 16% Program Development
3 Public Works Analyst charged 20% to Program Development, 20% Utilities, 20% Solid Waste, 20% Streets Maintenance.
City of Prescott, Arizona 200 Annual Budget FY2018
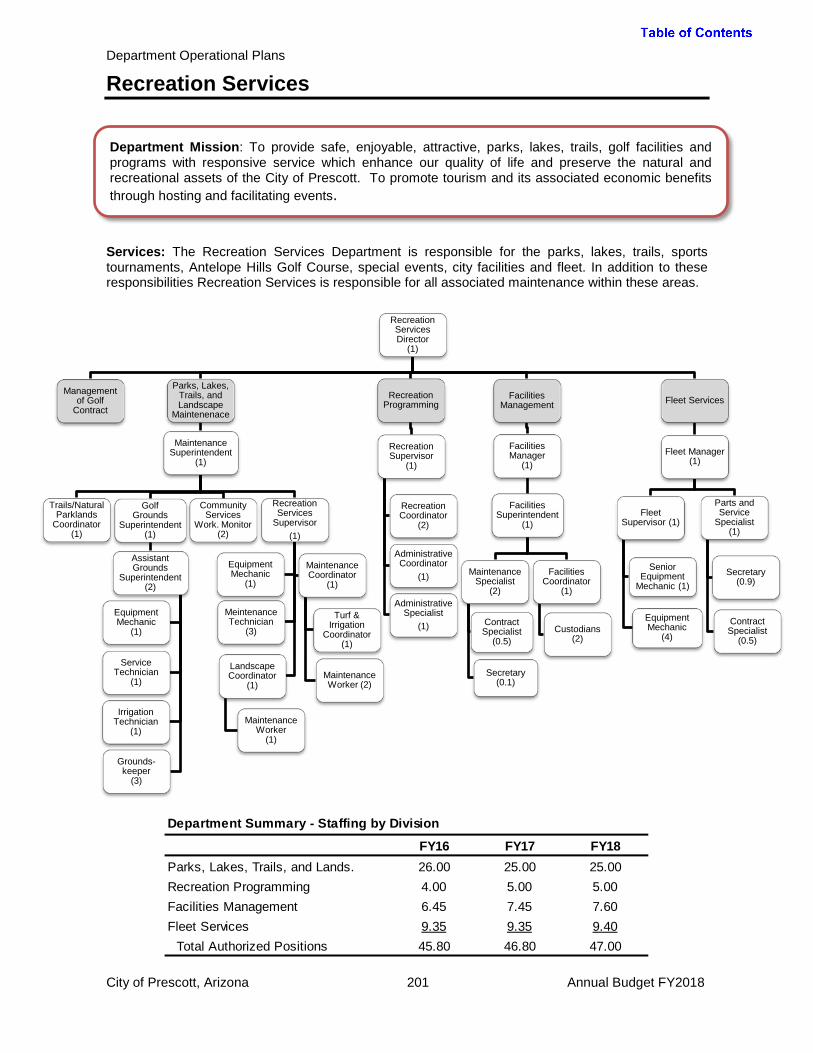
Department Operational Plans
Recreation Services
Services: The Recreation Services Department is responsible for the parks, lakes, trails, sports tournaments, Antelope Hills Golf Course, special events, city facilities and fleet. In addition to these responsibilities Recreation Services is responsible for all associated maintenance within these areas.
Department Summary - Staffing by Division
FY16 FY17 FY18Parks, Lakes, Trails, and Lands. 26.00 25.00 25.00Recreation Programming 4.00 5.00 5.00Facilities Management 6.45 7.45 7.60Fleet Services 9.35 9.35 9.40
Total Authorized Positions 45.80 46.80 47.00
Department Mission: To provide safe, enjoyable, attractive, parks, lakes, trails, golf facilities and programs with responsive service which enhance our quality of life and preserve the natural and recreational assets of the City of Prescott. To promote tourism and its associated economic benefits through hosting and facilitating events.
City of Prescott, Arizona 201 Annual Budget FY2018
Recreation Services Director
(1)
Parks, Lakes, Trails, and Landscape
Maintenenace
Maintenance Superintendent
(1)
Golf Grounds
Superintendent (1)
Assistant Grounds
Superintendent (2)
Equipment Mechanic
(1)
Service Technician
(1)
Irrigation Technician
(1)
Grounds-keeper
(3)
Trails/Natural Parklands
Coordinator (1)
Recreation Services
Supervisor (1)
Maintenance Coordinator
(1)
Turf & Irrigation
Coordinator (1)
Maintenance Worker (2)
Landscape Coordinator
(1)
Maintenance Worker
(1)
Meintenance Technician
(3)
Equipment Mechanic
(1)
Community Services
Work. Monitor (2)
Management of Golf
Contract Recreation
Programming
Recreation Supervisor
(1)
Recreation Coordinator
(2)
Administrative Coordinator
(1)
Administrative Specialist
(1)
Facilities Management
Facilities Manager
(1)
Facilities Superintendent
(1)
Maintenance Specialist
(2)
Contract Specialist
(0.5)
Secretary (0.1)
Facilities Coordinator
(1)
Custodians (2)
Fleet Services
Fleet Manager (1)
Fleet Supervisor (1)
Senior Equipment
Mechanic (1)
Equipment Mechanic
(4)
Parts and Service
Specialist (1)
Secretary (0.9)
Contract Specialist
(0.5)

Department Operational Plans
Recreation Services
Department Summary - Expenditure by TypeFY16
ActualFY17
BudgetFY17
EstimateFY18
Budget% Change
BudgetPersonnel 3,381,460$ 3,823,394$ 3,767,917$ 4,023,879$ 5%Supplies 1,659,399 1,664,175 1,571,837 1,621,283 -3%Internal Charges 945,969 907,874 911,432 914,685 1%Other Services & Charges 1,989,971 2,390,610 2,214,802 2,086,673 -13%Debt Service 399,538 386,914 386,914 3,335,867 762%
Subtotal Operations 8,376,337 9,172,967 8,852,902 11,982,387 31%Capital 209,237 6,464,461 2,352,030 5,735,800 -11%
Total 8,585,574$ 15,637,428$ 11,204,932$ 17,718,187$ 13%
Personnel 46.4%
Supplies 18.7%
Internal Charges 10.5%
Other Services & Charges 24.4%
Recreation Services FY18 Operating Expenditure Budget by Type
Department Summary - Operating Expenditures by Division and CapitalFY16
ActualFY17
BudgetFY17
EstimateFY18
Budget% Change
BudgetParks, Lakes, Trails, and Lands. 3,640,636$ 3,937,026$ 3,780,482$ 4,200,460$ 7%Recreation Programming 756,867 844,101 817,373 821,846 -3%Facilities Management 1,445,745 1,895,632 1,767,454 1,604,604 -15%Fleet Services 2,533,089 2,496,208 2,487,593 5,355,477 115%
Subtotal Operations 8,376,337 9,172,967 8,852,902 11,982,387 31%Capital 209,237 6,464,461 2,352,030 5,735,800 -11%
Total 8,585,574$ 15,637,428$ 11,204,932$ 17,718,187$ 13%
City of Prescott, Arizona 202 Annual Budget FY2018
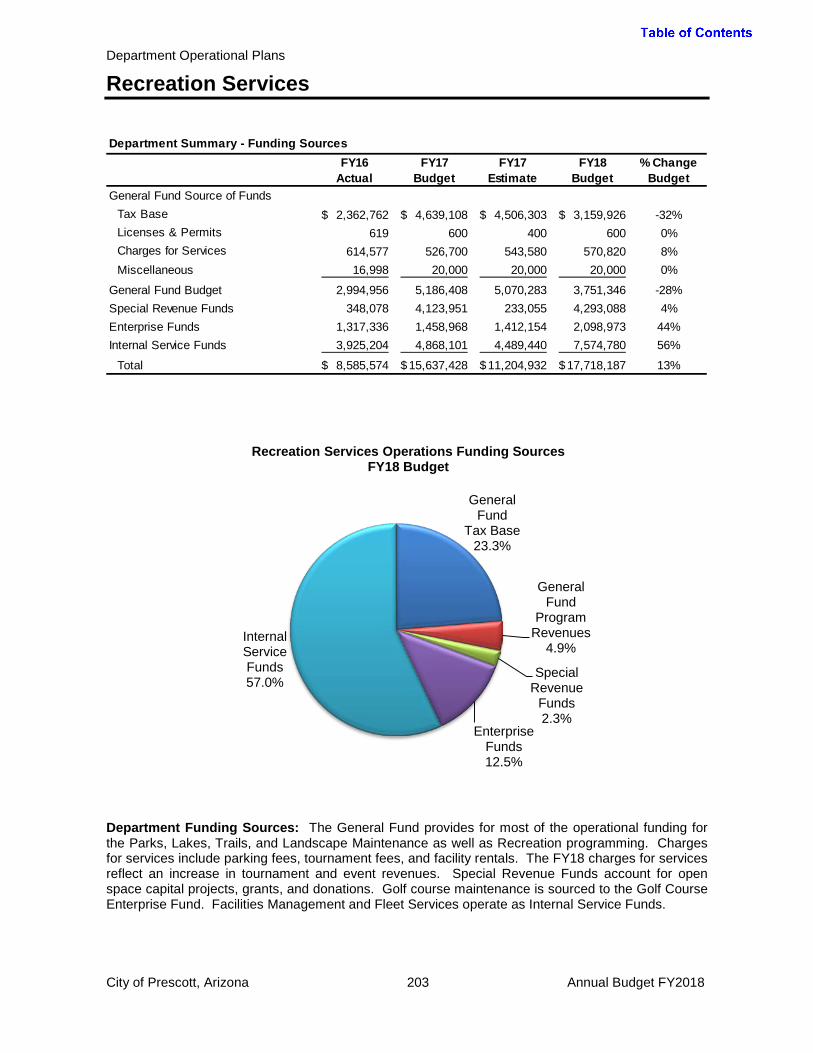
Department Operational Plans
Recreation Services
Department Funding Sources: The General Fund provides for most of the operational funding for the Parks, Lakes, Trails, and Landscape Maintenance as well as Recreation programming. Charges for services include parking fees, tournament fees, and facility rentals. The FY18 charges for services reflect an increase in tournament and event revenues. Special Revenue Funds account for open space capital projects, grants, and donations. Golf course maintenance is sourced to the Golf Course Enterprise Fund. Facilities Management and Fleet Services operate as Internal Service Funds.
Department Summary - Funding SourcesFY16
ActualFY17
BudgetFY17
EstimateFY18
Budget% Change
BudgetGeneral Fund Source of Funds
Tax Base 2,362,762$ 4,639,108$ 4,506,303$ 3,159,926$ -32%Licenses & Permits 619 600 400 600 0%Charges for Services 614,577 526,700 543,580 570,820 8%Miscellaneous 16,998 20,000 20,000 20,000 0%
General Fund Budget 2,994,956 5,186,408 5,070,283 3,751,346 -28%Special Revenue Funds 348,078 4,123,951 233,055 4,293,088 4%Enterprise Funds 1,317,336 1,458,968 1,412,154 2,098,973 44%Internal Service Funds 3,925,204 4,868,101 4,489,440 7,574,780 56%
Total 8,585,574$ 15,637,428$ 11,204,932$ 17,718,187$ 13%
General Fund
Tax Base 23.3%
General Fund
Program Revenues
4.9%
Special Revenue
Funds 2.3%
Enterprise Funds 12.5%
Internal Service Funds 57.0%
Recreation Services Operations Funding Sources FY18 Budget
City of Prescott, Arizona 203 Annual Budget FY2018
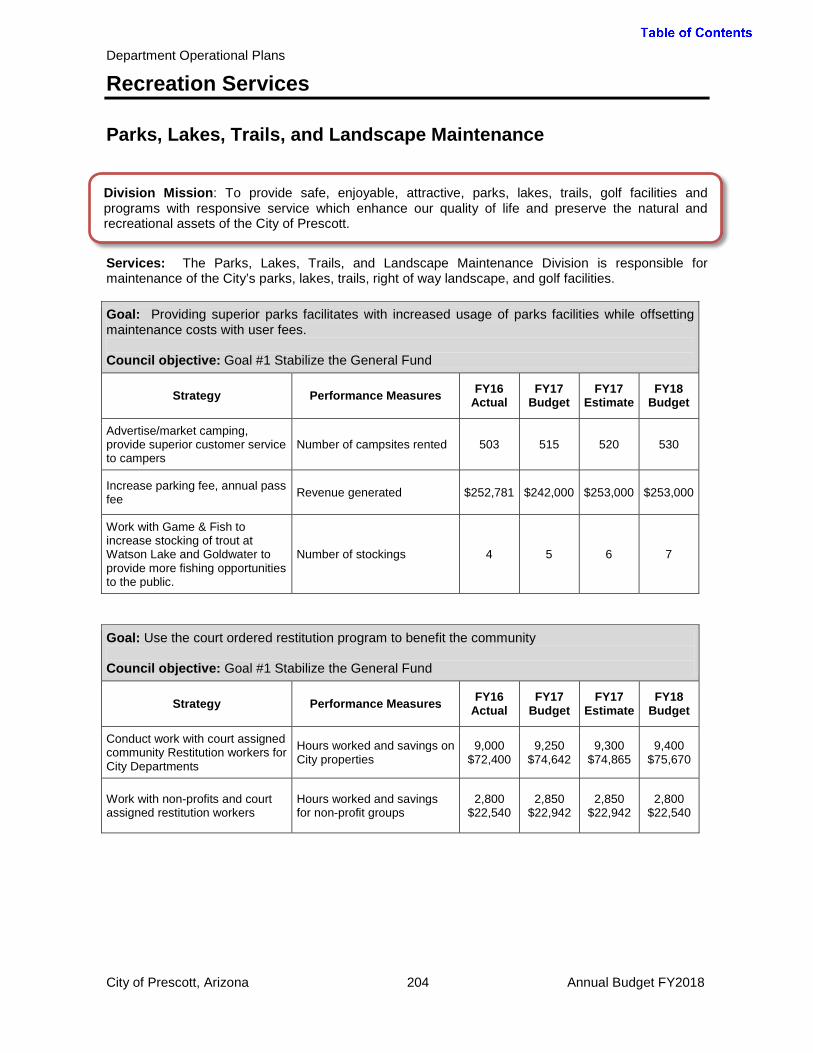
Department Operational Plans
Recreation Services
Parks, Lakes, Trails, and Landscape Maintenance
Services: The Parks, Lakes, Trails, and Landscape Maintenance Division is responsible for maintenance of the City’s parks, lakes, trails, right of way landscape, and golf facilities. Goal: Providing superior parks facilitates with increased usage of parks facilities while offsetting maintenance costs with user fees. Council objective: Goal #1 Stabilize the General Fund
Strategy Performance Measures FY16 Actual
FY17 Budget
FY17 Estimate
FY18 Budget
Advertise/market camping, provide superior customer service to campers
Number of campsites rented 503 515 520 530
Increase parking fee, annual pass fee Revenue generated $252,781 $242,000 $253,000 $253,000
Work with Game & Fish to increase stocking of trout at Watson Lake and Goldwater to provide more fishing opportunities to the public.
Number of stockings 4 5 6 7
Goal: Use the court ordered restitution program to benefit the community Council objective: Goal #1 Stabilize the General Fund
Strategy Performance Measures FY16 Actual
FY17 Budget
FY17 Estimate
FY18 Budget
Conduct work with court assigned community Restitution workers for City Departments
Hours worked and savings on City properties
9,000 $72,400
9,250 $74,642
9,300 $74,865
9,400 $75,670
Work with non-profits and court assigned restitution workers
Hours worked and savings for non-profit groups
2,800 $22,540
2,850 $22,942
2,850 $22,942
2,800 $22,540
Division Mission: To provide safe, enjoyable, attractive, parks, lakes, trails, golf facilities and programs with responsive service which enhance our quality of life and preserve the natural and recreational assets of the City of Prescott.
City of Prescott, Arizona 204 Annual Budget FY2018
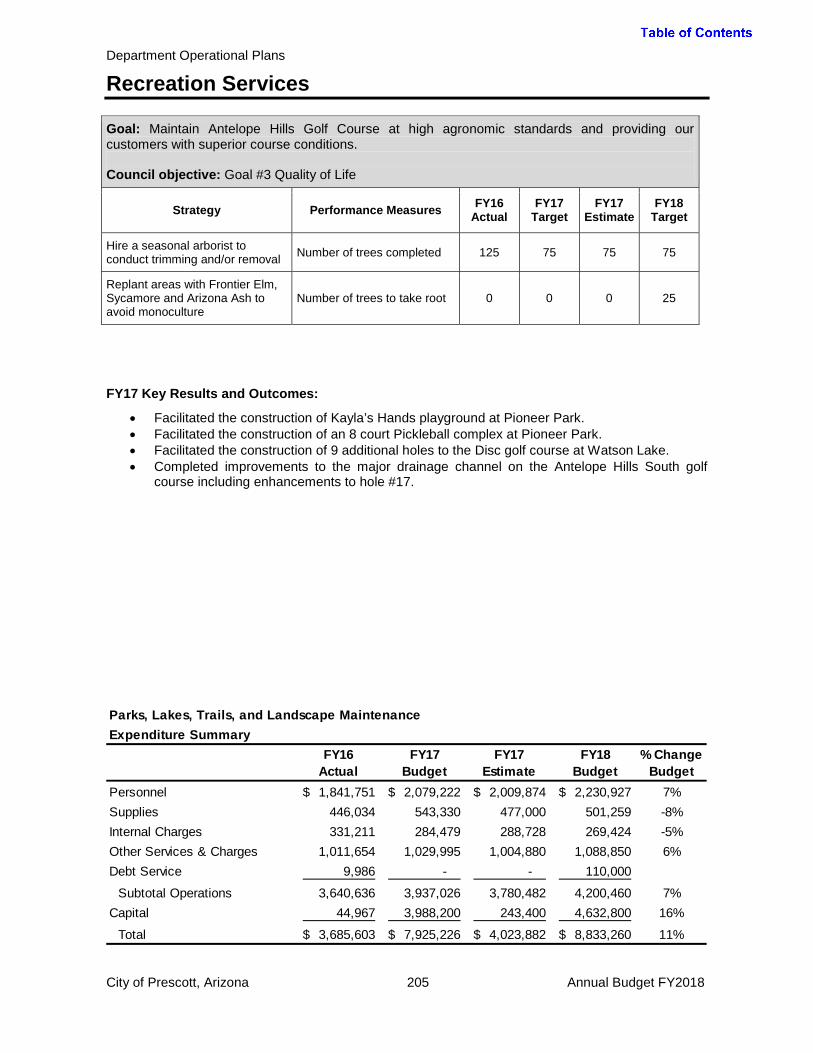
Department Operational Plans
Recreation Services
FY17 Key Results and Outcomes:
• Facilitated the construction of Kayla’s Hands playground at Pioneer Park. • Facilitated the construction of an 8 court Pickleball complex at Pioneer Park. • Facilitated the construction of 9 additional holes to the Disc golf course at Watson Lake. • Completed improvements to the major drainage channel on the Antelope Hills South golf
course including enhancements to hole #17.
Parks, Lakes, Trails, and Landscape MaintenanceExpenditure Summary
FY16 Actual
FY17 Budget
FY17 Estimate
FY18 Budget
% Change Budget
Personnel 1,841,751$ 2,079,222$ 2,009,874$ 2,230,927$ 7%Supplies 446,034 543,330 477,000 501,259 -8%Internal Charges 331,211 284,479 288,728 269,424 -5%Other Services & Charges 1,011,654 1,029,995 1,004,880 1,088,850 6%Debt Service 9,986 - - 110,000
Subtotal Operations 3,640,636 3,937,026 3,780,482 4,200,460 7%Capital 44,967 3,988,200 243,400 4,632,800 16%
Total 3,685,603$ 7,925,226$ 4,023,882$ 8,833,260$ 11%
Goal: Maintain Antelope Hills Golf Course at high agronomic standards and providing our customers with superior course conditions. Council objective: Goal #3 Quality of Life
Strategy Performance Measures FY16 Actual
FY17 Target
FY17 Estimate
FY18 Target
Hire a seasonal arborist to conduct trimming and/or removal Number of trees completed 125 75 75 75
Replant areas with Frontier Elm, Sycamore and Arizona Ash to avoid monoculture
Number of trees to take root 0 0 0 25
City of Prescott, Arizona 205 Annual Budget FY2018

Department Operational Plans
Recreation Services
Budget Notes and Significant Changes: The fuels reduction temporary/seasonal staff have been moved to this division from Community Risk Reduction for FY18, causing an increase in Personnel. The increase in Other Services and Charges is for ball field light replacements.
Capital DetailOpen Space Acquisitions 3,800,000$ Golf Cart Replacement 500,000 Pickleball restrooms 133,000 Golf Course Replacement Equipment 59,000 Inline Hockey Partership 50,000 Golf Course Bunkers Improvements 45,500 Acker Park Improvements (reimbursed with developer funds) 19,800 Picnic Area Expansion Program 15,000 Golf Course Cart Path Paving 10,500
4,632,800$
Authorized Staffing SummaryFY16 FY17 FY18
Authorized Staffing Level 26.00 25.00 25.00
Recreation Services Director 1.00 1.00 1.00Maintenance Superintendent 1.00 1.00 1.00Recreation Services Supervisor 1.00 1.00 1.00Special Proj. Administrator 1.00 - -Maintenance Coordinator 1.00 1.00 1.00Landscape Coordinator 1.00 1.00 1.00Equipment Mechanic 2.00 2.00 2.00Turf & Irrigation Coordinator 1.00 1.00 1.00Trails/Natural Parkland Coord. 1.00 1.00 1.00Comm. Svcs. Work Monitor 2.00 2.00 2.00Maintenance Worker 3.00 3.00 3.00Maintenance Technician 3.00 3.00 3.00Golf Grounds Superintendent 1.00 1.00 1.00Assistant Grounds Superintend. 2.00 2.00 2.00Service Technician 1.00 1.00 1.00Irrigation Technician 2.00 1.00 1.00Groundskeeper 2.00 3.00 3.00
City of Prescott, Arizona 206 Annual Budget FY2018
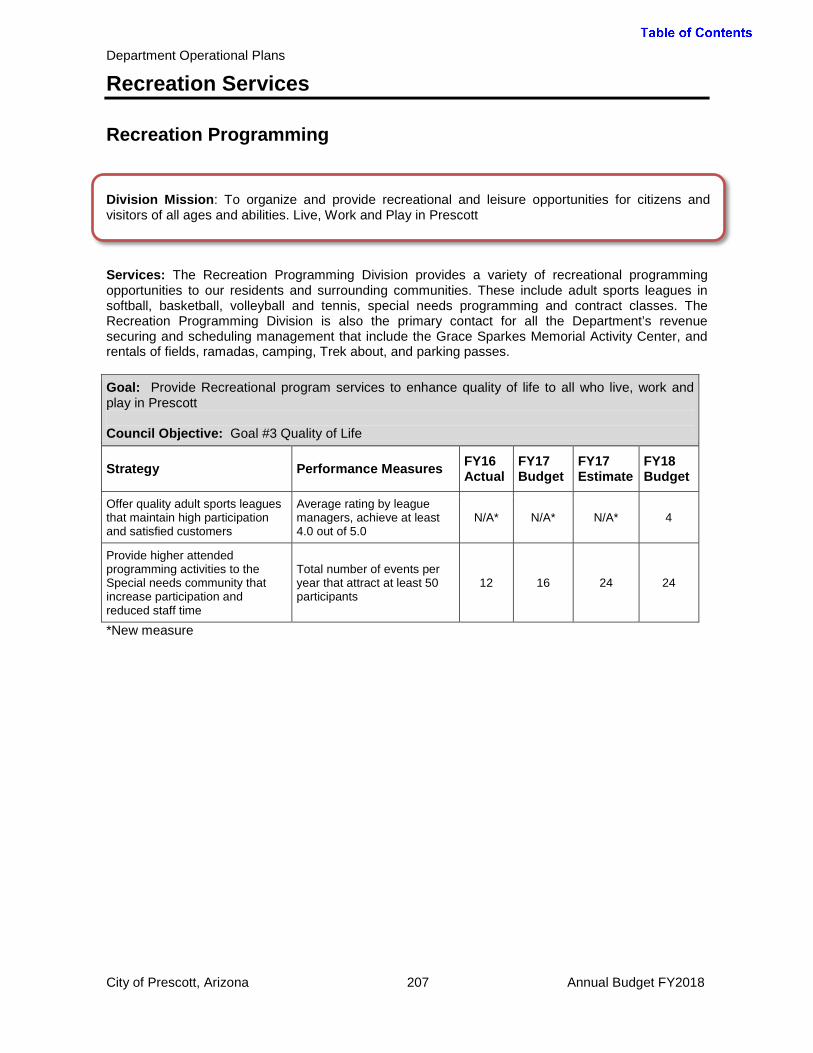
Department Operational Plans
Recreation Services
Recreation Programming
Services: The Recreation Programming Division provides a variety of recreational programming opportunities to our residents and surrounding communities. These include adult sports leagues in softball, basketball, volleyball and tennis, special needs programming and contract classes. The Recreation Programming Division is also the primary contact for all the Department’s revenue securing and scheduling management that include the Grace Sparkes Memorial Activity Center, and rentals of fields, ramadas, camping, Trek about, and parking passes. Goal: Provide Recreational program services to enhance quality of life to all who live, work and play in Prescott Council Objective: Goal #3 Quality of Life
Strategy Performance Measures FY16 Actual
FY17 Budget
FY17 Estimate
FY18 Budget
Offer quality adult sports leagues that maintain high participation and satisfied customers
Average rating by league managers, achieve at least 4.0 out of 5.0
N/A* N/A* N/A* 4
Provide higher attended programming activities to the Special needs community that increase participation and reduced staff time
Total number of events per year that attract at least 50 participants
12 16 24 24
*New measure
Division Mission: To organize and provide recreational and leisure opportunities for citizens and visitors of all ages and abilities. Live, Work and Play in Prescott
City of Prescott, Arizona 207 Annual Budget FY2018

Department Operational Plans
Recreation Services
Goal: Generate Annual Sporting and Special event calendars to attract visitation from outside our community to increase economic impact. Council Objective: Goal #1 Stabilize the General Fund
Strategy Performance Measures
FY16 Actual
FY17 Budget
FY17 Estimate
FY18 Budget
Maximize sports calendar with youth events that attract families during peak seasons increasing economic impact to the community
Increase the economic impact direct spending by 2%
$2,332,250 $2,400,000 $2,400,000 $2,500,000
Research and Develop shoulder season events to increase calendar and participation
Incorporate sporting events during the Jan-Mar and Oct-Dec seasons
0 1 1 3
Work with Prescott Area Hospitality Association to partner with contracted tournament directors
Tournaments attracted 1 3 3 5
Create good community relations with local businesses and community partners by establishing a diverse special events calendar that promotes the City and creates increased economic impact through tourism. Increase events throughout the year by establishing new events during non-peak seasons (Jan-Mar; Oct-Dec).
Number of events
66
68
68
70
FY17 Key Results and Outcomes:
• Hosted 25 sports tournaments with an estimated economic impact of $5,434,000; an increase of 90% over 2011.
City of Prescott, Arizona 208 Annual Budget FY2018

Department Operational Plans
Recreation Services
Budget Notes and Significant Changes: No significant changes.
Recreation ProgrammingExpenditure Summary
FY16 Actual
FY17 Budget
FY17 Estimate
FY18 Budget
% Change Budget
Personnel 428,879$ 492,525$ 497,469$ 501,252$ 2%Supplies 58,725 60,000 58,924 58,704 -2%Internal Charges 200,978 184,726 184,058 186,440 1%Other Services & Charges 68,285 106,850 76,922 75,450 -29%
Total 756,867$ 844,101$ 817,373$ 821,846$ -3%
Authorized Staffing SummaryFY16 FY17 FY18
Authorized Staffing Level 4.00 5.00 5.00
Recreation Supervisor 1.00 1.00 1.00Recreation Coordinator 2.00 2.00 2.00Administrative Coordinator - 1.00 1.00Administrative Specialist - 1.00 1.00Secretary 1.00 - -
City of Prescott, Arizona 209 Annual Budget FY2018
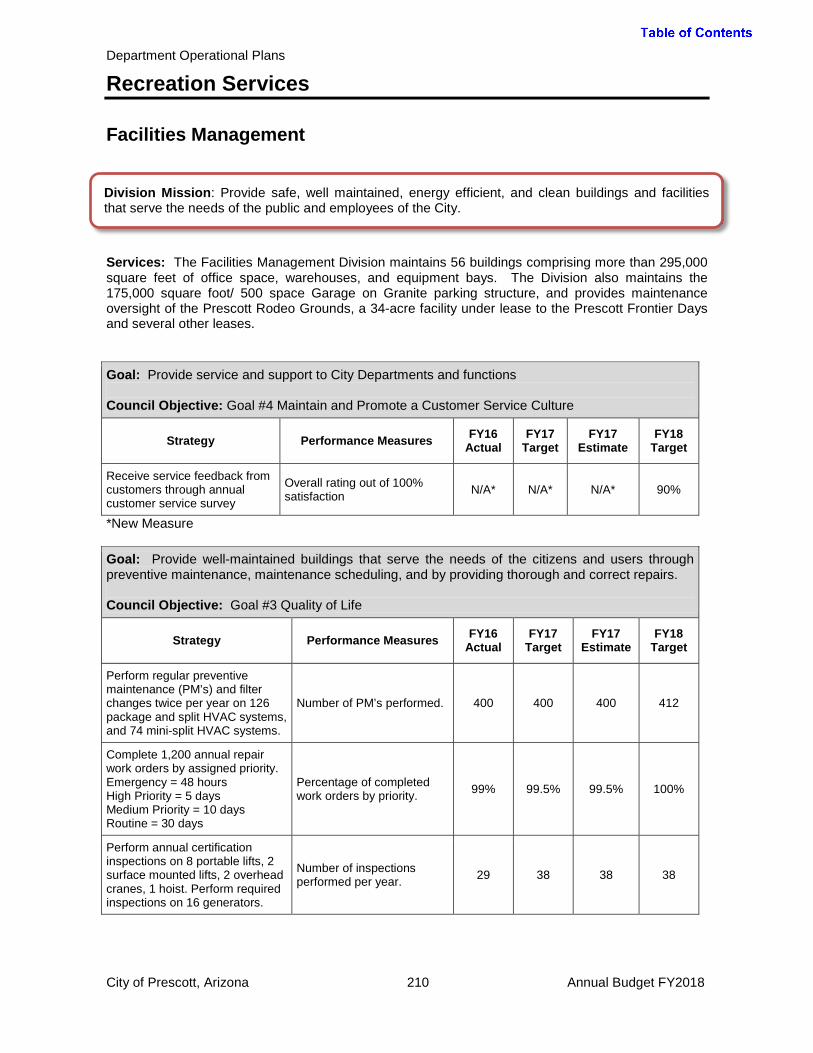
Department Operational Plans
Recreation Services
Facilities Management
Services: The Facilities Management Division maintains 56 buildings comprising more than 295,000 square feet of office space, warehouses, and equipment bays. The Division also maintains the 175,000 square foot/ 500 space Garage on Granite parking structure, and provides maintenance oversight of the Prescott Rodeo Grounds, a 34-acre facility under lease to the Prescott Frontier Days and several other leases. Goal: Provide service and support to City Departments and functions Council Objective: Goal #4 Maintain and Promote a Customer Service Culture
Strategy Performance Measures FY16 Actual
FY17 Target
FY17 Estimate
FY18 Target
Receive service feedback from customers through annual customer service survey
Overall rating out of 100% satisfaction N/A* N/A* N/A* 90%
*New Measure Goal: Provide well-maintained buildings that serve the needs of the citizens and users through preventive maintenance, maintenance scheduling, and by providing thorough and correct repairs. Council Objective: Goal #3 Quality of Life
Strategy Performance Measures FY16 Actual
FY17 Target
FY17 Estimate
FY18 Target
Perform regular preventive maintenance (PM’s) and filter changes twice per year on 126 package and split HVAC systems, and 74 mini-split HVAC systems.
Number of PM’s performed. 400 400 400 412
Complete 1,200 annual repair work orders by assigned priority. Emergency = 48 hours High Priority = 5 days Medium Priority = 10 days Routine = 30 days
Percentage of completed work orders by priority. 99% 99.5% 99.5% 100%
Perform annual certification inspections on 8 portable lifts, 2 surface mounted lifts, 2 overhead cranes, 1 hoist. Perform required inspections on 16 generators.
Number of inspections performed per year. 29 38 38 38
Division Mission: Provide safe, well maintained, energy efficient, and clean buildings and facilities that serve the needs of the public and employees of the City.
City of Prescott, Arizona 210 Annual Budget FY2018

Department Operational Plans
Recreation Services
FY17 Key Results and Outcomes:
• Reduced electric consumption through lighting retrofits in various buildings resulting in $22,000 in APS rebates and reducing annual costs by $56,000 since 2011.
• Reduced natural gas costs by installing more efficient HVAC units in various buildings annual natural gas costs have been reduced by$ 42,000 since 2011.
• Completed a major restoration to the Rodeo grounds including much needed electrical, fire suppression and esthetic improvements.
Facilities ManagementExpenditure Summary
FY16 Actual
FY17 Budget
FY17 Estimate
FY18 Budget
% Change Budget
Personnel 476,476$ 578,361$ 572,272$ 582,687$ 1%Supplies 149,752 135,445 123,111 136,970 1%Internal Charges 114,715 120,711 121,055 153,624 27%Other Services & Charges 704,802 1,061,115 951,016 731,323 -31%
Subtotal Operations 1,445,745 1,895,632 1,767,454 1,604,604 -15%Capital 129,404 1,938,261 1,930,000 393,000 -80%
Total 1,575,149$ 3,833,893$ 3,697,454$ 1,997,604$ -48%
Capital DetailRenovation of Parking Garage Stairs 350,000$ Grace Sparks Activity Center Renovations 30,000 Council Chambers Audio Visual Improvements 13,000
393,000$
Goal: Improve energy efficiency by replacing inefficient lighting Council Objective: Goal #1 Stabilize the General Fund, Goal #3 Quality of Life
Strategy Performance Measures FY16 Actual
FY17 Target
FY17 Estimate
FY18 Target
Upgrade T – 12 and T - 8 lighting in identified buildings to LED’s for increased efficiencies and lowered costs.
Lighting energy cost savings per year. 0% 5% 5% 2%
City of Prescott, Arizona 211 Annual Budget FY2018

Department Operational Plans
Recreation Services
Budget Notes and Significant Changes: Other Services and Charges relate to a decrease in utility costs as well as a parking garage stair repair project that was budgeted in FY17 and is now a capital project for FY18. This division was previously under a Field and Facilities department.
Authorized Staffing SummaryFY16 FY17 FY18
Authorized Staffing Level 6.45 7.45 7.60
Field & Facilities Director1 0.10 0.10 -Facilities Manager 1.00 1.00 1.00Facilities Maintenance Super. 1.00 1.00 1.00Maintenance Specialist 1.00 2.00 2.00Facilities Coordinator 1.00 1.00 1.00Custodian 2.00 2.00 2.00Business Manager2 0.10 0.10 -Secretary3 - 0.10 0.10Accounting Clerk3 0.10 - -Contract Specialist4 0.15 0.15 0.501 40% of Field & Facilities Director was charged to Solid Waste, 40% charged to Street Maintenance, and 10% charged to Fleet Services.2 40% of Business Manager was charged to Solid Waste, 40% charged to Street Maintenance and 10% charged to Fleet Services.3 90% of Secretary charged to Fleet Services4 50% of Contract Specialist charged to Fleet Service
City of Prescott, Arizona 212 Annual Budget FY2018
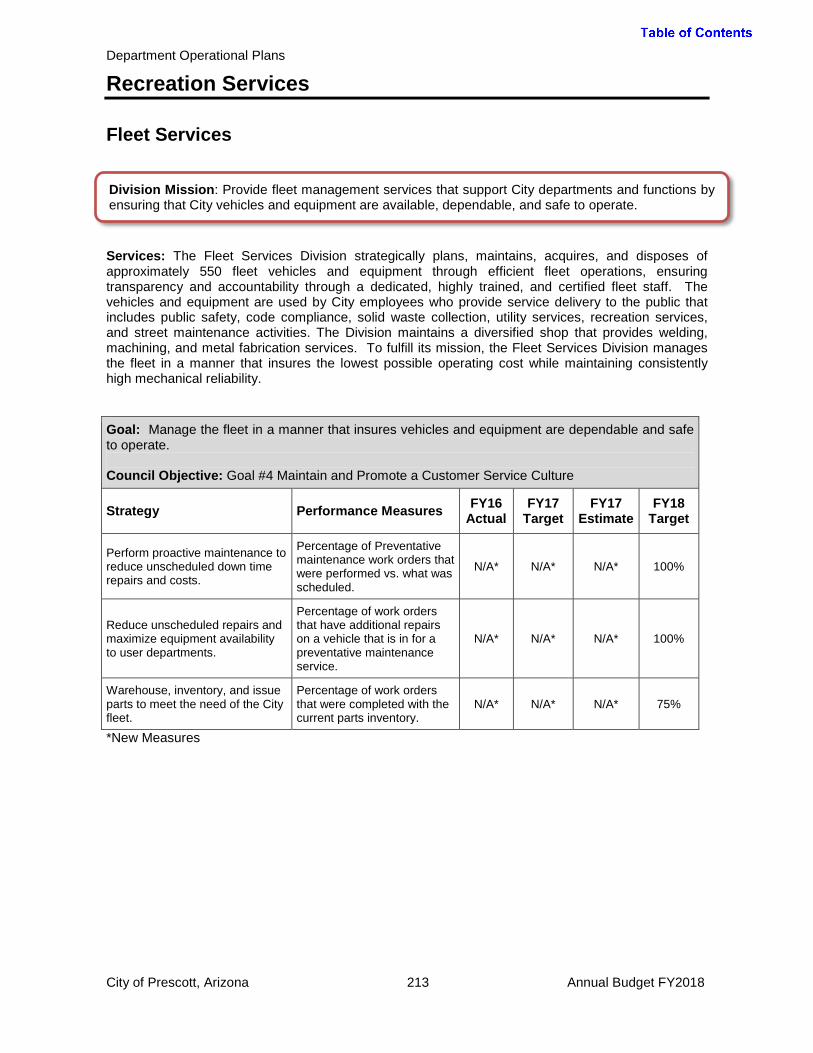
Department Operational Plans
Recreation Services
Fleet Services
Services: The Fleet Services Division strategically plans, maintains, acquires, and disposes of approximately 550 fleet vehicles and equipment through efficient fleet operations, ensuring transparency and accountability through a dedicated, highly trained, and certified fleet staff. The vehicles and equipment are used by City employees who provide service delivery to the public that includes public safety, code compliance, solid waste collection, utility services, recreation services, and street maintenance activities. The Division maintains a diversified shop that provides welding, machining, and metal fabrication services. To fulfill its mission, the Fleet Services Division manages the fleet in a manner that insures the lowest possible operating cost while maintaining consistently high mechanical reliability. Goal: Manage the fleet in a manner that insures vehicles and equipment are dependable and safe to operate. Council Objective: Goal #4 Maintain and Promote a Customer Service Culture
Strategy Performance Measures FY16 Actual
FY17 Target
FY17 Estimate
FY18 Target
Perform proactive maintenance to reduce unscheduled down time repairs and costs.
Percentage of Preventative maintenance work orders that were performed vs. what was scheduled.
N/A* N/A* N/A* 100%
Reduce unscheduled repairs and maximize equipment availability to user departments.
Percentage of work orders that have additional repairs on a vehicle that is in for a preventative maintenance service.
N/A* N/A* N/A* 100%
Warehouse, inventory, and issue parts to meet the need of the City fleet.
Percentage of work orders that were completed with the current parts inventory.
N/A* N/A* N/A* 75%
*New Measures
Division Mission: Provide fleet management services that support City departments and functions by ensuring that City vehicles and equipment are available, dependable, and safe to operate.
City of Prescott, Arizona 213 Annual Budget FY2018

Department Operational Plans
Recreation Services
Goal: Ensure that the type and number of vehicles necessary and appropriate to meet the needs of the City are available to departments and functions. Council Objective: Goal #4 Maintain and Promote a Customer Service Culture
Strategy Performance Measures FY16 Actual
FY17 Target
FY17 Estimate
FY18 Target
Provide the City with vehicles and equipment that allow users to perform their specific missions.
Percentage of equipment that is available to use. N/A* N/A* N/A* 100%
*New Measures Goal: Provide service and support to City Departments and functions. Council Objective: Goal #4 Maintain and Promote a Customer Service Culture
Strategy Performance Measures FY16 Actual
FY17 Target
FY17 Estimate
FY18 Target
Meet monthly with customers, and perform an annual customer service survey.
Average customer satisfaction rating out of 100%
81% 95% 95% 95%
Provide monthly billing and work order information to each department.
Develop a standard report, and send to Departments monthly for review.
N/A* N/A* N/A* 100%
*New Measures FY17 Key Results and Outcomes:
• Provided preventive maintenance for the approximately 548 City assets in accordance with original equipment manufacturers’ (OEM) recommendations and performed fleet vehicle repairs as needed.
• Continued truck safety inspections for the Fire Department and the Solid Waste Division. • Entered into a service agreement for emergency power generator services, preventive
maintenance, and load-bank testing. • Worked with Risk Management to have 34 vehicles repaired that were involved in an
accident, and made sure the work was completed correctly. • Completed all paper work for 24 newly purchased vehicles and equipment for City asset
numbers and Arizona titles. • Managed the Motor Pool consisting of vans, trucks, sedans and SUVs. • Completed 763 preventive maintenance (PM) work orders. • Completed 1,368 non- PM repair work orders. • Completed 2,131 total repair work orders in FY16. • Organized three Auctions disposing of 40 assets, various parts, and miscellaneous items,
returning $148,523 to various funding Divisions. • Procured an alignment machine, received training for all employees, and started performing
alignments on City assets. • Performed an annual fleet utilization study, identifying 13 vehicles for disposition or use in the
Carpool. City of Prescott, Arizona 214 Annual Budget FY2018
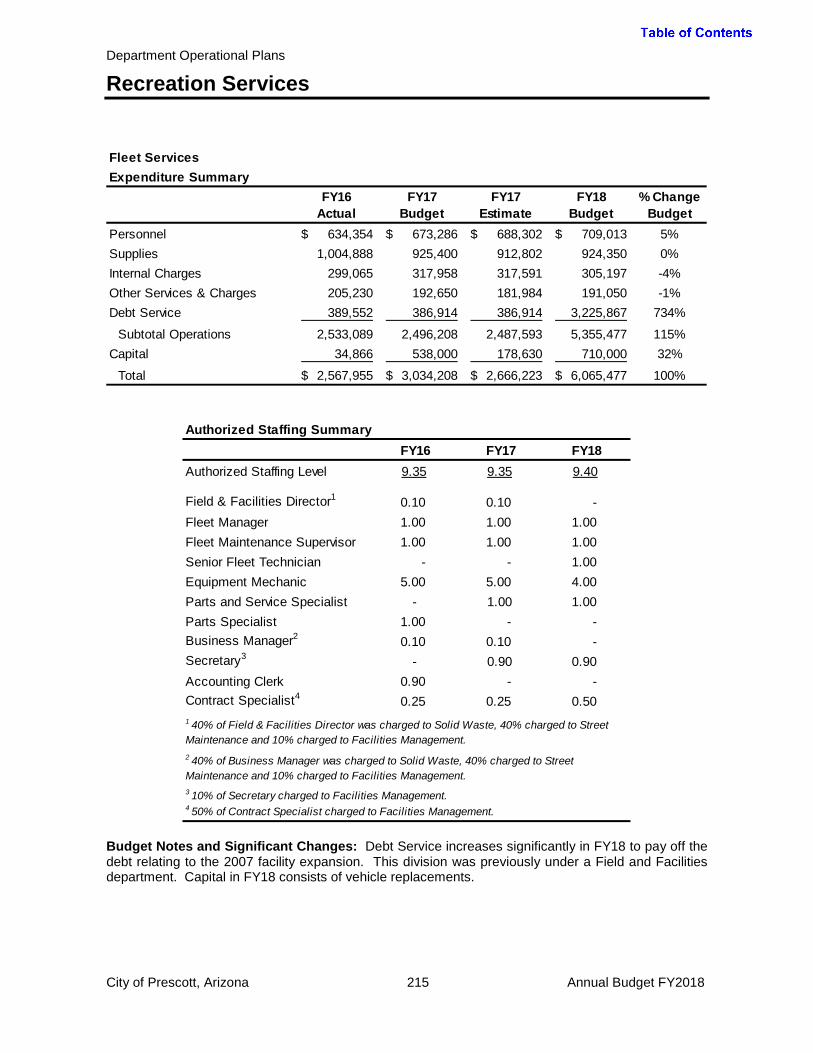
Department Operational Plans
Recreation Services
Budget Notes and Significant Changes: Debt Service increases significantly in FY18 to pay off the debt relating to the 2007 facility expansion. This division was previously under a Field and Facilities department. Capital in FY18 consists of vehicle replacements.
Fleet ServicesExpenditure Summary
FY16 Actual
FY17 Budget
FY17 Estimate
FY18 Budget
% Change Budget
Personnel 634,354$ 673,286$ 688,302$ 709,013$ 5%Supplies 1,004,888 925,400 912,802 924,350 0%Internal Charges 299,065 317,958 317,591 305,197 -4%Other Services & Charges 205,230 192,650 181,984 191,050 -1%Debt Service 389,552 386,914 386,914 3,225,867 734%
Subtotal Operations 2,533,089 2,496,208 2,487,593 5,355,477 115%Capital 34,866 538,000 178,630 710,000 32%
Total 2,567,955$ 3,034,208$ 2,666,223$ 6,065,477$ 100%
Authorized Staffing SummaryFY16 FY17 FY18
Authorized Staffing Level 9.35 9.35 9.40
Field & Facilities Director1 0.10 0.10 -Fleet Manager 1.00 1.00 1.00Fleet Maintenance Supervisor 1.00 1.00 1.00Senior Fleet Technician - - 1.00Equipment Mechanic 5.00 5.00 4.00Parts and Service Specialist - 1.00 1.00Parts Specialist 1.00 - -Business Manager2 0.10 0.10 -Secretary3 - 0.90 0.90Accounting Clerk 0.90 - -Contract Specialist4 0.25 0.25 0.501 40% of Field & Facilities Director was charged to Solid Waste, 40% charged to Street Maintenance and 10% charged to Facilities Management.2 40% of Business Manager was charged to Solid Waste, 40% charged to Street Maintenance and 10% charged to Facilities Management.3 10% of Secretary charged to Facilities Management.4 50% of Contract Specialist charged to Facilities Management.
City of Prescott, Arizona 215 Annual Budget FY2018
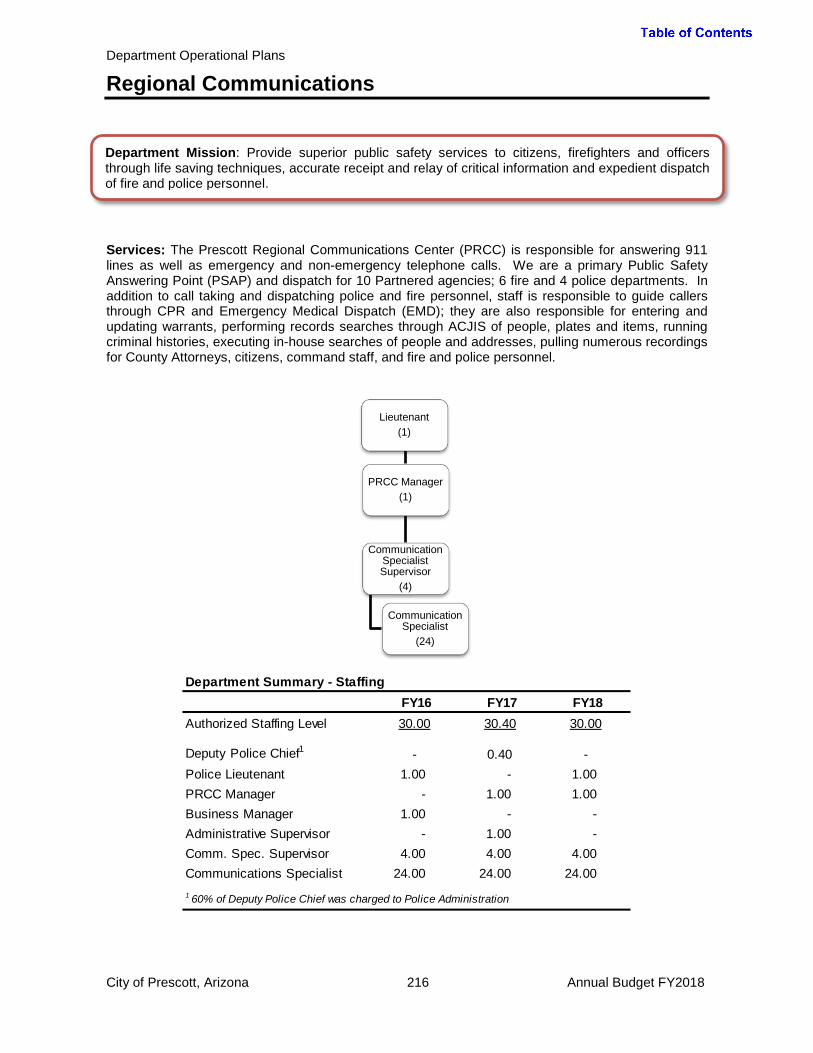
Department Operational Plans
Regional Communications
Services: The Prescott Regional Communications Center (PRCC) is responsible for answering 911 lines as well as emergency and non-emergency telephone calls. We are a primary Public Safety Answering Point (PSAP) and dispatch for 10 Partnered agencies; 6 fire and 4 police departments. In addition to call taking and dispatching police and fire personnel, staff is responsible to guide callers through CPR and Emergency Medical Dispatch (EMD); they are also responsible for entering and updating warrants, performing records searches through ACJIS of people, plates and items, running criminal histories, executing in-house searches of people and addresses, pulling numerous recordings for County Attorneys, citizens, command staff, and fire and police personnel.
Department Summary - StaffingFY16 FY17 FY18
Authorized Staffing Level 30.00 30.40 30.00
Deputy Police Chief1 - 0.40 -Police Lieutenant 1.00 - 1.00PRCC Manager - 1.00 1.00Business Manager 1.00 - -Administrative Supervisor - 1.00 -Comm. Spec. Supervisor 4.00 4.00 4.00Communications Specialist 24.00 24.00 24.001 60% of Deputy Police Chief was charged to Police Administration
Department Mission: Provide superior public safety services to citizens, firefighters and officers through life saving techniques, accurate receipt and relay of critical information and expedient dispatch of fire and police personnel.
City of Prescott, Arizona 216 Annual Budget FY2018
Lieutenant (1)
PRCC Manager (1)
Communication Specialist Supervisor
(4)
Communication Specialist
(24)

Department Operational Plans
Regional Communications
Goal: One hundred percent (100%) of 911 calls arriving at the PRCC will be answered within ten (10) seconds. Council Objective: Goal #3 Quality of Life
Strategy Performance Measures FY16 Actual
FY17 Budget
FY17 Estimate
FY18 Budget
Provide training, equipment and staffing to adequately comply with this national standard.
Answer 100% of 911 calls within ten seconds. 98.89% 99.50% 99.60% 99.75%
Goal: One hundred percent (100%) of PRCC’s seven 10-digit emergency lines will be answered within ten (10) seconds. Council Objective: Goal #3 Quality of Life
Strategy Performance Measures FY16 Actual
FY17 Budget
FY17 Estimate
FY18 Budget
Provide training, equipment and staffing to adequately comply with this national standard.
Answer 100% of PRCC’s seven 10-digit emergency lines within ten seconds.
97.61% 98.00% 98.50% 99.00%
FY17 Key Results and Outcomes:
• Handled 205,937 inbound calls, which included 82,968 fire, police and EMS responses. • Conducted two, three-day Emergency Medical Dispatch (EMD) classes of which a total of 30
dispatchers from various agencies/cities attended. • Collaborated with the Department of Public Safety to incorporate an ACJIS JWI (Justice Web
Interface) policy change. • Participated in and supported an airport mass casualty drill. • Became nationally certified with the National Center for Missing and Exploited Children. • Partnered with the Yavapai County Sheriff’s Office and trained personnel on a CodeRed
reverse emergency notification solution.
City of Prescott, Arizona 217 Annual Budget FY2018

Department Operational Plans
Regional Communications
Budget Notes and Significant Changes: The capital budget in FY18 is for a public safety software upgrade and a new dispatch recording system. Other Services & Charges increase with ongoing software licensing fees. Charges for services are charges to area partners who share the cost of the Regional Communications center. The General Fund Tax Base amount less the amount related to capital is charged to the Police and Fire Departments and is included in their budgets under internal charges.
Department Summary - Expenditure by TypeFY16
ActualFY17
BudgetFY17
EstimateFY18
Budget% Change
BudgetPersonnel 2,042,891$ 2,327,571$ 2,282,231$ 2,270,300$ -2%Supplies 13,334 18,350 18,350 18,350 0%Internal Charges 237,725 256,891 251,879 254,177 -1%Other Services & Charges 155,156 176,400 177,100 196,900 12%
Subtotal Operations 2,449,106 2,779,212 2,729,560 2,739,727 -1%Capital - 1,025,000 316,005 1,522,600 49%
Total 2,449,106$ 3,804,212$ 3,045,565$ 4,262,327$ 12%
Department Summary - Funding SourcesFY16
ActualFY17
BudgetFY17
EstimateFY18
BudgetGeneral Fund Sources of Funds
Tax Base 1,195,004$ 2,389,548$ 1,351,319$ 2,070,504$ Charges for Services 1,254,102 1,414,664 1,694,246 2,191,823
General Fund Budget 2,449,106$ 3,804,212$ 3,045,565$ 4,262,327$
City of Prescott, Arizona 218 Annual Budget FY2018
Personnel 82.9%
Supplies 0.7%
Internal Charges 9.3%
Other Services & Charges
7.2%
Regional Communications FY18 Operating Expenditure Budget by Type
Department Operational Plans
Regional Communications
THIS PAGE LEFT BLANK INTENTIONALLY
City of Prescott, Arizona 219 Annual Budget FY2018

Capital Budget
Capital Budget Overview ................................................................................................................ 222 Capital Budget Categories and Funding Sources .......................................................................... 224 Capital Budget Listing .................................................................................................................... 225 Capital Budget and Project Descriptions ........................................................................................ 228 Five-Year Capital Improvement Plan Summary ............................................................................. 266
City of Prescott, Arizona 220 Annual Budget FY2018

Capital Budget
THIS PAGE LEFT BLANK INTENTIONALLY
City of Prescott, Arizona 221 Annual Budget FY2018

Capital Budget
Capital Budget Overview
The Capital Budget for the City of Prescott is significant and is presented in a separate section of this document to provide more detail. The Department Operational Plans included the total allocated for capital in each Department. The City of Prescott plans for sustainable infrastructure improvements that keep pace with the growth of the community and meets the needs of the City’s residents. The City has significant investments in its streets, water infrastructure, wastewater infrastructure, public facilities, parks and other city infrastructure. In addition, capital investment is necessary to keep operations running smoothly such as vehicles, equipment, information technology, and facility improvements. Capital expenditures are purchases that meet the following requirements:
1. Estimated useful life over one year 2. Unit cost of $5,000 or more 3. If considered an addition or improvement to an existing asset, expenditure significantly
increases the capacity of an asset or extends the useful life. Funding for the capital budget is appropriated annually, however, many of these projects span multiple years. In this case, the budgeted amount in each year is the estimate for expenditures for that particular year. Requirements for funding projects are addressed each year prior to projects moving forward. Also, organizational changes, funding uncertainties, unforeseen emergencies, project delays, or plans by other governmental units can cause changes to the capital plan. Long-range planning requires estimating and projecting of revenues as well as expenditures. This is a dynamic process and is reviewed each year during the budgeting process. Financing of capital expenditures from available funds, pay-as-you-go funding, is the least costly and most desirable method to cover capital expenditures. Every effort will be made to accumulate funds to allow this method of funding. Should the City not have sufficient funds available, it has a formal Debt Policy and issues debt for the purpose of acquiring or constructing capital projects including buildings, machinery equipment and furniture and fixtures. These needs are addressed through the budget process and the annual five-year capital improvement plan. Capital Budget Categories The capital budget is separated into three categories, which are defined in the following table. Capital Budget Category Definition
Capital Improvement Plan (CIP) A project that is more than $100,000 for a new infrastructure asset or to increase the capacity, efficiency, or expected life span of an existing infrastructure asset. This consists of infrastructure projects such as streets, utilities, and airport projects as well as major renovations to or additional City buildings or facilities.
Vehicle Replacements and Additions
Requests regarding fleet additions or replacements.
Operating Capital All other capital requests not in the above categories, such as information technology infrastructure, major tools, and equipment purchases of any unit cost over $5,000. Projects otherwise matching the CIP definition but for which the cost is between $5,000 and $100,000 will be categorized as operating capital.
City of Prescott, Arizona 222 Annual Budget FY2018
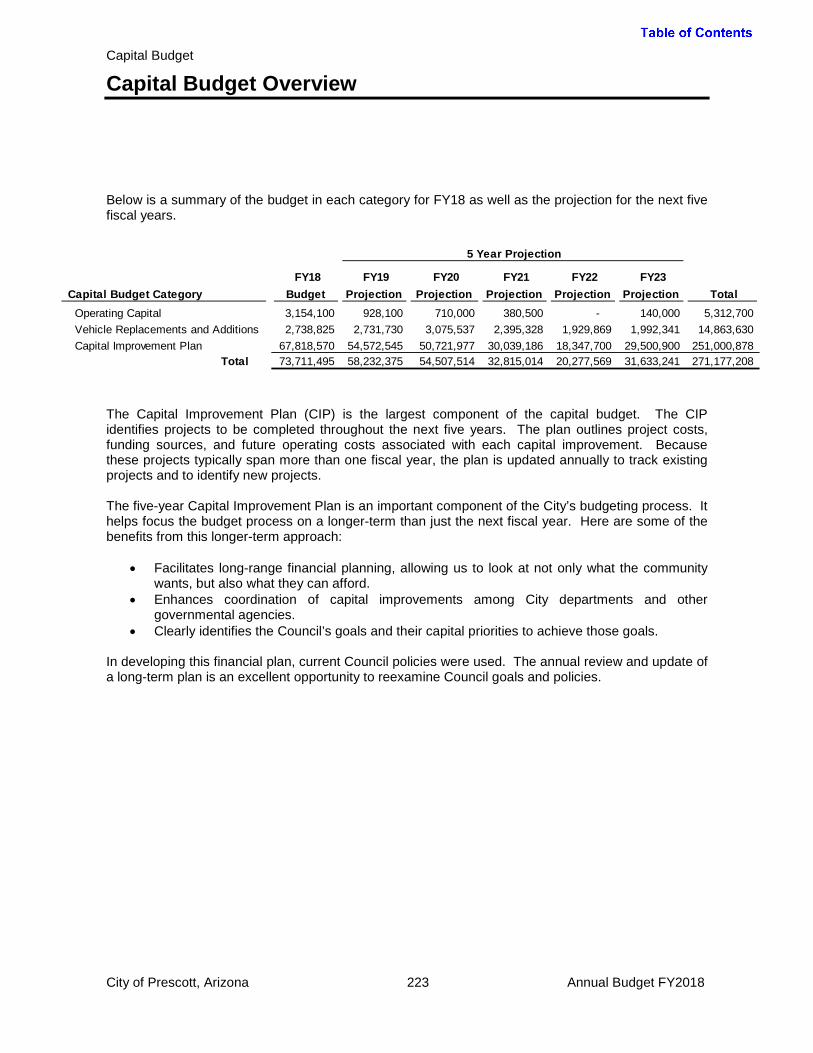
Capital Budget
Capital Budget Overview
Below is a summary of the budget in each category for FY18 as well as the projection for the next five fiscal years.
The Capital Improvement Plan (CIP) is the largest component of the capital budget. The CIP identifies projects to be completed throughout the next five years. The plan outlines project costs, funding sources, and future operating costs associated with each capital improvement. Because these projects typically span more than one fiscal year, the plan is updated annually to track existing projects and to identify new projects. The five-year Capital Improvement Plan is an important component of the City’s budgeting process. It helps focus the budget process on a longer-term than just the next fiscal year. Here are some of the benefits from this longer-term approach:
• Facilitates long-range financial planning, allowing us to look at not only what the community wants, but also what they can afford.
• Enhances coordination of capital improvements among City departments and other governmental agencies.
• Clearly identifies the Council’s goals and their capital priorities to achieve those goals. In developing this financial plan, current Council policies were used. The annual review and update of a long-term plan is an excellent opportunity to reexamine Council goals and policies.
City of Prescott, Arizona 223 Annual Budget FY2018
5 Year Projection
Capital Budget Category FY18
Budget FY19
Projection FY20
Projection FY21
Projection FY22
Projection FY23
Projection Total Operating Capital 3,154,100 928,100 710,000 380,500 - 140,000 5,312,700 Vehicle Replacements and Additions 2,738,825 2,731,730 3,075,537 2,395,328 1,929,869 1,992,341 14,863,630 Capital Improvement Plan 67,818,570 54,572,545 50,721,977 30,039,186 18,347,700 29,500,900 251,000,878
Total 73,711,495 58,232,375 54,507,514 32,815,014 20,277,569 31,633,241 271,177,208
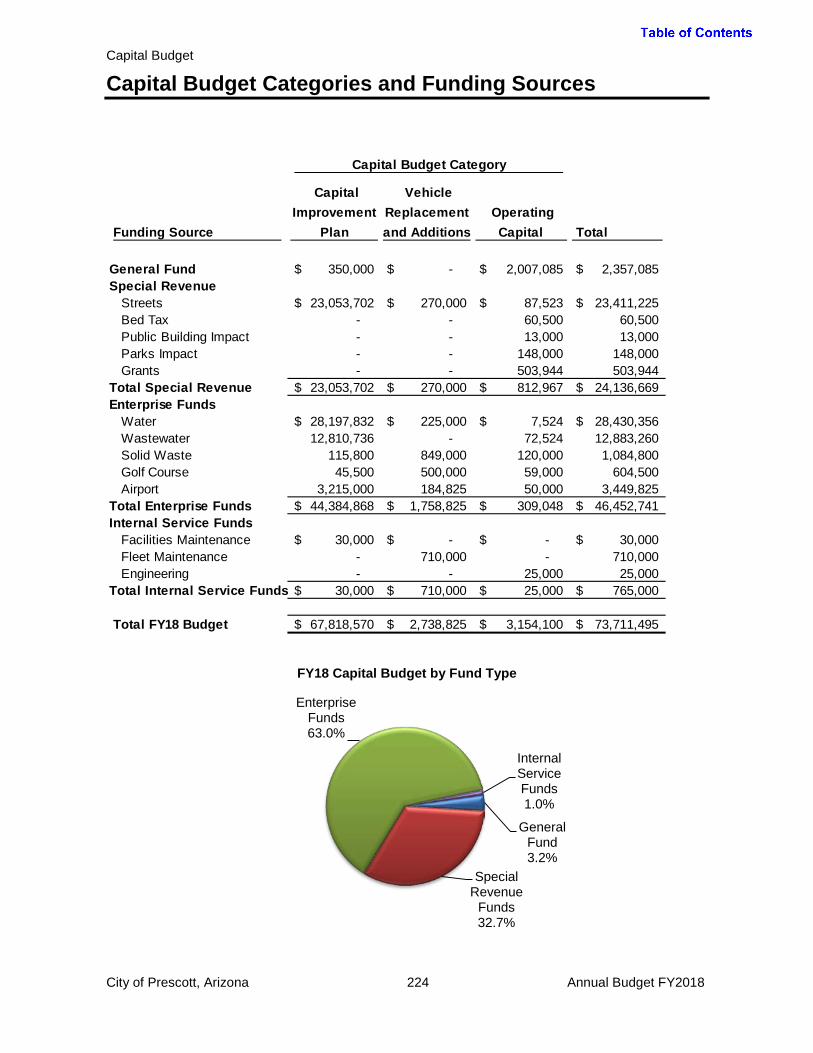
Capital Budget
Capital Budget Categories and Funding Sources
FY18 Capital Budget by Fund Type
Funding Source
Capital Improvement
Plan
Vehicle Replacement and Additions
Operating Capital Total
General Fund 350,000$ -$ 2,007,085$ 2,357,085$ Special Revenue
Streets 23,053,702$ 270,000$ 87,523$ 23,411,225$ Bed Tax - - 60,500 60,500 Public Building Impact - - 13,000 13,000 Parks Impact - - 148,000 148,000 Grants - - 503,944 503,944
Total Special Revenue 23,053,702$ 270,000$ 812,967$ 24,136,669$ Enterprise Funds
Water 28,197,832$ 225,000$ 7,524$ 28,430,356$ Wastewater 12,810,736 - 72,524 12,883,260 Solid Waste 115,800 849,000 120,000 1,084,800 Golf Course 45,500 500,000 59,000 604,500 Airport 3,215,000 184,825 50,000 3,449,825
Total Enterprise Funds 44,384,868$ 1,758,825$ 309,048$ 46,452,741$ Internal Service Funds
Facilities Maintenance 30,000$ -$ -$ 30,000$ Fleet Maintenance - 710,000 - 710,000 Engineering - - 25,000 25,000
Total Internal Service Funds 30,000$ 710,000$ 25,000$ 765,000$
Total FY18 Budget 67,818,570$ 2,738,825$ 3,154,100$ 73,711,495$
Capital Budget Category
City of Prescott, Arizona 224 Annual Budget FY2018
General Fund 3.2%
Special Revenue
Funds 32.7%
Enterprise Funds 63.0%
Internal Service Funds 1.0%

Capital Budget
FY18 Capital Budget Listing by Department
Page No. Description Funding FY18 Budget
Community Development
228 CDBG Annual Entitlement Grant GR 503,944 Fire
228 Hydraulic Extrication Tool Package G 100,000 228 Fire Records Management System (RMS) G 82,430 229 Thermal Imaging Cameras G 40,000 229 Blinkersign Warning System Station 74 G 8,595
Police229 Police Mobile Data Computer Replacement G 166,200
Regional Communications230 Public Safety Software System Upgrade G 1,497,600 230 Recording System for Dispatch G 25,000
2,423,769 Fleet/Facilities
230 Vehicle Replacement Fund - Fleet Services FS 710,000 231 Renovation of Parking Garage Stairs G 350,000 231 Grace Sparks Activity Center Renovations FM 30,000 231 Council Chambers Audio Visual Improvements PB 13,000
1,103,000 Recreation Services
232 Open Space Acquisitions S/OS 3,800,000 232 Golf Cart Replacement GC 500,000 232 Pickleball restrooms PI 133,000 233 Golf Course Replacement Equipment GC 59,000 233 Inline Hockey Partership BT 50,000 233 Golf Course Bunkers Improvements GC 45,500 234 Acker Park Improvements (reimbursed with developer funds) G 19,800 234 Picnic Area Expansion Program PI 15,000 234 Golf Course Cart Path Paving BT 10,500
4,632,800 Airport- Grant Funded
235 Security Upgrades G, GR 2,000,000 235 Airport Master Plan G, GR 520,000 236 Airport Pavement Maintenance Program - ADOT G, GR 350,000 236 RWY 3L PAPI and 21R PAPI Both Ends G, GR 195,000 237 New Equipment - Snow Broom G, GR 184,825
3,249,825 Airport - City Only Funded Projects
237 Airport Pavement Preservation Program - City G 100,000 237 Economic Impact Study G 50,000 238 FAA Tech Operations Facility - Building Upgrades and Maintenance G 50,000
Total City Only Funded 200,000
City of Prescott, Arizona 225 Annual Budget FY2018
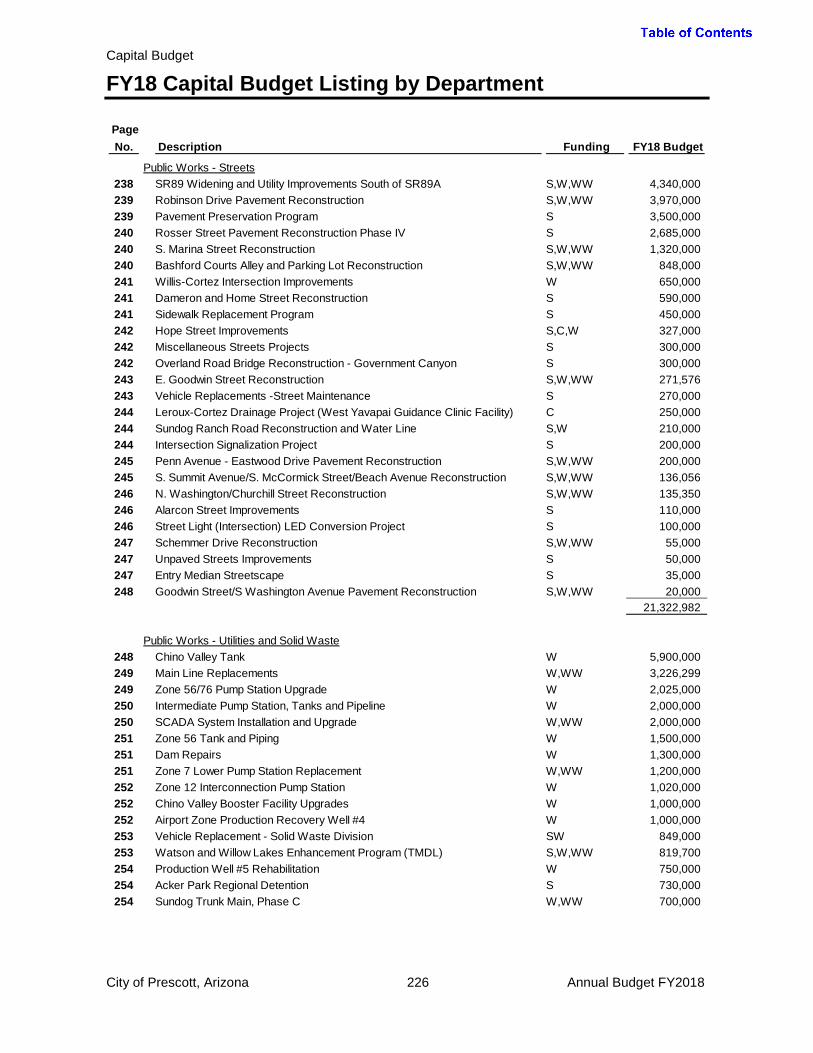
Capital Budget
FY18 Capital Budget Listing by Department
Page No. Description Funding FY18 Budget
Public Works - Streets238 SR89 Widening and Utility Improvements South of SR89A S,W,WW 4,340,000 239 Robinson Drive Pavement Reconstruction S,W,WW 3,970,000 239 Pavement Preservation Program S 3,500,000 240 Rosser Street Pavement Reconstruction Phase IV S 2,685,000 240 S. Marina Street Reconstruction S,W,WW 1,320,000 240 Bashford Courts Alley and Parking Lot Reconstruction S,W,WW 848,000 241 Willis-Cortez Intersection Improvements W 650,000 241 Dameron and Home Street Reconstruction S 590,000 241 Sidewalk Replacement Program S 450,000 242 Hope Street Improvements S,C,W 327,000 242 Miscellaneous Streets Projects S 300,000 242 Overland Road Bridge Reconstruction - Government Canyon S 300,000 243 E. Goodwin Street Reconstruction S,W,WW 271,576 243 Vehicle Replacements -Street Maintenance S 270,000 244 Leroux-Cortez Drainage Project (West Yavapai Guidance Clinic Facility) C 250,000 244 Sundog Ranch Road Reconstruction and Water Line S,W 210,000 244 Intersection Signalization Project S 200,000 245 Penn Avenue - Eastwood Drive Pavement Reconstruction S,W,WW 200,000 245 S. Summit Avenue/S. McCormick Street/Beach Avenue Reconstruction S,W,WW 136,056 246 N. Washington/Churchill Street Reconstruction S,W,WW 135,350 246 Alarcon Street Improvements S 110,000 246 Street Light (Intersection) LED Conversion Project S 100,000 247 Schemmer Drive Reconstruction S,W,WW 55,000 247 Unpaved Streets Improvements S 50,000 247 Entry Median Streetscape S 35,000 248 Goodwin Street/S Washington Avenue Pavement Reconstruction S,W,WW 20,000
21,322,982
Public Works - Utilities and Solid Waste248 Chino Valley Tank W 5,900,000 249 Main Line Replacements W,WW 3,226,299 249 Zone 56/76 Pump Station Upgrade W 2,025,000 250 Intermediate Pump Station, Tanks and Pipeline W 2,000,000 250 SCADA System Installation and Upgrade W,WW 2,000,000 251 Zone 56 Tank and Piping W 1,500,000 251 Dam Repairs W 1,300,000 251 Zone 7 Lower Pump Station Replacement W,WW 1,200,000 252 Zone 12 Interconnection Pump Station W 1,020,000 252 Chino Valley Booster Facility Upgrades W 1,000,000 252 Airport Zone Production Recovery Well #4 W 1,000,000 253 Vehicle Replacement - Solid Waste Division SW 849,000 253 Watson and Willow Lakes Enhancement Program (TMDL) S,W,WW 819,700 254 Production Well #5 Rehabilitation W 750,000 254 Acker Park Regional Detention S 730,000 254 Sundog Trunk Main, Phase C W,WW 700,000
City of Prescott, Arizona 226 Annual Budget FY2018

Capital Budget
FY18 Capital Budget Listing by Department
Page No. Description Funding FY18 Budget 255 Miscellaneous Water and Wastewater Projects W,WW 650,000 255 SR69 Corridor Water Main W 470,000 256 Impact Fee Ordinance Project W,WW 445,000 256 Zone 16 Improvements, Pumpstation, Tank, Pipelines and Haisley Rd S,W 336,700 257 Water and Wastewater Models Update W,WW 301,600 257 Zone 24/27, Water Pipeline Upsizing - from Thumb Butte Rd to Tank S,W 290,620 258 Operations Building Expansion WW 275,000 258 Vehicle Replacements - Public Works W,WW,E,S 225,000 259 Transfer Station Above Ground Fuel Tank S,SW 160,000 259 Production Well Rehabilitation Program W 150,000 259 Transfer Station/Street Maintenance Yard Paving S,SW 150,000 260 Citywide Stormwater Mapping S,C 125,000 260 Permitting and Inspection Software Implementation G,S,W,WW 90,031 261 Electrical Infrastructure and Security Lighting at Sundog Transfer Station S,SW 80,000 261 Emergency Wastewater Bypass Pump WW 65,000 261 Bashford Court, Trash and Recycling Compactors SW 40,000 262 Large Scale Printer/Scanner E 25,000
29,898,950 Public Works - Wastewater Centralization
262 Centralization - Sundog Trunk Main, Phase B WW 2,450,000 262 Centralization - SR89 Lift Station WW 2,400,000 263 Centralization - Sundog Liftstation WW 1,600,000 263 Centralization - Sundog Trunk Main, Phase A WW 1,200,000 264 Centralization - Airport Trunk Main Sewer Improvement WW 950,000
8,600,000 City Manager/Alt Water
264 CA1 with SRP and Prescott Valley - Modeling W 243,514 264 CA1 with SRP and Prescott Valley - Monitoring W 2,036,655
2,280,169
Funding Summary, all projectsGeneral Fund (G) 2,357,085 Bed Tax (BT) 60,500 Grants (GR) 503,944 Streets (Open Space) (S/OS) 3,800,000 Streets (S) 19,361,225 Streets - County Contribution (C) 250,000 Public Building Impact Fee (PB) 13,000 Parks Impact Fee (PI) 148,000 Water (W) 28,430,356 Wastewater (WW) 12,883,260 Solid Waste (SW) 1,084,800 Golf Course (GC) 604,500 General Fund - Airport (A) 322,125 Airport Grants (AG) 3,127,700 Engineering Fund (E) 25,000 Facilities Management (FM) 30,000 Fleet Services (FS) 710,000
Total 73,711,495
City of Prescott, Arizona 227 Annual Budget FY2018

Capital Budget
Capital Budget and Project Descriptions
Community Development CDBG Annual Entitlement Grant Dept/Division: Community Development Category: Operating Capital Funding Plan
FY18 Budget
FY19 Projection
FY20 Projection
FY21 Projection
FY22 Projection
FY23 Projection
Total
Grant Fund 503,944 - - - - - 503,944 Description: This is the annual CDBG Entitlement Grant received from HUD. The grant funds may be
spent on capital projects and grant administration. The grant is allocated through development and adoption of a budget and Annual Action Plan by the City Council.
Operating Impact:
The grant is in a reimbursement format, with Prescott expending the funds and then drawing down the grant for the various projects.
Fire Hydraulic Extrication Tool Package Dept/Division: Fire Department Category: Operating Capital Funding Plan
FY18 Budget
FY19 Projection
FY20 Projection
FY21 Projection
FY22 Projection
FY23 Projection
Total
General Fund 100,000 - - - - - 100,000 Description: Hydraulic extrication tools used to force entry by cutting, shredding, prying, and stretching
are used to gain access to entrapped patients/victims at auto accidents and other technical rescue locations. Prescott Fire Departments current equipment on each of the frontline apparatus is well over 12 years old and as such well past its useful life.
Operating Impact:
Annual tool inspection performed by manufacturer on site at the individual fire stations.
Fire Records Management System (RMS) Dept/Division: Fire Department Category: Operating Capital Funding Plan
FY18 Budget
FY19 Projection
FY20 Projection
FY21 Projection
FY22 Projection
FY23 Projection
Total
General Fund 82,430 - - - - - 82,430 Description: This project is for a records management system (RMS) to integrate with TriTech, the new
public safety software. In FY17 Central Arizona Fire and Medical Authority (CAFMA) worked with Prescott Fire to identify a preference for Alpine Software RedNMX RMS. This project will allow for seamless integration of records management systems between CAFMA and Prescott FD. This effort is needed to ensure we may be responsive to any inquiries made through a public records request to any event to which either agency responded to under the automatic aid compact.
Operating Impact:
The ongoing operating costs are estimated at $13,000 per year.
City of Prescott, Arizona 228 Annual Budget FY2018

Capital Budget
Capital Budget and Project Descriptions
Thermal Imaging Cameras Dept/Division: Fire Department Category: Operating Capital Funding Plan
FY18 Budget
FY19 Projection
FY20 Projection
FY21 Projection
FY22 Projection
FY23 Projection
Total
General Fund 40,000 - - - - - 40,000 Description: Four (4) Thermal Imaging Cameras.
Operating Impact:
Minimal
Blinkersign Warning System Station 74 Dept/Division: Fire Department Category: Operating Capital Funding Plan
FY18 Budget
FY19 Projection
FY20 Projection
FY21 Projection
FY22 Projection
FY23 Projection
Total
General Fund 8,595 - - - - - 8,595 Description: Purchase and installation of Blinkersign warning system at the approaches to Fire Station
74 on Smokehouse Drive. The project will provide for illuminated dual blinker/beacon sign kits that the approach ends of the station location. The equipment includes: 36” Blinkersigns, dual beacon/blinker sign kits, wireless key fob receiver cabinet, key fob transmitters, activation control panel, and omni-directional antenna kit.
Operating Impact:
N/A
Police
Police Mobile Data Computer Replacement Dept/Division: City Manager/Information Technology
Category: Operating Capital Funding Plan
FY18 Budget
FY19 Projection
FY20 Projection
FY21 Projection
FY22 Projection
FY23 Projection Total
General Fund 166,200 - - - - - 166,200 Description: This project represents replacement of the Mobile Data Computers (MDC) in existing Police
vehicles. New Police and Fire installations will be outfitted with the hardware outlined in this project while the scope of this project is existing MDC units. There are two viable hardware choices that IT has identified though discussion and testing with Police and Fire.
Operating Impact:
Police has 28 units for replacement. The first hardware choice is a Panasonic solution, estimated at $5,933 per unit. The second hardware choice is Dell, estimated at $4,000 per unit.
City of Prescott, Arizona 229 Annual Budget FY2018

Capital Budget
Capital Budget and Project Descriptions
Regional Communications
Public Safety Software System Upgrade Dept/Division: Information Technology/Regional Communications
Category: Operating Capital Funding Plan
FY18 Budget
FY19 Projection
FY20 Projection
FY21 Projection
FY22 Projection
FY23 Projection Total
General Fund 1,497,600 - - - - - 1,497,600 Description: This item represents a carryover of the FY17 public safety software dollar amount
combined with an additional amount to complete the project. This project is in conjunction with partner agencies with City of Prescott costs ($881,578) and non-City of Prescott PRCC partner costs ($932,024). The PRCC partner costs incurred by the City of Prescott during FY17 and FY18 during project implementation will be recovered from each partner agency on either a single year or three year repayment system as agreed to by the chief of each PRCC partner agency.
Operating Impact:
The yearly support and maintenance costs for TriTech will begin in FY19 and will be $117,729.92 for Prescott agencies and $123,049.19 for non-City of Prescott PRCC agencies.
Recording System for Dispatch Dept/Division: Regional Communications
Category: Operating Capital Funding Plan
FY18 Budget
FY19 Projection
FY20 Projection
FY21 Projection
FY22 Projection
FY23 Projection Total
General Fund 42,000 - - - - - 42,000 Description: Replacement of the current voice logging system utilized to store and query all telephone
and radio traffic both to and from the Prescott Regional Communications Center (PRCC).
Operating Impact:
While there will be an upfront investment in the upgrade, the annual operating budget impact will be limited to IT/Tech support as would be required by the manufacturer of the chosen product. Our current system requires an annual maintenance cost of approximately $3,500.
Fleet/Facilities
Vehicle Replacement Fund-Fleet Services Dept/Division: Field and Facilities
Category: Vehicle Replacements and Additions Funding Plan
FY18 Budget
FY19 Projection
FY20 Projection
FY21 Projection
FY22 Projection
FY23 Projection Total
Fleet Services 710,000 - - - - - 710,000
Description: Vehicle replacement for General Fund Departments. Timely replacement allows for a modern,
efficient, and well maintained fleet, crucial to the continued provision of services to the public. Operating Impact:
None
City of Prescott, Arizona 230 Annual Budget FY2018

Capital Budget
Capital Budget and Project Descriptions
Renovation of Parking Garage Stairs Dept/Division: Field and Facilities
Category: Capital Improvement Program Funding Plan FY18
Budget FY19
Projection FY20
Projection FY21
Projection FY22
Projection FY23
Projection Total General Fund 350,000 - - - - - 350,000 Description: Replacement of grand stairs (west side), northeast stairs, and southeast stairs. Project includes
mobilization, demolition, stringer preparation, new concrete treads/risers, landings, scaffolding, barricades, paint preparation, and paint.
Operating Impact:
None
Grace Sparks Activity Center Renovations
Dept/Division: Facilities Maintenance
Category: Capital Improvement Program
Funding Plan FY18
Budget FY19
Projection FY20
Projection FY21
Projection FY22
Projection FY23
Projection Total Facilities Maintenance 30,000 192,461 86,563 130,686 - - 439,710
Description: FY18: Provide magnetite window insulation to the offices where the new HVAC is being
installed. The current windows are single pane glass and the magnetite windows provide an R-8 insulation value to hold in the heating or cooling. This is an energy efficiency upgrade. FY19: Projects include a new fire sprinkler system throughout the building. FY20: Replace and provide new supply piping (water, gas) to the building. FY21: Replace and provide new drain piping to the building.
Operating Impact: None
Council Chambers Audio Visual Improvements Dept/Division: City Manager/Information Technology Category: Operating Capital Funding Plan FY18
Budget FY19
Projection FY20
Projection FY21
Projection FY22
Projection FY23
Projection Total Public Buildings Impact Fee 13,000 - - - - - 13,000
Description: This project will update and upgrade the audio visual equipment in the Council Chambers.
This project will revolve around several key areas: Replace and simplify connectivity at existing staff podium. Install new ceiling mounted speakers. Install new amplifier and sound mixer to improve sound clarity and fidelity (example-even out audio volume for a presenter). Install microphone windscreens. Install new shielded cables to remove electrical interference in current system.
Operating Impact:
City of Prescott, Arizona 231 Annual Budget FY2018

Capital Budget
Capital Budget and Project Descriptions
Recreation Services
Open Space Acquisitions Dept/Division: Recreation Services
Category: Capital Improvement Program Funding Plan
FY18 Budget
FY19 Projection
FY20 Projection
FY21 Projection
FY22 Projection
FY23 Projection Total
Streets Fund
3,800,000
- - - - - 3,800,000
Description: This project provides dedicated fund balance for future open space acquisition opportunities. This funding will carry forward until depleted.
Operating Impact:
Golf Course Replacement Dept/Division: Recreation Services/Golf Course
Category: Vehicle Replacements and Additions
Funding Plan FY18
Budget FY19
Projection FY20
Projection FY21
Projection FY22
Projection FY23
Projection Total Golf Course Fund 500,000 - - - - - 500,000
Description: This item is to purchase a new fleet of golf carts to replace the current fleet that was
purchased 6 years ago. The average life span of a golf cart is 5 years.
Operating Impact:
A new fleet of carts will lessen the impact of maintaining the older fleet therefore saving maintenance cost for repairs.
Pickleball Restrooms Dept/Division: Recreation Services
Category: Operating Capital Funding Plan
FY18 Budget
FY19 Projection
FY20 Projection
FY21 Projection
FY22 Projection
FY23 Projection Total
Park Impact 133,000 - - - - - 133,000 Description: New restroom building located near the new pickleball courts.
Operating Impact:
Impact to the operating budget will be general maintenance.
City of Prescott, Arizona 232 Annual Budget FY2018

Capital Budget
Capital Budget and Project Descriptions
Golf Course Replacement Equipment Dept/Division: Golf Course/Maintenance
Category: Operating Capital Funding Plan
FY18 Budget
FY19 Projection
FY20 Projection
FY21 Projection
FY22 Projection
FY23 Projection Total
Golf Course Fund 59,000 123,800 50,000 145,000 - - 377,800
Description: FY18: Fairway mower
FY19: Greens mower and Golf Utility Vehicle-workman FY20: Rough mower FY21: Golf course mower FY22: Rough mower, Utility Vehicles, Bunker Rake Equipment
Operating Impact:
Having operable and the right equipment for projects allows the maintenance crew to work more efficiently and reduce labor hours.
Inline Hockey Partnership Dept/Division: Recreation Services Category: Operating Capital Funding Plan
FY18 Budget
FY19 Projection
FY20 Projection
FY21 Projection
FY22 Projection
FY23 Projection Total
Bed Tax 50,000 - - - - - 50,000 Description: This item is for a public private partnership with the Arizona Coyotes to build an inline
hockey rink and facility. The City of Prescott will do the preparation and ground work for an estimated $50,000. The Arizona Coyotes will be installing the hockey rink and facility at their expense with an estimated value of $250,000.
Operating Impact:
The impacts to the operating budget will be minimal for general maintenance to maintain the rinks after completion.
Golf Course Bunkers Improvements Dept/Division: Golf Course/Maintenance Category: Capital Improvement Program Funding Plan
FY18 Budget
FY19 Projection
FY20 Projection
FY21 Projection
FY22 Projection
FY23 Projection Total
Golf Course Fund 45,500 45,500 45,500 45,500 - - 182,000
Description: Rebuild North and South bunkers, including complete excavation, drainage tile installation
with ADS and gravel to be phased over 4 years..
Operating Impact:
General maintenance after completion
City of Prescott, Arizona 233 Annual Budget FY2018

Capital Budget
Capital Budget and Project Descriptions
Acker Park Improvements (reimbursed with developer funds) Dept/Division: Recreation Services Category: Operating Capital Funding Plan
FY18 Budget
FY19 Projection
FY20 Projection
FY21 Projection
FY22 Projection
FY23 Projection Total
General Fund 19,800 - - - - - 19,800 Description: This item addresses funding needed improvement to Acker Park, and includes but is not
limited to parking upgrades, lighting, and other amenities.
Operating Impact:
This upgrade will ensure the systems operate properly, reduce maintenance costs, reduce replacement parts costs and reduce electrical costs by upgrading to new LED lights, signs and navigational aids.
Picnic Area Expansion Program Dept/Division: Recreation Services Category: Operating Capital Funding Plan
FY18 Budget
FY19 Projection
FY20 Projection
FY21 Projection
FY22 Projection
FY23 Projection Total
Park Impact 15,000 - - - - - 15,000 Description: This item addresses meeting future demand for picnic area expansion, to include adding
tables, grills, pads, garbage receptacles, and parking.
Operating Impact:
This item will reduce operating budget impacts as it will also replace deteriorating picnic area amenities.
Golf Course Cart Path Paving Dept/Division: Golf Course Category: Operating Capital Funding Plan
FY18 Budget
FY19 Projection
FY20 Projection
FY21 Projection
FY22 Projection
FY23 Projection Total
General Fund 10,500 10,500 10,500 10,500 - - 42,000 Description: Mil Pave greens to following tee (lead-ins and lead-outs) and all par 3’s. Phase
construction over 4 years. City of Prescott, Arizona 234 Annual Budget FY2018

Capital Budget
Capital Budget and Project Descriptions
Airport-Grant Funded
Security Upgrades Dept/Division: Airport Category: Capital Improvement Program Funding Plan FY18
Budget FY19
Projection FY20
Projection FY21
Projection FY22
Projection FY23
Projection Total Federal 1,900,000 - - - - - 1,900,000 State 50,000 - - - - - 50,000 City 50,000 - - - - - 50,000
Total 2,000,000 - - - - - 2,000,000
Description: FY17-Design upgrade of security fencing to include approximately 29,000 linear feet of fencing, with cameras, access control devices to meet FAA Runway Safety Action Team Report Item PRC-2006-006.This will coordinate with the design of the new ARFF and Airport Operations Building and the Master Lock System. FY18-Construct upgrades to include approximately 29,000 linear feet of fencing, with cameras, access control devices to meet FAA Runway Safety Action Team Report Item PRC-2006-006.This will coordinate with the design of the new ARFF and Airport Operations Building and the Master Lock System.
Operating Impact:
This project will include replacing the current access control system and motorized gates which will reduce the time airport maintenance and operations staff spends continually repairing the existing gates and access control system. In addition, it will ultimately require the creation an Airport Security Coordinator position to oversee the operation and administration of the access control system, airport badging system, and act as the primary airport security employee if the aircraft capacity exceeds 60 passengers. This position will include salary and benefits and regular training costs.
Airport Master Plan Dept/Division: Airport Category: Capital Improvement Program Funding Plan FY18
Budget FY19
Projection FY20
Projection FY21
Projection FY22
Projection FY23
Projection Total Federal 494,000 - - - - - 494,000 State 13,000 - - - - - 13,000 City 13,000 - - - - - 13,000 Total 520,000 - - - - - 520,000 Description: Conduct a comprehensive Airport Maser Plan Update to include Federal Aviation
Regulation Part 77 and Part 150 studies and completer additional elements that include and eALP, AGIS, and RIM study required for current and future grant assurances. Significant economic changes have taken place since 2007 which was the base year for all projections in the current master plan.
Operating Impact: None
City of Prescott, Arizona 235 Annual Budget FY2018

Capital Budget
Capital Budget and Project Descriptions
Airport Pavement Maintenance Program-ADOT Dept/Division: Airport Category: Capital Improvement Program Funding Plan
FY18 Budget
FY19 Projection
FY20 Projection
FY21 Projection
FY22 Projection
FY23 Projection Total
State 315,000 - 1,372,000 - - 1,350,000 3,037,000 City 35,000 - 153,000 - - 150,000 338,000 Total 350,000 - 1,525,000 - - 1,500,000 3,375,000
Description: Runway and taxiway pavement preservation Operating Impact:
Proper pavement maintenance, to include crack seal and seal coating on a regularly scheduled basis will allow the city to maximize the useful lifecycle of airport pavements and reduce the need for more costly pavement overlays and/or reconstruction.
RWY 3L PAPI and 21R PAPI Both Ends Dept/Division: Airport Category: Capital Improvement Program Funding Plan
FY18 Budget
FY19 Projection
FY20 Projection
FY21 Projection
FY22 Projection
FY23 Projection Total
State 175,500 - - - - - 175,500 City 19,500 - - - - - 19,500 Total 195,000 - - - - - 195,000
Description: FY17-Design-Runway 3L and 21R Precision Approach Path Indicators (PAPI)
Replacements FY18- Construct-Runway 3L and 21R Precision Approach Path Indicators (PAPI) Replacements
Operating Impact:
The various lighting, signage and navigational aid systems for the airport’s runways and taxiways have exceeded their useful life cycles and are in need of replacement to ensure the systems function properly. Due to their advanced age (25-plus years), the systems are experiencing frequent outages and equipment is in need of replacement before they suffer completer failure. Some system components are no longer supported by the manufacturer and replacement parts must be specially-made. Upgrading the systems will ensure the systems operate properly, reduce maintenance costs, reduce replacement part costs and reduce electrical costs by upgrading to new LED lights, signs and navigational aids. Airport staff inspects the airfield at least twice daily to ensure proper operation of all airfield lighting, signage and condition of pavement markings. Items that are non-functioning or need preventative care are performed in-house by staff. Tasks that are beyond staff ability are contracted out to the private sector.
City of Prescott, Arizona 236 Annual Budget FY2018
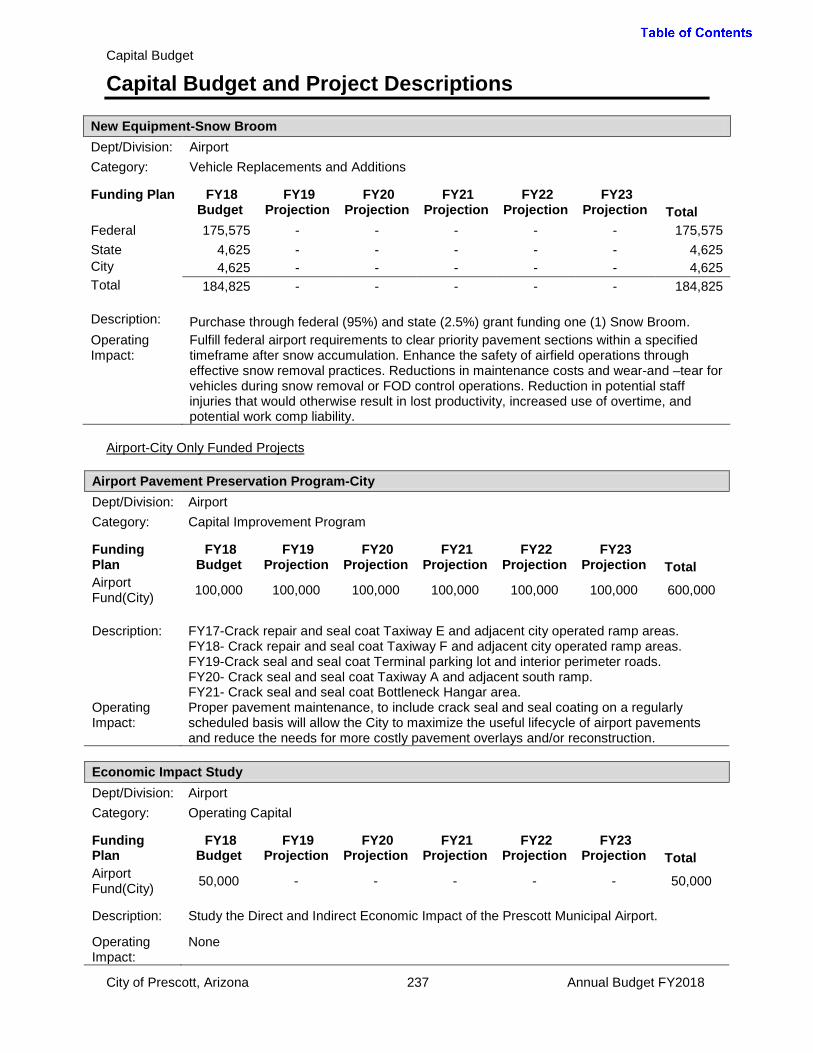
Capital Budget
Capital Budget and Project Descriptions
New Equipment-Snow Broom Dept/Division: Airport Category: Vehicle Replacements and Additions Funding Plan FY18
Budget FY19
Projection FY20
Projection FY21
Projection FY22
Projection FY23
Projection Total Federal 175,575 - - - - - 175,575 State 4,625 - - - - - 4,625 City 4,625 - - - - - 4,625 Total 184,825 - - - - - 184,825 Description: Purchase through federal (95%) and state (2.5%) grant funding one (1) Snow Broom. Operating Impact:
Fulfill federal airport requirements to clear priority pavement sections within a specified timeframe after snow accumulation. Enhance the safety of airfield operations through effective snow removal practices. Reductions in maintenance costs and wear-and –tear for vehicles during snow removal or FOD control operations. Reduction in potential staff injuries that would otherwise result in lost productivity, increased use of overtime, and potential work comp liability.
Airport-City Only Funded Projects
Airport Pavement Preservation Program-City Dept/Division: Airport Category: Capital Improvement Program Funding Plan
FY18 Budget
FY19 Projection
FY20 Projection
FY21 Projection
FY22 Projection
FY23 Projection Total
Airport Fund(City) 100,000 100,000 100,000 100,000 100,000 100,000 600,000
Description: FY17-Crack repair and seal coat Taxiway E and adjacent city operated ramp areas.
FY18- Crack repair and seal coat Taxiway F and adjacent city operated ramp areas. FY19-Crack seal and seal coat Terminal parking lot and interior perimeter roads. FY20- Crack seal and seal coat Taxiway A and adjacent south ramp. FY21- Crack seal and seal coat Bottleneck Hangar area.
Operating Impact:
Proper pavement maintenance, to include crack seal and seal coating on a regularly scheduled basis will allow the City to maximize the useful lifecycle of airport pavements and reduce the needs for more costly pavement overlays and/or reconstruction.
Economic Impact Study Dept/Division: Airport Category: Operating Capital Funding Plan
FY18 Budget
FY19 Projection
FY20 Projection
FY21 Projection
FY22 Projection
FY23 Projection Total
Airport Fund(City) 50,000 - - - - - 50,000
Description: Study the Direct and Indirect Economic Impact of the Prescott Municipal Airport.
Operating Impact:
None
City of Prescott, Arizona 237 Annual Budget FY2018
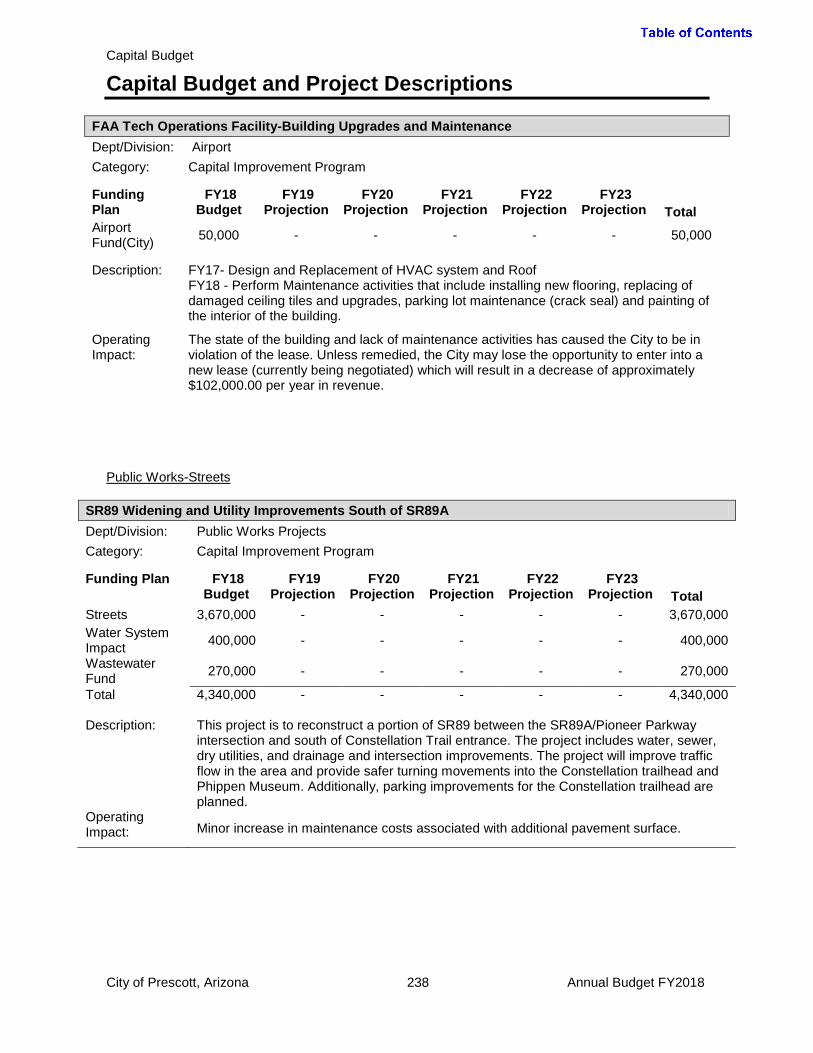
Capital Budget
Capital Budget and Project Descriptions
FAA Tech Operations Facility-Building Upgrades and Maintenance Dept/Division: Airport Category: Capital Improvement Program Funding Plan
FY18 Budget
FY19 Projection
FY20 Projection
FY21 Projection
FY22 Projection
FY23 Projection Total
Airport Fund(City) 50,000 - - - - - 50,000
Description: FY17- Design and Replacement of HVAC system and Roof
FY18 - Perform Maintenance activities that include installing new flooring, replacing of damaged ceiling tiles and upgrades, parking lot maintenance (crack seal) and painting of the interior of the building.
Operating Impact:
The state of the building and lack of maintenance activities has caused the City to be in violation of the lease. Unless remedied, the City may lose the opportunity to enter into a new lease (currently being negotiated) which will result in a decrease of approximately $102,000.00 per year in revenue.
Public Works-Streets
SR89 Widening and Utility Improvements South of SR89A Dept/Division: Public Works Projects Category: Capital Improvement Program Funding Plan FY18
Budget FY19
Projection FY20
Projection FY21
Projection FY22
Projection FY23
Projection Total Streets 3,670,000 - - - - - 3,670,000 Water System Impact 400,000 - - - - - 400,000
Wastewater Fund 270,000 - - - - - 270,000
Total 4,340,000 - - - - - 4,340,000 Description: This project is to reconstruct a portion of SR89 between the SR89A/Pioneer Parkway
intersection and south of Constellation Trail entrance. The project includes water, sewer, dry utilities, and drainage and intersection improvements. The project will improve traffic flow in the area and provide safer turning movements into the Constellation trailhead and Phippen Museum. Additionally, parking improvements for the Constellation trailhead are planned.
Operating Impact: Minor increase in maintenance costs associated with additional pavement surface.
City of Prescott, Arizona 238 Annual Budget FY2018

Capital Budget
Capital Budget and Project Descriptions
Robinson Drive Pavement Reconstruction Dept/Division: Public Works Projects Category: Capital Improvement Program Funding Plan
FY18 Budget
FY19 Projection
FY20 Projection
FY21 Projection
FY22 Projection
FY23 Projection Total
Streets 3,095,000 - - - - - 3,095,000 Water Fund 600,000 - - - - - 600,000 Wastewater Fund 275,000 - - - - - 275,000
Total 3,970,000 - - - - - 3,970,000 Description: This project is for reconstruction of Robinson Drive from Gurley Street to the City Limits.
The project includes water, sewer, dry utilities and drainage improvements as well as sidewalks on one side of the street.
Operating Impact:
This project will result in a reduction overall maintenance and operational expenses.
Pavement Preservation Program Dept/Division: Public Works Projects Category: Capital Improvement Program Funding Plan
FY18 Budget
FY19 Projection
FY20 Projection
FY21 Projection
FY22 Projection
FY23 Projection Total
Streets 3,500,00 3,500,00 3,500,00 3,500,00 4,500,000 4,500,000 23,000,000 Description: This is a recurring, annual program that includes pavement maintenance, preservation and
rehabilitation on various streets. Maintenance and preservation activities include various seal coatings, and micro surfacing projects. Pavement rehabilitation typically includes milling and overlay of various streets. Pavement reconstruction typically includes the complete reconstruction of the paved surface that has failed to a point beyond rehabilitation. The list of streets to be maintained, rehabilitated or reconstructed is evaluated on an annual basis using the Pavement Maintenance Program and is subject to change based on the actual performance of the pavement from year to year. As part of this program, minor curb, gutter and sidewalk repairs are made concurrently with the pavement preservation program. Streets where milling and paving is performed may require utility upgrades based on age and condition.
Operating Impact:
Continued maintenance of the city’s pavement asset will result in a reduction in overall maintenance and operational expenses, due to improved condition of the pavement system, as well as the elimination or reduction of on-going pavement maintenance.
City of Prescott, Arizona 239 Annual Budget FY2018
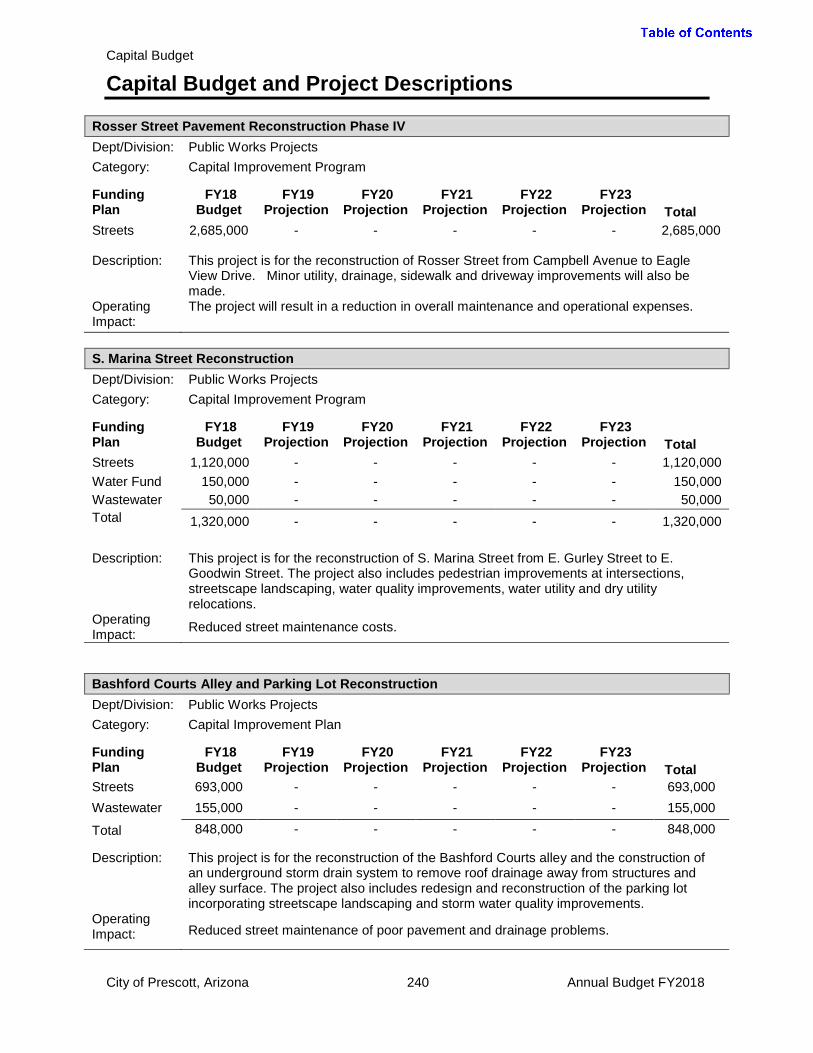
Capital Budget
Capital Budget and Project Descriptions
Rosser Street Pavement Reconstruction Phase IV Dept/Division: Public Works Projects Category: Capital Improvement Program Funding Plan
FY18 Budget
FY19 Projection
FY20 Projection
FY21 Projection
FY22 Projection
FY23 Projection Total
Streets 2,685,000 - - - - - 2,685,000 Description: This project is for the reconstruction of Rosser Street from Campbell Avenue to Eagle
View Drive. Minor utility, drainage, sidewalk and driveway improvements will also be made.
Operating Impact:
The project will result in a reduction in overall maintenance and operational expenses.
S. Marina Street Reconstruction Dept/Division: Public Works Projects Category: Capital Improvement Program Funding Plan
FY18 Budget
FY19 Projection
FY20 Projection
FY21 Projection
FY22 Projection
FY23 Projection Total
Streets 1,120,000 - - - - - 1,120,000 Water Fund 150,000 - - - - - 150,000 Wastewater 50,000 - - - - - 50,000 Total 1,320,000 - - - - - 1,320,000 Description: This project is for the reconstruction of S. Marina Street from E. Gurley Street to E.
Goodwin Street. The project also includes pedestrian improvements at intersections, streetscape landscaping, water quality improvements, water utility and dry utility relocations.
Operating Impact: Reduced street maintenance costs.
Bashford Courts Alley and Parking Lot Reconstruction Dept/Division: Public Works Projects Category: Capital Improvement Plan Funding Plan
FY18 Budget
FY19 Projection
FY20 Projection
FY21 Projection
FY22 Projection
FY23 Projection Total
Streets 693,000 - - - - - 693,000 Wastewater 155,000 - - - - - 155,000
Total 848,000 - - - - - 848,000 Description: This project is for the reconstruction of the Bashford Courts alley and the construction of
an underground storm drain system to remove roof drainage away from structures and alley surface. The project also includes redesign and reconstruction of the parking lot incorporating streetscape landscaping and storm water quality improvements.
Operating Impact: Reduced street maintenance of poor pavement and drainage problems.
City of Prescott, Arizona 240 Annual Budget FY2018
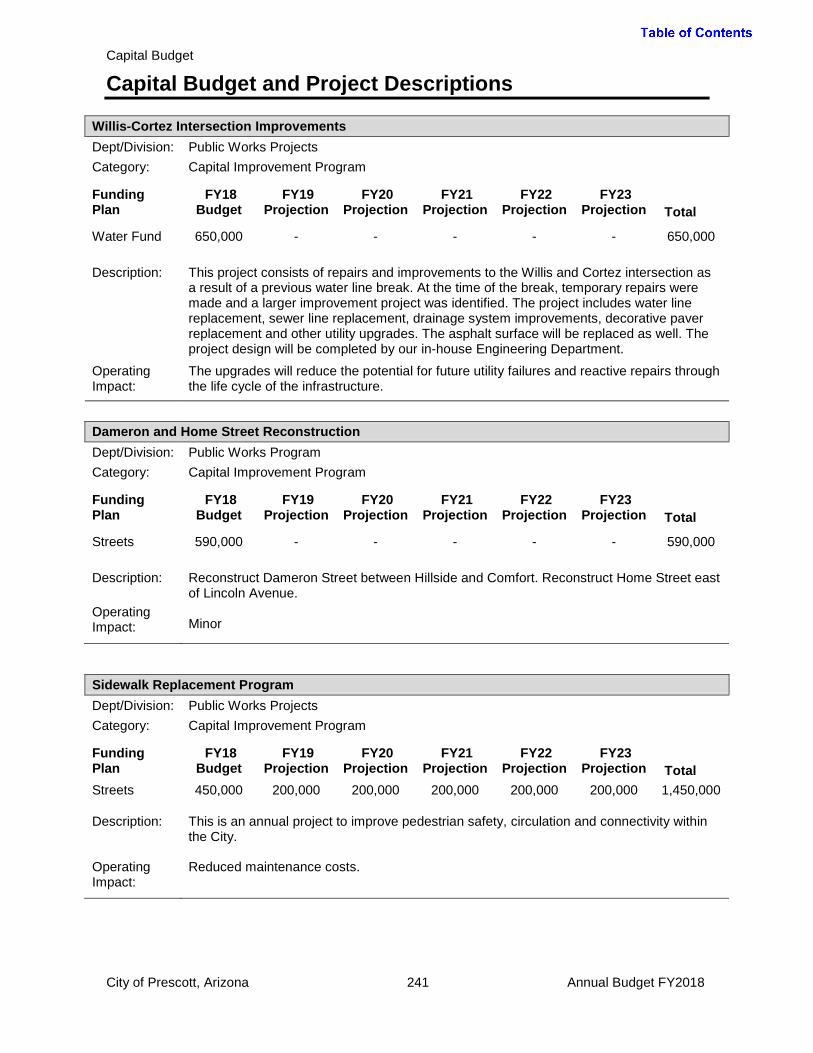
Capital Budget
Capital Budget and Project Descriptions
Willis-Cortez Intersection Improvements Dept/Division: Public Works Projects Category: Capital Improvement Program Funding Plan
FY18 Budget
FY19 Projection
FY20 Projection
FY21 Projection
FY22 Projection
FY23 Projection Total
Water Fund 650,000 - - - - - 650,000
Description: This project consists of repairs and improvements to the Willis and Cortez intersection as
a result of a previous water line break. At the time of the break, temporary repairs were made and a larger improvement project was identified. The project includes water line replacement, sewer line replacement, drainage system improvements, decorative paver replacement and other utility upgrades. The asphalt surface will be replaced as well. The project design will be completed by our in-house Engineering Department.
Operating Impact:
The upgrades will reduce the potential for future utility failures and reactive repairs through the life cycle of the infrastructure.
Dameron and Home Street Reconstruction Dept/Division: Public Works Program Category: Capital Improvement Program Funding Plan
FY18 Budget
FY19 Projection
FY20 Projection
FY21 Projection
FY22 Projection
FY23 Projection Total
Streets 590,000 - - - - - 590,000
Description: Reconstruct Dameron Street between Hillside and Comfort. Reconstruct Home Street east
of Lincoln Avenue. Operating Impact: Minor
Sidewalk Replacement Program Dept/Division: Public Works Projects Category: Capital Improvement Program Funding Plan
FY18 Budget
FY19 Projection
FY20 Projection
FY21 Projection
FY22 Projection
FY23 Projection Total
Streets 450,000 200,000 200,000 200,000 200,000 200,000 1,450,000 Description: This is an annual project to improve pedestrian safety, circulation and connectivity within
the City.
Operating Impact:
Reduced maintenance costs.
City of Prescott, Arizona 241 Annual Budget FY2018

Capital Budget
Capital Budget and Project Descriptions
Hope Street Improvements Dept/Division: Public Works Projects Category: Capital Improvement Program Funding Plan
FY18 Budget
FY19 Projection
FY20 Projection
FY21 Projection
FY22 Projection
FY23 Projection Total
Streets 227,000 - - - - - 227,000 Water Fund 100,000 - - - - - 100,000 Total 327,000 - - - - - 327,000 Description: The project is for paving, drainage and utility improvements on Hope Street, which is
currently unpaved. Operating Impact:
Reduction in street maintenance costs due to improvement of an unpaved street and improved street drainage.
Miscellaneous Streets Projects Dept/Division: Public Works Projects Category: Capital Improvement Program Funding Plan
FY18 Budget
FY19 Projection
FY20 Projection
FY21 Projection
FY22 Projection
FY23 Projection Total
Streets 300,000 300,000 300,000 300,000 300,000 300,000 1,800,000
Description: Funding source for roadway projects that become a priority that may not have been
specifically budgeted for in the Pavement Preservation, Rehabilitation and Reconstruction Program.
Operating Impact:
Completion of this project will result in a reduction in overall maintenance and operational expenses, due to the improved condition of the transportation systems.
Overland Bridge Reconstruction-Government Canyon Dept/Division: Public Works Projects Category: Capital Improvement Program Funding Plan
FY18 Budget
FY19 Projection
FY20 Projection
FY21 Projection
FY22 Projection
FY23 Projection Total
Streets 300,000 - - - - - 300,000 Description: ADOT is designing a replacement bridge on Overland Road east of Gurley Street. Project
design and construction to be administered by ADOT Bridge Group. This is the city’s matching contribution.
Operating Impact: No on-going maintenance and operations budget impacts.
City of Prescott, Arizona 242 Annual Budget FY2018

Capital Budget
Capital Budget and Project Descriptions
E. Goodwin Street Reconstruction Dept/Division: Public Works Projects Category: Capital Improvement Program Funding Plan
FY18 Budget
FY19 Projection
FY20 Projection
FY21 Projection
FY22 Projection
FY23 Projection Total
Streets 271,576 3,680,000 1,250,000 - - - 5,201,576 Water Fund - 300,000 150,000 - - - 450,000 Wastewater - 220,000 100,000 - - - 320,000
Total 271,576 4,200,000 1,500,000 - - - 5,971,576
Description: The Downtown Prescott drainage Study identified the East Goodwin Street project that
includes the design and construction of an underground storm drain system along Goodwin Street from Marina Street to Granite Creek. The East Goodwin Street project will reduce potential flooding due to street overflows along the portion of Whiskey Row from Goodwin Street and Gurley Street. Concurrently with the roadway improvements, street drainage, pedestrian and streetscape landscaping improvements are being considered. Subsurface water, wastewater and dry utility relocations and upgrades are included, as necessary.
Operating Impact:
Reduced street maintenance.
Vehicle Replacements-Street Maintenance Dept/Division: Field and Facilities Category: Vehicle Replacements and Additions Funding Plan
FY18 Budget
FY19 Projection
FY20 Projection
FY21 Projection
FY22 Projection
FY23 Projection Total
Streets 270,000 725,208 725,078 464,158 350,773 325,000 2,860,217
Description: FY2018-Vehicle No. 1001, 2002 Volvo 10-wheel dump truck w/plow and spreader.
FY2019:No. 906, 1999 Leeboy Paver; No.1111, 2005 Ford F350 4X2 1-ton utility bed truck;No.1150, 202 Dodge Ram crew cab pickup; No.1274, 2008 Ford F350 4X4 1-ton flatbed lift gate. FY2020:No.988, 2001 Freightliner water truck;No.1001,2002 Volvo 10-wheel dump truck w/plow and spreader; No.1002,2002 Volvo 10-wheel dump truck w/plow and spreader; No.1081, 2004 Chevrolet Tracker;No.1111, 2005 Ford F350 4X2 utility bed truck. FY2021: No. 1110, 2005 Ford F350 4X4 1-ton utility bed truck; No.1218, 2007 Peterbilt dump truck w/plow and spreader; No.1227, 2008 Ford F350 4X2 1-ton utility bed truck; No.1247,2008 Ford F250 4X2 crew cab pickup; No. 1295, 2008 Broom Bear street sweeper. FY2022: No.1027, 2003 Volvo 10-wheel dump truck w/plow and spreader; No.1036, 2003 Ford F350 Utility bed truck; No1055, 2002 Caterpillar double drum roller. FY2023: No.1195, 2007 Ford F150 4X4 pickup; No.1361, 2012 Tymco vactor-sweeper.
Operating Impact:
Operation and maintenance costs for vehicles are already budgeted in the Street Maintenance Division Operating fund.
City of Prescott, Arizona 243 Annual Budget FY2018
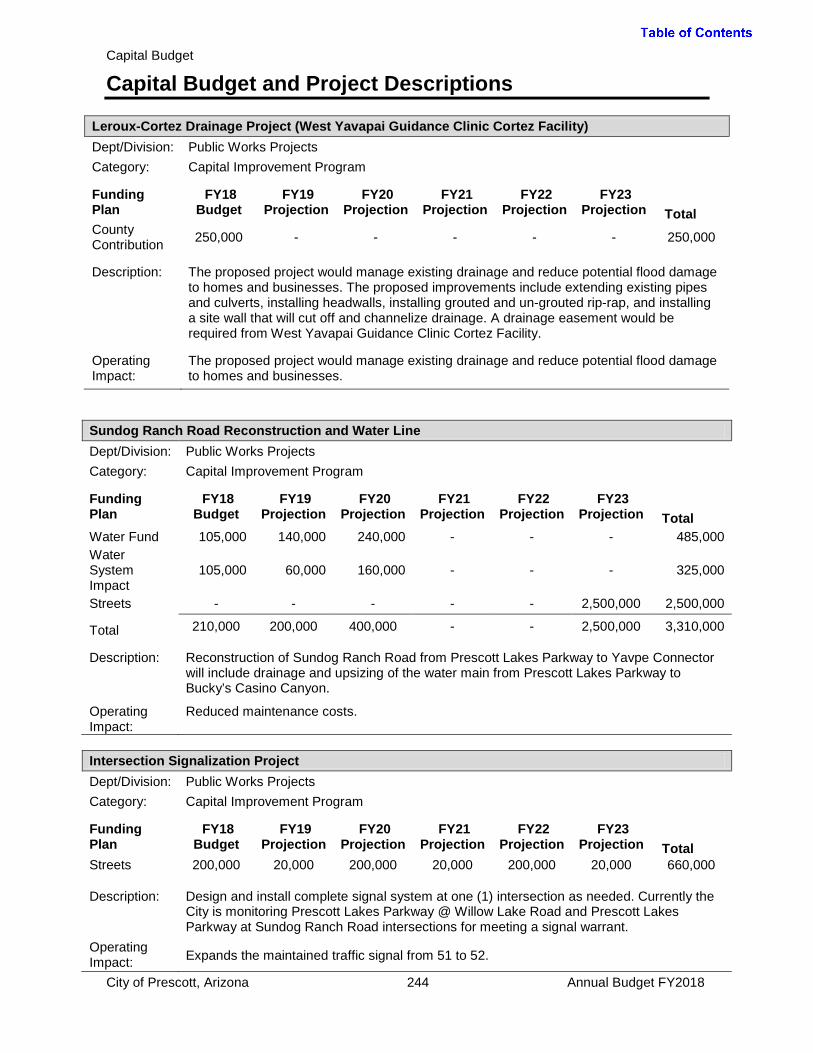
Capital Budget
Capital Budget and Project Descriptions
Leroux-Cortez Drainage Project (West Yavapai Guidance Clinic Cortez Facility) Dept/Division: Public Works Projects Category: Capital Improvement Program Funding Plan
FY18 Budget
FY19 Projection
FY20 Projection
FY21 Projection
FY22 Projection
FY23 Projection Total
County Contribution 250,000 - - - - - 250,000
Description: The proposed project would manage existing drainage and reduce potential flood damage
to homes and businesses. The proposed improvements include extending existing pipes and culverts, installing headwalls, installing grouted and un-grouted rip-rap, and installing a site wall that will cut off and channelize drainage. A drainage easement would be required from West Yavapai Guidance Clinic Cortez Facility.
Operating Impact:
The proposed project would manage existing drainage and reduce potential flood damage to homes and businesses.
Sundog Ranch Road Reconstruction and Water Line Dept/Division: Public Works Projects Category: Capital Improvement Program Funding Plan
FY18 Budget
FY19 Projection
FY20 Projection
FY21 Projection
FY22 Projection
FY23 Projection Total
Water Fund 105,000 140,000 240,000 - - - 485,000 Water System Impact
105,000 60,000 160,000 - - - 325,000
Streets - - - - - 2,500,000 2,500,000
Total 210,000 200,000 400,000 - - 2,500,000 3,310,000 Description: Reconstruction of Sundog Ranch Road from Prescott Lakes Parkway to Yavpe Connector
will include drainage and upsizing of the water main from Prescott Lakes Parkway to Bucky’s Casino Canyon.
Operating Impact:
Reduced maintenance costs.
Intersection Signalization Project Dept/Division: Public Works Projects Category: Capital Improvement Program Funding Plan
FY18 Budget
FY19 Projection
FY20 Projection
FY21 Projection
FY22 Projection
FY23 Projection Total
Streets 200,000 20,000 200,000 20,000 200,000 20,000 660,000 Description: Design and install complete signal system at one (1) intersection as needed. Currently the
City is monitoring Prescott Lakes Parkway @ Willow Lake Road and Prescott Lakes Parkway at Sundog Ranch Road intersections for meeting a signal warrant.
Operating Impact: Expands the maintained traffic signal from 51 to 52.
City of Prescott, Arizona 244 Annual Budget FY2018

Capital Budget
Capital Budget and Project Descriptions
Penn Avenue-Eastwood Drive Pavement Reconstruction Dept/Division: Public Works Projects Category: Capital Improvement Program Funding Plan
FY18 Budget
FY19 Projection
FY20 Projection
FY21 Projection
FY22 Projection
FY23 Projection Total
Streets Fund 200,000 - - 4,008,000 - - 4,208,000 Water Fund - - - 896,000 - - 896,000 Wastewater - - - 896,000 - - 896,000 Total 200,000 - - 5,800,000 - - 6,000,000 Description: This project is for the reconstruction of Penn Avenue from Gurley Street to Eastwood Drive
and the reconstruction of Eastwood Drive from Penn Avenue to Deveroux Drive. The project will include water, sewer, storm drain systems and other dry utilities, as necessary. Additionally, sidewalk will be added on Penn Avenue and storm drain in Eastwood Drive.
Operating Impact: Completion of this project will result in a reduction in overall maintenance and operational
expenses, due to the improved condition of the transportation and utility systems.
S. Summit Avenue / S. McCormick Street / Beach Avenue Reconstruction Dept/Division: Public Works Projects Category: Capital Improvement Program Funding Plan
FY18 Budget
FY19 Projection
FY20 Projection
FY21 Projection
FY22 Projection
FY23 Projection Total
Streets Fund 136,056 - 1,500,000 1,550,000 - - 3,186,056 Water Fund - 300,000 - - - - 300,000 Wastewater - 150,000 - - - - 150,000
Total 136,056 450,000 1,500,000 1,550,000 - - 3,636,056 Description: This project is for the reconstruction of S. Summit Avenue from W, Gurley Street to W.
Goodwin Street. The project also includes reconstruction of Beach Avenue from S. Summit Avenue to MCCormick Street and McCormick Street from W.Gurley Street to W.Goodwin Street. Additionally, streetscape, landscaping, drainage and pedestrian improvements are included in the project.
Operating Impact: Reduced street maintenance costs.
City of Prescott, Arizona 245 Annual Budget FY2018

Capital Budget
Capital Budget and Project Descriptions
N. Washington /Churchill Street Reconstruction Dept/Division: Public Works Projects Category: Capital Improvement Program Funding Plan
FY18 Budget
FY19 Projection
FY20 Projection
FY21 Projection
FY22 Projection
FY23 Projection Total
Streets 135,350 1,224,650 - - - - 1,360,000 Water - 160,000 - - - - 160,000 Wastewater - 10,000 - - - - 10,000 Total 135,350 1,394,650 - - - - 1,530,000 Description: The project is for the reconstruction of pavement, drainage and utility infrastructure on N
Washington Avenue from Sheldon Street to Churchill Street. The project also includes the reconstruction of Churchill Street between N Washington Avenue and Arizona Street.
Operating Impact:
None
Alarcon Street Improvements Dept/Division: Public Works Projects Category: Capital Improvement Program Funding Plan
FY18 Budget
FY19 Projection
FY20 Projection
FY21 Projection
FY22 Projection
FY23 Projection Total
Streets Fund 110,000 - - - - - 110,000 Description: This project is for street, water quality and streetscape improvements on Alarcon Street
from Sheldon Street to E Gurley Street. Improvements to Alarcon Street include pavement replacement. This project will also include streetscape beautification, and drainage improvements on Alarcon Street.
Operating Impact:
Completion of this project will result in a reduction in overall maintenance and operational expenses, due to the improved condition of the street and drainage systems.
Street Light (Intersection) LED Conversion Project Dept/Division: Public Works Projects Category: Capital Improvement Program Funding Plan
FY18 Budget
FY19 Projection
FY20 Projection
FY21 Projection
FY22 Projection
FY23 Projection Total
Streets 100,000 - - - - - 100,000 Description: This project will provide for the conversion of the City’s approximate 200 traffic signal and
roundabout (intersection) related cobra head street lights from High Pressure Sodium (HPS) to Light Emitting Diode (LED) saving energy and reducing operating costs.
Operating Impact:
The project may have a decrease to the overall operating budget by reducing electrical demand from the City’s electrical provider.
City of Prescott, Arizona 246 Annual Budget FY2018
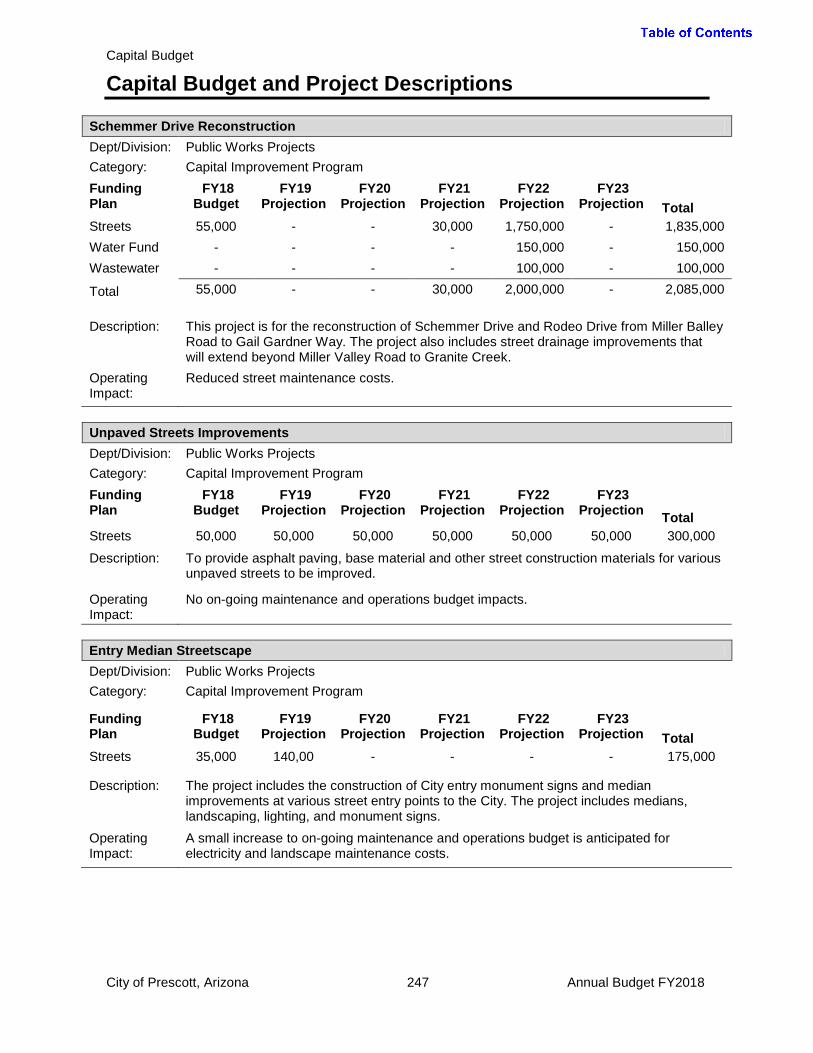
Capital Budget
Capital Budget and Project Descriptions
Schemmer Drive Reconstruction Dept/Division: Public Works Projects Category: Capital Improvement Program Funding Plan
FY18 Budget
FY19 Projection
FY20 Projection
FY21 Projection
FY22 Projection
FY23 Projection Total
Streets 55,000 - - 30,000 1,750,000 - 1,835,000 Water Fund - - - - 150,000 - 150,000 Wastewater - - - - 100,000 - 100,000
Total 55,000 - - 30,000 2,000,000 - 2,085,000 Description: This project is for the reconstruction of Schemmer Drive and Rodeo Drive from Miller Balley
Road to Gail Gardner Way. The project also includes street drainage improvements that will extend beyond Miller Valley Road to Granite Creek.
Operating Impact:
Reduced street maintenance costs.
Unpaved Streets Improvements Dept/Division: Public Works Projects Category: Capital Improvement Program Funding Plan
FY18 Budget
FY19 Projection
FY20 Projection
FY21 Projection
FY22 Projection
FY23 Projection Total
Streets 50,000 50,000 50,000 50,000 50,000 50,000 300,000 Description: To provide asphalt paving, base material and other street construction materials for various
unpaved streets to be improved.
Operating Impact:
No on-going maintenance and operations budget impacts.
Entry Median Streetscape Dept/Division: Public Works Projects Category: Capital Improvement Program Funding Plan
FY18 Budget
FY19 Projection
FY20 Projection
FY21 Projection
FY22 Projection
FY23 Projection Total
Streets 35,000 140,00 - - - - 175,000 Description: The project includes the construction of City entry monument signs and median
improvements at various street entry points to the City. The project includes medians, landscaping, lighting, and monument signs.
Operating Impact:
A small increase to on-going maintenance and operations budget is anticipated for electricity and landscape maintenance costs.
City of Prescott, Arizona 247 Annual Budget FY2018

Capital Budget
Capital Budget and Project Descriptions
Goodwin Street/S Washington Avenue Pavement Reconstruction Dept/Division: Public Works Projects Category: Capital Improvement Program Funding Plan
FY18 Budget
FY19 Projection
FY20 Projection
FY21 Projection
FY22 Projection
FY23 Projection Total
Streets 20,000 - 2,500,000 2,780,000 - - 5,300,000 Water Fund - - 495,000 - - - 495,000 Wastewater - - 275,000 - - - 275,000 Total 20,000 - 3,270,000 2,780,000 - - 6,070,000 Description: This project is for the reconstruction of E Goodwin Street from Mount Vernon Avenue to
Penn Avenue and reconstruction of S Washington from Acker Park to E Gurley Street. The project includes water, sewer, dry utility, drainage upgrades and streetscape features.
Operating Impact:
Completion of this project will result in a reduction in overall maintenance and operational expenses, due to the improved condition of the transportation and utility systems.
Public Works – Utilities and Solid Waste
Chino Valley Tank Dept/Division: Public Works Projects Category: Capital Improvement Program Funding Plan
FY18 Budget
FY19 Projection
FY20 Projection
FY21 Projection
FY22 Projection
FY23 Projection Total
Water Fund 2,950,000 - - - - - 2,950,00 Water System Impact A
2,950,000 - - - - - 2,950,000
Total 5,900,000 - - - - - 5,900,000 Description: This project is for the addition of a new 5-million gallon storage tank at the Chino Valley
water production facility. The new tank will supply additional water production storage from the Chino Valley well field to provide redundancy and capacity for future demands.
Operating Impact:
Minor operational impacts are expected for upkeep of the new facility.
City of Prescott, Arizona 248 Annual Budget FY2018
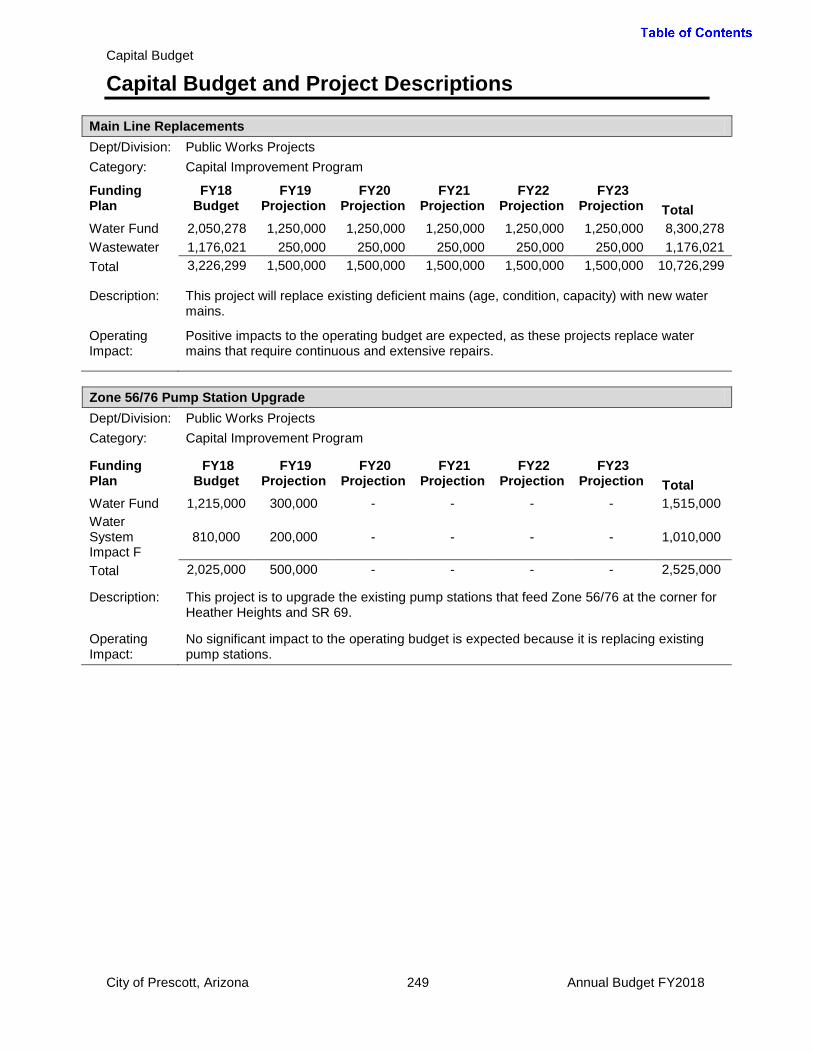
Capital Budget
Capital Budget and Project Descriptions
Main Line Replacements Dept/Division: Public Works Projects Category: Capital Improvement Program Funding Plan
FY18 Budget
FY19 Projection
FY20 Projection
FY21 Projection
FY22 Projection
FY23 Projection Total
Water Fund 2,050,278 1,250,000 1,250,000 1,250,000 1,250,000 1,250,000 8,300,278 Wastewater 1,176,021 250,000 250,000 250,000 250,000 250,000 1,176,021 Total 3,226,299 1,500,000 1,500,000 1,500,000 1,500,000 1,500,000 10,726,299 Description: This project will replace existing deficient mains (age, condition, capacity) with new water
mains.
Operating Impact:
Positive impacts to the operating budget are expected, as these projects replace water mains that require continuous and extensive repairs.
Zone 56/76 Pump Station Upgrade Dept/Division: Public Works Projects Category: Capital Improvement Program Funding Plan
FY18 Budget
FY19 Projection
FY20 Projection
FY21 Projection
FY22 Projection
FY23 Projection Total
Water Fund 1,215,000 300,000 - - - - 1,515,000 Water System Impact F
810,000 200,000 - - - - 1,010,000
Total 2,025,000 500,000 - - - - 2,525,000 Description: This project is to upgrade the existing pump stations that feed Zone 56/76 at the corner for
Heather Heights and SR 69.
Operating Impact:
No significant impact to the operating budget is expected because it is replacing existing pump stations.
City of Prescott, Arizona 249 Annual Budget FY2018

Capital Budget
Capital Budget and Project Descriptions
Intermediate Pump Station, Tanks and Pipeline Dept/Division: Public Works Projects Category: Capital Improvement Program Funding Plan
FY18 Budget
FY19 Projection
FY20 Projection
FY21 Projection
FY22 Projection
FY23 Projection Total
Water Fund 1,000,000 3,638,400 - - - - 4,638,400 Water System Impact B
1,000,000 3,638,400 - - - - 4,638,400
Total 2,000,000 7,276,800 - - - - 9,276,800 Description: The new intermediate pump station, tanks and pipeline facility will reduce the pipeline
pressure and provide additional tank storage closer to Prescott. The site is located about 1 mile north of Pioneer Parkway and 1 mile west of Willow Creek Road on currently undeveloped ranch land and the site will be accessed by a new road from Willow Creek Road. Initially, there will be two 3 million gallon (MG) tanks at the facility and space for a third future 3MG tank. The project will coordinate with upgrades to the Chino Valley pumping facility to adjust for lower operating pressures at the Chino Valley Facility.
Operating Impact:
Operating budget will increase with the addition of a new booster pump station.
SCADA System Installation and Upgrade Dept/Division: Public Works Projects Category: Capital Improvement Program Funding Plan
FY18 Budget
FY19 Projection
FY20 Projection
FY21 Projection
FY22 Projection
FY23 Projection Total
Water Fund 1,256,000 500,000 - - - - 1,756,000 Wastewater Fund 744,000 250,000 - - - - 994,000
Total 2,000,000 750,000 - - - - 2,750,000 Description: The installation/upgrades of the Supervisory Control and Data Acquisition (SCADA) System
will allow for automatic control and monitoring associated with the City’s water production facilities and wastewater facilities. This program will be implemented over a period of years.
Operating Impact:
Reduced labor and transportation costs due to ability to monitor the systems remotely. Reduced system failure-related costs due to ability to respond to emergency situations more promptly.
City of Prescott, Arizona 250 Annual Budget FY2018

Capital Budget
Capital Budget and Project Descriptions
Zone 56 Tank and Piping Dept/Division: Public Works Projects Category: Capital Improvement Program Funding Plan
FY18 Budget
FY19 Projection
FY20 Projection
FY21 Projection
FY22 Projection
FY23 Projection Total
Water Fund 690,000 425,000 750,000 - - - 1,865,000 Water System Impact F
810,000 425,000 750,000 - - - 1,985,000
Total 1.500.000 850,000 1,500,000 - - - 3,850,000 Description: This project will consist of a new 1.5 million gallon tank and piping from the new tank
westward to U-Haul along SR69 for Zone 56.
Operating Impact: Additional long-term tank maintenance including cleaning and painting
Dam Repairs Dept/Division: Public Works Projects Category: Capital Improvement Program Funding Plan
FY18 Budget
FY19 Projection
FY20 Projection
FY21 Projection
FY22 Projection
FY23 Projection Total
Water Fund 1,300,000 100,000 - 50,000 - - 1,450,000 Description: This project will be to design and completer repairs and remediation measures identified by
the Arizona Department of Water Resources (ADWR) Dam Safety Division. This phase will correct deficiencies for two large diameter valves at Granite Creek Dam and also provide required access at Granite Creek dam. Ongoing phases will address maintenance needs identifies by City personnel and/or ADWR Dam Safety Inspectors.
Operating Impact: No impact to the operating budget.
Zone 7 Lower Pump Station Replacement Dept/Division: Public Works Projects Category: Capital Improvement Program Funding Plan
FY18 Budget
FY19 Projection
FY20 Projection
FY21 Projection
FY22 Projection
FY23 Projection Total
Water Fund 475,000 - - - - - 475,000 Water System Impact F
725,000 - - - - - 725,000
Total 1,200,000 - - - - - 1,200,000 Description: This project will consist of relocating the existing Zone 7 pump station that feeds pressure
zones east of Prescott Lakes Parkway.
Operating Impact:
No significant impact to the operating budget is expected because this is a replacement for an existing pump station.
City of Prescott, Arizona 251 Annual Budget FY2018

Capital Budget
Capital Budget and Project Descriptions
Zone 12 Interconnection Pump Station Dept/Division: Public Works Projects Category: Capital Improvement Program Funding Plan
FY18 Budget
FY19 Projection
FY20 Projection
FY21 Projection
FY22 Projection
FY23 Projection Total
Water Fund 1,020,000 - - - - - 1,020,000 Description: The project consists of constructing a pump station at the southwest corner of Pioneer
Parkway and Willow Creek Road. The pump station will provide the City the ability to utilize airport area wells to serve properties throughout the Cities service area. This configuration will also provide water supply redundancy.
Operating Impact:
The upgrade will have an impact on the operating budget through additional facility Operation and Maintenance however; the cost to pump from this location is more cost effective and will reduce the electricity consumption.
Chino Valley Booster Facility Upgrades Dept/Division: Public Works Projects Category: Capital Improvement Program Funding Plan
FY18 Budget
FY19 Projection
FY20 Projection
FY21 Projection
FY22 Projection
FY23 Projection Total
Water Fund 500,000 1,840,000 - - - - 2,340,000 Water System Impact A
500,000 1,840,000 - - - - 2,340,000
Total 1,000,000 3,680,000 - - - - 4,680,000
Description: This project will consist of replacing the City of Prescott water booster facility (buildings, boosters, electrical, controls) in the Town of Chino Valley.
Operating Impact:
No significant impact to the operating budget is expected because the facilities are already operational. A decrease in operational costs may be experienced with modernized facilities and more efficient motors, pumps and buildings.
Airport Zone Production Recovery Well #4 Dept/Division: Public Works Projects Category: Capital Improvement Program Funding Plan
FY18 Budget
FY19 Projection
FY20 Projection
FY21 Projection
FY22 Projection
FY23 Projection Total
Water Fund 500,000 600,000 - - - - 1,100,000 Water System Impact B
500,000 600,000 - - - - 1,100,000
Total 1,000,000 1,200,000 - - - - 2,200,000
Description: This project is for a new well at the Zone 12 water storage tank site within the airport area. The project includes possible arsenic treatment that would only be used if determined to be necessary during initial well development and testing.
Operating Impact: Minor operational impacts are expected for upkeep of the new facility.
City of Prescott, Arizona 252 Annual Budget FY2018

Capital Budget
Capital Budget and Project Descriptions
Vehicle Replacement-Solid Waste Division Dept/Division: Field and Facilities/Residential Refuse Category: Vehicle Replacements and Additions Funding Plan
FY18 Budget
FY19 Projection
FY20 Projection
FY21 Projection
FY22 Projection
FY23 Projection Total
Solid Waste Fund 849,000 870,522 675,459 799,170 742,096 917,341 4,853,588
Description: 2018-Replace Vehicle No.1151, Autocar Side Load collection vehicle.
2018-Replace Vehicle No.1096, Autocar Side Load collection vehicle. 2018-Replace Vehicle No. 1028, Volvo Side Load collection vehicle. 2019-Replace Vehicle No. 1185, Autocar Side Load collection vehicle, Vehicle No. 1292, Autocar Side Load collection vehicle , and Vehicle no.1152, Autocar Front Load collection vehicle. 2020-Replace Vehicle No.1321 Autocar Side Load collection vehicle, Vehicle No.1149, Ford F350 delivery truck, Vehicle No.1268, F350 Service Truck, and Asset No.788, an Allied stationary crane. 2021-Replace Vehicle No.1225, Autocar Front Load collection vehicle, Vehicle No.1382, Volvo Rear Load collection vehicle, and Vehicle No.1381, Caterpillar Tool Carrier. 2022- Replace Vehicle No.1089, F750 delivery truck, Vehicle No.1146, F150 pickup truck, Vehicle No.1335, Autocar Side Load Collection vehicle, Vehicle No. 1336, Autocar Side Load collection vehicle, and Vehicle No.1086, F350 plow truck. 2023-Replace Vehicle No.1289, Autocar Front Load collection vehicle, Vehicle No.1257, Peterbilt Rolloff truck, Vehicle No.1442, Peterbilt Side Load collection vehicle, Vehicle No.1148, Ford F350 ParKan truck.
Operating Impact:
None. Operational and maintenance costs for vehicles are already budgeted in the Solid Waste operating fund.
Watson and Willow Lakes Enhancement Program (TMDL) Dept/Division: Public Works Projects Category: Capital Improvement Program Funding Plan
FY18 Budget
FY19 Projection
FY20 Projection
FY21 Projection
FY22 Projection
FY23 Projection Total
Water Fund 35,000 - - - - - 35,000 Wastewater 30,000 30,000 Streets 133,000 - - - - - 133,000 Aquifer Protection Fee
621,700 261,000 261,000 261,000 261,000 261,000 1,926,700
Total 819,700 261,000 261,000 261,000 261,000 261,000 2,124,700 Description: This project provides for water and sediment sampling, testing and data analysis at Willow
and Watson Lakes. It also provides for public involvement and dissemination of information gathered to identify potential future water quality improvement projects. Funding will be required for on-going data collection and analysis of the City’s lakes and watershed and to identify TMDL reduction projects that can be implemented to meet required EPA and ADEQ pollutant load reductions.
Operating Impact: No impact to operating budget.
City of Prescott, Arizona 253 Annual Budget FY2018
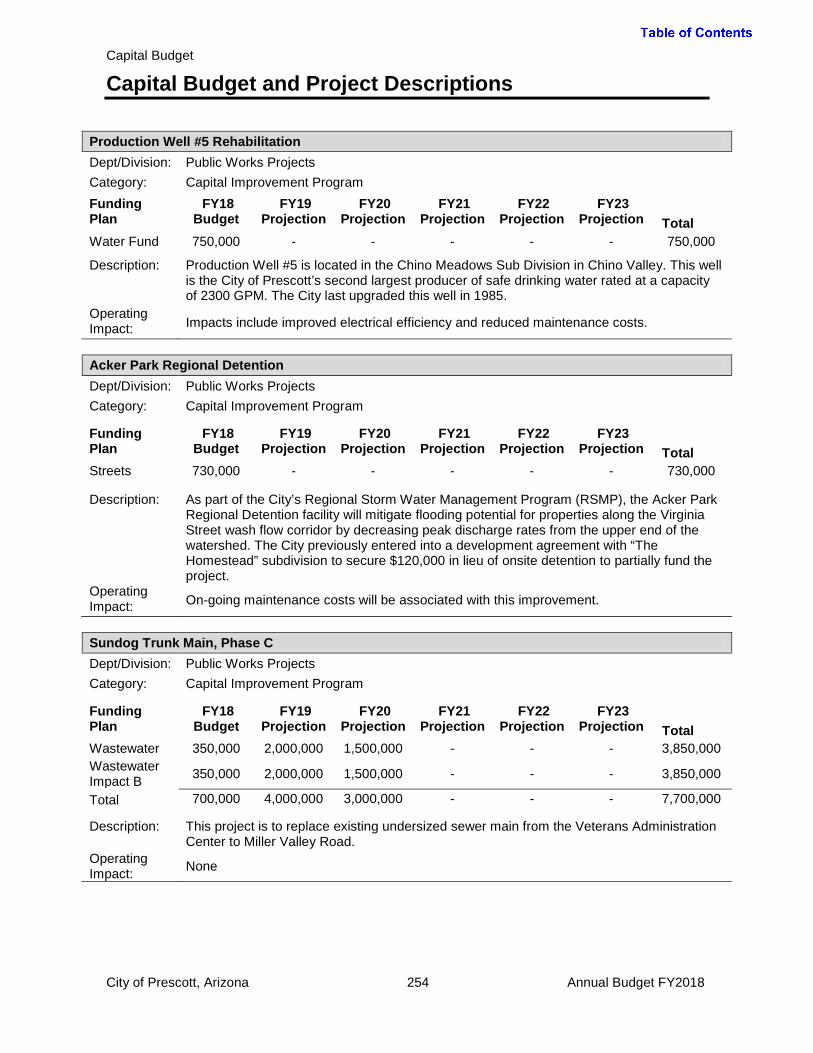
Capital Budget
Capital Budget and Project Descriptions
Production Well #5 Rehabilitation Dept/Division: Public Works Projects Category: Capital Improvement Program Funding Plan
FY18 Budget
FY19 Projection
FY20 Projection
FY21 Projection
FY22 Projection
FY23 Projection Total
Water Fund 750,000 - - - - - 750,000 Description: Production Well #5 is located in the Chino Meadows Sub Division in Chino Valley. This well
is the City of Prescott’s second largest producer of safe drinking water rated at a capacity of 2300 GPM. The City last upgraded this well in 1985.
Operating Impact: Impacts include improved electrical efficiency and reduced maintenance costs.
Acker Park Regional Detention Dept/Division: Public Works Projects Category: Capital Improvement Program Funding Plan
FY18 Budget
FY19 Projection
FY20 Projection
FY21 Projection
FY22 Projection
FY23 Projection Total
Streets 730,000 - - - - - 730,000 Description: As part of the City’s Regional Storm Water Management Program (RSMP), the Acker Park
Regional Detention facility will mitigate flooding potential for properties along the Virginia Street wash flow corridor by decreasing peak discharge rates from the upper end of the watershed. The City previously entered into a development agreement with “The Homestead” subdivision to secure $120,000 in lieu of onsite detention to partially fund the project.
Operating Impact: On-going maintenance costs will be associated with this improvement.
Sundog Trunk Main, Phase C Dept/Division: Public Works Projects Category: Capital Improvement Program Funding Plan
FY18 Budget
FY19 Projection
FY20 Projection
FY21 Projection
FY22 Projection
FY23 Projection Total
Wastewater 350,000 2,000,000 1,500,000 - - - 3,850,000 Wastewater Impact B 350,000 2,000,000 1,500,000 - - - 3,850,000
Total 700,000 4,000,000 3,000,000 - - - 7,700,000 Description: This project is to replace existing undersized sewer main from the Veterans Administration
Center to Miller Valley Road. Operating Impact: None
City of Prescott, Arizona 254 Annual Budget FY2018

Capital Budget
Capital Budget and Project Descriptions
Miscellaneous Water and Wastewater Projects Dept/Division: Public Works Projects Category: Capital Improvement Program Funding Plan
FY18 Budget
FY19 Projection
FY20 Projection
FY21 Projection
FY22 Projection
FY23 Projection Total
Water Fund 395,000 194,000 200,000 206,000 212,000 225,000 1,432,000 Wastewater Fund 255,000 199,000 205,000 212,000 218,000 225,000 1,314,000
Total 650,000 393,000 405,000 418,000 430,000 450,000 2,746,000 Description: Unforeseen and unexpected water system failures happen from time to time due to the
City’s aging infrastructure. Repairs to water pipe failures and/or valve or other system components are sometimes beyond normal maintenance repairs. This item is to provide for unanticipated design and construction necessary when a capital project has not been identified. Pavement rehabilitation is included at the water operations facility.
Operating Impact: No operating budget impact as this item is contemplated to repair existing facilities.
SR 69 Corridor Water Main Dept/Division: Public Works Projects Category: Capital Improvement Program Funding Plan
FY18 Budget
FY19 Projection
FY20 Projection
FY21 Projection
FY22 Projection
FY23 Projection Total
Water Fund 188,000 120,000 780,000 - - - 1,088,000 Water System Impact F
282,000 90,000 520,000 - - - 882,000
Total 470,000 200,000 1,300,000 - - - 1,970,000 Description: This project will be to design and construct a water main from the U-Haul location
Westward across a portion of SR69 north of the Frontier Village Shopping Center to Zone 56 Pump Station at Heather Heights Drive.
Operating Impact: None
City of Prescott, Arizona 255 Annual Budget FY2018

Capital Budget
Capital Budget and Project Descriptions
Impact Fee Ordinance Project Dept/Division: Public Works Projects Category: Capital Improvement Program Funding Plan
FY18 Budget
FY19 Projection
FY20 Projection
FY21 Projection
FY22 Projection
FY23 Projection Total
Water Fund 55,625 - - - - - 55,625 Wastewater Fund 55,625 - - - - - 55,625
Water System Impact A
175,660 - - - - - 175,660
Wastewater Impact A 158,090 - - - - - 158,090
Total 445,000 - - - - - 445,000 Description: Perform a rate and fee updated analysis associated with the water model update starting in
FY17. The rate and fee updated analysis will review previously projected revenues and operating budgets including the capital program. Through this analysis projected rate and fee increases to meet revenue requirements will be identified.
Operating Impact:
Increases to revenues will set funding capabilities for current and future operating budgets including capital requirements
Zone 16 Improvements, Virginia Pumpstation, Haisley Tank, Pipelines and Haisley Road Dept/Division: Public Works Projects Category: Capital Improvement Program Funding Plan
FY18 Budget
FY19 Projection
FY20 Projection
FY21 Projection
FY22 Projection
FY23 Projection Total
Water Fund 336,700 1,747,320 1,380,000 - - - 3,464,020 Water System Impact G
- 1,252,680 920,000 - - - 1,252,680
Streets - - 2,663,300 - - - 2,663,300 Total 336,700 3,000,000 4,963,300 - - - 8,300,000 Description: This project is to replace and upsize the Haisley Tank, replace and upsize the Virginia
Street Pump Station and replace and upsize the distribution pipeline from the south end of Virginia Street to Valley Ranch Circle. This project will increase the capacity to the areas served by Zone 16. As part of this project, Haisley Road between Senator Highway and Valley Ranch Circle will be reconstructed concurrently with the water line improvements.
Operating Impact:
Reduced maintenance due to elimination of aged infrastructure.
City of Prescott, Arizona 256 Annual Budget FY2018

Capital Budget
Capital Budget and Project Descriptions
Water and Wastewater Models Update Dept/Division: Public Works Projects Category: Capital Improvement Program Funding Plan
FY18 Budget
FY19 Projection
FY20 Projection
FY21 Projection
FY22 Projection
FY23 Projection Total
Water System Impact A
117,800 - - - - - 117,800
Water Fund 116,800 - - - - - 116,800 Wastewater Fund 67,000 - - - - - 67,000
Total 301,600 301,600 Description: The City’s water system production and distribution model was completed in 2013. The
water model serves as a broad overview and guidance of the water system capabilities and provides recommendations for system improvements. The water model needs to be updated every 5-years to account for changes in growth patterns, as-built infrastructure and facilities that have differed from original projections.
Operating Impact: There is no impact to the operating budget.
Zone 24/27, Water Pipeline Upsizing-From Thumb Butte Rd to Upper Thumb Butte Tank Dept/Division: Public Works Projects Category: Capital Improvement Program Funding Plan
FY18 Budget
FY19 Projection
FY20 Projection
FY21 Projection
FY22 Projection
FY23 Projection Total
Water Fund 207.100 1257,570 300,000 - - - 1,764,670 Water System Impact H
- 678,430 145,000 - - - 823,430
Streets 83,520 484,000 645,000 - - - 1,212,520 Total 290,620 2,420,000 1,090,000 - - - 3,800,620 Description: This project is to upgrade the existing 6” water line that currently supplies water to the
Lower and Upper Thumb Butte Tanks to a new 12” water line. This line will connect to the 12” water line in Thumb Butte Road, proceed up to the existing Lower Thumb Butte Water Tank and continue to the Upper Thumb Butte Water Tank.
Operating Impact: This project will reduce maintenance costs due to elimination of aged infrastructure.
City of Prescott, Arizona 257 Annual Budget FY2018
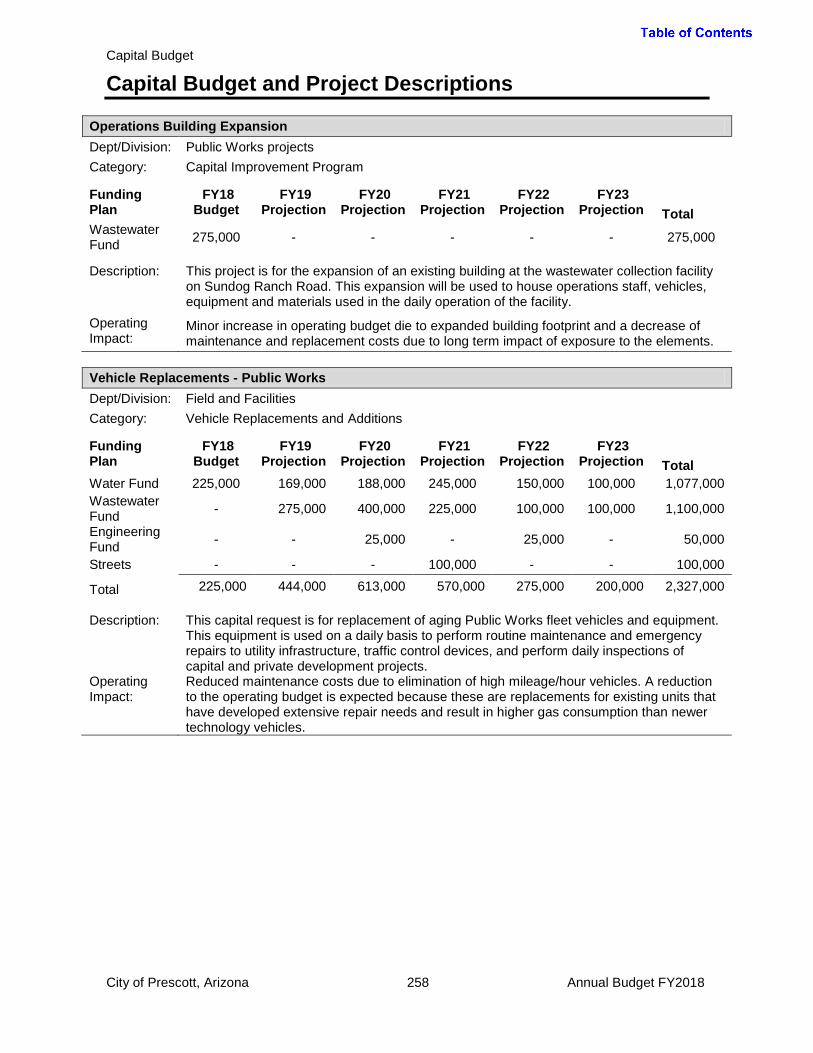
Capital Budget
Capital Budget and Project Descriptions
Operations Building Expansion Dept/Division: Public Works projects Category: Capital Improvement Program Funding Plan
FY18 Budget
FY19 Projection
FY20 Projection
FY21 Projection
FY22 Projection
FY23 Projection Total
Wastewater Fund 275,000 - - - - - 275,000
Description: This project is for the expansion of an existing building at the wastewater collection facility
on Sundog Ranch Road. This expansion will be used to house operations staff, vehicles, equipment and materials used in the daily operation of the facility.
Operating Impact:
Minor increase in operating budget die to expanded building footprint and a decrease of maintenance and replacement costs due to long term impact of exposure to the elements.
Vehicle Replacements - Public Works Dept/Division: Field and Facilities Category: Vehicle Replacements and Additions Funding Plan
FY18 Budget
FY19 Projection
FY20 Projection
FY21 Projection
FY22 Projection
FY23 Projection Total
Water Fund 225,000 169,000 188,000 245,000 150,000 100,000 1,077,000 Wastewater Fund - 275,000 400,000 225,000 100,000 100,000 1,100,000
Engineering Fund - - 25,000 - 25,000 - 50,000
Streets - - - 100,000 - - 100,000
Total 225,000 444,000 613,000 570,000 275,000 200,000 2,327,000 Description: This capital request is for replacement of aging Public Works fleet vehicles and equipment.
This equipment is used on a daily basis to perform routine maintenance and emergency repairs to utility infrastructure, traffic control devices, and perform daily inspections of capital and private development projects.
Operating Impact:
Reduced maintenance costs due to elimination of high mileage/hour vehicles. A reduction to the operating budget is expected because these are replacements for existing units that have developed extensive repair needs and result in higher gas consumption than newer technology vehicles.
City of Prescott, Arizona 258 Annual Budget FY2018
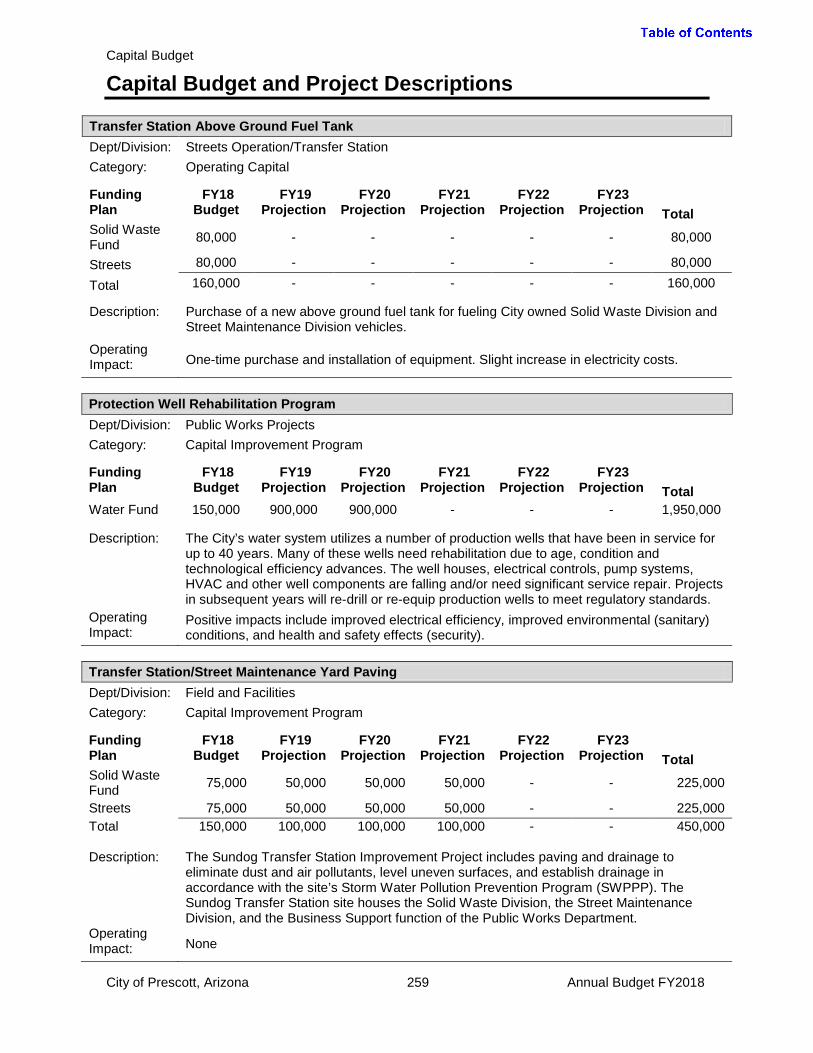
Capital Budget
Capital Budget and Project Descriptions
Transfer Station Above Ground Fuel Tank Dept/Division: Streets Operation/Transfer Station Category: Operating Capital Funding Plan
FY18 Budget
FY19 Projection
FY20 Projection
FY21 Projection
FY22 Projection
FY23 Projection Total
Solid Waste Fund 80,000 - - - - - 80,000
Streets 80,000 - - - - - 80,000
Total 160,000 - - - - - 160,000 Description: Purchase of a new above ground fuel tank for fueling City owned Solid Waste Division and
Street Maintenance Division vehicles.
Operating Impact: One-time purchase and installation of equipment. Slight increase in electricity costs.
Protection Well Rehabilitation Program Dept/Division: Public Works Projects Category: Capital Improvement Program Funding Plan
FY18 Budget
FY19 Projection
FY20 Projection
FY21 Projection
FY22 Projection
FY23 Projection Total
Water Fund 150,000 900,000 900,000 - - - 1,950,000 Description: The City’s water system utilizes a number of production wells that have been in service for
up to 40 years. Many of these wells need rehabilitation due to age, condition and technological efficiency advances. The well houses, electrical controls, pump systems, HVAC and other well components are falling and/or need significant service repair. Projects in subsequent years will re-drill or re-equip production wells to meet regulatory standards.
Operating Impact:
Positive impacts include improved electrical efficiency, improved environmental (sanitary) conditions, and health and safety effects (security).
Transfer Station/Street Maintenance Yard Paving Dept/Division: Field and Facilities Category: Capital Improvement Program Funding Plan
FY18 Budget
FY19 Projection
FY20 Projection
FY21 Projection
FY22 Projection
FY23 Projection Total
Solid Waste Fund 75,000 50,000 50,000 50,000 - - 225,000
Streets 75,000 50,000 50,000 50,000 - - 225,000 Total 150,000 100,000 100,000 100,000 - - 450,000 Description: The Sundog Transfer Station Improvement Project includes paving and drainage to
eliminate dust and air pollutants, level uneven surfaces, and establish drainage in accordance with the site’s Storm Water Pollution Prevention Program (SWPPP). The Sundog Transfer Station site houses the Solid Waste Division, the Street Maintenance Division, and the Business Support function of the Public Works Department.
Operating Impact: None
City of Prescott, Arizona 259 Annual Budget FY2018
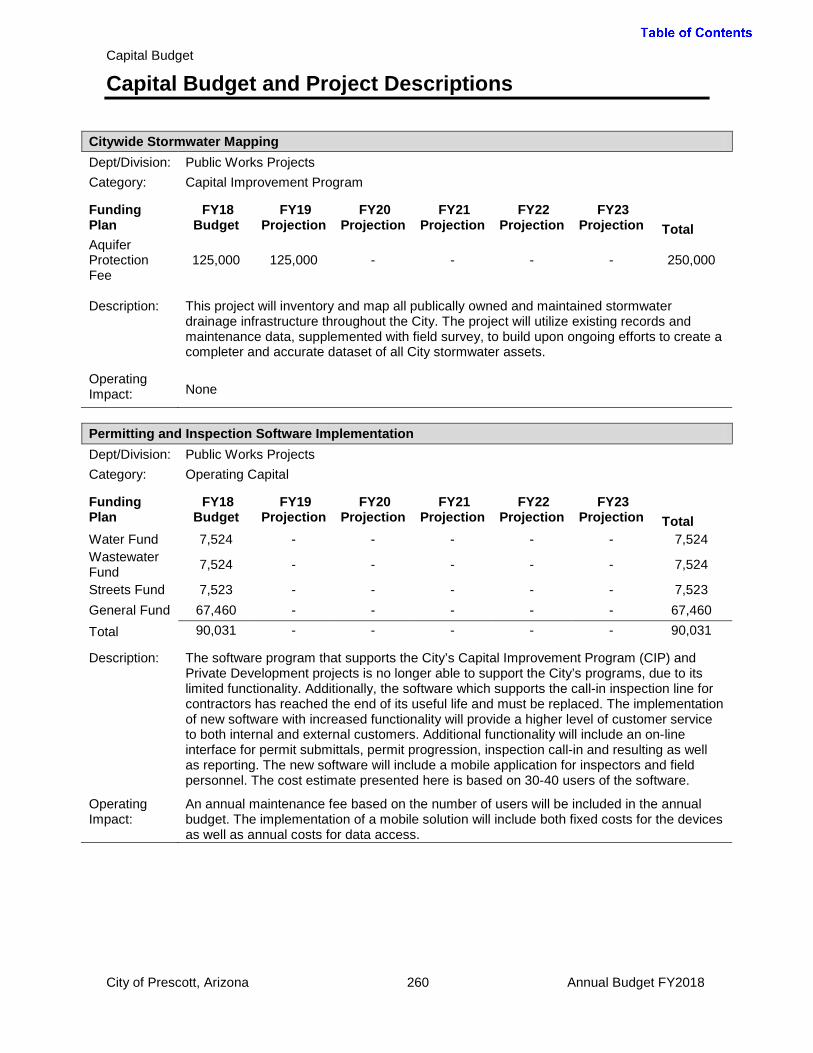
Capital Budget
Capital Budget and Project Descriptions
Citywide Stormwater Mapping Dept/Division: Public Works Projects Category: Capital Improvement Program Funding Plan
FY18 Budget
FY19 Projection
FY20 Projection
FY21 Projection
FY22 Projection
FY23 Projection Total
Aquifer Protection Fee
125,000 125,000 - - - - 250,000
Description: This project will inventory and map all publically owned and maintained stormwater
drainage infrastructure throughout the City. The project will utilize existing records and maintenance data, supplemented with field survey, to build upon ongoing efforts to create a completer and accurate dataset of all City stormwater assets.
Operating Impact: None
Permitting and Inspection Software Implementation Dept/Division: Public Works Projects Category: Operating Capital Funding Plan
FY18 Budget
FY19 Projection
FY20 Projection
FY21 Projection
FY22 Projection
FY23 Projection Total
Water Fund 7,524 - - - - - 7,524 Wastewater Fund 7,524 - - - - - 7,524
Streets Fund 7,523 - - - - - 7,523 General Fund 67,460 - - - - - 67,460 Total 90,031 - - - - - 90,031 Description: The software program that supports the City’s Capital Improvement Program (CIP) and
Private Development projects is no longer able to support the City’s programs, due to its limited functionality. Additionally, the software which supports the call-in inspection line for contractors has reached the end of its useful life and must be replaced. The implementation of new software with increased functionality will provide a higher level of customer service to both internal and external customers. Additional functionality will include an on-line interface for permit submittals, permit progression, inspection call-in and resulting as well as reporting. The new software will include a mobile application for inspectors and field personnel. The cost estimate presented here is based on 30-40 users of the software.
Operating Impact:
An annual maintenance fee based on the number of users will be included in the annual budget. The implementation of a mobile solution will include both fixed costs for the devices as well as annual costs for data access.
City of Prescott, Arizona 260 Annual Budget FY2018

Capital Budget
Capital Budget and Project Descriptions
Electrical Infrastructure and Security Lighting at Sundog Transfer Station Dept/Division: Public Works Projects Category: Capital Improvement Plan Funding Plan
FY18 Budget
FY19 Projection
FY20 Projection
FY21 Projection
FY22 Projection
FY23 Projection Total
Solid Waste Fund 40,800 - - - - - 40,800
Streets Fund 39,200 - - - - - 39,200 Total 80,000 - - - - - 80,000 Description: Install electrical infrastructure to support parking lot lighting, equipment ready line lighting,
automated gates, scales, and other facility locations. Operating Impact:
Increased APS electrical service bill is estimated at $500 per month and will be split 50/50 between Street Maintenance (1% Streets Open Space Sales Tax) and Solid Waste.
Emergency Wastewater Bypass Pump Dept/Division: Public Works Projects Category: Operating Capital Funding Plan
FY18 Budget
FY19 Projection
FY20 Projection
FY21 Projection
FY22 Projection
FY23 Projection Total
Wastewater Fund 65,000 - - - - - 65,000
Description: This item is a dry prime bypass pump for wastewater operations. The pump is for
emergency bypass uses during sewer overflows, system maintenance and bypass operations.
Operating Impact: Very minor budget impact associated with maintenance of the pump.
Bashford Court, Trash and Recycling Compactors Dept/Division: Field and Facilities Category: Funding Plan
FY18 Budget
FY19 Projection
FY20 Projection
FY21 Projection
FY22 Projection
FY23 Projection Total
Solid Waste Fund 40,000 - - - - - 40,000
Description: Self-contained compactors will be installed as part of the Bashford Court Alley Parking Lot
Reconstruction Project. The number of bins is being reduced to accommodate the parking spaces needed for the businesses. The compactors will allow for fewer bins in the alley in addition to reducing the number of collections.
Operating Impact:
The redesign only allowed for three enclosures for trash and recycling. The frequency of collection will be reduced with the compactors in service. With the reduced number of collections per week, this will minimize the wear and tear on the alley surface.
City of Prescott, Arizona 261 Annual Budget FY2018

Capital Budget
Capital Budget and Project Descriptions
Large Scale Printer/Scanner Dept/Division: Engineering Admin/Public Works Category: Operating Capital Funding Plan
FY18 Budget
FY19 Projection
FY20 Projection
FY21 Projection
FY22 Projection
FY23 Projection Total
Engineering Fund 25,000 - - - - 25,000
Description: The Engineering Division of Public Works provides in-house design services. This work
requires a large scale printer and scanner.
Operating Impact: Annual maintenance and supply cost will be reduced with the new printer.
Public Works –Wastewater Centralization
Centralization – Sundog Trunk Main, Phase B Dept/Division: Public Works Projects Category: Capital Improvement Program Funding Plan
FY18 Budget
FY19 Projection
FY20 Projection
FY21 Projection
FY22 Projection
FY23 Projection Total
Wastewater Fund 1,225,000 - - - - - 1,225,000
Wastewater Impact B 1,225,000 - - - - - 1,225,000
Total 2,450,000 - - - - - 2,450,000 Description: This project will convey wastewater flows along SR89 at the VA Hospital to Prescott Lakes
Parkway.
Operating Impact:
This project will reduce longer term operations and maintenance costs through a centralized wastewater system.
Centralization – SR89 Lift Station Dept/Division: Public Works Projects Category: Capital Improvement Program Funding Plan
FY18 Budget
FY19 Projection
FY20 Projection
FY21 Projection
FY22 Projection
FY23 Projection Total
Wastewater Fund 1,200,000 650,000 - - - - 1,850,000
Wastewater Impact B 1,200,000 650,000 - - - - 1,850,000
Total 2,400,000 1,300,000 - - - - 3,700,000 Description: This project is to construct a lift station at SR89 near the VA Hospital to move flows to the
Airport Water Reclamation Facility (AWRF). Operating Impact:
This project will reduce longer term operations and maintenance costs through a centralized wastewater system.
City of Prescott, Arizona 262 Annual Budget FY2018

Capital Budget
Capital Budget and Project Descriptions
Centralization – Sundog Lift Station Dept/Division: Public Works Projects Category: Capital Improvement Program Funding Plan
FY18 Budget
FY19 Projection
FY20 Projection
FY21 Projection
FY22 Projection
FY23 Projection Total
Wastewater Fund 800,000 - - - - - 800,000
Wastewater Impact B 800,000 - - - - - 800,000
Total 1,600,000 - - - - - 1,600,000 Description: This project is to construct a lift station at the Sundog Wastewater Treatment Plant (WWTP)
to move flows and process solids to the Airport Water Reclamation Facility (AWRF).
Operating Impact:
The operating budget will decrease due to the elimination of treatment processes no longer needed. This project will reduce longer term operations and maintenance costs through a centralized wastewater system.
Sundog Trunk Main, Phase A Dept/Division: Public Works Projects Category: Capital Improvement Program Funding Plan
FY18 Budget
FY19 Projection
FY20 Projection
FY21 Projection
FY22 Projection
FY23 Projection Total
Wastewater Fund 600,000 - - - - - 600,000
Wastewater Impact B 600,000 - - - - - 600,000
Total 1,200,000 - - - - - 1,200,000 Description: This project is to design replacements and upgrades to the Sundog Trunk Main as part of
the centralization program. Phase A replacements begin at Prescott Lakes Parkway and continue north along Highway 89, to Lillian Lane.
Operating Impact:
This project will reduce longer term operations and maintenance costs through a centralized wastewater system.
City of Prescott, Arizona 263 Annual Budget FY2018

Capital Budget
Capital Budget and Project Descriptions
Airport Trunk Main Sewer Improvement Dept/Division: Public Works Projects Category: Capital Improvement Program Funding Plan
FY18 Budget
FY19 Projection
FY20 Projection
FY21 Projection
FY22 Projection
FY23 Projection Total
Wastewater Fund 475,000 2,500,000 2,275,000 - - - 5,520,000
Wastewater Impact A 475,000 2,500,000 2,275,000 - - - 5,520,000
Total 950,000 5,000,000 4,550,000 - - - 10,500,000 Description: This project is for the Airport trunk main sewer line upsize improvement project to achieve
the single wastewater treatment plant centralization. This project will complete pipeline improvements from SR89 and Willow Creek (creek not road) to the Airport WRF.
Operating Impact:
This project will reduce longer term operations and maintenance costs through a centralized wastewater system.
City Manager/Alt Water
CA1 with SRP and Prescott Valley - Modeling Dept/Division: City Manager / Water Resource Management Category: Capital Improvement Program Funding Plan
FY18 Budget
FY19 Projection
FY20 Projection
FY21 Projection
FY22 Projection
FY23 Projection Total
BCWR Modeling 243,514 352,134 387,614 - - - 983,262
Description: This work is a prerequisite for the Big Chino Water Importation Project, which is not
presently programmed for construction. City Contract No. 2013-058, commits the City, in partnership with the Town of Prescott Valley and Salt River Project, to monitoring and modeling the Big Chino sub-basin. City Contract no.2017-246 describes the scope, cost and schedule for the Big Chino Sub-Basin Groundwater Flow Model.
Operating Impact: None
City of Prescott, Arizona 264 Annual Budget FY2018
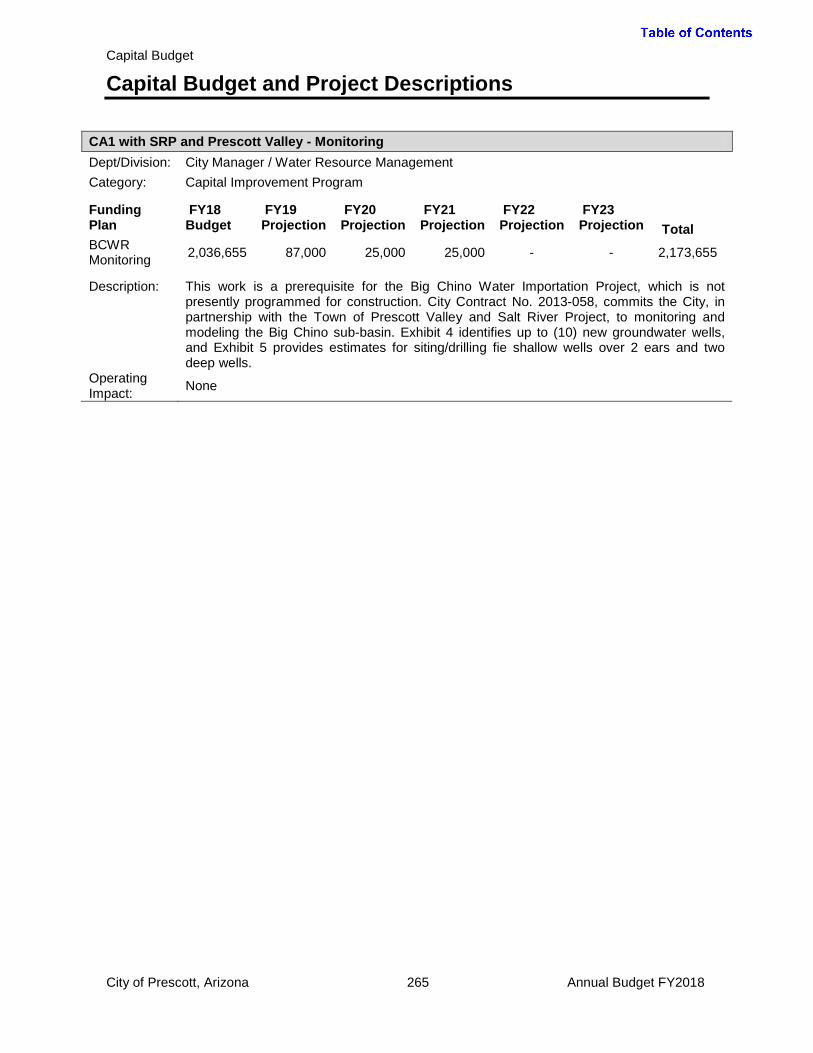
Capital Budget
Capital Budget and Project Descriptions
CA1 with SRP and Prescott Valley - Monitoring Dept/Division: City Manager / Water Resource Management Category: Capital Improvement Program Funding Plan
FY18 Budget
FY19 Projection
FY20 Projection
FY21 Projection
FY22 Projection
FY23 Projection Total
BCWR Monitoring 2,036,655 87,000 25,000 25,000 - - 2,173,655
Description: This work is a prerequisite for the Big Chino Water Importation Project, which is not
presently programmed for construction. City Contract No. 2013-058, commits the City, in partnership with the Town of Prescott Valley and Salt River Project, to monitoring and modeling the Big Chino sub-basin. Exhibit 4 identifies up to (10) new groundwater wells, and Exhibit 5 provides estimates for siting/drilling fie shallow wells over 2 ears and two deep wells.
Operating Impact: None
City of Prescott, Arizona 265 Annual Budget FY2018

Capital Budget
Five-Year Capital Improvement Plan Summary
City of Prescott, Arizona 266 Annual Budget FY2018
5 Year Projection
Description Funding FY18
Budget FY19
Projection FY20
Projection FY21
Projection FY22
Projection FY23
Projection Total Fleet/Facilities
Renovation of Parking Garage Stairs G 350,000 - - - - - 350,000 Grace Sparks Activity Center Renovations FM 30,000 192,461 86,563 130,686 - - 439,710 City Hall Roof Replacement FM - - - 325,000 - - 325,000
380,000 192,461 86,563 455,686 - - 1,114,710 Recreation Services
Open Space Acquisitions S/OS 3,800,000 - - - - - 3,800,000 Golf Course Bunkers Improvements GC 45,500 45,500 45,500 45,500 - - 182,000 Irrigation Improvements- South Golf Course GC - - 125,000 - - - 125,000 Irrigation Improvements- North Golf Course GC - - - 125,000 - - 125,000 Pioneer Park multi-use four field sports complex G, PI - - - - - 1,850,000 1,850,000
3,845,500 45,500 170,500 170,500 - 1,850,000 6,082,000 Airport- Grant Funded
Security Upgrades A, AG 2,000,000 - - - - - 2,000,000 Airport Master Plan A, AG 520,000 - - - - - 520,000 Airport Pavement Maintenance Program - ADOT A, AG 350,000 - 1,525,000 - - 1,500,000 3,375,000 RWY 3L PAPI and 21R PAPI Both Ends A, AG 195,000 - - - - - 195,000 RWY 3R-21L and 3L-21R and TWY A and C Lighting and Signage A, AG - 2,600,000 - - - - 2,600,000 Aircraft Rescue Fire Fighting and Airport Operations Facility A, AG - 500,000 3,000,000 - - - 3,500,000 RWY 21L and TWY D Extension - Land Acquisitions A, AG - 350,000 - 900,000 - - 1,250,000 TWY C Realignment A, AG - - 900,000 4,500,000 4,500,000 - 9,900,000 Land Acquisition for Aeronautical Development A, AG - - 350,000 900,000 - 1,900,000 3,150,000 Airspace Obstruction Mitigation A, AG - - 305,000 - - - 305,000 RWY 12-30 Shift Safety Area Improvements A, AG - - - 350,000 650,000 3,250,000 4,250,000
3,065,000 3,450,000 6,080,000 6,650,000 5,150,000 6,650,000 31,045,000 Airport - City Only Funded Projects
Airport Pavement Preservation Program - City A 100,000 100,000 100,000 100,000 100,000 100,000 600,000 FAA Tech Operations Facility - Building Upgrades and Maintenance A 50,000 - - - - - 50,000 Replacement Airline Terminal A - 1,000,000 5,000,000 2,000,000 - - 8,000,000 Bottleneck Area Hangar Development A - 950,000 - - - - 950,000 Airport Master Lock System A - 175,000 - - - - 175,000
Total Airport City Only Funded 150,000 2,225,000 5,100,000 2,100,000 100,000 100,000 9,775,000 Public Works - Streets
SR89 Widening and Utility Improvements South of SR89A S,W,WW 4,340,000 - - - - - 4,340,000 Robinson Drive Pavement Reconstruction S,W,WW 3,970,000 - - - - - 3,970,000 Pavement Preservation Program S 3,500,000 3,500,000 3,500,000 3,500,000 4,500,000 4,500,000 23,000,000 Rosser Street Pavement Reconstruction Phase IV S 2,685,000 - - - - - 2,685,000 Carleton Street Alarcon Street Pavement Reconst. and Drainage S,C,W,WW - 2,505,000 845,000 - - - 3,350,000 S. Marina Street Reconstruction S,W,WW 1,320,000 - - - - - 1,320,000 Bashford Courts Alley and Parking Lot Reconstruction S,W,WW 848,000 - - - - - 848,000 Willis-Cortez Intersection Improvements W 650,000 - - - - - 650,000 Dameron and Home Street Reconstruction S 590,000 - - - - - 590,000 Sidewalk Replacement Program S 450,000 200,000 200,000 200,000 200,000 200,000 1,450,000 Hope Street Improvements S,C,W 327,000 - - - - - 327,000 Miscellaneous Streets Projects S 300,000 300,000 300,000 300,000 300,000 300,000 1,800,000 Overland Road Bridge Reconstruction - Government Canyon S 300,000 - - - - - 300,000 E. Goodwin Street Reconstruction S,W,WW 271,576 4,200,000 1,500,000 - - - 5,971,576 Leroux-Cortez Drainage Project (WYGC Facility) C 250,000 - - - - - 250,000 Sundog Ranch Road Reconstruction and Water Line S,W 210,000 200,000 400,000 - - 2,500,000 3,310,000 Intersection Signalization Project S 200,000 20,000 200,000 20,000 200,000 20,000 660,000 Penn Avenue - Eastwood Drive Pavement Reconstruction S,W,WW 200,000 - - 5,800,000 - - 6,000,000 S. Summit/S. McCormick/Beach Reconstruction S,W,WW 136,056 450,000 1,500,000 1,550,000 - - 3,636,056 N. Washington/Churchill Street Reconstruction S,W,WW 135,350 1,394,650 - - - - 1,530,000 Alarcon Street Improvements S 110,000 - - - - - 110,000 Street Light (Intersection) LED Conversion Project S 100,000 - - - - - 100,000 Schemmer Drive Reconstruction S,W,WW 55,000 - - 30,000 - - 85,000 Unpaved Streets Improvements S 50,000 50,000 50,000 50,000 50,000 50,000 300,000 Goodwin Street/S Washington Avenue Pavement Reconstruction S,W,WW 20,000 - - - - - 20,000 Entry Median Streetscape S 35,000 140,000 - - - - 175,000 W. Gurley Street Pedestrian Enhancement Project S - 80,000 420,000 - - - 500,000 Gurley Street Reconstruction S,W,WW - - 650,000 - - - 650,000
21,052,982 13,039,650 9,565,000 11,450,000 5,250,000 7,570,000 67,927,632

Capital Budget
Five-Year Capital Improvement Plan Summary
City of Prescott, Arizona 267 Annual Budget FY2018
5 Year Projection
Description Funding FY18
Budget FY19
Projection FY20
Projection FY21
Projection FY22
Projection FY23
Projection Total Public Works - Utilities and Solid Waste
Chino Valley Tank W 5,900,000 - - - - - 5,900,000 Zone 16 Improvements, Pumpstation, Tank, Pipelines and Haisley Rd S,W 336,700 3,000,000 4,963,300 - - - 8,300,000 Main Line Replacements W,WW 3,226,299 1,500,000 1,500,000 1,500,000 1,500,000 1,500,000 10,726,299 Zone 24/27, Water Pipeline Upsizing - from Thumb Butte Rd to Tank S,W 290,620 2,420,000 1,090,000 - - - 3,510,000 Zone 56 Tank and Piping W 1,500,000 850,000 1,500,000 - - - 2,350,000 Airport Zone Production Recovery Well #4 W 1,000,000 1,200,000 - - - - 2,200,000 Zone 56/76 Pump Station Upgrade W 2,025,000 500,000 - - - - 2,525,000 Intermediate Pump Station, Tanks and Pipeline W 2,000,000 7,276,800 - - - - 9,276,800 SCADA System Installation and Upgrade W,WW 2,000,000 750,000 - - - - 2,750,000 Dam Repairs W 1,300,000 100,000 - 50,000 - - 1,450,000 Zone 7 Lower Pump Station Replacement W,WW 1,200,000 - - - - - 1,200,000 Zone 12 Interconnection Pump Station W 1,020,000 - - - - - 1,020,000 Chino Valley Booster Facility Upgrades W 1,000,000 3,680,000 - - - - 4,680,000 Watson and Willow Lakes Enhancement Program (TMDL) S,W,WW 819,700 261,000 261,000 261,000 261,000 261,000 2,124,700 Production Well #5 Rehabilitation W 750,000 - - - - - 750,000 Acker Park Regional Detention S 730,000 - - - - - 730,000 Sundog Trunk Main, Phase C W,WW 700,000 4,000,000 3,000,000 - - - 7,700,000 Citywide Drainage Improvement Program C 675,000 675,000 675,000 675,000 675,000 3,375,000 Miscellaneous Water and Wastewater Projects W,WW 650,000 393,000 405,000 418,000 430,000 450,000 2,746,000 SR69 Corridor Water Main W 470,000 200,000 1,300,000 - - - 1,970,000 Impact Fee Ordinance Project W,WW 445,000 - - - - - 445,000 Zone 41, Mingus Pump Station, Tank and Pipeline W - 350,000 3,150,000 - - - 3,500,000 Water and Wastewater Models Update W,WW 301,600 - - - - - 301,600 Operations Building Expansion WW 275,000 - - - - - 275,000 Production Well Rehabilitation Program W 150,000 900,000 900,000 - - - 1,950,000 Transfer Station/Street Maintenance Yard Paving S,SW 150,000 100,000 100,000 100,000 - - 450,000 Citywide Stormwater Mapping S,C 125,000 125,000 - - - - 250,000 Electrical Infrastructure and Security Lighting at Transfer Station S,SW 80,000 - - - - - 80,000 CIP Project Management Software S,W,WW,SW - 300,000 - - - - 300,000 Hassayampa Sewer Trunk Main Upsizing WW - 100,000 2,638,000 - - - 2,738,000 Montezuma Trunk Main Upsizing S,W,WW - 100,000 2,215,000 - - - 2,315,000 Willow Creek Levee Improvement C,GR - 100,000 150,000 1,500,000 - - 1,750,000 Upper Rancho Vista Pump Station Upgrade W - - 465,000 340,000 - - 805,000 Zone 40, Cedarwood Tank Upsizing W - - 225,000 750,000 - - 975,000 Zone 31, Pump Station W - - 220,000 1,000,700 - - 1,220,700 Zone 61/Zone 41/ Zone 40/Zone 0, Water Main Upgrades S,W,WW - - - 2,243,300 1,156,700 - 3,400,000 Stormwater Master Plan Update S,C,W - - - - 500,000 250,000 750,000 North Fork Miller Creek Channel Improvements C,GR - - - - 100,000 1,000,000 1,100,000 5th St, 6th St and Hillside Sewer Main Upsize S, W, WW - - - - 75,000 1,375,000 1,450,000 Granite Dells Ranch Development (DA) Wastewater Requirements WW - - - - - 4,100,000 4,100,000 Sewer Main Upsizing - Willow Creek, Rosser, and Demerse Area S,W,WW - - - - - 2,568,400 2,568,400 Heckthorn Water Main (DA) W - - - - - 381,000 381,000 Sun Street Sewer Main Upgrade S,W,WW - - - - - 310,000 310,000 City Lights Sewer Main Replacement WW - - - - - 285,500 285,500 Zone 42, Pipeline Upgrade S,W,WW - - - - - 175,000 175,000
28,444,919 28,880,800 24,757,300 8,838,000 4,697,700 13,330,900 107,158,999 Public Works - Wastewater Centralization
Sundog Trunk Main, Phase B WW 2,450,000 - - - - - 2,450,000 SR89 Lift Station WW 2,400,000 1,300,000 - - - - 3,700,000 Sundog Liftstation WW 1,600,000 - - - - - 1,600,000 Sundog Trunk Main, Phase A WW 1,200,000 - - - - - 1,200,000 Airport Trunk Main Sewer Improvement WW 950,000 5,000,000 4,550,000 - - - 10,500,000 Airport WRF Expansion, Phase 2 WW - - - - - - - Effluent Tank, Pipeline and Conversion WW - - - 350,000 3,150,000 - 3,500,000 Sundog Equalization Basin and Plant Decommissioning WW - - - - - - -
8,600,000 6,300,000 4,550,000 350,000 3,150,000 - 22,950,000 City Manager/Alt Water
CA1 with SRP and Prescott Valley - Modeling W 243,514 352,134 387,614 - - - 983,262 CA1 with SRP and Prescott Valley - Monitoring W 2,036,655 87,000 25,000 25,000 - - 2,173,655
2,280,169 439,134 412,614 25,000 - - 3,156,917

Capital Budget
Five-Year Capital Improvement Plan Summary
City of Prescott, Arizona 268 Annual Budget FY2018
5 Year Projection
Funding FY18
Budget FY19
Projection FY20
Projection FY21
Projection FY22
Projection FY23
Projection Total Funding Summary, all projects
General Fund (G) 350,000 - - - - 1,272,700 1,622,700 Grants (GR) - - - 1,500,000 - 250,000 1,750,000 Streets (Open Space) (S/OS) 3,800,000 - - - - - 3,800,000 Streets (S) 19,003,702 11,409,650 12,860,900 9,768,000 5,615,000 9,415,500 68,072,752 Streets - County Contribution (C) 250,000 1,325,000 825,000 675,000 1,075,000 1,550,000 5,700,000 Parks Impact Fee (PI) - - - - - 577,300 577,300 Water (W) 28,197,832 24,029,934 13,295,614 6,922,000 2,544,700 3,077,400 78,067,480 Wastewater (WW) 12,810,736 11,840,000 12,253,400 1,748,000 3,863,000 6,608,000 49,123,136 Solid Waste (SW) 115,800 55,000 50,000 50,000 - - 270,800 Golf Course (GC) 45,500 45,500 170,500 170,500 - - 432,000 General Fund - Airport (A) 267,500 2,375,000 5,483,500 2,360,000 277,500 602,500 11,366,000 Airport Grants (AG) 2,947,500 3,300,000 5,696,500 6,390,000 4,972,500 6,147,500 29,454,000 Facilities Management (FM) 30,000 192,461 86,563 455,686 - - 764,710
Total 67,818,570 54,572,545 50,721,977 30,039,186 18,347,700 29,500,900 251,000,878
Funding Summary by Fund TypeGeneral Fund 350,000 - - - - 1,272,700 1,622,700 Special Revenue Funds 23,053,702 12,734,650 13,685,900 11,943,000 6,690,000 11,792,800 79,900,052 Enterprise Funds 44,384,868 41,645,434 36,949,514 17,640,500 11,657,700 16,435,400 168,713,416 Internal Service Funds 30,000 192,461 86,563 455,686 - - 764,710
Total 67,818,570 54,572,545 50,721,977 30,039,186 18,347,700 29,500,900 251,000,878

Capital Budget
Five-Year Capital Improvement Plan Summary
THIS PAGE LEFT BLANK INTENTIONALLY
City of Prescott, Arizona 269 Annual Budget FY2018
Appendix
Budget Resolutions ........................................................................................................................ 272 Auditor General Schedules ............................................................................................................ 276 Authorized Position Listing ............................................................................................................. 288 Authorized Pay Ranges .................................................................................................................. 296 Glossary of Terms .......................................................................................................................... 297
City of Prescott, Arizona 270 Annual Budget FY2018

Appendix
THIS PAGE LEFT BLANK INTENTIONALLY
City of Prescott, Arizona 271 Annual Budget FY2018

Appendix
Budget Resolutions
Tentative Budget Resolution
City of Prescott, Arizona 272 Annual Budget FY2018

Appendix
Budget Resolutions
City of Prescott, Arizona 273 Annual Budget FY2018

Appendix
Budget Resolutions
Final Budget Resolution
City of Prescott, Arizona 274 Annual Budget FY2018

Appendix
Budget Resolutions
City of Prescott, Arizona 275 Annual Budget FY2018

Appendix
Auditor General Schedules
City of Prescott, Arizona 276 Annual Budget FY2018

Appendix
Auditor General Schedules
4/15
CITY OF PRESCOTT
TABLE OF CONTENTS
Fiscal Year 2018
Schedule A—Summary Schedule of Estimated Revenues and Expenditures/Expenses
Schedule B—Tax Levy and Tax Rate Information
Schedule G—Full-Time Employees and Personnel Compensation
Schedule C—Revenues Other Than Property Taxes
Schedule D—Other Financing Sources/<Uses> and Interfund Transfers
Schedule E—Expenditures/Expenses by Fund
Schedule F—Expenditures/Expenses by Department (as applicable)
City of Prescott, Arizona 277 Annual Budget FY2018

Appendix
Auditor General Schedules
SCHEDULE A
Fiscal Year General Fund
Special Revenue
Fund
Debt Service
Fund
Capital Projects
FundPermanent
Fund
Enterprise Funds
Available
Internal Service Funds Total All Funds
2017Adopted/Adjusted Budgeted Expenditures/Expenses* E 36,962,263 51,436,662 193,488 70,258,489 8,437,859 167,288,761
2017 Actual Expenditures/Expenses** E 34,795,984 25,740,403 193,488 46,652,334 7,582,075 114,964,284
2018 Fund Balance/Net Position at July 1*** 32,597,886 24,027,092 3,183 60,254,868 5,283,588 122,166,617
2018 Primary Property Tax Levy B 1,709,975 1,709,975
2018 Secondary Property Tax Levy B
2018 Estimated Revenues Other than Property Taxes C 35,366,729 25,600,870 5,731 48,054,070 7,227,287 116,254,687
2018 Other Financing Sources D 9,100,000 9,100,000
2018 Other Financing (Uses) D
2018 Interfund Transfers In D 45,000 389,683 717,911 1,152,594
2018 Interfund Transfers (Out) D 1,087,594 65,000 1,152,594
2018 Reduction for Amounts Not Available:
LESS: Internal Loans 4,625,969 4,625,969
2018 Total Financial Resources Available 64,006,027 49,952,645 8,914 118,126,849 12,510,875 244,605,310
2018 Budgeted Expenditures/Expenses E 49,596,004 46,292,788 5,731 82,222,349 10,736,379 188,853,251
EXPENDITURE LIMITATION COMPARISON 2017 20181. Budgeted expenditures/expenses 167,288,761$ 188,853,251$ 2. Add/subtract: estimated net reconciling items3. Budgeted expenditures/expenses adjusted for reconciling items 167,288,761 188,853,251 4. Less: estimated exclusions5. Amount subject to the expenditure limitation 167,288,761$ 188,853,251$ 6. EEC expenditure limitation $ $
****** Amounts on this line represent Fund Balance/Net Position amounts except for amounts not in spendable form (e.g., prepaids and inventories) or legally or contractually
required to be maintained intact (e.g., principal of a permanent fund).
Sch
FUNDS
Includes Expenditure/Expense Adjustments Approved in the current year from Schedule E.
CITY OF PRESCOTTSummary Schedule of Estimated Revenues and Expenditures/Expenses
Fiscal Year 2018
Includes actual amounts as of the date the proposed budget was prepared, adjusted for estimated activity for the remainder of the fiscal year.
City of Prescott, Arizona 278 Annual Budget FY2018
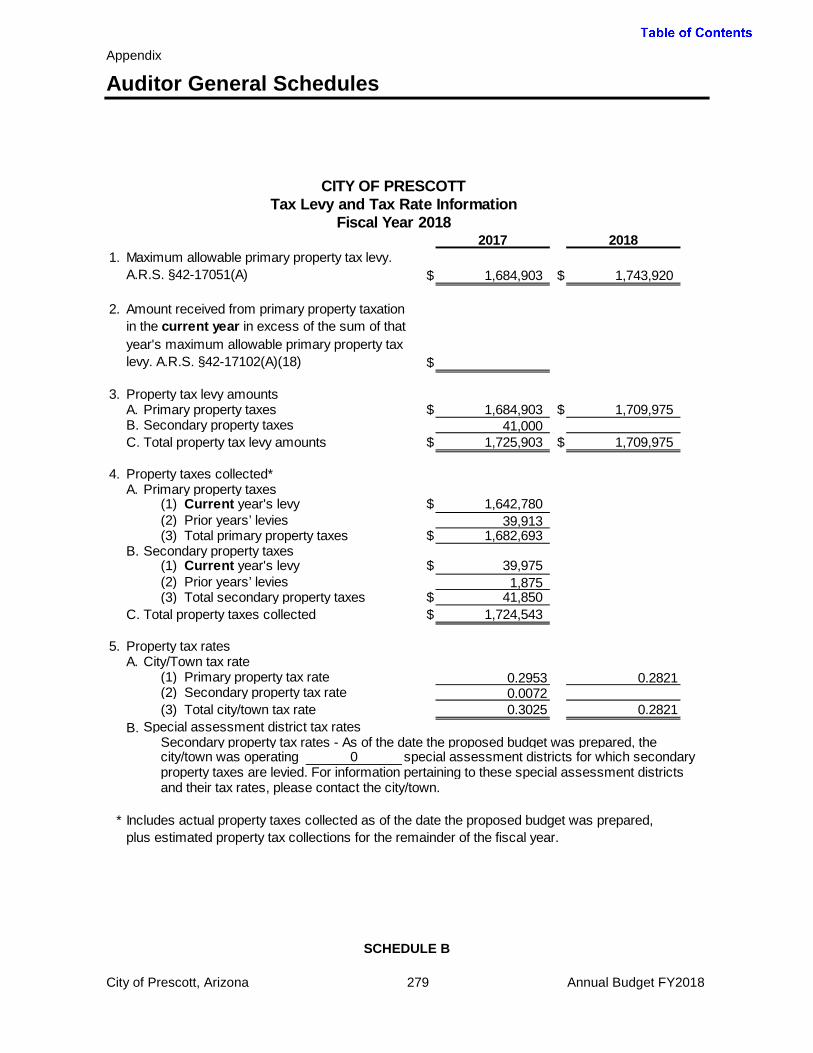
Appendix
Auditor General Schedules
SCHEDULE B
2017 20181.
$ 1,684,903 $ 1,743,920
2.
$
3. Property tax levy amountsA. Primary property taxes $ 1,684,903 $ 1,709,975B. Secondary property taxes 41,000C. Total property tax levy amounts $ 1,725,903 $ 1,709,975
4. Property taxes collected*A. Primary property taxes
(1) Current year's levy $ 1,642,780(2) Prior years’ levies 39,913(3) Total primary property taxes $ 1,682,693
B. Secondary property taxes(1) Current year's levy $ 39,975(2) Prior years’ levies 1,875(3) Total secondary property taxes $ 41,850
C. Total property taxes collected $ 1,724,543
5. Property tax ratesA. City/Town tax rate
(1) Primary property tax rate 0.2953 0.2821(2) Secondary property tax rate 0.0072(3) Total city/town tax rate 0.3025 0.2821
B. Special assessment district tax ratesSecondary property tax rates - As of the date the proposed budget was prepared, the
0 special assessment districts for which secondaryproperty taxes are levied. For information pertaining to these special assessment districtsand their tax rates, please contact the city/town.
*
city/town was operating
Includes actual property taxes collected as of the date the proposed budget was prepared, plus estimated property tax collections for the remainder of the fiscal year.
Amount received from primary property taxation in the current year in excess of the sum of that year's maximum allowable primary property tax levy. A.R.S. §42-17102(A)(18)
CITY OF PRESCOTTTax Levy and Tax Rate Information
Fiscal Year 2018
Maximum allowable primary property tax levy. A.R.S. §42-17051(A)
City of Prescott, Arizona 279 Annual Budget FY2018

Appendix
Auditor General Schedules
SCHEDULE C
ESTIMATED REVENUES
ACTUAL REVENUES*
ESTIMATED REVENUES
2017 2017 2018GENERAL FUND
Local taxesPrivilege and Use Tax $ 14,900,000 $ 15,400,000 $ 15,400,000Frachise Taxes 1,630,000 1,640,000 1,660,000
IntergovernmentalState 9,074,554 9,074,554 9,241,251County 3,066,662 3,066,522 3,289,562Local Jurisdictions 1,770,287 2,047,246 2,547,446
Other RevenuesLicenses and permits 1,063,600 855,150 854,250Charges for services 1,630,400 1,743,480 1,773,520Fines and forfeits 415,900 395,100 418,400Interest on investments 190,300 70,300 140,300Miscellaneous 41,000 41,000 42,000
Total General Fund $ 33,782,703 $ 34,333,352 $ 35,366,729
SPECIAL REVENUE FUNDSStreets
Streets Privilege Tax $ 14,300,000 $ 14,800,000 $ 14,800,000Intergovernmental - State (Highway Users Rev) 3,349,275 3,349,275 3,461,595Intergovernmental - County 1,050,000 600,000 1,475,000Charges for services 375,000 356,000 236,000Interest Earned 150,000 20,000 20,000Miscellaneous 276,098 265,000 265,000
Total Streets and Open Space Fund $ 19,500,373 $ 19,390,275 $ 20,257,595
Transient Occupancy TaxTransient Occupancy Tax $ 820,000 $ 880,000 $ 880,000Miscellaneous 72,000 72,000 71,000
Total Transient Occupancy Tax $ 892,000 $ 952,000 $ 951,000
Impact Fee FundsCharges for Services $ 24,359 $ 24,359 $ 25,000Interest 18,400 18,000 18,000
Total Impace Fee Funds $ 42,759 $ 42,359 $ 43,000
Grant FundsMiscellaneous Grants $ 7,089,949 $ 1,342,214 $ 4,293,670
Total Grant Funds $ 7,089,949 $ 1,342,214 $ 4,293,670
Trust FundsGifts and Donations $ 140,000 $ 138,694 $ 50,605Interest Earned 5,000 5,000 5,000
Total Gift Trust Fund $ 145,000 $ 143,694 $ 55,605
Total Special Revenue Funds $ 27,670,081 $ 21,870,542 $ 25,600,870 * Includes actual revenues recognized on the modified accrual or accrual basis as of the date the proposed budget
was prepared, plus estimated revenues for the remainder of the fiscal year.
CITY OF PRESCOTTRevenues Other Than Property Taxes
Fiscal Year 2018
SOURCE OF REVENUES
City of Prescott, Arizona 280 Annual Budget FY2018
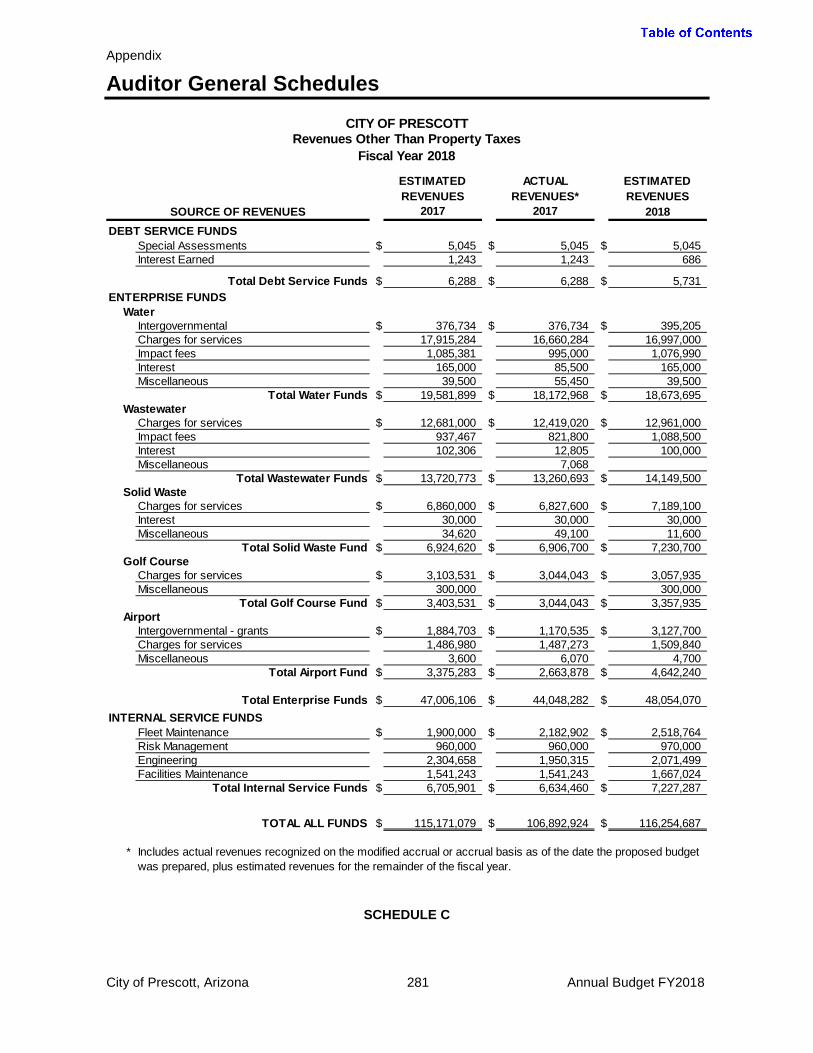
Appendix
Auditor General Schedules
SCHEDULE C
ESTIMATED REVENUES
ACTUAL REVENUES*
ESTIMATED REVENUES
2017 2017 2018DEBT SERVICE FUNDS
Special Assessments $ 5,045 $ 5,045 $ 5,045Interest Earned 1,243 1,243 686
Total Debt Service Funds $ 6,288 $ 6,288 $ 5,731ENTERPRISE FUNDS
WaterIntergovernmental $ 376,734 $ 376,734 $ 395,205Charges for services 17,915,284 16,660,284 16,997,000Impact fees 1,085,381 995,000 1,076,990Interest 165,000 85,500 165,000Miscellaneous 39,500 55,450 39,500
Total Water Funds $ 19,581,899 $ 18,172,968 $ 18,673,695Wastewater
Charges for services $ 12,681,000 $ 12,419,020 $ 12,961,000Impact fees 937,467 821,800 1,088,500Interest 102,306 12,805 100,000Miscellaneous 7,068
Total Wastewater Funds $ 13,720,773 $ 13,260,693 $ 14,149,500Solid Waste
Charges for services $ 6,860,000 $ 6,827,600 $ 7,189,100Interest 30,000 30,000 30,000Miscellaneous 34,620 49,100 11,600
Total Solid Waste Fund $ 6,924,620 $ 6,906,700 $ 7,230,700Golf Course
Charges for services $ 3,103,531 $ 3,044,043 $ 3,057,935Miscellaneous 300,000 300,000
Total Golf Course Fund $ 3,403,531 $ 3,044,043 $ 3,357,935Airport
Intergovernmental - grants $ 1,884,703 $ 1,170,535 $ 3,127,700Charges for services 1,486,980 1,487,273 1,509,840Miscellaneous 3,600 6,070 4,700
Total Airport Fund $ 3,375,283 $ 2,663,878 $ 4,642,240
Total Enterprise Funds $ 47,006,106 $ 44,048,282 $ 48,054,070INTERNAL SERVICE FUNDS
Fleet Maintenance $ 1,900,000 $ 2,182,902 $ 2,518,764Risk Management 960,000 960,000 970,000Engineering 2,304,658 1,950,315 2,071,499Facilities Maintenance 1,541,243 1,541,243 1,667,024
Total Internal Service Funds $ 6,705,901 $ 6,634,460 $ 7,227,287
TOTAL ALL FUNDS $ 115,171,079 $ 106,892,924 $ 116,254,687
* Includes actual revenues recognized on the modified accrual or accrual basis as of the date the proposed budget was prepared, plus estimated revenues for the remainder of the fiscal year.
CITY OF PRESCOTTRevenues Other Than Property Taxes
Fiscal Year 2018
SOURCE OF REVENUES
City of Prescott, Arizona 281 Annual Budget FY2018

Appendix
Auditor General Schedules
SCHEDULE D
FUND SOURCES <USES> IN <OUT>GENERAL FUNDGeneral Fund $ $ $ 45,000 $Airport 697,911Grants 389,683
Total General Fund $ $ $ 45,000 $ 1,087,594SPECIAL REVENUE FUNDSTransient lodging tax $ $ $ $ 65,000Grants 389,683
Total Special Revenue Funds $ $ $ 389,683 $ 65,000ENTERPRISE FUNDSWastewater $ 8,600,000 $ $ $Airport 717,911Golf Course 500,000
Total Enterprise Funds $ 9,100,000 $ $ 717,911 $
INTERNAL SERVICE FUNDSFleet Maintenance $ 2,836,713 $ $ $
Total Internal Service Funds $ 2,836,713 $ $ $
TOTAL ALL FUNDS $ 11,936,713 $ $ 1,152,594 $ 1,152,594
2018 2018
CITY OF PRESCOTTOther Financing Sources/<Uses> and Interfund Transfers
Fiscal Year 2018OTHER FINANCING INTERFUND TRANSFERS
City of Prescott, Arizona 282 Annual Budget FY2018
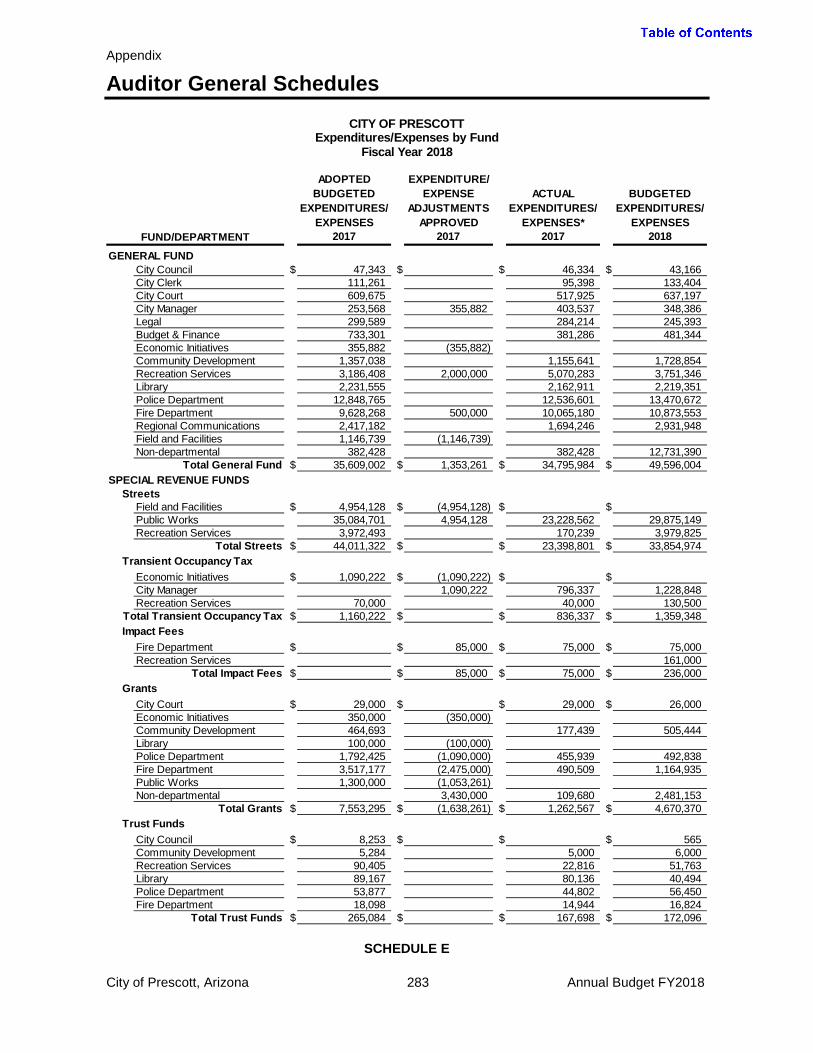
Appendix
Auditor General Schedules
SCHEDULE E
ADOPTED BUDGETED
EXPENDITURES/EXPENSES
EXPENDITURE/EXPENSE
ADJUSTMENTS APPROVED
ACTUAL EXPENDITURES/
EXPENSES*
BUDGETED EXPENDITURES/
EXPENSES 2017 2017 2017 2018
GENERAL FUNDCity Council $ 47,343 $ $ 46,334 $ 43,166City Clerk 111,261 95,398 133,404City Court 609,675 517,925 637,197City Manager 253,568 355,882 403,537 348,386Legal 299,589 284,214 245,393Budget & Finance 733,301 381,286 481,344Economic Initiatives 355,882 (355,882)Community Development 1,357,038 1,155,641 1,728,854Recreation Services 3,186,408 2,000,000 5,070,283 3,751,346Library 2,231,555 2,162,911 2,219,351Police Department 12,848,765 12,536,601 13,470,672Fire Department 9,628,268 500,000 10,065,180 10,873,553Regional Communications 2,417,182 1,694,246 2,931,948Field and Facilities 1,146,739 (1,146,739)Non-departmental 382,428 382,428 12,731,390
Total General Fund $ 35,609,002 $ 1,353,261 $ 34,795,984 $ 49,596,004SPECIAL REVENUE FUNDS
StreetsField and Facilities $ 4,954,128 $ (4,954,128) $ $Public Works 35,084,701 4,954,128 23,228,562 29,875,149Recreation Services 3,972,493 170,239 3,979,825
Total Streets $ 44,011,322 $ $ 23,398,801 $ 33,854,974Transient Occupancy Tax
Economic Initiatives $ 1,090,222 $ (1,090,222) $ $City Manager 1,090,222 796,337 1,228,848Recreation Services 70,000 40,000 130,500
Total Transient Occupancy Tax $ 1,160,222 $ $ 836,337 $ 1,359,348Impact Fees
Fire Department $ $ 85,000 $ 75,000 $ 75,000Recreation Services 161,000
Total Impact Fees $ $ 85,000 $ 75,000 $ 236,000Grants
City Court $ 29,000 $ $ 29,000 $ 26,000Economic Initiatives 350,000 (350,000)Community Development 464,693 177,439 505,444Library 100,000 (100,000)Police Department 1,792,425 (1,090,000) 455,939 492,838Fire Department 3,517,177 (2,475,000) 490,509 1,164,935Public Works 1,300,000 (1,053,261)Non-departmental 3,430,000 109,680 2,481,153
Total Grants $ 7,553,295 $ (1,638,261) $ 1,262,567 $ 4,670,370Trust Funds
City Council $ 8,253 $ $ $ 565Community Development 5,284 5,000 6,000Recreation Services 90,405 22,816 51,763Library 89,167 80,136 40,494Police Department 53,877 44,802 56,450Fire Department 18,098 14,944 16,824
Total Trust Funds $ 265,084 $ $ 167,698 $ 172,096
Expenditures/Expenses by FundFiscal Year 2018
CITY OF PRESCOTT
FUND/DEPARTMENT
City of Prescott, Arizona 283 Annual Budget FY2018
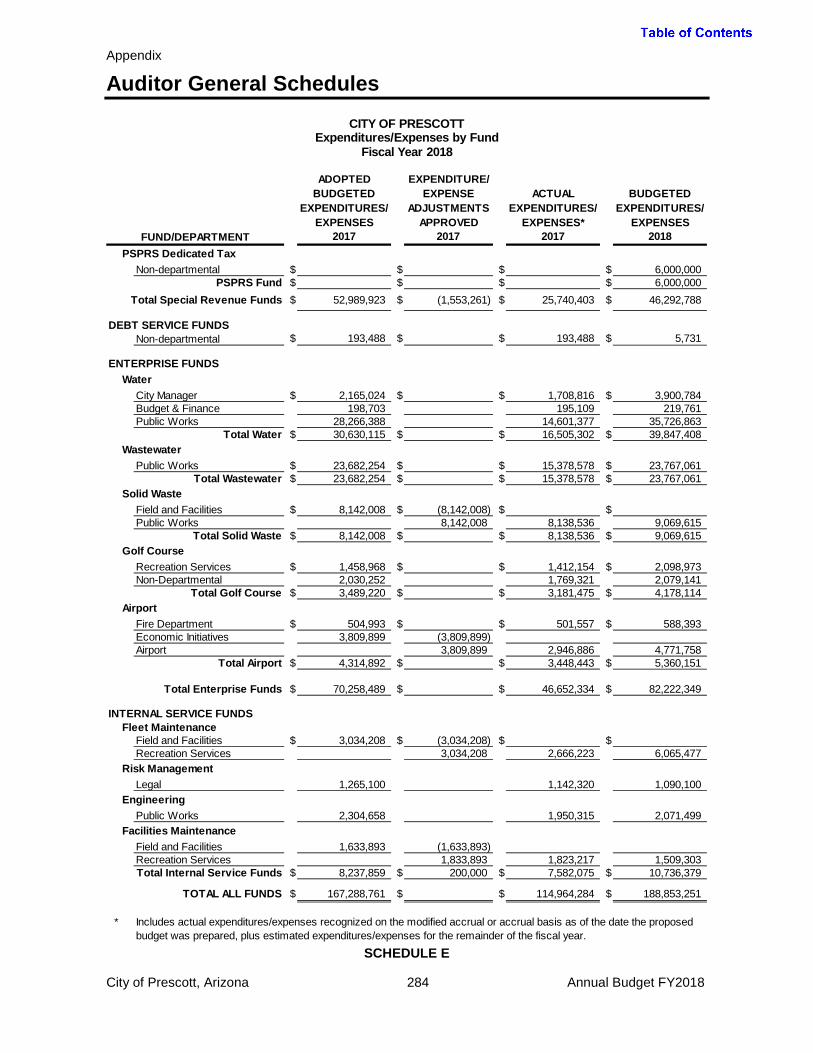
Appendix
Auditor General Schedules
SCHEDULE E
ADOPTED BUDGETED
EXPENDITURES/EXPENSES
EXPENDITURE/EXPENSE
ADJUSTMENTS APPROVED
ACTUAL EXPENDITURES/
EXPENSES*
BUDGETED EXPENDITURES/
EXPENSES 2017 2017 2017 2018
PSPRS Dedicated TaxNon-departmental $ $ $ $ 6,000,000
PSPRS Fund $ $ $ $ 6,000,000Total Special Revenue Funds $ 52,989,923 $ (1,553,261) $ 25,740,403 $ 46,292,788
DEBT SERVICE FUNDSNon-departmental $ 193,488 $ $ 193,488 $ 5,731
ENTERPRISE FUNDSWater
City Manager $ 2,165,024 $ $ 1,708,816 $ 3,900,784Budget & Finance 198,703 195,109 219,761Public Works 28,266,388 14,601,377 35,726,863
Total Water $ 30,630,115 $ $ 16,505,302 $ 39,847,408Wastewater
Public Works $ 23,682,254 $ $ 15,378,578 $ 23,767,061Total Wastewater $ 23,682,254 $ $ 15,378,578 $ 23,767,061
Solid WasteField and Facilities $ 8,142,008 $ (8,142,008) $ $Public Works 8,142,008 8,138,536 9,069,615
Total Solid Waste $ 8,142,008 $ $ 8,138,536 $ 9,069,615Golf Course
Recreation Services $ 1,458,968 $ $ 1,412,154 $ 2,098,973Non-Departmental 2,030,252 1,769,321 2,079,141
Total Golf Course $ 3,489,220 $ $ 3,181,475 $ 4,178,114Airport
Fire Department $ 504,993 $ $ 501,557 $ 588,393Economic Initiatives 3,809,899 (3,809,899)Airport 3,809,899 2,946,886 4,771,758
Total Airport $ 4,314,892 $ $ 3,448,443 $ 5,360,151
Total Enterprise Funds $ 70,258,489 $ $ 46,652,334 $ 82,222,349
INTERNAL SERVICE FUNDSFleet Maintenance
Field and Facilities $ 3,034,208 $ (3,034,208) $ $Recreation Services 3,034,208 2,666,223 6,065,477
Risk ManagementLegal 1,265,100 1,142,320 1,090,100
EngineeringPublic Works 2,304,658 1,950,315 2,071,499
Facilities MaintenanceField and Facilities 1,633,893 (1,633,893)Recreation Services 1,833,893 1,823,217 1,509,303Total Internal Service Funds $ 8,237,859 $ 200,000 $ 7,582,075 $ 10,736,379
TOTAL ALL FUNDS $ 167,288,761 $ $ 114,964,284 $ 188,853,251
*
Expenditures/Expenses by FundFiscal Year 2018
CITY OF PRESCOTT
Includes actual expenditures/expenses recognized on the modified accrual or accrual basis as of the date the proposed budget was prepared, plus estimated expenditures/expenses for the remainder of the fiscal year.
FUND/DEPARTMENT
City of Prescott, Arizona 284 Annual Budget FY2018

Appendix
Auditor General Schedules
SCHEDULE F
ADOPTED BUDGETED
EXPENDITURES/EXPENSES
EXPENDITURE/EXPENSE
ADJUSTMENTS APPROVED
ACTUAL EXPENDITURES/
EXPENSES*
BUDGETED EXPENDITURES/
EXPENSES 2017 2017 2017 2018
AirportAirport $ $ 3,809,899 $ 2,946,886 $ 4,771,758
Budget & Finance Total $ $ 3,809,899 $ 2,946,886 $ 4,771,758
Budget & FinanceGeneral Fund $ 733,301 $ $ 381,286 $ 481,344Water 198,703 195,109 219,761
Budget & Finance Total $ 932,004 $ $ 576,395 $ 701,105
City ClerkGeneral Fund $ 111,261 $ $ 95,398 $ 133,404
City Clerk Total $ 111,261 $ $ 95,398 $ 133,404
City CouncilGeneral Fund $ 47,343 $ $ 46,334 $ 43,166Trust Funds 8,253 565
City Council Total $ 55,596 $ $ 46,334 $ 43,731
City CourtGeneral Fund $ 609,675 $ $ 517,925 $ 637,197Grant Funds 29,000 29,000 26,000
City Court Total $ 638,675 $ $ 546,925 $ 663,197
City ManagerGeneral Fund $ 253,568 $ 355,882 $ 403,537 $ 348,386Water 2,165,024 1,708,816 3,900,784Transient Occupancy Tax 1,090,222 796,337 1,228,848
City Manager Total $ 2,418,592 $ 1,446,104 $ 2,908,690 $ 5,478,018
Community DevelopmentGeneral Fund $ 1,357,038 $ $ 1,155,641 $ 1,728,854Grant Funds 464,693 177,439 505,444Trust Funds 5,284 5,000 6,000
Community Development Total $ 1,827,015 $ $ 1,338,080 $ 2,240,298
Economic InitiativesGeneral Fund $ 355,882 $ (355,882) $ $Transient Occupancy Tax 1,090,222 (1,090,222)Grants 350,000 (350,000)Airport 3,809,899 (3,809,899)
Economic Initiatives Total $ 5,606,003 $ (5,606,003) $ $
Field and FacilitiesGeneral Fund $ 1,146,739 $ (1,146,739) $ $Streets 4,954,128 (4,954,128)Solid Waste 8,142,008 (8,142,008)Fleet Maintenance 3,034,208 (3,034,208)Facilities Maintenance 1,633,893 (1,633,893)
Field and Facilities Total $ 18,910,976 $ (18,910,976) $ $
Fire DepartmentGeneral Fund $ 9,628,268 $ 500,000 $ 10,065,180 $ 10,873,553Grants 3,517,177 (2,475,000) 490,509 1,164,935Impact Fee 85,000 75,000 75,000Trust Funds 18,098 14,944 16,824Airport 504,993 501,557 588,393
Fire Department Total $ 13,668,536 $ (1,890,000) $ 11,147,190 $ 12,718,705
Expenditures/Expenses by DepartmentFiscal Year 2018
CITY OF PRESCOTT
DEPARTMENT/FUND
City of Prescott, Arizona 285 Annual Budget FY2018

Appendix
Auditor General Schedules
SCHEDULE F
ADOPTED BUDGETED
EXPENDITURES/EXPENSES
EXPENDITURE/EXPENSE
ADJUSTMENTS APPROVED
ACTUAL EXPENDITURES/
EXPENSES*
BUDGETED EXPENDITURES/
EXPENSES 2017 2017 2017 2018
LegalGeneral Fund $ 299,589 $ $ 284,214 $ 245,393Risk Management 1,265,100 1,142,320 1,090,100
Legal Total $ 1,564,689 $ $ 1,426,534 $ 1,335,493
LibraryGeneral Fund $ 2,231,555 $ $ 2,162,911 $ 2,219,351Grants 100,000 (100,000)Trust Funds 89,167 80,136 40,494
Library Total $ 2,420,722 $ (100,000) $ 2,243,047 $ 2,259,845
Police DepartmentGeneral Fund $ 12,848,765 $ $ 12,536,601 $ 13,470,672Grants 1,792,425 (1,090,000) 455,939 492,838Trust Funds 53,877 44,802 56,450
Police Department Total $ 14,695,067 $ (1,090,000) $ 13,037,342 $ 14,019,960
Public WorksStreets $ 35,084,701 $ 4,954,128 $ 23,228,562 $ 29,875,149Grants 1,300,000 (1,053,261)Water 28,266,388 14,601,377 35,726,863Wastewater 23,682,254 15,378,578 23,767,061Solid Waste 8,142,008 8,138,536 9,069,615Engineering 2,304,658 1,950,315 2,071,499
Public Works Total $ 90,638,001 $ 12,042,875 $ 63,297,368 $ 100,510,187
Recreation ServicesGeneral Fund $ 3,186,408 $ 2,000,000 $ 5,070,283 $ 3,751,346Streets 3,972,493 170,239 3,979,825Transient Occupancy Tax 70,000 40,000 130,500Impact Fee 161,000Trust Funds 90,405 22,816 51,763Golf Course 1,458,968 1,412,154 2,098,973Fleet Services 3,034,208 2,666,223 6,065,477Facilities Maintenance 1,833,893 1,823,217 1,509,303
Recreation Services Total $ 8,778,274 $ 6,868,101 $ 11,204,932 $ 17,748,187
Regional CommunicationsGeneral Fund $ 2,417,182 $ $ 1,694,246 $ 2,931,948
Regional Communications Total $ 2,417,182 $ $ 1,694,246 $ 2,931,948
Non-departmentalGeneral Fund $ 382,428 $ $ 382,428 $ 12,731,390Debt Service 193,488 193,488 5,731Golf (Outsourced Operations) 2,030,252 1,769,321 2,079,141Grants 3,430,000 109,680 2,481,153PSPRS Dedicated Tax 6,000,000
Non-department Total $ 2,606,168 $ 3,430,000 $ 2,454,917 $ 23,297,415Total All Departments $ 167,288,761 $ $ 114,964,284 $ 188,853,251
*
Expenditures/Expenses by DepartmentFiscal Year 2018
CITY OF PRESCOTT
Includes actual expenditures/expenses recognized on the modified accrual or accrual basis as of the date the proposed budget was prepared, plus estimated expenditures/expenses for the remainder of the fiscal year.
DEPARTMENT/FUND
City of Prescott, Arizona 286 Annual Budget FY2018

Appendix
Auditor General Schedules
SCHEDULE G
City of Prescott, Arizona 287 Annual Budget FY2018
Full-Time Equivalent (FTE)
Employee Salaries and Hourly Costs Retirement Costs Healthcare Costs
Other Benefit Costs
Total Estimated Personnel
Compensation2018 2018 2018 2018 2018 2018
324.35 $ 18,820,893 $ 8,323,385 $ 2,559,593 $ 1,696,567 $ 31,400,438
Streets and Open Space 42.40 $ 2,360,439 $ 267,871 $ 406,687 $ 364,543 $ 3,399,540Transient Occupancy Tax 1.00 63,492 7,302 11,073 6,138 88,005Grants 16.00 804,756 333,303 85,544 41,565 1,265,168Trust 0.25 7,800 1,336 9,136
Total Special Revenue Funds 59.65 $ 3,236,487 $ 608,476 $ 503,304 $ 413,582 $ 4,761,849
Water 39.80 $ 2,179,655 $ 249,790 $ 358,671 $ 223,985 $ 3,012,101Wastewater 37.50 2,029,650 229,815 348,689 226,931 2,835,085Solid Waste 29.20 1,381,078 152,950 269,699 193,305 1,997,032Golf Course 13.50 540,127 62,115 78,015 54,931 735,188Airport 13.25 775,349 296,343 99,023 69,219 1,239,934
Total Enterprise Funds 133.25 $ 6,905,859 $ 991,013 $ 1,154,097 $ 768,371 $ 9,819,340
Fleet Maintenance 10.90 $ 504,557 $ 58,025 $ 86,219 $ 60,212 $ 709,013Engineering 19.00 1,235,358 142,067 176,782 116,154 1,670,361Facilities Maintenance 7.85 382,726 44,012 64,077 42,955 533,770
Total Internal Service Fund 37.75 $ 2,122,641 $ 244,104 $ 327,078 $ 219,321 $ 2,913,144
TOTAL ALL FUNDS 555.00 $ 31,085,880 $ 10,166,978 $ 4,544,072 $ 3,097,841 $ 48,894,771See Note
Note:Full-Time Equivalent (FTE) includes 494.00 FTE permanent employees and estimated 61.00 FTE temporary employees.
INTERNAL SERVICE FUND
SPECIAL REVENUE FUNDS
ENTERPRISE FUNDS
FUND
CITY OF PRESCOTTFull-Time Employees and Personnel Compensation
Fiscal Year 2018
GENERAL FUND
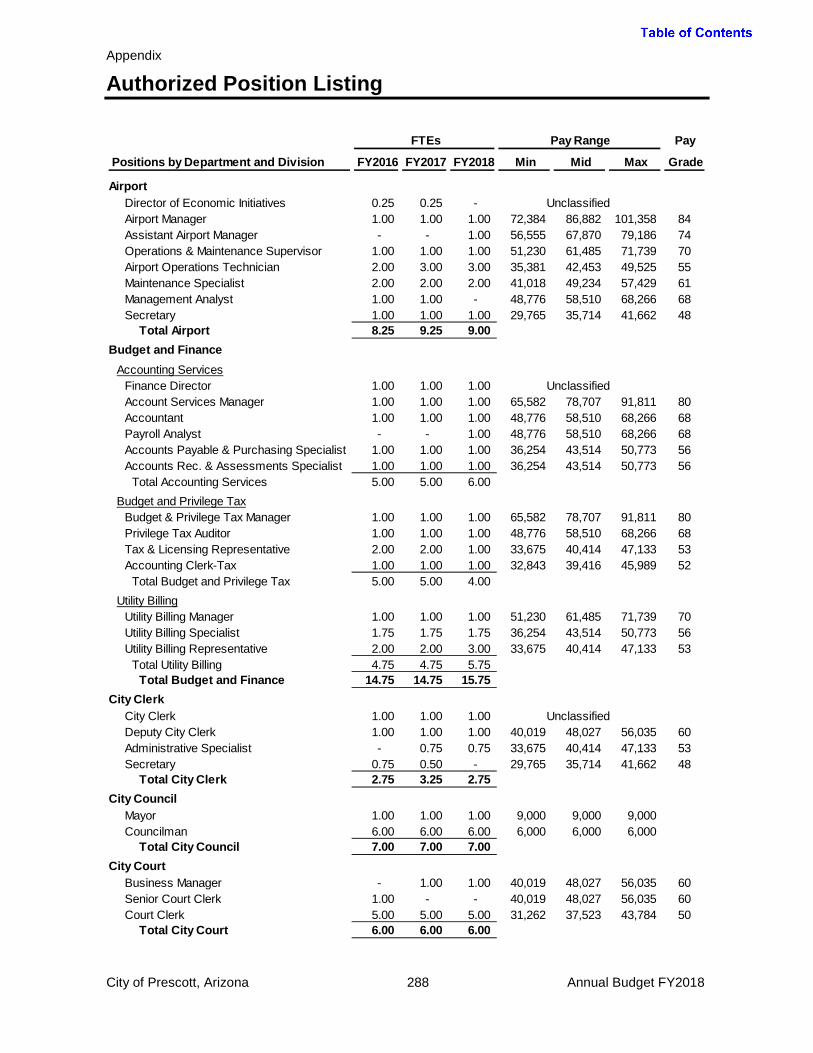
Appendix
Authorized Position Listing
Pay
FY2016 FY2017 FY2018 Min Mid Max Grade
AirportDirector of Economic Initiatives 0.25 0.25 - Airport Manager 1.00 1.00 1.00 72,384 86,882 101,358 84Assistant Airport Manager - - 1.00 56,555 67,870 79,186 74Operations & Maintenance Supervisor 1.00 1.00 1.00 51,230 61,485 71,739 70Airport Operations Technician 2.00 3.00 3.00 35,381 42,453 49,525 55Maintenance Specialist 2.00 2.00 2.00 41,018 49,234 57,429 61Management Analyst 1.00 1.00 - 48,776 58,510 68,266 68Secretary 1.00 1.00 1.00 29,765 35,714 41,662 48
Total Airport 8.25 9.25 9.00 Budget and Finance
Accounting ServicesFinance Director 1.00 1.00 1.00 Account Services Manager 1.00 1.00 1.00 65,582 78,707 91,811 80Accountant 1.00 1.00 1.00 48,776 58,510 68,266 68Payroll Analyst - - 1.00 48,776 58,510 68,266 68Accounts Payable & Purchasing Specialist 1.00 1.00 1.00 36,254 43,514 50,773 56Accounts Rec. & Assessments Specialist 1.00 1.00 1.00 36,254 43,514 50,773 56
Total Accounting Services 5.00 5.00 6.00 Budget and Privilege Tax
Budget & Privilege Tax Manager 1.00 1.00 1.00 65,582 78,707 91,811 80Privilege Tax Auditor 1.00 1.00 1.00 48,776 58,510 68,266 68Tax & Licensing Representative 2.00 2.00 1.00 33,675 40,414 47,133 53Accounting Clerk-Tax 1.00 1.00 1.00 32,843 39,416 45,989 52
Total Budget and Privilege Tax 5.00 5.00 4.00 Utility Billing
Utility Billing Manager 1.00 1.00 1.00 51,230 61,485 71,739 70Utility Billing Specialist 1.75 1.75 1.75 36,254 43,514 50,773 56Utility Billing Representative 2.00 2.00 3.00 33,675 40,414 47,133 53
Total Utility Billing 4.75 4.75 5.75 Total Budget and Finance 14.75 14.75 15.75
City ClerkCity Clerk 1.00 1.00 1.00 Deputy City Clerk 1.00 1.00 1.00 40,019 48,027 56,035 60Administrative Specialist - 0.75 0.75 33,675 40,414 47,133 53Secretary 0.75 0.50 - 29,765 35,714 41,662 48
Total City Clerk 2.75 3.25 2.75 City Council
Mayor 1.00 1.00 1.00 9,000 9,000 9,000 Councilman 6.00 6.00 6.00 6,000 6,000 6,000
Total City Council 7.00 7.00 7.00 City Court
Business Manager - 1.00 1.00 40,019 48,027 56,035 60Senior Court Clerk 1.00 - - 40,019 48,027 56,035 60Court Clerk 5.00 5.00 5.00 31,262 37,523 43,784 50
Total City Court 6.00 6.00 6.00
Pay Range
Positions by Department and Division
Unclassified
Unclassified
FTEs
Unclassified
City of Prescott, Arizona 288 Annual Budget FY2018
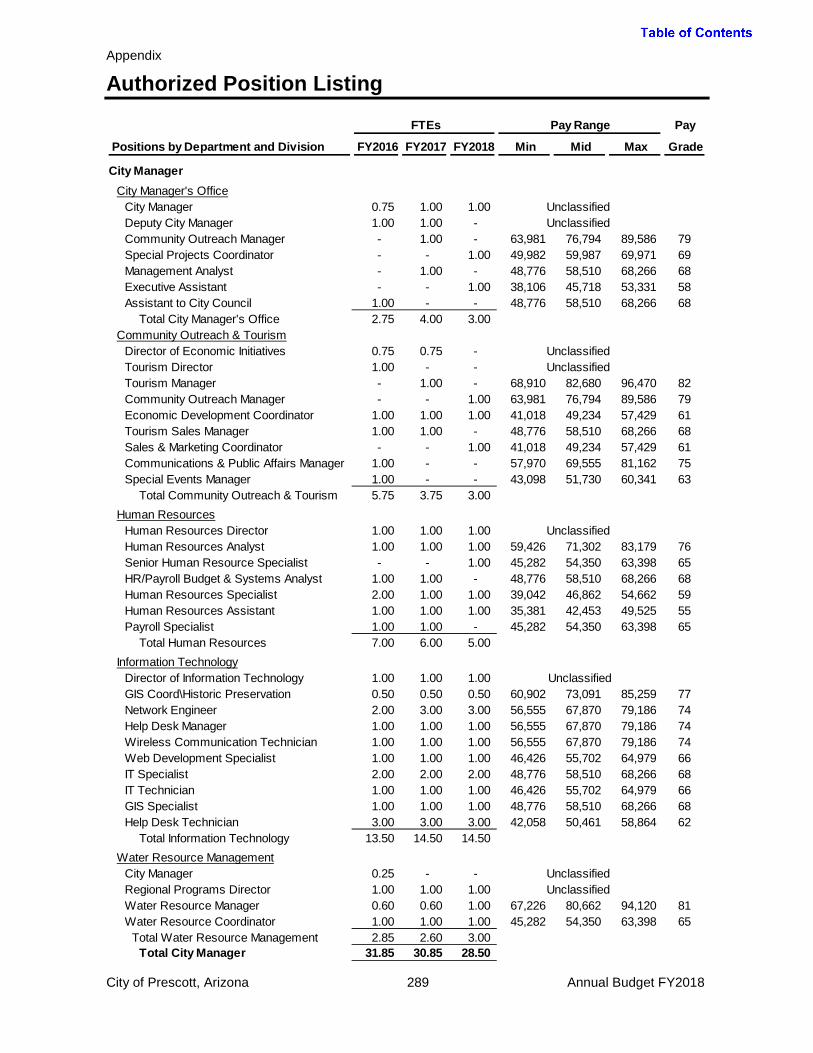
Appendix
Authorized Position Listing
Pay
FY2016 FY2017 FY2018 Min Mid Max Grade
City ManagerCity Manager's Office
City Manager 0.75 1.00 1.00 Deputy City Manager 1.00 1.00 - Community Outreach Manager - 1.00 - 63,981 76,794 89,586 79Special Projects Coordinator - - 1.00 49,982 59,987 69,971 69Management Analyst - 1.00 - 48,776 58,510 68,266 68Executive Assistant - - 1.00 38,106 45,718 53,331 58Assistant to City Council 1.00 - - 48,776 58,510 68,266 68
Total City Manager's Office 2.75 4.00 3.00 Community Outreach & Tourism
Director of Economic Initiatives 0.75 0.75 - Tourism Director 1.00 - - Tourism Manager - 1.00 - 68,910 82,680 96,470 82Community Outreach Manager - - 1.00 63,981 76,794 89,586 79Economic Development Coordinator 1.00 1.00 1.00 41,018 49,234 57,429 61Tourism Sales Manager 1.00 1.00 - 48,776 58,510 68,266 68Sales & Marketing Coordinator - - 1.00 41,018 49,234 57,429 61Communications & Public Affairs Manager 1.00 - - 57,970 69,555 81,162 75Special Events Manager 1.00 - - 43,098 51,730 60,341 63
Total Community Outreach & Tourism 5.75 3.75 3.00 Human Resources
Human Resources Director 1.00 1.00 1.00 Human Resources Analyst 1.00 1.00 1.00 59,426 71,302 83,179 76Senior Human Resource Specialist - - 1.00 45,282 54,350 63,398 65HR/Payroll Budget & Systems Analyst 1.00 1.00 - 48,776 58,510 68,266 68Human Resources Specialist 2.00 1.00 1.00 39,042 46,862 54,662 59Human Resources Assistant 1.00 1.00 1.00 35,381 42,453 49,525 55Payroll Specialist 1.00 1.00 - 45,282 54,350 63,398 65
Total Human Resources 7.00 6.00 5.00 Information Technology
Director of Information Technology 1.00 1.00 1.00 GIS Coord\Historic Preservation 0.50 0.50 0.50 60,902 73,091 85,259 77Network Engineer 2.00 3.00 3.00 56,555 67,870 79,186 74Help Desk Manager 1.00 1.00 1.00 56,555 67,870 79,186 74Wireless Communication Technician 1.00 1.00 1.00 56,555 67,870 79,186 74Web Development Specialist 1.00 1.00 1.00 46,426 55,702 64,979 66IT Specialist 2.00 2.00 2.00 48,776 58,510 68,266 68IT Technician 1.00 1.00 1.00 46,426 55,702 64,979 66GIS Specialist 1.00 1.00 1.00 48,776 58,510 68,266 68Help Desk Technician 3.00 3.00 3.00 42,058 50,461 58,864 62
Total Information Technology 13.50 14.50 14.50 Water Resource Management
City Manager 0.25 - - Regional Programs Director 1.00 1.00 1.00 Water Resource Manager 0.60 0.60 1.00 67,226 80,662 94,120 81Water Resource Coordinator 1.00 1.00 1.00 45,282 54,350 63,398 65
Total Water Resource Management 2.85 2.60 3.00 Total City Manager 31.85 30.85 28.50
Pay Range
Unclassified
Unclassified
Positions by Department and Division
Unclassified
FTEs
Unclassified Unclassified
Unclassified
Unclassified Unclassified
City of Prescott, Arizona 289 Annual Budget FY2018

Appendix
Authorized Position Listing
Pay
FY2016 FY2017 FY2018 Min Mid Max Grade
Community DevelopmentAdministration/Planning and Zoning
Community Development Director 0.50 0.50 0.50 Planning Manager 1.00 1.00 1.00 68,910 82,680 96,470 82Planner 1.00 1.00 1.00 51,230 61,485 71,739 70GIS Coord\Historic Preservation 0.50 0.50 0.50 60,902 73,091 85,259 77Administrative Specialist 1.00 1.00 1.00 33,675 40,414 47,133 53
Total Administration/Planning and Zoning 4.00 4.00 4.00 Building Safety
Community Development Director 0.50 0.50 0.50 Chief Building Official 1.00 1.00 1.00 63,981 76,794 89,586 79Plans Examiner/Building Inspector 2.00 3.00 3.00 45,282 54,350 63,398 65Building Inspector 2.00 2.00 3.00 43,098 51,730 60,341 63Permit Technician 1.00 1.00 2.00 31,262 37,523 43,784 50Plans Examiner/Building Fire Inspector - - 1.00 45,282 54,350 63,398 65
Total Building Safety 6.50 7.50 10.50 Code Compliance
Chief Code Compliance Officer 1.00 1.00 1.00 52,520 63,024 73,528 71Code Enforcement Officer 1.00 - - 38,106 45,718 53,331 58Secretary - - 1.00 29,765 35,714 41,662 48
Total Code Compliance 2.00 1.00 2.00 Total Community Development 12.50 12.50 16.50
Fire DepartmentAdministration
Fire Chief 1.00 1.00 1.00 Business Manager 1.00 1.00 1.00 40,019 48,027 56,035 60Secretary 1.00 - - 29,765 35,714 41,662 48
Total Administration 3.00 2.00 2.00 Community Risk Reduction
Division Chief/Battalion Chief 1.00 1.00 1.00 76,066 91,270 106,475 86Plans Examiner 1.00 1.00 - 46,426 55,702 64,979 66Fire Inspector 1.00 1.00 - 43,098 51,730 60,341 63Fuels Management Coordinator 1.00 1.00 1.00 36,254 43,514 50,773 56Fuel Reduction Technician 2.00 2.00 2.00 34,507 41,413 48,318 54Secretary - 1.00 - 29,765 35,714 41,662 48
Total Community Risk Reduction 6.00 7.00 4.00 Emergency Services
Division Chief/Battalion Chief 3.00 3.00 3.00 79,200 95,032 110,863 86FFire Captain 15.00 15.00 15.00 67,565 81,096 94,605 78FFire Engineer 18.00 18.00 18.00 52,796 63,333 73,892 68FFirefighter 21.00 21.00 21.00 47,820 57,389 66,957 64F
Total Suppression 57.00 57.00 57.00 Fire Professional Services
Division Chief/Battalion Chief 1.00 1.00 1.00 76,066 91,270 106,475 86Administrative Specialist 1.00 1.00 1.00 33,675 40,414 47,133 53
Total Fire Professional Services 2.00 2.00 2.00 Total Fire Department 68.00 68.00 65.00
Pay Range
Positions by Department and Division
FTEs
Unclassified
Unclassified
Unclassified
City of Prescott, Arizona 290 Annual Budget FY2018
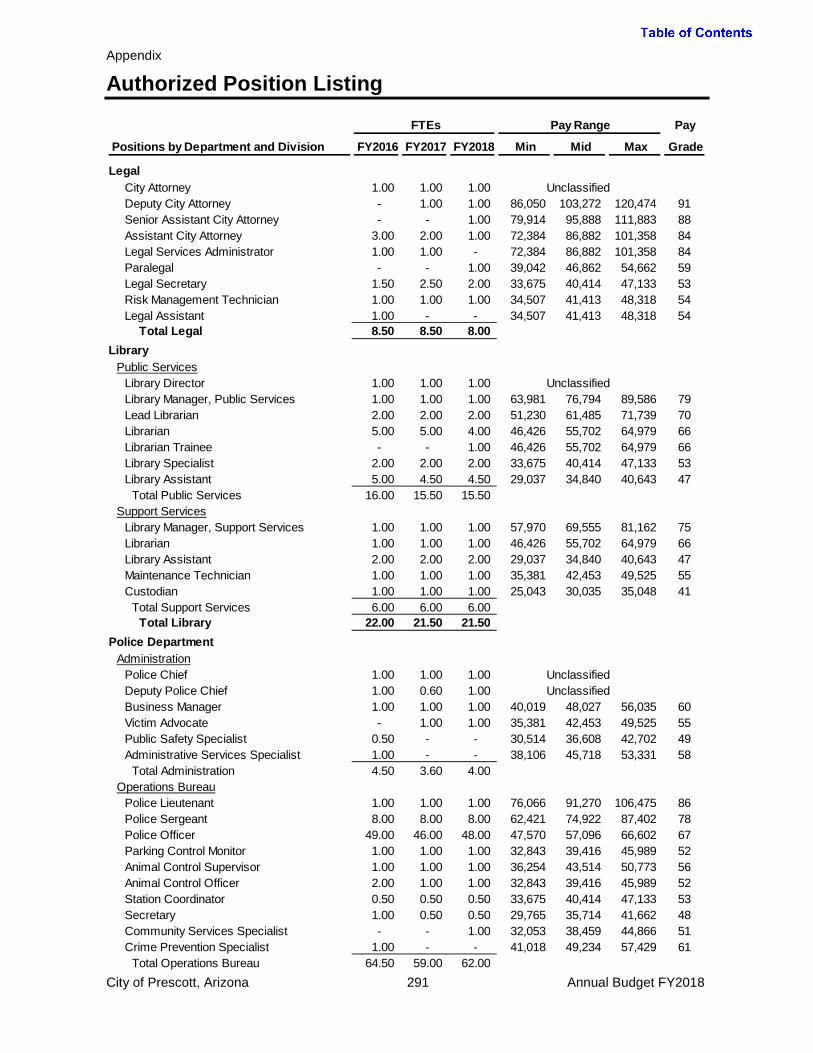
Appendix
Authorized Position Listing
Pay
FY2016 FY2017 FY2018 Min Mid Max Grade
LegalCity Attorney 1.00 1.00 1.00 Deputy City Attorney - 1.00 1.00 86,050 103,272 120,474 91Senior Assistant City Attorney - - 1.00 79,914 95,888 111,883 88Assistant City Attorney 3.00 2.00 1.00 72,384 86,882 101,358 84Legal Services Administrator 1.00 1.00 - 72,384 86,882 101,358 84Paralegal - - 1.00 39,042 46,862 54,662 59Legal Secretary 1.50 2.50 2.00 33,675 40,414 47,133 53Risk Management Technician 1.00 1.00 1.00 34,507 41,413 48,318 54Legal Assistant 1.00 - - 34,507 41,413 48,318 54
Total Legal 8.50 8.50 8.00 Library
Public ServicesLibrary Director 1.00 1.00 1.00 Library Manager, Public Services 1.00 1.00 1.00 63,981 76,794 89,586 79Lead Librarian 2.00 2.00 2.00 51,230 61,485 71,739 70Librarian 5.00 5.00 4.00 46,426 55,702 64,979 66Librarian Trainee - - 1.00 46,426 55,702 64,979 66Library Specialist 2.00 2.00 2.00 33,675 40,414 47,133 53Library Assistant 5.00 4.50 4.50 29,037 34,840 40,643 47
Total Public Services 16.00 15.50 15.50 Support Services
Library Manager, Support Services 1.00 1.00 1.00 57,970 69,555 81,162 75Librarian 1.00 1.00 1.00 46,426 55,702 64,979 66Library Assistant 2.00 2.00 2.00 29,037 34,840 40,643 47Maintenance Technician 1.00 1.00 1.00 35,381 42,453 49,525 55Custodian 1.00 1.00 1.00 25,043 30,035 35,048 41
Total Support Services 6.00 6.00 6.00 Total Library 22.00 21.50 21.50
Police DepartmentAdministration
Police Chief 1.00 1.00 1.00 Deputy Police Chief 1.00 0.60 1.00 Business Manager 1.00 1.00 1.00 40,019 48,027 56,035 60Victim Advocate - 1.00 1.00 35,381 42,453 49,525 55Public Safety Specialist 0.50 - - 30,514 36,608 42,702 49Administrative Services Specialist 1.00 - - 38,106 45,718 53,331 58
Total Administration 4.50 3.60 4.00 Operations Bureau
Police Lieutenant 1.00 1.00 1.00 76,066 91,270 106,475 86Police Sergeant 8.00 8.00 8.00 62,421 74,922 87,402 78Police Officer 49.00 46.00 48.00 47,570 57,096 66,602 67Parking Control Monitor 1.00 1.00 1.00 32,843 39,416 45,989 52Animal Control Supervisor 1.00 1.00 1.00 36,254 43,514 50,773 56Animal Control Officer 2.00 1.00 1.00 32,843 39,416 45,989 52Station Coordinator 0.50 0.50 0.50 33,675 40,414 47,133 53Secretary 1.00 0.50 0.50 29,765 35,714 41,662 48Community Services Specialist - - 1.00 32,053 38,459 44,866 51Crime Prevention Specialist 1.00 - - 41,018 49,234 57,429 61
Total Operations Bureau 64.50 59.00 62.00
Pay Range
Positions by Department and Division
FTEs
Unclassified
Unclassified
Unclassified Unclassified
City of Prescott, Arizona 291 Annual Budget FY2018

Appendix
Authorized Position Listing
Pay
FY2016 FY2017 FY2018 Min Mid Max Grade
Support BureauPolice Lieutenant 1.00 1.00 1.00 76,066 91,270 106,475 86Police Sergeant 1.00 1.00 1.00 62,421 74,922 87,402 78Police Officer 9.00 9.00 7.00 47,570 57,096 66,602 67Secretary 0.50 1.00 1.00 29,765 35,714 41,662 48Property &Evidence Technician-CSI 2.00 1.00 1.00 42,058 50,461 58,864 62Property & Evidence Technician - - 1.00 39,042 46,862 54,662 59Public Safety Specialist 0.50 0.50 - 30,514 36,608 42,702 49Administrative Services Specialist - 1.00 1.00 38,106 45,718 53,331 58Police Records Supervisor 1.00 1.00 1.00 51,230 61,485 71,739 70Police Records Clerk 4.00 4.00 3.00 33,675 40,414 47,133 53Police Services Coordinator - 1.00 - 32,053 38,459 44,866 51Police Training Coordinator 1.00 - - 32,053 38,459 44,866 51
Total Support Bureau 20.00 20.50 17.00 Total Police Department 89.00 83.10 83.00
Public WorksProgram Development
Public Works Director 0.30 0.30 0.16 Program Development Manager - 0.40 0.40 79,914 95,888 111,883 88City Engineer - 0.70 0.70 79,914 95,888 111,883 88Capital Project Manager 5.00 5.00 5.00 67,226 80,662 94,120 81Public Works Analyst 0.20 0.20 0.20 55,182 66,206 77,251 73Administrative Assistant 0.20 0.40 0.16 35,381 42,453 49,525 55Secretary 0.20 0.20 0.16 29,765 35,714 41,662 48Contract Specialist 2.00 0.80 0.32 41,018 49,234 57,429 61Development Coordinator/Records Control 1.00 0.10 0.10 37,170 44,595 52,042 57Development Review Supervisor 1.00 1.00 1.00 51,230 61,485 71,739 70Engineering Technician 1.00 1.00 1.00 43,098 51,730 60,341 63Permit Technician 1.00 1.00 1.00 37,170 44,595 52,042 57
Total Program Development 11.90 11.10 10.20 Utilities
Public Works Director 0.70 0.70 0.36 City Engineer - 0.30 0.30 79,914 95,888 111,883 88Civil Utility Engineer 1.00 1.00 1.00 68,910 82,680 96,470 82Program Development Manager 0.60 0.60 0.60 79,914 95,888 111,883 88Utilities Manager 1.00 1.00 1.00 77,958 93,558 109,138 87Water Resource Manager 0.40 0.40 - 67,226 80,662 94,120 81Public Works Analyst 0.80 0.80 0.40 55,182 66,206 77,251 73Senior Infrastructure Analyst - 1.00 1.00 68,910 82,680 96,470 82Development Coordinator/Records Control - 0.20 0.20 37,170 44,595 52,042 57Administrative Assistant 0.80 0.60 0.36 35,381 42,453 49,525 55Secretary 1.80 1.80 1.36 29,765 35,714 41,662 48Administrative Specialist 2.00 2.00 2.00 33,675 40,414 47,133 53Contract Specialist - 1.20 0.72 41,018 49,234 57,429 61Water Superintendent 1.00 1.00 1.00 60,902 73,091 85,259 77Water Distribution Supervisor 1.00 1.00 1.00 51,230 61,485 71,739 70Water Production Supervisor 1.00 1.00 1.00 51,230 61,485 71,739 70Wastewater Superintendent 1.00 1.00 1.00 60,902 73,091 85,259 77Wastewater Collection Supervisor 1.00 1.00 1.00 51,230 61,485 71,739 70WW Treatment Plant Operations Supv. 2.00 2.00 2.00 52,520 63,024 73,528 71
Pay Range
Positions by Department and Division
FTEs
Unclassified
Unclassified
City of Prescott, Arizona 292 Annual Budget FY2018
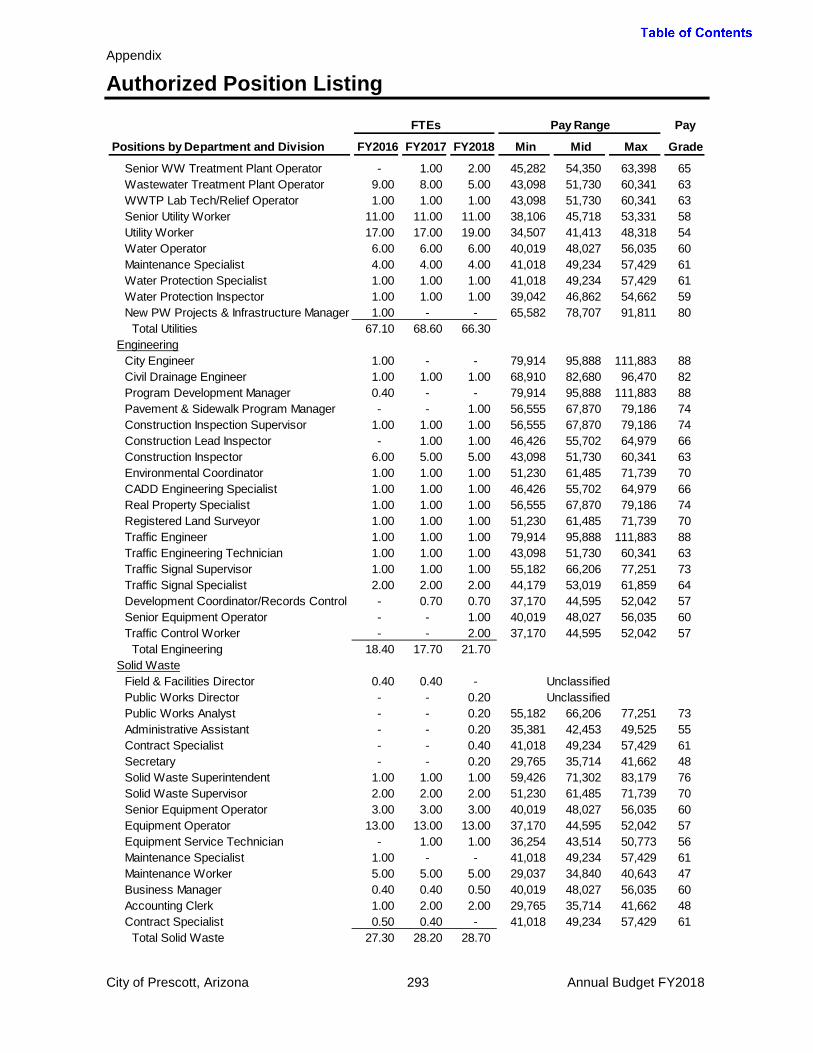
Appendix
Authorized Position Listing
Pay
FY2016 FY2017 FY2018 Min Mid Max Grade
Senior WW Treatment Plant Operator - 1.00 2.00 45,282 54,350 63,398 65Wastewater Treatment Plant Operator 9.00 8.00 5.00 43,098 51,730 60,341 63WWTP Lab Tech/Relief Operator 1.00 1.00 1.00 43,098 51,730 60,341 63Senior Utility Worker 11.00 11.00 11.00 38,106 45,718 53,331 58Utility Worker 17.00 17.00 19.00 34,507 41,413 48,318 54Water Operator 6.00 6.00 6.00 40,019 48,027 56,035 60Maintenance Specialist 4.00 4.00 4.00 41,018 49,234 57,429 61Water Protection Specialist 1.00 1.00 1.00 41,018 49,234 57,429 61Water Protection Inspector 1.00 1.00 1.00 39,042 46,862 54,662 59New PW Projects & Infrastructure Manager 1.00 - - 65,582 78,707 91,811 80
Total Utilities 67.10 68.60 66.30 Engineering
City Engineer 1.00 - - 79,914 95,888 111,883 88Civil Drainage Engineer 1.00 1.00 1.00 68,910 82,680 96,470 82Program Development Manager 0.40 - - 79,914 95,888 111,883 88Pavement & Sidewalk Program Manager - - 1.00 56,555 67,870 79,186 74Construction Inspection Supervisor 1.00 1.00 1.00 56,555 67,870 79,186 74Construction Lead Inspector - 1.00 1.00 46,426 55,702 64,979 66Construction Inspector 6.00 5.00 5.00 43,098 51,730 60,341 63Environmental Coordinator 1.00 1.00 1.00 51,230 61,485 71,739 70CADD Engineering Specialist 1.00 1.00 1.00 46,426 55,702 64,979 66Real Property Specialist 1.00 1.00 1.00 56,555 67,870 79,186 74Registered Land Surveyor 1.00 1.00 1.00 51,230 61,485 71,739 70Traffic Engineer 1.00 1.00 1.00 79,914 95,888 111,883 88Traffic Engineering Technician 1.00 1.00 1.00 43,098 51,730 60,341 63Traffic Signal Supervisor 1.00 1.00 1.00 55,182 66,206 77,251 73Traffic Signal Specialist 2.00 2.00 2.00 44,179 53,019 61,859 64Development Coordinator/Records Control - 0.70 0.70 37,170 44,595 52,042 57Senior Equipment Operator - - 1.00 40,019 48,027 56,035 60Traffic Control Worker - - 2.00 37,170 44,595 52,042 57
Total Engineering 18.40 17.70 21.70 Solid Waste
Field & Facilities Director 0.40 0.40 - Public Works Director - - 0.20 Public Works Analyst - - 0.20 55,182 66,206 77,251 73Administrative Assistant - - 0.20 35,381 42,453 49,525 55Contract Specialist - - 0.40 41,018 49,234 57,429 61Secretary - - 0.20 29,765 35,714 41,662 48Solid Waste Superintendent 1.00 1.00 1.00 59,426 71,302 83,179 76Solid Waste Supervisor 2.00 2.00 2.00 51,230 61,485 71,739 70Senior Equipment Operator 3.00 3.00 3.00 40,019 48,027 56,035 60Equipment Operator 13.00 13.00 13.00 37,170 44,595 52,042 57Equipment Service Technician - 1.00 1.00 36,254 43,514 50,773 56Maintenance Specialist 1.00 - - 41,018 49,234 57,429 61Maintenance Worker 5.00 5.00 5.00 29,037 34,840 40,643 47Business Manager 0.40 0.40 0.50 40,019 48,027 56,035 60Accounting Clerk 1.00 2.00 2.00 29,765 35,714 41,662 48Contract Specialist 0.50 0.40 - 41,018 49,234 57,429 61
Total Solid Waste 27.30 28.20 28.70
Pay Range
Positions by Department and Division
FTEs
Unclassified Unclassified
City of Prescott, Arizona 293 Annual Budget FY2018

Appendix
Authorized Position Listing
Pay
FY2016 FY2017 FY2018 Min Mid Max Grade
Street MaintenanceField & Facilities Director 0.40 0.40 - Public Works Director - - 0.28 Public Works Analyst - - 0.20 55,182 66,206 77,251 73Administrative Assistant - - 0.28 35,381 42,453 49,525 55Secretary - - 0.28 29,765 35,714 41,662 48Streets Maintenance Superintendent 1.00 1.00 1.00 59,426 71,302 83,179 76Streets Maintenance Supervisor 3.00 3.00 2.00 51,230 61,485 71,739 70Equipment Service Technician - 2.00 2.00 36,254 43,514 50,773 56Senior Equipment Operator 3.00 3.00 2.00 40,019 48,027 56,035 60Equipment Operator 13.00 15.00 15.00 37,170 44,595 52,042 57Traffic Control Worker 2.00 2.00 - 37,170 44,595 52,042 57Maintenance Worker 4.00 2.00 2.00 29,037 34,840 40,643 47Business Manager 0.40 0.40 0.50 40,019 48,027 56,035 60Accounting Clerk 1.00 1.00 1.00 29,765 35,714 41,662 48Contract Specialist 0.10 0.20 0.56 41,018 49,234 57,429 61Maintenance Specialist 1.00 - - 41,018 49,234 57,429 61Maintenance Technician 1.00 - - 35,381 42,453 49,525 55
Total Street Maintenance 29.90 30.00 27.10 Total Public Works 154.60 155.60 154.00
Recreation ServicesParks, Lakes, Trails, and Landscape Maintenance
Recreation Director 1.00 1.00 1.00 Maintenance Superintendent 1.00 1.00 1.00 59,426 71,302 83,179 76Recreation Services Supervisor 1.00 1.00 1.00 48,776 58,510 68,266 68Special Projects Administrator 1.00 - - 48,776 58,510 68,266 68Parks Regional Coordinator - - - 40,019 48,027 56,035 60Maintenance Coordinator 1.00 1.00 1.00 40,019 48,027 56,035 60Landscape Coordinator 1.00 1.00 1.00 40,019 48,027 56,035 60Turf & Irrigation Coordinator 1.00 1.00 1.00 40,019 48,027 56,035 60Trails/Natural Parklands Coordinator 1.00 1.00 1.00 40,019 48,027 56,035 60Equipment Mechanic 2.00 2.00 2.00 39,042 46,862 54,662 59Community Services Work Monitor 2.00 2.00 2.00 30,514 36,608 42,702 49Maintenance Worker 3.00 3.00 3.00 29,037 34,840 40,643 47Maintenance Technician 3.00 3.00 3.00 35,381 42,453 49,525 55Grounds Superintendent 1.00 1.00 1.00 56,555 67,870 79,186 74Assistant Grounds Superintendent 2.00 2.00 2.00 46,426 55,702 64,979 66Service Technician 1.00 1.00 1.00 32,843 39,416 45,989 52Irrigation Technician 2.00 1.00 1.00 35,381 42,453 49,525 55Groundskeeper 2.00 3.00 3.00 29,037 34,840 40,643 47
Total Parks, Lakes, Trails, and Landscape 26.00 25.00 25.00 Recreation Programming
Recreation Supervisor 1.00 1.00 1.00 56,555 67,870 79,186 74Recreation Coordinator 2.00 2.00 2.00 40,019 48,027 56,035 60Administrative Coordinator - 1.00 1.00 37,170 44,595 52,042 57Administrative Specialist - 1.00 1.00 33,675 40,414 47,133 53Secretary 1.00 - - 29,765 35,714 41,662 48
Total Recreation Programming 4.00 5.00 5.00
Pay Range
Positions by Department and Division
FTEs
Unclassified
Unclassified Unclassified
City of Prescott, Arizona 294 Annual Budget FY2018

Appendix
Authorized Position Listing
Pay
FY2016 FY2017 FY2018 Min Mid Max Grade
Facilities ManagementField & Facilities Director 0.10 0.10 - Facilities Manager 1.00 1.00 1.00 59,426 71,302 83,179 76Facilities Maintenance Superintendent 1.00 1.00 1.00 59,426 71,302 83,179 76Maintenance Specialist 1.00 2.00 2.00 41,018 49,234 57,429 61Facilities Coordinator 1.00 1.00 1.00 40,019 48,027 56,035 60Custodian 2.00 2.00 2.00 25,043 30,035 35,048 41Business Manager 0.10 0.10 - 40,019 48,027 56,035 60Secretary - 0.10 0.10 29,765 35,714 41,662 48Accounting Clerk 0.10 - - 29,765 35,714 41,662 48Contract Specialist 0.15 0.15 0.50 41,018 49,234 57,429 61
Total Facilities Management 6.45 7.45 7.60 Fleet Services
Field & Facilities Director 0.10 0.10 - Fleet Manager 1.00 1.00 1.00 59,426 71,302 83,179 76Fleet Maintenance Superintendent - - - 56,555 67,870 79,186 74Fleet Maintenance Supervisor 1.00 1.00 1.00 51,230 61,485 71,739 70Senior Equipment Mechanic - - 1.00 42,058 50,461 58,864 62Equipment Mechanic 5.00 5.00 4.00 39,042 46,862 54,662 59Parts and Service Specialist - 1.00 1.00 39,042 46,862 54,662 59Parts Specialist 1.00 - - 32,843 39,416 45,989 52Business Manager 0.10 0.10 - 40,019 48,027 56,035 60Secretary - 0.90 0.90 29,765 35,714 41,662 48Accounting Clerk 0.90 - - 29,765 35,714 41,662 48Contract Specialist 0.25 0.25 0.50 41,018 49,234 57,429 61
Total Fleet Services 9.35 9.35 9.40 Total Recreation Services 45.80 46.80 47.00
Regional CommunicationsDeputy Police Chief - 0.40 - Police Lieutenant 1.00 - 1.00 76,066 91,270 106,475 86PRCC Manager - 1.00 1.00 59,426 71,302 83,179 76Business Manager 1.00 - - 40,019 48,027 56,035 60Administrative Supervisor - 1.00 - 41,018 49,234 57,429 61Communications Specialist Supervisor 4.00 4.00 4.00 45,282 54,350 63,398 65Communications Specialist 24.00 24.00 24.00 39,042 46,862 54,662 59
Total Regional Communications 30.00 30.40 30.00 Total City-wide Authorized 501.00 497.50 494.00
Pay Range
Positions by Department and Division
FTEs
Unclassified
Unclassified
Unclassified
City of Prescott, Arizona 295 Annual Budget FY2018

Appendix
Authorized Pay Grade Ranges
Pay Grade
Annual Minimum
Annual Midpoint
Annual Maximum
Pay Grade
Annual Minimum
Annual Midpoint
Annual Maximum
20 14,913.60 17,888.00 20,862.40 68 48,776.00 58,510.40 68,265.60 21 15,288.00 18,324.80 21,382.40 69 49,982.40 59,987.20 69,971.20 22 15,662.40 18,803.20 21,923.20 70 51,230.40 61,484.80 71,739.20 23 16,057.60 19,260.80 22,464.00 71 52,520.00 63,024.00 73,528.00 24 16,452.80 19,739.20 23,025.60 72 53,830.40 64,604.80 75,358.40 25 16,868.80 20,238.40 23,608.00 73 55,182.40 66,206.40 77,251.20 26 17,284.80 20,758.40 24,211.20 74 56,555.20 67,870.40 79,185.60 27 17,721.60 21,257.60 24,814.40 75 57,969.60 69,555.20 81,161.60 28 18,158.40 21,798.40 25,417.60 76 59,425.60 71,302.40 83,179.20 29 18,616.00 22,339.20 26,062.40 77 60,902.40 73,091.20 85,259.20 30 19,073.60 22,900.80 26,707.20 78 62,420.80 74,921.60 87,401.60 31 19,552.00 23,462.40 27,372.80 79 63,980.80 76,793.60 89,585.60 32 20,051.20 24,065.60 28,059.20 80 65,582.40 78,707.20 91,811.20 33 20,550.40 24,668.80 28,766.40 81 67,225.60 80,662.40 94,120.00 34 21,070.40 25,272.00 29,494.40 82 68,910.40 82,680.00 96,470.40 35 21,590.40 25,916.80 30,222.40 83 70,636.80 84,760.00 98,883.20 36 22,131.20 26,561.60 30,971.20 84 72,384.00 86,881.60 101,358.40 37 22,672.00 27,227.20 31,761.60 85 74,193.60 89,044.80 103,875.20 38 23,254.40 27,892.80 32,552.00 86 76,065.60 91,270.40 106,475.20 39 23,836.80 28,600.00 33,363.20 87 77,958.40 93,558.40 109,137.60 40 24,419.20 29,307.20 34,195.20 88 79,913.60 95,888.00 111,883.20 41 25,043.20 30,035.20 35,048.00 89 81,910.40 98,280.00 114,670.40 42 25,667.20 30,804.80 35,921.60 90 83,948.80 100,755.20 117,540.80 43 26,312.00 31,574.40 36,816.00 91 86,049.60 103,272.00 120,473.60 44 26,956.80 32,364.80 37,752.00 92 88,212.80 105,851.20 123,489.60 45 27,643.20 33,155.20 38,688.00 93 90,417.60 108,492.80 126,568.00 46 28,329.60 33,987.20 39,665.60 94 92,664.00 111,196.80 129,729.60 47 29,036.80 34,840.00 40,643.20 95 94,993.60 113,984.00 132,974.40 48 29,764.80 35,713.60 41,662.40 96 97,364.80 116,833.60 136,302.40 49 30,513.60 36,608.00 42,702.40 97 99,798.40 119,745.60 139,713.60 50 31,262.40 37,523.20 43,784.00 98 102,294.40 122,740.80 143,208.00 51 32,052.80 38,459.20 44,865.60 99 104,852.80 125,819.20 146,785.60 52 32,843.20 39,416.00 45,988.80 100 107,473.60 128,960.00 150,467.20 53 33,675.20 40,414.40 47,132.80 101 110,156.80 132,184.00 154,211.20 54 34,507.20 41,412.80 48,318.40 102 112,902.40 135,491.20 158,080.00 55 35,380.80 42,452.80 49,524.80 103 115,731.20 138,881.60 162,032.00 56 36,254.40 43,513.60 50,772.80 104 118,622.40 142,355.20 166,067.20 57 37,169.60 44,595.20 52,041.60 105 121,596.80 145,912.00 170,227.20 58 38,105.60 45,718.40 53,331.20 106 124,633.60 149,552.00 174,491.20 59 39,041.60 46,862.40 54,662.40 107 127,753.60 153,296.00 178,838.40 60 40,019.20 48,027.20 56,035.20 108 130,936.00 157,123.20 183,310.40 61 41,017.60 49,233.60 57,428.80 109 134,222.40 161,054.40 187,907.20 62 42,057.60 50,460.80 58,864.00 110 137,571.20 165,089.60 192,608.00 63 43,097.60 51,729.60 60,340.80 64 44,179.20 53,019.20 61,859.20 64F 47,820.34 57,388.91 66,957.49 65 45,281.60 54,350.40 63,398.40 68F 52,796.00 63,332.69 73,891.89 66 46,425.60 55,702.40 64,979.20 78F 67,565.37 81,096.46 94,605.03 67 47,569.60 57,096.00 66,601.60 86F 79,200.17 95,031.54 110,862.91
City of Prescott, Arizona 296 Annual Budget FY2018
Appendix
Glossary of Terms
Accrual Basis - A basis of accounting in which transactions are recognized at the time they are incurred, as opposed to when cash is received or spent. Actual - Actual, as used in the fund summaries and department and division summaries within the budget document, represents the actual costs results of operations. This category is presented on a GAAP basis, with the exception that depreciation and amortization are not budgeted and principal payments on debt in the enterprise funds are budgeted as expenses. Adopted Budget - Formal action made by City Council which sets the spending limits for the fiscal year. Appropriation - An authorization granted by the City Council to make expenditures and to incur obligations for purposes specified in the Appropriation Ordinance. ARFF – Airport Rescue Fire Fighting Assessed Valuation - A value placed upon real estate or other property by the County Assessor and the State as a basis for levying ad valorem property taxes. Asset - Resources owned or held by a government which has monetary value. ASRS – Arizona State Retirement System – all civilian employees in the City of Prescott contribute to this statewide retirement system. Authorized Positions - Employee positions, which are authorized in the adopted budget, to be filled during the year. Balanced Budget - Arizona State law requires a “balanced” budget, which is “all-inclusive”. Arizona State Revised Statute (42-17151) defines a “balanced” budget as follows:
“Fix, levy and assess the amount to be raised from primary property taxation and secondary property taxation. This amount, plus all other sources of revenue, as estimated, and unencumbered balances from the preceding fiscal year, shall equal the total of amounts proposed to be spent in the budget for the current fiscal year.”
Base Budget Allowances - Ongoing expense for personnel, commodities, and contractual services. Beginning Balance - The beginning balance is the residual funds brought forward from the previous fiscal year (ending balance). Bond Refinancing - The payoff and re-issuance of bonds, to obtain better interest rates and/or bond conditions. Bonds - Bonds are debt instruments which require repayment of a specified principal amount on a certain date (maturity data), together with interest at a stated rate, or according to a formula for determining the interest rate. Budget - A budget is a plan of financial operation embodying an estimate of proposed expenditures and the means of financing them. Budget Basis - This refers to the basis of accounting used to estimate financing sources and uses in the budget. This generally takes one of three forms: GAAP, cash, or modified accrual. Budget Calendar - The schedule of key dates which a government follows in the preparation and adoption of the budget. City of Prescott, Arizona 297 Annual Budget FY2018

Appendix
Glossary of Terms
Budgetary Control - The control or management of a government in accordance with the approved budget for the purpose of keeping expenditures within the limitations of available appropriations and resources. C.Y.M.P.O. - Central Yavapai Metropolitan Planning Organization CAFR – Comprehensive Annual Financial Report – the audited financial statement for the City. Capital Assets - Assets of significant value and having a useful life of several years. Capital assets are also called fixed assets. Capital Improvements - Expenditures related to the acquisition, expansion or rehabilitation of an element of the government’s physical plant; sometimes referred to as infrastructure. Capital Improvement Program (CIP) - A plan for capital outlay to be incurred each year over a fixed number of years to meet capital needs arising from the government’s long-term needs. Capital Project - Major construction, acquisition, or renovation activities which add value to a government’s physical assets or significantly increase their useful life. Also called capital improvements. Capital Outlay - Items costing more than $5,000 and having a useful life of more than one year are defined as capital outlay. Carryover - Any equipment, contractual, commodity, or capital project that has been previously approved by the Mayor and Council but for various reasons has not been implemented on schedule. Under the State laws and generally accepted accounting principles only those costs relating to work actually done on or before the last day of the fiscal year can be reflected on the financial statements of that fiscal year. To avoid having to charge the project costs estimated to be incurred in a subsequent fiscal year as an unbudgeted item for that year and, therefore, a violation of State budget law, such project and the associated projected costs are included in the subsequent year’s budget. Cash Basis - A basis of accounting in which transactions are recognized only when cash is increased or decreased. Commodities - Expendable items used by operating or construction activities. Examples include office supplies, repair and replacement parts for equipment, fuels and lubricants, etc. Community Development Block Grant (CDBG) - Grant funds allocated by the Federal Government to the City of Prescott to use for the prevention and removal of slum and blight, and to benefit low and moderate income persons. The City of Prescott disburses these funds via an application process open to all non-profit organizations and City of Prescott departments. Compression - A problem that occurs when, due to market conditions, the bottom of the pay range moves up more rapidly than salaries of the incumbents. Consumer Price Index (CPI) - A statistical description of price levels provided by the U.S. Department of Labor. The index is used as a measure of the increase in the cost of living (i.e., economic inflation). Contingency - An appropriation of funds to cover unforeseen events that occur during the fiscal year, such as flood emergencies, Federal mandates, shortfalls in revenue and similar eventualities. Contractual Services - Contractual Services are services provided to the City by firms, individuals, or other City departments. City of Prescott, Arizona 298 Annual Budget FY2018

Appendix
Glossary of Terms
Cost Center - An organizational budget/operating unit within each City division or department. Cost-of-living Adjustment (COLA) - An increase in salaries to offset the adverse effect of inflation on compensation. D.A.R.E. - Drug Abuse Resistance Education Debt Service - Payment of interest and principal on an obligation resulting from the issuance of bonds and/or lease purchase contracts. Deficit - The excess of an entity’s liabilities over its assets or the excess of expenditures or expenses over revenues during a single accounting period. Department - A major administrative division of the City which indicates overall management responsibility for an operation or group of related operations within a functional area. Depreciation - An accrual accounting method of allocation a capital asset cost over multiple years. Development-related Fees - Those fees and charges generated by building, development and growth in a community. Included are building and street permits, development review fees, and zoning, platting and subdivision fees. Disbursement - The expenditure of monies from an account. Distinguished Budget Presentation Awards Program - A voluntary awards program administered by the Government Finance Officers Association to encourage governments to prepare effective budget documents. Division - A functional unit within a department consisting of one or more cost centers engaged in activities supporting the unit’s mission and objectives. Employee Benefits - Contributions made by a government to meet commitments or obligations for employee fringe benefits. Included are the government’s share of costs for Social Security and the various pension, medical, and life insurance plans. Encumbrance - A reservation of funds to cover purchase orders, contracts or other funding commitments which are yet to be fulfilled. The budget basis of accounting considers an encumbrance to be the equivalent of an expenditure. Enterprise Funds - Funds which are accounted for in a manner similar to a private business enterprise. Usually the governmental entity intends for enterprise funds to fully recover their costs (including depreciation) through user fees. The City of Prescott has six such self-supporting funds: Airport, Water, Wastewater, Golf, Solid Waste, and Transfer Station. Estimate - As used throughout the budget document, represents the most recent estimate for current year revenue and expenditures. The estimates used are prepared using several months of actual expenditure and revenue experience and are prepared to consider the impact of unanticipated price or other economic changes. Expenditures - Refers to current cash operating expenses and encumbrances. Expense - Charges incurred (whether paid immediately or unpaid) for operations, maintenance, interest or other charges.
City of Prescott, Arizona 299 Annual Budget FY2018

Appendix
Glossary of Terms
Expenditure Limitation - The Arizona State Legislature imposed constitutional amendment which limits the annual expenditures of all municipalities. This limit is set by the Economic Estimates Commission based on population growth and inflation. Fiscal Year - The time period designated by the City satisfying the beginning and ending period for recording financial transactions. The City of Prescott has specified July 1 to June 30 as its fiscal year. Fixed Assets - Assets of a long-term character which are intended to continue to be held or used, such as land, buildings, machinery, furniture and other equipment. Full-Time Equivalent Position - A part-time position converted to the decimal equivalent of a full-time position based on 2,080 hours per year. For example, a part-time typist working for 20 hours per week would be equivalent to .5 of a full-time position. Fund - An independent governmental accounting entity with a self-balancing group of accounts including assets, liabilities and fund balance. Fund Balance - The excess of the assets of a fund over its liabilities, reserves, and carryover. Governmental Fund: Includes the general fund, special revenue funds and debt service funds. Governmental funds account for all services provided which do not have revenues generated directly by providing services. Rather, revenues are more indirect in forms of taxes or fees. GAAP - Generally Accepted Accounting Principles. Uniform minimum standards for financial accounting and recording, encompassing the conventions, rules, and procedures that define accepted accounting principles. General Fund - A fund used to account for all general-purpose transactions of the City which do not require a special type of fund. General Obligation Bonds (G.O. Bonds) - Bonds that require voter approval and finance a variety of public capital projects such as streets, buildings, parks and improvements. The bonds are backed by the “full faith and credit” of the issuing government. GFOA – The Government Finance Officers Association is a professional association of approximately 18,500 state, provincial, and local government finance officers in the United States and Canada. GFOA is headquartered in downtown Chicago. Goal - A statement of broad direction, purpose or intent based on the needs of the community. A goal is general and timeless; that is, it is not concerned with a specific achievement in a given time period. Grant - A grant is a contribution by one government unit or funding source to another. The contribution is usually made to aid in the support of a specified function, i.e., library materials, drug enforcement, but it is sometimes for general purposes. Highway User Revenue Fund (HURF) - Highway user revenues are a gasoline tax collected by the state and distributed to counties and cities based on the county of origin and population. These revenues are to be used for highways and streets maintenance and construction. Impact Fees - Fees charged to developers or individuals to cover, in whole or in part, the anticipated costs of improvements that will be necessary as a result of the development. Improvement Districts - Consists of property owners desiring improvements to their property. Bonds are issued to finance these improvements, which are repaid by assessments on affected property. Improvement District debt is paid for by a compulsory levy (special assessment) made against certain properties to defray all or part of the cost of a specific capital improvement or service deemed to benefit primarily those properties. City of Prescott, Arizona 300 Annual Budget FY2018

Appendix
Glossary of Terms
Indirect Cost - A cost necessary for the functioning of the organization as a whole, but which cannot be directly assigned to one service. Infrastructure - The physical assets of a government (e.g., streets, water, sewer, public buildings and parks). Interfund Transfers - Transfer of resources between funds that are not recorded as revenues to the fund receiving or expenditures to the fund providing. Intergovernmental Revenue - Funds received from federal, state and other local government sources in the form of grants, shared revenues, and payments in lieu of taxes. Internal Charges - The charges to user departments for intercity services provided by another City departments. Levy - To impose taxes for the support of government activities. Long-term Debt - Debt with a maturity of more than one year after the date of issuance. Mandate - Legislation passed by the State or Federal government requiring action or provision of services and/or programs. Examples include the Americans with Disabilities Act which requires actions such as physical facility improvements and provision of specialized transportation services. Municipal Property Corporation (MPC) - The Municipal Property Corporation is a non-profit corporation established to issue bonds to fund City capital improvement projects. Net Budget - The legally adopted budget less all interfund transfers and interdepartmental charges. Objective - Desired output oriented accomplishments which can be measured and achieved within a given time frame. Achievement of the objective advances the activity organization toward a corresponding goal. Obligations - Amounts which a government may be legally required to meet out of its resources. They include not only actual liabilities, but also encumbrances not yet paid. Operating Budget - A budget for general expenditures such as salaries, utilities, and supplies. Operating Expenses - The cost for personnel, materials and equipment required for a department to function. Operating Funds - Resources derived from recurring revenue sources used to finance ongoing operating expenditures and pay-as-you-go capital projects. Other Services and Charges: Expenditures for service performed by firms or individuals outside of the City. These include contracted services, insurance, cleaning services, professional services, advertising, postage and freight, telecommunications, travel/training, printing and binding, utilities, rental equipment, and maintenance/repair. Pay-As-You-Go Capital Projects - Pay-as-you-go capital projects are capital projects whose funding source is derived from City revenue sources other than through the use of debt. Performance Indicators - Specific quantitative and qualitative measures of work performed as an objective of specific departments or programs. Performance Measure - Data collected to determine how effective or efficient a program is in achieving its objectives. City of Prescott, Arizona 301 Annual Budget FY2018

Appendix
Glossary of Terms
Personnel - All employer’s costs related to compensating employees of the City of Prescott, including employee fringe benefit costs such as City portion of retirement, social security, and health and industrial insurance. Primary Property Tax - A limited tax levy used to support general government operations. The total levy for primary property taxes is restricted to a 2% annual increase, plus allowances for previously unassessed property (primarily new construction). Program - A group of related activities performed by one or more organizational units for the purpose of accomplishing a function for which the City is responsible. Property Tax - A levy upon each $100 of assessed valuation of property within the City of Prescott. Arizona has two types of property taxes. Primary property taxes support the City of Prescott’s general fund, and secondary property taxes pay general obligation debt. PSPRS – Public Safety Personnel Retirement System – sworn police and fire personnel in the City of Prescott participate in this retirement system. Reserve - An account used either to set aside budgeted revenues that are not required for expenditure in the current budget year or to earmark revenues for a specific future purpose. Resolution - A special or temporary order of a legislative body; an order of a legislative body requiring less legal formality than an ordinance or statute. Resources - Total amounts available for appropriation including estimated revenues, fund transfers and beginning fund balances. Revenue - Sources of income financing the operations of government. SCADA - Supervisory Control and Data Acquisition Secondary Property Tax - An unlimited tax levy restricted to general bonded debt obligations. Service Level - Services or products which comprise actual or expected output of a given program. Focus is on results, not measures of workload. Supplies: Includes purchases of tangible personal property for operations. Operating supplies include articles, materials, and commodities which are consumed or generally altered when used. These items are necessary for the basic operation of the program or activity. Source of Revenue - Revenues are classified according to their source or point of origin. Special Assessment - A compulsory levy made against certain properties to defray all or part of the cost of a specific capital improvement or service deemed to benefit primarily those properties. Special Revenue Fund - to account for the proceeds of specific revenue sources that are legally restricted to expenditure for specified purposes. State-Shared Revenues - Revenues levied and collected by the State but shared on a predetermined basis with local governments. Tax Levy - The total amount to be raised by general property taxes for purposes specified in the Tax Levy Ordinance. Tax Rate - The amount of tax levied for each $100 of assessed valuation. City of Prescott, Arizona 302 Annual Budget FY2018

Appendix
Glossary of Terms
Taxes - Compulsory charges levied by a government for the purpose of financing services performed for the common benefit of the people. This term does not include specific charges made against particular persons or property for current or permanent benefit, such as special assessments. Transfers - Transfers are the authorized exchanges of cash or other resources between funds. Transfers In/Out - Amounts transferred from one fund to another to assist in financing the services for the recipient fund. U/W/I - Urban Wildland Interface Unrestricted Fund Balance - The portion of a fund’s balance that is not restricted for a specific purpose and is available for general appropriation. User Charges - The payment of a fee for direct receipt of a public service by the party benefiting from the service. Workload Indicator - A unit of work to be done (e.g., number of permit applications received, the number of household receiving refuse collection service, or the number of burglaries to be investigated).
City of Prescott, Arizona 303 Annual Budget FY2018