City of Vero Beach Final Budget Reading
319
SPECIAL CALL CITY COUNCIL MEETING TUESDAY, SEPTEMBER 21, 2021 5:10 P.M. CITY HALL, COUNCIL CHAMBERS, VERO BEACH, FLORIDA A G E N D A 1. CALL TO ORDER A) Roll Call 2. PUBLIC HEARINGS A) An Ordinance of the City of Vero Beach, Florida, Providing the Levy of Ad Valorem Taxes for the Fiscal Year 2021-2022 at a Millage Rate of 2.5000 which equates to $2.5000 per $1,000 of Assessed Property Value. B) An Ordinance of the City of Vero Beach, Florida, Adopting the Annual Budget of the City for the Fiscal Year beginning October 1, 2021 and Ending September 30, 2022; Appropriating funds for the Operating Expenses, Supplies, and Personnel, and otherwise appropriating funds for the Efficient and Effective Operation of the Government of the City of Vero Beach and its Departments; Such appropriations being from anticipated revenue; providing a means to amend the Annual Budget to carry forward the funding of Purchase Orders, Work Orders, and Grants outstanding as of September 30, 2021; Providing a means to amend the Annual Budget to reflect Grants received after September 30, 2021; and authorizing the Transfer of Funds Appropriated so long as the total combined appropriations shall not be increased thereby; Providing an Effective Date. Link to Backup Material (Exhibit A) – Operating Budget Book Link to Backup Material (Exhibit A) – 5 Year Capital Improvement Book 3. PUBLIC COMMENT 4. ADJOURNMENT Council meetings will be televised on Channel 13 and replayed. This is a Public Meeting. Should any interested party seek to appeal any decision made by Council with respect to any matter considered at such meeting or hearing, he will need a record of the proceedings and that, for such purpose he may need to ensure that a record of the proceedings is made, which record includes the testimony and evidence upon which the appeal is to be based. Anyone who needs a special accommodation for this meeting may contact the City’s Americans with Disabilities Act (ADA) Coordinator at 978-4920 at least 48 hours in advance of the meeting.
-
Upload
khangminh22 -
Category
Documents
-
view
3 -
download
0
Transcript of City of Vero Beach Final Budget Reading

SPECIAL CALL CITY COUNCIL MEETING TUESDAY, SEPTEMBER 21, 2021 5:10 P.M.
CITY HALL, COUNCIL CHAMBERS, VERO BEACH, FLORIDA
A G E N D A
1. CALL TO ORDER
A) Roll Call
2. PUBLIC HEARINGS
A) An Ordinance of the City of Vero Beach, Florida, Providing the Levy of Ad Valorem Taxes for the Fiscal Year 2021-2022 at a Millage Rate of 2.5000 which equates to $2.5000 per $1,000 of Assessed Property Value.
B) An Ordinance of the City of Vero Beach, Florida, Adopting the Annual Budget of the City for the Fiscal Year beginning October 1, 2021 and Ending September 30, 2022; Appropriating funds for the Operating Expenses, Supplies, and Personnel, and otherwise appropriating funds for the Efficient and Effective Operation of the Government of the City of Vero Beach and its Departments; Such appropriations being from anticipated revenue; providing a means to amend the Annual Budget to carry forward the funding of Purchase Orders, Work Orders, and Grants outstanding as of September 30, 2021; Providing a means to amend the Annual Budget to reflect Grants received after September 30, 2021; and authorizing the Transfer of Funds Appropriated so long as the total combined appropriations shall not be increased thereby; Providing an Effective Date.
Link to Backup Material (Exhibit A) – Operating Budget Book
Link to Backup Material (Exhibit A) – 5 Year Capital Improvement Book
3. PUBLIC COMMENT
4. ADJOURNMENT
Council meetings will be televised on Channel 13 and replayed.
This is a Public Meeting. Should any interested party seek to appeal any decision made by Council with respect to any matter considered at such meeting or hearing, he will need a record of the proceedings and that, for such purpose he may need to ensure that a record of the proceedings is made, which record includes the testimony and evidence upon which the appeal is to be based. Anyone who needs a special accommodation for this meeting may contact the City’s Americans with Disabilities Act (ADA) Coordinator at 978-4920 at least 48 hours in advance of the meeting.

ORDINANCE NO. 2021-
AN ORDINANCE OF THE CITY OF VERO BEACH, FLORIDA, PROVIDING THE LEVY OF AD VALOREM TAXES FOR THE FISCAL YEAR 2021-2022 AT A MILLAGE RATE OF 2.5000 WHICH EQUATES TO $2.5000 PER $1,000 OF ASSESSED PROPERTY VALUE.
BE IT ORDAINED BY THE CITY COUNCIL OF THE CITY OF VERO BEACH,
FLORIDA, THAT:
SECTION I
The City of Vero Beach, Florida, shall levy a general ad valorem tax of 2.5000 mills
against the value of all real and tangible personal property within the city limits subject to
taxation on the first day of January, 2021 to finance current operating expenses of the
City. The tax shall be assessed and collected in the manner provided by law.
SECTION II
The Fiscal Year 2021-2022 operating millage rate of 2.5000 levied hereby is
greater than the rolled-back millage rate of 2.3901 mills by 4.60%.
SECTION Ill
It shall be the duty of the Finance Director to deposit the proceeds of the tax levy
into a separate account as provided by law and to keep such account and make payments
from it as shall from time to time be directed by the Council.
This Ordinance was advertised by the "TRIM" notice for a tentative public hearing
to be held on the 7th day of September, 2021, and was advertised on the ___ day of
September, 2021, for a final public hearing to be held on the 21 st day of September, 2021,
at the conclusion of which hearing it was moved for adoption by Councilmember seconded by Councilmember ________
and adopted at ____ P. M. by the following vote:
Mayor Robert Brackett
Vice-Mayor Rey Neville
Councilmember Honey Minuse
Councilmember Bob McCabe
Councilmember Richard Winger
Page 1 of 2

ATTEST: CITY OF VERO BEACH, FLORIDA
Tammy K. Bursick Robert Brackett City Clerk Mayor
ADMINISTRATIVE REVIEW (For Internal Use Only-Sec. 2-77 COVB Code)
Approved as to form Approved as conforming to and legal sufficiency: municipal policy:
:A..&i<- QM,hn S. Turner Mont~ K. FallsCttyA::y City Manager
Approved as to technical requirements:
Page 2 of 2

MEMORANDUM
TO: Mayor and Council
FROM: Monte K. Falls, City Manager M~ftllL>-Cynthia D. Lawson, Finance Directo~
DATE: September 13, 2021
SUBJECT: PROPOSED FINAL FY 21-22 BUDGET- FINAL PUBLIC HEARING
Attached for your review and consideration at the final public TRIM hearing on September 21, 2021 is the proposed final Fiscal Year 2021-2022 budget (including the Five Year Capita l Program).
General Fund Millage and Ad Valorem Tax Revenue
As adopted at the first public hearing on September 7, 2021, the proposed final budget is balanced in the City's General Fund at a millage rate of 2.5000, which is 4.60% greater than the rolled-back millage rate of 2.3901 mill s.
This millage rate generates ad valorem tax revenue that is $494 K higher than last year's tax levy. In this tentative budget, the increased tax revenue has been used to offset a decrease in the amount of residual cash from elect ric sale proceeds used to balance the General Fund budget (year 4 of the 5 year transition plan) and to fund increases in personnel costs (sa laries and health insurance).
Staffing and Salaries
The proposed budget represents an increase of 3 positions City-wide for FY 21-22, with total full time City staffing increasing to 329 positions. One (1) of these positions is an additiona l Street Sweeper in the General Fund. Two (2) of these added positions are in the Water & Sewer Utility.
The proposed budget provides for a 2% salary increase for all employees City-wide. The proposed salary increase and other staffing changes resulted in a net increase of $529K in operating salaries City-wide.
Attachment A provides a comparison, by department and fund, of the budgeted staff positions and total salaries for FY 20-21 versus those proposed for FY 21-22.
Changes In Final Proposed Budget:
As adopted by City Counci l at the first public hearing on September 7, 2021, the final proposed budget includes the approved adjustments to all funds fo r updated estimates of revenue, genera l insurance costs and deductibles, Other Post Employment Benefits (OPEB) contributions, and audit costs.
Summary
The proposed final budget for FY 21-22 continues implementation of the five year budget transition in the City's General Fund using electric uti lity sale proceeds (as recommended by staff and the Finance Commission), and maintains current service levels. The final budget is balanced at a millage rate of 2.5000, which is the same as last year's millage rate.

.___________.__I I _ ________._____.._____I .._____________I I ._____I.___________.__
.______ ____ I_! __ !! ___ _
._______ ____ I_! __ !! ___ _
ATTACHMENT ACity of Vero BeachFull Time Staffing Levels ‐ FY 20‐21 vs FY 21‐22
Dept Dept Description
Budgeted Positions for
FY 20-21
Proposed Positions for
FY 21-22
Total Staffing Increase
(Reduction)
Budgeted Proposed Operating Operating Salary Budget
Salaries FY Salaries FY Increase 20-21 21-22 (Reduction)
GENERAL FUND 0100 City Council 5 5 ‐ $ 56,700 $ 56,700 $ ‐
0200 City Clerk 5 5 ‐ 284,429 290,028 5,599 0300 City Manager 2 2 ‐ 234,409 214,051 (20,358) 1100 City Attorney 3 3 ‐ 279,404 261,840 (17,564) 1200 Human Resources/ Risk Mgmt 4 4 ‐ 246,244 251,157 4,913 1300 Finance ‐ Administration 10 10 ‐ 535,474 546,088 10,614 1301 Finance ‐ Information Technology 7 7 ‐ 380,088 388,402 8,314 1302 Finance ‐ Purchasing 5 5 ‐ 327,383 332,196 4,813 1700 Planning & Development 4 4 ‐ 298,043 303,878 5,835 1801 Police ‐ Sworn Officers 57 57 ‐ 3,658,401 3,803,744 145,343 1801 Police ‐ Civilian 21 21 ‐ 940,986 955,874 14,888 2001 Public Works ‐ Engineering & Survey 4 4 ‐ 287,358 285,308 (2,050)
2005 Public Works ‐ Streets, Strmwtr, Traffic 17 18 1 826,243 852,927 26,684 2006 Public Works ‐ GIS 2 2 ‐ 140,228 143,015 2,787 3304 Public Works ‐ Grounds Maintenance 29 29 ‐ 1,158,946 1,180,806 21,860 3305 Public Works ‐ Admin 4 4 ‐ 321,288 302,136 (19,152) 3306 Public Works ‐ Fleet Mgmnt 7 7 ‐ 371,551 378,663 7,112 3309 Public Works ‐ Facilities Mgmnt 7 7 ‐ 402,102 407,856 5,754 4501 Recreation ‐ Leisure Square 1.7 1.7 ‐ 92,036 90,820 (1,216) 4502 Recreation ‐ Community Center 0.8 0.8 ‐ 35,059 35,568 509 4503 Recreation ‐ Riverside Tennis Complex 1.0 1.0 ‐ 53,615 54,659 1,044 4504 Recreation ‐ Parks, Playgrounds, Rental 1.2 1.2 ‐ 52,419 52,778 359 4505 Recreation ‐ Rec Programs & Comm Evnt 2.6 2.6 ‐ 115,176 116,973 1,797 4506 Recreation ‐ Beach Lifeguards 8.7 8.7 ‐ 363,073 365,473 2,400 4507 Recreation ‐ Administration 3.0 3.0 ‐ 194,032 197,869 3,837
Total General Fund 212 213 1 11,654,687 11,868,809 214,122
WATER & SEWER FUND 9000 Wastewater Treatment 8 8 ‐ 487,291 502,278 14,987 9002 Water Treatment 8 8 ‐ 489,725 495,424 5,699 9005 Water Sewer Admin 8 9 1 544,171 627,811 83,640 9007 Facility Maintenance & Asset Management 8 9 1 561,754 627,225 65,471
9010 Wastewater Collection 16 16 ‐ 718,046 819,583 101,537
9011 Water Distribution 13 13 ‐ 615,763 622,346 6,583 9012 Finance ‐ Customer Service 12 12 ‐ 536,335 545,760 9,425
Total Water and Sewer Fund 73 75 2 3,953,085 4,240,427 287,342
4000 Airport 12 12 ‐ 593,188 600,192 7,004
4100 Marina 5 5 ‐ 224,201 228,664 4,463
3308 Solid Waste 23 23 ‐ 922,895 938,524 15,629
3307 Cemetery 1 1 ‐ 47,133 48,011 878
Total City‐Wide 326 329 3 $ 17,395,189 $ 17,924,627 $ 529,438

ORDINANCE NO. 2021-_
AN ORDINANCE OF THE CITY OF VERO BEACH, FLORIDA, ADOPTING THE ANNUAL BUDGET OF THE CITY FOR THE FISCAL YEAR BEGINNING OCTOBER 1, 2021 AND ENDING SEPTEMBER 30, 2022; APPROPRIATING FUNDS FOR THE OPERATING EXPENSES, SUPPLIES, AND PERSONNEL, AND OTHERWISE APPROPRIATING FUNDS FOR THE EFFICIENT AND EFFECTIVE OPERATION OF THE GOVERNMENT OF THE CITY OF VERO BEACH AND ITS DEPARTMENTS; SUCH APPROPRIATIONS BEING FROM ANTICIPATED REVENUE; PROVIDING A MEANS TO AMEND THE ANNUAL BUDGET TO CARRY FORWARD THE FUNDING OF PURCHASE ORDERS, WORK ORDERS, AND GRANTS OUTSTANDING AS OF SEPTEMBER 30, 2021; PROVIDING A MEANS TO AMEND THE ANNUAL BUDGET TO REFLECT GRANTS RECEIVED AFTER SEPTEMBER 30, 2021 ; AND AUTHORIZING THE TRANSFER OF FUNDS APPROPRIATED SO LONG AS THE TOTAL COMBINED APPROPRIATIONS SHALL NOT BE INCREASED THEREBY; PROVIDING AN EFFECTIVE DATE.
BE IT ORDAINED BY THE CITY COUNCIL OF THE CITY OF VERO BEACH,
FLORIDA, THAT:
SECTION I
Attached as "Exhibit A" and incorporated in the ordinance is the annual budget for
the City of Vero Beach for the fiscal year beginning October 1, 2021 , and ending
September 30, 2022, which is hereby confirmed, adopted, and approved in all respects.
The budget is adopted after full , complete, and comprehensive hearings and expression
of all parties concerned, and is necessary to provide required funds for capital outlays,
operating expenses, expenditures for materials, labor, equipment, supplies, and
contingent expenses of the City and represents and presents the judgment and intent of
the City Council as to the needs of the Departments of the City Government as to their
fiscal requirements.
SECTION II
The funds and monies necessary to meet the appropriations stipulated by and in
the budget are expressly appropriated out of anticipated revenues not otherwise
appropriated.
Page 1 of 3
N:\Budget 22\Millage and TRIMIFirst Reading Ordinance Budget 2022.docx

SECTION 111
The Finance Director is authorized and directed to increase the corresponding line
item appropriations in the budget to the extent of those purchase orders which have been
issued before September 30, 2021 , but which have not been filled before then, and is
authorized and directed to pay all such purchase orders upon receipt of the goods or
services from the funds so appropriated. The Finance Director is further authorized and
directed to increase the budget appropriations to the extent of any unexpended balances
from state, federal, or other grants as of the end of business on September 30, 2021. Any
such unexpended balances, whether or not encumbered or outstanding as of September
30, 2021, shall be appropriated to the corresponding accounts in the same funds in which
such balances were outstanding as of September 30, 2021. The Finance Director shall
be authorized to expend such appropriations for the purposes approved by the City
Council in connection with such state, federal, or other grants, and work orders. The
Finance Director shall report to the City Council concerning all such purchase orders,
grants, and work orders before December 31 , 2021. Corresponding changes in the
anticipated revenue accounts are authorized to be made.
SECTION IV
The Finance Director is authorized and directed to maintain and amend the budget
to reflect the anticipated revenue and the appropriation of and expenditure of all grant
funds committed to or received by the City after September 30, 2021, and before October
1, 2022, in accordance with the directions of the City Council as to the appropriation and
expenditure of such grants as and when received.
SECTION V
To facilitate proper accounting for Council-approved funding of projects financed
from resources originating in more than one fund and for program/supervision allocation,
the Finance Director is authorized to amend the estimated revenues and appropriations
of the various funds affected to reflect the transactions pertaining to each fund involved.
SECTION VI
The Finance Director with the concurrence of the City Manager shall have the
authority to transfer appropriations from one account to another account of the budget, so
long as the total appropriations for each cost center, including the capital outlay accounts
Page 2 of 3
N:\Budget 22\Millage and TRIM\First Reading Ordinance Budget 2022.docx

related thereto, shall not be increased thereby. Appropriation transactions affecting funds
totals, other than those authorized in other sections of this ordinance, shall require the
prior approval of the City Council. Any such transactions are subject to any restrictive
statutes or ordinances, including those authorizing the issuance of any outstanding bonds. ******************************
This Ordinance was advertised by the "TRIM" notice for a tentative public hearing
to be held on the 7th day of September, 2021, and was advertised on the ___ day of
September, 2021 , for a final public hearing to be held on the 21 st day of September, 2021 ,
at the conclusion of which hearing it was moved for adoption by Councilmember ____________, seconded by Councilmember ________
and adopted at ____ P.M. by the following vote:
Mayor Robert Brackett
Vice-Mayor Rey Neville
Councilmember Honey Minuse
Councilmember Bob McCabe
Councilmember Richard Winger
ATTEST: CITY OF VERO BEACH, FLORIDA
Tammy K. Bursick Robert Brackett City Clerk Mayor
ADMINISTRATIVE REVIEW (For Internal Use Only- Sec. 2-77 COVB Code)
Approved as to form Approved as conforming to and legal sufficiency: municipal policy:
City Attorney ~!s\<(]-(1City Manager
App~ = cal requirements:
Cynthi.Lawson Finance Director
Page 3 of 3
N:\Budget 22\Millage and TRIM\First Reading Ord inance Budget 2022.docx

Exhibit A Proposed rudget
iscal Year 2021-2022
1• I Final Public Hearing September 21, 2021

CITY OF VERO BEACH, FLORIDA PROPOSED ANNUAL BUDGET
2021-2022
COUNCIL
Robert Brackett, Mayor
Rey Neville, Vice Mayor
Honey Minuse
Bob McCabe
Richard Winger
CITY MANAGER Monte K. Falls
CITY CLERK Tammy K. Bursick
CITY ATTORNEY John S. Turner
FINANCE DIRECTOR Cynthia D. Lawson

TABLE OF CONTENTS
Organizational Chart.................................................................................................................................. 1
General Fund (001)
Finance
Public Works
The Budget Process..................................................................................................................................... 3
Budgetary Principles .................................................................................................................................. 4
Fund Accounting Structure and Types of Funds ..................................................................................... 5
Revenue................................................................................................................................................... 8
Budget Summary by Department....................................................................................................... 10
Expenditures by Object ....................................................................................................................... 11
Administrative Charges Allocation Detail ......................................................................................... 15
City Council.......................................................................................................................................... 16
City Clerk ............................................................................................................................................. 18
City Manager........................................................................................................................................ 20
City Hall................................................................................................................................................ 22
City Attorney........................................................................................................................................ 24
Human Resources ................................................................................................................................ 26
Administration ................................................................................................................................ 28
Information Technology................................................................................................................. 31
Purchasing ....................................................................................................................................... 34
Planning & Development ................................................................................................................... 36
Police .................................................................................................................................................... 38
Engineering & Survey .................................................................................................................... 42
Streets............................................................................................................................................... 45
G.I.S.................................................................................................................................................. 48
Grounds Maintenance .................................................................................................................... 51
Administration ................................................................................................................................ 54
Fleet Management........................................................................................................................... 57
Facilities Management.................................................................................................................... 60

TABLE OF CONTENTS
General Fund (001) (continued)
Recreation
Leisure Square ................................................................................................................................ 63
Water & Sewer Fund (421 and 423)
Community Center ......................................................................................................................... 65
Riverside Tennis Complex.............................................................................................................. 66
Parks, Playgrounds & Rental Facilities ........................................................................................ 68
Recreation Programs & Community Events................................................................................ 69
Beach Lifeguards ............................................................................................................................ 71
Administration ................................................................................................................................ 73
General Fund Non Departmental ............................................................................................................ 75
General Government Capital & Construction (304) ............................................................................. 78
Infrastructure and Real Estate Improvements (311)............................................................................. 81
Stormwater Utility (302)........................................................................................................................... 82
Operating Budget Summary.............................................................................................................. 88
Revenues .............................................................................................................................................. 89
Operating Budget by Division............................................................................................................ 90
Operating Budget by Object .............................................................................................................. 91
Wastewater Treatment ....................................................................................................................... 94
Water Treatment ................................................................................................................................ 98
Wastewater Reuse............................................................................................................................. 102
Administration .................................................................................................................................. 105
Facility Maintenance and Asset Management................................................................................ 107
Wastewater Collection...................................................................................................................... 110
Water Distribution............................................................................................................................ 114
Customer Service .............................................................................................................................. 118
Non Departmental............................................................................................................................. 120
Renewal & Replacement (423)......................................................................................................... 122

TABLE OF CONTENTS
Airport Fund (441 and 443) ................................................................................................................... 126
Marina Fund (451).................................................................................................................................. 136
Solid Waste Fund (461) .......................................................................................................................... 147
Confiscated Property (601) .................................................................................................................... 157
Law Enforcement Education (602)........................................................................................................ 161
Crestlawn Cemetery (603)...................................................................................................................... 165
Historic Downtown Vero Beach Economic Development Zone (607) ................................................ 172
Five Year Capital Program Fiscal Years Ending 2022-2026 (see separate package)
Appendices:
Miscellaneous Statistical Data........................................................................................................... 178
Assessed Value for Operations.......................................................................................................... 179
General Fund Revenues Historical Comparison............................................................................. 180
General Fund Expenditures Historical Comparison ...................................................................... 181
Water & Sewer System Bond Coverage........................................................................................... 182
Full Time City Employees Historical Comparison ......................................................................... 183
Summary Schedule – Debt Service Requirements .......................................................................... 184
Individual Issue Debt Service Requirements Schedule .................................................................. 185
Glossary .............................................................................................................................................. 192

r ...
I
[ l
City of Vero Beach, Florida Organizational Chart
City Council
City Attorney City Clerk City Manager
Citizens of Vero Beach
Finance Director
W & S Director
Planning & Dev. Dir.
HR Director
Police Chief
Marina Director
Public Works Director
Airport Director
Recreation Director
1

BACKGROUND AND THE
BUDGET PROCESS
2

The Budget Process
The budget process begins in February and ends in September. Through a series of discussions and public meetings the City's level of service goals and anticipated revenues and expenses for the next fiscal year are discussed and documented as the Annual Budget. Revenues are projected from rate structures, historical data, estimates, and statistical trends available from City sources and outside agencies. Expenses are estimated based on cost analyses, expected needs, and historical data produced by the finance and operating departments. The budget process also produces the related but separately published Five Year Capital Program.
A brief summary of the timing and principal steps in the budget process follows:
DATE ACTIVITY
Feb-Mar City Council and City Manager establish service level goals and broad citywide objectives for the following budget year. Finance Department reviews and prepares the necessary forms and instructions and distributes them to the departments.
Mar-Apr City Manager reviews citywide objectives and service level goals with Department Heads.
April-May Department Heads return completed input forms to Finance for editing and compilation of preliminary budget document. Finance produces a complete and very detailed draft of the proposed budget.
June City Manager meets with Department Heads to review budget proposals.
July-Aug City Manager presents his proposed budget to the City Council for review in a series of meetings that are open to the public. At these meetings, the proposed budget is discussed in overview and in detail.
September The taxpayers are notified of the proposed property tax rate and its relationship to the prior year's rate.
City Council conducts two public hearings in compliance with the "Truth in Millage" Statute of Florida. These hearings provide the citizens with additional opportunities to express their views about the proposed budget. At the second hearing, the budget is adopted.
3

General Budgetary Principles
The annual budget is the primary financial planning tool for our City government. It is used to set forth the City's estimates of available resources and to specify the way in which those resources will be applied. Like any plan, the budget must be carefully monitored as the year progresses so that material variances may be identified and action taken to correct them. Further, since no plan will prove to be an absolutely accurate reflection of future events, management must have sufficient flexibility to make adjustments during the year without materially altering the general intent of the City Council as reflected in the adopted budget. The rules set forth below are intended to provide such control and flexibility. Formal budgetary integration is employed as a management control device during the year for the General Fund, Enterprise Funds, the Capital Projects funds, and the Cemetery (permanent fund). Formal budgetary integration is not employed for Debt Service, Internal Service, or Trust and Agency Funds.
Budgetary control is established at the departmental level. The principal tool of control is a set of monthly reports that compare on a line item level actual revenue and expenditures to budgeted revenue and expenditures. These reports are distributed to the City Manager and all department heads.
Quarterly financial reports which compare actual revenues and expenses to the budget are provided to the City Council and made available to the public. These reports are accompanied by an explanation of any significant variances between the actuals and the budget and the recommended action to address such variances.
The City Manager is authorized to transfer budgeted amounts between accounts within a department. At any time during the fiscal year, the City Manager may transfer unencumbered appropriated balances among line items within one department, or between departments that are in the same fund (provided that such transfer does not exceed fifty thousand dollars in any one fiscal year and does not exceed the total appropriation for that fund).
In the event that uncontrollable circumstances cause deviations from budget in excess of the City Manager's remedial authority, flexibility and relief are provided by budget amendment procedures as established by Florida Statutes. These statutes give City Council authority to adopt the budget and to modify it during the fiscal year.
Appropriations lapse at the end of the fiscal year.
4

FUND ACCOUNTING STRUCTURE
All operations of the City of Vero Beach are accounted for by the use of fund accounting. This system complies with the requirements of governmental accounting and auditing standards. Various funds are established to track transactions for different types of resources. Each fund is a separate entity with its own resources, liabilities and balances. Departments within the City which are formed to carry out a specific function are identified and accounted for within the system. Funds with similar objectives, activities, and legal restrictions are grouped together for reporting purposes.
TYPES OF FUNDS
Governmental Funds: These types of funds account for general governmental activities which are primarily supported by taxes, grants and similar revenue sources. They are reported using the current financial resources measurement focus and the modified accrual basis of accounting. Governmental funds which have adopted annual budgets include the following:
The General Fund (001) is the government’s primary operating fund. It accounts for all resources and activities of the general government, such as public safety, recreation and public works, which are financed primarily by taxes (ad valorem, sales), franchise fees, grants and other unrestricted revenue sources.
Capital Projects Funds are used to account for and report financial resources that are restricted, committed, or assigned to expenditure for capital outlays, including the acquisition or construction of capital facilities and other capital assets, except for those financed by enterprise funds. The City’s budgeted Capital Projects Funds include:
Stormwater Utility (302): This fund is used to account for the cost of providing Stormwater Management Services (engineering, capital improvements, billing and collection of assessments, and related consulting services) and capital facilities for stormwater management, in accordance with the requirements of the City’s stormwater utility ordinance.
General Government Capital and Construction (304): This fund is used to account for major capital equipment purchases and general infrastructure or construction projects. Sales tax transfers from Fund 311 and State or Federal grant revenues are the primary revenue sources for this fund.
Infrastructure & Real Estate Improvements (311): This fund is used to account for transfers to support general government capital projects (in Fund 304) and debt service payments for infrastructure and real estate purchases. The primary revenue source for this fund is infrastructure sales tax.
Enterprise Funds: These types of funds are used to account for activities for which fees are charged to external users for goods or services. These ‘business-type’ activities may also have outstanding debt that is secured by user fees and charges. The City’s enterprise funds are intended to be self-supporting through revenue generated by the services provided. All of the City’s enterprise funds have adopted budgets. The City’s enterprise funds are:
5

Enterprise Funds (continued):
The Water & Sewer Fund (421 and 423) accounts for the activities of the City’s water & sewer system for provision of water and sewer services to the customers within our designated service area. Water and Sewer operations are accounted for in Fund 421 and capital projects are accounted for in Fund 423.
The Municipal Airport Fund (441 and 443) accounts for the activities of the City’s general aviation airport. Airport operations are accounted for in Fund 441 and capital projects are accounted for in Fund 443.
The Municipal Marina Fund (451) accounts for the activities of the City municipal marina.
The Solid Waste Fund (461) accounts for the activities of the government’s solid waste disposal service to both commercial enterprises and residents.
Special Revenue Funds: Special revenue funds are used to account for and report the proceeds of specific revenue sources that are restricted or committed by laws or local ordinances to expenditures for specified purposes. The Special Revenue Funds included in the annual budget are:
The Confiscated Property Fund (601) which accounts for money confiscated or obtained through the auction of confiscated property which is set aside for specific police activities and equipment.
The Law Enforcement Education Fund (602) which accounts for funds obtained by assessments on police department charges successfully prosecuted in the court system which are mandated by State law to fund police officer education.
Historic Downtown Vero Beach Economic Development Zone Trust (607) This fund accounts for the proceeds of a dedicated tax increment set aside by City ordinance for improvements in the Historic Downtown district.
Permanent Funds: Permanent Funds account for assets that are permanently restricted for specific uses. The City’s budgeted permanent funds include:
Cemetery Fund (603) which accounts for the City’s municipal cemetery. Proceeds from graves sales in excess of annual operating costs are restricted for perpetual care of the cemetery.
6

GENERAL FUND
7

GENERAL FUND
REVENUE
2022 Budget vs 2021
Projected
2021‐2022 2020‐2021 Change $ Change % 2020‐2021 2019‐2020
Account Number Account Name Budget Projected Budget Actual
001.0000.311.010000 AD VALOREM TAXES 8,000,606 7,506,871 493,735 6.6% 7,506,871 7,355,475
001.0000.312.041000 LOCAL OPTION GAS TAX 549,183 497,967 51,216 10.3% 497,967 501,491
001.0000.313.100000 ELECTRIC UTILITY FRANCHISE FEE 1,662,000 1,620,000 42,000 2.6% 1,620,000 1,550,687
001.0000.313.300000 ROLL‐OFF FRANCHISE FEE 27,000 27,000 0 0.0% 27,000 29,032
001.0000.314.000000 UTILITY TAXES 2,810,000 2,700,000 110,000 4.1% 2,700,000 2,694,981
001.0000.315.000100 LOCAL COMMNS SERV TAX 1,260,795 1,154,132 106,663 9.2% 1,154,132 1,238,702
001.0000.316.000100 LOCAL BUSINESS TAX 155,000 155,000 0 0.0% 155,000 147,256
001.0000.322.000200 SIGN PERMIT FEES 7,500 7,500 0 0.0% 7,500 7,080
001.0000.322.000300 BURGLAR ALARM PERMITS 45,000 45,000 0 0.0% 45,000 44,863
001.0000.329.000200 TREE REPLCMNT/MITIGATN FEES 14,000 14,000 0 0.0% 14,000 36,207
001.0000.331.090400 HURRICANE FRANCES FEMA REIMB 0 0 0 n/a 0 155,798
001.0000.331.090500 HURRICANE JEANNE FEMA REIMB 0 0 0 n/a 0 ‐199,935
001.0000.331.090540 HURRICANE IRMA DR‐4337 FEMA REIMB 0 0 0 n/a 0 1,030,751
001.0000.331.090550 HURRICANE DORIAN DR‐4468 FEMA REIMB 0 0 0 n/a 0 70,154
001.0000.331.201030 JAG/FDLE PATROL RIFLES 0 0 0 n/a 0 4,166
001.0000.331.201040 JAG/FDLE RADAR SPEED SIGNS/FORENSIC LGHT 0 0 0 n/a 0 11,179
001.0000.331.202000 BULLETPROOF VEST PARTNERSHIP 0 0 0 n/a 0 7,731
001.0000.334.090400 HURRICANE FRANCES STATE REIMB 0 0 0 n/a 0 18,941
001.0000.334.090500 HURRICANE JEANNE STATE REIMB 0 0 0 n/a 0 ‐11,967
001.0000.334.090540 HURRICANE IRMA DR‐4337 STATE REIMB 0 0 0 n/a 0 51,420
001.0000.334.090550 HURRICANE DORIAN DR‐4468 STATE REIMB 0 0 0 n/a 0 11,692
001.0000.334.090560 CARES ACT FUNDING IRC SUBRECIPIENT AGRMT 0 0 0 n/a 0 59,870
001.0000.334.201010 FDOT/IPTM DRE CALL‐OUT GRANT 0 0 0 n/a 0 618
001.0000.335.012000 STATE REVENUE SHARING 604,375 579,524 24,851 4.3% 579,524 572,023
001.0000.335.014000 MOBILE HOME LICENSES 28,000 27,000 1,000 3.7% 27,000 28,187
001.0000.335.015000 ALCOHOLIC BEVRG LICENSES 65,000 60,000 5,000 8.3% 60,000 71,941
001.0000.335.018000 HALF CENT SALES TAX 1,378,350 1,190,478 187,872 15.8% 1,190,478 1,237,181
001.0000.342.010100 AIRPORT SECURITY 100,998 96,927 4,071 4.2% 96,927 41,077
001.0000.342.100200 POLICE INVSTGTN EXP REIMB 22,000 16,000 6,000 37.5% 16,000 32,027
001.0000.342.100300 POLICE SPECIAL DETAIL REIMB ‐ SRO 130,000 130,000 0 0.0% 130,000 96,661
001.0000.342.100400 POLICE SPECIAL DETAIL REIMB 193,000 193,000 0 0.0% 193,000 146,748
001.0000.343.700100 DEDICATORY TREE PLNTNG FEES 2,500 2,500 0 0.0% 2,500 7,978
001.0000.343.700200 TREE PLANTING APPLICATN FEES 1,000 1,000 0 0.0% 1,000 400
001.0000.343.900100 FDOT HWY LIGHTING AGREEMENT 141,567 133,443 8,124 6.1% 133,443 161,705
001.0000.347.000105 REC FEES & MEMBERSHIPS: LEISURE SQUARE 51,000 51,000 0 0.0% 51,000 50,919
001.0000.347.000106 REC FEES & MEMBERSHIPS: COMM CENTER 13,500 13,500 0 0.0% 13,500 5,365
001.0000.347.000107 REC FEES & MEMBERSHIPS: RVRSIDE TENNIS 45,000 45,000 0 0.0% 45,000 36,016
001.0000.347.000108 REC FEES & MEMBERSHIPS: PRKS,PLYGR,RNTLS 800 0 800 n/a 0 867
001.0000.347.000109 REC FEES & MEMBERSHIPS: PRGMS/EVENTS 233,500 233,500 0 0.0% 233,500 101,421
001.0000.349.000500 ADMINISTRATIVE CHARGES (see detail) 2,171,120 2,139,600 31,520 1.5% 2,139,600 1,883,270
001.0000.354.000100 FINES & FORFEITURES 120,000 139,000 ‐19,000 ‐13.7% 139,000 105,896
8

GENERAL FUND
REVENUE
2022 Budget vs 2021
Projected
2021‐2022 2020‐2021 Change $ Change % 2020‐2021 2019‐2020
Account Number Account Name Budget Projected Budget Actual
001.0000.354.000200 BURGLAR ALARM FINES 8,000 8,000 0 0.0% 8,000 18,675
001.0000.354.000300 CODE ENFORCEMENT FINES 25,000 25,000 0 0.0% 25,000 489,116
001.0000.360.000100 PLANNING DEPT REVENUE 100,000 90,000 10,000 11.1% 90,000 100,651
001.0000.361.010200 INTEREST ON INVESTMENTS 440,000 593,000 ‐153,000 ‐25.8% 593,000 2,228,041
001.0000.361.010300 INTEREST FROM BANK DEPOSITS 0 0 0 n/a 0 6,996
001.0000.362.000115 REC FACILITIES RENTAL: LEISURE SQUARE 41,000 41,000 0 0.0% 41,000 28,650
001.0000.362.000116 REC FACILITIES RENTAL: COMM CENTER 48,000 48,000 0 0.0% 48,000 28,620
001.0000.362.000117 REC FACILITIES RENTAL: RIVERSIDE TENNIS 8,000 8,000 0 0.0% 8,000 5,837
001.0000.362.000118 REC FACILITIES RENTAL: PRKS, PLAYGR, ETC 125,000 125,000 0 0.0% 125,000 77,353
001.0000.362.000600 RENTAL OF PW FACILITIES 74,200 74,200 0 0.0% 74,200 74,200
001.0000.362.000700 MISC RENTAL OF CITY OWNED PROPERTIES 0 0 0 n/a 0 5
001.0000.362.000800 COMMUNICATION EQUIP RENTAL 53,000 0 53,000 n/a 0 73,639
001.0000.365.090100 SALE SURPLUS MATLS/SCRAP 1,000 1,000 0 0.0% 1,000 24
001.0000.365.090200 SALE OF SURPLUS PROPERTY 1,000 1,000 0 0.0% 1,000 49,607
001.0000.366.000100 FOURTH OF JULY CONTRIBTN 15,000 15,000 0 0.0% 15,000 11,000
001.0000.366.000200 USTA FACILITY RECOVERY GRANT 0 0 0 n/a 0 2,250
001.0000.368.000100 POLICE MISC INCOME 21,000 18,000 3,000 16.7% 18,000 16,390
001.0000.368.000200 POLICE ADMIN FEES 2,000 3,500 ‐1,500 ‐42.9% 3,500 474
001.0000.369.000104 RECREATN JANITORIAL SVCS 5,000 5,000 0 0.0% 5,000 1,745
001.0000.369.060000 INSURANCE PROCEEDS 0 0 0 n/a 0 30,468
001.0000.369.060010 INSURANCE PROCEEDS ‐ HURRICANE 0 0 0 n/a 0 23,921
001.0000.369.090100 MISC REVENUE 35,000 35,000 0 0.0% 35,000 25,563
001.0000.369.090104 RECREATN MISC REVENUE 2,000 2,000 0 0.0% 2,000 1,274
001.0000.382.000300 CONTRIBTN FROM W/S FUND 1,031,000 1,025,000 6,000 0.6% 1,025,000 1,005,000
001.0000.382.000400 CONTRIBTN FROM SW FUND 183,000 181,000 2,000 1.1% 181,000 173,000
001.0000.382.000650 CONTR FROM HLTH INS FND 0 0 0 n/a 0 312,576
001.0000.382.001700 CONTRIBTN FROM MARINA 105,000 103,000 2,000 1.9% 103,000 101,000
001.0000.389.000100 CASH OVER/SHORT 0 0 0 n/a 0 100
001.0000.389.000500 UNAPPROPRIATED SURPLUS ‐103 ‐88,087 87,984 ‐99.9% ‐88,087 0
001.0000.389.000600 APPROPRIATED FUND BALANCE* 1,585,664 1,500,000 85,664 5.7% 1,500,000 0
001.0000.389.000600 APPROPRIATED FB RESERVE ‐ PENSION** 1,660,330 1,898,508 ‐238,178 ‐12.5% 1,898,508 0
001.0000.389.000600 APPROPRIATED FB RESERVE ‐ OPEB *** 472,441 517,605 ‐45,164 ‐8.7% 517,605 0
001.0000.389.000600 APPROPRIATED FB RESERVE ‐ CAP & INFR **** 2,000,000 0 2,000,000 n/a 0 0
001.0000.389.002105 REC SPONSORSHIP: PRGRMS/COMM EVENTS 13,000 13,000 0 0.0% 13,000 2,360
001.0000.389.002114 RECRN PERF ARTS COSTUMES 3,000 3,000 0 0.0% 3,000 2,685
001.0000.389.800000 CONTRIB FRM PRIVATE SOURCES 0 0 0 n/a 0 4,720
001.0000.389.800100 CONTR PRVT SRCS‐CENTENNIAL EVENT 0 0 0 n/a 0 1,010
Total 27,890,326 25,024,668 2,865,658 11.5% 25,024,668 24,292,824
* APPROPRIATION OF EXCESS FUND BALANCE FROM ELECTRIC SALE PROCEEDS TO BALANCE BUDGET‐YEAR 4 of 5 YEAR PLAN ** APPROPRIATION OF RESERVED FUND BALANCE FOR DEFINED BENEFIT PENSION PAYMENTS ‐ PER RESO 2019‐15 *** APPROPRIATION OF RESERVED FUND BALANCE FOR ELECTRIC UTILITY EMPLOYEE OPEB PREMIUMS AND TRUST CONTRIBUTIONS ‐ PER RESO 2019‐21 **** APPROPRIATION OF RESERVED FUND BALANCE FOR CAPITAL & INFRASTRUCTURE FOR MARINA SOUTH COMPLEX REBUILD
9

GENERAL FUND
BUDGET BY DEPARTMENT
2022 Budget vs 2021
Projected 2021‐2022 2020‐2021 2020‐2021 2019‐2020
Change $ Change % Department Budget Projected Budget Actual
City Council 70,438 86,903 ‐16,465 ‐18.9% 86,903 76,010
City Clerk 559,042 520,200 38,842 7.5% 520,200 540,421
City Manager 341,084 371,692 ‐30,608 ‐8.2% 371,692 359,361
City Hall 272,300 145,295 127,005 87.4% 145,295 110,571
City Attorney 426,372 458,274 ‐31,902 ‐7.0% 458,274 345,075
Human Resources 475,551 473,521 2,030 0.4% 473,521 453,390
Finance 950,996 945,528 5,468 0.6% 945,528 902,286
Information Technology 989,459 806,594 182,865 22.7% 806,594 812,685
Purchasing 569,700 570,442 ‐742 ‐0.1% 570,442 632,881
Planning & Development 533,222 545,369 ‐12,147 ‐2.2% 545,369 518,689
Police 8,912,787 8,722,809 189,978 2.2% 8,722,809 8,418,382
Public Works:
Engineering & Survey 621,943 509,913 112,030 22.0% 509,913 484,462
Streets 1,515,029 1,457,518 57,511 3.9% 1,457,518 1,397,448
GIS 210,992 207,252 3,740 1.8% 207,252 246,176
Grounds Maint 2,258,809 2,232,996 25,813 1.2% 2,232,996 2,204,238
Admin 582,355 573,655 8,700 1.5% 573,655 519,093
Fleet Mgmnt 52,763 22,611 30,152 133.4% 22,611 16,643
Facilities Mgmnt 811,732 806,324 5,408 0.7% 806,324 740,216
Subtotal Public Works 6,053,623 5,810,269 243,354 4.2% 5,810,269 5,608,276
Recreation:
Leisure Square 415,299 424,213 ‐8,914 ‐2.1% 424,213 435,518
Community Center 129,021 128,249 772 0.6% 128,249 109,974
Riverside Tennis Complex 137,711 118,790 18,921 15.9% 118,790 116,078
Parks, Playgrounds & Rental Facilities 287,654 307,700 ‐20,046 ‐6.5% 307,700 294,726
Recreation Programs & Community Events 333,611 326,969 6,642 2.0% 326,969 260,304
Beach Lifeguards 770,341 762,656 7,685 1.0% 762,656 727,210
Administration 338,734 321,510 17,224 5.4% 321,510 417,691
Subtotal Recreation 2,412,371 2,390,087 22,284 0.9% 2,390,087 2,361,501
Non‐Departmental 5,323,381 3,177,685 2,145,696 67.5% 3,177,685 3,671,499
General Fund 27,890,326 25,024,668 2,865,658 11.5% 25,024,668 24,811,027
10

GENERAL FUND Expenditures by Object
2022 Budget vs 2021
Projected
Account Number / Account Name 2021‐2022
Budget 2020‐2021
Projected Change $ Change % 2020‐2021
Budget 2019‐2020
Actual
112001 ‐ OPERATING SALARIES 11,868,809 11,654,687 214,122 1.8% 11,654,687 11,582,262
113002 ‐ PART TIME SALARIES 310,030 305,230 4,800 1.6% 305,230 253,593
114001 ‐ OVERTIME SALARIES 622,190 621,400 790 0.1% 621,400 575,538
114002 ‐ COURT OVERTIME 35,000 35,000 0 0.0% 35,000 26,690
114003 ‐ OVERTIME ‐ DISASTER 0 0 0 n/a 0 9,172
115002 ‐ CAREER DEVELOPMENT 40,660 40,420 240 0.6% 40,420 39,909
115004 ‐ NEW HIRE SIGNING BONUS 6,000 6,000 0 0.0% 6,000 6,000
115005 ‐ TUITION REIMBURSEMENT 10,000 10,000 0 0.0% 10,000 2,938
115006 ‐ CITY INCENTIVE 45,411 44,942 469 1.0% 44,942 44,428
115006 ‐ EMT/LIFEGUARD 7,500 8,500 ‐1,000 ‐11.8% 8,500 8,601
115007 ‐ EDUCATION 33,750 34,110 ‐360 ‐1.1% 34,110 33,103
115008 ‐ INCENTIVE OVERTIME 16,000 16,000 0 0.0% 16,000 13,366
115009 ‐ MEAL ALLOWANCE 2,000 2,000 0 0.0% 2,000 797
121001 ‐ SOCIAL SECURITY 993,551 976,506 17,045 1.7% 976,506 903,669
122001 ‐ PENSION FUND CONTRIBUTION 2,352,363 2,595,425 ‐243,062 ‐9.4% 2,595,425 2,541,293
122002 ‐ CONTRIB TO POLICE PENSION 715,403 755,091 ‐39,688 ‐5.3% 755,091 765,548
122003 ‐ CONTRIBUTION TO FIRE PENSION 16,726 107,999 ‐91,273 ‐84.5% 107,999 100,007
123001 ‐ GROUP LIFE INSURANCE 30,500 43,150 ‐12,650 ‐29.3% 43,150 27,340
123002 ‐ HOSPITALIZATION INSURANCE 2,565,888 2,505,081 60,807 2.4% 2,505,081 2,271,598
123004 ‐ RETIREMENT PREMIUM ASSIST 521,834 513,035 8,799 1.7% 513,035 484,710
123005 ‐ WORKERS COMPENSATION 334,000 267,500 66,500 24.9% 267,500 243,650
123006 ‐ CONTRIBUTION TO OPEB TRUST 244,607 246,811 ‐2,204 ‐0.9% 246,811 247,863
123007 ‐ RETIREMENT PREM ASSIST ‐ ELEC 321,663 349,478 ‐27,815 ‐8.0% 349,478 334,086
123008 ‐ CONTRIBUTION TO OPEB TRUST‐ELEC 150,778 168,127 ‐17,349 ‐10.3% 168,127 183,223
125001 ‐ STATE UNEMPLOYMENT COMP 0 0 0 n/a 0 6,082
331001 ‐ PROFESSIONAL SERVICES 174,262 93,262 81,000 86.9% 93,262 267,857
331002 ‐ STATE ACCREDITATION 3,000 3,000 0 0.0% 3,000 357
331020 ‐ FOURTH OF JULY EXPENDITURES 28,000 28,000 0 0.0% 28,000 0
332001 ‐ AUDIT 45,000 30,000 15,000 50.0% 30,000 62,514
334002 ‐ CLEANING & LAUNDRY 22,122 22,072 50 0.2% 22,072 15,595
334002 ‐ UNIFORM SERVICE 6,360 5,280 1,080 20.5% 5,280 5,021
334003 ‐ JANITORIAL SERVICES 89,890 80,705 9,185 11.4% 80,705 74,094
334004 ‐ SUMMER CAMP EXP 13,750 13,750 0 0.0% 13,750 5,888
334007 ‐ OTHER CONTRACTUAL SERVICES 302,158 181,758 120,400 66.2% 181,758 169,354
334014 ‐ INDIAN RIVER CRIME LAB 65,300 79,411 ‐14,111 ‐17.8% 79,411 93,450
334016 ‐ DISCOUNT ON CREDIT CARDS 3,000 3,000 0 0.0% 3,000 2,922
334020 ‐ BEACH CLEANING 61,500 60,000 1,500 2.5% 60,000 52,993
11

GENERAL FUND Expenditures by Object
2022 Budget vs 2021
Projected
Account Number / Account Name 2021‐2022
Budget 2020‐2021
Projected Change $ Change % 2020‐2021
Budget 2019‐2020
Actual
334021 ‐ FERTILIZER 5,000 5,000 0 0.0% 5,000 3,606
334022 ‐ PUMP AND WELL SUPPLIES 3,000 3,000 0 0.0% 3,000 1,091
334023 ‐ CONTRACT PAINTING SERVICES 25,000 25,000 0 0.0% 25,000 13,921
340001 ‐ MILEAGE ALLOWANCE 4,400 5,450 ‐1,050 ‐19.3% 5,450 2,668
340002 ‐ AUTO ALLOWANCE 4,800 4,800 0 0.0% 4,800 4,800
341001 ‐ CELL & TELEPHONE 700 1,500 ‐800 ‐53.3% 1,500 1,381
341001 ‐ TELEPHONE 68,200 55,100 13,100 23.8% 55,100 61,121
341002 ‐ TELECOMMUNICATIONS SVCS 39,000 39,000 0 0.0% 39,000 33,277
342001 ‐ POSTAGE 19,395 19,510 ‐115 ‐0.6% 19,510 18,299
343001 ‐ UTILITIES 542,700 570,005 ‐27,305 ‐4.8% 570,005 480,975
343002 ‐ STREET & HIGHWAY LIGHTING 415,000 371,500 43,500 11.7% 371,500 230,848
344001 ‐ MACH & EQUIP RENT 3,907 3,907 0 0.0% 3,907 3,707
344003 ‐ AIRPORT LAND RENT 56,000 53,400 2,600 4.9% 53,400 53,175
345001 ‐ GENERAL INSURANCE 619,098 540,416 78,682 14.6% 540,416 479,757
345003 ‐ G/L AND AUTO‐LOSSES/DEDUCTB 14,000 32,000 ‐18,000 ‐56.3% 32,000 4,555
346001 ‐ EQUIPMENT MAINTENANCE 77,382 71,737 5,645 7.9% 71,737 46,124
346002 ‐ VEHICLE MAINTENANCE 414,047 428,659 ‐14,612 ‐3.4% 428,659 456,983
346003 ‐ BUILDING MAINTENANCE 177,850 98,500 79,350 80.6% 98,500 87,178
346004 ‐ AIR CONDITIONING MAINT 6,000 7,922 ‐1,922 ‐24.3% 7,922 7,403
346012 ‐ NETWORK MAINTENANCE 4,000 4,000 0 0.0% 4,000 3,285
346013 ‐ OTHER VEHICLE & BOAT MAINT 8,855 8,855 0 0.0% 8,855 3,420
346028 ‐ MAIN TRAFFIC SIGNALS 115,000 115,000 0 0.0% 115,000 108,746
346054 ‐ POLICE RANGE GROUND MAINT 960 960 0 0.0% 960 0
346062 ‐ FUEL SYSTEM MAINTENANCE 1,500 1,500 0 0.0% 1,500 2,044
346063 ‐ ROAD MAINTENANCE MATERIALS 12,000 12,000 0 0.0% 12,000 14,234
346064 ‐ POLICE RANGE TRGT EQUP MAINT 500 500 0 0.0% 500 0
346082 ‐ DONATED BENCHES & PLAQUES 2,000 2,000 0 0.0% 2,000 2,022
346200 ‐ SOFTWARE MAINTENANCE 251,980 238,673 13,307 5.6% 238,673 214,289
347001 ‐ PRINTING & BINDING 28,807 31,332 ‐2,525 ‐8.1% 31,332 29,227
347002 ‐ MUNICIPAL CODE 8,500 7,500 1,000 13.3% 7,500 6,673
349001 ‐ ADVERTISING 16,850 16,350 500 3.1% 16,350 11,962
349002 ‐ ELECTION EXPENSE 39,000 6,500 32,500 500.0% 6,500 25,100
349003 ‐ SCHOOLS & MEETINGS 75,575 68,775 6,800 9.9% 68,775 29,601
349013 ‐ CODE ENFORCEMENT ABATEMNT 5,000 5,000 0 0.0% 5,000 581
349023 ‐ BAD DEBT 3,000 3,000 0 0.0% 3,000 153,578
349028 ‐ LANDFILL FEES 41,170 36,603 4,567 12.5% 36,603 35,961
349050 ‐ CENTENNIAL EVENT 0 0 0 n/a 0 9,888
12

GENERAL FUND Expenditures by Object
2022 Budget vs 2021
Projected
Account Number / Account Name 2021‐2022
Budget 2020‐2021
Projected Change $ Change % 2020‐2021
Budget 2019‐2020
Actual
349100 ‐ DR‐4283 HURRICANE MATTHEW EXP 0 0 0 n/a 0 3,428
349200 ‐ HURRICANE IRMA EXPENSES 0 0 0 n/a 0 49,735
349300 ‐ HURRICANE DORIAN EXPENSES 0 0 0 n/a 0 3,181
349400 ‐ COVID 19 EXPENSES 0 0 0 n/a 0 81,469
349500 ‐ HURRICANE ISAIAS EXPENSES 0 0 0 n/a 0 309
349600 ‐ IRC CARES ACT FUND AGRMT EXPENSES 0 0 0 n/a 0 16,594
351001 ‐ OFFICE SUPPLIES 50,625 50,235 390 0.8% 50,235 47,755
351003 ‐ OFFICE FURNITURE & EQUIP 10,750 8,450 2,300 27.2% 8,450 3,422
352001 ‐ GAS & OIL 272,854 218,438 54,416 24.9% 218,438 207,508
352003 ‐ VEHICLE PARTS & SUPPLIES 250,506 250,506 0 0.0% 250,506 289,189
352004 ‐ EQUIP PARTS & SUPPLIES 15,200 15,700 ‐500 ‐3.2% 15,700 10,403
352005 ‐ CONSUMABLE TOOLS 31,759 31,809 ‐50 ‐0.2% 31,809 28,054
352006 ‐ JANITORIAL SUPPLIES 58,010 52,201 5,809 11.1% 52,201 57,716
352007 ‐ SIGN MATERIAL 60,250 57,250 3,000 5.2% 57,250 58,560
352008 ‐ SAFETY SHOES & GLASSES 18,250 17,850 400 2.2% 17,850 18,231
352008 ‐ UNIFORMS & CLOTHING 35,050 34,450 600 1.7% 34,450 33,401
352009 ‐ BUILD SUPPLIES & MATLS 55,500 55,500 0 0.0% 55,500 35,558
352010 ‐ ELEC PARTS & SUPPLIES 15,000 15,000 0 0.0% 15,000 14,116
352011 ‐ PLUMB PARTS & SUPPLIES 6,000 6,000 0 0.0% 6,000 6,035
352012 ‐ SURVEY PARTS & SUPPLIES 1,400 1,400 0 0.0% 1,400 1,020
352014 ‐ OTHER COMMODITIES 35,247 35,247 0 0.0% 35,247 33,640
352015 ‐ TRAINING AIDS 3,140 3,140 0 0.0% 3,140 566
352017 ‐ SPECIAL EVENTS SUPPLIES 3,500 5,000 ‐1,500 ‐30.0% 5,000 3,228
352027 ‐ PERFORMING ARTS COSTUMES 1,500 1,500 0 0.0% 1,500 383
352033 ‐ ATHLETICS 6,750 11,475 ‐4,725 ‐41.2% 11,475 7,080
352035 ‐ ATHLETIC AREAS MAINT 7,500 6,455 1,045 16.2% 6,455 6,707
352036 ‐ PLAYGROUNDS MAINT 10,000 24,000 ‐14,000 ‐58.3% 24,000 3,396
352050 ‐ CRIME PREVENTION 1,700 1,700 0 0.0% 1,700 1,409
352059 ‐ SHOP SUPPLIES 18,000 20,000 ‐2,000 ‐10.0% 20,000 23,691
352061 ‐ INVESTIGATION EXPENSE 10,000 10,000 0 0.0% 10,000 3,378
352063 ‐ LANDSCAPE/RECREATION 186,896 185,237 1,659 0.9% 185,237 183,455
352064 ‐ RECREATION SPONSORSHIPS 4,000 4,000 0 0.0% 4,000 2,026
352065 ‐ SMALL EQUIPMENT 6,000 6,000 0 0.0% 6,000 5,998
352066 ‐ IRRIGATION MATERIALS 15,000 15,000 0 0.0% 15,000 14,249
352067 ‐ FENCING MATERIALS 0 7,000 ‐7,000 ‐100.0% 7,000 0
352068 ‐ CHEMICAL SUPPLIES 38,100 38,100 0 0.0% 38,100 22,857
352069 ‐ LANDSCAPE MATERIALS 27,000 27,000 0 0.0% 27,000 22,391
13

GENERAL FUND Expenditures by Object
2022 Budget vs 2021
Projected
Account Number / Account Name 2021‐2022
Budget 2020‐2021
Projected Change $ Change % 2020‐2021
Budget 2019‐2020
Actual
352070 ‐ ID SUPPLIES 3,306 3,306 0 0.0% 3,306 1,684
352071 ‐ AMMUNITION 17,000 17,000 0 0.0% 17,000 12,202
352072 ‐ UNIFORMS/EQUIP/ACCESSORY 17,996 17,996 0 0.0% 17,996 20,958
352073 ‐ SWALE SOD 4,000 4,000 0 0.0% 4,000 2,572
352074 ‐ LIFESKILLS PROGRAM 3,000 3,000 0 0.0% 3,000 0
354001 ‐ SUBSCRIPTIONS/MEMBERSHIPS 26,015 26,160 ‐145 ‐0.6% 26,160 17,923
354002 ‐ FLA LEAGUE OF CITIES 2,100 2,000 100 5.0% 2,000 2,122
354005 ‐ LAW LIBRARY/SUBSCRIPTIONS 2,000 6,000 ‐4,000 ‐66.7% 6,000 5,153
354006 ‐ DOWNTOWN FRIDAY FEST 1,900 1,900 0 0.0% 1,900 729
354008 ‐ MAIN STREET VERO BEACH 26,000 26,000 0 0.0% 26,000 26,000
355001 ‐ PURCHASES FOR RESALE 2,400 2,500 ‐100 ‐4.0% 2,500 530
355002 ‐ MISCELLANEOUS 13,550 13,737 ‐187 ‐1.4% 13,737 8,867
355003 ‐ K 9 EXPENSES 7,805 7,805 0 0.0% 7,805 6,236
355006 ‐ INVENTORY VARIANCE 1,000 1,000 0 0.0% 1,000 3,885
355009 ‐ EMPLOYEE BENEFITS / AWARDS 750 750 0 0.0% 750 595
355010 ‐ HOLIDAY DECORATIONS 25,000 25,000 0 0.0% 25,000 25,078
355011 ‐ RECORDING FEES 4,500 4,500 0 0.0% 4,500 3,469
355012 ‐ MEMORIAL IS FLAG 3,000 3,000 0 0.0% 3,000 2,941
355016 ‐ DEDICATORY TREE PLANTING 2,500 2,500 0 0.0% 2,500 4,177
355017 ‐ TREE & BEAUTIFICATION PROJECTS 15,000 15,000 0 0.0% 15,000 0
359900 ‐ INTERFUND SERVICES ‐273,000 ‐270,000 ‐3,000 1.1% ‐270,000 ‐242,609
359900 ‐ INTERFUND SVCS ‐1,000 ‐1,000 0 0.0% ‐1,000 ‐4,315
359900 ‐ INTERFUND SVCS LABOR ‐919,308 ‐940,545 21,237 ‐2.3% ‐940,545 ‐933,924
359900 ‐ PARK MAINT INCOME ‐368,002 ‐364,730 ‐3,272 0.9% ‐364,730 ‐342,831
365004 ‐ BANK CHARGES 10,000 2,500 7,500 300.0% 2,500 9,947
365015 ‐ TURTLE LIGHTS 1,200 1,200 0 0.0% 1,200 0
365018 ‐ ELECTRIC UTILITY OPERATING EXP‐POST SALE 20,000 0 20,000 n/a 0 57,919
6_____ ‐ CAPITAL Various, See Detail 573,271 212,663 360,608 169.6% 212,663 289,563
991022 ‐ ECONOMIC DEV ZONE TAX INCRM 98,225 91,099 7,126 7.8% 91,099 87,027
991023 ‐ TRANS TO CEMETERY 145,450 93,000 52,450 56.4% 93,000 48,000
991034 ‐ TRANS TO 3O4: GF CONSTRUCTION 0 0 0 n/a 0 300,000
991038 ‐ TRANS TO MARINA CAPITAL 2,000,000 0 2,000,000 n/a 0 0
Total for General Fund Expenditures 27,890,326 25,024,668 2,865,658 11.5% 25,024,668 24,811,027
14

I I I I
FY 21‐22 ADMINISTRATIVE COSTS ALLOCATION
Administrative Functions Allocated
CITY COUNCIL CITY CLERK CITY MGR CITY HALL CITY ATTY HUMAN RESOURCES FINANCE:
ADMINISTRATION INFORMATION TECHNOLOGY PURCHASING
PLANNING PUBLIC WORKS: ADMINISTRATION NON‐DEPARTMENTAL CITY HALL EQUIPMENT DEPRECIATION
Total Department
Budget Water & Sewer
$ 70,438 $
559,042 341,084 272,300 426,372 475,551
950,996 989,459 569,700 533,222 582,355
5,323,381 293,652
17,610 103,008 85,271 76,603 42,637
106,488
298,679 219,188 206,106 10,664
‐
8,733 57,552
$ 11,387,552 $ 1,232,541
Costs Allocated to Other Funds
Airport Marina Solid Waste
$ 8,805 7,211
42,636 26,610
149,230 17,505
$ 3,522 7,211
17,054 7,761 8,527 7,294
$ 1,409 515
6,822 14,141 8,527
33,551
107,391 17,915
103,086 29,327
‐
1,436 15,749
59,119 9,282
16,116 2,666 ‐
598 4,906
46,930 5,490 9,724 ‐
57,085 2,752
15,107 $ 526,900 $ 144,056 $ 202,053
Costs Remaining in
Cemetery General Fund in
$ 352 $ 38,741 45,839 395,259 1,705 187,596 1,162 146,023 4,264 213,186 1,459 309,254
‐
6,207 432,670 1,597 735,987 204 234,464 ‐ 490,564 ‐ 525,270 120 5,309,743
2,661 197,676 $ 65,570 $ 9,216,432
2,171,120$Administrative Charges Revenue in General Fund
Water & Sewer 10.8%
Airport 4.6%
Marina 1.3%
Solid Waste 1.8%
Cemetery 0.6%
General Fund 80.9%
FY 21‐22 ADMINISTRATIVE COSTS ALLOCATION
15

City Council Mission
The City Council is the legislative branch of the city government. It approves and promulgates the ordinances and resolutions and defines the policies to be carried out by city management. The Council represents the city's interests before other legislative and regulatory bodies and can establish citizen advisory boards and committees to assist the Council in its duties.
Staffing Table
Budget Budget 2021-2022 2020-2021 Change
Councilmembers 5 5 0 Total 5 5 0
Major Goals and Challenges
Establish an effective policy framework to ensure efficient operation of the City of Vero Beach to meet the needs of the residents and visitors to the city.
16

GENERAL FUND
CITY COUNCIL
2022 Budget vs 2021 Projected
2021‐2022 2020‐2021 Change $ Change % 2020‐2021 2019‐2020
Account Number Account Name Budget Projected Budget Actual
Personnel Costs
001.0100.511.112001 OPERATING SALARIES 56,700 56,700 0 0.0% 56,700 56,700
001.0100.511.121001 SOCIAL SECURITY 4,338 4,338 0 0.0% 4,338 4,307
001.0100.511.123001 GROUP LIFE INSURANCE 700 1,000 ‐300 ‐30.0% 1,000 562
001.0100.511.123002 HOSPITALIZATION INSURANCE 0 8,865 ‐8,865 ‐100.0% 8,865 9,959
Total Personnel Costs 61,738 70,903 ‐9,165 ‐12.9% 70,903 71,528
Operating Expenses
001.0100.511.341001 CELL & TELEPHONE 700 1,500 ‐800 ‐53.3% 1,500 1,381
001.0100.511.349003 SCHOOLS & MEETINGS 5,000 5,000 0 0.0% 5,000 1,902
001.0100.511.355002 MISCELLANEOUS 3,000 3,000 0 0.0% 3,000 1,199
Total Operating Expenses 8,700 9,500 ‐800 ‐8.4% 9,500 4,482
Capital Outlay001.0100.511.6_____ Various, See Detail 0 6,500 ‐6,500 ‐100.0% 6,500 0
Total Capital Outlay 0 6,500 ‐6,500 ‐100.0% 6,500 0
Total 70,438 86,903 ‐16,465 ‐18.9% 86,903 76,010
17

City Clerk Mission
The mission of the City Clerk is to prepare City Council agendas and publish all legal notices as required by State Statutes and City Code. The City Clerk also processes City ordinances, resolutions, contracts and other vital documents. Additionally, the City Clerk's office serves as secretary for 16 different Boards/Commissions. The City Clerk serves as Supervisor of Elections for the City of Vero Beach. All candidates for City Council file with the City Clerk's office. The City Clerk's office is responsible for the sale of cemetery lots for Crestlawn Cemetery, which includes answering questions about available lots, where remains are located, deed questions, resales back to the City, etc.
Staffing Table
Employee Type Budget
2021-2022 Budget
2020-2021 Change Full Time Non Bargaining 5 5 0 Full Time Bargaining 0 0 0
Total 5 5 Part Time 0 0 0
Total 5 5 0
Major Goals and Challenges The City Clerk's office will work with the City Attorney's office in making sure that each City Councilmember attends a four (4) hour required Ethics Training each year. The City Clerk will work with the Government Coordinator in continuing to update the City's website to make it user friendly. As well as having emergency notices posted on the website in a timely manner. Also, making sure the public is aware that the City's Government Channel is broadcast on both Comcast and AT&T, as well as livestreaming on the City website. The Clerk's office will continue to maintain the level of service that we have always provided to Council, Commissions, Staff and the Public.
18

GENERAL FUND
CITY CLERK 2022 Budget vs 2021
Projected
2021‐2022 2020‐2021 Change $ Change % 2020‐2021 2019‐2020
Account Number Account Name Budget Projected Budget Actual
Personnel Costs
001.0200.512.112001 OPERATING SALARIES 290,028 284,429 5,599 2.0% 284,429 277,148
001.0200.512.114001 OVERTIME SALARIES 1,000 ‐ 1,000 n/a ‐ 809
001.0200.512.121001 SOCIAL SECURITY 22,264 21,759 505 2.3% 21,759 19,409
001.0200.512.122001 PENSION CONTRIBUTION 83,913 91,702 ‐7,789 ‐8.5% 91,702 91,048
001.0200.512.123001 GROUP LIFE INSURANCE 800 1,100 ‐300 ‐27.3% 1,100 695
001.0200.512.123002 HOSPITALIZATION INSURANCE 55,637 54,610 1,027 1.9% 54,610 55,513
Total Personnel Costs 453,642 453,600 42 0.0% 453,600 444,622
Operating Expenses 001.0200.512.334007 OTHER CONTRACTUAL SERVICES 30,400 25,000 5,400 21.6% 25,000 25,149
001.0200.512.340001 MILEAGE ALLOWANCE 100 100 0 0.0% 100 6
001.0200.512.341001 TELEPHONE 2,700 1,800 900 50.0% 1,800 2,385
001.0200.512.342001 POSTAGE 1,200 1,200 0 0.0% 1,200 719
001.0200.512.346001 EQUIPMENT MAINTENANCE 500 500 0 0.0% 500 59
001.0200.512.347001 PRINTING & BINDING 4,000 5,500 ‐1,500 ‐27.3% 5,500 5,790
001.0200.512.347002 MUNICIPAL CODE 8,500 7,500 1,000 13.3% 7,500 6,673
001.0200.512.349001 ADVERTISING 7,500 7,000 500 7.1% 7,000 5,997
001.0200.512.349002 ELECTION EXPENSE 39,000 6,500 32,500 500.0% 6,500 25,100
001.0200.512.349003 SCHOOLS & MEETINGS 5,000 5,000 0 0.0% 5,000 88
001.0200.512.349050 CENTENNIAL EVENT 0 0 0 n/a 0 9,888
001.0200.512.351001 OFFICE SUPPLIES 3,000 3,000 0 0.0% 3,000 2,120
001.0200.512.354001 SUBSCRIPTIONS/MEMBERSHIPS 1,500 1,500 0 0.0% 1,500 1,128
001.0200.512.355002 MISCELLANEOUS 2,000 2,000 0 0.0% 2,000 1,603
Total Operating Expenses 105,400 66,600 38,800 58.3% 66,600 86,705
Capital Outlay001.0200.512.6_____ Various, See Detail 0 0 0 n/a 0 9,094
Total Capital Outlay 0 0 0 n/a 0 9,094
Total 559,042 520,200 38,842 7.5% 520,200 540,421
19

City Manager Mission The mission of the City Manager is to provide professional leadership and guidance in the execution of policies and programs established by the City Council. The City Manager administers and monitors the daily affairs of the City government, including law enforcement, civil engineering and public works, sanitation, financial operations, human resources, community development, and recreational activities. The City Manager creates and implements new management techniques to facilitate the effective delivery of municipal services, utility systems and enterprise operations which ensure reliable and environmentally safe potable water, sewer, reuse water, solid waste collection, marina operations and airport services. The City Manager fosters the effective use of all City assets and provides a safe work environment for all employees. The City Manager strives to make the City of Vero Beach a desired place to live, work, play, and visit by maintaining a skilled workforce that handles the daily needs of the general population, thus ensuring a clean and safe environment that produce a sense of pride and a high quality of life throughout the community.
Staffing Table
Employee Type Budget
2021-2022 Budget
2020-2021 Change Full Time Non Bargaining 2 2 0 Full Time Bargaining 0 0 0
Total 2 2 0 Part Time 0 0 0
Total 2 2 0
Major Goals and Challenges Administer the City in the most efficient manner to control ad valorem taxes and user fees, and yet be responsive to the needs and desires of the residents and utility customers of Vero Beach.
Develop annual budgets that ensure the financial integrity of the City.
Provide water and sewer, and solid waste services to customers in the City's service territories on a reliable, economical, environmentally acceptable and financially sound basis.
Operate the water and sewer, marina, airport and solid waste systems as self-sustaining, regulated businesses yielding reasonably consistent, positive rates of return paid to the residents of Vero Beach through annual contributions to the City's General Fund.
Continue pursuing cost reduction measures within the City organization and utility operations.
Ensure community involvement in decision-making.
Include Boards and Commissions as part of the decision-making process.
Address lagoon impact issues.
20

GENERAL FUND
CITY MANAGER 2022 Budget vs 2021
Projected
2021‐2022 2020‐2021 Change $ Change % 2020‐2021 2019‐2020
Account Number Account Name Budget Projected Budget Actual
Personnel Costs
001.0300.512.112001 OPERATING SALARIES 214,051 234,409 ‐20,358 ‐8.7% 234,409 229,410
001.0300.512.121001 SOCIAL SECURITY 16,375 17,932 ‐1,557 ‐8.7% 17,932 16,290
001.0300.512.122001 PENSION CONTRIBUTION 74,268 84,012 ‐9,744 ‐11.6% 84,012 83,425
001.0300.512.123001 GROUP LIFE INSURANCE 700 750 ‐50 ‐6.7% 750 566
001.0300.512.123002 HOSPITALIZATION INSURANCE 24,040 23,589 451 1.9% 23,589 23,212
Total Personnel Costs 329,434 360,692 ‐31,258 ‐8.7% 360,692 352,903
Operating Expenses
001.0300.512.340001 MILEAGE ALLOWANCE 250 250 0 0.0% 250 31
001.0300.512.340002 AUTO ALLOWANCE 4,800 4,800 0 0.0% 4,800 4,800
001.0300.512.341001 TELEPHONE 900 750 150 20.0% 750 819
001.0300.512.342001 POSTAGE 50 50 0 0.0% 50 18
001.0300.512.347001 PRINTING & BINDING 250 250 0 0.0% 250 235
001.0300.512.349003 SCHOOLS & MEETINGS 2,500 2,500 0 0.0% 2,500 111
001.0300.512.351001 OFFICE SUPPLIES 400 400 0 0.0% 400 267
001.0300.512.351003 OFFICE FURNITURE & EQUIP 500 0 500 n/a 0 177
001.0300.512.354001 SUBSCRIPTIONS/MEMBERSHIPS 2,000 2,000 0 0.0% 2,000 0
Total Operating Expenses 11,650 11,000 650 5.9% 11,000 6,458
Total 341,084 371,692 ‐30,608 ‐8.2% 371,692 359,361
21

City Hall Mission
City Hall accounts are used for expenses that are associated with the City Hall building and are not specifically allocable to any other department.
22

GENERAL FUND
CITY HALL 2022 Budget vs 2021
Projected
2021‐2022 2020‐2021 Change $ Change % 2020‐2021 2019‐2020
Account Number Account Name Budget Projected Budget Actual
Operating Expenses 001.0600.519.331001 PROFESSIONAL SERVICES 50,000 0 50,000 n/a 0 0
001.0600.519.334003 JANITORIAL SERVICES 39,500 39,095 405 1.0% 39,095 33,043
001.0600.519.341001 TELEPHONE 500 2,500 ‐2,000 ‐80.0% 2,500 132
001.0600.519.343001 UTILITIES 60,000 60,000 0 0.0% 60,000 54,713
001.0600.519.346001 EQUIPMENT MAINTENANCE 2,600 2,600 0 0.0% 2,600 1,450
001.0600.519.346003 BUILDING MAINTENANCE 108,000 28,000 80,000 285.7% 28,000 13,372
001.0600.519.346004 AIR CONDITIONING MAINT 2,500 4,000 ‐1,500 ‐37.5% 4,000 2,182
001.0600.519.349028 LANDFILL FEES 1,200 1,100 100 9.1% 1,100 1,049
001.0600.519.352006 JANITORIAL SUPPLIES 3,000 3,000 0 0.0% 3,000 2,541
001.0600.519.352009 BUILD SUPPLIES & MATLS 5,000 5,000 0 0.0% 5,000 2,089
Total Operating Expenses 272,300 145,295 127,005 87.4% 145,295 110,571
Total 272,300 145,295 127,005 87.4% 145,295 110,571
23

City Attorney Mission
The city attorney is the legal advisor to the City of Vero Beach pursuant to the City Charter. The city attorney's office provides a broad range of professional legal services to the organization, including research, analysis, and guidance on federal, state, and local laws and regulations affecting the city government and its operations, as well as on administrative, legislative, and procedural matters. The city attorney's office prepares and reviews legal, legislative, contractual, and other documents necessary to the city's municipal functions, goals, and policies. The city attorney's office represents the City in various judicial and administrative proceedings, including research and investigation of relevant legal, evidentiary, and practical matters, development of legal theories, preparation of pleadings and other documents necessary to the representation, and advocacy on behalf of the City in such proceedings. In addition to the city council, the city attorney's office advises and performs legal work for the City's charter officers, City departments and divisions, and the City's appointed boards and commissions. The city attorney or his designee attends all city council meetings and performs such other professional duties as may be required by law or by the city council.
Staffing Table Employee Type
Budget 2021-2022
Budget 2020-2021 Change
Full Time Non Bargaining 3 3 0 Full Time Bargaining 0 0 0
Total 3 3 0 Part Time 0 0 0
Total 0 0 0
Major Goals and Challenges
The major goals of the city attorney’s office are to facilitate and assist the City organization in accomplishment of its municipal functions, goals, and policies as established by the City Charter, the Code of Ordinances, and the City Council, and to assist the City's various departments and divisions in the delivery of municipal services and programs in conformance with applicable laws and regulations while maximizing City efficiencies and minimizing City exposure to risk. The major challenge for the city attorney's office is the efficient management and use of limited resources in a manner that will facilitate accomplishment of the mission and goals of the city attorney's office in meeting the legal services needs of the organization in a timely manner.
24

GENERAL FUND
CITY ATTORNEY 2022 Budget vs 2021
Projected
2021‐2022 2020‐2021 Change $ Change % 2020‐2021 2019‐2020
Account Number Account Name Budget Projected Budget Actual
Personnel Costs
001.1100.514.112001 OPERATING SALARIES 261,840 279,404 ‐17,564 ‐6.3% 279,404 203,818
001.1100.514.121001 SOCIAL SECURITY 20,031 21,374 ‐1,343 ‐6.3% 21,374 15,196
001.1100.514.122001 PENSION FUND CONTRIBUTION 90,275 101,137 ‐10,862 ‐10.7% 101,137 86,625
001.1100.514.123001 GROUP LIFE INSURANCE 500 800 ‐300 ‐37.5% 800 351
001.1100.514.123002 HOSPITALIZATION INSURANCE 37,601 35,384 2,217 6.3% 35,384 24,775
Total Personnel Costs 410,247 438,099 ‐27,852 ‐6.4% 438,099 330,765
Operating Expenses
001.1100.514.331001 PROFESSIONAL SERVICES 0 0 0 n/a 0 1,298
001.1100.514.340001 MILEAGE ALLOWANCE 500 100 400 400.0% 100 0
001.1100.514.341001 TELEPHONE 550 500 50 10.0% 500 443
001.1100.514.342001 POSTAGE 200 200 0 0.0% 200 96
001.1100.514.346001 EQUIPMENT MAINTENANCE 325 325 0 0.0% 325 417
001.1100.514.346200 SOFTWARE MAINTENANCE 200 200 0 0.0% 200 193
001.1100.514.347001 PRINTING & BINDING 50 50 0 0.0% 50 0
001.1100.514.349003 SCHOOLS & MEETINGS 3,600 3,600 0 0.0% 3,600 929
001.1100.514.351001 OFFICE SUPPLIES 1,200 1,000 200 20.0% 1,000 748
001.1100.514.351003 OFFICE FURNITURE & EQUIP 500 300 200 66.7% 300 0
001.1100.514.354001 SUBSCRIPTIONS/MEMBERSHIPS 2,500 3,300 ‐800 ‐24.2% 3,300 1,564
001.1100.514.354005 LAW LIBRARY/SUBSCRIPTIONS 2,000 6,000 ‐4,000 ‐66.7% 6,000 5,153
001.1100.514.355002 MISCELLANEOUS 0 100 ‐100 ‐100.0% 100 0
001.1100.514.355011 RECORDING FEES 4,500 4,500 0 0.0% 4,500 3,469
Total Operating Expenses 16,125 20,175 ‐4,050 ‐20.1% 20,175 14,310
Total 426,372 458,274 ‐31,902 ‐7.0% 458,274 345,075
25

I I I I
Human Resources/Risk Management Mission The Human Resources/Risk Management Department will strive for fair and equitable treatment of all employees in a manner that will ensure proactive support of the City's mission. The department will develop and implement policies, procedures, programs and services that will enhance and contribute to attainment of the goals and objectives of the City and its employees by: * Properly balancing the needs of the employees and the City in a manner that motivates everyone to operate efficiently and effectively when engaged in the performance of duties to support the citizens of our community. * Ensuring a diverse workforce in a safe, discrimination and harassment free environment through compliance with applicable employment laws, proactive investigation and defense of the City in claims of discrimination; and by providing appropriate training for management and employees in these areas. * Hiring the most qualified employees through comprehensive staffing reviews, an effective internal interviewing process, identifying the most efficient and cost effective recruiting programs, and conducting thorough background investigations. * Retaining valued employees by providing positive coaching/counseling, and ensuring open and proactive two‐way communications between employees and their managers. * Fostering positive and professional relationships on the part of all managers having direct or indirect involvement with labor organizations representing City employees through proper guidance and direction in the application and interpretation of labor agreements, training in proper documentation to support disciplinary action, and procedures to be used in investigating and adjusting grievances. * Ensuring compliance with applicable local, state, and federal labor laws. * Protect City resources including personnel, facilities, assets and real property from loss, and ensure the City's ability to deliver essential services following a loss. * Continue to coordinate and deliver a comprehensive and cost‐effective benefit package to help retain current employees and attract the best qualified applicants for openings in the future, while also being cost effective for the City. * Coordinate safety resources and training to ensure the well‐being of City employees while on the job, with the goal of reducing and/or eliminating exposures to disease, injury and death. * All Commercial Lines (Property, Boiler & Machinery, Auto, Marina, Aviation, Storage Tank Liability, General Liability and Workers' Compensation) Claims Administration: Work closely with insurance providers in regards to claims. Monitor insurance providers to ensure that we are receiving the best coverage at competitive prices. Ensure that insurers are working in the City's best interest when handling claims. * Property Damage Subrogation Administration: Recover monies due to the City from damage to City assets whenever possible. * Commercial Insurance Policy Management: Continuous evaluation of loss exposure to City assets with the goal of identifying alternative risk financing solutions that are economically advantageous to the City. Procure and monitor appropriate insurance policies through the City's Agent to protect City assets. * Employee Benefits Administration: Provide ongoing evaluation and assessment of employee insurance and benefit programs. Research new and innovative means to provide the highest level of benefits in a cost effective manner. * General Employee Pension Plan and Defined Contribution Pension Plan administration, and administrative support of Police Pension Plan. Provide support and education to employees to aid in their financial well‐being after retirement, and an understanding of their options with regard to retirement and benefits. * Employee Benefit Education and Assistance: Deliver continuing education to employees on the value and features of benefit packages offered through every available communication resource. Provide on‐site representation of all vendors. Provide daily assistance and guidance to employees regarding benefit choices and proper administration. Make available an employee assistance program to aid all employees in maintaining their physical and mental well being. * Regulatory Compliance: Remain compliant with COBRA, HIPAA , IRS Section 125 Cafeteria Plans, OSHA, ADA, NFPA, CMS, Health Care Reform and other Federal, State and local rules, regulations and standards. * Employee Safety and Training: Enhance existing in‐house training to provide city‐wide safety instruction at a reasonable cost. Solicit participation of City employees in supporting safe work practices and a safe work environment. Conduct emergency preparedness drills and practice evacuation procedures. Conduct City‐wide safety meetings and provide assistance to departments for mandatory departmental training. Continue enhancing security throughout City Hall.
Staffing Table Employee Type
Budget 2021‐2022
Budget 2020‐2021 Change
Full Time Non Bargaining 4 4 0 Full Time Bargaining 0 0 0
Total 4 4 0 Part Time 0 0 0
Total 4 4 0
Major Goals and Challenges * Continue to hold Labor Management Committee meetings to foster and maintain amicable relationship between the City and Teamsters Local 769, both Blue Collar & Clerical & Technical. * Within the scope of the Labor Management Committee, write job descriptions for new positions as needed for the blue collar unit; and, if necessary, revise job descriptions on the clerical and technical unit. * Lend support and guidance to managers in preparing disciplinary letters, disciplinary meetings, grievance handling, employee and labor relations, and other disciplinary issues that may arise. * Continue development and implementation of programs and procedures to maximize selection and retention of highly qualified employees. This includes background checks, physicals, and where applicable drug screenings in compliance with all federal, state and local laws. * Continue orientation of all newly hired employees, which will also incorporate diversity training, acceptable computer usage, and records retention training. * Monitor the performance appraisal system for compliance by all departments. * Continue working with the City Clerk's office to answer public records requests in a timely matter. * Continue the maintenance of Human Resources/Payroll system as well as the physical personnel records of all employees, emphasizing the importance of Human Resource's receipt of all employee related correspondence from the individual departments. * Maintain the organizational charts for all departments within the City. * Negotiate the Contracts for both Lieutenants and Rank & File, Teamsters Blue Collar and Clerical Technical Unions. * Complete EEO training for City and develop additional training as needed. * Identify exposures and determine the best practices to reduce, eliminate, share or insure risk. Work with departments to enforce contract requirements regarding insurance and safety. * Work with departments for prompt reporting of newly acquired assets. Maintain an effective loss control program to protect City resources including employees, facilities, vehicles and other assets owned or entrusted to the City government from loss. * Conduct worksite inspections with the departments and employees with the goal of reducing, controlling and/or eliminating workplace hazards. Work with departments on procedures to ensure prompt and proper responses are taken following any accident or loss. Create and implement an individual Safety Inspection Program for all departments. * Work with agent of record to ensure compliance with Healthcare Reform requirements and make recommendations regarding Plan design, cost sharing and possible alternatives to providing health care to control rising costs. * Promote employee wellness through health fairs, risk assessments, fitness activities, health talks and other enhancements using free resources as often as possible. Provide on‐going safety and wellness information to all employees utilizing the City's website and email. * Continue to improve the newly established Wellness Plan to assist employees in becoming healthier and to positively impact renewal rates. * Ensure compliance with existing policies such as cell phone usage, vehicle usage, Personal Protective Equipment (PPE) requirements and develop additional policies as the need arises. * Continue to provide support and guidance to the City's Employees and Retirees with regard to retirement and benefits. * Continue to develop policies and procedures to ensure safeguarding of City assets and resources. * Expand job safety training using monthly Safety Committee meetings, group seminars, videotapes, guest speakers, and other resources to reinforce safety practices and help control losses to City resources and employee injuries. Monitor departmental safety training to show compliance with developing procedures. Continue employee training in CPR, First Aid and the use of defibrillators to prepare City staff to respond to medical emergencies both on and off the job. * Ensure compliance with all applicable OSHA regulations and facilitate in‐house instruction in such areas as proper lifting techniques, fire protection, hazardous communications, forklift training, work zone safety, confined space, trenching, asbestos, ergonomics, etc. * Follow updated regulations when conducting DOT drug and alcohol testing and random testing on employees subject to the City's Drug‐Free Workplace Program as outlined in Code of Federal Regulations, Title 49; Part 40 and Florida Statutes, Chapter 440.102, Workers' Compensation. Maintain programs that provide discounts in insurance premiums or assessments as allowed in federal and state statutes. * Monitor the Emergency Management Plan to streamline processes and promote effective recovery of assets and monies following any disaster. * Work closely with Synergy NDS in the event of a disaster recovery event. * Ensure compliance on all Federal, State and local rules and regulations regarding safety, employment issues, labor issues, insurance and benefits.
26

GENERAL FUND
HUMAN RESOURCES / RISK MANAGEMENT 2022 Budget vs 2021
Projected
2021‐2022 2020‐2021 Change $ Change % 2020‐2021 2019‐2020
Account Number Account Name Budget Projected Budget Actual
Personnel Costs
001.1200.513.112001 OPERATING SALARIES 251,157 246,244 4,913 2.0% 246,244 241,121
001.1200.513.121001 SOCIAL SECURITY 19,214 18,838 376 2.0% 18,838 16,418
001.1200.513.122001 PENSION FUND CONTRIBUTION 70,350 76,879 ‐6,529 ‐8.5% 76,879 76,422
001.1200.513.123001 GROUP LIFE INSURANCE 800 1000 ‐200 ‐20.0% 1000 603
001.1200.513.123002 HOSPITALIZATION INSURANCE 49,695 48,725 970 2.0% 48,725 47,627
Total Personnel Costs 391,216 391,686 ‐470 ‐0.1% 391,686 382,191
Operating Expenses
001.1200.513.331001 PROFESSIONAL SERVICES 46,000 45,000 1,000 2.2% 45,000 48,713
001.1200.513.340001 MILEAGE ALLOWANCE 800 800 0 0.0% 800 0
001.1200.513.341001 TELEPHONE 1,600 1,600 0 0.0% 1,600 1,327
001.1200.513.342001 POSTAGE 1,000 1,000 0 0.0% 1,000 430
001.1200.513.346001 EQUIPMENT MAINTENANCE 500 500 0 0.0% 500 0
001.1200.513.346200 SOFTWARE MAINTENANCE 13,000 11,500 1,500 13.0% 11,500 9,214
001.1200.513.347001 PRINTING & BINDING 7,470 7,470 0 0.0% 7,470 4,747
001.1200.513.349003 SCHOOLS & MEETINGS 4,400 4,400 0 0.0% 4,400 1,416
001.1200.513.351001 OFFICE SUPPLIES 3,300 3,300 0 0.0% 3,300 2,358
001.1200.513.351003 OFFICE FURNITURE & EQUIP 2,200 2,200 0 0.0% 2,200 218
001.1200.513.352015 TRAINING AIDS 1,590 1,590 0 0.0% 1,590 127
001.1200.513.354001 SUBSCRIPTIONS/MEMBERSHIPS 1,725 1,725 0 0.0% 1,725 1,118
001.1200.513.355009 EMPLOYEE BENEFITS / AWARDS 750 750 0 0.0% 750 595
Total Operating Expenses 84,335 81,835 2,500 3.1% 81,835 70,263
Capital Outlay001.1200.513.6_____ Various, See Detail 0 0 0 n/a 0 936
Total Capital Outlay 0 0 0 n/a 0 936
Total 475,551 473,521 2,030 0.4% 473,521 453,390
27

Finance Administration
Mission The mission of the Finance Department is to enhance and promote professional management of governmental resources. This is accomplished, in part, by identifying, developing and advancing fiscal strategies and practices to account for and safeguard City assets; and by maximizing the return to the city on each dollar saved and each dollar spent for equipment and services. The Finance Department coordinates, administers and invests the pooled financial resources of the city and provides accounting, payroll, billing, bookkeeping, budgeting, treasury and cashiering services to all city departments, divisions and enterprises.
As the focal point of the city's management information system, this division provides timely and accurate accounting records for all financial transactions and distributes various reports to all levels of city management.
In addition to Information Systems, the department oversees the Purchasing and Customer Services divisions.
Staffing Table
Employee Type Budget
2021-2022 Budget
2020-2021 Change Full Time Non Bargaining 3 3 0 Full Time Bargaining 7 7 0
Total 10 10 0 Part Time 2 2 0
Total 12 12 0
Major Goals and Challenges To provide professional support to City Management for making fiscal decisions necessary to plan and implement the optimum use of City resources.
To provide reports that demonstrate fiscal accountability to other governmental entities, the general public and various regulatory agencies.
To prepare annual financial statements for audit by the City's Independent Certified Public Accountants and publish the City's Comprehensive Annual Financial Report.
To manage the City's pooled cash and investments to optimize returns in compliance with Florida Statutes.
To provide financial analysis and monitoring for utility rate setting and optimization initiatives.
To plan and implement improvements to Customer Service and banking technology.
Continue to implement process improvements to maximize efficiency with limited personnel resources in the Finance Administration division.
28

GENERAL FUND
FINANCE: ADMINISTRATION 2022 Budget vs 2021
Projected
2021‐2022 2020‐2021 Change $ Change % 2020‐2021 2019‐2020
Account Number Account Name Budget Projected Budget Actual
Personnel Costs 001.1300.513.112001 OPERATING SALARIES 546,088 535,474 10,614 2.0% 535,474 523,701
001.1300.513.113002 PART TIME SALARIES 44,355 42,330 2,025 4.8% 42,330 20,171
001.1300.513.114001 OVERTIME SALARIES 1,000 1,000 0 0.0% 1,000 145
001.1300.513.115009 MEAL ALLOWANCE 0 0 0 n/a 0 14
001.1300.513.121001 SOCIAL SECURITY 45,245 44,279 966 2.2% 44,279 39,337
001.1300.513.122001 PENSION FUND CONTRIBUTION 151,121 164,995 ‐13,874 ‐8.4% 164,995 160,464
001.1300.513.123001 GROUP LIFE INSURANCE 1,500 2,100 ‐600 ‐28.6% 2,100 1,301
001.1300.513.123002 HOSPITALIZATION INSURANCE 96,968 95,131 1,837 1.9% 95,131 83,903
Total Personnel Costs 886,277 885,309 968 0.1% 885,309 829,036
Operating Expenses
001.1300.513.334007 OTHER CONTRACTUAL SERVICES 20,000 20,000 0 0.0% 20,000 38,422
001.1300.513.341001 TELEPHONE 1,600 1,500 100 6.7% 1,500 1,315
001.1300.513.342001 POSTAGE 8,000 8,000 0 0.0% 8,000 7,390
001.1300.513.344001 MACH & EQUIP RENT 3,907 3,907 0 0.0% 3,907 3,707
001.1300.513.346001 EQUIPMENT MAINTENANCE 3,700 3,700 0 0.0% 3,700 575
001.1300.513.347001 PRINTING & BINDING 6,112 6,112 0 0.0% 6,112 5,416
001.1300.513.349001 ADVERTISING 3,000 3,000 0 0.0% 3,000 2,830
001.1300.513.349003 SCHOOLS & MEETINGS 2,000 2,000 0 0.0% 2,000 2,738
001.1300.513.351001 OFFICE SUPPLIES 9,500 9,500 0 0.0% 9,500 9,660
001.1300.513.351003 OFFICE FURNITURE & EQUIP 1,000 1,000 0 0.0% 1,000 397
001.1300.513.354001 SUBSCRIPTIONS/MEMBERSHIPS 1,500 1,500 0 0.0% 1,500 800
Total Operating Expenses 60,319 60,219 100 0.2% 60,219 73,250
Capital Outlay001.1300.513.6_____ Various, See Detail 4,400 0 4,400 n/a 0 0
Total Capital Outlay 4,400 0 4,400 n/a 0 0
Total 950,996 945,528 5,468 0.6% 945,528 902,286
29

GENERAL FUND
CAPITAL REQUEST DETAIL
Account 2021‐2022
Department Number Account Name Description Budget
Finance: Administration 001.1300.513.609001 COMPUTERS Replace four PC Workstations per IT 4,400
Department recommendation Total for Finance: Administration 4,400
30

Finance Information Technology
Mission
The mission of the Information Technology Division is to provide continuous, efficient, and secure operation of the City's information system infrastructure. Technical and operational services are provided to all departments of the City of Vero Beach resulting in the efficient and cost-effective use of current computer and communications technology by the City's workforce.
Staffing Table
Employee Type Budget
2021-2022 Budget
2020-2021 Change
Full Time Non Bargaining 2 2 0 Full Time Bargaining 5 5 0
Total 7 7 0 Part Time 0 0 0
Total 7 7 0
Major Achievements, Goals, and Challenges Major Achievements:
- GEMS AB Suite Upgrade to Windows Server 2016 - Replace City Network Storage Array - Initated upgrade of the Customer Service Cayenta Utility Billing System - Upgrade of email services to Microsoft Exchange 2016 - Review of IT Operations procedure manuals and workflows - Achived network PCI Compliance for the various credit card payment systems with Finance - Adapted to the challenges presented by the covid-19 pandemic
- Acquired and configured laptops for rapid deployment for temporary remote use - Retrofit existing computers with web-cam capabilities as needed
Goals: - Continue researching ways to increase cybersecurity countermeasures - Continue working to migrate City fiber circuits off of the Optical Ground Wire (OPGW) Fiber system - Ensure reliable and accurate processing of utility billing, meter reading, and financial accounting systems - Continue improving network security and monitoring systems - Review IT Policy & Procedures on an annual basis - Continue upgrading Windows servers to more current versions - Strategically position networking equipment to minimize user impact
Challenges: - Implementing newer software technologies with legacy desktop operating systems - Maintaining cost-effective, reliable, and efficient telecommunications network infrastructure - Opportunities for staff to keep current on technologies - Preparing and reacting to the constant cyber-security threat potentials - Supporting users and systems during the covid-19 pandemic
31

GENERAL FUND
FINANCE: INFORMATION TECHNOLOGY 2022 Budget vs 2021
Projected
2021‐2022 2020‐2021 Change $ Change % 2020‐2021 2019‐2020
Account Number Account Name Budget Projected Budget Actual
Personnel Costs
001.1301.513.112001 OPERATING SALARIES 388,402 380,088 8,314 2.2% 380,088 404,296
001.1301.513.114001 OVERTIME SALARIES 2,500 2,500 0 0.0% 2,500 1,490
001.1301.513.121001 SOCIAL SECURITY 29,904 29,268 636 2.2% 29,268 27,745
001.1301.513.122001 PENSION FUND CONTRIBUTION 108,202 117,056 ‐8,854 ‐7.6% 117,056 115,965
001.1301.513.123001 GROUP LIFE INSURANCE 1,000 1,600 ‐600 ‐37.5% 1,600 879
001.1301.513.123002 HOSPITALIZATION INSURANCE 102,801 109,357 ‐6,556 ‐6.0% 109,357 93,993
Total Personnel Costs 632,809 639,869 ‐7,060 ‐1.1% 639,869 644,368
Operating Expenses 001.1301.513.331001 PROFESSIONAL SERVICES 30,000 0 30,000 n/a 0 0
001.1301.513.341001 TELEPHONE 3,100 2,650 450 17.0% 2,650 2,242
001.1301.513.342001 POSTAGE 50 75 ‐25 ‐33.3% 75 1
001.1301.513.346001 EQUIPMENT MAINTENANCE 25,000 21,500 3,500 16.3% 21,500 20,978
001.1301.513.346012 NETWORK MAINTENANCE 4,000 4,000 0 0.0% 4,000 3,285
001.1301.513.346200 SOFTWARE MAINTENANCE 124,000 123,000 1,000 0.8% 123,000 109,436
001.1301.513.349003 SCHOOLS & MEETINGS 9,500 3,000 6,500 216.7% 3,000 4,027
001.1301.513.351001 OFFICE SUPPLIES 5,000 5,000 0 0.0% 5,000 4,221
001.1301.513.351003 OFFICE FURNITURE & EQUIP 500 500 0 0.0% 500 309
001.1301.513.354001 SUBSCRIPTIONS/MEMBERSHIPS 500 500 0 0.0% 500 300
Total Operating Expenses 201,650 160,225 41,425 25.9% 160,225 144,799
Capital Outlay001.1301.513.6_____ Various, See Detail 155,000 6,500 148,500 2284.6% 6,500 23,518
Total Capital Outlay 155,000 6,500 148,500 2284.6% 6,500 23,518
Total 989,459 806,594 182,865 22.7% 806,594 812,685
32

GENERAL FUND
CAPITAL REQUEST DETAIL
Account 2021‐2022
Department Number Account Name Description Budget
Finance: Information Technology 001.1301.513.600103 NETWORK EQUIPMENT (VMWARE HOST) Replace VMWare host purchased 10/2014. 8,000
Host serves all City departments 1 of 4 units.
(Part of a rolling replacement schedule.)
001.1301.513.600103 NETWORK EQUIPMENT (VMWARE HOST) Additional VMWare host and licenses to 17,000 increase cluster computing power and
redundancy from 4 hosts to 5 hosts. 001.1301.513.600103 NETWORK EQUIPMENT (AS50 SWITCHES) Replace VMWare cluster network/iSCSI 20,000
switches purchased 1/2014. 001.1301.513.601001 NETWORK SOFTWARE (UPGRADE VMWARE DR) Upgrade VMWare licenses at disaster recovery 25,000
site to match production licenses to allow inter‐cluster vMotion capabilities.
001.1301.513.601001 NETWORK SOFTWARE (UPG WINDOWS Upgrade Microsoft server operating systems 10,000 SERVERS) within the VMWare clusters to ensure
supportability and increase cyber‐security
protection. 001.1301.513.600105 CITY HALL DOOR ACCESS CONTROL Replace City Hall door access control system to 75,000
improve physical security and comply with
recommended industry security standards.
Total for Finance: Information Technology 155,000
33

Finance Purchasing
Mission The mission of the Purchasing Division is to provide centralized procurement services for products and services required by city departments, consistent with the provisions of Chapter 2, Article VIII of the City of Vero Beach Code of Ordinances. This division administers service and supply contracts central to city departments and mail delivery services throughout the City.
Staffing Table
Employee Type Budget
2021-2022 Budget
2020-2021 Change
Full Time Non Bargaining 3 3 0 Full Time Bargaining 2 2 0
Total 5 5 0 Part Time 0 0 0
Total 5 5 0
Major Goals and Challenges Our primary goal is to provide procurement services to end-user departments, while ensuring the City maximizes its return on its purchases; and is in compliance with procurement rules and regulations established in accordance with local, state and federal requirements.
Develop pooled services contracts to reduce the bidding and contract administration process.
34

GENERAL FUND
FINANCE: PURCHASING 2022 Budget vs 2021
Projected
2021‐2022 2020‐2021 Change $ Change % 2020‐2021 2019‐2020
Account Number Account Name Budget Projected Budget Actual
Personnel Costs 001.1302.513.112001 OPERATING SALARIES 332,196 327,383 4,813 1.5% 327,383 387,025
001.1302.513.121001 SOCIAL SECURITY 25,413 25,045 368 1.5% 25,045 27,967
001.1302.513.122001 PENSION FUND CONTRIBUTION 125,415 140,380 ‐14,965 ‐10.7% 140,380 140,423
001.1302.513.123001 GROUP LIFE INSURANCE 1,000 1,300 ‐300 ‐23.1% 1,300 798
001.1302.513.123002 HOSPITALIZATION INSURANCE 63,402 56,418 6,984 12.4% 56,418 55,122
Total Personnel Costs 547,426 550,526 ‐3,100 ‐0.6% 550,526 611,335
Operating Expenses
001.1302.513.334002 CLEANING & LAUNDRY 230 180 50 27.8% 180 172
001.1302.513.334003 JANITORIAL SERVICES 3,090 3,060 30 1.0% 3,060 3,000
001.1302.513.340001 MILEAGE ALLOWANCE 50 50 0 0.0% 50 0
001.1302.513.341001 TELEPHONE 1,100 1,000 100 10.0% 1,000 981
001.1302.513.342001 POSTAGE 150 200 ‐50 ‐25.0% 200 96
001.1302.513.346001 EQUIPMENT MAINTENANCE 1,000 1,000 0 0.0% 1,000 658
001.1302.513.346002 VEHICLE MAINTENANCE 2,044 1,766 278 15.7% 1,766 1,709
001.1302.513.346200 SOFTWARE MAINTENANCE 8,397 5,797 2,600 44.9% 5,797 5,628
001.1302.513.347001 PRINTING & BINDING 600 1,200 ‐600 ‐50.0% 1,200 1,448
001.1302.513.349001 ADVERTISING 150 150 0 0.0% 150 44
001.1302.513.349003 SCHOOLS & MEETINGS 1,100 1,200 ‐100 ‐8.3% 1,200 130
001.1302.513.351001 OFFICE SUPPLIES 1,900 1,900 0 0.0% 1,900 1,370
001.1302.513.351003 OFFICE FURNITURE & EQUIP 600 600 0 0.0% 600 115
001.1302.513.352001 GAS AND OIL 1,038 1,163 ‐125 ‐10.7% 1,163 1,010
001.1302.513.352008 UNIFORMS & CLOTHING 250 250 0 0.0% 250 250
001.1302.513.354001 SUBSCRIPTIONS/MEMBERSHIPS 525 350 175 50.0% 350 428
001.1302.513.355002 MISCELLANEOUS 50 50 0 0.0% 50 0
Total Operating Expenses 22,274 19,916 2,358 11.8% 19,916 17,039
Capital Outlay001.1302.513.6_____ Various, See Detail 0 0 0 n/a 0 4,507
Total Capital Outlay 0 0 0 n/a 0 4,507
Total 569,700 570,442 ‐742 ‐0.1% 570,442 632,881
35

I I I I
Planning & Development Mission The mission of the Planning and Development Department is to provide professional development permitting, land development and planning services and advice to the City Council, city advisory boards and commissions, City Manager and other city departments, and the public. These services are to be provided in a courteous, timely, and cost-effective manner, consistent with the policy direction of the City Council and in conformance with Federal and Florida laws and regulations and the Vero Beach Comprehensive Plan and City Code.
Staffing Table
Employee Type Budget
2021-2022 Budget
2020-2021 Change Full Time Non Bargaining 4 4 0 Full Time Bargaining 0 0 0
Total 4 4 0 Part Time 0 0 0
Total 4 4 0
Major Goals and Challenges In FY 22, the Department will continue to provide efficient and effective services within its current staffing levels. "Essential" services will be given the highest priority, which include development review and permitting, business tax administration, Community Rating System maintenance (FEMA/NFIP) and implementation of policies and actions in the adopted Comprehensive Plan update. The following are the major work program and performance goals established for FY 22:
Major Work Program Goals
1. Implement policies and directives of the Comprehensive Plan including amendments to the Future Land Use Map, Official Zoning Map, and Land Development Regulations.
2. Continue the multi-year work program identified in the adopted Comprehensive Plan to update the Land Development Regulations to clarify land use definitions, allowable uses by zoning district, inconsistency in development standards, lack of clarity in the text, and out-of-date land development regulations.
3. Implement the community vision for the former power plant site through the preparation of appropriate amendments to the Future Land Use Map and Official Zoning Map for an adapted reuse of the site.
4. Prepare appropriate policy amendments to the City's Comprehensive Plan for enhanced neighborhood protection.
Major Performance Goals
Achieve and improve upon the following average staff development review times:
o Code Compliance Certifications(department review only)- less than two business days o Code Compliance Certifications (other agency review required)- 5 business days or less o Minor Site Plans -10 business days or less o Major Site Plans - 20 business days or less
36

GENERAL FUND
PLANNING 2022 Budget vs 2021
Projected
2021‐2022 2020‐2021 Change $ Change % 2020‐2021 2019‐2020
Account Number Account Name Budget Projected Budget Actual
Personnel Costs
001.1700.515.112001 OPERATING SALARIES 303,878 298,043 5,835 2.0% 298,043 291,687
001.1700.515.113002 PART TIME SALARIES 0 0 0 n/a 0 0
001.1700.515.115002 CAREER DEVELOPMENT 2,500 2,500 0 0.0% 2,500 2,519
001.1700.515.121001 SOCIAL SECURITY 23,438 22,992 446 1.9% 22,992 20,707
001.1700.515.122001 PENSION FUND CONTRIBUTION 108,660 120,117 ‐11,457 ‐9.5% 120,117 119,586
001.1700.515.123001 GROUP LIFE INSURANCE 900 1,100 ‐200 ‐18.2% 1,100 727
001.1700.515.123002 HOSPITALIZATION INSURANCE 45,146 51,917 ‐6,771 ‐13.0% 51,917 50,855
Total Personnel Costs 484,522 496,669 ‐12,147 ‐2.4% 496,669 486,081
Operating Expenses
001.1700.515.331001 PROFESSIONAL SERVICES 10,000 10,000 0 0.0% 10,000 0
001.1700.515.340001 MILEAGE ALLOWANCE 250 250 0 0.0% 250 0
001.1700.515.341001 TELEPHONE 1,000 1,000 0 0.0% 1,000 762
001.1700.515.342001 POSTAGE 3,500 3,500 0 0.0% 3,500 2,807
001.1700.515.346001 EQUIPMENT MAINTENANCE 4,250 4,250 0 0.0% 4,250 3,705
001.1700.515.346200 SOFTWARE MAINTENANCE 13,200 13,200 0 0.0% 13,200 13,200
001.1700.515.347001 PRINTING & BINDING 3,000 3,000 0 0.0% 3,000 4,889
001.1700.515.349001 ADVERTISING 5,500 5,500 0 0.0% 5,500 2,546
001.1700.515.349003 SCHOOLS & MEETINGS 3,500 3,500 0 0.0% 3,500 1,265
001.1700.515.351001 OFFICE SUPPLIES 1,500 1,500 0 0.0% 1,500 998
001.1700.515.351003 OFFICE FURNITURE & EQUIP 500 500 0 0.0% 500 130
001.1700.515.354001 SUBSCRIPTIONS/MEMBERSHIPS 2,500 2,500 0 0.0% 2,500 2,306
Total Operating Expenses 48,700 48,700 0 0.0% 48,700 32,608
Total 533,222 545,369 ‐12,147 ‐2.2% 545,369 518,689
37

Police Mission We, the members of the Vero Beach Police Department, are committed to providing professional police service through a partnership with the community which promotes the highest quality of life and a sense of trust and safety for all residents, businesses, and visitors.
We will strive to accomplish the above through the application of technology, training, and the incorporation of management principles and other resources conducive to the mission's success.
Staffing Table
Employee Type Budget
2021-2022 Budget
2020-2021 Change Full Time Non Bargaining 5 5 0 Full Time Bargaining 73 73 0
Total 78 78 0 Part Time 0 0 0
Total 78 78 0
Major Goals and Challenges
Continue to expand and enhance community partnerships, maintain positive relations with all members of the community, and integrate social networking services that enhance our ability to communicate.
Implement a body-worn camera program to enhance and improve officer safety, transparency, and evidentiary casework.
Increase patrols and officer presence on our beaches, parks, and waterways. Maintain bicycle patrols throughout our city.
Maintain current drug control and crime prevention programs in the community, particularly with school children through the use of the LifeSkills and RAD Kids/Women programs.
Provide a School Resource Officer (SRO) program to Beachland Elementary, Rosewood Elementary, and St. Helen Catholic School.
Continue our traffic enforcement efforts throughout the city, by providing a safe, efficient environment for travel by reducing the rate and severity of traffic crashes. This is accomplished by focusing on speed and high-risk violation enforcement, impaired drivers, and the monitoring of school zones, and critical intersections.
Continue to develop and implement firearms, less lethal, and self-defense training programs that emphasize officer safety.
Continue to research and implement technological applications that streamline operations, reduce costs, and improve the quality of our services.
38

GENERAL FUND
POLICE 2022 Budget vs 2021
Projected
2021‐2022 2020‐2021 Change $ Change % 2020‐2021 2019‐2020
Account Number Account Name Budget Projected Budget Actual
Personnel Costs
001.1801.521.112001 OPERATING SALARIES 4,759,618 4,599,387 160,231 3.5% 4,599,387 4,490,554
001.1801.521.114001 OVERTIME SALARIES 523,000 523,000 0 0.0% 523,000 482,231
001.1801.521.114002 COURT OVERTIME 35,000 35,000 0 0.0% 35,000 26,690
001.1801.521.115002 CAREER DEVELOPMENT 38,160 37,920 240 0.6% 37,920 37,390
001.1801.521.115004 NEW HIRE SIGNING BONUS 6,000 6,000 0 0.0% 6,000 6000
001.1801.521.115005 TUITION REIMBURSEMENT 10,000 10,000 0 0.0% 10,000 2938
001.1801.521.115006 CITY INCENTIVE 45,411 44,942 469 1.0% 44,942 44,428
001.1801.521.115007 EDUCATION 33,750 34,110 ‐360 ‐1.1% 34,110 33,103
001.1801.521.115008 INCENTIVE OVERTIME 16,000 16,000 0 0.0% 16,000 13,366
001.1801.521.115009 MEAL ALLOWANCE 2,000 2,000 0 0.0% 2,000 783
001.1801.521.121001 SOCIAL SECURITY 417,609 405,324 12,285 3.0% 405,324 373,580
001.1801.521.122001 CONTRIB TO PENSION FUND 255,753 280,548 ‐24,795 ‐8.8% 280,548 272,390
001.1801.521.122002 CONTRIB TO POLICE PENSION 715,403 755,091 ‐39,688 ‐5.3% 755,091 765,548
001.1801.521.123001 GROUP LIFE INSURANCE 11,000 16,500 ‐5,500 ‐33.3% 16,500 10,465
001.1801.521.123002 HOSPITALIZATION INSURANCE 1,029,133 1,036,689 ‐7,556 ‐0.7% 1,036,689 928,706
Total Personnel Costs 7,897,837 7,802,511 95,326 1.2% 7,802,511 7,488,172
Operating Expenses 001.1801.521.331001 PROFESSIONAL SERVICES 10,512 10,512 0 0.0% 10,512 20,630
001.1801.521.331002 STATE ACCREDITATION 3,000 3,000 0 0.0% 3,000 357
001.1801.521.334002 CLEANING & LAUNDRY 12,000 12,000 0 0.0% 12,000 7,234
001.1801.521.334007 OTHER CONTRACTUAL SERVICES 19,307 19,307 0 0.0% 19,307 20,287
001.1801.521.334014 INDIAN RIVER CRIME LAB 65,300 79,411 ‐14,111 ‐17.8% 79,411 93,450
001.1801.521.341001 TELEPHONE 39,000 30,000 9,000 30.0% 30,000 37,010
001.1801.521.342001 POSTAGE 4,000 4,000 0 0.0% 4,000 5,652
001.1801.521.343001 UTILITIES 56,500 56,500 0 0.0% 56,500 45,432
001.1801.521.346001 EQUIPMENT MAINTENANCE 25,182 25,182 0 0.0% 25,182 14,238
001.1801.521.346002 VEHICLE MAINTENANCE 159,317 162,007 ‐2,690 ‐1.7% 162,007 179,303
001.1801.521.346003 BUILDING MAINTENANCE 25,000 25,000 0 0.0% 25,000 24,293
001.1801.521.346013 OTHER VEHICLE & BOAT MAINT 8,855 8,855 0 0.0% 8,855 3,420
001.1801.521.346054 POLICE RANGE GROUND MAINT 960 960 0 0.0% 960 0
001.1801.521.346064 POLICE RANGE TRGT EQUP MAINT 500 500 0 0.0% 500 0
001.1801.521.346200 SOFTWARE MAINTENANCE 76,008 68,426 7,582 11.1% 68,426 61,130
001.1801.521.347001 PRINTING & BINDING 3,800 3,800 0 0.0% 3,800 3,369
001.1801.521.349001 ADVERTISING 500 500 0 0.0% 500 347
001.1801.521.349003 SCHOOLS & MEETINGS 17,000 17,000 0 0.0% 17,000 8,217
39

GENERAL FUND
POLICE 2022 Budget vs 2021
Projected
2021‐2022 2020‐2021 Change $ Change % 2020‐2021 2019‐2020
Account Number Account Name Budget Projected Budget Actual
001.1801.521.349028 LANDFILL FEES 1,900 1,900 0 0.0% 1,900 1,323
001.1801.521.351001 OFFICE SUPPLIES 13,600 13,600 0 0.0% 13,600 11,983
001.1801.521.351003 OFFICE FURNITURE & EQUIP 1,550 1,550 0 0.0% 1,550 1,499
001.1801.521.352001 GAS & OIL 143,870 115,466 28,404 24.6% 115,466 114,235
001.1801.521.352004 EQUIP PARTS & SUPPLIES 12,500 12,500 0 0.0% 12,500 11,058
001.1801.521.352005 CONSUMABLE TOOLS 5,614 5,614 0 0.0% 5,614 3,851
001.1801.521.352006 JANITORIAL SUPPLIES 31,810 28,401 3,409 12.0% 28,401 28,157
001.1801.521.352007 SIGN MATERIAL 250 250 0 0.0% 250 0
001.1801.521.352008 UNIFORMS & CLOTHING 30,000 30,000 0 0.0% 30,000 31,960
001.1801.521.352014 OTHER COMMODITIES 20,747 20,747 0 0.0% 20,747 19,274
001.1801.521.352015 TRAINING AIDS 1,550 1,550 0 0.0% 1,550 439
001.1801.521.352050 CRIME PREVENTION 1,700 1,700 0 0.0% 1,700 1,409
001.1801.521.352061 INVESTIGATION EXPENSE 10,000 10,000 0 0.0% 10,000 3,378
001.1801.521.352070 ID SUPPLIES 3,306 3,306 0 0.0% 3,306 1,684
001.1801.521.352071 AMMUNITION 17,000 17,000 0 0.0% 17,000 12,202
001.1801.521.352072 UNIFORMS/EQUIP/ACCESSORY 17,996 17,996 0 0.0% 17,996 20,958
001.1801.521.352074 LIFESKILLS PROGRAM 3,000 3,000 0 0.0% 3,000 0
001.1801.521.354001 SUBSCRIPTIONS/MEMBERSHIPS 1,840 1,840 0 0.0% 1,840 2,168
001.1801.521.355002 MISCELLANEOUS 5,000 5,000 0 0.0% 5,000 1,947
001.1801.521.355003 K 9 EXPENSES 7,805 7,805 0 0.0% 7,805 6,236
Total Operating Expenses 857,779 826,185 31,594 3.8% 826,185 798,130
Capital Outlay001.1801.521.6_____ Various, See Detail 157,171 94,113 63,058 67.0% 94,113 132,080
Total Capital Outlay 157,171 94,113 63,058 67.0% 94,113 132,080
Total 8,912,787 8,722,809 189,978 2.2% 8,722,809 8,418,382
40

GENERAL FUND
CAPITAL REQUEST DETAIL
Account 2021‐2022
Department Number Account Name Description Budget
Police 001.1801.521.608004 RADAR UNIT (LASER SPEED MEASUREMENT The department is in need of 3 Laser Speed 8,000
UNIT) measurement units to replace aging units. 001.1801.521.604012 NETWORK EQUIPMENT (SWITCHES) Core network switches are needed to increase 20,000
the speed and capacity of the network and
replace those that are 9 years old.
001.1801.521.615009 PC WORKSTATIONS 5 PC's need to be replaced due to their age. 5,000 001.1801.521.611001 CRT BALLISTIC VESTS CRT ballistic vests will expire October 2021 and 20,000
need to be replaced. 001.1801.521.615053 MISC POLICE EQUIPMENT (EVIDENCE LOCKER A new locker system with integrated 30,000
SYSTEM) refrigerated storage is needed to preserve evidence and maintain chain of custody.
001.1801.521.699022 CAR VIDEO SYSTEMS Due to the limited capacity of our servers, the 16,480 Vero Beach Police Department plans to upload
and store in‐car‐video to the cloud and migrate
to a single solution where both In‐car video and
body camera footage are located on the same platform
001.1801.521.699023 BODY CAMERAS To strengthen our relationship with the 57,691 community and be transparent, the Vero Beach
Police Department plans to implement a body
worn camera program. Total for Police 157,171
41

Public Works Engineering & Survey
Mission The Mission of the Engineering & Survey Division is to provide professional expertise in the fields of civil engineering, land surveying, and construction inspection for the projects, programs, and policies of the City of Vero Beach, and to utilize that expertise in the following tasks:
• Design and execution of “Quality of Life” projects such as improvements to transportation, drainage systems, parks, and streetscapes.
• Coordination of public improvements with other agencies. • Performance of plan review services for other departments to insure compliance with ordinances. • Communication with the public regarding City of Vero Beach projects and policies. • Provide preliminary survey, stakeout, inspection, and as-built information for Public Works and projects
for other departments. • Assist Streets Division with road, swale, and ditch grading. • Review right of way applications, issue permits, perform inspections, and maintain database for right
of way permits. • Provide stakeout and inspection for right of way construction. • Conduct traffic studies and maintain database of traffic crashes within city. Implement traffic
improvements for City owned streets. • Research and stake easements and right of ways for the public, utility providers, and city departments. • Maintains database for all City-owned parcels. • Perform education, inspection and data collection efforts associated with NPDES Phase II permit
requirements.
Staffing Table
Employee Type Budget
2021-2022 Budget
2020-2021 Change
Full Time Non Bargaining 4 4 0 Full Time Bargaining 0 0 0
Total 4 4 0 Part Time 0 0 0
Total 4 4 0
Major Goals and Challenges • Continue implementation of National Pollutant Discharge Elimination System (NPDES) Phase II permit
requirements. • Continue implementation of stormwater improvements and policies as required by NPDES Phase II
permit and Central IRL Zone B BMAP. • Continue implementation of various quality of life projects. • Continue to map abandonment of right of ways, release of easements, and utility easements. • Implement database for traffic studies and traffic crashes. • Assist with annual street, sidewalk, and curb rehabilitation programs. • Provide assistance on miscellaneous drainage projects. • Design and implement economical methods to treat stormwater runoff and improve water quality in the
Indian River Lagoon. • Monitor and maintain existing stormwater infrastructure which is reaching the end of its design life.
42

GENERAL FUND
PUBLIC WORKS: ENGINEERING & SURVEY 2022 Budget vs 2021
Projected
2021‐2022 2020‐2021 Change $ Change % 2020‐2021 2019‐2020
Account Number Account Name Budget Projected Budget Actual
Personnel Costs
001.2001.519.112001 OPERATING SALARIES 285,308 287,358 ‐2,050 ‐0.7% 287,358 274,976
001.2001.519.114001 OVERTIME SALARIES 0 0 0 n/a 0 514
001.2001.519.121001 SOCIAL SECURITY 21,826 21,983 ‐157 ‐0.7% 21,983 20,000
001.2001.519.122001 PENSION FUND CONTRIBUTION 90,901 101,816 ‐10,915 ‐10.7% 101,816 100,162
001.2001.519.123001 GROUP LIFE INSURANCE 800 1,100 ‐300 ‐27.3% 1,100 667
001.2001.519.123002 HOSPITALIZATION INSURANCE 36,146 35,459 687 1.9% 35,459 33,495
Total Personnel Costs 434,981 447,716 ‐12,735 ‐2.8% 447,716 429,814
Operating Expenses 001.2001.519.334002 CLEANING & LAUNDRY 315 315 0 0.0% 315 158
001.2001.519.334007 OTHER CONTRACTUAL SERVICES 140,000 40,000 100,000 250.0% 40,000 39,667
001.2001.519.340001 MILEAGE ALLOWANCE 500 500 0 0.0% 500 0
001.2001.519.341001 TELEPHONE 500 500 0 0.0% 500 466
001.2001.519.346001 EQUIPMENT MAINTENANCE 1,000 1,700 ‐700 ‐41.2% 1,700 76
001.2001.519.346002 VEHICLE MAINTENANCE 3,308 3,485 ‐177 ‐5.1% 3,485 3,886
001.2001.519.346200 SOFTWARE MAINTENANCE 3,675 3,050 625 20.5% 3,050 2,493
001.2001.519.349003 SCHOOLS & MEETINGS 6,100 6,100 0 0.0% 6,100 2,352
001.2001.519.351001 OFFICE SUPPLIES 1,200 1,000 200 20.0% 1,000 1,486
001.2001.519.352001 GAS & OIL 3,214 2,747 467 17.0% 2,747 2,604
001.2001.519.352006 JANITORIAL SUPPLIES 0 50 ‐50 ‐100.0% 50 0
001.2001.519.352008 SAFETY SHOES & GLASSES 250 250 0 0.0% 250 250
001.2001.519.352012 SURVEY PARTS & SUPPLIES 1,400 1,400 0 0.0% 1,400 1,020
001.2001.519.352014 OTHER COMMODITIES 0 0 0 n/a 0 8
001.2001.519.354001 SUBSCRIPTIONS/MEMBERSHIPS 1,000 2,100 ‐1,100 ‐52.4% 2,100 650
001.2001.519.359900 INTERFUND SVCS ‐1,000 ‐1,000 0 0.0% ‐1,000 ‐4,315
Total Operating Expenses 161,462 62,197 99,265 159.6% 62,197 50,801
Capital Outlay001.2001.519.6_____ Various, See Detail 25,500 0 25,500 n/a 0 3,847
Total Capital Outlay 25,500 0 25,500 n/a 0 3,847
Total 621,943 509,913 112,030 22.0% 509,913 484,462
43

GENERAL FUND
CAPITAL REQUEST DETAIL
Account 2021‐2022
Department Number Account Name Description Budget
Public Works ‐ Engineering & Survey 001.2001.519.601001 COMPUTERS (AUTODESK WORKSTATION & AutoCad Workstation ‐ PC out of Warranty and 4,800
IPAD) scheduled for replacement; iPad for data
collection and GIS integration. 001.2001.519.607001 TRAFFIC COUNTERS Replacement for traffic counter lost during 1,700
traffic study in 2020. 001.2001.519.604002 SURVEY EQUIPMENT (GPS DATA COLLECTOR & Replacement for outdated equipment at end of 19,000
ANTENNA) it's life cycle. Total for Public Works ‐ Engineering & Survey 25,500
44

Public Works Streets
Mission
The mission of the Streets Division is to provide the public with safe rights of way by maintaining and improving roadways, stormwater systems, curbs, walkways, bike paths, street signs and pavement markings. The Division supplies special signs and pavement markings for other departments, events and agencies as needed; supplies heavy equipment services for other Public Works divisions and City departments as needed; constructs new sidewalks and stormwater infrastructure.
Staffing Table
Employee Type Budget 2021-2022
Budget 2020-2021 Change
Full Time Non Bargaining 2 2 0 Full Time Bargaining 16 15 +1
Total 18 17 +1 Part Time 0 0 0
Total 18 17 +1
Major Goals and Challenges • Assist with maintaining the Pavement Management System (PMS) database. • Prioritize pavement repair and restoration based upon PMS results via resurfacing, reconstruction,
Micro Surfacing and recycling. • Start asphalt millings on unimproved alleyways. • Expand Street Sweeper program with an additional sweeper. • Continue to supply signs for other departments as requested. • Continue the Sidewalk evaluation and Repair/Replacement program throughout the city. • Refurbish thermoplastic pavement markings from Beachland Blvd. To South City Limits, River to ocean. • Start the Curb Evaluation and Repair/Replacement program throughout the City. • Continue to assist the Water and Sewer Department with asphalt and concrete repairs. • Continue the Tree Trimming program in all public areas. • Continue to keep GIS sign inventory updated. • Adjust activities as necessary to implement the NPDES permit. • Continue the Stormwater Outfall Treatment Improvement program. • Continue the Stormwater Facilities Inspection program. • Continue providing the level of maintenance services necessary to maintain the current FEMA flood
insurance rating. • Replace all Regulatory signs between Date Palm and the North City limits, River to Ocean.
Capital Projects
• Replace failed culverts throughout the City. See 5 year Capital Program • Assist in the milling and resurfacing program • Stormwater quality improvements throughout the City • Stormwater Maintenance and Improvement throughout the City. See 5 year Capital Program.
45

GENERAL FUND
PUBLIC WORKS: STREETS 2022 Budget vs 2021
Projected
2021‐2022 2020‐2021 Change $ Change % 2020‐2021 2019‐2020
Account Number Account Name Budget Projected Budget Actual
Personnel Costs
001.2005.541.112001 OPERATING SALARIES 852,927 826,243 26,684 3.2% 826,243 773,362
001.2005.541.114001 OVERTIME SALARIES 5,000 5,000 0 0.0% 5,000 10,495
001.2005.541.121001 SOCIAL SECURITY 65,648 63,590 2,058 3.2% 63,590 54,600
001.2005.541.122001 CONTRIB TO PENSION FUND 233,020 255,239 ‐22,219 ‐8.7% 255,239 251,217
001.2005.541.123001 GROUP LIFE INSURANCE 2,000 3,100 ‐1,100 ‐35.5% 3,100 1,916
001.2005.541.123002 HOSPITALIZATION INSURANCE 211,972 199,451 12,521 6.3% 199,451 184,256
Total Personnel Costs 1,370,567 1,352,623 17,944 1.3% 1,352,623 1,275,846
Operating Expenses
001.2005.541.334002 UNIFORM SERVICE 6,360 5,280 1,080 20.5% 5,280 5,021
001.2005.541.334007 OTHER CONTRACTUAL SERVICES 25,000 25,000 0 0.0% 25,000 16,699
001.2005.541.343001 UTILITIES 10,000 18,000 ‐8,000 ‐44.4% 18,000 5,401
001.2005.541.346002 VEHICLE MAINTENANCE 129,592 134,523 ‐4,931 ‐3.7% 134,523 139,926
001.2005.541.346063 ROAD MAINTENANCE MATERIALS 12,000 12,000 0 0.0% 12,000 14,234
001.2005.541.349003 SCHOOLS & MEETINGS 5,000 5,000 0 0.0% 5,000 2,179
001.2005.541.349028 LANDFILL FEES 19,000 16,500 2,500 15.2% 16,500 17,505
001.2005.541.351003 OFFICE FURNITURE & EQUIP 1,600 0 1,600 n/a 0 0
001.2005.541.352001 MOTOR FUEL 62,910 44,092 18,818 42.7% 44,092 39,034
001.2005.541.352005 CONSUMABLE TOOLS 6,000 6,000 0 0.0% 6,000 9,153
001.2005.541.352007 SIGN MATERIAL 60,000 57,000 3,000 5.3% 57,000 58,560
001.2005.541.352008 SAFETY SHOES & GLASSES 6,400 6,000 400 6.7% 6,000 4,820
001.2005.541.352009 BUILD SUPPLIES & MATLS 7,500 7,500 0 0.0% 7,500 7,547
001.2005.541.352014 OTHER COMMODITIES 6,000 6,000 0 0.0% 6,000 4,991
001.2005.541.352073 SWALE SOD 4,000 4,000 0 0.0% 4,000 2,572
001.2005.541.359900 INTERFUND SERVICES ‐250,000 ‐250,000 0 0.0% ‐250,000 ‐221,864
Total Operating Expenses 111,362 96,895 14,467 14.9% 96,895 105,778
Capital Outlay001.2005.541.6_____ Various, See Detail 33,100 8,000 25,100 313.8% 8,000 15,824
Total Capital Outlay 33,100 8,000 25,100 313.8% 8,000 15,824
Total 1,515,029 1,457,518 57,511 3.9% 1,457,518 1,397,448
46

GENERAL FUND
CAPITAL REQUEST DETAIL
Account 2021‐2022
Department Number Account Name Description Budget
Public Works ‐ Streets 001.2005.541.615001 STREETS EQUIPMENT (MORTAR MIXER) Replace 2000 mortar mixer #211 ‐ will have to 3,600
start renting soon if not replaced. 001.2005.541.615001 STREETS EQUIPMENT (CONCRETE MIXER) Replace 2003 Concrete Mixer #2013 ‐ will have 4,000
to start renting soon if not replaced. 001.2005.541.614002 TRAILERS Replace 2007 equipment trailer. 7,500 001.2005.541.615063 PLATE COMPACTOR Replace 2007 self propelled compactor. 18,000
Total for Public Works ‐ Streets 33,100
47

Public Works Geographic Information Systems (GIS)
Mission
What is GIS? A geographic information system (GIS) is a framework for gathering, managing, and analyzing data. Rooted in the science of geography, GIS integrates many types of data. It analyzes spatial location and organizes layers of information into visualizations using maps and 3D scenes. With this unique capability, GIS reveals deeper insights into data, such as patterns, relationships, and situations that help users make smarter decisions. Incorporating GIS into an organization increases the efficiency of staff and reduces operating costs by allowing them access to city-wide data from their PC or mobile device.
The mission of the Geographic Information Systems (GIS) Division is to provide the City of Vero Beach, the public, and other agencies data that contains accurate geographic location and associated information for material assets or activities located in the City of Vero Beach (examples: zoning, stormwater infrastructure, water & sewer infrastructure, addresses, traffic signs, cemetery lots, streets, etc.); to maintain communication with City departments, and other agencies to ensure data quality and avoid data redundancy; and to remain informed of new technologies that may assist or improve data collection and distribution capabilities.
Staffing Table
Employee Type Budget
2021-2022 Budget
2020-2021 Change
Full Time Non Bargaining 2 2 0 Full Time Bargaining 0 0 0
Total 2 2 0 Part Time 0 0 0
Total 2 2 0
Major Goals and Challenges
Complete data and maps for panhandle ordinance. Create new public dashboards for baffle boxes and street sweeper data. Create digital field logs for Public Works Divisions and associated viewing dashboards. Create stranded utility pole database and add to map viewers. Maintain STEP system data and online maps. Assist in the deployment of an asset management platform for Public Works. Expand City projects database and viewer for Public Works and Water\Sewer Departments. Maintain water and sewer system data and interactive maps. Update stormwater system data and viewers to assist in required yearly reports. Continue to develop City easements database. Maintain City signs and traffic accidents database. Maintain City zoning database. Review and restructure cemetery database schema. Update roofline\address database to 2021 aerial base map. Update City address data to DOR for telecommunication tax. Maintain interactive GIS data download portal for public use.
48

GENERAL FUND
PUBLIC WORKS: GEOGRAPHIC INFORMATION SYSTEMS (GIS) 2022 Budget vs 2021
Projected
2021‐2022 2020‐2021 Change $ Change % 2020‐2021 2019‐2020
Account Number Account Name Budget Projected Budget Actual
Personnel Costs
001.2006.519.112001 OPERATING SALARIES 143,015 140,228 2,787 2.0% 140,228 177,554
001.2006.519.113002 PART TIME SALARIES 8,000 5,400 2,600 48.1% 5,400 9,405
001.2006.519.121001 SOCIAL SECURITY 11,553 11,141 412 3.7% 11,141 13,572
001.2006.519.122001 PENSION FUND CONTRIBUTION 38,834 42,494 ‐3,660 ‐8.6% 42,494 41,978
001.2006.519.123001 GROUP LIFE INSURANCE 450 550 ‐100 ‐18.2% 550 321
001.2006.519.123002 HOSPITALIZATION INSURANCE 24,040 23,589 451 1.9% 23,589 22,373
Total Personnel Costs 225,892 223,402 2,490 1.1% 223,402 265,203
Operating Expenses
001.2006.519.340001 MILEAGE ALLOWANCE 100 100 0 0.0% 100 0
001.2006.519.341001 TELEPHONE 350 100 250 250.0% 100 286
001.2006.519.342001 POSTAGE 50 50 0 0.0% 50 0
001.2006.519.346001 EQUIPMENT MAINTENANCE 400 400 0 0.0% 400 0
001.2006.519.346200 SOFTWARE MAINTENANCE 1,000 1,000 0 0.0% 1,000 495
001.2006.519.349003 SCHOOLS & MEETINGS 1,000 1,000 0 0.0% 1,000 285
001.2006.519.351001 OFFICE SUPPLIES 1,000 1,000 0 0.0% 1,000 652
001.2006.519.354001 SUBSCRIPTIONS/MEMBERSHIPS 200 200 0 0.0% 200 0
001.2006.519.359900 INTERFUND SERVICES ‐23,000 ‐20,000 ‐3,000 15.0% ‐20,000 ‐20,745
Total Operating Expenses ‐18,900 ‐16,150 ‐2,750 17.0% ‐16,150 ‐19,027
Capital Outlay001.2006.519.6_____ Various, See Detail 4,000 0 4,000 n/a 0 0
Total Capital Outlay 4,000 0 4,000 n/a 0 0
Total 210,992 207,252 ‐260 ‐0.1% 207,252 246,176
49

GENERAL FUND
CAPITAL REQUEST DETAIL
Account 2021‐2022
Department Number Account Name Description Budget
Public Works ‐ Geographic Information Systems (GIS) 001.2006.519.610002 COMPUTER WORKSTATIONS Graphics Workstation ‐ PC out of Warranty and 4,000
scheduled for replacement. Total for Public Works ‐ Geographic Information Systems (GIS) 4,000
50

Public Works Grounds Maintenance
Mission
The primary goal of the Grounds Maintenance Division is to provide safe and clean facilities in an environmentally sensitive manner, insuring that parks, beaches and public areas are maintained in a manner that supports the community's vision and retains their value over time. Goals and objectives are accomplished through the maintenance of parks and facilities by reliable and well-trained staff.
Staffing Table
Employee Type Budget
2021-2022 Budget
2020-2021 Change
Full Time Non Bargaining 2 2 0 Full Time Bargaining 27 27 0
Total 29 29 0 Part Time 0 0 0
Total 29 29 0
Major Goals and Challenges
Maintain and upgrade landscaping in 243 acres of City parks and properties. Furnish sanitation supplies and maintain cleanliness of 22 public restrooms and amenities in the City
parks. Maintain and improve landscaped medians, islands and parkways in major thoroughfares within the
city limits. Prepare park areas for community events through landscape maintenance, pest control and janitorial
tasks. Continue to implement cost and labor-saving landscaping and techniques, while maintaining a visually
aesthetic appearance for our parks and public spaces. Inspect and repair all irrigation systems, consisting of approximately 12,800 sprinkler heads, on City
properties. Replace damaged and declining landscape material on public properties utilizing Florida Friendly
guidelines. Continue tree replacement program on Victory Boulevard as needed. Oversee installation and maintenance of tree plantings throughout the City, including dedicatory trees,
to insure proper techniques are used for optimum survivability. Ensure standards and requirements are met for maintaining the City's Tree City USA designation (38
years).
51

GENERAL FUND
PUBLIC WORKS: GROUNDS MAINTENANCE 2022 Budget vs 2021
Projected
2021‐2022 2020‐2021 Change $ Change % 2020‐2021 2019‐2020
Account Number Account Name Budget Projected Budget Actual
Personnel Costs
001.3304.572.112001 OPERATING SALARIES 1,180,806 1,158,946 21,860 1.9% 1,158,946 1,165,783
001.3304.572.114001 OVERTIME SALARIES 20,000 20,000 0 0.0% 20,000 24,870
001.3304.572.121001 SOCIAL SECURITY 91,862 90,189 1,673 1.9% 90,189 84,609
001.3304.572.122001 CONTRIB TO PENSION FUND 343,007 375,898 ‐32,891 ‐8.7% 375,898 373,560
001.3304.572.123001 GROUP LIFE INSURANCE 3,000 4,500 ‐1,500 ‐33.3% 4,500 2,807
001.3304.572.123002 HOSPITALIZATION INSURANCE 331,562 301,189 30,373 10.1% 301,189 279,299
Total Personnel Costs 1,970,237 1,950,722 19,515 1.0% 1,950,722 1,930,928
Operating Expenses
001.3304.572.334002 CLEANING & LAUNDRY 5,850 5,850 0 0.0% 5,850 4,876
001.3304.572.334007 OTHER CONTRACTUAL SERVICES 36,251 36,251 0 0.0% 36,251 19,290
001.3304.572.334020 BEACH CLEANING 61,500 60,000 1,500 2.5% 60,000 52,993
001.3304.572.334021 FERTILIZER 5,000 5,000 0 0.0% 5,000 3,606
001.3304.572.334022 PUMP AND WELL SUPPLIES 3,000 3,000 0 0.0% 3,000 1,091
001.3304.572.343001 UTILITIES 267,000 267,000 0 0.0% 267,000 241,366
001.3304.572.346002 VEHICLE MAINTENANCE 82,589 87,455 ‐4,866 ‐5.6% 87,455 93,692
001.3304.572.349003 SCHOOLS & MEETINGS 1,600 1,600 0 0.0% 1,600 495
001.3304.572.352001 MOTOR FUEL 44,209 38,473 5,736 14.9% 38,473 35,874
001.3304.572.352005 CONSUMABLE TOOLS 9,000 9,000 0 0.0% 9,000 6,491
001.3304.572.352006 JANITORIAL SUPPLIES 16,000 16,000 0 0.0% 16,000 17,477
001.3304.572.352008 SAFETY SHOES & GLASSES 7,300 7,300 0 0.0% 7,300 8,858
001.3304.572.352014 OTHER COMMODITIES 6,000 6,000 0 0.0% 6,000 6,759
001.3304.572.352065 SMALL EQUIPMENT 6,000 6,000 0 0.0% 6,000 5,998
001.3304.572.352066 IRRIGATION MATERIALS 15,000 15,000 0 0.0% 15,000 14,249
001.3304.572.352067 FENCING MATERIALS 0 7,000 ‐7,000 ‐100.0% 7,000 0
001.3304.572.352068 CHEMICAL SUPPLIES 38,100 38,100 0 0.0% 38,100 22,857
001.3304.572.352069 LANDSCAPE MATERIALS 27,000 27,000 0 0.0% 27,000 22,391
001.3304.572.354001 SUBSCRIPTIONS & MEMBERSHIP 75 75 0 0.0% 75 100
001.3304.572.359900 PARK MAINT INCOME ‐368,002 ‐364,730 ‐3,272 0.9% ‐364,730 ‐342,831
Total Operating Expenses 263,472 271,374 ‐7,902 ‐2.9% 271,374 215,632
Capital Outlay001.3304.572.6_____ Various, See Detail 25,100 10,900 14,200 130.3% 10,900 57,678
Total Capital Outlay 25,100 10,900 14,200 130.3% 10,900 57,678
Total 2,258,809 2,232,996 25,813 1.2% 2,232,996 2,204,238
52

GENERAL FUND
CAPITAL REQUEST DETAIL
Account 2021‐2022
Department Number Account Name Description Budget
Public Works ‐ Grounds Maintenance 001.3304.572.609001 ATV Replacement for a malfunctioning 2016 ATV. 9,600
001.3304.572.609026 LANDSCAPING PROJECTS (A1A MEDIAN Continue replacement of high maintenance 3,500 PLANTINGS) plants with low maintenance Florida Friendly
plants. 001.3304.572.609002 MOWERS Replacement for 2005 riding mower (used as 12,000
backup mower) Total for Public Works ‐ Grounds Maintenance 25,100
53

Public Works Administration
Mission
The mission of the Administration Division is to provide professional leadership, management and administrative support for all divisions in the Department of Public Works which include: Solid Waste, Engineering and Survey, GIS, Streets, Facilities Management, Fleet Management, Grounds Maintenance and Cemetery, in the safest and most economical manner.
Coordinate public improvement projects with Indian River County, the State of Florida and other governmental agencies; assist other City departments in areas where our departmental assets are beneficial to fulfilling a project goal.
Our goal is to continue to promote and maintain the quality of life expected by the citizens of Vero Beach through the maintenance of and improvement to Public Works facilities.
Staffing Table
Employee Type Budget
2021-2022 Budget
2020-2021 Change
Full Time Non Bargaining 3 4 -1 Full Time Bargaining 1 0 +1
Total 4 4 0 Part Time 0 0 0
Total 4 4 0
Major Goals and Challenges
Serve as City representative on the Technical Complement of the Indian River County Metropolitan Planning Organization.
Coordinate the department's activities with City Council and other boards as directed by the City Manager.
Assist Engineering and Survey Sections with plan review, right of way permits and maintenance of various databases.
Support Project Administration of: Miscellaneous drainage projects for Streets Division; Annual Street Maintenance and Resurfacing contract; New sidewalk construction projects;
Coordinate Virgin Trains project within the City of Vero Beach.
54

GENERAL FUND
PUBLIC WORKS: ADMINISTRATION 2022 Budget vs 2021
Projected
2021‐2022 2020‐2021 Change $ Change % 2020‐2021 2019‐2020
Account Number Account Name Budget Projected Budget Actual
Personnel Costs
001.3305.519.112001 OPERATING SALARIES 302,136 321,288 ‐19,152 ‐6.0% 321,288 297,175
001.3305.519.114001 OVERTIME SALARIES 0 500 ‐500 ‐100.0% 500 0
001.3305.519.121001 SOCIAL SECURITY 23,113 24,617 ‐1,504 ‐6.1% 24,617 20,973
001.3305.519.122001 PENSION FUND CONTRIBUTION 92,886 108,062 ‐15,176 ‐14.0% 108,062 105,737
001.3305.519.123001 GROUP LIFE INSURANCE 900 1,200 ‐300 ‐25.0% 1,200 718
001.3305.519.123002 HOSPITALIZATION INSURANCE 60,700 47,528 13,172 27.7% 47,528 45,616
Total Personnel Costs 479,735 503,195 ‐23,460 ‐4.7% 503,195 470,219
Operating Expenses 001.3305.519.334003 JANITORIAL SERVICES 23,000 21,140 1,860 8.8% 21,140 20,845
001.3305.519.334007 OTHER CONTRACTUAL SERVICES 19,200 4,200 15,000 357.1% 4,200 3,076
001.3305.519.340001 MILEAGE ALLOWANCE 500 1,500 ‐1,000 ‐66.7% 1,500 334
001.3305.519.341001 TELEPHONE 6,000 6,000 0 0.0% 6,000 5,274
001.3305.519.342001 POSTAGE 1,000 1,000 0 0.0% 1,000 822
001.3305.519.343001 UTILITIES 5,000 18,000 ‐13,000 ‐72.2% 18,000 3,456
001.3305.519.346001 EQUIPMENT MAINTENANCE 1,000 1,000 0 0.0% 1,000 0
001.3305.519.346003 BUILDING MAINTENANCE 2,000 2,000 0 0.0% 2,000 1,548
001.3305.519.347001 PRINTING & BINDING 500 500 0 0.0% 500 356
001.3305.519.349001 ADVERTISING 200 200 0 0.0% 200 198
001.3305.519.349003 SCHOOLS & MEETINGS 1,600 1,600 0 0.0% 1,600 344
001.3305.519.349028 LANDFILL FEES 4,320 4,320 0 0.0% 4,320 3,708
001.3305.519.351001 OFFICE SUPPLIES 5,500 5,500 0 0.0% 5,500 6,047
001.3305.519.351003 OFFICE FURNITURE & EQUIP 1,000 1,000 0 0.0% 1,000 230
001.3305.519.352006 JANITORIAL SUPPLIES 1,800 1,500 300 20.0% 1,500 2,413
001.3305.519.354001 SUBSCRIPTIONS/MEMBERSHIPS 1,000 1,000 0 0.0% 1,000 223
Total Operating Expenses 73,620 70,460 3,160 4.5% 70,460 48,874
Capital Outlay001.3305.519.6_____ Various, See Detail 29,000 0 29,000 n/a 0 0
Total Capital Outlay 29,000 0 29,000 n/a 0 0
Total 582,355 573,655 8,700 1.5% 573,655 519,093
55

GENERAL FUND
CAPITAL REQUEST DETAIL
Account 2021‐2022
Department Number Account Name Description Budget
Public Works ‐ Admin 001.3305.519.609001 COMPUTERS AutoCad Workstation ‐ PC out of Warranty and 4,000
scheduled for replacement. 001.3305.519.666014 SOFTWARE (ASSET MGT) Replace outdated Public Works Access 25,000
databases. Total for Public Works ‐ Admin 29,000
56

Public Works Fleet Management
Mission
The mission of the Fleet Management Division is to ensure availability of all vehicles and equipment used by the various departments of the City of Vero Beach. The division provides preventive maintenance recommended by the manufacturer and remedial repairs to ensure proper operation; maintains inventory for replacement parts, fuel, and supplies; provides a qualified staff of mechanics and technicians; keeps records on all equipment regarding work performed, schedules, and costs. Staff operates the computerized fleet management and fuel dispensing systems and evaluates information to ensure the timely maintenance of all equipment. The division also researches and recommends standard equipment specifications, as well as provides guidance in the timing and type of vehicles and equipment to be replaced.
Staffing Table
Employee Type Budget
2019-2020 Budget
2018-2019 Change
Full Time Non Bargaining 1 1 0 Full Time Bargaining 6 6 0
Total 7 7 0 Part Time 0 0 0
Total 7 7 0
Major Goals and Challenges • Provide preventive maintenance program for 72 autos, 105 light trucks and cargo vans, 59 medium
and heavy duty trucks, 21 small utility vehicles, 34 pieces of heavy equipment, 70 trailers, 28 commercial mowers and 391 pieces of small engine equipment (e.g., generators, weed trimmers, edger’s, etc.), and 2 Police motorcycles.
• Perform maintenance and welding repairs for all dumpster containers for Solid Waste division. • Provide welding repairs as needed for City departments. • Manage the fleet in a fiscally responsible manner that insures the lowest possible operating cost while
maintaining consistently high mechanical reliability. This is being accomplished through a lease/purchase program for light vehicles spreading the capital cost of vehicle replacement over a 7-year period.
• Maintain a service facility that provides superior customer service, repair, and administrative support to the customer while maintaining a self-supporting posture.
• Keep the customer foremost in our minds when implementing policies and procedures for the betterment of the fleet and the City.
• Strive to obtain the absolute best ratio of dollars spent to miles driven. • Through sound purchasing and negotiating practices, acquire only appropriate and necessary vehicles
to meet the needs of City departments. • Continue to investigate Alternative Fuel options. • Provide standard vehicle/equipment acquisition program. • Implement vehicle replacement through lease/purchase program. • Optimize inventory stock if parts can be obtained by local suppliers in a timely manner.
57

GENERAL FUND
PUBLIC WORKS: FLEET MANAGEMENT 2022 Budget vs 2021
Projected
2021‐2022 2020‐2021 Change $ Change % 2020‐2021 2019‐2020
Account Number Account Name Budget Projected Budget Actual
Personnel Costs
001.3306.519.112001 OPERATING SALARIES 378,663 371,551 7,112 1.9% 371,551 369,770
001.3306.519.114001 OVERTIME SALARIES 1,200 1,200 0 0.0% 1,200 2,448
001.3306.519.121001 SOCIAL SECURITY 29,060 28,515 545 1.9% 28,515 26,526
001.3306.519.122001 PENSION FUND CONTRIBUTION 122,109 134,398 ‐12,289 ‐9.1% 134,398 133,009
001.3306.519.123001 GROUP LIFE INSURANCE 1,000 1,500 ‐500 ‐33.3% 1,500 886
001.3306.519.123002 HOSPITALIZATION INSURANCE 72,243 72,439 ‐196 ‐0.3% 72,439 67,180
Total Personnel Costs 604,275 609,603 ‐5,328 ‐0.9% 609,603 599,819
Operating Expenses 001.3306.519.334002 CLEANING & LAUNDRY 1,627 1,627 0 0.0% 1,627 1,436
001.3306.519.334007 OTHER CONTRACTUAL SERVICES 2,000 2,000 0 0.0% 2,000 1,879
001.3306.519.334023 CONTRACT PAINTING SVCS 1,000 1,000 0 0.0% 1,000 1,000
001.3306.519.341001 TELEPHONE 1,000 700 300 42.9% 700 457
001.3306.519.343001 UTILITIES 5,000 20,750 ‐15,750 ‐75.9% 20,750 3,563
001.3306.519.346001 EQUIPMENT MAINTENANCE 4,500 4,500 0 0.0% 4,500 1,516
001.3306.519.346002 VEHICLE MAINTENANCE 7,763 7,911 ‐148 ‐1.9% 7,911 8,100
001.3306.519.346003 BUILDING MAINTENANCE 3,500 3,500 0 0.0% 3,500 529
001.3306.519.346062 FUEL SYSTEM MAINTENANCE 1,500 1,500 0 0.0% 1,500 2,044
001.3306.519.347001 PRINTING & BINDING 600 600 0 0.0% 600 545
001.3306.519.349003 SCHOOLS & MEETINGS 2,500 2,500 0 0.0% 2,500 600
001.3306.519.349028 LANDFILL FEES 3,500 2,650 850 32.1% 2,650 3,187
001.3306.519.351001 OFFICE SUPPLIES 1,000 1,000 0 0.0% 1,000 726
001.3306.519.351003 OFFICE FURNITURE & EQUIP 800 800 0 0.0% 800 347
001.3306.519.352001 GAS & OIL 2,800 2,609 191 7.3% 2,609 2,293
001.3306.519.352003 VEHICLE PARTS & SUPPLIES 250,506 250,506 0 0.0% 250,506 289,189
001.3306.519.352004 EQUIP PARTS & SUPPLIES 2,700 3,200 ‐500 ‐15.6% 3,200 ‐655
001.3306.519.352005 CONSUMABLE TOOLS 3,000 3,000 0 0.0% 3,000 3,181
001.3306.519.352008 SAFETY SHOES & GLASSES 2,000 2,000 0 0.0% 2,000 2,012
001.3306.519.352014 OTHER COMMODITIES 500 500 0 0.0% 500 50
001.3306.519.352059 SHOP SUPPLIES 18,000 20,000 ‐2,000 ‐10.0% 20,000 23,691
001.3306.519.354001 SUBSCRIPTIONS/MEMBERSHIPS 7,000 6,000 1,000 16.7% 6,000 5,058
001.3306.519.359900 INTERFUND SVCS LABOR ‐919,308 ‐940,545 21,237 ‐2.3% ‐940,545 ‐933,924
Total Operating Expenses ‐596,512 ‐601,692 5,180 ‐0.9% ‐601,692 ‐583,176
Capital Outlay001.3306.519.6_____ Various, See Detail 45,000 14,700 30,300 206.1% 14,700 0
Total Capital Outlay 45,000 14,700 30,300 206.1% 14,700 0
Total 52,763 22,611 30,152 133.4% 22,611 16,643
58

GENERAL FUND
CAPITAL REQUEST DETAIL
Account 2021‐2022
Department Number Account Name Description Budget
Public Works ‐ Fleet Mgmnt 001.3306.519.600100 VEHICLE LIFT Replacement for inoperable heavy truck lift. 45,000
Existing lift is damaged beyond repair and
replacement of same type would be greater
than $100,000. Total for Public Works ‐ Fleet Mgmnt 45,000
59

Public Works Facilities Management
Mission
The mission of the Facilities Management Division is to provide a safe, comfortable operating environment for all General Fund Facilities, outside of the right-of-way (excluding janitorial services and grounds maintenance). Work includes maintenance and construction services for approximately 39 facilities and 130 buildings associated with: air quality; heating and air conditioning; electrical; interior and exterior lighting; plumbing (including approximately 85 restrooms); interior and exterior painting; major and minor renovations (such as carpentry/framing, and drywall); roofing; miscellaneous structures (such as fences, gates, dumpster enclosures, benches, trash baskets, lifeguard towers and boardwalk/crossovers); and coordinate capital improvement projects with private consultants and contractors.
Staffing Table
Employee Type Budget
2021-2022 Budget
2020-2021 Change
Full Time Non Bargaining 1 1 0 Full Time Bargaining 6 6 0
Total 7 7 0 Part Time 0 0 0
Total 7 7 0
Major Goals and Challenges • Maintenance of all City-owned General Fund Facilities, city park facilities, dune crossovers and
boardwalks. Services include carpentry, painting, air conditioning, plumbing, electrical, roofing, flooring and ceiling.
• Maintain lighting in all City parking lots, city parks, interior and exterior lighting for buildings, and turtle friendly beach lighting.
• Continue to build and install wooden trash baskets and benches as needed. • Continue concrete bench and table replacement/repairs at all parks as needed. • Continue to replace interior and exterior lighting with more efficient lights as needed. • Continue minor boardwalk repairs as needed. • Coordinate and supervise large repair and Construction projects completed through contracts.
60

GENERAL FUND
PUBLIC WORKS: FACILITIES MANAGEMENT 2022 Budget vs 2021
Projected
2021‐2022 2020‐2021 Change $ Change % 2020‐2021 2019‐2020
Account Number Account Name Budget Projected Budget Actual
Personnel Costs 001.3309.519.112001 OPERATING SALARIES 407,856 402,102 5,754 1.4% 402,102 403,442
001.3309.519.114001 OVERTIME SALARIES 10,000 5,000 5,000 100.0% 5,000 3,494
001.3309.519.121001 SOCIAL SECURITY 31,967 31,143 824 2.6% 31,143 29,125
001.3309.519.122001 PENSION FUND CONTRIBUTION 113,057 125,076 ‐12,019 ‐9.6% 125,076 121,672
001.3309.519.123001 GROUP LIFE INSURANCE 1,100 1,600 ‐500 ‐31.3% 1,600 905
001.3309.519.123002 HOSPITALIZATION INSURANCE 97,151 90,156 6,995 7.8% 90,156 70,060
Total Personnel Costs 661,131 655,077 6,054 0.9% 655,077 628,698
Operating Expenses 001.3309.519.334002 CLEANING & LAUNDRY 2,000 2,000 0 0.0% 2,000 1,465
001.3309.519.334007 OTHER CONTRACTUAL SERVICES 10,000 10,000 0 0.0% 10,000 4,885
001.3309.519.334023 CONTRACT PAINTING SERVICES 24,000 24,000 0 0.0% 24,000 12,921
001.3309.519.343001 UTILITIES 3,500 3,500 0 0.0% 3,500 1,113
001.3309.519.346002 VEHICLE MAINTENANCE 18,553 20,124 ‐1,571 ‐7.8% 20,124 19,427
001.3309.519.346004 AIR CONDITIONING MAINT 2,000 2,000 0 0.0% 2,000 3,513
001.3309.519.346082 DONATED BENCHES & PLAQUES 2,000 2,000 0 0.0% 2,000 2,022
001.3309.519.349003 SCHOOLS & MEETINGS 1,000 1,000 0 0.0% 1,000 901
001.3309.519.352001 GAS AND OIL 11,048 10,123 925 9.1% 10,123 9,032
001.3309.519.352005 CONSUMABLE TOOLS 8,000 8,000 0 0.0% 8,000 5,317
001.3309.519.352008 SAFETY SHOES & GLASSES 2,300 2,300 0 0.0% 2,300 2,291
001.3309.519.352009 BUILD SUPPLIES & MATLS 43,000 43,000 0 0.0% 43,000 25,922
001.3309.519.352010 ELEC PARTS & SUPPLIES 15,000 15,000 0 0.0% 15,000 14,116
001.3309.519.352011 PLUMB PARTS & SUPPLIES 6,000 6,000 0 0.0% 6,000 6,035
001.3309.519.352014 OTHER COMMODITIES 2,000 2,000 0 0.0% 2,000 2,558
001.3309.519.354001 SUBSCRIPTIONS/MEMBERSHIPS 200 200 0 0.0% 200 0
Total Operating Expenses 150,601 151,247 ‐646 ‐0.4% 151,247 111,518
Total 811,732 806,324 5,408 0.7% 806,324 740,216
61

Recreation Mission The mission of the Recreation Department is to provide, publicize, maintain, schedule and operate city recreation facilities and programs for the use of residents and visitors of all age groups, in accordance with a fee schedule set by City Council. The Department is to provide trained, certified water safety personnel at city beaches and aquatic facilities; to maintain playgrounds; and to provide funds to maintain city parks.
The Department is to administer the City of Vero Beach Recreation Department and staff including budgeting, staffing, requisitioning and the administration of trained, certified water safety personnel at city beaches and aquatic facilities.
The Department is to provide a Citywide Recreation Program Delivery System utilizing city recreation staff and facilities.
The Department is to provide ADA accessibility to users of recreation facilities and recreation programs.
The Department is to maintain affordable Recreation opportunities for children and older adults, as this is important and integral in maintaining an acceptable quality of life.
Staffing Table Employee Type
Budget 2021-2022
Budget 2020-2021 Change
Full Time Non Bargaining 9 10 -1 Full Time Bargaining 10 9 1
Total 19 19 0 Part Time 9 9 0
Total 28 28 0
Major Goals and Challenges Promote a happier, healthier citizen in a community that is a better place to live because it has an active, vital Recreation Department. Promote “The Benefits of Recreation Are Endless.”
Personal Benefits in the form of physical fitness, relaxation, rest and revitalization; Social Benefits in the form of stronger and healthier families, ethnic and cultural harmony, reduced anti-social behavior and enriched lives for persons with disabilities; Environmental Benefits in the form of a green and tree-filled city, habitat for native plants & animals, and open land protected green-space; Economic Benefits in the form of more productive and healthier citizens, increased tourism, and contributions to the quality of life sought by business and industry.
Position the Recreation Department as an important player in crime and drug prevention for children and young adults in programming and facilities for after school, summer, evening and weekend utilization.
Partnership with community organizations having common mission statements to enhance the delivery of recreational services in the most efficient and effective system to benefit the user and the taxpayer.
Increase Water Safety and Awareness through the department’s Aquatic Safety Division.
Maintain clean, efficient rental centers for the citizens of Vero Beach.
62

GENERAL FUND
RECREATION: LEISURE SQUARE 2022 Budget vs 2021
Projected
2021‐2022 2020‐2021 Change $ Change % 2020‐2021 2019‐2020
Account Number Account Name Budget Projected Budget Actual
Personnel Costs
001.4501.572.112001 OPERATING SALARIES 90,820 92,036 ‐1,216 ‐1.3% 92,036 100,117
001.4501.572.113002 PART TIME SALARIES 77,250 77,250 0 0.0% 77,250 90,359
001.4501.572.114001 OVERTIME SALARIES 2,000 5,562 ‐3,562 ‐64.0% 5,562 3,610
001.4501.572.115006 EMT/LIFEGUARD 2,000 3,500 ‐1,500 ‐42.9% 3,500 3,376
001.4501.572.121001 SOCIAL SECURITY 13,163 13,376 ‐213 ‐1.6% 13,376 14,107
001.4501.572.122001 PENSION FUND CONTRIBUTION 24,022 27,122 ‐3,100 ‐11.4% 27,122 26,505
001.4501.572.123001 GROUP LIFE INSURANCE 250 250 0 0.0% 250 224
001.4501.572.123002 HOSPITALIZATION INSURANCE 25,797 25,308 489 1.9% 25,308 27,523
Total Personnel Costs 235,302 244,404 ‐9,102 ‐3.7% 244,404 265,821
Operating Expenses
001.4501.572.334003 JANITORIAL SERVICES 8,400 6,980 1,420 20.3% 6,980 6,905
001.4501.572.340001 MILEAGE ALLOWANCE 400 400 0 0.0% 400 335
001.4501.572.341001 TELEPHONE 2,300 750 1,550 206.7% 750 2,094
001.4501.572.343001 UTILITIES 64,000 54,400 9,600 17.6% 54,400 61,176
001.4501.572.346001 EQUIPMENT MAINTENANCE 5,200 3,100 2,100 67.7% 3,100 873
001.4501.572.346002 VEHICLE MAINTENANCE 1,344 1,407 ‐63 ‐4.5% 1,407 653
001.4501.572.346003 BUILDING MAINTENANCE 24,000 24,000 0 0.0% 24,000 29,439
001.4501.572.346004 AIR CONDITIONING MAINT 800 800 0 0.0% 800 1,342
001.4501.572.347001 PRINTING & BINDING 300 300 0 0.0% 300 288
001.4501.572.349003 SCHOOLS & MEETINGS 375 375 0 0.0% 375 0
001.4501.572.349028 LANDFILL FEES 850 755 95 12.6% 755 782
001.4501.572.351001 OFFICE SUPPLIES 400 500 ‐100 ‐20.0% 500 1,227
001.4501.572.352001 GAS & OIL 825 825 0 0.0% 825 1,159
001.4501.572.352006 JANITORIAL SUPPLIES 1,500 700 800 114.3% 700 1,508
001.4501.572.352008 UNIFORMS & CLOTHING 400 400 0 0.0% 400 355
001.4501.572.352035 ATHLETIC AREAS MAINT 2,500 1,955 545 27.9% 1,955 2,359
001.4501.572.352063 LANDSCAPE/RECREATION 50,303 49,862 441 0.9% 49,862 48,978
001.4501.572.354001 SUBSCRIPTIONS/MEMBERSHIPS 0 0 0 n/a 0 775
Total Operating Expenses 163,897 147,509 16,388 11.1% 147,509 160,248
Capital Outlay001.4501.572.6_____ Various, See Detail 16,100 32,300 ‐16,200 ‐50.2% 32,300 9,449
Total Capital Outlay 16,100 32,300 ‐16,200 ‐50.2% 32,300 9,449
Total 415,299 424,213 ‐8,914 ‐2.1% 424,213 435,518
63

GENERAL FUND
CAPITAL REQUEST DETAIL
Account 2021‐2022
Department Number Account Name Description Budget
Recreation ‐ Leisure Square 001.4501.572.601009 COMPUTERS Replacement PC per IT dept. recommendation 1,100 001.4501.572.600011 LEISURE SQ. MISC. EQUIP (POOL CHLORINE More effective replacement for current 1,000
PUMP) automatic chlorine feeder pump 001.4501.572.600101 LEISURE SQ. EXERCISE EQUIPMENT 2 Treadmills, 1 Recumbent Bike, 2 Olympic Flat 14,000
Benches, Dumbells Total for Recreation ‐ Leisure Square 16,100
64

GENERAL FUND
RECREATION: COMMUNITY CENTER 2022 Budget vs 2021
Projected
2021‐2022 2020‐2021 Change $ Change % 2020‐2021 2019‐2020
Account Number Account Name Budget Projected Budget Actual
Personnel Costs
001.4502.572.112001 OPERATING SALARIES 35,568 35,059 509 1.5% 35,059 35,097
001.4502.572.113002 PART TIME SALARIES 5,000 5,150 ‐150 ‐2.9% 5,150 347
001.4502.572.114001 OVERTIME SALARIES 5,000 5,562 ‐562 ‐10.1% 5,562 2,076
001.4502.572.121001 SOCIAL SECURITY 3,486 3,501 ‐15 ‐0.4% 3,501 2,764
001.4502.572.122001 PENSION FUND CONTRIBUTION 9,408 10,332 ‐924 ‐8.9% 10,332 9,884
001.4502.572.123001 GROUP LIFE INSURANCE 100 100 0 0.0% 100 86
001.4502.572.123002 HOSPITALIZATION INSURANCE 9,733 8,997 736 8.2% 8,997 3,585
Total Personnel Costs 68,295 68,701 ‐406 ‐0.6% 68,701 53,839
Operating Expenses
001.4502.572.331001 PROFESSIONAL SERVICES 2,500 2,500 0 0.0% 2,500 1,995
001.4502.572.334003 JANITORIAL SERVICES 10,300 8,100 2,200 27.2% 8,100 7,956
001.4502.572.340001 MILEAGE ALLOWANCE 100 200 ‐100 ‐50.0% 200 101
001.4502.572.341001 TELEPHONE 650 400 250 62.5% 400 502
001.4502.572.342001 POSTAGE 50 50 0 0.0% 50 1
001.4502.572.343001 UTILITIES 15,700 16,600 ‐900 ‐5.4% 16,600 14,781
001.4502.572.346001 EQUIPMENT MAINTENANCE 1,000 1,380 ‐380 ‐27.5% 1,380 1,339
001.4502.572.346002 VEHICLE MAINTENANCE 1,905 1,993 ‐88 ‐4.4% 1,993 653
001.4502.572.346003 BUILDING MAINTENANCE 3,500 3,500 0 0.0% 3,500 3,622
001.4502.572.346004 AIR CONDITIONING MAINT 500 700 ‐200 ‐28.6% 700 321
001.4502.572.347001 PRINTING & BINDING 300 300 0 0.0% 300 288
001.4502.572.349028 LANDFILL FEES 1,500 1,337 163 12.2% 1,337 1,386
001.4502.572.351001 OFFICE SUPPLIES 150 100 50 50.0% 100 897
001.4502.572.352001 GAS & OIL 77 77 0 0.0% 77 0
001.4502.572.352006 JANITORIAL SUPPLIES 1,500 1,500 0 0.0% 1,500 2,090
001.4502.572.352008 UNIFORMS & CLOTHING 200 200 0 0.0% 200 113
001.4502.572.352063 LANDSCAPE/RECREATION 20,719 20,536 183 0.9% 20,536 20,021
001.4502.572.354001 SUBSCRIPTIONS/MEMBERSHIPS 75 75 0 0.0% 75 69
Total Operating Expenses 60,726 59,548 1,178 2.0% 59,548 56,135
Total 129,021 128,249 772 0.6% 128,249 109,974
65

GENERAL FUND
RECREATION: RIVERSIDE TENNIS COMPLEX 2022 Budget vs 2021
Projected
2021‐2022 2020‐2021 Change $ Change % 2020‐2021 2019‐2020
Account Number Account Name Budget Projected Budget Actual
Personnel Costs
001.4503.572.112001 OPERATING SALARIES 54,659 53,615 1,044 1.9% 53,615 53,326
001.4503.572.113002 PART TIME SALARIES 23,175 23,175 0 0.0% 23,175 18,354
001.4503.572.121001 SOCIAL SECURITY 5,954 5,874 80 1.4% 5,874 5,047
001.4503.572.122001 PENSION FUND CONTRIBUTION 14,457 15,800 ‐1,343 ‐8.5% 15,800 16,697
001.4503.572.123001 GROUP LIFE INSURANCE 150 150 0 0.0% 150 132
001.4503.572.123002 HOSPITALIZATION INSURANCE 9,036 8,865 171 1.9% 8,865 8,691
Total Personnel Costs 107,431 107,479 ‐48 0.0% 107,479 102,247
Operating Expenses
001.4503.572.334003 JANITORIAL SERVICES 1,200 480 720 150.0% 480 469
001.4503.572.340001 MILEAGE ALLOWANCE 150 200 ‐50 ‐25.0% 200 465
001.4503.572.341001 TELEPHONE 1,500 700 800 114.3% 700 1,347
001.4503.572.342001 POSTAGE 50 75 ‐25 ‐33.3% 75 83
001.4503.572.343001 UTILITIES 6,000 5,255 745 14.2% 5,255 4,180
001.4503.572.346001 EQUIPMENT MAINTENANCE 125 100 25 25.0% 100 240
001.4503.572.346002 VEHICLE MAINTENANCE 995 1,041 ‐46 ‐4.4% 1,041 0
001.4503.572.346003 BUILDING MAINTENANCE 750 900 ‐150 ‐16.7% 900 1,151
001.4503.572.347001 PRINTING & BINDING 250 300 ‐50 ‐16.7% 300 288
001.4503.572.349028 LANDFILL FEES 300 250 50 20.0% 250 250
001.4503.572.351001 OFFICE SUPPLIES 800 250 550 220.0% 250 863
001.4503.572.352001 GAS & OIL 115 115 0 0.0% 115 0
001.4503.572.352005 CONSUMABLE TOOLS 45 45 0 0.0% 45 0
001.4503.572.352006 JANITORIAL SUPPLIES 200 150 50 33.3% 150 451
001.4503.572.352008 UNIFORMS & CLOTHING 100 100 0 0.0% 100 0
001.4503.572.352033 ATHLETICS 750 300 450 150.0% 300 2,442
001.4503.572.352035 ATHLETIC AREAS MAINT 500 500 0 0.0% 500 997
001.4503.572.354001 SUBSCRIPTIONS/MEMBERSHIPS 50 50 0 0.0% 50 75
001.4503.572.355001 PURCHASES FOR RESALE 400 500 ‐100 ‐20.0% 500 530
Total Operating Expenses 14,280 11,311 2,969 26.2% 11,311 13,831
Capital Outlay001.4503.572.6_____ Various, See Detail 16,000 0 16,000 n/a 0 0
Total Capital Outlay 16,000 0 16,000 n/a 0 0
Total 137,711 118,790 18,921 15.9% 118,790 116,078
66

GENERAL FUND
CAPITAL REQUEST DETAIL
Account 2021‐2022
Department Number Account Name Description Budget
Recreation ‐ Riverside Tennis Complex 001.4503.572.600011 RIVERSIDE TENNIS CMPLX MISC. EQUIP.
(WINDSCREENS) Windscreens currently in use are old and falling apart. Most cannot be kept securely in place
7,000
001.4503.572.600012 RIVERSIDE TENNIS CMPLX MISC FAC IMPROV
(PAINTING) 001.4503.572.600012 RIVERSIDE TENNIS CMPLX MISC FAC IMPROV
(FLOORING) Total for Recreation ‐ Riverside Tennis Complex
Paint exterior of tennis complex building which has not been painted in many years. Replace existing flooring of tennis complex
building.
4,000
5,000
16,000
67

GENERAL FUND
RECREATION: PARKS, PLAYGROUNDS & RENTAL FACILITIES 2022 Budget vs 2021
Projected
2021‐2022 2020‐2021 Change $ Change % 2020‐2021 2019‐2020
Account Number Account Name Budget Projected Budget Actual
Personnel Costs
001.4504.572.112001 OPERATING SALARIES 52,778 52,419 359 0.7% 52,419 61,219
001.4504.572.114001 OVERTIME SALARIES 4,500 4,326 174 4.0% 4,326 4,509
001.4504.572.121001 SOCIAL SECURITY 4,382 4,341 41 0.9% 4,341 4,864
001.4504.572.122001 PENSION FUND CONTRIBUTION 13,960 15,447 ‐1,487 ‐9.6% 15,447 15,040
001.4504.572.123001 GROUP LIFE INSURANCE 150 150 0 0.0% 150 127
001.4504.572.123002 HOSPITALIZATION INSURANCE 10,844 10,638 206 1.9% 10,638 6,066
Total Personnel Costs 86,614 87,321 ‐707 ‐0.8% 87,321 91,825
Operating Expenses 001.4504.572.331001 PROFESSIONAL SERVICES 250 250 0 0.0% 250 175
001.4504.572.334002 CLEANING & LAUNDRY 100 100 0 0.0% 100 254
001.4504.572.334003 JANITORIAL SERVICES 4,400 1,850 2,550 137.8% 1,850 1,876
001.4504.572.341001 TELEPHONE 1,000 500 500 100.0% 500 808
001.4504.572.342001 POSTAGE 20 20 0 0.0% 20 9
001.4504.572.343001 UTILITIES 50,000 50,000 0 0.0% 50,000 45,794
001.4504.572.346002 VEHICLE MAINTENANCE 3,449 3,610 ‐161 ‐4.5% 3,610 4,797
001.4504.572.346003 BUILDING MAINTENANCE 5,000 4,000 1,000 25.0% 4,000 10,430
001.4504.572.346004 AIR CONDITIONING MAINT 200 422 ‐222 ‐52.6% 422 45
001.4504.572.347001 PRINTING & BINDING 250 300 ‐50 ‐16.7% 300 288
001.4504.572.349028 LANDFILL FEES 7,400 6,591 809 12.3% 6,591 6,591
001.4504.572.351001 OFFICE SUPPLIES 125 125 0 0.0% 125 101
001.4504.572.352001 GAS & OIL 1,122 1,122 0 0.0% 1,122 882
001.4504.572.352006 JANITORIAL SUPPLIES 1,500 700 800 114.3% 700 2,339
001.4504.572.352008 UNIFORMS & CLOTHING 300 200 100 50.0% 200 653
001.4504.572.352036 PLAYGROUNDS MAINT 10,000 24,000 ‐14,000 ‐58.3% 24,000 3,396
001.4504.572.352063 LANDSCAPE/RECREATION 115,874 114,839 1,035 0.9% 114,839 114,456
001.4504.572.354001 SUBSCRIPTIONS/MEMBERSHIPS 50 50 0 0.0% 50 40
Total Operating Expenses 201,040 208,679 ‐7,639 ‐3.7% 208,679 192,934
Capital Outlay001.4504.572.6_____ Various, See Detail 0 11,700 ‐11,700 ‐100.0% 11,700 9,967
Total Capital Outlay 0 11,700 ‐11,700 ‐100.0% 11,700 9,967
Total 287,654 307,700 ‐20,046 ‐6.5% 307,700 294,726
68

GENERAL FUND
RECREATION: RECREATION PROGRAMS & COMMUNITY EVENTS 2022 Budget vs 2021
Projected
2021‐2022 2020‐2021 Change $ Change % 2020‐2021 2019‐2020
Account Number Account Name Budget Projected Budget Actual
Personnel Costs
001.4505.572.112001 OPERATING SALARIES 116,973 115,176 1,797 1.6% 115,176 119,271
001.4505.572.113002 PART TIME SALARIES 75,000 74,675 325 0.4% 74,675 47,929
001.4505.572.114001 OVERTIME SALARIES 12,000 12,360 ‐360 ‐2.9% 12,360 1,978
001.4505.572.121001 SOCIAL SECURITY 15,604 15,469 135 0.9% 15,469 12,461
001.4505.572.122001 PENSION FUND CONTRIBUTION 30,939 33,941 ‐3,002 ‐8.8% 33,941 32,548
001.4505.572.123001 GROUP LIFE INSURANCE 300 300 0 0.0% 300 281
001.4505.572.123002 HOSPITALIZATION INSURANCE 23,495 23,048 447 1.9% 23,048 22,100
Total Personnel Costs 274,311 274,969 ‐658 ‐0.2% 274,969 236,568
Operating Expenses 001.4505.572.334004 SUMMER CAMP EXP 13,750 13,750 0 0.0% 13,750 5,888
001.4505.572.340001 MILEAGE ALLOWANCE 400 500 ‐100 ‐20.0% 500 762
001.4505.572.341001 TELEPHONE 250 350 ‐100 ‐28.6% 350 294
001.4505.572.342001 POSTAGE 50 50 0 0.0% 50 154
001.4505.572.346001 EQUIPMENT MAINTENANCE 1,100 0 1,100 n/a 0 0
001.4505.572.346003 BUILDING MAINTENANCE 5,000 6,500 ‐1,500 ‐23.1% 6,500 1,635
001.4505.572.347001 PRINTING & BINDING 1,000 1,200 ‐200 ‐16.7% 1,200 842
001.4505.572.349003 SCHOOLS & MEETINGS 500 500 0 0.0% 500 832
001.4505.572.351001 OFFICE SUPPLIES 250 1,000 ‐750 ‐75.0% 1,000 1,017
001.4505.572.352005 CONSUMABLE TOOLS 100 150 ‐50 ‐33.3% 150 61
001.4505.572.352006 JANITORIAL SUPPLIES 700 200 500 250.0% 200 740
001.4505.572.352008 UNIFORMS & CLOTHING 800 800 0 0.0% 800 70
001.4505.572.352017 SPECIAL EVENTS SUPPLIES 3,500 5,000 ‐1,500 ‐30.0% 5,000 3,228
001.4505.572.352027 PERFORMING ARTS COSTUMES 1,500 1,500 0 0.0% 1,500 383
001.4505.572.352033 ATHLETICS 3,000 5,000 ‐2,000 ‐40.0% 5,000 1,395
001.4505.572.352035 ATHLETIC AREAS MAINT 1,000 1,000 0 0.0% 1,000 69
001.4505.572.352064 RECREATION SPONSORSHIPS 4,000 4,000 0 0.0% 4,000 2,026
001.4505.572.354001 SUBSCRIPTIONS/MEMBERSHIPS 1,000 500 500 100.0% 500 491
001.4505.572.355001 PURCHASES FOR RESALE 2,000 2,000 0 0.0% 2,000 0
Total Operating Expenses 39,900 44,000 ‐4,100 ‐9.3% 44,000 19,887
Capital Outlay001.4505.572.6_____ Various, See Detail 19,400 8,000 11,400 142.5% 8,000 3,849
Total Capital Outlay 19,400 8,000 11,400 142.5% 8,000 3,849
Total 333,611 326,969 6,642 2.0% 326,969 260,304
69

GENERAL FUND
CAPITAL REQUEST DETAIL
Account 2021‐2022
Department Number Account Name Description Budget
Recreation ‐ Recreation Programs & Community Events 001.4505.572.600013 REC PRGMS & COMM EVENTS P.O.S. SYSTEM Adding Registration module to current 'Book 1,400
King' POS software 001.4505.572.600012 REC PRGMS & COMM EVENTS MISC FAC Replace 2008 gymnastics spring floor to 18,000
IMPROV (GYMNASTICS SPRING FLOOR) maintain safety of performing arts and camp
Total for Recreation ‐ Recreation Programs & Community Events participants.
19,400
70

GENERAL FUND
RECREATION: BEACH LIFEGUARDS 2022 Budget vs 2021
Projected
2021‐2022 2020‐2021 Change $ Change % 2020‐2021 2019‐2020
Account Number Account Name Budget Projected Budget Actual
Personnel Costs 001.4506.572.112001 OPERATING SALARIES 365,473 363,073 2,400 0.7% 363,073 357,920
001.4506.572.113002 PART TIME SALARIES 77,250 77,250 0 0.0% 77,250 67,028
001.4506.572.114001 OVERTIME SALARIES 33,990 33,990 0 0.0% 33,990 36,132
001.4506.572.115006 EMT/LIFEGUARD 5,500 5,000 500 10.0% 5,000 5,225
001.4506.572.121001 SOCIAL SECURITY 36,889 36,667 222 0.6% 36,667 33,481
001.4506.572.122001 PENSION FUND CONTRIBUTION 105,470 115,794 ‐10,324 ‐8.9% 115,794 103,872
001.4506.572.123001 GROUP LIFE INSURANCE 900 900 0 0.0% 900 864
001.4506.572.123002 HOSPITALIZATION INSURANCE 103,405 93,069 10,336 11.1% 93,069 87,875
Total Personnel Costs 728,877 725,743 3,134 0.4% 725,743 692,397
Operating Expenses
001.4506.572.341001 TELEPHONE 2,000 1,200 800 66.7% 1,200 1,661
001.4506.572.346002 VEHICLE MAINTENANCE 3,188 3,337 ‐149 ‐4.5% 3,337 4,837
001.4506.572.346003 BUILDING MAINTENANCE 1,100 1,100 0 0.0% 1,100 1,159
001.4506.572.347001 PRINTING & BINDING 250 300 ‐50 ‐16.7% 300 288
001.4506.572.349003 SCHOOLS & MEETINGS 1,900 1,500 400 26.7% 1,500 745
001.4506.572.351001 OFFICE SUPPLIES 300 125 175 140.0% 125 370
001.4506.572.352001 GAS & OIL 1,626 1,626 0 0.0% 1,626 1,385
001.4506.572.352008 UNIFORMS & CLOTHING 3,000 2,500 500 20.0% 2,500 0
001.4506.572.352033 ATHLETICS 3,000 6,175 ‐3,175 ‐51.4% 6,175 3,243
001.4506.572.352035 ATHLETIC AREAS MAINT 3,500 3,000 500 16.7% 3,000 3,282
001.4506.572.354001 SUBSCRIPTIONS/MEMBERSHIPS 100 100 0 0.0% 100 100
Total Operating Expenses 19,964 20,963 ‐999 ‐4.8% 20,963 17,070
Capital Outlay001.4506.572.6_____ Various, See Detail 21,500 15,950 5,550 34.8% 15,950 17,743
Total Capital Outlay 21,500 15,950 5,550 34.8% 15,950 17,743
Total 770,341 762,656 7,685 1.0% 762,656 727,210
71

GENERAL FUND
CAPITAL REQUEST DETAIL
Account 2021‐2022
Department Number Account Name Description Budget
Recreation ‐ Beach Lifeguards 001.4506.572.600011 REC BEACH LIFEGUARDS MISC. EQUIP. (AEDS) Automatic External Defibrillator 1,500
001.4506.572.615026 MEGAHERTZ RADIOS We need to fully convert over to the new radio 3,500 network by December 2021. The older radios will cease to operate after the change
001.4506.572.600011 REC BEACH LIFEGUARDS MISC. EQUIP. (RESCUE Assorted Rescue and Medical Equipment 6,500 EQUIP)
001.4506.572.600011 REC BEACH LIFEGUARDS MISC. EQUIP. Replace wooden storage shed at South Beach 10,000 (STORAGE SHED) Park to properly secure City property (ATVs,
radios, rescue equipment, etc). Total for Recreation ‐ Beach Lifeguards 21,500
72

GENERAL FUND
RECREATION: ADMINISTRATION 2022 Budget vs 2021
Projected
2021‐2022 2020‐2021 Change $ Change % 2020‐2021 2019‐2020
Account Number Account Name Budget Projected Budget Actual
Personnel Costs
001.4507.572.112001 OPERATING SALARIES 197,869 194,032 3,837 2.0% 194,032 287,790
001.4507.572.114001 OVERTIME SALARIES 1,000 1,400 ‐400 ‐28.6% 1,400 737
001.4507.572.121001 SOCIAL SECURITY 15,213 14,951 262 1.8% 14,951 20,584
001.4507.572.122001 PENSION FUND CONTRIBUTION 52,336 57,180 ‐4,844 ‐8.5% 57,180 63,064
001.4507.572.123001 GROUP LIFE INSURANCE 500 500 0 0.0% 500 459
001.4507.572.123002 HOSPITALIZATION INSURANCE 45,341 44,660 681 1.5% 44,660 39,814
Total Personnel Costs 312,259 312,723 ‐464 ‐0.1% 312,723 412,448
Operating Expenses
001.4507.572.340001 MILEAGE ALLOWANCE 300 500 ‐200 ‐40.0% 500 634
001.4507.572.341001 TELEPHONE 600 600 0 0.0% 600 516
001.4507.572.342001 POSTAGE 25 40 ‐15 ‐37.5% 40 21
001.4507.572.347001 PRINTING & BINDING 75 150 ‐75 ‐50.0% 150 150
001.4507.572.349003 SCHOOLS & MEETINGS 400 400 0 0.0% 400 45
001.4507.572.351001 OFFICE SUPPLIES 500 435 65 14.9% 435 644
001.4507.572.354001 SUBSCRIPTIONS/MEMBERSHIPS 75 75 0 0.0% 75 40
001.4507.572.355002 MISCELLANEOUS 2,500 2,587 ‐87 ‐3.4% 2,587 2,122
Total Operating Expenses 4,475 4,787 ‐312 ‐6.5% 4,787 4,172
Capital Outlay001.4507.572.6_____ Various, See Detail 22,000 4,000 18,000 450.0% 4,000 1,071
Total Capital Outlay 22,000 4,000 18,000 450.0% 4,000 1,071
Total 338,734 321,510 17,224 5.4% 321,510 417,691
73

GENERAL FUND
CAPITAL REQUEST DETAIL
Account 2021‐2022
Department Number Account Name Description Budget
Recreation ‐ Administration 001.4507.572.600014 SECURITY SYSTEM Security camera system for Leisure 15,000
Square/Community Center and other
recreation facilities 001.4507.572.600012 ADMINISTRATION MISC. EQUIP. (STORAGE Conex box(es) for storage, possibly shop space 7,000
Total for Recreation ‐ Administration BOXES) to replace Dodgertown facility
22,000
74

General Fund Non Departmental
Mission
The NonDepartmental accounts are used for expenses which are not directly associated with or allocable to any other department of the General Fund.
75

GENERAL FUND
NONDEPARTMENTAL 2022 Budget vs 2021
Projected
2021‐2022 2020‐2021 Change $ Change % 2020‐2021 2019‐2020
Account Number Account Name Budget Projected Budget Actual
Personnel Costs
001.9900.519.114003 OVERTIME ‐ DISASTER 0 0 0 n/a 0 9,172
001.9900.519.123005 WORKERS COMPENSATION 334,000 267,500 66,500 24.9% 267,500 243,650
001.9900.519.123004 RETIREMENT PREMIUM ASSIST 521,834 513,035 8,799 1.7% 513,035 484,710
001.9900.519.123006 CONTRIBUTION TO OPEB TRUST 244,607 246,811 ‐2,204 ‐0.9% 246,811 247,863
001.9900.519.123007 RETIREMENT PREM ASSIST ‐ ELEC 321,663 349,478 ‐27,815 ‐8.0% 349,478 334,086
001.9900.519.123008 CONTRIBUTION TO OPEB TRUST‐ELEC 150,778 168,127 ‐17,349 ‐10.3% 168,127 183,223
001.9900.519.125001 STATE UNEMPLOYMENT COMP 0 0 0 n/a 0 6,082
001.9900.522.122003 CONTRIBUTION TO FIRE PENSION 16,726 107,999 ‐91,273 ‐84.5% 107,999 100,007
Total Personnel Costs 1,589,608 1,652,950 ‐63,342 ‐3.8% 1,652,950 1,608,793
Operating Expenses 001.9900.519.331001 PROFESSIONAL SERVICES 25,000 25,000 0 0.0% 25,000 195,046
001.9900.519.331020 FOURTH OF JULY EXPENDITURES 28,000 28,000 0 0.0% 28,000 0
001.9900.519.332001 AUDIT 45,000 30,000 15,000 50.0% 30,000 62,514
001.9900.519.334016 DISCOUNT ON CREDIT CARDS 3,000 3,000 0 0.0% 3,000 2,922
001.9900.519.341002 TELECOMMUNICATIONS SVCS 39,000 39,000 0 0.0% 39,000 33,277
001.9900.519.343002 STREET & HIGHWAY LIGHTING 415,000 371,500 43,500 11.7% 371,500 230,848
001.9900.519.344003 AIRPORT LAND RENT 56,000 53,400 2,600 4.9% 53,400 53,175
001.9900.519.345001 GENERAL INSURANCE 619,098 540,416 78,682 14.6% 540,416 479,757
001.9900.519.345003 G/L AND AUTO‐LOSSES/DEDUCTB 14,000 32,000 ‐18,000 ‐56.3% 32,000 4,555
001.9900.519.346028 MAIN TRAFFIC SIGNALS 115,000 115,000 0 0.0% 115,000 108,746
001.9900.519.346200 SOFTWARE MAINTENANCE 12,500 12,500 0 0.0% 12,500 12,500
001.9900.519.349013 CODE ENFORCEMENT ABATEMNT 5,000 5,000 0 0.0% 5,000 581
001.9900.519.349023 BAD DEBT 3,000 3,000 0 0.0% 3,000 153,578
001.9900.519.349028 LANDFILL FEES 1,200 1,200 0 0.0% 1,200 180
001.9900.519.349100 DR‐4283 HURRICANE MATTHEW EXP 0 0 0 n/a 0 3,428
001.9900.519.349200 HURRICANE IRMA EXPENSES 0 0 0 n/a 0 49,735
001.9900.519.349300 HURRICANE DORIAN EXPENSES 0 0 0 n/a 0 3,181
001.9900.519.349400 COVID 19 EXPENSES 0 0 0 n/a 0 81,469
001.9900.519.349500 HURRICANE ISAIAS EXPENSES 0 0 0 n/a 0 309
001.9900.519.349600 IRC CARES ACT FUND AGRMT EXPENSES 0 0 0 n/a 0 16,594
001.9900.519.354001 SUBSCRIPTIONS/MEMBERSHIPS 600 520 80 15.4% 520 490
001.9900.519.354002 FLA LEAGUE OF CITIES 2,100 2,000 100 5.0% 2,000 2,122
001.9900.519.354006 DOWNTOWN FRIDAY FEST 1,900 1,900 0 0.0% 1,900 729
001.9900.519.354008 MAIN STREET VERO BEACH 26,000 26,000 0 0.0% 26,000 26,000
001.9900.519.355002 MISCELLANEOUS 1,000 1,000 0 0.0% 1,000 1,996
76

GENERAL FUND
NONDEPARTMENTAL 2022 Budget vs 2021
Projected
2021‐2022 2020‐2021 Change $ Change % 2020‐2021 2019‐2020
Account Number Account Name Budget Projected Budget Actual
001.9900.519.355006 INVENTORY VARIANCE 1,000 1,000 0 0.0% 1,000 3,885
001.9900.519.355010 HOLIDAY DECORATIONS 25,000 25,000 0 0.0% 25,000 25,078
001.9900.519.355012 MEMORIAL IS FLAG 3,000 3,000 0 0.0% 3,000 2,941
001.9900.519.355016 DEDICATORY TREE PLANTING 2,500 2,500 0 0.0% 2,500 4,177
001.9900.519.355017 TREE & BEAUTIFICATION PROJECTS 15,000 15,000 0 0.0% 15,000 0
001.9900.519.365004 BANK CHARGES 10,000 2,500 7,500 300.0% 2,500 9,947
001.9900.519.365015 TURTLE LIGHTS 1,200 1,200 0 0.0% 1,200 0
001.9900.519.365018 ELECTRIC UTIL OPERATING EXP‐POST SALE 20,000 0 20,000 n/a 0 57,919
Total Operating Expenses 1,490,098 1,340,636 149,462 11.1% 1,340,636 1,627,679
Debt Service and Transfers
001.9900.519.991022 ECONOMIC DEV ZONE TAX INCRM 98,225 91,099 7,126 7.8% 91,099 87,027
001.9900.519.991023 TRANS TO CEMETERY 145,450 93,000 52,450 56.4% 93,000 48,000
001.9900.519.991034 TRANS TO 3O4: GF CONSTRUCTION 0 0 0 n/a 0 300,000
001.9900.519.991038 TRANS TO MARINA CAPITAL 2,000,000 0 2,000,000 n/a 0 0
Total Debt Service and Transfers 2,243,675 184,099 2,059,576 1118.7% 184,099 435,027
Total 5,323,381 3,177,685 2,145,696 67.5% 3,177,685 3,671,499
77

~·· . r__ ·-~--C"t-·.
I .,-/. -.:?--i . ~-;_ '\..._ - ..r .. -<-~~v.iu-~Mitr:~ GENERAL
GOVERNMENT CAPITAL AND
CONSTRUCTION
78

Fund 304: GENERAL GOVERNMENT CAPITAL AND CONSTRUCTION
2021‐2022
Account Number Account Name Budget
REVENUES 304.0000.365.090150 SALE OF SURPLUS VEHICLES 30,000
304.0000.383.000100 VEHICLE LEASE ‐ PURCHASE PROCEEDS 1,046,372
304.0000.389.001600 TRANS FROM 311 GENERAL 2,233,000
304.0000.389.800000 CONTRIBUTIONS FROM PRIVATE SOURCES ‐ RECREATION 120,000
304.0000.389.000200 CASH CARRYOVER 843,077
Total Revenues $ 4,272,449
EXPENDITURES CITY CLERK / CITY COUNCIL
304.9900.512.601120 COUNCIL CHAMBER BROADCAST SYSTEM 100,000
POLICE
304.9900.521.610008 VBPD VEHICLES LEASE‐PURCHASE 500,000
304.9900.521.610011 VBPD VEHICLES LEASE‐PURCHASE DEBT SVC 401,579
VEHICLES ‐ FLEET AND STREETS/STORMWATER
304.9900.541.616008
304.9900.541.613003
304.9900.541.641411
304.9900.541.641409
304.9900.541.641413
304.9900.572.641413
304.9900.572.641414
PUBLIC WORKS
STREETS/STORMWTR VEHICLE PURCHASE
STREETS/STORMWTR VEHICLE LEASE‐PURCHASE
STREETS/STORMWTR VEHICLE LEASE‐PURCHASE DEBT SERVICE
GENERAL FUND VEHICLE LEASE‐PURCHASE
GENERAL FUND VEHICLE LEASE‐PURCHASE DEBT SERVICE
RECREATION VEHICLE LEASE‐PURCHASE
RECREATION VEHICLE LEASE‐PURCHASE DEBT SERVICE
205,000
250,000
104,426
233,585
199,085
62,787
18,987
304.9900.541.615062
304.9900.541.665006
304.9900.541.665006
304.9900.541.665008
304.9900.541.665009
304.9900.541.665023
304.9900.541.665026
304.9900.541.665030
304.9900.541.665031
STORMWATER
AIR CONDITIONER REPLACEMENTS ‐ CITYWIDE
ANNUAL STREET RESURFACING
SIDEWALK AND CURB REPLACEMENT
RADAR SPEED DETECTION SIGNS
PW COMPOUND ROOF REPAIRS
CONN BEACH BOARDWALK REPAIRS
BRIDGE REPAIR & MAINTENANCE (PER FDOT)
VETERANS ISLAND BRIDGE REPLACEMENT
FLEET GARAGE DOOR REPLACEMENT
40,000
375,000
30,000
15,000
250,000
200,000
30,000
20,000
20,000
304.9900.541.665003 STORMWATER MASTER PLAN 250,000
304.9900.541.665005 SECONDARY DRAINAGE 25,000
304.9900.541.617006 HUMISTON OUTFALL FLAP VALVE 50,000
304.9900.541.617009 STORMWATER MAINTENANCE & IMPROVEMENTS 50,000
304.9900.541.617012 STORMWATER OUTFALL REPAIRS AND PIPE LINING 100,000 79

Fund 304: GENERAL GOVERNMENT CAPITAL AND CONSTRUCTION
2021‐2022
Account Number Account Name Budget
EXPENDITURES (CONTINUED) RECREATION
304.9900.572.615030 PLAYGROUND EQUIPMENT 150,000
304.9900.572.615031 LEISURE SQUARE IMPROVEMENTS 30,000
304.9900.572.616018 BEACH LIFEGUARD TOWER AND SHED 120,000
304.9900.572.615029 CENTERSTAGE IMPROVEMENTS 220,000
304.9900.572.616024 MACWILLIAM PARK PAVILIONS REMODEL 105,000
304.9900.572.616026 PARK FACILITY MAINTENANCE & IMPROVEMENTS 100,000
304.9900.572.616027 BEACH ATV 17,000
Total Expenditures $ 4,272,449
Note: Please see Five Year Capital Program book for project descriptions and five year funding
80

Fund 311: INFRASTRUCTURE & REAL ESTATE IMPROVEMENTS
Account Number Account Name 2021‐2022
Budget
REVENUES 311.0000.312.060100
311.0000.361.010200
311.0000.389.000200
1 CENT SALES TAX
INTEREST ON INVEST
CASH CARRYOVER
MENTS
2,587,545
400
(240,986)
Total Revenues $ 2,346,959
EXPENDITURES 311.9900.541.991064
311.9900.541.991034
DEBT SERVICE TRANSF
TRANSFER TO 304 FOR INFRASTRUCTURE
ER SERIES 2016 113,959
2,233,000
Total Expenditures $ 2,346,959
Note: Please see Five Year Capital Program book for project descriptions and five year funding
81

_ ......... .. ---..!. _.-. 'r~--1.. 1.., _ _..1 -.••• : - .. I
'i:: I .......
I _ .. STORMWATER UTILITY
FUND
82

STORMWATER UTILITY FUND
REVENUE 2022 Budget vs 2021
Projected
2021‐2022 2020‐2021 Change $ Change % 2020‐2021 2019‐2020
Account Number Account Name Budget Projected Budget Actual
302.0000.331.000000 AMERICAN RESCUE PLAN GRANT FUNDING 500,000 0 500,000 n/a 0 0
Total 500,000 0 500,000 n/a 0 0
83

STORMWATER UTILITY FUND
STORMWATER UTILITY FUND
2022 Budget vs 2021 Projected
Account Number Account Name 2021‐2022
Budget 2020‐2021
Projected Change $ Change % 2020‐2021
Budget 2019‐2020
Actual
Capital Outlay 302.9900.538.6_____
Total Capital Outlay
Various, See Detail 500,000
500,000
0
0
500,000
500,000
n/a
n/a
0
0
0
0
Total 500,000 0 500,000 n/a 0 0
84

STORMWATER UTILITY FUND
CAPITAL REQUEST DETAIL
Account 2021‐2022
Department Number Account Name Description Budget
Stormwater Utility 302.9900.538.617002 STORMWATER CULVERT REPLACEMENTS Replace failed culverts to maintain positive 250,000
drainage in various locations throughout the City.
302.9900.538.617009 STORMWATER MAINTENANCE AND Repair existing drainage facilities and install new 250,000 IMPROVEMENT drainage facilities to improve and maintain
drainage function at various locations within the City.
Total for Stormwater Utility 500,000
Note: Please see Five Year Capital Program for project descriptions and five year funding
85

WATER & SEWER FUND
86

City of Vero Beach 1053 - 20th PLACE - P.O. BOX1389
VERO BEACH, FLORIDA - 32961-1389 Telephone : (772) 978-4770 • Fax: (772) 978-4707
OFFICE OF THE DIRECTOR OF FINANCE
September 14, 2021
Honorable Mayor and Members of the City Council City of Vero Beach Vero Beach, Florida 32960
Dear Mayor and Councilmembers:
As Finance Director, I have reviewed the budget for the Water & Sewer Fund for the Fiscal Year October 1, 2021 through September 30, 2022.
The adopted budget provides sufficient funds to pay the bond service requirements and the full expenses associated with the operation and maintenance of the water and sewer system.
This budget reflects anticipated operating revenues of $17,482,100 with total operating expenses of $13,993,082. This yields a projected net operating income of $3,489,018 which results in an estimated debt service coverage for Fiscal Year 2022 of 1.82.
Based on the above factors, I certify that the budget attached is a reasonable projection for Fiscal Year 2022.
Cynt . Lawson Finance Director
87

WATER AND SEWER FUND
OPERATING BUDGET Operating Revenue
Operating Expenses:
Wastewater Treatment Water Treatment Wastewater Reuse Water Sewer Administration Facility Maintenance & Asset Wastewater Collection Water Distribution Customer Service Non-Departmental
Total Operating Expenses
Net Operating Income
Debt Service
Transfer for Series 2013 Refunding Transfer for State Revolving Fund Loans
Total Debt Service Transfers
Surplus Revenue
Surplus Revenue Distribution
Transfer to General Fund Transfer to Capital Improvements Program Balance Available for Capital Additions
Total Distribution of Surplus
Budget 2021-2022
$ 17,482,100
1,667,620 3,273,237
350,500 1,087,228 1,066,490 1,917,718 1,510,943 1,013,385 2,105,961
13,993,082
3,489,018
1,129,408 791,542
1,920,950
$ 1,568,068
$ 1,031,000 5,700,000
(5,162,932)
$ 1,568,068
Budget 2020-2021
$ 17,392,500
1,646,543 3,181,392
337,500 1,016,160
974,835 1,722,412 1,459,238
980,055 2,039,011
13,357,146
4,035,354
1,128,056 791,542
1,919,598
$ 2,115,756
$ 1,025,000 1,800,000 (709,244)
$ 2,115,756
88

WATER AND SEWER FUND
REVENUE 2022 Budget vs 2021
Projected
2021‐2022 2020‐2021 Change $ Change % 2020‐2021 2019‐2020
Account Number Account Name Budget Projected Budget Actual
421.0000.331.090400 HURRICANE FRANCES FEMA REIMB 0 0 0 n/a 0 114,690
421.0000.331.090500 HURRICANE JEANNE FEMA REIMB 0 0 0 n/a 0 ‐203,946
421.0000.331.090550 HURRICANE DORIAN DR‐4468 FEMA REIMB 0 0 0 n/a 0 10,943
421.0000.334.090400 HURRICANE FRANCES STATE REIMB 0 0 0 n/a 0 33,084
421.0000.334.090500 HURRICANE JEANNE STATE REIMB 0 0 0 n/a 0 ‐10,352
421.0000.334.090550 HURRICANE DORIAN DR‐4468 STATE REIMB 0 0 0 n/a 0 1,824
421.0000.334.090560 CARES ACT FUNDING IRC SUBRECIPIENT AGRMT 0 0 0 n/a 0 8,436
421.0000.343.060100 METERED WATER SALES 9,250,000 9,100,000 150,000 1.6% 9,100,000 9,279,858
421.0000.343.060200 NEW WATER CONNECTIONS 10,000 10,000 0 0.0% 10,000 8,570
421.0000.343.060400 SEWER SERVICE CHARGES 6,800,000 6,800,000 0 0.0% 6,800,000 6,736,007
421.0000.343.060600 FIRE HYDRANT RENTAL 140,100 142,000 ‐1,900 ‐1.3% 142,000 140,100
421.0000.343.060700 TURN ON FEES 95,000 80,000 15,000 18.8% 80,000 94,230
421.0000.343.060800 PENALTY INCOME 40,000 25,000 15,000 60.0% 25,000 50,513
421.0000.343.060900 WATER & SEWER MISC CHARGES 0 0 0 n/a 0 20
421.0000.343.061500 IRRIGATION REUSE OTHERS 610,000 650,000 ‐40,000 ‐6.2% 650,000 608,067
421.0000.343.500000 W/S EQUALIZATION CHARGE 375,000 370,000 5,000 1.4% 370,000 389,698
421.0000.349.000100 BILLING SERVICE CHARGES 0 0 0 n/a 0 71
421.0000.361.010200 INTEREST ON INVESTMENTS 157,000 210,000 ‐53,000 ‐25.2% 210,000 529,619
421.0000.364.000200 GAIN OR LOSS ON DISPOSAL OF ASSETS 0 0 0 n/a 0 ‐36,628
421.0000.369.060000 INSURANCE PROCEEDS 0 0 0 n/a 0 4,728
421.0000.365.090100 SALE SURPLUS MATLS/SCRAP 0 500 ‐500 ‐100.0% 500 0
421.0000.369.090100 MISCELLANEOUS REVENUES 5,000 5,000 0 0.0% 5,000 9,122
421.0000.382.000650 CONTR FROM HLTH INS FND 0 0 0 n/a 0 53,681
421.0000.389.000100 CASH OVER SHORT 0 0 0 n/a 0 105
421.0000.389.000200 CASH CARRYOVER 5,162,932 709,244 4,453,688 627.9% 709,244 0
421.0000.389.700000 CAPITAL CONTRIBUTION ‐ ASSET TRANSFER 0 0 0 n/a 0 264
Total 22,645,032 18,101,744 4,543,288 25.1% 18,101,744 17,822,704
89

WATER AND SEWER FUND
BUDGET BY DEPARTMENT
2022 Budget vs 2021
Projected 2021‐2022 2020‐2021 2020‐2021 2019‐2020
Change $ Change % Department Budget Projected Budget Actual
Wastewater Treatment 1,667,620 1,646,543 21,077 1.3% 1,646,543 1,255,770
Water Treatment 3,273,237 3,181,392 91,845 2.9% 3,181,392 3,003,270
Wastewater Reuse 350,500 337,500 13,000 3.9% 337,500 202,544
Water Sewer Admin 1,087,228 1,016,160 71,068 7.0% 1,016,160 732,057
Facility Maintenance & Asset Mgt 1,066,490 974,835 91,655 9.4% 974,835 789,846
Wastewater Collection 1,917,718 1,722,412 195,306 11.3% 1,722,412 1,319,822
Water Distribution 1,510,943 1,459,238 51,705 3.5% 1,459,238 1,051,108
Customer Service 1,013,385 980,055 33,330 3.4% 980,055 894,598
Non‐Departmental 10,757,911 6,783,609 3,974,302 58.6% 6,783,609 4,942,333
Water & Sewer Fund 22,645,032 18,101,744 4,543,288 25.1% 18,101,744 14,191,348
90

WATER AND SEWER FUND Expenditures by Object
2022 Budget vs 2021
Projected
Account Number / Account Name 2021‐2022
Budget 2020‐2021
Projected Change $ Change % 2020‐2021
Budget 2019‐2020
Actual
112001 ‐ OPERATING SALARIES 4,240,427 3,953,085 287,342 7.3% 3,953,085 3,550,531
113002 ‐ PART TIME SALARIES 5,000 20,000 ‐15,000 ‐75.0% 20,000 0
114001 ‐ OVERTIME SALARIES 246,000 238,000 8,000 3.4% 238,000 168,988
114003 ‐ OVERTIME ‐ DISASTER 0 0 0 n/a 0 382
115009 ‐ MEAL ALLOWANCE 5,600 5,600 0 0.0% 5,600 1,926
121001 ‐ SOCIAL SECURITY 344,022 322,576 21,446 6.6% 322,576 259,258
122001 ‐ PENSION FUND CONTRIBUTION 1,041,750 1,124,715 ‐82,965 ‐7.4% 1,124,715 334,425
123001 ‐ GROUP LIFE INSURANCE 10,700 14,200 ‐3,500 ‐24.6% 14,200 8,761
123002 ‐ HOSPITALIZATION INSURANCE 988,902 907,440 81,462 9.0% 907,440 767,133
123004 ‐ RETIREMENT PREM ASSIST 149,251 161,792 ‐12,541 ‐7.8% 161,792 156,638
123005 ‐ WORKERS COMPENSATION 121,000 91,700 29,300 32.0% 91,700 88,947
123006 ‐ CONTRIBUTION TO OPEB TRUST 69,961 77,835 ‐7,874 ‐10.1% 77,835 6,386
125001 ‐ STATE UNEMPLOYMENT COMP 0 0 0 n/a 0 484
126001 ‐ COMPENSATED ABSENCES VAC 0 0 0 n/a 0 36,873
126002 ‐ COMPENSATED ABSENCES SICK 0 0 0 n/a 0 22,748
331001 ‐ PROFESSIONAL SERVICES 380,000 358,000 22,000 6.1% 358,000 196,646
331015 ‐ GIS EXPENSE 23,000 20,000 3,000 15.0% 20,000 20,745
331020 ‐ LICENSES & TESTING 145,000 145,000 0 0.0% 145,000 118,193
332001 ‐ AUDIT 14,000 19,000 ‐5,000 ‐26.3% 19,000 18,974
334003 ‐ JANITORIAL SERVICES 24,400 21,400 3,000 14.0% 21,400 15,069
334007 ‐ OTHER CONTRACTUAL SERVICES 162,500 162,500 0 0.0% 162,500 105,193
340001 ‐ MILEAGE ALLOWANCE 5,500 5,500 0 0.0% 5,500 4,009
341001 ‐ TELEPHONE 31,000 31,000 0 0.0% 31,000 23,576
341002 ‐ TELECOMMUNICATIONS SVCS 9,800 9,800 0 0.0% 9,800 8,459
342001 ‐ POSTAGE 77,650 77,650 0 0.0% 77,650 69,328
343001 ‐ UTILITIES 1,296,000 1,267,000 29,000 2.3% 1,267,000 1,031,523
344001 ‐ MACH & EQUIP RENT 52,000 52,000 0 0.0% 52,000 60,706
344003 ‐ AIRPORT LAND RENT 311,000 296,500 14,500 4.9% 296,500 295,554
344003 ‐ LAND RENT AIRPORT 30,000 30,000 0 0.0% 30,000 15,013
344004 ‐ ENVIRONMENTAL CLEANUP REC ‐130,000 ‐115,000 ‐15,000 13.0% ‐115,000 ‐108,844
344005 ‐ ENVIRONMENTAL CLEANUP EXP 25,000 10,000 15,000 150.0% 10,000 9,983
345001 ‐ GENERAL INSURANCE 291,908 247,788 44,120 17.8% 247,788 232,347
346001 ‐ EQUIPMENT MAINTENANCE 490,500 420,700 69,800 16.6% 420,700 620,057
346002 ‐ VEHICLE MAINTENANCE 124,129 120,421 3,708 3.1% 120,421 117,486
346003 ‐ BUILDING MAINTENANCE 2,000 2,000 0 0.0% 2,000 380
346017 ‐ OFFICE EQUIP MAINT 1,500 1,500 0 0.0% 1,500 483
346018 ‐ RADIO MAINT 500 500 0 0.0% 500 324
91

WATER AND SEWER FUND Expenditures by Object
2022 Budget vs 2021
Projected 2021‐2022 2020‐2021 2020‐2021 2019‐2020
Change $ Change % Account Number / Account Name Budget Projected Budget Actual
346029 ‐ STRUCTURE & IMPROV MAINT 83,000 81,500 1,500 1.8% 81,500 33,072
346030 ‐ WELL MAINTENANCE 80,000 80,000 0 0.0% 80,000 82,682
346031 ‐ SUPPLY MAINS MAINT 3,000 3,000 0 0.0% 3,000 0
346035 ‐ ELEC CONTROL SYS MAINT 40,000 40,000 0 0.0% 40,000 20,780
346042 ‐ GRAVITY MAINS & LATRLS MAINT 30,000 30,000 0 0.0% 30,000 11,392
346042 ‐ T & D MAINS MAINT 120,000 90,000 30,000 33.3% 90,000 134,227
346043 ‐ SERVICES MAINT 15,000 15,000 0 0.0% 15,000 4,241
346044 ‐ METERS MAINT 10,000 9,500 500 5.3% 9,500 94
346046 ‐ HYDRANTS MAINT 15,000 12,000 3,000 25.0% 12,000 13,130
346047 ‐ CUST PREMISES MAINT 10,000 10,000 0 0.0% 10,000 2,029
346047 ‐ CUSTOMER PREMISES MAINT 8,500 8,500 0 0.0% 8,500 2,483
346048 ‐ GROUND RESV MAINT 82,000 82,000 0 0.0% 82,000 10
346049 ‐ FORCE MAINS & APPURT MAINT 15,000 15,000 0 0.0% 15,000 19,251
346049 ‐ MAINS & APPURT MAINT 10,000 5,000 5,000 100.0% 5,000 6,814
346058 ‐ GROUNDS MAINT 34,448 33,183 1,265 3.8% 33,183 35,226
346059 ‐ ODOR CONTROL SYS MAINT 10,000 10,000 0 0.0% 10,000 0
346200 ‐ SOFTWARE & MAINTENANCE 255,000 216,500 38,500 17.8% 216,500 186,895
347001 ‐ PRINTING & BINDING 32,000 32,000 0 0.0% 32,000 28,751
349003 ‐ SCHOOLS & MEETINGS 29,000 28,000 1,000 3.6% 28,000 4,434
349005 ‐ FIRST AID 1,000 1,000 0 0.0% 1,000 346
349015 ‐ CREDIT BUREAU CHARGES 15,000 28,000 ‐13,000 ‐46.4% 28,000 5,349
349016 ‐ GF ADMIN CHARGE 1,232,541 1,256,596 ‐24,055 ‐1.9% 1,256,596 1,253,257
349019 ‐ METER DEPOSIT INTEREST 7,500 7,500 0 0.0% 7,500 13,610
349023 ‐ BAD DEBT 35,000 15,000 20,000 133.3% 15,000 47,698
349028 ‐ LANDFILL FEES 77,000 77,000 0 0.0% 77,000 54,501
349100 ‐ DR‐4283 HURRICANE MATTHEW EXP 0 0 0 n/a 0 12
349200 ‐ HURRICANE IRMA EXPENSES 0 0 0 n/a 0 1,465
349300 ‐ HURRICANE DORIAN EXPENSES 0 0 0 n/a 0 294
349400 ‐ COVID 19 EXPENSES 0 0 0 n/a 0 7,057
349500 ‐ HURRICANE ISAIAS EXPENSES 0 0 0 n/a 0 314
351001 ‐ OFFICE SUPPLIES 15,750 15,000 750 5.0% 15,000 11,013
351002 ‐ LOGS/CHARTS/FORMS/MAPS 1,500 1,000 500 50.0% 1,000 1,186
351003 ‐ OFFICE FURN & EQUIP 29,500 28,000 1,500 5.4% 28,000 8,217
352001 ‐ GAS & OIL 113,842 107,047 6,795 6.3% 107,047 66,431
352005 ‐ CONSUMABLE TOOLS 19,500 16,500 3,000 18.2% 16,500 18,110
352006 ‐ JANITORIAL SUPPLIES 10,350 10,350 0 0.0% 10,350 3,784
352008 ‐ UNIFORMS & CLOTHING 45,200 43,670 1,530 3.5% 43,670 32,299
92

WATER AND SEWER FUND Expenditures by Object
2022 Budget vs 2021
Projected
Account Number / Account Name 2021‐2022
Budget 2020‐2021
Projected Change $ Change % 2020‐2021
Budget 2019‐2020
Actual
352013 ‐ CHEMICAL & LAB SUPPLIES 31,000 26,000 5,000 19.2% 26,000 27,946
352013 ‐ CHEMICAL AND LAB SUPPLIES 7,000 7,000 0 0.0% 7,000 5,542
352014 ‐ OTHER COMMODITIES 24,000 23,000 1,000 4.3% 23,000 18,108
352027 ‐ TOOLS & INSTRUMENTS 500 500 0 0.0% 500 45
352019 ‐ CHEMICAL & WATER TR SUP 820,250 780,250 40,000 5.1% 780,250 839,693
352023 ‐ HORTICULTURE SUPPLIES 1,000 1,000 0 0.0% 1,000 29
353003 ‐ REPLACEMENT PAVEMENT 45,000 35,000 10,000 28.6% 35,000 15,587
354001 ‐ SUBSCRIPTIONS/MEMBERSHIPS 13,300 13,300 0 0.0% 13,300 7,420
355002 ‐ MISCELLANEOUS 2,000 2,000 0 0.0% 2,000 ‐2
355006 ‐ INVENTORY VARIANCE 0 0 0 n/a 0 ‐576
355007 ‐ GRACE 100,000 80,000 20,000 25.0% 80,000 118,044
355011 ‐ RECORDING FEES 5,000 5,000 0 0.0% 5,000 1,999
359900 ‐ INTERFUND SERVICES 0 0 0 n/a 0 ‐5,142
359910 ‐ INTERFUND SERVICES ‐ SOLID WASTE ‐176,599 ‐168,952 ‐7,647 4.5% ‐168,952 ‐168,474
6_____ ‐ CAPITAL Various, See Detail 45,000 45,000 0 0.0% 45,000 28,974
991004 ‐ TRANSFER TO GENERAL FUND 1,031,000 1,025,000 6,000 0.6% 1,025,000 1,005,000
991007 ‐ TRANS TO W/S R&R FUND 5,700,000 1,800,000 3,900,000 216.7% 1,800,000 1,700,000
991058 ‐ DEBT SVC TRF WW 310201 ORIG 651,124 651,124 0 0.0% 651,124 156,767
991059 ‐ DEBT SVC TRF DW 310220 20,542 20,542 0 0.0% 20,542 5,340
991060 ‐ DEBT SVC TRF WW 310201 AM#2 107,876 107,876 0 0.0% 107,876 22,832
991061 ‐ DEBT SVC TRF DW 310221 12,000 12,000 0 0.0% 12,000 2,744
991062 ‐ DEBT SVC TRF SERIES 2013 1,129,408 1,128,056 1,352 0.1% 1,128,056 40,334
Total for Water & Sewer Fund Expenditures 22,645,032 18,101,744 4,543,288 25.1% 18,101,744 14,191,348
93

Wastewater Treatment Mission
The mission of the Wastewater Treatment division is to promote public health, protect the environment and conserve water resources by purifying and reclaiming wastewater generated by the residents and businesses of our service territory.
Responsibilities of this division include complying with permit requirements of the Florida Department of Environmental Protection and the U.S. Environmental Protection Agency.
Staffing Table
Employee Type Budget
2021-2022 Budget
2020-2021 Change Full Time Non Bargaining 1 1 0 Full Time Bargaining 7 7 0
Total 8 8 0 Part Time 0 0 0
Total 8 8 0
Routine Goals
Continue to meet Federal and State permit requirements.
Major Goal
Start Engineering Design for the construction of the New Water Reclamation Facility.
94

WATER AND SEWER FUND
WASTEWATER TREATMENT
2022 Budget vs 2021 Projected
2021‐2022 2020‐2021 Change $ Change % 2020‐2021 2019‐2020
Account Number Account Name Budget Projected Budget Actual
Personnel Costs
421.9000.536.112001 OPERATING SALARIES 502,278 487,291 14,987 3.1% 487,291 429,024
421.9000.536.114001 OVERTIME SALARIES 50,000 50,000 0 0.0% 50,000 44,158
421.9000.536.115009 MEAL ALLOWANCE 800 800 0 0.0% 800 291
421.9000.536.121001 SOCIAL SECURITY 42,310 41,164 1,146 2.8% 41,164 33,404
421.9000.536.122001 CONTRIB TO PENSION FUND 162,677 180,040 ‐17,363 ‐9.6% 180,040 43,525
421.9000.536.123001 GROUP LIFE INSURANCE 1,300 1,800 ‐500 ‐27.8% 1,800 1,042
421.9000.536.123002 HOSPITALIZATION INSURANCE 114,356 103,036 11,320 11.0% 103,036 81,320
421.9000.536.126001 COMPENSATED ABSENCES VAC 0 0 0 n/a 0 2,455
421.9000.536.126002 COMPENSATED ABSENCES SICK 0 0 0 n/a 0 4,298
Total Personnel Costs 873,721 864,131 9,590 1.1% 864,131 639,517
Operating Expenses 421.9000.536.331001 PROFESSIONAL SERVICES 20,000 20,000 0 0.0% 20,000 14,223
421.9000.536.331020 LICENSES & TESTING 55,000 55,000 0 0.0% 55,000 38,604
421.9000.536.334003 JANITORIAL SERVICES 5,000 5,000 0 0.0% 5,000 1,848
421.9000.536.334007 OTHER CONTRACTUAL SERVICES 45,000 45,000 0 0.0% 45,000 39,370
421.9000.536.341001 TELEPHONE 5,000 5,000 0 0.0% 5,000 3,316
421.9000.536.342001 POSTAGE 500 500 0 0.0% 500 0
421.9000.536.343001 UTILITIES 270,000 270,000 0 0.0% 270,000 173,503
421.9000.536.344001 MACH & EQUIP RENT 18,000 18,000 0 0.0% 18,000 35,617
421.9000.536.346001 EQUIPMENT MAINTENANCE 75,000 75,000 0 0.0% 75,000 66,305
421.9000.536.346002 VEHICLE MAINTENANCE 3,849 3,362 487 14.5% 3,362 3,345
421.9000.536.346029 STRUCTURE & IMPROV MAINT 20,000 20,000 0 0.0% 20,000 3,893
421.9000.536.346058 GROUNDS MAINT 5,000 4,000 1,000 25.0% 4,000 6,280
421.9000.536.346059 ODOR CONTROL SYS MAINT 5,000 5,000 0 0.0% 5,000 0
421.9000.536.346200 SOFTWARE & MAINTENANCE 9,000 9,000 0 0.0% 9,000 5,297
421.9000.536.349003 SCHOOLS & MEETINGS 3,000 3,000 0 0.0% 3,000 410
421.9000.536.349005 FIRST AID 150 150 0 0.0% 150 246
421.9000.536.349028 LANDFILL FEES 70,000 70,000 0 0.0% 70,000 50,973
421.9000.536.351001 OFFICE SUPPLIES 1,500 1,500 0 0.0% 1,500 957
421.9000.536.351003 OFFICE FURN & EQUIP 4,000 4,000 0 0.0% 4,000 1,897
421.9000.536.352001 GAS AND OIL 15,000 15,000 0 0.0% 15,000 5,112
421.9000.536.352005 CONSUMABLE TOOLS 2,500 2,500 0 0.0% 2,500 1,796
421.9000.536.352006 JANITORIAL SUPPLIES 3,500 3,500 0 0.0% 3,500 1,987
421.9000.536.352008 UNIFORMS & CLOTHING 6,500 6,500 0 0.0% 6,500 4,716
421.9000.536.352013 CHEMICAL AND LAB SUPPLIES 7,000 7,000 0 0.0% 7,000 5,542
95

WATER AND SEWER FUND
WASTEWATER TREATMENT
2022 Budget vs 2021 Projected
2021‐2022 2020‐2021 Change $ Change % 2020‐2021 2019‐2020
Account Number Account Name Budget Projected Budget Actual
421.9000.536.352014 OTHER COMMODITIES 2,500 2,500 0 0.0% 2,500 2,030
421.9000.536.352019 CHEMICAL & WATER TR SUP 135,000 125,000 10,000 8.0% 125,000 128,391
421.9000.536.352023 HORTICULTURAL SUPPLIES 500 500 0 0.0% 500 0
421.9000.536.354001 SUBSCRIPTIONS/MEMBERSHIPS 1,400 1,400 0 0.0% 1,400 323
Total Operating Expenses 788,899 777,412 11,487 1.5% 777,412 595,981
Capital Outlay421.9000.536.6_____ Various, See Detail 5,000 5,000 0 0.0% 5,000 20,272
Total Capital Outlay 5,000 5,000 0 0.0% 5,000 20,272
Total 1,667,620 1,646,543 21,077 1.3% 1,646,543 1,255,770
96

WATER AND SEWER FUND
CAPITAL REQUEST DETAIL
Account 2021‐2022
Department Number Account Name Description Budget
Wastewater Treatment 421.9000.536.640100 MISC. TOOLS & EQUIPMENT Purchases of hand tools not considered 5,000
consumable that are used for the daily
operation and maintenance of each
Department. Total for Wastewater Treatment 5,000
97

Water Treatment Mission
The mission of the Water Treatment Division is to continuously produce an adequate supply of potable water that protects and promotes public health and meets State and Federal Standards.
Staffing Table Employee Type
Budget 2021-2022
Budget 2020-2021 Change
Full Time Non Bargaining 1 1 0 Full Time Bargaining 7 7 0
Total 8 8 0 Part Time 0 0 0
Total 8 8 0
Routine Goals Continue to meet State Consumptive Use Permit requirements.
Major Goals Plant and Building maintenance is scheduled for this year with a complete paint job at finish. An aggressive well rehabilitation program is scheduled for the next three years to restore surficial raw water production rates. Accelators 3 and 4 are scheduled for rehabilitation. Accelator 2 will be demolished. Ground Storage Tank No. 1 will be replaced with a new 2.0 million gallon tank.
98

WATER AND SEWER FUND
WATER TREATMENT
2022 Budget vs 2021 Projected
2021‐2022 2020‐2021 Change $ Change % 2020‐2021 2019‐2020
Account Number Account Name Budget Projected Budget Actual
Personnel Costs
421.9002.536.112001 OPERATING SALARIES 495,424 489,725 5,699 1.2% 489,725 471,081
421.9002.536.114001 OVERTIME SALARIES 50,000 50,000 0 0.0% 50,000 29,692
421.9002.536.115009 MEAL ALLOWANCE 800 800 0 0.0% 800 413
421.9002.536.121001 SOCIAL SECURITY 41,786 41,350 436 1.1% 41,350 34,739
421.9002.536.122001 PENSION CONTRIBUTION 164,159 181,295 ‐17,136 ‐9.5% 181,295 45,677
421.9002.536.123001 GROUP LIFE INSURANCE 1,300 1,700 ‐400 ‐23.5% 1,700 1,143
421.9002.536.123002 HOSPITALIZATION INSURANCE 115,041 112,910 2,131 1.9% 112,910 106,688
421.9002.536.126001 COMPENSATED ABSENCES VAC 0 0 0 n/a 0 8,308
421.9002.536.126002 COMPENSATED ABSENCES SICK 0 0 0 n/a 0 3,281
Total Personnel Costs 868,510 877,780 ‐9,270 ‐1.1% 877,780 701,022
Operating Expenses 421.9002.536.331001 PROFESSIONAL SERVICES 135,000 135,000 0 0.0% 135,000 65,603
421.9002.536.331020 LICENSES & TESTING 80,000 80,000 0 0.0% 80,000 79,589
421.9002.536.334003 JANITORIAL SERVICES 15,000 12,000 3,000 25.0% 12,000 9,706
421.9002.536.334007 OTHER CONTRACTUAL SERVICES 96,500 96,500 0 0.0% 96,500 58,598
421.9002.536.341001 TELEPHONE 4,000 4,000 0 0.0% 4,000 2,687
421.9002.536.342001 POSTAGE 1,500 1,500 0 0.0% 1,500 645
421.9002.536.343001 UTILITIES 725,000 700,000 25,000 3.6% 700,000 640,987
421.9002.536.344001 MACH & EQUIP RENT 30,000 30,000 0 0.0% 30,000 24,300
421.9002.536.344003 AIRPORT LAND RENT 311,000 296,500 14,500 4.9% 296,500 295,554
421.9002.536.344004 ENVIRONMENTAL CLEANUP REC ‐130,000 ‐115,000 ‐15,000 13.0% ‐115,000 ‐108,844
421.9002.536.344005 ENVIRONMENTAL CLEANUP EXP 25,000 10,000 15,000 150.0% 10,000 9,983
421.9002.536.346001 EQUIPMENT MAINTENANCE 200,000 175,000 25,000 14.3% 175,000 346,448
421.9002.536.346002 VEHICLE MAINTENANCE 15,090 15,607 ‐517 ‐3.3% 15,607 15,472
421.9002.536.346029 STRUCTURE & IMPROV MAINT 45,000 45,000 0 0.0% 45,000 26,143
421.9002.536.346030 WELL MAINTENANCE 80,000 80,000 0 0.0% 80,000 82,682
421.9002.536.346031 SUPPLY MAINS MAINT 3,000 3,000 0 0.0% 3,000 0
421.9002.536.346035 ELEC CONTROLS SYS MAINT 0 0 0 n/a 0 4
421.9002.536.346058 GROUND MAINT. 11,337 11,235 102 0.9% 11,235 11,379
421.9002.536.346059 ODOR CONTROL SYS MAINT 5,000 5,000 0 0.0% 5,000 0
421.9002.536.346200 SOFTWARE & MAINTENANCE 18,000 15,000 3,000 20.0% 15,000 13,117
421.9002.536.349003 SCHOOLS & MEETINGS 5,000 5,000 0 0.0% 5,000 950
421.9002.536.349005 FIRST AID 300 300 0 0.0% 300 100
421.9002.536.351001 OFFICE SUPPLIES 2,000 2,000 0 0.0% 2,000 1,103
421.9002.536.351002 LOGS/CHARTS/FORMS/MAPS 1,500 1,000 500 50.0% 1,000 1,186
99

WATER AND SEWER FUND
WATER TREATMENT
2022 Budget vs 2021 Projected
2021‐2022 2020‐2021 Change $ Change % 2020‐2021 2019‐2020
Account Number Account Name Budget Projected Budget Actual
421.9002.536.351003 OFFICE FURN & EQUIP 2,500 2,500 0 0.0% 2,500 1,041
421.9002.536.352001 GAS & OIL 15,000 15,000 0 0.0% 15,000 5,161
421.9002.536.352005 CONSUMABLE TOOLS 2,500 2,500 0 0.0% 2,500 2,143 421.9002.536.352006 JANITORIAL SUPPLIES 3,500 3,500 0 0.0% 3,500 1,683
421.9002.536.352008 UNIFORMS & CLOTHING 7,500 6,970 530 7.6% 6,970 3,830
421.9002.536.352013 CHEMICAL & LAB SUPPLIES 30,000 25,000 5,000 20.0% 25,000 27,267
421.9002.536.352014 OTHER COMMODITIES 2,500 2,500 0 0.0% 2,500 1,655
421.9002.536.352019 CHEMICAL & WATER TR SUP 650,000 625,000 25,000 4.0% 625,000 679,881
421.9002.536.352023 HORTICULTURE SUPPLIES 500 500 0 0.0% 500 29
421.9002.536.354001 SUBSCRIPTIONS/MEMBERSHIPS 1,500 1,500 0 0.0% 1,500 120
Total Operating Expenses 2,394,727 2,293,612 101,115 4.4% 2,293,612 2,300,202
Capital Outlay421.9002.536.6_____ Various, See Detail 10,000 10,000 0 0.0% 10,000 2,046
Total Capital Outlay 10,000 10,000 0 0.0% 10,000 2,046
Total 3,273,237 3,181,392 91,845 2.9% 3,181,392 3,003,270 .
100

WATER AND SEWER FUND
CAPITAL REQUEST DETAIL
Account 2021‐2022
Department Number Account Name Description Budget
Water Treatment 421.9002.536.640100 MISC. TOOLS & EQUIPMENT Purchases of hand tools not considered 10,000
consumable that are used for the daily
operation and maintenance of each
Department. Total for Water Treatment 10,000
101

Wastewater Reuse
Mission
The mission of the Wastewater Reuse Division is to produce and distribute reclaimed water for irrigation use to promote the conservation of potable water resources. Responsibilities of this division include meeting permit requirements of the Florida Department of Environmental Protection, St. John's River Water Management District and the U.S. Environmental Protection Agency.
Staffing Table
Staffing is provided by personnel of other Water Sewer divisions.
Routine Goals
Continue to make reclaimed water in accordance with FDEP requirements.
102

WATER AND SEWER FUND
WASTEWATER REUSE
2022 Budget vs 2021 Projected
2021‐2022 2020‐2021 Change $ Change % 2020‐2021 2019‐2020
Account Number Account Name Budget Projected Budget Actual
Operating Expenses 421.9004.536.331001 PROFESSIONAL SERVICES 10,000 10,000 0 0.0% 10,000 3,484
421.9004.536.331020 LICENSES & TESTING 10,000 10,000 0 0.0% 10,000 0
421.9004.536.343001 UTILITIES 180,000 180,000 0 0.0% 180,000 109,409
421.9004.536.346001 EQUIPMENT MAINTENANCE 50,000 50,000 0 0.0% 50,000 42,470
421.9004.536.346029 STRUCTURE & IMPR MAINT 5,000 5,000 0 0.0% 5,000 336
421.9004.536.346048 GROUND RESV MAINT 30,000 30,000 0 0.0% 30,000 0
421.9004.536.346049 MAINS & APPURT MAINT 10,000 5,000 5,000 100.0% 5,000 6,814
421.9004.536.346200 SOFTWARE & MAINTENANCE 10,000 7,000 3,000 42.9% 7,000 3,812
421.9004.536.352001 GAS & OIL 2,500 2,500 0 0.0% 2,500 0
421.9004.536.352005 CONSUMABLE TOOLS 1,000 1,000 0 0.0% 1,000 0
421.9004.536.352013 CHEMICAL & LAB SUPPLIES 1,000 1,000 0 0.0% 1,000 679
421.9004.536.352014 OTHER COMMODITIES 1,000 1,000 0 0.0% 1,000 262
421.9004.536.352019 CHEMICAL & WATER TR SUP 35,000 30,000 5,000 16.7% 30,000 31,421
Total Operating Expenses 345,500 332,500 13,000 3.9% 332,500 198,687
Capital Outlay421.9004.536.6_____ Various, See Detail 5,000 5,000 0 0.0% 5,000 3,857
Total Capital Outlay 5,000 5,000 0 0.0% 5,000 3,857
Total 350,500 337,500 13,000 3.9% 337,500 202,544
103

WATER AND SEWER FUND
CAPITAL REQUEST DETAIL
Account 2021‐2022
Department Number Account Name Description Budget
Wastewater Reuse 421.9004.536.640100 MISC. TOOLS & EQUIPMENT Purchases of hand tools not considered 5,000
consumable that are used for the daily
operation and maintenance of each
Department. Total for Wastewater Reuse 5,000
104

Administration Mission The mission of the Administration Division is to provide support to the operating divisions of the department. This also includes coordinating with other departments whose facilities or personnel may be affected by Water and Sewer operations. This Division monitors personnel actions, purchasing and payroll functions of the Department, and provides the interface for handling citizen
Staffing Table
Employee Type Budget
2021-2022 Budget
2020-2021 Change Full Time Non Bargaining 5 5 0 Full Time Bargaining 4 3 1
Total 9 8 1 Part Time 0 0 0
Total 9 8 1
Routine Goals Search for new methods and technologies that will reduce operational expenses, increase efficiency, and improve services to customers.
Continue our departmental document management system migration from paper to electronic records. This includes converting old paper maps, drawings, and details into electronic format that can be used for modeling and field operations.
Continue to streamline our departmental purchasing process and procedures to alleviate workload.
Major Goals
The STEP System mains were completed in July 2017. STEP Up and Save program is ongoing. A new program in conjunction with the construction of the new water reclamation facility will be discussed with City Council this fiscal year.
New goal for FY 21/22 is to implement the necessary changes required to comply with Senate Bill 712 "Clean Waterways Act". This includes a Sanitary Sewer Evaluation System of the gravity sewer infrastructure to identify deficiencies and implement corrective action, design and install emergency backup generators at key lift stations, and creation of an Asset Management Plan for infrastructure replacement and rehabilitation to safeguard the IRL from sanitary sewer overflows.
Perform Project Management on the new Water Reclamation Facility and Stormwater Irrigation Projects.
Persue grant funding for projects listed in the 5 Year Capital Improvement Program.
105

WATER AND SEWER FUND
ADMINISTRATION
2022 Budget vs 2021 Projected
2021‐2022 2020‐2021 Change $ Change % 2020‐2021 2019‐2020
Account Number Account Name Budget Projected Budget Actual
Personnel Costs 421.9005.536.112001 OPERATING SALARIES 627,811 544,171 83,640 15.4% 544,171 414,190
421.9005.536.113002 PART TIME SALARIES 5,000 20,000 ‐15,000 ‐75.0% 20,000 0
421.9005.536.114001 OVERTIME SALARIES 18,000 10,000 8,000 80.0% 10,000 17,432
421.9005.536.121001 SOCIAL SECURITY 49,787 43,924 5,863 13.3% 43,924 30,398
421.9005.536.122001 PENSION CONTRIBUTION 151,078 159,193 ‐8,115 ‐5.1% 159,193 43,596
421.9005.536.123001 GROUP LIFE INSURANCE 1,200 1,400 ‐200 ‐14.3% 1,400 1,032
421.9005.536.123002 HOSPITALIZATION INSURANCE 110,602 96,222 14,380 14.9% 96,222 74,091
421.9005.536.126001 COMPENSATED ABSENCES VAC 0 0 0 n/a 0 31,496
421.9005.536.126002 COMPENSATED ABSENCES SICK 0 0 0 n/a 0 34,485
Total Personnel Costs 963,478 874,910 88,568 10.1% 874,910 646,720
Operating Expenses
421.9005.536.331001 PROFESSIONAL SERVICES 35,000 60,000 ‐25,000 ‐41.7% 60,000 26,352
421.9005.536.341001 TELEPHONE 9,000 9,000 0 0.0% 9,000 8,617
421.9005.536.342001 POSTAGE 500 500 0 0.0% 500 28
421.9005.536.346001 EQUIPMENT MAINTENANCE 1,000 1,000 0 0.0% 1,000 0
421.9005.536.346200 SOFTWARE & MAINTENANCE 50,000 44,500 5,500 12.4% 44,500 35,617
421.9005.536.349003 SCHOOLS & MEETINGS 3,500 2,500 1,000 40.0% 2,500 1,104
421.9005.536.351001 OFFICE SUPPLIES 5,000 5,000 0 0.0% 5,000 3,478
421.9005.536.351003 OFFICE FURN & EQUIP 5,000 5,000 0 0.0% 5,000 1,069
421.9005.536.352006 JANITORIAL SUPPLIES 250 250 0 0.0% 250 0
421.9005.536.352008 UNIFORMS & CLOTHING 1,000 0 1,000 n/a 0 0
421.9005.536.352014 OTHER COMMODITIES 1,000 1,000 0 0.0% 1,000 606
421.9005.536.354001 SUBSCRIPTIONS/MEMBERSHIPS 7,500 7,500 0 0.0% 7,500 6,467
421.9005.536.355011 RECORDING FEES 5,000 5,000 0 0.0% 5,000 1,999
Total Operating Expenses 123,750 141,250 ‐17,500 ‐12.4% 141,250 85,337
Total 1,087,228 1,016,160 71,068 7.0% 1,016,160 732,057
106

Facility Maintenance, Asset Management and Warehouse
Mission The mission of the Facility Maintenance, Asset Management and Warehouse Division is to schedule and perform maintenance on equipment, track assets, provide a central database for equipment and distributed data, maximize equipment reliability, improve efficiency, and support the operations of all Water and Wastewater Divisions.
Staffing Table
Employee Type Budget
2021-2022 Budget
2020-2021 Change Full Time Non Bargaining 2 2 0 Full Time Bargaining 7 6 1
Total 9 8 1 Part Time 0 0 0
Total 9 8 1
Routine Goals Continue to improve centralizing and organizing department electronic data to alleviate redundancy, ensure data reliability, and improve data acquisition time.
Continue to schedule preventative maintenance and track corrective maintenance on equipment that is tracked by FDEP through our Enterprise Asset Management Program (EAM).
Reduce electrical costs by continuing to replace standard efficiency motors with higher efficiency motors as needed.
Evaluate potential energy and cost savings that may be available by pilot testing new technology.
Major Goals
Continue implementing and expanding the scope of our EAM system. Empower maintenance and field operations workforce through utilization of mobile devices to enable field access of data, maps, as well as work management information.
Update Reclaimed Water Plant Control Systems which will elevate reliability while increasing overall equipment efficiency.
Upgrade Potable Water Pump Systems to ensure reliability and efficiency. Completed 2 of the 4 pumps in FY 20/21.
Perform pilot test to deploy Water and Wastewater Treatment Plant operators with mobile devices to increase safety and efficiency of operations personnel. In FY 20/21, both Chief Operators have access remotely to view plant operations and cameras.
New to this Division is warehouse operations that was part of another City Department. The goal this year is to move the inventory of the Water and Sewer Department into the EAM system so that parts can be tracked along with work orders.
Update the Departments SCADA System with new technologies and procedures to meet the challenges of the current Cyber Security Environment.
107

WATER AND SEWER FUND
FACILITY MAINTENANCE & ASSET MANAGEMENT
2022 Budget vs 2021 Projected
2021‐2022 2020‐2021 Change $ Change % 2020‐2021 2019‐2020
Account Number Account Name Budget Projected Budget Actual
Personnel Costs 421.9007.536.112001 OPERATING SALARIES 627,225 561,754 65,471 11.7% 561,754 549,059
421.9007.536.114001 OVERTIME SALARIES 15,000 15,000 0 0.0% 15,000 6,590
421.9007.536.115009 MEAL ALLOWANCE 300 300 0 0.0% 300 42
421.9007.536.121001 SOCIAL SECURITY 49,153 44,145 5,008 11.3% 44,145 38,843
421.9007.536.122001 PENSION CONTRIBUTION 151,397 161,100 ‐9,703 ‐6.0% 161,100 51,231
421.9007.536.123001 GROUP LIFE INSURANCE 1,600 2,100 ‐500 ‐23.8% 2,100 1,367
421.9007.536.123002 HOSPITALIZATION INSURANCE 129,421 112,212 17,209 15.3% 112,212 96,145
421.9007.536.126001 COMPENSATED ABSENCES VAC 0 0 0 n/a 0 5,546
421.9007.536.126002 COMPENSATED ABSENCES SICK 0 0 0 n/a 0 2,358
Total Personnel Costs 974,096 896,611 77,485 8.6% 896,611 751,181
Operating Expenses
421.9007.536.331001 PROFESSIONAL SERVICES 10,000 10,000 0 0.0% 10,000 0
421.9007.536.334007 OTHER CONTRACTUAL SERVICES 2,000 2,000 0 0.0% 2,000 0
421.9007.536.341001 TELEPHONE 2,000 2,000 0 0.0% 2,000 662
421.9007.536.343001 UTILITIES 10,500 6,500 4,000 61.5% 6,500 7,327
421.9007.536.344001 MACH & EQUIP RENT 500 500 0 0.0% 500 0
421.9007.536.346001 EQUIPMENT MAINTENANCE 4,500 3,200 1,300 40.6% 3,200 4,340
421.9007.536.346002 VEHICLE MAINTENANCE 6,544 5,174 1,370 26.5% 5,174 8,973
421.9007.536.346029 STRUCTURE & IMPROV MAINT 3,500 2,000 1,500 75.0% 2,000 85
421.9007.536.346200 SOFTWARE & MAINTENANCE 12,000 9,000 3,000 33.3% 9,000 164
421.9007.536.349003 SCHOOLS & MEETINGS 10,000 10,000 0 0.0% 10,000 542
421.9007.536.349005 FIRST AID 150 150 0 0.0% 150 0
421.9007.536.351001 OFFICE SUPPLIES 1,500 1,500 0 0.0% 1,500 1,459
421.9007.536.351003 OFFICE FURN & EQUIP 5,000 3,500 1,500 42.9% 3,500 846
421.9007.536.352001 GAS & OIL 2,000 1,500 500 33.3% 1,500 1,529
421.9007.536.352005 CONSUMABLE TOOLS 5,000 4,000 1,000 25.0% 4,000 3,967
421.9007.536.352006 JANITORIAL SUPPLIES 200 200 0 0.0% 200 114
421.9007.536.352008 UNIFORMS & CLOTHING 4,500 4,500 0 0.0% 4,500 3,691
421.9007.536.352014 OTHER COMMODITIES 5,500 5,500 0 0.0% 5,500 3,488
421.9007.536.354001 SUBSCRIPTIONS/MEMBERSHIPS 2,000 2,000 0 0.0% 2,000 380
Total Operating Expenses 87,394 73,224 14,170 19.4% 73,224 37,567
Capital Outlay421.9007.536.6_____ Various, See Detail 5,000 5,000 0 0.0% 5,000 1,098
Total Capital Outlay 5,000 5,000 0 0.0% 5,000 1,098
Total 1,066,490 974,835 91,655 9.4% 974,835 789,846
108

WATER AND SEWER FUND
CAPITAL REQUEST DETAIL
Account 2021‐2022
Department Number Account Name Description Budget
Facility Maintenance & Asset Management 421.9007.536.640100 MISC. TOOLS & EQUIPMENT Purchases of hand tools not considered 5,000
consumable that are used for the daily
operation and maintenance of each
Total for Facility Maintenance & Asset Management Department.
5,000
109

Wastewater Collection Mission The mission of the Wastewater Collection Division is to ensure uninterrupted wastewater collection and to minimize external flows from infiltration and inflow into the gravity sewer system. This Division also maintains and repairs the electrical and mechanical pumping equipment associated with the wastewater transmission system.
The Division presently maintains: 132 miles of gravity sewer lines
65 miles of force mains 17 miles of STEP mains
2,862 manholes 128 Electrical Panels 248 Pumps 180 STEP Systems
Staffing Table
Employee Type Budget
2021-2022 Budget
2020-2021 Change Full Time Non Bargaining 2 2 0 Full Time Bargaining 14 14 0
Total 16 16 0 Part Time 0 0 0
Total 16 16 0
Routine Goals Reduce rainwater inflow into the wastewater collection system through repairs to deficiencies identified during scheduled smoke testing.
Continue the valve-exercising program for all force main and lift station valves throughout the system.
325 Force Main Valves; 248 Lift Station Valves.
Maintain the standard of response to customer inquiries at less than 30 minutes from time of call.
Replace Lift Station pumps and panels as warranted.
Continue to perform preventive maintenance on our lift stations a minimum of 20 times per month.
Major Goals Install STEP System service laterals.
Connect customers to the STEP System as customers "Sign Up to Save".
Implement a new TV and Inspection Section to televise and smoke test the gravity sewer system.
110

WATER AND SEWER FUND
WASTEWATER COLLECTION 2022 Budget vs 2021
Projected
2021‐2022 2020‐2021 Change $ Change % 2020‐2021 2019‐2020
Account Number Account Name Budget Projected Budget Actual
Personnel Costs
421.9010.536.112001 OPERATING SALARIES 819,583 718,046 101,537 14.1% 718,046 618,215
421.9010.536.114001 OVERTIME SALARIES 50,000 50,000 0 0.0% 50,000 28,426
421.9010.536.115009 MEAL ALLOWANCE 1,200 1,200 0 0.0% 1,200 470
421.9010.536.121001 SOCIAL SECURITY 66,615 58,847 7,768 13.2% 58,847 44,397
421.9010.536.122001 PENSION CONTRIBUTION 170,783 178,476 ‐7,693 ‐4.3% 178,476 52,118
421.9010.536.123001 GROUP LIFE INSURANCE 1,800 2,200 ‐400 ‐18.2% 2,200 1,529
421.9010.536.123002 HOSPITALIZATION INSURANCE 221,082 186,072 35,010 18.8% 186,072 150,428
421.9010.536.126001 COMPENSATED ABSENCES VAC 0 0 0 n/a 0 7,331
421.9010.536.126002 COMPENSATED ABSENCES SICK 0 0 0 n/a 0 3,526
Total Personnel Costs 1,331,063 1,194,841 136,222 11.4% 1,194,841 906,440
Operating Expenses 421.9010.536.331001 PROFESSIONAL SERVICES 45,000 45,000 0 0.0% 45,000 3,466
421.9010.536.334007 OTHER CONTRACTUAL SERVICES 12,000 12,000 0 0.0% 12,000 3,760
421.9010.536.341001 TELEPHONE 8,000 8,000 0 0.0% 8,000 6,516
421.9010.536.343001 UTILITIES 95,500 95,500 0 0.0% 95,500 87,487
421.9010.536.344001 MACH & EQUIP RENT 3,000 3,000 0 0.0% 3,000 789
421.9010.536.346001 EQUIPMENT MAINTENANCE 150,000 110,000 40,000 36.4% 110,000 152,496
421.9010.536.346002 VEHICLE MAINTENANCE 55,394 52,473 2,921 5.6% 52,473 43,806
421.9010.536.346029 STRUCTURE & IMPROV MAINT 3,500 3,500 0 0.0% 3,500 658
421.9010.536.346035 ELEC CONTROL SYS MAINT 40,000 40,000 0 0.0% 40,000 20,776
421.9010.536.346042 GRAVITY MAINS & LATRLS MAINT 30,000 30,000 0 0.0% 30,000 11,392
421.9010.536.346047 CUST PREMISES MAINT 10,000 10,000 0 0.0% 10,000 2,029
421.9010.536.346049 FORCE MAINS & APPURT MAINT 15,000 15,000 0 0.0% 15,000 19,251
421.9010.536.346058 GROUNDS MAINT 18,111 17,948 163 0.9% 17,948 17,567
421.9010.536.349003 SCHOOLS & MEETINGS 1,500 1,500 0 0.0% 1,500 115
421.9010.536.349005 FIRST AID 150 150 0 0.0% 150 0
421.9010.536.349028 LANDFILL FEES 2,000 2,000 0 0.0% 2,000 15
421.9010.536.351001 OFFICE SUPPLIES 750 750 0 0.0% 750 522
421.9010.536.351003 OFFICE FURN & EQUIP 5,000 5,000 0 0.0% 5,000 0
421.9010.536.352001 GAS & OIL 40,000 35,000 5,000 14.3% 35,000 24,491
421.9010.536.352005 CONSUMABLE TOOLS 2,500 2,500 0 0.0% 2,500 4,405
421.9010.536.352006 JANITORIAL SUPPLIES 1,000 1,000 0 0.0% 1,000 0
421.9010.536.352008 UNIFORMS & CLOTHING 12,500 12,500 0 0.0% 12,500 10,246
421.9010.536.352014 OTHER COMMODITIES 5,000 4,000 1,000 25.0% 4,000 4,657
421.9010.536.352019 CHEMICAL & WATER TR SUPPLIES 250 250 0 0.0% 250 0
111

WATER AND SEWER FUND
WASTEWATER COLLECTION 2022 Budget vs 2021
Projected
2021‐2022 2020‐2021 Change $ Change % 2020‐2021 2019‐2020
Account Number Account Name Budget Projected Budget Actual
421.9010.536.353003 REPLACEMENT PAVEMENT 20,000 10,000 10,000 100.0% 10,000 2,057
421.9010.536.354001 SUBSCRIPTIONS/MEMBERSHIPS 500 500 0 0.0% 500 40
421.9010.536.359900 INTERFUND SERVICES 0 0 0 n/a 0 ‐4,860
Total Operating Expenses 576,655 517,571 59,084 11.4% 517,571 411,681
Capital Outlay421.9010.536.6_____ Various, See Detail 10,000 10,000 0 0.0% 10,000 1,701
Total Capital Outlay 10,000 10,000 0 0.0% 10,000 1,701
Total 1,917,718 1,722,412 195,306 11.3% 1,722,412 1,319,822
112

WATER AND SEWER FUND
CAPITAL REQUEST DETAIL
Account 2021‐2022
Department Number Account Name Description Budget
Wastewater Collection 421.9010.536.640100 MISC. TOOLS & EQUIPMENT Purchases of hand tools not considered 10,000
consumable that are used for the daily
operation and maintenance of each
Department. Total for Wastewater Collection 10,000
113

Water Distribution
Mission The mission of the Water Distribution Division is to repair and maintain the water distribution system to assure uninterrupted delivery of water and maintain meter accuracy through testing and repair/replacement of meters.
The Division presently maintains: 290 Miles of transmission & distribution mains
11,975 Service lines 1,240 Fire hydrants and associated valves
22 Miles of reuse mains 137 City owned reduced pressure backflow preventers
13,050 Potable water meters 154 Reuse meters 36 Wellfield meters
Staffing Table Employee Type
Budget 2021-2022
Budget 2020-2021 Change
Full Time Non Bargaining 1 1 0 Full Time Bargaining 12 12 0
Total 13 13 0 Part Time 0 0 0
Total 13 13 0
Routine Goals
Inspect, paint, test, and exercise all fire hydrants throughout the system (1,231).
Exercise all valves throughout the systems every two (2) years or as specified by the manufacturer. (FDEP 62-555.350) (4,669).
Continue a water main flushing program to flush dead-end lines quarterly and other lines as necessary to maintain appropriate water quality standards (FDEP 62-555.350) (167 dead-end lines).
Continue the Backflow Prevention Program to protect the water system from possible contaminants. (FDEP 62-555.360):
137 City maintained 1,049 Commercial managed testable devices;
801 Residential managed testable devices.
Test wellfield meters every three (3) years as required by the Consumptive Use Permit and repair or replace as warranted (36).
Replace, according to age, approximately 1000 - 5/8" through 1" potable water meters annually. Repair and/or replace 1-1/2" through 2" meters as warranted. Test and repair, as needed, 3" and larger meters annually.
Major Goals Coordinate with the replacement of water mains on 43rd Avenue and State Road 60 and setup temporary services.
114

WATER AND SEWER FUND
WATER DISTRIBUTION
2022 Budget vs 2021 Projected
2021‐2022 2020‐2021 Change $ Change % 2020‐2021 2019‐2020
Account Number Account Name Budget Projected Budget Actual
Personnel Costs
421.9011.536.112001 OPERATING SALARIES 622,346 615,763 6,583 1.1% 615,763 552,187
421.9011.536.114001 OVERTIME SALARIES 60,000 60,000 0 0.0% 60,000 38,257
421.9011.536.115009 MEAL ALLOWANCE 2,500 2,500 0 0.0% 2,500 710
421.9011.536.121001 SOCIAL SECURITY 52,391 51,887 504 1.0% 51,887 41,607
421.9011.536.122001 CONTRIB TO PENSION FUND 194,057 217,085 ‐23,028 ‐10.6% 217,085 55,528
421.9011.536.123001 GROUP LIFE INSURANCE 1,900 2,600 ‐700 ‐26.9% 2,600 1,378
421.9011.536.123002 HOSPITALIZATION INSURANCE 151,811 140,041 11,770 8.4% 140,041 123,892
421.9011.536.126001 COMPENSATED ABSENCES VAC 0 0 0 n/a 0 ‐19,261
421.9011.536.126002 COMPENSATED ABSENCES SICK 0 0 0 n/a 0 ‐27,441
Total Personnel Costs 1,085,005 1,089,876 ‐4,871 ‐0.4% 1,089,876 766,857
Operating Expenses 421.9011.536.331001 PROFESSIONAL SERVICES 25,000 8,000 17,000 212.5% 8,000 3,084
421.9011.536.334007 OTHER CONTRACTUAL SERVICES 7,000 7,000 0 0.0% 7,000 3,465
421.9011.536.342001 POSTAGE 150 150 0 0.0% 150 0
421.9011.536.343001 UTILITIES 15,000 15,000 0 0.0% 15,000 12,810
421.9011.536.344001 MACH & EQUIP RENT 500 500 0 0.0% 500 0
421.9011.536.346001 EQUIPMENT MAINTENANCE 10,000 6,500 3,500 53.8% 6,500 7,998
421.9011.536.346002 VEHICLE MAINTENANCE 35,738 35,412 326 0.9% 35,412 36,998
421.9011.536.346029 STRUCTURE & IMPROV MAINT 6,000 6,000 0 0.0% 6,000 1,957
421.9011.536.346042 T & D MAINS MAINT 120,000 90,000 30,000 33.3% 90,000 134,227
421.9011.536.346043 SERVICES MAINT 15,000 15,000 0 0.0% 15,000 4,241
421.9011.536.346044 METERS MAINT 9,000 9,000 0 0.0% 9,000 30
421.9011.536.346046 HYDRANTS MAINT 15,000 12,000 3,000 25.0% 12,000 13,130
421.9011.536.346047 CUSTOMER PREMISES MAINT 8,500 8,500 0 0.0% 8,500 2,483
421.9011.536.346048 GROUND RESV MAINT 52,000 52,000 0 0.0% 52,000 10
421.9011.536.349003 SCHOOLS & MEETINGS 4,000 4,000 0 0.0% 4,000 82
421.9011.536.349005 FIRST AID 250 250 0 0.0% 250 0
421.9011.536.349028 LANDFILL FEES 5,000 5,000 0 0.0% 5,000 3,513
421.9011.536.351001 OFFICE SUPPLIES 2,000 1,250 750 60.0% 1,250 1,467
421.9011.536.351003 OFFICE FURN & EQUIP 3,000 3,000 0 0.0% 3,000 648
421.9011.536.352001 GAS & OIL 32,000 32,000 0 0.0% 32,000 24,625
421.9011.536.352005 CONSUMABLE TOOLS 6,000 4,000 2,000 50.0% 4,000 5,799
421.9011.536.352006 JANITORIAL SUPPLIES 1,900 1,900 0 0.0% 1,900 0
421.9011.536.352008 UNIFORMS & CLOTHING 12,000 12,000 0 0.0% 12,000 9,087
421.9011.536.352014 OTHER COMMODITIES 5,500 5,500 0 0.0% 5,500 5,259
115

WATER AND SEWER FUND
WATER DISTRIBUTION
2022 Budget vs 2021 Projected
2021‐2022 2020‐2021 Change $ Change % 2020‐2021 2019‐2020
Account Number Account Name Budget Projected Budget Actual
421.9011.536.353003 REPLACEMENT PAVEMENT 25,000 25,000 0 0.0% 25,000 13,530
421.9011.536.354001 SUBSCRIPTIONS/MEMBERSHIPS 400 400 0 0.0% 400 90
421.9011.536.359900 INTERFUND SERVICES 0 0 0 n/a 0 ‐282
Total Operating Expenses 415,938 359,362 56,576 15.7% 359,362 284,251
Capital Outlay421.9011.536.6_____ Various, See Detail 10,000 10,000 0 0.0% 10,000 0
Total Capital Outlay 10,000 10,000 0 0.0% 10,000 0
Total 1,510,943 1,459,238 51,705 3.5% 1,459,238 1,051,108
116

WATER AND SEWER FUND
CAPITAL REQUEST DETAIL
Account 2021‐2022
Department Number Account Name Description Budget
Water Distribution 421.9011.536.640100 MISC. TOOLS & EQUIPMENT Purchases of hand tools not considered 10,000
consumable that are used for the daily
operation and maintenance of each
Department. Total for Water Distribution 10,000
117

Finance Customer Service Mission
The mission of Customer Service is to provide courteous and efficient service to all utility customers and ensure that utility billings are rendered correctly and collections are made in a timely manner. To provide statistical data to other city departments and outside agencies as required. To promote efficient use of water and other natural resources as mandated by the State of Florida and the St. John's Water Management District.
Staffing Table
Employee Type Budget
2021-2022 Budget
2020-2021 Change Full Time Non Bargaining 3 3 0 Full Time Bargaining 9 9 0
Total 12 12 0 Part Time 0 0 0
Total 12 12 0
Major Goals and Challenges
To continue the development of personnel through on-the-job training.
To provide water conservation information to residential, commercial, and industrial customers.
To provide improved and expanded services as a part of the Utility Billing System enhancement schedule.
To continue to look for efficiencies and technology/process improvements which provide effective customer service while reducing costs.
To continue to educating the public about our Cayenta Self Service Portal and Invoice Cloud payment and e-billing system. This is an online tool that is accessable through www.covb.org and gives customers access to account data and the ability to receive e-bills and schedule online payments
118

WATER AND SEWER FUND
FINANCE: CUSTOMER SERVICE
2022 Budget vs 2021 Projected
2021‐2022 2020‐2021 Change $ Change % 2020‐2021 2019‐2020
Account Number Account Name Budget Projected Budget Actual
Personnel Costs
421.9012.536.112001 OPERATING SALARIES 545,760 536,335 9,425 1.8% 536,335 516,775
421.9012.536.114001 OVERTIME SALARIES 3,000 3,000 0 0.0% 3,000 4,433
421.9012.536.121001 SOCIAL SECURITY 41,980 41,259 721 1.7% 41,259 35,870
421.9012.536.122001 CONTRIB TO PENSION FUND 47,599 47,526 73 0.2% 47,526 42,750
421.9012.536.123001 GROUP LIFE INSURANCE 1,600 2,400 ‐800 ‐33.3% 2,400 1,270
421.9012.536.123002 HOSPITALIZATION INSURANCE 146,589 156,947 ‐10,358 ‐6.6% 156,947 134,569
421.9012.536.126001 COMPENSATED ABSENCES VAC 0 0 0 n/a 0 998
421.9012.536.126002 COMPENSATED ABSENCES SICK 0 0 0 n/a 0 2,241
Total Personnel Costs 786,528 787,467 ‐939 ‐0.1% 787,467 738,906
Operating Expenses
421.9012.536.331001 PROFESSIONAL SERVICES 85,000 55,000 30,000 54.5% 55,000 64,675
421.9012.536.334003 JANITORIAL SERVICES 4,400 4,400 0 0.0% 4,400 3,515
421.9012.536.340001 MILEAGE ALLOWANCE 500 500 0 0.0% 500 0
421.9012.536.341001 TELEPHONE 3,000 3,000 0 0.0% 3,000 1,778
421.9012.536.342001 POSTAGE 75,000 75,000 0 0.0% 75,000 68,655
421.9012.536.346002 VEHICLE MAINTENANCE 7,514 8,393 ‐879 ‐10.5% 8,393 8,892
421.9012.536.346003 BUILDING MAINTENANCE 2,000 2,000 0 0.0% 2,000 380
421.9012.536.346017 OFFICE EQUIP MAINT 1,500 1,500 0 0.0% 1,500 483
421.9012.536.346018 RADIO MAINT 500 500 0 0.0% 500 324
421.9012.536.346044 METERS MAINT 1,000 500 500 100.0% 500 64
421.9012.536.346200 SOFTWARE & MAINTENANCE 156,000 132,000 24,000 18.2% 132,000 128,888
421.9012.536.347001 PRINTING & BINDING 32,000 32,000 0 0.0% 32,000 28,751
421.9012.536.349003 SCHOOLS & MEETINGS 2,000 2,000 0 0.0% 2,000 1,231
421.9012.536.349015 CREDIT BUREAU CHARGES 15,000 28,000 ‐13,000 ‐46.4% 28,000 5,349
421.9012.536.351001 OFFICE SUPPLIES 3,000 3,000 0 0.0% 3,000 2,027
421.9012.536.351003 OFFICE FURN & EQUIP 5,000 5,000 0 0.0% 5,000 2,716
421.9012.536.352001 GAS & OIL 7,342 6,047 1,295 21.4% 6,047 5,513
421.9012.536.352008 UNIFORMS & CLOTHING 1,200 1,200 0 0.0% 1,200 729
421.9012.536.352014 OTHER COMMODITIES 1,000 1,000 0 0.0% 1,000 151
421.9012.536.352027 TOOLS & INSTRUMENTS 500 500 0 0.0% 500 45
421.9012.536.359910 INTERFUND SERVICES ‐ SOLID WASTE ‐176,599 ‐168,952 ‐7,647 4.5% ‐168,952 ‐168,474
Total Operating Expenses 226,857 192,588 34,269 17.8% 192,588 155,692
Total 1,013,385 980,055 33,330 3.4% 980,055 894,598
119

STAFFING TABLE
Employee TypeBudget
2000-2001Budget
1999-2000 ChangeFull Time Non Bargaining 13 12 1Full Time Bargaining 28 31 -3
Total 41 43 -2Part Time 0 0 0
Total 41 43 -2
Non Departmental Mission
The Non Departmental accounts are used for expenses which are not directly associated with or allocable to any other department of the Water Sewer Fund.
120

WATER AND SEWER FUND
NONDEPARTMENTAL
2022 Budget vs 2021 Projected
2021‐2022 2020‐2021 Change $ Change % 2020‐2021 2019‐2020
Account Number Account Name Budget Projected Budget Actual
Personnel Costs 421.9900.536.114003 OVERTIME ‐ DISASTER 0 0 0 n/a 0 382
421.9900.536.123005 WORKERS COMPENSATION 121,000 91,700 29,300 32.0% 91,700 88,947
421.9900.536.123004 RETIREMENT PREM ASSIST 149,251 161,792 ‐12,541 ‐7.8% 161,792 156,638
421.9900.536.123006 CONTRIBUTION TO OPEB TRUST 69,961 77,835 ‐7,874 ‐10.1% 77,835 6,386
421.9900.536.125001 STATE UNEMPLOYMENT COMP 0 0 0 n/a 0 484
Total Personnel Costs 340,212 331,327 8,885 2.7% 331,327 252,837
Operating Expenses
421.9900.536.331001 PROFESSIONAL SERVICES 15,000 15,000 0 0.0% 15,000 15,759
421.9900.536.331015 GIS EXPENSE 23,000 20,000 3,000 15.0% 20,000 20,745
421.9900.536.332001 AUDIT 14,000 19,000 ‐5,000 ‐26.3% 19,000 18,974
421.9900.536.340001 MILEAGE ALLOWANCE 5,000 5,000 0 0.0% 5,000 4,009
421.9900.536.341002 TELECOMMUNICATIONS SVCS 9,800 9,800 0 0.0% 9,800 8,459
421.9900.536.344003 LAND RENT AIRPORT 30,000 30,000 0 0.0% 30,000 15,013
421.9900.536.345001 GENERAL INSURANCE 291,908 247,788 44,120 17.8% 247,788 232,347
421.9900.536.349016 GF ADMIN CHARGE 1,232,541 1,256,596 ‐24,055 ‐1.9% 1,256,596 1,253,257
421.9900.536.349019 METER DEPOSIT INTEREST 7,500 7,500 0 0.0% 7,500 13,610
421.9900.536.349023 BAD DEBT 35,000 15,000 20,000 133.3% 15,000 47,698
421.9900.536.349100 DR‐4283 HURRICANE MATTHEW EXP 0 0 0 n/a 0 12
421.9900.536.349200 HURRICANE IRMA EXPENSES 0 0 0 n/a 0 1,465
421.9900.536.349300 HURRICANE DORIAN EXPENSES 0 0 0 n/a 0 294
421.9900.536.349400 COVID 19 EXPENSES 0 0 0 n/a 0 7,057
421.9900.536.349500 HURRICANE ISAIAS EXPENSES 0 0 0 n/a 0 314
421.9900.536.355002 MISCELLANEOUS 2,000 2,000 0 0.0% 2,000 ‐2
421.9900.536.355006 INVENTORY VARIANCE 0 0 0 n/a 0 ‐576
421.9900.536.355007 GRACE 100,000 80,000 20,000 25.0% 80,000 118,044
Total Operating Expenses 1,765,749 1,707,684 58,065 3.4% 1,707,684 1,756,479
Debt Service and Transfers
421.9900.536.991004 TRANSFER TO GENERAL FUND 1,031,000 1,025,000 6,000 0.6% 1,025,000 1,005,000
421.9900.536.991007 TRANS TO W/S R&R FUND 5,700,000 1,800,000 3,900,000 216.7% 1,800,000 1,700,000
421.9900.536.991058 DEBT SVC TRF WW 310201 ORIG 651,124 651,124 0 0.0% 651,124 156,767
421.9900.536.991059 DEBT SVC TRF DW 310220 20,542 20,542 0 0.0% 20,542 5,340
421.9900.536.991060 DEBT SVC TRF WW 310201 AM#2 107,876 107,876 0 0.0% 107,876 22,832
421.9900.536.991061 DEBT SVC TRF DW 310221 12,000 12,000 0 0.0% 12,000 2,744
421.9900.536.991062 DEBT SVC TRF SERIES 2013 1,129,408 1,128,056 1,352 0.1% 1,128,056 40,334
Total Debt Service and Transfers 8,651,950 4,744,598 3,907,352 82.4% 4,744,598 2,933,017
Total 10,757,911 6,783,609 3,974,302 58.6% 6,783,609 4,942,333
121

WATER SEWER R&R FUND
2021‐2022
Account Number Account Name Budget
REVENUES
423.0000.334.350003 SJRWMD GRANT ‐ CANAL PUMP STATION & WTP RETROFIT 1,500,000
423.0000.343.060900 WATER IMPACT FEES 175,000
423.0000.343.061000 SEWER IMPACT FEES 135,000
423.0000.343.061600 WASTEWATER UTILITY EXTENSION CHARGES 20,000
423.0000.343.062000 STEP SYSTEM PREPAYMENTS 275,000
423.0000.361.010100 INTEREST INCOME ‐ SPECIAL ASSESSMENTS 3,000
423.0000.363.000100 PENALTY INCOME 500
423.0000.365.090150 SALE OF SURPLUS VEHICLES 10,000
423.0000.382.000300 CONTRIBUTION FROM W/S REV FUND 5,700,000
423.0000.384.000100 PROCEEDS FROM BORROWING (WWTP RELOCATION) 2,500,000
423.0000.384.000100 PROCEEDS FROM BORROWING(CANAL PMP STN & WTP RETROFIT) 660,000
423.0000.384.000100 PROCEEDS FROM BORROWING(STEP SYS FRC MNS OUT CTY LMTS) 1,000,000
423.0000.389.000800 STEP SYSTEM SPECIAL ASSESSMENT REVENUE 1,500
423.0000.389.000200 CASH CARRY OVER 4,630,796
Total Revenues $ 16,610,796
EXPENDITURES
WASTEWATER TREATMENT
423.9000.536.610390 COMPUTERS 12,000
423.9000.536.611334 WASTEWATER TREATMENT PLANT METERS 5,000
423.9000.536.614004 PUMP AND MOTOR REPLACEMENT 5,000
423.9000.536.614005 ELECTRICAL EQUIPMENT REPLACEMENT 5,000
423.9000.536.615014 HVAC REPLACEMENT 1,000
423.9000.536.616072 WATER RECLAMATION FACILITY ‐ ENGINEERING (WWTP RELOC) 1,600,000
423.9000.536.616093 WATER RECLAMATION FACILITY ‐ CONSTRUCTION (WWTP RELOC) 500,000
423.9000.536.616094 WATER RECLAMATION FACILITY ‐ ONSITE FRC MNS ARPT(WWTP RELOC) 250,000
WATER TREATMENT
423.9002.536.601302 WELL FIELD GENERATORS (REPLACE PORTABLES) 120,000
423.9002.536.602391 EXTERIOR PAINTING OF BUILDINGS 47,000
423.9002.536.602393 SLAKER ROOM FLOOR EPOXY COATING REPAIR 50,000
423.9002.536.608304 DOOR REPLACEMENT 100,000
122

WATER SEWER R&R FUND
2021‐2022
Account Number Account Name Budget
EXPENDITURES (CONTINUED)
423.9002.536.610340 SECURITY SYSTEM 20,000
423.9002.536.610396 SCADA SYSTEM REPLACEMENT 20,000
423.9002.536.611305 CAUSTIC TANK REPLACEMENT 50,000
423.9002.536.611307 PIPE PAINTING (FILTER BAYS) 50,000
423.9002.536.611334 WATER PLANT AND WELL FIELD METERS 30,000
423.9002.536.612310 RO PLANT GENERATOR REPLACEMENT 635,000
423.9002.536.613010 HIGH SERVICE PUMP PLC REPLACEMENT 100,000
423.9002.536.614002 WELL FIELD PUMP AND MOTOR REPLACEMENT 200,000
423.9002.536.614006 PLANT PUMP AND MOTOR REPLACEMENT 10,000
423.9002.536.614007 HVAC REPLACEMENT 1,000
423.9002.536.614008 ELECTRICAL EQUIPMENT REPLACEMENT 65,000
423.9002.536.616045 GROUND STORAGE RESERVOIR PAINTING (3) 235,000
423.9002.536.616056 WATER TREATMENT MISC EQUIPMENT 10,000
423.9002.536.616062 FILTER INTERIOR PAINTING 75,000
423.9002.536.616066 ELECTRICAL SYSTEM REPLACEMENT (FILTERS 7 THROUGH 11) 350,000
423.9002.536.616073 2.0 MG GROUND STORAGE TANK WITH SITE WORK 2,085,000
423.9002.536.616074 ACCELATOR DEMOLITION & REHABILITATION (NO. 2, 3 AND 4) 1,100,000
423.9002.536.616075 RELOCATION OF LIME SLUDGE BEDS 200,000
423.9002.536.616076 RAW WATER LINE RELOCATION 150,000
423.9002.536.616077 SURFACE WASH PIPING REPLACEMENT 75,000
423.9002.536.616078 SB4 SYSTEM REPLACEMENT 95,000
423.9002.536.616079 ST. LUCIE COUNTY INTERCONNECT 43,000
423.9002.536.616081 FILTER ACTUATERS 50,000
423.9002.536.616090 WATER TREATMENT SVC VEHICLES (TRCKS/TRAILERS/ROLLING STCK) 9,000
423.9002.536.662307 SURFICIAL WELL REPLACEMENT 760,000
423.9002.536.691340 COMPUTER 12,000
423.9002.536.692320 FILTER MEDIA REPLACEMENT (FILTERS 7 THROUGH 11) 40,000
423.9002.536.693308 RO PLANT PRODUCTION WELL (FLORIDAN) 250,000
423.9002.536.693309 ACCELATOR F VALVE AND CHLORINATOR REPLACEMENT (NO. 3 & 4) 50,000
WASTEWATER REUSE
423.9004.536.601381
423.9004.536.610396
423.9004.536.611334
NUTRIENT REDUCTION STUDY
SCADA SYSTEM
REUSE METERS
50,000
25,000
7,500
123

WATER SEWER R&R FUND
2021‐2022
Account Number Account Name Budget
EXPENDITURES (CONTINUED)
423.9004.536.614009 PUMP AND MOTOR REPLACEMENT 5,000
423.9004.536.614010 ELECTRICAL PANEL REPLACEMENT 7,500
423.9004.536.616045 GROUND STORAGE RESERVOIR PAINTING (1) 45,000
423.9004.536.616082 RECLAIM WTR GRND STORAGE TNK & PMP SYS (WWTP RELOC) 100,000
423.9004.536.616083 MAIN RELIEF CANAL PMP STN, MAINS, WTP RETROFIT (SB 712) 2,000,000
423.9004.536.616085 AIA PIPE PIGGING 65,000
423.9004.536.616096 STORMWATER IRRIGATION PIPELINE 800,000
ADMINISTRATION
423.9005.536.610390 COMPUTERS 5,000
423.9005.536.611390 COPIER 6,550
FACILITY MAINTENANCE
423.9007.536.610340 SECURITY SYSTEM WAREHOUSE 100,000
423.9007.536.610390 COMPUTERS 5,000
423.9007.536.699393 TOOLS/SHOP/GARAGE/EQUIPMENT 35,000
423.9007.536.616086 MAINTENANCE BUILDING EXPANSION 600,000
WASTEWATER COLLECTION
423.9010.536.608361 LIFT STATION PUMP REPLACEMENT 35,000
423.9010.536.610390 COMPUTERS 3,000
423.9010.536.615053 STEP SYSTEM CUSTOMER EQUIPMENT 100,000
423.9010.536.616053 STEP SYSTEM SERVICES 30,000
423.9010.536.616055 SEPTIC TANK NUTRIENT REMOVAL STUDY (TMDL) 25,000
423.9010.536.616056 WASTEWATER COLLECTION MISC EQUIPMENT 25,000
423.9010.536.616064 LIFT STATION CONTROLLERS 10,000
423.9010.536.616068 IN‐PLACE LIFT STATION GENERATORS 150,000
423.9010.536.668361 ELECTRICAL PANEL REPLACEMENT 30,000
423.9010.536.671361 GRAVITY SEWER REHABILITATION 350,000
423.9010.536.616087 STEP SYSTEM FORCE MAINS (OUTSIDE CITY LIMITS) ‐ SB 712 1,000,000
423.9010.536.616088 MOCKINGBIRD DRIVE FORCE MAIN REPLACEMENT 200,000
423.9010.536.616089 LIFT STATION SCADA 50,000
423.9010.536.616090 WW COLLECTION SVC VEHICLES (TRCKS/TRAILERS/ROLLING STCK) 582,500
423.9010.536.616091 CAMERA INSPECTION EQUIP (MANHOLE INSPECTION CAMERA) 150,000
WATER DISTRIBUTION
423.9011.536.608334 WATER DISTRIBUTION METERS 60,000
124

WATER SEWER R&R FUND
2021‐2022
Account Number Account Name Budget
EXPENDITURES (CONTINUED)
423.9011.536.610390 COMPUTERS 3,000
423.9011.536.611331 LINE & SERVICE REPLACEMENT 350,000
423.9011.536.616045 GROUND STORAGE RESERVOIR PAINTING (2) 65,000
423.9011.536.616056 WATER DISTRIBUTION MISC EQUIPMENT 15,000
423.9011.536.641411 UTILITY LINE LOCATOR 30,000
CUSTOMER SERVICE
423.9012.536.616092 CUSTOMER SERVICE ‐ ITRON UPDATE (H/W & S/W) 20,900
423.9012.536.641416 CUST SVC VEH LEASE‐PURCHASE DEBT SVC 4,846
Total Expenditures $ 16,610,796
Note: Please see Five Year Capital Program book for project descriptions and five year funding
125

..A..
. --·-..
AIRPORT FUND
126

AIRPORT
OPERATING BUDGET Operating Revenue
Operating Expenses:
Airport operations (4000)
Total Operating Expenses
Net Operating Income
Debt Service
No outstanding debt on the Airport
Total Debt Service Transfers
Surplus Revenue
Surplus Revenue Distribution Transfer to Construction Fund Balance Available for Capital Additions
Total Distribution of Surplus
Budget 2021-2022
$ 3,486,500
3,092,913
3,092,913
393,587
--
-
$ 393,587
$ 468,000 (74,413)
$ 393,587
Budget 2020-2021
$ 3,167,300
2,689,444
2,689,444
477,856
--
-
$ 477,856
$ 350,000 127,856
$ 477,856
127

AIRPORT FUND
REVENUE
2022 Budget vs 2021 Projected
2021‐2022 2020‐2021 Change $ Change % 2020‐2021 2019‐2020
Account Number Account Name Budget Projected Budget Actual
441.0000.311.010000 AD VALOREM TAXES 14,000 14,000 0 0.0% 14,000 13,572
441.0000.331.090550 HURRICANE DORIAN DR‐4468 FEMA REIMB 0 0 0 n/a 0 2,152
441.0000.334.090550 HURRICANE DORIAN DR‐4468 STATE REIMB 0 0 0 n/a 0 359
441.0000.334.090560 CARES ACT FUNDING IRC SUBRECIPIENT AGRMT 0 0 0 n/a 0 1,980
441.0000.344.010100 AIRPORT RENTALS 2,000,000 2,000,000 0 0.0% 2,000,000 2,089,770
441.0000.344.010200 CITRUS PARK VILLAGE RENTALS 160,000 160,000 0 0.0% 160,000 158,740
441.0000.344.010300 FUEL FLOWAGE FEES 230,000 200,000 30,000 15.0% 200,000 209,467
441.0000.344.010400 SECURITY FEES 1,000 7,000 ‐6,000 ‐85.7% 7,000 0
441.0000.344.010500 RESOLUTION RENTALS 421,000 402,800 18,200 4.5% 402,800 386,531
441.0000.344.010700 GROSS RECEIPTS 320,000 300,000 20,000 6.7% 300,000 359,157
441.0000.344.010800 TERMINAL / RAMP FEES 0 0 0 n/a 0 10,060
441.0000.344.010850 AIRLINE RATES AND CHARGES 21,000 35,000 ‐14,000 ‐40.0% 35,000 14,056
441.0000.361.010200 INTEREST ON INVESTMENTS 26,000 35,000 ‐9,000 ‐25.7% 35,000 114,044
441.0000.364.000200 GAIN OR LOSS ON DISPOSAL OF ASSETS 0 0 0 n/a 0 ‐198,668
441.0000.369.040100 LANDFILL 3,500 3,500 0 0.0% 3,500 5,822
441.0000.369.090100 MISCELLANEOUS REVENUES 10,000 10,000 0 0.0% 10,000 19,627
441.0000.382.000650 CONTR FROM HLTH INS FND 0 0 0 n/a 0 7,952
441.0000.389.000200 CASH CARRY OVER 74,413 ‐127,856 202,269 ‐158.2% ‐127,856 0
441.0000.389.8xxxxx CONTRIBUTIONS FROM PRIVATE SOURCES 280,000 0 280,000 n/a 0 0
Total 3,560,913 3,039,444 521,469 17.2% 3,039,444 3,194,621
128

AIRPORT FUND
BUDGET BY DEPARTMENT
2022 Budget vs 2021
Projected 2021‐2022 2020‐2021 2020‐2021 2019‐2020
Change $ Change % Department Budget Projected Budget Actual
Airport 3,560,913 3,039,444 521,469 17.2% 3,039,444 2,752,420
Airport Fund 3,560,913 3,039,444 521,469 17.2% 3,039,444 2,752,420
129

AIRPORT FUND Expenditures by Object
2022 Budget vs 2021
Projected
Account Number / Account Name 2021‐2022
Budget 2020‐2021
Projected Change $ Change % 2020‐2021
Budget 2019‐2020
Actual
112001 ‐ OPERATING SALARIES 600,192 593,188 7,004 1.2% 593,188 717,287
113002 ‐ PART TIME SALARIES 35,000 35,000 0 0.0% 35,000 11,797
114001 ‐ OVERTIME SALARIES 35,000 35,000 0 0.0% 35,000 10,038
114003 ‐ OVERTIME ‐ DISASTER 0 0 0 n/a 0 367
121001 ‐ SOCIAL SECURITY TAXES 51,270 50,734 536 1.1% 50,734 52,488
122001 ‐ PENSION FUND CONTRIBUTION 149,652 164,603 ‐14,951 ‐9.1% 164,603 51,662
123001 ‐ GROUP LIFE INSURANCE 1,800 2,400 ‐600 ‐25.0% 2,400 1,508
123002 ‐ HOSPITALIZATION INSURANCE 133,236 130,465 2,771 2.1% 130,465 114,728
123004 ‐ RETIREMENT PREM ASSIST 9,717 10,540 ‐823 ‐7.8% 10,540 10,001
123005 ‐ WORKERS COMPENSATION 8,100 6,200 1,900 30.6% 6,200 5,563
123006 ‐ CONTRIBUTION TO OPEB TRUST 4,555 5,071 ‐516 ‐10.2% 5,071 375
126001 ‐ COMPENSATED ABSENCES VAC 0 0 0 n/a 0 ‐38,888
126002 ‐ COMPENSATED ABSENCES SICK 0 0 0 n/a 0 ‐52,034
331001 ‐ PROFESSIONAL SERVICES 75,000 65,000 10,000 15.4% 65,000 38,713
331002 ‐ OUTSIDE LEGAL SERVICES 5,000 5,000 0 0.0% 5,000 24,294
332001 ‐ AUDIT 9,000 4,000 5,000 125.0% 4,000 4,206
334002 ‐ CLEANING & LAUNDRY 1,100 1,000 100 10.0% 1,000 761
334003 ‐ JANITORIAL SERVICES 12,000 9,000 3,000 33.3% 9,000 8,866
334005 ‐ FIRE PROTECTION 200,000 158,000 42,000 26.6% 158,000 151,820
334007 ‐ OTHER CONTRACTUAL SERVICES 295,000 15,000 280,000 1866.7% 15,000 21,001
334010 ‐ AIRPORT SECURITY ‐ VBPD 100,998 96,927 4,071 4.2% 96,927 41,077
334013 ‐ AIRPORT SECURITY ‐ TSA 7,000 7,000 0 0.0% 7,000 0
334017 ‐ ENVIRONMENTAL 0 5,000 ‐5,000 ‐100.0% 5,000 0
340001 ‐ MILEAGE ALLOWANCE 1,500 1,500 0 0.0% 1,500 292
341001 ‐ TELEPHONE 9,000 9,000 0 0.0% 9,000 6,371
342001 ‐ POSTAGE 1,700 1,700 0 0.0% 1,700 1,338
343001 ‐ UTILITIES 115,000 107,000 8,000 7.5% 107,000 85,233
344001 ‐ MACH & EQUIP RENT 1,000 1,000 0 0.0% 1,000 12,849
344004 ‐ ENVIRONMENTAL CLEANUP 130,000 115,000 15,000 13.0% 115,000 108,923
345001 ‐ GENERAL INSURANCE 143,909 115,033 28,876 25.1% 115,033 105,474
346001 ‐ EQUIPMENT MAINTENANCE 4,000 3,000 1,000 33.3% 3,000 2,977
346002 ‐ VEHICLE MAINTENANCE 38,130 39,554 ‐1,424 ‐3.6% 39,554 47,856
346003 ‐ BUILDING MAINTENANCE 75,000 55,000 20,000 36.4% 55,000 77,690
346052 ‐ AIRFIELD MAINT 75,000 75,000 0 0.0% 75,000 36,036
346058 ‐ GROUNDS MAINT 54,120 53,637 483 0.9% 53,637 52,426
346061 ‐ AIRSIDE DRAINAGE MAINT 15,000 15,000 0 0.0% 15,000 8,799
346200 ‐ SOFTWARE MAINTENANCE 2,000 2,000 0 0.0% 2,000 1,016
349001 ‐ ADVERTISING 65,000 60,000 5,000 8.3% 60,000 10,961
349003 ‐ SCHOOLS & MEETINGS 10,000 10,000 0 0.0% 10,000 1,008
349008 ‐ COUNTY AD VALOREM TAXES 22,000 22,000 0 0.0% 22,000 21,991
130

AIRPORT FUND Expenditures by Object
2022 Budget vs 2021
Projected
Account Number / Account Name 2021‐2022
Budget 2020‐2021
Projected Change $ Change % 2020‐2021
Budget 2019‐2020
Actual
349016 ‐ GF ADMIN CHARGE 526,900 476,283 50,617 10.6% 476,283 297,092
349028 ‐ LANDFILL FEES 16,000 16,000 0 0.0% 16,000 13,656
349033 ‐ PROMOTION 5,000 10,000 ‐5,000 ‐50.0% 10,000 471
349100 ‐ DR‐4283 HURRICANE MATTHEW EXP 0 0 0 n/a 0 171
349200 ‐ HURRICANE IRMA EXPENSES 0 0 0 n/a 0 58
349300 ‐ HURRICANE DORIAN EXPENSES 0 0 0 n/a 0 50
349400 ‐ COVID 19 EXPENSES 0 0 0 n/a 0 7,169
349500 ‐ HURRICANE ISAIAS EXPENSES 0 0 0 n/a 0 15
351001 ‐ OFFICE SUPPLIES 3,000 3,000 0 0.0% 3,000 3,976
351003 ‐ OFFICE FURN & EQUIP 3,000 3,000 0 0.0% 3,000 1,009
352001 ‐ GAS AND OIL 13,334 9,509 3,825 40.2% 9,509 10,434
352002 ‐ TIRES & TUBES 1,000 1,000 0 0.0% 1,000 0
352005 ‐ CONSUMABLE TOOLS 2,000 1,000 1,000 100.0% 1,000 356
352006 ‐ JANITORIAL SUPPLIES 2,100 2,100 0 0.0% 2,100 1,591
352007 ‐ SIGN MATERIAL 2,000 2,000 0 0.0% 2,000 636
352008 ‐ UNIFORMS & CLOTHING 1,600 1,600 0 0.0% 1,600 1,000
352010 ‐ ELEC PARTS & SUPPLIES 1,000 1,000 0 0.0% 1,000 932
352013 ‐ CHEMICAL AND LAB SUPPLIES 7,000 7,000 0 0.0% 7,000 3,371
352014 ‐ OTHER COMMODITIES 1,000 1,000 0 0.0% 1,000 840
354001 ‐ SUBSCRIPTIONS/MEMBERSHIPS 7,000 5,000 2,000 40.0% 5,000 3,560
355002 ‐ MISCELLANEOUS 3,000 3,000 0 0.0% 3,000 973
365002 ‐ STORM DAMAGE 2,000 2,000 0 0.0% 2,000 1,336
6_____ ‐ CAPITAL Various, See Detail 0 60,400 ‐60,400 ‐100.0% 60,400 146,854
991017 ‐ NON OP TRANS TO CONST FUND 468,000 350,000 118,000 33.7% 350,000 500,000
Total for Airport Fund Expenditures 3,560,913 3,039,444 521,469 17.2% 3,039,444 2,752,420
131

AirportMission
The mission of the Airport is to provide safe and efficient aviation facilities and associated services to both commercial and non-commercial users while operating in harmony with the community's quality of life goals.
Vision A vibrant, forward-looking regional Airport serving the aviation industry and the public; an Airport that contributes to our local economy while honoring our historic and natural heritage.
Staffing Table
Employee Type Budget
2021-2022 Budget
2020-2021 Change Full Time Non Bargaining 3 3 0 Full Time Bargaining 9 9 0
Total 12 12 0 Part Time 4 4 0
Total 16 16 0
Major Goals Optimize operational safety, efficiency and effectiveness at the Airport:
Maintain an up-to-date Airport Layout Plan in compliance with FAA/FDOT regulations. Maintain safe aircraft operations and emergency response, and ensure coordination
with FAA, TSA, Airport tenants and users of the airfield. Begin development of a formal, FAA approved, Safety Management System program. Maximize FAA/FDOT and other funding for improvements to the Airport. Pursue legislative changes as necessary to maintain current FDOT funding eligibility. Ensure quality training and operational oversight for Airport users.
Optimize the airport's income potential in order to maintain financial self-sufficiency: Implement strategies to strengthen existing Airport business and attract new business Offer competitive rates and charges to aeronautical and non-aeronautical business. Evaluate development opportunities and offer competitive lease terms.
Meet the long range aviation needs of the community: Participate in local Aviation Safety, Planning, and Economic Development groups. Participate in Regional and Statewide Aviation Planning Committees. Participate in Florida Airports Council and national aviation groups.
Ensure that the Airport's short and long-term plans are environmentally compatible: Foster and maintain community pride in the Airport. Consider means to reduce energy use in a cost effective manner. Meet all FAA and TSA requirements for environmental stewardship.
Enhance the aesthetic value, safety, and quality of the Airport and its commercial properties: Improve aesthetics and help to enforce City Code at the Airport. Improve signage for better way-finding in and around the Airport. Be an attractive destination Airport.
Provide the City of Vero Beach with planning options for the Airport: Initiate an Airport Master Plan update. Monitor City and County land use compatibility with property surrounding the Airport.
132

AIRPORT FUND
AIRPORT
2022 Budget vs 2021 Projected
2021‐2022 2020‐2021 Change $ Change % 2020‐2021 2019‐2020
Account Number Account Name Budget Projected Budget Actual
Personnel Costs441.4000.542.112001 OPERATING SALARIES 600,192 593,188 7,004 1.2% 593,188 717,287
441.4000.542.113002 PART TIME SALARIES 35,000 35,000 0 0.0% 35,000 11,797
441.4000.542.114001 OVERTIME SALARIES 35,000 35,000 0 0.0% 35,000 10,038
441.4000.542.114003 OVERTIME ‐ DISASTER 0 0 0 n/a 0 367
441.4000.542.121001 SOCIAL SECURITY TAXES 51,270 50,734 536 1.1% 50,734 52,488
441.4000.542.122001 PENSION FUND CONTRIBUTION 149,652 164,603 ‐14,951 ‐9.1% 164,603 51,662
441.4000.542.123001 GROUP LIFE INSURANCE 1,800 2,400 ‐600 ‐25.0% 2,400 1,508
441.4000.542.123002 HOSPITALIZATION INSURANCE 133,236 130,465 2,771 2.1% 130,465 114,728
441.4000.542.123005 WORKERS COMPENSATION 8,100 6,200 1,900 30.6% 6,200 5,563
441.4000.542.123004 RETIREMENT PREM ASSIST 9,717 10,540 ‐823 ‐7.8% 10,540 10,001
441.4000.542.123006 CONTRIBUTION TO OPEB TRUST 4,555 5,071 ‐516 ‐10.2% 5,071 375
441.4000.542.126001 COMPENSATED ABSENCES VAC 0 0 0 n/a 0 ‐38,888
441.4000.542.126002 COMPENSATED ABSENCES SICK 0 0 0 n/a 0 ‐52,034
Total Personnel Costs 1,028,522 1,033,201 ‐4,679 ‐0.5% 1,033,201 884,892
Operating Expenses 441.4000.542.331001 PROFESSIONAL SERVICES 75,000 65,000 10,000 15.4% 65,000 38,713
441.4000.542.331002 OUTSIDE LEGAL SERVICES 5,000 5,000 0 0.0% 5,000 24,294
441.4000.542.332001 AUDIT 9,000 4,000 5,000 125.0% 4,000 4,206
441.4000.542.334002 CLEANING & LAUNDRY 1,100 1,000 100 10.0% 1,000 761
441.4000.542.334003 JANITORIAL SERVICES 12,000 9,000 3,000 33.3% 9,000 8,866
441.4000.542.334005 FIRE PROTECTION 200,000 158,000 42,000 26.6% 158,000 151,820
441.4000.542.334007 OTHER CONTRACTUAL SERVICES 295,000 15,000 280,000 1866.7% 15,000 21,001
441.4000.542.334010 AIRPORT SECURITY ‐ VBPD 100,998 96,927 4,071 4.2% 96,927 41,077
441.4000.542.334013 AIRPORT SECURITY ‐ TSA 7,000 7,000 0 0.0% 7,000 0
441.4000.542.334017 ENVIRONMENTAL 0 5,000 ‐5,000 ‐100.0% 5,000 0
441.4000.542.340001 MILEAGE ALLOWANCE 1,500 1,500 0 0.0% 1,500 292
441.4000.542.341001 TELEPHONE 9,000 9,000 0 0.0% 9,000 6,371
441.4000.542.342001 POSTAGE 1,700 1,700 0 0.0% 1,700 1,338
441.4000.542.343001 UTILITIES 115,000 107,000 8,000 7.5% 107,000 85,233
441.4000.542.344001 MACH & EQUIP RENT 1,000 1,000 0 0.0% 1,000 12,849
441.4000.542.344004 ENVIRONMENTAL CLEANUP 130,000 115,000 15,000 13.0% 115,000 108,923
441.4000.542.345001 GENERAL INSURANCE 143,909 115,033 28,876 25.1% 115,033 105,474
441.4000.542.346001 EQUIPMENT MAINTENANCE 4,000 3,000 1,000 33.3% 3,000 2,977
441.4000.542.346002 VEHICLE MAINTENANCE 38,130 39,554 ‐1,424 ‐3.6% 39,554 47,856
441.4000.542.346003 BUILDING MAINTENANCE 75,000 55,000 20,000 36.4% 55,000 77,690
441.4000.542.346052 AIRFIELD MAINT 75,000 75,000 0 0.0% 75,000 36,036
133

AIRPORT FUND
AIRPORT
2022 Budget vs 2021 Projected
Account Number Account Name 2021‐2022
Budget 2020‐2021
Projected Change $ Change % 2020‐2021
Budget 2019‐2020
Actual
441.4000.542.346058
441.4000.542.346061
441.4000.542.346200
441.4000.542.349001
441.4000.542.349003
441.4000.542.349008
441.4000.542.349016
441.4000.542.349028
441.4000.542.349033
441.4000.542.349100
441.4000.542.349200
441.4000.542.349300
441.4000.542.349400
441.4000.542.349500
441.4000.542.351001
441.4000.542.351003
441.4000.542.352001
441.4000.542.352002
441.4000.542.352005
441.4000.542.352006
441.4000.542.352007
441.4000.542.352008
441.4000.542.352010
441.4000.542.352013
441.4000.542.352014
441.4000.542.354001
441.4000.542.355002
441.4000.542.365002
GROUNDS MAINT
AIRSIDE DRAINAGE MAINT
SOFTWARE MAINTENANCE
ADVERTISING
SCHOOLS & MEETINGS
COUNTY AD VALOREM TAXES
GF ADMIN CHARGE
LANDFILL FEES
PROMOTION
DR‐4283 HURRICANE MATTHEW EXP
HURRICANE IRMA EXPENSES
HURRICANE DORIAN EXPENSES
COVID 19 EXPENSES
HURRICANE ISAIAS EXPENSES
OFFICE SUPPLIES
OFFICE FURN & EQUIP
GAS AND OIL
TIRES & TUBES
CONSUMABLE TOOLS
JANITORIAL SUPPLIES
SIGN MATERIAL
UNIFORMS & CLOTHING
ELEC PARTS & SUPPLIES
CHEMICAL AND LAB SUPPLIES
OTHER COMMODITIES
SUBSCRIPTIONS/MEMBERSHIPS
MISCELLANEOUS
STORM DAMAGE
54,120
15,000
2,000
65,000
10,000
22,000
526,900
16,000
5,000
0
0
0
0
0
3,000
3,000
13,334
1,000
2,000
2,100
2,000
1,600
1,000
7,000
1,000
7,000
3,000
2,000
53,637
15,000
2,000
60,000
10,000
22,000
476,283
16,000
10,000
0
0
0
0
0
3,000
3,000
9,509
1,000
1,000
2,100
2,000
1,600
1,000
7,000
1,000
5,000
3,000
2,000
483
0
0
5,000
0
0
50,617
0
‐5,000
0
0
0
0
0
0
0
3,825
0
1,000
0
0
0
0
0
0
2,000
0
0
0.9%
0.0%
0.0%
8.3%
0.0%
0.0%
10.6%
0.0%
‐50.0%
n/a
n/a
n/a
n/a
n/a
0.0%
0.0%
40.2%
0.0%
100.0%
0.0%
0.0%
0.0%
0.0%
0.0%
0.0%
40.0%
0.0%
0.0%
53,637
15,000
2,000
60,000
10,000
22,000
476,283
16,000
10,000
0
0
0
0
0
3,000
3,000
9,509
1,000
1,000
2,100
2,000
1,600
1,000
7,000
1,000
5,000
3,000
2,000
52,426
8,799
1,016
10,961
1,008
21,991
297,092
13,656
471
171
58
50
7,169
15
3,976
1,009
10,434
0
356
1,591
636
1,000
932
3,371
840
3,560
973
1,336
Total Operating Expenses 2,064,391 1,595,843 468,548 29.4% 1,595,843 1,220,674
Capital Outlay
441.4000.542.6_____ Various, See Detail 0 60,400 ‐60,400 ‐100.0% 60,400 146,854
Total Capital Outlay 0 60,400 ‐60,400 ‐100.0% 60,400 146,854
Debt Service and Transfers 441.4000.542.991017 NON OP TRANS TO CONST FUND 468,000 350,000 118,000 33.7% 350,000 500,000
Total Debt Service and Transfers 468,000 350,000 118,000 33.7% 350,000 500,000
Total 3,560,913 3,039,444 521,469 17.2% 3,039,444 2,752,420
134

Airport Construction Fund
2021‐2022
Account Number Account Name Budget
REVENUES 443.0000.331.011030 REHABILITATE RWY 12R‐30L (CONSTRUCTION) (AIP 43) 4,735,582
443.0000.331.011040 CONSTRUCT HANGAR (CARE ACT FUNDING) 88,035
443.0000.331.011051 REHABILITATE TWY B (DESIGN) 270,000
443.0000.331.011052 AIRPORT MASTER PLAN UPDATE (AIP 46) 270,000
443.0000.334.010990 CONSTRUCT HANGAR (442101) 352,140
443.0000.334.011030 REHABILITATE RWY 12R‐30L (CONSTRUCTION) 715,191
443.0000.334.011045 AIRPORT FACILITY AIR CONDITIONING REPLACEMENT 185,000
443.0000.334.011050 REHABILITATE SOUTHWEST APRON (433545) 280,000
443.0000.334.011051 REHABILITATE TWY B (DESIGN) 15,000
443.0000.334.011052 AIRPORT MASTER PLAN UPDATE 15,000
443.0000.334.011053 REDEVELOP COMMERCIAL PARK (PHASE I) 125,000
443.0000.334.011054 AIRPORT WAYFINDING SIGNAGE 400,000
443.0000.334.011055 PIPER AIRFIELD SECURITY PROJECT 484,000
443.0000.334.011056 AIRFIELD MARKING PROJECT 160,000
443.0000.334.011057 REHAB AIRPORT TERMINAL (DESIGN/CONSTRUCT) PH I 370,000
443.0000.383.001000 VEHICLE LEASE‐PURCHASE PROCEEDS 80,000
443.0000.389.800000 LOCAL PARTNERSHIP (PIPER AIRFIELD SECURITY PROJECT) 121,000
443.0000.389.001000 NON OPERATING XFR FROM AIRPORT FUND 468,000
443.0000.389.002000 CASH CARRY OVER 318,110
Total Revenues $ 9,452,058
EXPENDITURES 443.4000.542.617080 CONSTRUCT HANGAR 440,175 443.4000.542.617125 REHABILITATE RWY 12R‐30L (CONSTRUCTION) 5,563,196 443.4000.542.617135 AIRPORT FACILITY AIR CONDITIONING REPLACEMENT 370,000 443.4000.542.617140 REHABILITATE SOUTHWEST APRON 350,000 443.4000.542.617141 REHABILITATE TWY B (DESIGN) 300,000 443.4000.542.617142 AIRPORT MASTER PLAN UPDATE 300,000 443.4000.542.617143 REDEVELOP COMMERCIAL PARK (PHASE I) 250,000 443.4000.542.617144 AIRPORT WAYFINDING SIGNAGE 500,000 443.4000.542.617145 REHAB AIRPORT TERMINAL (DESIGN/CONSTRUCT) PH I 462,500 443.4000.542.617146 PIPER AIRFIELD SECURITY PROJECT 605,000 443.4000.542.617147 AIRFIELD MARKING PROJECT 200,000 443.4000.542.641400 AIRPORT VEHICLE LEASE‐PURCHASE 80,000 443.4000.542.641500 AIRPORT VEHICLE LEASE‐PURCHASE DEBT SVC 31,187
Total Expenditures $ 9,452,058
Note: Please see Five Year Capital Program book for project descriptions and five year funding
135

. -. ..,._
MARINA FUND
136

MARINA
OPERATING BUDGET Operating Revenue
Operating Expenses:
Marina Division Mooring Division
Total Operating Expenses
Net Operating Income
Debt Service
No Outstanding Marina Debt
Total Debt Service
Surplus Revenue
Surplus Revenue Distribution
Transfer to General Fund Capital Outlays Balance Available for Capital Additions
Total Distribution of Surplus
Budget 2021-2022
$ 9,042,837
1,226,323 243,186
1,469,509
7,573,328
-
-
$ 7,573,328
$ 105,000 7,485,620
(17,292)
$ 7,573,328
Budget 2020-2021
$ 1,986,750
1,207,933 238,630
1,446,563
540,187
-
-
$ 540,187
$ 103,000 648,000
(210,813)
$ 540,187
137

MARINA FUND
REVENUE
2022 Budget vs 2021
Projected
2021‐2022 2020‐2021 Change $ Change % 2020‐2021 2019‐2020
Account Number Account Name Budget Projected Budget Actual
451.0000.331.090400 HURRICANE FRANCES FEMA REIMB 0 0 0 n/a 0 12,650
451.0000.334.072000 FIND GRANT‐PH1 DESIGN/PERMITTING 76,250 274,500 ‐198,250 ‐72.2% 274,500 0
451.0000.334.072001 FIND GRANT‐SOUTH COMPLEX REBUILD 463,902 0 463,902 n/a 0 0
451.0000.334.______ OTHER STATE GRANTS ‐ MASTER PLAN PROJ 85,000 0 85,000 n/a 0 0
451.0000.334.090400 HURRICANE FRANCES STATE REIMB 0 0 0 n/a 0 699
451.0000.334.090560 CARES ACT FUNDING IRC SUBRECIPIENT AGRMT 0 0 0 n/a 0 1,381
451.0000.344.020100 TRANSIENT UTILITIES 20,000 20,000 0 0.0% 20,000 21,867
451.0000.344.020200 PERMANENT SLIP UTILITIES 11,000 11,000 0 0.0% 11,000 27,162
451.0000.344.020300 DOCK RENTAL 220,000 193,000 27,000 14.0% 193,000 195,689
451.0000.344.020400 DOCK RENTAL TRANSIENT 225,000 200,000 25,000 12.5% 200,000 258,588
451.0000.344.020500 HOUSE RENTAL DOCKMASTER 15,600 15,600 0 0.0% 15,600 15,600
451.0000.344.020600 DIESEL FUEL SALES 230,000 230,000 0 0.0% 230,000 219,505
451.0000.344.020700 OIL SALES 3,000 3,000 0 0.0% 3,000 3,433
451.0000.344.020800 GAS SALES 510,000 435,000 75,000 17.2% 435,000 544,491
451.0000.344.020900 LIVE ABOARD FEE 12,000 12,000 0 0.0% 12,000 14,325
451.0000.344.021100 ANCHORAGE RENTAL 245,000 245,000 0 0.0% 245,000 265,230
451.0000.344.021200 LOCKER RENTALS 500 500 0 0.0% 500 1,067
451.0000.344.021300 DRY STORAGE SOUTH COMPLEX 109,200 173,000 ‐63,800 ‐36.9% 173,000 158,190
451.0000.344.021400 DOCK RENTAL SOUTH COMPLEX 46,667 76,000 ‐29,333 ‐38.6% 76,000 74,975
451.0000.344.021600 BUILDING RENTAL SOUTH CMPLX 50,000 50,000 0 0.0% 50,000 7,500
451.0000.344.021700 ALCOHOL SALES 8,000 8,000 0 0.0% 8,000 8,799
451.0000.361.010200 INTEREST ON INVESTMENTS 0 150 ‐150 ‐100.0% 150 73
451.0000.369.090100 MISCELLANEOUS REVENUES 40,000 40,000 0 0.0% 40,000 71,794
451.0000.382.000650 CONTR FROM HLTH INS FND 0 0 0 n/a 0 1,989
451.0000.383.______ INTERFUND LOAN‐SOUTH COMPLEX REBUILD 4,671,718 0 4,671,718 n/a 0 0
451.0000.389.000700 GEN FUND CONTRIBUTION ‐ SOUTH COMPLEX 2,000,000 0 2,000,000 n/a 0 0
451.0000.389.000100 CASH/OVER AND SHORT 0 0 0 n/a 0 160
451.0000.389.000200 CASH CARRY OVER 17,292 210,813 ‐193,521 ‐91.8% 210,813 0
Total 9,060,129 2,197,563 6,862,566 312.3% 2,197,563 1,905,167
138

MARINA FUND
BUDGET BY DEPARTMENT
2022 Budget vs 2021
Projected 2021‐2022 2020‐2021 2020‐2021 2019‐2020
Change $ Change %Department Budget Projected Budget Actual
Marina Division 8,816,943 1,958,933 6,858,010 350.1% 1,958,933 1,387,995
Moorings Division 243,186 238,630 4,556 1.9% 238,630 196,883
Marina Fund 9,060,129 2,197,563 6,862,566 312.3% 2,197,563 1,584,878
139

MARINA FUND Expenditures by Object
2022 Budget vs 2021
Projected
Account Number / Account Name 2021‐2022
Budget 2020‐2021
Projected Change $ Change % 2020‐2021
Budget 2019‐2020
Actual
112001 ‐ OPERATING SALARIES 228,664 224,201 4,463 2.0% 224,201 200,171
113002 ‐ PART TIME SALARIES 45,000 45,000 0 0.0% 45,000 18,752
114001 ‐ OVERTIME SALARIES 3,750 3,000 750 25.0% 3,000 2,958
121001 ‐ SOCIAL SECURITY TAXES 21,222 20,823 399 1.9% 20,823 16,145
122001 ‐ PENSION FUND CONTRIBUTION 47,477 47,439 38 0.1% 47,439 17,277
123001 ‐ GROUP LIFE INSURANCE 600 600 0 0.0% 600 465
123002 ‐ HOSPITALIZATION INSURANCE 45,182 44,324 858 1.9% 44,324 33,845
123004 ‐ RETIREMENT PREM ASSIST 3,267 8,928 ‐5,661 ‐63.4% 8,928 8,546
123005 ‐ WORKER COMPENSATION 23,500 31,200 ‐7,700 ‐24.7% 31,200 24,363
123006 ‐ CONTRIBUTION TO OPEB TRUST 1,531 4,295 ‐2,764 ‐64.4% 4,295 320
125001 ‐ STATE UNEMPLOYMENT COMP 0 0 0 n/a 0 144
126001 ‐ COMPENSATED ABSENCES VAC 0 0 0 n/a 0 7,275
331001 ‐ PROFESSIONAL SERVICES 17,418 17,418 0 0.0% 17,418 113,789
332001 ‐ AUDIT 1,600 1,000 600 60.0% 1,000 922
334002 ‐ CLEANING & LAUNDRY 100 100 0 0.0% 100 0
334003 ‐ JANITORIAL SERVICES 6,075 6,075 0 0.0% 6,075 2,440
334007 ‐ OTHER CONTRACTUAL SERVICES 6,500 6,500 0 0.0% 6,500 1,392
334016 ‐ DISCOUNT ON CREDIT CARDS 34,414 27,000 7,414 27.5% 27,000 34,588
340001 ‐ MILEAGE ALLOWANCE 200 200 0 0.0% 200 0
341001 ‐ TELEPHONE 2,000 2,000 0 0.0% 2,000 1,312
342001 ‐ POSTAGE 493 400 93 23.3% 400 513
343001 ‐ UTILITIES 76,500 71,500 5,000 7.0% 71,500 70,088
345001 ‐ GENERAL INSURANCE 94,912 82,364 12,548 15.2% 82,364 77,918
346001 ‐ EQUIPMENT MAINTENANCE 9,500 9,500 0 0.0% 9,500 6,548
346002 ‐ VEHICLE MAINTENANCE 8,000 8,000 0 0.0% 8,000 5,660
346003 ‐ BUILDING MAINTENANCE 8,944 8,944 0 0.0% 8,944 1,175
346056 ‐ DOCKS MAINT 12,000 12,000 0 0.0% 12,000 331
346060 ‐ MARINA MOORINGS MAINT 12,000 18,000 ‐6,000 ‐33.3% 18,000 8,930
346200 ‐ SOFTWARE MAINTENANCE 3,000 3,000 0 0.0% 3,000 1,204
349001 ‐ ADVERTISING 2,000 5,333 ‐3,333 ‐62.5% 5,333 88
349003 ‐ SCHOOLS & MEETINGS 1,000 1,000 0 0.0% 1,000 450
349016 ‐ GF ADMIN CHARGE 144,056 130,761 13,295 10.2% 130,761 92,053
349028 ‐ LANDFILL FEES 10,000 5,700 4,300 75.4% 5,700 10,217
349100 ‐ DR‐4283 HURRICANE MATTHEW EXP 0 0 0 n/a 0 1
349200 ‐ HURRICANE IRMA EXPENSES 0 0 0 n/a 0 10
349400 ‐ COVID 19 EXPENSES 0 0 0 n/a 0 11,051
351001 ‐ OFFICE SUPPLIES 3,355 3,833 ‐478 ‐12.5% 3,833 1,601
352000 ‐ DIESEL 170,200 170,200 0 0.0% 170,200 138,072
352001 ‐ GAS AND OIL 343,500 343,500 0 0.0% 343,500 370,053
140

MARINA FUND Expenditures by Object
2022 Budget vs 2021
Projected
Account Number / Account Name 2021‐2022
Budget 2020‐2021
Projected Change $ Change % 2020‐2021
Budget 2019‐2020
Actual
352004 ‐ EQUIP PARTS & SUPPLIES 2,334 2,500 ‐166 ‐6.6% 2,500 1,960
352005 ‐ CONSUMABLE TOOLS 1,500 1,500 0 0.0% 1,500 147
352006 ‐ JANITORIAL SUPPLIES 3,889 4,333 ‐444 ‐10.2% 4,333 2,557
352008 ‐ UNIFORMS & CLOTHING 3,500 3,500 0 0.0% 3,500 1,682
352009 ‐ BUILD SUPPLIES & MATLS 600 600 0 0.0% 600 323
352010 ‐ ELEC PARTS & SUPPLIES 2,000 2,000 0 0.0% 2,000 567
352011 ‐ PLUMB PARTS & SUPPLIES 1,333 1,400 ‐67 ‐4.8% 1,400 58
352014 ‐ OTHER COMMODITIES 10,066 10,066 0 0.0% 10,066 8,248
352063 ‐ LANDSCAPE/MARINA 33,327 33,026 301 0.9% 33,026 34,036
354001 ‐ SUBSCRIPTIONS/MEMBERSHIPS 500 500 0 0.0% 500 275
355001 ‐ PURCHASES FOR RESALE 6,500 6,500 0 0.0% 6,500 8,309
355002 ‐ MISCELLANEOUS 10,000 10,000 0 0.0% 10,000 4,283
355003 ‐ ALCOHOL PURCH FOR RESALE 6,000 6,500 ‐500 ‐7.7% 6,500 5,697
6_____ ‐ CAPITAL Various, See Detail 7,485,620 648,000 6,837,620 1055.2% 648,000 135,069
991004 ‐ TRANSFER TO GENERAL FUND 105,000 103,000 2,000 1.9% 103,000 101,000
Total for Marina Fund Expenditures 9,060,129 2,197,563 6,862,566 312.3% 2,197,563 1,584,878
141

Marina Mission
The mission of the Vero Beach City Marina is to provide efficient first class service at reasonable cost to resident and visiting boaters in a manner that reflects well on the character of the City of Vero Beach. In order to fulfill our mission Marina personnel are trained to:
* Act as goodwill ambassadors for the city by promoting tourism and local business patronage.
* Exercise business, maintenance and safety practices that meet Industry and City standards.
* Ensure that Marina and Mooring operations maintain a favorable relationship with neighbouring residents, clubs, and businesses.
* Promote Clean Marina practices and assist in developing programs and procedures to keep the Indian River clean and environmentally safe.
Staffing Table
Employee Type Budget
2021-2022 Budget
2020-2021 Change Full Time Non Bargaining 2 2 0 Full Time Bargaining 3 3 0
Total 5 5 0 Part Time 2 2 0
Total 7 7 0
Major Goals and Challenges Comply with all Federal, State, and Local Environmental Regulations.
Identify available grant monies to assist in future projects.
Evaluate opportunities to expand facilities to meet demand.
Continue to move forward with the marina master plan in the most expeditious way possible,to rebuild the marina with its current limited revenue stream and aged infrastructure.
142

MARINA FUND
MARINA DIVISION 2022 Budget vs 2021
Projected
2021‐2022 2020‐2021 Change $ Change % 2020‐2021 2019‐2020
Account Number Account Name Budget Projected Budget Actual
Personnel Costs451.4100.575.112001 OPERATING SALARIES 152,443 149,467 2,976 2.0% 149,467 134,115
451.4100.575.113002 PART TIME SALARIES 30,000 30,000 0 0.0% 30,000 12,564
451.4100.575.114001 OVERTIME SALARIES 2,500 2,000 500 25.0% 2,000 1,982
451.4100.575.121001 SOCIAL SECURITY TAXES 14,148 13,882 266 1.9% 13,882 10,817
451.4100.575.122001 PENSION FUND CONTRIBUTION 31,651 31,626 25 0.1% 31,626 1,869
451.4100.575.123001 GROUP LIFE INSURANCE 600 600 0 0.0% 600 465
451.4100.575.123002 HOSPITALIZATION INSURANCE 30,121 29,549 572 1.9% 29,549 22,676
451.4100.575.123005 WORKER COMPENSATION 23,500 31,200 ‐7,700 ‐24.7% 31,200 24,363
451.4100.575.123004 RETIREMENT PREM ASSIST 3,267 8,928 ‐5,661 ‐63.4% 8,928 8,546
451.4100.575.123006 CONTRIBUTION TO OPEB TRUST 1,531 4,295 ‐2,764 ‐64.4% 4,295 320
451.4100.575.125001 STATE UNEMPLOYMENT COMP 0 0 0 n/a 0 144
451.4100.575.126001 COMPENSATED ABSENCES VAC 0 0 0 n/a 0 7,275
Total Personnel Costs 289,761 301,547 ‐11,786 ‐3.9% 301,547 225,136
Operating Expenses 451.4100.575.331001 PROFESSIONAL SERVICES 17,418 17,418 0 0.0% 17,418 113,789
451.4100.575.332001 AUDIT 1,600 1,000 600 60.0% 1,000 922
451.4100.575.334002 CLEANING & LAUNDRY 67 67 0 0.0% 67 0
451.4100.575.334003 JANITORIAL SERVICES 6,075 6,075 0 0.0% 6,075 2,440
451.4100.575.334007 OTHER CONTRACTUAL SERVICES 4,333 4,333 0 0.0% 4,333 933
451.4100.575.334016 DISCOUNT ON CREDIT CARDS 22,943 18,000 4,943 27.5% 18,000 23,174
451.4100.575.340001 MILEAGE ALLOWANCE 200 200 0 0.0% 200 0
451.4100.575.341001 TELEPHONE 1,333 1,333 0 0.0% 1,333 905
451.4100.575.342001 POSTAGE 329 267 62 23.2% 267 360
451.4100.575.343001 UTILITIES 51,000 47,667 3,333 7.0% 47,667 46,959
451.4100.575.345001 GENERAL INSURANCE 63,275 54,909 8,366 15.2% 54,909 53,560
451.4100.575.346001 EQUIPMENT MAINTENANCE 6,333 6,333 0 0.0% 6,333 3,955
451.4100.575.346002 VEHICLE MAINTENANCE 8,000 8,000 0 0.0% 8,000 5,660
451.4100.575.346003 BUILDING MAINTENANCE 5,963 5,963 0 0.0% 5,963 642
451.4100.575.346056 DOCKS MAINT 12,000 12,000 0 0.0% 12,000 331
451.4100.575.346200 SOFTWARE MAINTENANCE 3,000 3,000 0 0.0% 3,000 1,204
451.4100.575.349001 ADVERTISING 1,333 3,555 ‐2,222 ‐62.5% 3,555 59
451.4100.575.349003 SCHOOLS & MEETINGS 1,000 1,000 0 0.0% 1,000 450
451.4100.575.349016 GF ADMIN CHARGE 144,056 130,761 13,295 10.2% 130,761 92,053
451.4100.575.349028 LANDFILL FEES 6,667 3,800 2,867 75.4% 3,800 6,845
143

MARINA FUND
MARINA DIVISION 2022 Budget vs 2021
Projected
2021‐2022 2020‐2021 Change $ Change % 2020‐2021 2019‐2020
Account Number Account Name Budget Projected Budget Actual
451.4100.575.349100 DR‐4283 HURRICANE MATTHEW EXP 0 0 0 n/a 0 1
451.4100.575.349200 HURRICANE IRMA EXPENSES 0 0 0 n/a 0 10
451.4100.575.349400 COVID 19 EXPENSES 0 0 0 n/a 0 11,051
451.4100.575.351001 OFFICE SUPPLIES 2,237 2,555 ‐318 ‐12.4% 2,555 978
451.4100.575.352000 DIESEL 170,200 170,200 0 0.0% 170,200 138,072
451.4100.575.352001 GAS AND OIL 343,500 343,500 0 0.0% 343,500 370,053
451.4100.575.352004 EQUIP PARTS & SUPPLIES 1,556 1,667 ‐111 ‐6.7% 1,667 1,313
451.4100.575.352005 CONSUMABLE TOOLS 1,500 1,500 0 0.0% 1,500 147
451.4100.575.352006 JANITORIAL SUPPLIES 2,593 2,889 ‐296 ‐10.2% 2,889 1,713
451.4100.575.352008 UNIFORMS & CLOTHING 3,500 3,500 0 0.0% 3,500 1,682
451.4100.575.352009 BUILD SUPPLIES & MATLS 400 400 0 0.0% 400 216
451.4100.575.352010 ELEC PARTS & SUPPLIES 1,333 1,333 0 0.0% 1,333 380
451.4100.575.352011 PLUMB PARTS & SUPPLIES 889 933 ‐44 ‐4.7% 933 39
451.4100.575.352014 OTHER COMMODITIES 6,711 6,711 0 0.0% 6,711 5,526
451.4100.575.352063 LANDSCAPE/MARINA 22,218 22,017 201 0.9% 22,017 22,804
451.4100.575.354001 SUBSCRIPTIONS/MEMBERSHIPS 500 500 0 0.0% 500 275
451.4100.575.355001 PURCHASES FOR RESALE 6,500 6,500 0 0.0% 6,500 8,309
451.4100.575.355002 MISCELLANEOUS 10,000 10,000 0 0.0% 10,000 4,283
451.4100.575.355003 ALCOHOL PURCH FOR RESALE 6,000 6,500 ‐500 ‐7.7% 6,500 5,697
Total Operating Expenses 936,562 906,386 30,176 3.3% 906,386 926,790
Capital Outlay
451.4100.575.6_____ Various, See Detail 7,485,620 648,000 6,837,620 1055.2% 648,000 135,069
Total Capital Outlay 7,485,620 648,000 6,837,620 1055.2% 648,000 135,069
Debt Service and Transfers 451.4100.575.991004 TRANSFER TO GENERAL FUND 105,000 103,000 2,000 1.9% 103,000 101,000
Total Debt Service and Transfers 105,000 103,000 2,000 1.9% 103,000 101,000
Total 8,816,943 1,958,933 6,858,010 350.1% 1,958,933 1,387,995
144

MARINA FUND
MOORINGS DIVISION 2022 Budget vs 2021
Projected
2021‐2022 2020‐2021 Change $ Change % 2020‐2021 2019‐2020
Account Number Account Name Budget Projected Budget Actual
Personnel Costs451.4101.575.112001 OPERATING SALARIES 76,221 74,734 1,487 2.0% 74,734 66,056
451.4101.575.113002 PART TIME SALARIES 15,000 15,000 0 0.0% 15,000 6,188
451.4101.575.114001 OVERTIME SALARIES 1,250 1,000 250 25.0% 1,000 976
451.4101.575.121001 SOCIAL SECURITY TAXES 7,074 6,941 133 1.9% 6,941 5,328
451.4101.575.122001 PENSION FUND CONTRIBUTION 15,826 15,813 13 0.1% 15,813 15,408
451.4101.575.123002 HOSPITALIZATION INSURANCE 15,061 14,775 286 1.9% 14,775 11,169
Total Personnel Costs 130,432 128,263 2,169 1.7% 128,263 105,125
Operating Expenses
451.4101.575.334002 CLEANING & LAUNDRY 33 33 0 0.0% 33 0
451.4101.575.334007 OTHER CONTRACTUAL SERVICES 2,167 2,167 0 0.0% 2,167 459
451.4101.575.334016 DISCOUNT ON CREDIT CARDS 11,471 9,000 2,471 27.5% 9,000 11,414
451.4101.575.341001 TELEPHONE 667 667 0 0.0% 667 407
451.4101.575.342001 POSTAGE 164 133 31 23.3% 133 153
451.4101.575.343001 UTILITIES 25,500 23,833 1,667 7.0% 23,833 23,129
451.4101.575.345001 GENERAL INSURANCE 31,637 27,455 4,182 15.2% 27,455 24,358
451.4101.575.346001 EQUIPMENT MAINTENANCE 3,167 3,167 0 0.0% 3,167 2,593
451.4101.575.346003 BUILDING MAINTENANCE 2,981 2,981 0 0.0% 2,981 533
451.4101.575.346060 MARINA MOORINGS MAINT 12,000 18,000 ‐6,000 ‐33.3% 18,000 8,930
451.4101.575.349001 ADVERTISING 667 1,778 ‐1,111 ‐62.5% 1,778 29
451.4101.575.349028 LANDFILL FEES 3,333 1,900 1,433 75.4% 1,900 3,372
451.4101.575.351001 OFFICE SUPPLIES 1,118 1,278 ‐160 ‐12.5% 1,278 623
451.4101.575.352004 EQUIP PARTS & SUPPLIES 778 833 ‐55 ‐6.6% 833 647
451.4101.575.352006 JANITORIAL SUPPLIES 1,296 1,444 ‐148 ‐10.2% 1,444 844
451.4101.575.352009 BUILD SUPPLIES & MATLS 200 200 0 0.0% 200 107
451.4101.575.352010 ELEC PARTS & SUPPLIES 667 667 0 0.0% 667 187
451.4101.575.352011 PLUMB PARTS & SUPPLIES 444 467 ‐23 ‐4.9% 467 19
451.4101.575.352014 OTHER COMMODITIES 3,355 3,355 0 0.0% 3,355 2,722
451.4101.575.352063 LANDSCAPE/MARINA 11,109 11,009 100 0.9% 11,009 11,232
Total Operating Expenses 112,754 110,367 2,387 2.2% 110,367 91,758
Total 243,186 238,630 4,556 1.9% 238,630 196,883
145

MARINA FUND
CAPITAL REQUEST DETAIL
Account 2021‐2022
Department Number Account Name Description Budget
Marina 451.4100.575.615075 MARINA MASTER PLAN: PH 1 Design and permitting for Marina master plan 180,000
Demolish and rebuild the entire South Complex451.4100.575.615076 SOUTH COMPLEX REBUILD 7,135,620
including dry storage and docks 451.4100.575.615077 DREDGING / OTHER AREAS Dredge in and around existing marina docks 170,000
Total Capital Outlay 7,485,620
Note: Please see Five Year Capital Program for project descriptions and five year funding
146
SOLID WASTE FUND
147

SOLID WASTE
OPERATING BUDGET Operating Revenue
Operating Expenses:
Solid Waste Operations
Total Operating Expenses
Net Operating Income
Debt Service
No Outstanding Solid Waste Debt
Total Debt Service Transfers
Surplus Revenue
Surplus Revenue Distribution
Transfer to General Fund Capital Outlays Balance Available for Capital Additions
Total Distribution of Surplus
Budget 2021-2022
$ 3,069,700
2,752,883
2,752,883
316,817
--
-
$ 316,817
$ 183,000 246,443
(112,626)
$ 316,817
Budget 2020-2021
$ 3,104,854
2,752,101
2,752,101
352,753
--
-
$ 352,753
$ 181,000 85,340 86,413
$ 352,753
148

SOLID WASTE FUND
REVENUE
2022 Budget vs 2021
Projected
2021‐2022 2020‐2021 Change $ Change % 2020‐2021 2019‐2020
Account Number Account Name Budget Projected Budget Actual
461.0000.331.090550 HURRICANE DORIAN DR‐4468 FEMA REIMB 0 0 0 n/a 0 601
461.0000.334.090550 HURRICANE DORIAN DR‐4468 STATE REIMB 0 0 0 n/a 0 100
461.0000.334.090560 CARES ACT FUNDING IRC SUBRECIPIENT AGRMT 0 0 0 n/a 0 3,967
461.0000.343.040100 GARBAGE COLLECTION FEES 3,049,700 3,018,854 30,846 1.0% 3,018,854 2,760,365
461.0000.361.010200 INTEREST ON INVESTMENTS 7,000 10,000 ‐3,000 ‐30.0% 10,000 27,831
461.0000.365.090100 SALE OF SURPLUS MATLS & SCRP 4,000 4,000 0 0.0% 4,000 1,459
461.0000.365.090150 SALE OF SURPLUS VEHICLES 1,000 10,000 ‐9,000 ‐90.0% 10,000 9,100
461.0000.369.060000 INSURANCE PROCEEDS 0 0 0 n/a 0 126,905
461.0000.369.090100 MISCELLANEOUS REVENUES 8,000 8,000 0 0.0% 8,000 2,855
461.0000.382.000650 CONTR FROM HLTH INS FND 0 0 0 n/a 0 22,865
461.0000.383.000100 VEHICLE LEASE‐PURCHASE PROCEEDS 0 54,000 ‐54,000 ‐100.0% 54,000 0
461.0000.389.000200 CASH CARRYOVER 112,626 ‐86,413 199,039 ‐230.3% ‐86,413 0
461.0000.389.000500 UNAPPROPRIATED SURPLUS 0 0 0 n/a 0 0
Total 3,182,326 3,018,441 163,885 5.4% 3,018,441 2,956,048
149

SOLID WASTE FUND
BUDGET BY DEPARTMENT
2022 Budget vs 2021
Projected 2021‐2022 2020‐2021 2020‐2021 2019‐2020
Change $ Change % Department Budget Projected Budget Actual
Solid Waste 3,182,326 3,018,441 163,885 5.4% 3,018,441 2,698,929
Solid Waste Fund 3,182,326 3,018,441 163,885 5.4% 3,018,441 2,698,929
150

SOLID WASTE FUND Expenditures by Object
2022 Budget vs 2021
Projected
Account Number / Account Name 2021‐2022
Budget 2020‐2021
Projected Change $ Change % 2020‐2021
Budget 2019‐2020
Actual
112001 ‐ OPERATING SALARIES 938,524 922,895 15,629 1.7% 922,895 887,566
114001 ‐ OVERTIME SALARIES 14,000 14,000 0 0.0% 14,000 19,230
121001 ‐ SOCIAL SECURITY TAXES 72,868 71,672 1,196 1.7% 71,672 64,090
122001 ‐ PENSION FUND CONTRIBUTION 271,865 299,781 ‐27,916 ‐9.3% 299,781 77,835
123001 ‐ GROUP LIFE INSURANCE 2,900 3,600 ‐700 ‐19.4% 3,600 2,220
123002 ‐ HOSPITALIZATION INSURANCE 268,588 253,499 15,089 6.0% 253,499 241,308
123004 ‐ RETIREMENT PREM ASSIST 39,003 46,168 ‐7,165 ‐15.5% 46,168 43,893
123005 ‐ WORKER COMPENSATION 67,300 63,400 3,900 6.2% 63,400 92,195
123006 ‐ CONTRIBUTION TO OPEB TRUST 18,282 22,210 ‐3,928 ‐17.7% 22,210 1,744
126001 ‐ COMPENSATED ABSENCES VAC 0 0 0 n/a 0 7,874
126002 ‐ COMPENSATED ABSENCES SICK 0 0 0 n/a 0 9,297
331001 ‐ PROFESSIONAL SERVICES 3,900 3,900 0 0.0% 3,900 1,222
332001 ‐ AUDIT 2,500 1,300 1,200 92.3% 1,300 1,185
334002 ‐ CLEANING & LAUNDRY 6,600 6,600 0 0.0% 6,600 6,044
334007 ‐ OTHER CONTRACTUAL SERVICES 2,600 2,000 600 30.0% 2,000 1,294
342001 ‐ POSTAGE 150 150 0 0.0% 150 14
343001 ‐ UTILITIES 5,250 5,250 0 0.0% 5,250 891
344000 ‐ RENT 74,200 74,200 0 0.0% 74,200 74,200
344003 ‐ LAND RENT/AIRPORT 24,000 22,900 1,100 4.8% 22,900 22,789
345001 ‐ GENERAL INSURANCE 26,094 20,222 5,872 29.0% 20,222 20,246
346002 ‐ VEHICLE MAINTENANCE 356,900 362,323 ‐5,423 ‐1.5% 362,323 354,775
346390 ‐ CONTAINERS 35,000 35,000 0 0.0% 35,000 19,575
349001 ‐ ADVERTISING 200 200 0 0.0% 200 0
349003 ‐ SCHOOLS & MEETINGS 250 250 0 0.0% 250 256
349011 ‐ CUSTOMER SERVICE 176,599 168,952 7,647 4.5% 168,952 168,474
349016 ‐ GF ADMIN CHARGE 202,053 221,340 ‐19,287 ‐8.7% 221,340 188,331
349023 ‐ BAD DEBT 7,000 7,000 0 0.0% 7,000 26,352
349028 ‐ LANDFILL FEES 4,256 4,256 0 0.0% 4,256 5,235
349200 ‐ HURRICANE IRMA EXPENSES 0 0 0 n/a 0 20
349300 ‐ HURRICANE DORIAN EXPENSES 0 0 0 n/a 0 24
349400 ‐ COVID 19 EXPENSES 0 0 0 n/a 0 199
351001 ‐ OFFICE SUPPLIES 1,500 1,500 0 0.0% 1,500 1,703
351003 ‐ OFFICE FURN & EQUIP 300 300 0 0.0% 300 0
352001 ‐ MOTOR FUEL 112,951 101,383 11,568 11.4% 101,383 80,143
352004 ‐ EQUIP PARTS & SUPPLIES 500 500 0 0.0% 500 704
352005 ‐ CONSUMABLE TOOLS 2,000 2,000 0 0.0% 2,000 955
352008 ‐ UNIFORMS & CLOTHING 6,000 4,000 2,000 50.0% 4,000 5,931
352013 ‐ CHEMICAL AND LAB SUPPLIES 3,300 3,300 0 0.0% 3,300 2,083
151

SOLID WASTE FUND Expenditures by Object
2022 Budget vs 2021
Projected 2021‐2022 2020‐2021 2020‐2021 2019‐2020
Change $ Change % Account Number / Account Name Budget Projected Budget Actual
352014 ‐ OTHER COMMODITIES 4,400 5,000 ‐600 ‐12.0% 5,000 2,186
354001 ‐ SUBSCRIPTIONS/MEMBERSHIPS 250 250 0 0.0% 250 234
355007 ‐ GRACE 800 800 0 0.0% 800 2,502
6_____ ‐ CAPITAL Various, See Detail 246,443 85,340 161,103 188.8% 85,340 91,110
991004 ‐ TRANSFER TO GENERAL FUND 183,000 181,000 2,000 1.1% 181,000 173,000
Total for Solid Waste Fund Expenditures 3,182,326 3,018,441 163,885 5.4% 3,018,441 2,698,929
152

Public Works Solid Waste
Mission
The mission of the Solid Waste Division is to protect the environment, public health and welfare, and to enhance the quality of life by providing effective programs to collect and remove solid waste materials in a convenient, economical and environmentally sensitive manner. Activities include removal and disposal of all refuse accumulated inside the city limits from single-family and multi-family residences as well as commercial businesses and other non-residential customers. Refuse collection and disposal services include garbage, yard debris, appliances, construction debris, furniture and other household items. The residential recycling program is provided by an Indian River County contractor within the city limits.
Staffing Table
Employee Type Budget
2021-2022 Budget
2020-2021 Change
Full Time Non Bargaining 2 2 0 Full Time Bargaining 21 21 0
Total 23 23 0 Part Time 0 0 0
Total 23 23 0
Major Goals and Challenges
Provide bi-weekly side yard garbage collection to approximately 7,000 residential customers. Provide weekly curbside yard trash collection to approximately 7,000 residential customers. Provide up to 6 day a week container service to approximately 1,650 commercial customers. Continue to provide special collection services to all residential and non-residential customers within
24 hours of request. Improve cleanliness of dumpster enclosure areas. Improve convenience of dumpster use to multi-family residences. Manage roll-off container franchise agreements with private haulers. Collect fee for roll-out dumpster service. Continue replacement of heavy trucks on an 8/10 year cycle to reduce maintenance costs and minimize
out of service time. Attach all garbage charges to master water meter accounts.
153

SOLID WASTE FUND
SOLID WASTE
2022 Budget vs 2021
Projected
2021‐2022 2020‐2021 Change $ Change % 2020‐2021 2019‐2020
Account Number Account Name Budget Projected Budget Actual
Personnel Costs
461.3308.534.112001 OPERATING SALARIES 938,524 922,895 15,629 1.7% 922,895 887,566
461.3308.534.114001 OVERTIME SALARIES 14,000 14,000 0 0.0% 14,000 19,230
461.3308.534.121001 SOCIAL SECURITY TAXES 72,868 71,672 1,196 1.7% 71,672 64,090
461.3308.534.122001 PENSION FUND CONTRIBUTION 271,865 299,781 ‐27,916 ‐9.3% 299,781 77,835
461.3308.534.123001 GROUP LIFE INSURANCE 2,900 3,600 ‐700 ‐19.4% 3,600 2,220
461.3308.534.123002 HOSPITALIZATION INSURANCE 268,588 253,499 15,089 6.0% 253,499 241,308
461.3308.534.123005 WORKER COMPENSATION 67,300 63,400 3,900 6.2% 63,400 92,195
461.3308.534.123004 RETIREMENT PREM ASSIST 39,003 46,168 ‐7,165 ‐15.5% 46,168 43,893
461.3308.534.123006 CONTRIBUTION TO OPEB TRUST 18,282 22,210 ‐3,928 ‐17.7% 22,210 1,744
461.3308.534.126001 COMPENSATED ABSENCES VAC 0 0 0 n/a 0 7,874
461.3308.534.126002 COMPENSATED ABSENCES SICK 0 0 0 n/a 0 9,297
Total Personnel Costs 1,693,330 1,697,225 ‐3,895 ‐0.2% 1,697,225 1,447,252
Operating Expenses 461.3308.534.331001 PROFESSIONAL SERVICES 3,900 3,900 0 0.0% 3,900 1,222
461.3308.534.332001 AUDIT 2,500 1,300 1,200 92.3% 1,300 1,185
461.3308.534.334002 CLEANING & LAUNDRY 6,600 6,600 0 0.0% 6,600 6,044
461.3308.534.334007 OTHER CONTRACTUAL SERVICES 2,600 2,000 600 30.0% 2,000 1,294
461.3308.534.342001 POSTAGE 150 150 0 0.0% 150 14
461.3308.534.343001 UTILITIES 5,250 5,250 0 0.0% 5,250 891
461.3308.534.344000 RENT 74,200 74,200 0 0.0% 74,200 74,200
461.3308.534.344003 LAND RENT/AIRPORT 24,000 22,900 1,100 4.8% 22,900 22,789
461.3308.534.345001 GENERAL INSURANCE 26,094 20,222 5,872 29.0% 20,222 20,246
461.3308.534.346002 VEHICLE MAINTENANCE 356,900 362,323 ‐5,423 ‐1.5% 362,323 354,775
461.3308.534.346390 CONTAINERS 35,000 35,000 0 0.0% 35,000 19,575
461.3308.534.349001 ADVERTISING 200 200 0 0.0% 200 0
461.3308.534.349003 SCHOOLS & MEETINGS 250 250 0 0.0% 250 256
461.3308.534.349011 CUSTOMER SERVICE 176,599 168,952 7,647 4.5% 168,952 168,474
461.3308.534.349016 GF ADMIN CHARGE 202,053 221,340 ‐19,287 ‐8.7% 221,340 188,331
461.3308.534.349023 BAD DEBT 7,000 7,000 0 0.0% 7,000 26,352
461.3308.534.349028 LANDFILL FEES 4,256 4,256 0 0.0% 4,256 5,235
461.3308.534.349200 HURRICANE IRMA EXPENSES 0 0 0 n/a 0 20
461.3308.534.349300 HURRICANE DORIAN EXPENSES 0 0 0 n/a 0 24
461.3308.534.349400 COVID 19 EXPENSES 0 0 0 n/a 0 199
461.3308.534.351001 OFFICE SUPPLIES 1,500 1,500 0 0.0% 1,500 1703
154

SOLID WASTE FUND
SOLID WASTE
2022 Budget vs 2021
Projected
2021‐2022 2020‐2021 Change $ Change % 2020‐2021 2019‐2020
Account Number Account Name Budget Projected Budget Actual
461.3308.534.351003 OFFICE FURN & EQUIP 300 300 0 0.0% 300 0
461.3308.534.352001 MOTOR FUEL 112,951 101,383 11,568 11.4% 101,383 80,143
461.3308.534.352004 EQUIP PARTS & SUPPLIES 500 500 0 0.0% 500 704
461.3308.534.352005 CONSUMABLE TOOLS 2,000 2,000 0 0.0% 2,000 955
461.3308.534.352008 UNIFORMS & CLOTHING 6,000 4,000 2,000 50.0% 4,000 5,931
461.3308.534.352013 CHEMICAL AND LAB SUPPLIES 3,300 3,300 0 0.0% 3,300 2,083
461.3308.534.352014 OTHER COMMODITIES 4,400 5,000 ‐600 ‐12.0% 5,000 2,186
461.3308.534.354001 SUBSCRIPTIONS/MEMBERSHIPS 250 250 0 0.0% 250 234
461.3308.534.355007 GRACE 800 800 0 0.0% 800 2,502
Total Operating Expenses 1,059,553 1,054,876 4,677 0.4% 1,054,876 987,567
Net Operating & Personnel Costs 2,752,883 2,752,101 782 0.0% 2,752,101 2,434,819
Capital Outlay
461.3308.534.6_____ Various, See Detail 246,443 85,340 161,103 188.8% 85,340 91,110
Total Capital Outlay 246,443 85,340 161,103 188.8% 85,340 91,110
Debt Service and Transfers 461.3308.534.991004 TRANSFER TO GENERAL FUND 183,000 181,000 2,000 1.1% 181,000 173,000
Total Debt Service and Transfers 183,000 181,000 2,000 1.1% 181,000 173,000
Total 3,182,326 3,018,441 163,885 5.4% 3,018,441 2,698,929
155

SOLID WASTE FUND
CAPITAL REQUEST DETAIL
Account 2021‐2022
Department Number Account Name Description Budget
Solid Waste 461.3308.534.613001 SOLID WASTE VEHICLE PURCHASE Replace 2007 Crane Carrier rear loader. The truck 225,000
has exceeded its useful life and begun having more mechanical breakdowns which reduces our ability to provide timely service to our customers
461.3308.534.641500 SOLID WASTE LIGHT VEHICLE LEASE‐ Annual payment for current and prior lease‐ 21,443 PURCHASE DEBT SERVICE purchase agreements for light vehicle acquisition
Total for Solid Waste 246,443
Note: Please see Five Year Capital Program for project descriptions and five year funding
156

~·· . r__ ·-~--C"t-·.
I .,-/. -.:?--i . ~-;_ '\..._ - ..r .. -<-~~v.iu-~Mitr:~
CONFISCATED PROPERTY
157

Confiscated Property Mission
This Trust Fund is the depository for money either confiscated or derived by legal settlement agreements or obtained through the sale by auction of property confiscated by the Police Department through court forfeiture proceedings. The Police Department is allowed, after court approval, to keep money or goods confiscated as contraband when used as an instrument of a felony. The money may be used to support specific police activities or to purchase specific types of equipment.
No budget is presented for Fiscal Year 2021-2022. Sec. 932.7055, Florida Statutes, (8)(c) states that "Neither the law enforcement agency nor the entity having budgetary control over the law enforcement agency shall anticipate future forfeitures or proceeds therefore in the adoption and approval of the budget for the law enforcement agency."
158

CONFISCATED PROPERTY TRUST FUND
REVENUE 2022 Budget vs 2021
Projected
2021‐2022 2020‐2021 Change $ Change % 2020‐2021 2019‐2020
Account Number Account Name Budget Projected Budget Actual
601.0000.351.020000 CONFISCATED PROPERTY 0 0 0 n/a 0 55,520
Total 0 0 0 n/a 0 55,520
159

CONFISCATED PROPERTY TRUST FUND
CONFISCATED PROPERTY TRUST FUND
2022 Budget vs 2021 Projected
Account Number Account Name 2021‐2022
Budget 2020‐2021
Projected Change $ Change % 2020‐2021
Budget 2019‐2020
Actual
Operating Expenses 601.1801.521.355002 MISCELLANEOUS 0 14,000 ‐14,000 ‐100.0% 0 0
Total 0 14,000 ‐14,000 ‐100.0% 0 0
160

~·· . r__ ·-~--C"t-·.
I .,-/. -.:?--i . ~-;_ '\..._ - ..r .. -<-~~v.iu-~Mitr:~ LAW
ENFORCEMENT EDUCATION
161

Law Enforcement Education
Mission The City of Vero Beach receives fines, bond forfeitures, court costs, funds from defensive driving schools, and a two dollar assessment on each charge by the Police Department which is successfully prosecuted through the County court system. This two-dollar assessment is known as the Local Law Enforcement Education Fund and is mandated by the State to fund law enforcement related education for police officers.
162

LAW ENFORCEMENT EDUCATION FUND
REVENUE 2022 Budget vs 2021
Projected
2021‐2022 2020‐2021 Change $ Change % 2020‐2021 2019‐2020
Account Number Account Name Budget Projected Budget Actual
602.0000.351.030000 POLICE FINES/ORDINANCE 1480 0 2,953 ‐2,953 ‐100.0% 0 3,293
Total 0 2,953 ‐2,953 ‐100.0% 0 3,293
163

LAW ENFORCEMENT EDUCATION FUND
LAW ENFORCEMENT EDUCATION FUND
2022 Budget vs 2021 Projected
2021‐2022 2020‐2021 Change $ Change % 2020‐2021 2019‐2020
Account Number Account Name Budget Projected Budget Actual
Operating Expenses 602.1801.521.349003 SCHOOLS & MEETINGS 0 0 0 n/a 0 0
Total 0 0 0 n/a 0 0
164

c_ __ · _.I . ,, ,. c· ..::--_L.' I
, ··
_,,_
-------..
CRESTLAWN CEMETERY
165

CRESTLAWN CEMETERY TRUST FUND
REVENUE 2022 Budget vs 2021
Projected
2021‐2022 2020‐2021 Change $ Change % 2020‐2021 2019‐2020
Account Number Account Name Budget Projected Budget Actual
603.0000.343.040300 OPENING/CLOSING FEES & MISC 26,000 26,000 0 0.0% 26,000 26,350
603.0000.361.010200 INTEREST ON INVESTMENTS 100 500 ‐400 ‐80.0% 500 381
603.0000.364.010100 SALE OF GRAVE SPACES 138,000 135,000 3,000 2.2% 135,000 190,116
603.0000.364.020100 SALE OF COLUMNBARIUM SPCS 21,000 21,000 0 0.0% 21,000 20,560
603.0000.382.000650 CONTR FROM HLTH INS FND 0 0 0 n/a 0 994
603.0000.383.000100 CONTRIBUTIONS FROM GEN FND 145,450 93,000 52,450 56.4% 93,000 48,000
603.0000.389.000200 CASH CARRY/OVER ‐423 ‐3,324 2,901 ‐87.3% ‐3,324 0
Total 330,127 272,176 57,951 21.3% 272,176 286,401
166

CRESTLAWN CEMETERY TRUST FUND
BUDGET BY DEPARTMENT
2022 Budget vs 2021
Projected 2021‐2022 2020‐2021 2020‐2021 2019‐2020
Change $ Change % Department Budget Projected Budget Actual
Cemetery 330,127 272,176 57,951 21.3% 272,176 224,813
Crestlawn Cemetery Trust Fund 330,127 272,176 57,951 21.3% 272,176 224,813
167

CRESTLAWN CEMETERY TRUST FUND Expenditures by Object
2022 Budget vs 2021
Projected
Account Number / Account Name 2021‐2022
Budget 2020‐2021
Projected Change $ Change % 2020‐2021
Budget 2019‐2020
Actual
112001 ‐ OPERATING SALARIES 48,011 47,133 878 1.9% 47,133 46,127
114001 ‐ OVERTIME SALARIES 1,000 1,000 0 0.0% 1,000 825
121001 ‐ SOCIAL SECURITY TAXES 3,749 3,682 67 1.8% 3,682 2,979
122001 ‐ PENSION FUND CONTRIBUTION 13,963 15,268 ‐1,305 ‐8.5% 15,268 15,177
123001 ‐ GROUP LIFE INSURANCE 200 200 0 0.0% 200 115
123002 ‐ HOSPITALIZATION INSURANCE 21,313 20,909 404 1.9% 20,909 20,263
123004 ‐ RETIREMENT PREM ASSIST 4,029 4,295 ‐266 ‐6.2% 4,295 4,078
123005 ‐ WORKERS COMPENSATION 2,500 1,900 600 31.6% 1,900 1,877
123006 ‐ CONTRIBUTION TO OPEB TRUST 1,889 2,066 ‐177 ‐8.6% 2,066 2,167
331001 ‐ PROFESSIONAL SERVICES 0 0 0 n/a 0 90
334002 ‐ CLEANING/LAUNDRY 226 226 0 0.0% 226 0
334007 ‐ OTHER CONTRACTUAL SERVICES 1,400 500 900 180.0% 500 500
334016 ‐ DISCOUNT ON CREDIT CARDS 1,200 1,200 0 0.0% 1,200 928
341001 ‐ TELEPHONE 300 300 0 0.0% 300 205
343001 ‐ UTILITIES 5,300 5,000 300 6.0% 5,000 4,897
345001 ‐ GENERAL INSURANCE 5,927 4,303 1,624 37.7% 4,303 3,315
346002 ‐ VEHICLE MAINTENANCE 6,673 6,910 ‐237 ‐3.4% 6,910 6,280
346003 ‐ BUILDING MAINTENANCE 500 500 0 0.0% 500 0
346058 ‐ GROUNDS MAINTENANCE 64,212 63,647 565 0.9% 63,647 48,447
349016 ‐ GF ADMIN CHARGE 65,570 54,620 10,950 20.0% 54,620 52,537
349028 ‐ LANDFILL FEES 200 150 50 33.3% 150 151
352001 ‐ GAS AND OIL 2,790 2,242 548 24.4% 2,242 1,974
352008 ‐ UNIFORMS & CLOTHING 325 325 0 0.0% 325 325
352014 ‐ OTHER COMMODITIES 22,750 20,300 2,450 12.1% 20,300 11,076
352065 ‐ SMALL EQUIPMENT 2,100 500 1,600 320.0% 500 480
6_____ ‐ CAPITAL Various, See Detail 54,000 15,000 39,000 260.0% 15,000 0
Total for Crestlawn Cemetery Trust Fund Expenditures 330,127 272,176 57,951 21.3% 272,176 224,813
168

Public Works Crestlawn Cemetery
Mission
The mission of the Cemetery Division is to provide outstanding customer service to cemetery patrons and to maintain the Cemetery grounds in a manner that support the community's vision. Goals and objectives are accomplished through the maintenance of the grounds by reliable and well-trained staff.
Staffing Table
Employee Type Budget
2021-2022 Budget
2020-2021 Change
Full Time Non Bargaining 0 0 0 Full Time Bargaining 1 1 0
Total 1 1 0 Part Time 0 0 0
Total 1 1 0
Major Goals and Challenges
Enforce and update the Cemetery Ordinance. Continue to implement cost and labor-saving techniques pertaining to landscape maintenance. Inspect and repair the irrigation systems on the cemetery property. Work with Water and Sewer for a backup irrigation source to the property. Create plans to replace the landscaping at cemetery entrance in conjunction with the Garden Club to
incorporate Florida Friendly plants.
169

CRESTLAWN CEMETERY TRUST FUND
CEMETERY
2022 Budget vs 2021 Projected
2021‐2022 2020‐2021 Change $ Change % 2020‐2021 2019‐2020
Account Number Account Name Budget Projected Budget Actual
Personnel Costs603.3307.539.112001 OPERATING SALARIES 48,011 47,133 878 1.9% 47,133 46,127
603.3307.539.114001 OVERTIME SALARIES 1,000 1,000 0 0.0% 1,000 825
603.3307.539.121001 SOCIAL SECURITY TAXES 3,749 3,682 67 1.8% 3,682 2,979
603.3307.539.122001 PENSION FUND CONTRIBUTION 13,963 15,268 ‐1,305 ‐8.5% 15,268 15,177
603.3307.539.123001 GROUP LIFE INSURANCE 200 200 0 0.0% 200 115
603.3307.539.123002 HOSPITALIZATION INSURANCE 21,313 20,909 404 1.9% 20,909 20,263
603.3307.539.123005 WORKERS COMPENSATION 2,500 1,900 600 31.6% 1,900 1,877
603.3307.539.123004 RETIREMENT PREM ASSIST 4,029 4,295 ‐266 ‐6.2% 4,295 4,078
603.3307.539.123006 CONTRIBUTION TO OPEB TRUST 1,889 2,066 ‐177 ‐8.6% 2,066 2,167
Total Personnel Costs 96,654 96,453 201 0.2% 96,453 93,608
Operating Expenses
603.3307.539.331001 PROFESSIONAL SERVICES 0 0 0 n/a 0 90
603.3307.539.334002 CLEANING/LAUNDRY 226 226 0 0.0% 226 0
603.3307.539.334007 OTHER CONTRACTUAL SERVICES 1400 500 900 180.0% 500 500
603.3307.539.334016 DISCOUNT ON CREDIT CARDS 1,200 1,200 0 0.0% 1,200 928
603.3307.539.341001 TELEPHONE 300 300 0 0.0% 300 205
603.3307.539.343001 UTILITIES 5,300 5,000 300 6.0% 5,000 4,897
603.3307.539.345001 GENERAL INSURANCE 5,927 4,303 1,624 37.7% 4,303 3,315
603.3307.539.346002 VEHICLE MAINTENANCE 6,673 6,910 ‐237 ‐3.4% 6,910 6,280
603.3307.539.346003 BUILDING MAINTENANCE 500 500 0 0.0% 500 0
603.3307.539.346058 GROUNDS MAINTENANCE 64,212 63,647 565 0.9% 63,647 48,447
603.3307.539.349016 GF ADMIN CHARGE 65,570 54,620 10,950 20.0% 54,620 52,537
603.3307.539.349028 LANDFILL FEES 200 150 50 33.3% 150 151
603.3307.539.352001 GAS AND OIL 2,790 2,242 548 24.4% 2,242 1,974
603.3307.539.352008 UNIFORMS & CLOTHING 325 325 0 0.0% 325 325
603.3307.539.352014 OTHER COMMODITIES 22,750 20,300 2,450 12.1% 20,300 11,076
603.3307.539.352065 SMALL EQUIPMENT 2,100 500 1,600 320.0% 500 480
Total Operating Expenses 179,473 160,723 18,750 11.7% 160,723 131,205
Capital Outlay
603.3307.539.6_____ Various, See Detail 54,000 15,000 39,000 260.0% 15,000 0
Total Capital Outlay 54,000 15,000 39,000 260.0% 15,000 0
Total 330,127 272,176 57,951 21.3% 272,176 224,813
170

CRESTLAWN CEMETERY TRUST FUND
CAPITAL REQUEST
Account 2021‐2022
Department Number Account Name Description Budget
Crestlawn Cemetery Trust Fund 603.3307.539.617010 IRRIGATION WELL (NORTH WELL) Repair of the irrigation well to have 8,000
backup irrigation and take the
burden off of the east well. 603.3307.539.609027 CEMETERY MISC EQUIPMENT (ATV) Replacement for 2000 golf cart used 12,500
to apply herbicides on property.
603.3307.539.617010 IRRIGATION WELL (OLD DIXIE Inspect and rehab the east well for 7,500 WELL) functionality.
603.3307.539.662004 CEMETERY SITE IMPROVEMENTS Expansion of Section K sidewalk to 23,000 (SECTION K SIDEWALK) accommodate customers.
603.3307.539.662004 CEMETERY SITE IMPROVEMENTS Replacement of hedge along Old 3,000 (OLD DIXIE HEDGE/IRRIGATION) Dixie Highway
Total for Crestlawn Cemetery Trust Fund 54,000
171

~·· . r__ ·-~--C"t-·.
I .,-/. -.:?--i . ~-;_ '\..._ - ..r .. -<-~~v.iu-~Mitr:~
HISTORIC DOWNTOWN VERO
BEACH ECONOMIC
DEVELOPMENT ZONE
172

Historic Downtown Vero Beach Economic
Development Zone Trust Mission
In 2014, the City designated Historic Downtown Vero Beach as an economic development zone and tax increment area. This designation provides for the use of tax increment revenues to fund the costs of infrastructure and capital improvements in this zone, to further economic development and improvement. These tax increment revenues, along with any other public or private funding source so designated, are to be accounted for in a separate trust fund.
173

HISTORIC DOWNTOWN VERO BEACH ECONOMIC DEVELOPMENT ZONE TRUST FUND
REVENUE 2022 Budget vs 2021
Projected
Account Number Account Name 2021‐2022
Budget 2020‐2021
Projected Change $ Change % 2020‐2021
Budget 2019‐2020
Actual
607.0000.389.000200
607.0000.389.001000
CASH CARRYOVER
TRANS FROM GENERAL FUND
‐48,225
98,225
‐86,099
91,099
37,874
7,126
‐44.0%
7.8%
125,401
91,099
0
87,027
Total 50,000 5,000 45,000 900.0% 216,500 87,027
174

HISTORIC DOWNTOWN VERO BEACH ECONOMIC DEVELOPMENT ZONE FUND
HISTORIC DOWNTOWN VERO BEACH ECONOMIC DEVELOPMENT ZONE FUND
2022 Budget vs 2021 Projected
Account Number Account Name 2021‐2022
Budget 2020‐2021
Projected Change $ Change % 2020‐2021
Budget 2019‐2020
Actual
Capital Outlay 607.9900.519.6_____
Total Capital Outlay
Various, See Detail 50,000
50,000
5,000
5,000
45,000
45,000
900.0%
900.0%
216,500
216,500
0
0
Total 50,000 5,000 45,000 900.0% 216,500 0
175

HISTORIC DOWNTOWN VERO BEACH ECONOMIC DEVELOPMENT ZONE FUND
CAPITAL REQUEST DETAIL
Account 2021‐2022
Department Number Account Name Description Budget
Historic Downtown Vero Beach Economic Development Zone Trust 607.9900.519.600101 DOWNTOWN LIGHTING & SECURITY Engineering / design for lighting improvement 50,000
project Total for Historic Downtown Vero Beach Economic Development Zone Trust 50,000
Note: Please see Five Year Capital Program for project descriptions and five year funding
176

APPENDICES
177

CITY OF VERO BEACH, FLORIDA
MISCELLANEOUS STATISTICAL DATA
POPULATION approximately 17,503
EMPLOYEES General and Enterprise
Police Officers Total Employees
STREETS Miles, paved Miles, unpaved
CITY UTILITIES
Water Plant 290 Miles Water Transmission Mains 11,975 Service Lines 1,240 Fire Hydrants
Wastewater Plant 132 Miles Gravity Sewers 65 Miles Sewer Force Mains
Wastewater Reclamation Plant
DATE OF INCORPORATION City of Vero, 1919
City of Vero Beach, 1925
FORM OF GOVERNMENT Council/Manager
266 57
323
102 6
13.8 MGD
4.5 MGD
4.95 MGD
AREA 13.1 Square Miles
RECREATIONAL FACILITIES Protected Beaches 3
Approximately 25 Acres with Picnic Facilities
Playgrounds & Restrooms
Parks 17
Approximately 243 Acres Tennis Courts 12 Hand/Racquetball Courts 4 Baseball Fields 6 Boat Launching Facilities 3 Shuffleboard Courts 10 Pickleball Courts 12 Recreation Centers 6
Municipal Marina 1
INDIAN RIVER COUNTY PUBLIC SCHOOLS
K thru Grade 5 13 Middle Schools 4 Senior High Schools 2 Alternative Education Center 1 Career and Adult Education Center 1 Exceptional Student Education 1 Charter Schools 5 Community College 1
178

CITY OF VERO BEACH, FLORIDA
ASSESSED VALUES AND AD VALOREM TAX LEVIES LAST TEN FISCAL YEARS
(in 000s)
Assessed Less: Assessed Value ASSESSED VALUE FOR OPERATIONS TAX LEVIES AND COLLECTIONS
Fiscal Property Property Value for of One Millage Total Amount Percent Year Value Exemption Operations Mill (2) Tax Levy Collected Collected
2013 $ 2,738,160 $ 644,906 $ 2,093,254 $ 2,093 2.0336 $ 4,257 $ 4,115 96.7%
2014 2,805,380 678,888 2,126,492 2,126 2.0336 4,330 4,189 96.7%
2015 2,927,036 719,444 2,207,592 2,208 2.0336 4,504 4,335 96.2%
2016 3,271,056 900,249 2,370,807 2,371 2.3800 5,669 5,456 96.2%
2017 3,533,663 1,043,306 2,490,357 2,490 2.5194 6,277 6,067 96.7%
2018 3,816,977 1,148,123 2,668,855 2,669 2.5194 6,767 6,502 96.1%
2019 4,013,864 1,167,688 2,846,175 2,846 2.5194 7,192 6,938 96.5%
2020 4,220,353 1,177,041 3,043,312 3,043 2.5000 7,643 7,353 96.2%
2021 Note (3) Note (3) 3,174,943 3,175 2.5000 7,937 7,661 96.5% Note (4)
2022 Note (3) Note (3) 3,368,676 3,369 2.5000 8,422
Source: Property Appraiser's Office, Indian River County, Florida.
(1) By Florida Statutes property is assessed at 100% of market value. The values shown above were estimates made by Certified Property Appraisers for all property located within the municipal boundaries of the City of Vero Beach.
(2) The millage rate is for operating millage only. The City has no debt service millage.
(3) Not available at the time of budget preparation.
(4) Actual revenues collected through month end June 2021
179

CITY OF VERO BEACH, FLORIDA
GENERAL FUND REVENUES AND OTHER FINANCING SOURCES LAST TEN FISCAL YEARS
(in 000s)
TOTAL TAXES
CHARGES
INTER- LICENSES MISC REV FINES FISCAL GENERAL AD FOR RECREATION (2) GOVERNMENTAL & & OTHER AND YEAR FUND VALOREM UTILITY OTHER TRANSFERS SERVICES INCOME REVENUE INTEREST PERMITS SOURCES FORFEITS
2013 $ 20,172 $ 4,115 20.4% $ 3,493 17.3% $ 601 3.0% $ 7,070 35.0% $ 2,875 14.3% $ 1,525 7.6% $ 26 0.1% $ 143 0.7% $ 216 1.1% $ 108 0.5%
2014 19,831 4,189 21.1% 3,413 17.2% 652 3.3% 6,739 34.0% 2,682 13.5% 1,613 8.1% 48 0.2% 128 0.6% 234 1.2% 133 0.7%
2015 20,991 4,335 20.7% 3,322 15.8% 670 3.2% 6,877 32.8% 2,767 13.2% 324 1.5% 1,645 7.8% 143 0.7% 142 0.7% 622 3.0% 143 0.7%
2016 22,392 5,456 24.4% 3,372 15.1% 649 2.9% 6,652 29.7% 3,030 13.5% 323 1.4% 1,679 7.5% 98 0.4% 197 0.9% 816 3.6% 120 0.5%
2017 23,112 6,068 26.3% 3,387 14.7% 654 2.8% 6,625 28.7% 3,168 13.7% 327 1.4% 1,728 7.5% 49 0.2% 165 0.7% 772 3.3% 170 0.7%
2018 24,752 6,504 26.3% 3,507 14.2% 666 2.7% 6,640 26.8% 3,224 13.0% 307 1.2% 1,788 7.2% 24 0.1% 147 0.6% 1,758 7.1% 186 0.8%
2019 (3) 79,106 6,941 8.8% 4,997 6.3% 663 0.8% 59,714 75.5% 2,579 3.3% 364 0.5% 1,820 2.3% 414 0.5% 186 0.2% 1,129 1.4% 300 0.4%
2020 24,292 7,355 30.3% 5,513 22.7% 649 2.7% 1,279 5.3% 2,430 10.0% 203 0.8% 1,809 7.4% 2,235 9.2% 188 0.8% 1,984 8.2% 646 2.7%
2021 (1) 21,197 7,507 35.4% 5,501 26.0% 653 3.1% 1,309 6.2% 2,783 13.1% 366 1.7% 1,770 8.4% 593 2.8% 154 0.7% 373 1.8% 188 0.9%
2022 (1) 22,172 8,001 36.1% 5,760 26.0% 704 3.2% 1,319 5.9% 2,837 12.8% 367 1.7% 1,983 8.9% 440 2.0% 160 0.7% 428 1.9% 175 0.8%
(1) Budget (2) Beginning with FY 2014-15 Recreation activities revenue and expenditures are included in General Fund. (3) FY 2019 includes Transfer of $53.956M from residual of electric utility system sale to Florida Power & Light in December 2018.
180

CITY OF VERO BEACH, FLORIDA
GENERAL FUND EXPENDITURES AND OTHER USES LAST TEN FISCAL YEARS
(in 000s)
TOTAL FISCAL GENERAL GENERAL CULTURE & PUBLIC WORKS & NON- TRANSFERS YEAR FUND POLICE (1) GOVERNMENT RECREATION TRANSPORTATION DEBT SERVICE DEPARTMENTAL & OTHER USES
2013 $ 18,890 $ 6,722 35.6% $ 5,209 27.6% $ 3,329 17.6% $ 2,091 11.1% $ 20 0.1% $ 1,519 8.0% $ - 0.0%
2014 19,359 6,726 34.7% 5,041 26.0% 3,344 17.3% 1,974 10.2% 686 3.5% 1,588 8.2% 0 0.0%
2015 20,534 6,768 33.0% 4,972 24.2% 3,930 19.1% 2,185 10.6% 694 3.4% 1,985 9.7% 0 0.0%
2016 22,190 7,310 32.9% 5,574 25.1% 4,114 18.5% 2,444 11.0% 695 3.1% 2,030 9.1% 25 0.1%
2017 23,986 7,324 30.5% 5,747 24.0% 4,172 17.4% 2,209 9.2% 691 2.9% 3,571 14.9% 272 1.1%
2018 23,774 7,644 32.2% 5,913 24.9% 4,224 17.8% 2,288 9.6% - 0.0% 3,244 13.6% 461 1.9%
2019 23,972 8,346 34.8% 5,713 23.8% 4,440 18.5% 2,300 9.6% - 0.0% 3,054 12.7% 119 0.5%
2020 24,811 8,418 33.9% 5,754 23.2% 4,566 18.4% 2,401 9.7% - 0.0% 3,236 13.0% 435 1.8%
2021 (2) 25,025 8,723 34.9% 5,960 23.8% 4,623 18.5% 2,541 10.2% - 0.0% 2,994 12.0% 184 0.7%
2022 (2) 27,890 8,913 32.0% 6,264 22.5% 4,671 16.7% 2,719 9.8% - 0.0% 3,080 11.0% 2,244 8.0%
(1) The City maintains a Police Department. Fire, Rescue and EMT services are provided by Indian River County.
(2) Budget
181

CITY OF VERO BEACH, FLORIDA
WATER AND SEWER SYSTEM BOND COVERAGE LAST TEN FISCAL YEARS
(in 000s)
NET
REVENUE
DIRECT AVAILABLE DEBT SERVICE REQUIREMENTS:
FISCAL GROSS OPERATING FOR DEBT
YEAR 2013 2014 2015 2016 2017 2018 2019 2020
2021 (4)
2022 (4)
REVENUES (1) EXPENSES (2) SERVICE $ 15,545 $ 9,511 $ 6,034
15,710 9,580 6,130 16,178 9,523 6,655 16,271 10,247 6,024 17,026 10,133 6,893 17,193 11,074 6,119 17,427 11,528 5,899 17,950 11,335 6,615 17,393 13,357 4,035 17,482 13,993 3,489
$ PRINCIPAL
1,468 516
1,529 1,558 1,587 1,621 1,678 1,712 1,717 1,753
$ INTEREST TOTAL
635 $ 2,103 437 953 388 1,917 357 1,915 326 1,913 294 1,915 263 1,941 229 1,941 203 1,920 168 1,921
COVERAGE (3) 2.87 6.43 3.47 3.15 3.60 3.20 3.04 3.412.101.82
(1) Gross Revenues includes all revenues of the system (charges for
services, interest revenues and miscellaneous revenues). (2) Direct Operating Expenses includes all expenses of operating the
system except depreciation and interest expense. (3) Coverage includes both: 1) debt with a first lien on net revenues, such as bonds which require a minimum coverage of 1.20, and 2) debt with a secondary lien on net revenues, such as the Sunshine
State loans, which do not have a coverage requirement. The City's coverage factor is usually high enough that it is possible
to show the coverage which includes all debt. (4) Budget
182

CITY OF VERO BEACH, FLORIDA Full‐time Authorized Positions
LAST TEN FISCAL YEARS
General Fund2013 2014 2015 2016 2017 2018 2019 2020 2021 2022
City Clerk City Manager City Attorney Human Resources Finance
4 2 4
1.5 24
4 2 3
1.5 22
5 2 3
1.5 23
5 2 3 4
25
5 2 4 4
25
5 2 4 4
25
5 2 4 4
22
5 2 3 4
21
5 2 3 4
22
5234
22(2)
Planning & Development Police Department Public Works
7 74 81
6 72 71
6 72 71
4 76 71
5 76 73
5 76 73
4 78 71
4 78 70
4 78 70
47871
Recreation General Fund
0 198
0 182
16 200
19 209
19 213
19 213
19 209
19 206
19 207
19 208
(1)
Enterprise Funds Electric System Water and Sewer System Municipal Airport Municipal Marina Solid Waste
107 62 9 5
24
106 58 8 2
23
101 54 8 2
23
93 51 10 2
23
80 53 12 3
23
78 55 12 3
23
0 67 12 3
23
0 67 12 4
23
0 73 12 5
23
0 75125
23
(3)
Recreation Enterprise Funds
17 224
16 213
0 188
0 179
0 171
0 171
0 105
0 106
0 113
0 115
(1)
Cemetery 1 1 1 1 1 1 1 1 1 1
Risk Management 2.5 2.5 2.5 0 0 0 0 0 0 0 (2)
Citywide Totals: 425 398 391 389 385 385 315 313 321 324
(1): Recreation staff was moved to the General Fund for FY 14-15. (2): Risk Management staff was moved to the General Fund for FY 15-16. (3): Sixty Nine positions were budgeted for the 1st quarter FY18-19 to support Electric Utility operations until December 17, 2018 closing date for the FP&L sale (53 Electric System, 13 Customer Service, 3 Finance Warehouse).
183

CITY OF VERO BEACH, FLORIDA
SUMMARY SCHEDULE
ANNUAL DEBT SERVICE REQUIREMENTS - PRINCIPAL AND INTEREST
2022 113,959 1,920,950 528,538 2,563,447 2023 116,674 791,542 360,594 1,268,810 2024 114,328 791,542 242,457 1,148,327 2025 116,920 791,542 242,457 1,150,919 2026 114,450 791,542 - 905,992 2027 111,980 791,542 - 903,522 2028 114,448 791,542 - 905,990 2029 111,854 791,542 - 903,396 2030 114,199 791,542 - 905,741 2031 116,420 16,271 - 132,692
TOTAL $ 1,145,231 $ 8,269,558 $ 1,374,046 $ 10,788,835 LESS: INTEREST (130,231) (813,710) (84,124) (1,028,065) PRINCIPAL $ 1,015,000 $ 7,455,848 $ 1,289,922 $ 9,760,770
FISCAL YEAR GENERAL WATER & ENDING GOVERNMENT SEWER
SEPTEMBER 30, DEBT UTILITY
CAPITAL EQUIPMENT
LEASE PURCHASES
TOTAL CITY -WIDE DEBT
184

CITY OF VERO BEACH, FLORIDA
Schedule of Debt Service Requirements
Capital Improvement Revenue Note $1,400,000 Revenue Note, Series 2016
FISCAL YEAR ENDING
SEPTEMBER 30,
PRINCIPALOUTSTANDING
BEGINNING OF YEAR PRINCIPAL PAYMENT
INTEREST PAYMENT TOTAL
2022 2023 2024 2025 2026 2027 2028 2029 2030 2031
1,015,000 925,000 830,000 735,000 635,000 535,000 435,000 330,000 225,000 115,000
90,000 95,000 95,000
100,000 100,000 100,000 105,000 105,000 110,000 115,000
23,959 21,674 19,328 16,920 14,450 11,980
9,448 6,854 4,199 1,420
113,959 116,674 114,328 116,920 114,450 111,980 114,448 111,854 114,199 116,420
$ 1,015,000 $ 130,231 $ 1,145,231
Principal Date: October 1 Interest Dates: October 1, April 1
Source of Payment: One Cent Sales Tax Interest Rate: 2.47%
Loan Administrator: BB&T Bank
185

CITY OF VERO BEACH, FLORIDA
Schedule of Debt Service Requirements
Water & Sewer System Refunding Revenue Note $8,465,000, Series 2013
Note: Series 2013 refunded Series 2008
FISCAL YEAR ENDING
SEPTEMBER 30,
PRINCIPALOUTSTANDING
BEGINNING OF YEAR PRINCIPAL PAYMENT
INTEREST PAYMENT TOTAL
2022 1,120,000 1,120,000 9,408 1,129,408
$ 1,120,000 $ 9,408 $ 1,129,408
Principal Date: December 1 Interest Dates: June 1, December 1
Source of Payment: Water & Sewer System Revenues Interest Rate: 1.68%
Loan Administrator: BB&T Bank
186

CITY OF VERO BEACH, FLORIDA Schedule of Debt Service Requirements
Water & Sewer Revenue Loan $11,962,553 SRF Clean Water Loan WW310201 (Original and Amendment 2)
FISCAL YEAR PRINCIPAL ENDING OUTSTANDING PRINCIPAL INTEREST
SEPTEMBER 30, BEGINNING OF YEAR PAYMENT PAYMENT TOTAL
2022 6,064,443 607,130 151,870 759,000 2023 5,457,312 622,818 136,182 759,000 2024 4,834,494 638,913 120,087 759,000 2025 4,195,581 655,424 103,576 759,000 2026 3,540,157 672,363 86,637 759,000 2027 2,867,794 689,741 69,259 759,000 2028 2,178,053 707,570 51,430 759,000 2029 1,470,483 725,860 33,140 759,000 2030 744,624 744,624 14,376 759,000
$ 6,064,443 $ 766,556 $ 6,830,999
Principal Dates: February 15, August 15 Interest Dates: February 15, August 15
Source of Payment: Revenues Interest Rate: Original - 2.62%, Amendment #2 - 2.26%
Loan Administrator: Florida Department of Environmental Protection
187

CITY OF VERO BEACH, FLORIDA Schedule of Debt Service Requirements
Water & Sewer Revenue Loan $313,150, State Revolving Fund (SRF) Drinking Water Loan - DW310220
FISCAL YEAR ENDING
SEPTEMBER 30,
PRINCIPALOUTSTANDING
BEGINNING OF YEAR PRINCIPAL PAYMENT
INTEREST PAYMENT TOTAL
2022 2023 2024 2025 2026 2027 2028 2029 2030 2031
170,153 154,298 137,993 121,225 103,980
86,246 68,008 49,253 29,965 10,128
15,855 16,305 16,768 17,244 17,734 18,238 18,756 19,288 19,836 10,128
4,687 4,237 3,774 3,298 2,808 2,304 1,787 1,254
706 143
20,542 20,542 20,542 20,542 20,542 20,542 20,542 20,542 20,542 10,271
$ 170,153 $ 24,998 $ 195,151
Principal Dates: April 15, October 15 Interest Dates: April 15, October 15
Source of Payment: Water & Sewer Fund Revenues Interest Rate: 2.82%
Loan Administrator: Florida Department of Environmental Protection
188

CITY OF VERO BEACH, FLORIDA Schedule of Debt Service Requirements
Water & Sewer Revenue Loan State Revolving Fund (SRF) $196,800, Drinking Water Loan - DW310221
FISCAL YEAR ENDING
SEPTEMBER 30,
PRINCIPALOUTSTANDING
BEGINNING OF YEAR PRINCIPAL PAYMENT
INTEREST PAYMENT TOTAL
2022 2023 2024 2025 2026 2027 2028 2029 2030 2031
101,252 91,655 81,823 71,750 61,431 50,860 40,031 28,937 17,571
5,928
9,597 9,832
10,072 10,319 10,571 10,829 11,094 11,365 11,643
5,928
2,402 2,168 1,927 1,681 1,429 1,171
906 635 357
72
12,000 12,000 12,000 12,000 12,000 12,000 12,000 12,000 12,000
6,000
$ 101,252 $ 12,747 $ 114,000
Principal Dates: April 15, October 15 Interest Dates: April 15, October 15
Source of Payment: Revenues Interest Rate: 2.43%
Loan Administrator: Florida Department of Environmental Protection
189

CITY OF VERO BEACH, FLORIDA Schedule of Debt Service Requirements
Capital Lease Purchase $780,052.94 / Contract # 3352836 - Fleet/Police Vehicles 17-18
FISCAL YEAR PRINCIPAL ENDING OUTSTANDING PRINCIPAL INTEREST
SEPTEMBER 30, BEGINNING OF YEAR PAYMENT PAYMENT TOTAL
2022 163,164 163,164 4,781 167,945
$ 163,164 $ 4,781 $ 167,945
Principal & Interest Date: August 1 One Cent Sales Tax, Water/Sewer Utility, Airport Source of Payment: and Solid Waste Revenues
Interest Rate: 2.93% Loan Administrator: KS State Bank
Capital Lease Purchase $536,803.57 / Contract # 3354915 - Fleet/Police Vehicles 18-19
FISCAL YEAR PRINCIPAL ENDING OUTSTANDING PRINCIPAL INTEREST
SEPTEMBER 30, BEGINNING OF YEAR PAYMENT PAYMENT TOTAL
2022 222,976 109,329 8,808 118,136 2023 113,647 113,647 4,489 118,136
$ 222,976 $ 13,297 $ 236,273
Principal & Interest Date: August 15 One Cent Sales Tax, Airport and Solid Waste Source of Payment: Revenues
Interest Rate: 3.95% Loan Administrator: KS State Bank
Capital Lease Purchase $212,625.70 / Contract # 3357959 - Fleet/Police Vehicles 19-20
FISCAL YEAR PRINCIPAL ENDING OUTSTANDING PRINCIPAL INTEREST
SEPTEMBER 30, BEGINNING OF YEAR PAYMENT PAYMENT TOTAL
2022 168,873 40,437 4,864 45,301 2023 128,435 41,602 3,699 45,301 2024 86,833 42,800 2,501 45,301 2025 44,033 44,033 1,268 45,301
$ 168,873 $ 12,331 $ 181,204
Principal & Interest Date: December 15 Source of Payment: One Cent Sales Tax
Interest Rate: 2.88% Loan Administrator: KS State Bank
190

CITY OF VERO BEACH, FLORIDA Schedule of Debt Service Requirements
Capital Lease Purchase $675,107.25 / Contract # 3358236 - Police Vehicles 20-21
FISCAL YEAR PRINCIPAL ENDING OUTSTANDING PRINCIPAL INTEREST
SEPTEMBER 30, BEGINNING OF YEAR PAYMENT PAYMENT TOTAL
2022 538,018 128,831 15,495 2023 409,187 132,542 11,785 2024 276,645 136,359 7,967 2025 140,286 140,286 4,040
144,326 144,326 144,326 144,326
$ 538,018 $ 39,287 $ 577,305
Principal & Interest Date: April 1 Source of Payment: One Cent Sales Tax
Interest Rate: 2.88% Loan Administrator: KS State Bank
Capital Lease Purchase $247,398.00 / Contract # 3358617 - Fleet Vehicles 20-21
FISCAL YEAR PRINCIPAL ENDING OUTSTANDING PRINCIPAL INTEREST
SEPTEMBER 30, BEGINNING OF YEAR PAYMENT PAYMENT TOTAL
2022 196,892 47,140 5,690 52,830 2023 149,752 48,502 4,328 52,830 2024 101,250 49,904 2,926 52,830 2025 51,346 51,346 1,484 52,830
$ 196,892 $ 14,428 $ 211,320
Principal & Interest Date: August 1 Source of Payment: One Cent Sales Tax, Solid Waste Revenues
Interest Rate: 2.89% Loan Administrator: KS State Bank
191

Glossary Ad Valorem A tax levied in proportion to the value of property against which it is levied.
Appropriation A legal authorization granted by City Council to make expenditures and to incur obligations for specific purposes. An appropriation is usually limited in amount and to the time when it may be expended.
Assessed Valuation A valuation set upon real estate or other property by a government as a basis for levying taxes.
Budget A plan of financial operation for a single year embodying an estimate of proposed expenditures and the proposed means of financing them. The term "budget" is used in two senses in practice - the financial operation plan presented to the City Council for adoption or the plan finally approved by Council. It is usually necessary to specify whether the budget under consideration is preliminary and tentative or whether it has been approved by the Council.
Budgetary Control The control or management of the City in accordance with an approved budget for the purpose of keeping expenditures within the limitation of available appropriations and available revenues.
Capital Outlay Expenditures which result in the acquisition of or addition to fixed assets.
Capital Program A plan for capital expenditures to be incurred each year over a fixed period of years to meet capital needs arising from the long-term work program or otherwise. It sets forth each project or other contemplated expenditures in which the City is to have a part and specifies the full resources estimated to be available to finance the projected expenditures.
Capital Projects Fund A fund created to account for financial resources to be used for the acquisition or construction of major capital facilities (other than those financed by proprietary, special assessment and trust funds).
Debt Service Fund A fund established to account for the accumulation of resources for, and the payment of, general long-term debt principal, interest and related costs.
Debt Service Requirement The amount of money required to pay interest on outstanding debt, serial maturaties of principal for serial bonds, and required contributions to accumulate monies for future retirement of term bonds.
Department Basic organizational unit of the City which is functionally unique in its services.
Division A department or an organizational component of a department.
Encumbrances Commitments related to unperformed (executory) contracts for goods or services. Encumbrances outstanding at year-end are reported as reservations of fund balances in governmental fund types since they do not constitute expenditures or liabilities in the upcoming fiscal year.
Enterprise Funds Funds established to account for operations (a) that are financed and operated in a manner similar to private business enterprises - where the intent of the governing body is that the costs (expenses, including depreciation) of providing goods or services to the general public on a continuing basis be financed or recovered primarily through user charges; or (b) where the governing body has decided that periodic determination of revenues earned, expenses incurred, and/or net income is appropriate for capital maintenance, public policy, management control, accountability or other purposes. The City's enterprise funds are the water and sewer system, the solid waste system, the municipal airport and the marina.
Expenditures Decrease in net financial resources. Expenditures include current operating expenses which require the current or future use of net current assets, debt service and capital outlay.
Fiscal Year A 12-month period from October 1st through September 30th to which the annual operating budget applies. At the end of the fiscal year the City determines its financial position and the results of its operations.
192

Glossary Fund A fiscal and accounting entity with a self-balancing set of accounts recording cash and other financial resources, together with all related liabilities and residual equities or balances, and changes therein, which are segregated for the purpose of carrying on specific activities or attaining certain objectives in accordance with special regulations, restrictions, or limitations.
Fund Balance The fund equity of governmental and trust funds, i.e., the difference between fund assets and fund liabilities.
General Fund The general operating fund of the City. It is used to account for all financial resources, except those required to be accounted for in another fund. The general fund accounts for the normal recurring activities of the City (i.e., police, public works, general government, etc.). These activities are funded primarily by property taxes, intergovernmental revenues, licenses and fees.
Generally Accepted Accounting Principles (GAAP) Uniform minimum standards of/and guidelines for the financial accounting and reporting. GAAP govern the form and content of the basic financial statements of an entity. It encompass the conventions, rules, and procedures necessary to define accepted accounting practices and procedures. GAAP provide a standard to measure financial presentations.
Grants Contributions or gifts of cash or other assets from another government to be used or expended for a specified purpose, activity, or facility.
Intergovernmental Revenue Revenue from other governments in the form of grants, entitlements, shared revenues, or payments in lieu of taxes.
Nonoperating Expenses Fund expenses which are not directly related to the fund's primary service activities.
Object Code Unique identification number and title for an expenditure category. It represents the most detailed level of budgeting and recording expenditures; commonly referred to as a "line item" (e.g. 112001, Salaries & Wages; 351001, Office Materials and Supplies).
Operating Budget Plans of current expenditures and the proposed means of financing them. The annual operating budget is the summary means by which most of the financing, acquisition spending, and service delivery activities of the City are controlled. The use of annual operating budgets is usually required by law and is essential to sound financial management.
Operating Expenses Fund expenses which are directly related to the fund's primary service activities.
Personal Services General category that includes salaries and wages, pensions, health insurance, and other fringe benefits.
Reserve (1) An account used to earmark a portion of fund balance to indicate that it is not appropriate for expenditure, and (2) an account used to earmark a portion of fund equity as legally segregated for a specific future use.
Revenues (1) Increases in governmental fund type net current assets from other than expenditure, refunds, and residual equity transfers. Under National Council on Governmental Accounting (NCGA) Statement 1, general long-term debt proceeds and operating transfers-in are classified as "other financing sources" rather than revenues. (2) Increases in proprietary fund type net total assets from other than expense refunds, capital contributions, and residual equity transfers. Under NCGA Statement 1, operating transfers-in are classified separately from revenues.
Trust Funds Funds used to account for assets held by the City in a trustee capacity. These include expendable trust and pension and other post employment benefits (OPEB) trust funds. Pension and OPEB trust funds are accounted for in essentially the same manner as proprietary funds since capital maintenance is critical. Expendable trust funds are accounted for in essentially the same manner as governmental funds.
193

Five Year Capital Program
I• I
Fiscal Years Ending 2022-2026
Exhibit A (continued)

TABLE OF CONTENTS
General Government .....................................................................................................................1
Stormwater Utility Fund .............................................................................................................28
Water and Sewer Fund ................................................................................................................34
Airport Fund ................................................................................................................................83
Marina Fund.................................................................................................................................98
Solid Waste Fund .......................................................................................................................105
Historic Downtown Vero Beach Economic Development Zone ............................................109

~·· . r__ ·-~--C"t-·.
I .,-/. -.:?--i . ~-;_ '\..._ - ..r .. -<-~~v.iu-~Mitr:~ GENERAL
GOVERNMENT CAPITAL AND
CONSTRUCTION
1

I I
I I
I I
I I
CITY OF VERO BEACH FIVE YEAR CAPITAL IMPROVEMENT PROGRAM
FUND 304: General Government Capital and Construction
Account Number Account Name
FY 20-21 ORIGINAL BUDGET
FY 20-21 BUDGET
INCREASE (DECREASE)
FY 20-21 BUDGET
AMENDMENT FY 21-22 FY 22-23 FY 23-24 FY 24-25 FY 25-26
FUND BALANCE FORWARD (OCTOBER 1)
REVENUES 304.0000.334.040910 HMGP GRANT - VBPD ROOF REPLACEMENT & WINDOW UPGRADES 304.0000.365.090150 SALE OF SURPLUS VEHICLES 304.0000.369.060000 INSURANCE PROCEEDS 304.0000.383.000100 CAPITAL LEASE PROCEEDS (VEHICLE LEASE-PURCHASE) 304.0000.384.______ PROCEEDS FROM BORROWING: VETERANS MEM ISLAND BRIDGE 304.0000.389.000300 CONTRIBUTION FROM WHITAKER TRUST (RECREATION PROJECTS) 304.0000.389.001600 TRANS FROM 311 GENERAL 304.0000.389.800000 CONTRIBUTIONS FRM PRIVATE SOURCES-POLICE 304.0000.389.800000 CONTRIBUTIONS FRM PRIVATE SOURCES-RECREATION
Total Revenues
EXPENDITURES
4,640,435 Audited
4,820,267 1,325,364 482,287 443,719 51,431 239,062
-30,000
-618,830
--
2,000,000 100,000 250,000
580,800 -
46,515 249,844
---
19,756 (250,000)
580,800 30,000 46,515
868,674 --
2,000,000 119,756
-
-30,000
1,046,372 -
120,000 2,233,000
--
-40,000
925,580 1,100,000
132,000 2,433,000
-250,000
-40,000
718,396 --
2,333,000 --
-50,000
933,016 --
2,383,000 --
-50,000
491,450 --
2,383,000 --
2,998,830 646,915 3,645,745 3,429,372 4,880,580 3,091,396 3,366,016 2,924,450
CITY CLERK/CITY COUNCIL 304.9900.512.601120 COUNCIL CHAMBER BROADCAST SYSTEM 200,000 (100,000) 100,000 100,000 - - - -INFORMATION TECHNOLOGY 304.9900.513.616029 REPLACE CITY HALL SAN 304.9900.513.______ REPLACE NETWORK CORE SWITCHES 304.9900.513.______ REPLACE NETWORK EDGE SWITCHES 304.9900.513.______ REPLACE INTERNET FIREWALLS
50,000 ---
----
50,000 ---
----
----
----
-75,000 50,000
-
---
15,000 POLICE 304.9900.521.610008 POLICE VEHICLES (LEASE -PURCHASE ACQUISITION) 304.9900.521.610011 VBPD VEHICLES LEASE-PURCHASE DEBT SERVICE 304.9900.521.610015 VBPD ROOF REPLACEMENT AND WINDOW UPGRADES (HMGP 304.9900.521.610016 VBPD POLICE PISTOL RANGE IMPROVEMENTS 304.9900.521.610017 VBPD COVERED PARKING 304.9900.521.610018 REPLACE PD GENERATOR
424,000 377,260
-400,000
--
310,241 4,691
10,978 19,756 22,162
120,000
734,241 381,951
10,978 419,756 22,162
120,000
500,000 401,579
---
535,500 456,670
---
374,000 473,740
---
550,000 597,285
---
229,000 491,596
---
VEHICLES - FLEET AND STREETS/STORMWATER 304.9900.541.616008 STREETS/STORMWTR VEHICLE PURCHASE 304.9900.541.613003 STREETS/STORMWTR VEHICLE LEASE-PURCHASE 304.9900.541.641411 STREETS/STORMWTR VEHICLE LEASE-PURCHASE DEBT SERVICE 304.9900.541.641410 GENERAL FUND VEHICLE PURCHASE 304.9900.541.641409 GENERAL FUND VEHICLE LEASE-PURCHASE 304.9900.541.641413 GENERAL FUND VEHICLE LEASE-PURCHASE DEBT SERVICE 304.9900.572.641413 RECREATION VEHICLE LEASE-PURCHASE 304.9900.572.641414 RECREATION VEHICLE LEASE-PURCHASE DEBT SERVICE
223,000 -
48,270 -
194,830 206,791
-9,463
(9,596) --
31,537 151,279
(7,296) --
213,404 -
48,270 31,537
346,109 199,495
-9,463
205,000 250,000 104,426
-233,585 199,085
62,787 18,987
200,000 -
56,157 -
390,080 252,637
-14,104
235,000 -
56,157 -
313,180 284,275
31,216 21,116
290,500 -
56,157 -
351,016 363,123
32,000 28,304
125,000 -
56,157 -
262,450 348,241
-28,304
2
.

I I
I I
I I
CITY OF VERO BEACH FIVE YEAR CAPITAL IMPROVEMENT PROGRAM
FUND 304: General Government Capital and Construction
FY 20-21 FY 20-21 BUDGET FY 20-21
ORIGINAL INCREASE BUDGET Account Number Account Name BUDGET (DECREASE) AMENDMENT FY 21-22 FY 22-23 FY 23-24 FY 24-25 FY 25-26
PUBLIC WORKS 304.9900.541.615051 FEC RAILROAD CROSSING MAINTENANCE - 149,683 149,683 - - - - -304.9900.541.615062 AIR CONDITIONER REPLACEMENTS (VARIOUS LOCATIONS) 40,000 - 40,000 40,000 40,000 40,000 40,000 40,000 304.9900.541.616017 REPLACE TRAFFIC SIGNALS 26TH ST, ST LUCIE AVE 50,000 (50,000) - - - - - -304.9900.541.665002 ANNUAL STREET RESURFACING 525,000 - 525,000 375,000 625,000 625,000 625,000 625,000 304.9900.541.665006 SIDEWALK AND CURB REPLACEMENT 20,000 - 20,000 30,000 30,000 30,000 30,000 30,000 304.9900.541.665008 RADAR SPEED DETECTION SIGNS 10,000 - 10,000 15,000 15,000 15,000 15,000 15,000 304.9900.541.665009 PW COMPOUND ROOF REPAIRS 400,000 21,450 421,450 250,000 200,000 - - -304.9900.541.665023 CONN BEACH BOARDWALK REPAIRS 350,000 85,481 435,481 200,000 200,000 - - -304.9900.541.665026 BRIDGE REPAIR & MAINTENANCE (PER FDOT) 130,000 7,656 137,656 30,000 130,000 100,000 - -304.9900.541.665028 CITY HALL ROOF REPLACEMENT 900,000 - 900,000 - - - - -304.9900.541.665029 FLASHING BEACON SCHOOL SIGNS 16,000 - 16,000 - - - - -304.9900.541.665030 VETERANS ISLAND BRIDGE REPLACEMENT 160,000 (20,000) 140,000 20,000 1,100,000 - - -304.9900.541.665031 FLEET GARAGE DOOR REPLACEMENT - - - 20,000 20,000 20,000 20,000 20,000 STORMWATER 304.9900.541.665003 STORMWATER MASTER PLAN - - - 250,000 304.9900.541.665005 SECONDARY DRAINAGE 25,000 - 25,000 25,000 - - - -304.9900.541.617002 STORMWATER CULVERT REPLACEMENTS 300,000 (75,000) 225,000 - - - - -304.9900.541.617006 HUMISTON OUTFALL FLAP VALVE 25,000 (10,000) 15,000 50,000 - - - -304.9900.541.617009 STORMWATER MAINTENANCE & IMPROVEMENTS 250,000 75,000 325,000 50,000 - - - -304.9900.541.617012 STORMWATER OUTFALL REPAIRS AND PIPE LINING 100,000 (100,000) - 100,000 - - - -304.9900.541.617013 STORMWATER UTILITY ADOPTION 110,950 - 110,950 - - - - -RECREATION 304.9900.572.615030 PLAYGROUND EQUIPMENT 9,000 - 9,000 150,000 175,000 500,000 - -304.9900.572.615031 LEISURE SQUARE IMPROVEMENTS - - - 30,000 42,000 50,000 - -304.9900.572.616012 COMMUNITY CENTER IMPROVEMENTS 150,000 - 150,000 - 60,000 200,000 - -304.9900.572.616013 RIVERHOUSE IMPROVEMENTS 75,000 35,000 110,000 - - - - -304.9900.572.616015 TENNIS/PRO SHOP IMPROVEMENTS 60,000 - 60,000 - 72,000 60,000 - -304.9900.572.616018 BEACH LIFEGUARD TOWERS AND SHED 250,000 (250,000) - 120,000 250,000 - - -304.9900.572.615029 CENTERSTAGE IMPROVEMENTS - - - 220,000 - - - -304.9900.572.616021 PARK RESTROOM ROOF REPLACEMENTS 210,000 128,000 338,000 - - - - -304.9900.572.616023 HUMISTON PARK BATHROOM REMODEL 100,000 10,691 110,691 - - - - -304.9900.572.616024 MACWILLIAM PARK PAVILIONS REMODEL 150,000 (75,000) 75,000 105,000 - - - -304.9900.572.616026 PARK FACILITY MAINTENANCE & IMPROVEMENTS 180,000 (135,000) 45,000 100,000 55,000 55,000 55,000 -304.9900.572.616027 BEACH ATV - - - 17,000 - - - -304.9900.572.616030 POCAHONTAS PARK IMPROVEMENTS 100,000 (40,629) 59,371 - - - - -
Total Expenditures 6,829,564 311,084 7,140,648 4,272,449 4,919,148 3,483,684 3,178,385 2,285,748Excess (Deficiency) of Revenues over Expenditures
ENDING FUND BALANCE (SEPTEMBER 30)
(3,830,734) (3,494,903)
809,701 1,325,364
(843,077) (38,568) (392,288) 187,631 638,702
482,287 443,719 51,431 239,062 877,764
3
.

I
I I
I
I I
I
CITY OF VERO BEACH FIVE YEAR CAPITAL IMPROVEMENT PROGRAM
UNFUNDED PROJECTS FUND 304: General Government Capital and Construction
Total 5 Year ReductionAccount Number Account Name FY 21-22 FY 22-23 FY 23-24 FY 24-25 FY 25-26
POLICE no unfunded projects at this time - - - - -VEHICLES - FLEET AND STREETS/STORMWATER 304.9900.541.613003 STREETS/STORMWTR VEHICLE LEASE-PURCHASE - future stormwater vehicles moved to Stormwater Utility Fund -PUBLIC WORKS 304.9900.541.665002 ANNUAL STREET RESURFACING 250,000 - - - - 250,000 304.9900.541.6_____ DOWNTOWN ROTARY FOUNTAIN REPAIR 50,000 50,000 304.9900.541.6_____ SR 60 LANE ELIMINATION - 20th AVE TO FEC RAILROAD - - - - 500,000 500,000 304.9900.541.6_____ HUMISTON BOARDWALK REPLACEMENT 500,000 500,000 - - 1,000,000 304.9900.541.6_____ ADDITIONAL BEACHSIDE PARKING (COMMERCIAL/MULTIFAMILY) - 450,000 - - - 450,000 STORMWATER 304.9900.541.617___ STORMWATER MAINTENANCE & IMPROVEMENTS 225,000 future stormwater projects moved to Stormwater Utility Fund 225,000 RECREATION no unfunded projects at this time - - - - - -
Total (Net) Unfunded Projects 1,025,000 950,000 - - 500,000 2,475,000
4

FIVE YEAR CAPITAL PROGRAM EXPENDITURE REQUESTS FISCAL YEARS ENDING 2022‐2026
FUND 304 ‐ General Government Capital and Construction DEPARTMENT City Clerk/City Council
PROJECT NAME ACCOUNT #
Council Chamber Broadcast System 304.9900.512.601120
TYPE OF EXPENSE New Repair/Refurbish x Replace x
TOTAL PROJECT COST
PROJECT LOCATION City Hall
$ 200,000 GRANT FUNDING Amount Source/Agency
$ ‐
N/A
PROJECT DESCRIPTION Upgrades and repairs to broadcasting equipment for City Council Chambers
JUSTIFICATION The broadcast equipment is going over 10 years old. There are parts breaking down constantly and we have done our best
to keep the equipment running. It has come to the point where many of these parts are obsolete and don't exist anymore
and unless the equipment is repaired/updated we may not be able to have the capability to continue to televise our
meetings
5

FIVE YEAR CAPITAL PROGRAM EXPENDITURE REQUESTS FISCAL YEARS ENDING 2022‐2026
FUND 304 ‐ General Government Capital and Construction DEPARTMENT Information Technology
PROJECT NAME ACCOUNT #
Replace Network Core Switches 304.9900.513.______
TYPE OF EXPENSE New Repair/Refurbish Replace x
TOTAL PROJECT COST
PROJECT LOCATION City Hall
$ 75,000 GRANT FUNDING Amount Source/Agency
$ ‐
N/A
PROJECT DESCRIPTION Replace existing network core switches serving five (5) buildings
JUSTIFICATION The existing system was purchased and installed in FY 2017‐2018. Anticipated replacement may be needed in FY 24‐25 as
the system will be seven years old at that time. Vendor will provide support for 3 years after notification of "End of Sale"
(EOS) status. Currently EOS has not been announced, therefore it is anticipated that this announcement will be made within
the next year or two. Replacement as early as FY 24‐25 should be expected.
PROJECT NAME ACCOUNT #
Replace Network Edge Switches 304.9900.513.______
TYPE OF EXPENSE New Repair/Refurbish Replace x
TOTAL PROJECT COST
PROJECT LOCATION VARIOUS
$ 50,000 GRANT FUNDING Amount Source/Agency
$ ‐
N/A
PROJECT DESCRIPTION Replace Network Edge Switches in six (6) buildings
JUSTIFICATION The existing system was purchased and installed in FY 2017‐2018. Anticipated replacement may be needed in FY 24‐25 as
the system will be seven years old at that time. Vendor will provide support for 3 years after notification of "End of Sale"
(EOS) status. Currently EOS has not been announced, therefore it is anticipated that this announcement will be made within
the next year or two. Replacement as early as FY 24‐25 should be expected.
6
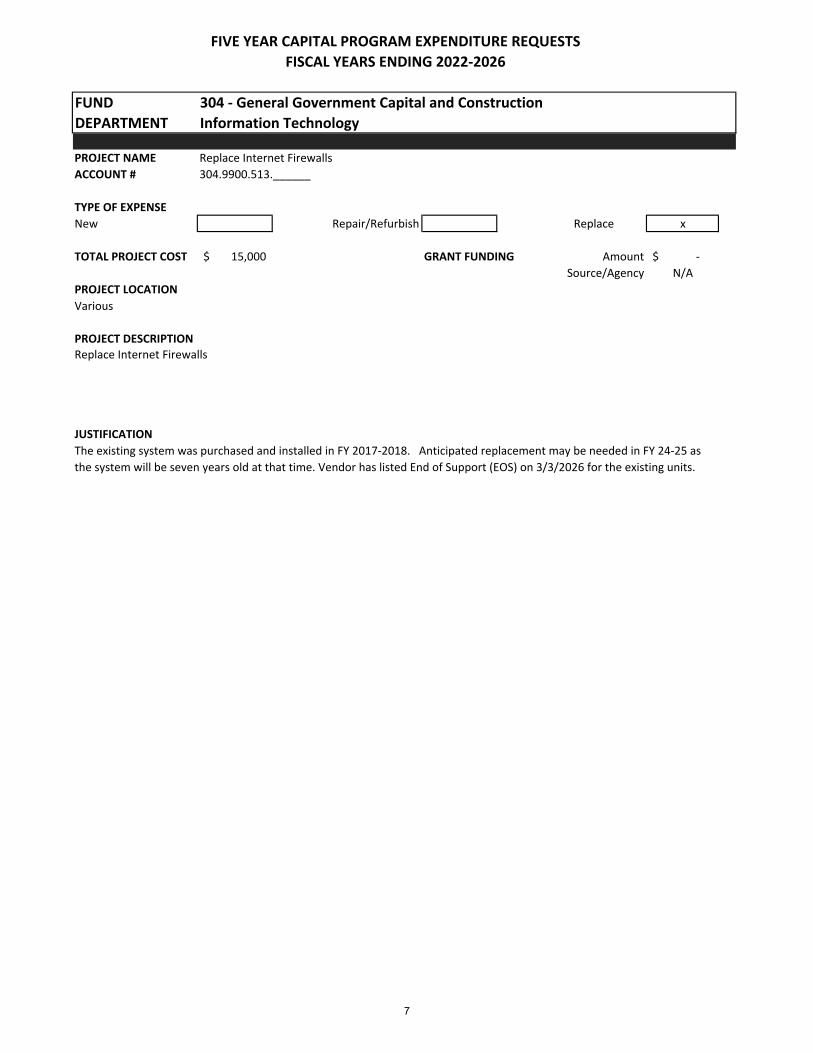
FIVE YEAR CAPITAL PROGRAM EXPENDITURE REQUESTS FISCAL YEARS ENDING 2022‐2026
FUND 304 ‐ General Government Capital and Construction DEPARTMENT Information Technology
PROJECT NAME ACCOUNT #
Replace Internet Firewalls 304.9900.513.______
TYPE OF EXPENSE New Repair/Refurbish Replace x
TOTAL PROJECT COST
PROJECT LOCATION Various
$ 15,000 GRANT FUNDING Amount Source/Agency
$ ‐
N/A
PROJECT DESCRIPTION Replace Internet Firewalls
JUSTIFICATION The existing system was purchased and installed in FY 2017‐2018. Anticipated replacement may be needed in FY 24‐25 as
the system will be seven years old at that time. Vendor has listed End of Support (EOS) on 3/3/2026 for the existing units.
7

FIVE YEAR CAPITAL PROGRAM EXPENDITURE REQUESTS FISCAL YEARS ENDING 2022‐2026
FUND 304 ‐ General Government Capital and Construction DEPARTMENT Police
PROJECT NAME Police Vehicles Lease‐Purchase Acquisition/Debt Service ACCOUNT # 304.9900.521.610008 / 304.9900.521.610011
TYPE OF EXPENSE New Repair/Refurbish Replace x
TOTAL PROJECT COST
PROJECT LOCATION Police Department patrol fleet
See schedule on next page GRANT FUNDING Amount Source/Agency
$ ‐
N/A
PROJECT DESCRIPTION Replace marked patrol units that are ready for destruction per replacement schedule using five year municipal lease‐
purchase financing
JUSTIFICATION In an effort to replace vehicles every (7) seven years the following vehicles need to be replaced during the
respective fiscal years.
8

FIVE YEAR CAPITAL PROGRAM EXPENDITURE REQUESTS FISCAL YEARS ENDING 2022‐2026
FUND 304 ‐ General Government Capital and Construction DEPARTMENT Police
Current Vehicle Replacement Vehicle
Purchase Increase to
Fiscal Year Vehicle # Use Description Price Debt Svc 2021‐2022 S‐21
S‐59 Marked Patrol Marked Patrol
2016 Dodge Charger
2016 Dodge Charger 50,000 50,000
S‐63 Mkd Patrol‐Sup 2016 Dodge Charger 50,000 S‐87 Marked Patrol 2016 Dodge Charger 50,000 S‐29 Mkd Patrol‐Sup 2015 Dodge Charger 50,000 S‐30 Mkd Patrol‐Sup 2015 Dodge Charger 50,000 S‐31 Mkd Patrol‐Sup 2015 Dodge Charger 50,000 S‐32 Marked Patrol 2015 Dodge Charger 50,000 S‐11 Marked Patrol 2015 Dodge Charger 50,000 S‐13 Mkd Patrol‐Sup 2015 Dodge Charger
Subtotal $ 50,000
500,000 $ 112,314 2022‐2023 S‐2 Unmarked Lt. 2014 Dodge Charger 35,000
S‐26 Unmarked Lt. 2014 Dodge Charger 35,000 S‐24 Detective 2015 Ford Taurus 32,000 S‐51 Detective 2015 Ford Taurus 32,000 S‐28 Marked Patrol 2015 Dodge Charger 55,000 S‐1 Code Enforce 2015 Nissan Van 32,500 S‐4 Code Enforce 2015 Nissan Van 32,500 S‐51 Parking Enforce 2015 Jeep Wrangler 42,000 S‐23 Animal Control 2015 Ford F‐250 43,000 S‐56 Crime Scene 2015 GMC Savana 35,000 S‐53 Marked Patrol 2016 Dodge Charger 55,000 S‐3 ATV 2016 Honda Pioneer 16,500 S‐25 Crime Scene 2016 Ford Taurus 35,000 S‐20 Marked Patrol 2017 Dodge Charger
Subtotal $ 55,000
535,500 $ 120,288 2023‐2024 S‐8 Unmarked Lt. 2016 Dodge Charger 36,000
S‐10 Crime Scene 2016 Ford Taurus 36,000 S‐19 Marked K‐9 2017 Chevy Tahoe 65,000 S‐34 Chief Unmarked Ford Taurus 36,000 S‐36 Marked Patrol 2017 Dodge Charger 55,000 S‐43 Marked Patrol 2017 Dodge Charger 55,000 S‐66 Sel Enf Sgt. 2016 Ford Taurus 55,000
2024‐2025
S‐86
S‐49 S‐59 S‐63
Unmarked Det.
Marked Patrol Marked Patrol Marked Patrol
2016 Ford Taurus
2017 Dodge Charger 2016 Dodge Charger 2016 Dodge Charger
Subtotal $ 36,000
374,000 55,000 55,000 55,000
$ 84,011
S‐70 S‐75
Marked Patrol Marked Patrol
2017 Dodge Charger2017 Dodge Charger
55,000 55,000
S‐76 Marked Patrol 2017 Dodge Charger 55,000
2025‐2026
S‐84 S‐85 S‐87 S‐89
S‐83 S‐80 S‐91 S‐90 S‐72
Marked Patrol Marked Patrol Marked Patrol Marked Patrol
Marked K‐9 Marked Patrol Unmarked Lt. Unmarked SIU Unmarked Cpt.
2017 Dodge Charger2016 Dodge Charger 2016 Dodge Charger 2017 Dodge Charger
2018 Chevy Tahoe 2019 Dodge Charger 2018 Dodge Charger 2018 Ford F150 2018 Chevy Impala
Subtotal
Subtotal
$
$
55,000 55,000 55,000 55,000
550,000 65,000 56,000 36,000 36,000 36,000
229,000
$
$
123,545
51,440
9

FIVE YEAR CAPITAL PROGRAM EXPENDITURE REQUESTS FISCAL YEARS ENDING 2022‐2026
FUND 304 ‐ General Government Capital and Construction DEPARTMENT Vehicles ‐ Fleet and Streets/Stormwater
PROJECT NAME Streets/Stormwater Vehicle Purchase (Replacement) ACCOUNT # 304.9900.541.616008
TYPE OF EXPENSE New Repair/Refurbish
TOTAL PROJECT COST See schedule below GRANT FUNDING
PROJECT LOCATION N/A
PROJECT DESCRIPTION Replace Streets Heavy Equipment per attached schedule
Replace
Amount Source/Agency
$
x
‐
N/A
JUSTIFICATION Needed to facilitate Public Works Maintenance and Construction
Current Vehicle Replacement Vehicle
Fiscal Year Vehicle # Dept Description Purchase
Description Price
2021‐2022 394 3034 3037
Streets 2004 Ford Flatbed
Streets 2008 John Deere Excavator Streets 2008 Trash Truck 10 Yard
Flatbed Dump Trk‐F754 72,000
Excavator‐ 27D 58,000
Trash Truck SBA 4300 75,000
Subtotal $ 205,000
2022‐2023 396 Streets 2004 Cat Front wheel Loader Cat Frontend Loader $ 200,000
2023‐2024 374 3050
Streets 1999 Leeboy Grader
Streets 2012 Cat Skid Loader Grader 685‐T 175,000
Skid Loader Cat 259B3 60,000
Subtotal $ 235,000
2024‐2025 3088 3102
Streets 2016 Bucket Truck Streets 2018 Vibratory Roller Streets 2018 F‐450 Dump Truck
F‐650 w/37' boom 200,000
Vibratory Roller 15,500
F‐450 Dump Truck 75,000
Subtotal $ 290,500
2025‐2026 3093 Streets 2017 Track Backhoe Track Backhoe 125,000
Subtotal $ 125,000
10

FIVE YEAR CAPITAL PROGRAM EXPENDITURE REQUESTS FISCAL YEARS ENDING 2022‐2026
FUND 304 ‐ General Government Capital and Construction DEPARTMENT Vehicles ‐ Fleet and Streets/Stormwater
PROJECT NAME Streets/Stormwater Vehicle Lease‐Purchase Acquisition / Debt Service ACCOUNT # 304.9900.541.613003 / 304.9900.541.641411
TYPE OF EXPENSE New x Repair/Refurbish Replace x
TOTAL PROJECT COST
PROJECT LOCATION N/A
See schedule below GRANT FUNDING Amount Source/Agency
$ ‐
N/A
PROJECT DESCRIPTION
Purchase and replace Streets Heavy Equipment using municipal lease purchase financing per schedule below.
JUSTIFICATION Needed to facilitate Public Works maintenance of roadways and drainage; the purchase of a second street sweeper has been
reported to be the most cost‐effective option for Public Works to improve water quality of stormwater runoff discharged into
the Indian River Lagoon. Current Vehicle Replacement Vehicle
Fiscal Year Vehicle # Dept Description Purchase
Description Price
Increase
to Debt
Svc 2021‐2022 *Second Sweeper Strt Sweeper Tymco 600 $ 250,000 $ 56,157
PROJECT NAME General Fund Vehicle Lease‐Purchase Acquisition / Debt Service ACCOUNT # 304.9900.541.641409 / 304.9900.541.641413
TYPE OF EXPENSE New Repair/Refurbish Replace x
TOTAL PROJECT COST
PROJECT LOCATION N/A
See schedule on next page GRANT FUNDING Amount Source/Agency
$ ‐
N/A
PROJECT DESCRIPTION Replace existing light vehicles through a lease‐purchase program per schedule on next page.
JUSTIFICATION By using a lease‐purchase program we predict that over a 10 year period the City will save approximately
$800,000 City‐wide over the current practice of keeping vehicles for 15 years. Savings will be achieved through
reductions in maintenance, repairs, fuel usage and increased value when vehicles are sold.
11

FIVE YEAR CAPITAL PROGRAM EXPENDITURE REQUESTS FISCAL YEARS ENDING 2022‐2026
FUND 304 ‐ General Government Capital and Construction DEPARTMENT Vehicles ‐ Fleet and Streets/Stormwater
Fiscal Year 2021‐2022
2022‐2023
2023‐2024
2024‐2025
2025‐2026
Current Vehicle
Vehicle # Dept Description 12‐4372 Grounds 2015 Ford F250 3/4 Ton 4x212‐724 Facilities 2015 Ford F150 Compact 4x214‐AP10 Warehouse 2015 Ford Transit Connect10‐641 Garage 2015 Ford Fusion Mid Sedan12‐3076 Streets 2015 Ford F250 3/4 Ton 4x212‐4371 Grounds 2015 Ford F250 3/4 Ton 4x212‐4369 Grounds 2015 Ford F150 1/2 Ton 4x212‐4373 Grounds 2015 Ford F150 1/2 Ton 4x2
40‐4176 Grounds 2016 Ford F350 1 Ton Dump12‐4090 Grounds 2016 Ford F250 3/4 Ton 4x212‐4091 Grounds 2016 Ford F250 3/4 Ton 4x212‐217 Stormwtr 2016 Ford F250 3/4 Ton 4x212‐4111 Grounds 2016 Ford F150 1/2 Ton 4x212‐4113 Grounds 2016 GMC 1500 1/2 Ton 4x212‐925 Traffic 2016 Ford F250 3/4 Ton 4x212‐4126 Grounds 2016 Ford F150 1/2 Ton 4x212‐728 Facilities 2016 Ford F250 3/4 Ton 4x212‐2007 Stormwtr 2016 Ford F250 3/4 Ton 4x212‐388 Streets 2016 Ford F250 3/4 Ton 4x2
12‐3080 Streets 2016 Ford F250 3/4 Ton 4x212‐3081 Streets 2016 Ford F250 3/4 Ton 4x212‐3087 Streets 2016 Ford F250 3/4 Ton 4x212‐4382 Grounds 2016 GMC 1500 1/2 Ton 4x212‐4383 Grounds 2016 GMC 1500 1/2 Ton 4x212‐4384 Grounds 2016 GMC 1500 1/2 Ton 4x212‐4385 Grounds 2016 GMC 1500 1/2 Ton 4x212‐4386 Grounds 2016 GMC 1500 1/2 Ton 4x212‐930 Traffic 2016 Ford F250 3/4 Ton 4x2
12‐873 40‐4419
Cemetery Grounds
2017 Ford F250 3/4 Ton 4x2 2017 Ford F350 1 Ton Dump
12‐4413 Grounds 2017 Ford F250 3/4 Ton 4x2 12‐645 Fleet 2017 Ford F150 1/2 Ton 4x4 12‐739 Facilities 2017 Ford F250 3/4 Ton 4x2 12‐113 40‐4420
Survey Grounds
2017 Ford F150 1/2 Ton 4x2 2017 Ford F350 1 Ton Dump
12‐646 Fleet 2017 Ford F150 1/2 Ton 4x2 14‐752 Facilities 2017 Chevrolet 3/4T cargo vn
12‐645 Fleet 2018 F‐150 4X4 crew cab 12‐4440 Grounds 2018 Ford F‐150 1/2T pickup 12‐4441 Grounds 2018 Ford F‐150 1/2T pickup 12‐646 Fleet 2018 Ford F150 1/2 Ton 4x4 12‐102 12‐4427
Survey Grounds
2018 Ford Transit Van 2018 Ford F250 3/4 T 4x2
40‐3096 Streets 2017 Ford F‐450 dump
Replacement Vehicle Increase
Purchase to Debt
Description Price Svc Lt Pickup 3/4T 30,770 Lt Pickup 1/2T 28,376 Ford Transit Connect 30,087 Ford Fusion 26,060 Lt Pickup 3/4T 30,770 Lt Pickup 3/4T 30,770 Lt Pickup 1/2T 28,376 Lt Pickup 1/2T 28,376
Subtotal $ 233,585 $ 52,470
Dump 2/3YD 47,450 Lt Pickup 1/2T 31,216 Lt Pickup 1/2T 31,216 Lt Pickup 3/4T 33,850 Lt Pickup 1/2T 31,216 Lt Pickup 1/2T 31,216 Lt Pickup 3/4T 4 door 38,250 Lt Pickup 1/2T 31,216 Lt Utility 3/4T 40,300 Lt Pickup 3/4T 33,850 Lt Utility 3/4T 40,300
Subtotal $ 390,080 $ 87,623
Lt Utility 3/4T 38,250 Lt Utility 3/4T 38,250 Lt Utility 3/4T 40,300 Lt Pickup 1/2T 31,216 Lt Pickup 1/2T 31,216 Lt Pickup 1/2T 31,216 Lt Pickup 1/2T 31,216 Lt Pickup 1/2T 31,216 Lt Utility 3/4T 40,300
Subtotal $ 313,180 $ 70,349
Lt Pickup 3/4T $ 33,850 Dump 2/3YD $ 47,450 Lt Utility 3/4T $ 40,300 Lt Pickup 3/4T 4 door $ 34,500 Lt Utility 3/4T $ 47,450 Lt Pickup 1/2T $ 32,000 Dump 2/3YD $ 47,450 Lt Pickup 1/2T $ 31,216 Cargo Van 3/4 T $ 36,800
Subtotal $ 351,016 $ 78,848
Lt Ptk 1/2T 4X4 crw cab $ 35,850 Lt Pickup 1/2T $ 32,000 Lt Pickup 1/2T $ 32,000 Lt Pickup 1/2T $ 34,500 Cargo Van 3/4 T $ 36,800 Lt Utility 3/4T $ 40,300 1.5T dump 3 yard $ 51,000
Subtotal $ 262,450 $ 58,953
12

FIVE YEAR CAPITAL PROGRAM EXPENDITURE REQUESTS FISCAL YEARS ENDING 2022‐2026
FUND 304 ‐ General Government Capital and Construction DEPARTMENT Vehicles ‐ Fleet and Streets/Stormwater
PROJECT NAME Recreation Vehicle Lease‐Purchase Acquisition / Debt Service ACCOUNT # 304.9900.572.641413/ 304.9900.572.641414
TYPE OF EXPENSE New Repair/Refurbish Replace x
TOTAL PROJECT COST
PROJECT LOCATION N/A
See schedule below GRANT FUNDING Amount Source/Agency
$ ‐
N/A
PROJECT DESCRIPTION Replace existing light vehicles through a lease‐purchase program per schedule below.
JUSTIFICATION By using a lease‐purchase program we predict that over a 10 year period the City will save approximately
$800,000 City‐wide over the current practice of keeping vehicles for 15 years. Savings will be achieved through
reductions in maintenance, repairs, fuel usage and increased value when vehicles are sold.
Current Vehicle Replacement Vehicle
Fiscal Year Vehicle # Dept Description Purchase
Description Price
Increase
to Debt
Svc 2021‐2022 14‐R10
12‐R20 Recreation 2003 Cargo Van
Recreation 2015 Ford F250 3/4 Ton 4x2 Van Cargo 3/4T 32,017
Lt Pickup 3/4T 30,770
Subtotal $ 62,787 $ 14,104
2023‐2024 12‐R41 Recreation 2017 Ford F150 1/2 Ton 4x2 Lt Pickup 1/2T $ 31,216 $ 7,012
2024‐2025 12‐R44 Recreation 2018 Ford F150 1/2 Ton 4x2 Lt Pickup 1/2T $ 32,000 $ 7,188
13

FIVE YEAR CAPITAL PROGRAM EXPENDITURE REQUESTS FISCAL YEARS ENDING 2022‐2026
FUND 304 ‐ General Government Capital and Construction DEPARTMENT Public Works
PROJECT NAME Air Conditioner Replacements (Various Locations) ACCOUNT # 304.9900.541.615062
TYPE OF EXPENSE New Repair/Refurbish Replace x
TOTAL PROJECT COST
PROJECT LOCATION Various.
$ 40,000 Annual GRANT FUNDING Amount Source/Agency
$ ‐
N/A
PROJECT DESCRIPTION 2021‐2022: Police Dept‐3.5 TN and 3 TN, Leisure Sq‐5 TN and 3 TN, Community Center‐3 TN, City Hall‐5 TN and 3.5 TN, PW
compound‐3.5 TN, 3.5 TN, 2 TN, and 2 TN.
JUSTIFICATION Air conditioner units are approximately 20 years old.
PROJECT NAME Annual Street Resurfacing ACCOUNT # 304.9900.541.665002
TYPE OF EXPENSE New Repair/Refurbish x Replace x
TOTAL PROJECT COST $ 375,000 to $ 625,000 GRANT FUNDING Amount $ ‐
Annual Range Source/Agency N/A PROJECT LOCATION Various
PROJECT DESCRIPTION Maintain existing streets, alleys and city owned parking lots throughout Vero Beach by various methods including
resurfacing, milling, microsurfacing and application of rejuvenator products.
JUSTIFICATION To keep pavement surfaces in good condition.
14

FIVE YEAR CAPITAL PROGRAM EXPENDITURE REQUESTS FISCAL YEARS ENDING 2022‐2026
FUND 304 ‐ General Government Capital and Construction DEPARTMENT Public Works
PROJECT NAME Sidewalk and Curb Replacement ACCOUNT # 304.9900.541.665006
TYPE OF EXPENSE New Repair/Refurbish x Replace x
TOTAL PROJECT COST $ 30,000 Annual GRANT FUNDING Amount $ ‐
Source/Agency N/A PROJECT LOCATION Citywide
PROJECT DESCRIPTION Make repairs to existing sidewalks and curbs.
JUSTIFICATION To keep sidewalks and curbs functional and safe.
PROJECT NAME ACCOUNT #
Radar Speed Detection Signs 304.9900.541.665008
TYPE OF EXPENSE New x Repair/Refurbish Replace x
TOTAL PROJECT COST
PROJECT LOCATION Varies
$ 15,000 Annual GRANT FUNDING Amount Source/Agency
$ ‐
N/A
PROJECT DESCRIPTION Purchase of 2 radar speed detection signs annually to replace existing radar signs reaching the end of their design life or to add radar speed detection signs where warranted.
JUSTIFICATION Public Works receives frequent complaints from residents with requests for traffic calming. Radar speed detection signs are a traffic calming technique that alerts speeding motorists to slow down.
15

FIVE YEAR CAPITAL PROGRAM EXPENDITURE REQUESTS FISCAL YEARS ENDING 2022‐2026
FUND 304 ‐ General Government Capital and Construction DEPARTMENT Public Works
PROJECT NAME Public Works Compound Roof Repairs ACCOUNT # 304.9900.541.665009
TYPE OF EXPENSE New Repair/Refurbish Replace x
TOTAL PROJECT COST $ 1,070,305 GRANT FUNDING Amount $ ‐
Source/Agency N/A PROJECT LOCATION 3405 Airport West Drive. Public Works metal buildings roofs.
PROJECT DESCRIPTION Previous Years $620,305 2021‐2022 Continue Replacement $250,000 2022‐2023 Continue Replacement $200,000
JUSTIFICATION Building roofs are 29 years old and have leaks due to rust of the metal roof panels.
PROJECT NAME ACCOUNT #
Conn Beach Boardwalk Repairs 304.9900.541.665023
TYPE OF EXPENSE New Repair/Refurbish x Replace x
TOTAL PROJECT COST
PROJECT LOCATION
$ 881,596 GRANT FUNDING Amount Source/Agency
$ ‐
N/A
Conn Beach and JC Park Boardwalks
PROJECT DESCRIPTION Replace support stringers, bents, decking of the boardwalk and lighting improvements. Previous Years $481,596 2021‐2022 $200,000 2022‐2023 $200,000
JUSTIFICATION The Conn Beach Boardwalk is one of the largest recreational assets in the City utilized by locals and visitors since originally constructed in 1984. Recent repair to replace the support bents, stringers, and decking of the main boardwalk completed
2020/2021. The wood piles, structural supports, beams, and decking of all walkovers are in need of replacement to continue the repairs. Lighting is also obsolete and in need of replacement.
16

FIVE YEAR CAPITAL PROGRAM EXPENDITURE REQUESTS FISCAL YEARS ENDING 2022‐2026
FUND 304 ‐ General Government Capital and Construction DEPARTMENT Public Works
PROJECT NAME ACCOUNT #
TYPE OF EXPENSE New
TOTAL PROJECT COST
PROJECT LOCATION
Bridge Repair & Maintenance (Per FDOT) 304.9900.541.665026
Repair/Refurbish x
$ 430,000 GRANT FUNDING
Replace
Amount $ ‐
Source/Agency N/A
Memorial Island Bridge, River Drive Bridge, Bay Drive Bridge, 27th Avenue Bridge
PROJECT DESCRIPTION Maintenance repairs to City owned bridges. Previous Years $170,000 Veterans Island bridge 2021‐2022 $30,000 River Drive and Bay Drive bridge designs 2022‐2023 $130,000 River Drive and Bay Drive bridge repairs, 27th Ave. bridge design 2023‐2024 $100,000 27th Avenue bridge repairs
JUSTIFICATION Bridge repairs and maintenance as recommended by the Florida Department of Transportation.
PROJECT NAME ACCOUNT #
Veterans Island Bridge Replacement 304.9900.541.665030
TYPE OF EXPENSE New Repair/Refurbish Replace x
TOTAL PROJECT COST $ 1,260,000
PROJECT LOCATION Bridge to Veterans Memorial Island
GRANT FUNDING Amount Source/Agency
$ ‐
N/A
PROJECT DESCRIPTION Full bridge replacement.
Previous Years 2021‐2022 2022‐2023
$140,000 Design of new bridge $20,000 Permitting
$1,100,000 Construction of new bridge
JUSTIFICATION The Veterans Island Bridge has reached the end of its design life. The bridge structure has experienced substantial deterioration over the last two years. The City's structural engineering consultant has recommended that the bridge be fully replaced within the next five years.
17

FIVE YEAR CAPITAL PROGRAM EXPENDITURE REQUESTS FISCAL YEARS ENDING 2022‐2026
FUND 304 ‐ General Government Capital and Construction DEPARTMENT Public Works
PROJECT NAME Fleet Garage Door Replacement ACCOUNT # 304.9900.541.665031
TYPE OF EXPENSE New Repair/Refurbish Replace x
TOTAL PROJECT COST $ 20,000 Annual GRANT FUNDING Amount $ ‐
Source/Agency N/A PROJECT LOCATION 3405 Airport West Drive ‐ Fleet Management Facility
PROJECT DESCRIPTION Garage door replacements for the Fleet Management division of Public Works.
JUSTIFICATION The garage doors are the original facility doors and have reached the end of their design life.
18

FIVE YEAR CAPITAL PROGRAM EXPENDITURE REQUESTS FISCAL YEARS ENDING 2022‐2026
FUND 304 ‐ General Government Capital and Construction DEPARTMENT Stormwater
PROJECT NAME Stormwater Master Plan ACCOUNT # 304.9900.541.665003
TYPE OF EXPENSE New x Repair/Refurbish Replace
TOTAL PROJECT COST $ 250,000 GRANT FUNDING Amount $ ‐
Source/Agency N/A PROJECT LOCATION Citywide
PROJECT DESCRIPTION Development of a stormwater master plan to support the needs analysis of Senate Bill 53 in addition to exploring flood protection and water quality improvements within the City.
JUSTIFICATION Senate Bill 53 requires jurisdictions to develop a 20 year needs and funding analysis. The analysis is to be submitted to the State in June of 2022.
PROJECT NAME Secondary Drainage ACCOUNT # 304.9900.541.665005
TYPE OF EXPENSE New Repair/Refurbish x Replace x
TOTAL PROJECT COST $ 25,000 GRANT FUNDING Amount $ ‐
Source/Agency N/A PROJECT LOCATION Various
PROJECT DESCRIPTION Repair/ Replace drainage structures, culverts and headwalls throughout the City.
JUSTIFICATION To keep the drainage system functional.
19

FIVE YEAR CAPITAL PROGRAM EXPENDITURE REQUESTS FISCAL YEARS ENDING 2022‐2026
FUND 304 ‐ General Government Capital and Construction DEPARTMENT Stormwater
PROJECT NAME ACCOUNT #
Humiston Outfall Flap Valve 304.9900.541.617006
TYPE OF EXPENSE New x Repair/Refurbish Replace
TOTAL PROJECT COST
PROJECT LOCATION Humiston Park Beach
$ 65,000 GRANT FUNDING Amount Source/Agency
$ ‐
N/A
PROJECT DESCRIPTION Design, permit and install new wave break at beach outfall. Previous Years 15,000 Wave break design 2021‐2022 50,000 Wave break permitting and construction
JUSTIFICATION The back flow prevention valve at Humiston Beach has repeatedly failed. The addition of a wave break system is needed to
protect the valve and allow the outfall to function properly.
PROJECT NAME ACCOUNT #
Stormwater Maintenance and Improvements 304.9900.541.617009
TYPE OF EXPENSE New x Repair/Refurbish x Replace x
TOTAL PROJECT COST
PROJECT LOCATION Various
$ 50,000 GRANT FUNDING Amount Source/Agency
$ ‐
N/A
PROJECT DESCRIPTION Repair existing drainage facilities and install new drainage facilities to improve and maintain drainage function at various
locations within the City. 2021‐2022 $50,000
JUSTIFICATION Various drainage projects to be constructed in an effort to address areas within the City that have been identified to have a need for improved drainage.
20

FIVE YEAR CAPITAL PROGRAM EXPENDITURE REQUESTS FISCAL YEARS ENDING 2022‐2026
FUND 304 ‐ General Government Capital and Construction DEPARTMENT Stormwater
PROJECT NAME ACCOUNT #
Stormwater Outfall Repairs and Pipe Lining 304.9900.541.617012
TYPE OF EXPENSE New Repair/Refurbish x Replace x
TOTAL PROJECT COST
PROJECT LOCATION 2021‐2022
$ 100,000
$100,000 Royal Park outfall
GRANT FUNDING Amount Source/Agency
$ ‐
N/A
PROJECT DESCRIPTION Inspect, repair and line existing drainage pipe.
JUSTIFICATION Much of the City's drainage system is nearing the end of its design life. Pipe lining and outfall repair is needed to maintain positive drainage and to extend the useful life of the system.
21

FIVE YEAR CAPITAL PROGRAM EXPENDITURE REQUESTS FISCAL YEARS ENDING 2022‐2026
FUND 304 ‐ General Government Capital and Construction DEPARTMENT Recreation
PROJECT NAME Playground Equipment ACCOUNT # 304.9900.572.615030
TYPE OF EXPENSE New x Repair/Refurbish x Replace
TOTAL PROJECT COST $ 825,000 GRANT FUNDING Amount Source/Agency Whitaker Trust
PROJECT LOCATION Troy Moody Park and Charles Park
PROJECT DESCRIPTION 2021/2022 Replacement of gazebos and decorative arches at/around Pocahantas Park playground 2022/2023 Playground replacement at Charles Park. 2023/2024 Playground Replacement at Pochahantas Park
$
x
90,000 90,000
JUSTIFICATION 2021/2022 2022/2023 2023/2024
Wear and tear to fencing and iron fixtures ‐ need replacement/upgrade Wear and tear of playground will need to be replaced. Wear and tear of playground will need to be replaced.
PROJECT NAME Leisure Square Improvements ACCOUNT # 304.9900.572.615031
TYPE OF EXPENSE New x Repair/Refurbish x Replace
TOTAL PROJECT COST $ 122,000 GRANT FUNDING Amount Source/Agency Whitaker Trust (playground)
PROJECT LOCATION Leisure Square
PROJECT DESCRIPTION 2021/2022 Exercise and weight room renovated. 2022/2023 Playground replaced.
2023/2024 Exercise and weight room renovated.
$
x
42,000 42,000
JUSTIFICATION 2021/2022 2022/2023 2023/2024
Repairs and maintenance to recreation facilities to improve appearance and safety The playground is going to need to be replaced due to long term wear.
Repairs and maintenance to recreation facilities to improve appearance and safety
22

FIVE YEAR CAPITAL PROGRAM EXPENDITURE REQUESTS FISCAL YEARS ENDING 2022‐2026
FUND 304 ‐ General Government Capital and Construction DEPARTMENT Recreation
PROJECT NAME Community Center Improvements ACCOUNT # 304.9900.572.616012
TYPE OF EXPENSE New x Repair/Refurbish x Replace x
TOTAL PROJECT COST $ 260,000 GRANT FUNDING Amount $ ‐
Source/Agency N/A PROJECT LOCATION Community Center
PROJECT DESCRIPTION 2022/2023 Kitchen sinks and cabinets replaced. 2023/2024 Roof replaced
JUSTIFICATION Repairs and maintenance to recreation facilities to improve appearance and safety
PROJECT NAME Tennis/Pro Shop Improvements
ACCOUNT # 304.9900.572.616015
TYPE OF EXPENSE New Repair/Refurbish x Replace x
TOTAL PROJECT COST $ 132,000 GRANT FUNDING Amount $ ‐
Source/Agency N/A PROJECT LOCATION Riverside Tennis Complex
PROJECT DESCRIPTION 2022/2023 4 courts will need to be resurfaced. 2023/2024 Racquetball Building roof and renovations
JUSTIFICATION Repairs and maintenance to recreation facilities to improve appearance and safety
23

FIVE YEAR CAPITAL PROGRAM EXPENDITURE REQUESTS FISCAL YEARS ENDING 2022‐2026
FUND 304 ‐ General Government Capital and Construction DEPARTMENT Recreation
PROJECT NAME Beach Lifeguard Towers and Storage Shed ACCOUNT # 304.9900.572.616018
TYPE OF EXPENSE New x Repair/Refurbish x
TOTAL PROJECT COST $ 370,000 GRANT FUNDING Source/Agency
PROJECT LOCATION Humiston, South Beach and Jaycee Beach Parks
PROJECT DESCRIPTION 2021/2022 Replacement of lifeguard 'Pods' at Jaycee and South Beaches 2022/2023 Tower and command center at Humiston Park
Replace
Amount Public Donations Whitaker Trust
$
x
370,000 250,000 120,000
JUSTIFICATION 2021/2022 2022/2023
Replacement of recreation facilities needed due to excessive wear and tear due to age Outdated and ineffective tower at Humiston will be replaced with a new tower and
command center
PROJECT NAME Centerstage Improvements ACCOUNT # 304.9900.572.615029
TYPE OF EXPENSE New x Repair/Refurbish x Replace x
TOTAL PROJECT COST $ 220,000 GRANT FUNDING Amount $ ‐
Source/Agency N/A PROJECT LOCATION Centerstage
PROJECT DESCRIPTION 2021/2022 Parent viewing room expanded, and emergency exit added
Engineering/design work already completed
JUSTIFICATION The parent viewing room is too small and is needed to allow parents the opportunity to watch children
participate in gym programs. And, there is currently no emergency exit for staff, children and visitors to use .
Project has been 'pushed back' for several years. Engineering already completed.
24

FIVE YEAR CAPITAL PROGRAM EXPENDITURE REQUESTS FISCAL YEARS ENDING 2022‐2026
FUND 304 ‐ General Government Capital and Construction DEPARTMENT Recreation
PROJECT NAME ACCOUNT #
TYPE OF EXPENSE New
TOTAL PROJECT COST
PROJECT LOCATION MacWilliam Park
PROJECT DESCRIPTION 2021/2022
JUSTIFICATION
MacWilliam Park Pavilion Remodel 304.9900.572.616024
Repair/Refurbish
$ 105,000 GRANT FUNDING
MacWilliam Park Pavilions replaced
Replace x
Amount $ ‐
Source/Agency N/A
Demolition of 5 pavilions and replacing with 3 new pavilions.
PROJECT NAME Park Facility Maintenance and Improvements ACCOUNT # 304.9900.572.616026
TYPE OF EXPENSE New Repair/Refurbish x Replace
TOTAL PROJECT COST $ 265,000 GRANT FUNDING Amount $ ‐
Source/Agency N/A PROJECT LOCATION Various City Parks
PROJECT DESCRIPTION Repair, replace benches, doors, and paint various park restrooms and pavilions
2021/2022 Riverside Park and Charles Park Covered Pavilions, plus others not completed in FY21 2022/2023 South, Jaycee Covered Pavilions 2023/2024 Pocahontas Covered Pavilions
JUSTIFICATION Repairs and maintenance to recreation facilities to improve appearance and safety
25

FIVE YEAR CAPITAL PROGRAM EXPENDITURE REQUESTS FISCAL YEARS ENDING 2022‐2026
FUND 304 ‐ General Government Capital and Construction DEPARTMENT Recreation
PROJECT NAME ACCOUNT #
TYPE OF EXPENSE New
TOTAL PROJECT COST
PROJECT LOCATION Various Beaches
PROJECT DESCRIPTION 2021/2022
JUSTIFICATION
Beach ATV 304.9900.572.616027
Repair/Refurbish
$ 17,000
Replace x
GRANT FUNDING Amount $ ‐
Source/Agency N/A
Replacement for older ATV which needs replacing
Our current ATV needs to be replaced. It is harder to fix and is becoming less reliable. This can be a problem
in we have an emergency.
26

I I
- - -
CITY OF VERO BEACH FIVE YEAR CAPITAL IMPROVEMENT PROGRAM
FUND 311: Infrastructure & Real Estate Improvements
FY 20-21 FY 20-21 BUDGET AMENDED
ORIGINAL INCREASE FY 20-21 Account Number Account Name BUDGET (DECREASE) BUDGET FY 21-22 FY 22-23 FY 23-24 FY 24-25 FY 25-26
Audited FUND BALANCE FORWARD (OCTOBER 1)
395,617
226,811 226,803 467,789 521,785 601,946 645,327
REVENUES 311.0000.312.060100 1 CENT SALES TAX 2,115,874 - 2,115,874 2,587,545 2,603,070 2,618,689 2,634,401 2,650,207 311.0000.361.010200 INTEREST ON INVESTMENTS 300 - 300 400 600 800 900 900 Total Revenues 2,116,174 - 2,116,174 2,587,945 2,603,670 2,619,489 2,635,301 2,651,107
EXPENDITURES 311.9900.521.991064 DEBT SERVICE TRANSFER SERIES 2016 116,182 - 116,182 113,959 116,674 114,328 116,920 114,450 311.9900.521.991___ DEBT SERVICE TRANSFER - VET MEM BRIDGE - - 92,000 92,000 92,000 304.9900.521.610009 TRANSFER TO 304 FOR INFRASTRUCTURE 2,000,000 - 2,000,000 2,233,000 2,433,000 2,333,000 2,383,000 2,383,000
Total Expenditures 2,116,182 - 2,116,182 2,346,959 2,549,674 2,539,328 2,591,920 2,589,450 Excess (Deficiency) of Revenues over Expenditures
(8) - (8)
240,986 53,996 80,161 43,381 61,657 ENDING FUND BALANCE (SEPTEMBER 30) 395,609 226,803 467,789 521,785 601,946 645,327 706,984
27

_ ......... .. ---..!. _.-. 'r~--1.. 1.., _ _..1 -.••• : - .. I
'i:: I .......
I _ .. STORMWATER UTILITY
FUND
28

CITY OF VERO BEACH FIVE YEAR CAPITAL IMPROVEMENT PROGRAM
FUND 302: STORMWATER UTILITY FUND
Account Number Account Name FY 21-22 FY 22-23 FY 23-24 FY 24-25 FY 25-26
FUND BALANCE FORWARD (OCTOBER 1) - - 17,004 131,351 199,638
REVENUES 302.0000.331.000000 AMERICAN RESCUE PLAN GRANT FUNDING 500,000 - - - -302.0000.343.062100 STORMWATER UTILITY FEES/ASSESSMENTS REVENUE - 1,250,000 1,200,000 1,100,000 1,100,000 302.0000.383.000100 CAPITAL LEASE PROCEEDS - 250,000 - - 360,000
Total Revenues 500,000 1,500,000 1,200,000 1,100,000 1,460,000
EXPENDITURES ASSESSMENT EXPENDITURES 302.9900.538.641xxx MISC ASSESSMENT EXPENDITURES (NOTICES, TAX COLL, ETC) - 151,839 104,496 100,556 100,556 VEHICLES 302.9900.538.641419 STREETS/STORMWTR VEHICLE LEASE-PURCHASE ACQUISITION - 250,000 - - 360,000 302.9900.538.641420 STREETS/STORMWTR VEHICLE LEASE-PURCHASE DEBT - 56,157 56,157 56,157 137,022 CAPITAL 302.9900.538.665005 SECONDARY DRAINAGE - 25,000 25,000 25,000 25,000 302.9900.538.617002 STORMWATER CULVERT REPLACEMENTS 250,000 250,000 250,000 250,000 250,000 302.9900.538.617004 TOWNSIDE CULVERT INSPECTION AND REPAIRS - - - 50,000 -302.9900.538.617009 STORMWATER MAINTENANCE AND IMPROVEMENT 250,000 750,000 400,000 550,000 525,000 302.9900.538.617012 STORMWATER OUTFALL REPAIRS AND PIPE LINING - - 175,000 - -302.9900.538.617xxx HUMISTON LIFT STATION PUMP REPLACEMENT - - 75,000 - -
Total Expenditures 500,000 1,482,996 1,085,653 1,031,713 1,397,578Excess (Deficiency) of Revenues over Expenditures
-17,004
114,347 68,287 62,422 ENDING FUND BALANCE (SEPTEMBER 30) - 17,004 131,351 199,638 262,060
29

FIVE YEAR CAPITAL PROGRAM EXPENDITURE REQUESTS FISCAL YEARS ENDING 2022‐2026
FUND 302 ‐ Stormwater Utility Fund DEPARTMENT Stormwater
PROJECT NAME Stormwater Vehicle Lease‐Purchase Acquisition / Debt Service ACCOUNT # 302.9900.538.641419 / 302.9900.538.641420
TYPE OF EXPENSE New x Repair/Refurbish Replace x
TOTAL PROJECT COST See schedule below GRANT FUNDING Amount $ ‐
Source/Agency N/A PROJECT LOCATION N/A
PROJECT DESCRIPTION Purchase and replace Streets Heavy Equipment using municipal lease purchase financing per schedule below.
JUSTIFICATION Needed to facilitate Public Works maintenance of roadways and drainage.
Current Vehicle Replacement Vehicle Fiscal Year Vehicle # Dept Description Description Purchase Increase to
2022‐2023 3054 Streets 2018 Tymco Strt Sweeper Strt Sweeper Tymco 600 $ 250,000 $ 56,157
2025‐2026 213 Streets 2016 Vaccon Sewer Truck Vaccon Sewer Truck $ 360,000 $ 80,865
30

FIVE YEAR CAPITAL PROGRAM EXPENDITURE REQUESTS FISCAL YEARS ENDING 2022‐2026
FUND 302 ‐ Stormwater Utility Fund DEPARTMENT Stormwater
PROJECT NAME Secondary Drainage ACCOUNT # 302.9900.538.665005
TYPE OF EXPENSE New Repair/Refurbish x Replace x
TOTAL PROJECT COST $ 25,000 Annual GRANT FUNDING Amount $ ‐
Source/Agency N/A PROJECT LOCATION Various
PROJECT DESCRIPTION Repair/ Replace drainage structures, culverts and headwalls throughout the City.
JUSTIFICATION To keep the drainage system functional.
PROJECT NAME Stormwater Culvert Replacements ACCOUNT # 302.9900.538.617002
TYPE OF EXPENSE New Repair/Refurbish Replace x
TOTAL PROJECT COST $ 250,000 Annual GRANT FUNDING Amount $ ‐
Source/Agency N/A PROJECT LOCATION Various
PROJECT DESCRIPTION Replace failed culverts in various locations throughout the City.
JUSTIFICATION Existing culverts have failed. They need to be replaced to maintain positive drainage.
31

FIVE YEAR CAPITAL PROGRAM EXPENDITURE REQUESTS FISCAL YEARS ENDING 2022‐2026
FUND 302 ‐ Stormwater Utility Fund DEPARTMENT Stormwater
PROJECT NAME ACCOUNT #
Townside Culvert Inspection and Repairs 302.9900.538.617004
TYPE OF EXPENSE New x Repair/Refurbish Replace
TOTAL PROJECT COST
PROJECT LOCATION Townside culvert
$ 50,000 GRANT FUNDING Amount Source/Agency
$ ‐
N/A
PROJECT DESCRIPTION Repairs to existing drainage trunk line 2024‐2025 50,000 Joint repairs
JUSTIFICATION Inspection of the townside culvert drainage system identified the need for joint repairs along the trunk line. The joint repairs will need
to be completed to ensure that the drainage system continues to operate as designed.
PROJECT NAME ACCOUNT #
Stormwater Maintenance and Improvements 302.9900.538.617009
TYPE OF EXPENSE New x Repair/Refurbish x Replace x
TOTAL PROJECT COST
PROJECT LOCATION Various
$ 250,000 to Annual Range
$ 750,000 GRANT FUNDING Amount Source/Agency
$ ‐
N/A
PROJECT DESCRIPTION Repair existing drainage facilities and install new drainage facilities to improve and maintain drainage function at various
locations within the City. 2021‐2022 $250,000 2022‐2023 $750,000 2023‐2024 $400,000 2024‐2025 $550,000 2025‐2026 $525,000
JUSTIFICATION Various drainage projects to be constructed in an effort to address areas within the City that have been identified to have a
need for improved drainage.
32

FIVE YEAR CAPITAL PROGRAM EXPENDITURE REQUESTS FISCAL YEARS ENDING 2022‐2026
FUND 302 ‐ Stormwater Utility Fund DEPARTMENT Stormwater
PROJECT NAME Stormwater Outfall Repairs and Pipe Lining ACCOUNT # 302.9900.538.617012
TYPE OF EXPENSE New Repair/Refurbish x Replace x
TOTAL PROJECT COST $ 175,000 GRANT FUNDING Amount $ ‐
Source/Agency N/A PROJECT LOCATION 2023‐2024 $175,000 Miracle Mile/Sexton Plaza outfall pipe repairs
PROJECT DESCRIPTION Inspect, repair and line existing drainage pipe.
JUSTIFICATION Much of the City's drainage system is nearing the end of its design life. Pipe lining and outfall repair is needed to maintain positive drainage and to extend the useful life of the system.
PROJECT NAME Humiston Lift Station Pump Replacement ACCOUNT # 302.9900.538.617___
TYPE OF EXPENSE New Repair/Refurbish Replace x
TOTAL PROJECT COST $ 75,000 GRANT FUNDING Amount $ ‐
Source/Agency N/A PROJECT LOCATION Humiston Park
PROJECT DESCRIPTION This item is to replace the high capacity pump installed at the Humiston Park Stormwater lift station in 2010.
2023‐2024 $75,000
JUSTIFICATION This pump is vital to prevent flooding on Ocean Drive and is nearing the end of its design life.
33

WATER & SEWER FUND
34

- - -- - -
- - - - - - - -
- - -
- - -- - -
CITY OF VERO BEACH FIVE YEAR CAPITAL IMPROVEMENT PROGRAM
FUND 423: Water Sewer R/R Fund FY 20-21
FY 20-21 BUDGET AMENDED ORIGINAL INCREASE FY 20-21
Account Number Account Name BUDGET (DECREASE) BUDGET FY 21-22 FY 22-23 FY 23-24 FY 24-25 FY 25-26 Audited
3,979,678 4,980,911 FUND BALANCE FORWARD (OCTOBER 1) 4,835,657 204,861 405,528 1,130,637 820,055
REVENUES 423.0000.334.350003 SJRWMD GRANT - CANAL PUMP STATION & WTP RETROFIT 1,500,000 - - - -423.0000.334.______ SJRWMD GRANT - JIWM PIPELINE - 1,000,000 1,189,753 - -423.0000.343.060900 WATER IMPACT FEES 175,000 - 175,000 175,000 175,000 175,000 175,000 175,000 423.0000.343.061000 SEWER IMPACT FEES 130,000 - 130,000 135,000 140,000 145,000 145,000 145,000 423.0000.343.061600 WASTEWATER UTILITY EXTENSION CHARGES 20,000 - 20,000 20,000 20,000 10,000 10,000 10,000 423.0000.343.062000 STEP SYSTEM PREPAYMENTS 275,000 - 275,000 275,000 275,000 275,000 275,000 275,000 423.0000.361.010100 INTEREST INCOME-SPECIAL ASSESSMENTS 3,000 - 3,000 3,000 3,000 3,000 3,000 3,000 423.0000.361.010200 INTEREST ON INVESTMENTS 423.0000.363.000100 PENALTY INCOME 500 - 500 500 500 500 500 500 423.0000.365.090150 SALE OF SURPLUS VEHICLES 10,000 - 10,000 10,000 10,000 - - -423.0000.382.000300 CONTRIBUTION FROM W/S REV FUND 1,800,000 - 1,800,000 5,700,000 2,750,000 2,000,000 2,000,000 2,000,000 423.0000.384.000100 PROCEEDS FROM BORROWING (WATER RECLAMATION FACILITY - WWTP RELOCATION) 1,050,000 (1,050,000) - 2,500,000 12,750,000 29,050,000 11,300,000 -423.0000.384.000100 PROCEEDS FROM BORROWING (CANAL PUMP STATION & WTP RETROFIT-SB 712) 1,450,000 (1,450,000) - 660,000 - - - -423.0000.384.000100 PROCEEDS FROM BORROWING (STEP SYSTEM FORCE MAINS OUTSIDE CITY LIMITS-SB 712) 2,000,000 (2,000,000) - 1,000,000 1,000,000 - - -423.0000.383.000100 VEHICLE LEASE-PURCHASE PROCEEDS - 46,000 47,000 47,600 -423.0000.389.000800 STEP SYSTEM SPECIAL ASSESSMENT REVENUE 1,500 - 1,500 1,500 1,500 1,500 1,500 -423.0000.389.800000 CONTRIBUTIONS FROM PRIVATE SOURCES (JIWM FOR CONSTRUCTION) - 1,000,000 1,000,000 - 4,000,000 2,569,257 - -
6,915,000 (3,500,000) 3,415,000 Total Revenues 11,980,000 22,171,000 35,466,010 13,957,600 2,608,500
EXPENDITURES WASTEWATER TREATMENT 423.9000.536.610390 COMPUTERS 10,500 (10,500) - 12,000 1,500 1,500 1,500 1,500 423.9000.536.611334 WASTEWATER TREATMENT PLANT METERS 5,000 - 5,000 5,000 5,000 5,000 5,000 5,000 423.9000.536.614004 PUMP AND MOTOR REPLACEMENT 5,000 - 5,000 5,000 5,000 5,000 5,000 5,000 423.9000.536.614005 ELECTRICAL EQUIPMENT REPLACEMENT 5,000 - 5,000 5,000 5,000 5,000 5,000 5,000 423.9000.536.615014 HVAC REPLACEMENT 1,000 - 1,000 1,000 1,000 1,000 1,000 1,000 423.9000.536.616072 WATER RECLAMATION FACILITY - ENGINEERING (WWTP RELOCATION) 900,000 (850,000) 50,000 1,600,000 1,100,000 900,000 450,000 -423.9000.536.616093 WATER RECLAMATION FACILITY - CONSTRUCTION (WWTP RELOCATION) 500,000 11,500,000 24,000,000 10,850,000 -423.9000.536.616094 WATER RECLAMATION FACILITY - ONSITE FORCE MAINS AIRPORT (WWTP RELOCATION) 250,000 - - - -
35

I
- - - - -
- - - - -
- - -
- - - - -
- - -- - - - -
- - -- - -
CITY OF VERO BEACH FIVE YEAR CAPITAL IMPROVEMENT PROGRAM
FUND 423: Water Sewer R/R Fund FY 20-21
FY 20-21 BUDGET AMENDED ORIGINAL INCREASE FY 20-21
Account Number Account Name BUDGET (DECREASE) BUDGET FY 21-22 FY 22-23 FY 23-24 FY 24-25 FY 25-26 WATER TREATMENT 423.9002.536.601302 WELL FIELD GENERATORS (REPLACE PORTABLES) 120,000 (100,000) 20,000 120,000 - - - -423.9002.536.602391 EXTERIOR PAINTING OF BUILDINGS 50,000 (47,000) 3,000 47,000 - - - -423.9002.536.602393 SLAKER ROOM FLOOR EPOXY COATING REPAIR 50,000 (50,000) - 50,000 - - - -423.9002.536.608304 DOOR REPLACEMENT 95,000 (80,000) 15,000 100,000 - - - -423.9002.536.610340 SECURITY SYSTEM 20,000 (10,000) 10,000 20,000 - - - -423.9002.536.610396 SCADA SYSTEM REPLACEMENT 20,000 (20,000) - 20,000 - - 350,000 -423.9002.536.611305 CAUSTIC TANK REPLACEMENT 50,000 (50,000) - 50,000 - - - -423.9002.536.611306 FLUORIDE TANK REPLACEMENT 30,000 10,000 40,000 423.9002.536.611307 PIPE PAINTING (FILTER BAYS) 50,000 (50,000) - 50,000 - - - -423.9002.536.611334 WATER PLANT AND WELL FIELD METERS 30,000 12,000 42,000 30,000 30,000 30,000 30,000 30,000 423.9002.536.612310 RO PLANT GENERATOR REPLACEMENT 650,000 (635,000) 15,000 635,000 - - - -423.9002.536.613010 HIGH SERVICE PUMP PLC REPLACEMENT 100,000 (100,000) - 100,000 - - - -423.9002.536.614002 WELL FIELD PUMP AND MOTOR REPLACEMENT 100,000 - 100,000 200,000 50,000 25,000 25,000 25,000 423.9002.536.614006 PLANT PUMP AND MOTOR REPLACEMENT 10,000 - 10,000 10,000 10,000 10,000 10,000 10,000 423.9002.536.614007 HVAC REPLACEMENT 1,000 - 1,000 1,000 1,000 1,000 1,000 1,000 423.9002.536.614008 ELECTRICAL EQUIPMENT REPLACEMENT 35,000 (15,000) 20,000 65,000 10,000 10,000 10,000 10,000 423.9002.536.615022 ROOF REPLACEMENT WELLS 29, 30 & SB 4 PUMP STATION 30,000 (10,000) 20,000 423.9002.536.616045 GROUND STORAGE RESERVOIR PAINTING (3) 85,000 (85,000) - 235,000 - - - -423.9002.536.616056 WATER TREATMENT MISC EQUIPMENT 10,000 - - - -423.9002.536.616062 FILTER INTERIOR PAINTING 75,000 (75,000) - 75,000 - - - -423.9002.536.616066 ELECTRICAL SYSTEM REPLACEMENT (FILTERS 7 THROUGH 11) 350,000 (350,000) - 350,000 - - - -423.9002.536.616073 2.0 MG GROUND STORAGE TANK with SITE WORK 195,000 (135,000) 60,000 2,085,000 - - - -423.9002.536.616074 ACCELATOR DEMOLITION & REHABILITATION (NO. 2, 3 and 4) 630,000 (600,000) 30,000 1,100,000 - - - -423.9002.536.616075 RELOCATION OF LIME SLUDGE BEDS 200,000 (200,000) - 200,000 - - - -423.9002.536.616076 RAW WATER LINE RELOCATION 150,000 (150,000) - 150,000 - - - -423.9002.536.616077 SURFACE WASH PIPING REPLACEMENT 75,000 (75,000) - 75,000 - - - -423.9002.536.616078 SB4 SYSTEM REPLACEMENT 45,000 (45,000) - 95,000 300,000 - - -423.9002.536.616079 ST. LUCIE COUNTY INTERCONNECT 50,000 (43,000) 7,000 43,000 - - - -423.9002.536.616080 RECOVERY BASIN PUMPS 30,000 - 30,000 423.9002.536.616081 FILTER ACTUATERS 50,000 (50,000) - 50,000 - - - -423.9002.536.616090 WATER TREATMENT SERVICE VEHICLES (TRUCKS, TRAILERS, ROLLING STOCK) 9,000 - - - -423.9002.536.661311 HIGH SERVICE PUMP (REPLACEMENT AND REFURB) 120,000 - 120,000 423.9002.536.662307 SURFICIAL WELL REPLACEMENT 250,000 335,000 585,000 760,000 150,000 150,000 150,000 150,000 423.9002.536.691340 COMPUTER 10,500 (10,500) - 12,000 1,500 1,500 1,500 1,500 423.9002.536.692320 FILTER MEDIA REPLACEMENT (FILTERS 7 THROUGH 11) 40,000 (40,000) - 40,000 - - - -423.9002.536.693308 RO PLANT PRODUCTION WELL (FLORIDAN) 250,000 750,000 - - -423.9002.536.693309 ACCELATOR F VALVE AND CHLORINATOR REPLACEMENT (NO. 3 & 4) 50,000 - - - -
36

I I
I I
I l
I l
CITY OF VERO BEACH FIVE YEAR CAPITAL IMPROVEMENT PROGRAM
FUND 423: Water Sewer R/R Fund
Account Number Account Name
FY 20-21 ORIGINAL BUDGET
FY 20-21 BUDGET
INCREASE (DECREASE)
AMENDED FY 20-21 BUDGET FY 21-22 FY 22-23 FY 23-24 FY 24-25 FY 25-26
WASTEWATER REUSE 423.9004.536.601381 NUTRIENT REDUCTION STUDY 423.9004.536.610396 SCADA SYSTEM 423.9004.536.611334 REUSE METERS 423.9004.536.614009 PUMP AND MOTOR REPLACEMENT 423.9004.536.614010 ELECTRICAL PANEL REPLACEMENT 423.9004.536.616045 GROUND STORAGE RESERVOIR PAINTING (1) 423.9004.536.616082 RECLAIMED WATER GROUND STORAGE TANK AND PUMP SYSTEM (WWTP RELOCATION) 423.9004.536.616083 MAIN RELIEF CANAL PUMP STATION, MAINS, WTP RETROFIT (SB 712) 423.9004.536.616084 TIRS PUMP STATION ELECTRICAL REHABILITATION 423.9004.536.616085 AIA PIPE PIGGING 423.9004.536.616096 STORMWATER IRRIGATION PIPELINE
50,000 25,000 7,500 5,000 7,500
45,000 150,000
1,450,000 150,000 65,000
-
(50,000) (25,000) (7,500) (5,000) (7,500)
(45,000) (150,000)
(1,340,000) (150,000) (65,000) 200,000
-------
110,000 --
200,000
50,000 25,000 7,500 5,000 7,500
45,000 100,000
2,000,000 -
65,000 800,000
--
7,500 5,000 7,500
-150,000
---
5,000,000
--
7,500 5,000 7,500
-4,150,000
---
3,759,010
--
7,500 5,000 7,500
---
150,000 --
--
7,500 5,000 7,500
------
ADMINISTRATION 423.9005.536.610390 COMPUTERS 423.9005.536.611390 COPIER FACILITY MAINTENANCE 423.9007.536.601391 UTILITY VAN 423.9007.536.601399 SOFTWARE FOR WAREHOUSE 423.9007.536.603395 OVERHEAD DOOR ACTUATORS 423.9007.536.610340 SECURITY SYSTEM WAREHOUSE 423.9007.536.610390 COMPUTERS 423.9007.536.699393 TOOLS/SHOP/GARAGE/ EQUIPMENT 423.9007.536.616086 MAINTENANCE BUILDING EXPANSION
3,000 -
-40,000
-25,000 5,000
15,000 420,000
3,000 -
41,700 (40,000)
5,500 (25,000)
--
(360,000)
6,000 -
41,700 -
5,500 -
5,000 15,000 60,000
5,000 6,550
---
100,000 5,000
35,000 600,000
3,000 -
----
5,000 5,000
3,000 -
----
5,000 5,000
3,000 -
----
5,000 5,000
3,000 -
----
5,000 5,000
-WASTEWATER COLLECTION 423.9010.536.601391 UTILITY VAN 423.9010.536.602391 SERVICE TRUCK CRANES 423.9010.536.608361 LIFT STATION PUMP REPLACEMENT 423.9010.536.610390 COMPUTERS 423.9010.536.615024 TRAILER MOUNTED DIESEL PUMP 423.9010.536.615052 HYBRID STEP (SEPTIC TANK EFFLUENT PUMP) SYSTEM 423.9010.536.615053 STEP SYSTEM CUSTOMER EQUIPMENT 423.9010.536.616050 SERVICE TRUCKS 423.9010.536.616053 STEP SYSTEM SERVICES 423.9010.536.616055 SEPTIC TANK NUTRIENT REMOVAL STUDY (TMDL) 423.9010.536.616056 WASTEWATER COLLECTION MISC EQUIPMENT 423.9010.536.616064 LIFT STATION CONTROLLERS 423.9010.536.616068 IN-PLACE LIFT STATION GENERATORS 423.9010.536.668361 ELECTRICAL PANEL REPLACEMENT 423.9010.536.671361 GRAVITY SEWER REHABILITATION 423.9010.536.616087 STEP SYSTEM FORCE MAINS (OUTSIDE CITY LIMITS)- SB 712 423.9010.536.616088 MOCKINGBIRD DRIVE FORCE MAIN REPLACEMENT 423.9010.536.616089 LIFT STATION SCADA 423.9010.536.616090 WASTEWATER COLLECTION SERVICE VEHICLES (TRUCKS/TRAILERS/ROLLING STOCK) 423.9010.536.616091 CAMERA INSPECTION EQUIPMENT (MANHOLE INSPECTION CAMERA)
-20,000 35,000
3,000 50,000
-250,000
30,000 50,000 5,000
10,000 120,000 30,000
250,000 500,000 100,000 50,000
379,000 90,000
41,637 ----75
200,000 75,000
-(25,000)
-4,000
(120,000) (30,000)
(200,000) (500,000) (100,000)
-(107,500)
(90,000)
41,637 20,000 35,000
3,000 50,000
75 450,000 75,000 30,000 25,000
5,000 14,000
--
50,000 --
50,000 271,500
-
--
35,000 3,000
--
100,000
30,000 25,000 25,000 10,000
150,000 30,000
350,000 1,000,000
200,000 50,000
582,500 150,000
--
35,000 3,000
--
450,000
30,000 -
5,000 10,000
150,000 30,000
450,000 1,000,000
-50,000
175,000 -
--
35,000 3,000
--
100,000
30,000 -
5,000 10,000
150,000 30,000
500,000 --
50,000 75,000
-
--
35,000 3,000
--
450,000
30,000 -
5,000 10,000
150,000 30,000
600,000 --
50,000 75,000
-
--
35,000 3,000
--
250,000 -
30,000 -
5,000 10,000
150,000 30,000
600,000 --
50,000 75,000
-
37

I I
I J
I I I I
CITY OF VERO BEACH FIVE YEAR CAPITAL IMPROVEMENT PROGRAM
FUND 423: Water Sewer R/R Fund
Account Number Account Name
FY 20-21 ORIGINAL BUDGET
FY 20-21 BUDGET
INCREASE (DECREASE)
AMENDED FY 20-21 BUDGET FY 21-22 FY 22-23 FY 23-24 FY 24-25 FY 25-26
WATER DISTRIBUTION 423.9011.536.608334 WATER DISTRIBUTION METERS 423.9011.536.610390 COMPUTERS 423.9011.536.611331 LINE & SERVICE REPLACEMENT 423.9011.536.616045 GROUND STORAGE RESERVOIR PAINTING (2) 423.9011.536.616050 WATER DISTRIBUTION SERVICE VEHICLES 423.9011.536.616056 WATER DISTRIBUTION MISC EQUIPMENT 423.9011.536.641411 UTILITY LINE LOCATOR 423.9011.536.6_____ CEMETERY TRANSMISSION MAIN RELOCATION
60,000 3,000
250,000 65,000
160,000 5,000
25,000 -
----
31,000 -
(25,000) -
60,000 3,000
250,000 65,000
191,000 5,000
--
60,000 3,000
350,000 65,000
-15,000 30,000
-
60,000 3,000
350,000 --
5,000 5,000
-
60,000 3,000
450,000 --
5,000 5,000
75,000
60,000 3,000
600,000 --
5,000 5,000
-
60,000 3,000
600,000 --
5,000 5,000
-CUSTOMER SERVICE 423.9012.536.615045 CUSTOMER SVC BILLING SOFTWARE IMPRVMTS/UPDATES 423.9012.536.616069 CUSTOMER SERVICE MOBILE RADIO REPLACEMENT 423.9012.536.616092 CUSTOMER SERVICE - ITRON UPDATE (H/W & S/W) 423.9012.536.641415 CUST SVC VEH LEASE-PURCHASE 423.9012.536.641416 CUST SVC VEH LEASE-PURCHASE DEBT SVC
203,650 12,000 5,000
-13,192
--
(5,000) --
203,650 12,000
--
13,192
--
20,900 -
4,846
---
46,000 10,333
---
47,000 20,891
---
47,600 31,582
----
31,582
Total Expenditures Excess (Deficiency) of Revenues over Expenditures
ENDING FUND BALANCE (SEP 30)
9,959,842 (6,399,588) 3,560,254 16,610,796 21,970,333 34,740,901 14,268,182 2,220,582 (3,044,842) (145,254) (4,630,796) 200,667 725,109 (310,582) 387,918
934,836 4,835,657 204,861 405,528 1,130,637 820,055 1,207,973
38

FIVE YEAR CAPITAL PROGRAM EXPENDITURE REQUESTS FISCAL YEARS ENDING 2022‐2026
FUND 423 ‐ Water Sewer R/R DEPARTMENT Wastewater Treatment
PROJECT NAME Computers ACCOUNT # 423.9000.536.610390
TYPE OF EXPENSE New Repair/Refurbish Replace x
TOTAL PROJECT COST $ 1,500 to $ 12,000 GRANT FUNDING Amount $ ‐
Annual Range Source/Agency N/A PROJECT LOCATION Wastewater Treatment Plant Operations Lab
PROJECT DESCRIPTION PC Replacement. Replacement of SCADA Server
JUSTIFICATION Replacement of failed PC's as needed. Replacement of the WWTP primary SCADA Server. This request is in accordance with
Information Systems' PC Replacement Program.
PROJECT NAME Wastewater Treatment Plant Meters ACCOUNT # 423.9000.536.611334
TYPE OF EXPENSE New Repair/Refurbish Replace X
TOTAL PROJECT COST $ 5,000 Annual GRANT FUNDING Amount $ ‐
Source/Agency N/A PROJECT LOCATION Wastewater Treatment Plant
PROJECT DESCRIPTION Replacement of various plant meters for process control and regulatory compliance.
JUSTIFICATION Normally, plant process meters are repaired and costs are covered under appropriate operating funds. However, occasionally,
meters need to be replaced instead of repaired. To better reflect this capital expense, this line item has been established.
39

FIVE YEAR CAPITAL PROGRAM EXPENDITURE REQUESTS FISCAL YEARS ENDING 2022‐2026
FUND 423 ‐ Water Sewer R/R DEPARTMENT Wastewater Treatment
PROJECT NAME Pump and Motor Replacement ACCOUNT # 423.9000.536.614004
TYPE OF EXPENSE New Repair/Refurbish Replace x
TOTAL PROJECT COST $ 5,000 Annual GRANT FUNDING Amount $ ‐
Source/Agency N/A PROJECT LOCATION Wastewater Treatment Plant
PROJECT DESCRIPTION Pump and Motor Replacements at Wastewater Treatment Plant
JUSTIFICATION Normally, pumps are repaired and costs are covered under appropriate operating funds. However, occasionally, pumps and/or
motors need to be replaced instead of repaired. To better reflect this capital expense, this line item has been established.
PROJECT NAME Electrical Equipment Replacement ACCOUNT # 423.9000.536.614005
TYPE OF EXPENSE New Repair/Refurbish Replace X
TOTAL PROJECT COST $ 5,000 Annual GRANT FUNDING Amount $ ‐
Source/Agency N/A PROJECT LOCATION Wastewater Treatment Plant
PROJECT DESCRIPTION Electrical Equipment Replacement at Wastewater Treatment Plant
JUSTIFICATION Normally, electrical equipment is repaired and costs are covered under appropriate operating funds. However, occasionally,
electrical equipment needs to be replaced instead of repaired. To better reflect this capital expense, this line item has been
established.
40

FIVE YEAR CAPITAL PROGRAM EXPENDITURE REQUESTS FISCAL YEARS ENDING 2022‐2026
FUND 423 ‐ Water Sewer R/R DEPARTMENT Wastewater Treatment
PROJECT NAME HVAC Replacement ACCOUNT # 423.9000.536.615014
TYPE OF EXPENSE New Repair/Refurbish X Replace X
TOTAL PROJECT COST $ 1,000 Annual GRANT FUNDING Amount $ ‐
Source/Agency N/A PROJECT LOCATION Wastewater Treatment Plant
PROJECT DESCRIPTION HVAC Replacement at Wastewater Treatment Plant
JUSTIFICATION Normally, HVAC equipment is repaired and costs are covered under appropriate operating funds. However, occasionally, HVAC
equipment needs to be replaced instead of repaired. To better reflect this capital expense, this line item has been established.
PROJECT NAME Water Reclamation Facility ‐ Engineering (WWTP Relocation) ACCOUNT # 423.9000.536.616072
TYPE OF EXPENSE New Repair/Refurbish Replace X
TOTAL PROJECT COST $ 4,100,000 GRANT FUNDING Amount $ ‐
Source/Agency N/A PROJECT LOCATION New Water Reclamation Facility to be location at Water Treatment Plant/Airport Area
PROJECT DESCRIPTION Replace current Wastewater Treatment Plant with new Water Reclamation Facility (Engineering)
JUSTIFICATION City Council (at their regular meeting of 4/7/20) unanimously voted to construct a new Water Reclamation Facility. Refer to 5 Year
Detail Worksheet for disbursement per year.
41

FIVE YEAR CAPITAL PROGRAM EXPENDITURE REQUESTS FISCAL YEARS ENDING 2022‐2026
FUND 423 ‐ Water Sewer R/R DEPARTMENT Wastewater Treatment
PROJECT NAME Water Reclamation Facility ‐ Construction (WWTP Relocation) ACCOUNT # 423.9000.536.616093
TYPE OF EXPENSE New Repair/Refurbish Replace X
TOTAL PROJECT COST $ 46,850,000 GRANT FUNDING Amount $ ‐
Source/Agency N/A PROJECT LOCATION New Water Reclamation Facility to be location at Water Treatment Plant/Airport Area
PROJECT DESCRIPTION Replace current Wastewater Treatment Plant with new Water Reclamation Facility (Construction)
JUSTIFICATION City Council (at their regular meeting of 4/7/20) unanimously voted to construct a new Water Reclamation Facility. Refer to 5 Year
Detail Worksheet for disbursement per year.
PROJECT NAME Water Reclamation Facility ‐ On‐Site Force Mains Airport (WWTP Relocation) ACCOUNT # 423.9000.536.616094
TYPE OF EXPENSE New X Repair/Refurbish Replace
TOTAL PROJECT COST $ 250,000 GRANT FUNDING Amount $ ‐
Source/Agency N/A PROJECT LOCATION Water Treatment Plant/Airport Area
PROJECT DESCRIPTION Replace current Wastewater Treatment Plant with new Water Reclamation Facility (On‐Site Force Mains Airport)
JUSTIFICATION City Council (at their regular meeting of 4/7/20) unanimously voted to construct a new Water Reclamation Facility. Refer to 5 Year
Detail Worksheet for disbursement per year.
42

FIVE YEAR CAPITAL PROGRAM EXPENDITURE REQUESTS FISCAL YEARS ENDING 2022‐2026
FUND 423 ‐ Water Sewer R/R DEPARTMENT Water Treatment
PROJECT NAME Well Field Generators (Replace 2 Portables) ACCOUNT # 423.9002.536.601302
TYPE OF EXPENSE New Repair/Refurbish Replace X
TOTAL PROJECT COST $ 120,000 GRANT FUNDING Amount $ ‐
Source/Agency N/A PROJECT LOCATION Water Treatment Plant
PROJECT DESCRIPTION Replacement of two (2) Water Treatment Plant portable generators.
JUSTIFICATION Replacement of two portable generators required by state regulations to supply emergency power during hurricanes and other
power outages with two fixed in‐place generators. Existing 27 year old units will have reached the end of their service lives.
PROJECT NAME Exterior Painting of Buildings ACCOUNT # 423.9002.536.602391
TYPE OF EXPENSE New Repair/Refurbish X Replace
TOTAL PROJECT COST $ 47,000 GRANT FUNDING Amount $ ‐
Source/Agency N/A PROJECT LOCATION Water Treatment Plant
PROJECT DESCRIPTION Water Treatment Plant Exterior Painting of Buildings.
JUSTIFICATION Routine painting for aesthetics and asset protection.
43

FIVE YEAR CAPITAL PROGRAM EXPENDITURE REQUESTS FISCAL YEARS ENDING 2022‐2026
FUND 423 ‐ Water Sewer R/R DEPARTMENT Water Treatment
PROJECT NAME Slaker Room Floor Epoxy Coating Repair ACCOUNT # 423.9002.536.602393
TYPE OF EXPENSE New Repair/Refurbish X Replace
TOTAL PROJECT COST $ 50,000 GRANT FUNDING Amount $ ‐
Source/Agency N/A PROJECT LOCATION Water Treatment Plant Slaker Room
PROJECT DESCRIPTION Water Treatment Plant Slaker Room Floor Epoxy Coating Repair
JUSTIFICATION Routine painting for aesthetics and to protect concrete.
PROJECT NAME Door Replacement ACCOUNT # 423.9002.536.608304
TYPE OF EXPENSE New Repair/Refurbish Replace X
TOTAL PROJECT COST $ 100,000 GRANT FUNDING Amount $ ‐
Source/Agency N/A PROJECT LOCATION Water Treatment Plant
PROJECT DESCRIPTION Water Treatment Plant door replacement.
JUSTIFICATION Replacement of 20 doors is required due to corrosion.
44

FIVE YEAR CAPITAL PROGRAM EXPENDITURE REQUESTS FISCAL YEARS ENDING 2022‐2026
FUND 423 ‐ Water Sewer R/R DEPARTMENT Water Treatment
PROJECT NAME Security System
ACCOUNT # 423.9002.536.610340
TYPE OF EXPENSE New Repair/Refurbish Replace X
TOTAL PROJECT COST $ 20,000 GRANT FUNDING Amount $ ‐
Source/Agency N/A PROJECT LOCATION Water Treatment Plant
PROJECT DESCRIPTION Upgrade and expand CCTV System at the Water Treatment Plant.
JUSTIFICATION Existing CCTV system has reached the end of it's expected lifespan. Expansion of system to include the Field Services and
Maintenance Buildings.
PROJECT NAME ACCOUNT #
SCADA System Replacement 423.9002.536.610396
TYPE OF EXPENSE New Repair/Refurbish Replace X
TOTAL PROJECT COST
PROJECT LOCATION Water Treatment Plant
$ 370,000 GRANT FUNDING Amount Source/Agency
$ ‐
N/A
PROJECT DESCRIPTION Supervisory Control and Data Acquisition (SCADA) Replacement. Replace Remote Telemetry Units located at well and pumping
facilities. Upgrade associated HMI software integration.
JUSTIFICATION The SCADA system enables staff to monitor and control treatment facilities, wells and other remote equipment and facilities.
This replacement is necessary due to obsolescence of hardware and software, cyber security concerns as well as reliability
issues. Future security requirements cannot be met with existing hardware.
45

FIVE YEAR CAPITAL PROGRAM EXPENDITURE REQUESTS FISCAL YEARS ENDING 2022‐2026
FUND 423 ‐ Water Sewer R/R DEPARTMENT Water Treatment
PROJECT NAME Caustic Tank Replacement ACCOUNT # 423.9002.536.611305
TYPE OF EXPENSE New Repair/Refurbish Replace X
TOTAL PROJECT COST $ 50,000 GRANT FUNDING Amount $ ‐
Source/Agency N/A PROJECT LOCATION Water Treatment Plant
PROJECT DESCRIPTION Water Treatment Plant Caustic Tank Replacement.
JUSTIFICATION Current 25 year old 10,000 gallon caustic storage tank is at the end of it lifecycle and requires replacement to maintain
environmental compliance.
PROJECT NAME Pipe Painting (Filter Bays) ACCOUNT # 423.9002.536.611307
TYPE OF EXPENSE New Repair/Refurbish X Replace
TOTAL PROJECT COST $ 50,000 GRANT FUNDING Amount $ ‐
Source/Agency N/A PROJECT LOCATION Water Treatment Plant Filter Bays
PROJECT DESCRIPTION Painting of Water Treatment Plant Pipe Filter Bays.
JUSTIFICATION Routine painting for aesthetics and corrosion protection.
46

FIVE YEAR CAPITAL PROGRAM EXPENDITURE REQUESTS FISCAL YEARS ENDING 2022‐2026
FUND 423 ‐ Water Sewer R/R DEPARTMENT Water Treatment
PROJECT NAME ACCOUNT #
Water Plant and Well Field Meters 423.9002.536.611334
TYPE OF EXPENSE New Repair/Refurbish Replace X
TOTAL PROJECT COST
PROJECT LOCATION Water Treatment Plant
$ 30,000 Annual GRANT FUNDING Amount Source/Agency
$ ‐
N/A
PROJECT DESCRIPTION Water Treatment Plant and Well Field Meters
JUSTIFICATION Normally, plant process and wellfield meters are repaired and costs are covered under appropriate operating funds. However,
occasionally, meters need to be replaced instead of repaired. To better reflect this capital expense, this line item has been
established.
PROJECT NAME ACCOUNT #
RO Plant Generator Replacement 423.9002.536.612310
TYPE OF EXPENSE New Repair/Refurbish Replace X
TOTAL PROJECT COST
PROJECT LOCATION RO Plant
$ 650,000 GRANT FUNDING Amount Source/Agency
$ ‐
N/A
PROJECT DESCRIPTION RO Plant Emergency Generator (1000 KW) Replacement
JUSTIFICATION Replacement of the RO Plant Emergency Generator that has been in service since 1992 and will reach the end of its projected
service life. New generator will support additional RO Plant Supply Pumps.
47

FIVE YEAR CAPITAL PROGRAM EXPENDITURE REQUESTS FISCAL YEARS ENDING 2022‐2026
FUND 423 ‐ Water Sewer R/R DEPARTMENT Water Treatment
PROJECT NAME ACCOUNT #
High Service Pump PLC
423.9002.536.613010 Replacement
TYPE OF EXPENSE New Repair/Refurbish Replace X
TOTAL PROJECT COST $
PROJECT LOCATION Lime Softening Plant (LSP)
100,000 GRANT FUNDING Amount Source/Agency
$ ‐
N/A
PROJECT DESCRIPTION Lime Softening Plant (LSP) Programmable Logic Controller (PLC) replacement.
JUSTIFICATION The PLC controls all automated functions and plant parameters as well as ensuring regulatory compliance. The current 21 year
old PLC has reached the end of its life cycle and is nearing obsolescence. The age of this unit impedes implementation of new technologies which increase operational efficiency or may be required for regulatory compliance.
PROJECT NAME ACCOUNT #
Well Field Pump and M
423.9002.536.614002 otor Replacement
TYPE OF EXPENSE New Repair/Refurbish Replace X
TOTAL PROJECT COST
PROJECT LOCATION Water Treatment Plant
$ 25,000 Annual Range
to $ 200,000 GRANT FUNDING Amount $ ‐
Source/Agency N/A
PROJECT DESCRIPTION Replacement of well motors and pumps.
JUSTIFICATION Normally, motors and pumps are repaired and costs are covered under appropriate operating funds. However, occasionally,
motors need to be replaced instead of repaired. To better reflect this capital expense, this line item has been established.
48

FIVE YEAR CAPITAL PROGRAM EXPENDITURE REQUESTS FISCAL YEARS ENDING 2022‐2026
FUND 423 ‐ Water Sewer R/R DEPARTMENT Water Treatment
PROJECT NAME ACCOUNT #
Plant Pump and Motor Replacement 423.9002.536.614006
TYPE OF EXPENSE New Repair/Refurbish Replace X
TOTAL PROJECT COST
PROJECT LOCATION Water Treatment Plant
$ 10,000 Annual GRANT FUNDING Amount Source/Agency
$ ‐
N/A
PROJECT DESCRIPTION Pump and motor replacement at Water Treatment Plant
JUSTIFICATION Normally, pumps and motors are repaired and costs are covered under appropriate operating funds. However, occasionally,
pumps and/or motors need to be replaced instead of repaired. To better reflect this capital expense, this line item has been
established.
PROJECT NAME ACCOUNT #
HVAC Replacement 423.9002.536.614007
TYPE OF EXPENSE New Repair/Refurbish Replace X
TOTAL PROJECT COST
PROJECT LOCATION Water Treatment Plant
$ 1,000 Annual GRANT FUNDING Amount Source/Agency
$ ‐
N/A
PROJECT DESCRIPTION HVAC replacement at Water Treatment Plant
JUSTIFICATION Normally, HVAC equipment is repaired and costs are covered under appropriate operating funds. However, occasionally, HVAC
equipment needs to be replaced instead of repaired. To better reflect this capital expense, this line item has been established.
49

FIVE YEAR CAPITAL PROGRAM EXPENDITURE REQUESTS FISCAL YEARS ENDING 2022‐2026
FUND 423 ‐ Water Sewer R/R DEPARTMENT Water Treatment
PROJECT NAME ACCOUNT #
Electrical Equipment R
423.9002.536.614008 eplacement
TYPE OF EXPENSE New Repair/Refurbish Replace X
TOTAL PROJECT COST
PROJECT LOCATION Water Treatment Plant
$ 10,000 Annual Range
to $ 65,000 GRANT FUNDING Amount $ ‐
Source/Agency N/A
PROJECT DESCRIPTION Electrical equipment replacement at Water Treatment Plant
JUSTIFICATION Normally, electrical equipment is repaired and costs are covered under appropriate operating funds. However, occasionally,
electrical equipment needs to be replaced instead of repaired. To better reflect this capital expense, this line item has been
established.
PROJECT NAME Ground Storage Reservoir Painting (3) (Water Treatment Plant ) ACCOUNT # 423.9002.536.616045
TYPE OF EXPENSE New Repair/Refurbish X Replace
TOTAL PROJECT COST $ 235,000 GRANT FUNDING Amount $ ‐
Source/Agency N/A PROJECT LOCATION Water Treatment Plant
PROJECT DESCRIPTION Painting of 3 ground storage reservoirs at the Water Treatment Plant.
JUSTIFICATION Routine painting for aesthetics and asset protection.
50

FIVE YEAR CAPITAL PROGRAM EXPENDITURE REQUESTS FISCAL YEARS ENDING 2022‐2026
FUND 423 ‐ Water Sewer R/R DEPARTMENT Water Treatment
PROJECT NAME Water Treatment Misc Equipment ACCOUNT # 423.9002.536.616056
TYPE OF EXPENSE New X Repair/Refurbish Replace X
TOTAL PROJECT COST $ 10,000 GRANT FUNDING Amount $ ‐
Source/Agency N/A PROJECT LOCATION Reverse Osmosis Plant (ROP)
PROJECT DESCRIPTION Water Treatment Miscellaneous Equipment (ammonia regulator, blend valve actuator)
JUSTIFICATION Miscellaneous equipment is required to ensure staff can complete emergencies, daily tasks, repairs, and maintenance without
interruption.
PROJECT NAME Filter Interior Painting ACCOUNT # 423.9002.536.616062
TYPE OF EXPENSE New Repair/Refurbish X Replace
TOTAL PROJECT COST $ 75,000 GRANT FUNDING Amount $ ‐
Source/Agency N/A PROJECT LOCATION Water Treatment Plant/Lime Softening Plant)
PROJECT DESCRIPTION Remove and replace protective coating on interior of filters.
JUSTIFICATION Routine painting for aesthetics and asset protection.
51

FIVE YEAR CAPITAL PROGRAM EXPENDITURE REQUESTS FISCAL YEARS ENDING 2022‐2026
FUND 423 ‐ Water Sewer R/R DEPARTMENT Water Treatment
PROJECT NAME Electrical System Replacement (Filters 7 through 11) ACCOUNT # 423.9002.536.616066
TYPE OF EXPENSE New Repair/Refurbish Replace X
TOTAL PROJECT COST $ 350,000 GRANT FUNDING Amount $ ‐
Source/Agency N/A PROJECT LOCATION Water Treatment Plant
PROJECT DESCRIPTION Electrical System Replacement (Filters 7 through 11)
JUSTIFICATION Replacement of electrical system for final water filtration media is required to maintain water quality and ensure regulatory
compliance.
PROJECT NAME 2.0 MG Ground Storage Tank with Site Work ACCOUNT # 423.9002.536.616073
TYPE OF EXPENSE New Repair/Refurbish Replace x
TOTAL PROJECT COST $ 2,145,000 GRANT FUNDING Amount $ ‐
Source/Agency N/A PROJECT LOCATION Water Treatment Plant (Lime Softening Plant)
PROJECT DESCRIPTION Replace 1.0 MG Ground Storage Tank with a 2.0 MG Ground Storage Tank including Site Work
JUSTIFICATION The current 1957 (prior to codes) tank design is inadequate for uplift from wind and has cracking along the edge. We have
budgeted the engineering in FY 20/21 and the construction of a new tank in FY 21/22.
52

FIVE YEAR CAPITAL PROGRAM EXPENDITURE REQUESTS FISCAL YEARS ENDING 2022‐2026
FUND 423 ‐ Water Sewer R/R DEPARTMENT Water Treatment
PROJECT NAME Accelator Demolition & Rehabilitation (No. 2, 3 and 4) ACCOUNT # 423.9002.536.616074
TYPE OF EXPENSE New Repair/Refurbish X Replace X
TOTAL PROJECT COST
PROJECT LOCATION
$ 1,100,000 GRANT FUNDING Amount Source/Agency
$ ‐
N/A
Water Treatment Plant/Lime Softening Plant (LSP)
PROJECT DESCRIPTION Accelator Nos. 2 (Demolition), 3 and 4 (Rehabilitation)
JUSTIFICATION Accelator No. 2, $100,000 has been decommissioned as it has reached the end of its life cycle and is not cost effective to repair.
With the expansion of the RO Plant, this unit is no longer needed.
Accelator Nos 3 and 4, $1,000,000: Coatings, troughs, and appurtenances have reached the end of their life cycles. There is
extensive corrosion of the tanks and internal components that need to be repaired and replaced to keep the units operable in
the future.
PROJECT NAME Relocation of Lime Sludge Beds ACCOUNT # 423.9002.536.616075
TYPE OF EXPENSE New Repair/Refurbish X Replace
TOTAL PROJECT COST $ 200,000 GRANT FUNDING Amount $ ‐
Source/Agency N/A PROJECT LOCATION Water Treatment Plant/Lime Softening Plant (LSP)
PROJECT DESCRIPTION Relocation of Lime Sludge Beds
JUSTIFICATION The Lime Sludge Beds need to be relocated to accommodate the new Water Reclamation Facility.
53

FIVE YEAR CAPITAL PROGRAM EXPENDITURE REQUESTS FISCAL YEARS ENDING 2022‐2026
FUND 423 ‐ Water Sewer R/R DEPARTMENT Water Treatment
PROJECT NAME Raw Water Line Relocation ACCOUNT # 423.9002.536.616076
TYPE OF EXPENSE New Repair/Refurbish X Replace
TOTAL PROJECT COST $ 150,000 GRANT FUNDING Amount $ ‐
Source/Agency N/A PROJECT LOCATION Water Treatment Plant/Reverse Osmosis Plant (ROP)
PROJECT DESCRIPTION Raw Water Line Relocation
JUSTIFICATION This raw water line needs to be relocated to accommodate the new Water Reclamation Facility.
PROJECT NAME Surface Wash Piping Replacement ACCOUNT # 423.9002.536.616077
TYPE OF EXPENSE New Repair/Refurbish Replace X
TOTAL PROJECT COST $ 75,000 GRANT FUNDING Amount $ ‐
Source/Agency N/A PROJECT LOCATION Water Treatment Plant/Lime Softening Plant (LSP)
PROJECT DESCRIPTION Surface Wash Piping Replacement
JUSTIFICATION The Surface Wash Piping is over 30 years old and has reached the end of its life cycle.
54

FIVE YEAR CAPITAL PROGRAM EXPENDITURE REQUESTS FISCAL YEARS ENDING 2022‐2026
FUND 423 ‐ Water Sewer R/R DEPARTMENT Water Treatment
PROJECT NAME SB4 System Replacement ACCOUNT # 423.9002.536.616078
TYPE OF EXPENSE New X Repair/Refurbish Replace X
TOTAL PROJECT COST $ 395,000 GRANT FUNDING Amount $ ‐
Source/Agency N/A PROJECT LOCATION South Beach
PROJECT DESCRIPTION South Beach 4 Ground Storage Tank (GST) System Replacement
JUSTIFICATION Replace electrical system, install a Chlorine Booster System, and install a new backup Generator System as part of
refurbishment to place this GST online (increase pressure and chlorine residual in south end of service territory).
PROJECT NAME St. Lucie County Interconnect ACCOUNT # 423.9002.536.616079
TYPE OF EXPENSE New X Repair/Refurbish Replace
TOTAL PROJECT COST $ 50,000 GRANT FUNDING Amount $ ‐
Source/Agency N/A PROJECT LOCATION South Beach
PROJECT DESCRIPTION St. Lucie Interconnect
JUSTIFICATION Water Main interconnect with St. Lucie County Utilities on North Hutchinson Island.
55

FIVE YEAR CAPITAL PROGRAM EXPENDITURE REQUESTS FISCAL YEARS ENDING 2022‐2026
FUND 423 ‐ Water Sewer R/R DEPARTMENT Water Treatment
PROJECT NAME ACCOUNT #
Filter Actuators
423.9002.536.616081
TYPE OF EXPENSE New Repair/Refurbish Replace X
TOTAL PROJECT COST
PROJECT LOCATION Water Treatment Plant
$ 50,000 GRANT FUNDING Amount Source/Agency
$ ‐
N/A
PROJECT DESCRIPTION Filter Actuators
JUSTIFICATION Replace filter actuators on sand filter throughout Lime Softening Plant as needed due to end of life cycles.
PROJECT NAME Water Treatment Service Vehicles (Trucks, Trailers, Rolling Stock) ACCOUNT # 423.9002.536.616090
TYPE OF EXPENSE New X Repair/Refurbish Replace X
TOTAL PROJECT COST $ 9,000 GRANT FUNDING Amount $ ‐
Source/Agency N/A PROJECT LOCATION Reverse Osmosis Plant (ROP)
PROJECT DESCRIPTION Water Treatment Miscellaneous Equipment (mower)
JUSTIFICATION Miscellaneous service vehicles are required to ensure staff has the equipment to complete emergencies, daily tasks, repairs,
and maintenance without interruption. This will include a replacement mower as the current unit has reached the end of its
life cycle.
56

FIVE YEAR CAPITAL PROGRAM EXPENDITURE REQUESTS FISCAL YEARS ENDING 2022‐2026
FUND 423 ‐ Water Sewer R/R DEPARTMENT Water Treatment
PROJECT NAME Surficial Well Replacement ACCOUNT # 423.9002.536.662307
TYPE OF EXPENSE New Repair/Refurbish Replace X
TOTAL PROJECT COST $ 150,000 to $ 760,000 GRANT FUNDING Amount $ ‐
Annual Range Source/Agency N/A PROJECT LOCATION Water Treatment Plant
PROJECT DESCRIPTION Remove surficial water production wells
JUSTIFICATION Replacement of surficial production wells that are not meeting capacity requirements and as per our Sanitary Survey.
PROJECT NAME Computer ACCOUNT # 423.9002.536.691340
TYPE OF EXPENSE New Repair/Refurbish Replace X
TOTAL PROJECT COST $ 1,500 to $ 12,000 GRANT FUNDING Amount $ ‐
Annual Range Source/Agency N/A PROJECT LOCATION Water Treatment Plant
PROJECT DESCRIPTION PC Replacement. Replacement SCADA Server
JUSTIFICATION Replacement of failed PC's as needed. Replacement of the WTP primary SCADA Server. This request is in accordance with
Information Systems' PC Replacement Program.
57

FIVE YEAR CAPITAL PROGRAM EXPENDITURE REQUESTS FISCAL YEARS ENDING 2022‐2026
FUND 423 ‐ Water Sewer R/R DEPARTMENT Water Treatment
PROJECT NAME Filter Media Replacement (Filters 7 through 11) ACCOUNT # 423.9002.536.692320
TYPE OF EXPENSE New Repair/Refurbish Replace x
TOTAL PROJECT COST $ 40,000 GRANT FUNDING Amount $ ‐
Source/Agency N/A PROJECT LOCATION Water Treatment Plant
PROJECT DESCRIPTION Filter Media Replacement (Filters 7 through 11)
JUSTIFICATION Replacement of final water filtration media is required to maintain water quality and ensure regulatory compliance.
PROJECT NAME RO Plant Production Well (Floridan) ACCOUNT # 423.9002.536.693308
TYPE OF EXPENSE New X Repair/Refurbish Replace
TOTAL PROJECT COST $ 1,000,000 GRANT FUNDING Amount $ ‐
Source/Agency N/A PROJECT LOCATION Reverse Osmosis Plant (ROP)
PROJECT DESCRIPTION RO Plant Production Well (Floridan)
JUSTIFICATION Installation of an additional Floridan well to provide raw water to the RO Plant.
58

FIVE YEAR CAPITAL PROGRAM EXPENDITURE REQUESTS FISCAL YEARS ENDING 2022‐2026
FUND 423 ‐ Water Sewer R/R DEPARTMENT Water Treatment
PROJECT NAME Accelator F Valve and Chlorinator Replacement (No. 3 & 4) ACCOUNT # 423.9002.536.693309
TYPE OF EXPENSE New Repair/Refurbish Replace X
TOTAL PROJECT COST $ 50,000 GRANT FUNDING Amount $ ‐
Source/Agency N/A PROJECT LOCATION Reverse Osmosis Plant (ROP)
PROJECT DESCRIPTION Accelator F Valve and Chlorinator Replacement (No 3 & 4)
JUSTIFICATION The Valve and Chlorinators (Nos 3 & 4) have reached the end of their life cycles.
59

FIVE YEAR CAPITAL PROGRAM EXPENDITURE REQUESTS FISCAL YEARS ENDING 2022‐2026
FUND 423 ‐ Water Sewer R/R DEPARTMENT Wastewater Reuse
PROJECT NAME ACCOUNT #
Nutrient Reduction Study 423.9004.536.601381
TYPE OF EXPENSE New X Repair/Refurbish Replace
TOTAL PROJECT COST $ 50,000
PROJECT LOCATION New Water Reclamation Facility (WRF)
GRANT FUNDING Amount Source/Agency
$
N/A ‐
PROJECT DESCRIPTION Nutrient Reduction Study
JUSTIFICATION Study required to document the amount of nitrogen and phosphorous reduction by constructing the Water Reclamation
Facility (WRF). This study will be used to apply for grants through the Clean Waterways Act. This study will also be used for
TMDL credits to meet the City's reduction requirements.
PROJECT NAME ACCOUNT #
SCADA System 423.9004.536.610396
TYPE OF EXPENSE New Repair/Refurbish Replace X
TOTAL PROJECT COST $
PROJECT LOCATION Wastewater Treatment Plant
25,000 GRANT FUNDING Amount Source/Agency
$
N/A ‐
PROJECT DESCRIPTION Replace obsolete radios, antennas and appurtenances for the reuse Supervisory Control and Data Acquisition (SCADA) System.
JUSTIFICATION The Supervisory Control and Data Acquisition system is used to control systems and collect data at various sites throughout the reclaimed water distribution system. The existing system, installed in 1991 is obsolete and no longer serviceable. The proposed system will provide improve data collection and control to enable optimizing system operations.
60

FIVE YEAR CAPITAL PROGRAM EXPENDITURE REQUESTS FISCAL YEARS ENDING 2022‐2026
FUND 423 ‐ Water Sewer R/R DEPARTMENT Wastewater Reuse
PROJECT NAME Reuse Meters ACCOUNT # 423.9004.536.611334
TYPE OF EXPENSE New Repair/Refurbish X Replace X
TOTAL PROJECT COST $ 7,500 Annual GRANT FUNDING Amount $ ‐
Source/Agency N/A PROJECT LOCATION Wastewater Treatment Plant
PROJECT DESCRIPTION Replacement/repair of reuse meters.
JUSTIFICATION Reuse system meters are replaced or repaired as warranted.
PROJECT NAME Pump and Motor Replacement ACCOUNT # 423.9004.536.614009
TYPE OF EXPENSE New Repair/Refurbish Replace X
TOTAL PROJECT COST $ 5,000 Annual GRANT FUNDING Amount $ ‐
Source/Agency N/A PROJECT LOCATION Wastewater Treatment Plant
PROJECT DESCRIPTION Pump and Motor Replacement at the Wastewater Treatment Plant
JUSTIFICATION Normally, pumps are repaired and costs are covered under appropriate operating funds. However, occasionally, pumps
and/or motors need to be replaced instead of repaired. To better reflect this capital expense, this line item has been established.
61

FIVE YEAR CAPITAL PROGRAM EXPENDITURE REQUESTS FISCAL YEARS ENDING 2022‐2026
FUND 423 ‐ Water Sewer R/R DEPARTMENT Wastewater Reuse
PROJECT NAME ACCOUNT #
Electrical Panel Replacement 423.9004.536.614010
TYPE OF EXPENSE New Repair/Refurbish Replace X
TOTAL PROJECT COST $
PROJECT LOCATION Wastewater Treatment Plant
7,500 Annual GRANT FUNDING Amount Source/Agency
$
N/A ‐
PROJECT DESCRIPTION Electrical equipment replacement at the Wastewater Reuse Plant.
JUSTIFICATION Normally, electrical equipment is repaired and costs are covered under appropriate operating funds. However, occasionally, electrical equipment needs to be replaced instead of repaired. To better reflect this capital expense, this line item has been established.
PROJECT NAME Ground Storage Reservoir Painting (1) ACCOUNT # 423.9004.536.616045
TYPE OF EXPENSE New Repair/Refurbish X Replace
TOTAL PROJECT COST $ 45,000 GRANT FUNDING Amount $ ‐
Source/Agency N/A PROJECT LOCATION John's Island
PROJECT DESCRIPTION Wastewater Reuse Plant Storage Tank Painting
JUSTIFICATION Routine recoating for aesthetics and asset protection.
62

FIVE YEAR CAPITAL PROGRAM EXPENDITURE REQUESTS FISCAL YEARS ENDING 2022‐2026
FUND 423 ‐ Water Sewer R/R DEPARTMENT Wastewater Reuse
PROJECT NAME Reclaimed Water Ground Storage Tank and Pump System (WWTP Relocation) ACCOUNT # 423.9004.536.616082
TYPE OF EXPENSE New X Repair/Refurbish Replace
TOTAL PROJECT COST
PROJECT LOCATION
$ 4,400,000 GRANT FUNDING Amount Source/Agency
$
N/A ‐
Water Treatment Plant (Site of future Water Reclamation Facility (WRF)) (24" Reclaimed Water from WRF to Country Club
Drive) PROJECT DESCRIPTION Reclaimed 3.0 MG Ground Storage Tanks (2) including Site Work, Reclaimed Water Pump Station, and 24" Reclaimed Water Main (WWTP Relocation)
JUSTIFICATION As part of WRF construction.
PROJECT NAME Main Relief Canal Pump Station, Mains, WTP Retrofit (SB 712) ACCOUNT # 423.9004.536.616083
TYPE OF EXPENSE New X Repair/Refurbish Replace
TOTAL PROJECT COST
PROJECT LOCATION
$ 2,110,000 GRANT FUNDING Source/Agency
Amount SJRWMD
$ 1,500,000 1,500,000
Water Treatment Plant (Site of future Water Reclamation Facility) and 43rd Avenue
PROJECT DESCRIPTION Main Relief Canal Pump Station, 16" Water Main from Canal Pump Station to WTP, Retrofit Existing WTP and Pump Station,
and 16" Water Main from WTP to Ground Storage Tanks
JUSTIFICATION Backup water supply for Reclaimed Water System.
63

FIVE YEAR CAPITAL PROGRAM EXPENDITURE REQUESTS FISCAL YEARS ENDING 2022‐2026
FUND 423 ‐ Water Sewer R/R DEPARTMENT Wastewater Reuse
PROJECT NAME TIRS Pump Station Electrical Rehabilitation ACCOUNT # 423.9004.536.616084
TYPE OF EXPENSE New Repair/Refurbish X Replace
TOTAL PROJECT COST $ 150,000 GRANT FUNDING Amount $ ‐
Source/Agency N/A PROJECT LOCATION Town of Indian River Shores
PROJECT DESCRIPTION Town of Indian River Shores (TIRS) Pump Station Electrical Rehabilitation
JUSTIFICATION The current electrical system on this Pump Station has reached the end of its life cycle and requires refurbishment.
PROJECT NAME S.R. A1A Pipe Pigging ACCOUNT # 423.9004.536.616085
TYPE OF EXPENSE New X Repair/Refurbish Replace
TOTAL PROJECT COST $ 65,000 GRANT FUNDING Amount $ ‐
Source/Agency N/A PROJECT LOCATION Along S.R. A1A North Town of Indian River Shores (TIRS)
PROJECT DESCRIPTION S.R. A1A Pipe Pigging
JUSTIFICATION Required to increase flow through 1960's vintage reclaimed water main along S.R. A1A in the Town of Indian River Shores.
64

FIVE YEAR CAPITAL PROGRAM EXPENDITURE REQUESTS FISCAL YEARS ENDING 2022‐2026
FUND 423 ‐ Water Sewer R/R DEPARTMENT Wastewater Reuse
PROJECT NAME ACCOUNT #
Stormwater Irrigation Pipeline 423.9004.536.616096
TYPE OF EXPENSE New X Repair/Refurbish Replace
TOTAL PROJECT COST
PROJECT LOCATION
$ 9,759,010 GRANT FUNDING Amount SJRWMD
Private Sources
$ 9,759,010 2,189,753 7,569,257
Water Treatment Plant to John's Island Water Management's South Entrance.
PROJECT DESCRIPTION 29,150 LF of 16" Stormwater Irrigation Pipeline
JUSTIFICATION Transmit treated canal water as irrigation water to the Barrier Island. This will reduce water demands, provide an alternative water supply, and improve water quality (nutrient‐loading reduction).
65

FIVE YEAR CAPITAL PROGRAM EXPENDITURE REQUESTS FISCAL YEARS ENDING 2022‐2026
FUND 423 ‐ Water Sewer R/R DEPARTMENT Administration
PROJECT NAME Computers ACCOUNT # 423.9005.536.610390
TYPE OF EXPENSE New X Repair/Refurbish Replace X
TOTAL PROJECT COST $ 3,000 to $ 5,000 GRANT FUNDING Amount $ ‐
Annual Range Source/Agency N/A PROJECT LOCATION Wastewater Treatment Plant, Water Treatment Plant and Field Services Operations
PROJECT DESCRIPTION PC Replacement
JUSTIFICATION Replacement of failed PC's as needed. This request is in accordance with Information Systems' PC Replacement Program.
PROJECT NAME Copier ACCOUNT # 423.9005.536.611390
TYPE OF EXPENSE New X Repair/Refurbish Replace X
TOTAL PROJECT COST $ 6,550 GRANT FUNDING Amount $ ‐
Source/Agency N/A PROJECT LOCATION Field Operations Facility
PROJECT DESCRIPTION Replace Field Service Division's current copier/printer/scanner that has reached the end of its life cycle.
JUSTIFICATION This machine is over 9 years old and is heavily utilized. A dependable copier/scanner is a crucial tool in our everyday
workflow.
66

FIVE YEAR CAPITAL PROGRAM EXPENDITURE REQUESTS FISCAL YEARS ENDING 2022‐2026
FUND 423 ‐ Water Sewer R/R DEPARTMENT Facility Maintenance
PROJECT NAME ACCOUNT #
Security System
423.9007.536.610340
TYPE OF EXPENSE New X Repair/Refurbish Replace
TOTAL PROJECT COST
PROJECT LOCATION
$ 100,000 GRANT FUNDING Amount Source/Agency
$ ‐
N/A
Water Treatment Plant, Waste Water Treatment Plant, Field Operations Building
PROJECT DESCRIPTION Replacement of Water and Sewer's Access Control System
JUSTIFICATION The Water and Sewer's Access Control System has reached the end of it's service life. The software is no longer supported by
the manufacturer. The system needs to replaced and upgraded to accomadate the furture Water Reclamation Facility and
Storm Water Pumping Facility, and to comply with sate and federal regulations regarding the physical security of critical
infrastructure. An expansion of the Closed Circuit Television System is included as well.
PROJECT NAME Computers ACCOUNT # 423.9007.536.610390
TYPE OF EXPENSE New X Repair/Refurbish Replace X
TOTAL PROJECT COST $ 5,000 Annual GRANT FUNDING Amount $ ‐
Source/Agency N/A PROJECT LOCATION For use at Plants and throughout our Service Territory.
PROJECT DESCRIPTION Computers
JUSTIFICATION Replacement of failed computers as needed and additional units as we continue to expand our Enterprise Asset
Maintenance (EAM) System.
67

FIVE YEAR CAPITAL PROGRAM EXPENDITURE REQUESTS FISCAL YEARS ENDING 2022‐2026
FUND 423 ‐ Water Sewer R/R DEPARTMENT Facility Maintenance
PROJECT NAME Tools/Shop/Garage/Equipment ACCOUNT # 423.9007.536.699393
TYPE OF EXPENSE New X Repair/Refurbish Replace X
TOTAL PROJECT COST $ 5,000 to $ 35,000 GRANT FUNDING Amount $ ‐
Annual Range Source/Agency N/A PROJECT LOCATION Wastewater Treatment Plant and Water Treatment Plant
PROJECT DESCRIPTION Replace and/or purchase new tools and equipment for our shops and garages as needed.
JUSTIFICATION Occasionally new tools and equipment are needed or must be replaced due to end of life cycle. This will include a new
barcode scanner system for the Warehouse.
PROJECT NAME Maintenance Building Expansion ACCOUNT # 423.9007.536.616086
TYPE OF EXPENSE New X Repair/Refurbish Replace
TOTAL PROJECT COST $ 660,000 GRANT FUNDING Amount $ ‐
Source/Agency N/A PROJECT LOCATION Water Treatment Plant 2515 Airport N Rd, Bldg A
PROJECT DESCRIPTION Expansion of the Maintenance Building
JUSTIFICATION Additional Maintenance Building space is needed to accommodate expanded maintenance activities at the Water Treatment
Plant and in preparation for the new Water Reclamation Facility construction.
68

FIVE YEAR CAPITAL PROGRAM EXPENDITURE REQUESTS FISCAL YEARS ENDING 2022‐2026
FUND 423 ‐ Water Sewer R/R DEPARTMENT Wastewater Collection
PROJECT NAME Lift Station Pump Replacement ACCOUNT # 423.9010.536.608361
TYPE OF EXPENSE New Repair/Refurbish Replace X
TOTAL PROJECT COST $ 35,000 Annual GRANT FUNDING Amount $ ‐
Source/Agency N/A PROJECT LOCATION Throughout our sewer service territory.
PROJECT DESCRIPTION Lift Station Pump Replacements
JUSTIFICATION There are 248 pumps in lift stations that our department maintains. These pumps are serviced annually and repaired as
needed. They have a life cycle of 10‐15 years.
PROJECT NAME Computers ACCOUNT # 423.9010.536.610390
TYPE OF EXPENSE New Repair/Refurbish Replace x
TOTAL PROJECT COST $ 3,000 Annual GRANT FUNDING Amount $ ‐
Source/Agency N/A PROJECT LOCATION Field Operations (Building F)
PROJECT DESCRIPTION PC Replacement
JUSTIFICATION Replacement of failed PC's as needed. This request is in accordance with Information Systems' PC Replacement Program.
69

FIVE YEAR CAPITAL PROGRAM EXPENDITURE REQUESTS FISCAL YEARS ENDING 2022‐2026
FUND 423 ‐ Water Sewer R/R DEPARTMENT Wastewater Collection
PROJECT NAME STEP System Customer Equipment ACCOUNT # 423.9010.536.615053
TYPE OF EXPENSE New X Repair/Refurbish Replace
TOTAL PROJECT COST $ 100,000 to $ 450,000 GRANT FUNDING Amount $ ‐
Annual Range Source/Agency N/A PROJECT LOCATION Wastewater Collection System.
PROJECT DESCRIPTION A sewage collection system that uses a septic tank to contain and treat solids, a pump station to remove the clear effluent, and a drain field to act as a backup to the pump station for disposal of the effluent during power outages. This is the STEP System equipment (parts and components).
JUSTIFICATION Reduce pollutant loads from septic systems that enter the Indian River Lagoon via groundwater.
PROJECT NAME STEP System Services ACCOUNT # 423.9010.536.616053
TYPE OF EXPENSE New X Repair/Refurbish Replace
TOTAL PROJECT COST $ 30,000 Annual GRANT FUNDING Amount $ ‐
Source/Agency N/A PROJECT LOCATION Wastewater Collection System
PROJECT DESCRIPTION A sewage collection system that uses a septic tank to contain and treat solids, a pump station to remove the clear effluent, and a drain field to act as a backup to the pump station for disposal of the effluent during power outages. These are the services connecting the Systems to the homes.
JUSTIFICATION Reduce pollutant loads from septic systems that enter the Indian River Lagoon via groundwater.
70

FIVE YEAR CAPITAL PROGRAM EXPENDITURE REQUESTS FISCAL YEARS ENDING 2022‐2026
FUND 423 ‐ Water Sewer R/R DEPARTMENT Wastewater Collection
PROJECT NAME ACCOUNT #
Septic Tank Nutrient Rem
423.9010.536.616055 oval Study (TMDL)
TYPE OF EXPENSE New X Repair/Refurbish Replace
TOTAL PROJECT COST
PROJECT LOCATION
$ 50,000 GRANT FUNDING Amount Source/Agency
$ ‐
N/A
In City Limits STEP System Basins.
PROJECT DESCRIPTION Septic Tank Nutrient Removal Study (TMDL)
JUSTIFICATION Study required to document the amount of nitrogen and phosphorous reduction by constructing STEP System in County area. This study will be used to apply for grants through the Clean Waterways Act. This study will also be used for TMDL credits to meet the City's reduction requirements.
PROJECT NAME ACCOUNT #
Wastewater Collection M
423.9010.536.616056 isc Equipment
TYPE OF EXPENSE New X Repair/Refurbish Replace
TOTAL PROJECT COST
PROJECT LOCATION
$ 5,000 Annual Range $ 25,000 GRANT FUNDING Amount $ ‐
Source/Agency N/A
Throughout our service territory.
PROJECT DESCRIPTION Wastewater Collection Miscellaneous Equipment
JUSTIFICATION Miscellaneous equipment is required to ensure field crews can complete emergencies, daily tasks, repairs, and maintenance without interruption. This includes a purchase of a Lateral Inspection Camera that will be used to inspection sewer laterals.
71

FIVE YEAR CAPITAL PROGRAM EXPENDITURE REQUESTS FISCAL YEARS ENDING 2022‐2026
FUND 423 ‐ Water Sewer R/R DEPARTMENT Wastewater Collection
PROJECT NAME ACCOUNT #
Lift Station Controllers 423.9010.536.616064
TYPE OF EXPENSE New Repair/Refurbish Replace X
TOTAL PROJECT COST
PROJECT LOCATION
$ 10,000 Annual GRANT FUNDING Amount Source/Agency
$ ‐
N/A
Various lift station sites throughout the sewer service territory.
PROJECT DESCRIPTION The duplexer is a low cost, scada ready, pump controller designed to perform level control for duplex lift station applications.
JUSTIFICATION These controllers will replace the old Allen Bradley pressure switch systems. Parts for the Allen Bradley pressure controllers are costly and difficult to find.
PROJECT NAME In‐Place Lift Station Generators ACCOUNT # 423.9010.536.616068
TYPE OF EXPENSE New X Repair/Refurbish Replace
TOTAL PROJECT COST $ 150,000 Annual GRANT FUNDING Amount $ ‐
Source/Agency N/A PROJECT LOCATION Various lift station sites throughout the sewer Service Territory.
PROJECT DESCRIPTION In‐Place Lift Station Generators
JUSTIFICATION These generators will be placed at critical lift stations to ensure coverage during power outages. Required as part of the Clean Waterways Act.
72

FIVE YEAR CAPITAL PROGRAM EXPENDITURE REQUESTS FISCAL YEARS ENDING 2022‐2026
FUND 423 ‐ Water Sewer R/R DEPARTMENT Wastewater Collection
PROJECT NAME Electrical Panel Replacement ACCOUNT # 423.9010.536.668361
TYPE OF EXPENSE New Repair/Refurbish Replace X
TOTAL PROJECT COST $ 30,000 Annual GRANT FUNDING Amount $ ‐
Source/Agency N/A PROJECT LOCATION Various lift station sites.
PROJECT DESCRIPTION Electrical panel replacement program.
JUSTIFICATION This is an ongoing program to replace lift station electrical panels as warranted. Typically, these electrical panels have a service life of 30 years. The City has 128 lift stations and we replace approximately 4 panels annually.
PROJECT NAME Gravity Sewer Rehabilitation ACCOUNT # 423.9010.536.671361
TYPE OF EXPENSE New Repair/Refurbish X Replace X
TOTAL PROJECT COST $ 350,000 to $ 600,000 GRANT FUNDING Amount $ ‐
Annual Range Source/Agency N/A PROJECT LOCATION Various gravity sewer sites throughout the sewer Service Territory.
PROJECT DESCRIPTION Gravity Sewer Rehabilitation
JUSTIFICATION This is our Department's ongoing program to evaluate sanitary sewer systems, document deficiencies and perform the
necessary corrective actions. This will also be required by Senate Bill 712 (Clean Waterways Act).
73

FIVE YEAR CAPITAL PROGRAM EXPENDITURE REQUESTS FISCAL YEARS ENDING 2022‐2026
FUND 423 ‐ Water Sewer R/R DEPARTMENT Wastewater Collection
PROJECT NAME STEP System Force Mains (Outside City Limits) ‐ SB 712 ACCOUNT # 423.9010.536.616087
TYPE OF EXPENSE New X Repair/Refurbish Replace
TOTAL PROJECT COST $ 2,000,000 GRANT FUNDING Amount $ ‐
Source/Agency N/A PROJECT LOCATION Various sites outside of the City Limits.
PROJECT DESCRIPTION STEP System Force Mains (Outside City Limits)
JUSTIFICATION Expand the STEP System project outside of the City Limits. This will be a requirement of Senate Bill 712 (Clean Waterways
Act).
PROJECT NAME Mockingbird Drive Force Main Replacement ACCOUNT # 423.9010.536.616088
TYPE OF EXPENSE New Repair/Refurbish Replace X
TOTAL PROJECT COST $ 200,000 GRANT FUNDING Amount $ ‐
Source/Agency N/A PROJECT LOCATION Mockingbird Drive
PROJECT DESCRIPTION Mockingbird Drive Force Main Replacement
JUSTIFICATION This force main has a high spot that accumulates hydrogen sulfide gas. The City has experienced a break in this line this year. We have prepared a set of drawings to replace a portion of the main.
74

X
FIVE YEAR CAPITAL PROGRAM EXPENDITURE REQUESTS FISCAL YEARS ENDING 2022‐2026
FUND 423 ‐ Water Sewer R/R DEPARTMENT Wastewater Collection
PROJECT NAME Lift Station SCADA ACCOUNT # 423.9010.536.616089
TYPE OF EXPENSE New X Repair/Refurbish Replace
TOTAL PROJECT COST $ 50,000 Annual GRANT FUNDING Amount $ ‐
Source/Agency N/A PROJECT LOCATION Various lift station sites throughout the sewer Service Territory.
PROJECT DESCRIPTION Lift Station SCADA (Supervisory Control and Data Acquisition)
JUSTIFICATION Monitoring and collecting lift station data via Remote Telemetry Units (RTU) will reduce downtime and staff time on‐site. This
will be a requirement of Senate Bill 712 (Clean Waterways Act).
PROJECT NAME Wastewater Collection Service Vehicles (Trucks/Trailers/Rolling Stock) ACCOUNT # 423.9010.536.616090
TYPE OF EXPENSE New X Repair/Refurbish Replace
TOTAL PROJECT COST $ 75,000 to $ 582,500 GRANT FUNDING Amount $ ‐
Annual Range Source/Agency N/A PROJECT LOCATION Various locations throughout the wastewater collection system.
PROJECT DESCRIPTION Vacuum Truck, Excavator with Trailer, Dump Truck, and Service Truck (crew).
JUSTIFICATION Replacement equipment and new equipment to comply with Clean Waterways Act.
75
X

FIVE YEAR CAPITAL PROGRAM EXPENDITURE REQUESTS FISCAL YEARS ENDING 2022‐2026
FUND 423 ‐ Water Sewer R/R DEPARTMENT Wastewater Collection
PROJECT NAME Camera Inspection Equipment/Manhole Inspection Camera ACCOUNT # 423.9010.536.616091
TYPE OF EXPENSE New X Repair/Refurbish Replace
TOTAL PROJECT COST
PROJECT LOCATION
$ 150,000 GRANT FUNDING Amount Source/Agency
$ ‐
N/A
Various lift station sites throughout the sewer Service Territory.
PROJECT DESCRIPTION Camera Inspection Equipment and Manhole Inspection Camera
JUSTIFICATION Camera Inspection Equipment Utilized for sewer line and lateral inspections (assess conditions). Manhole Inspection Camera
is a portable, automated manhole scanner to expedite manhole inspections and reduce confined space entry. Capable of reporting and advanced analysis. This camera equipment will be a requirement of Senate Bill 712 (Clean Waterways Act).
76

FIVE YEAR CAPITAL PROGRAM EXPENDITURE REQUESTS FISCAL YEARS ENDING 2022‐2026
FUND 423 ‐ Water Sewer R/R DEPARTMENT Water Distribution
PROJECT NAME Water Distribution Meters ACCOUNT # 423.9011.536.608334
TYPE OF EXPENSE New Repair/Refurbish Replace X
TOTAL PROJECT COST $ 60,000 Annual GRANT FUNDING Amount $ ‐
Source/Agency N/A PROJECT LOCATION Various site throughout the water distribution system.
PROJECT DESCRIPTION Water Distribution Meters
JUSTIFICATION Approximately 1000 5/8" thru 1" water meters in the water distribution system are replaced annually to ensure accurate
consumption and billing.
PROJECT NAME Computers ACCOUNT # 423.9011.536.610390
TYPE OF EXPENSE New Repair/Refurbish Replace X
TOTAL PROJECT COST $ 3,000 Annual GRANT FUNDING Amount $ ‐
Source/Agency N/A PROJECT LOCATION Field Operations Building F
PROJECT DESCRIPTION PC Replacement
JUSTIFICATION Replacement of failed PC's as needed. This request is in accordance with Information Systems' PC Replacement Program.
77

FIVE YEAR CAPITAL PROGRAM EXPENDITURE REQUESTS FISCAL YEARS ENDING 2022‐2026
FUND 423 ‐ Water Sewer R/R DEPARTMENT Water Distribution
PROJECT NAME Line and Service Replacement ACCOUNT # 423.9011.536.611331
TYPE OF EXPENSE New Repair/Refurbish Replace X
TOTAL PROJECT COST $ 350,000 to $ 600,000 GRANT FUNDING Amount $ ‐
Annual Range Source/Agency N/A PROJECT LOCATION Various site throughout the water distribution system.
PROJECT DESCRIPTION Line and Service replacements throughout the Water Distribution System
JUSTIFICATION This project is on‐going and consists of the replacement of old galvanized, transite, and cast iron mains and service lines
through out Water Distribution System.
PROJECT NAME Ground Storage Reservoir Painting (2) ACCOUNT # 423.9011.536.616045
TYPE OF EXPENSE New Repair/Refurbish X Replace
TOTAL PROJECT COST $ 130,000 GRANT FUNDING Amount $ ‐
Source/Agency N/A PROJECT LOCATION South A1A (SB4) and Mockingbird Dr.
PROJECT DESCRIPTION Painting of Water Distribution Ground Storage Tanks.
JUSTIFICATION Routine recoating for aesthetics and asset protection.
78

FIVE YEAR CAPITAL PROGRAM EXPENDITURE REQUESTS FISCAL YEARS ENDING 2022‐2026
FUND 423 ‐ Water Sewer R/R DEPARTMENT Water Distribution
PROJECT NAME ACCOUNT #
Water Distribution Misc
423.9011.536.616056 Equipment
TYPE OF EXPENSE New X Repair/Refurbish Replace
TOTAL PROJECT COST
PROJECT LOCATION
$ 5,000 to Annual Range
$ 15,000 GRANT FUNDING Amount $ ‐
Source/Agency N/A
Various locations throughout our Water Distribution Service Territory.
PROJECT DESCRIPTION Water Distribution Misc Equipment (includes an Aquatap)
JUSTIFICATION Miscellaneous equipment is required to ensure field crews can complete emergencies, daily tasks, repairs, and maintenance
without interruption. This will include an Aquatap complete hot tap kit with a cordless compact drill which is used for making
water line taps and installing new water services. This equipment performs taps through corp stops or any other valve from
3/4" to 2".
PROJECT NAME ACCOUNT #
Utility Line Locator 423.9011.536.641411
TYPE OF EXPENSE New Repair/Refurbish Replace X
TOTAL PROJECT COST
PROJECT LOCATION
$ 5,000 to Annual Range
$ 30,000 GRANT FUNDING Amount Source/Agency
$ ‐
N/A
Various locations throughout our Water Distribution Service Territory.
PROJECT DESCRIPTION Utility Locate and Mark Ground Penetrating Radar (GPR) System
JUSTIFICATION This advanced technological unit will assist in streamlining our utility locates. It does not require any digging or excavating to
operate. This noninvasive and versatile equipment allows us to perform locates efficiently and quickly.
79

FIVE YEAR CAPITAL PROGRAM EXPENDITURE REQUESTS FISCAL YEARS ENDING 2022‐2026
FUND 423 ‐ Water Sewer R/R DEPARTMENT Water Distribution
PROJECT NAME Cemetery Transmission Main Relocation ACCOUNT # 423.9011.536.______
TYPE OF EXPENSE New Repair/Refurbish Replace X
TOTAL PROJECT COST $ 75,000 GRANT FUNDING Amount $ ‐
Source/Agency N/A PROJECT LOCATION Crestlawn Cemetery
PROJECT DESCRIPTION Cemetery Transmission Main Relocation
JUSTIFICATION Relocate transmission main to accommodate a Public Works Project.
80

FIVE YEAR CAPITAL PROGRAM EXPENDITURE REQUESTS FISCAL YEARS ENDING 2022‐2026
FUND 423 ‐ Water Sewer R/R DEPARTMENT Customer Service
PROJECT NAME Customer Service ‐ Itron Update (H/W & S/W) ACCOUNT # 423.9012.536.616092
TYPE OF EXPENSE New x Repair/Refurbish x Replace x
TOTAL PROJECT COST $ 20,900 GRANT FUNDING Amount $ ‐
Source/Agency N/A PROJECT LOCATION Customer Service billing department
PROJECT DESCRIPTION FY 21‐22
Meter Reading Itron handheld devices 15,900
Temetra Software upgrade 5,000
20,900 JUSTIFICATION The Itron handheld devices will replace our 6 current machines that were purchased in the 2012‐2013 budget. The current Handhelds will no longer be supported after December 31, 2021. The current reading software, MVRS, is a 23 year old
system not flexible for today's reading system needs. Temetra is the updated software that ITRON uses. Temetra is a hosted solution and ITRON will handle all of the updates and service. We will also have to do a software upgrade.
81

FIVE YEAR CAPITAL PROGRAM EXPENDITURE REQUESTS FISCAL YEARS ENDING 2022‐2026
FUND 423 ‐ Water Sewer R/R DEPARTMENT Customer Service
PROJECT NAME Customer Service Vehicle Lease‐Purchast Acquisition / Debt Service ACCOUNT # 423.9012.536.641415 / 641416
TYPE OF EXPENSE New Repair/Refurbish Replace x
TOTAL PROJECT COST See schedule below GRANT FUNDING Amount $ ‐
Source/Agency N/A PROJECT LOCATION Customer Service field services department
PROJECT DESCRIPTION Replace Customer Service meter & field services vehicles on 5‐6 year schedule
JUSTIFICATION By using a lease‐purchase program the City keeps its vehicle fleet current and functional, which achieves savings through reductions in maintenance, repairs, fuel usage and increase value when vehicles are sold.
Current Vehicle Replacement Vehicle
Fiscal Year 2022 ‐ 2023
Vehicle # 12‐CS18 12‐CS19
Dept Cust Svc Cust Svc
Description 2016 Ford F‐150 Pickup
2016 Ford F‐150 Pickup
Description Lt Pickup 1/2T Lt Pickup 1/2T
Subtotal
Purchase Price
23,000
23,000
$ 46,000
Increase to
Debt Svc
$ 10,333
2023 ‐ 2024 12‐CS20 12‐CS21
Cust Svc Cust Svc
2016 Ford F‐150 Pickup
2017 Ford F‐150 Pickup
Lt Pickup 1/2T Lt Pickup 1/2T
Subtotal
23,500
23,500
$ 47,000 $ 10,557
2024 ‐ 2025 12‐CS22 12‐CS23
Cust Svc Cust Svc
2017 Ford F‐150 Pickup
2018 Ford F‐150 Pickup
Lt Pickup 1/2T Lt Pickup 1/2T
Subtotal
23,800
23,800
$ 47,600 $ 10,692
82

..A..
. --·-..
AIRPORT FUND
83

- - - - -
- - - - -
- -- -- -- -- -- -- -
- - - - -- - - - -- - - - -- - - - -- - - - -
- - - - -
- - -- - -- - -- - -- - -- - -- - -- - -- - -- - -- - -- - -- - -- - -- - -
CITY OF VERO BEACH FIVE YEAR CAPITAL IMPROVEMENT PROGRAM
FUND 443: Airport Construction Fund
84
FY 20-21 FY 20-21 Budget Increase Amended FY
Account Number Account Name Original Budget (Decrease) 20-21 Budget FY 21-22 FY 22-23 FY 23-24 FY 24-25 FY 25-26
Audited
1,444,385
2,051,404FUND BALANCE FORWARD (OCTOBER 1) 1,322,947 1,004,837 1,031,946 864,976 747,006
REVENUES 443.0000.331 FEDERAL GRANTS/CAPITAL 443.0000.331.011000 REHABILITATE RWY 12R-30L (DESIGN) (AIP 42) 1,260,000 (879,892) 380,108 443.0000.331.011030 REHABILITATE RWY 12R-30L (CONSTRUCTION) (AIP 43) 1,593,000 - 1,593,000 4,735,582 - - - -443.0000.331.011035 REHABILITATE GA APRON (CONSTRUCTION) (AIP 44) 1,600,000 1,413,841 3,013,841 443.0000.331.011040 CONSTRUCT HANGAR (CARE ACT FUNDING) 500,000 400,000 900,000 88,035 - - - -443.0000.331.011051 REHABILITATE TWY B (DESIGN) 270,000 - - - -443.0000.331.011052 AIRPORT MASTER PLAN UPDATE (AIP 46)
-270,000 315,000 - - -
443.0000.331.______ REHABILITATE TWY B (CONSTRUCTION) -
- 2,430,000 - - -443.0000.331.______ EXTEND/MARK/LIGHT TWY E-WEST OF RWY 4 (DESIGN & EA)
-- - - 450,000 810,000
443.0000.331.______ EXTEND/MARK/LIGHT TWY E-WEST OF RWY 4 (CONSTRUCT) -
- - - - 2,700,000 443.0000.331.______ PURCHASE ARFF VEHICLE (AIP 47)
-- - 765,000 - -
443.0000.331.______ REHABILITATE AIRPORT DRAINAGE SYSTEM -
- - - 900,000 900,000-
443.0000.334 STATE GRANTS/CAPITAL 443.0000.334.010750 REHABILITATE NORTH APRON (437981) 272,000 1,027,579 1,299,579 443.0000.334.010850 AIRPORT SECURITY IMPROVEMENTS (439717-1) 96,000 42,468 138,468 443.0000.334.010850 AIRPORT SECURITY FENCE (439717-2) - 69,496 69,496 443.0000.334.010970 RECONSTRUCT CENTER APRON (431034) 800,000 1,145,241 1,945,241 443.0000.334.010980 REHABILITATE RWY 12R-30L (DESIGN) (434636) 69,750 (35,206) 34,544 443.0000.334.010990 CONSTRUCT HANGAR (442101) 2,400,000 1,200,000 3,600,000 352,140 - - - -443.0000.334.011010 CONSTRUCT NATURAL GAS PIPELINE (_____) - 200,000 200,000 443.0000.334.011030 REHABILITATE RWY 12R-30L ( CONSTRUCTION) (_____) 424,500 - 424,500 715,191 - - - -443.0000.334.011045 AIRPORT FACILITY AIR CONDITIONING REPLACEMENT 320,000 (305,000) 15,000 185,000 - - - -443.0000.334.011050 REHABILITATE SOUTHWEST APRON (433545) 1,200,000 (1,200,000) - 280,000 - - - -443.0000.334.011051 REHABILITATE TWY B (DESIGN) 15,000 - - - -443.0000.334.011052 AIRPORT MASTER PLAN UPDATE (_____) 15,000 17,500 - - -443.0000.334.011053 REDEVELOP COMMERCIAL PARK (PHASE 1) (_____) 125,000 125,000 - - -443.0000.334.011054 AIRPORT WAYFINDING SIGNAGE 400,000 - - - -443.0000.334.011055 PIPER AIRFIELD SECURITY PROJECT 484,000 - - - -443.0000.334.011056 AIRFIELD MARKING PROJECT 160,000 - - - -443.0000.334.011057 REHAB AIRPORT TERMINAL (DESIGN/CONSTRUCT) PH I 370,000 230,000 - - -443.0000.334.______ REHAB AIRPORT TERMINAL (CONSTRUCT) PH II - 450,000 150,000 - -443.0000.334.______ CONSTRUCT GA APRON (_____) - 800,000 560,000 - -443.0000.334.______ REHABILITATE TWY B (CONSTRUCTION) - 135,000 - - -443.0000.334.______ EXTEND TAXIWAY B (DESIGN) - - 376,000 - -443.0000.334.______ REDEVELOP COMMERCIAL PARK (PHASE 2) (_____) - - 125,000 125,000 -443.0000.334.______ PURCHASE ARFF VEHICLE (_____) - - 42,500 - -443.0000.334.______ EXTEND/MARK/LIGHT TWY E-WEST OF RWY 4 (DESIGN & EA) - - - 25,000 45,000 443.0000.334.______ EXTEND/MARK/LIGHT TWY E-WEST OF RWY 4 (CONSTRUCT) - - - - 150,000

- - -- - -
- - - - -- - - - -
- - -- - -
- - - - -- - - - -- - - - -
- - - - -- - - - -
- - - - -
- - -
- - -- - -- - -- - -- - -- - -- - -- - -- - -- - -- - -- - -- - -- - -- - -- - -
CITY OF VERO BEACH FIVE YEAR CAPITAL IMPROVEMENT PROGRAM
FUND 443: Airport Construction Fund
FY 20-21 FY 20-21 Budget Increase Amended FY
Account Number Account Name Original Budget (Decrease) 20-21 Budget FY 21-22 FY 22-23 FY 23-24 FY 24-25 FY 25-26 443.0000.334 STATE GRANTS/CAPITAL (CONTINUED) 443.0000.334.______ REHABILITATE AIRPORT DRAINAGE SYSTEM - - - 50,000 50,000 443.0000.383.001000 VEHICLE LEASE-PURCHASE PROCEEDS 80,000 - - - -443.0000.389.800000 LOCAL PARTNERSHIP (REHAB SOUTHWEST APRON) 300,000 (300,000) -443.0000.389.800000 LOCAL PARTNERSHIP (NATURAL GAS PIPELINE) - 200,000 200,000 443.0000.389.800000 LOCAL PARTNERSHIP (CONSTRUCT GA APRON) - 200,000 140,000 - -443.0000.389.800000 LOCAL PARTNERSHIP (PIPER AIRFIELD SECURITY PROJECT) 121,000 - - - -443.0000.389.001000 NON OPERATING XFR FROM AIRPORT FUND 350,000 - 350,000 468,000 500,000 150,000 100,000 350,000
11,185,250 2,978,527 14,163,777 9,133,948
5,202,500 2,308,500
1,650,000
5,005,000
Total Revenues
EXPENDITURES 443.4000.542.616021 REHABILITATE NORTH APRON 340,000 1,284,474 1,624,474 443.4000.542.617010 AIRFIELD SECURITY IMPROVEMENTS (AIR SERVICE) 120,000 139,956 259,956 443.4000.542.617030 RECONSTRUCT CENTER APRON 1,000,000 1,431,551 2,431,551 443.4000.542.617080 CONSTRUCT HANGAR 3,000,000 1,500,000 4,500,000 440,175 - - - -443.4000.542.617100 REHABILITATE RWY 12R-30L (DESIGN) 1,395,000 (971,712) 423,288 443.4000.542.617120 CONSTRUCT NATURAL GAS PIPELINE - 400,000 400,000 443.4000.542.617125 REHABILITATE RWY 12R-30L (CONSTRUCTION) 2,190,000 - 2,190,000 5,563,196 - - - -443.4000.542.617130 REHABILITATE GA APRON (CONSTRUCTION) 1,600,000 1,413,841 3,013,841 443.4000.542.617135 AIRPORT FACILITY AIR CONDITIONING REPLACEMENT 400,000 (370,000) 30,000 370,000 - - - -443.4000.542.617140 REHABILITATE SOUTHWEST APRON 1,500,000 (1,500,000) - 350,000 - - - -443.4000.542.641400 AIRPORT VEHICLE LEASE-PURCHASE 80,000 - - - -443.4000.542.641500 AIRPORT VEHICLE LEASE-PURCHASE DEBT SVC 19,124 - 19,124 31,187 25,391 17,970 17,970 17,970 443.4000.542.617141 REHABILITATE TWY B (DESIGN) 300,000 - - - -443.4000.542.617142 AIRPORT MASTER PLAN UPDATE 300,000 350,000 - - -443.4000.542.617143 REDEVELOP COMMERCIAL PARK (PHASE 1) 250,000 250,000 - - -443.4000.542.617144 AIRPORT WAYFINDING SIGNAGE 500,000 - - - -443.4000.542.617145 REHAB AIRPORT TERMINAL (DESIGN/CONSTRUCT) PH I 462,500 287,500 - - -443.4000.542.617146 PIPER AIRFIELD SECURITY PROJECT 605,000 - - - -443.4000.542.617147 AIRFIELD MARKING PROJECT 200,000 - - - -443.4000.542.______ CONSTRUCT GA APRON - 1,000,000 700,000 - -443.4000.542.______ REHABILITATE TWY B (CONSTRUCTION) - 2,700,000 - - -443.4000.542.______ REHAB AIRPORT TERMINAL (CONSTRUCT) PH II - 562,500 187,500 - -443.4000.542.______ EXTEND TAXIWAY B (DESIGN & EA) - - 470,000 - -443.4000.542.______ REDEVELOP COMMERCIAL PARK (PHASE 2) - - 250,000 250,000 -443.4000.542.______ PURCHASE ARFF VEHICLE - - 850,000 - -443.4000.542.______ EXTEND/MARK/LIGHT TWY E-WEST OF RWY 4 (DESIGN & EA) - - - 500,000 900,000 443.4000.542.______ EXTEND/MARK/LIGHT TWY E-WEST OF RWY 4 (CONSTRUCT) - - - - 3,000,000 443.4000.542.______ REHABILITATE AIRPORT DRAINAGE SYSTEM - - - 1,000,000 1,000,000
11,564,124 3,328,110 14,892,234 9,452,058
5,175,391 2,475,470
1,767,970
4,917,970
Total Expenditures & TransfersExcess (Deficiency) of Revenues over Expenditures (378,874) (349,583) (728,457) (318,110)
27,109
(166,970) (117,970)
87,030 ENDING FUND BALANCE (SEP 30) 1,065,511 85 1,322,947 1,004,837 1,031,946 864,976 747,006 834,036

CITY OF VERO BEACH FIVE YEAR CAPITAL IMPROVEMENT PROGRAM
FUND 443: Airport Construction Fund UNFUNDED PROJECTS
Account Number Account Name FY 21-22 FY 22-23 FY 23-24 FY 24-25 FY 25-26
REVENUES
443.0000.334 STATE GRANTS/CAPITAL 443.4000.334.______ EXTEND TAXIWAY B (CONSTRUCTION) - - - - 2,960,000
Total Revenues
- - - -
2,960,000 EXPENDITURES 443.4000.542.______ EXTEND TAXIWAY B (CONSTRUCTION) - - - - 3,700,000
Total Expenditures
- - - -
3,700,000 Total (Net) Unfunded Projects $ - $ - $ - $ - $ 740,000
86

FIVE YEAR CAPITAL PROGRAM EXPENDITURE REQUESTS FISCAL YEARS ENDING 2022‐2026
FUND 443 ‐ Airport Construction DEPARTMENT Airport
PROJECT NAME ACCOUNT #
CONSTRUCT HANGAR 443.4000.542.617080
TYPE OF EXPENSE New x Repair/Refurbish Replace
TOTAL PROJECT COST
PROJECT LOCATION
$ 5,000,000 GRANT FUNDING Source/Agency
Amount FDOT CARES
$ 5,000,000 $ 4,000,000 $ 1,000,000
North Ramp/Airport midfield
PROJECT DESCRIPTION Construct new hangar ramp to support the increasing need for leasable aeronautical property.
JUSTIFICATION This project is intended to increase capacity to handle a variety of operations that utilize aircraft at VRB. This will lay
out infrastructure demands for potential tenants to develop adjacent to a newly constructed ramp. The funds used
to match this grant will be coming from the federal CARES Act.
PROJECT NAME REHABILITATE RUNWAY 12R‐30L (CONSTRUCTION) ACCOUNT # 443.4000.542.617125
TYPE OF EXPENSE New Repair/Refurbish x Replace
TOTAL PROJECT COST
PROJECT LOCATION Runway 12R‐30L
$ 7,753,196 GRANT FUNDING Source/Agency
Amount FAA FDOT
$ 7,468,273 $ 6,328,582 $ 1,139,691
PROJECT DESCRIPTION Mill and overlay main runway (12R‐30L).
JUSTIFICATION Rehabilitate main runway 12R/30L (7,314' x 106') to maintain safety of operations through construction methods
and the updating of equipment.
87

FIVE YEAR CAPITAL PROGRAM EXPENDITURE REQUESTS FISCAL YEARS ENDING 2022‐2026
FUND 443 ‐ Airport Construction DEPARTMENT Airport
PROJECT NAME AIRPORT FACILITY AIR CONDITIONING REPLACEMENT ACCOUNT # 443.4000.542.617135
TYPE OF EXPENSE New Repair/Refurbish x Replace X
TOTAL PROJECT COST
PROJECT LOCATION Various locations
$ 400,000 GRANT FUNDING Source/Agency
Amount FDOT
$
$
200,000 200,000
PROJECT DESCRIPTION This project is intended to replace multiple air conditioning units, associated equipment, and/or damage that has
been caused by age and/or malfunctioning units.
JUSTIFICATION Multiple air conditioning units that are on several airport owned buildings will soon be in need of replacement. The
airport will need state financial assistance for required replacements to ensure continued airport revenue.
PROJECT NAME ACCOUNT #
REHABILITATE SOUTHWEST APRON 443.4000.542.617140
TYPE OF EXPENSE New Repair/Refurbish x Replace
TOTAL PROJECT COST
PROJECT LOCATION
$ 350,000 GRANT FUNDING Source/Agency
Amount FDOT
$
$
280,000 280,000
Southwest Apron ‐ Flight Safety Apron
PROJECT DESCRIPTION This project proposes to rehabilitate about 550,000 sf of general aviation aircraft parking apron located at the
former Flight Safety Academy site. Includes milling and overlay, marking, and tie‐downs as needed. At this time we
JUSTIFICATION This area of apron has FDOT inspection ratings of poor to fair.
88

FIVE YEAR CAPITAL PROGRAM EXPENDITURE REQUESTS FISCAL YEARS ENDING 2022‐2026
FUND 443 ‐ Airport Construction DEPARTMENT Airport
PROJECT NAME Airport Vehicle Lease‐Purchase Acquisition / Debt Service ACCOUNT # 443.4000.542.641400 / 443.4000.542.641500
TYPE OF EXPENSE New x Repair/Refurbish Replace
TOTAL PROJECT COST See schedule below GRANT FUNDING Amount $ ‐
Source/Agency N/A PROJECT LOCATION Various
PROJECT DESCRIPTION Replacement of current Airport fleet vehicles using capital lease‐purchase per attached replacement schedule.
JUSTIFICATION By using a lease‐purchase program the City Garage predicts that over a 10 year period the City will save
approximately $800,000 City‐wide over the current practice of keeping vehicles for 15 years. Savings will be
achieved through reductions in maintenance, repairs, fuel usage and increased value when vehicles are sold.
2021‐2022
Current Vehicle Replacement Vehicle
Vehicle # Dept Description Purchase
Description Price Increase to
Debt Svc 30‐A09 Airport 1986 Chevy 500 Ford F‐550 50,000
Ford F‐150 30,000
Subtotal $ 80,000 $ 17,970
PROJECT NAME ACCOUNT #
REHABILITATE TAXIWAY B (DESIGN) 443.4000.542.617141
TYPE OF EXPENSE New Repair/Refurbish X Replace
TOTAL PROJECT COST
PROJECT LOCATION
$ 300,000 GRANT FUNDING Source/Agency
Amount FAA
FDOT
$
$
$
285,000 270,000 15,000
This taxiway serves multiple aeronautical businesses on the west side of the Airport.
PROJECT DESCRIPTION Taxiway B serves 3 full‐service FBOs and 1 SASO. The taxiway is about 2,100 feet long and 35 feet wide and has 3
connectors. Milling of entire length with a two‐inch overlay is proposed. Marking and lighting rehabilitation will
complete the project. If funding is available, would like to prepare an environmental assessment and design for an
extension to Taxiway B.
JUSTIFICATION PCI reports indicate that Taxiway B may need milling and overlay. This scope of work includes but is not limited to
the design costs associated with survey and geotechnical costs, permitting, construction inspection and material
testing costs, mobilization, maintenance of traffic, erosion control, pavement markings, lighting and signage
(includes conduits, lights, conductors, cans, lightning protection, and vault upgrades), drainage, storm water
structures, fencing and gates, sodding, and utilities. The sponsor will comply with Aviation Program Assurances.
89

FIVE YEAR CAPITAL PROGRAM EXPENDITURE REQUESTS FISCAL YEARS ENDING 2022‐2026
FUND 443 ‐ Airport Construction DEPARTMENT Airport
PROJECT NAME ACCOUNT #
AIRPORT MASTER PLAN UPDATE 443.4000.542.617142
TYPE OF EXPENSE New Repair/Refurbish Replace X
TOTAL PROJECT COST
PROJECT LOCATION Planning Study.
$ 650,000 GRANT FUNDING Source/Agency
Amount FAA FDOT
$
$
$
617,500 585,000 32,500
PROJECT DESCRIPTION Update 2016 Airport Master Plan.
JUSTIFICATION Aircraft operations have reached nearly record traffic levels and non‐aeronautical development has increased.
Construction activity at the airport has created demand for new aeronautical land and many properties displayed
on the past master plan are no longer vacant. Changes in the airport's fleet mix may warrant another look at the 20‐
year horizon and a master plan update.
PROJECT NAME ACCOUNT #
REDEVELOP COMMERCIAL PARK (PHASE 1) 443.4000.542.617143
TYPE OF EXPENSE New Repair/Refurbish X Replace X
TOTAL PROJECT COST
PROJECT LOCATION
$ 500,000 GRANT FUNDING Source/Agency
Amount FDOT
$
$
250,000 250,000
Airport Commercial Village in central area near Aviation Boulevard.
PROJECT DESCRIPTION Project proposes to demolish vacant buildings or make major repairs to existing in order to make room for revenue‐
producing development in the core business area of the airport along Aviation Boulevard.
JUSTIFICATION This project will assist to create shovel ready properties in desirable locations on airport property.
90

FIVE YEAR CAPITAL PROGRAM EXPENDITURE REQUESTS FISCAL YEARS ENDING 2022‐2026
FUND 443 ‐ Airport Construction DEPARTMENT Airport
PROJECT NAME ACCOUNT #
AIRPORT WAYFINDING SIGNA
443.4000.542.617144 GE
TYPE OF EXPENSE New Repair/Refurbish Replace X
TOTAL PROJECT COST
PROJECT LOCATION Various Locations
$ 500,000 GRANT FUNDING Source/Agency
Amount FDOT
$
$
400,000 400,000
PROJECT DESCRIPTION Project proposes to demolish existing signage and replace with new to aid in navigation around airport property.
JUSTIFICATION Existing signage is old, outdated, inaccurate, and internally lighted. For lower maintenance, each sign will be
replaced with externally lit concrete block monument signs. External graphics may be updated/replaced as needed,
including on existing signage installed during the Airport Drive project (2017‐18).
PROJECT NAME REHAB AIRPORT TERMINAL (DESIGN/CONSTRUCT) PH 1 ACCOUNT # 443.4000.542.617145
TYPE OF EXPENSE New Repair/Refurbish x Replace x
TOTAL PROJECT COST
PROJECT LOCATION
$ 750,000 GRANT FUNDING Source/Agency
Amount FDOT
$
$
600,000 600,000
Airport Terminal Building
PROJECT DESCRIPTION Rehabilitation of the Airport Terminal Building to include, but not limit to; Ceiling repair, door upgrades, painting,
light upgrades (LED) and technology upgrades.
JUSTIFICATION The current terminal building was constructed as an add‐on to a post‐WWII terminal. The construction of the
extension was completed in 2008. Since the completion of the terminal work, we have experienced cracks in the
ceiling and other repairs that need to be accomplished. Alongside this, we would like to include updates for the
technology in the Airport Conference room.
91

FIVE YEAR CAPITAL PROGRAM EXPENDITURE REQUESTS FISCAL YEARS ENDING 2022‐2026
FUND 443 ‐ Airport Construction DEPARTMENT Airport
PROJECT NAME ACCOUNT #
PIPER AIRFIELD SECURITY PROJECT 443.4000.542.617146
TYPE OF EXPENSE New x Repair/Refurbish x Replace x
TOTAL PROJECT COST
PROJECT LOCATION
$ 605,000 GRANT FUNDING Source/Agency
Amount FDOT
P3
$
$
$
605,000 484,000 121,000
Piper Manufacturing Facility
PROJECT DESCRIPTION Project will be used to increase security and public safety in the area of Piper Manufacturing as they have direct
access to the airport Operations Area. This includes fencing and access control.
JUSTIFICATION As piper continues to grow they have found a need to increase security measures and repair / replace dilapidated
fencing around their facility. Piper has direct access to the airfield and poses a security risk to the airport if their
measures are insufficient.
PROJECT NAME ACCOUNT #
AIRFIELD MARKING PROJECT 443.4000.542.617147
TYPE OF EXPENSE New Repair/Refurbish x Replace
TOTAL PROJECT COST
PROJECT LOCATION Various Locations
$ 200,000 GRANT FUNDING Source/Agency
Amount FDOT
$
$
160,000 160,000
PROJECT DESCRIPTION Airfield marking rehabilitation to ensure the safe operation and navigation of aircraft on the Airfield.
JUSTIFICATION As a Part 139 certified airport, Vero Beach is required to maintain the markings on Airport property. Airfield
markings are crucial to the safe operations of vehicles on the airfield. These markings provide guidance that
prevents runway incursions, assists drivers and pilots to maintain situational awareness, and identify critical safety
areas.
92

FIVE YEAR CAPITAL PROGRAM EXPENDITURE REQUESTS FISCAL YEARS ENDING 2022‐2026
FUND 443 ‐ Airport Construction DEPARTMENT Airport
PROJECT NAME ACCOUNT #
CONSTRUCT GA APRON 443.4000.542.______
TYPE OF EXPENSE New X Repair/Refurbish Replace
TOTAL PROJECT COST
PROJECT LOCATION
$ 1,700,000 GRANT FUNDING Source/Agency
Amount FDOT P3
$ 1,700,000 $ 1,360,000 $ 340,000
East end of general aviation ramp area currently undeveloped (grass parking).
PROJECT DESCRIPTION This project will construct public general aviation apron along Taxiway C in center of the airport.
JUSTIFICATION Project anticipates adding approximately 13,410 SY of asphaltic pavement, along with drainage, tie‐downs, and
ancillary lighting/signage as needed. This project allows additional capacity for parking of smaller general aviation
aircraft in the center area of the airport.
PROJECT NAME ACCOUNT #
REHABILITATE TAXIWAY B (CONSTRUCTION) 443.4000.542.______
TYPE OF EXPENSE New Repair/Refurbish X Replace
TOTAL PROJECT COST
PROJECT LOCATION
$ 2,700,000 GRANT FUNDING Source/Agency
Amount FAA
FDOT
$ 2,565,000 $ 2,430,000 $ 135,000
This taxiway serves multiple aeronautical businesses on the west side of the Airport.
PROJECT DESCRIPTION Taxiway B serves 3 full‐service FBOs and 1 SASO. The taxiway is about 2,100 feet long and 35 feet wide and has 3
connectors. Milling of entire length with a two‐inch overlay is proposed. Marking and lighting rehabilitation will
complete the project. If funding is available, would like to prepare an environmental assessment and design for an
extension to Taxiway B.
JUSTIFICATION PCI reports indicate that Taxiway B may need milling and overlay. This scope of work includes but is not limited to
consultant and design fees, survey and geotechnical costs, permitting, construction inspection and material testing
costs, mobilization, maintenance of traffic, erosion control, demolition, pavement enhancement or reconstruction,
joint construction, pavement markings, lighting and signage (includes conduits, lights, conductors, cans, lightning
protection, and vault upgrades), drainage, storm water structures, fencing and gates, sodding, utilities, and all labor
and incidentals required to rehabilitate or reconstruct the apron pavement. The sponsor will comply with Aviation
Program Assurances.
93

FIVE YEAR CAPITAL PROGRAM EXPENDITURE REQUESTS FISCAL YEARS ENDING 2022‐2026
FUND 443 ‐ Airport Construction DEPARTMENT Airport
PROJECT NAME ACCOUNT #
REHAB AIRPORT TERMINAL (CONSTRUCT
443.4000.542.______ ) PH II
TYPE OF EXPENSE New Repair/Refurbish x Replace x
TOTAL PROJECT COST
PROJECT LOCATION
$ 750,000 GRANT FUNDING Source/Agency
Amount FDOT
$
$
600,000 600,000
Airport Terminal Building
PROJECT DESCRIPTION Rehabilitation of the Airport Terminal Building to include, but not limit to; Ceiling repair, door upgrades, painting,
light upgrades (LED) and technology upgrades.
JUSTIFICATION The current terminal building was constructed as an add‐on to a post‐WWII terminal. The construction of the
extension was completed in 2008. Since the completion of the terminal work, we have experienced cracks in the
ceiling and other repairs that need to be accomplished. Alongside this, we would like to include updates for the
technology in the Airport Conference room.
PROJECT NAME ACCOUNT #
EXTEND TAXIWAY B (DESIGN/EA) 443.4000.542.______
TYPE OF EXPENSE New x Repair/Refurbish Replace
TOTAL PROJECT COST
PROJECT LOCATION
$ 470,000 GRANT FUNDING Source/Agency
Amount FDOT
$
$
376,000 376,000
This taxiway serves multiple aeronautical businesses on the west side of the Airport.
PROJECT DESCRIPTION Construct an extension to Taxiway B north of RWY 12R parallel to RWY 22. Project scope would include 3,200' x 50'
taxiway, marking, and lighting. A new run‐up area at the north end would also be included.
JUSTIFICATION New development and increased traffic at VRB has created a demand to increase capacity.
94

FIVE YEAR CAPITAL PROGRAM EXPENDITURE REQUESTS FISCAL YEARS ENDING 2022‐2026
FUND 443 ‐ Airport Construction DEPARTMENT Airport
PROJECT NAME ACCOUNT #
REDEVELOP COMMERCIAL PARK (PHASE 2) 443.4000.542.______
TYPE OF EXPENSE New Repair/Refurbish X Replace X
TOTAL PROJECT COST
PROJECT LOCATION
$ 500,000 GRANT FUNDING Source/Agency
Amount FDOT
$
$
250,000 250,000
Airport Commercial Village in central area near Aviation Boulevard.
PROJECT DESCRIPTION Project proposes to demolish vacant buildings or make major repairs to existing in order to make room for revenue‐
producing development in the core business area of the airport along Aviation Boulevard.
JUSTIFICATION This project will assist to create shovel ready properties in desirable locations on airport property.
PROJECT NAME ACCOUNT #
PURCHASE ARFF VEHICLE 443.4000.542.______
TYPE OF EXPENSE New Repair/Refurbish Replace X
TOTAL PROJECT COST
PROJECT LOCATION
$ 850,000 GRANT FUNDING Source/Agency
Amount FAA FDOT
$
$
$
807,500 765,000 42,500
FIRE STATION #3 ‐ 43RD AVE.
PROJECT DESCRIPTION Purchase Aircraft Rescue and Fire Fighting (ARFF) vehicle with 1,500‐gal capability.
JUSTIFICATION Larger aircraft and more frequent operations at our airport warrant a greater capacity for firefighting to ensure
safety is properly met with the traveling public.
95

FIVE YEAR CAPITAL PROGRAM EXPENDITURE REQUESTS FISCAL YEARS ENDING 2022‐2026
FUND 443 ‐ Airport Construction DEPARTMENT Airport
PROJECT NAME EXTEND/MARK/LIGHT TWY E‐WEST OF RWY 4 (DESIGN & EA) ACCOUNT # 443.4000.542.______
TYPE OF EXPENSE New X Repair/Refurbish Replace
TOTAL PROJECT COST
PROJECT LOCATION
$ 1,400,000 GRANT FUNDING Source/Agency
Amount FAA
FDOT
$ 1,330,000 $ 1,260,000 $ 70,000
Airport Midfield west of runway 4‐22
PROJECT DESCRIPTION Project is proposed to extend existing Taxiway E west to the end of the main runway for improved traffic flow and
increased capacity. This project will initiate an environmental assessment and complete the design drawings for
advertisement to contractors.
JUSTIFICATION Was planned for in FAA‐approved 2016 Airport Master Plan. Capacity need due to increased increased demand for
developable property. Annual operations at VRB were approximately 240,000 in 2018. Monthly operations in
January 2019 were over 23,000 (767 operations per day). Run‐up areas and taxiways are becoming crowded.
PROJECT NAME EXTEND MARK LIGHT TAXIWAY E WEST OF RUNWAY 4 (CONSTRUCT) ACCOUNT # 443.4000.542.______
TYPE OF EXPENSE New x Repair/Refurbish Replace
TOTAL PROJECT COST
PROJECT LOCATION
$ 6,000,000 GRANT FUNDING Source/Agency
Amount FAA
FDOT
$ 5,700,000 $ 5,400,000 $ 300,000
Airport Terminal Building
PROJECT DESCRIPTION
Project is proposed to extend existing Taxiway E west to the end of the main runway for improved traffic flow and
increased capacity. This project will complete any design work needed for advertisement to contractors, and
complete the construction, including QA and RPR services.
JUSTIFICATION Was planned for in FAA‐approved 2016 Airport Master Plan. Capacity need due to increased increased demand for
developable property. Annual operations at VRB were approximately 240,000 in 2018. Monthly operations in
January 2019 were over 23,000 (767 operations per day). Run‐up areas and taxiways are becoming crowded.
96

FIVE YEAR CAPITAL PROGRAM EXPENDITURE REQUESTS FISCAL YEARS ENDING 2022‐2026
FUND 443 ‐ Airport Construction DEPARTMENT Airport
PROJECT NAME ACCOUNT #
REHABILITATE AIRPORT DRAINAGE SYSTEM 443.4000.542.______
TYPE OF EXPENSE New Repair/Refurbish X Replace
TOTAL PROJECT COST
PROJECT LOCATION Various locations
$ 2,000,000 GRANT FUNDING Source/Agency
Amount FAA
FDOT
$ 1,900,000 $ 1,800,000 $ 100,000
PROJECT DESCRIPTION Project proposes to rehabilitate existing runway/taxiway drainage system as necessary to improve safety and
operability of the airfield.
JUSTIFICATION Many of the existing runway and taxiway drainage systems need rehabilitation in the near future to meet
continuing airport development and retention requirements with water management districts.
97

. -. ..,._
MARINA FUND
98

CITY OF VERO BEACH FIVE YEAR CAPITAL IMPROVEMENT PROGRAM
FUND 451: Marina
FY 20-21 FY 20-21 BUDGET
ORIGINAL INCREASE AMENDED Account Number Account Name BUDGET (DECREASE) FY 20-21
CASH & INVESTMENTS BALANCE FORWARD (OCTOBER 1)
323,298
-Audited
516,577
NET CASH AFTER OPERATING ACTIVITES/TRANSFERS 162,687 - 162,687
451.0000.334.072000 FL INLAND NAV DISTRICT (FIND) GRANT- PH1 DESIGN/PERMITTING 274,500 - 274,500 451.0000.334.072001 FL INLAND NAV DISTRICT (FIND) GRANT- SOUTH COMPLEX REBUILD - - -451.0000.383.______ INTERFUND LOAN - SOUTH COMPLEX REBUILD 451.0000.389.000700 GEN FUND CAPITAL CONTRIBUTION - SOUTH COMPLEX REBUILD 451.0000.334.______ POTENTIAL STATE GRANTS (per Master Plan) - - -451.0000.383.______ PROCEEDS FROM BORROWING, INTERFUND LOANS - - -451.0000.389.000700 GEN FUND CAPITAL CONTRIBUTION - ALL OTHER MASTER PLAN PROJ
TOTAL CASH AVAILABLE FOR CAPITAL EXPENDITURES 437,187 - 437,187
CAPITAL EXPENDITURES 451.4100.575.______ INTERFUND DEBT SERVICE - SOUTH COMPLEX REBUILD - - -451.4100.575.______ PROJECTED INTERFUND DEBT SERVICE - REMAINING MASTER PLAN - - -451.4100.575.615074 MARINA FORKLIFT PURCHASE - - -451.4100.575.604003 CENTER DOCK REPAIRS - - -451.4100.575.615071 LOUNGE REMODEL / FURNITURE - - -451.4100.575.615072 SOUTH RESTROOM UPDATE / REMODEL - - -451.4100.575.615075 MARINA MASTER PLAN: PH 1 DESIGN/PERMITTING 648,000 - 648,000 451.4100.575.615076 SOUTH COMPLEX PROJECT (DRY STORAGE BUILDING, FLOATING DOCK, B - - -451.4100.575.615077 DREDGING / OTHER AREAS - - -451.4100.575.______ BULKHEAD - - -451.4100.575.______ LAGOON DOCKS - - -451.4100.575.______ DREDGING LAGOON - - -451.4100.575.______ NORTH DOCK - - -451.4100.575.______ FUEL/CENTER DOCK - - -451.4100.575.______ SOUTH DOCK - - -
Total Expenditures 648,000 - 648,000
(210,813)
-
(210,813)
Excess (Deficiency) of Cash over Expenditures
FY 21-22 FY 22-23 FY 23-24 FY 24-25 FY 25-26
305,764 288,472 702,531 1,015,838 1,059,453
171,458 751,000 817,000 950,000 950,000
76,250 - - - -463,902 - - - -
4,671,718 2,000,000
85,000 589,864 2,037,725 534,432 -- 1,579,349 3,124,475 689,543 -
- 750,000 750,000 500,000 -
7,468,328 3,670,213 6,729,200 2,673,975 950,000
- 336,942 336,942 336,942 336,942 - - 166,751 569,443 569,443 - - - - -- - - - -- - - - -- - - - -
180,000 - - - -7,135,620 - - - -
170,000 - 1,445,469 - -- - 745,203 - -- 2,558,213 - - -- 361,000 - - -- - 1,606,545 - -- - 2,114,983 - -- - - 1,723,975 -
7,485,620 3,256,155 6,415,893 2,630,360 906,385
(17,292) 414,058 313,307 43,615 43,615 ENDING CASH BALANCE (SEPTEMBER 30) 112,485 305,764 288,472 702,531 1,015,838 1,059,453 1,103,068
99

FIVE YEAR CAPITAL PROGRAM EXPENDITURE REQUESTS FISCAL YEARS ENDING 2022‐2026
FUND 451 ‐ Marina DEPARTMENT Marina
PROJECT NAME ACCOUNT #
Marina Master Plan: Ph 1 Design/Permitting 451.4100.575.615075
TYPE OF EXPENSE New x Repair/Refurbish Replace
TOTAL PROJECT COST
PROJECT LOCATION 3611 Rio Vista Blvd.
$ 828,000 GRANT FUNDING Amount Source/Agency
$ 350,750 F.I.N.D.
PROJECT DESCRIPTION Design and Permitting for Marina Master Plan
JUSTIFICATION Marina docks and infrastructure are beyond their service life and need to be replaced.
PROJECT NAME South Complex Project (Dry Storage Building, Floating Dock) ACCOUNT # 451.4100.575.______
TYPE OF EXPENSE New Repair/Refurbish Replace X
TOTAL PROJECT COST
PROJECT LOCATION 3599 Rio Vista Blvd.
$ 7,135,620 GRANT FUNDING Amount Source/Agency FIND
Interfund Loan
Capital Contribution
$
$
$
463,902
4,671,718
2,000,000
PROJECT DESCRIPTION Demolish and Rebuild the entire Marina South Complex
JUSTIFICATION The facility as a whole is 52 years old and the docks are approximately 40 years old and have exceeded the expected service
lift. In addition the dry storage part of the complex is in the bottom 2% of the dry storage market for both the number of
spaces available and the size boats that we can fit inside. Rebuilding the south complex will put the city marina in a better
postion in the dry storage market to be more competive and increase revenues for the marina and the city. The most
important parts of this project is it will be a safer more resilient complex and more opportunities for area residents to store
their boats.
100

FIVE YEAR CAPITAL PROGRAM EXPENDITURE REQUESTS FISCAL YEARS ENDING 2022‐2026
FUND 451 ‐ Marina DEPARTMENT Marina
PROJECT NAME ACCOUNT #
Dredging/Other Areas 451.4100.575.______
TYPE OF EXPENSE New x Repair/Refurbish Replace
TOTAL PROJECT COST
PROJECT LOCATION 3611 Rio Vista Blvd.
$ 1,615,469 GRANT FUNDING Amount Source/Agency
$ 807,735 N/A
PROJECT DESCRIPTION Dredge in and around existing marina docks
JUSTIFICATION As part of the marina master plan, Dredgeing needs to be done. We have multiple shallow areas that contribute to the under
utilization of many of the marina's slips. The vast majority of the shallow areas that need to be dredged are MUCK, removing
that will increase the water quality.
PROJECT NAME ACCOUNT #
Bulkhead 451.4100.575.______
TYPE OF EXPENSE New Repair/Refurbish x Replace
TOTAL PROJECT COST
PROJECT LOCATION 3611 Rio Vista Blvd.
$ 745,203 GRANT FUNDING Amount Source/Agency
$ 329,000 N/A
PROJECT DESCRIPTION Bulkhead shore line at Main complex
JUSTIFICATION The bulkhead along the main marina complex has been slowly receeding over the marina's life of nearly 90 years. This has
contibuted into some slips becoming un usable as well as electrical sheds starting to lean as the ground below shifts.
101

FIVE YEAR CAPITAL PROGRAM EXPENDITURE REQUESTS FISCAL YEARS ENDING 2022‐2026
FUND 451 ‐ Marina DEPARTMENT Marina
PROJECT NAME ACCOUNT #
Lagoon Docks 451.4100.575.______
TYPE OF EXPENSE New x Repair/Refurbish Replace
TOTAL PROJECT COST
PROJECT LOCATION 3611 Rio Vista Blvd.
$ 2,558,213 GRANT FUNDING Amount Source/Agency
$ 409,314 N/A
PROJECT DESCRIPTION Demolish and replace and expand Lagoon docks
JUSTIFICATION The existing Lagoon Docks are beyond their service life, those docks only take up a small portion of that area, expanding will provide additional slips for residents and guests.
PROJECT NAME ACCOUNT #
Dredging Lagoon 451.4100.575.______
TYPE OF EXPENSE New Repair/Refurbish x Replace
TOTAL PROJECT COST
PROJECT LOCATION 3611 Rio Vista Blvd.
$ 361,000 GRANT FUNDING Amount Source/Agency
$ 180,550 N/A
PROJECT DESCRIPTION Dredge Lagoon
JUSTIFICATION When the lagoon was dredged in the 1950's it was dug to a depth of approxomately 6 feet. Over the last 60 years it has silted
in and is now at a depth of 3 feet.
102
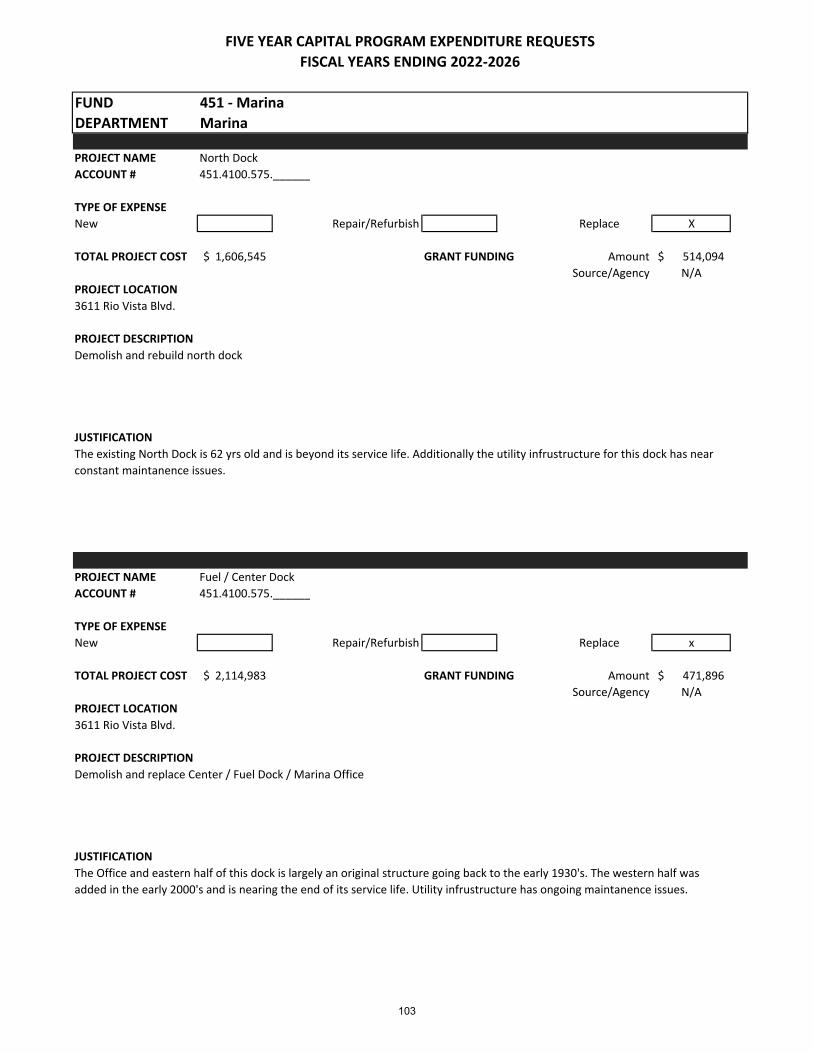
FIVE YEAR CAPITAL PROGRAM EXPENDITURE REQUESTS FISCAL YEARS ENDING 2022‐2026
FUND 451 ‐ Marina DEPARTMENT Marina
PROJECT NAME ACCOUNT #
North Dock 451.4100.575.______
TYPE OF EXPENSE New Repair/Refurbish Replace X
TOTAL PROJECT COST
PROJECT LOCATION 3611 Rio Vista Blvd.
$ 1,606,545 GRANT FUNDING Amount Source/Agency
$ 514,094 N/A
PROJECT DESCRIPTION Demolish and rebuild north dock
JUSTIFICATION The existing North Dock is 62 yrs old and is beyond its service life. Additionally the utility infrustructure for this dock has near
constant maintanence issues.
PROJECT NAME ACCOUNT #
Fuel / Center Dock 451.4100.575.______
TYPE OF EXPENSE New Repair/Refurbish Replace x
TOTAL PROJECT COST
PROJECT LOCATION 3611 Rio Vista Blvd.
$ 2,114,983 GRANT FUNDING Amount Source/Agency
$ 471,896 N/A
PROJECT DESCRIPTION Demolish and replace Center / Fuel Dock / Marina Office
JUSTIFICATION The Office and eastern half of this dock is largely an original structure going back to the early 1930's. The western half was added in the early 2000's and is nearing the end of its service life. Utility infrustructure has ongoing maintanence issues.
103

FIVE YEAR CAPITAL PROGRAM EXPENDITURE REQUESTS FISCAL YEARS ENDING 2022‐2026
FUND 451 ‐ Marina DEPARTMENT Marina
PROJECT NAME ACCOUNT #
South Dock 451.4100.575.______
TYPE OF EXPENSE New Repair/Refurbish Replace x
TOTAL PROJECT COST
PROJECT LOCATION 3599 Rio Vista Blvd
$ 1,723,975 GRANT FUNDING Amount Source/Agency
$ 534,432 N/A
PROJECT DESCRIPTION Demolish and rebuild south dock
JUSTIFICATION The South Dock is believed to be 30‐40 yrs old and it has passed its service life. Additionally the utilities infrustructure have on
going maintanence issues.
104

SOLID WASTE FUND
105

CITY OF VERO BEACH FIVE YEAR CAPITAL IMPROVEMENT PROGRAM
FUND 461: Solid Waste
FY 20-21 FY 20-21 Budget Amended Original Increase FY 20-21
Account Number Account Name Budget (Decrease) Budget FY 21-22 FY 22-23 FY 23-24 FY 24-25 FY 25-26 Audited
AVAILABLE CASH AND INVESTMENTS BALANCE FORWARD (OCTOBER 1)
630,355
- 1,174,866 792,135 679,509 593,950 595,267 529,396
NET CASH AFTER OPERATING ACTIVITES/TRANSFERS 117,753 - 117,753 133,817 185,000 185,000 185,000 185,000 461.0000.383.000100 CAPITAL LEASE PROCEEDS (VEHICLE LEASE-PURCHASE) 54,000
-
54,000 - - 32,000 32,000 87,000 171,753 - 171,753 133,817 185,000 217,000 217,000 272,000
CAPITAL EXPENDITURES 461.3308.534.613001 SOLID WASTE VEHICLE PURCHASE - 469,948 469,948 225,000 254,000 165,000 225,000 230,000 461.3308.534.641400 SOLID WASTE LIGHT VEHICLE LEASE-PURCHASE ACQUISITION 54,000 - 53,831 - - 32,000 32,000 87,000 461.3308.534.641500 SOLID WASTE LIGHT VEHICLE LEASE-PURCHASE DEBT SERVICE 31,340 - 30,705 21,443 16,559 18,683 25,871 33,919
Total Expenditures 85,340 469,948 554,484 246,443 270,559 215,683 282,871 350,919 Excess (Deficiency) of Cash over Expenditures
86,413 (469,948) (382,731) (112,626) (85,559)
1,317 (65,871) (78,919)
AVAILABLE ENDING CASH BALANCE (SEPTEMBER 30) 716,768
I l 792,135 679,509 593,950 595,267 529,396 450,477
106

FIVE YEAR CAPITAL PROGRAM EXPENDITURE REQUESTS FISCAL YEARS ENDING 2022‐2026
FUND 461 ‐ Solid Waste DEPARTMENT Public Works
PROJECT NAME ACCOUNT #
Solid Waste Vehicle Purchase (Replace Garbage Trucks) 461.3308.534.613001
TYPE OF EXPENSE New Repair/Refurbish Replace x
TOTAL PROJECT COST
PROJECT LOCATION N/A
See schedule below GRANT FUNDING Source/Agency
Amount $ ‐
N/A
PROJECT DESCRIPTION Replace Garbage trucks.
JUSTIFICATION The trucks will have exceeded the normal years of service and begin having more mechanical breakdowns which
reduces our ability to provide timely service to our customers.
Current Vehicle Replacement Vehicle
Fiscal Year Vehicle # Dept Description Purchase
Description Price 2021‐2022 547 Solid Waste 2007 Crane Carrier Rr Ldr Rear Loader $ 225,000
2022‐2023 556 Solid Waste 2016 Mack Front Loader Front Loader $ 254,000
2023‐2024 12‐542 Solid Waste 2004 International Claw Tk Claw Truck $ 165,000
2024‐2025 536 Solid Waste 2002 Crane Carrier Rr Ldr Rear Loader $ 225,000
2025‐2026 533 Solid Waste 2004 Crane Carrier Rr Ldr Rear Loader $ 230,000
107

FIVE YEAR CAPITAL PROGRAM EXPENDITURE REQUESTS FISCAL YEARS ENDING 2022‐2026
FUND 461 ‐ Solid Waste DEPARTMENT Public Works
PROJECT NAME Solid Waste Light Vehicle Lease‐Purchase Acquisition / Debt Service ACCOUNT # 461.3308.534.641400 / 461.3308.534.641500
TYPE OF EXPENSE New Repair/Refurbish Replace x
TOTAL PROJECT COST See schedule below GRANT FUNDING Amount $ ‐
Source/Agency N/A PROJECT LOCATION N/A
PROJECT DESCRIPTION Replace existing light vehicles through a lease‐purchase program per schedule below.
JUSTIFICATION By using a lease‐purchase program we predict that over a 10 year period the City will save approximately
$800,000 City‐wide over the current practice of keeping vehicles for 15 years. Savings will be achieved through
reductions in maintenance, repairs, fuel usage and increased value when vehicles are sold.
Current Vehicle Replacement Vehicle
Fiscal Year Vehicle # Dept Description Purchase
Description Price Increase to
Debt Svc
2023‐2024
2024‐2025
2025‐2026 2025‐2026
12‐560
12‐561
12‐563 12‐535
Solid Waste 2017 F150
Solid Waste 2017 F150
Solid Waste 2018 F150 Solid Waste 2002 F450 Liftgate
Lt Pickup 1/2T $ 32,000
Lt Pickup 1/2T $ 32,000
Lt Pickup 1/2T 32,000
Ford F450 Liftgate 55,000
Subtotal $ 87,000
$ 7,188
$ 7,188
$ 19,542
108

~·· . r__ ·-~--C"t-·.
I .,-/. -.:?--i . ~-;_ '\..._ - ..r .. -<-~~v.iu-~Mitr:~
HISTORIC DOWNTOWN VERO
BEACH ECONOMIC
DEVELOPMENT ZONE
109

I I
I I
- - -- - - - -- - - - -
Account Number
FUND BALANCE FORWARD (OCTOBER 1)
REVENUES 607.0000.389.001000 TRANSFER FROM GENERAL FUND
Total Revenues
EXPENDITURES 607.9900.519.600101 DOWNTOWN LIGHTING & SECURITY 607.9900.519.600102 DOWNTOWN SIDEWALK IMPROVEMENTS
Total Expenditures Excess (Deficiency) of Revenues over Expenditures
ENDING FUND BALANCE (SEPTEMBER 30)
* Per Resolution 2015-12 Downtown EDZ Tax Increment ends with Fiscal Year 25-26
CITY OF VERO BEACH FIVE YEAR CAPITAL IMPROVEMENT PROGRAM
FUND 607: HISTORIC DOWNTOWN VERO BEACH ECONOMIC DEVELOPMENT ZONE TRUST
FY 20-21 FY 20-21 BUDGET AMENDED
ORIGINAL INCREASE FY 20-21 Account Name BUDGET (DECREASE) BUDGET FY 21-22 FY 22-23 FY 23-24 FY 24-25 FY 25-26
Audited
144,045
160,545 246,644 294,869 194,076 94,276 195,477
91,099 - 91,099
91,099 - 91,099
112,000 (107,000) 5,000 104,500 (104,500) -
216,500 (211,500) 5,000
(125,401) 211,500 86,099 18,644 246,644
assumes 1% annual growth in value 98,225
98,225 99,207 100,199 101,201 102,213
50,000 200,000 200,000 - 200,000
50,000 200,000 200,000 - 200,000
48,225 (100,793) (99,801) 101,201 (97,787)
294,869 194,076 94,276 195,477 97,690
99,207 100,199 101,201 102,213
110

FIVE YEAR CAPITAL PROGRAM EXPENDITURE REQUESTS FISCAL YEARS ENDING 2022‐2026
FUND 607 ‐ Historic Downtown Vero Beach Economic Development Zone DEPARTMENT Historic Downtown Vero Beach Economic Development Zone
PROJECT NAME Downtown Lighting & Security ACCOUNT # 607.9900.519.600101
TYPE OF EXPENSE New X Repair/Refurbish Replace
TOTAL PROJECT COST
PROJECT LOCATION
$ 655,000 GRANT FUNDING Amount Source/Agency
$ ‐
N/A
Downtown Vero Beach. 14th Ave (18th St to 20th St and 21st St to 23rd St); Old Dixie Hwy (18th St to 20th St); 21st St (16th Ave
to FEC ROW); and 19th St (EDZ Boundary to 14th Ave) PROJECT DESCRIPTION The installation of additional lighting on Main Street (14th Avenue), Old Dixie Highway, 19th Street, and 21st Street in
Downtown Vero Beach. The project costs include engineering to verify the amount of additional light fixtures needed,
purchase and installation of light fixtures, including directional boring for electrical conduit.
The project is phased over five fiscal years. FY21 & FY22: engineering & design; FY23: installation of lights on 14th Ave (21st
St to 23rd St); FY24: installation of lights on 21st Street; FY26: installation of lights on old Dixie Highway.
JUSTIFICATION The installation of additional lighting in Downtown Vero Beach will improve pedestrian safety on the core retail streets in
Downtown; The project is listed as A‐1 in the Economic Development Plan.
111