Basic Education - BUDGET
54
VOTE 14 ESTIMATES OF NATIONAL EXPENDITURE 2019 BUDGET BASIC EDUCATION
-
Upload
khangminh22 -
Category
Documents
-
view
1 -
download
0
Transcript of Basic Education - BUDGET

VOTE
14
ESTIMATES OF NATIONAL EXPENDITURE
2019BUDGET
BASIC EDUCATION


Estimates of National Expenditure
2019
National Treasury
Republic of South Africa

ISBN: 978-0-621-47021-5
RP: 17/2019
The 2019 Estimates of National Expenditure is compiled with the latest available information from departmental and other sources. Some of this information is unaudited or subject to revision.
The Estimates of National Expenditure e-publications for individual votes are available on www.treasury.gov.za. Compared to this Estimates of National Expenditure publication, the e-publications for each vote contain more comprehensive coverage of all public entities. Also included are tables containing information on programme specific personnel expenditure, conditional grants to provinces and municipalities, public private partnerships and information on donor funding. Expenditure information at the level of site service delivery is included, where applicable.

Foreword
The Estimates of National Expenditure (ENE) publications are an integral part of the comprehensive annual budget process. The economic climate has made it necessary to focus on reprioritising existing resources towards areas where the most value can be derived for all South Africans. The budgets shown in this document reflect the outcome of a robust negotiation process, led by a committee of senior officials in central government departments, under the political guidance of the Ministers’ Committee on the Budget. There was also wide-ranging intergovernmental consultation on budgets in the provincial and local spheres of government. Ultimately, these decisions are considered and endorsed by Cabinet.
The ENE publications present the detail of national government’s expenditure estimates for the three-year 2019 medium-term expenditure framework period, most importantly for 2019/20 allocations contained in the Appropriation Bill, 2019, as tabled by the Minister of Finance, for Parliament’s consideration and adoption.
The abridged ENE provides extensive information on the priorities, spending plans and service delivery commitments of all 40 national government votes, as well as for associated government agencies. The e-publications for each vote contain more detail on goods and services, transfers and subsidies, donor funding, public entities, and lower-level spending information on service delivery.
This information in these chapters ensures that Parliament, the public, civil society, the media, government departments, public entities and the executive can keep state institutions accountable and ensure that public funds are spent to achieve the outcomes for which they were intended. Since its launch in February 2018, the Vulekamali online portal has become the main source of transparent, user-friendly information, including information contained in ENE publications, for anybody who wants to know more about how government compiles its budget and spends public funds. The website, www.vulekamali.gov.za, continues to evolve, and now also provides geospatial information on government’s infrastructure projects, which are focal in this year’s budget as a key impetus for economic growth. I encourage you to be active citizens and use this information to hold government accountable for obtaining the best possible outcomes with the funds entrusted to it.
I wish to thank the executive for the political leadership shown in the budget process, our government colleagues for all of their efforts and contributions, and my team at the department for working diligently to bring it all together.
Dondo Mogajane Director-General: National Treasury

Introduction The Estimates of National Expenditure publications
The Estimates of National Expenditure (ENE) publications describe in detail government’s expenditure plans over the next three financial years, also known as the medium-term expenditure framework (MTEF) period. The 2019 MTEF period is from 2019/20 to 2021/22.
The ENE publications contain information on how government institutions have spent their budgets in previous years. They explain how these institutions intend to use their allocations over the medium term to achieve their goals, and the outputs and outcomes their spending is expected to lead to. The publications include tables depicting non-financial performance indicators and targets, departmental receipts, personnel, significant as well as detailed expenditure trends and estimates by programme, subprogramme and economic classification for each department and for entities that report to the vote’s executive authority. Explanatory narratives set out the institution’s purpose (and that of its programmes), its mandate and programme-level objectives and descriptions of subprogrammes. A more in-depth narrative analyses the institution’s expected expenditure over the MTEF period. Summary data tables at the end of each vote contain data on provincial and municipal conditional grants, public-private partnerships, donor funding, infrastructure, and expenditure at the level of site service delivery, where applicable.
A separate 2019 ENE Overview publication is also available on www.treasury.gov.za and summarises the ENE information across all votes. The 2019 ENE Overview contains a narrative explanation and budget-wide summary tables; and it also has a write-up on how to interpret the information that is contained in each section of the publications.


Basic Education
National Treasury
Republic of South Africa

Contents Budget summary .......................................................................................................... 1 Vote purpose ............................................................................................................... 1 Mandate ...................................................................................................................... 1 Selected performance indicators .................................................................................. 1 Expenditure analysis .................................................................................................... 2 Expenditure trends ...................................................................................................... 5 Expenditure estimates ................................................................................................. 6 Expenditure trends and estimates for significant spending items ................................. 6 Goods and services expenditure trends and estimates ................................................. 7 Transfers and subsidies expenditure trends and estimates ........................................... 7 Personnel information ................................................................................................. 8 Departmental receipts ................................................................................................. 9 Programme 1: Administration ...................................................................................... 9 Programme 2: Curriculum Policy, Support and Monitoring .......................................... 11 Programme 3: Teachers, Education Human Resources and Institutional Development 13 Programme 4: Planning, Information and Assessment ................................................. 15 Programme 5: Educational Enrichment Services .......................................................... 18 Entities ........................................................................................................................ 20 Additional tables ......................................................................................................... 25

1
Vote 14 Basic Education Budget summary
2019/20 2020/21 2021/22
R million Total Current
payments Transfers and
subsidies Payments for capital assets Total Total
MTEF allocation Administration 496.3 481.5 0.4 14.4 527.2 558.5Curriculum Policy, Support and Monitoring 1 989.0 1 375.7 612.3 1.0 2 103.3 2 217.7Teachers, Education Human Resources and Institutional Development
1 366.2 105.1 1 260.7 0.4 1 442.6 1 523.2
Planning, Information and Assessment 13 144.3 509.7 10 764.5 1 870.1 13 876.7 15 364.2Educational Enrichment Services 7 508.8 65.6 7 442.7 0.4 8 037.9 8 525.8Total expenditure estimates 24 504.5 2 537.6 20 080.7 1 886.2 25 987.6 28 189.4Executive authority Minister of Basic Education Accounting officer Director-General of Basic Education Website address www.education.gov.za The Estimates of National Expenditure e-publications for individual votes are available on www.treasury.gov.za. These publications provide more comprehensive coverage of vote specific information, particularly about goods and services, transfers and subsidies, personnel, entities, donor funding, public-private partnerships, conditional grants to provinces and municipalities, and expenditure information at the level of service delivery, where appropriate.
Vote purpose Develop, maintain and support a South African school education system for the 21st century.
Mandate The Department of Basic Education derives its mandate from the following legislation:
• the National Education Policy Act (1996), which inscribed into law the policies, legislative and monitoring responsibilities of the Minister of Basic Education, and the formal relations between national and provincial authorities
• the South African Schools Act (1996), which promotes access to education, promotes quality and democratic governance in the schooling system, and makes schooling compulsory for children aged 7 to 15 to ensure that all learners have access to quality education without discrimination
• the Employment of Educators Act (1998), which regulates the professional, moral and ethical responsibilities of educators, as well as the competency requirements for teachers.
Selected performance indicators Table 14.1 Performance indicators by programme and related outcome Indicator Programme MTSF outcome Past Current Projections
2015/16 2016/17 2017/18 2018/19
2019/20 2020/21 2021/22 Number of learners obtaining subject passes towards a national senior certificate through the Second Chance programme per year
Curriculum Policy, Support and Monitoring
Outcome 1: Quality basic education
–1 5 6352 73 7803 25 000 40 000 45 000 50 000
Number of underperforming schools monitored on the implementation of the early grade reading assessment per year
Curriculum Policy, Support and Monitoring
–1 20 50 75 100 125 150

2019 Estimates of National Expenditure
2
Table 14.1 Performance indicators by programme and related outcome Indicator Programme MTSF outcome Past Current Projections 2015/16 2016/17 2017/18 2018/19 2019/20 2020/21 2021/22 Percentage of public schools with home language workbooks for learners in grades 1 to 6 per year
Curriculum Policy, Support and Monitoring
Outcome 1: Quality basic education
100%(17 930)
100%(17 778)
100%(17 048)
100% 100% 100% 100%
Percentage of public schools with mathematics workbooks for learners in grades 1 to 9
Curriculum Policy, Support and Monitoring
100%(23 680)
100%(23 542)
100%(22 777)
100% 100% 100% 100%
Number of Funza Lushaka bursaries awarded to students enrolled for initial teacher education per year
Teachers, Education Human Resources and Institutional Development
13 980 14 343 15 134 13 500 13 000 12 500 12 500
Number of new schools built and completed through the accelerated school infrastructure delivery initiative per year
Planning, Information and Assessment
51 16 124 50 59 59 29
Number of schools provided with sanitation facilities through the accelerated school infrastructure delivery initiative per year
Planning, Information and Assessment
412 9 29 286 717 691 995
Number of schools provided with water through the accelerated school infrastructure delivery initiative per year
Planning, Information and Assessment
605 10 43 325 227 125 –5
Number of schools provided with nutritious meals on each school day per year
Educational Enrichment Services
20 029 20 300 19 841 19 800 20 302 20 708 21 122
1. No historical data available. 2. The project was piloted in 2016/17. As a result, the number of learners is much lower in this year than the following year, when the scope of the project
was increased. 3. Target of 20 000 exceeded in this year because of the inclusion of learners supported at community colleges and NGO support centres in the reported
total. Learners supported by these centres are not included in the targets for subsequent years as the centres are not funded through the Second Chance programme.
4. Low achievement due to delays in finalising the merging and rationalisation of schools before finalising plans to rebuild the remaining inappropriate ones.
5. Project completed.
Expenditure analysis Schooling 2025, the overarching plan for the basic education sector, encapsulates the long-term vision of education priorities, targets and programmes articulated for the sector in the National Development Plan. Over the medium term, the department will continue to focus on: accelerating the delivery of and improving school infrastructure; enhancing teaching and learning by ensuring access to high-quality learner and teacher support materials; increasing the supply of quality teachers; improving matric completion rates; providing educational opportunities to learners with severe to profound intellectual disabilities; monitoring performance; and providing nutritious meals for learners in schools through the national school nutrition programme.
Providing school infrastructure The department is committed to providing appropriate and adequate basic education infrastructure. This commitment is reflected in the department’s anticipated spending of 51.4 per cent (R40.4 billion) of its total budget over the MTEF period on various activities related to school infrastructure. These activities are mainly carried out in the Planning, Information and Assessment programme through 2 infrastructure grants: the education infrastructure grant and the school infrastructure backlogs grant.
The education infrastructure grant is allocated R34.3 billion over the medium term to provide co-funding for the department’s ongoing infrastructure programme, which includes maintaining existing and building new infrastructure. An additional R200.3 million in 2019/20 has been earmarked in KwaZulu-Natal and Western Cape

Vote 14: Basic Education
3
for the reconstruction and rehabilitation of school infrastructure affected by natural disasters.
Funds from the school infrastructure backlogs grant are intended to eradicate and replace inappropriate school infrastructure and provide basic services, such as water and sanitation, to schools. This grant is allocated R6.1 billion over the medium term in the Planning, Information and Assessment programme, including an additional R2.8 billion to provide safe and appropriate sanitation at schools. R2 billion is allocated in 2019/20 to replace 59 inappropriate and unsafe schools with newly built schools, provide water to 227 schools and provide sanitation to 717 schools.
Enhancing teaching and learning Central to providing quality basic education is ensuring the delivery of an improved curriculum and access to learning and teaching support material of high quality, and ensuring this material is used effectively. Accordingly, the department expects to print and deliver an estimated 61 million workbooks for grades R to 9 in each year over the medium term in life skills, languages and mathematics. These workbooks are expected to be distributed to more than 24 000 public schools across South Africa. To this end, R3.7 billion over the MTEF period is allocated in the Curriculum and Quality Enhancement Programmes subprogramme in the Curriculum Policy, Support and Monitoring programme. An estimated R3 million of this allocation over the MTEF period will be shifted for the introduction and maintenance of a planning and monitoring system to ensure that the correct number and type of workbooks and learner-teacher support materials are delivered to the correct schools.
Over the medium term, the department intends to promote teaching and learning in, and improving the learner pass rates of, mathematics, science and technology. To achieve this, the department plans to: support 50 000 learners in co-curricular services related to mathematics, science and technology; support 1 500 teachers and subject advisers in curriculum assessment policy statement training; support 1 000 teachers in structured teacher development programmes specific to these subjects; and train 1 000 mathematics subject advisers on the mathematics framework. To provide appropriate teaching and learning facilities at schools, the department plans to: support 300 teachers in ICT integration training; supply 300 schools with subject-specific computer hardware and software; repair, maintain or replace workshop equipment and machinery at 200 technical schools; and provide 1 000 schools with laboratory equipment, apparatus and consumables. Funding for this is made available in the maths, science and technology grant, which is allocated R1.2 billion over the MTEF period in the Curriculum and Quality Enhancement Programmes subprogramme in the Curriculum Policy, Support and Monitoring programme.
Increasing the supply of quality teachers The department aims to increase the supply of newly qualified teachers in mathematics, science and technology in different phases by providing 38 000 Funza Lushaka bursaries to prospective teachers over the medium term. The number of bursary awards is set to decrease from 13 500 in 2018/19 to 13 000 in 2019/20 and 12 500 thereafter as the general increase in university costs exceeds this allocation’s average annual growth of 5.5 per cent over the MTEF period. While some Funza Lushaka bursary recipients qualify for fee-free funding at universities, the department expects the demand for Funza Lushaka bursaries to remain unchanged as students prefer this bursary because they are guaranteed a work placement offer after qualifying. For the National Student Financial Aid Scheme to administer these bursaries, R3.9 billion over the MTEF period is allocated in the Education Human Resources Development subprogramme in the Teachers, Education Human Resources and Institutional Development programme.
Improving matric completion rates The Second Chance programme, which is in its third year of implementation, aims to increase the number of young people obtaining a matric qualification. Over the medium term, the department expects 135 000 learners to gain subject passes through the programme, and will provide support to these learners by means of face-to-face classes, broadcast media, online and offline facilities, and printed materials. The development and distribution of online psychosocial programmes to support learners in their preparations for the matric examinations, including tutoring, access to resources, one-on-one career guidance, life orientation and telephonic counselling, is expected to cost R5 million in 2019/20.

2019 Estimates of National Expenditure
4
R260.2 million over the MTEF period is allocated in the Curriculum Implementation and Monitoring subprogramme in the Curriculum Policy, Support and Monitoring programme for activities related to the Second Chance programme. However, due to a Cabinet-approved budget reduction of R25 million over the medium term, the Second Chance programme will not expand as rapidly as initially projected.
Providing educational opportunities to learners with intellectual disabilities In its second year of implementation, the learners with profound intellectual disabilities grant aims to improve the provision of quality education to learners with severe to profound intellectual disabilities. Over the MTEF period, funds from the grant are intended to provide access to quality, publicly funded education to more than 10 000 such learners by recruiting 9 provincial coordinators for the grant and 230 outreach team members. While the provincial coordinators will ensure the effective management of the grant, the outreach team members will strengthen the capacity of district-based support teams and provide support to caregivers and learners. The 9 provincial coordinators, 230 outreach team members, 900 caregivers from 500 care centres, and 919 teachers in 104 selected schools that have enrolled learners will be provided with training on the learners with severe to profound intellectual disability policy and learning programme. R719.9 million over the MTEF period is allocated in the Curriculum Policy, Support and Monitoring programme for the grant.
Monitoring performance The department aims to ensure that the education sector assesses the quality of teaching and learning, and provides remedial action in identified areas to improve learning outcomes in numeracy and literacy. As such, the national assessment programme is being redesigned to enable the implementation of a three-tier model that involves systemic evaluation, diagnostic assessment and summative examination. As part of the redesign, over the medium term, the department intends to focus on conducting the first cycle of systemic evaluation by providing all schools with a series of diagnostic instruments for teachers to use in their classroom teaching, and setting up national and provincial systems for the phasing in of a universal external examination at the end of grade 9. R205 million is allocated for these activities over the MTEF period in the Planning, Information and Assessment programme.
To assist teachers in measuring the reading progress of learners at different intervals in grades 1 to 3, the department will continue to print, distribute and implement the early grade reading assessment toolkit. The use of the toolkit has been incorporated in the teacher training programme in the primary school reading intervention programme, and teacher training workshops on how to use the toolkits are expected to be held in all provinces over the MTEF period. In 2019, the programme is expected to be implemented in 4 700 schools, to be expanded incrementally to 20 000 schools over the medium term. An estimated 700 000 learners in grades 1 to 3 are expected to benefit from the programme over the same period. R44 million has been allocated over the medium term to expand the use of the assessment toolkit in the Curriculum Implementation and Monitoring subprogramme in the Curriculum Policy, Support and Monitoring programme.
Providing meals for learners The department contributes to the National Development Plan’s priority of eliminating poverty and supporting food security through the national school nutrition programme. As part of the programme, the department plans to provide meals to more than 9 million learners each year over the medium term in over 20 000 quintile 1 to 3 schools. To this end, R23 billion is allocated over the MTEF period in the Educational Enrichment Services programme for the national school nutrition programme grant.

Vote 14: Basic Education
5
Expenditure trends Table 14.2 Vote expenditure trends by programme and economic classification Programmes 1. Administration 2. Curriculum Policy, Support and Monitoring 3. Teachers, Education Human Resources and Institutional Development 4. Planning, Information and Assessment 5. Educational Enrichment Services Programme
Ann
ual b
udge
t
Adj
uste
d
appr
opria
tion
Aud
ited
ou
tcom
e
Ann
ual b
udge
t
Adj
uste
d
appr
opria
tion
Aud
ited
ou
tcom
e
Ann
ual b
udge
t
Adj
uste
d
appr
opria
tion
Aud
ited
ou
tcom
e
Ann
ual b
udge
t
Adj
uste
d
appr
opria
tion
Rev
ised
es
timat
e
Aver
age:
Ou
tcom
e/An
nual
bu
dget
(%
)
Aver
age:
Ou
tcom
e/Ad
just
ed
appr
opria
tion
(%)
R million 2015/16 2016/17 2017/18 2018/19 2015/16 - 2018/19 Programme 1 357.7 360.3 386.5 377.9 388.4 418.3 416.3 426.6 435.1 450.5 472.1 472.1 106.8% 103.9%Programme 2 1 877.8 1 844.9 1 797.7 1 936.1 1 902.2 1 826.7 1 802.0 1 783.0 1 731.1 1 905.0 1 867.1 1 854.3 95.9% 97.5%Programme 3 1 171.5 1 163.4 1 163.5 1 163.7 1 160.0 1 177.4 1 215.1 1 252.1 1 243.8 1 290.5 1 313.0 1 313.0 101.2% 100.2%Programme 4 12 129.7 11 974.0 11 511.9 12 500.2 12 621.4 11 720.0 13 248.3 12 801.9 12 785.8 11 971.3 12 938.3 12 938.3 98.2% 97.3%Programme 5 5 974.5 5 943.8 5 936.5 6 291.7 6 341.4 6 333.7 6 727.0 6 730.0 6 736.2 7 105.1 7 109.0 7 109.0 100.1% 100.0%Total 21 511.1 21 286.4 20 796.1 22 269.6 22 413.5 21 476.1 23 408.6 22 993.6 22 932.0 22 722.4 23 699.6 23 686.8 98.9% 98.3%Change to 2018 Budget estimate
977.1
Economic classification Current payments
2 431.9 2 528.7 2 589.3 2 548.5 2 580.7 2 561.4 2 446.6 2 451.5 2 303.9 2 431.2 2 433.5 2 427.8 100.2% 98.9%
Compensation of employees
440.9 439.9 439.5 472.1 471.2 454.4 476.7 477.1 472.5 504.6 510.6 510.6 99.1% 98.8%
Goods and services
1 943.4 2 041.2 2 102.3 2 030.0 2 063.2 2 060.7 1 921.3 1 925.8 1 785.9 1 875.1 1 871.5 1 865.8 100.6% 98.9%
Interest and rent on land
47.5 47.5 47.5 46.3 46.3 46.3 48.6 48.6 45.5 51.5 51.5 51.5 98.4% 98.4%
Transfers and subsidies
17 033.9 16 810.1 16 818.6 17 465.0 17 839.1 17 845.8 18 502.8 18 503.8 18 930.4 18 953.4 19 128.0 19 120.8 101.1% 100.6%
Provinces and municipalities
15 856.5 15 631.8 15 631.8 16 213.0 16 586.2 16 579.6 17 154.3 17 154.3 17 570.1 17 519.0 17 696.1 17 689.0 101.1% 100.6%
Departmental agencies and accounts
1 104.0 1 104.0 113.3 118.9 118.9 123.8 134.8 134.8 134.8 145.0 145.0 145.0 34.4% 34.4%
Foreign governments and international organisations
13.3 13.3 21.0 17.3 17.3 19.2 18.5 18.5 18.2 19.1 19.1 19.1 113.6% 113.6%
Non-profit institutions
60.1 60.1 60.1 72.2 72.2 76.2 99.5 99.5 106.0 111.0 106.0 106.0 101.6% 103.1%
Households – 1.0 992.4 1 043.6 1 044.5 1 047.0 1 095.8 1 096.8 1 101.3 1 159.3 1 161.7 1 161.7 130.4% 130.2%Payments for capital assets
2 045.4 1 947.6 1 387.7 2 256.1 1 993.6 1 063.5 2 459.2 2 038.3 1 635.4 1 337.9 2 137.9 2 137.9 76.9% 76.7%
Buildings and other fixed structures
2 038.5 1 940.5 1 382.5 2 249.4 1 987.0 1 056.8 2 444.0 2 029.0 1 625.8 1 329.1 2 129.1 2 129.1 76.8% 76.6%
Machinery and equipment
6.7 7.0 5.2 6.6 6.6 6.7 12.9 7.0 5.2 5.3 5.3 5.3 71.1% 86.8%
Software and other intangible assets
0.1 0.1 – 0.1 0.0 – 2.3 2.3 4.4 3.5 3.5 3.5 131.4% 134.7%
Payments for financial assets
– – 0.5 – – 5.4 – – 62.3 – 0.3 0.3 – –
Total 21 511.1 21 286.4 20 796.1 22 269.6 22 413.5 21 476.1 23 408.6 22 993.6 22 932.0 22 722.4 23 699.6 23 686.8 98.9% 98.3%
2019 Estimates of National Expenditure
6
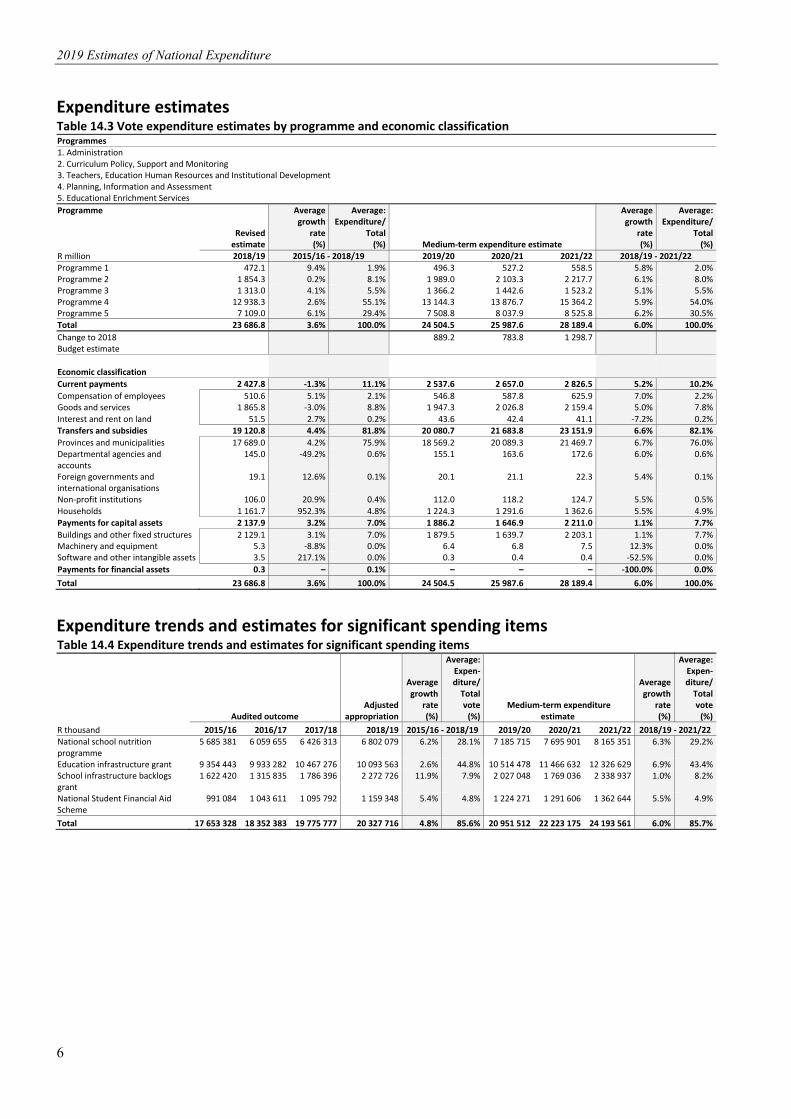
Expenditure estimates Table 14.3 Vote expenditure estimates by programme and economic classificationProgrammes 1. Administration 2. Curriculum Policy, Support and Monitoring 3. Teachers, Education Human Resources and Institutional Development 4. Planning, Information and Assessment 5. Educational Enrichment Services Programme
Revised estimate
Average growth
rate (%)
Average:Expenditure/
Total(%) Medium-term expenditure estimate
Average growth
rate (%)
Average:Expenditure/
Total(%)
R million 2018/19 2015/16 - 2018/19 2019/20 2020/21 2021/22 2018/19 - 2021/22 Programme 1 472.1 9.4% 1.9% 496.3 527.2 558.5 5.8% 2.0%Programme 2 1 854.3 0.2% 8.1% 1 989.0 2 103.3 2 217.7 6.1% 8.0%Programme 3 1 313.0 4.1% 5.5% 1 366.2 1 442.6 1 523.2 5.1% 5.5%Programme 4 12 938.3 2.6% 55.1% 13 144.3 13 876.7 15 364.2 5.9% 54.0%Programme 5 7 109.0 6.1% 29.4% 7 508.8 8 037.9 8 525.8 6.2% 30.5%Total 23 686.8 3.6% 100.0% 24 504.5 25 987.6 28 189.4 6.0% 100.0%Change to 2018 Budget estimate
889.2 783.8 1 298.7
Economic classification Current payments 2 427.8 -1.3% 11.1% 2 537.6 2 657.0 2 826.5 5.2% 10.2%Compensation of employees 510.6 5.1% 2.1% 546.8 587.8 625.9 7.0% 2.2%Goods and services 1 865.8 -3.0% 8.8% 1 947.3 2 026.8 2 159.4 5.0% 7.8%Interest and rent on land 51.5 2.7% 0.2% 43.6 42.4 41.1 -7.2% 0.2%Transfers and subsidies 19 120.8 4.4% 81.8% 20 080.7 21 683.8 23 151.9 6.6% 82.1%Provinces and municipalities 17 689.0 4.2% 75.9% 18 569.2 20 089.3 21 469.7 6.7% 76.0%Departmental agencies and accounts
145.0 -49.2% 0.6% 155.1 163.6 172.6 6.0% 0.6%
Foreign governments and international organisations
19.1 12.6% 0.1% 20.1 21.1 22.3 5.4% 0.1%
Non-profit institutions 106.0 20.9% 0.4% 112.0 118.2 124.7 5.5% 0.5%Households 1 161.7 952.3% 4.8% 1 224.3 1 291.6 1 362.6 5.5% 4.9%Payments for capital assets 2 137.9 3.2% 7.0% 1 886.2 1 646.9 2 211.0 1.1% 7.7%Buildings and other fixed structures 2 129.1 3.1% 7.0% 1 879.5 1 639.7 2 203.1 1.1% 7.7%Machinery and equipment 5.3 -8.8% 0.0% 6.4 6.8 7.5 12.3% 0.0%Software and other intangible assets 3.5 217.1% 0.0% 0.3 0.4 0.4 -52.5% 0.0%Payments for financial assets 0.3 – 0.1% – – – -100.0% 0.0%Total 23 686.8 3.6% 100.0% 24 504.5 25 987.6 28 189.4 6.0% 100.0%
Expenditure trends and estimates for significant spending items Table 14.4 Expenditure trends and estimates for significant spending items
Audited outcome Adjusted
appropriation
Averagegrowth
rate(%)
Average: Expen-diture/
Total vote
(%) Medium-term expenditure
estimate
Averagegrowth
rate(%)
Average:Expen-diture/
Total vote
(%)R thousand 2015/16 2016/17 2017/18 2018/19 2015/16 - 2018/19 2019/20 2020/21 2021/22 2018/19 - 2021/22 National school nutrition programme
5 685 381 6 059 655 6 426 313 6 802 079 6.2% 28.1% 7 185 715 7 695 901 8 165 351 6.3% 29.2%
Education infrastructure grant 9 354 443 9 933 282 10 467 276 10 093 563 2.6% 44.8% 10 514 478 11 466 632 12 326 629 6.9% 43.4%School infrastructure backlogs grant
1 622 420 1 315 835 1 786 396 2 272 726 11.9% 7.9% 2 027 048 1 769 036 2 338 937 1.0% 8.2%
National Student Financial Aid Scheme
991 084 1 043 611 1 095 792 1 159 348 5.4% 4.8% 1 224 271 1 291 606 1 362 644 5.5% 4.9%
Total 17 653 328 18 352 383 19 775 777 20 327 716 4.8% 85.6% 20 951 512 22 223 175 24 193 561 6.0% 85.7%

Vote 14: Basic Education
7
Goods and services expenditure trends and estimates Table 14.5 Vote goods and services expenditure trends and estimates
Audited outcome Adjusted
appropriation
Averagegrowth
rate(%)
Average: Expen-diture/
Total(%)
Medium-term expenditure estimate
Averagegrowth
rate(%)
Average:Expen-diture/
Total (%)
R thousand 2015/16 2016/17 2017/18 2018/19 2015/16 - 2018/19 2019/20 2020/21 2021/22 2018/19 - 2021/22 Administrative fees 33 525 24 576 15 732 6 493 -42.1% 1.0% 6 009 5 378 6 740 1.3% 0.3%Advertising 2 032 18 280 14 360 12 553 83.5% 0.6% 39 287 40 858 48 292 56.7% 1.8%Minor assets 426 801 336 2 310 75.7% – 3 461 3 720 3 988 20.0% 0.2%Audit costs: External 17 062 20 513 21 835 26 052 15.2% 1.1% 26 335 27 841 29 392 4.1% 1.4%Bursaries: Employees 392 364 394 458 5.3% – 460 479 507 3.4% – Catering: Departmental activities 18 839 27 743 20 519 30 618 17.6% 1.2% 22 210 23 468 25 831 -5.5% 1.3%Communication 4 755 9 334 4 729 12 488 38.0% 0.4% 6 225 6 692 7 066 -17.3% 0.4%Computer services 65 653 74 785 69 434 94 626 13.0% 3.9% 82 927 96 370 97 846 1.1% 4.6%Consultants: Business and advisory services
123 576 171 664 167 274 140 468 4.4% 7.7% 130 978 110 849 118 309 -5.6% 6.3%
Legal services 1 964 2 475 3 969 1 669 -5.3% 0.1% 1 842 1 943 2 050 7.1% 0.1%Contractors 348 1 858 1 706 4 712 138.3% 0.1% 6 043 4 207 2 574 -18.3% 0.2%Agency and support/outsourced services
60 478 31 764 45 158 44 372 -9.8% 2.3% 38 252 40 800 60 988 11.2% 2.3%
Entertainment – – – 227 – – 240 253 267 5.6% – Fleet services (including government motor transport)
1 778 2 335 2 563 1 091 -15.0% 0.1% 998 1 054 1 112 0.6% 0.1%
Inventory: Clothing material and accessories
– 34 45 17 – – 45 47 50 43.3% –
Inventory: Farming supplies – – – 48 – – 51 54 57 5.9% – Inventory: Fuel, oil and gas – – – 4 – – – – – -100.0% – Inventory: Learner and teacher support material
968 726 981 781 1 018 474 1 088 919 4.0% 51.9% 1 152 730 1 215 813 1 282 405 5.6% 59.2%
Inventory: Materials and supplies – – – 89 – – 46 49 52 -16.4% – Inventory: Other supplies 107 260 73 032 20 761 6 346 -61.0% 2.7% 412 435 459 -58.3% 0.1%Consumable supplies 1 953 1 254 3 985 985 -20.4% 0.1% 1 604 1 695 1 789 22.0% 0.1%Consumables: Stationery, printing and office supplies
48 308 58 767 11 067 49 714 1.0% 2.1% 51 092 53 800 54 231 2.9% 2.6%
Operating leases 11 950 1 203 922 4 569 -27.4% 0.2% 5 139 5 291 5 768 8.1% 0.3%Rental and hiring 3 485 6 146 3 171 8 326 33.7% 0.3% 2 519 2 557 2 704 -31.3% 0.2%Property payments 102 277 119 012 129 775 135 470 9.8% 6.2% 151 781 162 624 175 015 8.9% 7.8%Travel and subsistence 93 089 117 634 124 264 162 587 20.4% 6.4% 176 755 181 274 191 561 5.6% 8.9%Training and development 1 883 938 2 265 3 091 18.0% 0.1% 7 075 8 226 7 486 34.3% 0.3%Operating payments 416 481 304 414 89 136 15 245 -66.8% 10.6% 10 946 12 086 12 816 -5.6% 0.6%Venues and facilities 16 076 10 004 14 006 17 919 3.7% 0.7% 21 829 18 951 20 070 3.9% 1.0%Total 2 102 316 2 060 711 1 785 880 1 871 466 -3.8% 100.0% 1 947 291 2 026 814 2 159 425 4.9% 100.0%
Transfers and subsidies expenditure trends and estimates Table 14.6 Vote transfers and subsidies trends and estimates
Audited outcome Adjusted
appropriation
Averagegrowth
rate(%)
Average: Expen-diture/
Total(%)
Medium-term expenditure estimate
Averagegrowth
rate(%)
Average: Expen-diture/
Total(%)
R thousand 2015/16 2016/17 2017/18 2018/19 2015/16 - 2018/19 2019/20 2020/21 2021/22 2018/19 - 2021/22 Households Social benefits Current 1 341 3 362 5 495 2 399 21.4% – – – – -100.0% – Employee social benefits 1 341 1 489 3 962 2 399 21.4% – – – – -100.0% – Claims against the state – 1 873 1 533 – – – – – – – – Departmental agencies and accounts Departmental agencies (non-business entities)
Current 113 307 123 848 134 760 144 960 8.6% 0.7% 155 063 163 565 172 561 6.0% 0.8%Education, Training and Development Practices Sector Education and Training Authority
602 170 405 417 -11.5% – 429 453 478 4.7% –
South African Council for Educators – 5 000 9 743 16 000 – – 20 000 21 100 22 261 11.6% 0.1%Umalusi Council for Quality Assurance in General and Further Education and Training
112 705 118 678 124 612 128 543 4.5% 0.7% 134 634 142 012 149 822 5.2% 0.7%

2019 Estimates of National Expenditure
8
Table 14.6 Vote transfers and subsidies trends and estimates
Audited outcome Adjusted
appropriation
Averagegrowth
rate(%)
Average: Expen-diture/
Total(%)
Medium-term expenditure estimate
Averagegrowth
rate(%)
Average: Expen-diture/
Total(%)
R thousand 2015/16 2016/17 2017/18 2018/19 2015/16 - 2018/19 2019/20 2020/21 2021/22 2018/19 - 2021/22 Households Other transfers to households Current 991 090 1 043 611 1 095 832 1 159 348 5.4% 5.9% 1 224 271 1 291 606 1 362 644 5.5% 6.0%Claims against the state 6 – 40 – -100.0% – – – – – – National Student Financial Aid Scheme
991 084 1 043 611 1 095 792 1 159 348 5.4% 5.9% 1 224 271 1 291 606 1 362 644 5.5% 6.0%
Non-profit institutions Current 60 055 76 178 106 020 106 049 20.9% 0.5% 112 014 118 175 124 676 5.5% 0.5%National Education Collaboration Trust
60 000 76 120 99 959 105 984 20.9% 0.5% 111 945 118 102 124 598 5.5% 0.5%
Childline South Africa 55 58 61 65 5.7% – 69 73 78 6.3% – Historic school restoration – – 6 000 – – – – – – – – Foreign governments and international organisations
Current 20 998 19 196 18 212 19 052 -3.2% 0.1% 20 111 21 116 22 278 5.4% 0.1%Association for the Development of Education in Africa
153 130 119 148 -1.1% – 150 158 167 4.1% –
Southern and Eastern Africa Consortium for Monitoring Educational Quality
3 135 3 348 3 335 3 295 1.7% – 3 480 3 671 3 873 5.5% –
Guidance, Counselling and Youth Development Centre for Africa
157 131 120 178 4.3% – 186 196 207 5.2% –
UNESCO (United Nations Educational, Scientific and Cultural Organisation)
17 553 15 587 14 638 15 431 -4.2% 0.1% 16 295 17 091 18 031 5.3% 0.1%
Provinces and municipalities Provincial revenue funds Current 5 960 386 6 283 842 6 737 644 7 232 102 6.7% 36.0% 7 663 451 8 209 409 8 707 102 6.4% 37.9%Learners with profound intellectual disabilities grant
– – 66 023 186 788 – 0.3% 220 785 242 864 256 222 11.1% 1.1%
Occupational specific dispensation for education sector therapists grant
66 275 – – – -100.0% 0.1% – – – – –
National school nutrition programme grant
5 685 381 6 059 655 6 426 313 6 802 079 6.2% 34.3% 7 185 715 7 695 901 8 165 351 6.3% 35.5%
HIV and AIDS (life skills education) grant
208 730 224 187 245 308 243 235 5.2% 1.3% 256 951 270 644 285 529 5.5% 1.3%
Capital 9 671 385 10 295 726 10 832 421 10 464 046 2.7% 56.7% 10 905 780 11 879 891 12 762 617 6.8% 54.7%Maths, science and technology grant 316 942 362 444 365 145 370 483 5.3% 1.9% 391 302 413 259 435 988 5.6% 1.9%Education infrastructure grant 9 354 443 9 933 282 10 467 276 10 093 563 2.6% 54.8% 10 514 478 11 466 632 12 326 629 6.9% 52.8%Total 16 818 562 17 845 763 18 930 384 19 127 956 4.4% 100.0% 20 080 690 21 683 762 23 151 878 6.6% 100.0%
Personnel information Table 14.7 Vote personnel numbers and cost by salary level and programme¹ Programmes 1. Administration 2. Curriculum Policy, Support and Monitoring 3. Teachers, Education Human Resources and Institutional Development 4. Planning, Information and Assessment 5. Educational Enrichment Services
Number of posts estimated for
31 March 2019 Number and cost2 of personnel posts filled/planned for on funded establishment Number
Number of
funded posts
Number of posts
additional to the
establishment Actual Revised estimate Medium-term expenditure estimate
Average growth
rate(%)
Average: Salary
level/Total(%)
2017/18 2018/19 2019/20 2020/21 2021/22 2018/19 - 2021/22
Basic Education Number Cost Unit cost Number Cost
Unit cost Number Cost
Unit cost Number Cost
Unit cost Number Cost
Unit cost
Salary level 825 – 715 472.5 0.7 699 510.6 0.7 697 546.8 0.8 693 587.8 0.8 688 625.9 0.9 -0.5% 100.0%1 – 6 212 – 199 54.0 0.3 198 57.9 0.3 198 62.5 0.3 198 67.5 0.3 198 72.9 0.4 – 28.5%7 – 10 296 – 236 118.7 0.5 230 123.1 0.5 228 132.1 0.6 227 141.6 0.6 226 151.1 0.7 -0.6% 32.8%11 – 12 221 – 198 167.9 0.8 187 175.0 0.9 179 180.5 1.0 177 191.3 1.1 172 199.3 1.2 -2.7% 25.7%13 – 16 94 – 80 92.8 1.2 82 102.7 1.3 90 121.6 1.4 89 129.2 1.5 90 139.6 1.6 3.2% 12.6%Other 2 – 2 39.1 19.6 2 51.9 26.0 2 50.1 25.0 2 58.1 29.1 2 63.0 31.5 – 0.3%Programme 825 – 715 472.5 0.7 699 510.6 0.7 697 546.8 0.8 693 587.8 0.8 688 625.9 0.9 -0.5% 100.0%Programme 1 310 – 297 165.1 0.6 287 169.4 0.6 295 193.0 0.7 294 207.0 0.7 291 219.8 0.8 0.5% 42.0%Programme 2 114 – 108 89.1 0.8 102 98.1 1.0 92 98.9 1.1 90 103.6 1.2 90 110.6 1.2 -4.1% 13.5%Programme 3 152 – 100 65.2 0.7 99 70.2 0.7 99 75.2 0.8 98 80.6 0.8 98 86.3 0.9 -0.3% 14.2%Programme 4 181 – 152 116.8 0.8 152 131.7 0.9 150 133.6 0.9 149 147.1 1.0 147 157.2 1.1 -1.1% 21.5%Programme 5 68 – 58 36.3 0.6 59 41.2 0.7 61 46.0 0.8 62 49.4 0.8 62 52.0 0.8 1.7% 8.8%1. Data has been provided by the department and may not necessarily reconcile with official government personnel data. 2. Rand million.

Vote 14: Basic Education
9
Departmental receipts Table 14.8 Departmental receipts by economic classification
Audited outcome Adjusted estimate
Revised estimate
Averagegrowth
rate (%)
Average: Receipt
item/Total
(%) Medium-term receipts estimate
Averagegrowth
rate (%)
Average: Receipt
item/Total
(%) R thousand 2015/16 2016/17 2017/18 2018/19 2015/16 - 2018/19 2019/20 2020/21 2021/22 2018/19 - 2021/22 Departmental receipts 18 254 15 521 25 653 14 933 14 933 -6.5% 100.0% 10 882 9 997 9 212 -14.9% 100.0%Sales of goods and services produced by department
2 686 2 339 2 480 3 018 3 018 4.0% 14.2% 2 667 2 782 2 997 -0.2% 25.5%
Sales by market establishments
107 105 100 108 108 0.3% 0.6% 135 140 150 11.6% 1.2%
of which: Market establishment: Rental parking: Covered and open
107 105 100 108 108 0.3% 0.6% 135 140 150 11.6% 1.2%
Administrative fees – 2 120 2 380 2 300 2 300 – 9.1% 2 400 2 500 2 700 5.5% 22.0%of which: Services rendered: Exam certificates
– 2 119 2 380 2 300 2 300 – 9.1% 2 400 2 500 2 700 5.5% 22.0%
Sales: Entrance fees – 1 – – – – – – – – – – Other sales 2 579 114 – 610 610 -38.2% 4.4% 132 142 147 -37.8% 2.3%of which: Services rendered: Commission on insurance and garnishees
2 579 112 – 108 108 -65.3% 3.8% 130 140 145 10.3% 1.2%
Replacement of security cards
– 2 – 2 2 – – 2 2 2 – –
Sale of assets less than R5 000
– – – 500 500 – 0.7% – – – -100.0% 1.1%
Sales of scrap, waste, arms and other used current goods
– 150 – 200 200 – 0.5% 200 200 200 – 1.8%
of which: Wastepaper – 150 – 200 200 – 0.5% 200 200 200 – 1.8%Interest, dividends and rent on land
10 121 10 397 20 020 11 000 11 000 2.8% 69.3% 8 000 7 000 6 000 -18.3% 71.1%
Interest 10 121 10 397 20 020 11 000 11 000 2.8% 69.3% 8 000 7 000 6 000 -18.3% 71.1%Sales of capital assets 22 – – 15 15 -12.0% – 15 15 15 – 0.1%Transactions in financial assets and liabilities
5 425 2 635 3 153 700 700 -49.5% 16.0% – – – -100.0% 1.6%
Total 18 254 15 521 25 653 14 933 14 933 -6.5% 100.0% 10 882 9 997 9 212 -14.9% 100.0%
Programme 1: Administration Programme purpose Provide strategic leadership, management and support services to the department.
Expenditure trends and estimates Table 14.9 Administration expenditure trends and estimates by subprogramme and economic classification Subprogramme
Audited outcome Adjusted
appropriation
Averagegrowth
rate(%)
Average: Expen-diture/
Total(%)
Medium-term expenditure estimate
Averagegrowth
rate(%)
Average:Expen-diture/
Total(%)
R thousand 2015/16 2016/17 2017/18 2018/19 2015/16 - 2018/19 2019/20 2020/21 2021/22 2018/19 - 2021/22 Ministry 28 157 31 439 32 678 30 844 3.1% 7.2% 31 096 33 172 35 142 4.4% 6.3%Department Management 65 088 79 872 81 708 88 445 10.8% 18.4% 88 302 94 461 100 168 4.2% 18.1%Corporate Services 55 727 63 853 64 864 74 763 10.3% 15.1% 72 084 76 695 81 166 2.8% 14.8%Office of the Chief Financial Officer
64 176 62 723 63 399 73 217 4.5% 15.4% 87 537 93 533 99 080 10.6% 17.2%
Internal Audit 8 085 5 775 6 692 7 394 -2.9% 1.6% 8 047 8 626 9 144 7.3% 1.6%Office Accommodation 165 242 174 639 185 731 197 482 6.1% 42.2% 209 187 220 713 233 757 5.8% 41.9%Total 386 475 418 301 435 072 472 145 6.9% 100.0% 496 253 527 200 558 457 5.8% 100.0%Change to 2018 Budget estimate
21 669 12 507 13 068 13 927

2019 Estimates of National Expenditure
10
Table 14.9 Administration expenditure trends and estimates by subprogramme and economic classification Economic classification
Audited outcome Adjusted
appropriation
Averagegrowth
rate(%)
Average: Expen-diture/
Total(%)
Medium-term expenditure estimate
Averagegrowth
rate(%)
Average:Expen-diture/
Total(%)
R thousand 2015/16 2016/17 2017/18 2018/19 2015/16 - 2018/19 2019/20 2020/21 2021/22 2018/19 - 2021/22 Current payments 367 339 404 293 422 076 459 849 7.8% 96.6% 481 464 510 673 540 088 5.5% 97.0%Compensation of employees 143 760 151 227 165 092 169 427 5.6% 36.8% 192 973 207 048 219 790 9.1% 38.4%Goods and services1 176 055 206 745 211 486 238 964 10.7% 48.7% 244 934 261 207 279 150 5.3% 49.9%of which: Audit costs: External 17 062 15 995 14 559 22 052 8.9% 4.1% 22 835 24 250 25 584 5.1% 4.6%Communication 2 724 3 033 2 889 2 777 0.6% 0.7% 2 831 2 986 3 150 4.3% 0.6%Computer services 17 415 21 577 20 526 28 979 18.5% 5.2% 24 369 25 709 27 123 -2.2% 5.2%Consumables: Stationery, printing and office supplies
2 315 2 516 3 571 3 072 9.9% 0.7% 3 390 3 580 3 776 7.1% 0.7%
Property payments 102 211 119 011 129 775 135 470 9.8% 28.4% 151 781 162 624 175 015 8.9% 30.4%Travel and subsistence 14 519 15 137 15 883 21 242 13.5% 3.9% 20 316 21 436 22 615 2.1% 4.2%Interest and rent on land 47 524 46 321 45 498 51 458 2.7% 11.1% 43 557 42 418 41 148 -7.2% 8.7%Transfers and subsidies1 1 014 2 364 2 180 701 -11.6% 0.4% 429 453 478 -12.0% 0.1%Departmental agencies and accounts
602 170 405 417 -11.5% 0.1% 429 453 478 4.7% 0.1%
Households 412 2 194 1 775 284 -11.7% 0.3% – – – -100.0% – Payments for capital assets 18 000 11 583 10 629 11 412 -14.1% 3.0% 14 360 16 074 17 891 16.2% 2.9%Buildings and other fixed structures
14 226 7 216 8 040 8 016 -17.4% 2.2% 9 981 11 119 12 390 15.6% 2.0%
Machinery and equipment 3 774 4 367 2 589 3 089 -6.5% 0.8% 4 044 4 599 5 125 18.4% 0.8%Software and other intangible assets
– – – 307 – – 335 356 376 7.0% 0.1%
Payments for financial assets 122 61 187 183 14.5% – – – – -100.0% – Total 386 475 418 301 435 072 472 145 6.9% 100.0% 496 253 527 200 558 457 5.8% 100.0%Proportion of total programme expenditure to vote expenditure
1.9% 1.9% 1.9% 2.0% – – 2.0% 2.0% 2.0% – –
Details of transfers and subsidies Households Social benefits Current 412 2 194 1 775 284 -11.7% 0.3% – – – -100.0% – Employee social benefits 412 321 242 284 -11.7% 0.1% – – – -100.0% – Claims against the state – 1 873 1 533 – – 0.2% – – – – – Departmental agencies and accounts
Departmental agencies (non-business entities)
Current 602 170 405 417 -11.5% 0.1% 429 453 478 4.7% 0.1%Education, Training and Development Practices Sector Education and Training Authority
602 170 405 417 -11.5% 0.1% 429 453 478 4.7% 0.1%
1. Estimates of National Expenditure data tables are available and can be downloaded from www.treasury.gov.za. These data tables contain detailed information by goods and services, and transfers and subsidies item by programme.
Personnel information Table 14.10 Administration personnel numbers and cost by salary level¹
Number of posts estimated for
31 March 2019 Number and cost2 of personnel posts filled/planned for on funded establishment Number
Number of
funded posts
Number of posts
additional to the
establishment Actual Revised estimate Medium-term expenditure estimate
Averagegrowth
rate(%)
Average: Salary
level/Total(%)
2017/18 2018/19 2019/20 2020/21 2021/22 2018/19 - 2021/22
Administration Number Cost Unit cost Number Cost
Unit cost Number Cost
Unit cost Number Cost
Unit cost Number Cost
Unit cost
Salary level 310 – 297 165.1 0.6 287 169.4 0.6 295 193.0 0.7 294 207.0 0.7 291 219.8 0.8 0.5% 100.0%1 – 6 127 – 119 32.2 0.3 118 34.5 0.3 118 37.2 0.3 117 39.9 0.3 116 42.8 0.4 -0.6% 40.2%7 – 10 99 – 99 48.8 0.5 96 50.7 0.5 96 54.6 0.6 96 58.9 0.6 95 62.4 0.7 -0.3% 32.8%11 – 12 43 – 43 38.2 0.9 39 37.0 0.9 41 41.6 1.0 41 44.6 1.1 40 46.6 1.2 0.8% 13.8%13 – 16 39 – 34 40.7 1.2 32 41.3 1.3 38 53.1 1.4 38 56.9 1.5 38 60.9 1.6 5.9% 12.5%Other 2 – 2 5.2 2.6 2 6.0 3.0 2 6.4 3.2 2 6.8 3.4 2 7.2 3.6 – 0.7%1. Data has been provided by the department and may not necessarily reconcile with official government personnel data. 2. Rand million.

Vote 14: Basic Education
11
Programme 2: Curriculum Policy, Support and Monitoring Programme purpose Develop curriculum and assessment policies, and monitor and support their implementation.
Objectives • Increase the number of learners who complete grade 12 by providing the Second Chance programme to
learners who failed to meet the national senior certificate requirements annually. • Improve the learning and teaching of critical foundational skills by developing, printing and distributing
2 volumes of grades 1 to 6 literacy/languages, grades 1 to 3 life skills (quintiles 1 to 3), grades 1 to 9 numeracy/mathematics, grades 1 to 6 English first additional language, and grade R workbooks to all learners in public schools annually.
• Improve learners’ reading proficiency levels in the foundation phase in all underperforming rural and township schools by using the early grade reading assessment toolkit to assess learners’ reading levels annually. This includes learners’ phonic knowledge, word recognition, and fluency and comprehension skills in the early grades.
• Fast-track the rollout and implementation of ICT in schools by providing teacher training, ICT devices, digital content, software, connectivity, IT support to schools, and online learner and teacher support material annually.
• Increase learner participation and success rates in mathematics, science and technology by providing ICT equipment, machinery, subject-specific resources and teacher development to schools each year over the medium term by: – supporting 300 teachers in ICT integration training – supplying 300 schools with subject-specific computer hardware – supplying 300 schools with subject-related software in accordance with minimum specifications – repairing, maintaining or replacing workshop equipment and machinery for technology subjects at
200 technical schools – providing 200 schools with funds for the maintenance of equipment and machinery – providing 1 000 schools with laboratory equipment, apparatus and consumables, including manipulatives
for mathematics – supporting 50 000 learners in co-curricular services related to mathematics, science and technology – supporting 1 500 teachers and subject advisers in curriculum assessment policy statement training – supporting 1 000 teachers in structured teacher development programmes specific to mathematics,
science and technology.
Subprogrammes • Programme Management: Curriculum Policy, Support and Monitoring manages delegated administrative and
financial responsibilities, and coordinates all monitoring and evaluation functions in the programme. • Curriculum Implementation and Monitoring supports and monitors the implementation of the national
strategy for learner attainment framework to monitor the quality of teaching and improve the quality of mathematics, science, technology and languages in all public schools from grades R to 12.
• Curriculum and Quality Enhancement Programmes supports programmes that enhance curriculum outcomes in the basic education system, and increases participation and success in mathematics, science and technology through structured programmes.

2019 Estimates of National Expenditure
12
Expenditure trends and estimates Table 14.11 Curriculum Policy, Support and Monitoring expenditure trends and estimates by subprogramme and economic classification Subprogramme
Audited outcome Adjusted
appropriation
Averagegrowth
rate(%)
Average: Expen-diture/
Total(%)
Medium-term expenditure estimate
Averagegrowth
rate(%)
Average:Expen-diture/
Total(%)
R thousand 2015/16 2016/17 2017/18 2018/19 2015/16 - 2018/19 2019/20 2020/21 2021/22 2018/19 - 2021/22 Programme Management: Curriculum Policy, Support and Monitoring
2 433 3 447 2 502 4 212 20.1% 0.2% 2 782 2 881 3 079 -9.9% 0.2%
Curriculum Implementation and Monitoring
507 574 440 271 269 397 328 536 -13.5% 21.4% 384 887 411 858 432 366 9.6% 19.0%
Curriculum and Quality Enhancement Programmes
1 287 733 1 382 973 1 459 198 1 534 368 6.0% 78.4% 1 601 290 1 688 585 1 782 220 5.1% 80.8%
Total 1 797 740 1 826 691 1 731 097 1 867 116 1.3% 100.0% 1 988 959 2 103 324 2 217 665 5.9% 100.0%Change to 2018 Budget estimate
(37 895) (21 094) (34 593) (38 907)
Economic classification Current payments 1 479 752 1 463 445 1 298 011 1 304 945 -4.1% 76.8% 1 375 706 1 446 247 1 524 389 5.3% 69.1%Compensation of employees 76 077 72 019 89 090 98 065 8.8% 4.6% 98 947 103 626 110 635 4.1% 5.0%Goods and services1 1 403 675 1 391 426 1 208 921 1 206 880 -4.9% 72.1% 1 276 759 1 342 621 1 413 754 5.4% 64.1%of which: Advertising 403 10 570 13 111 6 261 149.5% 0.4% 32 187 33 197 40 208 85.9% 1.4%Agency and support/outsourced services
5 506 8 509 11 216 27 143 70.2% 0.7% 10 352 13 363 10 391 -27.4% 0.7%
Inventory: Learner and teacher support material
968 726 981 531 1 018 474 1 087 934 3.9% 56.2% 1 151 390 1 214 299 1 280 845 5.6% 57.9%
Consumables: Stationery, printing and office supplies
23 114 52 460 3 155 18 054 -7.9% 1.3% 27 075 29 804 29 012 17.1% 1.3%
Travel and subsistence 10 279 10 586 30 056 20 489 25.9% 1.0% 17 864 17 681 19 226 -2.1% 0.9%Venues and facilities 10 917 1 152 8 915 7 207 -12.9% 0.4% 15 259 12 052 12 789 21.1% 0.6%Transfers and subsidies1 317 210 362 818 431 812 558 299 20.7% 23.1% 612 273 656 319 692 417 7.4% 30.8%Provinces and municipalities 316 942 362 444 431 168 557 271 20.7% 23.1% 612 087 656 123 692 210 7.5% 30.8%Foreign governments and international organisations
157 131 120 178 4.3% – 186 196 207 5.2% –
Households 111 243 524 850 97.1% – – – – -100.0% – Payments for capital assets 745 423 1 206 3 856 73.0% 0.1% 980 758 859 -39.4% 0.1%Machinery and equipment 745 423 731 656 -4.2% – 980 758 859 9.4% – Software and other intangible assets
– – 475 3 200 – 0.1% – – – -100.0% –
Payments for financial assets 33 5 68 16 -21.4% – – – – -100.0% – Total 1 797 740 1 826 691 1 731 097 1 867 116 1.3% 100.0% 1 988 959 2 103 324 2 217 665 5.9% 100.0%Proportion of total programme expenditure to vote expenditure
8.6% 8.5% 7.5% 7.9% – – 8.1% 8.1% 7.9% – –
Details of transfers and subsidies Households Social benefits Current 111 243 524 850 97.1% – – – – -100.0% – Employee social benefits 111 243 524 850 97.1% – – – – -100.0% – Foreign governments and international organisations
Current 157 131 120 178 4.3% – 186 196 207 5.2% – Guidance, Counselling and Youth Development Centre for Africa
157 131 120 178 4.3% – 186 196 207 5.2% –
Provinces and municipalities Provinces Provincial revenue funds Current – – 66 023 186 788 – 3.5% 220 785 242 864 256 222 11.1% 11.1%Learners with profound intellectual disabilities grant
– – 66 023 186 788 – 3.5% 220 785 242 864 256 222 11.1% 11.1%
Capital 316 942 362 444 365 145 370 483 5.3% 19.6% 391 302 413 259 435 988 5.6% 19.7%Maths, science and technology grant
316 942 362 444 365 145 370 483 5.3% 19.6% 391 302 413 259 435 988 5.6% 19.7%
1. Estimates of National Expenditure data tables are available and can be downloaded from www.treasury.gov.za. These data tables contain detailed information by goods and services, and transfers and subsidies item by programme.

Vote 14: Basic Education
13
Personnel information Table 14.12 Curriculum Policy, Support and Monitoring personnel numbers and cost by salary level¹
Number of posts estimated for
31 March 2019 Number and cost2 of personnel posts filled/planned for on funded establishment Number
Number of funded
posts
Number of posts
additional to the
establishment Actual Revised estimate Medium-term expenditure estimate
Averagegrowth
rate(%)
Average: Salary
level/Total(%)
2017/18 2018/19 2019/20 2020/21 2021/22 2018/19 - 2021/22 Curriculum Policy, Support and Monitoring
Number Cost
Unit cost Number Cost
Unit cost Number Cost
Unit cost Number Cost
Unit cost Number Cost
Unit cost
Salary level 114 – 108 89.1 0.8 102 98.1 1.0 92 98.9 1.1 90 103.6 1.2 90 110.6 1.2 -4.1% 100.0%1 – 6 19 – 17 4.6 0.3 17 5.2 0.3 17 5.7 0.3 17 6.1 0.4 17 6.6 0.4 – 18.2%7 – 10 26 – 23 11.3 0.5 22 10.6 0.5 19 10.4 0.5 19 11.2 0.6 20 12.6 0.6 -3.1% 21.4%11 – 12 55 – 55 44.2 0.8 51 49.5 1.0 42 45.2 1.1 42 48.4 1.2 40 49.8 1.2 -7.8% 46.8%13 – 16 14 – 13 14.2 1.1 12 14.6 1.2 14 18.6 1.3 12 17.3 1.4 13 19.9 1.5 2.7% 13.6%Other – – – 14.8 – – 18.1 – – 19.1 – – 20.6 – – 21.7 – – – 1. Data has been provided by the department and may not necessarily reconcile with official government personnel data. 2. Rand million.
Programme 3: Teachers, Education Human Resources and Institutional Development Programme purpose Promote quality teaching and institutional performance through the effective supply, development and utilisation of human resources.
Objectives • Ensure the adequate supply of qualified recruits in the system by securing posts for Funza Lushaka bursary
holders, by June of the year after qualifying, in each year over the medium term. • Improve the quality of teaching and learning by ensuring an adequate supply of young and qualified
teachers through awarding 13 000 Funza Lushaka bursaries to prospective teachers in 2019/20. • Improve the quality of teaching and learning by monitoring and supporting the implementation of the policy
on educator post provisioning in all provincial education departments annually. • Enhance accountability by monitoring and supporting the implementation of educator performance
management systems and school evaluations annually.
Subprogrammes • Programme Management: Teachers, Education Human Resources and Institutional Development manages
delegated administrative and financial responsibilities, and coordinates all monitoring and evaluation functions in the programme.
• Education Human Resources Management is responsible for the planning, provisioning and monitoring of education human resources; the oversight and strengthening of educator performance management systems and school evaluations; and education labour relations and conditions of service.
• Education Human Resources Development oversees and translates the integrated strategic planning framework for teacher education and development into a wide range of teacher training programmes, collaborative professional development activities, and agreements with partners and relevant service providers. The subprogramme also coordinates activities with the national institute for curriculum and professional development to promote best practice in classroom teaching and teacher development.
• Curriculum and Professional Development Unit manages and develops an innovative and effective system for teacher development and curriculum implementation. This entails the creation of teacher development platforms, and the evaluation and impact assessment of teacher knowledge testing tools for determining teacher needs in content and pedagogical knowledge.

2019 Estimates of National Expenditure
14
Expenditure trends and estimates Table 14.13 Teachers, Education Human Resources and Institutional Development expenditure trends and estimates by subprogramme and economic classification Subprogramme
Audited outcome Adjusted
appropriation
Averagegrowth
rate(%)
Average: Expen-diture/
Total(%)
Medium-term expenditure estimate
Averagegrowth
rate(%)
Average:Expen-diture/
Total(%)
R thousand 2015/16 2016/17 2017/18 2018/19 2015/16 - 2018/19 2019/20 2020/21 2021/22 2018/19 - 2021/22 Programme Management: Teachers, Education Human Resources and Institutional Development
2 508 2 428 1 569 3 132 7.7% 0.2% 1 973 2 107 2 248 -10.5% 0.2%
Education Human Resources Management
137 249 75 790 61 116 64 750 -22.2% 6.9% 68 575 72 875 77 541 6.2% 5.0%
Education Human Resources Development
1 012 096 1 089 931 1 170 153 1 230 183 6.7% 91.9% 1 279 447 1 350 356 1 425 088 5.0% 93.6%
Curriculum and Professional Development Unit
11 695 9 248 10 985 14 976 8.6% 1.0% 16 204 17 224 18 309 6.9% 1.2%
Total 1 163 548 1 177 397 1 243 823 1 313 041 4.1% 100.0% 1 366 199 1 442 562 1 523 186 5.1% 100.0%Change to 2018 Budget estimate
22 561 (11) (298) 161
Economic classification Current payments 87 877 112 298 121 197 121 115 11.3% 9.0% 105 082 112 184 119 637 -0.4% 8.1%Compensation of employees 69 017 71 411 65 189 70 173 0.6% 5.6% 75 246 80 606 86 324 7.1% 5.5%Goods and services1 18 860 40 887 56 008 50 942 39.3% 3.4% 29 836 31 578 33 313 -13.2% 2.6%of which: Catering: Departmental activities 4 017 957 1 690 5 103 8.3% 0.2% 2 176 2 295 2 420 -22.0% 0.2%Computer services 285 341 3 300 2 854 115.5% 0.1% 1 595 1 683 1 776 -14.6% 0.1%Agency and support/outsourced services
2 638 3 911 28 411 13 381 71.8% 1.0% 1 339 1 413 1 491 -51.9% 0.3%
Consumables: Stationery, printing and office supplies
819 575 937 941 4.7% 0.1% 1 044 1 101 1 161 7.3% 0.1%
Travel and subsistence 8 929 19 756 14 774 20 034 30.9% 1.3% 19 806 20 895 22 045 3.2% 1.5%Venues and facilities 208 3 466 1 697 3 680 160.6% 0.2% 1 753 1 849 1 950 -19.1% 0.2%Transfers and subsidies1 1 075 280 1 064 685 1 122 129 1 191 482 3.5% 90.9% 1 260 716 1 329 955 1 403 103 5.6% 91.9%Provinces and municipalities 66 275 – – – -100.0% 1.4% – – – – – Departmental agencies and accounts
– 5 000 9 743 16 000 – 0.6% 20 000 21 100 22 261 11.6% 1.4%
Foreign governments and international organisations
17 706 15 717 14 757 15 579 -4.2% 1.3% 16 445 17 249 18 198 5.3% 1.2%
Households 991 299 1 043 968 1 097 629 1 159 903 5.4% 87.6% 1 224 271 1 291 606 1 362 644 5.5% 89.3%Payments for capital assets 281 223 438 428 15.1% – 401 423 446 1.4% – Machinery and equipment 281 223 438 428 15.1% – 401 423 446 1.4% – Payments for financial assets 110 191 59 16 -47.4% – – – – -100.0% – Total 1 163 548 1 177 397 1 243 823 1 313 041 4.1% 100.0% 1 366 199 1 442 562 1 523 186 5.1% 100.0%Proportion of total programme expenditure to vote expenditure
5.6% 5.5% 5.4% 5.5% – – 5.6% 5.6% 5.4% – –
Details of transfers and subsidies Households Social benefits Current 215 357 1 837 555 37.2% 0.1% – – – -100.0% – Employee social benefits 215 357 1 837 555 37.2% 0.1% – – – -100.0% – Departmental agencies and accounts
Departmental agencies (non-business entities)
Current – 5 000 9 743 16 000 – 0.6% 20 000 21 100 22 261 11.6% 1.4%South African Council for Educators
– 5 000 9 743 16 000 – 0.6% 20 000 21 100 22 261 11.6% 1.4%
Households Other transfers to households Current 991 084 1 043 611 1 095 792 1 159 348 5.4% 87.6% 1 224 271 1 291 606 1 362 644 5.5% 89.2%National Student Financial Aid Scheme
991 084 1 043 611 1 095 792 1 159 348 5.4% 87.6% 1 224 271 1 291 606 1 362 644 5.5% 89.2%

Vote 14: Basic Education
15
Table 14.13 Teachers, Education Human Resources and Institutional Development expenditure trends and estimates by subprogramme and economic classification Details of transfers and subsidies
Audited outcome Adjusted
appropriation
Averagegrowth
rate(%)
Average: Expen-diture/
Total(%)
Medium-term expenditure estimate
Averagegrowth
rate(%)
Average:Expen-diture/
Total(%)
R thousand 2015/16 2016/17 2017/18 2018/19 2015/16 - 2018/19 2019/20 2020/21 2021/22 2018/19 - 2021/22 Foreign governments and international organisations
Current 17 706 15 717 14 757 15 579 -4.2% 1.3% 16 445 17 249 18 198 5.3% 1.2%UNESCO (United Nations Educational, Scientific and Cultural Organisation)
17 553 15 587 14 638 15 431 -1.1% – 16 295 17 091 18 031 4.1% –
Association for the Development of Education in Africa
153 130 119 148 -4.2% 1.3% 150 158 167 5.3% 1.2%
Provinces and municipalities Provinces Provincial revenue funds Current 66 275 – – – -100.0% 1.4% – – – – – Occupational specific dispensation for education sector therapists grant
66 275 – – – -100.0% 1.4% – – – – –
1. 1.Estimates of National Expenditure data tables are available and can be downloaded from www.treasury.gov.za. These data tables contain detailed information by goods and services, and transfers and subsidies item by programme.
Personnel information Table 14.14 Teachers, Education Human Resources and Institutional Development personnel numbers and cost by salary level¹
Number of posts estimated for
31 March 2019 Number and cost2 of personnel posts filled/planned for on funded establishment Number
Number of
funded posts
Number of posts
additional to the
establishment Actual Revised estimate Medium-term expenditure estimate
Averagegrowth
rate(%)
Average: Salary
level/Total(%)
2017/18 2018/19 2019/20 2020/21 2021/22 2018/19 - 2021/22 Teachers, Education Human Resources and Institutional Development Number Cost
Unit cost Number Cost
Unit cost Number Cost
Unit cost Number Cost
Unit cost Number Cost
Unit cost
Salary level 152 – 100 65.2 0.7 99 70.2 0.7 99 75.2 0.8 98 80.6 0.8 98 86.3 0.9 -0.3% 100.0%1 – 6 14 – 12 3.4 0.3 13 3.9 0.3 13 4.3 0.3 13 4.6 0.4 13 5.0 0.4 – 13.2%7 – 10 88 – 46 23.9 0.5 44 24.8 0.6 44 26.6 0.6 43 28.1 0.7 43 30.2 0.7 -0.8% 44.2%11 – 12 37 – 31 25.9 0.8 30 27.0 0.9 30 28.9 1.0 29 29.9 1.0 29 32.0 1.1 -1.1% 29.9%13 – 16 13 – 11 12.0 1.1 12 14.3 1.2 12 15.3 1.3 13 18.0 1.4 13 19.2 1.5 2.7% 12.7%Other – – – 0.0 – – 0.1 – – 0.1 – – 0.1 – – 0.0 – – – 1. Data has been provided by the department and may not necessarily reconcile with official government personnel data. 2. Rand million.
Programme 4: Planning, Information and Assessment Programme purpose Promote quality and effective service delivery in the basic education system through planning, implementation and assessment.
Objectives • Improve the delivery of school infrastructure over the medium term by providing oversight and support to
provinces through quarterly reporting on schools’ furniture needs and deliveries, the national education infrastructure management system, and the education infrastructure grant.
• Contribute to improved teaching and learning through improving and upgrading infrastructure by 2019/20, by: – building 59 schools to replace unsafe structures – providing water to 227 schools – providing sanitation to 717 schools.
• Track improvements in the quality of teaching and learning by providing standardised national assessments for grade 3, 6 and 9 learners, and the administration of a credible public examination in grade 12 each year.
• Strengthen the capacity of district offices to support schools through quarterly provincial visits that monitor, evaluate and make recommendations on curriculum oversight, institutional management and governance

2019 Estimates of National Expenditure
16
support provided and human resources management operations.
Subprogrammes • Programme Management: Planning, Information and Assessment delegates administrative and financial
responsibilities, and coordinates all monitoring and evaluation functions in the programme. • Financial Planning, Information and Management Systems develops systems and procedures to support and
maintain integrated education management systems based on learner record information. This is done to monitor and report on the implementation of education information policy in the basic education sector. This subprogramme also focuses on cross-cutting aspects such as resource planning, financial support, and the development and monitoring of national funding norms and standards with provincial education departments.
• School Infrastructure uses funding from the school infrastructure backlogs grant to eradicate infrastructure backlogs. This includes replacing school buildings constructed from inappropriate materials such as mud, and providing water and sanitation to schools that do not have these facilities. The education infrastructure grant provides co-funding for the ongoing infrastructure programme in provinces to allow for the provision of infrastructure requirements. This includes the maintenance of existing infrastructure and the construction of new infrastructure, where required, to progressively meet the minimum norms and standards for school infrastructure.
• National Assessments and Public Examinations provides standardised national assessments for grade 3, 6 and 9 learners, and the regulation and standardisation of assessments through the implementation of an integrated assessment framework for grades 4 to 11; and administers credible public examinations in grade 12. This provides reliable data on learner performance to support the improvement of the quality of basic education.
• National Education Evaluation and Development Unit facilitates school improvement through systematic evaluation. The unit evaluates how district offices, provincial departments and the national department monitor and support schools, school governing bodies and teachers. This entails identifying critical factors that inhibit or advance the attainment of sector goals and school improvement, and making focused recommendations for addressing problem areas that undermine school improvement and the attainment of sector goals.
• Planning and Delivery Oversight Unit assists the department in meeting objectives by monitoring the planning and delivery of selected priorities, and assisting provinces with this. The unit works with provinces to ensure that provincial initiatives are aligned with national priorities, and provides institutional support for their effective delivery.
Expenditure trends and estimates Table 14.15 Planning, Information and Assessment expenditure trends and estimates by subprogramme and economic classification Subprogramme
Audited outcome Adjusted
appropriation
Averagegrowth
rate(%)
Average: Expen-diture/
Total(%)
Medium-term expenditure estimate
Averagegrowth
rate(%)
Average:Expen-diture/
Total(%)
R thousand 2015/16 2016/17 2017/18 2018/19 2015/16 - 2018/19 2019/20 2020/21 2021/22 2018/19 - 2021/22 Programme Management: Planning, Information and Assessment
3 100 2 963 3 490 3 371 2.8% – 3 556 3 797 3 995 5.8% –
Financial Planning, Information and Management Systems
39 704 47 068 96 173 46 975 5.8% 0.5% 44 751 57 511 58 049 7.3% 0.4%
School Infrastructure 10 985 280 11 257 963 12 262 272 12 379 004 4.1% 95.8% 12 545 910 13 236 601 14 667 866 5.8% 95.5%National Assessments and Public Examinations
377 131 289 205 282 403 356 431 -1.9% 2.7% 392 153 412 012 458 634 8.8% 2.9%
National Education Evaluation and Development Unit
25 580 26 185 20 669 20 154 -7.6% 0.2% 19 150 20 285 21 236 1.8% 0.1%
Planning and Delivery Oversight Unit
81 111 96 569 120 804 132 378 17.7% 0.9% 138 811 146 487 154 442 5.3% 1.0%
Total 11 511 906 11 719 953 12 785 811 12 938 313 4.0% 100.0% 13 144 331 13 876 693 15 364 222 5.9% 100.0%Change to 2018 Budget estimate
966 971 897 737 804 892 1 323 548

Vote 14: Basic Education
17
Table 14.15 Planning, Information and Assessment expenditure trends and estimates by subprogramme and economic classification Economic classification
Audited outcome Adjusted
appropriation
Averagegrowth
rate(%)
Average: Expen-diture/
Total(%)
Medium-term expenditure estimate
Averagegrowth
rate(%)
Average:Expen-diture/
Total(%)
R thousand 2015/16 2016/17 2017/18 2018/19 2015/16 - 2018/19 2019/20 2020/21 2021/22 2018/19 - 2021/22 Current payments 612 435 531 872 410 695 484 766 -7.5% 4.2% 509 737 517 071 567 917 5.4% 3.8%Compensation of employees 119 782 126 111 116 796 131 748 3.2% 1.0% 133 601 147 127 157 165 6.1% 1.0%Goods and services1 492 653 405 761 293 899 353 018 -10.5% 3.2% 376 136 369 944 410 752 5.2% 2.7%of which: Catering: Departmental activities
7 740 12 809 6 557 11 723 14.8% 0.1% 15 005 15 668 16 529 12.1% 0.1%
Computer services 47 865 50 675 44 352 58 499 6.9% 0.4% 52 963 63 978 64 947 3.5% 0.4%Consultants: Business and advisory services
120 287 167 667 162 072 131 427 3.0% 1.2% 129 943 109 770 117 164 -3.8% 0.9%
Agency and support/outsourced services
48 259 16 910 4 111 3 392 -58.7% 0.1% 25 509 24 914 47 935 141.8% 0.2%
Consumables: Stationery, printing and office supplies
21 531 2 458 2 875 26 286 6.9% 0.1% 18 488 18 054 19 047 -10.2% 0.1%
Travel and subsistence 53 166 64 428 56 422 88 275 18.4% 0.5% 107 809 109 211 115 218 9.3% 0.8%Transfers and subsidies1 9 530 823 10 131 882 10 696 477 10 331 755 2.7% 83.1% 10 764 537 11 730 417 12 604 922 6.9% 82.1%Provinces and municipalities 9 354 443 9 933 282 10 467 276 10 093 563 2.6% 81.4% 10 514 478 11 466 632 12 326 629 6.9% 80.3%Departmental agencies and accounts
112 705 118 678 124 612 128 543 4.5% 1.0% 134 634 142 012 149 822 5.2% 1.0%
Foreign governments and international organisations
3 135 3 348 3 335 3 295 1.7% – 3 480 3 671 3 873 5.5% –
Non-profit institutions 60 000 76 120 99 959 105 984 20.9% 0.7% 111 945 118 102 124 598 5.5% 0.8%Households 540 454 1 295 370 -11.8% – – – – -100.0% – Payments for capital assets 1 368 609 1 051 061 1 622 724 2 121 755 15.7% 12.6% 1 870 057 1 629 205 2 191 383 1.1% 14.1%Buildings and other fixed structures
1 368 285 1 049 535 1 617 716 2 121 045 15.7% 12.6% 1 869 482 1 628 591 2 190 735 1.1% 14.1%
Machinery and equipment 324 1 526 1 063 710 29.9% – 575 614 648 -3.0% – Software and other intangible assets
– – 3 945 – – – – – – – –
Payments for financial assets 39 5 138 55 915 37 -1.7% 0.1% – – – -100.0% – Total 11 511 906 11 719 953 12 785 811 12 938 313 4.0% 100.0% 13 144 331 13 876 693 15 364 222 5.9% 100.0%Proportion of total programme expenditure to vote expenditure
55.4% 54.6% 55.8% 54.6% – – 53.6% 53.4% 54.5% – –
Details of transfers and subsidies Households Social benefits Current 540 454 1 295 370 -11.8% – – – – -100.0% – Employee social benefits 540 454 1 295 370 -11.8% – – – – -100.0% – Departmental agencies and accounts
Departmental agencies (non-business entities)
Current 112 705 118 678 124 612 128 543 4.5% 1.0% 134 634 142 012 149 822 5.2% 1.0%Umalusi Council for Quality Assurance in General and Further Education and Training
112 705 118 678 124 612 128 543 4.5% 1.0% 134 634 142 012 149 822 5.2% 1.0%
Foreign governments and international organisations
Current 3 135 3 348 3 335 3 295 1.7% – 3 480 3 671 3 873 5.5% – Southern and Eastern Africa Consortium for Monitoring Educational Quality
3 135 3 348 3 335 3 295 1.7% – 3 480 3 671 3 873 5.5% –
Provinces and municipalities Provinces Provincial revenue funds Capital 9 354 443 9 933 282 10 467 276 10 093 563 2.6% 81.4% 10 514 478 11 466 632 12 326 629 6.9% 80.3%Education infrastructure grant 9 354 443 9 933 282 10 467 276 10 093 563 2.6% 81.4% 10 514 478 11 466 632 12 326 629 6.9% 80.3%Non-profit institutions Current 60 000 76 120 99 959 105 984 20.9% 0.7% 111 945 118 102 124 598 5.5% 0.8%National Education Collaboration Trust
60 000 76 120 99 959 105 984 20.9% 0.7% 111 945 118 102 124 598 5.5% 0.8%
1. Estimates of National Expenditure data tables are available and can be downloaded from www.treasury.gov.za. These data tables contain detailed information by goods
and services, and transfers and subsidies item by programme.

2019 Estimates of National Expenditure
18
Personnel information Table 14.16 Planning, Information and Assessment personnel numbers and cost by salary level¹
Number of posts estimated for
31 March 2019 Number and cost2 of personnel posts filled/planned for on funded establishment Number
Number of
funded posts
Number of posts
additional to the
establishment Actual Revised estimate Medium-term expenditure estimate
Averagegrowth
rate(%)
Average: Salary
level/Total(%)
2017/18 2018/19 2019/20 2020/21 2021/22 2018/19 - 2021/22 Planning, Information and Assessment Number Cost
Unit cost Number Cost
Unit cost Number Cost
Unit cost Number Cost
Unit cost Number Cost
Unit cost
Salary level 181 – 152 116.8 0.8 152 131.7 0.9 150 133.6 0.9 149 147.1 1.0 147 157.2 1.1 -1.1% 100.0%1 – 6 41 – 41 11.2 0.3 41 11.7 0.3 41 12.7 0.3 41 13.7 0.3 41 14.8 0.4 – 27.4%7 – 10 56 – 46 23.7 0.5 45 24.4 0.5 45 26.2 0.6 44 27.5 0.6 43 28.7 0.7 -1.5% 29.6%11 – 12 66 – 49 43.5 0.9 48 45.0 0.9 47 47.1 1.0 47 50.5 1.1 46 52.9 1.1 -1.4% 31.4%13 – 16 18 – 16 19.5 1.2 18 23.1 1.3 17 23.5 1.4 17 25.2 1.5 17 27.0 1.6 -1.9% 11.5%Other – – – 18.9 – – 27.5 – – 24.1 – – 30.3 – – 33.9 – – – 1. Data has been provided by the department and may not necessarily reconcile with official government personnel data. 2. Rand million.
Programme 5: Educational Enrichment Services Programme purpose Monitor and support provinces to implement care and support programmes for learning and teaching.
Objectives • Reduce barriers to learning by implementing school sport, safety and social cohesion programmes each year
over the medium term to ensure the holistic development of learners, enhance their learning experience, and maximise their school performance.
• Improve learner health and wellness by implementing school health programmes, including the provision of nutritious meals, to all learners in quintiles 1 to 3 primary, secondary and identified special schools annually.
Subprogrammes • Programme Management: Educational Enrichment Services manages delegated administrative and financial
responsibilities, and coordinates all monitoring and evaluation functions in the programme. • Partnerships in Education partners with stakeholders in support of education in an attempt to make
education a societal issue; and manages policy, programmes and systems aimed at creating a safe and cohesive learning environment. The goal is to promote holistic learner development through facilitating sports and enrichment programmes in schools; and promote social cohesion, an understanding of human rights, gender equity, non-racism, non-sexism, and democratic and constitutional values in education in public schools and school communities.
• Care and Support in Schools manages policies, the provision of meals and the promotion of learner access to public services. This includes interventions aimed at encouraging healthy habits and alleviating poverty.
Expenditure trends and estimates Table 14.17 Educational Enrichment Services expenditure trends and estimates by subprogramme and economic classification Subprogramme
Audited outcome Adjusted
appropriation
Averagegrowth
rate(%)
Average: Expen-diture/
Total(%)
Medium-term expenditure estimate
Averagegrowth
rate(%)
Average:Expen-diture/
Total(%)
R thousand 2015/16 2016/17 2017/18 2018/19 2015/16 - 2018/19 2019/20 2020/21 2021/22 2018/19 - 2021/22 Programme Management: Educational Enrichment Services
2 191 3 062 15 290 3 715 19.2% 0.1% 3 880 4 264 4 475 6.4% 0.1%
Partnerships in Education 17 686 22 014 24 107 30 627 20.1% 0.4% 31 244 33 935 35 736 5.3% 0.4%Care and Support in Schools 5 916 579 6 308 646 6 696 756 7 074 626 6.1% 99.5% 7 473 665 7 999 670 8 485 635 6.2% 99.5%Total 5 936 456 6 333 722 6 736 153 7 108 968 6.2% 100.0% 7 508 789 8 037 869 8 525 846 6.2% 100.0%Change to 2018 Budget estimate
3 840 73 736 10

Vote 14: Basic Education
19
Table 14.17 Educational Enrichment Services expenditure trends and estimates by subprogramme and economic classification Economic classification
Audited outcome Adjusted
appropriation
Averagegrowth
rate(%)
Average: Expen-diture/
Total(%)
Medium-term expenditure estimate
Averagegrowth
rate(%)
Average:Expen-diture/
Total(%)
R thousand 2015/16 2016/17 2017/18 2018/19 2015/16 - 2018/19 2019/20 2020/21 2021/22 2018/19 - 2021/22 Current payments 41 909 49 499 51 909 62 839 14.5% 0.8% 65 610 70 836 74 464 5.8% 0.9%Compensation of employees 30 836 33 607 36 343 41 177 10.1% 0.5% 45 984 49 372 52 008 8.1% 0.6%Goods and services1 11 073 15 892 15 566 21 662 25.1% 0.2% 19 626 21 464 22 456 1.2% 0.3%of which: Catering: Departmental activities 568 2 490 2 375 2 616 66.4% – 1 358 1 418 1 580 -15.5% – Contractors – 145 114 290 – – 900 1 000 1 100 56.0% – Inventory: Learner and teacher support material
– 250 – 985 – – 1 340 1 514 1 560 16.6% –
Consumables: Stationery, printing and office supplies
529 758 529 1 361 37.0% – 1 095 1 261 1 235 -3.2% –
Travel and subsistence 6 196 7 727 7 129 12 547 26.5% 0.1% 10 960 12 051 12 457 -0.2% 0.2%Operating payments 818 768 575 1 274 15.9% – 2 227 2 330 2 462 24.6% – Transfers and subsidies1 5 894 235 6 284 014 6 677 786 7 045 719 6.1% 99.2% 7 442 735 7 966 618 8 450 958 6.2% 99.1%Provinces and municipalities 5 894 111 6 283 842 6 671 621 7 045 314 6.1% 99.2% 7 442 666 7 966 545 8 450 880 6.3% 99.1%Non-profit institutions 55 58 6 061 65 5.7% – 69 73 78 6.3% – Households 69 114 104 340 70.2% – – – – -100.0% – Payments for capital assets 102 203 374 410 59.0% – 444 415 424 1.1% – Machinery and equipment 102 203 358 410 59.0% – 444 415 424 1.1% – Software and other intangible assets
– – 16 – – – – – – – –
Payments for financial assets 210 6 6 084 – -100.0% – – – – – – Total 5 936 456 6 333 722 6 736 153 7 108 968 6.2% 100.0% 7 508 789 8 037 869 8 525 846 6.2% 100.0%Proportion of total programme expenditure to vote expenditure
28.5% 29.5% 29.4% 30.0% – – 30.6% 30.9% 30.2% – –
Details of transfers and subsidies Households Social benefits Current 63 114 64 340 75.4% – – – – -100.0% – Employee social benefits 63 114 64 340 75.4% – – – – -100.0% – Households Other transfers to households Current 6 – 40 – -100.0% – – – – – – Claims against the state 6 – 40 – -100.0% – – – – – – Provinces and municipalities Provinces Provincial revenue funds Current 5 894 111 6 283 842 6 671 621 7 045 314 6.1% 99.2% 7 442 666 7 966 545 8 450 880 6.3% 99.1%National school nutrition programme grant
5 685 381 6 059 655 6 426 313 6 802 079 6.2% 95.6% 7 185 715 7 695 901 8 165 351 6.3% 95.7%
HIV and AIDS (life skills education) grant
208 730 224 187 245 308 243 235 5.2% 3.5% 256 951 270 644 285 529 5.5% 3.4%
Non-profit institutions Current 55 58 6 061 65 5.7% – 69 73 78 6.3% – Childline South Africa 55 58 61 65 5.7% – 69 73 78 6.3% – Historic School Restoration – – 6 000 – – – – – – – – 1. Estimates of National Expenditure data tables are available and can be downloaded from www.treasury.gov.za. These data tables contain detailed information by goods
and services, and transfers and subsidies item by programme.
Personnel information Table 14.18 Educational Enrichment Services personnel numbers and cost by salary level¹
Number of posts estimated for
31 March 2019 Number and cost2 of personnel posts filled/planned for on funded establishment Number
Number of
funded posts
Number of posts
additional to the
establishment Actual Revised estimate Medium-term expenditure estimate
Averagegrowth
rate(%)
Average: Salary
level/Total(%)
2017/18 2018/19 2019/20 2020/21 2021/22 2018/19 - 2021/22
Educational Enrichment Services Number Cost Unit cost Number Cost
Unit cost Number Cost
Unit cost Number Cost
Unit cost Number Cost
Unit cost
Salary level 68 – 58 36.3 0.6 59 41.2 0.7 61 46.0 0.8 62 49.4 0.8 62 52.0 0.8 1.7% 100.0%1 – 6 11 – 10 2.6 0.3 9 2.5 0.3 9 2.7 0.3 10 3.2 0.3 11 3.8 0.3 6.9% 16.0%7 – 10 27 – 22 11.0 0.5 23 12.6 0.5 24 14.2 0.6 25 16.1 0.6 25 17.3 0.7 2.8% 39.8%11 – 12 20 – 20 16.1 0.8 19 16.5 0.9 19 17.6 0.9 18 17.9 1.0 17 18.0 1.1 -3.6% 29.9%13 – 16 10 – 6 6.5 1.1 8 9.3 1.2 9 11.1 1.2 9 11.8 1.3 9 12.7 1.4 4.0% 14.3%Other – – – 0.2 – – 0.3 – – 0.4 – – 0.4 – – 0.3 – – – 1. Data has been provided by the department and may not necessarily reconcile with official government personnel data. 2. Rand million.

2019 Estimates of National Expenditure
20
Entities South African Council for Educators
Mandate The South African Council for Educators was established in terms of the South African Council for Educators Act (2000) as a professional council for educators. The council aims to enhance the status of the teaching profession through registering educators appropriately, managing professional development and promoting a code of ethics for all educators.
Selected performance indicators Table 14.19 South African Council for Educators performance indicators by programme/objective/activity and related outcome Indicator Programme/Objective/Activity MTSF outcome Past Current Projections 2015/16 2016/17 2017/18 2018/19 2019/20 2020/21 2021/22Number of research projects undertaken per year
Research and advisory
Outcome 1: Quality basic education
6 6 5 3 5 5 3
Number of educators oriented and signed up on the continuing professional teacher development system per year
Professional development 56 679 87 702 74 022 50 000 15 0001 10 000 5 000
Number of educators monitored and supported on the continuing professional teacher development system per year
Professional development 33 360 35 913 1 163 26 3202 63 7083 63 708 63 708
Number of new registrations of educators per year
Registration of educators 35 262 37 977 34 087 38 000 35 000 10 0003 10 0003
Number of disciplinary cases concluded per year
Ethics and code of conduct 550 536 327 500 500 600 600
1. Most serving educators will have been signed up on the system by 2019/20, after which the council expects to sign up only new entrants. 2. The system will be expanded to all educators after initially including only principals and deputy principals. The council is completing the registration of educators in public
and private schools. In 2020/21 and 2021/22, it will focus solely on new entrants to the profession. 3. All practising educators are expected to have been registered with the council by 2020/21, after which the council will register only new entrants to the profession.
Expenditure analysis Over the medium term, the South African Council for Educators will focus on professionalising teaching by ensuring that all educators, including new entrants, are registered. In recognising that continuing professional teacher development remains pivotal to improving the quality of the country’s teaching force, the council will continue to administer and promote the professional teacher development system over the period ahead.
Expenditure required to fulfil these obligations is expected to be R328.6 million over the MTEF period. The council is expected to generate 77.1 per cent (R253.2 million) of its revenue over the same period through members’ fees, and the remainder through transfers from the department and interest on investments.
Programmes/Objectives/Activities Table 14.20 South African Council for Educators expenditure trends and estimates by programme/objective/activity
Audited outcome Revisedestimate
Averagegrowth
rate(%)
Average:Expen-diture/
Total(%)
Medium-term expenditure estimate
Averagegrowth
rate(%)
Average:Expen-diture/
Total(%)
R thousand 2015/16 2016/17 2017/18 2018/19 2015/16 - 2018/19 2019/20 2020/21 2021/22 2018/19 - 2021/22 Administration 38 421 36 042 38 594 64 807 19.0% 61.9% 65 002 63 488 66 378 0.8% 60.3%Research and advisory 1 438 903 1 302 1 970 11.1% 2.0% 2 608 2 648 2 691 11.0% 2.3%Professional development 12 913 13 162 12 999 23 243 21.6% 21.6% 26 014 25 657 26 765 4.8% 23.6%Registration of educators 4 080 5 259 4 951 6 558 17.1% 7.4% 7 559 7 944 8 360 8.4% 7.0%Ethics and code of conduct 4 028 4 677 5 196 6 118 14.9% 7.2% 7 517 7 805 8 117 9.9% 6.8%Total 60 880 60 043 63 042 102 696 19.0% 100.0% 108 700 107 542 112 311 3.0% 100.0%

Vote 14: Basic Education
21
Statements of historical financial performance and position Table 14.21 South African Council for Educators statements of historical financial performance and position Statement of financial performance
Budget Audited outcome Budget dited outcome Budget dited outcome
Budget estimate
Revisedestimate
Average:Outcome/
Budget(%)
R thousand 2015/16 2016/17 2017/18 2018/19 2015/16 - 2018/19 Revenue Non-tax revenue 58 248 61 510 59 700 63 535 73 810 73 678 87 420 89 732 103.3%Sale of goods and services other than capital assets
56 880 57 594 56 400 58 755 69 130 68 465 84 120 84 120 100.9%
of which: Administrative fees 56 880 57 594 56 400 58 755 69 130 68 465 84 120 84 120 100.9%Other non-tax revenue 1 368 3 916 3 300 4 780 4 680 5 213 3 300 5 612 154.3%Transfers received 11 557 9 211 11 692 7 239 9 743 8 303 16 000 17 548 86.3%Total revenue 69 805 70 721 71 392 70 774 83 553 81 981 103 420 107 280 100.8%Expenses Current expenses 69 805 60 880 72 212 60 043 75 703 63 042 99 200 102 696 90.5%Compensation of employees 32 182 34 599 35 434 34 365 36 862 36 862 49 377 55 222 104.7%Goods and services 35 923 24 950 34 978 23 645 35 441 22 780 46 323 43 974 75.6%Depreciation 1 700 1 331 1 800 2 033 3 400 3 400 3 500 3 500 98.7%Total expenses 69 805 60 880 72 212 60 043 75 703 63 042 99 200 102 696 90.5%Surplus/(Deficit) – 9 841 (820) 10 731 7 850 18 939 4 220 4 584
Statement of financial position
Carrying value of assets 66 600 5 401 63 127 65 888 78 188 78 188 62 488 62 488 78.4%of which: Acquisition of assets (65 200) (2 799) (62 571) (62 522) (14 746) (14 746) (5 946) (5 946) 57.9%Investments – 60 978 – – – – – – – Receivables and prepayments 288 1 609 1 604 1 577 1 577 1 577 1 577 1 577 125.6%Cash and cash equivalents 19 977 35 485 34 938 45 631 41 181 41 181 54 201 54 201 117.4%Total assets 86 865 103 473 99 669 113 096 120 946 120 946 118 266 118 266 107.1%Accumulated surplus/(deficit) 82 413 32 998 95 243 107 432 78 188 78 188 78 188 78 188 88.9%Capital and reserves 3 275 63 702 – – 37 094 37 094 34 414 34 414 180.8%Capital reserve fund – 2 347 – 108 108 108 108 108 1 236.6%Trade and other payables 377 1 382 1 382 1 927 1 927 1 927 1 927 1 927 127.6%Provisions 800 3 044 3 044 3 474 3 474 3 474 3 474 3 474 124.8%Derivatives financial instruments – – – 155 155 155 155 155 150.0%Total equity and liabilities 86 865 103 473 99 669 113 096 120 946 120 946 118 266 118 266 107.1%
Statements of estimates of financial performance and position Table 14.22 South African Council for Educators statements of estimates of financial performance and position Statement of financial performance
Revised estimate
Averagegrowth
rate(%)
Average:Expen-diture/
Total(%) Medium-term estimate
Averagegrowth
rate(%)
Average:Expen-diture/
Total(%)
R thousand 2018/19 2015/16 - 2018/19 2019/20 2020/21 2021/22 2018/19 - 2021/22 Revenue Non-tax revenue 89 732 13.4% 87.6% 88 700 86 442 90 050 0.1% 81.5%of goods and services other than capital assets 84 120 13.5% 81.6% 83 200 83 192 86 800 1.1% 77.4%of which: Administrative fees 84 120 13.5% 81.6% 83 200 83 192 86 800 1.1% 77.4%Other non-tax revenue 5 612 12.7% 6.0% 5 500 3 250 3 250 -16.6% 4.1%Transfers received 17 548 24.0% 12.4% 20 000 21 100 22 261 8.3% 18.5%Total revenue 107 280 14.9% 100.0% 108 700 107 542 112 311 1.5% 100.0%Expenses Current expenses 102 696 19.0% 100.0% 108 700 107 542 112 311 3.0% 100.0%Compensation of employees 55 222 16.9% 56.6% 59 879 64 667 69 842 8.1% 57.8%Goods and services 43 974 20.8% 39.8% 46 131 40 375 39 969 -3.1% 39.6%Depreciation 3 500 38.0% 3.6% 2 690 2 500 2 500 -10.6% 2.6%Total expenses 102 696 19.0% 100.0% 108 700 107 542 112 311 3.0% 100.0%Surplus/(Deficit) 4 584 – – (1)
Statement of financial position
Carrying value of assets 62 488 126.2% 45.2% 69 608 76 298 76 298 6.9% 61.6%of which: Acquisition of assets (5 946) 28.6% -18.8% (9 919) (9 489) (9 489) 16.9% -7.5%Receivables and prepayments 1 577 -0.7% 1.4% 1 577 1 577 1 577 – 1.4%Cash and cash equivalents 54 201 15.2% 38.6% 45 201 36 201 36 201 -12.6% 37.0%Total assets 118 266 4.6% 100.0% 116 386 114 076 114 076 -1.2% 100.0%Accumulated surplus/(deficit) 78 188 33.3% 64.4% 110 722 108 412 108 412 11.5% 87.8%Capital and reserves 34 414 -18.6% 30.3% – – – -100.0% 7.3%Capital reserve fund 108 -64.2% 0.6% 108 108 108 – 0.1%Trade and other payables 1 927 11.7% 1.6% 1 927 1 927 1 927 – 1.7%Provisions 3 474 4.5% 3.0% 3 474 3 474 3 474 – 3.0%Derivatives financial instruments 155 – 0.1% 155 155 155 – 0.1%
Total equity and liabilities 118 266 4.6% 100.0% 116 386 114 076 114 076 -1.2% 100.0%

2019 Estimates of National Expenditure
22
Personnel information Table 14.23 South African Council for Educators personnel numbers and cost by salary level
Number of posts estimated for
31 March 2019 Number and cost1 of personnel posts filled/planned for on funded establishment Number Number
of funded
posts
Number of posts
on approved establishment Actual Revised estimate Medium-term expenditure estimate
Averagegrowth
rate(%)
Average:Salary
level/Total(%)
2017/18 2018/19 2019/20 2020/21 2021/22 2018/19 - 2021/22 South African Council for Educators
Number Cost
Unit cost
Number Cost
Unit cost
Number Cost
Unit cost
Number Cost
Unit cost
Number Cost
Unit cost
Salary level
163 163 126 36.9 0.3 163 55.2 0.3 163 59.9 0.4 163 64.7 0.4 163 69.8 0.4 8.1% 100.0%
1 – 6 59 59 49 3.8 0.1 59 8.5 0.1 59 9.1 0.2 59 9.9 0.2 59 10.7 0.2 7.7% 36.2%7 – 10 91 91 68 23.1 0.3 91 32.7 0.4 91 35.5 0.4 91 38.3 0.4 91 41.4 0.5 8.2% 55.8%11 – 12 5 5 5 3.9 0.8 5 3.5 0.7 5 3.9 0.8 5 4.2 0.8 5 4.5 0.9 8.7% 3.1%13 – 16 8 8 4 6.0 1.5 8 10.5 1.3 8 11.4 1.4 8 12.3 1.5 8 13.3 1.7 8.2% 4.9%1. Rand million.
Umalusi Council for Quality Assurance in General and Further Education and Training
Mandate The Umalusi Council for Quality Assurance in General and Further Education and Training derives its mandate from the National Qualifications Framework Act (2008), as well as the General and Further Education and Training Quality Assurance Act (2001). As an external and independent quality assurance body, the council’s mandate is to set and maintain standards in general and further education and training through the development and management of the general and further education and training qualifications sub-framework.
Selected performance indicators Table 14.24 Umalusi Council for Quality Assurance in General and Further Education and Training performance indicators by programme/objective/activity and related outcome Indicator Programme/Objective/Activity MTSF outcome Past Current Projections 2015/16 2016/17 2017/18 2018/19 2019/20 2020/21 2021/22Number of reports produced on the management of qualifications in the sub-framework per year
Qualifications, curriculum and certification
Outcome 1: Quality basic education
–1 –1 3 3 12 1 1
Percentage of error-free learner records for which a certificate is printed per year
Qualifications, curriculum and certification
–1 –1 99.9% (1 017 949/ 1 018 136)
100% 100% 100% 100%
Percentage of verification requests received that are completed within 2 working days per year
Qualifications, curriculum and certification
–1 –1 98% (19 600/ 19 923)
95% 95% 95% 95%
Number of quality assurance of assessment reports published for qualifications registered on the general and further education and training qualifications sub-framework per year
Quality assurance of assessment –1 12 16 103 10 10 10
Percentage of question papers approved per assessment body per qualification per examination cycle
Quality assurance of assessment –1 –1 103%(1 124/ 1 090)
100% 100% 100% 100%
1. No historical data available. 2. The 3 reports previously completed will be incorporated to form a single review. 3. The council has decided to produce 10 of these reports from 2018/19 onwards.
Expenditure analysis Over the medium term, the Umalusi Council for Quality Assurance in General and Further Education and Training intends to continue to focus on quality assurance for exit examinations in schools, technical and vocational education and training colleges, and adult education centres; and sign language assessments. The council also expects to continue moderating the setting and marking of examination papers; conducting school-based assessments; accrediting private education and training providers; and undertaking research into education matters.
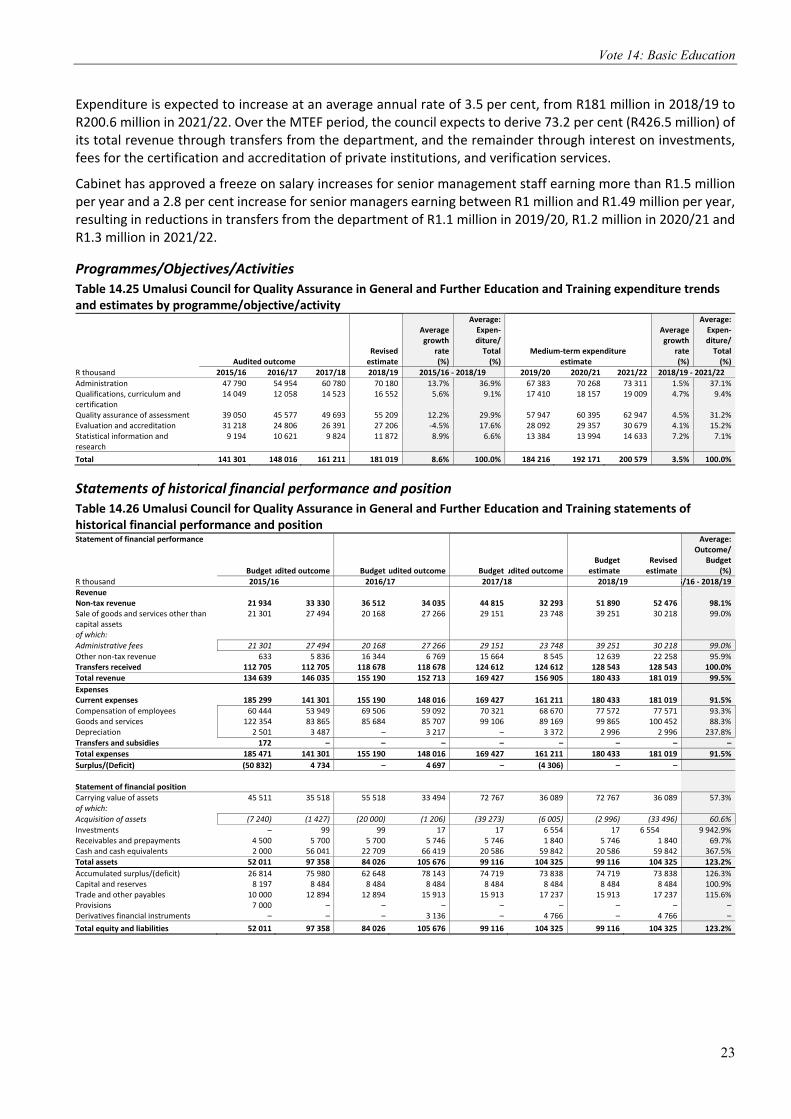
Vote 14: Basic Education
23
Expenditure is expected to increase at an average annual rate of 3.5 per cent, from R181 million in 2018/19 to R200.6 million in 2021/22. Over the MTEF period, the council expects to derive 73.2 per cent (R426.5 million) of its total revenue through transfers from the department, and the remainder through interest on investments, fees for the certification and accreditation of private institutions, and verification services.
Cabinet has approved a freeze on salary increases for senior management staff earning more than R1.5 million per year and a 2.8 per cent increase for senior managers earning between R1 million and R1.49 million per year, resulting in reductions in transfers from the department of R1.1 million in 2019/20, R1.2 million in 2020/21 and R1.3 million in 2021/22.
Programmes/Objectives/Activities Table 14.25 Umalusi Council for Quality Assurance in General and Further Education and Training expenditure trends and estimates by programme/objective/activity
Audited outcome Revisedestimate
Averagegrowth
rate(%)
Average:Expen-diture/
Total(%)
Medium-term expenditure estimate
Averagegrowth
rate(%)
Average:Expen-diture/
Total(%)
R thousand 2015/16 2016/17 2017/18 2018/19 2015/16 - 2018/19 2019/20 2020/21 2021/22 2018/19 - 2021/22 Administration 47 790 54 954 60 780 70 180 13.7% 36.9% 67 383 70 268 73 311 1.5% 37.1%Qualifications, curriculum and certification
14 049 12 058 14 523 16 552 5.6% 9.1% 17 410 18 157 19 009 4.7% 9.4%
Quality assurance of assessment 39 050 45 577 49 693 55 209 12.2% 29.9% 57 947 60 395 62 947 4.5% 31.2%Evaluation and accreditation 31 218 24 806 26 391 27 206 -4.5% 17.6% 28 092 29 357 30 679 4.1% 15.2%Statistical information and research
9 194 10 621 9 824 11 872 8.9% 6.6% 13 384 13 994 14 633 7.2% 7.1%
Total 141 301 148 016 161 211 181 019 8.6% 100.0% 184 216 192 171 200 579 3.5% 100.0%
Statements of historical financial performance and position Table 14.26 Umalusi Council for Quality Assurance in General and Further Education and Training statements of historical financial performance and position Statement of financial performance
Budget udited outcome Budget udited outcome Budget udited outcome Budget
estimate Revisedestimate
Average:Outcome/
Budget (%)
R thousand 2015/16 2016/17 2017/18 2018/19 5/16 - 2018/19 Revenue Non-tax revenue 21 934 33 330 36 512 34 035 44 815 32 293 51 890 52 476 98.1%Sale of goods and services other than capital assets
21 301 27 494 20 168 27 266 29 151 23 748 39 251 30 218 99.0%
of which: Administrative fees 21 301 27 494 20 168 27 266 29 151 23 748 39 251 30 218 99.0%Other non-tax revenue 633 5 836 16 344 6 769 15 664 8 545 12 639 22 258 95.9%Transfers received 112 705 112 705 118 678 118 678 124 612 124 612 128 543 128 543 100.0%Total revenue 134 639 146 035 155 190 152 713 169 427 156 905 180 433 181 019 99.5%Expenses Current expenses 185 299 141 301 155 190 148 016 169 427 161 211 180 433 181 019 91.5%Compensation of employees 60 444 53 949 69 506 59 092 70 321 68 670 77 572 77 571 93.3%Goods and services 122 354 83 865 85 684 85 707 99 106 89 169 99 865 100 452 88.3%Depreciation 2 501 3 487 – 3 217 – 3 372 2 996 2 996 237.8%Transfers and subsidies 172 – – – – – – – – Total expenses 185 471 141 301 155 190 148 016 169 427 161 211 180 433 181 019 91.5%Surplus/(Deficit) (50 832) 4 734 – 4 697 – (4 306) – – Statement of financial position Carrying value of assets 45 511 35 518 55 518 33 494 72 767 36 089 72 767 36 089 57.3%of which: Acquisition of assets (7 240) (1 427) (20 000) (1 206) (39 273) (6 005) (2 996) (33 496) 60.6%Investments – 99 99 17 17 6 554 17 6 554 9 942.9%Receivables and prepayments 4 500 5 700 5 700 5 746 5 746 1 840 5 746 1 840 69.7%Cash and cash equivalents 2 000 56 041 22 709 66 419 20 586 59 842 20 586 59 842 367.5%Total assets 52 011 97 358 84 026 105 676 99 116 104 325 99 116 104 325 123.2%Accumulated surplus/(deficit) 26 814 75 980 62 648 78 143 74 719 73 838 74 719 73 838 126.3%Capital and reserves 8 197 8 484 8 484 8 484 8 484 8 484 8 484 8 484 100.9%Trade and other payables 10 000 12 894 12 894 15 913 15 913 17 237 15 913 17 237 115.6%Provisions 7 000 – – – – – – – – Derivatives financial instruments – – – 3 136 – 4 766 – 4 766 – Total equity and liabilities 52 011 97 358 84 026 105 676 99 116 104 325 99 116 104 325 123.2%

2019 Estimates of National Expenditure
24
Statements of estimates of financial performance and position Table 14.27 Umalusi Council for Quality Assurance in General and Further Education and Training statements of estimates of financial performance and position Statement of financial performance
Revised estimate
Averagegrowth
rate(%)
Average:Expen-diture/
Total(%) Medium-term estimate
Average growth
rate (%)
Average:Expen-diture/
Total(%)
R thousand 2018/19 2015/16 - 2018/19 2019/20 2020/21 2021/22 2018/19 - 2021/22 Revenue Non-tax revenue 52 476 16.3% 23.7% 49 582 50 159 50 757 -1.1% 26.8%Sale of goods and services other than capital assets
30 218 3.2% 17.1% 27 962 29 639 31 419 1.3% 15.7%
of which: Administrative fees 30 218 3.2% 17.1% 27 962 29 639 31 419 1.3% 15.7%Other non-tax revenue 22 258 56.2% 6.5% 21 620 20 520 19 338 -4.6% 11.1%Transfers received 128 543 4.5% 76.3% 134 634 142 012 149 822 5.2% 73.2%Total revenue 181 019 7.4% 100.0% 184 216 192 171 200 579 3.5% 100.0%Expenses Current expenses 181 019 8.6% 100.0% 184 216 192 171 200 579 3.5% 100.0%Compensation of employees 77 571 12.9% 40.9% 80 938 84 950 89 190 4.8% 43.9%Goods and services 100 452 6.2% 57.0% 100 278 104 221 108 389 2.6% 54.5%Depreciation 2 996 -4.9% 2.1% 3 000 3 000 3 000 0.0% 1.6%Total expenses 181 019 8.6% 100.0% 184 216 192 171 200 579 3.5% 100.0%Surplus/(Deficit) – – – – Statement of financial position
Carrying value of assets 36 089 0.5% 34.3% 36 089 36 089 36 089 – 34.6%of which: Acquisition of assets (33 496) 186.3% -10.1% (3 000) (3 000) (3 000) -55.3% -10.2%Investments 6 554 304.5% 3.2% 6 554 6 554 6 554 – 6.3%Receivables and prepayments 1 840 -31.4% 3.7% 1 840 1 840 1 840 – 1.8%Cash and cash equivalents 59 842 2.2% 58.8% 59 842 59 842 59 842 – 57.4%Total assets 104 325 2.3% 100.0% 104 325 104 325 104 325 – 100.0%Accumulated surplus/(deficit) 73 838 -0.9% 73.4% 73 838 73 838 73 838 – 70.8%Capital and reserves 8 484 – 8.3% 8 484 8 484 8 484 – 8.1%Trade and other payables 17 237 10.2% 15.3% 17 237 17 237 17 237 – 16.5%Derivatives financial instruments 4 766 – 3.0% 4 766 4 766 4 766 – 4.6%Total equity and liabilities 104 325 2.3% 100.0% 104 325 104 325 104 325 – 100.0%
Personnel information Table 14.28 Umalusi Council for Quality Assurance in General and Further Education and Training personnel numbers and cost by salary level
Number of posts estimated for
31 March 2019 Number and cost1 of personnel posts filled/planned for on funded establishment Number Number
of funded
posts
Number of posts
on approved establishment Actual Revised estimate
Medium-term expenditure estimate
Averagegrowth
rate(%)
Average:Salary
level/Total(%)
2017/18 2018/19 2019/20 2020/21 2021/22 2018/19 - 2021/22 Umalusi Council for Quality Assurance in General and Further Education and Training
Number Cost
Unit cost
Number Cost
Unit cost
Number Cost
Unit cost
Number Cost
Unit cost
Number Cost
Unit cost
Salary level
141 141 135 68.7 0.5 141 77.6 0.6 141 80.9 0.6 141 85.0 0.6 141 89.2 0.6 4.8% 100.0%
1 – 6 54 54 53 13.2 0.2 54 14.8 0.3 54 15.6 0.3 54 16.4 0.3 54 17.2 0.3 5.2% 38.3%7 – 10 52 52 48 24.5 0.5 52 28.3 0.5 52 29.7 0.6 52 31.1 0.6 52 32.5 0.6 4.7% 36.9%11 – 12 21 21 20 15.5 0.8 21 17.9 0.9 21 18.7 0.9 21 19.6 0.9 21 20.6 1.0 4.8% 14.9%13 – 16 13 13 13 13.1 1.0 13 14.2 1.1 13 14.6 1.1 13 15.4 1.2 13 16.2 1.2 4.6% 9.2%17 – 22 1 1 1 2.4 2.4 1 2.3 2.3 1 2.3 2.3 1 2.5 2.5 1 2.6 2.6 3.3% 0.7%1. Rand million.
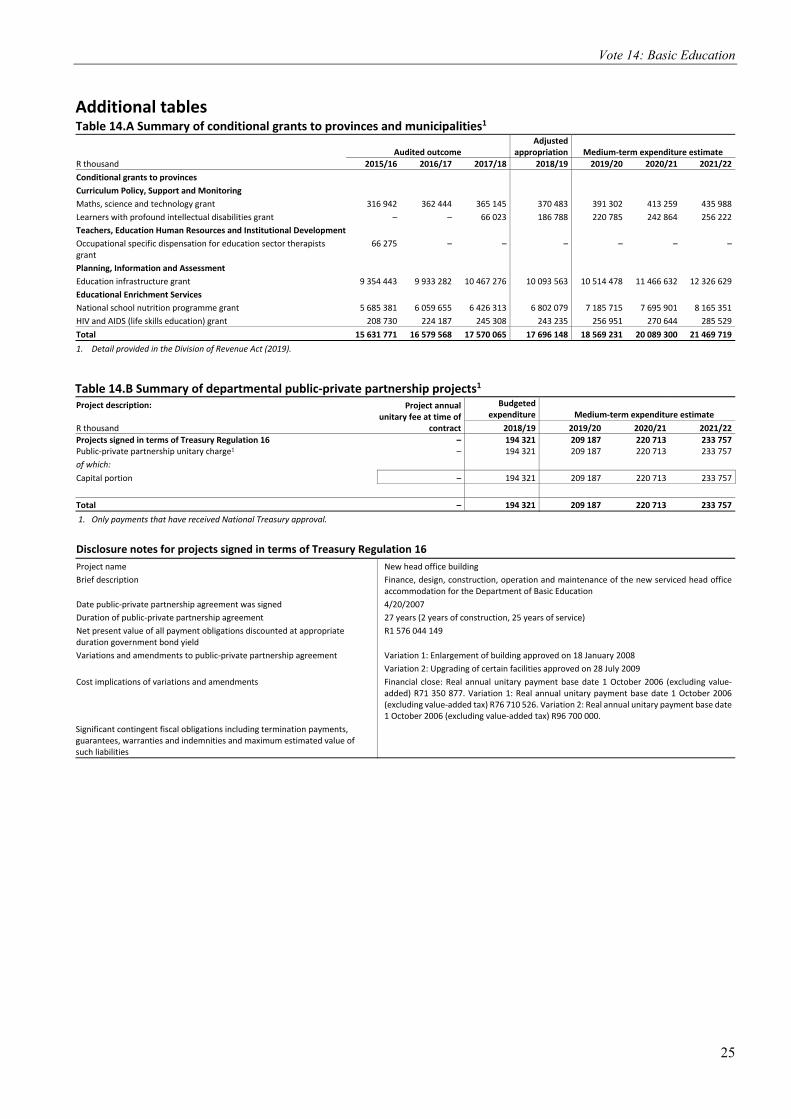
Vote 14: Basic Education
25
Additional tables Table 14.A Summary of conditional grants to provinces and municipalities1
Audited outcome Adjusted
appropriation Medium-term expenditure estimate R thousand 2015/16 2016/17 2017/18 2018/19 2019/20 2020/21 2021/22 Conditional grants to provinces Curriculum Policy, Support and Monitoring Maths, science and technology grant 316 942 362 444 365 145 370 483 391 302 413 259 435 988Learners with profound intellectual disabilities grant – – 66 023 186 788 220 785 242 864 256 222Teachers, Education Human Resources and Institutional Development Occupational specific dispensation for education sector therapists grant
66 275 – – – – – –
Planning, Information and Assessment Education infrastructure grant 9 354 443 9 933 282 10 467 276 10 093 563 10 514 478 11 466 632 12 326 629Educational Enrichment Services National school nutrition programme grant 5 685 381 6 059 655 6 426 313 6 802 079 7 185 715 7 695 901 8 165 351HIV and AIDS (life skills education) grant 208 730 224 187 245 308 243 235 256 951 270 644 285 529Total 15 631 771 16 579 568 17 570 065 17 696 148 18 569 231 20 089 300 21 469 7191. Detail provided in the Division of Revenue Act (2019).
Table 14.B Summary of departmental public-private partnership projects1
Project description: Project annual unitary fee at time of
contract
Budgetedexpenditure Medium-term expenditure estimate
R thousand 2018/19 2019/20 2020/21 2021/22 Projects signed in terms of Treasury Regulation 16 – 194 321 209 187 220 713 233 757Public-private partnership unitary charge1 – 194 321 209 187 220 713 233 757of which: Capital portion – 194 321 209 187 220 713 233 757 Total – 194 321 209 187 220 713 233 757 1. Only payments that have received National Treasury approval.
Disclosure notes for projects signed in terms of Treasury Regulation 16 Project name New head office building Brief description Finance, design, construction, operation and maintenance of the new serviced head office
accommodation for the Department of Basic Education Date public-private partnership agreement was signed 4/20/2007 Duration of public-private partnership agreement 27 years (2 years of construction, 25 years of service) Net present value of all payment obligations discounted at appropriate duration government bond yield
R1 576 044 149
Variations and amendments to public-private partnership agreement Variation 1: Enlargement of building approved on 18 January 2008 Variation 2: Upgrading of certain facilities approved on 28 July 2009
Cost implications of variations and amendments Financial close: Real annual unitary payment base date 1 October 2006 (excluding value-added) R71 350 877. Variation 1: Real annual unitary payment base date 1 October 2006 (excluding value-added tax) R76 710 526. Variation 2: Real annual unitary payment base date 1 October 2006 (excluding value-added tax) R96 700 000.
Significant contingent fiscal obligations including termination payments, guarantees, warranties and indemnities and maximum estimated value of such liabilities
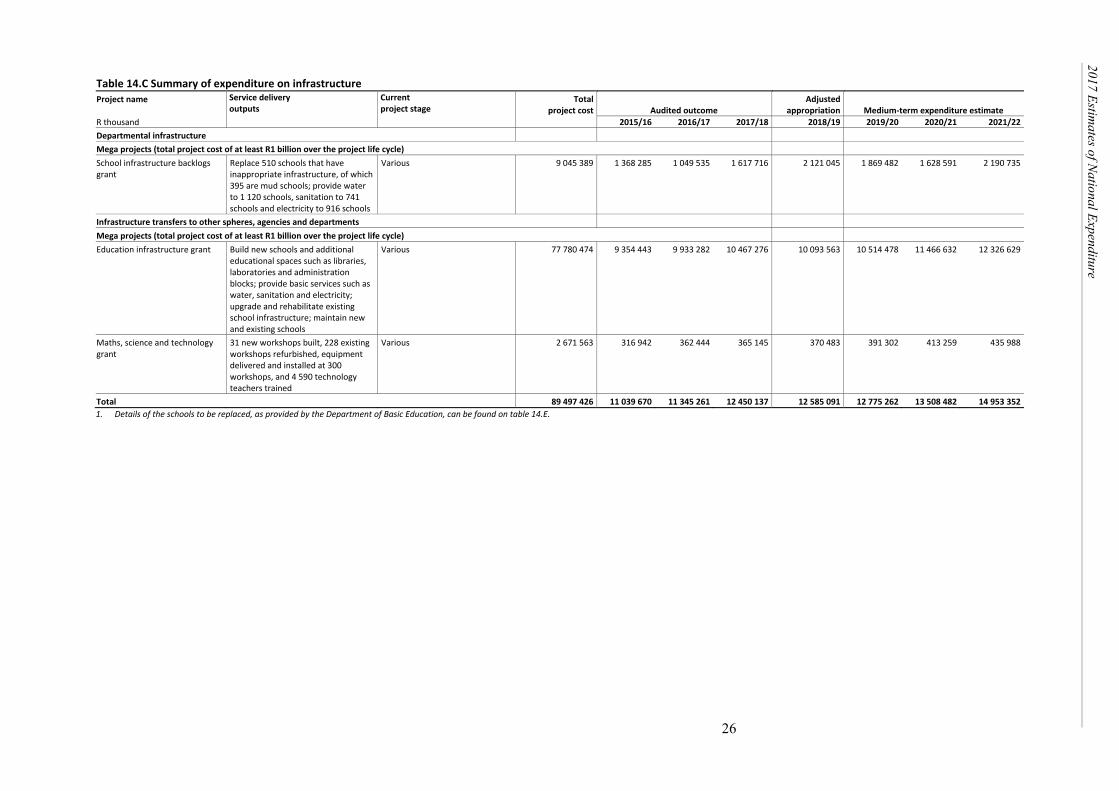
26
2017 Estimates of National Expenditure
Table 14.C Summary of expenditure on infrastructure Project name Service delivery
outputs Current project stage
Totalproject cost Audited outcome
Adjustedappropriation Medium-term expenditure estimate
R thousand 2015/16 2016/17 2017/18 2018/19 2019/20 2020/21 2021/22 Departmental infrastructure Mega projects (total project cost of at least R1 billion over the project life cycle) School infrastructure backlogs grant
Replace 510 schools that have inappropriate infrastructure, of which 395 are mud schools; provide water to 1 120 schools, sanitation to 741 schools and electricity to 916 schools
Various 9 045 389 1 368 285 1 049 535 1 617 716 2 121 045 1 869 482 1 628 591 2 190 735
Infrastructure transfers to other spheres, agencies and departments Mega projects (total project cost of at least R1 billion over the project life cycle) Education infrastructure grant Build new schools and additional
educational spaces such as libraries, laboratories and administration blocks; provide basic services such as water, sanitation and electricity; upgrade and rehabilitate existing school infrastructure; maintain new and existing schools
Various 77 780 474 9 354 443 9 933 282 10 467 276 10 093 563 10 514 478 11 466 632 12 326 629
Maths, science and technology grant
31 new workshops built, 228 existing workshops refurbished, equipment delivered and installed at 300 workshops, and 4 590 technology teachers trained
Various 2 671 563 316 942 362 444 365 145 370 483 391 302 413 259 435 988
Total 89 497 426 11 039 670 11 345 261 12 450 137 12 585 091 12 775 262 13 508 482 14 953 352 1. Details of the schools to be replaced, as provided by the Department of Basic Education, can be found on table 14.E.

Vote 14: Basic Education
27
Table 14.D Summary of donor funding Donor Project Programme Period of
commitment Amount
committed Main economic classification
Spending focus Audited outcome Estimate Medium-term expenditure estimate
R thousand 2015/16 2016/17 2017/18 2018/19 2019/20 2020/21 2021/22 Foreign In cash European Union Primary education sector
policy support programme Teachers, Education Human Resources and Institutional Development
5 years 1 332 638 Goods and services
Contribute to improving learner performance in literacy and numeracy at the primary school level to achieve better throughput to secondary, higher and vocational training in South Africa. Key performance indicators include: net enrolment ratio in primary schools, percentage of public ordinary and special schools with toilets, percentage of schools offering home language instruction in grade 3, national average learner performance in grade 3 in literacy and numeracy, national average learner performance in grade 6 in language and mathematics, number of public higher education institutions involved in initial teacher education for teaching in the foundation phase, and number of students enrolled in the initial teacher education programmes specialising in the foundation phase
315 69 884 104 846 – – – –
European Union Rural education assistants project
Curriculum Policy, Support and Monitoring
3 years 58 328 Goods and services
Improve the level of youth unemployment to assist with supporting a variety of curricular activities particularly relating to improving numeracy, literacy and reading skills by coordinating homework clubs, mathematics clubs, reading clubs, creative arts clubs and agricultural clubs. Development systems to determine continuity and sustainability
– – – 29 162 29 164 29 164 –

28 2019 Estimates of National Expenditure
Table 14.D Summary of donor funding Donor Project Programme Period of
commitment Amount
committed Main economic classification
Spending focus Audited outcome Estimate Medium-term expenditure estimate
R thousand 2015/16 2016/17 2017/18 2018/19 2019/20 2020/21 2021/22 Foreign In cash European Union Systematic improvement
of language and numeracy in foundation phase
Curriculum Policy, Support and Monitoring
3 Years 59 509 Goods and services
Develop (or build) the capacity of the state by designing and developing programmes to strengthen the capacity of the individuals within the structures of the state. This will be done through improving the pedagogical practices and skills in foundation phase language and numeracy teaching; improving the service delivered in the routine support given to teachers in schools by heads of department and subject advisers; and creating work opportunities specifically for young people from poor and rural areas by providing training to be foundation phase teachers
– – – – 26 779 16 529 16 201
European Union Technology grades 7 to 9 Curriculum Policy, Support and Monitoring
3 years 59 999 Goods and services
Develop and implement innovative basic education delivery models through the introduction of diverse technological knowledge and skills, in response to the fourth industrial revolution. The introduction of robotics and Lego will play a part in strengthening the curriculum. The programmes to be designed and developed will contribute to enhancing skills and knowledge compatible with the changing environment of technology and address gaps in state capacity, potentially improving the way quality basic education is being delivered
– – – – 20 480 19 564 19 955
Total 1 510 474 315 69 884 104 846 29 162 76 423 65 257 36 156

Vote 14: Basic Education
29
Table 14.E New schools to replace inappropriate structures, 2019/201 National EMIS No
Province Education district
School name Latitude Longitude Implementing agent Project stage Appointed contractor Contract value R'000
200100923 Eastern Cape Uitenhage Amamfengu public- primary school
-34.0110 24.3480 Coega Development Corporation
Construction Masithembeke Construction 38 366
200100034 Eastern Cape Uitenhage Andrieskraal primary school -33.7515 24.6730 Coega Development Corporation
Construction Marnolda 37 519
200401265 Eastern Cape Libode Bomvini senior primary school -31.3085 29.2005 Coega Development Corporation
Construction Sinokuhle Construction 18 307
200400142 Eastern Cape Qumbu Dumba junior primary school -31.2099 29.0556 Coega Development Corporation
Practical completion Triple Option Trading (trading as Zibele Construction)
17 644
200401291 Eastern Cape Qumbu Gabazi junior secondary school -31.1370 28.9741 Coega Development Corporation
Construction Develex 42 932
200600250 Eastern Cape Cofimvaba Heukile senior primary school -31.7260 27.5952 Coega Development Corporation
Practical completion Mbokotho Investments (trading as ZM Construction)
11 095
200300235 Eastern Cape Cofimvaba Lower Tsojana junior secondary school
-31.9439 27.7840 Coega Development Corporation
Practical completion Edge to Edge 18 378
200401236 Eastern Cape Qumbu Lugongqozo senior primary school
-31.1748 29.0128 Coega Development Corporation
Practical completion Delevex 11 314
200500500 Eastern Cape Lusikisiki Madlalisa senior primary school -31.2297 29.2212 Coega Development Corporation
Practical completion HDM Construction 27 948
200300267 Eastern Cape Cofimvaba Mahlatini junior secondary school
-31.9939 27.6418 Coega Development Corporation
Practical completion Mbokotho Investments (trading as ZM Construction)
12 387
200500604 Eastern Cape Qumbu Mawonga senior primary school -31.2132 29.1819 Coega Development Corporation
Practical completion Denrob Business Enterprise 20 631
200400519 Eastern Cape Libode Mayibenye senior primary school -31.7083 29.2388 Coega Development Corporation
Practical completion Lubbe Construction 21 574
200400586 Eastern Cape Libode Mgungundlovu junior primary school
-31.5739 29.1947 Coega Development Corporation
Practical completion Express Builders 21 507
200300341 Eastern Cape Cofimvaba Middle Qutsa senior primary school
-32.0472 27.6752 Coega Development Corporation
Practical completion Mbokotho Investments (trading as ZM Construction)
17 361
200400607 Eastern Cape Qumbu Mkhambeni senior primary school
-31.1686 28.9518 Coega Development Corporation
Practical completion Delevex 10 277
200600526 Eastern Cape Cofimvaba Mtingwevu junior secondary school
-31.7467 27.6200 Coega Development Corporation
Practical completion H and Z Building Construction
18 145
200501354 Eastern Cape Qumbu Mziwoxolo junior primary school -31.1594 29.1567 Coega Development Corporation
Practical completion Edge to Edge 20 574
200400720 Eastern Cape Libode Ndimakude junior secondary school
-31.6976 28.9210 Coega Development Corporation
Practical completion Express Builders 18 605
200400791 Eastern Cape Qumbu Nkanti senior primary school -31.2902 29.0682 Coega Development Corporation
Practical completion Denrob Business Enterprise 17 444
200200979 Eastern Cape East London Nkosinathi primary school -32.8832 27.5494 Coega Development Corporation
Practical completion Core Facts 9 897
200300474 Eastern Cape King William’s Town
Nolusapho senior primary school -32.1306 27.6383 Coega Development Corporation
Practical completion Core Facts 9 885
200100929 Eastern Cape Uitenhage Nomzamo Madikizela Mandela primary school
-33.8980 25.1428 Coega Development Corporation
Practical completion Alexander Maintenance and Electrical Services
25 717
200501430 Eastern Cape Mbizana Phandulwazi junior primary school
-31.1226 29.9699 Coega Development Corporation
Practical completion Triple Option Trading (trading as Zibele Construction)
17 788
200300539 Eastern Cape Cofimvaba Philemon junior secondary school
-31.9742 27.9086 Coega Development Corporation
Practical completion Uvuko Civils Maintenance and Construction
18 251
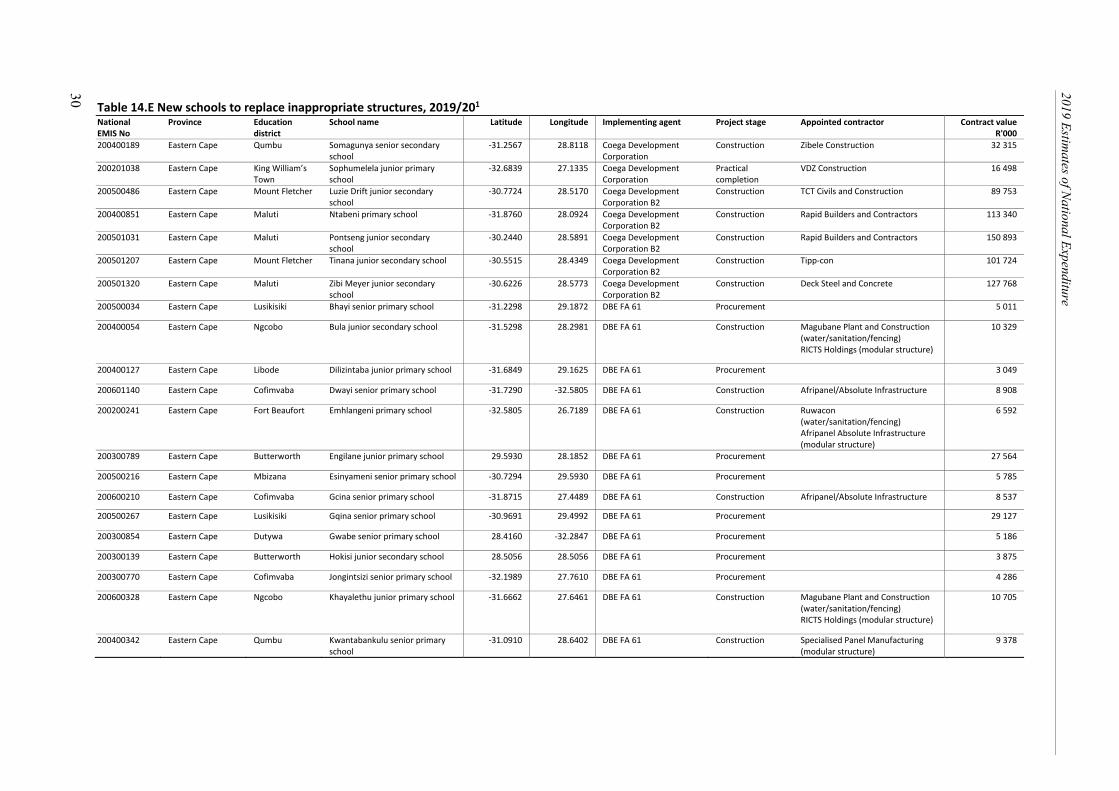
30 2019 Estimates of National Expenditure
Table 14.E New schools to replace inappropriate structures, 2019/201 National EMIS No
Province Education district
School name Latitude Longitude Implementing agent Project stage Appointed contractor Contract value R'000
200400189 Eastern Cape Qumbu Somagunya senior secondary school
-31.2567 28.8118 Coega Development Corporation
Construction Zibele Construction 32 315
200201038 Eastern Cape King William’s Town
Sophumelela junior primary school
-32.6839 27.1335 Coega Development Corporation
Practical completion
VDZ Construction 16 498
200500486 Eastern Cape Mount Fletcher Luzie Drift junior secondary school
-30.7724 28.5170 Coega Development Corporation B2
Construction TCT Civils and Construction 89 753
200400851 Eastern Cape Maluti Ntabeni primary school -31.8760 28.0924 Coega Development Corporation B2
Construction Rapid Builders and Contractors 113 340
200501031 Eastern Cape Maluti Pontseng junior secondary school
-30.2440 28.5891 Coega Development Corporation B2
Construction Rapid Builders and Contractors 150 893
200501207 Eastern Cape Mount Fletcher Tinana junior secondary school -30.5515 28.4349 Coega Development Corporation B2
Construction Tipp-con 101 724
200501320 Eastern Cape Maluti Zibi Meyer junior secondary school
-30.6226 28.5773 Coega Development Corporation B2
Construction Deck Steel and Concrete 127 768
200500034 Eastern Cape Lusikisiki Bhayi senior primary school -31.2298 29.1872 DBE FA 61 Procurement 5 011
200400054 Eastern Cape Ngcobo Bula junior secondary school -31.5298 28.2981 DBE FA 61 Construction Magubane Plant and Construction (water/sanitation/fencing)
10 329
RICTS Holdings (modular structure)
200400127 Eastern Cape Libode Dilizintaba junior primary school -31.6849 29.1625 DBE FA 61 Procurement 3 049
200601140 Eastern Cape Cofimvaba Dwayi senior primary school -31.7290 -32.5805 DBE FA 61 Construction Afripanel/Absolute Infrastructure 8 908
200200241 Eastern Cape Fort Beaufort Emhlangeni primary school -32.5805 26.7189 DBE FA 61 Construction Ruwacon (water/sanitation/fencing) Afripanel Absolute Infrastructure (modular structure)
6 592
200300789 Eastern Cape Butterworth Engilane junior primary school 29.5930 28.1852 DBE FA 61 Procurement 27 564
200500216 Eastern Cape Mbizana Esinyameni senior primary school -30.7294 29.5930 DBE FA 61 Procurement 5 785
200600210 Eastern Cape Cofimvaba Gcina senior primary school -31.8715 27.4489 DBE FA 61 Construction Afripanel/Absolute Infrastructure 8 537
200500267 Eastern Cape Lusikisiki Gqina senior primary school -30.9691 29.4992 DBE FA 61 Procurement 29 127
200300854 Eastern Cape Dutywa Gwabe senior primary school 28.4160 -32.2847 DBE FA 61 Procurement 5 186
200300139 Eastern Cape Butterworth Hokisi junior secondary school 28.5056 28.5056 DBE FA 61 Procurement 3 875
200300770 Eastern Cape Cofimvaba Jongintsizi senior primary school -32.1989 27.7610 DBE FA 61 Procurement 4 286
200600328 Eastern Cape Ngcobo Khayalethu junior primary school -31.6662 27.6461 DBE FA 61 Construction Magubane Plant and Construction (water/sanitation/fencing)
10 705
RICTS Holdings (modular structure)
200400342 Eastern Cape Qumbu Kwantabankulu senior primary school
-31.0910 28.6402 DBE FA 61 Construction Specialised Panel Manufacturing (modular structure)
9 378

Vote 14: Basic Education
31
Table 14.E New schools to replace inappropriate structures, 2019/201 National EMIS No
Province Education district
School name Latitude Longitude Implementing agent Project stage Appointed contractor Contract value R'000
200300204 Eastern Cape Cofimvaba Lampta senior primary school -32.1547 27.8135 DBE FA 61 Procurement 3 868 200300231 Eastern Cape Butterworth Lower Nofotyo junior secondary
school -32.1947 27.8237 DBE FA 61 Procurement 3 915
200300852 Eastern Cape Dutywa Lukhozana senior secondary school
-32.1492 28.7055 DBE FA 61 Procurement 27 564
200400456 Eastern Cape Qumbu Mahobe senior primary school -31.2415 28.8735 DBE FA 61 Construction Ruwacon (water/sanitation/fencing) Kwikspace Modular Building (modular structure)
9 959
200300288 Eastern Cape Cofimvaba Masakane senior primary school -31.9267 27.7983 DBE FA 61 Construction Afripanel/Absolute Infrastructure
9 269
200200436 Eastern Cape Fort Beaufort Masivuyiswe junior secondary school
-32.8357 26.7996 DBE FA 61 Construction Ruwacon (water/sanitation/fencing) Afripanel Absolute Infrastructure (modular structure)
9 043
200400510 Eastern Cape Ngcobo Matiyase junior primary school -31.6441 27.8117 DBE FA 61 Construction Magubane Plant and Construction (water/sanitation/fencing)
10 354
RICTS Holdings (modular structure) 200400521 Eastern Cape Ngcobo Mbabakazi junior secondary
school -31.4509 28.2158 DBE FA 61 Construction Magubane Plant and Construction
(water/sanitation/fencing) 10 265
RICTS Holdings (modular structure) 200200462 Eastern Cape Fort Beaufort Mdumiseni primary school -32.7697 26.7893 DBE FA 61 Construction Ruwacon
(water/sanitation/fencing) Afripanel Absolute Infrastructure (modular structure)
9 212
200400573 Eastern Cape Dutywa Melibuwa senior primary school -32.1061 28.9463 DBE FA 61 Procurement 29 542 200300323 Eastern Cape Cofimvaba Mfezeko senior primary school -32.0021 28.1856 DBE FA 61 Procurement 5 191 200500698 Eastern Cape Qumbu Mkiwane senior primary school -31.1322 29.0238 DBE FA 61 Construction Ruwacon
(water/sanitation/fencing) Kwikspace Modular Building (modular structure)
8 523
200501421 Eastern Cape Mount Frere Mlenze senior primary school -30.8055 28.6676 DBE FA 61 Construction Specialised Panel Manufacturing (modular structure)
8 016
200400618 Eastern Cape Qumbu Mmangweni junior primary school
-31.2897 28.8569 DBE FA 61 Construction Ruwacon (water/sanitation/fencing) Kwikspace Modular Building (modular structure)
3 823
200300358 Eastern Cape Butterworth Mnyaka junior secondary school -32.5798 28.4285 DBE FA 61 Procurement 5 052 200500763 Eastern Cape Lusikisiki Mpolosa senior primary school -31.0055 29.1242 DBE FA 61 Procurement 4 223 200400665 Eastern Cape Mount Fletcher Msobomvu senior primary school -31.2409 28.4138 DBE FA 61 Construction Specialised Panel Manufacturing
(modular structure) 9 890
200300397 Eastern Cape Butterworth Mvumelwano junior primary school
-32.5391 28.4844 DBE FA 61 Procurement 3 415
200300405 Eastern Cape Butterworth Mzinjane senior primary school -32.4440 28.1083 DBE FA 61 Procurement 4 253

32 2019 Estimates of National Expenditure
Table 14.E New schools to replace inappropriate structures, 2019/201 National EMIS No
Province Education district
School name Latitude Longitude Implementing agent Project stage Appointed contractor Contract value R'000
200500841 Eastern Cape Qumbu Nazareth senior primary school -31.1591 29.0332 DBE FA 61 Construction Ruwacon (water/sanitation/fencing) Kwikspace Modular Building (modular structure)
8 086
200400711 Eastern Cape Qumbu Ncitshane junior primary school -31.3818 28.6381 DBE FA 61 Procurement 27 565 200500880 Eastern Cape Lusikisiki Ngibe senior primary school -31.4083 29.5896 DBE FA 61 Procurement 3 389 200500885 Eastern Cape Lusikisiki Ngozi senior primary school -31.0194 29.1969 DBE FA 61 Procurement 28 000 200300450 Eastern Cape Butterworth Ngweyesizwe junior primary
school -32.4504 28.3527 DBE FA 61 Procurement 3 406
200400811 Eastern Cape Ngcobo Nogwaza senior primary school -31.7740 27.9407 DBE FA 61 Procurement 31 961 200300493 Eastern Cape Cofimvaba Nontuthuzelo combined school -32.0590 28.1405 DBE FA 61 Procurement 5 240 200300545 Eastern Cape Butterworth Qhamile junior primary school -32.4569 28.1597 DBE FA 61 Procurement 4 303 200600697 Eastern Cape Lady Frere Qumbu senior primary school -31.6639 26.8457 DBE FA 61 Construction
Afripanel/Absolute Infrastructure 7 298
200501110 Eastern Cape Mount Frere Silindini senior primary school -30.6790 29.1837 DBE FA 61 Procurement 3 495 200401016 Eastern Cape Qumbu Skobeni senior primary school -31.1272 28.9498 DBE FA 61 Procurement 5 022 200200854 Eastern Cape King William’s
Town Tsenekana primary school -33.0838 27.1605 DBE FA 61 Construction Ruwacon
(water/sanitation/fencing) Afriplane Absolute Infrastructure (modular structure)
9 278
200401119 Eastern Cape Ngcobo Voyizana senior primary school -31.6485 27.9204 DBE FA 61 Procurement 27 718 200300725 Eastern Cape Butterworth Vuyolwethu junior primary
school -32.5278 28.3791 DBE FA 61 Procurement 6 072
200800891 Eastern Cape Cofimvaba Woodhouse pre-primary school -31.9557 27.5727 DBE FA 61 Procurement 29 763 200401149 Eastern Cape Ngcobo Xokonxa senior primary school -31.4799 28.2286 DBE FA 61 Construction Magubane Plant and Construction
(water/sanitation/fencing) 8 511
RICTS Holdings (modular structure) 200600941 Eastern Cape Cofimvaba Zanendyebo senior primary
school -32.0518 27.4466 DBE FA 61 Procurement 3 624
200401175 Eastern Cape Qumbu Zanokanyo junior primary school -31.0782 28.7225 DBE FA 61 Construction Ruwacon (water/sanitation/fencing) Afriplane Absolute Infrastructure (modular structure)
9 255
200200981 Eastern Cape King William’s Town
Zanokhanyo lower primary school
-32.7416 27.1982 DBE FA 61 Construction Specialised Panel Manufacturing (modular structure)
9 874
200401190 Eastern Cape Qumbu Zimbengwini senior primary school
-30.9110 28.7192 DBE FA 61 Construction Nakiseni Business Enterprise (water/sanitation/fencing)
8 465
Specialised Panel Manufacturing (modular structure)
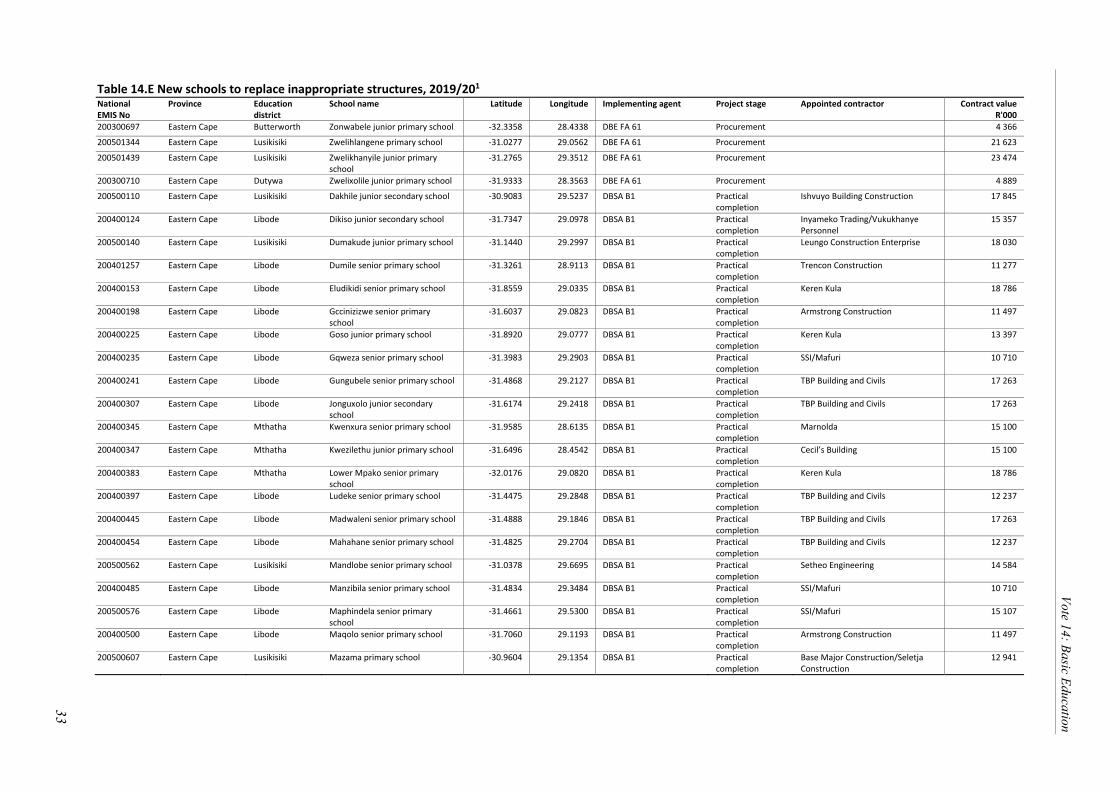
Vote 14: Basic Education
33
Table 14.E New schools to replace inappropriate structures, 2019/201 National EMIS No
Province Education district
School name Latitude Longitude Implementing agent Project stage Appointed contractor Contract value R'000
200300697 Eastern Cape Butterworth Zonwabele junior primary school -32.3358 28.4338 DBE FA 61 Procurement 4 366 200501344 Eastern Cape Lusikisiki Zwelihlangene primary school -31.0277 29.0562 DBE FA 61 Procurement 21 623 200501439 Eastern Cape Lusikisiki Zwelikhanyile junior primary
school -31.2765 29.3512 DBE FA 61 Procurement 23 474
200300710 Eastern Cape Dutywa Zwelixolile junior primary school -31.9333 28.3563 DBE FA 61 Procurement 4 889 200500110 Eastern Cape Lusikisiki Dakhile junior secondary school -30.9083 29.5237 DBSA B1 Practical
completion Ishvuyo Building Construction 17 845
200400124 Eastern Cape Libode Dikiso junior secondary school -31.7347 29.0978 DBSA B1 Practical completion
Inyameko Trading/Vukukhanye Personnel
15 357
200500140 Eastern Cape Lusikisiki Dumakude junior primary school -31.1440 29.2997 DBSA B1 Practical completion
Leungo Construction Enterprise 18 030
200401257 Eastern Cape Libode Dumile senior primary school -31.3261 28.9113 DBSA B1 Practical completion
Trencon Construction 11 277
200400153 Eastern Cape Libode Eludikidi senior primary school -31.8559 29.0335 DBSA B1 Practical completion
Keren Kula 18 786
200400198 Eastern Cape Libode Gccinizizwe senior primary school
-31.6037 29.0823 DBSA B1 Practical completion
Armstrong Construction 11 497
200400225 Eastern Cape Libode Goso junior primary school -31.8920 29.0777 DBSA B1 Practical completion
Keren Kula 13 397
200400235 Eastern Cape Libode Gqweza senior primary school -31.3983 29.2903 DBSA B1 Practical completion
SSI/Mafuri 10 710
200400241 Eastern Cape Libode Gungubele senior primary school -31.4868 29.2127 DBSA B1 Practical completion
TBP Building and Civils 17 263
200400307 Eastern Cape Libode Jonguxolo junior secondary school
-31.6174 29.2418 DBSA B1 Practical completion
TBP Building and Civils 17 263
200400345 Eastern Cape Mthatha Kwenxura senior primary school -31.9585 28.6135 DBSA B1 Practical completion
Marnolda 15 100
200400347 Eastern Cape Mthatha Kwezilethu junior primary school -31.6496 28.4542 DBSA B1 Practical completion
Cecil’s Building 15 100
200400383 Eastern Cape Mthatha Lower Mpako senior primary school
-32.0176 29.0820 DBSA B1 Practical completion
Keren Kula 18 786
200400397 Eastern Cape Libode Ludeke senior primary school -31.4475 29.2848 DBSA B1 Practical completion
TBP Building and Civils 12 237
200400445 Eastern Cape Libode Madwaleni senior primary school -31.4888 29.1846 DBSA B1 Practical completion
TBP Building and Civils 17 263
200400454 Eastern Cape Libode Mahahane senior primary school -31.4825 29.2704 DBSA B1 Practical completion
TBP Building and Civils 12 237
200500562 Eastern Cape Lusikisiki Mandlobe senior primary school -31.0378 29.6695 DBSA B1 Practical completion
Setheo Engineering 14 584
200400485 Eastern Cape Libode Manzibila senior primary school -31.4834 29.3484 DBSA B1 Practical completion
SSI/Mafuri 10 710
200500576 Eastern Cape Libode Maphindela senior primary school
-31.4661 29.5300 DBSA B1 Practical completion
SSI/Mafuri 15 107
200400500 Eastern Cape Libode Maqolo senior primary school -31.7060 29.1193 DBSA B1 Practical completion
Armstrong Construction 11 497
200500607 Eastern Cape Lusikisiki Mazama primary school -30.9604 29.1354 DBSA B1 Practical completion
Base Major Construction/Seletja Construction
12 941

34 2019 Estimates of National Expenditure
Table 14.E New schools to replace inappropriate structures, 2019/201 National EMIS No
Province Education district
School name Latitude Longitude Implementing agent Project stage Appointed contractor Contract value R'000
200500633 Eastern Cape Libode Mceteni senior primary school -31.4102 29.2991 DBSA B1 Practical completion
SSI/Mafuri 10 710
200400560 Eastern Cape Libode Mdavuza senior primary school -31.3021 28.9590 DBSA B1 Practical completion
Trencon Construction 11 277
200400640 Eastern Cape Libode Mpatiswa senior primary school -31.7215 28.9463 DBSA B1 Practical completion
Keren Kula 13 397
200400659 Eastern Cape Libode Mqokolweni senior primary school
-31.4106 29.1685 DBSA B1 Practical completion
Trencon Construction 11 277
200401256 Eastern Cape Libode Mseleni senior primary school -31.4288 29.2548 DBSA B1 Practical completion
SSI/Mafuri 15 107
200400723 Eastern Cape Libode Ndlovayiphathwa senior primary school
-31.4434 29.1152 DBSA B1 Practical completion
Trencon Construction 11 277
200400725 Eastern Cape Libode Ndluzula junior primary school -31.7322 29.3779 DBSA B1 Practical completion
Armstrong Construction 11 497
200400746 Eastern Cape Libode Ngidini senior primary school -31.6489 29.1052 DBSA B1 Practical completion
Armstrong Construction 11 497
200400747 Eastern Cape Mthatha Nginza senior primary school -31.7159 28.8977 DBSA B1 Practical completion
Keren Kula 13 397
200400796 Eastern Cape Libode Nkonkoni senior primary school -31.4658 29.1394 DBSA B1 Practical completion
TBP Building and Civils 17 263
200401344 Eastern Cape Mthatha Nobantu junior primary school -31.8552 28.5809 DBSA B1 Practical completion
Sizisa Ukhanyo 13 800
200400810 Eastern Cape Libode Nogaya senior primary school -31.2681 29.1050 DBSA B1 Practical completion
Maunga Projects 14 870
200400818 Eastern Cape Libode Nomandla senior primary school -31.5975 29.1745 DBSA B1 Practical completion
Armstrong Construction 11 497
200400835 Eastern Cape Libode Notsolo senior primary school -31.4498 29.1468 DBSA B1 Practical completion
Trencon Construction 11 277
200400881 Eastern Cape Libode Ntsonyini junior secondary school
-31.5971 29.2564 DBSA B1 Practical completion
Armstrong Construction 15 072
200400931 Eastern Cape Libode Qaka junior primary school -31.6092 29.4172 DBSA B1 Practical completion
Armstrong Construction 11 497
200401246 Eastern Cape Libode Sidanda senior primary school -31.7512 29.1381 DBSA B1 Practical completion
Armstrong Construction 15 072
200401014 Eastern Cape Libode Sizane junior secondary school -31.8224 29.0044 DBSA B1 Practical completion
Keren Kula 18 786
200401015 Eastern Cape Libode Sizwe junior primary school -31.7148 29.2126 DBSA B1 Practical completion
Armstrong Construction 11 497
200401021 Eastern Cape Libode Sompa senior primary school -31.3578 29.1532 DBSA B1 Practical completion
TBP Building and Civils 12 237
200401045 Eastern Cape Libode Tembeni senior primary school -31.7904 29.1148 DBSA B1 Practical completion
Armstrong Construction 11 497
200501192 Eastern Cape Lusikisiki Thabatha primary school -31.2806 29.5310 DBSA B1 Practical completion
Inyameko/Deck Steel Concrete 16 230
200501232 Eastern Cape Libode Tshantshala senior primary school
-31.4325 29.3334 DBSA B1 Practical completion
SSI/Mafuri 10 710
200401099 Eastern Cape Libode Upper Mbange senior primary school
-31.6649 28.9641 DBSA B1 Practical completion
Keren Kula 13 397

Vote 14: Basic Education
35
Table 14.E New schools to replace inappropriate structures, 2019/201 National EMIS No
Province Education district
School name Latitude Longitude Implementing agent Project stage Appointed contractor Contract value R'000
200401127 Eastern Cape Mthatha Vulindlela junior primary school -31.6227 29.3703 DBSA B1 Practical completion
Alfdav Construction 12 660
200401136 Eastern Cape Libode Vuyani senior primary school -31.7182 29.2840 DBSA B1 Practical completion
Armstrong Construction 11 497
200401142 Eastern Cape Libode Welese junior secondary school -31.8029 29.0228 DBSA B1 Practical completion
Keren Kula 13 397
200400664 Eastern Cape Libode Zingisile senior primary school -31.7376 28.9616 DBSA B1 Practical completion
Keren Kula 13 397
200400031 Eastern Cape Mthatha Bekisizwe junior primary school -31.9229 29.0517 DBSA B2 Practical completion
Sivubo Construction 29 447
200400032 Eastern Cape Libode Bekizulu senior secondary school -31.5370 29.0080 DBSA B2 Practical completion
Leungo Construction Enterprise 81 997
200500065 Eastern Cape Lusikisiki Bukazi junior secondary school -31.1790 29.4557 DBSA B2 Practical completion
Khutala Consulting 41 876
200400056 Eastern Cape Libode Bungu junior secondary school -31.3849 29.1174 DBSA B2 Practical completion
Siyavuna Trading 24 461
200401325 Eastern Cape Libode Chief Henry Bokleni senior secondary school
-31.5648 29.1116 DBSA B2 Practical completion
Leungo Construction Enterprise 74 692
200400100 Eastern Cape Libode Dalibango senior primary school -31.6806 29.2803 DBSA B2 Practical completion
Isiphiwo Trading 16 498
200400103 Eastern Cape Libode Dalibunga junior secondary school
-31.3553 29.1204 DBSA B2 Practical completion
Tauris Garden Trading 44 310
200400132 Eastern Cape Libode Dokodela junior secondary school
-31.5945 29.1035 DBSA B2 Practical completion
Simunye Developers 30 302
200501398 Eastern Cape Qumbu Dweba senior secondary school -31.1838 29.1087 DBSA B2 Practical completion
Mebalabala Holdings 31 897
200500244 Eastern Cape Lusikisiki Gcinilifu junior secondary school -31.0225 29.5184 DBSA B2 Practical completion
Baitiredi Property Management 23 138
200400209 Eastern Cape Mthatha Gobidolo senior primary school -31.9776 29.0982 DBSA B2 Practical completion
Sivumbo Trading and Projects 19 422
200300111 Eastern Cape Cofimvaba Gobinamba senior secondary school
-31.7667 29.2725 DBSA B2 Construction Bahlaphing and Keep Africa 63 101
200400264 Eastern Cape Mthatha Hlabatshane senior secondary school
-31.7410 28.8623 DBSA B2 Practical completion
CPro Construction 47 534
200400283 Eastern Cape Qumbu Jenca junior primary school -31.2958 28.5645 DBSA B2 Practical completion
Develex (trading as Excel Builders and Construction)
49 236
200500381 Eastern Cape Lusikisiki Kwandumiso senior primary school
-31.2717 29.6489 DBSA B2 Practical completion
Deck Steel Concrete 34 328
200400353 Eastern Cape Libode Langeni senior primary school -31.5825 28.8781 DBSA B2 Practical completion
Ishivuyo Building Construction 29 067
200400384 Eastern Cape Qumbu Lower Ngcolokeni senior primary school
-31.0966 28.8855 DBSA B2 Practical completion
Lulworth Building Services 23 637
200400393 Eastern Cape Qumbu Lower Tyira junior secondary school
-31.1803 28.8074 DBSA B2 Practical completion
Uvuko Civils Maintenance and Construction
23 197
200500439 Eastern Cape Lusikisiki Lubala senior primary school -31.1898 29.4985 DBSA B2 Construction Tech-com Solution and Bila Civil Contractors
15 400
200400395 Eastern Cape Mthatha Lucvingweni junior secondary school
-31.4588 28.7565 DBSA B2 Practical completion
Ishivuyo Building Costruction 29 256
200400423 Eastern Cape Qumbu Luxeni junior secondary school -31.0623 28.6135 DBSA B2 Practical completion
Shota Engineering 25 865

36 2019 Estimates of National Expenditure
Table 14.E New schools to replace inappropriate structures, 2019/201 National EMIS No
Province Education district
School name Latitude Longitude Implementing agent Project stage Appointed contractor Contract value R'000
200500546 Eastern Cape Lusikisiki Mali junior secondary school -31.0199 29.5498 DBSA B2 Practical completion
Edge to Edge 27 408
200400479 Eastern Cape Libode Mangala senior secondary school -31.4109 28.8764 DBSA B2 Practical completion
SSI/Mafuri 35 746
200500563 Eastern Cape Lusikisiki Mangena primary school -31.3076 29.4053 DBSA B2 Practical completion
Cecil’s Building 27 173
200400582 Eastern Cape Libode Mfundweni junior primary school -31.7719 29.1223 DBSA B2 Practical completion
Express Builders 21 758
200500701 Eastern Cape Lusikisiki Mkumbi junior secondary school -31.0353 29.4470 DBSA B2 Practical completion
Nako Development Projects 21 508
200500702 Eastern Cape Lusikisiki Mkumeni junior primary school -31.0676 29.4877 DBSA B2 Practical completion
Shota Engineering 18 867
200400685 Eastern Cape Libode Mvume Springs senior primary school
-31.5567 29.3036 DBSA B2 Practical completion
Mebalabala Holdings 15 523
200500820 Eastern Cape Lusikisiki Mxhume junior secondary school -31.3365 29.7617 DBSA B2 Practical completion
Specialised Construction and Civil Works
49 893
200500834 Eastern Cape Qumbu Mzuzile senior primary school -31.1396 29.1374 DBSA B2 Practical completion
Zibele Construction 14 656
200500851 Eastern Cape Qumbu Ndakana senior primary school -31.2029 29.1415 DBSA B2 Practical completion
Dimenges Projects 21 083
200500256 Eastern Cape Lusikisiki Ndimbaneni senior primary school
-31.3251 29.4674 DBSA B2 Practical completion
Zamadunga Business Enterprise 36 106
200400741 Eastern Cape Mthatha Ngcenduna junior secondary school
-31.8899 29.0318 DBSA B2 Practical completion
Core Facts 30 033
200500912 Eastern Cape Lusikisiki Nkozo junior secondary school -31.1960 29.4204 DBSA B2 Practical completion
Theta Trading-LG Construction 24 393
200400886 Eastern Cape Qumbu Nxanxadi junior secondary school -31.1308 28.8209 DBSA B2 Practical completion
MPS Builders 22 836
200400918 Eastern Cape Libode Pondolwendlovu combined secondary school
-31.7047 28.9446 DBSA B2 Practical completion
Baphalaborwa 72 Construction 31 698
200400005 Eastern Cape Mthatha Sinolwazi senior secondary school
-31.5637 28.7971 DBSA B2 Practical completion
Tarman BR Tsima 45 541
200501133 Eastern Cape Qumbu Sizwe junior primary school -31.0213 29.0141 DBSA B2 Practical completion
Murandu Building Solutions 24 263
200401017 Eastern Cape Libode Smuts Ndamase senior secondary school
-31.4590 29.1704 DBSA B2 Practical completion
EMC Construction 59 853
200501177 Eastern Cape Libode Taleni senior primary school -31.3533 29.3499 DBSA B2 Practical completion
Tarman BR Tsima 26 360
200401363 Eastern Cape Mthatha Thwaluphahla senior primary school
-31.8108 28.9196 DBSA B2 Practical completion
Mvumisi Projects 27 633
200501214 Eastern Cape Lusikisiki Tobintetho senior primary school -30.9732 29.4605 DBSA B2 Practical completion
Baitiredi Property Management 21 215
200401083 Eastern Cape Libode Tyityane senior primary school -31.5370 29.4378 DBSA B2 Practical completion
Max-Wezie Civil and Building Contractors
32 124
200401115 Eastern Cape Libode Victor Poto senior secondary school
-31.4462 29.0592 DBSA B2 Practical completion
Bahlaphing and Keep Africa 53 194
200401139 Eastern Cape Libode Waban senior secondary school -31.6757 29.1207 DBSA B2 Practical completion
Phumi Riety 33 706

Vote 14: Basic Education
37
Table 14.E New schools to replace inappropriate structures, 2019/201 National EMIS No
Province Education district
School name Latitude Longitude Implementing agent Project stage Appointed contractor Contract value R'000
200501374 Eastern Cape Lusikisiki Zamekile junior primary school -31.0593 29.5341 DBSA B2 Practical completion
Bahlaphing and Keep Africa 21 255
200501307 Eastern Cape Qumbu Zamilizwe senior primary school -31.1538 29.1368 DBSA B2 Practical completion
SR General Trading 21 260
200401165 Eastern Cape Qumbu Zamukulungisa senior primary school
-31.2934 28.6200 DBSA B2 Practical completion
Cece Trading 28 008
200401302 Eastern Cape Libode Zanokhanyo senior secondary school
-31.5924 29.0121 DBSA B2 Practical completion
Moreteng Investment/Mozadem Civils
41 731
200401183 Eastern Cape Libode Zibungu junior secondary school -31.3726 28.6007 DBSA B2 Practical completion
Siyavuna Trading 39 424
200100136 Eastern Cape Graaff-Reinet Cookhouse primary school -32.7457 25.8026 DBSA B3 Construction Pan-African Development 68 727 200500144 Eastern Cape Lusikisiki Dumezweni senior primary
school 29.3676 -31.0356 DBSA B3 Construction HDM Construction 71 866
200400326 Eastern Cape Ngcobo Kidston PJS School -31.8716 28.1138 DBSA B3 Procurement 124 683 200400781 Eastern Cape Mount Fletcher Ngxaza junior secondary school -31.1716 28.5089 DBSA B3 Procurement Deck Steel and Concrete 80 243 200400064 Eastern Cape Mthatha Caba senior primary school -31.7028 28.3630 DBSA B3 Construction Comu Property Developers 67 566 200401284 Eastern Cape Mount Fletcher Inxu junior secondary school -31.2235 28.5962 DBSA B3 Construction Marnolda 60 505 200600458 Eastern Cape Cradock Mbekweni high school -31.6921 28.7060 DBSA B3 Construction Edge to Edge 66 504 200300164 Eastern Cape Butterworth Mzamomhle senior secondary
school -32.2169 28.4899 DBSA B3 Construction Makhathini Projects 54 895
200200660 Eastern Cape King William’s Town
Ntyatyambo primary school -33.1737 27.2925 DBSA B3 Construction Makgotamitshe Construction 69 047
200300538 Eastern Cape Dutywa Phathilizwe junior secondary school
-32.2395 28.6443 DBSA B3 Construction Makhathini Projects 108 393
200600742 Eastern Cape Ngcobo Sifonondile junior secondary school
-31.4521 27.6232 DBSA B3 Construction Soaring Summits Developers 59 863
200501102 Eastern Cape MT Frere Sihlahleni junior secondary school
-30.7926 28.9809 DBSA B3 Construction Zamadunga Enterprise 78 896
200601151 Eastern Cape Queenstown Siyavuya junior secondary school -32.0068 27.3223 DBSA B3 Construction Kingsway Civil 56 189 200501140 Eastern Cape MT Fletcher Solomzi junior secondary school -30.9199 28.4717 DBSA B3 Design 66 873 200401154 Eastern Cape Dutywa Xuba junior secondary school -32.0653 28.7358 DBSA B3 Construction TCT Civils and Construction 55 025 200300013 Eastern Cape Butterworth Bawana senior primary school -32.3816 28.4303 DPW Practical
completion Edge to Edge 21 243
200400178 Eastern Cape Ngcobo Exhibeni junior primary school -31.7928 27.9321 DPW Practical completion
Fez Building Construction 23 825
200400185 Eastern Cape Dutywa Fudumele senior primary school -32.0544 28.8192 DPW Practical completion
Mpumalanga Construction 23 326
200400252 Eastern Cape Dutywa Gwenteshe junior primary school -32.0395 28.6753 DPW Practical completion
Denrob Business Enterprise 18 386
200300152 Eastern Cape Butterworth J M Bolotini senior primary school
-32.1527 28.1157 DPW Practical completion
Alexander Construction 20 726
200400332 Eastern Cape Dutywa Kosana senior primary school -32.0962 28.8518 DPW Practical completion
Master Pave (trading as Mopp Construction)
22 319

38 2019 Estimates of National Expenditure
Table 14.E New schools to replace inappropriate structures, 2019/201 National EMIS No
Province Education district
School name Latitude Longitude Implementing agent Project stage Appointed contractor Contract value R'000
200400538 Eastern Cape Ngcobo Mboleni junior primary school -31.5374 28.2768 DPW Practical completion
HDM Construction 22 351
200300334 Eastern Cape Dutywa Mhala junior secondary school -32.0091 28.3873 DPW Practical completion
Mpumalanga Construction 20 712
200400688 Eastern Cape Dutywa Mwezeni senior primary school -32.0997 28.6979 DPW Practical completion
Fez Building Construction 21 102
200300477 Eastern Cape Dutywa Nombulelo junior primary school -31.9145 28.3749 DPW Construction Bila Civil Contractors 25 550
200300486 Eastern Cape Butterworth Nonceba junior primary school -32.1783 28.2514 DPW Practical completion
HDM Construction 24 929
200400807 Eastern Cape Dutywa No-OfisiO senior primary school -32.1398 28.9931 DPW Practical completion
Tauris Gardens 18 541
200300571 Eastern Cape Butterworth Siseko junior secondary school -32.1100 28.1948 DPW Practical completion
Master Pave (trading as Mopp Construction)
20 223
200300575 Eastern Cape Butterworth Siyanda senior primary school -32.3178 28.1603 DPW Practical completion
Fez Building Construction 21 801
200300640 Eastern Cape Butterworth Upper Tobotshana junior primary school
-32.3693 28.1452 DPW Practical completion
Edge to Edge 16 425
200300706 Eastern Cape Dutywa Zwelinzima senior primary school -32.3548 28.6681 DPW Practical completion
Gordon Builders 27 329
200401337 Eastern Cape Mount Fletcher Dalibango junior secondary school
-31.2787 28.4471 Independent Development Trust
Practical completion
Botani Construction 14 498
200500113 Eastern Cape Mount Frere Daluhlanga senior secondary school
-30.6922 29.3695 Independent Development Trust
Practical completion
Umbutho Civils and Electrical 23 024
200500159 Eastern Cape Mbizana Eblorweni senior primary school -30.8470 29.6858 Independent Development Trust
Practical completion
Zamadunga Enterprise 20 600
200401233 Eastern Cape Ngcobo Emthwaku senior primary school -31.7270 27.9573 Independent Development Trust
Practical completion
Nomantombi Trading Demo Construction
22 438
200400330 Eastern Cape Qumbu Konkabi junior secondary school -31.1796 28.7505 Independent Development Trust
Practical completion
Demo Construction 23 648
200500372 Eastern Cape MT Frere Kuyasa senior primary school -33.5648 26.8929 Independent Development Trust
Practical completion
Umbutho Civils and Electrical 19 935
200500419 Eastern Cape MT Frere Lokwe junior secondary school -32.0176 29.0820 Independent Development Trust
Practical completion
Ishvuyo Construction 31 832
200500667 Eastern Cape Lusikisiki Mgqumangwe senior primary school
-31.0323 29.1702 Independent Development Trust
Practical completion
Zipho Zetho 20 313
200500673 Eastern Cape Mbizana Mhlabuvelile senior primary school
-30.8189 29.7064 Independent Development Trust
Practical completion
Zamadunga Enterprise 20 837
200400647 Eastern Cape MT Fletcher Mpindweni primary school -31.0108 28.5486 Independent Development Trust
Practical completion
HDM Construction 21 626
200501401 Eastern Cape MT Frere Nqantosi junior primary school -30.9075 29.0078 Independent Development Trust
Practical completion
HDM Construction 21 551
200501052 Eastern Cape MT Frere Qumra junior secondary school -30.9383 29.0582 Independent Development Trust
Practical completion
TP Construction 23 533
200400133 Eastern Cape Libode Dokodela senior primary school -31.5945 29.1035 IDT ACT Construction Xol-Mak Construction 24 696
200300428 Eastern Cape Butterworth Dotshanga senior primary school -32.3913 28.1146 IDT ACT Practical completion
Mtalido’s Construction 19 118

Vote 14: Basic Education
39
Table 14.E New schools to replace inappropriate structures, 2019/201 National EMIS No
Province Education district
School name Latitude Longitude Implementing agent Project stage Appointed contractor Contract value R'000
200400231 Eastern Cape Qumbu Gqukunda senior primary school -31.0188 28.6011 IDT ACT Practical completion
Develex 10 750
200200273 Eastern Cape Fort Beaufort Imvisiswano junior primary school
-32.8354 26.9547 IDT ACT Construction Bendolite Trading 35 327
200600310 Eastern Cape Cofimvaba Jongulwandle junior primary school
-31.9588 27.5120 IDT ACT Construction Ishvuyo Construction 20 450
200300238 Eastern Cape Butterworth Lukanyo junior primary school -32.1347 27.9407 IDT ACT Construction Elona Themba Construction 26 572 200300299 Eastern Cape Cofimvaba Mawushe junior secondary
school -31.9310 27.6675 IDT ACT Construction Elona Themba Construction 29 424
200300362 Eastern Cape Butterworth Mpenduza junior secondary school
-32.3620 28.0993 IDT ACT Practical completion
HDM Construction 18 926
200400652 Eastern Cape Libode Mqakama junior secondary school
-31.6360 29.3134 IDT ACT Practical completion
HDM Construction 34 920
200400749 Eastern Cape Mthatha Ngonyama junior primary school -32.0002 28.6585 IDT ACT Construction Ishvuyo Construction 29 045 200300496 Eastern Cape Dutywa Nozizwe junior secondary school -32.2355 28.4210 IDT ACT Construction Siyazama Housing 31 312 200501071 Eastern Cape Lusikisiki Rwantsana junior secondary
school -31.0723 29.2753 IDT ACT Construction Xol-Mak Construction 29 381
200300564 Eastern Cape Dutywa Shixini junior secondary school -32.2598 28.6574 IDT ACT Construction Xol-Mak Construction 28 014 200401034 Eastern Cape Qumbu Sulenkama junior secondary
school -31.0156 28.6882 IDT ACT Practical
completion HDM Construction 26 823
200300585 Eastern Cape Dutywa Tamsanqa senior primary school -31.9442 28.4925 IDT ACT Construction Mtalido’s Construction 12 697 200200922 Eastern Cape King William’s
Town Zamakukhanya LHPS -32.7309 27.4645 IDT ACT Construction Elona Themba Construction 37 906
200601018 Eastern Cape Lady Frere Agnes senior primary school -31.6965 27.0301 NDPW Construction Xol-Mak Construction 32 543 200200013 Eastern Cape Fort Beaufort Amakhuze LHPS -32.6846 26.9347 NDPW Practical
completion SNZN Construction 9 028
200500021 Eastern Cape Maluti Bavumile junior primary school -30.2980 28.8663 NDPW Construction Zibele Construction 36 731 200500114 Eastern Cape Maluti Damane senior primary school -30.5546 28.6782 NDPW Construction Malome Business Enterprise 17 298 200501208 Eastern Cape Mount Fletcher Edward Zibi senior secondary
school -30.5496 28.4447 NDPW Construction Xol-Mak Construction 38 905
200400239 Eastern Cape Qumbu Gungqwane junior secondary school
28.6805 -31.0378 NDPW Construction Tewo Building and Civil Contractors 37 940
200600298 Eastern Cape Cofimvaba Intlangano senior primary school -32.1972 27.5123 NDPW Construction Malome Business Enterprise 16 606 200300221 Eastern Cape Dutywa Lower Dadamba junior
secondary school -32.2791 28.3669 NDPW Construction HDM Construction 35 856
200500603 Eastern Cape Maluti Mavundleni senior primary school
-30.1076 29.0272 NDPW Construction Core Facts 20 829
200500745 Eastern Cape Maluti Mothibisi junior secondary school
-30.3838 28.3805 NDPW Construction Triple Option Trading 39 027
200600547 Eastern Cape Lady Frere Ncalukeni junior primary school -31.6560 27.1766 NDPW Construction Develex 15 054 200300427 Eastern Cape Butterworth Ndoqa junior secondary school -32.4012 28.4427 NDPW Construction Elona Themba Construction 20 196

40 2019 Estimates of National Expenditure
Table 14.E New schools to replace inappropriate structures, 2019/201 National EMIS No
Province Education district
School name Latitude Longitude Implementing agent Project stage Appointed contractor Contract value R'000
200600668 Eastern Cape Lady Frere Phakamisa junior primary school -31.7419 26.9282 NDPW Construction Malome Business Enterprise 7 761 200501023 Eastern Cape Maluti Phuthalichaba junior primary
school -30.2401 28.8596 NDPW Construction Brainwave Projects 28 935
200501167 Eastern Cape Mount Fletcher ST Thomas 28.5199 -30.6736 NDPW Construction TCT Civils and Construction 53 651 200401035 Eastern Cape Qumbu Sulenkama senior secondary
school -31.0159 28.6846 NDPW Construction Zibele Construction 42 892
200501185 Eastern Cape Mount Frere Tembeni senior primary school -30.6390 29.4998 NDPW Construction Afro-Big Construction 11 455 200600837 Eastern Cape Queenstown Thembisa LHPS -32.2464 26.7297 NDPW Construction GVK-Siyazama Building
Construction 39 980
440101281 Free State Thabo Mofutsanyana
Bethlehem combined school -28.2019 28.3262 DBSA Practical completion
Tlotliso Sempe Construction 53 354
440101273 Free State Thabo Mofutsanyana
Clarens intermediate school -28.5199 28.4218 DBSA Practical completion
Zidlaphi Kgomo and Associates 29 030
442506215 Free State Fezile Dabi Dorrington Matsepe intermediate school
-27.6401 27.1725 DBSA Practical completion
CPro/Sobharhuzuza 72 653
443611175 Free State Fezile Dabi Lehutso primary school -26.8461 27.8621 DBSA Practical completion
Stefanutti Stocks 47 561
441811178 Free State Fezile Dabi Metsimatle secondary school -26.9801 28.2150 DBSA Practical completion
Tawana Business Projects Ikatiseng Constructor
23 891
435101171 Free State Thabo Mofutsanyana
Ntsu secondary school -28.2229 28.2907 DBSA Practical completion
Stefanutti Stocks 65 378
443611162 Free State Fezile Dabi Pele-Ya-Pele secondary school -26.7590 27.9479 DBSA Practical completion
Siyavuna Trading 2 984
442506216 Free State Fezile Dabi Phephetso secondary school -27.6343 27.1838 DBSA Practical completion
Stefanutti Stocks 53 477
441610173 Free State Fezile Dabi Qalabotjha secondary school -27.0253 28.6014 DBSA Practical completion
Baitiredi Management Properties 29 835
440303280 Free State Motheo Tjhebelopele combined school -29.1910 26.2691 DBSA Construction Solidaire Construction 45 464 444611263 Free State Fezile Dabi Vredefort primary school -27.0021 27.3736 DBSA Practical
completion Clear Choice Builders 40 205
441407302 Free State Thabo Mofutsanyana
Caledonpark intermediate school -28.8849 27.8843 FS IDT Practical completion
Siyavuna Trading 32 998
440304242 Free State Motheo Heide primary school -29.1319 26.2509 FS IDT Practical completion
Matakanye Construction 40 755
442807329 Free State Thabo Mofutsanyana
Itemoheng primary school -28.6704 27.3896 FS IDT Construction Baphalaborwa 72 Construction and Civil Engineering
39 491
441304247 Free State Xhariep Luckhoff combined school -29.7511 24.7864 FS IDT Practical completion
Clear Choice Builders 55 774
440506229 Free State Fezile Dabi Nampo A secondary school -27.2511 26.6540 FS IDT Construction Baphalaborwa 72 Construction and Civil Engineering
41 297
444103117 Free State Xhariep PT Sanders combined school -30.0205 25.7714 FS IDT Practical completion
Clear Choice Builders 41 893
440404238 Free State Lejeleputswa Boshof intermediate school -28.5384 25.2427 FS IDT Practical completion
Mellet and Johneys Construction 24 235

Vote 14: Basic Education
41
Table 14.E New schools to replace inappropriate structures, 2019/201 National EMIS No
Province Education district
School name Latitude Longitude Implementing agent Project stage Appointed contractor Contract value R'000
442304245 Free State Xhariep Diamanthoogte combined school -29.3913 24.9885 FS IDT Construction Leungo Construction 50 061 442607323 Free State Motheo Sehlabeng secondary school -29.1752 27.4430 FS IDT Construction Segabokeng Building Construction 39 690 441207300 Free State Motheo Tweespruit primary school -29.1909 27.0331 FS IDT Practical
completion Segabokeng Building Construction 26 122
443203219 Free State Xhariep Bergmanshoogte intermediate school
-30.2716 25.2707 FS PED Construction Elebone/Shabangu 47 720
441103221 Free State Xhariep Edenhoogte primary school -29.7198 25.9371 FS PED Construction Elebone/Shabangu 41 347 443203224 Free State Xhariep Oranjekrag intermediate school -30.5754 25.5041 FS PED Construction Lezmin (trading as Ikaheng
Developers and Plant Hire) 42 932
443803227 Free State Xhariep Smithfield primary school 26.5386 -30.2188 FS PED Construction Elebone/Shabangu 39 312 440203228 Free State Xhariep Williamsville primary school -30.2503 25.7091 FS PED Construction Shota Engineering/E-Value 46 043 441207299 Free State Motheo Dawiesville intermediate school -29.1854 27.0378 DBSA Practical
completion Ruwacon 39 388
444802119 Free State Motheo Ebenhaeserhoogte intermediate school
-29.7202 27.0069 DBSA Practical completion
Ruwacon 50 188
442607303 Free State Motheo Hermana primary school -29.1874 27.4371 FSA PED Practical completion
Ruwacon 46 004
441207304 Free State Motheo Thaba Patchoa intermediate school
-29.3187 27.1180 FSA PED Practical completion
Ruwacon 38 255
500414622 KwaZulu-Natal Amajuba Enhlanhleni primary school 30.1768 -27.9946 Adopt-a-School Foundation Practical completion
–2 17 199
500163799 KwaZulu-Natal Vryheid Ingweni Phaphama primary school
30.9467 -27.9593 Adopt-a-School Foundation Practical completion
–2 15 343
500185777 KwaZulu-Natal Amajuba Lembe primary school 30.5258 -27.5113 Adopt-a-School Foundation Practical completion
–2 13 788
925661573 Limpopo Greater Sekhukhune
Honoko primary school -24.6361 30.0434 DBSA Practical completion
Bitupquip Construction 22 365
923240921 Limpopo Capricorn Molepo primary school -24.0367 29.7614 DBSA Practical completion
TCT Civil and Construction 24 710
991103202 Limpopo Waterberg Sedibeng School for the Deaf -24.5427 30.4220 DBSA Practical completion
Marnolda/Botlhabatsatsi 39 487
800004630 Mpumalanga Ehlanzeni Goba primary school -25.8109 31.9169 DBSA Practical completion
One Turn Construction 16 937
800010629 Mpumalanga Nkangala Loding primary school -25.1033 28.7557 DBSA Practical completion
One Turn Construction 18 179
800016725 Mpumalanga Gert Sibande Ngema combined school -27.0771 30.5147 DBSA Practical completion
CPro Construction 16 937
800035019 Mpumalanga Bohlabela Tiyimeleni primary school -24.8893 31.2683 DBSA Practical completion
Soaring Summits Developers 19 204
800030403 Mpumalanga Gert Sibande Wesselton primary school -26.4959 29.9691 DBSA Practical completion
Mabra Construction 22 056
600101416 North West Potchefstroom Motaung primary school -26.2027 26.7862 DBSA Practical completion
Comu Property Developers 44 487
600102189 North West Tlokwe Toevlug primary school -26.3249 26.8103 DBSA Practical completion
JST Construction 34 465
300043308 Northern Cape Siyanda Sternham intermediate school -28.9065 22.0083 DBSA Practical completion
Ruwacon Construction 26 041

42 2019 Estimates of National Expenditure
Table 14.E New schools to replace inappropriate structures, 2019/201 National EMIS No
Province Education district
School name Latitude Longitude Implementing agent Project stage Appointed contractor Contract value R'000
188000293 Western Cape Metro North Delft South primary school -33.9922 18.6387 WC ED Practical completion
Good Hope 38 848
105310646 Western Cape Metro South Delta primary school -34.0639 18.4845 WC ED Practical completion
Ruwacon 32 000
105490490 Western Cape Metro South Die Duine primary school -34.0349 18.5241 WC ED Practical completion
Ruwacon 40 094
103007995 Western Cape Metro North Du Noon primary school -33.8214 18.5405 WC ED Practical completion
Basil Read 47 108
115330191 Western Cape Overberg Hawston primary school -34.3898 19.1324 WC ED Practical completion
Ruwacon 33 794
105480428 Western Cape Metro Central Heideveld primary school -33.9675 18.5550 WC ED Practical completion
Basil Read 39 178
101320544 Western Cape Metro North Kasselsvlei primary school -33.9176 18.6425 WC ED Practical completion
Vusela 34 408
103323810 Western Cape Metro Central Kensington secondary school -33.9084 18.5070 WC ED Practical completion
Basil Read 37 853
119353019 Western Cape Eden and Central Karoo
Knysna secondary school -34.0461 23.0947 WC ED Practical completion
Boshard Construction 36 275
105313610 Western Cape Metro Central Mount View secondary school -33.9899 18.5247 WC ED Practical completion
Edel Construction 46 494
132470414 Western Cape Metro North Parkview primary school -33.5663 18.4885 WC ED Practical completion
Filcon 32 268
105480630 Western Cape Metro Central Portia primary school -33.9965 18.5151 WC ED Practical completion
Basil Read 35 852
105480673 Western Cape Metro Central Red River primary school -33.9886 18.5525 WC ED Practical completion
Haw and Inglis 51 044
102480711 Western Cape Metro Central Rosewood primary school -33.9555 18.5619 WC ED Practical completion
Group Five 35 959
101323039 Western Cape Metro East Scottsdene secondary school -33.8611 18.7244 WC ED Practical completion
Good Hope 42 321
Information provided by Department of Basic Education. 1. Excludes projects in the planning phase. 2. Adopt-a-School Foundation uses communities to construct schools.


Private Bag X115, Pretoria, 0001 | 40 Church Square, Pretoria, 0002
Tel +27 12 315 5944 | Fax +27 12 406 9055
Web: www.treasury.gov.za
2019BUDGET