ECONOMICS - Department of Basic Education
50
1 SENIOR CERTIFICATE Grade 12 SELF STUDY GUIDE BOOKLET 2 Topic BUSINESS CYCLES ECONOMICS
-
Upload
khangminh22 -
Category
Documents
-
view
3 -
download
0
Transcript of ECONOMICS - Department of Basic Education

1
SENIOR CERTIFICATE
Grade 12 SELF STUDY GUIDE
BOOKLET 2
TopicBUSINESS CYCLES
ECONOMICS

2
TABLE OF CONTENTS PAGE
1. Introduction 32. How to use this self-study guide 43. Topic: Business Cycle 5
3.1.1 Notes/Summaries/Key concepts 53.1.2 Worked Example (ECON) 6 - 113.1.3 Questions 12- 293.2 Answers 30 - 423.3 Examinationguidance(Topicspecific)
4.StudyandExaminationTips(SubjectSpecific) 43 - 485. References & Acknowledgements 49

3
INTRODUCTION
The declaration of COVID-19 as a global pandemic by the World Health Organisation led to the
disruption of effective teaching and learning in many schools in South Africa. The majority of learners
in various grades spent less time in class due to the phased-in approach and rotational/ alternate
attendance system that was implemented by various provinces. Consequently, the majority of schools
werenotabletocompletealltherelevantcontentdesignedforspecificgradesinaccordancewiththe
Curriculum and Assessment Policy Statements in most subjects.
As part of mitigating against the impact of COVID-19 on the current Grade 12, the Department
of Basic Education (DBE) worked in collaboration with subject specialists from various Provincial
Education Departments (PEDs) developed this Self-Study Guide. The Study Guide covers those
topics, skills and concepts that are located in Grade 12, that are critical to lay the foundation for
Grade 12. The main aim is to close the pre-existing content gaps in order to strengthen the mastery
of subject knowledge in Grade 12. More importantly, the Study Guide will engender the attitudes in
the learners to learning independently while mastering the core cross-cutting concepts.

4
HOW TO USE THIS SELF STUDY GUIDE?
2.1 This Study Guide addresses content and offers strategies to understand the differen aspects of assessing Business Cycles in a step-by-step approach, with consolidation activities to conclude.
2.2 The explanations and activities are intended to supplement the work you may have covered in class or have gained from textbooks, and it does not replace them.
2.3 Activities proceed from the low-order, simple focused examples to middle-order with paragraphandgraphicalconstructionandinterpretationandfinallyhigher-orderquestions that require application of knowledge that may relate to current issues.
2.4 Itisimportanttoallocatesufficienttimeto:• Carefullyreadtheexplanationsprovided;underlineorhighlightkeyconcepts,difficult
vocabulary, important data, and relevant data. • Underline key concepts within the question and ensure that correct interpretation is done
before attempting the question.• Practice the skill of drawing graphs dealt with in the Business Cycles.
2.5 Attempt the activities on your own; make constant reference to the explanatory notes but avoid referring to the suggested answers before attempting to answer an activity.
2.6 Compare your answers to the suggested answers and do your corrections in a different colour-ink pen. Note that you will learn more by discovering your weaknesses (when you get things wrong) and trying to understand why your thinking was out of line with what was expected.
2.7 Theactivitiesprovidedmaynotbesufficienttoperfectyourskills.Alwaysrefertosimilar questions from past examination papers for this purpose. Repetitive practice is always valuable.
5
MACRO ECONOMICSBUSINESS CYCLES
Outcome• Analysis and explanation of business cycles, and how they are used in forecasting.• Know the types of business cycles and what happens in the economy over a few years.• Understanding the different phases of a business cycle can help individuals make lifestyle
decisions,investorsmakefinancialdecisionsandgovernmentmakeappropriatepolicydecisions.
The composition and features of business cyclesKey concepts
Term Description
Business Cycle
Successive periods of increasing and decreasing economic activity / a time series showing repeated increasing and decreasing economic activity/ the recurrent (not periodic) pattern of expansion and contraction in the level of economic activity.Business cycle refers to the changes in the economy that produces a cyclical pattern thatrepeatsitselfeverythreetofiveyears.Itisalsoknownastheeconomiccycle.
RecoveryWhen GDP begins to increase following a contraction and a trough in the business cycle; an economy is considered in recovery until real GDP returns to its long-run potential level.
ProsperityIncreased output and excessive economic activities following the recovery / economic growth rate on a year - to -year basis is positive, at an increasing rate.
Expansion A period between the trough and peak including both recovery and prosperity.
RecessionA negative economic growth for at least two successive quarters/ a decline in economic activity lasting more than a few months.
Depression Continuous decrease in the production output and economic activities.
Contraction A period between the peak and trough including both recession and depression.
PeakThe highest point between the end of an economic expansion (end of prosperity) and the start of a contraction (start of recession).
BoomThe period immediately before and through the upper turning point is known as the boom.
TroughThe lowest point between the end of an economic contraction (end of depression) and the start of a expansion (start of recovery).
Real business cycle
An actual business cycle is obtained when the effects of irregular events, seasons and long-term growth trend are removed from the time series data.
6
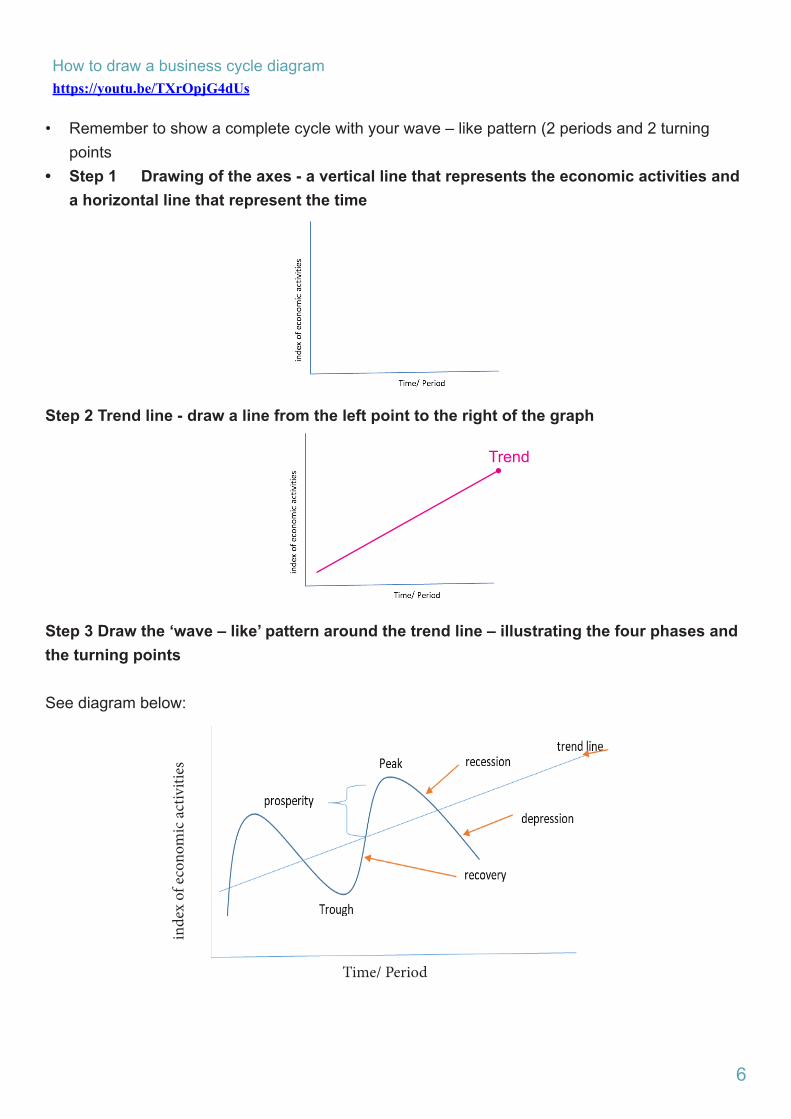
How to draw a business cycle diagram https://youtu.be/TXrOpjG4dUs
• Remember to show a complete cycle with your wave – like pattern (2 periods and 2 turning points
• Step 1 Drawing of the axes - a vertical line that represents the economic activities and a horizontal line that represent the time
Step 2 Trend line - draw a line from the left point to the right of the graph
Step 3 Draw the ‘wave – like’ pattern around the trend line – illustrating the four phases and the turning points
See diagram below:
inde
x of
eco
nom
ic a
ctiv
ities
Time/ Period
Trend
7
Characteristics of the phases, points and periods of a business cycle
Recovery phase• Recovery phase is an improvement in economic activity that occurs immediately after a trough.• An increase in production output occurs. • Unemploymentdecreasesasconsumersgainconfidenceineconomicgrowth.• The increased employment leads to rise in income.• An economy is considered in recovery until real GDP returns to its long-run potential level.
Prosperity phase• Businessesandconsumershavegainedconfidenceintheeconomy.• A sustained increase in the production process is evident. • Employment levels are at highest, wages and salaries rise and spending increases.• The demand for goods and services rises.• Thehighdemandofgoodsandserviceswillcauseariseintheinflationrate.
Recession phase • A negative economic growth for at least two successive quarters occurs immediately after the
peak. • The high prices hike of goods and services discourage consumer demand. • Production output will decline due to high interest rate. • The demand for credit due to increased interest rates will fall.• Unemployment rate will rise due to retrenchment. • There is a decline in the economic activity and growth.
Depression phase • Continuous decrease in the production output and economic activity leading to a shutdown of
most economic activities.• There is negative impact on investment spending.• It occurs when a sustained decline in economic growth is evident.• Unemployment rate is extremely high. • Most businesses become bankrupt and down scale or close.• A drastic decline in luxury consumer goods and services.
8
The Boom• The period immediately before and through the upper turning point is known as the boom.
Two turning points of business cycle
Peak• Is the highest turning point of the business cycle. • Production of goods and services are at the highest output level.• Employment is also at a maximum level. • The high demand of goods and services cause a price hike.• Anincreaseininflationoccursbecauseofincreasingprices.
Trough• This is lowest point of the business cycle at the end of the contraction period.• Income levels are at the lowest due to high job losses.• Lowlevelsofinvestmentsbyfirms.• Households use most of their savings to provide necessities.
Periods of business cycle
The expansion periods• A period that consists of the recovery and prosperity phases (expansion = recovery +
prosperity).• It is the upswing in economic activities from trough to peak.• Expansion is an upward sustained growth in the economic activities that lead to the increase in
the gross domestic product (GDP).• During this period, the economy experiences sustained growth.
The contraction periods• A period that consists of both the recession and the depression phases (contraction = recession
+ depression).• It is a downswing from peak to trough.• It shows a rapid decrease in the production activities in the economy.• There is a decline in employment and decrease in the gross domestic product (GDP).
9
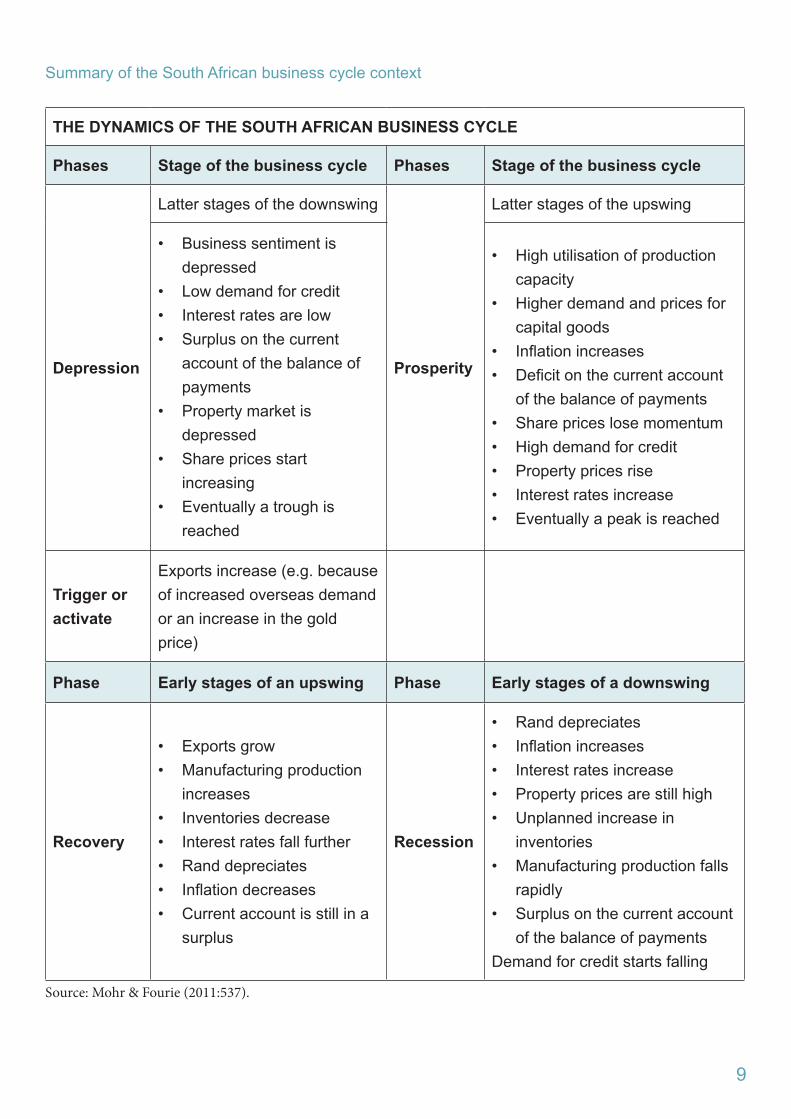
Summary of the South African business cycle context
THE DYNAMICS OF THE SOUTH AFRICAN BUSINESS CYCLE
Phases Stage of the business cycle Phases Stage of the business cycle
Depression
Latter stages of the downswing
Prosperity
Latter stages of the upswing
• Business sentiment is depressed
• Low demand for credit• Interest rates are low• Surplus on the current
account of the balance of payments
• Property market is depressed
• Share prices start increasing
• Eventually a trough is reached
• High utilisation of production capacity
• Higher demand and prices for capital goods
• Inflationincreases• Deficitonthecurrentaccount
of the balance of payments• Share prices lose momentum• High demand for credit• Property prices rise• Interest rates increase• Eventually a peak is reached
Trigger or activate
Exports increase (e.g. because of increased overseas demand or an increase in the gold price)
Phase Early stages of an upswing Phase Early stages of a downswing
Recovery
• Exports grow• Manufacturing production
increases• Inventories decrease• Interest rates fall further• Rand depreciates• Inflationdecreases• Current account is still in a
surplus
Recession
• Rand depreciates• Inflationincreases• Interest rates increase• Property prices are still high• Unplanned increase in
inventories• Manufacturing production falls
rapidly• Surplus on the current account
of the balance of paymentsDemand for credit starts falling
Source: Mohr & Fourie (2011:537).
10
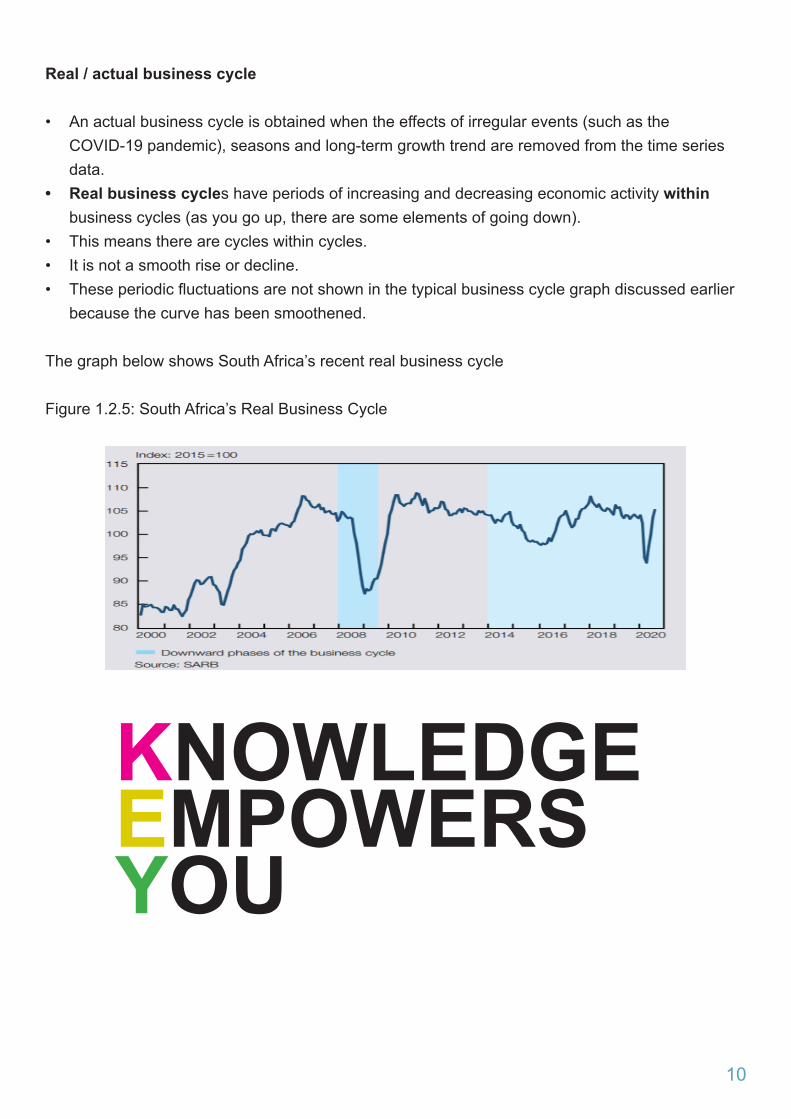
Real / actual business cycle
• An actual business cycle is obtained when the effects of irregular events (such as the COVID-19 pandemic), seasons and long-term growth trend are removed from the time series data.
• Real business cycles have periods of increasing and decreasing economic activity within business cycles (as you go up, there are some elements of going down).
• This means there are cycles within cycles.• It is not a smooth rise or decline.• Theseperiodicfluctuationsarenotshowninthetypicalbusinesscyclegraphdiscussedearlier
because the curve has been smoothened.
The graph below shows South Africa’s recent real business cycle
Figure 1.2.5: South Africa’s Real Business Cycle
KNOWLEDGEEMPOWERSYOU
11
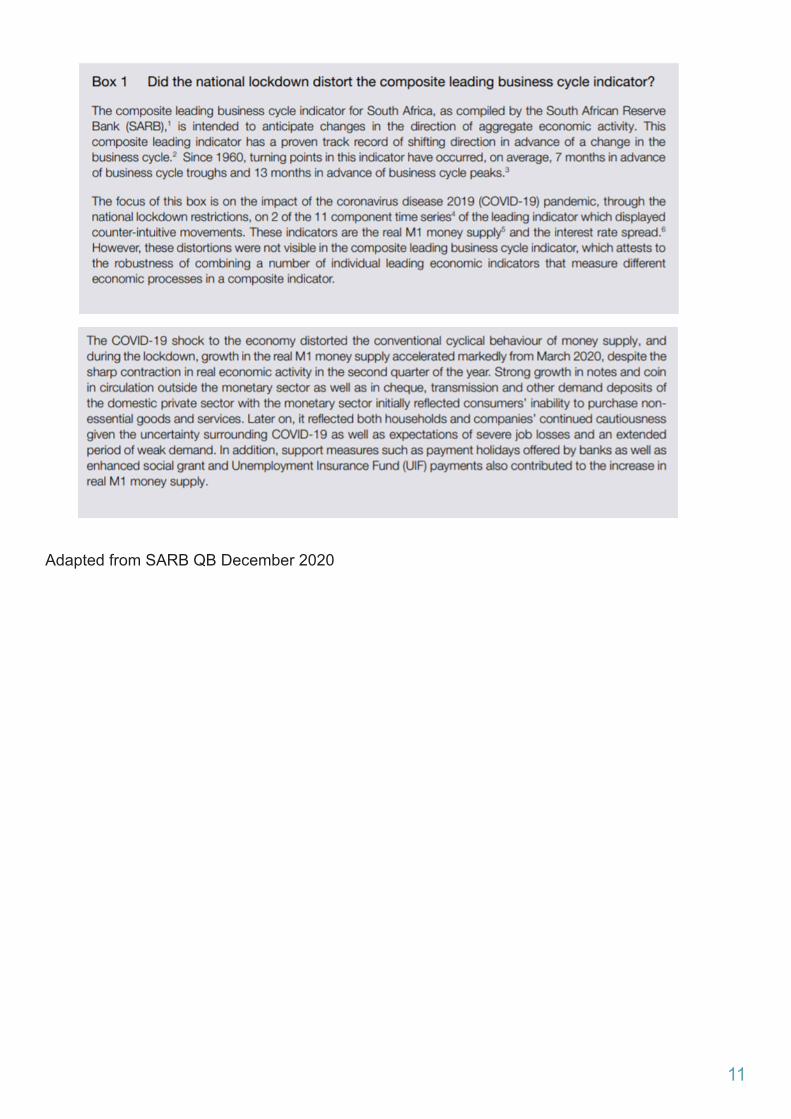
Adapted from SARB QB December 2020

12
ACTIVITY 1
1.1 Various options are provided as possible answers to the following questions. Choose the answer and write only the letter (A–D) next to the question numbers (1.1.1 to 1.1.2) in the ANSWER BOOK, e.g., 1.1.9 D
1.1.1 A period when there is a general increase in economic activities is known as a(n)…
A. downswingB. upswingC. depressionD. recession
1.1.2 The point where economic contraction is at its lowest is called a … A. troughB. peakC. lengthD. trend
1.1.3 Employmentfiguresinthebusinesscyclewillincreaseduringa…
A. recessionB. recoveryC. depressionD. trough
1.1.4 During an economic recession … will increase
A. employmentB. productionC. spendingD. unemployment
(4x2) (8)
13
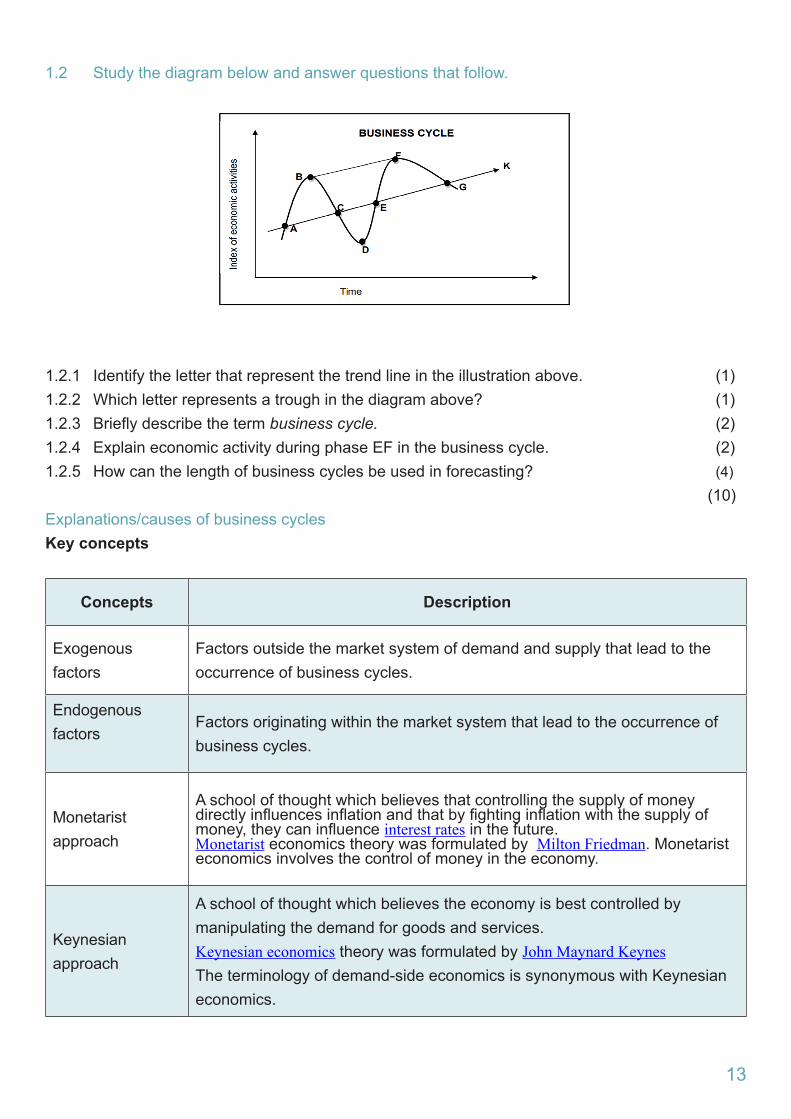
1.2 Study the diagram below and answer questions that follow.
1.2.1 Identify the letter that represent the trend line in the illustration above. (1)1.2.2 Which letter represents a trough in the diagram above? (1)1.2.3 Brieflydescribethetermbusiness cycle. (2)1.2.4 Explain economic activity during phase EF in the business cycle. (2)1.2.5 How can the length of business cycles be used in forecasting? (4) (10)Explanations/causes of business cyclesKey concepts
Concepts Description
Exogenous factors
Factors outside the market system of demand and supply that lead to the occurrence of business cycles.
Endogenous factors
Factors originating within the market system that lead to the occurrence of business cycles.
Monetaristapproach
A school of thought which believes that controlling the supply of money directlyinfluencesinflationandthatbyfightinginflationwiththesupplyofmoney,theycaninfluenceinterest rates in the future. Monetarist economics theory was formulated by Milton Friedman. Monetarist economics involves the control of money in the economy.
Keynesianapproach
A school of thought which believes the economy is best controlled by manipulating the demand for goods and services.Keynesian economics theory was formulated by John Maynard Keynes The terminology of demand-side economics is synonymous with Keynesian economics.
14
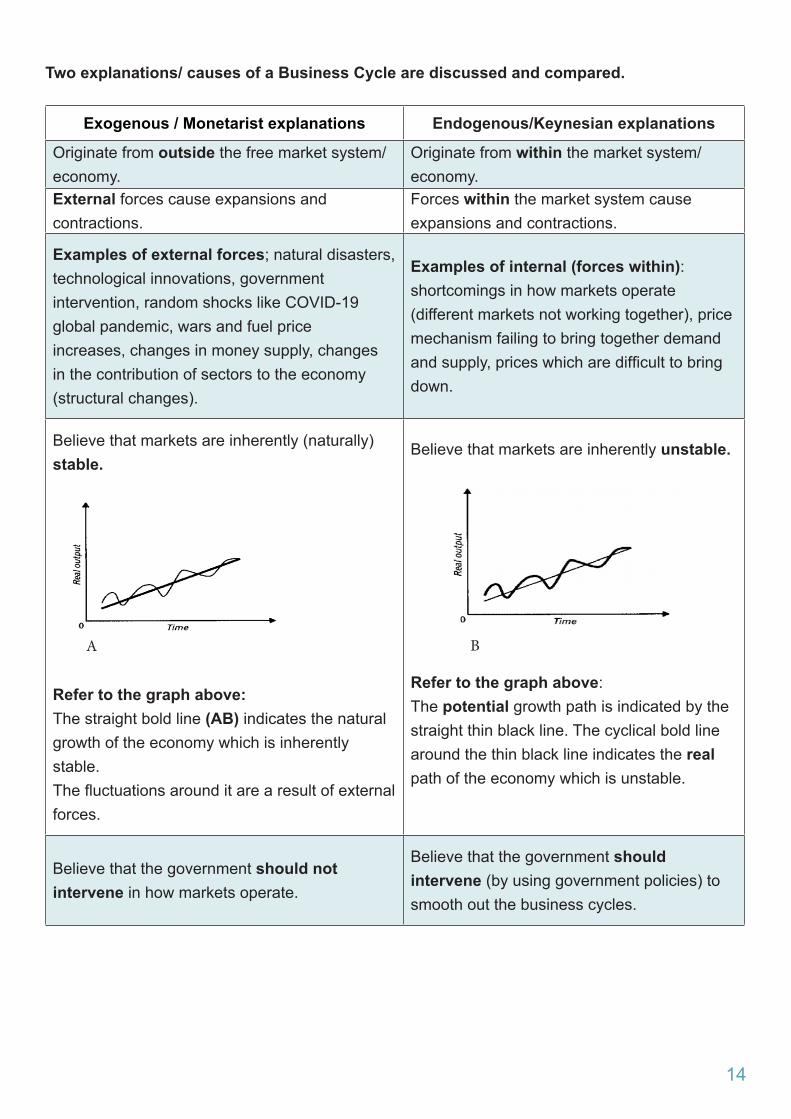
Two explanations/ causes of a Business Cycle are discussed and compared.
Exogenous / Monetarist explanations Endogenous/Keynesian explanations
Originate from outside the free market system/economy.
Originate from within the market system/ economy.
External forces cause expansions and contractions.
Forces within the market system cause expansions and contractions.
Examples of external forces; natural disasters, technological innovations, government intervention, random shocks like COVID-19 global pandemic, wars and fuel price increases, changes in money supply, changes in the contribution of sectors to the economy (structural changes).
Examples of internal (forces within): shortcomings in how markets operate (different markets not working together), price mechanism failing to bring together demand andsupply,priceswhicharedifficulttobringdown.
Believe that markets are inherently (naturally) stable.
Refer to the graph above:The straight bold line (AB) indicates the natural growth of the economy which is inherently stable.Thefluctuationsarounditarearesultofexternalforces.
Believe that markets are inherently unstable.
Refer to the graph above:The potential growth path is indicated by the straight thin black line. The cyclical bold line around the thin black line indicates the real path of the economy which is unstable.
Believe that the government should not intervene in how markets operate.
Believe that the government should intervene (by using government policies) to smooth out the business cycles.
A B
15
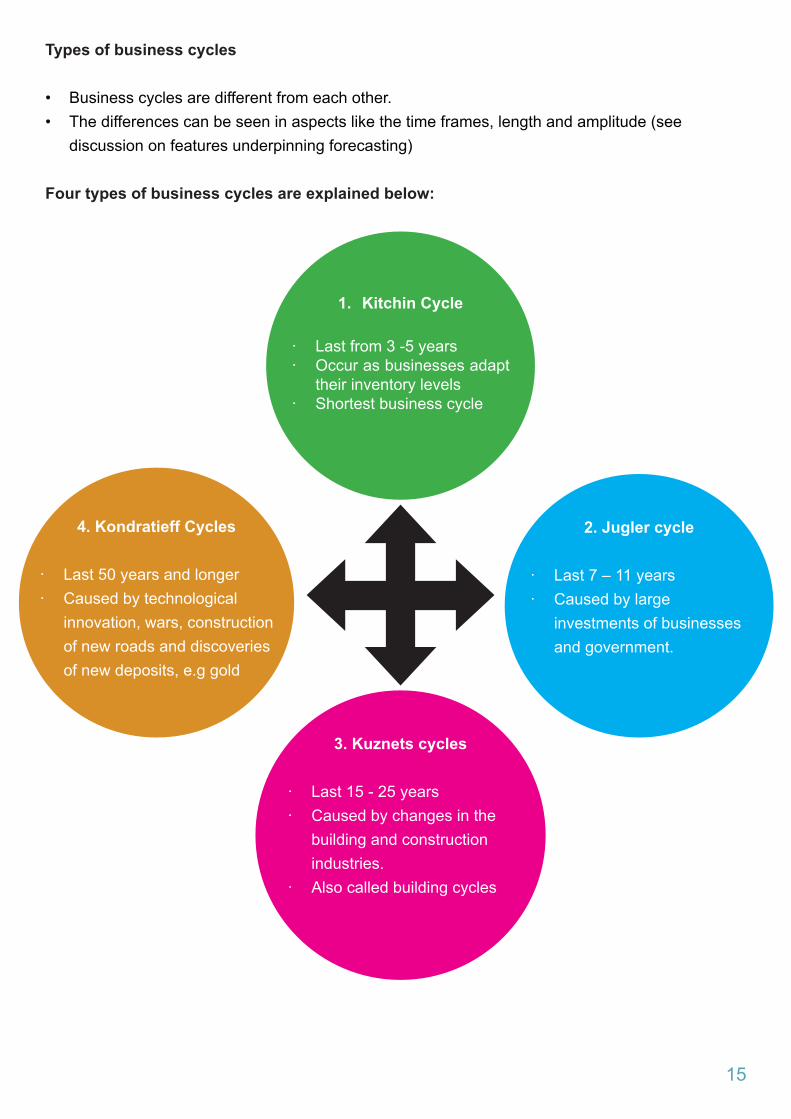
Types of business cycles
• Business cycles are different from each other.• The differences can be seen in aspects like the time frames, length and amplitude (see
discussion on features underpinning forecasting)
Four types of business cycles are explained below:
2. Jugler cycle
· Last 7 – 11 years· Caused by large
investments of businesses and government.
4. Kondratieff Cycles
· Last 50 years and longer· Caused by technological
innovation, wars, construction of new roads and discoveries of new deposits, e.g gold
3. Kuznets cycles
· Last 15 - 25 years· Caused by changes in the
building and construction industries.
· Also called building cycles
1. Kitchin Cycle
· Last from 3 -5 years· Occur as businesses adapt
their inventory levels· Shortest business cycle
16
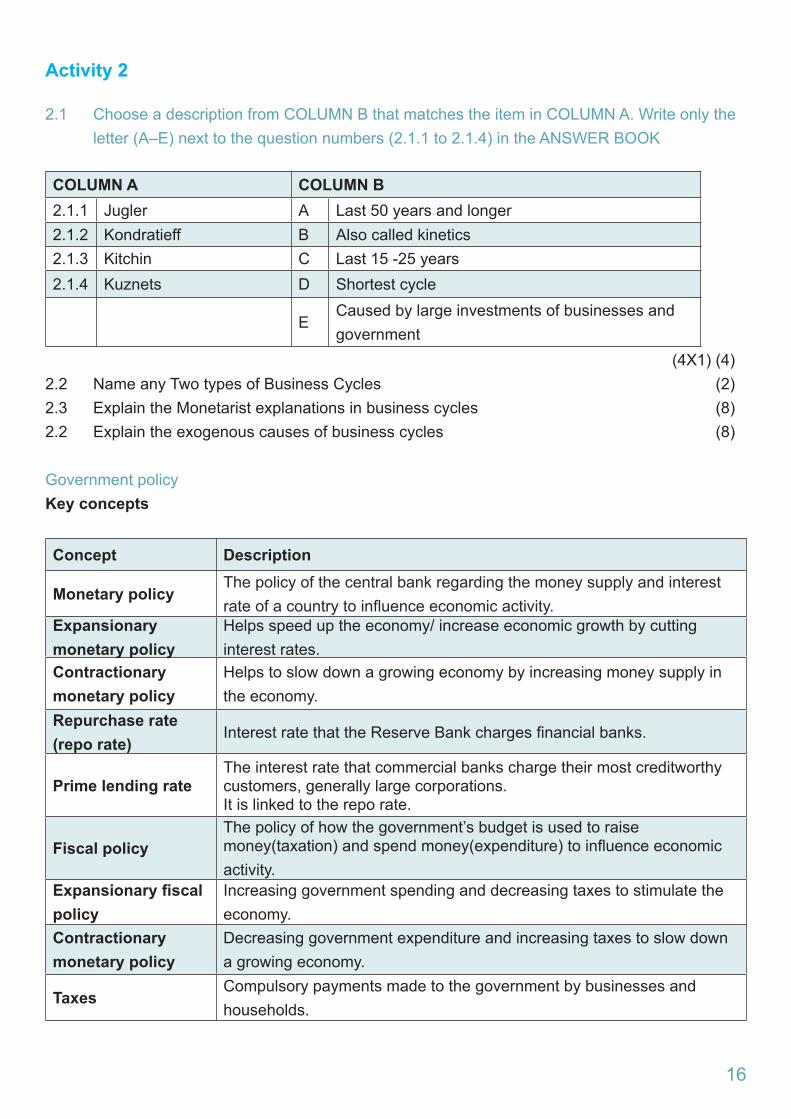
Activity 2
2.1 Choose a description from COLUMN B that matches the item in COLUMN A. Write only the letter (A–E) next to the question numbers (2.1.1 to 2.1.4) in the ANSWER BOOK
COLUMN A COLUMN B2.1.1 Jugler A Last 50 years and longer2.1.2 Kondratieff B Also called kinetics2.1.3 Kitchin C Last 15 -25 years2.1.4 Kuznets D Shortest cycle
ECaused by large investments of businesses and government
(4X1) (4)2.2 Name any Two types of Business Cycles (2)2.3 Explain the Monetarist explanations in business cycles (8)2.2 Explain the exogenous causes of business cycles (8)
Government policyKey concepts
Concept Description
Monetary policyThe policy of the central bank regarding the money supply and interest rateofacountrytoinfluenceeconomicactivity.
Expansionary monetary policy
Helps speed up the economy/ increase economic growth by cutting interest rates.
Contractionary monetary policy
Helps to slow down a growing economy by increasing money supply in the economy.
Repurchase rate (repo rate)
InterestratethattheReserveBankchargesfinancialbanks.
Prime lending rateThe interest rate that commercial banks charge their most creditworthy customers, generally large corporations. It is linked to the repo rate.
Fiscal policyThe policy of how the government’s budget is used to raise money(taxation)andspendmoney(expenditure)toinfluenceeconomicactivity.
Expansionary fiscal policy
Increasing government spending and decreasing taxes to stimulate the economy.
Contractionary monetary policy
Decreasing government expenditure and increasing taxes to slow down a growing economy.
TaxesCompulsory payments made to the government by businesses and households.
17
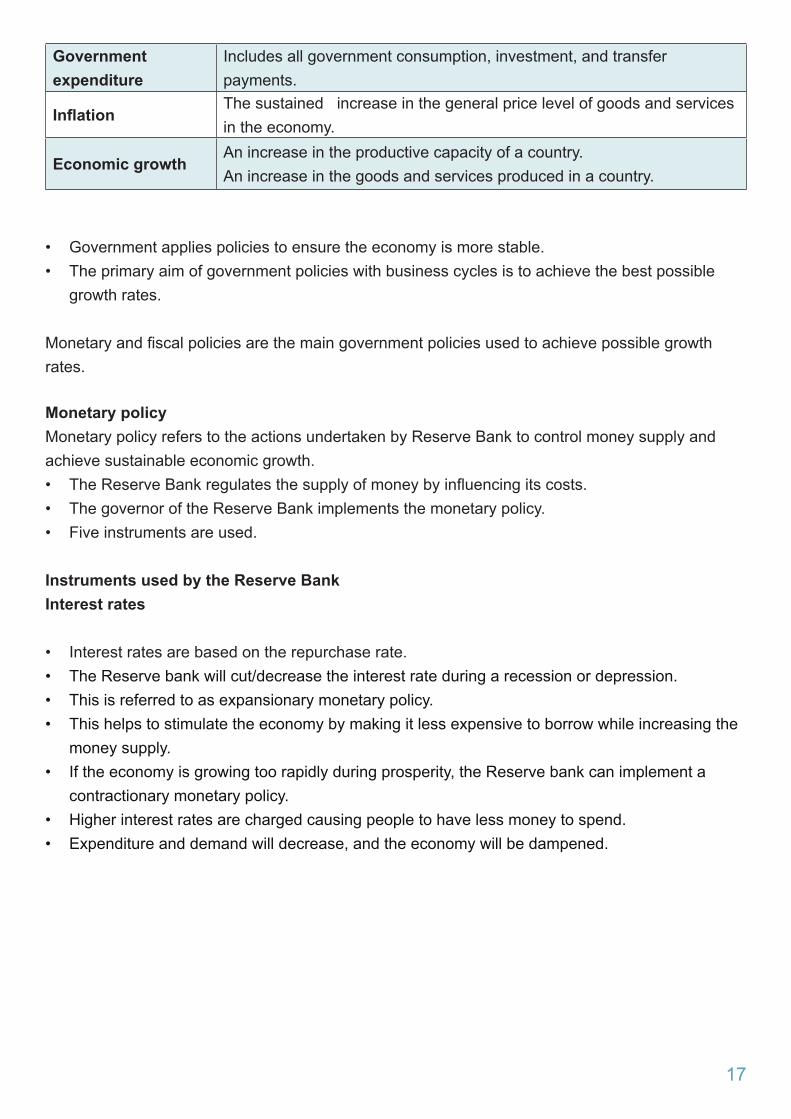
Government expenditure
Includes all government consumption, investment, and transfer payments.
Inflation The sustained increase in the general price level of goods and services in the economy.
Economic growthAn increase in the productive capacity of a country. An increase in the goods and services produced in a country.
• Government applies policies to ensure the economy is more stable.• The primary aim of government policies with business cycles is to achieve the best possible
growth rates.
Monetaryandfiscalpoliciesarethemaingovernmentpoliciesusedtoachievepossiblegrowthrates.
Monetary policyMonetary policy refers to the actions undertaken by Reserve Bank to control money supply and achieve sustainable economic growth.• TheReserveBankregulatesthesupplyofmoneybyinfluencingitscosts.• The governor of the Reserve Bank implements the monetary policy.• Five instruments are used.
Instruments used by the Reserve BankInterest rates
• Interest rates are based on the repurchase rate.• The Reserve bank will cut/decrease the interest rate during a recession or depression.• This is referred to as expansionary monetary policy.• This helps to stimulate the economy by making it less expensive to borrow while increasing the
money supply.• If the economy is growing too rapidly during prosperity, the Reserve bank can implement a
contractionary monetary policy.• Higher interest rates are charged causing people to have less money to spend.• Expenditure and demand will decrease, and the economy will be dampened.
18
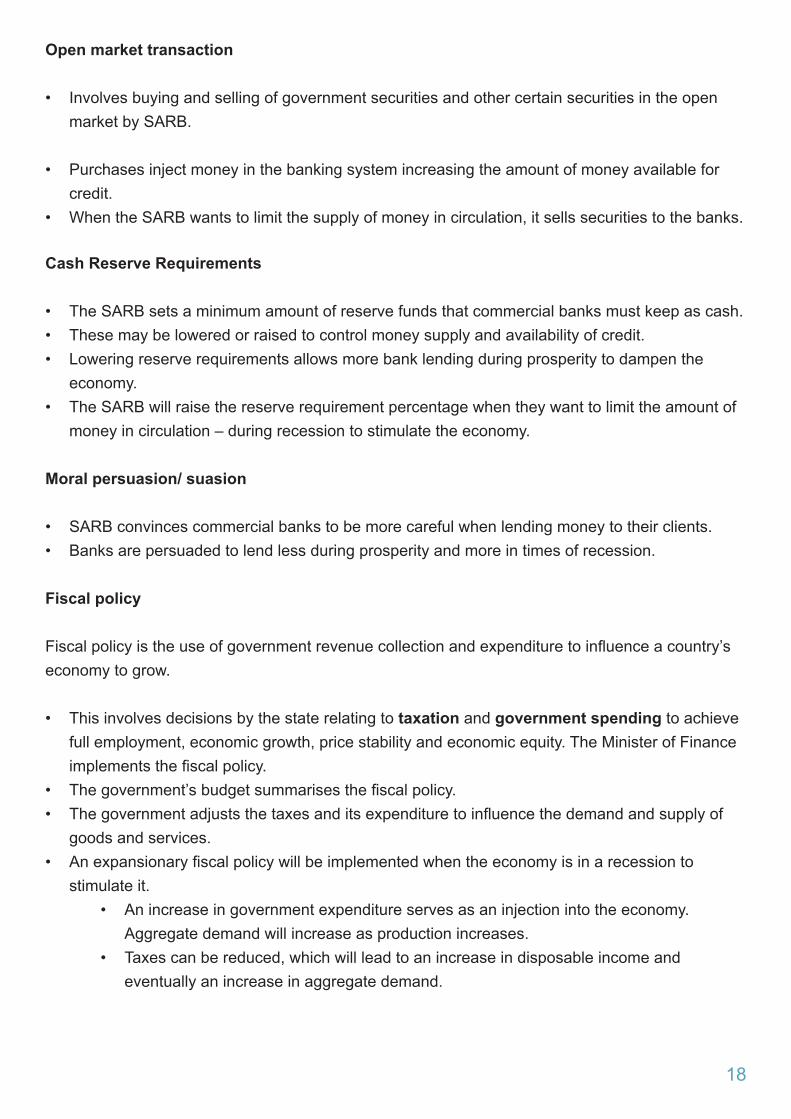
Open market transaction
• Involves buying and selling of government securities and other certain securities in the open market by SARB.
• Purchases inject money in the banking system increasing the amount of money available for credit.
• When the SARB wants to limit the supply of money in circulation, it sells securities to the banks.
Cash Reserve Requirements
• The SARB sets a minimum amount of reserve funds that commercial banks must keep as cash.• These may be lowered or raised to control money supply and availability of credit.• Lowering reserve requirements allows more bank lending during prosperity to dampen the
economy.• The SARB will raise the reserve requirement percentage when they want to limit the amount of
money in circulation – during recession to stimulate the economy.
Moral persuasion/ suasion
• SARB convinces commercial banks to be more careful when lending money to their clients.• Banks are persuaded to lend less during prosperity and more in times of recession.
Fiscal policy
Fiscalpolicyistheuseofgovernmentrevenuecollectionandexpendituretoinfluenceacountry’seconomy to grow.
• This involves decisions by the state relating to taxation and government spending to achieve full employment, economic growth, price stability and economic equity. The Minister of Finance implementsthefiscalpolicy.
• Thegovernment’sbudgetsummarisesthefiscalpolicy.• Thegovernmentadjuststhetaxesanditsexpendituretoinfluencethedemandandsupplyof
goods and services.• Anexpansionaryfiscalpolicywillbeimplementedwhentheeconomyisinarecessionto
stimulate it.• An increase in government expenditure serves as an injection into the economy.
Aggregate demand will increase as production increases.• Taxes can be reduced, which will lead to an increase in disposable income and
eventually an increase in aggregate demand.

19
• Acontractionary/restrictivefiscalpolicywillbeimplementedwhentheeconomygrowstoofastto curb the growing economic activity.
• A decrease in government expenditure will decrease aggregate demand.• Taxes can be increased which will decrease disposable income.
The new economic paradigmKey concepts
Concepts Description
Economic paradigm
A basic principle that describes how an economy works or should work. A paradigm is a perspective or set of ideas.It is a way of viewing a condition e.g., the economy
New economic paradigm
Refers to government policies designed to ensure a high rate of economic growthwithouthavingsupplylimitationsandpriceinflation.
UnemploymentOccurs when a person who is actively searching for employment is unable tofindwork.Is often used as a measure of the wealth of the economy.
Phillips Curve Illustratestherelationshipbetweenunemploymentandinflation
Demand-side policies
Attempts to increase or decrease aggregate demand to affect output, employment,andinflation.
Supply-side policies
Policies aimed at increasing aggregate supply (AS).
Aggregate demand (AD)
It is the total spending on goods and services in the economy.AD = C+I+G+(X-M)
Aggregate supply (AS)
Aggregate Supply (AS) is the total quantity of goods and services supplied at every price level.It is the total value of goods and services produced in the economy in a given period.

20
Government can use monetary and fiscal policies to smooth out the business cycle
The new economic paradigm
• Theoriesthatexplainthecausesofbusinesscyclesareonlytrueunderspecificcircumstances.• Governmentsneedtoapplypoliciesthatwillpreventpeaksendingwithinflationortroughsthat
end with unemployment.• The new economic paradigm in terms of the smoothing of business cycles encourages
achieving stability through sound, long term decisions relating to demand and supply in the economy.
• The new economic paradigm refers to government policies designed to ensure a high rate of economicgrowthwithouthavingsupplylimitationsandpriceinflation.
• This new way of thinking (new economic paradigm) lies in demand – side and supply side policies.
Demand-side policies
• Monetaryandfiscalpoliciesfocusonaggregatedemand.• Demand side policy is relying on aggregate demand only.• The aggregate demand is created by households, businesses, and the government (C + G + I).• Demand side policy does not render ideal results on its own i.e. sustained growth without supply
limitationsandpriceinflation.• Growth is often cut short because of all sorts of bottle necks that develop in the economy.
Examplesofbottleneckssuchas,inflation,balanceofpaymentdeficits,andshortagesofskilledlabour, etc.
• Figure 1 shows what happens when only focusing on the demand side policies which rely on aggregate demand

21
Figure 1: Demand- side policy without an increase in supply
• When demand increase (from D1 – D2) the quantity increases from Q1 to Q2.• The quantity increase is a desired result, but supply did not increase• Supplyisoftensaidtobe‘sticky’(fixed)intheshort-term)• The shifting of demand from D1 to D2 resulted in a price increase from P1 to P2.• Thisleadstoinflation–anundesiredresult.• It is clear that Aggregate Supply also needed to be managed. • Ifthecostofincreasingproductionisflexible;agreaterrealproductionoutputcanbesupplied
at any given price level.
0
22
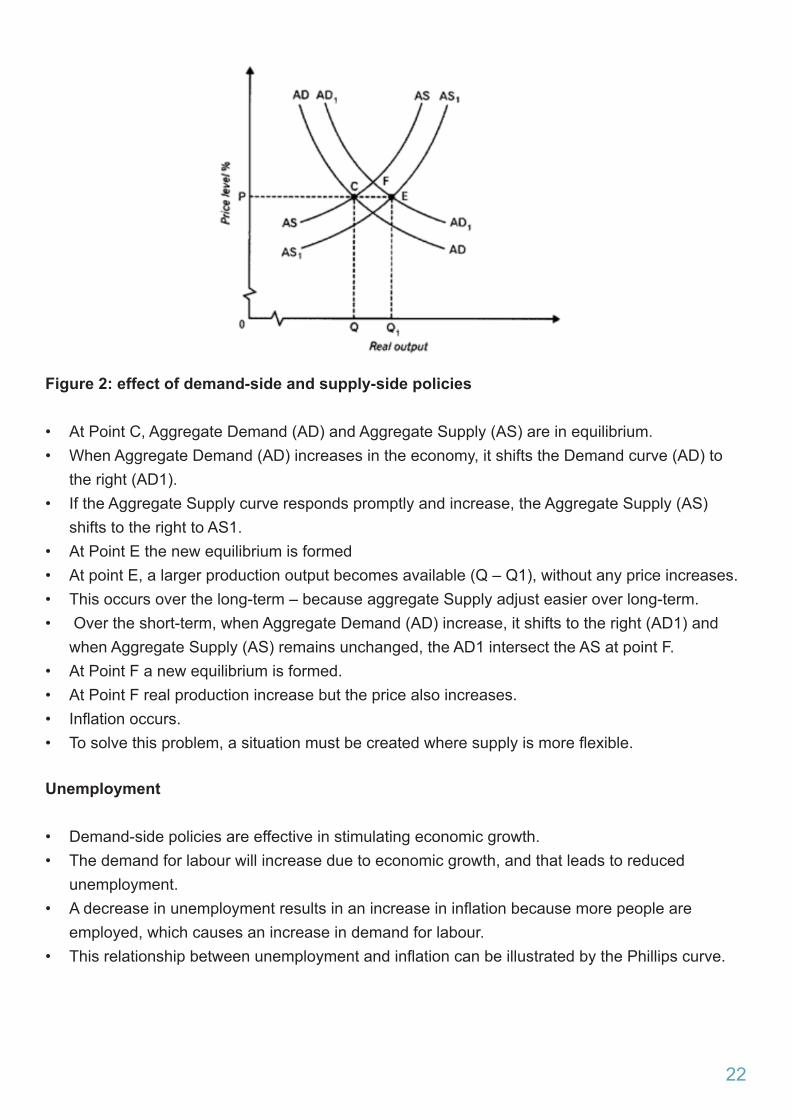
Figure 2: effect of demand-side and supply-side policies
• At Point C, Aggregate Demand (AD) and Aggregate Supply (AS) are in equilibrium. • When Aggregate Demand (AD) increases in the economy, it shifts the Demand curve (AD) to
the right (AD1).• If the Aggregate Supply curve responds promptly and increase, the Aggregate Supply (AS)
shifts to the right to AS1. • At Point E the new equilibrium is formed • At point E, a larger production output becomes available (Q – Q1), without any price increases.• This occurs over the long-term – because aggregate Supply adjust easier over long-term.• Over the short-term, when Aggregate Demand (AD) increase, it shifts to the right (AD1) and
when Aggregate Supply (AS) remains unchanged, the AD1 intersect the AS at point F.• At Point F a new equilibrium is formed.• At Point F real production increase but the price also increases.• Inflationoccurs.• Tosolvethisproblem,asituationmustbecreatedwheresupplyismoreflexible.
Unemployment
• Demand-side policies are effective in stimulating economic growth.• The demand for labour will increase due to economic growth, and that leads to reduced
unemployment.• Adecreaseinunemploymentresultsinanincreaseininflationbecausemorepeopleare
employed, which causes an increase in demand for labour.• ThisrelationshipbetweenunemploymentandinflationcanbeillustratedbythePhillipscurve.
23
Phillips graph
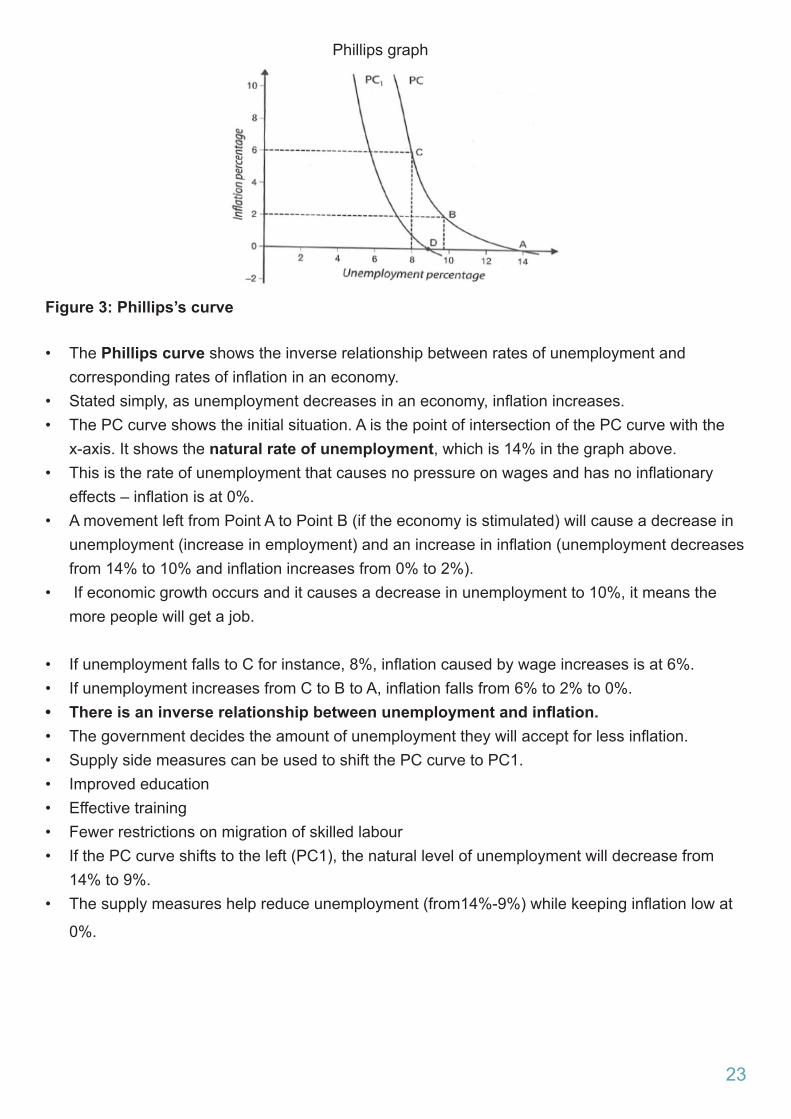
Figure 3: Phillips’s curve
• The Phillips curve shows the inverse relationship between rates of unemployment and correspondingratesofinflationinaneconomy.
• Statedsimply,asunemploymentdecreasesinaneconomy,inflationincreases.• The PC curve shows the initial situation. A is the point of intersection of the PC curve with the
x-axis. It shows the natural rate of unemployment, which is 14% in the graph above. • Thisistherateofunemploymentthatcausesnopressureonwagesandhasnoinflationary
effects–inflationisat0%.• A movement left from Point A to Point B (if the economy is stimulated) will cause a decrease in
unemployment(increaseinemployment)andanincreaseininflation(unemploymentdecreasesfrom14%to10%andinflationincreasesfrom0%to2%).
• If economic growth occurs and it causes a decrease in unemployment to 10%, it means the more people will get a job.
• IfunemploymentfallstoCforinstance,8%,inflationcausedbywageincreasesisat6%.• IfunemploymentincreasesfromCtoBtoA,inflationfallsfrom6%to2%to0%.• There is an inverse relationship between unemployment and inflation.• Thegovernmentdecidestheamountofunemploymenttheywillacceptforlessinflation.• Supply side measures can be used to shift the PC curve to PC1.• Improved education • Effective training • Fewer restrictions on migration of skilled labour• If the PC curve shifts to the left (PC1), the natural level of unemployment will decrease from
14% to 9%.• Thesupplymeasureshelpreduceunemployment(from14%-9%)whilekeepinginflationlowat
0%.

24
Activity 33.1 Study the graph below and answer the questions that follow.
Source google.com
3.1.1 Provide a name for the graph given above. (1)3.1.2 What is the original natural rate of unemployment in the graph above? (1)3.1.3 Brieflydescribethetermnew economic paradigm (2)3.1.4 Explainhowthegovernmentcanuseitsfiscalpolicytospeeduptherecoveryofan economy (2)3.1.5 Redraw the graph to show the impact of supply side policies in the economy (4)3.2.1 Write the acronym SARB in full. (1)3.2.2 What type of monetary policy should SARB implement to prevent a trough in the business cycle? (1)3.2.3 Brieflydescribethetermrecovery (2)3.2.4 Explain the negative impact of COVID-19 in the manufacturing sector. (2)3.2.5 How can the SARB prevent further recessions in the economy? (2X2) (4)3.3 With the aid of a graph, explain the effect of demand-side and supply-side policies in smoothing out business cycles. (8)
Supply-side policies
The supply-side policies focus on aggregate supply of the producers. For example, when the cost of production is reduced, producers can supply more goods & services.• Reduction of production costs by providing subsidies to businesses. • Cash incentives such as decrease tax to produce certain goods and services.• Infrastructural services – the government can supply infrastructure services such as transport,
communication, and energy.• Administrative costs – government can reduce administrative costs such as inspections and
unnecessary regulations.• Improvingtheefficiencyofinputs• Capital consumption - more production capacity through decreased taxes.
25
• Human resources development - better trained staff (SETAS).• Free advisory services - technical advice from expensive expert sources.• Improvingtheefficiencyofmarkets.• Deregulation – no government intervention by the removal of rules and regulations. • Competition – create a competitive environment by developing new enterprises (SMMEs). • Private state-owned enterprises (SOEs) to increase competition.
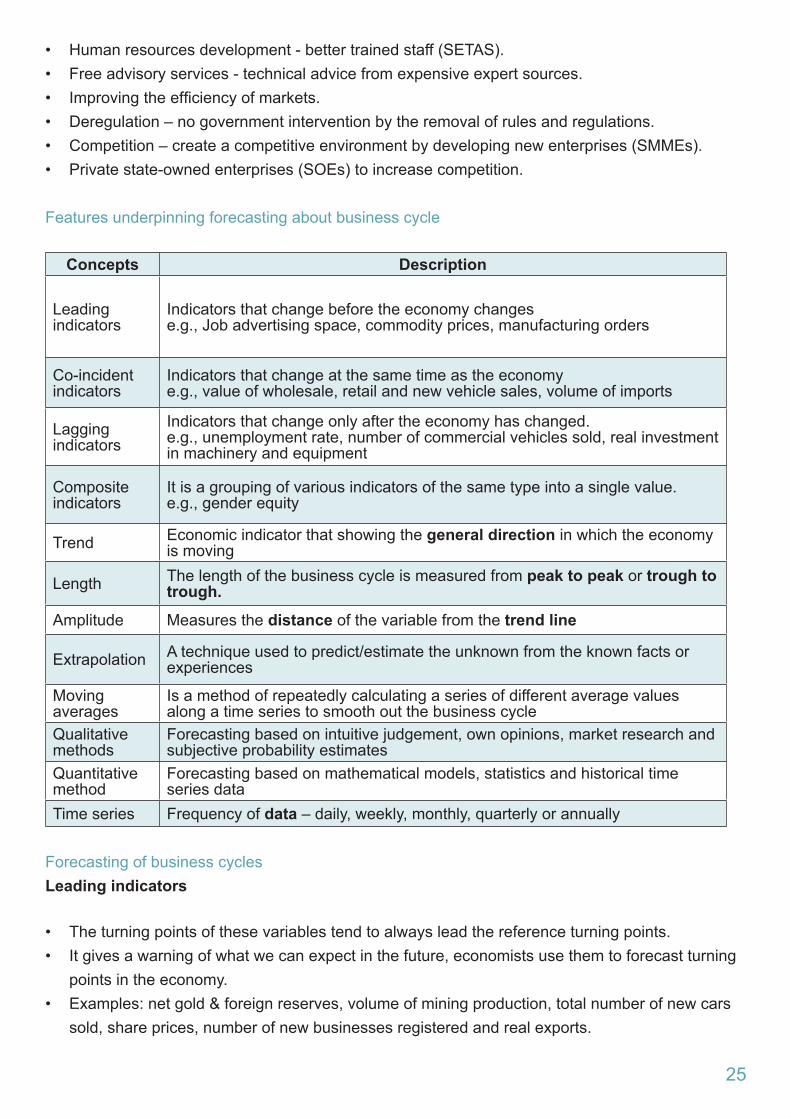
Features underpinning forecasting about business cycle
Concepts Description
Leading indicators
Indicators that change before the economy changese.g., Job advertising space, commodity prices, manufacturing orders
Co-incident indicators
Indicators that change at the same time as the economye.g., value of wholesale, retail and new vehicle sales, volume of imports
Lagging indicators
Indicators that change only after the economy has changed.e.g., unemployment rate, number of commercial vehicles sold, real investment in machinery and equipment
Composite indicators
It is a grouping of various indicators of the same type into a single value.e.g., gender equity
Trend Economic indicator that showing the general direction in which the economy is moving
Length The length of the business cycle is measured from peak to peak or trough to trough.
Amplitude Measures the distance of the variable from the trend line
Extrapolation A technique used to predict/estimate the unknown from the known facts or experiences
Moving averages
Is a method of repeatedly calculating a series of different average values along a time series to smooth out the business cycle
Qualitative methods
Forecasting based on intuitive judgement, own opinions, market research and subjective probability estimates
Quantitative method
Forecasting based on mathematical models, statistics and historical time series data
Time series Frequency of data – daily, weekly, monthly, quarterly or annually
Forecasting of business cycles Leading indicators
• The turning points of these variables tend to always lead the reference turning points.• It gives a warning of what we can expect in the future, economists use them to forecast turning
points in the economy.• Examples: net gold & foreign reserves, volume of mining production, total number of new cars
sold, share prices, number of new businesses registered and real exports.

26
Lagging indicators
• These variables tend to always lag with the reference turning points.• They indicate what has already happened in the economy.• Examples: the hours worked in construction, employment, the number of commercial vehicles
sold and investment in capital goods (machinery & equipment).
Coincident Indicators
• The turning points of these variables tend to always coincide with the reference turning points.• They provide information about the current situation of the economy.Examples: the real GDP, registered unemployment, volume of imports and the volume of manufacturing production.
Composite Indicators
• It is a grouping of various indicators of the same type into a single value.• Thesinglefigureformsthenormforacountry’seconomicperformance.
Trend line
• It is the general direction of the economy.• The trend line that rises gradually will be positively sloped in the long run.• The rising line indicates a growing economy.
Length
• The length is measured from peak to peak or trough to trough. • Longer cycles show strength and shorter cycles show weakening regarding the economic
activities.
Amplitude
• Measures the distance of the variable from the trend line.• Amplitude is the vertical (height) difference between a trough and the next peak in the cycle.• A larger amplitude means more extreme changes that occur in cycle.
27
Extrapolation
• A technique used to predict/estimate the unknown from the known facts or experiences.• Extrapolation is to estimate something unknown from facts that are known.• The extrapolation from known facts is used to predict future share prices. Moving averages
• Moving averages are used to analyse the changes in a series of data over a certain period of time.
28
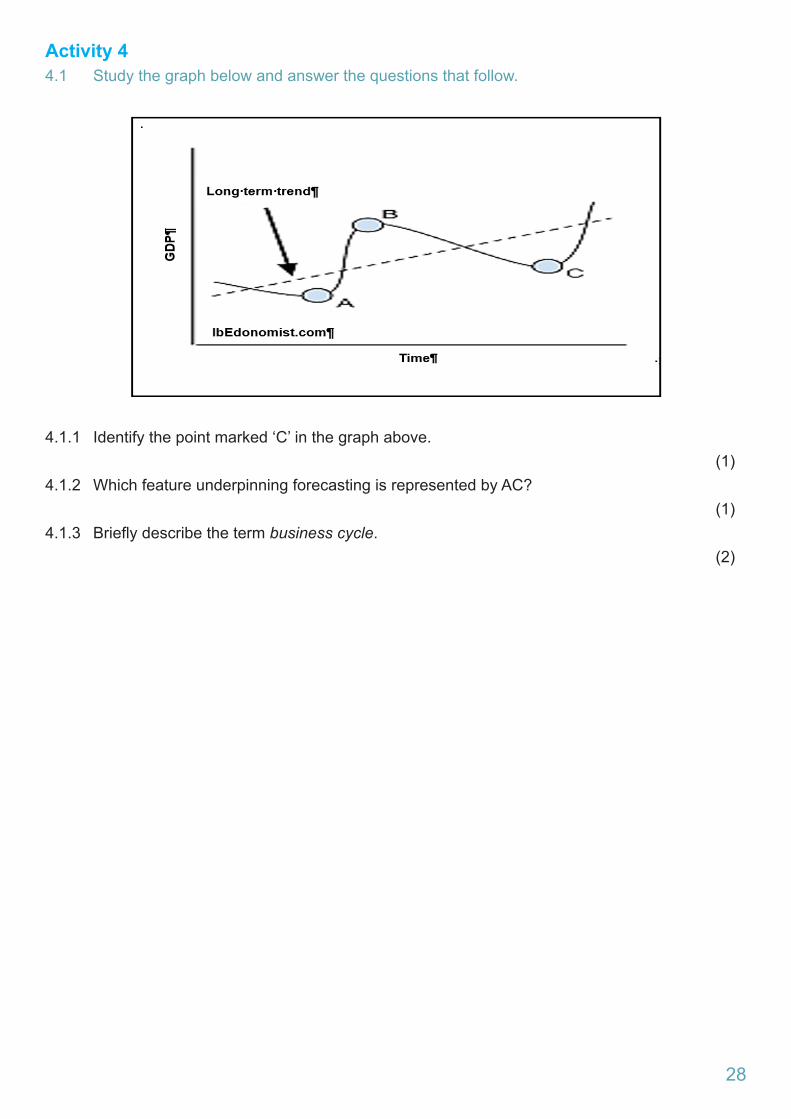
Activity 44.1 Study the graph below and answer the questions that follow.
4.1.1 Identify the point marked ‘C’ in the graph above. (1)4.1.2 Which feature underpinning forecasting is represented by AC? (1)4.1.3 Brieflydescribethetermbusiness cycle. (2)

29
Activity 5 5.1 BrieflydescribethetermExtrapolation. (2)5.2 Brieflydescribethetermamplitude. (2)5.3 How accurate are leading indicators? (2) 5.4 Discuss the trend line in the forecasting of business cycles. (8) 5.5 Brieflydiscusslaggingindicatorsasafeatureunderpinningforecasting. (4x2)(8)5.6 Distinguish between the amplitude and trend line as features underpinning forecasting (4 x 2)(8)

30
1.11.1.1 B PPUpswing1.1.2 A PP Trough1.1.3 B PPRecovery1.1.4 D PP Unemployment
1.21.2.1 Identify the letter that represent the trend line in the illustration above. (1) KP
1.2.2 Which letter represents a trough in the diagram above? (1) DP
1.2.3 Briefly describe the term business cycle (2)• Successive periods of increasing and decreasing economic activity / a time series
showing repeated increasing and decreasing economic activity/ the recurrent (not periodic) pattern of expansion and contraction in the level of economic activity. PP
(Accept any other relevant, correct response)
1.2.4 Explain economic activity during phase EF in the business cycle. (2)• Economy is growing and improving rapidly.PP• More businesses open up and employment increasePP• Higher demand and higher prices for capital goodsPP• FirmsmakehigherprofitsandhouseholdsalariesincreasePP
1.2.5 How can the length of business cycles be used in forecasting? (4)• The length is remains relatively stable and can be used to forecast the next cycle with
similar lengthPP• If a business cycle has 13 years, it can be predicted that 12 years will pass between
successive peaks or trough, or it can take 6 years for an economy to pass through a trough PP
• Longer cycles show strength which will indicate that the next cycle will also be strongPP

31
2.4 Explain the Monetarist explanations in business cycles (8)
• RefertothoseindependentfactorsthatcaninfluencebusinesscyclesandoriginateoutsidetheeconomyPP
• Some economists believe that business cycles are caused by exogenous factors such as those described below PP
• The monetarists believe markets are inherently stablePP• Disequilibrium is caused by incorrect use of policies, e.g. monetary policy PP• Governments should not intervene in the market PP• Sunspot theory based on the belief that increased solar radiation causes changes in weather
conditions PP• Weather conditions, technological changes and shocks cause upswings and downswings PP(Accept any other correct relevant response) A maximum of 1 mark for examples
32
ACTIVITY 3 3.1 DATA RESPONSE
3.1.1 Provide a name for the graph given above.• Phillips Curve P (1)
3.1.2 What is the original natural rate of unemployment in the graph above?• 14% P (1)
3.1.3 Brieflydescribethetermnew economic paradigm• The new economic paradigm refers to government policies designed to ensure a high
rate of economic growth without having supply constraints and price infation. PP (Accept any other correct relevant response) (2)
3.1.4 Explainhowthegovernmentcanuseitsfiscalpolicytospeeduptherecoveryofan economy
Government can speed up the recovery of the economy by:• reducing taxes Pwhich will give consumers and companies more money to spend on
goods and services and for companies to expand theri production capacity.P• increasing government spending P whiich will increase aggregate expenditure and
demand and thus stimulate economic activity and employment. P• increasing government spending and simultaneously decreasing taxes PP
(Accept any other correct relevant response) (Any 1 x 2) (2)
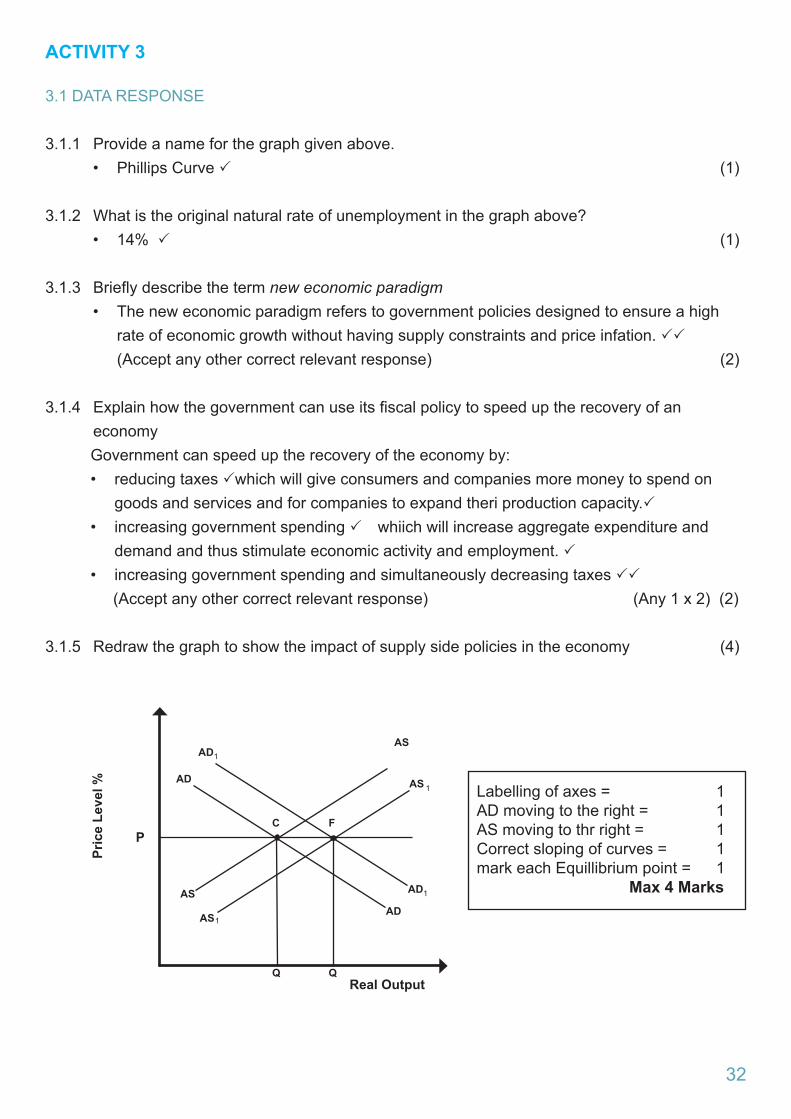
3.1.5 Redraw the graph to show the impact of supply side policies in the economy (4)
AS
1
1
1AD
AS
AS
1AS
AD
AD
AD
Q
C
Q
FP
Real Output
Pric
e Le
vel % Labelling of axes = 1
AD moving to the right = 1AS moving to thr right = 1Correct sloping of curves = 1mark each Equillibrium point = 1 Max 4 Marks

33
3.2.1 Write the acronym SARB in full. (1)• South African Reserve BankP
3.2.2 What type of monetary policy should SARB implement to prevent a trough in the business cycle?
• Expansionary monetary policyP 3.2.3 Briefly describe the term recovery. (2)
• Sustained level of increase in economic activity which occurs after a troughPP (Accept any other correct relevant response) 3.2.4 Explain the negative impact of COVID-19 in the manufacturing sector. (2)
• COVID-19 led to a total shutdown of the economic activities PP(Accept any other correct relevant response)
3.2.5 How can the SARB prevent further recessions in the economy? (2x2 ) ( 4)The SARB can prevent the recessions by:
• Adjusting the repo rate downwards which will lead to lower interest ratesPP• Decreasing cash reserve requirements to make more money available in the banks, for
loansPP• Buying securities in the open market (open market transactions) PP• Stabilising the exchange rates to increase the money supplyPP
3.3 How can South Africa’s fiscal policy contribute to a higher economic growth rate? (8)
• Increasing government spending to encourage economic activity directly from the private sector. PP
• Transferring funds to individuals who may then spend that money to buy goods and services. PP
• Decreasing tax revenue to encourage economic activity which increases individuals’ disposable income. PP
• The disposable income will increase demand for consumer goods and services. PP• The increase in demand for goods and services leads to decreased unemployment. PP• Theexpansionaryfiscalpolicycanbebeneficialwhentheeconomyisinrecession.PP

34
Activity 4
4.1.1 Identify the point marked ‘C’ in the graph above • TroughP (1)
4.1.2 Which feature underpinning forecasting is represented by AC?• LengthP (1)
4.1.3 Brieflydescribethetermbusiness cycle • Successive periods of increasing and decreasing economic activity / a time series
showing repeated increasing and decreasing economic activity/ the recurrent (not periodic) pattern of expansion and contraction in the level of economic activityPP (2)
35
Activity 5
Briefly describe the term Extrapolation Extrapolation means to estimate something unknown from the facts and information that is known using past data, where predictions are made about the future based on assumptions related to trends.PP (2X1) (2)
5.2 Briefly describe the term amplitude It is the difference between the value of total output between peak and trough measured from the trend line to the peak and trough PP (2X1) (2)How accurate are leading indicators? (2) Leading indicators often face trade-offs between accuracy, precision and lead time in predicting future events PPLooking at several leading indicators in conjunction with other types of data can help provide information about the future health an economy. PP1.1 Discuss the trend line in the forecasting of business cycles.
• It represents the average position of a cycle. PP• Indicates the general direction in which the economy is moving. PP• An upward trend suggest that the economy is growing. PP• Trend line usually has a positive slope, because production capacity increases over time. PP (Accept any other relevant answer) (4x 2) (8)
5.5 Briefly discuss lagging indicators as a feature underpinning
Forecasting (4 x 2) (8)• Lagging follow immediately after the coincident indicators PP • ServetoconfirmthebehaviourofthecoincidentindicatorsPP • Ifitdoesnotconfirmtheupswingordownswing,forinstance,itsignalsthattheupswingor
downswing is weak. PP• A weak downswing will most likely end at an early stage PP• Change direction after reference turning points in the business cycle has been reachedPP• Confirmchangesthatwerefirstindicatedbytheleadingindicatorsandthenthecoincident
indicators PP• Provide an advance signal of a turning point in the business cyclePP • Firsttoreflectimbalancesthatintensify(increase)orsubsidise(decrease)intheeconomyPP• Influenceofmovementsonsubsequentmovementsintheleadingindicatorshelpexplainthe
view that one business cycle generates the next one. PP (4 x 2) (8)

36
5.6 Distinguish between the amplitude and trend line as features underpinning forecasting (4 x 2) (8) Amplitude
• The power of the underlying forces such as interest rates, exports, or consumer spending PP• A large amplitude during upswing demonstrates strong underlying forces PP• The duration of a cycle with a large amplitude is usually longer than one with a smaller
amplitude PP• The extent of change – the larger the amplitude the more extreme the changes that may occur PP
• During an upswing unemployment may decrease from 20% to 10% (a decrease of 50%) inflationmayincreasefrom3%to6%(by100%)orasurplusonthecurrentaccount(ofthebalanceofpayments)canchangefromsurplustoadeficitPP
Trend line:
• The trend line that rises gradually will be positively sloped in the long run, the rising line indicates a growing economyPP
• The trend indicates the general direction in which indexes that were used in the business cycle move PP
• The trend will change when the time series data change their behaviour patterns of the past PP• Some forces have to be overcome for the time series data to change their behaviour patterns of
the past, e.g. Resistance points and ChannelsPP • (Accept any other relevant facts response) (Any 2 x 4) (8)

37
Activity 6 Discuss in the new economic paradigm in detail. (26 marks)Evaluate the use of tax cuts as a means to stimulate the economy. (10 marks) [40]INTRODUCTION
The“neweconomicparadigm”discouragespolicymakersfromusingmonetaryandfiscalpoliciestofine-tunetheeconomy,butratherencouragesachievingstabilitythroughsoundlong-termpolicydecisions relating to demand and supply in an economy.PP (Accept any other relevant introduction) (Max 2)
MAIN PARTDEMAND-SIDE POLICIES
Demand-sidepoliciesreferstomeasuresundertakenbythegovernmenttoinfluencetheaggregatedemand in the economy. PPThegovernmentusesmonetaryandfiscalpolicytoachievethisgoal.PPWhenhouseholds,firmsandgovernmentspendmore,aggregatedemandintheeconomyincreases. PPThismakestheeconomygrowbutcanleadtoinflation.PPInflation P• Aggregate demand increases more quickly than aggregate supply and this causes prices to
increase. PP• When the supply does not react to the increase in demand, prices will increase. PP• Thiswillleadtoinflation(asustainedandconsiderableincreaseinthegeneralpricelevel).PP
Unemployment P• Demand-side policies are effective in stimulating economic growth. PP• Economic growth can lead to an increase in the demand for labour. PP• More people will be employed, and unemployment will decrease. PP• Whenunemploymentdecreasesinflationislikelytoincrease.PP
SUPPLY-SIDE POLICIES
Supply-sidepoliciesrefertoanymeasuresundertakenbygovernmenttoinfluencethelevelofaggregate supply in the economy. PP Government might try to stimulate aggregate supply by reducingthecostofproductionorimprovingtheefficiencyofinputs.PPReduction of costs of production P• Reducing the cost of production means that a greater output can be supplied at any given price
level. PP• Governments can roll out measures that can reduce the cost of production of businesses
directly or indirectly. PP
38
• E.g.provisionofinfrastructuralservices,efficientadministration,lessredtapeandnocorruption. PP
• Infrastructural services P – transport, communication, water, and energy costs often result in substantial costs to businesses. PP
• Governmentcanmakeasignificantcontributionifchargesarereasonable,andservicesareefficientseenthatalltheseservicesareundergovernmentcontrolinSouthAfrica.PP
• Administrative costs P – inspections, reports on the application of various laws, regulations and by-laws, tax returns etc. adds to production costs. PP
• Decreaseadministrativecosts(redtape)canmakebusinessesmoreefficient.PP• Cash incentives P – subsidies for businesses to locate in neglected areas where unemployment
is high PP and compensation to exporters for certain costs they incur in the development of export markets. PP
Improving the efficiency of inputs P
Greaterefficiencyisusuallyachievedwithincentiveschemesandmeasuressuchas:• Tax rates – high rates of personal income tax are a disincentive to work. PP• High rates of corporate income tax are a disincentive to invest because they increase costs and
reducenetprofits.PP• High indirect taxes such as VAT are a disincentive to produce because they increase selling
prices. PP• Capital consumption P – replacing capital goods regularly creates opportunities for businesses
to keep up with technological development. PP• Depreciationallowancesaresubtractedfromgrossprofitbeforetaxesarecalculatedand
therefore reduce the amount of tax liability. PP• Human resource development P – the quality of labour can be improved by improving health
care, education, training or the mobility of labour. PP• Free advisory services P – these promotes opportunities to export and establish businesses in
foreign countries; improve the quality of human resources through the skills development act. PP
Improving the efficiency of markets P
Measuresthatimprovemarketefficiencyinclude:• Deregulation: P remove laws, regulations and other forms of government controls that interfere
in markets and make the markets free. PP • Addresslabourandotherresourcemarketinflexibilities.PP• Remove price, import, and exchange controls. PP• Competition P – Implement measures that can increase competition. PP encourage the
establishment of new businesses. PP Invite foreign direct investments. PP Remove power imbalances, such as monopolies and opportunities for collusion (oligopolies). PP

39
• LevellingtheplayingfieldP – private businesses cannot compete with public enterprises. PP • Public enterprises have legislative protection and supported by government. PP • Corruption needed to be dealt with vigorously. PP (Max 26)
40
ADDITIONAL PARTEvaluate the use of tax cuts as a means to stimulate the economy.
• Ataxcutisgenerallyseenasafiscalmeasuretostimulatetheeconomy.• The assumption is that tax cuts will increase the amount of money for spending and therefor will
lead to an increase in aggregate demand. PP • In an economy that is already weak, tax cuts will provide an immediate boost in demand,
howevertaxcutswillcreatelargerbudgetdeficits.PP• Over the long term, and in a healthy economy, this will put downward pressure on a country’s
currencywhichcouldultimatelyincreaseinflationthroughhigherpricesforimports.PP• Intime,ifinflationishighenoughandtheeconomyisstrongenough,itcouldconvincethe
central bank to initiate contractionary monetary policy, such as higher interest rates. • The result of that is slower economic growth. P• A lot depends on which segment of society gets the tax cuts. P• Cuts to lower-income families directly translate into increased spending. That boosts demand
and economic growth. PP• Tax cuts to higher-income families are often invested, saved, or used to pay off debt. PP
That tax cuts to higher income families boosts the stock market and banks, but not retail. PP (10)
(Accept any other correct relevant response)
CONCLUSION
Paying attention to the above discussed indicators and other features of business cycle forecasting can enable the country to prepare suitable policies to deal with the changes at hand. PP (Max.2)
41
Activity 7
Discuss ALL the features underpinning the forecasting of business cycles, excluding the economic indicators. (26 marks)Why is price stability important to prevent extreme fluctuations in business cycles? (10 marks) [40]INTRODUCTIONBusinesscyclesistherecurringfluctuations(upsanddowns)ineconomicactivity,relativetotheeconomic trend value. PP (2)
BODY MAIN PART
Extrapolation PThis means using historical data and predicting the future on that basis. For example: If the economy grows or decreases continually, predictions can be made by means of extrapolation along the same trend line. PP
Moving averages PReferstotheaveragepriceofanindicatoroveraspecifiedperiod.Movingaveragesareusedtolook at price trends. PP Tables indicating the moving averages of share prices are used to indicate whether they are moving upwards or downwards. PP Information can be gathered from this on a daily, monthly or annual basis. PPAs the new members (for the day, week or month) are added and the older members are deleted, the average ‘moves’. PPBycalculatingamovingaverage,aforecastercansmoothouttheminorfluctuationsinadataseries. This makes it easier to spot trends. PP
Trend line PThe trend line that rises gradually will be positively sloped in the long run; the rising line indicates a growing economy. PPThe trend indicates the general direction in which indexes that were used in the business cycle move. PPThe trend will change when the time series data change their behaviour patterns of the past.PP However, some forces have to be overcome for that to happen e.g. Resistance points and Channels. PP

42
Length of a cycle PMeasuring a cycle from peak to peak or trough to trough. PPLonger cycles show strength and shorter cycles show weakness with regard to economic activities. PP
Amplitude PMeasures the distance of the variable from the trend line. PPAmplitude refers to the vertical (height) difference between a trough and the next peak of a cycle. PP
The larger the amplitude, the more extreme the changes that occur. PPMax 8 marks to headings and/or examples [26]
ADDITIONAL PART
Whyispricestabilityimportanttopreventextremefluctuationsinbusinesscycles?Pricestabilityleadstoinflationstability.PPIf prices are stable then the demand for goods and services will be stable. PPProductionofgoodsandserviceswillnotfluctuateandemploymentwillbestable.PPUnemployment will not increase if prices are stable. PPInterestrateswillremainunchanged,andtheeconomywillcontinuetogrowwithoutbigfluctuation.PP
CONCLUSIONGovernment uses the monetary policy to achieve price stability and control the amount of money in circulation. PP (2) [40]

43
Examination Tips
How to prepare/study for the examination During the study processYou need to draw up a timetable to study Economics every day.The Business cycle study guide aims to support you to help you to get good marks during the assessment.Use the study guide together with other sources to study towards the best possible marks in the examination.
Use the structure of the question paper to guide you in preparing for the examinations
• Every topic and subtopic is very important if you strive to get the best marks in Economics. • Do not select (spot) the content, it will hamper your opportunity to get good marks. • The concepts are very important to know and describe in order to understand the content and
get marks. • Make time to study smart, make notes, refer to you study guide, the examination guideline and
other sources to add more information to your notes.• Work out the activities and compare with the solution do not give up if performance is not what
you desire. Practice makes perfect. Good luck!!• You have made it so far against all odds, you can!!! Good luck!!!
Typical examination questions
What to expectHow to approach/ respond to the questions
Section AQuestion 1 Multiple questionMatch column A with column BGive the term
Section A Questions 1.1 consist of multiple choice
(8X2) (16) 1.2 match column A with column B (8X 1) (8) 1.3 give the most correct term/ concept.No abbreviation, acronyms and examples will be accepted
(6X1) (6)
To cover the full scope, study all the concepts in each main topic.Knowing all your Concepts and the description thereof will help you to get full marks in Section A
44
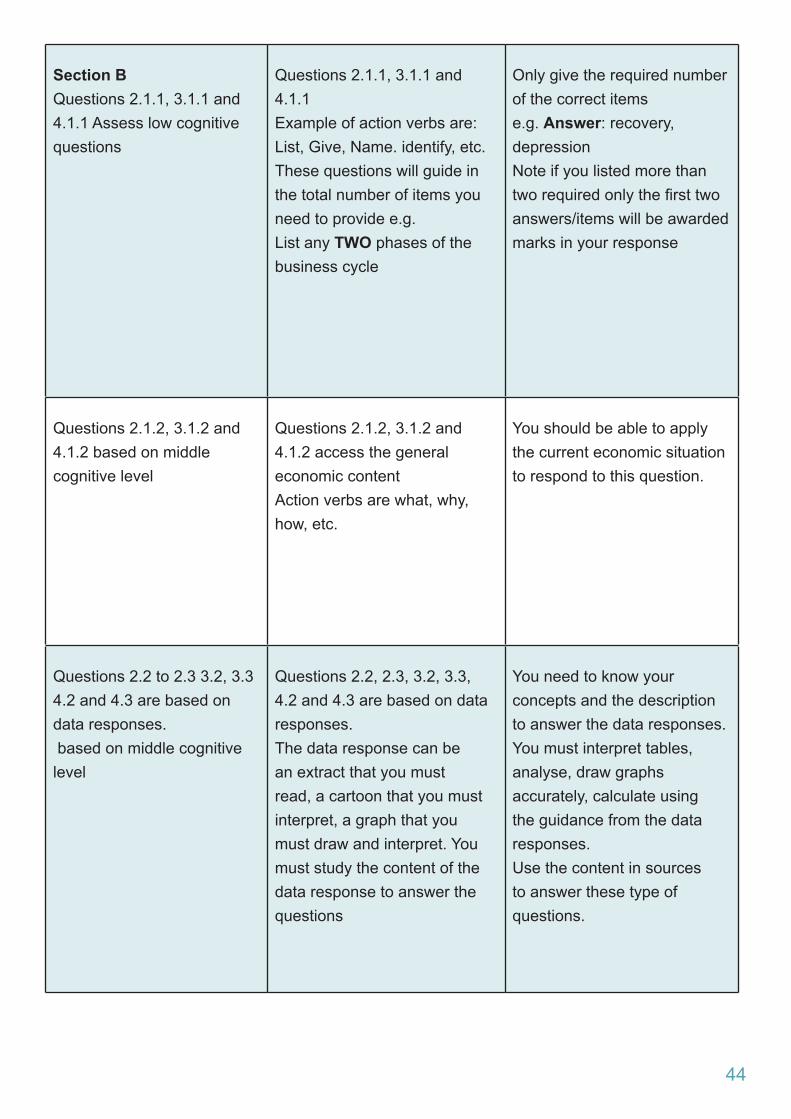
Section BQuestions 2.1.1, 3.1.1 and 4.1.1 Assess low cognitive questions
Questions 2.1.1, 3.1.1 and 4.1.1 Example of action verbs are: List, Give, Name. identify, etc.These questions will guide in the total number of items you need to provide e.g. List any TWO phases of the business cycle
Only give the required number of the correct items e.g. Answer: recovery, depression Note if you listed more than tworequiredonlythefirsttwoanswers/items will be awarded marks in your response
Questions 2.1.2, 3.1.2 and 4.1.2 based on middle cognitive level
Questions 2.1.2, 3.1.2 and 4.1.2 access the general economic content Action verbs are what, why, how, etc.
You should be able to apply the current economic situation to respond to this question.
Questions 2.2 to 2.3 3.2, 3.3 4.2 and 4.3 are based on data responses. based on middle cognitive level
Questions 2.2, 2.3, 3.2, 3.3, 4.2 and 4.3 are based on data responses. The data response can be an extract that you must read, a cartoon that you must interpret, a graph that you must draw and interpret. You must study the content of the data response to answer the questions
You need to know your concepts and the description to answer the data responses. You must interpret tables, analyse, draw graphs accurately, calculate using the guidance from the data responses.Use the content in sources to answer these type of questions.
45
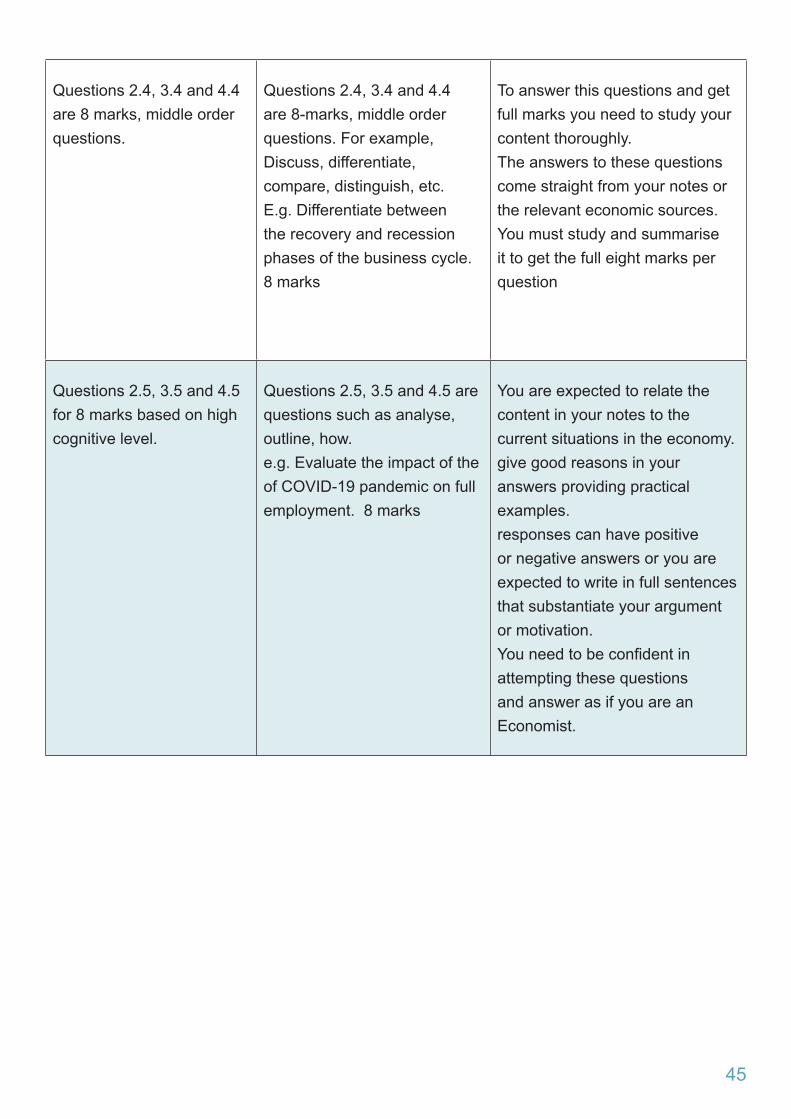
Questions 2.4, 3.4 and 4.4 are 8 marks, middle order questions.
Questions 2.4, 3.4 and 4.4 are 8-marks, middle order questions. For example, Discuss, differentiate, compare, distinguish, etc.E.g. Differentiate between the recovery and recession phases of the business cycle. 8 marks
To answer this questions and get full marks you need to study your content thoroughly. The answers to these questions come straight from your notes or the relevant economic sources. You must study and summarise it to get the full eight marks per question
Questions 2.5, 3.5 and 4.5 for 8 marks based on high cognitive level.
Questions 2.5, 3.5 and 4.5 are questions such as analyse, outline, how. e.g. Evaluate the impact of the of COVID-19 pandemic on full employment. 8 marks
You are expected to relate the content in your notes to the current situations in the economy. give good reasons in your answers providing practical examples.responses can have positive or negative answers or you are expected to write in full sentences that substantiate your argument or motivation.Youneedtobeconfidentinattempting these questions and answer as if you are an Economist.
46
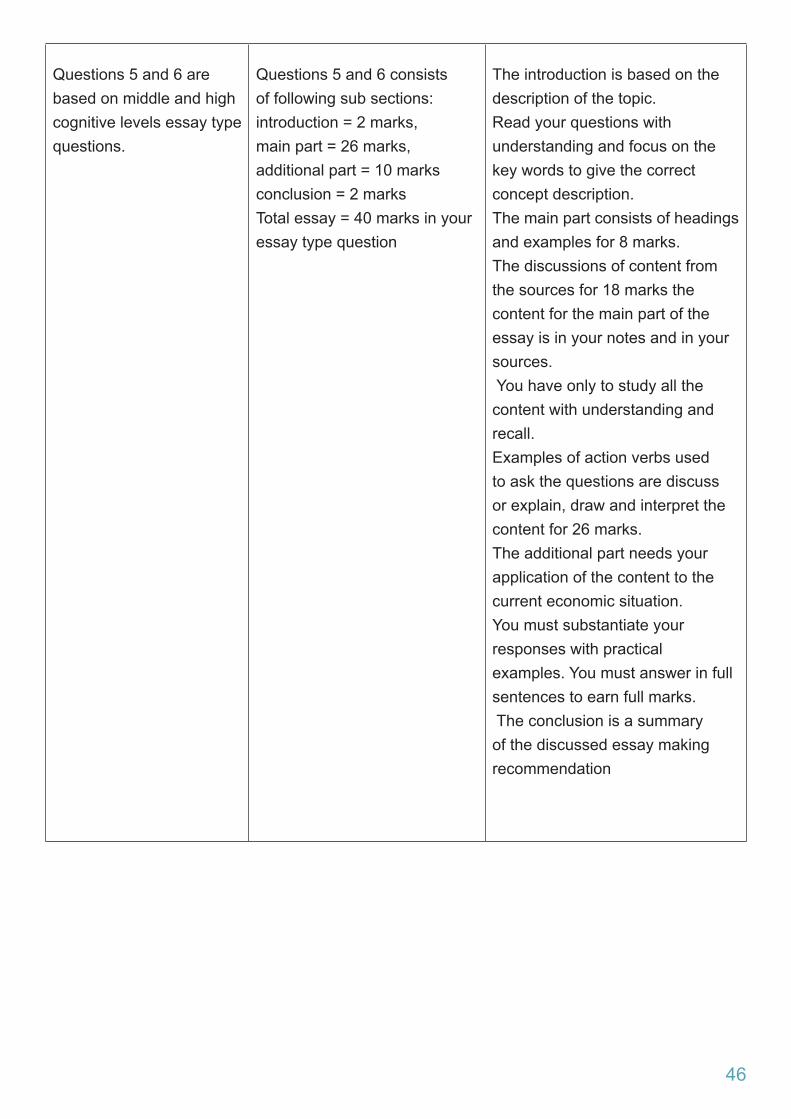
Questions 5 and 6 are based on middle and high cognitive levels essay type questions.
Questions 5 and 6 consists of following sub sections: introduction = 2 marks,main part = 26 marks, additional part = 10 marks conclusion = 2 marks Total essay = 40 marks in your essay type question
The introduction is based on the description of the topic.Read your questions with understanding and focus on the key words to give the correct concept description.The main part consists of headings and examples for 8 marks.The discussions of content from the sources for 18 marks the content for the main part of the essay is in your notes and in your sources. You have only to study all the content with understanding and recall.Examples of action verbs used to ask the questions are discuss or explain, draw and interpret the content for 26 marks.The additional part needs your application of the content to the current economic situation. You must substantiate your responses with practical examples. You must answer in full sentences to earn full marks. The conclusion is a summary of the discussed essay making recommendation
47
4. General Examination TipsHINT: Apply the following when answering the question paper:
Section A
• When answering Section, A – short questions, it is important not to rush but to read the questions carefully and to make sure you understand what the question is asking.
• You are looking for the MOST correct answer in the multiple-choice questions. (Question 1.1) • There are 4 options so try to eliminate the completely wrong answer(s). • Read carefully to identify the correct answer, identify the distractors that will also appear to be
correct. • The answer will NEVER be two options. Only ONE option will be correct. • Your answer will immediately be marked incorrect if you write TWO options.• Choose a description from column B that matches the item in column A. There are 8 marks for
these questions in (Question 1.2)• Give ONE term for each of the following descriptions, know your concepts. • There are 6 marks for these questions in each paper (Question 1.3). Know your concepts and
definitionstoanswerthesequestions.• No marks will be awarded for abbreviations, acronyms and examples.
Section B
• When answering Section B - Choose 2 of the 3 questions.• Read through the questions to select the ones that you know best. • Use your 10 minutes reading time to identify the questions you know best.• The mark allocation should guide you to the length of your answers. • Discuss, explain, why, how and what type of questions should be answered in full sentences.• For example: 4-mark questions must be answered with at least 2 facts, in full sentences.• Calculations – Start off with the formula; then show all steps in the calculations. • Specify the items when doing calculations – e.g.
◊Consumption (C) R 1000◊Government spending (G) + R 800◊ Investment (I) + R 250◊GDP = R 2050
Paragraph (8-mark questions)
• Ensurethatyouhavesufficientfactstoanswerthequestion.• E.g. Differentiate between two concepts (X and Y). Write at least TWO facts for X and TWO
facts for Y. The mark allocation will be (2x4=8)• If required to explain or discuss, write at least four facts on the topic. The mark allocation will be
(4x2=8)
48
Data response questions • Answer any TWO of the three questions.• Each data response question consists of 5 questions.• Application type questions in question 2.5, 3.5 and 4.5 must be answered in full sentences and
relate to relevant content.
SECTION C – is the essay questions• Answer ONE of the two questions.• The introduction should be a description. Do not repeat any part of the question in your
introduction.• Make use of headings where possible- a maximum of 8 marks are allocated for headings and
examples.• Includesufficientfactstocoverthe26marksinthebody.Thesefactsshouldbewritteninfull
sentences to obtain maximum marks.• The conclusion must not repeat any of the facts already mentioned in the body or introduction.
Read the table outlining the structure of the essay to ensure that you have an appropriate conclusion.
49
References
Bantjies, J. Burger, M. Engelbrecht, M. Ross, D. (2013) Focus Economics Grade 12, Maskew Miller Longman.Badernhost, I. Mabaso, GST, Mbotho, JN., Tshabalala, HSS (2011) Via Afrika Economics Grade 10, Via Afrika. Badernhost, I. Mabaso, GST, Tshabalala, HSS (2012) Via Afrika Economics Grade 12, Via Afrika. Levin, M. and Pretorius, M. (2012). Enjoy Economics Grade 12, Heinemann.Mohr & Fourie, Economics for South African Students (2011:537).Madz Okere, C (2017) The ‘Distinction-bound student’ Study Guide Grade 12.Chaplin C, Seifontein B, Van Zyl C, (2013) Solutions for all Grade 12.InternetYoutubeEloff, M. Nel, D. Pretorius, A. (2013) Clever Economics Grade 12, Macmillan.Basson, E. Beautement. V Smith, L. (2013) Oxford Successful Economics Grade 12, Oxford University Press.
Acknowledgements
TheDepartmentofBasicEducation(DBE)gratefullyacknowledgesthefollowingofficialsforgivingup their valuable time and families, and for contributing their knowledge and expertise to develop this this study guide for the children of our country, under very stringent conditions of COVID-19.
Writers:Sithembiso Tshabalala, Thabisa Ntontela-Seleho, Smangaliso Khambule, Moleboheng Rambuda, Richard Gouws, Claudette Kumalo and Lusanda Booi.
DBE Subject Specialist: Percy Masango
The development of the Study Guide was managed and coordinated by Ms CherylWeston and Dr Sandy Malapile.

50