Central Department of Economics
65
SOCIO ECONOMIC STATUS OF SLUM DWELLER IN NEPAL "A CASE STUDY OF SLUM COMMUNITY IN KATHMANDU VALLEY" A Thesis Submitted to the Central Department of Economics In Partial Fulfillment of the Requirements for the Degree of Master of Arts in Economics By TARA PRASAD ADHIKARI T. U. Regd. No.: 6-1-40-1624-98 Central Department of Economics Tribhuvan University Kirtipur, Kathmandu, September, 2013
-
Upload
khangminh22 -
Category
Documents
-
view
0 -
download
0
Transcript of Central Department of Economics

SOCIO ECONOMIC STATUS OF SLUM DWELLER IN NEPAL
"A CASE STUDY OF SLUM COMMUNITY IN KATHMANDU
VALLEY"
A ThesisSubmitted to the Central Department of Economics
In Partial Fulfillment of the Requirements for the Degree of Master of Arts in Economics
By
TARA PRASAD ADHIKARIT. U. Regd. No.: 6-1-40-1624-98
Central Department of EconomicsTribhuvan University
Kirtipur, Kathmandu, September, 2013

2070/ 07 /
RECOMMENDATION LETTER
This thesis entitled “Socio Economic Status of Slum Dweller in Nepal”: "A Case Study of
Slum Community in Kathmandu Valley" has been prepared by Tara Prasad Adhikari under
my supervision and guidance. This work is the outcome of his intensive and independent
research work and has been prepared in the format as required by the faculty. I hereby
recommend this project report for approval and acceptance.
Professor Pitambar Bahadur Rawal Chhetri(Supervisor)
Central Department of Economics

2065/ 07 …/…..
APPROVAL LETTER
This thesis entitled “Socio Economic Status of Slum Dweller in Nepal”: "A Case Study of
Slum Community in Kathmandu Valley" submitted by Tara Prasad Adhiakri has been
accepted as partial fulfillment of the requirements for the Degree of Master of Arts in
Economics.
Approved by
________________________ Dr. Ram Prasad Gyanwaly (Head of the Department)
___________________________Prof. Dr. Kamal Raj Dhungel (External Examiner)
___________________________________Professor Pitambar Bahadur Rawal Chhetri (Internal Examiner)

ACKNOWLEDGEMENTS
All the successful attempts are the result of contribution of some co-operative hands. A number of individuals have helped and encouraged me in various ways in completing this study. Though I may not be able to mention the names of them, I here with wish to express my special gratitude to the following individuals.
First, I am highly indebted to my respected teacher, Professor Pitambar Bahadur Rawal Chhetri for her valuable guidance and supervision to conduct and complete Thesis.
I wish to express my gratitude to Associate Prof. Dr. Ram Prasad Gyanwaly, Head of the Central Department of Economics, for his valuable suggestion and comments. Moreover, I am deeply indebted to all my respected teachers for their valuable advices and inspiration to complete this Thesis.
I would be failing in my duty if I do not express my gratitude to my unending inspiration and immense love has brought me to the present status. I am sincerely grateful to my brothers Raju Adhikari and Krishna. Similarly, I am grateful to my friend Mr. Binod Ghimire, Prakash Shrestha , Kiran Pahadi, Sosendra Adhikari and Bibek Dhungel. Likewise, I am deeply indebted to Mr. Krishna KC, The Chairperson of High Powered Bagmati Civilization Integrated Development Committee (HPBCID), Gopal Sapkota, and the Lawyer of Dhaulagiri Law Forum. I am also greatly obliged to all the respondents who helped me collect the required information. I express my sincere thanks all those who helped me directly or indirectly.
Finally, especially thanks go to Dr. Chakrapani Luitel who inspired me to study the Economics.
Tara Prasad Adhikari
ABSTRACT

Everyone has a right to live in a decent house, so do the people living in the slum
and the squatter communities. It implies that access to various forms of housing should be
available. The housing issue of growing squatter population in urban and rural Nepal still
remains unaddressed and unsolved due to the lack of specific Policy and programs which
creates obstacles in introducing slum upgrading programs and providing securities of
tenure. Lack of policy and programs have forced hundreds of thousands of people continue
to live in fear and in a vulnerable situation in the slums and squatter settlements in different
parts of Nepal. The risk of living in the slums and squatter communities gets higher as these
areas becomes targets of development.
The capital city Kathmandu is not an exception, rather the problem is more acute
and ever growing. As this study showed, almost 40 squatter communities have been in
existence in Kathmandu. Some of them are decades old and few are comparatively new.
They have migrated to Kathmandu for various reasons and the prominent reason is to attain
a secured and better life. They are forced to squat not by choice but by compulsion as they
have no access to the current housing market. They are contributing in the city economy by
providing valuable service as low paid workers in different areas. However, they have not
been integrated into the city development program. Their need and issues like housing,
basic facilities and secure tenure poses a big question.
Concerned public sectors, private sectors, civil societies and donor agencies need
to pay a high attention on slums settlements issues, before the problem becomes too big.
Without improving the living condition of the poor and the marginalized people, no
development program will be successful neither a city will remain in peace and harmony. It
is very important that a high priority must be given in upgrading or arranging alternatives,
whichever is an appropriate, in the slum and squatter settlement in Kathmandu valley.
The study is "Socio-economic Status of Dwellers in Nepal" (A Case Study on
Slum Dwellers in Kathmandu Valley). It has been carried out using primary data sources
obtained from Slum settlement area of Kathmandu Valley. The general objectives of this
study are to find out the socio-economic condition of Slum Dwellers in Kathmandu Valley.
The specific objectives of study area are: a) To find out the financial status of slum
dwellers, b) To find out the present settlement status of slum dwellers. c) To find out the
expected permanent settlement in future. d) To find out the educational status of slum
dwellers. e) To find out the religious status of slum dwellers. f) To find out the health and
sanitation status of slum dwellers. g) To find out the Occupational Characteristics of slum
dwellers. h) To fine out the social status of slum dwellers. i) To find out the causes and
consequences of slum present settlement of slum dwellers in Kathmandu Valley.
Descriptive research design has been adopted for this study and other method of
methodology techniques, research design, data collection and interview, sampling etc. are
used. There were 40 settlements of Slum dwellers in Kathmandu valley. In both of the
settlements (Mandikhatar and Sankhamul), 183 of the total household were selected as
sample size. To generate the primary data the structured questionnaire, key informant
interview and observation also limited by simple random sampling from the Slum household
of this Kathmandu valley only.
LIST OF THE TABLE PAGE
1. Number of households and population of squatters settlements 242. Age composition of population (male & female) of squatter settlements 253. Number of literate and illiterate population and literacy rate of squatter 27 4. Number of population by level of education and its percentage 285. Distribution of eligible population having citizenship in squatter settlements 296. Distribution of eligible population having election card in squatter settlements 307. Distribution of households by ethnicity in squatter settlements 328. Distribution of Population by ethnicity in squatter settlements 339. Classification of households by religion in squatter settlements 3410. Number and percentage of households by construction type of house in squatter settlements
35
11. Distribution of Population by main occupation in squatter settlements 3712. Number of households and population by vocational training of squatters settlements 3813. Distribution of households by main sources of drinking water in squatter settlements 39 14. Number of household with and without toilet in squatter settlements 4115. Distribution of population getting sick last one month. 4216. Distribution of population sending for treatment centre. 4317. Distribution of households by main fuel used for cooking in squatter settlements 4418. Distribution of households with and without electricity facility in squatter settlement 4619. Distribution of households with and without television in squatter settlements 4720. Basic statistics of monthly household income in squatter settlements 4821. List of the ten major migrated districts with highest number of migrated households in squatter
settlements. 50 22. Number of population about marital status in squatters settlements 51 23. Distribution of population in Monthly Expenditure pattern. 5324. Distribution of population who are spending money to get well during this last month? 55
LIST OF THE FIGURE PAGE 1. Number of households and population of squatters settlements 252. Age composition of population (male & female) of squatter settlements 263. Number of literate and illiterate population and literacy rate of squatter 27 4. Number of population by level of education. 285. Distribution of eligible population having citizenship in squatter settlements 296. Distribution of eligible population having election card in squatter settlements 317. Distribution of households by ethnicity in squatter settlements 328. Distribution of Population by ethnicity in squatter settlements 339. Classification of households by religion in squatter settlements 3410. Number of households by construction type of house in squatter settlements 3611. Distribution of Population by main occupation in squatter settlements 3712. Number of households and population by vocational training of squatters settlements 3813. Distribution of households by main sources of drinking water in squatter settlements 40 14. Number of household with and without toilet in squatter settlements 41

15. Distribution of population getting sick last one month. 4216. Distribution of population sending for treatment centre. 4317. Distribution of households by main fuel used for cooking in squatter settlements 4518. Distribution of households with and without electricity facility in squatter settlement 4619. Distribution of households with and without television in squatter settlements 4720. Basic statistics of monthly household income in squatter settlements 48
21. Number of population about marital status in squatters settlements 52 22. Distribution of population in Monthly Expenditure pattern. 5323. Basic statistics of treatment expenditure during last one month in squatter settlements 55
LIST OF CONTENTS PAGE
RECOMMENDATION iAPPROVAL SHEET iiACKNOWLEDGEMENT iiiABSTRACT ivLIST OF TABLE viLIST OF FIGURE vii\LIST OF CONTENTS viiiABBREVIATIONS xi
CHAPTER-I
INTRODUCTION1.1 Backgrounds 1 1.2 Statement of the Problem 6

1.3 Objectives of the Study 7 1.4 Importance of the Study 71.5 Limitation of the Study 9 CHAPTER –IILITERATURE REVIEW 10
CHAPTER –III 20RESEARCH METHODOLOGY
3.1. Reasons for Selecting the Field Area; 20
3.2. Target Groups 20
3.3. Research Design; 21
3.4. Sample Size and Technique 21
3.5. Nature and Source of Data 21
3.6. Tools and Techniques of Data 21
3.6.1. Households Survey 22
3.6.2. Observation 22
3.6.3. Interview 22
3.7. Analysis of Data 22
CHAPTER –IV
DATA ANALYSIS AND PRESENTATION
4.0. Introduction of the Study Area 23
4.1. Households and population composition 24
4.2. Literacy rate and level of education 26
4.3. Citizenship 29
4.4. Election Card 30
4.5. Ethnicity 31

4.6. Religion 34
4.7. House Construction 35
4.8. Occupation 36
4.9. Sources of drinking water 39
4.10. Health and Sanitation 40
4.11. Cooking Fuel 44
4.12. Electricity 45
4.13. Television 47
4.14. Monthly income 48
4.15. Migration 50
4.16. Marital status 51
4.17. Monthly Expenditure 52
CHAPTER - VSUMMARY, CONCLUSION AND RECOMMENDATION5.1 Summary 565.2 Conclusion 595.3 Recommendation 60
BIBLIOGRAPHY 63
APPENDICES
APPENDIX-I 65
APPENDIX-II 70

LIST OF ABBREVIATION
AIDS - Acquired Immune Deficiency SyndromeAPA - American Psychiatric AssociationBCC - Behavior Change CommunicationCBO - Communication Based OrganizationDEM - Diagnostic & Statistical Manual of Mental Physical DisorderFHI - Family Health InternationalGovt. - GovernmentHIV - Human Immune Deficiency VirusICCPR - International Covenant on Economic Social & Culture RightsIEC - Information, Education & CommunicationINGO - Non-Governmental OrganizationINSEC - Informal Sector Service CentreNCASC - National Centre for AIDS & STDs ControlNGO - Non-Government OrganizationUNDP - United Nation Development PrgrammeCBO Community Based OrganizationCBS Central Bureau of StatisticsCDE Central Department of EconomicsDDC District Development Committeee. g. For ExampleFGD Focus Group Discussion

Fig. Figurei. e. That isINGO International Non-Governmental OrganizationM.A. Master of ArtsNGO Non-Governmental OrganizationNLA National Labor AcademyNo. NumberNPC National Planning CommissionT. U. Tribhuvan UniversityVDC Village Development Committee

CHAPTER – IINTRODUCTION
1.1 Background
Nepal is widely known as an agricultural country bounded to the north by China and
elsewhere by India expanded between approximately 26.22’ to 30.27’ north latitude and between
approximately 80.12' east longitudes. It covers the area 1, 47,181 Sq. km. and about two third part
of country occupied by high mountains and hills. Only 17 percent of the total and remains the Terai
area. According to the World Development Report (2006), the per capita income of Nepal is US$
260 and about 25 percent of total population falls under absolute poverty live. The people of Nepal
are socially segmented along the lines of caste, sub-caste and ethnic, sub-ethnic groups. The
member of such groups cannot be stated with sufficient precision, partly because it is dependent on
the definition employed, while the 2001 census records more than 60 such groups and 20 major
languages and the National Ethnic Groups Development Committee has identified 60 such groups.
After establishment of democracy in Nepal, due to the various reasons such as political
instability, lack of resettlement of poor and landless people, Maoist insurgency communities began
to resettle with their own efforts. On the process, these communities have started to migrate to
capital city as well as other urban area of Nepal. Because of this reasons, riverside and various
public places are covered by slum communities. In the literal meaning, slum means the landless and
homeless people who are suffering from the problem of resettlement. But in wider sense, slum
means a densely populated urban area which is characterized by a generally low standard of living.
Slums may also be known as shantytowns, barrios, ghettos, although some of these terms have
specific cultural meanings. In the later part of the 20th century, slums exploded worldwide,
becoming a cause for serious concern among humanitarian organizations, as an alarmingly high
number of people live in various parts of public places of the south Asian country such as Nepal,
India and Bangladesh etc.
Slums can be formed in several ways. Classically, slums have emerged in existing
neighborhoods which fall upon hard times. In some cases, these neighborhoods have been
prestigious and well respected. A slum forms as homes are slowly subdivided into cramped
tenement apartments, and the population becomes highly concentrated. At the same time, access to
services like healthcare, fresh food, and basic sanitation may start to become restricted, creating
filth and squalor. A slum can also arise from nowhere, as is the case with many of the shantytowns
found in developing nations. These slums sometimes seem to emerge overnight, compacting

humanity into filthy, densely packed areas with poorly constructed and often dangerous homes. In
campaigns against slums, many cities have forcibly evicted people from these shantytowns, creating
a ripple effect as forcibly displaced people attempt to relocate to new regions. Most of the people
who live in slums are extremely poor, and many are treated as second class citizens by their society.
Health problems tend to be very high, as a result of improper sanitation and lack of access to basic
health care. Malnutrition is another serious problem in many slums, as is crime, which can make a
slum very dangerous for its inhabitants. Many people view slums as the ultimate symbol of
inequality, and in some regions, slums have ended up in some much unexpected locations,
sometimes neighboring the homes of the wealthy. Organizations which campaign against slums
argue that no human being should be forced to live in slum conditions and that as a basic act of
humanity; cities need to provide livable low cost housing and regulate construction to eliminate the
growth of slums. Unfortunately, the solution to slums is not this simple. The world's population is
rapidly growing, putting immense pressure on available resources, and as developing countries
become more developed, this pressure is likely to grow. Although it is somewhat disheartening to
think about, gross inequality seems to go hand in hand with growing societies
Usually slum and squatter terms are used as one term but these two are related but different
in meaning. Slum means 'Overcrowded and squalid back street, district etc. usually in city houses
or building in poor condition for human habitat whereas squatter means person who take
unauthorized possession of unoccupied premises.
Everyone has a right to live in a decent house, so do the people living in the slum and the squatter
communities. The housing issue of growing squatter population in urban and rural Nepal still
remains unaddressed and unsolved which creates obstacles in introducing slum upgrading
programmers and providing security of tenure. The capital city Katmandu is not an exception.
Rather the problem is more acute and ever growing. There have been 40 squatter communities
existence in Katmandu valley. Some of them are decades old and some are comparatively new. The
prominent reason, they have migrated to Katmandu, is to attain a secured and better life. They are
forced to squat not by choice but by compulsion as they have no access to the current housing
market. Urban areas of Katmandu valley which is the largest urban centre in the country with five
major cities, are suffering most due to this uncontrolled urban growth. Several government
organization and local bodies responsible to manage the areas in the valley and hundreds of
government communities and non government organizations working in these sectors have so far
failed to make any significant improvement in the situation.

Increasing trend in the number of the squatter settlements is one of the key issues
related to uncontrolled urban growth in Katmandu valley. It was estimated that there were 17
squatter communities in Katmandu in 1985, but now the number has grown to forty squatter
settlements. As increasing trend of these settlements has significant impacts in the local
environment of the valley, any plans and programs designed to improve the valley's urban
environment must effectively address the issue of squatter population. There are 12,726 people
(6,612 male and 6,114 female) living in 2,735 households in the forty squatter settlements of the
valley. The five indigenous settlements consist of 517 people (277 male and 240 female) in 109
households. The settlements along the banks of Bishnumati River are recognized as indigenous
settlements rather than squatter settlements as the residents of these settlements are not willing to be
identified as squatters. So, there are altogether 45 settlements located in Kathmandu valley
including these five settlements – Inyatole, Ramghat, Hyumat, Dhaukhel and Bhimmukteshwor.
Out of the 40 settlements major (24) are situated along the river bank of Bagmati, Bishnumati,
hanumante, Dhobikhola and Tukucha. These settlements are highly mismanaged with highly
polluted environment and flood risks. The major religion followed by resident of the squatter
settlements is Hindu. About 71% squatter population followed Hinduism. 18% are Buddhist, 9%
are Christian and 2% are others (kirant and Islam). It is well known that most of the squatter
population relies on daily wages for their income. 53% more than half of the households are mainly
dependent on daily wages. There are some 26% households engaged in services with regular
income and 12% households are doing small scale business. In the end, it can be said that squatter’s
problems are waiting to be solved by implementing good plan and policies. Till the date, slum and
squatter problems are not caught by right of concern people and government which would be threat
for Kathmandu valley. If it is not address on time, there is no doubt that it will take the shape of
massive problem. Therefore, it should be given proper management, political commitment, and
sharp and focused work plan to decrease the problem. Only then healthy develop Kathmandu can d
be imagined.
The Kathmandu valley, which encompasses a surface area of only about 600 [km.sup.2],
has undergone unprecedented and dramatic changes over the last tour decades. The massive
increase in its population (from 500,000 in 1970 to above 3 million in 2010) and its subsequent
overall urbanization have to a large extent reduced the open spaces available and agricultural fields
which formerly surrounded the three major historic cities in the basin: Kathmandu, Lalitpur, and
Bhaktapur. Similarly, the cities' urban fabric has become denser. The height of new buildings is
continually on the rise. It has been estimated that within the next twenty years, the entire Valley

will be covered with constructions, leaving far behind the former traditional divide between cities
and clustered villages which prevailed in the area for centuries (Toffin 2007). The growth of
settlements has been (and still is) generally spontaneous. Little planning intervention has been
enforced by the government and municipal authorities. Urban areas continue to grow haphazardly,
with no appropriate infrastructure such as water supply and sewerage systems, despite warnings by
environmentalists.
Such steady urbanization has produced a considerably negative impact, including
traffic congestion, atmospheric pollution, and a total collapse of the former fragile ecological
equilibrium between man and his environment. The situation is aggravated by the high elevation of
the Valley (1350 m), which accentuates vehicle emissions, and its bowl-shaped topography, which
restricts air movement. The rivers have also undergone tremendous pressure from the increase in
demographic growth and in economic activities. They are now highly polluted by the discharge of
untreated sewage and the widespread dumping of solid waste. They often resemble open sewers.
For those who were there in the late 1960s or early 1970s, the Valley has changed beyond any
recognition. Its local architecture of dazzling beauty and its exceptional landscape made up of green
rice-fields covering rural areas have nearly disappeared or are on the wane. Even the view of the
Himalayan peaks in the foreground is now hardly visible due to a haze of pollution. The overall
state of deterioration is so serious that UNESCO is threatening to declassify some sites, especially
the Pashupatinath area along the Bagmati River, which was designated as major items on the World
Heritage List in 1979.
Observing the various causes of illegal and mismanaged slum settlements in capital
city of Kathmandu valley, there should be the essential subject matter of micro study about the
economic and social status of overall slum dwellers that are living in the various public places such
as riverside, temple areas, public grounds etc. For the objective of modern city mechanism, it will
be the burning issue of study of slum settlement such as their human rights, social status, health,
education, employment level, poverty, women status as well as the most important part of the study
is real economic condition and their contribution to the nation. It is the major topic for this research
program i.e. “Socio Economic Status of Slum Dweller”
1.2. Statement of Problem
Nepal has inequality disparities among various factors such as casts, cultures, religions,
inequality between rich and poor. Everyone has a right to live in a better house, but the people who

are living in the slum and the squatter communities; there are the burning issues of study about their
essential topics. The housing issue of growing squatter population around the city area of Nepal , in
urban and rural Nepal still remains unaddressed and unsolved which creates obstacles in
introducing slum upgrading programmers and providing security of tenure.
Presently, Kathmandu Valley has almost 40 squatter communities. Some of them are
decades old and some are comparatively new. The major reason for slum formation is migration.
People are forced to squat not by choice but by compulsion as they have no access to the current
housing market. Urban areas of Katmandu valley which is the largest urban centre in the country
with five major cities are affected most due to this uncontrolled urban growth. Several government
organization and local bodies responsible to manage the areas in the valley and hundreds of
government communities and non-government organizations working in these sectors have so far
failed to make any significant improvement in the situation. There is the hidden subject matter of
study of this community i.e. the study about the real economic status and social status. It provides
long term solution of the slum community.
In Kathmandu valley, almost all the slum communities are dwellings of wide variety of
ethnic groups, residing in the squatter settlements. The major castes are Brahman, Tamang, Chhetri,
Lama, Limbhu, Rai, Gurung, Newar, Pariyar, Magar, Majhi, kunwar, Thakuri, Sherpa,
Biswakarma, Duela, Giri, Pujari and many others. Altogether 121 castes are classified into 4 major
ethnic groups- Dalit, Janjati, Madhise and others. There are 64% of households of Janajati group,
28% of in the category of ' others ', 7% households of Dalit and 1% households of Madhesi or
Muslim community.
The present study is guided by the following two research questions.
i) What is the economic status of slum dwellers?
ii) What is the social status of slum dwellers?
1.3. Objective of the Study
The general objective of the study is to find out the socio-economic status of the
slum dwellers in Kathmandu Valley. The specific objectives of the study have been to
a) Look into the economic status of the slum dwellers; particularly the occupational,
financial status.

b) Look into the social status that includes education, health, and religion among other
aspects of the dwellers.
c) Find out the causes and consequences of slum settlement in Kathmandu Valley.
1.4. Importance of the Study
The study is a case study of slum dwellers in Kathmandu district. Kathmandu is the
capital city of Nepal. The study will highlight the socio-economic condition of slum
dwellers. The study is to see income generating activities, how to effective about changes
needed for slum communities. The study will help the uplift their living standard. It may
serve as a helpful guidance for future research studies related to migrated slum dwellers for
national and international organizations. The study will also attempt to find out the ways to
join the gap between general urban people and slum people. The study will also help the
policy makers and development planners for introducing relevant development
interventions.
Identification of the poor is a difficult problem in the urban areas because of the wide
variation of economic activates the have different labor productivity and wages. Women
are termed as wage laborers in manufacturing industries, involved in risky works such as
sex trade, street children, people living in slums and squatter settlement, informal
commercial venders, rag pickers, and internally-displaced low-income people and constitute
a big chunk of the urban poor in Nepal. Urban poverty is likely to increase in Nepal in the
foreseeable future due to rapid urbanization. The Department of Urban Development and
Building Construction need an ‘integrated poor community development program’ besides
engaging in sector wise physical planning. NGOs and community based organizations can
contribute to comprehensive urban poor community development programs if one were to
go by the experiences of South Africa. Understanding the dynamics of urban poverty and
the squatter communities in Nepal is urgent now. These limited researches on urban poverty
and the real picture of city slum community have revealed the knowledge gap in this regard.
This gap needs to be narrowed down through studies on social composition in
slums/squatter settlements, the income/ expenditure flow structures as well as potential
welfare programs to children and elderly in order to entail better utilization of the allocated
resources for poverty alleviation. This research will be the better guidelines for the various
organizations who are interested to do something better for those communities. In new

constitution of Nepal, there may be the better information of settlement solution. The most
important part of this research is for the better identification of slum dwellers and their
recent activities where there will present overall expectation of all valley located slum
dwellers to the government.
1.5. Limitation of the study
This study concentrates on the total slum community located around the Kathmandu
valley; the study may not reveal the exact picture of what is happening elsewhere in Nepal.
This study deals only with the micro-level socio economic condition of slum dwellers. It
may not be generalized in micro level because of lack of time and money. This study is only
focus on household specific causes of poverty and other aspects of slum dwellers and
confine to health, education, living status, sanitation, livestock and small cottage industries.
CHAPTER – II

LITERATURE REVIEW
Nepal is one of the poorest countries of the world. The income level of Nepalese
women is very low. As women make half of county's population education of women is
very important and it should receive top priority in the context of development of modern
Nepal women's health is a societal issue. Improving women's health and well-being
improves not only their own life but also those of their children and contributes to improve
household and community welfare.
This is the important part of research work. The literature review will be done under
two categories the empirical review and review of conceptual study. For these different
journals, books, reports, previous research work articles are used. Other published and
unpublished documents related to subject will be reviewed.
Background And Case Study of Settlement and Slum Improvements in Nepal (2012),
Nepal, known for its natural beauty and the highest mountain in the world, is according to
World Bank indicators, one of the least developed countries in the world. The country,
historically a kingdom, had a multi- party democratic system introduced in 1990, but it
failed to sustain the process due to corruption. There are 58 municipalities and 80 Town
Development Committees in the country. Most of the urban functions, like water,
provision, sewerage disposal and roads are centralized and the responsibility of Nepal
Government. A Local Self Governance Act was introduced in 1999 in a move towards
attempt to decentralizing governance, but the national government is still in control. The
elections held for local governments in the 1990s, was not repeated after 5 years due to the
internal conflict and security reasons.
The Nepali Slum Project"(R.K. Puram, ParvatiaCamp, 2011), declares the living
conditions of Nepali migrants in the slums of Section 4 R.K. Puram, New Delhi (Parvatia
Camp). The slum cluster consists of 75 families mostly from Nepal and earns their
livelihood by working as security guards and servants. Almost all of them were from Hindu
background. The aim of the project is to improve the quality of life of the people living in
the slums around R.K. Puram area who have no means to better their lives without any
external assistance. The ultimate goal of the project is to give an opportunity to help the
people to develop themselves physically, mentally, socially, educationally, and spiritually
to face the world with confidence and dignity. Additional funds are required to expand to

other areas close to the church. Additional 500 families will be benefited from the
expanded program. A large Nepali congregation can be built with an independent Nepali
Methodist church. This will be unique and will be a model for replication. In addition,
community development programs will bring about improvement in the living standards of
a sizeable population of God's children.
A slum millionaire, (Rubeena Mahato, 2010) writes inside a cramped room in
Balaju, Kathmandu, a group of women are poring over some papers. Oblivious to the noise
outside and people bustling about in the tiny room, they are engrossed in checking and
rechecking figures. Fifty, two hundred, thousand, they murmur in a low voice as they
carefully record the numbers in ledgers. This is the one-roomed office of the Pragati
Women's Cooperative, run by women from slums and squatter communities, and it is their
hard-earned monthly savings that they are so meticulously noting down. It’s hard to believe
that the savings that started with Rs 1 a month now total Rs 10.5 million. The women, who
helped raise this money, working as construction workers and household help in the city,
beam with pride as they mention
The Bagamati River Slums Report (Rishi Malla, 2010) reveals that the clinics or the
local medical teams were said to have never visited the slums. Those interviewed found no
need to visit a doctor or hospital in the absence of illness and have also been ignoring dental
problems. Mr. Mugar told us that he went to the dental hospital because they were giving
free dental checkups; the check up and cleaning was free but in order to get fully treated he
had to go through certain procedures which would have cost him Rs. 2500($36), which was
impossible. The government hospital is the popular place for people to get themselves
treated. One lady however, did say that she went to 'witch doctor' occasionally for health
treatments. The interviewed report is suffering regularly from stomach pain and
headache. Sometimes the pain goes away or they take paracetamol tablets to take the pain
away. If the pain is prolonged for many days they visit a government hospital. They do not
feel a regular primary care doctor is necessary, but rather feel that the doctor who takes
away their current problem (disease) is important. Children do not play ball games out
in the slum. They can be seen running around with friends and chasing each other around.
But the children do play regular standardized sports and games in their school.

Slum Dwelling Women, Marginalization and Pokhara valley (2010) describes the
socio-demographic condition and the socio-economic status of women dwelling in the
slums of the Pokhara, west Nepal. More specifically, the study explored and analyzed
gendered position of the same respondent in their household decision-making. The study is
based on primary data but secondary data also been used. Interview schedule and focus
group discussion are the key tools & techniques used for the study. Out of the 41 slums in
the 18 wards of Pokhara only three settlements/wards namely Shiva tole from ward 9,
Krantitole from 15 and Shanti tole from ward 18 selected for the study. The three wards
and the settlements/clusters selected based on distance from the highway. Sixty ever-
married women selected as respondents i.e. 20 from the each settlement.
The study shows that mostly Gurung and Dalit constitute the slum community of
Pokhara valley and most of the slum dwellers are migrants. The study found unsatisfactory
socio-economic background of the women in slums such as high illiteracy, no facilities of
capacity building, very less involvement in social organization, having no access to
economic resources, less participation in decision making process and domestic violence
against women increases their vulnerability. Violence against these women is the result of
their noiselessness, non-representation and marginalization. Gender inequalities among the
school going children is observed insignificant than in married people.
Gerard Toffin, 2010, in his “Squatter and slum settlements in the Kathmandu
Valley” says that the frenzied urbanization of the Kathmandu Valley has thus created zones
of uncertainty, poverty, and unemployment that are the subject of delicate political issues.
For instance, in these shanty-enclaves there is a growing concentration of people that can
be easily mobilized by populist and skilled politicians to rally their causes. They also
provide a convenient source of "vote banks" for political parties which encourage settlers
to enroll on the electoral lists. That is why, so it is said, they are not evicted. For a large
part of the urbanite population, Sukumbasi squatters have become a figure of otherness,
localized on riparian urban margins, an image of a "social other" who does not share the
same values as other urbanites, and is a threat to urban sites, cultural integrity and ecology.
They are looked upon as an undesirable population. In other words, a study of these urban
fringes sheds light on the broader political context and reveals a nascent class conflict
between, on the one hand, the poor, and, on the other hand, a middle-class that has taken
advantage of the economic changes and which does not recognize the rights of these illegal
settlers. In many ways, it is a valuable key to understanding the urban contemporary
entities.
The Anarchic Urbanization of the Kathmandu Valley (1970-2010) revels that the
Kathmandu valley, which encompasses a surface area of only about 600 [km.sup.2], has
undergone unprecedented and dramatic changes over the last tour decades. The massive
increase in its population (from 500,000 in 1970 to above 3 million in 2010) and its
subsequent overall urbanization have to a large extent reduced the open spaces available
and agricultural fields which formerly surrounded the three major historic cities in the
basin: Kathmandu, Lalitpur, and Bhaktapur. Similarly, the cities' urban fabric has become
denser. The height of new buildings is continually on the rise. It has been estimated that
within the next twenty years, the entire Valley will be covered with constructions, leaving
far behind the former traditional divide between cities and clustered villages which
prevailed in the area for centuries. The growth of settlements has been (and still is)
generally spontaneous. Little planning intervention has been enforced by the government
and municipal authorities. Urban areas continue to grow haphazardly, with no appropriate
infrastructure such as water supply and sewerage systems, despite warnings by
environmentalists.
The Politics of Slum and Squatter Settlements: sukumbasi, svabasi, hukumbasi (2008) revels that the squatters are the
object of fear, anxiety, suspicion and misconceptions among most of the population. The word Sukumbasi itself carries negative
connotations. The Nepalese belonging to the urban middle-class in particular view them as dangerous social outsiders, even
invaders, and river polluters. Their shanty-encroachments on rivers are seen as obstacles to restoring the original riparian
landscape and ecology. It is also said that these illegal settlers are puppets in the hands of Maoists, communists and other
leftist parties. They supposedly represent a 'clientele' ready to be summoned at any time to participate in demonstrations and
rallies organised by these activists. It is thus believed that sukumbasis formed the backbone of the huge demonstrations that
succeeded in overthrowing King Gyanendra's direct rule and in abolishing the monarchy in April 2006. In addition, the idea prevails
that these people are fake indigents and are helped unjustifiably by local bodies and foreign agencies. A word has been coined,
hukumbasi (probably derived from the term hukum, meaning 'order'), to designate this category of person. A hukumbasi is someone who
pretends to be a sukumbasi in order to obtain a land title, lalpurja, as well as other advantages granted to the underprivileged
(Yamamoto 2007: 141). The term is used outside the Kathmandu Valley as well as in other squatter settlement contexts. This
discourse renders illegitimate the squatters' claim to be relocated and arouses strong suspicion about them.

An article in The Rising Nepal, April 29, 2008 writes that the slums and squatter
settlements are on the rise day by day in the Kathmandu Valley, a study has shown. There
are 47 such settlements on the bank of the different rivers in the Valley, according to a
study report conducted by Lumanti Support Group for Shelter, a non-governmental
organization working in the field of squatter settlements
Report on squatter and Slum Settlements in Kathmandu in 2008 by Lumanti
revels that the slum and squatter as one terms but these two are related but different in
meaning. Slum means 'Overcrowded and squalid back street, district etc. usually in city
houses or building in poor condition for human habitat whereas squatter means person who
take unauthorized possession of unoccupied premises. Everyone has a right to live in a
decent house, so do the people living in the slum and the squatter communities. The housing
issue of growing squatter population in urban and rural Nepal still remains unaddressed and
unsolved which creates obstacles in introducing slum upgrading programmers and
providing security of tenure. The capital city Katmandu is not an exception. Rather the
problem is more acute and ever growing. There have been 40 squatter communities
existence in Katmandu valley. Some of them are decades old and some are comparatively
new. The prominent reason, they have migrated to Katmandu, is to attain a secured and
better life. They are forced to squat not by choice but by compulsion as they have no access
to the current housing market. Urban areas of Katmandu valley which is the largest urban
centre in the country with five major cities, are suffering most due to this uncontrolled
urban growth. Several government organization and local bodies responsible to manage the
areas in the valley and hundreds of government communities and non government
organizations working in these sectors have so far failed to make any significant
improvement in the situation.
Un Habitat, in 2003 in its paper presents the results of a first global enumeration of slums at the country level. The
data are analyzed and comparisons established at sub-regional and regional levels while trying to understand what is happening
globally. This document is the culmination of attempts to come to grips with changes in the way we measure slums, starting by
providing an agreed universal definition of this type of settlements and a clear methodological approach. The preliminary
estimations presented in this document represent a baseline year level that permits the preparation of quantitative estimates
for future trends. By providing the methodology and the quantitative knowledge base, the document strives to enhance the use
of information on urban poverty, as a powerful policy-making tool to help induce the desired structural changes for poverty
alleviation.

Sharma, in 2001 revels that women have little role in family's decision-making
due to their illiteracy and non-involvement in direct income generating works. Nepal is a
male dominated country where women's decision-making authority comes only after the
men. The women make decisions only when the males are not in the home or they have
gone outside their village. (Status of women, vol. 4 part II). In the same manner, while
making decisions on an agriculture sector, the women's role is limited only to selection of
seeds and manure. The women make 18.5% decisions by themselves and 12.5% jointly
with men. About the power and authority of decision making, Dr. Rizal advocates that "a
Nepalese wife exercise as much power and authority in the household as her husband. In
some cases her power and authority may even exceed to that of her husband.
Hada in 2001, ”Squatter Communities (slums) in Kathmandu Metropolitan City” says that the growth of the urban population
has contributed to a surge in squatter communities. Such settlements have emerged--in various parts of the Kathmandu Valley
(Hada 2001). About 75-settlements have been identified so tar, 65 of which are located in Kathmandu Metropolitan City. The majority
are established along riverbanks, which traditionally formed the borderline between cities. The rivers concerned are mainly the
Vishnumati, which flows from north to south to the west of Kathmandu city and the Bagmati which borders Kathmandu to the south.
These two waterways converge in the heart of the capital. A smaller group of squatter settlements are located in a non-riparian
environment, in the Kathmandu suburbs, often on the periphery of former independent settlements. This is the case near Bauddha
(Bodnath), Chabahil, Maharajganj, and Guhyeshvari. In Nepali, all these areas, riparian and inland, are called Sukumbasibasti, and the
squatters living there Sukumbasi, a word applied to any displaced and landless persons, as well as to families illegally occupying
land or a recently deforested area. As a matter of fact, this word has become synonymous in Nepal with an excluded person, with no
means of subsistence. (4) Legally, a sukumbasi is a person who can prove that nobody in his family over the last three
generations held any land title, Lalpurja.
Ghimire, in 1997 explains that the education is essential for women and girls to become self-dependent, more productive,
skill full, creative and to recognize their right place in the society and enter the mainstream of development of the nation
Khatiwada, in 1998 deals with the national and sectoral development policies, goals and programmers will be ascertained
to involve women in the mainstream of national development. He further writes that contribution of women to household labor will be
evaluated scientifically and substantially by reviewing the national accounting system. For the effective coordination and
implementation of women development activities, existing institutional structure will be strengthened, expanded and agencies,
organizations and local bodies working in the field of women's development. For measuring women's participation in development
appropriate gender desegregated indicators will be reformulated and modified and monitoring and evaluation measures will be
carried out effectively. (NPC 1998)
Acyarya, in 1997 further revels that the women still have fewer social options for survival other than marriage.
According to culturally defined ideals, getting married and producing children are the ultimate goals for women. All other options

including education and employment are only secondary. Some orthodox people believe that if a daughter is given away before her
menstruation she is sent percent virgin and giving away of virgin is really a great "Punya" of religious credit.
Women and Education (Ghimire and Neupane) Neupane in 1982, shows that female education plays an important role to reduce
population growth. The fertility rate decreases as the education of women and vice versa. So to reduce the fertility rate it is
necessary to provide facilities for all women especially in village area in the field of education. If they are engaged in other works
outside the home there is little chance to have more children.
Laibenstine in 1974, pointed out that with the increase in per-capita income, the number of high parity children for the
representative families falls.
Spencer in 1967 postulated that fertility increase in response to the progress of society and culture and infect is a
great agency for mankind advancement. The theory emphasizes the fact that the human evaluation has played an important role in
human fertility decline.
Dumont in 1901 observed his cases about the difference in fertility in cities and villages. He found that low birth rate
in cites and high birth rate in village is due to rise in social ladder in city dwellers.
CHAPTER - III
RESEARCH METHODOLOGY
This chapter describes the various methods applied in order to complete the research
work. The method deals with selecting the field area, reasons for selecting the topic,
research design universe and sampling, methods of data collection, data analysis procedure
and limitation of the study. 3.8. Justification for Selecting the Field Area
Out of the 75 distract, Kathmandu district is the capital city of the Nepal. Due to the
home war of Maoist insurgency, most of rural, very poor and homeless people are migrated
to Kathmandu and started to live around the various public places of the city such as
Bagmati River, Bisnumati River, Dhobikhola and Tukucha etc. These are the major study
area of the research project.
Some important reason for selecting the topic for research has been that the subject is
formed not reached in detail. The socio-economic conditions of the dwellers are not that
well person. The slum dwellers are formed to be backward and deprived of many
fundamental rights. Although dwellers are located in the mid of developed Kathmandu
urban centers they are deprived of the logic needs and are encountering difficulties.
Although NGOs and INCOs have done everything, such activating is not sufficient to
affectively solve the problems of slum dwellers.
3.9. Target Groups
The target population of this study is the slum dwellers who are facing discrimination
from society and existing for survive with critical economic condition and its harmful
effects. Those have been interviewed who are struggling for lives, during the time of
interview.
3.10. Research Design
The study is descriptive as well as analytical in nature. The main focus of the study is
to find out and analyze the socio- economic status of slum dwellers in Kathmandu valley
the description of institution, social organization, economic condition, education status as
well as the research would describe the occupation, income, family size, family status and
financial status, and this impact on the socio-economic status of slum dwellers.
3.11. Sample Size and Technique
Lists of all slum settlements were made. The settlements were categorized into
riverside settlements and public places. Altogether 27 riverside settlement and 13 public

places were enumerated. Altogether households with 105 from riverside settlement and 78
from public places were enumerated. Since the population was small households from the
slum dwellers were considered. Hence, a complete census of slum dwellers from two sides
was considered for the study.
3.12. Nature and Source of Data
Both primary and secondary sources were used for data collection. Primary data were
collected through field work such as observation and household’s survey. Similarly
secondary data were collected through published and unpublished materials such as research
articles, books, journals, news articles, record of district offices, NGOs, government
documents from different libraries and institutions and various social organizations etc.
Both qualitative as well as quantities data are used in this study.3.13. Tools and Techniques of Data Collection
To generate the primary data following tools and techniques were used:
3.13.1. Households Survey
To collect the primary data household survey was conducted using both structured and
unstructured questionnaires. Only one set of the structured questionnaire contained both open
and close questions. In this process, questionnaires consisted questions on social, religion,
economic and occupational, house settlement characteristics, and also educational activities of
slum people. Unstructured questionnaires was use to find out the origin of the people, cultural
activities view towards the slums from various so-called discrimination. 3.13.2. Observations
Participant observation has also been the main source for obtaining primary data. The
researcher was familiar with the slum community of Kathmandu valley, so the researcher had
already obtained and information through observations on household structure, settlement
patterns, and social behaviors. The information was obtained through observation method. 3.13.3. Interview
The household head of each households from the slum community as well as a
woman of the household in the absence of household head and also some elders of the village

have been selected for the interview to obtain the required primary data and focusing on real
economic status ,social discrimination, clan and origin of the of this community.3.14. Analysis of Data
Collection of data has no meaning until it is processed and analyzed properly. Thus the
success of the study lies in the presentation and analysis of the collected data. Mainly, the both
qualitative and quantitative data will be analyzed by explaining, describing, analyzing with
using the tables and suitable figures where it was necessary to show. Moreover, the collected
data were checked and verified manually in order to minimize the errors. Data were
organized and arranged into suitable tables and also systematically described by using
graphs and pictures.
CHAPTER – IVDATA ANALYSIS AND INTERPRETATION
4.0. Introduction of the Study Area
Kathmandu is the capital and, with close to one million inhabitants, the largest
metropolitan city of Nepal. The city is the urban core of the Kathmandu Valley in the
Himalayas, which contains two sister cities: Lalitpur (Patan), 5 kilometres (3.1 mi) to its
south and Bhaktapur or Bhadgaon, 12 kilometres (7.5 mi) to its east, and a number of
smaller towns. It is also a cronymed as 'KTM' and named 'tri-city'. In the last census
(2001), the city of Kathmandu had 671,846 inhabitants. Population estimates for 2005 were
790,612 and for 2010 they stood at 989,273. The municipal area is (50.67 square
kilometers (19.56 sq mi)) and the population density is 19,500 per km². The city stands at
an elevation of approximately 1,400 meters (4,600 ft) in the bowl-shaped valley in central
Nepal surrounded by four major mountains, namely: Shivapuri, Phulchowki, Nagarjun and
Chandragiri. Kathmandu valley is part of three districts, Kathmandu District, Lalitpur
District and Bhaktapur District, with the highest population density in the country and
accounting for about 1/5 of its population.
Kathmandu District is a district located in Kathmandu Valley, Bagmati Zone of
Nepal, a land locked country in South Asia. It is one of the seventy-five districts of Nepal,
covers an area of 395 km2 and is the most densely populated district of Nepal with a
population of 1,081,845 in 2001. The district's headquarters is Kathmandu City, also the
capital of Nepal. Kathmandu district is one of the three districts located in Kathmandu
valley, which itself is located in the hills of Bagmati Zone, Central development region,
Nepal. The district is located from 27'27"E to 27'49"E and 85'10"N85'32"N. The district is
surrounded by-east: Bhaktapur district and Kabhrepalanchokdistrict,west: Dhading and
Nuwakotdistricts,north: Nuwakot and Sindhupalchok districts, and South: Lalitpur and
Makwanpur districts.
The altitude of the district ranges between 1262 m. to 2732 m. above the sea
level. The total population of Nepal is 18.5 million in 1991 and female constitutes 50.1
percent of the total and male constitute 49.9 percent of the total. Similarly in the census of
2001, total population is 23.1 million and female constitute 49.96 percent of the total. Data
shows not only persistence of high fertility but also increasing fertility over the ears (CBS,
1991 and 2001). High fertility is not only one of major causes of women's high death rate
but it is also an important variable in limiting
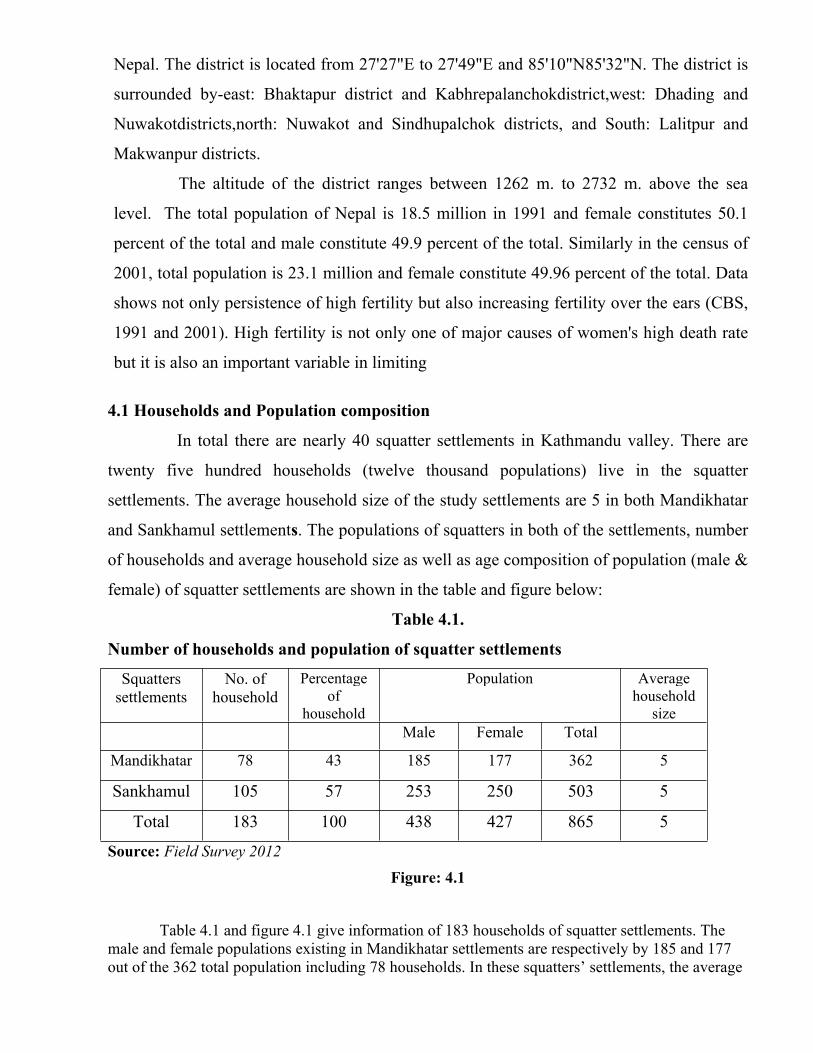
4.1 Households and Population composition
In total there are nearly 40 squatter settlements in Kathmandu valley. There are
twenty five hundred households (twelve thousand populations) live in the squatter
settlements. The average household size of the study settlements are 5 in both Mandikhatar
and Sankhamul settlements. The populations of squatters in both of the settlements, number
of households and average household size as well as age composition of population (male &
female) of squatter settlements are shown in the table and figure below:
Table 4.1.
Number of households and population of squatter settlements
Squatters settlements
No. of household
Percentage of
household
Population Average household
sizeMale Female Total
Mandikhatar 78 43 185 177 362 5
Sankhamul 105 57 253 250 503 5
Total 183 100 438 427 865 5
Source: Field Survey 2012Figure: 4.1
Table 4.1 and figure 4.1 give information of 183 households of squatter settlements. The male and female populations existing in Mandikhatar settlements are respectively by 185 and 177 out of the 362 total population including 78 households. In these squatters’ settlements, the average

household size is 5. In Sankhamul settlements, there are almost 253 male populations and 250 female populations out of the 503 total populations, in this settlements the average household size is also 5.
Table 4.2.Age composition of population (male & female) of squatter settlementsAge ( In Years) Mandikhatar Sankhamul
Male Female Total Male Female TotalBelow 15 50 41 91 56 55 111
15-59 123 122 245 190 171 301
Above 59 12 14 26 13 18 31Total 185 177 362 259 244 503
Percentage (%) 51 49 100 51 49 100
Source: Field Survey 2012
Figure: 4.2
Table 4.2 and figure 4.2 show the sex composition of the population residing in the
two settlements. Table shows that the maximum number people are under the age range of
15-59 years. It also shows that the lowest numbers are above the range of 59 age groups for
both the areas. In both of the settlements, there is maximum percentage of male population
(i.e. 51%).
4.2. Literacy Rate and Level of Education
The study has explained the literacy status of the squatter population settlements for
the literacy rate which is defined as the ability to read and write and computed only for
population aged six years and above. The overall literacy rate of squatter population in both
settlements is found to be higher for male than female.
Field information which is given in table 4.4 shows the level of education of
residents of squatter settlements. The residents aged six years and above were asked for
their completed level of education. The information was classified as primary, secondary
and higher level. By observing the both of the settlements, the secondary level education
achievers are greater than other.
Table 4.3
Number of literate and illiterate population and literacy rate of squatter population
Scatters
Settlements
Male Female
Literate Illiterate Total Literate Illiterate Total
Mandikhatar 85 0 85 55 2 57
Sankhamul 205 33 238 168 66 234
Total 290 33 323 223 68 291
Source: Field Survey 2012
Figure: 4.3
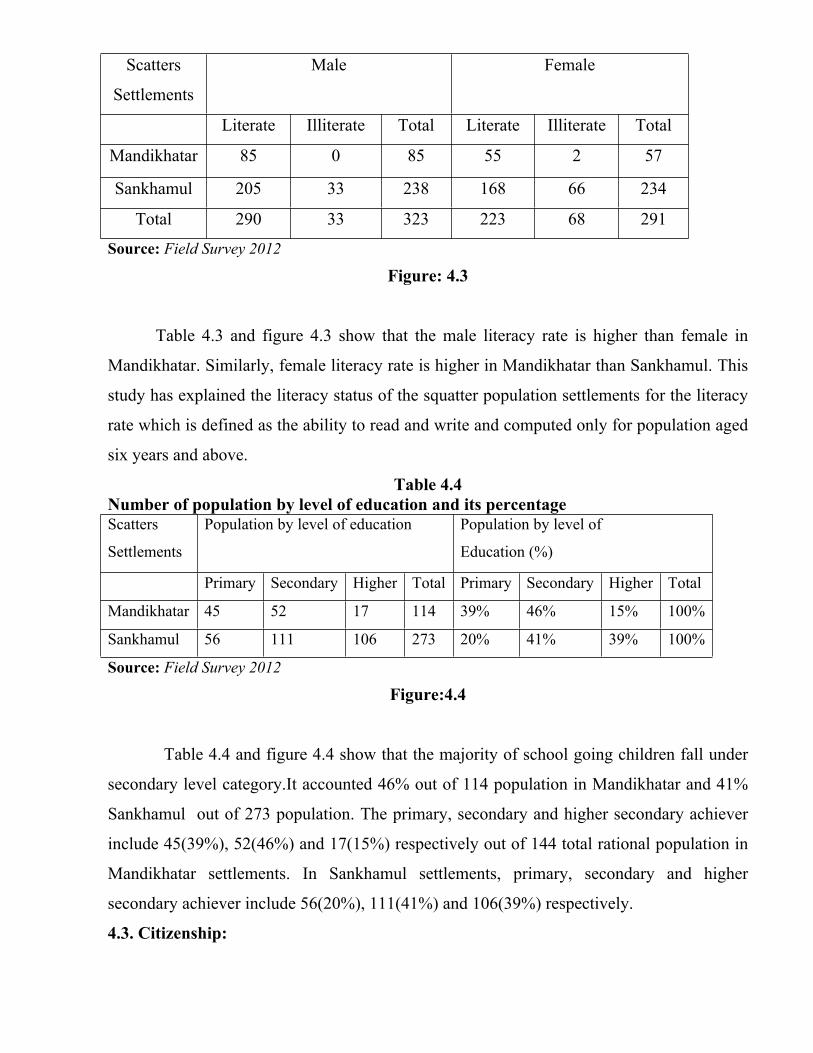
Table 4.3 and figure 4.3 show that the male literacy rate is higher than female in
Mandikhatar. Similarly, female literacy rate is higher in Mandikhatar than Sankhamul. This
study has explained the literacy status of the squatter population settlements for the literacy
rate which is defined as the ability to read and write and computed only for population aged
six years and above.
Table 4.4Number of population by level of education and its percentageScatters
Settlements
Population by level of education Population by level of
Education (%)
Primary Secondary Higher Total Primary Secondary Higher Total
Mandikhatar 45 52 17 114 39% 46% 15% 100%
Sankhamul 56 111 106 273 20% 41% 39% 100%
Source: Field Survey 2012
Figure:4.4
Table 4.4 and figure 4.4 show that the majority of school going children fall under
secondary level category.It accounted 46% out of 114 population in Mandikhatar and 41%
Sankhamul out of 273 population. The primary, secondary and higher secondary achiever
include 45(39%), 52(46%) and 17(15%) respectively out of 144 total rational population in
Mandikhatar settlements. In Sankhamul settlements, primary, secondary and higher
secondary achiever include 56(20%), 111(41%) and 106(39%) respectively.
4.3. Citizenship:
Field information reveals that all the population possessed citizenship cards and population below 16 years of age do not
qualify for the citizenship paper. Hence, the remaining percent of both settlements may fall under 16 years of age. Also some
respondents refused to say whether they had citizenship cards or not.
Table 4.5
Number and percentage of eligible population having citizenship in squatter settlementsScatters Settlements
Total respondents Number and percent of respondents with citizenship
Male Female Total Male % Female % Total %
Mandikhatar 104 106 210 100 51 98 49 198 94
Sankhamul 182 172 354 161 53 140 47 301 85
Source: Field Survey 2012Figure: 4.5
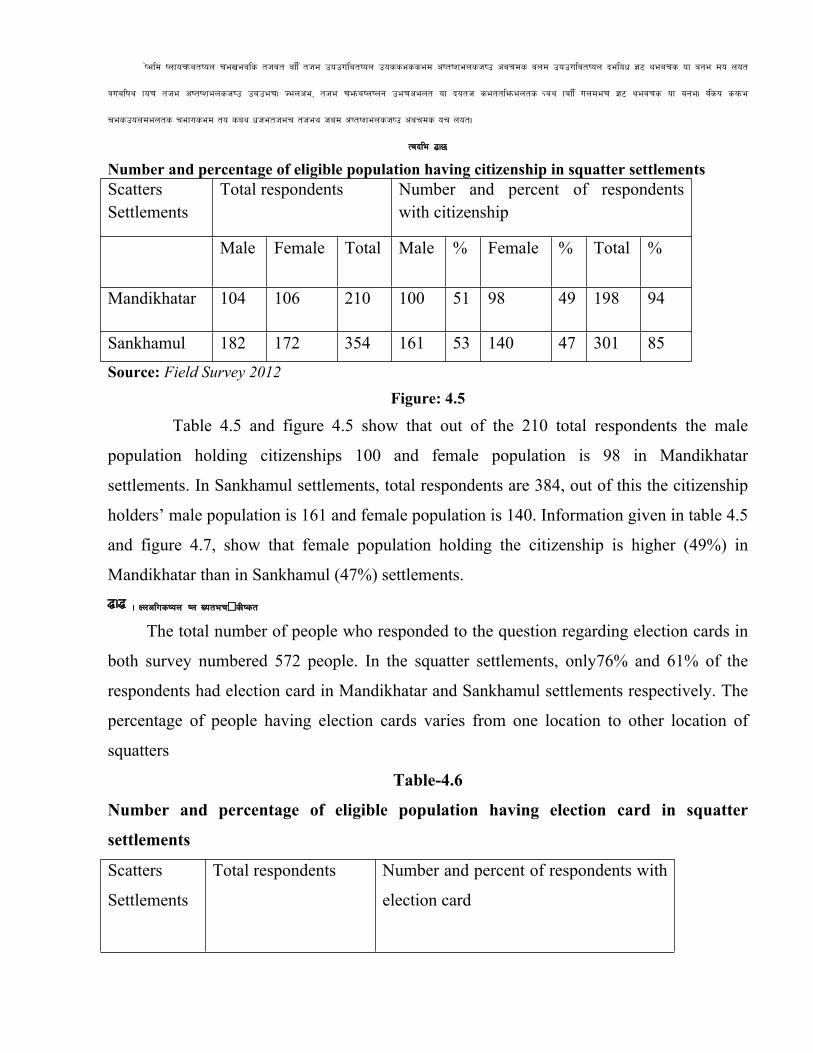
Table 4.5 and figure 4.5 show that out of the 210 total respondents the male
population holding citizenships 100 and female population is 98 in Mandikhatar
settlements. In Sankhamul settlements, total respondents are 384, out of this the citizenship
holders’ male population is 161 and female population is 140. Information given in table 4.5
and figure 4.7, show that female population holding the citizenship is higher (49%) in
Mandikhatar than in Sankhamul (47%) settlements.4.4 . Inclusion in Voter’s List
The total number of people who responded to the question regarding election cards in
both survey numbered 572 people. In the squatter settlements, only76% and 61% of the
respondents had election card in Mandikhatar and Sankhamul settlements respectively. The
percentage of people having election cards varies from one location to other location of
squatters
Table-4.6
Number and percentage of eligible population having election card in squatter
settlements
Scatters
Settlements
Total respondents Number and percent of respondents with
election card

Male Female Total Male % Female % Total %
Mandikhatar 118 114 232 90 51 86 49 176 76
Sankhamul 174 166 340 108 52 98 48 206 61
Source: Field Survey 2012Figure: 4.6
Table 4.6 and figure 4.6 show that the total number of population having election card
is 176 which includes 90(51%) male and 86(49%) female out of the 232 total respondents in
Mandikhatar Settlements. In Sankhamul Settlements, the total number of population having
election card is 206 which includes 108(52%) male and 98(48%) female out of the 340 total
respondents.
4.5. Ethnicity
People belonging to a wide variety of ethnic group are residing in the squatter
settlements. The major castes noted are Brahman, Tamang, Chhetri, Lama, Limbu ,Rai,
Newar, Pariyar, Magar, Majhi, Kunwar, Thakuri, Sherpa, Bishwakarma, Dwul, Giri, Pujari,
and Many others. Altogether 47 different castes have been noted during survey. All these
caste have been classified into 4 major ethnic groups such as Dalit, Janajati,
Madhise/Muslim, and Others based on the ethnicity category defined by population census
2001. The survey shows that majority of squatters belong to Janajati group.
Table-4.7Number and percentage of households by ethnicity in squatter settlementsScatters
Settlements
Total
house-
holds
Number of households and Percentage
Dalit % Janajati % Madhesi/
Muslim
% Other %
Mandikhatar 78 7 9 52 67 0 0 19 24

Sankhamul 105 0 0 80 76 0 0 25 24
Source: Field Survey 2012
Figure: 4.7
Table 4.7 and figure 4.7 give all the total population that is classified into various
ethnicity groups such as Dalit, Janajati, Madhesi/Muslim and others. The population
composition revels 7 household of Dalit , 52 household of Janajati, 19 household of other
non-classified population and there is no household of Madhesi/Muslim out of the 78
household in Mandikhatarsettlemtents. In Sankhamul Settlements, there is no household of
Dalit, 80 households of Janajati, 25 household of other non-classified population and
similarly, there is no household of Madhesi/Muslim out of the 105 households.
Scatters
Settlemens
Total
Popul
-ation
Population Population (%)
Dalit Janajat
i
Madhesi/
Muslim
Other Dalit Janajat
i
Madhesi
/Muslim
Other
Mandikat
ar
362 28 244 0 90 8% 67% 0% 25%
Sankhamu
l
503 0 384 0 119 0% 76% 0% 24%
Table-4.8Source: Field Survey 2012
Figure: 4.8Number and percentage of Population by ethnicity in squatter settlements
Table 4.8 and figure 4.8 show the total population that is classified into various
ethnicity groups such as Dalit, Janajati, Madhesi/Muslim and other. In the diversification of
population composition implies 28 Dalit, 244 Janajati, 90 other non- classified populations
and there is no population of Madhesi/Muslim out of the 362 total population
inMandikhatarsettlemtents. In Sankhamul Settlements, there is no population of Dalit, 384
of Janajati, 119 of other non-classified population and there is no population of
Madhesi/Muslim out of the 503 total populations.4.6. Religion
The major religion followed by residents of the squatter settlements is Hindu. About
49% and 60% squatter population identified themselves as Hindu in Mandikhatarand
Sankhamul settlements respectively. The second highest is Buddhist and third religion noted
is Christian. Other religion like Islam and Kirant were also noted in the survey.
Table-4.9
Number and percentage of households by religion in squatter settlements
Scatters Settlements
Total house-holds
Number and Percentage of households
Buddhist % Christian
% Hindu % Other %
Mandikhatar
78 33 42 6 8 38 49 1 1
Sankhamul 105 30 29 12 11 63 60 0 0Source: Field Survey 2012
Figure: 4.9
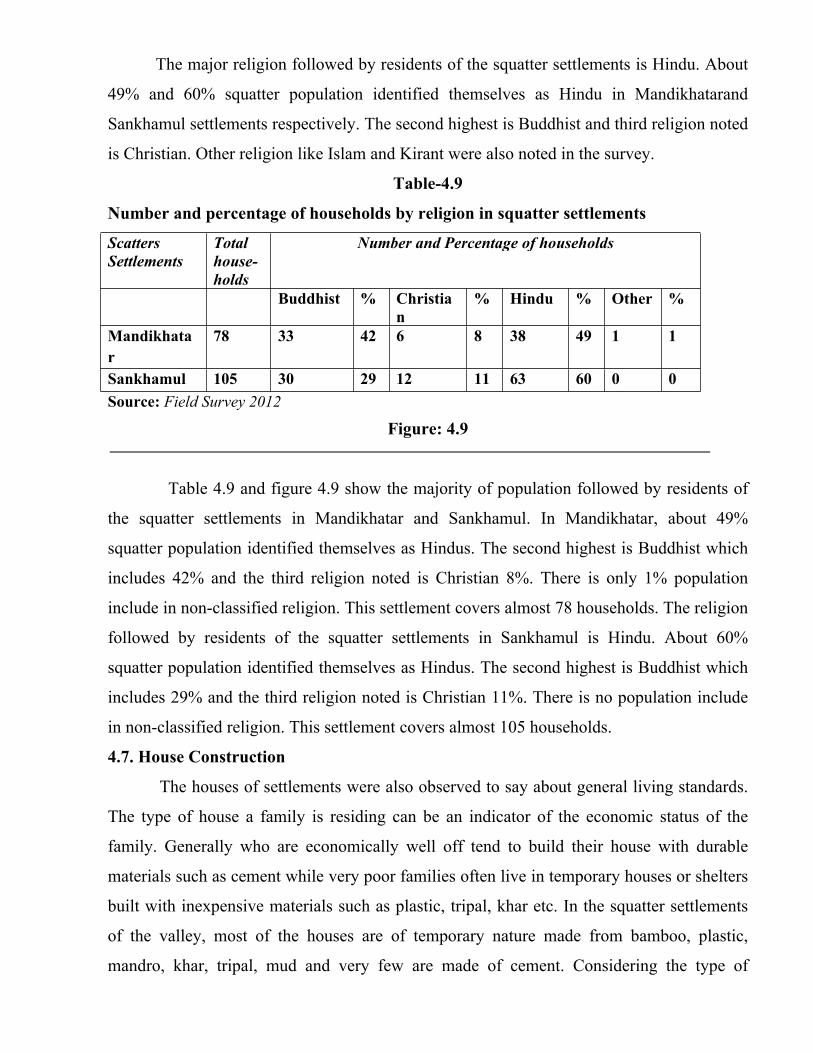
Table 4.9 and figure 4.9 show the majority of population followed by residents of
the squatter settlements in Mandikhatar and Sankhamul. In Mandikhatar, about 49%
squatter population identified themselves as Hindus. The second highest is Buddhist which
includes 42% and the third religion noted is Christian 8%. There is only 1% population
include in non-classified religion. This settlement covers almost 78 households. The religion
followed by residents of the squatter settlements in Sankhamul is Hindu. About 60%
squatter population identified themselves as Hindus. The second highest is Buddhist which
includes 29% and the third religion noted is Christian 11%. There is no population include
in non-classified religion. This settlement covers almost 105 households.
4.7. House Construction
The houses of settlements were also observed to say about general living standards.
The type of house a family is residing can be an indicator of the economic status of the
family. Generally who are economically well off tend to build their house with durable
materials such as cement while very poor families often live in temporary houses or shelters
built with inexpensive materials such as plastic, tripal, khar etc. In the squatter settlements
of the valley, most of the houses are of temporary nature made from bamboo, plastic,
mandro, khar, tripal, mud and very few are made of cement. Considering the type of

materials used for wall and roof, a house is categorized as permanent, semi-permanent and
temporary type as defined in Population Census of 2001.
Table-4.10 Number and percentage of households by construction type of house in squatter settlements
squatter settlements
Total Households
Numbers of household
Permanent % Semi-Permanent
% Temporary %
Mandikhatar 78 1 1 13 17 64 82
Sankhamul 105 0 0 104 99 1 1
Source: Field Survey 2012
Figure: 4.10
Table 4.10 and figure 4.10 show the construction types of house in squatter
settlements. In the squatter settlements of the valley, most of the houses are of temporary
nature made from bamboo, plastic, mandro, khar, tripal, mud and very few are made of
cement. Considering the type of materials used for wall and roof, a house is categorized as
permanent, semi-permanent and temporary nature as defined in Population Census of 2001.
According to the above table 4.10, the numbers of households are classified as permanent,
semi- permanent and temporary which include 1 household, 13 household and 64 household
respectively out of 78 total households in Mandikhatar settlements. Likewise, in Sankhamul
settlements, there is no house of permanent nature, semi-permanent includes 104 household
and 1 household include in temporary nature. 4.8. Occupation
It is well known that most of the squatter populations rely on daily wages for their income. This study also shows that
more than half of the households are mainly dependent on daily wages. There are some households engaged in services with regular
income, and some of households are doing small scale business.. This survey shows a clear relation between the type of house and
the occupation of the residents in the house. Many families living in permanent types houses are engaged in service and small
business whereas more families of temporary type house depend on daily wages. This indicates that the people engaged in service
and small business tend to be better off than the people who depend on daily wages. The number of households by main occupation for
both locations is given below:
Table-4.11
Number and percentage of Population by main occupation in squatter settlements

Scatters
Settlements
Total
household
Main occupation
Service % Small
Business
% Wages % Other %
Mandikhatar 78 14 18 6 8 53 68 5 6
Sankhamul 105 22 21 14 13 41 39 28 27
Source: Field Survey 2012Figure: 4.11
Table 4.11 and figure 4.11 show that there are more households engaged in daily
wages (53). Only 6 households are engaged in small business, almost 14 household are
involved in service sectors and around 5 households follow the other non-classified
occupation in Mandikhatar settlements. In Sankhamul settlements, there are more
households are that are engaged in daily wages (41). Only 14 households are engaged in
small business, almost 22 household involve in service sectors and around 28 household
follow other non-classified occupation.
Table 4.12
Number of households and population by vocational training of squatters settlements
Squatters
settlements
No. of
house-
holds
Vocational Training Total
Popu-
lation
%
Informal % Semi-
skilled
% Skilled %
Mandikhatar 78 230 64 70 19 62 17 362 100
Sankhamul 1o5 304 60 116 23 83 17 503 100
Source:Field Survey 2012
Figure: 4.12
Table 4.12 and figure 4.12 show that both of the settlements are suffering from the
informal trained human capital because Mandikhatar and Sankhamul settlements have
230(64%) and 304(60%) informal trained manpower respectively where the semi-skilled
and skilled manpower are respectively by 70(19%) and 62(17%) in Mandikhatar settlement
and 116(23%) and 83(17%) in Sankhamul respectively.4.9. Sources of drinking water
Almost of all households depends on a variety of sources for water. Major sources
are piped water, tube well and stone spouts. More than half of the households are using
piped water either from private piped or neighbors piped or public well. As pipe water is not
enough to meet the water demand, many squatter households use tube wells as well to meet
their water needs. Majority of the people depend upon the water pipe, tube well and public
well in both of the settlements.
Table-4.13
Number and percentage of households by main sources of drinking water in squatter
settlements
Scatters
settlements
Total
Households
Drinking
water
Pipe
Well(public) Natural
Tap
Stream Tube
well
Stone
Spout
Mandikhatar 78 28 20 2 0 18 0
Sankhamul 105 10 18 12 0 65 0
Source: Field Survey 2012
Figure: 4.13
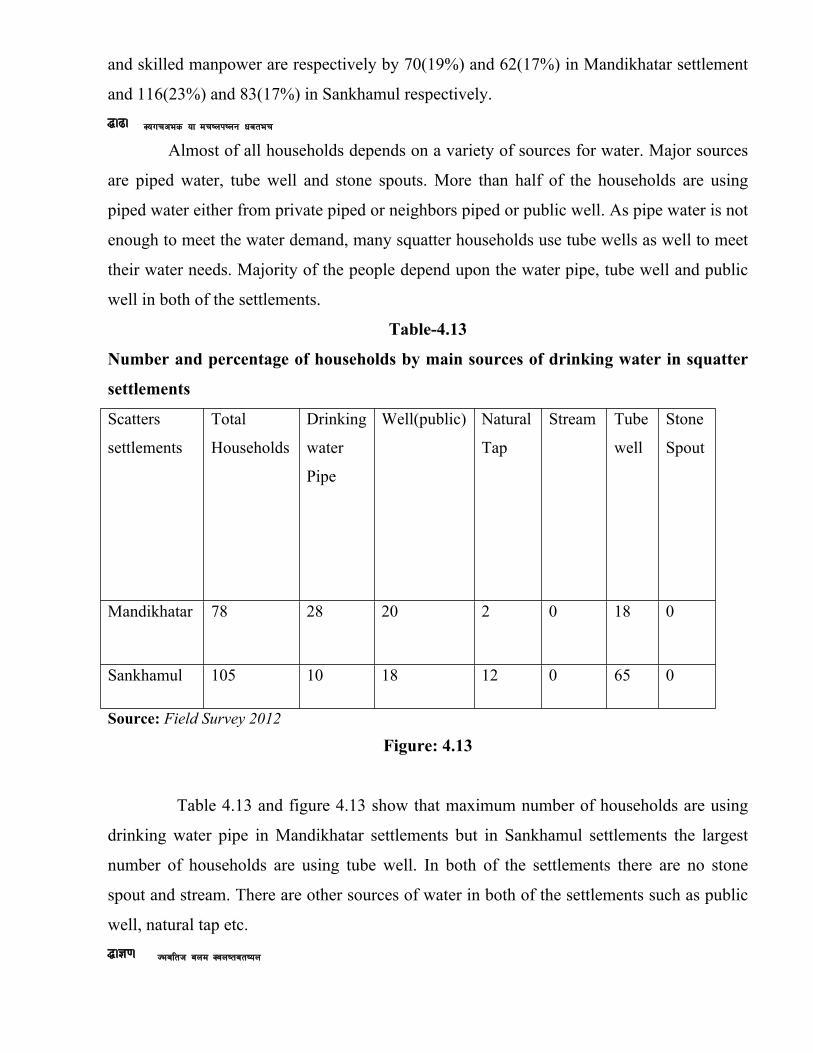
Table 4.13 and figure 4.13 show that maximum number of households are using
drinking water pipe in Mandikhatar settlements but in Sankhamul settlements the largest
number of households are using tube well. In both of the settlements there are no stone
spout and stream. There are other sources of water in both of the settlements such as public
well, natural tap etc. 4.10. Health and Sanitation

This research survey shows that almost all the households were suffered from skin allergy in both of the settlements.
In survey process, various diseases appeared in the settlements. The major reason to increase in multiple of diseases is the
proper health care and cleanness as well as hygienic food and vitamins.
The available of toilets and types of toilets used were studied in this study. Some of
the households have no toilet in the house. The majority of households followed latraine
drained to river in Mandikhatar settlements but largest number of household are using
modern toilet in Sankhamul settlements. This survey clearly shows that, even in the modern
age almost 40% people have no better idea for the use of modern toilet.
Table-4.14
Number of household with and without toilet in squatter settlements
Scatters Settlements
Total house-holds
Household without toilet
Number of household with toilet
open space
River -side
Total
Modern Toilet
Pit -Latrine
Latrine drained to river
Total
Mandikhatar 78 1 0 1 0 2 74 76Sankhamul 105 0 3 3 63 8 28 99
Source: Field Survey 2012
Figure: 4.14
Table 4.14 and figure 4.14 show the number of household with and without toilet
in squatter settlement. Largest numbers of households are followed latrine drained to river
i.e. 74 household in Mandikhattar settlements but the largest number of households are
using modern toilet i.e. 63 household in Sankhamul settlements. In both of the settlements
there is other type of toilet use such as open space, river-side, pit latrine etc.
Table 4.15
Did you get sick last one month?
Squatters
settlements
Total
No. of
Popu-
lation
Types of diseases

Fever Typhoid Viral Jaundice Cholera Skin
Allergy
Total
No. on
sick
people
Mandikhatar 362 9 4 13 3 25 55 109
Sankhamul 503 23 9 21 7 41 82 183
Source: Field Survey 2012
Figure: 4.15
Table 4.15 and figure 4.15 show health situation of squatters. Almost 109 total
people are suffering from various diseases such as fever i.e. 9 people, typhoid i.e. 4 people,
Viral i.e. 13 people Jaundice i.e. 3 people, Cholera i.e. 25 people and skin allergy i.e. 55
people in Mandikhatar settlements. In Sankhamul settlements almost 183 total people are
suffering from various diseases such as fever i.e. 23 people, typhoid i.e. 9 people, viral i.e.
21 people, jaundice i.e. 7 people, cholera i.e. 41 people and skin allergy i.e. 82 people. In
both of the settlements, most of the patients are suffering from skin allergy.
Table 4.16Where did you go for treatment?Squatters
settlements
Total No.
of
Population
Treatment Centre
Government
Hospital
Local
Community
Hospital
Private
Hospital
Others Total
No. of
sick
people
Mandikhatar 362 16 63 5 25 109
Sankhamul 503 39 70 9 65 183
Source: Field Survey 2012Figure: 4.16
Table 4.16 and figure 4.16 show that the total number of sick people in
Mandikhatar and Sankhamul settlements is respectively 109 and 183. The most of the sick
people get treated from local community hospital 63 people of Mandikhatar and 70 people

of Snakhamul settlement reported visiting local community hospital. In Mandikhatar
settlements, 16 sick people got treated from Government hospital but in Sankhamul
settlements there is 39 persons have gone to the government hospital. In another side It
seems to be the second majority of sick people have gone various non- organized treatment
center such as Dhami ,Jhakri, Mata, Joitishi etc. such as Mandikhatar(25) and
Sankhamul(65). But in private hospital their excess seem to very nominal i.e. 5 and 9 people
of Mandikhatar and Sankhamul respectively. 4.11. Cooking Fuel
The status of a household is also related to the type of fuel used for cooking.
Considering the current market prices, households that can afford liquefied petroleum gas
(LPG) can be regarded as better off than those using kerosene and firewood. In both of
squatter settlements, largest number of the households use mainly LGP for cooking and
second largest number of the households are using kerosene, while(22%- Mandikhatar and
3% - Sankhamul) households are using firewood. The remaining households use other solid
biomass fuels such as dung and agriculture residue. It is interesting to note that a few
households also use electricity for cooking. These households are also grouped with other
cooking fuel. This revel that easy availability an important variable expressing fuel use.
Table-4.17
Number and percentage of households by main fuel used for cooking in squatter
settlements
Scatters
Settlements
Total
house-
holds
Number of household
LP
Gas
% Kerosene % Fire
wood
% Other %
Mandikhatar 78 31 40 30 38 17 22 0 0
Sankhamul 105 68 65 25 24 9 9 3 3
Source: Field Survey 2012
Figure: 4.17

Table 4.17 and figure 4.17 show the maximum number of households are using
LP Gas as the source of fuel used for cooking in both Mandikhatar and Sankhamul
settlements respectively by 31 i.e. 40% population and 68 i.e. 24% population. There are
other sources of cooking fuel used such as Kerosene, fire wood and other sources. 4.12. Electricity
This survey shows that the maximum percentage households are facing lack of electricity facility in both of the
settlements. Some households are using electricity service by exchanging the ware using single meter. But in Sankhamul more
households have access to just 6 households are not getting electricity facility. It is already mentioned that second majority
households are connected to electricity without meters due to the frequent movement of household”s construction and temporary
types.
Table-4.18
Number and percentage of households with and without electricity facility in squatter settlements
Scatters
Settlements
Total
House-
holds
House-
holds
without
Electricit
y
% Household with electricity
With
Meter
% Without
Meter
% Total %
Mandikhatar 78 30 38 38 49 10 13 48 62
Sankhamul 105 6 6 75 71 24 23 99 94
Source: Field Survey 2012Figure: 4.18
Table 4.18 and figure 4.25 show that the almost 30 households do not have
electricity connection in Mandikhata settlements. But in Sankhamul settlements, there are
only 6 households out of total 105 households who are not connected to electricity facility.
In Mandikhatar settlements, the numbers of households connected to electricity facility with
meters are 38 households and without meters just with 10 households. In Sankhamul

settlements, almost 75 households are connected to electricity meter and just 24 households
have no meter.4.13. Television
Based on field data, the majority of the household are watching television and
some of the households are not getting due to the very week condition of households
construction. Some households found that they are not watching television due to high
charge of cable provider.
Table-4.19
Number and percentage of households with and without television in squatter settlementsScatters Settlements Total
Household
Household with
Television
Household without
Television
Mandikhatar 78 70 8
Sankhamul 105 95 10
Source: Field Survey 2012
Figure: 4.19
Table 4.19 and figure 4.19 show that almost 70 numbers of households are
watching television out of 78 total households, but remaining 8 households don’t have
television in Mandikhatar settlements. In Sankhamul settlements almost 95 number of
households are watching television out of 105 total households, but remaining 10
households don’t have television.4.14. Monthly income
It is well known that a family’s living standard is determined by its monthly
income. But, it is generally difficult to obtain information of income from interviews as
respondents usually do not feel comfortable to disclose their incomes. Therefore, the data on
income should be considered as supportive information only rather than direct indicator of
living standard. This study gathered information on household income by asking the head of
households the monthly incomes of his/ her family. Each individuals separate income was
not asked and respondents were not forced to tell their income if they were not willing.
Table-4.20
Basic statistics of monthly household income in squatter settlements

Scatters
Settlements
Total
Household
Monthly Income
Less than
Rs. 3000
Rs.3000-
Rs 6000
Rs.6000-
Rs 9000
Rs.9000-
Rs 12000
More than
Rs. 12000
Mandikhatar 78 10 28 20 12 8
Sankhamul 105 18 22 30 20 15
Source: Field Survey 2012Figure: 4.20
Table 4.20 and figure 4.20 give information of monthly household income in
squatter settlements. The total number of household of Mandikhatar settlements is 78. In
this settlement, almost 10 households earn just less then Rs 3000 per month. Likewise, the
total number of households such as 28, 20, 12 and 8 earn between the interval respectively
by Rs.3000-Rs 6000, Rs.6000-Rs 9000, Rs.9000-Rs 12000 and More than Rs. 12000. In
Sankhamul settlements, almost 18 households earn just less then Rs 2000 per month.
Likewise the total number of households such as 22, 30, 20 and 15 earn between the interval
respectively by Rs.3000-Rs 6000, Rs.6000-Rs 9000, Rs.9000-Rs 12000 and More than Rs.
12000.
Mandikhatar Settlements Sankhamul Settlements
Number of households = 78 Number of households = 105
Average Monthly Income (Mean) = Rs. 6730.77
Average Monthly Income (Mean) = Rs. 7271.43
Median = Rs. 6150 Median = Rs. 7250
Mode = Rs. 5076 Mode = Rs. 7333.33
Standard Deviation (SD) = 3511.41 Standard Deviation (SD) = 3853.57
Coefficient of Variation of Mandikhatar Settlements (C.V.M) = 52.17%
Coefficient of Variation of Sankhamul Settlements (C.V.S) = 53%
According to the field data, calculating the various mathematical derivation, mean,
median, mode and standard deviation of the Sankhamul settlement is higher than in

Mandikhatar settlements. In coefficient of variation analysis, income distribution in
Mandikhatar is more homogeneous, more uniform, more equitable and more stable than in
Sankhamul settlements.
4.15. Migration
Regarding the causes for migration, the squatters have mentioned various reasons
such as lack of basic facilities and employment opportunities in their villages, lack of land,
inability to pay rent and victims of natural disasters. For the purpose of analysis, all reasons
have been grouped into seven major categories – landlessness, disaster, conflict, better
opportunity of work, better facilities, poverty and others. The reasons are all linked to one
another, but these are the main reasons indicated by the respondents. Some of households
were not willing to mention the reasons for migration and some mentioned social reasons.
Table-4.21List of major migrated districts with highest number of migrated households and percentage in squatter settlements with top ten districts and others
Migrated Population to Mandikhatar by number and Percentage
Migrated Population to Sankhamul by number and Percentage
Name of Districts No. of House-holds
Percentage (%)
Name of Districts No. of House-holds
Percentage (%)
Kathmandu 25 32.05 Kathmandu 21 20Nuwakot 12 15.38 Sindhupalchowak 12 11.43Sindhupalchowak 10 12.82 Ramechhap 10 9.52Dolakha 5 6.41 Lalitpur 10 9.52Ramechhap 4 5.13 Dolakha 8 7.62Kavre 4 5.13 Kavre 6 5.71Sindhuli 3 3.85 Makawanpur 5 4.76Dhading 3 3.85 Khotang 4 3.81Lamjung 2 2.56 Okhaldhunga 4 3.81Okhaldhunga 2 2.56 Sindhuli 3 2.86Others Distircts 8 10.26 Others District 22 20.96Total 78 100 Total 105 100 Source: Field Survey 2012 Table 4.21 gives various studies that show squatter settlements have grown
significantly in the last few years. Except for a few settlements, where the people are residing
for more than ten years, many squatter settlements seem to be recently developed. This study
has tried to analyze the migration pattern of squatter population by asking them about their
preciously residing location or district in the country.

The analysis shows that there is a huge internal migration within the valley from one
location to another. In both of the settlements the maximum numbers of households are
migrated from inside the valley. The numbers of migrated households in Mandikhatar and
Sankhamul settlements are respectively 25 and 21 which are maximum than other district. The
top ten migrated districts are from Nuwakot (12), Sindhupalchowak(10), Dolakha(5),
Ramachhap(4), Kavre(4), Sindhuli(3), Dhading(3),Lamjung(2) Okhaldhunga(2) in Mandikhatar
settlements. In Sankhamul settlements, The top ten migrated districts are Sindhupalchowak(12),
Ramachhap(10),Lalitpur(10), Dolakha(8), Kavre(6), Makawanpur(5) , Khotang(4),
Okhaldhunga(4), Sindhuli(3). The table shows that 8 households and 22 households are
migrated from other various districts in Mandikhatar and Sankhamul settlements respectively.
4.16. Marital status
This survey clearly shows that the percentage of female married population is higher in
both of the settlements. Because of the polygamy system and illegal marriage affairs, the female
married population is higher than male married population in both of the settlements.
Table- 4.22
Number of population about marital status in squatters settlements
Squatters
settlements
No. of
household
Population
Male Married Female Married Total Married
Mandikhatar 78 187 39 157 41 80
Sankhamul 1o5 253 55 250 58 113
Source: Field Survey 2012
Figure: 4.21
Table 4.22 and figure 4.21 show that total married male is 39 and female is 41 out
of the total population respectively out of the total population of 187 and 157 in
Mandikhatar settlements. In Sankhamul settlements, total married male is 55 and female is
58 out of the total population respectively by 253 and 250 population. 4.17. Monthly Expenditure

It is well known that a family’s living standard is also determined by its monthly
expenditure pattern. Even expenditure information is also difficult to capture. Respondents
usually do not feel comfortable to disclose their expenditure. Therefore, the data on
expenditure should be considered as supportive information only rather than direct indicator
of living standard. This study gathered information on household income by asking the head
of households the monthly expenditure of his/ her family. Each individual’s separate
expenditure was not asked and respondents were not forced to tell their expenditure if they
were not willing.
Table -4.23
Basic statistics of monthly household expenditure in squatter settlements
Scatters
Settlements
Total Household Monthly Expenditure
Less
than
Rs. 3000
Rs.3000
-
Rs 6000
Rs.6000
-
Rs 9000
Rs.9000-
Rs 12000
More
than
Rs.12000
Mandikhatar No of
households
78 8 30 22 11 7
Percentage
(%)
100 10.26 38.46 28.21 14.10 8.97
Sankhamul No of
households
105 16 24 32 19 14
Percentage
(%)
100 15.24 22.86 30.48 18.10 13.33
Source: Field Survey 2012Figure: 4.22
Table 4.23, and figure 4.30 show the basic statistics of monthly household
expenditure in squatter settlement. Total numbers of household spend in Mandikhatar
settlements is 78. In this settlement, almost 8 households expense just less then Rs 3000 per
month. Likewise the total numbers of households such as 30, 22, 11 and 7expensebetween
the interval respectively by Rs.3000-Rs 6000, Rs.6000-Rs 9000, Rs.9000-Rs 12000 and
More than Rs. 12000. In Sankhamul settlements, almost 16 households expense just less

then Rs 2000 per month. Likewise, the total number of households such as 24, 32, 19 and 14
expense between the interval respectively by Rs.3000-Rs 6000, Rs.6000-Rs 9000, Rs.9000-
Rs 12000 and More than Rs. 12000.
Mandikhatar Settlements Sankhamul Settlements
Number of households = 78 Number of households = 105
Average Monthly Expenditure (Mean) = Rs. 6692.31
Average Monthly Expenditure (Mean) = Rs. 7224.86
Median = Rs. 6136.36 Median = Rs. 7171.88
Mode = Rs. 5200 Mode = Rs. 7172.86
Standard Deviation (SD) = 3313.61 Standard Deviation (SD) = 3722.90
Coefficient of Variation of Mandikhatar Settlements (C.V.M) = 49.51%
Coefficient of Variation of Sankhamul Settlements (C.V.S) = 51.40%
According to the field data, calculating the various mathematical derivation, mean,
median, mode and standard deviation of the Sankhamul settlement is higher than in
Mandikhatar settlements. In coefficient of variation analysis, expenditure tendency in
Mandikhatar is more homogeneous, more uniform, more equitable and more stable than in
Sankhamul settlements.
Table-4.24Basic statistics of treatment expenditure during last one month in squatter settlementsScatters
Settlements
Total no. of
population
Treatment expenditure
Less
than Rs.
500
Rs.500-
Rs
1000
Rs.1000-
Rs 2000
More than
Rs. 2000
Total No.
on sick
people
Mandikhatar 362 70 20 12 7 109
Sankhamul 503 105 20 42 16 183
Source: Field Survey 2012
Figure: 4.23
Table 4.24 and figure 4.23 show that spending pattern of population of different
settlements. Total number of population in Mandikhatar settlements is 362. In this
settlement, 70 people reported expenditures for treatment during last one month. Medical
expenses amounted to Rs 500 or less. Less people were reported spending Rs 2000 or more
for medical facilities. Total number of population in Sankhamul settlements is 503. In this
settlement, 105 people reported expenditures for treatment during last one month. Medical
expenses amounted to Rs 500 or less. Less people were reported spending Rs 2000 or more
for medical facilities
CHAPTER - V
SUMMARY, CONCLUSION AND RECOMMENDATION
5.1. Summary
The 40 squatter settlements of Kathmandu valley are providing shelter for about more than twelve thousand people in more than twenty five
hundred households. The average household size of our study settlements is 5 people of Mandikhatar and Sankhamul settlements
respectively have same household size.
The study has explained the literacy status of the squatter population settlements. Generally, the literacy rate, which is defined as the ability
to read and write, is computed only population aged six years and above. The literacy rate of squatter population in both settlements is found
to be at male literacy rate is higher than female literacy rate.
This study has tried to see whether the residents of squatters have citizenship card or not. The eligible age for holding a citizenship is 16
years or more. The research shows that the majority populations have citizenship cards.
The total number of people who responded to the question regarding election cards in both survey settlements shows that in the squatter
settlements, only 76% and 61% of had election card in Mandikhatar and Sankhamul settlements respectively. The percentage of people
having election cards varies from one location to other location of squatters.
People belonging to a wide variety of ethnic group are residing in the squatter settlements. All these caste have been classified into 4 major
ethnic groups such as Dalit, Janajati, Madhise/Muslim, and others based on the ethnicity category defined by population census 2001. The
survey shows that majority of squatters belong to Janajati group.
The major religion followed by residents of the squatter settlements is Hindu. About 49% and 60% squatter population identified themselves
as Hindu in Mandikhatar and Sankhamul settlements respectively. The second highest is Buddhist and third religion noted is Christian.
Other religion like Islam and Kirant were also noted in the survey
The houses of settlements were also observed to see general living standards. The type of house a family is residing can be an indicator of
the economic status of the family. In the squatter settlements of the valley, most of the houses are of temporary nature made from bamboo,
plastic, mandro, khar, tripal, mud and very few are made of cement. Considering type of materials used for wall and roof, a house is
categorized as permanent, semi-permanent and temporary type as defined in Population Census of 2001.
It was also found the majority of the squatter populations rely on daily wages for their income. This study also shows that more than half of
the households are mainly dependent on daily wages. There are some households engaged in services with regular income, and some of
households are doing small scale business.
Almost all households depend on a variety of sources for water. Major sources are piped water, tube well and stone spouts. More than half of
the households are using piped water either from private pipes or neighbors pipes or public well.
This research survey shows that the majority of households were suffering from skin allergy in both of the settlements. In survey process,
various diseases wear reported in the settlements. The major reason for the increase in multiple diseases is the absence of the proper health
care and cleanness as well as lack of hygienic food and vitamins.
The availability of toilets and types of toilets used were studied in this study. Some of the households have no toilet in the house. This
survey clearly shows that, even in the modern age almost 40% people have no idea of modern toilet.
The status of a household is also related to the type of fuel used for cooking. Considering the current market prices, households that can
afford liquefied petroleum gas (LPG) can be regarded as better off than those using kerosene and firewood. In the both of squatter
settlements, largest number of the households use mainly LGP for cooking and second largest number of the households are using kerosene,
while(22%- mandikhatar and 3% - sankhamul) households are using firewood.
This survey shows that the maximum percentage households do not have of electricity connection in both of the settlements. Even the
households using electricity service have done by exchanging the ware using single meter.
Field dada shows the majority of the household are watching television and there are some households are not having television is because
of their poverty and households construction. Some households reported not watching television due to high charges by cable provider.
Family’s living standard is determined by its monthly income. But, it is generally difficult to capture true figure of income from interviews
as respondents usually do not feel comfortable to disclose their income. Therefore, the data on income should be considered as supportive
information only rather than direct indicator of living standard give some information.
Regarding the reason for migration, the squatters have mentioned various reasons such as lack of basic facilities and employment
opportunities in their villages, lack of land, inability to pay rent and victims of natural disasters. For the purpose of analysis, all reasons have
been grouped into seven major categories – landlessness, disaster, conflict, better opportunity of work, better facilities, poverty and others.
This survey clearly shows that the percentage of female married population is higher in both of the settlements. This is because of the
frequent marriages of the females in the settlements.

5.2. Conclusion
A study of the river front slums sand squatter communities and other settlements in
Kathmandu valley has been proved to be highly useful as it was conducted at the right time.
The study revealed the number of the settlements and families living on the river banks and
other locations in Kathmandu. It also presented an excellent profile on the socio economic
condition of the slum and squatter communities in Kathmandu valley.
This study is conducted to support the initiation taken by Bagmati Sbhyata Ekirit
Bikash Samiti to conserve and develop the river areas along the Bagmati and its tributaries.
The study shows that 81% of the squatter families in Kathmandu are living along the river
banks, while the rest are living in other locations. The housing structure is now changing
from temporary to semi permanent type. The percentage of the houses with temporary and
semi permanent nature seems to be almost fifty-fifty. Comparatively new settlement along
the Manohara River has more houses with temporary type. The permanent type houses are
still very few. One of the reasons for this could be the lack of security of tenure, which is
holding back people to invest a high amount in improving housing. The communities
studied also have low incomes. The per capita income in the studied communities is below
Rs 100 per day. The lowest communities have slightly higher income.
River banks are the areas that highly attract the squatter communities. River banks
are highly crowded with the poor families. For decades the issue related to the poor families
living in the slums and squatter settlements have not been addressed. The settlements were
allowed to grow without government getting involved in tenure issues and improving the
settlements or the people’s living condition. The study gives enough background
information on the need of improving the settlements or the people’s living condition. The

study gives enough background information on the need of improving slums and squatter
communities making proper arrangement of alternatives with tenure security and with
respect to helping people live a decent life as well as contributing to conserve the holy
rivers.
5.3. Recommendations
Through this study we can come to a conclusion that slum dwellers are facing
various problems. The following points need to be considered for improving the overall
socio-economic condition of the slum people.
The squatter problem in the valley is associated with the river banks. Unless and until
the issues of slums and squatter population is addressed, the issues related to natural,
religious, cultural and social heritage, human civilization, environmental will not be solved.
Therefore, I would like to appeal to a government, NGOs, INGOs, industrialists,
businessmen, civil society organizations, and squatter communities for support and
partnership to address the squatter’s problem in Kathmandu valley.
Expansion of qualitative and practicable education
Avoid the social stratification and hierarchical system.
Social awareness needs to be created among Slum people.
In the study area most of the slum households are landless. They should be provided
with land for cultivation and house to live.
Skillful training should be provided for protecting their traditional knowledge from
going it in decreasing stage which can create self-employment to them.
Caste-based discrimination among in Slum Dalits should be eliminated at first; only
then the discrimination form upper castes and others urban residential will end.
The main cause of the socio-economic and cultural poverty in Slum community of
the area has been found to be alcoholism, smoking and very lack of cleanness. So,
such habit should be minimized.
Equitable distribution of resource for all slums landless and homeless should be
provided.
Most of the Slum people do not have saving habits they should be encouraged to
make certain savings.
There is excess labor force engaged in daily wage base work. It should be
transformed into other productive sectors.
To raise public awareness through seminars, workshops, interaction and networking
so as to orient policy makers and development practitioners about slum people.
Incorporation of Slum people upgrading program is government plan and programs
which should be targeted towards those who are really marginalized.
The status of women in the study area is worsening due to the illiteracy and unemployment so non-formal education and vocational
training most be provided to uplift their condition.
Provide the skill development training.
Providing the proper ‘health & sanitation’ facility and awareness for slum people
In all respects the slum populations are found to be living with very low incomes and
in areas which are not good for human settlement. There is rampant poverty and deprivation
of basic needs.
This study has been able to provide a vivid picture of the stature of the people living
in the slum areas of Kathmandu valley. Based on the study the following recommendations
are made.
The government should take up the issue very seriously. No political parties should
use the population for their benefits. They should all devote collectively to solve the
problems of the slum population. Until and use the issue is genuinely taken up without
rested in least than only a solution will arrange. The government should looks at the
problem seriously and find out the genuine population who require help and settle them at
appropriate locations and discourage further migration of other such people in the located
area.
At last, public sectors, private sectors, civil societies and donor agencies need to pay a
high attention on slums, squatter and indigenous settlements issues, before the problem
becomes too big. Without improving the living condition of the poor and marginalized

people, no development program will be successful neither a city will remain in peace and
harmony.

BIBLIOGRAPHY
Adhikari, J. 2007. "Urbanization and Change in Pokhara, Nepal", in Nepalis Inside and Outside Nepal. Ed. by H. Ishii, D.N. Gellner, K. Nawa. Delhi: Manohar, pp. 17-55.
Agier, M. 2008. "Quel temps aujourd'hui en ces lieux incertains ?" L'Homme, 185-186: 105-120
A Situation Analysis of Urban Poor Communities in Kathmandu and Lalitpur. 2001. Lumanti Support Group for Shelter. . Bista, D.B., (1996). The People of Nepal (6th ed.). Kathmandu Neapl : Ratna Pustak Bhandar.
Caplan, A.P., (1970). Priest and Cobbler : A Study of Social Change in Hindu Village in Western Nepal. Kathmandu : Ratna Pustak BhandarCBS, (2005). Nepal in Figures. Ramshahpath, Kathmandu : His Majesty's Government
National Planning Commission Secretariat.
Dupont, V. 2007. "La place des slums dans les villes indiennes", Revue urbanisme [Dossier : Villes indiennes], 355, July-August 2007, pp. 1-11.
DNF, (2062 Mansir). Voice of Liberation. Kathmandu : Dalit NGO Federation.
Feldhaus, A. 1995. Water and Womanhood Religious meanings of Rivers in Maharashtra. New York: Oxford University Press.
Hada, J. 2001. Housing and Squatter Settlements. In City Diagnostic Report for City Development Strategy. Kathmandu Metropolitan City/the Word Bank.
Jha, H. B. (May 3 & 4, 2004). Dalits and Their Participation in National and Local Governance. National Seminar Paper, Lalitpur : Center for Economic and Technical Studies
Kathmandu Valley. Environment Outlook. 2007. Kathmandu, International Centre for Integrated Mountain Development (ICIMOD).
Khatri, P.K., (2044 BS.). Nepali Samaj Ra Sanskriti. Kathmandu : Sajha PrakashanMacdonald, A.W., (1987). The Ethnology of Nepal and South Asia.
KIRDRC, (2002). Good Governance in the Kamali, an Exploratory Study, Jumla : Karnali
Integrated Rural Development and Research Center.

Liechty, N. 2008 (1st edition: 2003). Suitably Modern." Making Middle Class Culture in a New Consumer Society. Kathmandu: Martin Chaudhuri.
New Beginnings: Housing the Urban Poor. A Case Study of Kirtipur Housing Project. 2005. Kathmandu, Lumanti, Support Group for Shelter.
Pradhan, P. and Perera, R. 2005. Urban Growth ant its Impact on the Livelihoods of Kathmandu Valley, Nepal. Urban Management Programme--Asia Occasional Paper n[degrees]63, Asian Institute of Technology, Pathumthani (Thailand).
Rademacher, M. 2005. Culturing Urban Ecology: Development, Statemaking, and River Restoration in Kathmandu. Ph.D. Dissertation, Yale University.
Shrestha, B.J. and S. Shrestha. 2008. "Proposed Outer Ring Road for the Kathmandu Valley", Spaces (Kathmandu), 4,6, pp. 52-58.
Tanako, M. 1997. Conditions of Low Income Squatters in Kathmandu. Kathmandu: Lumanti.
Toffin, G. 2007. Newar Society." City, Village and Periphery. Kathmandu, Himal Books/Social Science Baha.
Yamamoto, Y. 2007. "The Sukumbasi transformation from Communitas to Community: the birth and death of “Proto-Charisma' among squatters in Pokhara, Nepal", in Nepalis Inside and Outside Nepal. Edited by H. Ishii, D. Gellner, K. Nawa, Delhi: Manohar, pp. 115-158.

APPENDIX I: - QUESTIONNAIRE HOUSEHOLD SURVEYTRIBHUVAN UNIVERSITY
CENTRAL DEPARTMENT OF ECONOMICSSOCIO-ECONOMIC STATUS OF SLUM DWELLERS IN KATHMANDU VALLEY
(A Case Study of Sankhamul and Mandikhatar Scatters Settlements)
1 Place of Interview Date of Interview: -2069/……/…….
Temporary District: - ……………. VDC/Municipality: - …………. Wad. No: …… Tole: - …...
Permanent District: - ……………. VDC/Municipality: - ……………. Wad. No: …… Tole: - …...
When did you permanents settle at the location ?
……………………………………………………………………………………..2. Name of Respondent: - …………………………………… Sex: - ……
Age: - ….…Religion: - ………..……Occupation: - ………..…………. Education:-……………………….. Marital Status: - ……………..
3. Family size:Male: - …………….. Female: - ……………. Total:-…………
S.N Full name Relation of head
Age Sex Education Marital Status
Occupation
12345678910111213
Socio- economic Background

1. Where do you like to settle? a) Kathmandu Valley b) In your own village c) Others Places (specify)…………………………………………………..
2. What type of house do you have? i) Kachchi ii) Semi Pakki iii) Pakki
3. What kind of home do you need for settlement?a) Pakki b) Kachchi c) Semi Pakki
d) Only field e) Others (specify).. ……………………………..4. What is your occupation?
a) Farming b) Service c) Business d) Daily wagee) Student e) Others (specify).. ……………………….….
5. What kind of government support did you get so far? a) Financial support b) Skill training support c) Educational Support.
If financial support how much………………………………………….…….6. How much is your monthly income?
a) Less than Rs. 4,000 b) Rs. 4,000 - 8,000c) Rs. 8,000 - 12,000 d) More than Rs. 12,000
If specify……………………………………..
7. What are the major income sources or occupation of your family?a) Agriculture/Farming b) Service c) Business d) Daily wage
e) Unemployed e) others (specify)…………… If no where do you go for defecation? ………………………………
8. Do you have your own house? a) Yes b) No ,
If not where are you planning to settle?...................................................................
9 What is your main contemporary income source?i) Agriculture ii) wage iii) traditional work iv) Government job v)
Business vi) others ………………………. If any other secondary income sources.i) ……………. ii) …………. iii)……………. iv) ……………..
10. Annual Expenditure
S.N. Name of items Annual Expenditure1 Food2 Health3 Education

4 Entertainment5 Clothes6 Others
Occupational Characteristics
1. What types of grain do you produce?
S.N Name of Grains Production ( in muri)12345
2. Number of live stocks that you keep in your house and their annual income.
S.N. Name of live stocks Number Annual income1234567
3. Do you follow the traditional occupation?i) Yes ii) No If no, why?a) Low income.b) Difficult to collect the crops (Bali) from the servers (Bista).c) Other. ………………………………………………………….
If Yes, What do you think about Bali Pratha (crops system)? i) Positive ii) Negative If “Negative”
Why don’t you transform (change) this system?……………………………………………………………………………
4. Do you want to change your occupation?i) Yes ii) No
If you want so, which sector do you choose?i) Business ii) wage iii) Agriculture iv) other
Educational Activities
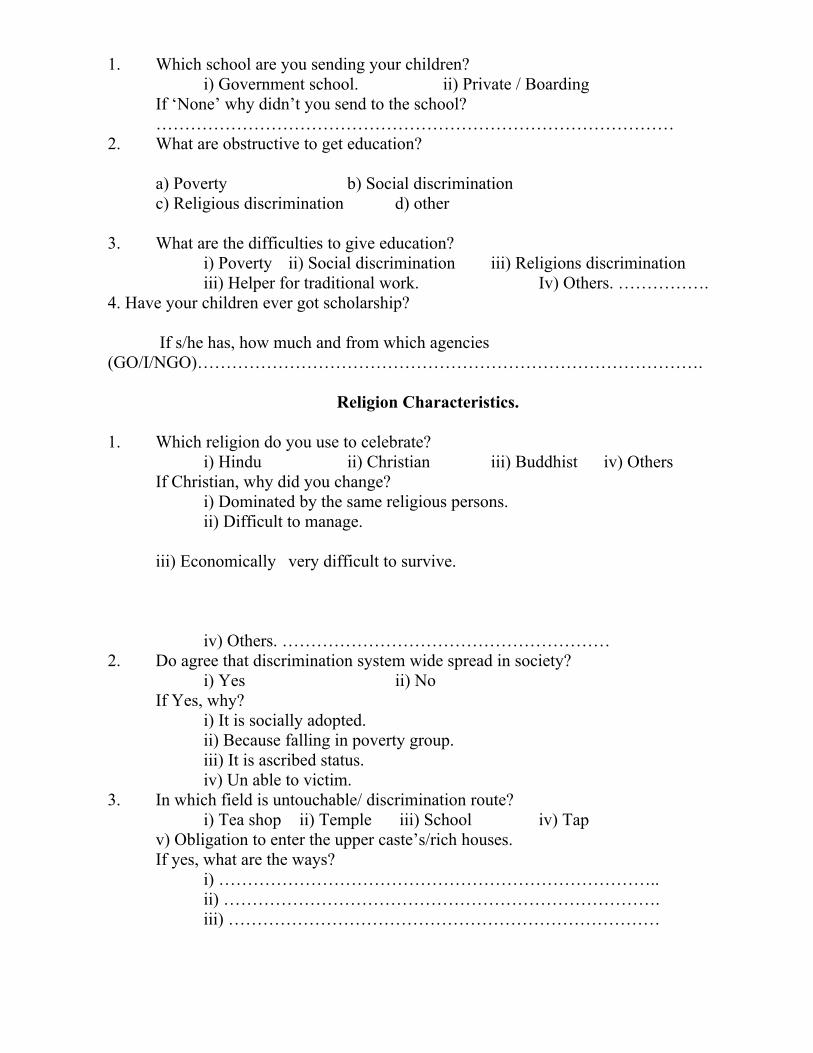
1. Which school are you sending your children?i) Government school. ii) Private / Boarding
If ‘None’ why didn’t you send to the school?………………………………………………………………………………
2. What are obstructive to get education?
a) Poverty b) Social discriminationc) Religious discrimination d) other
3. What are the difficulties to give education?i) Poverty ii) Social discrimination iii) Religions discrimination iii) Helper for traditional work. Iv) Others. …………….
4. Have your children ever got scholarship?
If s/he has, how much and from which agencies (GO/I/NGO)…………………………………………………………………………….
Religion Characteristics.
1. Which religion do you use to celebrate?i) Hindu ii) Christian iii) Buddhist iv) Others
If Christian, why did you change?i) Dominated by the same religious persons.ii) Difficult to manage.
iii) Economically very difficult to survive.
iv) Others. ………………………………………………… 2. Do agree that discrimination system wide spread in society?
i) Yes ii) NoIf Yes, why?
i) It is socially adopted.ii) Because falling in poverty group.iii) It is ascribed status.iv) Un able to victim.
3. In which field is untouchable/ discrimination route?i) Tea shop ii) Temple iii) School iv) Tap
v) Obligation to enter the upper caste’s/rich houses.If yes, what are the ways?
i) …………………………………………………………………..ii) ………………………………………………………………….iii) …………………………………………………………………
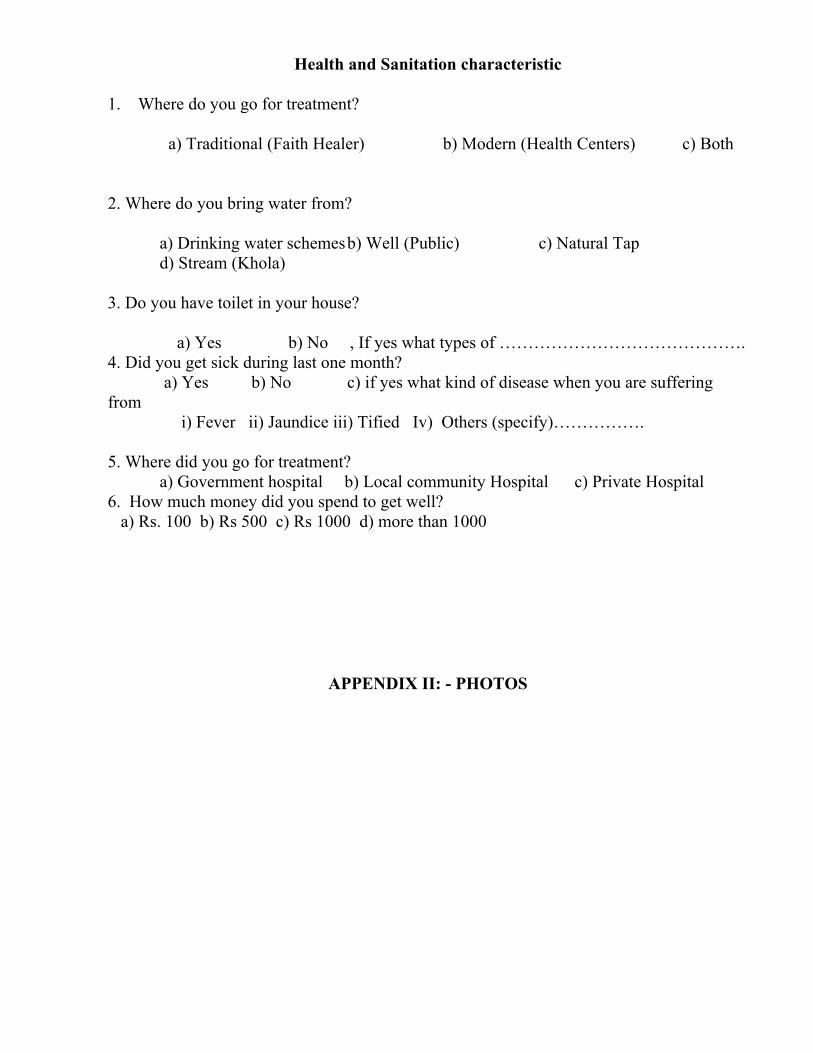
Health and Sanitation characteristic
1. Where do you go for treatment?
a) Traditional (Faith Healer) b) Modern (Health Centers) c) Both
2. Where do you bring water from?
a) Drinking water schemesb) Well (Public) c) Natural Tap d) Stream (Khola)
3. Do you have toilet in your house?
a) Yes b) No , If yes what types of …………………………………….4. Did you get sick during last one month? a) Yes b) No c) if yes what kind of disease when you are suffering from i) Fever ii) Jaundice iii) Tified Iv) Others (specify)…………….
5. Where did you go for treatment? a) Government hospital b) Local community Hospital c) Private Hospital 6. How much money did you spend to get well? a) Rs. 100 b) Rs 500 c) Rs 1000 d) more than 1000
APPENDIX II: - PHOTOS
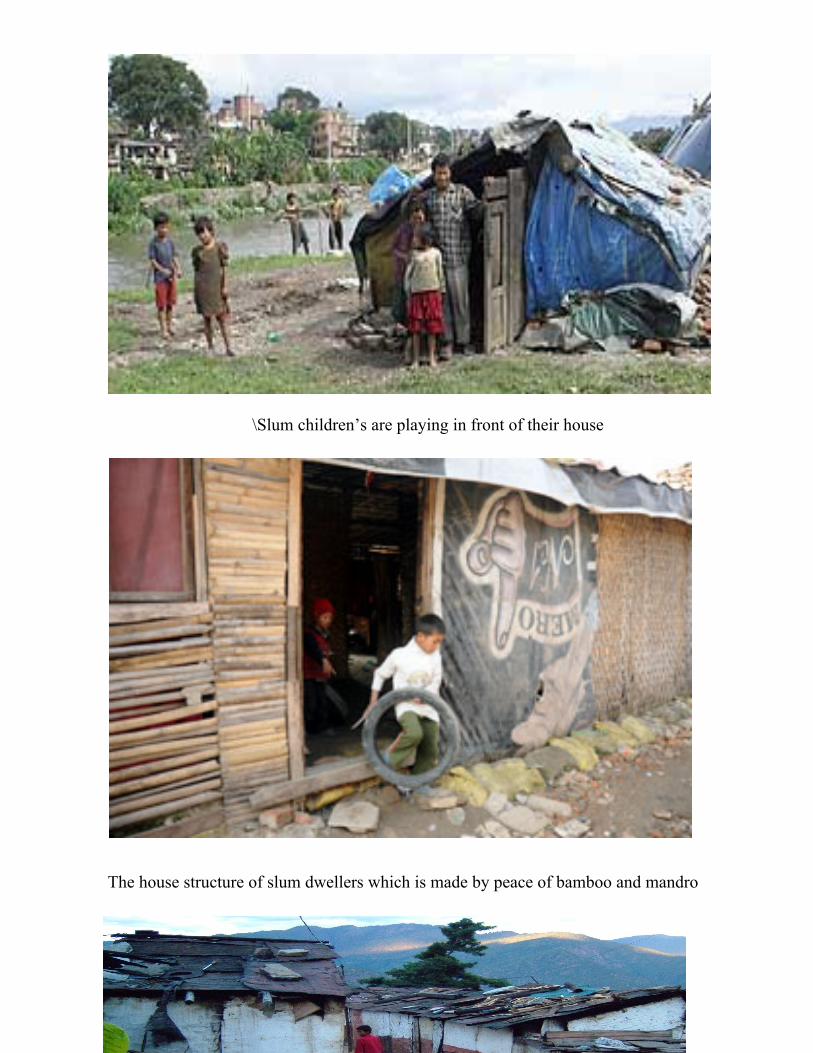
\Slum children’s are playing in front of their house
The house structure of slum dwellers which is made by peace of bamboo and mandro

View of slum village
Slum children are playing in front of their local school

Slum settlements of river side
Slum settlements of river side