yangon university of economics department of management ...
76
i YANGON UNIVERSITY OF ECONOMICS DEPARTMENT OF MANAGEMENT STUDIES MBA PROGRAMME THE EFFECT OF PROMOTIONAL MIX ON BRAND EQUITY AND BRAND RESONANCE OF CLEAR SHAMPOO IN YANGON HTET HTET AUNG MBA II-2 23 rd BATCH, MBA DECEMBER, 2019
-
Upload
khangminh22 -
Category
Documents
-
view
0 -
download
0
Transcript of yangon university of economics department of management ...

i
YANGON UNIVERSITY OF ECONOMICS
DEPARTMENT OF MANAGEMENT STUDIES
MBA PROGRAMME
THE EFFECT OF PROMOTIONAL MIX ON BRAND
EQUITY AND BRAND RESONANCE OF CLEAR
SHAMPOO IN YANGON
HTET HTET AUNG
MBA II-2
23rd BATCH, MBA
DECEMBER, 2019

ii
YANGON UNIVERSITY OF ECONOMICS
DEPARTMENT OF MANAGEMENT STUDIES
MBA PROGRAMME
THE EFFECT OF PROMOTIONAL MIX ON BRAND
EQUITY AND BRAND RESONANCE OF CLEAR
SHAMPOO IN YANGON
ACADEMIC YEAR (2017-2019)
Supervised By:
Dr. Nwe Ni Aung
Lecturer
Department of Management Studies
Yangon University of Economics
Submitted By:
Htet Htet Aung
MBA II-2
MBA 23rd Batch
2017-2019

iii
YANGON UNIVERSITY OF ECONOMICS
DEPARTMENT OF MANAGEMENT STUDIES
MBA PROGRAMME
THE EFFECT OF PROMOTIONAL MIX ON BRAND
EQUITY AND BRAND RESONANCE OF CLEAR
SHAMPOO IN YANGON
A thesis submitted to the Board of Examiners in partial fulfillment of the
requirements for the degree of Master of Business Administration (MBA)
Supervised By:
Dr. Nwe Ni Aung
Lecturer
Department of Management Studies
Yangon University of Economics
Submitted By:
Htet Htet Aung
MBA II-2
MBA 23rd Batch
2017-2019

iv
ACCEPTANCE
This is to certify that the thesis entitled “The Effect of Promotional Mix on
Brand Equity and Brand Resonance of Clear Shampoo in Yangon” has been accepted
by the Examination Board for awarding Master of Business Administration (MBA)
degree.
Board of Examiners
……………………………………..
(Chairman)
Dr. Tin Win
Rector
Yangon University of Economics
DECEMBER, 2019
……………………………………..
(Supervisor)
……………………………………..
(Examiner)
……………………………………..
(Examiner)
……………………………………..
(Examiner)

i
ABSTRACT
This study aims to examine the effect of promotional mix on brand equity and to
analyze the effect of brand equity on brand resonance of Clear Shampoo by Unilever
Myanmar in Yangon. The data are collected from 396 sample respondents of Clear
Shampoo users in Botahtaung Township by using simple random sampling method
through structured questionnaire. In this study, it is found that advertising, personal
selling and public relations have strong effect on brand awareness, and all promotional
mix have strong effect on brand associations. Advertising, sale promotions, direct
marketing and public relations have strong effect on perceived quality, and sale
promotions and direct marketing have strong effect on brand loyalty. This study finds that
brand associations, perceived quality and brand loyalty strongly affect brand resonance.
The study recommends that the company should increase sale promotions for brand
loyalty to achieve strong brand resonance.

ii
ACKNOWLEDGEMENTS
I would like to express my deepest gratitude to Professor Dr. Tin Win, Rector of
Yangon University of Economics, for allowing me to undertake this study as a partial
fulfillment towards the Master Degree of Business Administration.
I would also like to offer my sincere thanks to Professor Dr. Nilar Myint Htoo,
Pro-rector, Yangon University of Economics for permission to do this study as a partial
fulfillment towards the Degree of Master of Business Administration (MBA).
I would like to express my truthful thanks to Professor Dr. Nu Nu Lwin, Head of
Department, Department of Management Studies, Department of Management Studies of
Yangon University of Economics, for her permission, guidance and support for this
study.
I would like to describe my sincere gratitude to Professor Dr. Myint Myint Kyi
and Professor Dr. Hla Hla Mon, Department of Management Studies for their guidance
and constructive comments during this study.
Especially, I would like to acknowledge and thank my supervisor, Dr. Nwe Ni
Aung, Lecturer, Department of Management Studies, for her guidance, encouragement
and useful advice during the planning and development of this research study as I would
not be able to finish this paper without her support.
I feel grateful to all Associate Professors and Lecturers from Department of
Management Studies, Yangon University of Economics, for high guidance, opinions,
administrative support during the period of study. I would like to express my gratitude to
all teachers and visiting lecturers who have made their grateful efforts in sharing their
knowledge and experiences in MBA Programme during this two years for coursework.
Htet Htet Aung
23rd Batch, MBA
MBA II 2
December, 2019

iii
CONTENTS Page
ABSTRACT i
ACKNOWLEDGEMENTS ii
CONTENTS iii
LIST OF TABLES v
LIST OF FIGURES vi
CHAPTER 1 INTRODUCTION
1.1 Rationale of the Study 2
1.2 Objectives of the Study 3
1.3 Scope and Method of the Study 3
1.4 Organization of the Study 4
CHAPTER 2 THEORICAL BACKGROUND
2.1 Promotional Mix 5
2.2 Brand Equity 9
2.3 Brand Resonance 12
2.4 Previous Studies 13
2.5 Conceptual Framework of the Study 17
CHAPTER 3 PROFILE AND PROMOTIONAL MIX OF CLEAR SHAMPOO
IN YANGON
3.1 Background of Unilever Myanmar 19
3.2 Research Design 21
3.3 Profile of the Respondents 23

iv
3.4 Promotional Mix of Clear Shampoo 26
CHAPTER 4 ANALYSIS ON THE EFFECT OF PROMOTIONAL
MIX ON BRAND EQUITY AND BRAND RESONANCE OF
CLEAR SHAMPOO
4.1 Analysis on the Effect of Promotional Mix on Brand Equity of 28
Clear Shampoo in Yangon
4.2 Analysis on the Effect of Brand Equity on Brand Resonance of 37
Clear Shampoo in Yangon
CHAPTER 5 CONCLUSION
5.1 Findings and Discussions 41
5.2 Suggestions and Recommendations 43
5.3 Needs for Further Research 45
REFERENCES
APPENDIX

v
LIST OF TABLES
Table No. Particular Page
Table 3.1 Products of Unilever EAC Myanmar 20
Table 3.2 Reliability Analysis 22
Table 3.3 Demographic Factors of Respondents 24
Table 4.1 Promotional Mix 29
Table 4.2 Brand Equity 31
Table 4.3 Effect of Promotional Mix on Brand Awareness 32
Table 4.4 Effect of Promotional Mix on Brand Associations 34
Table 4.5 Effect of Promotional Mix on Perceived Quality 35
Table 4.6 Effect of Promotional Mix on Brand Loyalty 36
Table 4.7 Brand Resonance 38
Table 4.8 Effect of Brand Equity on Brand Resonance 39
vi
LIST OF FIGURES
Figure No. Particular Page
Figure 2.1 Five Major Promotional Tools 5
Figure 2.2 Conceptual Framework of the Study by Gupta 13
Figure 2.3 Conceptual Framework of the Study by Buil et al., 15
Figure 2.4 Conceptual Framework of the Study by Gordan 16
Figure 2.5 Conceptual Framework of the Study 17

1
CHAPTER 1
INTRODUCTION
In this era of increasing in globalization trend and technology in communication
and transportation, consumers can easily have a variety of choices of personal care
products among competitive brands all over the world. The expenditure of purchase
products especially of personal care in a household can be large portion in Yangon. In the
last decades, consumers did not think about the brands very much and they bought what
they saw in the shop. Nowadays, consumers start taking care of the brand they use
because they have the mindset that their beauty and hygiene can be improved by the
brands they use also for shampoo products. Most people choose shampoo brands with
popular brand name and they believe that famous brands are more reliable, useful, and
high quality.
A brand can be defined as “a name, term, sign, symbol, or design, or combination
of them which is intended to identify the goods and services and to
differentiate them from those of competitors” (Kotler & Keller, 2009). The brand equity
concept is one of the popular concepts that is commonly used by marketers nowadays.
(Keller, 1993) implied that brand equity enables the customers to make distinctions
between their preferred brand and others, and this influences how he or she responds to
marketing of the brand. The customer-based brand equity can be divided into brand
awareness, brand associations, brand superiority and brand effect. This study emphasizes
the promotional mix, brand equity and brand resonance. The brand resonance can be
separated into brand salience, brand performance, brand imagery, brand judgement and
brand feeling.
There are a large number of shampoo brands for consumers to choose.
Competition in shampoo brands become very high resulting in high pressure on profit
margin. Firms spend millions each year on promotional mix on building brand equity and
brand resonance. Many Fast Moving Consumer Goods companies including shampoo
companies are doing various marketing strategies to grow their sales in Myanmar. It is
very interesting that which promotional mix strategy has more impact on brand equity
and brand resonance in Myanmar. To investigate the effect of promotional mix on brand
2
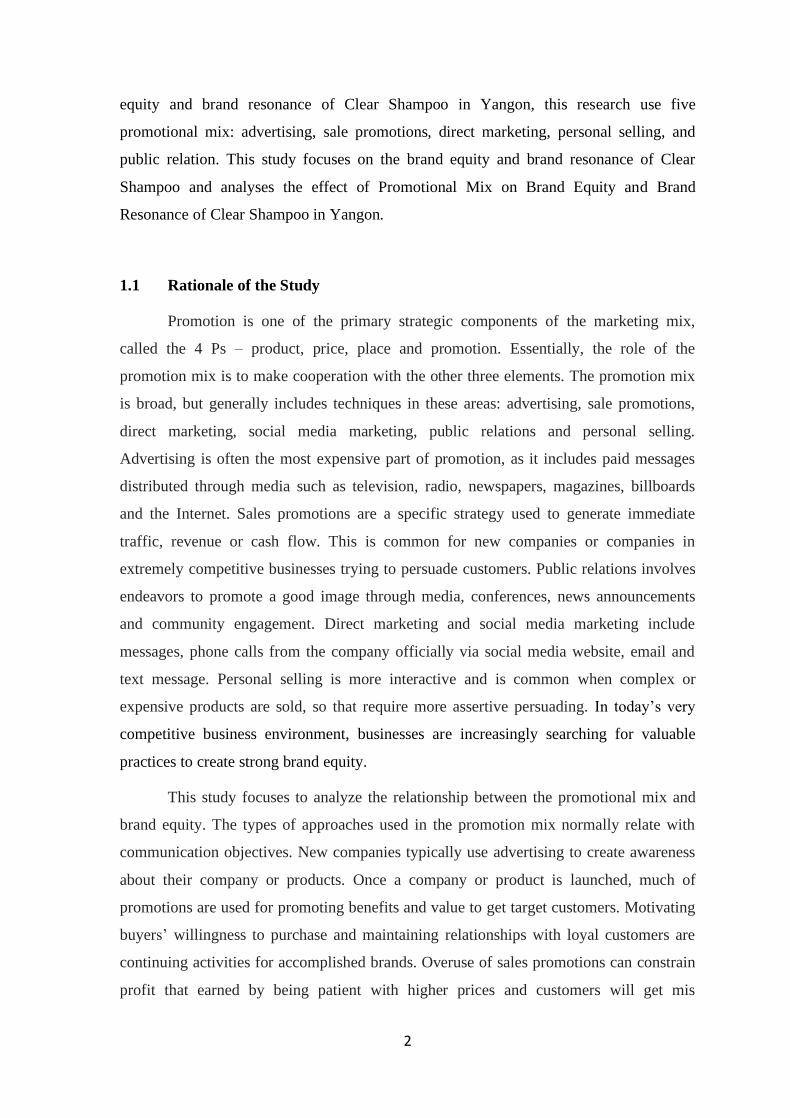
equity and brand resonance of Clear Shampoo in Yangon, this research use five
promotional mix: advertising, sale promotions, direct marketing, personal selling, and
public relation. This study focuses on the brand equity and brand resonance of Clear
Shampoo and analyses the effect of Promotional Mix on Brand Equity and Brand
Resonance of Clear Shampoo in Yangon.
1.1 Rationale of the Study
Promotion is one of the primary strategic components of the marketing mix,
called the 4 Ps – product, price, place and promotion. Essentially, the role of the
promotion mix is to make cooperation with the other three elements. The promotion mix
is broad, but generally includes techniques in these areas: advertising, sale promotions,
direct marketing, social media marketing, public relations and personal selling.
Advertising is often the most expensive part of promotion, as it includes paid messages
distributed through media such as television, radio, newspapers, magazines, billboards
and the Internet. Sales promotions are a specific strategy used to generate immediate
traffic, revenue or cash flow. This is common for new companies or companies in
extremely competitive businesses trying to persuade customers. Public relations involves
endeavors to promote a good image through media, conferences, news announcements
and community engagement. Direct marketing and social media marketing include
messages, phone calls from the company officially via social media website, email and
text message. Personal selling is more interactive and is common when complex or
expensive products are sold, so that require more assertive persuading. In today’s very
competitive business environment, businesses are increasingly searching for valuable
practices to create strong brand equity.
This study focuses to analyze the relationship between the promotional mix and
brand equity. The types of approaches used in the promotion mix normally relate with
communication objectives. New companies typically use advertising to create awareness
about their company or products. Once a company or product is launched, much of
promotions are used for promoting benefits and value to get target customers. Motivating
buyers’ willingness to purchase and maintaining relationships with loyal customers are
continuing activities for accomplished brands. Overuse of sales promotions can constrain
profit that earned by being patient with higher prices and customers will get mis

3
understanding of company which always gives promotions. If so, customers will not buy
at normal time when promotion is provided.
A brand is a unique symbol, design, words or combination of these. Brand
represents an image of a product, such as product quality, creditability and sometimes the
living standard of the customers who is using it. From the perspective of consumer, brand
equity is an suitable starts to evaluate product equity which includes a lot of related
measures such as brand awareness, brand quality, brand association and brand loyalty
(Jing et al., 2015). In this very competitive business environment, companies really need
to retain customers and to make customers feel that they have made right decision of
purchasing their products. This paper especially explores the roles of promotional mix
and the effect of promotional mix on the brand equity and brand resonance of in Yangon,
Myanmar. In Myanmar, there are not many brands to choose in Shampoo brands. But
nowadays, customers have many choices to buy shampoo among local and international
brands.
1.2 Objectives of the Study
The main objective of the study is to examine the role of promotional mix in
brand equity and brand resonance of Fast Moving Consumer Goods product, Clear
Shampoo. The specific objectives are set as follows.
1. To examine the effect of promotional mix on brand equity of Clear Shampoo in
Yangon
2. To analyze the effect of brand equity on brand resonance of Clear Shampoo in
Yangon
1.3 Scope and Method of the Study
This study focuses on the impact of promotional mix on brand equity and brand
resonance. This study is mainly focused on shampoo care users of Clear Shampoo in
Yangon. Both primary and secondary data are used in this study. Primary data are
collected from sample respondents by using structured questionnaires. The questionnaire
is designed using multiple choices and Likert scales questions. Simple random sampling
method is used to choose collect data. Botahtaung township is selected by using simple
4
random sampling method to calculate the sample size. The sample size of 396 is obtained
by using Yamane’s Sampling Formula. The descriptive method and linear regression
model are applied in this study. Secondary data was gathered from textbooks, internet
websites, previous research paper and international research paper. This survey is
conducted during August and September 2019.
1.4 Organization of the Study
The study is organized by five chapters. Chapter (1) includes introduction,
rationale of the study, objectives of the study, scope and method of the study and
organization of the study. Chapter (2) includes theoretical background concerned with the
study. Chapter (3) states the profile and promotional mix of Clear Shampoo by Unilever
Myanmar. Chapter (4) describes the effect of promotional mix on brand equity of Clear
Shampoo in Yangon and the analysis of the effect of brand equity on brand resonance of
Clear Shampoo in Yangon. Chapter (5) consists of the conclusion presenting the key
findings and discussions, suggestions and recommendation and needs for further research.

5
CHAPTER 2
THEORITICAL BACKGROUND
In this chapter, definition and concept of promotional mix through aspects
including advertising, promotions, direct marketing, personal selling and public relations,
brand equity through brand awareness, brand association, perceived quality and brand
loyalty and brand resonance is explained.
2.1 Promotional Mix
According to Ross, promotional mix is “the total marketing communication
program of a specific product”. Similarly, promotional mix can be defined as “any
marketing effort whose function is to inform or persuade potential customers about the
merit a product has for the purpose of inducing a customer either to start buying or
continue to purchase the firm product” (Adebi, 2006). Promotional mix endeavors to
catch the attention of new customers, encourage loyalty, encourage trial, inform and
remind potential customers about new arrivals, encourage new customers, modify
attitudes, build an image, encourage brand switching etc. (Kotler, Keller, Koshy, & Jha,
2007).
Figure 2.1: Five Major Promotional Tools
Source: Kotler & Armstrong, (2010).
A company’s total promotional mix or marketing communication mix comprises
the specific blend of advertising, sale promotions, public relations, personal selling, and
Advertising
Promotional
Mix
Personal
Selling
Sale
Promotions Direct
Marketing
Public
Relations

6
direct marketing tools that the company uses to persuade and communicate customer
value and build customer relationships (Kotler & Armstrong, 2010). The five major
promotional tools are illustrated in (Figure 2.1). Companies use all or some activities
together to communicate with existing customer and potential customers by its distinct
features, its superior quality, what the price it offers, where they can be available at etc.
The key objective of doing promotion by the companies is to motivate the consumers to
purchase their product. Well planned and budgeted promotional mix can bring more
customers to the company and can get more loyal customers. The promotion mix is one
of the marketing strategies which is used to get eye-catching on their products as a result
of increasing sale during that short period of time. Sale promotion can motivate
consumers to buy their products but it does not relate to the brand equity.
2.1.1 Advertising
Advertising is a dominant way of communicating a brand’s functional and
emotional value (Buil , Chernatony, & Martinez, 2010). The usefulness of this
communication tool depends on its content message, the implementation or how the
advertisement convey the message, and the rate of which a consumer sees the
advertisement. Advertising creates brand awareness, links strong, favorable, a unique
association to the brand in consumers’ memory, and the elicits positive brand judgements
and feelings. (Keller, 2007). However, to achieve this result, the advertising requires a
appropriate design and execution. (Kotler & Armstrong, 2010) described advertising as
any paid form of non-personal presentation and promotion of ideas, goods and services
and it is required price. Advertising can reduce knowledge barrier of the customers or
potential customers about products or services. Advertising strategy consists of two major
elements. They are creating messages and selecting media. The advertising are meant to
prohibit the misunderstanding of the customers and to build a good understanding about
various marketing mix such product, price, place, and promotions of the brand or product
to customers. Advertising includes the Internet, television, radio, newspapers, magazines,
roadside billboard and so on. Different media can give different effectiveness in
distribution messages about the brand to different targeted customers.
2.1.2 Sale Promotions
Sales promotions is one of the important elements of marketing promotion.
Consumer promotion (e.g. coupons, contests, samples, price packs & sweepstakes) is a

7
component of sales promotion that is targeted towards the ultimate buyers of consumer
products (Kotler & Armstrong, 2010). Sales promotion is basically a marketing procedure
engaged in maximized increase in sales within a period of time (Kotler & Armstrong,
2010) emphasized that sales promotions consist of a short time enticement to promote
purchase or sales of a good or service. Sale promotion contains a set of various and often
short motive tools which is used for consumer’s or buyer’s provocation to buy more and
faster (Gupta, 1988). Similarly, (Brassington & Pettit, 2000) defined sale promotion as
tactical marketing procedures with mostly short-term incentives, which are to enhance the
product or service, in order to accomplish particular sales or marketing objectives.
While talking about promotions, there are two types of promotions which all
companies use in real life: consumer promotion and trade promotion. Mainly fast moving
consumer goods companies rarely sell directly to the end users. They must have mediums
such as distributors, wholesalers and retailor. There are two types of sale promotion:
consumer promotion and trade promotion. Objective of consumer promotion is to
increase short term customer buying or to enhance customer brand involvement. And
companies use trade promotions for getting wholesales and retails to bring new products
and keep more inventory, buy more to promote company’s products and give the products
more shelf space (Kotler & Armstrong, 2010).
2.1.3 Direct Marketing
According to (Kotler & Armstrong, 2010), direct marketing includes connecting
directly with targeted individual consumers carefully to obtain an immediate response
and develop lasting customer relationships. Marketers communicate directly with
customers, often on a one to one, interactive basis. Using detailed customers’ databases,
they modify their marketing offers and communications to the needs of defined segments
or even individual buyers. Similarly, (Brassington & Pettit, 2000) defined direct
marketing as an intelligent system of advertising, using at least one advertising media to
accomplish measurable reaction anywhere, shaping a bases for making and further
building up an on-going direct relationship between an organization and its clients, to
have the capacity to make and manage quality organization with sometimes hundreds or
thousands of individual clients, an organization needs to have as much information as
possible about each one and needs to be able to access, control and investigate that
information, subsequently the database is essential to the process of building the
relationship.

8
Direct marketing is interactive and immediate that buyers can communicate with
sellers by phone or on the seller’s Web site to create the configuration of information,
products, or services they desire, and then order them on the spot. Moreover, direct
marketing gives consumers a great measure of control. Consumers choose which catalogs
they will search and which Web sites they will visit. Direct marketing also has the
advantages of low cost, speedy and efficient alternative for sellers. Direct marketing has
grown rapidly in business to business marketing. Direct marketing has lower cost per
contact media such as telephone selling, direct mail, and company Web sites. Similarly,
online direct marketing results in lower costs, improved efficiencies, and quicker
handling of channels and logistics functions, such as ordering process, inventory
handling, and delivery (Kotler & Armstrong, 2010).
2.1.4 Personal Selling
According to Reece et al., (2007), personal selling included person to person
communication with a prospect thereby, creating relations, finding needs, matching the
appropriate products with these requirements and communicating benefits through
educating, reminding or persuading. Personal selling is one of the traditional components
of promotional mix. In this approach, products or brands characteristics are represented
by a sale person to the consumers for the purpose of making sales. Therefore, the success
in this method lies in the capacity of the sale person to persuade the regulars to buy the
brands (Sontakki, 2012). Characteristics and personality measures are important
components of personal selling as these have an influence on the consumers (Lamont &
Lundstrom, 1977).
This demanded for ethics and ethical training to the sale persons along with
personal characteristics (Donoho et al., 2013). (Kim & Hyun, 2011) suggested that
frequency of visit, personality, information as important characteristics of personal
selling. Personal selling via over the counter and face to face contact is instrumental in
offering information tailored to the different needs of customers. Initial awareness about
the brand, development of brand image, association, perceived quality and loyalty about
the brand is dependent on the influence of sale persons which are the important
facilitators of brand choice (Mudambi, 2002).

9
2.1.5 Public Relations
Public relations is another effective promotional mix that can be used to influence
brand equity. According to (Kotler & Armstrong, 2010), public relations was defined as
building good relations with the company’s various publics by obtaining favorable
publicity, making up a good corporate image, and handling or avoiding unfavorable
rumors, stories, and events. Public relations functions includes generating and delivering
interesting information in the media to attract attention to a person, product or service,
publicizing specific products, building and maintaining relationships with shareholders
and others in the financial community, and/or development public relations with donors
or members of nonprofit organization to gain financial or volunteer support. Sponsorship
is one of the good ways of public relations promotional tools that is also a good way to
attract the customer’s attention.
When a company gives sponsorship in events, customers generally have good and
positive view about sponsorship. Sponsorship can sometimes be used as corporate social
responsibility by the company. Public relations, a part of promotional mix, is a strategy of
building and maintaining company’s image and goodwill through non-paid
communication media. The ultimate objectives of public relations are to keep a positive
status of the brand and maintain a strategic relationship with the public, prospective
customers, partners, investors, employees and other stakeholders which leads to a positive
image of the brand and makes it seem honest, successful, important, and relevant.
2.2 Brand Equity
The American Marketing Association defines a brand as a name, term, sign,
symbol or design or a combination of them, intended the goods or services of one seller
or group of sellers and to differentiate them from those of competitors. Thus, a brand is
product or service that make different in some way from other competitors’ ones. A
creditable brand can get a certain level of quality and customers will purchase again if
they satisfy. Branding is all about encouraging to buy its products and services with the
power of brand equity. Nowadays, companies are trying to build brand equity for their
products by making their products easy memorable, and easily recognized among
competitors’ products and services. (Aaker, 1996) defined brand equity from an
organizational perspective, as a set of assets linked to a brand’s name, symbol that adds to
10
the value provided by a product or service to the firm and/or firm’s customers. Brand
equity is built and measured by brand awareness, perceived quality, brand association,
and brand loyalty (Aaker, 1991).
Advertising and word of mouth are the best way to create brand awareness and
brand association (Jing Bill Xu and Andrew Chan: 2009). Brand equity includes brand
strength and brand value. Brand strength is the set of associations and behaviors on the
part of the brand’s customers, channel members. Brand value is the financial result of
management’s ability to influence brand strength via planned and strategic actions in
delivering greater current and future profits and lowered risks (Rajendra, Srivastava,
Allan, & Shocker, 1991). (Keller, 1993) said that the effect of brand equity can help
consumer gain the effect of premium prices, or that consumers usually have grater
product evaluation for brand products with high name recognition.
From consumer-based view, brand equity is the someone’s willingness to
continue to purchase the brand or not. Theoretical background for measures of brand
equity are brand awareness, brand association, perceived quality and brand loyalty.
2.2.1 Brand Awareness
(Aaker, 1991) defined brand awareness as the ability of a potential buyer to
recognize or remember that a brand is a member of a certain category. Brand awareness
represents the presence of the brand in the mind of the customers (Keller, 1993). There is
two dimensions that comprised in the brand awareness. These are brand recognition and
brand recall. Brand recognition can be defined as the ability of consumers to remember
prior experiences with the brand when given the brand as a cue (Keller, 1993).
Keller described that brand awareness was essential because it boosted the
possibility of brand selection due to the saliency of the brand in the memory of the
consumers especially under low involvement of conditions. Brand awareness has a direct
impact on brand image. (Yoo & Donthu, 2001) proved that the level of brand equity was
positively related to the extent to which brand awareness is evident in the product. In
order to have positive associations for a brand the consumer must have a level of brand
awareness for that brand in his or her mind. Without awareness, it will be impossible to
get any additional value for the consumers or the brand over basic need satisfaction. The
higher awareness level increased the likelihood of considering brand and the effect of
awareness on buying decision. (Runndle & Benett, 2001).

11
2.2.2 Brand Associations
Brand associations consist of all brand-related thoughts, feelings, perceptions,
smells, colors, music, images, experiences, beliefs, and attitudes (Kotler & Keller, 2009).
And a brand association can be anything connected in memory to a brand (Aaker, 1991).
(Keller, 1993) defined brand associations as “a set of associations linked to the brand that
consumers hold in memory”. Brand associations includes memory in the top of the mind,
the perceptions of consumers about a brand in the mind set is brand image (Keller, 1993).
The brand image can be either negative or positive. Positive brand image provided to a
favorable behavior, especially in the process of purchase decision by the consumer, as it
differentiate product, brand name extension, and create a positive feeling about the brand
(Aaker, 1996). (Keller, 1993) described that certain intangible and tangible traits for
measuring the brand image established in consumer’s mind set.
2.2.3 Perceived Quality
Perceived quality was defined as the consumer's opinion of the overall quality or
value of the product or service regarding to its intended purpose, relative to options
(Keller, 2007). Perceived quality was defined as the perception of functional excellence
on behalf of the consumer (Aaker, 1996). Consumers often express their perceptions
about the quality of product or service on the basis of a variety of informational hints that
they associate with the product (Schiffman & Kanuk, 2000). Perceived quality does not
directly link with actual/objective quality, product quality, or the manufacturing quality
but is merely an intangible overall feeling about a brand (Aaker, 1991). Intrinsic cues are
related to physical characteristics of the product itself, such as color, flavor, form and
appearance, while extrinsic cues are related to the product but not in the physical part
such as brand name, quality, country of origin, packaging, advertising and product
information.
2.2.4 Brand Loyalty
Brand loyalty, a core dimension of (Aaker, 1991) brand equity model, was
defined as the affection that a customer has to a brand. Behavioral loyalty is related to
consumer behavior in the market and can be suggested by the number of repeated
purchases (Keller, 1993). Similarly, brand loyalty can be defined as commitment to
repetitively purchase the brand as the first choice in spite of the marketing efforts of other
brands and loyalty is a intensely held promise to re-buy or support a preferred product or

12
service consistently in the future, thereby causing repeated same brand or similar brand
set purchase pattern (Oliver, 1999) Brand loyalty comprises of two dimensions: behaviors
and attitudes. Behavioral dimension is characterized by significant actions resulting from
loyalty, while attitudinal dimension indicates to formative manners as commitment i.e. a
desire to sustain a cherished relationship (Chen & Chang, 2008). Brand loyalty is the final
preferred result of consumer knowledge (Schiffman & Kanuk, 2000). According to
(Rowley & Dawes, 1999) brand loyalty is the possibility of affirmative attitudes and
behaviors of customers towards a specific brand; this could lead to repeat obtain and
affirmative word of mouth.
2.3 Brand Resonance
(Keller, 1993) defined brand resonance as that the customers devote deep feeling
to the brand, even seeing it as a life partner. Thus, when consumers purchase the brand
willingly, it expresses personal consciousness and style and it must be connected to self-
image of consumers. (Chen & Chang, 2008) explained that the brand resonance has a
positive effect on consumers such as high loyalty toward a brand, easier development of
new products under that brand, causing consumers to have more accommodation for the
brand. Brand resonance would establish psychological attachment, in turn protecting
behavioral loyalty, which affects purchase retention.
In the customer-based brand equity (CBBE) model proposed by (Keller, 1993),
the brand resonance was officially proposed. Later, (Keller, 2001) defined brand
resonance as the relationship between consumers and brands, or the extent to which
consumers sense the brands, and there are differences in the potency consumers’
emotional resonance with brands, which can be divided into four levels, which are
attachment, behavioral loyalty, sense of community, and active engagement. (Keller,
1993) indicated that in order to resonate with a certain brand, consumers need to not only
frequently use products of the brand, but also need to actively be concerned about
information relating to the brand. (Chen & Chang, 2008) further explained brand
resonance, believing that consumer loyalty caused by brand resonance can be expressed
in two ways, which are behavioral loyalty and emotional loyalty.

13
2.4 Pervious Studies
Many previous researches which focus on the analysis of the effect of
promotional mix on brand equity, show that there is positive relationship between the
promotional mix in building brand equity.
Studies strongly argue that as consumers are exposed to a brand’s advertising
more frequently, they develop not only higher brand awareness and stronger associations
other than positive acuity of the brand quality (Yoo, Donthu, & Lee, 2000). Promotional
mix especially advertising spend on a brand can increase scope and frequency of the
brand; the level of brand awareness (Keller, 2007). Based on the study results (Buil ,
Chernatony, & Martinez, 2010), there are several managerial implications.
Figure (2.2) Conceptual Framework of the Study by Gupta
Source: Gupta, (2017)
Advertising is one of the important marketing mix tool for companies influencing
brand equity dimensions. However, due to the growing number of brands competing in
Advertising
Radio
TV
Internet
Celebrity endorsements
Sales Promotion
Price
Non-Price
Personal Selling
Publicity Word of
Mouth
Promotional
Mix
Brand
Switching Behavior
Brand
Equity
Switching
Barriers
Brand
Awareness
Brand Image Perceived Quality
Brand
Loyalty
Alternative
Attractiveness
Inter-personal
relations
Switching Costs
Learning
Search
Continuity

14
the markets with the same elements, advertising spend perceived by consumers improve
awareness but it is not enough to positively impact the associations correlated to the
brand. Companies should pay special attention to those aspects relating to the design of
their advertising campaigns in the media, trying to develop original creative strategies.
Advertising is the most costing tools among others promotional tools. Thus, the
higher the spend in advertising, the higher the level of brand awareness are likely to be.
Positive, strong and distinctive brand associations can also be created by advertising
(Keller, 2007). Like brand awareness, brand associations comes from consumer brand
interaction. Thus, advertising can promote brand association through capability to create,
modify or reinforce associations with new contact. Hence, the higher advertising
spending on the brand, the stronger will be the associations in the consumers’ mind.
Emphasizing on brand equity and dimensions of brand equity, various
promotional tools, such as price promotions of price discounts have a direct effect on
them. Researches prove that price promotions have an unenthusiastic impact on brand
image. Hence, not all promotional tools, but some tools such as frequent price or
monetary promotions can have negative influence on perception of quality and brand
loyalty because these promotional tools make consumers to think about the price in
priority not to think about the brand and quality first. But non price promotions have
positive effect on brand image, perceived quality and brand loyalty and brand awareness
can be increased by both price and non price promotions (Hawley & Tong, 2009).
According to the research (Buil , Chernatony, & Martinez, 2010), marketing
managers should be aware of the effects that promotional actions have on consumers
perceptions. While price promotions are common, the result of this study indicated that
frequent use of monetary promotions dilutes some brand equity dimensions.
Consequently, brand managers should be aware of the dangers of using this type of
promotions. By contrast, it would be wiser to use non monetary promotional tools, since
they appeared to be more consistent with the brand equity creation strategies.

15
Figure (2.3) Conceptual Framework of the Study by Buil et al.,
Source: Buil et al, (2010)
Price is one of the most important cues used by consumers to compare the quality
of a product. Price promotions may reduce reference prices, which in turn can lead to
unfavorable quality evaluation (Mela, Gupta, & Jedidi, 1998). In addition, this kind of
sale promotions are not long enough to establish long term brand associations and can
create uncertainty about brand quality (Winner, 1986), which results in negative brand
perceptions. In addition, repetitive monetary promotions may pull the low quality of the
brand that in long term period because consumer may think of that brand has unstable
quality. Expecting to expected price and actual price negatively affect on brand equity,
selection decisions, and perceived quality which is resulted the reduction of brand equity.
Also, monetary promotions are not enough for providing brand awareness (Shimp &
Terence, 1997).
Research studies on word of mouth which is one of the tools in direct marketing,
have highlighted its influence on brand awareness, brand image, brand associations,
brand loyalty and perceived quality (Murtiasih, 2002). Also the information provided by a
family, friends and others can affect the formation about brand equity (Matos & Rossi,
2008). Consumers rely on information about the brand that represents the experiences of

16
others and only search information is perceived as credible (Chattopadhyay, Dutta, &
Sivani, 2010).
By direct marketing, the marketers can offer specific promotional offer to a
particular set of target audience. It is the effective way to get benefits from potential
customers. Customers generally have less time to explore in the market and want to save
time and energy as well. That is how and what direct marketing targets to give more and
specific benefits that are suitable to customers.
Personal selling is instrumental to offering information about the products tailored
to the different needs that each member in an organization buying center has. (Mudambi,
2002), argued preference, initial awareness and associations of a brand are often achieved
by direct contacts with sale persons in business markets. These consultants and sale
representatives are the most effective avenues for achieving brand awareness and brand
choice.
Figure (2.4) Conceptual Framework of the Study by Gordan
Source: Gordan (2010).
Brand
Awareness
Brand
Associations
Brand
Superiority
Brand Affect
Brand
Resonance

17
The results of previous study (Gordan, 2010) provided empirical evidence of the
importance that brand associations which is one of the dimensions of brand equity, play
in the overall brand building process. Studies have also empirically proved that celebrities
endorsements if use appropriately can serve as a valuable role in developing brand equity
by developing a higher degree of attention and recall, perceptions of image and quality
and enhancing the brand’s competitive position (Hawley & Tong, 2009).
The previous study has showed that brand associations directly influence
customers’ cognitive evaluations and effective responses to the brand and high brand
resonance. From a practical point of view, the results highlight the importance of
imparting brand association into the mind of the consumer through the marketing
messages. The study suggested that dimensions of brand equity will impact how
consumer feel about the brand, brand feeling included in the brand resonance model.
2.5 Conceptual Framework of the Study
This conceptual framework is designed to analyze the effect of
promotional mix on brand equity and brand resonance of Clear Shampoo in Yangon.
Thus, the independent variables are the promotional mix: advertising, promotions, direct
marketing, personal selling, and public relations, the mediating variables is measures of
brand equity: brand awareness, brand associations, perceived quality and brand loyalty,
and dependent variable in this will be brand resonance. In the conceptual framework, the
relationship between the five independent variables such as: advertising, promotions,
direct marketing, personal selling, and public relations and the dependent variable, brand
equity and brand resonance has been conceptualized. The conceptual framework of this
study is shown in the Figure (2.4).
Figure (2.5) Conceptual Framework
Source: Own Compilation (2019)
Brand Equity
- Brand Awareness
- Brand Associations
- Perceived Quality
- Brand Loyalty
Brand Resonance
Promotional Mix
- Advertising
- Sale Promotions
- Direct Marketing
- Personal Selling
- Public Relations

18
In this conceptual framework, brand equity – in terms of brand awareness, brand
association, perceived quality and brand loyalty- is the key factors that are influenced by
advertising, sale promotions, direct marketing, personal selling, and public relations and
finally stimulates brand resonance. Conclusion, this study investigates whether brand
resonance and brand equity are associated with promotional mix of Clear Shampoo in
Yangon.

19
CHAPTER 3
PROFILE AND PROMOTIONAL MIX OF CLEAR SHAMPOO IN
YANGON
This chapter includes the profile of Clear Shampoo in Myanmar,
descriptive and analysis study of the respondents – Research Design, Reliability Analysis,
profile of the respondents and Descriptive explanation of the variables.
3.1 Background of Unilever Myanmar
Clear Shampoo is one of the brands of Unilever. Unilever is a British-Dutch
transnational consumer goods company co-headquartered in London, United Kingdom
and Rotterdam, Netherlands. Its products include food and beverages, home care and
beauty & personal care products. Unilever is one of the oldest multinational companies;
its products are available in around 190 countries. Unilever owns over 400 brands, and
thirteen brands with sales of over one billion euros: Axe/Lynx, Dove, Omo, Heartbrand
ice creams, Hellmann's, Knorr, Lipton, Lux, Magnum, Rexona/Degree, Sunsilk and Surf.
The two companies operate as a single business, with a common board of directors.
Unilever is organized into four main divisions – Foods, Refreshment, Home Care, and
Beauty & Personal Care.
Unilever is coming into the Myanmar market with the launch of full business
operations including a new manufacturing facility and new headquarters in Yangon.
Unilever, whose roots in the country go back over 80 years, will execute a sustainable
growth business model based on its Sustainable Living Plan, and will work with
Myanmar’s government, key stakeholders and civil society. Unilever has made a
‘significant financial investment’ to build its new factory in Yangon and aims to build up
its team of staff to 150 local employees by the end of June 2013. As part of its long-term
commitment to South East Asia and Myanmar, Unilever today declared a joint venture
with Europe & Asia Commercial Company (EAC) Ltd to build on its current operations
in the country.
Unilever Myanmar and Europe & Asia Commercial Company (EAC) Ltd will
combine their respective Personal Care & Home Care businesses, forming Unilever EAC

20
Myanmar Company Limited. The joint entity, with annual sales in excess of €100
Million, will manufacture, market and distribute Home & Personal Care products in
Myanmar.
As Unilever is one of the fast moving consumer goods companies and it
manufactures many products which concerned with food and beverages, home care and
personal care products.
Table (3.1) Products of Unilever EAC Myanmar
No Categories Brand Name
1 Food Knorr
2 Skin Cleansing Lux, Lifebuoy, Family Care, Domi, Misss Bar
3 Skin Care Pond’s, Fair & Lovely, Vaseline, Citra
4 Oral Care Signal, Close Up, 3D
5 Hair Care Clear, Sunsilk, Dove, Misss, O2, Bon
6 Deodorant Rexona
7 Household Care Sunlight, Mr. Care, E-Lan Dish Wash
8 Fabric Wash E-Lan, E-Co, Rose, Win,
9 Fabric Conditioner Fino
Source: Data from Unilever Myanmar (2019)
In Myanmar, Unilever Myanmar has successfully created its own market
segmentation and target in personal care market from the perspective of market share and
awareness. Clear Shampoo is introduced in Myanmar in 2012 by Unilever Myanmar.
Both product line for unisex and for men only has been sold since that time. All size of
sachet and bottle has been available. Other variants of Sakura, Herbal and Natural are
introduced newly. There are various sizes in Clear Shampoo: 9ml, 20ml, 80ml, 170ml,
340ml and 480ml. There are four colors in each size: pink, blue, sakura and men. Herbal
variant is available in two size: 310ml and 450ml. Clear Shampoo is one of the one
billion brands of Unilever Myanmar. The brand value proposition of is anti-dandruff.
Clear has comparative price and comparative benefit compared to other Unilever EAC

21
products such as Dove, Sunsilk, O2, and Misss and other competitors’ brands: Pantene,
Head & Shoulders, Eushido, etc.
3.2 Research Design
This study aims to examine the promotional mix of Clear Shampoo and analyzing
the effect of promotional mix on brand equity and brand resonance of Clear Shampoo in
Yangon. To achieve these objectives, both primary and secondary data are used.
Secondary data are obtained from text books, previous research papers and internet
websites.
3.2.1 Sample Selection
When deciding to calculate the sample size, firstly population is needed to know.
To get the population for the study, one downtown of Yangon was chosen among six
downtowns by using simple random sampling method. The sample size was calculated
based on the population of people in Botahtaung (40,995) (2014 Myanmar Census).
To determine the sample size of this study, Yamane’s Sampling Formula was
used,
n = N
1+(𝑁𝑒2)
n = Sample size
N = population size
e = level of precision or sampling of Error
According to the calculation result, the sample size for this study was 396
respondents. To obtain the primary data, 396 respondents of each household out of 8,397
household in Botahtaung township were asked whether they have used Clear Shampoo or
not by using simple random sampling method. The respondents were surveyed with the
systematic survey question in Yangon. It is found 17 do not have valid data, out of 396
respondents, therefore, only 379 respondent’s data can be obtained. The respondents were
surveyed by simple random sampling method. SPSS (Statistical Package for the Social
Scientists) is a data management and statistical analysis tool which has a very versatile
data processing capability.

22
After the survey data were collected, these results will be entered SPSS to analyze
the results and test the reliability analysis. Descriptive and analytical research method
was used in this study. Descriptive research is aimed to describe characteristics of
consumers, to estimate percentage in a specific population that has a certain form, and to
count frequency in consumer behavior. The survey questions used for this study consist
of three main parts; (1) Demographic information, (2) Promotional Mix and Brand Equity
of Clear Shampoo, and (3) Brand Resonance of Clear Shampoo. The questions in part is
closed questions and that are the respondents are required to choose one or more out of
given possible answer. The questions in part 2 and 3 are measured with a five point of
Likert scale ranging from “strongly disagree to strongly agree” (1= strongly disagree, 2=
disagree, 3= neutral, 4= agree and 5= strongly disagree). In this chapter all parts of survey
questions will be discussed by descriptive research method.
3.2.2 Reliability Analysis
Reliability analysis was undertaken in order to test the internal consistency of the
variables in the questionnaire. Cronbach’s alpha is a measure of internal reliability of the
questionnaire. Cronbach’s alpha was selected to conduct the reliability test as it is the
most common tool for internal consistency coefficient in particular psychometric
measurement.
Table (3.2) Reliability Analysis
Category Cronbach’s
Alpha
No of Items Interpretation
Advertising 0.814 7 Good
Promotion 0.867 7 Good
Direct Marketing 0.861 7 Good
Personal Selling 0.893 7 Good
Public Relation 0.768 7 Acceptable
Brand Awareness 0.771 7 Acceptable
Brand Associations 0.912 7 Excellent
Perceived Quality 0.905 7 Excellent
Brand Loyalty 0.949 7 Excellent
Brand Resonance 0.965 20 Excellent
Source: Survey Data (2019)

23
The reliability test is a process of measuring the consistency of repeatability of the
scale. Cronbach’s alph test to see if multiple question Likert scale surveys are reliable.
These questions measure latent variables – hidden or unobservable variables like: a
person’s conscientiousness, openness. Cronbach’s alpha will tell if the test is accurately
measuring the variable of interest. (Tvaakol and Dennick, 2011). The standard minimum
value is 0.7 according to Nunnally (1978) and Malhorta (2004). Table (3.2) showed that
the Cronbach’s Alpha of all the factors were more than 0.7. Therefore, it can be
interpreted that the data is considered to be reliable and valid.
3.3 Profile of Respondents
According to the survey data, the respondent’s demographic factors are classified
into five categories such as gender, age, education, occupation and income. All of these
topics will is discussed in the table as follows. The data are presented in terms of number
and percentage of respondent as below Table (3.3).
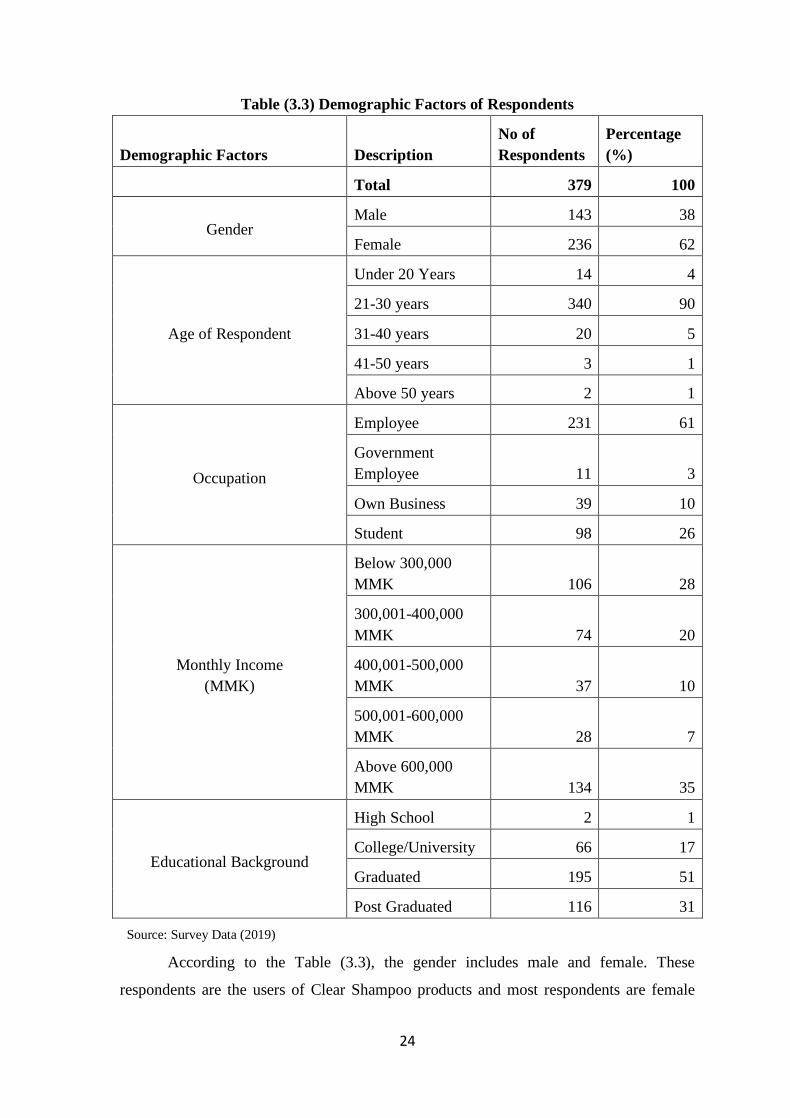
According to the Table (3.3), the gender includes male and female. These
respondents are the users of Clear Shampoo products and most respondents are female
than male for this study. It can be seen that female respondents use personal care products
especially shampoo products than male. For the age group, the range is from 20 to over
50 years old. The largest distribution of the respondents is the group of respondents who
are 21 to 30 years old. The respondents who aged between 31 to 40 years old were
ranking the second place. The third and fourth place occupied by the group of
respondents who between below 20 years old and who between 41 to 50 years old. The
smallest portion of distribution is age group over 50 years old. Therefore, it can be
verified that that young adult group would like to use Clear Shampoo as personal care
products more than older people and children as it is a beauty product and young adult
people focus on beauty more.
24
Table (3.3) Demographic Factors of Respondents
Demographic Factors Description
No of
Respondents
Percentage
(%)
Total 379 100
Gender Male 143 38
Female 236 62
Age of Respondent
Under 20 Years 14 4
21-30 years 340 90
31-40 years 20 5
41-50 years 3 1
Above 50 years 2 1
Occupation
Employee 231 61
Government
Employee 11 3
Own Business 39 10
Student 98 26
Monthly Income
(MMK)
Below 300,000
MMK 106 28
300,001-400,000
MMK 74 20
400,001-500,000
MMK 37 10
500,001-600,000
MMK 28 7
Above 600,000
MMK 134 35
Educational Background
High School 2 1
College/University 66 17
Graduated 195 51
Post Graduated 116 31
Source: Survey Data (2019)
According to the Table (3.3), the gender includes male and female. These
respondents are the users of Clear Shampoo products and most respondents are female

25
than male for this study. It can be seen that female respondents use personal care products
especially shampoo products than male. For the age group, the range is from 20 to over
50 years old. The largest distribution of the respondents is the group of respondents who
are 21 to 30 years old. The respondents who aged between 31 to 40 years old were
ranking the second place. The third and fourth place occupied by the group of
respondents who between below 20 years old and who between 41 to 50 years old. The
smallest portion of distribution is age group over 50 years old. Therefore, it can be
verified that that young adult group would like to use Clear Shampoo as personal care
products more than older people and children as it is a beauty product and young adult
people focus on beauty more.
The occupational level of the respondents is divided in to four group: As shown in
the Table (3.3), the majority of respondents’ occupations are private company employee
by 231 respondents of total respondents. The minority of respondents’ occupations are
Government Employee and Own Business by 11 and 39 respectively. This research
presents that a person who is private company’s employee and student use Clear
Shampoo.
This research shows that the largest percentage of respondents whose income
range is above 600,000 MMK. The respondents group who get below 300,000 MMK and
the range between 300,000 MMK and 400,000MMK are the second and third largest
consumers group of this survey. The smallest distribution of the group of Clear Shampoo
users is the ranges between 400,000 MMK and 600,000 MMK. In the result, the
consumption is not very dependent on the rate of monthly income. It can be said that
Clear Shampoo has low price with fair quality which is target to low income level
consumer group and it also has high price with high quality product which is targeted to
high income level consumer group.
The educational level is divided into four groups. As shown in Table (3.3), The
majority group of the educational level in this study is graduate by 195 respondents with
51%. The second highest percentage is post graduate by 116 respondents with 31%. The
minority group is high school educational level with 1%. In the result, the result shows
that the graduate and post graduate respondents like to buy more products of Clear
because most graduate people are employees and they pay more attention to their beauty
and personal care.

26
3.4 Promotional Mix of Clear Shampoo
Today, Clear Shampoo is one of the reasonable price products and products
having good quality. It is available in every area in Myanmar. Most consumers recognize
Clear brand because of its effective promotional mix. There are many different tools in
promotional mix by which Unilever Myanmar uses. All types of promotional mix,
advertising, promotions, direct marketing, personal selling and public relations are also
used for Clear Shampoo in Myanmar. Regarding to promotional tool of advertising, Clear
Shampoo advertise its products, new product lunch and promotions on TV, radio,
magazine, etc. It is also advertised with attractive commercial video. And most people
recognize that Clear Shampoo is advertised intensely. Since the beginning of product
launch, Clear spends its budget in advertising.
Clear Shampoo uses both types of promotions – consumer promotions and trade
promotions. From the perceptive of consumer promotions, Clear Shampoo gives many
types of sale promotions such as buy one get one free, price discount, gifts offered
promotions and products offered promotions by cooperating with other brands. One of
the attractive gifts offered promotions is that it gives football which is designed with the
signature of Cristiano Ronaldo who is the most famous professional football player.
Another gifts that offered by Clear Shampoo as promotions is iPhone X, mobile data,
phone bill, Player Unknown’s Battle Ground (PUBG) game items, and so on to get the
awareness and sale growth in that period of time.
Direct marketing is also a good promotional tool to keep in touch with its
customers. Social media marketing is included in direct marketing. Clear always uploads
events news, promotions news, new product launch news, etc.. on social media like
Facebook, Instagram, etc. Its customers can search about the products and
recommendation from social influencers on social media at any time. Clear Shampoo has
its own sale person at its sale counter in shopping mall who can listen its customers’
problems, who can choose and advise the appropriate products for each customer and
who can explain about the products clearly.
Clear Shampoo does many public relations activities such as sponsorship in
singing competitions, donations across the country, hiring Myanmar and International
brand ambassadors as public figure. By seeing hiring process of brand ambassador, Clear
Shampoo really considers some facts like its target consumers are not only women also

27
men. Thus, it hires Cristiano Ronaldo who is the most famous professional football player
and who is the idol person of most of the men all over the world as a brand ambassador to
get the achievement of public interest. By hiring him as a Clear’s brand ambassador,
Clear can get customers who are not only football players, also athlete from various kind
of sports.
The first brand ambassador Myanmar is May Myat Noe who is the Miss Asia
Pacific World in 2014. Now Clear hires Shwe Hmone Yati who is one of the most
famous actresses in Myanmar. It can be seen that Clear really takes care of the Myanmar
people’s interest. In singing competitions, Clear takes part as a sponsor. In sponsorship,
advertising can be on air while the singing competition is playing on live. From the
advertising on the sponsorship events, Clear can get awareness from the potential
customers and people have positive perspective on events sponsorship. Clear Shampoo
plays as a sponsor in Player Unknown’s Battle Ground (PUBG) game contest in Yangon.
From this event, Clear can get the awareness and positive perspectives from e-sports
players. In this year, Clear Shampoo held an event named Clear New Generation Dance
Party to get attention and awareness from Electro Dance Music (EDM) ravers. According
to this public relations activities, Clear brand can take advantages by following trend in
Myanmar.

28
CHAPTER 4
ANALYSIS ON THE EFFECT OF PROMOTIONAL MIX ON BRAND
EQUITY AND BRAND RESONANCE OF CLEAR SHAMPOO IN
YANGON
In this chapter, brand equity in this questionnaire was measured and analyzed by
the mean and standard deviation of each dimensions in which – advertising, promotions,
direct marketing, personal selling, and public relations. Moreover, the relationship
between brand equity and brand resonance of consumers were analyzed by regression
analysis.
4.1 Analysis on the Effect of Promotional Mix on Brand Equity of Clear
Shampoo in Yangon
In this study, the promotional mix of Clear Shampoo is analyzed. The five
variables of promotional mix are used as independent variables and each measures of
brand equity and brand resonance as dependent variables, in this analysis. The results of
the analysis are shown in the following tables.
4.1.1 Promotional Mix of Clear Shampoo
The promotional mix of Clear Shampoo is analyzed. The five variables of
promotional mix are used as independent variables as advertising, promotions, direct
marketing, personal selling and public relations. The results of the analysis are shown in
the Table (4.1) which is presenting the mean value and standard deviation of promotional
mix that influences on brand equity of Clear Shampoo in Yangon. The overall mean
value of promotional mix is shown in Appendix III.
According to the Table (4.1), the overall mean value of advertising is 3.62 which
is greater than the neutral score of 3. Among the questions of advertising, the highest
mean value is 3.9. The lowest mean values of advertising is 3.35. It can be said that the
advertising of Clear Shampoo is high. It can be interpreted that consumers have the
strong awareness of Clear Shampoo’s advertising and TV commercials. This mean that
Clear brand does not spend very much on the road-side billboard ad and ad in shopping

29
mall, cinema, etc. In a result, the advertising of Clear Shampoo is effective to attract and
stimulate the consumers.
Table (4.1) Promotional Mix
No Description Mean
1 Advertising 3.62
2 Sale Promotions 3.31
3 Direct Marketing 2.83
4 Personal Selling 3.20
5 Public Relations 3.22
Overall Mean 3.24
Source: Survey Data (2019)
To analyze the sale promotions of Clear brand, seven different questions are asked
to 379 respondents of Clear Shampoo users. The overall mean value of sale promotions
which related to promotional mix of Clear Shampoo is 3.31 which is greater than the
neutral score of 3. The highest mean value of sale promotions is 3.59. The lowest mean
value of the sale promotions of Clear Shampoo is 3.16. The sale promotions awareness
level of Clear Shampoo is high. The most effective sale promotion of Clear Shampoo is
giving buy 1 get 1 free promotion. This kind of sale promotion can encourage the
awareness of the brand and willingness to buy the Clear Shampoo. Although the mean
value is higher than the neutral point, consumers analyze the sale promotions of Clear
Shampoo is not very useful and attractive enough to purchase Clear Shampoo when its
promotion is available. It can be concluded that consumers recognize the sale promotions
of Clear Shampoo and some promotions of Clear Shampoo can drive consumers to
purchase.
As shown in Table (4.1), the overall mean value of direct marketing related to
promotional mix of Clear Shampoo is 2.83. The highest mean value of direct marketing
of Clear Shampoo is 3.51. Although the lowest mean value is 2.45. The highest
awareness level of the direct marketing is related to social media marketing in direct
marketing. it can be interpreted that Clear brand has strong social media marketing in
direct marketing. The questions about receiving information via mobile phone is strong
question since it shows that Clear Shampoo is weak in direct marketing especially on
mobile phone text message. As a result, consumers analyze that Clear brand is weak in

30
direct marketing of mobile text message and email but the social media marketing of
Clear brand is strong.
According to the Table (4.1), overall mean value of personal selling is 3.20 which
is higher than the neutral score of 3. The highest mean value of personal selling of Clear
Shampoo is 3.38 and the lowest mean value is 3.00. It can be said that the personal selling
of Clear Shampoo is effective. The highest mean value comes from confidence of sale
person. It can be said that Clear Shampoo’s sale persons have high confidence on their
products what they are selling. On the other words, the feedback and quality of the
product is trustable so that their confident level on their can be recognized by consumers.
The highest mean value related to public relations is 3.61. The lowest mean value
of 2.93. The overall mean value of public relations which is related to promotional mix of
Clear Shampoo is 3.22 which is greater than the neutral score of 3, as shown in Table
(4.1). The highest acceptance level of public relations is about the awareness of ad and
activities in some popular events. Consumers analyze that Clear brand has strong in
public relation activities in popular events. The question about awareness of changes in
brand ambassador Myanmar has low acceptance from respondents. The mean value of
each question about public relations except recognition of changes in Clear Brand
Ambassador Myanmar is high. It can be concluded that consumers recognize the
advertising and activities of Clear brand in Yangon and they have the knowledge of
public figure of Clear in Myanmar and International.
4.1.2 Brand Equity of Clear Shampoo
The brand equity of Clear Shampoo is analyzed in this study. The five measures
of brand equity: brand awareness, brand associations, perceived quality and brand loyalty
are used. The results of the analysis are shown in the Table (4.2) which is presenting the
mean value and standard deviation of brand equity of Clear Shampoo in Yangon. Seven
different questions are addressed to 379 respondents of Clear Shampoo’s users. The
overall mean value of brand equity is shown in Appendix III.
As shown in Table (4.2), the overall mean value of brand awareness is 3.48 which
is greater than the neutral score of 3. The highest mean value of the brand awareness is
3.82 and the lowest mean value is 2.94. It can be interpreted that Clear brand has very
high brand awareness. Consumers are highly aware of Clear brand because the score of
recognition of brand by logo, symbol and color and the questions: easily recall features of

31
the brand and able to detect the brand in the shop and having knowledge of separate
product line for men. It can be said that consumers recognize the brand’s target customers
of men separately. It can be concluded that overall mean value of brand awareness is high
and consumers are highly aware of Clear Shampoo although they do not know exactly
how many variants that Clear Shampoo has in each product line. It could be that they
have their favorite variant when using it.
Table (4.2) Brand Equity
No Description Mean
1 Brand Awareness 3.48
2 Brand Associations 3.44
3 Perceived Quality 3.43
4 Brand Loyalty 3.20
Overall Mean 3.39
Source: Survey Data (2019)
According to the result, overall mean value of that measure of brand equity is 3.44
which is greater than the neutral score of 3. Mean value of each question in brand
associations is higher than the neutral score of 3. It is found that the respondents are
highly associated with Clear Shampoo. The highest mean value comes from trust on the
company, Unilever Myanmar, which produces Clear Shampoo. The question of believe in
quality, brand has many fans, worthy to buy Clear Shampoo, and mainstream in industry
get the high score.
Based on the study, overall mean value of perceived quality is 3.43 which is
greater than the neutral score of neutral score of 3. The highest mean value of perceived
quality 3.80 and the lowest mean value is 3.00. It can be generally interpreted that
respondents are satisfied the perceived quality of Clear Shampoo. Highest mean value of
perceived quality comes from the question of having stylish packaging design in the
market. Clear Shampoo can attract respondents by packaging design and packaging
quality especially. The second highest mean value comes from consistent quality and
better benefits than expectation is third place that respondents are satisfied with.

32
According to the Table (4.2), all the mean value of measure of brand equity for
seven questions of brand loyalty are higher than the neutral score of 3. Only brand loyalty
of the respondents is low when other brands give promotions. Highest mean value of
brand loyalty is 3.52 which comes from the recommendation to others. It can be
interpreted that respondents highly recommend Clear brand to others, family, friends,
colleagues and their environments. Overall mean value of brand loyalty is 3.20 which is
greater than the neutral score of 3. It can be concluded that respondents have loyalty on
Clear Shampoo.
4.1.3 Effect of Promotional Mix on Brand Awareness of Clear Shampoo
This section represents the analysis of promotional mix on brand equity of Clear
Shampoo in Yangon. Table (4.3) shows the effect of independent variables (advertising,
promotions, direct marketing, personal selling and public relations) on dependent variable
(brand awareness). Linear regression model is used to know detail of it.
Table (4.3) Effect of Promotional Mix on Brand Awareness
Model
Unstandardized
Coefficients t Sig. VIF
B Std. Error
(Constant) 1.176 .181 6.496 .000
Advertising .200*** .062 3.215 .001 1.996
Promotion -.033 .055 -.601 .548 2.439
Direct Marketing .017 .053 .312 .755 2.180
Personal Selling .150*** .058 2.580 .010 1.900
Public Relations .361*** .051 7.150 .000 1.621
R .586
R Square .343
Adjusted R Square .334
F Value 38.947***
Durbin Watson 1.944
Source: Survey Data (2019)
Notes: *** Significant at 1% level, ** Significant at 5% level, * Significant at 10% level

33
According to the result shown in Table (4.3), R square and adjusted R Square is at
34% and 33% respectively. This indicated that the model explains most of the variability
of the response data around its mean. According to the result, advertising, personal selling
and public relations have significant coefficient at 1% level and it has positive sign.
Overall evaluation of the model explains that the promotional mix on brand awareness
well since the estimation produced expected positive signs and highly significant
coefficients for three elements out of five elements in this research. Every one unit
increases in advertising, personal selling and public relations help brand awareness to
increase.
The advertising of Clear Shampoo has high degree positivity on brand awareness
because recognition of the advertising on TV commercial, radio, and on billboard of
road-side, café, cinema, and shopping malls can increase the awareness of the brand. The
personal selling of Clear Shampoo has high degree positivity on brand awareness because
facts what sale persons talk about can increase how many product lines that Clear
Shampoo has can increase the awareness level of consumers. Based on the result of
analysis, public relation activities has high degree positivity on brand awareness because
the use of public figure like brand ambassadors can increase the awareness level of Clear
brand.
4.1.4 Effect of Promotional Mix on Brand Associations of Clear Shampoo
This section includes the effect of promotional mix on brand associations of Clear
Shampoo. The independent variables are advertising, promotions, direct marketing,
personal selling, and public relations and the dependent variable of brand equity is brand
awareness. The following Table (4.4) shows the results of the analysis by using linear
regression model.
According to the result shown in Table (4.4), R square and adjusted R Square is at
64% and 63% respectively. This indicated that the model explains most of the variability
of the response data around its mean. All variables are strongly significant as stated by
regression analysis table. Advertising, sale promotions, direct marketing, personal selling
and public relations have significant coefficient at 1% level and it has positive sign.
Every one unit increases in advertising, promotions, personal selling and public relations
help brand associations to increase.

34
Table (4.4) Effect of Promotional Mix on Brand Associations
Model
Unstandardized
Coefficients t Sig. VIF
B Std. Error
(Constant) .074 .144 .514 .608
Advertising .279*** .049 5.651 .000 1.996
Promotion .289*** .043 6.661 .000 2.439
Direct Marketing -.132*** .042 -3.112 .002 2.180
Personal Selling .242*** .046 5.222 .000 1.900
Public Relations .309*** .040 7.701 .000 1.621
R .798
R Square .637
Adjusted R Square .632
F Value 131.091***
Durbin Watson 1.898
Source: Survey Data (2019)
Notes: *** Significant at 1% level, ** Significant at 5% level, * Significant at 10% level
Based on the result, advertising has high degree positivity on brand associations
because the attractiveness of the commercial video can be recognized associated with the
brand like the customers ask the brand at the retail shop as the brand how it is advertised
on TV. The sale promotions has high impact on brand association positively because
some promotions gifts can persuade the consumers. Direct marketing has high impact on
brand associations. The increase in direct marketing can lead to decrease in brand
associations. Consumers have a mindset that they have negative perceptive on direct
marketing activities of direct phone call, heavy text message, etc. The negative sign
explains that direct marketing needs to be improved and find more effective ways.
Personal selling of the Clear Shampoo has high effect on the brand association because
confidence and having knowledge about their products of sale persons of Clear Shampoo
at the sale counter can influence on the brand associations. Based on the result, public
relations has highest impact on the brand associations among others promotional mix of
Clear Shampoo because consumers want to use the brand what their idols recommend or
represent.

35
4.1.5 Effect of Promotional Mix on Perceived Quality of Clear Shampoo
Table (4.5) shows the result which related to the analysis on the effect of
independent variables (advertising, promotions, direct marketing, personal selling, and
public relations) on dependent variable (perceived quality) by using linear regression
model.
According to the result shown in Table (4.5), R square and adjusted R Square is at
65% and 64% respectively. This indicated that the model explains most of the variability
of the response data around its mean. Four variables out of five are strongly significant
and personal selling is not significant as stated by regression analysis table. Advertising,
sale promotions, direct marketing and public relations has significant coefficient at 1%
level and it has positive sign. Every one unit increases in advertising, promotions, direct
marketing and public relations help perceived quality to increase.
Table (4.5) Effect of Promotional Mix on Perceived Quality
Model
Unstandardized
Coefficients t Sig. VIF
B Std. Error
(Constant) -.030 .162 -.186 .853
Advertising .276*** .056 4.954 .000 1.996
Promotion .439*** .049 8.950 .000 2.439
Direct Marketing .184*** .048 3.866 .000 2.180
Personal Selling .004 .052 .072 .943 1.900
Public Relations .148*** .045 3.262 .001 1.621
R .805
R Square .648
Adjusted R Square .643
F Value 137.313***
Durbin Watson 1.801
Source: Survey Data (2019)
Notes: *** Significant at 1% level, ** Significant at 5% level, * Significant at 10% level
Based on the result, advertising can influence on the perceived quality of Clear
Shampoo because advertising is the best tool to communicate its products with its

36
consumers. Advertising can express the promised quality that Clear brand can offer like
anti-dandruff. Sale promotions has high impact on the perceived quality of Clear
Shampoo because the quality of the products is consistent and the attractiveness of the
packaging quality is good even when it gives promotions. Direct marketing because
social influencers such as beauty bloggers, actors, and actress write recommendations of
Clear Shampoo on social media and consumer believe the quality of the products. The
public relations high effect on perceived quality because the public figures such as brand
ambassadors who they like represent that brand.
4.1.6 Effect of Promotional Mix on Brand Loyalty of Clear Shampoo
According to the Table (4.6), the result is related to the analysis of the effect of
independent variables (advertising, promotions, direct marketing, personal selling and
brand loyalty) on the measure of brand equity (brand loyalty) by using linear regression
model.
Table (4.6) Promotional Mix on Brand Loyalty
Model
Unstandardized
Coefficients t Sig. VIF
B Std. Error
(Constant) -.518 .201 -2.575 .010
Advertising .162** .069 2.343 .020 1.996
Promotion .657*** .061 10.823 .000 2.439
Direct Marketing .261*** .059 4.412 .000 2.180
Personal Selling -.023 .065 -.350 .726 1.900
Public Relations .091 .056 1.612 .108 1.621
R .791
R Square .625
Adjusted R Square .620
F Value 124.353***
Durbin Watson 1.851
Source: Survey Data (2019)
Notes: *** Significant at 1% level, ** Significant at 5% level, * Significant at 10% level

37
According to the result shown in Table (4.6), R square and adjusted R Square is at
63% and 62% respectively. This indicated that the model explains most of the variability
of the response data around its mean. Three variables out of five are strongly significant
and personal selling and public relations are not significant as stated by regression
analysis table. Based on the analysis as shown in Table (4.6), advertising has significant
coefficient at 5% level and it has positive sign. Sale promotions and direct marketing
have the significant coefficient at 1% level and it has positive sign. Every one unit
increases in advertising, promotions, and direct marketing help brand loyalty to increase
by 0.16, 0.66 and 0.26 respectively.
This means that the advertising has an impact on brand loyalty because consumer
in rural area are loyal to purchase the products with its advertising. Sale promotions can
effect positively and highly on brand loyalty because consumers want to switch brand
when other brands give promotions but Clear does not offer the brand. Direct marketing
activities based on customer relationship management such as using personal data of their
like, birthday, favorite products, etc can have high impact to increase the brand loyalty
because they will feel that the brand give favour and takes care of them.
4.2 Effect of Brand Equity on Brand Resonance of Clear Shampoo in Yangon
This section is related to the analysis of the effect of brand equity on brand
resonance of Clear Shampoo in Yangon. Table (4.8) shows the effect of independent
variables (brand equity) on dependent variable (brand resonance). Linear regression
model is used to know detail of it.
4.2.1 Brand Resonance of Clear Shampoo
Brand resonance of Clear Shampoo is examined by addressing twenty different
questions to 379 respondents of Clear Shampoo. The result of brand resonance is shown
in the Table (4.7) with mean value and standard deviation.

38
Table (4.7) Brand Resonance
No Description Mean Std.
Deviation
1 First place in my mind 3.26 1.13
2 Recall symbol and logo of Clear Shampoo 3.63 1.03
3 Better quality compared to other brands 3.26 0.96
4 Satisfaction with basic needs 3.31 1.10
5 Fair price compared to other brands 3.11 0.98
6 Remember core message of Clear Shampoo 3.06 1.17
7 Recognize smell of Clear Shampoo 3.49 1.08
8 Good opinion on Clear Shampoo 3.54 0.92
9 Trust the brand 3.19 0.95
10 Consistent quality 3.41 0.91
11 Strongly recommend to others 3.35 0.99
12 Personally relevant to the brand 3.30 1.03
13 Having knowledgeable staff 3.33 0.82
14 Feeling of self-respect 3.08 0.97
15 Feeling of social approval 3.00 0.99
16 Feeling of security 3.18 0.99
17 Really love Clear Shampoo 3.21 1.03
18 The necessary brand 3.07 1.09
19 Proud to be Clear’s customer 3.00 1.11
20 Loyalty to Clear Shampoo 3.01 1.10
Overall Mean 3.24
Source: Survey Data (2019)
According to the Table (4.7), each mean value of brand resonance for twenty
different questions is greater than the neutral score of 3 except the questions of proud to
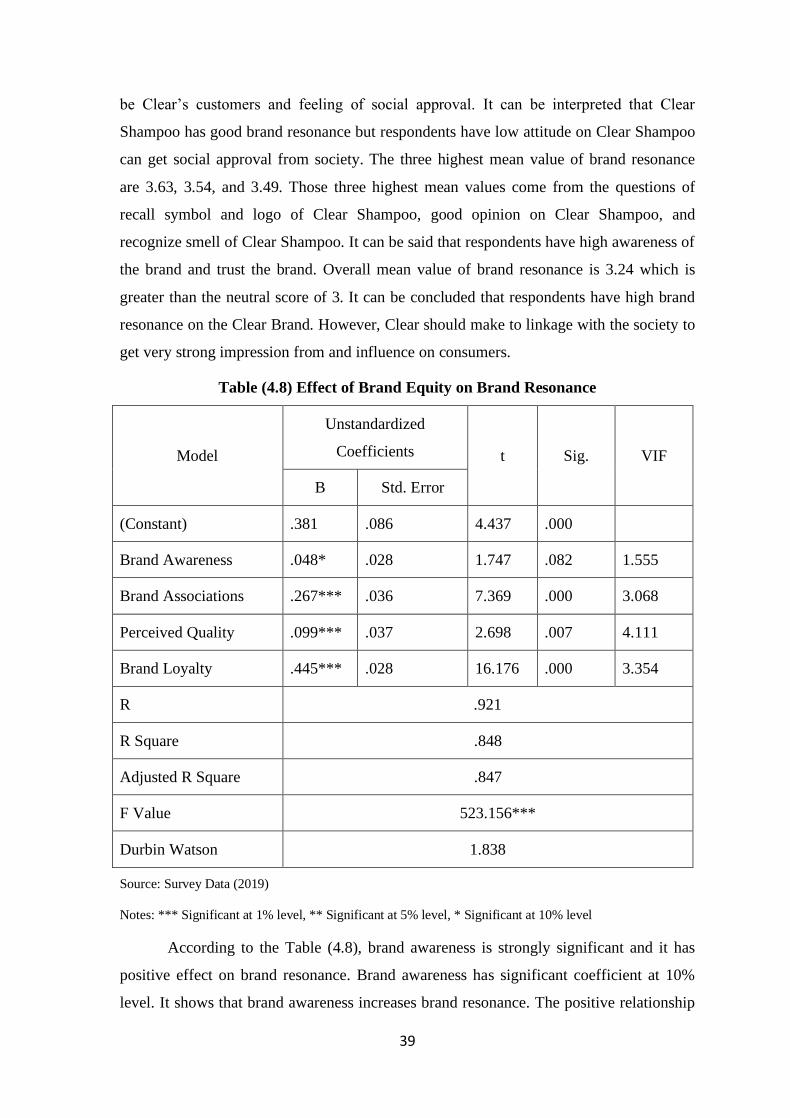
39
be Clear’s customers and feeling of social approval. It can be interpreted that Clear
Shampoo has good brand resonance but respondents have low attitude on Clear Shampoo
can get social approval from society. The three highest mean value of brand resonance
are 3.63, 3.54, and 3.49. Those three highest mean values come from the questions of
recall symbol and logo of Clear Shampoo, good opinion on Clear Shampoo, and
recognize smell of Clear Shampoo. It can be said that respondents have high awareness of
the brand and trust the brand. Overall mean value of brand resonance is 3.24 which is
greater than the neutral score of 3. It can be concluded that respondents have high brand
resonance on the Clear Brand. However, Clear should make to linkage with the society to
get very strong impression from and influence on consumers.
Table (4.8) Effect of Brand Equity on Brand Resonance
Model
Unstandardized
Coefficients t Sig. VIF
B Std. Error
(Constant) .381 .086 4.437 .000
Brand Awareness .048* .028 1.747 .082 1.555
Brand Associations .267*** .036 7.369 .000 3.068
Perceived Quality .099*** .037 2.698 .007 4.111
Brand Loyalty .445*** .028 16.176 .000 3.354
R .921
R Square .848
Adjusted R Square .847
F Value 523.156***
Durbin Watson 1.838
Source: Survey Data (2019)
Notes: *** Significant at 1% level, ** Significant at 5% level, * Significant at 10% level
According to the Table (4.8), brand awareness is strongly significant and it has
positive effect on brand resonance. Brand awareness has significant coefficient at 10%
level. It shows that brand awareness increases brand resonance. The positive relationship

40
means that every one unit increase in brand awareness increase help to increase brand
resonance by 0.05.
As it can be seen in Table (4.8), brand associations has positive effect on brand
resonance and it is strongly significant. Brand associations has significant coefficient at
1%. It shows that brand associations increases brand resonance. Every one unit brand
associations increase helps to increase 0.27 in brand resonance.
And perceived quality has positive sign and it has highly significant coefficient at
1% level. It can be interpreted that it has positive relationship with brand resonance.
Positive relationship means that every one unit increase of perceived quality helps to
increase brand resonance by 0.1.
As shown in Table (4.8), brand loyalty has positive sign and it has strongly
significant coefficient at 1% level. It can be said that brand loyalty has positive impact on
brand resonance. It indicates that every one unit increase in brand loyalty leads to
increase 0.45 in brand resonance.
To sum up, the evaluation of the model explains that the promotional mix on
brand loyalty well since the estimation produced expected positive signs and highly
significant coefficients for all elements in this research. As the result as shown in Table
(4.8), R square and adjusted R Square is at 84% and 84% respectively. This indicated that
the model explains most of the variability of the response data around its mean. All
variables has positive sign and strongly significant. Moreover, according to regression
coefficient (beta), brand loyalty is at the first place of brand equity, brand associations as
second place, perceived quality as third place on brand resonance, and brand awareness
as last place. According to t-text result that explains the significant of coefficients, brand
loyalty has most positive impact on brand equity.

41
CHAPTER 5
CONCLUSION
This chapter concludes the whole study of the effect of promotional mix
(advertising, promotions, direct marketing, personal selling and public relations) of Clear
Shampoo on brand equity (measures of brand equity are brand awareness, brand
associations, perceived quality and brand loyalty) and brand resonance of Clear Shampoo
in Yangon. In this chapter, all aspects of the study are included. This chapter describes
finding and discussion, suggestions and recommendations, and needs for further study for
promotional mix, brand equity and brand resonance.
5.1 Findings and Discussions
According to the result of the research, the profile of respondents shows that both
female and male respondents use Clear Shampoo and percentage of women’s purchase is
higher than percentage of men’s purchase. Almost all age group of intervals use Clear
Shampoo. Adult age group would like to use Clear Shampoo mostly. Most Clear
Shampoo’s users are private company employees with high income level and mainly
come from graduated and post graduated.
According to the result of the research, in the effect of the promotional mix on
brand awareness, promotional mix of advertising, promotions and public relations have a
significant relationship with brand awareness. Since advertising, sale promotions and
public relations have a positive impact on the brand awareness, the increase in these
promotional tools can lead to increase in brand awareness especially in public relations.
Although the brand awareness of the Clear Shampoo is high, the awareness level can be
increase by spending more in public relations because public relations tool of promotional
mix has positive significant effect and the most effective tools on brand awareness
compared to other tools.
As the result of the study, all of the promotional tools: advertising, sale
promotions, direct marketing, personal selling, and public relations have significant effect
on the brand associations. Advertising, promotions, personal selling and public relations
has positive impact on the brand associations highly. The increase in advertising, sale

42
promotions, personal selling and public relations can lead to increase in brand
associations. Although the brand associations of Clear Shampoo is high according to the
research in this study, Clear should increase the activities on all types of promotional mix
to get more brand associations from its consumers. There is one thing in the result that
direct marketing has negative impact on the brand associations and it is highly significant.
The increase in direct marketing can make brand associations decrease. But the
awareness level of social media marketing which is included in the direct marketing is
high, other direct marketing activities such as direct email, direct phone call and direct
text message to its potential customers, have negative perceptive.
Personal selling has a significant impact on both brand awareness and brand
associations. And as the mean value can be seen in the result, respondents agree the
usefulness of Clear’s personal selling because the overall mean value is higher than the
neutral score. There are some weaknesses in personal selling of Clear Shampoo. They are
few or no tester in the Clear Shampoo sale counter, and sale persons’ weaknesses in
listening carefully to customers’ problems and to needs and want of customers.
Hospitality, product knowledge and confidence on products of sale persons are very
good.
It can be seen in the result of the research, perceived quality is impacted by sale
promotions, advertising, direct marketing, and public relations. Promotions, advertising,
direct marketing, and public relations have positive impact on the perceived quality of
Clear Shampoo and it is significant. Perceived quality of Clear Shampoo is high. To get
more perceived quality of Clear, advertising can increase the perceived quality. The result
shows that Clear Shampoo has high effectiveness in advertising. Respondents recognize
Clear Shampoo advertising among advertising of competitor products. Respondents
recognize especially TV commercial with attractive commercial video which are
intensely advertised by spending advertising budget highly. But respondents do not
recognize the road-side billboards advertising and advertising in shopping malls, cinemas,
and café.
In the result of the study, brand loyal is affected by sale promotions, direct
marketing, and public relations. Sale promotions, direct marketing, and public relations
have significant impact on the brand loyalty and they have positive impact. Thus, the
increase in these variables can lead to increase in brand loyalty. According to the result of
the research, Clear Shampoo has high level of brand loyalty. According to the finding of

43
the study, brand resonance of the Clear Shampoo is quite good especially in that Clear
brand is the first choice of the consumers. All of the measures of brand equity, brand
awareness, brand association, perceived quality and brand loyalty, have significant effect
on the brand resonance of Clear Shampoo and have positive impact on brand resonance.
Brand loyalty, perceived quality and brand associations can positively impact more on
brand resonance than brand awareness and perceived quality. The increase in brand
loyalty and association can lead to increase in brand resonance. The brand loyalty can be
increased by increasing the promotion. The mean value of the promotions shows that the
promotions of the Clear Shampoo are recognized well. And respondents are willing to
buy Clear Shampoo more when it gives buy one get one promotions and price discounts
than when gifts offered promotions. They are aware of the promotion news in
newspapers, journals, magazines, etc. But the frequency of promotions offered by Clear
Shampoo is low and the frequency of gifts offered promotion is also low.
5.2 Suggestions and Recommendations
According to the finding of the study, public relations is the most effective tool
that can impact on the brand awareness. Although the awareness of public relations
activities is high, Clear should increase its public relations activities in corporate social
responsibility. Because of the awareness of corporate social responsibility activities done
by Clear is low, corporate social responsibility like brand with purpose, should be done
more than corporate social responsibility of donation to charity. Clear should take care of
the consumer’s scalp and hair health by spending its budget in some activities such as
giving speech for hair and scalp health, free testing dandruff activities, etc.
According to the finding of the study, direct marketing is significant at 1% level
and it is negative impact on brand associations. Since direct marketing has negative
impact, Clear must find new way in direct marketing carefully to avoid getting low brand
associations. Because of the low effectiveness in direct marketing, Clear Shampoo should
emphasize on direct marketing by using customer relationship management. It seems that
Clear brand only spend in other promotional tools such as advertising, promotions, etc.
Engagement with separate products and its targeted customers should be done by more
linkage promotional tools.

44
According to the finding, both brand awareness and brand associations are
affected by good personal selling of Clear Shampoo. Although the sale persons have high
confidence and ability to explain about their products, they are weak in listening to what
customers want to tell. Thus, Clear should give training to sale persons to solve that issue.
And it should assess the sale persons’ performance by hiring agency and some bonus
should be given if the sale person is qualified.
According to the finding of the study, Clear Shampoo has good perceived quality.
Although Clear Shampoo has good perceived quality, it can be increased by spending
more budget on advertising. Clear Shampoo has effective advertising promotional tool
especially TV commercials. But Clear Shampoo is weak in billboard advertising.
Although billboard advertising in cinema, café, and restaurants are not very much
necessary, billboard advertising must be placed in shopping mall and markets. Visibility
can increase rate of purchasing especially in Fast Moving Consumer Goods industry.
Thus, instead of spending in billboard on the road-side, Clear should spend its budget in
advertising in the markets and shopping malls. Not only on that but also, by using
advertising Clear Shampoo should attract men to buy only Clear Shampoo by pointing
out that the separate product line for men is modified to be compatible with the scalp of
men since the scalp of men and woman is quite different because of having separate
product line for Men. Herbal product of Clear Shampoo more emphasize on natural
ingredients. Therefore, it can keep touch old people to reach these natural ingredients
based herbal products.
According to the finding of the study, brand loyalty of Clear Shampoo can be
increased by promotions mostly. As described in the finding, to increase the brand
resonance via increasing brand loyalty of Clear Shampoo, it should spend more budget in
promotions. Clear Shampoo has quite effective promotions and respondents are aware of
the promotion news. But according to the research, the gifts offered promotions by Clear
Shampoo is not very attractive and consumers are not very interested in those gifts
offered. Therefore, Clear should give promotion with buy one get one free and price
discount which can increase consumers’ willingness to purchase.

45
5.3 Needs for Further Study
This study focuses only on the effect of promotional mix on brand equity and
brand resonance of Clear Shampoo in Yangon. Among two types of promotions,
consumer promotions and trade promotions, this study do research on consumer
promotions only. Thus, the other thing is that further study could be directed at the effect
of trade promotions on brand equity and brand resonance of the brand. The target
population is limited in this study because this study focuses only on Yangon area. But
Clear is sold in the whole country not only in Yangon. Thus, further research should
target the whole country, Myanmar to know the Clear Shampoo still have high brand
equity and brand resonance all over the Myanmar country. Instead of studying only Clear
brand, further study should examine the comparative brand equity between Clear brand
and other major competitors’ brand in the hair care industry.

REFERENCES
Aaker, D. A., (1991). Managing Brand Equity. New York: The Fress Press.
Aaker, D. A., (1996). Measuring Brand Equity across Products and Markets.
California Management Review, 38(3), 102-120.
Atilgan, E., Aksoy, S., and Akinci, S., (2005). Determinants of the Brand Equity: A
Verification Approach in the Beverage Industry in Turkey. Marketing
Intelligence & Planning, 23(3), 237-248.
Brassington, F. & Pettitt, S. (2000). Principles of Marketing. Journal of Marketing
Research, 34(3) 347-356.
Buil, I., Chernatony, L. D., Martinez, E., (2010). The Effect of Advertising and Sale
Promotions on Brand Equity. University of Zaragoza.
Chen, C. F., & Chang, Y. Y., (2008). Airline Brand Equity, Brand Preference and
Purchase Intentions: the Moderating Effects of Switching Costs. Journal
of Air Transport Management, 14(1), 40-42.
Chttopadhyay, T., Dutta, R. N., & Sivani, S. (2010). Media Mix Elements Affecting
Brand Equity of the Indian Passenger Car Market: A Study. IIMB
Management Review. 22(4), 173-185.
Gordan, B. S. (2010). The Impact of Brand Equity Drivers on Consumer-Based Brand
Resonance in Multiple Product Categories. Paper 4121, Florida State
University.
Gupta, S. (1988). Impact of Sales Promotions on When, What, How Much to Buy.
Journal of Marketing Research, 25(4), 324-355.
Gupta, R. (2017). Promotional Mix and Brand Switching Behaviour: A Synthesis of
Evidences, Measurement and Moderating Variables. International Journal
of Business and Management Invention, 6(9), 16-30.
Keller, K. L., (1993). Conceptualizing, Measuring and Managing Customer-Based
Brand Equity. Journal of Marketing, 57(2), 1-22.
Keller, K. L. (2007). Strategic Brand Management: Building, Managing Brand
Equity. (3rd ed.). New York: Prentice Hall.
Keller, K. l., Lehmann, D. R. (2006). Brands and Branding: Research Finding and
Future Priorities. Marketing Science, 25(6), 740-759.

Keller, K. L. (2001). Building Customer-Based Brand Equity: A Blueprint for
Creating Strong Brands. Cambridge, MA: Marketing Science Institute.
Keller, K. L., Parameswaran, M. G., & Jacob, I. (2011). Strategic Brand
Management: Building, Measuring, and Managing Brand Equity (13th
ed.). New York: Pearson.
Kim, J. H., & Hyun, Y. J. (2011). A Model to Investigate the Influence of Marketing
Mix Efforts and Corporate Image on Brand Equity in the IT Software
Sector. Marketing Management, 40(6), 424-438.
Kotler, P., & Keller, K. L. (2009). Marketing Management (13th ed.). New Jersey, NJ:
Asoke K. Ghosh.
Kotler, P., Armstrong, G. (2010). Principles of Marketing (13th ed.). New Jersey:
Pearson.
Kotler, P., & Keller, K. L., Koshy, A., Jha, M. (2007). Marketing Management. (12th
ed.). New Delhi: Pearson.
Kotler, P., & Keller, K. L., Koshy, A., Jha, M. (2012). Marketing Management. (14th
ed.). New Delhi: Pearson.
Mudambi, S. (2002). Branding Imprtance in Business-to-Business Markets: Three
Buyers Clusters. Industrial Marketing Management, 31(6), 525-533.
Mela, C. F., Gupta, S., Jedidi, K. (1998). Assessing Long Term Promotional
Influences on Market Structure. International Journal of Research in
Marketing, 15(3), 89-107.
Murtiasih, S. (2002). How Word of Mouth Influence Brand Equity for Automotive
Products in Indonesia. Procedia – Social and Behaviourial Sciences,
81(6), 40-44.
Oliver, R. L. (1999). Whence Consumer Loyalty. Journal of Marketing, 63, 33-44.
Rahmani, Z., Sari, Mojaveri, I. H. S., Tehran, Allabakhsh, I. A. A. (2012). Impact of
Advertising and Sale Promotions on Brand Equity. Journal of Business
Studies Quarterly 4(1), 64-73.
Rajh, E. (2005). The Effects of Marketing Mix Elements on Brand Equity. Economic
Trends and Economic Policy, 102, 30-59.
Rundle, T., and Benett, R. (2001). A Brand for All Seasons. Journal of Product and
Brand Management, 10(1).
Schiffman, L. G., & Kanuk, L. L. (2000). The Mass Marketing of Luxury. Journal of
Marketing Management, 29(5-6), 562-583.

Shimp., Terence, A. (1997). Advertising, Promotion, and Supplemental Aspects of
Integrated Marketing Communications. (14th ed.). Orlando, FL: Dryden.
Winner, R. S., (1986). A Reference Price Model of Brand Choice for Frequently
Purchased Products. Journal of Consumer Research, 13, 250-256.
Yoo, B., Donthu, N. (2001). Developing and Validating a Multidimensional
Consumer-Based Brand Equity Scale. Journal of Business Research, 52,
1-14.
Yoo, B., Donthu, N., Lee, S. (2000). An Examination of Selected Marketing Mix
Elements and Brand Equity. Journal of the Academy of Marketing Science,
28(2), 195-211.

Appendix- I
Questionnaires
This questionnaire is a part of MBA program from Yangon University of
Economic. This is designed for the study of the Effect of Promotional Mix on Brand
Equity and Brand Resonance of Clear Shampoo in Yangon. It is granted that your
specific data will not be sold or announced to public.
There are questions to answer. Please help to finish all questions and return the
questionnaire to us. Your privacy data are fully secured with us. I am very thankful for
your time and participation.
Section (A) Please choose one answer.
(1) Gender
Male Female
(2) Age of Respondents:
Under 20 years 21-30 years 31-40 years
41-50 years Above 50 years
(3) Occupation
Students Employees Gov. Employees
Own Business Others
(4) Monthly Income
Below 300,000 MMK 300,001-400,000 MMK
400,001-500,000MMK 500,001-600,000 MMK
Above 600,000 MMK
(5) Educational Background
High School College/University Graduated
Post Graduated

Section (B) Promotional Mix
Please describe your perception on the relevant box. Please tick under the scale number
according to your perceptions.
Scales: 1- Strongly disagree, 2- Disagree, 3- Neutral, 4- Agree, 5-Strongly agree
No Promotional Mix 1 2 3 4 5
Measurement of Advertising
1 I can recognize the Clear Shampoo advertising among
competitive brands.
2 I can recognize Clear Shampoo in TVC frequently.
3 I feel Clear Shampoo commercial video advertising is
very attractive.
4 I am aware of Clear Shampoo ad at Road-side
Billboard, posters and LED signboards frequently.
5 I am aware of Clear Shampoo ad at bus-stop, café-
shops, cinema and shopping mall frequently.
6 Clear Shampoo is intensively advertised.
7 Clear Shampoo seems to spend a lot on its advertising
compared to advertising for competing shampoo
brands.
Measurement of Promotions
8 I aware Clear Shampoo sales promotion event news at
journals, newspaper and magazines.
9 I will buy one of product of Clear Shampoo if there is
price discounts promotion,
10 I will buy one of product of Clear Shampoo if there is
buy-one-get-one-free promotion.
11 Clear Shampoo frequently offers gifts.

12 The gifts given from sale promotion of Clear Shampoo
events are useful and attractive.
13 Clear Shampoo gives promotions more frequently than
competing brands of shampoo.
14 I will buy only Clear Shampoo when Clear Shampoo
and other brands give promotions at the same time.
Measurement of Social Media Marketing
15 I can get new products and promotional news at Clear
Shampoo social media websites up to date.
16 I have ever received notifications from Clear Shampoo
for new products to my emails.
17 I have ever received information for new products to
my mobile phone as text message.
18 I have ever received information for sales promotion to
my mobile phone as text message.
19 I have received personal contact (phone call) with
Clear Shampoo.
20 I have seen beauty bloggers’ recommendation on social
media.
21 I can easily search on Facebook when I want to know
about the Clear Products.
Measurement of Personal Selling
22 Tester of Clear Shampoo products at supermarket and
convenience store and promotions encourages me to
buy.
23 Sale person at Clear Shampoo can explain product
ingredients and effects well.
24 Sale persons at Clear Shampoo counter gives you
warm greeting and hospitality.
25 Sale persons always listen your needs and wants.
26 Sale persons always care about your problems.
27 I am satisfied the quality of service provided by Clear
Sale persons.
28 Sale persons of Clear have confident about the
products that are being sold.

Measurement of Public Relation
29 I am awareness of public related CSR activities about
Clear Shampoo frequently on TVC and journals.
30 I am aware of Clear Shampoo ad at Stage-Show, Music
festivals and sport events frequently.
31 I am aware of Clear Shampoo ad at singing
competition.
32 I am aware of Clear Shampoo ad at Myanmar
traditional festival. (eg.,Thingyan Festival)
33 I am aware the change of Clear Brand Ambassador
Myanmar.
34 I know the Clear Brand Ambassador Myanmar.
35 I know the Clear Brand Ambassador International.
Brand Equity
Measurement of Brand Awareness
36 I recognize the symbol/logo/color of Clear Shampoo
brand.
37 I can easily recall some of the features of Clear
Shampoo.
38 At the place of purchase, I could visually detect Clear
Shampoo brand without much effort
39 I know the Clear Shampoo’s motto.
40 I know Clear has separate line of products for Men.
41 I know Clear Shampoo has 2 colors for Men
42 I know Clear Shampoo has 4 colors for unisex.
Measurement of Brand Association
43 I know that Clear Shampoo has many “fans.”
44 Clear Shampoo products are the mainstream in its
industry.
45 I believe that Clear Shampoo products have
considerable quality.
46 Considering what I would pay for Clear Shampoo, I
would get much more than my money’s worth.
47 I trust the company which makes Clear Shampoo.
48 I can get better benefits from Clear Shampoo when

compared to other brands.
49 Within shampoo products I consider Clear Shampoo a
good buy.
Measurement of Perceived Quality
50 Clear Shampoo maintains consistent quality.
51 The packaging design of Clear Shampoo is stylish.
52 Clear Shampoo offers many benefits as I expected.
53 Using Clear Shampoo can reflect personal taste.
54 I would regularly take note of new Clear Shampoo
products.
55 I would specifically go to specialized stores or counters
to purchase.
56 Using Clear Shampoo is a symbol of social status.
Measurement of Brand Loyalty
57 I would like to recommend Clear Shampoo to others.
58 When I buy shampoo, Clear Shampoo would be my
first choice.
59 I am still willing to buy this brand even if its price is a
little higher than that of its competitors.
60 I will not buy other brands if Clear Shampoo is not
available at the store.
61 I am still willing to buy Clear Shampoo even if another
brand has the same attributes and features.
62 Even if other brands give promotions, I will buy Clear
Shampoo.
63 I am still willing to buy even if Clear Shampoo does
not give promotions.

Section (C) Brand Resonance
Please describe your perception on the relevant box. Please tick under the scale number
according to your perceptions.
Scales: 1- Strongly disagree, 2- Disagree, 3- Neutral, 4- Agree, 5-Strongly agree
No Brand Resonance 1 2 3 4 5
1. When I think about shampoo, Clear Shampoo
comes to my mind first.
2. I can quickly recall the symbol and logo of Clear
Brand.
3. Compared to other shampoo brands, Clear gives a
better quality.
4. Compared to other shampoo brands, Clear satisfies
my basic needs.
5. Compared to other brands, Clear price is high.
6. I remember the core message of Clear Shampoo.
7. I can recognize the smell of Clear Shampoo.
8. My overall opinion of Clear Shampoo is good.
9. I trust Clear Shampoo so much.
10. The quality of Clear Shampoo is consistent.
11. I am likely to recommend Clear Shampoo to
others.
12. Personally, Clear Shampoo is relevant to me.
13. The staffs of Clear Shampoo are knowledgeable.
14. Clear Shampoo gives me a feeling of self-respect.
15. Clear Shampoo gives me a feeling of social
approval.
16. Clear Shampoo gives me a feeling of security.
17. I really love Clear Shampoo.
18. Clear Shampoo is the one brand that I need.
19. I am proud to have others know that I am customer
of Clear Shampoo.
20. I consider myself loyal to Clear Shampoo.
THANK YOU!

Appendix – II
Output of the SPSS
Regression Analysis on Promotional Mix (Advertising, Promotions, Direct
Marketing, Personal selling and Public Relations), Measures of Brand Equity (Brand
Awareness, Brand Associations, Perceived Quality and Brand Loyalty) and Brand
Resonance.
(1) Promotional Mix on Brand Awareness
Model Summaryb
Model R R
Square
Adjusted
R Square
Std.
Error of
the
Estimate
Change Statistics Durbi
n-
Watso
n
R
Square
Change
F
Change df1 df2
Sig. F
Change
1 .586a .343 .334 .58593 .343 38.947 5 373 .000 1.944
a. Predictors: (Constant), Advertising, Promotions, Direct Marketing, Personal Selling,
Public Relations
b. Dependent Variable: Brand Awareness
ANOVAa
Model Sum of
Squares df Mean Square F Sig.
1 Regression 66.855 5 13.371 38.947 .000b
Residual 128.057 373 .343
Total 194.912 378
a. Dependent Variable: Brand Awareness
b. Predictors: (Constant), Advertising, Promotions, Direct Marketing, Personal
Selling,
Public Relations

Coefficientsa
Model
Unstandardized
Coefficients
Standardized
Coefficients t Sig.
Collinearity
Statistics
B Std.
Error Beta
Toleranc
e VIF
1 (Constant) 1.176 .181 6.496 .000
Advertising .200 .062 .191 3.215 .001 .501 1.996
Promotion -.033 .055 -.039 -.601 .548 .410 2.439
Direct
Marketing .017 .053 .019 .312 .755 .459 2.180
Personal
Selling .150 .058 .149 2.580 .010 .526 1.900
Public
Relations .361 .051 .382 7.150 .000 .617 1.621
a. Dependent Variable: Brand Awareness
(2) Promotional Mix on Brand Associations
Model Summaryb
Model R R
Square
Adjusted
R Square
Std.
Error of
the
Estimate
Change Statistics Durbi
n-
Wats
on
R
Square
Change
F
Change df1 df2
Sig. F
Change
1 .798a .637 .632 .46615 .637 131.091 5 373 .000 1.898
a. Predictors: (Constant), Advertising, Promotions, Direct Marketing, Personal Selling,
Public Relations
b. Dependent Variable: Brand Associations
ANOVAa
Model Sum of Squares df Mean Square F Sig.
1 Regression 142.429 5 28.486 131.091 .000b
Residual 81.052 373 .217
Total 223.481 378
a. Dependent Variable: Brand Associations
b. Predictors: (Constant), Advertising, Promotions, Direct Marketing, Personal
Selling, Public Relations

Coefficientsa
Model
Unstandardized
Coefficients
Standardized
Coefficients t Sig.
Collinearity
Statistics
B Std.
Error Beta Tolerance VIF
1 (Constant) .074 .144 .514 .608
Advertising .279 .049 .249 5.651 .000 .501 1.996
Promotion .289 .043 .324 6.661 .000 .410 2.439
Direct
Marketing -.132 .042 -.143 -3.112 .002 .459 2.180
Personal
Selling .242 .046 .224 5.222 .000 .526 1.900
Public
Relations .309 .040 .306 7.701 .000 .617 1.621
a. Dependent Variable: Brand Associations
(3) Promotional Mix on Perceived Quality
Model Summaryb
Model R R
Square
Adjusted
R Square
Std.
Error of
the
Estimate
Change Statistics Durbi
n-
Wats
on
R
Square
Change
F
Change df1 df2
Sig. F
Change
1 .805a .648 .643 .52612 .648 137.31
3 5 373 .000 1.801
a. Predictors: (Constant), Advertising, Promotions, Direct Marketing, Personal Selling,
Public Relations
b. Dependent Variable: Perceived Quality

ANOVAa
Model Sum of Squares df Mean Square F Sig.
1 Regression 190.040 5 38.008 137.313 .000b
Residual 103.246 373 .277
Total 293.286 378
a. Dependent Variable: Perceived Quality
b. Predictors: (Constant), Advertising, Promotions, Direct Marketing, Personal
Selling,
Public Relations
Coefficientsa
Model
Unstandardized
Coefficients
Standardized
Coefficients t Sig.
Collinearity
Statistics
B Std.
Error Beta Tolerance VIF
1 (Constant) -.030 .162 -.186 .853
Advertising .276 .056 .215 4.954 .000 .501 1.996
Promotion .439 .049 .429 8.950 .000 .410 2.439
Direct
Marketing .184 .048 .175 3.866 .000 .459 2.180
Personal
Selling .004 .052 .003 .072 .943 .526 1.900
Public
Relations .148 .045 .128 3.262 .001 .617 1.621
a. Dependent Variable: Perceived Quality

(4) Promotional Mix on Brand Loyalty
Model Summaryb
Model R R
Square
Adjusted
R Square
Std.
Error of
the
Estimate
Change Statistics Durbi
n-
Wats
on
R
Square
Change
F
Change df1 df2
Sig. F
Change
1 .791a .625 .620 .65178 .625 124.35
3 5 373 .000 1.851
a. Predictors: (Constant), Advertising, Promotions, Direct Marketing, Personal
Selling,
Public Relations
b. Dependent Variable: Brand Loyalty
ANOVAa
Model Sum of Squares df Mean Square F Sig.
1 Regression 264.138 5 52.828 124.353 .000b
Residual 158.459 373 .425
Total 422.597 378
a. Dependent Variable: Brand Loyalty
b. Predictors: (Constant), Advertising, Promotions, Direct Marketing, Personal
Selling,
Public Relations

Coefficientsa
Model
Unstandardized
Coefficients
Standardized
Coefficients t Sig.
Collinearity
Statistics
B Std.
Error Beta
Toleranc
e VIF
1 (Constant) -.518 .210 -2.575 .010
Advertising .162 .069 .105 2.343 .020 .501 1.996
Promotion .657 .061 .536 10.823 .000 .410 2.439
Direct
Marketing .261 .059 .207 4.412 .000 .459 2.180
Personal
Selling -.023 .065 -.015 -.350 .726 .526 1.900
Public
Relations .091 .056 .065 1.612 .108 .617 1.621
a. Dependent Variable: Brand loyalty
(5) Promotional Mix on Brand Equity
Model Summaryb
Model R R
Square
Adjusted
R Square
Std.
Error of
the
Estimate
Change Statistics Durbi
n-
Wats
on
R
Square
Change
F
Change df1 df2
Sig. F
Change
1 .851a .724 .720 .38798 .724 195.27
2 5 373 .000 1.947
a. Predictors: (Constant), Advertising, Promotions, Direct Marketing, Personal
Selling,
Public Relations
b. Dependent Variable: Brand Loyalty
ANOVAa
Model Sum of Squares df Mean Square F Sig.
1 Regression 146.970 5 29.394 195.272 .000b
Residual 56.147 373 .151
Total 203.118 378
a. Dependent Variable: Brand Equity
b. Predictors: (Constant), Advertising, Promotions, Direct Marketing, Personal
Selling, Public Relation

Coefficientsa
Model
Unstandardized
Coefficients
Standardized
Coefficients t Sig.
Collinearity Statistics
B Std.
Error Beta Tolerance VIF
1 (Constant) .175 .120 1.460 .045
Advertising .229 .041 .214 5.573 .000 .501 1.996
Promotion .338 .036 .398 9.355 .000 .410 2.439
Direct
Marketing .083 .035 .094 2.346 .020 .459 2.180
Personal
Selling .093 .039 .091 2.424 .016 .526 1.900
Public
Relations .227 .033 .236 6.796 .000 .617 1.621
a. Dependent Variable: Brand Equity
(6) Brand Equity on Brand Resonance
Model Summaryb
Model R
R
Squar
e
Adjusted
R Square
Std.
Error of
the
Estimate
Change Statistics Durbi
n-
Wats
on
R
Square
Change
F
Change df1 df2
Sig. F
Change
1 .921a .848 .847 .30869 .848 523.156 4 347 .000 1.870
a. Predictors: (Constant), Brand Awareness, Brand Associations, Perceived Quality,
Brand Loyalty
b. Dependent Variable: Brand Resonance

ANOVAa
Model Sum of Squares df Mean Square F Sig.
1 Regression 199.411 4 49.853 523.156 .000b
Residual 35.639 347 .095
Total 235.050 378
a. Dependent Variable: Brand Resonance
b. Predictors: (Constant), Brand Awareness, Brand Associations, Perceived Quality,
Brand Loyalty
Coefficientsa
Model
Unstandardized
Coefficients
Standardized
Coefficients t Sig.
Collinearity
Statistics
B Std.
Error Beta Tolerance VIF
1 (Constant) .381 .086 4.437 .000
Brand
Awareness .048 .028 .044 1.747 .082 .643 1.555
Brand
Associations .267 .036 .260 7.369 .000 .326 3.068
Perceived
Quality .099 .037 .110 2.698 .007 .243 4.111
Brand
Loyalty .445 .028 .596 16.176 .016 .298 3.354
a. Dependent Variable: Brand Resonance

APPENDIX – III
Promotional mix of Clear Shampoo
No Advertising Mean Std.
Deviation
1 Recognition of advertising 3.92 0.89
2 Recognition of TV Commercial 3.91 0.89
3 Attractiveness of commercial video 3.60 1.03
4 Awareness of ad at Road-side Billboard 3.38 1.10
5 Awareness of ad at bus-stop, cafe', cinema, and
shopping 3.35 1.13
6 Intensiveness of ad 3.58 0.99
7 Spending in advertising 3.58 0.96
Overall Mean 3.62
Promotions
8 Awareness of promotion event news at journals,
newspaper and magazines 3.24 1.16
9 Willingness to buy when price discount 3.49 1.14
10 Willingness to buy when buy 1 get 1 free 3.59 1.22
11 Frequency of gift offers 3.21 1.13
12 Usefulness and attractiveness of sale promotion
gifts 3.16 1.17
13 Frequency of promotion 3.28 1.16
14 Willingness to buy when promotion at the same
time 3.17 1.15
Overall Mean 3.31

Direct Marketing
15 Getting up-to-date news from social media website 3.27 0.90
16 Receiving of e-mail from Clear Shampoo 2.54 1.17
17 Receiving information about new product via
mobile phone text message 2.45 1.20
18 Receiving information about sales promotion via
mobile phone text message 2.76 1.23
19 Receiving personal contact (phone call) 2.50 1.29
20 Found of beauty bloggers' recommendation 2.78 1.15
21 Easy search on Facebook 3.51 0.99
Overall Mean 2.83
Personal Selling
22 Encourage of products tester at supermarket and
convenience store 3.00 1.07
23 Sale person's ability to explain about products 3.24 0.98
24 Hospitality of sale person 3.33 0.82
25 Listen customer's needs and wants carefully 3.13 0.90
26 Caring about customer’s problem 3.09 0.91
27 Satisfaction the quality of service provided by sale
person 3.22 0.90
28 Confidence of sale person 3.38 0.85
Overall Mean 3.20
Public Relations
29 Awareness of CSR activity on TV and Journals 3.05 1.03
30 Awareness of ad at stage-show, festivals, sport
events 3.61 0.99

31 Awareness of ad at singing competition 3.21 1.07
32 Awareness of ad at Myanmar Traditional Festival 3.33 1.06
33 Recognition of changes in Brand Ambassador 2.93 1.23
34 Having knowledge of Brand Ambassador
Myanmar 3.12 1.41
35 Having knowledge of Brand Ambassador
International 3.27 1.39
Overall Mean 3.22
Brand Equity of Clear Shampoo
No Brand Awareness Mean Std.
Deviation
36 Recognition of the Brand by logo, symbol, and
color 3.82 0.99
37 Easily recall features of the Brand 3.72 0.99
38 Able to detect the brand in the place of purchase 3.72 0.94
39 Having the knowledge of brand’s motto 3.03 1.35
40 Having the knowledge of separate product line for
men 3.95 1.03
41 Having the knowledge of product variants for men 3.18 1.22
42 Having the knowledge of product variants for
unisex 2.94 1.17
Overall Mean 3.48
Brand Associations
43 Brand has many fans 3.46 0.96
44 Mainstream in industry 3.40 0.95
45 Believe in quality 3.50 0.92

46 Get much more than money’s worth 3.34 0.89
47 Trust on the company 3.58 0.99
48 Better benefits than other brands 3.33 0.99
49 Clear is worthy to buy 3.45 0.96
Overall Mean 3.44
Perceived Quality
50 Having consistent quality 3.71 0.84
51 Having stylish packaging design 3.80 0.98
52 Better benefits offer than expectation 3.63 1.08
53 Reflection of personal taste 3.58 1.05
54 Taking note when new product has been launched 3.10 1.19
55 Go directly to the specific counter to buy 3.20 1.29
56 Use for symbol of social status 3.00 1.27
Overall Mean 3.43
Brand Loyalty
57 Recommending to others 3.52 1.15
58 First choice 3.28 1.32
59 Willingness to buy if the price is higher 3.27 1.19
60 Will not buy other brands if Clear is unavailable 3.01 1.34
61 Willingness to buy if other brands have same
attributes and features 3.20 1.13
62 Will buy Clear if other brands give promotions 3.00 1.15
63 Will buy Clear if it does not give promotions 3.11 1.20
Overall Mean 3.20