YANGON REGION, EASTERN DISTRICT - MIMU
59
THE REPUBLIC OF THE UNION OF MYANMAR The 2014 Myanmar Populaon and Housing Census Department of Populaon Ministry of Labour, Immigraon and Populaon October 2017 YANGON REGION, EASTERN DISTRICT Botahtaung Township Report
-
Upload
khangminh22 -
Category
Documents
-
view
2 -
download
0
Transcript of YANGON REGION, EASTERN DISTRICT - MIMU
THE REPUBLIC OF THE UNION OF MYANMAR
The 2014 Myanmar Population and Housing Census
Department of Population
Ministry of Labour, Immigration and Population
October 2017
YANGON REGION, EASTERN DISTRICT Botahtaung Township Report

The 2014 Myanmar Population and Housing Census
Yangon Region, Eastern District
Botahtaung Township Report
Department of Population
Ministry of Labour, Immigration and Population
Office No. 48
Nay Pyi Taw
Tel: +95 67 431 062
www.dop.gov.mm
October 2017


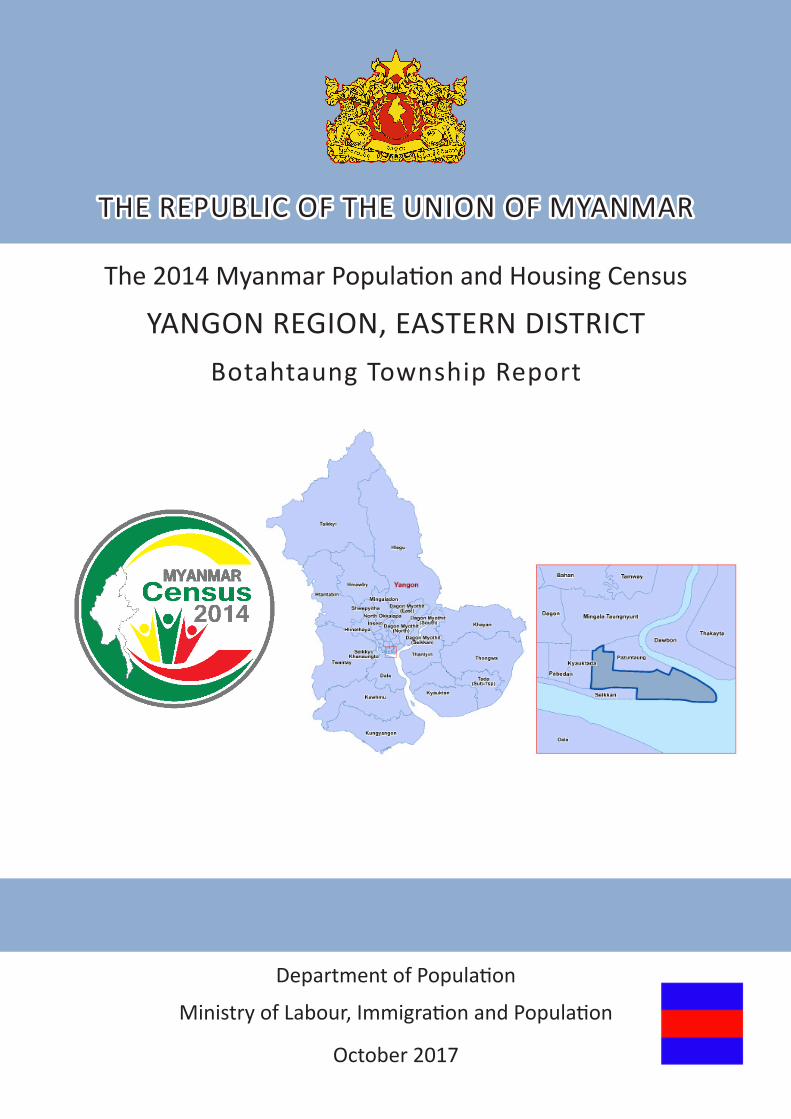
Figure 1: Map of Yangon Region, showing the townships

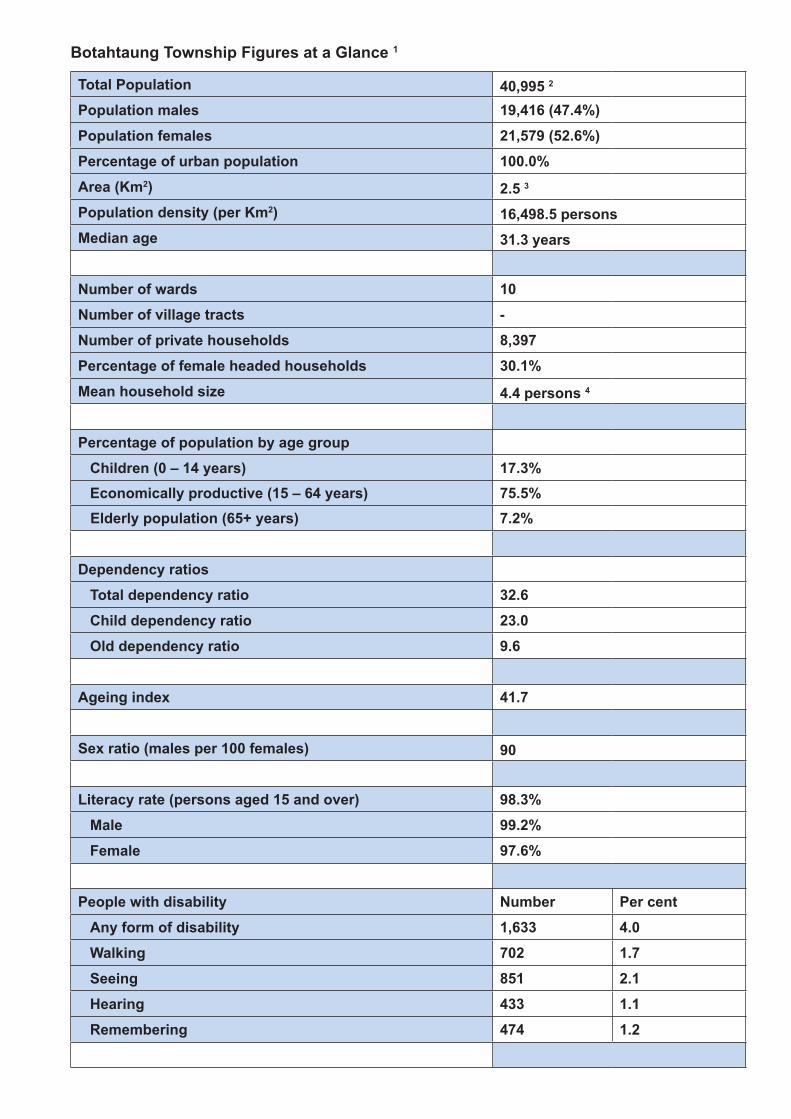
Botahtaung Township Figures at a Glance 1
Total Population 40,995 2
Population males 19,416 (47.4%)
Population females 21,579 (52.6%)
Percentage of urban population 100.0%
Area (Km2) 2.5 3
Population density (per Km2) 16,498.5 personsMedian age 31.3 years
Number of wards 10
Number of village tracts -
Number of private households 8,397
Percentage of female headed households 30.1%
Mean household size 4.4 persons 4
Percentage of population by age group
Children (0 – 14 years) 17.3%Economically productive (15 – 64 years) 75.5%
Elderly population (65+ years) 7.2%
Dependency ratios
Total dependency ratio 32.6
Child dependency ratio 23.0
Old dependency ratio 9.6
Ageing index 41.7
Sex ratio (males per 100 females) 90
Literacy rate (persons aged 15 and over) 98.3%
Male 99.2%
Female 97.6%
People with disability Number Per cent
Any form of disability 1,633 4.0
Walking 702 1.7
Seeing 851 2.1
Hearing 433 1.1
Remembering 474 1.2

Type of Identity Card (persons aged 10 and over) Number Per centCitizenship Scrutiny 30,218 82.2Associate Scrutiny 261 0.7Naturalised Scrutiny 513 1.4National Registration 1,043 2.8Religious 248 0.7Temporary Registration 227 0.6Foreign Registration 157 0.4Foreign Passport 322 0.9None 3,771 10.3
Labour Force (aged 15 – 64) Both sexes Male Female Labour force participation rate 57.8% 76.2% 41.3% Unemployment rate 4.9% 4.8% 5.1% Employment to population ratio 55.0% 72.6% 39.2%
Ownership of housing unit (Tenure) Number Per centOwner 4,468 53.2Renter 1,337 15.9Provided free (individually) 227 2.7Government quarters 2,165 25.8Private company quarters 93 1.1Other 107 1.3
Material for housing Wall Floor RoofDhani/Theke/In leaf 0.1% 1.8%Bamboo 2.7% 1.7% <0.1%Earth <0.1% 0.1%Wood 6.2% 15.4% 0.1%Corrugated sheet 2.5% 76.6%Tile/Brick/Concrete 88.2% 81.8% 21.2%Other 0.2% 0.9% 0.3%
Main source of energy for cooking Number Per centElectricity 6,753 80.4LPG 732 8.7Kerosene * <0.1Biogas 99 1.2Firewood 41 0.5Charcoal 709 8.4Coal * 0.2Other 45 0.5

Main source of energy for lighting Number Per cent
Electricity 8,334 99.2
Kerosene * <0.1
Candle 35 0.4
Battery * 0.2
Generator (private) * <0.1
Water mill (private) - -
Solar system/energy - -
Other * 0.1
Main source of drinking water Number Per cent
Tap water/piped 1,980 23.6
Tube well, borehole * 0.1
Protected well/spring 33 0.4
Bottled/purifier water 6,343 75.5
Total Improved Water Sources 8,367 99.6
Unprotected well/spring * <0.1
Pool/pond/lake * <0.1
River/stream/canal - -
Waterfall/rainwater - -
Other 26 0.4
Total Unimproved Water Sources 30 0.4
Main source of water for non-drinking use Number Per cent
Tap water/piped 8,227 98.0
Tube well, borehole 91 1.1
Protected well/spring 48 0.6
Unprotected well/spring * <0.1
Pool/pond/lake * 0.2
River/stream/canal - -
Waterfall/rainwater - -
Bottled/purifier water * 0.1
Other * <0.1

Type of toilet Number Per cent
Flush 2,427 28.9
Water seal (Improved pit latrine) 5,932 70.6
Total Improved Sanitation 8,359 99.5
Pit (Traditional pit latrine) * 0.1
Bucket (Surface latrine) * <0.1
Other * <0.1
None 28 0.4
Availability of communication amenities Number Per cent
Radio 3,444 41.0
Television 7,920 94.3
Landline phone 2,728 32.5
Mobile phone 7,823 93.2
Computer 3,354 39.9
Internet at home 3,723 44.3
Households with none of the items 159 1.9
Households with all of the items 715 8.5
Availability of Transportation equipment Number Per cent
Car/Truck/Van 2,143 25.5
Motorcycle/Moped 121 1.4
Bicycle 1,288 15.3
4-Wheel tractor * 0.2
Canoe/Boat * 0.1
Motor boat * 0.2
Cart (bullock) * 0.2
Note: 1 Population figures for Botahtaung Township are as of 29th March 2014.
2 Includes both household population and institution population.
3 Settlement and Land Record Department, Ministry of Agriculture, Livestock and Irrigation, (2014-2015)
4 Calculated based on conventional household population
* Less than 20.

1
Contents
Introduction ................................................................................................................................................3
Census information on Botahtaung Township ...........................................................................................5
(A) Demographic Characteristics .........................................................................................................7
(B) Religion ........................................................................................................................................11
(C) Education .....................................................................................................................................12
(D) Economic Characteristics ............................................................................................................16
(E) Identity Cards ...............................................................................................................................22
(F) Disability ......................................................................................................................................23
(G) Housing Conditions and Household Amenities ............................................................................26
Type of housing unit .....................................................................................................................26
Type of toilet .................................................................................................................................27
Source of drinking water ..............................................................................................................29
Source of lighting .........................................................................................................................31
Type of cooking fuel .....................................................................................................................33
Communication and related amenities .........................................................................................35
Transportation items ....................................................................................................................37
(H) Fertility and Mortality ....................................................................................................................38
Fertility .........................................................................................................................................38
Childhood Mortality and Maternal Mortality ..................................................................................40
Definitions and Concepts .........................................................................................................................43
List of Contributors ...................................................................................................................................47


3
Introduction
In April 2014, the Government of the Republic of the Union of Myanmar conducted its latest census, after three decades without a Population and Housing Census. In the post-independence period, comprehensive population and housing censuses were only successfully undertaken in 1973, 1983 and most recently in April 2014.
Censuses are an important source of benchmark information on the characteristics of the population and households in every country. One unique feature of a census is its ability to provide information down to the lowest administrative level. Such information is vital for planning and evidence based decision-making at every level. Additional data uses include allocation of national resources; the review of administrative boundaries; the positioning of social infrastructures, drawing national development plans, service provision and developing social infrastructure, and for humanitarian preparedness and response.
The results of the 2014 Census have been published so far in a number of volumes. The first was the Provisional Results released in August 2014. The Census Main Results were launched in May 2015. These included The Union Report, Highlights of the Main Results, and reports of each of the 15 States and Regions. The reports on Occupation and Industry and Religion were launched in March 2016 and July 2016, respectively. All the publications are available online at http://www.dop.gov.mm/ and http://myanmar. unfpa.org/node/15104.
The current set of the 2014 Census publications comprise township and sub-township reports. Their preparation involved collaborative efforts of the Department of Population and UNFPA. This report contains selected demographic and socio-economic characteristics of Botahtaung Township in Yangon Region. The information included in this report is the situation of 2014 March 29, Census night. Township level information is very important. However, the level of confidence of township estimates is not the same as Union level information. Some of the townships have relatively small populations; the interpretation of these estimates should be made with caution. Some of the indicators, such as IMR/U5MR, were adopted only after careful analysis considering a number of factors to ensure consistency in the results. Estimates for townships with relatively small number of observations should not be taken as exact estimates of the mortality level, but rather they should be regarded as reasonable indicators for the scale of mortality risk they experience, an indication of which townships are better off and which are in a more vulnerable situation.


5
Census information on Botahtaung Township


7
(A) Demographic Characteristics
Total population 40,995 *
Males 19,416
Females 21,579
Sex ratio 90 males per 100 females
Percentage of urban population 100.0 %
Area (Km2) 2.5 **
Population density (persons per Km2) 16,498.5 persons
Number of wards 10
Number of village tracts -
Total Urban Rural
Population in conventional households 36,661 36,661 -
Number of conventional households 8,397 8,397 -
Mean household size 4.4 persons ***
• In Botahtaung Township, there are more females than males with 90 males per 100 females.
• All the population in the Township lives in urban areas.
• The population density of Botahtaung Township is 16,499 persons per square kilometre.
• There are 4.4 persons living in each household in Botahtaung Township. This is equal to the Union average.
Note: * Includes both household population and institution population.
** Settlement and Land Record Department, Ministry of Agriculture, Livestock and Irrigation, (2014-2015)
*** Calculated based on conventional household population

8
Table 1: Population and number of conventional households by sex by ward; Botahtaung Township
(East District, Yangon Region)
Total Males Females
Total 8,397 40,995 19,416 21,579
Ward 8,397 40,995 19,416 21,579
1 No(1)(W) 322 1,393 644 749
2 No(2)(W) 1,362 6,727 3,591 3,136
3 No(3)(W) 700 3,481 1,666 1,815
4 No(4)(W) 857 4,593 2,090 2,503
5 No(5)(W) 680 3,066 1,350 1,716
6 No(6)(W) 816 4,127 1,910 2,217
7 No(7)(W) 607 3,431 1,634 1,797
8 No(8)(W) 845 3,949 1,701 2,248
9 No(9)(W) 654 2,866 1,327 1,539
10 No(10)(W) 1,554 7,362 3,503 3,859
Sr WardNo. of
Conventional households
Population

9
• The proportion of productive working population between 15 to 64 years of age in Botahtaung Township is 75.5 per cent.
• The proportion of children aged 14 and below together with the proportion of the elderly aged 65 and over are less than the proportion of the working age group population.
• Fewer proportions of children and elderly reduce the dependency of those age groups on the working age population.
Figure 2: Population by broad age groups, Botahtaung Township
Table 2: Population by 5-year age groups, Botahtaung Township
Age groups Total Males FemalesTotal 40,995 19,416 21,579 0 - 4 2,043 1,018 1,025 5 - 9 2,192 1,085 1,107 10 - 14 2,870 1,533 1,337 15 - 19 4,053 2,150 1,903 20 - 24 4,582 2,336 2,246 25 - 29 3,755 1,830 1,925 30 - 34 3,284 1,521 1,763 35 - 39 2,837 1,270 1,567 40 - 44 2,937 1,352 1,585 45 - 49 3,023 1,314 1,709 50 - 54 2,631 1,152 1,479 55 - 59 2,271 997 1,274 60 - 64 1,553 704 849 65 - 69 1,094 470 624 70 - 74 691 284 407 75 - 79 546 186 360 80 - 84 353 121 232 85 - 89 189 61 128 90 + 91 32 59

10
Figure 3: Population pyramid (Union, Yangon Region, East District and Botahtaung Township)
• The birth rate has been noticeably declining in Botahtaung Township since the last 20 years.
• The population has declined noticeably in age groups 25-29 to 35-39 and age groups 40-44 and 45-49 have increased slightly.
• Compared to Union level, there is a larger percentage of working age group 15-64 population in Botahtaung Township.
• Starting from age group 25-29, there are less males than females in all age groups.

11
(B) Religion
• At the Union level, the composition of the population by religion is: 87.9% Buddhist, 6.2% Christian, 4.3% Islam, 0.5% Hindu, 0.8% Animist, 0.2% Other religion and 0.1% No religion.
• In Yangon Region, it is 91.0% Buddhist, 3.2% Christian, 4.7% Islam, 1.0% Hindu, 0.1% Other religion, and less than 0.1% each for Animist and those with No religion respectively.
Note: * Less than 0.1 per cent.

12
(C) Education
Table 3: Population aged 5 - 29 and current school attendance by sex by age
Total Males Females Total Males Females
5 427 208 219 121 64 57
6 419 205 214 286 140 146
7 420 193 227 320 146 174
8 450 235 215 328 169 159
9 443 228 215 337 171 166
10 477 259 218 366 198 168
11 460 236 224 343 179 164
12 497 276 221 337 182 155
13 622 300 322 419 216 203
14 646 331 315 405 214 191
15 598 289 309 322 172 150
16 621 292 329 325 159 166
17 660 331 329 295 148 147
18 685 332 353 282 135 147
19 675 303 372 268 141 127
20 739 326 413 169 83 86
21 659 317 342 131 74 57
22 688 318 370 80 39 41
23 686 305 381 54 32 22
24 629 297 332 25 16 9
25 665 291 374 22 11 11
26 636 276 360 19 10 9
27 567 256 311 15 11 4
28 591 256 335 6 3 3
29 567 262 305 6 5 1
Total population Currently attendingAge

13
• School attendance in Botahtaung Township drops starting from age 11 for both males and females.
• Compared to the Union, the school attendance of males and females in Botahtaung Township is much higher than the Union after age 14 onwards.

14
Figure 7: Literacy rate, Yangon Region (aged 15 and over)
Union : 89.5%
Yangon Region : 96.6%
East District : 97.1%
Botahtaung Township : 98.3%

15
Table 4: Youth literacy rate (15 - 24), Botahtaung Township
• The literacy rate of those aged 15 and over in Botahtaung Township is 98.3 per cent. It is higher than the literacy rate of Yangon Region (96.6%) and the Union (89.5%). Female literacy rate is 97.6 per cent and for the males it is 99.2 per cent.
• The literacy rate for youth aged 15-24 is 98.6 per cent with 98.1 per cent for females and 99.1 per cent for males.
Table 5: Population aged 25 and over by highest level of education completed, urban/rural and sex
• Some 2.6 per cent of the population aged 25 and over have never been to school.
• There are 1.3 per cent of males aged 25 and over who have never attended school as against 3.5 per cent for females.
• Among those aged 25 and over, 7.0 per cent has completed primary school (grade 5) and only 37.3 per cent has completed university/college education.
SexTotal
Population(15 - 24)
Literacy Rate(15 - 24)
Total 6,640 98.6
Males 3,110 99.1
Females 3,530 98.1
(grade 1 -4) (grade 5)
Total 25,255 646 2.6 1,179 1,774 4,772 6,394 172 9,413 683 92 130
Urban 25,255 646 2.6 1,179 1,774 4,772 6,394 172 9,413 683 92 130
Rural - - - - - - - - - - - -
Males 11,294 151 1.3 371 562 2,318 3,298 130 4,071 261 65 67
Females 13,961 495 3.5 808 1,212 2,454 3,096 42 5,342 422 27 63
OtherTotal None % Never attended
Primary school Middle school (grade 6 - 9)
High school (grade 10 - 11)
Diploma University/ College
Post-graduate and above
Vocational training

16
(D) Economic Characteristics
Table 6: Population aged 10 and over by labour force participation rate and unemployment rate by sex and age group
Total Males Females Total Males Females
10 - 14 10.1 12.5 7.5 2.1 2.6 1.0
15 - 19 35.0 40.8 28.5 6.4 6.0 7.0
20 - 24 63.7 72.2 54.9 12.9 12.3 13.6
25 - 29 71.9 87.2 57.4 6.6 6.8 6.2
30 - 34 68.6 89.6 50.5 4.7 4.6 4.7
35 - 39 64.0 90.3 42.6 3.1 3.9 1.8
40 - 44 64.3 90.5 42.0 1.5 2.0 0.8
45 - 49 58.8 89.0 35.7 1.3 1.4 1.3
50 - 54 57.1 84.9 35.5 0.9 1.2 0.2
55 - 59 50.2 76.6 29.5 0.4 0.5 0.3
60 - 64 30.0 49.0 14.3 0.4 0.3 0.8
65 - 69 16.3 29.1 6.6 - - -
70 - 74 11.3 19.7 5.4 - - -
75 + 4.2 7.8 2.4 - - -
15 - 24 50.2 57.2 42.8 10.7 10.2 11.6
15 - 64 57.8 76.2 41.3 4.9 4.8 5.1
Age groupsLabour Force Participation Rate Unemployment Rate

17
• Labour force participation rate for the population aged 15-64 in Botahtaung Township is 57.8 per cent.
• The labour force participation rate of females is 41.3 per cent and is much lower than that of their male counterparts which is 76.2 per cent.
• In Botahtaung Township, labour force participation rate for the population aged 10-14 is 10.1 per cent.
• The unemployment rate for those aged 15-64 in Botahtaung Township is 4.9 per cent. There is not much difference between the unemployment rate for males (4.8%) and for females (5.1%).
• The unemployment rate for young females aged 15-24 is 11.6 per cent.
Table 7: Population aged 10 and over not in the labour force by usual activity status and sex
• Among those aged 10 and over who are not in the labour force, 46.6 per cent of males are full time students while 58.3 per cent of females are household workers.
Total Did not seek work
Full time student
Household worker
Pensioner,retired,elderly Ill, disabled Other
Total 18,280 0.7 28.8 41.6 16.5 1.5 10.9
Males 5,748 1.6 46.6 5.3 23.0 2.2 21.3
Females 12,532 0.3 20.6 58.3 13.5 1.2 6.1
SexUsual activity status
18
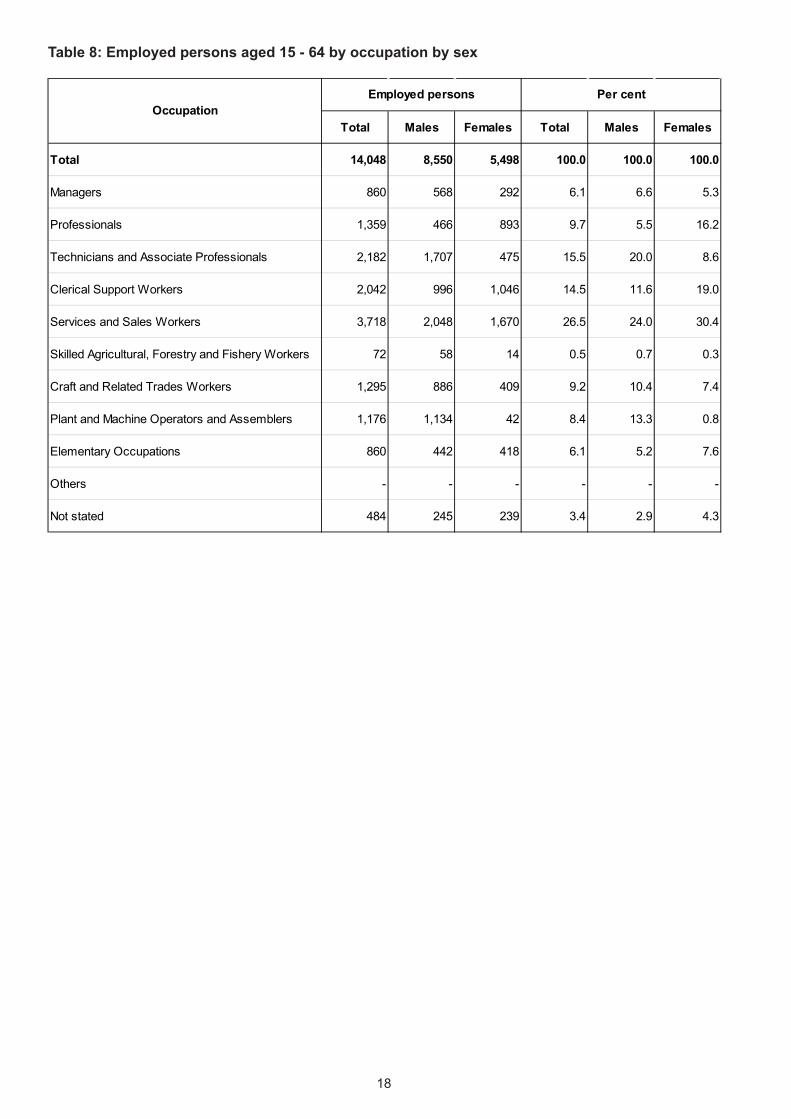
Table 8: Employed persons aged 15 - 64 by occupation by sex
Total Males Females Total Males Females
Total 14,048 8,550 5,498 100.0 100.0 100.0
Managers 860 568 292 6.1 6.6 5.3
Professionals 1,359 466 893 9.7 5.5 16.2
Technicians and Associate Professionals 2,182 1,707 475 15.5 20.0 8.6
Clerical Support Workers 2,042 996 1,046 14.5 11.6 19.0
Services and Sales Workers 3,718 2,048 1,670 26.5 24.0 30.4
Skilled Agricultural, Forestry and Fishery Workers 72 58 14 0.5 0.7 0.3
Craft and Related Trades Workers 1,295 886 409 9.2 10.4 7.4
Plant and Machine Operators and Assemblers 1,176 1,134 42 8.4 13.3 0.8
Elementary Occupations 860 442 418 6.1 5.2 7.6
Others - - - - - -
Not stated 484 245 239 3.4 2.9 4.3
Employed persons Per centOccupation

19
• In Botahtaung Township, 26.5 per cent of the employed persons aged 15-64 are services and sales workers and is the highest proportion, followed by technicians and associate professionals with 15.5 per cent.
• Analysis by sex shows that 24.0 per cent of males and 30.4 per cent of females are services and sales workers.
• In Yangon Region, 23.7 per cent are services and sales workers and 4.4 per cent are in technicians and associate professionals.

20
Table 9: Employed persons aged 15 - 64 by industry by sex
Total Males Females Total Males Females
Total 14,048 8,550 5,498 100.0 100.0 100.0
Agriculture, forestry and fishing 117 90 27 0.8 1.1 0.5
Mining and quarrying 29 21 8 0.2 0.2 0.1
Manufacturing 775 395 380 5.5 4.6 6.9
Electricity, gas, steam and air conditioning supply 107 98 9 0.8 1.1 0.2
Water supply; sewerage, waste management and remediation activities 12 7 5 0.1 0.1 0.1
Construction 407 318 89 2.9 3.7 1.6
Wholesale and retail trade; repair of motor vehicles and motorcycles 2,621 1,581 1,040 18.7 18.5 18.9
Transportation and storage 1,403 1,300 103 10.0 15.2 1.9
Accommodation and food service activities 1,462 788 674 10.4 9.2 12.3
Information and communication 448 271 177 3.2 3.2 3.2
Financial and insurance activities 209 73 136 1.5 0.9 2.5
Real estate activities 78 47 31 0.6 0.5 0.6
Professional, scientific and technical activities 163 108 55 1.2 1.3 1.0
Administrative and support service activities 1,311 726 585 9.3 8.5 10.6
Public administration including civil servants 2,562 1,837 725 18.2 21.5 13.2
Education 583 93 490 4.2 1.1 8.9
Human health and social work activities 319 112 207 2.3 1.3 3.8
Arts, entertainment and recreation 97 65 32 0.7 0.8 0.6
Other service activities 331 145 186 2.4 1.7 3.4
Activities of households as employers; undifferentiated goods- and services- producing activities of households for own use
248 20 228 1.8 0.2 4.1
Activities of extraterritorial organizations and bodies 25 15 10 0.2 0.2 0.2
Not stated 741 440 301 5.3 5.1 5.5
Employed persons Per centIndustry

21
• In Botahtaung Township, the proportion of employed persons working in the industry of “Wholesale and retail trade; repair of motor vehicles and motorcycles” is the highest with 18.7 per cent.
• The second highest industry is “Public administration including civil servants” at 18.2 per cent.
• There are 18.5 per cent of males and 18.9 per cent of females working in “Wholesale and retail trade; repair of motor vehicles and motorcycles” industry.
• In Yangon Region, there are 15.8 per cent of employed population working in “Wholesale and retail trade; repair of motor vehicles and motorcycles” and 4.7 per cent in “Public administration including civil servants” industry.

22
(E) Identity Cards
Table 10: Population aged 10 and over by type of identity card, urban/rural and sex
• In Botahtaung Township, 82.2 per cent of the population aged 10 and over have Citizenship Scrutiny Card while 10.3 per cent have none.
• Analysis by sex shows that 11.5 per cent of males and 9.2 per cent of females do not have any type
of card.
Note: * Less than 0.1 per cent.
Citizenship Scrutiny Card
Associate Scrutiny Card
Naturalised Scrutiny
Card
National Registration
Card
Religious Card
Temporary Registration
Card
Foreign Registration
Card
Foreign Passport None
Total 30,218 261 513 1,043 248 227 157 322 3,771
Urban 30,218 261 513 1,043 248 227 157 322 3,771
Rural - - - - - - - - -
Males 13,871 131 266 456 242 96 65 201 1,985
Females 16,347 130 247 587 6 131 92 121 1,786

23
(F) Disability
Table 11: Population by disability prevalence rate and type of disability by sex by age group
Total Not disabled With any of 4 disabilities
Disability prevalence
rate (%)Seeing Hearing Walking Remembering
Total 40,995 39,362 1,633 4.0 851 433 702 474
0 - 4 2,043 2,039 4 0.2 - - 2 3
5 - 9 2,192 2,174 18 0.8 5 2 9 9
10 - 14 2,870 2,846 24 0.8 11 2 3 9
15 - 19 4,053 4,014 39 1.0 19 6 16 14
20 - 24 4,582 4,550 32 0.7 17 5 4 10
25 - 29 3,755 3,715 40 1.1 16 8 10 14
30 - 34 3,284 3,239 45 1.4 18 9 8 17
35 - 39 2,837 2,794 43 1.5 22 4 12 12
40 - 44 2,937 2,872 65 2.2 37 8 18 16
45 - 49 3,023 2,903 120 4.0 65 16 36 21
50 - 54 2,631 2,492 139 5.3 77 22 35 29
55 - 59 2,271 2,112 159 7.0 82 30 62 36
60 - 64 1,553 1,404 149 9.6 83 39 51 30
65 - 69 1,094 928 166 15.2 103 47 77 38
70 - 74 691 557 134 19.4 66 38 69 42
75 - 79 546 380 166 30.4 76 67 101 54
80 - 84 353 208 145 41.1 76 56 86 51
85 - 89 189 95 94 49.7 54 46 70 43
90 + 91 40 51 56.0 24 28 33 26
Age groups
Total Population Type of disability
24
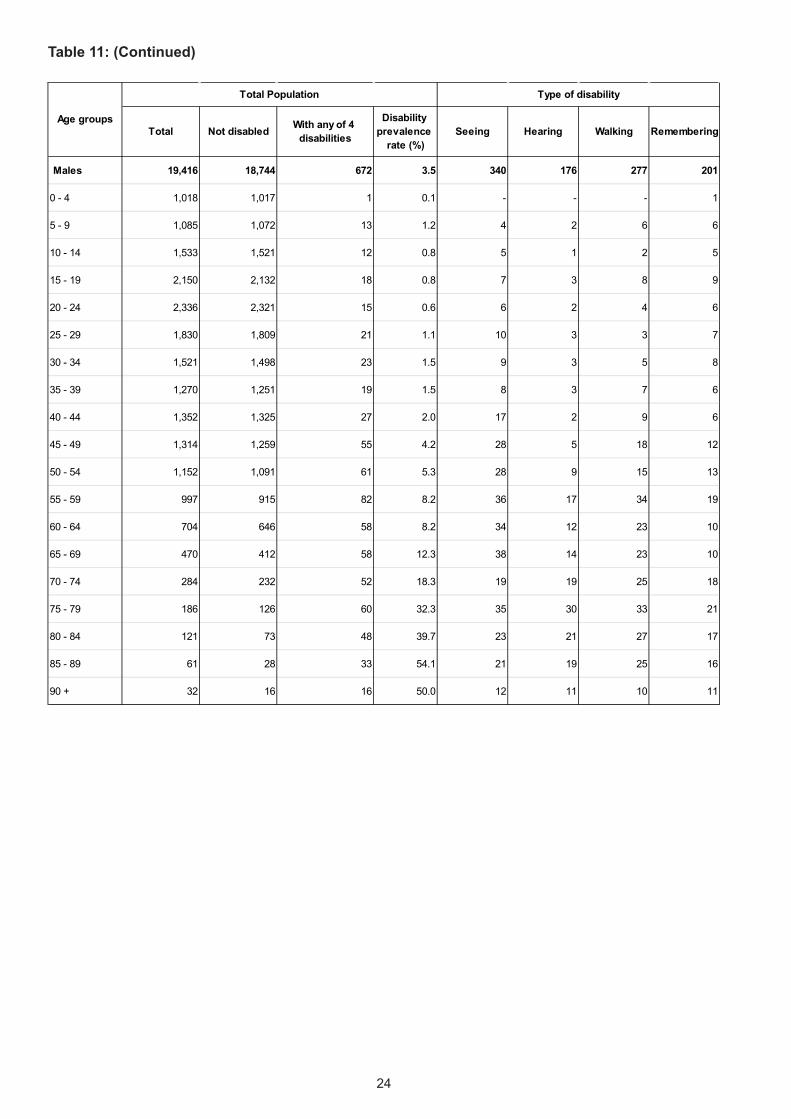
Table 11: (Continued)
Total Not disabled With any of 4 disabilities
Disability prevalence
rate (%)Seeing Hearing Walking Remembering
Males 19,416 18,744 672 3.5 340 176 277 201
0 - 4 1,018 1,017 1 0.1 - - - 1
5 - 9 1,085 1,072 13 1.2 4 2 6 6
10 - 14 1,533 1,521 12 0.8 5 1 2 5
15 - 19 2,150 2,132 18 0.8 7 3 8 9
20 - 24 2,336 2,321 15 0.6 6 2 4 6
25 - 29 1,830 1,809 21 1.1 10 3 3 7
30 - 34 1,521 1,498 23 1.5 9 3 5 8
35 - 39 1,270 1,251 19 1.5 8 3 7 6
40 - 44 1,352 1,325 27 2.0 17 2 9 6
45 - 49 1,314 1,259 55 4.2 28 5 18 12
50 - 54 1,152 1,091 61 5.3 28 9 15 13
55 - 59 997 915 82 8.2 36 17 34 19
60 - 64 704 646 58 8.2 34 12 23 10
65 - 69 470 412 58 12.3 38 14 23 10
70 - 74 284 232 52 18.3 19 19 25 18
75 - 79 186 126 60 32.3 35 30 33 21
80 - 84 121 73 48 39.7 23 21 27 17
85 - 89 61 28 33 54.1 21 19 25 16
90 + 32 16 16 50.0 12 11 10 11
Age groups
Total Population Type of disability

25
Table 11: (Continued)
• Four in every 100 persons in Botahtaung Township have, at least, one form of disability.
• Slightly more females than males have disability.
• The prevalence of disability increases with age and it increases considerably after the age of 65.
• Difficulties with seeing and walking were the most commonly mentioned forms of disability in the Township.
Total Not disabled With any of 4 disabilities
Disability prevalence
rate (%)Seeing Hearing Walking Remembering
Females 21,579 20,618 961 4.5 511 257 425 273
0 - 4 1,025 1,022 3 0.3 - - 2 2
5 - 9 1,107 1,102 5 0.5 1 - 3 3
10 - 14 1,337 1,325 12 0.9 6 1 1 4
15 - 19 1,903 1,882 21 1.1 12 3 8 5
20 - 24 2,246 2,229 17 0.8 11 3 - 4
25 - 29 1,925 1,906 19 1.0 6 5 7 7
30 - 34 1,763 1,741 22 1.2 9 6 3 9
35 - 39 1,567 1,543 24 1.5 14 1 5 6
40 - 44 1,585 1,547 38 2.4 20 6 9 10
45 - 49 1,709 1,644 65 3.8 37 11 18 9
50 - 54 1,479 1,401 78 5.3 49 13 20 16
55 - 59 1,274 1,197 77 6.0 46 13 28 17
60 - 64 849 758 91 10.7 49 27 28 20
65 - 69 624 516 108 17.3 65 33 54 28
70 - 74 407 325 82 20.1 47 19 44 24
75 - 79 360 254 106 29.4 41 37 68 33
80 - 84 232 135 97 41.8 53 35 59 34
85 - 89 128 67 61 47.7 33 27 45 27
90 + 59 24 35 59.3 12 17 23 15
Age groups
Total Population Type of disability

26
(G) Housing Conditions and Household Amenities
Type of housing unit
Table 12: Conventional households by type of housing unit by urban/rural
• The majority of the households in Botahtaung Township are living in apartment/condominium (83.2%) followed by households in wooden houses (7.5%).
Residence Total Apartment/ Condominium
Bungalow/ Brick house
Semi-paccahouse
Woodenhouse
Bamboohouse
Hut 2 - 3years Hut 1 year Other
Total 8,397 83.2 3.3 3.5 7.5 1.9 - 0.1 0.6
Urban 8,397 83.2 3.3 3.5 7.5 1.9 - 0.1 0.6
Rural - - - - - - - - -

27
Type of toilet
Figure 14: Proportion of households with access to improved sanitation
Union : 74.3%
Yangon Region : 91.1%
East District : 96.4%
Botahtaung Township : 99.5%

28
Table 13: Conventional households by type of toilet by urban/rural
• About 99.5 per cent of the households in Botahtaung Township have improved sanitation facilities (flush toilet (28.9%), water seal (improved pit latrine) (70.6%)).
• Compared to other townships in Yangon Region, Botahtaung belongs to the group with the highest proportion of households having improved sanitation facilities.
• The proportion of households with improved sanitation facilities in Yangon Region is 91.1 per cent while it is 74.3 per cent at the Union level.
• Some 0.4 per cent of the households in the township have no toilet facilities. For the entire Yangon Region, it is 3.3 per cent.
Note: * Less than 0.1 per cent.
Total Urban Rural
28.9 28.9 -
70.6 70.6 -
99.5 99.5 -
0.1 0.1 -
* * -
* * -
0.4 0.4 -
Per cent 100.0 100.0 -
Number 8,397 8,397 -
Type of toilet
Total
Flush
Water seal (Improved pit latrine)
Improved sanitation
Pit (Traditional pit latrine)
Bucket (Surface latrine)
Other
None

29
Source of drinking water
Figure 15: Proportion of households with access to improved source of drinking water
Union : 69.5%
Yangon Region : 77.3%
East District : 94.9%
Botahtaung Township : 99.6%

30
Table 14: Conventional households by source of drinking water by urban/rural
• In Botahtaung Township, 99.6 per cent of households use improved sources of drinking water (tap water/piped, tube well, borehole, protected well/spring and bottled water/water purifier).
• Compared to other townships in Yangon Region, it is found to be high and it is also higher than the Union average (69.5%).
• Some 75.5 per cent of the households use water from bottled water/water purifier and 23.6 per cent use water from tap water/piped.
• Some 0.4 per cent of the households use water from unimproved sources.
Note: * Less than 0.1 per cent.
Total Urban Rural
23.6 23.6 -
0.1 0.1 -
0.4 0.4 -
75.5 75.5 -
99.6 99.6 -
* * -
* * -
- - -
- - -
0.4 0.4 -
0.4 0.4 -
Per cent 100.0 100.0 -
Number 8,397 8,397 -
Total improved drinking water
Source of drinking water
Tap water/ Piped
Tube well, borehole
Protected well/ Spring
Bottled water/ Water purifier
Total
Unprotected well/Spring
Pool/Pond/ Lake
River/stream/ canal
Waterfall/ Rain water
Other
Total unimproved drinking water

31
Source of lighting
Figure 16: Proportion of households using electricity for lighting
Union : 32.4 %
Yangon Region : 69.3%
East District : 89.4%
Botahtaung Township : 99.2%

32
Table 15: Conventional households by source of lighting by urban/rural
• In Botahtaung Township, 99.2 per cent of the households use electricity for lighting. This proportion belongs to the highest group in electricity usage compared to other townships in Yangon Region. The percentage of households that use electricity in Yangon Region is 69.3 per cent.
Note: * Less than 0.1 per cent.
Total Urban Rural
99.2 99.2 -
* * -
0.4 0.4 -
0.2 0.2 -
* * -
- - -
- - -
0.1 0.1 -
Per cent 100.0 100.0 -
Number 8,397 8,397 -
Water mill (private)
Solar system/energy
Other
Total
Source of lighting
Electricity
Kerosene
Candle
Battery
Generator (private)

33
Type of cooking fuel
Figure 17: Proportion of households using wood-related cooking fuel
Union : 81.0%
Yangon Region : 47.2%
East District : 32.1%
Botahtaung Township : 8.9%

34
Table 16: Conventional households by type of cooking fuel by urban/rural
• In Botahtaung Township, households mainly use wood-related fuels for cooking with 0.5 per cent using firewood and 8.4 per cent using charcoal.
• Some 80.4 per cent of households mainly use electricity for cooking.
Note: * Less than 0.1 per cent.
Total Urban Rural
80.4 80.4 -
8.7 8.7 -
* * -
1.2 1.2 -
0.5 0.5 -
8.4 8.4 -
0.2 0.2 -
0.5 0.5 -
Per cent 100.0 100.0 -
Number 8,397 8,397 -
Charcoal
Coal
Other
Total
Type of cooking fuel
Electricity
LPG
Kerosene
BioGas
Firewood

35
Communication and related amenities
Table 17: Conventional households by availability of communication and related amenities by urban/rural
• Some 94.3 per cent of the households in Botahtaung Township have access to television and is the highest among the access of communication and related amenities.
• In Botahtaung Township, about half of the households (41.0%) reported having a radio.
Residence Conventional households Radio Television Land line
phoneMobilephone Computer Internet
at home% with none of
the items% with all of the
items
Total 8,397 41.0 94.3 32.5 93.2 39.9 44.3 1.9 8.5
Urban 8,397 41.0 94.3 32.5 93.2 39.9 44.3 1.9 8.5
Rural - - - - - - - - -

36
Figure 19: Proportion of households with access to mobile phone
• Some 93.2 per cent of the households in Botahtaung Township reported having mobile phones and is found to be high compared to other townships in Yangon Region.
Union : 32.9%
Yangon Region : 60.9%
East District : 76.1%
Botahtaung Township : 93.2%
37
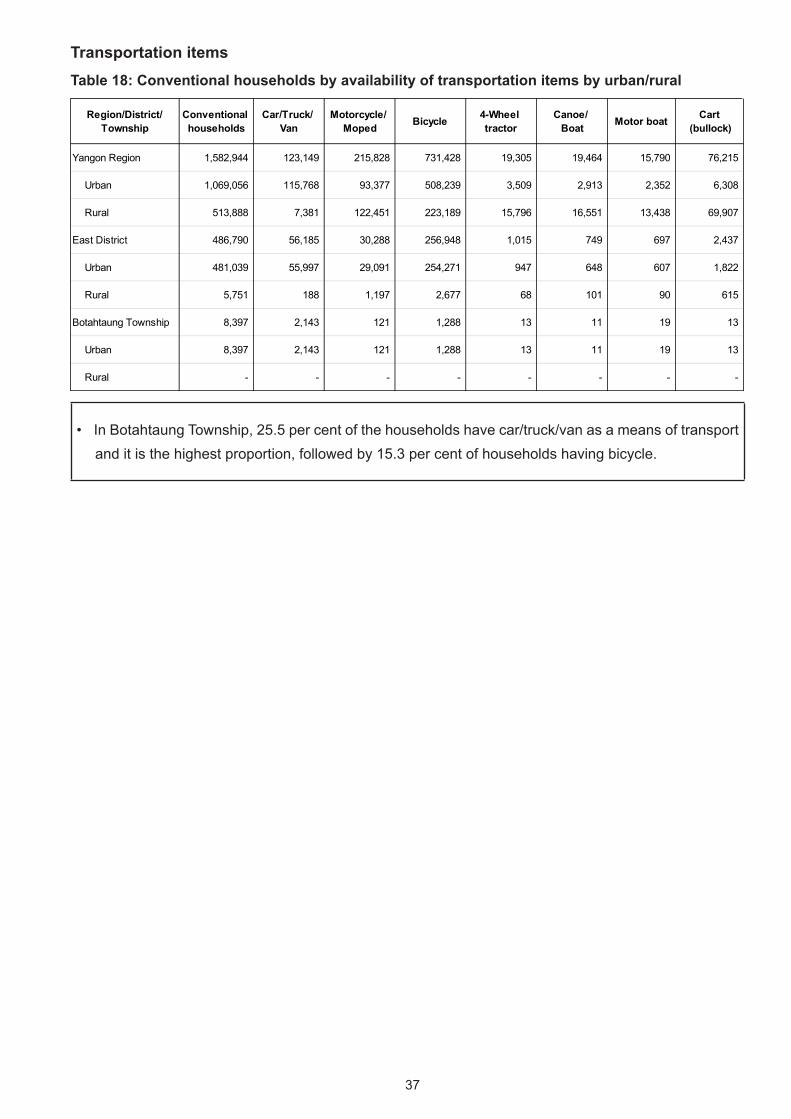
Transportation items Table 18: Conventional households by availability of transportation items by urban/rural
• In Botahtaung Township, 25.5 per cent of the households have car/truck/van as a means of transport and it is the highest proportion, followed by 15.3 per cent of households having bicycle.
Region/District/Township
Conventional households
Car/Truck/ Van
Motorcycle/ Moped Bicycle 4-Wheel
tractorCanoe/
Boat Motor boat Cart (bullock)
Yangon Region 1,582,944 123,149 215,828 731,428 19,305 19,464 15,790 76,215
Urban 1,069,056 115,768 93,377 508,239 3,509 2,913 2,352 6,308
Rural 513,888 7,381 122,451 223,189 15,796 16,551 13,438 69,907
East District 486,790 56,185 30,288 256,948 1,015 749 697 2,437
Urban 481,039 55,997 29,091 254,271 947 648 607 1,822
Rural 5,751 188 1,197 2,677 68 101 90 615
Botahtaung Township 8,397 2,143 121 1,288 13 11 19 13
Urban 8,397 2,143 121 1,288 13 11 19 13
Rural - - - - - - - -

38
(H) Fertility and Mortality
Fertility
• Age specific fertility rate is the highest at age group 25-29.
• For women aged 15-49, the total fertility rate is 1.2 children per woman and is lower than the total fertility rate of 2.5 at the National level.

39
Figure 21: Total fertility rate
Union : 2.5
Yangon Region : 1.9
East District : 1.7
Botahtaung Township : 1.2

40
• The expectation of life at birth in Yangon Region is 65.5 years and is higher than that of National level at 64.7 years.
• The female life expectancy at 70.8 years is higher than that of the males at 60.5 years.
Childhood Mortality and Maternal Mortality
• The Infant and Under 5 mortality rates in East District are lower than the Union average. The Infant mortality in East District is 33 deaths under age one per 1,000 live births while Under 5 mortality is 37 deaths under age 5 per 1,000 live births.
• The Infant and Under 5 mortality rates in Botahtaung Township are lower than those in Yangon Region and East District. The Infant mortality in Botahtaung is 23 per 1,000 live births and Under 5 mortality is 26 per 1,000 live births.

41
• In Yangon Region, there are 213 women dying while during pregnancy/delivery or within 42 days of termination of pregnancy for every 100,000 live births.
• The maternal mortality ratio in Yangon Region is lower than that of the Union level.
• Compared to the average maternal mortality ratio of 140 for Southeast Asian countries, the maternal mortality ratio of 282 for Myanmar is high.

42

43
Definitions and Concepts
Population: The population in this report corresponds to the de-facto population of Myanmar on Census Night (see below).
Census Night: The night between the 29th and the 30th March 2014. Every person in Myanmar was enumerated where they spent the Census Night.
Rural area: Areas classified by the Department of General Administration (GAD) as village tracts. Generally these are areas with low population density and a land use which is predominantly agricultural.
Urban area: Areas classified by the GAD as wards. Generally these areas have an increased density of building structures, population and better infrastructural development.
Population Density: The population density relates to the number of persons in a given administrative area to the surface of the area, expressed in square kilometres (Km2 ). Areas covered by water are excluded from the calculation.
Mean Household Size: The average number of persons per household (people living in households divided by number of conventional households).
Sex ratio: The number of males for every 100 females in a population.
Dependency ratio: The total dependency ratio is the ratio of dependents (people younger than 15 years and older than 64) to the population of working-age (age 15-64). Data are shown as the proportion of dependents per 100 working-age population. Three different measures can be calculated: total dependency ratio, child dependency ratio and old age dependency ratio.
Child Dependency Ratio: is the proportion of people younger than 15 years to the working age population (15-64).
Old Dependency Ratio: is the proportion of people older than 64 years to the working age population (15-64).
Ageing Index: The number of persons aged 65 years and over per 100 people under the age of 15 years.
Median Age: The age that divides a population into two numerically equal groups; that is, half the people are younger than this age and half are older.
Education: Education is the process by which people learn through instruction and teaching. The 2014 MPHC placed an emphasis on literacy skills, school attendance and educational attainment. The other categorisations used under education were:
(a) Literacy: The ability to read and write in any language with reasonable understanding.
(b) School attendance: The attendance at any regular educational institution or systematic instruction at any level of education during the last 12 months. This included schooling at pre-primary, primary, middle, high school and tertiary institutions of higher learning. The options were: (a) Currently attending; (b) Attended previously; (c) Never attended.

44
(c) Educational Attainment: The highest grade/standard/diploma/degree completed within the most advanced level attended in the education system of the country where the education was received. It covered both public and private institutions accredited by government.
Disability: Disability is a situation where a person is at a greater risk than the general population of experiencing restrictions in performing routine activities (including activities of daily living) or participating in roles (such as work) if no supportive measures are offered. The difficulties covered in the 2014 census included:
(a) Walking difficulty (wheel chairs, crutches, limping, problems climbing steps);
(b) Seeing difficulty (low vision, blind);
(c) Hearing difficulty (partially or completely deaf);
(d) Mental/Intellectual difficulty (slow learning development making it hard to compete with their counterparts at school, other mental conditions).
Identity card: An identity card is a document used to verify aspects of a person›s personal identity. There are several types of identity cards issued by the Government of Myanmar, and national passports in the case of foreigners.
Labour Force Status: According to the type of usual economic activities during the 12 months before Census Night, all persons 10 years of age and over were classified as follows:
Labour Force: The Labour force is a general term covering “employed” and “unemployed” persons in the population.
Employed: “Employed” persons refer to those who did any work during the time of the week before the census date or worked for more than 6 months in the 12 months before the census date for pay or profit, such as a wage, salary, allowance, business profit, etc. Also included in this category were persons
45
working in family businesses, on a farm, in a store, in a private hospital etc., even though they were not paid any wages.
Unemployed: “Unemployed” persons refer to those who had no work but were able to work and actually seeking a job during the reference period, or at the time of the census enumeration.
Not in labour force: This category comprised persons who had no work and did not make any positive efforts to find a job during the 6 months before the census date or were unable to work. This included full time students, household work, elderly people, etc.
Employment Status: All employed persons were classified according to the economic activity status in the place where they worked during the last 12 months or if they worked in more than one place, where they worked most of the time. There were five employment categories:
(a) Employee (Government): those employed and working for government including in state organisation institutions.
(b) Employee (Private organisation): those employed and working for private employers or private organisations. All people in private companies, NGOs, international organisations, retail and wholesale enterprises fell under this category.
(c) Employer: persons who during the reference period worked in their own business, which also employed one or more other persons.
(d) Own account worker: self-employed persons who worked in their own business or worked in their own/family business for family gain and did not have any employees.
(e) Unpaid family worker: persons who worked in a business, farm, trade or professional enterprise operated by a member of the household/family and received no pay.
Labour force participation rate: The labour force participation rate is the ratio between the labour force and the overall size of the total population of the same age range. This is an important indicator as it portrays the proportion of the population that is economically active.
Labour force participation rate
=
Labour force (Employed + Unemployed) x 100
Total Population
Unemployment rate: The percentage of the total labour force that is unemployed but actively seeking employment and willing to work. These are people who are without work, looking for jobs and available for work.
Unemployment rate =Unemployed
x 100Labour force
(Employed + Unemployed)

46
Employment to population ratio: A statistical ratio that measures the proportion of the country’s working-age population (ages 15 to 64) that is employed. The International Labour Organization (ILO) states that a person is considered employed if they have worked at least 1 hour in “gainful” employment in the most recent week.
Employment to population ratio
=Employed
x 100Total Population
Occupation: Occupation refers to the kind of work an employed person did in the establishment during the 12 months (reference period) before the census date. Put differently, occupation is the kind of work done during the last 12 months by the person employed, regardless of the industry of the establishment. In the 2014 Myanmar Census, field data collectors were instructed to collect a detailed description of the work being done such as accounts clerk, data entry operator (clerk), legal secretary, domestic worker, fisherman, human resource manager, etc. If an employed person was engaged in two or more jobs, the kind of work was decided by the work in which he/she was mainly engaged in, that is in terms of time. The occupational classification is based on the ISCO 2008.
Industry: Industry refers to the main activity of the establishment where an employed person usually worked during the 12 months (reference period) before the census date. In the 2014 Myanmar Census, industry was explained to the enumerators as the type of economic activity carried out at the person’s place of work. It is defined in terms of the kind of goods produced or services supplied by the enterprise in which the person works and not necessarily the specific duties or functions of the person’s job. For example, a clerical officer working in stores within a factory that makes television sets. The industry should be recorded as manufacture of electrical goods. If an employed person worked in two or more establishments, “industry” was decided by the establishment where he/she worked most. The industrial classification is based on the ISIC Revision 4.
Live Birth: A live birth is one where the infant shows one or more of the following signs of life immediately after birth: crying or similar sounds, movement of the limbs or any other parts of the body and/or any other tangible signs of life. The census was concerned only with children born alive. Also collected was information on the last live birth of ever married female respondents.
Total fertility rate (TFR): The average number of children that a woman would give birth to if all women lived to the end of their childbearing years and bore children according to the current schedule of age-specific fertility rates.
Age specific fertility rate (ASFR): The age-specific fertility rate measures the annual number of births to women of a specified age or age group per 1,000 women in that age group. Unless otherwise specified, the reference period for the age-specific fertility rates is the calendar year.

47
List of ContributorsContributors to the Yangon Region, East District, Botahtaung Township Report
Name Institution RolePrepared by
Daw ThidaAssistant Director,Department of Population
Leader
Daw Yin Wai LwinImmigration Assistant,
Department of PopulationAssistant
U Wai Yan OoImmigration Assistant,Department of Population
Assistant
Translator and Reviewer
Daw Tin Tin Nyunt UNFPA Consultant Translation and Review
Data Processing and IT Team
Daw Sandar MyintDeputy Director,Department of Population
Programming and generation of tables
Daw Su Myat OoImmigration Assistant, Department of Population
Generation of tables
Daw Aye Thiri Zaw Junior Clerk, Department of Population Generation of tables
Daw Lin Lin Mar Staff Officer, Department of Population Generation of maps
U Thant Zin OoAssistant Computer Operator, Department of Population
Generation of maps
U Khun Zin Naing Tun Junior Clerk, Department of Population Generation of maps
Designer
U Naing Phyo Kyaw Staff Officer, Department of Population Graphic Designer
Daw Cho Zin Win Junior Clerk, Department of Population Graphic Designer


49
The Townships Reports
can be downloaded at :
www.dop.gov.mm
or
http://myanmar.unfpa.org/census