PDF download - Central European Review of Economics and ...
178
-
Upload
khangminh22 -
Category
Documents
-
view
5 -
download
0
Transcript of PDF download - Central European Review of Economics and ...
CENTRAL EUROPEAN REVIEW OF ECONOMICS AND MANAGEMENT
Volume 3, Number 4 December 2019
Wydawnictwo: Wyższa Szkoła Bankowa we Wrocławiu, ul. Fabryczna 29-31, 53-609 Wrocław
Vol. 3, No. 4
3
Editor-in-chief: Prof. Johannes (Joost) Platje, [email protected]
Secretary of editorial board: Dr. Tomasz Rólczyński, [email protected]
Members of editorial board: Prof. Michael Wheeler, Harvard Business School, USA; Prof.
John Hall, University of Pretoria, South Africa; Prof. Petr Polák, University of Brunei
Darussalam, Brunei; Prof. Yanping Zhao, Ocean University in Qingdao, China; Dr Corrado
Topi, University of York, England; Dr. Wim Westerman, University of Groningen, The
Netherlands; Dr. Ynte van Dam, University of Wageningen, The Netherlands; Prof. Francisco
Vargas, University of Sonora, Mexico; Dr. Luis Velazquez, University of Sonora, Mexico;
Prof. Mike Ellenbecker, University of Massachusetts Lowell, USA; Prof. Diana Tirca,
“Constantin Brancusi” University of Targu-Jiu, Romania; Prof. Thomas Weith, Leibniz-
Zentrum für Agrarlandschaftsforschung e.V., Germany; Prof. Barbara Despiney-Żochowska,
University Paris 1 Pantheon-Sorbonne, France; Prof. Walter Leal Filho, Hamburg University
of Applied Sciences, Germany; Prof. Tatjana Tambovceva, Riga Technical University,
Latvia; Prof. Osvaldo Quelhas, Federal Fluminense Universidade, Brazil; Prof. Valentina
Pidlisnyuk, Jan Evangelista Purkyne University, Czech Republic; Dr. Les Duckers, University
of Coventry, United Kingdom; Dr. Wytze van der Gaast, JIN Climate and Sustainability,
Netherlands; Prof. Jena Laage-Hellmann, Chalmers University of Technology, Sweden; Prof.
Vasilij Szwec, Mining University in Dniepropietrovsk, Ukraine; Prof. Jan Vachal, VSTE v
Ceskich Budejovicach, Czech Republic; Prof Ali Emrouznejad, Aston University, United
Kingdom; Prof. Marian Noga, WSB University in Wrocław, Poland; Prof. Aniela Styś, WSB
University in Wrocław, Poland; Prof. Piotr Migoń, The University of Wrocław, Poland; Prof.
Marek Bugdol, Jagiellonian University, Poland.
Advisory board: Prof. Stefan Forlicz, WSB University in Wrocław, Poland; Prof. Jacek
Mercik, WSB University in Wrocław, Poland; Prof. Jaroslav Nenadal, Technical University
of Ostrava, Czech Republic; Dr. Wim Lambrechts, Open University of The Netherlands, The
Netherlands; Prof. Jana Brauweiler, University of Applied Science Zittau/Görlitz, Germany;
Prof. Jarl Kampen, University of Anwerp, Belgium; Prof. Ralph Wrobel, Westsaxonian
University of Applied Science, Germany; Prof. Diana Cibulskiene, Siauliai University,
Lithuania; Prof. Stanisław Styś, WSB University in Wrocław, Poland; Prof. Krzysztof Łobos,
WSB University in Wrocław, Poland; Prof. Jacek Unold, WSB University in Wrocław,
Poland; Prof. Maciej Jasiński, WSB University in Wrocław, Poland; Dr Bolesław
Goranczewski, WSB University in Wrocław, Faculty of Economics in Opole, Poland; Prof.
Piotr Jedynak, Jagiellonian University, Poland; Prof. Andrzej Bujak, WSB University in
Wrocław, Poland.
Contact: Tomasz Rólczyński, [email protected], +48 71 376 23 43, ul. Fabryczna
29-31, 53-609 Wrocław, Poland
The journal is reviewed according to the principle of double blind peer review, as well as in
compliance with the standards of the Polish Ministry of Science and Higher Education.
CEREM is a continuation of the WSB University in Wrocłąw Research Journal (Zeszyty
Naukowe WSB we Wrocławiu – ISSN 1643-7772; eISSN 2392-1153), which is included in B
list of the Polish Ministry of Science and Higher Education from 23.12.2015 (8 points).
CEREM is registered in the IC Journal Master List, and indexed in CEJSH, Index Copernicus
and BazEkon
Copyright by Wyższa Szkoła Bankowa we Wrocławiu
ISSN 2543-9472; eISSN 2544-0365
Cover and logo design: Sebprojekt.pl Wydawnictwo: Wyższa Szkoła Bankowa we Wrocławiu, ul. Fabryczna 29-31, 53-609, Wrocław.

4
5
CONTENTS
1. Wolfgang BESSLER, Hidde STEENBEEK, Wim WESTERMAN, Do
Mergers and Acquisitions Increase Default Risk? Evidence from the
European market ……………………………………………...……………. 7
2. Hans VISSER, The Islamic Economy: its origins, its world view and its
claims …………………………….. ……………………………………… 53
3. David S. ZEPEDA, Javier ESQUER, Carlos ANAYA, Teaching and
Mindsets Regarding Sustainable Development – a Mexican case study …. 91
4. Nadka KOSTADINOVA, Nadezhda PETROVA, Georgi ALEKSIEV,
Sustainability of the Bulgarian Food Processing Industry ……………… 103
5. Tomasz MUSIAŁOWSKI, The Impact of Inflation on the Cost of
Adjustable-Rate Mortgages ……………………………………………... 113
6. Bartosz FORTUŃSKI, The Impact of Foreign Trade on the Netherlands’
Real CO2 Emissions ….………………………………………………….. 135
7. Markus WILL, Towards a Sustainable Circular Economy – remarks on
plastics and wood-waste sector ………………………………………….. 149
CENTRAL EUROPEAN REVIEW OF ECONOMICS AND MANAGEMENT ISSN 2543-9472; eISSN 2544-0365
www.cerem-review.eu
www.ojs.wsb.wroclaw.pl Vol. 3, No. 4, 7-51, December 2019
Correspondence address: Wolfgang Bessler, Professor of Finance and Banking, Justus-Liebig University
Giessen, Germany, E-mail: [email protected]. Hidde Steenbeek, Faculty of
Economics and Business, University of Groningen, The Netherlands, E-mail:
[email protected]. Wim Westerman, Faculty of Economics and Business, University of
Groningen, The Netherlands, E-mail, [email protected].
Received: 20.11.2019, Revised: 11.12.2019, Accepted: 16.12.2019
doi: http://dx.10.29015/cerem.861
© 2019 WSB UNIVERSITY IN WROCŁAW
Do mergers and acquisitions increase default
risk? Evidence from the European market Authors:
Wolfgang BESSLER, Justus-Liebig University Giessen, Germany
Hidde STEENBEEK, Wim WESTERMAN, University of Groningen, The
Netherlands
Abstract:
Aim: In this study, we examine the changes in default risk of the bidder over the course of a merger or acquisition. The data set consists of 531 deals in which the acquirers are European firms. We employ a general set of determinants to analyse the change in default risk and extend the literature by providing new empirical evidence for the European capital market. Research design: Abnormal returns are analysed to provide preliminary insights into the merger induced valuation effects. All hypothesized relationships on the changes in default risk are tested via a regression analyses. We differentiate these results further by analysing which factors determine the increase in default risk. Findings: Previous research on this issue reported mixed results. The main finding of our empirical analysis is that, on average, mergers and acquisitions of European bidders significantly increase default risk during the post-merger period. Originality: This study adds to the mergers and acquisitions literature for European bidders and targets. The empirical findings suggest that some observed relationships and determinants are different in Europe than in the United States. Implications: This research introduces a default risk model that could be applied to predict bidder performance subsequent to a merger or acquisition by analysing possible changes in default risk of the bidder. It also provides some possible explanations for the average increase in default risk. This study may help practitioners to better assess the potential risks when acquiring other firms. Key words: mergers & acquisitions, abnormal returns, default risk, Europe JEL: G32, G34
Wolfgang BESSLER, Hidde STEENBEEK, Wim WESTERMAN
8
1. Introduction
The total deal value of global mergers and acquisitions (M&As) is at its highest
level since 2015 and the average deal value has been increasing since the global
financial crisis of 2008 (Bureau van Dijk 2018). Mergers and acquisitions have
advanced to become one of the most important growth strategy in many industries
and for many firms, small and large, resulting in less firms being publicly listed
(Lattanzio et al. 2019). Nevertheless, merging with or acquiring other firms has
always been risky as the outcome can either be value creating or value destroying
for the shareholder of the bidder, and it is not that obvious in advance which
outcome will occur. Therefore, the objective of this study is to examine the effects
that a corporate merger or acquisition has on the default probability of the acquirer.
Previous academic studies combining the research on default risk and M&As is
rather limited and provides at best ambiguous results. As usual, most M&A research
primarily focusses on the United States and there is a lack of research for other
regions. Consequently, our study focusses on Europe. The outcome of this research
might be of interest to managers of bidder and target firms, investors and corporate
finance advisors alike, as a firm’s change in default risk after acquiring another firm
is clearly of essential importance.
Default or bankruptcy of a firm is defined in legal terms as the moment the firm
can no longer pay its debt. In technical terms, this is the case when the liabilities
become larger than the assets of a firm, resulting in negative equity. There are a
number of different approaches to estimate and predict the default probability of a
firm. The Merton distance to default model (Merton 1974), an adaptation of the
Black and Scholes (1973) option pricing model, is an approach to estimate the
default risk. The distance to default is a measure for how far away a firm is from
defaulting on its liabilities, making it inversely related to default risk. The Merton
model assumes efficient financial markets, which is a reasonable assumption for our
European capital markets and our study. We first apply the Merton model and use
the Altman Z’’-score (Altman et al. 2014) as a robustness check.
In our analysis, we first examine for a European data set the valuation effects of
bidders and targets involved in an acquisition for the period surrounding the
DO MERGERS AND ACQUISITIONS INCREASE DEFAULT RISK?
9
announcement and then analyse the determinants explaining these effects. This leads
to the main research focus of this article, the analysis how a merger and acquisition
affect the default risk of the bidder after deal completion. Previous research on this
topic has provided mixed outcomes on both separate samples and partially
overlapping ones (Koerniadi et al. 2015; Maksimovna 2015). This ambiguity can be
due to multiple reasons, for example, restrictions on the sample size and sample
period of these studies.
The aim of this research is to employ a general set of determinants including
some sample requirements to extend the research on this topic and to provide new
findings for the European capital market. The research involves a sample of 531
deals by European acquiring firms that were completed between October 1998 and
March 2018. We find support for the idea that distance to default is significantly
related to the size of the valuation effects. Moreover, we create a uniform model that
provides empirical evidence for a significant influence of a number of determinants
on the acquirer’s default risk subsequent to a merger or acquisition. For this, we
employ various analyses for the full sample and for various subsamples. Overall,
this research adds new insights to the previous literature and to specific topics such
as the firm’s distance to default, market valuations, and relative size.
This article continues as follows. First, we provide a review of the literature on
mergers and acquisitions. The methodology section outlines our research strategy
followed by the data and our descriptive statistics. Subsequently, we discuss the
results in terms of both valuation effects and change in default risk. Finally, we offer
concluding remarks including the summary of the research and implications for
practice as well as future research.
2. Literature review and hypotheses
In this section, we discuss the previous literature on the relationship between
mergers and acquisitions and the financial valuation effects of the bidder and target
firms. Our focus is especially on the relationship between M&As and changes in
Wolfgang BESSLER, Hidde STEENBEEK, Wim WESTERMAN
10
default risk. Both of these topics are discussed along several major features,
resulting in eight hypotheses.
M&As and valuation effects. Hackbarth and Morellec (2008) suggest that for
their sample of U.S. public takeovers between 1985 and 2002, the valuation effects
in terms of cumulative abnormal returns surrounding the announcement period (-1
day and +1 day) are on average substantial and significantly positive for the
acquired firm (target).1 Alexandridis et al. (2010) study firms across the globe. They
provide evidence for both a world-wide and a European subsample that target firms
experience positive and highly significant abnormal returns during the period
surrounding the M&A announcement. Ishii and Xuan (2014) also find for a strictly
US sample positive valuation effects for the target in the period surrounding the
announcement. Tang and Xu (2016) report positive and significant abnormal returns
for the target in the 5 days after the announcement date for their sample of mostly
US deals. An explanation for these observations is that, on average, the acquirer has
to pay a substantial premium for buying the shares of the target (Savor, Lu 2009). If
markets are efficient, meaning that all M&A related information is incorporated
instantaneously and fully in the stock price, then there should be hardly any stock
price reaction of the target before and after the announcement but only on the day
when the deal becomes public knowledge. The size of the premium and the stock
price reaction could depend on a number of factors, which we will explore later on.
Often, the size of this premium is based on possible synergy gains and most to
nearly all synergy gains go to the target shareholders, resulting in positive valuation
effects (Bessler, Schneck 2015, 2016). The finding that the target company’s
cumulative abnormal return (CAR) is positive and significant is also in line with the
previous literature (Mitchell et al. 2001). The above-described findings and those
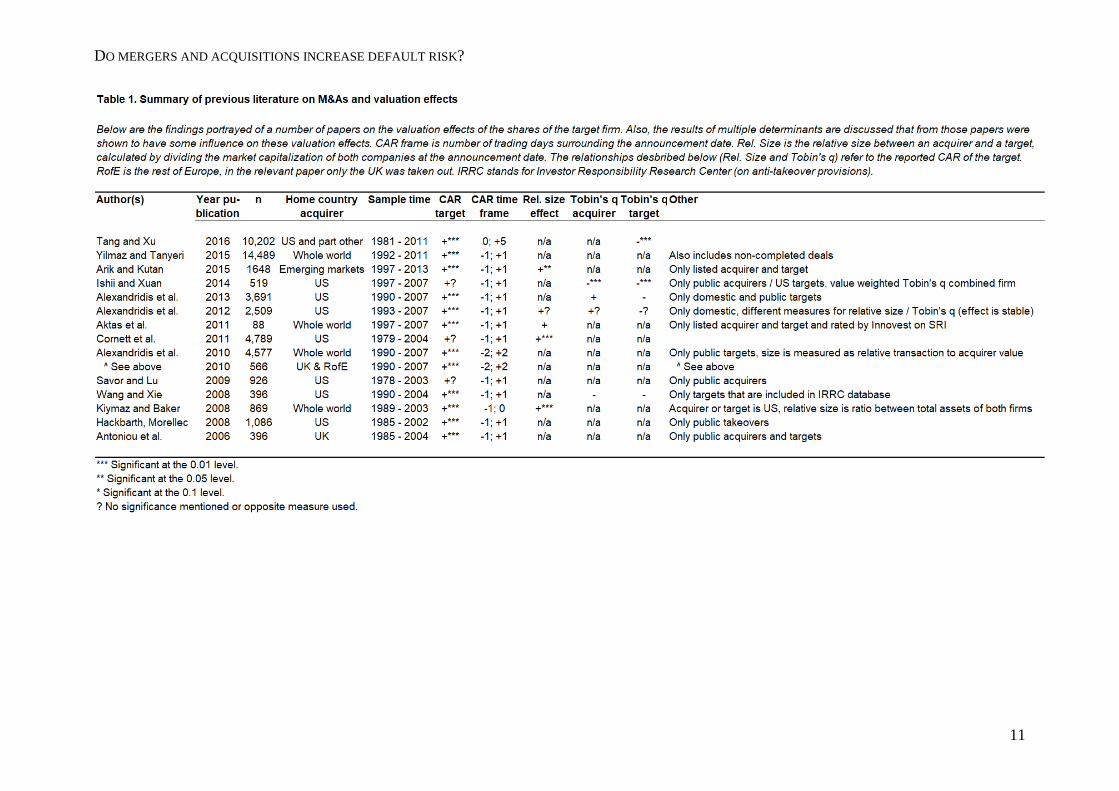
from the literature are shown in Table 1 leading to the formulation of our first
hypothesis.
1 In this context, a valuation effect is an information induced change of a share price of a
listed company. Abnormal returns are the risk adjusted percentage share price change minus
the percentage price change of the overall market (Brown and Warner, 1985). Cumulative
abnormal returns refer to the sum of abnormal returns. The calculation of this measure is
explained in more detail in the methodology section.
DO MERGERS AND ACQUISITIONS INCREASE DEFAULT RISK?
11
Wolfgang BESSLER, Hidde STEENBEEK, Wim WESTERMAN
12
H1: In the period surrounding the announcement of an M&A deal, there are positive
valuation effects and positive abnormal returns for the target, meaning that the share
price of the bidder increases by more than the appropriate benchmark.
The hypothesized relationship might be influenced by a number of variables,
including the relative size between the acquiring firm and the target firm (Cornett et
al. 2011). Moeller et al. (2004) first provide support for a size effect on the valuation
outcomes in M&As. Arık and Kutan (2015) suggest that the relative size does
indeed have a significant positive impact on the share price of the target. In these
cases, the target is relatively smaller compared to the acquirer. There is, on average,
a higher premium when the relative size of the acquirer increases, as the size of the
premium becomes less relevant for the acquirer.
There could be another economic intuition for explaining this relationship when
the relative sizes change. For cases where the target is relatively larger than the
bidder, the integration into the smaller bidder may require more diligent integration
work within the acquiring firm (Antoniou et al. 2008). There is empirical evidence
that this relative size effects may only become relevant over time but they are
reflected in the target returns surrounding the M&A announcement (Kiymaz, Baker
2008). In Table 1, we summarize the findings of various studies on this effect.
Consequently, we formulate the second hypothesis as follows:
H2: When the target is relatively smaller than the acquiring firm, its share price
increase will be relatively higher in the period surrounding the announcement of an
M&A deal than for larger targets.
Another firm characteristic that may influence the size of the valuation effect
during a merger or acquisition is Tobin’s q, defined as a ratio between the market
value of a firm’s assets and the replacement value of the firm’s assets (Tobin 1969).
The Tobin’s q can also be seen as a forward-looking proxy for how ‘well’ a firm is
managed (Dezsö, Ross 2012). This means that a ‘better’ managed firm more
effectively creates cash flows from its assets and therefore increases its market value
(cf. Lang et al. 1989). In some of the previous literature, this measure is extended to
relative Tobin’s q (Alexandridis et al. 2012). A higher value of this measure
indicates that the acquiring firm is ‘better’ managed and creates cash flows more
efficiently than the target. Intuitively, this suggests that if the acquiring firm has
DO MERGERS AND ACQUISITIONS INCREASE DEFAULT RISK?
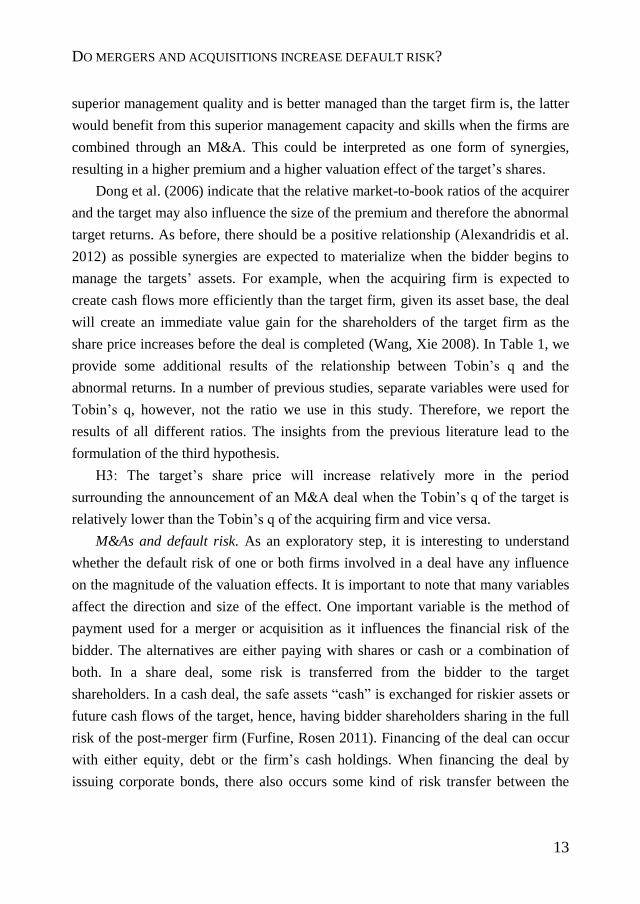
13
superior management quality and is better managed than the target firm is, the latter
would benefit from this superior management capacity and skills when the firms are
combined through an M&A. This could be interpreted as one form of synergies,
resulting in a higher premium and a higher valuation effect of the target’s shares.
Dong et al. (2006) indicate that the relative market-to-book ratios of the acquirer
and the target may also influence the size of the premium and therefore the abnormal
target returns. As before, there should be a positive relationship (Alexandridis et al.
2012) as possible synergies are expected to materialize when the bidder begins to
manage the targets’ assets. For example, when the acquiring firm is expected to
create cash flows more efficiently than the target firm, given its asset base, the deal
will create an immediate value gain for the shareholders of the target firm as the
share price increases before the deal is completed (Wang, Xie 2008). In Table 1, we
provide some additional results of the relationship between Tobin’s q and the
abnormal returns. In a number of previous studies, separate variables were used for
Tobin’s q, however, not the ratio we use in this study. Therefore, we report the
results of all different ratios. The insights from the previous literature lead to the
formulation of the third hypothesis.
H3: The target’s share price will increase relatively more in the period
surrounding the announcement of an M&A deal when the Tobin’s q of the target is
relatively lower than the Tobin’s q of the acquiring firm and vice versa.
M&As and default risk. As an exploratory step, it is interesting to understand
whether the default risk of one or both firms involved in a deal have any influence
on the magnitude of the valuation effects. It is important to note that many variables
affect the direction and size of the effect. One important variable is the method of
payment used for a merger or acquisition as it influences the financial risk of the
bidder. The alternatives are either paying with shares or cash or a combination of
both. In a share deal, some risk is transferred from the bidder to the target
shareholders. In a cash deal, the safe assets “cash” is exchanged for riskier assets or
future cash flows of the target, hence, having bidder shareholders sharing in the full
risk of the post-merger firm (Furfine, Rosen 2011). Financing of the deal can occur
with either equity, debt or the firm’s cash holdings. When financing the deal by
issuing corporate bonds, there also occurs some kind of risk transfer between the
Wolfgang BESSLER, Hidde STEENBEEK, Wim WESTERMAN
14
shareholders of the target and the acquirer (Billett et al. 2004). Overall, according to
Bessler et al. (2011), it is important to analyse the deal by differentiating with
respect to leverage and changes in leverage of the bidder, the employed financing
instruments (cash, debt, or equity) as well as the method of payment (cash and
shares). These are all important variables for analysing the bidders’ post-merger
change in default risk.
We now review and discuss the literature with respect to merger-induced
changes in default risk. In our empirical analysis, we implement the Merton distance
to default model as our main measure for default risk and changes in default risk.
The distance to default is defined as how many standard deviations a firm is away
from defaulting on its liabilities when concentrating on the distribution of the total
asset values. Distance to default and default risk must be negatively correlated: the
higher the distance to default, the lower is the default risk. So far, the literature using
structural default risk models for analysing the changes in default risk from before to
subsequent of a merger or acquisition is limited. The outcomes of the few studies so
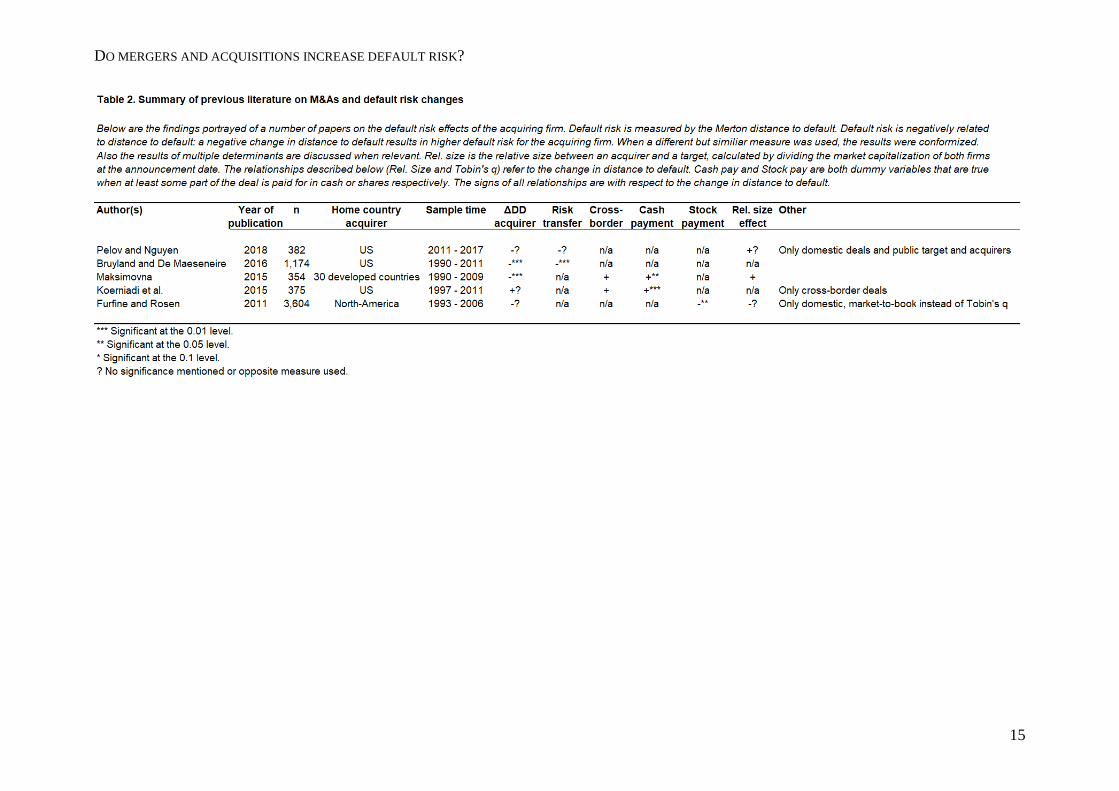
far are summarized in Table 2. Therefore, this research widens the scope of the
M&A literature on this topic although it is to some extent exploratory.
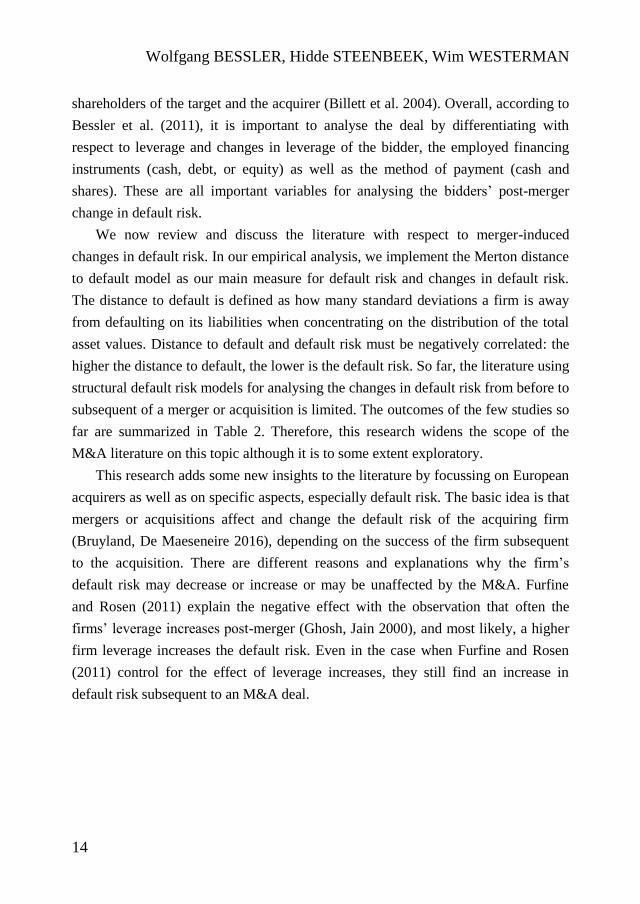
This research adds some new insights to the literature by focussing on European
acquirers as well as on specific aspects, especially default risk. The basic idea is that
mergers or acquisitions affect and change the default risk of the acquiring firm
(Bruyland, De Maeseneire 2016), depending on the success of the firm subsequent
to the acquisition. There are different reasons and explanations why the firm’s
default risk may decrease or increase or may be unaffected by the M&A. Furfine
and Rosen (2011) explain the negative effect with the observation that often the
firms’ leverage increases post-merger (Ghosh, Jain 2000), and most likely, a higher
firm leverage increases the default risk. Even in the case when Furfine and Rosen
(2011) control for the effect of leverage increases, they still find an increase in
default risk subsequent to an M&A deal.
DO MERGERS AND ACQUISITIONS INCREASE DEFAULT RISK?
15
Wolfgang BESSLER, Hidde STEENBEEK, Wim WESTERMAN
16
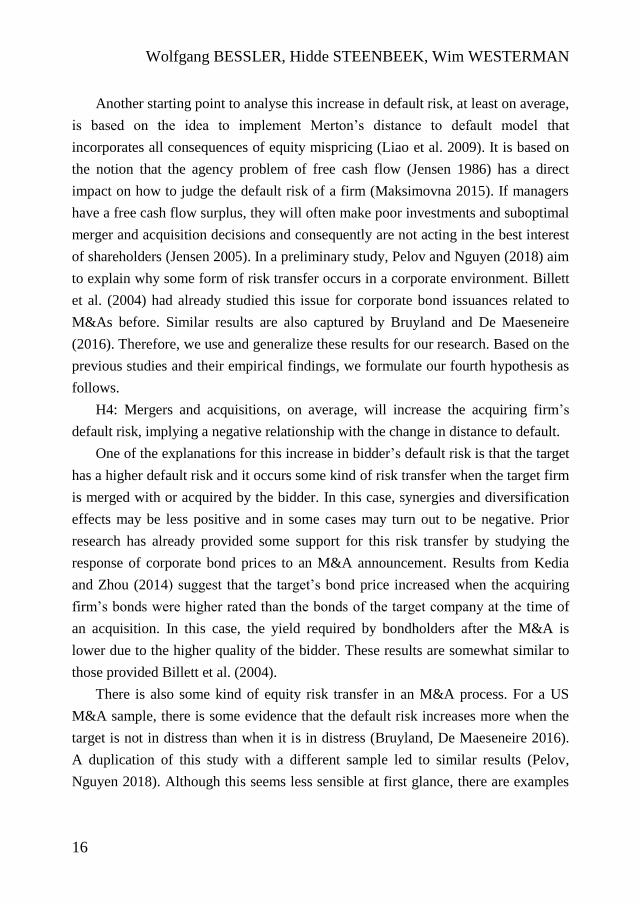
Another starting point to analyse this increase in default risk, at least on average,
is based on the idea to implement Merton’s distance to default model that
incorporates all consequences of equity mispricing (Liao et al. 2009). It is based on
the notion that the agency problem of free cash flow (Jensen 1986) has a direct
impact on how to judge the default risk of a firm (Maksimovna 2015). If managers
have a free cash flow surplus, they will often make poor investments and suboptimal
merger and acquisition decisions and consequently are not acting in the best interest
of shareholders (Jensen 2005). In a preliminary study, Pelov and Nguyen (2018) aim
to explain why some form of risk transfer occurs in a corporate environment. Billett
et al. (2004) had already studied this issue for corporate bond issuances related to
M&As before. Similar results are also captured by Bruyland and De Maeseneire
(2016). Therefore, we use and generalize these results for our research. Based on the
previous studies and their empirical findings, we formulate our fourth hypothesis as
follows.
H4: Mergers and acquisitions, on average, will increase the acquiring firm’s
default risk, implying a negative relationship with the change in distance to default.
One of the explanations for this increase in bidder’s default risk is that the target
has a higher default risk and it occurs some kind of risk transfer when the target firm
is merged with or acquired by the bidder. In this case, synergies and diversification
effects may be less positive and in some cases may turn out to be negative. Prior
research has already provided some support for this risk transfer by studying the
response of corporate bond prices to an M&A announcement. Results from Kedia
and Zhou (2014) suggest that the target’s bond price increased when the acquiring
firm’s bonds were higher rated than the bonds of the target company at the time of
an acquisition. In this case, the yield required by bondholders after the M&A is
lower due to the higher quality of the bidder. These results are somewhat similar to
those provided Billett et al. (2004).
There is also some kind of equity risk transfer in an M&A process. For a US
M&A sample, there is some evidence that the default risk increases more when the
target is not in distress than when it is in distress (Bruyland, De Maeseneire 2016).
A duplication of this study with a different sample led to similar results (Pelov,
Nguyen 2018). Although this seems less sensible at first glance, there are examples
DO MERGERS AND ACQUISITIONS INCREASE DEFAULT RISK?
17
that could lead to this outcome. First, when the cash flows of bidder and target are
negatively correlated, resulting in lower risk when they are combined, resulting in a
higher valuation. Second, when the target is in distress and the assets are extremely
low valued, the acquisition could be a project with a positive net present value.
Therefore, from a risk management perspective, it seems in some instances
beneficial for the acquiring firm to acquire or merge with a distressed target.
Therefore, for some deals the premium paid for such a target could be lower than
that of a non-distressed target, resulting in a lower payment and possible lower
increase in leverage but higher gains. The fifth hypothesis is therefore formulated as
follows.
H5: In specific circumstances, there will be a larger increase in default risk of
the bidder when the target is less risky and vice versa, implying a negative
relationship with change in distance to default.
An additional aspect is that most research usually finds different outcomes
between cross-border and domestic mergers (cf. Maksimovna 2015). Cross-border
M&A deals could contribute to the diversification of risk (Amihud, Lev 1981) and
this should result in a decrease in default risk. This reasoning may explain the
difference in the results of Furfine and Rosen (2011) and Koerniadi et al. (2015).
The first study uses only US domestic M&A’s and finds, on average, an increase in
default risk. The second study focusses only on US cross-border deals and provides
evidence for an average decrease in default risk. In addition, when a new host
country is more distand than a host country that is on the same continent, this might
result in higher diversification opportunities. Consequently, the above reasoning
leads to the following hypothesis.
H6: Change in distance to default of the acquirer will be positively related to
geographical diversification, implying that there might be a decrease in default risk
when the deal is cross-border and/or cross-continent and vice versa.
Another possible explanation for an increase in default risk, which we already
indicated above, is the increase of post-merger leverage (Ghosh, Jain 2000).
Whether this occurs or not depends on the financing of the deal and the method of
payment that the acquirer employs. It is widely established that there are differences
in valuation effects between different financing and payment methods, due to
Wolfgang BESSLER, Hidde STEENBEEK, Wim WESTERMAN
18
different information asymmetries (Bessler et al. 2011). When an M&A is paid for
in cash, it is possible that the deal is financed by issuing additional debt (bonds), and
therefore leverage and risk could increase (Furfine, Rosen 2011). However, it is also
possible that for a cash deal the bidder either has accumulated cash or issued new
equity before the deal announcement (Bessler et al. 2011). Nevertheless, agency
problems imply that bidders pay with cash when a positive deal outcome is highly
likely and with shares when the deal outcome is much riskier, sharing risk and
possible losses with the target shareholders. Consequently, this also suggests that
share deals are more likely to increase the bidders’ default risk.
In contrast, another aspect is that since the acquirer is exchanging the safer
liquid assets “cash” for the riskier future cash flows of the target company, default
risk might increase (Furfine, Rosen 2011), especially when the deal outcome is
risky. This relationship is supported by Koerniadi et al. (2015). In contrast, when the
target is acquired by paying with shares (the bidder issues shares and transfers them
to the target’s shareholders for exchange of the target shares), there is usually no
increase in leverage, but a decrease. Consequently, when paying with shares, the
leverage of the firm is seldom increased, but often the equity is increased and
leverage is decreased, unless a high level of debt is assumed from the target or the
bidder had increased leverage during the period before and now uses the equity
issuing for the deal to adjust back to its optimal capital structure. Importantly, a
steep increase in cash as a method of payment for M&As was observed for various
reasons during the last decade. We tend to follow the agency problem argument and
state our hypothesis seven as follows.
H7: When in M&As the target shareholders are at least partially paid for with
shares, there will be a larger increase in default risk than with cash payments,
indicating a negative relationship for share deals with change in distance to default
and a positive relationship for cash deals.
As already discussed, the relative firm size in a deal might affect the size of the
valuation effect of a target firm (Asquith et al. 1983). In Table 2, a number of
outcomes for this relationship are summarized. It seems that a positive relationship
is supported, meaning that when the acquirer is relatively larger than the target, the
increase of the default risk will be relatively smaller. Acquiring a smaller target
DO MERGERS AND ACQUISITIONS INCREASE DEFAULT RISK?
19
might lead to a less complicated integration process then when buying a larger target
(Antoniou et al. 2008). This results in the eighth and last hypothesis.
H8: In M&A’s there will be larger increase in default risk when the target is
relatively larger and vice versa, indicating a negative relationship with change in
distance to default.
3. Methodology
In this section, we introduce the methodology for measuring abnormal returns as
well as the Merton’s distance to default model and explain how we integrate these
measures into our research. First, we analyse the valuation effects surrounding an
M&A announcement and then the distance to default. For this analysis, a number of
variables are required, which we define and provide in Table 3.
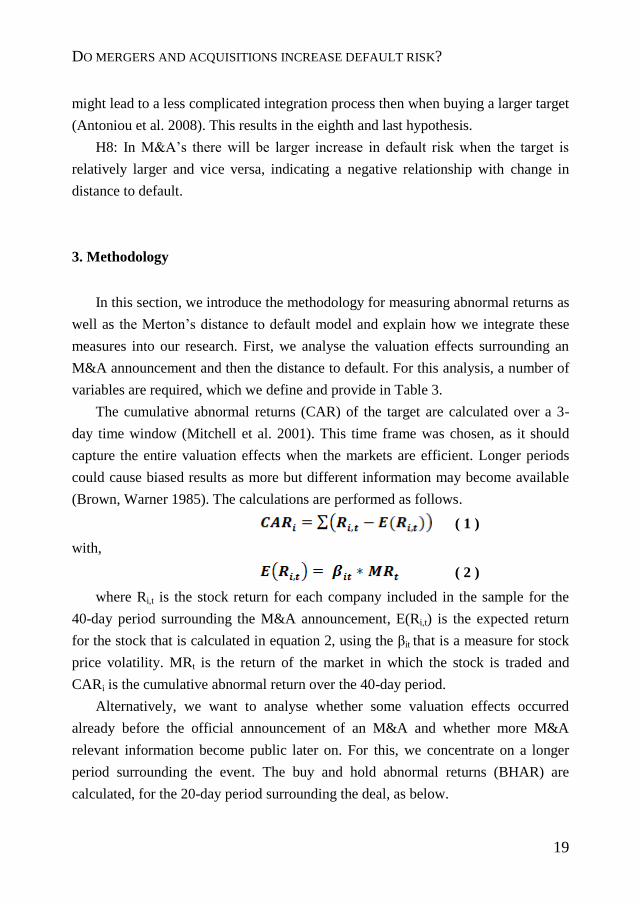
The cumulative abnormal returns (CAR) of the target are calculated over a 3-
day time window (Mitchell et al. 2001). This time frame was chosen, as it should
capture the entire valuation effects when the markets are efficient. Longer periods
could cause biased results as more but different information may become available
(Brown, Warner 1985). The calculations are performed as follows.
( 1 )
with,
( 2 )
where Ri,t is the stock return for each company included in the sample for the
40-day period surrounding the M&A announcement, E(Ri,t) is the expected return
for the stock that is calculated in equation 2, using the βit that is a measure for stock
price volatility. MRt is the return of the market in which the stock is traded and
CARi is the cumulative abnormal return over the 40-day period.
Alternatively, we want to analyse whether some valuation effects occurred
already before the official announcement of an M&A and whether more M&A
relevant information become public later on. For this, we concentrate on a longer
period surrounding the event. The buy and hold abnormal returns (BHAR) are
calculated, for the 20-day period surrounding the deal, as below.
Wolfgang BESSLER, Hidde STEENBEEK, Wim WESTERMAN
20
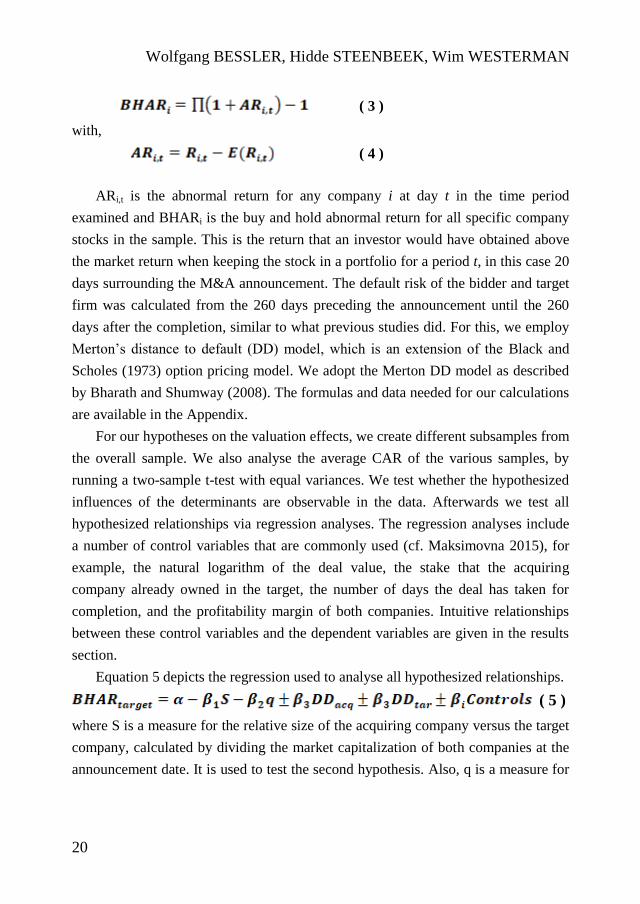
( 3 )
with,
( 4 )
ARi,t is the abnormal return for any company i at day t in the time period
examined and BHARi is the buy and hold abnormal return for all specific company
stocks in the sample. This is the return that an investor would have obtained above
the market return when keeping the stock in a portfolio for a period t, in this case 20
days surrounding the M&A announcement. The default risk of the bidder and target
firm was calculated from the 260 days preceding the announcement until the 260
days after the completion, similar to what previous studies did. For this, we employ
Merton’s distance to default (DD) model, which is an extension of the Black and
Scholes (1973) option pricing model. We adopt the Merton DD model as described
by Bharath and Shumway (2008). The formulas and data needed for our calculations
are available in the Appendix.
For our hypotheses on the valuation effects, we create different subsamples from
the overall sample. We also analyse the average CAR of the various samples, by
running a two-sample t-test with equal variances. We test whether the hypothesized
influences of the determinants are observable in the data. Afterwards we test all
hypothesized relationships via regression analyses. The regression analyses include
a number of control variables that are commonly used (cf. Maksimovna 2015), for
example, the natural logarithm of the deal value, the stake that the acquiring
company already owned in the target, the number of days the deal has taken for
completion, and the profitability margin of both companies. Intuitive relationships
between these control variables and the dependent variables are given in the results
section.
Equation 5 depicts the regression used to analyse all hypothesized relationships.
( 5 )
where S is a measure for the relative size of the acquiring company versus the target
company, calculated by dividing the market capitalization of both companies at the
announcement date. It is used to test the second hypothesis. Also, q is a measure for
DO MERGERS AND ACQUISITIONS INCREASE DEFAULT RISK?
21
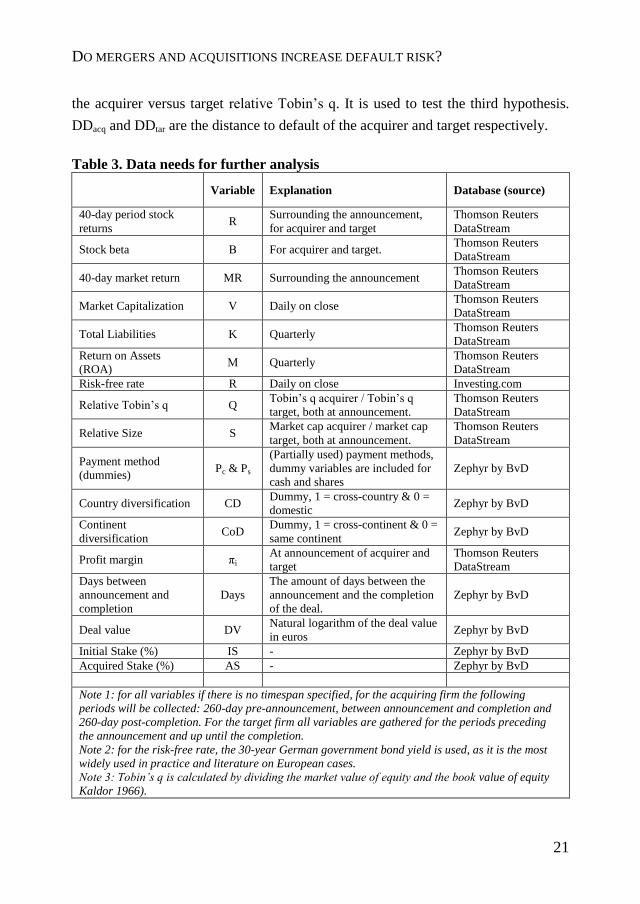
the acquirer versus target relative Tobin’s q. It is used to test the third hypothesis.
DDacq and DDtar are the distance to default of the acquirer and target respectively.
Table 3. Data needs for further analysis
Variable Explanation Database (source)
40-day period stock
returns R
Surrounding the announcement,
for acquirer and target
Thomson Reuters
DataStream
Stock beta Β For acquirer and target. Thomson Reuters
DataStream
40-day market return MR Surrounding the announcement Thomson Reuters
DataStream
Market Capitalization V Daily on close Thomson Reuters
DataStream
Total Liabilities K Quarterly Thomson Reuters
DataStream
Return on Assets
(ROA) Μ Quarterly
Thomson Reuters
DataStream
Risk-free rate R Daily on close Investing.com
Relative Tobin’s q Q Tobin’s q acquirer / Tobin’s q
target, both at announcement.
Thomson Reuters
DataStream
Relative Size S Market cap acquirer / market cap
target, both at announcement.
Thomson Reuters
DataStream
Payment method
(dummies) Pc & Ps
(Partially used) payment methods,
dummy variables are included for
cash and shares
Zephyr by BvD
Country diversification CD Dummy, 1 = cross-country & 0 =
domestic Zephyr by BvD
Continent
diversification CoD
Dummy, 1 = cross-continent & 0 =
same continent Zephyr by BvD
Profit margin πi At announcement of acquirer and
target
Thomson Reuters
DataStream
Days between
announcement and
completion
Days
The amount of days between the
announcement and the completion
of the deal.
Zephyr by BvD
Deal value DV Natural logarithm of the deal value
in euros Zephyr by BvD
Initial Stake (%) IS - Zephyr by BvD
Acquired Stake (%) AS - Zephyr by BvD
Note 1: for all variables if there is no timespan specified, for the acquiring firm the following
periods will be collected: 260-day pre-announcement, between announcement and completion and
260-day post-completion. For the target firm all variables are gathered for the periods preceding
the announcement and up until the completion.
Note 2: for the risk-free rate, the 30-year German government bond yield is used, as it is the most
widely used in practice and literature on European cases.
Note 3: Tobin’s q is calculated by dividing the market value of equity and the book value of equity
Kaldor 1966).
Wolfgang BESSLER, Hidde STEENBEEK, Wim WESTERMAN
22
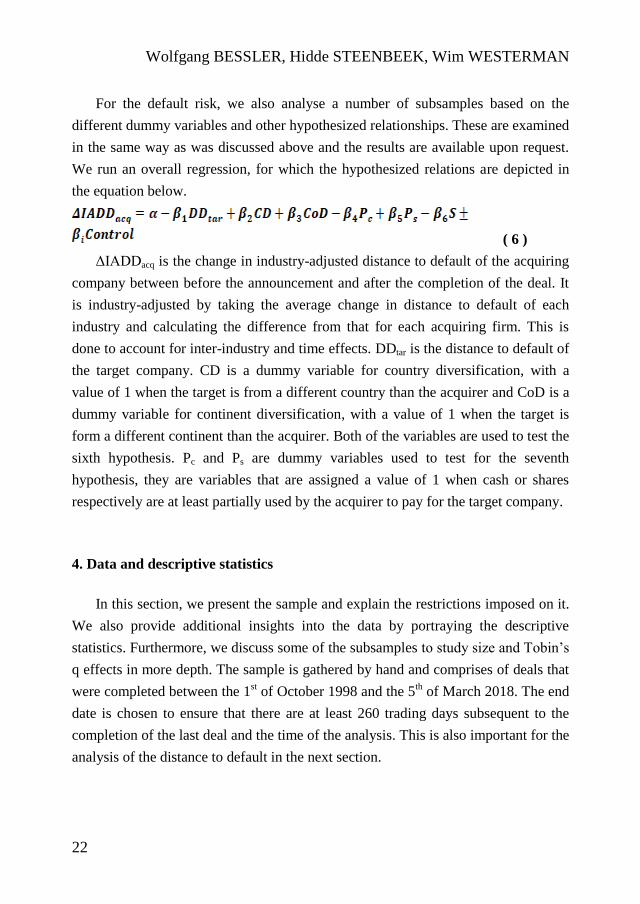
For the default risk, we also analyse a number of subsamples based on the
different dummy variables and other hypothesized relationships. These are examined
in the same way as was discussed above and the results are available upon request.
We run an overall regression, for which the hypothesized relations are depicted in
the equation below.
( 6 )
ΔIADDacq is the change in industry-adjusted distance to default of the acquiring
company between before the announcement and after the completion of the deal. It
is industry-adjusted by taking the average change in distance to default of each
industry and calculating the difference from that for each acquiring firm. This is
done to account for inter-industry and time effects. DDtar is the distance to default of
the target company. CD is a dummy variable for country diversification, with a
value of 1 when the target is from a different country than the acquirer and CoD is a
dummy variable for continent diversification, with a value of 1 when the target is
form a different continent than the acquirer. Both of the variables are used to test the
sixth hypothesis. Pc and Ps are dummy variables used to test for the seventh
hypothesis, they are variables that are assigned a value of 1 when cash or shares
respectively are at least partially used by the acquirer to pay for the target company.
4. Data and descriptive statistics
In this section, we present the sample and explain the restrictions imposed on it.
We also provide additional insights into the data by portraying the descriptive
statistics. Furthermore, we discuss some of the subsamples to study size and Tobin’s
q effects in more depth. The sample is gathered by hand and comprises of deals that
were completed between the 1st of October 1998 and the 5
th of March 2018. The end
date is chosen to ensure that there are at least 260 trading days subsequent to the
completion of the last deal and the time of the analysis. This is also important for the
analysis of the distance to default in the next section.
DO MERGERS AND ACQUISITIONS INCREASE DEFAULT RISK?
23
There are multiple restrictions for constructing the sample. First of all, banks
and utilities are excluded (Furfine, Rosen 2011) as well as all deals with a value
below €1 million (Moeller et al. 2005) to include only deals that have a significant
economic impact (Maksimovna 2015). Only M&A’s are included in the sample,
which means that LBO’s and private equity deals are excluded. The pre-merger
ownership must be below 50% and the post-merger ownership of the target by the
bidder must exceeds 50% (Furfine, Rosen 2011). Because of our focus on Europe, a
requirement is that an acquiring firm’s home country has to belong to the enlarged
European Union of 28 countries. Our requirements lead to a sample size of 1,050
deals, which details have been obtained via Zephyr by Bureau van Dijk (BvD). The
data, however, had to be thoroughly cleaned by hand because of missing data on key
variables. This resulted in a final sample size of 531 M&As. The cleaning procedure
is available upon request. The distance to default, profit margin, and the CAR are
winsorized on the 1% and 99% level, to account for extreme values and outliers in
these variables. Our robustness test suggests that this practice does not significantly
influence the results.
In Table 4, we provide the geographic locations of all firms. There are a number
of countries that have a rather low number of acquiring firms over the sample
period. As an unpublished robustness test available from the authors upon request,
the deals were excluded in which the acquiring firm was from a small deal country
with fewer than 10 deals over the sample period. The results do not change
significantly when leaving these deals out of the sample though. The spread of
country and continent diversification deals can also be found in Table 4.
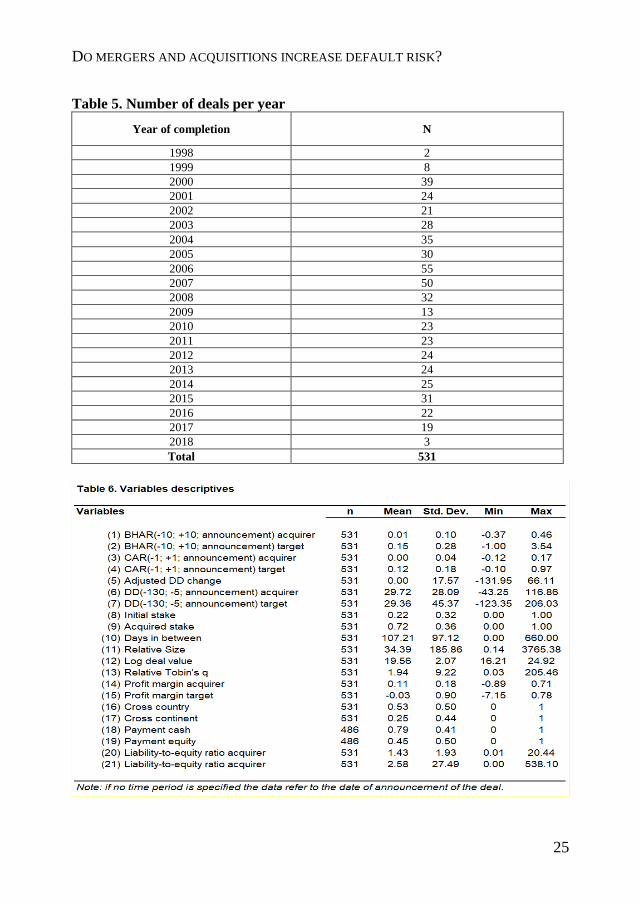
In Table 5, we present the number of deals per year. From this table no real
pattern can be observed. There is a higher number of deals in the years prior to the
2008/2009 Global Financial Crisis, which might be due to the positive growth
expectations during these years. Furthermore, it needs to be noted that the sample is
unevenly spread over the countries. In an unpublished test that is available upon
request, we find indications that this does not have a material impact on our results.

Wolfgang BESSLER, Hidde STEENBEEK, Wim WESTERMAN
24
Table 4. Distribution of deals
No. of
acquirors
No. of
targets
No. of
acquirors
No. of
targets
Home
country Industry
Austria 3 5
Chemicals, rubber, plastics, non-
metallics 68 66
Belgium 14 9 Construction 32 32
Denmark 9 5 Education, Health 3 3
Finland 16 13 Food, Beverages, tobacco 31 31
France 88 63 Hotels & Restaurants 18 18
Germany 50 38 Machinery & Equipment,
furniture, recycling 82 81
Great-Britain 170 127 Metals & metal products 28 28
Greece 11 16 Post and Telecommunication 43 43
Ireland 21 5 Primary sector (agriculture,
mining, etc.) 14 14
Italy 23 10 Publishing, print 9 9
Luxembourg 8 2 Textiles, wearing apparel,
leather 5 5
Malta 1 1 Transport 7 7
Netherlands 38 15 Wholesale & retail trade 37 37
Poland 12 15 Wood, cork, paper 7 7
Portugal 2 5 Other services 147 150
Spain 26 16 Total 531 531
Sweden 39 19
Other-Europe 0 32 Geographical diversification
North-
America 0 95 Domestic
249
SCA 0 14 Cross-border 282
Asia 0 12 Total 531
Africa 0 9
Oceania 0 4 Europe 396
Other 0 1 Cross-continent 135
Total 531 531 Total 531
DO MERGERS AND ACQUISITIONS INCREASE DEFAULT RISK?
25
Table 5. Number of deals per year
Year of completion N
1998 2
1999 8
2000 39
2001 24
2002 21
2003 28
2004 35
2005 30
2006 55
2007 50
2008 32
2009 13
2010 23
2011 23
2012 24
2013 24
2014 25
2015 31
2016 22
2017 19
2018 3
Total 531
WOLFGANG BESSLER, HIDDE STEENBEEK, WIM WESTERMAN
26
DO MERGERS AND ACQUISITIONS INCREASE DEFAULT RISK?
27
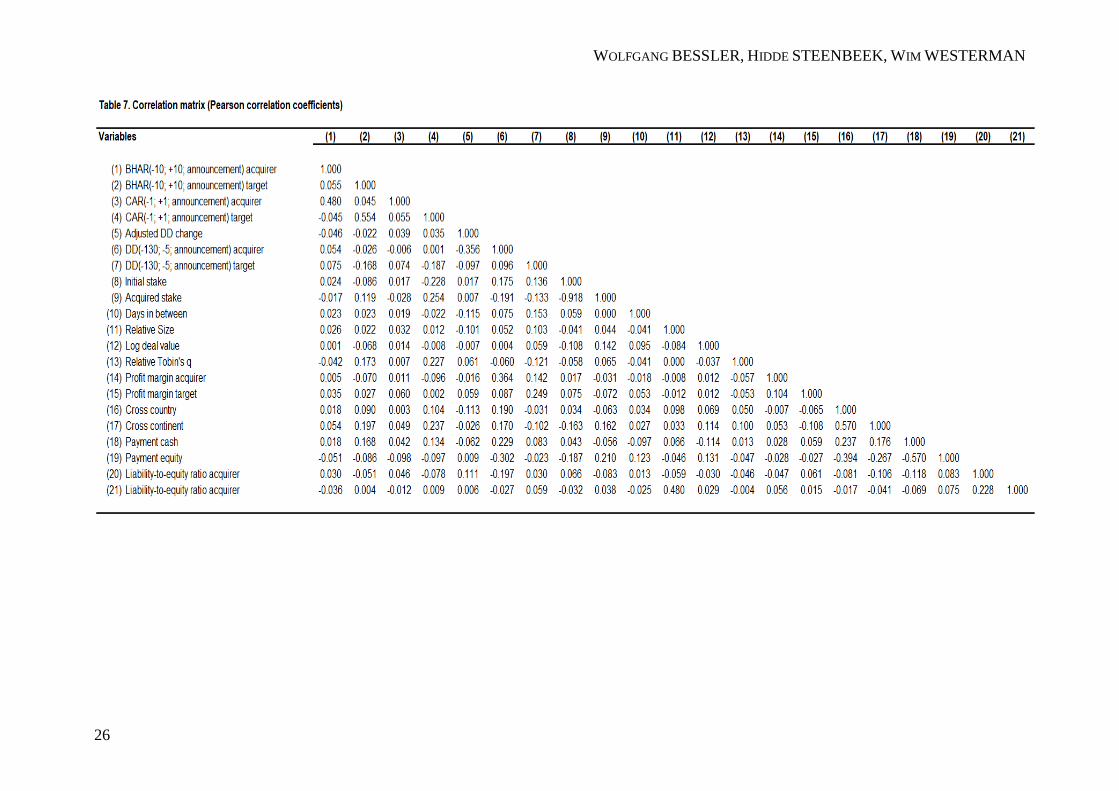
Table 6 shows the descriptive statistics of our study. In Table 7 we present the
correlation matrix. Overall, most Pearson correlation coefficients are close to zero.
The correlation between the distance to default of the acquirer and the industry-
adjusted change in distance to default is ρ=-0.356. When the first variable rises by
1%, the second one decreases by 0.356%. Acquiring firms with higher distance to
default before the deal experience a decrease in their distance to default during the
merger process. The correlation between initial stake and acquired stake is very low
(ρ=-0.918), but only the first is chosen as a control variable. The correlation between
share payments and cross-country deals is also remarkable (ρ=-0.394). Cross-
country deals are less often paid with shares. Acquirers are less prone to exchange
shares with a foreign target in an M&A deal, or more likely, the shareholders of the
foreign targets are much less interested in receiving shares of the bidder as the
monitoring and transaction cost for these shares could be relatively high later on.
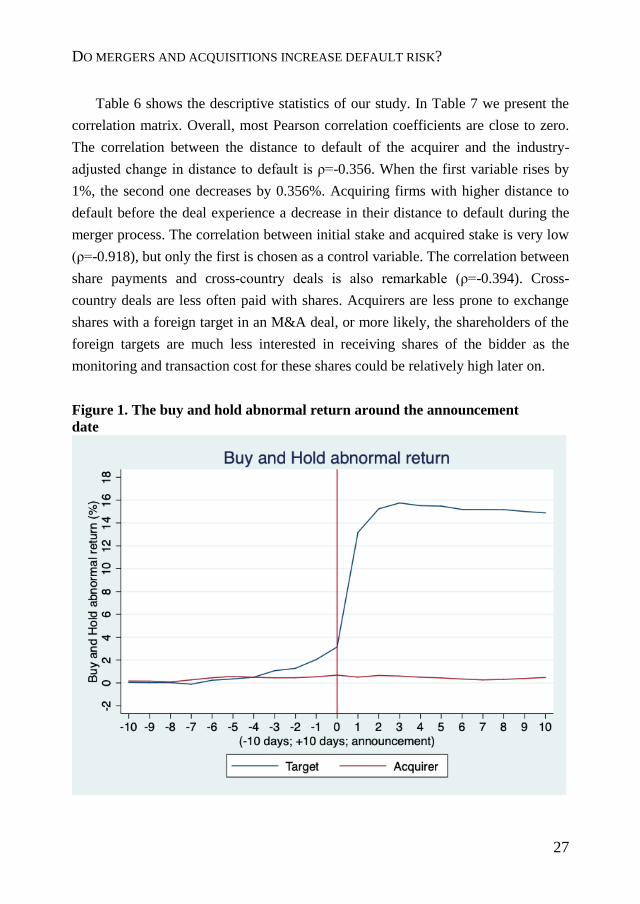
Figure 1. The buy and hold abnormal return around the announcement
date
Wolfgang BESSLER, Hidde STEENBEEK, Wim WESTERMAN
28
Figure 1 depicts the development of the average buy and hold abnormal returns
(BHAR) for the 20-day period surrounding the announcement for the entire sample.
There is a run-up period before the announcement in the abnormal returns of the
target of around 6 days. After the third day, the target underperforms the market.
These observations are confirmed by unpublished but available on request t-tests for
various CAR intervals (cf. Tang, Xu 2016). A run-up period indicates that markets
are most likely not perfectly efficient, since apparently some investors have access
to privileged information and trade on these beforehand. Underperformance
afterwards is not standard and could be caused by sampling of unsuccessful deals
(Schwert 1996), which is not the case here. Another reason might be that an M&A
deal is overpriced surrounding the announcement. This would lead to the market
compensating this error later on.
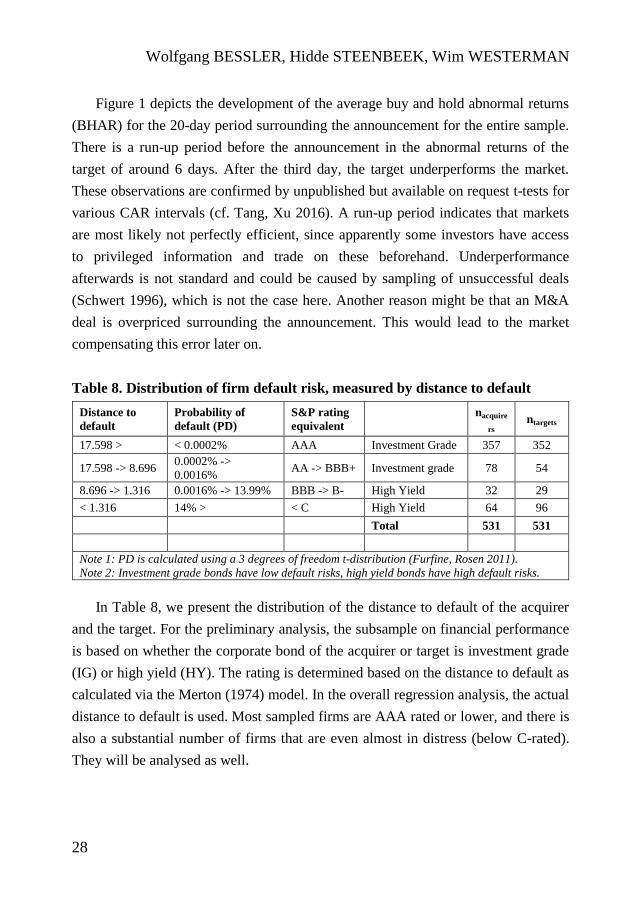
Table 8. Distribution of firm default risk, measured by distance to default
Distance to
default
Probability of
default (PD)
S&P rating
equivalent
nacquire
rs
ntargets
17.598 > < 0.0002% AAA Investment Grade 357 352
17.598 -> 8.696 0.0002% ->
0.0016% AA -> BBB+ Investment grade 78 54
8.696 -> 1.316 0.0016% -> 13.99% BBB -> B- High Yield 32 29
< 1.316 14% > < C High Yield 64 96
Total 531 531
Note 1: PD is calculated using a 3 degrees of freedom t-distribution (Furfine, Rosen 2011).
Note 2: Investment grade bonds have low default risks, high yield bonds have high default risks.
In Table 8, we present the distribution of the distance to default of the acquirer
and the target. For the preliminary analysis, the subsample on financial performance
is based on whether the corporate bond of the acquirer or target is investment grade
(IG) or high yield (HY). The rating is determined based on the distance to default as
calculated via the Merton (1974) model. In the overall regression analysis, the actual
distance to default is used. Most sampled firms are AAA rated or lower, and there is
also a substantial number of firms that are even almost in distress (below C-rated).
They will be analysed as well.
DO MERGERS AND ACQUISITIONS INCREASE DEFAULT RISK?
29
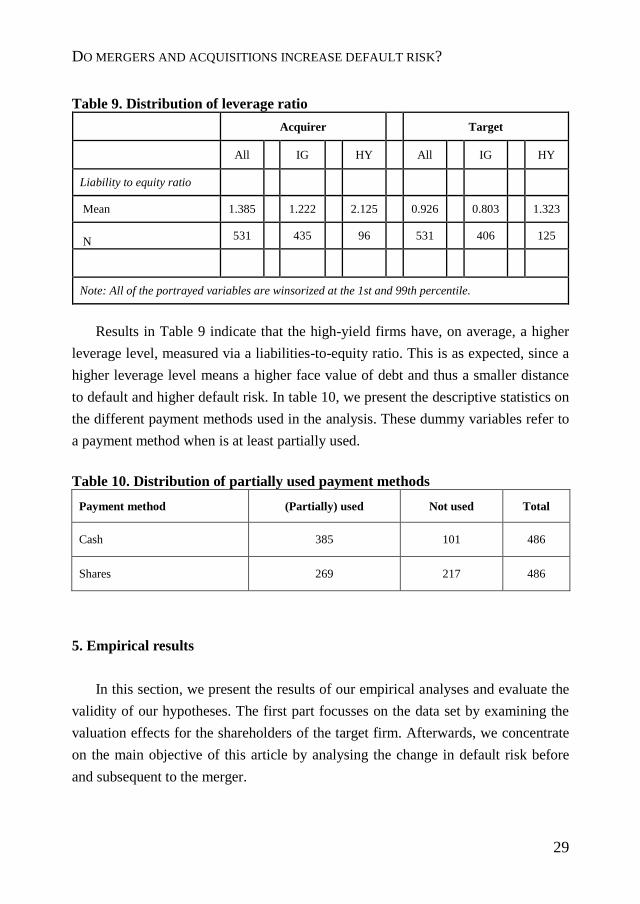
Table 9. Distribution of leverage ratio
Acquirer
Target
All
IG
HY
All
IG
HY
Liability to equity ratio
Mean 1.385
1.222
2.125
0.926
0.803
1.323
N 531
435
96
531
406
125
Note: All of the portrayed variables are winsorized at the 1st and 99th percentile.
Results in Table 9 indicate that the high-yield firms have, on average, a higher
leverage level, measured via a liabilities-to-equity ratio. This is as expected, since a
higher leverage level means a higher face value of debt and thus a smaller distance
to default and higher default risk. In table 10, we present the descriptive statistics on
the different payment methods used in the analysis. These dummy variables refer to
a payment method when is at least partially used.
Table 10. Distribution of partially used payment methods
Payment method (Partially) used Not used Total
Cash 385 101 486
Shares 269 217 486
5. Empirical results
In this section, we present the results of our empirical analyses and evaluate the
validity of our hypotheses. The first part focusses on the data set by examining the
valuation effects for the shareholders of the target firm. Afterwards, we concentrate
on the main objective of this article by analysing the change in default risk before
and subsequent to the merger.
Wolfgang BESSLER, Hidde STEENBEEK, Wim WESTERMAN
30
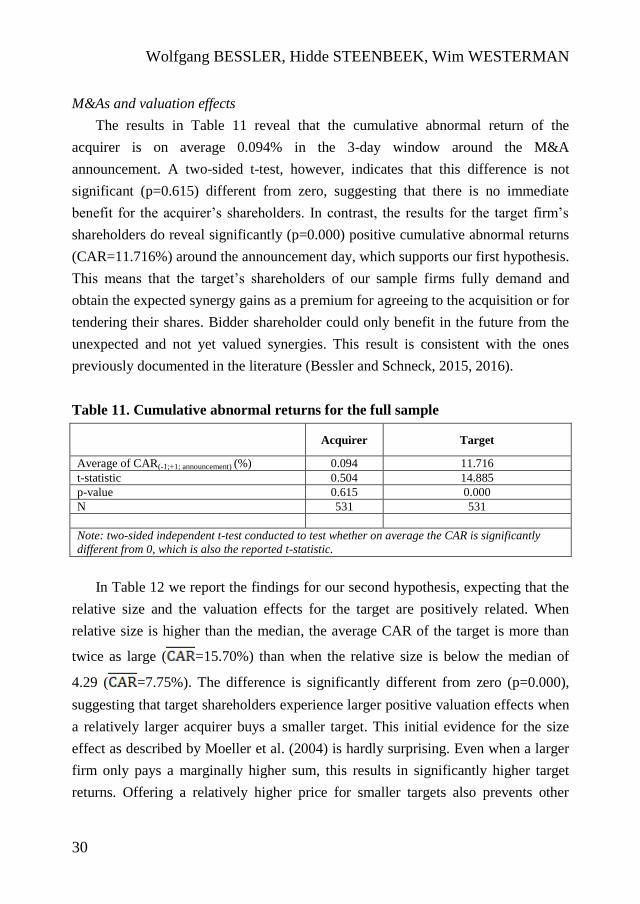
M&As and valuation effects
The results in Table 11 reveal that the cumulative abnormal return of the
acquirer is on average 0.094% in the 3-day window around the M&A
announcement. A two-sided t-test, however, indicates that this difference is not
significant (p=0.615) different from zero, suggesting that there is no immediate
benefit for the acquirer’s shareholders. In contrast, the results for the target firm’s
shareholders do reveal significantly (p=0.000) positive cumulative abnormal returns
(CAR=11.716%) around the announcement day, which supports our first hypothesis.
This means that the target’s shareholders of our sample firms fully demand and
obtain the expected synergy gains as a premium for agreeing to the acquisition or for
tendering their shares. Bidder shareholder could only benefit in the future from the
unexpected and not yet valued synergies. This result is consistent with the ones
previously documented in the literature (Bessler and Schneck, 2015, 2016).
Table 11. Cumulative abnormal returns for the full sample
Acquirer Target
Average of CAR(-1;+1; announcement) (%) 0.094 11.716
t-statistic 0.504 14.885
p-value 0.615 0.000
N 531 531
Note: two-sided independent t-test conducted to test whether on average the CAR is significantly
different from 0, which is also the reported t-statistic.
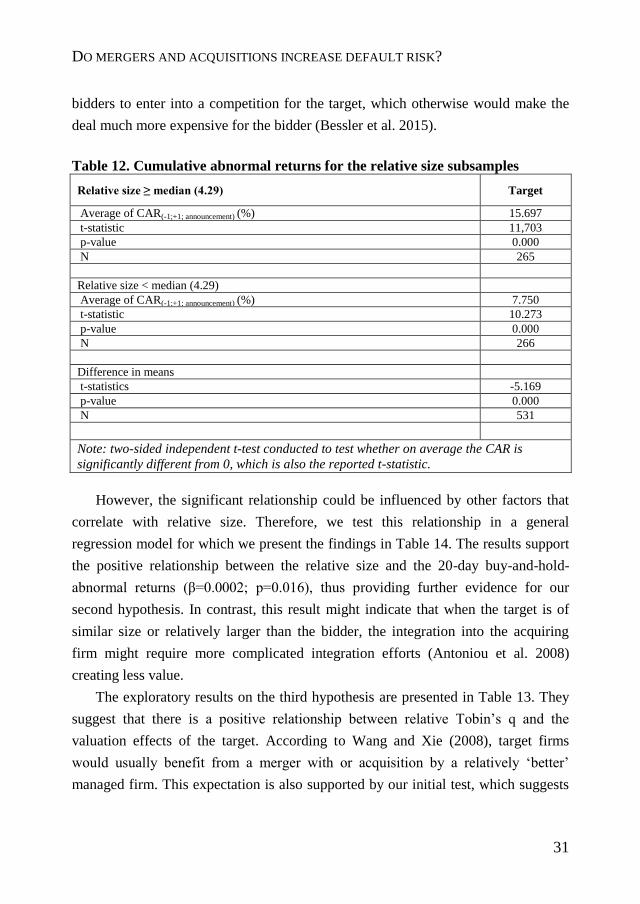
In Table 12 we report the findings for our second hypothesis, expecting that the
relative size and the valuation effects for the target are positively related. When
relative size is higher than the median, the average CAR of the target is more than
twice as large ( =15.70%) than when the relative size is below the median of
4.29 ( =7.75%). The difference is significantly different from zero (p=0.000),
suggesting that target shareholders experience larger positive valuation effects when
a relatively larger acquirer buys a smaller target. This initial evidence for the size
effect as described by Moeller et al. (2004) is hardly surprising. Even when a larger
firm only pays a marginally higher sum, this results in significantly higher target
returns. Offering a relatively higher price for smaller targets also prevents other
DO MERGERS AND ACQUISITIONS INCREASE DEFAULT RISK?
31
bidders to enter into a competition for the target, which otherwise would make the
deal much more expensive for the bidder (Bessler et al. 2015).
Table 12. Cumulative abnormal returns for the relative size subsamples
Relative size ≥ median (4.29) Target
Average of CAR(-1;+1; announcement) (%) 15.697
t-statistic 11,703
p-value 0.000
N 265
Relative size < median (4.29)
Average of CAR(-1;+1; announcement) (%) 7.750
t-statistic 10.273
p-value 0.000
N 266
Difference in means
t-statistics -5.169
p-value 0.000
N 531
Note: two-sided independent t-test conducted to test whether on average the CAR is
significantly different from 0, which is also the reported t-statistic.
However, the significant relationship could be influenced by other factors that
correlate with relative size. Therefore, we test this relationship in a general
regression model for which we present the findings in Table 14. The results support
the positive relationship between the relative size and the 20-day buy-and-hold-
abnormal returns (β=0.0002; p=0.016), thus providing further evidence for our
second hypothesis. In contrast, this result might indicate that when the target is of
similar size or relatively larger than the bidder, the integration into the acquiring
firm might require more complicated integration efforts (Antoniou et al. 2008)
creating less value.
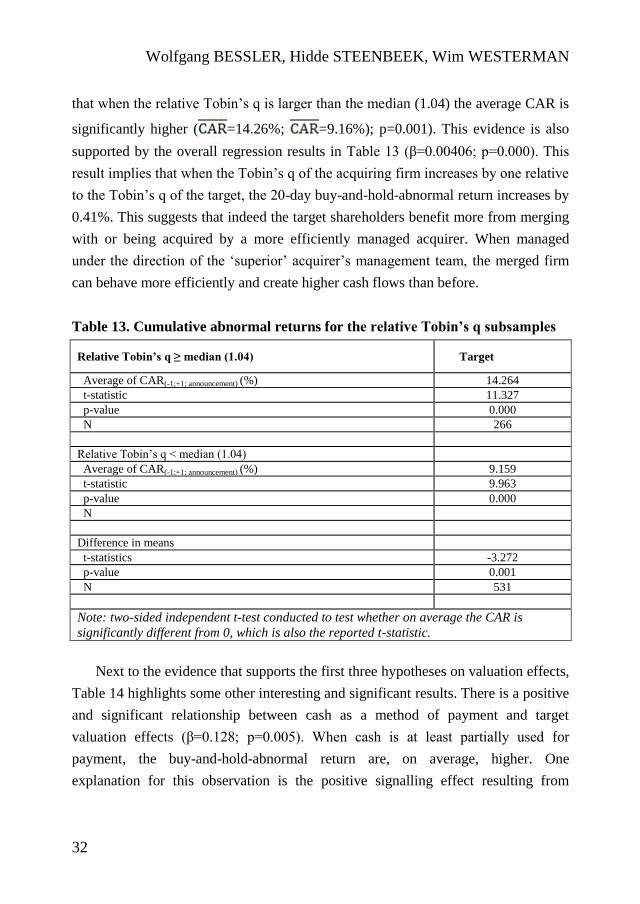
The exploratory results on the third hypothesis are presented in Table 13. They
suggest that there is a positive relationship between relative Tobin’s q and the
valuation effects of the target. According to Wang and Xie (2008), target firms
would usually benefit from a merger with or acquisition by a relatively ‘better’
managed firm. This expectation is also supported by our initial test, which suggests
Wolfgang BESSLER, Hidde STEENBEEK, Wim WESTERMAN
32
that when the relative Tobin’s q is larger than the median (1.04) the average CAR is
significantly higher ( =14.26%; =9.16%); p=0.001). This evidence is also
supported by the overall regression results in Table 13 (β=0.00406; p=0.000). This
result implies that when the Tobin’s q of the acquiring firm increases by one relative
to the Tobin’s q of the target, the 20-day buy-and-hold-abnormal return increases by
0.41%. This suggests that indeed the target shareholders benefit more from merging
with or being acquired by a more efficiently managed acquirer. When managed
under the direction of the ‘superior’ acquirer’s management team, the merged firm
can behave more efficiently and create higher cash flows than before.
Table 13. Cumulative abnormal returns for the relative Tobin’s q subsamples
Relative Tobin’s q ≥ median (1.04) Target
Average of CAR(-1;+1; announcement) (%) 14.264
t-statistic 11.327
p-value 0.000
N 266
Relative Tobin’s q < median (1.04)
Average of CAR(-1;+1; announcement) (%) 9.159
t-statistic 9.963
p-value 0.000
N
Difference in means
t-statistics -3.272
p-value 0.001
N 531
Note: two-sided independent t-test conducted to test whether on average the CAR is
significantly different from 0, which is also the reported t-statistic.
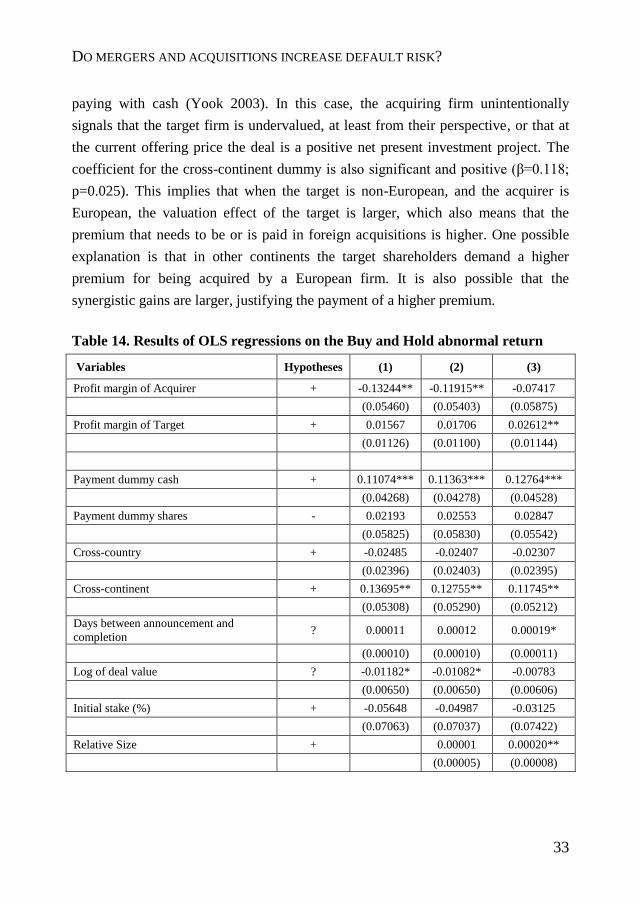
Next to the evidence that supports the first three hypotheses on valuation effects,
Table 14 highlights some other interesting and significant results. There is a positive
and significant relationship between cash as a method of payment and target
valuation effects (β=0.128; p=0.005). When cash is at least partially used for
payment, the buy-and-hold-abnormal return are, on average, higher. One
explanation for this observation is the positive signalling effect resulting from
DO MERGERS AND ACQUISITIONS INCREASE DEFAULT RISK?
33
paying with cash (Yook 2003). In this case, the acquiring firm unintentionally
signals that the target firm is undervalued, at least from their perspective, or that at
the current offering price the deal is a positive net present investment project. The
coefficient for the cross-continent dummy is also significant and positive (β=0.118;
p=0.025). This implies that when the target is non-European, and the acquirer is
European, the valuation effect of the target is larger, which also means that the
premium that needs to be or is paid in foreign acquisitions is higher. One possible
explanation is that in other continents the target shareholders demand a higher
premium for being acquired by a European firm. It is also possible that the
synergistic gains are larger, justifying the payment of a higher premium.
Table 14. Results of OLS regressions on the Buy and Hold abnormal return
Variables Hypotheses (1) (2) (3)
Profit margin of Acquirer + -0.13244** -0.11915** -0.07417
(0.05460) (0.05403) (0.05875)
Profit margin of Target + 0.01567 0.01706 0.02612**
(0.01126) (0.01100) (0.01144)
Payment dummy cash + 0.11074*** 0.11363*** 0.12764***
(0.04268) (0.04278) (0.04528)
Payment dummy shares - 0.02193 0.02553 0.02847
(0.05825) (0.05830) (0.05542)
Cross-country + -0.02485 -0.02407 -0.02307
(0.02396) (0.02403) (0.02395)
Cross-continent + 0.13695** 0.12755** 0.11745**
(0.05308) (0.05290) (0.05212)
Days between announcement and
completion ? 0.00011 0.00012 0.00019*
(0.00010) (0.00010) (0.00011)
Log of deal value ? -0.01182* -0.01082* -0.00783
(0.00650) (0.00650) (0.00606)
Initial stake (%) + -0.05648 -0.04987 -0.03125
(0.07063) (0.07037) (0.07422)
Relative Size +
0.00001 0.00020**
(0.00005) (0.00008)

Wolfgang BESSLER, Hidde STEENBEEK, Wim WESTERMAN
34
Table 14. Cont. …
Variables Hypotheses (1) (2) (3)
Relative Tobin’s q +
0.00437*** 0.00406***
(0.00102) (0.00091)
DD[-130; -5; announcement] acquirer ?
-0.00034
(0.00040)
DD[-130; -5; announcement] target ?
-0.00086***
(0.00027)
Constant
0.27943*** 0.24454** 0.18836*
(0.10192) (0.09966) (0.09705)
Observations
486 486 486
Adjusted R-squared
0.06355 0.08192 0.10300
F-statistic 6.94 7.41 7.52
Robust standard errors in parentheses
*** p<0.01, ** p<0.05, * p<0.1
Note 1: The dependent variable is the BHAR, which is the Buy and Hold abnormal return of the 20-
day period [-10; +10] surrounding the announcement date.
Note 2: DD is the distance to default of the respective firm (a higher value on this variable refers to a
better performing firm).
Note 3: All variables are either the mean from the period surrounding the announcement date, which
is shown by the number of business days in the brackets, or at the announcement date.
The last result to be discussed is the negative and significant relationship
between the distance to default of the target and its buy-and-hold-abnormal return
(β=-0.00086; p=0.001). A riskier target in an M&A deal will generate higher
abnormal returns (BHAR) for its shareholders. This could be resulting from a
favourable market reaction because the acquirer is in a way rescuing the target from
defaulting, but at a very lucrative price at it assumes the default risk. However, the
target’s default risk may not cause any problems when integrated into the bidder’s
operations. Another example is that the risk and cash flows af bidder and target are
negatively correlated, offering some diversification benefits. Along this thinking it is
also possible that acquiring firms value target firms with a lower distance to default
relatively higher as the potential gains may exceed the ones from normal deals, and
they usually are able to bear the risk that might be transferred through the M&A
transaction. Figuring out the reasoning behind this and how an acquisition or merger
affects the default risk over the deal process are the main objectives of this study.
DO MERGERS AND ACQUISITIONS INCREASE DEFAULT RISK?
35
M&As and default risk
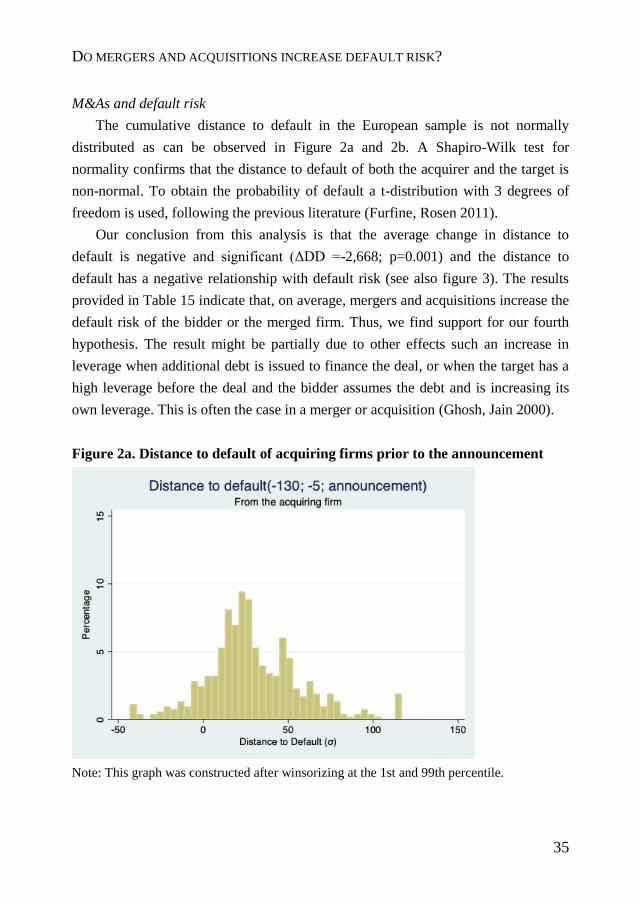
The cumulative distance to default in the European sample is not normally
distributed as can be observed in Figure 2a and 2b. A Shapiro-Wilk test for
normality confirms that the distance to default of both the acquirer and the target is
non-normal. To obtain the probability of default a t-distribution with 3 degrees of
freedom is used, following the previous literature (Furfine, Rosen 2011).
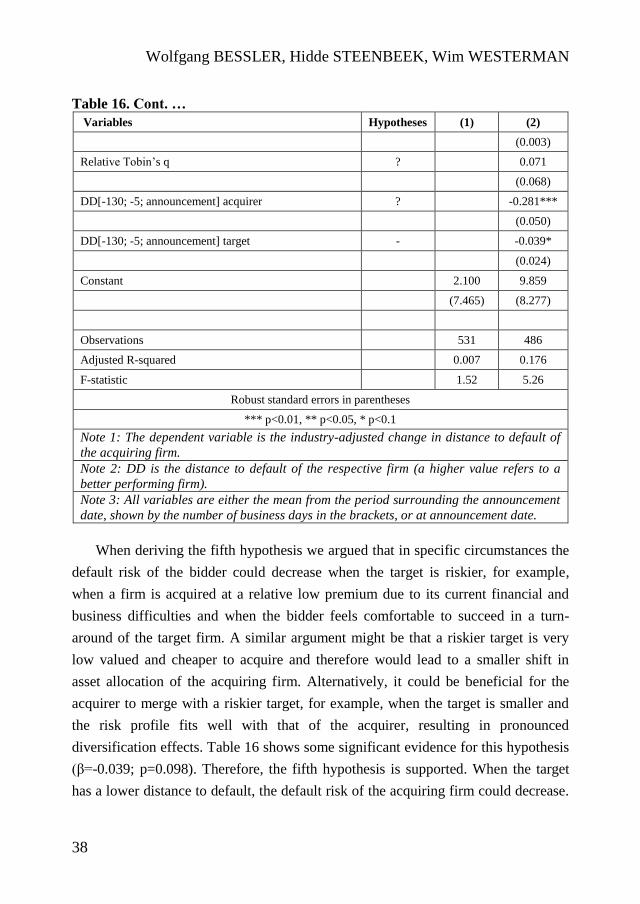
Our conclusion from this analysis is that the average change in distance to
default is negative and significant (ΔDD =-2,668; p=0.001) and the distance to
default has a negative relationship with default risk (see also figure 3). The results
provided in Table 15 indicate that, on average, mergers and acquisitions increase the
default risk of the bidder or the merged firm. Thus, we find support for our fourth
hypothesis. The result might be partially due to other effects such an increase in
leverage when additional debt is issued to finance the deal, or when the target has a
high leverage before the deal and the bidder assumes the debt and is increasing its
own leverage. This is often the case in a merger or acquisition (Ghosh, Jain 2000).
Figure 2a. Distance to default of acquiring firms prior to the announcement
Note: This graph was constructed after winsorizing at the 1st and 99th percentile.
Wolfgang BESSLER, Hidde STEENBEEK, Wim WESTERMAN
36
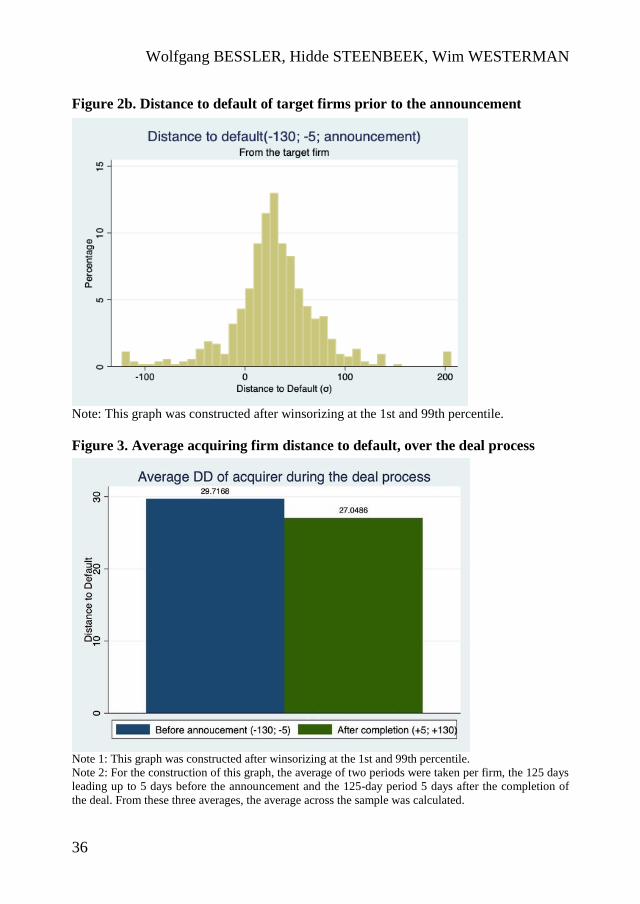
Figure 2b. Distance to default of target firms prior to the announcement
Note: This graph was constructed after winsorizing at the 1st and 99th percentile.
Figure 3. Average acquiring firm distance to default, over the deal process
Note 1: This graph was constructed after winsorizing at the 1st and 99th percentile.
Note 2: For the construction of this graph, the average of two periods were taken per firm, the 125 days
leading up to 5 days before the announcement and the 125-day period 5 days after the completion of
the deal. From these three averages, the average across the sample was calculated.

DO MERGERS AND ACQUISITIONS INCREASE DEFAULT RISK?
37
Table 15. Results of the change in Merton distance to default Acquirer
Average change in distance to default -2.668
t-statistic -3.443
P 0.001
Note: two-sided independent t-test conducted to test whether on average the change in
distance to default is significantly different from 0.
Table 16. OLS regression results for the industry-adjusted change in distance
to default
Variables Hypotheses (1) (2)
BHAR[-10; +10; announcement] acquirer ? -7.120 -4.599
(7.925) (8.420)
BHAR[-10; +10; announcement] target ? -1.208 -3.463
(4.731) (4.830)
Profit margin of Acquirer + -2.349 12.877**
(5.311) (5.872)
Profit margin of Target + 1.325 2.098**
(1.052) (0.928)
Days between announcement and completion ? -0.021*** -0.011
(0.008) (0.007)
Log of deal value ? 0.023 0.158
(0.391) (0.387)
Initial stake (%) + 1.120 5.486*
(2.491) (2.968)
Payment dummy cash - -1.172
(2.313)
Payment dummy shares + -5.104**
(2.004)
Cross-country + -4.667**
(1.855)
Cross-continent + 4.543*
(2.562)
Relative Size -
-0.005*
Wolfgang BESSLER, Hidde STEENBEEK, Wim WESTERMAN
38
Table 16. Cont. …
Variables Hypotheses (1) (2)
(0.003)
Relative Tobin’s q ?
0.071
(0.068)
DD[-130; -5; announcement] acquirer ?
-0.281***
(0.050)
DD[-130; -5; announcement] target -
-0.039*
(0.024)
Constant
2.100 9.859
(7.465) (8.277)
Observations
531 486
Adjusted R-squared
0.007 0.176
F-statistic 1.52 5.26
Robust standard errors in parentheses
*** p<0.01, ** p<0.05, * p<0.1
Note 1: The dependent variable is the industry-adjusted change in distance to default of
the acquiring firm.
Note 2: DD is the distance to default of the respective firm (a higher value refers to a
better performing firm).
Note 3: All variables are either the mean from the period surrounding the announcement
date, shown by the number of business days in the brackets, or at announcement date.
When deriving the fifth hypothesis we argued that in specific circumstances the
default risk of the bidder could decrease when the target is riskier, for example,
when a firm is acquired at a relative low premium due to its current financial and
business difficulties and when the bidder feels comfortable to succeed in a turn-
around of the target firm. A similar argument might be that a riskier target is very
low valued and cheaper to acquire and therefore would lead to a smaller shift in
asset allocation of the acquiring firm. Alternatively, it could be beneficial for the
acquirer to merge with a riskier target, for example, when the target is smaller and
the risk profile fits well with that of the acquirer, resulting in pronounced
diversification effects. Table 16 shows some significant evidence for this hypothesis
(β=-0.039; p=0.098). Therefore, the fifth hypothesis is supported. When the target
has a lower distance to default, the default risk of the acquiring firm could decrease.

DO MERGERS AND ACQUISITIONS INCREASE DEFAULT RISK?
39
This result is in line with previous research, e.g. by Bruyland and De Maeseneire
(2016). Another reason for this result could be that the acquiring firm might gain
more from tax benefits such as a large loss carry forward or high deductible interest
payments. This can be due to high yield targets being, on average, higher levered
than investment grade targets, as is presented in Table 9. These are all very special
cases and examples. However, on average, we observe that the distance to default
will decrease (the default risk will increase) after the merger, resulting often in
negative long-run buy–and-hold-abnormal returns.
From the sixth hypothesis, we expect that there is a positive relationship
between geographical diversification and change in distance to default, meaning that
a cross-border merger would decrease the default risk of the acquirer. The results in
Table 16 indicate that the opposite is more likely (β=-4.667; p=0.012). This suggests
that cross-border mergers are risk increasing, implying that it might be more
challenging to assess the target’s risk correctly, or harder to integrate a foreign
target. It is necessary and important to distinguish between cross-border and cross-
continent deals, due to potentially large cultural differences. Therefore, we also
hypothesized that cross-continent deals would be more diversifying and risk
decreasing. In Table 15, we provide a significant indication supporting this part of
the sixth hypothesis (β=4.543; p=0.012). This might suggest that a cross-continent
merger is indeed risk diversifying, but could also mean that when a deal is cross-
continental it mitigates the effect of the negative influence of cross-country mergers.
The seventh hypothesis suggests that if the bidder pays for a deal with cash, he
is convinced that this deal is profitable and that the merger should most likely
decrease the default risk. In contrast, mergers are paid with shares of the bidder
when the deal is much riskier and this should result in a higher default risk as the
bidder attempts to share the risk with the shareholders of the target, which are
becoming bidder shareholders. Table 16 reveals that there is a significant negative
influence of share payment on the distance to default of the acquiring firm (β=-
5.104; p=0.011), thus supporting our hypothesis. This could mean that there is some
risk transfer when shares are used as a payment method. The bidder and its
shareholders try to share the risk of a possible difficult and often unsuccessful deal
with the shareholders of the target. In addition, it can be observed from Table 15 that
Wolfgang BESSLER, Hidde STEENBEEK, Wim WESTERMAN
40
there is some form of negative and significant relationship between relative size and
change in distance to default (β=-0.005; p=0.083). This suggests that integrating a
relatively smaller target should be less of a problem, but merging with a larger target
is more complicated for the acquiring firm, resulting in a lengthier and more difficult
process, which would result in a worse post-deal performance and thus an increase
in default risk.
Above, we discussed all results on hypothesized relationships on the change in
default risk. From the overall regression results, another interesting conclusion can
also be drawn: the coefficient of the distance to default of the acquirer is highly
significant and negative (β=-0.281; p=0.000). An acquirer with a higher distance to
default will have a larger decrease in distance to default from the merger or
acquisition, increasing its default risk and vice versa. Risky acquirers might see a
decrease in default risk surrounding the merger or acquisition. This can be driven by
some form of diversification that is only applicable to these acquirers. We also ran
the same regressions on a different time interval for the distance to default. The
unpublished results are on average largely the same, but some results in the
robustness test are less significant and the exploratory power of that model is lower.
As another robustness test, we compared these regression results to the regression
results of the Altman Z’’-score. Both of the tests are available upon request.
The Altman Z’’-score (Altman et al. 2014) for our sample is given by the
following formula:
(7)
with X1 being (current assets – current liabilities) / total assets, X2 is the retained
earnings / total assets, X3 is the EBIT / total assets and X4 is the book value of equity
/ total liabilities.
Table 17. Results for the change in Altman Z’’-score of the acquiring firm
Acquirer Average change in Altman Z’’-score -0.227
t-statistic -4.192
p-value 0.000
N 410
Note: two-sided independent t-test conducted to test whether on average the change in
Altman Z’’-score is significantly different from 0.
DO MERGERS AND ACQUISITIONS INCREASE DEFAULT RISK?
41
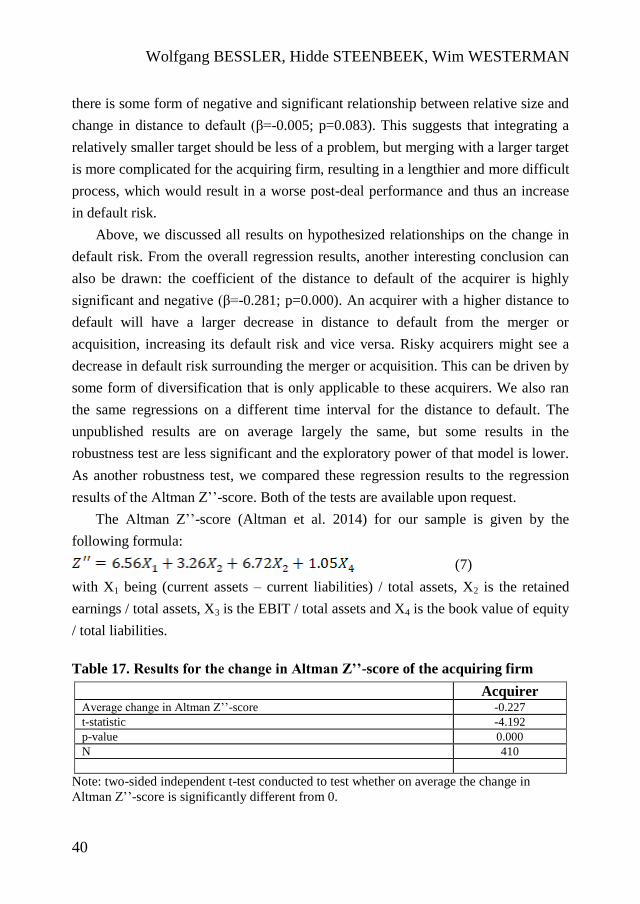
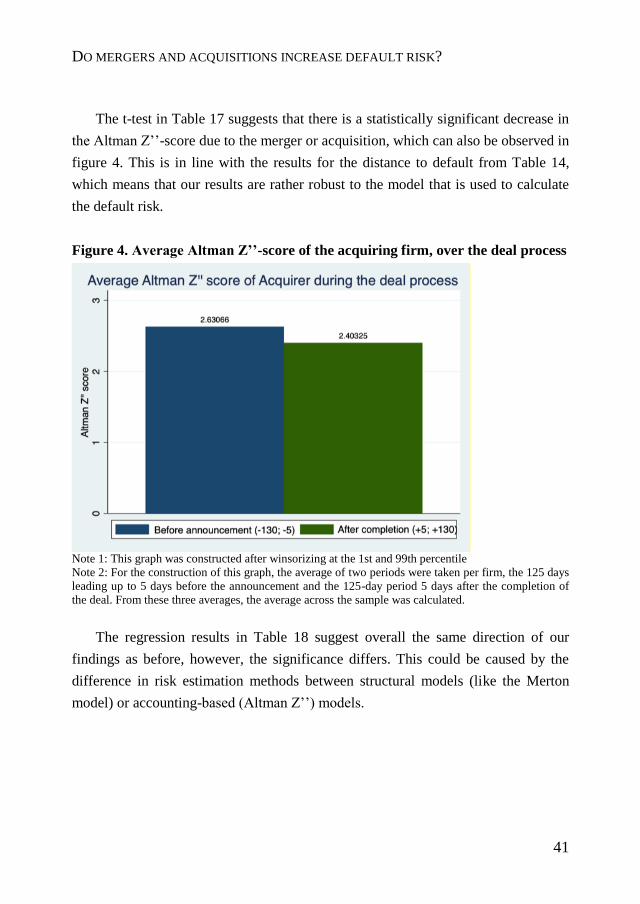
The t-test in Table 17 suggests that there is a statistically significant decrease in
the Altman Z’’-score due to the merger or acquisition, which can also be observed in
figure 4. This is in line with the results for the distance to default from Table 14,
which means that our results are rather robust to the model that is used to calculate
the default risk.
Figure 4. Average Altman Z’’-score of the acquiring firm, over the deal process
Note 1: This graph was constructed after winsorizing at the 1st and 99th percentile
Note 2: For the construction of this graph, the average of two periods were taken per firm, the 125 days
leading up to 5 days before the announcement and the 125-day period 5 days after the completion of
the deal. From these three averages, the average across the sample was calculated.
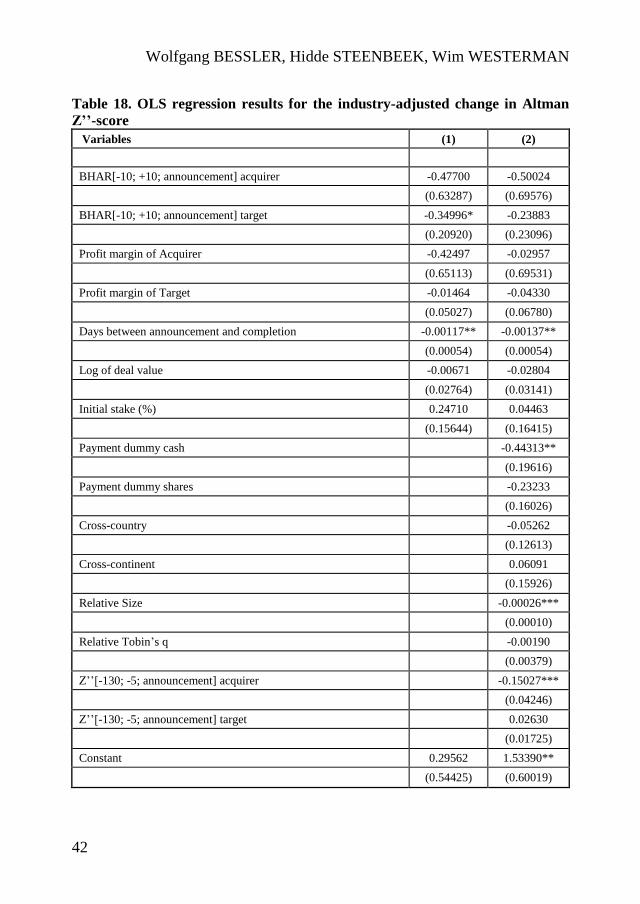
The regression results in Table 18 suggest overall the same direction of our
findings as before, however, the significance differs. This could be caused by the
difference in risk estimation methods between structural models (like the Merton
model) or accounting-based (Altman Z’’) models.
Wolfgang BESSLER, Hidde STEENBEEK, Wim WESTERMAN
42
Table 18. OLS regression results for the industry-adjusted change in Altman
Z’’-score
Variables (1) (2)
BHAR[-10; +10; announcement] acquirer -0.47700 -0.50024
(0.63287) (0.69576)
BHAR[-10; +10; announcement] target -0.34996* -0.23883
(0.20920) (0.23096)
Profit margin of Acquirer -0.42497 -0.02957
(0.65113) (0.69531)
Profit margin of Target -0.01464 -0.04330
(0.05027) (0.06780)
Days between announcement and completion -0.00117** -0.00137**
(0.00054) (0.00054)
Log of deal value -0.00671 -0.02804
(0.02764) (0.03141)
Initial stake (%) 0.24710 0.04463
(0.15644) (0.16415)
Payment dummy cash -0.44313**
(0.19616)
Payment dummy shares -0.23233
(0.16026)
Cross-country -0.05262
(0.12613)
Cross-continent 0.06091
(0.15926)
Relative Size
-0.00026***
(0.00010)
Relative Tobin’s q
-0.00190
(0.00379)
Z’’[-130; -5; announcement] acquirer
-0.15027***
(0.04246)
Z’’[-130; -5; announcement] target
0.02630
(0.01725)
Constant 0.29562 1.53390**
(0.54425) (0.60019)
DO MERGERS AND ACQUISITIONS INCREASE DEFAULT RISK?
43
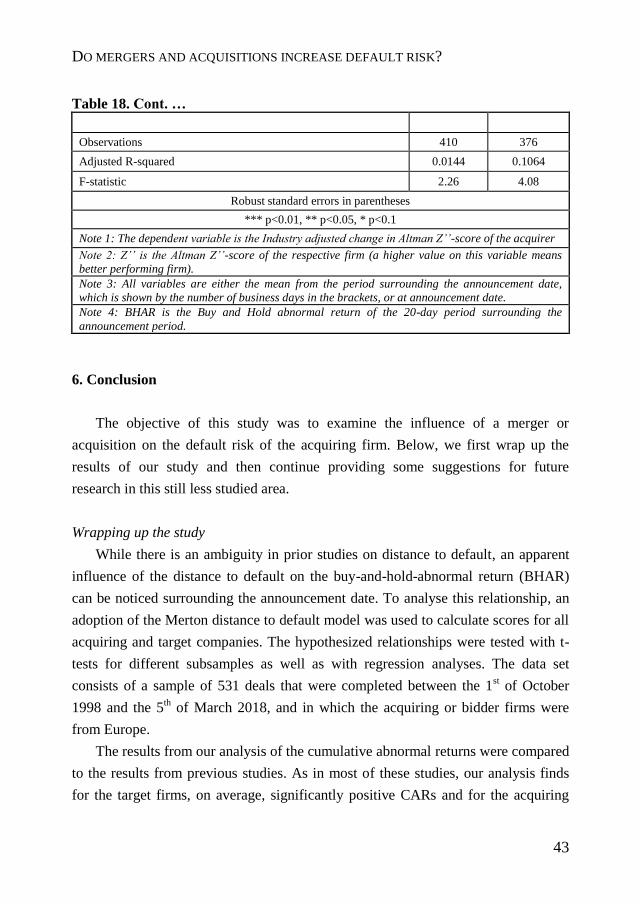
Table 18. Cont. …
Observations 410 376
Adjusted R-squared 0.0144 0.1064
F-statistic 2.26 4.08
Robust standard errors in parentheses
*** p<0.01, ** p<0.05, * p<0.1
Note 1: The dependent variable is the Industry adjusted change in Altman Z’’-score of the acquirer
Note 2: Z’’ is the Altman Z’’-score of the respective firm (a higher value on this variable means
better performing firm).
Note 3: All variables are either the mean from the period surrounding the announcement date,
which is shown by the number of business days in the brackets, or at announcement date.
Note 4: BHAR is the Buy and Hold abnormal return of the 20-day period surrounding the
announcement period.
6. Conclusion
The objective of this study was to examine the influence of a merger or
acquisition on the default risk of the acquiring firm. Below, we first wrap up the
results of our study and then continue providing some suggestions for future
research in this still less studied area.
Wrapping up the study
While there is an ambiguity in prior studies on distance to default, an apparent
influence of the distance to default on the buy-and-hold-abnormal return (BHAR)
can be noticed surrounding the announcement date. To analyse this relationship, an
adoption of the Merton distance to default model was used to calculate scores for all
acquiring and target companies. The hypothesized relationships were tested with t-
tests for different subsamples as well as with regression analyses. The data set
consists of a sample of 531 deals that were completed between the 1st of October
1998 and the 5th of March 2018, and in which the acquiring or bidder firms were
from Europe.
The results from our analysis of the cumulative abnormal returns were compared
to the results from previous studies. As in most of these studies, our analysis finds
for the target firms, on average, significantly positive CARs and for the acquiring
Wolfgang BESSLER, Hidde STEENBEEK, Wim WESTERMAN
44
firms only CARs that are insignificantly different from zero. When analysing the
buy-and-hold-abnormal returns (BHARs), two observations are important. First, an
underperformance with the target is visible after the third day subsequent to the
announcement. It may be that M&A announcements in our sample are first
overpriced during the announcement period. Therefore, the initial outperformance
overshoots and is too high, leading to a reversal and a small market performance
decline later on. The second but important finding of this analysis is the negative
effect of distance to default of the target on the buy-and-hold-abnormal return of the
target. Analysing this effect was our main motivation and initiation for this study.
On average, we observe for our sample that mergers and acquisitions increase
the default risk of the acquiring firm. This means that some mergers might decrease
this risk but most often, the default risk is higher after the M&A, which is consistent
with the poor stock price performance of many deals post M&A. A number of
explanations and reasons for this observation were already suggested in the literature
and empirically tested. Firms and managers might be considering alternatives to
avoid this effect by acquiring only firms that offer great synergies or diversification
effects, by not overpaying for targets, by having a sound financing of the deal and
not overextending its own debt capacity, by staying away from mergers among
equals, and by acquiring defaulting targets only if a turnaround seems very likely.
We hypothesised that geographical diversification would decrease the default
risk. However, for our sample, we reject this hypothesis and provide significant
support for the opposite hypothesis: in cross-country deals the default risk increases,
on average. However, what does help in diversifying the default risk, is acquiring a
target that is situated on a different continent. This suggests that a cross-continent
merger is indeed risk diversifying, but it could also mean that when the deal is cross-
continent it mitigates the negative effect of cross-country mergers.
The next relationship that we analysed was that mergers that are partially paid
with shares would increase the default risk. In contrast, when cash was used as a
payment method, it would decrease default risk. From the overall regression, it
became evident that share payments increased the default risk and cash payments
had no significant effect. The hypothesis stating that relative size between the target
and the acquirer would be negatively related to the change in distance to default was
DO MERGERS AND ACQUISITIONS INCREASE DEFAULT RISK?
45
supported. This suggests that relatively larger target firms such as mergers among
equals are more complicated to integrate into the acquiring firm.
Future research implications
Our research applies a model that could be employed to predict bidder
performance subsequent to an M&A deal by analysing a change in default risk of the
acquiring firm. This result might be of interest to managers of acquiring firms as
well as corporate finance advisors. Our study also provides some explanations why
firms still undertake certain deals even though the default risk, on average,
increases. This study, however, does have some limitations, one of them being
variables that are needed for the calculation of distance to default were unavailable,
limiting the sample. Another limitation of the research is that for the calculation of
the Merton distance to default the time to maturity of all firms’ liabilities was
assumed to be one year. In real-life, these liabilities have different times to maturity.
From our data we noticed that for the high-yield acquirers the distance to default
increases over the deal period. This could have been related to the deal, however, it
might also be the case that without the deal the distance to default would still have
increased because it could not decrease further. This is something that is outside of
the scope of this research and is something for future research to look into, by
comparing these results with a control sample without mergers and acquisitions.
Wolfgang BESSLER, Hidde STEENBEEK, Wim WESTERMAN
46
References
Alexandridis G., Mavrovitis Ch.F., Travlos N.G. (2012), How have M&As changed? Evidence from
the sixth merger wave, “The European Journal of Finance”, vol. 18, pp. 663-688.
Alexandridis G., Petmezas D., Travlos N.G. (2010), Gains from mergers and acquisitions around the
world: new evidence, “Financial Management”, vol. 39 no. 4, pp. 1671-1695.
Altman E.I., Iwanicz-Drozdowska M., Laitinen E.K., Suvas A. (2014), Distressed firm and bankruptcy
prediction in an international context. A review and empirical analysis of Altman’s z-score model,
https://papers.ssrn.com/sol3/papers.cfm?abstract_id=2536340 [12.12.2019].
Amihud Y., Lev B. (1981), Risk reduction as a managerial motive for conglomerate mergers, “Bell
Journal of Economics”, vol. 12 no. 2, pp. 605-617.
Antoniou A., Arbour P., Zhao H. (2008), How much is too much. Are merger premiums too high?,
“European Financial Management”, vol. 14 no. 2, pp. 268-287.
Arık E., Kutan A.M. (2015), Do mergers and acquisitions create wealth effects? Evidence from twenty
emerging markets, “Eastern European Economics”, vol. 53 no. 6, pp. 529-550.
Asquith P., Bruner R.F., Mullins D.W. Jr (1983), The gains to bidding firms from merger, “Journal of
Financial Economics”, vol. 11 no. 1-4, pp. 121-139.
Bessler W., Drobetz W., Zimmermann J. (2011), Financing corporate mergers and acquisitions, in:
Capital structure and corporate financing decisions. Theory, evidence and practise, Baker H.K., Martin
G. (eds.) (Kolb Series in Finance), John Wiley & Sons, Hoboken, NJ, pp. 419-444.
Bessler W., Schneck C. (2015), Excess premium offers and bidder success in European takeovers,
“Eurasian Economic Review”, vol. 5 no. 1, pp. 23-62.
Bessler W., Schneck C. (2016), Excess takeover premiums and bidder contests in Merger &
Acquisitions. New methods for determining abnormal offer prices, in: Analysis of large and complex
data, Wilhelm A.F.X., Kestler H.A. (eds.), Springer, Berlin-Heidelberg, pp. 323-333.
Bessler W., Schneck C. Zimmermann J. (2015), Bidder contests in international mergers and
acquisitions. The impact of toeholds, preemptive bidding, and termination fees, “International Review
of Financial Analysis”, vol. 42, pp. 4-23.
Bharath S.T., Shumway T. (2008), Forecasting default with the Merton distance to default model, “The
Review of Financial Studies”, vol. 21 no. 3, pp. 1339-1369.
Billett M.T., King T.-H.D., Mauer D.C. (2004), Bondholder wealth effects in mergers and acquisitions.
New evidence from the 1980s and 1990s, “The Journal of Finance”, vol. 59 no. 1, pp. 107-135.
Black F., Scholes M. (1973), The pricing of options and corporate liabilities, “Journal of Political
Economy”, vol. 81 no. 3, pp. 637-654.
Brown S.J., Warner J.B. (1985), Using daily stock returns. The case of event studies, “Journal of
Financial Economics”, vol. 14 no. 1, pp. 3-31.
DO MERGERS AND ACQUISITIONS INCREASE DEFAULT RISK?
47
Bruyland E., De Maeseneire W. (2016), The risk effects of acquiring distressed firms, “Journal of
Business Finance & Accounting”, vol. 43 no. 9-10, pp. 1297-1324.
Bureau van Dijk (2018), Global M&A review 2018, Bureau van Dijk,
https://www.bvdinfo.com/BvD/media/reports/Global-M-A-Review-2018.pdf [12.12.2019].
Cornett M.M., Tanyeri B., Tehranian H. (2011), The effect of merger anticipation on bidder and target
firm announcement period returns, “Journal of Corporate Finance”, vol. 17 no. 3, pp. 595-611.
Dezsö C.L., Ross D.G. (2012), Does female representation in top management improve firm
performance? A panel data investigation, “Strategic Management Journal”, vol. 33 no. 9, pp. 1072-
1089.
Dong M., Hirshleifer D., Richardson S., Teoh S.H. (2006), Does investor misvaluation drive the
takeover market?, “The Journal of Finance”, vol. 61 no. 2, pp. 725-762.
Furfine C.H., Rosen R.J. (2011), Mergers increase default risk, “Journal of Corporate Finance”, vol. 17
no. 4, pp. 832-849.
Ghosh A., Jain P.C. (2000), Financial leverage changes associated with corporate mergers, “Journal of
Corporate Finance”, vol. 6 no. 4, pp. 377-402.
Hackbarth D., Morellec E.E. (2008), Stock returns in mergers and acquisitions, “The Journal of
Finance”, vol. 63 no. 3, pp. 1213-1252.
Ishii J., Xuan Y. (2014), Acquirer-target social ties and merger outcomes, “Journal of Financial
Economics”, vol. 112 no. 3, pp. 344-363.
Jensen M.C. (1986), Agency costs of free cash flow, corporate finance, and takeovers, “The American
Economic Review”, vol. 76 no. 2, pp. 323-329.
Jensen M.C. (2005), Agency costs of overvalued equity, “Financial Management”, vol. 34 no. 1, pp. 5-
19.
Kaldor N. (1966), Marginal productivity and the macro-economic theories of distribution. Comment on
Samuelson and Modigliani, “Review of Economic Studies”, vol. 33 no. 4, pp. 309-319.
Kedia S., Zhou X. (2014), Informed trading around acquisitions. Evidence from corporate bonds,
“Journal of Financial Markets”, vol. 18 no. C, pp. 182-205.
Kiymaz H., Baker H.K. (2008), Short-term performance, industry effects, and motives. Evidence from
large M&As, “Quarterly Journal of Finance and Accounting”, vol. 47 no. 2, pp. 17-44.
Koerniadi H., Krishnamurti Ch., Tourani-Rad A. (2015), Cross-border mergers and acquisitions and
default risk, “International Review of Financial Analysis”, vol. 42, pp. 336-348.
Lang L., Stulz R., Walkling R.A. (1989), Managerial performance, Tobin’s Q, and the gains from
successful tender offers, “Journal of Financial Economics”, vol. 24 no. 1, pp. 137-154.
Lattanzio G., Megginson W.L., Sanati A. (2019), Listing gaps, merger waves, and the privatization of
American equity finance, https://papers.ssrn.com/sol3/papers.cfm?abstract_id=3329555 [12.12.2019].
Wolfgang BESSLER, Hidde STEENBEEK, Wim WESTERMAN
48
Liao H.H., Chen T.-K., Lu Ch.-W. (2009), Bank credit risk and structural credit models. Agency and
information asymmetry perspectives, “Journal of Banking & Finance”, vol. 33 no. 8, pp. 1520-1530.
Maksimovna K.M. (2015), Influence of mergers and acquisitions on the default risk of the acquiring
firm, “European Journal of Economics and Management Sciences”, no. 3, pp. 70-73.
Merton R.C. (1974), On the pricing of corporate debt. The risk structure of interest rates, “The Journal
of Finance”, vol. 29 no. 2, pp. 449-470.
Mitchell M., Andrade G., Stafford E. (2001), New evidence and perspectives on mergers, “Journal of
Economic Perspectives”, vol. 15 no. 2, pp. 103-120.
Moeller S.B., Schlingemann F.P., Stulz R.M. (2004), Firm size and the gains from acquisitions,
“Journal of Financial Economics”, no. 73, pp. 201-228.
Moeller S.B., Schlingemann F.P., Stulz R.M. (2005), Wealth destruction on a massive scale? A study
of acquiring-firm returns in the recent merger wave, “The Journal of Finance”, vol. 60 no. 2, pp. 757-
782.
Pelow S., Nguyen H.H. (2018), Distressed mergers and acquisitions, MSc Thesis in Accounting &
Finance, Lund University School of Economics and Management.
Savor P.G., Lu Q. (2009), Do stock mergers create value for acquirers?, “The Journal of Finance”, vol.
64 no. 3, pp. 1061-1097.
Schwert G.W. (1996), Markup pricing in mergers and acquisitions, “Journal of Financial Economics”,
vol. 41 no. 2, pp. 153-192.
Tang Z., Xu X. (2016), What causes the target stock price run-up prior to M&A announcements?,
“Journal of Accounting and Finance”, vol. 16 no. 6, pp. 106-120.
Tobin J. (1969), A general equilibrium approach to monetary theory, “Journal of Money, Credit and
Banking”, vol. 1 no. 1, pp. 15-29.
Wang C., Xie F. (2008), Corporate governance transfer and synergistic gains from mergers and
acquisitions, “The Review of Financial Studies”, vol. 22 no. 2, pp. 829-858.
Yılmaz I.S., Tanyeri B. (2016), Global merger and acquisition (M&A) activity: 1992-2011, “Finance
Research Letters”, vol. 17 no. C, pp. 110-117.
Yook K.C. (2003), Larger return to cash acquisitions. Signaling effect or leverage effect?, “The Journal
of Business”, vol. 76 no. 3, pp. 477-498.
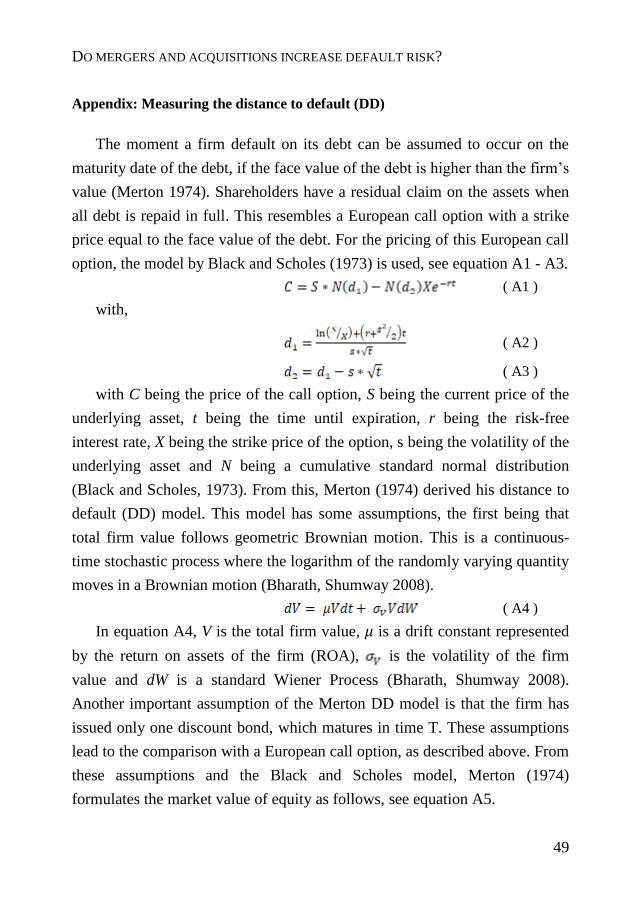
DO MERGERS AND ACQUISITIONS INCREASE DEFAULT RISK?
49
Appendix: Measuring the distance to default (DD)
The moment a firm default on its debt can be assumed to occur on the
maturity date of the debt, if the face value of the debt is higher than the firm’s
value (Merton 1974). Shareholders have a residual claim on the assets when
all debt is repaid in full. This resembles a European call option with a strike
price equal to the face value of the debt. For the pricing of this European call
option, the model by Black and Scholes (1973) is used, see equation A1 - A3.
( A1 )
with,
( A2 )
( A3 )
with C being the price of the call option, S being the current price of the
underlying asset, t being the time until expiration, r being the risk-free
interest rate, X being the strike price of the option, s being the volatility of the
underlying asset and N being a cumulative standard normal distribution
(Black and Scholes, 1973). From this, Merton (1974) derived his distance to
default (DD) model. This model has some assumptions, the first being that
total firm value follows geometric Brownian motion. This is a continuous-
time stochastic process where the logarithm of the randomly varying quantity
moves in a Brownian motion (Bharath, Shumway 2008).
( A4 )
In equation A4, V is the total firm value, μ is a drift constant represented
by the return on assets of the firm (ROA), is the volatility of the firm
value and dW is a standard Wiener Process (Bharath, Shumway 2008).
Another important assumption of the Merton DD model is that the firm has
issued only one discount bond, which matures in time T. These assumptions
lead to the comparison with a European call option, as described above. From
these assumptions and the Black and Scholes model, Merton (1974)
formulates the market value of equity as follows, see equation A5.
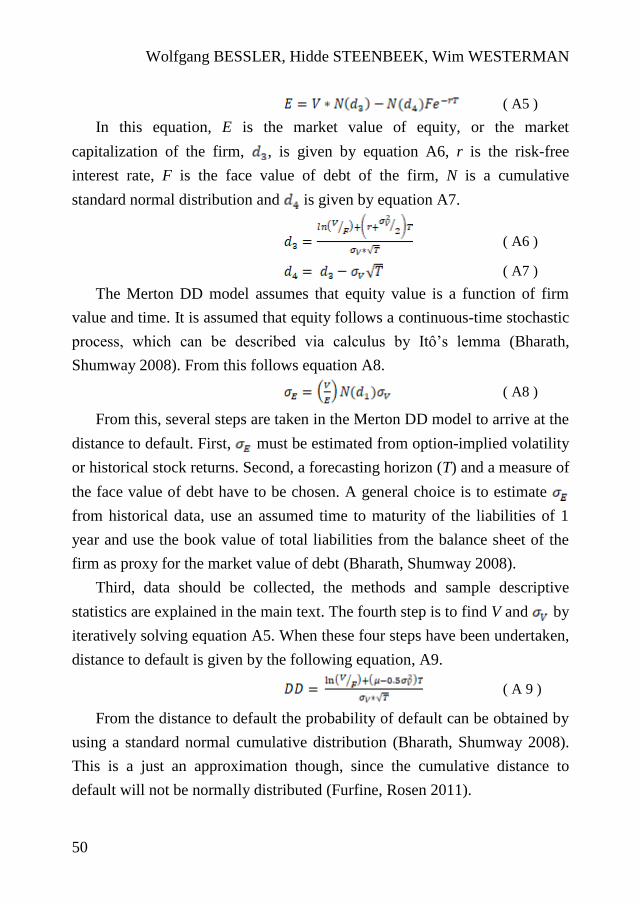
Wolfgang BESSLER, Hidde STEENBEEK, Wim WESTERMAN
50
( A5 )
In this equation, E is the market value of equity, or the market
capitalization of the firm, , is given by equation A6, r is the risk-free
interest rate, F is the face value of debt of the firm, N is a cumulative
standard normal distribution and is given by equation A7.
( A6 )
( A7 )
The Merton DD model assumes that equity value is a function of firm
value and time. It is assumed that equity follows a continuous-time stochastic
process, which can be described via calculus by Itô’s lemma (Bharath,
Shumway 2008). From this follows equation A8.
( A8 )
From this, several steps are taken in the Merton DD model to arrive at the
distance to default. First, must be estimated from option-implied volatility
or historical stock returns. Second, a forecasting horizon (T) and a measure of
the face value of debt have to be chosen. A general choice is to estimate
from historical data, use an assumed time to maturity of the liabilities of 1
year and use the book value of total liabilities from the balance sheet of the
firm as proxy for the market value of debt (Bharath, Shumway 2008).
Third, data should be collected, the methods and sample descriptive
statistics are explained in the main text. The fourth step is to find V and by
iteratively solving equation A5. When these four steps have been undertaken,
distance to default is given by the following equation, A9.
( A 9 )
From the distance to default the probability of default can be obtained by
using a standard normal cumulative distribution (Bharath, Shumway 2008).
This is a just an approximation though, since the cumulative distance to
default will not be normally distributed (Furfine, Rosen 2011).
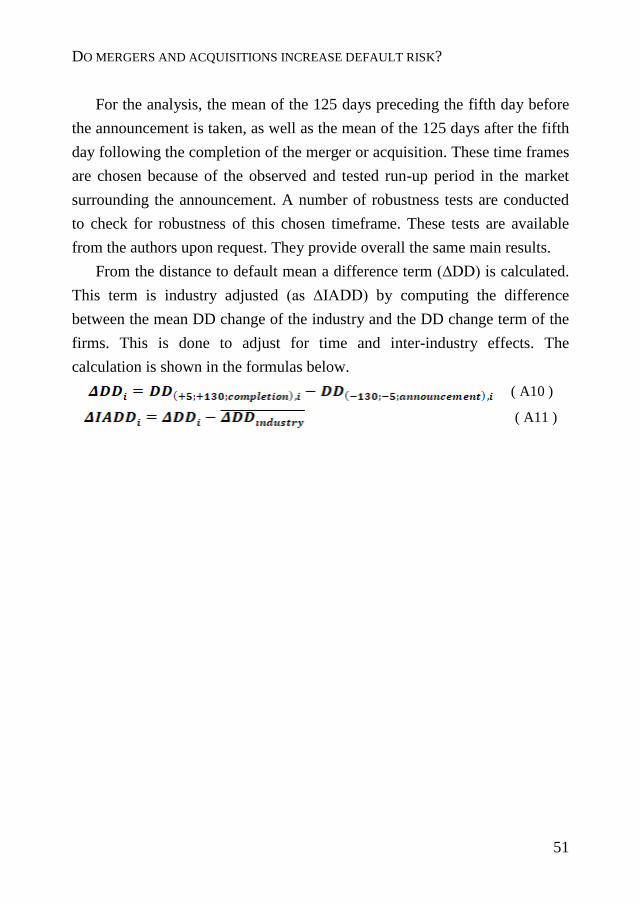
DO MERGERS AND ACQUISITIONS INCREASE DEFAULT RISK?
51
For the analysis, the mean of the 125 days preceding the fifth day before
the announcement is taken, as well as the mean of the 125 days after the fifth
day following the completion of the merger or acquisition. These time frames
are chosen because of the observed and tested run-up period in the market
surrounding the announcement. A number of robustness tests are conducted
to check for robustness of this chosen timeframe. These tests are available
from the authors upon request. They provide overall the same main results.
From the distance to default mean a difference term (∆DD) is calculated.
This term is industry adjusted (as ∆IADD) by computing the difference
between the mean DD change of the industry and the DD change term of the
firms. This is done to adjust for time and inter-industry effects. The
calculation is shown in the formulas below.
( A10 )
( A11 )
CENTRAL EUROPEAN REVIEW OF ECONOMICS AND MANAGEMENT ISSN 2543-9472; eISSN 2544-0365
www.cerem-review.eu
www.ojs.wsb.wroclaw.pl Vol. 3, No. 4, 53-89, December 2019
Correspondence address: Hans VISSER Ph.D., Professor Emeritus of Monetary Economics, School of
Business and Economics, Vrije Universiteit Amsterdam, The Netherlands. E-mail: [email protected]
Received: 13.09.2018, Revised: 30.10.2019, Accepted: 24.11.2019
doi: http://dx.doi.org/ 10.29015/cerem.765
© 2019 WSB UNIVERSITY IN WROCŁAW .
The Islamic economy: its origin, its world view and
its claims
Hans VISSER
Vrije Universiteit Amsterdam, The Netherlands
Abstract:
Aim: This article takes a critical look at the claims made by advocates of an Islamic economy, in particular that it differs fundamentally from capitalism and socialism because it is built “on a superior ethical basis. The aim is to find out whether this claim can be creditably sustained and why it is made. Design: The world view behind the Islamic economy is probed into by means of a literature study encompassing publications by prominent students of Islam and Islamic economics, predominantly themselves Muslims, which have appeared in a wide range of professional books, magazines and paper series. Conclusions: It is concluded that an Islamic economic system does not differ fundamentally from mixed-economy non-Islamic ones and that there is little reason for non-Muslims to accord Islamic ethics special status. Further, it is found that important drivers of the attempts to Islamize the economy are frustration about the sorrow state of the Islamic world at least since the early nineteenth century and a wish to regain something of its former glory. In other words, identity politics is at play. There may an element of subjectivity in this conclusion, as it depends on interpretations that are hard to prove or disprove conclusively, but statements by leading Muslim advocates of Islam economists give it weight. The conclusion may help to interpret developments in the Muslim world, which is an indispensable step in finding a way to deal with them. Key words: Relation of Economics to Social Values, History of Economic Thought since 1925, Financial Economics, Monetary Systems, Financial Institutions and Services, Comparative Financial Markets and Institutions, Comparative Economic Systems, Religion) JEL: A13, B26, E42, G20, N20, P50, Z12
Hans VISSER
54
1. Introduction
Advocates of Islamic finance and of other forms of an Islamic economy claim
that the Islamic economy is a system that is fundamentally different from other
systems, being based on an ethical basis that is lacking in other systems. In order to
find out why this claim is made and whether there is supporting evidence, the world
view behind the Islamic economy is probed into: how do the advocates of the
Islamic economy look at the world and the role or the duty of Muslims in it. We start
with an account of the genesis of the idea of an Islamic economy that led to the
foundation of specifically Islamic financial institutions. This is followed by a sketch
of the worldview behind the Islamic economy and this world view is confronted
with conventional capitalism. Next, the standard check list of Islamic economic
ethics, a major ingredient of the Islamic world view, is discussed. Then I point to
two issues where the Islamic economy, and again Islamic finance in particular, has
some catching up to do, namely environmental, social and governance issues (ESG)
and income distribution, and the article wraps up with a confrontation between the
professed ethics and the real world of the Islamic economy and an attempt to find
the driving motives behind the Islamic world view. The tone may be quite critical at
times, but I have no axe to grind and my critique is to a large extent shared by
Muslim observers of the Islamic economy, in particular the Islamic financial
landscape.
2. The genesis of the Islamic economy
In the heyday of the Abbasid caliphate (750-1258) Baghdad became a
flourishing centre of science, philosophy and invention. This ended with the sacking
of Baghdad by Mongol forces in 1258, but its intellectual pre-eminence had already
been eroding. One important factor was that less and less room was available for
ijtihad, independent judicial reasoning by a qualified legal scholar leading to new
legal rules. Ijtihad is one of the secondary sources of Islamic jurisprudence or fiqh;
the Quran and the Hadith, that is the acts and utterances of the prophet Muhammad,
THE ISLAMIC ECONOMY
55
being the primary sources. Ijtihad was widely applied in deciding what was
admissible and what not when new products were developed, new kinds of trade
relations developed, new political organizations arose, new inventions were made,
new medical techniques were developed and so on. It made for flexibility and easy
acceptance of change in society. However, fiqh scholars from the ninth century
onwards increasingly argued that all important questions had been settled and that
the then existing fiqh body was sufficient to answer all questions (Schacht 1982: 70;
Hallaq 1984; Ebrahim, Sheikh 2018). Measures taken by the founder of the Mamluk
sultanate of Egypt, al-Malik al-Zahir Baybars, who had made the Mamluks the
dominant force in the Islamic Middle East after the demise of the Abbasid caliphate,
accelerated this process. In 1265 he appointed one supreme judge for each of the
four great Sunni law schools in order to bring some uniformity and predictability in
jurisdiction, which he felt was necessary for strong centralized government. He
furthermore required all judges to stick to the doctrine of the law school to which
they belonged and follow judgements of earlier law scholars from their own school,
rather than apply ijtihad. Baybars imposed this system first in Cairo and next in
Damascus (Allan 2019). Also in the thirteenth century, the Islamic world was
confronted by the Reconquista, the conquering of Islamic-held territory in the
Iberian peninsula by Christian kingdoms, and by the Mongol invasion. There was a
feeling that God had withdrawn his favour from Muslims and that to win it back
Muslims had to follow the divine laws without questioning. There was no longer a
place for rationalism, doubt had to replaced by certainty (de Bellaigue 2018: xxxv)
By the fourteenth century it was agreed among the fiqh scholars, in Sunni Islam at
least, that there was no place any longer for ijtihad and that ‘the gate of ijtihad’ had
closed (Egger 2018: 63-64). This meant that intellectual curiosity was frowned
upon, as it could easily lead to fitna, that is schism, social unrest, seditious dissent,
civil war.
The Renaissance that transformed Europe between the fourteenth century and
the seventeenth century left the Islamic world thus largely untouched and ‘largely’
became ‘totally’ when the Ottoman political and religious leaders, horrified when
they saw how Martin Luther’s attacks on the abuses of the Roman Catholic church
went viral thanks to the printing press, took care not to let anything similar happen
Hans VISSER
56
in their empire (Rubin 2017: chapter 6). There was no lively public debate, no
exchange of new ideas over large areas, no empirical experimentation, no setting up
of scientific organizations such as the Royal Society (1660) in England, no press
disseminating news and trade information, no development of new machinery, such
as James Hargreaves’s spinning Jenny and James Watt’s steam engine, no advance
in medical knowledge, such as the development of the smallpox vaccine by Edward
Jenner in 1796, and no chemical science as for instance developed by Robert Boyle
and Joseph Louis Gay-Lussac. Nothing of this kind was remotely possible in the
Islamic world under the fierce opposition of the ulama, the religious scholars,
whether or not hand in glove with the worldly rulers, against any innovation and
with the abysmally low prevailing literacy rates. In the early nineteenth century
literacy in the Ottoman empire is reported to have been no more than two or three
per cent, whereas in England and the Dutch Republic it was already over 50 per cent
by 1700 (Rubin 2017: 107, 198).
In the nineteenth century the Islamic world was rudely confronted with the fact
that European countries were far ahead in science, education, medicine, transport,
military organization, industry and communication and that the gap was widening
rapidly. Strongmen such as Muhammad Ali Pasha, who ruled Egypt (formally as
Ottoman viceroy) from 1805 to 1849, and Mahmud II, who reigned as the Ottoman
sultan from 1808 to 1839, enforced modernization, ruthlessly suppressing all
opposition (de Bellaigue 2018). Islam played no role whatsoever in the
achievements of nineteenth-century progress and Europeans, joined by intellectuals
from the Islamic world, saw it as an obscurantist remnant. There were, however,
Muslims who agreed that Islam had become fossilized but reacted by preaching a
much more liberal form of Islam than what had become the mainstream. One man
who stood out was Jamal al-Din al-Afghani (1839-1897). As European countries
became more openly imperialist in the Middle East and Northern Africa as the
nineteenth century wore on – Tunisia for instance became a French colony in 1881
and Britain took control of Egypt in 1882, while the French had already taken over
Algeria in 1830 – aversion to European influence grew (India, Ceylon and the Dutch
East Indies had been colonized earlier). Building on this aversion he inspired a pan-
Islamist movement that united the Muslim world against European imperialism.
THE ISLAMIC ECONOMY
57
This was possible thanks to much better communication as travel became ever
easier, education improved and the printing press at last became common in the
Islamic world, offering a propagation mechanism for revolutionary ideas as it had
done more than three centuries earlier in Western Europe for Martin Luther’s
denouncement of the Roman Catholic Church’s malpractices. In 1899 al-Afghani’s
pupil Muhammad Abduh (1849-1905) was named Grand Mufti of Egypt, the highest
authority on Islamic jurisprudence and the head of Egypt’s religious law courts, by
the khedive (Ottoman viceroy; a mufti is an Islamic lawyer who is authorized to
issue a fatwa, or legal opinion). Abduh shook up al-Azhar University, introducing
secular subjects and modern sanitary conditions, and he propagated an enlightened
Islam that no longer denied a place for human reasoning, thus reviving ijtihad. He
even maintained that the Quran, the holy scripture of Islam, could be interpreted
differently according to time and place and that it might contain errors, introduced
by humans. This was, and is, anathema to mainstream Muslims and met with fierce
opposition. Instrumental in spreading his ideas was Muhammad Rashid Rida (1865-
1935), who published a journal, al-Manar (The Beacon), to which Abduh
contributed legal rulings and reformist essays (Hashmi 2004a, c; de Bellaigue 2018:
chapter 5).
The First World War and the resulting break-up of the Ottoman empire put an
end to pan-Islamism and liberal reformist currents gave way to movements that
attempted to make an alleged ‘pure’ Islam, not tainted by liberal secular notions, fit
for governing life in the twentieth century. An important role was played by the
Muslim Brotherhood in Egypt, founded in 1928 by Hassan al-Banna (1906-1949).
Similar movements sprang up in other parts of the world with a large Muslim
population. Muslim intellectuals in British India and, after the 1947 Partition, in
Pakistan distinguished themselves specifically by developing ideas on how to
organize the economy of an Islamic society. A pioneering role was played by
Maulana or Mawlana Sayyid Abu’l-A’la Maududi (1903-1979), the founder of the
Islamist Jamaat e-Islami party (‘maulana’ or ‘mawlana’, literally ‘our master’, is an
honorific title for religious Muslim scholars in South Asia). Maududi (also spelled
Mawdudi or Maudoodi) wrote, as editor of a journal he founded in 1932 for
Muslims in British India: “The plan of action I had in mind was that I should first
Hans VISSER
58
break the hold which Western culture and ideas had come to acquire over the
Muslim intelligentsia, and to instil in them the fact that Islam has a code of life of its
own, its own culture, its own political and economic systems and a philosophy and
an educational system which are all superior to anything that Western civilization
could offer. I wanted to rid them of the wrong notion that they needed to borrow
from others in the matter of culture and civilization” (quoted in Slomp 2003: 240).
The economic system thus figured explicitly in his plans for an Islamic revival
(Kuran 2004: chapter 4). After delivering an address on the subject in 1941
(Maududi 1941/1999), he went into more detail in several works on the principles
that should govern an Islamic state (Maududi 1963, 1999). Others in India and later
in Pakistan followed in his footsteps, in particular Anwar Iqbal Qureshi in 1946
(Qureshi 1946), Naiem Siddiqhi in 1948 and Mahmud Ahmad in 1952 (see Gafoor
1996: 37; Mahmud Ahmad 1999). In Egypt a prominent exponent of one of the
more radical wings of the Muslim Brotherhood, Sayyid Qutb (1906-1966), wrote on
the characteristics of an Islamic society, though without going into detail specifically
on the economy, as Maududi had done (Hashmi 2004b). Qutb emphasized the idea
of social justice in Islam (Qutb 2000; Damir-Geilsdorf 2018). He also preached
violent action, first of all against leaders of Muslim countries who were seen to
betray Islam.
The ideas of these, and other, Islamic reformists paved the way for the
establishment of Islamic financial institutions, which after some earlier small-scale
experiments took off in the 1970s, when the oil states were awash with liquidity
thanks to the oil crises. After a meeting of the foreign ministers of Islamic countries
in Jeddah to discuss Islamic banking, the Nasser Social Bank of Egypt was set up in
1971 with government support. It mainly provided qard hasan loans (interest-free
loans against at best a very low administrative fee) to the poor and the needy,
scholarships to students and micro-credit to small projects on a profit-and-loss
sharing (PLS) basis (Abedifar et al. 2015). Another such meeting in late 1973 led to
the foundation of the Islamic Development Bank (IDB) in 1974, which owed very
much to the initiative of Egypt and Pakistan, arguably the cradles of twentieth-
century Islamic banking. It went open for business in 1975 and first helped oil-
importing countries cope with the oil crisis by buying oil and selling it to them on a
THE ISLAMIC ECONOMY
59
murabaha basis. Murabaha involves the purchase by a party, often a financier, of a
good desired by another party, often the financier’s client. The financier sells the
good on to the client with a markup, usually against deferred payment. The oil-
producing Gulf states provided most of IDB’s initial capital, as it was in their
interest to sell oil to other Muslim-majority states and promptly be paid the full
market price, without the resentment that balance-of-payment crises might otherwise
cause in the importing countries (Wilson 2008). Private banking following Islamic
principles also started in 1975, with the foundation of the Dubai Islamic Bank by a
group of pious merchants (though with the governments of the UAE and Kuwait
contributing respectively 20 percent and 10 per cent of the capital), followed by the
Faisal Islamic Bank in Egypt and Sudan in 1977.
In other sectors of the economy there had always been segments catering for the
needs of pious Muslims, but following the lead of the finance industry we are now
witnessing an increasingly internationally active Islamic ‘modest clothing’ industry
for women, a specialized Islamic travel industry, an Islamic pharmaceuticals
industry, an Islamic cosmetics industry and an Islamic media and recreation industry
(see Thomson Reuters 2017). In this way the post-World War I reformers’ ideal of
an Islamic economy is more and more taking shape, though they would perhaps not
approve of the direction Islamic finance has taken. It is often seen as conventional
banking made more complicated, not without some justification.
3. World view behind the Islamic economy and a critique
Now what are the distinguishing features of an Islamic economy? In the view of
the likes of Maududi and Qutb and also more recent proponents of a specifically
Islamic organization of the economy, Islam is fundamentally different from
capitalism and communism. The latter two lack, in their view, a moral code.
Capitalism lets individuals pursue their selfish ends without regard for the needs of
others while communism imposes unacceptable restrictions to individual liberties
and opportunities for self-fulfilment. Proponents of Islamic finance make much of
Hans VISSER
60
this moral code. This is a central notion of Islam: sharia is God’s universal moral
law and both legal and moral laws ideally flow from it.
As communism is no serious player at the moment, we will focus on the alleged
superiority of the Islamic economy, and in particular Islamic finance, over
capitalism. First, the presumed contrast between Islam and capitalism is highly
questionable. Capitalism is often equated with Anglo-American free-market neo-
liberalism where huge firms have free play. However, insofar this really exists (the
US is far from a free market) it is only one historical form of capitalism among
many. Capitalism can be denoted as a way of organizing production. Capitalism is a
system characterized by private ownership of the means of production (note that
other definitions of capitalism are possible, see for a dazzling multitude of possible
connotations Rodinson 2014: chapter I). Capitalism in this definition is not
synonymous with a free market economy. Capitalism can exist in highly regulated
societies, such as Nazi Germany, and on the other hand non-capitalist organizational
forms can exist and even flower in more or less free market economies, think of
cooperatives and the former Yugoslav communist market economy with workers’
self-management. Now Islamic economies arguably are, like most other economies,
mixed economies with both private firms and government production of goods and
services. The Islamic version distinguishes itself by an explicit moral code, said to
be derived from divine law. A prominent feature of this moral code in economic life
are the bans on riba, gharar and maysir, and on haram goods such as pork, alcohol
and adult entertainment. What are these for? One of the most prominent scholars of
Islamic finance, Professor M. Kabir Hassan of the University of New Orleans
(Hassan 2017: 1) says:
Islamic finance is built on a foundation of socioeconomic justice for all and
sustainable growth facilitated by prudent stewardship of natural resources so that
future generations may also enjoy the fruits of economic development.
In the same vein, Dr Asad Zaman (Zaman 2015: 13), the Vice-Chancellor of the
Pakistan Institute of Development Studies, maintains that
THE ISLAMIC ECONOMY
61
Since the spirit of Islam is in stark and violent conflict with the spirit of
Capitalism, the form taken by institutions designed to express this spirit must
also be different. Capitalist financial institutions are designed to support the
process of accumulation of wealth, which is at the heart of capitalist societies.
Central to Islam is the spirit of service, and spending on others, which is
expressed by diverse, service-oriented institutions, radically different from
those dominant in capitalist societies.
These are far from modest claims, repeated in numerous publications (another
influential one is a book by the prominent Muslim Brother Yusuf al-Qaradawi,
2010). What is behind it? The ‘Thou shalt nots’ of the various bans may give a
negative impression: you shouldn’t do this and you shouldn’t do that, but they have
a positive purpose, namely to fulfil the maqasid al-shariah or goals, higher
objectives, of Islamic law. These should bring about the socioeconomic justice
mentioned by Hassan and already emphasized by Hassan al-Banna. There is a strong
tendency among writers on Islamic finance and the Islamic economy in general to
follow medieval scholars, and in this case the great philosopher Al-Ghazali (c.1058-
1111), who defined the maqasid al-sharia as safeguarding
(a) people’s religion, broadly defined as their way of life
(b) their life or soul
(c) their family or offspring
(d) their property or wealth
(e) their intellect or reason, also interpreted as their dignity.
These serve to promote their welfare or maslaha, the goodness of this life and
the hereafter (Ghazanfar, Islahi 1990; 2011). However, one may wonder whether
these norms are really that unique and insofar they are, to what degree they are
reflected in day-to-day behaviour. The higher objectives certainly are not unique.
Then why all the fuss? An answer can be found in another quote from M. Kabir
Hassan (Hassan 2017: 2):
Islamic economics and finance is gaining traction because much of the Muslim
world wants to relive long-gone times when Islam was the dominant force driving
Hans VISSER
62
world history. Muslims believe they have a responsibility to extend the message
of Allah’s final messenger to all humanity. (…) Now that Muslim states are
politically free from their colonizers, they are seeking to cultivate their own
home-grown, Islam-based systems of knowledge. Islamic economics and finance
is part of this.
And here we may have Des Pudels Kern, the gist of the matter: the Islamic
economy or Islamic economics serves to throw off the frustration that drove the
Islamic reformers at the end of the nineteenth century and in the twentieth century.
Imagine: Islam claims to be the final, perfect religion, after Jews and Christians
allegedly corrupted God’s revelation (see for instance Quran, Sura 5). It swept
everything before it. In an astonishingly short time the armies of Islam conquered
the Middle East, North Africa and most of the Iberian peninsula and in 732 or 733,
only one century after the death of the prophet Muhammad, they had progressed as
far as the region between Tours and Poitiers, where their push was halted by
Frankish and Burgundian forces under Charles Martel. The cities of the Islamic
world became centres of intellectual life and scholarship without equal in the whole
of Europe. If it is so superior, how then is it possible that in the nineteenth century
the Islamic world had become a mere shadow of its former self? That of course was
hard to swallow. The Islamic economy then is one means for the umma, the global
community of Muslims, to reassert itself (see on the concept of umma Widhiyoga
2019). And that is indeed what an overwhelming majority of Islamic religious
leaders find to applaud in Islamic finance, according to enquiries (Khan, Bhatti
2018).
Let us now go back to the claim that capitalism lacks a moral code, or an ethics.
It is by no means only Muslims that condemn capitalism for encouraging greed,
selfishness and corruption but also communists, socialists of all stripes and church
leaders, think of the encyclical Rerum Novarum issued by pope Leo XIII in 1891,
the encyclical Quadragesimo anno issued in 1931 by pope Pius XI and the almost
ritual condemnation of capitalism by the World Council of Churches. Now it may be
true that capitalism has an orientation to the accumulation of wealth and too often
gives free play to unsavoury characters, but first you have to wear blinkers not to see
THE ISLAMIC ECONOMY
63
the same in the Islamic variant of capitalism, and second, the greed for gain is not
the exclusive province of capitalists. Political power corrupts at least to the same
degree, if not more. Both the power of capitalists and the power of political elites
need to be held in check by countervailing power (Galbraith 1963). A very
important and effective form of countervailing power is civil society with its fact-
finding by NGOs and the media and this flourishes best in mixed-economy
parliamentary democracies (though even there NGOs and the media face
harassment, see “The Economist” 2019). The Islamic world, certainly in the Gulf
region, too often does not allow civic society to flourish,
Capitalism is a structure for organizing the economy. If it is embedded in a
market economy it is based on the notion that decentralized ownership and decision-
making makes the best use of human creative powers and helps to prevent
centralizing too much power in the hands of the government, but that is not different
in Islam. There is nothing in Islam that inherently is inimical to capitalism
(Rodinson 2014), indeed, the first wife of the Prophet, Khadija, was a capitalist
entrepreneur and he himself was one of her employees for a number of years. Over
and above this basic foundation, capitalist market economies can harbour various
ethical rules. These need not necessarily come from religion, though of course
religions are extremely influential producers of ethical rules (and enforcers of rules
of behaviour preferred by religious elites). Ethical rules can also be produced by
nationalistic and political movements, such as communism and fascism (ethical
rules or systems are not by definition always pleasant). A very important source of
ethical rules is action by NGOs. Changing views on racism, homosexuality,
corporate social responsibility, accountability of government, conservation of nature
and animal rights have to a large extent been initiated by NGOs, and not by
organized religion, often even against the opposition of organized religion or
religious groups. Ethical rules can furthermore result out of confrontations between
interest groups, for instance employers and employees, leading to changing views on
labour rights and stakeholdership. Capitalism thus need not necessarily have the
maximization of profits and shareholder value as its overriding objective. And
whatever the defects of capitalism, it is the only system that fully makes use of the
entrepreneurial qualities and the innovate power of the people. Karl Marx and
Hans VISSER
64
Friedrich Engels, who expected capitalism to collapse under its own contradictions,
still talked about bourgeois capitalism as a system that had conjured up most
impressive means of production and transport (“… die modern bürgerliche
Gesellschaft, die so gewaltige Produktions- und Verkehrsmittel hervorgezaubert
hat”; Marx, Engels 1890/1974). Some Muslim scholars who want to emphasize the
uniqueness of Islam claim that Islam has a different epistemology than the capitalist
world. They are not impressed by the productive powers so admired by Marx and
Engels and flatly deny that there is any scarcity of resources. This is because “The
Qur’an states that Allah has provided an abundance of everything that humankind
needs in order to subsist” (Golestani 2018; in the same vein Cattelan 2018). If there
is scarcity, that is because of limitations of mankind’s productive capacity, not of a
lack of resources. The Islamic economy knows no scarcity, thanks to the ethical
values of Islam. The well-off do not strive for ever more income and wealth and the
less-well-off receive everything they need. An ideal somewhat removed from
reality.
Capitalism leaves room for various ethical systems, including Islamic ethics,
and these systems are not mutually exclusive. Further, neither Islam nor any other
religion can claim moral superiority. In the financial sector a case in point is Triodos
Bank. Triodos Bank is a Dutch ethical bank that specializes in financing sustainable
business. Khan and Mohomed (2017) confront Triodos Bank with Islami Bank
Bangladesh Limited (IBBL), which they deem an ideal Islamic bank as it probably
far exceeds other Islamic banks, in their words, “in terms of financial inclusion,
microfinance, gender balance, SME financing and green banking while still being
financially stable and profitable” (Khan, Mohomed 2017: 111). After a careful
analysis of the banks’ business practices they conclude that Triodos Bank “has some
significant lead over IBBL regarding ethical practices,” and if Triodos Bank exceeds
IBBL with regard to ethical practices “then it is far ahead of other Islamic banks in
such comparison”.1
1 Islami Bank Bangladesh has since lost its lustre. In 2017 the government forced senior executives and
board members of Islami Bank to resign because of the bank’s links with the Islamist Jamaat-e-Islami
party. In 2018 another purge followed. The new management has not maintained Islami Bank’s former
high standards and just like in government-owned banks loans now often are granted to people with
political connections, who have a poor track record when its comes to paying back their loans. The
central bank of Bangladesh found many irregularities and breaches of financial regulations in Islami
THE ISLAMIC ECONOMY
65
There is little reason for self-congratulation for Islamic banks. Islamic finance is
not of a completely different moral character than conventional finance. Indeed, it is
a common complaint among Islamic observers that Islamic finance in practice
comes down to mimicking the operations and products of conventional banking
while nominally observing Islamic rules (e.g., El-Gamal 2006: 65, 138, 163; Asutay
2012; Ayub 2017). It often boils down to ticking off boxes on a standard check list.
In the other sectors of the Islamic economy things may be more clear-cut, but there
too business practices will not differ much from conventional capitalist ones.
4. The standard check list of Islamic economic ethics
The Islamic economy wants to obey the injunctions of Islamic religious law. But
while orthodox Jews would be content to follow God’s commandments and not
necessarily understand what they are good for, the proponents of the Islamic
economy strongly believe that the Islamic rules are beneficial for mankind (Alwani
2016). The maqasid al-sharia reflect these claims. Let us now look how the three
items on the standard check list of Islamic finance ethics score in this respect. These
items are:
(a) the ban on riba
(b) the ban on gharar and maysir,
(c) the ban on haram goods and services
(a) the ban on riba
A central plank in Islamic finance’s platform is the ban on interest. It is a moot
point whether riba can really be equated with interest, but dissenters are few and far
between (Suharto 2018). One form of riba concerned a pre-Islamic Arabic custom. If
a debt was not paid on maturity (after one year), the principal was doubled,
according to most commentators (for instance, Fazlur Rahman 1964; Qureshi 1991:
Bank’s loans (The government initiates a coup at Bangladesh’s biggest bank, “The Economist”, 6 April
2017, Islami Bank Bangladesh has declined since a boardroom coup in 2017, “The Economist”, 6
April 2019). Jamaat-e-Islami was allied with the Bangladesh Nationalist Party, whose leader Khaleda
Zia is the arch-foe of Sheikh Hasina Wajed, the prime minister and leader of the ruling Awami League.
Hans VISSER
66
54). Quran 3:130, which admonishes the believers not to devour “usury, doubled
and multiplied,” most probably refers to this custom. The ban on riba was aimed, in
the view of some commentators, at preventing the debtor getting enslaved. That
would make the ban on riba from the Quran irrelevant for present-day banking and
finance, as it would only bear on riba al-jahiliyya, the riba practised by the Arabs in
the pre-Muslim “time of ignorance” (Rahman 1964; Kuran 1995: 156-157; R.
Zaman 2011; El-Gamal 2019: 114-115). Nevertheless, fiqh scholars are adamant
that riba includes interest.
The deleterious effects of interest are extensively discussed in the Islamic
literature. Interest makes the wealthy even more wealthy while they put no effort in
it and it leads to exploitation of the weak, the borrower, by the strong, the lender. It
is also averred that interest contributes to gambling with other people’s money (see
Hassan 2017). This is the standard view, but it is a flawed one. First, it is not all true
that the lender is always the strong party and the borrower the weak one. If you hold
a time or savings deposit at a bank, the only power you have is to switch to another
bank and one cannot reasonably claim that the depositors exploit the bank.
Depositors have at best very weak power to dictate rates. Second, a very large part
of savings is in the form of collective savings. Fixed-income securities are
predominantly owned by pension funds and insurance companies. Pension plans that
invest in fixed-income securities are not known as seriously increasing income
disparities. Even abstracting from the low interest rates of the last decade or so, it
can be maintained that interest as a cause of income and wealth disparities pales into
insignificance alongside successful business ventures, grossly unequal pay, the rise
of the gig economy, unequal access to education, political clout of the rich (which
translates into low effective tax rates for the rich), tax evasion, cronyism, bribery,
restrictions of market access in order to create rents (think of the vast business
empires of the Egyptian army and the Iranian Revolutionary Guard) and other shady
dealings. What remains true is that borrowing against interest may result in
gambling, or in very risky balance sheet ratios. Credit, including borrowing money
(as distinct from buying against deferred payment), is an excellent means to help a
business and individuals increase their opportunities, but it may easily get out of
hand. The solution, however, is not to condemn debt per se, but to stop giving debt
THE ISLAMIC ECONOMY
67
favourable tax treatment, in other words to reduce or phase out tax deductibility of
interest. Limits to loan-to-value ratios in mortgage finance can also help. The point
is that interest-bearing debt is a useful tool in the financial instrument box, but that it
should not be used excessively, in common with so much in human activities. Riba
is equated with interest, but it has the connotation of excess, unearned income, a
rent. Farooq (2012, 2019) argues that the fixation on interest has led to the neglect of
many kinds of unjustified and unjust enrichment, including monopolies, rent-
seeking lobbying and rewarding contracts to privileged parties. The proponents of a
separate Islamic epistemology tend to be blind to it. Golestani (2018) sees riba as
one of the worst instruments of exploitation of human beings by other human beings
and claims that it has been abolished root and branch by Islam. Quod non, see
below, and rent seeking by sheltered or favoured firms also stays out of his purview
(though he mentions bribery).
The Islamic condemnation of interest is mistaken. Another question is whether
the Islamic alternatives are fundamentally different. Interest on money loans is
forbidden in Islamic finance. However, they fulfil a very useful role and the business
community cannot easily do without. Islamic business firms cannot do without
either, however much fiqh scholars would like to see debt replaced by profit-and-
loss sharing arrangements. Profit-and-loss sharing (musharaka) and profit sharing
(mudaraba) arrangements are, however, beset with information and moral-hazard
problems and are not very popular (see Visser 2019: 71-75). Buying goods on credit
is allowed, but cannot fully fulfil the needs of Islamic business firms. The Islamic
financial sector therefore takes recourse to hiyal, that is, legal fictions, tricks. A very
popular Islamic contract for instance is tawarruq. In a tawarruq a financier buys
commodities and sells these to its customer against deferred payment. The customer
sells the goods against cash, or asks the financier to sell them as its agent. Usually
the goods are immediately sold on. The end result is a money loan. A tawarruq deal
is made up of separate contracts which are individually halal, and as the contracts
are not formally dependent on each other either (which would imply gharar or
avoidable uncertainty and is not allowed in Islamic contract law), tawarruq cannot
be labelled haram, or so the reasoning goes. Still, it obviously aims at getting a
money loan or investing money against a predetermined fixed payment (Ayub, Paldi
Hans VISSER
68
2015). Fiqh scholars of AAOIFI (Accounting and Auditing Organization for Islamic
Financial Institutions) and the Fiqh Academy of the Organization of the Islamic
Conference, two authoritative organizations that set standards for the Islamic finance
industry, would love to reduce its use, but the need for it is overwhelming, not only
among non-financial firms but also, in fact most of all, among the banks, which need
it for cash management purposes (both for borrowing and investing funds). In the
United Arab Emirates, Malaysia and Kuwait the central bank offers the commercial
banks facilities for tawarruq-based short-term borrowing and investments (CBUAE
2010). With tawarruq it can truly be said that Islamic finance is conventional finance
made more complicated. Tawarruq is extremely popular. According to Sohaib Umar
of the Central Bank of Bahrain it is the most widely-used Islamic finance product in
Malyasia and Saudi Arabia. Out of a global total of US$1.7 trillion of outstanding
Islamic financing in the mid-2010s some US$750 to 800 billion was estimated to
consist of tawarruq assets (Umar 2015).
(b) The ban on gharar and maysir
This ban sounds very innocuous and even sympathetic: there should not be any
ambiguity or avoidable uncertainty in contracts, gharar, and you should not practice
speculation, maysir. Now speculation is a slippery concept, it means trying to profit
from intertemporal price differences, but in this wide definition a choice between
renting and buying a home is also a question of speculation. If we interpret it in a
narrower way as something like cornering the market and then charge extortionate
prices, most people will probably agree it is despicable. Note that Tenach/the Old
Testament also condemns it. Proverbs 11:26 says, in the King James version:
He that withholdeth corn, the people shall curse him: but blessing shall be upon
the head of him that selleth it.
Or, in a modern translation:
Him who monopolises grain, the people curse - but blessings upon the head of
him who distributes it! (New American Bible, United States Conference of
Catholic Bishops, http://www.nccbuscc.org/nab/bible/proverbs/proverb11.htm)
THE ISLAMIC ECONOMY
69
However, the ban on maysir is not completely innocuous; it has, jointly with the
ban on gharar, a great impact on insurance activities for Muslims. Fiqh scholars see
conventional insurance as tainted by both gharar and maysir. Gharar is involved
because there is ambiguity in the contract: policy holders do not exactly know what
they will receive in return – it may be nothing, it may be a million euros. It is also
seen as gambling or speculation, maysir, if you pay your insurance premium and
receive either nothing or much more than your accumulated premiums in return
(Maududi 1999: 288). The conventional idea that you buy security is rejected.
However, if you pay premiums to Islamic takaful or mutual insurance companies,
you buy security in the same way as with a conventional insurance policy. Running
a takaful firm is complicated and policy holders are not always well served (see
Visser 2019: 151-155).
Another problem is that, as noted above, fiqh scholars consider contracts that are
dependent on each other as guilty of gharar, because the fulfilment of one contract is
a condition for the validity of the other, which introduces avoidable uncertainty with
respect to the fulfilment of the contractual obligations. The result is that you have,
for instance, first to make sure that finance is available before you buy a house, you
cannot make a purchase conditional on finding finance as that would create
ambiguity. Furthermore, it is very difficult to hedge risks, such as foreign exchange
risks, first because conventional hedging products are interest-related, but second
because Islamic variants have to circumvent the non-dependency rule. Hedging
usually consists of more than one agreement combined in one contract. Recent
solutions for this probems involve one-sided promises, wa’ds, but these do not
provide the same level of legal certainty as a conventional derivative. Such wad’s
are also involved in ijara wa iqtina, hire-purchase (see Visser 2019: chapter 4,
section 4.4.6).
(c) the ban on haram goods and services
Here we have the same phenomenon as noted above on interest: avoiding
excesses is better than an outright ban. But Muslims have little choice if they take
the bans in the Quran and the Hadith seriously, though it is not immediately obvious
to non-Muslims that the Islamic ethics system is superior to other systems in this
Hans VISSER
70
respect. This will be clear for instance if we look at the ban on many forms of
entertainment. On this category the Quran and the Hadith are less clear than on other
categories. Fiqh scholars restrict the choices people can make in varying degrees.
Arguably people should be not be forced to live in a very narrowly restricted way,
just to please a number of strict ulama and fiqh scholars who detest modernity.
Moreover, vibrant city life with an innovation-oriented population is not possible if
there is no room for experiments in all sectors of life, including entertainment. It is
telling that when the strict Almoravids and after them Almohads took over Cordoba
in 1090 respectively 1147, not only the Jewish philosopher Moses ben Maimon, or
Maimonides, had to flee to Baghdad, but that the Almoravid burned al-Ghazali’s
manuscripts more than once (Garnier 2018: 102) and the Almohads expelled the
great Islamic scholar Ibn Rushd, or Averroes. Puritanical masters kill freedom, fun
and creativity.
5. Areas of relative neglect
The Islamic economy has lofty ideals but there is a large gap between those
ideals and actual practice. Mimicking conventional finance while meeting a series of
requirements in order to formally meet sharia norms does not lift an institution to a
different ethical plane. Moreover, sticking to al-Ghazali’s old list of maqasid al-
sharia has led to a lack of attention to a number of issues that in the present global
situation are felt to be essential for people’s wellbeing and the preservation of the
planet, such as justice, human rights, universal education, accountability and
transparency, environmental protection, animal rights and corporate social
responsibilities. The Islamic world was confronted with the issue by outside
pressure. It has been reported for instance that Australian cattle exports to Malaysia
fell from over 50,000 head in 2015 to 21,330 in 2017, largely because Australian
producers are not allowed to export cattle for ritual slaughter. This is because
exporters are held responsible under Australian law for ensuring that the entire
supply chain conforms to Australian standards, even after the cattle has left the
country, and Australian authorities have grown increasingly critical of Malaysia’s
THE ISLAMIC ECONOMY
71
standards of animal welfare. Slaughter practices at religious festivals have been
found espcially worrying and Australian producers were in 2018 not allowed to sell
cattle, nor sheep and goats, to Malaysia for ritual slaughter.2 Another issue
concerning the thought complex of the Islamic economy is income distribution.
True, there are a few voices calling for including some of these items among the
maqasid al-sharia, but so far they are a small minority (Khan 2016; Opwis 2017).
We now zoom in on two of the issues where the Islamic economy still has a lot
of catching up to do: (a) ESG (Environmental, Social and Governance), (b) income
distribution.
(a) ESG (Environmental, Social and Governance)
Under the ESG label we include CSR (Corporate Social Responsibility) and SRI
(Socially Responsible Investment). In principle following the sharia should include
everything encompassed by these notions, initiatives in these areas should thus be
superfluous for Islamic financial institutions and Islamic organizations in general. It
is argued, for instance, that “From an Islamic perspective, social responsibility
exercised by a business organization is seen as a benefit, rather than as a cost (…)
Individuals and businesses are encouraged to sacrifice, give and spend their wealth
for the poor and needy, in view of the afterlife recognition. This sense of duty,
responsibility, and spirit of sacrifice, nourished by the Islamic religion, serves to
remove egocentrism and greed and to promote the compassion, care, cooperation
and harmony of the community” (Litardi et al. 2019). There is much overlap with
the conventional emphasis in corporate social responsibility on People, Planet and
Profit, though, as Litardi et al. note, the Islamic approach includes a religious
element. This includes fear of the consequences for the afterlife if God’s commands
are not obeyed (the concept of divine grace and forgiveness which figures
prominently in Christianity and to which there are some parallels in Buddhist Pure
Land schools is largely absent in Islam). As everywhere else, there is some
divergence between principles and practice. Litari et al. note that there is very little
evidence of a real practical commitment to implement CSR and to social reporting
2 Eid al Adha festival of sacrifice heaps pressure on Malaysia to fix its livestock supply chain,
www.salaamgateway.com, 22 August 2018.
Hans VISSER
72
among large Arab companies. Khan and Usman (2016) studied vision statements,
mission statements and annual reports of five Islamic banks in Pakistan and asked
bank managers about CSR practices followed by these banks. It turned out that the
banks paid attention to the needs of society and the community, while only two of
the five banks mentioned the environment. The welfare of employees and customers
was neglected. The authors did not investigate the actual practices of the banks, but
a failure to mention an item in mission statements and annual reports is not a good
omen. It has further been found that a couple of Islamic banks in Malaysia pay
attention to the environmental impact of their offices, but that they generally do not
consider environmental and social risks when approving financing. Subsidiaries of
foreign banks usually are more environmentally conscious, thanks to their
international shareholders (Kunhibava et al. 2018: 145-146). And while the
Sustainable Development Goals of the UN are being addressed by a couple of banks
in Malaysia and Indonesia, Islamic banks from the Gulf region were hardly
interested (Thomson Reuters 2018: 29). San José and Cuesta (2019) note that
Islamic finance is more focused on formal sharia compliance than on social and
environmental goals.
Islamic financial institutions and their advocates emphasize their contribution to
responsible finance, while tending to neglect such initiatives as the UN Global
Compact. This is the more remarkable as the Islamic Development Bank and its
private sector arm, the Islamic Corporation for the Development of the Private
Sector (ICD), give their full support to the Sustainable Development Goals of the
United Nations. Participants in the UN Global Compact commit themselves to obey
a set of principles on human rights, labour, the environment and anti-corruption in
their activities and to contribute to broader societal goals such as the UN Social
Development Goals. The few Islamic firms among the 885 financial institutions that
participated as per 1 September 2016 mainly belonged to groups that were not
exclusively Islamic, based in non-Muslim-majority countries.3 Such initiatives as the
UN Global Compact, the United Nations’ Environment Programme Finance
Initiative Principles for Responsible Banking (UNEP-FI) and the Dubai Declaration
3 ‘UN Global Compact lacks Islamic banking participation’, IFN Alerts,
[email protected], 12 February 2016.
THE ISLAMIC ECONOMY
73
of Financial Institutions in the UAE on Sustainable Finance also find a very
lukewarm response from Islamic financial institutions.4
In the social sphere the record is not impressive either. Like their conventional
peers from countries lacking critical monitoring by NGOs and groups of
shareholders, Islamic financial institutions tend to pay no attention to labour
conditions in the projects financed by them, even if these were reported to be
extremely poor on the building sites in the Gulf countries Bahrain, Qatar and Dubai
in which they were heavily involved (Leins 2010; Amnesty International 2013). The
lot of foreign labour in the UAE seems to have improved somewhat by reforms
introduced in 2011 and 2016 after fierce international criticism, by giving them
somewhat more freedom to change jobs, but domestic workers remained helpless
against misbehaving employers, and then the reforms only applied to the UAE
where it is unclear what effect they have (“The Economist” 2016; Fanack 2018).
Bad treatment of labour is clearly contrary to Islamic ethical principles, but there are
no formal Islamic labour codes. The codes developed by the International Labour
Organization (ILO) and the United Nations, however, seem to be fully in conformity
with Islamic principles and could easily be adopted by governments of Islamic-
majority countries (Reda 2016). In this area there is still a lot to do for them.
One area that has especially suffered from neglect was corporate governance.
While standard ESG screening includes corporate governance, sharia screening of
Islamic investment does not (Pathan 2016). For banks, it is far from universal. The
European Corporate Governance Institute (ECGI) describes corporate governance as
follows:
Corporate governance refers to the way in which private and public companies,
enterprises, entrepreneurship and financial institutions are governed and run in
relation to their purpose, values, ownership, representation, accountability,
financing, investment, performance, leadership, direction, management,
employment, law, regulation and taxation.5
4 Dubai Declaration on sustainable finance welcomes first and only fully-fledged Islamic financial
institution, IFN Alerts, [email protected], 1 September 2017. 5 http://www.ecgi.global/content/about-ecgi [30.06.2018].
Hans VISSER
74
The concept in this formulation includes a smorgasbord of issues, but it boils
down to the question whether an organization is run decently, with “decently”
having a different connotation for different groups of people in different regions and
different times. Transparency and accountability can be seen as key elements in any
definition.
The Islamic finance literature is fully aware of the fact that Islamic financial
institutions often exhibit serious deficiencies in the area of corporate governance.
Things are made more complex in Islamic finance than in conventional finance
because of the former’s peculiarities. For instance, holders of investment accounts in
Islamic banks should periodically receive a part of the bank’s profits, but the bank
may decide to prevent low payments to investment account holders in lean years to
prevent them defecting to competitors. This raises an agency problem, and thus to a
corporate governance problem, as such payments go at the expense of profits left to
shareholders. Then, investment account holders can only vote with their feet, but
only after the investment has matured. They simply have to trust the bank managers
to invest the funds such that the interests of the investors are best served. They run
the same risks as shareholders, but unlike shareholders they have no voice in
appointing managers nor can they withhold their approval of the annual accounts.
Supervisors in a number of jurisdictions therefore allow deposit guarantees for
investment accounts in order to limit the downward risks, which is at variance with
the profit sharing or profit-and-loss sharing character of the Islamic investment
funds. But already on a more basic level there are plenty of corporate governance
problems. Sairally (2013) notes that the Islamic banks tend to restrict themselves to
making sure that formal legal and sharia norms are observed and economic
responsibilities are met. And even here they are often lax. Ayaz and Mansoori
(2017) point to incompetent board members, moral hazard and sloppy risk
management. All these elements became glaringly apparent in a notorious case of
repeated fraud at Dubai Islamic Bank in the 1990s and early 2000s, when after fraud
was detected the directors preferred a hush-hush approach over taking strong
measures to prevent fraud in future (Mukmimin 2018). Even sharia compliance is
not guaranteed. There are numeral voices in the Islamic world calling for taking
corporate social responsibility more serious. Some authors think that Islamic ethics
THE ISLAMIC ECONOMY
75
is the answer to all governance problems and that there is no need to look further.
Zainuldin et al. (2018), after elaborating on the various governance problems in
Islamic banks, blithely state that consultative consultation, that is allowing all
stakeholders to contribute to the decision-making process, is the way to ensure that
Islamic ethics rule the process so that everybody takes account of other peoples’
interests and no dishonesty will occur. As Islamic ethics is based on presumed
divine revelation, it is important to support any proposal with references to the
prophet Muhammad and Zainuldin et al. argue that consultative (shuratic) decision-
making characterized the leadership of the prophet and the caliphs (the worldly and
spiritual leaders of the Muslim community) after him. In their view conventional
agency theory neglects ethical stances, but their conclusion that “the Islamic ethical
system incorporated in their business activities forms Islamic banks into
organisations that place higher ethical considerations and therefore makes Islamic
banks to have less severe agency problems compared to conventional banks” looks
like wishful thinking dressed up as a fact. A sharia-based ethics would at the very
least require something like a unified sharia governance framework, but it has been
found, for instance, for Bangladesh that such a framework is lacking and that it is
left to the banks how they apply the sharia principles. It is argued that this lax
attitude by the banking supervisory authorities leads to poor accounting practices,
financial products that do not fully comply with the sharia, questionable
organization of the banks’ shariah boards and lack of information for the
stakeholders (Alam et al. 2019).
To end this section on a postive note, Islamic-majority countries, like the rest of
the world, no longer shut their eyes for environmental problems and the depletion of
natural resources. Projects for greening the economy are proliferating, especially in
oil-exporting countries that have the funds and want to diversify the economy in
time for the expected future run-down of oil and gas production, first of all the UAE.
Islamic financial institutions have responded to this new awareness of environmental
issues, stimulated by the Islamic Development Bank, and offer their services to issue
green sukuk for that purpose. It is a market that started in the second half of the
2010s and promises fast growth (Soo 2017). Furthermore, Islamic ESG-oriented
investment funds have slowly appeared over the 2010s, with Malaysia in the lead,
Hans VISSER
76
again with the active support of the Islamic Development Bank. Furthermore,
investors increasingly include corporate social responsibility in their investment
criteria and investment funds have to respond to these requirements. There is thus a
ready market for debt and equity that meet ESG principles. Islamic pension funds
start to follow this trend. Also, central banks or Ministries of Finance are setting up
central sharia boards that issue obligatory guidelines for Islamic financial
institutions. Some examples are Indonesia, Kuwait, Lebanon, Malaysia, Oman,
Pakistan, Sudan, Nigeria and the UAE; followed by the Central Bank of Iraq which
announced in October 2019 that it is establishing a national sharia board.
All in all, it is probably fair to conclude that in the light of ESG and associated
standards Islamic financial institutions cannot claim to play in another ethical league
than conventional ones and even generally belong to the laggards.
(b). Income distribution
There is a strong emphasis in the fiqh on the need to provide the poor with
sufficient income to survive in a relatively decent manner and preferably to supply
them with the means to earn an income that enables them to meet their basic needs.
Rising above that minimum is, however, generally seen as their own responsibility.
This is inherent in Islamic views on income and wealth (Allheedan 2016). It is in the
first place the responsibility of family members to support each other, the wider
community only comes into view if dire poverty has to be averted and relatives are
unable to offer sufficient support (Alwani 2016).
Muslim authors make much of zakat, in particular zakat mal, the obligatory
wealth tax of Islam, as a means to combat poverty. An influential advocate of
Islamic finance, Muhammad Nejatullah Siddiqi, calls zakat one of the two main
pillars of Islam’s economic system, the other one being the abolition of riba (Siddiqi
1983: 36). Yusuf al-Qaradawi calls it a unique institution and a measure of far-
reaching economic consequences:
“On the one hand it is a means of spiritual purification and on the other a way to
regain balance and equilibrium in social and economic life (al-Qaradawi 2000,
vol. I: i).”

THE ISLAMIC ECONOMY
77
Others praise it as “a system through which a Muslim society can eradicate
poverty and inequalities,” while admitting that its potential is not fully exploited
(Bashir et al. 2012; Bashir 2018). Zakat is, however, not a very fair tax. The assets
subject to zakat make up a lower percentage of richer people’s portfolio than of the
poorer part of the population, in particular if the latter are working in agriculture or
as artisans. That is because the set of zakatable items heavily draws on the Quran
and the Hadith, that of course leave out products that did not yet exist at the time,
while the application of analogy as a method in jurisprudence has not remedied the
discrepancy. The fact that the fiqh scholars are far from unanimous on the set of
zakatable items does not help either and offers wide scope for the well-heeled to
take their obligations lightly (see on the complex discussions which assets are
zakatable: Rehman, Ahmedov 2011; Sadeq 2002, or the brief survey in Visser 2019:
chapter 3, section 3.3). Zakat is, furthermore, not a very effective tax because it only
brings in low amounts of money. Figures from the Islamic Research and Training
Institute (IRTI), a subsidiary of the Islamic Development Bank, for a couple of
Muslim-majority countries do not exceed 0.3 per cent of GDP: zakat collected in
Malaysia amounted to 0.24 per cent of GDP in 2011, 0.025 per cent of GDP in
Indonesia in 2012 and 0.06 per cent of GDP in Pakistan in 2010-2011 (Islamic
Social Finance Report 2014: 42), while in Sudan in 2013 it brought in 0.3 per cent of
GDP (absolute sum in Islamic Social Finance Report 2015: 40 combined with GDP
figure from World Bank). In Brunei Darussalam zakat collection fluctuated between
0.05 per cent and 0.12 per cent of GDP between 2001 and 2017 (Bashir et al. 2012).
Moreover, zakat is not only used for helping the poor and people suffering from
temporary misfortune, but also for dawah, that is, spreading the message of Islam,
for the propagation of an Islamic way of life and for the people administering the
zakat funds:
In fact the sadaqat [zakat] collection is for the poor, the helpless, those employed
to administer the funds, those whose hearts need to be won over [to the truth],
ransoming the captives, helping the destitute, in the Way of Allah and for the
wayfarer. That is a duty enjoined by Allah; and Allah is All-Knowledgeable, Wise
(Quran 9: 60).
Hans VISSER
78
The distribution of the funds over the categories varies widely, not only between
countries but also between regions within a country, but generally the poor and
destitute receive much less than the full zakat receipts, the more so as collection
costs can easily exceed ten per cent, in Sudan hovering around 20 per cent (figures
in Islamic Social Finance Report 2014: 47; Islamic Social Finance Report 2015: 47).
The glorification of zakat by fiqh scholars is another sign of their focus on the past.
The sums needed in present-day societies for social purposes can only be brought in
by taxes and social-security premiums. One can only agree with Muhammad Umer
Chapra when he sees zakat not as a replacement for tax- and premium-funded social
insurance but as a social self-help measure of the Muslim society to support the poor
and destitute who for some reason fall through the social safety net (Chapra 1992:
274). It is to be noted that compliance with the obligation to pay zakat mal is low. It
has been argued that much higher zakat collection levels should be possible, figures
as high as 7.25% of GDP have been quoted in the case of Pakistan (Shaikh 2017). If
this is correct, zakat could make a difference, even if it would still be insufficient to
meet social expenditure on the scale required now.
In Islam there seems to be no urgent feeling that providing a minimum is
perhaps not enough and that inequality in itself should not be exorbitant, though all
Muslims and in particular the rich are encouraged to give generously above the
obligatory zakat al-mal. One occasion is the annual eid al-fitr, or the Festival of
Breaking the Fast, at the end of Ramadan, when Muslims are asked to give zakat al-
fitr for the benefit of the poor, or directly to the poor. Additional charity (sadaqah) is
applauded; al-Qaradawi (2010: 102) quotes a saying of the prophet Muhammad:
I shall give alms to the poor again and again till each of them comes to possess at
least one hundred camels (al-Qaradawi 2010: 102).
Still, it is only the genuinely poor whose poverty is not the result of their own
negligence or unwillingness to look for work outside their own region who should
be eligible for help, and even then it is first of all the duty of their relatives to
provide assistance (al-Qaradawi 2010: 46ff). For all the quotes from the Hadith that

THE ISLAMIC ECONOMY
79
fill the pages of publications by the likes of al-Qaradawi, the Islamic world, and
especially the Middle East, cuts a relatively poor figure when it comes to income
distribution. A study on incomes and income distribution in the Middle East shows
that the region does worse than other regions in the world (Alvaredo et al. 2017).
Admittedly, such figures should be interpreted with some caution, countries from
the Middle East, and North Africa for that matter, do not cut such a poor figure if we
look at Gini coefficients of income or consumption distribution – but on the other
hand the rich may have all kinds of wealth and income items that stay below the
radar of statistical bureaus (not only in the Middle East).
Top 1% income share six regions, 2015, in per cent
Brazil 28
Middle East 26
India (2014) 22
USA 20
China 14
Western Europe 12________________________
Note: distribution of pretax national income (before taxes and transfers, except pensions and
unemployment insurance) among equal-split adults (income of households divided equally
among adult members) (source: Alvaredo et al. 2017).
The argument here bore on the contention that zakat is an adequate instrument to
combat poverty, and with widespread views on income distribution in the Islamic
world. This is in no way meant as a judgement of individual charitable giving by
Muslims, sadaqah. Still, the claim of those who flatly deny that there is any scarcity
of natural resources and that Islam has already had achieved much in reducin
poverty and exploitation sounds a bit hollow.
6. Final comments
It is one thing to extol the ethics of Islam, but it is unfair to compare the Islamic
ideals with the practice of other thought systems or world views. Ideals of the one
Hans VISSER
80
should be compared with ideals of the others and practices of the one with the
practices of the others, and above all every society should compare its ideals with its
own practices. There are few societies where the results will not be sobering. As for
Islam, remember the conviction of Dr Asad Zaman that “Central to Islam is the
spirit of service, and spending on others.” Even if Islamic ethics were superior,
Islamic behaviour is not. Quite a number of Muslim-majority countries score for
instance very poorly on the 2018 Corruption Perception Index of Transparency
International. Some countries do quite well: the United Arab Emirates scores rank
23, equal with Uruguay and just below the United States, Brunei Darussalam shares
rank 31 with Taiwan, Qatar has rank 33, just above Israel, and all these countries
score better than Spain and Italy. However, Malaysia, not exactly an underdeveloped
failed state, scores a lowly rank 61, Tunisia and Morocco both 73, Turkey 78 and
Kuwait 78, Indonesia 89, Egypt and Algeria both 105, Pakistan 117, Iran 138,
Mauritania 144 and Afghanistan and Sudan 172 (Transparency International 2019;
the list ranks 180 countries). Muslim-majority countries have little reason to look
down on the ethical behaviour of non-Muslims. Farooq (2019) has every reason to
find it extremely shameful that countries that call themselves an Islamic Republic
and/or publicly profess to follow the sharia (Saudi Arabia, Pakistan, Iran,
Mauritania, Sudan and Afghanistan) have such a poor score on the Corruption
Perception Index.
Even more shameful are the human rights violations committed by a number of
governments of Muslim-majority countries, including governments that actively
support the spread of Islam and present themselves as modern, open societies (think
oil-rich smaller Gulf states, see Fanack 2018). Now this can be seen as the cynical
behaviour of political elites that do everything to stay in power. Quite another thing
are the deep-seated convictions among the Muslim populace, based on their
understanding of the sharia. According to research by Pew Research Center the
percentage of the Muslim population that was in favour of stoning people who had
committed adultery was over 80 in Egypt and Pakistan, 70 in Jordan, roughly 42 in
Indonesia, some 23 in Lebanon and around 17 in Turkey (“The Economist” 2011).
Non-Muslims should be pardoned for not feeling ethically inferior if they do not
share such ideas.

THE ISLAMIC ECONOMY
81
Not to remain in a negative mode, it cannot be denied that there are positive
developments on the neglected issues. Environmental problems are slowly but
surely receiving more attention from governments and the business community, just
as in the rest of the world simply because they can no longer be neglected. Water
management and renewable energy are getting more prominence, with the United
Arab Emirates in the vanguard. Just as in Christianity, in Islam man is seen as God’s
steward or vice-regent, and Muslims can see it as a task assigned by God to take
care of the earth (Quran 2: 30, 35: 39). So there is room for cooperation between
Muslims and others on these issues – though the whole idea of mankind in a special
position mandated to rule the earth has come under attack recently because it is held
responsible for ruining the earth and for institutionalised cruelty to animals (Harari
2014: 465). Be that as it may, the identity politics of the Islamic world do not
necessarily stand in the way of joint action, the Islamic Development Bank for
instance wholeheartedly supports the Development Goals of the United Nations.
Still, as Prof. Mahmoud El-Gamal noted,
The modus operandi of Islamic finance is worrisome for two reasons: it glorifies
irrational adherence to outdated medieval jurisprudence, and supports the
development of a separatist and boastful Islamic identity (El-Gamal 2007a).
El-Gamal would prefer cooperative forms of finance that meet ethical norms and
sees no need for a separate specifically Islamic financial sector (El-Gamal 2007b).
He tends to see Islamic finance first of all as a form of capitalist Islamism sponsored
by the Gulf states and adopted by other states, all competing for petrodollars. He
expects Islamic finance not to survive a drying-up of the stream of petrodollars (El-
Gamal 2019). However, the Islamic economy is more than Islamic finance, it is
more and more an integrated whole of Islamic products and services that may bring
a more uniform lifestyle to Muslim communities in different continents. The
crumbling of the American-led post-second-world-war rule-based world order
means that more tribal sentiments come to the fore; identity politics receive a boost
and the Islamic economy is an important element in this process.
Hans VISSER
82
A tricky question for an economist to answer is whether behind the tendency of
the advocates of Islamic finance to rely on medieval fiqh scholars there does not lie
a more fundamental question, a question that plagues all religions that rely on holy
scriptures: how to square allegedly divine revelation from far more than a
millennium ago with the exigencies of modern life and the results of centuries of
scientific discoveries? Do all injunctions in the scriptures still apply now?
Discussion of the nature of divine revelation and its application today can easily
become dangerous in the Islamic world. Liberal reformers such as Fazlur Rahman
(1919-1988), who had to flee Pakistan for the United States, found out the hard way
that the more strict factions within Islam are strong enough to have deviations from
traditional views on divine revelation declared anathema (see on Fazlur Rahman Birt
1996). The philologist Nasr Hamid Abu Zayd (1943-2010) was declared an apostate
for similar reasons and saw himself forced to move from Egypt to the Netherlands
(for his views on divine revelation, see Abu Zayd 2000). Earlier, Muhammad Abduh
also met with fierce opposition. In Christianity by contrast, sixteenth-century
Protestant reformers in Switzerland, in particular John Calvin (1509-1564), held that
much of the divine revelation in the Old Testament (Tenach) applied specifically to
the Jewish people living at that time and is not binding on later generations (Biéler
2005: 400-422). Such ideas are now widely accepted. And then, organized religion
has largely lost its hold on society, in Western Europe at least, and increasingly also
in the America’s. In Islam there is the additional problem that the Hadith is assigned
equal status with the Quran, while it is not obvious (to an outsider at least) that the
prophet Muhammad’s utterings on issues that were important in his time should be
given equal status with God’s supposedly immutable commands for later
generations. It looks reasonable to reason that the prophet Muhammad accepted
slavery, for instance, like St Paul did half a millennium earlier, simply because it
was the normal thing in his time and not because of some divine instruction. Raising
such questions is something many Muslims will not easily do, as rational analysis
and research in matters of religion tends to be seen as tainted by waswas, flusterings
of Shaytain, or Satan, meant to throw doubt in the minds of the believers about the
truth of the Quran and the Hadith. Better to accept what the Prophet said
unquestiongly and this, especially in the minds of Wahabites and other salafist,
THE ISLAMIC ECONOMY
83
preferably as interpreted by medieval jurists such as Ibn Taymiyya (1263-1328).
This attitude leads them to defend and even advocate such abominations as child
brides, amputation of hands or feet, and beheading, crucifixion and stoning
(according to Ibn Taymiyya, harsh punishments are an expression of God’s mercy,
as they help His worshippers remember His ordinances; even the condemned will
accept the punishments if the ruler imposes them for the wellbeing of his subjects,
Ibn Taymiyya 2019:169-170). Still, there are voices advocating a reinterpretation of
the Quran and the Hadith taking into account the social and economic changes that
have taken place since these were written down (M.A. Khan 2016). They refrain,
though, from radical ideas on divine revelation.
It looks reasonable to expect the identity aspect to play a prominent role for a
considerable period of time (see Hassan 2017: 2, quoted above). The umma wants to
make its presence felt again and be taken seriously. This is fully understandable, but
this goes hand in hand with the idea that Islamic ethical norms are superior. First, to
a non-Muslim observer they are not, and second, there is a disconnect between the
ideals and the real world. A problem for many Muslims themselves may be that if
the development of the various sectors of an Islamic economy makes it possible to
keep away from conventional providers, the pressure on them to conform to strict
norms may increase and turn into coercion (see on bigotry among European
Muslims Koopmans 2015). Group pressure is another aspect of Islam, or rather
Islamic society, where non-Muslims can discern little of the alleged superiority of
Islamic ethics.
References
Ahlborn M., Wortmann M. (2017), Output gap similarities in Europe. Detecting country groups, Center
for European Governance and Economic Development Research Discussion Papers, no. 305, Georg-
August Universität, Göttingen.
Abedifar P., Ebrahim S.M., Molyneux P., Tarazi A. (2015), Islamic Banking and finance. Recent
empirical literature and directions for future research, “Journal of Economic Surveys”, vol. 29 no. 4,
pp. 637-670.
Abu Zayd N. (2000), The Qur’an: God and man in communication, inaugural lecture Cleveringa chair,
Leiden University, http://www.let.leidenuniv.nl/forum/01_1/onderzoek/lecture.pdf [12.12.2019].
Ahmad M. (1999), Towards interest-free banking, Adam, Delhi.
Hans VISSER
84
Alam Md. K., Ab Rahman S., Mustafa H., Mohammed Shah S., Hossain Md.S. (2019), Shariah
governance framework of Islamic banks in Bangladesh. Practices, problems and recommendations,
“Asian Economic and Financial Review”, vol. 9 no. 1, pp. 118-132.
Allan M. (2019), Inleiding, in: Ahmad Ibn Taymiyya T.a.D., Bid, vecht en heers, Prometheus,
Amsterdam, pp. 11-41.
Allheedan A. (2016), Poverty and wealth in Islam’s sacred texts’, chapter 14 in: Poverty and wealth in
Judaism, Christianity, and Islam, Kollar N., Shafiq M. (eds.), Palgrave Macmillan, New York, pp. 263-
274.
al-Qaradawi Y. (2000), Fiqh al zakah, vol. I, King Abdulaziz University, Jeddah,
http://iei.kau.edu.sa/Pages-E-EnglishPublications.aspx [12.12.2019].
al-Qaradawi Y. (2010), Economic security in Islam, Dar al Wahi Publication, Kuala Lumpur.
Alvaredo F., Assouad L., Piketty T. (2017), Measuring inequality in the Middle East 1990-2016. The
world’s most unequal region?, CEPR Discussion Paper No. DP12405.
Alwani Z. (2016), Socioeconomic and gender justice in the Qur’an. Modern challenges, chapter 5 in:
Poverty and wealth in Judaism, Christianity, and Islam, Kollar N.R., Shafiq M. (eds.), Palgrave
Macmillan, New York, pp. 77-103.
Amnesty International (2013), The dark side of migration. Spotlight on Qatar’s construction sector
ahead of the World Cup, https://www.amnesty.org/en/documents/MDE22/010/2013/en/ [12.12.2019].
Asutay M. (2012), The socio-ethical failure in Islamic banking and finance, “New Horizon”, no. 182.
Ayaz M., Mansoori M.T. (2017), Strengthening corporate governance regime for Islamic banks in
Pakistan. Focusing on the principles of Amana and Mas’ulıyah, “Journal of Islamic Business and
Management”, vol. 7 no. 2, pp. 178-196.
Ayub M. (2017), Liquidity management by Islamic banks. An issue or a contrivance for risk-free
returns, “Journal of Islamic Business and Management”, vol. 7 no. 1, pp. 8-19.
Ayub M., Paldi C. (2015), Dichotomy between Sharī‘ah compliance and the economic goals of Islamic
finance institutions, “Journal of Islamic Business and Management”, vol. 5 no. 2, pp. 69-98.
Bashir Sharif M., Nur Annisa Haji Sarbini H., Abdullah H.R. (2012), Zakat management and capital
assistances programme in Brunei Darussalam, “The Journal of Muamalat and Islamic Finance
Research”, vol. 9 no. 1, pp. 27-60.
Bashir A.-H. (2018), Reducing poverty and income inequalities. Current approaches and Islamic
perspective, “JKAU Islamic Economics”, vol. 31 no. 1, pp. 93-104.
Biéler A. (2005), Calvin’s economic and social thought, WCC Publications, World Council of
Churches, Geneva.
Birt Yahya M. (1996), The message of Fazlur Rahman, Association of Muslim Researchers,
https://fazlur-rahman.livejournal.com/736.html [12.12.2019].
THE ISLAMIC ECONOMY
85
Cattelan V. (2018), Theoretical development and shortages of contemporary Islamic economics studies.
Research programmes and the paradigm of shared prosperity, IKAM Reports 6/Research Papers 1,
https://ssrn.com/abstract=3203696 [12.12.2019].
CBUAE (2010), Product details shariacompliant certificate of deposit (ICD), Central Bank of the UAE,
www.centralbank.ae/en/pdf/notices/11-2010_2.pdf [12.12.2019].
Chapra M.U. (1992), Islam and the economic challenge, The International Institute of Islamic Thought,
The Islamic Foundation, Hemdon, VA – Nairobi.
Damir-Geilsdorf, S. (2018), “…So that it may not circulate solely between the wealthy among you.”.
The critique of capitalism and the vision of a “balanced society” (mujtamaʽ mutawāzin) in the writings
of Sayyid Qutb (1906-1966), in: Muslims and capitalism. An uneasy relationship?, Hendrich B. (ed.),
Ergon Verlag, Baden-Baden, pp. 173-89.
de Bellaigue Ch. (2018), The Islamic enlightenment. The modern struggle between faith and reason,
Vintage, London.
Ebrahim M.S., Sheikh M. (2018), The political economy and underdevelopment of the Muslim world.
A juridico-philosophical perspective, “Arab Law Quarterly”, vol. 32 no. 4, pp. 385-412.
Egger V.O. (2018), A history of the Muslim world since 1260. The making of a global community, 2nd
ed., Routledge, New York – London.
El-Gamal M.A. (2006), Islamic finance. Law, economics, and practice, Cambridge University Press, New
York.
El-Gamal M.A. (2007a), Incoherent pietism and Sharia arbitrage, “Financial Times”, 23 May.
El-Gamal M.A. (2007b), Mutualization of Islamic banks, in: Handbook of Islamic banking, Kabir Hassan
M., Lewis M.K. (eds.), Edward Elgar, Cheltenham, UK – Northampton, MA, USA, pp. 310-324.
El-Gamal M.A (2019), “Islamic finance” after state-sponsored capitalist-islamism, in: Islamaic finance.
Between religious norms and legal practice, Decock W., Sagaert V. (eds.), Intersentia, Cambridge, UK,
pp. 109-124.
Fanack (2018), In the United Arab Emirates, human rights under attack, https://fanack.com/united-arab-
emirates/human-rights/human-rights-under-attack, 3 August [12.12.2019].
Farooq M.O. (2012), Exploitation, profit and the riba-interest reductionism, “International Journal of
Islamic and Middle Eastern Finance and Management”, vol. 5 no. 4, pp. 292-320.
Farooq M.O. (2019), Rent-seeking behaviour and ẓulm (injustice/exploitation) beyond ribā-interest
equation, “ISRA International Journal of Islamic Finance”, vol. 11 no. 1, pp. 110-123.
Gafoor A.L.M.A. (1996), Interest-free commercial banking, A.S. Noordeen, Kuala Lumpur.
Galbraith J.K. (1963), American capitalism. The concept of countervailing power, 2nd ed., Penguin,
Harmondsworth.
Hans VISSER
86
Garnier S. (2018), Review of Amira K. Bennison (2016), The Almoravid and Almohad empires, Edinburgh
University Press, Edinburgh, “Studia Islamica”, vol. 113 no. 1, pp. 97-103.
Ghazanfar S.M., Azim Islahi A. (1990), Economic thought of an Arab scholastic: Abu Hamid al-Ghazali
(A.H. 450-505/A.D. 1058-1111), “History of Political Economy”, vol. 22 no. 2, pp. 381-403.
Ghazanfar S.M., Azim Islahi A. (2011), Economic thought of Al-Ghazali, King Abdulaziz University
Press, Jeddah.
Golestani T.A. (2018), Shi’i Islamic perspective on finance (Foundations of the Islamic economical
system), “New Horizon”, no. 199, pp. 25-30.
Harari Y.N. (2014), Sapiens. A brief history of humankind, Vintage, London.
Hashmi S.H. (2004a), Abduh, Muhammad (1849-1905), in: Encyclopedia of Islam and the Muslim world,
Martin R.C. (ed.), Macmillan Reference USA, New York, pp. 6-7.
Hashmi S.H. (2004b), Qutb, Sayyid (1906-1966), in: Encyclopedia of Islam and the Muslim world,
Martin R.C. (ed.), Macmillan Reference USA, New York, pp. 568-569.
Hashmi S.H. (2004c), Rida, Rashid (1865-1935), in: Encyclopedia of Islam and the Muslim world,
Martin R.C. (ed.), Macmillan Reference USA, New York, p. 597.
Hallaq W.B. (1984), Was the gate of Ijtihad closed?, “International Journal of Middle East Studies”, vol.
16 no. 1, pp. 3-41.
Hassan M.K. (2017), Introduction. Empirical research on Islam and economic life, in: Handbook of
empirical research on Islam and economic life, Kabir Hassan M. (ed.), Edward Elgar, Cheltenham, pp.
1-19.
Ibn Taymiyya T. al-Din A. (2019), Bid, vecht en heers, Prometheus, Amsterdam.
IFN Alerts (2016), UN Global Compact lacks Islamic banking participation,
[email protected], 21 February [12.12.2019].
IFN Alerts (2017), Dubai Declaration on sustainable finance welcomes first and only fully-fledged
Islamic financial institution, [email protected], 1 September [12.12.2019].
Islamic Social Finance Report 2014 (2014), Islamic Research and Training Institute (IRTI) with the
cooperation of Thomson Reuters, Jeddah.
Islamic Social Finance Report 1436H 2015 (2015), Jeddah: Islamic Research and Training Institute
(IRTI) with the cooperation of Thomson Reuters.
Khan M.A. (2016), Reconstruction of Islamic economic thought. Need for innovative thinking
(Ijtihad), working paper, https://ssrn.com/abstract=2892074 [12.12.2019].
Khan A.Q., Ali Bhatti A. (2018), Islamic banking and finance. A new paradigm in international relations,
“Journal of Islamic Business and Management”, vol. 8 no. 1, pp. 85-101.
THE ISLAMIC ECONOMY
87
Khan T., Mohomed A.B.R.N. (2017), Ethical banking and Islamic banking. A comparison of Triodos
Bank and Islami Bank Bangladesh Limited, “Islamic Economic Studies”, 25 Special Issue, April, pp.
111-154.
Khan M.M., Usman M. (2016), Corporate social responsibility in Islamic banks in Pakistan, “Journal of
Islamic Business and Management”, vol. 6 no. 2, pp. 179-190.
Koopmans R. (2015), Religious fundamentalism and hostility against outgroups. A comparison of
Muslims and Christians in Western Europe, “Journal of Ethnic and Migration Studies”, vol. 41 no. 1,
pp. 33-57.
Kunhibava S., Tan Yen Ling S., Ruslan Md. K. (2018), Sustainable financing and enhancing the role of
Islamic banks in Malaysia, “Arab Law Quarterly”, vol. 32 no. 2, pp. 129-157.
Kuran T. (1995), Islamic economics and the Islamic subeconomy, “Journal of Economic Perspectives”,
vol. 9 no. 4, pp. 155-173.
Kuran T. (2004), Why the Middle East is economically underdeveloped. Historical mechanisms of
institutional stagnation, “Journal of Economic Perspectives”, vol. 18 no. 3, pp. 71–90.
Leins S. (2010), Zur Ethik des islamischen Finanzmarktes, „Zeitschrift für Wirtschafts- und
Unternehmensethik“, vol. 11 no. 1, pp. 66-75.
Litardi I., Fiorani G., Harb D. (2019), Corporate social responsibility in Islamic culture. Comparison
between Western CSR and Islamic CSR: focus on Islamic reporting initiative and Islamic financial
institution, “European Journal of Islamic Finance”, Special Issue Islamic and Social Finance, pp. 1-7.
Marx K., Engels F. (1890/1974), Manifest der Konnunistischen Partei, in: Marx K., Engels F.,
Ausgewählte Schriften in zwei Bänden, Dietz Verlag, Berlin.
Maududi S.A. A’la (1941/1999), The economic problem of man and its Islamic solution, address
delivered at the Muslim University, Aligarh, 20 October, in: Maududi S.A.A’la, Economic system of
Islam, 4th ed., Ahmad K. (ed.), Husain R. (trans.), Islamic Publications, Lahore, pp. 8-36.
Maududi S.A. A’la (1963), Economic and political teachings of the Qur’an, in: Sharf M.M. (ed.), A
history of Muslim philosophy, vol. 1, Otto Harrassowitz, Wiesbaden.
Maududi S.A. A’la (1999), Economic system of Islam, 4th ed., Ahmad K. (ed.), Husain R. (trans.),
Islamic Publications, Lahore.
Mukmimin K. (2018), How close Islamic banks are to global fraud. Learnings from Dubai Islamic
Bank in the time of sub-prime crisis, “EJIF – European Journal of Islamic Finance”, no. 11.
Opwis F. (2017), New trends in Islamic legal theory. Maqāsid al-Sharī‛a as a new source of law?, “Die
Welt des Islams”, vol. 57 no. 1, pp. 7-32.
Pathan R. (2016), Environmental, social and governance (ESG) investing strategies in Islamic funds,
Islamic Commercial Law Report 2017, Thomson Reuters, pp. 146-148.
Quran (2004), The Qur’an in English translation, adapted and presented by MidEastWeb for
Coexistence, www .mideastweb.org [12.12.2019].
Hans VISSER
88
Qureshi A.I. (1946), Islam and the theory of interest, Shaikh Muhammad Ashraf, Lahore.
Qutb S. (2000), Social justice in Islam, Hardie J.B. (trans.), Islamic Publications International, Oneonta,
NY.
Rahman F. (1964), Riba and interest, “Islamic Studies (Karachi)”, vol. 3 no. 1, pp. 1-43.
Reda L. (2016), International labour standards and Islamic teachings. The principles of the basic
entitlement package for migrant workers in Arab countries, “Arab Law Quarterly”, vol. 30 no. 3, pp.
199-223.
Rehman J., Ahmedov A. (2011), Islamic law of obligatory Alms (Zakat). A teaching and learning
manual, UK Centre for Legal Education, University of Warwick, Coventry,
https://www.heacademy.ac.uk/system/files/introduction_to_welfare_and_zakat_law_in_islam.pdf
[12.12.2019].
Rodinson M. (2014), Islam et capitalisme, Éditions Demopolis, Paris.
Rubin J. (2017), Rulers, religion, and riches. Why the West got rich and the Middle East did not,
Cambridge University Press, New York.
Sadeq A.Al-Hasan (2002), A survey of the institution of Zakah. Issues, theories and administration,
Discussion Paper No. 11, 2nd ed., Islamic Research and Training Institute, Islamic Development Bank,
Jedda.
Sairally B.S. (2013), Evaluating the corporate social performance of Islamic financial institutions: an
empirical study, “International Journal of Islamic and Middle Eastern Finance and Management”, vol.
6 no. 3, pp. 238-260.
San-Jose L., Cuesta J. (2019), Are Islamic banks different? The application of the Radical Affinity Index,
“International Journal of Islamic and Middle Eastern Finance and Management”, vol. 12 no. 1, pp. 2-29.
Schacht J. (1982), An introduction to Islamic law, Oxford University Press, Oxford.
Shaikh S.A. (2017), Welfare potential of Zakat. An attempt to estimate economy wide Zakat Collection
in Pakistan, “Journal of Islamic Economics, Banking and Finance”, vol. 13 no. 1, pp. 52-70.
Slomp J. (2003), The “political equation” in Al-jihad fi al-Islam of Abul A‘la Mawdudi (1903-1979),
in: A faithful presence. Essays for Kenneth Cragg, Thomas D., Amos C. (eds.), Melisende, London, pp.
237-255.
Soo S. (2017), Recent developments in Islamic capital markets – green Sukuk, IFN Annual Guide
2018, pp. 18-20.
Suharto U. (2018), Riba and interest in Islamic finance. Semantic and terminological ıssue,
“International Journal of Islamic and Middle Eastern Finance and Management”, vol. 11 no. 1, pp. 131-
138.
“The Economist” (2011), Pakistan: A great deal of ruin in a nation, April 2.
“The Economist” (2016), Migrant workers in the UAE, April 9.
THE ISLAMIC ECONOMY
89
“The Economist” (2019), The new censors. The global gag on free speech is tightening, August 17.
Thomson Reuters (2017), Outpacing the mainstream. State of the Global Islamic Economy Report
2017/18, SalaamGateway.com [12.12.2019].
Thomson Reuters (2018), Islamic Finance Development Report 2018, https://ceif.iba.edu.pk/pdf/Reuters-
Islamic-finance-development-report2018.pdf [12.12.2019].
Transparency International (2019), Corruption Perception Index 2018, www.tranparency.org
[12.12.2019].
Umar S. (2015), Commodity Murabahah / Tawarruq. Why regulators must stop its use’, in: Islamic
Commercial Law Report 2016, ISRA, Thomson Reuters, pp. 64-67.
Visser H. (2019), Islamic finance. Principles and practice, 3rd ed., Edward Elgar, Cheltenham, UK –
Northampton, MA.
Widhiyoga G. (2019), The construction of the Umma. From global consciousness to an aspirational
global society, “The Muslim World”, vol. 109 no. 3, pp. 209-223.
Wilson R. (2008), Development and spread of Islamic banking, “Orient”, vol. 49 no. III, pp. 12-24.
Zainuldin M.H., Kiat Lui T., Yii K.J. (2018), Principal-agent relationship issues in Islamic banks. A
view of Islamic ethical system, “International Journal of Islamic and Middle Eastern Finance and
Management”, vol. 11 no. 2, pp. 297-311.
Zaman A. (2015), Building genuine Islamic financial institutions, “Journal of Islamic Economics,
Banking and Finance”, vol. 11 no. 2, pp. 13-31.
Zaman R. (2011), Riba and interest in Islamic banking. An historical review, chapter 12: in: The
foundations of Islamic banking. Theory, practice and education, Ariff M., Iqbal M. (eds.), Edward Elgar,
Cheltenham.
CENTRAL EUROPEAN REVIEW OF ECONOMICS AND MANAGEMENT ISSN 2543-9472; eISSN 2544-0365
www.cerem-review.eu
www.ojs.wsb.wroclaw.pl Vol. 3, No. 4, 91-102, December 2019.
Contact details: David S. Zepeda, Javier Esquer, Carlos Anaya, University of Sonora, Hermosillo,
México. E-mail: David S. Zepeda: [email protected], Javier Esquer [email protected],
Carlos Anaya: [email protected].
Received: 23.10.2019, Revised: 23.11.2019, Revised: 11.12.2019, Revised: 18.12.2019; Accepted:
18.12.2019.
doi: http://dx.doi.org/10.29015/cerem.860
© 2019 WSB UNIVERSITY IN WROCŁAW
Teaching and mindsets regarding sustainable
development – a Mexican case study
David S. ZEPEDA QUINTANA, Javier ESQUER, Carlos ANAYA
University of Sonora, México
Abstract:
Aim: The world has become increasingly interconnected and complex, posing serious challenges to
sustainable development, which may be easily ignored as they are often of a low probability nature.
This creates the need to identify and deal with these challenges. This research aims to identify if
teaching interventions, applied to engineering students, produces changes in students’ perceptions and
mindset about business sustainability and sustainable development and, as consequence, support the
creation of necessary cognitive capabilities for dealing with complex problems.
Design / Research methods: Questionnaires were applied in a Mexican university to students of a
course in sustainable development. The experiment consists of three phases: (1) a pre-test (n=337), (2)
intervention and (3) a post-test (n=329) in order to assess the differences after the interventions.
Conclusions / findings: Changes in the students' perception were observed. While this on the one hand
shows that teaching supports the creation of students’ cognitive capabilities necessary to contribute to
business sustainability, effects may also be contrary to what was intended. The results must be threated
carefully; nevertheless, they provide the basis for further research.
Originality / value of the article: This paper provides a new perspective on the conditions for teaching
sustainable development and sustainable business. It presents a case study on the development of
students’ awareness of and capacities to solve the complex problems of sustainable development
Keywords: Sustainable development, complexity, teaching interventions, education for sustainable
development, functional stupidity
JEL: Q01, D81, A20
David S. ZEPEDA QUINTANA, Javier ESQUER, Carlos ANAYA
92
1. Introduction
Although sustainable business has become increasingly popular (at least the
literature), there is no clear information or evidence available about successful
practice (Dyllick, Muff 2016). On the contrary, it seems that problems have
worsened due to the interconnectivity and complexity of human systems and
activities (Helbing 2009; Taleb 2012). This situation may be the result of a lack of
real understanding of the concept (Stubbs, Cocklin 2008; Bocken et al. 2014) or that
we do not really have the proper information or capacity to solve these complex
problems of business sustainability (Allen et al. 2014). In this context, the creation
of human capital with the necessary capacities to generate sustainable strategies in
an environment of complexity and uncertainty becomes relevant (Naveen 2006;
Voss et al. 2007).
The world has become increasingly interconnected and complex (Taleb 2012).
This represents a great challenge for sustainable business and consequently for
sustainable development itself. When we talk about sustainable development, we
usually talk about a balance between environment, society and economy; systems
that face complex challenges individually and that require some knowledge,
information and strategies in the task of finding solutions to complex problems
(Miller et al. 2014). Therefore, a change is required not only in business
management structures but also in the generation of talent and capabilities of
professionals who make and will make decisions in business (Vora 2013).
During the last decades the application of knowledge management techniques
has become widespread among firms and is currently set as a paradigm for
management of business (Gonzalez, Martins 2017). However, this focus on
knowledge may result in the neglect or ignorance of other equally important factors
influencing the performance of businesses including the unknown (Carrillo 2007).
Therefore, the development of instruments that reduces ignorance as well as
fragilities of business are required, this with the intention of being prepared to deal
with unexpected events that can threaten sustainability.
In this context, universities emerges as an interesting change factor since they
have the responsibility to lead society towards a sustainable future through the
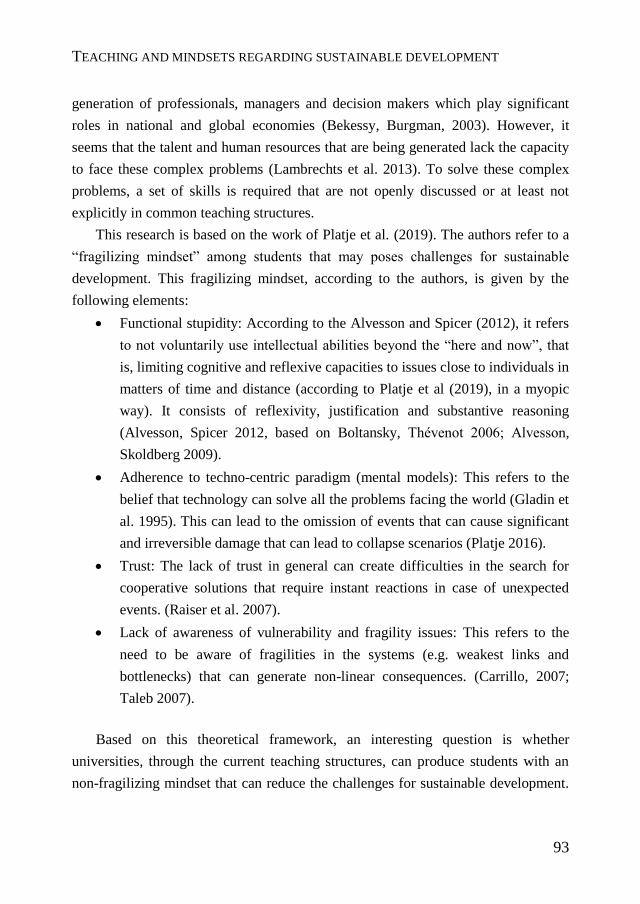
TEACHING AND MINDSETS REGARDING SUSTAINABLE DEVELOPMENT
93
generation of professionals, managers and decision makers which play significant
roles in national and global economies (Bekessy, Burgman, 2003). However, it
seems that the talent and human resources that are being generated lack the capacity
to face these complex problems (Lambrechts et al. 2013). To solve these complex
problems, a set of skills is required that are not openly discussed or at least not
explicitly in common teaching structures.
This research is based on the work of Platje et al. (2019). The authors refer to a
“fragilizing mindset” among students that may poses challenges for sustainable
development. This fragilizing mindset, according to the authors, is given by the
following elements:
Functional stupidity: According to the Alvesson and Spicer (2012), it refers
to not voluntarily use intellectual abilities beyond the “here and now”, that
is, limiting cognitive and reflexive capacities to issues close to individuals in
matters of time and distance (according to Platje et al (2019), in a myopic
way). It consists of reflexivity, justification and substantive reasoning
(Alvesson, Spicer 2012, based on Boltansky, Thévenot 2006; Alvesson,
Skoldberg 2009).
Adherence to techno-centric paradigm (mental models): This refers to the
belief that technology can solve all the problems facing the world (Gladin et
al. 1995). This can lead to the omission of events that can cause significant
and irreversible damage that can lead to collapse scenarios (Platje 2016).
Trust: The lack of trust in general can create difficulties in the search for
cooperative solutions that require instant reactions in case of unexpected
events. (Raiser et al. 2007).
Lack of awareness of vulnerability and fragility issues: This refers to the
need to be aware of fragilities in the systems (e.g. weakest links and
bottlenecks) that can generate non-linear consequences. (Carrillo, 2007;
Taleb 2007).
Based on this theoretical framework, an interesting question is whether
universities, through the current teaching structures, can produce students with an
non-fragilizing mindset that can reduce the challenges for sustainable development.
David S. ZEPEDA QUINTANA, Javier ESQUER, Carlos ANAYA
94
This includes the generation of strategies that allows to reduce ignorance and the
fragility of business. This paper presents a case study on the impact of teaching
interventions on the perception and mindset of students regarding business
sustainability and sustainable development with the intention to relate to the
question whether universities are producing professionals with the necessary
cognitive capabilities for the solution of complex problems that can lead us to
collapse scenarios.
2. Method
In order to obtain relevant information about students' perception on business
sustainability and the conditions for teaching development and sustainable business
an experiment was carried out. The experiment consisted of the application of a
questionnaire consisting of different statements that were evaluated with a 5-point
Likert-items scale. The statements included in the questionnaire are directly related
to the elements of a fragilizing mindset (Table 1).
Students had to assess the statements presented in Table 1 on a Likert-type scale
in the range from (1) strongly disagree to (5) strongly agree, with the option “don’t
know”. The questionnaires were carried out in 15 groups of students taking part in
the subject "sustainability in the engineering" of the engineering division of the
University of Sonora, México. The experiment consisted of three phases: (1) a pre-
test (n=337), (2) intervention and (3) a post-test (n=329) in order to assess the
differences after the interventions. This experiment follows a similar procedure than
the one presented in Platje et al. (2019).
Procedure
In Summer 2018, the questionnaires were filled out beginning of the semester. This
in order to ensure that the opinion of the students was not compromised or subject to
bias on the part of the teacher. The “Microsoft Forms” digital platform was used,
which could accessed through a personal cell phone or laptop.
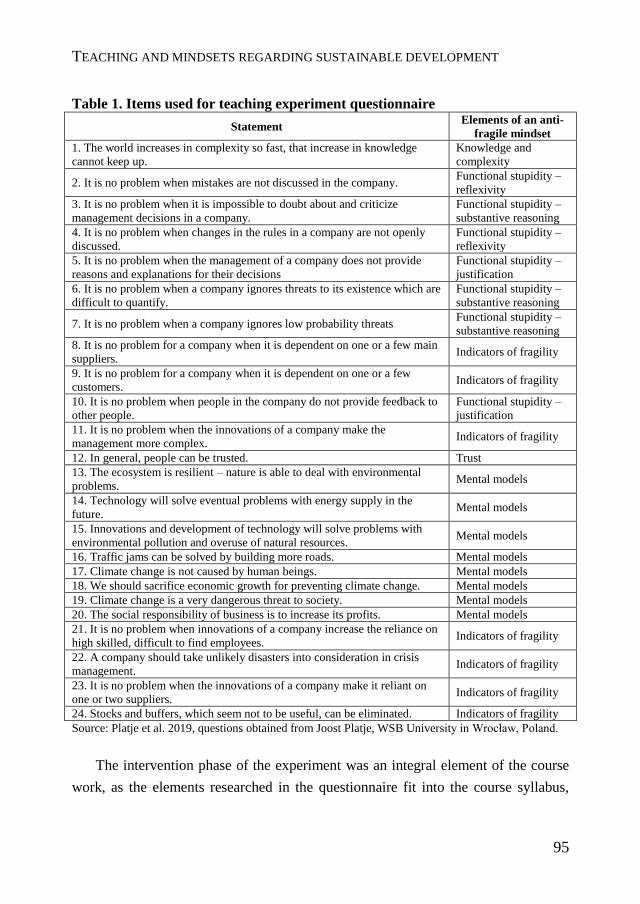
TEACHING AND MINDSETS REGARDING SUSTAINABLE DEVELOPMENT
95
Source: Platje et al. 2019, questions obtained from Joost Platje, WSB University in Wrocław, Poland.
The intervention phase of the experiment was an integral element of the course
work, as the elements researched in the questionnaire fit into the course syllabus,
Table 1. Items used for teaching experiment questionnaire
Statement Elements of an anti-
fragile mindset
1. The world increases in complexity so fast, that increase in knowledge
cannot keep up.
Knowledge and
complexity
2. It is no problem when mistakes are not discussed in the company. Functional stupidity –
reflexivity
3. It is no problem when it is impossible to doubt about and criticize
management decisions in a company.
Functional stupidity –
substantive reasoning
4. It is no problem when changes in the rules in a company are not openly
discussed.
Functional stupidity –
reflexivity
5. It is no problem when the management of a company does not provide
reasons and explanations for their decisions
Functional stupidity –
justification
6. It is no problem when a company ignores threats to its existence which are
difficult to quantify.
Functional stupidity –
substantive reasoning
7. It is no problem when a company ignores low probability threats Functional stupidity –
substantive reasoning
8. It is no problem for a company when it is dependent on one or a few main
suppliers. Indicators of fragility
9. It is no problem for a company when it is dependent on one or a few
customers. Indicators of fragility
10. It is no problem when people in the company do not provide feedback to
other people.
Functional stupidity –
justification
11. It is no problem when the innovations of a company make the
management more complex. Indicators of fragility
12. In general, people can be trusted. Trust
13. The ecosystem is resilient – nature is able to deal with environmental
problems. Mental models
14. Technology will solve eventual problems with energy supply in the
future. Mental models
15. Innovations and development of technology will solve problems with
environmental pollution and overuse of natural resources. Mental models
16. Traffic jams can be solved by building more roads. Mental models
17. Climate change is not caused by human beings. Mental models
18. We should sacrifice economic growth for preventing climate change. Mental models
19. Climate change is a very dangerous threat to society. Mental models
20. The social responsibility of business is to increase its profits. Mental models
21. It is no problem when innovations of a company increase the reliance on
high skilled, difficult to find employees. Indicators of fragility
22. A company should take unlikely disasters into consideration in crisis
management. Indicators of fragility
23. It is no problem when the innovations of a company make it reliant on
one or two suppliers. Indicators of fragility
24. Stocks and buffers, which seem not to be useful, can be eliminated. Indicators of fragility
David S. ZEPEDA QUINTANA, Javier ESQUER, Carlos ANAYA
96
which was dealt with in 12 workshops. During classes, theoretical and practical
aspects of sustainable development were dealt with. Focus was on understanding the
relationship between human activities and environmental deterioration, social and
economic crises. Issues related to the aforementioned fragilizing mindset, non-
linearity (e.g. related to consumption habits and environmental deterioration), low-
probability events (e.g. business disasters such as Chernobyl and oil spills), lack of
general trust (e.g. corruption in the political structures of Mexico) and adherence to
technocentric paradigm (e.g. energy efficiency, industry 4.0) were topics discussed
during class.
During the workshops, short lectures were given on topics such as complexity of
systems, innovation, fragilities and “black swans”. At the end ofg the course, the
repeat questionnaire was carried out, using the same platform as for the first
questionnaire. The participants were not informed the repeat questionnaire was the
same as the first questionnaire. The duration of the workshops was 45 – 60 minutes
the time lapse between applications (phase 1 and phase 2) was approximately 4
months. SPSS was used for analysis. Analysis has been carried out based on
statistical hypothesis testing in order to assess differences between the two samples.
3. Results
The answers to the items of the two groups are presented in Table 2. The groups
were analyzed using a two-tailed test for hypothesis testing among groups and
among pre and post test for each item. All items were tested for significant
differences. In the table, means of pre-test and post-test are presented, as well as the
differences, the z-statistic and the p-value for each item. A critical z-score value for
rejection (-zα/2 = -1.96 and zα/2 = 1.96) was used assuming 5% significance level
(split 2.5% each on either side) to test the following hypothesis:
(1) H0. µ1 = µ2
(2) H1. µ 1 ≠ µ2

TEACHING AND MINDSETS REGARDING SUSTAINABLE DEVELOPMENT
97
Equation (1) establishes that the means of pre-test and post-test have no significant
changes while equation (2) establishes that there exists a significative statistical
change in the means.
After performing the statistical test for both samples, it was found that the null
hypothesis cannot be rejected (z = 0.609; p = 0.2709), so it can be said that there are
no significant statistical changes before and after the intervention; However, after
performing the test for each of the questions, it was found that there are significant
changes in items 1, 2, 3, 4, 6, 7, 8, 14, 16, 18 (Table 2).
The statement with the greatest variation between pre-test and post-test is
statement 1 “The world increases in complexity so fast, that increase in knowledge
cannot keep up”. Most participants went from neither agree nor disagree to agree
with this statement. This may be because issues related to the interconnection of
systems, complexity and limitations of knowledge were explicitly discussed during
the workshops.
Items 2-7 related to functional stupidity, show a decrease between pre-test and
post-test. A tendency to agree less with statements such as "It is no problem when
mistakes are not discussed in the company" and "It is no problem when a company
ignores low probability threats" can be observed. This situation is interesting as it
shows the reported willingness of the students to openly discuss situations that
normally may be omitted.
Statement 8 “It is no problem for a company when it is dependent on one or a
few main suppliers” showed a slight reduction in the level of agreement. It is worth
mentioning that this situation may not only due to the intervention, but also to the
economic context of the region where there is a strong dependence mainly on one or
two industrial sectors (automotive and aerospace) which, during the realization
period of the experiment, have suffered the impacts of the application of different
policies and structural reforms by the federal government.
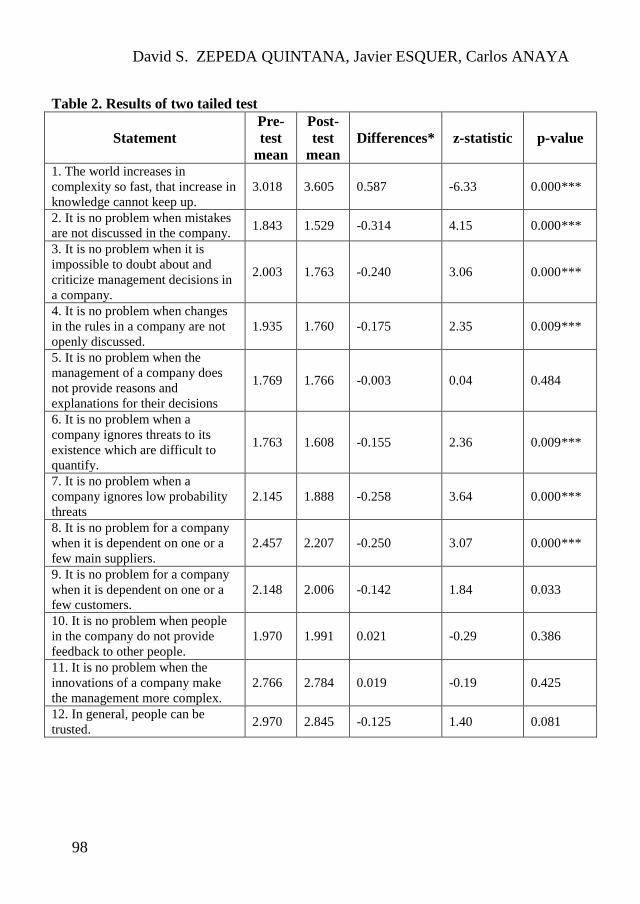
David S. ZEPEDA QUINTANA, Javier ESQUER, Carlos ANAYA
98
Table 2. Results of two tailed test
Statement
Pre-
test
mean
Post-
test
mean
Differences* z-statistic p-value
1. The world increases in
complexity so fast, that increase in
knowledge cannot keep up.
3.018 3.605 0.587 -6.33 0.000***
2. It is no problem when mistakes
are not discussed in the company. 1.843 1.529 -0.314 4.15 0.000***
3. It is no problem when it is
impossible to doubt about and
criticize management decisions in
a company.
2.003 1.763 -0.240 3.06 0.000***
4. It is no problem when changes
in the rules in a company are not
openly discussed.
1.935 1.760 -0.175 2.35 0.009***
5. It is no problem when the
management of a company does
not provide reasons and
explanations for their decisions
1.769 1.766 -0.003 0.04 0.484
6. It is no problem when a
company ignores threats to its
existence which are difficult to
quantify.
1.763 1.608 -0.155 2.36 0.009***
7. It is no problem when a
company ignores low probability
threats
2.145 1.888 -0.258 3.64 0.000***
8. It is no problem for a company
when it is dependent on one or a
few main suppliers.
2.457 2.207 -0.250 3.07 0.000***
9. It is no problem for a company
when it is dependent on one or a
few customers.
2.148 2.006 -0.142 1.84 0.033
10. It is no problem when people
in the company do not provide
feedback to other people.
1.970 1.991 0.021 -0.29 0.386
11. It is no problem when the
innovations of a company make
the management more complex.
2.766 2.784 0.019 -0.19 0.425
12. In general, people can be
trusted. 2.970 2.845 -0.125 1.40 0.081
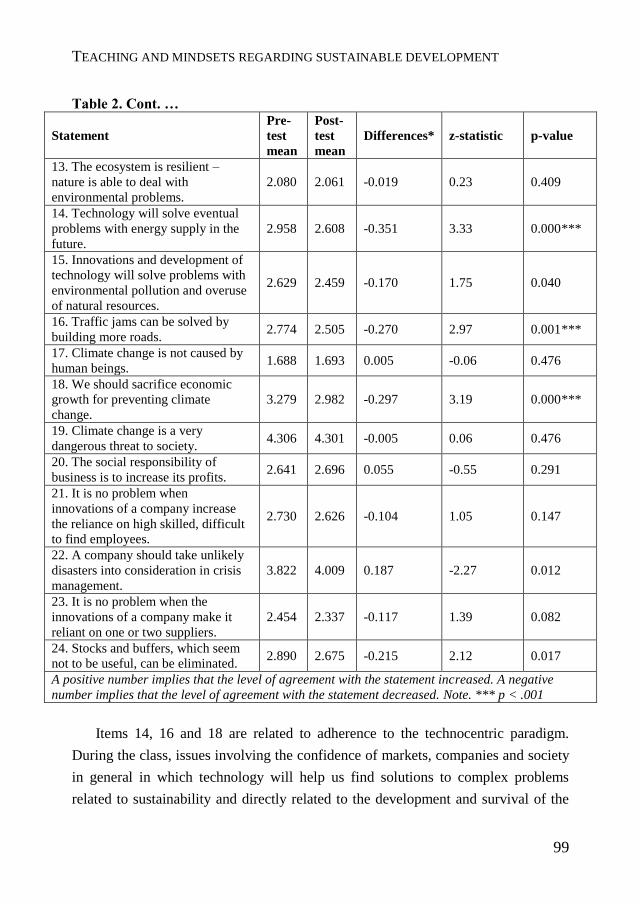
TEACHING AND MINDSETS REGARDING SUSTAINABLE DEVELOPMENT
99
Table 2. Cont. …
Statement
Pre-
test
mean
Post-
test
mean
Differences* z-statistic p-value
13. The ecosystem is resilient –
nature is able to deal with
environmental problems.
2.080 2.061 -0.019 0.23 0.409
14. Technology will solve eventual
problems with energy supply in the
future.
2.958 2.608 -0.351 3.33 0.000***
15. Innovations and development of
technology will solve problems with
environmental pollution and overuse
of natural resources.
2.629 2.459 -0.170 1.75 0.040
16. Traffic jams can be solved by
building more roads. 2.774 2.505 -0.270 2.97 0.001***
17. Climate change is not caused by
human beings. 1.688 1.693 0.005 -0.06 0.476
18. We should sacrifice economic
growth for preventing climate
change.
3.279 2.982 -0.297 3.19 0.000***
19. Climate change is a very
dangerous threat to society. 4.306 4.301 -0.005 0.06 0.476
20. The social responsibility of
business is to increase its profits. 2.641 2.696 0.055 -0.55 0.291
21. It is no problem when
innovations of a company increase
the reliance on high skilled, difficult
to find employees.
2.730 2.626 -0.104 1.05 0.147
22. A company should take unlikely
disasters into consideration in crisis
management.
3.822 4.009 0.187 -2.27 0.012
23. It is no problem when the
innovations of a company make it
reliant on one or two suppliers.
2.454 2.337 -0.117 1.39 0.082
24. Stocks and buffers, which seem
not to be useful, can be eliminated. 2.890 2.675 -0.215 2.12 0.017
A positive number implies that the level of agreement with the statement increased. A negative
number implies that the level of agreement with the statement decreased. Note. *** p < .001
Items 14, 16 and 18 are related to adherence to the technocentric paradigm.
During the class, issues involving the confidence of markets, companies and society
in general in which technology will help us find solutions to complex problems
related to sustainability and directly related to the development and survival of the
David S. ZEPEDA QUINTANA, Javier ESQUER, Carlos ANAYA
100
species were discussed. However, statement 18 “We should sacrifice economic
growth for preventing climate change” underwent an interesting modification.
Students reduced their level of agreement with this item when reverse behavior
could be expected. This may be due to the fact that during the classes, the balance
that is intended to be found between the economic, environmental and social
perspective in all strategies and policies for sustainable development is emphasized.
Finally, statements 22 and 24 related to the indicators of fragility show an
interesting behavior. The statement "A company should take unlikely disasters into
consideration in crisis management" (22) showed an increase in the level of
agreement after the intervention while the statement "Stocks and buffers, which
seem not to be useful, can be eliminated" (24) presented a reduction in the level of
agreement. This may be because during classes and workshops the importance of the
systems approach in solving complex problems as well as in low probability events
and non-linear effects were emphasized.
4. Discussion and conclusion
First of all, these results should be carefully analyzed since they do not represent
the perception of all students. The study was carried out in the engineering faculty of
the university which has a specific academic and cultural direction. However, it is
interesting to observe the modifications found in the perception of the students.
The results obtained show changes in the students' perception in some of the
statements related to functional stupidity, lack of general trust, indicators of fragility
and mental models. This means that the conditions for teaching sustainable
development and sustainable business in this case of study can potentially contribute
to creating in students the cognitive capabilities necessary to generate an non-
fragilizing mindset and, consequently, contribute to business sustainability and
sustainable development.
The research shown here only represents the case of one university with a very
specific academic and cultural context; It is necessary to repeat this experiment in
TEACHING AND MINDSETS REGARDING SUSTAINABLE DEVELOPMENT
101
different faculties and universities in order to identify if students of different
disciplines suffer the same modifications in their perceptions.
References
Ahern, J. (2011), From fail-safe to safe-to-fail: Sustainability and resilience in the new urban
world, “Landscape and urban Planning”, vol. 100 no.4, pp.341-343.
Allen, J.H., Beaudoin, F., Lloyd-Pool, E., Sherman, J., (2014), Pathways to sustainability careers:
building capacity to solve complex problems, “Sustainability: The Journal of Record”, vol. 7 no.1,
pp.47-53.
Alvesson, M., Skoldberg, K. (2009), positivism, social constructionism, critical realism: Three
reference points in the philosophy of science, “Reflexive methodology: New vistas for qualitative
research”, pp.15-52.
Alvesson, M., Spicer, A. (eds., (2010). Metaphors we lead by: Understanding leadership in the real
world, Routledge, Abingdon.
Bekessy, S., Burgman, M. (2003), Universities and sustainability, “TELA: Environment, Economy and
Society”, no.11, pp.1-4.
Bocken, N.M., Short, S.W., Rana, P., Evans, S. (2014), A literature and practice review to develop
sustainable business model archetypes, “Journal of Cleaner Production”, vol. 65, pp.42-56.
Boltanski, L., Thévenot, L., (2006), On justification: Economies of worth, Princeton University Press,
Princeton.
Carrillo, F.J. (2007), The coming of age of knowledge-based development, “Journal of Knowledge
Management”, vol.11 no.5, pp.3-5.
Dwivedi, M. (2010), Role of media in disaster management and early warning, Amity Institute of
Disaster Management.
Dyllick, T., Muff, K. (2016), Clarifying the meaning of sustainable business: Introducing a typology
from business-as-usual to true business sustainability, “Organization & Environment”, vol. 29 no.2,
pp.156-174.
Gladwin, T.N., Kennelly, J.J., Krause, T.S. (1995), Shifting paradigms for sustainable development:
Implications for management theory and research, “Academy of management Review”, vol.20 no.4,
pp. 874-907.
Gonzalez, R.V.D., Martins, M.F. (2017), Knowledge management process: a theoretical-conceptual
research, “Gestão & Produção”, vol.24 no.2, pp.248-265.
Helbing, D. (2009), Managing complexity in socio-economic systems, “European Review”, vol.17
no.2, pp. 423-438.
Vora, K.M., (2013), Business excellence through sustainable change management, “The TQM
Journal”, vol.25 no.6, pp.625-640.
David S. ZEPEDA QUINTANA, Javier ESQUER, Carlos ANAYA
102
Lambrechts, W., Mulà, I., Ceulemans, K., Molderez, I., Gaeremynck, V. (2013), The integration of
competences for sustainable development in higher education: an analysis of bachelor programs in
management, “Journal of Cleaner Production”, vol. 48, pp. 65-73.
Mandelbrot, B.B., Hudson, R.L. (2010), The (mis) behaviour of markets: a fractal view of risk, ruin
and reward, Profile Books, London.
Miller, T.R., Wiek, A., Sarewitz, D., Robinson, J., Olsson, L., Kriebel, D., Loorbach, D. (2014), The
future of sustainability science: a solutions-oriented research agenda, “Sustainability science”, vol.9
no.2, pp.239-246.
Murphy, K., Packer, C., Stevens, A., Simpson, S. (2007), Effective early warning systems for new and
emerging health technologies: Developing an evaluation framework and an assessment of current
systems, “International journal of technology assessment in health care”, vol.23 no.3, pp.324-330.
Naveen, L. (2006), Organizational complexity and succession planning, “Journal of Financial and
Quantitative Analysis”, vol.41 no.3, pp.661-683.
Platje, J. (2016), Efficiency, fragility and unsustainable development, “Prace Naukowe Uniwersytetu
Ekonomicznego we Wrocławiu”, vol.452, pp.46-57.
Platje, J.., Will, M., Van Dam, Y.K., (2019), A fragility approach to sustainability–researching effects
of education. “ Journal of Sustainability in Higher Education”, vol. 20 no. 7, pp. 1220-1239.
Raiser, M., Rousso, A., Steves, F., Teksoz, U. (2007), Trust in transition: Cross-country and firm
evidence. “The Journal of Law, Economics, & Organization”, vol.24 no.2, pp.407-433.
Rouse, M. (2016), What is early warning system?, https://whatis.techtarget.com/definition/early-
warning-system [20.10.2019].
Stubbs, W., Cocklin, C., (2008), Conceptualizing a “sustainability business model”, “Organization &
environment”, vol. 21 no.2, pp.103-127.
Taleb, N.N., (2007), The black swan: The impact of the highly improbable, Random house, New York.
Taleb, N. N. (2012), Antifragile: how to live in a world we don't understand, Allen Lane, London.
Taleb, N.N., Martin, G.A., (2012), How to prevent other financial crises, “SAIS Review of
International Affairs”, vol.32 no.1, pp.49-60.
Voss, J.P., Newig, J., Kastens, B., Monstadt, J., Nölting, B., (2007), Steering for sustainable
development: a typology of problems and strategies with respect to ambivalence, uncertainty and
distributed power, “Journal of Environmental Policy & Planning”, vol.9 no.3-4, pp.193-212.
CENTRAL EUROPEAN REVIEW OF ECONOMICS AND MANAGEMENT ISSN 2543-9472; eISSN 2544-0365
www.cerem-review.eu
www.ojs.wsb.wroclaw.pl Vol. 3, No. 4, 103-111, December 2019
Correspondence address: Nadka Kostadinova, Nadezhda Petrova, Georgi Aleksiev, Trakia University,
Stara Zagora, Bulgaria. E-mail: Nadka Kostadinova: [email protected]; Georgi Aleksiev:
Received: 13.01.2019, Revised: 17.07.2019, Revised: 22.10.2019, Accepted: 17.12.2019
doi: http://dx.10.29015/cerem.745
© 2019 WSB UNIVERSITY IN WROCŁAW .
Sustainability of the Bulgarian food processing
industry
Nadka KOSTADINOVA, Nadezhda PETROVA, Georgi ALEKSIEV
Trakia University, Stara Zagora, Bulgaria
Abstract:
Aim: The Bulgarian agricultural sector underwent a transformation during the last decade of the 20th century, reducing its economic importance. After accessing the European Union in 2007, Bulgarian producers gained access to this market and reoriented their production. This created important challenges in the supply chain. The aim of this article is to investigate the sustainability of the functioning and development of the food processing industry in Bulgaria. In order to achieve this goal, the following issues are addressed: the state and development of the Bulgarian food industry, the problems and prospects for its sustainable functioning. Design / Research methods: The methods used to solve the tasks are: analysis and synthesis, systematic and structural approach, statistical calculations. Conclusion / findings: While the Bulgarian food processing industry is developing seems to be more sustainable that other industries, scale enlargement and intensification take place. Besides positive and negative tendencies, the authors identify recommendations to foster sustainable development of the industry. Originality / value of the article: The prospects for the sustainable development of the food processing industry are important for the opportunities for development of foreign markets as a result of the liberalization and globalization of trade, as well as the preservation of the position of the industry in the national market. Keywords: sustainable development, processing industry, economic relevance JEL: Q13, Q18, Q57
Nadka KOSTADINOVA, Nadezhda PETROVA, Georgi ALEKSIEV
104
1. Introduction
The Food and Beverage Industry is a traditional processing industry, one of the
oldest in Bulgaria, which occupies an important place in the structure of the national
economy. The industry receives raw materials and intermediates from the agrarian
sector, processes and produces food and beverages for final consumption or
processed materials used as raw materials in other industries.
The food industry has a social significance, since the goods produced by the
sector satisfy the daily needs of the population and ensures the normal functioning
of the human organism. The established industrial relations with other sectors and its
contribution to the stability and development of the national economy are an
indication of its economic importance.
The prospects for the sustainable development of Bulgarian food processing
industry are in direct connection and dependence not only on the opportunities for
development of the foreign markets as a result of the liberalization and globalization
of trade, but also on the preservation of its positions in our national market. The aim
of the present study is to investigate the sustainability of the functioning and
development of the food processing industry in Bulgaria.
In order to achieve the goal, the following issues are addressed: the state and
development of our food industry, the problems and prospects for its sustainable
functioning. The methods used to solve the tasks are: analysis and synthesis, system
and structural approach, statistical calculations.
2. Sustainable development of Bulgarian food processing industry
Sustainable development was defined as meeting “the needs of the present
generation without compromising the ability of future generations to meet their
needs” (WCED 1987). A sustainable food supply would than mean that food will be
produced and consumed in such a way, that will not interrupt next generations’ food
supply (Baldwin 2011).
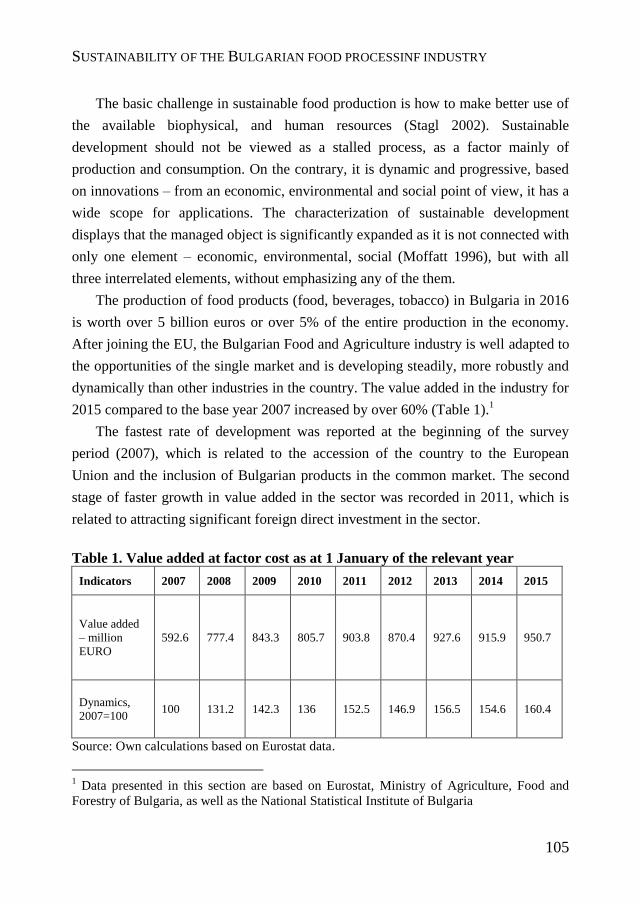
SUSTAINABILITY OF THE BULGARIAN FOOD PROCESSINF INDUSTRY
105
The basic challenge in sustainable food production is how to make better use of
the available biophysical, and human resources (Stagl 2002). Sustainable
development should not be viewed as a stalled process, as a factor mainly of
production and consumption. On the contrary, it is dynamic and progressive, based
on innovations – from an economic, environmental and social point of view, it has a
wide scope for applications. The characterization of sustainable development
displays that the managed object is significantly expanded as it is not connected with
only one element – economic, environmental, social (Moffatt 1996), but with all
three interrelated elements, without emphasizing any of the them.
The production of food products (food, beverages, tobacco) in Bulgaria in 2016
is worth over 5 billion euros or over 5% of the entire production in the economy.
After joining the EU, the Bulgarian Food and Agriculture industry is well adapted to
the opportunities of the single market and is developing steadily, more robustly and
dynamically than other industries in the country. The value added in the industry for
2015 compared to the base year 2007 increased by over 60% (Table 1).1
The fastest rate of development was reported at the beginning of the survey
period (2007), which is related to the accession of the country to the European
Union and the inclusion of Bulgarian products in the common market. The second
stage of faster growth in value added in the sector was recorded in 2011, which is
related to attracting significant foreign direct investment in the sector.
Table 1. Value added at factor cost as at 1 January of the relevant year
Indicators 2007 2008 2009 2010 2011 2012 2013 2014 2015
Value added
– million
EURO
592.6 777.4 843.3 805.7 903.8 870.4 927.6 915.9 950.7
Dynamics,
2007=100 100 131.2 142.3 136 152.5 146.9 156.5 154.6 160.4
Source: Own calculations based on Eurostat data.
1 Data presented in this section are based on Eurostat, Ministry of Agriculture, Food and
Forestry of Bulgaria, as well as the National Statistical Institute of Bulgaria
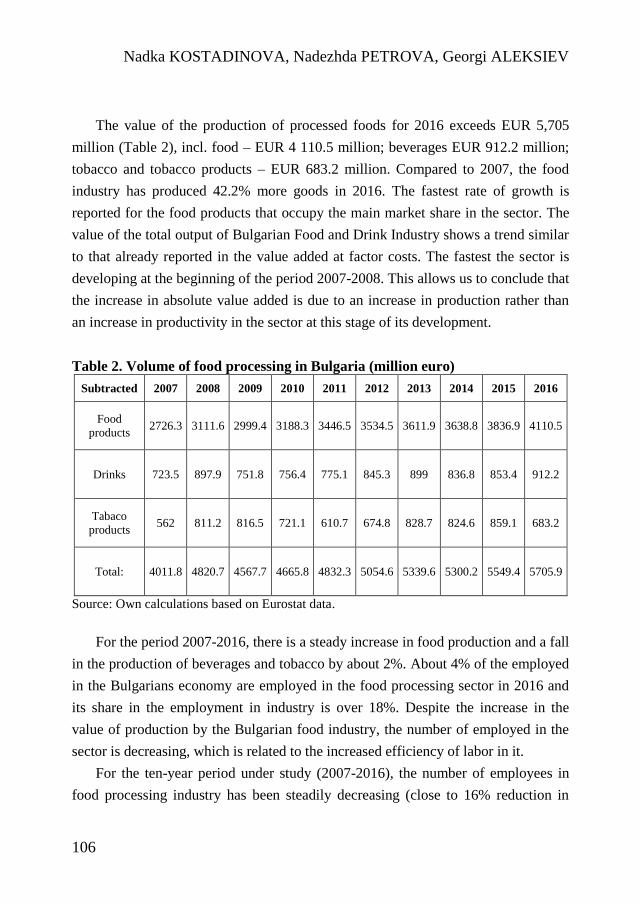
Nadka KOSTADINOVA, Nadezhda PETROVA, Georgi ALEKSIEV
106
The value of the production of processed foods for 2016 exceeds EUR 5,705
million (Table 2), incl. food – EUR 4 110.5 million; beverages EUR 912.2 million;
tobacco and tobacco products – EUR 683.2 million. Compared to 2007, the food
industry has produced 42.2% more goods in 2016. The fastest rate of growth is
reported for the food products that occupy the main market share in the sector. The
value of the total output of Bulgarian Food and Drink Industry shows a trend similar
to that already reported in the value added at factor costs. The fastest the sector is
developing at the beginning of the period 2007-2008. This allows us to conclude that
the increase in absolute value added is due to an increase in production rather than
an increase in productivity in the sector at this stage of its development.
Table 2. Volume of food processing in Bulgaria (million euro)
Subtracted 2007 2008 2009 2010 2011 2012 2013 2014 2015 2016
Food
products 2726.3 3111.6 2999.4 3188.3 3446.5 3534.5 3611.9 3638.8 3836.9 4110.5
Drinks 723.5 897.9 751.8 756.4 775.1 845.3 899 836.8 853.4 912.2
Tabaco
products 562 811.2 816.5 721.1 610.7 674.8 828.7 824.6 859.1 683.2
Total: 4011.8 4820.7 4567.7 4665.8 4832.3 5054.6 5339.6 5300.2 5549.4 5705.9
Source: Own calculations based on Eurostat data.
For the period 2007-2016, there is a steady increase in food production and a fall
in the production of beverages and tobacco by about 2%. About 4% of the employed
in the Bulgarians economy are employed in the food processing sector in 2016 and
its share in the employment in industry is over 18%. Despite the increase in the
value of production by the Bulgarian food industry, the number of employed in the
sector is decreasing, which is related to the increased efficiency of labor in it.
For the ten-year period under study (2007-2016), the number of employees in
food processing industry has been steadily decreasing (close to 16% reduction in
SUSTAINABILITY OF THE BULGARIAN FOOD PROCESSINF INDUSTRY
107
2016 compared to 2007), but the value of output for this period has increased by
more than 42%. Data show that processing plants have invested more in automated
production, resulting in a reduction in the number of employees. These productions,
however, require a more skilled labor – and consequently – a higher wage, which
leads to an increase in the cost per employee.
The export and import of processed food are of particular importance for the
sustainable development of the sector. The size of exports is one of the main
indicators of the sustainability and competitiveness of a given sector. From 2007 to
2013 there is a steady trend of export growth in the two food sectors – nearly 3 times
for food and tobacco products, while exports of beverages are decreasing (mainly
due to the loss of export positions in the wine industry).
After 2013, exports from the food industry show a slight decrease and
fluctuations in food products and more significant – in tobacco products – about
16% compared to 2013, and for beverages – about 23%. The food group has a major
contribution to the export of the food processing industry, with a share of 86.5% in
2016, the share of tobacco products is 10.5% and of beverages – 3%. The state and
trends of the imports from the food processing industry reveal how much of the
demand in the country is satisfied by producers outside the national economy.
3. Sustainability of the food processing industry and youth employment
We have concluded so far that Bulgarian food processing industry and
agriculture has increased their labor productivity and have been able to produce
better economic results with the use of less labor resources. Although labor
efficiency is very important for the competitiveness of both sectors it does effect
employment rates and thus youth employment in particular.
The employment of young people in agriculture has mixed trends in Bulgaria in
the period 2009-2016 as shown on Chart 1. In 2009 more than 15,000 young people
(age from 15 to 24) are engaged with the production in the sector, while at the end of
the period that number drops to a little over 11,000 with the lowest numbers in 2011
– 7,800. Significantly larger part of the workforce in agriculture is formed by the
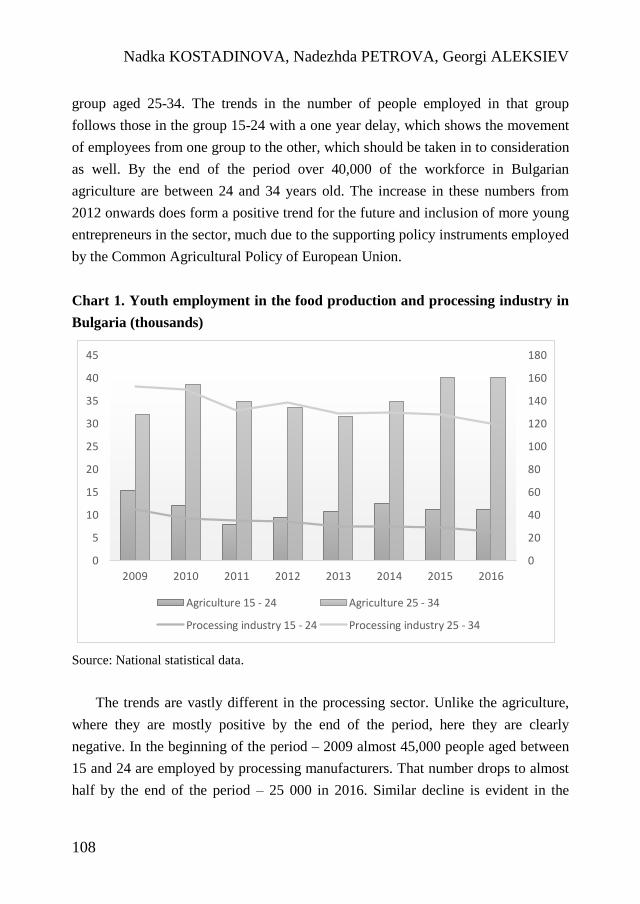
Nadka KOSTADINOVA, Nadezhda PETROVA, Georgi ALEKSIEV
108
group aged 25-34. The trends in the number of people employed in that group
follows those in the group 15-24 with a one year delay, which shows the movement
of employees from one group to the other, which should be taken in to consideration
as well. By the end of the period over 40,000 of the workforce in Bulgarian
agriculture are between 24 and 34 years old. The increase in these numbers from
2012 onwards does form a positive trend for the future and inclusion of more young
entrepreneurs in the sector, much due to the supporting policy instruments employed
by the Common Agricultural Policy of European Union.
Chart 1. Youth employment in the food production and processing industry in
Bulgaria (thousands)
0
20
40
60
80
100
120
140
160
180
0
5
10
15
20
25
30
35
40
45
2009 2010 2011 2012 2013 2014 2015 2016
Agriculture 15 - 24 Agriculture 25 - 34
Processing industry 15 - 24 Processing industry 25 - 34
Source: National statistical data.
The trends are vastly different in the processing sector. Unlike the agriculture,
where they are mostly positive by the end of the period, here they are clearly
negative. In the beginning of the period – 2009 almost 45,000 people aged between
15 and 24 are employed by processing manufacturers. That number drops to almost
half by the end of the period – 25 000 in 2016. Similar decline is evident in the
SUSTAINABILITY OF THE BULGARIAN FOOD PROCESSINF INDUSTRY
109
group aged between 25 and 34 years – from 153,000 in 2009 to 120,500 in 2016.
The increase in investments by the same enterprises while the employed numbers
drop is a clear evidence of increase in labor productivity and decrees in labor
requirements. This trend although positive for the enterprises, which improve their
competitiveness leads to a decrees in jobs in the sector.
Further studies on the motivation of young people to work in agriculture and the
food processing industry is required in order to fully examine the problem.
4. Concluding remarks
As a result of the research conducted on the sustainable development of the
Bulgarian food industry, several conclusions can be summarized:
Bulgarian food processing industry is developing and it shows increased
sustainably when compared to other industrial sectors – its share in the
added value is high and does not intermittently increase;
The increase in added value has been achieved with fewer employees, which
is a positive trend and is evidence of automation and modernization in the
industry;
The steady upward trend in food production is mainly a result of the
increase in food production. This is related to these products increased
consumption and increase of the purchasing power of the population;
Competition with importers processing raw materials with a higher level of
subsidy has a negative impact on the sector's development.
In order to improve the conditions for sustainable development of processed
food products in Bulgaria, the following recommendations can be
formulated:
The funds foreseen in the Rural Development Program 2014-2020 should
focus primarily on food processing and tax incentives to support the
investments of the processing enterprises in the treatment of raw materials
and thus adding value to them;
Nadka KOSTADINOVA, Nadezhda PETROVA, Georgi ALEKSIEV
110
Aligning the level of subsidies in agriculture and subsidizing the production
of raw materials, that are a priority for Bulgaria (fruits, vegetables, animal
products);
Encourage the participation of Bulgarian processing companies and research
organizations in the Horizon 2020 initiatives;
Stimulation of protected brands – traditional products and provision of
support for certification;
Supporting small businesses in food processing industry to help them meet
EU standards and EU requirements;
Promoting exports to third countries and searching for new markets for
traditional Bulgarian products;
Supporting the export of products for specific market niches on the
European and international markets in line with consumer demand for
healthy foods, organic food and other high added value foods.
The trends are vastly different in the processing sector. Unlike the agriculture,
where they are mostly positive by the end of the period, here they are clearly
negative. The increase in investments by the same enterprises while the employed
numbers drop is a clear evidence of increase in labor productivity and decrees in
labor requirements. This trend although positive for the enterprises, which improve
their competitiveness leads to a decrees in jobs in the sector. In order to improve the
sustainability of the sector a bigger part of the younger people employed in it should
carry relevant degrees to the food processing industry. This is a slowly developing
trend, delayed by the lack of adequate educational structures in the country.
The food processing industry occupies a significant share in the country's
economy by a measure of value added, people employed, and export value. Its
greater adaptability, sustainability and dynamic development make it an industry in
the group of priority sectors for the national economy.
References
Baldwin Ch.J. (ed.) (2011), Sustainability in the food industry, Wiley-Blackwell, Hoboken, NJ.
Kovacheva Ts. (2010), Development and competitive abilities of the food processing industry in the
European market, “Economics and Management of Agriculture”, vol. 55 no. 2, pp. 3-12.
SUSTAINABILITY OF THE BULGARIAN FOOD PROCESSINF INDUSTRY
111
Malamova N. et. al (2017), Competitive development and price evolution in the food chain in Bulgaria
(in Bulgarian), SAA, EIA.
Malamova N. (2014), Competitive potential and factors for the development of the food industry in
Bulgaria, “Bulgarian Journal of Economics and Agriculture Management” (in Bulgarian), vol. 59 no.
2, pp. 3-19.
Moffatt I. (1996), Sustainable development. Principles, analysis and policies. Parthenon Publishing
Group, Carnforth.
Stagl S. (2002), Local organic food markets. Potentials and limitations for contributing to sustainable
development, “Empirica”, vol. 29 no. 2, pp. 145-162.
WCED (1987), Our common future, United Nations World Commission on Environment and
Development, Oxford University Press, Oxford.
Websites
Eurostat, http://ec.europa.eu/eurostat
Ministry of Agriculture, Food and Forestry of Bulgaria, https://www.mzh.government.bg/en/
National Statistical Institute of Bulgaria, Industry, Short-Term Business Statistics,
https://www.nsi.bg/en/content/4472/short-term-business-statistics
UN Comtrade, https://comtrade.un.org
CENTRAL EUROPEAN REVIEW OF ECONOMICS AND MANAGEMENT ISSN 2543-9472; eISSN 2544-0365
www.cerem-review.eu
www.ojs.wsb.wroclaw.pl Vol. 3, No. 4, 113-134, December 2019
Correspondence address: Tomasz Musiałowski, Wrocław University of Economics, Poland. E-mail:
Received: 15-09-2017, Revised: 14-02-2018, Revised: 27-10-2019, Accepted: 27-10-2019
doi: http://dx.doi.org/10.29015/cerem.356
© 2019 WSB UNIVERSITY IN WROCŁAW
The impact of inflation on the cost of adjustable-
rate mortgages
Tomasz MUSIAŁOWSKI
Wrocław University of Economics, Poland
Abstract:
Aim: To assess how inflation affects the cost of adjustable-rate mortgage from the perspective of personal finances. Design / Research methods: Adjustable-Rate Mortgage simulations were carried out, showing both the nominal and real costs of a mortgage loan. The behavior and the relationship between the inflation rate and WIBOR 3M rate were compared.
Conclusions / findings: The analysis shows that the real cost of mortgage decreases with an increase in inflation. During the period under review, inflation declined, reducing both the real and nominal cost of the loan. There was a strong positive correlation between the WIBOR 3M rate and the inflation rate. Equally strong, although a negative correlation was observed between the inflation rate and the real interest rate. With the decline in inflation, real mortgage rates increased, and vice versa. Particular attention was paid to the periods in which inflation was rising. WIBOR 3M rate reacted to this increase to a much lesser extent and with a lag compared to the inflation rate.
Originality / value of the article: Considering that forecasts presented by the National Bank of Poland predict inflation growth in the coming years, a thorough examination of the inflation impact on the mortgage costs is an important issue for risk management in households with mortgage.
Key words: inflation, adjustable- rate mortgage, debt management, personal finance JEL: D140
1. Introduction
Inflation is a very complex phenomenon, affecting numerous and varied
dimensions of economic life of all economic entities: from nations to enterprises, to
every person who owns funds. Inflation is a sustained increase in prices whose
consequence is a decrease in the purchasing power of currency. In other words,
Tomasz MUSIAŁOWSKI
114
inflation provides information on how the purchasing power of currency changes
(Damodaran 2007: 509–13). Currency is a carrier of value and with the value falling
a smaller number of goods and services can be purchased for the same amount of
money.
The history of inflation dates back to the beginnings of economy with the level
of inflation being strongly linked to the size of money supply. In the Middle Ages
prices stayed at a relatively fixed level. The first global increase in prices came with
the discovery of gold and silver sources in the New World and a sudden increase in
the amount of money in the economy of that time. The second increase, and on a
greater scale, began with the advent of the twentieth century and the abandonment of
the gold standard (Samuelson, Nordhaus 2012: 619–22). The history of modern
inflation begins with the introduction of fiduciary money and the possibility to print
theoretically unlimited additional money.
High inflation is harmful for the entire economy, capable of slowing down
economic growth and leading to irrational behavior of economic entities, which is
the reason why the governments pursue monetary policy in a manner that seeks to
keep inflation at a stable and low level, thereby stimulating a long-term economic
growth (Musielak-Linkowska 2007: 13). In Poland, monetary policy is run by the
Monetary Policy Council, a constitutional body of the National Bank of Poland
(NBP), which has a variety of instruments for combating inflation, in particular, the
interest rate (the Act on the National Bank of Poland of 1997 Article 12). The NBP’s
inflation target is at 2,5% with a possible fluctuation of 1 percentage point from the
target. The NBP influences the level of inflation mainly by defining interest rates
which determine the profitability of the monetary policy instruments (National Bank
of Poland 2016). The two of those rates, deposit rate and Lombard rate, can have a
considerable impact on the costs of mortgages in Poland.
The deposit rate is the interest rate on deposits of commercial banks charged by a
central bank; Lombard rate is the interest rate on the central bank’s loans granted
against securities. These rates are linked to WIBOR rate, which defines the interest
rates applied when commercial banks lend money to one another (ACI Polska 2016).
The WIBOR level is between the levels of these two rates, since it would not be
viable for a commercial bank to lend money to other banks more cheaply than to a
THE IMPACT OF INFLATION ON COST OF ADJUSTABLE-RATE MORTGAGE
115
central bank whose default risk is smaller; or to borrow from other banks at a higher
cost than that when borrowing from the National Bank of Poland.
The WIBOR rate, on the other hand, is the basis for the calculation of adjustable-
rate mortgage in Poland. Banks determine the interest rates on those loans at the
level of WIBOR rate plus a margin.
An excessive increase in inflation can be the reason for the Monetary Policy
Council to raise the interest rates of the National Bank of Poland. This measure will
lead to an increase in WIBOR rate, and thus an increase in the mortgage rates,
thereby increasing the nominal amount of interest rates. On the other hand, however,
inflation will reduce the real value of installments paid. In the existing literature the
problem of the impact of inflation on the cost of adjustable-rate mortgage has not
been solved.
The first section of the paper encompasses a review of literature which discusses
the impact of inflation on the cost of credits and loans, in particular, mortgages.
Personal finances do not represent a part of financial science that has been developed
considerably in Poland, with very few Polish scholars addressing the subject of
inflation from the point of view of an individual – that is why English language
publications are predominant in the literature. A substantial number of papers
focuses on the issue of choosing between a fixed-rate mortgage and adjustable-rate
mortgage.
In order to examine how inflation impacted the real mortgage cost in Poland, a
study was conducted which will be outlined in the second section of this paper. The
study consists of two mortgage simulations: one for a mortgage loan taken out on 1
January 2001 for 15 years and the second for the loan taken out on 1 January 2006
for the term of 10 years. The choice of such timeframes was linked to high WIBOR
rates in the years 2001 and 2002, which were the legacy of the hyperinflation of the
1990’.
The aim of the paper is to determine the effects of inflation, mainly from the
perspective of the science concerned with personal finances. Making decisions on
taking mortgage, many people do not take into consideration inflation; while making
decisions to on a long term debt obligation, even as long as 30 years, for a relatively
substantial amount of money in relation to income on the basis of nominal values,
Tomasz MUSIAŁOWSKI
116
people fail to take into account the risk involved in the change of the level of interest
rates or the time value of money.
2. Literature review
Inflation is a phenomenon inextricably linked to money. The first attempts to
address the subject of inflation date as early as the Middle Ages. The Czech
chronicler Kosmas writes the following: ”it is certain that no disaster, no plague nor
death could do more harm to the people of God than the frequent change and
treacherous deterioration of monies (Kosmas 1968: 165).”
Spoiling money, that is, melting down coins into new ones, smaller and of lesser
purity was a frequent procedure among Medieval rulers. In the fourteenth century
Oresmes (Nicolas Oresme), a lecturer at Sorbonne and Bishop of Lisieux in his
Treatise on the origin, nature, law, and alterations of monies voiced his view against
the nominalist concept of money. He maintains that money should have autonomous
value as noble metal and in spoiling it one leads to its decline in trade and a decline
of better money in circulation (good coinage is driven out of circulation by bad).
Moreover, in the sixteenth century, of the same view was Nicolaus Copernicus in
Treatise on Money and Thomas Gresham in Information Touching the Fall of
Exchange (sometimes knows as Copernicus-Gresham law) (Morawski 2002: 48–49).
E. Henry Phelps-Brown and Sheila V. Hopkins studied inflation based on the
available data from England (since the 17th century, Great Britain) over the period of
seven centuries until the present times. They observe that a clear increase in inflation
has been linked to an increase in money supply (Phelps-Brown, Hopkins 1956). Such
events occurred during the conquest of Scotland and Wales in the 13th century, at the
time of immense colonial acquisitions at the turn of the 17th century and the North
American gold rush in the 18th century. The events which had a ruining effect on the
English (and British) economy – Hundred Years’ War, Wars of the Roses, the
English Civil War, Napoleonic Wars and Revolutions of 1848 – caused deflation.
The turning point leading to the change in the nature of inflation came with the
Great War. Its participants suspended the possibility of exchanging money for
precious metal, fearing that the hostile nations would use it to their advantage; that
THE IMPACT OF INFLATION ON COST OF ADJUSTABLE-RATE MORTGAGE
117
the situation will return to normal after the end of the war was a widely held
expectation. The war was financed largely by an inflation policy while the 1920’
saw the attempts made to return to the situation before 1914. This, however, proved
unrealistic with one of the effects of these attempts being deflation, which in the
following decade would lead to the Great Depression (Morawski 2002: 130–44) in
1929, whose end in the 1930’ marked the departure from the gold standard
(Morawski 2002: 162–64).
With money becoming fiduciary, the governments could theoretically issue it
with no limitations turning the inflation phenomenon into an important issue for
growing economic sciences.
The first landmark theory pertaining to inflation was formulated by Irving
Fisher, who asserts that prices change along with the amount of money in circulation,
while taking into account the speed at which money circulates and the total volume
of transactions in which this money has been used (Fisher 1914). After the Second
World War, the leading macroeconomic theory was Keynesian economics created by
John M. Keynes, which consists in a strong intervention on the part of state
governments. In the 1960’ the theory yielded good results; however, the following
decade saw inflation grow with economies becoming inured to interventionist
stimulations (Morawski 2002: 153–54). Keynesian economics was superseded by
monetarism, which stood in opposition to Keynes’s theory, with Milton Friedman
being its most prominent figure. Friedman expanded the Fisher’s quantity theory of
money: money is neutral, which means that it does not influence the development of
real economic values, being capable of affecting only nominal values. Monetarists
advocated to keep inflation at a level of approximately 3-4% annually,
commensurate to the natural growth of the economy’s supply potential (Morawski
2002: 198–200).
Since Fisher’s times, inflation has been one of the topics addressed rather
frequently in finances. However, the focus has been mostly on the macroeconomic
side with much less attention being paid to examining inflation from the perspective
of an enterprise, and with even fewer studies concerned with inflation from the point
of view of a household or an individual.
In the 1970s Donald R. Lessard and Franco Modigliani (1975) formulated the
Tomasz MUSIAŁOWSKI
118
phenomenon of mortgage tilt: countering inflation brings about an increase in
mortgage interest rates – investors compensate in this way the loss of purchasing
power of their receivables, which in turn leads to increased annual payments needed
to purchase a house at a particular value. However, when mortgage rates grow only
to such a degree as to protect the value of the money made available, the increased
payments, despite the increased nominal amount, fail to increase the real value of
costs borne by the borrower for purchasing a house, since this money continues to be
its equivalent.
Nevertheless, this increase has a significant impact on the distribution of cash
flow over time. High mortgage rates which are to compensate for the future decline
in purchasing power of money have the effect that initial installments can be a
considerable burden for borrowers when set beside their income. Over time the
purchasing power of money is reduced, which is coupled with the reduced burden of
household budgets, and yet the initial high installments are a factor which restricts
the demand for home loans among those who may be interested in borrowing money
to purchase a property, and yet they cannot afford it over a long-term. The higher the
inflation, and thus higher initial installments, the more people have to abandon home
purchase plans (Lessard, Modigliani 1975: 13–20).
Another problem which they have observed was the uncertainty as regards future
inflation. For loans with a fixed interest rate, which have been the most popular type
of mortgages in the United States, the rates are dependent on the inflation recorded at
the moment of signing a mortgage contract. The level of inflation, however, is
characterized by high volatility and therefore granting loans at a low level of
inflation involves some risk for lenders, while with high inflation the risk is on the
side of borrowers. Such a situation leads to considerable market imbalances: with
low inflation loan demand is high, but supply is low; with high inflation, on the other
hand, the situation is reverse – supply is incomparably higher than demand (Lessard,
Modigliani 1975: 21). The uncertainty related to future inflation represents a
substantial cost in business operations for enterprises which sign long-term
agreements – and banks providing mortgages are certainly that (Fischer, Modigliani
1978: 828–29).
Lessard and Modigliani have demonstrated several possible solutions to the
THE IMPACT OF INFLATION ON COST OF ADJUSTABLE-RATE MORTGAGE
119
above problems, which could consist in a varying rate depending on the level of a
specific reference rate (ARM – Adjustable-Rate Mortgage) or price level adjusted
mortgage (PLAM). This would solve the problem linked to the lender’s risk and the
imbalance on the part of supply, albeit the interest rate risk would be shifted entirely
onto the borrower. This would not solve the problems relating to demand – with high
inflation, mortgages would still be available to households which could afford them
in a situation of fixed monetary value. This problem could be partially managed in
that the interest rates would be based on the level of prices of goods and services;
however, such a construction could undermine the stability of the US financial
system (Lessard, Modigliani 1975: 27–37).
These observation have been confirmed by empirical studies conducted by James
R. Kearl, who emphasizes that inflation in its own right as well as the measures
designed to counter it exert influence on both mortgage supply and demand, and
simultaneously the demand on the property market (Kearl 1979). James R. Follain
estimated, based on an econometric model, that an increase in inflation by 1% caused
a decline in demand for housing at a level ranging from 4 to 5% (Follain 1982).
In 1991 Jeffrey Telgarsky and Katherine Mark (1991) compared various forms
of loan interest using as their example data from Turkey, where over the years 1970-
1990 inflation was high and showing high volatility: from 1970 to 1977 it ranged
between 10 and 20%, with inflation turning into hyperinflation at a level of over
110% and not falling below 40% until 1990. The authors compared a mortgage with
fixed rates, different types of adjustable-rate mortgage and interest rates adjusted
according to inflation rate. In the case of the fixed rate mortgage, creditworthiness
proved to be very low owing to the significant burden of the first installment, which
is a considerable drawback from the borrower’s point of view. Moreover, the
lender’s internal rate of return after the payment period of 15 years was negative
because of fixed-rate installments and the rapidly decreasing value of money: e.g. the
real value of the loan paid back which was granted in the amount of 26 249 lira was
only 16 763 lira.
The interest of the borrower would have been secured if the mechanism of
adjusting payments according to the inflation rate had been applied; however, the
analysis showed a substantial risk being borne by the borrower: when in 1988 real
Tomasz MUSIAŁOWSKI
120
wages fell, the borrower’s burden would have amounted to as many as 40% of his
salary (instead of the predicted 20%). Adjustable rate is an indirect solution: it
transfers the risk arising from price volatility onto borrower, but not to such a degree
as PLAM: when inflation increases, the rates increase, but the principle value stays at
the nominal level, allowing a bank to recover its receivables together with some of
the interest rates (internal rate of return is positive, but lower than in the case of
PLAM). A drawback of ARM is reduced loan availability, since the first payment is
only slightly lower than is the case for fixed rates.
The author notes that in countries with interest rates based on price level adjusted
mortgage the consumers’ pressure (e.g. Brasil, Chile and Israel) forced banks or
regulators to change the form of interest rates in such a way as to make it less risky
for borrowers (Telgarsky, Mark 1991). The research conducted by Telgarsky and
Mark was theoretical in its nature, whereas James D. Shilling, Upinder S. Dhillon
and C. F. Sirmans carried out an empirical study on micro-data on loans taken out in
the USA. They find that households with a more stable income and those which
considered the possibility of moving into next property tended to choose loans with
adjustable rather than fixed rates (Dhillon et al. 1987). John Y. Campbell and João F.
Cocco address the problem of the choice of mortgage rates focusing on risk
management and not economic costs. They argue that households with a lower ratio
of property value to income, a more stable income, lower risk aversion and a higher
probability of moving house should choose adjustable-rate mortgage. However, the
authors caution that their recommendation arises from the fact that they do not accept
loan terms under which the lender were to suffer a loss (Campbell, Cocco 2003).
Inflation is the borrower’s best friend, for it reduces the real value of debt –
especially in the case of fixed interest rates when the value of housing, prices of
other goods and services, and wages grow while the nominal amount of payment
does not change. This is demonstrated by the late 1970’ in the United States when
the fast growing inflation reduced substantially borrowers’ debts (Bodie et al. 2007:
17). It is also worth noting that assuming that the difference between the nominal
rate and inflation rate is the same, higher inflation at higher interest rates over a long-
term reduces the real cost of a loan more than is the case for lower inflation and
lower interest rates (Debelle 2004: 55–56).

THE IMPACT OF INFLATION ON COST OF ADJUSTABLE-RATE MORTGAGE
121
Personal finances are an interdisciplinary subject and as such its research issues
often go beyond the traditional framework within which the science of finances is
considered (Schuchardt et al. 2007). In dealing with people’s finances one should
bear in mind that homo oeconomicus does not really exist, as it is a simplified model
of rational economic decisions (Thaler 1996: 227). An individual who makes
financial decisions must remember about his flaws and human limitations – in this
case mainly psychological constraints. One example of such limitations is the
phenomenon of money illusion. Irving Fisher defines money illusion as a lack of
discernment that a dollar or any other currency can gain or lose in value (Fisher
1928). Don Patinkin refers to money illusion as any departure from making decisions
exclusively in real conditions: a person will feel money illusion if excessive demand
on goods does not depend solely on relative prices and on real value (Patinkin 1965:
22). Moreover, Wassily Leontief argues that money illusion does not occur if
demand and supply functions are homogeneous of degree zero (Leontief 1936).
Money illusion is strongly related to framing effect by which a different
presentation of the same situation can lead to a completely different behavior
(Tversky, Kahneman 1981). People’s preferences largely depend on whether a
problem is expressed in nominal units or in real units. The framing effect can be
observed in the perception of time and risk tolerance. If a situation is presented in
nominal conditions, people show a tendency to choose nominally less risky
solutions, even if in real conditions this solution may prove to be more risky;
likewise, if a problem is described in real conditions, people tend to choose a
solution that is less risky in real conditions (Shafir et al. 1997).
The studies conducted by Robert J. Shiller suggest that people do not perceive
inflation as a factor affecting an increase in wages (Shiller 1997a). Less than 1/3 of
respondents knew that their nominal salary had increased over the last years because
of inflation (Shiller 1997b). The findings of these observations can be transposed
onto the way the mortgage costs are perceived, with the effect being that decisions as
to the choice of mortgage are made on the basis of nominal data, while disregarding
the influence of inflation. In addition, the effect of mental accounting is also present
here in that people “enter in the books” gains and losses in separate “mental
accounts”, which in turn makes them fail to notice the links between them (Thaler
Tomasz MUSIAŁOWSKI
122
1980). In the case of mortgages they tend to ignore the fact that inflation affects the
decline in the real value of their payments and of their salary because it is recognized
(entered in the books) as an increase in prices.
Research shows that the key information when choosing mortgage is the current
cost in relation to household’s resources and abilities (Breslaw et al. 1996; Edwards
1997), or nominal interest rates (Leece 1995). The nominal mortgage rate is precisely
what provides the basis for borrowers’ choice of the cheapest offers, with the
borrowers paying little attention (sometimes paying no attention at all) to the factors
exerting a substantial influence on long-term costs. Borrowers who search for loans
focus exclusively on mortgages, without considering any other additional products
such as life insurance or repayment protection insurance. If these components are
required by banks, they see them as mortgage costs (Skinner et al. 2000). In making
their choice, consumers also pay attention to the reputation and trust which a
particular institution enjoys (Rowlingson 2000), frequently discussing the issue with
family and close friends (Skinner et al. 2000).
3. Description of the study
Making a decision on taking out a mortgage on the basis of the current financial
situation, taking no account of inflation forecasts nor forecasts with respect to
changes in income and household costs is vitiated by two serious hazards. The first
one involves financial problems in case of increased inflation, and thus an increase in
monthly payments, if household’s income does not grow as well. The second is the
risk of failing to choose the right moment for taking out a loan.
The study concerned with the scale of the first hazard was conducted based on
mortgage simulations which were carried out using available national data. The study
consisted of two mortgage simulations: one for a mortgage taken out on 1 January
2001 for a 15-year-term and the second one taken out on 1 January 2006 for 10-year-
term. The choice of such timeframes was dictated by the attempt to select the longest
possible mortgage horizon while being limited by high WIBOR rate in 2001 and
2002.
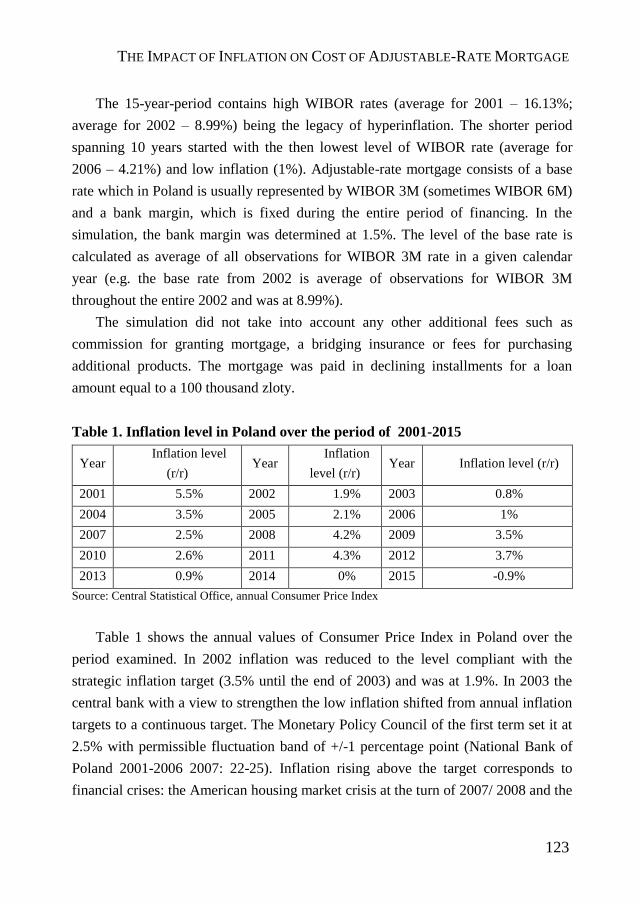
THE IMPACT OF INFLATION ON COST OF ADJUSTABLE-RATE MORTGAGE
123
The 15-year-period contains high WIBOR rates (average for 2001 – 16.13%;
average for 2002 – 8.99%) being the legacy of hyperinflation. The shorter period
spanning 10 years started with the then lowest level of WIBOR rate (average for
2006 – 4.21%) and low inflation (1%). Adjustable-rate mortgage consists of a base
rate which in Poland is usually represented by WIBOR 3M (sometimes WIBOR 6M)
and a bank margin, which is fixed during the entire period of financing. In the
simulation, the bank margin was determined at 1.5%. The level of the base rate is
calculated as average of all observations for WIBOR 3M rate in a given calendar
year (e.g. the base rate from 2002 is average of observations for WIBOR 3M
throughout the entire 2002 and was at 8.99%).
The simulation did not take into account any other additional fees such as
commission for granting mortgage, a bridging insurance or fees for purchasing
additional products. The mortgage was paid in declining installments for a loan
amount equal to a 100 thousand zloty.
Table 1. Inflation level in Poland over the period of 2001-2015
Year Inflation level
(r/r) Year
Inflation
level (r/r) Year Inflation level (r/r)
2001 5.5% 2002 1.9% 2003 0.8%
2004 3.5% 2005 2.1% 2006 1%
2007 2.5% 2008 4.2% 2009 3.5%
2010 2.6% 2011 4.3% 2012 3.7%
2013 0.9% 2014 0% 2015 -0.9%
Source: Central Statistical Office, annual Consumer Price Index
Table 1 shows the annual values of Consumer Price Index in Poland over the
period examined. In 2002 inflation was reduced to the level compliant with the
strategic inflation target (3.5% until the end of 2003) and was at 1.9%. In 2003 the
central bank with a view to strengthen the low inflation shifted from annual inflation
targets to a continuous target. The Monetary Policy Council of the first term set it at
2.5% with permissible fluctuation band of +/-1 percentage point (National Bank of
Poland 2001-2006 2007: 22-25). Inflation rising above the target corresponds to
financial crises: the American housing market crisis at the turn of 2007/ 2008 and the
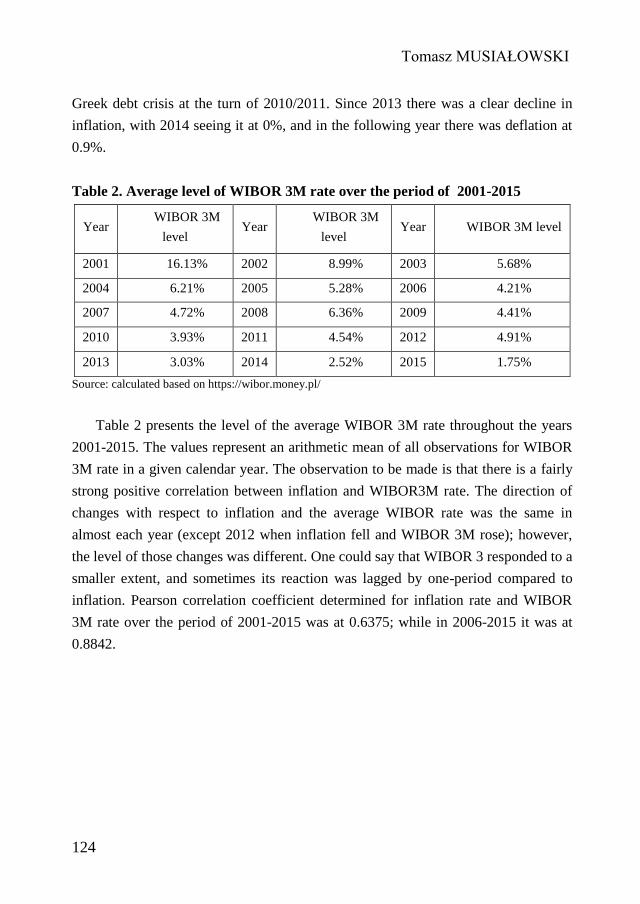
Tomasz MUSIAŁOWSKI
124
Greek debt crisis at the turn of 2010/2011. Since 2013 there was a clear decline in
inflation, with 2014 seeing it at 0%, and in the following year there was deflation at
0.9%.
Table 2. Average level of WIBOR 3M rate over the period of 2001-2015
Year WIBOR 3M
level Year
WIBOR 3M
level Year WIBOR 3M level
2001 16.13% 2002 8.99% 2003 5.68%
2004 6.21% 2005 5.28% 2006 4.21%
2007 4.72% 2008 6.36% 2009 4.41%
2010 3.93% 2011 4.54% 2012 4.91%
2013 3.03% 2014 2.52% 2015 1.75%
Source: calculated based on https://wibor.money.pl/
Table 2 presents the level of the average WIBOR 3M rate throughout the years
2001-2015. The values represent an arithmetic mean of all observations for WIBOR
3M rate in a given calendar year. The observation to be made is that there is a fairly
strong positive correlation between inflation and WIBOR3M rate. The direction of
changes with respect to inflation and the average WIBOR rate was the same in
almost each year (except 2012 when inflation fell and WIBOR 3M rose); however,
the level of those changes was different. One could say that WIBOR 3 responded to a
smaller extent, and sometimes its reaction was lagged by one-period compared to
inflation. Pearson correlation coefficient determined for inflation rate and WIBOR
3M rate over the period of 2001-2015 was at 0.6375; while in 2006-2015 it was at
0.8842.
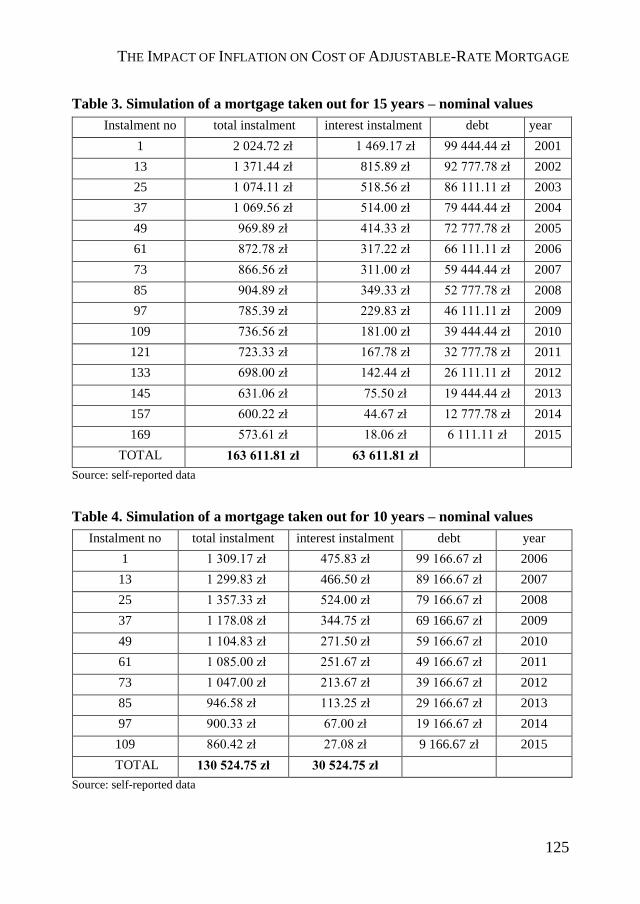
THE IMPACT OF INFLATION ON COST OF ADJUSTABLE-RATE MORTGAGE
125
Table 3. Simulation of a mortgage taken out for 15 years – nominal values
Instalment no total instalment interest instalment debt year
1 2 024.72 zł 1 469.17 zł 99 444.44 zł 2001
13 1 371.44 zł 815.89 zł 92 777.78 zł 2002
25 1 074.11 zł 518.56 zł 86 111.11 zł 2003
37 1 069.56 zł 514.00 zł 79 444.44 zł 2004
49 969.89 zł 414.33 zł 72 777.78 zł 2005
61 872.78 zł 317.22 zł 66 111.11 zł 2006
73 866.56 zł 311.00 zł 59 444.44 zł 2007
85 904.89 zł 349.33 zł 52 777.78 zł 2008
97 785.39 zł 229.83 zł 46 111.11 zł 2009
109 736.56 zł 181.00 zł 39 444.44 zł 2010
121 723.33 zł 167.78 zł 32 777.78 zł 2011
133 698.00 zł 142.44 zł 26 111.11 zł 2012
145 631.06 zł 75.50 zł 19 444.44 zł 2013
157 600.22 zł 44.67 zł 12 777.78 zł 2014
169 573.61 zł 18.06 zł 6 111.11 zł 2015
TOTAL 163 611.81 zł 63 611.81 zł
Source: self-reported data
Table 4. Simulation of a mortgage taken out for 10 years – nominal values
Instalment no total instalment interest instalment debt year
1 1 309.17 zł 475.83 zł 99 166.67 zł 2006
13 1 299.83 zł 466.50 zł 89 166.67 zł 2007
25 1 357.33 zł 524.00 zł 79 166.67 zł 2008
37 1 178.08 zł 344.75 zł 69 166.67 zł 2009
49 1 104.83 zł 271.50 zł 59 166.67 zł 2010
61 1 085.00 zł 251.67 zł 49 166.67 zł 2011
73 1 047.00 zł 213.67 zł 39 166.67 zł 2012
85 946.58 zł 113.25 zł 29 166.67 zł 2013
97 900.33 zł 67.00 zł 19 166.67 zł 2014
109 860.42 zł 27.08 zł 9 166.67 zł 2015
TOTAL 130 524.75 zł 30 524.75 zł
Source: self-reported data
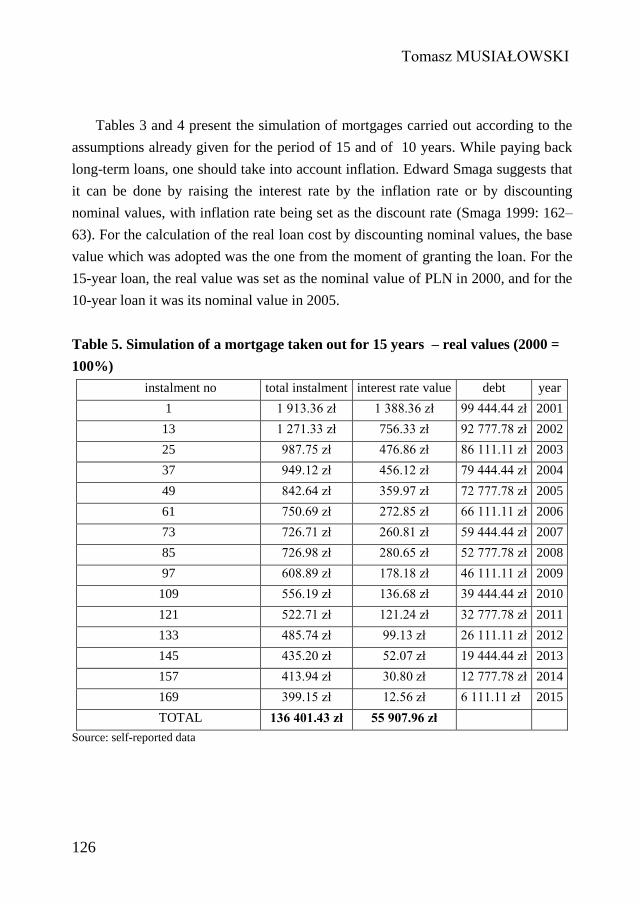
Tomasz MUSIAŁOWSKI
126
Tables 3 and 4 present the simulation of mortgages carried out according to the
assumptions already given for the period of 15 and of 10 years. While paying back
long-term loans, one should take into account inflation. Edward Smaga suggests that
it can be done by raising the interest rate by the inflation rate or by discounting
nominal values, with inflation rate being set as the discount rate (Smaga 1999: 162–
63). For the calculation of the real loan cost by discounting nominal values, the base
value which was adopted was the one from the moment of granting the loan. For the
15-year loan, the real value was set as the nominal value of PLN in 2000, and for the
10-year loan it was its nominal value in 2005.
Table 5. Simulation of a mortgage taken out for 15 years – real values (2000 =
100%)
instalment no total instalment interest rate value debt year
1 1 913.36 zł 1 388.36 zł 99 444.44 zł 2001
13 1 271.33 zł 756.33 zł 92 777.78 zł 2002
25 987.75 zł 476.86 zł 86 111.11 zł 2003
37 949.12 zł 456.12 zł 79 444.44 zł 2004
49 842.64 zł 359.97 zł 72 777.78 zł 2005
61 750.69 zł 272.85 zł 66 111.11 zł 2006
73 726.71 zł 260.81 zł 59 444.44 zł 2007
85 726.98 zł 280.65 zł 52 777.78 zł 2008
97 608.89 zł 178.18 zł 46 111.11 zł 2009
109 556.19 zł 136.68 zł 39 444.44 zł 2010
121 522.71 zł 121.24 zł 32 777.78 zł 2011
133 485.74 zł 99.13 zł 26 111.11 zł 2012
145 435.20 zł 52.07 zł 19 444.44 zł 2013
157 413.94 zł 30.80 zł 12 777.78 zł 2014
169 399.15 zł 12.56 zł 6 111.11 zł 2015
TOTAL 136 401.43 zł 55 907.96 zł
Source: self-reported data
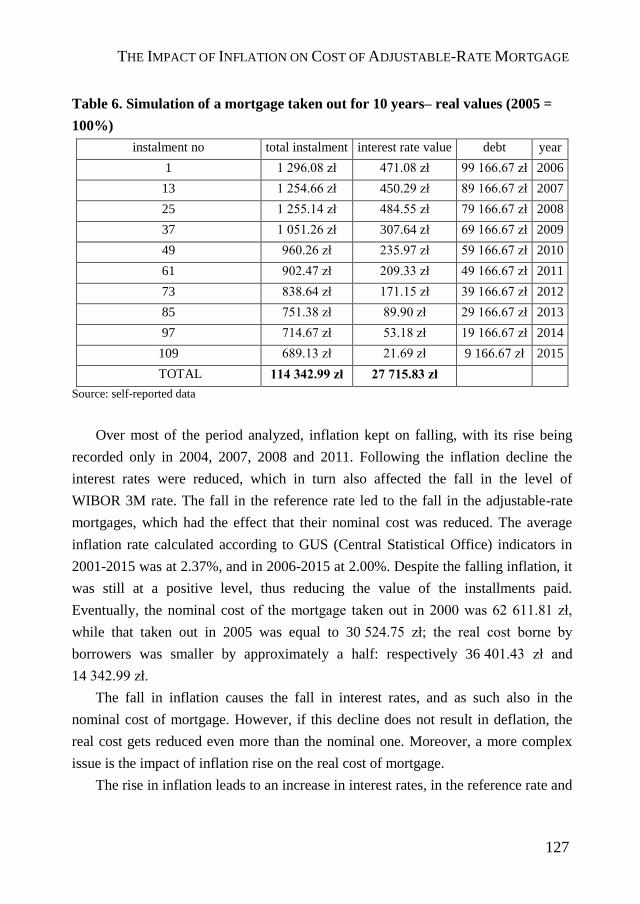
THE IMPACT OF INFLATION ON COST OF ADJUSTABLE-RATE MORTGAGE
127
Table 6. Simulation of a mortgage taken out for 10 years– real values (2005 =
100%)
instalment no total instalment interest rate value debt year
1 1 296.08 zł 471.08 zł 99 166.67 zł 2006
13 1 254.66 zł 450.29 zł 89 166.67 zł 2007
25 1 255.14 zł 484.55 zł 79 166.67 zł 2008
37 1 051.26 zł 307.64 zł 69 166.67 zł 2009
49 960.26 zł 235.97 zł 59 166.67 zł 2010
61 902.47 zł 209.33 zł 49 166.67 zł 2011
73 838.64 zł 171.15 zł 39 166.67 zł 2012
85 751.38 zł 89.90 zł 29 166.67 zł 2013
97 714.67 zł 53.18 zł 19 166.67 zł 2014
109 689.13 zł 21.69 zł 9 166.67 zł 2015
TOTAL 114 342.99 zł 27 715.83 zł
Source: self-reported data
Over most of the period analyzed, inflation kept on falling, with its rise being
recorded only in 2004, 2007, 2008 and 2011. Following the inflation decline the
interest rates were reduced, which in turn also affected the fall in the level of
WIBOR 3M rate. The fall in the reference rate led to the fall in the adjustable-rate
mortgages, which had the effect that their nominal cost was reduced. The average
inflation rate calculated according to GUS (Central Statistical Office) indicators in
2001-2015 was at 2.37%, and in 2006-2015 at 2.00%. Despite the falling inflation, it
was still at a positive level, thus reducing the value of the installments paid.
Eventually, the nominal cost of the mortgage taken out in 2000 was 62 611.81 zł,
while that taken out in 2005 was equal to 30 524.75 zł; the real cost borne by
borrowers was smaller by approximately a half: respectively 36 401.43 zł and
14 342.99 zł.
The fall in inflation causes the fall in interest rates, and as such also in the
nominal cost of mortgage. However, if this decline does not result in deflation, the
real cost gets reduced even more than the nominal one. Moreover, a more complex
issue is the impact of inflation rise on the real cost of mortgage.
The rise in inflation leads to an increase in interest rates, in the reference rate and
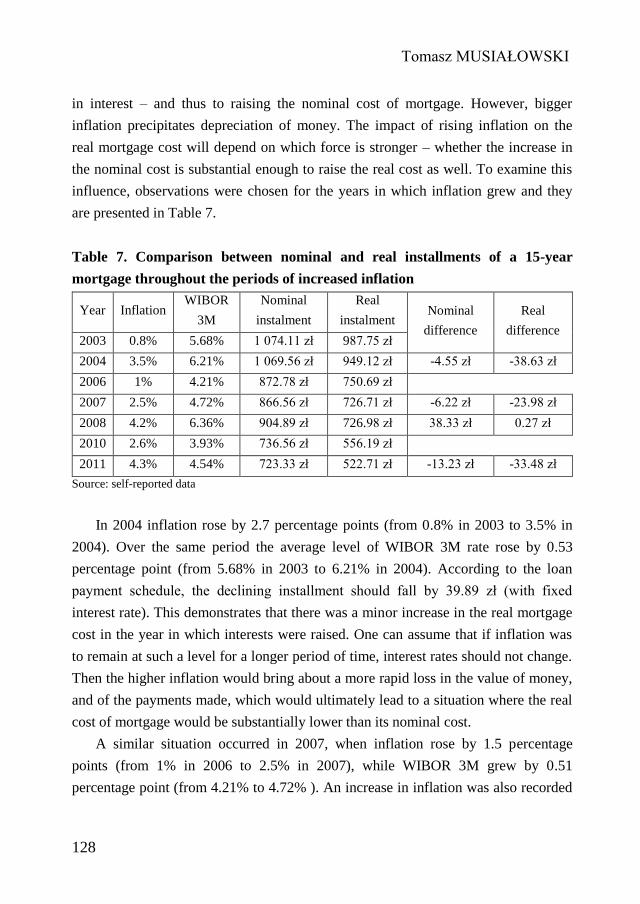
Tomasz MUSIAŁOWSKI
128
in interest – and thus to raising the nominal cost of mortgage. However, bigger
inflation precipitates depreciation of money. The impact of rising inflation on the
real mortgage cost will depend on which force is stronger – whether the increase in
the nominal cost is substantial enough to raise the real cost as well. To examine this
influence, observations were chosen for the years in which inflation grew and they
are presented in Table 7.
Table 7. Comparison between nominal and real installments of a 15-year
mortgage throughout the periods of increased inflation
Year Inflation WIBOR
3M
Nominal
instalment
Real
instalment Nominal
difference
Real
difference 2003 0.8% 5.68% 1 074.11 zł 987.75 zł
2004 3.5% 6.21% 1 069.56 zł 949.12 zł -4.55 zł -38.63 zł
2006 1% 4.21% 872.78 zł 750.69 zł
2007 2.5% 4.72% 866.56 zł 726.71 zł -6.22 zł -23.98 zł
2008 4.2% 6.36% 904.89 zł 726.98 zł 38.33 zł 0.27 zł
2010 2.6% 3.93% 736.56 zł 556.19 zł
2011 4.3% 4.54% 723.33 zł 522.71 zł -13.23 zł -33.48 zł
Source: self-reported data
In 2004 inflation rose by 2.7 percentage points (from 0.8% in 2003 to 3.5% in
2004). Over the same period the average level of WIBOR 3M rate rose by 0.53
percentage point (from 5.68% in 2003 to 6.21% in 2004). According to the loan
payment schedule, the declining installment should fall by 39.89 zł (with fixed
interest rate). This demonstrates that there was a minor increase in the real mortgage
cost in the year in which interests were raised. One can assume that if inflation was
to remain at such a level for a longer period of time, interest rates should not change.
Then the higher inflation would bring about a more rapid loss in the value of money,
and of the payments made, which would ultimately lead to a situation where the real
cost of mortgage would be substantially lower than its nominal cost.
A similar situation occurred in 2007, when inflation rose by 1.5 percentage
points (from 1% in 2006 to 2.5% in 2007), while WIBOR 3M grew by 0.51
percentage point (from 4.21% to 4.72% ). An increase in inflation was also recorded
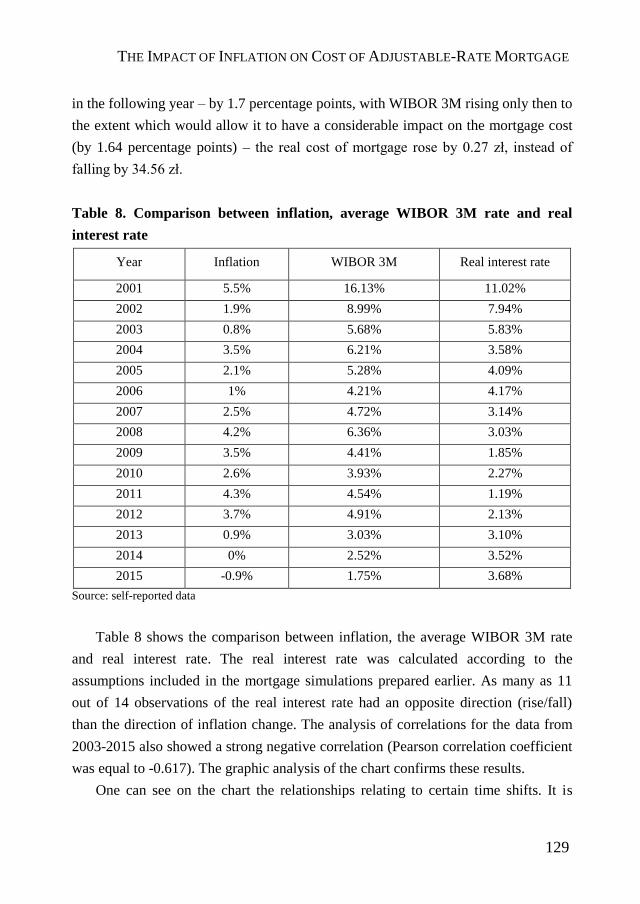
THE IMPACT OF INFLATION ON COST OF ADJUSTABLE-RATE MORTGAGE
129
in the following year – by 1.7 percentage points, with WIBOR 3M rising only then to
the extent which would allow it to have a considerable impact on the mortgage cost
(by 1.64 percentage points) – the real cost of mortgage rose by 0.27 zł, instead of
falling by 34.56 zł.
Table 8. Comparison between inflation, average WIBOR 3M rate and real
interest rate
Year Inflation WIBOR 3M Real interest rate
2001 5.5% 16.13% 11.02%
2002 1.9% 8.99% 7.94%
2003 0.8% 5.68% 5.83%
2004 3.5% 6.21% 3.58%
2005 2.1% 5.28% 4.09%
2006 1% 4.21% 4.17%
2007 2.5% 4.72% 3.14%
2008 4.2% 6.36% 3.03%
2009 3.5% 4.41% 1.85%
2010 2.6% 3.93% 2.27%
2011 4.3% 4.54% 1.19%
2012 3.7% 4.91% 2.13%
2013 0.9% 3.03% 3.10%
2014 0% 2.52% 3.52%
2015 -0.9% 1.75% 3.68%
Source: self-reported data
Table 8 shows the comparison between inflation, the average WIBOR 3M rate
and real interest rate. The real interest rate was calculated according to the
assumptions included in the mortgage simulations prepared earlier. As many as 11
out of 14 observations of the real interest rate had an opposite direction (rise/fall)
than the direction of inflation change. The analysis of correlations for the data from
2003-2015 also showed a strong negative correlation (Pearson correlation coefficient
was equal to -0.617). The graphic analysis of the chart confirms these results.
One can see on the chart the relationships relating to certain time shifts. It is
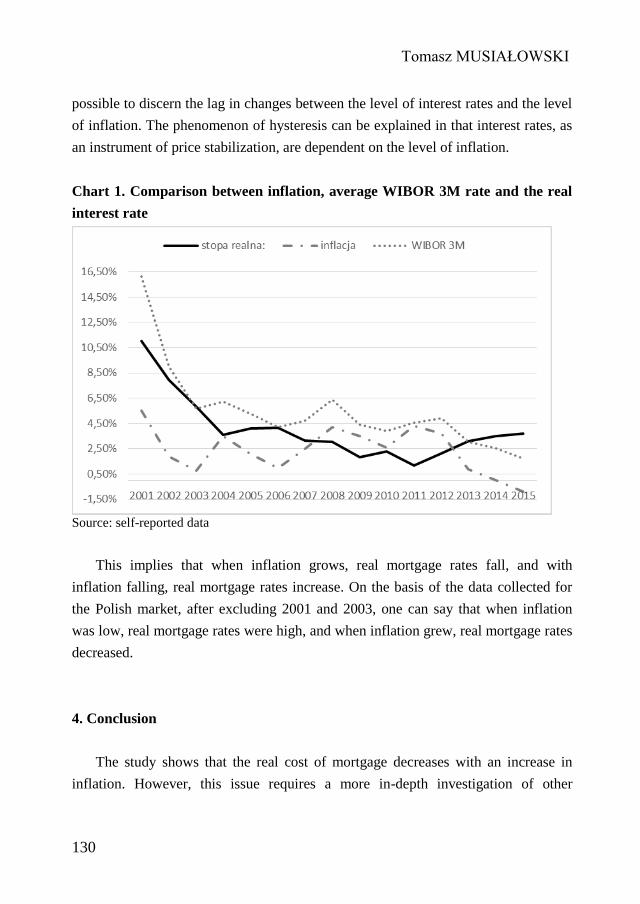
Tomasz MUSIAŁOWSKI
130
possible to discern the lag in changes between the level of interest rates and the level
of inflation. The phenomenon of hysteresis can be explained in that interest rates, as
an instrument of price stabilization, are dependent on the level of inflation.
Chart 1. Comparison between inflation, average WIBOR 3M rate and the real
interest rate
Source: self-reported data
This implies that when inflation grows, real mortgage rates fall, and with
inflation falling, real mortgage rates increase. On the basis of the data collected for
the Polish market, after excluding 2001 and 2003, one can say that when inflation
was low, real mortgage rates were high, and when inflation grew, real mortgage rates
decreased.
4. Conclusion
The study shows that the real cost of mortgage decreases with an increase in
inflation. However, this issue requires a more in-depth investigation of other
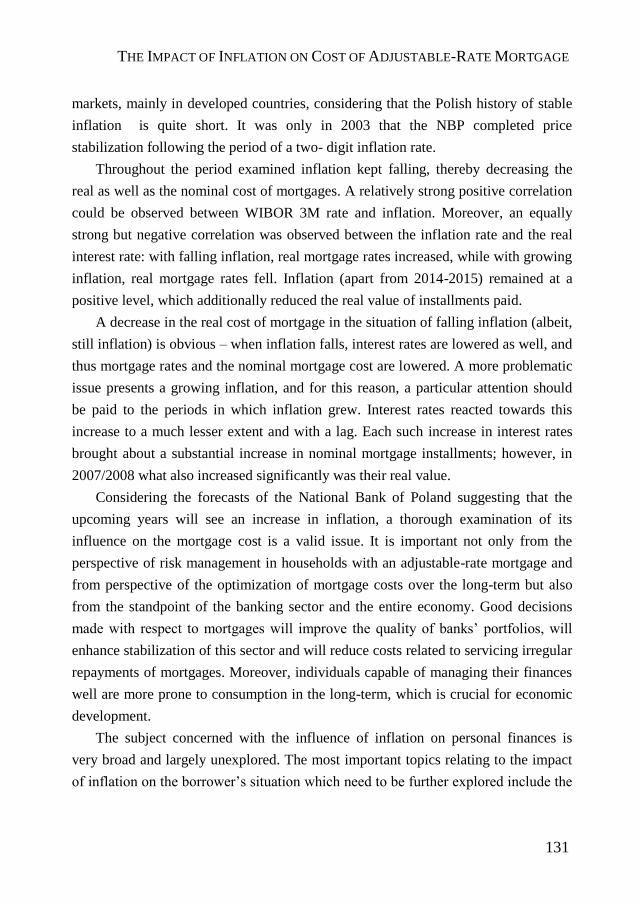
THE IMPACT OF INFLATION ON COST OF ADJUSTABLE-RATE MORTGAGE
131
markets, mainly in developed countries, considering that the Polish history of stable
inflation is quite short. It was only in 2003 that the NBP completed price
stabilization following the period of a two- digit inflation rate.
Throughout the period examined inflation kept falling, thereby decreasing the
real as well as the nominal cost of mortgages. A relatively strong positive correlation
could be observed between WIBOR 3M rate and inflation. Moreover, an equally
strong but negative correlation was observed between the inflation rate and the real
interest rate: with falling inflation, real mortgage rates increased, while with growing
inflation, real mortgage rates fell. Inflation (apart from 2014-2015) remained at a
positive level, which additionally reduced the real value of installments paid.
A decrease in the real cost of mortgage in the situation of falling inflation (albeit,
still inflation) is obvious – when inflation falls, interest rates are lowered as well, and
thus mortgage rates and the nominal mortgage cost are lowered. A more problematic
issue presents a growing inflation, and for this reason, a particular attention should
be paid to the periods in which inflation grew. Interest rates reacted towards this
increase to a much lesser extent and with a lag. Each such increase in interest rates
brought about a substantial increase in nominal mortgage installments; however, in
2007/2008 what also increased significantly was their real value.
Considering the forecasts of the National Bank of Poland suggesting that the
upcoming years will see an increase in inflation, a thorough examination of its
influence on the mortgage cost is a valid issue. It is important not only from the
perspective of risk management in households with an adjustable-rate mortgage and
from perspective of the optimization of mortgage costs over the long-term but also
from the standpoint of the banking sector and the entire economy. Good decisions
made with respect to mortgages will improve the quality of banks’ portfolios, will
enhance stabilization of this sector and will reduce costs related to servicing irregular
repayments of mortgages. Moreover, individuals capable of managing their finances
well are more prone to consumption in the long-term, which is crucial for economic
development.
The subject concerned with the influence of inflation on personal finances is
very broad and largely unexplored. The most important topics relating to the impact
of inflation on the borrower’s situation which need to be further explored include the
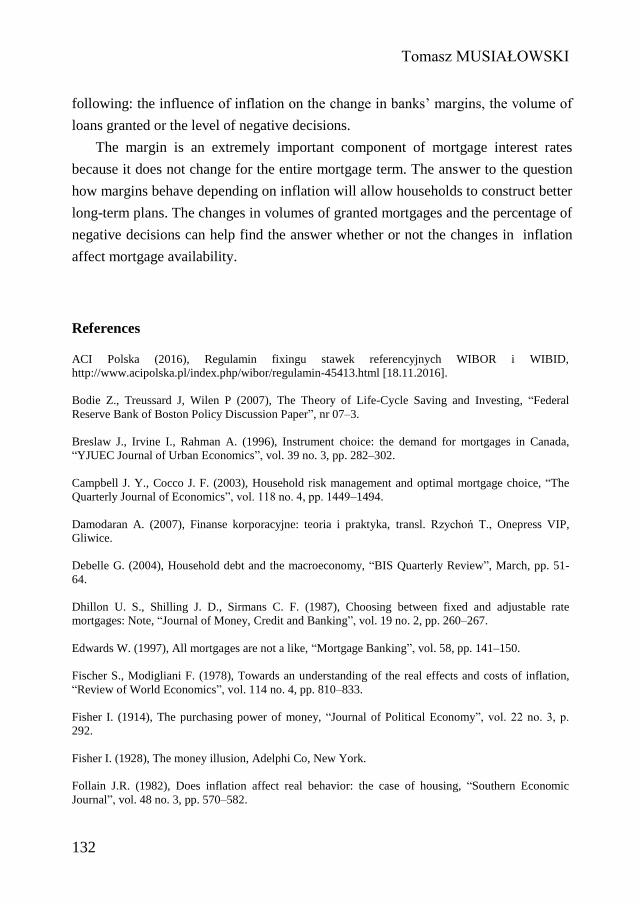
Tomasz MUSIAŁOWSKI
132
following: the influence of inflation on the change in banks’ margins, the volume of
loans granted or the level of negative decisions.
The margin is an extremely important component of mortgage interest rates
because it does not change for the entire mortgage term. The answer to the question
how margins behave depending on inflation will allow households to construct better
long-term plans. The changes in volumes of granted mortgages and the percentage of
negative decisions can help find the answer whether or not the changes in inflation
affect mortgage availability.
References
ACI Polska (2016), Regulamin fixingu stawek referencyjnych WIBOR i WIBID,
http://www.acipolska.pl/index.php/wibor/regulamin-45413.html [18.11.2016].
Bodie Z., Treussard J, Wilen P (2007), The Theory of Life-Cycle Saving and Investing, “Federal
Reserve Bank of Boston Policy Discussion Paper”, nr 07–3.
Breslaw J., Irvine I., Rahman A. (1996), Instrument choice: the demand for mortgages in Canada,
“YJUEC Journal of Urban Economics”, vol. 39 no. 3, pp. 282–302.
Campbell J. Y., Cocco J. F. (2003), Household risk management and optimal mortgage choice, “The
Quarterly Journal of Economics”, vol. 118 no. 4, pp. 1449–1494.
Damodaran A. (2007), Finanse korporacyjne: teoria i praktyka, transl. Rzychoń T., Onepress VIP,
Gliwice.
Debelle G. (2004), Household debt and the macroeconomy, “BIS Quarterly Review”, March, pp. 51-
64.
Dhillon U. S., Shilling J. D., Sirmans C. F. (1987), Choosing between fixed and adjustable rate
mortgages: Note, “Journal of Money, Credit and Banking”, vol. 19 no. 2, pp. 260–267.
Edwards W. (1997), All mortgages are not a like, “Mortgage Banking”, vol. 58, pp. 141–150.
Fischer S., Modigliani F. (1978), Towards an understanding of the real effects and costs of inflation,
“Review of World Economics”, vol. 114 no. 4, pp. 810–833.
Fisher I. (1914), The purchasing power of money, “Journal of Political Economy”, vol. 22 no. 3, p.
292.
Fisher I. (1928), The money illusion, Adelphi Co, New York.
Follain J.R. (1982), Does inflation affect real behavior: the case of housing, “Southern Economic
Journal”, vol. 48 no. 3, pp. 570–582.
THE IMPACT OF INFLATION ON COST OF ADJUSTABLE-RATE MORTGAGE
133
Kearl J.R. (1979), Inflation, mortgage, and housing, “Journal of Political Economy”, vol. 87 no. 5, pp.
1115–1138.
Kosmas (1968), Kosmasa Kronika Czechów, transl. Wojciechowska M., wyd. 1, Skarby Biblioteki
Narodowej, Wydawnictwo Naukowe PWN, Wrocław-Warszawa.
Leece D. (1995), An econometric analysis of choice of mortgage design in the United Kingdom,
“Applied Economics”, vol. 27 no. 12, pp. 1173–1186.
Leontief W.W. (1936), The fundamental assumption of Mr. Keynes’ monetary theory of
unemployment, “The Quarterly Journal of Economics”, vol. 51 no. 1, pp. 192–197.
Lessard D., Modigliani F. (1975), Inflation and the housing market: problems and potential solutions,
in: New mortgage designs for stable housing in an inflationary environment, eds. Lessard D,
Modigliani F., 294. Conference Series 14. Massachusetts, The Federal Reserve Bank of Boston,
Boston, pp. 15-45.
Morawski W. (2002), Zarys powszechnej historii pieniądza i bankowości, Trio, Warszawa.
Musielak-Linkowska M. (2007), Cel inflacyjny w Polsce: założenia i realizacja, CeDeWu, Warszawa.
Narodowy Bank Polski (2016), Polityka pieniężna,
http://www.nbp.pl/home.aspx?f=/polityka_pieniezna/polityka_pieniezna.html [18.11.2016].
Narodowy Bank Polski (2007), Narodowy Bank Polski 2001-2006, Narodowy Bank Polski, Warszawa.
Patinkin D. (1965), Money, interest, and prices; an integration of monetary and value theory, Harper &
Row, New York.
Phelps-Brown E.H., Hopkins S.V. (1956), Seven centuries of the prices of consumables, compared
with builders’ wage-rates, “Economica”, vol. 23 no. 92, pp. 296–314.
Rowlingson K. (2000), Fate, hope and insecurity: future orientation and forward planning, Policy
Studies Institute, London.
Samuelson, P.A., Nordhaus W.D. (2012), Ekonomia, transl. Bukowski A., Środa J., Dom Wydawniczy
Rebis, Poznań.
Schuchardt J., Bagwell D.C., Bailey W.C., DeVaney S.A., Grable J.E., Leech I.E., Lown J.M., Sharpe
D.L., Xiao J.J (2007), Personal finance: an interdisciplinary profession, “Journal of Financial
Counseling and Planning”, vol. 18 no. 1, pp. 62–70.
Shafir E., Diamond P., Tversky A. (1997), Money illusion, “Quarterly Journal of Economics”, vol. 112
no. 449, pp. 341–374.
Shiller R.J. (1997a), Public resistance to indexation: a puzzle, Brookings Papers on Economic Activity,
vol. 1, pp. 159–228.
Shiller R.J. (1997b), Why do people dislike inflation? in: Reducing inflation: motivation and strategy,
eds. Romer C.D., Romer D.H., National Bureau of Economic Research, Cambridge, MA. pp. 13-70.
Tomasz MUSIAŁOWSKI
134
Skinner C., Ford J. (2000), Planning, postponing or hesitating: understanding financial planning,
Centre for Housing Policy, University of York, York.
Smaga E. (1999), Arytmetyka finansowa, Wydawnictwo Naukowe PWN, Kraków-Warszawa.
Telgarsky J.P., Mark K. (1991), Alternative mortgage instruments in high-inflation economies,
“Housing Finance International”, vol. 6, pp. 27-46.
Thaler R.H. (1980), Toward a positive theory of consumer choice, “Journal of Economic Behavior &
Organization”, vol. 1 no. 1, pp. 39-60.
Thaler, R. H. (1996), `Doing economics without homo economicus', in: Economics: how do
economists do economics?, eds. Medema S.G., Samuels W.J., Edward Elgar, Cheltenham, pp. 227-237.
Tversky A, Kahneman D. (1981), The framing of decisions and the psychology of choice, “Science”,
vol. 211 no. 4481, pp. 453–458.
Ustawa z dnia 29 sierpnia 1997 r. o Narodowym Banku Polskim. Dz.U. 1997 nr 140 poz. 938.
Websites
https://wibor.money.pl/
CENTRAL EUROPEAN REVIEW OF ECONOMICS AND MANAGEMENT ISSN 2543-9472; eISSN 2544-0365
www.cerem-review.eu
www.ojs.wsb.wroclaw.pl Vol. 3, No.4, 135-147, December 2019
Correspondence address: Bartosz Fortuński, ul. Ozimska 46a Opole, The Faculty of Economics of the
Opole University, Poland. E-mail: [email protected].
Received: 03.10.2018, Revised: 13.12.2018, Accepted: 02.01.2019
doi: http://dx.doi.org/10.29015/cerem.356
© 2019 WSB UNIVERSITY IN WROCŁAW
The impact of foreign trade on the Netherlands’
real CO2 emissions
Bartosz FORTUŃSKI
University of Opole, Poland
Abstract:
Aim: CO2 emissions and the related climate change are a global problem, where the direct impact of
actions of individual countries depends on their total share in CO2 emissions. In order to assess the
potential for policy measures, the openness of an economy, and the related import and export and their
impacts on emissions should be considered. The aim of this paper is the attempt to show the real CO2
emissions of the Netherlands as well as the impact of its trade on CO2 emissions in other countries in
the world and in the EU in 2015.
Design / Research methods: This study was conducted on the group of countries that are the major
emitters of CO2 in the world including most of the EU members. Countries with negligible CO2
emissions were omitted. Actual CO2 emissions were obtained by applying the actual emission factor.
This takes into account the transfer of CO2 in export products and services as well as those imported by
particular countries.
Conclusions / findings: The real CO2 emissions in the Netherlands are significantly different from the
gross values, which represent the CO2 emissions in the particular countries. It is also important to
indicate that isolated actions of a single country within the European Union itself do not deliver the
intended global and regional target – significant CO2 emissions reduction. The approach proposed in
this study, when applied, may have serious implications for individual EU member states in
implementing their energy policy objectives.
Originality / value of the article: The article shows a different approach to the issue of CO2 emission,
including the importance of international trade in a globalizing world.
Keywords: EU energy policy, CO2 emissions, exports and imports, the Netherlands, climate policy
JEL: Q37, Q40, Q53, Q56
Bartosz FORTUŃSKI
136
1. Introduction
We live in a global world and as a consequence the activities of particular
countries directly or indirectly have an impact on other countries. Some countries
may contribute significantly to the reduction of global CO2 emissions in the energy
sector, bearing high costs in comparison with other countries; nonetheless this may
not have significant effects on real reduction of CO2 emissions. Policy regarding
CO2 emissions of one country seems not to affect the efforts other countries in this
field. Given that CO2 emissions are a global problem, the impact of the effort of
individual countries depends on their share in total global emissions. The real share
in emissions depends not only on the direct emissions in a country, but also the
emissions “hidden” in imports and exports. In other words, the openness of an
economy may significantly influence its factual share in total emissions.
As is shown in this paper, the European Union (the EU) and the Netherlands are
in a leading position in terms of the value of international exchange. This means that
the Netherlands, regarding economic performance, depends on other countries the
similar way these countries depend on the Netherlands (in terms of international
trade value). Thus, all actions planned and realized by the EU as well as the
Netherlands have an impact on other countries via trade. The Netherlands, as the key
economy of EU member state, may use its position in the international exchange by
implementation of EU energy policy, encouraging other countries to achieve
solutions in similar way. The Netherlands with all members of the EU could achieve
that with the use of relevant instruments such as ecological and energy fees.
The main purpose of this paper is to show the real CO2 emissions in the
Netherlands, as well as the impact of trade on CO2 emissions based on the analysis
of the key trade partners of the Netherlands. The analysis does not concern gross
value of emissions, but its real volume, accounting for CO2 transfer in export and
import of products and services. For this case study, only the year 2015 is
considered, as the aim of the article is to provide a general picture, making clear that
isolated actions, like changes in the Dutch energy industry, are unlikely to achieve
the intended targets unless other EU members as well other large global players will
undertake similar actions.
THE IMPACT OF THE NETHERLANDS FOREIGN TRADE …
137
2. Trade in the Netherlands in 2015
The Netherlands is one of the biggest economies in the EU and one of the world
leaders in trade (World GDP Ranking 2015). In 2015 the country was on the eight
position regarding world export as well as import (The Observatory of Economic
Complexity 2017). The Netherlands total export reached USD 428 billion, and total
import USD 454 billion. In this paper, regarding export the largest 64 partners of the
Netherlands are considered (Table 1). These countries account for 94.62% (USD
404.993 billion) of total export. Most export goes to EU countries such as Germany,
Belgium, Luxembourg, Great Britain, France and Italy (74.18%, USD 317.47
billion). When considering the share in exports, any type of climate policy should
consider the interaction with these countries.
Regarding imports, 63-trade partners of the Netherlands, accounting for 95.42%
of Dutch import, were considered (Table 2). Turkmenistan was not taken into
consideration due to the very low value of trade. During the period considered the
Netherlands imported most from the following countries: Germany, Belgium, China,
USA and Russia. Dutch imports from the EU countries was at the level of 52.25%
(USD 237.72 billion). Regarding import, The Netherlands has a stronger relation
with non-EU countries than in the case of export. The economies of the countries
considered in this paper, The Netherlands included, accounted for 90.05% of world
GDP in 2015 (The World Bank 2017).
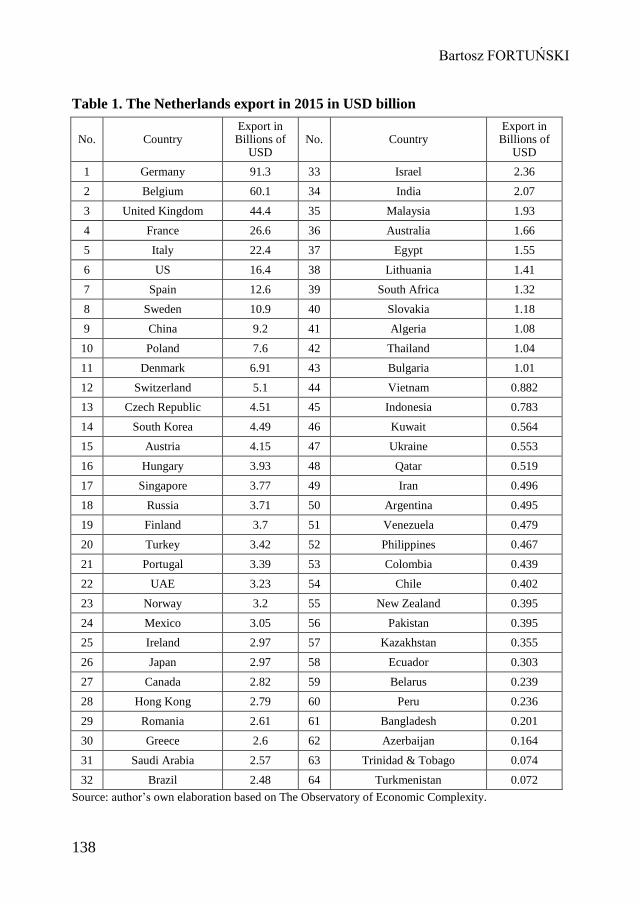
Bartosz FORTUŃSKI
138
Table 1. The Netherlands export in 2015 in USD billion
No. Country Export in
Billions of USD
No. Country Export in
Billions of USD
1 Germany 91.3 33 Israel 2.36
2 Belgium 60.1 34 India 2.07
3 United Kingdom 44.4 35 Malaysia 1.93
4 France 26.6 36 Australia 1.66
5 Italy 22.4 37 Egypt 1.55
6 US 16.4 38 Lithuania 1.41
7 Spain 12.6 39 South Africa 1.32
8 Sweden 10.9 40 Slovakia 1.18
9 China 9.2 41 Algeria 1.08
10 Poland 7.6 42 Thailand 1.04
11 Denmark 6.91 43 Bulgaria 1.01
12 Switzerland 5.1 44 Vietnam 0.882
13 Czech Republic 4.51 45 Indonesia 0.783
14 South Korea 4.49 46 Kuwait 0.564
15 Austria 4.15 47 Ukraine 0.553
16 Hungary 3.93 48 Qatar 0.519
17 Singapore 3.77 49 Iran 0.496
18 Russia 3.71 50 Argentina 0.495
19 Finland 3.7 51 Venezuela 0.479
20 Turkey 3.42 52 Philippines 0.467
21 Portugal 3.39 53 Colombia 0.439
22 UAE 3.23 54 Chile 0.402
23 Norway 3.2 55 New Zealand 0.395
24 Mexico 3.05 56 Pakistan 0.395
25 Ireland 2.97 57 Kazakhstan 0.355
26 Japan 2.97 58 Ecuador 0.303
27 Canada 2.82 59 Belarus 0.239
28 Hong Kong 2.79 60 Peru 0.236
29 Romania 2.61 61 Bangladesh 0.201
30 Greece 2.6 62 Azerbaijan 0.164
31 Saudi Arabia 2.57 63 Trinidad & Tobago 0.074
32 Brazil 2.48 64 Turkmenistan 0.072
Source: author’s own elaboration based on The Observatory of Economic Complexity.
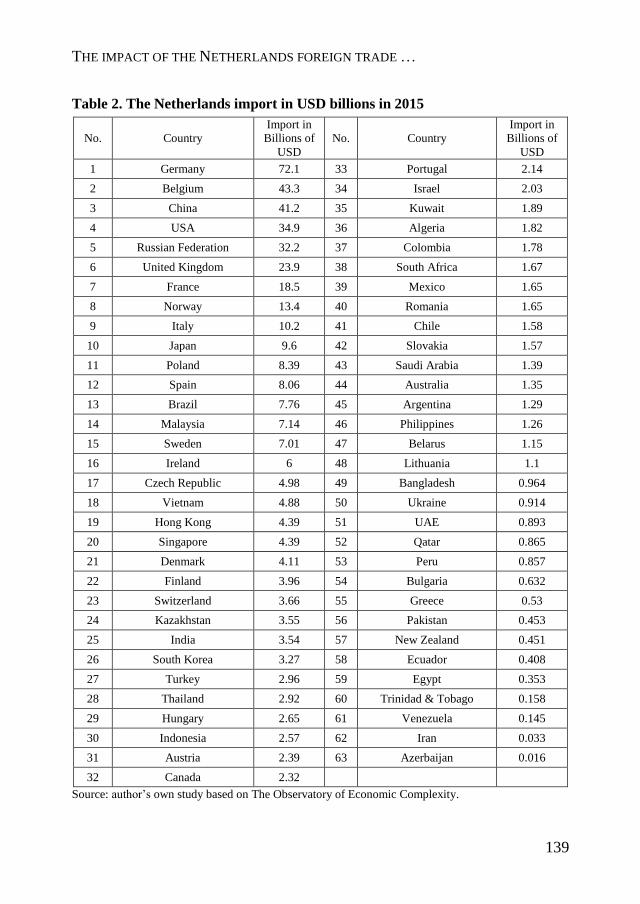
THE IMPACT OF THE NETHERLANDS FOREIGN TRADE …
139
Table 2. The Netherlands import in USD billions in 2015
No. Country
Import in
Billions of
USD
No. Country
Import in
Billions of
USD
1 Germany 72.1 33 Portugal 2.14
2 Belgium 43.3 34 Israel 2.03
3 China 41.2 35 Kuwait 1.89
4 USA 34.9 36 Algeria 1.82
5 Russian Federation 32.2 37 Colombia 1.78
6 United Kingdom 23.9 38 South Africa 1.67
7 France 18.5 39 Mexico 1.65
8 Norway 13.4 40 Romania 1.65
9 Italy 10.2 41 Chile 1.58
10 Japan 9.6 42 Slovakia 1.57
11 Poland 8.39 43 Saudi Arabia 1.39
12 Spain 8.06 44 Australia 1.35
13 Brazil 7.76 45 Argentina 1.29
14 Malaysia 7.14 46 Philippines 1.26
15 Sweden 7.01 47 Belarus 1.15
16 Ireland 6 48 Lithuania 1.1
17 Czech Republic 4.98 49 Bangladesh 0.964
18 Vietnam 4.88 50 Ukraine 0.914
19 Hong Kong 4.39 51 UAE 0.893
20 Singapore 4.39 52 Qatar 0.865
21 Denmark 4.11 53 Peru 0.857
22 Finland 3.96 54 Bulgaria 0.632
23 Switzerland 3.66 55 Greece 0.53
24 Kazakhstan 3.55 56 Pakistan 0.453
25 India 3.54 57 New Zealand 0.451
26 South Korea 3.27 58 Ecuador 0.408
27 Turkey 2.96 59 Egypt 0.353
28 Thailand 2.92 60 Trinidad & Tobago 0.158
29 Hungary 2.65 61 Venezuela 0.145
30 Indonesia 2.57 62 Iran 0.033
31 Austria 2.39 63 Azerbaijan 0.016
32 Canada 2.32
Source: author’s own study based on The Observatory of Economic Complexity.
Bartosz FORTUŃSKI
140
3. The emission of CO2 in the Netherlands and its 63 main trade partners in
2015
One of the main aims of the European energy policy is to achieve the so-called 3
× 20% by 2020. This involves reduction of CO2 emissions by 20% compared to the
base year 1990, the increase in the share of renewable energy in the energy mix to
the level of 20% and improvement in the efficiency of energy use by 20% in
comparison to 1990 (European Parliament 2020). These aims are interconnected.
The last two goals are determinants of CO2 emission reduction, in turn influencing
other aims of the EU energy policy. As shown in this section, the factual CO2
emissions depend on the emissions embraced in international trade. As a
consequence, policy measures will have limited effects when action is only taken on
a national scale and not in the framework of international trade. In this section, the
gross the emissions for the Netherlands are calculated, taking into consideration
international trade. A rough measure is used, in order to sketch a global picture.
3.1 Gross emission
The gross emission of CO2 it is the total amount of CO2 emitted by a country.
Table 5 presents the emissions of the Netherlands and its 64 trade partners. The
largest CO2 emitters in 2015 were the following countries: China, USA, India,
Russia and Japan. The EU Members States were responsible for 10.17% of world
emission of CO2 emissions, making the EU as a whole the third largest emitter of
CO2 in the world. As an individual country, Netherlands ranks 26th.
As shown in Table 6, if all the guidelines, in accordance with the provisions of
the EU energy policy concerning the reduction of CO2, would be applied to all trade
partners of the Netherlands, then only 17 countries would have achieved the
objectives concerning the reduction of CO2 emissions already in 2015. It should be
mentioned that total CO2 emission from all sectors has been considered, not only
emissions generated by the power industry.
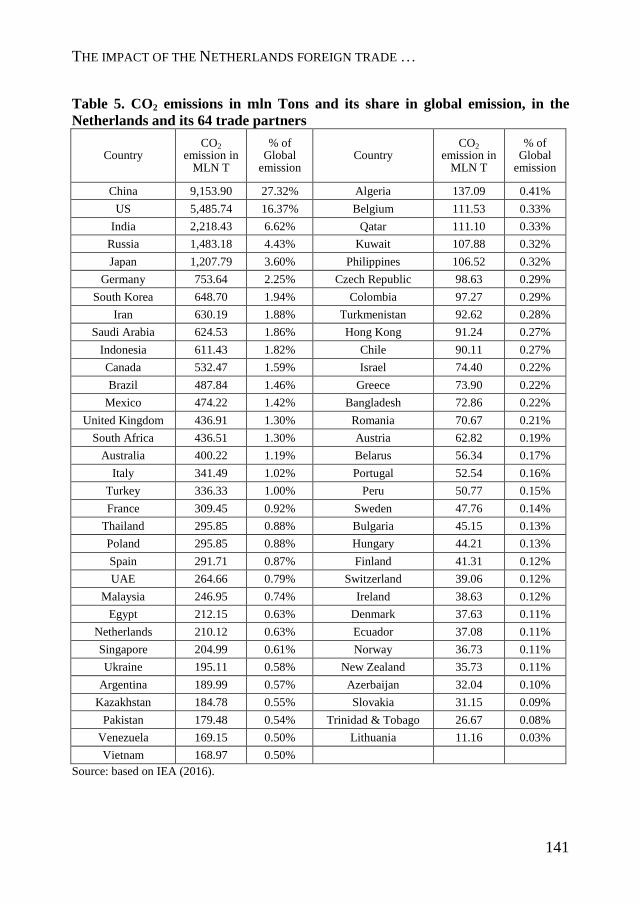
THE IMPACT OF THE NETHERLANDS FOREIGN TRADE …
141
Table 5. CO2 emissions in mln Tons and its share in global emission, in the
Netherlands and its 64 trade partners
Country CO2
emission in MLN T
% of Global
emission Country
CO2 emission in
MLN T
% of Global
emission
China 9,153.90 27.32% Algeria 137.09 0.41%
US 5,485.74 16.37% Belgium 111.53 0.33%
India 2,218.43 6.62% Qatar 111.10 0.33%
Russia 1,483.18 4.43% Kuwait 107.88 0.32%
Japan 1,207.79 3.60% Philippines 106.52 0.32%
Germany 753.64 2.25% Czech Republic 98.63 0.29%
South Korea 648.70 1.94% Colombia 97.27 0.29%
Iran 630.19 1.88% Turkmenistan 92.62 0.28%
Saudi Arabia 624.53 1.86% Hong Kong 91.24 0.27%
Indonesia 611.43 1.82% Chile 90.11 0.27%
Canada 532.47 1.59% Israel 74.40 0.22%
Brazil 487.84 1.46% Greece 73.90 0.22%
Mexico 474.22 1.42% Bangladesh 72.86 0.22%
United Kingdom 436.91 1.30% Romania 70.67 0.21%
South Africa 436.51 1.30% Austria 62.82 0.19%
Australia 400.22 1.19% Belarus 56.34 0.17%
Italy 341.49 1.02% Portugal 52.54 0.16%
Turkey 336.33 1.00% Peru 50.77 0.15%
France 309.45 0.92% Sweden 47.76 0.14%
Thailand 295.85 0.88% Bulgaria 45.15 0.13%
Poland 295.85 0.88% Hungary 44.21 0.13%
Spain 291.71 0.87% Finland 41.31 0.12%
UAE 264.66 0.79% Switzerland 39.06 0.12%
Malaysia 246.95 0.74% Ireland 38.63 0.12%
Egypt 212.15 0.63% Denmark 37.63 0.11%
Netherlands 210.12 0.63% Ecuador 37.08 0.11%
Singapore 204.99 0.61% Norway 36.73 0.11%
Ukraine 195.11 0.58% New Zealand 35.73 0.11%
Argentina 189.99 0.57% Azerbaijan 32.04 0.10%
Kazakhstan 184.78 0.55% Slovakia 31.15 0.09%
Pakistan 179.48 0.54% Trinidad & Tobago 26.67 0.08%
Venezuela 169.15 0.50% Lithuania 11.16 0.03%
Vietnam 168.97 0.50%
Source: based on IEA (2016).
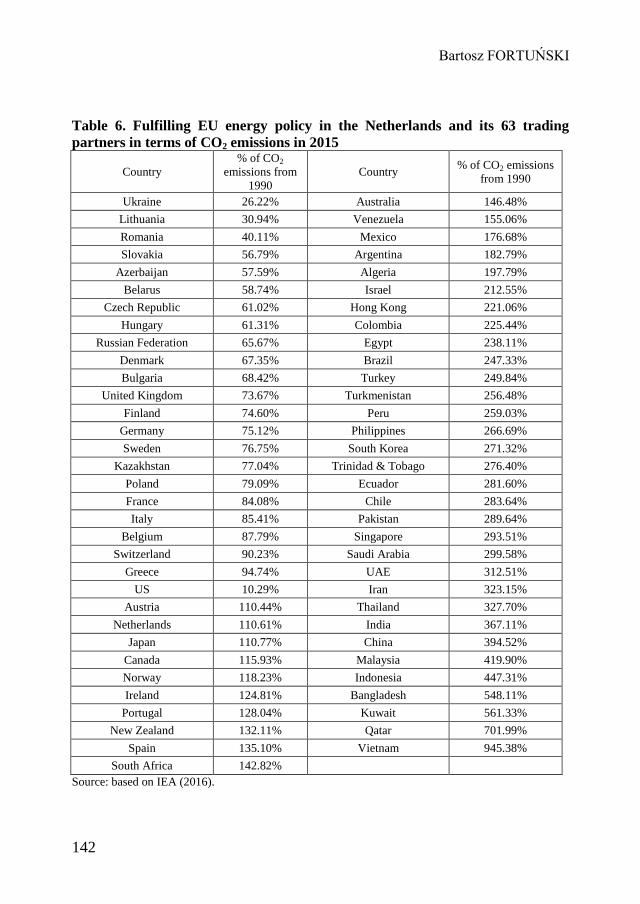
Bartosz FORTUŃSKI
142
Table 6. Fulfilling EU energy policy in the Netherlands and its 63 trading
partners in terms of CO2 emissions in 2015
Country
% of CO2
emissions from
1990
Country % of CO2 emissions
from 1990
Ukraine 26.22% Australia 146.48%
Lithuania 30.94% Venezuela 155.06%
Romania 40.11% Mexico 176.68%
Slovakia 56.79% Argentina 182.79%
Azerbaijan 57.59% Algeria 197.79%
Belarus 58.74% Israel 212.55%
Czech Republic 61.02% Hong Kong 221.06%
Hungary 61.31% Colombia 225.44%
Russian Federation 65.67% Egypt 238.11%
Denmark 67.35% Brazil 247.33%
Bulgaria 68.42% Turkey 249.84%
United Kingdom 73.67% Turkmenistan 256.48%
Finland 74.60% Peru 259.03%
Germany 75.12% Philippines 266.69%
Sweden 76.75% South Korea 271.32%
Kazakhstan 77.04% Trinidad & Tobago 276.40%
Poland 79.09% Ecuador 281.60%
France 84.08% Chile 283.64%
Italy 85.41% Pakistan 289.64%
Belgium 87.79% Singapore 293.51%
Switzerland 90.23% Saudi Arabia 299.58%
Greece 94.74% UAE 312.51%
US 10.29% Iran 323.15%
Austria 110.44% Thailand 327.70%
Netherlands 110.61% India 367.11%
Japan 110.77% China 394.52%
Canada 115.93% Malaysia 419.90%
Norway 118.23% Indonesia 447.31%
Ireland 124.81% Bangladesh 548.11%
Portugal 128.04% Kuwait 561.33%
New Zealand 132.11% Qatar 701.99%
Spain 135.10% Vietnam 945.38%
South Africa 142.82%
Source: based on IEA (2016).
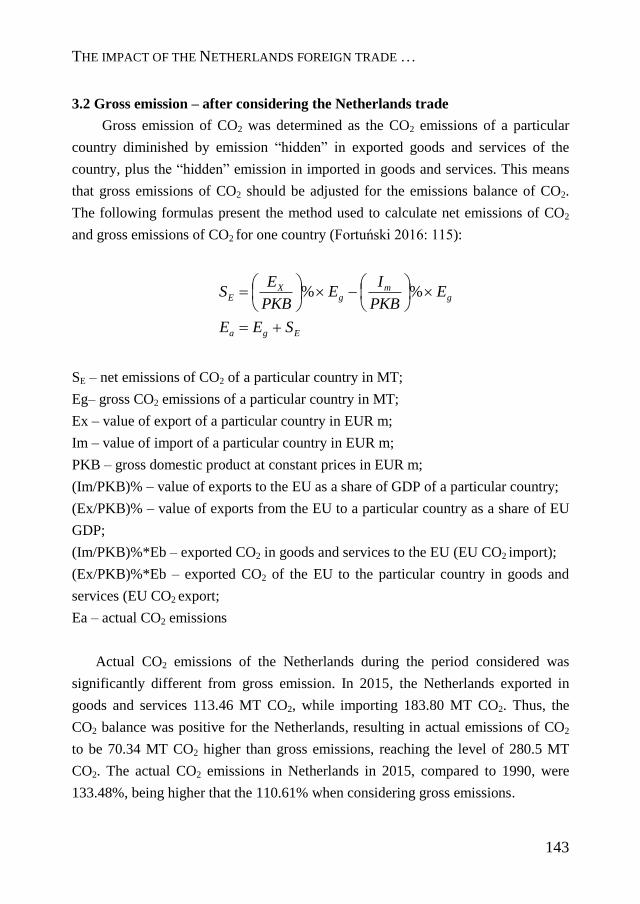
THE IMPACT OF THE NETHERLANDS FOREIGN TRADE …
143
3.2 Gross emission – after considering the Netherlands trade
Gross emission of CO2 was determined as the CO2 emissions of a particular
country diminished by emission “hidden” in exported goods and services of the
country, plus the “hidden” emission in imported in goods and services. This means
that gross emissions of CO2 should be adjusted for the emissions balance of CO2.
The following formulas present the method used to calculate net emissions of CO2
and gross emissions of CO2 for one country (Fortuński 2016: 115):
Ega
gm
gX
E
SEE
EPKB
IE
PKB
ES
%%
SE – net emissions of CO2 of a particular country in MT;
Eg– gross CO2 emissions of a particular country in MT;
Ex – value of export of a particular country in EUR m;
Im – value of import of a particular country in EUR m;
PKB – gross domestic product at constant prices in EUR m;
(Im/PKB)% – value of exports to the EU as a share of GDP of a particular country;
(Ex/PKB)% – value of exports from the EU to a particular country as a share of EU
GDP;
(Im/PKB)%*Eb – exported CO2 in goods and services to the EU (EU CO2 import);
(Ex/PKB)%*Eb – exported CO2 of the EU to the particular country in goods and
services (EU CO2 export;
Ea – actual CO2 emissions
Actual CO2 emissions of the Netherlands during the period considered was
significantly different from gross emission. In 2015, the Netherlands exported in
goods and services 113.46 MT CO2, while importing 183.80 MT CO2. Thus, the
CO2 balance was positive for the Netherlands, resulting in actual emissions of CO2
to be 70.34 MT CO2 higher than gross emissions, reaching the level of 280.5 MT
CO2. The actual CO2 emissions in Netherlands in 2015, compared to 1990, were
133.48%, being higher that the 110.61% when considering gross emissions.
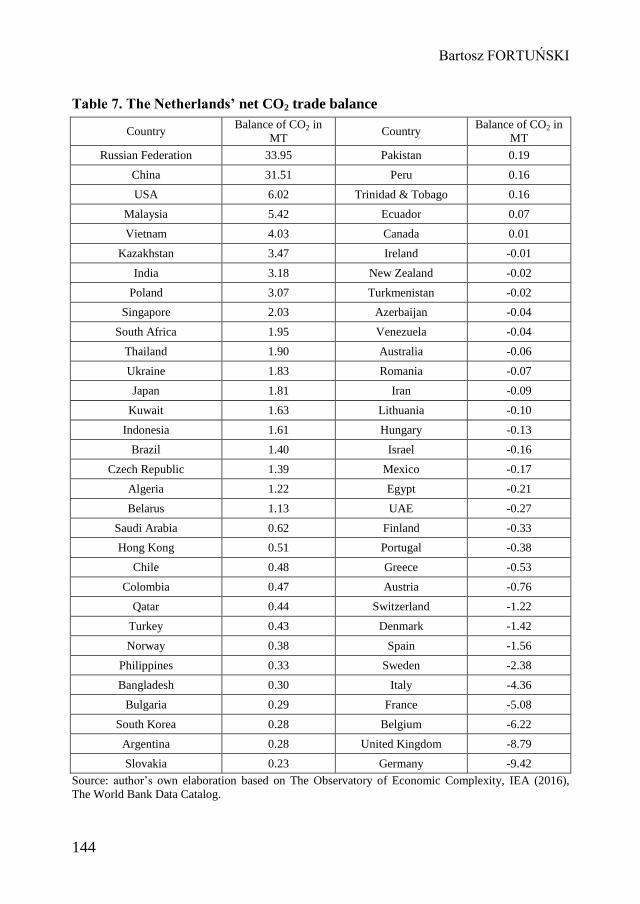
Bartosz FORTUŃSKI
144
Table 7. The Netherlands’ net CO2 trade balance
Country Balance of CO2 in
MT Country
Balance of CO2 in
MT
Russian Federation 33.95 Pakistan 0.19
China 31.51 Peru 0.16
USA 6.02 Trinidad & Tobago 0.16
Malaysia 5.42 Ecuador 0.07
Vietnam 4.03 Canada 0.01
Kazakhstan 3.47 Ireland -0.01
India 3.18 New Zealand -0.02
Poland 3.07 Turkmenistan -0.02
Singapore 2.03 Azerbaijan -0.04
South Africa 1.95 Venezuela -0.04
Thailand 1.90 Australia -0.06
Ukraine 1.83 Romania -0.07
Japan 1.81 Iran -0.09
Kuwait 1.63 Lithuania -0.10
Indonesia 1.61 Hungary -0.13
Brazil 1.40 Israel -0.16
Czech Republic 1.39 Mexico -0.17
Algeria 1.22 Egypt -0.21
Belarus 1.13 UAE -0.27
Saudi Arabia 0.62 Finland -0.33
Hong Kong 0.51 Portugal -0.38
Chile 0.48 Greece -0.53
Colombia 0.47 Austria -0.76
Qatar 0.44 Switzerland -1.22
Turkey 0.43 Denmark -1.42
Norway 0.38 Spain -1.56
Philippines 0.33 Sweden -2.38
Bangladesh 0.30 Italy -4.36
Bulgaria 0.29 France -5.08
South Korea 0.28 Belgium -6.22
Argentina 0.28 United Kingdom -8.79
Slovakia 0.23 Germany -9.42
Source: author’s own elaboration based on The Observatory of Economic Complexity, IEA (2016),
The World Bank Data Catalog.
THE IMPACT OF THE NETHERLANDS FOREIGN TRADE …
145
In Table 7, the net CO2 trade balance is presented for the Netherlands. Russia,
China, USA, Malaysia and Vietnam were the main net exporters of CO2 to the
Netherlands in 2015. Germany, Great Britain, Belgium, France and Italy were the
main recipients of the Netherlands’ net export of CO2 in 2015. Taking into
consideration only the EU countries, the balance of CO2 emissions was positive for
the Netherlands amounting to -36.57 MT CO2. While Poland, the Czech Republic,
Bulgaria and Slovakia were net CO2 exporters to the Netherlands, Germany, Great
Britain, Belgium, France and Italy were net importers.
4. Conclusion
Efforts of The Netherlands, and the whole European Union, to develop and
implement policy to deal with global warming and develop clean energy will
unlikely be successful without similar actions in other countries. The effectiveness
of implementing EU energy policy by member states is limited to its own territory.
This is, among other things, the result from the fact that the EU energy policy is not
being regarded as a sustainable development policy and is related to high costs
(Fortuński 2012, 2013a, 2013b, 2016a, 2016b, 2016c; Bogrocz 2008; Graczyk,
Jakubczyk 2005; Kaczmarski 2010; Kryk 2012a, 2012b).
While being able to influence their own emissions, a country’s influence on
“hidden” emissions is a more complicated issue. The import of CO2 intensive goods
and services negatively influences the actual emission of CO2 in the Netherlands. As
a consequence the planned reduction according to its energy policy in 2015 was not
achieved, while the 2020 goals could be jeopardized. The actual emission level of
CO2 for the Netherlands’ main trade partners considerably varied from real
emissions. The results of the research indicate that CO2 emission is not only a global
problem caused by production and consumption activities within a country, but also
strongly related to international trade. As a consequence, new instruments may need
to be developed that provide trade partners to undertake effective actions towards
the reduction of CO2 emission. An example is an eco-energy tax, which could be
applied by the EU to all trade partners, individual countries or groups of countries
Bartosz FORTUŃSKI
146
according to the share in the total of a particular country’s export to the EU
(Bielecki et al. 2016: 43-46). The measure used in this paper for calculation of real
emission is a rough one. This measure should be refined and applied to, for example,
particular products (e.g., according to the logic of the carbon footprint or
environmental footprint of a good or service (https://footprint.wwf.org.uk/#/), in
order to create a better picture of the most CO2 emission intensive goods and
services traded, and develop effective policy measures.
References
Bielecki S., Zalewski P., Fortuński B. (2016), Wybrane problemy zarządzania energetyką,
Wydawnictwo Texter, Warszawa.
Bogrocz-Koczwara M., Herlender K. (2008), Bezpieczeństwo energetyczne a rozwój odnawialnych
energii, „Energetyka”, no. 3, pp. 194-197.
European Parliament (2020), Briefing - European policies on climate and energy towards 2020, 2030
and 2050, Policy Department for Economic, Scientific and Quality of Life Policies Directorate-General
for Internal Policies Author: Georgios Amanatidis.
https://www.europarl.europa.eu/RegData/etudes/BRIE/2019/631047/IPOL_BRI(2019)631047_EN.pdf
[20.10.2019].
Fortuński B. (2012), „Wyniki” proekologicznego podejścia do energetyki w Unii Europejskiej w
oparciu o model EFQM, in: Orientacja na wyniki we współczesnej gospodarcze, Borys T., Rogala P.
(eds.), Prace Naukowe Uniwersytetu Ekonomicznego we Wrocławiu, nr 265, Wydawnictwo
Uniwersytetu Ekonomicznego, Wrocław, pp.113-125.
Fortuński B. (2013a), Wykorzystanie wybranych surowców energetycznych w kontekście polityki
energetycznej Unii Europejskiej, in: Efektywne gospodarowanie zasobami przyrodniczymi i energią,
Graczyk A. (ed.), Prace Naukowe Uniwersytetu Ekonomicznego we Wrocławiu, nr 317, Wydawnictwo
Uniwersytetu Ekonomicznego, Wrocław, pp. 13-22.
Fortuński B. (2013b), Wyzwania i problemy zrównoważonego rozwoju w energetyce światowej w
kontekście polityki energetycznej UE, „Handel Wewnętrzny”, vol. 6A p. 1, pp. 299-309.
Fortuński B. (2016a), Globalna sprawiedliwość a polityka energetyczna Unii Europejskiej, in: Globalna
sprawiedliwość, Janikowska O., Słodczyk J., Wydawnictwo Uniwersytetu Opolskiego, Opole.
Fortuński B. (2016b), Polityka energetyczna Unii Europejskiej – 3x20. Diagnoza i perspektywy w
kontekście zrównoważonego rozwoju, in: Ekonomia środowiska i polityka ekologiczna, Becla A.,
Kociszewski K. (eds.), Prace Naukowe Uniwersytetu Ekonomicznego we Wrocławiu, nr 453,
Wrocław, Wydawnictwo Uniwersytetu Ekonomicznego, pp. 179-189.
Fortuński B. (2016c), Wpływ handlu zagranicznego Unii Europejskiej na rzeczywistą emisję CO2,
„Ekonomia XXI wieku”, vol. 11 no. 3, pp. 109-120.

THE IMPACT OF THE NETHERLANDS FOREIGN TRADE …
147
Graczyk A., Jakubczyk Z. (2005), Rozwój rynku energii elektrycznej w Polsce w kontekście integracji
z Unią Europejską, Prace Naukowe Akademii Ekonomicznej we Wrocławiu nr 156, Wydawnictwo
Akademii Ekonomicznej we Wrocławiu, Wrocław.
International Energy Agency (IEA) (2016), CO2 Emissions from fuel combustion highlights. 2015
Edition, IEA, Paris.
Kaczmarski M. (2010), Bezpieczeństwo energetyczne Unii Europejskiej, Wydawnictwa Akademickie i
Profesjonalne, Warszawa.
World GDP Ranking (2015), http://knoema.com/nwnfkne/world-gdp-ranking-2014-data-and-charts
[02.09.2014].
Kryk B. (2012a), Kontrowersje polskiej polityki energetycznej w kontekście realizacji wymogów
unijnych, „Ekonomia i Prawo”, vol. 11 no. 4, pp. 151-166.
Kryk B. (2012b), Wzrost efektywności energetycznej – wyzwanie inwestycyjne dla polskiego sektora
energetycznego, in: Kapitał ludzki i społeczny w rozwoju regionalnym, t. 1, Ł. Dymek, K. Bedrunka
(eds.), Politechnika Opolska, Opole.
The Observatory of Economic Complexity by Alexander Simoes,
http://atlas.media.mit.edu/en/profile/country/deu/#Exports [02.02.2017].
The World Bank Data Catalog, http://data.worldbank.org/data-catalog/world-development-indicators
[09.09.2017].
Websites
https://footprint.wwf.org.uk/#/
CENTRAL EUROPEAN REVIEW OF ECONOMICS AND MANAGEMENT ISSN 2543-9472; eISSN 2544-0365
www.cerem-review.eu
www.ojs.wsb.wroclaw.pl Vol. 3, No. 4, 149-183, December 2019
Correspondence address: Markus Will, University of Applied Sciences Zittau/Görlitz, Zittau, Germany.
E-mail: [email protected].
Received: 11.12.2019, Revised: 24.12.2019, Accepted: 25.12.2019
doi: http://dx.10.29015/cerem.862
© 2019 WSB UNIVERSITY IN WROCŁAW
Towards a Sustainable Circular Economy –
Remarks on plastics and wood-waste sector
Markus WILL
University of Applied Sciences Zittau/Görlitz, Germany
Abstract:
Aim: As the traditional approach towards entering a path of sustainable development based on a “efficiency, consistency, sufficiency approach” is questionable, This article discusses opportunities and challenges for the circular economy to become a “last chance” for the current capitalistic and market based system to become more sustainable. Design / Research methods: Two case studies of material (waste) streams of plastics and wood-waste are presented in order to identify challenges in the development and functioning of the circular economy. Conclusions / findings: While the circular economy can deal with threats to sustainability embraced in an efficiency and sufficiency approach, it refers to a technology-driven consistency approach, not questioning the consumption and production patterns in the capitalist economy, and the functioning of the market economy as such. Key words: Circular economy, recycling, sustainability JEL: Q53, Q56
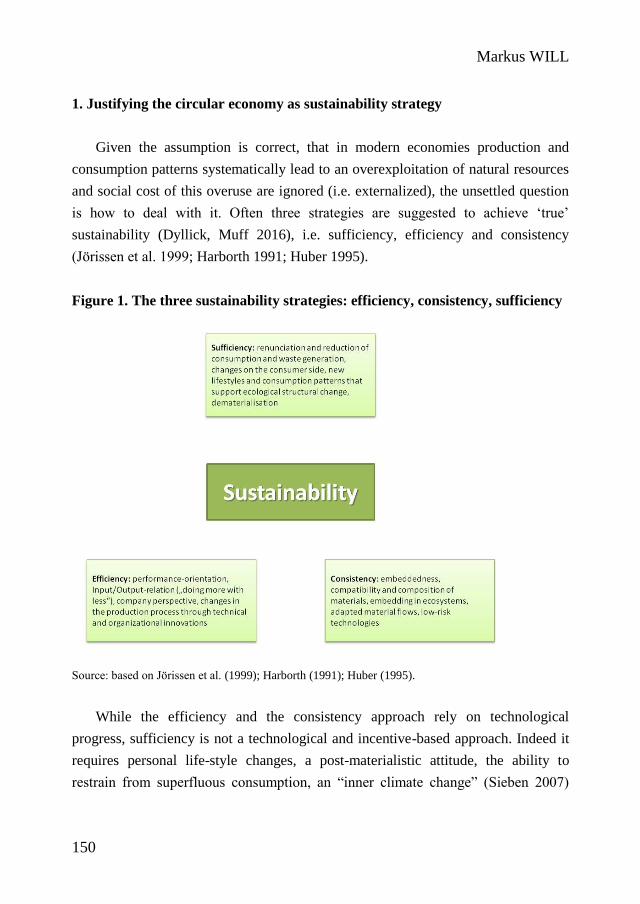
Markus WILL
150
1. Justifying the circular economy as sustainability strategy
Given the assumption is correct, that in modern economies production and
consumption patterns systematically lead to an overexploitation of natural resources
and social cost of this overuse are ignored (i.e. externalized), the unsettled question
is how to deal with it. Often three strategies are suggested to achieve ‘true’
sustainability (Dyllick, Muff 2016), i.e. sufficiency, efficiency and consistency
(Jörissen et al. 1999; Harborth 1991; Huber 1995).
Figure 1. The three sustainability strategies: efficiency, consistency, sufficiency
Source: based on Jörissen et al. (1999); Harborth (1991); Huber (1995).
While the efficiency and the consistency approach rely on technological
progress, sufficiency is not a technological and incentive-based approach. Indeed it
requires personal life-style changes, a post-materialistic attitude, the ability to
restrain from superfluous consumption, an “inner climate change” (Sieben 2007)
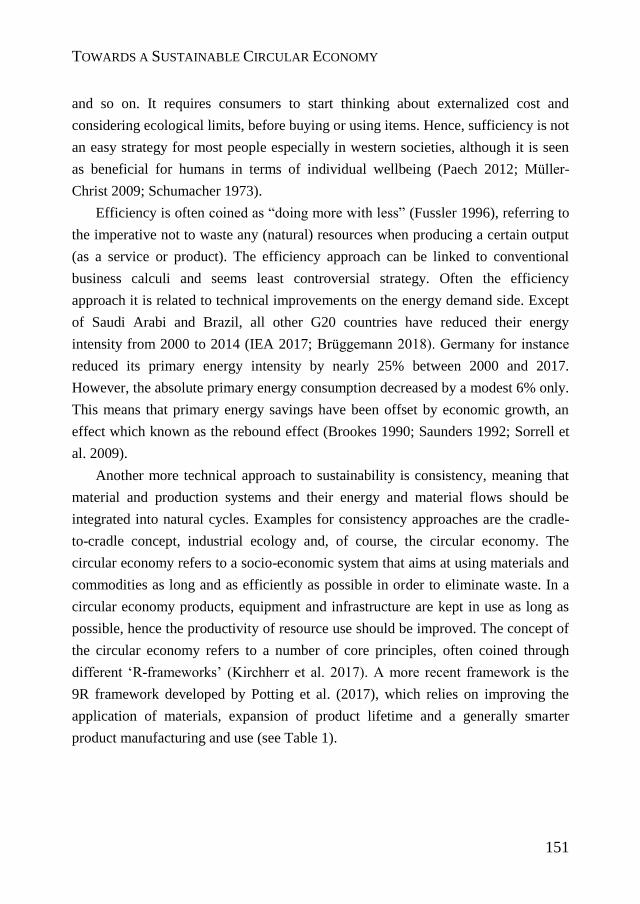
TOWARDS A SUSTAINABLE CIRCULAR ECONOMY
151
and so on. It requires consumers to start thinking about externalized cost and
considering ecological limits, before buying or using items. Hence, sufficiency is not
an easy strategy for most people especially in western societies, although it is seen
as beneficial for humans in terms of individual wellbeing (Paech 2012; Müller-
Christ 2009; Schumacher 1973).
Efficiency is often coined as “doing more with less” (Fussler 1996), referring to
the imperative not to waste any (natural) resources when producing a certain output
(as a service or product). The efficiency approach can be linked to conventional
business calculi and seems least controversial strategy. Often the efficiency
approach it is related to technical improvements on the energy demand side. Except
of Saudi Arabi and Brazil, all other G20 countries have reduced their energy
intensity from 2000 to 2014 (IEA 2017; Brüggemann 2018). Germany for instance
reduced its primary energy intensity by nearly 25% between 2000 and 2017.
However, the absolute primary energy consumption decreased by a modest 6% only.
This means that primary energy savings have been offset by economic growth, an
effect which known as the rebound effect (Brookes 1990; Saunders 1992; Sorrell et
al. 2009).
Another more technical approach to sustainability is consistency, meaning that
material and production systems and their energy and material flows should be
integrated into natural cycles. Examples for consistency approaches are the cradle-
to-cradle concept, industrial ecology and, of course, the circular economy. The
circular economy refers to a socio-economic system that aims at using materials and
commodities as long and as efficiently as possible in order to eliminate waste. In a
circular economy products, equipment and infrastructure are kept in use as long as
possible, hence the productivity of resource use should be improved. The concept of
the circular economy refers to a number of core principles, often coined through
different ‘R-frameworks’ (Kirchherr et al. 2017). A more recent framework is the
9R framework developed by Potting et al. (2017), which relies on improving the
application of materials, expansion of product lifetime and a generally smarter
product manufacturing and use (see Table 1).
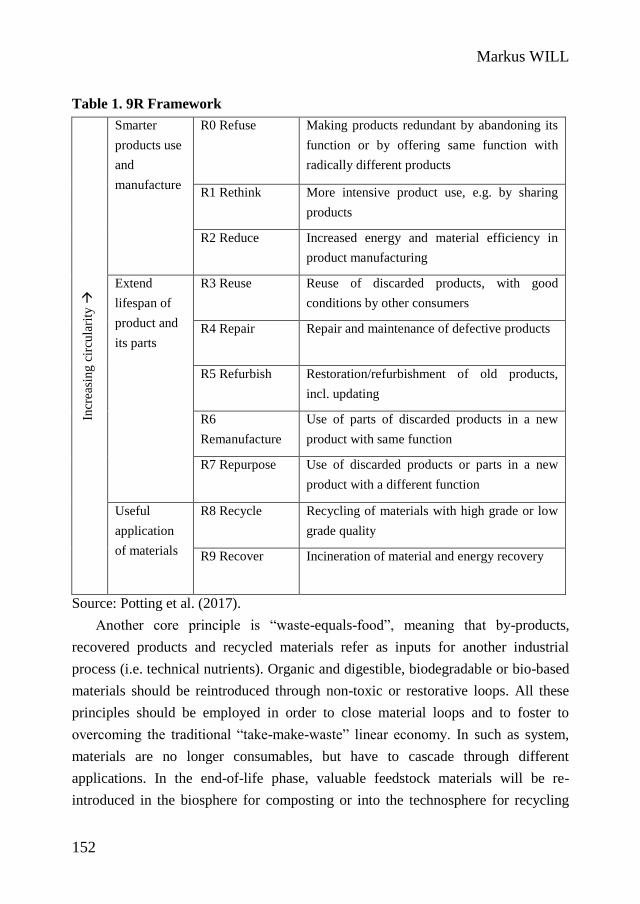
Markus WILL
152
Table 1. 9R Framework
Incr
easi
ng
cir
cula
rity
Smarter
products use
and
manufacture
R0 Refuse Making products redundant by abandoning its
function or by offering same function with
radically different products
R1 Rethink More intensive product use, e.g. by sharing
products
R2 Reduce Increased energy and material efficiency in
product manufacturing
Extend
lifespan of
product and
its parts
R3 Reuse Reuse of discarded products, with good
conditions by other consumers
R4 Repair Repair and maintenance of defective products
R5 Refurbish Restoration/refurbishment of old products,
incl. updating
R6
Remanufacture
Use of parts of discarded products in a new
product with same function
R7 Repurpose Use of discarded products or parts in a new
product with a different function
Useful
application
of materials
R8 Recycle Recycling of materials with high grade or low
grade quality
R9 Recover Incineration of material and energy recovery
Source: Potting et al. (2017).
Another core principle is “waste-equals-food”, meaning that by-products,
recovered products and recycled materials refer as inputs for another industrial
process (i.e. technical nutrients). Organic and digestible, biodegradable or bio-based
materials should be reintroduced through non-toxic or restorative loops. All these
principles should be employed in order to close material loops and to foster to
overcoming the traditional “take-make-waste” linear economy. In such as system,
materials are no longer consumables, but have to cascade through different
applications. In the end-of-life phase, valuable feedstock materials will be re-
introduced in the biosphere for composting or into the technosphere for recycling
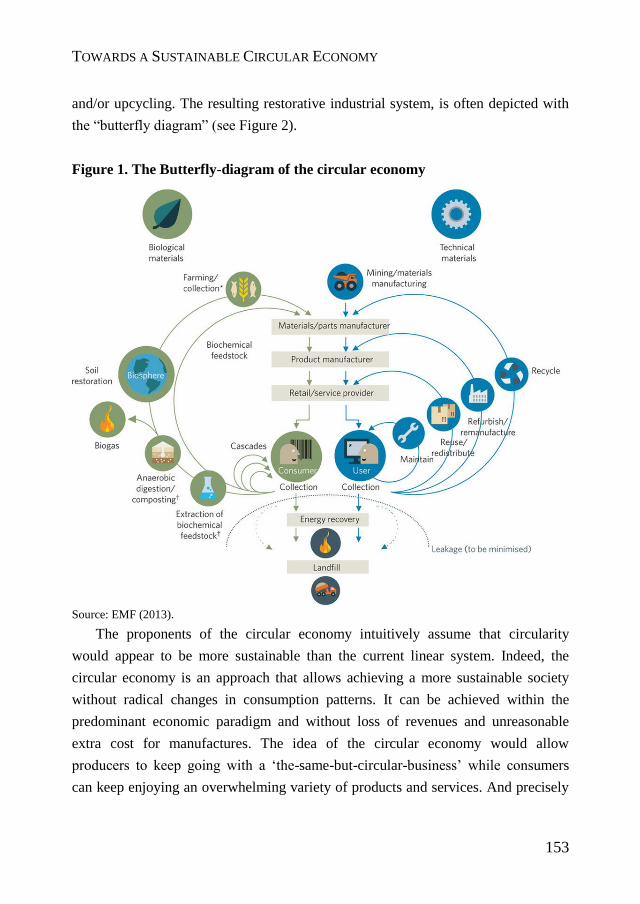
TOWARDS A SUSTAINABLE CIRCULAR ECONOMY
153
and/or upcycling. The resulting restorative industrial system, is often depicted with
the “butterfly diagram” (see Figure 2).
Figure 1. The Butterfly-diagram of the circular economy
Source: EMF (2013).
The proponents of the circular economy intuitively assume that circularity
would appear to be more sustainable than the current linear system. Indeed, the
circular economy is an approach that allows achieving a more sustainable society
without radical changes in consumption patterns. It can be achieved within the
predominant economic paradigm and without loss of revenues and unreasonable
extra cost for manufactures. The idea of the circular economy would allow
producers to keep going with a ‘the-same-but-circular-business’ while consumers
can keep enjoying an overwhelming variety of products and services. And precisely
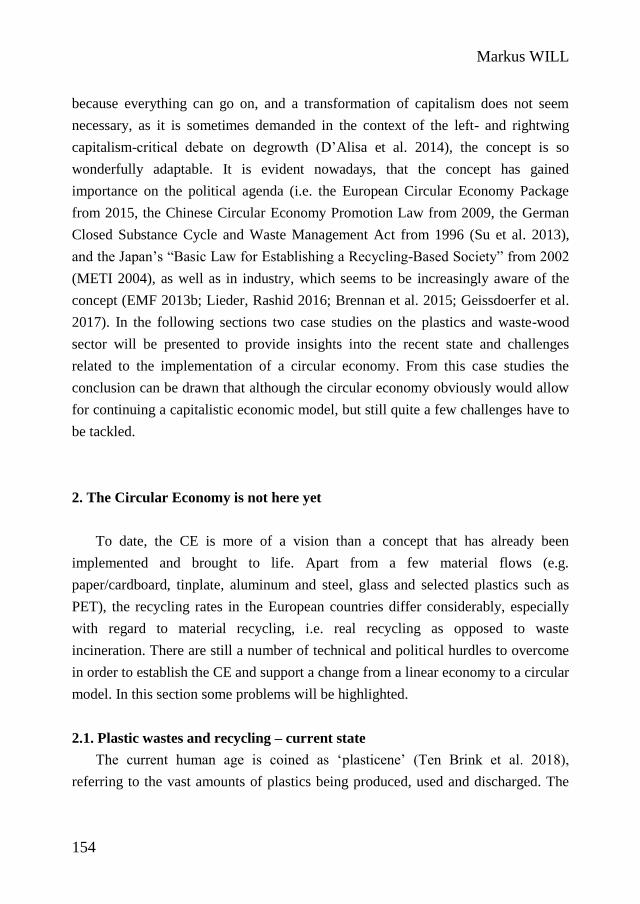
Markus WILL
154
because everything can go on, and a transformation of capitalism does not seem
necessary, as it is sometimes demanded in the context of the left- and rightwing
capitalism-critical debate on degrowth (D’Alisa et al. 2014), the concept is so
wonderfully adaptable. It is evident nowadays, that the concept has gained
importance on the political agenda (i.e. the European Circular Economy Package
from 2015, the Chinese Circular Economy Promotion Law from 2009, the German
Closed Substance Cycle and Waste Management Act from 1996 (Su et al. 2013),
and the Japan’s “Basic Law for Establishing a Recycling-Based Society” from 2002
(METI 2004), as well as in industry, which seems to be increasingly aware of the
concept (EMF 2013b; Lieder, Rashid 2016; Brennan et al. 2015; Geissdoerfer et al.
2017). In the following sections two case studies on the plastics and waste-wood
sector will be presented to provide insights into the recent state and challenges
related to the implementation of a circular economy. From this case studies the
conclusion can be drawn that although the circular economy obviously would allow
for continuing a capitalistic economic model, but still quite a few challenges have to
be tackled.
2. The Circular Economy is not here yet
To date, the CE is more of a vision than a concept that has already been
implemented and brought to life. Apart from a few material flows (e.g.
paper/cardboard, tinplate, aluminum and steel, glass and selected plastics such as
PET), the recycling rates in the European countries differ considerably, especially
with regard to material recycling, i.e. real recycling as opposed to waste
incineration. There are still a number of technical and political hurdles to overcome
in order to establish the CE and support a change from a linear economy to a circular
model. In this section some problems will be highlighted.
2.1. Plastic wastes and recycling – current state
The current human age is coined as ‘plasticene’ (Ten Brink et al. 2018),
referring to the vast amounts of plastics being produced, used and discharged. The
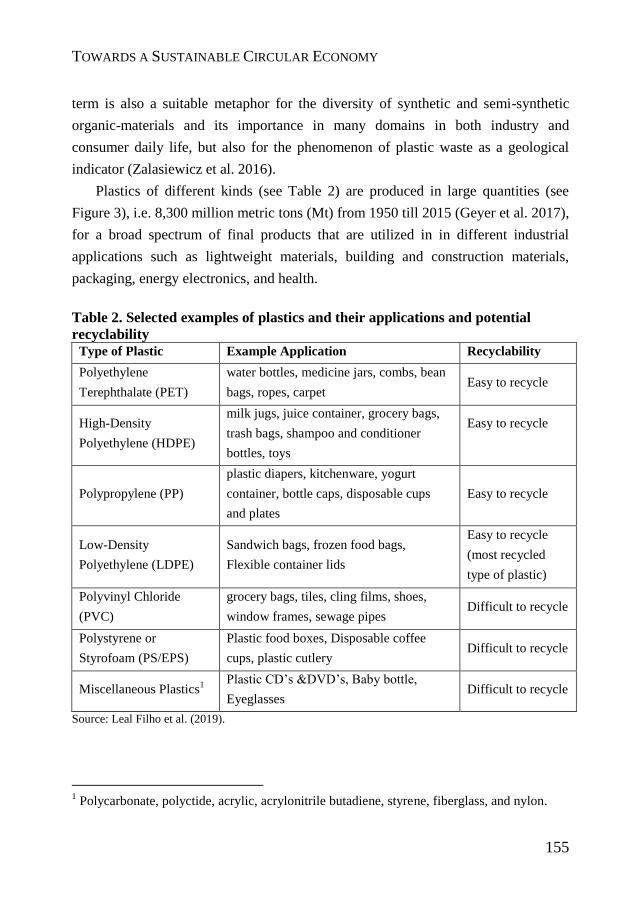
TOWARDS A SUSTAINABLE CIRCULAR ECONOMY
155
term is also a suitable metaphor for the diversity of synthetic and semi-synthetic
organic-materials and its importance in many domains in both industry and
consumer daily life, but also for the phenomenon of plastic waste as a geological
indicator (Zalasiewicz et al. 2016).
Plastics of different kinds (see Table 2) are produced in large quantities (see
Figure 3), i.e. 8,300 million metric tons (Mt) from 1950 till 2015 (Geyer et al. 2017),
for a broad spectrum of final products that are utilized in in different industrial
applications such as lightweight materials, building and construction materials,
packaging, energy electronics, and health.
Table 2. Selected examples of plastics and their applications and potential
recyclability
Type of Plastic Example Application Recyclability
Polyethylene
Terephthalate (PET)
water bottles, medicine jars, combs, bean
bags, ropes, carpet Easy to recycle
High-Density
Polyethylene (HDPE)
milk jugs, juice container, grocery bags,
trash bags, shampoo and conditioner
bottles, toys
Easy to recycle
Polypropylene (PP)
plastic diapers, kitchenware, yogurt
container, bottle caps, disposable cups
and plates
Easy to recycle
Low-Density
Polyethylene (LDPE)
Sandwich bags, frozen food bags,
Flexible container lids
Easy to recycle
(most recycled
type of plastic)
Polyvinyl Chloride
(PVC)
grocery bags, tiles, cling films, shoes,
window frames, sewage pipes Difficult to recycle
Polystyrene or
Styrofoam (PS/EPS)
Plastic food boxes, Disposable coffee
cups, plastic cutlery Difficult to recycle
Miscellaneous Plastics1
Plastic CD’s &DVD’s, Baby bottle,
Eyeglasses Difficult to recycle
Source: Leal Filho et al. (2019).
1 Polycarbonate, polyctide, acrylic, acrylonitrile butadiene, styrene, fiberglass, and nylon.
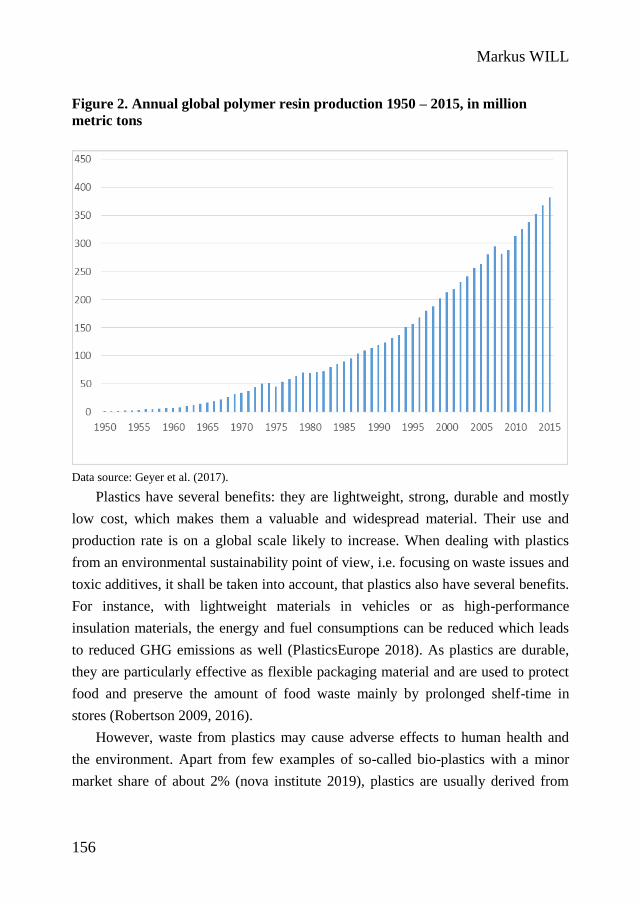
Markus WILL
156
Figure 2. Annual global polymer resin production 1950 – 2015, in million
metric tons
Data source: Geyer et al. (2017).
Plastics have several benefits: they are lightweight, strong, durable and mostly
low cost, which makes them a valuable and widespread material. Their use and
production rate is on a global scale likely to increase. When dealing with plastics
from an environmental sustainability point of view, i.e. focusing on waste issues and
toxic additives, it shall be taken into account, that plastics also have several benefits.
For instance, with lightweight materials in vehicles or as high-performance
insulation materials, the energy and fuel consumptions can be reduced which leads
to reduced GHG emissions as well (PlasticsEurope 2018). As plastics are durable,
they are particularly effective as flexible packaging material and are used to protect
food and preserve the amount of food waste mainly by prolonged shelf-time in
stores (Robertson 2009, 2016).
However, waste from plastics may cause adverse effects to human health and
the environment. Apart from few examples of so-called bio-plastics with a minor
market share of about 2% (nova institute 2019), plastics are usually derived from
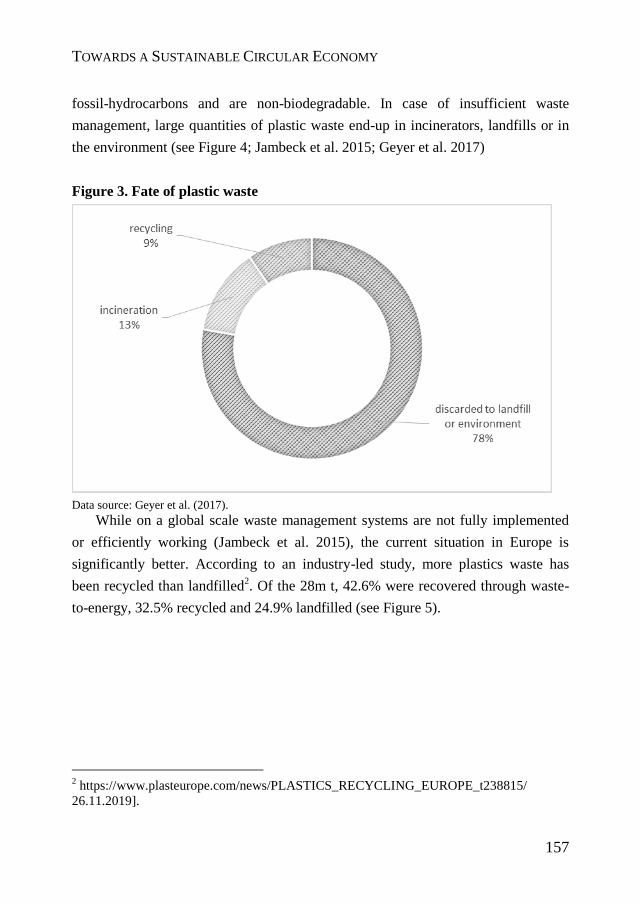
TOWARDS A SUSTAINABLE CIRCULAR ECONOMY
157
fossil-hydrocarbons and are non-biodegradable. In case of insufficient waste
management, large quantities of plastic waste end-up in incinerators, landfills or in
the environment (see Figure 4; Jambeck et al. 2015; Geyer et al. 2017)
Figure 3. Fate of plastic waste
Data source: Geyer et al. (2017).
While on a global scale waste management systems are not fully implemented
or efficiently working (Jambeck et al. 2015), the current situation in Europe is
significantly better. According to an industry-led study, more plastics waste has
been recycled than landfilled2. Of the 28m t, 42.6% were recovered through waste-
to-energy, 32.5% recycled and 24.9% landfilled (see Figure 5).
2 https://www.plasteurope.com/news/PLASTICS_RECYCLING_EUROPE_t238815/
26.11.2019].
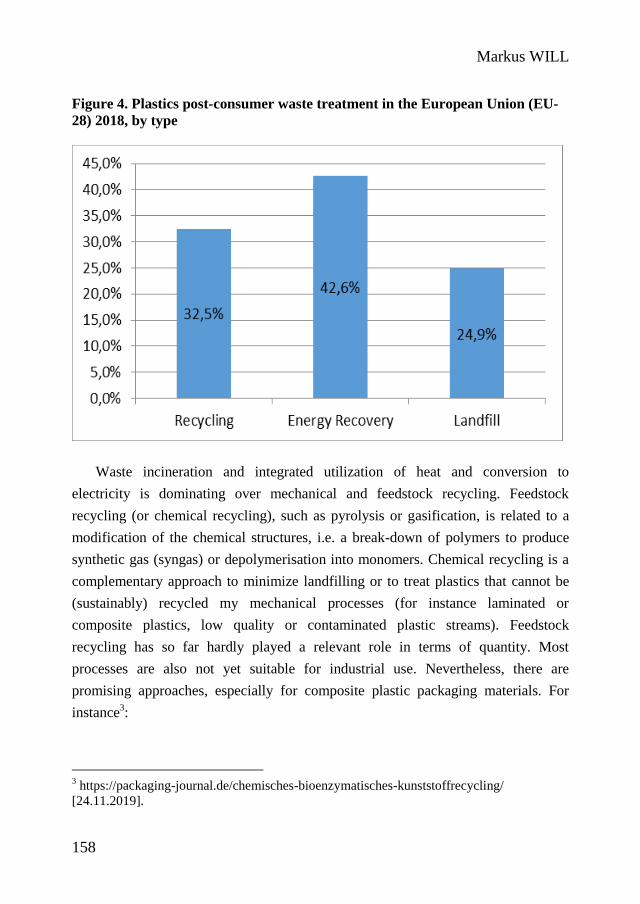
Markus WILL
158
Figure 4. Plastics post-consumer waste treatment in the European Union (EU-
28) 2018, by type
Waste incineration and integrated utilization of heat and conversion to
electricity is dominating over mechanical and feedstock recycling. Feedstock
recycling (or chemical recycling), such as pyrolysis or gasification, is related to a
modification of the chemical structures, i.e. a break-down of polymers to produce
synthetic gas (syngas) or depolymerisation into monomers. Chemical recycling is a
complementary approach to minimize landfilling or to treat plastics that cannot be
(sustainably) recycled my mechanical processes (for instance laminated or
composite plastics, low quality or contaminated plastic streams). Feedstock
recycling has so far hardly played a relevant role in terms of quantity. Most
processes are also not yet suitable for industrial use. Nevertheless, there are
promising approaches, especially for composite plastic packaging materials. For
instance3:
3 https://packaging-journal.de/chemisches-bioenzymatisches-kunststoffrecycling/
[24.11.2019].
TOWARDS A SUSTAINABLE CIRCULAR ECONOMY
159
The Swiss company gr3n applies microwave radiation to recycle PET waste,
which is broken down into ethylene glycol and terephthalic acid to be used a
basic chemical. The company gr3n is a central player within the EU funded
H2020 DEMETO consortium, together with industry partners such as H&M
and Coca Cola.
ChemCyclingTM project is carried out by a consortium led by BASF and
aims at the processing of difficult to recycle mixed plastic waste (i.e. multi-
layer packaging and composite plastics) into purified pyrolysis oil, which
can be further broken down into enthylene and propylene in a steam cracker
at 850°C. First prototypes for products, such as the insulating packaging
material Styropor® CcycledTM
by Storopack and polyamide and
polyethylene packaging films for mozzarella cheese produced by Südpack
are available.
There is a bioenzymatic process for plastics recycling developed by the
French company Carbios. PET and other polyesters, as well as multilayer
materials and functional sportswear is are broken down into their basic
components. Enzymatic processes are running at significantly lower
temperatures of about 65°C. Residuals include only water non-treatable
materials such as aluminium or paper.
Mechanical recycling or material recovery, representing 99% of recycled
quantities4, refers to processing waste plastics into a secondary raw material or a
product, without significant changes in the chemical characteristics. In general, all
kinds of pure thermoplastics can by mechanically recycling without major quality
losses. Mechanical plastic recycling involves different processes such as collecting,
sorting and shredding, washing, melting and pelletizing. Obviously plastic waste
processing is rather specific to the type of resin, but the first step is typically the
automatic and/or manual sorting to ensure removal of contaminants and separation
of different plastic streams. Technological progress, for example reliable detectors
4 https://www.plasticseurope.org/en/focus-areas/circular-economy/zero-plastics-
landfill/recycling-and-energy-recovery [24.11.2019].
Markus WILL
160
(such as FT-NIR) and sophisticated decision and recognition software, has helped to
improve the productivity and accuracy of automatic sorting of plastics.
Although plastic recycling is a relatively mature process, there are still problems
especially with regard to flexible packaging and composite materials. The
challenges are mainly related to shortcomings in the collections, sorting and
separation of different fractions of plastics with a high purity grade.
Challenges with collection
Waste collection is the transfer of solid wastes from the point-of use (‘source’)
to disposal in terms of recycling, treatment or landfill. Waste collection includes the
door-to-door and curbside collections and/or the transfer of waste to central
collection points. Waste collection schemes vary considerably between European
countries, but also between municipalities. Sometimes plastic waste is not collected
separately but ends up in mixed municipal solid waste. In case of source-separation
of plastic waste and plastic packaging in particular, there are different approaches:
(1) mono-stream collection, where plastic waste is comingled with metals or
multilayer packaging and (2) single or dual collection where plastic waste is
collected as part of a dry recyclable streams with other types of recyclables such as
paper and cardboard, glass or textiles. This takes place usually in terms of curbside-
collections, depot containers or recycling yards. However, there is the problem that
many residents fail to separate the waste correctly. For instance, in Germany where
packaging waste is collected separately in the “yellow bin”, there is a misthrow-rate
of about 40-60% (BVSE 2019), which increases the cost of collection and
processing and reduces the quality of recycled materials. Additionally, many things
ending up in the waste bin are contaminated with grease, food, but also feces and
other impurities making it very difficult to recycle.
Challenges with separation
Also the subsequent classification and sorting, aiming at separation of different
waste streams is confronted with several challenges. In principle, the following
requirements are placed on sorting processes: they should obtain marketable
fractions of suitable quality, they should guarantee for high yields and sufficient
TOWARDS A SUSTAINABLE CIRCULAR ECONOMY
161
throughput capacities at low running costs and low maintenance requirements.
However, the sorting of plastics is challenging for multi-layer flexible packaging,
composite materials and black-colored plastics. Black plastics account for a
considerable proportion of the total volume of PE/PP in the plastic waste streams.
However, carbon black and carbon absorb the radiation in the wavelength range of
the near infrared detector and thus prevent detection. In addition, black objects can
hardly be distinguished from the sorting belt. New innovative sorting methods are
needed to detect and separate the black objects. There are promising approaches to
this, e.g. the UniSort Black process from RTT/Steinert (Handschick 2019). Multi-
layer foils and films are rather complex compositions of hard foil, mostly made of
PS/PE, soft films (PA/PE, PP/PA, PP/PA/PE), shrink films (PET/PE/EVOH/PE),
laminated PET, PE or PP foils (aluminium, paper), metallized films (PET/Alu) or
cellophane (Handschick 2019), which must be sorted or separated into usable
fractions. Most multi-layer plastics are, however, usually be incinerated and
landfilled due to their limited recyclability. There are options for the recycling of
multi-layer packaging at the research state. In particular this is separation by
mechanical, physical or chemical delaminations of layers and compatibilization by
the addition of generation of suitable molecules that act as compatibilizers (Kaiser et
al. 2018). All known approaches are able to recycle multilayer packaging, but are
costly in terms of energy inputs (Kaiser et al. 2018).
Plastic waste exports
Although recycling technologies and energy-recovery are available, about half
of the plastic collected is exported to countries outside the EU for “treatment”.
Previously a significant share of plastic waste was exported to China and Hong
Kong. The quality of the recyclable materials declined gradually in terms of
impurities. It turned out that much of the plastic waste was unmanageable waste.
The Chinese government decided to implement the “green fence operation” aiming
at improved quality monitoring of incoming waste flows and reduction of illegal
shipping. In addition to China announced a new import policy in 2017, which is now
limiting or banning the import of nonindustrial plastic waste. Several types of plastic
waste from consumer goods, including PE, PS, PVC, PET, PP and bales of PET
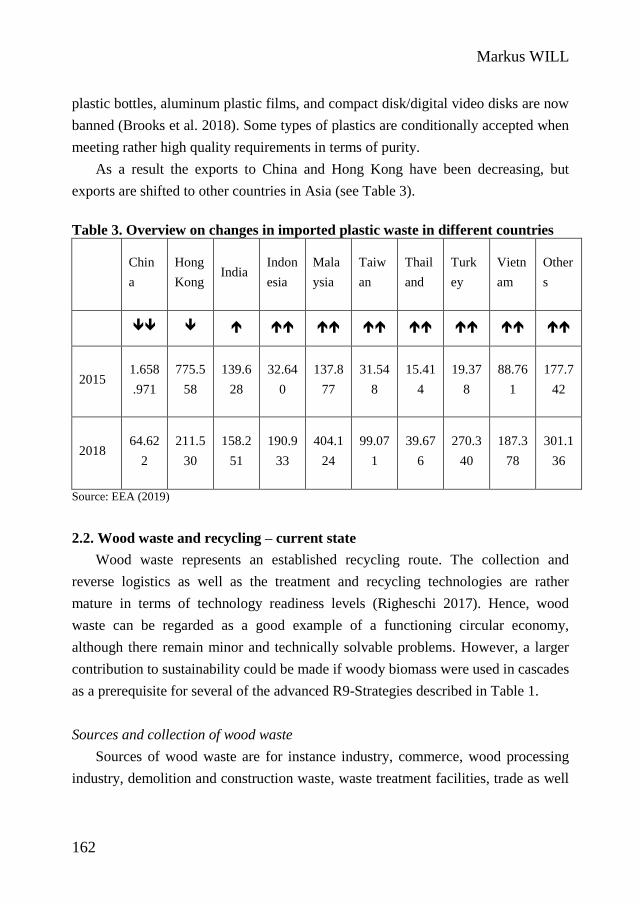
Markus WILL
162
plastic bottles, aluminum plastic films, and compact disk/digital video disks are now
banned (Brooks et al. 2018). Some types of plastics are conditionally accepted when
meeting rather high quality requirements in terms of purity.
As a result the exports to China and Hong Kong have been decreasing, but
exports are shifted to other countries in Asia (see Table 3).
Table 3. Overview on changes in imported plastic waste in different countries
Chin
a
Hong
Kong India
Indon
esia
Mala
ysia
Taiw
an
Thail
and
Turk
ey
Vietn
am
Other
s
2015 1.658
.971
775.5
58
139.6
28
32.64
0
137.8
77
31.54
8
15.41
4
19.37
8
88.76
1
177.7
42
2018 64.62
2
211.5
30
158.2
51
190.9
33
404.1
24
99.07
1
39.67
6
270.3
40
187.3
78
301.1
36
Source: EEA (2019)
2.2. Wood waste and recycling – current state
Wood waste represents an established recycling route. The collection and
reverse logistics as well as the treatment and recycling technologies are rather
mature in terms of technology readiness levels (Righeschi 2017). Hence, wood
waste can be regarded as a good example of a functioning circular economy,
although there remain minor and technically solvable problems. However, a larger
contribution to sustainability could be made if woody biomass were used in cascades
as a prerequisite for several of the advanced R9-Strategies described in Table 1.
Sources and collection of wood waste
Sources of wood waste are for instance industry, commerce, wood processing
industry, demolition and construction waste, waste treatment facilities, trade as well
TOWARDS A SUSTAINABLE CIRCULAR ECONOMY
163
as municipalities and private households. The following waste-wood categories can
be distinguished (Righeschi 2017):
Post consumer wood: household waste like furniture and commerce
(package), construction waste, port related activities and wood-processing
industry.
Parks and gardens: wood scraps and leaves produced in private and public
parks and gardens.
Driftwood and rivers: wood coming from forests falling into rivers and then
ending up on seaside because of sea currents and storms.
Brushwood: wood and timber from local forest.
In order to allow for effective recycling, segregation at source or at an early
stage is essential. Post consumer waste wood is collected in different ways, e.g. by
regular kerb-site collection, door-to-door collections services as well as by recycling
stations and private collection platforms. Parks and garden waste is usually collected
by landscape maintenance companies, and then brought to local recycling stations.
For citizens not able to bring their garden wastes to the recycling stations, door-to-
door collection maybe available. Construction and demolition waste from building
yards is disposed via pick-up or delivery to waste management companies. In the
most waste management schemes, the waste producer needs to prove the legally
correct disposal by means of a delivery certificate. The wood waste is typically
unprocessed, coarsely pre-crushed or bulky. Wood waste coming to a storage or
recycling facility needs to be weighed and allocated to a waste category. Then the
material is unloaded to an inbound material storage by self-haulers. Again, qualified
personnel is needed to check the delivery loads for mis-sorted waste and
contaminants according to the waste wood categories (i.e. visual inspection).
Contaminant materials, e.g. metal fittings, have no influence in the storage.
Volumes, pile heights and the storage area size depend on local conditions and legal
(statutory) requirements (e.g. OHS, air pollution, water pollution, fire protection.
(VDI 4807)
Markus WILL
164
Quality requirements and recycling options
Recycled wood to be used for derived timber products must, according to the
German regulation (i.e. Altholzverordnung AltholzV), meet limit values for several
parameters for pollutant concentration (e.g. heavy metals, copper, chlorine, fluorine,
pentachlorophenol, polychlorinated biphenyls). The use of wood chips for the
production of wood composites is restricted to certain wood categories (i.e.
untreated or mechanically treated wood, glued or painted wood without halogen-
organic compounds or preservatives, wood containing halogen-organic compounds;
without preservatives, wood containing halogen-organic compounds without
preservatives, contaminated wood, including halogen-organic compounds, but
without PCB.
In order to ensure environmentally treatment and recycling of waste wood, i.e.
with minimal emissions of toxic substances and pollutants, the operator of a waste
wood treatment plant must ensure that only the waste wood categories approved for
this purpose are used. Additionally, all impurities must be removed (i.e. inorganic or
organic substances foreign to wood, in particular soil material, stones, concrete,
metal parts, paper, cardboard, textiles, plastics or foils that adhere to, are mixed with
or are connected to the waste wood) and is free of PCB containing waste wood. Also
for the energy recovery certain requirements have to be met. Energy recovery is
limited to certain waste wood quality categories and firing plant sizes and thermal
capacities.
Pre-Treatment of wood waste
Wood waste pre-treatment is required to meet the quality criteria for the
subsequent materials recycling or energy recovery stage. Most important quality
criteria are the particle size distribution (i.e. grading curve), contaminant fracture,
pollutant concentration and moisture. Mobile and stationary processing technology
can be used for the various unit processes (VDI 4087):
Presorting aims at removal of contaminants that interfere with subsequent
steps (i.e. solid metal items, stones, concretes, larger composites (carpet,
mattresses), packaging materials, mis-sorted waste wood. Another objective
of the presorting is to homogenize the batch. Presorting is carried out

TOWARDS A SUSTAINABLE CIRCULAR ECONOMY
165
manually by hand or mechanically by means of excavators with sorting
grabs. Presorted wood is then transferred to the next steps with excavators,
wheel loaders or trucks.
Particle size reduction ensures the required particle size, reduces and wood
waste volume and helps to remove embedded contaminants). Primary size
reduction allows, depending on the employed equipment (e.g. crushers,
chippers, hammer mill, etc.), a reduction of particle sizes of 200 to 500 mm.
Ferrous scrap can be separated with magnetic separators, and manual sorting
on a conveyor belt is employed to reduce other contaminants. Secondary
size reductions aims at fine fractions for instance for wood chips (< 50 to
200mm) and is accomplished with low- or high speed crushers or mills.
Size classification is required to produce a specified particle size distribution
or to meet other requirements regarding fine fractions and overlengths in
order to prevent clogging in conveying belts. Various types of screening
technologies are used (e.g. drum screens, star or disk screens, tumbler
screens, oscillating screens, vibratory screens, bar sizers, etc.)
Sorting refers to further removal of contaminants and segregation by waste
wood categories. Sorting technologies include manual sorting (i.e. excavator
sorting (500 mm – 50 mm) and manual sorting (> 50 mm) for coarse
contaminants and mis-sorted materials. Automated sorting for metals is
accomplished by magnetic separators (drum or overhead magnets) and eddy
current separators and by gravity separators (air classification for
lightweight plastics, paper, and sink-float processes for heavier items such
as glass, stones, metals). For certain materials, also sensor based-
technologies are employed (NIR for plastics and wood, X-ray for (dark)
plastics and stones, and induction sorters for electrically conductive
components).
Recycling options for wood waste
There are different routes for the recycling of wood waste apart of direct
combustion and incineration, such as
1. processing waste wood into wood pellets
Markus WILL
166
2. manufacturing of wood-based panels
3. bioreffinery applications
Other recycling routes, for instance the production of syngas by Fischer-Tropsch
Synthesis, gasification and pyrolysis and the manufacturing of activated
carbon/industrial charcoal, are available but not further considered in this paper.
Ad 1) Wood pellets
Essentially the production of pellets is a process of densification (Krizan 2015).
Pellets production usually includes the pre-treatment (if not done in another
recycling facility as described above), the pelletization and the post-treatment of
produced pellets (Döring 2011; Protic et al. 2011). The pre-treatment of wood waste
is, as described above, related to reducing the particle size and removal of
contaminants. Size reduction takes with chippers for coarse grinding and hammer
mills for fine grinding. The smaller the particle size, the stronger the pellets will be
(Protic et al. 2011). Another depending factor for pellet production is the moisture
content and therefore dryers are employed for adjusting the moisture to specified
levels. Force dryers seem to be the only reliable way to achieve an moisture
optimum. Several types of dryers are on the market (e.g. tube bundle dryers, drum
dryers, belt dryers, low temperature dryers, superheated steam dryers and fluidized
bed dryers), with drum dryers being the state-of-the art (Protic et al. 2011). Drum
dryers use heated air from heat exchangers (indirect drum dryers) or flue gases from
furnaces for the drying process. Cyclones at the end of the drying section are used
for separation from the hot gaseous stream. The dried material is then conveyed to
silos for moisture equalization for 10-24 hours. Before being processed, particle
sizes need to be balanced, i.e. separation of undesired fractions, in oscillating
screens. The next step is conditioning, where a thin film of water is added on the
surface of the wood particles to allow binding in the pelleting machines. The
technology for wood pelleting has emerged from other fields where densification of
material is necessary, for instance animal feed. Different milling machines are
available, but ring die pellet mils seem to be common (Protic et al. 2011). Main
elements are the dies and rollers. Incoming material is ‘trapped’ between the roller
and die and is pressed through the die channels. In order to get pellets of appropriate
TOWARDS A SUSTAINABLE CIRCULAR ECONOMY
167
quality, the space between die and rollers needs to be even. Pellets leave the mill as
string and are cut with special knives into pieces of about 40mm. The temperature of
the pellets after milling is between 80-130°C and therefore it needs cooling before
further handling. The pellets are transported from the pelleting machine with a
bucket elevator to the cooling machine. Common coolers use dry and cool air to
remove heat and moisture from the pellets. The produced pellets are stored in silos
and packed in smaller bags (10-25 kg) or jumbo bags (1-1,5 m3).
Ad 2) Wood based panels5
Wood-based panels include (VDI 3462/2):
• plywood – veneer panels, coreboard, moulded veneer products
• particleboards – structural particleboard, furniture-grade particleboard,
OSB, moulded wood particle products
• fibreboard – wood fibre insulation board, LDF, MDF and HDF boards
• moulded wood fibre products
Plywood is made of several layers of wood veneers of other material layser
(laminae, battens, particleboard) that are bonded together under pressure (0,5 – 10
N/mm2) at temperatures between 100 and 150°C. Different resin binder systems are
used in the glueing process (urea formaldehyde resin UF, urea melamine
formaldehyde resin MUF, phenol formaldehyde resin PF, white glue PVAc).
Particleboard and moulded particleboard products are made from dried wood
particles, i.e. industrial wood waste, roundwood and specific types of recovered
waste wood or straw. A first step, roundwood, recovered or green wood is broken
down into chips and flakes. Recovered wood usually requires additional cleaning,
i.e. removal metals or other heavy particles. In a particle drier, the particles are dried
from their initial moisture content (i.e. 20 – 180% rel. to dry wood mass) to a final
moisture content between 1 to 10% rel. to dry wood mass depending on the binders
used. Different drying technologies are available, e.g. direct- and indirect heated
particle driers, conveyor driers, recirculating air driers, rotary driers). For the gluing
5 The following technical descriptions are based on the VDI guidline VDI 3462 on Emission
control – Wood Machining and Processing, Machining and Finishing of Wood and Wood-
Based Materials.
Markus WILL
168
of the dried wood particles mechanical blenders are used. For the adhesive solution,
that glues the particles together, different binders (primarily UF, but also MUF,
MUPF, PF and PMDI or mixtures) and additives such as hydrophobing agents (e.g.
paraffin’s) or hardeners (e.g. aqueous solutions of ammonium sulphate) are mixed
with water. The resonated particles are then air-laid, prepressed and forwarded to a
multi-daylight, continous or calendar presses. The mat is pressed under heat (160-
250°C) and pressure (3-5 N/mm2). Particle mat is composed of a coarse core layer
and two fine face layers. Finishing includes sanding and edge trimming as well as
trimming to the final dimensions.
Fibreboards, such Low-density fibreboards (LDF), medium-density fibreboards
(MDF) or high-density fibreboards (HDF) are made of wood fibres produced by
thermo-mechanical pulping of wood chips. The wood-chips are washed and
preheated in a vessel with steam at atmospheric pressure. Steamed wood chips are
then dehydrated and fed into a digester with a plug-screw feeder. The digester is
used to soften the wood chips with steam at 7 to 10 bar, which allows naturally
occurring binders in the wood to work. The mixture of liberated wood-fibres and
condensates are transported via a refiner/defibrator to a drier, where the mixture is
flashed to atmospheric pressure. Volatile wood compounds are emitted with vapour
and exhaust gases from the drier. Gluing of the fibres is the next step and
accomplished with blowline blending, this means that the binder and adhesives are
injected into the wood-fibre mixture via spray nozzles. In addition mechanical and
pneumatic blending is applied to reduce adhesive solution and formaldehyde
consumption. After the blending drum the fibres are conveyed to a cyclone,
separated from the conveying air stream and discharged onto a fiber belt. The
resonated fibres are then transferred in a classifier and sent via another cyclone and a
mat former to the press. Mat former means that the resonated particles are air-laid
into a continuous mat that is prepressed and the conveyed to single, batch or
continuous or calender presses. The mat is pressed under heat (about 160-250°C)
and pressure (about 3-5 N/mm2) to form the particle board. Usually the particle mat
has one coarse layer and two finer layers. Exhaust airs are captured and cleaned or
used as combustion air in a firing system. The finishing stage includes a treatment of
TOWARDS A SUSTAINABLE CIRCULAR ECONOMY
169
the surface, i.e. by sanding to remove the press skin and sawing and edge-trimming
to adjust the thickness of the board.
Moulded wood fibre products are produced usually in dry processes. Similar to
the production of fibreboards, the dried wood fibres are mixed with powedered
binders and additives and, in some cases polyester is injected. The mixtures are air-
laid into mats by forming machinges and pressed with roller presses (VDI 3462/2).
Subsequently, the fibre mats are cut and pressed into moulded products in heated
steel tools. Finally the moulded wood fibre is cut to the final dimension and
laminated with plastic films or textile fabrics.
Wood-plastic composites (WPC) are made of wood fiber/flour and
thermoplastics (i.e. PE, PP, PVC, PLA, in some cases even plastic recyclates) and
other lingo-cellulosic or inorganic filler materials and additives (i.e. colorants,
colorants, coupling agents, UV stabilizers, blowing agents, foaming agents, and
lubricants). The compounding requires higher temperatures (max 200°C) to enhance
the bonding of plastics and wood fibres (Taifor 2017). To get the material in the
desired shape, extruders and injection moulding is used. Extruded WPS can be
formed in solid and hollow profiles. There is a large variety of injection moulded
parts, for instance mobile phone covers of car door panels and car interior (Kim, Pal
2011).
Ad 3) Bioreffinery
Biorefineries are combining process technologies between biogenic raw
materials and industrial intermediates and final products (Kamm, Kamm 2007). In
analogy to oil refineries, biorefineries are concerned with using biomass as
efficiently and sustainably as possible. The objective is to utilize biomass building
blocks as most complete as possible. Various types and concepts of bioreffineries
are currently under development or in operation6 (Lindorfer et al. 2019), but the
lignocellulose biorefinery (cellulose/hemicellulose/lignin biorefinery) is of particular
importance to wood-waste. They are considered to have a huge potential for large
scale application (Kamm, Kamm 2004), as the waste wood and other wood-like
6 I.e. sugar or starch biorefinery, vegetable oil and algal lipid biorefinery, synthesis gas
biorefinery, biogas biorefinery, green biorefinery.
Markus WILL
170
biomass is available in sufficient quantities and with sufficient quality. At the same
time, market niches exist for the conversion products both in the conventional fossil-
based chemical industry but as well in a future bio-based economy. Lignocellulosic
materials consists of three primary chemical fractions that can be exploited as
precursors for chemical processes:
• hemicelluloses/polyoses (a suger-polymer of pentosis)
• cellulose (which is a glucose polymer)
• lignin (a polymer of phenols).
Following a mechanical pre-treatment (i.e. reduction and grinding), the primary
refining includes a physical-chemical pulping of the lignocelluloses. This means
that, simply, pressure and temperature is applied to fractionize the biomass mixture
into cellulose, hemicelluloses and lignin. Pulping can be accomplished with or
without chemical agents (VDI 6310). A huge variety of solvents and combinations
thereof have been used for the separation of wood components (so called
“organosolv pulping”). Solvents can include acids or alkaline substances or ethanol.
Organosolv processes (e.g. the Allcel process, see Areste et al. 2015; Pye et al.
1991; Lange et al. 2015) are considered as having advantages, especially as sources
for lignin, because lignin can be easily separated from the pulping solvents.
The raw products, cellulose, hemicelluloses and lignin, can be processed in the
secondary refining, where two approaches can be differentiated (though
combinations are possible):
• Direct production of fermentable carbohydrates for further biotechnological
conversion: The enzymatic conversion of cellulose and hemicellulose
into monomer carbohydrates (sugars e.g. glucose, xylose, arabinose,
etc.) takes place in the presence of pulped lignin, which can then be
separated. The resulting carbohydrates can be further used in
biotechnological production.
• Isolated processing of separate streams of cellulose, hemicelluloses and
lignin: Cellulose can processed into paper or dissolving pulp or can be
used as raw fermentation process following enzymatic hydrolysis.
Several mono- and polymer carbohydrates from the hemicellulose
fraction can as well be separated and finished (e.g. xylose). Other
TOWARDS A SUSTAINABLE CIRCULAR ECONOMY
171
fermentable carbohydrates can be utilized as raw fermentation materials
in other biotechnological processes. However, the separated
hemicelluloses fraction may also contains a range of different chemicals
(such as acetic acid, furfural) which may lead to a degradation of
original hemicelluloses and need therefore be extracted. The extracted
materials can be processed in the chemical sector.
• Lignin is produced in both approaches and can be used in various ways for
valorizing. Lignin can be used directly as input material (e.g.
lignosulphonates), as working material (i.e. injection-mouldable
compounds), lignite-based composite materials (i.e. bioplastics,
biopolymers), as component in binders and coatings or as surfactant and
dispersant additive. Up to know it seems that the use of lignin for high-
value-added application seems largely unexploited (Lange et al. 2015).
The valorization of lignite to chemicals may involves several options for
new products. The major problem with the valorization of lignin is its
structural diversity and heterogeneity. The single batches are not
reproducible and differ much in their characteristics. This makes it hard
to use it for up-scaled mass production and to add value in a larger
scope. However, research on fractionation and purification processes
aiming at reproducible lignite streams is ongoing (Lange et al. 2015).
Cascading use
Resource cascading aims at a sequential re-use of resources (such as wood,
plastics, paper, textiles) for a multiple application as high-quality products before
the final use for energy recovery (Sirkin, ten Houten 1994; Gustavsson, Sathre 2011;
Höglmeier et al. 2017). Multi-stage cascade use of biomass takes place when a
biogenic raw material is processed into a biobased end product and this end product
is used at least once more. Only after multiple material uses an energetic use can
follow. This is corresponds very much to the idea of a circular economy. In the
wood sector, as well as in paper/cardboard, significant cascading material flows can
be found. A typical cascade for wood ideally compromises the following product
life’s: (1) round timber production, (2) solid wood and veneer products (furniture),
Markus WILL
172
(3) chip-based products (particle boards), (4) fiber-based products (paper and
cardboard). The final material use of wood waste is related to the (5) production of
bio-based chemicals before the remaining end-of life products can be used for
energy recovery. An ideal cascade like this would allow using wood in four different
types of products over time before the waste wood is utilized for energy recovery.
In 2010, a cascade factor of 1.57 was calculated for both industries in Europe.
This means that wood resources used from the forest were used slightly more than
one and a half times (Mantau 2013). In recent years wood waste have been
increasingly used to produce particle boards (Schrägle 2015 in Fehrenbach 2016).
By means of an optimized sorting and treatment of wood, the complete amount of
waste wood (in categories A I and AII) could potentially be returned to the market
for material recycling. This is about 50-80% of the German market volume in 2015
(Fehrenbach et al. 2016; Garcia, Hora 2017) and would allow to meet up to 50% the
fibre demand for derived timber products from recovered wood. However, only a
smaller fraction of about 13 to 20 % of waste wood is used for material recycling
(Mantau 2013; Sommerhuber et al. 2015; Garcia, Hora 2017), and an even smaller
fraction of approximately 6% in multiple-stage cascades (Höglmeier 2015). Another
reason for the rather low material recycling is the fact that until recently, it was
financially more attractive to sell waste wood (AI and A II) for energy recovery.
Generally speaking, for an assessment of the environmental benefits of wood
cascading, it should be kept in mind that whenever waste wood is used for material
recycling it cannot be used to substitute fossil energy carriers such as coal
(Höglmeier 2015).
Challenges
With the exception of paper and wood-based materials, a broad implementation
of biomass cascades has not yet taken place, at least not in Germany. A
differentiated analysis of barriers has shown that no single factors are responsible for
this (see Table 4).
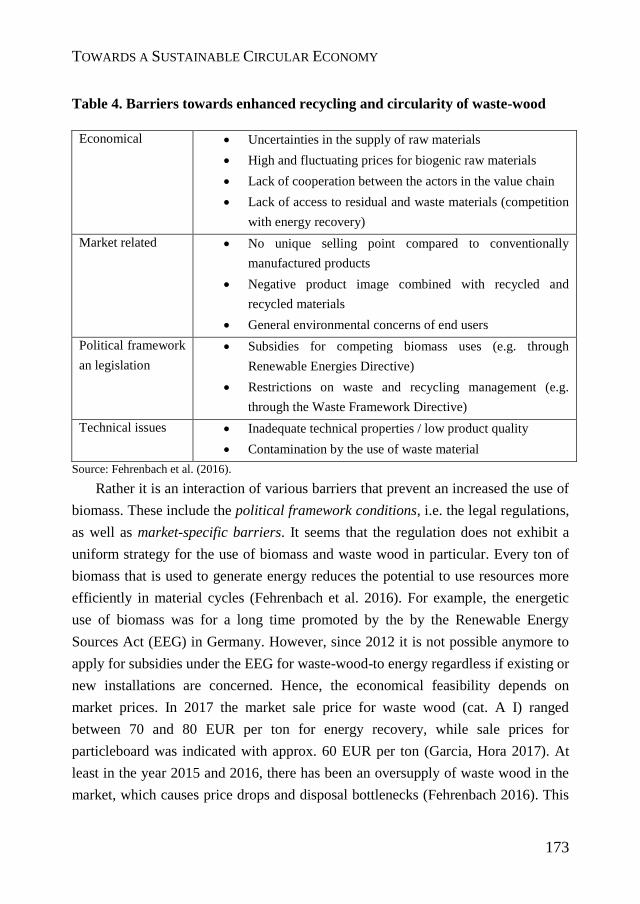
TOWARDS A SUSTAINABLE CIRCULAR ECONOMY
173
Table 4. Barriers towards enhanced recycling and circularity of waste-wood
Economical Uncertainties in the supply of raw materials
High and fluctuating prices for biogenic raw materials
Lack of cooperation between the actors in the value chain
Lack of access to residual and waste materials (competition
with energy recovery)
Market related No unique selling point compared to conventionally
manufactured products
Negative product image combined with recycled and
recycled materials
General environmental concerns of end users
Political framework
an legislation
Subsidies for competing biomass uses (e.g. through
Renewable Energies Directive)
Restrictions on waste and recycling management (e.g.
through the Waste Framework Directive)
Technical issues Inadequate technical properties / low product quality
Contamination by the use of waste material
Source: Fehrenbach et al. (2016).
Rather it is an interaction of various barriers that prevent an increased the use of
biomass. These include the political framework conditions, i.e. the legal regulations,
as well as market-specific barriers. It seems that the regulation does not exhibit a
uniform strategy for the use of biomass and waste wood in particular. Every ton of
biomass that is used to generate energy reduces the potential to use resources more
efficiently in material cycles (Fehrenbach et al. 2016). For example, the energetic
use of biomass was for a long time promoted by the by the Renewable Energy
Sources Act (EEG) in Germany. However, since 2012 it is not possible anymore to
apply for subsidies under the EEG for waste-wood-to energy regardless if existing or
new installations are concerned. Hence, the economical feasibility depends on
market prices. In 2017 the market sale price for waste wood (cat. A I) ranged
between 70 and 80 EUR per ton for energy recovery, while sale prices for
particleboard was indicated with approx. 60 EUR per ton (Garcia, Hora 2017). At
least in the year 2015 and 2016, there has been an oversupply of waste wood in the
market, which causes price drops and disposal bottlenecks (Fehrenbach 2016). This
Markus WILL
174
would, according to economic logic, create incentives for material recycling, as
cheap input material is available. Strategy papers contain numerous declarations of
intent to strengthen the cascade of biomass. However, practical implementation
lacks a clear line, stability and ambitious goals (Fehrenbach et al. 2016). The
Circular Economy package for instance refers directly to waste-wood only with
regard to packaging waste. The proposed target for reuse and recycling is set 60%
for 2025 and 75% for 2030. Though, material recycling and energy recovery are
considered as equivalent. For a long-term establishment of biomass cascades, their
economic feasibility is crucial. Provided the right policy instruments are in place,
reducing conflicting incentives between energy recovery and material recycling,
there is room for optimism. Still, it is necessary to see the full picture here, taking
into account an entire economic system which is – or should – move into the
direction of a circular and bio-based economy. At least, the coupling of different
industrial sectors should be aimed for, as in the case of PET recycling to textiles.
Distortions between petrochemical and bio-based products are just as
undesirable as a competition between energetic and material use. Indirect distortions
are related, for instance, to sustainability criteria for biomass production, which not
always are required for petrochemical products. A factor of success for a circular
economy in the field of wood and bio-waste is therefore to ensure equal political
treatment of the material and energetic use of biomass (Fehrenbach et al. 2016;
Odegard, Bergsma 2012).
However, it is not always a matter of political market interventions, as in the
long run, only concepts that are not endlessly depended on state-aid have lasting
success. Support of R&D and start-up financing is desirable as a basis for industrial
implementation, in particular to bridge the gap between product development at
laboratory scale and up-scale to industry levels. Beyond that “seed fundings”,
market intervention may leads to further market distortions, i.e. complete or partial
lock-out of certain innovative products or even the destruction of established
cascades.
Another obstacle is a perceived lack of cooperation within the value chain.
Involved companies involved often do not consider themselves as being a part of
cascade. Thus, they only show interest if there is an interest in the recycling of the of
TOWARDS A SUSTAINABLE CIRCULAR ECONOMY
175
by-products and waste products as alternative and cost-effective raw materials
(Fehrenbach et al. 2016). Improved cooperation can be achieved, e.g. by taking into
account recovery and recyclability of raw materials in product design (i.e. Design
for Environment). The benefits of the circular economy are obvious (Goverse 2011):
The use of cascades in the process is much easier, safer and more cost effective than
the use of other materials (e.g. waste wood, printing inks in paper recycling). At the
same time established structures and transparency over the process chain help to
further implement cascade utilization (Fehrenbach et al. 2016).
Regarding technological barriers: A basic prerequisite for the establishment of
cascades are functioning logistics and supply chains. Barriers are mainly seen
concerning collections and sorting and hence the quality of waste-wood to be
recovered (Fehrenbach et al. 2016). It is detrimental, when in the construction and
demolition sector, waste wood of different qualities is disposed in one stream, i.e.
not separated. As a result, untreated or only mechanically treated wood is mixed
with contaminated or polluted with harmful substances. This problem occurs also in
other sectors such as the commercial and private collection. Waste sorting in
separation usually takes place at the recycling center, usually, by means of visual
inspection, i.e. basis of quality features that can be directly seen. However, the
quality requirements in terms of thresholds (e.g. arsenic, lead, etc.) are rather strict
and would need laboratory analysis. Hence, it can be assumed that in order to avoid
a misjudgement, a lot of woods is categorized in lower quality grades (i.e. category
AIII or A IV). In Austria, for instance particular emphasis is given to source sorting
(i.e. sorting directly at the source) and separate storage. Material passes are issued to
the waste, indicating the type of waste, origin, treatment steps, contaminations and
similar properties. For this purpose, the waste wood stream is first sorted and
sampled (Fehrenbach et al. 2016).
3. Conclusions
This paper has provided an overview on the recent state and challenges of the
circular economy by means of two example material (waste) streams of plastics and
Markus WILL
176
wood-waste. It is argued that the circular economy refers to the consistency strategy
of sustainability and, being a technology driven approach, allows continuing with
consumption and production patterns in a capitalistic and market based economy.
The circular economy deals with closed-loop production and consumption systems,
eliminating negative externalities and the reliance of import of natural resources,
while reducing the ecological footprint. It aims at retreating from one-time use
goods to “long-term prescription in a product-as-a-service way” which requires
innovation in use cases and business models. From the two in-depth case studies on
plastics and wood-waste in can be concluded, that there are a couple of advanced
approaches. Recycling of plastics, for instance, is mature for a variety of plastics
such as PET, PP and PE, but there are problems especially in the packaging sector.
Here we see a very short product-lifetime of packaging materials and often a
complex composition of materials (i.e. multilayer foils). The wood-sector shows that
for wood of good quality, i.e. wood without pollutants from preservatives and paints,
the circle is already closed. In order to improve the circularity factor, more cascades
in the product use are recommended. Wood should be used in different products
such as round timber, furniture, particle board and then it can be recycled for particle
boards. At the end of this third product life, utilization in bio-refineries is
technologically unproblematic. Incineration and energy recovery may represent the
final stage of a sustainable and circular wood cascade. In order to upgrade the
mature recycling processes towards increased circularity (see Table 1), a number of
interventions have to take place to overcome recent barriers. But a solution to our
sustainability problems must come from within the dominating (economic) system
or at least be capable of being linked to it. My personal opinion is that a paradigm
shift towards a less materialistic lifestyle is taking place in niches of society, but so
far and foreseeably no critical mass has been reached. “It’s your economy, stupid!”
(Lotter 2019), and its large-scale transformation “on the fly” is unlikely to take place
in the face of diverse institutional and technological path dependencies. The
transition to a more sustainable and circular economy also include the way in which
the interplay of technologies and sectors is organized and managed (Geels, Schot
2007; Grin et al. 2010). It can be assumed that, in addition to technologies,
production and consumption patterns, purchasing preferences and values must also
TOWARDS A SUSTAINABLE CIRCULAR ECONOMY
177
be changed as overarching forms of action coordination (Rip, Kemp 1998). The
fundamental change from one regime state to another encompasses several
subsystems of society and must be expected to take place over longer periods of
time. Transition means that a reasonably stable socio-technical system (“dynamic
equilibrium”) reorganizes itself into a new stable system state. Such a transition is
characterized by the following characteristics (Frantzeskaki et al. 2012)
‒ Transformations are co-evolutionary processes that demand
multiple changes in socio-technical configurations
‒ Different actors from different social subsystems and social groups
are involved (“multi-actor-process”)
‒ Transformations are associated with – in terms of scope – radical
changes that take place over longer periods of 25 to 50 years.
‒ Transformations include innovation (e.g. novel design for
circularity approaches, reverse logistics and data-driven supply
chain management as well recycling technologies) and ex-novation
(e.g. linear take-make-waste models).
From an analytical perspective, there are, beside others, two approaches applied
for theorizing about complex transitions of large-scale socio-technological systems:
namely (a) the multi-impulse model for sustainability innovations and (b) the multi-
level concept. Both approaches have in common that they consider social factors
and actor constellations as central elements of a successful diffusion of sustainability
innovations. In contrast to older models of the innovation research, i.e. technology
push and market pull, various aspects and factors have to be taken into account to
explain the diffusion of innovations (multi-impulse model, Fichter 2005). Still, there
are push and pull factors. Push factors exert a pressure for change by provide
alternatives or by delegitimization of existing structures (“throw away soviecy”).
Such push factors can be technological innovations (“tech push”) but also (supra-)
governmental regulations and laws (“regulatory push”, for instance ambitious
recycling quota). Also civil society actors, consumer and environmental protection
organisations or environmental movements such as “Fridays for Future” or the Ellen
McArthur Foundation are of increasing importance as they are able to bring issues
on the political agenda or by scandalizing (“civil society push”). Pull factors support
Markus WILL
178
alternative options and have a particular impact in early-stage innovations. Pull
factors includes changing demand-side changes (“market pull”). The regulatory pull
comprises state incentives in the form of direct or indirect subsidies and/or R&D
funding. Finally there is a vision pull, providing orientation for innovation
processes. Often the vision pull is related to visionary leaders, such as Ellen
McArthur, who is taking this role in the public sphere. The second analytical
approach refers to the multi-level-perspective (MLP). The basic idea here is that
transition and innovation within socio-technical systems takes place on different
levels (Geels, Schot 2007; Grin et al. 2010; Verbong, Loorbach 2010). They are the
result of interactions between the micro-level (niches), the meso-level (regime) and
the macro-level (socio-technical landscape):
Macro-level: cross-cutting developments, megatrends, changes is framework
conditions, changes of the natural environment, economic and demographic
development
Meso-level: Socio-technical regimes include the predominant practical rules and
technologies that are relevant to the predominant socio-technical systems
stability and reinforcement. Socio-technical regimes are highly institutionalised
and can be changed only in the medium term and under sufficient pressure
Niches are ‘innovation incubators’ for radical novelties. They are important are
important, because they allow for learning processes, e.g. about technical
specification, user preferences, public policies, symbolic meanings. Niches are
protected areas, in a way that they are shielded from market factors and allow
for early stage innovations. Once industrial maturity has been reached, these
innovations must provide additional impetus in a protected market niche. Such
niche management includes the phases of shielding, nurturing, and enabling
(“empowerment”), through which a successive regime change can be achieved
(Smith and Raven 2012)
The theoretical perspectives described above may not only provide opportunities
for analytical purposes, but also for orientation and fostering of the circular
economy in terms of policies and governance. Sufficiency is an approach that relies
on a mind shift in a consumer society. Or, as Leo Tolstoy allegedly put it “If you see
that some aspect of your society is bad, and you want to improve it, there is only one
TOWARDS A SUSTAINABLE CIRCULAR ECONOMY
179
way to do so: you have to improve people”. However, my personal opinion is that a
change in technology might be more likely than a change in the state of mind of
people. And, on the other hand, the tech fix in terms of circular economy may allow
continuing with a capitalistic market economy, which causes less environmental
damages.
References
Aresta M., Dibenedetto A., Dumeignil F. (2015), Biorefineries – an introduction, Walter de Gruyter,
Berlin/Boston.
Brennan G., Tennant M., Blomsma F. (2015), Business and production solutions. Closing the loop, in:
Sustainability. Key issues, Kopnina H., Shoreman-Ouimet E. (eds), EarthScan, Routledge, London, pp.
219-239.
Brookes L. (1990), The greenhouse effect. The fallacies in the energy efficient solution, “Energy
Policy”, vol. 18 no. 2, pp. 199-201.
Brooks A., Wang S., Jambeck J.R. (2018), The Chinese import ban and its impact on global plastic
waste trade, “Science Advances”, vol. 4 no. 6, https://advances.sciencemag.org/content/4/6/eaat0131
[23.12.2019].
Brüggemann A. (2018), How energy-efficient is Germany?, KfW Research No. 213, Frankfurt/M.
BVSE (2019), Recycling Nachrichten, https://www.bvse.de/recycling/recycling-nachrichten/4371-test-
kampagne-der-dualen-systeme-startete-in-euskirchen.html [23.08.2019].
D’Alisa G., Federico D., Kallis G. (eds.) (2015), Degrowth. A vocabulary for a new era (Book info
page containing download samples), Routledge, London.
Döring S. (2011), Pellets als Energieträger. Technologie und Anwendung, Springer, Berlin –
Heidelberg.
Dyllick T., Muff K. (2016), Clarifying the meaning of sustainable business. Introducing a typology
from business-as-usual to true business sustainability, “Organization & Environment”, vol. 29, no. 2,
pp. 156-174.
EEA (2019), The plastic waste trade in the circular economy,
https://www.eea.europa.eu/themes/waste/resource-efficiency/the-plastic-waste-trade-in [28.11.2019].
EMF (2013), Towards the circular economy, vol.1, Ellen MacArthur Foundation, Isle of Wight.
Fehrenbach H., Breitmayer E., Kay S., Bienge K. (2017), Biomassekaskaden. Mehr
Ressourceneffizienz durch Kaskadennutzung von Biomasse – von der Theorie zur Praxis, UBA Texte
53/2017, https://www.umweltbundesamt.de/sites/default/files/medien/1410/publikationen/2017-06-
13_texte_53-2017_biokaskaden_abschlussbericht.pdf [23.12.2019].
Markus WILL
180
Fichter K. (2005), Interpreneurship. Nachhaltigkeitsinnovationen in interaktiven Perspektiven eines
vernetzenden Unternehmenertums, Metropolis-Verlag, Marburg.
Frantzeskaki N., Loorbach D., Meadowcroft J. (2012), Governing transitions to sustainability.
Transition management as a governance approach towards pursuing sustainability, “International
Journal of Sustainable Development”, vol. 15 no. 1/2, pp. 19-36.
Fussler C. (1996), Driving eco-innovation. A breakthrough discipline for innovation and sustainability,
Pitman Publishing, London.
Garcia C.A., Hora G. (2017), State-of-the-art of waste wood supply chain in Germany and selected
European countries, “Waste Management”, vol. 70, pp. 189-197.
Geels F.W., Schot J. (2007), Typology of sociotechnical transition pathways, “Res Policy”, vol. 36 no.
3, pp. 399-417.
Geissdoerfer M., Savaget P., Bocken N., Hultink E.J. (2016), The circular economy. A new
sustainability paradigm?, “Journal of Cleaner Production”, vol. 143, pp. 757-768.
Geyer R., Jambeck J.R., Law K.L. (2017), Production, use, and fate of all plastics ever made, “Science
Advances”, vol. 3 no. 7, https://advances.sciencemag.org/content/3/7/e1700782 [23.12.2019].
Goverse T., Hekkert M-P., Groenewegen P., Worrell E., Smits R.E.H.M. (2001), Wood innovation in
the residential construction sector; opportunities and constraints, “Resources, Conservation and
Recycling”, vol. 34, pp. 53-74.
Grin J., Rotmans J., Schot J. (2010), Transitions to sustainable development. New directions in the
study of long term transformative change, Routledge, London.
Gustavsson L., Sathre R. (2011), Energy and CO2 analysis of wood substitution in construction,
“Climatic Change”, vol. 105 no. 1/2, pp. 129-153.
Handschick. B. (2019), Kunststoff-Sortierung – Anforderungen und Möglichkeiten. RTT Steinert
GmbH , Presentation at the 28th. Seminar “Kunststoffrecycling in Sachsen”, Dresden.
Harborth H.J. (1991), Dauerhafte Entwicklung statt globaler Umweltzerstörung, Sigma, Berlin.
Höglmeier K., Weber-Blaschke G., Richter K. (2017), Potentials for cascading of recovered wood from
building deconstruction. A case study for south-east Germany, “Resources, Conservation and
Recycling”, vol. 117, pp. 304-314.
Hoglmeier K., Steubing B., Weber-Blaschke G., Richter K. (2015), LCA-based optimization of wood
utilization under special consideration of a cascading use of wood, “Journal of Environmental
Management”, vol. 152C, pp. 158-170.
Huber J. (1995), Nachhaltige Entwicklung. Strategien für eine ökologische und soziale Erdpolitik,
Sigma, Berlin.
IEA (2017), World energy balances 2017, International Energy Agency, Paris.
TOWARDS A SUSTAINABLE CIRCULAR ECONOMY
181
Jambeck J.R., Geyer R., Wilcox C., Siegler T.R., Perryman M., Andrady A., Narayan R., Law K.L.
(2015), Plastic waste inputs from land into the ocean, “Science”, no. 347, pp. 768-771.
Jörissen J., Kopfmüller J., Brandl V., Pateau M. (1999), Ein integratives Konzept nachhaltiger
Entwicklung, Wissenschaftliche Berichte FZKA 6393, Forschungszentrum Karlsruhe.
Kaiser K., Schmid M., Schlummer M. (2018), Recycling of polymer-based multilayer packaging. A
review, “Recycling”, vol. 3 no. 1.
Kamm B., Kamm M. (2004), Biorefinery – systems, „Chemical and Biochemical Engineering
Quaterly”, vol. 18 no. 1, pp. 1-6.
Kim J.K., Pal K. (2011), Recent advances in the processing of wood–plastic composites, Springer,
Berlin – Heidelberg.
Kirchherr J., Reike D., Hekkert M. (2017), Conceptualizing the circular economy. An analysis of 114
definitions, “Resources, Conservation & Recycling”, vol. 127, pp. 221-232.
Krizan P. (2015), The densification process of wood waste, De Gruyter Open Ltd, Warsaw – Berlin.
Lange H., Bartzoka E.D., Crestini C. (2015), Lignin biorefinery. Structure, pretreatment and use, in:
Biorefineries. An introduction, Aresta M., Dibenedetto A., Dumeignil F. (eds.), Walter de Gruyter,
Berlin – Boston, pp. 257-283.
Leal Filho W., Saari U., Fedoruk M., Iital A., Moora H., Klöga M., Voronova V. (2019), An overview
of the problems posed by plastic products and the role of extended producer responsibility in Europe,
“Journal of Cleaner Production”, vol. 214, pp. 550-558.
Lieder M., Rashid A. (2016), Towards circular economy implementation. A comprehensive review in
context of manufacturing industry, “Journal of Cleaner Production”, vol. 115, pp. 36-51.
Lindorfer J., Lettner M., Hesser F., Fazeni K., Rosenfeld D., Annevelink B., Mandl M. (2019),
Technical, economic and environmental assessment of biorefinery concepts. Developing a practical
approach for characterization, IEA Bioenergy Task 42: Biorefining in a Circular Economy,
https://www.ieabioenergy.com/wp-content/uploads/2019/07/TEE_assessment_report_final_20190704-
1.pdf [23.12.2019].
Lotter W. (2019), It’s your economy, stupid! Die Grünen leben in der Ökonomie der
Industriegesellschaft, “Kursbuch”, no. 197.
Mantau U., Saal U., Prins K., Steierer F., Lindner M., Verkerk H., Eggers J., Leek N., Oldenburger J.,
Asikainen A., Anttila P. (2010), EUwood. Real potential for changes in growth and use of EU forests.
Final report, Hamburg.
METI (2004), Handbook on resource recycling legislation and 3R initiatives, Japanese Ministry of
Economy, Trade and Industry, Tokyo.
Müller-Christ G. (2009), Salutogenese und Nachhaltigkeit. Die Ressourcenperspektive als
moderierendes Element zwischen Gesundheitsmanagement und Unternehmensführung, in: Leithäuser
T., Meyerhuber S., Schottmayer M., Sozialpsychologisches Organisationsverstehen, VS Verlag für
Sozialwissenschaften, GWV Fachverlage GmbH, Wiesbaden, pp. 139-162
Markus WILL
182
nova institute (2019), Bio-based building blocks and polymers. Global capacities, production and
trends 2018-2023, https://european-
biotechnology.com/fileadmin/Content/NewsAndStories/2019/Nova_exec.pdf [23.12.2019].
Odegard I., Bergsma G. (2012), Cascading of biomass, 13 solutions for a sustainable biobased
economy. Report, CE Delft, Delft.
Paech N. (2012), Liberation from excess. The road to a post-growth economy, oekom verlag, Munich.
PlasticsEurope (2018), Plastic – the facts. An analysis of European plastics production, demand and
waste data, PlasticsEurope – Association of Plastics Manufacturers. Brussels,
https://www.plasticseurope.org/download_file/force/2367/521 [23.12.2019].
Potting J., Hekkert M.P., Worrell E., Hanemaaijer A. (2017), Circular economy. Measuring innovation
in the product chain, PBL Netherlands Assessment Agency,
https://www.pbl.nl/sites/default/files/downloads/pbl-2016-circular-economy-measuring-innovation-in-
product-chains-2544.pdf [23.12.2019].
Protic M., Dragan M., Stefanovic V. (2011), Wood pellets production technology, “Safety
Engineering”, vol. 1 no. 1, pp. 23-26.
Pye E.K., Lora J.H. (1991), The Alcell process, a proven alternative to kraft pulping, “Tappi Journal”,
vol. 74 no. 83, pp. 113-118.
Righeschi S. ( 2017), Baseline evaluation of current wood waste recycling. Deliverable within the
FORCE- Cities Cooperating for Circular Economy Project. Co-funded by the Horizon 2020
Framework Programme of the European Union, http://www.ce-force.eu/ [23.12.2019].
Rip A., Kemp R. (1998), Technological change, in: Human choice and climate change. International
assessment, Rayner St., Malone E.L. (eds.), Battelle Press, Columbus, OH, pp. 327-399.
Robertson G.L. (2009), Food packaging and shelf life, in: Food packaging and shelf life. A practical
guide, Robertson G.L. (ed.), CRC Press, Boca Raton, FL, pp. 1-16.
Robertson G.L. (2016), Packaging and food and beverage shelf life, in: The stability and shelf life of
food, Robertson G.L. (ed.), 2nd ed., Woodhead Publishing, Cambridge.
Saunders H. (1992), The Khazzom-Brookes postulate and neoclassical growth, “Energy Journal”, vol.
13 no. 4, pp. 131-148.
Schrägle R. (2015), Schadstoffe in Spanplatten. Status quo vor dem Hintergrund von Kaskadennutzung
und Altholzeinsatz, “HolzZentralblatt”, no. 3, 16 January 2015, pp. 56-57.
Schumacher E.F. (1973), Small is beautiful. Economics as if people mattered, Blond & Briggs,
London.
Sieben D. (2007), Die innere Dimension der Nachhaltigkeit, “Ökologisches Wirtschaften”, vol. 22 no.
1, pp. 23-24.
TOWARDS A SUSTAINABLE CIRCULAR ECONOMY
183
Sirkin T., ten Houten M. (1994), The cascade chain. A theory and tool for achieving resource
sustainability with application for product design, “Resources, Conservation and Recycling”, vol. 10
no. 3, pp. 213-277.
Smith A., Raven R. (2012), What is protective space? Reconsidering niches in transitions to
sustainability, “Research Policy”, vol. 41 no. 6, pp. 1025-1036.
Sommerhuber P. (2016), Resource efficiency of wood-plastic composites. Identifying secondary
material substitution potentials and an environmentally sound end-of-life treatment, dissertation at
Faculty of Mathematics, Informatics and Natural Sciences, Department of Biology of Universität
Hamburg [unpublished].
Sorrell S., Dimitropoulos J., Sommerville M. (2009), Empirical estimates of the direct rebound effect.
A review, “Energy Policy”, vol. 37 no. 4, pp. 1356-1371.
Su B., Heshmati A., Geng Y., Yu X. (2013), A review of the circular economy in China. Moving from
rhetoric to implementation, “Journal of Cleaner Production”, vol. 42, pp. 215-227.
Taifor A. (2017), A review of wood plastic composites effect on the environment, “Journal of Babylon
University/Engineering Sciences”, vol. 25, no. 2, pp. 360-367.
Ten Brink P., Schweitzer J.P., Watkins E., Janssens C., De Smet M., Leslie H., Galgani F. (2018),
Circular economy measures to keep plastics and their value in the economy, avoid waste and reduce
marine litter, Economics Discussion Papers, http://www.economics-
ejournal.org/economics/discussionpapers/2018-3 [25.06.2018].
Thrän D., Arendt D., Adwiraah H., Kaltschmitt M. (2016), Nebenprodukte, Rückstände und Abfälle,
in: Energie aus Biomasse – Grundlagen, Techniken und Verfahren, Kaltschmitt M., Hartmann H.,
Hofbauer H. (eds.), 3rd ed., Springer, Berlin – Heidelberg.
VDI 3462/2 (2013), Emission control, wood machining and processing. Production of wood-based
panels, Verein Deutscher Ingenieure, Beuth Verlag, Berlin.
VDI 4807 (2016), Planning, construction and managing of scrap wood yards, Verein Deutscher
Ingenieure, Beuth Verlag, Berlin.
VDI 6310 (2016), Classification and quality criteria of biorefineries, Verein Deutscher Ingenieure,
Beuth Verlag, Berlin.
Verbong G., Loorbach D. (2010), Governing the energy transition. Reality, illusion or necessity?,
Routledge, Taylor and Francis Group, New York.
Zalasiewicz J., Waters C.N., Ivar do Sul J., Corcoran P.L., Barnosky A.D., Cearreta A, Edgeworth M.,
Galuszka A., Jeandel C., Leinfelder R., McNeill J.R., Steffen W., Summerhayes C., Wagreich M.,
Williams M., Wolfe A.P., Yonan Y. (2016), The geological cycle of plastics and their use as a
stratigraphic indicator of the Anthropocene, “Anthropocene”, vol. 13, pp. 4-17.