
european journal of economics and business studies
300
EJES EUROPEAN JOURNAL OF ECONOMICS AND BUSINESS STUDIES January-April 2018 Volume 4, Issue 1 ISSN 2411-9571 (Print) ISSN 2411-4073 (online)
-
Upload
khangminh22 -
Category
Documents
-
view
0 -
download
0
Transcript of european journal of economics and business studies
EJES
EUROPEAN JOURNAL OF ECONOMICS
AND BUSINESS STUDIES
January-April 2018
Volume 4, Issue 1
ISSN 2411-9571 (Print)
ISSN 2411-4073 (online)

REVISTIA
PUBLISHING AND RESEARCH
EUROPEAN JOURNAL OF ECONOMICS
AND BUSINESS STUDIES
January-April 2018
Volume 4, Issue 1
Every reasonable effort has been made to ensure that the material in this book is true, correct, complete, and appropriate at the time of writing. Nevertheless, the publishers,
the editors and the authors do not accept responsibility for any omission or error, or for any injury, damage, loss, or financial consequences arising from the use of the book. The
views expressed by contributors do not necessarily reflect those of Revistia.
Typeset by Revistia
Copyright © Revistia. All rights reserved. No part of this book may be reproduced in any form or by any electronic or mechanical means, including information storage and
retrieval systems, without written permission from the publisher or author, except in the case of a reviewer, who may quote brief passages embodied in critical articles or in a
review.
Address: 11, Portland Road, London, SE25 4UF, United Kingdom
Tel: +44 2080680407
E-Mail: office@revistia. com
Web: https://ejes.revistia.com
ISSN 2411-9571 (Print)
ISSN 2411-4073 (online)
Indexed in Elsevier’s Mendeley, WorldCat, RePEc & Ideas, Google Scholar, Crossref

Editorial & International Scientific Advisory Board
Ahmet Ecirli, PhD - Institute of Sociology, Bucharest, Romania
Nicos Rodosthenous, PhD - Aristotle University of Thessaloniki, Greece
Irene Salmaso, PhD - University of Florence, Italy
Nino Orjonikidze, PhD - Gori State Teaching University, Georgia
Javier Cachón Zagalaz, PhD - Universidad de Jaén, Spain
Gonca Atıcı, PhD - Istanbul University, School of Business, Turkey
Enkhtuya Dandar - University of Science and Technology, Mongolia
Basira Azizaliyeva, PhD - National Academy of Sciences, Azerbaijan
Natalia Kharadze, PhD - Ivane Javakhishvili Tbilisi State University, Georgia
Federica Roccisano, PhD -
Tatiana Pischina, PhD - Academy of Economic Studies, Moldova
Irina Golitsyna, PhD - Kazan (Volga) Federal University, Russia
Ekaterine Gulua, PhD - Ivane Javakhishvili Tbilisi State University, Georgia
Mariam Gersamia, PhD - Ivane Javakhishvili Tbilisi State University, Georgia
Jean d'Amour - Åbo Akademi University, Finland
Ornela Bilali, PhD - “Aleksander Xhuvani” University, Albania
Niyazi Berk, PhD - Bahcesehir University, Istanbul, Turkey
Jesus Francisco Gutierrez Ocampo, PhD - Tecnologico Nacional de Mexico
Chandrasekaran Nagarajan, PhD - IFMR Graduate School of Business, India
Carmen Cecilia Espinoza Melo, PhD - Universidad Católica de la Santísima Concepción in Chile
Fouzi Abderzag, PhD
Valentinas Navickas, PhD - Kaunas University of Technology, Lithuania
Elenita Velikova, PhD - University of National and World Economy, Bulgaria
Agnieszka Huterska, PhD - Nicolaus Copernicus University in Toruń
Ewa Badzińska, PhD - Poznan University of Technology, Poland
Khaled Salah, PhD - Faculty of Education - Alexandria University, Egypt
Maria João Mimoso, PhD - Portucalense University Oporto, Portugal

Nastaran Norouzi Richards-Carpenter, PhD - Richmond Business School, London, UK
Sajitha Lakmali Hewapathirana, PhD - University of Colombo, Sri Lanka
Habib Kocak, PhD - Marmara University, Turkey
Amel Alić, PhD - University of Zenica, Bosnia and Herzegovina
Eugenia Strano - University Magna Graecia of Catanzaro, Italy
Asta Savaneviciene, PhD - Kaunas University of Technology, Lithuania
Nino Liparteliani, PhD - Gori State Teaching University, Georgia
Jadvyga Ciburiene, PhD - Kaunas University of Technology, Lithuania
Mirela Ujkani Miti, PhD - University of Tirana Albania
Vania Ivanova, PhD - University of National and World Economy, Bulgaria
Wawan Lulus Setiawan - Institute of Cooperative Management, Indonesia
Wan Kamal Mujani, PhD - The National Universiti of Malaysia
Maria Irma Botero Ospina, PhD - Universidad Militar Nueva Granada, Colombia
Mohd Aderi Che Noh, PhD - National University of Malaysia
Francisco Javier Blanco-Encomienda, PhD - University of Granada, Spain
Driss Harizi, PhD - Hassan University of Settat, Morocco
Maleerat Ka-Kan-Dee, PhD
Ana Paula Marques, PhD - University of Minho, Portugal
Smaragda Papadopoulou, PhD - Universityof Ioannina - Greece
Maia Chania, PhD - Davit Agmashenebeli University of Georgia
Besik Bolkvadze, PhD - Batumi Shota Rustaveli State University, Georgia
Adebayo Emmanuel, PhD - Federal University of Technology, Akure, Nigeria
Marwan Al Qur’an, PhD - International Business & Strategy, Abu Dhabi University, UAE
Manasi Gore, PhD - Pune University, Maharashtra, India
Dominika Pazder, PhD - Poznań University of Technology, Poland
Copyright © Revistia
ISSN 2411-9571 (Print) ISSN 2411-4073 (online)
European Journal of Economics
and Business Studies April 2018 Vol 4 No 1
5
TABLE OF CONTENTS
INNOVATIVE PRACTICES AS A KEY FOR A BETTER MANAGEMENT IN TOURISM INDUSTRY ............................. 8
NIKOLAY TSONEV
SVETOSLAV KALEYCHEV
THE ROLE OF AUDITORS AGAINST MONEY LAUNDERING - ALBANIA CASE .....................................................17
NERTILA CIKA SOTIRAQ DHAMO
IGLI TOLA
ORGANIZATIONAL CONFLICT MANAGEMENT CHALLENGES .............................................................................30
NATALIA KHARADZE
EKATERINE GULUA
ANALYSIS OF THE ENERGY DEPENDENCE OF THE EUROPEAN UNION.............................................................42
SVETLA BONEVA
PUBLIC SERVICE EMPLOYEE MOTIVATION ISSUES IN GEORGIA .......................................................................49
SALOME SAKVARELIDZE
THE WAYS OF CREATING NEW PATHS FOR FINANCIAL ORGANIZATIONS WITHIN THE FRAMEWORK OF SPATIAL DEPENDENCY .......................................................................................................................................56
EMEL ALTIN
MURAT KASIMOĞLU
ALI KÜÇÜKÇOLAK
ROLE OF CORPORATE COMMUNICATION IN BOOMERANG................................................................................66
NEHA SHARMA
AUDIT TESTS AND THEIR IMPACT ON FRAUD DETECTION-CASE OF ALBANIA .................................................79
MIRELA UJKANI MITI
ELENA MYFTARAJ (TOMORI)
TRACKING THE NEW DEMAND FOR JUSTICE IN THE BIG DATA ECOSYSTEM ...................................................89
CARMEN VARGAS PÉREZ
JUAN LUIS PEÑALOZA FIGUEROA
IMPACT EVALUATION OF INDONESIA CONDITIONAL CASH TRANSFER PROGRAM (BSM) ON STUDENT ACHIEVEMENT.....................................................................................................................................................98
ROSINTA HOTMAIDA FEBRIANTI PURBA
THE IMPACT OF CARBON TAX APPLICATION ON THE ECONOMY AND ENVIRONMENT OF INDONESIA .......... 110
PUTRI AYU
THE IMPORTANCE OF RESOURCE ASSESSMENT FOR ENTREPRENEURSHIP AND LOCAL ECONOMIC DEVELOPMENT IN KOSOVO .............................................................................................................................. 121
SEJDI REXHEPI MJELLMA KADRIU
CREATIVE ACCOUNTING – SOME ASPECTS OF KNOWLEDGE AND IMPLEMENTATION IN ALBANIA............... 134
MIRELA UJKANI MITI
ISSN 2411-9571 (Print) ISSN 2411-4073 (online)
European Journal of Economics
and Business Studies April 2018 Vol 4 No 1
6
ELENA MYFTARAJ (TOMORI) BRISEJDA RAMAJ ZENUNI
STATE PROCUREMENT ELECTRONIC SYSTEM EFFICIENCY IN GEORGIA........................................................ 146
TINATIN MEDZMARIASHVILI
ECONOMIC GROWTH THOUGH COMPETITIVE ADVANTAGE AND SPECIALIZATION: THE EXAMPLE OF WINEMAKING IN MOLDOVA ............................................................................................................................... 150
PROF. DR. TATIANA PÎŞCHINA
ROMEO FORTUNA
ORIENTAL CULTURAL VALUES DEPICTED IN ADVERTISING; WITH SPECIAL REFERENCE TO SRI LANKAN CONTEXT ........................................................................................................................................................... 156
SAJITHA LAKMALI HEWAPATHIRANA
R.I.BATUWANGALA
FACTORS OF FAILURE OF THE IRAQI BANKING SYSTEM IN THE IMPLEMENTATION OF THE DECISIONS OF THE BASEL COMMITTEE ................................................................................................................................... 161
JASIM MOHAMMED MUSHIB JANABI
ZAINAB HUSHAM QASIM AL-RIKABI
PROFESSIONAL ETHICS IN ACCOUNTING AS ASSESSED BY MANAGERS OF ENTITIES.................................. 167
GRAŻYNA VOSS
THE REFLECTION OF THE CONSUMERS’ SPIRITUAL PERSPECTIVE TO THE MATERIALISM: A CASE FROM TURKEY ............................................................................................................................................................. 176
SÜREYYA KARSU DILŞAD ÇOKNAZ
MEFTUNE ÖZBAKIR UMUT
MELTEM NURTANIŞ VELIOĞLU
THE ROLE OF POLICY INSTRUMENTS ON THE PATTERN OF DIFFUSION: THE CASE OF SOLAR PHOTOVOLTAIC IN ASIA PACIFIC...................................................................................................................... 186
FARAH ROSLAN
SERVICE QUALITY AND EDUCATION COST IMPLICATION THE DECISION TO STAY ACTIVE RE-STUDY MEDIATED BY STUDENT SATISFACTION – A STUDY AT PRIVATE UNIVERSITY IN WEST JAVA ....................... 193
YENNY MAYA DORA
COLLECTIVE INTELLIGENCE: A NEW MODEL OF BUSINESS MANAGEMENT IN THE BIG-DATA ECOSYSTEM . 201
JUAN LUIS PEÑALOZA FIGUEROA
CARMEN VARGAS PÉREZ
TAX STRUCTURE AND DEVELOPING COUNTRIES ............................................................................................ 213
LUMNIJE THAÇI
ARBNORA GËRXHALIU
EMPLOYEE SATISFACTION VS. EMPLOYEE ENGAGEMENT VS. EMPLOYEE NPS ............................................ 221
MAYA YANEVA
THE SHARING ECONOMY AT TOURIST TOURS AND ITS IMPACT ON THE TOURIST BUSINESS (TRAVEL AGENCIES) IN BULGARIA .................................................................................................................................. 228

ISSN 2411-9571 (Print) ISSN 2411-4073 (online)
European Journal of Economics
and Business Studies April 2018 Vol 4 No 1
7
MARIANA IANEVA
THE IMPACT OF PRODUCT EXPOSURE AS A KEY ELEMENT OF SALES PROMOTION ..................................... 235
SHAIP BYTYÇI
IMPORTANCE OF QUALITY CONTROL IMPLEMENTATION IN THE PRODUCTION PROCESS OF A COMPANY .......................................................................................................................................................... 240
FRANCISCO JAVIER BLANCO-ENCOMIENDA ELENA ROSILLO-DÍAZ
JUAN FRANCISCO MUÑOZ-ROSAS
RELATIONSHIP BETWEEN ECONOMIC FACTORS AND NON-PERFORMING LOANS- THE CASE OF ALBANIA.. 245
VALBONA GJINI
LUCIANA KOPRENCKA
CONSULTANCY SERVICES AND THEIR IMPACT IN FINANCIAL REPORTING - CASE OF ALBANIA ................... 253
BRISEJDA ZENUNI RAMAJ MIRELA UJKANI MITI
COMMON CHARACTERISTICS AND DIFFERENCES IN EXTERNAL AND INTERNAL AUDITING .......................... 261
FATMIR MEHMETI
INSTAGRAM, FACEBOOK OR TWITTER: WHICH ENGAGES BEST? A COMPARATIVE STUDY OF CONSUMER BRAND ENGAGEMENT AND SOCIAL COMMERCE PURCHASE INTENTION....................................................... 268
İBRAHIM KIRCOVA
YILMAZ YAMAN
ŞIRIN GIZEM KÖSE
GLOBAL FINANCIAL CRISES: THE IMPACT ON ALBANIAN ECONOMIC GROWTH ............................................ 279
ÇELJETA SHERIFI
GÜNGÖR TURAN
RENEWABLE ENERGY AND SOLAR BUSINESS IN THE EUROPEAN UNION ...................................................... 295
NONCHO DIMITROV

ISSN 2411-9571 (Print) ISSN 2411-4073 (online)
European Journal of Economics
and Business Studies April 2018 Vol 4 No 1
8
DOI: 10.26417/ejes.v4i1.p8-16
Open Access. © 2018 Nikolay Tsonev and Svetoslav Kaleychev.
This is an open access article licensed under the
Creative Commons Attribution-NonCommercial-NoDerivs 4.0 License
Innovative Practices as a Key for a Better Management in Tourism Industry
Nikolay Tsonev
Assoc. Prof. Dr. University of National and World Economy, Bulgaria
Svetoslav Kaleychev
Assist. PhD, University of National and World Economy, Bulgaria
Abstract:
The dynamics in socio-economic life raises the need of new organizational and managerial solutions that meet the requirements of contemporary society . Innovative technologies, as part of these solutions, have a major impact on all areas of life and determine the direction of social development. Modern managers and leaders in the economic industry strive to implement the best innovation practices that will be the key for achiev ing of the maximum results and ultimate goals. In this respect, tourism as a sector of global economic and social importance is aware of the need to implement innovative practices in all tourism activ ities. International tourism market show specific changes in the actual and potential tourist behavior. These changes are significant and affect all of the participants in the process of formation and realization of the tourism products, producers and distributors. The main goal is connected with the achiev ing of a more personal experience, inner satisfaction and maximum recovery as expression of the global contemporary trends in the tourism business. In a more dynamic competitive environment, participants in the tourism market must increasingly rely on the implementation and use of innovative technologies that improve management, organizational structure, economic policy and contributing for the success of the tourism companies.
Keywords: tourism, innovation, management
1. Introduction
Today 's society lives in an extremely dynamic, comprehensive, full of information and opportunities world. This is due to the growing and determining role of digitization in an increasing number of industrial sectors of the world economy. It shoul d be noted the fact that the modern economy, especially in its practical and applied part, is directing its efforts towards introducing new and innovative practices of production process, organization of business, positioning of production and serv ices and their market consumption. In today 's global society , these practices are enormous and the rate at which they change and evolve is extremely large. This remarkably dynamic environment in which the world economy develops also has an impact on the tourism industry . It must be said that travel and tourism industry is one of the world’s largest industries with a global economic contribution of over 7.6 trillion U.S. dollars in 2016, which is 10,2% of world GDP. The sector now supports 292 million people in enviroment – that’s 1 of 10 jobs on the planet and it developing is under the strategic impact of modern innovations in all directions of its activ ities. Due to the broad access of information and the opportunity for global and fast communication, the tourism industry is shaping under conditions of a strong and highly changing competitiv e environment. These conditions determined the need of implement and use of new and innovative practices and technologies to identify the difference and contribute to success of indiv idual tourism enterprises. It is the extremely complex and highly competitive environment in which modern tourism enterprises develop their activ ities and it determines the need for creation of a better management and organizational standards, leading for the best management decisions that will be the key to maximizing efficiency. They also lead the introduction of new and innovative practices, which are a direct expression of the contemporary requirements of tourists, regarding used tourist products and serv ices. At this stage, it may

ISSN 2411-9571 (Print) ISSN 2411-4073 (online)
European Journal of Economics
and Business Studies April 2018 Vol 4 No 1
9
be necessary to conclude that modern tourism enterprises are directing their efforts towards for the use of innovative practices that will lead to implementation of better managerial decisions at all stages of management actions.
At a global level, innovation policy is becoming a key factor and a key tool for achiev ing competitiveness in tourism. Changes in tourism supply as a result of globalization processes lead to new challenges for the tourism business in Bulgaria as well. The short and long-term development policies should be rethought by the market participants, regarding the new conditions.
World tourism trends pose to the state policy in Bulgaria the need to stimulate the development of innovations and the adoption of the relevant regulations, which direct the business towards to implementation of innovation policy. Innovation takes central place at the EU's growth and jobs strategy. A key feature of the economics of knowledge is the creation, conservation, dissemination and use of knowledge as a way to achieve accelerated growth rates and greater competitiveness.1
It can reasonably be argued that, to a large extent, the management of the tourist enterprise or destination determines and guides the choice of tourists seeking new and fulfilling tourist experiences. The technological prov ision and the better organizational structure of serv ices, following the introduction of innovative practices and technologies, create positive impressions, comfort and personal satisfaction during the tourist stay and the various tourist activ ities that accompany it.
2. Method
Based on the information prov ided and according to the purpose of the present study, to reveal the manifestations and the effects of the better management in tourism as a result of the application of innovative practices, a method of study was chosen. Taking into account the nature of the matter under consideration, the "questionnaire" methodology is applied as a comprehensive and in-depth approach to innovation focusing on consumer experiences and experiences as the basis for choosing solutions. The questionnaire surveys are a very traditional way of conducting research. They are particularly useful for non experimental descriptive designs that seek to describe reality . Likewise, the questionnaire survey approach is frequently used to collect information on attitudes and behavior2.
The advantages of questionnaires are as follow: practical; large amounts of information can be collected from a large number of people in a short period of time and in a relatively cost effective way; can be carried out by the researcher or by any number of people with limited affect to its validity and reliability ; the results of the questionnaires can usually be quickly and easily quantified by either a researcher or through the use of a software package; can be analyzed more 'scientifically ' and objectively than other forms of research; when data has been quantified, it can be used to compare and contrast other research and may be used to measure change and positiv ists believe that quantitative data can be used to create new theories and / or test ex isting hypotheses3.
The focus of attention is on studying a specific innovative hotel practice with an innovative character based on the study of the better results achieved by managers of the hotel complexes, to highlight and present the usefulness of introducing innovative technology in the tourism industry .
A basic principle of design as a "way of thinking" is to create a harmony between the function of the product / serv ice and the shape and environment in which it is used so that the user remains with positive impressions4
3. Analysis
Creating better management in tourism companies is an extremely complex and dynamic process related to the change and restructuring of business models, activ ities, processes and competencies in order to better exploit the opportuniti es created by the implemented innovative technologies, taking into account their strategic and future influence of the enterprise. The development of new management models and activ ities is a key factor of creating conditions through which tourist preferences will be more flex ible, market oriented and innovative, effective and responsive to current and future changes in economic reality and in the minds of today’s and future tourists. The goal of a better management of tourism
1Ianev a, M., Georgieva, R.,"Innovations of the MICE tourism: Opportunities in Bulgaria", 3rd International Scientific Business Conference on Leadership and Management: Integrated Politics of Research and Innovations – LIMEN 2017, Belgrade, Serbia 2 Mathers. M., Fox, N., A. Hunn, “Surveys and questionnaires”, NIHR RDS for the East Midlands / Yorkshire & Humber 2009 3http://libw eb.surrey.ac.uk/library/skills/Introduction%20to%20Research%20and%20Managing%20Information%20Leicester/page_51.htm 4 Stankov a.M, Kaleychev.S., 2017, “ The trajectory of creativity and innovation in tourism” XIII International Scientific Conference -
Modern Science, Business and Education, Dobrich, Bulgaria

ISSN 2411-9571 (Print) ISSN 2411-4073 (online)
European Journal of Economics
and Business Studies April 2018 Vol 4 No 1
10
companies is to create conditions and environment for faster entry of a new and innovative technological solutions, increasing their reliance on the company's activ ity in order to achieve more efficient, higher quality results, as well as creating serv ices and products that meet the interests and demands of a wider range of real and potential consumers1. The best management is the key that enables modern tourists to have more control over their personal experiences and emotions during the tourist experience. Reality shows that a better organization in a tourist enterprise is not related for example, only to a certain type of interface or IT program, or a certain type of new digital product that is offered to tourists . Rather, it expresses how the tourist company operates and how it offers its products and serv ices, allowing tourists to get the most out of any tourist activ ity during their stay.
Modern innovative technologies, developed specific business models and types of management, revolutionized the process of making and creating the management solutions offered by the tourism industry . Examples of such innovations are the use of personal smart phones such as key card for hotel rooms; hotel accommodation using personal mobile phone; mobile reservations; electronic media in the hotel lobby; electronic luggage stickers carry ing their own information platforms; use on-board smart phones; hotel search optimization systems; Internet Protocol Voice Phones that are linked to the hotel's internal system ( in-room telephones, through which v isitors can order a room serv ice directly from the touch screen) using system communicates directly with the relevant hotel departments; portable identify guests tablet menus and reservation systems table in restaurants; an electronic device that can track every action of the cook and his team, and the customer can even give him a comment or talk about the recipe; cyber-mirror that allows you to get weather information, read the news, or define a route while looking around, wondering what to wear and many others.
On the basis of the information prov ided so far, the report will present innovative practice in tourism, aimed to create a better organization in the hotel industry in order to achieve the most efficient management decisions, improv e the working process and maximize the satisfaction of the tourists. The essence of this innovative practice is bracelet chip serv ice introduced in the 2014 season in Bulgarian hotel complexes and subsequently distributed in a large number of hotels operating on the Bulgarian Black Sea coast. At present 50 hotels use this device.
Chip bracelet is an innovative and modern solution designed to improve the overall tourist experience during rest, recreation or entertainment. The hotel complexes in Bulgaria, which have implemented it in their business, aim to offer complex serv ice, using the chip bracelet such as a room key or a multipurpose payment device. With it help, guests do not wear a wallet or room key because the intelligent bracelet allows the opening of the personal room or the payment of different purchases to be done with just one touch of the bracelet to the specific touchscreen.
Figure 1. Example of an all-inclusive access control bracelet with non-contact tag
Source:https://www.tripadvisor.com.au/LocationPhotoDirectLink-g8766716-d8762779-i280667790-Melia_Braco_Village-Rio_Bueno_Trelawny_Parish_Jamaica.html
In technical terms, the chip bracelet consists of two parts (Figure 1). One part is a colored strap with a buckle that allows adjustment of the width when placing the hand of the tourist. It is made of water-resistant, impact-resistant, sun-resistant
1 Stankov a, M. & S. Kirilov, S. Kaleichev, I. Vasenska (2015), “Innovation and tourism – Getting sustainability trough good practices”. Sustainable mountain regions: make them work, International Scientific conference, Proceedings 14-16 May 2015, Borovets, Bulgaria.
ISBN 978-954-411-220-2, p. 175.

ISSN 2411-9571 (Print) ISSN 2411-4073 (online)
European Journal of Economics
and Business Studies April 2018 Vol 4 No 1
11
materials, allowing it to be used in various conditions without disturbing its integrity . The shape and color combinations of the bracelet are tailored to the feeling of wear and tear. The second part consists of a chip a non-contact PVC tag attached to the bracelet. The tag allows multiple use with rewriting and reading. It is a major component of the so-called “Chip Bracelet” because it brings all the information about the tourist who uses it. It can reasonably said that is collection of an electronic identity card with tourist data and an electronic debit card that holds some of its financial resources.
The conceptual innovation in chip bracelet serv ice is related to the ability to improve and optimize the organization of work, serv ice and by the statistics from bracelet data to take the best management decisions for the overall functioning of a hotel complex. Every tourist can charge their bracelet chip electronically on each of the receptions or areas designated for this activ ity , with a sum determined by him / her, and then dispose and pay with his / her means at each of the commercial premises designated by the hotel complex. On this way, a tourist without physical money can use a variety of serv ices. On the other hand, the chip bracelet promptly informs the holder for any financial transaction, the type of purchased products or serv ices and the available financial amount at its disposal at any point of its stay.
Whether the hotel guest is in the pool, sports or collects sun rays, the bracelet chip allows secure, fast and easy access to any serv ice or product offered in the complex. It frees it from the necessity of wearing cash currency, from worry ing about its security , while enabling him / her to quickly and easily make a payment, with just one hand movement and touching the bracelet chip to a corresponding sensor device.
Such smart dev ices are used by chains like "Four Seasons", "Hilton", "Hyatt" , "Marriott", "Holiday Inn", etc. Here is the place to note the example of "Palladium Hotel Group" 2014 presents the VIB (Very Important Bracelet) smart bracelet so that guests can do everything from one device. With it help, the guests do not wear a wallet, telephone or room key, as everything is available from the smart bracelet: they can open their rooms, enter various venues around the hotel, pay for each product using a code combination, and receive exclusive discounts. (Figure 2).
Figure 2. Example of a bracelet used in Paradisus Palma Real Golf & Spa Resort
Source:https://www.tripadvisor.com.au/LocationPhotoDirectLink-g147293-d583034-i72425847-Paradisus_Palma_Real_Golf_Spa_Resort-Punta_Cana_La_Altagracia_Province_Dom.html
4. Results and discussion
In this report, a survey conducted in 2017 was carried out among twenty managers who have implemented the above mentioned innovative technological dev ice in the activ ities of the hotel complexes they manage. Hotel complexes incorporating the device are represented by different categories, the four stars being the most numerous - twelve, followed by five of the three stars and three of the five stars hotels. The managers receive a system of questions aimed at acquiring information on the usefulness of the device used and the information that is acquired by it in the process of taking the best possible management decisions. The aim of the study is to identify and compare the perceptions of indiv idual managers about the role, importance and effectiveness of using chip bracelets during a real business environment. The research aims to acquire, analyze and synthesize information related to managers' attitude towards the innovative system of serv ice and organization offered to hotel complexes managed by them. The current study consists of a questionnaire survey with formulated questions. The survey was conducted among 20 managers of hotel complexes located on the Bulgarian Black

ISSN 2411-9571 (Print) ISSN 2411-4073 (online)
European Journal of Economics
and Business Studies April 2018 Vol 4 No 1
12
Sea coast. They manage hotels with different sizes, mode of operation and type of the offered tourist products and serv ices. All of that implies differences and specifics in the choice of answers determined by the essence of their activ ity , way of work and management capabilities.
A system of questions has been set up for managers in the following form:
1. What is your nationality?
Bulgarian other ...........................................
2. What is your age?
26- 35 years 36 - 45 years
46-55 years over 55 years old
3 Are you support the implementation of innovative practices to optimize the activ ities of hotel complexes?
yes no I have no opinion
4. Do you think that the serv ice in the complex is much faster using a bracelet chip?
(Yes) (Maybe) (No) (I have no opinion)
5. Is the statistical information obtained by using a bracelet chip in the complex improv ing your management decisions?
(Yes) (Maybe) (No) (I have no opinion)
6. Does the accounting organization of the complex improve after the implementation of the bracelet chip as the primary payment instrument?
(Yes) (Maybe) (No) (I have no opinion)
7. Is the efficiency of the staff in the work process increased due to the use of a bracelet chip by the guests of the complex?
(Yes) (Maybe) (No) (I have no opinion)
8. Do you receive a faster information about each serv ice that is paid in the various venues around the hotel complex?
(Yes) (Maybe) (No) (I have no opinion)
9. Do you think the process of activating and charging the bracelet chips is fast enough?
(Yes) (Maybe) (No) (I have no opinion)
10. Do you think that turists used bracelet chip as a serv ice method in the complex, are satisfied with it?
(Yes) (Maybe) (No) (I have no opinion)
11. Do you think that the use of bracelet chip in the future will find a wider manifestation in the tourism industry?
(Yes) (Maybe) (No) (I have no opinion)
The answers to the questions were analyzed and presented in graphs, the results being presented in a quantitative and proportional ratio. For the purpose of this report an analysis of the information obtained from the survey will be presented in graphical form.

ISSN 2411-9571 (Print) ISSN 2411-4073 (online)
European Journal of Economics
and Business Studies April 2018 Vol 4 No 1
13
Figure 3: Nationality of the tourists involved in the survey
Source: own survey
From the information presented in (Figure 3), it is clear that the managers who participated in the survey are only bulgarians. This fact is due to the successful tourism business in Bulgaria and the favorable opportunities for building professional bulgarian managers to meet the contemporary requirements of the dynamic tourism industry .
Figure 4: Age range of participants in the study
Source: own survey
In the analysis of the obtained data in (Figure 4), it is clear that the largest number of participants in the survey are in the age range of 36-45 years old, accounting for more than half of the total number of all respondents. This fact is due to the preference of hotel owners to hire already established managers with experience but also with knowledge of new technologies, products and serv ices in the hotel industry . The second most important group involved in the survey is between the ages of 26-35. The representatives of this group being the young wave of managers who are less experienced but familiar with all new trends of modern tourism and are digitally oriented, hav ing the skills to deal with the latest and innovative technologies and methods of serv ice and business. The third age group by number of respondents in the study ranged from 46-55 years. Here we can find mainly managers with very wide practical experience but can be said that they belong to the older generation that is not technologically oriented in terms of processes related to the implementation and operation with innovative technologies and products in hotel industry . Managers of the age range over 55 years were not identified during the survey, perhaps due to the fact that they could very hardly use new and innovative technologies during their management duties. Which determines and sets the hotel owners who want to implement such technologies to orient themselves to other types of managers.
Nationality0
20
Bulgarians
Others
Bulgarians, 20
Others, 0
0
5
10
15
26- 35 years36 - 45years
46 - 55years +55 years
26- 35 years, 5
36 - 45 years, 12
46 - 55 years, 3
+55 years, 0

ISSN 2411-9571 (Print) ISSN 2411-4073 (online)
European Journal of Economics
and Business Studies April 2018 Vol 4 No 1
14
Figure 5: Are you support the implementation of innovative practices to optimize the activ ities of hotel complexes?
Source: own survey
In the survey (Figure 5) presents the answers of third question asked to all participants, which aimed at establishing the attitudes and preferences of managers towards the introduction and use of optimization practices in tourist serv ices. As the results show, 100% of all respondents are optimization supporters It can reasonably be concluded that modern managers in the tourism industry have a positive attitude towards the optimization of the stay in the hotel complexes managed by them.
Figure 6: Summarized results of the study of the attitude towards the optimization of the serv ice in selected hotel complexes.
Source: own survey
Figure 6 shows the value attitude in the answers to the questions received in the study. A specific point in the survey is the systematisation of questions from the fourth to eleventh in a way that addresses questions that combine four types of answers: "Yes", "Maybe", "No" and " I have no opinion"
20
00%
10%
20%
30%
40%
50%
60%
70%
80%
90%
100%
Yes No No opinion
Question 4
Question 5
Question 6
Question 7
Question 8
Question 9
Question 10
Question 11
Yes 18 19 16 18 20 15 17 17
Maybe 2 2 2 2 2 2
No 2
No opinion 1 2 1 1 1
0
5
10
15
20
25

ISSN 2411-9571 (Print) ISSN 2411-4073 (online)
European Journal of Economics
and Business Studies April 2018 Vol 4 No 1
15
Regarding the fourth question from the survey, it is clear that the choice of the “Yes” answer is a leading one and takes into account the personal and direct experience of the managers regarding the innovative approach in the serv ice. Followed by the answer "Maybe," with notably small amounts of background of the overall opinion on the asked question. The specific moment in the analysis of the information on the given question is related to the fact that the answer "No" does’t ex ist in the selection of the interv iewed managers, which itself is a testimonial for the positive impact of an innovative approach. The fifth question also integrates almost absolute values of the “Yes” response. Followed from the "I have no opinion" response that was noted with only one participant in the surveyed group. The preferred answer is in values from which it can be accepted as dominating and shows the direct experience of managers regarding the usefulness of using chips bracelets in the overall activ ity of the complex. On the six th question, the analysis of the information shows extremely high values of the "Yes" answer, the second and the third choice of the respondents being the answers "Maybe" and " I have no opinion " with two preferences. It is noteworthy that the answer "No" is missing as it is a direct expression of the additional efficiency in accounting that comes from the introduction of the innovative product. The leading answer to the seventh question is related to the choice of "Yes", which is extremely dominant. Only two people chose the "Maybe" response during the study. The other two responses were not preferred by any of the study participants. This question shows the overall positive result of the introduction of the chip bracelet, with better management decisions affecting all levels and structures in the hotel complex. The eighth question is extremely interesting from an informational point of v iew as it shows the effectiveness of the innovative product implementation. 100% of all managers have chosen the "Yes" answer, confirming the high levels of creativ ity and innovativeness embedded in the innovative approach of this kind of tourist serv ice. The ninth question also addresses the tangible leading role of the "Yes” answer, but must be noticed that this is the only question that contains the four types of answers selected in the study. The second most important answers are "Maybe" and "No" with 2 preferences, while the third choice is the " I have no opinion " option, preferred by only one of the managers surveyed. The tenth question combine together three of the possible answers, div iding their number into similar amount in the study so far. A leading choice is the “Yes” answer chosen by seventeen managers involved in the study, followed by the answer "Maybe" with two preferences, and the third is the "I have no opinion" with only one answer. These magnitudes of our responses are due to the fact that still in the Bulgarian hotel serv ices are some specifics regarding the management priorities. Some of them sometimes do not take into account the values of satisfaction of their tourists in contrast to other leading world and European hotel industry . The last eleventh question takes into account the leading role of the "Yes" response as the main choice of surveyed managers. Followed by the answer "Maybe," while the " I have no opinion" answer takes the third position. It should be noted that the answer "No" is not preferred by any of the survey participants. The answer to this question clearly reflects the v iews and opinions of the interv iewed managers about the future of the hotel serv ice and draws attention to the use of creative and innovative approaches in it.
5. Conclusion
The data obtained from this study show that innovative practices impacting on better management decisions, consequently improv ing organizational structure in tourism serv ices and they are increasingly important in the activ ity of each touris t enterprise. It can be argued that the innovative products and serv ices offered by the tourist companies, modeling and predetermine the choice of a specific tourist destination in the conditions of an extremely dynamic competitive environment. Modern tourists orient their preferences to destinations that prov ide them with comfortt, security , fast and quality serv ice as well as technological solutions that contribute to a more complete personal satisfaction and memorable holiday. Undoubtedly , the innovative products and serv ices offered by tourism companies are one of the most important factors in the contemporary tourism business, they allow modern managers to make decisions that are based on a large practical information and which are aimed at maximally satisfy ing all the requirements of tourists. The 21st century tourist is extremely knowledgeable and has a variety of modern methods and technologies to modeling his preferences and ways to achieve a full tourist experience and satisfaction. That is why it can reasonably be argued that tourism innovations are the key to better management in tourism, being one of the most important prerequisites for creating a better organizational structure in hotel complexes and one of the main factors, which determine the preferences and motivation of modern tourists.

ISSN 2411-9571 (Print) ISSN 2411-4073 (online)
European Journal of Economics
and Business Studies April 2018 Vol 4 No 1
16
References
[1] Ianeva, M., Georgieva, R.,"Innovations of the MICE tourism: Opportunities in Bulgaria", 3rd International Scientific Business Conference on Leadership and Management: Integrated Politics of Research and Innovations – LIMEN 2017, Belgrade, Serbia
[2] Kaleychev.S., 2017, “ Influence of technological transformations on innovative practices in tourism ”, XXV Symposium "Quality , Competitiveness, Sustainable Development" - "The Challenges of the New Technological Transformation", Sofia, Bulgaria
[3] Mathers. M., Fox, N., A. Hunn, “SURVEYS AND QUESTIONNAIRES”, NIHR RDS for the East Midlands / Yorkshire & Humber 2009
[4] Stankova.M, Kaleychev.S., 2017, “The trajectory of creativity and innovation in tourism” XIII International Scientific Conference - Modern Science, Business and Education, Dobrich, Bulgaria
[5] Stankova, M. & S. Kirilov , S. Kaleichev, I. Vasenska (2015), “ Innovation and tourism – Getting sustainability trough good practices”. Sustainable mountain regions: make them work, International Scientific conference, Proceedings 14-16 May 2015, Borovets, Bulgaria. ISBN 978-954-411-220-2, p. 175.
[6] Tsonev, N., Kaleychev, S., Innovative practices as a premise for creating a better organization in tourism companies”, 3rd International Scientific Business Conference on Leadership and Management: Integrated Politics of Research and Innovations – LIMEN 2017 , Belgrade, Serbia
[7] http://libweb.surrey.ac.uk/library/skills/Introduction% 20to% 20Research% 20and% 20Managing% 20Information% 20Leicester/page_51.htm

ISSN 2411-9571 (Print) ISSN 2411-4073 (online)
European Journal of Economics
and Business Studies April 2018 Vol 4 No 1
17
DOI: 10.26417/ejes.v4i1.p17-29
Open Access. © 2018 Nertila Cika et al..
This is an open access article licensed under the
Creative Commons Attribution-NonCommercial-NoDerivs 4.0 License
The Role of Auditors against Money Laundering - Albania Case
Nertila Cika
PhD Cand., Faculty of Economy, University of Tirana, Albania
Sotiraq Dhamo
Prof. Dr. , Faculty of Economy, University of Tirana, Albania
Igli Tola
Faculty of Economy, University of Tirana, Albania
Abstract
In the process of the globalization of the economy one of the biggest challenges is combating and preventing criminal activ ities such as the money laundering. This phenomenon affects the failure of many sectors, such as monetary and banking system, the loss of public confidence in the financial system, the problem in calculating GDP in the affected countries. Albania has been considered a 'paradise' for investing and money laundering from suspicious or illegal activ ities, for more than 20 years. To prevent Money Laundering is necessary to make proper legislation and the involvement of several parties, including also the accounting professionals. The purpose of this paper is to estimate the role and function performed by Albanian Chartered Auditors (CAA –EKR) and auditors of State High Control Institution against Money Laundering. We try to give answer to the main research questions as: Are the Albanian auditors involved in fighting Money Laundering? Which is the level of legislation of Albania regulated against Money Laundering? What is the role of professional body of the auditors in preventing Money Laundering? The conclusions of this paper are based on literature rev iew and data analysis through the independent test, Chi-Square test, gathered from questionnaires designed and intended for Albanian auditors to understand practically how they face this phenomenon in Albania. We find out a negligence of the auditors in reporting ML.Typically the construction companies with Albanian capital are involved in the money laundry transactions and further research studies are recommended to be made.
Keywords: money laundering, auditors, accounting professionals, procedure, financial statements
Introduction
For many years the world faces a very delicate and negative phenomenon that is money laundering. With the development of the world's economies, with the increase of controls over the use of money and their source, the efforts of certain person s or groups have been increased to "clean" their money earned by criminal activ ity , corruption and tax evasion. Globalization of the economy has caused this phenomenon from a national phenomenon to become an international phenomenon because the efforts of criminal groups to “clean” money actually extend to other countries where the opportunities evaluated by them are greater. According to INCSR (2017, Volume 2, March 2017, pg 6) as in past years, money laundering continues to be a serious global threat. As transnational criminal organizations, terrorist groups, and other bad actors increasingly draw upon new technologies and criminal techniques to fund their illegal activ ities and generate and launder their considerable proceeds, the challenges faced by the financial, law enforcement, superv isory, legal, and intelligence communities are exacerbated. Jurisdictions flooded with illicit funds remain vulnerable to the breakdown of the rule of law, the corruption of public officials, and destabilization of their economies.
ISSN 2411-9571 (Print) ISSN 2411-4073 (online)
European Journal of Economics
and Business Studies April 2018 Vol 4 No 1
18
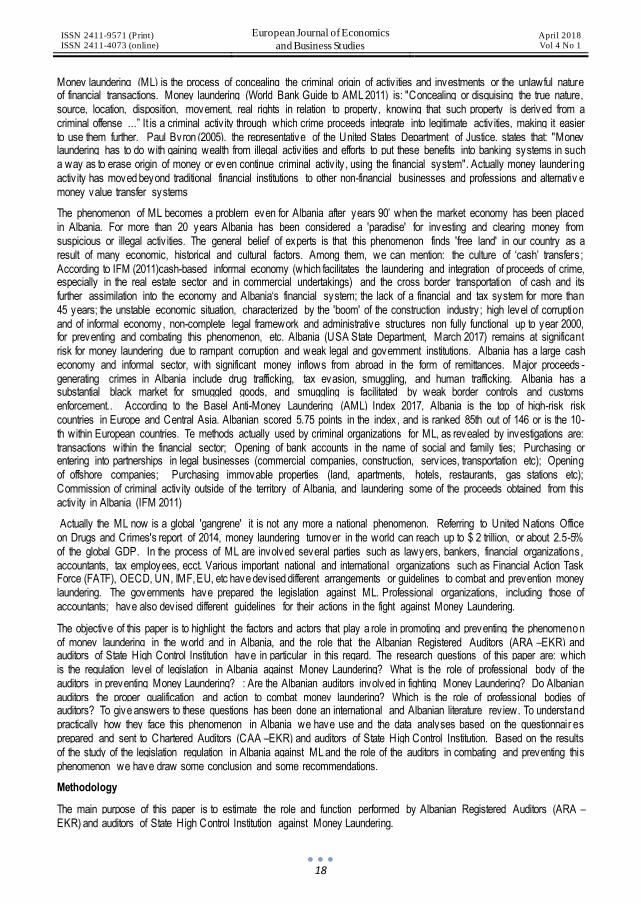
Money laundering (ML) is the process of concealing the criminal origin of activ ities and investments or the unlawful nature of financial transactions. Money laundering (World Bank Guide to AML 2011) is: "Concealing or disguising the true nature, source, location, disposition, movement, real rights in relation to property , knowing that such property is derived from a criminal offense ...” It is a criminal activ ity through which crime proceeds integrate into legitimate activ ities, making it easier to use them further. Paul Byron (2005), the representative of the United States Department of Justice, states that: "Money laundering has to do with gaining wealth from illegal activ ities and efforts to put these benefits into banking systems in such a way as to erase origin of money or even continue criminal activ ity , using the financial system". Actually money laundering activ ity has moved beyond traditional financial institutions to other non-financial businesses and professions and alternativ e money value transfer systems
The phenomenon of ML becomes a problem even for Albania after years 90’ when the market economy has been placed in Albania. For more than 20 years Albania has been considered a 'paradise' for investing and clearing money from suspicious or illegal activ ities. The general belief of experts is that this phenomenon finds 'free land' in our country as a result of many economic, historical and cultural factors. Among them, we can mention: the culture of ‘cash’ transfers; According to IFM (2011)cash-based informal economy (which facilitates the laundering and integration of proceeds of crime, especially in the real estate sector and in commercial undertakings) and the cross border transportation of cash and its further assimilation into the economy and A lbania‘s financial system; the lack of a financial and tax system for more than 45 years; the unstable economic situation, characterized by the 'boom' of the construction industry ; high level of corruption and of informal economy, non-complete legal framework and administrative structures non fully functional up to year 2000, for preventing and combating this phenomenon, etc. Albania (USA State Department, March 2017) remains at significant risk for money laundering due to rampant corruption and weak legal and government institutions. Albania has a large cash economy and informal sector, with significant money inflows from abroad in the form of remittances. Major proceeds -generating crimes in Albania include drug trafficking, tax evasion, smuggling, and human trafficking. Albania has a substantial black market for smuggled goods, and smuggling is facilitated by weak border controls and customs enforcement.. According to the Basel Anti-Money Laundering (AML) Index 2017, Albania is the top of high-risk risk countries in Europe and Central Asia. Albanian scored 5.75 points in the index, and is ranked 85th out of 146 or is the 10-th within European countries. Te methods actually used by criminal organizations for ML, as revealed by investigations are: transactions within the financial sector; Opening of bank accounts in the name of social and family ties; Purchasing or entering into partnerships in legal businesses (commercial companies, construction, serv ices, transportation etc); Opening of offshore companies; Purchasing immovable properties (land, apartments, hotels, restaurants, gas stations etc); Commission of criminal activ ity outside of the territory of Albania, and laundering some of the proceeds obtained from this activ ity in Albania (IFM 2011)
Actually the ML now is a global 'gangrene' it is not any more a national phenomenon. Referring to United Nations Office on Drugs and Crimes's report of 2014, money laundering turnover in the world can reach up to $ 2 trillion, or about 2.5-5% of the global GDP. In the process of ML are involved several parties such as lawyers, bankers, financial organizations, accountants, tax employees, ecct. Various important national and international organizations such as Financial Action Task Force (FATF), OECD, UN, IMF, EU, etc have devised different arrangements or guidelines to combat and prevention money laundering. The governments have prepared the legislation against ML. Professional organizations, including those of accountants; have also devised different guidelines for their actions in the fight against Money Laundering.
The objective of this paper is to highlight the factors and actors that play a role in promoting and preventing the phenomeno n of money laundering in the world and in Albania, and the role that the Albanian Registered Auditors (ARA –EKR) and auditors of State High Control Institution have in particular in this regard. The research questions of this paper are: which is the regulation level of legislation in Albania against Money Laundering? What is the role of professional body of the auditors in preventing Money Laundering? : Are the Albanian auditors involved in fighting Money Laundering? Do Albanian auditors the proper qualification and action to combat money laundering? Which is the role of professional bodies of auditors? To give answers to these questions has been done an international and Albanian literature rev iew. To understand practically how they face this phenomenon in Albania we have use and the data analyses based on the questionnair es prepared and sent to Chartered Auditors (CAA –EKR) and auditors of State High Control Institution. Based on the results of the study of the legislation regulation in Albania against ML and the role of the auditors in combating and preventing this phenomenon we have draw some conclusion and some recommendations.
Methodology
The main purpose of this paper is to estimate the role and function performed by Albanian Registered Auditors (ARA –EKR) and auditors of State High Control Institution against Money Laundering.

ISSN 2411-9571 (Print) ISSN 2411-4073 (online)
European Journal of Economics
and Business Studies April 2018 Vol 4 No 1
19
To achive the objective of the paper, the methodology used is a combination of primary and secondary data. The primary method used is the survey (questionnaire), which enables quantification because it measures the facts objectively . This method enables many cases to be studied with many subjects, and this gives us the ability to use statistical analysis and is more reliable than quality research. Questionnaires were addressed to 212 member of the Institute of Chartered Auditors of Albania (ICAA -IEKA) and to 20 auditors of Supreme Audit Institute (SAI-KLSH). The survey was conducted in Albanian language and the questionnaires are distributed during 2017 by e-mail using Google form. In total we get 46 responses. At first glance, this seems a small number of responses, but knowing that our target champion was no more than 232 indiv iduals, we can say that we have reached about 20 percent. So, this is a good percentage to take survey for this population.
In the survey, most of the questions (9) are closed because they are easier to get an answer from the auditor, and it's easier to make their encryption because they are converted more quickly into statistical data. Only one question of the questionnaire was open questions so that respondents were free to express their opinion regarding the improvement of the procedures against ML. Searching was designed in such a way as to facilitate data collection and at the same time to achieve satisfactory results that would draw conclusions as close to reality
Among the secondary data used, an important place has had the literature on the ML in Albanian and foreign language, especially the Albanian legislation on ML, reports published by specialized national and international institutions, the various guide of international organization on ML and other studies and materials published in this filed. It helps to present a v iew on the ML as a phenomenon and its effects in economy and the necessity to combat it by all the parties involved, to analize the level of legislation on AML and the relative insituttions in Albania, particulary the requirements for companies and auditors and for comaprision with interenatioanl practice.
Reivew of Literature and Theoretical framework
There is important to understand what ML is, what is the role and the consequences in the national and global economy, why the parties are involved in this phenomenon and the role of the governments and vary professional bodies.
3.1 Money laundering as phenomenon
Any amount of money that is either directly or indirectly circulated, re-translated or transferred; transformed or allied to products and property derived from criminal or illegal activ ities and criminal offenses constitutes "dirty" (Bank Of Albania 2017) ”. Money Laundering is the process used to hide the source of money or assets arising from the activ ity criminal. Crime is motivated by profits and involves a variety of illegal activ ities from drug trafficking and smuggling to fraud, robbery and corruption.(GDPML 2015) Money laundering (Duhaime. C . 2014) is a process whereby the proceeds of crime are transformed into apparently legitimate money or other assets. It is said that the term ‘money laundering’ was coined from the practice of the American mafia who, at one time, channelled the cash proceeds of crime through launderettes to legitimize the cash. Whether this is true or not, the term ‘money laundering’ is now widely used. According to wikipedia definition Money laundering is the process of transforming the profits of crime and corruption into ostensibly "legitimate" assets (https://en.wikipedia.org/wiki/Money_laundering-30.01.2018). Anti-money laundering (AML) is a term mainly used in the financial and legal industries to describe the legal controls that require financial institutions and other regulated entities to prevent, detect, and report money laundering activ ities. Many countries have drafted their legislation to combat and prevent money laundering. Many international organizations have also been set up to combat money laundering.Anti-money laundering guidelines came into prominence globally as a result of the formation of the Financial Action Task Force (FATF) and the promulgation of an international framework of anti-money laundering standards. An effective AML program (AMF/CFT 2017) requires a jurisdiction to criminalise money laundering, giv ing the relevant regulators and police the powers and tools to investigate; be able to share information with other countries as appropriate; and require financial institutions to identify their customers, establish risk-based controls, keep records, and report suspicious activ ities. Money laundering (IFAC 2004) is the funneling of cash or other funds generated from illegal activ ities through legitimate financial institutions and businesses to conceal the source of the fund. Money laundering involves the manipulation of large quantities of illicit funds to distance them from their source quickly and in as undetectable a manner as possible. Because money -laundering activ ities may, however, have indirect effects on an entity ’s financial statements, they are of concern to externa l auditors
3.2. Albanian regulation AML
The regulation on AML in Albania has been started to prepare from the year 1995 and after. Albanian regulation and the relevant institution on AML is based on the international and European standards and legislation. Clearing money by

ISSN 2411-9571 (Print) ISSN 2411-4073 (online)
European Journal of Economics
and Business Studies April 2018 Vol 4 No 1
20
investing personally or through third parties is considered a criminal offense, sanctioned by Law: No. 9086, dated 19.06.2003 "On some amendments to Law no. 7895, dated 27.01.1995 "Penal Code of the Republic of Albania"; Law: No. 9085, dated 19.06.2003 "On some additions and amendments to Law no. 7905, dated 21.03.1995 "The Criminal Procedure Code of the Republic of Albania"; Law: No. 9084, dated 19.06.2003 "On some additions and amendments to Law no. 8610, dated May 17, 2000 "On the prevention of money laundering". As explained above, the prov ision of direct or indirect assistance, criminal or even extrajudicial activ ities deriv ing from good, movable or non-property and income, is also punishable. This is because you qualify as a Participant in this process.
Albanian AML legislation (Law No.9917, dated 19.5.2008/2011 Article no 3) define and the subjects involved in Money Laundering Prevention and legal obligation. Law no. 9084, dated 19.06.2003 states that subjects that should be v igilant and active participants in preventing and combating this phenomenon are besides the Banks and entities performing banking and financial activ ities, licensed by the Bank of Albania, other institutions or entities such Notaries, Lawyers, Registered Auditors, Consultancy Offices and Certified Chartered Accountants. This AML legislation considers as very important institution on fighting and prevention ML the Bank of Albania (BOA) and other commercial banks. The Bank of Albania, as well as its other counterparty banks in other countries, exercises a superv isory and controlling role over the entities licensed by it (Second Level Banks, Currency Exchange Points, etc). In exercising this function, it creates legal obligations for the prevention of the money laundering phenomenon.. In addition to the rigorous control of these units, the BOA also compiles mandatory enforceable regulatory policies for these vulnerable entities (Law No.9917, dated 19.5.2008 article 3). The law requires that any suspicious cases ev idencing during the oversight exercise be reported to the GDPML. In the event of confirmation of its suspicions, the BOA continues with monetary sanctions, the removal or suspension of licenses of the entities involved in the ML until the criminal offense of the responsible persons.
The main structure monitoring and directing the AML in Albania is General Directory for Prevention of Money Laundering (GDPML). The law no. 8610, dated 17.05.2000 establishment of the Albanian Financial Intelligence Unit (FIU). The unit was then baptized under the designation of the GDPML. This structure is empowered by the AML legislation (against money laundering and the fight against terrorism financing) to collect, manage and analyze reports submitted by enforcers to prevent and combat money laundering and terrorist financing. Apart from supply ing data to the prosecution and court, GDPML cooperates closely with other Financial Intelligence Units around the world. This is because nowadays money can be invested anywhere within a few minutes.
3.3 The AML regulation for Auditors and Accountants.
Albanian AML regulation involve in the fighting ML and the accounting profession and professional bodies which are e very important part of the entities and their business transaction. In particular it involve the registered auditors member of AIRA – IEKA) and the auditors of Supreme Audit Institution (High State Control). In order to assess whether the company has maintained an effective and AML compliance framework, the Inspection Procedure guided by the GDPML advises also to follow the Independent Testing of the Unit. The main purpose of independent testing is usually to determine the adequacy of the company's AML program, including whether it operates in accordance with the requirements of the AML Law and the policies pursued by society itself. Beside that in Albania GDPML has not the direct oversight on the professional auditors and accountants bodies, the legislation require from the company accountants to deal with the Internal Control System and their v iability to prov ide links to: Care should be shown to the documentation needed to identify the customer and his / her background; Categorize the risk from customers and the transactions carried out with them to identify customers potentially involved in local or international Money Laundering Schemes and to these clients should be shown Growth Care, not allowing to be overlooked without any transaction being scanned with them; As soon as their doubts come to their attention, public or anti criminal authorities should be contacted to report the case. Reporting also implies the filing of all the proofs we have available; The data they have available should not be deleted after reporting them to the relevant instances but should be kept to prevent this client or other related natural or legal persons from resuming the trade co-operation with auditors and accountants; Lastly , these accounting or auditing specialists need to periodically train relevant personnel training to be updated with the latest techniques and schemes that are used within this criminal record.
On other hand the professional bodies of Registered Auditors in Albania (IEKA-ICAA), based on Albanian regulation requirements on ML and the international standards of auditing has adopted some regulation regarding to the ML. One document used by ICAA for the rules on AML is Code of Ethics for Albanian registered Auditors (ARA). In Section 21 of the Code of Ethics (IEKA(2014) that each Registered Auditor should apply to best practice his duty, the procedure is followed up before accepting a business client.

ISSN 2411-9571 (Print) ISSN 2411-4073 (online)
European Journal of Economics
and Business Studies April 2018 Vol 4 No 1
21
Before accepting an engagement with a client, an ARA should assess whether this accession would create any threat to respect for fundamental principles. Potential threats to integrity or professional conduct may arise, for example, from controversial issues related to the client (owners, direction and activ ities). One case may be the taking of a potential client with unlawful activ ities such as money laundering, which makes them dishonest and manipulative about the proper reporting of the financial situation.The threat posed by each client needs to be assessed and protective measures are taken to eliminate or reduce threats to an acceptable level. Among these measures ARA should obtain the necessary warranty from the client that he will improve the governance practices of the company and will strengthen the internal control system in the framework of the ML fight or other illegal activ ities. Where there is no possibility and no optimism is seen to minimize the threats to a level acceptable by legislation, an ARA should not accept engagement with the client, as it is in v iolation of the basic principles of the profession to exercise by ARA. In article 27 of Code of Ethics is clarified when ARA is permitted and advisable to take into custody of Customer Assets. In this case ARA is legally required to seek information on the source of these assets and assess their legal and regulatory obligations. Only after this bureaucratic procedure has been carried out the EKR can demonstrate readiness to perform this serv ice.
There is also the Law No. 10 091, dated 5.3.2009 for the Legal audit and professional organization of auditors and chartered accountant in Albania, which have some more requirements on AML for auditors. Article 45 of this law requires to the registered auditors or auditing companies that are engaged in the statutory audit of private entities for which there is a public interest are obliged to publish annually within the first three months of the year reports of transparency giv ing all the necessary information regarding to the company and its engagements.All this procedural obligation arises to eliminate the possibility for these companies to have associates, joint executives or to be related parties to the entities to which they have performed the external audit serv ice. Since, in cases of breach of the principle of related parties, the auditor may not perform his / her duties in accordance with the law, and consequently , he / she may not record cases of criminal offenses, such as Money Laundering.
The Law No. 10 091, amended, in Article 3 “Public oversight” regulate the role of Public Oversight Board to oversee audit professionals. The mission of ARA is for auditing to be carried out in the context of a transparent, controlled and prudent environment and in the serv ice of public interest. This is because, as controlled as the environment, the easier it is to identify cases of legal v iolations such as money laundering. This is a rule of nature, because the jolts love darkness. Thus, enlightenment 'enlightenment' not only facilitates the detection of money laundering schemes, but it also helps prevent the phenomenon, as discouraged parties are involved. This is based on the principle of the Sample Force.
At the article 11 of Law No.9917 For ML prevention, dated 19.5.2008 amended and updated later, it is adv ised that the entity is obliged to apply a policy for the implementation of procedures for enhanced v igilance in the case of clients and transactions of high risk categories. This procedure advises that the entity minimally employs a Responsible Person and a Vice-Responsible for Preventing Money Laundering at administration / management levels at the head office and at any branch office, subsidiary or agency.
The normative acts and other prov isions based on this law state that at least the responsible person or deputy responsible for AMLs have been professionally established in the accounting field and have been prov ided with the necessary information on audit legal practices. This is because only an accountant or auditor is able to identify , analyze or prevent ML transactions. This accumulated ability from education and experience to read the accounting records and to deepen the analysis of transactions or backlogs that are hidden behind dubious accounting records. The law states the obligation for the private or public entities to keep accounting and other regular and transparent records and books, to conserve the documentations for each transaction with or on behalf or clients form at least 5 years, and to facilitate the GDPL for the possible controls. There is clear here the very important role of the accountants and auditors. The companies and accountatnas and auditors are obligated to report to the GDPML for all the trasanciton done in cash for an amount on 1 milion ALL (aaround 7.5 thousand Euro).
If we compare the regulation in Albania and its requirement for auditors, accountants and companies for AML there are similarities. In general all the AML regulation require the companies to apply a policy for the implementation of procedures for AML, to have e person responsible for Preventing Money Laundering at administration / management levels, require from auditors and accountants serv ing to their clients to apply certain procedures and v igilance to prevent the engagement with suspicious clients and to inform to proper AML authorities when during their engagement they have reasonable doubts that clients is curry on ML transactions.

ISSN 2411-9571 (Print) ISSN 2411-4073 (online)
European Journal of Economics
and Business Studies April 2018 Vol 4 No 1
22
The results of AML regulation over the years
During the recent years Albania has done e significant progress in improv ing its AML regulation and has established the legal and regulatory framework. In 2016, the Albanian parliament passed several significant constitutional and legal reforms aimed at tackling corruption and organized crime. The reforms, if implemented properly , will result in better enforcement of money laundering and other financial crime laws. Albania has made technical improvements to its AML regime. These include increasing predicate crimes covered by the AML law, establishing Customer Due Diligence (CDD) measures for financial institutions, and improv ing the powers and processes used by authorities
In recent years GDPML has had god results on AML. As it shown in report of GDPML before the Co-ordination Committee of the Fight against Money Laundering on 15.02.2017, during 2016 approx imately € 29 million was blocked through 61 administrative orders from the GDPML, which marked a significant increase compared to the prev ious year (2015) when about € 16 million were blocked through 47 orders. Over the last three years 56 million Euros have been blocked in the bank accounts of suspected persons (8 milion for total years from 2000-2013)
In this report mention above, GDPML was concerned on the level that of accounting professionals involved in reporting and recording cases of suspected of money laundering.
Table 1- cases of suspected of money laundering reported by Reporting Subjects
Reporting Subjects Year 2013 Year 2014 Year 2015 Year 2016
Banks 420 822 585 619
Transfers company 45 74 79 209
Notary 15 122 303 205
Audit firm 1 0 0 1
Accounting ex perts 1 4 1 0 Motor v ihicle trading company 0 9 36 35
CIPRO 20 64 210 134
DPD 36 48 45 47
Source: Annual Report 2016. GDPML (General Directory for Preventation of Money Laundering). Pg.17 SARs reported by entities over the years.
As is clear from the table outlined in this report, the compilation of SARs (Suspicious activ ity report) by the accounting and accounting firms' offices is year after year in negligible figures. This situation becomes even more alarming when we think that it is precisely these professionals who can have full access to the activ ity and reports of each economic entity , being contracted by these units to keep their accounting or to carry out control in cases suspicion from the steering group for problems in different units of the unit.
As it is shown on the table 2 below, during these years is noted that the training on AML regulation attended by auditors was very low.
Table 2: Number of trained professionals to AML
Subjects Year 2014 Year 2015 Year 2016 Banks 120 285 108
Notery 237 73 127
EKA 1 0 1
Construction company 38 0 8
OJF 0 45 0
Insurance company 0 35 1
Superv isory authorities and Institutions 139 58 108
Motor v ihicle trading company 14 0 3
Foreign ex change points. 70 73 77
Source: Annual Report 2016. GDPML (General Directory for Preventation of Money Laundering). Pg. 12
Here we can perhaps get an explanation of why the number of accounting professionals reporting to the Compensation Offices in the GDPML is so low, with regard to suspected money laundering cases. One of the underly ing reasons is the training of accounting experts on AML regulation and procedures. As an integral part of the fulfillment of the obligation deriv ing from the law, the GDPML has probably been shown to be less active in raising awareness, training or sensitizing

ISSN 2411-9571 (Print) ISSN 2411-4073 (online)
European Journal of Economics
and Business Studies April 2018 Vol 4 No 1
23
the subjects of accounting activ ity , or the accounting experts themselves have shown negligence by not taking part in meetings or seminars with this framework.
Money Loundering effects on the economy.
Money Laundering is e phenomenon that has e several effects on the economy in national and international level. ML effect on microeconomics, and on macroeconomics
5.1 Effect on microeconomics.
One of the most serious microeconomic effects of money laundering is the large number of bankruptcies in the private sector. Money launderers often use the first companies (market leader), which associate the proceeds of illegal activ ity with legitimate funds to hide the wrong profits. In some cases, the first companies are able to offer priced products under what the manufacturers are costing to produce. Therefore, first companies have a competitive edge over legitimate firms that attract capital funds from financial markets. This makes it difficult, let's not say that it is impossible, for a lawful business to compete against big companies with subsidized funds, a situation that could result in private business -management by criminal organizations. The management principles of these criminal enterprises are not in line with the traditional principles of a free legal business market, resulting in further negative macroeconomic effects
Effect on macroeconomics
On point of macroeconomic v iew the ML effect financial, fiscal and banking system
Monetary and Budgetary Effects
In some developing countries, illegal revenue may lead to government budget shrinking, resulting in a loss of control over economy by governments. Indeed, in some cases, the size of the accumulated wealth pooled money laundering can be used to strike markets or even small economies
Money laundering can also adversely affect currency exchange rates or interest rates as money launderers reinvest funds where their schemes are less likely to be disclosed, rather than where the return rates are higher. Similarly , money laundering can increase the threat of monetary instability due to the misapprehension of resources from artificial distortions in asset and commodity prices. The unpredictable nature of money laundering, coupled with the loss of policy control, can make sound economic policy difficult to achieve, causing galloping distortions in the market.
Money launderers are not interested in generating profits from their investments but in protecting their income. They therefore invest their funds in activ ities that are not necessarily economically useful for the country where the funds are placed. Moreover, as long as money laundering and financial crime convey funds from sound investments in low -quality investments that hide their income, economic growth may suffer. In some countries, for example, all industries, such as hotels and cunstruction, have not been funded due to current demand, but due to the short-term interests of money launderers. When these industries do not fit the money launderers, they abandon them, causing a drop in these sectors and major damage to these economies.
Fiscal effect
Money laundering reduces government tax revenue and hence indirectly damages the honest taxpayers. It also makes government tax collection more difficult. This revenue loss generally means higher tax rates than would normally be the case if unpaid crime proceeds were legitimate.
It also threatens the efforts of many states to introduce reforms to their economies through privatization. Criminal organizations have the financial capacity to surpass legitimate buyers for prev ious state-owned enterprises. Moreover, while privatization initiatives are often beneficial, they can also serve as a means of fundraising. In the past, criminals have been able to buy marinas, resorts, casinos and banks to hide their illegal income and further their criminal activ ities
Effect on the Banking System.
Countries cannot allow reputation and financial institutions to be harmed by money laundering, especially in today 's world economy. Consumer confidence in the markets and in the signaling role of profits has weakened and eroded by money laundering. The negative reputation derived from these activ ities reduces the opportunities for sustainable growth by attracting international criminal organizations with undesirable reputation and short-term goals. This may lead to slower economic growth and economic growth at minimum levels. Moreover, once a country 's financial reputation has been

ISSN 2411-9571 (Print) ISSN 2411-4073 (online)
European Journal of Economics
and Business Studies April 2018 Vol 4 No 1
24
damaged, its resurgence is very difficult and requires significant government resources to correct a problem that could be prevented by proper anti-money laundering controls. It would not be difficult to imagine the fall or the failure of a reputable financial center if it would become synonymous with the purification of criminal assets. This is because we consider the importance of 'good name' and reputation in attracting and retaining business in the financial industry . Therefore, the importance of confidence and the need for transparency in the financial system cannot be underestimated, especially as it is known that it makes a significant contribution to the GDP.
Analysis of results and research findings
The questionnaire answered 46 registered auditors and SAI’auditors, of whom 46.7% were female and 53.3% male. 38 (83% ) respondes are registered auditors and 8 (17% ) are SAI’auditors. According to the survey data, majority of all respondets are over 50 years. This is not a strange think, because to be an accounting porffesional to need to have lots of work experineces, so it is difficult to find an accounting expert who is younger than 30 years.
The majority (60.5 % ) of registered auditors answered that they Never encountered the ML phenomenon within a year meanwhile the SAI’s auditors mostly (62.5 % ) respond to face this phenomenon in few cases within a year.
Almost all the respondents answered that are mostly informed on the ML and AML regulation by the professional bodies they adhere to. We expected this answer because, the professional bodies in Albania, are organized according to EU regulations and are also positively assessed by internationals institutions.
We included in the questionaire some questions about the size, ownership, industry etc of the enterprises, which are more inclined to undertake Money Laundering, to take the information if the ML phenomenon is depended by this factors. As we expected the Registered Auditors responds that it is VIP Business with annual turnover over 150 million lek which are more included in Money Laundering, while 58% of SAIs auditors respond that are VIP Business and 48% respond that are SME. The answers for this question are presented in the table.
Table 3: The effect of the company size on the ML
Source: Authors own work
The question on the impact of the lifespan of the business on the ML of activ ity most of Registered auditors are doubled between categories '1 – 3 years' and 'over 10 years'. However, prevails the idea that they have '1 to 3 year' in activ ity. While SAI’s auditors support categories: '5 to 10 years' and 'over 10 years', and with a light majority wins idea '5 to 10 years'. So in conclusion in ML activ ities are involved more the young and old businesses.
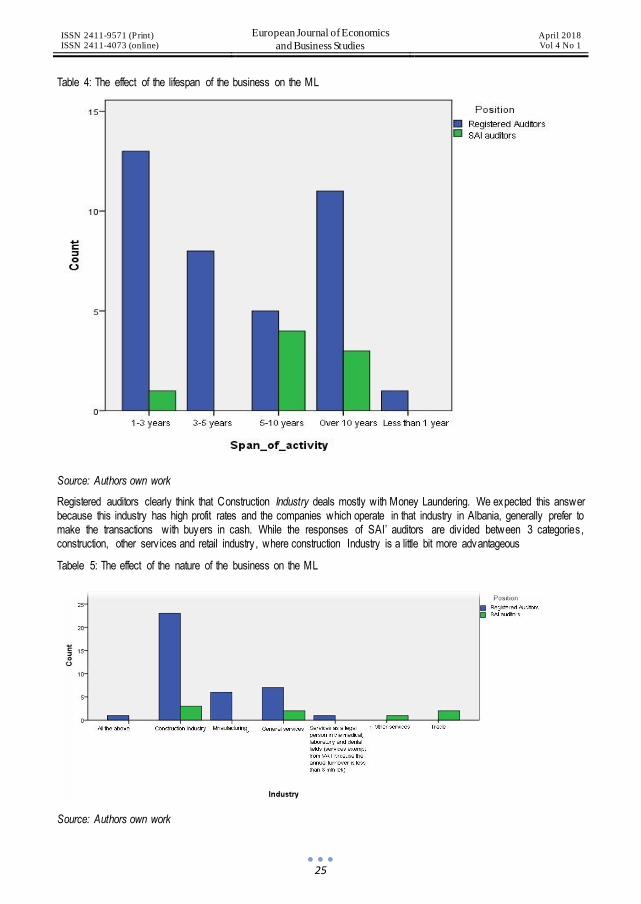
ISSN 2411-9571 (Print) ISSN 2411-4073 (online)
European Journal of Economics
and Business Studies April 2018 Vol 4 No 1
25
Table 4: The effect of the lifespan of the business on the ML
Source: Authors own work
Registered auditors clearly think that Construction Industry deals mostly with Money Laundering. We expected this answer because this industry has high profit rates and the companies which operate in that industry in Albania, generally prefer to make the transactions with buyers in cash. While the responses of SAI’ auditors are div ided between 3 categories, construction, other serv ices and retail industry , where construction Industry is a little bit more advantageous
Tabele 5: The effect of the nature of the business on the ML
Source: Authors own work

ISSN 2411-9571 (Print) ISSN 2411-4073 (online)
European Journal of Economics
and Business Studies April 2018 Vol 4 No 1
26
To the question if companies owned by Albanian capital or foreign capital, both categories have responded in majority that, companies with owned by Albanian capital are mostly involved in this illegal activ ity . This was a response we expected, because it is much easier to create ghost companies with a Albanian partner.
Regarding to the level of collaboration between auditors and other accountants with state institutions such GDPML and Central Bank, in relative to ML, registered auditors respond something in the midst of ‘Weak' and ' Good'. While SAI’s auditors seem to have a more fruitful collaboration with these institutions as they are between 'Good ' and ' Very good'. Probably because they are employed in the state institution as SAI is. This is not a good sign of the fighting of this phenomenon, as it requires inter-disciplinary collaboration to achieve the expected results. However, this non-coordinat ion between the institutions and accounting professionals was noted, even in the GDPML report for the year 2017 where it was ev idenced that during one year were trained only one accounting expert and one auditor
Independence test
To prove the independence of the data received from the survey we used Chi-Square test. According to this test method should be calculate the index ‘p’ .To be independence between data tested this ‘p’ should be lower than 0.5 and to be depended the ‘p’ should be greater than 0.5.
6.1.a. Chi-Square test for the influence or not in the answers given by respondents of their position, age and gender.
To prove the independence between the position of the auditors and the source that they use for information based on Chi-Square test, we find out that the 'p‘ value is 0.37 > 0.05, so the variables are independent. So the information given by the auditors are not depended by their position.
Testing the relationship between age and source of information the result is that 'p‘ value is 0.048 < 0.05, so the variables are dependent. So, we can say that source of information that the auditors use, depend just by their age. Younger experts use more technology and international updates, than the older who less flex ible and use just info, prov ided by professional bodies.
Table 6
Chi-Square Tests –position-source of information
Value df Asy mptotic Significance (2-sided)
Pearson Chi-Square 6.499a 6 .370
Likelihood Ratio 6.455 6 .374
N of Valid Cases 46
Chi-Square Tests age-source of information
Value df
Asy mptotic
Significance (2-sided)
Pearson Chi-Square 29.013a 18 .048
Likelihood Ratio 28.943 18 .049
N of Valid Cases 46
Source: Authors own work
The ‘p‘value calculated for testing of relationship between Gender – Source of information result to be 0.58 > 0.05, so the the variables are independent. That mean that the gender do not has influence on source on the information used by auditors

ISSN 2411-9571 (Print) ISSN 2411-4073 (online)
European Journal of Economics
and Business Studies April 2018 Vol 4 No 1
27
Table 7
Chi-Square Tests –gender –source of inforamtion
Value df Asy mptotic Significance (2-sided)
Pearson Chi-Square 4.721a 6 .580
Likelihood Ratio 6.237 6 .397
N of Valid Cases 46
Source: Authors own work
6.1.b. Chi-Square test the relationship that exists between business size and other business characteristics
We have tested the relationship between the business size on duration of activ ities, industry and ownership.
Testing the relationship between business size and Duration of activ ity the ‘p‘value result to be 0.027 < 0.05, so it is lower than 0.05 (0.027 < 0.05) what means that these variables are dependent. That mean that bigger businesses longer their business life.
Chi-Square Tests - business size - industry
Value df
Asy mptotic Significance (2-sided)
Pearson Chi-Square 31.794a 12 .010
Likelihood Ratio 22.557 12 .032
N of Valid Cases 46
The ‘p‘value calculated by Chi-Square test for relationship business size with industry is 0.01 < 0.05, so the variables are dependent.
Table 8
Chi-Square Tests – business size-duration of activity
Value df
Asy mptotic Significance
(2-sided)
Pearson Chi-Square 17.299a 8 .027
Likelihood Ratio 22.102 8 .005
N of Valid Cases 46
Source: Authors own work
The Chi-Square Independence test has given us a ‘p‘value 0.348 > 0.05 for the relationship of business size with ownership of business which proves a independence relation between these variables..That means the ownership do not efect the size of the companies.
Table 9
Chi-Square Tests - business size with ownership
Value df Asy mptotic Significance (2-sided)
Pearson Chi-Square 4.452a 4 .348
Likelihood Ratio 5.660 4 .226
N of Valid Cases 46
Source: Authors own work
Conclusions
Money laundering is considered by the international institutions and the researches as an illegal activ ity . It is a criminal activ ity through which crime proceeds integrate into legitimate activ ities, making it easier to use them further. It involves the

ISSN 2411-9571 (Print) ISSN 2411-4073 (online)
European Journal of Economics
and Business Studies April 2018 Vol 4 No 1
28
manipulation of large quantities of illicit funds to distance them from their source quickly and in as undetectable a manner as possible.
Globalization of the economy has caused the ML from a national phenomenon to become an international phenomenon because the efforts of criminal groups to “clean” money actually extend to other countries where the opportunities evaluated by them are great. The increase of illegal activ ities on drugs, human traffics, corruptions are factors in the increase of the amounts of money which “need” to be clean by them owners. To combat and prevent ML several organization national and international has draw the rules, standards and legislation for AML, such Financial Action Task Force which has issue International standards on combating money laundering and the financing of terrorism.
Albania has been considered as a country with high activ ity on money laundering as a result of many economic, historical and cultural factors such: cash-based informal economy, the cross border transportation of cash and its further assimilation into the economy and Albania‘s financial system; the lack of a financial and tax system for more than 45 years; the unstable economic situation, characterized by the 'boom' of the construction industry ; high level of corruption and of informal economy, non-complete legal framework and administrative structures non fully functional up to year 2000, for preventing and combating this phenomenon; the ex istence of a substantial black market for smuggled goods, and smuggling is facilitated by weak border controls and customs enforcement, etc.
ML activ ities has negative impact in the economy, it avoids the honest competition on the market, it has monetary, budgetary and fiscal effect, in the banking and financial system
Money laundering activ ities may, however, have indirect effects on an entity ’s financial statements and direct effect on the operating, financing and investing activ ity of the companies. Because the auditors and accountants are offering serv ices to the companies they can encounter ML activ ities. So the legislation AML requires from them to attend some procedures in relationships with clients and with doubtful ML transactions encounter during their engagement. Register Auditors Professional bodies in Albania (IRA-IEKA) in its Code of Ethic require to them members to attend the right procedures again ML. Several regulation such Civ il Code, AML law, Law for registered Auditors, Bank law states several requirement for companies, registered auditor and accountants.
From the literature rev iew and questionnaire we find out that there is e proper AML legislation in Albania and in coherence with international AML regulations and standards but it need to be implemented. Actually there is e positive progress in Albania against ML. From the survey was found out that there is e negligence of the auditors in the training on AML regulations.
The survey finds out that the construction industry , the big companies and the very yang and old companies are more affected by ML transactions. More affected by ML transaction are also the companies owned by Albanian capital
There is e lack of inter-disciplinary collaboration between auditors and other accountants with state institutions such GDPML and Central Bank, in relative to ML.
There is a need from Professional Bodies of Auditors and SAI for much more training on AML. There is necessary that the auditors to have much more in their sight during the engagement the ML transactions.
To achieve the expected results on AML there should be done much more to improve inter-disciplinary collaboration between auditors and other accountants with state institutions charged on AML.
To have e better and more information on the AML situation in Albaia and the beter invelvemt of auditors and accountants ti si recommended further research to be made including in the sampla more audtoras and the chartered accountants.
To have e better and more information on the AML situation in Albania and the better involvement of auditors and accountants it is recommended further research to be made including in the sample more auditors and the chartered accountants.
Literature
[1] ACCA. (2013)-Accountants and Money Laundering, Brief Guide for UK Practising Firms. 29 Lincoln’s Inn Fields
[2] Arunajith, U. (2015-)Effects of money laundering on economic progress. The Sunday Times. South Africa
[3] Bank of Albania. 2016- Brochure for ML. Pg 6. Tirana.
[4] Bank of Albania.2016- Statistical report 2016. Tirana
[5] Basel AML Index , 2017- Published by Basel Institute on Gov ernance, pg 3, 2017
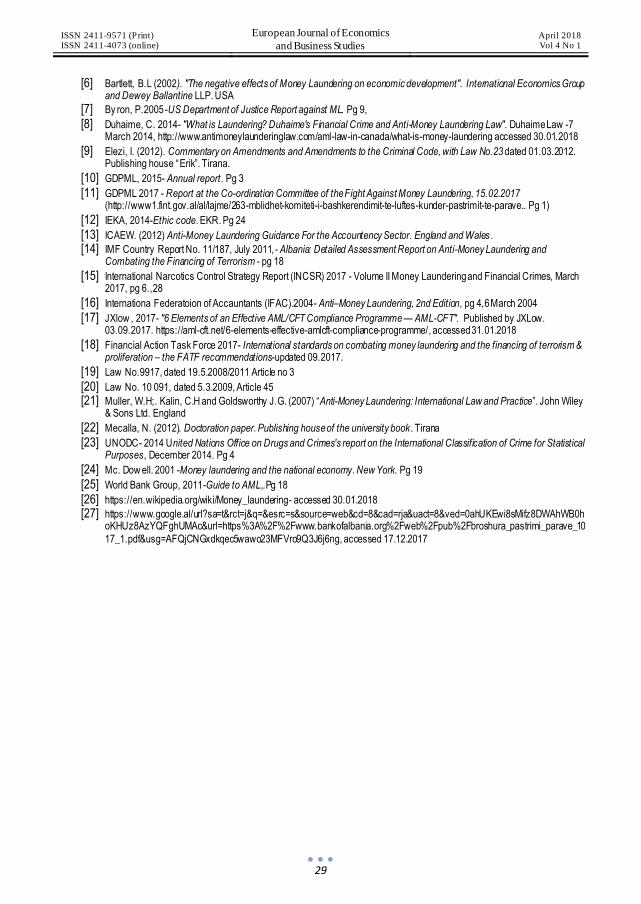
ISSN 2411-9571 (Print) ISSN 2411-4073 (online)
European Journal of Economics
and Business Studies April 2018 Vol 4 No 1
29
[6] Bartlett, B.L (2002). "The negative effects of Money Laundering on economic development". International Economics Group and Dewey Ballantine LLP. USA
[7] By ron, P.2005 -US Department of Justice Report against ML. Pg 9,
[8] Duhaime, C. 2014- "What is Laundering? Duhaime's Financial Crime and Anti-Money Laundering Law". Duhaime Law -7 March 2014, http://www.antimoneylaunderinglaw.com/aml-law-in-canada/what-is-money-laundering accessed 30.01.2018
[9] Elezi, I. (2012). Commentary on Amendments and Amendments to the Criminal Code, with Law No.23 dated 01.03.2012. Publishing house “Erik”. Tirana.
[10] GDPML, 2015- Annual report. Pg 3
[11] GDPML 2017 - Report at the Co-ordination Committee of the Fight Against Money Laundering, 15.02.2017 (http://www1.fint.gov.al/al/lajme/263-mblidhet-komiteti-i-bashkerendimit-te-luftes-kunder-pastrimit-te-parave.. Pg 1)
[12] IEKA, 2014-Ethic code. EKR. Pg 24
[13] ICAEW. (2012) Anti-Money Laundering Guidance For the Accountency Sector. England and Wales .
[14] IMF Country Report No. 11/187, July 2011,- Albania: Detailed Assessment Report on Anti-Money Laundering and Combating the Financing of Terrorism - pg 18
[15] International Narcotics Control Strategy Report (INCSR) 2017 - Volume II Money Laundering and Financial Crimes, March 2017, pg 6.,28
[16] Internationa Federatoion of Accauntants (IFAC).2004- Anti–Money Laundering, 2nd Edition, pg 4,6 March 2004
[17] JXlow , 2017- "6 Elements of an Effective AML/CFT Compliance Programme — AML-CFT". Published by JXLow. 03.09.2017. https://aml-cft.net/6-elements-effective-amlcft-compliance-programme/, accessed 31.01.2018
[18] Financial Action Task Force 2017- International standards on combating money laundering and the financing of terrorism & proliferation – the FATF recommendations-updated 09.2017.
[19] Law No.9917, dated 19.5.2008/2011 Article no 3
[20] Law No. 10 091, dated 5.3.2009, Article 45
[21] Muller, W.H;. Kalin, C.H and Goldsworthy J.G. (2007) “Anti-Money Laundering: International Law and Practice”. John Wiley & Sons Ltd. England
[22] Mecalla, N. (2012). Doctoration paper. Publishing house of the university book . Tirana
[23] UNODC- 2014 United Nations Office on Drugs and Crimes's report on the International Classification of Crime for Statistical Purposes, December 2014. Pg 4
[24] Mc. Dow ell. 2001 -Money laundering and the national economy. New York. Pg 19
[25] World Bank Group, 2011-Guide to AML,.Pg 18
[26] https://en.wikipedia.org/wiki/Money_laundering- accessed 30.01.2018
[27] https://www.google.al/url?sa=t&rct=j&q=&esrc=s&source=web&cd=8&cad=rja&uact=8&ved=0ahUKEwi8sMifz8DWAhWB0hoKHUz8AzYQFghUMAc&url=https%3A%2F%2Fwww.bankofalbania.org%2Fweb%2Fpub%2Fbroshura_pastrimi_parave_10
17_1.pdf&usg=AFQjCNGxdkqec5wawo23MFVro9Q3J6j6ng, accessed 17.12.2017
ISSN 2411-9571 (Print) ISSN 2411-4073 (online)
European Journal of Economics
and Business Studies April 2018 Vol 4 No 1
30
DOI: 10.26417/ejes.v4i1.p30-41
Open Access. © 2018 Natalia Kharadze and Ekaterine Gulua.
This is an open access article licensed under the
Creative Commons Attribution-NonCommercial-NoDerivs 4.0 License
Organizational Conflict Management Challenges
Natalia Kharadze
PhD in Economics, Manager of HPML, Professor of TSU
Ekaterine Gulua
PhD in Economics, CEO of HPML, Professor of TSU
Abstract
There is no organization without conflict situations. It is known that 80% of conflict situations occur independent ly of human will. Its causes are people’s indiv idual characteristics, as well as structure of the organization, conditioned by the culture established in the organization. How correctly organizational management analyzes the causes of conflicts, managing stress, diagnostic of the conflict and its management are reflected on the psychological climate of the organization. The psychological climate is directly related to the labor productiv ity of each member of the organization and the whole organization itself. On the background of strenuous labor relations, the potential of the organization members is spent on the settlement of the conflict env ironment and it takes a large part of their time budget. Proper use of time resources affects labor productiv ity . The Human Resources Management Laboratory which is functioning at Ivane Javakhishv ili Tbilisi State University has already conducted a research in this regard. Due to the actuality of the issue, the laboratory aimed to conduct a further research about conflict situations in the organization. The research was focused on the Faculty of Economics and Business of Ivane Javakhishv ili Tbilisi State U niversity . 458 respondents were interv iewed including Bachelor's and Master’s Degree Students, Professors and Administration Representatives. The questionnaire included 36 questions and 133 options of response. As a result of the research,frequency of conflict situations in the organization was established, the active link of conflict situations. The reasons for the involvement of the collective team members into the conflict have been identified. The attitude of respondents of different categories was interesting in terms of resolv ing conflict situations. Conflict situations combined with the rest of the stages include the analysis of the causes. Different categories of respondents differently understand the importance of analyzing the causes of conflicts. The study finally made many interesting problems clear. The results obtained were processed by the SPSS program. We have formulated the hypothesis, studied the influence of the status and the gender of a respondent (bachelor, master, professor, and representative of the administration) on up to 15 variables. Trends were revealed through the tables developed on dispersion analysis. The conclusions made on the basis of the analysis of the survey results gave us the opportunity to make recommendations for the recovering and systemic improvement of the established values in the organization. The planned events will help the collective to undergo 3 stages of self-organizatio n, meet the needs of the members, which will improve the psychological situation in the collective. It will facilitate each member’s involvement in order to protect the organization's prestige and traditions. It is interesting to note that the majority of respondents are loyal to the university , which confirms the true fact that Ivane Javakhishv ili Tbilisi State University is number one university in the country as well as in the region, is being developed and is constantly maintaining the championship and is try ing to improve the conditions of the collective members.
Keywords: Conflict Management, University , Human Resources Management, Management of Higer Education Institutions
ISSN 2411-9571 (Print) ISSN 2411-4073 (online)
European Journal of Economics
and Business Studies April 2018 Vol 4 No 1
31
Introduction
There is no organization without conflict situations. It is known that 80% of conflict situations occur independently of human will. Its causes are people’s indiv idual characteristics, as well as structure of the organization, conditioned by the culture established in the organization. How correctly organizational management analyzes the causes of conflicts, managing stress, diagnostic of the conflict and its management are reflected on the psychological climate of the organization. The psychological climate is directly related to the labor productiv ity of each member of the organization and the whole organization itself. Conflicts often lead to reduction of productiv ity and outflow of the best staff. (Engert, Gandhi, Schaninger, & So, 2010) On the background of strenuous labor relations, the potential of the organization members is spent on the settlement of the conflict env ironment and it takes a large part of their time budget. Proper use of time resources affects labor productiv ity . The Human Resources Management Laboratory which is functioning at Ivane Javakhishv ili Tbilisi State University has already conducted a research in this regard. Studies were related to time management, professors ' assessment criteria, and articles were published as well. (Kharadze N. Gulua E., 2016); (Kharadze, Natalia; Gulua, Ekaterine; Duglaze, Davit, 2017); (Gulua, Ekaterine; Kharadze, Natalia;, 2017); (Kharadze & Gulua, 2017).
Due to the actuality of the issue, the laboratory aimed to conduct a further research about conflict situations in the organization. The research was focused on the Faculty of Economics and Business of Ivane Javakhishv ili Tbilisi State University . 458 respondents were interv iewed including Bachelor's and Master’s Degree Students, Professors and Administration Representatives. The questionnaire included 36 questions and 133 options of response.
As a result of the research,frequency of conflict situations in the organization was established, the active link of conflic t situations. The reasons for the involvement of the collective team members into the conflict have been identified. The attitude of respondents of different categories was interesting in terms of resolv ing conflict situations. Conflict situations combined with the rest of the stages include the analysis of the causes. Different categories of respondents differently understand the importance of analyzing the causes of conflicts. The study finally made many interesting problems clear. The results obtained were processed by the SPSS program. We have formulated the hypothesis, studied the influence of the status and the gender of a respondent (bachelor, master, professor, and representative of the administration) on up to 15 variables. Trends were revealed through the tables developed on dispersion analysis. The conclusions made on the basis of the analysis of the survey results gave us the opportunity to make recommendations for the recovering and systemic improvement of the established values in the organization. The planned events will help the collective to undergo 3 stages of self-organization (Armstrong, 2000), meet the needs of the members, which will improve the psychological situation in the collective. It will facilitate each member’s involvement in order to protect the organization's prestige and traditions. It is interesting to note that the majority of respondents are loyal to the university , which confirms the true fact that Ivane Javakhishv ili Tbilisi State University is number one university in the country as well as in the region, is being developed and is constantly maintaining the championship and is try ing to improve the conditions of the collective members.
Effective work and psychological climate of the organization are often influenced by the current conflict analysis and management. There is no organization without conflict situations. A man is in conflict when he cannot see possibilities of changing the situation that is unacceptable to him. Although some forms of conflict are not only permissible but also desirable (Ebong, November 16, 2017) I do not support such an opinion and based on the practice we believe that in spite of the positive results of the conflict, it causes enormous energy expenditure and health disorder, I think the timely management of conflictogene is expedient in order not to be raised it in a conflict. The study showed that about 10% of respondents are often and always involved in conflict situations.
The largest number of conflict situations was reported with the administration, it constitutes 41% of respondents and the lowest 10% - with the staff.
Any conflict situation requires management. You cannot ignore the regularity of escalating conflicts. People try to respond to the conflictogenes that were addressed towards them with a stronger conflictogene. This regularity can be explained thus: when receiv ing a conflictogene the v ictim wants to compensate for psychological failure and tries to respond to the offence with an offence, what’s more it should not be weak, which causes increasing of the strength of the conflict. Unfortunately , people are so created, they painfully react to abusing and insulting and show anti-reaction. Of course, people with high morals have to be self-restrained, religion and ethical teachings tell us this too. The law of conflict escalation is often compared to the law of mechanics, where there is a similarity and also a major difference. The first is that people have a stronger anti-action and the second is that the law of mechanics is independent of our will, but we can stop escalation of conflicts, because it depends on human will.

ISSN 2411-9571 (Print) ISSN 2411-4073 (online)
European Journal of Economics
and Business Studies April 2018 Vol 4 No 1
32
Conflict management begins with its prediction. In order to predict a conflict, we must know the reasons that often lead to a conflict.
These are the reasons: amount of wages, undesirable labor conditions, mismanagement of labor, irrelevance of workers’ rights and duties, nonrhythmicity of labor, inconvenient working schedule, low level of discipline and others. A positive resolution of conflicts, first of all, implies eliminating the reasons that cause a conflict.
The main thing is to ask four questions: Where? What? When? How? Where is the real cause of the conflict? What should we do? When can we start acting? How should we act? Leave a conflict without attention is the same as to leave a gas stove, iron or candle in a flat where there is nobody. There may be no fire, but if it starts, one may extinguish it or not.
It is interesting to see what the study has shown, how the respondents have been involved in a conflict management or prevention. Do they have to involve a third person in solv ing their problem? Only 4% manage it always and often, which means there is no involvement of the superv isors in the management of conflict situations.
It is interesting to know the reason for the conflicts in which respondents have to be? If we consider that a large number of respondents have identified the conflict situation with the administration, it is no surprise that 25% of respondents name the wrong management system mostly as the reason for the conflict, followed by the character of a person (23% ) and 20% - unprofessionalism. There is a serious problem with the establishment of the collective in the organization, so it is not surprising that the respondents indicate the grave nature of people. It is difficult to keep calm when the collective is experiencing a crisis, there are defects in the management process and there is not a proper motivation of the actors.
According to the survey, 80% of respondents settle most of the conflict situations by themselves, the court's involvement is rare - only 2% indicated this position, 4% settle it with the help of friends and only 7% - with the involvement of the head.
The survey found that most respondents (77.7% ) believe that stating their opinions causes aggression in human beings. Naturally , such a form of communication can neither help establish psychological climate in the organization nor avoid conflicts. The conflict may not be formed, but the appeared conflictogene has a negative influence on consequences.
Almost 90% of respondents indicate that the success of the organization is influenced by the manager’s role. Consequently , we should assume that they mean a superv isor also to be the reason for failure and tension in the organization.
It is known that from the 6 stages of the conflict resolution (analy tical problem, prediction of conflict resolution options, determination of criteria, implementation of a conflict resolution plan, control of implementation, analysis of results)the six th is an analysis of results. The study has shown that approx imately 70% of respondents analyze the conflict situation, which can be considered as a good indicator.
Approx imately 32% of respondents frequently or always receive information about current conflict situations through informal communication, which indicates an unhealthy organizational culture.
Approx imately 46% of respondents are using their own channels to get the information they need. Hiding information due to different reasons often causes alarms, because hiding information makes a vacuum, this vacuum is filled with thousands of rumors that are not related to reality , there is a mistrust towards people.
Approx imately 61% of respondents sometimes or almost never solve a problem with stating his/her opinion. This may be due to many reasons. One of them can be thought as a strategy to avoid a conflict. They do not consider themselves as important members of the team.
The fact that an attempt to evade conflict situations is high and also that the respondents are dissatisfied with the organization's psychological climate and the dominant organizational culture is proved by that only about 12% of respondents often or always state their positions.
Obviously , the behavior of respondents are often conditioned by the fear of losing a job or of being excluded from the collective. To the question - whether the selection criteria are acceptable and transparent or not, a positive position was indicated by 30% . Since the organization believes that selection of personnel is largely subjective, we can conclude that the passiv ity and involvement of respondents in the management process are caused by fear of losing jobs.
From the theory two forms of collective are known: primary and secondary collectives. In the first case, the relationship is based on emotional and friendly feelings and includes 2-5 persons, and in the second case the formation of the collective is according to functions and purposes. The survey has shown that 21% are only members of the primary collective.

ISSN 2411-9571 (Print) ISSN 2411-4073 (online)
European Journal of Economics
and Business Studies April 2018 Vol 4 No 1
33
The survey has revealed that 41% try to prove their truth during the conflict, 1.3% agree with the opponent’s position; 16% do not contradict the opponent and remain in his/her position, 31% look for a compromise option, 5,4% do not pay attention to the conflict.
As a result of filtration, we have chosen different types of respondents to identify such factors as Q1 .... Q15, with the use of statistics we had an opportunity to analyze the connection of respondents with different status to specific variables:
We have formulated the following hypothesis:
H1: The status (Q1) - (undergraduates, master students, PhD students, academic personnel and administrative personnel) affects the variable. Q2- (conflict situations are often observed),
H2: The status affects the variable Q3 - What is the cause of the conflict in which you are involved (personal character, unprofessionalism, nepotism and equalization, mismanagement and other answers)?
H3: The status affects the variable Q6-Does your opinion often invoke aggression?
H4: The status affects the variable Q12. Do you hold your own position in an official writing form?
It turned out that the rate of presence of conflict situations is much lower in students and the higher rate was observed in the administration. In particular, there are always 1,2% of bachelors in the conflict, 0,2% of master students, 0,2% of doctoral students, 5,3% of academic staff and 8,6% of administration. As we see the administration have to work in the most tense and stressful situation, which can be evaluated as the deficiency in management. See the Diagram 1.
It is interesting to find out with whom the conflict situations the respondents mostly have. See the Diagram 2. From bachelor s the lowest indicator (16,2% ) is observed in their category. Most of them (36.8% ) are in a conflict with the administration.
Master students have the least conflict in their category and with the staff and it constitutes 4,9% and they most frequently have conflicts with the administration (65.4% ).
PhD students have the least (2% ) conflict with academic personnel and most frequently are in conflict situations with the administration and this figure is 65,3% .
Academic personnel have the least conflict with the staff, and it constitutes 5% and most often with the administrative staff and this rate is 3% .
As for the administration they have the least conflict with the members of administration itself and this figure is 8,3% and most frequently they are confronted with the students and professors and these rates are 16.7% and 13,9% respectively .
It is also interesting that only academic personnel do not indicate having conflicts with everyone and 22% of administrativ e personnel confirm having conflicts with everyone and are on a leading position.
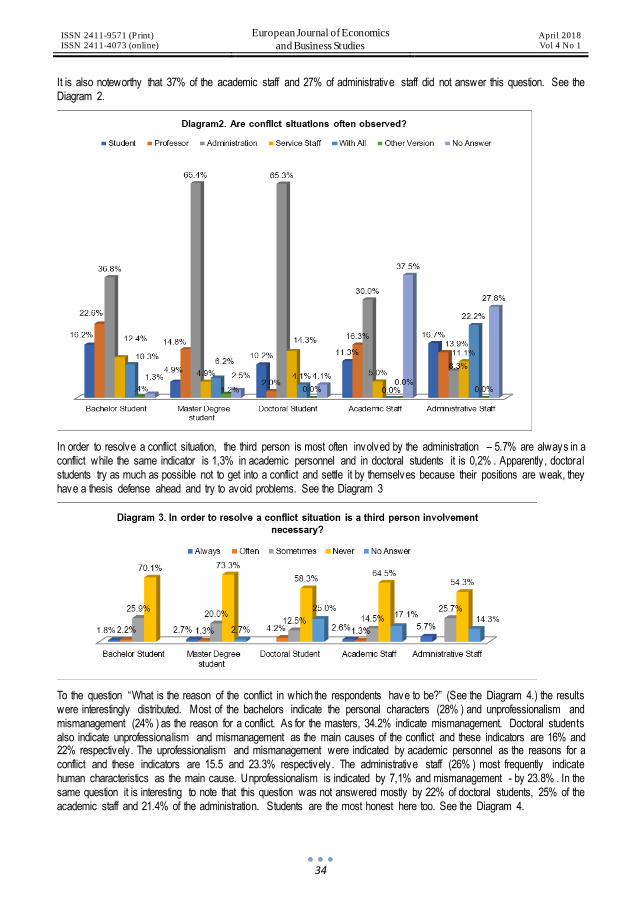
ISSN 2411-9571 (Print) ISSN 2411-4073 (online)
European Journal of Economics
and Business Studies April 2018 Vol 4 No 1
34
It is also noteworthy that 37% of the academic staff and 27% of administrative staff did not answer this question. See the Diagram 2.
In order to resolve a conflict situation, the third person is most often involved by the administration – 5.7% are always in a conflict while the same indicator is 1,3% in academic personnel and in doctoral students it is 0,2% . Apparently , doctoral students try as much as possible not to get into a conflict and settle it by themselves because their positions are weak, they have a thesis defense ahead and try to avoid problems. See the Diagram 3
To the question “What is the reason of the conflict in which the respondents have to be?” (See the Diagram 4.) the results were interestingly distributed. Most of the bachelors indicate the personal characters (28% ) and unprofessionalism and mismanagement (24% ) as the reason for a conflict. As for the masters, 34.2% indicate mismanagement. Doctoral students also indicate unprofessionalism and mismanagement as the main causes of the conflict and these indicators are 16% and 22% respectively . The uprofessionalism and mismanagement were indicated by academic personnel as the reasons for a conflict and these indicators are 15.5 and 23.3% respectively . The administrative staff (26% ) most frequently indicate human characteristics as the main cause. Unprofessionalism is indicated by 7,1% and mismanagement - by 23.8% . In the same question it is interesting to note that this question was not answered mostly by 22% of doctoral students, 25% of the academic staff and 21.4% of the administration. Students are the most honest here too. See the Diagram 4.

ISSN 2411-9571 (Print) ISSN 2411-4073 (online)
European Journal of Economics
and Business Studies April 2018 Vol 4 No 1
35
Most of the respondents manage to resolve a conflict situation by themselves. See the Diagram 5. The administrative staff most often solve problems for bachelors (9,8% ), for academic personnel (7,7% ), 8,6% of administrative personnel turn to a colleague to solve a problem, 5,7% - to the administration. 28.2% of the academic staff and 17.1% of the administration avoided answering this question. The degree of independence of the academic personnel seems to be much more difficult comparing to the administration representatives’. See the Diagram 5.
When asked whether stating their opinions causes aggression or not, 79% of bachelors answered ‘yes’ to this question. (see the Diagram 6). This indicator is high also in doctoral students - 81% and the highest percentage was recorded by the administration representatives - 94.3% . If we recall that the most frequently the respondents were in a conflict situation with the administration representatives, it is not surprising that exactly they indicate that stating their opinions causes aggression. All respondents answered the question. This shows the answers to those questions that they avoided answering. See the Diagram 6.
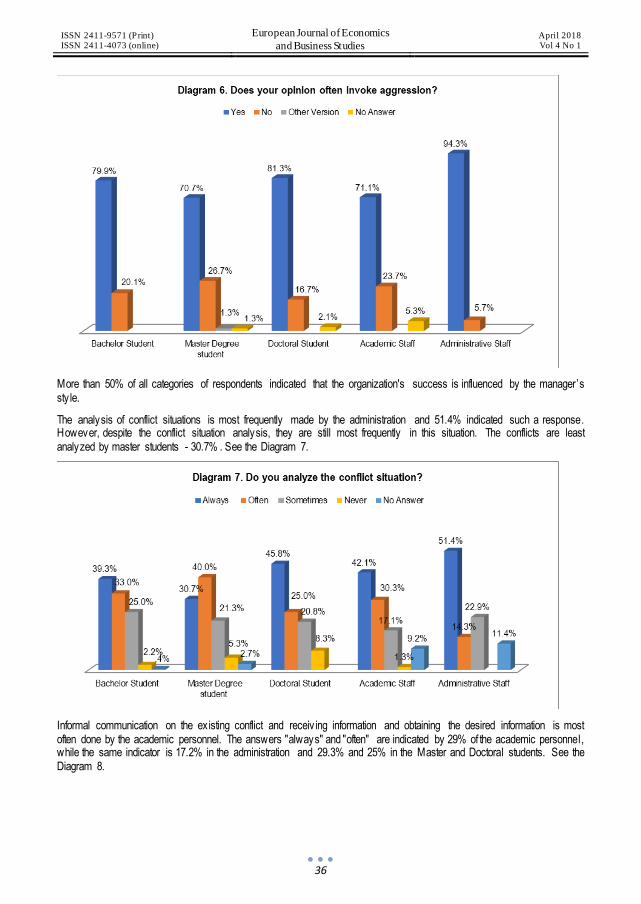
ISSN 2411-9571 (Print) ISSN 2411-4073 (online)
European Journal of Economics
and Business Studies April 2018 Vol 4 No 1
36
More than 50% of all categories of respondents indicated that the organization's success is influenced by the manager’s sty le.
The analysis of conflict situations is most frequently made by the administration and 51.4% indicated such a response. However, despite the conflict situation analysis, they are still most frequently in this situation. The conflicts are least analyzed by master students - 30.7% . See the Diagram 7.
Informal communication on the ex isting conflict and receiv ing information and obtaining the desired information is most often done by the academic personnel. The answers "always" and "often" are indicated by 29% of the academic personnel, while the same indicator is 17.2% in the administration and 29.3% and 25% in the Master and Doctoral students. See the Diagram 8.
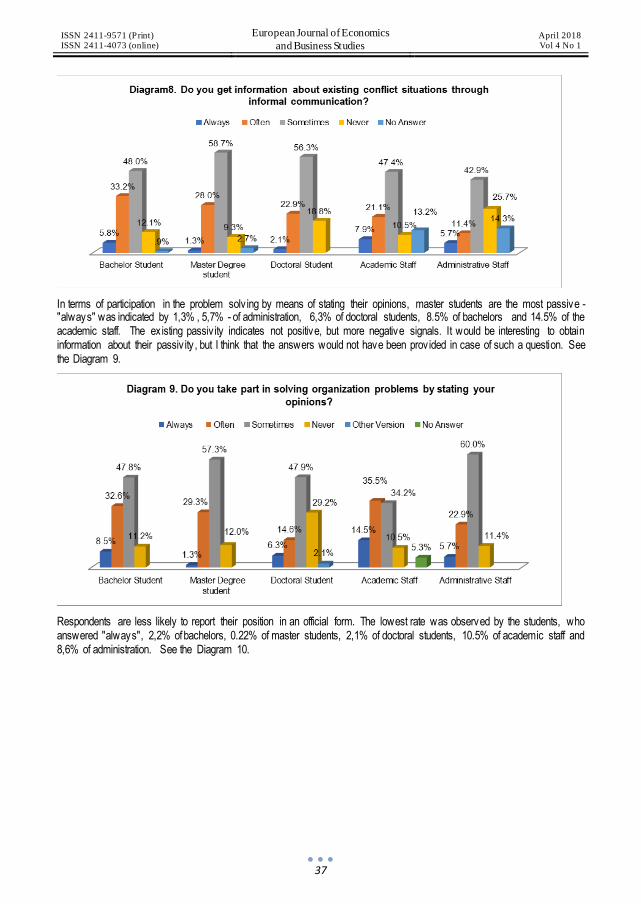
ISSN 2411-9571 (Print) ISSN 2411-4073 (online)
European Journal of Economics
and Business Studies April 2018 Vol 4 No 1
37
In terms of participation in the problem solv ing by means of stating their opinions, master students are the most passive - "always" was indicated by 1,3% , 5,7% - of administration, 6,3% of doctoral students, 8.5% of bachelors and 14.5% of the academic staff. The ex isting passiv ity indicates not positive, but more negative signals. It would be interesting to obtain information about their passiv ity , but I think that the answers would not have been prov ided in case of such a question. See the Diagram 9.
Respondents are less likely to report their position in an official form. The lowest rate was observed by the students, who answered "always", 2,2% of bachelors, 0.22% of master students, 2,1% of doctoral students, 10.5% of academic staff and 8,6% of administration. See the Diagram 10.

ISSN 2411-9571 (Print) ISSN 2411-4073 (online)
European Journal of Economics
and Business Studies April 2018 Vol 4 No 1
38
"How do you behave during a conflict?" – The respondents indicated the following answers: they try to prove their truth, agree with the opponent's position, do not oppose the opponents but remain in their positions, seek a compromise option and do not pay attention to the conflict. See the Diagram 11
Bachelors most frequently try to prove their own truth and this indicator is 51% . Representatives of the administration apply this method the least frequently (26,3% ). The respondents share their opponents’ position the least frequently , in this case the maximum figure was observed by administrative staff and amounted to 2,6% ; In respondents the priority is to find a compromise option and most of the doctoral students have to use this way.

ISSN 2411-9571 (Print) ISSN 2411-4073 (online)
European Journal of Economics
and Business Studies April 2018 Vol 4 No 1
39
To study the influence of the status on the variables we have used different statistical procedures, a dispersion analysis, similar (Kruskal-Wallis Test) – One-Way ANOVA, as the analysis deals with nonparametric variables and consumer tables. (Kruskal-Wallis Test)
Following the Kruskal-Wallis Test we've got the following types of tables: Table 1 and Table 2. Table 1 presents differences between mean variables (Q2, Q4, Q6, Q15), according to each status.
Kruskal-Wallis Test
Table 1 Ranks
Q1 Status N Mean Rank
Q2
1 Bachelor Student 220 199.54 2 Master Degree student 72 219.47
3 Doctoral Student 46 232.38
4 Academic Staff 46 165.80
5 Administrativ e Staff 25 233.08
Total 409
Q4
1 Bachelor Student 217 195.07
2 Master Degree student 68 216.15
3 Doctoral Student 37 198.19
4 Academic Staff 54 206.07
5 Administrativ e Staff 25 204.48 Total 401
Q6
1 Bachelor Student 224 224.80
2 Master Degree student 73 241.28
3 Doctoral Student 47 217.88
4 Academic Staff 72 235.88
5 Administrativ e Staff 35 192.39
Total 451
Q15
1 Bachelor Student 222 195.32
2 Master Degree student 73 216.09
3 Doctoral Student 47 266.94
4 Academic Staff 68 255.29
5 Administrativ e Staff 31 271.56
Total 441
Table 2 Chi-square test results shows whether a status connection ex ists with these variables.
Q2 Q4 Q6 Q15
Chi-Square 11.723 1.995 8.036 28.579
df 4 4 4 4
Asymp. Sig. 0.020 0.737 0.090 0.000
As shown in Table 2, Q1-status is statistically in a significant connection with Q2, on 0.05 levels and it has a tight statistical connection with Q15 (P <0.001)
As a result of constructing a crosstab tables, we have received tables that show a connection of status with each variable (Q 2, Q4, Q6 and Q15). In the Tables 3; 4; 5; 6 show the statistical connection between a status and these questions is shown according to a Chi-square test.
With respect to Q 2 (Conflict situations are mostly observed * status)
Table 3. Chi-square test results Value df Asy mp. Sig. (2-sided)
Pearson Chi-Square 63.204a 16 .000
Likelihood Ratio 69.792 16 .000

ISSN 2411-9571 (Print) ISSN 2411-4073 (online)
European Journal of Economics
and Business Studies April 2018 Vol 4 No 1
40
Linear-by -Linear Association .068 1 .795
N of Valid Cases 409
a. 8 cells (32.0%) have expected count less than 5. The minimum expected count is 2.38.
As it seems from the Chi-square test a status has a statistically significant, close relationship with Q2 (P <0.001).
With respect to Q 4 ( What is the cause of the conflict in which you are involved? * Status)
Table 4. Chi-Square Tests Value df Asy mp. Sig. (2-sided)
Pearson Chi-Square 21.759a 16 0.151
Likelihood Ratio 23.614 16 0.098
Linear-by -Linear Association 0.752 1 0.386
N of Valid Cases 401
a. 5 cells (20.0%) have expected count less than 5. The minimum expected count is 1.31.
As it seems from the Chi-square test, there is no statistically significant connection between a status and Q4, in any case P> 0.05.
With respect to Q 6
Table 5.Chi-Square Tests Value df Asy mp. Sig. (2-sided)
Pearson Chi-Square 8.053a 4 0.090
Likelihood Ratio 9.364 4 0.053
Linear-by -Linear Association .685 1 0.408
N of Valid Cases 451
a. 0 cells (0.0%) have expected count less than 5. The minimum expected count is 7.22.
As it seems from the Chi-square test a status has a statistically significant, close relationship with Q6 (P <0.001).
With respect to Q 15
Table 6. Chi-Square Tests Value df Asy mp. Sig. (2-sided)
Pearson Chi-Square 54.174a 16 0.000
Likelihood Ratio 53.779 16 0.000
Linear-by -Linear Association 22.801 1 0.000
N of Valid Cases 441
a. 9 cells (36.0%) have expected count less than 5. The minimum expected count is .42.
As it seems from the Chi-square test a status has a statistically significant, close relationship with Q15 (P <0.001).
Graphic representation of Q15 frequency distribution according to the indiv idual status:
To verify the strength of the Q1 status with Q2, Q4, Q6, Q15 variables, we used the correlation, which resulted in the Table 7. As the variables that should be analyzed are nonparametric, we have used Kendall’s (Kendall's tau_b) and Spearman’s (Spearman's rho) tests to get correlation coefficients.
Table 7 Q2 Q4 Q6 Q15
Kendall's tau_b Q1 Correlation Coefficient 0.105* 0.039 -0.019 0.312**
Sig. (2-tailed) 0.049 0.351 0.666 0.000
N 409 401 451 441
Spearman's rho Q1 Correlation Coefficient 0.101* 0.046 -0.020 0.242**
Sig. (2-tailed) 0.048 0.363 0.666 0.000
N 409 401 451 441
As shown in Table 7, a status has a correlative relationship according to both tests with Q2 (Conflict situations are most frequently observed), statistically significant relationship (at 0.05 level) and with Q15 (How do you behave during a conflict?)
ISSN 2411-9571 (Print) ISSN 2411-4073 (online)
European Journal of Economics
and Business Studies April 2018 Vol 4 No 1
41
Statistically close connection at 0.01 level (P <0.001), however, we should note that it has a weak positive correlativ e relationship with Q2 and an average positive correlative connection with Q15 .
Thus, from the listed hypotheses Hypotheses H1 and H4 have been proved.
The best way to resolve conflicts is the continuous improvement of the processes and not the best solution for them even by the best methods (Eichfeld, Golding, & Hamilton, 2017) .
A proper system of compensation, normal labor conditions, correct organization of labor, correct distribution and clarity of the rights and duties leave no place for a conflict. (Gulua, 2017); (Gulua, 2015) .
Based on the conclusions revealed by the survey, we have prepared recommendations that will have a considerable positive impact on a conflict management. It is important:
To improve organizational processes and support transparency based on clearly defined goals;
Proper formulation of functions, duties and rights among organization members
Informing about expected changes timely ;
Improvement of formal and informal communication means;
Support for development and improvement of qualifications;
To support understanding and realizing the democratic principles.
Bibliography:
[1] Armstrong, M. (2000). Human Resource Manaqement Practice. London: Kogan Page Limited.
[2] Ebong, I. (November 16, 2017). Conflict Is Good. Bain &Company.
[3] Eichfeld, A., Golding, D., & Hamilton, D. (2017). Continuous improvement—make good management every leader’s daily habit. McKinsey& Company.
[4] Engert, O., Gandhi, N., Schaninger, W., & So, J. (2010, June). Assessing cultural compatibility : A McKinsey perspective on getting practical about culture in M&A. McKinsey & Company.
[5] Gulua, E. (2015). Ex igency of Effective Cooperation between Higher Education Institutions and Business Organizations in Post Soviet Georgia. Proceedings of Multidisciplinary Academic Conference on Economics, Management and Marketing. Prague: EBSCO INFORMATION SERVICES.
[6] Gulua, E. (2017). Modern Challenges of Higher Education. Business and Economics, 226.
[7] Gulua, Ekaterine; Kharadze, Natalia;. (2017). Impact of Time Management on Personal Development of Master’s Degree Students. ICSS XXIII. Vienna.
[8] Kharadze N. Gulua E. (2016). Self-Management Peculiarities of Master's Students in Georgia. Challenges of Globalization in Economics and Business, 613.
[9] Kharadze, N., & Gulua, E. (2017). TIME MANAGEMENT PECULIARITIES BASED ON GENDER. Forsight-management: best world practice of development F 79 and integration of education, science and business: Materials I, 39.
[10] Kharadze, Natalia; Gulua, Ekaterine;. (2017). Time Management Pecularities of Shota Rustaveli State University MA Students. Innovative Economics and Management, 20-25.
[11] Kharadze, Natalia; Gulua, Ekaterine; Duglaze, Davit. (2017). Free-Time Management among Master’s Degree Students of Georgia. ICSS XXIII. Vienna.

ISSN 2411-9571 (Print) ISSN 2411-4073 (online)
European Journal of Economics
and Business Studies April 2018 Vol 4 No 1
42
DOI: 10.26417/ejes.v4i1.p42-48
Open Access. © 2018 Svetla Boneva.
This is an open access article licensed under the
Creative Commons Attribution-NonCommercial-NoDerivs 4.0 License
Analysis of the Energy Dependence of the European Union
Svetla Boneva
Assoc. Prof. Dr., University of National and World Economy, Sofia
Abstract
The main objective of the research paper is to accomplish a comparative analysis of the energy dependence of the EU member states. This objective is de-composited in several sub-objectives: First, to make a short literature rev iew and a summary of the main ideas concerning energy dependence; Second, to clarify the methodology used for analysis of the energy dependence of the EU. Third, to analyze the nominal energy dependency of the EU, as well as the Union energy dependency by energy types.Fourth, to analyze the energy intensity of the economy of the European Union countries. The research and analytical methods used for the development of the paper involve comparative analysis of the available data on energy security indicators, graphical and table presentation of statistical and empirical data and survey of available legal and analy tical research on the topic. Entirely secondary data sources have been used in the research. The research results comprise:
- the introduction of two new concepts as a result of the analysis – the nominal energy dependency and the real energy dependency;
- the construction of an energy dependency classify ing scheme for the European Union member states;
- the construction of an classification grid of the energy dependence of the EU member states by energy type. The research results present the author contribution to the research field of energy dependency. They add value not only in analy tical terms but also pave the road for formulating further ideas and ev idence-based recommendations on policy measures.
Keywords: energy dependency of the EU, nominal energy dependency, real energy dependency, energy intensity of the economy
Introduction
Literature Review
Energy system is the “cardiovascular” system of any economy: a well-prov ided-for electricity , petrol and natural gas economy has one of the major prerequisites of sustainable economic growth. Economic and social welfare of any state depend on many factors, among which safe and reliable energy supply 1. (Vassileva, A., S. Boneva, 2015). Many authors argue that the availability of energy is a key factor affecting the well-being and smooth functioning of modern economies 2 (Chalvatzis, K.J., E. Hooper, 2009).
1 Vassilev a A., S. Boneva, Energy Security And Energy Consumption In Bulgaria, The Review of International Affairs, v ol. LXVI, № 1157, January – March, 2015, pp. 27-45 2 Chalv atzis, K.J., E. Hooper, Energy security vs. climate change: Theoretical framework development and experience in selected EU
electricity markets, Renewable and Sustainable Energy Reviews, 13, 2009, 2703–2709

ISSN 2411-9571 (Print) ISSN 2411-4073 (online)
European Journal of Economics
and Business Studies April 2018 Vol 4 No 1
43
In the last decades the requirement to secure energy resources has become dominant to the extent that it drives foreign affairs agendas of countries at all stages of development1 (Williams P.A., 2006). In the past national energy agendas have focused on security of energy supplies which has been achieved using different (mostly domestic) energy sources. The result can be observed in a large variety of national energy mixes in Europe – with Norway rely ing on hydro, France on nuclear and Poland on coal sources. These countries have achieved a considerable degree of energy independence. Unlike them, a huge number of European countries import fuels, technologies or electricity to secure their energy supply . The dependency of the European Union on energy imports, particularly of oil and more recently of gas, are the main policy concerns relating to the security of energy supplies2 (Eurostat, 2018).
Contemporary environmental concerns increasingly dominate policy and influence the energy mix in new directions 3 (Bishop J.D.K., G.A., Amaratunga, C. Rodrigues, 2008). The threats posed by climate change and local air pollution discredit local fossil energy sources in Europe. Imported nuclear fuel for the EU nuclear power plants and imported natural gas (v ia ex isting pipelines from the former USSR countries or liquefied from Northen Africa and the Middle East) have been increasingly promoted as environmentally friendlier solutions, however contributing directly to energy supply dependency . According the IEA methodology of calculating national energy balances, the primary nuclear heat appears as an indigenous resource thus reducing statistically the energy dependence of the countries operating nuclear reactors for electricity generation. The reason behind this is the principle of using the steam from nuclear reactors as the primary energy form for the energy statistics. However, the majority of countries which use nuclear power import their nuclear fuel and if this fact could be taken into account, it would lead to an increase in the supply dependence on other countries4. (IEA, EUROSTAT, OECD, 2005) All authors admit that the EU and Russia are energy interdependent – Russia is a major supplier for the EU and the EU is a major market for Russian gas, crude oil and nuclear fuel5 6 (Krickovic, A., 2015; Kaveshnikov, N.,2010).
Renewable energy really contributes to reducing energy dependence and reducing the greenhouse gas emissions, except for some specificities of biomass7 (Finkler, T., 2018). Renewable energy technologies are indeed making headway in research and development, and have actual contribution to the world’s energy needs. In the same time, I share the opinion that renewable energy technologies could cause or deepen ex isting technological dependence for countries that are less innovative in respect to renewable energy technologies and components for them – a fact that is underestimated when national goals and policy measures are set in countries of different stages of economic development and different set of energy mixes. While the importance of renewable energy for the energy mix of the future is indisputable, the above mentioned aspect of renewable technologies distribution is not deeply studied in the literature yet.
2. Methodology and analysis of the energy dependence of the EU
As this paper presents a brief analysis of the energy dependency of the EU, the methodology of its measurements should be clarified in the first place. Energy dependency shows the extent to which an economy relies upon imports in order to meet its energy needs. The methodology used for calculating the energy efficiency indicator is the ratio of net imports div ided by the sum of gross inland energy consumption plus maritime bunkers (Formula 1). Net imports are calculated as total imports minus total exports8. Gross inland consumption is a cumulative value comprising: Indigenous production + Production other sources + Imports – Exports – International marine bunkers + Stock changes. International Marine Bunkers are quantities of fuels delivered to ships of all flags that are engaged in international nav igation which may take
1 Williams P.A., Projections for the geopolitical economy of oil after w ar in Iraq, Futures 2006; 38:1074–88. 2 Eurostat, Energy production and imports, 2018, http://ec.europa.eu/eurostat/statistics-ex plained/index.php/Energy_production_and_imports 3 Bishop J.D.K., Amaratunga G.A., Rodriguez C., Using strong sustainability tooptimize electricity generation fuel mixes, Energy Policy, 2008; 36(3): 971–80. 4 IEA, EUROSTAT, OECD, Energy Statistics Manual, 2005, Printed in France by STEDI 5 Krickov ic A., When Interdependence Produces Conflicts: EU-Russia Energy Relations as a security Dilemma, Contemporary Security Policy , Volume 36, issue I, 2015 6 Kav eshnikov, N., The issue of energy security in relations between Russia and the European Union, European Security, Volume 19, Issue 4, 2010 7 Finkler, T., Renewable Energy: Status and Struggles, Publication of Renewable Energy Focus Group by Tad Finkler and Kathleen Hannon, 2018, https://web.stanford.edu/class/e297c/trade_environment/energy/hfocus.html 8 Commission Regulation (EU) No. 844/2010 of 20 September 2010 amending Regulation (EC) No. 1099/2008 of the European Parliament and of the Council on energy statistics. Regulation (EC) No 1099/2008 of the European Parliament and of the Council of 22 October 2008 on energy statistics. European Commission, SEC(2008)2869, Green Paper - Towards a secure, sustainable and competitive European energy network
European Commission, COM (2008) 782 final/2, Towards a secure, sustainable and competitive European energy network

ISSN 2411-9571 (Print) ISSN 2411-4073 (online)
European Journal of Economics
and Business Studies April 2018 Vol 4 No 1
44
place at sea, on inland lakes and waterways, and in coastal waters. Energy dependency may be negative in the case of net exporter countries (e.g. Norway) while positive values over 100 % indicate the accumulation of stocks during the reference year (e.g. Malta).
Formula 1
Energy dependence = Net imports / ∑ {Gross inland energy consumption + International maritime bunkers}
The methodology and the common conceptual framework that has been largely used for the calculation of the energy dependency indicator has one shortcoming – it does not take into account the efficiency of generation, transfer, distribution and consumption of energy that vary from country to country . Thus the methodology for calculating energy dependency is appropriate for calculating what I call nominal energy dependency.
If one adheres to this methodology he may come to a paradox. A country consuming more energy than the energy it produces will be nominally an energy dependent country . In real terms however, the efficiency of generation, transfer, distribution and consumption of energy in this country (e.g. Germany) could be higher than that of another country (or countries) that could be nominally less energy dependent (e.g. Bulgaria) or even energy independent one.
Adhering to these considerations we can conclude that energy dependence is a relative (not absolute) indicator affected by the efficiency of generation, transfer, distribution and consumption of every single unit of energy. Moreover, energy resources impact directly the competitiveness of any economic system not v ia their availability or scarcity but v ia the efficiency of their usage for different economic activ ities.
Therefore analyzing the energy efficiency of the EU one needs to consider:
The main general trends in nominal energy dependency in the EU member states;
The real energy dependency of these countries that could be analyzed when the energy efficiency indicators such as the energy intensity of the economy are accounted for.
The energy intensity of the economy is an indicator defined by the ratio between the gross inland consumption of energy and the gross domestic product (GDP) for a given calendar year and is measured in kilograms of oil equivalent per 1 000 Euro. It reveals the energy consumption of an economy and its overall energy efficiency. The gross inland consumption of energy is the cumulative gross inland consumption of five energy types: coal, electricity , oil, natural gas and renewable energy sources. Since gross inland consumption is measured in kilograms of oil equivalent (kgoe) and the GDP in 1 000 Euro, this ratio is measured in “kgoe per 1 000 EUR”.
Table 1. Energy dependence ranging of the European Union member states and selected neighboring countries
geo\time 1990 2000 2010 2016
Malta 100 100,3 99 100,9 0,9
Cypr us 98,3 98,6 100,8 96,2 -2,13632
Luxembour g 99,5 99,6 97,1 96,1 -3,41709
Italy 84,7 86,5 82,6 77,5 -8,50059
Lithuania 71,7 59,4 81,8 77,4 7,949791
Belgium 75,1 78,1 78,2 76 1,198402
Tur key 52,9 65,7 70,6 74,9 41,5879
Gr eece 62 69,5 69,1 73,6 18,70968
Por tugal 84,1 85,1 75,1 73,5 -12,604
Spain 63,1 76,6 76,7 71,9 13,94612
Ir eland 68,6 84,9 86,6 69,1 0,728863
Ger many 46,5 59,4 60,3 63,5 36,55914
Austr ia 68,5 65,4 63,2 62,4 -8,90511
Eur o ar ea (19 countr ies) 57,5 64,1 62,1 61,9 7,652174
Slovakia 77,5 65,5 63,1 59 -23,871
FYRMacedonia 47,7 39,9 43 58,7 23,0608
Hungar y 49 55,2 56,4 55,6 13,46939
EU (28 countr ies) 44,3 46,7 52,7 53,6 20,99323
Slovenia 45,7 52,8 48,7 48,4 5,908096
Cr oatia 39,8 48,4 46,6 47,8 20,1005
Latvia 88,9 61 45,5 47,2 -46,9066
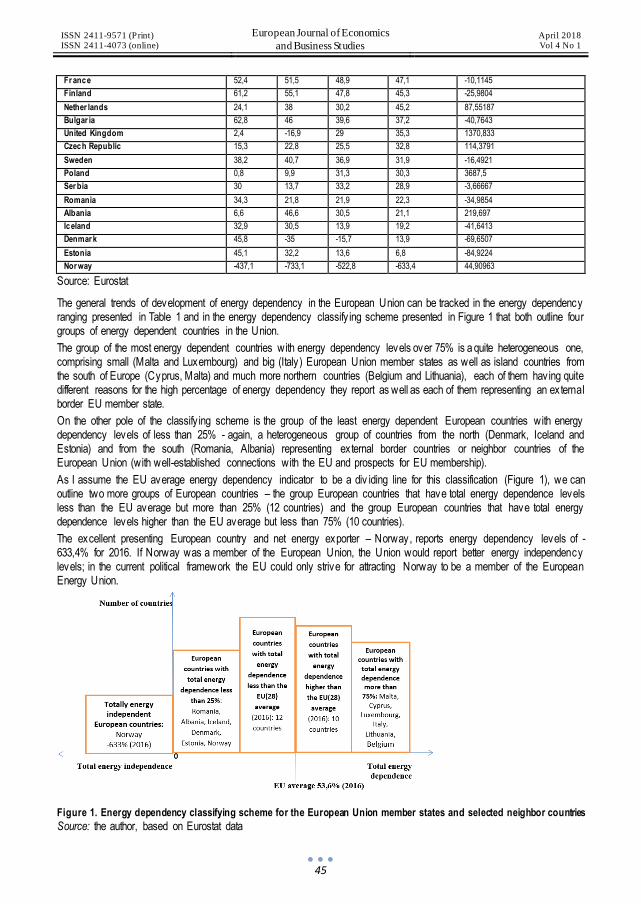
ISSN 2411-9571 (Print) ISSN 2411-4073 (online)
European Journal of Economics
and Business Studies April 2018 Vol 4 No 1
45
Fr ance 52,4 51,5 48,9 47,1 -10,1145
Finland 61,2 55,1 47,8 45,3 -25,9804
Nether lands 24,1 38 30,2 45,2 87,55187
Bulgar ia 62,8 46 39,6 37,2 -40,7643
United Kingdom 2,4 -16,9 29 35,3 1370,833
Czech Republic 15,3 22,8 25,5 32,8 114,3791
Sweden 38,2 40,7 36,9 31,9 -16,4921
Poland 0,8 9,9 31,3 30,3 3687,5
Ser bia 30 13,7 33,2 28,9 -3,66667
Romania 34,3 21,8 21,9 22,3 -34,9854
Albania 6,6 46,6 30,5 21,1 219,697
Iceland 32,9 30,5 13,9 19,2 -41,6413
Denmar k 45,8 -35 -15,7 13,9 -69,6507
Estonia 45,1 32,2 13,6 6,8 -84,9224
Nor way -437,1 -733,1 -522,8 -633,4 44,90963
Source: Eurostat
The general trends of development of energy dependency in the European Union can be tracked in the energy dependency ranging presented in Table 1 and in the energy dependency classify ing scheme presented in Figure 1 that both outline four groups of energy dependent countries in the Union.
The group of the most energy dependent countries with energy dependency levels over 75% is a quite heterogeneous one, comprising small (Malta and Luxembourg) and big (Italy) European Union member states as well as island countries from the south of Europe (Cyprus, Malta) and much more northern countries (Belgium and Lithuania), each of them having quite different reasons for the high percentage of energy dependency they report as well as each of them representing an external border EU member state.
On the other pole of the classify ing scheme is the group of the least energy dependent European countries with energy dependency levels of less than 25% - again, a heterogeneous group of countries from the north (Denmark, Iceland and Estonia) and from the south (Romania, Albania) representing external border countries or neighbor countries of the European Union (with well-established connections with the EU and prospects for EU membership).
As I assume the EU average energy dependency indicator to be a div iding line for this classification (Figure 1), we can outline two more groups of European countries – the group European countries that have total energy dependence levels less than the EU average but more than 25% (12 countries) and the group European countries that have total energy dependence levels higher than the EU average but less than 75% (10 countries).
The excellent presenting European country and net energy exporter – Norway, reports energy dependency levels of -633,4% for 2016. If Norway was a member of the European Union, the Union would report better energy independency levels; in the current political framework the EU could only strive for attracting Norway to be a member of the European Energy Union.
Figure 1. Energy dependency classifying scheme for the European Union member states and selected neighbor countries
Source: the author, based on Eurostat data

ISSN 2411-9571 (Print) ISSN 2411-4073 (online)
European Journal of Economics
and Business Studies April 2018 Vol 4 No 1
46
Energy dependence in the European Union is obv ious by the fact that it imports more than half of the energy it needs from third countries and this tendency is steadily rising decade after decade since 1990. According to Eurostat data v irtually more than half (53.6 % ) of the EU-28’s gross inland energy consumption in 2016 came from imported sources. The gap between energy supply and demand, caused by the reduction of primary energy production in the EU in this period, caused an increasing dependency on energy imports in most of the EU member states from third countries.
The analysis of the percent change of energy dependency of the European countries for 2016 compared to 1990 shows that only two countries (Estonia and Denmark) reduced significantly (e.g. by more than 50 percentage points) their energy dependence (by -84,92% and -69,65% respectively). Three more countries from Eastern Europe (Latv ia and Bulgaria and Romania) considerably reduced their energy efficiency (by -46,9% , -40,76% and -34,99% respectively). The European Union as a whole increased its energy dependency by 20% for the period and the absolute records in increasing the energy dependency belongs to Poland (+3687,5% ) and the United Kingdom (+1370,83% ). Other EU member states that increased their energy dependency in the last four decades are the Czech Republic, the Netherlands and Germany. The neighbor countries of the EU also worsened their positions – Turkey, Albania, even Norway are much more energy dependent in 2016 than in 1990 (although Norway still remains a net exporter of energy).
The energy dependence of any particular country is to a large extent pre-determined by the available indigenous energy resources in this country as well as from the available infrastructure for energy generation and distribution and other factors. Based on Eurostat data for 2016 we can present the energy dependence of the EU member states by energy sources in a classification grid (Figure 2)
Total nominal energy
dependency
Dependency on coal Dependency on
petroleum
Dependency on natural
gas More than the EU
av erage
Malta, Cy prus,
Lux embourg, Italy , Lithuania, Belgium, Greece, Portugal, Spain, Ireland,
Germany , Austria, Slov akia, Hungary
Portugal, Austria,
Cy prus, Luxembourg, Italy , Latv ia, France, Belgium, Denmark, Slov akia, Lithuania,
Croatia, Netherlands, Sw eden, Spain, United Kingdom
Slov enia, Latvia,
Greece, Portugal, Malta, Lux embourg, Belgium, Ireland, France, Bulgaria,
Spain, Netherlands, Germany , Sweden, Czech Republic, Poland, Lithuania,
Finland, Austria, Italy
Greece, Lithuania,
Estonia, Finland, Slov enia, Luxembourg, Portugal, Spain, Sw eden, Belgium,
France, Ireland, Italy , Slov akia, Czech Republic, Austria, Germany , Bulgaria
Less than the EU
av erage
Romania, Denmark,
Estonia, Poland, Sw eden, Czech Republic, UK, Bulgaria, Netherlands, Finland
France, Latv ia, Croatia, Slov enia
Finland, Ireland,
Germany , Hungary, Slov enia, Bulgaria, Romania, Greece, Estonia, Poland, Czech
Republic
Slov akia, Hungary,
Estonia, Romania, United Kingdom, Denmark
Poland, Hungary ,
United Kingdom, Croatia, Romania, Denmark, Netherlands
Countries w ith highest energy dependency rates
(ov er 75%) Malta, Cy prus, Lux embourg, Italy ,
Lithuania, Belgium
(ov er 90%) Portugal, Austria, Cy prus, Luxembourg,
Italy , Latv ia, France, Belgium, Danemark
(ov er 100%) Slov enia, Latvia, Greece, Portugal,
Malta, Lux embourg
(ov er 100%) Greece, Lithuania, Estonia, Finland
Countries w ith lowest energy dependency rates
(below 25%) Romania, Albania, Iceland, Denmark, Esonia, Norway
(below 20%) Romania, Poland, Greece, Estonia, Czech Republik
(below 80%) Estonia, Romania, United Kingdom, Denmark
(below 70%) United Kingdom, Croatia, Romania, Denmark, Netherlands
Figure 2. Classification grid of the energy dependence of the EU member states by energy type
Source: The author, based on Eurostat data for 2016
The analysis of the energy dependence of the EU member states by energy type (energy source) shows that more half of them are import dependent on petroleum products (20 countries), natural gas (18 countries) and coal (16 countries). The reasons for this dependence are the primary energy production facilities that are currently in use (for coal), the well-known, established decades ago and functioning older and newer pipelines and transport routes bringing natural gas from Russia
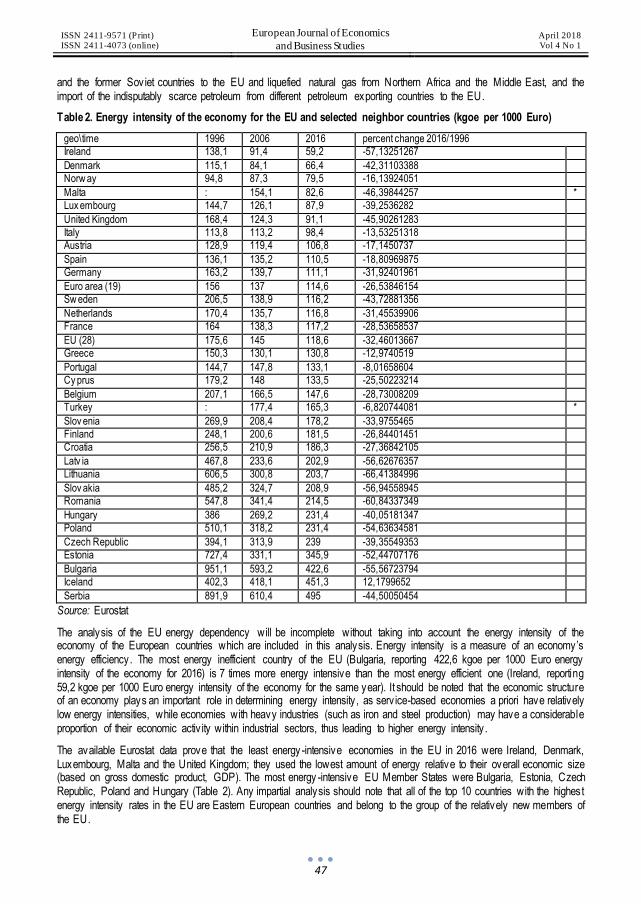
ISSN 2411-9571 (Print) ISSN 2411-4073 (online)
European Journal of Economics
and Business Studies April 2018 Vol 4 No 1
47
and the former Soviet countries to the EU and liquefied natural gas from Northern Africa and the Middle East, and the import of the indisputably scarce petroleum from different petroleum exporting countries to the EU.
Table 2. Energy intensity of the economy for the EU and selected neighbor countries (kgoe per 1000 Euro)
geo\time 1996 2006 2016 percent change 2016/1996
Ireland 138,1 91,4 59,2 -57,13251267
Denmark 115,1 84,1 66,4 -42,31103388
Norw ay 94,8 87,3 79,5 -16,13924051
Malta : 154,1 82,6 -46,39844257 *
Lux embourg 144,7 126,1 87,9 -39,2536282
United Kingdom 168,4 124,3 91,1 -45,90261283
Italy 113,8 113,2 98,4 -13,53251318
Austria 128,9 119,4 106,8 -17,1450737
Spain 136,1 135,2 110,5 -18,80969875
Germany 163,2 139,7 111,1 -31,92401961
Euro area (19) 156 137 114,6 -26,53846154
Sw eden 206,5 138,9 116,2 -43,72881356
Netherlands 170,4 135,7 116,8 -31,45539906
France 164 138,3 117,2 -28,53658537
EU (28) 175,6 145 118,6 -32,46013667
Greece 150,3 130,1 130,8 -12,9740519
Portugal 144,7 147,8 133,1 -8,01658604
Cy prus 179,2 148 133,5 -25,50223214
Belgium 207,1 166,5 147,6 -28,73008209
Turkey : 177,4 165,3 -6,820744081 *
Slov enia 269,9 208,4 178,2 -33,9755465
Finland 248,1 200,6 181,5 -26,84401451
Croatia 256,5 210,9 186,3 -27,36842105
Latv ia 467,8 233,6 202,9 -56,62676357
Lithuania 606,5 300,8 203,7 -66,41384996
Slov akia 485,2 324,7 208,9 -56,94558945
Romania 547,8 341,4 214,5 -60,84337349
Hungary 386 269,2 231,4 -40,05181347
Poland 510,1 318,2 231,4 -54,63634581
Czech Republic 394,1 313,9 239 -39,35549353
Estonia 727,4 331,1 345,9 -52,44707176
Bulgaria 951,1 593,2 422,6 -55,56723794
Iceland 402,3 418,1 451,3 12,1799652
Serbia 891,9 610,4 495 -44,50050454
Source: Eurostat
The analysis of the EU energy dependency will be incomplete without taking into account the energy intensity of the economy of the European countries which are included in this analysis. Energy intensity is a measure of an economy’s energy efficiency. The most energy inefficient country of the EU (Bulgaria, reporting 422,6 kgoe per 1000 Euro energy intensity of the economy for 2016) is 7 times more energy intensive than the most energy efficient one (Ireland, reporting 59,2 kgoe per 1000 Euro energy intensity of the economy for the same year). It should be noted that the economic structure of an economy plays an important role in determining energy intensity , as serv ice-based economies a priori have relatively low energy intensities, while economies with heavy industries (such as iron and steel production) may have a considerable proportion of their economic activ ity within industrial sectors, thus leading to higher energy intensity .
The available Eurostat data prove that the least energy -intensive economies in the EU in 2016 were Ireland, Denmark, Luxembourg, Malta and the United Kingdom; they used the lowest amount of energy relative to their overall economic size (based on gross domestic product, GDP). The most energy -intensive EU Member States were Bulgaria, Estonia, Czech Republic, Poland and Hungary (Table 2). Any impartial analysis should note that all of the top 10 countries with the highest energy intensity rates in the EU are Eastern European countries and belong to the group of the relatively new members of the EU.
ISSN 2411-9571 (Print) ISSN 2411-4073 (online)
European Journal of Economics
and Business Studies April 2018 Vol 4 No 1
48
Between 1996 and 2016 the energy intensity of all EU economies fell. The biggest reductions in energy intensity however were recorded in Lithuania, Slovakia, Latv ia, and Bulgaria (-66,41% , -56,95% , - 56,63% and -55,57% ), where the amount of energy required to produce a unit of economic output (as measured by the GDP) fell by more than 50% between 1996 and 2016. By contrast, the smallest decreases in percentage terms were recorded for Portugal (-8,02% ), Greece (-12,97% ) and Italy (-13.53% ); these were the only Member States where the reduction in energy intensity was below 15.0 % .
Conclusions:
Since most of the Eastern European EU member states hold the first places in energy intensity of the economy (and energy inefficiency respectively) and most of them have high energy dependence levels as well, the main strategic recommendation for these countries will be to enter and active members of the European Energy Union. Thus these European territories will become less energy dependent. To become more energy efficient as well, these countries should formulate new policy measures aimed at reducing their energy intensity that should be implemented at national level as well as coordinated at EU level.
References
[1] Bishop J.D.K., Amaratunga G.A., Rodriguez C., Using strong sustainability tooptimize electricity generation fuel mixes, Energy Policy, 2008; 36(3): 971–80.
[2] Chalv atzis, K.J., E. Hooper, Energy security vs. climate change: Theoretical framework development and experience in selected EU electricity markets, Renewable and Sustainable Energy Reviews, 13, 2009, 2703–2709
[3] Commission Regulation (EU) No. 844/2010 of 20 September 2010 amending Regulation (EC) No. 1099/2008 of the
European Parliament and of the Council on energy statistics. [4] European Commission, COM (2008) 782 final/2, Towards a secure, sustainable and competitive European energy network [5] European Commission, SEC(2008)2869, Green Paper - Towards a secure, sustainable and competitive European energy
netw ork
[6] Eurostat, Energy production and imports, 2018, http://ec.europa.eu/eurostat/statistics-ex plained/index.php/Energy_production_and_imports
[7] Finkler, T., Renewable Energy: Status and Struggles, Publication of Renewable Energy Focus Group by Tad Finkler and Kathleen Hannon, 2018, https://web.stanford.edu/class/e297c/trade_environment/energy/hfocus.html
[8] IEA, EUROSTAT, OECD, Energy Statistics Manual, 2005, Printed in France by STEDI [9] Kav eshnikov, N., The issue of energy security in relations between Russia and the European Union, European Security,
Volume 19, Issue 4, 2010 [10] Krickov ic A., When Interdependence Produces Conflicts: EU-Russia Energy Relations as a security Dilemma,
Contemporary Security Policy, Volume 36, issue I, 2015 [11] Regulation (EC) No 1099/2008 of the European Parliament and of the Council of 22 October 2008 on energy statistics. [12] Vassilev a A., S. Boneva, Energy Security And Energy Consumption In Bulgaria, The Review of International Affairs, vol.
LXVI, № 1157, January – March, 2015, pp. 27-45
[13] Williams P.A., Projections for the geopolitical economy of oil after w ar in Iraq, Futures 2006; 38:1074–88.

ISSN 2411-9571 (Print) ISSN 2411-4073 (online)
European Journal of Economics
and Business Studies April 2018 Vol 4 No 1
49
DOI: 10.26417/ejes.v4i1.p49-55
Open Access. © 2018 Salome Sakvarelidze.
This is an open access article licensed under the
Creative Commons Attribution-NonCommercial-NoDerivs 4.0 License
Public Service Employee Motivation Issues in Georgia
Salome Sakvarelidze
PHD student of Ivane Javakhishv ili Tbilisi State University , Faculty of Economics and Business
Abstract
The motivated employee represents the essential condition of any organization’s success. Public and private sector managers should constantly work toward coordinating and increasing employee motivation in order to ensure the timely and effective implementation of the plans set by the organization. Accordingly , proper assessment of processes and prompt determination of indiv iduals’ driv ing motives are needed. Studies have shown that public serv ice employees from all around the world face challenges, such as: incompatibility of knowledge, experience and position, as well as hard and lightweight work. Consequently , public managers should be aware of modern human resource management methods that can be used in effective and efficient ways to increase employee work quality . The main purpose of the paper is to determine the current situation of the public sector in Georgia. In addition, the research seeks to identify and examine the factors that influence employee demotivation and to determine under what conditions motivation can be a worthwhile investment in a public organizations. Methodologically , the work is based on analysis of the available literature and the results of the research statistically processed based on the survey example of 449 respondents from different Georgian ministries selected by a random simple.
Keywords: Human Resource Management, Motivation, Public Sector Employee, Performance Appraisal, Maslow Hierarchy of Needs.
Introduction
Human Resource Management is an important process which plays a significant role in the success of any organization. It was established in the mid-twentieth century in the US (Paichadze, Chokheli, Paresashvili, 2011, p.22). Globalization, technology development, demographic changes and economic challenges had an exceptional impact on it. The main objective of the management is to make current job analyses, that includes candidates attration, selection, trainning, communication, remuneration and motivation (Dessler, 2009, p. 2).
In the 21st century the motivated employee is the essential condition for any organizations’ success. Their indiv idual motivation is influenced with various biological, intellectual, social and emotional factors. Based on this, Georgian public sector managers need to take a series of expedient measures in order to create and prov ide effective system which has impact on employees’ indiv idual performance and their work quality .
The main purpose of the paper is to determine the current working environment of the public sector in Georgia. The research has exposed the main demotivation elements that needs to be eliminated in order to ensure effective and efficient functioning of human resource management system in the country .
Literature Review and Theoretical Framework
Public employee motivation is important to improve public sector efficiency. In developing and developed countries motivation for public sector workers, their trust toward managers, professional liability , satisfaction and ethical development is gradually reduced (Global Center for Public Serv ice Excellence, 2014, p. 1). Elmer Staats believes that the public serv ice

ISSN 2411-9571 (Print) ISSN 2411-4073 (online)
European Journal of Economics
and Business Studies April 2018 Vol 4 No 1
50
is the integrity of attitude, a sense of responsibility and a sense of morality (Perry , Wise, 1990, p. 368). In Vandenabeele's opinion public serv ice motivation is ‘the belief, values and attitudes that go beyond self-interest and organizational interest, that concern the interest of a larger political entity and that motivate indiv iduals to act accordingly whenever appropriate’ (Belle, Cantarelli, 2010, p. 6). It is important to note that the resources to support motivation process in the public sector always will be a limited factor.
Some of the scholars believe that the main reason to decrease the public sector employee motivation is lack of autonomy and diversity , low salary , organization policy and ineffective communication. Recent research has shown that 83 percent of the public servants of OECD Member States are dissatisfied and 84 percent express their distrust toward managers (Global Center for Public Serv ice Excellence, 2014, p. 2). Furthermore, in several countries’ public institutions the researches were conducted, for e.g.:
In 2013, around 1000 public employees were interv iewed in the UK. 70% of respondents felt low motivation. At the same time, 80% of respondents thought to leave the current serv ice within the next three years. The reason for this was the reduced salary and the absence of appropriate equipment required to perform the work effectively (Global Center for Public Serv ice Excellence, 2014, p. 5);
According to the research conducted in 2010 in Netherlands, only 1 in 10 citizens thought that public employees worked hard and effectively . Additionally , 45% of respondents believed that the same work in public serv ice organizations could be done with fewer employees (Loon, 2015, p. 34);
Jung and Rainay have observed that in the United States clear organizational mission and perceived goal relevance increased civ il servants motivation (Belle, Cantarelli, 2010, p. 16).
According to Perry and Wais, the high rate employee public serv ice motivation positively reflects on work performance and are less dependent on utilitarian incentives. Additionally , increases the public organization membership desire (Belle, Cantarelli, 2010, p.5). As stated by, Brewer's and Selden's definition, strong motives are necessary to perform public, community and social serv ices (Belle, Cantarelli, 2010, p. 6). As reported by one study, there are four main factors that draw indiv idual’s motivation in public agencies: the attractiveness of public policy making, commitment to public interests and civ ic duties, self-sacrifice and compassion (Global Center for Public Serv ice Excellence, 2014, p. 6).
According to Bright, public serv ice motivation is strongly linked to gender, education, management and indiv idual monetary desire. Dahart and Davis have examined that women had a high level attraction to policy making and compassion. Additionally , Perry's study showed, that men had higher public interest and commitment than women (Belle, Cantarelli , 2010, pp. 15-16). Perry argues, that public serv ice motivation depends on indiv iduals’ socialization through sociohistorical institutions. As stated by Moianah and Pandey (Moynihan, Pandey, 2007, pp. 42-43):
The level of education positively reflects the public serv ice motivation;
Membership of the professional society has a positive effect on indiv iduals motivation;
Organizational culture affects an employee’s motivation;
Employees who experience a hierarchical culture have lower level motivation in the civ il serv ices;
Organizations that have red tapes (regulations, procedures and etc.) have lower level employee motivation;
Employees who work in a friendly environment and have the right to make decisions are more likely to have a higher level motivation;
Motivation is also effected through length of organizational membership.
Perry and Wise argue that indiv iduals with high public interest are more likely to choose public institutions. In addition, indiv iduals with high public serv ice motivation are more willing to protect public interests and exhibit higher levels of organizational commitment, which in turn contributes to higher work performance and job satisfaction. Consequently , attempts to leave the current job is minimized (Moynihan, Pandey, 2007, p. 41).
Weibel examined that the salary played an important role in the successful and efficient execution of the unpleasant cases, which strengthened extrinsic motivation and, on the contrary, weakened the intrinsic (Belle, Cantarelli, 2010, p. 19-20). According to McKee, motivation can be internal and external (McKee, 2011, p. 62):

ISSN 2411-9571 (Print) ISSN 2411-4073 (online)
European Journal of Economics
and Business Studies April 2018 Vol 4 No 1
51
Internal motivation is the feeling of inner satisfaction and sense of development;
External motivation is the result of external forces involvement, such as tangible incentives, social status and more.
Fredrickson and Hart suggest that the main motivation of public officials should be patriotism (Perry , Wise, 1990, p. 369). Turner and Lawrence think that the importance of autonomy and clear objectives promotes motivation. They assume that employees will be more motivated when they realize the importance of their work and have a sense of responsibility towards the outcomes of their assigned tasks (Perry , Wise, 1990, p. 371).
Methodology
The aim of the survey was to establish the objectives, to determine the target population, to select the respondents and to prepare the questionnaire. Accordingly , all the Georgian Ministries, Prosecutor's office, Parliament and Tbilisi City Hall’s 449 specialists randomly took part in the research. Research was carried out completely anonymous in August-October, 2017. The questionnaire was designed v isually well, was easily readable and included 33 questions that combined Likert type scale, open and closed questions.
Quantitative method of research was used to uncover trends in thoughts and opinions. This method is highly popular and widely distributed in a number of scientific disciplines. The software package IBM SPSS Statistics v .22 was used to process and analyse the materials. This program is an effective statistical tool to prov ide data base and its further statistical processing and analyses.
Results and Findings
Figure № 1: Respondents' education
During the survey 449 public employees were examined. In the study 67% women and 33% men have participated. Additionally , 60% participants are 31-40, 27% 41-50, 10% over 51 and 3% are 20-30 years old.
46% have a Master's degree and 41% Bachelor's Degree from different Georgian Universities. It should be also noted that there are a few civ il servants who have obtained higher education abroad. Besides, only 4% are having Doctor’s or Professor’s title.
Figure № 2: Respondents' level of motivation
41%
46%
1%8%
4% Local Bachelor'sDegreeLocal Master'sdegreeForeign Bachelor'sDegreeForeign Master'sDegreePhd, Professor andOther
3.8 4.914.7
21.627.4
13.8 13.8
1 2 3 4 5 6 7

ISSN 2411-9571 (Print) ISSN 2411-4073 (online)
European Journal of Economics
and Business Studies April 2018 Vol 4 No 1
52
As a result of the survey, average motivation level of employees in Georgian public agencies is 4.6 point. Approx imately 23.4% of interv iewed civ ilians have rated low level motivation. 21.6% of them rated the issue on average, while the remaining 55% of respondents rated high level motivation in the institutions.
45% of public employees found that the organizations have a modern-liberal env ironment, 34% find difficult to answer the question and only 21% consider that they have a traditional bureaucratic governance in the agencies.
One of the most important part of the research was to examine the needs of respondents based on the Maslow pyramid of needs. According to data analysis, the primary requirement for 58.8% of employees is self-actualization and afterwards the basic physiological needs (12.7% ), safety and security needs (11.6% ), esteem needs (8.7% ) and belongingness and love needs (8.2 % ) are presented.
Figure № 3: Needs sorted by priorities
The question whether the respondent’s effort and remuneration is fair compared to other people working in the same situation 33% of examinees feel that it is fair, 40% disagree and 27% of respondents can not respond to the issue. In addition, according to data analysis, about 60% of employees are not satisfied with the salary, 27% have difficulty in giv ing the answer and only a small portion of respondents (13% ) are satisfied with their wages.
As a result of the survey, 74% of respondents are dissatisfied with the possibility of a career advancement in the organization and only 26% of respondents are satisfied with this issue.
Figure № 4: The main reasons to leave the current job
About leav ing the current job, it is clear that only 21% of respondents have never thought of leav ing their positions, 42% rarely , 27% often and only 10% is everyday thinking to leave the office. The main reason to leave the organization is the desire for self-realization, bureaucracy, low salary and ex isting work schedule. Additionally , 69% of interv iewed men and 58.5% of women report bureaucracy as a main reason of changing the current institution. At the same time, all the respondents of age 20-30, 42.3% of 41-50, and 57.1% of over 51-year employees have named work schedule as the main reason for changing the job.
According to the survey results, 15.8% of respondents never, 50.8% rarely , 33% often and 0.4% every day participate in various training programs and conferences which are offered by the organizations. In addition, it was established that 47.4% of public servants by their will rarely find information on the available training programs and conferences. It should be also noted that 28.7% of respondents frequently and 2% every day investigate the information on this issue. Analyses also showed that 21.8% of employees independently never find information of the training programs and conferences.
12.7
11.6
8.2
8.7
58.8
0 10 20 30 40 50 60 70
Physiological needs
Safety and security needs
Belongingness and love needs
Esteem needs
Self-actualization
Sel f-realization
62%
Exis ting work
schedule36%
Bureaucracy1%
Low sa lary 1%
Self-realization Existing work scheduleBureaucracy Low salary
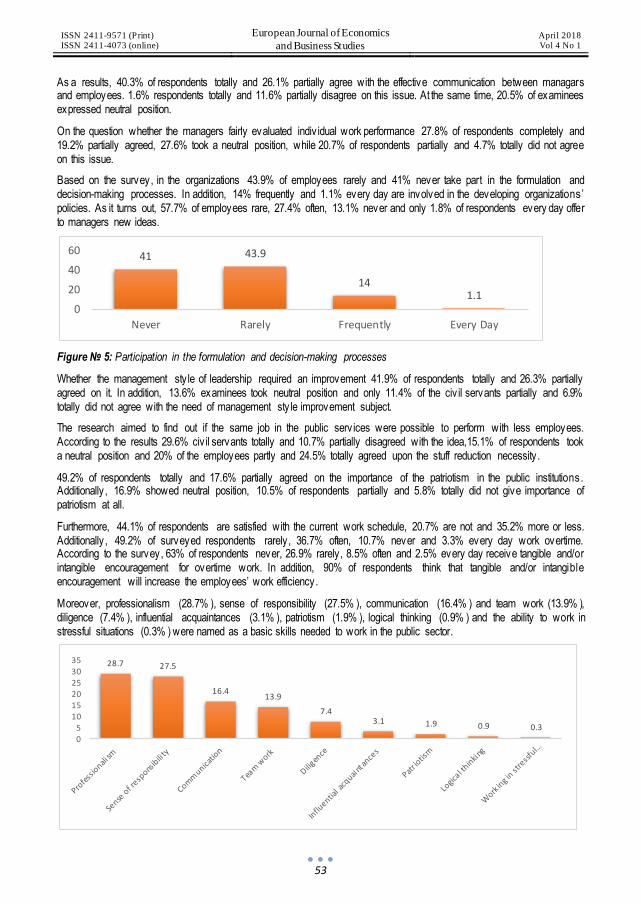
ISSN 2411-9571 (Print) ISSN 2411-4073 (online)
European Journal of Economics
and Business Studies April 2018 Vol 4 No 1
53
As a results, 40.3% of respondents totally and 26.1% partially agree with the effective communication between managars and employees. 1.6% respondents totally and 11.6% partially disagree on this issue. At the same time, 20.5% of examinees expressed neutral position.
On the question whether the managers fairly evaluated indiv idual work performance 27.8% of respondents completely and 19.2% partially agreed, 27.6% took a neutral position, while 20.7% of respondents partially and 4.7% totally did not agree on this issue.
Based on the survey, in the organizations 43.9% of employees rarely and 41% never take part in the formulation and decision-making processes. In addition, 14% frequently and 1.1% every day are involved in the developing organizations ’ policies. As it turns out, 57.7% of employees rare, 27.4% often, 13.1% never and only 1.8% of respondents every day offer to managers new ideas.
Figure № 5: Participation in the formulation and decision-making processes
Whether the management sty le of leadership required an improvement 41.9% of respondents totally and 26.3% partially agreed on it. In addition, 13.6% examinees took neutral position and only 11.4% of the civ il servants partially and 6.9% totally did not agree with the need of management sty le improvement subject.
The research aimed to find out if the same job in the public serv ices were possible to perform with less employees. According to the results 29.6% civ il servants totally and 10.7% partially disagreed with the idea,15.1% of respondents took a neutral position and 20% of the employees partly and 24.5% totally agreed upon the stuff reduction necessity .
49.2% of respondents totally and 17.6% partially agreed on the importance of the patriotism in the public institutions. Additionally , 16.9% showed neutral position, 10.5% of respondents partially and 5.8% totally did not give importance of patriotism at all.
Furthermore, 44.1% of respondents are satisfied with the current work schedule, 20.7% are not and 35.2% more or less. Additionally , 49.2% of surveyed respondents rarely , 36.7% often, 10.7% never and 3.3% every day work overtime. According to the survey, 63% of respondents never, 26.9% rarely , 8.5% often and 2.5% every day receive tangible and/or intangible encouragement for overtime work. In addition, 90% of respondents think that tangible and/or intangible encouragement will increase the employees’ work efficiency.
Moreover, professionalism (28.7% ), sense of responsibility (27.5% ), communication (16.4% ) and team work (13.9% ), diligence (7.4% ), influential acquaintances (3.1% ), patriotism (1.9% ), logical thinking (0.9% ) and the ability to work in stressful situations (0.3% ) were named as a basic skills needed to work in the public sector.
41 43.9
141.1
0
20
40
60
Never Rarely Frequently Every Day
28.7 27.5
16.413.9
7.43.1 1.9 0.9 0.3
0
5
1015
20
2530
35

ISSN 2411-9571 (Print) ISSN 2411-4073 (online)
European Journal of Economics
and Business Studies April 2018 Vol 4 No 1
54
Figure № 6: Basic skills needed in the public agencies
According to the research, examinees named the organization's policy (44.1% ), low salary (21.4% ), ineffectiv e communication (2.2% ) as a main demotivators in the public sector. In addition, 1.1% respondents think that bureaucracy , nepotism, feeling of instability , transparency, monotony, injustice and work underestimation are the key demotivation elements in the offices. Furthermore, 29% of respondents think that the main demotivators presented in the questionnair e, such as lack of autonomy and diversity , low salary, organization policy and inefficient communication are not the main ones.
Figure № 7: Main Demotivators in the organizations
Based on the research, it was found that in the organizations managers increase employee motivation through positive assessment (22.2% ), material incentives (15.6% ), career advancement (9.7% ), offering interesting tasks (7.6% ), good communication with the managers (7.5% ), work stability (7.1% ), intangible encouragement (6.9% ), engaging to formulate organization's strategy (4.7% ) and participating in training programs (1% ). Furthermore, 11.5% of respondents believe that the managers are not using the different encouragement systems.
Conclusion
One of the most important issues for the state sector is to take care of the available human resources. Despite Georgia’s significant steps forward and international progress, relation with public servants remains one of the main challenge.
As a results of the survey , the staff motivation in Georgian public agencies is higher than average. According to Maslow ’s pyramid of need, the primary requirement for servants are self-actualization and only afterwards is presented physiological needs (food, water and etc), safety needs (security ), esteem needs (feeling of accomplishment) and belongingness and love needs (friends). Most of the respondents are dissatisfied with the career advancement opportunity in the organizations and the ex isting wages. In addition, managers rarely organize and offer the training programs and conferences for employees. Furthermore, respondents by their will seldom find information about the current training programs. Most of the respondents are not involved in formulating strategies and decision-making processes in the organizations and there are a few employees who regularly offer new ideas to leaders. According to the results of the research, organizations have a favorable working culture (breaks, vacations, communications/relationships between managers and employees). Among the surveyed employees there are a few specialists who think that managers do not fairly evaluate their work. A large number of respondents believe that the organization's management sty le needs improvement and staff reduction. In addition, some part of the specialists think that the feeling of patriotism in public institutions is an important factor. The study also showed that the co-workers were more or less satisfied with the work schedule, despite the fact that they had overtime work, whose tangible and /or intangible incentives were rare. Besides, respondents assume that tangible and /or intangible encouragement will be an important contributor to perform work more efficiently . According to data analysis, the main reasons for leav ing the jobs were the desire for self-actualization, the bureaucracy, low salary and work schedule. Respondents have also revealed the main skills which were needed to work in the public sector. Skills like professionalism, sense of responsibility , communication, diligence, influential acquaintances, patriotism, logical thinking, teamworking and ability to work in the stressful situations. Additionally , respondents also named organization policy, low wages, inefficient communication, bureaucracy, nepotism, sense of instability , transparency, monotony, injustice and labor underestimati on as a main demotivation elements. Beyond, the research has also found that managers raise the motivation through positive assessment, material incentives, career advancement opportunity , constant communication, stable serv ice, involv ing in planning strategies and participating in different training programs.
Consequently , leaders employed in Georgian public agencies should prov ide some kind motivation for the employees to fulfill the high quality work. Due to the actuality of the issue, human resource management specialists should be aware of
21.4
44.1
2.2 2.2
29
1.10
10
20
30
40
50
Low Salary Organization'sPolicies
IneffectiveCommunication
All Neither Other
ISSN 2411-9571 (Print) ISSN 2411-4073 (online)
European Journal of Economics
and Business Studies April 2018 Vol 4 No 1
55
the efficient use of modern human resources management capabilities, which will ultimately facilitate the improvement of the ex isting environment. In order to implement this, proper assessment of the processes and prompt determination of indiv iduals’ driv ing motives are needed. The motivation process is a complicated mechanism were motivation theories are still processed. Since there is no one of the best strategy, it is important to analyze, that human beings are different and require indiv idual approaches.
References
[1] Belle, N., Cantarelli, P. (2010). Public Serv ice Motivation: The State of the Art. Retrieved June 23,2017,https://www.researchgate.net/publication/289751177_Public_serv ice_motivation_The_state_of_the_art.
[2] Dessler, G. (2009). Human Resource Management. New Jersey: Pearson. [3] Global Center For Public Serv ice and Excellence. (2014). Motivation of Public Serv ice Officials, Insights
for Practitioners. UNDP: Singapore. [4] Loon, M.N. (2015). The role of public serv ice motivation in performance, Examining the potentials and
pitfalls through an institutional approach. Retrieved November 22,2017, https://dspace.library.uu.nl/handle/1874/318812.
[5] McKee, A. (2011). Management A focus on Leaders. New Jersey: Prentice Hall. [6] Moynihan, P.D., Pandey, S. (2007). The Role of Organizations in Fostering Public Serv ice Motivation.
Public Administration Review, 40-50. [7] Paichadze, N., Chokheli, E., Paresashvili, N, (2011). Human Resource Management. Tbilisi: Sitkhva. [8] Perry, L.J., Wise. R. L. (1990). The Motivation Bases of Public Serv ice. Public Administration Review,
50(3): 367-373.
ISSN 2411-9571 (Print) ISSN 2411-4073 (online)
European Journal of Economics
and Business Studies April 2018 Vol 4 No 1
56
DOI: 10.26417/ejes.v4i1.p56-65
Open Access. © 2018 György Emel Altın et al..
This is an open access article licensed under the
Creative Commons Attribution-NonCommercial-NoDerivs 4.0 License
The Ways of Creating New Paths for Financial Organizations within the Framework of Spatial Dependency
Emel Altın
Şırnak University , Şırnak, Turkey
Murat Kasımoğlu
İstanbul Ticaret University , Istanbul, Turkey
Ali Küçükçolak
Istanbul Ticaret University , İstanbul, Turkey
Abstract
Spatial dependence of financial organizations has been examined by economic geography, clustering and institutionalist approaches. In literature, there has been many studies which investigate how spatial dependency occurs and which factors effect spatial dependency but none of them link spatial dependency with dimensions of financial system. Within the framework of spatial dependency, our study focuses on the notions that financial depth, financial effectiveness, financial stability and financial accessibility as financial system dimensions that effect spatial dependence of financial organizations. To test the propositions, we collected data from financial databases for chosen 25 countries endowed with financial centers between the years of 2007-2011. We aim to identify the factors that affect spatial dependencies and the ways of creating new paths for financial centers. The obtained data from databases are analyzed through the STATA statistical packaged software. After the validation of measures a series of panel data analysis was conducted to test the hypotheses and to define how financial system dimensions create a spatial dependency on financial centers. Analyses results highlighted the notions that competitiveness power, capital based financial system, external shocks such as financial crisis and knowledge asymmetry to create new paths for financial centers.
Keywords: spatial dependency, financial system, path creation, financial centers
Introduction
Financial centers as a best representation of finance organizations clusters still should reside spatially in certain regions despite technological improvements and digitalization, because complex information such as merger/acquisition agreements, know-how, non-written rules and social embeddedness can’t be transferred to electronic media (Grote, 2009). Unlike O’Brien (1992), movements of capital and trade are facilitated by the attractiveness of factors such as reducing transaction costs, liquidity and increasing efficiency. Financial centers always ex ist spatially and their differentia ted roles and performances in the financial system only change their spatial pathways (Martin, 1994). When we analyze the factors underly ing the evolution of clusters at different levels of analysis, it is seen that the effects of spatial density dependence on location choice of new firms are stronger at the regional level (Greeve, 2000). Arthur’s (1988) spatial dependence theory claims that new firms make their location choices randomly at the beginning. This means that it is not predicted which region have become more advantageous at the beginning but it is certain that ex istence regions are more advantageous than other regions for new organizations because of scale economies and positive externalities. This create a geographic lock in for financial organizations. Beside cluster economics, financial organizations
ISSN 2411-9571 (Print) ISSN 2411-4073 (online)
European Journal of Economics
and Business Studies April 2018 Vol 4 No 1
57
make their location choices according to their information gathering, processing and transcription functions. When economic factors and spatial structures are considered together, financial markets structure, financial institutions ’ activ ities, finance sector management, legal framework, personal and corporate tax, financial information dissemination mechanisms, qualified labor and technological/physical infrastructure constitute the spatial dependency factors of financial centers (Thakor, 1996; Z/Yen, 2011). In path dependency literature, aggregation effect and centrifugal-centripetal forces on financial centers cause lock-in and despite external shocks (the formation of other highly competitiv e financial centers, low transaction and transportation cost) financial institutions resist change of location (depending upon knowledge asymmetry, backward and forward linkages, qualified labor, prestige, established infrastructure and business culture) through centers that have more advantageous conditions. Over time, financial centers become self-
1 This paper is developed by the PHD Thesis whose author is Emel Altın and named “Spatial Dependency of Financial Organizations and Analysis of Effective Variables on Developing New Spatial Paths: A Research at Financial Centers”, Dicle University , Institute of Social Sciences, Department of Business Administration, Diyarbakır, 2016
reinforcing and spatially dependent structures (Fujita et.al.., 1999; Schmutzler, 1999). This prov ides information on the reasons for new spatial pathways chosen by rising and falling financial centers (Martin, 2009; Grote, 2002). In case New Economic Geography, the distribution of financial clusters depends on initial conditions and historical events (Fujita et.al. 1999). Financial centers surv ive or die under the effect of small historical events (Ottav iano and Thessie, 2004), structure of clusters and government policy (Bosker et.al., 2007). New Economic Geographical Models claim that the success rate of financial clusters is related to external economics such as specialized local labor input, access of financial markets and scale effect, information dissemination, etc. (Krugman, 2011). Finally , spatial pathways of financial firms can sometimes be determined by historical accidents. Historical accidents are unexpected events that affect the output of any activ ity (such as the formation and persistence of ineffective technological standards) of financial firms (Ottav iano and Thessie, 2004). Small but cumulative historical accidents can create large regional imbalances even in homogeneous regions. In the theories of financial centers, it can be seen how the historical accidents shaped the financial geography and the small changes that took place cumulatively created a discontinuous change in the space (Krugman, 1998). As a result, financial firms which do not have the mobility of resources and labor prefer to locate in centers where market is deep and transportation costs are low and prices are stability in financial markets (Ottav iano and Thessie, 2004). The clusters formed in these regions have been self-reinforce over time. The spatial paths of main financial center in Germany from Berlin to Frankfurt between the years 1949-2006 can be given example for historical accidents. After the establishment of the Central Bank in Frankfurt, the concentration of foreign banks in Frankfurt increased steadily and Berlin lost its importance as a main financial center. However, after the 1980s, when foreign banks were shifting to global markets such as London, the intensity of foreign banks in Frankfurt gradually decreased. Therefore, the concentration of foreign banks in Frankfurt has developed in the form of reverse U (Grote, 2002). The need for the presence of a financial center in Dubai was first spoken by the state, then a tourism-oriented and new airline company was set up for this need. The arising tourism-based economic clusters prov ided the necessary env ironment for the establishment of the DIFC (Hvidt, 2009). Therefore, infrastructure investments carried out by the state in transportation, technology and physical areas can also be considered as historical accidents for financial centers to develop new spatial pathways. For example, infrastructural studies carried out in the transportation sector in Istanbul have caused the financial clusters to shift from Galata to Levent-Maslak as a historical accident. In this context, the study begins by a literature rev iew of financial system dimensions that translate path dependence of financial centers to spatial dependence and the effects of orientation of financial centers as bank based or capital based on creating new spatial paths, then will go on to development of hypotheses. Research methodology, analyses results and research model will take place at second section. The results of the analyses will be discussed and recommendation will be prov ided for countries.
Literature Review and Theoretical Framework
Financial Depth
Financial depth means financial size. Financial size of finance centers depends on credits given by commercial banks and other financial institutions to private sector and transactions in capital markets. The credits given by commercial banks and other financial institutions to the private sector measure the activ ities of the banks (Levine, 1997). High liquidity at financial centers prov ide to lower transaction costs and in a result of this, large financial transactions can take place quickly in markets. The reliability of financial systems is determined by the liquidity and credibility . Crocco, Calvente and Castro (2006) argue that financial institutions, especially foreign banks, make their location choices according to financial depth of markets to meet their financial needs (Wong, 2012). Liquid markets offer low capital cost
ISSN 2411-9571 (Print) ISSN 2411-4073 (online)
European Journal of Economics
and Business Studies April 2018 Vol 4 No 1
58
opportunities to firms. According to economies of scale, liquid markets prefer to take place in financial centers that perform large financial transactions and whose financial size is at a certain level. On the other hand, it is a prestige for firms to be listed on the stock exchanges of leading financial centers (Karreman and Knaap, 2007; Karreman, 2010). The financial systems of the developing countries should be bank-based because they can’t compete with stock exchanges which have high financial depth as in developed countries (Claessens et.al., 2002). Liu and Strange (1997) used the ratio of total value of stocks traded on Stock Exchange to the GDP to measure the depth (size and performance) of stock exchanges in financial centers. Besides, information in deep financial markets creates sectoral positive externalities. Clustering effect prevents financial sector from becoming a fragmented structure spatially by creating a depth for financial centres. Unless expansion of knowledge hinterland, financial depth only creates short-term or medium-term path dependence for financial sectors (Porteous, 1995; Park, 2012). Financial depth does not occur randomly in financial system. Financial depth ensues with small historical events by following an evolutionary process. Innovations in financial institutions, tools and markets, the development of institutional control mechanisms and the increase of public banks deepens the financial system structure (Fratianni and Spinelli, 2006).
Financial Efficiency
Financial efficiency implies efficient financial resource use and easy implementation of financial transactions (at the same time minimizing transaction costs) (Cihak et al., 2012). Financial efficiency is about the costs that financial centers face (Zhao et al., 2004). Bank efficiency score and stock turnover ratio of stock exchanges (Porteous, 1995; Donaubauer et al., 2014; Cihak et al., 2012) can be used to measure financial efficiency. The bank efficiency score is calculated as the ratio of the total personnel expenses and general expenses to total assets and the average of the net interest margin. The ratio of general expenses to total assets is the share of operating expenses of banks in all assets. Total assets represent total income assets, bank cash assets, bank deposits, fixed assets other than real estate, value of brands, other tangible assets, current tax assets, deferred tax, discontinued operations and other assets. Low overhead costs can be used as a measure of efficiency. But very low overheads can also be interpreted as inefficient competitiveness. Therefore, overheads alone can’t be used directly to measure bank activ ity . Interest margin is a measure of the intermediary costs of banks. It is used as a measure of the effectiveness of the banking system. The growth of interest margins push-off investors from the banking system and affects the development of the financial system negatively . The activ ity expenses of banks are calculated as the ratio of average interest margins and overheads to total assets. Low bank efficiency score points to effective banking system (Allen and Gale, 2004). Total stock turnover rate of stock exchanges which is the ratio of stock traded on stock exchanges to the market value of stocks and used as liquidity of stock markets, is not a direct measure of stocks trading costs (Demirgüç-Kunt and Levine, 1999). Nevertheless, Kerr (1965) and Porteous (1999) used this indicator to how liquidity is important for spatial dependence in financial centers. Active small stock exchanges have a high turnover rate. On the contrary, the inactive big stock market where liquidity is low has a low turnover rate. The increase in the efficiency of the financial system structure in parallel with the economic development also increases the number of transactions on financial markets and the diversity of financial instruments (Liu and Strange, 2013). In terms of location selection, financial institutions select only a certain region, despite the advantages of other places in terms of cost because of the influence of factors such as quality control, speed, security and confidentiality in information-based transactions and the influence of centrifugal and centripetal forces. This create a lock in and then a spatial dependence for financial centers. For example, because of the lock-in effects, insurance firms prefer to locate in Zurich instead of Ireland which is more advantageous in terms of low costs. Lock-in effects usually mean that the financial institutions can’t be separated from the inefficiency regions and thus a region is preferable than the other regions (Porteous, 1995; Porteous, 1999). Therefore, financial clusters prov ide their efficiency by increasing financial firms’ geographical prox imity to each other and firm density . The geographical prox imity has a positive effect on gaining non-transferable competitive power, information and resources. Advantage of face to face communication among firms, being close information technology and media clusters in financial clusters are also one each a contributing factor in attracting skilled workers to the cluster and increasing the reputation of the financial center (Kuah, 2008). From the v iew point of location choice, efficiency of financial centres depends on chance in the first place that they are founded (Liebowitz and Margolis, 1999). Over time, increasing returns of financial centers may cause inertia (or lock-in) and irreversibility and potential path inefficiency by small historical accidents. Financial clusters prov ide their efficiency slowly by making their future choices depending on learning process. In the long term, if firms give up to move other advantageous places, then their transactions costs gradually decrease with the help of learning process (Arthur, 1994). On the other side, financial systems tend to converge to the most efficient system. Therefore, the convergence of financial systems can be conceptualized by path dependency. Bank and capital market development complement each other. Changes in a financial system (from a bank-focused financial system to a capital- based financial system, or
ISSN 2411-9571 (Print) ISSN 2411-4073 (online)
European Journal of Economics
and Business Studies April 2018 Vol 4 No 1
59
v ice versa) are not easy. Due to the interdependence of the components of the financial system, a change in composition systematically creates inefficiency in other components. Therefore, inefficient financial systems which has changed its focus tend to return to their old systems where they can be efficient. In a radical change in the financial system, the system can only surv ive if the increasing of productiv ity is greater than the social costs (Hölz, 2003).
Financial Stability
The globalization has brought with it the integration of financial systems. In this way, the increase in capital circulation and the increase of innovations in financial products has brought risks such as the deterioration of financial stability . Therefore, depending on the hierarchical levels of financial systems, the dynamics that compete each other have become dynamics that complements each other. In short, financial systems have been become interdependent. The continual change of finance geography under these influences have been increased the pressure of competition on financial centers. Therefore, more flex ible rules and forms of governance have been emerged (Kruse, 2003). Financial stability and currency stability are most needed factors by the markets during the globalization phase (Grote, 2002). Financial integration has risks of increasing instability , of the rapid spread of financial crises among countries especially in the financial system. The way to be protected from these risks isn't only just isolation. Isolated financial centers trigger a stable but poor financial systems (Young et al., 2009). Especially in uncertain environments where there is economic instability , firms which need high liquidity in rural tend to move center. Financial systems shift towards from peripheral to center and tend to cluster at the center because of the advantages of the center that prov ide (Klagge and Martin, 2005). During a crisis, it is not important whether the financial system is bank-oriented or capital oriented. A stable financial system is more resistant to those financial crises. Bank-oriented system is more complicate rather than to capital based financial system because of firm-bank-worker relations and their learning process. This makes difficult to prov ide stability and weakens reflex towards external shocks. Thus, less complex and consistent financial systems are more resistant to crises despite they are less efficient (Hölz, 2003). Financial instability is an important indicator because it destroys the flow of capital in financial centers. The Bank Z-score is often used to measure the financial stability of the banking sector. This indicator is determined by the probability that a banking system in a country defaults (does not fulfil l its obligations) in terms of basic accounting and auditing. Z = (k + μ) / σ. The capital asset rate in the formula represents the standard deviation of the profitability of assets, and the profitability of assets (proxy) in place of the variance of σ (Cihak et al., 2013). Bank Z-Score expressed as the risk of failure of the banks. High Z-Score means that banks are at risk of low failure. There is a negative relationship between the increase in competitiveness and the probability of banks failing. In other words, when the competition between the banks increases, the risk of failing the banks is decreasing. Another point of v iew on the financial stability of banks is that the incentives they will have for increasing the credibility of banks with more market forces will increase. Therefore, managers are more cautious to improve the quality of their assets. Monitoring of such institutions is also easier. Successful banks are generally regarded as stable. Bank failures can be solved through mergers, capital increases and other support mechanisms. As for capital markets, financial stability can be measured by price fluctuations of shares on stock exchange market (Schaeck, 2009).
Financial Accessibility
Financial centers which have the high-level of global accessibility deliver their innovative financial serv ices and products developed with their accumulation of finance and experience to customers using extensive information networks (Kruse, 2003). It is seen that international financial market accessibility is the third important factor affecting the competitiveness level of financial centers in the Global Financial Centers Index (Z/Yen, 2015). The increasing of the number of listed firms on the stock exchange has caused increasing of the information asymmetry on the market. However, firms that have specific areas of expertise, which wants to change this situation to an advantage prefer to locate in places close to knowledge resources (Karreman and van der Knaap, 2007; Karreman, 2010). Therefore, financial accessibility creates spatial dependence for financial institutions. Financial accessibility was measured by the number of banks and bank branches per 100,000 people and the number of firms listed on the stock exchange per 1,000,000 people at the end of the year. This indicator does not include investment companies, mutual funds and other common investment instruments. The number of companies in the financial system and the number of firms listed on the stock exchange is related to the creation of spatial dependency in information networks, in terms of prox imity to the markets, customers and information resource. At the same time, financial accessibility is effective in achiev ing a certain level of scale economics for financial centers. Porteous (1995) points out that the financial sector has the most reliable and valuable information (information hinterland and asymmetric information). For example, in China, Beijing’s main financial institutions prefer to establish their headquarters close to central government buildings, which are a source of

ISSN 2411-9571 (Print) ISSN 2411-4073 (online)
European Journal of Economics
and Business Studies April 2018 Vol 4 No 1
60
non-standard information policies. Besides, Hong Kong prefers to stay close to financial information sources and Shanghai to trade information sources (Zhao, Smith and Sit, 2003).
In the light of the literature, we argue that four dimensions of financial system create spatial dependency for financial centers through the positive externalities of clusters, geographical prox imity and knowledge asymmetry and propose the hypotheses following:
H1: Financial system depth doesn’t have a significant effect on the spatial dependence of financial centers.
H2: Financial system efficiency doesn’t have a significant effect on the spatial dependence of financial centers.
H3: Financial system stability doesn’t have a significant effect on the spatial dependence of financial centers.
H4: Financial system accessibility doesn’t have a significant effect on the spatial dependence of financial centers.
Research Method
Sample and Data Collection
In the study, a dataset was created from secondary sources as The Global Financial Center Index by Z- Yen, have started to be published since 2007 and The Global Financial Development Database with contains 203 comparative indicators of the system structure of the economy. In the study, the financial system structure of the countries was used as proxy because of the lack of comparable time series databases of the cities where the finance centers are located. Panel Balanced Data obtained from 25 countries between years 2007-2011 were analyzed through the STATA 11 statistical packet program and four hypotheses were tested through panel data analyses.
Analyses
In the study, 25 Financial Centers were ranked according to the indexes (September Period) of Globalization Center Index of Financial Centers between 2007 and 2011. The first 9 global centers (London, New York, Hong Kong, Singapore, Tokyo, Zurich, Toronto, Sydney, Frankfurt) were compared with the next 10 reginal centers (Paris, Dubai, Seoul, Dublin, Amsterdam, Stockholm, Brussels, Qatar, Madrid, Vienna) and the last 6 national centers (Sao Paulo, Wellington, Helsinki, Johannesburg, Rome, Lisbon). Two ANOVA tests were used to test whether the spatial dependencies of financial centers differed significantly according to the degree of globalization of financial centers and whether the spatial dependencies of financial centers differed significantly according to their being banking or capital market oriented. The structure of the financial system of countries is focused on banking or capital markets has been determined by considering the prev ious studies made by looking at the literature. The financial centers at London, New York, Hong Kong, Singapore, Zurich, Toronto, Sydney, Paris, Seoul, Amsterdam have capital based financial systems. The rest of 15 financial centers, analyzed have bank based financial systems. As a result, when the globalization degree shift from national to global the financial systems converge to capital oriented market structure. Besides, the spatial dependencies of financial centers differed significantly according to the degree of globalization of financial centers.
The empirical model of the study is grounded by research of Demirgüç-Kunt et al. (1999). Panel data analysis was used to analyze the effect of the financial system structure on the spatial dependence of financial centers. In the panel data analysis, it was decided that Driscoll Kraay Model was used according to the annually data structure (unit and time lengths) and the models had fixed effects. The time effect in the model was expressed by i_year. Competitiveness scores representing spatial dependencies of financial centers were dependent variable in the models. Four dimensions of financial system structure as financial depth, financial efficiency, financial stability and financial accessibility are independent variables. In models the effect of each dimension on spatial dependence was evaluated separately considering the globalization degree of the finance centers and their structure of capital markets and the banking sector. GDP per person and inflation rate data affecting the financial system of countries are also added as control variables in each model. The models are included two dummy variables (global and regional), in order to avoid falling into the dummy variable trap. Finally , a time invariant variable is added to each model to show whether the financial centers are bank-oriented or capital-oriented. Panel data analysis is conducted after all data are made stationary. Total value of stocks traded on Stock Exchange to the GDP, the number of firms listed on the stock exchange per 1,000,000 people, the number of banks and bank branches per 100,000 people and logarithm of GDP per person are stationary at the first difference. The ratio of commercial banks and other financial institutions to private sector to the GDP, the bank efficiency score, stock turnover ratio on stock exchanges, Bank Z Score, price fluctuations of shares on stock exchange market and inflation rate are stationary at 0 level. We conduct unit root tests according to Harris Tzavalis.

ISSN 2411-9571 (Print) ISSN 2411-4073 (online)
European Journal of Economics
and Business Studies April 2018 Vol 4 No 1
61
Findings
In this study, panel data analysis is also conducted to test the hypotheses and to define the direction of relations. In two ways, fixed effect panel data analysis, Driscoll - Kraay Method corrects assumption deviations such as autocorrelation, heteroscedasticity and correlation between units. But despite ANOVA test shows that the financial centers differ in terms of market-orientation (bank-based vs. capital-based) and internationalization degree, Driscoll - Kraay Method omits dummy variables because of multiple linear dependence. Therefore, we can’t see in which direction they effect spatial dependence of financial centers in the model. When we examined the effect of financial depth of banking and capital markets on the spatial dependence of financial centers in the Table 1, it is seen that the ratio of commercial banks and other financial institutions to private sector to the GDP (credit) parameter has a positive effect (β1 = 0.9336) on the spatial dependency of finance centers. This variable was statistically significant at the 5% level of significance (p = 0,000). It is seen that the ratio of total value of stocks traded on Stock Exchange to the GDP (stock_traded) is a positive effect (β2 = 0,1291) on the spatial dependence of the financial centers. At 5% significance level, this variable was statistically significant (p = 0.002). When the time effect is examined, it can be said that financial depth has increased spatial dependency for financial centers over time. As a result, Hypothesis 1 was rejected.
[Table 1. Panel Data Analysis Results on the Financial Depth on Spatial Dependence of Financial Centers]
Panel Data Model Independent Variables Depended Variables
β Sig. R2 Model Sig.
1 credit Skor 0,9336 0,000 0,6892 0,000
First Difference of
stock_traded
0,1291 0,002
inflation 1,4109 0,000
First Difference of log GDP
30,1517 0,445
i_y ear 2008 468,7952 0,000
i_y ear 2009 500,0881 0,002
i_y ear 2010 514,5387 0,000
i_y ear 2011 537,1381 0,000
When we examined the effect of financial efficiency on spatial dependence of financial centers in the Table 2, the bank efficiency score (bank_effiency) positively affects (β1 = 5,544,698) spatially dependence on financial centers but it is not statistically significant at the 5% level of significance (p = 0.259). Stock turnover ratio on stock exchanges (stock_turnover) affects the spatial dependency of financial centers in the positive direction (β2 = 0.3532193). At the 5% level of significance, this variable was statistically significant (p = 0,000). Therefore, as the stock turnover ratio on stock exchanges increases, the spatial dependence of financial centers also increases. When the time effect is examined, it can be said that the financial efficiency has increased spatial dependency for financial centers over time. As a result, Hypothesis 2 was partially rejected.
[Table 2. Panel Data Analysis Results on the Financial System Efficiency on Spatial Dependence of Financial Centers]
Panel Data Model Independent Variables Depended Variables
Β Sig. R2 Model Sig.
2 constant Skor 531,1804 0,000 0,6892 0,000
bank_efficiency 5,544698 0,259
stock_turnov er 0,3532193 0,000
inflation 0,482238 0,161
First Difference of Log GDP -57,14116 0,000
i_y ear 2009 32,82129 0,000 i_y ear 2010 514,5387 0,000
i_y ear 2011 537,1381 0,000
When we examined the effect of financial stability on spatial dependence of financial centers in the Table 3, the bank Z score (z_score) negatively affects (β1 = -2,3810) spatially dependence on financial centers and it is statistically significant at the 5% level of significance (p = 0.018). Price fluctuations of shares on stock exchange market

ISSN 2411-9571 (Print) ISSN 2411-4073 (online)
European Journal of Economics
and Business Studies April 2018 Vol 4 No 1
62
(price_fluctuation) affects the spatial dependency of financial centers in the positive direction (β2 = 0.4329) but at the 5% level of significance, this variable was not statistically significant (p = 0,464). When the time effect is examined, it can be said that the financial stability has increased spatial dependency for financial centers over time. As a result, Hypothesis 3 was partially rejected.
[Table 3. Panel Data Analysis Results on the Financial System Stability on Spatial Dependence of Financial Centers]
Panel Data Model Independent Variables Depended
Variables
Β Sig. R2 Model Sig.
3 z_score Skor -2,3810 0,018 0,6060 0,000
price_fluctuation 0,4329 0,464
inflation 0,9546 0,004
First Difference of Log GDP -19,1296 0,675
i_y ear 2008 605,7266 0,000
i_y ear 2009 635,31 0,000
i_y ear 2010 654,6829 0,000
i_y ear 2011 680,4405 0,000
When we examined the effect of financial accessibility on spatial dependence of financial centers in the Table 4, the number of banks and bank branches per 100,000 people (bank_branch) positively affects (β1
= 0,6935) spatially dependence on financial centers and but it is not statistically significant at the 5% level of significance (p = 0.208). the number of firms listed on the stock exchange per 1,000,000 people (listed_firm) affects the spatial dependency of financial centers in the negative direction (β2 =-2,017032) but at the 5% level of significance, this variable was not statistically significant (p = 0,139). When the time effect is examined, it can be said that the financial accessibility has increased spatial dependency for financial centers over time. As a result, Hypothesis 4 was accepted.
[Table 4. Panel Data Analysis Results on the Financial System Accessibility on Spatial Dependence of Financial Centers]
Panel Data Model Independent Variables Depended Variables
Β Sig. R2 Model Sig.
4 constant Skor 583,7038 0,000 0,5943 0,000
First Difference of bank_branch
0,6935219 0,208
First Difference of
listed_firm
-2,017032 0,139
inflation 0,9785195 0,000
First Difference of Log GDP -13,28406 0,824
i_y ear 2009 28,1813 0,000
i_y ear 2010 42,06522 0,000
i_y ear 2011 68,04861 0,000
The research model is being shaped as it has been shown at Figure 1 below:

ISSN 2411-9571 (Print) ISSN 2411-4073 (online)
European Journal of Economics
and Business Studies April 2018 Vol 4 No 1
63
[Fig 01. Final Research Model]
Conclusion and Discussions
Financial centres determine their spatial paths according to their financial products, transactions and information flow direction. When we look at their evolution, they emerge in cities where international competitive is high. They need places where they have physical capital, financial development, institutional efficiency, social-cultural character, workforce, global attraction, profitable investment opportunities, confidential and wide knowledge hinterland. Competitive power of financial centers has forced their institutional capacities over time. When they reach natural boundary at one location, their competitive env ironment has affected their success adversely and let them develop new spatial paths. Many of global financial centers form multi-centered clusters over time, because they hav e enough financial depth and liquity to create new attractive clusters which have low capital investment cost opportunity in some other place. Unlike global financial centers, it is not very easy to change locations for natural financial centers because of their strong spatial dependency. Hence, they can create new spatial paths only through historical accidents such as government policies or incentives. Government investments and incentives, technological changes, new sectors that demand new and specific financial produts/serv ice, replace of knowledge suppliers such as exchange stock, public enterprices and headquarters of big financial entreprices etc. and destructive external shocks such as natural disastors, financial crises, terrorism and wars are strong reasons to break a path dependence and create new spatial paths for financial centers. Especially changing their locations get easy for financial centers when the value of knowledge decrease in the location. On the other side, financial centers create new spatial paths to them changing in their financial functions and roles in terms of financial systems and prox imity to customers that they serv ice.
Financial centres create their new spatial ways by a planned way or randomly (Arthur, 1994). If financial centres follow a planned new spatial way, strategists should search new opportunities and prov ide reallocation of resources or they move towards another location depends on the constraints of their old location based on their collective learning processes (Hassink, 2005). If new spatial paths are chosen randomly, external shocks which can’t be predicted by looking historical small events broke path dependencies and create another one (Martin and Sunley, 2006, Martin, 2010). In multiple centered financial clusters, location choice is also random but their spatial diffusion follows a cumulative but indeterminate process in the long- term (Wang, 2005; Krugman, 1998; Boschma and van der Knaap, 1997). New spatial paths can be created by expanding of knowledge hinterland, rev ising legal and organizational regulations for creating innovative technologic areas and new products and reallocation of resources (Garud and Karnoe, 2000; Martin, 2010; Martin and Sunley, 2006b).
This research show us that a way to break spatial dependence of financial centers is shifting of bank based financial system to capital based financial system. Financial centers that need to create new spatial paths should develop innovative products and tools in capital markets and widen their hinterlands enough strong to destroy the influence of their centripetal forces. Variety of financial products required differentiated places. While the liquidity degree and size of financial markets determine in which stock exchange that firms should list, the locations of the listed firms on stock exchange determine the boundaries of financial centers. While number of listed firms increase on stock exchanges, the information asymmetry is increasing in stock exchanges too. Therefore, this reduces spatial dependence and allows the
ISSN 2411-9571 (Print) ISSN 2411-4073 (online)
European Journal of Economics
and Business Studies April 2018 Vol 4 No 1
64
creation of new spatial paths. High turnover ratio of stock market indicates more liquid financial centers. On the other hand, there is a negative relationship between spatial dependence and financial stability . Financial system stability concerns financial centres’ minimizing the risks created by financial integration. Generally financial instability increases the risk of financial crisis. Financial crisis as a dynamic external shock creates new spatial paths for financial centers by directing government policies and remodeling financial markets. A high Z-score implies that banks have low bankruptcy probability and high financial stability . Independence banks can move more easily towards plaees where have more advantageous conditions.
References
[1] Allen, F.; Gale, D. (2004) Competition and Financial Stability, Journal of Money, Credit, and Banking, 36(3): 453-480 Arthur,
W. B. (1994). Increasing Returns and Path Dependence in the Economy, University of Michigan Press, Ann Arbor. [2] Arthur, W.B. (1988) Urban Systems and Historical Path Dependence, Ausubel, J.H.; Herman, R. (Eds), Cities and Their Vital
Systems: Infrastructure Past, Present, and Future, National Academy Press, p. 85-98. [3] Boschma, R.; van der Knaap, B. (1997) New Technology and Windows of Locational Opportunity, Reijnders, J. (Eds) Economics
and Evolution, Cheltenham: Edward Elgar, p. 171-202. [4] Bosker, M.; Brakman, S.; Garretsen, H.; Schramm, M. (2007) Adding Geography to the New Economic Geography, CESIFO
Working Paper, Number: 2038, Category 10: Empirical and Theoretical Methods. [5] Cı̇ hak, M.; Demirgüç-Kunt A.; Feyen, E.; Levine, R. (2012) Benchmarking Financial Systems around the World, Policy Research
Working Paper, No: 6175. [6] Cı̇ hak, M.; Demirgüç-Kunt A.; Feyen, E.; Levine, R. (2013) Financial Development in 205 Economies, 1960 to 2010, Working
Paper No: 18946, National Bureau of Economic Research, p.1-53 [7] Claessens, S.; Klingebiel, D.; Schmukler, S.L. (2002) Ex plaining the Migration of Stocks from Ex changes in Emerging
Economies to International Center, Policy Research Working Paper, 2816, The World Bank [8] Crocco, M A, Cavalcante, A and Castro (2006) The Behaviour of Liquidity Preference of Banks and Public and Regional
Dev elopment: The Case of Brazil, Journal of Post Keynesian Economics, 28(2): 217-240 [9] Dem ı̇ rgüç-Kunt, A.; Levine, R. (1999) Bank Based and Market Based Financial Systems: Cross Country Comparisons, World
Bank Policy Research Working Paper, No: 2143 [10] Donaubauer, J.; Meyer, B.; Nunnenkamp, P. (2014) A New Global Index of Infrastructure: Construction, Rankings and
Applications, Kiel Working Papers, No: 1929. [11] Fratı̇ annı̇ , M.; Spinelli F. (2006) Italian City-States and Financial Evolution, European Review of Economic History, 10(3): 257-
278. Fujı̇ ta, M.; Krugman, P.; Venables, A. J. (1999) The Spatial Economy: Cities, Regions and International Trade, The MIT Press,
[12] Cambridge, Massachusetts, London, England. [13] Garud, R.; Kornoe, P. (2001) Path Creation as a Process of Mindful Deviation, Garud, R.; Kornoe, P. (eds.) Path Dependence
and Creation, Lawrence Erlbaum Associates Inc., New York, p.1-40 [14] Grev e, H. R. (2000). An Ecological Theory of Spatial Evolution: Local Density Dependence in Tokyo Banking, 1894-1936, Social
Forces, 80(3): 847-879. [15] Grote, M. H. (2002) Frankfurt - An Emerging International Financial Center, d. Felsenstein, D.; Schamp E.W.; Shachar, A.
(eds.),Emerging Nodes in the Global Economy: Frankfurt and Tel Aviv Compared, Kluwer Academic Publishers, p. 81-107.
[16] Grote, M. H. (2009) Financial Centers Between Centralization and Virtualization, Alessandrini, P.; Fratianni, M.; Zazzaro, A. (eds.), The Changing Geography of Banking and Finance, Springer, NewYork, USA, p. 277-294.
[17] Hass ı̇ nk, R. (2005) How to Unlock Regional Economies from Path Dependency? From Learning Region to Learning Cluster, European Planning Studies, 13(4): 521-535
[18] Hölz, W. (2003) Convergence of Financial Systems: Towards An Evolutionary Perspective, Working Papers Series: Growth and Employ ment in Europe: Sustainability and Competitiveness, Wirtschaftsuniversität Wien, Working Paper No: 31.
[19] Hv ı̇ dt, M. (2009) The Dubai Model: An Outline of Key Components of the Dev elopment Process in Dubai, International Journal of Middle East Studies, (41): 397-418
[20] Karreman, B. (2010). Financial Services and Emerging Markets. PhD Thesis, The Erasmus University Rotterdam, Rotterdam Karreman, B.; van der Knaap, B. (2007) The Financial Centres of Shanghai and Hong Kong: Competition or Complementarity?, ERIM
[21] Report Series Research In Management, (62): 1-28.
[22] Kerr, D. (1965) Some Aspects of the Geography of Finance in Canada, Canadian Geographer, 9(4): 175-912 [23] Klagge, B.; Martin, R. (2005) Decentralized versus Centralized Financial Systems: Is There a Case for Local Capital Markets?,
Journal of Economic Geography, (5): 387–421 [24] Krugman, P. (1998) What’s New About the New Economic Geography?, Oxford Review of Economic Policy, 14(2): 7-17.
Krugman, P. (2011) The New Economic Geography, Now Middle-Aged, Regional Studies, 45(1): 1-7 [25] Kruse, C. (2003) When Form Follows Function – Financial Centers as Starting Points for Researching the Interrelationship
Betw een Financial Intermediaries and the Management of Firms, 43rd ERSA-Conference, Jyväskylä, p.1-14 [26] Kuah, A. T. H. (2008).Is There a Diamond in the City? Leveraging the Competitive Advantage of the London Financial Centre,
[27] Singapore Management Review,30(2): 1-17.
ISSN 2411-9571 (Print) ISSN 2411-4073 (online)
European Journal of Economics
and Business Studies April 2018 Vol 4 No 1
65
[28] Lev ı̇ ne, R. (1997) Financial Development and Economic Growth: Views and Agenda, Journal of Economic Literature, (XXXV): 688– 726
[29] Lı̇ ebow ı̇ tz, S.J.; Margolis, S.E. (1999) Path Dependence, Encyclopedia of Law and Economics, 0770, p.981-998
[30] Lı̇ u, Y.C.; Strange, R. (1997) An Empirical Ranking of International Financial Centers in the Asia-Pacific Region, The International Executive, 39(5): 651- 674
[31] Martı̇ n, R. (1994) Stateless Monies, Global Financial Integration and National Economic Autonomy: the End of Geography?, Corbridge, S.; Martin, R.; Thrift, N.(eds.), Money, Power and Space, Basil Blackwell Ltd., Oxford UK & Cambridge USA, p.
253-279. [32] Martı̇ n, R. (2009) Rethinking Regional Path Dependence: Beyond Lock-in to Ev olution, Papers in Ev olutionary Economic
Geography (PEEG), Utrecht University, Number: 0910, p. 1-41. [33] Martı̇ n, R. (2010) Roepke Lecture in Economic Geography - Rethinking Regional Path Dependence: Beyond Lock-in to
Ev olution, [34] Economic Geography, 86(1): 1-27. [35] Martı̇ n, R.; Sunley, P. (2006) Path Dependence and Regional Economic Evolution, Journal of Economic Geography, (6): 395-
438. O’Brı̇ en, R. (1992) Global Financial Integration: the End of Geography, Pinter, London.
[36] Ottav ı̇ Ano, G.; Thisse, J. F. (2004) New Economic Geography: What About the N?, CORE Working Paper, January [37] Park, J. H. (2012) Comparative Study on Asian Financial Capitals’ Competitiveness: Focused on Strengths and Weaknesses of
The City Of Seoul. Master Thesis. California: University of Southern California [38] Porteous, D.J. (1995) The Geography of Finance Spatial Dimensions of Intermediary Behaviour, Avebury Ashgate Publishing
Limited, England [39] Porteous, D.J. (1999) The Development of Financial Centers: Location, Information, Externalities and Path Dependence, Martin,
R. (eds.) Money and the Space Economy, John Wiley&Sons, UK., p.95-115. [40] Schaeck, K. (2009) Bank Market Structure, Competition, and Stability: Issues and Concepts, Alessandrini, P.; Fratianni, M.;
Zazzaro, A. (eds.), The Changing Geography of Banking and Finance, Springer, NewYork, USA, p. 133-153. [41] Schmultzer, A. (1999) The New Economic Geography, Journal of Economic Surveys, 13(4): 355-379. [42] Thakor, A. V. (1996) The Design of Financial Systems: An Overview, Journal of Banking & Finance, 20: 917-948 The Global
Financial Development Database, 2015 [43] Wang, D. T. (2005) Multinational Corporations’ (MNCs) Strategic Location and the Dev elopment of Financial Service Hubs in
China, 101 AAG Conference, 5-9 April 2005, Denver. [44] Wong, Y. C. A. (2012) A Study of Shanghai and Hong Kong as International Financial Centres - A Review of Their Developments
and Attributable Factors, PhD Thesis, Edinburgh Napier University. [45] Z/Yen Group (2007) The Global Financial Centers Index 2, Long Finance. Z/Yen Group (2008) The Global Financial Centers
Index 4, Long Finance. Z/Yen Group (2009) The Global Financial Centers Index 6, Long Finance. Z/Yen Group (2010) The Global Financial Centers Index 8, Long Finance. Z/Yen Group (2011) The Global Financial Centers Index 10, Long Finance. Z/Yen Group (2015) The Global Financial Centers Index 16, Long Finance.
[46] Zhao, S. X., C.J. Smith and K.T.O. Sit. (2003) China’s WTO Accession and Its Impact on Spatial Restructuring of Financial
Centres in Mainland China and Hong Kong. Annual Meeting of the American Association of Geographers, Los Angeles, (19-23 March 2003), p.1-55.
[47] Zhao, S.X.B.; Zhang, L.; Wang, T. D. (2004) Determining Factors of the Dev elopment of a National Financial Center: The Case of China, Geoforum, 35: 577-592
ISSN 2411-9571 (Print) ISSN 2411-4073 (online)
European Journal of Economics
and Business Studies April 2018 Vol 4 No 1
66
DOI: 10.26417/ejes.v4i1.p66-78
Open Access. © 2018 Neha Sharma. This is an open access article licensed under the
Creative Commons Attribution-NonCommercial-NoDerivs 4.0 License
Role of Corporate Communication in Boomerang
Neha Sharma
PhD, Assoc/ Prof. School of Inspired Leadership, Gurgaon, India
Abstract
Purpose – The study tries to analyze the trends in alumni relations and the role of corporate communication in developing organizational identification and a positive boomerang behavior intention among former employees. The approach of the study has been from the point of v iew of making this process formal and emphasize on the impact of corporate communication in maintaining alumni relationships, and attracting the former talent for the organization. Methodology- An exploratory methodology was designed to capture the perceptions of current and former employees of nine multinational companies (MNCs) in India, on alumni communication practices prevailing in their organizations. Transcripts of semi-structured interv iews were analyzed, coded thematically and the essence of experiences was jointly combined into one description. Findings – Study showed that corporate alumni website, personalized messages on discounts on products and serv ices, emails, social networking platforms, alumni engagement events, leadership and value training workshops and corporate communication standards, particularly consistency, have a positive impact on organizational identification and finally inspire the former employees to rejoin the organization. Practical implications – A number of significant managerial implications are drawn from this study, for example using both corporate communication and training to influence former employees’ attitudes and decision to participate in volunteering activ ities or rejoin the prev ious employer. Still, it should be noted that the effect of corporate communication on the behaviors of former employees depend on communication standards and HR interventions in maintaining relationships with alumni. Originality/value – The results prov ide valuable insights from the key former and current employees perspectives into the effectiveness of alumni communication process to facilitate the recruitment of high performing employees or their involvement in other mutually beneficially activ ities . Further rehiring alumni is one such innovative method which when done in the right manner can prov ide a quick solution to the talent crunch. Paper type: Research paper
Keywords: Corporate Communication, Boomerang, Personalized Messages, Alumni Website, Communication Standards, Training
1.Introduction
The current trends in the VUCA (volatile, uncertain, complex and ambiguous) world have imposed fresh challenges on talent acquisition and management. Employability is of great significance to employers in order to ensure an adequate pool of employable indiv iduals who are competent, flex ible, understand organizational culture and possess the right skill sets (Emmerik et al., 2012). This has given rise to search of a new phenomenon popularly called ‘boomerang’ (Hart, 2009). “Boomerang” is a concept developed to identify , attract and rehire high performing employees who have joined some other organization and updated skill sets to suit the future job requirements (Sullivan, 2006; Hart, 2009). This era of identify ing and nurturing boomerang employability , creates a unique competition for job seekers and new challenges for organizations to maintain relationships with former high-performers.
Iyer et al., (2000) have mentioned that corporate communication plays a v ital role in building relationships with alumni and it develops mutually beneficial relationships among all stakeholders (Welch, 2015). Many organizations like Deloitte, Ernst and Young, IBM, Booz Allen, Kronos and KPMG have well designed alumni communication program and have been

ISSN 2411-9571 (Print) ISSN 2411-4073 (online)
European Journal of Economics
and Business Studies April 2018 Vol 4 No 1
67
successful in nurturing boomerang employability (Sullivan, 2006). Recently , organizations have recognized corporate communication as a strategic management function and exercise it to guide, motivate, influence and maintain conducive relationships with internal and external stakeholders, and to build corporate reputation (Argenti and Foremam, 2002; Mazzei 2010; Goodman, 2010). Boomerang employees or alumni have also been considered as one of the major stakeholders who can build corporate reputation (Sullivan, 2006; Sung and Yang, 2009). Despite a widespread discussion and acceptance on communicating with alumni and developing boomerang employability among practitioners, the concept among academia and industry , is still fuzzy with little ev idence to understand how ‘boomerangs’ can be targeted and developed to get positive results (Sullivan, 2006; Sung and Yang, 2009). Therefore, it would be significant to understand how corporate communication (CC) dimensions can influence boomerang employability from current and former employees’ perspectives. This study explores the extent to which practitioners in India use communication dimensions to identify and support boomerang behavior intention and motivate former employees to rejoin. Secondly , the study prov ides an approach to examining processes and behaviors by investigating them from the perspective of former employees rather than just focusing on current employees. Thirdly , the study introduces the organizational identification construct into the context of boomerang. The construct has proven useful in reconciling conflicting organizational behavioral research (Iyer et al., 1997; Tsui et al., 1992) and has the potential to prov ide insights into the attitudes and behaviors of former employees.
The study draws practitioner’s attention to communication dimensions, which might facilitate former employees to rejoin and convince management to focus on specific communication dimensions, to deal with employee turnover and retention issues. The study also tries to fill the gap in communication literature by proposing a model using grounded theory (Glaser and Strauss, 1967) that links alumni corporate communication dimensions with organizational identity and intention to rejoin (boomerang). However, the literature rev iew will herein be presented in advance of the results of the primary study in order to identify the specific CC dimensions studies by prev ious researchers that may influence organizational identification and boomerang.
2.Literature Review
2.1Corporate Communication (CC): Theoretical perspective and implications
Corporate communication is an essential management function in contemporary organizations (Goodman, 2010). Organizations have recognized CC as a strategic management function to guide, motivate, inform and influence internal and external stakeholders for achiev ing competitive advantage (Argenti and Foreman 2002; Argenti, 2007; Goodman, 2001). Recently , researchers have identified the need to maintain strong relationship with former employees through proper management of alumni communication programs (Hart, 2009; Sullivan, 2006). Also, communicating with former employees is considered as critical and essential to building trust and meeting organizational objectives (Iyer et al., 2000; Hart, 2009). Communication spawns knowledge sharing, and builds trust. This is explained in the resource based and constructiv is t approaches (Mazzei, 2010) which elaborate that communication is a social process of interaction or interpretation that gives a sense and meaning to social reality , organizational actions, events, organizational roles and processes. Further, social interactions among employees and external communities lead to knowledge creation and trustworthy relationships (Kalla, 2005b).
Researchers have also associated organizational outcomes like employer branding, job satisfaction, commitment, loyalty, organizational identification and organization reputation with corporate communication in their studies (Sharma and Kamalanabhan, 2012; Punjaisri et al 2009; Papasolomou and Vrontis, 2006). However, there is hardly any study in corporate communication literature that has explained the relationship between corporate communication dimensions and an indiv idual intention to re-join the prev ious organization- ‘boomerang’.
2.1.1 Dimensions of Corporate Communication
Tukiainen (2001) has given an agenda model of communication and explained that corporate communication has four dimensions. The first dimension describes how stakeholders of an organization use the communication system (channels , messages) to seek information. He explains here that channels of communication (as described by researchers like Mazzei, 2010; Robson and Tourish, 2005) and the quality of message content (Mazzei, 2010; Welch, 2015) are essential for the overall effectiveness of a communication process. The second dimension in his model describes the communicative way of conduct of employees (Quinn and Hargie, 2004) which is an essential factor in creating organization communication relationships. It includes whether the communication is regular, organized and equal. The third dimension of agenda model of CC describes the horizontal interaction between the colleagues and the informal way of action and the atmosphere based on human relations including face-to-face, verbal communication and unofficial communication network (Robson and Tourish, 2005). The fourth dimension of this model does the evaluation of the functionality of organizational communication

ISSN 2411-9571 (Print) ISSN 2411-4073 (online)
European Journal of Economics
and Business Studies April 2018 Vol 4 No 1
68
as a whole. In this, consistency of communication, right timing of information flow and quantity of information specify the experience of general functioning of information flow.
Moreover, Asif and Sargeant, (2000) believe that communication relationships between all the stakeholders of an organization is another important dimension of corporate communication. Researcher believe that relationships are the act of communication that build a mutual understanding between sender and receiver of information and develop a strong communication relationship based on trust and cooperation (Asif and Sargeant, 2000). The contemporary communication researchers have suggested that corporate communication should be more than a simple exchange of information, but rather a cooperative effort across the various groups (Teeni, 2001).
Furthermore, communication researchers have explained that corporate communication should follow ‘communication standards’ (Bishop, 2006).This suggests that corporate communicators, in their roles as representatives of organizations acting in the public sphere, have a responsibility for authenticity , that is, a duty to use communication standards as a mode of action in their practice. Bishop (2006) proposes the standards of authentic communication which specify that communication should be clear, relevant, timely , truthful and consistent.
Therefore, the alumni CC dimensions that are considered crucial for this study are messages, channels, feedback, communication standards and communication relationships.
2.2Boomerang behavior intention as an outcome
Boomerang is a concept developed to identify and rehire top performing employees (Hart, 2009; Sullivan, 2006). However, in this study we will try to understand the perceptions of former employees and their intention towards boomerang. As defined by Warshaw and Davis (1985), behavior intention (BI) is a degree to which a person has consciously planned to perform a behavior. Therefore, boomerang behavior intention may imply the degree to which the former employee has formulated conscious plan to rejoin the prev ious organization (Hart, 2009; Warshaw and Davis, 1985).
Sullivan, (2006) says boomerang recruitments have one of the highest ROIs in recruiting, when compared to many other sources of recruitment. He further explains that the time and efforts spent in recruitment and training of the boomerang is comparatively much lower when compared to the same for a new recruit. Boomerangs after hav ing spent time outside the organization, understand not only the organization’s expectations and competitive positioning, but may also have upgraded skills and acquired experiences of best practices and drivers for results, making their competencies unique to the organization.
The study conducted on employee engagement by The Workforce Institute and WorkplaceTrends.com (Cavalli, 2017) reveals a changing mindset about hiring former employees. This study conducted a national survey among 1,800 human resources (HR) managers, and employees, and found that despite having past organizational policies on forbidding former employees from hiring process, a large number of managers said they would definitely consider rehiring former employees. Moreover, the survey also identified a growing desire among job seekers to rejoin their prev ious organizations. Huhman. (2012) believes managers and organizations are in constant search for suitable talent to meet the growing needs in a dynamic and volatile business world. Boomerangs join the organization with a much higher commitment levels and a desire to succeed, and need minimal training to get back to work. Half (2016) explains that organizations are identify ing the value of a ready talent pool and open to re-hiring its former employees who have been away for some years.
Researchers have established that consistent communication through various former and informer channels develops a sense of organizational identification and spawns a positive behavior among alumni (Newman and Petrosko,2011; Sung and Yang, 2009). Alumni communication programs, which are part of alumni relations, include managing alumni website, social media, special events and written materials (Hart, 2009; Iyer et al., 2000). Written materials that organizations use to stay in touch with their constituents include annual reports, catalogs, newsletters, magazines, inv itations and blogs (Hart, 2009; Lev ine, 2008). Jones and Volpe, 2010; Sung and Yang 2009 studies on alumni relations of education institutions explain that the effective communication between the institute and the alumni result in higher likelihood of a quality relationship, organizational identification and favorable opinion of their alma mater.
2.3 Organizational identification as a mediating variable
Organizational identification refers to the perceptual connection that organizational stakeholders create with their organization. Social identity theory and, in particular, the proposition that indiv iduals' perceived membership in the social group enabled by communication, prov ides the basis for perceived oneness (Tajfel and Turner, 1985; Dutton et al., 1994). Social identity theory maintains that indiv iduals classify themselves into various social groups, including religious affiliation,
ISSN 2411-9571 (Print) ISSN 2411-4073 (online)
European Journal of Economics
and Business Studies April 2018 Vol 4 No 1
69
gender, and organizational membership, in order to define themselves in the social env ironment and to enhance their self-esteem. The strength of organizational identification depends on the indiv idual's perception of the attractiveness of being a member of the organization (Ashforth and Mael, 1989; Dutton et al., 1994). Through the organizational identification concept, institutional professionals can recruit and utilize alumni in a role to establish a connection for the long-term (Weerts et al. 2010). Iyer et al (1997) have empirically established in their study on accounting firms that social interactions through communication builds alumni organizational identification which further results in positive behavior outcomes. In their study , alumni organizational identification is considered as a mediating variable between communication and positive behavior outcomes.
Researchers (Bergstrom et al., 2002; De Chernatony, 2001) propose that corporate communication can engender stakeholders’ identification, reflecting their sense of ‘oneness’ because it is about getting relevant information about an organization, participating in important discussions, communicating organizational values, benefits and connecting with people of similar interests and organizational associations. Steele (1988) claims that indiv iduals generally desire to be identified with a group or a concept for a long time, therefore, organizational identification developed as an employee of a firm will likely remain a component of the ex -employee's self-concept. Furthermore, researchers (Dutton et al., 1994) emphasize that alumni may use their identification with their former firm to reinforce their self-esteem. Communication researchers have established that organizational identification is one of the outcomes of corporate and internal communication practices (Smidts et al., 2001; Sharma and Kamalanabhan, 2014).
The advantage of organizational identification for this study is based on social identity theory which forms the base of corporate communication, and it also prov ides an explanation for ex -employees' favorable behaviors towards their former firm (Iyer et al., 1997).
However, due to the dearth of research on inter-linkages of alumni corporate communication and boomerang behavior intention, there is hardly any study that empirically depicts the influences of the corporate communication dimensions on boomerang behavior intention. Moreover, as explained in the prev ious section, the current study intends to see organizational identification as a mediating variable between alumni corporate communication and boomerang behavior intention.
3.Research Methodology
3.1 Research design, data collection and sample
Given the highly contemporary and scarce research on communication and boomerang talent, qualitative study can prov ide much greater detail and richer data that may be collated into distinct constructs (Insch et al., 1997, p 1). During the qualitative analysis the researcher sought to understand the ways in which the participants in the study made meaning of their experiences and behaviors (Schein, 1985). For our study, nine organizations were selected which had alumni relations and communication departments. The nine organizations had recently undertaken a lot of communication initiatives to identify and develop boomerang employees. The available research literature on the topic was combined with 41 semi-structured interv iews comprising of 18 (05- senior; 08-middle; 05-junior level management) HR/alumni communication/C C professionals and 23 alumni (06-senior; 12 middle; 15- junior level management) of the selected nine organizations in India. This interv iew sample drew on senior (with more than 20 years of experience), middle management (between 10-20 years of experience) and junior (below 10 years of experience) HR/alumni communication/CC professionals, as well as alumni of the selected organizations. The mix of functions was designed to understand the perceptions of all managerial levels on alumni communication process and its effect on boomerang behaviors.
These organizations belonged to IT, manufacturing, health care and consulting sectors. The interv iews were conducted telephonically during July to November 2017 and the duration of interv iews was approx imately 60 to 90 minutes respectively . Due to confidentiality concerns, the company and indiv idual identities have been made anonymous.
Furthermore, as described in grounded theory (Glaser and Strauss, 1967), it should further be noted that the interv iewees were specifically selected to get relevant data related to the context of the study. Each interv iew was subsequently transcribed and analyzed. The first step in the qualitative data analysis was to classify and code discrete categories of meaning in the data. The next stage in the analysis was to move from a descriptive to a conceptual level of analysis which is supported in grounded theory (Glaser and Strauss, 1967) wherein relationships between variables appear as the researcher codes and interprets the responses of interv iews.
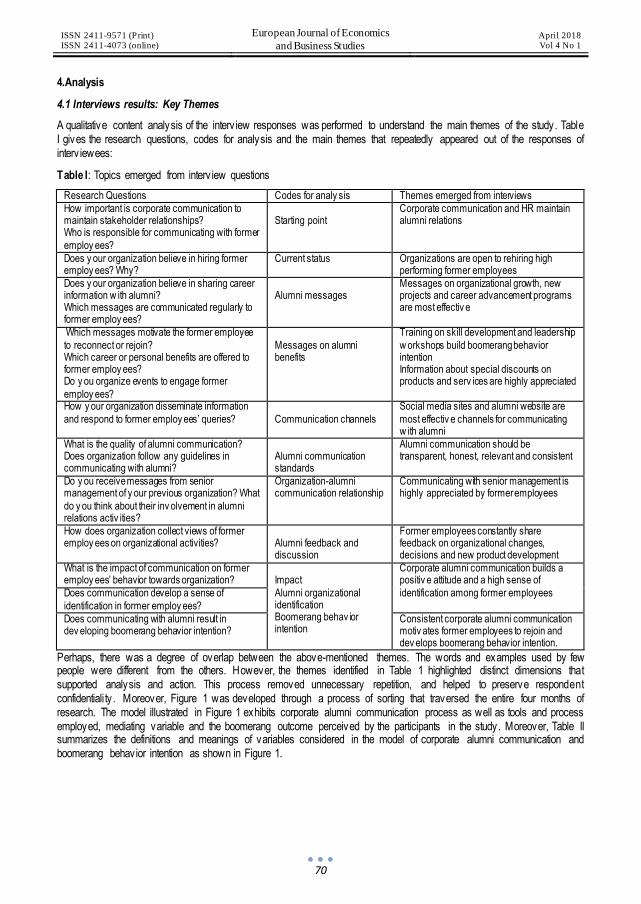
ISSN 2411-9571 (Print) ISSN 2411-4073 (online)
European Journal of Economics
and Business Studies April 2018 Vol 4 No 1
70
4.Analysis
4.1 Interviews results: Key Themes
A qualitative content analysis of the interv iew responses was performed to understand the main themes of the study. Table I gives the research questions, codes for analysis and the main themes that repeatedly appeared out of the responses of interv iewees:
Table I: Topics emerged from interv iew questions
Research Questions Codes for analy sis Themes emerged from interviews
How important is corporate communication to maintain stakeholder relationships? Who is responsible for communicating with former
employ ees?
Starting point
Corporate communication and HR maintain alumni relations
Does y our organization believe in hiring former employ ees? Why?
Current status Organizations are open to rehiring high performing former employees
Does y our organization believe in sharing career information w ith alumni? Which messages are communicated regularly to former employ ees?
Alumni messages
Messages on organizational growth, new projects and career advancement programs are most effectiv e
Which messages motivate the former employee
to reconnect or rejoin? Which career or personal benefits are offered to former employ ees? Do y ou organize events to engage former
employ ees?
Messages on alumni benefits
Training on skill development and leadership
w orkshops build boomerang behavior intention Information about special discounts on products and serv ices are highly appreciated
How y our organization disseminate information
and respond to former employ ees’ queries?
Communication channels
Social media sites and alumni website are
most effectiv e channels for communicating w ith alumni
What is the quality of alumni communication? Does organization follow any guidelines in communicating with alumni?
Alumni communication standards
Alumni communication should be transparent, honest, relevant and consistent
Do y ou receive messages from senior management of y our previous organization? What
do y ou think about their inv olvement in alumni relations activ ities?
Organization-alumni communication relationship
Communicating with senior management is highly appreciated by former employees
How does organization collect views of former employ ees on organizational activities?
Alumni feedback and discussion
Former employees constantly share feedback on organizational changes, decisions and new product development
What is the impact of communication on former employ ees’ behavior towards organization?
Impact
Alumni organizational identification Boomerang behav ior intention
Corporate alumni communication builds a positiv e attitude and a high sense of
identification among former employees Does communication develop a sense of
identification in former employ ees?
Does communicating with alumni result in dev eloping boomerang behavior intention?
Consistent corporate alumni communication motiv ates former employees to rejoin and dev elops boomerang behavior intention.
Perhaps, there was a degree of overlap between the above-mentioned themes. The words and examples used by few people were different from the others. However, the themes identified in Table 1 highlighted distinct dimensions that supported analysis and action. This process removed unnecessary repetition, and helped to preserve respondent confidentiality . Moreover, Figure 1 was developed through a process of sorting that traversed the entire four months of research. The model illustrated in Figure 1 exhibits corporate alumni communication process as well as tools and process employed, mediating variable and the boomerang outcome perceived by the participants in the study. Moreover, Table II summarizes the definitions and meanings of variables considered in the model of corporate alumni communication and boomerang behavior intention as shown in Figure 1.

ISSN 2411-9571 (Print) ISSN 2411-4073 (online)
European Journal of Economics
and Business Studies April 2018 Vol 4 No 1
71
Figure 1: Conceptual Model of the study
Table II: Meanings and definitions of variables of the study
Variables Meaning and definitions Source (adapted from studies of)
Corporate alumni communication
The strategic communication between organization and its stakeholders (former employees) to develop a strong sense of identification and mutually
beneficial relationships
Goodman, 2010; Van Reil, 1995; Hart, 2009
Alumni Messages
Messages pertaining to organization’s goals and performance, alumni benefits like discounts on products and serv ices, latest research and dev elopment, opinions of experts on contemporary topics
Hart, 2009; New man and Petrosko, 2011; Sung and Yang, 2009; Sharma and Kamalanabhan, 2012
Alumni communication
technological channels
Alumni communication channels reliant on
technology like alumni website, social media sites like LinkedIn and Facebook, webinars, podcasts, online discussion forums, blogs etc.
Hart, 2009; Iy er et al., 2000
Alumni communication non-technological channels
Non-technological channels of alumni communication that are not supported by technology like face to face conversations, alumni
ev ents, meetings etc.
Lev ine, 2008; Sertoglu and Berkowitch, 2002
Organization-alumni communication relationships
The act of communication that builds a mutual understanding betw een sender and receiver of information and dev elop a strong communication relationship based on trust and cooperation
betw een management and former employees
Iy er et al., 1997; Sharma and Kamalanabhan, 2012
Alumni Communication
standards
Attributes of effectiv e alumni communication
messages like clarity, authenticity, truthful, consistent, relevant, distinctive and timely
Bishop, 2006; Sung and Yang, 2009
Alumni feedback Tw o way communication between organization and its stakeholders to prepare and improve mutually beneficial plans
Bishop, 2006; Hart, 2009;
Alumni organizational identification
A perceiv ed oneness of former employees with the organization and the ex perience of the
organization's successes and failures as one's own.
Mael and Ashforth, 1992, p. 103; Iyer et al., 1997
Boomerang behav ior intention
The degree to w hich the former employee has formulated conscious plan to rejoin the previous organization
Iy er et al., 2000; Hart, 2009; Warshaw and Dav is, 1985
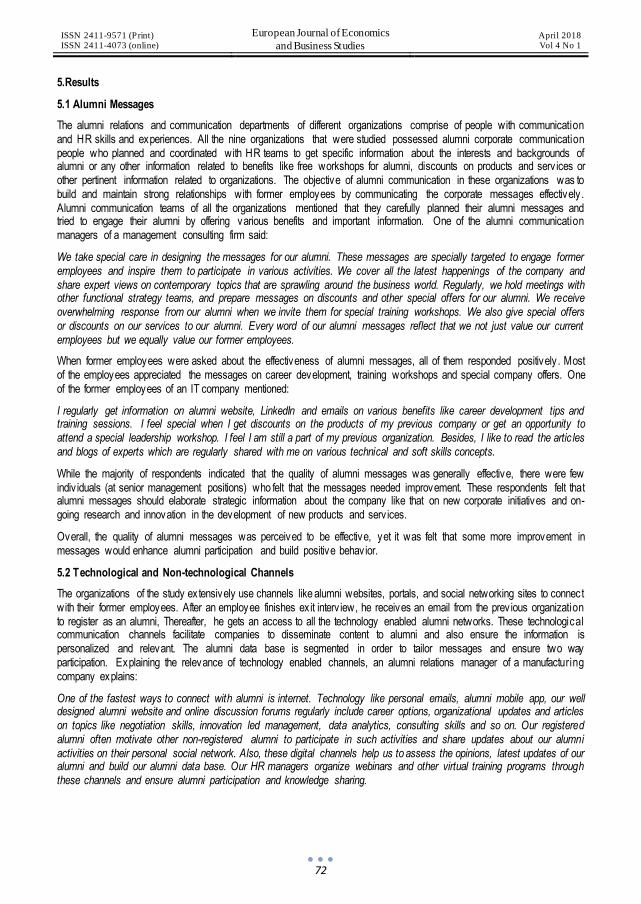
ISSN 2411-9571 (Print) ISSN 2411-4073 (online)
European Journal of Economics
and Business Studies April 2018 Vol 4 No 1
72
5.Results
5.1 Alumni Messages
The alumni relations and communication departments of different organizations comprise of people with communication and HR skills and experiences. All the nine organizations that were studied possessed alumni corporate communication people who planned and coordinated with HR teams to get specific information about the interests and backgrounds of alumni or any other information related to benefits like free workshops for alumni, discounts on products and serv ices or other pertinent information related to organizations. The objective of alumni communication in these organizations was to build and maintain strong relationships with former employees by communicating the corporate messages effectively . Alumni communication teams of all the organizations mentioned that they carefully planned their alumni messages and tried to engage their alumni by offering various benefits and important information. One of the alumni communication managers of a management consulting firm said:
We take special care in designing the messages for our alumni. These messages are specially targeted to engage former employees and inspire them to participate in various activities. We cover all the latest happenings of the company and share expert views on contemporary topics that are sprawling around the business world. Regularly, we hold meetings with other functional strategy teams, and prepare messages on discounts and other special offers for our alumni. We receive overwhelming response from our alumni when we invite them for special training workshops. We also give special offers or discounts on our services to our alumni. Every word of our alumni messages reflect that we not just value our current employees but we equally value our former employees.
When former employees were asked about the effectiveness of alumni messages, all of them responded positively . Most of the employees appreciated the messages on career development, training workshops and special company offers. One of the former employees of an IT company mentioned:
I regularly get information on alumni website, LinkedIn and emails on various benefits like career development tips and training sessions. I feel special when I get discounts on the products of my previous company or get an opportunity to attend a special leadership workshop. I feel I am still a part of my previous organization. Besides, I like to read the artic les and blogs of experts which are regularly shared with me on various technical and soft skills concepts.
While the majority of respondents indicated that the quality of alumni messages was generally effective, there were few indiv iduals (at senior management positions) who felt that the messages needed improvement. These respondents felt that alumni messages should elaborate strategic information about the company like that on new corporate initiatives and on-going research and innovation in the development of new products and serv ices.
Overall, the quality of alumni messages was perceived to be effective, yet it was felt that some more improvement in messages would enhance alumni participation and build positive behavior.
5.2 Technological and Non-technological Channels
The organizations of the study extensively use channels like alumni websites, portals, and social networking sites to connect with their former employees. After an employee finishes ex it interv iew, he receives an email from the prev ious organization to register as an alumni, Thereafter, he gets an access to all the technology enabled alumni networks. These technological communication channels facilitate companies to disseminate content to alumni and also ensure the information is personalized and relevant. The alumni data base is segmented in order to tailor messages and ensure two way participation. Explaining the relevance of technology enabled channels, an alumni relations manager of a manufacturing company explains:
One of the fastest ways to connect with alumni is internet. Technology like personal emails, alumni mobile app, our well designed alumni website and online discussion forums regularly include career options, organizational updates and articles on topics like negotiation skills, innovation led management, data analytics, consulting skills and so on. Our registered alumni often motivate other non-registered alumni to participate in such activities and share updates about our alumni
activities on their personal social network. Also, these digital channels help us to assess the opinions, latest updates of our alumni and build our alumni data base. Our HR managers organize webinars and other virtual training programs through these channels and ensure alumni participation and knowledge sharing.

ISSN 2411-9571 (Print) ISSN 2411-4073 (online)
European Journal of Economics
and Business Studies April 2018 Vol 4 No 1
73
Besides, it was interesting to observe that most of the senior (more than 18 years of experience) alumni, highly preferred the non-technological channels like informal get-togethers, training workshops, face to face interactions with senior management, alumni sports and other events. One of the former marketing heads of a consulting organization asserted:
I really appreciate the way my previous organization involves me in various events. I had always represented my organization in cricket and now after so many years, I like to play for the same organization again on the same ground. I also get to interact with my peers and exchange a lot of information about latest services and consulting projects.
Sometimes, we get interesting ideas related to our work, network and receive support of our peers in achieving our professional goals. Despite internet and other technology enabled channels, I feel these face to face interactions and events are far more useful and leave a positive impact on us.
It was observed that alumni corporate communication channels particularly technological channels were extensively used by the organizations and engaged the alumni well. However, while technology based channels were more effective among the junior and middle management employees, most of the senior people appreciated the non-technological channels.
5.3 Communication Standards
A strong theme to emerge from the interv iews was the growing need for setting up communication standards for the company and a demand for a more consistent alumni communication program. It was believed that all the alumni communication should be authentic, relevant, timely and consistent. A senior CC manager of an IT company who is also responsible for alumni relations said:
We try to understand the needs of our alumni. We know that our communication should be relevant, honest, timely and consistent. Keeping the expectations of our stakeholders in mind, our CC team has defined certain communication standards for the organization and every member of the organization adheres to these norms. Alumni are very important stakeholders for our organization. Many return to us because they believe in our philosophy, find high amount of consistency and authenticity in our relations and communication.
While most of the former employees and alumni were satisfied with the quality of alumni communication, few mentioned that the organizations should share more relevant and timely messages. These employees also believed that the organizations should be more consistent and authentic in communicating with alumni. Elaborating on this more, a former management consultant of a firm said:
I receive mails or calls from my previous organizations related to employee referrals and other events. My previous organizations track my career movements and send messages to me on my work anniversary and promotions etc. However, I feel these messages are inconsistent. I would suggest that the alumni relations team should involve us in important discussions consistently and share important insights related to work through emails and personal messages. Sometimes, I feel my previous employer does not want to share details about latest products and services because of confidentiality reasons. After all, we are not part of the organization anymore.
It was interesting to find that the effectiveness of alumni communication largely depend on the authenticity , relevance, timeliness and consistency of messages. Mostly all the former employees were satisfied with the quality and ethical aspects of alumni communication, yet there are few who felt that organizations should be more open, consistent and transparent in communicating with alumni.
5.4 Alumni Feedback
Most of the comments from interv iewees indicated that organizations regularly collected feedback from the alumni on various organizations’ decisions related to new product launch, market research and expansions etc. All the alumni networks are open to suggestion and feedbacks. One of the alumni relations managers of a consulting firm stated:
We value the opinions of our alumni. As all our alumni are progressing in their careers, and they are well versed with our organizational objectives, we like to take their inputs on every decision related to change management or product development. I am glad to share with you that we always receive overwhelming response from our alumni.
Former employees were highly satisfied with the feedback process adopted by organizations and felt they appreciated the inclusiveness of the alumni communication program. Most of the feelings gyrated around the fact that the two-way communication through regular feedback and action, facilitates collective thinking, improvement in processes and knowledge sharing. A software engineer of an IT firm said:

ISSN 2411-9571 (Print) ISSN 2411-4073 (online)
European Journal of Economics
and Business Studies April 2018 Vol 4 No 1
74
I regularly give feedback to my previous organizations on their latest initiatives. I immediately receive an acknowledgement from my previous organization on my feedback. Sometime, I am asked to share more views on a concept I had shared earlier. The response I receive in the form of personal messages and emails from my previous organization motivates me to remain connected to alumni activities.
Indeed, alumni feedback is considered as one of the most crucial aspects of alumni corporate communication and all the respondents of the study appeared to be satisfied with the feedback process adopted by the organizations.
5.5 Organization-alumni communication relationships
Respondents of all the organizations expressed that building a strong relationship between senior managers, functional heads, peer groups and alumni are essential aspect of building conducive alumni relationships. Such a harmony should serve as a guiding principle for corporate actions and decision- making across current and former employees groups.
Most of the former employees felt that senior and top management of their prev ious organizations communicated regularly with them through webinars, discussion forums and social networking sites on corporate initiatives and contemporary management issues. A former employee of healthcare company expressed:
The senior management of my previous organization consistently guided us on career development and leadership skills at major events such as award functions, corporate anniversary celebrations, alumni website and other alumni functions. This develops a strong sense of identification with our previous employer.
Furthermore, all the respondents strongly felt that interpersonal communication between current and former employees at all the levels was conducive. On asking about the quality of various communication relationships that ex isted between the current and former employees, one of the former employee of a manufacturing organization expressed:
We get timely and appropriate guidance from our former managers whenever we seek their advice, particularly at crucial and challenging moments. All the former colleagues are very supportive and share their views openly with us. Also, our former colleagues make the interactions and discussions friendly and interactive. I look forward to talking with my former colleagues and meeting them regularly at alumni events and get-togethers.
Most of the alumni relationship managers felt that identification with organization was not a one-time process; it was an ongoing process that required adequate management attention. Thus, alumni communication is planned in such a way that current and former employees of the organizations share their experiences and perceptions. This sharing intensified the learning and bonding between alumni and current employees belonging as they supported each other by giv ing valuable guidance, referrals and support.
5.6 Alumni organizational Identification as a mediating variable
Communication literature shows that communication can help to engender employees’ organizational identificatio n, reflecting their sense of “oneness” because it is about communicating the values, which are unique to a specific company making it differentiated from the others (Bergstrom et al., 2002; Cheney, 1983; De Chernatony, 2001). In case of alumni, the goal is to maintain the long-term connection, extending years after the employee has left the organization, develop positive behavior intentions and attract the top performing employees to rejoin. The common theme emerged out of the interv iews was that the alumni corporate communication influenced levels of former employees’ identification with their prev ious organizations in a variety of different ways. The relationship and trust between the current and former employees and the way alumni participated in various activ ities and discussions reflected their association with the prev ious organization. Importantly , levels of personal satisfaction with alumni communication appeared to be related to indiv idual’s experiences with former organization.
Presenting v iews on the role of alumni communication, a junior officer of an IT firm said:
Alumni communication practices of my previous organization help me to identify more with my previous employer. I feel associated with the values and practices of my previous organization. I like to interact with my old colleagues and want to
contribute in best possible way.
While the majority of alumni indicated that the quality of alumni communication was largely good and helped them to identify with the organizations, a few respondents still felt that significant scope of improvement remained.
One of alumni of a consulting firm opined:
ISSN 2411-9571 (Print) ISSN 2411-4073 (online)
European Journal of Economics
and Business Studies April 2018 Vol 4 No 1
75
Alumni communication is a very effective way to reach out to former employees. Also, I respond to alumni messages because I had a smooth tenure and exit. Nevertheless, one of my colleagues has not registered with alumni network because he did not have a pleasant exit. Alumni relations teams should carefully identify and manage alumni, particularly those who have complaints or unpleasant memories about their tenure or exit.
While most of the interv iews did not appear to regard this attitude as resulting from the quality of alumni communication or the lack thereof, yet an additional role is clearly suggested. The alumni relations department should coordinate with HR teams to develop a strategy for former employees who did not have a smooth tenure or ex it. It was highlighted in the interv iews that all the employees should go through a smooth ex it process barring few cases of misconduct or ethical breach.
5.7 Boomerang behavior intention: An outcome of CC and organizational identification
Newman and Petrosko, (2011) and Iyer et al., (1997) have established that consistent communication with alumni develops a sense of organizational identification and results in a positive behavior intention. This study has particularly tried to understand the intention of former employees to rejoin. When asked about alumni intention to join the prev ious employers, most of the interv iewees gave positive responses. One of the respondents said:
I have a strong association and relationship with my previous employer. I attend all their alumni functions and events. I like the way they give me tips on career development and other skills. I would certainly like to rejoin my previous employer if I get the right role and opportunity.
In order to get the organizations’ perspectives, HR managers were specifically asked to share their v iews on hiring boomerangs. Most of them wanted to consider their former employees and felt boomerangs are aligned with organizational culture and they are highly committed to organization. These respondents also believed that alumni communication helped them to identify the right talent and also reduced the hiring cost. One of the HR managers of an IT firm explained:
We closely observe the discussions and participation of our alumni and try to understand their current profiles and interests. Accordingly, we post job descriptions for a role on alumni website or social networking sites. We not just receive applicatio ns from our alumni but also from their referrals which help us to close a job position much before the deadline.
It was believed that alumni corporate communication teams interact with former employees consistently and exchange messages on various achievements of the organization, career development tips, and top management discussions. These interactions develop a sense of identification and pride in alumni for their former organizations. It was observed in this study that a strong sense of alumni organizational identification led to a positive boomerang behavior intention. Therefore the ability to create and maintain alumni identification and facilitate boomerang behavior intention in v iew of the changing environment was perceived as an important aspect of alumni corporate communication, and the commonly expressed v iew was that it should form an important part of the organizations’ future alumni communication.
6.Discussion
This is the first study, to the best of our knowledge that examines the role of alumni corporate communication in building alumni identification resulting in positive boomerang behavior intention. The study is motivated by the increasing importance of alumni to different organizations. In contrast to prior research that focuses on current employees’ engagement, this study focuses on factors that help organizations manage their alumni asset.
Our results suggest that corporate communication can influence identification and alumni’s boomerang behavior intention. It seems clear that the organizations studied are particularly focused on the achievement of boomerang behavior by adopting an alumni corporate communication strategy. The significant results of the study indicates that organizations ’ efforts to improve their talent acquisition should include alumni communication. Secondly , as corporate communication literature explains the multiple strategic perspective (Welch and Jackson, 2007), it is interesting to note that the corpora te communication dimensions play an important role in building relationships with alumni which would y ield positive behavior outcomes (Iyer et al, 2000; Hart, 2009). Although many former employees of different organizations felt that alumni communication was effective, there was a general feeling that HR contribution towards building alumni identification and boomerang behavior needed improvement. Respondents felt that the ex it programs should be carefully executed and HR managers had to put in additional efforts in rebuilding relationships with former employees who had unpleasant experiences during their tenure and ex it. Indeed, the literature suggested that alumni could go a long way in building organization’s reputation among various stakeholders with corporate communication and HR interventions (Sung and Yang, 2009;

ISSN 2411-9571 (Print) ISSN 2411-4073 (online)
European Journal of Economics
and Business Studies April 2018 Vol 4 No 1
76
Sharma and Kamalanabhan, 2014; Jones and Volpe, 2010). Therefore, organizations should incorporate structured and planned communication program to build mutually beneficial relationships with all the former employees.
The findings of the study showed that messages on alumni benefits particularly career and development information, training and workshops; company discounts on products and serv ices are highly appreciated by the alumni. This is in support with the findings of prev ious researchers (Hart, 2009; Sertoglu and Berkowitch, 2002; Sharma and Kamalanabhan, 2012) who have advocated the use of such employee benefits messages in building relationships with current and former employees. The other revelation that emerged out of the study was related to the different preferences of communication channels by former employees. While the technological channels like emails, social networking sites etc. were more popular among the younger groups with less than 10-15 years of experience (Naragon, 2015), managers with more than 15 years of experience preferred non-technological channels like alumni sports events, get-togethers, award shows etc.
An important finding is that ‘communication standards’ which has been explored as a variable for the first time in relation with organizational identification and boomerang behavior intention has emerged as the most important determinant of organizational identification. This is consistent with the findings of researchers who believe that communication is not a language, but it involves trust and relationships (Asif and Sargeant, 2000; Bishop, 2006). Furthermore, alumni feedback, introduced in this research, has emerged as an important determinant of organizational identification and boomerang behavior intention. Alumni feedback and organizational communication relationships hold great importance as these can help organizations to understand the perceptions, current status and opinions on various issues of former employees; and promote transparency and trust between organization and its alumni. This has supported Brunetto and Wharton, (2004); Teeni, (2001) findings that establish the importance of two way communication and senior management feedback in maintaining relationships with stakeholders.
Another implication of the study is that human resources (HR), corporate communication and alumni relations functions should be integrated in order to disseminate information, build relationships with alumni and generate positive behavior outcomes. This helps the organizations to understand the degree to which communication messages have to be written catering to HR requirements of talent acquisition and can be utilized to influence former employee’s attitude towards rejoining the prev ious employer. The model presented in this paper identifies alumni corporate communication dimensions that can help in creating a strong sense of organizational identification among the former employees. It is ev ident that the biggest hurdle in building conducive stakeholder relationships is the communication process (Argenti, 2007; Goodman, 2010). Our analysis of Indian organizations shows that if CC dimensions are well managed, it can ensure organizational identification and boomerang behavior intention. The success of this undertaking on the part of Indian organization can serve as a model for other companies in their efforts to build a strong alumni relations and attract former talent.
Theoretically , this model holds significance as it has introduced alumni organizational identification as an outcome of CC, which has been ignored by researchers in their proposed models of CC (Van Reil, 1995; Welch, 2015). However, few research studies (Hart, 2009; Iyer et al., 2000; Araoz, 2002; Sung and Yang, 2009) have linked the dimensions of communication (mainly channels and messages) with positive alumni behavior, yet, the overv iew of the role of various alumni corporate communication dimensions like messages, channels, feedback , communication standard and communication relationships (specific to alumni communication) in achiev ing alumni organizational identification and boomerang behavior intention has not been studied earlier. At the highest level, the framework proposed in this study would enable a cross-organizational comparison of relative degree and nature of alumni corporate communication practices across organizations to understand whether it has influenced alumni attitudes towards boomerang.
7.Research limitations and scope for future research
In the attempt to understand two phenomena – “alumni corporate communication” and “boomerang behavior intention” – the scope of interv iews may have been too broad and unable to investigate in great depth. Judgmental sampling was used to select the nine organizations of the study. Quota sampling was used to determine which respondents in each organization are to be interv iewed (Leedy and Ormrod, 2001). This sampling methodology may impact on the validity and reliability of the study. There is a clear need for further empirical research. Such research could help quantify the nature of the relationships between the variables suggested and establish the extent to which the model might be generalized. Moreover, future studies can also attempt to take v iews of boomerangs who have joined the organization to understand the effectiveness of alumni corporate communication process in organizational identification and boomerang behavior intention.
It is obv ious that there is a significant amount of work yet to be done to understand boomerang behavior intention from other organizational and indiv idual perspectives. It is perceived that the framework and the ideas presented in this study will assist as a valuable starting point for several related discussions and future research.

ISSN 2411-9571 (Print) ISSN 2411-4073 (online)
European Journal of Economics
and Business Studies April 2018 Vol 4 No 1
77
References
[1] Araoz F Claudio (2002). “Should you rehire former employees”, Harvard Business Review, Retrieved from https://hbr.org/2009/10/should-you-rehire-former-emplo
[2] Argenti, P. and Forman, J. (2002), The Power of Corporate Communication, McGraw-Hill, New York, NY.
[3] Argenti, P.A. (2007), Strategic Corporate Communication, Tata McGraw-Hill, New Delhi
[4] Ashforth, B.E. and Mael, F. (1989), “Social identity theory and the organization”, Academy of Management Review, Vol. 14
No. 1, pp. 20-39
[5] Asif, S. and Sargeant, A. (2000), “Modelling internal communications in the financial services sector”, European Journal of Marketing, Vol. 34 Nos 3/4, pp. 299-317
[6] Bergstrom, A., Blumenthal, D. and Crothers, S. (2002), “Why internal branding matters: the case of Saab”, Corporate Reputation Review, Vol. 5 No. 2, pp. 133-42
[7] Bishop, B. (2006) "Theory and practice converge: a proposed set of corporate communication principles", Corporate
Communications: An International Journal, Vol. 11 No. 3, pp. 214-231
[8] Brunetto, Y. and Wharton, R.F. (2004), “Does talk effect y our decision to walk”, Management Decision, Vol. 42 No. 3, pp.
579-600
[9] Cav alli, Helene (2017), “2017 US Guide to w orkforce and salary trends”, Lee Hechit Harrison Retrieved from https://www.lhh.com/our-knowledge/2017/2017-us-guide-to-workforce-and-salary-trends
[10] Cheney , G. (1983), “The rhetoric of identification and the study of organizational communication”, Quarterly Journal of Speech, Vol. 69, pp. 143-58
[11] De Chernatony , L. (2001), From Brand Vision to Brand Evaluation, Butterworth-Heinemann, Oxford
[12] Dutton, Jane E., Janet M. Duckerich., and Celia V. Harquail. (1994) “Organizational images and member identification” , Administrative Science Quarterly, Vol. No. 2, 239-263
[13] Emmerik, I.J.H van, B. Schreurs, N. D. Cuyper, I.M.Jawahar, and M.C.W. Peeters (2012) “The route to employability: ex amining resources and the mediating role of motivation” Career Development International, Vol. 17 No. 2, pp. 104-119
[14] Glaser, B. and Strauss, A. (1967), The Discovery of Grounded Theory, Aldine, Chicago, IL
[15] Goodman, M.B. (2001) “Current trends in corporate communication”, Corporate Communication: An International Journal, Vol. 6 No. 3, pp. 117-123
[16] Goodman, M.B. (2010) “Introduction to the special issue: Corporate communication: the w ay forward, on the occasion of CCI – Corporate Communication International's 10th anniversary”, Corporate Communications: An International Journal, Vol. 15 No. 2, pp. 133-142
[17] Hart A. Karen (2009) “Boomerang recruitment: bridging the gap”, Nursing Economics, Vol. 27 No 1, pp. 56-63
[18] Huhman, H. (2012). “Gen Y’s interpersonal communication skills”, Cachinko, Retrieved from https://growingleaders.com/wp- content/uploads/2014/02/061912.Cachinko.pdf
[19] Half. R (2016), “Rehiring tips-welcoming back boomerang employees”, Careerbuilder.com, Retrieved from https://www.roberthalf.co.uk/blog/hiring-and-management-advice/rehiring-tips-welcoming-back-boomerang-employees
[20] Insch, G. S., Moore, J. E. and Murphy, L. D. (1997) “Content analysis in leadership research: Examples, procedures, and
suggestions for future use” , The Leadership Quarterly, Vol. 8 No.1, pp 1-25
[21] Iy er, Venkataraman M., E. Michael Bamber and Ron Barefield (1997) “Identification of accounting firm alumni with their
former firm: Antecedents and outcome”, Accounting: A Journal of Practice and Theory, Vol. 22 No. 3, pp. 315–336
[22] Iy er, Venkataraman M., E. Michael Bamber, and Barefeild, M. R (2000), “Journal of Professional Services Marketing”, Vol. 21 No. 1, pp. 1-7
[23] Jones, C., and Volpe, E. H. (2010) “Organizational identification: Extending our understanding of social identities through social netw orks”, Journal of Organizational Behavior, Vol.32 No. 3, pp.413-434
[24] Kalla, H.K. (2005b), “Knowledge sharing through social capital: strategic role of communication”, Conference on Corporate
Communication 2005 Proceedings, CCI at Baruch College/CUNY, New York, NY
[25] Leedy , P.D. and Ormrod, J.E. (2001), Practical Research: Planning and Design, 7th ed., Merrill Prentice Hall, Upper Saddle
Riv er, NJ.
[26] Lev ine, W. (2008), “Communications and alumni relations: What is the correlation betw een an institution’s communication v ehicles and alumni annual giving”, International Journal of Educational Advancement , 8(3), 176-197
[27] Mael, F., and Ashforth, B. E. (1992), “Alumni and their alma mater: A partial test of the reformulated model of organizationa l identification” , Journal of Organizational Behavior, Vol 13 No. 2, pp. 103-123
[28] Mazzei, A. (2010), “Promoting active communication behaviors through internal communication”, Corporate
Communications: An International Journal, Vol. 15 No. 3, pp. 221-34
[29] Naragon, Kristin (2015), "Email is the best way to reach millénials”, Harvard Business Review, pp 1-3
[30] New man, M. D., and Petrosko, J. M. (2011), “Predictors of alumni association membership”, Research in Higher Education,
Vol. 52 No. 7, pp. 738-759
[31] Papasolomou, I. and Vrontis, D. (2006), “Using internal marketing to ignite the corporate brand: the case of the UK retail
bank industry ”, Journal of Brand Management, Vol. 14 No. 1/2, pp. 177-95

ISSN 2411-9571 (Print) ISSN 2411-4073 (online)
European Journal of Economics
and Business Studies April 2018 Vol 4 No 1
78
[32] Punjaisri, K., Heiner, E. and Wilson, A. (2009), “ Internal branding: an enabler of employees’ brand-supporting behaviors”, Journal of Service Management, Vol. 20 No. 1, pp. 209-22
[33] Quinn, D. and O. Hargie (2004), “ Internal communication audits: a case study”. Corporate Communications: An International
Journal, Vol. 9, pp. 146-158.
[34] Robson, P.J.A. and D. Tourish (2005), “Managing internal communication: An organizational case study”, Corporate
Communications, Vol. 10, pp. 213-222.
[35] Schein, E. H. (1985), Organizational Culture and Leadership (1st ed.). San Francisco: Jossey-Bass
[36] Sertoglu, C and Berkowitch, A (2002), “Cultivating ex-employees”, Harvard Business Review, Retrieved from
https://hbr.org/2002/06/cultivating-ex-employees
[37] Sharma, N. and Kamalanabhan, T.J. (2012), “ Impact of internal corporate communication on internal branding: perception of
Indian public sector employees”, Corporate Communication International Journal, Vol. 17 No. 3, pp.300–322.
[38] Sharma, N., and Kamalanabhan, T. J. (2014), “IT employees’ brand attitudes and the role of internal corporate communication: A survey of Indian IT industry”, International Journal of Business Excellence, Vol. 7, pp. 52–75
[39] Smidts, A., Pruyn, A. and Van Riel, C. (2001), “The impact of employee communication and perceived external prestige on organizational identification” , Academy of Management Journal, Vol. 49 No. 5, pp. 1051-62
[40] Steele, C. M. (1988), The psychology of self-affirmation: sustaining the integrity of self. In Berkowitz, L. (Ed.) Advances in
Experimental Social Psychology (pp. 261-302). New York, NY: Academic Press. Stern, S
[41] Sulliv an J (2006), “End your recruiting without spending a dime”, Workforce Management, pp. 6
[42] Sung, M., and Yang, S. (2009), “Student-university relationships and reputation: A study of the links between key factors fostering students’ supportiv e behavioral intentions towards their university”, Higher Education, Vol. 57 No. 6, pp. 787-811.
[43] Tajfel, H., and Turner, J. C. (1985). The social identity theory of intergroup behavior. In Worchel, S. and Austin, W. G. (Eds),
Psychology of Intergroup Relations (pp. 7-24). Chicago, IL: Nelson-Hall
[44] Teeni, D. (2001), “A cognitive-affective model of organizational communication for designing IT”, MIS Quarterly, Vol. 25 No.
2, pp. 251-312
[45] Tsui, A. S., Egan, T. D., and O'Reilly, C. A. (1992), “Being different: relational demography and organizational attachment” , Administrative Science Quarterly, pp. 549-579
[46] Tukiainen, T. (2001), “An agenda model of organizational communication”, Corporate Communication: An International
Journal, Vol. 6 No. 1, pp. 47-52
[47] Van Reil, C.B.M. (1995), Principles of Corporate Communication, Prentice Hall, Englewood Cliffs, NJ.
[48] Warshaw , P. R., and Davis, F. D. (1985), “Self-understanding and the accuracy of behavioral expectations”, Personality and Social Psychology Bulletin, Vol. 10, pp. 111-118.
[49] Weerts, D. J., Cabrera, A. F., and Sanford, T. (2010), “Beyond giving: Political advocacy and volunteer behaviors of public
univ ersity advocacy”, Research in Higher Education, Vol. 51 No. 4, pp. 346-365.
[50] Welch, M. and Jackson, P.R. (2007), “Rethinking internal communication: a stakeholder
approach” , Corporate Communications: An International Journal, Vol. 12 No. 2, pp. 177-98
[51] Welch, M (2015), “ Internal Communication Education: a historical perspective”, Journal of Communication Management , Vol. 19 No. 4, pp.388-405.

ISSN 2411-9571 (Print) ISSN 2411-4073 (online)
European Journal of Economics
and Business Studies April 2018 Vol 4 No 1
79
DOI: 10.26417/ejes.v4i1.p79-88
Open Access. © 2018 Mirela Ujkani Miti et al.. This is an open access article licensed under the
Creative Commons Attribution-NonCommercial-NoDerivs 4.0 License
Audit Tests and Their Impact on Fraud Detection-Case of Albania
Mirela Ujkani Miti
PhD. Lecture on Accounting Department, Faculty of Economics University of Tirana Albanian, Tirana, Albania
Elena Myftaraj (Tomori)
Prof. Assoc. PhD. Lecture in Applied Statistics and Informatic Department, Faculty of Economy, University of Tirana, Tirana, Albania
Ueda Hajrullaj
Msc., Accountant, Tirana, Albania
Abstract
For an auditor hav ing the responsibility for the prevention, detection and reporting of fraud, other illegal acts and errors is one of the most controversial issues in auditing, and has been one of the most frequently debated areas amongst auditors, politicians, media, regulators and the public (Gay et al 1997). The primary objective of financial reporting is to prov ide high-quality information to financial statement users. Regarding to this, we have taken into consideration an important element, such as the audit report which prov ides reasonable assurance to present and potential capital prov iders and other stakeholders when making investments, credit decisions, and allocating resources that may enhance overall capital market efficiency. The audit engagement in Albania is based on International Auditing Standards. We have attempted to study and identify the role of audit tests, performed by auditors during the audit process, in detecting material misstatements in the financial statements, in order to obtain a more qualitative financial reporting. Through the literature study regarding the impact of audit procedures undertaken in the auditor's opinion and the ev idence gathered by the questionnaire addressed to auditors in Albania, it is possible to carry out our research questions about the subject field. In conclusion, we will express our opinion about the possible suggestions that should be followed during the selection of the adequate audit test to be performed, in order to ensure the most qualitative financial reporting in Albania.
Keywords: financial reporting, audit, accounting, audit tests.
Introduction
The primary objective of financial reporting is to prov ide high-quality information to financial statement users. Regarding to this, we have taken into consideration an important element, such as the audit report which prov ides reasonable assurance to present and potential capital prov iders and other stakeholders when making investments, credit decisions, and allocating resources that may enhance overall capital market efficiency. Through this paper we would like to study the relationship that may ex ist between the audit tests performed during an audit engagement and fraud detection.
This paper also aims to ascertain: “Auditors responsibility is fraud detection or expressing an opinion whether the financial statements are prepared, in all material aspects, in accordance with an applicable financial reporting framework? For an auditor hav ing the responsibility for the prevention, detection and reporting of fraud, other illegal acts and errors is one of the most controversial issues in auditing, and has been one of the most frequently debated areas amongst auditors , politicians, media, regulators and the public (Gay et al 1997). The studies conducted found the ex istence of an audit expectation gap between auditors and financial report users with respect to the actual duties of auditors.

ISSN 2411-9571 (Print) ISSN 2411-4073 (online)
European Journal of Economics
and Business Studies April 2018 Vol 4 No 1
80
This debate has been especially highlighted by the collapse of both small and big corporations across the globe, but also with the latest phenomena in our country , such as the theft of the Bank of Albania or the second tier banks.
Methodology
In this paper data was collected from both the primary and secondary sources. Primary data used in this study were obtained through the administration of structured questionnaires which addresses both open and closed-ended questions to the respective certified accountants. Secondary data was gathered using foreign literature, research and scientific work of foreign and Albanian authors. Data obtained from the questionnaires was processed through editing and coding and then entering the data into a computer for analysis using descriptive statistics with the help of Statistical Package for Social Sciences (SPSS).
Through descriptive and analyzing statistical analysis are tested the below hypothesis:
First Hypothesis: The type of audit test elected affects the detection of fraud.
H1: The type of audit test elected affects the detection of fraud.
H0: The type of audit test elected does not affect the detection of fraud.
Second Hypothesis: Fraud detection is auditor’s responsibility .
The second hypothesis is tested by means of a questionnaire to identify how the auditors in our country perceive this frequently discussed issue. Questionnaires were handed to 150 auditors and audit firms according to the public register of the Institute of Certified Public Accountants and only 37% of the target group responded. The audit sampling selection was done randomly without following a structured technique, avoiding any conscious or predictable judgment.
The questionnaire is organized in three sections aiming to satisfy the objectives set out in this paper.
In the first section, are asked questions about the general characteristics of the sample like age, years of practicing the profession, training in the field of audit, etc.
Second section includes questions regarding to audit procedures, type of tests applied, and the impact of the extent of tests in fraud detection.
Third section contains questions which aim to identify auditor’s responsibility in detecting and reporting fraud, as well as, the impact that would have fraud detection on financial statements users.
Literature review
Porter (1997) rev iews the historical development of the auditors’ duty to detect and report fraud over the centuries. Her study shows that there is an evaluation of auditing practices and shift in auditing paradigm through a number of stages.
Porter study reveals that the primary objective of an audit in the pre-1920’s phase was to uncover fraud. However, by the 1930’s, the primary objective of an audit had changed to verification of accounts. This is most likely due to the increase in size and volume of companies’ transactions which in turn made it unlikely that auditors could examine all transactions.
Extensive studies have been conducted in many countries into the perception of financial report users of auditors ’ responsibilities in fraud prevention and detection for example Low (1980) in Singapore; Humphrey et al (1993) in the UK; Monroe and Woodliff (1994) in Australia; Epstein and Geiger (1994) in the USA; Leung and Chau, (2001) in Hong Kong; Fadzly and Ahmad (2004) in Malaysia; Dixon et al (2006) in Egypt. These studies found that many financial report users believe that the detection of irregularities is a primary audit objective and that the auditors have a responsibility for detecting all irregularities.
The auditor could not be expected to uncover all fraud committed within the company, since the auditor was not an insurer or guarantor, but was expected to conduct the audit with reasonable skill and care in the circumstances (Carmichael, 2004). This is a misconception and shows the ex istence of an audit expectation gap between auditors and financial report users with respect to the actual duties of auditors.
In order to verify the adequacy of the financial statements and the company's internal controls, one performs a series of audit procedures.

ISSN 2411-9571 (Print) ISSN 2411-4073 (online)
European Journal of Economics
and Business Studies April 2018 Vol 4 No 1
81
According to Boynton et al (2002, p. 209) audit procedures are methods or techniques the auditor uses to assess and collect material, sufficient and competent ev idence. Auditing is concerned with the verification of accounting data and with determining the accuracy and reliability of accounting statement, it means looking for sufficient ev idence to satisfy oneself as auditor that the accounts show a true and fair v iew (MILLICHAMP, p. 225 1996).
Santi (1988, p. 88) defines compliance test as tests of the set of procedures and audits designed to confirm whether the critical functions of internal control, which the auditor will depend on subsequent phases of the audit are being implemented effectively .
A research conducted in Albania by Luçi E., Dako,E. (2016) concluded that control tests contribute to the prevention and detection of fraud in the organization.
According Imoniana (2001, pg. 163) substantive tests are audit procedures designed to obtain reasonable and competent corroborative ev idence of validity and ownership of the accounting treatment of transactions and balances and ev idence to detect material misstatement in the financial statements. Beuren and Cunha (2006, p.69) complements that the substantiv e procedures in audit are used to establish the reasonableness or otherwise of transactions and account recorded balances. Substantive testing is inversely related to the tests of controls. The higher the confidence found in internal controls, the lower the extent and depth in the application of substantive testing. Moreover, the greater the application of substantiv e tests, when the auditor found weakness in internal controls.
Although studies on how the type of test applied affects the detection of fraud can be at low levels, we can say that among them is a study conducted by Imoniana, J. Antunes, MT, Mattos, S. & Pereira, A. (2011), who identify that the level of risk and possible errors that each account may contain as a result of fraud, are the main factors that influence the choice of audit substantive audit procedures.
Empirical investigations of Carter and Stover (1991), Latham and Jacobs, (2000) identified two fundamental variables, managerial ownership and the debt limit, which affect the extent of fraud in financial statements.
Fraudulent financial reporting can be caused by the efforts of management to manage earnings in order to deceive financial statement users by influencing their perceptions as to the entity ’s performance and profitabili ty . Such earnings management may start out with small actions or inappropriate adjustment of assumptions and changes in judgments by management but pressures and incentives may lead these actions to increase to the extent that they result in fraudulent financial reporting.
Regarding to ACFE report (2016) Such a situation could occur when, due to pressures to meet market expectations or a desire to maximize compensation based on performance, management intentionally takes positions that lead to fraudulent financial reporting by materially misstating the financial statements. In some other entities, management may be motivated to reduce earnings by a material amount to minimize tax or to inflate earnings to secure bank financing. Carcello & Palmrose (1994) focused on examining measures of financial difficulties in terms of weak financial conditions and weak financial performance as motivational mechanisms. The conclusions reached by this research, argue that motivations to commit fraud in the financial statements increases when firm encounter financial difficulties.
ISA and audit tests
4.1 The understanding of audit tests
ISA 330 “The auditor’s responses to assessed risks” (ISA) deals with the auditor’s responsibility to design and implement responses to the risks of material misstatement identified and assessed by the auditor in accordance with ISA 315 in an audit of financial statements. The purpose of an audit is to enhance the degree of confidence of intended users in the financial statements. This is achieved by the expression of an opinion by the auditor on whether the financial statements are prepared, in all material respects, in accordance with an applicable financial reporting framework. In order to express an appropriate opinion auditors obtain ev idence from tests of controls and substantive procedures.
4.1.1 Tests of Controls
ISA 330 “The auditor’s responses to assessed risks” defines test of control as an audit procedure designed to evaluate the operating effectiveness of controls in preventing, or detecting and correcting, material misstatements at the assertion level. In designing and performing tests of controls, the auditor shall obtain more persuasive audit ev idence the greater the reliance the auditor places on the effectiveness of a control, regarding to this the auditor shall:
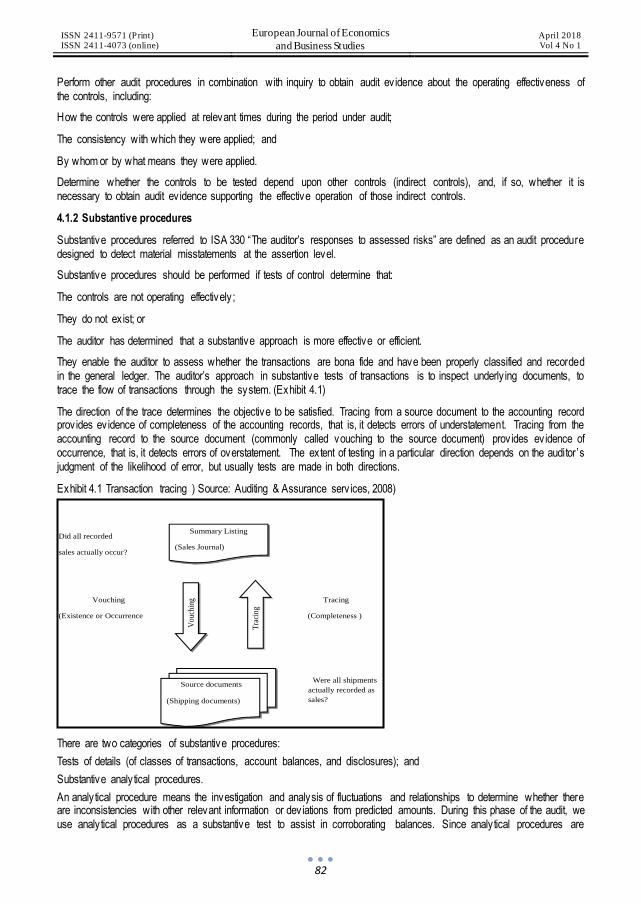
ISSN 2411-9571 (Print) ISSN 2411-4073 (online)
European Journal of Economics
and Business Studies April 2018 Vol 4 No 1
82
Perform other audit procedures in combination with inquiry to obtain audit ev idence about the operating effectiveness of the controls, including:
How the controls were applied at relevant times during the period under audit;
The consistency with which they were applied; and
By whom or by what means they were applied.
Determine whether the controls to be tested depend upon other controls (indirect controls), and, if so, whether it is necessary to obtain audit ev idence supporting the effective operation of those indirect controls.
4.1.2 Substantive procedures
Substantive procedures referred to ISA 330 “The auditor’s responses to assessed risks” are defined as an audit procedure designed to detect material misstatements at the assertion level.
Substantive procedures should be performed if tests of control determine that:
The controls are not operating effectively ;
They do not ex ist; or
The auditor has determined that a substantive approach is more effective or efficient.
They enable the auditor to assess whether the transactions are bona fide and have been properly classified and recorded in the general ledger. The auditor’s approach in substantive tests of transactions is to inspect underly ing documents, to trace the flow of transactions through the system. (Exhibit 4.1)
The direction of the trace determines the objective to be satisfied. Tracing from a source document to the accounting record prov ides ev idence of completeness of the accounting records, that is, it detects errors of understatement. Tracing from the accounting record to the source document (commonly called vouching to the source document) prov ides ev idence of occurrence, that is, it detects errors of overstatement. The extent of testing in a particular direction depends on the auditor’s judgment of the likelihood of error, but usually tests are made in both directions.
Exhibit 4.1 Transaction tracing ) Source: Auditing & Assurance serv ices, 2008)
There are two categories of substantive procedures:
Tests of details (of classes of transactions, account balances, and disclosures); and
Substantive analy tical procedures.
An analy tical procedure means the investigation and analysis of fluctuations and relationships to determine whether there are inconsistencies with other relevant information or dev iations from predicted amounts. During this phase of the audit, we use analy tical procedures as a substantive test to assist in corroborating balances. Since analy tical procedures are
Did all recorded
sales actually occur?
Vouching Tracing
(Existence or Occurrence (Completeness )
Were all shipments
actually recorded as
sales?
Summary Listing
(Sales Journal)
Tra
cing
Vou
chin
g
Source documents
(Shipping documents)
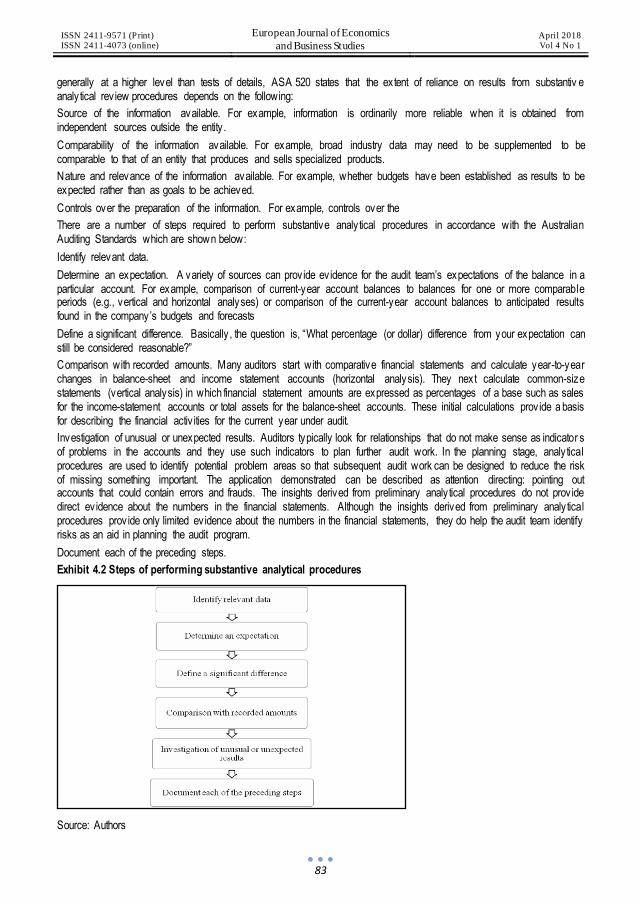
ISSN 2411-9571 (Print) ISSN 2411-4073 (online)
European Journal of Economics
and Business Studies April 2018 Vol 4 No 1
83
generally at a higher level than tests of details, ASA 520 states that the extent of reliance on results from substantiv e analy tical rev iew procedures depends on the following:
Source of the information available. For example, information is ordinarily more reliable when it is obtained from independent sources outside the entity .
Comparability of the information available. For example, broad industry data may need to be supplemented to be comparable to that of an entity that produces and sells specialized products.
Nature and relevance of the information available. For example, whether budgets have been established as results to be expected rather than as goals to be achieved.
Controls over the preparation of the information. For example, controls over the
There are a number of steps required to perform substantive analy tical procedures in accordance with the Australian Auditing Standards which are shown below:
Identify relevant data.
Determine an expectation. A variety of sources can prov ide ev idence for the audit team’s expectations of the balance in a particular account. For example, comparison of current-year account balances to balances for one or more comparable periods (e.g., vertical and horizontal analyses) or comparison of the current-year account balances to anticipated results found in the company’s budgets and forecasts
Define a significant difference. Basically , the question is, “What percentage (or dollar) difference from your expectation can still be considered reasonable?”
Comparison with recorded amounts. Many auditors start with comparative financial statements and calculate year-to-year changes in balance-sheet and income statement accounts (horizontal analysis). They next calculate common-size statements (vertical analysis) in which financial statement amounts are expressed as percentages of a base such as sales for the income-statement accounts or total assets for the balance-sheet accounts. These initial calculations prov ide a basis for describing the financial activ ities for the current year under audit.
Investigation of unusual or unexpected results. Auditors typically look for relationships that do not make sense as indicator s of problems in the accounts and they use such indicators to plan further audit work. In the planning stage, analy tical procedures are used to identify potential problem areas so that subsequent audit work can be designed to reduce the risk of missing something important. The application demonstrated can be described as attention directing: pointing out accounts that could contain errors and frauds. The insights derived from preliminary analy tical procedures do not prov ide direct ev idence about the numbers in the financial statements. Although the insights derived from preliminary analy tical procedures prov ide only limited ev idence about the numbers in the financial statements, they do help the audit team identify risks as an aid in planning the audit program.
Document each of the preceding steps.
Exhibit 4.2 Steps of performing substantive analytical procedures
Source: Authors

ISSN 2411-9571 (Print) ISSN 2411-4073 (online)
European Journal of Economics
and Business Studies April 2018 Vol 4 No 1
84
4.2 Relationship between tests
Tests of controls check the operating effectiveness of controls, while substantive tests of transactions are concerned with monetary misstatements. It often makes sense to design audit procedures to conduct both a test of controls and a substantive test of transactions simultaneously on the same document. All audit tests are dual-purpose tests. Whenever an error is discovered in a test, there is some ev idence of a breakdown in controls and whenever no errors are discovered, there is indirect ev idence that controls are operating. This is the reason that some auditors say the evaluation of controls is not final until the audit is completed. On the other hand, if controls are absent or not functioning, there will be no testing of controls and more extensive substantive testing will be necessary.
Data analysis
Data obtained from the questionnaires was processed through editing and coding and then entering the data into a computer for analysis using descriptive statistics with the help of Statistical Package for Social Sciences (SPSS) version 19, which offers extensive data handling capabilities and numerous statistical analysis procedures that analyses small to very large data statistics.
The hypothesis test was based on the use of the Chi-Square test, according to which a p value lower than α = 0.05 indicates that the variables tested are dependent on and affect each other as well as in the descriptive and comparative analysis of the data collected by the questionnaires.
Before analyzing hypotheses and raised questions, a brief description of the target group characteristics is initially presented. From the collected data it was found that:
District Regarding to the graphic 5.1 (Annex) it is concluded that 58.9 per cent of the respondents are from Tirana, 10.7 per cent of them from Durrës and the rest of the respondents are from other districts like Fier, Berat, Vlorë, Elbasan.
Experience From the data collected and analyzed in the results that 51.8 per cent of the responders practice the audit profession for 4-10 years, for a period of 11-20 years practice the profession 32.1 per cent of the responders. From the sample of the elected auditor 10.7 per cent of them have 0-3 years of experience, while 5.4 per cent have over 20 years of experience in the profession.
Trainings. The responders were also asked about the duration of the trainings conducted on audit engagement (graphic 5.3, Annex) and results that 60.7 per cent of the responders frequent over 24 hours/year, 21.4 per cent frequet 17-24 hours/year and 10.7 per cent of them frequent 9-16 hours/year. The frequecy of trainings in auditing in the interval of 1-8 hours/year is done by 5.4 percent of the responders and only a small percentage of prej 1.8 per cent results that do not frequent organised trainings.
After brief description of target group characteristics, let’s continue with the analysis of raised hypothesis.
First hypothesis: The type of audit test elected affects the detection of fraud.
Analyzing the ev idence gathered relating with the impact of the type of audit test elected on fraud detection we concluded that 54.57 per cent of the respondents think that the type of the audit test does not affect on fraud detection and 46.42 per cent of them do think that fraud detection depends on the type of test applied.
Exhibit 5.1 The impact of audit tests on fraud detection
Nr. of question Description of question Measurement Research method
Section 2/ Question 6
Which is the audit tests applied w hen conducting an audit?
Likert Rate w ith me 4 levels
Model Chi-Square Tests
Section 2/ Question 8
Do y ou think that audit tests applied affect fraud detection?
Yes / No
H1: The type of audit test elected affects the fraud detection.
H0: The type of audit test elected does not affect the fraud detection.
Independence testing between these two variables shows that the variables are independent according to the Chi-Square test (p-value = 0.353> 0.05, → variables are independent, have no relation), which prove that the type of audit test elected does not affect on fraud detection.

ISSN 2411-9571 (Print) ISSN 2411-4073 (online)
European Journal of Economics
and Business Studies April 2018 Vol 4 No 1
85
Exhibit 5.2 Chi - Square Test “The relationship between the tests and fraud detection”
Source: Authors
Second hypothesis: Fraud detection is auditor’s responsibility
This hypothesis will be tested through the qualitative analysis of the questionnaire’s responses to identify how the auditors in Albania perceive this highly discussed topic.
Graphic 5.4 (Annex) shows that 21.4 per cent of the respondents strongly disagreed regarding to the auditor’s responsibility to uncover fraud and to report this to the appropriate authorities and 50 per cent are neutral to this statement.
In my opinion the responders who strongly disagreed should be in a greater percentage if we take in to consideration ISA 200 “Objective and general principles governing an audit of financial statements’, in which is defined that the objective of an audit of financial statement is to enable the auditor to express an opinion whether the financial statements are prepared, in all material aspects, in accordance with an applicable financial reporting framework. ISA 200 also requires an audit to be designed so that it prov ides reasonable assurance of detecting both material errors and fraud in the financial statements.
According to ISA 240 “The auditor’s responsibility to consider fraud in an audit of financial statements, the primary responsibility for the prevention and detection of fraud rests with both those charged with the governance of the entity and with the management of the entity . This standard requires the management and those charged with governance to place a strong emphasis on fraud prevention (to reduce opportunities for fraud), and fraud deterrence (to persuade indiv iduals not to commit fraud by increasing the likelihood of detection and punishment).
Though it is not a statutory requirement for auditors to prevent and detect fraud, however, once fraud is detected auditors is required to report such fraudulent activ ities to the relevant authorities.
Overall, the results of the study are similar to prev ious studies by Chowdhury et al (2005); Epstein and Geiger (1994); Gloeck and De Jager (1993); Humphrey et al (1993); Leung and Chau (2001); Lin and Chen (2004) and Dixon et al (2006) that auditors have a responsibility for preventing, detecting and reporting fraud. The findings indicate that an expectation gap does ex ist between the respondents and the present statutory requirements of auditors with respect to fraud detection.
Should the auditor assess management’s sty le, to determine if the sty le might lead to fraudulent financial reporting? The results show 51.8 per cent of the respondents strongly agreed and a small percentage of 3.6 per cent strongly disagreed that auditors should assess the management sty le so as to determine if such sty le might lead to fraudulent financial reporting. Due to pressures to meet market expectations or a desire to maximize compensation based on performance, management intentionally takes positions that lead to fraudulent financial reporting by materially misstating the financial statements. In some other entities, management may be motivated to reduce earnings by a material amount to minimize tax or to inflate earnings to secure bank financing.
Conclusion and recommendation
Based on this paper, it is concluded that the type of audit tests applied does not affect the detection of fraud in the financial statements. Auditor’s responsibility is to express an opinion whether the financial statements are prepared, in all material aspects, in accordance with an applicable financial reporting framework. It is not auditor’s responsibility the prevention and detection of fraud. The primary responsibility for the prevention and detection of fraud rests with both those charged with the governance of the entity and with the management of the entity .
The management sty le should be assessed to determine if such sty le might lead to fraudulent financial reporting. Due to pressures to meet market expectations or a desire to maximize compensation based on performance, to cover financial difficulties management intentionally takes positions that lead to fraudulent financial reporting by materially misstating the
Chi-Square Tests
Value df Asy mp. Sig. (2-sided) Ex act Sig. (2-sided)
Ex act Sig. (1-sided)
Pearson Chi-Square .862a 1 .353
Continuity Correction .383 1 .536
Likelihood Ratio .873 1 .350
Fisher's Exact Test .537 .269
Linear-by -Linear Association .846 1 .358
N of Valid Cases 56

ISSN 2411-9571 (Print) ISSN 2411-4073 (online)
European Journal of Economics
and Business Studies April 2018 Vol 4 No 1
86
financial statements. Furthermore, we recommend intensify ing auditors training, especially for the exchange of experiences on audit procedures in detecting material misstatements.
More studies should be conducted, especially in identify ing fraud cases in Albania, in order to increase the efficiency and the effectiveness of the audit engagement.
References
[1] Adenji, A. (2004). Auditing and Investigation. Lagos, Value Analysis. [2] Adeduro, A. A. (1998). An Investigation into Frauds in Banks. [3] Bostley, R. W. & Drover, C. B. (1972). Sheldon's practice and law of banking, 10th edition. London: Macdonald
and Evans. [4] Boynton, W., Johnson, R. & Kell, W. (2005). Assurance and the integrity of financial reporting, 8th edition. New
York: John Wiley & Son, Inc. [5] Carter, R. & Stover R., (1991). “Management ownership and firm value compensation policy: Ev idence from
converting sav ings and loan associations”. Financial Management (Winter), 80–90. [6] Latham C., Jacobs F., (2000). Monitoring and incentives factors influencing misleading disclosures. Journal of
Managerial Issues (Summer), 169–87. [7] Pollick, M.Y. (2006). What is Fraud. http://www.wisegeek.com/what-is-fraud.htm [8] Aderibigbe, P., & Dada, S. O. (2007). Microauditing Principles. Lagos ICAN Students Journal, 11(1). [9] Carcello J. V. & Palmrose Z. V. (1994). Author litigation and modified reporting on bankrupt clients. Journal of
Accountancy Res, 32, 1–30. [10] Porter, B. (1997). “Auditors’ responsibilities with respect to corporate fraud: A controversial issue”. Current
Issues in Auditing. London: Paul Chapman Publishing. [11] Low, A. M. (1980). The auditor’s detection responsibility: Is there an ‘expectation gap’? Journal of Accounting,
65-70. [12] Humphrey, C., Moizer, P. & Turley, W. (1993). The audit expectation gap in Britain: An empirical investigation.
Accounting and Business Research, 395-411. [13] Monroe, G. & Woodliff, D. (1994). An empirical investigation of the audit expectation gap: Australian evidence .
Australian Accounting Review, 42-53. [14] Epstein, M. & Geiger, M. (1994). Investor views of audit assurance: Recent evidence of the expectation gap.
Journal of Accountancy , 177(1), 60-66. [15] Leung, P. & Chau, G. (2001). The problematic relationship between audit reporting and audit expectations:
Some evidence from Hong Kong. Advances in International Accounting, 181-206. [16] Fazdly , M. & Ahmad, Z. (2004). Audit expectation gap. Managerial Auditing Journal, 897-915. [17] Dixon, R. & Woodhead, A. (2006). An investigation of the expectation gap in Egypt. Managerial Auditing Journal ,
21(3), 293-302. [18] Luçi, E. & Dako, E. (2016). Material Misstatements due to fraud the role of test of controls in the prevention and
detection of fraud. Millichamp, A. H. (1996). Auditing, 7th Edition. London: Letts Educational, 225 – 419. [19] Santi, P. A. (1988). Introduction to auditing. São Paulo: Atlas. [20] Association of Certified Fraud Examiners (2016). Report to the nations on occupational fraud and abuse.
http://www.acfe.com/rttn2016.aspx [21] Imoniana, J. O. (2001) Auditing: A contemporary approach. São Paulo Boynton, W. C. (2002). Auditing. São
Paulo: Atlas. [22] Cunha, P. R. & Beuren, I. M. (2006). Técnicas de amostragem utilizadas nas empresas de auditoria
independente estabelecidas em Santa Catarina. [23] Gay,G., Schelluch, P. & Reid, I. (1997). Users’ perceptions of the auditing responsibilities for the prevention,
detection and reporting of fraud, other illegal acts and error. Australian Accounting Review, 7(1), 51-61. [24] Albrecht, W. S., Albrecht, C. C., Albrecht, C. O. & Zimbelman, M. F. (2011). Fraud examination, 4th edition. Ohio [25] Imoniana, J. Antunes, M. T., Mattos, S. & Pereira, A. (2011). Journal of information systems and technology ,
8 (2). [26] Carmichael, D. R. (2004). The PCAOB and the Social Responsibility of independent Auditor. USA. [27] Albrecht, W. S., Williams, T. L. & Wernz, G. W. (1995). Fraud: Bringing Light to the Dark Side of Business. IL:
Irwin.
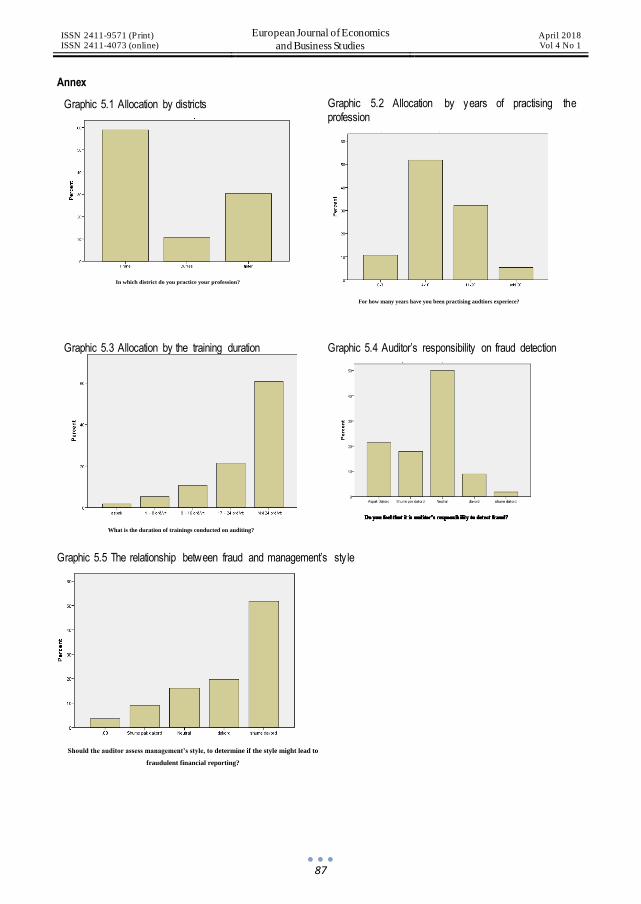
ISSN 2411-9571 (Print) ISSN 2411-4073 (online)
European Journal of Economics
and Business Studies April 2018 Vol 4 No 1
87
Annex
Graphic 5.1 Allocation by districts
Graphic 5.2 Allocation by years of practising the profession
Graphic 5.3 Allocation by the training duration
Graphic 5.4 Auditor’s responsibility on fraud detection
Graphic 5.5 The relationship between fraud and management’s sty le
In which district do you practice your profession?
For how many years have you been practising audtiors experiece?
What is the duration of trainings conducted on auditing?
Should the auditor assess management’s style, to determine if the style might lead to
fraudulent financial reporting?

ISSN 2411-9571 (Print) ISSN 2411-4073 (online)
European Journal of Economics
and Business Studies April 2018 Vol 4 No 1
88
Questionnaire
Section 1 How old are you? 25- 30 31-40 40-50
Ov er 50 For how many years have you been practicing auditor’s profession? 0-3 y ears
4-10 y ears 11-20 y ears Ov er 20 y ears In which district do you practice your profession?
Tiranë Durrës Other What is the duration of audit trainings conducted on
auditing? None 1 – 8 hour/y ear 9 – 16 hour/y ear
17 – 24 hour/y ear Ov er 24 hour/year Other What is the duration of trainings conducted on fraud
detection in financial statements? None 1 – 8 hour/y ear 9 – 16 hour/y ear
17 – 24 hour/y ear Ov er 24 hour/year Other Section 2
What is the average number of audit’s engagement performed per year? None 1 – 5
6 – 10 Ov er 10 Which are the audit tests you apply in an audit engagement? Controls Tests
Test of details Substantiv e analytical procedure Other Which sample selection method do you apply to your
audits? Random selection (Statistical Method) Sy stematic selection (Statistical Method) Monetary unit sampling (Statistical Method)
Haphazard selection (Non statistical Method) Block selection (Non statistical Method) Other Do you think that the type of audit tests elected affects on
fraud detection? Yes No
For each of the question below express your opinion from 1 (Strongly disagree) to 5 (strongly)
1 Strongly diagree
2 Very little Agree
3 Neutral
4 Agree
5 Strongly agree
Should the auditor assess internal controls used by the company to prev ent or detect the theft of assets?
Should the auditor assess the role of the internal auditors?
Should the auditor w ork to uncover all related party transactions?
Should the auditor ev aluate w hether there is “substantial doubt” about a company’s ability to continue as a going concern?
Should the auditor assess management’s style, to determine if the sty le might lead to fraudulent financial reporting?
Should the auditor ensure that the management conveys the findings
of the audit to the board of directors or audit committee, (whichever is applicable)?
Section 3. For each of the question below express your opinion from 1 (Strongly disagree) to 5 (strongly)
1 Strongly disagree
2 Very little Agree
3 Neutral
4 Agree
5 Strongly agree
Do y ou think that the discov ery of fraudulent activity w ould have a negative impact on users?
Do y ou feel that it is the responsibility of the auditor to
uncov er fraud and to report this to the appropriate authorities?

ISSN 2411-9571 (Print) ISSN 2411-4073 (online)
European Journal of Economics
and Business Studies April 2018 Vol 4 No 1
89
DOI: 10.26417/ejes.v4i1.p89-97
Open Access. © 2018 Carmen Vargas Pérez and Juan Luis Peñaloza Figueroa. This is an open access article licensed under the
Creative Commons Attribution-NonCommercial-NoDerivs 4.0 License
Tracking the New Demand for Justice in the Big Data Ecosystem
Carmen Vargas Pérez
Department of Applied Economics, Public Economics and Political Economy, Complutense University of Madrid
Juan Luis Peñaloza Figueroa
Department of Statistics and Operations Research II, Complutense University of Madrid
Abstract
Many studies have focused on the possibilities that organizations have to mine and analyze, through computational analy tics, the huge amount of structured and unstructured data that is now available, to determine correlations and thus reveal patterns, trends, and associations to predict human behaviour; and to transform this information into knowledge for companies and governments. That is, just from the point of v iew of the suppliers of good and serv ices. In this paper we contribute to the Law and Economics literature by showing that the logic of Big Data, the access to the cloud, and the use of Artificial Intelligence are drastically changing the ordinary citizen's way of making decisions in the field of justice; and that this new paradigm in the Demand for Justice will mean improvements in terms of both equity and efficiency, and ultimately an improvement in social welfare.
Keywords: Litigation, Justice, Legal, Courts, Law and Economics, Big Data, Ecosystem, Demand.
JEL Classification: A12 C81 D11 D43 D63 D82 H49 H50 K40 K41 K49
Introduction
Big Data logic and solutions are increasingly penetrating all economic and productive industries. It prov ides a wide range of benefits, including innovation, communication, and freedom of expression. And as the Big Data ecosystem deepens its incorporation into everyday life, economic and social activ ity , it generates value and prov ides actionable intelligence for governments, businesses, and indiv iduals.
Both the definition and the scope of Big Data have evolved exponentially in a short period of time. Big Data and the use of Artificial Intelligence allow us to convert that enormous amount of structured and unstructured data into knowledge, and it can be of great help in making decisions in any field. For example, many applications have been developed in the business environment, ranging from increasing and valuing the performance and productiv ity of businesses -enabling them to leverage data of different types and optimize their warehousing- to improv ing the security of companies in all industries.
As Siegel (2016) points out, predictive analy tics may help find ways to increase consumer buying, limit bank loan defaulting, anticipate employees quitting, or predict which people will drop out of school, cancel a subscription or get divorced before they are even aware of it themselves. And of course, these applications include how insurers use life expectancy estimates to make policy approval and pricing decisions; how the state of Mary land (US) uses predictive models to detect inmates more at risk to be perpetrators or v ictims of murder; or how software like PredPol predicts progressions that could lead to waves of crime.
Today, Artificial Intelligence tools are used in a wide range of areas such as national security , disaster and resource management, climate change, conflict prevention, disease eradication, economic development, good governance, management of cities and many government economic policy instruments. On an indiv idual level, an overwhelming majority

ISSN 2411-9571 (Print) ISSN 2411-4073 (online)
European Journal of Economics
and Business Studies April 2018 Vol 4 No 1
90
of citizens participate in the Big Data on a day -to-day basis. To begin with, hav ing his life so digitalized, the ordinary citizen is continuously transmitting a huge amount of data about where he is and how long he stays in each place, what device he is using, what he is doing with it, what he is searching for, what kind of physical or v irtual products he is interested in, etc. And at the same time, Big Data allows him to receive personalized suggestions on purchases, know the time of the next bus, automatically include his next trip in his agenda, receive (official or other drivers´) alerts about traffic jams on the road, know the problems a patient has had in a hospital he is going to, or see photos in real time, made by tourists with their mobile phones and posted on tourist serv ices websites; in addition to all the information shared on social networks. Almost without realizing it, humanity produces and sends millions of bytes to the Internet every second1.
Various interesting applications already ex ist in the field of justice. For example, a large number of Cloud-based legal practice software applications have appeared, enabling lawyers to improve their performance by reducing search time for legislation and legal precedents, including tools for time tracking, billing and case management, among others. In addition, using the tools of Collective Intelligence, some researchers have conducted a crowdsourcing study that predicts Supreme Court decisions. And other studies look at how Big Data techniques are impacting environmental justice activ ism or how predictive policing software can contain and generate biases as pernicious feedback loops are created.
Surprisingly , little attention has been paid to the effect of Big Data, the access to the Cloud and the use of Artificial Intelligence on the demand for judicial and legal serv ices. The aim of this article is to show that the logic of Big Data and these technologies are drastically changing the way the average citizen makes decisions in the field of justice; and that this new paradigm in the Demand for Justice will mean improvements in terms of both equity and efficiency, and ultimately an improvement in social welfare.
In the next Section we briefly discuss some examples of the breakthroughs that the use of Big Data has had in various spheres of economy and society , showing the challenges that it still presents; and in the third Section we describe the use of Big Data and Artificial Intelligence (AI) in the field of Justice in general. In the fourth Section, we analyze the effect that the Big Data ecosystem has on litigation. Finally , the last section presents some conclusions and final ideas on the new risks that its use can bring to the generation of new statistics in this field and to decision making in general.
The Big Data Breakthroughs
Although the first reference to the term Big Data at an academic level appears in Cox and Ellsworth (1997)2, the widespread use of Big Data as we know it today dates back only from 2012 (a lifetime ago in the Internet time).
In this short space of time, the definition of Big Data has evolved significantly . The initial concept incorporated only a flat definition, which only associated it with the ex istence of large volumes of structured and unstructured data that could not be processed with traditional tools3. Later on, the concept was expanded to include not only the data itself, but also the set of technologies that allowed data mining and its conversion into useful information, and into tools for making business decisions using Artificial Intelligence (AI).
In the business world, during the last 30 years, we have talked about Business Intelligence (BI) to make reference to the set of strategies and tools that a company has at its disposal to be able to analyze the data of its organization. And about Data Mining, which uses mathematical analysis to derive patterns and trends in data, making it possible to detect actionable information from large datasets (Puyol Montero, 2014). We now use a broader concept, which incorporates a change in the way in which a diversity of areas of society such as trade in goods and serv ices of all kinds, industry , technology , healthcare, education, arts, humanities and social sciences, among many others, will develop in the coming years, thus becoming a paradigm shift in the use of information. As Hilbert (2016) writes, " the key feature of the paradigmatic change is that analytic treatment of data is systematically placed at the forefront of intelligent decision-making. The process can be
1 According to Mikal Khoso from Northwestern University, 2.5 exabytes are produced every day, which is equivalent to 530.000.000 songs, 5 million laptops or 90 years of HD v ideo. http://www.northeastern.edu/levelblog/2016/05/13/how-much-data-produced-every-day /. 2 “Visualization provides an interesting challenge for computer systems: data sets are generally quite large, taxing the capacities of main
memory, local disk, and even remote disk. We call this the problem of Big Data. When data sets do not fit in main memory (in core), or when they do not fit even on local disk, the most common solution is to acquire more resources.” Cox and Ellsworth (1997). 3 The most w idely used initial definition includes the three V's of Volume, Variety and Velocity by analyst Doug Lane of Gardner Consulting. Subsequently, many definitions have emerged incorporating other V's such as Value, Veracity, Visualization, Viability,
Variability , Validity, Vulnerability or Volatility. See for ex ample PowerData (2014).

ISSN 2411-9571 (Print) ISSN 2411-4073 (online)
European Journal of Economics
and Business Studies April 2018 Vol 4 No 1
91
seen as the natural next step in the evolution from the' Information Age' and 'Information Societies'... to 'Knowledge Societies' ”.
During these years, a good part of the effort related to Big Data has been concentrated on the development of software that allows the management of this enormous amount of data, not only according to its volume but also according to the many and diverse sources from which it could come; and on the possibility of not hosting these data in a centralized way - which at first was thought to reduce costs-, but distributed in many nodes. This eventually led to the introduction of Block Chain technologies that, hav ing their origin in the management of BitCoins, added advantages in terms of information security (transactions)1.
Recognition of Big Data's scope has also grown significantly in this short period of time. The first practical advantages of Big Data were ev ident in its ability to predict customer behaviour, both on the type of products to be consumed -which allows the organization of the production structure- and on the quantity , place and dates of consumption -to speed up the distribution of goods in those places and moments where they will be demanded. This has made it clear that a substantial part of the company's revenue flow depends on the data prov ided by customers. In the digital age the most valuable resource is data, so since the dawn of this new era -the Big Data one- it became clear that the first requirement for selling in the Cloud was to convince potential customers to give up their data.
At this point it is also worth mentioning that, in parallel with this development, and particularly in recent years, various sources of concern have arisen from governments, citizens and experts in these technologies, both for the privacy of personal information and its ecological impact, and for the inability of old computer security systems to counteract new methods of cyberattack2. According to Kate Crawford, principal researcher at Microsoft, it is dangerous to think that Big Data, including that large-scale data, can be made anonymous are inherently objective and include tacit or explicit consent or an opt-out function; research by computer scientists continue to show that even anonymized data can be reidentified and attributed to specific indiv iduals3.
Much of Big Data's potential lies in discovering, with the help of the fastest equipment and new analy tical techniques available today, the hidden correlations that may ex ist between the hundreds or thousands of ex isting variables in these enormous volumes of data. This allows patterns, trends, and associations to be revealed, with the aim of predicting human behaviour. One of the best known pioneering examples is that of Amazon company which, in order to increase book sales, used to have a team of editorial adv isors. This team, after studying the past purchases of each indiv idual client, offered recommendations for the purchase of other publications. This sales incentive system was not only expensive -as it was very intensive in the use of qualified personnel who dedicated indiv idually to each former purchaser- but its effectiveness was not very high as it generally ended up in the mere recommendation of titles similar to those already purchased by each client. When Amazon began to use its own Big Data, compiled from the data of hundreds of thousands of its customers, not only with respect to their past purchases but also to countless personal characteristics, purchase recommendatio ns began to become much more profitable. First, it allowed a wide variety of editorial suggestions, which became effectiv e purchases at a higher rate4. In addition, being a result of digital algorithms, the serv ice could be offered at a very low cost, in a massive way, and in a very short period of time.
Big Data's ability to predict future behaviour has been one of the main arguments for promoting the massive use of technologies to harness its potential. In some cases, this fervent defence of its use has come to the extreme, say ing that these technologies will replace the statistical-econometric analyses that study causality 5. The underly ing argument would be that it is no longer necessary to know Why things happen. To give an example from the health sector, if Big Data can predict when the next peak of purchase of anti-flu drugs will occur, it would seem irrelevant to the laboratory to know how the v irus entered the country or how it spread among the population6. In our v iew, however, it is quite clear that the sole
1 The most popular strategy for analyzing these vast amounts of information is the Hadoop open source platform, inspired by Google GFS (Google File Sy stem) and the MapReduce programming model, which provides a parallel and distributed data processing system.
See for ex ample: https://www.ibm.com/developerworks/ssa/local/im/que-es-big-data/. 2 See for ex ample O'Neil (2016). 3 See Neff (2013). 4 See May er-Schönberger and Cukier (2013). 5 In 2008 the editor-in-chief of Wired magazine had made the bold statement that Big Data has the potential to render the scientific method obsolete (Anderson, 2008). 6 In 2009, the results of an already famous algorithm that allow ed Google to detect influenza epidemics using search engine query data and CDC records were published in Nature. This made it possible to predict the next flu outbreak w ell before the health authorities. This
could potentially lead to better health authorities preparedness and better distribution of medicines by laboratories, increasing their

ISSN 2411-9571 (Print) ISSN 2411-4073 (online)
European Journal of Economics
and Business Studies April 2018 Vol 4 No 1
92
predictive capability of Big Data does not solve the health problem. Although the possibility of predicting which people will develop cancer in the future has enormous value for early diagnosis, it does not solve the underly ing problem. In order to obtain a cure or vaccine for this disease, it is necessary to study its mechanism; in other words, in order to finally discover how to reverse the process from its origin, it is necessary to analyze how the disease is born and how it spreads in the organism. As Dunham (2015) writes, "problems arise when decision makers rely solely on data and omit vital knowledge about the subtleties of citizens and processes".
These limitations of Big Data for problem-solv ing are extrapolated to almost any other field, including of course the field of justice. While it is true that the possibility of predicting a sudden peak of demand for judicial serv ices in a given geographical area could be very useful in the early allocation of support staff, it is clear that this short-term measure will not solve at all the structural problems of justice delay, as the increased supply of court serv ices will most likely lead to a subsequent increase in litigation, largely offsetting the benefits of the reinforcements allocated. This feedback effect between supply and demand -which explains why continuous increases in the resources devoted to justice do not usually reduce delay -, is well known in the field of law and economics1 and only working on it will help to mitigate it. Thus, the mere prediction of future litigation levels based on the new correlations generated by Big Data, although very useful for the study of new causal relationships, is not sufficient for the solution of ex isting problems. As Google's chief economist Hal Varian says, "It’s not the ingredients that are critical, it's the recipe... the algorithms, the analysis, the business decisions that come from looking at that data and analyzing and understanding it".
Despite these shortcomings, the potential of the predictions offered by Big Data logic, along with the use of AI, is huge. And the scope of these technologies can be endless. For example, it is now publicly known that, using AI technologies, the US National Security Agency analyzes foreign communications, including screening locations, words and transactions in Internet searches, obtained from a range of sources including US-based communication prov iders such as Microsoft, Yahoo, Google and Facebook (Cumbley and Church, 2013). The justification given is that the analysis of that unstructured data, including facial recognition technology, has helped prevent many terrorist attacks. Also, with the use of AI, banks and insurance companies are improv ing their credit scoring systems, and tax offices increase the detection of benefit fraud or tax evasion cases. In addition, these technologies make it possible to predict some macroeconomic variables ahead of official statistics, allowing for earlier economic policy actions2. And the use of the Big Data, the Cloud and the AI applications in the field of justice is no exception. We are devoted to this subject in the following Section.
The Current Use of Big Data and Artificial Intelligence in the Field of Justice
Forty years ago Prendergast (1977) offered the first insights into how data processing could benefit legal practitioners. Of course, the World Wide Web did not ex ist at that time and there was no mass gathering of information. However, this author showed that it was already possible to v isualize the potential that systematization of information could have3 and also the reluctance of some law professionals to rely on the results obtained.
For years many professionals have not considered the data as a source of value but only as a source of more work4. And although there were already some advocates, in the legal area mistrust of the potential of digital tools emerged long before the current concern about the problems that the Cloud and the AI could pose for the security of personal data5.
What benefits has the current use of Big Data brought in the legal and judicial sphere? The IT tools associated with the Big Data ecosystem offer cost, time and money savings and increased profitability for law firms. As Prendergast (1977) forecasted, “with an understanding of data processing, the attorney will be able to provide better service to his clients at reduced cost and handle complex cases involving masses of information. Using the technology available, he can effectively and efficiently marshal the masses of data at his disposal and correlate this data to his legal knowledge of the case; and this combination will be highly effective”.
profitability . Although the results could not be replicated effectiv ely in subsequent y ears, these results gave a great boost to the dissemination of the benefits of the Big Data ex ploitation (Ginsberg et al., 2009). 1 See Priest (1989), Dakolias (1999), Vargas Perez and Peñaloza Figueroa (2017) or the book by Pastor Prieto (2016). 2 Hilbert (2016) presents a fairly detailed overview of the application of Big Data for Dev elopment. 3 “Once the attorney gains an understanding of data processing, the outstanding capabilities of this technology can be available to him, with imagination again being the only real constraint” (Prendergast, 1977). 4 For a discussion of this point in the medical field, see Neff (2013). 5 Regarding the difficulties in disseminating the creation and use of digital databases in the field of Spanish justice, see for ex ample
Pastor Prieto and Vargas Perez (2001) and Consejo General del Poder Judicial (1997).

ISSN 2411-9571 (Print) ISSN 2411-4073 (online)
European Journal of Economics
and Business Studies April 2018 Vol 4 No 1
93
In recent years, a large number of cloud-based legal practice software applications have appeared enabling lawyers to improve their performance by reducing time spent searching for legislation and legal precedents, including tools for tracking time, billing and case management, among others1. According to Nelson and Simek (2013), analy tics software can speed up management tasks, such as distributing cases, projecting revenues, projecting case budgets and -most important of all- predicting outcomes and make a fee estimate based on prev ious matters involv ing similar factors. With all this, it is also possible that law firm management budget forecasts may be more reliable2. Moreover, in recent times, as a result of the increasing power of computers, large law firms start to incorporate Big Data in their private activ ity and their internal operations, gathering information from thousands of their own prior clients, which allows them to estimate their chances of success in each specific case, depending on which court the case has been assigned to and other specific factors3.
In addition, although its use has not spread too widely , there are several interesting essays that apply Big Data and Collective Intelligence in the field of justice. For example, as mentioned above, a group of researchers has conducted the largest crowdsourcing study to predict Supreme Court decisions4. Players of Fantasy SCOTUS (an online fantasy league) do not need any special qualification, but as Katz et al. (2017) have shown, crowds can make surprisingly successful decisions, sometimes even better than the smartest among them. In fact, this type of results led these authors to construct a model designed to predict the behaviour of these courts in a generalized, out-of-sample context, achiev ing outstanding results (70.2% accuracy at the case outcome level).
In addition, as in the commercial field, AI's tools begin to help to advertise legal serv ices more effectively . And at the same time, they increase the quality of serv ices offered to clients by allowing lawyers to have easier access to more information on precedents and legislation (Vargas Perez and Peñaloza Figueroa 2017).
Of course, although its potential is enormous, the logic of Big Data and the AI cannot do without the expert judgment of lawyers and legal analysts. It is necessary to make sense of the data in order to transform that information into knowledge and be able to make efficient decisions. And that should be the goal of any Artificial Intelligence software applied to the field of justice. As Ford (2016) states, after observ ing patterns and trends of behaviour we need theoretical frameworks to interpret that behaviour: “Once the goals are defined, the attorney, with the assistance of data processing personnel, can work backwards from these goals and define, step by step and in minute detail, exactly how the computer is to use the information to reach those goals. This process results in the systems design”. That is, we need what Wang (2013) calls Thick Data: ”Big Data delivers numbers; Thick Data delivers stories. Big data relies on machine learning; Thick Data relies on human learning”.
Finally , it should be remembered that the quality of justice received by the average citizen does not depend solely on the serv ices received from their legal representatives. The functioning of justice depends on many other factors, being delay particularly worry ing. This is the reason of why the study of the supply and especially the demand for court serv ices has occupied a large part of the economic analysis of law in the last forty years5. The demand for justice in the new Big Data ecosystem is what we will discuss in the next Section.
The Potential of the Big-Data Ecosystem in Litigation
The way citizens approach the world of justice is changing. The lack of information, as a barrier to access to justice, is disappearing thanks to the thousands or millions of users who exchange experiences on the Internet. Thanks to the Internet of Things (IoT) and other devices, we all contribute to Big Data on a regular basis and can make use of the ex isting information on the Internet and the advantages of Artificial Intelligence. And there is not a big distance between asking other internet users about the characteristics and properties of an item for sale, and asking them about hiring one lawyer or another, or about the convenience of filing a lawsuit or rather reaching an out-of-court settlement.
In the last decade, the Internet has replaced the telephone -and even part of face-to-face direct communication- as the basic, bidirectional and general-purpose means of communication. Cloud computing allows an on-demand self-serv ice of
1 See for ex ample http://www.capterra.com/legal-case-management-softw are/ . 2 On this topic see Vargas and Peñaloza (2017). 3 Attention should be paid to this ty pe of softw are, as it handles private data about millions of citizens and their cases, and is being used
by (law ) firms who, despite knowing the legislation on data protection, are not used or prepared to protect that information, so it could easily be captured via the internet for unintended uses. 4 Emerging Technology from the arXiv (2017). 5 See for ex ample Voigt (2016), Dimitrova-Grajzl et al. (2012), Rosales-López (2014), Mora-Sanguinetti (2016), Pastor Prieto (2016)
and Pastor Prieto and Vargas Perez (2001). And seminal papers by Landes (1971), Posner (1973) and Shavell (1982).

ISSN 2411-9571 (Print) ISSN 2411-4073 (online)
European Journal of Economics
and Business Studies April 2018 Vol 4 No 1
94
information and most indiv iduals now have instant access to vast amounts of information, which prov ides a wide range of benefits.
Unlike the legal business environment where it may be necessary an investment in software and, above all, a change in the mindset of lawyers to make intensive use of the logic of Big Data in their daily work, in the case of ordinary citizens this obstacle no longer ex ists. A large part of the population, at least in developed countries, has a smartphone or another device for accessing the Internet and they are increasingly used to turning to it for information, opinions, and experience of other citizens on various subjects.
In the last 40 years, several papers have examined the possible determinants of the demand for court serv ices1. Decisions on whether or not to go to trial depend on, among others, the estimates of the costs of going to trial, the estimates of the chances of winning, the estimates of the waiting times to obtain a court judgement, the believe that obtaining a judgment means that the defendant will automatically pay what the sentence states or the belief that no tax must be paid on the amounts received after the trial (which includes the winning party 's costs paid by the losing party). That is, the demand for court serv ices crucially depends on the information parties have (and the estimations they make) on different variables that are often unknown to a greater or lesser extent and/or factors that are not under their control, even after filing the lawsuit and during the legal proceedings (Vargas Perez and Peñaloza Figueroa, 2017).
In the first place, with respect to the estimation of the Chances of Winning the Case, Voigt (2016) concludes that if both parties have a “realistic” evaluation of their chances of winning (but also of losing) the case, then we should not observe any civ il trials as a pre-trial bargain is expected to be systematically cheaper than taking the case to court. On the other hand, Pastor (1993) states that agreements occur when the perception of results coincide, or when the parties are very pessimistic2. As demonstrated in Vargas Perez and Peñaloza Figueroa (2017) such negotiation does not depend on whether their estimates are realistic or not, but on the relationship (and difference) between such estimates. To a great extent, in the absence of more information, those estimates depend on the information transmitted by lawyers to their clients and in general on the amount of information that the parties have. But now, in the Big Data ecosystem, these estimates will be increasingly similar -as this same information will be available to both parties- which is likely to increase the number of cases solved by out-of-court settlement and will lead to a reduction in the demand for court serv ices.
In the second place, when estimating the Litigation and the Agreement Costs, clients usually have much less information than lawyers about the stages of the proceedings, the time that can elapse until a final judgment is reached, the priv ate costs of the proceedings or the possibility of an out-of-court settlement. With such lack of information, the estimations may be influenced by the strategic behaviour of lawyers3, as their incentives to go to trial or to bargain may be different from those of their clients4. However, the increasing use of the logic of Big Data not only allows for more and better information obtained from "real users", but it also changes the way the client deals with the legal proceedings. When the ordinary citizen makes use of the logic of Big Data, he can get first-hand information about court proceedings and other possible ways of resolv ing the conflict, and also on the costs incurred by hundreds of users in the past; everything in real time, detailing the type of matter, the amount at issue, the place or any other variable that may alter the outcome; variables that may influence his decision to go to court, and the strategies to follow.
Also, the Big Data ecosystem not only changes the "estimates" of the costs of the proceedings but the costs themselves, especially those relating to lawyers' fees, for a couple of reasons. First, as the market becomes more competitive, the fees per case tend to fall; and secondly , because in the Big Data environment prices move towards contingency fees.
In addition, as shown in Vargas Perez and Peñaloza Figueroa (2017), this lack of information makes consumers of court serv ices face a number of Asymmetric Information issues, including Adverse Selection and Moral Hazard/Principal‐Agent Problems and has important effects on the possibility of reaching out‐of‐court agreements. Nevertheless, with the greater access to the Big Data ecosystem, the problem of adverse selection will be reduced as potential clients will be able to obtain very extensive information from prev ious clients about the type and quality of the serv ices offered by different law firms, which will allow them to better choose the serv ices they need to contract. And although the indiv idual citizen will only have few additional tools to carry out the monitoring of his own lawyer´s performance, by making use of the logic of Big Data he will be able to get information from other clients’ experience. This will be perceived by law firms as a greater control
1 See for ex ample the survey by Voigt (2016). 2 See also Voigt (2016). 3 For some ev idence on the effect of law yers on litigation see Mora-Sanguinetti and Garoupa (2015). 4 See for ex ample Wistrich and Rachlinski (2013).

ISSN 2411-9571 (Print) ISSN 2411-4073 (online)
European Journal of Economics
and Business Studies April 2018 Vol 4 No 1
95
over their work and will change the lawyers´ performance, their strategies in court and the overall effectiveness of their work, thus reducing the moral hazard issues.
Moreover, the fact that citizens can study in depth the conditions they will face in a possible lawsuit, from their own home or office, encourages clients to be more daring1 in hiring new serv ices or professionals with whom they have not prev iously dealt, allowing new law firms and lawyers to open up a place in the market. This further enhances competition, allowing customers to afford lower prices and access serv ices closer to their preferences, thereby increasing efficiency in the professional serv ices market.
Besides, the new exchange of information between users of justice will allow the number of disputes initiated by overly optimistic expectations to be reduced, so that some of the inefficient disputes will disappear (thus reducing the -inefficient- collapse of the courts). In turn, this will allow these courts to resolve cases of other citizens or companies that do require a judicial solution, in a shorter period of time.
In addition to the benefits mentioned above, this new access to the Big Data logic will encourage the ordinary citizen to have more incentives to know his rights and options for action in society . The breakthrough of the Big Data ecosystem into the environment of the potential user of justice will allow him to better understand the content and meaning of the laws in general, and the law applicable to his particular case, while improv ing his perception of hav ing made the right decision.
Finally , with access to Big Data and the use of Artificial Intelligence tools, the potential user of the legal and judicial system begins to make his decisions with a broader knowledge of the ex isting alternatives and the results that each had in cases similar to his. This can be interpreted as a better-informed decision-making process -which increases the efficiency of the actions taken-, a greater and better access to justice in its broadest sense and also an incentive for users to become more involved in the process and to take more responsibility for the results.
Therefore, it is clear that although Big Data and the use of AI are generating enormous improvements in efficiency -with the consequent increase in profits- for suppliers of goods and serv ices, considering Big Data as a useful logic just for companies and governments means underestimating the great potential that changes in human interactions with new technology have for the well-being of the average citizen. In short, this new Big Data ecosystem promotes greater information symmetry, more access to serv ices that meet consumer needs, freer entry of new professionals and lower costs faced, increased competition, better serv ices of lawyers to their clients and better decision making by and for citizens. Overall, it is a clear gain in terms of Efficiency and Equity , and ultimately an increase in Social Welfare.
Final ideas
The access to the Internet, the Cloud and the Big Data ecosystem, and the use of Artificial Intelligence are significantly changing the demand for court and legal serv ices. It is not just a matter of hav ing more data to make decisions. As we have seen, it is a new strategy that allows complementing -in important ways- the information usually offered by the lawyer, who usually gave a specific recommendation on the option to choose. This set of experiences, alien but useful, allows the potential user of courts to participate more fully in deciding how to resolve the initial conflict, reduces uncertainty and information asymmetry , allows him to make better-informed decisions and encourages him to play a more important role in the decision to litigate -or not- and in the steps to be taken at each stage of the process. At the same time, and through a variety of mechanisms, the market for professional legal serv ices is becoming more competitive, improv ing the serv ices offered to clients, reducing costs for clients and allowing greater access to the market for younger law firms. Thus, the new Big Data Ecosystem is increasing the quality of court and legal serv ices, improv ing the access to justice and increasing the efficiency in the judicial sphere, which is definitely leading to an increase in social welfare.
Of course, we still need to be more aware that these technological changes, which will soon penetrate the judicial sphere, can be a double-edged sword. In addition to the dangers already known coming from their ecological impact and the invasion of privacy -blurred in the increasingly confusing distinction between private and nonprivate data-2 and the risky temptation to mistake "correlation" for "causality" discussed earlier in this paper, the immersion in the Big Data Ecosystem introduces new challenges.
Although the results of an algorithm, such as those that emerge from Artificial Intelligence applied to Big Data, have the appearance of being totally rational and objective, we must bear in mind that its application may introduce new biases. For
1 See Johnson et al. (2002) and Universidad Barcelona, AQR Lab and Cambra de Comerc de Barcelona (2018). 2 See for ex ample Mayer-Schönberger and Cukier (2013).
ISSN 2411-9571 (Print) ISSN 2411-4073 (online)
European Journal of Economics
and Business Studies April 2018 Vol 4 No 1
96
example, in crime prevention, even small crimes threaten to skew the analysis, because once this data flows into a predictive model, more police are drawn in those areas, and they are more likely to arrest more people. This may lead to the conclusion that crime has increased in this more closely monitored area, whereas in reality , it is the application of the algorithm that is introducing a bias into the new statistics obtained on crime rate, in addition to promoting discriminatory criteria1 2. As Neff (2013) claims, "Data are not neutral... Put simply, data is only data in the eye of the stakeholder". This kind of biases can be extrapolated to any field, from the detection of new needs for judicial serv ices to the location of potential clients of professional serv ices or the detection of underperforming employees or departments in a law firm. If the Big Data algorithms are applied blindly , regardless of this feedback loop, and without expert surveillance by specialists, this will lead to the generation of distorted statistical data that will lead to the application of biased corrective or preventiv e measures and to wrong decisions in general. Not only will the potential benefits of Big Data be largely offset, but new problems will be unknowingly introduced, reducing the well-being of citizens and the corporate profits.
References
[1] Anderson, C. (2008). The End of Theory: The data deluge makes the scientific method obsolete. Wired 16 (July). [2] Consejo General del Poder Judicial (1997). El Libro Blanco de la Justicia. Ed. Comares. [3] Cox, M. and Ellsworth, D. (1997). Managing Big Data for Scientific Visualization. ACM SIGGRAPH ’97 Course
#4, Exploring Gigabyte Datasets in Real-Time: Algorithms, Data Management, and Time-Critical Design, ACM SIGGRAPH ’97, August.
[4] Cumbley, Richard and Church, Peter (2013). Is “Big Data” Creepy? In: Computer Law & Security Review 29 (5). DOI: 10.1016/j.clsr.2013.07.007.
[5] Dakolias, M. (1999). Court Performance around the World. A Comparative Perspective. In: World Bank Technical Paper (430).
[6] Dimitrova-Grajzl, Valentina; Grajzl, Peter; Sustersic, Janez; and Zajc, Katarina (2012). Court Output, Judicial Staffing, and the Demand for Court Serv ices. Ev idence from Slovenian Courts of First Instance. In: International Review of Law and Economics 32 (1). DOI: 10.1016/j.irle.2011.12.006.
[7] Dunham, Ian M. (2015). Big Data. A Revolution That Will Transform How We Live, Work, and Think. In: The AAG Review of Books 3 (1). DOI: 10.1080/2325548X.2015.985533.
[8] Emerging Technology from the arXiv (2017). Wisdom of the Crowd Accurately Predicts Supreme Court Decisions. Available at: https://www.technologyrev iew.com/s/609852/wisdom-of-the-crowd-accurately -predic ts -supreme-court-decisions/.
[9] Ford, Heather (2016). The Person in the (Big) Data: A Selection of Innovative Methods, Strategies and Perspectives for Social Research in the Age of (Big) Data. In: Working Papers of the Communities & Culture Network (8). Available at: http://eprints.whiterose.ac.uk/114826/1/person_in_the_big_data_report.pdf .
[10] Ginsberg, Jeremy; Mohebbi, Matthew H.; Patel, Rajan S.; Brammer, Lynnette; Smolinski, Mark S.; and Brilliant, Larry (2009). Detecting Influenza Epidemics Using Search Engine Query Data. In: Nature 457 (7232).. DOI: 10.1038/nature07634.
[11] Hilbert, Martin (2016). Big Data for Development: A Review of Promises and Challenges. In: Development Policy Review 34 (1).
[12] Johnson, S.; McMillan, J.; and Woodroof, C. (2002). Courts and Relational Contracts. In: Journal of Law, Economics and Organisation 18.
[13] Katz, Daniel Martin; Bommarito, Michael J.; and Blackman, Josh (2017). A General Approach for Predicting the Behaviour of the Supreme Court of the United States. In: PloS one 12 (4), e0174698. DOI: 10.1371/journal.pone.0174698.
[14] Landes, William M. (1971). An Economic Analysis of the Courts. In: The Journal of Law and Economics 14 (1). DOI: 10.1086/466704.
[15] Mayer-Schönberger, Viktor; and Cukier, Kenneth (2013). Big data. A Revolution that will Transform How We Live, Work, and Think. Boston: Houghton Mifflin Harcourt.
[16] Mora-Sanguinetti, Juan S.; and Garoupa, Nuno (2015). Do Lawyers Induce Litigation? Evidence from Spain, 2001–2010. In: International Review of Law and Economics 44. DOI: 10.1016/j.irle.2015.06.003.
1 A 2014 White House report from the office of President Obama underlined that Big Data leads to ‘v ex ing issues (Big Data technologies can cause societal harms beyond damages to priv acy, such as discrimination against individuals and groups)’, Hilbert (2016). 2 For a broad discussion on this issue see for example O'Neil (2016).
ISSN 2411-9571 (Print) ISSN 2411-4073 (online)
European Journal of Economics
and Business Studies April 2018 Vol 4 No 1
97
[17] Mora-Sanguinetti, Juan S. (2016). Ev idencia Reciente sobre los Efectos Económicos del Funcionamiento de la Justicia en España. In: Boletin Económico del Banco de España 34.
[18] Neff, Gina (2013): Why Big Data Won’t Cure Us. In: Big data 1 (3). Available at: http://online.liebertpub.com/doi/ full/ 10.1089/big.2013.0029.
[19] Nelson, Sharon D.; and Simek, John W. (2013). Big Data_ Big Pain or Big Gain for Lawyers. In: Law Practice Magazine 39-4.
[20] O’Neil, Cathy (2016). Weapons of Math Destruction. How Big Data Increases Inequality and Threatens Democracy. First edition. New York: Crown.
[21] Pastor, Santos (1993). ¡Ah de la Justicia!, Política Judicial y Economía: Civ itas. [22] Pastor Prieto, S. (2016). Análisis Económico de la Justicia y Reforma Judicial.: Tirant lo Blanch. [23] Pastor Prieto, Santos; and Vargas Perez, Carmen (2001). El Coste de la Justicia, Datos y un Poco de Análisis.
In: Cuadernos de Derecho Judicial (15). [24] Peñaloza Figueroa, Juan Luis and Vargas Perez, Carmen (2004). ¿Qué Costes Económicos y Sociales
Comporta la Ejecución de Sentencias Judiciales? Cuadernos de Estudios Empresariales 1(4). [25] Posner, R. A. (1973). An Economic Approach to Legal Procedure and Judicial Administration. In: Journal of
Legal Studies 2. [26] PowerData (2014). 7 Definiciones de Big Data. https://blog.powerdata.es/el-valor-de-la-gestion-d e-
datos/bid/381767/7-definiciones-de-big-data. [27] Prendergast, James D. (1977). The Use of Data Processing in Litigation. In: Jurimetrics Journal 17 (3). [28] Priest, G. (1989). Private Litigants and the Court Congestion Problem. Boston University Law Review, 69. In:
Boston University Law Review (69). [29] Puyol Montero, Jav ier (2014). Una Aprox imación al Big Data. In: Revista de Derecho UNED 14. [30] Rosales Lopez, V. (2008). Economics of Court Performance. An Empirical Analysis. European Journal of Law
and Economics, 25(3). [31] Rosales-López, V. (2014). Demanda y Oferta de Justicia Civ il en España. In: Panorama de las Administraciones
Públicas: OECD Publishing. [32] Rosales Lopez, V; and Jimenez-Rubio, D. (2016). Empirical Analysis of Civ il Litigation Determinants: the Case
of Spain. European Journal of Law and Economics. 1(18). [33] Shavell, Steven (1982). The Social Versus the Private Incentive to Bring Suit in a Costly Legal System. In:
Journal of Legal Studies 9. Available at: http://www.law.harvard.edu/faculty /shavell/pdf/11_J_legal_stud_333.pdf
[34] Siegel, Eric (2016): Predictive analy tics. The Power to Predict who will Click, Buy, Lie, or Die. Available at: https://www.synapse.koreamed.org/Synapse/Data/PDFData/1088HIR/hir-19-63.pdf.
[35] Universidad Barcelona, AQR Lab and Cambra de Comerc de Barcelona (2018). Impacto Económico del Sistema de Ejecución de Sentences Judiciales y Propuestas de Mejora. Available at: https://www.google.es/url?sa=t&rct=j&q=&esrc=s&source=web&cd=1&ved=0ahUKEwiitZKC5_rYAhVGsxQKHXv9BYQQFggoMAA&url=https% 3A%2F%2Fwww.icpb.es%2Ffotos2% 2FEJECUCIONES_SENTENCIAS_ENERO_2018.pdf&usg=AOvVaw2kYIy1D4m0ZetuvF7toTOb.
[36] Vargas Perez, Carmen; and Peñaloza Figueroa, Juan Luis (2017). Big Data and the Demand for Court and Legal Serv ices. In: European Journal of Interdisciplinary Studies 9 (1).
[37] Vargas Pérez, Carmen; and Peñaloza Figueroa, Juan Luis (2005). The Duration of Civ il Cases. A Surv ival Analysis. Perspectivas. Revista de Análisis en Economía y Comercio Exterior. 1(1), México. http://eprints.ucm.es/42178/).
[38] Voigt, Stefan (2016). Determinants of Judicial Efficiency. A survey. In: Eur J Law Econ 42 (2). DOI: 10.1007/s10657-016-9531-6.
[39] Wang, Tricia (2013). Big Data Needs Thick Data. In: Ethnography Matters. Available at: http://ethnographymatters.net/blog/2013/05/13/big-data-needs-thick-data/.
[40] Wistrich, Andrew J.; Rachlinski, Jeffrey (2013). How Lawyers’ Intuitions Prolong Litigation. In: Cornell Law Faculty Publications (602).

ISSN 2411-9571 (Print) ISSN 2411-4073 (online)
European Journal of Economics
and Business Studies April 2018 Vol 4 No 1
98
DOI: 10.26417/ejes.v4i1.p98-109
Open Access. © 2018 Rosinta Hotmaida Febrianti Purba. This is an open access article licensed under the
Creative Commons Attribution-NonCommercial-NoDerivs 4.0 License
Impact Evaluation of Indonesia Conditional Cash Transfer Program (BSM) on Student Achievement
Rosinta Hotmaida Febrianti Purba
Master of Science in Economics, Faculty of Economics and Business, Universitas Gadjah Mada, Indonesia
Abstract
One of the Indonesia's Government efforts to improve the quality of education, particularly at the primary and secondary level, is the prov ision of BSM. This program launched under TNP2K due to the lack of significant BOS program in overcoming the number of drop out students due to parenting difficulties in meeting other educational needs such as uniforms, shoes, transportation costs and other education expenses not covered by BOS funds. However, the implementation of BSM has drawn a lot of criticism, especially regarding budget management and in terms of targeting, thus potentially hampering the achievement of BSM policy objectives. At the same time, there are inclusive errors and depending on the level of education, 50 to 70 percent of beneficiaries are ineligible. Whereas the budget for BSM program is proportional and in 2017 reaches Rp. 416.1 trillion or 27.4 percent of total APBN expenditure. Using the data from the 5th Indonesian Family Life Survey (IFLS) wave 5th, this study analyses the impact of BSM delivery on student achievement as measured by the final school exam scores. The method of analysis used is Propensity Score Matching, so the average treatment effect of BSM policy can be obtained. Despite the low targeting performance, the analysis shows that the program has a positive effect. Analysis shows Students who receive BSM program assistance get a higher test score of 5.6 percent than students who do not receive the program. Based on the analysis, the paper concludes that the program should be maintained and targeting efficiency needs to be improved as the program has a meaningful effect for low-income households in terms of increasing student achievement.
Keywords: BSM, cash transfer, PSM, student score, subsidy program.
Introduction
People center development places humans as the subject of development (Korten, 1984). In terms of investment, Becker in Sulistyaningrum (2016) indicates that education has a positive relationship with economic growth, namely through human capital investments (human capital) future income will increase. Based on the findings of the World Bank, the rate of return on investment in education shows a higher figure than physical investment, which is 15.3 percent versus 9.1 percent (Fattah, 2009). Human capital in the form of education and health will increase the potential of indiv idual income, and will affect the economy through a number of externalities (DE Silva & Sumarto, 2015). Becker and Amartya Sen suggest that educational investments are means of addressing the problem of poverty and democratic growth. Through educational investment, a person's standard of liv ing will increase, thus equipping indiv iduals with the ability to access jobs to generate income. The role of education is also seen in the macro level. Augmented Solow -Swan model incorporates the role of education as a production factor that capable to explaining the variation in real per capita income between countries (DE Silva & Sumarto, 2015).
The awareness related to importance of education is used as a means to eradicate poverty from 9% to 10% (Bappenas, 2013). Various government poverty allev iation programs have suppressed poverty year after year. One way to allev iate poverty is through the Anti Poverty Program whose benefits are targeted specifically to the poor. The Anti Poverty Program in Indonesia is part of the Social Safety Net (SSN) introduced in 1998 (Daly & Fane, 2002).

ISSN 2411-9571 (Print) ISSN 2411-4073 (online)
European Journal of Economics
and Business Studies April 2018 Vol 4 No 1
99
The Conditional Cash Transfer program has been widely introduced in Latin America and some countries around the world as a social policy tool for reducing poverty . Distribution of cash assistance to poor households based on the requirements of beneficiaries in education and health. The program is also a kind of support to meet SDG's goals to eradicate poverty and improve the education and health sector.
Table 1 Poverty Reduction Program Scheme
No Program Name
Social Protection Program
Volume Target Amount Period of Implementation
1 Rice Subsidy (Raskin) 15 Kg per poor household ev ery month 15.5 million poor
households 1998-Present
2 Family Hope Program
(PKH)
1.4 Million Rupiah (IDR) cash transfer
per household ev ery year
2.4 million v ery poor
households 2007-Present
3 Poor Student Assistance (BSM)
Cash transfer Primarly School: IDR 380 thousand/y ear, Junior High School: IDR 450
thousand/y ear, Senior High School: IDR 750 thousand/y ear.
8.7 million students
2008–Present
4 Temporary Direct Assistance (BLSM)
IDR 150,000 cash aid per poor and v ulnerable household
15.5 million households.
2013 (4 months duration)
Source: Poverty Reduction Acceleration Team (TNP2K)
The target of BSM is 25 percent of the poorest households categorized by per capita expenditure level. The program focuses on children in school age, which is between 7 and 18 years old. The BSM program w as launched under TNP2K due to the lack of significance of BOS program in overcoming the number of drop out students and increasing the number of student participation in school participation as shown in Graph 1. It is caused by the difficulty of parents/family in fulfilling other education needs such as uniform, , shoes, transportation costs and other education expenses not covered by BOS funds (TNP2K, 2012). The TNP2K poverty reduction program like BSM has been regarded as a success. However, how this success is achieved is much less clear (Ashcroft, 2015). This is because the impact evaluation system does not always ex ist to catch it.
Graph 1 The Growth of Dropouts Students by Education Level 2014-2017
SD: Primarly School
SMP: Junior High School
SMA: Senior High School
SMK: vocational secondary school
Source: Ministry of Education and Culture, 2017

ISSN 2411-9571 (Print) ISSN 2411-4073 (online)
European Journal of Economics
and Business Studies April 2018 Vol 4 No 1
100
Government Intervention
The role of strategic education in the economy is to encourage every country to prov ide a certain quality education serv ices to its citizens. Government presence is necessary because education serv ices cannot be fully prov ided by market mechanisms. Through several policy programs such as BOS, BSM, and PKH known as Conditional Cash Transfer. Government intervention is needed to ensure that all residents have access to affordable and quality of education serv ices. In almost every country , this government obligation is contained in the basic constitution. In practice, governments in some countries, especially in developing countries have prioritized budget allocations for education. In some developing countries, the government designed an educational subsidy program to ensure that children have access to education serv ices, such as PROGRESA (Programa de Educacion, Salud y Aliimentacion) in Mexico, PRAF (Programa de Asignacion Familiar) in Honduras, PETI (Programa de Erradicacao do Trabalho Infantil) in Brazil, FA (Familias en Accion) in Colombia, in Indonesia there are BOS (Sulistyaningrum, 2016) and BSM (Yulianti, 2015).
From the budget side, the proportion of the The Indonesian Budget (APBN) for education is at least 20 percent. Because it is proportional, the amount of education budget will follow the amount of APBN expenditure allocation. In APBN 2017, education budget is allocated IDR 416.1 trillion or 27.4 percent of total APBN expenditure. Figure 2 shows the graph of the development of the education budget during 2009 - 2017 with an increasing trend.
Based on data from the Ministry of Finance of Indonesia, the target of the 2017 education budget is allocated for school rehabilitation, professional allowances, Smart Indonesia Card, Bidik Misi assistance, and School Operational Assistance (BOS), and Poor Student Assistance (BSM). BSM funds in APBN 2017 of Rp. 45.2 trillion or about 11 percent of the total education budget. This shows that the BSM program is crucial and is expected to have a positive impact on the quantity and quality of education serv ices throughout Indonesia.
Figure 2 Government Expenditure Trends in the Education Sector
Source: Ministry of Finance Indonesia
Compliers and Non-Compliers Issues
During the first year of operation, BSM coverage reached 3.6 million students. The number increased to 8 million by 2013 and covers 33 prov inces in Indonesia. Unfortunately , the World Bank (2012a) found that there was a misnomer in the first year of BSM implementation. The problem is that BSM was also accepted by non-target students in 2009 as shown in Figure 1, which is larger than the targeted students. Figure 1 also shows that the percentage of beneficiaries receiv ing the program (decile 1 - decile 3) is only 40 percent of those who should receive it. The budget is only able to absorb less than 15 percent of the poorest people. The World Bank (2012a) argues that BSM is 'ineffective in identify ing students' as beneficiaries of the program. The reasons are lack of program socialization, limited program monitoring and the need to prove the database used in targeting.
Figure 1 Percentage of Children Aged 6-18 Years Receiving BSM (Based on Desile Consumption)
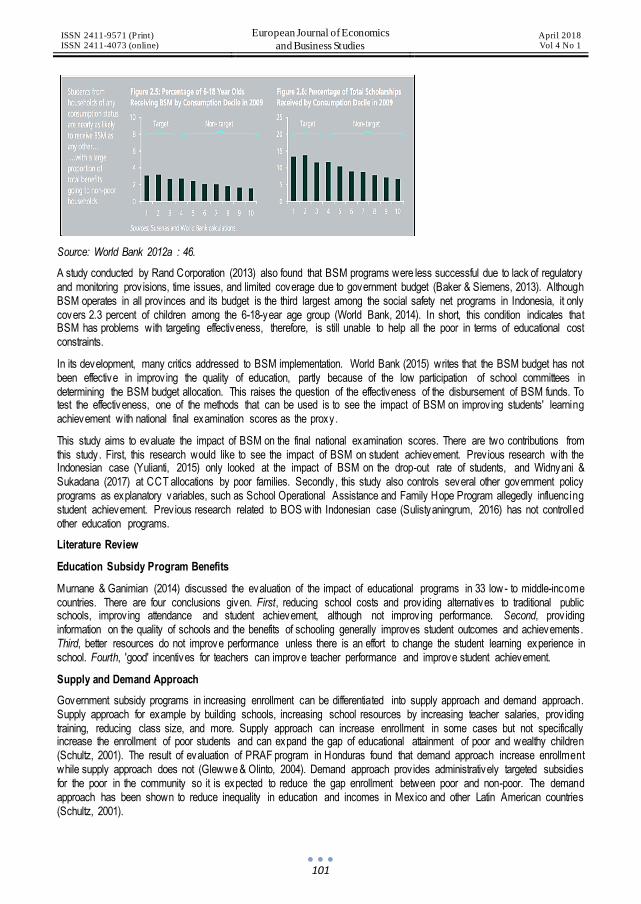
ISSN 2411-9571 (Print) ISSN 2411-4073 (online)
European Journal of Economics
and Business Studies April 2018 Vol 4 No 1
101
Source: World Bank 2012a : 46.
A study conducted by Rand Corporation (2013) also found that BSM programs were less successful due to lack of regulatory and monitoring prov isions, time issues, and limited coverage due to government budget (Baker & Siemens, 2013). Although BSM operates in all prov inces and its budget is the third largest among the social safety net programs in Indonesia, it only covers 2.3 percent of children among the 6-18-year age group (World Bank, 2014). In short, this condition indicates that BSM has problems with targeting effectiveness, therefore, is still unable to help all the poor in terms of educational cost constraints.
In its development, many critics addressed to BSM implementation. World Bank (2015) writes that the BSM budget has not been effective in improv ing the quality of education, partly because of the low participation of school committees in determining the BSM budget allocation. This raises the question of the effectiveness of the disbursement of BSM funds. To test the effectiveness, one of the methods that can be used is to see the impact of BSM on improv ing students' learning achievement with national final examination scores as the proxy.
This study aims to evaluate the impact of BSM on the final national examination scores. There are two contributions from this study. First, this research would like to see the impact of BSM on student achievement. Prev ious research with the Indonesian case (Yulianti, 2015) only looked at the impact of BSM on the drop-out rate of students, and Widnyani & Sukadana (2017) at CCT allocations by poor families. Secondly , this study also controls several other government policy programs as explanatory variables, such as School Operational Assistance and Family Hope Program allegedly influencing student achievement. Prev ious research related to BOS with Indonesian case (Sulistyaningrum, 2016) has not controlled other education programs.
Literature Review
Education Subsidy Program Benefits
Murnane & Ganimian (2014) discussed the evaluation of the impact of educational programs in 33 low - to middle-income countries. There are four conclusions given. First, reducing school costs and prov iding alternatives to traditional public schools, improv ing attendance and student achievement, although not improv ing performance. Second, prov iding information on the quality of schools and the benefits of schooling generally improves student outcomes and achievements. Third, better resources do not improve performance unless there is an effort to change the student learning experience in school. Fourth, 'good' incentives for teachers can improve teacher performance and improve student achievement.
Supply and Demand Approach
Government subsidy programs in increasing enrollment can be differentiated into supply approach and demand approach. Supply approach for example by building schools, increasing school resources by increasing teacher salaries, prov iding training, reducing class size, and more. Supply approach can increase enrollment in some cases but not specifically increase the enrollment of poor students and can expand the gap of educational attainment of poor and wealthy children (Schultz, 2001). The result of evaluation of PRAF program in Honduras found that demand approach increase enrollment while supply approach does not (Glewwe & Olinto, 2004). Demand approach prov ides administratively targeted subsidies for the poor in the community so it is expected to reduce the gap enrollment between poor and non-poor. The demand approach has been shown to reduce inequality in education and incomes in Mexico and other Latin American countries (Schultz, 2001).

ISSN 2411-9571 (Print) ISSN 2411-4073 (online)
European Journal of Economics
and Business Studies April 2018 Vol 4 No 1
102
Impact Evaluation of Education Subsidy Programs in Various Countries
Fiszbein & Schady (2009: 128-129) prov ides a summary of studies conducted by the World Bank in estimating the impact of CCT (conditional cash transfer) on enrollment and school attendance. Almost every evaluation shows a positive effect of CCT on enrollment, although the effect is sometimes found among some age groups and not in other groups.
Table 1 presents some of the results of impact evaluation studies in various countries. Based on time series data of national level of Bangladesh, enrollment level of male middle school is higher than female student. Beginning in the early 1990s education subsidies for female students were introduced in Bangladesh and lowered the level of inequality of male and female enrollment. S. Khandker, Pitt, & Fuwa (2010) evaluated the impact of the subsidy program and found that there was a significant impact on the enrollment of high school girls. Endogenous issues arise from the time of program introduction. The FE conditional logit model is used to eliminate v illage-level heterogeneity that may affect factors from outcomes, indiv idual school enrollment, and program introduction times. The available data is sufficient to estimate the marginal effect but not to identify the average effect. Samples are broken down into ages 11-18 and 13-18 years, for both men and women. The age is a risky age for drop out students.
The FA Program in Columbia covers aspects of health, nutrition, and education. This program was implemented in 2001. Attanasio, Fitzsimons, & Gomez (2005) evaluated the impact of the FA on education. In the field of education, the FA prov ides monthly subsidies to eligible mothers. Terms of subsidies are welfare under a certain cut-off, have children aged 7-17 years, and live in the treatment area. The impact of subsidy was measured by comparing enrollment rates between indiv iduals in the treatment area and control areas. Enrollment prior to the enactment of the FA Program was analysed to see if there was any difference between treatment and control areas, due to the anticipated effects and/ or different fundamentals across regions. The impact estimation is done by linear regression parametric method. The results obtained from the procedure are not different from the regression method. Linear regression is chosen because of its parametric foundation. Based on the impact evaluation, the FA program effectively increased the enrollment rate in the 14-17 year age group, both in rural and urban areas.
Maluccio & Flores (2004) evaluated the impact of the RPS program in Nicaragua. The RPS program prov ides additional income for households to increase food expenditure, reduce primary school drop-out rates, and improve health care and nutrition for under-fives. Household and indiv idual-level data are taken before and after the RPS program is implemented. This allows the calculation of the average program impact with double-difference method. In the educational aspect, the average effect on the enrollment of children aged 7-13 years showed significant results for follow-up in 2001 and 2002. Prior to the RPS program, enrollment rates in the treatment and control groups showed almost the same number, around 70% . During follow-up in 2001 and 2002, enrollment in the treatment group reached 90% while in the control group 75.1% and 79.2% .
The PROGRESA in Mexico prov ides a wide range of assistance to families belonging to the extreme-poor category and targeting mainly rural communities. The goal is to improve standards of liv ing, health and nutrition, and increase educationa l opportunities for children. In determining households that are included in the poor enough category to obtain subsidies, household household well-being indexes are calculated based on the 1997 census, from information on household consumption, assets, and income. The success of the randomization design is ev ident from the insignificant value of enrollment differences from the treatment and control group prior to the start of the program. The difference-in-differ ence estimator showed that the PRORESA program increased enrollment by 0.66 years at the baseline level of 6.80 year old school (Schultz, 2001).
Table 2 Study on the Impact Evaluation of Education Subsidy Programs in Several Countries
Program Variable Method Result References
Country : Bangladesh
Program: female school stipend program
Y:enrollment
Fix ed Effect coditional logit: school/village level
Tw o data set: cross section of Household and School panel data
Based on cross section data of households, the program
improv es secondary education for w omen. Based on school panel data: the program has a significant
impact on the enrollment rate of w omen
(S. Khandker et al., 2010)
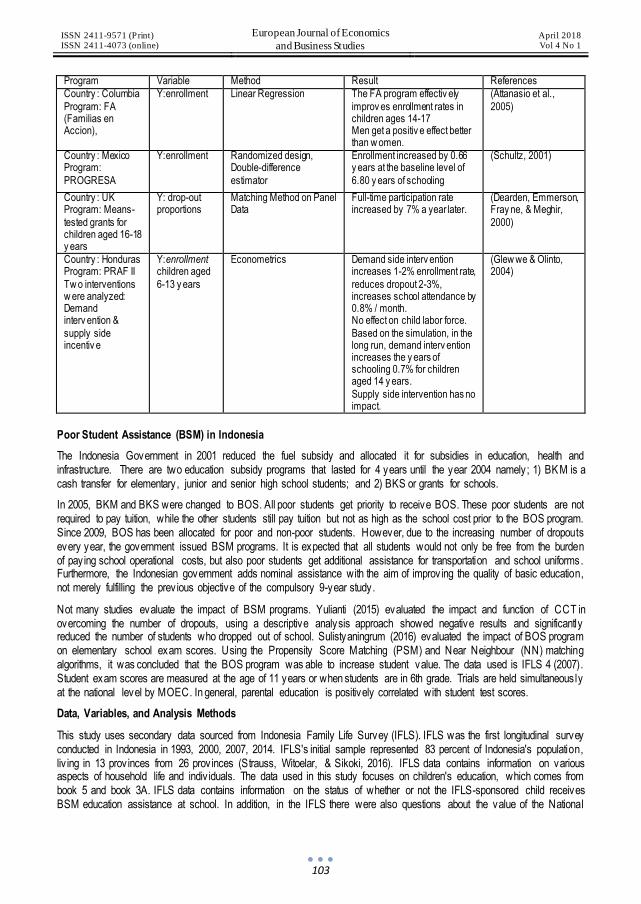
ISSN 2411-9571 (Print) ISSN 2411-4073 (online)
European Journal of Economics
and Business Studies April 2018 Vol 4 No 1
103
Program Variable Method Result References
Country : Columbia
Program: FA (Familias en Accion),
Y:enrollment Linear Regression The FA program effectiv ely
improv es enrollment rates in children ages 14-17 Men get a positiv e effect better than w omen.
(Attanasio et al.,
2005)
Country : Mexico Program:
PROGRESA
Y:enrollment Randomized design, Double-difference
estimator
Enrollment increased by 0.66 y ears at the baseline level of
6.80 y ears of schooling
(Schultz, 2001)
Country : UK Program: Means-
tested grants for children aged 16-18 y ears
Y: drop-out proportions
Matching Method on Panel Data
Full-time participation rate increased by 7% a year later.
(Dearden, Emmerson, Fray ne, & Meghir,
2000)
Country : Honduras Program: PRAF II
Tw o interventions w ere analyzed: Demand interv ention &
supply side incentiv e
Y:enrollment children aged
6-13 y ears
Econometrics Demand side interv ention increases 1-2% enrollment rate,
reduces dropout 2-3%, increases school attendance by 0.8% / month. No effect on child labor force.
Based on the simulation, in the long run, demand interv ention increases the y ears of schooling 0.7% for children aged 14 y ears.
Supply side intervention has no impact.
(Glew we & Olinto, 2004)
Poor Student Assistance (BSM) in Indonesia
The Indonesia Government in 2001 reduced the fuel subsidy and allocated it for subsidies in education, health and infrastructure. There are two education subsidy programs that lasted for 4 years until the year 2004 namely; 1) BKM is a cash transfer for elementary, junior and senior high school students; and 2) BKS or grants for schools.
In 2005, BKM and BKS were changed to BOS. All poor students get priority to receive BOS. These poor students are not required to pay tuition, while the other students still pay tuition but not as high as the school cost prior to the BOS program. Since 2009, BOS has been allocated for poor and non-poor students. However, due to the increasing number of dropouts every year, the government issued BSM programs. It is expected that all students would not only be free from the burden of pay ing school operational costs, but also poor students get additional assistance for transportation and school uniforms. Furthermore, the Indonesian government adds nominal assistance with the aim of improv ing the quality of basic education, not merely fulfilling the prev ious objective of the compulsory 9-year study.
Not many studies evaluate the impact of BSM programs. Yulianti (2015) evaluated the impact and function of CCT in overcoming the number of dropouts, using a descriptive analysis approach showed negative results and significantly reduced the number of students who dropped out of school. Sulistyaningrum (2016) evaluated the impact of BOS program on elementary school exam scores. Using the Propensity Score Matching (PSM) and Near Neighbour (NN) matching algorithms, it was concluded that the BOS program was able to increase student value. The data used is IFLS 4 (2007). Student exam scores are measured at the age of 11 years or when students are in 6th grade. Trials are held simultaneously at the national level by MOEC. In general, parental education is positively correlated with student test scores.
Data, Variables, and Analysis Methods
This study uses secondary data sourced from Indonesia Family Life Survey (IFLS). IFLS was the first longitudinal survey conducted in Indonesia in 1993, 2000, 2007, 2014. IFLS's initial sample represented 83 percent of Indonesia's population, liv ing in 13 prov inces from 26 prov inces (Strauss, Witoelar, & Sikoki, 2016). IFLS data contains information on various aspects of household life and indiv iduals. The data used in this study focuses on children's education, which comes from book 5 and book 3A. IFLS data contains information on the status of whether or not the IFLS-sponsored child receives BSM education assistance at school. In addition, in the IFLS there were also questions about the value of the National
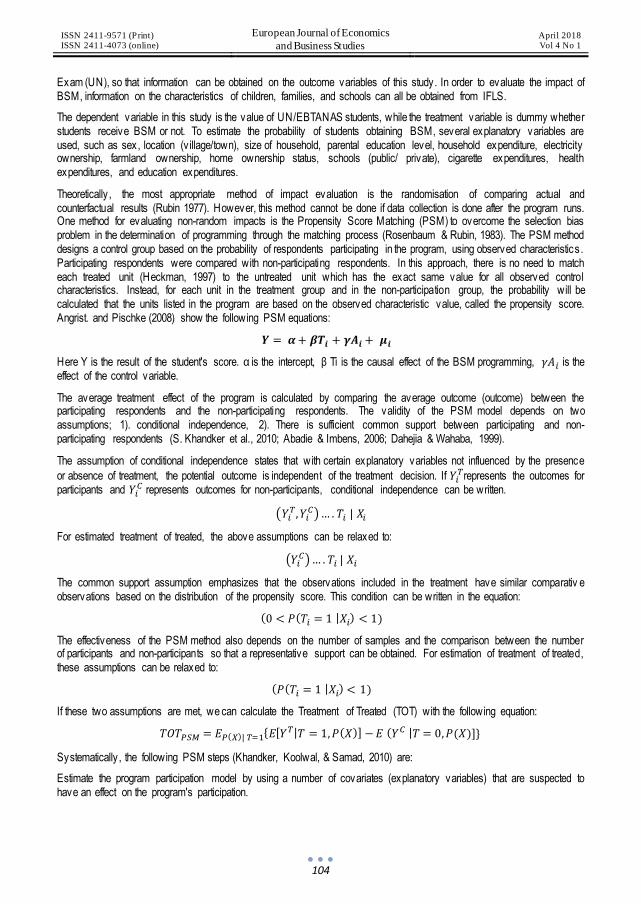
ISSN 2411-9571 (Print) ISSN 2411-4073 (online)
European Journal of Economics
and Business Studies April 2018 Vol 4 No 1
104
Exam (UN), so that information can be obtained on the outcome variables of this study. In order to evaluate the impact of BSM, information on the characteristics of children, families, and schools can all be obtained from IFLS.
The dependent variable in this study is the value of UN/EBTANAS students, while the treatment variable is dummy whether students receive BSM or not. To estimate the probability of students obtaining BSM, several explanatory variables are used, such as sex, location (v illage/town), size of household, parental education level, household expenditure, electricity ownership, farmland ownership, home ownership status, schools (public/ private), cigarette expenditures, health expenditures, and education expenditures.
Theoretically , the most appropriate method of impact evaluation is the randomisation of comparing actual and counterfactual results (Rubin 1977). However, this method cannot be done if data collection is done after the program runs. One method for evaluating non-random impacts is the Propensity Score Matching (PSM) to overcome the selection bias problem in the determination of programming through the matching process (Rosenbaum & Rubin, 1983). The PSM method designs a control group based on the probability of respondents participating in the program, using observed characteristics . Participating respondents were compared with non-participating respondents. In this approach, there is no need to match each treated unit (Heckman, 1997) to the untreated unit which has the exact same value for all observed control characteristics. Instead, for each unit in the treatment group and in the non-participation group, the probability will be calculated that the units listed in the program are based on the observed characteristic value, called the propensity score. Angrist. and Pischke (2008) show the following PSM equations:
𝒀 = 𝜶 + 𝜷𝑻𝒊 + 𝜸𝑨𝒊 + 𝝁𝒊
Here Y is the result of the student's score. α is the intercept, β Ti is the causal effect of the BSM programming, 𝛾𝐴𝑖 is the effect of the control variable.
The average treatment effect of the program is calculated by comparing the average outcome (outcome) between the participating respondents and the non-participating respondents. The validity of the PSM model depends on two assumptions; 1). conditional independence, 2). There is sufficient common support between participating and non-participating respondents (S. Khandker et al., 2010; Abadie & Imbens, 2006; Dahejia & Wahaba, 1999).
The assumption of conditional independence states that with certain explanatory variables not influenced by the presence
or absence of treatment, the potential outcome is independent of the treatment decision. If 𝑌𝑖𝑇represents the outcomes for
participants and 𝑌𝑖𝐶 represents outcomes for non-participants, conditional independence can be written.
(𝑌𝑖𝑇, 𝑌𝑖
𝐶) … . 𝑇𝑖 | 𝑋𝑖
For estimated treatment of treated, the above assumptions can be relaxed to:
(𝑌𝑖𝐶) … . 𝑇𝑖 | 𝑋𝑖
The common support assumption emphasizes that the observations included in the treatment have similar comparativ e observations based on the distribution of the propensity score. This condition can be written in the equation:
(0 < 𝑃(𝑇𝑖 = 1 |𝑋𝑖) < 1)
The effectiveness of the PSM method also depends on the number of samples and the comparison between the number of participants and non-participants so that a representative support can be obtained. For estimation of treatment of treated, these assumptions can be relaxed to:
(𝑃(𝑇𝑖 = 1 |𝑋𝑖) < 1)
If these two assumptions are met, we can calculate the Treatment of Treated (TOT) with the following equation:
𝑇𝑂𝑇𝑃𝑆𝑀 = 𝐸𝑃(𝑋)| 𝑇=1{𝐸[𝑌𝑇|𝑇 = 1, 𝑃(𝑋)] − 𝐸 (𝑌𝐶 |𝑇 = 0, 𝑃(𝑋)]}
Systematically , the following PSM steps (Khandker, Koolwal, & Samad, 2010) are:
Estimate the program participation model by using a number of covariates (explanatory variables) that are suspected to have an effect on the program's participation.

ISSN 2411-9571 (Print) ISSN 2411-4073 (online)
European Journal of Economics
and Business Studies April 2018 Vol 4 No 1
105
Determine the shared common support area that represents the distribution of the propensity score between the participating and nonparticipant groups, and perform the balancing test.
Match participants and non-participants using several techniques; nearest-neighbor matching, caliper or radius matching, stratification or interval matching, kernel and local linear matching, difference in difference matching.
In addition, according to Marco Caliendo & Kopenig (2005), the implementation steps of PSM are as follows:
Estimated Propensity Score
There are two steps to do estimation of propensity score that is choosing model specification and variable selection. The choice of variables should be based on prev ious findings as well as relevant economic theory.
Choosing a Matching Algorithm
Five different matching algorithms according to M. Caliendo & Kopeinig (2005): Nearest Neighbors (NN), Caliper and Radius, Stratification and Interval, Kernel and Local Linear and Weighting (Figure 2), and this paper will use NN matching algorithms. There is no superior method among all matching methods. This is due to the trade-off between bias and variance that will affect the estimated value of ATT (Caliendo and Kopeinig, 2008).
Testing over lap or common support
This stage is an important part in matching estimation (Sulistyaningrum, 2016) for ensuring matching between the treated group and the control group.
Test the Matching Quality
Tests that can be performed include standardized bias, t test before and after matching and F joint equality of means test on sample matched. If there is no difference (receiv ing H0), it means that the sample used has good matching quality . If the match quality is poor or there is still a difference, it's better to repeat the same steps until the matching quality is satisfactory.
Sensitivity Analysis
Sensitiv ity analysis was conducted to see the presence of hidden bias due to unmeasured variables in treated and untreated groups. The Wilcoxon marked rank test can be used to perform to perform sensitiv ity analysis.

ISSN 2411-9571 (Print) ISSN 2411-4073 (online)
European Journal of Economics
and Business Studies April 2018 Vol 4 No 1
106
Results and Discussion
Table 3 Samples of Beneficiaries and Non BSM Program Receivers
Beneficiaries Non BSM Program
205 1.252
Source : Indonesia Family Life Survey (IFLS) Database
Table 3 shows that there were 205 students who received the last one year program and 1,252 students did not receive. To determine household treatment and control, a matching process is done by including all household characteristics variable that has been determined by TNP2K as the condition of program beneficiaries.
The variables used in the PSM must meet the Conditional Independent Assumption (CIA) in which the outcome variable must be independent of the conditional treatment of the propensity score (Caliendo & Kopeinig, 2005). The model meets the CIA if the outcomes to be administered from the treatment group are not influenced by other variables other than treatment variables, meaning the outcome of the intervention is not the influence of other factors outside the intervention. The probability score match is a solution to the problem of dimensions and can be estimated using probit or logit models. Since most statistical literature tends to use probit, this study also uses probit models to obtain predictive propensity scores (Dehejia & Wahba, 1998). The probability of obtaining BSM is determined by various indiv idual characteristics as in table 4 above. In column 1 (table 4), internet access variables, mobile ownership, estimated number of students in the classroom, length of trip to school, household expenditure logs for food in a month is significant.
Table 4 BSM Probit Model
bsm
Parameter Estimation
Coefficient (1)
Std. Err (2)
Man -.0428243 .0886154
Age .0636282 .0540174
Internet -.2231214** .1013334
Phone -.2347335** .100796
Transportation .0042593 .0048241
Class_size -.0088417** .004373
public .1461131 .1394117
jumlah_art .047976 .0304487
Yearsof_schooling -.0414357*** .011099
Lnfood -.2225261*** .0843454
Urban .1273698 .0957205
lnav gsmok14 .0047508 .0231115
lneduc_ex p14 -.0656882 .0421147
_Cons 2.48459** 1.31741
Note: dependent variable is BSM where 1 for receiver, 0 other
*Significant at 10% , **significant at 5% , ***significant at 1%
This study used Near Neighbor Matching, because the data distribution did not differ significantly in the treated group and control group as shown in Figure 2. The distribution of treated group had higher propensity score than the control group.

ISSN 2411-9571 (Print) ISSN 2411-4073 (online)
European Journal of Economics
and Business Studies April 2018 Vol 4 No 1
107
Figure 2 Propensity Score Distribution and Common Support
Sianesi (2006) states that common support should be checked, requiring that there be treated group units and control groups that have similarity values of propensity matching after matching when the density values of the treatment group and the control group occur overlap (intersection). The common support area represents the similarity of characteristics between the two groups based on the similarity of the distribution of its propensity values. Table 5 confirms that common support is met because there is an overlap propensity score between treated and control groups.
Table 5 Characteristics of Explanatory Variables (Average)
Non-BSM BSM Difference (p-v alue)
Total Final Ex ams (UAN) Value 15.33 15.04 0.29 0.09 Av erage Final Exams (UAN) Value 7.66 7.52 0.14 0.09 Final Ex ams (UAN): Mathematics 7.50 7.31 0.20 0.10 Final Ex ams (UAN): Bahasa 7.82 7.71 0.11 0.00
dummy student gender 0.49 0.48 0.01 0.24 Student age 13.15 13.17 -0.02 0.27 dummy using internet or not 0.69 0.50 0.19 0.00 dummy using mobile phone or not 0.74 0.56 0.17 0.00
Approx imate length of trip to school 10.52 11.46 -0.94 0.00 Estimated number of students in the class 30.53 27.90 2.63 0.00 Dummy public or private SD ty pe 0.86 0.90 -0.05 0.00 Amount of Household member 4.72 4.97 -0.24 0.00
Head of household education 8.82 6.40 2.41 0.00 log Household ex penses for food 14.44 14.22 0.22 0.00 dummy urban or rural 0.61 0.54 0.07 0.00 lnav g_smoking14 9.29 9.30 -0.01 0.89
lneduc_ex p14 12.97 12.51 0.46 0.00
Estimates are conducted to analyse how far the impact of the BSM program affect student attainment. Figure 3 shows the results of the Average Treatment Effects on the Treated (ATET) of the BSM program as a whole. From the estimation results using NN Matching the author found that the BSM program was able to increase the average score of BSM recipient students by 5.6 percent greater than the students who did not receive the program at the level of significance of 10 percent.
Figure 3 BSM Effect on Student Score Average (New Method)
Source: processed using STATA
02
46
Den
sity
0 .1 .2 .3 .4 .5Propensity Score
Treated Control

ISSN 2411-9571 (Print) ISSN 2411-4073 (online)
European Journal of Economics
and Business Studies April 2018 Vol 4 No 1
108
Cash transfer programs can have a positive effect on student achievement (Sulistyaningrum, 2016). As in other developing countries, cash transfers such as BSM are indeed able to decrease not only drop-out rates, and allow improvements in achievement of poor students.
Figure 3 ATT Estimation with NN Matching
Discussion and Conclusion
This study as a whole, indicates that estimated using PSM, BSM program managed to improve student achievement test results. BSM program has a positive and significant impact on the average score of children. Students receiv ing program assistance received a higher test score of 5.6 percent. As a program of assistance to poor students, BSM helps students gain access to education, especially basic education, because the government can ensure direct use of subsidies for students, although it is difficult to properly monitor the use of aid funds. As Widnyani & Sukadana (2017) finds in evaluating the use of CCT funds in the form of BLSM by households, the increase in family income due to CCT increases household consumption of cigarettes. Thus, further research can evaluate the allocation of the use of BSM funds by indiv iduals so that it is known whether the aid program is being used properly .
Researcher are aware of the limitations of the preparation of this paper, such as; 1) the impact evaluation of matching methods makes it possible to overcome the bias through statistical techniques and form a comparison group although there is no counterfactual data, but the bias is not completely eliminated. Nevertheless, the matching method is considered to be the best alternative after RCT (Almunawaroh, 2016); 2) there is possibility of causality by the use of household expenditure variable, education expenditure, food expenditure and cigarette expenditure. Thus, it is necessary to conduct further study to form a more comprehensive construct related to the effectiveness of the BSM program.
Acknowledgment
I would like to thank to Jesus Christ who accompany and never giive up on me, to Indonesia Endowment Fund for Education (LPDP) Ministry of Finance Republic of Indonesia for supporting the author by scholarship. I am so grateful as well to Gumilang Sahadewo, Ph.D. for giv ing and always encouraging the author to accomplish this project. My best gratitude for my parents, D. Purba and N. Marbun; my brothers, Deddy and Hefry ; my sister Nita and Sarma also Dear my niece, thanks for your pray ing and pure love; my life partner upon crisis and joy, Lintong; all sponsor who made this dream gonna be happened; Ms. Viv in, Mr. Adhi, Mr. Anang Prihantoro, Mr. Cosmas Batubara, Mr. Edmond, F r. Banu, Mr. Kamto, Mr. Prosil Mabsus, and the last but not least, all my true friends, Geny and Vic who adorn this paper, Kiki, Yuni, Tante Ditha, Widya, Bara, Wahyu, Nia; my dogs, Axello and Nesia for being together during working on and finishing this paper.
References
[1] Almunawaroh, D.F. 2016. Dampak Kebijakan Program Keluarga Harapan terhadap Konsumsi Rumah Tangga Indonesia Tahun 2014. Tesis,
Fakultas Ekonomika dan Bisnis, Universitas Gadjah Mada, Yogyakarta. [2] Abadie, A., & Imbens, G. W. (2006). Large sample properties of matching estimators for average treatment effects. Econometrica, 74(1), 235–
267. https://doi.org/10.1111/j.1468 -0262.2006.00655.x
[3] Angrist J. D. and J. S. Pischke. (2008). Mostly Harmless Econometrics : An Empiricist ’ s Companion. Massachusettts I Nstitute of Technology and The London School of Economics, (March), 290. https://doi.org/10.1017/CBO 9781107415324.004
[4] Attanasio, O., Fitzsimons, E., & Gomez, A. (2005). The Impact of a Conditional Education Subsidy on School enrollment in Colombia. Centre
for the Evaluation of Development Policies (EDePo), Report Sum, 1–14.
[5] Baker, R., & Siemens, G. (2013). Educational Data Mining and Learning Analytics Ryan S.J.d. Baker, Teachers College, Columbia University George Siemens, Athabasca University 1. Cambridge Handbook of the Learning Sciences.
[6] Caliendo, M., & Kopeinig, S. (2005). Some Practical Guidance for the Implementation of Propensity Score Matching. DIW Discuss ion Paper,
485(1), 1–29. https://doi.org/10.1111/j.1467-6419.2007.00527.x
ISSN 2411-9571 (Print) ISSN 2411-4073 (online)
European Journal of Economics
and Business Studies April 2018 Vol 4 No 1
109
[7] Caliendo, M., & Kopenig, S. (2005). Some Practical Guidance for the Implementation of Propensity Score Matching. IZA Institute fo r the Study
of Labor, Discussion paper no.1588.
[8] Dahejia, R. H., & Wahaba, S. (1999). Causal effects in non-ex perimental studies. Journal of the American Statistical Association, 94(448), 1053–
1062. [9] Daly, A., & Fane, G. (2002). Anti-Poverty Programs in Indonesia. Bulletin of Indonesian Economic Studies, 38(3), 309–329.
https://doi.org/10.1080/00074910215535
[10] Dearden, L., Emmerson, C., Frayne, C., & Meghir, C. (2000). Education Subsidies and School Drop-Out Rates (Vol. 12). [11] DE Silva, I., & Sumarto, S. (2015). Dynamics of Growth, Poverty and Human Capital: Evidence From Indonesian Sub-National Data. Journal of
Economic Development, 40(2), 1–33.
[12] Fiszbein, A., & Schady, N. R. (2009). Conditional cash transfers. World Bank Policy Report (Vol. 1). https://doi.org/10.1016/ S0378 -
4266(03)00124-9 [13] Glewwe, P., & Olinto, P. (2004). Evaluating of the Impact of Conditional Cash Transfers on Schooling: A n Ex perimental Analysis of Honduras’
PRAF Program, 1–50.
[14] Heckman, G. J. (1997). Dunkl operators. Asterisque, 245, 223–246. [15] Khandker, S., Pitt, M., & Fuwa, N. (2010). Subsidy to Promote Girls’ Secondary Education: The Female Stipend Program in Bangl adesh. MPRA,
(23688).
[16] Khandker, S. R., Koolwal, G. B., & Samad, H. A. (2010). Handbook on Impact Evaluation. World Bank. Washington.
[17] Korten, D. (1984). Rural development programming: The learning process approach. In Peoplecentered Development contributions toward theory and planning frameworks.
[18] Maluccio, J. A., & Flores, R. (2004). Impact Evaluation of a Contional Cash Transfer Program: the Nicaraguan Red De Proteccion Social.
[19] Murnane, R. J., & Ganimian, A. J. (2014). Improving Educational Outcomes in Developing Countries: Lessons From Rigoroues Evaluation. [20] Rosenbaum, P. R., & Rubin, D. B. (1983). a. “ The Central Role of the Propensity Score in Observational Studies for Causal Eff ects.” Biometrika,
70(1), 41–55. https://doi.org/10.1093/biomet/70.1.41
[21] Rubin, D. B. (1977). Assignment to Treatment Group on the Basis of a Covariate. Journal of Educational Statistics, 2(1), 1 –26.
[22] Schultz, T. P. (2001). Economic Growth Center School Subsidies for the Poor: Evaluating the Mex ican PROGRESA Poverty Program. New Haven.
[23] Strauss, J., Witoelar, F., & Sikoki, B. (2016). User’s Guide for the Indonesia Family Life Survey, Wave 5. RAND Labor and Pop ulation Working
Paper Series, 2. [24] Sulistyaningrum, E. (2016). Impact Evaluation of the School Operational Assistance Program (Bos) Using the Matching Method. Journal of
Indonesian Economy and Business: JIEB, 35–62(31), 1. Retrieved from
http://search.proquest.com.virtual.anu.edu.au/docview/1786605462/fulltex tPDF/5D05B 29836A74980P Q/26?accountid=8330 [25] World Bank. (2014). World Development Indicators 2014. Group. https://doi.org/10.1596/978-1-4648-0163-1
[26] World Bank. (2015). World Development Indicators 2015. World Bank. https://doi.org/10.1596/978 -0 -8213-7386-6
[27] Yulianti, N.R. (2015). The Functioning and Effect of a Cash Transfer Program in Indonesia. International Institute of Social Studies.
[28] Widnyani, I.A.M., & Sukadana, I.W. 2017. Dampak Unconditional Cash Transfers (UCT): Studi Kasus Bantuan Langsung Sementara Ma syarakat (BLSM) pada Rumah Tangga Miskin di Indonesia. Udayana University.
Appendix
Abbreviation
PSM Propensity Score Matching BAPPENAS Indonesian Ministry of National Dev elopment Planning (Badan Perencanaan dan
Pembangunan Nasional) BDT Integrated Database
BSM Poor Student Assistance (Bantuan Siswa Miskin) BOS School Operational Assistance (Bantuan Operasional Siswa) BKM Special Assistance for Student (Bantuan Khusus Murid) BKS Special Assistance for School (Bantuan Khusus Sekolah)
CCT Conditional Cash Transfer BLT Direct Cash Assistance (Bantuan Langsung Tunai) BPS Central Bureau of Statistics (Badan Pusat Statistik) GDP Gross Domestic Product JAMKESMAS Indonesian National Health Insurance (Jaminan Kesehatan Masyarakat)
JPS Social Safety Net (Jaringan Pengaman Sosia)l KPS Social Protection Cards (Kartu Perlindungan Sosial) LPG Liquid Petroleum Gas PKH Family Hope Program (Program Keluarga Harapan)
PPLS Social Protection Program Data Collection RASKIN Rice for the Poor (Beras Miskin) SKTM Certificate of inability /Poor (Surat Keterangan Miskin) TNP2K National Team for Accelerating Poverty Reduction (Tim Nasional Percepatan
Penanggulangan Kemiskinan)
ISSN 2411-9571 (Print) ISSN 2411-4073 (online)
European Journal of Economics
and Business Studies April 2018 Vol 4 No 1
110
DOI: 10.26417/ejes.v4i1.p110-120
Open Access. © 2018 Putri Ayu. This is an open access article licensed under the
Creative Commons Attribution-NonCommercial-NoDerivs 4.0 License
The Impact of Carbon Tax Application on the Economy and Environment of Indonesia
Putri Ayu
Master of Science in Economics, Faculty of Economics and Business, Universitas Gadjah Mada, Indonesia
Abstract
As the most efficient market with a mitigation instrument basis, carbon tax is highly recommended by economists and international organizations. This paper examines the impact of implementing carbon tax policy on value of change in GDP, GDP Quantity Index, Government Household Demand, Private Household Demand, and CO2
emission effects in Indonesia by using the dynamic energy Computable General Equilibrium (CGE) model. This study used GTAP-E that was part of GTAP 9 in 2011. GTAP-E consists of 140 countries and 57 sectors aggregated into eleven regions and eight sectors. There were three scenarios of carbon tax used in this paper that were China, Singapore, and India. The result shows that both GDP and GDP index have a negative impact due to the carbon tax of US $20/tCO2, US$ 10/tCO2, and US $1.60/t CO2. The greater the application of the carbon tax is, the greater the decrease of values of GDP, Government Household Demand, Private Household Demand towards carbon tax policies in Indonesia are. The negative impact of carbon tax is greater for the Private Household Demand that is indicated by all commodities except crude oil has decreasing demand from baseline scenario (no tax). While in the Government Household Demand, agriculture sector, crude oil, refined oil product, and other industries, carbon tax has a positive impact. In the environmental facet, if the carbon tax in Indonesia is implemented in accordance with the above simulation, then it appears that carbon tax can reduce emissions of CO2.
Keywords: Carbon Tax, GDP, Government Household Demand, Private Household Demand, CO2 Emissions, GTAP-E
Introductions
Global warming is now an interesting issue because of the many disasters having recently occurred (Yusuf et al., 2015). The total of anthropogenic GHG emissions had continued to increase in 1970 to 2010 with larger absolute decadal increases towards the end of this period. Despite a growing number of climate change mitigation policies, the annual GHG emissions grow on average by 1.0 gigatonne carbon diox ide equivalent (GtCO2eq) or 2.2% per year from 2000 to 2010 if compared to 0.4 GtCO2eq (1.3% ) per year from 1970 to 2000 (IPCC, 2014). IPCC (2014) suggest that it can make significant and dangerous global climate changes.
The Kyoto Protocol and the United National Framework Convention on Climate Change are two of climates policies in the world (Wesseh et al., 2017). The climates policies still have a debate about procedures of greenhouse gas (CHG) abatement. Controversy still hangs over a specific abatement mechanism. Perman (2003) reveals that institutional approaches to facilitate internationalization of externalities and command, control instruments, and economic incentive (market-based) instruments are the instruments available for pollution control. Furthermore, Wei (2014) suggest that the price-based, quantity -based, and command-and-control mechanisms are three popular procedures of abatement.
Nordhaus (2014) recommends that the government should use the price-based and quantity -based mechanisms as a tool to reduce GHG. Perman (2003) suggests that command and control prov ide advantages enabling polluters to be flex ible in reducing pollution, but it may not always be feasible or desirable on other grounds for establishing regulations in such ways. Quantity -based mechanism is a mechanism to reduce highly redundant costs. Polluters will buy permits in that the total emissions will be equal to the total emissions generated so that only the lowest cost reductions will be made (Perman,
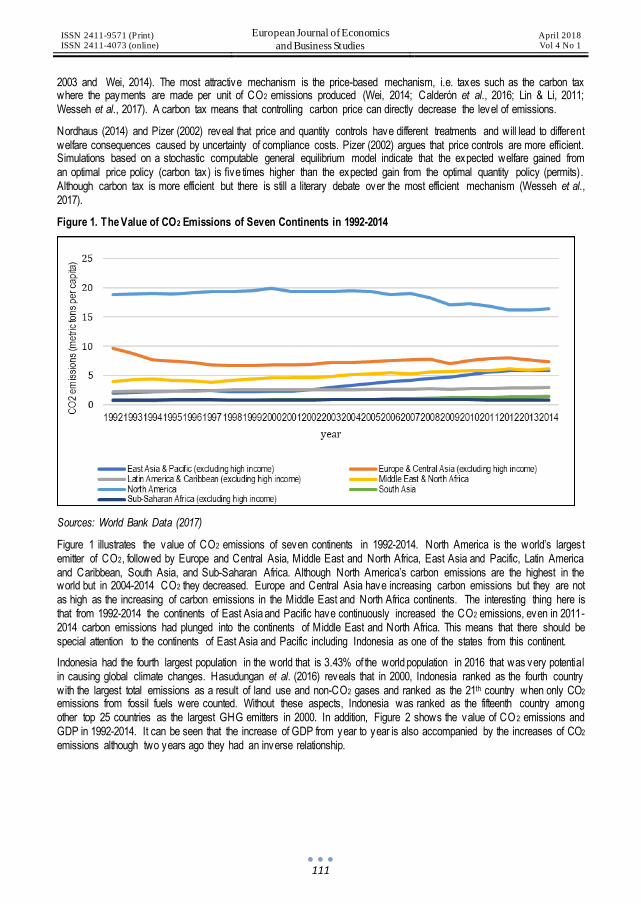
ISSN 2411-9571 (Print) ISSN 2411-4073 (online)
European Journal of Economics
and Business Studies April 2018 Vol 4 No 1
111
2003 and Wei, 2014). The most attractive mechanism is the price-based mechanism, i.e. taxes such as the carbon tax where the payments are made per unit of CO2 emissions produced (Wei, 2014; Calderón et al., 2016; Lin & Li, 2011; Wesseh et al., 2017). A carbon tax means that controlling carbon price can directly decrease the level of emissions.
Nordhaus (2014) and Pizer (2002) reveal that price and quantity controls have different treatments and will lead to different welfare consequences caused by uncertainty of compliance costs. Pizer (2002) argues that price controls are more efficient. Simulations based on a stochastic computable general equilibrium model indicate that the expected welfare gained from an optimal price policy (carbon tax) is five times higher than the expected gain from the optimal quantity policy (permits). Although carbon tax is more efficient but there is still a literary debate over the most efficient mechanism (Wesseh et al., 2017).
Figure 1. The Value of CO2 Emissions of Seven Continents in 1992-2014
Sources: World Bank Data (2017)
Figure 1 illustrates the value of CO2 emissions of seven continents in 1992-2014. North America is the world’s largest emitter of CO2, followed by Europe and Central Asia, Middle East and North Africa, East Asia and Pacific, Latin America and Caribbean, South Asia, and Sub-Saharan Africa. Although North America’s carbon emissions are the highest in the world but in 2004-2014 CO2 they decreased. Europe and Central Asia have increasing carbon emissions but they are not as high as the increasing of carbon emissions in the Middle East and North Africa continents. The interesting thing here is that from 1992-2014 the continents of East Asia and Pacific have continuously increased the CO2 emissions, even in 2011-2014 carbon emissions had plunged into the continents of Middle East and North Africa. This means that there should be special attention to the continents of East Asia and Pacific including Indonesia as one of the states from this continent.
Indonesia had the fourth largest population in the world that is 3.43% of the world population in 2016 that was very potential in causing global climate changes. Hasudungan et al. (2016) reveals that in 2000, Indonesia ranked as the fourth country with the largest total emissions as a result of land use and non-CO2 gases and ranked as the 21th country when only CO2 emissions from fossil fuels were counted. Without these aspects, Indonesia was ranked as the fifteenth country among other top 25 countries as the largest GHG emitters in 2000. In addition, Figure 2 shows the value of CO 2 emissions and GDP in 1992-2014. It can be seen that the increase of GDP from year to year is also accompanied by the increases of CO2 emissions although two years ago they had an inverse relationship.
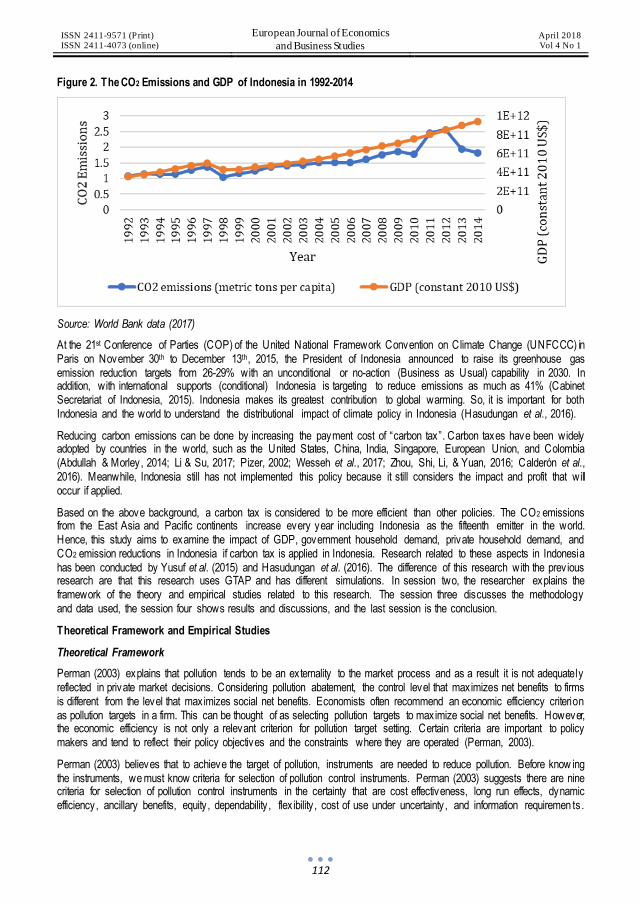
ISSN 2411-9571 (Print) ISSN 2411-4073 (online)
European Journal of Economics
and Business Studies April 2018 Vol 4 No 1
112
Figure 2. The CO2 Emissions and GDP of Indonesia in 1992-2014
Source: World Bank data (2017)
At the 21st Conference of Parties (COP) of the United National Framework Convention on Climate Change (UNFCCC) in Paris on November 30th to December 13th, 2015, the President of Indonesia announced to raise its greenhouse gas emission reduction targets from 26-29% with an unconditional or no-action (Business as Usual) capability in 2030. In addition, with international supports (conditional) Indonesia is targeting to reduce emissions as much as 41% (Cabinet Secretariat of Indonesia, 2015). Indonesia makes its greatest contribution to global warming. So, it is important for both Indonesia and the world to understand the distributional impact of climate policy in Indonesia (Hasudungan et al., 2016).
Reducing carbon emissions can be done by increasing the payment cost of “carbon tax”. Carbon taxes have been widely adopted by countries in the world, such as the United States, China, India, Singapore, European Union, and Colombia (Abdullah & Morley, 2014; Li & Su, 2017; Pizer, 2002; Wesseh et al., 2017; Zhou, Shi, Li, & Yuan, 2016; Calderón et al., 2016). Meanwhile, Indonesia still has not implemented this policy because it still considers the impact and profit that will occur if applied.
Based on the above background, a carbon tax is considered to be more efficient than other policies. The CO2 emissions from the East Asia and Pacific continents increase every year including Indonesia as the fifteenth emitter in the world. Hence, this study aims to examine the impact of GDP, government household demand, private household demand, and CO2 emission reductions in Indonesia if carbon tax is applied in Indonesia. Research related to these aspects in Indonesia has been conducted by Yusuf et al. (2015) and Hasudungan et al. (2016). The difference of this research with the prev ious research are that this research uses GTAP and has different simulations. In session two, the researcher explains the framework of the theory and empirical studies related to this research. The session three discusses the methodology and data used, the session four shows results and discussions, and the last session is the conclusion.
Theoretical Framework and Empirical Studies
Theoretical Framework
Perman (2003) explains that pollution tends to be an externality to the market process and as a result it is not adequately reflected in private market decisions. Considering pollution abatement, the control level that maximizes net benefits to firms is different from the level that maximizes social net benefits. Economists often recommend an economic efficiency criterion as pollution targets in a firm. This can be thought of as selecting pollution targets to maximize social net benefits. However, the economic efficiency is not only a relevant criterion for pollution target setting. Certain criteria are important to policy makers and tend to reflect their policy objectives and the constraints where they are operated (Perman, 2003).
Perman (2003) believes that to achieve the target of pollution, instruments are needed to reduce pollution. Before know ing the instruments, we must know criteria for selection of pollution control instruments. Perman (2003) suggests there are nine criteria for selection of pollution control instruments in the certainty that are cost effectiveness, long run effects, dynamic efficiency, ancillary benefits, equity , dependability , flex ibility , cost of use under uncertainty , and information requiremen ts.

ISSN 2411-9571 (Print) ISSN 2411-4073 (online)
European Journal of Economics
and Business Studies April 2018 Vol 4 No 1
113
But in uncertainty , criteria for selection of pollution control instruments are dependability , flex ibility , cost of use under uncertainty , and information requirements.
There are three instruments of pollution control that are (Perman, 2003):
Institutional approaches to facilitate internalization of externalities: facilitation of bargaining, specification of liability , and development of social responsibility
Command and control instruments: input controls over quantity and/or mix of inputs, technology controls, output quotas or prohibitions, emissions licenses, and location controls (zoning, planning controls, relocation)
Economic incentive (market-based) instruments: emissions charges/taxes, user charges/fees/natural, resource taxes, product charges/taxes, emissions abatement and resource management subsidies, marketable (transferable marketable) emissions permits, deposit-refund systems, non-compliance fees, performance bonds, and liability payments.
In many instruments control pollution, the economic incentive (market-based) instruments are more effective in cost than command and control instruments but not all (Perman, 2003).
Figure 3. Target Setting under Perfect Information
Figure 3 displays that the efficient target (M*) is the level of emissions that equates the marginal cost of emissions abatement (MC) and the marginal damage of emissions (MD). The total net social benefit represented by the shaded area in Figure 3. This is the maximum net benefit available. The emissions are at any level other than M* that means the efficiency losses and thus attained net benefits fall short of their maximum level (Perman, 2003).
The equilibrium if there are transaction cost and environmental regulation can be seen in Figure 4 (Perman, 2003).
Figure 4. The Benefit Regulations
Source: Perman (2003)
Curve D represents the marginal gross benefits of pollution abatement (the damages are avoided). The marginal, real resource costs of pollution abatement correctly are represented by the curve labelled as D. If there are no other costs, an efficient outcome will require ZA units of abatement. Indirect costs including impacts on unemployment and trade competitiveness may also be induced. Adding these to the resource abatement costs, the composite cost curve B is obtained with a correspondingly lower efficient abatement level, ZB. If the induced effects are beneficial rather than harmful,
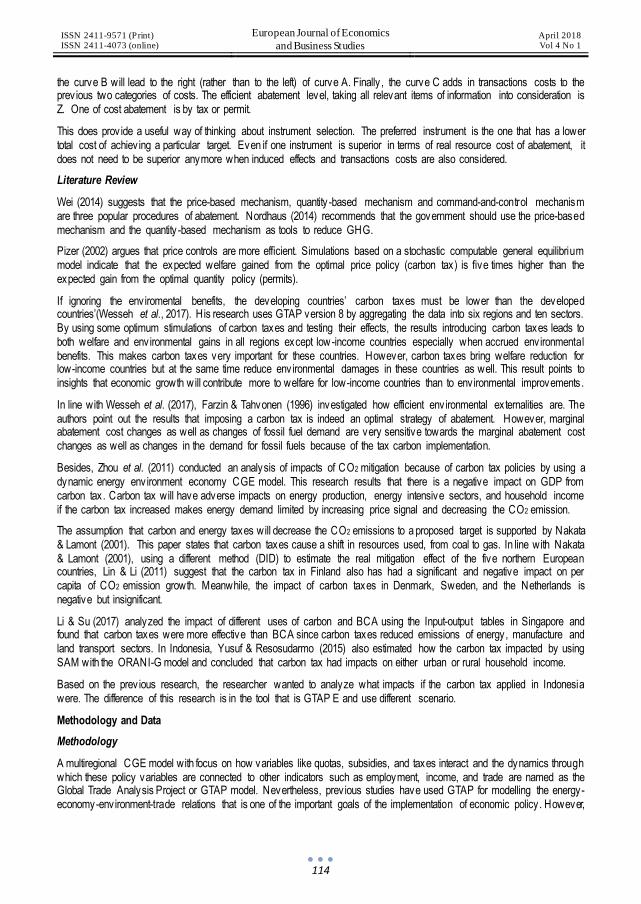
ISSN 2411-9571 (Print) ISSN 2411-4073 (online)
European Journal of Economics
and Business Studies April 2018 Vol 4 No 1
114
the curve B will lead to the right (rather than to the left) of curve A. Finally , the curve C adds in transactions costs to the prev ious two categories of costs. The efficient abatement level, taking all relevant items of information into consideration is Z. One of cost abatement is by tax or permit.
This does prov ide a useful way of thinking about instrument selection. The preferred instrument is the one that has a lower total cost of achiev ing a particular target. Even if one instrument is superior in terms of real resource cost of abatement, it does not need to be superior anymore when induced effects and transactions costs are also considered.
Literature Review
Wei (2014) suggests that the price-based mechanism, quantity -based mechanism and command-and-control mechanism are three popular procedures of abatement. Nordhaus (2014) recommends that the government should use the price-based mechanism and the quantity -based mechanism as tools to reduce GHG.
Pizer (2002) argues that price controls are more efficient. Simulations based on a stochastic computable general equilibrium model indicate that the expected welfare gained from the optimal price policy (carbon tax) is five times higher than the expected gain from the optimal quantity policy (permits).
If ignoring the enviromental benefits, the developing countries’ carbon taxes must be lower than the developed countries’(Wesseh et al., 2017). His research uses GTAP version 8 by aggregating the data into six regions and ten sectors. By using some optimum stimulations of carbon taxes and testing their effects, the results introducing carbon taxes leads to both welfare and environmental gains in all regions except low-income countries especially when accrued environmental benefits. This makes carbon taxes very important for these countries. However, carbon taxes bring welfare reduction for low-income countries but at the same time reduce environmental damages in these countries as well. This result points to insights that economic growth will contribute more to welfare for low-income countries than to environmental improvements.
In line with Wesseh et al. (2017), Farzin & Tahvonen (1996) investigated how efficient env ironmental externalities are. The authors point out the results that imposing a carbon tax is indeed an optimal strategy of abatement. However, marginal abatement cost changes as well as changes of fossil fuel demand are very sensitive towards the marginal abatement cost changes as well as changes in the demand for fossil fuels because of the tax carbon implementation.
Besides, Zhou et al. (2011) conducted an analysis of impacts of CO2 mitigation because of carbon tax policies by using a dynamic energy environment economy CGE model. This research results that there is a negative impact on GDP from carbon tax. Carbon tax will have adverse impacts on energy production, energy intensive sectors, and household income if the carbon tax increased makes energy demand limited by increasing price signal and decreasing the CO2 emission.
The assumption that carbon and energy taxes will decrease the CO2 emissions to a proposed target is supported by Nakata & Lamont (2001). This paper states that carbon taxes cause a shift in resources used, from coal to gas. In line with Nakata & Lamont (2001), using a different method (DID) to estimate the real mitigation effect of the five northern European countries, Lin & Li (2011) suggest that the carbon tax in Finland also has had a significant and negative impact on per capita of CO2 emission growth. Meanwhile, the impact of carbon taxes in Denmark, Sweden, and the Netherlands is negative but insignificant.
Li & Su (2017) analyzed the impact of different uses of carbon and BCA using the Input-output tables in Singapore and found that carbon taxes were more effective than BCA since carbon taxes reduced emissions of energy, manufacture and land transport sectors. In Indonesia, Yusuf & Resosudarmo (2015) also estimated how the carbon tax impacted by using SAM with the ORANI-G model and concluded that carbon tax had impacts on either urban or rural household income.
Based on the prev ious research, the researcher wanted to analyze what impacts if the carbon tax applied in Indonesia were. The difference of this research is in the tool that is GTAP E and use different scenario.
Methodology and Data
Methodology
A multiregional CGE model with focus on how variables like quotas, subsidies, and taxes interact and the dynamics through which these policy variables are connected to other indicators such as employment, income, and trade are named as the Global Trade Analysis Project or GTAP model. Nevertheless, prev ious studies have used GTAP for modelling the energy-economy-environment-trade relations that is one of the important goals of the implementation of economic policy. However,
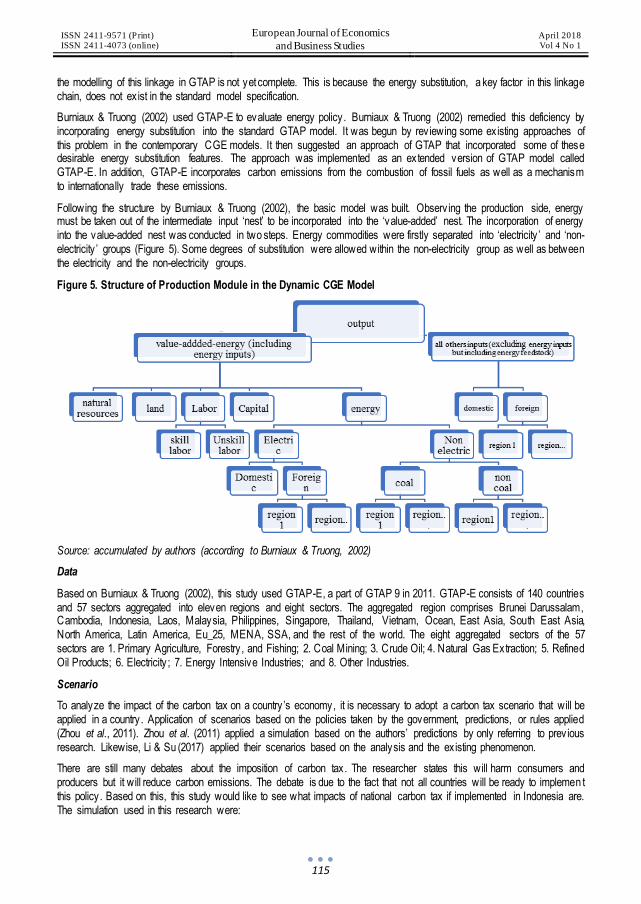
ISSN 2411-9571 (Print) ISSN 2411-4073 (online)
European Journal of Economics
and Business Studies April 2018 Vol 4 No 1
115
the modelling of this linkage in GTAP is not yet complete. This is because the energy substitution, a key factor in this linkage chain, does not ex ist in the standard model specification.
Burniaux & Truong (2002) used GTAP-E to evaluate energy policy. Burniaux & Truong (2002) remedied this deficiency by incorporating energy substitution into the standard GTAP model. It was begun by rev iewing some ex isting approaches of this problem in the contemporary CGE models. It then suggested an approach of GTAP that incorporated some of these desirable energy substitution features. The approach was implemented as an extended version of GTAP model called GTAP-E. In addition, GTAP-E incorporates carbon emissions from the combustion of fossil fuels as well as a mechanism to internationally trade these emissions.
Following the structure by Burniaux & Truong (2002), the basic model was built. Observ ing the production side, energy must be taken out of the intermediate input ‘nest’ to be incorporated into the ‘value-added’ nest. The incorporation of energy into the value-added nest was conducted in two steps. Energy commodities were firstly separated into ‘electricity ’ and ‘non-electricity ’ groups (Figure 5). Some degrees of substitution were allowed within the non-electricity group as well as between the electricity and the non-electricity groups.
Figure 5. Structure of Production Module in the Dynamic CGE Model
Source: accumulated by authors (according to Burniaux & Truong, 2002)
Data
Based on Burniaux & Truong (2002), this study used GTAP-E, a part of GTAP 9 in 2011. GTAP-E consists of 140 countries and 57 sectors aggregated into eleven regions and eight sectors. The aggregated region comprises Brunei Darussalam, Cambodia, Indonesia, Laos, Malaysia, Philippines, Singapore, Thailand, Vietnam, Ocean, East Asia, South East Asia, North America, Latin America, Eu_25, MENA, SSA, and the rest of the world. The eight aggregated sectors of the 57 sectors are 1. Primary Agriculture, Forestry , and Fishing; 2. Coal Mining; 3. Crude Oil; 4. Natural Gas Extraction; 5. Refined Oil Products; 6. Electricity ; 7. Energy Intensive Industries; and 8. Other Industries.
Scenario
To analyze the impact of the carbon tax on a country ’s economy, it is necessary to adopt a carbon tax scenario that will be applied in a country . Application of scenarios based on the policies taken by the government, predictions, or rules applied (Zhou et al., 2011). Zhou et al. (2011) applied a simulation based on the authors’ predictions by only referring to prev ious research. Likewise, Li & Su (2017) applied their scenarios based on the analysis and the ex isting phenomenon.
There are still many debates about the imposition of carbon tax. The researcher states this will harm consumers and producers but it will reduce carbon emissions. The debate is due to the fact that not all countries will be ready to implemen t this policy. Based on this, this study would like to see what impacts of national carbon tax if implemented in Indonesia are. The simulation used in this research were:

ISSN 2411-9571 (Print) ISSN 2411-4073 (online)
European Journal of Economics
and Business Studies April 2018 Vol 4 No 1
116
Scenario one (SIM 1): Carbon tax of US $20 per ton for CO2
Scenario two (SIM 2): Carbon tax of S $10 (US $7,478) per ton of CO2
Scenario three (SIM 3): Carbon tax of 100 rupees (US $1.06) per ton of CO2
Scenario one was based on the use of Chinese carbon tax (ministry of China). Since China is the world’s largest of population and the first country to apply the carbon tax in Asia, the authors assumed that this might be applicable in Indonesia because of the similarity of features. The second scenario followed the tax implications that Singapore’s state (SU $10/tCO2) applies. This simulation was used because Singapore is the only ASEAN country that implements carbon tax. Indonesia applies the same amount of assumptions as neighboring countries whose aim is to reduce emissions. Finally , India implements a carbon tax of 100 rupees (US $1.06) per ton of CO2. This simulation was used by considering the facts that Indonesia and India are in the top five countries with the largest population and that they both are developing countries.
The author would see the effect change in values of GDP, GDP Quantity Index, Government and Private Household Demands for Commodity in Indonesia and CO2 emission because of carbon tax in different scenarios.
Result and Discussions
Result
Table 1. Impacts of Carbon Tax on Changes of Values of GDP in Nineteen Regions
Table 1 shows the impact of using the Indonesian carbon tax scenario on the change of value of GDP in the aggregated nineteen regions by observ ing how the percentage changes from the baseline to the new shock/equilibrium. It is observed that Indonesia itself has the greatest impact due to the implementation of carbon tax. When apply ing a carbon tax of US $ 20/tCO2 (SIM1), the change of value of GDP to the baseline is -0.07 meaning that the decline of GDP value is 0.07% . In the second scenario, there is a decrease in GDP by 0.02% but not as big as the implementation of the carbon tax in the scenario one. In contrast, the use of carbon taxes of US $ 1.06 (100 rupee)/tCO2 GDP makes all regions not change the GDP. In the scenario one, the impact of Indonesia’s carbon tax on scenario one and two brings advantages on the GDP values of Cambodia, Laos, Philippines, Thailand, East Asia, other SE Asia, South America, North America, Latin America, Eu_25, and MENA; while Brunei Darussalam, Vietnam, and MENA have a decreased value of GDP. Other regions do not change.
Table 2. Impacts of Carbon Tax on the GDP Quantity Index in Nineteen Regions
qgdp (GDP
Quantity Index) Pre SIM
qgdp (% Change)
Post SIM 1 Post SIM 2 Post SIM 3 SIM 1 SIM 2 SIM 3
Brunei Darussalam
16691.42 16691.313 16691.375 16691.408 -0.001 0 0
Cambodia 12829.56 12829.833 12829.663 12829.58 0.002 0.001 0
Indonesia 845924.6 845497.063 845834.25 845915.063 -0.051 -0.011 -0.001
Laos 8254.104 8254.124 8254.112 8254.106 0 0 0
Malay sia 289259.6 289260.188 289259.719 289259.594 0 0 0
No. Change of Value of GDP
SIM 1
SIM 2
SIM 3 No. Change of Value of GDP
SIM 1 SIM 2
SIM 3
1 Brunei Darussalam -0.05 -0.02 0 11 East Asia 0.02 0.01 0
2 Cambodia 0.02 0.01 0 12 Other SE Asia 0.01 0.01 0
3 Indonesia -0.07 -0.02 -0.001
13 South Asia 0.02 0.01 0
4 Laos 0.01 0 0 14 North America 0.02 0.01 0
5 Malay sia 0 0 0 15 Latin America 0.01 0.01 0
6 Philippines 0.02 0.01 0 16 EU_25 0.02 0.01 0
7 Singapore 0 0 0 17 MENA -0.01 0 0
8 Thailand 0.01 0.01 0 18 SSA 0 0 0
9 Vietnam -0.01 0 0 19 Rest of World 0 0 0
10 Oceania -0.01 -0.01 0

ISSN 2411-9571 (Print) ISSN 2411-4073 (online)
European Journal of Economics
and Business Studies April 2018 Vol 4 No 1
117
Philippines 224095.3 224096.078 224095.578 224095.328 0 0 0
Singapore 274064.7 274064.688 274064.719 274064.719 0 0 0
Thailand 345669.8 345679.438 345673.625 345670.656 0.003 0.001 0
Vietnam 135539.9 135537.219 135538.875 135539.688 -0.002 -0.001 0
Oceania 1595230 1595229.875 1595229.75 1595230.25 0 0 0
East Asia 15203581 15203768 15203654 15203597 0.001 0 0
Other SE Asia 56480.4 56480.414 56480.402 56480.402 0 0 0
South Asia 2305595 2305698.25 2305635 2305603.5 0.004 0.002 0
North America 18490694 18490752 18490716 18490698 0 0 0
Latin America 4770430 4770457.5 4770440.5 4770432.5 0.001 0 0 EU_25 17368588 17368812 17368674 17368606 0.001 0 0
MENA 3988132 3988123.5 3988128.5 3988130.75 0 0 0
SSA 1460651 1460648 1460649.75 1460650.5 0 0 0
Rest of the w orld 4085433 4085339.5 4085392.25 4085423.5 -0.002 -0.001 0
Table 2 illustrates the impact of carbon tax on the GDP Quantity Index in nineteen regions. It appears that the change of GDP Quantity index of Indonesia has the greatest decline. The higher the tax simulation is, the greater the decrease changes. Brunei Darussalam, Vietnam and, the rest of the world have negative impacts on Indonesia’s carbon tax; while Cambodia, Thailand, East Asia, South Asia, Latin America, and Eu_25 have positive impacts for scenario one. In scenario three, the impact of carbon tax of US $1.06/tCO2 on the GDP Quantity Index will only affect Indonesia with the value of -0.001% .
Figure 6. Government Household Demand of Commodity in Indonesia
In Figure 6, it appears that the implementation of the carbon tax at US$20/tCO2 will lead to a decrease in demand of Government Household for coal, gas, electricity , energy , and intensive industries commodities. The agriculture sector, crude oil, refined oil product, and other industries have a positive impact. However, when the carbon tax is lowered (SIM 2 and 3), the government household demand only occurs in the sectors of coal and energy intensive industries that are v isible from the point where the curve is still below the zero point.
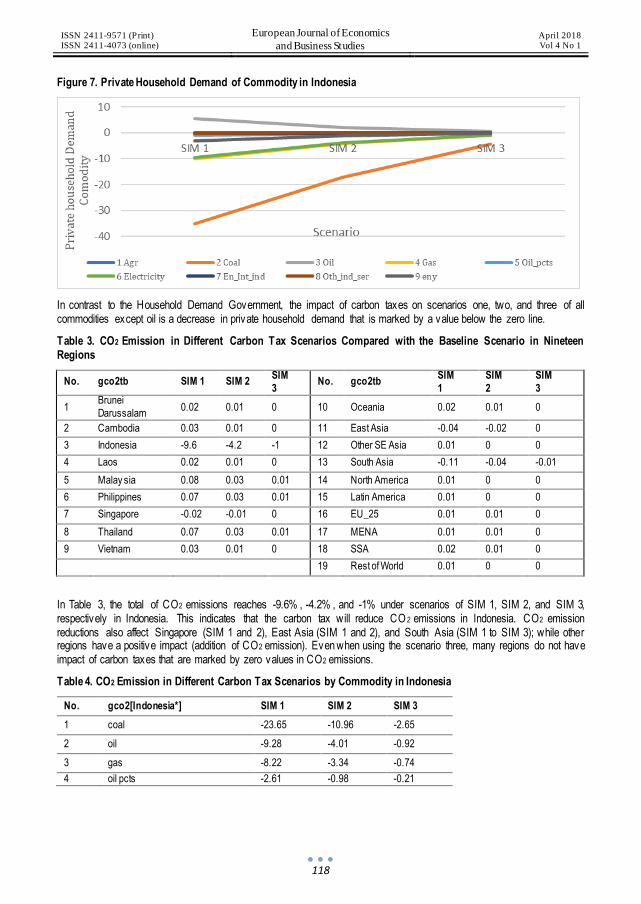
ISSN 2411-9571 (Print) ISSN 2411-4073 (online)
European Journal of Economics
and Business Studies April 2018 Vol 4 No 1
118
Figure 7. Private Household Demand of Commodity in Indonesia
In contrast to the Household Demand Government, the impact of carbon taxes on scenarios one, two, and three of all commodities except oil is a decrease in private household demand that is marked by a value below the zero line.
Table 3. CO2 Emission in Different Carbon Tax Scenarios Compared with the Baseline Scenario in Nineteen Regions
No. gco2tb SIM 1 SIM 2 SIM
3 No. gco2tb
SIM
1
SIM
2
SIM
3
1 Brunei
Darussalam 0.02 0.01 0 10 Oceania 0.02 0.01 0
2 Cambodia 0.03 0.01 0 11 East Asia -0.04 -0.02 0
3 Indonesia -9.6 -4.2 -1 12 Other SE Asia 0.01 0 0
4 Laos 0.02 0.01 0 13 South Asia -0.11 -0.04 -0.01
5 Malay sia 0.08 0.03 0.01 14 North America 0.01 0 0
6 Philippines 0.07 0.03 0.01 15 Latin America 0.01 0 0
7 Singapore -0.02 -0.01 0 16 EU_25 0.01 0.01 0
8 Thailand 0.07 0.03 0.01 17 MENA 0.01 0.01 0
9 Vietnam 0.03 0.01 0 18 SSA 0.02 0.01 0
19 Rest of World 0.01 0 0
In Table 3, the total of CO2 emissions reaches -9.6% , -4.2% , and -1% under scenarios of SIM 1, SIM 2, and SIM 3, respectively in Indonesia. This indicates that the carbon tax will reduce CO2 emissions in Indonesia. CO2 emission reductions also affect Singapore (SIM 1 and 2), East Asia (SIM 1 and 2), and South Asia (SIM 1 to SIM 3); while other regions have a positive impact (addition of CO2 emission). Even when using the scenario three, many regions do not have impact of carbon taxes that are marked by zero values in CO2 emissions.
Table 4. CO2 Emission in Different Carbon Tax Scenarios by Commodity in Indonesia
No. gco2[Indonesia*] SIM 1 SIM 2 SIM 3
1 coal -23.65 -10.96 -2.65
2 oil -9.28 -4.01 -0.92
3 gas -8.22 -3.34 -0.74
4 oil pcts -2.61 -0.98 -0.21

ISSN 2411-9571 (Print) ISSN 2411-4073 (online)
European Journal of Economics
and Business Studies April 2018 Vol 4 No 1
119
From the perspective of Indonesia’s commodity side (Table 4), the biggest reduction of CO2 emissions is coal with the values of -23.65% , -10.96, -2.65% , respectively at SIM 1, 2, and 3. Furthermore, the highest impact of carbon tax is on coal products followed by oil and gas products, respectively ; while the lowest impact of carbon tax is on refined oil products (dampak pajak karbon tertinggi adalah pada coal produk yang kemudian diikuti oleh oil and gas products, sedangkan dampak pajak karbon terendah adalah pada refined oil products). Higher carbon tax will reduce CO2 emissions in Indonesia.
Discussion
Table 1 and 2 show that the impact of a carbon tax in Indonesia will reduce GDP of the country itself and may also affect other countries. This study is equivalent to research conducted by Zhou et al. (2011) using GTAP 6 indicating that the use of carbon tax in China will reduce the value of GDP. Similar results are also obtained by Calderón et al. (2016) arguing that CO2 mitigation policy will reduce GDP and the domestic consumption. The decline of GDP is due to the amount of tax paid by producers that will increase the price of commodities. The increase of prices will lead to low purchasing power that will adversely affect the economy.
Figure 6 and 7 show the demands of government and private households are against carbon tax policies in Indonesia. It turns out that the negative impact of carbon tax more affects the private household that is indicated by all commodities except crude oil that has decreasing demand from the baseline scenario (no tax). While in the government household, the agriculture sector, crude oil, refined oil product, and other industries have a positive impact. This is caused by the amount of income received by the government will be allocated to agriculture and other sectors as an effort to handle emission reduction. One of the efforts that can be done is the search of new renewable natural resources. It will boost the demand of this sector. A decrease in the demand of private side is also shown by the research of Zhou et al. (2011).
From the environmental side, if the carbon tax in Indonesia is implemented in accordance with the above simulation, then it appears that carbon emissions can reduce emissions of CO2. A carbon tax of 20USD/tCO2 will be able to reduce CO2 emissions by -9.6% meaning that when government policies want to reduce emissions to 29% , higher carbon taxes are required. However, that carbon taxes will also lower demand and GDP should also be noted. Moreover, if v iewed from the commodity side, the coal commodity with the use of the carbon tax scenario one is nearing the ideals of Indonesia in the CO2 emissions BAU. The carbon emission decreasing because of carbon tax is also indicated by the research of Calderón et al., (2016); Li & Su, (2017); Lin & Li, (2011); Nakata & Lamont, (2001); Yusuf & Resosudarmo, (2015); and Zhou et al., (2011).
Conclusion
As one of the CO2 mitigation methods, carbon tax can reduce energy use, improve energy efficiency, and simultaneously promote the development of renewable energy. Of course, carbon tax also has its defects. For example, it would slow down the economic growth, decrease social welfares, damage the competitiveness of related industries, and lead to carbon leakage. Therefore, scientific and rational carbon taxation is crucial for countries that implement carbon tax.
Motivated by the controversial issue of real mitigation effect of carbon taxed and CO2 emissions of East Asia and Pacific continents including Indonesia that increase every year (Indonesia is the 15th largest emitter in the world), the researcher analyzed the impact of GDP, government household demand, private household demand, and CO2 emission reductions in Indonesia if carbon tax is applied in Indonesia under different carbon tax policies by using a dynamic energy environment economy CGE model with GTAP-E.
Both GDP and GDP index have a negative impact due to the carbon tax of US $ 20/tCO2, US $ I0/tCO2, and $ 1.60/tCO2. The greater the application of the carbon tax is, the greater the decrease of the value of GDP.
The demand of governments and private household is against carbon tax policies in Indonesia. It turns out that the negativ e impact of carbon tax affects private households more that is indicated by all commodities except crude oil that has decreasing demand of baseline scenario (no tax). In the government household, agriculture sector, crude oil, refined oil product, and other industries have a positive impact.
From the environmental side, if the carbon tax in Indonesia is implemented in accordance with the above simulation, then it appears that carbon tax can reduce emissions of CO2.

ISSN 2411-9571 (Print) ISSN 2411-4073 (online)
European Journal of Economics
and Business Studies April 2018 Vol 4 No 1
120
Acknowledgments
I would like to thank to Indonesia Endowment Fund for Education of (LPDP) Ministry of Finance of the Republic of Indonesia for supporting the author by scholarship. I am so grateful as well to Prof. Tri Widodo, M.Ec.Dev., Ph.D for giv ing and always encouraging the author to accomplish this project. My best gratitude for my parents, Darmizal and Ermayetty ; my grandmother; my brothers, thanks for your pray ing; and the last but not least, all my friends, Devi, Alia, Ade, Jum, Rini, and Ramlah for being together during working on and finishing this paper.
References
[1] Abdullah, S., & Morley, B. (2014). Environmental taxes and economic growth: Ev idence from panel causality tests. Energy Economics, 42, 27–33.
[2] Burniaux, J.-M., & Truong, T. P. (2002). GTAP-E: an energy-environmental version of the GTAP model. GTAP Technical Papers, (16), 1–61. 3
[3] Calderón, S., Alvarez, A. C., Loboguerrero, A. M., Arango, S., Calv in, K., Kober, T., … Fisher-Vanden, K. (2016). Achiev ing CO 2 reductions in Colombia: Effects of carbon taxes and abatement targets. Energy Economics, 56, 575–586.
[4] Farzin, Y. H., & Tahvonen, O. (1996). Global carbon cycle and optimal time path for the carbon tax. Oxford Economic Papers, 48(4), 513–536.
[5] Hasudungan, V. W. H. (2016). The Impact of Implementing Carbon Tax and Feed-in Tariff: A CGE Analysis of the Indonesian Cas.
[6] Li, Y., & Su, B. (2017). The impacts of carbon pricing on coastal megacities: A CGE analysis of Singapore. Journal of Cleaner Production, 165, 1239–1248.
[7] Lin, B., & Li, X. (2011). The effect of carbon tax on per capita CO2 emissions. Energy Policy, 39(9), 5137–5146. [8] Nakata, T., & Lamont, A. (2001). Analysis of the impacts of carbon taxes on energy systems in Japan. Energy
Policy, 29(2), 159–166. [9] Nordhaus, W. D. (2014). After Kyoto : Alternative Mechanisms to Control Global Warming. The American
Economic Review, 96(2), 31–34. [10] Perman, R., Ma, Y., McGilvray.J, Common., M. (2003). Natural Resource and Enviromental Econoics
3editionth. Perason, London [11] Pizer, W. A. (2002). Combining price and quantity controls to mitigate global climate change. Journal of Public
Economics, 85(3), 409–434. [12] Resosudarmo, B. P. (2003). Computable General Equilibrium Model on Air Pollution Abatement Policies with
Indonesia as a Case Study. Economic Record, 79(SpecialIssue), S63–S73. [13] Wei, Y. (2014). Ceep-Bit Working Paper Series Climate policy modeling : An online SCI-E and SSCI based
literature rev iew Zhimin Huang Beijing Institute of Technology. [14] Wesseh, P. K., Lin, B., & Atsagli, P. (2017). Carbon taxes, industrial production, welfare and the environment.
Energy, 123, 305–313. [15] Yusuf, A. A., & Resosudarmo, B. P. (2015). On the distributional impact of a carbon tax in developing countries:
the case of Indonesia. Environmental Economics and Policy Studies, 17(1), 131–156. [16] Zhou, S., Shi, M., Li, N., & Yuan, Y. (2011). Impacts of Carbon Tax Policy on CO2 Mitigation and Economic
Growth in China. Advances in Climate Change Research, 2(3), 124–133.

ISSN 2411-9571 (Print) ISSN 2411-4073 (online)
European Journal of Economics
and Business Studies April 2018 Vol 4 No 1
121
DOI: 10.26417/ejes.v4i1.p121-133
Open Access. © 2018 Sejdi Rexhepi and Mjellma Kadriu. This is an open access article licensed under the
Creative Commons Attribution-NonCommercial-NoDerivs 4.0 License
The Importance of Resource Assessment for Entrepreneurship and Local Economic Development in Kosovo
Sejdi Rexhepi
Prof. Dr., Faculty of Philosophy, Departament of Political Science, University of Prishtina
Mjellma Kadriu
Msc, Faculty of Philosophy, Departament of Political Science, University of Prishtina
Abstract
Kosovo is an underdevelopment country that faces challenges such as poverty , large numbers of unemployment people, and slow economic development. Faced with this fact, country is estimated to be rich in considerable natural resources as well as a relatively young population. Therefore, knowledge and assessment of resources is an important prerequisite for their valorization in function of faster economic development. In underdeveloped countries such as Kosovo, there are not enough professional institutions that prov ide reliable data on available national resources and their comparative advantages. In these circumstances entrepreneurship and economic development are closely related to entrepreneurial courage and the overall perception for resources and market trends. Entrepreneurship is a basic prerequisite for activating resources. This is particularly the case in underdeveloped localities with high degree of unemployment. For this purpose, indiv idual knowledge is very important to undertake activ ities that would be successfully concluded. In this research an effort will be made to explain the importance of knowing and evaluating local resources for entrepreneurship and local economic development. In particular, the role of civ il and business perceptions will be explained and interpreted with proper statistical methods in order to bring professional and scientific conclusions.
Keywords: resource assessment, local economic development, human and natural resources, entrepreneurship
Introduction
Entrepreneurship in underdeveloped countries, especially in countries that have did not close the transition process from the state-run economy to the economy based on market laws (as is Kosovo), is accompanied with insecurity and lack of courage as a result of lack experience and sufficient informations, for market demand and competition, as well as lack of sufficient information on available local resources and comparative advantages to which local economic development can be sustained.
Entrepreneurship is an important factor and we can even say that it is a basic precondition for activating available resources. This is particularly in the case of underdeveloped localities with a high degree of unemployment. For this purpose, indiv idua l knowledge is very important factor to undertake activ ities that would be successfully concluded. But that is insufficient to surv ive within a global competition that has included every segment of economic life.
Identify ing of development opportunities, namely the available resources and the comparative advantages that the locality has is very important for any entrepreneurial initiative. Personal knowledges is key to take entrepreneurial action, but they are insufficient to undertake successful actions, particularly in the context of global competition, where small businesses need to be very creative to maintain their ex isting market position, and to take benefits of the advantages that the locality and its resources available offers.

ISSN 2411-9571 (Print) ISSN 2411-4073 (online)
European Journal of Economics
and Business Studies April 2018 Vol 4 No 1
122
Entrepreneurship identifies development opportunities, but for this purpose, financial resources are also necesary, as well as qualified human resources, that are capable for assessing the ex isting situation and predicting the future. In underdeveloped and in transition countries, entrepreneurs in most cases do not even have enough experience and knowledge, as well as sufficient financial resources, so they don't have courage and entrepreneurial security . They therefore take certain entrepreneurial actions with excessive care, and often in the hope of support from the state, in particular to avoid risk and uncertainty in the market.
Therefore, these countries should evaluate their material and human potentials as well as comparative advantages, in order to help potential entrepreneurs to benefit from their creativ ity to take advantage offered by the locality as are natural sources, labor and other dependable costs such as transport costs, renewable energy sources, market, etc.
Based on what we said above, and as result of many limiting factors, these research emphasize the importance that have subjective knowledge and perception for the resources that the locality has abundant, and which active entrepreneurs hip can use comparative advantages in function of creating new businesses and developing ex isting ones. This aspect has been examined from the perspective of the subjective perception of the ordinary citizen, respectively by the experience of the businesses and partly the perception created by the information produced by the general business environment. In this way, the citizen's perceptions about development policies have been evaluated in order to understand if they more expect by their private initiative, the role of the state, or the combined public-private partnership.
Uncertainty in the market and the lack of sufficient experience (being a new economy) has made that this research give a special emphasis to the subjective perception of the role that the state should have in promoting entrepreneurship and their support, and in particular informing entrepreneurs about the size and value of natural and human resources available, as well as promoting ideas and supporting new and ex isting businesses.
The work consists of three main parts. In the first and the second part, the theoretical issues related to entrepreneurs hip and local economic development has been elaborated. The third part focuses on the core of research: Entrepreneurship and Local Economic Development in Kosovo. Initially , the general situation of the economy was presented, and in particular the issues related to entrepreneurship, labor and economic development. Then the analysis and interpretation of collected data through questioners has been done. The data have been elaborated with adequate statistical methods that have led to the drawing up of a scientific and professional conclusion.
Introduction to the Concept of Entrepreneurship
Entrepreneur and entrepreneurship as an activ ity is old as human activ ities itself. However, the contemporary meaning of these concepts has been given by Schumpeter who is rightly considered as a creator of entrepreneurship as a field of scientific study. He defined entrepreneur as a person who creates innovations by doing things differently . “Schumpeter defined entrepreneurs as innovators who take advantage of change, including: (i) the introduction of a new (or improved) good; (ii) the introduction of a new method of production; (iii) the opening of a new market; (iv ) the exploitation of a new source of supply ; and (v) the re-engineering/organization of business management processes. Schumpeter’s definition therefore equates entrepreneurship with innovation in the business sense; that is identify ing market opportunities and using innovative approaches to exploit them.”1 “Joseph Schumpeter pointed out a century ago that entrepreneurs are often innovators, bringing new goods and technologies to markets, opening up new markets, processes, and ideas, and commercializing new knowledge. But, it is often mistakenly suggested that innovation by entrepreneurs is less important for growth in low-income developing countries than in more advanced economies.” 2
Schumpeter's definition of entrepreneur is base almost all of the definitions that we find from different authors and institutions. Thus for example, according to OECD “Entrepreneurs are those persons (business owners) who seek to generate value, through the creation or expansion of economic activ ity , by identify ing and exploiting new products, processes or markets.”3
1 Ahmad, N. and Seymour, Richard G., (2008), Defining Entrepreneurial Activity: Definitions Supporting Frameworks for Data Collection OECD Statistics Working Paper, Organisation for Economic Co-operation and Development, p.8., http://w ww.oecd.org/officialdocuments/publicdisplaydocumentpdf/?doclanguage=en&cote=std/doc(2008)1 2 Szirmai, A., Naudé, W., and Goedhuys, M., Entrepreneurship, Innovation, and Economic Development: An Overview, p.3; http://i.unu.edu/media/unu.edu/publication/12592/chapter-1.pdf 3 Ahmad, N. and Seymour, Richard G., (2008), Defining Entrepreneurial Activity: Definitions Supporting Frameworks for Data Collection OECD Statistics Working Paper, Organization for Economic Co-operation and Development, p.14.,
http://w ww.oecd.org/officialdocuments/publicdisplaydocumentpdf/?doclanguage=en&cote=std/doc(2008)1

ISSN 2411-9571 (Print) ISSN 2411-4073 (online)
European Journal of Economics
and Business Studies April 2018 Vol 4 No 1
123
The Global Entrepreneurship Monitor gives a similar definition. He sees the entrepreneur as an attempt to create something new from a business, a self-employed or a business organization. “Any attempt at new business or new venture creation, such as self-employment, a new business organization, or the ex pansion of an ex isting business, by an indiv idual, a team of indiv iduals, or an established business.”1
In the United States, for instance, the entrepreneur is often defined as one who starts his own, new and small business2, and according to Oxford dictionary entrepreneur is “a person who sets up a business or businesses, taking on financial risks in the hope of profit.”3
Entrepreneurship and local economic development
Entrepreneur activ ity and entrepreneurship are closely linked with the entrepreneur itself, creative and courageous man who carries out activ ities to transform his ideas into processes, products, or new values. As defined by the OECD “Entrepreneurial activ ity is the enterprising human action in pursuit of the generation of value, through the creation or expansion of economic activ ity , by identify ing and exploiting new products, processes or markets. Entrepreneurship is the phenomenon associated with entrepreneurial activ ity .”4 Entrepreneurship is a fundamental driver of economic evolution. Entrepreneurs can be seen as the key actors to optimally benefit from new unexpected opportunities.” 5
Through its active courage, the entrepreneur allocates resources where he thinks they will be used in the most productiv e way. Or as economist J.B.Say had said before 200 years, he “shifts economic resources out of an area of lower and into an area of higher productiv ity and greater y ield.”6
It is worth mentioning the opinion of the Austrian School which, speaking of entrepreneurship, pay particular attention to the role of the institutions in the economy, emphasizing that they have a fundamental role to make entrepreneurial actions to take place as they affect the allocation of entrepreneurial talent. In this way they emphasize that entrepreneurship as a process is unevenly distributed among the countries, so “...,thus an important explanation of the uneven economic development of regions and nations.7
As Krugman observes, the location is a determining factor of development with the advantages it offers, whether it's resources, transport-related costs, market prox imity , and so on. Entrepreneurs are the motor forces that put these advantages in the function of economic development. The role of entrepreneurs is particularly important in underdeveloped countries where small businesses are the main prov iders of employment and development. “Entrepreneurs in low-income developing countries prov ide innovations that are important for firm and country growth, even if they are incremental in nature. Innovation in developing countries involves the process by which firms master and implement the design and production of goods and serv ices that are new to them.8
Recognizing the importance of entrepreneurship in economic development and in order to assist policymakers, UNCTAD has developed the Entrepreneurship Policy Framework in 2012, resolution on Entrepreneurship for Development in 2014, and in the year 2015 work paper Promoting Entrepreneurship for Development, where it emphasized the importance of entrepreneurship in the context of the sustainable development goals – by creating jobs and driv ing economic growth and innovation, improv ing social conditions and helping address environmental challenges9. “UNCTAD recognize the fact that
1 Cited by Bjorv atn, K., (2015), Youth-entrepreneurship-and-development.pdf, p. 15, https://www.oecd.org/derec/sweden 2 Drucker, P. F., Innovation and Entrepreneurship, p. 21; http://w ww.untagsmd.ac.id/files/Perpustakaan_Digital_1/ENTREPRENEURSHIP%20Innovation%20and%20entrepreneurship.PDF 3 https://en.oxforddictionaries.com/definition/entrepreneur 4 Ahmad, N. and Seymour, Richard G., (2008), Defining Entrepreneurial Activity: Definitions Supporting Frameworks for Data Collection OECD Statistics Working Paper, Organisation for Economic Co-operation and Development, p.14., http://w ww.oecd.org/officialdocuments/publicdisplaydocumentpdf/?doclanguage=en&cote=std/doc(2008)1 5 Stam, E. and Lambooy, Jan., (2012), Entrepreneurship, Knowledge, Space, and Place: Evolutionary Economic Geography meets
Austrian Economics, p.8; https://www.uu.nl/sites/default/files/rebo_use_dp_2012_12-11.pdf 6Drucker ,Peter F., Innovation and Entrepreneurship, p. 21., http://w ww.untagsmd.ac.id/files/Perpustakaan_Digital_1/ENTREPRENEURSHIP%20Innovation%20and%20entrepreneurship.PDF 7 Stam, E. and Lambooy, Jan., (2012), Entrepreneurship, Knowledge, Space, and Place: Evolutionary Economic Geography meets
Austrian Economics, p. 8, 2012; https://www.uu.nl/sites/default/files/rebo_use_dp_2012_12-11.pdf 8 Szirmai, A., Naudé, W., and Goedhuys, M., (2011), Entrepreneurship, Innovation, and Economic Development: An Overview, p. 26; http://i.unu.edu/media/unu.edu/publication/12592/chapter-1.pdf 9 United Nations Conference on Trade and Development, (2015), Promoting entrepreneurship for development, p.2,
http://unctad.org/meetings/en/SessionalDocuments/ciid29_en.pdf

ISSN 2411-9571 (Print) ISSN 2411-4073 (online)
European Journal of Economics
and Business Studies April 2018 Vol 4 No 1
124
entrepreneurship can make a critical contribution towards attaining the sustainable development goals of the post-2015 development agenda, including poverty eradication, empowerment of youth and women and other disadvantaged groups, and full and productive employment for all. It can also help tackle environmental challenges. This will require supporting the evolution towards a new generation of entrepreneurs and entrepreneurship policymakers with a v ision and joint commitment to promote entrepreneurship for sustainable development.” 1.
Entrepreneurship is guided by different objectives. Some scholars argue that the ultimate goal for entrepreneurship is to create wealth2. However, it is “widely believed that entrepreneurship is beneficial for economic growth and development” and “the entrepreneurship has been remarkably resurgent over the past three decades in countries that achieved substantial poverty reduction, and donors and international development agencies have turned to entrepreneurship to improve the effectiveness and sustainability of aid.”3
Entrepreneurship and economic development are closely linked. We can even say that local economic development is closely related to the activation of local resources through entrepreneurship. According to World Bank “The purpose of local economic development (LED) is to build up the economic capacity of a local area to improve its economic future and the quality of life for all. It is a process by which public, business and nongovernmental sector partners work collectively to create better conditions for economic growth and employment generation.”4
For the economic development, one particular consideration has the evaluation of resources to determine the relative advantages of the locality for holding the ex isting businesses and attracting new businesses. A special role in this directio n has the local government in drafting local public policies and supporting the entrepreneurial activ ity through material, informative or financial support. There are even many authors who think that the municipal government is the main responsible for local economic development. For these purpose, assessing and recognizing resources is a necessary precondition for all participant in the developing. Recognizing the resources and designing strategies for their use is a much-needed input of any other entrepreneurial activ ity .
No matter which economic development model will be applied knowledge and assessment of available resources is essential for entrepreneurship and development. Over the past several decades development local and regional development policies have been oriented towards employment growth and job diversity , developing the economic base of communities, managing local assets to increase the factors that promote the location and the developing of intensive information industry .5 Location Incentives are targeted toward specific firms to encourage them to move to a community , or occasionally to expand their operations. “Commonly given initiatives include tax credits, abatements, or rebates as well as free or reduced-cost land. An alternative form is public infrastructure that is built (or tailored) to the needs of a new business.”6
Traditionally , most local economic development models revolve around the creation and retention of jobs. So, for example, the export-base/primary-jobs model, which is very popular with economic development practitioners, stems from the requirement to local governments for prov iding specific conditions (initiatives) to promote the arrival of firms or industries in certain area.”7
Economic Base Theory sees the economic system made up of the non-basic part that is produced for local consumption; and the other called basic, which produce goods and serv ices primarily for export.8 This theory departs from the assumption that the basis of the development of a locality or region are businesses and industries that produce goods and serv ices that are dedicated to the outside market, which then indirectly affect the development of businesses and non-basic sectors as
1 Ibid, p.18 2 Szirmai, A., Naudé, W., and Goedhuys, M., ((2011), Entrepreneurship, Innovation, and Economic Development: An Overview, p. 19; http://i.unu.edu/media/unu.edu/publication/12592/chapter-1.pdf 3 Naudé, W., (2013), Entrepreneurship and Economic Development: Theory, Evidence and Policy, p. 4; http://ftp.iza.org/dp7507.pdf 4http://w eb.worldbank.org/WBSITE/EXTERNAL/TOPICS/EXTURBANDEVELOPMENT/EXTLED/0,,contentMDK:20185186~menuPK:399161~pagePK:148956~piPK:216618~theSitePK:341139,00.html 5 Stimson, J. R., Stough, R. R.,. Roberts, H. B., (2006), Regional Economic Development, Analysis and Planing Straategy, Springer, p.55 6 Greenw ood , Daphne T., and Holt , Richard P.F., ((2010); Local Economic development in the 21st Century, Quality of Life and Sustainability , M.E. Sharpe, London, p.15-16. 7 Ibid, p.15. 8 Stimson, J. R., Stough, R. R.,. Roberts, H. B., (2006), Regional Economic Development, Analysis and Planing Straategy, Springer,
p.106.

ISSN 2411-9571 (Print) ISSN 2411-4073 (online)
European Journal of Economics
and Business Studies April 2018 Vol 4 No 1
125
well. However, there are opinions that the economic base model is not a sufficient answer to how a local economy should develop. The development models are also linked to the projected development goals, the two most important being creating more jobs and increasing per capita income. In reality , economic development means more than creating jobs; it also means creating jobs that are paid enough for a decent standard of liv ing.1
Location incentives are targeted toward specific firms to encourage them to move to a community , or occasionally to expand their operations. “Commonly given initiatives include tax credits, abatements, or rebates as well as free or reduced-cost land. An alternative form is public infrastructure that is built (or tailored) to the needs of a new business” 2
Traditionally , it is considered that the good business climate is important for attracting and retaining ex isting businesses, creating jobs and wealth. Indeed, there are various indices that express the terms of doing business, such as the Economic Freedom Index which shows a liberal political trend as they are focused on businesses, or the State Competiveness Index is another well-known index measure which assesses each state in terms of "the policies and conditions that ensure and sustain a high level of per capita income and its continued growth."3
Entrepreneurship and Local economic Development in Kosovo
a) General data
Kosovo is a small country that lies in the Western Balkans. As a new state, it has inherited a plundered economy and destroyed by the war caused by Serbia with the dissolution of the former Yugoslav ia. Leaving out of a system of socialis t economy, the transformation of the economy is faced with various problems known as transition problems from the socialis t to the capitalist economy. Almost all sectors of the economy were at the "infant stage" of development in relation to the region as well, which resulted with high trade deficit, where, after 17 years, only about 11% of imports are covered by exports4.
Adoption of the laws of the market economy, without a sufficiently active state role in the economy in regulation and superv ision, has made more developed in stihic way than under a well-planned plan. On the other hand, the fiscal policy was mainly in the function of filling the state budget, and monetary policy almost did not ex ist at all since the state of Kosovo uses the euro as a currency for the exchange of goods and serv ices. On the other hand, the financial system as a result of inherited circumstances, including the fact that "The judicial system suffers from poor access, inefficiencies and delays5, has resulted for years with average high interest rates (those in the year 2014 dropped to 9.3% and in 2015 to 7.7% )6 which could have been an obstacle to development, mainly reflected through informal business which in 2017 was estimated to be 32% of the overall business activ ity 7 to escape fees and taxes as a way to ex ist but also to neutralize the very high interest rates. Doubts about collusion among banks have consistently ex isted, although the same have never been officially proven.
The administration of the new state, which has been confronted with a large number of other political and economic problems, has been in a difficult position in exercising its role in accordance with the principles of free market economy.
Kosovo is considered to be very rich with underground resources, arable land as well as with a young workforce. However, the country continues to be poor. Although the per capita income from 2000 to 2016 has tripled from $ 1,088 to $ 3,641, it remains the poorest third country in Europe8, while resources continue to be used inefficiently , due to the fact that natural
1Greenw ood , Daphne T., and Holt , Richard P.F., ((2010); Local Economic development in the 21st Century, Quality of Life and
Sustainability , M.E. Sharpe, London, p.15-16. 2 Greenw ood , Daphne T., and Holt , Richard P.F., ((2010); Local Economic development in the 21st Century, Quality of Life and Sustainability , M.E. Sharpe, London, p.15-16 3 Ibid, p.20-22 4In 2016 the ex port w as 309,627 and imports 2,789,491 which resulted in a deficit of 2,479,864. In this way imports were covered only
for 11.1%, Foreign Trade Statistics December 2017, Kosovo Agency of Statistics p. 9, http://ask.rks-gov.net/media/3825/statistikat-e-tregtis%C3%AB-s%C3%AB-jashtme-dhjetor-2017.pdf. 5 Communication from the Commission to the European Parliament, the Council, the European Economic and Social Committee and the Committee of the Regions, 2016 Communication on EU Enlargement Policy, European Commission, 2016, p. 37.
https://ec.europa.eu/neighbourhood-enlargement/sites/near/files/pdf/key_documents/2016/20161109_report_kosovo.pdf 6 Ibid, p. 38 7 Business Climate in Kosovo, (2017), Institute for Dev elopment Researche, Riinvest, Prishtina, p. 27; http://w ww.riinvestinstitute.org/uploads/files/2017/May/19/Klima_e_Biznesit1495199071.pdf. 8 The World Bank In Kosov o, Recent Economic Developments, http://www.worldbank.org/en/country/kosovo/overview#3

ISSN 2411-9571 (Print) ISSN 2411-4073 (online)
European Journal of Economics
and Business Studies April 2018 Vol 4 No 1
126
resources are not valued, and their valorization requires financial means, while the workforce is new but not prepared for entrepreneurship and the challenges posed by the market economy. Thus, although the growth rates since 2000 on average have been above 3% (during 2008-2016, GDP on the average was 3.4% increase)1, Kosovo (Kosovo) continues to be underdeveloped and on a scale with high unemployment. The unemployment rate for 2014 was 35.3% , in 2015 it was 32.9% , and in 2016 it was 27.5% 2. Kosovo, as elsewhere in the Western Balkans, suffers from high rates of unemployment, especially among young people. In 2014, about 2 out of 3 young Kosovars in the labor force did not have a job, contributing heavily to the 35 percent unemployment rate among the population. What is worse, the current economic growth is able to create jobs for only about 29% of the 11,500 people entering the labor market each year.3
The economic development without dilemma is related to the resources that a country has available. But this is just a necessary precondition, for their use financial means are required, as well as skilled workforce with entrepreneurial skills. The experiences of developed countries have shown that small and medium-sized businesses are generators of employment and development.4 The problem lies in the fact that countries can be rich in natural and human resources, but because of different factors, the same are not used efficiently and in the worst cases they are unused at all.
There are studies that prove that small and medium-sized enterprises are job generators. In Kosovo there are 33,465 active enterprises employ ing 155,135 employees.5 About 99% of enterprises are small businesses employ ing 1-9 employees.
However, the number of businesses that are registered and closed for a short time is relatively large. Thus, during the period 2007-2016, were registered 85,447 and in same time were closed more than 14,275 businesses.6 Only during 2016 10,424 new businesses were registered, while 2,350 businesses were closed at the same time.7
The number of enterprises that appear as registered but which are not active at the same time is considerable. This is because of many factors. One of them may be the lack of sufficient market and competition information. Likewise, an important factor that may have an impact on the early failure of initial businesses or on the discontinuation of their activ ity may also be the lack of sufficient information on the comparative advantages of locality based on natural and human resources and the degree of their use. This aspect of information has been considered crucial in this research, where through a concrete case of study data have been collected about the importance of knowledge of available resources for entrepreneurship, business and development. The data has been collected through a questionnaire consisting of 20 questions, which have distributed more than 100 respondents. Such a sample can be considered as sufficient representative of the researched population to draw based conclusions.8
b) Analysis and Interpretation of Data for Entrepreneurship and local economic development in Kosovo
The research was intended to evaluate the importance of assessing and recognizing natural and human resources for entrepreneurship. Being limited by objective factors such as lack of data from relevant private or state institutions, the research is based on primary data collected through questionnaires. The data have been processed through the SPSS statistical program and are interpreted following on the basis of professional and scientific achievements in the field of enterprise and local economic development. Relevant methods such as descriptive and comparative methods have been used to describe the ex isting situation as well as to compare the data and the results of the research. The inductive method
1 Ibid. 2 Statistical Yearbook of the Republic of Kosovo for 2017, http://ask.rks-gov.net/media/3636/vjetari_statistikor_i_republik%C3%ABs_-s%C3%AB_-kosov%C3%ABs_-2017_-final.pdf 3 UNDP, The new entrepreneurs, http://www.ks.undp.org/content/kosovo/en/home/sustainable-development-goals/goal-1-no-pov erty .html 4 See the research Dav id G.W. Birch, Job Creation in America: How Our Smallest Companies Put the Most People to Work, 1987. 5 Statistical Yearbook of the Republic of Kosovo for 2017, p. 151-153. http://ask.rks-gov .net/media/3636/vjetari_statistikor_i_republik%C3%ABs_-s%C3%AB_-kosov%C3%ABs_-2017-final.pdf. 6 The difference betw een the number of activ e and registered enterprises is considerable. This derives from the definition of activ e
enterprises, which only include enterprises which in the current period are paying contributions to their employees. Statistical Yearbook of the Republic of Kosov o, 2017 7 Statistical Yearbook of the Republic of Kosovo for 2017, p. 159, http://ask.rks-gov .net/media/3636/vjetari_statistikor_i_republik%C3%ABs_-s%C3%AB_-kosov%C3%ABs_-2017-final.pdf. 8 Matthew s, B., Ross, L., Research Methods: A Practical Guide for the Social Sciences, (2010), Pearson Education Limited.

ISSN 2411-9571 (Print) ISSN 2411-4073 (online)
European Journal of Economics
and Business Studies April 2018 Vol 4 No 1
127
has been used to complete the general conclusions regarding the expectations and perceptions of citizens and entrepreneurs about the importance of knowing and evaluating resources for promoting entrepreneurial activ ity .
Other sources have been used in the paper, from professional and scientific literature such as books and publications, but also by interpreting from the institutions and professional institutions. To promote based conclusions, the questionnaire has been distributed and completed in 10 different cities of Kosovo, ranging from different age, sex and occupation. The data are then presented in tabular and graphical form and are interpreted
Table 1. The importance of knowing the resources of locality for doing the business
According to the questionnaire it has been found that in respondents' responses 91% answered that recognizing the resources of their locality to do business is very important.
80% of respondents answered that the locality they live is rich in natural resources. However, acknowledging the fact that the locality is rich in resources is not sufficient to promote entrepreneurial activ ity . For this reason, knowledge and financial resources are also needed to transform potential resources in products and serv ices.
Respondents have been asked the same open question as to what resources their locality is rich, and 52% of respondents answered that their locality is rich in arable land and 43% of the locality in which they live is rich in natural resources.
For starting a business activ ity or expanding their activ ity , the main source of information on the resources in their locality is mainly taken from market research by 63% and only by 24% from state institutions. This shows that the entrepreneu rs have the difficulty in prov iding information about the resources available on the locality where they live or want to develop their business activ ity . In the absence of relevant research institutions, they are obliged to conduct market research, or to engage a businesses or entities that do these evaluations. As it is seen, 63% of potential entrepreneurs prov ide this information through market research, while only 24% of information is prov ided by relevant state institutions.
This data are very important because new businesses and new entrepreneurs are usually faced with lack of funds for financing of their activ ity , and dealing with market research costs naturally is an obstacle for undertaking a business venture.
The importance of knowing the resources of your locality to do business
Very much 91%
A little 9%
The locality you live is rich with natural resources
Yes 80%
No 15%
I don't know 5%
The locality is rich with natural resources like
Water 5%
Arable land 52%
Natural resources 43%
The source of information for the resources available on your locality
State institutions 24%
Priv ate institutions 12%
Market research 63% Others 1%

ISSN 2411-9571 (Print) ISSN 2411-4073 (online)
European Journal of Economics
and Business Studies April 2018 Vol 4 No 1
128
As seen from Table 2, according to all respondents, their locality can be developed with the resources they possess (100% ). Although all respondents answered that the locality can be developed with the resources available to them (91% ). Data shows that they do not have enough information about the comparative advantages of their locality in which enterprises and entrepreneurship activ ity should be based (human capital 16% and natural resources 30% ).
Natural resources are a potential for development but as it happens to many countries, they are unused if there is no financial funding and lack of entrepreneur capable for materializing their use. The fact that access to bank loans for potent ial entrepreneurs is 21% , which indicates the difficulties that ex ist to utilize resources in a productive and sustainable way.
Table 2. The resources and locality development
The locality you live can develop with the resources it possesses Yes 100%
The location y ou live has advantages in resources like
Human capital 16%
Natural resources 30%
Both 54%
The resources of y our locality can be used for dev elopment purposes
Yes 91%
No 2%
I don't know 7%
The financial resources you provide for y our business
Ow n capital 25%
Loan bank 21%
Both 51%
Others 3%

ISSN 2411-9571 (Print) ISSN 2411-4073 (online)
European Journal of Economics
and Business Studies April 2018 Vol 4 No 1
129
According to the respondents (Table 3), the factors influencing the development of their locality are 53% which include financial funds, entrepreneurial skills and knowledge. Respondents' knowledge is the factor with the smallest percentage (7% ) of impact as a local development factor according to the results of the questionnaire. This is a concern for the fact that in the contemporary economy human capital skills are important both for enterprise and entrepreneurship activ ities.
Supporting the fastest local development in the courage and entrepreneurial initiative (45% ) indicates the readiness of respondents to deal with market economy laws, even though 32% of them require a more pronounced role of the state in this regard. Market research is very important for an enterprise's success (92% ), but on the other hand, respondents have responded that inappropriate state and local development policies have been the factors that have prevented entrepreneurial ability in their locality (45% ). While the lowest percentage was the lack of knowledge of natural and human resources by 4% as a constraining factor of entrepreneurial ability , for the fact that they think they have enough information on natural and human resources.
Table 3. Factors that have impact on development of locality
The factors that has impact on dev elopment of y our locality
Financial fund 18%
Entrepreneurial ability 22% Know ledge 7%
Combined 53%
The w ays to achieve faster local economic
dev elopment
With initiativ e of the residents 19%
With initiativ e of entrepreneurs 45%
With state interv entions 32%
Others 4%
The importance of market research for an entrepreneur
Very much 92%
Somew hat 6%
I don't know 2%
The factors that hampers entrepreneurial ability in y our locality
Lack of know ledge of natural and human resources 4%
Lack of natural resources 25%
Inappropriate dev elopment policies 45%
Lack of entrepreneurial skills 18%
Insufficient financial resources 8%
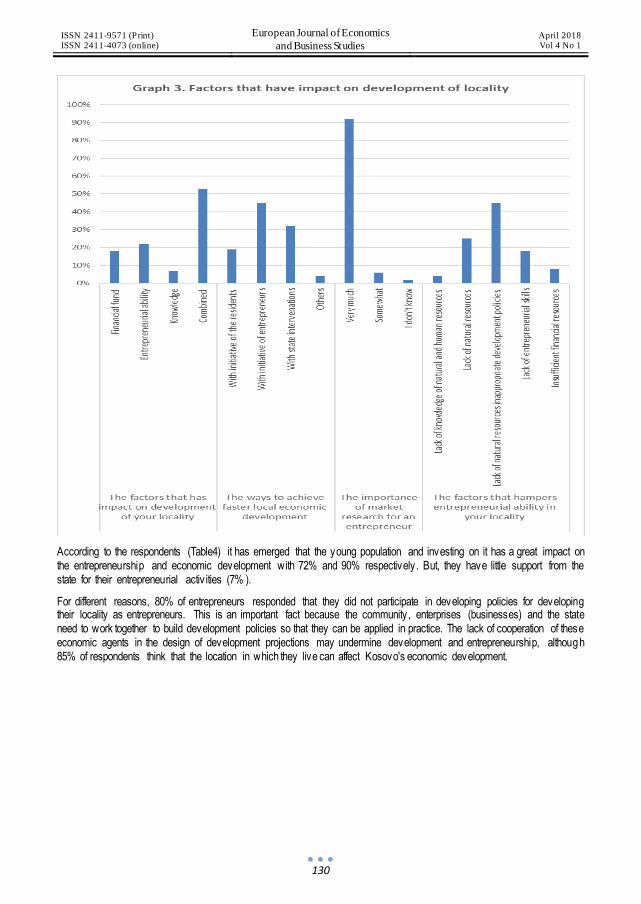
ISSN 2411-9571 (Print) ISSN 2411-4073 (online)
European Journal of Economics
and Business Studies April 2018 Vol 4 No 1
130
According to the respondents (Table4) it has emerged that the young population and investing on it has a great impact on the entrepreneurship and economic development with 72% and 90% respectively . But, they have little support from the state for their entrepreneurial activ ities (7% ).
For different reasons, 80% of entrepreneurs responded that they did not participate in developing policies for developing their locality as entrepreneurs. This is an important fact because the community , enterprises (businesses) and the state need to work together to build development policies so that they can be applied in practice. The lack of cooperation of these economic agents in the design of development projections may undermine development and entrepreneurship, although 85% of respondents think that the location in which they live can affect Kosovo's economic development.

ISSN 2411-9571 (Print) ISSN 2411-4073 (online)
European Journal of Economics
and Business Studies April 2018 Vol 4 No 1
131
Table 4: Importance of young population, support of state, participation in development policy and locality economic development
Conclusion
Local economic development today is one of the most debated topics in academic and practical field. Evaluation of human and natural resources is a precondition for information and support of ex isting businesses but also for attracting potential entrepreneurs. Having in mind this fact, during the survey we have handled professional and scientific literature related to entrepreneur and local development, as well as about the importance that have assessment and knowledge of resources for entrepreneurship and development of locality . For this purpose through research instruments such as questionnaires, are addressed these topics to draw conclusions that we are presenting as follows:
Entrepreneurship is a key factor in small states in order to increase employment but also economic development. Smaller countries, hav ing a small market, small population and small geographic space, cannot claim to have large investors and
ISSN 2411-9571 (Print) ISSN 2411-4073 (online)
European Journal of Economics
and Business Studies April 2018 Vol 4 No 1
132
businesses that employ a large number of workers. Therefore, entrepreneurship and its development in these countries represent the main source of employment. But also the evaluation and use of natural and human resources of country is necessary, which based on research, results that Kosovo is rich. But to use them, the state needs to find ways to clearly assess and define comparative advantages in relation to the region and other countries. In this way it would motivate and increase entrepreneurial courage, which itself is insufficient. Through policies support to entrepreneurs, indirectly the use of resources and economic development would be promoted.
Given that the country is rich with arable land, then this advantage should be used to create new jobs in order to reduce poverty and increase overall well-being. This does not only imply the promotion of entrepreneurship in the agricultural sector but, above all, the promotion of entrepreneurship in the sector of light food industries where many new jobs can be generated. The fact that Kosovo is a country with trade deficit balance, especially as a result of the import of food products, makes us conclude that the promotion of comparative advantages in this sector and other considered sectors, may lead to what has emerged from research that Kosovo can develop with its resources.
Getting started from the survey, country has with abundance natural resources as well as labor force, two most important inputs of production process, so local and central government should work together with the community in order to materialize these advantages.
There is a need for financial funds for entrepreneurship activ ity . However, young entrepreneurs have difficulties to borrow from banks and just a small number of entrepreneurs may have bank loans, while the rest will prov ide funding for their activ ity from own sources, or combination of both of these sources. In this regard, it is very important to find modality to support financing through affordable interest rates. As research suggests, financial resources are one of three factors that affect locality development along with entrepreneurial skills and knowledge. Therefore, special attention should be paid to these factors.
That Kosovo economy is in the phase of closing transition shows the data from the survey, where almost half of the respondents think that the initiatives of the entrepreneurs are the way for development of local economy, and just one third think that state should have an active role in the economy. These are a signal to the government, community and entrepreneurs to create policies that promote entrepreneurial initiatives as a basis for development. However, research has also found factors that hinder the entrepreneur, as are inadequate development policies.
According to the data, the new population has high impact on the development of entrepreneurship. While, investment in new population affects very much entrepreneurship development. From all this, it can be concluded that the new population and investment in it, present the main strength of entrepreneurship development. For that, state support is necessary in order to materialize respondents’ expectation the locality they live can affect overall Kosovo's economic development.
As a conclusion, evaluating and knowing resources of locality is initial point and impassable step for entrepreneurs to create and implement innovative ideas. But to have a successful entrepreneurship is necessary state support through different fiscal and monetary policies.
Reference
[1] Ahmad, N., and Seymour, G. R., (2008) Defining Entrepreneurial Activ ity : Definitions Supporting Frameworks for Data Collection OECD Statistics Working Paper, Organization for Economic Co-operation and Development; http://www.oecd.org/officialdocuments/publicdisplaydocumentpdf/?doclanguage=en&cote=std/doc(2008)1
[2] Amstrong, H., and Taylor, J., (2000), Regional Economics and Policy, Third edition, Blackwell Publishing. [3] Bjorvatn, K., (2015), Youth-entrepreneurship-and-development pdf, , https://www.oecd.org/derec/sweden [4] Blakely , Edward, J., Leigh, Green, N., (2010), Planning Local Economic Development, Theory and Practice,
SAGE. [5] Drucker, P.eter, F., (2002), Innovation and Entrepreneurship, Perfectbound; http://www.untag-
smd.ac.id/files/Perpustakaan_Digital_1/ENTREPRENEURSHIP% 20Innovation% 20and% 20entrepreneurship.PDF
[6] Fitzgerald, J., Leigh,G, Nancey., (2002), Economic Revitalization, Cases and Strategies for City Suburb, SAGE Publications.
[7] Greenwood , Daphne T., and Holt , Richard P.F., (2010), Local Economic development in the 21st Century, Quality of Life and Sustainability , M.E. Sharpe, London.
[8] Hague, C., Hague, E., & Breitbach C ., (2011), Regional and Local Economic Development, Polgrave

ISSN 2411-9571 (Print) ISSN 2411-4073 (online)
European Journal of Economics
and Business Studies April 2018 Vol 4 No 1
133
Macmillan. [9] Matthews, B., Ross, L., Research Methods: A Practical Guide for the Social Sciences, (2010), Pearson
Education Limited. [10] Naudé, W., (2013) Entrepreneurship and Economic Development: Theory, Ev idence and Policy;
http://ftp.iza.org/dp7507.pdf [11] Pike, A., Rodriguese- Pose, A., & Tomaney, J., (2008), Local and Regional Development, Routledge. [12] Stam, E., and Lambooy , J., (2012), Entrepreneurship, Knowledge, Space, and Place: Evolutionary Economic
Geography meets Austrian Economics; Utrecht School of Economics, Tjalling C. Koopmans Research Institute; https://www.uu.nl/sites/default/files/rebo_use_dp_2012_12-11.pdf
[13] timson, Robert, J., Stough, Roger, R., & Roberts, Brian, H., (2006), Regional Economic Development, Analysis and Planning StrATEGY, Second Edition, Springer.
[14] Szirmai, A., Naudé W., and Goedhuys, M., (2011) Sample material, First chapter, Entrepreneurship, Innovation, and Economic Development: An Overv iew, p.3; http://i.unu.edu/media/unu.edu/publication/12592/chapter-1.pdf
[15] Business climate in Kosovo, Institute for Development Researche Riinvest, 2017; http://www.riinvestinstitute.org/uploads/files/2017/May/19/Klima_e_Biznesit1495199071.pdf.
[16] Kosovo Agency of Statistics, Foreign Trade Statistics December 2017, p. 9, In 2016; the export was 309,627 and imports 2,789,491 which resulted in a deficit of 2,479,864. In this way imports were covered only for 11.1% ; http://ask.rks-gov.net/media/3825/statistikat-e-tregtis% C3% AB-s% C3%AB-jashtme-dhjetor-2017.pdf.
[17] Statistical Yearbook of the Republic of Kosovo for 2017, http://ask.rks-gov.net/media/3636/v jetari_statis tikor_i_republik% C3% ABs_-s% C3%AB_-kosov%C3%ABs_-2017_-final.pdf
[18] The European Economic and Social Committee and the Committee of the Regions, Communication from the Commission to the European Parliament, the Council, 2016 Communication on EU Enlargement Policy, European Commission, 2016; https://ec.europa.eu/neighbourhood-enlargement/sites/near/ files/pdf/key_documents/2016/20161109_report_kosovo.pdf
[19] [The World Bank In Kosovo, Recent Economic Developments, http://www.worldbank.org/en/country /kosovo/overv iew#3
[20] UNDP, The new entrepreneurs, http://www.ks.undp.org/content/kosovo/en/home/sustainable-development-goals/goal-1-no-poverty .html
[21] United Nations Conference on Trade and Development, (2015), Promoting entrepreneurship for development; http://unctad.org/meetings/en/SessionalDocuments/ciid29_en.pdf
[22] https://en.oxforddictionaries.com/definition/entrepreneur [23] http://web.worldbank.org/WBSITE/EXTERNAL/TOPICS/EXTURBANDEVELOPMENT/EXTLED/0,
contentMDK:20185186~menuPK:399161~pagePK:148956~piPK:216618~theSitePK:341139,00.html

ISSN 2411-9571 (Print) ISSN 2411-4073 (online)
European Journal of Economics
and Business Studies April 2018 Vol 4 No 1
134
DOI: 10.26417/ejes.v4i1.p134-145
Open Access. © 2018 Mirela Ujkani Miti et al.. This is an open access article licensed under the
Creative Commons Attribution-NonCommercial-NoDerivs 4.0 License
Creative Accounting – Some Aspects of Knowledge and Implementation in Albania
Mirela Ujkani Miti
PhD., Lecture on Accounting Department, Faculty of Economics University of Tirana Albanian, Tirana, Albania
Elena Myftaraj (Tomori)
Prof. Assoc. PhD., Lecture in Applied Statistics and Informatic Department, Faculty of Economy, University of Tirana, Tirana, Albania
Brisejda Ramaj Zenuni
Msc., PhD Candidate at the Department of Accounting, University of Tirana, Faculty of Economy, Lecture in Financial and Accounting Department, University of Vlora “Ismail Qemali”, Faculty of Economy, Vlore, Albania
Abstract
This paper comes as a result of exploring the creative accounting level of recognition and its use by accounting professionals during the preparation of the financial statements of the entities (SMEs) in Albania. In our country the financial reporting is based on national accounting standards which are in accordance with international accounting standards (IFRS for SME). So, based on the literature rev iew, we will give some definitions of creative accounting as well as aspects of its use in different countries. Starting from those practices, we will identify the main factors why managers and accounting professionals exercise creative accounting. Through an analysis based on questionnaire’s data addressed to accounting professionals, we want to show if such practice is implemented in our country and how it is v isualized by accounting professionals. In conclusion of this paper we will give some recommendations on the recognition and use of creative accounting by accountants in our country .
Keywords: accounting standards, creative accounting, financial reporting, management, accountant professional
Introduction
Creative accounting is often considered as art of accounting information, because the accounting information will be reflected in the financial statements in such a way as to show the positive aspects of the financial position and performance of the entity , thus avoiding the possible negative aspects of it. The current accounting principles and rules under IFRS and NAS allow managers to choose different methods to apply when preparing the financial statements, prov iding flex ibility and thus allowing them to apply creative accounting. Frequent cases of occurrence of this practice in reality , such as cases where the entities do not recognize bad debts in the current year but defer them in the following years or when they reassessment of inventory stocks, delay over time of recognition of income, recognition and measurement of prov isions, etc. These cases are also due to interpretations of both accounting standards and tax legislation and especially in cases where, there is basic and alternative treatment for an element or issue. In this context, creative accounting has its benefits , always if there is no abusive purpose. But in most cases, creative accounting is identified as a negative phenomenon. As soon as the word "Creative Accounting" is mentioned, what comes up in the mind is something dishonest, a form of manipulation or fraud of accounting information. But they differ from each other. Popescu L.M and Nişulescu I. (2014) in their study have clearly identified often does not reflect what is said to be "a true and fair v iew" for an entity - because we think it has there have been many cases when the entities have benefited greatly using creative accounting techniques and this has led them to continue their economic activ ities during these difficult times. Accounting and financial reporting
ISSN 2411-9571 (Print) ISSN 2411-4073 (online)
European Journal of Economics
and Business Studies April 2018 Vol 4 No 1
135
standards, whether international or national, have been continuously improved, and among other reasons we may also mention the fact that they aim to reduce the implementation of accounting practices by accountant professionals including and apply ing the creative accounting practices.
Precisely these reasons led us to explore whether it is recognized creative accounting, whether it is used and whether it is perceived as a good/bad practice for entities or professional accountants in Albania.
Literature review
The concept of creative accounting has ex isted early . One of the early researchers Copeland (1968) defined the concept of manipulating the accounting. But its term has emerged in the Anglo-Saxon literature in 1970 as an accounting practice that can (or can not) follow the accounting principles or standards but dev iates from what these principles or standards are intended to achieve, in order to show a desired image of the company to the interested parties. On the other hand, creative accounting is the transformation of financial accounting amounts (numbers) in order to "actually prov ide a financial reporting they wish to benefit from existing rules and (or) ignore some (or all) of them" Kamal Naser (1993).
Thus, through creative accounting, different "space / Absences" are used in the accounting principles or standards for the accounting treatment of various issues, in order to show the desired results for the interested parties. Jawad and Xia (2015) have highlighted new aspects of creative accounting in manners with accounting numbers (amounts) and argue that "Innovation is an essential part of the creative accounting in accounting practices. Naturally , they have been asked "creativ e accounting is good or bad practice?" Or is it "use or abuse?"
Answers to questions will certainly depend on the purpose for which the creative accounting itself is used, and based on accounting standards the responsibility for preparing the financial statements is management, then the fact of "abuse / bad" through creative accounting techniques, it will be management. This attitude also supports Bhasin, (2013) in his own study.1
Arthur Levitt (Chairman, SEC) in 1998 drew attention to creative accounting practices, pointing out that accounting principles are not intended to be a "tight jacket", and therefore the degree of flex ibility is needed for allowing financial reporting to keep pace with business innovations. The problem arises when companies use this flex ibility to create illusions in their financial reports, illusions that are not the true and fair v iew of the entity (Mulford and Comiskey, 2002). According to Jones (2011) the definition of creative accounting is: "Using flex ibility in accounting within the conceptual framework to manage the measurement and presentation of elements of financial statements / events, so that they give the private interests of the developer rather than the user." The authors Syed Zulfiqar Ali Shah, Safdar Butt and Yasir Bin Tariq (2011) in their work of creative accounting have considered it as a “tool” more than a "weapon".2
According to Michael Jameson (1988) "The accounting process consists of many issues related to conflict judgment and conflict between presentation of financial results and financial transactions. This flex ibility prov ides opportunities for manipulation, fraud and distortion. These activ ities practiced by unscrupulous accounting people are known as creative accounting". And listening to the latest scandals Enroll etc., it is noticed that creative accounting has begun to be directed towards fraud, thus satisfy ing the interests of only the preparers of the financial statements and not of other interested parties. To get benefits from senior executives, managers are often tempted to show higher profits, which lead to adoption of creative accounting techniques (Vyas et al., 2015). There is no doubt that these accounting scandals have reduced the confidence of interest groups in financial reporting around the world.
By Peter A, Eddie M, (2008) changes facing accounting are:
The increasing sophistication of customers.
The development of a global economy where national frontiers become less important.
Rapid changes in technology.
The deregulation of domestic markets (For example, electricity , water, gas).
1 Bhasin, M.L.(2013),Corporate governance and forensic accountant: an exploratory study, Journal of Accounting, Business and Management, October, 20(2), 55-75. 2 “Use or Abuse of Creative Accounting Technique” International Journal of Trade, Economics and Finance, Vol. 2, No. 6, December
2011

ISSN 2411-9571 (Print) ISSN 2411-4073 (online)
European Journal of Economics
and Business Studies April 2018 Vol 4 No 1
136
Increased pressure from owners (shareholders) for competitive economic returns.
The increasing volatility of financial markets.
Conflict of interest among different interest groups is the true cause of creative accounting (Diana, B., Victoria, B. and Alina, V 2009). In his study David Schiff, (1993) has mentioned six of the many ways companies can change their earnings:
Capitalizing expenses instead of writing them off.
Receivables or inventories growing faster than sales.
Hiding pension liabilities.
Negative cash flow.
Consolidating owned subsidiary ’s income and net worth, with the impossibility of receiv ing the same.
Following seemingly conservative practice in a situation of reverse direction [e. g., if layers of lower priced LIFO (last-in, first-out) - cost inventory are “inflated” and sold at current prices, current earnings power is overstated.
In some countries (such as Greece) creative accounting is considerate to extend on the law (Baralex is S 2004), while in some states it is considered illegal (Healy and Wahlen, 1999). There are no normative acts for creative accounting in Albania. What we can say with certainty is that accountant professionals generally help companies operate more efficiently , keep accurate and up to date financial records, ensure that taxes are paid in time, analyze financial records and prepare financial statements. In this regard, the main group of accountants and accounting techniques used are exactly the accountants and as a result the focus of our work is based on this target group.
Methodologhy
The methodology of our work is based on the descriptive analysis of the national accounting standards (NAS) in Albania, with the aim of identify ing the opportunities ex isting on the use of creative accounting by accountant professionals during the preparation of the financial statements. Based on the full set of NASs, we tried to present the spaces through which an accountant professional can use creative accounting techniques. But also through the statistical analysis of the data collected by the questionnaire addressed to the accountant professionals who according to Law no. 10091, dated 05.03.2009 "On Statutory audit and organization of professions of registered accounting expert and approved accountant" , are responsible for the preparation of the financial statements, we tried to give an overv iew on the recognition and use of the creative accounting. The questionnaire were distributed to about 170 email accountant professionals and we received responses from 87 of them, more focused in the Tirana city , because this city is the main center of development both economically and professionally . Data processing was carried out with SPSS 20. In addition to the descriptive statistics extracted from the processing of questionnaires data, the independence test was applied to test for the independence of two variables.
In conclusion, based on the study of the literature and the findings of the study, besides giv ing a general overv iew of the recognition and use of creative accounting we will also give our opinion as recommendations to be followed by accountant professionals and other organizations involved in the correct implementation of this accounting.
Main factors of using creative accounting
The use of creative accounting, among other things, is also due to the high competition in the current conditions of economic development. This is because the entities are increasingly seeking to present to third parties with good financial results through financial statements. In such an environment, entities usually start using creative accounting practices, especially in an inappropriate situation with a v iew to increasing income / revenue, or manipulating assets and liabilities to report a financial position that is most better than the current situation. There are many factors that are considered as reasons for implementing creative accounting techniques; where some of them are presented below;1
The highest share price
Increase the value of the company
1 The financial number game by Charles W.Mulford &Eugene E.Comiskey, 2002 (J.Wiley &Sons)

ISSN 2411-9571 (Print) ISSN 2411-4073 (online)
European Journal of Economics
and Business Studies April 2018 Vol 4 No 1
137
Lower capital cost
Lower borrowing costs, or lower financial constraints and constraints (borrowing cost effects)
Efforts to evaluate performance by increasing profit-based rewards
Effects in avoiding high taxes / taxes.
As noted above, the reasons for using creative accounting imply concealing the essence of transactions, resulting in "distorted" financial statements and, at the same time, the failure of entities. But this phenomenon is due to the fact that accounting standards cannot cover all aspects or cases of transactions carried out by an entity , but there are many instances when it is left to management to decide on the application of accounting policies or methods accounting estimates, such as in the case of inventory valuation, amortization methods, or asset valuation methods (at historical cost or fair value methods), or estimate of the prov isions; etc.
Consequently , the direction/top management of the entity "plays" within the legal framework, misusing the accounting policies, making it possible to submit to financial statements what they w ant to present. Numerous discussions come about the above reason, especially in the recognition of revenues. These discussions are among standard preparers, policy makers in the accounting or fiscal field, and accountant professionals in the role of standard implementers in the entities.
The moment when the revenue or expense should be recognized identifies many cases of entities factors that misuse the accounting standard for revenue and in their cases or realize delay in time of revenue or expense, or the contrary in depending if they wish to record a higher or lower profit. These reasons of timely deleveraging among the interested parties have led to constant variations in the accounting standards. This phenomenon is also known in Albania, for example, the recognition of revenues in the construction contracts where in the first set of national accounting standards, revenues in the construction contracts was not specifically identified, while with the changes made in 2015 in complete set of NAS they are clearly ev idenced the case of construction contracts, but again the space ex ists for the judgment of the direction/ top managements.
The change in accounting policies is another widely used phenomenon, because it is also possible to change the accounting policy accordingly , and as a result it can "play" with this "space" that allows standards.
The above mentioned cases of course have to be said to apply in Albania as well, because of the fact that their space or misinterpretation brings the use of "creation" over the applicability of accounting standards; where by studying the complete set of NASs we are presenting the following possible spaces as is following:
Table no 1 “Spaces to use creative accounting, according NAS”
No NAS Description
1 NAS 1 “Conceptual framew ork “
Paragraph 9; allows direction to use its own judgment. "If NAS 1 does not specifically address a transaction, event or circumstance, the management of an entity should use its judgment in developing and implementing an accounting policy ..."
2
NAS 4
“ Inv entory”
Paragraph 14; allow s direction to determine not only the method but also the formulas.
"How ev er, for inventories of a different nature or use, the calculation of the cost may justify the use of formulas other than those mentioned abov e"
Paragraph 19-22; allows the direction to allocate the ov erhead factory, based on different methods. "Production costs that hav e been incurred before this moment should be allocated to indiv idual products on the basis of a reasonable and appropriate method ..." or ... "An entity may use techniques such as the standard cost method, the retail price method or the latest purchase price to
measure the cost of inv entories if the result from the use of these methods approximates the cost "
3 NAS 5 “Property , plant and equipment; and Intangible Assets”
Paragraphs 31-32; 36-37 identify the fact that an entity is allow ed to choose the amortization method; but also of its change, if there is any necessary information ... "Factors such as a change in how an asset is used, premature consumption, technological progress, and changes in market prices may indicate that the v alue of the remaining or useful life of an asset has changed since the last reporting date. If such indicators are present, an entity will review its previous estimates and if ex pectations
change, then the entity w ill change the residual value, amortization method or useful life Paragraphs 85 to 88; impairment tests - allows the entity to recognize impairment based on information sources.
4 NAS 6“ Prov isions, contingent
liabilities and
The conditions and measurement methods in knowing of a provision, allow direction to use the necessary spaces for their recognition.
ISSN 2411-9571 (Print) ISSN 2411-4073 (online)
European Journal of Economics
and Business Studies April 2018 Vol 4 No 1
138
contingent assets”
5 NAS 8
“The rev enue”
Paragraphs 24-34; Recognition of such incomes/expenses at the right time, or delay ing the timely
may be; Paragraphs. 24-27 construction contract "Reliable assessment of the result requires reliable estimates of the completion phase, future costs and receivables of invoices" Paragraph 45. "Methods of recognition of interest income" is left to their choice.
Source; by authors based on NAS;1
Based on these reasons and in Albania the complete set of NASs is in accordance with IFRS for SMEs, as well as the necessary spaces some of which were underwritten (See further on Annex), we decided to give on the basis of a questionnaire the knowledge of creative accounting and how much is the level of its implementation. One more reason is the fact that the implementation of standards in Albania has started from January 1, 2008, and now has been past nine years, enough time to apply the space for use of creative accounting.
Data Analysis of the aspects of knowledge and implementation of creative accounting in Albania
Initially understand the level of knowledge of creative accounting and then to test professionals on the knowledge and use of creative accounting techniques and tools, we developed a questionnaire. The questionnaire contained closed and open questions (in answer Yes / No / N/A) especially when they should be expressed on the financial reporting legislation in Albania and what opinions could y ield on the continuous improvement. Likert level is also used to test the knowledge and use of accounting techniques. The questionnaires were distributed to 170 professionals in the field of accounting, mainly in the Tirana city .
The target group consisted of accountants, approved accountants and auditor because the three professionals according to Albanian law no. 10091, dated 05.03.2009 "On Statutory audit and organization of professions of registered accounting expert and approved accountant", they have obligation to prepare financial statements. The questionnaire was distributed v ia email and received an answer from 87 professionals. Knowing that the purpose of the questionnaire would be the level of recognition of creative accounting and if he used who would be the factors and arguments for its use, the questionnaire was prepared in the first section with closed questions to create a group knowledge respondents and its level, while the second section of the questionnaire was designed to respond to the implementation and the factors that led to it, or they think it will lead to the use of creative accounting during the preparation of the financial statements. This section was prepared using the Likert scale with five levels. For the above, the main questions of our research are; How well known the creative accounting; Are creative accounting techniques used; What are the factors that lead to the use of creative accounting; How ethical do they think its use?.
According to the data analysis collected, it was found that the target group consisted of 70.2% accountant professionals have a working experience of over 5 years in the field of financial statements preparation (Graph No 1 - Appendix II).
The level of knowledge of creative accounting resulted that 71.9% of respondents know creative accounting, while 28.2% of them did not know it. And then we went to the test to see how this knowledge level was, using the Likert scale with 5 levels (up to a lot) from where the average level of "3" know of this accounting resulted with about 43.9 % of respondents who answered that they know it and only 22.8% resulted in level 4 of knowledge. In this regard, we judge that the concept of creative accounting is known in our country , by the accountant professionals.
Regarding the use of this accounting data analysis technique, it was found that 45.6% of them had prev iously used the techniques and the concrete results (see Annex II-graphs 2 and 3) that the technique of cost capitalization was the technique the most used by most respondents (by about 42.1% ), followed by the use of variation techniques in the use of different methods, when permitted by the standards of use of alternative methods or free judgement of direction allowed (31.6 % ). While the techniques of revenue recognition or timely recognition of their costs or expenses were the least widely used techniques by professionals (about 12-15% of them, as shown in Chart 4). Regarding the factors that led to the use of data analysis techniques, it was found that the greatest weight was attributed to investment absorption (33.3% ) or low -interest borrowing (by 19.3% see chart no. 1). Meanwhile, in realistically significant levels, there was also the behavior of benefits for those who wanted to manipulate by 15.8% and to avoid intervening by regulators or political consequences by 10.5% . This latter factor is related to the fact of using tax legislation in the preparation of financial statements for avoiding
1 http://www.kkk.gov.al/page.php?id=1&l2=136&gj=sh

ISSN 2411-9571 (Print) ISSN 2411-4073 (online)
European Journal of Economics
and Business Studies April 2018 Vol 4 No 1
139
tax liabilities for not recording unknown costs for calculating the profit on the period. Graphically , these factors are expressed in graph 1 as follows;
Graphic no 1 “The factors that lead to use creative accounting
Source: The authors
Also a question addressed to professionals was the fact that who are more inclined to use creative accounting, managers, accountants, or stakeholders and interested third parties. Responses resulted that the stakeholders / owners and interested third parties were more likely to manipulate the financial statements through the use of creative accounting (by 78.9%), while managers and accountants were of equal weight in terms of the motiv e of using creative accounting with 10.5% . As a result, we asked their opinion on how reliable the financial statements would be when they thought that creative accounting techniques could be used. Responses were 80.7% in the moderately reliable range and only 1.8% thought they were completely reliable.
But our analysis of the data went further to test the ex istence of relation between the use of creative accounting with the legal form of the entity (as a limited liability company, shareholder, etc.) and constructed hypotheses:
H0; There is no relation between the use of creative accounting technique and legal form of the entity .
H1; There is a relation between the use of creative accounting technique and legal form the entity .
The results of the statistical test test used indicated that the use of techniques was not dependent on the entity 's legal form (p-value> 0.05) (see table no.1 -Apendix II).
The focus of the analysis could not remain beyond testing how ethical the use of creative accounting was, depending on the experience that they had in their work as an accountant professional, resulted that professionals over 6 years of experience considered the use of creative accounting more unethical (the velue is 1-Likert scales) while professionals with less than 5 years of experience considered ethically(values 5 by Likert scale)) using creative accounting. See Chart No. 2.
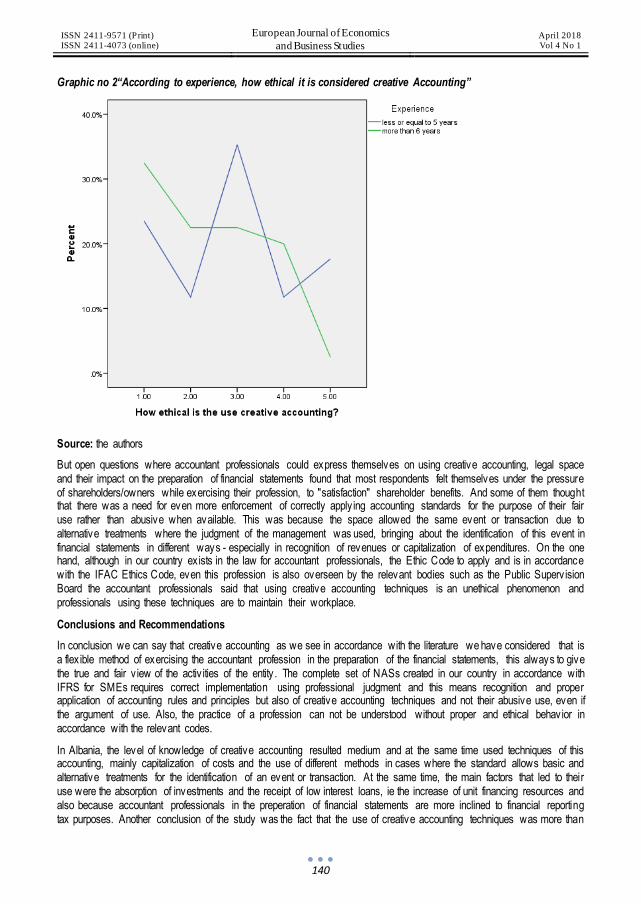
ISSN 2411-9571 (Print) ISSN 2411-4073 (online)
European Journal of Economics
and Business Studies April 2018 Vol 4 No 1
140
Graphic no 2“According to experience, how ethical it is considered creative Accounting”
Source: the authors
But open questions where accountant professionals could express themselves on using creative accounting, legal space and their impact on the preparation of financial statements found that most respondents felt themselves under the pressure of shareholders/owners while exercising their profession, to "satisfaction" shareholder benefits. And some of them thought that there was a need for even more enforcement of correctly apply ing accounting standards for the purpose of their fair use rather than abusive when available. This was because the space allowed the same event or transaction due to alternative treatments where the judgment of the management was used, bringing about the identification of this event in financial statements in different ways - especially in recognition of revenues or capitalization of expenditures. On the one hand, although in our country ex ists in the law for accountant professionals, the Ethic Code to apply and is in accordance with the IFAC Ethics Code, even this profession is also overseen by the relevant bodies such as the Public Superv ision Board the accountant professionals said that using creative accounting techniques is an unethical phenomenon and professionals using these techniques are to maintain their workplace.
Conclusions and Recommendations
In conclusion we can say that creative accounting as we see in accordance with the literature we have considered that is a flex ible method of exercising the accountant profession in the preparation of the financial statements, this always to give the true and fair v iew of the activ ities of the entity . The complete set of NASs created in our country in accordance with IFRS for SMEs requires correct implementation using professional judgment and this means recognition and proper application of accounting rules and principles but also of creative accounting techniques and not their abusive use, even if the argument of use. Also, the practice of a profession can not be understood without proper and ethical behavior in accordance with the relevant codes.
In Albania, the level of knowledge of creative accounting resulted medium and at the same time used techniques of this accounting, mainly capitalization of costs and the use of different methods in cases where the standard allows basic and alternative treatments for the identification of an event or transaction. At the same time, the main factors that led to their use were the absorption of investments and the receipt of low interest loans, ie the increase of unit financing resources and also because accountant professionals in the preperation of financial statements are more inclined to financial reporting tax purposes. Another conclusion of the study was the fact that the use of creative accounting techniques was more than

ISSN 2411-9571 (Print) ISSN 2411-4073 (online)
European Journal of Economics
and Business Studies April 2018 Vol 4 No 1
141
enough to satisfy the shareholder or owner's benefits and they were not dependent on the legal form of the entity . In this regard, most accountant professionals felt that this accounting was not ethical, and at the same time its use would count in the untrustworthy financial statements, since it itself related to the abusive and incorrect use of creative accounting.
In this regard, we believe that strengthening the role of the bodies on the correct implementation of their accounting standards and their flex ibility needs to be further intensified, through the interaction of key stakeholders such as accountant professionals, professional associations and Public Superv isor Bord of the profession, tax authorities, etc. On the other hand, this would further strengthen the belief that the financial statements prov ide the reality of the entity 's activ ity .
Although within the NAS set-up set, there are spaces that allow the use of creative accounting, we see creative accounting as a tool to increase the financial and economic position of the entity if used fairly , as opposed to a growth of today because of abuse, will be a future failure for it.
Literature and References
[1] Dr. Sayed Zulfiqar Ali Shah, Dr. Safdar Butt and Yasir Bin Tariq, (2011) Use or Abuse of Creative Accounting Techniques, International Journal of Trade, Economics and Finance, Vol. 2, No. 6,
[2] Firas Aziz M. Jawad, Xinping Xia (2015) International Financial Reporting Standards and Moral Hazard of Creative Accounting on Hedging International Journal of Finance and Accounting 2015, 4(1): 60-70
[3] Bhasin, M.L.(2013),Corporate governance and forensic accountant: an exploratory study, Journal of Accounting, Business and Management, October, 20(2), 55-75.
[4] Copeland, R.M. (1968), Income Smoothing, journal of accounting research, VVI, Supplement, 101-116 [5] Oriol Amat, John Blake and Jack Dowds, (1999) “The Ethics of Creative Accounting”, Economic Working Papers
1999, [6] Naser, K. (1993) “Creative Financial Accounting: its nature and use” Prentice Hall, London. [7] Griffiths, I. (1986) “Creative accounting” Sidgwick & Jackson, London. [8] IFAC (International Federation of Accountant), (2011), [Online], Available: http://www. ifac. org/ [9] Dr. Sayed Zulfiqar Ali Shah, Dr. Safdar Butt, Creative Accounting: A Tool to Help Companies in a Crisis or a
Practice to Land Them into Crises, International Conference on Business and Economics Research, Singapore, 2011
[10] Laura, M.P. and Ileana, A. (2013), “Detecting creative accounting practices and their impact on the quality of information presented in financial statements” journal of knowledge management, economics and information technology, vol, 3, issue 6, dec. pp.1
[11] POPESCU Laura – Maria; NIȘULESCU Ileana (2014) “Creative Accounting Versus Fraud” SEA - Practical Application of Science Volume II, Issue 3 (5)
[12] Baralex is Syros (2004) “creative accounting in small advancing countries; the Greek case”; Managerial auditing journal, Vol. 19, issue 3 pp 440-461
[13] Law no. 10091, dated 05.03.2009 "On Statutory audit and organization of professions of registered accounting expert and approved accountant"
[14] Complete set of improved NAS. Websites
[1] www.kkk.gov.al [2] www.ieka.org.al
Appendix I- "NAS Accounting Spaces, allowing the application of creative accounting"
NAS no 1
Paragraph 97 "... If NAS 1 does not specifically address a transaction, event or circumstance, the management of an entity shall use its judgment in the development and implementation of an accounting policy that results in information: (a) suitabl e for the needs of users' economic decision-making; and (b) Reliable, for the fact that the financial statements: (i) faithfully represent the financial position, financial performance and cash flows of the entity ; (ii) represent the economic essence of transactions, events and other conditions, and not merely the legal form; (iii) are neutral, is free from prejudice; (iv) measured; and (v) complete in all material respects

ISSN 2411-9571 (Print) ISSN 2411-4073 (online)
European Journal of Economics
and Business Studies April 2018 Vol 4 No 1
142
NAS no 4
Paragraph 14 ".... For those goods that are not interchangeable in ordinary markets or that are specific to specific projects , the cost shall be determined on the basis of the specific identification method. The cost-based method of specific identification is not suitable for homogeneous products such as raw materials used in production and purchased parts frequently and at different prices. To determine the cost of such an inventory, the weighted average or "first entry , ex it" method (FIFO) should be used. To calculate the cost of inventories that have the same nature and use for the entity , the same formula should be used. However, for inventories of a different nature or use, the calculation of the cost may justify the use of formulas other than those mentioned above”
Paragraph 19 ".... Those production costs that are made from the moment when these products become indiv idually identifiable can be easily and directly linked to the product and can therefore be distributed directly to indiv idual products. Production costs that have been made before this moment should be distributed through indiv idual products on the basis of a reasonable and appropriate method. "
Paragraph 22”....An entity may use techniques such as the standard cost method, the retail price method or the latest purchase price to measure the cost of inventories if the outcome of using these methods approx imates the cost.
NAS no 5
Paragraph 31; “an entity shall take into account all of the following factors in determining the useful life of an asset: (a) the expected use of the asset. The use is estimated by reference to expected assets or expected outputs. (b) Expected physical consumption, which depends on the factors of use, such as the number of tours during which the asset is used, repair and maintenance plans, as well as the care and maintenance of the asset when the asset is not in use. (c) Technical or commercial obsolescence arising from changes or improvements in production, or from a change in the requirements for the product or serv ice prov ided by the asset. (d) Legal or similar restrictions on the use of assets, such as the expiration date of lease contracts.
Paragraph 32; the chosen amortization method should systematically reflect the way the entity will realize the future economic benefits of the long-term asset acquired during its useful life. The most common methods of amortization include the straight-line method, the residual value method and the use-based method such as the method of the units produced
Paragraph 36 -37 change of depreciation method, residual value or useful life (.... Factors such as a change in how an asset is used, premature consumption, technological progress, and changes in prices the market may indicate that the residual value or useful life of an asset has changed since the last reporting date. If such indicators are present, an entity will rev iew its prev ious estimates and if the expectations change, the entity will change the residual value, amortization method or useful life as a change in an accounting estimate in accordance with NAS 1 General Framework for the preparation of financial statements)
NAS no 6,
Conditions in the recognition of passive prov isions / conditional assets
NAS no 8
Revenue-Recognition at the right time or delay in recognition of the income / expense that may arise may be;
Paragraphs 24-27; construction contract ... (A reliable outcome estimate requires reliable estimates of the completion phase, future costs and invoice receivables.
Paragraphs 24-27; construction contract ... (A reliable outcome estimate requires reliable estimates of the completion phase, future costs and invoice receivables.
Paragraphs 28 -34 prov ide guidance on the method of completion percentage. Methods of Phase of Completion ... (problems in recognizing the respective revenues and expenditures)
Paragraph 34”..... If it is not possible to collect an amount already recognized as an income, the entity will recognize the uncollectable amount as an expense instead of adjusting the amount of contract revenue”.
Paragraph 45 “Interest income is recognized on the basis of the straight-line method on the Internal Interest Rate (IRR) and effective interest rate”

ISSN 2411-9571 (Print) ISSN 2411-4073 (online)
European Journal of Economics
and Business Studies April 2018 Vol 4 No 1
143
Appendix II- DATA ANALYSIS Source: the Authors
Graphic no 1
Graphic no 2
Graphic no 3
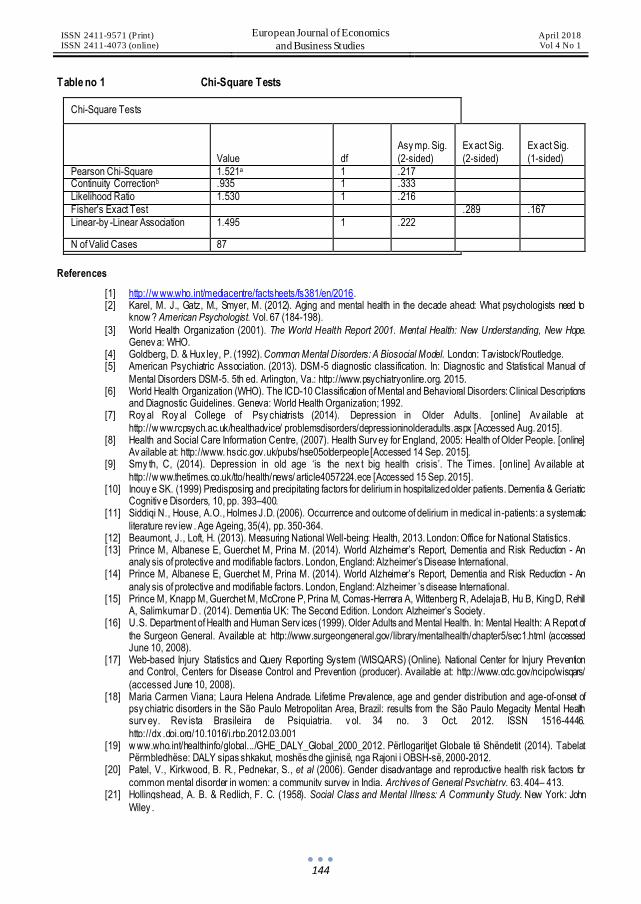
ISSN 2411-9571 (Print) ISSN 2411-4073 (online)
European Journal of Economics
and Business Studies April 2018 Vol 4 No 1
144
Table no 1 Chi-Square Tests
Chi-Square Tests
Value df
Asy mp. Sig.
(2-sided)
Ex act Sig.
(2-sided)
Ex act Sig.
(1-sided)
Pearson Chi-Square 1.521a 1 .217 Continuity Correctionb .935 1 .333
Likelihood Ratio 1.530 1 .216
Fisher's Exact Test .289 .167
Linear-by -Linear Association 1.495 1 .222
N of Valid Cases 87
References
[1] http://w ww.who.int/mediacentre/factsheets/fs381/en/2016. [2] Karel, M. J., Gatz, M., Smyer, M. (2012). Aging and mental health in the decade ahead: What psychologists need to
know ? American Psychologist. Vol. 67 (184-198).
[3] World Health Organization (2001). The World Health Report 2001. Mental Health: New Understanding, New Hope. Genev a: WHO.
[4] Goldberg, D. & Hux ley, P. (1992). Common Mental Disorders: A Biosocial Model. London: Tavistock/Routledge. [5] American Psychiatric Association. (2013). DSM-5 diagnostic classification. In: Diagnostic and Statistical Manual of
Mental Disorders DSM-5. 5th ed. Arlington, Va.: http://www.psychiatryonline.org. 2015. [6] World Health Organization (WHO). The ICD-10 Classification of Mental and Behavioral Disorders: Clinical Descriptions
and Diagnostic Guidelines. Geneva: World Health Organization; 1992. [7] Roy al Roy al College of Psy chiatrists (2014). Depression in Older Adults. [online] Av ailable at:
http://w ww.rcpsych.ac.uk/healthadvice/ problemsdisorders/depressioninolderadults.aspx [Accessed Aug. 2015]. [8] Health and Social Care Information Centre, (2007). Health Surv ey for England, 2005: Health of Older People. [online]
Av ailable at: http://www. hscic.gov.uk/pubs/hse05olderpeople [Accessed 14 Sep. 2015]. [9] Smy th, C, (2014). Depression in old age ‘is the nex t big health crisis’. The Times. [on line] Av ailable at:
http://w ww.thetimes.co.uk/tto/health/news/ article4057224.ece [Accessed 15 Sep. 2015]. [10] Inouy e SK. (1999) Predisposing and precipitating factors for delirium in hospitalized older patients. Dementia & Geriatric
Cognitiv e Disorders, 10, pp. 393–400. [11] Siddiqi N., House, A.O., Holmes J.D. (2006). Occurrence and outcome of delirium in medical in-patients: a systematic
literature rev iew . Age Ageing, 35(4), pp. 350-364. [12] Beaumont, J., Loft, H. (2013). Measuring National Well-being: Health, 2013. London: Office for National Statistics. [13] Prince M, Albanese E, Guerchet M, Prina M. (2014). World Alzheimer’s Report, Dementia and Risk Reduction - An
analy sis of protective and modifiable factors. London, England: Alzheimer’s Disease International. [14] Prince M, Albanese E, Guerchet M, Prina M. (2014). World Alzheimer’s Report, Dementia and Risk Reduction - An
analy sis of protective and modifiable factors. London, England: Alzheimer ’s disease International. [15] Prince M, Knapp M, Guerchet M, McCrone P, Prina M, Comas-Herrera A, Wittenberg R, Adelaja B, Hu B, King D, Rehill
A, Salimkumar D . (2014). Dementia UK: The Second Edition. London: Alzheimer’s Society. [16] U.S. Department of Health and Human Serv ices (1999). Older Adults and Mental Health. In: Mental Health: A Report of
the Surgeon General. Available at: http://www.surgeongeneral.gov/library/mentalhealth/chapter5/sec1.html (accessed June 10, 2008).
[17] Web-based Injury Statistics and Query Reporting System (WISQARS) (Online). National Center for Injury Prevention and Control, Centers for Disease Control and Prevention (producer). Available at: http://www.cdc.gov/ncipc/wisqars/
(accessed June 10, 2008). [18] Maria Carmen Viana; Laura Helena Andrade. Lifetime Prevalence, age and gender distribution and age-of-onset of
psy chiatric disorders in the São Paulo Metropolitan Area, Brazil: results from the São Paulo Megacity Mental Health surv ey. Rev ista Brasileira de Psiquiatria. v ol. 34 no. 3 Oct. 2012. ISSN 1516-4446.
http://dx .doi.org/10.1016/j.rbp.2012.03.001 [19] w ww.who.int/healthinfo/global.../GHE_DALY_Global_2000_2012. Përllogaritjet Globale të Shëndetit (2014). Tabelat
Përmbledhëse: DALY sipas shkakut, moshës dhe gjinisë, nga Rajoni i OBSH-së, 2000-2012. [20] Patel, V., Kirkwood, B. R., Pednekar, S., et al (2006). Gender disadvantage and reproductive health risk factors for
common mental disorder in women: a community survey in India. Archives of General Psychiatry, 63, 404– 413. [21] Hollingshead, A. B. & Redlich, F. C. (1958). Social Class and Mental Illness: A Community Study. New York: John
Wiley .
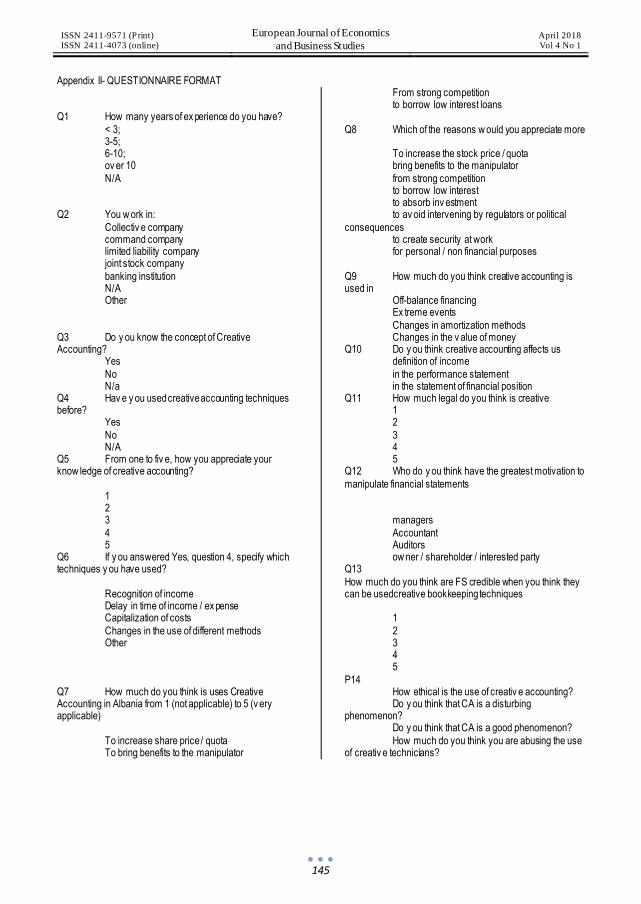
ISSN 2411-9571 (Print) ISSN 2411-4073 (online)
European Journal of Economics
and Business Studies April 2018 Vol 4 No 1
145
Appendix II- QUESTIONNAIRE FORMAT Q1 How many years of ex perience do you have?
< 3; 3-5; 6-10; ov er 10
N/A Q2 You w ork in:
Collectiv e company command company limited liability company joint stock company
banking institution N/A Other
Q3 Do y ou know the concept of Creative Accounting? Yes
No N/a Q4 Hav e y ou used creative accounting techniques before? Yes
No N/A Q5 From one to fiv e, how you appreciate your know ledge of creative accounting?
1 2 3
4 5 Q6 If y ou answered Yes, question 4, specify which techniques y ou have used?
Recognition of income Delay in time of income / ex pense Capitalization of costs
Changes in the use of different methods Other
Q7 How much do you think is uses Creative Accounting in Albania from 1 (not applicable) to 5 (v ery applicable)
To increase share price / quota To bring benefits to the manipulator
From strong competition to borrow low interest loans
Q8 Which of the reasons w ould you appreciate more To increase the stock price / quota bring benefits to the manipulator
from strong competition to borrow low interest to absorb inv estment to av oid intervening by regulators or political
consequences to create security at work for personal / non financial purposes
Q9 How much do you think creative accounting is used in Off-balance financing Ex treme events
Changes in amortization methods Changes in the v alue of money Q10 Do y ou think creative accounting affects us definition of income
in the performance statement in the statement of financial position Q11 How much legal do you think is creative 1 2
3 4 5 Q12 Who do y ou think have the greatest motivation to
manipulate financial statements managers
Accountant Auditors ow ner / shareholder / interested party Q13
How much do you think are FS credible when you think they can be usedcreative bookkeeping techniques 1
2 3 4 5
P14 How ethical is the use of creativ e accounting? Do y ou think that CA is a disturbing phenomenon? Do y ou think that CA is a good phenomenon?
How much do you think you are abusing the use of creativ e technicians?

ISSN 2411-9571 (Print) ISSN 2411-4073 (online)
European Journal of Economics
and Business Studies April 2018 Vol 4 No 1
146
DOI: 10.26417/ejes.v4i1.p146-149
Open Access. © 2018 Tinatin Medzmariashvili. This is an open access article licensed under the
Creative Commons Attribution-NonCommercial-NoDerivs 4.0 License
State Procurement Electronic System Efficiency in Georgia
Tinatin Medzmariashvili
PHD student of Ivane Javakhishv ili Tbilisi State University , Faculty of Economics and Business
Abstract
State procurement has significant strategic importance for Georgia, while it serves the rational expenditure of the state funds and the creation of a transparent competitive environment for the state and the business sector. In the last few years, the development of electronic technologies have formulated united state procurement electronic system. State financial resource spending requires business correspondence based on a single electronic system, which facilitates the acquisition of the buyer and the supplier openly , easily and without any unnecessary restrictions. Electronic system elaboration ensures maximal transparency of procurement procedures and rational spending of the state financial resources. Furthermore, increases competition among the bidders participating in the tender and raises public awareness. E-procurement system increases efficiency of the procurement processes, through saving purchaser’s and potential supplier’s financial, human and time-consuming resources. Besides, the tender procedures are transparent and easy to understand for any person interested in it.It is effective and efficient for any country to use the state procurement electronic system, as it prov ides transparent procedures and eliminates competition restrictions, corruption and discrimination risks.
Keywords: State procurement, Electronic system, tenders, procurement procedures.
Introduction
State procurement – this is the procurement of any goods, serv ice and civ il works by procurement organization with the means belonging to the state (or equalized) (Khodeli, Broladze, Julakidze, 2014, p. 57). State procurements represent one of the most important fields and 12% of entire domestic product comes to it (State Procurement Agency, 2017, p. 2). Respectively , the greatest importance is given to rational spending of state financial resources, maximally transparent supply of information to the society and healthy development in the field of state procurement, establishment of fair and non discriminative environment. It is important that the field of state procurement works in order as for state as well as for private sector. Despites the fact that it is particularly actually to make rational and purposeful spending of state means, for the country it is important to have the increase of small and middle business involvement in state procurements, development of competition in private sector which in its turn prov ides the growth of their incomes. For today the state procurement are presented only as the instrument of economic regulation and not the means for prov iding state necessities and serve the increase of competitive advantages (ШАБУРИШВИЛИ, 2016, p. 139).
Role of Informative Technologies in State Procurement
In modern world daily the importance of information technologies are being increased, in private as well as state sector. The crucial changes in the field of state procurements of Georgia are associated with exactly the information technologies. State procurements comprise the important part of entire domestic product and serve the rational spending of state means and creation of transparent – competitive environment for state as well as business sector. It has to prov ide maximum protection of procurement organization and society through the way of publicity , rationality , equality , responsibility and increase of effectiveness (Gaprindashvili, 2012, p. 91). When proceeding state procurements during recent period particular place is occupied by the establishment of modern information technologies and electronic system. Special importance in information society is given to the effective usage of monetary resources being under the ownership of budget-fun ded organizations and physical entities, establishment of such contacts between customer and suppliers, during which on the
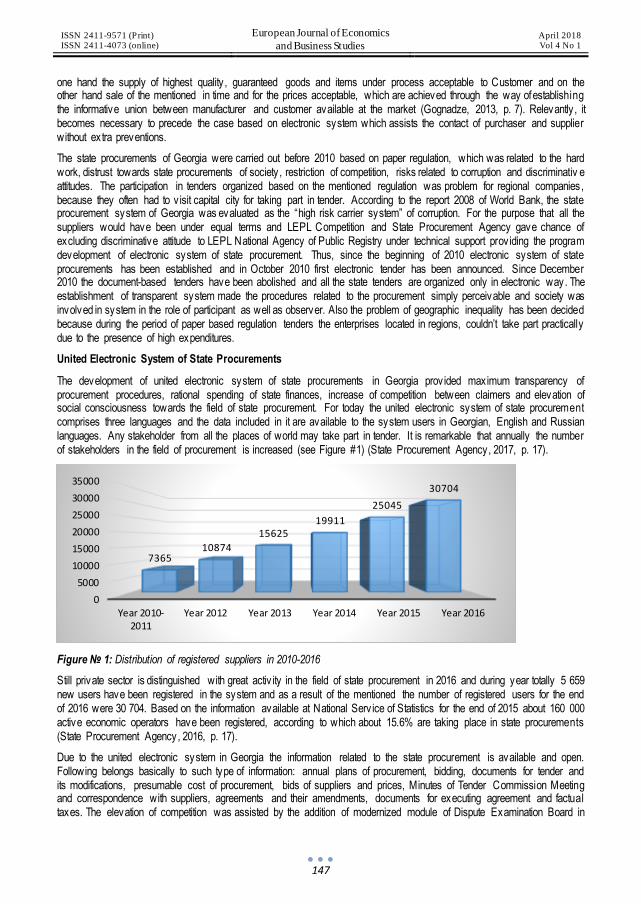
ISSN 2411-9571 (Print) ISSN 2411-4073 (online)
European Journal of Economics
and Business Studies April 2018 Vol 4 No 1
147
one hand the supply of highest quality , guaranteed goods and items under process acceptable to Customer and on the other hand sale of the mentioned in time and for the prices acceptable, which are achieved through the way of establishing the informative union between manufacturer and customer available at the market (Gognadze, 2013, p. 7). Relevantly , it becomes necessary to precede the case based on electronic system which assists the contact of purchaser and supplier without extra preventions.
The state procurements of Georgia were carried out before 2010 based on paper regulation, which was related to the hard work, distrust towards state procurements of society , restriction of competition, risks related to corruption and discriminativ e attitudes. The participation in tenders organized based on the mentioned regulation was problem for regional companies, because they often had to v isit capital city for taking part in tender. According to the report 2008 of World Bank, the state procurement system of Georgia was evaluated as the “high risk carrier system” of corruption. For the purpose that all the suppliers would have been under equal terms and LEPL Competition and State Procurement Agency gave chance of excluding discriminative attitude to LEPL National Agency of Public Registry under technical support prov iding the program development of electronic system of state procurement. Thus, since the beginning of 2010 electronic system of state procurements has been established and in October 2010 first electronic tender has been announced. Since December 2010 the document-based tenders have been abolished and all the state tenders are organized only in electronic way. The establishment of transparent system made the procedures related to the procurement simply perceivable and society was involved in system in the role of participant as well as observer. Also the problem of geographic inequality has been decided because during the period of paper based regulation tenders the enterprises located in regions, couldn’t take part practically due to the presence of high expenditures.
United Electronic System of State Procurements
The development of united electronic system of state procurements in Georgia prov ided maximum transparency of procurement procedures, rational spending of state finances, increase of competition between claimers and elevation of social consciousness towards the field of state procurement. For today the united electronic system of state procurement comprises three languages and the data included in it are available to the system users in Georgian, English and Russian languages. Any stakeholder from all the places of world may take part in tender. It is remarkable that annually the number of stakeholders in the field of procurement is increased (see Figure #1) (State Procurement Agency, 2017, p. 17).
Figure № 1: Distribution of registered suppliers in 2010-2016
Still private sector is distinguished with great activ ity in the field of state procurement in 2016 and during year totally 5 659 new users have been registered in the system and as a result of the mentioned the number of registered users for the end of 2016 were 30 704. Based on the information available at National Serv ice of Statistics for the end of 2015 about 160 000 active economic operators have been registered, according to which about 15.6% are taking place in state procurements (State Procurement Agency, 2016, p. 17).
Due to the united electronic system in Georgia the information related to the state procurement is available and open. Following belongs basically to such type of information: annual plans of procurement, bidding, documents for tender and its modifications, presumable cost of procurement, bids of suppliers and prices, Minutes of Tender Commission Meeting and correspondence with suppliers, agreements and their amendments, documents for executing agreement and factual taxes. The elevation of competition was assisted by the addition of modernized module of Dispute Examination Board in
0
5000
10000
15000
20000
25000
30000
35000
Year 2010-2011
Year 2012 Year 2013 Year 2014 Year 2015 Year 2016
736510874
1562519911
25045
30704

ISSN 2411-9571 (Print) ISSN 2411-4073 (online)
European Journal of Economics
and Business Studies April 2018 Vol 4 No 1
148
electronic system, made the procedure of appealing tender more simplified and any stakeholder registered as “supplier” in system may appeal the bids at Board and claimer who directly takes part in decisions/activ ity of tender/competition if it is considered that the regulations have been infringed under law and/or relevant normative acts and/or its rights have been humiliated.
While reforming the public procurements system the priorities and the demands were defined, which shouls have been meet by the legislative amendements for the private and public sectors (Gaprindashvili, 2015, p. 955). The establishment of united electronic system has significantly increased the indicator of involvement of private sector in state procurements. Also from the side of procurement organizations the number of tenders announced has been increased and in 2011 the quantitative indicator of electronic tenders exceeds 14 times the volume of tenders paper-based (see Figure #2) (State Procurement Agency, 2018).
Figure № 2: Distribution of Paper and Electronic Tenders in 2010-2016
191 487 127 GEL has been saved from the budget during 2011 through united electronic system of state procurement (Competition and State Procurement Agency, 2012, p. 17), in 2012 – 155 610 107 (Competition and State Procurement Agency, 2013, p. 18), in 2013 – 231 062 588 (Competition and State Procurement Agency, 2014, p. 10), and in 2014 – 241 132 563 GEL (State Procurement Agency, 2015, p. 10.), in 2015 – 299 704 216 GEL (State Procurement Agency, 2016, p. 10), in 2016 – 278 435 040 GEL (State Procurement Agency, 2017, p. 12). This represents significant sav ing for state budget (see Figure #3).
Figure № 3: Distribution of Budget Savings in 2011-2016
It is remarkable that state procurements represent one of the most important fields for any country . The government has to create the terms optimal for the establishment – development of business: prov ide political, economic and social stability in the country . Special attention has to be given to the development of healthy competition between the stakeholder through the state procurements which in its turn prov ides the rational spending of state means and maximum usage of own possibilities by the companies (Shaburishv ili, Medzmariashvili, 2017, p. 258). The government has to create the competitiv e environment and prov ide the field of state procurement through organized legal basis.
year 2010 Paper Tenders 2375
year 2011 Electronic Tenders 33598
year 2012 Electronic Tenders 29180
year 2013 Electronic Tenders 29225
year 2014 Electronic Tenders 31303
year 2015 Electronic Tenders 37571
year 2016 Electronic Tenders 39085
0
50,000,000
100,000,000
150,000,000
200,000,000
250,000,000
300,000,000
350,000,000
year 2011 year 2012 year 2013 year 2014 year 2015 year 2016
ISSN 2411-9571 (Print) ISSN 2411-4073 (online)
European Journal of Economics
and Business Studies April 2018 Vol 4 No 1
149
Electronic system prov ides not only the simple transactions at the duration stage of tender, this gives possibility to use the information available in the system for making business processes more refined. The procurement organizations have possibilities to examine the tenders organized by other organizations and consider the information obtained when executing own tenders. Also system gives suppliers chance to study the requirements of state sector and further consider this when processing business. The electronic system of procurement is effective not only for the companies taking part in it, but for state institutions as well, because all the procedures starting with apply ing the applications of companies and evaluating their technical data and ended up with offering process and paying, takes place subject to electronic system. As a result, time necessary for procedures has significantly decreased and also problems will be less (Transparency International Georgia, 2013, p. 5). Also, representatives of private sector through the schedules presented in advance by procurement organizations gives representatives of private sector plan the own activ ity during year.
Conclusion
Thus, all in all, modern information technologies assisted the development of state procurement system of Georgia. The electronic procurement system increased the effectiveness of procurement process and for today is saved, as financial, human and time resources of potential supplier organizations. Also, it assisted the publicity of process, elevation of trust towards the society , increase of healthy competition and what is most important rational spending of monetary means designed for state procurement. The increasing stage of LEPL “State Procurement Agency” gives the possibility to express the presumption of making united electronic system of state procurement more refined and more perfect. The policy of state procurement in Georgia prov ides the rational, reasonable and transparent spending of state financial resources. Despites, it significantly increases the level of competition in private sector and prov ides the maximum involvement of business subjects.
The united electronic system of state procurement prov ided the elevation of trust towards society and made transparent the mechanism for spending state financial resources. The electronization of procurement processes made the participation in tenders non bureaucratic and transparent. For today all the stakeholders may in shortest period search for the information if whether procurer executes the procurement of which item and of what type. The mentioned decrease the risks of corruption and creates fair env ironment. At this stage the united electronic system of state procurement is being refined and modified, which in future prov ides the perfection of processes related to the state procurements.
References
[1] Competition and State Procurement Agency. (2012). Competition and State Procurement Agency Annual Report 2011. Tbilisi.
[2] Competition and State Procurement Agency. (2013). Competition and State Procurement Agency Annual Report 2012. Tbilisi.
[3] Competition and State Procurement Agency. (2014). Competition and State Procurement Agency Annual Report 2013. Tbilisi.
[4] Gaprindashv ili G. (2012). State Procurement Policy, Reforms and Resultes in Georgia. ECONOMICS AND BUSINESS, 91-
96.
[5] Gaprindashv ili G. (2015). Public Procurement Development Stages in Georgia. International Journal of Social, Behavioral, Educational and Management Engineering Vol:9 N3, 955-958.
[6] Gognadze g. (2013). Organization of state procurement management Using internet technologies. Tbilisi: Dissertation.
[7] Khodeli g, Broladze z, Julakidze sh,. (2014). Public finances and property Management Guide. Tbilisi: Democratic Governance in Georgia (G3) Program.
[8] Shaburishv ili sh, Medzmariashvili T,. (2017). Competiton Regulation Methods in the State Procurement Sy stem of Georgia. The First International Scholarly and Practical Conference Competition Policy: Contemporary Trends and Challenges, (pp. 255-259). Tbilisi.
[9] State Procurement Agency. (2015). State Procurement Agency Annual Report 2014. Tbilisi.
[10] State Procurement Agency. (2016). State Procurement Agency Annual Report 2015. Tbilisi.
[11] State Procurement Agency. (2017). State Procurement Agency Annual Report 2016. Tbilisi.
[12] State Procurement Agency. (2018, February). www.tenders.procurement.gov.ge. Retrieved from www.procurement.gov.ge.
[13] State Procurement Agency Annual Report 2016. (2017). Tbilisi.
[14] Transparency International Georgia. (2013). Georgias' Public Procurement System. Tbilisi.
[15] ШАБУРИШВИЛИ Ш.Т. (2016). ГОСУДАРСТВЕННЫЕ ЗАКУПКИ КАК ИНСТРУМЕНТ ПОВЫШЕНИЯ КОНКУРЕНТНЫХ ПРЕИМУЩЕСТВ НАЦИОНАЛЬНОЙ ЭКОНОМИКИ. МАТЕРІАЛИ ІІІ Міжнародної нау ково-практичної конференції, присвяченої 25-річчю Маріупольського державного університету, (pp. 139-140). Маріуполь.

ISSN 2411-9571 (Print) ISSN 2411-4073 (online)
European Journal of Economics
and Business Studies April 2018 Vol 4 No 1
150
DOI: 10.26417/ejes.v4i1.p150-155
Open Access. © 2018 Tatiana Pîşchina and Romeo Fortuna. This is an open access article licensed under the
Creative Commons Attribution-NonCommercial-NoDerivs 4.0 License
Economic Growth Though Competitive Advantage and Specialization: The Example of Winemaking in Moldova
Prof. Dr. Tatiana Pîşchina
ASEM
Romeo Fortuna
Abstract
This article addresses growth through economic specialization based on completive advantage. Winemaking is one of the key branches of Moldova’s economy, which stands for about 20 percent of Moldova’s GDP. It has high potential in terms of contribution to qualitative economic growth. About 90 percent of Moldovan wine is intended for export to countries like Great Britain, Germany, Czech Republic, Poland, Greece, Scandinavia, US, Japan and China, and only 10 percent for local consumption. Winemaking is one of Moldova’s specialties, which enjoys long-lived traditions and v iv id history of Moldova’s wineries, including Milesti Mici registered in 2005 as world’s biggest winery by Guinness World Records. The concept of this study suggests that economic growth must be induced through competitive areas of specialization, which are present in any economy. Substantial investments are required to develop those areas. Structurally , winemaking branch in Moldova is comprised of small and medium enterprises flex ible and open to innovation, which is a strong prerequisite to develop those areas into drivers of economic growth eventually resulting into new jobs, higher export, higher GDP, better liv ing conditions. Winemaking alone cannot be the answer to Moldova’s economic problem. Yet, this study highlights the importance of focusing on competitive advantage and specialized growth to create qualitative internally -driven economic growth, particularly important for nations struggling within current socio-economic affairs.
Keywords: Economic Growth, Competitive, Advantage, Specialization, Winemaking, Moldova
Introduction
Competitive Advantage and Specialization
The character and implications of globalization to the modern world, as well as its controversy (Birdsall, 2006; Stiglitz, 2012; Lenzner, 2011) require a fresh approach of economic growth particularly when it comes to developing nations. Such economies are in constant balancing act between national interests supported by the national authorities, on the one hand, and the international perspective carried by such organizations as World Trade Organization, International Monetary Fund, World Bank and others. Balancing of economic interests concerns such areas as structural priorities between various branches of the economy, as well as economic specialization. Specialization policy, in its turn, defines the effectiveness of production allocation between industries and various branches of the economy and other financial activ ities, therefore, affects economic growth and optimization of development potential in context of opportunities and pressures posed by globalization (Pischina, 2007, p.81). Wise specialization decisions should be balanced through the principles of comparativ e advantage, the principles which theoretically define basic dimensions and logic of specialization (Porter, 1985). As the result, specialization can contribute to the effectiveness and increases in productiv ity , to the optimization of balance of payments, and finally to the competitiveness of national economy . Slow pace of economic growth is often explained by insufficient participation in international trade. The theory of comparative advantage states that national consumption can be boosted not only by means of expanding or strengthening the internal factors, but also though participation in international trade and specialization within international div ision of labor, which expands the boundaries of national

ISSN 2411-9571 (Print) ISSN 2411-4073 (online)
European Journal of Economics
and Business Studies April 2018 Vol 4 No 1
151
production capacities. Thus, the policy of concentration on the industries and products that form competitive advantage of a nation positively contributes to the structure of the demand, the structure of external trade and production factors of the trading partners, and finally , to the rate of economic growth.
Economic effectiveness with which indiv idual nations are able to produce various goods is changing overtime. Movements in allocation of resources and technologies lead to the movements in specialization, and therefore, to changes in relative effectiveness of production of indiv idual economies. For instance, innovation in research development and production of synthetic fibre and artificial rubber radically altered the structure of production resources whereby increasing relative manufacturing effectiveness of those products and goods produced on their basis.
It is generally accepted that the more a factor is specialized (concentrated) in export production, the more it benefits from foreign trade. Conversely , the higher the share of the factor in the products competing with imports, the more it loses in trade. It is also believed that owners of neutral factors (approx imately equally represented in both export and import substitution industries) generally benefit from foreign trade, as the country 's aggregate gain from foreign trade is accompanied by an expansion in demand for these factors, especially if they can move between the sectors of the economy.
Modern economists largely modify the classical theory. The theory of factors forms the basis for quantitativ e models and schematics of comparative costs, carried out in the works of Clement and Springerborg (2001), Clement and Skocpol (1979), as well as P. Elsworth, C. Kindleberner, J. Mide, R. Harrod and others. According to their theories, international trade is based on rational mutually beneficial principles profitable for all participating actors. Perhaps true for the developed economies, the same is not necessarily applicable to their developing counterparts. Developing and developed nations are usually characterized by major differences in the liv ing standards, as well as effectiveness in production and labour. Conditional upon those differences, the benefits of foreign trade for the developed economies increases, whilst profitabili ty gains on import of the developing ones are usually limited, coupled with the fact that foreign debt for those trading partners usually increases.
Thus, developing economies should be specifically careful to observe and exploit their own national specific advantages. This means that the goals and gains from specialization directly relate to the abilities and limitations defined by the national peculiarities, the level of its economic development, as well as its socio-economic policies. In addition, regional component helps to identify both strengths and weaknesses of the national economy, and to define economic branches that may have competitive advantages.
A relatively small number of market economy laws operate in specific or somewhat peculiar economic circumstances unusual for the economic behavior in which they normally apply , especially in conditions of uncertainty of indiv idual economies in transition, showing new, prev iously unknown properties. Thus, the approach to growth creation and structural transformations for the developing nations must be designed carefully , and somewhat differently , in order to avoid creating economic structures harmful and often incompatible with the peculiarities of a given society and economy. Similar aspects were described in-depth in several papers by the author (Pischina, 2001, 2007, 2007a).
For the developing nations, it is important to take into account the principles of an integrated, systemic approach. According to this principle, we propose to consider all processes, including specialization processes. Objectively , the economy of each country is part of a single global economy, which in its essence is a large closed planetary economy. The processes occurring in any part of this whole are interrelated, interdependent and affect each other and socio-economic interests of one another.
Economic strategy for developing countries must involve the definition of their niche in context of globalization that is based on reasonable considerations taking into account specialization and being able to ex ploit its advantages for obtaining certain benefits. Developing countries should learn how to effectively develop in conditions of international competitiveness, while preserv ing their uniqueness primarily in specialization of industrial and economic branches (Pischina, 2007, 2007a).
Specialization: The Example of Winemaking in Moldova
Winemaking is one of Moldova’s specialties, which enjoys long-lived traditions and v iv id history of Moldova’s wineries, including Milesti Mici registered in 2005 as world’s biggest winery by Guinness World Records. The concept of this study suggests that economic growth must be induced through competitive areas of specialization, which are present in any economy. The most important branches of the specialization of the Republic of Moldova are v iticulture and winemaking. This set of industries forms 20 percent of the gross domestic product (GDP) of the country . The Republic of Moldova is one of the 70 nations with sophisticated wine-growing and winemaking complex, and the only country in the world that exports

ISSN 2411-9571 (Print) ISSN 2411-4073 (online)
European Journal of Economics
and Business Studies April 2018 Vol 4 No 1
152
over 90 percent of the wines produced. Viticulture and winemaking have been the main activ ity of Moldovan population for many decades. According to the International Organization of Vine and Wine (OIV), the Republic of Moldova ranks 20th among the world's leading wine producers and as the 13th global wine exporter.
Table 1: Wine Production in the Main Producing Countries (excl. juice and musts), 2017
Source: OIV
In 2017, Moldovan wines were exported to 42 countries for almost $104 million, exceeding $93 million in 2015. Most wines from the Republic of Moldova were sold in Belarus (20 percent), as well as in China (9.5 percent), Romania (7.5 percent), followed by Russia, Ukraine Czech Republic. Moldovan wines won about 300 medals at international competitions, 60 percent out of which were gold.
From the 1960s to approx imately 1980s Moldova’s plantations of v ineyards and assortment of manufactured products expanded. At that time, Moldova was the main supplier of wines to USSR, when every second bottle of wine, and every third bottle of sparkling wine in the Soviet Union was produced in either in Moldova or using Moldovan wineries. In the heyday of winemaking industry , the territory covered with v ineyards in Moldova was more than 220 thousand hectares, where roughly 1.1 million tons of grapes were harvested, and more than 42 million hectoliters of wine were produced (Wine-making and Viticulture, 2017).
In the mid-1980s, Moldova’s winemaking industry experienced a rough period under the so-called ‘dry law’ as part of the national fight against the addiction to alcohol. Dozens of hectares of grapevine, as well as valuable wine, were destroyed in that period. Production areas were reduced more than 3 times, and priceless stocks of wine, crops and winemaking technologies were destroyed. Handling of the matter by the authorities resulted more or less into a national tragedy, encompassing cultural, but most importantly economic damage from conglomerates to single households whose income was in producing and selling wine (Wine-making and Viticulture, 2017).
Today the total area of v ineyards in Moldova is 147 thousand hectares, including 113 thousand hectares of commodity plantations. Over 95 percent are privately owned. Currently , Moldovan winemakers produce over a hundred of various types of grapes, covering the European varieties to about 70 percent, Caucasian varieties to about 14 percent, as well as local varieties of about 16 percent. In 2017, Moldova produced 8 million hectoliters of wine, which is 20 percent increase over 2016, that is while the global wine production trend is negative, as seen in the Table 2 below.

ISSN 2411-9571 (Print) ISSN 2411-4073 (online)
European Journal of Economics
and Business Studies April 2018 Vol 4 No 1
153
Table 2: Trends in Global Wine Production
Source: OIV
International Vine and Wine Organization (OIV) notes that global wine production decreased by 8.2 percent in 2017, reaching 246.7 million hectoliters, the lowest level since 1961. The global decline in wine production is caused by various factors, including unfavorable weather conditions in three major wine producers in Europe: Italy , France and Spain. According to the estimates of OIV, Italy 's production decreased by 23 percent to 39.3 million hectoliters, France's productio n decreased by 19 percent to 36.7 million hectoliters, and in Spain - by 15 percent to 33.5 million hectoliters. The statistics , however, exclude China, which is the 7th global winemaker.
In 2002, Moldovan government adopted the Program for the Restoration and Development of Viticulture and Winemaking for 2002 - 2020 (Government Decision No. 1313 of 07.10.2002), with the aim to strengthen and integrate v iticulture and winemaking. The initiative helped to start rev italizing the industry and the branch of winemaking. Many winemaking enterprises emerged, investing not only in modern technologies and equipment, but also in planting v ineyards, helping to form an agro-industrial winery complex – cluster. The rebirth of winemaking started to positively affect the economy as a whole. In this way, small and medium-sized enterprises emerged as the driv ing force behind the development of the winemaking cluster, as well as the entire economy of the Republic of Moldova. Those often family -owned companies support and develop the traditions of v iticulture and winemaking, and also are among the main generators of job-creating and subsequently economic growth.
Small enterprises have certain advantages in comparison with the large ones. For example, they are less inert compared to large enterprises, more adaptive to innovative technologies. In a market characterized by intense competition, small and medium-sized enterprises are quickly adaptable and able to respond in a more flex ible way to structural, market and economic changes. However, small and medium-sized enterprises have their vulnerabilities. They are at risk of financial strain, shortage of production capacities, and relatively small research base. Yet, not only in Moldova, but globally , small businesses are at the forefront of the wine industry , combining innovations w ith tradition. For example, in France, small to medium sector accounts for half of annual wine production, 54 percent of v ineyards and 77 percent of permanent workers. That is to say, in Europe, 210 thousand small wineries united in national associations, which formed the European Confederation of Independent Wine-Growers (CEVI). In Australia and New Zealand, 80 percent of all wine producers are small. Among them there are many enterprises producing organic wines. Their role is not only in promoting wine, w ine tourism and other activ ities associated with winemaking, but also in creating jobs. Thus, the role of such enterprises in the total economy, especially a developing economy like Moldova, cannot be overestimated. Nevertheless, the amount of small wine producers in Moldova is still relatively small.
Challenges of Moldova’s Wine-making Cluster
The EU regulatory framework assumes a definition of small wine producers with the criterion being the volume of production (on average 1000 hectoliters per year). In most winemaking economies special legal norms have been established to support small wine producers. General rules have been adopted to ensure fair competition in the industry . Taxation and

ISSN 2411-9571 (Print) ISSN 2411-4073 (online)
European Journal of Economics
and Business Studies April 2018 Vol 4 No 1
154
the licensing costs are reduced, registration is simplified, and subventions and special funds for promotion are established. Similarly , in the United States, taxation for the small enterprises that produce less than 250 thousand gallons (950 thousand liters) is normally reduced. In Slovenia, an enterprise that has no more than 1 hectare of v ineyards and produces less than 80 hectoliters of wine per year is considered small. The amount of sanctions for various v iolations depends on the manufacturer's category, and promotion subventions for small and medium-sized wineries reach 52 thousand euros per year for three consecutive years (MSWPA, 2010).
Unfortunately , Moldova’s legislation does not assume a separate regulation supporting small enterprises and does not contain differences for small wineries. In general, the legal framework presents many obstacles. On the one hand, for over five year, the state allocated partial compensations for the planting of v ineyards (including involv ing small enterprises in the process), but on the other hand it did not prov ide their owners with formal opportunity to produce and sell wines made from the crops grown on these plantations. Nevertheless, small wineries are carriers of tradition and quality . They form a real potential, which should be both supported and exploited.
In particular, small wineries find it difficult financially to fulfill the conditions for obtaining a license. The cost of the license for all wineries in Moldova is the same, standing for 20 thousand lei per year (the amount is one of the largest in the world), which contradicts the principles of fair competition. The conditions include owning own warehouse with an area of at least 500 square meters with fully digitalized accounting system (often the area of the whole enterprise is smaller) and own production capacities, including equipment for processing wines with cold, heat, filters, bottling line, laboratory with licensed personnel, trade-marks, labels approved for the respective product range. In general, most mandatory requirements are irrelevant in conditions of market economy. In many European economies, such as France, Spain, Italy , Austria, smaller winemakers in particular do not need a license for wine production. In Australia and New Zealand the license is only needed for export. Instead, other regulation models are used for registration in the wine-growing and winemaking industry , for instance, through the obligation to register plantations in the Vineyard Cadaster and wine production in the Register of Wine Producers.
Small producers are exposed to greater risks, not only financial, but also in terms of exposures, such as to climate conditions. In order to support smaller enterprises so important for economic growth, the state must share the risk and minimize exposure.
Moldovan winemaking is very attractive for potential foreign investors. A significant number of projects are being implemented in this particular industry branch. Every year the total number of wineries in the Republic grows, increasing from 120 in 2002 to 165. New plants are created not only with the help of companies and their external trading partners, but also attracting loans from both Moldovan and foreign banks and funds. Investors from France, Germany, Russia, the Netherlands, Belgium and the US recognize the potential of the wine industry of the Republic of Moldova and establish joint ventures with local companies.
Presently , Moldova’s winemaking industry is focused on the efforts of the dedicated specialists, the enterprises and the state as a whole on the new v ineyards, on control of the quality of raw materials, training of the specialists in line with modern production technologies, while acquisition and application of modern equipment takes place.
Moldova, which is part of the WTO, has all relevant laws regulating the activ ities of the industry . The wine is produced in conjunction with the European classification: high quality with a name reflecting duly controlled place of origin (VDO) and (VDOC). Moldova's wines are known in the CIS countries, as well as in the Baltic States, England, Ireland, Germany, Holland, Israel and other countries. As already mentioned, about 90 percent of wine production is intended for export, and only 10 percent is sold on the domestic market. The volume of exports in recent years is estimated at 1.3 to 2 billion lei (90-150 million US dollars). However, the Republic of Moldova has not yet managed to reach its pre-economic crisis sales volumes.
Objectively , the potential of the Republic of Moldova to develop v iticulture and winemaking and to improve the quality of the wine to the level of highest global standards is quite large. In case of winemaking industry unique in its organizational structure, investments are needed in innovation of technology supporting wineries, crops, tools, in other words, the entire value chain to achieve highest quality of the end product at relevant profitability . Structurally , winemaking branch in Moldova is comprised of small and medium enterprises, which are flex ible and open to innovation, which is a strong prerequisite to develop those areas into drivers of economic growth eventually resulting into new jobs, higher export, higher GDP, better liv ing conditions. The activ ities associated with attracting the investments, the emergence of new plants and modernization of the old ones, with an emphasis on increasing the share of production of high-quality wines, will not only increase export volumes, but can also help conquer new markets and occupy new price positions. In addition, wine tourism, including winery tours and promotion of Moldovan wine in conjunction with other events will help to raise the image of Moldova as a country in general.
ISSN 2411-9571 (Print) ISSN 2411-4073 (online)
European Journal of Economics
and Business Studies April 2018 Vol 4 No 1
155
Conclusion
Specialization is a powerful tool for solv ing social, economic, env ironmental and energy security problems, as well as demographic changes, and limitations though natural resources. For the Republic of Moldova, it is an opportunity to strengthen the economy, which will allow Moldovan companies to compete internationally . Conversely , Moldova may continue its journey as a weak economy, and exporter of cheap highly qualified labor that the country itself is unable to take advantage of. Therefore, it is absolutely crucial to create common focus on exploitation of competitive advantages and specialization of the economy, at the same time supporting small and medium size enterprises to carry out activ ities building up to long-term economic growth.
In order to develop socio-economic potential of the nation, it is necessary to identify and use supporting mechanisms to reorient the production structure to specialization areas and to the international markets. This study highlights the importance of focusing on competitive advantage and specialized growth to create qualitative internally -driven economic growth, particularly important for nations struggling within current socio-economic affairs. As for specialization, winemaking is one important area the Republic of Moldova is known for. It is necessary for Moldova to focus specifically on realizing its competitive advantages, developing and strengthening traditional branches of specialization, in particular, v iticulture and winemaking, to which its international partners can certainly contribute through investments and various partnerships. Implementation must be supported by the state, as only common effort will allow the tradition of winemaking to turn into profitable business.
The European Union, as one of Moldova’s crucial trading partners, should more actively support initiatives aimed at the existing and the new businesses due to the benefit for the citizens of the Republic of Moldova and to the European community as a whole that those businesses will create. Winemaking alone cannot be the answer to Moldova’s economic problem. Specialization and support for small and medium businesses operating across economic branches step by step would help reverse current negative trends of economic stagnation and brain drain. Investment and support must be prov ided in synergy between public and private sectors. Technology, human capital and financial and other highly profitable sectors remain crucial to address. Thus, the example of Moldova has broader relevance and is interesting for other developing economies, as well as for the representatives of international governmental and private sector organizations.
References:
[1] Birdsall, N. (2006). Rising inequality in the new global economy, International
[2] Journal of Development Issues, Vol. 5 Iss: 1, pp.1 – 9.
[3] Clement M., R. Springborg R., Globalization and the Politics of Development in the Middle East, Cambridge University Press, 2001.
[4] Clement M ., Skocpol T, States and social revolutions : a comparative analysis of France, Russia, and China, New York : Cambridge University Press, 1979.
[5] Lenzner, R. (2011). In Forbes. (Retrieved November 2016):
[6] http://www.forbes.com/sites/robertlenzner/2011/11/20/ the-top-0-1-of-the-nation-earn-half-of-all-capital-gains/Porter, Michael, E. (1985), Competitive Advantage: Creating and sustaining superior performance, NY: Free Press, 1985 (Republished with a new introduction, 1998).
[7] Pischina, T.V. (2001), Macroeconomics – Main Aspects of Transitional and Market Economy, Chisinau, Eurika Publishing, 2001.
[8] Pîşchina, T. V. (2007), Structural Economic Priorities in Time of Globalization: Methodologies, Principles, Experience (Teza de Dr. Habilitat în Economie cu titlu de manuscript C.Z.U.: 339.9(043.2)), Chisinau, 2007, 260 p.
[9] Pischina, T. (2007a). Problems And Mechanisms For Improv ing The Structure Of Foreign Trade In Context Of Strengthening Global Integration Processes. Chişinău, ASEM, Vol.1.pp.266-271.ISBN 978-9975-75-117-9.
[10] Stiglitz, J. E. (2012). The Price of Inequality , W. W. Norton & Company, 448 pp. ISBN 978-0-393-08869-4.
[11] MSWPA, Moldovan Small Wine Producers Association (2010), https://www.winemoldova.com/presses/v iew/2 accessed in January 2017.
[12] Wine-making and Viticulture, 2017, online article www. v inmoldova.md/index.php?mod=content&id=3 4 accessed in January 2017.
ISSN 2411-9571 (Print) ISSN 2411-4073 (online)
European Journal of Economics
and Business Studies April 2018 Vol 4 No 1
156
DOI: 10.26417/ejes.v4i1.p156-160
Open Access. © 2018 Sajitha Lakmali Hewapathirana and R.I.Batuwangala. This is an open access article licensed under the
Creative Commons Attribution-NonCommercial-NoDerivs 4.0 License
Oriental Cultural Values Depicted in Advertising; with Special Reference to Sri Lankan Context
Sajitha Lakmali Hewapathirana
Department of Mass Media , University of Colombo, Sri Lanka
R.I.Batuwangala
Department of Comparative Education , Zhejiang Normal University , China
Abstract
Since the terrorist menace that affected the country for over 30 years was eradicated, Sri Lanka entered into an era of rapid social and economic development. In this process, mass media can play a significance role. Therefore a need arises to study the role of Advertising media in the sphere of cultural development. The nature and development of the Sri Lankan advertising culture mostly depends on the form of oriental cultural values. Cultural dimension is an essential factor for understanding advertising environments. It can be defined as a learned system of knowledge, attitudes, behaviors, beliefs and norms, which are shared among a group of people from various nations or cultures. Sufficient emphasis has not yet been paid on the advertising culture, which is a significant component in the concept development and cultural processes of Sri Lanka. The advertising in oriental cultural values settings remains a relatively unexplored area of research across all disciplines, even that of media communications study. Therefore, the authors of this paper attempt to fill this lacuna. This study examines the effect of oriental cultural values for advertising culture in Sri Lanka. This research aims to foster cultivation of Sri Lankan cultural values through the concept development of advertising.
Keywords: Culture, Advertising, Oriental, Values, Beliefs
Introduction
Background
Advertising is a deeply pervasive and motivational part of all lives lived in consumerist economies. It competent to directly impact for the values of the culture While it reflects society to a certain degree, it also has the effect of ‘generalization ’ values or behaviors. First need to clear in this study the concept of “oriental”. One thrust is the perspective known as “Orientalism,” which focuses on the West’s perception of the “Orient” in the construction of its self-identity (Said, 1978). This perspective has undergone something of a reversal in the past two decades. The theory of orientalism, as a "discourse" in all its epistemological and methodological dimensions, has raised a storm of arguments. It has been criticized for the vagueness of terminology, the self contradictions in its theoretical system and the reinforcement of the binary opposition between the Occident and the Orient. (Said, 1978) However, for all the arguments of the so called post orientalism, orientalism still has a great impact on postmodernist studies and culture, which deals with transnational capitalism as well as Sri Lanka’s search for modernity . On one hand, oriental cultural ideologies and images have severely been used within the advertising industry in the country , celebrating Sri Lanka’s traditional history and culture. On the other hand, libertarian life sty les and values also seem to have used to address the needs of contemporary consumer culture. In this sense, the advertising industry symbolizes Sri Lanka’s deep anxiety and ambivalence toward its own cultural ideologies and materialis t culture of global capitalism.

ISSN 2411-9571 (Print) ISSN 2411-4073 (online)
European Journal of Economics
and Business Studies April 2018 Vol 4 No 1
157
Purpose of the study
In order to achieve above research aims the researchers looked into the following guide questions:
Examination of contemporary advertising approaches on Oriental Cultural Values Depicted in Advertising in Sri Lanka
Examination of working with cultural hegemony in advertising.
Documenting the specialties for an alternative oriental concept from the western concept
The purpose is to explore how the oriental cultural ideologies and values are being reproduced within the advertising industry in contemporary Sri Lanka. The research is conducted to obtain a better oriental cultural understanding of Sri Lanka. The foundation of the research is to understand different perspectives of oriental and west cultures.
The study will reveal noteworthy results of telev ision advertisements focused more on highlighting oriental cultural aspects in their advertisements. Furthermore the research will help to understand cross-cultural concepts of western and Asian advertising industry .
Limitation
The field of interest in research is regarding four major markets in Sri Lanka (banking, telecommunication, transportatio n, food & beverages) and selecting the two most famous advertisements in each category broadcast in telev ision media with consideration to the common audience who watch telev ision regularly .
Special in (Commercial credit , Lanka bell , Sunquick , TVS )
Problem Discussion
Cultural systems play a decisive role in the productions of social relations, while the economy only relays and shifts them in their reproduction (Baudrillard , 1975). Influencing the buyer’s preferences is culture as according to Geert Hofstede personal feelings and thinking patterns are much influenced by social env ironment where one grew up. The study mainly focuses on oriental cultural values depicted in advertisements in Sri Lankan context. The goal of this study is to find out how the oriental cultural ideologies and values are being reproduced within the advertising industry in contemporary Sri Lanka. The research is expected to contribute in prov iding new and useful information as it aims to represent the need of values as well as oriental perspective in the local advertising industry within the global capitalism.
Hypothesis
The advertising industry is basically driven by the idea of widening markets for selected products and serv ices. It makes use of cultural and traditional ideologies not to change the status quo but to manipulate consumer demand in an opportunistic manner. It is this inherent pragmatic characteristic within advertising industry that transforms it into an ideological apparatus of oriental culture perspective.
Theoretical concept
Brief view of Storytelling
Sri Lanka is categorized as a third world developing country in the world. It has not been developed a sophisticated culture of advertising in comparison to the West when considering the earliest approaches of the storytelling, which dealt with the ideology of oriental culture.
At the dawn of the 20th century, some French children made an incredible finding in the Pyrenees Mountains – drawings of extinct animals in caves. The 35,000-year-old paintings on the walls of the Lascaux Caves are the earliest recorded ev idence of storytelling.. For ancient humans, storytelling was magic. There was little separation between what was spoken and what happened and, it seemed logical that if we could describe a great hunt in all its v iv idness and glory, to those who did not participate, then it should be possible to tell a story about a hunt and see it happen later. When it didn’t work all the time, they decided that perhaps drawing the story would help. The caves of Lascaux and others from the same period are not only the first story telling arts, but also the first v isual arts, first cartoons, and first narrated slide shows. The technolog ies we use today are innovative, but the methods of storytelling are ancient. Different stories and different ways of telling the same stories, shaped distinct cultures. People’s stories are often similar to those of other cultures, but distinct from each other. . Your culture’s stories became part of your self-identity . It’s possible that culture is rooted in storytelling. With

ISSN 2411-9571 (Print) ISSN 2411-4073 (online)
European Journal of Economics
and Business Studies April 2018 Vol 4 No 1
158
story telling came cultural and societal bonding. When we invented stories, we invented gods, heroes, v illains, and magic. The roots of psychology, of lecture-sty le teaching, of religion, all capsuled within stories.
Not only had the most ancient of stories and story forms been developed by the time they were written down, but also genres had been differentiated, though some were specific to their own cultures.
There was one common theme throughout most ancient storytelling, no matter where they were found in the world: they were at heart didactic, stories expounding on morality and teaching about the pleasures of a morally good life while describing the misery that followed ill deeds. As you can imagine, this contributed greatly to stories shaping their culture . Instead of standardizing advertisements across the global market, a message can be communicated more effectively by incorporating cultural values in advertisements and allowing communication to play an effective role in interacting with the consumer through advertising. According to De Mooij “if we want to know how advertising works across cultures, we’ll first have to learn how communication works” (De Mooij 2010:97). In advertising communication process, the basic purpose is to inform and persuade the customer about the product. It is also important for business units to know about the customer likes and dislikes. Understanding cultures is very important for global advertising and the Hofstede model of national is applicable to global advertising and marketing. The model explains various concepts of self, identity , personality that further help in devising branding strategies (De Mooij, 2010). Standardized advertisements across global market are not as effective as adaptive strategies for local markets; therefore it has become increasingly important to understand the local cultures. Cultural values depicted in advertising are an integrated part of the consumer self rather than environmental factors (De Mooij, 2010). Consumer self-identity (culture, image, values) along with social and mental processes (prev iously described in consumer buying behavior) affects the advertising appeal and sty le. (De Mooij, 2010). Advertising reflects the pattern of our thinking, the way we do things in our daily life i.e. eating, relax ing, talking, working, hav ing fun, things which moves us.
It’s proven according to the Baudrillard argument; Cultural systems that play the decisive role in the productions of social relations, while the economy only relays and shifts them in their reproduction (Baudrillard, 1975).
Oriental cultural perspectives
The word “culture” is the most powerful word in the human dictionary. By culture humans get the true meaning of a real human. Culture is derived from the Latin word “Cultura” meaning “cultivation” and was first used by Romans; however Germans practiced sociological meanings of culture two hundred years ago under the name of “kulturges-chichte” (Burke, 2008). Sir Edward Burnett Taylor, an English anthropologis t in 1871 gave one of the earliest definitions of culture, which is used today as well. He defined cultures as;
“Complex whole which includes knowledge, beliefs, art, morals, law, Customs and any other capabilities and habits acquired by man as member of society (Taylor & Samovar: 2009, p 9).
In this globalization world people identify and understand each other distinctly because of their culture. According to our research topic we try to reveal and compare some differences of both the Western and Oriental cultural perspectives. Advertising is the biggest part of marketing communication in worldwide business activ ities today. It’s not merely a popular and direct medium of sell products, besides advertising delivers and spreads more cultural values to the society . When studying about culture of the world we can recognize two categories as the oriental culture and the western culture. Oriental culture is mainly based on a collection of human relations, myths and values, whereas the Western culture portrays dynamic lifesty le, development in the countries and many new technologies, which w ere developed. In Asian perspective we can see that there are many gods, beliefs and myths ty ing people’s hands and it’s difficult to change their minds at once. Apart from that, religion also mainly affects the Asian mind and has different ideologies to the West. In Western cultures there are fewer gods or fewer religions and they contribute their full effort in inventing modern technology and knowledge for the sake of development. Furthermore, the Oriental culture is built on various traditions and rules and therefore focuses less on modern technologies. Western culture is able to break their rules with more ease and create more with the development and find something new. One special difference in Oriental culture is sympathy. People live for the other. For an example parents live for their children, a husband lives for his wife, children live for their parents etc. for the western culture its v ise versa. The differences between these two cultures are numerous. But from this brief explanation we tried to clarify that the culture is located as the central layer between personality and human nature.
When considering culture according to the research topic, cultural knowledge and understanding is very important in business as culture Influences every aspect of marketing. Oriental indiv iduals are guided by the cultural illustrations and historically created systems of advertising as it represents the way people think, how they communicate with each other,

ISSN 2411-9571 (Print) ISSN 2411-4073 (online)
European Journal of Economics
and Business Studies April 2018 Vol 4 No 1
159
how they express feelings, how they live, eat, relax, enjoy and everything (De Mooij , 2005). Cultures differ in the way people experience and use aspects such as time, space, relationships, power, risk, masculinity , femininity and many others. According to De Mooij, advertising is a cultural artefact and in order to build relationships between consumers and brands, advertising must reflect people’s values.
Methodology
Media industry watcher Nielsen Sri Lanka estimated Sri Lanka’s total advertising spend on the media in 2016 to be approx imately LKR 90 billion (USD 585 million at January 2017 exchange rate).
This research is based on qualitative approach for gaining more in depth knowledge and to get a clear picture from describing ex isting data and analyzing the Oriental cultural concept. Another reason for choosing qualitative research method is the variation in number of consumers in Sri Lanka. The total population of Sri Lanka is approx imately 21.2 Million with telev ision subscription of around 70% . Most respondents said they trusted and was influenced by telev ision mostly (56% ) followed by news papers (20% ) and the internet ( 21% ). There is a trend among the younger generation to turn to the internet as source of advertising. Notably radio 's trust level is very low among this sample (Secretariat for Media Reforms, 2016). When comparing the three major modes for marketing communication i.e. telev ision, radio and magazine, telev ision media prov ides a greater impact than others by combining sight and sounds with addition of offering more creative breadths (Kelly & Jugenheimer:2008).
It would be difficult to get clear results through quantitative research done on a small portion of a very large target audience. However continuation of this research by quantitative analysis on a large target audience and more diverse scope can prov ide generalizable results. Telev ision is the most trusted type of media.
Yin (1989) described five strategies for conducting research which are; Survey, experiments, archival analysis, case study and history. In this research the question under observation contains “how” factor and the purpose of the research is to get better understanding of Oriental cultural values in advertisements therefore requires content analysis and focus group discussion has been adopted to answer the question.
Data for the study will be gathered in qualitative nature v ia focus group discussions with v iewers; field observation; in-depth interv iews with opinion leaders who were likely to influence the decision-making process in the community ; Advertising creators, media practitioners and rev iew of reports, studies, and evaluations to distill lessons learned. It will be create a space for articulating diverse v iewpoints, approaches, and opinions. The study focuses on advertising v iewers who liv ing in Sri Lanka. It will be included 20 focus group discussions and 100 in-depth interv iews. In order to test the hypothesis, correlation and regression techniques were basically applied.
Data Collection & sample selection
According to Denscombe (1998), data can be collected through four main sources; questionnaire, interv iew, documents and observations. In this research we have used direct observation plus content analysis of various v ideos of telev ision commercials for data collection. However in case study approach, for maintaining the reliability and validity of research, it is more appropriate to use more than one source of ev idence.
The primary data was collected through direct observation and interpretation of the research. To maintain the validity and credibility of research, systematic observation and content analysis was carried out with the help of two neutral observers of the v ideos. For comparison of telev ision commercials, judgmental sampling technique was used for separating advertisements of various industries on basis of four criteria.
Are the advertisements using the method of storytelling or not
Are advertisements depicting Oriental cultural values
Is that product famous or not in the market
Conclusion drawing and verification
The broadcasting time of commercials is within last five years and not beyond that duration i.e. 2012-2017.
Once the data was separated on basis of above criteria, eight telev ision advertisements were selected representing the various fields of market.

ISSN 2411-9571 (Print) ISSN 2411-4073 (online)
European Journal of Economics
and Business Studies April 2018 Vol 4 No 1
160
Discussion, Result and Conclusion
The study result clearly shows that, workplace collectiv ism has a strong and significant effect on business activ ities and participation rather other underlined variables. Sufficient emphasis has not been paid on advertising culture, which is a significant component in the concept development and cultural processes in the country . The advertising in Oriental cultural value settings remains a relatively unexplored area of research across all disciplines, even that of media communications study. Therefore, in this study the researchers attempted to fill this void. This research is expected to develop a Sri Lankan and oriental cultural relationship through concept development of advertising.
Sri Lanka has not yet paid sufficient attention in Oriental effect in advertising and we are still following and being influenced by the western concept. In western concept the changes and developments occur day by day but in oriental culture seems regressive. Advertising firms and the clients also give priority to making and creating commercials based on human feelings. Then the problem may not be similar to consumer’s requests. Mostly this happens unconsciously in the Sri Lankan advertising field. However the younger generation seems to be try ing to spread and widen the understanding of oriental culture, but it is also unsuccessful. Currently TV commercials follow the trend of shifting to new media commercials and its contents are produced according to the demand of western market necessities. It is essential to expand new theoretical and conceptual areas about oriental cultural values and reinforce methodologies to address the folk consciousness consciously . Consumers and advertising creators and clients should be empowered to understand the connection between oriental culture and human relationship. Finally The advertising industry is basically driven by the idea of widening markets for selected products and serv ices. It makes use of cultural and traditional ideologies not to change the status quo but to manipulate consumer demand in an opportunistic manner. It is this inherent pragmatic characteristic within advertising industry that transforms it into an ideological apparatus of oriental culture perspective.
References
[1] Balabanis, G., Diamantopoulos, A., Mueller, R., & Melewar, T. (2001). The Impact of Nationalism, Patriotism and Internationalism on Consumer Ethnocentric Tendencies. Journal of International Business Studies, 32(1), 157-175.
Retriev ed from http://www.jstor.org/stable/3069515
[2] Baudrillard Jean, ( 1975 ). Mirror of Production, USA, ISBN 0-914386-06-9.
[3] DeMooij, Markie, (1998). Global marketing and advertising: understanding Cultural paradox. California SAGE ltd.
[4] De Mooij M, (2010). Global marketing advertising: understanding cultural paradoxes by SAGE publications.
[5] De Mooij, M., (2005). Global marketing and advertising: Understading cultural paradoxes. Thousands Oaks: SAGE
Publications,Inc . P.122
[6] Hofstede Geert, (1997). Culture and Organizations , software of minds , Mc Grawth Hill, Newyork.
[7] Hofstede.G. & Hofstede J., (2010). Culture and Organizations-software of Minds McGraw- Hill international London.
[8] Lee.M & Johansson.C (1999). Principles of Advertising , a global perspective Haworth Press Inc.
[9] Naresh K. Malhotra, James Agarwal, Mark Peterson, (1996). "Methodological issues in cross‐cultural marketing research: A
state‐of‐the‐art rev iew", International Marketing Review, Vol. 13 Issue: 5, pp.7-43
[10] Peeter W.J. Verlegh, Jan-Benedict E.M. Steenkamp, (1999). A review and meta-analysis of country-of-origin research, In Journal of Economic Psychology, Volume 20, Issue 5,Pages 521-546, ISSN 0167-4870.
[11] Robert K Ying, (1994). case study research: Design and Methods. Thousand Oaks: SAGE Publications ltd.
[12] Said E, (1978) . Orientalism. NY: Pantheon.
[13] Secretariat for Media Reforms, (2016). Sri Lanka International Media Support : colombo , SriLanka. www.mediasupport.org
[14] Web site and Articles
[15] De Mooij Markie, Geert Hofstede(2011), Cross Cultural Consumer Behavior: A Review of Research Findings, Journal of
International Consumer Marketing, 23:181-192,2011, .
[16] De Mooij Markie (2004), Translating Advertising, Painting the Tip of the Iceberg, Cross cultural Communication Company
and Univ ersal de Navarra, Spain, vol 10 No.2 (2004)
[17] Geert Hofstede, Robert R. McCrae( 2004), Personality and Culture Revisited: Linking Traits and Dimensions of Culture, vol 38, no 52-88.
[18] Global Ad Spends -ZenithOptimedia, (2016). Sri Lanka Ad Spends Nielsen Lanka Ad Tracking Solution, Internet includes w ired and mobile. Retrieved from : https://lmd.lk/wp-content/uploads/2017/02/Nielsen-Sri-Lanka-2016-Review.pdf
[19] Retriev ed from: https://gupea.ub.gu.se/bitstream/2077/33925/1/gupea_2077_33925_1.pdf
[20] Retriev ed from : http://findwritingservice.com/blog/cultural-essay-difference-of-east-and-west

ISSN 2411-9571 (Print) ISSN 2411-4073 (online)
European Journal of Economics
and Business Studies April 2018 Vol 4 No 1
161
DOI: 10.26417/ejes.v4i1.p161-166
Open Access. © 2018 Jasim Mohammed Mushib Janabi and Zainab Husham Qasim Al-Rikabi. This is an open access article licensed under the
Creative Commons Attribution-NonCommercial-NoDerivs 4.0 License
Factors of Failure of the Iraqi Banking System in the Implementation of the Decisions of the Basel Committee
Jasim Mohammed Mushib Janabi
Zainab Husham Qasim Al-Rikabi
Abstract
The role of the banking system is very important and sensitive in any inquisitive system in our modern world, because it is the other side of this economy in exchange for real activ ities and the great crossroads of the efficiency of the economic system and the legitimacy of its organizations according to the basic objectives of each national economy in any society . Based on this importance above, the importance of apply ing the banking system to the rules and decisions of the Basel Committee in all its copies1 (1), which can ensure that the banking system could avoid the risks that can lead to the entry into crises and serious intransigence. This paper seeks to prov ide a broad presentation of the possibilities of application of the Iraqi banking system to the decisions of the Basel Committee and seeks to prov ide a presentation of obstacles and factors that led to the failure of the Iraqi banking system to implement the decisions of the Basel Committee in all copies and both internal and external. This paper also seeks to look at the possibility of adapting the banking system in order to comply with the requirements of the implementation of Basel decisions from an economic and financial point of v iew represented by the v iews of economists and financial institutions inside and outside this body.
Keywords: banking system, basel committee decisions, and internal and external failure factors
Introduction
The efficiency of the performance of the banking system is of great economic importance. This path can be achieved through the application of the banking system's standards to respectable efficiency standards and this has become urgent in the Iraqi banking system for the Iraqi economy to reach the edge of the beginning of development, especially after 2003, which marked the country 's embrace of the market economy and openness to the world.
This paper examines the factors and reasons behind the failure of the Iraqi banking system to implement of Basel III standards issued by the Basel Committee on International Banking Superv ision.
This paper has reached the factors and categorized them internally and externally from inside and outside the banking system and reached a number of reasons that are concentrated in institutional weakness and its unfavorable pattern for the implementation of international standards such as Basel III , And the weakness of the methods of assessment of risks and inaccuracies in the selection of guarantees for credit as well as administrative and logistical problems play an importan t role in this as one of the reasons for the internal failure of the Iraqi banking system in the application of standards Basel III. This is related to many objective reasons emanating from the general env ironment in Iraq in all economic, legal and political aspects, such as the poor legislation and the economic system, the low ability of the authorities to implement the law, the effects of the influence of politicians as well as the important issue which is the lack of integration of the financial market which is not integrated and does not
1 Bank of international settlements, Basel committee on banking supervision, finalizing Basel III In brief , Basel, 2017

ISSN 2411-9571 (Print) ISSN 2411-4073 (online)
European Journal of Economics
and Business Studies April 2018 Vol 4 No 1
162
play its role in accordance with the role of the typical system as well as the absence of an automated payment system that prov ides financial information and data to the regulatory bodies, especially the Central Bank to be able to apply international standards for banking.
This paper focused on the possibility of delay ing the implementation of Basel III now and only uses the implementation of the Basel I and II standards until the completion of the shortcomings of the internal and external banking system then it may be qualified in this context to apply standards Basel III later.
Component of the Iraqi Banking System
The banking system consists of several types of institutions that manage the life of cash and financing now and we will try to display these items to give a clear image of the scope of our study.
First: The central Bank of Iraq:
It is obv ious that each country has a central bank that manages the life and monetary policy of the country . As it is clear, Iraq has this body that manages the cash operations as well as monitoring and managing the cash flow exported to the Iraqi economy. This institution was characterized by its heritage and old. This bank was established with the beginning of the establishment of the modern Iraqi state under the name of (Iraqi National Bank) in 1947 on the ruins of (The Currency Council) that established by the British Mandate authority of Iraq in London in 1931. The Council was formally abolished in 1949. In 1956, the National Bank of Iraq became the Central Bank of Iraq. Its responsibility included issuing currency, controlling foreign exchange transactions, superv ising and superv ising the banking system1. The Central Bank exercises these roles in vary ing and fluctuating proportions of success for reasons related to its sty le of performance and level of independence as an independent body, as well as the general situation that the state has been going through since 2003 and so far. With regard to its role in the implementation of Basel Committee decisions and standards, the Central Bank established the Financial Stability Section in 2017.
This section is concerned with the implementation of Basel decisions and standards and measuring the quantitative impact before application with regard to adequacy and ratio analysis LCR and NSFR2, and measuring the compliance of Iraqi banks with international standards, especially Standard No. (9)3.
Second: Governmental and Private Commercial Banks:
Commercial banks are the main financing mechanism and the most important part of the structures of the banking system that practice banking and finance in any economy. The most important criteria for the efficiency of the financial and financi al apparatus of any country are the efficient performance of these banks in all their classes and methods of managing them and dealing with their duties. The Iraqi banking system contains 70 commercial banks, governmental and private. The governmental are Rafidain Bank and Rashid Bank and the Iraqi Bank for Trade (TBI) as well as many specialized banks such as The Agricultural Bank and The Industrial Bank and The Real Estate Bank and The Islamic Bank of Nahrain, also a governmental fund that carries out housing lending is The Housing Fund, which is relatively limited in business and financing capacity and is not covered by the Central Bank's superv ision because its loans do not contain a final interest rate.
The private banks are a group of banks with private national capital as well as some branches of foreign banks and their total number are (64) banks until the preparation of this paper. The governmental banks have about 94% of the net deposits of the Iraqi banking system and net assets4.
Third: Exchange and transfer money companies:
The Iraqi market operates about 2000 exchange companies working in the field of mediating the exchange of foreign currencies against the Iraqi dinar. There are financial transfer companies working in the field of transfer of funds to and from the Iraqi market and acts with some control by the Central Bank and represent a modest percentage of net cash flows in the Iraqi market, There are also a parallel markets that do business similar to the competence of these companies without
1 https://www.cbi.iq/page/39, in 18 January 2018 2 These ratios mean liquidity coverage ratio and net fix ed financing ratio, respectively. 3This criterion w as delayed until 2020 to prov ide institutional requirements in the Iraqi banking system according to the v ision of ex perts of the Central Bank of Iraq. 4 https://cbi.iq/page/37, opcit , in 19 January 2018.
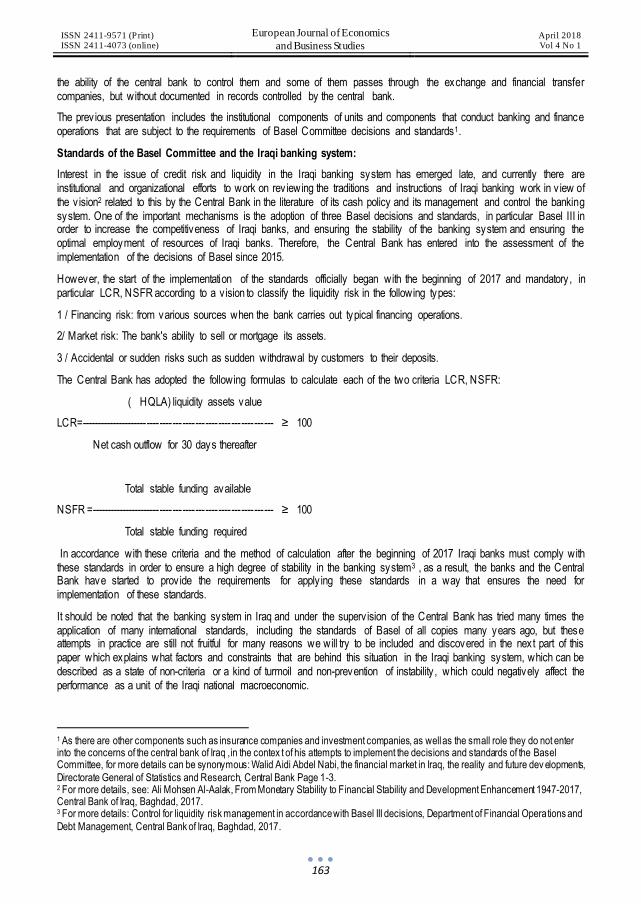
ISSN 2411-9571 (Print) ISSN 2411-4073 (online)
European Journal of Economics
and Business Studies April 2018 Vol 4 No 1
163
the ability of the central bank to control them and some of them passes through the exchange and financial transfer companies, but without documented in records controlled by the central bank.
The prev ious presentation includes the institutional components of units and components that conduct banking and finance operations that are subject to the requirements of Basel Committee decisions and standards1.
Standards of the Basel Committee and the Iraqi banking system:
Interest in the issue of credit risk and liquidity in the Iraqi banking system has emerged late, and currently there are institutional and organizational efforts to work on rev iewing the traditions and instructions of Iraqi banking work in v iew of the v ision2 related to this by the Central Bank in the literature of its cash policy and its management and control the banking system. One of the important mechanisms is the adoption of three Basel decisions and standards, in particular Basel III in order to increase the competitiveness of Iraqi banks, and ensuring the stability of the banking system and ensuring the optimal employment of resources of Iraqi banks. Therefore, the Central Bank has entered into the assessment of the implementation of the decisions of Basel since 2015.
However, the start of the implementation of the standards officially began with the beginning of 2017 and mandatory, in particular LCR, NSFR according to a v ision to classify the liquidity risk in the following types:
1 / Financing risk: from various sources when the bank carries out typical financing operations.
2/ Market risk: The bank's ability to sell or mortgage its assets.
3 / Accidental or sudden risks such as sudden withdrawal by customers to their deposits.
The Central Bank has adopted the following formulas to calculate each of the two criteria LCR, NSFR:
( HQLA) liquidity assets value
LCR=------------------------------------------------------------ ≥ 100
Net cash outflow for 30 days thereafter
Total stable funding available
NSFR =--------------------------------------------------------- ≥ 100
Total stable funding required
In accordance with these criteria and the method of calculation after the beginning of 2017 Iraqi banks must comply with these standards in order to ensure a high degree of stability in the banking system3 , as a result, the banks and the Central Bank have started to prov ide the requirements for apply ing these standards in a way that ensures the need for implementation of these standards.
It should be noted that the banking system in Iraq and under the superv ision of the Central Bank has tried many times the application of many international standards, including the standards of Basel of all copies many years ago, but these attempts in practice are still not fruitful for many reasons we will try to be included and discovered in the next part of this paper which explains what factors and constraints that are behind this situation in the Iraqi banking system, which can be described as a state of non-criteria or a kind of turmoil and non-prevention of instability , which could negatively affect the performance as a unit of the Iraqi national macroeconomic.
1 As there are other components such as insurance companies and investment companies, as well as the small role they do not enter into the concerns of the central bank of Iraq ,in the contex t of his attempts to implement the decisions and standards of the Basel Committee, for more details can be synonymous: Walid Aidi Abdel Nabi, the financial market in Iraq, the reality and future dev elopments,
Directorate General of Statistics and Research, Central Bank Page 1-3. 2 For more details, see: Ali Mohsen Al-Aalak, From Monetary Stability to Financial Stability and Development Enhancement 1947-2017, Central Bank of Iraq, Baghdad, 2017. 3 For more details: Control for liquidity risk management in accordance with Basel III decisions, Department of Financial Operations and
Debt Management, Central Bank of Iraq, Baghdad, 2017.
ISSN 2411-9571 (Print) ISSN 2411-4073 (online)
European Journal of Economics
and Business Studies April 2018 Vol 4 No 1
164
Factors of failure of the Iraqi banking system in implementing the decisions of the Basel Committee:
The application of financial standards, which deal with capital adequacy and other standards1, to raise the efficiency of the performance of the banking system in any economy, impedes all obstacles and failure factors. In this regard, we will div ide these obstacles and the failure factors for the banking system in its attempts to implement the decisions of the Basel Committee, especially Basel III into internal factors from the Iraqi banking system itself, and other factors from the nation al env ironment which deals with this banking system, so that we can come up with a clearer image of the problem of our study as follows:
A / Internal factors:
1 / Institutional factors: where many banks are weak institutional types such as the old and backward methods of management and decision-making, especially governmental banks as well as the rule of family sty le2 in the management of most private banks which has been reflected in the departure of these banks as business enterprises from many advanced management methods, which can make them conform to the standards of banking management, headed by the Basel Committee, especially Basel III, as well as some institutional weakness in the Central Bank, which represents the role of the director and the first sergeant in the banking system, where it suffers from many institutional weaknesses, especially in the units specialized in the control of financial stability , as these units are new and complain of the manifestations of the government bureaucracy is disabled for its role so far and for internal and external reasons of the Central Bank of Iraq.
It is worth noting that there are many cases of inconsistency in the procedures of some units of the Central Bank with other units due to poor institutional coordination. A low level of independence of the Central Bank institution can be envisaged in terms of policies, programs and procedures for the governmental institution3.
2/ The Iraqi banks do not evaluate the credit and risk and classified according to the degree of risk, but it still depends on the classification which is unscrupulous and taken in exchange for granting uncertain types of guarantees in terms of real estate guarantee in return for granting loans and this type of guarantees in case that the property is personal and indiv idual and taken for personal housing. Therefore, the bank cannot sell it when the borrower fails to pay for the ex istence of Iraqi legal barriers to prevent this absolutely , so that these guarantees cannot be liquidated as well as personal guarantees are weak types of guarantees and It should be noted that the Iraqi banks achieve an important measure of their profits from purchases from the window sell of the US dollar prov ided by the central bank, which directs part of its assets to this purpose.
3/ The joints of the Iraqi banking system from the Central Bank of Iraq to the rest of its banking components complain of low technical capabilities and expertise of the administrative and technical staff and control, especially in the middle and lower levels as well as some higher departments and this result either from the low level of performance evaluation of employees or low level of training programs or indifference and seriousness of the banking departments and administrativ e levels, the middle and the low level in both negative and positive motivation, as well as the adoption of inherited methods in the banking system that belongs to historical reasons has made the Iraqi economy closed for decades and away from the new bank management and finance knowledge 4
4/ There are other administrative and logistical problems related to the banking serv ices of infrastructure, communication networks, information transmission and types of buildings intended for banking are a relatively backward year compared to international standards. This necessarily affects the efficiency of performance and attempts to implement international standards such as Basel III.
1 It should be noted that the implementation of Basel III w ill lead to low er capital adequacy ratios for all Iraqi banks except for newly established banks. Basel II and Basel II are currently taking credit risk into account only, unlike Basel III, w hich takes into account market
risk, credit and operational risk. 2Walid Aidi Abdul Nabi, The Iraqi Central Bank and the ev olution of its oversight and monetary role and directions of his strategic plan, the Central Bank of Iraq, Baghdad. 3 Walid Aidi Abdul Nabi, Central Bank of Iraq and the ev olution of its ov ersight and monetary role and the directions of his strategic plan,
the Central Bank of Iraq, Baghdad Page 6-7, and Abdul Moneim Alsayd Ali, Independence of central banks with special reference to the Central Bank of Iraq, , No. 57-58, 2012, p. 145. 4 For more details: (Azhar Abid Sabbar, The impact of the Iraqi banking system in economic growth and the requirements of the coefficient of monetary stability for the period (2000-2012), Journal of Administration and Economics and the University of Karbala, No.
(11), Volume (3), 2014, page 268..

ISSN 2411-9571 (Print) ISSN 2411-4073 (online)
European Journal of Economics
and Business Studies April 2018 Vol 4 No 1
165
B/ External factors:
1/ Legislation and its negative impact : It can be noted through a careful study of the Iraqi legislative system related to the management and control of the banking system as well as the general legislative system, in general and in the current situation are complaining of some cases of conflict and clash and does not prov ide a legal structure to protect the parties of the financial process administered by the banking system legally ,therefore, there can be legal gaps which are the main reasons for the evasion of banks from the central control and the inev itability of the application of international standards, especially the implementation of the Basel III standards, which necessarily need a specific legal sty le to support its application in an integrated manner1.
2/ General economic situation: The general economic situation is complaining from the unilateralism of the economy by rely ing on the oil sector to generate gross domestic product and national income. This situation leads to the stagnation of the banking system and the decrease in investment demand on credit, which leads banks to search for unsecured and high risk types of credit demand, including consumer credit demand.
3/ The absence of a national payment system that prov ides a database for the concerned institutions, especially the Central Bank, to study and evaluate the extent to which the banking system's institutions comply with the basic standards, including the standards of the Basel committee when it starts to apply as it now, which is leading to the prov ision of misleading and deceptive data to the Central Bank2, and this continues to lead to a high difficulty in implementing the decisions and standards of Basel copies as well as Basel III which is the subject of paper.
4/ The phenomenon of administrative and financial corruption where Iraq is witness as an inherent phenomenon of corruption in public and private institutions, which confuses all the regulatory measures, including the possibility of adopting standards of efficiency in the management of the financial process in the banking system because this phenomenon affects a negative outputs which certainly against the standards of efficiency and accounting in accordance with international banking standards such as Basel standards.
5/ The decline of the ability of public authorities to impose the law in many areas and sectors because of the weakness of prestige and control of the state, which led to a volatile security situation in many areas of Iraq and this certainly affects the commitment of the banking system of the law in addition to the decline of the ability of banks to meet the requirements of banking management disciplined and efficient security env ironment troubled, because the general situation affects negatively and positively on any economic work, especially banking because of the sensitiv ity of banking when the security situation in any country in the world.
6/ The lack of an integrated financial market in Iraq both in the economic and financial sections in the country .The most important institutions that lack in the financial market in Iraq are companies specializing in credit assessment and credit guarantee. In general, the financial market in Iraq is a primitive market and does not rise to the duties and tasks that must be done by any integrated financial market.
7/ The lack of faith of decision makers in the political authority on the subject of the independence of the Central Bank, leading to practices and pressures led to the failure of many of the duties of the Central Bank as a result of this as well as the possession of banks by some influential political forces led to influence on the general policy of the Central Bank of Iraq and its capabilities in the implementation of standards of efficiency and management banking such as Basel III and similar standards whether it was Iraqi or international standards.
The conclusion
Based on what is presented in this paper, we can include the concluding observations so that we can conclude what is the behavior of our problem, namely, the failure of the Iraqi banking system to implement the Basel III standards until now, as the issue is based on the following trends: first, what are the criteria of Basel? .And how they match the reality of the dev ice bank system now? , it is a matter of risk measurement because Basel III focuses on measuring the market risks, c redit risks and operational risks altogether. This is what Iraqi banks cannot meet because they apply the Basel I which measure the credit risk only and the banking system cannot met it alone. Therefore, it is safest to wait for the Basel III application.
1 For more details: Judicial supreme Council on its website (Iraqi legislation database) http://www.iraqld.iq/identity_search.aspx. 2 For more details: Central Bank of Iraq, Monetary Policy Report of the Central Bank of Iraq for the y ears 2012 and 2013, the Central Bank of Iraq, the monetary policy report of the Central Bank of Iraq for the first quarter 2014.
ISSN 2411-9571 (Print) ISSN 2411-4073 (online)
European Journal of Economics
and Business Studies April 2018 Vol 4 No 1
166
The practical reasons for the failure of the banking system in the application of the Basel standards are reasons that arise from within the Iraqi banking system and are concentrated in the institutional weakness and its unfavorable to the application of international standards such as Basel III in addition to weak assessment of risks and inaccuracies in the selection of guarantees for credit as well as administrative and logistical problems that play a role as one of the reasons for internal failure of the Iraqi banking system in the application of Basel III.
There are objective reasons come from the general env ironment in Iraq related to the political, legal and economic aspects such as the poor legislation and the economic system, the low capacity of the authorities in the implement of the law and the influence of politicians as well as the important issue which is the lack of integration of the financial market. The financial market is not integrated and does not play its role in line with its role model, as well as the absence of an automated payment system that prov ides financial information and data to regulatory bodies headed by the Central Bank to be able to apply international standards for banking. All these things affect the ability of the central banking system and banks to implement the Basel III standards which, when applied, can lead to more efficiency of the Iraqi banking system and to use it in the financing, banking and all related disciplines.
Resources and References
[1] Banking of international settlements, Basel committee on banking superv ision, finalizing Basel lll In brief, Basel, 2017. https//www.cbi.iq/page/39, in 18 January 2018 .
[2] Ali Mohsen Alalak, From Monetary Stability to Financial Stability and Strengthening Development 1947-2017, Central Bank of Iraq, Baghdad, 2017.
[3] Liquidity risk management controls in accordance with the Basel III decisions, Department of Financial Operations and Debt Management, Central Bank of Iraq, Baghdad, 2017.
[4] Walid Aidi Abdul Nabi, the Iraqi Central Bank and the evolution of its oversight and monetary role and the directions of his strategic plan, the Central Bank of Iraq, Baghdad.
[5] Abdul-Moneim Al-Sayed Ali, The Independence of Central Banks with Special Reference to the Central Bank of Iraq, Arab Economic Research Journal, Center for Arab Unity Studies, No. 57-58, 2012.
[6] Azhar Abid Sabbar,The Effect of the Iraqi Banking System on Economic Growth and the Requirements of the Monetary Stability Factor for the period (2000-2012), Journal of Administration and Economics, University of Karbala, Issue (11), Vol. (3), 2014.
[7] Judicial Supreme Council on its website: (http://www.iraqld.iq/identity_search.aspx ) Iraqi Legislation Database.
[8] Sadiq Rashed Al-Shammari, Department of Banks Reality and Practical Applications, First Edition, Dar Safa Publishing and Distribution, Amman, 2015, p.114.
[9] Central Bank of Iraq, Monetary Policy Report of the Central Bank of Iraq for the years 2012 and 2013.
[10] Central Bank of Iraq, Monetary Policy Report of the Central Bank of Iraq for the first quarter of 2014.

ISSN 2411-9571 (Print) ISSN 2411-4073 (online)
European Journal of Economics
and Business Studies April 2018 Vol 4 No 1
167
DOI: 10.26417/ejes.v4i1.p167-175
Open Access. © 2018 Grażyna Voss. This is an open access article licensed under the
Creative Commons Attribution-NonCommercial-NoDerivs 4.0 License
Professional Ethics in Accounting as Assessed by Managers of Entities
Grażyna Voss
University of Science and Technology in Bydgoszcz – Faculty of Management, Corresponding Author: Grażyna Voss
Abstract
The code of professional ethics in accounting constitutes a collection of ethical standards, the observation of which is an indispensable part of contemporary accounting. Their scope and practical use give rise to no doubts, and for this reason all necessary measures must be taken to ensure their correct and common application. The evaluation of the practical application of ethical standards in accounting as assessed by managers of organisational units gives rise to doubts and therefore the role of professional ethics must be strengthened by means of actions to promote and educate or to apply directly precautionary measures and the ones confirming the observation of ethical standards by units. However, introduction of such solutions requires a change in legal regulations and in the approach in all the business entities operating on the market.
Keywords: ethics, accounting, code of ethics, ethical standards in accounting,
JEL Classification : G01, M21, M41.
Introduction
Conduct that did not comply with legal requirements and social norms happened as early as in the ancient times, when human societies along with moral standards, which constitute the basis of ethics, were created [Hendriksen, Van Breda, 2002, p. 237]. European ethics stems from the philosophy of ancient Greece and Rome, however, business ethics concerns the moral dimension of economic activ ity and constitutes a collection of standards specify ing what is morally correct and incorrect in business [Klimczak, 2003, p. 81]. It led to the formulation and implementation of ethical codes, which include the principles that should be followed by managers and employees of business entities. It seems that an effectiv e implementation of international solutions concerning creating ethical codes in accounting requires a specific preparation of the Polish society , of both employees of accounting serv ices and managers of business entities responsible for compliance with accounting principles for superv ision but also of all stakeholders [G. Voss 2016 p. 58]. In the modern world, the need to implement ethics programs ex ists and it results from the necessity to introduce ethical principles in the world of business so that business is run honestly [Karmańska, 2007, p. 401].
Professional accountants constitute one of the occupational groups subject to ethical judgement. Being responsible for keeping accounting records and prov iding reliable reports is inseparable from professional ethics, which is described in “The Code of Professional Ethics in Accounting” prepared by the Accounting Standards Committee of the Research Council of the Accountants Association in Poland. The Code constitutes a collection of rules, ethical, moral and professional principles people engaged in accounting and related areas should possess, as well as a collection of attitudes and behaviours expected from people with professions of public trust, which include accountants, financiers and related professions.
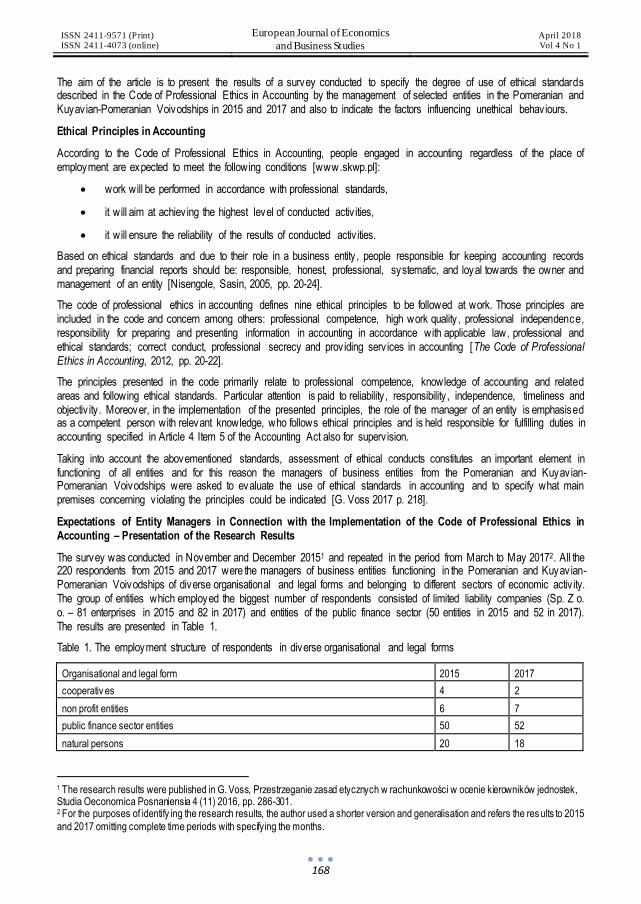
ISSN 2411-9571 (Print) ISSN 2411-4073 (online)
European Journal of Economics
and Business Studies April 2018 Vol 4 No 1
168
The aim of the article is to present the results of a survey conducted to specify the degree of use of ethical standards described in the Code of Professional Ethics in Accounting by the management of selected entities in the Pomeranian and Kuyavian-Pomeranian Voivodships in 2015 and 2017 and also to indicate the factors influencing unethical behaviours.
Ethical Principles in Accounting
According to the Code of Professional Ethics in Accounting, people engaged in accounting regardless of the place of employment are expected to meet the following conditions [www.skwp.pl]:
work will be performed in accordance with professional standards,
it will aim at achiev ing the highest level of conducted activ ities,
it will ensure the reliability of the results of conducted activ ities.
Based on ethical standards and due to their role in a business entity , people responsible for keeping accounting records and preparing financial reports should be: responsible, honest, professional, systematic, and loyal towards the owner and management of an entity [Nisengole, Sasin, 2005, pp. 20-24].
The code of professional ethics in accounting defines nine ethical principles to be followed at work. Those principles are included in the code and concern among others: professional competence, high work quality , professional independence, responsibility for preparing and presenting information in accounting in accordance with applicable law, professional and ethical standards; correct conduct, professional secrecy and prov iding serv ices in accounting [The Code of Professional Ethics in Accounting, 2012, pp. 20-22].
The principles presented in the code primarily relate to professional competence, knowledge of accounting and related areas and following ethical standards. Particular attention is paid to reliability , responsibility , independence, timeliness and objectiv ity . Moreover, in the implementation of the presented principles, the role of the manager of an entity is emphasised as a competent person with relevant knowledge, who follows ethical principles and is held responsible for fulfilling duties in accounting specified in Article 4 Item 5 of the Accounting Act also for superv ision.
Taking into account the abovementioned standards, assessment of ethical conducts constitutes an important element in functioning of all entities and for this reason the managers of business entities from the Pomeranian and Kuyavian-Pomeranian Voivodships were asked to evaluate the use of ethical standards in accounting and to specify what main premises concerning v iolating the principles could be indicated [G. Voss 2017 p. 218].
Expectations of Entity Managers in Connection with the Implementation of the Code of Professional Ethics in Accounting – Presentation of the Research Results
The survey was conducted in November and December 20151 and repeated in the period from March to May 20172. All the 220 respondents from 2015 and 2017 were the managers of business entities functioning in the Pomeranian and Kuyavian-Pomeranian Voivodships of diverse organisational and legal forms and belonging to different sectors of economic activ ity. The group of entities which employed the biggest number of respondents consisted of limited liability companies (Sp. Z o. o. – 81 enterprises in 2015 and 82 in 2017) and entities of the public finance sector (50 entities in 2015 and 52 in 2017). The results are presented in Table 1.
Table 1. The employment structure of respondents in diverse organisational and legal forms
Organisational and legal form 2015 2017
cooperativ es 4 2
non profit entities 6 7
public finance sector entities 50 52
natural persons 20 18
1 The research results were published in G. Voss, Przestrzeganie zasad etycznych w rachunkowości w ocenie kierowników jednostek, Studia Oeconomica Posnaniensia 4 (11) 2016, pp. 286-301. 2 For the purposes of identify ing the research results, the author used a shorter version and generalisation and refers the res ults to 2015
and 2017 omitting complete time periods with specifying the months.

ISSN 2411-9571 (Print) ISSN 2411-4073 (online)
European Journal of Economics
and Business Studies April 2018 Vol 4 No 1
169
partnerships 16 17
joint-stock companies 43 42
limited liability companies 81 82
ALTOGETHER 220 220
Source: own study based on the survey.
The majority of the respondents (112 – 50.91% in 2015 and 129 – 58.67% in 2017) indicated that they were not employed in entities required to audit financial statements by statutory auditors, only 108 respondents in 2015 and 91 in 2017 were employed in big entities where financial statements were audited. The requirement of auditing financial statements is defined by the Article 64 of the Accounting Act1. The people participating in the research were employed by entities with various number of employees. The majority of the respondents worked in entities employ ing up to 250 workers (72 people in 2015 and 73 in 2017). The smallest group constituted of entities with up to 5 employees (20 respondents in 2015 and 17 in 2017).
Figure 1. The level of employment (number of employees) in the enterprises employ ing the respondents
Source: own study based on the survey.
In the conducted research, a significant diversification in terms of the respondents’ employment, both in terms of the organisational and legal form and the size of the enterprises with regard to the level of employment, can be noticed. The presented criteria do not have any impact on the business entities’ implementation of ethical standards in accounting, which concern all business units.
The questionnaire was completed by people holding managerial positions in the examined entities. The majority of the group consisted of women (119 people in 2015 and 124 in 2017). People aged 31-50 were most numerous (146 people in 2015 and 144 in 2017), and the smallest group consisted of relatively young people of 30 and younger (17 people in 2015 and 15 in 2017). The results are presented in figure 2.
Figure 2. The age structure of the respondents
1 The Accounting Act of 29th September 1994, Journal of Laws 2017, Item 2201.
9.09%
30.91%32.73%
27.27%
7.73%
33.18% 33.18%
25.91%
0.00%
5.00%
10.00%
15.00%
20.00%
25.00%
30.00%
35.00%
up to 5 people up to 50 people up to 250 people over 250 people
2015 2017
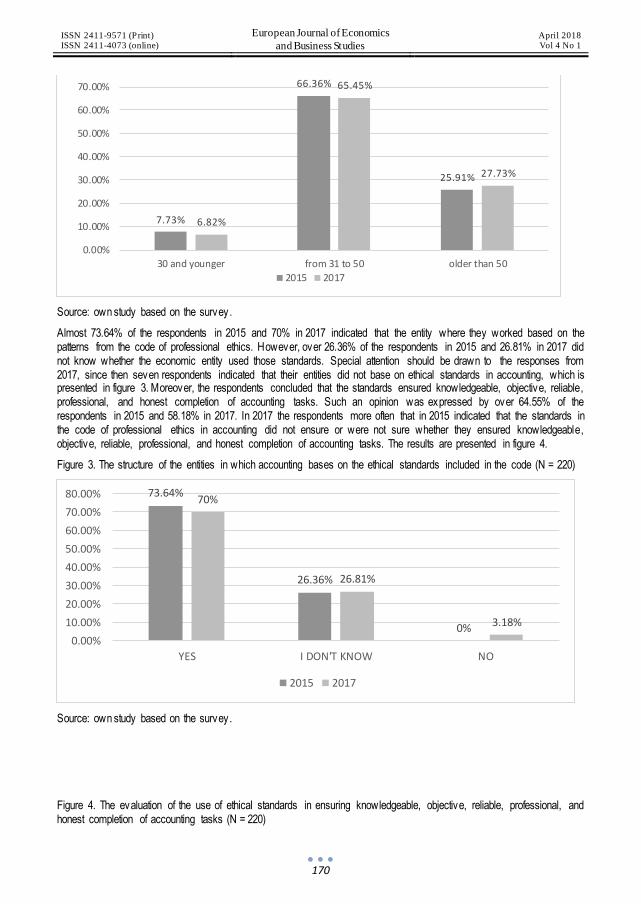
ISSN 2411-9571 (Print) ISSN 2411-4073 (online)
European Journal of Economics
and Business Studies April 2018 Vol 4 No 1
170
Source: own study based on the survey.
Almost 73.64% of the respondents in 2015 and 70% in 2017 indicated that the entity where they worked based on the patterns from the code of professional ethics. However, over 26.36% of the respondents in 2015 and 26.81% in 2017 did not know whether the economic entity used those standards. Special attention should be drawn to the responses from 2017, since then seven respondents indicated that their entities did not base on ethical standards in accounting, which is presented in figure 3. Moreover, the respondents concluded that the standards ensured knowledgeable, objective, reliable, professional, and honest completion of accounting tasks. Such an opinion was expressed by over 64.55% of the respondents in 2015 and 58.18% in 2017. In 2017 the respondents more often that in 2015 indicated that the standards in the code of professional ethics in accounting did not ensure or were not sure whether they ensured knowledgeable, objective, reliable, professional, and honest completion of accounting tasks. The results are presented in figure 4.
Figure 3. The structure of the entities in which accounting bases on the ethical standards included in the code (N = 220)
Source: own study based on the survey.
Figure 4. The evaluation of the use of ethical standards in ensuring knowledgeable, objective, reliable, professional, and honest completion of accounting tasks (N = 220)
7.73%
66.36%
25.91%
6.82%
65.45%
27.73%
0.00%
10.00%
20.00%
30.00%
40.00%
50.00%
60.00%
70.00%
30 and younger from 31 to 50 older than 50
2015 2017
73.64%
26.36%
0%
70%
26.81%
3.18%
0.00%
10.00%
20.00%
30.00%
40.00%
50.00%
60.00%
70.00%
80.00%
YES I DON'T KNOW NO
2015 2017

ISSN 2411-9571 (Print) ISSN 2411-4073 (online)
European Journal of Economics
and Business Studies April 2018 Vol 4 No 1
171
Source: own study based on the survey.
The respondents were not unanimous regarding the prevalence of unethical conducts which they had noticed and experienced at work. In 2015 14 people noticed such conducts and 16 in 2017. In 2015 76 respondents indicated occasional contact with such conducts and as many as 88 in 2017, which means that the number of people experiencing unethical conducts is growing. As far as the group of respondents who concluded that they had not experienced unethical conducts is concerned, a change can also be noticed (2015 – 102 people, 2017 – 87 people). Disseminating information on ethical standards in accounting or ethical norms used in business might have made respondents choose the answer stating that they were not always able to identify or recognise and classify unethical conduct. The commonness of trainings and publications on this subject improves social knowledge and awareness regarding the use of ethical standards and social impacts resulting from unethical behaviour [A. Huterska, pp. 7-12]. The results are presented in figure 5.
Figure 5. The percentage of encounters with unethical behaviour in accounting
Source: own study based on the survey.
The respondents were also asked to indicate a few examples which in their opinion could contributed to unethical conduct, which is presented in figure 6. The most people, 142 in 2015 and 156 in 2017, indicated the influence of managers on their
64.55%
8.18%
27.27%
58.18%
12.73%
29.09%
0.00%
10.00%
20.00%
30.00%
40.00%
50.00%
60.00%
70.00%
YES NO I DON'T KNOW
2015 2017
6.36%
34.55%
46.36%
12.73%
7.27%
40% 39.55%
13.18%
0.00%
5.00%
10.00%
15.00%
20.00%
25.00%
30.00%
35.00%
40.00%
45.00%
50.00%
YES, OFTEN YES, OCCASIONALLY RATHER NO NO
2015 2017

ISSN 2411-9571 (Print) ISSN 2411-4073 (online)
European Journal of Economics
and Business Studies April 2018 Vol 4 No 1
172
subordinates, and an attempt to hide mistakes made earlier was indicated by 134 respondents in 2015 and 122 in 2017. The most significant change and an increase in the number of indications concerned the need to increase the independence of the chief accountant. In 2015 38 respondents and in 2017 61 people mentioned insufficient independence of the chief accountant. The activ ities that can contribute to the v iolation of ethical standards are varied, however, they mostly aim at benefits resulting from the improvement of results and economic indicators or keeping a job. Unfortunately , the respondents chose all the examples that could influence unethical conduct mentioned in the questionnaire. The respondents were also allowed to choose more than one answer here (220 respondents chose 881 answers). The reasons for unethical behaviour and detailed indications are presented in figure 6.
Figure 6. The assessment of the frequency of the occurrence of specific situations influencing unethical conduct (2015 – N = 881, 2017 – N = 895)
Source: own study based on the survey.
142
97
134
98
4438
102
28
40
94
8
56
156
87
122
101
57 61
104
2233
87
8
57
0
20
40
60
80
100
120
140
160
180
2015 2017

ISSN 2411-9571 (Print) ISSN 2411-4073 (online)
European Journal of Economics
and Business Studies April 2018 Vol 4 No 1
173
The respondents (81.82% in 2015 and 86.82% in 2017) were willing to admit that introducing a general obligation to audit financial statements by statutory auditors (in entities not mentioned in Article 64 of the Accounting Act) might contribute to promoting ethical behaviour in accounting. The main problem however is the frequency of conducting such auditing. The majority of the respondents, 80 people in 2015 and 88 in 2017, concluded that such auditing could be conducted every two years, 54 respondents in 2015 and 56 in 2017 indicated that every four years would be frequently enough. Only fewer respondents, 46 in 2015 and 47 in 2017, concluded that such auditing could be carried out every year so that all objectives could be achieved. The results are presented in figure 7. Although 108 respondents in 2015 and 91 in 2017 managed entities whose financial statements were audited by statutory auditors, over 80% of the respondents saw the need to superv ise the reliability and following ethical standards. The statutory obligation to verify financial statements involves changes in legal regulations, however, it does not constitute the only solution in the area of verification of the standards of accounting and ethical norms.
Figure 7. The evaluation of the frequency of financial statements auditing by a statutory auditor in the entities not mentioned in Article 64 of the Accounting Act (N=220)
Source: own study based on the survey.
Answering another question whether in order to ensure greater professional independence of accountants and a more significant role of ethical standards an “organisation” certify ing financial and accounting activ ities and issuing the certificate of ethics in accounting, which would confirm ethical conduct, needs to be established, 153 people in 2015 and 158 in 2017 assumed that establishing such an organisation would ensure more independence of accountants and increase the role of ethical standards in accounting. 67 respondents expressed the opposite opinion in 2015 and 62 in 2017, which figure 8 presents.
Figure 8. The assessment of the need to establish an organisation certify ing the confirmation of the use of ethical standards (N = 220)
Source: own study based on the survey.
4054
80
46
29
56
88
47
0
20
40
60
80
100
the requirement toverity statments should
not be int roduced
every 4 years every 2 yeares every years
2015 2017
69.55%
30.45%
71.82%
28.18%
0.00%
20.00%
40.00%
60.00%
80.00%
YES NO
2015 2017
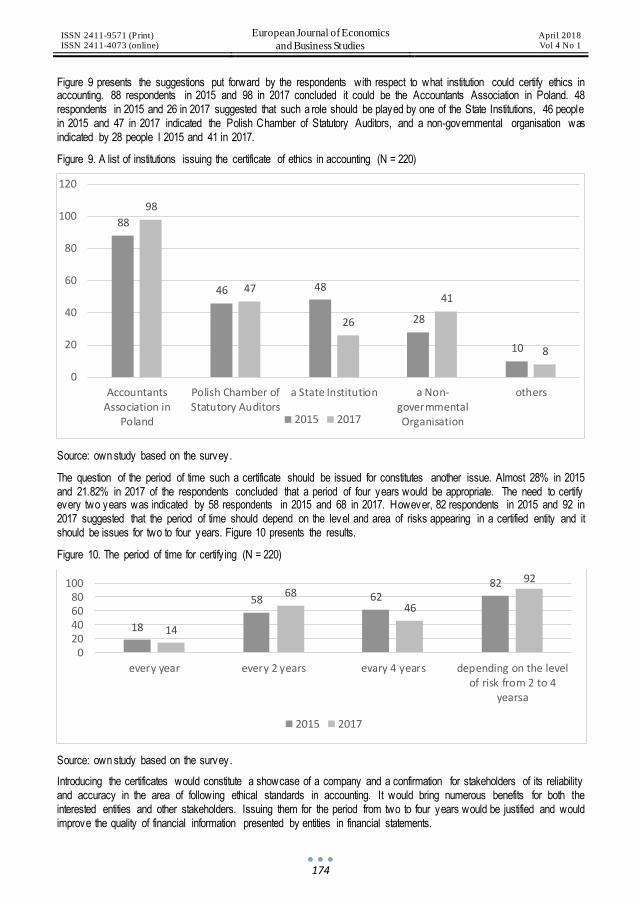
ISSN 2411-9571 (Print) ISSN 2411-4073 (online)
European Journal of Economics
and Business Studies April 2018 Vol 4 No 1
174
Figure 9 presents the suggestions put forward by the respondents with respect to what institution could certify ethics in accounting. 88 respondents in 2015 and 98 in 2017 concluded it could be the Accountants Association in Poland. 48 respondents in 2015 and 26 in 2017 suggested that such a role should be played by one of the State Institutions, 46 people in 2015 and 47 in 2017 indicated the Polish Chamber of Statutory Auditors, and a non-governmental organisation was indicated by 28 people I 2015 and 41 in 2017.
Figure 9. A list of institutions issuing the certificate of ethics in accounting (N = 220)
Source: own study based on the survey.
The question of the period of time such a certificate should be issued for constitutes another issue. Almost 28% in 2015 and 21.82% in 2017 of the respondents concluded that a period of four years would be appropriate. The need to certify every two years was indicated by 58 respondents in 2015 and 68 in 2017. However, 82 respondents in 2015 and 92 in 2017 suggested that the period of time should depend on the level and area of risks appearing in a certified entity and it should be issues for two to four years. Figure 10 presents the results.
Figure 10. The period of time for certify ing (N = 220)
Source: own study based on the survey.
Introducing the certificates would constitute a showcase of a company and a confirmation for stakeholders of its reliability and accuracy in the area of following ethical standards in accounting. It would bring numerous benefits for both the interested entities and other stakeholders. Issuing them for the period from two to four years would be justified and would improve the quality of financial information presented by entities in financial statements.
88
46 48
28
10
98
47
26
41
8
0
20
40
60
80
100
120
AccountantsAssociation in
Poland
Polish Chamber ofStatutory Auditors
a State Institution a Non-govermmentalOrganisation
others
2015 2017
18
58 6282
14
68
46
92
020406080
100
every year every 2 years evary 4 years depending on the levelof risk from 2 to 4
yearsa
2015 2017

ISSN 2411-9571 (Print) ISSN 2411-4073 (online)
European Journal of Economics
and Business Studies April 2018 Vol 4 No 1
175
Conclusion
Financial statements are based on reliable accounting books, whose rules of keeping are clearly specified by legal regulations. However, the frequency of changes in the national and international standards does not allow everyone interested to interpret the results correctly and in accordance with the changes. Financial information constitutes the basis for making decisions for stakeholders and for this reason reliable information is a valuable source of data. An entity manage r superv ises the correct preparation of statements and in the case of selected units external and internal auditors confirm their reliability . Discussing the superv ision attention should be drawn to various irregularities described as frauds, malpractices or financial scandals. In order to improve the situation, business ethics and ethical codes including professional codes are more and more often discussed. Accountants have the code of professional ethics. However, the conducted research shows that it can be v iolated by both accountants and managers. The reasons for irregularities are often connected with the influence of managers on their subordinates, an attempt to hide mistakes made earlier, fear of losing jobs, the willingness to create a financial result, pressure exerted by the management aiming at the best results and economic indicators, as well as the lack of criminal sanctions for unethical conduct. If unwanted activ ities are not perceived negatively by the business environment, the temptation to v iolate the standards increases especially in the situation when the reason for the v iolation is the fear of losing a job or measurable financial benefits. For those reasons the respondents indicated the obligation to conduct financial statements auditing for all economic entities. However, entities managers indicate the need to verify the following of ethical standards in accounting, issuing quality certificates and informing the public opinion about the results of verifications as alternative solutions for the problem of following ethical standards.
Biblography
[1] Hendriksen E. A., Van Breda M. F. 2002, Teoria rachunkowości, PWN, Warszawa. [2] Huterska A., Public-Private Partnership in Building Sustainable Development of the Kuyavian-Pomeranian
Voivodship Vol 9 No 1 (2017): EJIS, p. 7 – 12 [3] Karmańska A. 2007, Bezpieczeństwo biznesu, dylematy etyczne i profesjonalizm zawodu księgowego, [w:]
Rachunkowość wczoraj, dzisiaj, jutro, (red.) T. Cebrowska, A. Kowalik, R. Stępień, SKwP, Warszawa. [4] Klimczak B. 2003, Etyka gospodarcza, Wydawnictwo Akademii Ekonomicznej im. Oskara Lange we
Wrocławiu, Wrocław. [5] Kodeks zawodowej etyki w rachunkowości, 2012. wydanie drugie, SKwP, Warszawa. [6] Nakonieczna J. 2008, Społeczna odpowiedzialność przedsiębiorstw międzynarodowych, Difin, Warszawa. [7] Nisengole S., Sasin W. 2005, Vademecum finansisty i księgowego, Agencja Wydawnicza „Interfart” Łódź. [8] Ustawa z dnia 29 września 1994 r. o rachunkowości, Dz. U. z 2017r. poz. 2201. [9] http://www.skwp.pl/Kodeks,Zawodowej,Etyki,w,Rachunkowosci,3356.html (15.03.2015) [10] G.Voss 2016, Kształtowanie norm etycznych a odpowiedzialność zawodowa księgowych, Wydawnictwo
Uniwersytetu Technologiczno-Przyrodniczego w Bydgoszczy [11] G. Voss 2016, Przestrzeganie zasad etycznych w rachunkowości w ocenie kierowników jednostek, Studia
Oeconomica Posnaniensia, 4 (11), [12] G. Voss 2017, Certificate of Ethics in Accounting and Professional Independence of Accountants, European
Journal of Economics and Business Studies.

ISSN 2411-9571 (Print) ISSN 2411-4073 (online)
European Journal of Economics
and Business Studies April 2018 Vol 4 No 1
176
DOI: 10.26417/ejes.v4i1.p176-185
Open Access. © 2018 Süreyya Karsu et al.. This is an open access article licensed under the
Creative Commons Attribution-NonCommercial-NoDerivs 4.0 License
The Reflection of the Consumers’ Spiritual Perspective to the Materialism: A Case from Turkey
Süreyya Karsu
Assoc. Prof. Dr., Abant İzzet Baysal University , Faculty of Economics and Administrative Sciences
Dilşad Çoknaz
Assoc. Prof. Dr., Abant İzzet Baysal University , School of Physical Education and Sports
Meftune Özbakır Umut
Assist. Prof. Dr., Abant İzzet Baysal University , Faculty of Economics and Administrative Sciences
Meltem Nurtanış Velioğlu
Prof. Dr., Abant İzzet Baysal University , Faculty of Economics and Administrative Sciences
Abstract
The purpose of the study is to investigate the effect of spiritual well-being on materialism, to contribute the marketing literature and to create awareness to marketing practitioners in developing marketing strategies. The research was conducted on 1243 people 18 and upper age, liv ing in Turkey. Data was collected by online survey in 2018. Data tool has two dimensions; the first scale which includes three sub-dimensions (transcendence, harmony with nature and anomie) was used to measure spiritual well-being -scale's validity and reliability were done by Ekşi and Kardaş (2017)-. And the second scale was used to measure materialism -scale's validity and reliability was done by Richins (2004) and the Turkish translation was done by Tiltay (2014)-. The first dimension which measures the spiritual well-being (29 expressions) total Cronbach alpha coefficient is 0,890. The second dimension which measures the materialism (6 expressions) total Cronbach alpha coefficient is 0,767. The results indicate that the spiritual well-being explain the materialistic attitudes significantly but at a low level. Transcendence and Anomie, which are the sub-dimensions of spiritual well-being, have positive relations -not negative- with materialistic attitudes opposite to expectations is another result of study. Especially the anomie is found as the most powerful sub-dimension that explains materialistic attitudes. Harmony with nature, another sub-dimension of spiritual well-being, is found to have no significant relation with materialistic attitudes.
Keywords: reflection, consumers’ spiritual perspective, materialism, Turkey
1. Introduction
Extreme wealth disease is seen as one of the greatest criticisms of contemporary consumer societies in 21st century where consumption habits have changed rapidly . This disease, in a life where materialism dominates people, constantly moves the expectations of the people upward. There are studies on the subject that materialism reduces life satisfaction (Kau, Kwon, Tan & Wirtz, 2000; Ryan & Dziurawiec, 2001).In this period that the excessive consumption is taken to centre and the dissatisfaction grows increasingly , people’s differentiation pursuits has brought the concept of spirituality to the agenda. Spirituality as to its structure has intellectual, spiritual and inner components that include universal values. In terms of the consumption dimension, spirituality reduces the desire for conspicuous consumerism (Stillman, Fincham, Vohs, Lambert & Phillips, 2012). Researchers study on areas such as marketing, management, psychology, religion, philosophy, nursing,
ISSN 2411-9571 (Print) ISSN 2411-4073 (online)
European Journal of Economics
and Business Studies April 2018 Vol 4 No 1
177
guidance and counseling (Kale, 2004; 2006) and the academicians, publishers and cultural researchers (Schneiders, 1989) in recent years have focused on the concept of spirituality .
According to Koenig, McCullough and Larson (2001) spiritualism is a personal search for understanding the answers to questions of a person about life, about the meaning of life, and related to what is considered sacred or supreme.
Spiritual beliefs and values may or may not be connected to the religion. A person who doesn’t have religious beliefs can have spiritual dimensions (Dhamania, 2014). The spiritual needs are formed from trust, hope, love, integrity , desire to find the meaning and purpose of life, relationships, forgiveness, creativ ity , hav ing experiences, sensuality , speech, consolation, rituals, pray and worships (Aslan & Konuk Şener, 2009).
1.1. Materialism, Spiritualism and Spiritual Well-being
1.1.1. Definition of Materialism
Materialism has different definitions made by different researchers. Richins and Dawson (1992) define materialism as held beliefs about the importance of possessions in one’s life. As an important life value (Kasser & Ahuvia, 2002) materialism which is an enduring belief that happiness can be achieved through possessing specific objects (Burroughs & Rindfleisch, 2002). Materialism is defined as a focus on lower order needs, such as physical comfort and safety , over higher order needs, such as self-expression, belonging, and quality of life (Inglehart, 1990). According to Dittmar et al., (2014) materialism is seen as an indiv idual difference in people’s long-term endorsement of values, goals, and associated beliefs that centres on the importance of acquiring money and possessions that convey status.
Materialism concept has been frequently seen in academic studies after Belk (1985)’s research and there are also many studies in the marketing literature. Materialism is associated with status and profits. The characteristics of materialis t consumers are the desire for status and seeking identity in society . The focal point of materialists is the feeling of ownership and purchasing (Santini, Júnior, Sampaio & Araújo, 2017).
Shrum et al., (2014) suggest that to understand the multifaceted functions of materialism in at least three ways. First, the general hypothesis is that materialism is problematic and the results are diminished well-being. Second, considering materialism as a stable trait variable. The third, considering materialism as an indiv idual variation variable that lacks a specific focus on the underly ing motivational processes that may mediate or moderate the relationship between materialism and well-being.
Materialism can be thought of as a cluster of related characteristics-traits, attitudes, and values focussing on assets and leading the selection of events and things. It is said to be that the more materialistic people generally tend to be acquisitiv e (a trait), hav ing positive affect related to acquisition (an attitude), and placing high priority on ownership (a value) (Browne & Kaldenberg, 1997).
1.1.2. Definition of Spiritualism and Spiritual Well-being
Spirituality is an unclear concept, and people are having difficulty in describing this concept (Dyson, Cobb & Forman, 1997). Generally accepted concepts of spiritual studies are; the inner world of the quiche, inner motivation, inner integrity , the intention of one's consciously searching for the meaning of life, mutual commitment in the life cycle of the energy that transcends all material concepts and categories, known world and beyond, by one's own self, social and natural env ironment, and spirituality that transcends the limits of human consciousness and can see the big picture (Chandler, Holden & Kolander, 1992; Kale, 2004; Pandey, Gupta & Arora, 2009; Standifer, Evans & Dong, 2010).
People use spiritual expressions while defining well-being (Hodder, 2009). Self-esteem is determined as a partial mediator of the spirituality–well-being relationship (Joshanloo & Daemi, 2015). The defining attributes of spiritual well-being are: (1) hav ing a subjective feeling of happiness; (2) affirming the self-worth; (3) managing interpersonal relationships with an open, accepting attitude; and (4) possessing an internal “energy" (Yang, Yen & Chen, 2010).
Gomez and Fisher (2003) explain that there are four different dimensions of spirituality . The communal domain expresses in the quality and depth of inter-personal relationships, between self and others, and includes love, justice, hope and faith in humanity . The transcendental domain deals with the relationship of self with some-thing or some-one beyond the human level, such as a cosmic force, transcendent reality or God, and involves faith towards, adoration and worship of, the source of mystery of the universe. The personal domain deals with how one intra-relates with oneself with regard to meaning, purpose and values in life. The environmental domain deals with care and nurture for the physical and biological world

ISSN 2411-9571 (Print) ISSN 2411-4073 (online)
European Journal of Economics
and Business Studies April 2018 Vol 4 No 1
178
include a sense of awe, wonder and unity with the environment. The four domains of spiritual well-being integrate to form the overall spiritual well-being of indiv iduals.
Spiritual well-being is involv ing the relationship of a person with a higher power within a certain system of religious beliefs , and the sense of meaning and purpose in life so meaning and purpose in life can be independent from a certain religious structure (Ekşi & Kardaş, 2017).
2. Research on Materialism and Spiritual Well-being
There are various studies which investigate relationship between materialism and different variables such as values, well-being, subjective well-being, and spiritual-well-being in literature. Kasser and Ahuvia (2002) investigated whether the values focused on money, image, and popularity were associated with lowered well-being or not, even in environmental circumstances supportive of such values. As expected by Kasser and Ahuvia (2002), the participants of the research who had strongly internalized materialistic values also reported lowered self-actualization, v itality and happiness, as well as increased anxiety , physical symptomatology, and unhappiness. Karabati and Cemalcilar (2010) study is primarily concerned with specify ing value antecedents of materialism in Turkish adult sample and results prov ided strong ev idence toward positive associations between self-enhancement motives and materialism. The findings also validate the central assumption in the literature that materialism diminishes well-being.
Materialism has generally held connotation that is associated with character deficiencies, self-centeredness, and unhappiness, and most extant research v iews materialism as having a negative influence on well-being (Shrum et al., 2014). Materialism is also associated with other negative indicators of well-being, such as loneliness (Pieters, 2013), depression (Mueller et al., 2011), and low self-esteem (Christopher, Drummond, Jones, Marek & Therriault, 2006; Richins & Dawson, 1992). Nelson (2009) has found that materialism leads to lowered mental well-being, and that spirituality is negatively correlated with the endorsement of materialistic attitudes.
Hudders and Pandelaere (2012) investigate the relations between luxury consumption, materialism and cognitive and affective subjective well-being aspects simultaneously , in Dutch-speaking Belgium. The results show that materialis tic consumers are more inclined to consume luxury goods than less materialistic consumers, luxury consumption leads to enhanced positive mood, diminished negative mood and increased satisfaction with life.
One of the concepts thought to influence materialism is spiritual well-being. Some researches show that spiritual wants which are about self-actualization conflict materialistic desires (Arndt, Solomon, Kasser, & Sheldon, 2004; Rindfleisch, Burroughs & Wong, 2008; Rothschild, Abdollahi & Psyzczynski, 2009; Stillman et al., 2012).According to Stillman et al., (2012) most spiritual tenets argue that materialism and spiritual life are incompatible, so the conflict between spirituality and materialism is striking. In this conflict; self-enhancement values (epitomized by materialistic pursuits such as conspicuous consumption) and self-transcendence values (epitomized by spirituality and religion) are oppositional and conflicting. For this, the sense of spirituality should correspond to a diminished desire to consume conspicuously because conspicuous consumption exemplifies self-enhancement. Also they found that higher levels of spirituality correspond to a decreased desire to consume material goods in a conspicuous manner.
In another research about spiritual well-being and materialism, it was determined that the communal well-being was negatively related to perceptions of the active/illegal dimension is the passive dimension and was positively related to perceptions of the ‘no harm, no foul’ dimension and the ‘doing good’/recycling dimension. Materialism was positively associated with perceptions of actively benefiting from illegal actions, passively benefiting at the expense of the seller, actively benefiting from questionable but legal actions and benefiting from ‘no harm, no foul’ actions (Chowdhury & Fernando, 2013).
The last study that is mentioned in the relevant section is Shrivastava et al., (2017)'s study. They investigated whether experimentally primitive participants with spirituality -related, mortality -related, and neutral texts, affects materialis tic attitudes among Dubai residents. There were no significant differences in mean self-reported materialism scores between conditions.
In the light of prev ious findings and discussions on materialism and spirituality , the purpose of the current study is to contribute the marketing literature on forward over the effects of spiritualism and materialism and to create awareness for the marketing professionals in developing marketing strategies as one of the pioneer study by understanding whether the consumers in Turkey make a connection between spiritual well-being and materialistic attitudes or not.
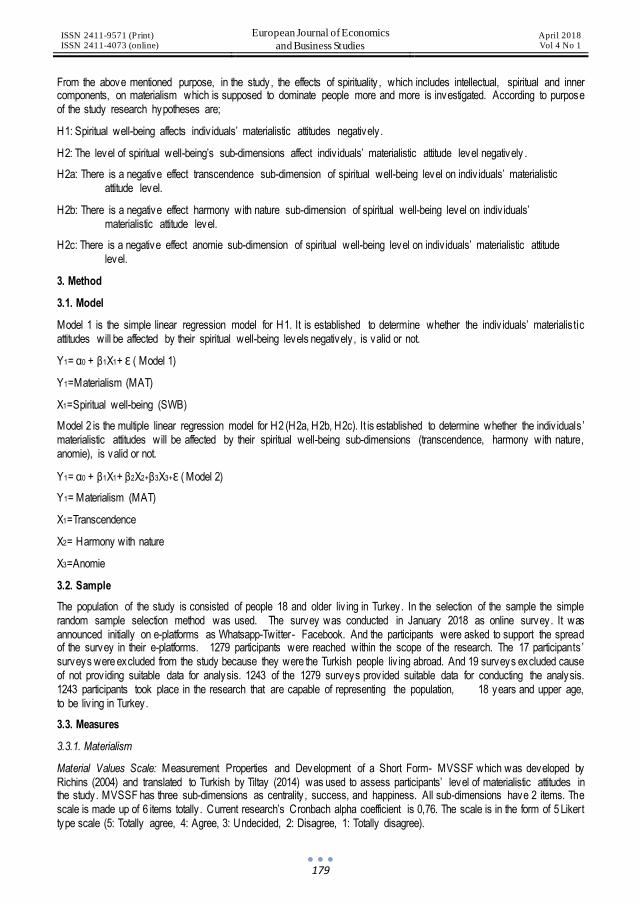
ISSN 2411-9571 (Print) ISSN 2411-4073 (online)
European Journal of Economics
and Business Studies April 2018 Vol 4 No 1
179
From the above mentioned purpose, in the study, the effects of spirituality , which includes intellectual, spiritual and inner components, on materialism which is supposed to dominate people more and more is investigated. According to purpose of the study research hypotheses are;
H1: Spiritual well-being affects indiv iduals’ materialistic attitudes negatively .
H2: The level of spiritual well-being’s sub-dimensions affect indiv iduals’ materialistic attitude level negatively .
H2a: There is a negative effect transcendence sub-dimension of spiritual well-being level on indiv iduals’ materialistic attitude level.
H2b: There is a negative effect harmony with nature sub-dimension of spiritual well-being level on indiv iduals’ materialistic attitude level.
H2c: There is a negative effect anomie sub-dimension of spiritual well-being level on indiv iduals’ materialistic attitude level.
3. Method
3.1. Model
Model 1 is the simple linear regression model for H1. It is established to determine whether the indiv iduals’ materialis tic attitudes will be affected by their spiritual well-being levels negatively , is valid or not.
Y1= α0 + β1X1+ Ɛ ( Model 1)
Y1=Materialism (MAT)
X1=Spiritual well-being (SWB)
Model 2 is the multiple linear regression model for H2 (H2a, H2b, H2c). It is established to determine whether the indiv iduals ’ materialistic attitudes will be affected by their spiritual well-being sub-dimensions (transcendence, harmony with nature, anomie), is valid or not.
Y1= α0 + β1X1+ β2X2+β3X3+Ɛ ( Model 2)
Y1= Materialism (MAT)
X1=Transcendence
X2= Harmony with nature
X3=Anomie
3.2. Sample
The population of the study is consisted of people 18 and older liv ing in Turkey. In the selection of the sample the simple random sample selection method was used. The survey was conducted in January 2018 as online survey. It was announced initially on e-platforms as Whatsapp-Twitter- Facebook. And the participants were asked to support the spread of the survey in their e-platforms. 1279 participants were reached within the scope of the research. The 17 participants ’ surveys were excluded from the study because they were the Turkish people liv ing abroad. And 19 surveys excluded cause of not prov iding suitable data for analysis. 1243 of the 1279 surveys prov ided suitable data for conducting the analysis. 1243 participants took place in the research that are capable of representing the population, 18 years and upper age, to be liv ing in Turkey.
3.3. Measures
3.3.1. Materialism
Material Values Scale: Measurement Properties and Development of a Short Form- MVSSF which was developed by Richins (2004) and translated to Turkish by Tiltay (2014) was used to assess participants’ level of materialistic attitudes in the study. MVSSF has three sub-dimensions as centrality , success, and happiness. All sub-dimensions have 2 items. The scale is made up of 6 items totally . Current research’s Cronbach alpha coefficient is 0,76. The scale is in the form of 5 Likert type scale (5: Totally agree, 4: Agree, 3: Undecided, 2: Disagree, 1: Totally disagree).
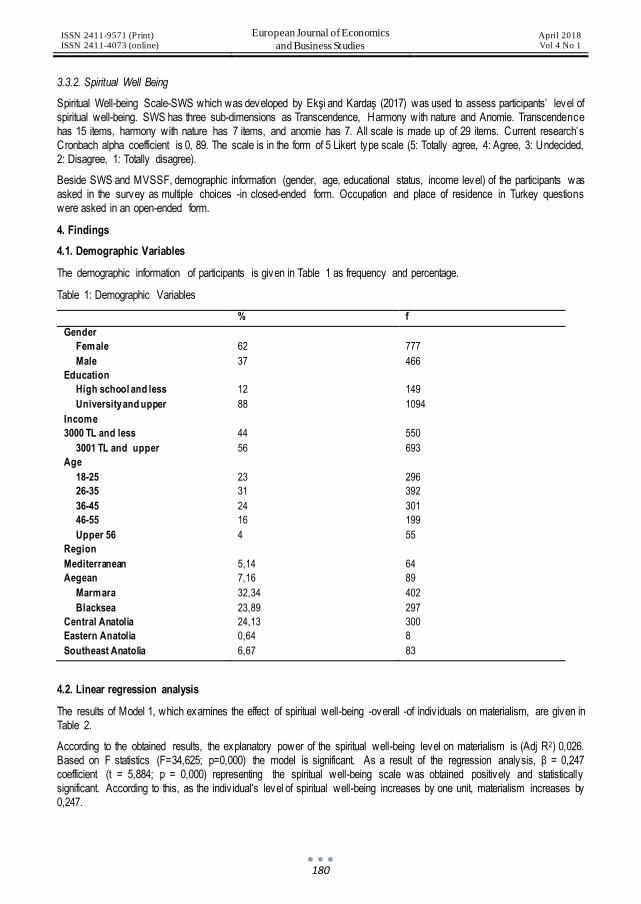
ISSN 2411-9571 (Print) ISSN 2411-4073 (online)
European Journal of Economics
and Business Studies April 2018 Vol 4 No 1
180
3.3.2. Spiritual Well Being
Spiritual Well-being Scale-SWS which was developed by Ekşi and Kardaş (2017) was used to assess participants’ level of spiritual well-being. SWS has three sub-dimensions as Transcendence, Harmony with nature and Anomie. Transcendence has 15 items, harmony with nature has 7 items, and anomie has 7. All scale is made up of 29 items. Current research’s Cronbach alpha coefficient is 0, 89. The scale is in the form of 5 Likert type scale (5: Totally agree, 4: Agree, 3: Undecided, 2: Disagree, 1: Totally disagree).
Beside SWS and MVSSF, demographic information (gender, age, educational status, income level) of the participants was asked in the survey as multiple choices -in closed-ended form. Occupation and place of residence in Turkey questions were asked in an open-ended form.
4. Findings
4.1. Demographic Variables
The demographic information of participants is given in Table 1 as frequency and percentage.
Table 1: Demographic Variables
% f
Gender
Female 62 777
Male 37 466
Education
High school and less 12 149
University and upper 88 1094
Income
3000 TL and less 44 550
3001 TL and upper 56 693
Age
18-25 23 296
26-35 31 392
36-45 24 301
46-55 16 199
Upper 56 4 55
Region
Mediterranean 5,14 64
Aegean 7,16 89
Marmara 32,34 402
Blacksea 23,89 297
Central Anatolia 24,13 300
Eastern Anatolia 0,64 8
Southeast Anatolia 6,67 83
4.2. Linear regression analysis
The results of Model 1, which examines the effect of spiritual well-being -overall -of indiv iduals on materialism, are given in Table 2.
According to the obtained results, the explanatory power of the spiritual well-being level on materialism is (Adj R2) 0,026. Based on F statistics (F=34,625; p=0,000) the model is significant. As a result of the regression analysis, β = 0,247 coefficient (t = 5,884; p = 0,000) representing the spiritual well-being scale was obtained positively and statistically significant. According to this, as the indiv idual's level of spiritual well-being increases by one unit, materialism increases by 0,247.

ISSN 2411-9571 (Print) ISSN 2411-4073 (online)
European Journal of Economics
and Business Studies April 2018 Vol 4 No 1
181
The results of Model 2, which examines the effect of spiritual well-being -three sub-dimensions- of indiv iduals on materialism, are given in Table 2.
According to the obtained results, the explanatory power of the spiritual well-being’s sub-dimensions (transcendence, harmony with nature and anomie) on materialism is (Adj R2) 0,085. Based on F statistics (F= 39,339; p=0,000) the model is significant.
Based on the regression analysis, β = 0,082 coefficient (t=3,485; p=0,001) representing the transcendence sub-dimension was obtained positively and statistically significant. According to this, as the indiv idual's level of transcendence increase s by one unit, materialism increases by 0, 82.
Based on the regression analysis, β = 0,044 coefficient (t=0,97;p=0,332) representing the harmony with nature sub-dimension was determined. And the relation between harmony with nature and materialism was not statistically significant.
Based on the regression analysis, β = 0,229 coefficient (t=10,178; p=0,000)) representing the anomie sub-dimension was obtained positively and statistically significant. According to this, as the indiv idual's level of anomie increases by one unit, materialism increases by 0,229.
Table 2: Regression analyses with materialism as the dependent variable
Dependent v ariable: Materialism
Independent v ariable
β
t-test
p
F test
Adj. R2
Spiritual w ell-being -overall 0,247 5,884 0,000 34,625 (p=0,000) 0,026
Transcendence
0,082
3,485
0,001
39,339 (p=0,000)
0,085
Harmony with nature 0,044 0,97 0,332
Anomie 0,299 10,178 0,000
According to the results of regression analysis, “the research Model 1, which expects that indiv iduals’ materialistic attitudes will be affected by their spiritual well-being levels negatively” is not valid.
In Model 2, which tests whether the indiv iduals’ materialistic attitudes will be affected by their spiritual well-being’s sub-dimensions (transcendence, harmony with nature, anomie), only two of the dimensions -transcendence, anomie- are found to be significant.
Although negative correlation between spiritual well-being and materialism has been frequently cited in the literature it has been found, in current research, that there is a positive relationship between these. Based on this finding, the researchers preferred to investigate whether this situation was affected from demographic variables or not. And six more regression analysis was performed according to the demographic characteristics of the participants.
Simple regression results are given in Table 3 to examine whether the level of spiritual well-being of indiv iduals affects materialism on the basis of gender, income, and education variables.
Table 3: Regression analyses with materialism as the dependent variable on demographic variables
Dependent v ariable: Materialism
Independent v ariable:
β
t-test
p
F test
Adjusted R2
GENDER
Male 0,173 2,661 0,008 7,084 0,013
Female 0,298 5,319 0,000 28,288 0,034
INCOME
3000 TL and less 0,238 3,541 0,000 12,537 0,021
3001 TL and upper 0,210 3,919 0,000 15,362 0,020
EDUCATION
High school and less 0,341 2,526 0,013 6,381 0,035
Univ ersity and upper 0,228 5,152 0,000 26,543 0,023

ISSN 2411-9571 (Print) ISSN 2411-4073 (online)
European Journal of Economics
and Business Studies April 2018 Vol 4 No 1
182
Gender
According to the obtained results, on the basis of gender, the explanatory power of the spiritual well-being level of males on materialism is (Adj R2) 0,013. Based on F statistics (F= 7,084; p=0,008) the regression is significant. As a result of the regression analysis, β= 0,173 coefficient (t=2,661;p=0,008) representing the spiritual well-being level of males was obtained positively and statistically significant. According to this, as the males’ level of spiritual well-being increases by one unit, materialism increases by 0,173.
According to the obtained results, on the basis of gender, the explanatory power of the spiritual well-being level of females on materialism is (Adj R2) 0,034. Based on F statistics (F= 28,288; p=0,000) the regression is significant. As a result of the regression analysis, β= 0,298 coefficient (t=5,319;p=0,000) representing the spiritual well-being level of females was obtained positively and statistically significant. According to this, as the females’ level of spiritual well-being increases by one unit, materialism increases by 0,298.
Income
According to the obtained results, on the basis of income level, the explanatory power of the spiritual well-being level of participants- 3000 TL and less income- on materialism is (Adj R2) 0,021. Based on F statistics (F= 12, 537; p= 0,000) the regression is significant. As a result of the regression analysis, β= 0,238 coefficient (t=3,541;p=0,000) representing the spiritual well-being level of participants- 3000 TL and less income- was obtained positively and statistically significant. According to this, as the participants’- 3000 TL and less income- level of spiritual well-being increases by one unit, materialism increases by 0,238.
According to the obtained results, on the basis of income level, the explanatory power of the spiritual well-being level of participants- 3001 TL and upper income- on materialism is (Adj R2) 0,020. Based on F statistics (F= 15, 362; p= 0,000) the regression is significant. As a result of the regression analysis, β= 0,210 coefficient (t=3,919;p=0,000) representing the spiritual well-being level of participants- 3001 TL and upper income- was obtained positively and statistically significant. According to this, as the participants’- 3001 TL and upper income- level of spiritual well-being increases by one unit, materialism increases by 0,210.
Education
On the on the basis of education level, the explanatory power of the spiritual well-being level of participants-high school and less- on materialism is (Adj R2) 0,035. Based on F statistics (F= 6,381; p=0,013) the regression is significant. As a result of the regression analysis, β= 0,341 coefficient (t=2,526;p=0,013) representing the spiritual well-being level of participants- high school and less- was obtained positively and statistically significant. According to this, as the participants ’- high school and less- level of spiritual well-being increases by one unit, materialism increases by 0,341.
On the on the basis of education level, the explanatory power of the spiritual well-being level of participants- university and upper- on materialism is (Adj R2) 0,023. Based on F statistics (F= 26,543; p=0,000) the regression is significant. As a result of the regression analysis, β= 0,228 coefficient (t=5,152; p=0,000 ) representing the spiritual well-being level of participants- university and upper- was obtained positively and statistically significant. According to this, as the participants’- university and upper- level of spiritual well-being increases by one unit, materialism increases by 0,228.
5. Conclusion
The currents study’s results indicate that the spiritual well-being explain the materialistic attitudes significantly but at a low level. As the level of spiritual well-being increases, the level of materialism also increases. This situation surprisingly differs from the general literature (Stillman et al., 2012; Chowdhury & Fernando, 2013; Arndt et al., 2004; Rindfleisch et al., 2008, Burroughs & Rindfleisch, 2002).
Among the studies we reached, the research of Shrivastava, Pietschnig, Yousuf and Kassi (2017) is the only study that resemblance with current study’s results. Shrivastava et al., (2017) research results show that spirituality does not affect materialism in Dubai case.
In another study, which investigated the relation between materialism and life satisfaction, materialism was negatively correlated with life satisfaction for Americans but was positively correlated for expatriates or Dutch (Dawson & Bamossi, 1991). Although the study of Dawson and Bamossi (1991) is not directly related with spiritualism its results show that some variables that are likely to influence materialism can reveal different outcomes in different cultures.

ISSN 2411-9571 (Print) ISSN 2411-4073 (online)
European Journal of Economics
and Business Studies April 2018 Vol 4 No 1
183
Another consequence of the current study is that the transcendence and anomie - sub-dimensions of spiritual well-being- have positive relations with materialism opposite to expectations. Especially the anomie is found as the most powerful sub-dimension that explains materialistic attitudes. Harmony with nature, another sub-dimension of spiritual well-being, is found to have no significant relation with materialistic attitudes.
The fact that the anomie is the strongest sub-dimension in explaining the materialism can be explained with the anomie items structures which are directed the unhappiness and search of the indiv iduals. In current study, those who have high anomie scores have higher materialist tendencies. Shrum et al., (2014) expresses that many people believe in that the materialism make them happier. On United Nations Development Programme World Happiness Report (2017) Turkey ranks 69th among 156 countries. With the support of this finding, relatively , as in the context of current research’s sample, the unhappiness of people liv ing in Turkey may be assessable increasing the materialism.
In the current research sample, contrary to expectations, a positive relationship between spirituality and materialism has been examined. To understand whether this situation can be affected by demographic variables researchers investigated demographic variables. According to the results of gender variable, it was determined that as the spiritual well-being increases materialism increases both in females & males. However, it was determined that the spiritual well-being effect on materialism was more significant and stronger in females than males. Deb, McGirr, and Sun (2016)’s research results showed that the female students were found to be more spiritual than males, and females’ spiritual and ex istential well-beings were significantly higher than males. These results are contrast to the findings of Eastman, Fredenberger, Campbell, and Calvert (1997) and Kasser and Ryan (1993) researches. They found out that the males were more materialistic than females.
According to the results of income variable, it was determined that as the spiritual well-being increases materialism increases both in low and high income groups. However, it was determined that the spiritual well-being effect on materialism was more significant and stronger in low income groups than high income groups. This result has a similarity with the results of Deb et al., (2016)’s research findings as “university students coming from high-income families, are more inclined to spirituality”. Contrast to current research, (Kasser, 2002) found out that the higher income adults’ well-being and materialistic values have negative relation.
It is thought in Turkey that as the level of education increases, the income of people increases relatively ; based on this perspective between income and education, the current study’s results similarly show that the spiritual well-being effect on materialism was stronger in low level of education groups than high level of education groups.
This study is thought to be an intense study depending on its features; it has questioned the effect of spirituality on materialism which can be considered as one of the sensitive issues in Turkey; despite the sensitiv ity to the subject suitable data for analyses has been reached to % 97,1; study covers all regions of Turkey; without a demographic constraint, a large group of people aged 18 years and upper have been attended online voluntarily .
Unlike the literature and the expectations of the researchers, the emergence of different results in the study has given rise to new questions. Especially the question of why the spiritual well-being increases materialism rather than reduces come to agenda. It is estimated that the reasons for this situation may be due to the effects of socio-cultural differences and may be due to the concept of spiritualism itself which is being discussed as a difficult concept to describe.
According to the surprising results of Turkey case, it is considered that the reasons of the effect of spiritualism on materialism should be investigated deeply in future studies.
6. References
[1] Arndt, J., Solomon, S., Kasser, T., & Sheldon, K. M. (2004). The urge to splurge rev isited: Further reections on apply ing terror management theory to materialism and consumer behaviour. Journal of Consumer Psychology, 14, 225-229.
[2] Arslan, H. & Konuk Şener, D. (2009). Stigma, spiritüalite ve konfor kavramlarının Meleis’in kavram geliştirme sürecine göre irdelenmesi [Studying the concepts of stigma, spirituality and comfort in accordance with Meleis’ concept development process]. Maltepe Üniversitesi Hemşirelik Bilim ve Sanatı Dergisi, Cilt:2, Sayı:1, 51-58.
[3] Belk, R. W. (1985). Materialism: Trait aspects of liv ing in the material world. Journal of Consumer Research. 12(3), 265-280.
ISSN 2411-9571 (Print) ISSN 2411-4073 (online)
European Journal of Economics
and Business Studies April 2018 Vol 4 No 1
184
[4] Browne, B.A & Kaldenberg, D.OP. (1997). Conceptualizing self-monitoring: links to materialism and product involvement. Journal of Consumer Marketing, 14 (1), 31-44.
[5] Burroughs, J. E., & Rindfleisch, A. (2002). Materialism and well-being: A conflicting values perspective. Journal of Consumer Research, 29(3), 348–370.
[6] Chandler, C. K., Holden, J. M. & Kolander, C.A. (1992). Counseling for spiritual wellness: theory and practise. Journal of Counseling & Development, 71, 168-175.
[7] Christopher, A. N., Drummond, K., Jones, J. R., Marek, P., & Therriault, K. M. (2006). Beliefs about one’s own death, personal insecurity , and materialism. Personality and Individual Differences, 40, 441–451.
[8] Chowdhury, R.M.M.I.& Fernando, M. (2013). The role of spiritual well-being and materialism in determining consumers’ ethical beliefs: An empirical study with Australian consumers. Journal of Business Ethics, March, Volume 113, Issue1, 61–79.
[9] Dawson, S. & Bamossy, G. (1991). If we are what we have. What are we when we do not have? Journal of Social Behavior and Personality, Special Issue, 363-374.
[10] Deb, S., McGirr, K.& Sun, J. (2016). Spirituality in Indian University students and its associations with socioeconomic status, religious background, social support, and mental health. Journal of Religion and Health, 55,1623–1641.
[11] Dhamani, K.A. (2014). Spirituality and nursing. Journal of Holistic Nursing, 32(4), 341-46. [12] Dittmar, H., Bond, R.& Hurst, M. (2014). The relationship between materialism and personal well- being: A
meta-analysis. Journal of Personality and Social Psychology, Vol. 107, No. 5, 879–924. [13] Dyson, J., Cobb, M. & Forman, D. (1997). The meaning of spirituality : a literature rev iew. Journal of Advanced
Nursing, 26, 1183–1188. [14] Eastman, J. K., Fredenberger, B., Campbell, D., & Calvert, S. (1997). The relationship between status
consumption and materialism: A cross-cultural comparison of Chinese, Mexican, and American students. Journal of Marketing: Theory and Practice, 5(1), 52–66.
[15] Ekş ̧i, H., & Kardas ̧, S. (2017). Spiritual well-being: Scale development and validation. Spiritual Psychology and Counseling, 2, 73–88.
[16] Gomez, R., & Fisher, J. W. (2003). Domains of spiritual well-being and development and validation of the spiritual well-being questionnaire. Personality and Individual Differences, 35, 1975–1991.
[17] Hodder, J. (2009). Spirituality and well-being: ‘New Age’ and ‘evangelical’ spiritual expressions among young people and their implications for well-being. International Journal of Children’s Spirituality, 14 (3), 197–212.
[18] Hudders, H. L., & Pandelaere, M. (2012). The silver lining of materialism: The impact of luxury consumption on subjective well-being. Journal of Happiness Studies, 13, 411-437.
[19] Inglehart, R. (1990). Culture shift in advanced industrial society. Princeton, NJ: Princeton University Press. [20] Joshanloo, M. & Daemi, F. (2015). Self-esteem mediates the relationship between spirituality and
subjective well-being in Iran. International Journal of Psychology, 50 (2): 115–120. [21] Kale, S.H. (2004). Spirituality , religion, and globalization". Journal of Macromarketing 24 (2): 92-107. [22] Kale, S.H. (2006). Consumer spirituality and marketing. Asia-Pacific Advances in Consumer
Research. Volume 7,(Eds.) Margaret CraigLees, Teresa Davis, and GaryGregory, Sydney, Australia: Associationfor Consumer Research, 108-110.
[23] Karabati, S. & Cemalcilar, Z. (2010). Values, materialism, and well-being: A study with Turkish university students. Journal of Economic Psychology, 31(4), 624–633.
[24] Kasser, T., & Ahuvia, A. (2002). Materialistic values and well-being in business students. European Journal of Social Psychology, 32(1), 137–146.
[25] Kasser, T., & Ryan, R. M. (1993). A dark side of the American dream: Correlates of financial success as a central life aspiration. Journal of Personality and Social Psychology, 65(2), 410–422.
[26] Kau, A. K., Kwon, J., Tan, S. J., & Wirtz, J. (2000). The influence of materialistic inclination on values life satisfaction and aspirations: An empirical analysis. Social Indicators Research, 49, 317–333.
[27] Koenig, H.G., McCullough, M. & Larson, D.B. (2001). Handbook of Religion and Health, New York: Oxford University Press, ISBN 019511866-9.
[28] Kusdil, M.E. & Kagitcibasi, C. (2000). Türk ögretmenlerin deger yönelimleri ve Schwartz deger kuramı [Value orientations of Turkish schoolteachers and the Schwartz value theory]. Türk Psikoloji Dergisi, 45, 59-76.
[29] Mueller, A., Mitchell, J. E., Peterson, L. A., Faber, R. J., Steffen, K. J., Crosby, ….. Metrics, P. (2011). Depression, materialism, and excessive Internet use in relation to compulsive buying. Comprehensive Psychiatry, 52, 420–424.

ISSN 2411-9571 (Print) ISSN 2411-4073 (online)
European Journal of Economics
and Business Studies April 2018 Vol 4 No 1
185
[30] Nelson, J. M. (2009). Psychology, religion, and spirituality. New York: Springer. [31] Pandey, A., Gupta, R. K. & Arora A. P. (2009). Spiritual climate of business organizations and its impact on
customers’ experience . Journal of Business Ethics,88:313–332. [32] Pieters, R. (2013). Bidirectional dynamics of materialism and loneliness: Not just a v icious cycle. Journal of
Consumer Research, December, Vol 40, 615–631. [33] Richins, M. L. (2004). The material values scale: Measurement properties and development of a short
form. Journal of Consumer Research, June, 31(1), 209-219. [34] Richins, M. L., & Dawson, S. (1992). A consumer values orientation for materialism and its measurement:
Scale development and validation. Journal of Consumer Research, 19(3), 303–316. [35] Rindfleisch, A., Burroughs, J. E., & Wong, N. (2008). The safety of objects: Materialism, ex istential insecurity ,
and brand connection. Journal of Consumer Research, 36, 1-16. [36] Rothschild, Z. K., Abdollahi, A., & Psyzczynski, T. (2009). Does peace have a prayer? The effect of mortality
salience, compassionate values, and religious fundamentalism on hostility toward out-groups. Journal of Experimental Social Psychology, 45, 816-827.
[37] Ryan, L., & Dziurawiec, S. (2001). Materialism and its relationship to life satisfaction. Social Indicators Research, 55, 185–197.
[38] Santini, F.0, Júnior, L. W., Sampaio, C.H& Araújo, C.F. (2017). Meta-analysis of the antecedent and consequent constructs of materialism. Review of Business Management, São Paulo, 19 (66), 538-556.
[39] Schneiders, S. M. (1989), Spirituality in the academy. Theological Studies, 50 (4), 676-697. [40] Schwartz, S.H. (1992). Universals in the content and structure of values: Theory and empirical test in 20
countries. In M. Zanna (Ed.), Advances in experimental social psychology, Vol.25, (pp.1-6). New York: Academic Press.
[41] Schwartz, S.H.& Boehnke, K. (2004). Evaluating the structure of human values with confirmatory factor analysis. Journal of Research in Personality, 38 (3). 230-255.
[42] Shrivastava, A., Pietschnig, J., Yousuf, A.& Kassie, S. (2017). Influencing factors of materialism among residents of the UAE: The role of mortality salience and spirituality . Journal of Articles in Support of the Null Hypothesis, Vol. 13, No. 2, 113-123.
[43] Shrum, L. J., Lowrey, T. M., Pandelaere, M., Ruvio, A. A., Gentina, E., Furchheim, ….. Steinfield, L. (2014). Materialism: The good, the bad, and the ugly . Journal of Marketing Management, 30, Issue17-18, 1858-1881.
[44] Standifer , R.L., Evans, K.R. & Dong, B. (2010). The influence of spirituality on buyer perception within business-to-business marketing relationships: A cross-cultural exploration and comparison. Journal of Relationship Marketing, 9,132–160.
[45] Stillman, T. F., Fincham, F. D., Vohs, K. D. V., Lambert, N. M., & Phillips, C. A. (2012). The material and immaterial in con ict: Spirituality reduces conspicuous consumption. Journal of Economic Psychology, 33, 1-7.
[46] Tiltay, Muhammet Ali (2014). Bir tüketici davranışı olarak bireysel bağış: bağış motivasyonlarının doğrudan ve dolay lı bağış üzerindeki etkisi [Indiv idual donation as a consumer behaviour: The effect of donation motivations on giv ing to indiv idual and charity giv ing].T.C. Eskişehir Osmangazi Üniversitesi Sosyal Bilimler Enstitüsü, İşletme Anabilim Dalı, (Danışman: Ömer Torlak), Yayınlanmamış Doktora Tezi.
[47] United Nations Development Programme World Happiness Report (2017). World Happiness Report, Retrieved from http://unsdsn.boun.edu. tr/
[48] Yang, C.T., Yen, S.Y. & Chen J.O. (2010). Spiritual well-being: a concept analysis. Hu Li Za Zhi,57(3):99-104.

ISSN 2411-9571 (Print) ISSN 2411-4073 (online)
European Journal of Economics
and Business Studies April 2018 Vol 4 No 1
186
DOI: 10.26417/ejes.v4i1.p186-192
Open Access. © 2018 Farah Roslan. This is an open access article licensed under the
Creative Commons Attribution-NonCommercial-NoDerivs 4.0 License
The Role of Policy Instruments on the Pattern of Diffusion: The Case of Solar Photovoltaic in Asia Pacific
Farah Roslan
Faculty of Economy, Science and Management, Universiti Sultan Zainal Abidin, Kuala Terengganu, Malaysia
Abstract
While an increasing number of literature investigates the role of policy instruments on the renewable energy technologies (RETs) investment, the effect of policy instruments on the pattern of diffusion on RETs remain understudied. Therefore, this paper explores the effectiveness of the policy instruments on the pattern of diffusion of solar PV capacity for a set of 6 Asia Pacific countries from 2000 to 2015. The present study is different from prev ious literature by exploring the effect of policy inducement namely subsidies and tax incentives on the pattern of diffusion of solar PV. The analysis is performed by estimating a diffusion of innovation equation using a pooled OLS model. Results indicate the behaviour of prev ious adopter and policy intervention does reflect indiv iduals’ tendency to switch to the PV technology. In detail, the ex istence of tax incentives promotes the shift of solar PV capacity during the analysis period. By exploring the effect of policy inducement on the pattern of diffusion, there is a potential for the current policy to be introduced at the states level to facilitate the diffusion of solar PV.
Keywords: Bass diffusion, renewable energy policy, renewable energy technology diffusion, tax incentive, subsidy, solar energy
1. Introduction
Most of countries has renewable energy sources (RES) targets and policy interventions in place (REN21, 2016). Such deployment policies, i.e. the desired diffusion of RES into the market v ia remuneration such as subsidies and tax incentives can be effective tools in creating a market pull which fosters the uptake of renewables. Recently , the design characteristics of the policy incentives and the regulatory uncertainty surrounding the incentives have drawn increasing interest from researchers with numerous literatures concentrating on measuring the competitiveness of the policy schemes on the performance of RES investment (Groba & Breitschopf, 2013; Ritzenhofen & Spinler, 2016; Romano, Scandurra, Carfora, & Fodor, 2017; Zhix in & Xin, 2011). While an increasing number of studies investigate specific designed features of policy incentives on the RES incentives, however, limited research is available to measure the effect of policy intervention on the pattern of diffusion on RETs (Davies & Diaz-Rainey, 2011; Radomes & Arango, 2015). Therefore, this paper aims to explore the effect of policy incentives namely subsidy and tax incentives on the pattern of diffusion of RES capacity based on Bass diffusion of innovation model (Bass, 1969) in the context of Asia Pacific countries.
1.1 Electricity overview and solar photovoltaic (PV) development in Asia Pacific countries
Asia Pacific is a diverse region, it has the world’s ten populous countries and has almost 60 per cent of world’s population (IRENA, 2013). At present, a vast majority of electricity generated is derived mainly from coal, where its demand will spike nearly 53 per cent between 2010 and 2035 (DLA PIPER, 2010). Nevertheless, the region has less than three percent of global oil resources and eight percent of global gas resources (Estrada, Park, & Ramayandi, 2010). The Asia Pacific cumulative installed capacity from renewable energy sources (excluding hydropower) is expected to reach 535.2 gigawatt GW by 2020 (Global Data, 2016). Of all the renewable energy resources, solar energy is relatively abundant in most of the region, with solar PV installed capacity stood at 63.3 GW in 2014 (IRENA, 2013).
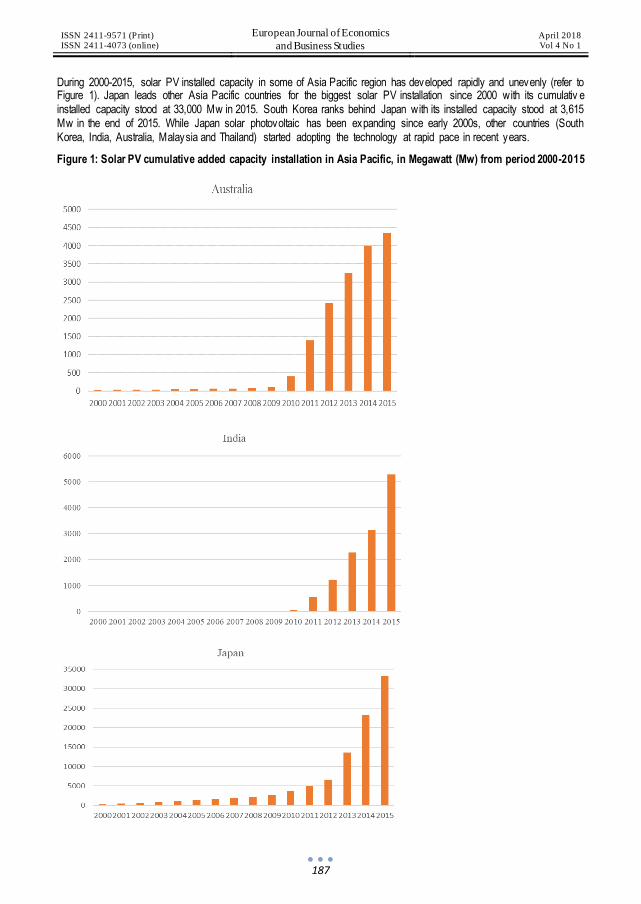
ISSN 2411-9571 (Print) ISSN 2411-4073 (online)
European Journal of Economics
and Business Studies April 2018 Vol 4 No 1
187
During 2000-2015, solar PV installed capacity in some of Asia Pacific region has developed rapidly and unevenly (refer to Figure 1). Japan leads other Asia Pacific countries for the biggest solar PV installation since 2000 with its cumulativ e installed capacity stood at 33,000 Mw in 2015. South Korea ranks behind Japan with its installed capacity stood at 3,615 Mw in the end of 2015. While Japan solar photovoltaic has been expanding since early 2000s, other countries (South Korea, India, Australia, Malaysia and Thailand) started adopting the technology at rapid pace in recent years.
Figure 1: Solar PV cumulative added capacity installation in Asia Pacific, in Megawatt (Mw) from period 2000-2015

ISSN 2411-9571 (Print) ISSN 2411-4073 (online)
European Journal of Economics
and Business Studies April 2018 Vol 4 No 1
188
Source: International Renewable Energy Agency (IRENA, 2015)
2.0 Renewable energy technology modelling diffusion
Since its appearance in 1969, the Bass model has been applied for a wide variety of real-world problems for the theory of diffusion of innovation such as forecasting (Chu & Pan, 2008; Tseng & Hu, 2009), new product growth (Cheng, 2012; Chiang & Wong, 2011; Kaldasch, 2011), and innovation diffusion (Cho & Koo, 2012; Meade & Islam, 2006; Peres et al. 2010). Prev ious studies in RETs diffusion include PV system adoption in Tennessee’s poultry industry (Bazen & Brown, 2009), India (Peter et al. 2006), and the United States and Japan under the lenses of an innovation value-added chain framework (Shum & Watanabe, 2009).
Watanabe et al. (2000) finds the “Sunshine Project” policy initiative had resulted in more R&D on PV systems, which in turn raised solar cell production and lowered prices. Furthermore, they used patent data on companies manufacturing PV
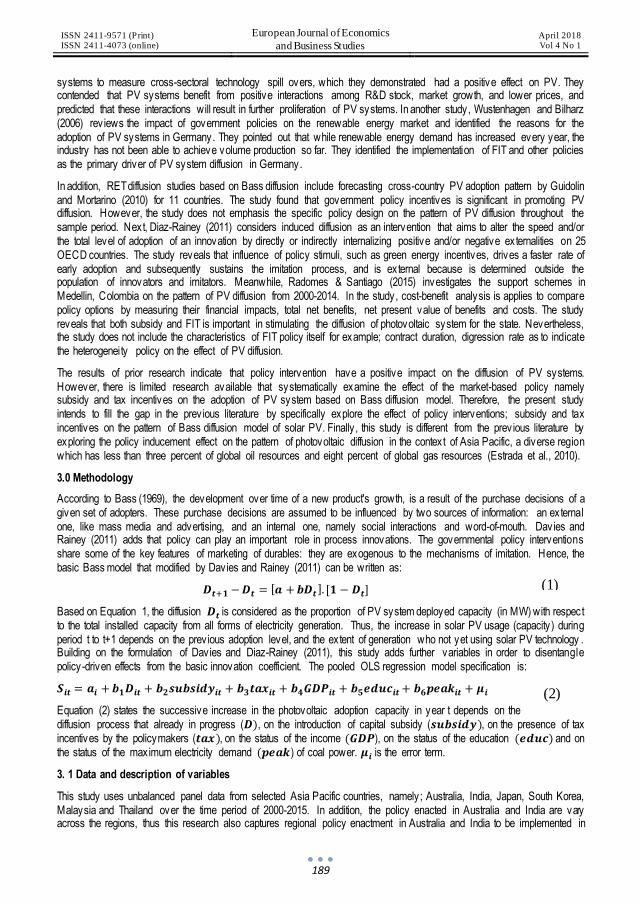
ISSN 2411-9571 (Print) ISSN 2411-4073 (online)
European Journal of Economics
and Business Studies April 2018 Vol 4 No 1
189
systems to measure cross-sectoral technology spill overs, which they demonstrated had a positive effect on PV. They contended that PV systems benefit from positive interactions among R&D stock, market growth, and lower prices, and predicted that these interactions will result in further proliferation of PV systems. In another study, Wustenhagen and Bilharz (2006) rev iews the impact of government policies on the renewable energy market and identified the reasons for the adoption of PV systems in Germany. They pointed out that while renewable energy demand has increased every year, the industry has not been able to achieve volume production so far. They identified the implementation of FIT and other policies as the primary driver of PV system diffusion in Germany.
In addition, RET diffusion studies based on Bass diffusion include forecasting cross-country PV adoption pattern by Guidolin and Mortarino (2010) for 11 countries. The study found that government policy incentives is significant in promoting PV diffusion. However, the study does not emphasis the specific policy design on the pattern of PV diffusion throughout the sample period. Next, Diaz-Rainey (2011) considers induced diffusion as an intervention that aims to alter the speed and/or the total level of adoption of an innovation by directly or indirectly internalizing positive and/or negative externalities on 25 OECD countries. The study reveals that influence of policy stimuli, such as green energy incentives, drives a faster rate of early adoption and subsequently sustains the imitation process, and is external because is determined outside the population of innovators and imitators. Meanwhile, Radomes & Santiago (2015) investigates the support schemes in Medellin, Colombia on the pattern of PV diffusion from 2000-2014. In the study, cost-benefit analysis is applies to compare policy options by measuring their financial impacts, total net benefits, net present value of benefits and costs. The study reveals that both subsidy and FIT is important in stimulating the diffusion of photovoltaic system for the state. Nevertheless, the study does not include the characteristics of FIT policy itself for example; contract duration, digression rate as to indicate the heterogeneity policy on the effect of PV diffusion.
The results of prior research indicate that policy intervention have a positive impact on the diffusion of PV systems. However, there is limited research available that systematically examine the effect of the market-based policy namely subsidy and tax incentives on the adoption of PV system based on Bass diffusion model. Therefore, the present study intends to fill the gap in the prev ious literature by specifically explore the effect of policy interventions; subsidy and tax incentives on the pattern of Bass diffusion model of solar PV. Finally , this study is different from the prev ious literature by exploring the policy inducement effect on the pattern of photovoltaic diffusion in the context of Asia Pacific, a diverse region which has less than three percent of global oil resources and eight percent of global gas resources (Estrada et al., 2010).
3.0 Methodology
According to Bass (1969), the development over time of a new product's growth, is a result of the purchase decisions of a given set of adopters. These purchase decisions are assumed to be influenced by two sources of information: an external one, like mass media and advertising, and an internal one, namely social interactions and word-of-mouth. Davies and Rainey (2011) adds that policy can play an important role in process innovations. The governmental policy interventions share some of the key features of marketing of durables: they are exogenous to the mechanisms of imitation. Hence, the basic Bass model that modified by Davies and Rainey (2011) can be written as:
𝑫𝒕+𝟏 − 𝑫𝒕 = [𝒂 + 𝒃𝑫𝒕 ]. [𝟏 − 𝑫𝒕]
Based on Equation 1, the diffusion 𝑫𝒕 is considered as the proportion of PV system deployed capacity (in MW) with respect to the total installed capacity from all forms of electricity generation. Thus, the increase in solar PV usage (capacity) during period t to t+1 depends on the prev ious adoption level, and the extent of generation who not yet using solar PV technology . Building on the formulation of Davies and Diaz-Rainey (2011), this study adds further variables in order to disentangle policy-driven effects from the basic innovation coefficient. The pooled OLS regression model specification is:
𝑺𝒊𝒕 = 𝒂𝒊 + 𝒃𝟏𝑫𝒊𝒕 + 𝒃𝟐𝒔𝒖𝒃𝒔𝒊𝒅𝒚𝒊𝒕 + 𝒃𝟑𝒕𝒂𝒙𝒊𝒕 + 𝒃𝟒𝑮𝑫𝑷𝒊𝒕 + 𝒃𝟓𝒆𝒅𝒖𝒄𝒊𝒕 + 𝒃𝟔𝒑𝒆𝒂𝒌𝒊𝒕 + 𝝁𝒊
Equation (2) states the successive increase in the photovoltaic adoption capacity in year t depends on the diffusion process that already in progress (𝑫), on the introduction of capital subsidy (𝒔𝒖𝒃𝒔𝒊𝒅𝒚), on the presence of tax incentives by the policymakers (𝒕𝒂𝒙), on the status of the income (𝑮𝑫𝑷), on the status of the education (𝒆𝒅𝒖𝒄) and on the status of the maximum electricity demand (𝒑𝒆𝒂𝒌) of coal power. 𝝁𝒊 is the error term.
3. 1 Data and description of variables
This study uses unbalanced panel data from selected Asia Pacific countries, namely; Australia, India, Japan, South Korea, Malaysia and Thailand over the time period of 2000-2015. In addition, the policy enacted in Australia and India are vary across the regions, thus this research also captures regional policy enactment in Australia and India to be implemented in
(1)
(2)
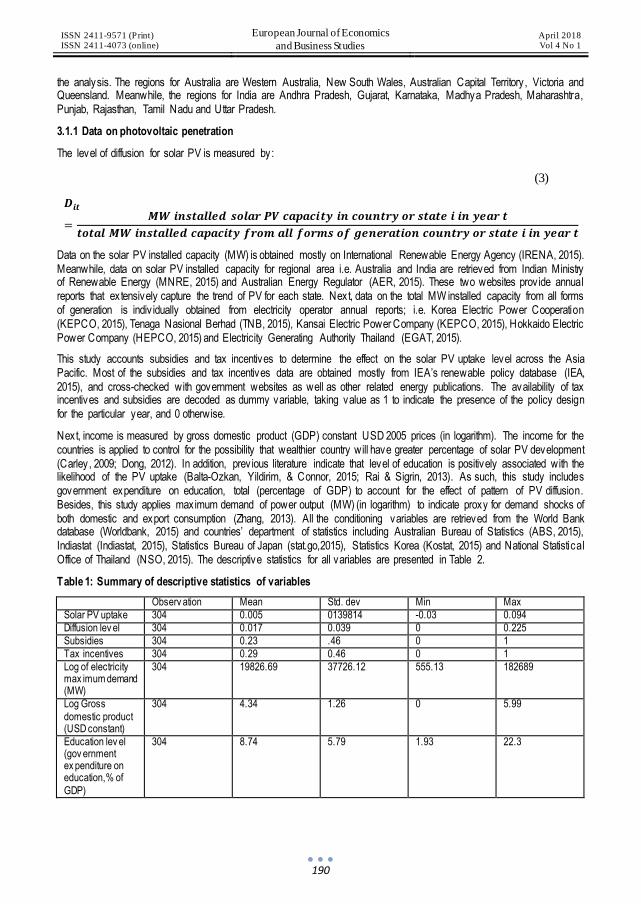
ISSN 2411-9571 (Print) ISSN 2411-4073 (online)
European Journal of Economics
and Business Studies April 2018 Vol 4 No 1
190
the analysis. The regions for Australia are Western Australia, New South Wales, Australian Capital Territory , Victoria and Queensland. Meanwhile, the regions for India are Andhra Pradesh, Gujarat, Karnataka, Madhya Pradesh, Maharashtra, Punjab, Rajasthan, Tamil Nadu and Uttar Pradesh.
3.1.1 Data on photovoltaic penetration
The level of diffusion for solar PV is measured by:
𝑫𝒊𝒕
=𝑴𝑾 𝒊𝒏𝒔𝒕𝒂𝒍𝒍𝒆𝒅 𝒔𝒐𝒍𝒂𝒓 𝑷𝑽 𝒄𝒂𝒑𝒂𝒄𝒊𝒕𝒚 𝒊𝒏 𝒄𝒐𝒖𝒏𝒕𝒓𝒚 𝒐𝒓 𝒔𝒕𝒂𝒕𝒆 𝒊 𝒊𝒏 𝒚𝒆𝒂𝒓 𝒕
𝒕𝒐𝒕𝒂𝒍 𝑴𝑾 𝒊𝒏𝒔𝒕𝒂𝒍𝒍𝒆𝒅 𝒄𝒂𝒑𝒂𝒄𝒊𝒕𝒚 𝒇𝒓𝒐𝒎 𝒂𝒍𝒍 𝒇𝒐𝒓𝒎𝒔 𝒐𝒇 𝒈𝒆𝒏𝒆𝒓𝒂𝒕𝒊𝒐𝒏 𝒄𝒐𝒖𝒏𝒕𝒓𝒚 𝒐𝒓 𝒔𝒕𝒂𝒕𝒆 𝒊 𝒊𝒏 𝒚𝒆𝒂𝒓 𝒕
Data on the solar PV installed capacity (MW) is obtained mostly on International Renewable Energy Agency (IRENA, 2015). Meanwhile, data on solar PV installed capacity for regional area i.e. Australia and India are retrieved from Indian Ministry of Renewable Energy (MNRE, 2015) and Australian Energy Regulator (AER, 2015). These two websites prov ide annual reports that extensively capture the trend of PV for each state. Next, data on the total MW installed capacity from all forms of generation is indiv idually obtained from electricity operator annual reports; i.e. Korea Electric Power Cooperation (KEPCO, 2015), Tenaga Nasional Berhad (TNB, 2015), Kansai Electric Power Company (KEPCO, 2015), Hokkaido Electric Power Company (HEPCO, 2015) and Electricity Generating Authority Thailand (EGAT, 2015).
This study accounts subsidies and tax incentives to determine the effect on the solar PV uptake level across the Asia Pacific. Most of the subsidies and tax incentives data are obtained mostly from IEA’s renewable policy database (IEA, 2015), and cross-checked with government websites as well as other related energy publications. The availability of tax incentives and subsidies are decoded as dummy variable, taking value as 1 to indicate the presence of the policy design for the particular year, and 0 otherwise.
Next, income is measured by gross domestic product (GDP) constant USD 2005 prices (in logarithm). The income for the countries is applied to control for the possibility that wealthier country will have greater percentage of solar PV development (Carley, 2009; Dong, 2012). In addition, prev ious literature indicate that level of education is positively associated with the likelihood of the PV uptake (Balta-Ozkan, Yildirim, & Connor, 2015; Rai & Sigrin, 2013). As such, this study includes government expenditure on education, total (percentage of GDP) to account for the effect of pattern of PV diffusion. Besides, this study applies maximum demand of power output (MW) (in logarithm) to indicate proxy for demand shocks of both domestic and export consumption (Zhang, 2013). All the conditioning variables are retrieved from the World Bank database (Worldbank, 2015) and countries’ department of statistics including Australian Bureau of Statistics (ABS, 2015), Indiastat (Indiastat, 2015), Statistics Bureau of Japan (stat.go,2015), Statistics Korea (Kostat, 2015) and National Statistical Office of Thailand (NSO, 2015). The descriptive statistics for all variables are presented in Table 2.
Table 1: Summary of descriptive statistics of variables
Observ ation Mean Std. dev Min Max
Solar PV uptake 304 0.005 0139814 -0.03 0.094
Diffusion lev el 304 0.017 0.039 0 0.225
Subsidies 304 0.23 .46 0 1
Tax incentives 304 0.29 0.46 0 1
Log of electricity max imum demand (MW)
304 19826.69 37726.12 555.13 182689
Log Gross
domestic product (USD constant)
304 4.34 1.26 0 5.99
Education lev el (gov ernment ex penditure on education,% of
GDP)
304 8.74 5.79 1.93 22.3
(3)
ISSN 2411-9571 (Print) ISSN 2411-4073 (online)
European Journal of Economics
and Business Studies April 2018 Vol 4 No 1
191
4.0 Preliminary analysis
Based on Table 3, the result of pooled OLS reveals that ex isting level of diffusion is significant in fostering the shift of solar PV capacity . In specific, 1 per cent increase in the ex isting of penetration level stimulates the shift of solar PV by 0.288 percentage point on average per year. For the policy enactment, it is reveals only tax incentives are important in fostering the uptake of the PV technology. In detail for a 10-unit increase in tax incentives, the diffusion pattern of solar PV will increase by 8 percentage point. However, the effect of subsidy on the deployment of solar PV is not significant during the period of study. In addition, the result from the control variables show that income is necessary for facilitating uptake of photovoltaic for the countries.
In addition, the regression is also tested with robustness check. The result of Wooldridge (2002) test p-value more than 10 per cent significant level reveals that the regression is not suffering from serial correlation problem. Next, the result from the Breusch-Pagan (1979) test of p-value more than 10 per cent significant level also reveals that the regression does not suffering from heteroskedasticity problem.
Table 2: Pooled ordinary least square (OLS) regression results
Note: The values in parentheses are standard errors. * indicates significance at 10 per cent. ** significance at 5 per cent, *** significance at 1 per cent.
4.1 Discussion
The result of the analysis confirms the role of diffusion level is important in motivating the shift of PV technology capacity for the countries. Based on the policy inducement effect, the findings show the policy incentive has driven the uptake of solar PV in Asia Pacific. This finding is consistent with the literature that effective energy support policies are necessary to catalyse the diffusion process until renewable energy technologies can compete with the conventional sources (Keyuraphan, Thanarak, Ketjoy, & Rakwichian, 2012). A supportive tax policy reduce the costs and risks of renewable energy investments by lowering the upfront investment costs (Sawin et al. 2004). This study finds that subsidies does not help to stimulate the diffusion pattern of the photovoltaic during the analysed period Apart from that, the analysis suggests that income plays a positive impact on solar PV uptake. This finding is consistent with Rode and Weber (2012) and Sardianou and Genoudi (2013) where household wealth is often cited as being determinants in PV system. Next, although not significant, the inverse relationship between peak demands of conventional electricity suggests that conventional energy is still needed in order to cater the society ’s needs for the context of Asia Pacific. In addition, since the solar PV is operating in small scales, thus it does not sufficient to cater the electricity demand for the society . Lastly , level of education does not affecting the diffusion pattern for the solar PV. This is maybe true that societies does not need to acquire a certain level of awareness about the technology (Romano et al. 2017).
Conclusion and limitation
Drawing on the Bass (1969) and Davies models of innovation diffusion (2011), this paper develops several assumptions that suggest the patterns of diffusion are different when policy plays an important role in the diffusion process. In specific, this paper explores the effectiveness of the renewable energy policy instruments on the pattern of diffusion of solar
Dependent v ariable: successive increase of solar PV
Independent v ariables
Intercept 𝑎𝑖 -0.045 (0.039)
Diffusion lev el 𝐷𝑖 0.284*** (0.026)
Tax relief 0.007*** (0.003)
Subsidy 0.001 (0.002)
Log peak demand for coal pow er -0.002 (0.005)
Log income 0.002** (0.001)
Education 0.002 (0.006)
R-square ov erall 0.546
R-square adjusted 0.474
Breusch-Pagan 0.12 Wooldridge 0.11
No. Observation 304
F-statistics 7.67***

ISSN 2411-9571 (Print) ISSN 2411-4073 (online)
European Journal of Economics
and Business Studies April 2018 Vol 4 No 1
192
photovoltaic capacity for a set of 6 Asia Pacific countries from 2000 to 2015. The present study is different from prev ious literature by exploring the effect of policy inducement namely; subsidy and tax incentives on the pattern of diffusion on solar photovoltaic uptake. It has found that countries will follow a Bass curve when there is a strong policy incentive occur. Besides that, the ex istence of tax incentives also promotes the shift of solar photovoltaic capacity throughout the analysis period.
The present study presents a limitation that must be noted. First, low coefficient for the policy variables for the regression analysis suggest the renewable energy for most countries has been deployed in great amount in more advance countries (i.e. Japan, South Korea and Australia) and recently in middle income countries (Malaysia, India and Thailand), and the enactment of the policy are just been implemented recently for most countries. Therefore, future research could carefully examine the effects of policy schemes by including European countries in the analysis, where the enactment of the policy schemes has been implemented since year 1990 (Jenner et al. 2013).
References
[1] Balta-Ozkan, N., Yildirim, J., & Connor, P. M. (2015). Regional distribution of photov oltaic deployment in the UK and its determinants: A spatial econometric approach. Energy Economics, 51, 417–429. http://doi.org/10.1016/j.eneco.2015.08.003
[2] Bass, F. M. (1969). A New Product Growth for Model Consumer Durables. Management Science, 15(5), 215–227.
http://doi.org/10.1287/mnsc.1040.0264 [3] Carley , S. R. (2009). State renewable energy electricity policies: An empirical evaluation of effectiv eness. Energy Policy, 37(8),
3071–3081. http://doi.org/10.1016/j.enpol.2009.03.062 [4] Dav ies, S. W., & Diaz-Rainey, I. (2011). The patterns of induced diffusion: Ev idence from the international diffusion of w ind
energy . Technological Forecasting and Social Change, 78(7), 1227–1241. http://doi.org/10.1016/j.techfore.2011.03.012 [5] DLA PIPER. (2010). Renewable energy in Asia Pacific. A Reference Manual for Anyone Involved in the Energy Sector, 1–92.
Retriev ed from http://www.nortonrose.com/knowledge/publications/pdf/file29339.pdf?lang=en-gb [6] Dong, C. G. (2012). Feed-in tariff v s. renewable portfolio standard: An empirical test of their relativ e effectiveness in promoting
w ind capacity development. Energy Policy, 42, 476–485. http://doi.org/10.1016/j.enpol.2011.12.014 [7] Estrada, G., Park, D., & Ramayandi, A. (2010). ADB Economics Working Paper Series Financial Development and Economic
Grow th in Dev eloping Asia, (233). [8] Groba, F., & Breitschopf, B. (2013). Impact of Renewable Energy Policy and Use on Innovation A Literature Review. DIW
Berlin Discussion Papers, 1318, 1–43. Retrieved from http://www.econstor.eu/handle/10419/85049 [9] Irena. (2013). Renew able Energy and Jobs Annual Rev iew 2014, (May ), 12.
http://doi.org/http://www.irena.org/menu/index.aspx?mnu=Subcat&PriMenuID=36&CatID=141&SubcatID=585 [10] Key uraphan, S., Thanarak, P., Ketjoy, N., & Rakwichian, W. (2012). Subsidy schemes of renewable energy policy for electricity
generation in Thailand. Procedia Engineering, 32, 440–448. http://doi.org/10.1016/j.proeng.2012.01.1291 [11] Paper, T. B., Sawin, J. L., Flavin, C., Babu, Y. D., Energy, T., & Delhi, N. (2004). National Policy Instruments Policy Lessons
for the Adv ancement & Diffusion of Renew able Energy Project Director : Energy, (January). http://doi.org/10.4324/9781849772341
[12] Radomes, A. A., & Arango, S. (2015). Renewable energy technology diffusion: An analysis of photovoltaic-system support schemes in Medellín, Colombia. Journal of Cleaner Production, 92, 152–161. http://doi.org/10.1016/j.jclepro.2014.12.090
[13] Rai, V., & Sigrin, B. (2013). Diffusion of env ironmentally -friendly energy technologies: buy versus lease differences in residential PV markets. Environmental Research Letters, 8(1), 14022. http://doi.org/10.1088/1748-9326/8/1/014022
[14] REN21. (2016). Renewables 2016 Global Status Report . Renewables 2016 Global Status Report. http://doi.org/ISBN 978-3-
9818107-0-7 [15] Ritzenhofen, I., & Spinler, S. (2016). Optimal design of feed-in-tariffs to stimulate renew able energy investments under
regulatory uncertainty - A real options analysis. Energy Economics, 53, 76–89. http://doi.org/10.1016/j.eneco.2014.12.008 [16] Romano, A. A., Scandurra, G., Carfora, A., & Fodor, M. (2017). Renewable investments: The impact of green policies in
dev eloping and developed countries. Renewable and Sustainable Energy Reviews . http://doi.org/10.1016/j.rser.2016.10.024 [17] Watanabe, C., Wakabayashi, K., & Miyazawa, T. (2000). Industrial dynamism and the creation of a `v irtuous cycle’ between
R&D, market grow th and price reduction. The case of photov oltaic pow er generation (PV) dev elopment in Japan. Technovation, 20(6), 299–312. http://doi.org/10.1016/S0166-4972(99)00146-7
[18] Zhix in, Z., & Xin, R. (2011). Causal Relationships between Energy Consumption and Economic Growth. Energy Procedia, 5, 2065–2071. http://doi.org/10.1016/j.egypro.2011.03.356

ISSN 2411-9571 (Print) ISSN 2411-4073 (online)
European Journal of Economics
and Business Studies April 2018 Vol 4 No 1
193
DOI: 10.26417/ejes.v4i1.p193-200
Open Access. © 2018 Yenny Maya Dora. This is an open access article licensed under the
Creative Commons Attribution-NonCommercial-NoDerivs 4.0 License
Service Quality and Education Cost Implication the Decision to Stay Active Re-Study Mediated by Student Satisfaction – A Study at Private University in West Java
Yenny Maya Dora
Faculty of Business and Management Universitas Widyatama Bandung Indonesia
Abstract
This study aims to analyze the implication of serv ice quality variables and education costs in relation to student satisfaction variables as well as variables of Student Decision to Stay Active Re-study at Private University in West Java. This research was conducted by survey method, the data obtained by the distribution of student questionnaires. The population of this research is private university student in West Java. Data were analyzed using Structural Equation Modeling (SEM) with AMOS 18. From the results of this study can be concluded that the decision of students to Stay Active Re-study is implication the variable Serv ices Quality and Education Cost through student satisfaction variable.
Keywords: Quality of Serv ice, Cost of Education, Student Satisfaction, Student Decision
Introduction
Education is a necessity for every young generation as the nation successors, so the young generation must strive to achieve the highest education as a prov ision to compete in seizing the opportunity to work in the workplace. Private Universities present to accommodate students who cannot be accommodated by State Universities. Private Universities are growing and developing like the serv ice industry in general. Of whom students are one of the customers of Private Universities.
The quality of a Private University is determined by the serv ice quality that is prov ided, in which the serv ice quality can be identified through customer satisfaction in this case is the students. For Private Universities, serv ice satisfaction is more oriented towards the students because they are the primary customers of the universities. Private universities as serv ice industry should continue to think more maturely about the importance of serv ice to students, it is now increasingly perceived that Quality of Serv ice and Customer Satisfaction is a v ital aspect in order to surv ive in the serv ice business and win the competition (Tjiptono, 2004). Student satisfaction will be achieved if there is a match between serv ices that are prov ided to students with what is expected by them. As it is expressed by Wadhwa and Radja (2006) that student satisfaction to the serv ices that are received is seen from the match between the expectation and the serv ice performance that is received. This is in accordance with the statement of Lupiyoadi (2001), that Cost is a factor which influences the level of customer satisfaction.
Currently there are 58 private universities in West Java. Source: http://dikti.go.id, 2017. The number of many universities when it is v iewed from the university perspective results in a fairly tight competition in obtaining prospective students. The potentials and advantages of each private university will be deployed as much as possible and become a positive selling point, but otherwise the Private Universities which are unable and unrivaled competitiveness will feel the impact of this competition in the form of the lack of student number.
On the other hand, the growth of private universities make the prospective students have many alternatives in choosing a university . This causes the distribution to be very lame between one particular Private University with other although with relatively similar characteristics of Private University eg study programs which are managed, facilities and infrastructure which are owned for example permanent lecture, laboratory, education cost, etc. There are certain private universities that
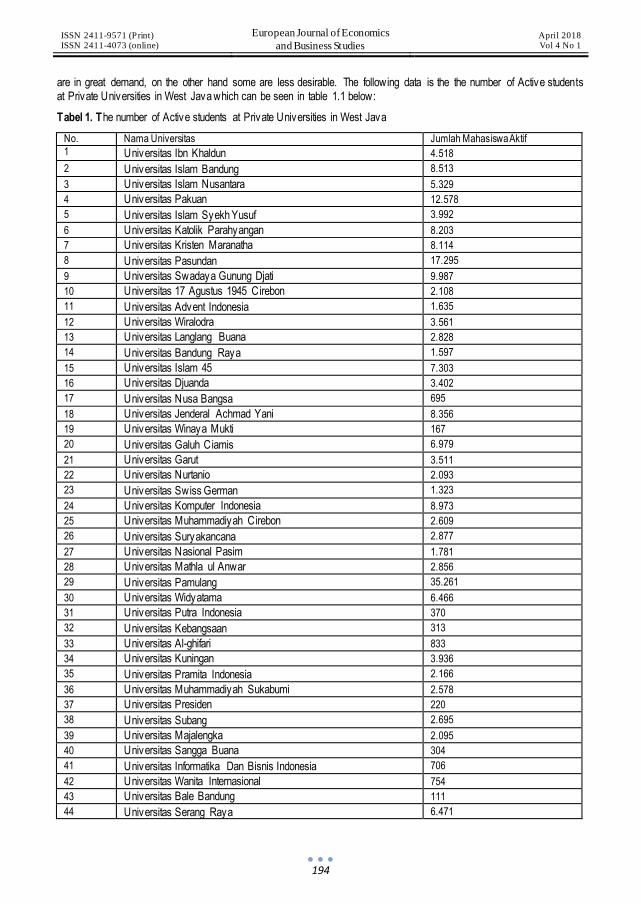
ISSN 2411-9571 (Print) ISSN 2411-4073 (online)
European Journal of Economics
and Business Studies April 2018 Vol 4 No 1
194
are in great demand, on the other hand some are less desirable. The following data is the the number of Active students at Private Universities in West Java which can be seen in table 1.1 below:
Tabel 1. The number of Active students at Private Universities in West Java
No. Nama Universitas Jumlah Mahasiswa Aktif
1
Universitas Ibn Khaldun 4.518
2 Universitas Islam Bandung 8.513
3 Universitas Islam Nusantara 5.329
4 Universitas Pakuan 12.578
5 Universitas Islam Syekh Yusuf 3.992
6 Universitas Katolik Parahyangan 8.203
7 Universitas Kristen Maranatha 8.114
8 Universitas Pasundan 17.295
9 Universitas Swadaya Gunung Djati 9.987
10 Universitas 17 Agustus 1945 Cirebon 2.108
11 Universitas Advent Indonesia 1.635
12 Universitas Wiralodra 3.561
13 Universitas Langlang Buana 2.828
14 Universitas Bandung Raya 1.597
15 Universitas Islam 45 7.303
16 Universitas Djuanda 3.402
17 Universitas Nusa Bangsa 695
18 Universitas Jenderal Achmad Yani 8.356
19 Universitas Winaya Mukti 167
20 Universitas Galuh Ciamis 6.979
21 Universitas Garut 3.511
22 Universitas Nurtanio 2.093
23 Universitas Swiss German 1.323
24 Universitas Komputer Indonesia 8.973
25 Universitas Muhammadiyah Cirebon 2.609
26 Universitas Suryakancana 2.877
27 Universitas Nasional Pasim 1.781
28 Universitas Mathla ul Anwar 2.856
29 Universitas Pamulang 35.261
30 Universitas Widyatama 6.466
31 Universitas Putra Indonesia 370
32 Universitas Kebangsaan 313
33 Universitas Al-ghifari 833
34 Universitas Kuningan 3.936
35 Universitas Pramita Indonesia 2.166
36 Universitas Muhammadiyah Sukabumi 2.578
37 Universitas Presiden 220
38 Universitas Subang 2.695
39 Universitas Majalengka 2.095
40 Universitas Sangga Buana 304
41 Universitas Informatika Dan Bisnis Indonesia 706
42 Universitas Wanita Internasional 754
43 Universitas Bale Bandung 111
44 Universitas Serang Raya 6.471
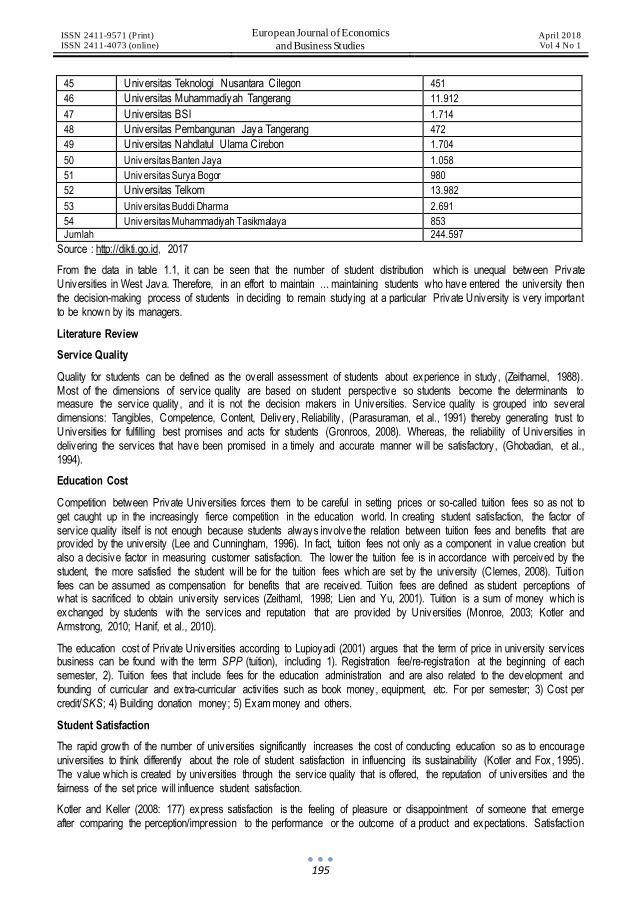
ISSN 2411-9571 (Print) ISSN 2411-4073 (online)
European Journal of Economics
and Business Studies April 2018 Vol 4 No 1
195
45 Universitas Teknologi Nusantara Cilegon 451
46 Universitas Muhammadiyah Tangerang 11.912
47 Universitas BSI 1.714
48 Universitas Pembangunan Jaya Tangerang 472
49 Universitas Nahdlatul Ulama Cirebon 1.704
50 Univ ersitas Banten Jaya 1.058
51 Univ ersitas Surya Bogor 980
52 Universitas Telkom 13.982
53 Univ ersitas Buddi Dharma 2.691
54 Univ ersitas Muhammadiyah Tasikmalaya 853
Jumlah 244.597
Source : http://dikti.go.id, 2017
From the data in table 1.1, it can be seen that the number of student distribution which is unequal between Private Universities in West Java. Therefore, in an effort to maintain ... maintaining students who have entered the university then the decision-making process of students in deciding to remain studying at a particular Private University is very important to be known by its managers.
Literature Review
Service Quality
Quality for students can be defined as the overall assessment of students about experience in study, (Zeithamel, 1988). Most of the dimensions of serv ice quality are based on student perspective so students become the determinants to measure the serv ice quality , and it is not the decision makers in Universities. Serv ice quality is grouped into several dimensions: Tangibles, Competence, Content, Delivery, Reliability , (Parasuraman, et al., 1991) thereby generating trust to Universities for fulfilling best promises and acts for students (Gronroos, 2008). Whereas, the reliability of Universities in delivering the serv ices that have been promised in a timely and accurate manner will be satisfactory, (Ghobadian, et al., 1994).
Education Cost
Competition between Private Universities forces them to be careful in setting prices or so-called tuition fees so as not to get caught up in the increasingly fierce competition in the education world. In creating student satisfaction, the factor of serv ice quality itself is not enough because students always involve the relation between tuition fees and benefits that are prov ided by the university (Lee and Cunningham, 1996). In fact, tuition fees not only as a component in value creation but also a decisive factor in measuring customer satisfaction. The lower the tuition fee is in accordance with perceived by the student, the more satisfied the student will be for the tuition fees which are set by the university (Clemes, 2008). Tuition fees can be assumed as compensation for benefits that are received. Tuition fees are defined as student perceptions of what is sacrificed to obtain university serv ices (Zeithaml, 1998; Lien and Yu, 2001). Tuition is a sum of money which is exchanged by students with the serv ices and reputation that are prov ided by Universities (Monroe, 2003; Kotler and Armstrong, 2010; Hanif, et al., 2010).
The education cost of Private Universities according to Lupioyadi (2001) argues that the term of price in university serv ices business can be found with the term SPP (tuition), including 1). Registration fee/re-registration at the beginning of each semester, 2). Tuition fees that include fees for the education administration and are also related to the development and founding of curricular and extra-curricular activ ities such as book money, equipment, etc. For per semester; 3) Cost per credit/SKS; 4) Building donation money; 5) Exam money and others.
Student Satisfaction
The rapid growth of the number of universities significantly increases the cost of conducting education so as to encourage universities to think differently about the role of student satisfaction in influencing its sustainability (Kotler and Fox, 1995). The value which is created by universities through the serv ice quality that is offered, the reputation of universities and the fairness of the set price will influence student satisfaction.
Kotler and Keller (2008: 177) express satisfaction is the feeling of pleasure or disappointment of someone that emerge after comparing the perception/impression to the performance or the outcome of a product and expectations. Satisfaction

ISSN 2411-9571 (Print) ISSN 2411-4073 (online)
European Journal of Economics
and Business Studies April 2018 Vol 4 No 1
196
is a function of perception/impression of performance and expectation. According to Jurkowitsch, et al (2006), "Student satisfaction is defined as the student's fulfillment response." This means that student satisfaction is defined as the response to the needs fulfillment of the students. Wijaya (2012) argues that "Customer satisfaction of education serv ice is one of the determinants on educational competition success." Satisfaction is a positive emotional state that is resulted from student and university interaction over time (Li-wei and Tsung-chi, 2007).
The Decision in Remaining Active to Study
According to Peter and Olson (2013) define purchasing decision making as follow: The core process in consumer decision making is the integration process which is used to combine knowledge to evaluate two or more alternative behaviors and choose one of them.
Schiffman and Kanuk (2007) argue that decision-making process as important process that is influenced by the external env ironment that consists of marketing mix (product, promotion, price, distribution) and socio-cultural env ironment (family , informational source, non-commercial sources, social class, culture and sub-cultures). Then, the internal env ironment (psychological factors) consists of motivation, personality , learning, perception, and attitude. Similarly , as it is proposed by James F. Engel, Rogerd D. Blackwell, Paul W. Miniard, (1992) who state that consumer decisions in choosing a product/serv ice is influenced by three things: 1) Environmental/external influences that consist of cultural factors, social class, personal influence, family , and situation; 2) The Influence of Indiv idual/Internal Differences that consist of Consumer Resources (time, money, attention), motivation and involvement, knowledge, attitude, personality , lifesty le, and demography 3) Psychological influences that consist of processing, information, learning, changing attitudes and behavior.
2.5 Research Framework and Hypotheses
2.5.1 Research Framework
The following is the research framework which can be seen in Figure 1 below:
Figure 1. Research Framework (Source: Processed Data, 2018)
Based on the framework in Figure 1, the research hypothesis is as follows:
1. H1: There is an influence between Serv ice Quality to Student Satisfaction. 2. H2: There is an influence between Education Cost to Student Satisfaction. 3. H3: There is an influence between Student Satisfaction to Decision in Remaining Active To Study. 4. H4: There is an influence between Serv ice Quality to Active and Decisions in Remaining Active to Study which is mediated by Satisfaction. 5. H5: There is an influence between Education Cost to to Active and Decisions in Remaining Active to Study w hich is mediated by Satisfaction.
Research Methods
Research Design
This study is done by using Crosssectional development method. Cross-sectional research is a study whose data collection is done at a certain point in time.

ISSN 2411-9571 (Print) ISSN 2411-4073 (online)
European Journal of Economics
and Business Studies April 2018 Vol 4 No 1
197
Data Analysis Method
The method which is used to analyze the data of this study is using structural equation model (SEM). According to Ferdinand (2014), Measurement model is intended to confirm a dimension or factor based on its empirical indicators. Structural models are models of relation structures that form or explain causality between factors.
Research Variables
The research variables can be grouped into two: first, exogenous variable (free) is Serv ice Quality (X1), and Education Cost (X2). Second, endogenous variable consists of Satisfaction (Y1) and Decision in Remaining Active to Study (Y2) (dependent variables).
Population and Sample
In this study, the population is the students in Faculty of Business and Management at Private Universities in West Java which are still active in 2016/2017 Academic Year which are 244,597 students. Of the population of 244,597 students, researchers only take some of the population as research subjects (Sekaran, 2006). While the sample size in the study is the appropriate sample size in a research, it is 30 to 500. Furthermore, the guidelines for sample size depend on the parameters that are estimated. The guidelines are 5 to 10 times of the variables that are estimated. The number of variables in this study are 5 variables, then based on Maximum likelihood (ML) estimation technique estimate on SEM with percentage of uncertainty clearance which is used in research by 5% . Then the number of samples in this study is 350 students.
Sampling method with certain criteria (purposive sampling), i.e. the sampling which is done by taking the selected people according to the specific characteristics that are possessed by the sample. Researchers use purposive samples because researchers use students with certain criteria to be sampled. The criteria are the minimum students who are in the ≥ 3rd semester, and the students are still active studying.
Research Results and Discussion
Analisis Structural Equation Modeling (SEM)
The result of data analysis with structural equation modeling method or SEM, with the help of AMOS program 18 version can be made the measurement table of Goodness Of Fit research model as follows: presented in table 2.
Table 2. Feasibility Test Results of Structural Equation Model (SEM) Model
Criteria Cut-Off-Value Analy sis Results Ev aluation Model
2 (Chi-Square) Ex pected small 389.988 Fit
Probability ≥ 0.05 0.266 Fit
RMSEA ≤ 0.083 0.018 Fit
CMIN/DF ≥ 2.00 1.047 Fit
GFI ≥ 0.90 0.916 Fit
AGFI ≥ 0.90 0.876 Marginal
TLI ≥ 0.96 0.997 Fit
CFI ≥ 0.95 0.988 Fit
Source: Processed Data, 2018
These results indicate that the model which is used is acceptable. Measurement indexes TLI, CFI, CMIN/DF and RMSEA are within the expected value range even though AGFI is received marginally . Thus the feasibility test of the SEM model has met the acceptance requirement.
Hypothesis Testing
After all assumptions can be met, then hypothesis will be tested as it is proposed in the prev ious chapter. To test the hypothesis which is proposed, it is done by analyzing the regression weights for each of its exogenous constructs against its endogenous constructs. By looking at the C.R value which is identical with t-count, on the processing result compared with the critical value is ± 1.96 at the 0.05 significance level (5% ). The results of hypothesis testing are presented in table 3.
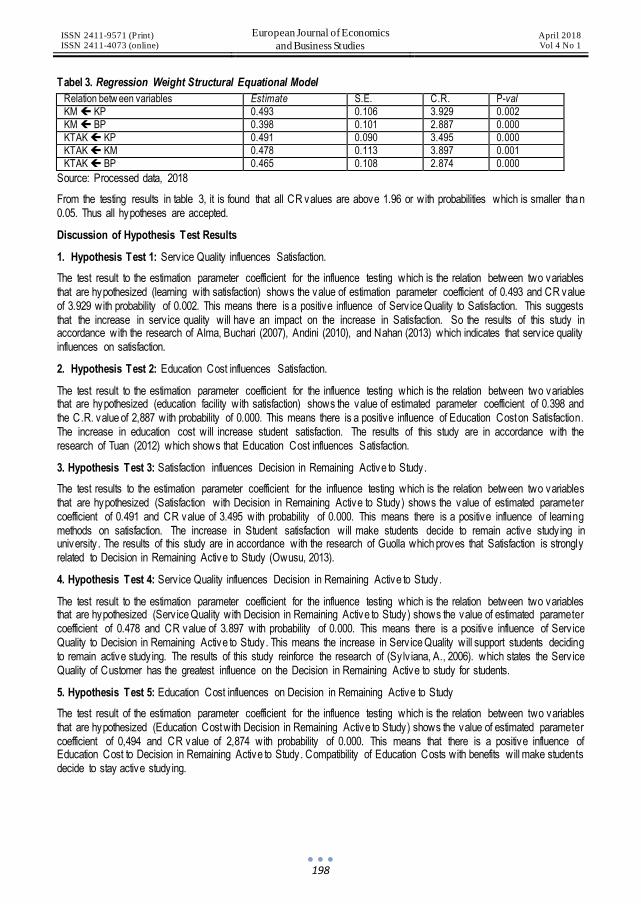
ISSN 2411-9571 (Print) ISSN 2411-4073 (online)
European Journal of Economics
and Business Studies April 2018 Vol 4 No 1
198
Tabel 3. Regression Weight Structural Equational Model
Relation betw een variables Estimate S.E. C.R. P-val
KM KP 0.493 0.106 3.929 0.002
KM BP 0.398 0.101 2.887 0.000
KTAK KP 0.491 0.090 3.495 0.000
KTAK KM 0.478 0.113 3.897 0.001
KTAK BP 0.465 0.108 2.874 0.000
Source: Processed data, 2018
From the testing results in table 3, it is found that all CR values are above 1.96 or with probabilities which is smaller tha n 0.05. Thus all hypotheses are accepted.
Discussion of Hypothesis Test Results
1. Hypothesis Test 1: Serv ice Quality influences Satisfaction.
The test result to the estimation parameter coefficient for the influence testing which is the relation between two variables that are hypothesized (learning with satisfaction) shows the value of estimation parameter coefficient of 0.493 and CR value of 3.929 with probability of 0.002. This means there is a positive influence of Serv ice Quality to Satisfaction. This suggests that the increase in serv ice quality will have an impact on the increase in Satisfaction. So the results of this study in accordance with the research of Alma, Buchari (2007), Andini (2010), and Nahan (2013) which indicates that serv ice quality influences on satisfaction.
2. Hypothesis Test 2: Education Cost influences Satisfaction.
The test result to the estimation parameter coefficient for the influence testing which is the relation between two variables that are hypothesized (education facility with satisfaction) shows the value of estimated parameter coefficient of 0.398 and the C.R. value of 2,887 with probability of 0.000. This means there is a positive influence of Education Cost on Satisfaction. The increase in education cost will increase student satisfaction. The results of this study are in accordance with the research of Tuan (2012) which shows that Education Cost influences Satisfaction.
3. Hypothesis Test 3: Satisfaction influences Decision in Remaining Active to Study.
The test results to the estimation parameter coefficient for the influence testing which is the relation between two variables that are hypothesized (Satisfaction with Decision in Remaining Active to Study) shows the value of estimated parameter coefficient of 0.491 and CR value of 3.495 with probability of 0.000. This means there is a positive influence of learning methods on satisfaction. The increase in Student satisfaction will make students decide to remain active studying in university . The results of this study are in accordance with the research of Guolla which proves that Satisfaction is strongly related to Decision in Remaining Active to Study (Owusu, 2013).
4. Hypothesis Test 4: Serv ice Quality influences Decision in Remaining Active to Study.
The test result to the estimation parameter coefficient for the influence testing which is the relation between two variables that are hypothesized (Serv ice Quality with Decision in Remaining Active to Study) shows the value of estimated parameter coefficient of 0.478 and CR value of 3.897 with probability of 0.000. This means there is a positive influence of Serv ice Quality to Decision in Remaining Active to Study. This means the increase in Serv ice Quality will support students deciding to remain active studying. The results of this study reinforce the research of (Sy lv iana, A., 2006). which states the Serv ice Quality of Customer has the greatest influence on the Decision in Remaining Active to study for students.
5. Hypothesis Test 5: Education Cost influences on Decision in Remaining Active to Study
The test result of the estimation parameter coefficient for the influence testing which is the relation between two variables that are hypothesized (Education Cost with Decision in Remaining Active to Study) shows the value of estimated parameter coefficient of 0,494 and CR value of 2,874 with probability of 0.000. This means that there is a positive influence of Education Cost to Decision in Remaining Active to Study. Compatibility of Education Costs with benefits will make students decide to stay active studying.
ISSN 2411-9571 (Print) ISSN 2411-4073 (online)
European Journal of Economics
and Business Studies April 2018 Vol 4 No 1
199
Conclusions
Serv ice Quality has a positive and significant influence on Student Satisfaction, it means that Hypothesis 1 is accepted and answers the first research problem of this study.
Education cost has a positive and significant influence on Student Satisfaction, it means that Hypothesis 2 is accepted and answers the second research problem of this study.
Student Satisfaction has a positive and significant influence on decision in remaining active to study, it means that Hypothesis 3 is accepted and answers the third research problem of this study.
Serv ice Quality has a positive and significant influence on Decision in Remaining Active to Study. And the indirect influence of Serv ice Quality to student satisfaction which is mediated by Student Satisfaction variable is significant, it means that Hypotersis 4 is accepted and answers the fourth research problem of this study.
Direct Influence of Education Costs to Decisions in Remaining Active to Study, And indirect influence of Serv ice Quality to Decision in Remaining Active to Study which is mediated by Student Satisfaction variable is significant, it means that Hypotersis 5 is accepted and answers the fifth problem research of this study.
Bibliography
[1] Alma, Buchari.2007. Pemasaran Stratejik Jasa Pendidikan/Strategic Marketing of Education Serv ices, Second Edition, Bandung, Alfabeta.
[2] Cardona, M.Melchor., Bravo, J.Jose., 2012. “Serv ice Quality perceptions in higher education institutions: the case of a colombian university”. Journal research high education, 28:23-29.
[3] Chang, Hsin Hsin and Hsin-Wei Wang. 2011. The Moderating Effect of Customer Perceived Value on Online Shopping Behaviour. Online Information Review. Vol. 35 No. 3. pp. 333-359.
[4] Chang, Kuo-Chien, Mu-Chen Chen, Chia-Lin Hsu, Nien-Te Kuo. 2010. The Effect of Serv ice Convenience on PostPurchasing Behaviours. Industrial Management & Data System. Vol. 110 No. 9.
[5] Ciernes, M.D. (2008). An Empirical Analysis of Customer Satisfaction in International Air Travel. Innovative Marketing 4(2), 50-62.
[6] Dimitriades, Zoe S. 2006. Customer Satisfaction, Loyalty and Commitment in Serv ice Organizations. 2006. Management Research News. Vol. 29. No. 12.
[7] Engel, James F, Blackwell, Rogre D and Miniard, Paul W, (1994), Perilaku Konsumen/Consumer Behavior, Volume-1, Binaputra Aksara, Jakarta
[8] Ghobadian,A., S. Speller, dan M. Jores. (1994). Serv ice Quality : Concepts and Models. International Journal of Quality and Reliability Management 11 (9).
[9] Gronroos. 2008. Serv ice Logic Revisited: Who Creates Value? And Co-Creates?,European Business Review 20 (4).
[10] Gronross, C., dan A. Ravald. (2010). Serv ice as Business Logic: Implication for Value Creation and Marketing. Journal of Serv ice Management 22 (1), 5-22.
[11] Hanif, M., Hafeez, S., Riaz, A. (2010). Factor Affecting Customer Satisfaction.Interna tional Research Journal of Finance and Economics 60.
[12] Hassan, Masoodul, Saad Hassan, Muhammad Saqib Nawaz and Ibrahim Aksel. 2013. Measuring Customer Satisfaction and Loyalty Through Serv ice Fairness, Serv ice Quality and Price Fairness Perception: An Empirical Study Of Pakistan Mobile Telecommunication Sector. Sci.Int.(Lahore), 25 (4).
[13] Hellier, Phillip K; Gus M Geursen, Rodney A. Carr, John A. Rickard. 2003. Customer Repurchase Intention A General Structural Equation Model. European Journal of Marketing. Vol. 37. No. 11/12.
[14] Hermann et al. 2007. “The Influence of Price Fairness on Customer Satisfaction: An Empirical Test in The Context of Automobile Purchases”. Journal of Product & Brand Management. Vol.16, No.1
[15] Huang, Chun-Chun., 2014.”The Relationship Among Brand Equity , Customer Satisfaction, And Brand Resonance ToRepurchase Intention Of Cultural And Creative Industries In Taiwan”. International journal of
organization innovation,6:106-120 [16] Kassim, Norizan, Nor Asiah Abdullah. 2010. The Effect of Perceived Serv ice Quality Dimensions on Customer
Satisfaction, Trust, and Loyalty in E-Commerce Setting A Cross Cultural Analysis. Asia Pacific Journal of Marketing and Logistics. Vol. 22 No. 3.
[17] Kotler, P., dan Armstrong, G. (2010). Principles of Marketing. Eight Edition. Englewood Cliffs, New Jersey: Prentice-Hall, Inc.
ISSN 2411-9571 (Print) ISSN 2411-4073 (online)
European Journal of Economics
and Business Studies April 2018 Vol 4 No 1
200
[18] Kotler, Philip dan Kevin Lane Keller, 2008. Manajemen Pemasaran/Management of Marketing (Thirteen Edition), Jakarta: PT. Indeks.
[19] Lee, M., dan Cunningham, L.F. (1996). Customer Loyalty in the Air Industry . Transportation Quarterly 50 (2). [20] Lien, T.B., dan Yu, C. C. (2001). An Integrated Model for the Effects of Perceived Product, Perceived Serv ice
Quality , and Perceived Price Fairness on Customer Satisfaction and Loyalty . Journal of Consumer Satisfaction, Dissatisfaction, and Complaining Behavior 14.
[21] Lupiyoadi, Rambat, 2001, Manajemen Pemasaran Jasa: Teori dan Praktek / Management of Serv ice Marketing: Theory and Practice, Salemba Empat, Jakarta.
[22] Monroe, Kent B. (2003). Pricing: Making Profitable Decisions 3rd edition. New York: McGraw-Hill. [23] Owusu Alfred, 2013 . Influences of Price And Quality On Consumer Purchase Of Mobile Phone In The Kumasi
Metropolis In Ghana A Comparative Study, European Journal of Business and Management , Vol.5, N o.1. [24] Parasuraman, A., Zeithaml, V. A., & Berry , L. 1988. SERVQUAL: A Multiple-Item Scale for Measuring Consumer
Perceptions of Serv ice Quality . Journal of Retailing, Vol.64 No. 1. [25] Parasuraman, A., Zeithaml, V. A., dan L.L Berry . (1991). Five Imperatives for Improv ing Serv ice Quality . Sloan
Management Review, 29-38. [26] Peter, J. Paul dan Olson, Jerry C. 2013. Perilaku Konsumen dan Strategi Pemasaran/Consumer Behavior and
Marketing Strategy. Volume 9. Book 1. Salemba Empat : Jakarta. [27] Polyorat, Kawpong and Suvernus Sophansiri. 2010. The Influence of Serv ice Quality Dimensions on Customer
Satisfaction and Customer Loyalty in The Chain Restaurant Context: A Thai Case. Journal of Global Business and Technology, Vol. 6. pp. 64-76
[28] Shiffman, Leon G and Kanuk, Leslie, Laser, 2007, Perilaku Konsumen/Consumer Behavior, Seventh Edition, Indeks, Jakarta.
[29] Sylv iana, A., 2006. ”Pengaruh Kualitas Pelayanan Dan Kepuasan Mahasiswa Terhadap Intensi Meregistras i Ulang Mahasiswa/ The Influence of Serv ice Quality and Student Satisfaction of Intention to Re-Register Student”.Jurnal Organisasi dan Manajemen/Journal of Organization and Management 2:60-78
[30] Tjiptono, Fandy. 2004. Manajemen Jasa/Management of Serv ice. Yogyakarta: Andi Offset. Tjiptono, Fandy. 1997. Strategi Pemasaran/Marketing Strategy. Yogyakarta: Andi Offset
[31] Tuan, Nguyen. Minh.,2012. “Effects of Quality Serv ice and Price Fairness on Student Satisfaction, International Journal of Business and Social Science,3.
[32] Wadhwa, Raja. 2006. School Organization. Journal Of Education. Vol 72. JURKOWITSCH, S ET AL. (2006). “Student Satisfaction Model for Austrian Higher Education Prov iders Considering Aspects Of Marketing Communications”. Special Edition on Consumer Satisfaction -Global Perspective. Volume 2, Issue 3, 9-22
[33] Wijaya, D. 2012. Pemasaran Jasa Pendidikan/Education Serv ice Marketing. Jakarta: Salemba Empat. [34] Zeithaml, V.A. (1988). Consumer Perceptions of Price, Quality , Value: A Means-end Model and Synthesis of
Ev idence. Journal of Marketing 52.

ISSN 2411-9571 (Print) ISSN 2411-4073 (online)
European Journal of Economics
and Business Studies April 2018 Vol 4 No 1
201
DOI: 10.26417/ejes.v4i1.p201-212
Open Access. © 2018 Juan Luis Peñaloza Figueroa and Carmen Vargas Pérez. This is an open access article licensed under the
Creative Commons Attribution-NonCommercial-NoDerivs 4.0 License
Collective Intelligence: A New Model of Business Management in the Big-Data Ecosystem
Juan Luis Peñaloza Figueroa
Department of Financial Economics and Decision Methods, Complutense University of Madrid
Carmen Vargas Pérez
Department of Applied Economics, Public Economics and Political Economy, Complutense University of Madrid
Abstract
We are immersed in a world characterized by globalization, the widespread use of technology, the transition from administrative management to smart management, the networking of companies and the use of knowledge as an intangible asset, which raises the need for a rev iew of the logic and practice of current business management. This situation requires rethinking and assessing the validity of these management systems to respond to changes in the business environment and market volatility . Our interest is twofold. The first is to study how different sets of business factors collectively work to get the company to operate and manage change, volatility and uncertainty within the Big-Data ecosystem framework. The second is to lay the foundations for the development of a management proposal based on collective intelligence (CI), whose key factors are interaction, interactive learning, distributed collaboration and the valorisation of knowledge in all its dimensions.
Keywords: Collective intelligence, Big Data Ecosy stem, Interaction, Valuation of knowledge, Business management.
JEL: C42, C44, D21, D46, D71, D81, J24, M12, M14, M15, M54.
1. Introduction
The logic of the Big-Data paradigm has rendered obsolete traditional forms of management based on attacking the consequences (costs and profits per product unit) rather than the causes of the problems faced by companies. This paradigm has also given rise to the emergence of new forms of business management based on relevant intangible assets, such as the degree of knowledge possessed by the company and the intelligence stocks of its employees. Assets that are recognized today as valuable for the development of business management in the 21st century.
In complex systems such as companies, the decisions that are made are linked to the exploitation of the knowledge and collective intelligence of its workers, to the extent that they enable the transformation of interactiv ity , learning and collaboration into economic value.
Hence the importance of studying the role of collective intelligence, understood as the real capacity of a group of people or workers to solve the problems that affect them, which in turn strengthens their cohesion and collaboration as a group. This kind of intelligence is now manifested in entirely new ways, as new communication technologies, especially the Internet, have made it possible for a large number of people around the world to work together in ways never before possible in human history (Malone 2004). The usefulness of collective intelligence is manifested in different areas of activ ity such as marketing, electoral processes and the design of public policies, among many others. Summing up, it is a new business and institutional management model in which it is possible to measure and verify the interaction and collaboration between its workers, as well as with technology, with the aim of designing intervention policies and improv ing productiv ity and business results.

ISSN 2411-9571 (Print) ISSN 2411-4073 (online)
European Journal of Economics
and Business Studies April 2018 Vol 4 No 1
202
In any context where the predominant business management is hierarchical, integration and understanding efforts among the members of the work teams of the company will be conditioned or limited in their shared relationships. These structures are more closed to horizontal communication and limit collective intelligence, causing loss of skills and knowledge of those members who are below a certain level and do not have options of participation or opinion on certain problems faced by the company.
The rest of the work is structured as follows. In Section 2 we deal with the problems related to the management of companies and its relationship with the exploitation of collective intelligence. In Section 3 we carry out a brief rev iew of the state of the art of business management and the exploitation of collective intelligence, in addition to analyzing the role of Digital Disruption in the development of the CI. In Section 4 we study the considerations to be taken into account about CI in the Big Data Ecosystem. In Section 5 we offer some ideas and advancements for the elaboration of a proposal to exploit CI at the business level. Finally , we include a six th Section of conclusions.
2. Approaching the Problem in Collective Intelligence
It's amazing how Big-Data can wake us up to the world around us. We talk about how the logic of human beings' actions is changing as electronic devices allow us to experience, in real time or not, sight, sounds and even smells, from the comfort of our offices, liv ing rooms, study spaces, etc. The impact of these changes also has a significant impact on the way we manage our economic-social activ ity , especially the way we work, interact and participate in a company's environment.
Such technological and non-technological changes and advances altogether are changing the logic of action of citizens, companies, public entities and institutions in general (Peñaloza & Vargas, 2018). And they accelerate the immersion of all economic-social agents in the Big-Data ecosystem, stimulating the development of concepts and theories that better capture the growing complex ity of the structure of phenomena and business relations. This complex ity is expressed in huge amounts of data, which prov ide greater predictive power and better meaningful solutions in knowledge-based environments and digitization (Hitt et. al., 2007).
In this context, many of the problems related to the traditional management model of the company are associated with the fact that key factors that influence the type of organizational structure, business performance, ways of working and sources of profit of the company are not taken into account. These key factors include interaction, collaboration, indiv idual and collective learning, and decentralization of decision-making, among many others.
This perception involves observ ing and analysing management phenomena from a multidimensional perspective that involves nesting, interdependence and redundancy of information. However, the traditional management practice is basically interested in a one-dimensional perception of management phenomena, an interest that is reflected in the development of an indiv idual, group/equipment, industrial or regional analysis, etc. Metaphorically speaking, the traditional model can be understood as the use of lenses that only allow us to observe the different levels in which a phenomenon manifests itself as a single analy tical level, so that its understanding will be incomplete and limited as far as the management process is concerned.
Therefore, the shift from administrative management to smart management calls into question the basic fundamentals of the company's traditional management model, as it moves from a centralised organisational structure to a decentralised network and from the use of tangible assets to the use of intangible assets (knowledge, interaction, shared responsibility , etc.). Processes which, in turn, are major challenges, namely given the need to accelerate the transition from the digitisation process to the contextualized incorporation of new forms of interaction and collaboration. The relevance of this observation lies in the need to incorporate these events into the business management process, both tactical and strategic. The idea is to build a new management model based on a process of integration of the indiv idual intelligences by equipping them with analy tical and descriptive processing capabilities and empowerment for shared decision-making in the company (collective intelligence).
From this perspective, it is understood that collective intelligence is an essential part of the business management process and is based on the connection between people and between people and/or computers. The idea is to facilitate the production of ideas, to exchange ideas and arguments, and to improve the company's "social sensitiv ity". However, this presents us with new challenges related to the identification of the different types of intelligence and personalities that best contribute to achiev ing the goals of optimizing collective knowledge, to transform the enormous amount of data that companies have today into value.

ISSN 2411-9571 (Print) ISSN 2411-4073 (online)
European Journal of Economics
and Business Studies April 2018 Vol 4 No 1
203
In short, facilitating the path to a smart business management model involves studying how different sets of business factors work collectively to get the company to operate and manage change, volatility and uncertainty as it makes its immersion in the Big-Data ecosystem. And it aims to achieve not only its adaptation to the different scenarios and maintain its competitiveness in the long term to respond to the volatility of the markets in which it operates, but also to encourage collective decision-making based on ev idence and logical reasoning on the various complex issues that are part of business management.
3. State of the Art: Big-Data the Revolution in Management
The need for a rev iew of the logic and practice of today 's business management requires rethinking and assessing the validity of management systems, to respond to changes in the business environment, market volatility , interaction and collaboration between workers and technology.
Due to the intrinsically hierarchical nature of companies, management models are characterized by establishing watertight hierarchical relationships, which extend to the lower levels (areas, departments,...), where access to information is completely asymmetrical and flows in a single direction. The information goes from the company’s management to departments or areas with almost no feedback. It is a model in which interaction, learning and collaboration do not have any real and effective relevance in decision-making, except for some anecdotal reference of an executive (CEO or Manager) who has spoken with one of its employees.
Indeed, numerous theoretical discussions and empirical research have identified relationships between different dimensions that are nested among each other. The discussion around these relationships has covered aspects such as: relationships between environmental factors and organizational structures (Pfeffer & Salancik, 1978; Aldrich & Pfeffer, 1976), between organizational technologies and organizational structures (Fry & Slocum, 1984; Comstock & Scott, 1977; Thompson, 1967; Woodward, 1965), between the organization of indiv idual subunits and attitudes (Hulin & Roznowski, 1985), between group norms/stimuli and indiv idual behavior (Hackman, 1992), between departmental structures and indiv idual attitudes (Brass, 1981; Oldham & Hackman, 1981; Rousseau, 1978; James & Jones, 1976), and between work climate/culture and indiv idual behavior (Martocchio, 1994; James, James & Ashe, 1990).
All these studies, which describe hierarchical relationships in management, explain the influence of relationships associated with one dimension on other analy tical dimensions or estates, and point out the need to rethink the current form of business management. More specifically , they show that today 's top-level executives tend to make predictions about company performance and results based on a set of general and incomplete information, and almost never take into account the direct and indirect contributions of their workers or their various departments, which are treated as black boxes that execute their orders or decisions. Moreover, they act as the sole creators of economic and business value.
In fact, in any type of company, interdependent relationships cross all the dimensions or strata that comprise it (Hoffman, 1997), putting into question the old hierarchical relationships based on a vertical nesting of decisions, which cancels the contributions of indiv iduals and working groups. This suggests that any study of indiv idual behaviour within a company or company should not only take into account (measure) indiv idual attributes but should also take into account the characteristics of the environment in which workers work and the nature of the operations they perform.
The effects of interaction are at the heart of the theories of contingency and interaction between different strata. Researchers have often lamented the difficulty of identify ing interactions between the different levels at which business management problems occur. Hence the importance of developing capacities to detect interactions and new forms of learning and collaboration between workers. This detection is determined by the extent of cross-interaction between workers and between workers and the management team.
This means that the relationships between parties and events that occur through interaction-collaboration become much more relevant, as immersion in the Big-Data ecosystem becomes widespread, with the result that the elements that form part of the business management architecture become more and more rationally connected and purposefully shared (Von Bertalanffy , 1968).
The relevant question in this situation is: How to connect people and computers so that they are collectively smarter than people, teams and computers have ever been acting indiv idually? It is a question of dev ising new bottom-up mechanisms to facilitate effective and efficient collective decision-making at the enterprise level. To this end, it will be necessary to design a networked platform to manage ideas, alternatives and debates, within and outside work teams, and at the enterprise level on the alternatives, the tactical actions and the complex business strategies.
ISSN 2411-9571 (Print) ISSN 2411-4073 (online)
European Journal of Economics
and Business Studies April 2018 Vol 4 No 1
204
In general, management specialists have a long history of recognizing that organizational and management phenomena develop within complex and dynamic systems. For this reason, collective intelligence studies emphasize the fact that identification of patterns typically associated with what is considered "smart" is not sufficient to consider a company or work team smart (Malone & Klein, 2007). On the contrary, multiple skills and competencies, such as communication, consensus readiness and interpersonal skills, are needed to effectively integrate indiv idual intelligences and obtain optimal solutions to the problems faced by companies.
This leads to the study of the characteristics and conditioning factors in which "distributed collaboration" is developed within companies, and how to build an organization more sensitive to interactions, learning, collaboration and shared responsibility .
Collaboration is philosophically different and possibly more demanding than cooperation, where the desired results are relatively clear, the distribution of future returns can be negotiated in advance and the cooperating parties essentially act in their own interest (Miles et al., 2005). Collaboration often involves unpredictable outcomes and depends largely on trust and a shared commitment to the values of honesty and fairness.
In contrast to cooperation, collaboration implies that the parties take into consideration both the interests of others and their own (von Krogh, 1998). Collaboration can be directed towards any mutually desired goal: identify ing and then solv ing a problem, resolv ing a conflict, creating a new product or business, and so on. Companies that opt for collaborative practice as a strategy should be able to develop the capacities, structures and processes to support a collaborative approach. For example, Nokia has a network of more than 300 high-tech small businesses and has developed trust-based relationships with them for continuous interaction to facilitate the development of certain technological innovations (David, J. et al. 2007).
This type of prax is implies the recognition that a collaborative approach is essential in the knowledge management process to capture a significant part of the economic value associated with an action, performance or innovation (Teece, 1986). In other words, the aim is to build a management system in which the business conversation involves all the company's professionals and technicians without exception in addressing critical issues, with the aim of promoting collective decision -making based on logical reasoning and the presentation of arguments and ev idence.
Similarly , in terms of learning and/or self-learning, the effects of feedback from experimental and cognitive developments make it possible to convert the results into a shared and collaborative learning process. In this process, the regulatory leaning systems stimulate the reflex ive function of knowledge, interpreting the environment based on knowledge itself. While organizational systems use this energy to organize and reduce internal entropy, and limit external entropy (Mele, et. al., 2010).
3.1 The Role of Digital Disruption in the Development of Collective Intelligence
The relevant question that arises in the knowledge economy is: How can a multitude of people be smarter than the sum of its parts? One possible answer can be found in the concept of digital disruption, understood as the change that occurs when new digital technologies and new business models affect the value proposals of ex isting goods and serv ices (Rouse, 2014).
It is clear that new technologies drive a revolution in the internal and external functioning of companies and that, in their process of digital transformation, they promote new working models based on open innovation and collective intelligence as their most significant engines. This perception of disruption poses new challenges related to the constant search for innovation, learning and collaboration, as a way of working in the company and in its relationship with customers, collaborators and suppliers. In this context, business management needs to answer a set of questions such as: What is the role of each indiv idual in this process of exploiting collective intelligence (CI)? What would the organizational principles of the company be to optimize CI? What would be the rules and restrictions for the exchange of ideas through communication technologies? and How do they relate and communicate with the new digital env ironment, both internally and externally?
Indeed, the rapid increase in the use of mobile devices, not only for personal use but also for work, has increased the potential for digital disruption in many areas of business activ ity . This is why the concept of collective intelligence has acquired a leading role not only in taking advantage of all the opportunities that arise in uncertain environments, with digital transformation as a backdrop but also to define the new business management model.

ISSN 2411-9571 (Print) ISSN 2411-4073 (online)
European Journal of Economics
and Business Studies April 2018 Vol 4 No 1
205
4. Considerations of Collective Intelligence in the Big-Data Ecosystem
4.1 From Division of Labour to Collective Intelligence
The contextualization of the discussion of the specificity of collective intelligence opens the possibility of positive results through collaboration, whose scale exceeds indiv idual capacity . However, it could be argued that this is a generic effect of any form of collaboration in which indiv iduals come together (Tomasello, 2014).
Indeed, knowledge is distributed and shared among different indiv idual agents whose cognitive abilities and rational faculties are limited in many respects (Kahneman, 2012). As one would expect, this is also the principle behind the div ision of labour that underpins the functioning of complex social and economic systems: when humans work together, they achieve better results than indiv iduals who work on their own.
The result of joint activ ity for tracking a phenomenon is not only more extensive but also greater than indiv idual contributions. The term "superior" refers to the possibility that group activ ities produce a qualitatively different, but not necessarily optimal, performance than the sum of indiv idual actions. Thus, if all that is needed for a network or group of people to offer a smart solution is to div ide the work between multiple actors (classic scenario of the div ision of labour), it would be difficult to explain how the "total sum" differs in terms of indiv idual knowledge and competences.
But the most v isible cases of collective intelligence show that what makes the fusion of indiv idual intelligences into a qualitatively different phenomenon is the fact that, by joining forces, people sometimes achieve results that could only arise as a result of their interactions and collaboration. The product of these interactions and collaboration is said to be qualitatively different from simple aggregation because the interaction itself contributes to generating something radically new.
4.2 How can Companies Prepare for Digital Transformation while Discovering the True Value of their Organisation's Data and Exploiting the CI of their Workers?
The trends prevailing in today 's business dynamics are towards continuous and widespread change and increasing interdependencies (White, 2000), in turbulent env ironments characterized by uncertainties and entropy. To better understand these changes and manage the process more effectively , a more dynamic and comprehensive v ision of business management has been suggested including the exploitation of collective intelligence. This involves integrating the complex ity of the relationships between workers and managers, and between workers and computers, in order to better understand disruptive processes and the flow of real organizational change and management model.
The need for strategic management to complement the digital transformation of companies is a fact, as it is the exploitation of collective intelligence to transform it into actionable intelligence. Why? Because "many collaborators" are smarter than a few; and because collective wisdom shapes businesses, the economy and society . However, we must bear in mind that digital disruption has a positive or negative impact not only on the development of different economic industries but also on the different professions, skills and competences of the elements that make up the society of knowledge.
4.3 Limitations of Collective Intelligence
Let us remember that the wisdom of work teams is defined as any group of people who can act collectively to make decisions and solve complex problems (Surowiecki, 2005). In practice, however, not all groups behave wisely ; for example, a multitude of investors go mad in a market bubble. One possible explanation is that this occurs when the decision-making environment is not prepared to accept collective intelligence as a resource and a productive investment, and loses the benefits of personal judgments and private information that forms part of the background of workers. Therefore, the work team will only be able to achieve the level of success of its most capable member, rather than surpassing that level.
The manifestation of these limitations coupled with the managers' fear of losing "control" appears when it ex ists: too much centralization, for example, an excess of bureaucracy does not allow collecting the wisdom of low -level workers; too much compartmentalization, for example, when the information held in one department is not accessible to other departments of the company (work islands); too much imitation or status quo, so decisions are limited to doing what has "always worked".
Another constraint in the implementation of CI is related to the measurement and ev aluation of its effectiveness, as it is a logical structure for capturing the knowledge resulting from reflection and critical thinking based on logical and experimental reasoning.

ISSN 2411-9571 (Print) ISSN 2411-4073 (online)
European Journal of Economics
and Business Studies April 2018 Vol 4 No 1
206
Similarly , we can point out that current systems of collective deliberation or reflection tend to be biased in various ways (MIT-CCI-Center for Collective Intelligence studies). Among the most prominent biases we have:
Informational pressures, which occur when opinions are not independent and action comes from imitation, according to the established guideline that "the majority cannot be wrong".
Social pressures, which appear when interacting with other participants distorts one's own opinion by the presence of negative factors such as fear of conflict, fear of ridicule or being marginalized from the group; or even by opportunistic and figurative attitudes.
Common knowledge effect, which arises when the participant is satisfied with the information and knowledge he or she already has, and does not explore new sources and perspectives that enrich the analysis of the problem.
Polarization bias, which manifests itself as a tendency to the radicalization of positions or proposals regarding any issue that involves cultural, social or political values, to the point of turning them into dogmas or automatically defending positions, without any reasoning or considering the ev idence.
In short, business relations theory holds that the behaviour of a single autonomous element is different from the behaviour of that element when it interacts with other elements.
5. Basics for a Management Proposal Based on Collective Intelligence
In this Section, we present some ideas and advances for the elaboration of a management proposal based on collective intelligence, whose key factors are interaction, learning, collaboration and the transformation of knowledge into value in all its dimensions. This means a flex ible and reversible organizational design that makes possible the integral transformation of the company, responds to changes in market conditions and incorporates the impact of technological innovations. The structure consistent with these requirements is based on the formation of open and dynamic, highly interrelated and complementary work teams: teams of multi-purpose professionals, articulated by the network communication highways (Intranet), which are permeable to brainstorming, creativ ity , shared learning, distributed collaboration and decentralized decision-making (Peñaloza & Vargas, 2017)
Thanks to the Internet and computers, our ways of working and our work habits have been transformed, but also our way of thinking and organizing our economy and infrastructure, and our lives have changed. The 21st century is the history of collaborative interactions and actions, where groups have learned to exploit the benefits of diversity and heterogeneity . As a result, companies are shifting to more decentralised and flex ible ways to better meet their customers' demands and increase business performance.
In general, the basis for generating a proposal for network management based on the exploitation of the CI includes a set of considerations such as the following:
5.1 Diversity, Independence and Intelligent Aggregation:
When we talk about diversity and its impact on the effectiveness of collective intelligence, we refer to cognitive heterogeneity , understood as the diversity of experiences, skills and professional maturity of managers and employees of companies or firms, which can be analyzed both indiv idually and collectively (Hambrick, et. al. 1996). This heterogenei ty will influence how information is interpreted and used, as well as how interaction and collaboration are managed (Weingart, et. al. 2005; Naranjo, 2007).
Cognitive sty les define the ways in which indiv iduals encode, process and communicate information, and are related to their respective functional and educational specializations (Kozhevnikov, et. al. 2005). Having the right amount of cognitive sty le diversity is important for team performance. Prev ious research suggests that collective intelligence allows not only high performance at a given time but also better performance over time, even in tasks that do not require a team to explicitly learn a new procedure or body of knowledge (Engel, et al. to. 2014; Aggarwal & Woolley, 2013; Woolley et al. 2010; Gibson & Cohen, 2003).
On the other hand, interdependence can be described as the extent to which the participation of several indiv iduals is required to complete a given task, and to achieve a specific objective in order to obtain a given result, i.e. to complete the work (Wageman, 1995). Interaction among group members is v ital to organizational work (Van der Vegt, Emans & Van de Vliert, 1999), as it could have a significant impact on indiv idual and/or team performance (Guzzo & Dickson, 1996). One

ISSN 2411-9571 (Print) ISSN 2411-4073 (online)
European Journal of Economics
and Business Studies April 2018 Vol 4 No 1
207
characteristic related to interaction, and which influences team results, is interdependence. In this regard, theory and research suggest that interdependence in both tasks and results is positively related to the functioning of work teams or companies (efficiency, effectiveness, decision-making, etc.) (Allen, Sargent & Bradley, 2003; Gully , et. al. 2002; Shaw, et. al. 2000; Van der Vegt & Van de Vliert, 2001; Janssen, Van de Vliert & Veenstra, 1999; Wageman & Baker, 1997; Wageman, 1995).
Since the CI is understood as the integration of indiv idual intelligences for efficient knowledge management and their transformation into value, knowledge aggregation, considering many sources, can produce more information (synergies) or less information (redundancy) than the sum of its parts. This attribute can prov ide working groups with innovative and creative problem-solv ing strategies that will be better than solutions generated by non-interacting indiv iduals. They can also prov ide various forms of collaboration and coordination among working group members or between groups (Bettencourt, 2009; Watkins, 2007).
In this context, the quantification of information in terms of aggregation does not imply the arithmetic sum of such intelligences, but rather the merging of them, considering the interdependencies ex isting between indiv idual intelligences, to create a system of collaboration and competition between the members of a work team or the workers of a company.
5.2 Factors Facilitating the Development of CI
If we consider the different perspectives immersed in collective intelligence, one way to integrate them is to identify the attributes or set of attributes that are common in CI. Attributes that allow us to examine the factors that facilitate the development of collective intelligence, such as diversity , learning or awareness, while among the factors that inhibit it are prejudice or market failure, among others.
A key issue in the CI-based business management strategy is to determine how each of these factors map specific and generic components, and how they use concepts and theories to facilitate the development of collective intelligence. Among the most relevant mechanisms to make a working group smart, that is, to turn it into a learning and collective collaboration machine, we have:
Diversity: The group includes members with a wide range of knowledge or skills (and the ability to recognize successful and unsuccessful outcomes).
Relative independence: group members use their own knowledge and skills without being over-influenced by others. When members of the group influence each other a lot, some negative results can occur.
Relative decentralization: the actions of the group members are merged in such a way that they find an adequate range of stability , so that indiv idual knowledge is global and collectively useful and maintains its uniqueness and location.
Compliance: mechanisms that generate similarities among the majority of the group members.
Influencers: indiv iduals who have some differences among group members.
Internal peer reviewers: mechanisms that make indiv idual group members rewarded for their successes and penalized for their failures.
Non-monetary incentives: social-entrepreneurial recognition, v isibility at work and rewards in kind based on contributions and fostering collaboration.
Relative rivalry: stimulation of competitiveness between groups (corporate games).
5.3 Dense Communications Structure
Dense communication structures can be said to improve the productiv ity of members of a group or between groups. One of the mechanisms through which structures improve productiv ity is by improv ing user identification and trust in the group. For example, management of "mutual knowledge" is a problem if the work teams are geographically distributed (Cramton, 2001), as long as the bandwidth of the communication system is narrow.
In this situation the difficulties of sharing "collective knowledge" are manifested as:
• Lack of specific communication accessible to all users.

ISSN 2411-9571 (Print) ISSN 2411-4073 (online)
European Journal of Economics
and Business Studies April 2018 Vol 4 No 1
208
• Retention of contextual information.
• Asymmetric distribution of information.
• Difficulty in understanding the importance of information.
• Differences in the speed of access to information.
• Difficulty in interpreting the different solutions proposed.
5.4 Shared Vocabulary and Infrastructure
Label vocabulary is the basis of social nav igation and shared expression in a user community , and its evolution is based on the influence of the user community and personal tendencies (Sen et. al. 2006). The shared vocabulary is formed by the set of tags used by users or user groups, where the personal tendency is manifested as a choice of tags based on personality , preferences and beliefs that they use in their decisions. This trend is evolv ing as people interact with the labelling system. Hence, the influence of a user group on the labelling system mitigates the impact of users' personal tendencies.
Therefore, group performance will depend on the degree of collaborative creation in developing a common vocabulary to describe the different forms of written, v isual and oral communication representation (Schwartz, 1995).
5.5 Cultural Boundaries in the Company
In general, although there is consensus on the fact that organizational culture is relevant to the implementation of a business strategy, there is no consensus on the possibilities of its management to reorient and transform it, given that culture is often not part of the functions of companies, mainly the traditional ones. However, thinking about cultural change in the company means combining rational and logical aspects with creative and emotional v isions. It is like a simplify ing approach to the diversity of opinions, with a descriptive-objective approach and subjective appraisals and valuations.
For example, a culture based on the importance of rank or position makes it difficult for a lower-ranking person, who is more capable than his or her superior, to carry out collaborative work. The lower-ranking person is usually told what to do. This practice is not collaborative and may be a manifestation of the reluctance to share solutions and decisions with others because they see information control as a source of power within the company.
However, the main barrier to collaboration within the company may be the difficulty in building a culture of agreement or consensus when different points of v iew ex ist. This can hinder effective decision-making. Even if the cooperating members succeed in reaching an agreement, they are likely to agree from different perspectives. This type of behaviour is called a "cultural boundary" (Blau, 1970). Hence, the importance of becoming aware that people in their multiple facets can group their wills asymmetrically or symmetrically and create joint workspaces with added values that are compatible with business scenarios.
5.6 Incentives for Distributed Collaboration
Here the question is how to build a dynamic and coherent incentive system, with strategic management based on collective intelligence. This dynamic system should mainly motivate activ ities and actions that stimulate the exploitation of collective intelligence. Therefore, it is not a system for the motivation of employees as isolated units, but of transforming the social value created by employees together into economic value (commercialization).
Although theories such as motivation and all its substitutes guide us on the right track, it is logical to think that there is no magic formula to obtain the best possible collective performance of its employees. In general, the development of an incentive scheme includes stages such as:
• Exhaustive diagnosis of the current situation and clear determination of long-term objectives, as well as those of the work teams or teams of professionals that make up the company.
• Evaluation of the company's human capital stock
• Definition of new jobs and their role in the work teams
• Establishment of a scale of non-monetary and monetary incentives (preventing the latter from becoming a "grandfathered right")

ISSN 2411-9571 (Print) ISSN 2411-4073 (online)
European Journal of Economics
and Business Studies April 2018 Vol 4 No 1
209
• Inclusion of an item dedicated to the incentive system in the company's budgets (the item must be flex ible and the incentives must be dynamic)
• Communication of the criteria and conditions of this system to all employees in the company.
5.7 How Collective Intelligence Operates in the Business Environment
A CI-based management system is part of the corporate brain of the company and extends from collecting data from different sources to managing collective action to generate value. This management system has a double role: one is to coordinate and channel the generation of ideas, solutions and proposals from its employees; and another is similar to a search engine to answer questions or doubts from users. The aim is to overcome the deficiencies in communication and knowledge transfer, which are a constant in large corporations, where internal communication mechanisms are not always agile as might be expected from them.
The implementation of a corporate digital brain would involve the application of a management system based on question -answer rounds to the group of workers. The first round would focus on the coordinators or influencers raising the problems and mechanisms to their workers to evaluate proposals or suggestions, and for them to formulate their proposals. The second round has the task of requiring employees to order alternatives according to their reliability and feasibility . In the third round, the coordinators will order alternatives according to their frequency (frequency distribution). And so on and so forth.
The digital brain must also fulfil its role of logistical, conceptual, technological and predictive support. For example, if employees pose a question to the application, the system should understand the question and look for the answer in its database to prov ide it to the user. If it doesn’t find it, it must be able to predict which people within the company might answer the question or doubt, and send a notification to raise the issue and encourage them to post that information in its database. Of course, the system will learn from this process and the application will be self-sufficient if someone repeats the question in the future.
Synthesizing, the application analyses the interactions between workers in real time and prov ides companies with this data so that they can know who is the most participatory, on what issues they need to be trained and in which areas they have the most experience. The application must report at all times the data being shared, although responsibility for its misuse will ultimately lie with the company itself. In this process, the CI will evolve with the successes, misunderstandings, problems and solutions with which it lives; and it will acquire skills, will learn to solve and evaluate the results, and to structure its way to face complex situations plagued with uncertainty .
6. Conclusions
Greater access to information and greater direct participation of workers are realities that companies must take advantage of, to transform collective knowledge into economic value, in the sense of achiev ing better results from the interaction between people and between people and technology, as an intangible resource for organizational and business design.
Enabling heterogeneous, active and continuous spaces for mutual communication and organized participation, allows the maturation and improvement of a group's collective intelligence. Especially if it is characterized by diversity as a source of corporate advantage and if the social elements of understanding, empathy and collaboration are enabled and mature.
It is necessary to improve the capacity of collective intelligence measurement and to study which types of intelligences and personalities best contribute to the objective of optimising collective knowledge.
For smart management and for the company or work team to be smart, it is not enough to identify the behavioural patterns that have typically been associated with “being intelligent”. Other communication skills, consensus preparation and interpersonal skills are needed to form effective teams.
Knowledge transfer is the factor that determines the necessary competencies and competitive advantage for the integration of intelligence in the company or organization. This is because the richness of solv ing many problems can be limited or enhanced by other factors inherent in the group, such as its history, conflicts, successes, learning and capacity for cohesion and collective understanding.
ISSN 2411-9571 (Print) ISSN 2411-4073 (online)
European Journal of Economics
and Business Studies April 2018 Vol 4 No 1
210
References
[1] Aggarwal, I., & Woolley, A. W. (2013). Do you see what I see? The effect of members’ cognitive sty les on team processes and errors in task execution. Organizational Behavior and Human Decision Processes, 122(1), 92–99.
[2] Aldrich, Howard E. & Pfeffer, Jeffrey, (1976). Environments of Organization. Annual Review of Sociology, 2, 79-105.
[3] Allen, B. C., Sargent, L. D. & Bradley, L. M. (2003). Differential Effects of Task and Reward Interdependence on Perceived Helping Behavior, Effort, and Group Performance. Small Group Research, 34(6), 716-740.
[4] Argote, Linda. (2011). Organizational learning research: Past, present and future. Management Learning, 42(4), 439–446.
[5] Bettencourt, Luis, M. A. (2009). The Rule of Information Aggregation and Emergence of Collective Intelligence Behaviour. Topics in Cognitive Science, 1, 598-620.
[6] Brass, Daniel (1984). Being in the Right Place: A Structural Analysis of Indiv idual Influence in an Organization. Administrative Science Quarterly, 29(4), 518-539.
[7] Brass, Daniel J. (1981). Structural relationships, job characteristics, and worker satisfaction and performance. Administrative Science Quarterly, 26, 331-348.
[8] Broadbent, Stefana & Gallotti, Mattia, (2015). Collective Intelligence: How Does It Emerge?. NESTA. University London, June.
[9] Carpenter, M.A., Geletkanycz, M.A. & Sander, W. M.G. (2004). Upper Echelons Research Revisited: Antecedents, Elements, and Consequences of Top Management Team C omposition. Journal of Management, 30, 749-778.
[10] Comstock, D. E., & Scott, W. R. (1977). Technology and the Structure of Subunits: Distinguishing Indiv idual and Workgroups effects. Administrative Science Quarterly, 177-202.
[11] Cramton, Catherine D. (2001). The Mutual Knowledge Problem and Its Consequences for Dispersed Collaboration. Organization Science, 12(3), 346-371.
[12] David, J. Ketchen, Jr., Duane Ireland, R. & Snow, Charles C. (2007). Strategic Entrepreneurship, Collaborative Innovation, and Wealth Creation. Strategic Entrepreneurship Journal, 1, 371–385.
[13] Engel, D., Woolley, A. W., Jing, L. X., Chabris, C. F., & Malone, T. W. (2014). Reading the Mind in the Eyes or Reading between the Lines? Theory of Mind Predicts Collective Intelligence Equally Well Online and Face-To-Face. PloS One, 9(12), 115-212.
[14] Erlinghagen, Marcel. (2008). Self-Perceived Job Insecurity and Social Context: A Multi-Level Analysis of 17 European Countries. European Sociological Review, 24 (2), 183–197. DOI:10.1093/esr/jcm042, available online at www.esr.oxfordjournals.org.
[15] Fisher John G. (2005). How to Run Successful Incentive Schemes. Editorial Kogan Page. NY.
[16] Fry, Louis & Slocum, John, (1984). Technology, Structure, and Workgroup Effectiveness: A test of a Contingency Model. Academy of Management Journal, 27(2), 221-246.
[17] Gibson, C. B., & Cohen, S. G. (2003). Virtual teams that work: Creating conditions for v irtual team effectiveness. San Francisco: John Wiley & Sons.
[18] Gully , S. M., Incalcaterra, K. A., Joshi, A. & Beaubien, J. M. (2002). A Meta-Analysis of TeamEfficacy, Potency, and Performance: Interdependence and Level of Analysis as Moderators of Observed Relationships. Journal of Applied Psychology, 87(5), 819-832.
[19] Guzzo, R. A. & Dickson, M. W. (1996). Teams in Organizations: Recent Research on Performance and Effectiveness. Annual Review of Psychology, 47(1), 307-338.
[20] Hackman, J. Richard (1992). Group influences on indiv iduals in organizations. In M. D. Dunnette & L. M. Hough (Eds.), Handbook of industrial and organizational psychology (Vol. 3, pp. 199-267).
[21] Hambrick, D.C., Cho, T.S. & Chen, M. (1996). The influence of Top Management Team Heterogeneity on Firm’s Competitive Moves. Administrative Science Quarterly , 41, 659-684.

ISSN 2411-9571 (Print) ISSN 2411-4073 (online)
European Journal of Economics
and Business Studies April 2018 Vol 4 No 1
211
[22] Hayo, C. & Baarspul MSc. (2009). Team Performance: The Relationship between Interdependence and the Outcome of Decisión Making. University of Twente. December.
[23] Herzberg, Frederick. I. (1987). One more time: How do you motivate employees? Harvard Business Review, 65(5), 109-120. Sep/Oct. 87.
[24] Hitt, Michael A., Beamish, Paul W., Jackson, Susan E. & Mathieu, John E. (2007). Building theoretical and empirical bridges across levels: multilevel research in management. Academy of Management Journal. 50(6), 1385-1399.
[25] Hofmann, David A. (1997). An Overv iew of the Logic and Rationale of Hierarchical Linear Models. Journal of Management, 23(6), 723.744.
[26] Hulin, C. L., Romowski, M., & Hachiya, D. (1985). Alternative opportunities and withdrawal decisions: Empirical and theoretical discrepancies and an integration. Psychological Bulletin, 97, 233-250.
[27] Hull, Clark. L. (1943). Principles of behaviour. Appleton-Century-Crofts, INC. New York.
[28] Ioannides, Yannis M. (2009). Scott E. Page The Deference: How The Power of Diversity Creates Better Groups, Firms, Schools, and Societies. Journal of Economic Literature, March 5. Available in http://ase.tufts.edu/economics/documents/papers/2009/ioannidesReviewPage.pdf .
[29] Janssen, O., Veenstra, Ch. & Van de Vliert, E. (1996). Conflict Decision Making Management Teams. Gedrag en Organisatie, 9(6), 368-384.
[30] James, Lawrence R., & Jones, Allen P (1976). Organizational structure: A rev iew of structural dimensions and their relationships with indiv idual attitudes and behaviour. Organizational Behavior and Human Performance, 16, 74-113.
[31] James J.R., James, J.A. & Ashe, D.K. (1990). The meaning of organizations: The role of cognitions and values. In Schneider, B. (Ed.), Organizational climate and culture (pp. 40-48). San Francisco.
[32] Kahneman, D. (2012). Thinking, Fast and Slow. Penguin S.A., London.
[33] Kozhevnikov, M., Kosslyn, S., & Shephard, J. (2005). Spatial versus object v isualizers: A new characterization of v isual cognitive sty le. Memory & Cognition, 33(4), 710–726.
[34] Lee, Edward A. (2006). The problem with Threads. Technical Report No. UCB/EECS-2006-1Available. Center for Hybrid and Embedded Software Systems (CHESS) at UC Berkeley.
[35] Malone, Thomas w. & Klein, Mark. (2007). Harnessing Collective Intelligence to Address Global Climate Change. Innovations. Summer 2007.
[36] Martocchio, J.J. (1994). The effects of absence culture on indiv idual absence. Human Relations, 47, 243-262.
[37] Maslow, Abraham H. (1991). Motivación y Personalidad. Ediciones Díaz De Santos S.A.
[38] Mele, Cristina, Pels, Jacqueline & Polese, Francesco. (2010). A Brief Review of Systems Theories and Their Managerial Applications. Serv ice Science 2(1/2), pp: 126-135.
[39] Miller, C.C., Burke, L.M. & Glick, W. H. (1998). Cognitive Diversity among Upper-Echelon Executives: Implications for Strategies Decisión Processes. Strategic Management Journal, 9(1), 39-58.
[40] Miles RE, Miles G & Snow CC. (2005). Collaborativ e Entrepreneurship: How Communities of Networked Firms Use Continuous Innovation to Create Economic Wealth. Stanford University Press: Stanford, CA.
[41] Naranjo Gil, David. (2007) Diversidad cognitiva y uso de sistema de control de gestión en la descentralización oganizativa. Revista Europea de Dirección y Economía de la Empresa, 16(3), 23-38.
[42] Oldham, G. R., & Hackman, J. R. (1981). Relationship between organizational structure and employee reactions: Comparing alternative frameworks. Administrative Science Quarterly , 26, 66-83.
[43] Oldham, C. R., Hackman, J. R., & Pearce, J. L. (1976). Conditions under which employees respond to work. Journal of Applied Psychology, 61, 395-403.
[44] Olson, Mancur. (1971). The Logic of Collective Action. Public Goods and the Theory of the Groups, Harvard Economic Studies,, Vol CXXIV. Harvard University Press.
[45] Ouchi, William. (1982). Teoría Z. Editorial Orbis, Buenos Aires.
ISSN 2411-9571 (Print) ISSN 2411-4073 (online)
European Journal of Economics
and Business Studies April 2018 Vol 4 No 1
212
[46] Peñaloza Figueroa, Juan Luis & Vargas Pérez, Carmen (2018). Ecosistema de Big-Data: Tendencias y Retos en el 2018. ED: Especial Directivos Nº 1725, Sección Marketing y Ventas. Quincena del 1 al 14 Enero. Editorial Wolters Kluwer España.
[47] Peñaloza Figueroa. Juan Luis & Vargas Pérez, Carmen (2017). Business Strategies Based on Large Sets of Data and Interaction: Business Intelligence. European Journal of Economics and Business Studies, 9(1), 156-167, June.
[48] Pfeffer, J. & Salancik, G. R. (1978), The External Control of Organizations: A Resource Dependence Perspective, Harper & Row, New York.
[49] Rousseau, D. M. (1978). Characteristics of departments, positions, and indiv iduals: Contexts for attitudes and behaviour. Administrative Science Quarterly , 23: 521-540.
[50] Sen, Shilad, Lam, Shyong K., Rashid, Al Mamunur, Cosley, Dan, Frankowski, Dan, Osterhouse, Jeremy, Harper, F. Maxwell & Riedl, John. (2006). Tagging, Communities, Vocabulary, Evolution. CSCW’06, 4(8), November, Banff, Alberta, Canada.
[51] Shaw, J. D., Duffy , M. K., & Stark, E. M. (2000). Interdependence and Preference for Group Work: Main and Congruence Effects on the Satisfaction and Performance of Group Members. Journal of Management, 26(2), 259-279.
[52] Surowiecki, James. (2005). The Wisdom of Crowds: Why the Many Are Smarter Than the Few and How Collective Wisdom Shapes Business, Economies, Societies and Nations Little. Anchor Books. A Div ision of Random House, Inc. New York.
[53] Teece David J. (1986). Profiting from technological innovation: implications for integration, collaboration, licensing, and public policy. Research Policy, 15, 285–305.
[54] Thompson, J. D. (1967), Organizations in Action. McGraw Hill, New York.
[55] Tomasello, Michael. (2014). A Natural History of Human Thinking. Cambridge MA: Harvard University Press.
[56] Van der Vegt, G. S., & Van de Vliert, E. (2001). Intragroup Interdependence and Effectiveness: Review and Proposed Directions for Theory and Practice. Journal of Managerial Psychology, 17(1), 50-68.
[57] Van der Vegt, G. S., Emans, B. J. M., & Van de Vliert, E. (1999). Effects of Interdependencies in Project Teams. The Journal of Social Psychology, 139(2), 202-214.
[58] Von Krogh G. (1998). Care in knowledge creation. California Management Review 40, 133–153.
[59] Wageman, R. (1995). Interdependence and Group Effectiveness. Administrative Science Quarterly , 40(1), 145-180.
[60] Wageman, R. & Baker, G. (1997). Incentives and Cooperation: The Joint Effects of Task and Reward Interdependence on Group Performance. Journal of Organizational Behaviour, 18(2), 139-158.
[61] Watkins, Jennifer H. (2007). Prediction Markets as an Aggregation Mechanism for Collective Inteligence. eScholarship.org – The California Digital Library – UCLA.
[62] Weingart, L.R., Dahlin, K.B. & Hinds, P.J. (2005). Team Diversity and Infomation Use. Academy of Management Journal, 6, 1107-1123.
[63] Woodward, J. (1965), Industrial Organization: Theory and Practice, Oxford University Press, London.
[64] Woolley, A. W., Chabris, C. F., Pentland, A., Hashmi, N., & Malone, T. W. (2010). Ev idence for a Collective Intelligence Factor in the Performance of Human Groups. Science, 330(6004), 686–688.

ISSN 2411-9571 (Print) ISSN 2411-4073 (online)
European Journal of Economics
and Business Studies April 2018 Vol 4 No 1
213
DOI: 10.26417/ejes.v4i1.p213-220
Open Access. © 2018 Lumnije Thaçi and Arbnora Gërxhaliu. This is an open access article licensed under the
Creative Commons Attribution-NonCommercial-NoDerivs 4.0 License
Tax Structure and Developing Countries
Lumnije Thaçi
Assistant Professor, Faculty of Mechanical and Computer Engineering,
Department of Economic Engineering, University of Mi "Isa Boletini", Kosovo
Arbnora Gërxhaliu
Candidate of the Society of Certified Accountants and Auditors in Kosovo (SCAAK)
Abstract
The main source of public revenue compared to other sources are Taxes, as in developed countries and developing countries, therefore the tax system has an extraordinary role in sustainable economic development and employment growth. Also, tax policy that acts in a complementary way to monetary policy is of v ital importance also due to the preservation of economic stability by limiting the level of inflation and balancing the equilibrium on the market. The main purpose of this paper is to explore the tax structure in developing countries and their comparison with developed countries. In this paper some tax theory will be discussed. It will also be shown for impractical research and their effects on economic development and the growth of social welfare. Although there is no consensus among researchers, most empirical studies show a negative link between public spending and economic growth. However, in order for the tax effects to be the highest in the economy in developing countries, the international trade tax and the VAT should be replaced rather within the country .
Keywords. Structure of taxes, direct taxes, indirect taxes, developing countries, economic development.
1. Introduction
The purpose of tax ing efficiently is to make the looked-for fiscal policy goals (delivery, redistribution and stabilization) in the most efficient way, thus reducing undesired distortions, reducing the cost of collecting taxes and promoting economic growth. Tax efficiency and especially the tax structure explained role in achiev ing economic growth and fiscal consolidation (Stoilov, Patonov 2012). Direct and indirect taxes should be countered by balancing each other. However, in developing countries, direct taxes have a limited space and thus indirect taxes have more important role. A well- structured system of systems requires the combination of direct and indirect taxes of different proportions. Taxes in pursuing the principle of equality . direct taxes are progressive in sort, also some indirect taxes, such as taxes on extra goods are also progressive in sort. This means that the well-off class has to maintain the highest incidence of taxes, while the low -income group is either exempt from tax (indirect tax) or should pay lesser charges (indirect tax) for goods consumed by the masses. Thus, taxes help to reduce income and capital inequality (Rahul, 2015).
Tax policies in practice vary dramatically among the poorest and richest countries (Gordon, Li). In order to increase revenue, low-income countries have historically supported more international trade taxes, while richer countries use more taxes on consumption and revenues (McNabb, LeMay -Boucher, 2014, Gordon, Li). Between 2000 and 2002, small states collected around 36 percent of tax revenues in international trade compared to 1.1 percent collected from the same source in the OECD (Borg, 2006). In this process, however, the poorest countries collect much less revenue as a share of GDP than they gather in the richest countries (Gordon, Li). Currently , personal income taxes are relatively small in developing countries, while taxes such as the VAT have become central to mobilizing domestic revenue (Newbery and Stern, 1987)

ISSN 2411-9571 (Print) ISSN 2411-4073 (online)
European Journal of Economics
and Business Studies April 2018 Vol 4 No 1
214
cited in (Lauren, Tiffany, Stephanie, 2008). Property and land taxes are relatively effective domestic taxes, but tend to be weak in developing countries. Property taxes represent about 6.7% of total OECD revenue, compared to 2.4% in developing and transition countries (Bird, 1999). Corporate income tax increases 17% of total tax in developing countries, compared to 10% (pre-crisis) in the OECD. While personal income taxes from a significant percentage of tax revenues in high-income countries (around 9-11% of GDP), developing countries increase only about 1-3% of GDP by Personal Income Tax (Peter, Buttrick, Duncan, 2010) cited in (Velde, 2013).
There some reasons why developing countries are less able to use the tax system to redistribute income. First, income and wealth taxes show a relatively small role in the tax structure of developing countries, as opposed to developed countries. Second, indiv idual income tax in developing countries is often merely on a wage withholding tax. In many countries, labor sector fees account for more than 90% of total personal income tax revenues. In some countries, tax law has allowed tax administration restrictions to effectively exclude some types of tax revenues (for example, income from foreign assets held abroad). Third, it is certainly politically difficult to set effective tax on income and pelf tax in many countries. It may be appropriate to pass tax legislation that is progressive but in practice does not impose significant tax liabilities in the upper classes (Bird, Zolt, 2003).
A well- functioning revenue system is a necessary condition for sustainable and inclusive economic development. However, revenue systems in some developing countries have substantial shortcomings. Revenue funded on public spending on physical, social and administrative infrastructure that enables businesses to start or expand. The revenue system is also a central element in supporting a strong citizen-state relationship that supports effective, accountable and sustainable governments. These elements contribute to stronger economic results and employment growth (Easter, 2002). Tax changes often appear to improve the efficiency of the tax system. That is, under the new tax system the cost (administrative, compliance and economic) of revenue growth will be lower. This may be the case in the medium and long term. However, in the short route, there will be future administrative and compliance costs associated with the transition of a new regime. Dynamic gains associated with the redistribution of production factors or goods and serv ices in higher value uses also occur over time and are more skeptically seen by non-economists, cited in (Carnahan, 2015).
In developing countries, there is no magical tax strategy to encourage economic growth. Some countries with high tax burdens have high growth rates and some countries with low tax burdens have low growth rates. Despite many theoretical and empirical research, as well as policy and policy polemics, there is no simple answer to taxation on economic growth in developing countries. Theoretical literature suggests that the tax has a negative effect on economic growth. Thus, high tax rates reduce economic growth. The reason for this is that higher rates may be more distorted and thus negatively affect growth, while lower rates may generate productive income. However, empirical literature suggests direct and rev erse relationships between tax burden and growth rates. Of course, the highest tax burden may lower or increase economic growth rates. Thus, future economic output may be higher than the optimal tax rate and thus future tax revenues would be higher at a lower tax rate (Nantob, 2014).
The rest of the paper will be organized as follows: Chapter 2 will outline the importance of taxes in developing countries. Chapter 3 will summarize the theoretical aspect of taxation. Chapter 4 presents a rev iew of empirical literature on the impact of taxes on economic development. The final chapter will present the conclusions and recommendations.
Importance of taxes in developing countries
The financial crisis in 2008 comes to uncover the debate about the size of fiscal multipliers. In recent years, the slowdown in economic activ ity caused waves of fiscal stimulus, implemented by developed and emerging economies to unequivocally support fiscal policy in stabilizing economic fluctuations. There is limited discussion in the literature on the evaluation method and the value of the fiscal multipliers. Ev idence suggests that they depend on time in the business cycle and across countries. They may also depend on other factors, as shown by Espinoza and Senhadji (2011) in broad empirical ev idence for developed economies, but less for developing countries. Fiscal multipliers may be higher in developing countries, due to frequent occurrences of significant economic shortages, as reflected in the negative production gaps and high levels of unemployment (Blanchard and Leigh 2013), cited in (Abaida, Abdeljabbar).
According to Fjeldstad (2013) challenges for many developing countries is not only the largest tax (egg increase of the tax on GDP), but the taxation of a larger number of citizens and enterprises more consensual and to encourage engagement constructive of state-citizens about taxes. This is not easy for various reasons, by erasing the economic structure and history. Nevertheless, historical and contemporary experiences show that taxpayer behavior can be transformed by

ISSN 2411-9571 (Print) ISSN 2411-4073 (online)
European Journal of Economics
and Business Studies April 2018 Vol 4 No 1
215
reforming the tax and expenditure system, bringing as a greater willingness to pay . And a greater tendency to mobilize the demand for better public serv ices.
General adv ice of international institutions such as the IMF and World Bank to emerging economies over the last decades has been the replacement of international trade taxes with local consumption tax, particularly value added tax (VAT) and maintaining relatively high rates of corporate income tax. Unlike developed countries where personal income tax and social security contributions increase by two-thirds of total taxes, a tight tax base and high implementation costs make direct impractical taxation for developing countries. The income tax base consists mainly of the income of employees in the public sector, because all other taxpayers are self-employed or small businesses that avoid paying all or most of the income tax. In addition, personal income tax is easily avoided (Avi-Yonah, Margalioth, 2006). The VAT was recommended or endorsed by the IMF in 90% of the overall sample, the percentage of which was identical (90) both low -income and lower-middle income country group. However, simplification of tax administration was consulted at 50% and 20% of low and lower-middle-income countries, respectively . Expanding the tax base, it is recommended in 80% of the total sample or 100% of the low-income group and 60% of the lower-middle income group (Lauren, Tiffany, Stephanie, 2008).
According to Bernardi (2009), the role of political variables and the evolution of institutions in the process of increasing fiscal pressure typically characterized by shifting from planned economies to a market structure and a democratic government cannot be forgotten. This result is not a specific feature for a single site as the analysis was conducted for a large number of locations in different areas of the world. However, the empirical analysis shows that the structure of the tax system (direct and indirect taxation) should not be related to the evolution of democratic institutions. As stated above, the political reasons justify this result and in addition, the greatest administrative difficulties in direct tax administration have to be taken into account, especially in the case of personal income tax which requires the assessment of total income and allowances allowed for a large number of taxpayers.
Gordon, Li (2005) explored how the predicted change policies dropped if the firm can successfully avoid taxes by conducting all business in cash, in order to avoid any use of the financial sector. The main hypothesis of this paper is that governments must be based on available information from bank records to identify taxable entities and to measure the amount of their taxable activ ity . Firms then undergo tax if they choose to use the financial sector. When tax rates are high enough, firms may give up economic benefits from using banks to avoid these taxes. This threat of non-mediation may be small in rich countries, where the value of financial intermediation is considerable. However, in poor countries, this threat to non-mediation can be a key factor that limits the government's ability to collect tax revenues and shape government policy more. The size of the informal economy estimates is on average more than two times higher in poor countries than in rich countries. Developing countries have an informal sector representing an average of about 40% , perhaps up to 60% in some countries (Scheider, Buehn and Montenegro, 2010). Non-formal sectors represent many small informal traders that cannot be efficiently brought into the tax network (the cost of collection is high and the income potential is limited), cited in (Velde, 2013).
Bird, Martinez-Vazquez (2008) using cross-section data from 1990-1999 argue that a more legitimate and responsible state is a key factor for a more appropriate taxation effort in developing and high-income countries. Thus, these empirical results strongly suggest that corruption as well as say, and accountability play an important role in determining the level of tax efforts of developing and transition countries. The results show that demand side determinants are very important in explaining tax performance. The authors also observed a strong relationship between the quality of government and tax efforts in high-income countries. Also, the authors observed that demand side determinants are very important in explaining tax performance to high-income countries. The two variables, control of corruption and voice and accountability are statistically significant comparable or even higher than the traditional supply factors. The study also shows that high-income countries have the potential to improve their tax performance by improv ing their institutions. Improv ing corruption, voice and accountability may not last longer or be necessarily more difficult than changing opportunities for tax projects and economic structure.
According to Besley, Persson (2014) ultimately , closer scrutiny is the underly ing fact that developing countries today are not so different - with regard to the share of tax on GDP and taxation structure - from modern income countries high at a similar stage of development. This model suggests that low taxation may reflect a range of factors that also help explain why low tax countries are poor. From this perspective, the most important challenge is undertaking the steps that encourage development, instead of specific measures focused exclusively on improv ing the tax system.
Tax can be used as a means of controlling inflation in developing countries in order to achieve economic and financial stability . Through taxation, the government can control the following inflation: if inflation is due to higher prices of key items,
ISSN 2411-9571 (Print) ISSN 2411-4073 (online)
European Journal of Economics
and Business Studies April 2018 Vol 4 No 1
216
then the government may reduce the indirect tax rate. If inflation is due to increased demand, the government can lower the demand effectively by increasing its rate. Increasing the tax rate may limit consumption, which can reduce demand and then inflation may be contracted (Rahul, 2015).
In literature, it is generally assumed that the promotion of economic growth and social justice are shared by developed and developing countries. However, a number of major differences between developed and emerging economies, such as the differences in the type of industries (mainly the relatively high share of agriculture and small businesses in developing countries), the size of administrative costs and compliance, the level of corruption, monetization in the economy, polity restrictions and the relative size of the informal economy may require different tax designs (Avi-Yonah, Margalioth, 2006).
Theoretical aspects
In terms of taxation, many financial theorists have been taken into account, since taxes are the essential part of the budget revenue, which means that taxes are one of the main instruments in redistributing national income to finance state spending. Different theories are presented with regard to taxation, so some of them will be presented in this paper.
The neoclassical growth model - (inter Alios Swam 1956; Solow 1956) does not prov ide scope for assessing the potential for fiscal policy to affect the long-run steady-state growth rate; in this model a change in the tax rate may lead to a shift to a shift in the steady-state growth path, but not in its slope. Endogenous growth models prov ide a sound theoretical basis to examine the effects of different tax categories on economic growth (or at least investment decisions affecting economic growth). Mendoza's work et al. (1997) is particularly illustrative of the various distortions of growth arising from the choice of the tax rate. However, an important issue lies in the fact that their model deals with the marginal tax rates, cited in (McNabb, LeMay-Bucher, 2014).
Altruism - Is altruism a reasonable theory of bequests? At the very least, we know that it is not the full theory of bequests: the tests of its economic implications are routinely rejected. The best well-known example of such a test is based on the observation that altruistic bequests should be compensatory: a parent with two children should make bigger transfers to a child who is worse off. However, in practice, bequests are predominantly split equally between children. Some support for the desire for compensating children is prov ided by work of McGarry (1999) who finds ev idence suggesting that inter v ivos gift may be compensatory even though bequests are not, and by Light and McGarry (2004) show that a fair number of indiv iduals show intention of behaving in a compensatory manner. Bernheim and Severinov (2003) suggest that bequests may serve as a signal of parental altruism and show that in thas context equal splitting may arise, cited in (Kopczuk, 2010).
Bequest Motives - While there are usually many parties that are either directly or indirectly affected by any particular tax, this is particularly starkly v isible in the context of transfer taxation. There are two sides to every bequest: donor’s and donee’s. The action of the donor (the choice of bequest) directly affects welfare of the donee. Because bequests are usually not bought and sold, there is a possible externality here. The presence of an externality has important implications for the economic analysis of efficient policies, because it is well-known that optimal policy involves the correcting of externalities. We know in a reasonably well how the presence of a simple externality affects the structure of optimal policy (Sandmo, 1975, Kopcuk, 2003a, Micheletto, 2008) when the externality can be directed directly : he dies by modify ing the formula for the tax imposed on the sole source of externality , cited in (Kopczuk, 2010).
The Standard Theory of Optimal Taxation posits that a tax system should be chosen to maximize a social welfare function subject to a set of constraints. The literature on optimal taxation typically treats the social planner as a utilitarian: that is, the social welfare function is based on the utilities of indiv iduals in the society . The primary focus of modern optimum tax research has been the schedule of marginal tax rates on labor income. A well-know early of the Mirrlees (1971) model optimality of a zero-top marginal tax rate. In the Mirrlees model, the schedule of marginal tax rates is the main battleground in the tradeoff between equality and efficiency. Consider an increase in the marginal tax rate at a given level of income. This tax increase has a cost of efficiency because it discourages the indiv iduals who earn that income from exerting effort. Recent work has undermined the practical significance of this finding, but its intuition may still have important implications for high-income taxation, cited in (Mankiw, Weinzierl, Yagan).
The optimal taxation literature also recommends equal tax rates on all forms of consumption, as seen, for example, in Atkinson - Stiglitz (1976). Developing countries have over time been replacing excises taxes, where rates often varied dramatically by good, with a VAT one or at least only a few rates. The effective rates, though, are low due to a combination of exempt (or zero-rated) goods and evasion. One other standard result from the optimal tax literature is that a small open economy should take full advantage of any gains from trade, and not distort trade patterns. With evasion such a dominant
ISSN 2411-9571 (Print) ISSN 2411-4073 (online)
European Journal of Economics
and Business Studies April 2018 Vol 4 No 1
217
issue, countries face additional to lower tax rates, in order to draw firms into the formal economy and to reduce the incentives on those who are already in the formal economy to underreport their income or value-added (Gordon, 2009).
(Creedy) has considered, within a limited bus, the extent to which economic theory can prov ide specific policy advice with regard to income tax structures. According to the author, many of the results are negative or too broad to prov ide direct policy guidance. In fact, most of the theories have been clarified instead just because it is very difficult to produce clear arguments. In giv ing policy advice, inev itably it turns out that the role of the economist is to explore implications of adopting alternative value estimates - and there are few results that do not depend in any way on the final objectives of a tax system. Wide-ranging tax literature does not prov ide and refuse to prov ide clear guidance but instead clarifies: the exact way in which the optimal tax system depends on a wide range of factors, some of which relate to court judgments value, while others relate to behavioral response or basic conditions, such as skills, which exhibit considerable heterogeneity in practice.
Review of the literature.
Taxes are needed to finance public goods, to control other market imperfections; and achieve social justice through redistribution. Economic growth (efficiency) is promoted through the first set of goals; while social justice (equality) is promoted through redistribution and delivery of public goods and merit, especially health and education (Avi-Yonah, Margalioth, 2006). This paper will present a rev iew of empirical literature on the impact of taxes on economic growth in developing countries.
This study looked at the effects of VAT on the economic growth of the 19 developing countries for the period from 1995 to 2010. For the data analysis, the GMM panel was used. Subsequently , the effect of VAT through the sav ings channel on accumulation and capital productiv ity and finally the impact of VAT on economic growth was examined. The results derived from VAT have a negative effect on increasing capital accumulation at the level; the positive effect of VAT on the level of economic growth seems to be imposed through other channels than the increase in sav ings, and its effects on capital accumulation. Results of the GMM system evaluator showed a statistically significant relationship between VAT and productiv ity growth (Kolahi, Noor, 2015).
According to (Alegana, 2014) the purpose of the study was to determine the effect of tax incentives on economic growth in Kenya. In the research, secondary data were used, using descriptive analysis, correlation analysis and regression analysis. The findings showed that it was a reverse ratio between GDP growth rate and tax incentives and GDP growth and development stage, while having a positive relationship between GDP growth rate and investment levels, rate of GDP growth and the level of productive population and the rate of GDP growth and literacy levels.
Eugene, Abigail (2016) examined the effect of tax policy on economic growth in Nigeria. The study uses 20-year time series data (1994 - 2013), OLS regression analysis was used to investigate relationships that ex ist between dependent and independent variables. Findings found that taxes have a significant effect on Nigeria's economic growth. It showed that the percentage of indirect taxes to the total has increased over the years. Different components have different effect on economic growth, the result showed that indirect taxation has a strong positive relationship with the level of economic growth in Nigeria. The result of direct tax analysis showed a weak relationship between economic growth and direct tax policy.
Lumbantobing, Ichihashi, (2012) investigated how the tax system, in fact, affects the country 's economic growth rate and the distribution of income through the use of a panel data of cross-national data composed of 65 countries during the 1970s - 2006. For the evaluation analysis, OLS was applied, case effect and fixed effect estimates. This document concludes that corporate income tax rates are highly related to economic growth and income inequality . However, the personal income tax rate does not have an impact on economic growth and inequality of income.
McNabb, LeMay-Bucher (2014) investigated the relationship between tax structure and economic growth in developed and developing countries from 1980 to 2010. Results from Common Correlated Effects Mean Group (CMG) estimator (Pearson 2006) conclude that tax increases of income (especially personal income tax) offset by the reduction of trade or consumer taxes have had a negative impact on the GDP growth rate. We also emphasize the fact that trade liberalization has not had any significant positive effect on economic growth. Net income increases in personal income taxes are found to be particularly damaging in middle and low-income countries.
Nantob (2014) explore effects of tax increases on economic growth in 47 developing countries, analyzing the effects of four kinds of taxes, namely income tax, taxes on goods and serv ices, taxes on income, profits, capital gains and taxes on

ISSN 2411-9571 (Print) ISSN 2411-4073 (online)
European Journal of Economics
and Business Studies April 2018 Vol 4 No 1
218
international trade to economic growth. Using a dynamic panel data over the period 2000 - 2012 and using the GMM estimator to address issues of endogeneity , econometric results show that: (1) there is a relationship not linear between tax revenues and economic growth. (2) there is a relationship not linear between taxes on income, profits and capital gains, taxes on international trade and economic growth in particular. These taxes reduce economic growth in the short term and then these effects diminish over time when these taxes rise.
Gordon, Li (2005), characterized the way tax revenues related to tax rates. Regression analysis was used to determine the ratio of tax revenue / GDP, compared to the maximum rate of VAT and minimum personal tax rates and corporate focusing separately on data from poor countries and rich. In rich countries (18 observations), the results look quite sensitive; if the average basis of consumption tax was about two thirds of GDP, it means that the rate the effective tax rate is 87. The coefficient of .46 at the level of the minimum tax income also seems acceptable, given the frequent use of a progressive rate structure under the personal income tax, resulting in an average tax rate too lower than the maximum legal rate. In poor countries (25 observations), in contrast, the results are dramatically different: the coefficient is lower than the rate the average VAT is far below the maximum level of legal tax, perhaps because the informal economy is often much greater in poorer countries. negative coefficient on the rate of tax on income, however, suggests the opposite causes; when incomes are very low due to a large informal economy, the statutory tax rates become higher to collect more of the few firms that remain part of the taxable sector.
Borg (2006) empirically analyzed in small countries the link between international trade income, GDP per capita, GDP size of and open trade level, using Two-Stage Least Square method (TSLS) in 130 countries from 1999 to 2004. The regression results show that the rate of international trade taxes in total revenue is negatively related to GDP per capita. While the rate of tax on international trade is positively related to economic opening. Also, results show that small States totaling HDI tend to collect more of their tax revenues from taxes on income, profits and profitability of capital, while small states with low HDI tend to increase most tax revenues from taxes on international trade.
Empirical literature in developed countries shows that there is a negative relationship taxes on GDP. Dackehag, Hansson (2012) studied how tax rates on corporate income and personal income affect economic growth using panel data from 1975 to 2010 by 25 rich countries of the OECD. The results showed that the taxation of corporate income and personal income negatively affects economic growth. However, the correlation between the tax on corporate earnings and economic growth is strong.
Stoilov, Patonov (2012) explored the basic trend in the distribution of the overall tax burden in the EU member states during the period from 1995 to 2010, using regression analysis. Comparative analysis is focused on the differences between countries in terms of the overall tax burden as measured by the GDP ratio of the tax and the determination of the tax structure, presented by div iding the total on standard components such as direct taxes, indirect taxes and social contributions. The regression coefficient expresses the impact of public spending on GDP growth. It has a negative sign and statistically significant at 1 percent. Consequently , this the result is a reliable empirical ev idence about the negativ e impact of budget expenditures on economic growth. Tax structure based on direct taxes is the most effective in terms of supporting the economic growth in the EU countries.
Conclusions and recommendations
The main objective of this study was to investigate the tax structure in developing countries. Tax policy of these countries consists of a tax structure, where the share of revenues collected from more budget tax revenues from taxes on international trade and much less from direct taxes. Based on the rev iew of the empirical literature, it was found that most of the research tax impact on economic growth had a negative relationship. Also, according to the theoretical literature taxes do not affect economic growth.
Since the tax impact on the economy is at a high intensity and attracting foreign investors to be a high turnout, developing countries need to apply a more effective tax policy through the use of more direct taxes and the gradual reduction of tax revenues from international trade taxes in order to encourage taxpayers to increase their participation in production, trade and investment growth. Substantial additional income can grow in many developing countries through established methods, tailored and unique circumstances of countries rankings. Approval and making clear ready laws and regulations that include a strong defense of taxpayers - the main problem is often the application (IMF, 2011).
Also, it is important even in these countries the permanent extension of the tax base, so that the tax burden on ex isting taxpayers to be lower, because it would affect in reducing tax evasion and increasing GDP.

ISSN 2411-9571 (Print) ISSN 2411-4073 (online)
European Journal of Economics
and Business Studies April 2018 Vol 4 No 1
219
In developing countries, it is very important the growth number of enterprises in conducting payment operations through the banking system - namely the creation of powerful taxpayer’s relations - the bank, because this would affect their attraction in the formal sector, and as a result this also increase public revenues. But that this increase cooperation, prov ision of serv ices by banks should be convenient for enterprises. With regard to the role of banks in tax enforcement, the authors have derived the following projections for countries where banks prov ide only a modest added value: 1. Tax revenues as a share of GDP will be lower, limited by the threat the not mediation. 2. The tax base will be tight, sealed in intensive equity firms particularly value the use of financial intermediation. 3. Optimal tax structure would impose a significant burden on the income taxes of the capital, in order to concentrate the tax burden on those firms are less willing to give up the use of the financial sector. 4. Fees will used to protect the taxed sector. 5. Inflation will be used as a means of indirectly to taxation of non-taxed economy (cash). 6. The entry of foreign firms may be limited to those sectors which are subject to tax, but should be encouraged in various sectors of non-taxed. 7. There is likely to be limited to red border duty-free sectors (Gordon, Li, 2005).
Because taxes are a source of important public revenues in developing countries, future research should be intensified on the need to reform tax policy, so that their impact is greater in economic growth and increased social welfare. Also, because developing countries are characterized by their specificity in economic and tax structure, future research should focus on the country level.
References
[1] Kolahi, G. H. S.; Noor, M. B. Z., (2015): “The effect of Value Add Tax on Economic Growth and its Sources in Developing”, International Journal of Economic and Finance, Vol. 8, No. 1, 2016, http://dx.doi.org/10.5539/ijef.v8n1p217, pp. 217 – 228.
[2] Eugene, N.; Abigail, Ch. E., (2016): “Effect of Tax Policy on Economic Growth in Nigeria (1994-2013), International Journal of Business Administration, vol. 7, No. 1, 2016, http://ijba.sciedupress.com, pp. 50 – 58.
[3] Alegana, H., (2014): “The Effect of Tax Incentives on Economic Growth in Kenya” pp. 1 – 13. [4] Carnahan, M (2015): “Taxation Challenges in Developing Countries”, Asia & Pacific Policy Studies, Vol. 2, No.
1, The Australian National University and Wiley Publishing Asia Pty.Ltd, pp. 169 – 182. [5] Kopczuk, W (2010): Economics of Estate Taxation: A Brief Revie of Theory and Evidence”, NBER Working
Paper 15741, http://www.nber.org/papers/15741, pp. 1 – 23. [6] Mankiw, G. N; Weinzierl, M; Yagan, D, “Optimal Taxation in Theory and Practice”, [email protected],
[email protected], [email protected]. pp. 1 – 29. [7] Creedy, J. “The Personal Income Tax Structure: Theory and Policy”, The University of Melbourne, pp. 1 – 40. [8] Abaida, S.; Abdeljabbar, A., “Fiscal Multipliers in Developing Countries: Review of the Recent Literature,
University of Hassan Premier, Settat Morocco, [email protected], [email protected], pp. 185 – 191. [9] Stoilova, D.; Patonov, N (2012): “An Empirical Ev idence for the Impact of Taxation on Economy Growth in the
European Union”, Book of Proceedings – Tourism and Management Studies International Conference Algarve 2012, vol. 3, pp. 1031 – 1039.
[10] Fjeldstad, O-H. (2013): “Taxation and Development”, A rev iew of donor support to strengthen tax system in developing countries, WIDER Working Paper No. 2013/010, United Nations University , pp. 1 – 28.
[11] Dackehag, M.; Hansson, A. (2012): “Taxation of Income and Economic Growth: An Empirical Analysis of 25 Rich OECD Countries, Working Paper 2012:6, University Lund, pp. 1 – 31.
[12] Avi-Yonah, R.; Margalioth, Y. (2006): “Taxation in Developing Countries: Some Recent Support and Challenges to the Conventional View, 1st OECD INTR Conference, pp. 1 – 32.
[13] McNabb, K.; LeMay-Boucher, Ph. (2014): “Tax Structures, Economic Growth and Development”, Working Paper 22, www.ictd.ac, pp. 1- 38.
[14] Rahul, (2015): “Role of Direct and Indirect Tax in Development of Indian Economy” IJRFM, Vol. 5, International Journal of Research in Finance and Marketing, [email protected], pp. 91 – 97.
[15] Bird, M. R.; Zolt, M. E. (2003): “Introduction to Tax Policy Design and Development, World Bank, pp. 1 – 39. [16] Nantob, Y. (2014): “Taxes and Economic Growth in Developing Countries: A Dynamic Panel Approach”, Munich
Personal Repack Archive (MPRA), No. 61346, https://mpra.ub.uni-muenchen.de/61346/, pp. 1 – 24. [17] Besley, T.; Persson, T. (2014): “Why Do Developing Countries Tax So Little? Journal of Economic Perspectives,
Vol. 28. No. 4, pp. 99 – 120. [18] Gordon, R. (2009): “Initiative for Policy Dialogue Working Paper Series”, Overv iew of Tax Policy in Developing
Countries, pp. 1 – 14.

ISSN 2411-9571 (Print) ISSN 2411-4073 (online)
European Journal of Economics
and Business Studies April 2018 Vol 4 No 1
220
[19] Gordon, R.; Li, W., “Puzzling Tax Structures in Developing Countries: A Comparison of Two Alternativ e Explanations”, pp. 1 -41.
[20] Gordon, R.; Li, W. (2005): “Tax Structure in Developing Countries: Many Puzzles and Possible Explanation”, Working Paper 11267, http://www.nber.org/papers/ë11267, National Burau of Economic Research, pp. 1 – 34.
[21] Bird, M. R.; Martinez-Vazquez, J. (2008): “Tax Effort in Developing Countries and High-Income Countries: The Impact of Corruption, Voice and Accountability , http://scholarëorks.gsu.edu?econ_facpub, pp. 55 – 71.
[22] Borg, M. (2006): “Taxation Structures in Small States with Special Reference to Revenue Implications Following Trade Liberalization”, Bank of Valletta Review, N0. 34, pp. 1 -18.
[23] Lauren, D.; Tiffany, M.; Stephanie, O. (2008): “Taxation Policy in Developing Countries - What is the IMF’s Involvement”, The Bretton Woods Project, DV406 Consultancy Project, 1- 37.
[24] Bernardi, L., (2009) “The Political Economy of Taxation”. Lessons from Developing Countries, Rassegna Bibliografica, pp. 283 – 294.
[25] Lumbantobing, A., I., R.; Ichihashi, M., (2012): “The Effects of Tax Structure on Economic Growth and Income Inequality”, IDEC Discussion Paper 2012, Hiroshima University , pp. 1 – 25.
[26] Velde, W., D., (2013): “Taxation and Developing Countries”, Economic and Private Sector, Professional Evidence and Applied Knowledge Serv ices, Structured Professional Development, EPS Peaks, Training Notes, pp. 3 – 41.
[27] IMF (2011), (2013): “Taxation and Developing Countries”, Economic and Private Sector, Professional Ev idence and Applied Knowledge Serv ices, Structured Professional Development, EPS Peaks, Training Notes, pp. 3 – 41.
ISSN 2411-9571 (Print) ISSN 2411-4073 (online)
European Journal of Economics
and Business Studies April 2018 Vol 4 No 1
221
DOI: 10.26417/ejes.v4i1.p221-227
Open Access. © 2018 Maya Yaneva. This is an open access article licensed under the
Creative Commons Attribution-NonCommercial-NoDerivs 4.0 License
Employee Satisfaction vs. Employee Engagement vs. Employee NPS
Maya Yaneva
PhD student, Institutional affiliation: VUZF, University of Finance,
Business and Entrepreneurship, Sofia, Bulgaria
Abstract
Human Resources are key for the success of business organizations. The science is focusing on Human Resources Management in times when technical resources are rapidly developing and significantly changing the working environment. The requirements toward the human resources are evolv ing as well. At the same time, the expectations of the candidates toward the employers are getting more demanding in terms of working conditions and appreciation. Employee profiles and change management are key aspects of HR management while the companies are striv ing to adjust their learning and development programs, working environment and structures in order to retain and develop their associates. Companies start to measure their employees’ satisfaction, than converting to employee engagement and nowadays more and more organizations are focusing on employee NPS (net promoter score)1, which is not only promoting the products or serv ices of the company they are engaged in, but also the company as an employer. This paper is focusing on employee satisfaction, employee engagement and eNPS (employee net promoter score). It gives guidance what are the global trends with local impact, presenting results from several surveys on the Bulgarian market of global and local companies executed between 2012 and 2017. The primary focus of the research is to outline which channels and ways of communications are the most beneficial in the attempts of the business organizations to address their employees, boost their enjoyment and motivation and make them ambassadors of the product and serv ices they produce, but also promote them as an employer. Presenting the outcome of the surveys is giv ing guidance on top drivers for employee satisfaction, engagement and loyalty . It is leading to conclusions that are enlightening the associates’ interpretation of those drivers in the different contexts of business environment. The organizations are conducting internal surveys within their global structures, but also participating in researches on the local market in Bulgaria to cross check the findings and the trends. Local cultural differences are influencing the organizational culture and trends of the business. The paper analyses the results related to the Bulgarian market and prov ides further recommendations as to how to address the findings resulting from the survey.
Keywords: employee satisfaction, employee engagement, employee NPS, net promoter score, communication, human resources, employee retention
Introduction
Every organization is striv ing for profitable and sustainable business; therefore, it is important to analyze the drivers that are supporting the achievement of its main goal. High utilization and efficiency of the employees, as one of the main resources in each organization, are the most complex and difficult to address in times of developing technology and digitalization. The human resources as one of the main resources of each organization remain an intriguing area for the science and practice in order to outline, which drivers enhance the efficiencies and human productiv ity . Human resources management as a field of the management science is focusing on employees and their interactions with the employers.
1 AON Hew itt, Engagement survey, 2015 and 2016

ISSN 2411-9571 (Print) ISSN 2411-4073 (online)
European Journal of Economics
and Business Studies April 2018 Vol 4 No 1
222
Due to the constant and accelerating industrial development, the science is shifting from regulation of the basic needs of labor force in the beginning of the 20th century, through human resources management in mid of the century, and further to direction of human capital development in the recent years.
Similar to the Maslow’s pyramid “Hierarchy of needs”, employees’ needs and expectations evolve, hence very often it is used to support and v isualize the engagement levels of employees in the organizations.
Figure 1. Maslow’s pyramid “Hierarchy of needs” and employees’ needs and expectations in the organization.
Whereas the attitude in working environment is being provoked by the engagement of the employees, different types of employee attitude-, satisfaction- and engagement surveys are being utilized in the organizations in order to ensure that the leadership gets detailed and full picture of employees feelings, perceptions and expectations. These tools are seeking the feedback from the employees about the actions and decisions of the management in terms of ensuring stable working environment, responding to the basic and safety needs of their associates and further prov iding opportunities for development. until the level of full utilization of the employees’ potential.
The objective of this article is to present how the measurement of the employee satisfaction in a global company evolves to net promoter score survey and comparing the results with employee engagement survey in Bulgarian market that is being rolled out.
The company is a leading global business process outsourcing (BPO) prov ider of customer care and complementary back-office processes its clients are many of the largest and well-known brands in the world. These clients have selected and continue to partner with the BPO prov ider for one reason: The company delivers the results that are wanted and expected. With over than 30 years of industry experience, this BPO organization has twice been ranked as the top overall call center outsourcing prov ider in Datamonitor’s annual Black Book of Outsourcing survey. Nowadays its’ more than 75,000 employees prov ide clients with predictable and measurable return on their customer investment by building customer loyalty , increasing sales and improv ing efficiency. With locations span of more than120 sites in 25 countries across North America, South America, Europe, Africa, and Asia Pacific, the key capital of the company are the employees. The associates are the ones who actually deliver the results expected by the clients. Moreover, to be a leader in the industry or preferred and trusted partner a business organization should even exceed the expectations. The success of the business is in the hands of the associates all over the word, therefor the focus of the organization is to ensure that they retain satisfied and engaged employees that committed and contribute to the success of their employer and clients. This is a very complex task of the human resources partner management team in the company.
In 2009 the HR organization rolls out globally associates’ satisfaction survey. Through massive internal communication campaign, the company announces the upcoming survey as a v ital tool to prov ide the organization and its leadership with associates’ v iews and opinions on issues that directly affect them.
The survey contents seven questions:
What is your overall satisfaction with the company?
Did you receive the tools to execute your job properly? Do you receive praise and recognition for your job and results?

ISSN 2411-9571 (Print) ISSN 2411-4073 (online)
European Journal of Economics
and Business Studies April 2018 Vol 4 No 1
223
Do you receive training that keeps you prepared for your tasks?
Are you given the opportunity to learn and grow in the company?
Do you think that your opinion counts and actions will be taken based on this survey?
Do you feel that your management is keeping you informed about key issues?
Seven questions with field for free text answer are shared v ia web based anonymous survey that gives the opportunity to export and analyze the data. It prov ides breakdown per location, site, team, department, client supported and length of serv ice with the company. The management of every location rev iews the results, presents the outcome of the survey on global and local level and discuss proposal for action plan during open sessions with the employees. Afterwards action plans are shared and regularly updated about the progress of each action.
The results in terms of overall satisfaction of the office in question for the period from 2009 and 2014 vary from 74% to 92% . This office in Sofia ex ists since 2006 and following the global tendency of correlation between employee satisfaction and tenure in the company the first couple of years during significant growth of the business growth the associate satisfaction is in the range of 85% and above. In 2013 and 2014 after couple of years of stable employee population, the satisfaction decreases to 77% and 74% .
At the same time, the global HR management team is considering a change that aims to deliver better understanding of the employees’ feelings toward the employer. They have launched a new brand and People-first strategy. They want to ensure their employee survey aligns to these priorities and is a useful business tool that predicts retention and performance . Thus, they made curtain changes to the employee survey in 2015 to address these needs. The changes are meant to help clarify ing the purpose of the survey to the associates and measure the success of their People-first strategy. Through dedicated informational campaign, the launch of the new survey describes what the changes are and why they are happening. New employee engagement category is replacing the satisfaction category. It is a more rigorous test of how employees think, feel and behave toward an organization. According to the HR management team the satisfaction is a passive measure and does not reflect company’s’ goal to create passionate and engaged promoters of its employers brand. An overall engagement category score is replacing the overall satisfaction score. In order to ensure the survey meets industry standards, they have rev ised their Employee Net Promoter Score (eNPS) to only one item, that is the true parallel measure of Customer Net Promoter Score. It measures employee advocacy using an 11-point scale (0-10) and is based on the fundamental perspective that employees can div ided into three (3) categories: Promoters, Passives and Detractors. eNPS is the “ultimate” measure of success - engaged employees are much more likely to promote their organization.
According to the presented scoring system 10 9 8 7 6 5 4 3 2 1 0, where 10 is very likely and 0 is not likely at all, promoters score with 10 and 9, passives are 8 and 7 and detractors are from 6 to 0, inclusive.
The formula for eNPS calculation: % Promoters - % Detractors = eNPS
The survey items examine five important associate experiences that impacts eNPS and engagement. The new format of the survey includes the following categories:
Figure 2. Employee Net Promoter Score categories.
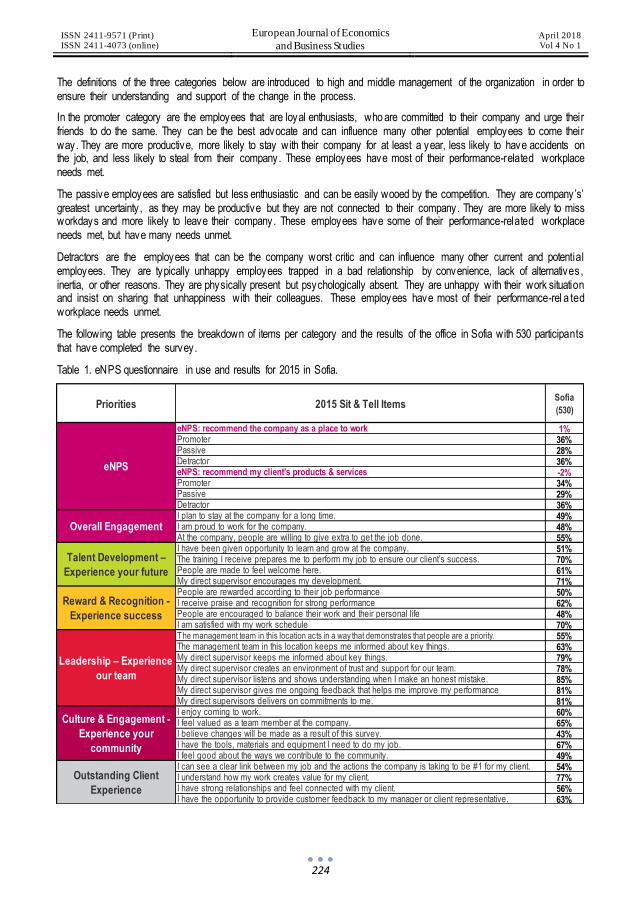
ISSN 2411-9571 (Print) ISSN 2411-4073 (online)
European Journal of Economics
and Business Studies April 2018 Vol 4 No 1
224
The definitions of the three categories below are introduced to high and middle management of the organization in order to ensure their understanding and support of the change in the process.
In the promoter category are the employees that are loyal enthusiasts, who are committed to their company and urge their friends to do the same. They can be the best advocate and can influence many other potential employees to come their way. They are more productive, more likely to stay with their company for at least a year, less likely to have accidents on the job, and less likely to steal from their company. These employees have most of their performance-related workplace needs met.
The passive employees are satisfied but less enthusiastic and can be easily wooed by the competition. They are company’s’ greatest uncertainty , as they may be productive but they are not connected to their company. They are more likely to miss workdays and more likely to leave their company. These employees have some of their performance-related workplace needs met, but have many needs unmet.
Detractors are the employees that can be the company worst critic and can influence many other current and potential employees. They are typically unhappy employees trapped in a bad relationship by convenience, lack of alternatives, inertia, or other reasons. They are physically present but psychologically absent. They are unhappy with their work situation and insist on sharing that unhappiness with their colleagues. These employees have most of their performance-rel a ted workplace needs unmet.
The following table presents the breakdown of items per category and the results of the office in Sofia with 530 participants that have completed the survey.
Table 1. eNPS questionnaire in use and results for 2015 in Sofia.
Priorities 2015 Sit & Tell ItemsSofia
(530)
eNPS: recommend the company as a place to work 1%Promoter 36%Passive 28%Detractor 36%eNPS: recommend my client's products & services -2%Promoter 34%Passive 29%Detractor 36%I plan to stay at the company for a long time. 49%I am proud to work for the company. 48%At the company, people are willing to give extra to get the job done. 55%I have been given opportunity to learn and grow at the company. 51%The training I receive prepares me to perform my job to ensure our client’s success. 70%People are made to feel welcome here. 61%My direct supervisor encourages my development. 71%People are rewarded according to their job performance 50%I receive praise and recognition for strong performance 62%People are encouraged to balance their work and their personal life 48%I am satisfied with my work schedule 70%The management team in this location acts in a way that demonstrates that people are a priority. 55%The management team in this location keeps me informed about key things. 63%My direct supervisor keeps me informed about key things. 79%My direct supervisor creates an environment of trust and support for our team. 78%My direct supervisor listens and shows understanding when I make an honest mistake. 85%My direct supervisor gives me ongoing feedback that helps me improve my performance 81%My direct supervisors delivers on commitments to me. 81%I enjoy coming to work. 60%I feel valued as a team member at the company. 65%I believe changes will be made as a result of this survey. 43%I have the tools, materials and equipment I need to do my job. 67%I feel good about the ways we contribute to the community. 49%I can see a clear link between my job and the actions the company is taking to be #1 for my client. 54%I understand how my work creates value for my client. 77%I have strong relationships and feel connected with my client. 56%I have the opportunity to provide customer feedback to my manager or client representative. 63%
Outstanding Client
Experience
Overall Engagement
Leadership – Experience
our team
eNPS
Talent Development –
Experience your future
Reward & Recognition -
Experience success
Culture & Engagement -
Experience your
community
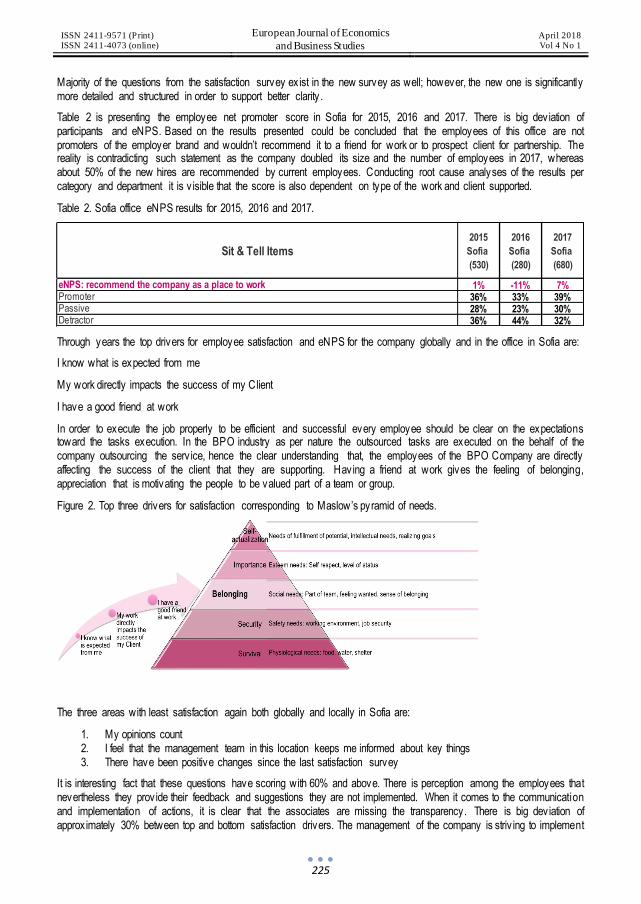
ISSN 2411-9571 (Print) ISSN 2411-4073 (online)
European Journal of Economics
and Business Studies April 2018 Vol 4 No 1
225
Majority of the questions from the satisfaction survey ex ist in the new survey as well; however, the new one is significantly more detailed and structured in order to support better clarity .
Table 2 is presenting the employee net promoter score in Sofia for 2015, 2016 and 2017. There is big deviation of participants and eNPS. Based on the results presented could be concluded that the employees of this office are not promoters of the employer brand and wouldn’t recommend it to a friend for work or to prospect client for partnership. The reality is contradicting such statement as the company doubled its size and the number of employees in 2017, whereas about 50% of the new hires are recommended by current employees. Conducting root cause analyses of the results per category and department it is v isible that the score is also dependent on type of the work and client supported.
Table 2. Sofia office eNPS results for 2015, 2016 and 2017.
Through years the top drivers for employee satisfaction and eNPS for the company globally and in the office in Sofia are:
I know what is expected from me
My work directly impacts the success of my Client
I have a good friend at work
In order to execute the job properly to be efficient and successful every employee should be clear on the expectations toward the tasks execution. In the BPO industry as per nature the outsourced tasks are executed on the behalf of the company outsourcing the serv ice, hence the clear understanding that, the employees of the BPO Company are directly affecting the success of the client that they are supporting. Having a friend at work gives the feeling of belonging, appreciation that is motivating the people to be valued part of a team or group.
Figure 2. Top three drivers for satisfaction corresponding to Maslow’s pyramid of needs.
The three areas with least satisfaction again both globally and locally in Sofia are:
1. My opinions count 2. I feel that the management team in this location keeps me informed about key things 3. There have been positive changes since the last satisfaction survey
It is interesting fact that these questions have scoring with 60% and above. There is perception among the employees that nevertheless they prov ide their feedback and suggestions they are not implemented. When it comes to the communication and implementation of actions, it is clear that the associates are missing the transparency. There is big deviation of approx imately 30% between top and bottom satisfaction drivers. The management of the company is striv ing to implement
Sit & Tell Items2015
Sofia
(530)
2016
Sofia
(280)
2017
Sofia
(680)
eNPS: recommend the company as a place to work 1% -11% 7%Promoter 36% 33% 39%Passive 28% 23% 30%Detractor 36% 44% 32%
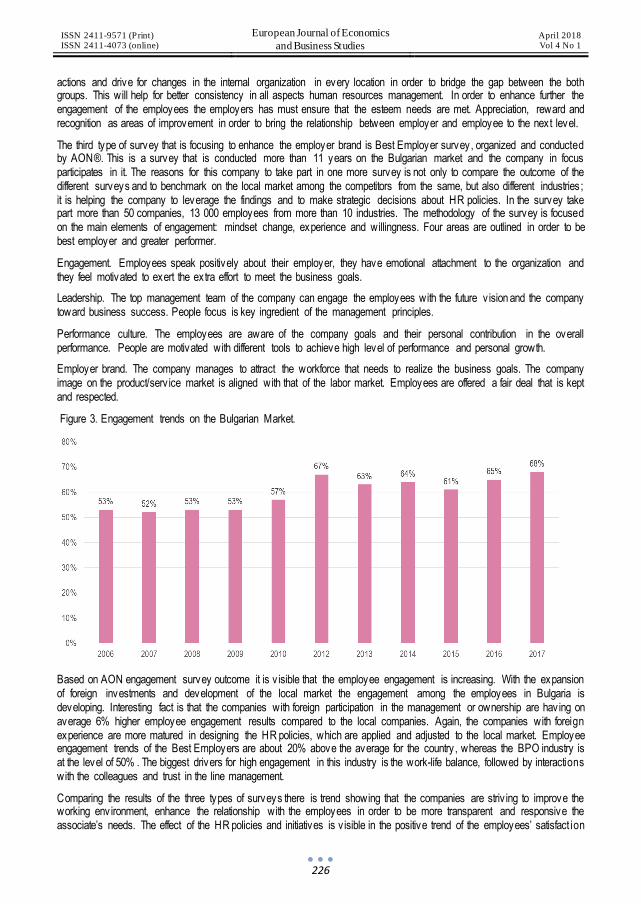
ISSN 2411-9571 (Print) ISSN 2411-4073 (online)
European Journal of Economics
and Business Studies April 2018 Vol 4 No 1
226
actions and drive for changes in the internal organization in every location in order to bridge the gap between the both groups. This will help for better consistency in all aspects human resources management. In order to enhance further the engagement of the employees the employers has must ensure that the esteem needs are met. Appreciation, reward and recognition as areas of improvement in order to bring the relationship between employer and employee to the next level.
The third type of survey that is focusing to enhance the employer brand is Best Employer survey, organized and conducted by AON®. This is a survey that is conducted more than 11 years on the Bulgarian market and the company in focus participates in it. The reasons for this company to take part in one more survey is not only to compare the outcome of the different surveys and to benchmark on the local market among the competitors from the same, but also different industries; it is helping the company to leverage the findings and to make strategic decisions about HR policies. In the survey take part more than 50 companies, 13 000 employees from more than 10 industries. The methodology of the survey is focused on the main elements of engagement: mindset change, experience and willingness. Four areas are outlined in order to be best employer and greater performer.
Engagement. Employees speak positively about their employer, they have emotional attachment to the organization and they feel motivated to exert the extra effort to meet the business goals.
Leadership. The top management team of the company can engage the employees with the future v ision and the company toward business success. People focus is key ingredient of the management principles.
Performance culture. The employees are aware of the company goals and their personal contribution in the overall performance. People are motivated with different tools to achieve high level of performance and personal growth.
Employer brand. The company manages to attract the workforce that needs to realize the business goals. The company image on the product/serv ice market is aligned with that of the labor market. Employees are offered a fair deal that is kept and respected.
Figure 3. Engagement trends on the Bulgarian Market.
Based on AON engagement survey outcome it is v isible that the employee engagement is increasing. With the expansion of foreign investments and development of the local market the engagement among the employees in Bulgaria is developing. Interesting fact is that the companies with foreign participation in the management or ownership are having on average 6% higher employee engagement results compared to the local companies. Again, the companies with foreign experience are more matured in designing the HR policies, which are applied and adjusted to the local market. Employee engagement trends of the Best Employers are about 20% above the average for the country , whereas the BPO industry is at the level of 50% . The biggest drivers for high engagement in this industry is the work-life balance, followed by interactions with the colleagues and trust in the line management.
Comparing the results of the three types of surveys there is trend showing that the companies are striv ing to improve the working env ironment, enhance the relationship with the employees in order to be more transparent and responsive the associate’s needs. The effect of the HR policies and initiatives is v isible in the positive trend of the employees’ satisfact ion
ISSN 2411-9571 (Print) ISSN 2411-4073 (online)
European Journal of Economics
and Business Studies April 2018 Vol 4 No 1
227
and engagement. In the last years it is not any more that important an employee to be satisfied with the employer as this keeps the company at the average level, there is nothing special to engage the employee. It is more important to engage the employees, to make them feel that they contribute to the success of the business, to feel the respect and the appreciation, to praise them by giv ing them the opportunity for creativ ity .
No matter what type and how often surveys are rolled out in the company if the employees do not see any consequences after that the engagement will decrease in the organization. For the success of every company is crucial to check the pulse of the employees and to make sure that the proper communication, right policies and processes are in place to support that initiative in order to bring this relationship to the next level.
People are getting used to the new things very fast and tend to forget the improvements in the surrounding working environment and if they are not reminded about the efforts invested, or the costs associated in simple office space refurbishment they will take it as given. Hence, the management in the organization in partnership with HR team should systematically inform the employees of the investments done, which are directly or indirectly supporting working environment enhancements.
The surveys are helping to gather detailed feedback that is giv ing indication if the efforts of the leadership are in the right direction. These pulse checks are supporting the calibration on expectations between employees and employers. It may happen that a social benefit, which is introduced to employees, is with such bad quality that may cause very negative reactions instead of appreciation. It is possible that international companies are rolling out global initiatives, which do not match the local cultural specifics and may cause dissatisfaction among the associates in curtain theritory . The frequency of the surveys needs to be well planned. Having too often surveys is not giv ing sufficient time for analuzses and auctioning, hav ing irregular surveys might be interpreted by the people as lack of interest from the management side. No matter what is the selected approach it should be supported by proper communication campaign.
The employees are keen to see the outcome of the survey. They are waiting eagerly to see if their own opinion is shared broadly in the organization. Therefor precise timeline needs to be presented in the very begging what are the dates for the different stages. Again this related to transparency and commitment of the employer. At the end, equally important to the investments and the survey, is that the management of the organization, in a frank and open manner declares what are the changes that are realistic to happen based on the feedback from the survey, and what cannot be actioned, but prov iding reasonable explanations for that.
Bibliography:
[1] Maslow, A. H. (1943), A Theory of Human Motivation, Psychological Review, 50, 370-396. , http://psychclassics.yorku.ca/Maslow/motivation.htm
[2] Derek R. Allen, and Wilburn, M. (2002) Linking Customer and Employee Satisfaction to the Bottom Line: A Comprehensive Guide to Establishing the Impact of Customer and Employee Satisfaction on Critical Business Outcomes, Milwaukee, Wisconsin: ASQ Quality Press
[3] Shopov, D. and Atanasova, M. (1998), Human Resources Management, Sofia:Trakia-M [4] Paunov, M. (2009), Values of the Bulgarians. Contemporary Portrait on European Background, Sofia:
Stopanstvo [5] Paunov, M. (1999), Organizational Behavior, Sofia: Ciela [6] Drucker, P. (1988), The coming of the new organizations. Harvard business rev iew [7] Drucker, P. (1994), Business purpose and business mission. Tasks, responsibilities, practices, New York:
Harper and Row publishers [8] Kamenov, K., Asenov, A. and Hadjiev, K. (2000), Human, Team, Leaders, Sofia: Lyuren
ISSN 2411-9571 (Print) ISSN 2411-4073 (online)
European Journal of Economics
and Business Studies April 2018 Vol 4 No 1
228
DOI: 10.26417/ejes.v4i1.p228-234
Open Access. © 2018 Mariana Ianeva. This is an open access article licensed under the
Creative Commons Attribution-NonCommercial-NoDerivs 4.0 License
The Sharing Economy at Tourist Tours and Its Impact on the Tourist Business (Travel Agencies) in Bulgaria
Mariana Ianeva
Assoc. Prof. Dr., Ph. D. Student Ralitsa Georgieva,
University of World and National Economy, Department “Economics of tourism”, Sofia, Bulgaria
Abstract
This paper examines the sharing economy and the application of its manifestations in the field of business as a whole and in particular- at the tourism sector in Bulgaria. Identified are theories, regarding the technology of the sharing economy, that are also being studied by foreign researchers in order to differentiate its specificity and to illustrate its impact on diverse aspects of business. The development of the collaborative consumption also determines a restructuring of the tourist market and imposes changes in the demand for tourist product. A result of the opportunities it offers is the emergence of unpredictabili ty at the consumer’s behavior- tourists are looking for a new type of product to be created for their indiv idual needs. Improv ing the link between the client and the others, involved at the creation of a tourist package, as well as offering new and diverse tourist products are presented as a way to respond to the current demand changes. Outlined are trends in the formation of a new tourist product, adapted to the contemporary consumer’s needs. The paper analyzes the impact of the sharing economy on indicators, measuring changes of the attitude of tourists, connected to the preferred ways of travelling. Relatively to the examined subject, it is also researched the behavior of the Bulgarian tour operators, aimed at preserv ing and expanding their market positions. It is proved the need to adapt the product policy of the travel agencies to the outlined economic situation, in order to achieve sustainable development and competitiveness.
Keywords: sharing economy, tourist business, travels
JEL: L83, М21.
Introduction
The development of the shared consumption also determines the restructuring of the tourist market and imposes changes in the demand for tourist products. Result of the opportunities it prov ides is the emergence of unpredictabili ty of the consumer’s behavior - tourists are looking for a new type of product to be matched to their indiv idual needs. Opportunities to improve the relationship between the end-user and others, involved in creating the travel package, as well as offering new and diverse tourist products, are presented as a way to respond to current demand changes. New trends in touristic behavior and expectations, related to the digital economy lead to digital marketing and promotion, but also are an environment for capacity building and product development.
The main goal of this article is to explore the application of the shared consumption on the modern tourist market, clarify ing the essence and the prerequisites for its use, as well as its influence on the development of the tourist business in Bulgaria and in particular on the outgoing Bulgarian tour operators. In the present study the thesis is based on the concept that the product of the tour operator, which according to the respective user’s preference includes element of sharing in the travel program- most often a property or transport selected by the respective client, can innovate the product range and contribute for sustainable activ ity of tour operators operating in the modern network environment. The subject of the current research are the specific trends of the tourist market, connected to the supply and demand in tourism in the network economy and more over of the tour

ISSN 2411-9571 (Print) ISSN 2411-4073 (online)
European Journal of Economics
and Business Studies April 2018 Vol 4 No 1
229
operator’s products that are adaptable in the new economy in order to ensure the sustainability of the business. The subject is the tour operator’s business in Bulgaria. The tasks set out in this paper prove the thesis and relate to the network economy and shared consumption in tourism, the reasons for the restructuring of the tourist market and the impact of shared consumption on tour operators and the competitive advantages of new products.
Exposure
Network economy and shared consumption in tourism
The fast progress of the Internet-based technologies and the resulting abundance of economic activ ity on the Internet accelerate the establishment and development of a separate network economy. It can be described as a multitude of networking, software applications and human capital that makes networks and applications work together for online businesses and agents (corporations and indiv iduals) who are engaged in buying and selling goods and serv ices on a direct or indirect way. The network economy has three key parameters: information, knowledge, speed. These three Internet-based factors define new ways of doing business through mutually beneficial relationships with business partners, knowing and fulfilling customer wishes. It is defined as an environment in which any enterprise, company or indiv idual located at any point in the economic system can contact easily and at extremely low cost with any other enterprise, company or indiv idual to collaborate work, trade, exchange of ideas or mutual enjoyment.
The network economy can also be described as a qualitatively new form of economic order characterized by the development and spread of Internet technologies, formation of a critical mass of economic agents, reorganization of forms of joint enterprise activ ity . It is characterized by the modernization of the infrastructure in the economy and the establishment of network institutional structures. It is also characterized by low fixed costs, unlimited marginal costs and rapid product distributio n. Characteristically for today 's economic environment is the constant creation of better and better versions of online communication. The value of the e-serv ices increases in proportion to their multiplication, generating an increasing need of them.
Business priorities are already changing as they are driven by maximizing their own internal revenues to maximizing their infrastructure as a whole. The companies’ business activ ity becomes less perfect and adaptable to the established market, but more flex ible and decentralized. Continuous self-renewal and creation of a flex ible network of new organizations and new forms of organizations are being carried out. In the authors' v iew, a shared economy arises and can function in the context of a networked internet economy, an integral part of which is.
These processes also lead to a change of the corporate behavior and organization of the business. Tsonev (2014) found that marketing as part of the business process is not isolated from these new transformations. Marketing is no longer limited at improv ing the use of traditional channels, but also involves the continuous deployment and use of creative solutions that will maximize the return on investments (Tsonev & Zlatanova, 2014). Creativ ity is crucial in distinguishing the message and attracting the targeted audience and effectively reaching the various audiences, including those involved in shared travelling, as a new form of tourist product.
Collaborative economy or participative economy,sharing economy, are concepts that indicate the increased applicability of a business model that prov ides serv ices or the right to use a resource on an equal basis access (peer-to-peer-P2P) without acquiring ownership. The term "sharing economy" enters the Oxford Dictionary in 2015 as "an economic system in which assets or serv ices are shared between private indiv iduals, both free of charge and with payment, typically v ia the Internet" (Heo, 2016, p.16).
Ex isting informational resources in the area of shared consumption highlight three main areas of research: first, joint consumption as a business model and its influences; secondly, the nature of shared consumption and third, sustainable development and the economy of shared consumption. (Cheng, 2016, p.70)
Experts identify as the most important stimulating factors of shared consumption – the economic factors, based on ex isting problems and the need for resource efficiency. The technological factors - mobile applications, social media and the Internet as well as social and cultural factors are also significant.
As far as barriers to shared consumption are concerned, the picture is radically different. The most significant are the cultural and social dimensions. Government policies and business behavior are also significant retention factors for shared consumption. (Ivanova, 2017)
1.1. Advantages and disadvantages of the sharing economy

ISSN 2411-9571 (Print) ISSN 2411-4073 (online)
European Journal of Economics
and Business Studies April 2018 Vol 4 No 1
230
Advantages of the sharing economy
The current paper examines 5 basic ways for the sharing economy to bring positive impact of the society :
More efficient use of resources
The sharing economy is a real alternative to the traditional consumer’s model where consumers buy more and more new products that they soon throw away or abandon somewhere in anticipation of the latest market developments. Unlike this model, in the sharing economy, a person can buy an object or real estate that can then be used by many. In this way, the owner regains some of the money spent on the purchase, and those who hire him save a considerable amount because they do not have to buy it either. The benefit is for all participants in the process as well as for nature as a whole.
Rise of the micro entrepreneurship
The new sharing platforms allow every person to become a micro entrepreneur who can make the most of what he/she has - available space, cars, tools, equipment or specific skills. In recent years, dozens of new sharing sites have emerged, which in fact allow an internet user to share almost everything - even fitness equipment, boats, tents and what not. In this way, everyone can be with many new sources of income that he has not even suspected
Strong emphasis on trust
The sharing economy places trust in the focus of the relationship. The new platforms, which are part of it, invest a lot of resources in building trust through various online tools for evaluating participants, allowing unscrupulous consumers to drop out naturally . This effect may be important at a time when companies, institutions and authorities of all kinds experience a lack of confidence.
Optimizing of the urban infrastructure
At a time when more than half of the planet's population lives in cities, and megacities with more than 10 million inhabitants are already 34, municipal authorities and infrastructure companies are panting and often fail to deliver the expected quality of life for everyone. Under these conditions, a sharing economy can bring significant opportunities for optimization, contributing greatly to a better life for all residents. Sites and mobile applications for shared travel or shared use of garages and parking places can allow for more efficient use of resources, which will relieve even heavy traffic in large settlements.
Opportunity to earn from the spare time
Time has always been the main resource that people can share in exchange of money, and that is the very nature of job hiring. With new online platforms like iamfree.pro, however, sharing time is greatly facilitated and is being rolled out to another level. Consumers now have the freedom to earn money at any point in which they want to free their own time whenever they need to. They can, for example, take up a huge number of tasks today and free the next few days to travel. They can earn money from both qualified labor and serv ices that do not require special skills, such as walking dogs or make shopping purchases for someone else. This makes time much more convertible and allows participants in the sharing economy to earn even from their free fifteen minutes instead of hav ing to work for 8 hours for 5 days a week to earn their salary at the end of the month.
Disadvantages of the sharing economy
Tax and tax regulation
On the one hand, traditional regulatory frameworks rarely fit these new patterns of market relations. On the other hand, cash flows between countries, income and profit are difficult to detect, verify and prove by the tax authorities. And often the parties themselves deliberately avoid paying taxes or are simply unaware that they owe them.
Undercutting market prices
The argument against the shared travel sites is that they are actually being used by carriers operating in the “gray” sector and accordingly undercutting the prices of licensed carriers.
Risk of lowering certain standards
The sharing economy prov ides prerequisites for unfair competition, avoids tax ing and can pose a threat to safety and health if serv ices do not meet certain standards.

ISSN 2411-9571 (Print) ISSN 2411-4073 (online)
European Journal of Economics
and Business Studies April 2018 Vol 4 No 1
231
Insecurity
Insecurity in a sharing economy is something that can be managed but still ex ists. It can be expressed in different spheres and in different ways: uncertainty about personal data, uncertainty about one's own health and well-being, uncertainty about fraud or lies, and many others. Uncertainty may occur both in the serv ice prov ider or the material resource and in the host country .
The concept of the shared consumption covers three systems based on: the redistribution markets, shared lifestyle and product. Regarding the sector breakdown, the main sectors of the shared economy are: Shared Financing (LendingClub, Prosper), sharing serv ices, skills, work (TaskRabbit, Fiverr, Gigwalk), property leasing (Airbnb, HommeAway), automobile (Uber, Lift, RalayRides), streaming music and v ideo (Sportify).
On the other hand, depending on the bidder-user relationship, the scope of the concept of shared consumption is addressed in four areas of the sharing economy: first, customer to customer relationships (C2C); secondly, between two consumers, but through a business (C2B- consumer to business); thirdly, between business and consumer (B2C), and fourth, business to business (B2B).
In the tourism sector, and in particular in the tour operator’s business, we rev iew the concept of sharing consumption in terms of areas related to second, third and fourth group relationships.
2. Reasons for restructuring the tourism market
The reasons for the restructuring of the tourism market are multifaceted. Globally , there are several trends in the development of the tourism market.
An increasingly pronounced trend is that economic conditions reduce the purchasing power of a wide range of consumers of travel goods and services. Thus, price becomes an important criterion for making a travel decision. In parallel, it is observed that income-generating groups seek not only high-quality , but also low-quality tourist products. This leads to the purchase of a large number of expensive and cheap tours abroad. The result is the appearance of a tourist with unpredictable consumer behavior. At the same time, the tourist does not want to be part of the general tourist group without name and personality . He desires and requires indiv idual serv ice. Gaining experience for a short time determines the usefulness of the supply . This means a demand for ever-better quality serv ices in a shorter time without place restrictions, i.e. all over the world, as well as different variations of assembling the package tour. (Ianeva, 2011, p. 17-18) In this way, travel agencies appear to serve the interests of tourists looking for a shared journey. This segment is interesting to be researched, as it will allow the diversification of their products.
Under the current conditions, the solvency, the type and volume of tourism demand by social groups are not a one-way dimension, a factor that plays a major role in decision-making on tourism supply. Reducing the retirement age and working week hours and increasing the leisure time leads to an increasing number of potential tourists that dispose with limited but sufficient resources for travelling. At the same time, well-qualified indiv iduals increase their working hours and reduce their free time. Hence the result - an increasing number of low-paid tourists spend more and more money on and during their trip, while the middle class of society buys cheaper tours. This is also due to the increase in sales of trips abroad on the principle of shared travel package and by tour operator on indiv idual request.
Responding to the changes of the tourist demand, most of the tourism supply focuses on preserving and expanding its presence in the market by offering new and diverse tourism products, by improving end-user connectivity through new networking technologies, by improv ing the internal interaction between the different participants in the formation of the overall touris t product. There is a growing supply of goods and services on international markets, incl. and tourist, which emphasize the personal preferences of tourists. The personal preferences are also a basis of building the products of tour operators associated with the sharing economy.
Individualisation of travel, on one hand, and the diversification of tourism supply, on the other hand, imposes a new way of communication between seller and customer - this leads to an increase at the direct sales. The era of the informational technologies defines the emergence and development of the global distribution systems. The computer "tourist guide" plays the role of travel agent and directly sales a complex of tourist products. New informational technologies, besides information, booking and sales, also prov ide payment options in a non-cash way.
The fact that the tourist chooses an individual travel module with limited solvency brings to the fore the alternative combination of acceptable price and product quality as well as components selected by both the customer and the tour operator. Aggressive pricing is becoming a very important tool for the market behavior of the touristic enterprises. This also leads to the emergence
ISSN 2411-9571 (Print) ISSN 2411-4073 (online)
European Journal of Economics
and Business Studies April 2018 Vol 4 No 1
232
of the elements of a shared travelling and an organized travel tour by a tour operator. Thus the tourist saves on the cost of the trip without affecting the quality of the product offered.
Both these trends and a number of other factors determine the structural changes and the demand for the tour operator product .
3. Impact of the shared consumption on tour operators and competitive advantages of shared-component products created by tour operator and client
The impact of the sharing consumption on tour operators on the Bulgarian market and their product can be explained in several aspects. The use of online platforms1 offering sharing consumption of items part of the touristic package allows the client to choose a different- low cost trip. But in our opinion, not only the low price of this kind of tours determines the guidelines for this type of new tourism demand. Significant is also the transformation of the supply and demand in the global Internet env ironmen t and its capabilities to experiment with tourists.
The researches of various authors focus on the relationship between users and serv ice prov iders, which enables the creation of joint value. Subsequently , other authors (Shaw, Bailey, & Williams, 2011, p.207) v iew SDL as a research paradigm in the tourism management and a key feature of the economy of experience. According to Ivanova (2017) the quality of social interconnections is an important factor for the satisfaction of tourists in this type of serv ice.
Based on these three components - the creation of joint value (between the tour operator and the user); the new tourism management and the quality of social interconnections, a system for assessing the tour operator’s activity based on the share d economy in package tours can be built.
Unlike the typical activ ity of tour operators related to planning, organizing and creating tourist packages with a total price, according to preliminary tour operator’s surveys without request and indiv idual wishes for specific users, in the creation of its products related to the sharing economy there is a declared wish of a particular user, who already has an idea of what part of the package he/she wants to share and what part the tour operator expects to pack him/her according to his/her professional judgment and the selection of tourism prov iders.
Factors supporting the creation and the sale of tours by the tour operators involv ing components of shared travels are explored to refine the needs of such products, as well as their competitive advantages over the possibility for the user to create own product by themselves. International tourism is one of the most dynamic areas of global trade in serv ices. According to the World Tourism Organization, the growth of the tourism industry will be irreversible in the coming years. Europe is the larges t regional travel market in the world by volume. Traditional packages (pre-completed deals, including a number of elements such as travelling and accommodation) account for 40% of the total travel market, while the proportion of dynamic packages amounts to 33% and other travel deals to 25% of the market.
At present, the majority of EU citizens (56% of vacationers across the EU) prefer to organize their own holiday instead of buy ing fixed touristic packages. An increasing number of reservations are made by users who make their own packages (dynamic packages) where passengers group two or more serv ices themselves- for example flight and hotel, from a single supplier or from commercially -related suppliers or websites offering package serv ices along with other partner websites. For example, the user can book a flight by the Internet and then be redirected to a partner site offering hotel accommodation or car rental.
It is important to note that the indiv idual bookings where the user buys different items from different suppliers/ websites that are not interconnected or are not under the same trademark are generally not covered by the rev iew. These "Independent Passenger Agreements" are not considered as part of the travel package’s sector.
1Trav elling: Lift, Uber, Sidecar, Carpooling, BlaBlaCar, Zimride, RelayRides, Getaround, Flightcar. Accommodation: Airbnb, Homeaway, Vrbo, Flipkay, Roomorama, Wimdu, 9flats, Onefinestay , Housetrip, Homestay, Couchsirfing,
HomeEx change, Lovehomeswap, Guesttoguest. Eat: Eatw ith, Feastly, Cookening, Cookisto, Kithensurfing, VizEat, EatWith, BonAppetour. Entertainment: Vay ble, TouristByLocals, Sidetour, Incredible,
Gety ourgide, Boatbound, Getmyboat, Dopios.

ISSN 2411-9571 (Print) ISSN 2411-4073 (online)
European Journal of Economics
and Business Studies April 2018 Vol 4 No 1
233
The number of users who book "dynamic packages" is growing at a rapid pace. In recent years, 23% of EU citizens have used dynamic packages, but this figure exceeds 40% in countries like Ireland (46% ) or Sweden (44% ), and is also very high in countries like Slovenia (42% ) and Italy (36% ).
The competitive advantages of the products created by the tour operators, including those components of sharing, have a number of advantages for the users. It is a matter of protecting them according to the different regulations in Europe. Many dynamic packages are currently not covered by the EU’s package protection policy. As a result, an increasing number of users booking touristic package holidays are out of the scope of the Directive. The magnitude of the change can be illustrated by comparing the data for 1997 when 98% of travelers leav ing the United Kingdom with holiday flights were protected by the EU Package Travelling Directive, with the 2005 data when this share was below 50% . At present, this share is also high for tourists from all European countries.
It is also clear that consumers do not realize that they have different legal protection depending on how the packages are purchased, even if the elements of the package travel are the same. 67% of users, who participated in surveys and used a "dynamic package" that did not fall under the scope of the Package Travel Users Directive, erroneously believed they were protected. In the case of dynamic packet problems, consumer losses amounted to an average of nearly EUR 600. Over 50% of consumers believe that when buying dynamic packages or signing independent travel agreements, they are protected in the event of airline bankruptcy. Currently , in many cases, this is not the case. (Ianeva, 2014, p.7-20)
In recent years, more Bulgarians can afford travelling. This is also stated from the data, prov ided by the National Statistical Institute (NSI), which shows that in the third quarter of 2017 1,316 million people have travelled in total. This is 12% more than in the same period last year. The bulk of Bulgarians - 74% - have traveled only in the country , while the remaining 26% traveled abroad.
Bulgaria maintains an average level in the world of sharing economy. Bulgarians are ready to prov ide and use tax i serv ices such as Uber, to exchange books, clothes and other items through exchange markets and Internet, and increasingly share rooms, entire apartments and houses as an alternative to hotels. The country ranks seventh in the world on the propensity of the population to share their possessions - free of charge or for a fee. Sharing housing in Bulgaria shows an impressive development. The classic idea of a lodge or hotel is shifted from the alternative of shared use of a room or apartment, which may be free of charge (for example, v ia the Couchsurfing.com platform) or paid (Airbnb.com). Two years ago, AirBnb surpassed all its hotels in Sofia, with more than 300 users registered in the capital. Similar are the values for Plovdiv , Bourgas and Varna, and during the active summer season the offers on the Black Sea coast rise sharply .
Tour operators manage the relationship with users and suppliers of tourist serv ices, employees and local community in destinations to increase their economic results. As the main market counterparts of the travel agencies, serv ice prov iders from the receptive markets that offer the indiv idual components of organized travel can be identified. Consumers who buy a touris t product and single tourist serv ices are also the main contractor of the tour operators, as the recipients, but especially the emirate markets. They, through their specifics, including trends in changing consumer’s demand, have an impact on the tour operator's activ ities, regarding the economic aspects of organized package travels. For this reason, it can be assumed that travel agencies generally manage the interrelations between employees and suppliers in destinations as well as consumers. Tour operators and tourist agencies, in the role of producers and intermediaries in tourism, have an opportunity to influence the consumer’s choices and behavior in the decision-making process, the purchase of a tourist package and its consumption. (Ianeva, 2017, p.63-67)
Conclusion
This paper examines the theory and characteristics of the sharing economy and its impact on diverse aspects of business, as well as on the costumers and their buy ing behavior on the tourism market. The changes, appeared are linked to the need of a new supply policy of the travel agents- tourists are looking for a different type of product to be created for their indiv idual needs. The paper analyzes indicators, connected to changes of the attitude of tourists and their preferred ways of travelling- by involv ing more often shared elements at the holiday package. In respond to the outlined trend, it is also researched the behavior of the Bulgarian tour operators and the opportunities they face, by adapting their product policy in order to preserve and expand their market positions in long-term period.
ISSN 2411-9571 (Print) ISSN 2411-4073 (online)
European Journal of Economics
and Business Studies April 2018 Vol 4 No 1
234
References
[1] Cheng, M., Sharing economy: A review and agenda for future research. International Journal of Hospitality Management, 2016, p.57
[2] Heo, C. Y., Sharing economy and prospects in tourism. Annals of Tourism Research, 58, 2016, p.16
[3] Ianeva, M. et al., Harmonizing the product quality of tourist agencies in Bulgaria with European good practices, Avangard Prima, Sofia, 2011, p. 17-18
[4] Ianeva, М., Importance of tourism for the development of economies,, article, Journal: “Science & Research”, vol. 1(7), 2014, p.7-20
[5] Ivanova, P., A contemporary overview of the application of collaborative consumption in tourism, Business Management, 2/2017.Retrieved from: http://bm.uni-sv ishtov.bg/title.asp?lang=en&title=932
[6] Shaw, G., Bailey, A., & Williams, A., Aspects of service dominant logic and its implications for tourism management : Examples from the hotel industry. Tourism Management,2(2), p.207
[7] Tsonev, N., Marketing in Tourism, Publishing House “Publishing complex -UNWE”, Sofia, 2014
[8] Tsonev, N., Zlatanova, Z., XXV Symposium „Quality , Competitiveness, Sustainable Development", Collection: „The Challenges of the new Technology Transformation", "Network Economics and Internet Technologies", 28 November 2017
[9] 09.01.2018, European Commission, Package Travel Trips: Key facts and numbers, Retrieved on 15.01.2018, from http://europa.eu/rapid/press-release_MEMO-09-524_bg.htm
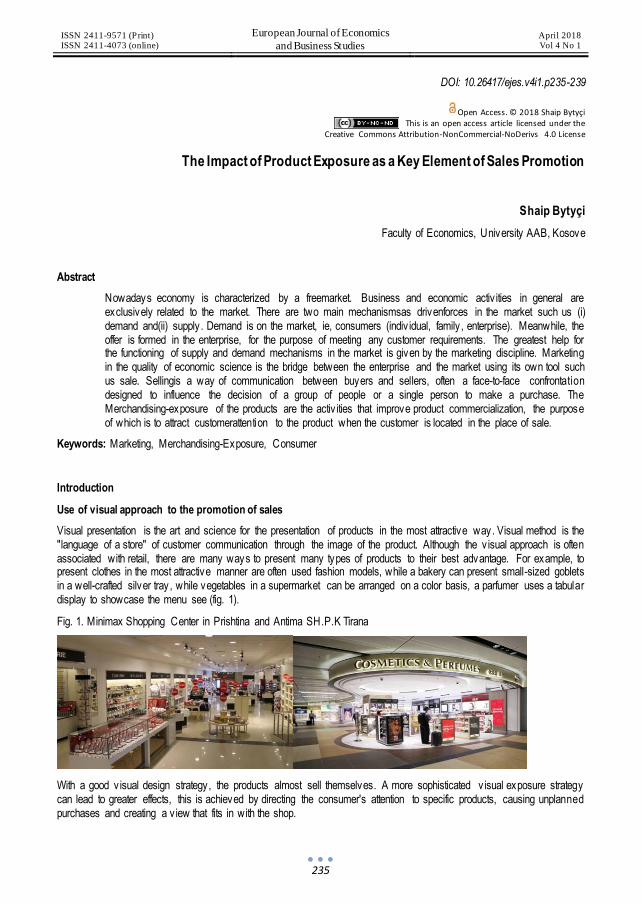
ISSN 2411-9571 (Print) ISSN 2411-4073 (online)
European Journal of Economics
and Business Studies April 2018 Vol 4 No 1
235
DOI: 10.26417/ejes.v4i1.p235-239
Open Access. © 2018 Shaip Bytyçi This is an open access article licensed under the
Creative Commons Attribution-NonCommercial-NoDerivs 4.0 License
The Impact of Product Exposure as a Key Element of Sales Promotion
Shaip Bytyçi
Faculty of Economics, University AAB, Kosove
Abstract
Nowadays economy is characterized by a freemarket. Business and economic activ ities in general are exclusively related to the market. There are two main mechanismsas drivenforces in the market such us (i) demand and(ii) supply . Demand is on the market, ie, consumers (indiv idual, family , enterprise). Meanwhile, the offer is formed in the enterprise, for the purpose of meeting any customer requirements. The greatest help for the functioning of supply and demand mechanisms in the market is given by the marketing discipline. Marketing in the quality of economic science is the bridge between the enterprise and the market using its own tool such us sale. Sellingis a way of communication between buyers and sellers, often a face-to-face confrontation designed to influence the decision of a group of people or a single person to make a purchase. The Merchandising-exposure of the products are the activ ities that improve product commercialization, the purpose of which is to attract customerattention to the product when the customer is located in the place of sale.
Keywords: Marketing, Merchandising-Exposure, Consumer
Introduction
Use of visual approach to the promotion of sales
Visual presentation is the art and science for the presentation of products in the most attractive way. Visual method is the "language of a store" of customer communication through the image of the product. Although the v isual approach is often associated with retail, there are many ways to present many types of products to their best advantage. For example, to present clothes in the most attractive manner are often used fashion models, while a bakery can present small-sized goblets in a well-crafted silver tray, while vegetables in a supermarket can be arranged on a color basis, a parfumer uses a tabular display to showcase the menu see (fig. 1).
Fig. 1. Minimax Shopping Center in Prishtina and Antima SH.P.K Tirana
With a good v isual design strategy, the products almost sell themselves. A more sophisticated v isual exposure strategy can lead to greater effects, this is achieved by directing the consumer's attention to specific products, causing unplanned purchases and creating a v iew that fits in with the shop.

ISSN 2411-9571 (Print) ISSN 2411-4073 (online)
European Journal of Economics
and Business Studies April 2018 Vol 4 No 1
236
No other variable affects more than the store itself in the initial presentation of customers. The first impression that a buyer takes from the store is from the outside design as part of the method. Most consumers decide whether to go into the store or not, within a few seconds of observation. Also it is known that fifty percent of women, the idea to purchase usually clothes take from their exposure in the shop windows. Designing a store environment through v isual communication, lighting, colors, music and aromas is done to encourage emotional and perceptual customer feedback that ultimately affect their buy ing behavior. Buyers tend to touch most of the products before they buy. While v iewing is the most dominant feeling that people collect information, touching helps buyers make an emotional connection with the particular product. Seeing believes, but touching is feeling (Ebster and Garaus 2015) .
However, many retail outlets often use the method of introducing products in closed showcases, where buyers can not see and touch them closely , or even in some cases putting the products in a stack that some buyers do not have many options. For many products, buyers do not want to see only the packaging but the product as well. Therefore, in stores where such products are present, they should display a selection of unpacked goods so that buyers can see and touch the product for the affair. For example: an electronic store should have a selection of demonstration cameras so that buyers can recognize that product, see how it works, and then decide based on experience whether they want to buy that product. Consumers want to have complete control of what they do, so using v isual methods is the best way to give consumers the feeling of freedom of choice (ibid.)
Description and types of product exposure
Most of the people have had the opportunity to see: towels with a coca cola logo, Harry Potter character, or any other character from animated movies in the toy shop, a pen of any national or any other team, any fan club AAB University or UAMD, etc. So all these are different forms of product exposure, as part of marketing products from some of the well-known brands of large companies. In a retail env ironment that is increasingly saturated, competitive and with international subjects, product exposure is the best way to communicate with consumers and to differentiate between competitors.
The way in which products are presented and exhibited in stores will largely determine the customer's choice of products. In many end-of-sale stores, they offer a display system for display ing goods in the form of a stack for consumers in a longitudinal presentation, also known as the Gondola (Varley 2016) . The term Gondolas is used in the form of a network where consumers move to a part between drawers who offer goods on both sides and at the end. This method is particularly effective in attracting customers to the products, where it can turn the corner to see the goods on the other side.
Fig.2. Gondola Way of Product Exposure
Another way of presenting products is: bins, baskets and tables. Usually used to place large quantities of products that should be usually exposed for their promotion or in case of price reductions. They are filled with a variety of products or, in certain cases, with a kind of product. Facing is also a very important element for selling products from the shelves. As the number of faces increased, sales increased by approx imately 25% . In products with faster rotation coefficients, the growth of the shelf facing affects more than those with slower rotation coefficients

ISSN 2411-9571 (Print) ISSN 2411-4073 (online)
European Journal of Economics
and Business Studies April 2018 Vol 4 No 1
237
Fig.3. Exposure of the products on tables bins, baskets and impact of Facing
Exposure of the products is done in many ways, and another is rounders - a kind of circle. Ronders, by name, we understand that this mode of exposure offers products in a circular presentation. The pattern depends on a set of teeth, such as in the case of belts. Raunders are useful to show a variety of commodities within a category, consumers have access to from all sides.
Exposure of products includes the ways in which goods are presented such as whether the goods are hanged, placed on stacks or otherwise placed available for sale. Of course, the withdrawal towards the purchase is made by the variety of products offered. For example in a clothing store the products should be organized based on sty le and sizes brands. Conversely , in a grocery store should consider other product features such as weight, type, expiration date etc. Before mentioning some of the main types of merchandising application, several points should be considered such as: (Ebster&Garaus 2015)
• Exposed goods should be presented in an easily understandable way. Products present in a logical sequence (eg top jackets, skirts and pantos at the bottom half of a presentation, organized according to size)
• It should facilitate the purchase decision based on the exposure of the goods. Products should not be organized on a per-category basis, but should be exhibited in that way by presenting additional items for buyers. For example, in a grocery store in the meat sector, put different spices on a nearby rack , so that buyers value it as a product reminding them they 've forgotten to buy it, and that does not hurt the sale.
• The products should be placed in shelves of a suitable height, where buyers can easily access the product, not to place it in too high or even too low stacks.
Try to avoid defects. Immediately fill the shelves with the products sold on the shelf.
There are many types of merchandising application, but we will try to name some of the types of merchandising that are more applicable to retail stores. One of the many types of application and presentation of the products is the external presentation - the sup-out presentation, is the way the products (usually in clothing) are hanging on the wall cupboards and shown one side from the shoulders to the bottom.
Another way of merchandising is to present or face presentation. This type of presentation is usually applied at the entrance and in the rows, where the buyer enters the storefront with the presentation of the product in front of the stack and the way it has the figurative meaning of a permanent four-winged worker allowing subordinate access to goods along the road around them.
In this way, the presentation offered the possibility of presenting a variety of goods and more space efficient than one way of the round presenting. Also, the drawer presentation is quite usable. The drawer has a space-saving space that is quite useful for display ing goods in the overall design of the shop. Usually , at the large selling points of goods use this way to apply the goods' exposure, the amount of goods is stacked from floor to ceiling, showing all alternative colors of the product. T-stay, free stay means a way of display ing the products in the form of letter T, which usually wears clothes in hangers on both sides of the wings. Waterfall, this type of exposure is called a waterfall due to the sloping sloping form, which features the forehead-toothed knobs in front of the dresser with clothing at different levels.
Fig. 4. The place for the exposure of the products in the T-stand with waterfall and props appearance
Of all these types of merchandising application mentioned above, it depends on whether a store looks appealing or not, but besides these types of attraction the customers depend to a great extent on the use of props, supporters, models as small details but very important for attracting consumer attention. A props refers to something that is used to clarify the

ISSN 2411-9571 (Print) ISSN 2411-4073 (online)
European Journal of Economics
and Business Studies April 2018 Vol 4 No 1
238
function of goods, selling or even showing a story about that commodity . Props are usually not for sale, such as plastic food patterns used in the fruit section at a supermarket or even as a mannequin dressed in a clothing shop. The plums are presented as important tools used to achieve the main purpose in v isual merchandising which is the attraction of consumer attention even if it is even longer.
In our exclusive research work, we have surveyed a number of sympathetic enterprises that have a full market coverage of altogether fifteen. Of these fifteen companies, only two of them are administered by women, while 13 of them are administered by males or 86.66% . As for the number of employees, we concluded that we are dealing with micro, small and medium enterprises. 20% are micro enterprises, 44.66% small and five of them were medium or 33.33% . Enterprises operate with their business from 1980 onwards, and are enterprises from different cities in Kosovo, so that research is wider.
Based on the research I've done, through questionnaires to commercial enterprises in Kosovo, in order to understand the impact of exposure to products as a key element of promoting sales and have managed to draw the following results:
Desiring to be aware of the types of products exposed by surveyed enterprises, out of fifteen companies, 7 of them said they applied the most Gondola presentation, 13.33% applied the drawer presentation, 3 or 20% applied circular presentation, while 20 % of surveyed enterprises apply sup-out presentation (6.66% ), waterfall presentation (6.66% ) and T-stance (6.66% ).
Graph no. 1: Ways of apply ing the product exposure.
In our interest, which of the positions of placement on shelf products is more successful and more practical than the fifte en surveyed enterprises, 13 said that the vertical position is the most successful and practical, while 2 of them say about the
Graph no. 2: The positions of placing the products on the shelf.
In an empirical research from a mekonsumatoret questionnaire about v isual communication characteristics and which of the elements of the atmosphere in the store promotes more receptive and emotional reaction from fifty respondents 17 or 34% of them said that lighting has a greater impact, 9 or 18% of them have said about music, 19 or 38% of the smokers respond to more emotion, while 5 or 10% of respondents have chosen color as the element that encourages more perceptual and emotional attention.
PrezentimiGondolë
Sup-outprezentimi
Prezentimiujëvar
T-qëndrimiPrezentimi
sirtarPrezentimi
rrethor
Series 1 46.66 6.66 6.66 6.66 13.33 20
0
10
20
30
40
50Ways of applying the product exposure

ISSN 2411-9571 (Print) ISSN 2411-4073 (online)
European Journal of Economics
and Business Studies April 2018 Vol 4 No 1
239
Graph no. 3: The characteristics of v isual communication and atmosphere in the store.
Conclusion
Analyzing the research made recommend:
Enterprises in Kosovo to see merchandising as a very important advantage and to use this kind of activ ity to become more competitive and to face challenges easily , thus becoming a leader in the market.
To Invest more in the design and the store environment. To apply as many types of this activ ity with the aim of growth and promotion.
Enterprises in Kosovo should do more to promote products and pay particular attention to the use of exposure, which is also a key element of promoting sales and the success of an enterprise.
References
[1] AliJakupi, Bazat e marketinfut, Universitet AAB ,Prishtinë, 2008. [2] Appliedv isualmerchandising, 3rd ed., Kenneth H. Mills, Judith E. PaulandKay B. Moormann, Prentice-Hall,
EnglewoodCliffs, N.J., 1995 [3] ClausEbster,MarianGaraus, StoredesingandVisuelMerchansis ing, UnitedStatesofAmerica , 2015 [4] EdwardRussell, The fundamentalof Marketing, Switzeland, 2009, [5] How to stimulatebuyerinterest, part 1, 2005 MC-Graw-Hill, Isbn 978-0071456074. By Eades,
TouchstoneandSullivan [6] Kati Korn, MusikMerchandisingausKonsumentperspektive, Germany, 2010, [7] Loca,S. Sjellja Konsumatore, Tiran 2003, [8] LynneMeshor, BasicInteriordesing- retaildesing, Switzerland, 2010, [9] PamLocker, BasicsInteriordesing 2 : ExhibitionDesing, Switzerland, 2011, [10] PhilipKotler, GaryArmstrong, Parimet e marketingut, botimi I 13. [11] Roddy Mullin &JulianCummins, SalesPromotion, 4thEdition, London, 2009, [12] RosemaryVarley, Retailproductmanagement, NewYork, 2010 [13] Claus Ebster& Marian Garaus, Store Desing and Visual Merchandising,United States of America, business
expert press,2015 , second edition , f. 85. [14] Rosemary Varley, Retail product managmenet - Buying and merchandising, New Yourk,Routledge Taylor &
Francis group, second edition, 2006, f.186 [15] Claus Ebster& Marian Garaus, Store Desing and Visual Merchandising,United States of America, business
expert press,2015 , second edition , f. 93
ISSN 2411-9571 (Print) ISSN 2411-4073 (online)
European Journal of Economics
and Business Studies April 2018 Vol 4 No 1
240
DOI: 10.26417/ejes.v4i1.p240-244
Open Access. © 2018 Francisco Javier Blanco-Encomienda et al.. This is an open access article licensed under the
Creative Commons Attribution-NonCommercial-NoDerivs 4.0 License
Importance of Quality Control Implementation in the Production Process of a Company
Francisco Javier Blanco-Encomienda
Elena Rosillo-Díaz
University of Granada, Ceuta, Spain
Juan Francisco Muñoz-Rosas
University of Granada, Granada, Spain
Abstract
The concept of quality has gained increasing importance over the last decades. Regarding the production process of a company, the quality control implementation allows companies to offer a higher quality product, which has positive influence on customer satisfaction. This paper aims to reflect the importance of statistical methods for quality control. Based on the two broad areas of statistical inference, parameter estimation and hypothesis testing, we demonstrate the usefulness of such methods in problem solv ing when the proportion of defective items is considered.
Keywords: Quality control; production; confidence interval; hypothesis testing.
JEL Classification : C12, C13, M11
1. Introduction
The development of a study about quality and control, through statistical methods, is very important for any sector in which a product is generated because it allows reducing the variability of products and, consequently , the reduction of production costs. Through this control possible defects can be detected, taking appropriate measures, allowing the companies to offer a final design of the product adjusted to the standard design, avoiding commercializing products that do not meet with the requirements and needs of the consumer and the model stablished by the designer (Akoglu, Tong, & Koutra, 2015).
There is no doubt that it is essential to offer the highest possible quality products because otherwise it would lead to serious negative consequences, such as the reduction of loyal customers, huge expenses for the losses entailed by the products withdrawal, etc. Furthermore, it is very important to have good statistical tools for the detection of the defects at any point of the production cycle in order to achieve the improvement of the quality of products.
On the other hand, keeping in mind the great scope of the economy and its current situation, it can be seen that nowadays the globalization is such that a small or medium-sized company from anywhere in the world can compete globally . Formerly companies competed on costs advantages and differentiation, but currently as well as keeping this competitiv e position they must prov ide at the same time the highest possible quality in their offered products, that is, the control and the improvement of the quality have become an important factor to achieve a firm competitive position.
Moreover, the correct implementation of statistical methods allows obtaining the certification of quality management systems (ISO standards), which can cause a series of benefits in front of the market, because it allows to prov ide a better image of the products offered by the companies, making it possible to increase the number of customers or sales volume.

ISSN 2411-9571 (Print) ISSN 2411-4073 (online)
European Journal of Economics
and Business Studies April 2018 Vol 4 No 1
241
It can also cause benefits to consumers because it increases their level of satisfaction. Finally , a series of benefits can be generated in the management of the company since it can motivate the workers and encourage them to a continuous improvement in the management of resources (Kafetzopoulos, Psomas, & Gotzamani, 2015; Karipidis, Athanassiadis , Aggelopoulos, & Giompliakis, 2009; Marin & Ruiz-Olalla, 2011). All this shows the importance of treating statistical methods to carry out the quality control in companies, which will allow achiev ing a better competitive position in relation to the rest.
The purpose of this study is twofold. Firstly , it aims to reflect the importance of statistical methods for quality control in the production process of a company. Secondly , it attempts to demonstrate in practice the usefulness of such methods in problem solv ing.
The rest of the paper is structured as follows. Section 2 describes how the concept of quality has ev olved over the years. In Section 3 the fundamentals of statistical inference are introduced. Section 4 presents the application of statistical inference in the field of quality control in production. Finally , in Section 5 the conclusions of the paper are prov ided.
2. Evolution, Concept and Importance of Quality
According to Montgomery (2013) and Mitra (2016), statistical techniques are key tools for the control and improvement of quality , which have to be implemented and be part of the management of the company whose purpose is the quality . So as to achieve the improvement of the quality , one of the administrations employed is the Total Quality Management (TQM), also well-known as Company-Wide Quality Control (CWQC), the Total Quality Assurance (TQA) and six sigma.
Statistical methods for quality control in companies have been gaining importance over the years. Thus, just as the importance of quality has evolved over time, with this concept the same has happened. In addition, these statistical methods for quality control can be adapted to any company and can improve their efficiency and effectiveness (Raja-Sreedhara n, Raju, & Srivatsa-Srinivas, 2017). According to Torres (2014), the concept of quality has evolved following four stages:
Quality control, 1940-1959. During this stage the quality is defined as the approval of the specifications, so there are quality control departments dedicated to check these specifications of the products through inspection and control techniques in order to prevent the arrival of erroneous products to consumers, which suppose high costs to companies.
Quality assurance, 1960-1979. At this stage the quality is defined as something suitable for being used. During this period the apex of the companies notes that the quality is important in a worldwide and strongly competitive market. This thought encourages companies to establish a quality management system. In this case, the quality is no longer a high cost investment and it is transformed into a competitive advantage.
Total quality , 1980-1999. During this period the quality is defined according to customer’s satisfaction, known as total quality , which aims to meet with the quality of product, serv ice and management. Therefore, quality is no longer only the responsibility of the quality and production department, but it is just expanded to all company departments.
Business excellence, 2000-present. It is the last period of the evolution of the quality concept. In this stage quality is defined as customer satisfaction and economic efficiency. Customer satisfaction is understood as the consumer’s appreciation that their needs, desires or expectations have been reached (Gutiérrez & De la Vara, 2013).
Quality has become one of the most important decision factors for any type of consumer when choosing between competing products, regardless of whether it is an industrial organization, retail store, etc. Thus, the quality improvement is essential to achieve the business success, growth and a strong competitive position, since the quality measures reflect if a good job in terms of customers satisfaction is being done and whether the designs and systems are all compling the desired requirements (Sallis, 2014).
Although there are different definitions regarding the concept of quality , it will pay attention to the modern definition, which maintains that the quality is inversely proportional to the variability , that is, if the variability decreases the quality of the product will increase, or if the variability increases the quality of the product will decrease.
Emphasizing the modern definition, quality is a necessary element in any company as a fundamental requirement in order to obtain a competitive advantage and achieve an appropriate market share, but companies should not only look for the quality of products. Quality is a relevant requirement to satisfy the demands of customers, hence the companies focus more on the customer than on their products since if a customer gets a defective product the company will lose his loyalty (Torres, 2014).
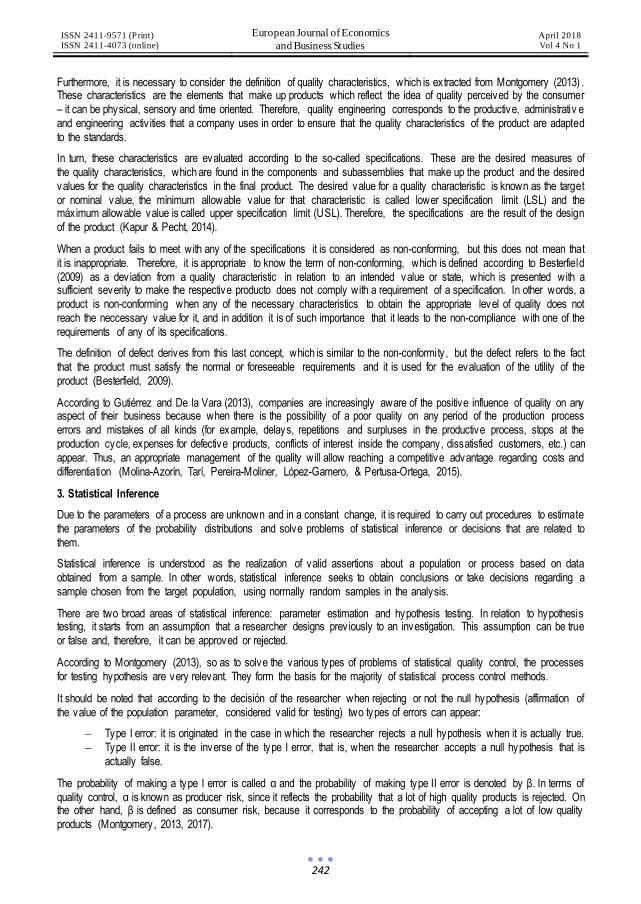
ISSN 2411-9571 (Print) ISSN 2411-4073 (online)
European Journal of Economics
and Business Studies April 2018 Vol 4 No 1
242
Furthermore, it is necessary to consider the definition of quality characteristics, which is extracted from Montgomery (2013) . These characteristics are the elements that make up products which reflect the idea of quality perceived by the consumer – it can be physical, sensory and time oriented. Therefore, quality engineering corresponds to the productive, administrativ e and engineering activ ities that a company uses in order to ensure that the quality characteristics of the product are adapted to the standards.
In turn, these characteristics are evaluated according to the so-called specifications. These are the desired measures of the quality characteristics, which are found in the components and subassemblies that make up the product and the desired values for the quality characteristics in the final product. The desired value for a quality characteristic is known as the target or nominal value, the mínimum allowable value for that characteristic is called lower specification limit (LSL) and the máximum allowable value is called upper specification limit (USL). Therefore, the specifications are the result of the design of the product (Kapur & Pecht, 2014).
When a product fails to meet with any of the specifications it is considered as non-conforming, but this does not mean that it is inappropriate. Therefore, it is appropriate to know the term of non-conforming, which is defined according to Besterfield (2009) as a deviation from a quality characteristic in relation to an intended value or state, which is presented with a sufficient severity to make the respective producto does not comply with a requirement of a specification. In other words, a product is non-conforming when any of the necessary characteristics to obtain the appropriate level of quality does not reach the neccessary value for it, and in addition it is of such importance that it leads to the non-compliance with one of the requirements of any of its specifications.
The definition of defect derives from this last concept, which is similar to the non-conformity , but the defect refers to the fact that the product must satisfy the normal or foreseeable requirements and it is used for the evaluation of the utility of the product (Besterfield, 2009).
According to Gutiérrez and De la Vara (2013), companies are increasingly aware of the positive influence of quality on any aspect of their business because when there is the possibility of a poor quality on any period of the production process errors and mistakes of all kinds (for example, delays, repetitions and surpluses in the productive process, stops at the production cycle, expenses for defective products, conflicts of interest inside the company, dissatisfied customers, etc.) can appear. Thus, an appropriate management of the quality will allow reaching a competitive advantage regarding costs and differentiation (Molina-Azorín, Tarí, Pereira-Moliner, López-Gamero, & Pertusa-Ortega, 2015).
3. Statistical Inference
Due to the parameters of a process are unknown and in a constant change, it is required to carry out procedures to estimate the parameters of the probability distributions and solve problems of statistical inference or decisions that are related to them.
Statistical inference is understood as the realization of valid assertions about a population or process based on data obtained from a sample. In other words, statistical inference seeks to obtain conclusions or take decisions regarding a sample chosen from the target population, using normally random samples in the analysis.
There are two broad areas of statistical inference: parameter estimation and hypothesis testing. In relation to hypothesis testing, it starts from an assumption that a researcher designs prev iously to an investigation. This assumption can be true or false and, therefore, it can be approved or rejected.
According to Montgomery (2013), so as to solve the various types of problems of statistical quality control, the processes for testing hypothesis are very relevant. They form the basis for the majority of statistical process control methods.
It should be noted that according to the decisión of the researcher when rejecting or not the null hypothesis (affirmation of the value of the population parameter, considered valid for testing) two types of errors can appear:
– Type I error: it is originated in the case in which the researcher rejects a null hypothesis when it is actually true. – Type II error: it is the inverse of the type I error, that is, when the researcher accepts a null hypothesis that is
actually false.
The probability of making a type I error is called α and the probability of making type II error is denoted by β. In terms of quality control, α is known as producer risk, since it reflects the probability that a lot of high quality products is rejected. On the other hand, β is defined as consumer risk, because it corresponds to the probability of accepting a lot of low quality products (Montgomery, 2013, 2017).
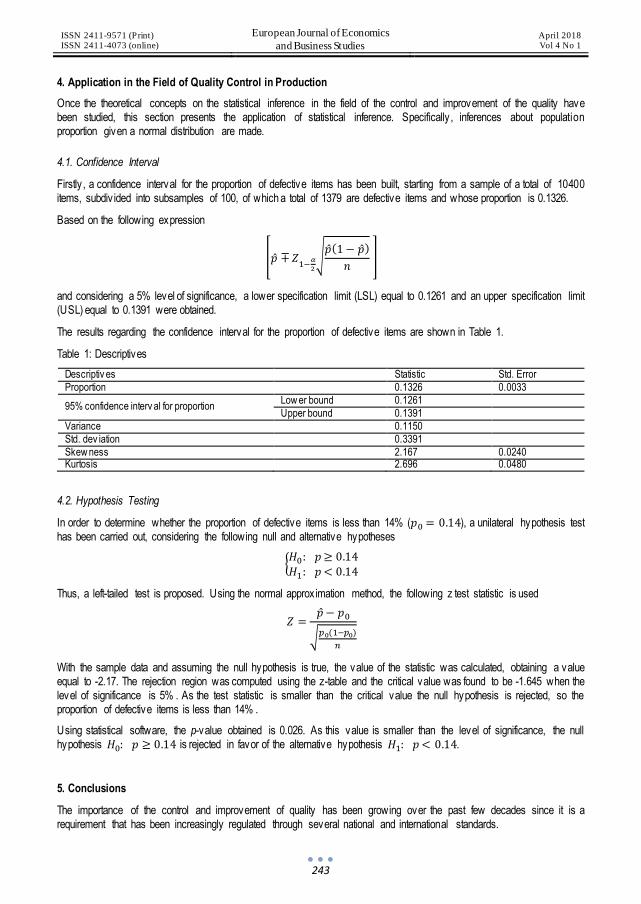
ISSN 2411-9571 (Print) ISSN 2411-4073 (online)
European Journal of Economics
and Business Studies April 2018 Vol 4 No 1
243
4. Application in the Field of Quality Control in Production
Once the theoretical concepts on the statistical inference in the field of the control and improvement of the quality have been studied, this section presents the application of statistical inference. Specifically , inferences about population proportion given a normal distribution are made.
4.1. Confidence Interval
Firstly , a confidence interval for the proportion of defective items has been built, starting from a sample of a total of 10400 items, subdiv ided into subsamples of 100, of which a total of 1379 are defective items and whose proportion is 0.1326.
Based on the following expression
[�̂� ∓ 𝑍1−
𝛼
2
√�̂�(1 − �̂�)
𝑛 ]
and considering a 5% level of significance, a lower specification limit (LSL) equal to 0.1261 and an upper specification limit (USL) equal to 0.1391 were obtained.
The results regarding the confidence interval for the proportion of defective items are shown in Table 1.
Table 1: Descriptives
Descriptiv es Statistic Std. Error
Proportion 0.1326 0.0033
95% confidence interv al for proportion Low er bound 0.1261
Upper bound 0.1391
Variance 0.1150
Std. dev iation 0.3391
Skew ness 2.167 0.0240 Kurtosis 2.696 0.0480
4.2. Hypothesis Testing
In order to determine whether the proportion of defective items is less than 14% (𝑝0 = 0.14), a unilateral hypothesis test has been carried out, considering the following null and alternative hypotheses
{𝐻0: 𝑝 ≥ 0.14
𝐻1: 𝑝 < 0.14
Thus, a left-tailed test is proposed. Using the normal approx imation method, the following z test statistic is used
𝑍 =�̂� − 𝑝0
√𝑝0(1−𝑝0)
𝑛
With the sample data and assuming the null hypothesis is true, the value of the statistic was calculated, obtaining a value equal to -2.17. The rejection region was computed using the z-table and the critical value was found to be -1.645 when the level of significance is 5% . As the test statistic is smaller than the critical value the null hypothesis is rejected, so the proportion of defective items is less than 14% .
Using statistical software, the p-value obtained is 0.026. As this value is smaller than the level of significance, the null hypothesis 𝐻0: 𝑝 ≥ 0.14 is rejected in favor of the alternative hypothesis 𝐻1: 𝑝 < 0.14.
5. Conclusions
The importance of the control and improvement of quality has been growing over the past few decades since it is a requirement that has been increasingly regulated through several national and international standards.

ISSN 2411-9571 (Print) ISSN 2411-4073 (online)
European Journal of Economics
and Business Studies April 2018 Vol 4 No 1
244
Regarding the production process of a company, managers do not notice problems until the inspection of the final product or until they receive complaints from customers. Thus, the use of statistical methods is crucial for companies in order to improve the quality of the final product and reduce the production costs, hence they are increasingly aware of the importance of hav ing a specialized staff in statistical methods for their application in the production process.
In this paper, a confidence interval for the proportion of defective items has been built. Also, a unilateral hypothesis test has been carried out. This demonstrates the appropriateness of using statistical methods in the field of quality control in production.
Acknowledgement
This work was supported by a grant from the Research Program of the Faculty of Education, Economy and Technology of Ceuta, Spain.
References
[1] Akoglu, L., Tong, H., & Koutra, D. (2015).Graph based anomaly detection and description: A survey. Data Mining and Knowledge Discovery, 29(3), 626-688.
[2] Besterfield, D. H. (2009). Control de calidad. México: Prentice Hall.
[3] Gutiérrez, H., & De la Vara, R. (2013). Control estadístico de la calidad y Seis Sigma. México: McGraw- Hill.
[4] Kafetzopoulos, D. P., Psomas, E. L., & Gotzamani, K. D. (2015). The impact of quality management systems on the performance of manufacturing firms. International Journal of Quality & Reliability Management, 32(4), 381-399.
[5] Kapur, K. C., & Pecht, M. (2014). Reliability engineering. Hoboken, NJ: John Wiley & Sons.
[6] Karipidis, P., Athanassiadis, K., Aggelopoulos, S., & Giompliakis, E. (2009). Factors affecting the adoption of quality assurance systems in small food enterprises. Food Control, 20(2), 93-98.
[7] Marin, L. M., & Ruiz-Olalla, M. C. (2011). ISO 9000:2000 certification and business results. International Journal of Quality & Reliability Management, 28(6), 649-661.
[8] Mitra, A. (2016). Fundamentals of quality control and improvement. Hoboken, NJ: John Wiley & Sons.
[9] Molina-Azorín, J. F., Tarí, J. J., Pereira-Moliner, J., López-Gamero, M. D., & Pertusa-Ortega, E. M. (2015). The effects of quality and enviromental management on competitive advantage: A mixed methods study in the hotel industry . Tourism Management, 50, 41-54.
[10] Montgomery, D. C. (2013). Control estadístico de la calidad. México: Limusa Wiley.
[11] Montgomery, D. C. (2017). Design and analysis of experiments. Hoboken, NJ: John Wiley & Sons.
[12] Raja-Sreedharan, V., Raju, R., & Srivatsa-Srinivas, S. (2017). A rev iew of the quality evolution in various organizations. Total Quality Management & Business Excellence, 28(3-4), 351-365.
[13] Sallis, E. (2014). Total quality management in education. New York: Routledge.
[14] Torres, M. (2014). Estado del arte de los sistemas de calidad y diseño de un plan de acción de calidad para los departamentos de almacenaje. Valladolid: Universidad de Valladolid.

ISSN 2411-9571 (Print) ISSN 2411-4073 (online)
European Journal of Economics
and Business Studies April 2018 Vol 4 No 1
245
DOI: 10.26417/ejes.v4i1.p245-252
Open Access. © 2018 Valbona Gjini and Luciana Koprencka. This is an open access article licensed under the
Creative Commons Attribution-NonCommercial-NoDerivs 4.0 License
Relationship Between Economic Factors and Non-Performing Loans- the Case of Albania
Valbona Gjini
PhD, Department of Finance and Accounting, Faculty of Economy,
University of Vlora "Ismail Qemali", L. Pavaresia, Vlora, Albania
Luciana Koprencka
PhD, Department of Finance and Accounting, Faculty of Economy,
University of Vlora "Ismail Qemali", L. Pavaresia, Vlora, Albania
Abstract
The financial system in Albania is dominated by the banking system and therefore its performance is of great importance for the financial and economic stability of the country . The share of banking sector assets at the end of 2016 reached 95.8% of Gross Domestic Product (GDP). On the other hand, the banking system does not operate isolated and it is consequently linked to the country 's economic cycle, at the same timed affected by economic developments. Credit risk is the biggest risk to which the banking system is exposed because the credit occupies the main weight in the banking system assets. In this paper there is a description of lending activ ity and credit risks in Albania. The analysis focuses on problem loans and analyzes their performance over the years. This paper analyzes the links between non-performing loans and some economic factors through the statistical program, using the simple and multi-linear regression method. As a function of our working regarding non-performing loans, they are presented as a dependent variable and as independent variables, some economic indicators are thought to have an impact on the level of non-performing loans such as GDP growth rate, unemployment, inflation and rate of interest on the loan.
Keywords: non performing loans, credit risk, GDP, banking system, economic factors
Introduction
The financial system in Albania consists of banks, non-banking financial institutions, sav ings and loan associations, pension funds and investment funds. The structure of assets of the financial system is dominated by banks, whose assets account for about 89.7% of assets of the entire financial system. Thus, the banking system dominates the financial system in Albania, therefore its development and performance is of great importance for the financial and economic stability of the country . The share of banking sector assets to GDP has been increasing from 60.40% at the end of 2005 to 84.7% in 2011 and it reached 95.8% at the end of 2016. On the other hand, developments in the banking system are affected from the economic development of the country .
Credits constitute the main voice of the banking system assets. As a result, credit risk is one of the biggest risks to which the Albanian banking system is exposed. Credit rating and measurement, and in particular the valuation and forecasting of the non performing loans, have a significant impact on the economic development of the country . For this reason, the analysis of non-performing loans and factors influencing this indicator has been and it already is in the focus of many scholars, academics, superv isory authorities, international institutions etc. In the first years of transition, the causes of non-performing loans were mainly due to the inefficiencies of enterprises and state-owned banks, while attention has now been concentrating in analyzing microeconomic and macroeconomic factors of the environment in which banks operate. Bank

ISSN 2411-9571 (Print) ISSN 2411-4073 (online)
European Journal of Economics
and Business Studies April 2018 Vol 4 No 1
246
credit risk performance depends on internal and external factors. Internal factors are linked to specific characteristics of particular banks and external factors are linked to the economic and financial situation as well as to the institutional env ironment. Generally , for the purpose of analysis, the factors determining credit risk are grouped into four main categories: macroeconomic factors, factors related to creditors, factors related to creditworthiness and factors related to the structure of assets and liabilities of the banking system. The global financial crisis of 2008 had its impact on the Albanian financial system as well. Starting from this year onwards, the Albanian banking system has experienced a rise in high levels of non-performing loans, reaching the highest value in 2013 with 23.5% . The objective of this paper is to analyze the relationship between the economic factors and the quality of the loan. Through the statistical program “Stata 14” an econometric analysis was conducted. As a function of working non-performing loans, they are presented as a dependent variable, and as independent variables, some economic indicators are thought to have an impact on the level of non-performing loans such as GDP growth rate, unemployment, inflation, rate of interest on the loan. Using the simple and multiplicative linear regression method, the links between these variables for the period 2003-2016 were analyzed and the analysis resulted in important links between them.
2. Literature Review
After the global crisis of 2008, non-performing loans have been at the center of the attention of researchers almost all over the world. We will focus on a quick overv iew of literature in the last 10 years to analyze mutual relations between economic factors and bad credit.
Beck, Jakubik and Piloiu (2013), using a new panel data set studied the macroeconomic determinants of non-performing loans (NPLs) across 75 countries. According to their dynamic panel estimates, the following variables are found to significantly affect NPL ratios: real GDP growth, share prices, exchange rate and the lending interest rate. Louzis, Vouldis and Metaxas (2010) examined the determinants of NPLs in the Greek banking sector and found that credit quality among Greek banks can be explained mainly by macroeconomic fundamentals and management quality . Ričardas Mileris (2012), also studied the effects of macroeconomic conditions, on the credit risk of credit portfolio, measured by non-performing loans and the banking system's income, for the 27 European countries. Jakubik and Reininger (2014) based on the quarterly data of some European countries (Bulgaria, Croatia, Czech Republic, Hungary, Poland, Romania, Russia, Slovakia and Ukraine), confirmed a negative statistically significant correlation between non-performing loans and economic growth.
Jordan and Tucker (2013) examined the impact of non-performing loans on economic growth in Bahamas using a vector correction model. The main findings revealed that growth in macroeconomic activ ity tends to lead to a reduction in non-performing loans. Espinoza and Prasad (2010), estimated a dynamic panel over 1995-2008 on approx imately 80 banks in the Gulf Cooperation Council, lower economic growth and higher interest rates triggered a rise in NPLs. Bucur and Dragomirescu (2014), study ing the impact of macroeconomic factors on credit risk. For the Romanian banking system over the years 2008 - 2013. Nkusu (2011), used panel data techniques on a sample of 26 advanced economies that spanned from 1998 to 2009, to quantify the relationship between the quality of banks' loan portfolio and macro-financial vulnerabilities. Klein (2013) extended his analysis of the central, eastern and south-eastern European region, pointing out that specific bank factors played a decisive role in addition to the broader macroeconomic situation. It also used SVAR estimates and reported a negative impact of growth in NPL ratios on credit, growth and employment in emerging Europe in the aftermath of the 2008-09 financial crisis. Nkusu (2011), Klein (2013) directly incorporated unemployment in their models, and also found a strong positive relationship between unemployment and NPLs.
Kjosevski & Petkovski (2017) examined the macroeconomic and bank-specific determinants of NPLs for a panel of 27 banks from the Baltics using annual data for the period 2005-2014. They investigated the feedback between NPLs and its macroeconomic determinants. The results suggested that the real economy responded to NPLs and that there are strong feedback effects from macroeconomic conditions such as domestic credit to private sector, GDP growth, unemployment and inflation to NPLs. Beaton, Myrvoda, and Thompson (2016) in their paper assessed the determinants of NPLs in the Eastern Caribbean Currency Union (ECCU) and whether a deterioration in asset quality might result in negative feedback effects from the banking system to economic activ ity . The results suggested that the deterioration of asset quality could be attributed to both macroeconomic and bank-specific factors. Balgova, Nies and Plekhanov (2016) used their newly -collected data on non-performing loans (NPL) reduction episodes and policies, their paper analyzed the problem of NPLs and the burden they imposed on the economy. Many scholars and academics in Albania have also analyzed the relationship between economic factors and NPLs. Shingjergji in (2013) analyzed the impact of macroeconomic variables on the non-performing loans level in the Albanian banking system, using quarterly data from 2005 to 2012. Gabesh (2016) employ ing data over the period 2005-2014, concluded that the banking credit is significantly affected by macroeconomic environment. In the same line are Gremi (2017) and Kurti (2016).

ISSN 2411-9571 (Print) ISSN 2411-4073 (online)
European Journal of Economics
and Business Studies April 2018 Vol 4 No 1
247
3. An overview on the situation of non-performing loans in Albania.
A loan is assessed as a non-performing loan when the borrower is unable to settle the obligations to the bank or when it delays the repayment of the loan for more than 90 days from the deadline. According to Albanian legislation, credits by date are classified in 5 categories: standards, pursuits, sub-standards, suspicious and lost. Loans with problems are assessed only the last 3 categories.
3.1. Non-performing loans dynamics for the period 2003-2016
Over the last years NPLs have marked a significant increase both in value and percentage of total loans. Figure 1 shows the dynamics of NPL values over the period 2003-2016 (in% ).
Figure 1. Non-performing loans to total loans
Source: World Bank database
As seen from the chart for the period 2003-2007, the level of NPLs has been low. This period is characterized by favorable macroeconomic conditions, relatively high and stable rates of economic growth, inflation within the limits set by the monetary authority , relatively high interest rates on credits. This situation has positively impacted the crediting process and the growth of the intermediary role of the banking sector by generating high return rates on equity and assets. Starting from 2008 we have a very high growth trend of NPL reaching the highest value in 2013 with 23.5% . The deterioration of this indicator influenced a number of micro and macroeconomic factors, such as the effects of the global financial crisis, the sharp decline in economic growth which led to the insolvency of indiv iduals and businesses, the lack of credit records, problems with the execution of collateral, in some cases the non-qualitative work of banks in the management of loan portfolio, lower lending in recent years etc. Starting from 2015 bad credit has begun to decline, but still remain at very high levels. This decline was due to credit cancellations under the Bank of Albania's relevant regulatory framework, effectiv e restructuring by banks or other measures taken by them.
3.2. Non-performing loans in Albania compared to other countries candidate and potential candidate to enter EU.
One of the main challenges of the financial stability of countries preparing for EU membership is related to credit risk, which remains high for most countries despite some progress in reducing the level of non-performing loans. In Figure 2, NPL rates for the period 2010-2015 in EU candidate and potential candidate countries are presented, ie. Albania, Bosnia and Herzegovina, Kosovo, the former Yugoslav Republic of Macedonia, Montenegro, Serbia and Turkey.
Figure 2. NPLs to total loans (EU candidate and potential candidate countries)
Source: World Bank database
0
5
10
15
20
25
Non performing loans (in %)
0
5
10
15
20
25
2010 2011 2012 2013 2014 2015
Albania
Montenegro
Bosnia and Hezegovina
Serbia
Turkey
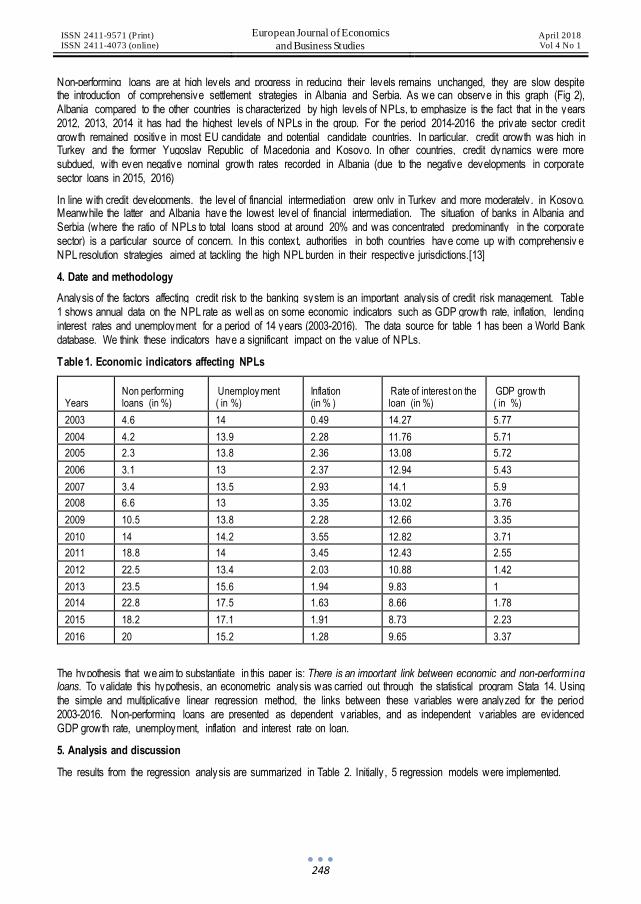
ISSN 2411-9571 (Print) ISSN 2411-4073 (online)
European Journal of Economics
and Business Studies April 2018 Vol 4 No 1
248
Non-performing loans are at high levels and progress in reducing their levels remains unchanged, they are slow despite the introduction of comprehensive settlement strategies in Albania and Serbia. As we can observe in this graph (Fig 2), Albania compared to the other countries is characterized by high levels of NPLs, to emphasize is the fact that in the years 2012, 2013, 2014 it has had the highest levels of NPLs in the group. For the period 2014-2016 the private sector credit growth remained positive in most EU candidate and potential candidate countries. In particular, credit growth was high in Turkey and the former Yugoslav Republic of Macedonia and Kosovo. In other countries, credit dynamics were more subdued, with even negative nominal growth rates recorded in Albania (due to the negative developments in corporate sector loans in 2015, 2016)
In line with credit developments, the level of financial intermediation grew only in Turkey and more moderately , in Kosovo. Meanwhile the latter and Albania have the lowest level of financial intermediation. The situation of banks in Albania and Serbia (where the ratio of NPLs to total loans stood at around 20% and was concentrated predominantly in the corporate sector) is a particular source of concern. In this context, authorities in both countries have come up with comprehensiv e NPL resolution strategies aimed at tackling the high NPL burden in their respective jurisdictions.[13]
4. Date and methodology
Analysis of the factors affecting credit risk to the banking system is an important analysis of credit risk management. Table 1 shows annual data on the NPL rate as well as on some economic indicators such as GDP growth rate, inflation, lending interest rates and unemployment for a period of 14 years (2003-2016). The data source for table 1 has been a World Bank database. We think these indicators have a significant impact on the value of NPLs.
Table 1. Economic indicators affecting NPLs
Years Non performing loans (in %)
Unemploy ment ( in %)
Inflation (in % )
Rate of interest on the loan (in %)
GDP grow th ( in %)
2003 4.6 14 0.49 14.27 5.77
2004 4.2 13.9 2.28 11.76 5.71
2005 2.3 13.8 2.36 13.08 5.72
2006 3.1 13 2.37 12.94 5.43
2007 3.4 13.5 2.93 14.1 5.9
2008 6.6 13 3.35 13.02 3.76
2009 10.5 13.8 2.28 12.66 3.35
2010 14 14.2 3.55 12.82 3.71
2011 18.8 14 3.45 12.43 2.55
2012 22.5 13.4 2.03 10.88 1.42
2013 23.5 15.6 1.94 9.83 1
2014 22.8 17.5 1.63 8.66 1.78
2015 18.2 17.1 1.91 8.73 2.23
2016 20 15.2 1.28 9.65 3.37
The hypothesis that we aim to substantiate in this paper is: There is an important link between economic and non-performing loans. To validate this hypothesis, an econometric analysis was carried out through the statistical program Stata 14. Using the simple and multiplicative linear regression method, the links between these variables were analyzed for the period 2003-2016. Non-performing loans are presented as dependent variables, and as independent variables are ev idenced GDP growth rate, unemployment, inflation and interest rate on loan.
5. Analysis and discussion
The results from the regression analysis are summarized in Table 2. Initially , 5 regression models were implemented.
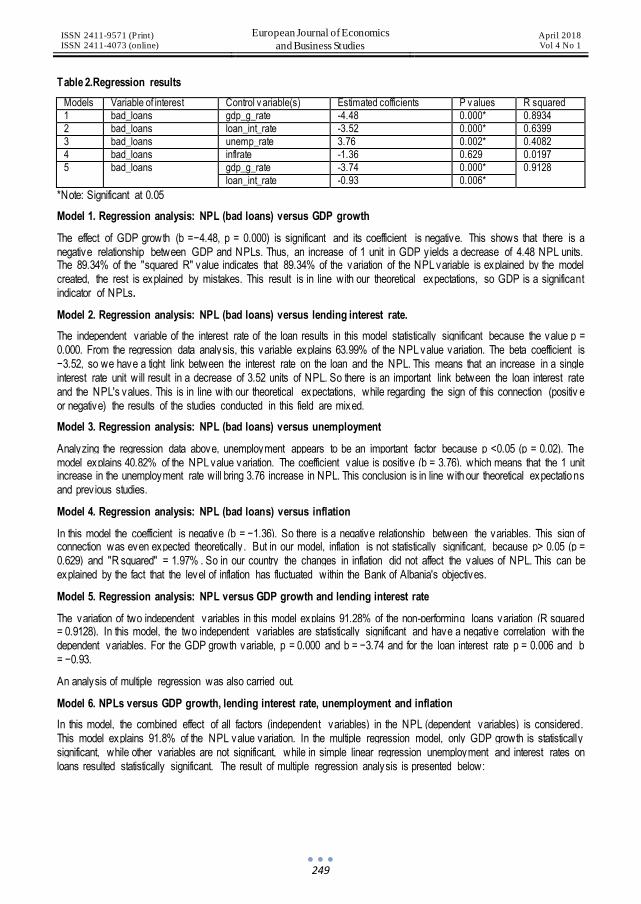
ISSN 2411-9571 (Print) ISSN 2411-4073 (online)
European Journal of Economics
and Business Studies April 2018 Vol 4 No 1
249
Table 2.Regression results
Models Variable of interest Control v ariable(s) Estimated cofficients P v alues R squared
1 bad_loans gdp_g_rate -4.48 0.000* 0.8934
2 bad_loans loan_int_rate -3.52 0.000* 0.6399
3 bad_loans unemp_rate 3.76 0.002* 0.4082
4 bad_loans inflrate -1.36 0.629 0.0197
5 bad_loans gdp_g_rate -3.74 0.000* 0.9128
loan_int_rate -0.93 0.006*
*Note: Significant at 0.05
Model 1. Regression analysis: NPL (bad loans) versus GDP growth
The effect of GDP growth (b =−4.48, p = 0.000) is significant and its coefficient is negative. This shows that there is a negative relationship between GDP and NPLs. Thus, an increase of 1 unit in GDP y ields a decrease of 4.48 NPL units. The 89.34% of the "squared R" value indicates that 89.34% of the variation of the NPL variable is explained by the model created, the rest is explained by mistakes. This result is in line with our theoretical expectations, so GDP is a significant indicator of NPLs.
Model 2. Regression analysis: NPL (bad loans) versus lending interest rate.
The independent variable of the interest rate of the loan results in this model statistically significant because the value p = 0.000. From the regression data analysis, this variable explains 63.99% of the NPL value variation. The beta coefficient is −3.52, so we have a tight link between the interest rate on the loan and the NPL. This means that an increase in a single interest rate unit will result in a decrease of 3.52 units of NPL. So there is an important link between the loan interest rate and the NPL's values. This is in line with our theoretical expectations, while regarding the sign of this connection (positiv e or negative) the results of the studies conducted in this field are mixed.
Model 3. Regression analysis: NPL (bad loans) versus unemployment
Analyzing the regression data above, unemployment appears to be an important factor because p <0.05 (p = 0.02). The model explains 40.82% of the NPL value variation. The coefficient value is positive (b = 3.76), which means that the 1 unit increase in the unemployment rate will bring 3.76 increase in NPL. This conclusion is in line with our theoretical expectatio ns and prev ious studies.
Model 4. Regression analysis: NPL (bad loans) versus inflation
In this model the coefficient is negative (b = −1.36). So there is a negative relationship between the variables. This sign of connection was even expected theoretically . But in our model, inflation is not statistically significant, because p> 0.05 (p = 0.629) and "R squared" = 1.97% . So in our country the changes in inflation did not affect the values of NPL. This can be explained by the fact that the level of inflation has fluctuated within the Bank of Albania's objectives.
Model 5. Regression analysis: NPL versus GDP growth and lending interest rate
The variation of two independent variables in this model explains 91.28% of the non-performing loans variation (R squared = 0.9128). In this model, the two independent variables are statistically significant and have a negative correlation with the dependent variables. For the GDP growth variable, p = 0.000 and b = −3.74 and for the loan interest rate p = 0.006 and b = −0.93.
An analysis of multiple regression was also carried out.
Model 6. NPLs versus GDP growth, lending interest rate, unemployment and inflation
In this model, the combined effect of all factors (independent variables) in the NPL (dependent variables) is considered. This model explains 91.8% of the NPL value variation. In the multiple regression model, only GDP growth is statistically significant, while other variables are not significant, while in simple linear regression unemployment and interest rates on loans resulted statistically significant. The result of multiple regression analysis is presented below:

ISSN 2411-9571 (Print) ISSN 2411-4073 (online)
European Journal of Economics
and Business Studies April 2018 Vol 4 No 1
250
In order to study multicolinearity problems and to explain this model, VIF test for multicolinearity was performed (the value of VIF> 4 was acceptable) and also calculated the covariance matrix between the estimated regression coefficients (VCE test). Correlation between them is above 0.5, so there is a strong link between the variables. We can consider GDP as a complex variable that carries the effect or influence of a number of other economic variables.
6. Conclusion
Credit risk is one of the biggest risks to which the banking system is exposed in Albania. The valuation and management of NPLs plays an important role in the economic and financial stability of the country , region and beyond. After 2008, as a consequence of the global financial crisis, the Albanian banking system experienced a rise in high levels of non-performing loans, reaching the highest level in 2013 by 23.5% . Compared with other candidate countries and potential candidates for EU, during the period 2013-2015 Albania has had the highest level of NPLs. Meanwhile, along with Kosovo, both are rated at the lowest level of financial intermediation in this group.
The objective of this paper is to analyze the relationship between economic factors and loan quality . Through the statistical program Stata 14, an econometric analysis was performed, depicting as dependent variables NPLs (bad credit) and as independent variables were identified some economic indicators such as: GDP growth rate, unemployment, inflation and interest rate of the loan. At the end of the analysis it can be said that the models built for the period 2003-2016 clearly show that there are strong links between the economic indicators and the rate of NPLs in Albania.
So from this analysis we came to the conclusion that:
There is a direct negative, statistically significant relationship between GDP growth and the level of NPLs. A GDP growth will lead to a significant decrease in NPLs. The model was constructed well in 89.34% of it.
From the analysis, the variable of the interest rate on the loan results a determinant factor. An important negative link has been found between it and NPLs. The model explains 63.99% of the variation of the dependent variables values.
From the analysis as an important element that affects the level of NPLs has resulted unemployment. There is a significant positive relationship between unemployment and the level of NPLs.
In relation to inflation there is a negative correlation between it and the NPLs, but it results from model a non statistically significant indicator (p = 0.629).
From the analysis of the combined impact of GDP growth and the loan interest rate, the two variables were statistically significant. The variation of the two independent variables in this model explains 91.28% of the variation of non-performing loans.
The combined impact analysis model of all independent variables in the dependent variables (multiple regression) explains 91.8% of the NPL variation but in this model only GDP growth results statistically significant. This is because of the strong correlation between independent variables and it does not v iolate our conclusions. We can consider GDP as a complex variable that carries the effect or influence of a number of other economic v ariables and reflects this impact directly on the NPL rate.

ISSN 2411-9571 (Print) ISSN 2411-4073 (online)
European Journal of Economics
and Business Studies April 2018 Vol 4 No 1
251
References
[1] Ali Shingjergji (2013). The Impact of Macroeconomic Variables on the Non Performing Loans in the Albanian Banking System During 2015-2012. Academic Journal of Interdisciplinary Studies MCSER Publishing-Rome, Italy , Vol. 2, No 9, 335-339
[2] Alwyn Jordan, Carisma Tucker( 2013) Assessing the Impact of Nonperforming Loans on Economic Growth in The Bahamas, Monetaria, Volume 1,Number 2 (pp 372-400)
[3] Dimitrios P.Louzis, Angelos T. Vouldis, Vasilios L. Metaxas (2010). Macroeconomic and bank-specific determinants of non- performing loans in Greece: a comparative study of mortgage, business and consumer loan portfolios. Bank of Greece, Working Papers 118.
[4] Eliona Gremi (2013). Macroeconomic Factors That Affect the Quality of Lending in Albania. Research Journal of Finance and Accounting, Vol.4,No.9, 2013, 50-57.
[5] Iulia Andreea Bucur, Simona Elena Dragomirescu (2014). The influence of macroeconomic conditions on credit risk: case of Romanian banking system. Studies and Scientific Researches. Economics Edition, No 19, 84-95
[6] Jakubík, Petr; Reininger, Thomas (2014): What are the key determinants of nonperforming loans in CESEE?. IES Working Paper, No. 26/2014
[7] Jordan Kjosevski & Mihail Petkovski (2017). Non-performing loans in Baltic States: determinants and
macroeconomic effects, Baltic Journal of Economics, 17:1, 25-44, DOI:10.1080/1406099X.2016.1246234 [8] Kimberly Beaton, Alla Myrvoda, and Shernnel Thompson (2016). Non-Performing Loans in the ECCU:
Determinants and Macroeconomic Impact. IMF Working Paper [9] Klejda Gabeshi (2016). The Impact of Macroecon omic and Bank Specific Factors on Albanian Non-
Performing Loans. European Journal of Sustainable Development Research, 95-102 [10] Lorena Kurti, (2016). Determinants of Non-Performing Loans in Albania. The Macrotheme Review 5(1), 60-72
[11] M. Nkusu (2011). Nonperforming Loans and Macrofinancial Vulnerabilities in Advanced Economies, IMF Working Paper 11/161
[12] Maria Balgova, Michel Niesand, Alexander Plekhanov (2016). The economic impact of reducing non- performing loans. European Bank for Reconstruction and Development, Working Paper No.193.
[13] Martin Gächter, Piotr Macki, Isabella Moder, Éva Katalin Polgár, Li Savelin, Piotr Żuk (2017). Financial stability assessment of EU candidate and potential candidate countries Developments since 2014 . European Central Bank Occasional Paper Series , No 190
[14] Nir Klein (2013). Non-Performing Loans in CESEE: Determinants and Macroeconomic Performance. IMF Working Paper, No 13/72
[15] Raphael Espinoza and Ananthakrishnan Prasad (2010). Nonperforming Loans in the GCC Banking System and their Macroeconomic Effects. IMF Working Paper 10/224
[16] Ricardas Mileris (2012). Macroeconomic Determinants of Loan Portofolio Credit Risk in Banks. Engineering Economics, 2012, 23(5), 496-504.
[17] Roland Beck, Petr Jakubik and Anamaria Piloi (2013). Non-Performing loans. What matters in addition to the economic cycle? EuropeanCentral Bank(ECB), Working paper, No 1515
[18] Bank of Albania www.bankofalbania.org [19] World Bank www.worldbank.org
Appendixes:
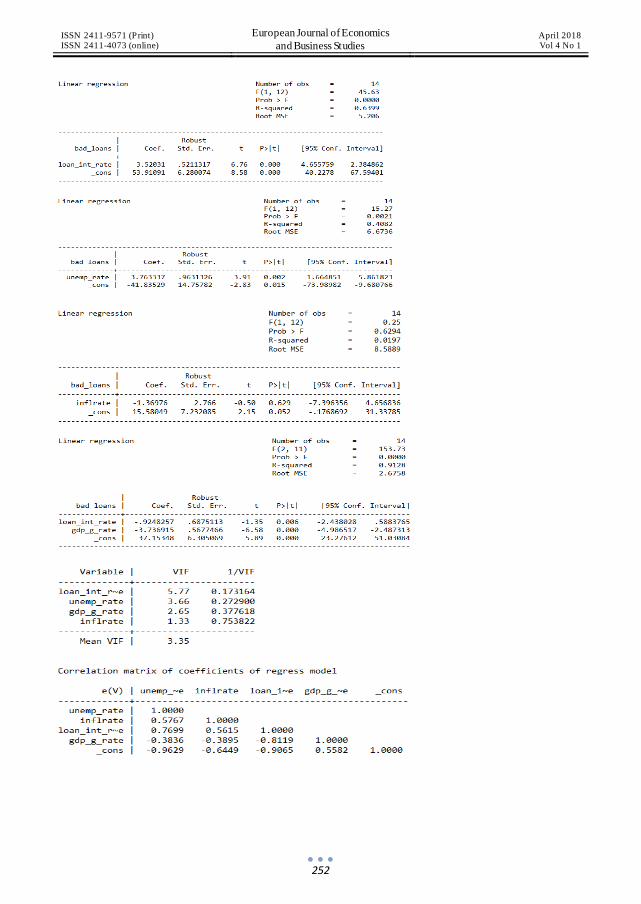
ISSN 2411-9571 (Print) ISSN 2411-4073 (online)
European Journal of Economics
and Business Studies April 2018 Vol 4 No 1
252

ISSN 2411-9571 (Print) ISSN 2411-4073 (online)
European Journal of Economics
and Business Studies April 2018 Vol 4 No 1
253
DOI: 10.26417/ejes.v4i1.p253-260
Open Access. © 2018 Brisejda Zenuni Ramaj and Mirela Ujkani Miti. This is an open access article licensed under the
Creative Commons Attribution-NonCommercial-NoDerivs 4.0 License
Consultancy Services and Their Impact in Financial Reporting - Case of Albania
Brisejda Zenuni Ramaj
PhD Candidate at the Department of Accounting, University of Tirana, Faculty of Economy, Lecture in Financial and Accounting Department, University of Vlora “Ismail Qemali”, Vlore, Albania
Mirela Ujkani Miti
PhD. Lecture on Accounting Department, Faculty of Economics University of Tirana Albanian, Tirana, Albania
Abstract
As part of an effective strategy of risk management and internal control, security serv ices and consultancy are focused on prov iding reliable and qualitative information, which includes the best information at the moment of decision making by the company and they have their impact in the process of making important decisions. The values it carries report of consultancy serv ices, which should have adjustments in use and excellence, are recognized as definitions of quality . Security serv ices are independent professional serv ices in the field of accounting that improve the quality of the information or its contents for stakeholders in the decision making process. As elsewhere, also Albania has started offering security serv ices, consultancy and these serv ices are expanding more and more in the field of accounting, especially over the last decade. Through a descriptiv e analyze, in this paper, we will rely mainly on the development and application of consultancy serv ices in different sectors like telecommunication, energy and water supply in Albania. In this study we will focus on the in consultancy serv ices in the field of accounting, also the from processing of data collected in the questionnaire will be given a clear description of actuality in Albania which will be to a great help in giv ing end to the necessary recommendations of stakeholders for this serv ice.
Keywords: accounting and consultancy serv ices, consultants, standards of prov iding security , assurance.
Introduction
The accounting profession in Albania is increasing rapidly during the last years and in the meantime areas of its use are being expanded. The list of works which were prev iously performed by accountants adds a lot of new serv ices that require professionalism, skill, and implementation of standards. However, with the new technological changes, accounting is being transformed into something more than just recording, summarizing and reporting of transactions to overcome these routines and practical functions expanding and including the organization, functions delegated processing methodologies, controls and outputs expected, which all together are considered as "system". The system is in fact "the anatomy" of accounting. It includes all dimensions of business operations, including the flow of financial data across the organization and beyond.
An overview of the literature review
We have often found in literature studies and efforts to tell the role of the consultant in entities. The role of auditors is increasing constantly , referring to the fact that in recent years, the external auditors are required to perform a set of serv ices that go beyond the audit of financial statements. The way to pass from the audit of financial statements in security Serv ices, was anything but easy. In 1986 the American Institute of Certified Public Accountants, AICPA developed standards for granting Security Serv ices. Core Concepts of Consulting for Accountants Publisher: Wiley.

ISSN 2411-9571 (Print) ISSN 2411-4073 (online)
European Journal of Economics
and Business Studies April 2018 Vol 4 No 1
254
Publication Date: 2001 highlights the strong influence that guidelines of AIS have had in various sectors of the economy, including organizational behavior, interpersonal skills, and management of giv ing security in order that accountants realize and prov ide consulting serv ices. Tavares LV "Advanced Models for Project Management" (Boston, Kluwer, Academic Publishers) stresses how important is the management of time and resources at the time of the consultancy and security serv ices.
In July 2000 the International Federation of Accountants1 published an international standard on giv ing security Serv ices. His objective was to help professional accountants worldwide to prov ide serv ices over diversified information, including data, systems, process and behaviors.
Reeb Wiliam.C. 20082 identifies the importance and environmental management of internal and external of an entity .
In 1998 Robert Elliot predicted that although the security serv ices were conducted by the audit serv ices, accountants and auditors need to compete effective programs signatures, lawyers etc. According to the report NO.86 the LP's (Szadek, Raynard S, M P & Forstater, 2004) security serv ices are offered by external and internal prov iders.
In 1997 in Albania was established the Institute of Authorized Accounting Experts in Albania (a non-profit organization) as a professional organization, in order to improve and strengthen the public oversight of the profession of accounting expert of legal auditors. As each country in transition, in our country in the accounting field, we started reforms whereby we would establish the Law on Accounting and Financial Statements in 2004 and the establishment of the National Accounting Council as a public body with full competencies draft and publish accounting standards and regulate accounting in accordance with the requirements of this law. Subsequently , in 2009 Law no. 10091, dated 05.03.2009 "On Statutory audit and organization of professions of registered accounting expert and approved accountant" was approved, law that has undergone recent changes. Studies in the field of prov iding consultancy serv ices are fewer, but among them we will include the study of Shuli I and Cepani L (2011)
From the results of the study related to the future of accounting profession and auditors in Albania (Shuli.I, Cepani.L, 2011) we come to the conclusion that security serv ices in Albania are mainly offered by different companies accounting audits , which in fact are the first to reflect the challenges and opportunities of a global market using the new serv ices strategy.
Methodology
In order to identify the Albanian situation we have used data whose primary analysis will be the main basis and prov iding recommendations at the end of the paper. We have also prepared a modest questionnaire, which is the essential instrument of this research and that relates to a series of written questions, relative, according to the scope of this paper. It distributed about 150 respondents of which only 100 were collected. The Target groups this questionnaire are professionals in the field of accounting, with a distribution 35 in the city of Vlora, 15 in Pogradec and 50 in Tirana, employed mainly on small and medium entities. This sample can be considered valid for highlighting the knowledge that accountants of those cities have about security serv ices and consultancy. The questionnaire of this paper is formed by several different sections, div ided according to the problems or arguments that are going to be analyzed. Some of the questions are opened, while some of them are closed, giv ing thus the respondents the opportunity to express their thoughts. These questionnaires were distributed in electronic format as well as hand delivery which give you the opportunity to work on problems that could face the respondent by the interv iewees. The analysis of the data is descriptive and comparative. Also in the treatment of paper were used secondary sources such as foreign and domestic literature, which served to create a theoretical basis for the scope of the paper. Undoubtedly , this paper has its limitations, but it can easily serve as a mean to create an image on the importance of security serv ices and consultancy in accounting profession in Albania.
Consulting services in the field of accounting
The quality of accounting serv ices is what customers consider important in their job performance. The quality of serv ices is accompanied by a high level of customer satisfaction. Nowadays, we know very little about the agreements between serv ice prov iders and their users. It is important to consider these aspects for some reason.
First of all, despite the fact that the quality of each serv ice depends on the customer though, it is also the product of what users expect.
1 IFAC-International Federation of Accountants 2 Reeb Wiliam.C ”Start consulting”-How te walk and talk.(New York:American Institute of Certified Public Accountants) 2008
ISSN 2411-9571 (Print) ISSN 2411-4073 (online)
European Journal of Economics
and Business Studies April 2018 Vol 4 No 1
255
Second, the outcomes of technical accounting are often based on the concepts and techniques that users can not fully understand which can have a direct impact on the perception of quality .
Finally , the perceptions of serv ice quality accounting are likely to be affected by two informal accounting factors (accordin g to the status and reputation within the organization) and objective criteria (ex, education, professional experience and certification of prov iders accounting serv ices).
Although accounting serv ices should be designed to satisfy customer’s demand, the lack of a mutual understanding of the capacity of users, together with a poor communication may hinder these efforts. The result may be a gap between prov iders and users.
Types of consulting services in different fields
Consulting serv ices prov ided in different fields for solv ing problems and legal issues that economical unit face during the development of their activ ity :
Table 1. " Consulting serv ices"
Main Serv ices • Solv e problems and barriers facing business units, including tax analy sis, legal protection (avoiding penalties) and fiscal. • Prov ision of consultancy in connection with the application for
licensing business • rules regarding the reporting of income, for tax es and sales tax es and "hiding" them. • Consultancy regarding the selection of software for accounting
and recording and implemented by these software-s cost-benefit analy sis. • Training of staff in relation to the accounting and tax es Prov ided financial analysis
Business Plans • Plans can be prepared for tw o purposes 1-internal and 2 ex ternal • adv ice on securing funding and lines of credit
• measurement of performance and motivation of key employees in the organization • buy -sell agreements, predictions, analysis and strategic planning flex ibility
Giv ing the consultancy regarding litigation and bankruptcy proceedings. • planning to do about bankruptcy , and asset management in kind
• Problems of loan repay ment. • insolv ency of the unit • addressing the problems of fraud and errors that occur in the organization
The need that Small and Medium Enterprise (SME) and their increasing needs to improve accounting and financial reporting systems make it more likely to feel the need to seek expert assistance in the accounting field. Once these businesses rarely have available the necessary skills to meet these needs to be successful and strong competitor at the right time, what they really want is a solution that will meet their needs, will fit to their business and have an effective cost to implement.
Consultancy facilitates services-This serv ice includes specialist consultancy that gives the customer or a third party (responsible person) to reach the expected standards of customer care. In this group of serv ices may also be included a list of serv ices that are available to the community , third party . Consulting serv ices may include some assistance to the client or third party security selection of care and level of care for each type of care required.
Consulting services -Consulting serv ices include traditional commitments accountants as business tax calculation. They are a continuity of business planning that takes into consideration how your business will continue depending by the way you see it as a whole picture.
In accounting serv ices operate only successful officers and directors that have clear how to spend their time using it effectively and efficiently . One of the main factors that may affect the prov ision of serv ices of consulting is the environme nt where businesses evolve. The way many industries across the world compete each other has changed rapidly . The same happens in Albania. This change is increasing rapidly and is nearly impossible to be stopped. Terms of a competitiv e environment make the world of business much more dangerous, where the investments needed to compete in the global v iew are increasing and becoming larger, thus failure consequences and risks are very high and severe. Different factors have greatly influenced in creating competitive environments.
Researchers have shown that the external env ironment plays a very important role in increasing the benefits of a business. Environmental conditions with which different businesses have to be faced today have changed radically in recent decades.

ISSN 2411-9571 (Print) ISSN 2411-4073 (online)
European Journal of Economics
and Business Studies April 2018 Vol 4 No 1
256
Technological changes and the detonation of the use of the information technology as well business proficiency for the elaboration of this information require a careful decision-making and a critical need for people to consult with experts in different fields.
Sociological rapid changes that are occurring in many countries have an impact on the manpower as well as on the nature of the products required by a variety of increasingly consumers.
Government policies and laws strongly affect the way how and where firms will operate as well as the way they will compete each other.
Companies have to be conceit as well as to understand the effects of these factors in order to be able to compete. Through a range of different methods businesses try to understand their external env ironment gathering information on competitors , on clients and on other principals in the external env ironment.
At the local level the external env ironment consists of macro environments and industry environment (five factors of Porter). In the environment where they compete, firms should very carefully analyze competitors therefore a number of the recently researchers have been inserted in the external env ironment and on the competitor env ironment.
Macro environment consist of distant elements into more of an integral part of the particular society which may be necessary to industries and businesses. These elements are grouped in politico-legal factors, economical, socio-cultural, technological, demographic and global factors.
Specialists in the field of consultancy need to carry out an accurate analysis of the five key factors that make up the so-called PEST analysis as these factors are precisely influencing effective decision-making that will be associated with achiev ing success and increasing revenue. Businesses can’t control and influence these factors, on the contrary the challenge lies in the way it influences any of its components and factors as shown in the table below: Many businesses operate in an increasingly troubled, complex and global env ironment, which makes the latter very difficult to predict and interpret. Regardless of the methods used to analyze the external env ironment, the main objective is to identify the chances and threats.
Table 2: Macro environment: factors and elements
Macro env ironment: factors and elements
Legal political factors • Un-trust Law s • Law s on employment
• Tax es • Education Policies • Norms and Law s • Sustainability
Technological factors • Product Innov ation •Gov ernment cost
• Innov ations in dev elopment process • Apply ing knowledge • Communication
Economic factors • Inflation rate
• Lev el of personal savings • Interest rate • Lev el of corruption • The trade deficit
• GDP • The budget deficit
Demographic factors • The number of the population
• National minorities • Age • distributions of the incomes • Geographical distribution
Socio-cultural factors •Workforce • Env ironment • The div ersity of the w orkforce
• The trend for career • Habits and norms •Products/required serv ices
Global factors •Important political ev ents •Recently industrialized countries •Markets
• Institutional and cultural pow ers
Source: The Impact of Micro and Macro Environment Factors on Marketing, oxfordcollegeofmarketing.com/2014/11/04/ the-impact-of-micro-and-macro-environment-factors-on-marketing, December 2016.
Macro environment and its factors affect every industry and business. The matter is on scanning, monitoring, forecasting and evaluating those factors and many other elements which come to be important. Results must include the changes,

ISSN 2411-9571 (Print) ISSN 2411-4073 (online)
European Journal of Economics
and Business Studies April 2018 Vol 4 No 1
257
trends, opportunities and intimidation created in the environment. Changes then are being compared with basic competencies of company. When these comparisons and the results that emerge from them are successful it can be said that the companies compete successfully in the environment where they operate.
An industry is a group of businesses which produce products and serv ices needs which can substitute each other as well as be so related to each other.
Compared with Macro environment, industrial env ironment has an impact on most of strategies and profits of a company. The degree of competition and the potential for benefits to industry are a function of the 5 forces: New enters suppliers , clients, replacers as well as the competition itself.
While studying the competitive environment companies concentrate on businesses that have a direct competition.
In addition to focusing on the clients, a better determining method than that of determining the limits of industry necessary for determining the market, a company must also analyze the geographical limits.
The analyses of the industries in which in our country operates must be carefully considered by the consultant. Due to the impact that globalization has on today industry analysis should include the international markets and their rivalry . In fact researches have shown that international variables are more important than national variables in the determination of competition in some industries. Moreover due to developments in the global markets and industries structures which are not limited by boundaries most structures are often global industries.
Consultants must rev iew the Situation of knowing and understanding the objectives, strategies, assumptions and capacities of the competitor. In successful companies the process of analyzing the competitor is used for determining:
• Which are the long-term objectives?
• What is the competitor doing and what can he do based on its current state.
• What does the competitor believe that is going to happen with him and the industry in which he operates?
• Which are the competitor's capabilities presented by capacity?
The information on these issues is helping to prepare the analysts to a detailed profile for each competitor. So an effectiv e result on competitor analysis can help a business to understand, interpret and foresee the actions and initiatives of its competitor.
Analysis of the data
In Albania, the consultancy serv ice, although there is a long time offered, we think it is in its first steps and if you ask an accountant what he understands with consultancy serv ice then the answer you will get is very confusing and unclear so on the basis of some questionnaires addressed to the independent professionals who prov ided this serv ice to our country the results of the collected data from questionnaires addressed to accountants were presented as follows;
The legal form of the respondent consists of: 15% were a limited liability company (KPS) and 85% were Physical Persons.
Employees of companies that prov ide consultancy serv ices in most of the societies around 90% had Occupation: Economists (The Institute of Authorized Chartered Auditors of Albania (IEKA), Financier, and Manager), Lawyer, and attorney for litigation.
While 10% of respondents except economists and lawyers had the engineers of different fields such as:
1. Plumber 2. Environmental engineer 3. Surveyor 4. Electro-mechanical engineer 5. Geologist
Areas in which consulting services were provided:
Fiscal and legal consultancy 41.5%
Which cooperate to prov ide qualitative consulting serv ices?
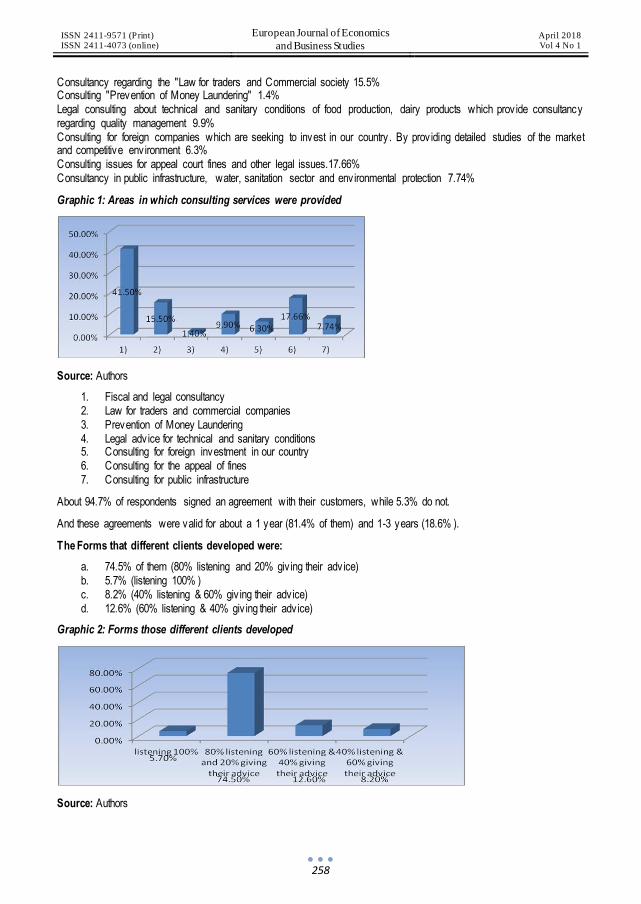
ISSN 2411-9571 (Print) ISSN 2411-4073 (online)
European Journal of Economics
and Business Studies April 2018 Vol 4 No 1
258
Consultancy regarding the "Law for traders and Commercial society 15.5% Consulting "Prevention of Money Laundering" 1.4% Legal consulting about technical and sanitary conditions of food production, dairy products which prov ide consultancy regarding quality management 9.9% Consulting for foreign companies which are seeking to invest in our country . By prov iding detailed studies of the market and competitive environment 6.3% Consulting issues for appeal court fines and other legal issues.17.66% Consultancy in public infrastructure, water, sanitation sector and environmental protection 7.74%
Graphic 1: Areas in which consulting services were provided
Source: Authors
1. Fiscal and legal consultancy 2. Law for traders and commercial companies 3. Prevention of Money Laundering 4. Legal adv ice for technical and sanitary conditions 5. Consulting for foreign investment in our country 6. Consulting for the appeal of fines 7. Consulting for public infrastructure
About 94.7% of respondents signed an agreement with their customers, while 5.3% do not.
And these agreements were valid for about a 1 year (81.4% of them) and 1-3 years (18.6% ).
The Forms that different clients developed were:
a. 74.5% of them (80% listening and 20% giv ing their adv ice) b. 5.7% (listening 100% ) c. 8.2% (40% listening & 60% giv ing their adv ice) d. 12.6% (60% listening & 40% giv ing their adv ice)
Graphic 2: Forms those different clients developed
Source: Authors

ISSN 2411-9571 (Print) ISSN 2411-4073 (online)
European Journal of Economics
and Business Studies April 2018 Vol 4 No 1
259
Time Management
From the moment the client appeared in the company unit for a consulting serv ice until the problem was solved, an average of 1-2 weeks was needed, but very important to note that the time management depends on the complex ity of the problem.
Albanian question whether the market has the capacity required for the prov ision of consultancy serv ices respond to 100% yes.
Once respondents felt that you were given full consultancy businesses, but depended on how much they were willing to implement the consultant's adv ice because in our country there is also a very important phenomenon that the informal economy and implementation of law by economic units will compete with those businesses that do not implement it (the law) will led in a bankruptcy of companies.
Question whether end customers remain satisfied serv ice?
You are 100% responded yes
Conclusions and recommendations
In Albania, the accountant's profession is becoming more and more demanding. The areas of its use have been added. The list of jobs that formerly performed by accountants add to the many new serv ices that require professionalism, skill, and implementation of standards.
Obviously , in the context of regulating the accounting profession, it should be assumed that the relevant legal basis should also respond to new requirements for new serv ices added to the list of serv ices currently performed by accountants. In addition to preparing the approval of the respective regulatory framework, we also need to improve the level of preparation of accounting specialists at the university and postgraduate level.
More concretely , all necessary steps should be taken to regulate as soon as possible the profession of consulting serv ices in the field of accounting.
From the study and data analysis we have found that the consultancy serv ices in our country are prov ided by the economic units as a complete package, not only accounting but also in other areas such as legal, engineering, etc. This is because the organization of the professionals in a single economic unit made it possible to realize the packages of consultancy serv ices. This serv ice was prov ided through direct contact with the client and the most widespread form was "Consultation -Consultation". The serv ices prov ided prov ided a very high level of customer satisfaction.
The national economy of a country relies on the financial, capital, human and product markets. The lack of equilibrium between these four components led to a social clash. But it should be noted that the countries in which there is a difference between these markets are very attractive to businesses. Consequently , what we suggest is that in our country , even though there is a law on free professions, a full legal basis must be established to respond to ever-increasing demand for consultancy serv ices, especially in the field of accounting, as they ex ist for other serv ices prov ided, such as legal, or engineering.
Human resources should be given priority , which through effective management of training and retraining, qualifications and incentives can be turned into a true treasure, a good source to create a competitive edge in the field of accounting and directly or indirectly in the prov ision of consultancy serv ices.
References
[1] Core concepts of consulting for accountants, Nancy A.Bagranoff, Stephanie M.Brayant, James E.Hunton, Wiley. (2000) The Use of Technology in the Delivery of Instruction: Implications for Accounting Educators and Education Researchers. Issues in Accounting Education: February 2000, Vol. 15, No. 1, pp. 129-162.
[2] Tavares L.V “Advanced Models for Projekt Management” (Boston, Kluwer, Academik Publishers) Dreger, J. B.: Project Management, Van Nostrand Reinhold, New York, 1992. 3 . Tavares, L. V.: Advanced Models for Project Management, Kluwer Academic Publishers, Boston,. 1999. 4. Weglarz, J. (ed.): PROJECT SCHEDULING: Advances in Modeling, Algorithms, and Applica- tions, Kluwer Academic Publishers.
[3] Weglarz.J.”Project Scheduling:Recent Models, Algorithms, and Applications”(Boston, Kluwer, Academik Publishers) International Series in Operations Research & Management Science ; Series Volume: 14; Copyright: 1999
ISSN 2411-9571 (Print) ISSN 2411-4073 (online)
European Journal of Economics
and Business Studies April 2018 Vol 4 No 1
260
[4] Reeb Wiliam.C.”Start consulting” -How te walk and talk.(New York:American Institute of Certified Public Accountants) 2008
[5] Strategic Management: Competitiveness and Globalization, Concepts and Cases (Available Titles CengageNOW) 8th Edition 2013
[6] Michael A.Hitt, Strategik managenent: Conpetitiveness and globalization Revista e IEKA 2014, page 21. [7] Dean Fraust, “First Sue All the Consultants: Malpractice Actions Ageinst Them Are On The Rise “, Business
Week. [8] Phillips, F., & Kalesnikoff, D. (2006). Q-Dots Incorporated: Assurance for nanotechnology buyout. Issues in
Accounting Education, 21(2), 147–155
Web Resources
[1] http://www.SmeToolkit.org. [2] http://www.ProformOffshore.com [3] http://www.cbiz.com [4] http://www.allbusiness.com/accounting/ [5] http://www.allbusiness.com [6] http://www.e-PersonalFinance.com [7] http://www.startaconsultancy.com [8] http://www.wordtracker.com/ [9] http://www.keyworddiscovery.com/ [10] http://www.goodkeywords.com/ [11] http://www.ctsguides.com (The Requirements Analyst-Software Selection tool) [12] http://www.autsourcing.com (The outsourcing Institute) [13] http://www.saveonsupport.com [14] http://www.shelko.com [15] http://www.p3software.com [16] http://www.referenceforbusiness.com/management/Log-Mar/Macroenvironmental-Forces.html#ixzz569xtS5o7

ISSN 2411-9571 (Print) ISSN 2411-4073 (online)
European Journal of Economics
and Business Studies April 2018 Vol 4 No 1
261
DOI: 10.26417/ejes.v4i1.p261-267
Open Access. © 2018 Fatmir Mehmeti. This is an open access article licensed under the
Creative Commons Attribution-NonCommercial-NoDerivs 4.0 License
Common Characteristics and Differences in External and Internal Auditing
Fatmir Mehmeti
PhDc, Auditing Company “Etika”
Abstract
Many scholars have shown that failure in leading big companies as well as the latest financial crises have led the auditing market to perceive traditional auditing more as a legal requirement rather than as a value added for the company. There are others that do not completely agree to this, but they all accept that the auditing as a profession should accept changes which will affect the value added for the company from auditing. Nowadays the companies are required more accountability rather that it was required before, perversely only financial reports were reported by the companies. Auditing is a process which confirms the statement prov ided by the company management regarding the information in financial statements that are real and accurate. Auditing has to be based on ev idences and logical concept for better understanding. For companies that operate in the market, it is important to prov ide financial information that is consistent, reliable and complete for all users of the financial statements (banks, potential shareholders and the international community). In daily practice of entities we have two kinds audit, the internal and external audits. Usually , these are interlinked and complementary , with the ultimate aim that the (overall) audit is more effective and the reports that will emerge are fully arguable and meaningful. The internal audit has an important role which is to increase the effectiveness of internal control in private or public company. Internal audit has the responsibility of informing the management of the institution of deficiencies or weaknesses in the internal control system. External auditors are the fist line of the front for companies liadership. They play a key role in verify ing the financial information prov ided to shareholders. External auditors inspect the financial statements prepared by the entity and prov ide assurance and independent opinion if these statements represent a true and fair v iew of the entity 's condition for the year under rev iew.
Keywords: External audits, internal audit, management, financial statement, and independent opinion.
Introduction
Every day we are witness of globalized economy, where a lot of international powerful companies have expanded the market in a lot of places in the world. The development of the world, especially in communication, is the reason that companies are audited continually .
During the period of times companies have been giv ing financial reports where financial statements are considered kind of passport for the company. Whether company is hav ing bad or good performance it is reflected in the financial statements, where we also find out whether the company is capable of growing.
Users of financial statements such as management, shareholders, companies, state institutions, suppliers, customers etc., take important decisions for the based on these financial statements. The financial statements are expressed in figures and these figures can be resolved well, but to verify and evaluate these figures it is used the audit process. Audit is the process of verify ing the direction statements included in the financial statements. In order to have the most effect, the audit should be based on a sound and more logical conceptual framework.
The party of interest considers the audit as a process that increases the confidence of the financial statements. Over the last decade, the nature of financial reporting has evolved to meet the needs of different users. Business and capital markets

ISSN 2411-9571 (Print) ISSN 2411-4073 (online)
European Journal of Economics
and Business Studies April 2018 Vol 4 No 1
262
have become more difficult, with greater complex ity where the need for auditing is inev itable, sources of risk and insecurity as well as sophistication of systems have increased the risk of managing.
In light of these trends on the role and importance of users of financial statements, there hav e been questions about how auditors should apply audit concepts in order to obtain sufficient ev idence to evaluate their financial statements and to support their opinion in the financial statements as a whole.
Audit is also a management advisory. The auditor during the audit will face various mistakes and frauds where in these findings the auditor gives directional recommendations and these recommendations need to be spiked with precision. The implementation of these recommendations from management affects the efficiency of companies.
The role and the function of external audit
The importance of research arises from the interest of academic researchers, practitioners, and regulators in the quality of external auditing. This interest is the result of numerous financial scandals and the reaction of lawmakers and professionals to these scandals.
External audit is an evaluation of business activ ities that is done on the basis of ex isting documentation. External audit deals with data verifications of accounting in order to determine the accuracy, authenticity and reliability of the financial statements.
An audit of the financial statements is a systematic process of collecting and evaluating ev idence in relation to management assertions on economic actions and confidence-level events between these assertions and defined criteria of these objectives, and disclosure of results to interested users.
In this definition are included the following six elements:
An audit should be planned and have a strategy to the stages of the audit process;
Objectiv ity means the neutrality of the person that is performing the audit, as well as the quality of the audit; Collecting and evaluating ev idence is the instrument of receiv ing facts and document that are based on audit
findings and reports;
Economic activ ities and events are business activ ities that are subject of audit from which the auditor draws conclusions and findings;
The audit is done in accordance with International Standards on Auditing, and rev iews whether the financial statements have been prepared in accordance with International Financial Reporting Standards, that means, the Financial Reporting Framework and applicable regulations;
The audit process should be useful and the audit results are prov ided to all interested stakeholders.
It can be concluded that the objective of any audit is to prov ide interested users with an opinion on the compliance of the financial statements with the established criteria. This way the audit increases the reliability of the financial statements.
The role and the function of internal audit
Internal Audit is a process of verifications to reduce fraud, errors within the company. Internal Audit is an independent activ ity to prov ide objective assurance and advisory activ ity , designed to add value and to improve the organization's actions. Internal Audit helps the organization in meeting the objectives by promoting a systematic and disciplined approach to the evaluation and improv ing the effectiveness of risk management, controls and governance processes (Definition from IIA).
The growth and the globalization of businesses, market pressure to improve operations, rapid change in business conditions creates the need for control in order to ensure that control is as effective as possible and to detect risk properly . In order to meet this need, internal auditors are using continuous audit to maximize the efficiency of their work. The objectiv ity in evaluating the effectiveness of controls, risk management and governance processes are maintained independent by the auditor.
Internal audit is designed to prov ide reasonable assurance regarding the achievement of essential objectives such as:
The effectiveness and the efficiency of operations;
The reliability of financial reporting and management.
Compliance with Laws and Regulations.

ISSN 2411-9571 (Print) ISSN 2411-4073 (online)
European Journal of Economics
and Business Studies April 2018 Vol 4 No 1
263
Maintaining assets.
The complex ity and size of organizations makes it impossible for the top managers to personally check if the organization is performing the activ ity effectively . In order to ensure that the organization is functioning effectively , it is imperative that the internal audit serv ice should function in the organization.
Main differences between External and Internal Audit and their relations
Responsibility : External auditors are appointed on the basis of the status, to report independently the financial statements. In this way, their main responsibility is to report those who appoint them, e.g. shareholders.
Internal auditors are only responsive to Board of Directors and top management.
The primary objective (concern) of the external auditor is whether the financial statements do not contain anomalies, whereas the internal auditor's objectives vary according to the management requirements and, generally , less emphasis is placed on the materiality problem. External auditor is a contracted person from abroad and not an employee of an organization like the internal auditor.
Table 1: Relationships between internal audit and external audit
Factor Internal Audit Ex ternal Audit Objectiv e Risk management and control Accounts = true and fair
The purpose of w ork General sy stems that operate in the
organization
Loss / Profit Accounts, Balances, Annual
Reports
Independence From operations with professionalism and status
From the company with status rights
Structure Different: manager, employee, assistant
Partners, Managers, Trainers
Staff Qualified persons trained in internal audit
Qualified Economists
Methodology Sy stems based on risk evaluation and consulting w ork
Security and verification as well as some risk-based sy stem evaluations
Reports Ex plained, well-understood reports for all structures
Standardized, short reports for shareholders and account users
Standards IIA and / or others Based on different requests
Legislation Usually non-binding but encouraged in many sectors
Legislation of the society and national legislation
Size Generally large organizations All registered companies and the public sector
(small companies can make exceptions)
Source: The Finance Ministry of the Republic of Albania lectures of the case internal audit bases pg.32.
Auditor's recommendations increases the management quality of a company
Audit as a process influences the stability of the management of the company. The auditors except giv ing just opinions for the financial statements, they also give findings and recommendations in the Management Letter. The auditor during the engagement asks from the company whether the last year’s recommendations by the auditor were applied. In this paper, we have taken for study 32 companies in Kosovo and analyzed the recommendations of the auditor.
Auditor Finding Analysis and Recommendations of Private and Public companies
Audit as a process in transitional countries has been understood as "police theory" but ov er time, companies have realized that auditing is a process that helps companies to increas the management efficiency of companies.
Auditor's recommendations are like instructors giv ing instructions on how to drive, and the auditor is an instructor who gives instructions on how to run the company. We have investigated some private and public companies where the findings and recommendations given in the "Management Letter" have been received since the management letter is a document that is only prov ided to board members and the company, and they are not published and are not availiabe outside the company.
In this study, 28 private companies and 4 public companies were taken into consideration, where in the management letter were analyzed the most frequent findings of private companies and public companies.

ISSN 2411-9571 (Print) ISSN 2411-4073 (online)
European Journal of Economics
and Business Studies April 2018 Vol 4 No 1
264
According to our judgment the management paper is a very important document in the audit process, as the auditor writes all the findings that he finds during the audit process and writes it to the management letter, as well as gives recommendations for these findings, where management should consider improv ing.
As we pointed out above in the 28 private companies and 4 public companies some of the auditor's findings were, as follows:
Table 2 Findings by the auditor for private companies
Findings
Financial statements that are not reported under the IFRS rules 11%
Receiv able accounts 15%
Lack of internal regulations 19%
Tax Laws, Taxes 24%
Softw are does not process financial statements under the IFRS rules 12%
Stocks 8%
Money 2%
Assets 3%
Short Term Obligations 2%
Long Term Obligations 4%
Private Companies:
Graph 1 Findings from the auditor for private companies
Public Companies:
Table 3 Findings of the auditor for public companies
Findings
Financial statements that are not reported under the IFRS rules 5%
Receiv able accounts 29%
Findings0%
Financial statements that are not reported under
the IFRS rules 11%
Receivable accounts
15%
Lack of internal regulations
19%Tax Laws, Taxes
24%
Software does not process financial statements under
the IFRS rules 12%
Stocks8%
Money2%
Assets3%
Short Term Obligations
2%
Long Term Obligations 4%
FINDINGS

ISSN 2411-9571 (Print) ISSN 2411-4073 (online)
European Journal of Economics
and Business Studies April 2018 Vol 4 No 1
265
Procurement 12%
Tax Laws, Taxes 9%
Contingent Obligations 6%
Money 7%
Assets 32%
Graph 2 Findings from the auditor for public companies
gs
According to the data of public and private companies, regarding the compilation of financial statements based on International Standards for Financial Reporting, out of 24 private enterprises, 11% do not present the IFRS financial statements, while in public enterprises this percentage is lower 5% .
In Kosovo, until 2013, companies submitted financial statements to the Tax Administration in Kosovo, where the latter was not strict and unified for submitting financial statements. Most small and medium-sized companies have submitted financial reports only to the comprehensive income statement. But with the entry into force of the Financial Reporting Law, these companies are required to prepare IFRS financial statements.
During the audit, the companies presented a comprehensive income statement where the auditor recommended to have all IFRSs compiled. Other findings are receivable accounts where these accounts affect the efficiency of the enterprise, if the company increases sales at the same time it also increases the receivable accounts the company in the future will have problems with the cash flow as well as on the items of accounts that appear in the balance sheet (there are a lot of financia l positions which realistically are old more than a year). Their collection is difficult to recover and therefore the auditor recommends that he or she proves, that means, to know approx imately how much the company was able to collect this value.
We faced a lot of cases with sales growth. When there is a missing of cash simultaneously with the lack of cash the companies get a loan. The auditor recommends that the problem in this case is that even that their sales have been increasing the problem is that they took a loan. 28 private companies 15% have problems with receivable accounts.
Financial statements that are not reported under
the IFRS rules5%
Receivable accounts
29%
Procurement12%
Tax Laws, Taxes9%
Contingent Obligations
6%
Money2%
Assets32%
FINDINGS
ISSN 2411-9571 (Print) ISSN 2411-4073 (online)
European Journal of Economics
and Business Studies April 2018 Vol 4 No 1
266
A problem with public companies is that the receivable accounts are very large in the balance sheet accounts, that are older than 2008. With the government's decision and w ith the approval of the law on forgiveness of public debts Law no. 05 / L -043 on 22.07.2015 public companies according to this law until December 31, 2008 are free of all debts, but despite this law being implemented the companies did not delete these debts to the assets in the financial statements.
Another finding that is repeatable in private companies is that every company has to have internal rules to operate the management system in the company and must have the internal legal infrastructure where the employees of the company operate according to these internal regulations. 19% of companies do not have any internal regulations, while public utilities in recent years have drafted internal regulations although they still have to work because they are not properly completed.
At the public companies there are very sensitive department like procurement, where the auditor is very careful in this department because large amounts of purchases are made in public companies and auditors have to observe whether the procedures have been followed in accordance with the Public Procurement Law. 12% of private software companies do not process reports as required by international standards. The auditor has given the recommendations to have the ability to adapt and generate reports under IFRSs.
The auditor of the public enterprise observed also the failure to respect the fiscal laws in Kosovo where the findings are 9% in public enterprises, and 24% at private enterprises. Many times based on our experience the auditor's recommendatio ns have influenced the enterprises to make corrections on tax and helped to not get fined by the Tax Administration of Kosovo-ATK.
The auditor often finds irregularities in the cash registers, 2% in private enterprise while in the public enterprise 7% . Assets of private companies are 3% , while public companies are 32% . The question arises is why do public companies have so many recommendations for assets? The reason is that in 2007 all public companies have revalued the assets-assets where the company that did the valuation was not licensed in Kosovo and the auditor was reserved for the valuation of these assets. Public companies have not defined all the properties they had before the last war in Kosovo. The auditor expresses reservations that some properties of the public enterprise are usurped.
In some companies dealing with food business activ ities, the auditor has found that the sales managers have made deceptive receivable accounts, where substantial amounts (to the audited enterprise) have been debt, whereas after the customer's confirmation of the debt, it turns out that this client does not owe. Sales managers did not end up paying debts but used the customer's payments for their own purposes by deceiv ing the company's owed debt. This case is worth mentioning because it has had large amounts of value, where the owners were very pleased with the auditors observation.
Conclusion
The audit of the company is the generator of enterprise development, but at first it was difficult to develop collaboration between auditors and the company, as they were convinced that the auditor had a bad intention for the company. But the development of the profession in a continuous and professional manner (always in the interest of the companies) has incluenced the actors to understand the audit as a promoter for development.
The audit process has had different challenges, especially with the global crisis, where part of the blame was also thrown on non-professional auditors. The auditor should be professional in his judgment to decide on his actions in accordance with professional standards. Most companies have collaborated with auditors and throughout the work of auditors have been detected many nonconformities.
The audit as a process increases the credibility of the financial reporting presented by the company and increases the cooperation with partners such as enterprises, investors, other institutions etc. In modern times and with the expansion of the global market the auditor is a very important factor in the company's performance. Nowadays, the audit has become a very powerful pillar for company efficiency.
Audit plays an important role in managing companies in the best posible and most efficient way. Public and private companies, by apply ing internal and external auditing, have increased management system efficiency within their company. Companies that have an organized audit system have fewer findings and recommendations from external auditors, while companies that do not have an organized audit system have many nonconformity and mistakes, and their financial reporting is unreliable because these systems are not subject to audits. During the data collection for this study we observed that companies that have an audit system have fewer penalties from the tax administration and state control institutions.

ISSN 2411-9571 (Print) ISSN 2411-4073 (online)
European Journal of Economics
and Business Studies April 2018 Vol 4 No 1
267
References
[1] ACCA, (2012), Audit and Assurance [2] Audit and Assurance Faculty , (2009). Changes in financial reporting and audit practice [3] GrantThornton, (2010).Evaluating the internal and external audit function [4] Internal Audit Manual, Ministry of Finance of Albania 2010. [5] Karapici Vjollca, “Auditim”, teks 2002. [6] Karapici Vjollca, “Leksione te parashkruara ne Auditim” 2006. [7] Komapania e Auditimit “ETIKA” (2016). Letermenaxhmeti i Ndermarrjeve Publike dhe Ndermarrjeve Private
The changing role of Internal Audit, Deloite 2009.

ISSN 2411-9571 (Print) ISSN 2411-4073 (online)
European Journal of Economics
and Business Studies April 2018 Vol 4 No 1
268
DOI: 10.26417/ejes.v4i1.p268-278
Open Access. © 2018 İbrahim Kırcova et al.. This is an open access article licensed under the
Creative Commons Attribution-NonCommercial-NoDerivs 4.0 License
Instagram, Facebook or Twitter: Which Engages Best? A Comparative Study of Consumer Brand Engagement and Social Commerce Purchase Intention
İbrahim Kırcova
Yıldız Technical University
Yılmaz Yaman
Yıldız Technical University
Şirin Gizem Köse
Yıldız Technical University
Abstract
Social media networks compete with each other, and they make an effort to increase their number of users while at the same time try ing to create engagement. That is because a social media brand with high engagement creates high commitment and that leads to satisfy ing its business partners. This also increases the social commerce through that social media brand. Social commerce is defined as the commercial activ ities through social media channels, and it is a subdimension of online commerce. The new realities increased the interest towards social commerce through social networks and made it valuable to explore for both practical and academic environments. This study aims to investigate social media engagement regarding social media networks and explore the relationship between social media engagement and social commerce purchase intention. In the light of these objectives, a survey was conducted to collect the data and shared through social media networks. Hypotheses in the research were analyzed by using independent samples t-test, one-way ANOVA, Pearson correlation, and multiple regressions. Results showed social media networks differ according to consumer brand engagement. Also, consumer brand engagement differs according to age, education level, and income level. Another result proves that consumer brand engagement differs according to social media usage frequency and time spent using social media. Furthermore, social commerce purchase intention differs according to the social media networks. Finally , the study found that there is a positive relationship between consumer brand engagement and social commerce purchase intention.
Keywords: Consumer Brand Engagement, Social Commerce, Social Media Marketing
Introduction
Consumer brand engagement (CBE) represents the specific brand interactions of consumers’ in cognitive, emotional, and behavioral dimensions (Hollebeek, Glynn, & Brodie, 2014). This engagement can be observed through social media networks (Boyd & Ellison, 2007). Social media networks are not just the channels that people interact with each other by creating a profile page, but also they have become the platforms that prov ide new business models and thus made the emergence of social commerce concept possible (Liang & Turban, 2011). Studies on social commerce started to increase after 2010 and 110 different studies have been carried out by the end of 2015 (Busalim & Hussin, 2016a). The objectives of most of these studies are related to the conceptualization of social commerce, understanding consumer behavior in this context and investigating the interface of the websites that make social commerce. Busalim & Hussin (2016a) indicate that in the studies they investigated, there is only one of them emphasizes on consumer engagement in social commerce. The

ISSN 2411-9571 (Print) ISSN 2411-4073 (online)
European Journal of Economics
and Business Studies April 2018 Vol 4 No 1
269
common social networks have their own construct, and culture and therefore, they have different engagement levels (Clark, Black, & Judson, 2017; Smith, Fischer, & Yongjian, 2012). A study takes these differences into account is expected to contribute to both academic and managerial areas.
From this point of v iew, the primary objective of this research is to compare the engagement levels of social media networks and explore the relationship between these engagements with social commerce. In this context, the fundamental questions of the research are:
RQ1: Is there a difference between social media networks regarding consumer engagement?
RQ2: Does high consumer engagement turn into high social commerce purchase intention?
RQ3: Which social media network user tends to purchase in social commerce?
The study starts with the literature rev iew of consumer brand engagement and social commerce concepts and continues with organizing research model and building research model and hypotheses. After giv ing information related to sampling, method, and analyses, hypotheses were tested. The results have been evaluated from academic and managerial points.
Literature Review
Service-Dominant Marketing and Consumer Brand Engagement
Consumer brand engagement (also known as customer brand engagement) is a concept that is supported by serv ice dominant marketing theory and appeared in the literature in the 2000s (Brodie, Hollebeek, Jurić, & I lić, 2011). In serv ice dominant marketing, customers take part in producing the serv ice as a result of the engagement with customers. Together with this, the element that determines the value of the product is associated with the satisfaction level of customer (Erdoğan, Tiltay, & Kimzan, 2011). From this point of v iew, consumer engagement is a reflection of customer’s particular psychological state induced by the customer’s interactive experiences with a brand or platform (Brodie et al., 2011).
Nowadays social media prominently affects every area of life as it is a new form of communication (Klososky, 2011), it also started to influence purchase decision (Pongpaew, Speece, & Tiangsoongnern, 2017). The social media platforms that offer their users engagement remain on the agenda of marketers. At present time, brands try to manage a range of processes that start from identity creation on social networks, blogs, and other digital tools and continue with customer serv ice in the frame of social media marketing (Kırcova & Enginkaya, 2015). Therefore, nowadays consumer engagement means consumers’ experiences on social media platforms and accordingly reflections of their psychological states.
Fundamentally consumer engagement has three dimensions: a) cognitive processing b) affection c) activation. Cognitive processing is “a consumer's level of brand-related thought processing and elaboration in a particular consumer/brand interaction”. As consumer’s cognitive processing capacity increases, the engagement also increases. Affection is defined as “a consumer's degree of positive brand-related affect in a particular consumer/brand interaction.” Finally , activation is “a consumer's level of energy, effort and time spent on a brand in a particular consumer/brand interaction.” (Hollebeek et al., 2014)
Engagement in social platforms includes how consumers use, share and talk about the content related to brand and company (Kırcova & Enginkaya, 2015). The first expectation of brands that use social media marketing is users’ adaptation and contribution to the content and engaging with the brand (Tsimonis & Dimitriadis, 2014). Nowadays most of the consumers engage with brands through social media and brands also use social media networks as customer serv ices and as a fundamental contact point with consumers (Clark et al., 2017).
When the penetration rate of social networks are investigated, we can see that the most used social networks are Facebook (% 63), Instagram (% 27) and Twitter (% 22) (Smartinsight, 2017). In Turkey, most used social networks are Facebook, Twitter and Google+ while Instagram is the fifth most used social network after Youtube and it is the most developing one (Statista, 2017). In the consumer researches that were carried out on social media networks, it was found that the users of Facebook, Instagram, and Twitter differentiate according to some dimensions (Clark et al., 2017). However, this differentiation was not investigated from the point of engagement.
This study investigates consumer engagement of three most prominent social networks comparatively . In this context, first three hypotheses are related to the differentiation of consumer engagement according to social media networks, socio-demographic variables, and social media usage habits.

ISSN 2411-9571 (Print) ISSN 2411-4073 (online)
European Journal of Economics
and Business Studies April 2018 Vol 4 No 1
270
H1: Consumer brand engagement differs according to social media networks.
H2: Consumer brand engagement differs according to socio-demographic variables.
H3: Consumer brand engagement differs according to social media usage habits.
Engagement and Social Commerce Purchase Intention
The fact that the social media networks like Facebook and Twitter become popular opened the way for a new e-business distribution channel named social commerce (Liang, Ho, Li, & Turban, 2011). Social commerce can be defined as doing commercial transactions through social media networks. Nowadays many e-commerce firms aim to reach the global market by moving their commercial activ ities to social media (Zhou, Zhang, & Zimmermann, 2013).
Social commerce concept has been increasingly popular in the recent years. For instance, there are 25 million commercial profiles worldwide as of December 2017. This number was 15 million in June 2017. Nowadays, % 80 of people on Instagram follow a business profile and % 25 of people on Instagram (equals to 200 million people) v isit a commercial page every day. These facts point that social commerce has become an area that companies are especially interested in (Instagram-Press, 2017).
Academic studies related to social commerce increased after Yahoo introduced common shopping interface named social commerce for the first time in 2005. It is identified that there are 110 studies in years 2010-2015. Most of these studies focused on user behavior on social commerce, social commerce models, website designs, security and firm performance (Busalim & Hussin, 2016b). With the development of social commerce concept, consumers’ intention of shopping through social media networks often became subject of studies. These studies generally focused on perceived trust, risk and social support (Farivar, Turel, & Yuan, 2017; S Kim & Park, 2013; Liang et al., 2011).
It is observed that firms engage with consumers in an attempt to stay connected with them. In a research, it is found that marketers should especially invest more in Facebook and Twitter to reach customers and engage more with them (Smith et al., 2012). Therefore social media engagement has become an essential element for both marketing and sales activ ities. From this point of v iew, it is expected that as social network engagement increases, purchase intention in social commerce also increases.
Social media increasingly become a part of life and studies prove that it affects purchasing decisions together with daily socialization needs. Various studies indicate that social media explains % 18 to % 79 of social commerce (Abed, Dwivedi, & Williams, 2017). For instance, Kim & Park (2013) found that trust in social media explains % 33 of social commerce purchase intention. Another study specifies that perceived commercial risk and trust in website explain % 54 of social commerce purchase intention (Farivar et al., 2017).
The primary objective of social commerce is gaining benefit through social networks. This benefit is measured by determining purchase intention which is an indicator of consumer behavior (Liang et al., 2011). In this context, H4 and H5 are as follows:
H4: Social commerce purchase intention differs according to social media networks.
H5: There is a positive relationship between social commerce purchase intention and consumer brand engagement.
Methodology
The selection of social networks used in the research
It has been 20 years since the first big social network website opened. According to the classification of Boyd & Ellison (2007), social network sites that become widespread in 1997, nowadays has turned into a global network that includes 2.46 billion people (Statista, 2017). Facebook has become the most crowded community in the world with its more than 2 billion users after ten years of its establishment which is 2005 (Huffington Post, 2015).
In the world, Facebook (% 94) is the primary social media network that businesses use for marketing purposes, and Twitter (% 68), Linkedin (% 56) and Instagram (% 54) follows it (StatistaX, 2017). Although Instagram appeared lastly , Instagram is expected to be in the first three social networks in the year 2018 with its pace. Therefore it can be seen that the most important and primary tools for social commerce transactions are Facebook, Twitter, and Instagram.

ISSN 2411-9571 (Print) ISSN 2411-4073 (online)
European Journal of Economics
and Business Studies April 2018 Vol 4 No 1
271
According to a research carried out by Hootsuite, more than 1/3 of the world uses social media networks as of 2017, and the networks increase their user numbers annually % 21. Turkey is the 12th country that has the biggest user number with its penetration rate of % 60.
Similar to the world, the most used social media networks in Turkey are Youtube, Facebook, Instagram and Twitter (We Are Social, 2017). This research was carried out on the most used social networks in Turkey and the world in the context of social commerce. The research involves the first three networks Facebook, Instagram, and Twitter. Youtube was excluded since it focuses on v ideo.
Variables of the Research
Studies on social media engagement fundamentally have two different approaches:
The studies focusing on the reactions of consumers (number of likes, number of comments, follower number etc.) to the posts made by Brand X or Brand Group X’s account in social media networks (Malhotra, Scholar, Hill, & Malhotra, n.d.; Mishra & Mishra, 2017; Olczak & Sobczyk, 2013; Pletikosa Cvijikj & Michahelles, 2013).
The studies focusing on consumers’ declaration related with engagement based on the personal experiment on social media (Clark et al., 2017; Enginkaya & Esen, n.d.; Hollebeek et al., 2014; Kabadayi & Price, 2014; Pongpaew et al., 2017).
This study follows the second approach. Therefore, in this research Hollebeek et al.’s (2004) social media engagement measure was used. The scale has three dimensions: cognitive processing, affective and activation. This study also used Kim & Park’s (2013) social commerce purchase intention scale.
The research was carried out with an online survey. In the first question, participants were asked which social media network they use the most. According to this answer, they were given a specially designed survey. This means, participants only answer the questions related to the social media they use the most. Tablo 1 shows the details of three-dimensio nal consumer brand engagement (CBE) and one dimension purchase intention (PI) scales.
Table 1: Measures of The Research
CBE_Cognitive Processing
1.1 Using F/I/T gets me to think about F/I/T.
1.2 Using F/I/T stimulates my interest to learn more about F/I/T.
1.3 I think about F/I/T a lot w hen I'm using it.
CBE_Affection
2.1 I feel v ery positive when I use F/I/T.
2.2 Using F/I/T makes me happy.
2.3 I feel good w hen I use F/I/T.
2.4 I'm proud to use F/I/T.
TME_Activation
3.1 I spend a lot of time using F/I/T, compared to other professional social networking sites.
3.2 Whenev er I'm using professional social networking sites, I usually use F/I/T.
3.3 F/I/T is one of the brands I usually use when I use professional social networking sites.
Purchase Intention
I am likely to purchase products on F/I/T
Giv en the opportunity , I would consider purchasing products on F/I/T in the future.
It is likely that I w ill actually purchase products on F/I/T in the near future.
Giv en the opportunity , I intend to purchase products on F/I/T.
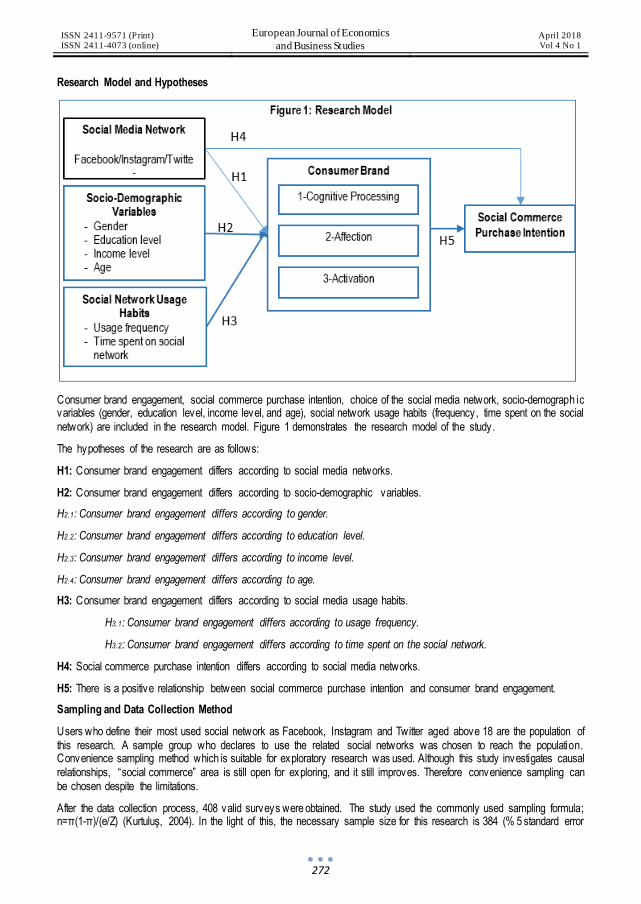
ISSN 2411-9571 (Print) ISSN 2411-4073 (online)
European Journal of Economics
and Business Studies April 2018 Vol 4 No 1
272
Research Model and Hypotheses
Consumer brand engagement, social commerce purchase intention, choice of the social media network, socio-demograph ic variables (gender, education level, income level, and age), social network usage habits (frequency, time spent on the social network) are included in the research model. Figure 1 demonstrates the research model of the study.
The hypotheses of the research are as follows:
H1: Consumer brand engagement differs according to social media networks.
H2: Consumer brand engagement differs according to socio-demographic variables.
H2.1: Consumer brand engagement differs according to gender.
H2.2: Consumer brand engagement differs according to education level.
H2.3: Consumer brand engagement differs according to income level.
H2.4: Consumer brand engagement differs according to age.
H3: Consumer brand engagement differs according to social media usage habits.
H3.1: Consumer brand engagement differs according to usage frequency.
H3.2: Consumer brand engagement differs according to time spent on the social network.
H4: Social commerce purchase intention differs according to social media networks.
H5: There is a positive relationship between social commerce purchase intention and consumer brand engagement.
Sampling and Data Collection Method
Users who define their most used social network as Facebook, Instagram and Twitter aged above 18 are the population of this research. A sample group who declares to use the related social networks was chosen to reach the population. Convenience sampling method which is suitable for exploratory research was used. Although this study investigates causal relationships, “social commerce” area is still open for exploring, and it still improves. Therefore convenience sampling can be chosen despite the limitations.
After the data collection process, 408 valid surveys were obtained. The study used the commonly used sampling formula; n=π(1-π)/(e/Z) (Kurtuluş, 2004). In the light of this, the necessary sample size for this research is 384 (% 5 standard error
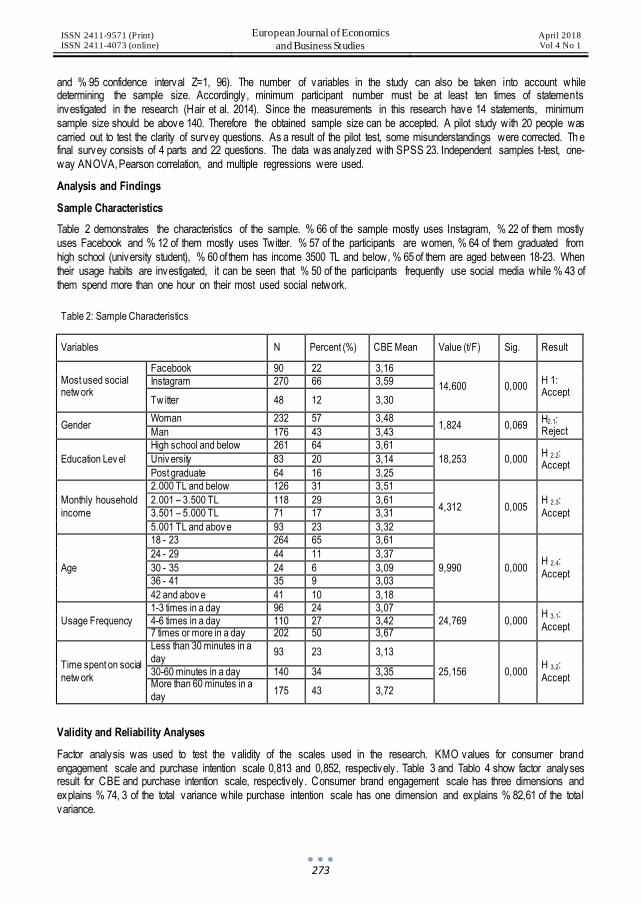
ISSN 2411-9571 (Print) ISSN 2411-4073 (online)
European Journal of Economics
and Business Studies April 2018 Vol 4 No 1
273
and % 95 confidence interval Z=1, 96). The number of variables in the study can also be taken into account while determining the sample size. Accordingly , minimum participant number must be at least ten times of statements investigated in the research (Hair et al. 2014). Since the measurements in this research have 14 statements, minimum sample size should be above 140. Therefore the obtained sample size can be accepted. A pilot study with 20 people was carried out to test the clarity of survey questions. As a result of the pilot test, some misunderstandings were corrected. Th e final survey consists of 4 parts and 22 questions. The data was analyzed with SPSS 23. Independent samples t-test, one-way ANOVA, Pearson correlation, and multiple regressions were used.
Analysis and Findings
Sample Characteristics
Table 2 demonstrates the characteristics of the sample. % 66 of the sample mostly uses Instagram, % 22 of them mostly uses Facebook and % 12 of them mostly uses Twitter. % 57 of the participants are women, % 64 of them graduated from high school (university student), % 60 of them has income 3500 TL and below, % 65 of them are aged between 18-23. When their usage habits are investigated, it can be seen that % 50 of the participants frequently use social media while % 43 of them spend more than one hour on their most used social network.
Table 2: Sample Characteristics
Variables N Percent (%) CBE Mean Value (t/F) Sig. Result
Most used social netw ork
Facebook 90 22 3,16
14,600 0,000 H 1: Accept
Instagram 270 66 3,59
Tw itter 48 12 3,30
Gender Woman 232 57 3,48
1,824 0,069 H2.1: Reject Man 176 43 3,43
Education Lev el
High school and below 261 64 3,61
18,253 0,000 H 2.2: Accept
Univ ersity 83 20 3,14
Post graduate 64 16 3,25
Monthly household
income
2.000 TL and below 126 31 3,51
4,312 0,005 H 2.3:
Accept
2.001 – 3.500 TL 118 29 3,61
3.501 – 5.000 TL 71 17 3,31
5.001 TL and abov e 93 23 3,32
Age
18 - 23 264 65 3,61
9,990 0,000 H 2.4:
Accept
24 - 29 44 11 3,37
30 - 35 24 6 3,09
36 - 41 35 9 3,03
42 and abov e 41 10 3,18
Usage Frequency
1-3 times in a day 96 24 3,07
24,769 0,000 H 3.1:
Accept 4-6 times in a day 110 27 3,42 7 times or more in a day 202 50 3,67
Time spent on social
netw ork
Less than 30 minutes in a
day 93 23 3,13
25,156 0,000 H 3.2:
Accept 30-60 minutes in a day 140 34 3,35 More than 60 minutes in a
day 175 43 3,72
Validity and Reliability Analyses
Factor analysis was used to test the validity of the scales used in the research. KMO values for consumer brand engagement scale and purchase intention scale 0,813 and 0,852, respectively . Table 3 and Tablo 4 show factor analyses result for CBE and purchase intention scale, respectively . Consumer brand engagement scale has three dimensions and explains % 74, 3 of the total variance while purchase intention scale has one dimension and explains % 82,61 of the total variance.
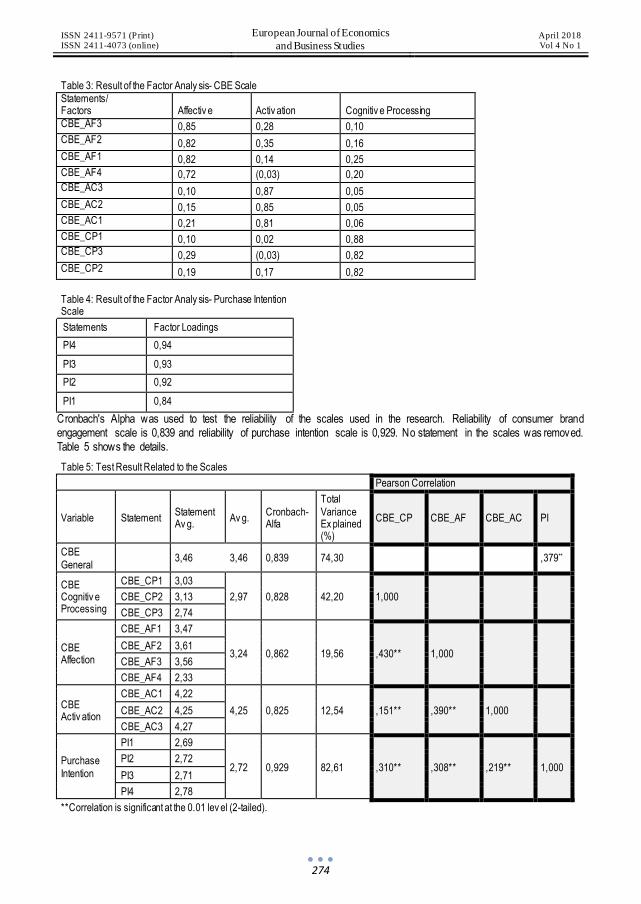
ISSN 2411-9571 (Print) ISSN 2411-4073 (online)
European Journal of Economics
and Business Studies April 2018 Vol 4 No 1
274
Table 3: Result of the Factor Analy sis- CBE Scale
Statements/ Factors Affectiv e Activ ation Cognitiv e Processing
CBE_AF3 0,85 0,28 0,10
CBE_AF2 0,82 0,35 0,16
CBE_AF1 0,82 0,14 0,25
CBE_AF4 0,72 (0,03) 0,20
CBE_AC3 0,10 0,87 0,05
CBE_AC2 0,15 0,85 0,05
CBE_AC1 0,21 0,81 0,06
CBE_CP1 0,10 0,02 0,88 CBE_CP3 0,29 (0,03) 0,82
CBE_CP2 0,19 0,17 0,82
Table 4: Result of the Factor Analy sis- Purchase Intention Scale
Statements Factor Loadings
PI4 0,94
PI3 0,93
PI2 0,92
PI1 0,84
Cronbach's Alpha was used to test the reliability of the scales used in the research. Reliability of consumer brand engagement scale is 0,839 and reliability of purchase intention scale is 0,929. No statement in the scales was removed. Table 5 shows the details.
Table 5: Test Result Related to the Scales
Pearson Correlation
Variable Statement Statement Av g.
Av g. Cronbach-Alfa
Total
Variance Ex plained (%)
CBE_CP CBE_AF CBE_AC PI
CBE
General 3,46 3,46 0,839 74,30 ,379**
CBE Cognitiv e Processing
CBE_CP1 3,03
2,97 0,828 42,20 1,000 CBE_CP2 3,13
CBE_CP3 2,74
CBE Affection
CBE_AF1 3,47
3,24 0,862 19,56 ,430** 1,000 CBE_AF2 3,61
CBE_AF3 3,56
CBE_AF4 2,33
CBE Activ ation
CBE_AC1 4,22
4,25 0,825 12,54 ,151** ,390** 1,000 CBE_AC2 4,25
CBE_AC3 4,27
Purchase
Intention
PI1 2,69
2,72 0,929 82,61 ,310** ,308** ,219** 1,000 PI2 2,72
PI3 2,71
PI4 2,78
**Correlation is significant at the 0.01 lev el (2-tailed).

ISSN 2411-9571 (Print) ISSN 2411-4073 (online)
European Journal of Economics
and Business Studies April 2018 Vol 4 No 1
275
Results of correlation analyses show that all three dimensions of consumer brand dimensions are in a linear relationship with social commerce purchase intention. Cognitive processing dimension has the highest correlation (0,310); affectiv e dimension (0,308) and activation dimension (0,219) follow it. Consumer brand engagement in general also has a positive relationship with social commerce purchase intention (0,379).
Results of Hypotheses
The first hypothesis was accepted after apply ing one way ANOVA. As seen in Table 2, Instagram (3, 59) has the highest engagement when compared to two other social media networks (3, 16-3, 30).
In order to test the second hypothesis, t-test was used for gender and one way ANOVA was used for the three other variables. According to the results, consumer brand engagement does not differ according to gender but differs according to age, education and income level. Therefore, H 2.1 (sig. = 0,069) was rejected while H 2.2 (sig. = 0,000), H2.3 (sig. = 0,000) and H2.4 (sig. = 0,000) were accepted.
Table 2 shows that consumer brand engagement differs according to usage frequency and time spent on the social network. It can be seen that people who use social network frequently and spend more time on that network have higher engagement points as expected. Therefore H 3.1 (sig. = 0,000) and H3.2 (sig. = 0,000) are accepted after apply ing one way ANOVA.
H4 was tested by apply ing one way ANOVA. According to the results, social commerce purchase intention differs according to the social media network. In this respect, Instagram was first with the highest average (2, 92) and Facebook (2, 54) and Twitter (1, 92) follow it. Therefore, H4 is accepted.
In order to test the last hypothesis, correlation and multiple regression analysis were applied. According to the Pearson correlation analysis that can be seen in Table 5, there is a positive relationship (0,379) between consumer brand engagement and social commerce purchase intention. Results of the regression analysis show that consumer brand engagement explains social commerce purchase intention (Table 6: R2:0,146; F: 31,237; Sig.:0.000). Hence, H5 is accepted.
Table 6: CBE-PI Regression Analysis
Model R R Square Adjusted R Square Std. Error of the Estimate
1 ,382a ,146 ,140 1,16410
a. Predictors: (Constant), Activation, Cognitive Processing, Affection
ANOVAa Model Sum of Squares df
Mean Square F
Sig.
1 Regression 93,712 3 31,237 23,051 ,000b
Residual 547,468 404 1,355
Total 641,180 407
a. Dependent Variable: Purchase Intention
b. Predictors: (Constant), Activation, Cognitive Processing, Affection
Conclusion
Consumer brand engagement is a reflection of a consumer’s psychological state that appears during the interactiv e experience with a brand or social media platform (Brodie et al., 2011). Nowadays consumers experience this through social media platforms. Now that social media affects daily decisions, this situation peaked, and social media currently leads the purchase decisions of consumers.
Consumer brand engagement concept is explored in literature within the scope of serv ice-dominant marketing theory, and the concept was studied in various perspectives (Brodie et al., 2011). At present time, the fact that half of the world population use social media platforms makes brands highly interested in social media and therefore, social media have become a channel that commercial activ ities take place. Brands try to be influential on these platforms and strengthen their relationships with their consumers by creating high engagement. This relationship also increases trust and loyalty to the brand and consequently prov ides direct or indirect marketing support.
There are various studies on social commerce which is positioned as a sub-branch of electronic commerce (Liang & Turban, 2011). However, there is still need for studies that address its relationship with brand engagement. This study aims to fill
ISSN 2411-9571 (Print) ISSN 2411-4073 (online)
European Journal of Economics
and Business Studies April 2018 Vol 4 No 1
276
the gap by addressing customer brand engagement levels according to social media platforms and its relationship with social commerce purchase intention.
Users of Facebook, Instagram and Twitter are included in this research. The sample mostly comprised of young university students (% 65). The sample mostly uses Instagram (% 66), Facebook (% 22) and Twitter (% 12), respectively . Although the biggest social network is Facebook regarding the number of users, Instagram is continuously growing. It is also found in the study that especially young people choose Instagram.
Consumer brand engagement scale (Hollebeek et al., 2014) that consists of 3 dimensions and 10 statements and social commerce purchase intention scale (Kim & Park, 2013) consists of one dimension and 4 statements. The scales were valid and reliable. Later, hypotheses were tested and all hypotheses except H 2.1 were accepted.
The main focus of the study is to determine whether there is a relationship between consumer brand engagement and social commerce purchase intention since there is a gap in the literature regarding this relationship. The most important finding of the study is that there is a positiv e relationship between consumer brand engagement and social commerce purchase intention and consumer brand engagement can explain purchase intention in social commerce. Another finding is that this relationship differs according to social media network. High engagement means high purchase intention.
This study determined the positive relationship between consumer brand engagement and social media purchase intention as an academic contribution. The study also advises for marketing practitioners about which social media network to focus while making social media investment. Managers should understand the importance of engagement and reserve the highest budget on the social network that gets the most engagement. Even though Facebook is the biggest social network, Instagram started to attract investments with its high engagement and purchase intention rate. Findings of the study support these statements. According to the findings, the most used social network is Instagram (% 66), and it also has the highest consumer brand engagement mean (3.59). Although Facebook is the second most used social network (% 22), consumer brand engagement mean of Twitter (3.30) is higher than Facebook (3.16).
Although social commerce is only % 10 of e-commerce (Emarketer. com, 2017), it is an area that has a potential to develop. Therefore it continues to draw the attention of both consumers and brands. Despite the fact that brands currently invest on Instagram that gives the best results (Entrepreneur.com, 2017), they used to invest in Facebook years ago, and the appearance of a new innovative platform can change the rules of the game.
Bibliography
[1] Abed, S. S., Dwivedi, Y. K., & Williams, M. D. (2017). Social commerce adoption research from the consumer context: A literature rev iew. International Journal of Business Information Systems, 25(4), 510–525. https://doi.org/10.1504/IJBIS.2017.085175
[2] Boyd, D. m., & Ellison, N. B. (2007). Social Network Sites: Definition, History, and Scholarship. Journal of Computer-Mediated Communication, 13(1), 210–230. https://doi.org/10.1111/j.1083-6101.2007.00393.x
[3] Brodie, R. J., Hollebeek, L. D., Jurić, B., & Ilić, A. (2011). Customer Engagement: Conceptual Domain, Fundamental Propositions, and Implications for Research. Journal of Service Research, 14(3), 252–271. https://doi.org/10.1177/1094670511411703
[4] Busalim, A. H., & Hussin, A. R. C. (2016a). Understanding social commerce: A systematic literature rev iew and directions for further research. International Journal of Information Management. https://doi.org/10.1016/j.ijinfomgt.2016.06.005
[5] Busalim, A. H., & Hussin, A. R. C. (2016b). Understanding social commerce: A systematic literature rev iew and directions for further research. International Journal of Information Management, 36(6), 1075–1088. https://doi.org/10.1016/j.ijinfomgt.2016.06.005
[6] Clark, M., Black, H. G., & Judson, K. (2017). Brand community integration and satisfaction with social media sites: a comparative study. Journal of Research in Interactive Marketing, 11(1), 39–55. https://doi.org/10.1108/JRIM-07-2015-0047
[7] Digital in 2017: Global Overv iew - We Are Social. (2017). Retrieved November 18, 2017, from https://wearesocial.com/special -reports/digital-in-2017-global-overv iew
[8] Erdoğan, B. Z., Tiltay, M. A., & Kimzan, H. S. (2011). Pazarlama Teorisi’nin Felsefi Temelleri Değişim mi? İlişki mi? Tüketici ve Tüketim Araştırmaları Dergisi, 3(1), 1–28. Retrieved from http://betadergi.com/ ttad/yonetim/icerik/makaleler/52-published.pdf
ISSN 2411-9571 (Print) ISSN 2411-4073 (online)
European Journal of Economics
and Business Studies April 2018 Vol 4 No 1
277
[9] Emarketer. com. (2017). US Social Commerce 2017: Influencing and Driv ing Sales - eMarketer. Retrieved December 16, 2017, from https://www.emarketer.com/Report/US-Social-Commerce-2017-Influencing-Driv ing-Sales/2001922
[10] Enginkaya, E., & Esen, E. (n.d.). DIMENSIONS OF ONLINE CUSTOMER ENGAGEMENT. Retrieved from http://www.pressacademia.org/images/documents/jbef/archives/vol_3_issue_1/paper -7.pdf
[11] Entrepreneur.com. (2017). Faceoff: Instagram Vs. Facebook, For Business. Retrieved December 17, 2017, from https://www.entrepreneur.com/article/280833
[12] Facebook. (2017). Black Friday and Cyber Monday 2017 on Facebook and Instagram. Retrieved November 28, 2017, from https://www.facebook.com/iq/articles/how -did-black-friday-and-cyber-monday-unfold-on-facebook-and-instagram?sc=em.mkto&mb=fbiq&mp=fbiq&scn=tl.momentsholidays.blackfri&mid= tl.momentsholidays.blackfri.blackfridaycybermonday.1608&wfid=&mkt_tok=eyJpIjoiWTJFeE
[13] Farivar, S., Turel, O., & Yuan, Y. (2017). A trust-risk perspective on social commerce use: an examination of the biasing role of habit. Internet Research, 27(3), 586–607. https://doi.org/10.1108/IntR-06-2016-0175
[14] Hair Jr, J. F., William, C., Babin, B. J., & Anderson, R. E. (2014). Multivariate Data Analysis - Seventh Edition. [15] Hollebeek, L. D., Glynn, M. S., & Brodie, R. J. (2014). Consumer brand engagement in social media:
Conceptualization, scale development and validation. Journal of Interactive Marketing, 28(2), 149–165. https://doi.org/10.1016/j.intmar.2013.12.002
[16] Huffington Post. (2015). Facebook Is Now Bigger Than The Largest Country On Earth | HuffPost. Retrieved November 18, 2017, from https://www.huffingtonpost.com/2015/01/28/ facebook-biggest-country_n_6565428.html
[17] Instagram-Press. (2017). Celebrating a Community of 25 Million Businesses – Instagram. Retrieved December 7, 2017, from https://instagram-press.com/blog/2017/11/30/celebrating-a-community -of-25-million-businesses/
[18] Kabadayi, S., & Price, K. (2014). Consumer – brand engagement on Facebook: liking and commenting behaviors. Journal of Research in Interactive Marketing, 8(3), 203–223. https://doi.org/10.1108/JRIM-12-2013-0081
[19] Kırcova, İ., & Enginkaya, E. (2015). Sosyal Medya Pazarlama. BETA Yayın. [20] Kim, S., & Park, H. (2013). Effects of various characteristics of social commerce (s- commerce) on consumers’
trust and trust performance. International Journal of Information Management, 33(2), 318–332. [21] Kim, S., & Park, H. (2013). Effects of various characteristics of social commerce (s-commerce) on consumers’
trust and trust performance. International Journal of Information Management, 33(2), 318–332. https://doi.org/10.1016/j.ijinfomgt.2012.11.006
[22] Klososky, S. (2011). Manager’s guide to social media. McGraw-Hill. [23] Liang, T.-P., Ho, Y.-T., Li, Y.-W., & Turban, E. (2011). What Drives Social Commerce: The Role of Social
Support and Relationship Quality . International Journal of Electronic Commerce, 16(2), 69–90. https://doi.org/10.2753/JEC1086-4415160204
[24] Liang, T.-P., & Turban, E. (2011). Introduction to the Special Issue Social Commerce: A Research Framework for Social Commerce. International Journal of Electronic Commerce, 16(2), 5–14. https://doi.org/10.2753/JEC1086-4415160201
[25] Malhotra, A., Scholar, T. W. L., Hill, C., & Malhotra, C. K. (n.d.). Creating Brand Engagement on Facebook by. [26] Mishra, K., & Mishra, A. (2017). 4.4.09 Building brand engagement through Twitter marketing strategies,
4(April 2016), 380–390. Retrieved from http://www.ingentaconnect.com/content/hsp/jdsmm/2017/00000004/00000004/art00009
[27] Olczak, A., & Sobczyk, R. (2013). Brand Engagement on Facebook Based on Mobile Phone Operators’ Activ ity Within Four European Countries. Studia Ekonomiczne. Retrieved from https://www.infona.pl/resource/bwmeta1.element.desklight-ecdf2abe-3986-40a4-8240-6cb82b6e8645
[28] Pletikosa Cvijikj, I., & Michahelles, F. (2013). Online engagement factors on Facebook brand pages. Social Network Analysis and Mining, 3(4), 843–861. https://doi.org/10.1007/s13278-013-0098-8
[29] Pongpaew, W., Speece, M., & Tiangsoongnern, L. (2017). Social presence and customer brand engagement on Facebook brand pages. Journal of Product & Brand Management, 26(3), 262–281. https://doi.org/10.1108/JPBM-08-2015-0956
[30] Smartinsight. (2017). Global Social Media Statistics Summary 2017. Retrieved November 30, 2017, from https://www.smartinsights.com/social-media-marketing/social-media-strategy/new-global-social-media-research/

ISSN 2411-9571 (Print) ISSN 2411-4073 (online)
European Journal of Economics
and Business Studies April 2018 Vol 4 No 1
278
[31] Smith, A. N., Fischer, E., & Yongjian, C. (2012). How Does Brand-related User-generated Content Differ across YouTube, Facebook, and Twitter? Journal of Interactive Marketing, 26(2), 102–113. https://doi.org/10.1016/j.intmar.2012.01.002
[32] Statista. (2017). Turkey: social media usage 2016-2017. Retrieved November 30, 2017, from https://www.statista.com/statistics/570098/distribution-of-social-media-used-turkey/
[33] StatistaX. (2017). Social media platforms used by marketers worldwide 2017. Retrieved December 7, 2017, from https://www.statista.com/statistics/259379/social-media-platforms-used-by-marketers-worldwide/
[34] StatistaY. (2017). Number of social media users worldwide 2010-2021. Retrieved November 18, 2017, from https://www.statista.com/statistics/278414/number -of-worldwide-social-network-users/
[35] Tsimonis, G., & Dimitriadis, S. (2014). Brand strategies in social media. Marketing Intelligence & Planning, 32(3), 328–344. https://doi.org/10.1108/MIP-04-2013-0056
[36] Zhou, L., Zhang, P., & Zimmermann, H. D. (2013). Social commerce research: An integrated v iew. Electronic Commerce Research and Applications, 12(2), 61–68. https://doi.org/10.1016/j.elerap.2013.02.003

ISSN 2411-9571 (Print) ISSN 2411-4073 (online)
European Journal of Economics
and Business Studies April 2018 Vol 4 No 1
279
DOI: 10.26417/ejes.v4i1.p279-294
Open Access. © 2018 Çeljeta Sherifi and Güngör Turan. This is an open access article licensed under the
Creative Commons Attribution-NonCommercial-NoDerivs 4.0 License
Global Financial Crises: The Impact on Albanian Economic Growth
Çeljeta Sherifi
PhD Cand., Epoka University , Economics Department, Tirana, Albania
Güngör Turan
Prof. Dr., Epoka University , Economics Department, Tirana, Albania
Abstract
This study presents the main causes and characteristics of the 2008 world financial crises, focusing on its impact on Albania`s economic growth; by examining the channels through which the global crises affected it. The methodology used to measure the impact of the crises is regression analysis and Johansen co-integration test, for exports and remittances as two important influencing components of GDP. The data is taken by INSTAT and World Bank on a quarterly basis, for 2004-2013 interval. The analysis showed that the crisis had a negativ e impact to a range of indicators causing a decline in emigrants’ remittances, exports, FDI, affecting so GDP and the entire economic growth of Albania.
Keywords: GDP, financial crisis, exports, FDI, Albania
Introduction
Some years ago, the world economy faced the most severe financial crisis since the Great Depression of the last century. It started to appear in the middle of 2007 in the United States, due to subprime mortgage crises, and for a short time spread all over the world. Although the impact of the crisis was not uniform across all countries, no region of the world was unaffected; all regions experienced a considerable reduction in GDP growth and many countries suffered recession.
There is no precise definition of “financial crisis” but a common v iew is that disruptions in financial markets rise to the level of a crisis when the flow of credit to households and businesses is constrained and the real economy of goods and serv ices is adversely affected.1 In the 19th and early 20th centuries, many financial crises were associated with banking panics, and many recessions coincided with these panics. Other situations that are often called financial crises include stock market crashes and the bursting of other financial bubbles, currency crises, and sovereign defaults. Financial crises directly result in a loss of paper wealth; they do not directly result in changes in the real economy unless a recession or depression follows.2
The financial crisis of 2008 is considered by many economists to be the worst financial crisis since the Great Depression of the 1930s3. Around the world stock markets have fallen, large financial institutions have collapsed or been bought out, and governments of all nations have had to come up with rescue packages to save their financial systems. US financial institutions had been lending on a massive scale to many home borrowers with low -document loans. The people who sold the loans got their commission, and the investment banks securitized the loans and on-sold these securities as quickly as
1 Jickling, Mark. “Averting Financial Crisis”. CRT Report for US Congress. 21 March 2008. 2 P. Kindleberge, Charles, & Aliber, Robert. “Manias, Panics, and Crashes: A History of Financial Crises”, 5th Ed. New Jersey: John Wiley & Sons, Inc., Hoboken, 2005. 3 Roubini, Rogoff and Behrav esh. Reuters. 29 February, 2009.
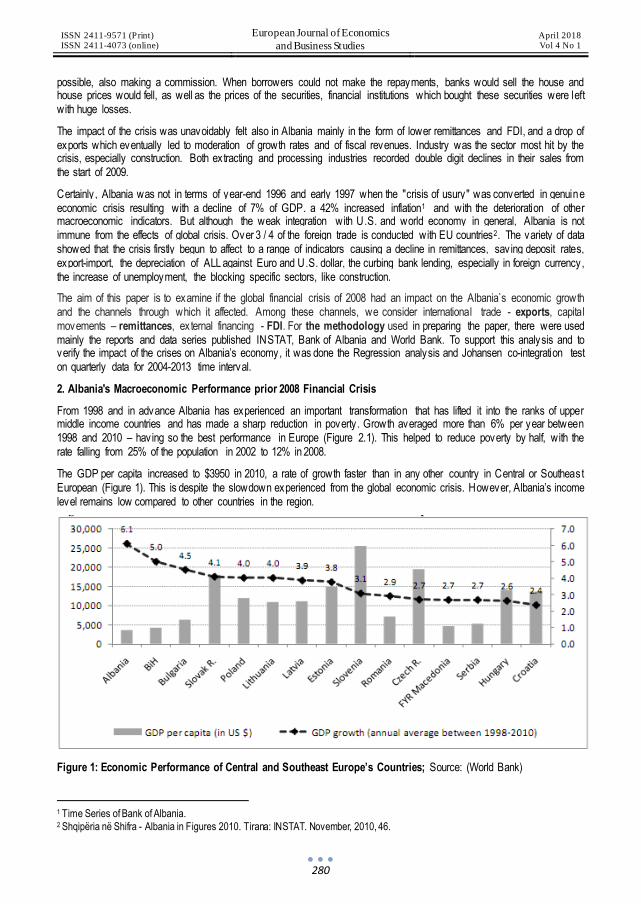
ISSN 2411-9571 (Print) ISSN 2411-4073 (online)
European Journal of Economics
and Business Studies April 2018 Vol 4 No 1
280
possible, also making a commission. When borrowers could not make the repayments, banks would sell the house and house prices would fell, as well as the prices of the securities, financial institutions which bought these securities were left with huge losses.
The impact of the crisis was unavoidably felt also in Albania mainly in the form of lower remittances and FDI, and a drop of exports which eventually led to moderation of growth rates and of fiscal revenues. Industry was the sector most hit by the crisis, especially construction. Both extracting and processing industries recorded double digit declines in their sales from the start of 2009.
Certainly , Albania was not in terms of year-end 1996 and early 1997 when the "crisis of usury" was converted in genuine economic crisis resulting with a decline of 7% of GDP, a 42% increased inflation1 and with the deterioration of other macroeconomic indicators. But although the weak integration with U.S. and world economy in general, Albania is not immune from the effects of global crisis. Over 3 / 4 of the foreign trade is conducted with EU countries2. The variety of data showed that the crisis firstly begun to affect to a range of indicators causing a decline in remittances, sav ing deposit rates, export-import, the depreciation of ALL against Euro and U.S. dollar, the curbing bank lending, especially in foreign currency, the increase of unemployment, the blocking specific sectors, like construction.
The aim of this paper is to examine if the global financial crisis of 2008 had an impact on the Albania`s economic growth and the channels through which it affected. Among these channels, we consider international trade - exports, capital movements – remittances, external financing - FDI. For the methodology used in preparing the paper, there were used mainly the reports and data series published INSTAT, Bank of Albania and World Bank. To support this analysis and to verify the impact of the crises on Albania’s economy, it was done the Regression analysis and Johansen co-integration test on quarterly data for 2004-2013 time interval.
2. Albania's Macroeconomic Performance prior 2008 Financial Crisis
From 1998 and in advance Albania has experienced an important transformation that has lifted it into the ranks of upper middle income countries and has made a sharp reduction in poverty . Growth averaged more than 6% per year between 1998 and 2010 – hav ing so the best performance in Europe (Figure 2.1). This helped to reduce poverty by half, with the rate falling from 25% of the population in 2002 to 12% in 2008.
The GDP per capita increased to $3950 in 2010, a rate of growth faster than in any other country in Central or Southeast European (Figure 1). This is despite the slowdown experienced from the global economic crisis. However, Albania’s income level remains low compared to other countries in the region.
Figure 1: Economic Performance of Central and Southeast Europe’s Countries; Source: (World Bank)
1 Time Series of Bank of Albania. 2 Shqipëria në Shifra - Albania in Figures 2010. Tirana: INSTAT. November, 2010, 46.

ISSN 2411-9571 (Print) ISSN 2411-4073 (online)
European Journal of Economics
and Business Studies April 2018 Vol 4 No 1
281
This strong and successful economic growth has been a result of shifting labor and recourses from low to higher productiv ity sectors such as serv ices and construction. It has also been supported by stable macroeconomic policies, structural reforms and other notable improvements in the business environment, energy, financial sector, tax administration and public financial management. These policies, combined with an acceleration of public investment in 2008 and 2009 of course served to soften the impact of the global financial crisis.
Serv ices and construction until crisis begun represented more than 60% of GDP (Figure 2). The expansion of these sectors has been driven by an increase in the domestic demand sustained by increasing productiv ity , emigrants’ remittances and other inflows1. Industrial sector shares around 39% of GDP, as a result of the growth of textile and shoe manufacturing and more recently due to the expansion of construction materials. The share of agriculture in GDP has been halved during the same period.
Figure 2: GDP Composition %; Source: (INSTAT)
In agriculture, 70% of production has been for subsistence2 and value added per person has been less than one fifth of that in other sectors. Hence the shift to other sectors brought an increase in the share of higher productiv ity jobs. But again the agriculture sector remains dominant, accounting for 18% of GDP and about 40% of employment3, which means there is still potential for increasing overall productiv ity .
The considerable growth was supported by a continuous increase in investment. Total gross investment has increased from 24.6% of GDP in 2000 to 29.5% in 2009, and private investment from 18% to 21.4% over the same period (Figure 3). The structure of investment has been directed towards the construction sector, with only about 10% of GDP going to investment for production purposes till 2006. Since then, non-construction investment has increased but the share of construction investment remains high.
1Albania - Sustaining Grow th Beyond the Transition. A World Bank Country Economic Memorandum. 24 December, 2004. Report No. 29257-AL 2 World Bank, 2007 3 INSTAT

ISSN 2411-9571 (Print) ISSN 2411-4073 (online)
European Journal of Economics
and Business Studies April 2018 Vol 4 No 1
282
As a result of the sustained economic growth, poverty in Albania has fallen substantially . The absolute poverty rate1 fell from 25.4% in 2002 to 18.5% in 2005 to 12.4% in 2008.
The impressive growth record of the past decade has been supported by both a strong and stable macroeconomic policies and a major progress in structural reforms. The most important reforms2 that have been taken in recent years are the following:
Business climate: a one-stop-shop called the National Registration Center, a credit registry and introduction of a flat tax, together with administrative simplification of the tax regime.
Financial sector: strengthened financial superv ision and changes to the legal and regulatory framework of the banking system to improve the execution of collateral and credit risk management.
Infrastructure: unbundling of the electricity network, privatization of the distribution system, and introduction of a best practice legal framework for telecommunications.
Public administration: introduction of electronic procurement in the public sector and introduction of a law on concessions.
These reforms have been combined with an improvement in overall governance. Albania is becoming every day more integrated into global economic systems, becoming so more dependent on international trade, technology and capital. This is very important for Albania to consider and adapt to.
Albanian economic performance during the world crisis shows that firstly Albania was not affected. Micro and macroeconomic indicators showed that it has escaped this economic "storm", showing so an economic stability . But in the next years data show a serious effect given that a good portion of the revenues come from remittances of migrants from neighbor countries, which are maximally affected by the crisis, it is right to say that the Albanian economy also has felt the effects of this economic crisis.
In the last quarter of 2008, the financial sector in Albania started to feel the impact of the global financial crisis. The main development was an increasing sensitiv ity of the public for their sav ings in the banking sector. People started to withdraw their deposits. At the beginning, there was no pressure on the exchange rate but it started to increase at the beginning of 2009, when it was noticed a contraction in the inflow of foreign currency, due to a decline in exports and remittances. The quality of the loan portfolio started to deteriorate, and the nonperforming loans reached 8% of the entire loan portfolio at the end of April 2009. Due to a decline in interest income margins and an increasing amount of prov isions, some of the banks have started to accumulate negative financial results.
1 Fraction of the population w hose real per capita monthly consumption is below Lek 4891 in 2002 prices. 2 Albania The New Growth Agenda - A Country Economic Memorandum. World Bank. 2 November, 2010. Report No. 53599-AL

ISSN 2411-9571 (Print) ISSN 2411-4073 (online)
European Journal of Economics
and Business Studies April 2018 Vol 4 No 1
283
On the other hand, almost all the banks have increasingly supported loans in domestic currency. The banking sector remained well capitalized and liquid. The capital adequacy ratio was 17.1% in March 2009, compared to the required minimum level of 12% . Liquid assets were 42% of total assets1. It means that the banking sector was able to cover for a worst scenario that combines no economic growth, a higher level of depreciation for the exchange rate, and a higher level of non-performing loans.
3. Transmission Channels
Investors’ behavior under market imperfections and the presence of multiple equilibria can cause a shock to be transmitted from one economy to another. However, whether a shock is transmitted, and whether it has a large impact on another country will depend very much on how vulnerable the real sector and financial system are. An economy is more vulnerable if it has weak macroeconomic fundamentals or financial system. The degree of vulnerability also increases with the number and size of linkages with the real economy and financial system of other economies. Thus, the transmission channels can be real (economic) or financial.
One of the most commonly studied real channels of contagion involves trade linkages. If the export market of an economy experiences a shock such that its demand for imports declines, the exporting economy’s trade account will be adversely affected. Trade linkages help explain cross-country correlations in exchange market pressure during crisis episodes, after controlling for other macroeconomic factors.2 While trade linkages may help explain contagion between economies that are closely related, they leave some cases of contagion unanswered, such as the one between Russia and Brazil in late 1990s, as the two countries did not have substantial trade links. Sometimes financial linkages might be the more important channels. A financial crisis in one economy can lead to reductions in trade credit, foreign direct investments and other capital outflows. There are many ways that financial linkages help propagate spillovers or contagion, and the extent is partly determined by the degree of financial market integration between the economies concerned.
The general model of Transmission Channel is as follows:
Crisis i t = Α (Channel 0,i,t ) + ΒX t
where Crisis i t , is a dummy variable equals to one during the crisis period in economy i and zero otherwise; Xt is a set of other possible explanatory variables and Β is the corresponding coefficient matrix ; Channel 0,i,t , is a variable (or a set of variables) which measures the intensity of the transmission channel in question between the identified “ground zero” economy and economy I, with its corresponding coefficient matrix being Α. The significance of the transmission channels is thus indicated by the significance of the coefficient Α.3
Escaith H. et al. (2010) maintain that international trade was both a casualty of the 2008–09 crisis and one of its main channels of transmission. A decrease in trade is expected when world output falls following a severe financial crisis. Karshenas (2009) noted that the impact of the global economic crisis on different LDCs has varied depending on the nature of their trade specialization. He stated that the global economic crisis has led to a sharp reduction in world trade and rapid de-cline in commodity prices and it is one of the main mechanisms through which LDCs have been affected. Escaith et al. (2010) suggest that the demand for consumer durable and investment goods was particularly affected by the sudden stop in bank credits. The 2008–09 crisis has highlighted new short-term and long-term dynamics in trade and GDP.4 There were three channels through which the global financial crisis was transmitted to Albania.
3.1. Transmission Channel 1: International Trade - Exports
European countries went through a severe recession during the recent financial crisis, suffering a tightening in budget and rising in public debt5. The EU is Albania’s most important export market so the recession in Europe had serious
1 Bank of Albania 2 Glick R. and A.K. Rose, 1999. “Contagion and trade: Why are currency crises regional?” Journal of International Money and Finance, v ol. 18(4), pp. 603-617. 3 Cheung, Chi-sang Tam and Jessica Szeto, Contagion Of Financial Crises: A literature Review Of Theoretical And Empirical
Framew orks, Research Note 02/2009 4 Escaith, H. et al., “Global Value Chains and the Crisis: Reshaping International Trade Elasticity?” in Cattaneo, O. et al. (eds.), Global Value Chains in a Postcrisis World: A Development Perspective. Washington: The World Bank, 2010, 73–124. 5 Turan, G. & Bala A., 2014. “European Crisis and the Effect on Albanian Economy”, Academic Journal of Interdisciplinary Studies. Vol 3,
No 3, pp. 230-237. Doi:10.5901/ajis.2014.v3n3p230

ISSN 2411-9571 (Print) ISSN 2411-4073 (online)
European Journal of Economics
and Business Studies April 2018 Vol 4 No 1
284
implications for Albanian exporters. The main trade partners remain Italy and Greece, whose exports are approx imately 63% and 7% respectively .
By looking the data during 2005-2015 period (Figure 5), up to 2008 exports in Albania have shown a continuous increase. But it can be notated clearly that in 2009 the total amount of exports had a serious decrease because of the effect of world financial crises.
Figure 6: Exports in million USD in 2005-2015 period; Source: (World Bank)
3.2. Transmission Channel 2: Remittances
The money that migrants send from countries where they work, to their families, at home are otherwise known as remittances. This migration promotion is explained by “push-and-pull” model1. According to this model, economic conditions, demographic pressures, unemployment in sending countries ('Push Factors’), interact with higher wages, labor force requirements, family reunification ('Pull Factors') in host countries (Smith 1997).
1 Hagel, John. & S. Brow n, John. “From Push to Pull-Emerging Models for Mobilizing Resources”
Working Paper, October 2005
658 798
1,078
1,355
1,091
1,545
1,951 1,968
2,332 2,431
1,930
Exports in USD (milion)
Exports
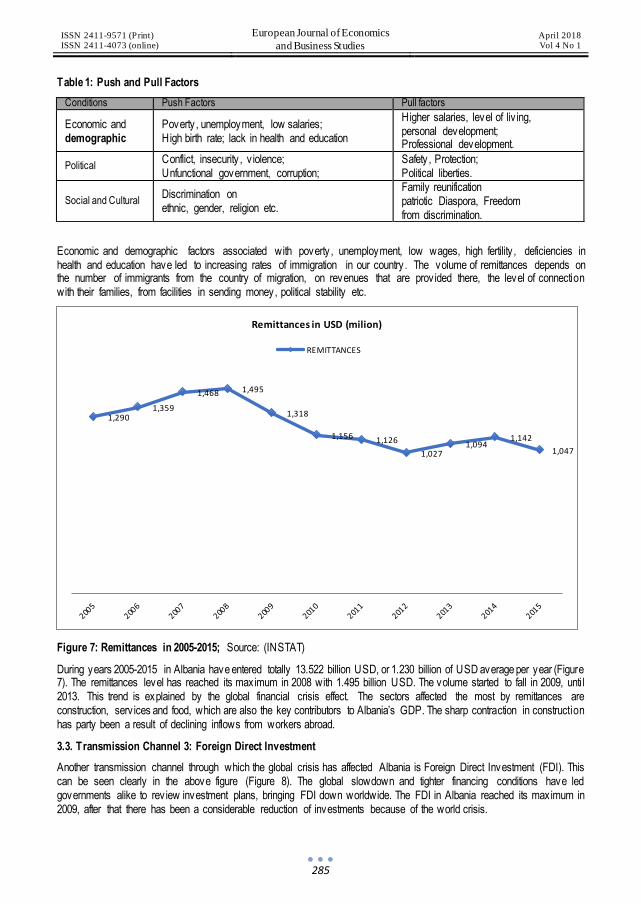
ISSN 2411-9571 (Print) ISSN 2411-4073 (online)
European Journal of Economics
and Business Studies April 2018 Vol 4 No 1
285
Table 1: Push and Pull Factors
Conditions Push Factors Pull factors
Economic and demographic
Poverty , unemployment, low salaries; High birth rate; lack in health and education
Higher salaries, level of liv ing, personal development;
Professional development.
Political Conflict, insecurity , v iolence; Unfunctional government, corruption;
Safety , Protection; Political liberties.
Social and Cultural Discrimination on ethnic, gender, religion etc.
Family reunification patriotic Diaspora, Freedom from discrimination.
Economic and demographic factors associated with poverty , unemployment, low wages, high fertility , deficiencies in health and education have led to increasing rates of immigration in our country . The volume of remittances depends on the number of immigrants from the country of migration, on revenues that are prov ided there, the level of connection with their families, from facilities in sending money, political stability etc.
Figure 7: Remittances in 2005-2015; Source: (INSTAT)
During years 2005-2015 in Albania have entered totally 13.522 billion USD, or 1.230 billion of USD average per year (Figure 7). The remittances level has reached its maximum in 2008 with 1.495 billion USD. The volume started to fall in 2009, unti l 2013. This trend is explained by the global financial crisis effect. The sectors affected the most by remittances are construction, serv ices and food, which are also the key contributors to Albania’s GDP. The sharp contraction in construction has party been a result of declining inflows from workers abroad.
3.3. Transmission Channel 3: Foreign Direct Investment
Another transmission channel through which the global crisis has affected Albania is Foreign Direct Investment (FDI). This can be seen clearly in the above figure (Figure 8). The global slowdown and tighter financing conditions have led governments alike to rev iew investment plans, bringing FDI down worldwide. The FDI in Albania reached its maximum in 2009, after that there has been a considerable reduction of investments because of the world crisis.
1,290 1,359
1,468 1,495
1,318
1,156 1,126
1,027 1,094
1,142
1,047
Remittances in USD (milion)
REMITTANCES

ISSN 2411-9571 (Print) ISSN 2411-4073 (online)
European Journal of Economics
and Business Studies April 2018 Vol 4 No 1
286
Figure 8: FDI inflows for years 2005-2015; Source: (INSTAT)
4. Regression Analysis; Johansen co-integrtion test, VECM and Granger Casuality test
We are going to use Regression Analysis and Johansen co-integrtion test in order to asertain the relationship between the dependent variable Gross Domestic Product (GDP) as the main macroeconomic indicator, and the indipendent one, exports. This analysis will examine if there exsist a strong or weak relationship between GDP and Export and to make some coclusions by interpreting the regression equation and other data. This study employs quarterly data from 2004 to 2013, so for a 10 year period. The data for this research are obtained from Central Bank of Albania and INSTAT. The regression model in this study is:
GDP= α+ β1EXP + β2RMT + e
Where:
α: is the intercept
β1, β2, β3: is the estimated regression coefficients
e: is the error term
GDP: Gross Domestic Product is the dependent variable
EXP: Exports is the independent variable
RMT : Remittances
The hypothesis for this equation is represented by the following:
H0: Exports and remittances have a significant impact on Gross Domestic Product in the long run
H1: H0 is not true
262 325
652
1,241 1,343
1,089 1,049 920
1,254 1,149
991
FDI 2005-2015
FDI
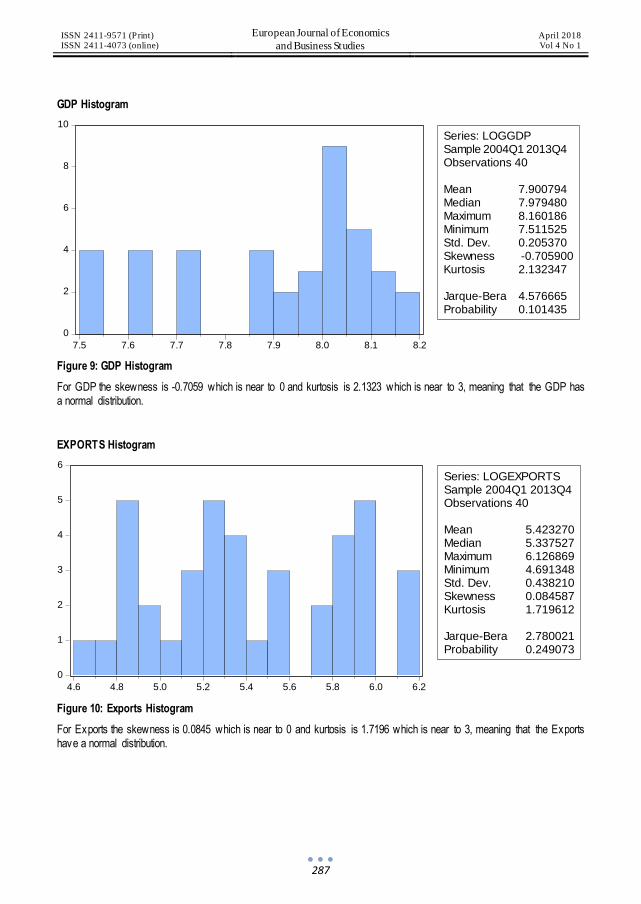
ISSN 2411-9571 (Print) ISSN 2411-4073 (online)
European Journal of Economics
and Business Studies April 2018 Vol 4 No 1
287
GDP Histogram
0
2
4
6
8
10
7.5 7.6 7.7 7.8 7.9 8.0 8.1 8.2
Series: LOGGDPSample 2004Q1 2013Q4Observations 40
Mean 7.900794Median 7.979480Maximum 8.160186Minimum 7.511525Std. Dev. 0.205370Skewness -0.705900Kurtosis 2.132347
Jarque-Bera 4.576665Probability 0.101435
Figure 9: GDP Histogram
For GDP the skewness is -0.7059 which is near to 0 and kurtosis is 2.1323 which is near to 3, meaning that the GDP has a normal distribution.
EXPORTS Histogram
0
1
2
3
4
5
6
4.6 4.8 5.0 5.2 5.4 5.6 5.8 6.0 6.2
Series: LOGEXPORTSSample 2004Q1 2013Q4Observations 40
Mean 5.423270Median 5.337527Maximum 6.126869Minimum 4.691348Std. Dev. 0.438210Skewness 0.084587Kurtosis 1.719612
Jarque-Bera 2.780021Probability 0.249073
Figure 10: Exports Histogram
For Exports the skewness is 0.0845 which is near to 0 and kurtosis is 1.7196 which is near to 3, meaning that the Exports have a normal distribution.
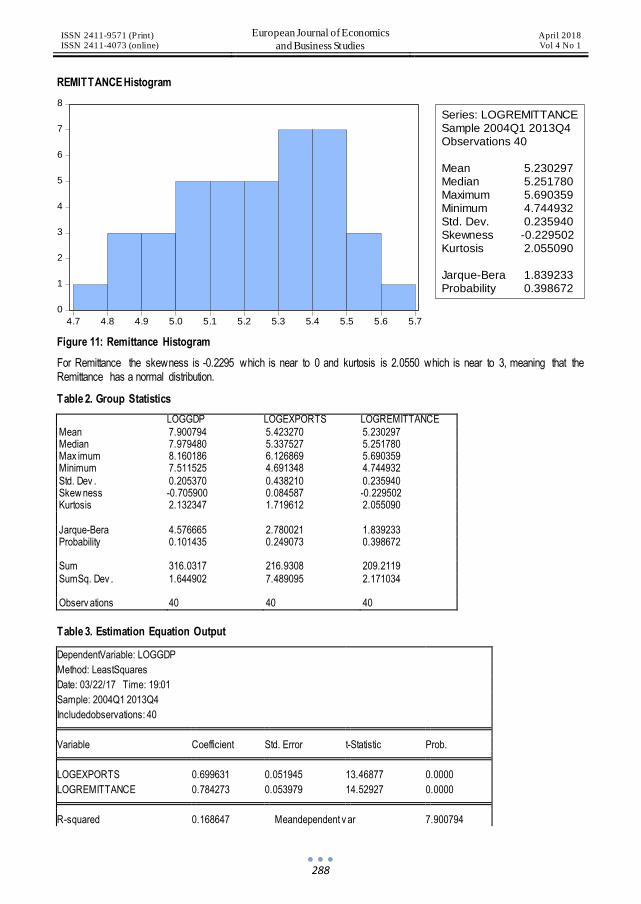
ISSN 2411-9571 (Print) ISSN 2411-4073 (online)
European Journal of Economics
and Business Studies April 2018 Vol 4 No 1
288
REMITTANCE Histogram
0
1
2
3
4
5
6
7
8
4.7 4.8 4.9 5.0 5.1 5.2 5.3 5.4 5.5 5.6 5.7
Series: LOGREMITTANCESample 2004Q1 2013Q4Observations 40
Mean 5.230297Median 5.251780Maximum 5.690359Minimum 4.744932Std. Dev. 0.235940Skewness -0.229502Kurtosis 2.055090
Jarque-Bera 1.839233Probability 0.398672
Figure 11: Remittance Histogram
For Remittance the skewness is -0.2295 which is near to 0 and kurtosis is 2.0550 which is near to 3, meaning that the Remittance has a normal distribution.
Table 2. Group Statistics
LOGGDP LOGEXPORTS LOGREMITTANCE
Mean 7.900794 5.423270 5.230297 Median 7.979480 5.337527 5.251780 Max imum 8.160186 6.126869 5.690359 Minimum 7.511525 4.691348 4.744932
Std. Dev . 0.205370 0.438210 0.235940 Skew ness -0.705900 0.084587 -0.229502 Kurtosis 2.132347 1.719612 2.055090
Jarque-Bera 4.576665 2.780021 1.839233 Probability 0.101435 0.249073 0.398672 Sum 316.0317 216.9308 209.2119
SumSq. Dev . 1.644902 7.489095 2.171034 Observ ations 40 40 40
Table 3. Estimation Equation Output
DependentVariable: LOGGDP
Method: LeastSquares
Date: 03/22/17 Time: 19:01
Sample: 2004Q1 2013Q4
Includedobservations: 40 Variable Coefficient Std. Error t-Statistic Prob. LOGEXPORTS 0.699631 0.051945 13.46877 0.0000
LOGREMITTANCE 0.784273 0.053979 14.52927 0.0000 R-squared 0.168647 Meandependent v ar 7.900794
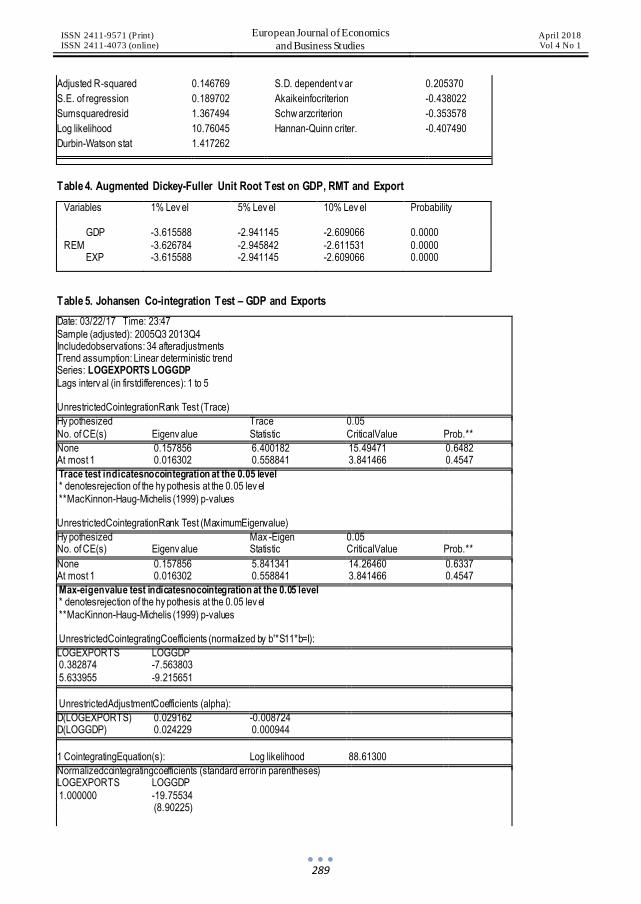
ISSN 2411-9571 (Print) ISSN 2411-4073 (online)
European Journal of Economics
and Business Studies April 2018 Vol 4 No 1
289
Adjusted R-squared 0.146769 S.D. dependent v ar 0.205370
S.E. of regression 0.189702 Akaikeinfocriterion -0.438022
Sumsquaredresid 1.367494 Schw arzcriterion -0.353578
Log likelihood 10.76045 Hannan-Quinn criter. -0.407490
Durbin-Watson stat 1.417262 Table 4. Augmented Dickey-Fuller Unit Root Test on GDP, RMT and Export
Variables 1% Lev el 5% Lev el 10% Lev el Probability
GDP -3.615588 -2.941145 -2.609066 0.0000
REM -3.626784 -2.945842 -2.611531 0.0000 EXP -3.615588 -2.941145 -2.609066 0.0000
Table 5. Johansen Co-integration Test – GDP and Exports
Date: 03/22/17 Time: 23:47
Sample (adjusted): 2005Q3 2013Q4 Includedobservations: 34 afteradjustments Trend assumption: Linear deterministic trend Series: LOGEXPORTS LOGGDP
Lags interv al (in firstdifferences): 1 to 5 UnrestrictedCointegrationRank Test (Trace) Hy pothesized Trace 0.05
No. of CE(s) Eigenv alue Statistic CriticalValue Prob.**
None 0.157856 6.400182 15.49471 0.6482 At most 1 0.016302 0.558841 3.841466 0.4547 Trace test indicatesnocointegration at the 0.05 level * denotesrejection of the hy pothesis at the 0.05 lev el
**MacKinnon-Haug-Michelis (1999) p-values UnrestrictedCointegrationRank Test (MaximumEigenvalue) Hy pothesized Max -Eigen 0.05 No. of CE(s) Eigenv alue Statistic CriticalValue Prob.**
None 0.157856 5.841341 14.26460 0.6337 At most 1 0.016302 0.558841 3.841466 0.4547 Max-eigenvalue test indicatesnocointegration at the 0.05 level * denotesrejection of the hy pothesis at the 0.05 lev el
**MacKinnon-Haug-Michelis (1999) p-values UnrestrictedCointegratingCoefficients (normalized by b'*S11*b=I): LOGEXPORTS LOGGDP 0.382874 -7.563803
5.633955 -9.215651 UnrestrictedAdjustmentCoefficients (alpha): D(LOGEXPORTS) 0.029162 -0.008724 D(LOGGDP) 0.024229 0.000944
1 CointegratingEquation(s): Log likelihood 88.61300 Normalizedcointegratingcoefficients (standard error in parentheses) LOGEXPORTS LOGGDP
1.000000 -19.75534 (8.90225)

ISSN 2411-9571 (Print) ISSN 2411-4073 (online)
European Journal of Economics
and Business Studies April 2018 Vol 4 No 1
290
Adjustmentcoefficients (standard error in parentheses) D(LOGEXPORTS) 0.011165 (0.00783) D(LOGGDP) 0.009277
(0.00461)
In Table 5, Trace test indicates no co-integrating equation at the 0.05 level where the Trace statistic is close to 5% critical value (Johansen, 1988), Max -Eigen value test also indicates that there is no co-integration at 0.05 level because Max-Eigen statistic is near to 5% critical value. In other words GDP and exports are not co-integrated to each other in the long run.
Table 6. Johansen Cointegration Test – GDP and Remittance
Date: 03/22/17 Time: 23:46 Sample (adjusted): 2005Q3 2013Q4 Includedobservations: 34 afteradjustments
Trend assumption: Linear deterministic trend Series: LOGGDP LOGREMITTANCE Lags interv al (in firstdifferences): 1 to 5
UnrestrictedCointegrationRank Test (Trace)
Hy pothesized Trace 0.05 No. of CE(s) Eigenv alue Statistic CriticalValue Prob.**
None * 0.436224 22.87434 15.49471 0.0032 At most 1 0.094869 3.388977 3.841466 0.0656
Trace test indicates 1 cointegratingeqn(s) at the 0.05 level * denotesrejection of the hy pothesis at the 0.05 lev el
**MacKinnon-Haug-Michelis (1999) p-values UnrestrictedCointegrationRank Test (MaximumEigenvalue)
Hy pothesized Max -Eigen 0.05 No. of CE(s) Eigenv alue Statistic CriticalValue Prob.**
None * 0.436224 19.48536 14.26460 0.0068 At most 1 0.094869 3.388977 3.841466 0.0656
Max-eigenvalue test indicates 1 cointegratingeqn(s) at the 0.05 level * denotesrejection of the hy pothesis at the 0.05 lev el **MacKinnon-Haug-Michelis (1999) p-values
UnrestrictedCointegratingCoefficients (normalized by b'*S11*b=I):
LOGGDP LOGREMITTANCE -9.472212 -2.682587
-0.103667 -9.586329
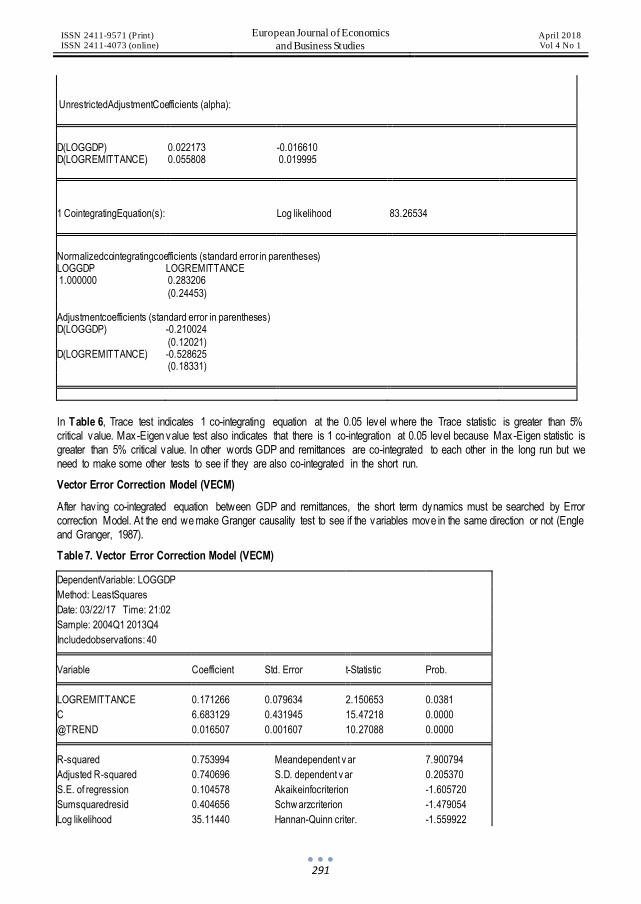
ISSN 2411-9571 (Print) ISSN 2411-4073 (online)
European Journal of Economics
and Business Studies April 2018 Vol 4 No 1
291
UnrestrictedAdjustmentCoefficients (alpha):
D(LOGGDP) 0.022173 -0.016610 D(LOGREMITTANCE) 0.055808 0.019995
1 CointegratingEquation(s): Log likelihood 83.26534
Normalizedcointegratingcoefficients (standard error in parentheses) LOGGDP LOGREMITTANCE 1.000000 0.283206
(0.24453) Adjustmentcoefficients (standard error in parentheses) D(LOGGDP) -0.210024
(0.12021) D(LOGREMITTANCE) -0.528625 (0.18331)
In Table 6, Trace test indicates 1 co-integrating equation at the 0.05 level where the Trace statistic is greater than 5% critical value. Max-Eigen value test also indicates that there is 1 co-integration at 0.05 level because Max -Eigen statistic is greater than 5% critical value. In other words GDP and remittances are co-integrated to each other in the long run but we need to make some other tests to see if they are also co-integrated in the short run.
Vector Error Correction Model (VECM)
After hav ing co-integrated equation between GDP and remittances, the short term dynamics must be searched by Error correction Model. At the end we make Granger causality test to see if the variables move in the same direction or not (Engle and Granger, 1987).
Table 7. Vector Error Correction Model (VECM)
DependentVariable: LOGGDP
Method: LeastSquares
Date: 03/22/17 Time: 21:02
Sample: 2004Q1 2013Q4
Includedobservations: 40 Variable Coefficient Std. Error t-Statistic Prob. LOGREMITTANCE 0.171266 0.079634 2.150653 0.0381
C 6.683129 0.431945 15.47218 0.0000
@TREND 0.016507 0.001607 10.27088 0.0000 R-squared 0.753994 Meandependent v ar 7.900794
Adjusted R-squared 0.740696 S.D. dependent v ar 0.205370
S.E. of regression 0.104578 Akaikeinfocriterion -1.605720
Sumsquaredresid 0.404656 Schw arzcriterion -1.479054
Log likelihood 35.11440 Hannan-Quinn criter. -1.559922
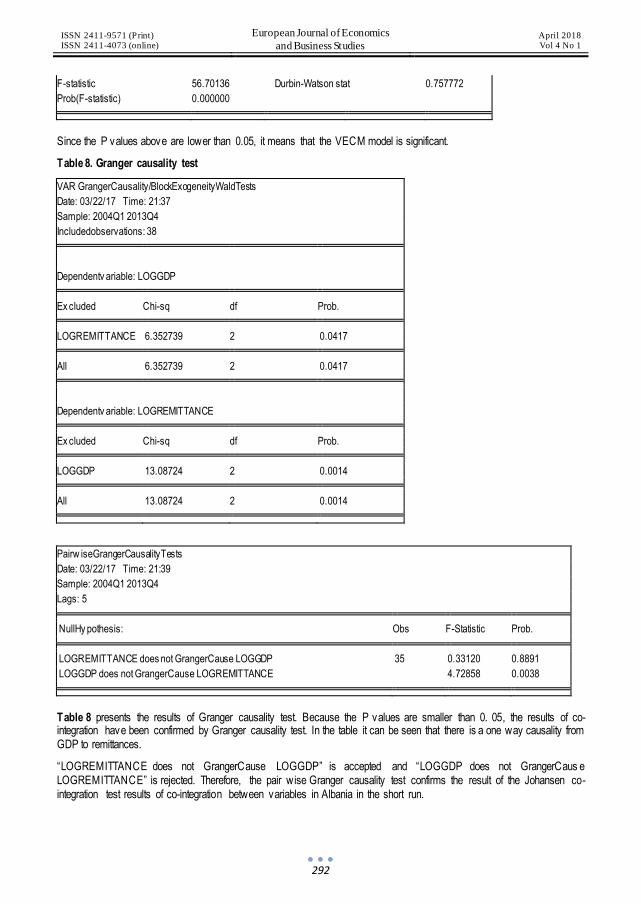
ISSN 2411-9571 (Print) ISSN 2411-4073 (online)
European Journal of Economics
and Business Studies April 2018 Vol 4 No 1
292
F-statistic 56.70136 Durbin-Watson stat 0.757772
Prob(F-statistic) 0.000000 Since the P values above are lower than 0.05, it means that the VECM model is significant.
Table 8. Granger causality test
VAR GrangerCausality/BlockExogeneityWaldTests
Date: 03/22/17 Time: 21:37
Sample: 2004Q1 2013Q4
Includedobservations: 38
Dependentv ariable: LOGGDP Ex cluded Chi-sq df Prob. LOGREMITTANCE 6.352739 2 0.0417 All 6.352739 2 0.0417
Dependentv ariable: LOGREMITTANCE Ex cluded Chi-sq df Prob. LOGGDP 13.08724 2 0.0014 All 13.08724 2 0.0014
Pairw iseGrangerCausalityTests
Date: 03/22/17 Time: 21:39
Sample: 2004Q1 2013Q4
Lags: 5
NullHy pothesis: Obs F-Statistic Prob.
LOGREMITTANCE does not GrangerCause LOGGDP 35 0.33120 0.8891
LOGGDP does not GrangerCause LOGREMITTANCE 4.72858 0.0038
Table 8 presents the results of Granger causality test. Because the P values are smaller than 0. 05, the results of co-integration have been confirmed by Granger causality test. In the table it can be seen that there is a one way causality from GDP to remittances.
“LOGREMITTANCE does not GrangerCause LOGGDP” is accepted and “LOGGDP does not GrangerCaus e LOGREMITTANCE” is rejected. Therefore, the pair wise Granger causality test confirms the result of the Johansen co-integration test results of co-integration between variables in Albania in the short run.

ISSN 2411-9571 (Print) ISSN 2411-4073 (online)
European Journal of Economics
and Business Studies April 2018 Vol 4 No 1
293
5. Conclusions
The entire world economy has been affected deeply by global financial crises, which was a result of unbalanced financial activ ity . The world economists failed to predict the risk coming from crediting. As result, most of developed countries ’ economies experienced recession. Less affected by the crises were developing countries and countries whose financial systems are not much integrated in the global market.
Albania was one of the countries which despite the global tendency, continued to have positive growth, being the country with the highest economic growth rate in the Europe during the crises period. The economic growth rate of Albania for 2008 was 7,5% and for 2009, 3.3% 1. At the beginning of the global crisis, the Albanian financial system was largely unaffected for many reasons. Firstly , Albanian economy is not integrated into the global financial market. Secondly , banks in Albania are well capitalized and have very little, if any, exposure to complex financial instruments, which were the genesis of the global crises. Thirdly , the response of the government throughout the fiscal and monetary policy played an important role in coping successfully with the crises.
But after 2009, the impact of global and EU countries crisis started to appear in large doses. The fact that most of Albanian emigrants work in European countries and since export is conducted mostly with EU countries, Albania`s economy suffered a negative external shock transmitted mainly through exports, remittances and in foreign capital flows, causing a decrease in economic growth. As stated from the results of the equations, in the long run GDP was strongly co-integrated with REM variable, which caused a tightening in the budget and rise in the public debt. It was also proved that GDP and REM are co-integrated also in the short run and they move in the same direction.
References/ Bibliography
[1] Albania; The New Growth Agenda - A Country Economic Memorandum. World Bank. 2 November, 2010. Report No. 53599-AL
[2] Albania - Sustaining Growth Beyond the Transition. A World Bank Country Economic Memorandum. 24 December, 2004. Report No. 29257-AL
[3] Bank of Albania (BSH). www.bankofalbania.org [4] D’Arista, J. and Griffith-Jones, S. (2010). “Agenda and Criteria for Financial Regulatory Reform”, 2010, 1. [5] Cheung, L. Chi-sang, T. & Szeto, J. (2009) Contagion Of Financial Crises: Aliterature Review Of Theoretical
And Empirical Frameworks, Research Note 02/2009 [6] Engle, R F. & Granger, C. W. J. (1987) “Co-Integration and Error Correction: Representation, Estimation, and
Testing”, Econometrica, Vol. 55, No. 2, pp. 251-276. [7] Escaith, H. et al., “Global Value Chains and the Crisis: Reshaping International Trade Elasticity?” in Cattaneo,
O. et al. (eds.), Global Value Chains in a Postcrisis World: A Development Perspective. Washington: The World Bank, 2010, 73–124.
[8] Farewell to 2009: “Impacts of the global crisis in Latin America and the Caribbean” , Cluster for Poverty , Human Development and MDGs Regional Bureau for Latin America and the Caribbean, UNDP, December, 2009.
[9] Glick R. and A.K. Rose, (1999). “Contagion and trade: Why are currency crises regional?”. [10] Journal of International Money and Finance, vol. 18(4), pp. 603-617. [11] Hagel, J. & S. Brown, J. (2005). “From Push to Pull-Emerging Models for Mobilizing Resources”. Working
Paper, October 2005. [12] International Monetary Fund Albania. (2010). Article IV Consultation Preliminary Conclusions of the Mission.
March 10, 2010 [13] Institute of Statistics of Republic of Albania (INSTAT) - www.instat.gov.al [14] International Monetary Fund (IMF). www.imf.org [15] Jickling, M. (2008) Averting Financial Crisis. CRT Report for US Congress. [16] Johansen, S. (1988). “Statistical analysis of cointegration vectors”. Journal of Economic Dynamics and
Control, 12, 231-254. [17] Karshenas, M. and Moghadam, V.M. (2009). Bringing Social Policy Back In: “A look at the Middle East and
North Africa”. International Journal of Social Welfare. ISSN 1369-6866.
1 World Bank. http://data.worldbank.org/indicator/TX.VAL.MRCH.CD.WT?end=2015&locations=AL&start=2000, accessed on 01
February 2017.
ISSN 2411-9571 (Print) ISSN 2411-4073 (online)
European Journal of Economics
and Business Studies April 2018 Vol 4 No 1
294
[18] Kindleberge, P. Ch, and Aliber, R. (2005). “Manias, Panics, and Crashes: A History of Financial Crises”. 5th Ed. New Jersey: John Wiley & Sons, Inc., Hoboken.
[19] Sharpe, M.E. (2010). “Problems of Economic Transition” . vol. 53, no. 6, October 2010, Inc. ISSN 1061–1991/2010, 45–62
[20] Mellor, M. (2010). “The Future of Money: From Financial Crisis to Public Resource” . London-New York: Pluto Press.
[21] Račickas, E. & Vasiliauskaitė, A. (2010) “Economics and Management: 2010. 15”, Global Financial Crisis and Its Impact On Lithuanian Economy, ISSN 1822-6515, 1006-1007
[22] Steil, B (2009). Lessons of the Financial Crisis. Council Special Report No. 45. March, 2009. [23] Singh F. B. & Yadav A.P. (2010) “Global Financial Crunch and India's Economic Growth : A deep Insight”.
Indian Journal of Finance, 4(1) [24] Shqipëria në Shifra - Albania in Figures 2010. Tirana: INSTAT. November, 2010. [25] Turan, G. & Bala A. (2014). “European Crisis and the Effect on Albanian Economy”. Academic Journal of
Interdisciplinary Studies. Vol 3, No 3, pp. 230-237. Doi:10.5901/ajis.2014.v3n3p230 [26] Tregtia E Jashtme-Foreign Trade 2005 – 2009. (2010). Tirana: INSTAT. [27] World Bank. Available:
http://data.worldbank.org/indicator/TX.VAL.MRCH.CD.WT?end=2015&locations=AL&start=2000 (February 01, 2017)
ISSN 2411-9571 (Print) ISSN 2411-4073 (online)
European Journal of Economics
and Business Studies April 2018 Vol 4 No 1
295
DOI: 10.26417/ejes.v4i1.p295-299
Open Access. © 2018 Noncho Dimitrov. This is an open access article licensed under the
Creative Commons Attribution-NonCommercial-NoDerivs 4.0 License
(Review Article)
Renewable Energy and Solar Business in the European Union
Noncho Dimitrov
Abstract
The solar business faces major challenges related to the constantly changing regulatory framework, corporate interests and public pressure. Successful adaptation to the high requirements of regulators and competitiv e alternative energy sources is needed. The solar business is one of the levers with which the European Union has consistently underlined its commitment to international cooperation and the fight against the effects of greenhouse gas emissions. The formation of the internal market in the energy sector requires the elimination of many barriers and trade barriers, the approx imation of tax and pricing policies, norm and standards measures, and environmental and safety regulations. This requires the development and implementation of successful strategies by solar energy producers, traders and consumers.
Keywords: solar business, renewable energy sources (RES), European Union (EU), renewable energy, photovoltaic systems
Introduction
The solar business is of great importance for the future of the whole energy sector; its research will allow discovering potential opportunities and possible threats to its development in the member states of the European Union. It needs strategic thinking, which allows outlining possible alternatives and long-term development. It is related to making strategic decisions about its goals and strategies. It aims to reorganize the business and focuses on the creation and implementation of effective strategies. It requires analyzing and forecasting trends in global energy policy with a v iew to discovering and exploiting the favorable opportunities for photovoltaic development. Also, it helps to reduce its vulnerability and recognizing serious threats. It requires an objective assessment of the potential built in the new sector and integrates the strategic actions of law enforcement and law enforcement authorities in line with the European ones.
Encouraging of that type of business and the renewable energy sources (RES) is one of the main purpose of the energy policy of EU. It aims is to double the share of RES in the total energy consumption and to reach 20% of that consumption in the whole EU (Directive 2011/77/EC and Directive 2009/28/EC). Decision № 1230/2003/ЕО about "Intelligent Energy – Europe" (IEE) contains measures to promote RES and to increase the energy efficiency. There are sub-programs supporting projects for the development of solar business and expanding cooperation between the EU and developing countries in the field of RES. The Framework Program amounted to more than € 200 million for the period up to 2013. Nevertheless, the European Commission and the European Parliament debated much more amounts.
At the UN Conference in Kyoto in December 1997, the importance of creating a concerted action plan to reduce greenhouse gases (in particular CO2) has become apparent. The EU has pledged to reduce its CO2 emissions by 8% over 1990 levels. One of the world's largest emissions trading schemes has been set up.
The renewable energy and the solar business in EU
Although, the energetics falls within the scope of action of the EU, the energy policy remains responsibility of the Member States in accordance with the principle of subsidiarity . At present, the EU is dependent on oil and gas imports. Therefore, the EU's constant concern for increasing the use of RES and reducing the greenhouse effect can be noted.
ISSN 2411-9571 (Print) ISSN 2411-4073 (online)
European Journal of Economics
and Business Studies April 2018 Vol 4 No 1
296
According to the Comision, the Parliament and the Council of Europe, the energy policy must constitute part of the general goals of EU economic policy, based on market integration and deregulation. In addition, the state intervention must be limited to what is necessary to protect the public interest and prosperity , sustainable development, consumer protection and economic and social cohesion. However, beyond these common objectives, energy policy must pursue specific objectives that reconcile competitiveness, security of supply and environmental protection.
The Commission set the overall framework: "Strategic Energy Review in the EU" which should help to achieve the main goals. Specific proposals have been made, such as the creation of the internal gas and electricity market, ensuring that the EU's internal energy market ensures security of supply and solidarity between Member States and calls for a genuine community debate on different energy sources to address the challenges of climate change changes in a way that is consistent with the Lisbon goals, rely ing on the Strategic Energy Technology Plan and strengthening the Common Foreign Energy Policy.
On 23 and 24 March, European Consilium called for an Energy Policy for Europe (EPE) and called on the Commission and the Council to prepare a set of actions with a clear timetable in order to be able to adopt a priority action plan.1 EPE has three main objectives:
Enhance security of supply by developing a common approach to foreign policy and engaging in dialogue with Member States and partners.
Ensuring the competitiveness of European economies and availability of affordable energy by working together with Member States to complete the opening up of the internal market for electricity and gas to all consumers.
Promoting environmental sustainability by enhancing EU leadership by adopting an energy efficiency action plan, continuing the development of renewable energies and implementing the biomass action plan, rely ing on support for research, development and demonstration activ ities.
Accept the common energy targets; the EU sets different sector goals, including: maintaining the percentage of solid fuel in total energy consumption; increasing the ratio of natural gas in the energy balance; establishing maximum safety conditions as a prerequisite for the planning, construction and operation of nuclear power plants; increasing the share of (RES). Agreement has been reached that at least a doubling of the share of renewable energy sources in total energy consumption should be made. The Commission should make this objective a concrete measure. There is some opposition to indiv idual measures and many disputes about whether and in what form they are implemented at EU level.
The European Parliament recognizes the crucial importance of RES and shows the importance of setting mandatory targets for 2020, which sends a clear signal to market players and national policy makers, pointing out that RES are the future of EU energy and part of the EU's environmental and industrial strategy. The Commission sets out measures to increase the use of photovoltaic products and businesses, create market-based incentives, and remove barriers to the development of the electricity market from RES. The European Strategy for Sustainable, Competitive and Secure Energy places particular emphasis on RES, the full potential of which will only be realized with a long-term commitment to their development and deployment.
The EU Framework Program for Research covers many energy, research, development and demonstration projects to support energy policy objectives. They aim at improv ing the level of perception, competitiveness and scope of traditional energy, promoting the perception of new forms of energy for energy -saving and rational use.
The Seventh Framework Program for research, technological development and demonstrations activ ities of the European Community runs from 2007 to 2013, established research tasks to be carried out to achieve the main objectives of reducing energy consumption. It also proposes wider cooperation and focus on research in this area, including proposals to fund these actions.
In order to remove various barriers and measures and to improve the marketing of the internal market, additional electricity grids were opened on 25 July 1996 for large industrial users.
The increasing dependence of some Western countries on energy imports and their increased energy vulnerability create a favorable environment for future interstate conflict of resources. In order to understand changes in EU energy policy, it is necessary to identify the main challenges for energy development in the Eurozone.
Europe is poor on its own energy resources. Production costs for coal mining on average for Europe are 4-5 times higher than world prices. Oil has two to seven time’s higher production costs than those in the Middle East, for example, with
1 Green Energy Handling Agency (www.oem-ag.at)

ISSN 2411-9571 (Print) ISSN 2411-4073 (online)
European Journal of Economics
and Business Studies April 2018 Vol 4 No 1
297
reserves for about 4-5 years. Natural gas accounts for about 2% of the world's reserves, and for limited consumption, it can be extracted for another 20 years. 2% of the world's uranium reserves are in the EU, mostly in France, and the y ield may last another 40 years. There is significant RES potential but it is not enough to meet industrial demand.
The main challenge facing the Community remains the increasing dependence on energy resources, but the EU has limited response opportunities. Dependence on imported resources will reach 70% in 2020 and dependence on oil - 90%
The main importer of natural gas is Russia, importer of oil - the Middle East. In addition to this dependence, which requires flex ible geopolitical solutions, the environmental consequences of the use of organic fuels are compounded.
The EU is responsible for creating around 20% of the world's carbon diox ide emissions. Notwithstanding all measures and commitments, in 2010-2013, this emission are 20% above and not 8% below the 1990 level, as required by the Kyoto Protocol. In addition to limiting greenhouse gas emissions, significant investment resources must also be prov ided to meet the limitations of other anthropogenic gases. At the same time, the EU has a share of 15% of the energy consumption in the world; the average annual growth of consumption is 1-2% .
The growth of energy consumption is mainly concentrated in the serv ice and household sector. Industry in the EU is stabilizing its energy consumption thanks to its investment in modernization. This applies to both the old Member States and the newly acceded countries.
Transport remains a significant consumer of energy resources, accounting for about 67% of oil consumption. Forecasts for growth in transport resource consumption amounted to about 16% for cars and 90% for av iation for 50% traffic growth.1
EU`s energy policy
Europe's energy policy faces a number of energy challenges, including: growing import dependency, insufficient diversification, high and unstable energy prices, rising global energy demand, security risks affecting producer and transit countries , growing threats related to climate change, slow progress in energy efficiency, challenges related to the use of an increasing share of RES and also the need for greater transparency, further integration and interconnection of energy markets. Energy policy uses a number of measures to achieve a competitive energy market, security of energy supply and the sustainable development of the energy sector.
Strategic changes tend to gradually reduce the role of oil, coal, with natural gas dominating new capacities, the nuclear sector is relatively maintaining its share, and its future depends on several factors - the process of implementing the Kyoto Protocol, competitiveness, public acceptability , the achievement of common nuclear safety standards, etc.
Due to the great importance of gas and oil for the security of the EU's energy supply , the Union has adopted a number of measures to ensure that risk assessments are carried out and that adequate plans for preventive and contingency planning have been developed. A number of regulations on measures to ensure the security of energy supply were adopted in October 2010 to strengthen crisis prevention and response mechanisms. In some, Member States are required to maintain minimum stocks of oil corresponding to the larger of the following two quantities: average daily net imports over a period of 90 days or average daily inland consumption over a period of 61 days.
In response to the crisis in Ukraine in March 2014, the European Council called on the Commission to present by June 2014 a comprehensive plan to reduce the EU's energy dependence. The plan encourages measures to help the EU secure good positions in order to be able to develop the technologies it needs to achieve its policy goals and at the same time to ensure that, its companies can take advantage of the opportunities offered by a new approach to energy.
The European Parliament supports the idea of a common energy policy for solv ing issues of competitiveness, security and sustainable development. It has repeatedly called for coherency, determination, cooperation and solidarity between Member States in meeting the current and future challenges of the EU internal market and the political commitment of all EU Member States, as well as a strong European Commission initiative to progress towards achiev ing of the 2020 targets.
Parliament aims at a stronger integration of the energy market and the adoption of ambitious objectives in terms of renewable energy, energy efficiency and greenhouse gas emission reductions. In this context, the EU stresses that the new energy policy must support the long-term goal of reducing greenhouse gas emissions by 80-95% by 2050. It also supports the diversification of energy sources and supply routes. In v iew of Europe's growing dependence on fossil fuels, Parliament welcomed the SET-Plan as it is convinced that it will make a significant contribution to sustainability and security of supply and will which is absolutely indispensable for the achievement of the EU 2020 energy and climate goals.
1 Communication from the Commission to the European Parliament, The Council and the Economic and Social Committee: Update of
the Nuclear Illustrativ e Programme in the Context of the Second Strategic Energy Rewiew.

ISSN 2411-9571 (Print) ISSN 2411-4073 (online)
European Journal of Economics
and Business Studies April 2018 Vol 4 No 1
298
The Common European Energy Policy can be described as follows: measures to increase energy efficiency, management of the consumption of imported petroleum products, actions to stimulate RES and an open option for the use of nuclear energy. The success of this policy is measured by the specific efforts of the specific countries in the community , the effort s of the energy industry and consumers.
Characteristics of solar business in the EU
The essence of the solar business and the energy produced by RES in the EU countries has in three main directions:
Fighting climate changes;
Promoting the creation of growth and jobs;
Limiting the EU`s external dependence on gas and oil imports.
At the heart of the policy is Europe's main energy goal: by 2020, the EU should reduce greenhouse gas emissions in its energy consumption. This objective will allow the EU to measure progress in redeploy ing the modern energy sector to one that will respond fully to challenges such as sustainability , competitiveness and security of supply . The goal is to achieve a 30% by 2030 and by 60-80% by 2050. The concerns are not only about climate change, but also about the security of Europe's energy supply and economy and the welfare of its citizens. Achiev ing the goal can limit the increasing risk to the EU from greater instability and higher oil and gas prices contribute to a more competitive EU energy market and promote technology and employment.
Strategically this means that the EU will take the lead in the world in preparing a new industrial revolution that will benef it both developed and developing countries. In order to achieve this objective, the Commission also proposes to focus attention on a number of energy policy measures:
improv ing energy efficiency;
increasing the share of energy from RES;
new measures to ensure that the benefits of the internal energy market will reach every consumer;
increasing solidarity between Member States with a longer-term v iew of developing energy technologies.
This includes a 10-point energy action plan and a timetable for the measures that the EU will implement to achieve the new strategic goal. In addition, EU Member States must ensure guaranteed access to green electricity producers' electricity systems, including housing and small business installations.
Photovoltaic systems:
The sun is the largest renewable resource for power generation throughout the solar system. Thanks to this, photovoltaic systems have a very high degree of technology and have a very long economic life - up to 30 years.
The widespread use of solar electricity means large equipment on large areas with "sun-harvesting" equipment in the regions where the radiation of our main light and heat source is the strongest. Experts predict that this will be done by 2050. The solar battery should become more efficient, more reliable and above all operate more economically .
In the future, panel coatings will play a crucial role. Thanks to the latest nanoparticle coatings, the size of which is only one millionth of a millimeter, cost sav ings of 80% can be expected compared to today 's silicon technology for the production of photovoltaic systems. The new conception of color-sensitive nanocrystalline semiconductor coatings has led to an increase in efficiency, even in low diffuse lighting. The imposition of photovoltaic modules as a mass product is already a fact. But their price is still not competitive enough. Development and refinement continues to be a difficult process and many of the initial expectations are not met. Nevertheless, over the past 20 years, the cost of solar equipment has fallen by nearly 60%.
Thanks to such strategies and strategic prospects, photovoltaic business helps to avoid CO2 emissions. The advantages of photovoltaic power generation are obvious. That̀ s why the EU and the Member States are keen to increase significantly the share of cogeneration in the production of electricity and heat in the coming years.
The strategic prospects in the European Union are mainly geared to a larger market share of panels for solar electricity generation. Many of the leading European companies are converting part of their plasma panel production into solar line production lines. Companies invest hundreds of millions of euros in 2010 to build production lines. Teams are prepared to work on new projects and the companies rely on the results of their research to develop this new business into a profitable business. Industry experts estimate that solar panels will account for 80% of the solar-powered electricity business.

ISSN 2411-9571 (Print) ISSN 2411-4073 (online)
European Journal of Economics
and Business Studies April 2018 Vol 4 No 1
299
The objectives of European energy are 20% less greenhouse gases than 1990 levels, 20% less energy consumption and 20% share of total energy consumption from renewable energy sources.
The sun is an immense source of energy. However, until today his role in the energy industry was almost negligible in the context of the use of underground natural resources. There is an accelerated depletion of natural resources as well as an increase in the level of tox ic pollution. The steadily rising prices of electricity , oil, gas, oil cause a corresponding response. Consumers reduce fuel use and scientists are looking at ways to develop alternative energy sources, new and effectiv e ways to meet energy needs. In the new energy sector, massive use of solar energy practically has no geographical and climatic constraints.
Solar energy becomes the main source of electricity . The sunlight technologies are not something new. Modern, sophisticated technologies uses sunlight energy everywhere - from illuminating premises in buildings to powering vehicles. In many European countries, solar systems are proven effective and are present in almost every home or business. The consumption of solar energy systems will increase especially in Japan and Germany. The initial investments are justified by the high efficiency in reducing energy costs and it fully satisfy the need of energy. An important aspect of solar systems are their ecology. According to experts, using of sunlight as an energy source will increase drastically in the next years. Other even thinks that the Sun will become a major energy source until 2050. Support for the use of solar energy is also boosted in southern European countries such as Spain, Italy and Greece. In these countries, governments are increasingly aware that the sun's energy can be used to protect the environment and energy dependence from other countries.
Growth is already a fact - after 2009 photovoltaic business grew by more than 70% and reached a global volume of 4 GWp and the sector was over EUR 16 billion. Average annual growth over the past 5 years is about 50% .
Compared to other non-energy business, the return on photovoltaic power plants is longer and therefore the profits are lower. At the expense of the lower profit in the production of ecological electricity , the market risk for the realization of the production is 0, because the latest amendments to the Energy Law and the special Law for stimulating the use of renewable energy sources, guarantee 100% preferential price. However, even without preferences, the energy business to produce green energy is less at risk than most other types of business due to the high degree of universality of the commodity - electricity and the liberalization of the market. In a liberalized market, each manufacturer can determine to whom to sell electricity . No doubt, investments in photovoltaic parks and systems as well as in solar parks are the new winning wave for legally guaranteed investments.
Conclusions:
The modern world faces the challenge of energetic and the environment, a challenge that is clear for Europe and shared by all Member States. There is a tremendous need to prov ide competitive and clean energy in the conditions of climate change, increasing global demand for energy and uncertainties about future deliveries. If a Member State fails to tackle the challenge, it will affect the rest. If problems arise outside the EU, they can affect the whole of the EU. That is why Europe needs a stable energy policy amid a depletion of energy and a growing dependency on raw materials imports. It is likely, most of the oil and gas producing countries in some time to face the inability to increase their own production capacity to the planned level and the supply commitments made because of their limited reserves. Soon the first effects of resource depletion will be felt, the more likely the interruptions in the supply of energy products will endanger the energy and national security of our country . That̀ s why the solar business is the future.
References
[1] Communication from the Commission to the European Parliament, The Council and the Economic and Social
Committee: Update of the Nuclear Illustrative Programme in the Context of the Second Strategic Energy
Rewiew.
[2] Green Energy Handling Agency (www.oem-ag.at)