Insper Ph.D. in Business Economics Darcio Genicolo Martins ...
101
Insper Ph.D. in Business Economics Darcio Genicolo Martins Essays on Public Procurement São Paulo 2020
-
Upload
khangminh22 -
Category
Documents
-
view
0 -
download
0
Transcript of Insper Ph.D. in Business Economics Darcio Genicolo Martins ...

Insper Ph.D. in Business Economics
Darcio Genicolo Martins
Essays on Public Procurement
São Paulo 2020

Darcio Genicolo Martins
Essays on Public Procurement
Dissertation submitted as a partial requirement to obtain the degree of Ph.D. in Business Economics in the field of research on Strategy, Marketing and Industrial Organization at the Insper Institute of Education and Research.
Supervisor: Paulo Furquim de Azevedo
São Paulo 2020

Genicolo-Martins, Darcio Essays on Public Procurement./ Darcio Genicolo Martins. – São Paulo, 2020. 100 f. (número de folhas) Tese (Doutorado) – Insper, 2020.
Orientador: Paulo Furquim de Azevedo, Ph.D. 1. Public Procurement; 2. Health Litigation; 3. Law Enforcement; 4. Small and Medium-Sized Enterprises; 5. Frequent Losers. I. Genicolo-Martins, Darcio. II. Essays on Public Procurement.

Darcio Genicolo Martins
Essays on Public Procurement
Dissertation submitted as a partial requirement to obtain the degree of Ph.D. in Business Economics in the field of research on Strategy, Marketing and Industrial Organization at Insper. Supervisor: Paulo Furquim de Azevedo
Board of Examiners
Paulo Furquim De Azevedo
Insper
Sandro Cabral
Insper
Bernardo de Oliveira Guerra Ricca
Insper
Gabriel de Abreu Madeira
FEA-USP
Gustavo Federico Torrens
Indiana University


Acknowledgments
I want to express my deepest thanks to my advisor, Paulo Furquim de Azevedo.
I cannot describe the importance of our conversations for the execution of the work.
Also, I had the privilege, almost weekly, to count on your advice, which I will take
forever in my life. His generosity and competence are rare to find, and he is a role
model for me. Thank you, Paulo!
Besides, I am grateful to Insper for providing all the conditions for my academic
development in this doctoral period. Dynamic, innovative, avant-garde, and, above all,
human, Insper is a unique institution in Brazil. I want to thank Marco Bonomo and
Sergio Firpo, coordinators of the doctoral program in this period, for their full support
for me and all students.
I am grateful to Charles Kirschbaum for assisting him in the discipline
“Dissertation Seminar.” I have learned a lot from you. Thank you, Hedibert Freitas
Lopes. I was honored to have been your student and to enjoy talking about scientific
matters and life in general.
A sincere thanks to Laura Valladão de Mattos, my master’s advisor. It was she
who showed me, in theory, and practice, how to seek excellence with ethics in
academic research. I am grateful to Roland Veras Saldanha Jr. for having been my
friend and tutor for so long. This Ph.D. title has much of you.
Finally, I am very grateful to PUC-SP for giving me the first opportunity as a
professor and researcher.

À minha esposa Maria Claudia e a meus
filhos Bernardo e Vicente, pelo tempo
que deixamos de estar juntos.
A meus pais, Olga e Carlos Alberto, por
tudo que representam para mim.

“I keep falling, maybe half the time, maybe half the time...”
Interpol, “All the Rage Back Home” (2014)

Abstract This dissertation investigates factors that could undermine the performance of public
tenders. It is organized into three different papers that address distinct aspects of public
procurement’s institutional design. In the first paper, I investigate the impact of health
litigation on the efficiency of public procurement. In the second paper, I estimate the
costs of implementing a program that incentivizes public buyer units to restrict public
tenders to small and medium-sized enterprises (SMEs). Finally, in the third paper, I
propose a cartel detection method for public procurement.
Keywords: public procurement, health litigation, enforcement, small and medium-
sized enterprises, frequent losers

Table of Contents 1 INTRODUCTION .......................................................................................... 11
2 BITTER PILLS TO SWALLOW: ENFORCEMENT COSTS OF HEALTH LITIGATION ................................................................................................. 13
2.1 INSTITUTIONAL BACKGROUND ............................................................... 16
2.1.1 HEALTH: “RIGHT OF ALL AND A DUTY OF THE STATE” ......................... 17
2.1.2 PLANNING UNDER PRESSURE: JUDICIAL DECISIONS AND ADMINISTRATIVE REQUESTS AS RESTRICTIONS FOR PLANNING ...... 20
2.1.3 BUYING UNDER PRESSURE: URGENT PURCHASES AS PUBLIC INFORMATION............................................................................................. 24
2.2 DATA AND SAMPLE DEFINITION .............................................................. 26
2.2.1 PUBLIC PROCUREMENT DATA: HEALTH-RELATED PRODUCTS .......... 27
2.2.2 HEALTH LITIGATION DATA ........................................................................ 29
2.3 EMPIRICAL STRATEGY ............................................................................. 29
2.3.1 THE ENFORCEMENT COSTS OF HEALTH LITIGATION ........................... 30
2.3.2 THE “UNDER THE GUN” EFFECT .............................................................. 37
2.4 CONCLUSION.............................................................................................. 39
2.5 FURTHER STEPS ........................................................................................ 40
3 SMES AND PUBLIC PROCUREMENT: THE COSTS OF RESTRICTING TENDERS .................................................................................................... 41
3.1 INSTITUTIONAL BACKGROUND ............................................................... 44
3.1.1 PUBLIC PROCUREMENT AND SME LAW IN BRAZIL ................................ 44
3.1.2 SME-ONLY PUBLIC TENDERS: GROUP 65 AS AN EXCEPTION.............. 47
3.2 DATA ............................................................................................................ 49
3.3 EMPIRICAL STRATEGY AND RESULTS ................................................... 51
3.3.1 MAIN SPECIFICATION AND IDENTIFICATION STRATEGY ...................... 51
3.3.2 RESULTS ..................................................................................................... 54
3.4 CONCLUSION.............................................................................................. 59
3.5 FURTHER STEPS ........................................................................................ 60
4 FREQUENT LOSERS IN PUBLIC TENDERS: ANTICOMPETITIVE BEHAVIOR OR BAD LUCK? ...................................................................... 61

4.1 MODELS FOR DETECTING CARTELS IN PUBLIC TENDERS ................. 62
4.2 FREQUENT LOSERS: DEFINITION AND CHARACTERISTICS ................ 67
4.2.1 DATA SOURCE AND DESCRIPTION .......................................................... 67
4.2.2 DEFINITION OF FREQUENT LOSERS: ‘ALWAYS LOSERS’ OUTLIERS .. 68
4.2.3 BEC SAMPLE: CHARACTERISTICS OF FREQUENT LOSERS ................. 72
4.3 FREQUENT LOSERS AND OUTCOMES IN TENDERS ............................. 76
4.4 CONCLUSION.............................................................................................. 83
4.5 FURTHER STEPS ........................................................................................ 84
FINAL REMARKS ..................................................................................................... 85
REFERENCES .......................................................................................................... 86
APPENDIX A: PAPER 1 ........................................................................................... 92
APPENDIX B: PAPER 2 ........................................................................................... 98
11
1 INTRODUCTION
Public Procurement accounts for nearly 12% of GDP and 29% government
expenditure in OECD member countries. Governments are expected to carry it out
efficiently and with high standards of conduct to ensure a high quality of service
delivery and safeguard the public interest. This dissertation investigates factors that
could undermine the performance of public tenders. The dissertation is organized into
three different papers that address distinct aspects of public procurement’s institutional
design.
In the first paper, I investigate the impact of health litigation on the efficiency of
public procurement. Public health procurement is shaped not only by administrative
choices but also by judicial decisions that enforce the law on public buyer units. Judicial
enforcement is costly for two reasons. First, as mandatory purchases are invariably
urgent, judicial enforcement undermines procurement planning. Second, as judicial
sanctions for noncompliance are severe, auctioneers have higher incentives to
maximize tender success at the expense of higher prices, which we call the “under the
gun” effect.
Unique data on health litigation and procurement of prescription and
nonprescription drugs allow us to estimate the overall enforcement costs and the
“under the gun” effect. Judicial enforcement implies (i) higher negotiated prices (from
30.73% to 44.37%), (ii) fewer participant firms (from 28.63% to 32.21%), (iii) fewer bids
(from 39.40% to 45.93%), and (iv) a lower probability of success (from 38.56% to
48.66%) in urgent tenders in comparison with ordinary tenders. To estimate the “under
the gun” effect, we utilize urgent administrative tenders that are not subject to judicial
sanctions. We estimate that judicial sanctions increase prices between 8.83% and
9.97%.
Thus, judicial enforcement compels the executive branch to carry out the
purchases, which generates high costs to the public budget. These results suggest
that judges should consider the social costs associated with the enforcement of court
decisions when the judiciary acts as a policymaker.
In the second paper, I estimate the costs of implementing a program that
incentivizes public buyer units to restrict public tenders to small and medium-sized
enterprises (SMEs). While there are numerous examples of policies that benefit small
12
and medium-sized enterprises (SMEs) worldwide, research offers little direct evidence
on the benefits of such policies for the economy. Additionally, assessments of the costs
of implementing such policies are practically ignored in the literature.
This second paper exploits a quasi-experimental variation from a program
incentivizing the restriction of public tenders to SMEs in Sao Paulo, Brazil, to estimate
this policy’s costs. The way that this institutional change occurred allows me to assess
those costs only indirectly. Using detailed data on public procurement and a variation
of the standard DiD method (difference-in-differences in reverse), I estimate the pre-
intervention effects of the policy shift. I find that before the policy shift, for group 65 (the
‘switched’ group) in comparison with other groups (the ‘always treated’ group): (i) the
negotiated prices were lower (between 4.58% and 8.08%); (ii) the number of
participants was approximately 22% higher; and (iii) the number of valid bids was
approximately 25% higher.
These results suggest that the policy of incentivizing the restriction of public
tenders to SMEs may severely undermine the quality and efficiency of the public
procurement process. Finally, before the policy change, sellers who won tenders for
group 65 were more distant from the public buyer units (approximately 4 km). This
result may indicate that the policy change has successfully induced more local
suppliers to win more bids for this group of items.
Finally, in the third paper, I propose a cartel detection method for public
procurement. The systematic loss by firms of public tenders in which they participate
for long periods and several times may indicate a cartel. This paper proposes a
screening method to detect cartels in public tenders by considering frequent losers.
Using data on public procurement in Sao Paulo State, Brazil, from 2009 and 2019, we
estimate that frequent losers are associated with 10% higher prices, 32% more
participants, and 29% more bids.
These results are consistent with the behavior of a cartel (higher prices) that
tries to avoid detection by manipulating variables that signal competition (number of
players and bids). The proposed method can address two limitations of traditional
screening methods: (i) the ability to distinguish between tacit collusion and explicit
collusion and (ii) the identification of a possible cartel before the conclusion of public
tender processes.

13
2 BITTER PILLS TO SWALLOW: ENFORCEMENT COSTS OF HEALTH LITIGATION1
Judicial enforcement is a central feature of public policy for several countries. In
some areas, such as healthcare and social security in Brazil, judicial review is
pervasive enough to completely modify the policy as originally formulated by the
executive. This phenomenon has received attention from a wide range of scholars and
policy makers to understand its features and how judicial review shape public policy
(BARREIRO and FURTADO, 2015; BIEHL, SOCAL and AMON, 2016; CNJ/INSPER,
2019; FERRAZ, 2009; WANG, 2015). Nevertheless, although recognized as a relevant
subject, the enforcement costs associated to judicial review of public policy has been
largely neglected by the literature. The governmental bodies that have to comply with
judicial decisions also incur in additional costs related to enforcement, due to both
unplanned purchases and distortion in incentives to avoid judicial sanctions. This paper
estimates the public procurement waste generated by judicial litigation in healthcare in
Brazil.
Healthcare litigation is arguably the most relevant case of judicial review of
public policies in Brazil (FERRAZ, 2009). The Brazilian Constitution states that all
citizens have the “right to life,” and the state has the explicit public health objective of
“providing universal coverage” for everyone. Available or potential budget resources
must be considered across time for these objectives to be materialized and sustainable
in the long run.
The Unified Health System (SUS) is precisely the materialization of this
statement: a coordinated set of financially viable actions, public programs, and
infrastructure, aiming to achieve the objectives established in the Constitution. Based
on aggregate social preferences, the government chooses priorities and implements
public policies subject to budget restrictions.
However, the judiciary has a strict interpretation of the Constitution that
generally ignores the budgetary dimension. This means that in Brazil, it is possible to
obtain any medication or medical procedure through litigation regardless of the costs
1 I am very thankful to Rita Joyanovic, Volnir Pontes Junior, Mário Alexandre Reis da Silva, and the staff of the Department of Finance of Sao Paulo State (SEFAZ/SP) for outstanding collaboration. I am also grateful to Paula Sue Facundo de Siqueira and the staff of the Department of Public Health of Sao Paulo State (SES/SP) for providing so useful information.

14
involved. Court orders have granted a range, for example, from acetylsalicylic acid
(aspirin or similar) to galsulfase, indicated for treating rare and severe joint disease
(mucopolysaccharidosis type VI). Individual treatment with galsulfase has an estimated
annual cost of US$400 thousand2.
This rigid interpretation of law leads to significant distortions in implementing
health policies, such as public procurement of prescription and nonprescription drugs.
Court decisions are enforced as preliminary injunctions that require the government to
make purchases within one-third of the time planned acquisitions are made, hampering
all public buying processes.
The way the planning procedures for the acquisition of these goods are carried
out may substantially affect the procurement conditions or outcomes and ultimately
might influence the results of public policies. Public bureaus should have the
appropriate time to identify all needs and ends, analyze market conditions, and set
relevant tender parameters (item specifications, quantities, and reference prices, for
instance).
Favorable planning circumstances may increase the likelihood of achieving
public policy goals efficiently and effectively. On the other hand, under unfavorable
planning conditions, purchases might be inadequate to meet public needs and more
expensive, undermining public policies’ final impact.
There is a vast literature on the waste of resources in public services, including
public procurement. A prominent approach separates the causes of waste into two
primary sources: corruption and mismanagement (BANDIERA; PRAT; VALLETTI,
2009).
The involvement of officials in corruption (i.e., active waste), such as favoring
private firms in public tenders in exchange for bribery, has received much attention in
the literature and from policymakers for its impact on public procurement efficiency
(BASHEKA, 2011; MIRONOV; ZHURAVSKAYA, 2016).
On the other hand, mismanagement (passive waste) might lead to higher prices
for various other reasons, such as inadequate civil servant skills (BEST; HJORT;
2 See https://www.ncbi.nlm.nih.gov/books/NBK409825/#:~:text=The%20annual%20acquisition%20cost%20of,recommended%20dosing%20regimen%20is%20%24399%2C100 for additional information. Access in: 08 Nov. 2020.

15
SZAKONYI, 2017), lack of incentives to minimize costs (ASHRAF, BANDIERA, LEE,
2016; BANDIERA et al., 2017; CULLEN et al., 2016) or improper management
practices (BLOOM et al., 2015; KVASNIČKA; STANĚK; KRČÁL, 2015; LEWIS-
FAUPEL et al., 2016; RASUL; ROGGER, 2018; RASUL; ROGGER; WILLIAMS, 2018),
which may increase the probability of collusion or bid rigging (CLARK et al., 2018;
MOORE, 2012).
Mismanagement and corruption are often associated mainly with internal
aspects of public administration. However, the external dimension is quite relevant to
understanding the functioning and distortions of the procurement process. Restrictions
imposed and behaviors shown by control agencies and other stakeholders acting as
watchdogs might strongly influence public officials’ decisions and, as a result,
undermine efficiency (BREWER; WALKER, 2010).
Accordingly, this paper contributes to the vast literature on public procurement
efficiency (ASHRAF; BANDIERA; LEE, 2016; BANDIERA; PRAT; VALLETTI, 2009;
LEWIS-FAUPEL et al., 2016) by providing evidence that external shocks may affect
procurement outcomes by harming the ex ante process of planning. Notably, this policy
experiment allows the inefficiency due to the judicial review of public procurement to
be estimated.
Health litigation and administrative requests are exogenous shocks that affect
how the government buys prescription and over-the-counter drugs. Thus, those shocks
can be separated into urgent (litigated and administrative requests) and ordinary
(standard procedure) types of purchases, treatments, and control groups, respectively.
I estimate the impact of health litigation and administrative requests (planning
and executing a tender) on public procurement efficiency, comparing urgent and
ordinary purchases. The objective is to assess the effects of those court orders’
enforcement costs and administrative demands on public tender efficiency.
Additionally, I compare litigated and administrative purchases to identify the
“under the gun” effect. Administrative and litigated purchases are similar in all adverse
planning and execution conditions. However, if the government fails to comply with a
court order to purchase medicines, public bureaus are subject to severe punishment.
Thus, the “under the gun” effect is an attempt to isolate the possibility of severe
penalties as an additional cost to the government.

16
I construct unique administrative data on bid-level public procurement
transactions of litigated, administrative, and ordinary health-related item purchases in
the state of Sao Paulo, Brazil, from January 2009 to December 2019.
The main findings indicate higher reference prices for urgent than ordinary
purchases (from 60.4% to 68.93% higher). This result suggests that unfavorable
conditions for compliance with court orders or administrative requests (shorter delivery
time, lower quantities, and the threat of punishment) significantly increase expectations
regarding acquisition costs.
Moreover, the (over)enforcement costs consist of (i) higher negotiated prices
(from 30.73% to 44.37% higher), (ii) fewer participant firms (from 28.63% to 32.21%
fewer), (iii) fewer bids (from 39.40% to 45.93% fewer), and (iv) a lower probability of
success (from 38.56% to 48.66% less probable) in urgent tenders than in ordinary
purchases.
Finally, I estimate the “under the gun” effect: a litigated purchase is between
8.83% and 9.97% more expensive than an administrative request, a difference
attributed to the possibility of a judicial punishment of government members in the first
and not in the second case.
In summary, judicial decisions compel the executive branch to carry out
purchases that generate high public budget costs.
The remainder of the paper is organized as follows. Section 2 characterizes the
institutional background of health litigation, administrative requests, public
procurement, and the policy experiment in Sao Paulo, Brazil. Section 3 describes the
relevant datasets and sample definitions. Section 4 presents the empirical analysis.
Section 5 concludes the paper.
2.1 Institutional Background
This section provides a brief institutional background on litigation related to
prescription drugs in the context of public tenders in Brazil.
First, I briefly introduce some relevant elements of Brazil’s health litigation issue

17
and its direct impacts on the public budget. I focus on the impacts of judicial decisions
and administrative requests on the planning process of public tenders. Finally, I briefly
describe the bidding process for prescription drugs, underlining the bidding
negotiations’ difficulties resulting from court orders and administrative demands.
2.1.1 Health: “Right of All and a Duty of the State”
To promote universal health coverage, the 1988 Brazilian Federal Constitution
created Brazil’s Unified Public Health System (SUS), which consists of a massive set
of actions and programs jointly subsidized and implemented by the federal
government, states, and municipalities. Although the SUS still has some issues and
distortions, in general, it has brought excellent results for public health in Brazil
(CASTRO et al., 2019; SOARES, 2019).
One of the SUS’s main goals is to facilitate access to prescription and
nonprescription drugs and other health items. However, this objective must meet public
budget constraints, especially in emerging economies with a chronic fiscal deficit such
as Brazil. In that respect, the SUS provides a list of procedures, medicines, and other
health-related products that the government is committed to offering the population
through its programs.
The SUS list works as a “social contract.” It is how Brazilian society deals with
the trade-off between universal health coverage and public budget costs. Periodically,
the SUS list is updated to keep up with technological changes in the health area and
treatments of new and known diseases. The ultimate goal is to serve as many people
as possible as long as the government maximizes new therapies’ cost-efficacy.
However, judges in Brazil tend to interpret the constitutional text literally and
disregard costs in their analyses and decisions. Among many articles in the
Constitution is a specific one (Article 196) that states:
Health is a right of all and a duty of the state and shall be guaranteed utilizing social and economic policies aimed at reducing the risk of illness and other hazards and at the universal and equal access to actions and services for its

18
promotion, protection, and recovery. 3
This article is a general article that gives rise to a wide range of interpretations
that bring significant distortions to the health system and proper public resources use.
Since mid-2000, the common understanding of judges has been that the
government must provide all health items and procedures for the population at any
time. This strict interpretation creates a detrimental scheme of incentives for different
groups of agents. Individuals often sue the Brazilian state “[…] claiming that they have
the right to receive the treatment they need or to be funded by the public health system”
(WANG, 2015), whether or not the treatment is on the SUS list.
It is relatively easy and inexpensive to access the legal system in this context:
individuals need only a prescription for the desired drugs and a private lawyer or public
defender. In addition, the success rate of health litigation is very high: in the state of
Sao Paulo, for example, approximately 85% of first-instance claims prosper
(CONSELHO NACIONAL DE JUSTIÇA-INSPER, 2019), and the rates in superior
courts are even higher.
The combination of the low cost of accessing the legal system and high success
rates leads to strong incentives to obtain medicines through the courts. There has been
a steady upward trend in judicial claims for health-related products in Brazil in recent
years; first instances of this type of court order totaled almost 96,000 in 2017,
increasing almost 130% over 2008 (CONSELHO NACIONAL DE JUSTIÇA-INSPER,
2019). In the same period, the growth in the total number of lawsuits in the lower courts
was only approximately 50%.
In the state of Sao Paulo, the growth pattern was even higher. An approximate
increase of 913% occurred between 2008 and 2017, increasing from 2,317 to 23,465
yearly lawsuits for health products (CONSELHO NACIONAL DE JUSTIÇA-INSPER,
2019).
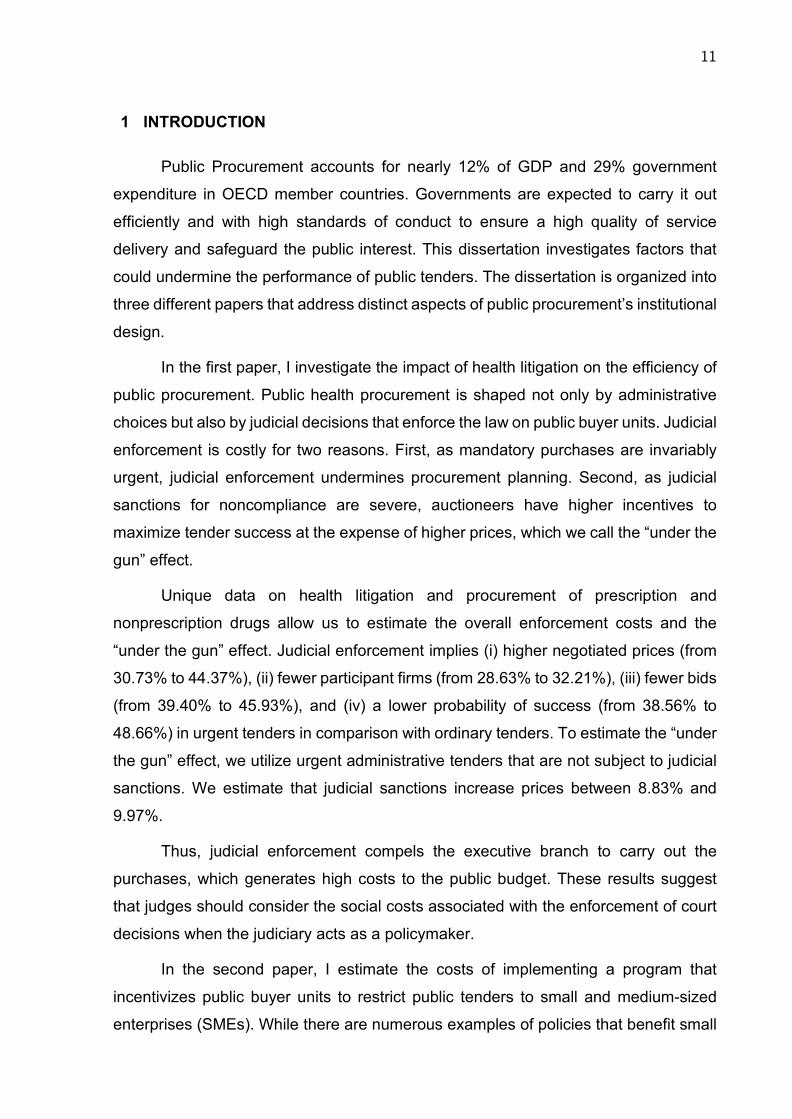
The lawsuits occur in many municipalities with wide dispersion throughout the
state of Sao Paulo (Figure 1). A higher concentration of cases occurs in the most
populous municipalities in absolute terms.
3 BRASIL. Constitution (1988). Constitution of the Federative Republic of Brazil. Brasília, DF, 1988. Available at: http://english.tse.jus.br/arquivos/federal-constitution. Access in: 08 Nov. 2020.

19
Figure 1 - Distribution of Health Litigation Cases – Municipalities in the State of Sao
Paulo (2008-2019)
Source: S-CODES (SES/SP) and (CNJ-INSPER, 2019).
In addition to wide spatial dispersion, court orders consist of a massive variety
of different items across time, including differences in dosages and drug presentations.
Between 2009 and 2018, approximately 2,760 different items were ordered at least
once a year on average.
The large and increasing number of successful judicial requests strongly affects
the public health budget. The state government of Sao Paulo has a total annual budget
of $58 billion, of which approximately 10% ($5.9 billion) goes to funding the Public
Health System in the state. In 2018, public spending only for litigated health items was
nearly 5% of the annual budget (US$300 million) of the Department of Public Health of
Sao Paulo state (SES/SP).
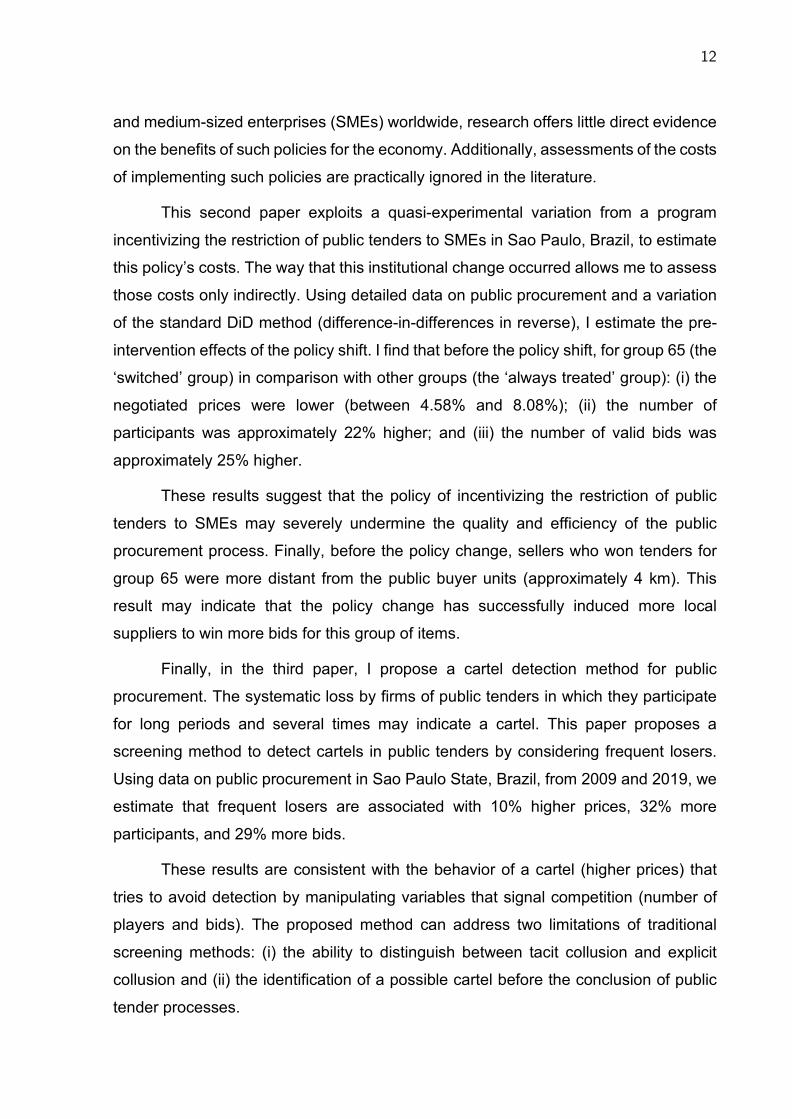
The SES/SP is responsible for managing public resources and implementing
policies and programs to promote public health in the state of Sao Paulo. It consists of
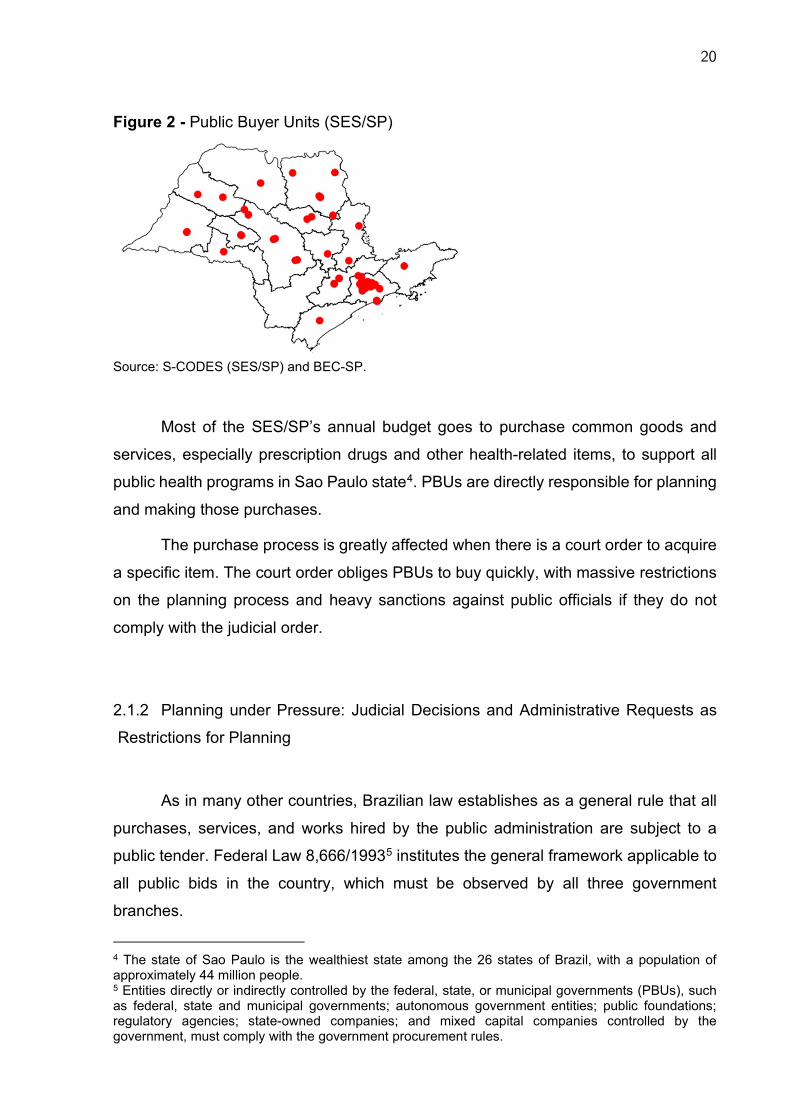
99 decentralized public buyer units (PBUs) distributed throughout the state (Figure 2).
Every year, each PBU receives funds directly from the SES/SP headquarters and can
manage its budget with a high degree of autonomy.
20
Figure 2 - Public Buyer Units (SES/SP)
Source: S-CODES (SES/SP) and BEC-SP.
Most of the SES/SP’s annual budget goes to purchase common goods and
services, especially prescription drugs and other health-related items, to support all
public health programs in Sao Paulo state4. PBUs are directly responsible for planning
and making those purchases.
The purchase process is greatly affected when there is a court order to acquire
a specific item. The court order obliges PBUs to buy quickly, with massive restrictions
on the planning process and heavy sanctions against public officials if they do not
comply with the judicial order.
2.1.2 Planning under Pressure: Judicial Decisions and Administrative Requests as
Restrictions for Planning
As in many other countries, Brazilian law establishes as a general rule that all
purchases, services, and works hired by the public administration are subject to a
public tender. Federal Law 8,666/19935 institutes the general framework applicable to
all public bids in the country, which must be observed by all three government
branches.
4 The state of Sao Paulo is the wealthiest state among the 26 states of Brazil, with a population of approximately 44 million people. 5 Entities directly or indirectly controlled by the federal, state, or municipal governments (PBUs), such as federal, state and municipal governments; autonomous government entities; public foundations; regulatory agencies; state-owned companies; and mixed capital companies controlled by the government, must comply with the government procurement rules.

21
According to Law 8,666/1993, a public purchase comprises three distinct,
mandatory, and subsequent phases: (i) the internal phase (planning and publication of
the notice), (ii) the external phase (negotiation between purchasing units and suppliers,
and (iii) delivery of items.
The internal phase of an ordinary purchase consists of the public administration
carrying out careful procurement preparation and planning. At this stage, PBUs first
identify their needs and select what types of goods or services might be appropriate to
meet those demands. Guided by the SES/SP headquarters, the purchases made by
each PBU take into account local and regional demands. However, the most important
requirement is that the SES/SP exclusively purchase items that appear on the SUS
list.
The tender preparation commission then creates a purchase order defining the
main parameters of the bidding process. These parameters consist of the number of
items to be purchased and their specifications, the bidding schedule for all participants,
the bidding procedure6, the auctioneer in charge, quantities, reference prices7, delivery
addresses, and minimum bidder requirements for participation, payment method, and
possible fines. These parameters, except reference prices, are brought together in a
document called a public notice8.
Choosing suitable bid parameters, such as quantities and reference prices,
increases the chances of an efficient purchase. PBUs need enough time to accurately
organize a proposal and take advantage of the government’s ability to buy items on a
large scale at better prices. Nonetheless, in some situations, planning time is scarce.
When court decisions reach the government, they force PBUs to buy items in
very adverse conditions. First, these healthcare-related court decisions are almost
exclusively enforced through injunctions (99.94% of all court decisions). The
injunctions’ application makes the deadlines for planning purchases and delivery of
items very tight (between 1 and 10 days) compared to the deadlines for ordinary
purchases (from 30 to 180 days). Consequently, the internal phase of litigated
purchases is accomplished, on average, in one-third of the time of ordinary purchases,
6 In Brazil, different types of competitive tendering formats are available to procurers, such as invitation (sealed-bid tendering) and reverse auction. 7 The maximum price a PBU is willing to pay for the item. It is private information. 8 The notice must be published in the Official Gazette.

22
which undermines the process of setting the essential tender parameters.
Additionally, court orders have specific features that bring difficult and
unpredictable elements to the purchase planning process. For example, since PBUs
generally do not buy items that are not on the SUS list, they have less experience
planning the purchase of these items. Most litigated products (almost 75%), mainly
high-cost products and those intended for severe or rare diseases, such as cancer and
amyotrophic lateral sclerosis (ALS), are not listed in the SUS.
However, the courts also order prescription drugs that are on the SUS list. Most
court orders require the whole treatment of a specific disease for an individual: a set
or package of different prescription drugs. Almost 65% of claims consist of items on
the SUS list ordered along with non-SUS items. Although some of these items are on
the SUS list, they also have a material impact on the public budget and purchase
planning: litigated purchases use resources that would have been used for other
purposes or were outside the initially planned budget.
Other relevant reasons for litigation are “off-label” uses of SUS-list items
(approximately 20%) and “jumping the line”9 in public programs (nearly 11%).
Additionally, judges heed complementary justifications such as individuals’ insufficient
financial resources and imminent risk of death without requiring detailed evidence of
these conditions in their decisions. Only 4% of judicial claims are due to lack of stock
or inability to provide service. Thus, this situation indicates that the “litigation shock” is
poorly correlated with a possible unobservable characteristic of PBUs, such as
mismanagement.
Only in rare cases can the government execute a court order using existing
stock since (i) planning is performed to meet the demands of existing programs, and
(ii) it is challenging to maintain and manage strategic stocks due to drugs’ high degree
of perishability and the massive variety of items. For these reasons, health litigation
acts as an exogenous shock, a severe restriction to be addressed in the planning
process. It is impossible to precisely anticipate where, when, what, and what quantities
the SES/SP might have to purchase. PBUs have little control over planning under these
conditions. Additionally, health litigation has very little to do with the quality of the public
9 Cases in which the individual is entitled to receive the medication through a public program but does not want to wait to undergo the standard procedures to obtain it.

23
policies implemented.
There are also other costs to the government resulting from the judiciary
monitoring and actively participating in public purchases. Penalties are extremely
severe for public officials if they do not comply with a court order. This potential threat
constitutes an additional restrictive element to tenders generated by court orders. The
primary forms of punishment for noncompliance are (i) fines (sometimes reaching
significant and disproportionate amounts); (ii) administrative, civil and criminal liability;
and (iii) blocking and “hijacking” public funds.
Since 2009, the SES/SP has tried to mitigate the monitoring and punishment
costs generated by court orders. The mechanism used is negotiating an item’s supply
directly with an individual before a court order occurs. This procedure is known as an
administrative request.
Administrative requests are evaluated by a scientific committee that can judge
whether a request is valid. This commission uses the scientific literature with a healthy
level of evidence, using evidence-based medicine criteria and protocols recognized by
the medical community.
One main difference between a judicial and an administrative request is that the
latter undergoes a scientific examination and tends to represent a better use of the
resource and the drug. As it is a more rigid and scientific process, it tends to be less
sought after and generate fewer purchasing processes. The purchases generated by
administrative orders totaled 9,700 between 2009 and 2019, representing
approximately 6.5% of the total purchases from court orders.
Administrative requests bring another benefit to public administration. There are
no penalties for the public officials involved in the event of a failure in the requested
item’s purchase process. Nevertheless, there is no difference between a court order
and an administrative request regarding planning purchases. Like a court order, an
administrative request generates a purchase order with immediate delivery and using
budget resources not designated for this purpose.
In general, purchases of prescription and nonprescription drugs can be
classified into three groups: (i) ordinary, (ii) administrative, and (iii) litigated. Table 1
summarizes the types of purchases and their characteristics.

24
Table 1 – Types of Purchases
Source: Prepared by the author.
Health litigation and administrative requests significantly impair the public
procurement process, forcing public administration to respond to these demands
without proper planning promptly. The purchase and negotiation process itself is
severely hampered.
2.1.3 Buying under Pressure: Urgent Purchases as Public Information
The external phase covers the time lapse between the publication of the public
notice and the contractual signature. This phase involves interaction between the
government and firms through a previously chosen competitive tendering procedure
and other parameters defined in the internal phase.
The main objective of a bidding process conducted by a PBU is to seek the best
possible contract for the government, taking into account the parameters defined in the
planning phase. The public official responsible for negotiating with suppliers cannot
change any previously defined parameters such as quantities, delivery time, reference
prices, and tendering procedures.
The way the internal phase routines are performed may substantially affect the
bidding process results. Given that urgent purchases (litigated or administrative
purchases) are planned under very restrictive conditions, they can make negotiations
very difficult. Therefore, these urgent purchases' expected outcomes tend to be much
worse than the outcomes when purchases are made under ordinary planning
Ordinary Administrative Litigated
Source of funds Planned budget Extra-budget Extra-budget
Quantity Higher quantity Lower quantity Lower quantity
Delivery time Usually from 30 to 180 days From 1 to 10 days From 1 to 10 days
Threat of punishment No punishment No punishment Potential punishment
Type of purchaseFeatures

25
conditions.
In addition, informing all that a tender is an urgent purchase can amplify these
effects. It is mandatory by law to provide information in the public notice that the
purchase originated from a court order or administrative request; this is public
information10. For example, participating suppliers know that the SES/SP and its
officers responsible for the bidding may be punished if negotiation for a litigated
purchase is unsuccessful. Thus, making this situation, public information can be a
relevant imbalance factor in the bargaining process between the government and
firms.
Despite the differences in planning conditions, ordinary and urgent purchases
are made through the state e-platform under the same operational conditions. Each
PBU purchases in a decentralized way through the Bolsa Eletronica de Compras
(BEC), the e-procurement platform of Sao Paulo state. Since 2007, it has been
mandatory to use the BEC to purchase common goods and services in Sao Paulo
state, including all 99 SES/SP units.
The BEC figures of SES/SP buying are expressive. In 2018, approximately
US$1.7 billion were traded, and since 2009, the electronic platform has handled more
than R$7.4 billion in SES/SP negotiations (approximately 34% of all state purchases).
Almost 55,000 item purchase offers were negotiated, comprehending approximately
6,350 different traded items. The BEC has an extensive catalog of standardized items
and services that are described in great detail11.
The SES/SP uses the same two types of competitive tendering procedures
available at the BEC to make ordinary and urgent (litigated and administrative)
purchases: (i) sealed-bid tendering (convite) and (ii) multiround descending auctions
(pregão).
In sealed bids, firms send their proposals to the government by a specific date
specified in the notice. At a later date, the proposals and participants become public
information when the auctioneer “opens” the envelopes. The winning firm is the one
among those with appropriate documentation that submitted the lowest bid. Convite is
allowed up to the purchase value limit of R$176,000 (approximately US$35,200).
10 See Appendix A for examples of public notices containing explicit disclaimers for urgent purchases. 11 See details in section 3.1.

26
Pregão has no limit on the purchase value. This mode is a combination of a modified
sealed-bid tender and reverse auction. In this case, PBUs rank the qualified proposals
only under the conditions set out in the sealed-bid phase’s notice. Then, the auctioneer
publicly reveals all valid proposals, keeping firms’ identities anonymous.
Next, the descending auction begins: for 20 minutes, each qualified firm submits
its bids, knowing the current lowest valid bid. If there is a valid bid between 16 and 20
minutes, the auction will be extended for another 4 minutes. It ends only if 4 minutes
passed with no valid bid. The final criterion12 for winning the tender is presenting the
lowest bid price, which must be lower than the reference price.
One of the main differences between the convite and pregão modes is that the
latter allows for a negotiation phase after the reverse auction during which companies
and the government can negotiate the lowest final price previously obtained. On the
other hand, since convite has a single phase, it tends to be a more straightforward
procedure to perform and monitor.
Planning and executing tenders consist of a very costly public administration
process that demands relevant financial and human resources. An acquisition made
by pregão or convite can have administrative costs from US$500 to US$5,20013,
depending on the bid complexity. Thus, if a public tender fails to obtain a supplier, it
creates relevant waste for the government.
2.2 Data and Sample Definition
This section describes each data source and details the sample characteristics
used in the empirical section. First, I present the bidding-level data on common goods
and services purchased by the Sao Paulo state government through the BEC with a
particular interest in what health-related products the SES/SP purchased and how from
2009 to 2019.
Second, I describe the dataset at the individual level for all lawsuits associated
12 “Best price” criterion. 13 For more information, see: https://www.cgu.gov.br/noticias/2017/07/cgu-divulga-estudo-sobre-eficiencia-dos-pregoes-realizados-pelo-governo-federal/nota-tecnica-no-1-081-2017-cgplag-dg-sfc.pdf/view. Access in: 08 Nov. 2020.

27
with requests for free health-related products that occurred in the state courts of Sao
Paulo during this period. This dataset includes information on individual court requests
and judges’ decision texts.
I utilize a unique combination of administrative databases in public procurement
bidding processes, health litigation registers, and judicial decision texts in Sao Paulo,
Brazil, from January 2009 to December 2019.
2.2.1 Public Procurement Data: Health-Related Products
I use administrative data on bidding-level public procurement tenders of
common goods and services in the state of Sao Paulo, Brazil, from January 2009 to
December 2019. These transactions took place under the BEC electronic procurement
platform, which is available to all PBUs across the state. The Department of Finance
of Sao Paulo state (SEFAZ/SP) is responsible for BEC bidding data's operational
management and centralization.
In total, 1,344 PBUs make regular purchases through the BEC, including state-
level executive, legislative, and judiciary bureaus in the state of Sao Paulo as well as
other affiliated entities, such as some municipalities located in the state of Sao Paulo
and a group of private organizations. PBUs purchased 169,607 different types of items
(goods and services), totaling 3,866,407 transactions from 19,007 distinct firms in this
period.
The BEC has a very detailed catalog of standardized goods and services
organized in three levels: group, class, and item. For instance, health items are
classified as group 65 (Medical, dental and hospital equipment and supplies). Thus,
the item coded 110639 is the drug “Furosemide 40 milligrams, coated tablets, units,”
belonging to class 6531 (Medicines prescribed with or without ANVISA
notification/registration) and group 65.

28
Table 2 - Descriptive Statistics: Public Tenders
Variable Obs Mean Std. Dev. Min Max
urgent 59708 .3 .46 0 1
quantity 59708 4062184.9 9.822e+08 1 2.400e+11
reference price 59708 68.14 778.24 .01 96843.23
negotiated price 59708 38.44 421.38 0 17065.03
#firms 45007 3.22 2.42 1 18
#bids 45007 9.91 14.56 1 655
distance 38440 305.05 296.89 .01 2479.06
firm age 38440 189.58 150.48 2 750
convite 59708 .19 .39 0 1
Source: BEC-SP.
Data are organized by purchase offer (PO), the electronic document issued by
the PBU that identifies and quantifies the goods and services that will be purchased. A
PO is defined by a 22-character code and may contain one or more listed items, but
each item has its own purchase process. Thus, the purchase of an item is uniquely
identified by the combination of the PO and the purchased item codes (POI).
Each POI provides information about the internal phase parameters, such as
item quantities and reference prices, and external phase outcomes, such as bid prices
(winners and losers), number of participant firms, number of bids, whether the public
tender was successful or not, and the identification of the PBU and the auctioneer,
among other variables.
In the empirical section, I restrict attention to SES/SP purchases of prescription
and nonprescription drugs. It is possible to identify government acquisitions as
ordinary, administrative, and litigated purchases using bidding notices.
In the public notice, there is a section called “Object of the Contract” that
consists of a description of what is being purchased and the reason for the purchase.
I use a regular expression algorithm (REGEX) to process the public notice texts and
identify which POIs correspond to litigated purchases14.
14 First, I randomly selected 1,203 purchase orders, separating expressions that could identify the type of bid for each purchase order. Then, I ran an algorithm that checked the “Object of the Contract” field of all POs for the selected expressions, creating a binary variable for each type of bid.
29
2.2.2 Health Litigation Data
Data about health litigation come from two sources: the S-CODES database
and texts of court decisions.
Managed by the SES/SP, S-CODES is an administrative database that contains
a detailed record of all health claims against the state of Sao Paulo from 2009 to 2019.
The main variables that I derive from the S-CODES database for each litigated
item are15 (i) the SUS list: a dummy variable with the value of 1 if the item belongs to
the SUS list and 0 otherwise; (iii) the Package, with a value of 1 if the item was jointly
litigated with other products and 0 otherwise; and (iii) the Preliminary injunction, with a
value of 1 if the court decision was enforced through a preliminary injunction and 0
otherwise.
Moreover, I use the texts of all court decisions against the state of Sao Paulo
about health-related products from 2009 to 2019 to identify two aspects of health
litigation: (i) individuals’ main reasons for litigating and (ii) the main arguments used by
judges to grant or reject a judicial claim. I use a supervised machine learning method
to process all text decisions and search for litigation and judges’ decision patterns.
2.3 Empirical Strategy
The empirical analysis is organized into two distinct parts.
First, to estimate the overall enforcement effect, I compare ordinary and urgent
purchases, using judicial decisions and administrative requests that obligate the
government to provide free prescription and nonprescription drugs to individuals. To
avoid selection bias due to court orders, the first set of estimations restrict the analysis
only to drugs that are regularly purchased by the government, as part of the healthcare
public policy; and to the judicial orders that were motivated for reasons uncorrelated
with the supply of those drugs.
Second, to estimate the “under the gun” effect, I compare two types of urgent
15 S-CODES has the same primary key (item code) as the BEC database.

30
tenders (litigated and administrative purchases) that differ only with regard the
sanctions for non-compliance. As explained in more detail in this section, this
comparison is not subject to selection bias since the choice between litigated or
administrative urgent purchases is due to claimant’s personal features that, although
relevant for assessing judicial outcome, are irrelevant in public tenders.
2.3.1 The Enforcement Costs of Health Litigation
As mentioned before, when there is an injunction or an administrative request
that forces the government to make an urgent acquisition, the SES/SP has significantly
less time to plan it and a lower degree of discretion in setting key procurement
parameters than in an ordinary purchase. This first estimation aims to illustrate the
impact of these exogenous and anomalous requests on the critical parameters of
tenders.
First, it is essential to note that both judicial and administrative requests
constitute shocks that are not correlated with any unobserved factors in the purchase
process. Although a judicial or administrative order’s success depends on individuals’
characteristics, the order purchase process does not.
The principle of impersonality16 in public administration makes the planning and
execution of the purchase utterly independent of the requesting individual’s
characteristics. Thus, the purchase results do not depend on who placed the order or
who will benefit from it. The tender outcomes depend on the purchase characteristics,
such as the items to be purchased, planning, and market conditions.
Who makes the purchase, i.e., public officials of the PBUs, judicial orders, or
administrative requests, functions as an exogenous restriction on the way they make
purchases. Primarily, in this particular case, the shocks separate the purchases into
two types according to planning conditions and required delivery time: ordinary and
urgent purchases. Since planning conditions and delivery time are very similar between
purchases based on judicial orders and administrative requests, they are classified as
16 The principle of impersonality establishes that the public administration must be impartial in defending the public interest in any administrative action. This principle avoids discrimination or privileges for specific individuals. Therefore, bids must be planned and executed regardless of who requests them.

31
urgent.
Thus, I identify the effects of these exogenous shocks on the tender results,
comparing ordinary and urgent purchase types. Differences in reference prices
between urgent and ordinary purchases of purchase order I, with a good g and in time
t, for instance, are estimated in the following specification for the log of reference price:
ln𝑅𝑅𝑅𝑅𝑅𝑅_𝑃𝑃𝑃𝑃𝑃𝑃𝑃𝑃𝑅𝑅𝑖𝑖𝑖𝑖𝑖𝑖 = 𝛽𝛽𝑈𝑈𝑃𝑃𝑈𝑈𝑅𝑅𝑈𝑈𝑈𝑈𝑖𝑖𝑖𝑖𝑖𝑖 + 𝛼𝛼𝑖𝑖 + 𝜆𝜆𝑖𝑖 + 𝐱𝐱𝐱𝐱 + 𝜖𝜖𝑖𝑖𝑖𝑖𝑖𝑖 (1)
where 𝛼𝛼𝑖𝑖 and 𝜆𝜆𝑖𝑖 are item fixed effects and time trend dummies, respectively, and 𝐱𝐱 is
a vector of control variables. The variable 𝑈𝑈𝑃𝑃𝑈𝑈𝑅𝑅𝑈𝑈𝑈𝑈𝑖𝑖𝑖𝑖𝑖𝑖 has a value of 1 if it is a litigated
or administrative purchase and 0 if it is an ordinary purchase.
I use data of all public bids related to SUS-list medicines from January 2009 to
December 2019. The data include only items with at least one urgent purchase and at
least one ordinary tender. The results are shown in Table 3.
Table 3 - Reference Prices: Urgent vs. Ordinary Purchases
(1) (2) (3) (4)
OLS FE FE FE
urgent .4988*** .5243*** .4967*** .4725***
(.0379) (.0383) (.0377) (.0373)
type_mgmt .6535*** .6488*** .553***
(.0516) (.051) (.0521)
sealed-bid -.1708***
(.0184)
_cons .33*** .2554*** -.3851*** -.2307***
(.0607) (.0699) (.0807) (.0809)
Observations 59708 59708 59708 59708
R-squared .7767 .0702 .0781 .0816
Item dummies YES YES YES YES
Year dummies NO YES YES YES
PBU dummies YES NO YES YES
Standard errors are in parentheses.
*** p<.01, ** p<.05, * p<.1

32
It is possible to observe that reference prices are consistently higher in urgent
purchases, considering all specifications: items are, on average, from 60.40% to
68.93% more expensive than in ordinary purchases.
The positive difference in reference prices captures the effects of worse
conditions for planning purchases: smaller quantities, shorter delivery times, and the
potential risk of punishment. As shown in Table 4, the quantities chosen are indeed
lower for urgent purchases.
Table 4 - Quantities: Urgent vs. Ordinary Purchases
(1) (2) (3) (4)
OLS FE FE FE
urgent -.8128*** -.8811*** -.8272*** -.9402***
(.0625) (.0623) (.0626) (.0635)
type_mgmt -1.2808*** -1.2642*** -1.7127***
(.1076) (.107) (.1082)
sealed-bid -.8***
(.0428)
_cons 7.412*** 6.1144*** 7.3626*** 8.0859***
(.1117) (.1003) (.1458) (.1492)
Observations 59708 59708 59708 59708
R-squared .4141 .1606 .1702 .195
Item dummies YES YES YES YES
Year dummies NO YES YES YES
PBU dummies YES NO YES YES
Standard errors are in parentheses.
*** p<.01, ** p<.05, * p<.1
Usually, governments seek to buy goods and services from the private sector
on a large scale to obtain higher discounts on negotiated prices. This “bulk
procurement” effect might be maximized if PBUs could adequately plan the acquisition
process of goods and services.
The results suggest the following general mechanism: court orders or
administrative orders create worse conditions for planning a given public tender. This
shock impacts the capacity to define the amount to be purchased, and the maximum
prices PBUs are willing to pay.

33
Given that budgetary resources are scarce, especially for urgent orders, PBUs
choose smaller quantities and pay higher prices to comply with court orders at the
proper time. Thus, PBUs lose bargaining power and the possibility of substantial bulk
discounts.
The effective fulfillment of court orders or administrative requests occurs in the
external phase, consisting of the negotiation itself. Compliance with these external
requests directly impacts the total amount of public spending. Unplanned,
extrabudgetary resources are used to meet these external requests.
In urgent purchases, the negotiated quantities are, on average, nearly 53%
smaller than in ordinary purchases. Both reference prices and negotiated prices may
be affected: the lower the quantities purchased, the higher the prices are.
I use a specification similar to that presented above, as a baseline to model
differences in outcomes y between urgent and ordinary purchases of purchase order i
with good g and in time t:
ln𝑦𝑦𝑖𝑖𝑖𝑖𝑖𝑖 = 𝛽𝛽𝑈𝑈𝑃𝑃𝑈𝑈𝑅𝑅𝑈𝑈𝑈𝑈𝑖𝑖𝑖𝑖𝑖𝑖 + 𝛼𝛼𝑖𝑖 + 𝜆𝜆𝑖𝑖 + 𝐳𝐳𝐱𝐱 + 𝜖𝜖𝑖𝑖𝑖𝑖𝑖𝑖 (2)
where 𝐳𝐳 is a vector of controls, including the purchased quantities defined in the internal
phase. This is a way to capture possible bulk discounts. The estimations for negotiated
prices are presented in Table 5.

34
Table 5 - Negotiated Prices: Urgent vs. Ordinary Purchases (1) (2) (3) (4)
OLS FE FE FE
urgent .3672*** .3526*** .3568*** .268***
(.0414) (.0429) (.0417) (.0432)
lquantity -.3081*** -.3011*** -.3025*** -.3301***
(.036) (.0334) (.034) (.034)
type_mgmt -.1814** -.1422* -.4735***
(.0801) (.0742) (.0863)
sealed-bid -.5403***
(.0344)
_cons 2.4156*** 1.2356*** 1.3862*** 2.0863***
(.2934) (.206) (.2665) (.2892)
Observations 38440 38440 38440 38440
R-squared .879 .3393 .3396 .3798
Item dummies YES YES YES YES
Year dummies NO YES YES YES
PBU dummies YES NO YES YES
Standard errors are in parentheses.
*** p<.01, ** p<.05, * p<.1
As shown, the government buys the same product under different planning
situations: ordinary and urgent conditions. Negotiated prices are consistently higher for
urgent purchases. On average, items purchased in adverse conditions are from
30.73% to 44.37% more expensive than those purchased in ordinary tenders.
Higher prices for urgent purchases suggest that adverse trading conditions
strongly affect government bargaining power. On the other hand, tight deadlines and
small quantities can alienate firms potentially interested in selling to the government.
Table 6 presents estimations for the number of participant firms in urgent vs. ordinary
purchases.

35
Table 6 - Participant Firms: Urgent vs. Ordinary Purchases (1) (2) (3) (4)
OLS FE FE FE
urgent -.3887*** -.3831*** -.3811*** -.3373***
(.019) (.0191) (.0191) (.02)
lquantity .148*** .1475*** .1468*** .1604***
(.0068) (.0068) (.0068) (.0079)
type_mgmt -.0463* -.0672** .096***
(.0267) (.0281) (.0293)
sealed-bid .2661***
(.0184)
_cons -.3167*** -.0293 .0419 -.303***
(.0632) (.0563) (.0701) (.0841)
Observations 38430 38430 38430 38430
R-squared .4691 .2645 .2647 .2886
Item dummies YES YES YES YES
Year dummies NO YES YES YES
PBU dummies YES NO YES YES
Standard errors are in parentheses.
*** p<.01, ** p<.05, * p<.1
There is a consistent drop in firms that participate in urgent purchases, varying
from 28.63% to 32.21%, compared to ordinary ones. This result may indicate that the
screening process is impaired in urgent purchases, as PBUs are not able to attract as
many suppliers as usual.
A possible consequence of attracting a smaller number of interested suppliers
is less competitive bidding. Few companies do not necessarily mean less competition.
For instance, very few companies offer certain specific medicines, but they consist of
oligopolies with very competitive dynamics. However, Table 7 supports the first idea in
the case of the tenders studied here.

36
Table 7 - Number of Bids: Urgent vs. Ordinary Purchases (1) (2) (3) (4)
OLS FE FE FE
urgent -.509*** -.5009*** -.5166*** -.6148***
(.0366) (.0325) (.0322) (.0342)
lquantity .2162*** .2208*** .2261*** .1956***
(.0158) (.0134) (.0137) (.0127)
type_mgmt .478*** .5265*** .1602***
(.0446) (.0409) (.04)
sealed-bid -.5973***
(.0337)
_cons -.2387* -.1271 -.6847*** .0893
(.1362) (.1025) (.1281) (.1311)
Observations 38430 38430 38430 38430
R-squared .4232 .2181 .2232 .2703
Item dummies YES YES YES YES
Year dummies NO YES YES YES
PBU dummies YES NO YES YES
Standard errors are in parentheses.
*** p<.01, ** p<.05, * p<.1
Although the number of participants for urgent purchases is approximately 30%
lower, the number of bids is even smaller. On average, the number of valid bids falls
from 39.40% to 45.93% in urgent purchases compared to ordinary ones.
This firm behavior may reflect the lack of incentives to be more aggressive in
the context of urgent purchases. Since there are fewer participating companies and
less bargaining power for PBUs, suppliers make less effort to lower prices.
Moreover, adverse conditions for purchasing medicines can generate another
problem related to firm screening processes. When conditions are precarious, the
bidding process might fail. There may be a lack of interest among suppliers, or the
PBUs cannot obtain a reasonable price. Urgent purchases tend to be significantly more
likely to fail than ordinary purchases, as shown in Table 8.

37
Table 8 - Successful Tenders: Urgent vs. Ordinary Purchases (1) (2) (3) (4)
LOGIT LOGIT LOGIT LOGIT
urgent -.4871*** -.4871*** -.6667*** -.5471***
(.0252) (.0252) (.029) (.0301)
lquantity .2378*** .2378*** .2508*** .2803***
(.006) (.006) (.0063) (.0065)
type_mgmt .1628** .756***
(.0695) (.073)
sealed-bid .9603***
(.0305)
_cons -1.8201*** -1.8201*** -2.1149*** -2.9174***
(.3403) (.3403) (.3536) (.3615)
Observations 59672 59672 59672 59672
r2_p .1238 .1238 .1328 .1572
Item dummies YES YES YES YES
Year dummies NO NO NO YES
PBU dummies NO NO YES YES
Standard errors are in parentheses.
*** p<.01, ** p<.05, * p<.1
Urgent purchases are from 38.56% to 48.66% less likely to succeed than
ordinary purchases. Failure to bid has relevant implications in terms of budgetary costs.
First, when a court-ordered purchase is not made, it generates relevant punishment
costs, such as fines and blocking of budgetary resources for the PBU. In addition, as
mentioned in section 2.3, planning and executing a purchase have high costs.
Therefore, resources are wasted in case of failure.
2.3.2 The “Under the Gun” Effect
As already mentioned, urgent purchases consist of those arising from court
orders and administrative orders. Both litigated and administrative purchases are made
under challenging conditions in terms of planning and execution. However, there is a
single significant difference between them: a litigated tender likely results in public
officials' punishment if they fail to complete the purchase.
Making public the information that a tender is of a litigated type might have an
38
additional effect on the results of bidding processes. Since all participants learn that
the government is under even higher pressure to purchase, firms have additional
advantages over PBUs in the bargaining process.
This section’s main objective is to estimate this “additional effect”; I call it the
“under the gun” effect. I use all public bid data, including SUS-list and non-SUS-list
medicines, from January 2009 to December 2019.
I restrict the analysis to items with at least one litigated purchase and at least
one administrative tender; data on ordinary purchases are excluded from those
estimations. The idea is to compare litigated and administrative purchases exclusively.
Using the same identification strategy presented in section 4.1, I adopt the following
specification as the baseline equation:
ln𝑦𝑦𝑖𝑖𝑖𝑖𝑖𝑖 = 𝛽𝛽𝐴𝐴𝐴𝐴𝐴𝐴𝑖𝑖𝑖𝑖𝑖𝑖 + 𝛼𝛼𝑖𝑖 + 𝜆𝜆𝑖𝑖 + 𝐳𝐳𝐱𝐱 + 𝜖𝜖𝑖𝑖𝑖𝑖𝑖𝑖 (3)
where 𝐴𝐴𝐴𝐴𝐴𝐴𝑖𝑖𝑖𝑖𝑖𝑖 has a value of 1 if it is an administrative purchase and 0 if it is a litigated
purchase. Table 9 presents the estimation of the results for negotiated prices.
Negotiated prices are lower for administrative purchases. On average, administrative
tenders are 8.11% to 9.06% less expensive than litigated tenders.

39
Table 9 - Negotiating Prices: The “Under the Gun” Effect, Litigated vs. Administrative
Tenders (1) (2) (3) (4)
OLS FE FE FE
administrative -.095*** -.0859*** -.0859*** -.0846***
(.0238) (.0243) (.0243) (.0242)
lquantity -.4003*** -.3942*** -.3942*** -.3981***
(.0233) (.0236) (.0236) (.0234)
type_mgmt -.1564 -.184 -.4322*
(.181) (.1879) (.2519)
sealed-bid -.5173***
(.0401)
_cons 2.4521*** 3.9031*** 4.0871*** 4.5326***
(.2431) (.1344) (.2391) (.3013)
Observations 51013 51013 51013 51013
R-squared .9293 .3718 .3718 .3837
Item dummies YES YES YES YES
Year dummies NO YES YES YES
PBU dummies YES NO YES YES
Standard errors are in parentheses.
*** p<.01, ** p<.05, * p<.1
In other words, litigated purchases are between 8.83% and 9.97% more
expensive than administrative purchases. This difference is the “under the gun” effect.
With similar planning and execution conditions between administrative and litigated
purchases, the estimated price difference can be attributed exclusively to the possible
punishment of PBUs in case of failure to purchase.
2.4 Conclusion
Implementing public policies demands various types of resources, such as
common goods and services. It is crucial that the process of purchasing these goods
and services be well planned and executed so that the government may use its budget
efficiently and achieve public policy goals effectively.
This paper investigates the enforcement costs of health litigation and
administrative requests for the public budget. I evaluate the government waste

40
generated when the judiciary directly affects public policy. In this case, health litigation
imposes multifold restrictions on the public procurement process, harming tender
outcomes.
From a policy perspective, this research indicates that judges should consider
the public budget implications and administrative costs of purchasing health items
under pressure in their decisions. An institutional arrangement integrating the judiciary
and the executive branches, enabling joint actions, might mitigate waste in the health
litigation context.
2.5 Further Steps
There are two main ways to advance this paper. The first is developing a
theoretical model that explains the mechanisms of the "under the gun" effect, focusing
on the behavior of the auctioneer responsible for public purchases.
A second way is to explore potential heterogeneities in the "under the gun" effect
among auctioneers. The idea is to open the “black box” of the fixed effects related to
those auctioneers, relating academic backgrounds, capabilities, tenure, among other
characteristics, with differences in effects on the waste generated in litigated
purchases.

41
3 SMES AND PUBLIC PROCUREMENT: THE COSTS OF RESTRICTING TENDERS
Small and medium-sized enterprises are extremely important for employment
and production worldwide. In Europe, for instance, SMEs represent nearly 99.8% of all
registered companies, accounting for more than half of the European GDP and two-
thirds of all jobs in the private sector (PWC, 2014). Similar figures can be observed in
Brazil, where approximately 97% of all firms are SMEs17, representing approximately
50% of Brazil’s formal jobs (BASTOS et al., 2018).
In recent years, governments worldwide have implemented public policies that
favor SMEs based on the potential or actual benefits these policies can bring to the
economy.
The literature widely acknowledges that SMEs have massive potential for job
creation, local development, and innovation (SIGMA, 2016). However, there is limited
evidence on the social costs of such policies since most research and case studies do
not address this point. This paper exploits a quasi-experimental variation from a public
SME-related program to estimate the costs of incentivizing restricted public tenders to
SMEs in Sao Paulo, Brazil.
The use of public procurement as a policy tool has been a major trend worldwide
(THAI, 2017). Policies that favor sustainable or ‘green’ procurement18 or utilize social
criteria to restrict bids to a target group of sellers19 are prime examples of public
procurement policies that aim to achieve social and economic outcomes.
One of the most widespread practices to promote local development through
public procurement is the restriction of public tenders to SMEs. The significant
presence of SMEs in the economy suggests that these companies are an essential
channel through which to infuse economic development (FREEDMAN, 2013; MEL;
MCKENZIE; WOODRUFF, 2008), although there is evidence that the effectiveness of
17 This terminology varies slightly from country to country. In Brazil, the term most widely used to refer to these companies is 'small and micro enterprises', which is equivalent to the term SMEs in the international literature. 18 Public tenders with environmentally oriented procurement goals. See also (LUNDBERG; MARKLUND, 2018). 19 ‘Social’ public procurement refers to policies that favor specific social groups in public tenders, such as woman-owned companies or companies with minimum labor standards. See also (MCCRUDDEN, 2007).

42
this mechanism depends on the quality of management practices (MCKENZIE;
WOODRUFF, 2015) or how capital is provided through investment in SMEs
(FAFCHAMPS et al., 2014).
The primary justifications for implementing policies that favor SMEs in public
procurement are related to the various entry barriers to public tender that SMEs face
(HOEKMAN; TAS, 2020; LOADER, 2015; OECD, 2018). Better access to the public
procurement market might catalyze SMEs’ productive potential, especially in contexts
with demand constraints (CARDOZA et al., 2016; FERRAZ; FINAN; SZERMAN, 2015).
It may expand government networks of goods and services providers, thus enhancing
the competition among firms and enabling public acquisitions at more competitive
prices (LOADER, 2013).
Despite the potential positive effects generated by favoring SMEs in public
tenders, such a policy may undermine the quality and efficiency of the public
procurement process (NAKABAYASHI, 2013). First, it may lead to smaller-scale
purchases per bid because SMEs generally cannot handle large orders.
Second, restricting public bid participation may harm firms’ screening process
and increase the likelihood of selecting fewer, less efficient firms or no firms at all
(LOADER, 2013; NAKABAYASHI, 2013). Thus, either negotiated prices may be higher
than usual, or there may be a waste of public resources since planning and executing
a bid is costly. However, there is evidence that the costs of negotiating and executing
public contracts may be mitigated by public managers’ contract management
capabilities and private sellers’ contract execution capabilities (CABRAL, 2017).
Additionally, depending on the characteristics of their sector, SMEs may not
reach competitive price-cost levels when providing a good or service to the government
(NAKABAYASHI, 2013). Thus, organizing an unsuccessful tender means wasting
resources; the government may incur severe costs with few results for SMEs or the
local economy.
While there are numerous examples of policies favoring SMEs in public tenders,
there is little direct evidence of the impacts of such policies on firms' performance.
Additionally, the costs of implementing such a policy are practically ignored in the
literature.
Estimating the public costs of favoring SMEs in public procurement is a

43
complicated issue to assess empirically because doing so requires establishing an
appropriate counterfactual (HOEKMAN; TAS, 2020). I utilize a policy experiment in the
state of Sao Paulo, Brazil, to estimate the costs of favoring SMEs in public
procurement. I exploit the timing of a change in a policy of restricted SME tenders
(March 2018) that affect only a specific group of items (group 65). The identification
strategy simultaneously uses time and cross-sectional variations to estimate the
effects of this policy shift.
However, in this paper, examining how institutional change occurred allows the
costs of the SME policy to be assessed only indirectly. Instead of using a standard
difference-in-differences (DiD) method, it is necessary to use a variation of this method
known as difference-in-differences in reverse (DiDiR), or ‘time-reversed DiD’ (KIM;
LEE, 2019). In the DiD method, there is a control group that is never treated and a
treatment group that is treated at some point in time. In the DiDiR method, the control
group is always treated (instead of always untreated), and the other group is the
‘switched group,’ subject to the change in policy.
In Sao Paulo state, PBUs can procure goods in public tenders exclusive to
SMEs. Between August 2014 and February 2018, the government’s default choice
consisted of executing SME-only tenders for all items with a value less than or equal
to R$80,000, except for a group of items identified as code 65, for which open tenders
were mandatory.
PBUs can avoid restricted tenders for SMEs provided that they incur in a costly
process of justification to its watchdogs. In case of any irregularity or failure to comply
strictly with the law, public officers can be punished. From March 2018 on, after a
change in the law’s interpretation, group 65 became subject to the general rule just like
any other group of purchased items. Thus, the ‘always treated’ group here consists of
all groups of items but group 65, comprising the switched group.
Notably, DiDiR identifies pre-switch-period effects; i.e., it estimates effects for
the past (KIM; LEE, 2019), assessing the policy switch costs indirectly. I estimate this
pre-switch-period effect on the switched group, comparing the observed outcomes for
group 65 before the shift in policy and the outcomes that would have occurred for this
group if there had been opt-out costs before March 2018.
Thus, the DiDiR method reveals that the negotiated prices are, on average,

44
between 4.58% and 8.08% lower for group 65 than other groups before March 2008.
Moreover, in the pre-period, the number of participants in group 65 is approximately
22% higher than that in other groups of items.
The number of valid bids follows the same pattern as the number of participant
firms: there were approximately 25% more valid bids in group 65 than in the other
groups of items. Finally, before the policy change, sellers that won tenders for items in
group 65 were approximately 4 km further away from PBUs than in open tenders.
This paper has five sections, including this introduction. Section 2 provides a
brief overview of the institutional background related to SME law and public
procurement in Sao Paulo, Brazil, which is relevant to the empirical section. Section 3
describes the datasets and sample definitions. Section 4 presents the empirical
analysis. Section 5 concludes the paper.
3.1 Institutional Background
This section provides a brief institutional background on SMEs’ participation in
the context of public tenders in Sao Paulo, Brazil. I focus on the details that are most
pertinent for the empirical analysis.
First, I briefly discuss general aspects of public procurement and the legislation
on micro and small businesses in Brazil, highlighting the established criteria for the
occurrence of SME-only public tender. Finally, I describe how the state of Sao Paulo
applied this law in accordance with its own understanding of exclusive tenders for
health-items.
3.1.1 Public Procurement and SME law in Brazil
Public procurement constitutes a relevant part of economies worldwide. In 2016,
OECD countries spent approximately 12% of GDP on public procurement, while in
Brazil, this proportion was approximately 10% in the same year.
As in many other countries, Brazilian law establishes as a general rule that all

45
purchases, services, and works hired by the public administration should be subject to
a public tender. Federal Law 8,666/1993 institutes a general framework applicable to
all public bids in the country, and all three government branches must adhere to this
framework.
Entities directly or indirectly controlled by the federal, state, or municipal
governments must comply with the government procurement rules. Federal, state and
municipal governments, autonomous government entities, public foundations,
regulatory agencies, state-owned companies, and mixed capital companies controlled
by the government are subject to these rules. These entities are known as PBUs.
Although the public administration may decide to make purchases centrally, in
Brazil, almost all acquisitions are decentralized and made by PBUs. A ministry or
bureau may consist of many PBUs with budgetary autonomy and make purchases
from private companies. PBUs may contract a wide variety of products and services
from private companies, including engineering and infrastructure work. This paper
focuses on common and standardized goods, as they allow for a cleaner assessment
of the effect of the SME law.
The primary purpose of a bidding process conducted by a PBU is to seek the
best contract possible for the government. The Brazilian public procurement law
provides guidelines on how the procurement process should be organized and
executed. In some cases, public tenders for SMEs are subject to different treatment.
The Brazilian federal SME law was created in 200620 to regulate favored,
simplified and differentiated treatment for this sector, as provided for in the Federal
Constitution21. This law’s explicit goal was to promote SMEs’ economic and social
development and competitiveness as a strategy for job creation, income distribution,
social inclusion, reduced informality, and a strengthened economy.
The Brazilian SME law adopts the following classification for companies,
according to their annual gross revenue: (i) microbusiness: annual gross revenue of
R$360,000 or less (roughly US$72,000); and (ii) small business: annual gross revenue
greater than R$360,000.00 and less than or equal to R$4,800,000 (between
20 Federal Law n. 123/2006. 21 BRASIL. Constitution (1988). Constitution of the Federative Republic of Brazil. Brasília, DF, 1988. Available at: http://english.tse.jus.br/arquivos/federal-constitution. Access in: 08 Nov. 2020.

46
US$72,000 and US$960,000). In this paper, these companies are referred to as SMEs.
SMEs enjoy many benefits provided by law, including tax benefits and fewer
bureaucratic requirements to adhere to. In addition, public tenders held at the federal,
state, and municipal levels can grant differentiated and privileged treatment to SMEs
to promote economic and social development, increase public policies’ efficiency, and
stimulate technological innovation22.
The content of the SME law, in its 2006 version, indicated that the public
administration could create tenders exclusively for the participation of SMEs in
purchases in which the item value was up to R$80,000 (approximately US$16,000.00).
Thus, choosing tenders for SMEs only was optional for PBUs.
However, the federal SME law underwent a significant change from SMEs’
exclusivity in tenders in 201423. The term ‘could’ has been replaced with ‘must,’ making
it mandatory to execute exclusive public tenders for SMEs up to a value per item of
R$80,000, unless the bid’s conditions fall within the exceptions provided for in the
updated legislation. In short, the law changed PBUs’ default choice if the item value
fell below the threshold of eighty thousand reais: previously, the default choice was
open bids.
PBUs can avoid restricted bids if at least one of the following conditions is met:
(i) there are two or fewer potential competing SME suppliers that are locally or
regionally based and able to comply with the notice requirements, and (ii) PBUs
consider that the differentiated and simplified treatment for SMEs might not be
advantageous for the public administration24. Thus, PBUs choose whether the public
tender is restricted, but they must justify their choices to their watchdogs, such as audit
courts or the judiciary.
On the one hand, this discretion provided for by law can be beneficial since
PBUs can more efficiently choose the bidding type to be carried out. However, there
are costs involved in the process of avoiding bids restricted to SMEs. For each bidding
procedure, PBUs must create an extensive report listing in detail the reasons that
justify the use of an open bidding process to the detriment of a bidding process
22 Federal Law n. 123/2006. 23 Federal Law n. 147/2014. 24 Idem.

47
restricted to SMEs.
Additionally, these PBU justifications are subject to scrutiny by both the audit
courts and the judiciary. If these bodies consider the arguments unfounded or
insufficient, administrative proceedings and punishments may be brought against the
public agents responsible for planning and executing the bid in question. Thus, this
discretion brings costs to PBUs. I call these costs associated with avoiding SME-only
tenders opt-out costs.
3.1.2 SME-only Public Tenders: Group 65 As an Exception
Sao Paulo is the wealthiest and most populous state in Brazil. This state
accounts for approximately 23% of the total population and nearly one-third of Brazil’s
GDP (nearly US$500 billion in 2018). This amount is equivalent to the GDP of countries
such as Sweden, Poland, and Belgium and more than twice the GDP of Portugal,
Greece, and Finland25. The state of Sao Paulo has a diversified economy driven by
the automobile, textile, chemical, aeronautical, and computer industries, in addition to
services such as finance and agriculture.
Since 2005, all PBUs in the state of Sao Paulo have been required to purchase
common goods and services through Bolsa Eletronica de Compras (BEC), an
electronic purchasing platform. The BEC figures are revealing: in 2019, approximately
R$13 billion (about US$3 billion) in trade was conducted on this e-platform. Since its
implementation in 2005, BEC has moved more than R$105 billion (about US$20 billion)
in negotiations; 860,000 purchase offers have been made, and approximately 4.8
million items have been sold.
Despite being subject to federal laws, Brazilian states have the prerogative to
regulate or interpret these laws’ specific elements. The state of Sao Paulo, for example,
has a specific interpretation of how to apply SME law in public procurement.
Since BEC’s implementation, the Sao Paulo state government has considered
25 Source: Brazilian Institute of Geography and Statistics (IBGE). See also https://www.ibge.gov.br/cidades-e-estados/sp.html. Access in: 08 Nov. 2020.

48
the group of items consisting of health-related products, including medication and
hospital supplies (code 65), as a strategic set of items in the public procurement
process. For example, bidding procedures related to medication can only be carried
out with dynamic reverse auctions (pregao) or sealed bidding (convite). Direct
negotiation (dispensa de licitacao), which is very common in purchasing other types of
common goods, has always been prohibited for group 65 in Sao Paulo.
Between 2006 and 2014, when the first version of the SME law was enforced,
PBUs located in the state of Sao Paulo had the default choice to hold open tenders; it
was optional to set procedures restricted to SMEs. During this period, following this
legal arrangement, there was low adherence to restricted bids; items in these bids
accounted for 6 to 13% of the total number of items bid for in the state of Sao Paulo.
However, for group 65, there were no bids exclusively for SMEs in this same period.
The government had an internal orientation to hold open tenders for group 65, with the
explicit agreement of the audit court of the state of Sao Paulo (TCE-SP).
After 2014, with the update of the federal law on SMEs, the default choice was
to execute SME-only tenders if the item value was less than or equal to R$80,000. In
the state of Sao Paulo, if PBUs consider that any item in a bidding process falls within
the exceptions provided for by law, they must justify in detail the reasons for the non-
execution of an exclusive bid for SMEs through a report sent to TCE-SP.
This justification offered by PBUs to avoid restricted tenders requires not only
excessive work effort for PBUs but also is subject to the scrutiny of the TCE-SP and
the judiciary. Public officers can face punishment if there are irregularities or failure to
comply strictly with the law.
With the introduction of considerable opt-out costs for PBUs, this incentive
scheme appears to be effective in encouraging the choice of offering exclusive bids to
SMEs: adherence to this procedure has increased from approximately 13% to almost
70%, on average, in subsequent periods.
However, between August 2014 and February 2018, bids related to group 65
did not change. The Sao Paulo state government and TCE-SP, in a joint agreement,
used a specific interpretation of the new version of the federal SME law to leave group
65 as an exception. The federal law provides that the requirement of restricted bids to
SMEs does not apply when “it is not advantageous to the public administration or
49
represents a loss to public resources.” Thus, using this guideline, which allows for a
high degree of discretion, the state of Sao Paulo and TCE-SP operated on the
interpretation that because group 65 constitutes a set of strategic items to meet such
an essential public policy, it should always be subject to open bids. Thus, in this period,
there was no bidding restricted to SMEs involving group 65.
However, in November 2017, a different control agency in the state of Sao
Paulo, PGE-SP26, issued a document containing a legal opinion27 that changed this
interpretation. This document reinforces that the principle of isonomy in law
enforcement should prevail in public procurement. Then, group 65 should be
considered for public procurement purposes in the same way as other groups.
Hence, as of March 2018, the opt-out costs also apply to group 65. Between
March 2018 and December 2019, adherence to exclusive bids for SMEs for this group
was, on average, 43%. This lower proportion of restricted bids for SMEs for group 65
compared with other groups may be due to the existence of more oligopolies in this
group of items, which include, for example, medication. Thus, in many cases, it is not
possible to find at least three potential suppliers that are SMEs.
3.2 Data
This section describes the data source and details the sample characteristics
used in the empirical section.
I use administrative data on bidding-level public procurement tenders of
common goods and services in the state of Sao Paulo, Brazil, from January 2016 to
December 2019. All transactions took place on the electronic procurement platform
called BEC, available for all PBUs across the state. The SEFAZ/SP is responsible for
the operational management and centralization of BEC’s bidding data.
On BEC, 1,344 PBUs regularly make purchases. These entities include state-
level bureaus from the executive, legislative, and judiciary branches in the state of Sao
Paulo as well as other affiliated entities, such as municipalities located in the state of
26 Attorney General of the State of Sao Paulo (PGE-SP). 27 PGE-SP’s Referential Opinion n. 13/2019.

50
Sao Paulo and private organizations. PBUs purchased 82,569 different items (goods),
totaling 832,984 successful transactions from 2016 to 2019.
Table 10 - Descriptive Statistics: Public Tenders
Variable Obs Mean Std. Dev. Min Max
quantity 832984 30720.76 2211000.4 1 1.165e+09
reference price 832984 8450.3 346551.49 0 1.166e+08
negotiated price 832984 5896.56 251894.44 0 1.027e+08
#firms 832984 4.76 3.27 1 79
#bids 832984 11.99 17.93 1 894
distance 832984 182.71 209.77 .01 2694.34
firm age 832984 152.95 144.91 1 969
convite 832984 .55 .5 0 1
Source: BEC-SP.
BEC has a very detailed catalog of standardized goods and services organized
in three levels of detail: group, class, and item. For instance, health items are classified
as group 65 (medical, dental, and hospital equipment and supplies). The item coded
as 110639 refers to the drug ‘Furosemide 40 milligrams, coated tablets, units’,
belonging to class 6531 (Medicines prescribed with or without ANVISA
notification/registration) and group 6528.
Data are organized by purchase offer (PO), the electronic document issued by
the PBU that identifies and quantifies the goods and services that will be purchased. A
PO is defined by a 22-character code and may contain one or more items listed, but
each item has its own purchase process. Thus, the purchase of an item is uniquely
identified by the combination of the PO and the purchased item codes (POI).
There is a crucial variable for the empirical section, defined from the item group
28 Another example is group 89 (Foodstuff). Item 257419 refers to ‘Special coffee; gourmet; roasted in uniform grains; consisting of 100% Arabic grains; free of strange taste; free of fermented black, green, burnt, black-green grains, soft drink or better; striking flavor, medium and clear roasting, chocolate notes, marked sweetness, low bitterness; minimum superior global quality of 7.30 points on the sensory scale; vacuum packaging; with minimum validity on the delivery date of 10 months, with date of manufacture and expiry printed on the packaging’, which belongs to class 8965 (Coffees, Teas, Chocolate and Other Soluble Drinks).

51
codes. It is a binary variable that assumes the value of 1 if it belongs to group 6529 and
0 otherwise. The items in group 65 constitute the ‘switched group,’ i.e., the set of items
affected by the purchasing policy change. Group 65 accounted for almost 27% of all
purchases from 2016 to 2019. All other groups of items comprise the ‘control group.’
There are 75 groups of items, excluding group 65. Between 2016 and 2019, the
most significant groups were groups 89 (food products), 75 (office supplies), 86
(computer products), and 79 (cleaning materials), representing 37.5% of the total
purchases in this period.
For each POI, there is information about item quantities, bid prices (winners and
losers), the number of participant firms, the number of bids, whether the public tender
was successful or not, the identification of the PBU, and firms’ and PBUs’ location,
among other variables.
3.3 Empirical Strategy and Results
This section is organized into two parts. First, I describe the method I use to
estimate the impacts of the SME public procurement policy shift on the selected
outcomes. I perform a DiD analysis, but unlike a standard DiD, the control group is
always treated instead of always untreated (KIM; LEE, 2019). Then, I discuss the
identifying assumptions in the context of the DiDiR I employ. In the second part, I
discuss the main results.
3.3.1 Main Specification and Identification Strategy
The identification strategy exploits the timing of a change in the policy of
restricted SME tenders (March 2018) that affect only a specific group of items (group
65). Thus, it is possible to simultaneously use time and cross-sectional variations to
estimate the potential effects of this policy shift.
29 Items related to medical, dental, and hospital equipment and supplies.
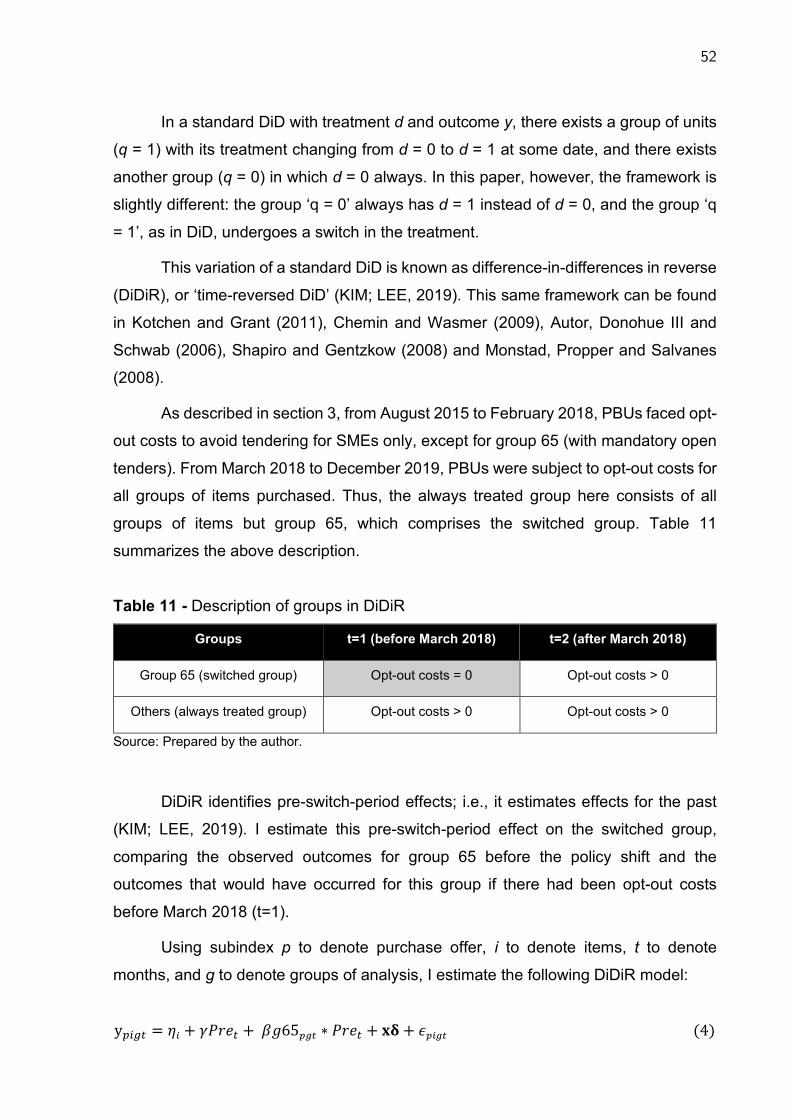
52
In a standard DiD with treatment d and outcome y, there exists a group of units
(q = 1) with its treatment changing from d = 0 to d = 1 at some date, and there exists
another group (q = 0) in which d = 0 always. In this paper, however, the framework is
slightly different: the group ‘q = 0’ always has d = 1 instead of d = 0, and the group ‘q
= 1’, as in DiD, undergoes a switch in the treatment.
This variation of a standard DiD is known as difference-in-differences in reverse
(DiDiR), or ‘time-reversed DiD’ (KIM; LEE, 2019). This same framework can be found
in Kotchen and Grant (2011), Chemin and Wasmer (2009), Autor, Donohue III and
Schwab (2006), Shapiro and Gentzkow (2008) and Monstad, Propper and Salvanes
(2008).
As described in section 3, from August 2015 to February 2018, PBUs faced opt-
out costs to avoid tendering for SMEs only, except for group 65 (with mandatory open
tenders). From March 2018 to December 2019, PBUs were subject to opt-out costs for
all groups of items purchased. Thus, the always treated group here consists of all
groups of items but group 65, which comprises the switched group. Table 11
summarizes the above description.
Table 11 - Description of groups in DiDiR
Groups t=1 (before March 2018) t=2 (after March 2018)
Group 65 (switched group) Opt-out costs = 0 Opt-out costs > 0
Others (always treated group) Opt-out costs > 0 Opt-out costs > 0
Source: Prepared by the author.
DiDiR identifies pre-switch-period effects; i.e., it estimates effects for the past
(KIM; LEE, 2019). I estimate this pre-switch-period effect on the switched group,
comparing the observed outcomes for group 65 before the policy shift and the
outcomes that would have occurred for this group if there had been opt-out costs
before March 2018 (t=1).
Using subindex p to denote purchase offer, i to denote items, t to denote
months, and g to denote groups of analysis, I estimate the following DiDiR model:
y𝑝𝑝𝑖𝑖𝑖𝑖𝑖𝑖 = 𝜂𝜂𝑖𝑖 + 𝛾𝛾𝑃𝑃𝑃𝑃𝑅𝑅𝑖𝑖 + 𝛽𝛽𝑈𝑈65𝑝𝑝𝑖𝑖𝑖𝑖 ∗ 𝑃𝑃𝑃𝑃𝑅𝑅𝑖𝑖 + 𝐱𝐱𝐱𝐱 + 𝜖𝜖𝑝𝑝𝑖𝑖𝑖𝑖𝑖𝑖 (4)

53
where y is an outcome, 𝜂𝜂𝑖𝑖 is item fixed effects, and Pre is a dummy variable with the
value of 1 if it is a month before March 2018 and 0 otherwise. The variable g65 is binary
with a value of 1 if it belongs to group 65 and 0 otherwise. The covariates are
represented by 𝐱𝐱. The error 𝜖𝜖𝑖𝑖𝑖𝑖𝑖𝑖 is clustered by item.
The coefficient of interest, 𝛽𝛽, captures the pre-switch-period effect of the shift in
the SME tender policy on the outcomes for the switched group. The central identifying
assumption behind the empirical model is that in the period after the shift in the tenders
policy, the outcomes for group 65 and the set of all other groups of items would have
followed a similar trajectory. Thus, it is necessary to check whether the always treated
and switched groups' outcome paths are parallel in the post-switch period.
The validity of this assumption of parallel trends in the post-switch period can
be partially assessed by estimating the following nonparametric regression, similar to
Naritomi (2019) and Gallego, Prem and Vargas (2020):
y𝑝𝑝𝑖𝑖𝑖𝑖 = 𝜂𝜂𝑖𝑖 + 𝑆𝑆𝑅𝑅𝐴𝐴𝑅𝑅𝑆𝑆𝑈𝑈𝑅𝑅𝑃𝑃𝑖𝑖 + � 𝜏𝜏𝑖𝑖3
𝑘𝑘=−3
(𝛽𝛽𝑈𝑈65𝑝𝑝𝑖𝑖𝑖𝑖 ∗ 𝑆𝑆𝑅𝑅𝐴𝐴𝑅𝑅𝑆𝑆𝑈𝑈𝑅𝑅𝑃𝑃𝑖𝑖) + 𝜇𝜇𝑝𝑝𝑖𝑖𝑖𝑖 (5)
where 𝜂𝜂𝑖𝑖 is the group fixed effects, and Semester is a set of dummies for each
semester in this period. The error 𝜇𝜇𝑖𝑖𝑖𝑖𝑖𝑖 is clustered by the group of items. Figure 3 plots
the coefficients (without a constant) and the 95 percent confidence intervals from
estimating equation (5) with log prices as the dependent variable. The graphs for the
other outcomes of interest are included in the appendix B.

54
Figure 3 - Log Prices: Difference between the always treated group and the switched group
Source: BEC-SP.
Although there are few periods observed after the change in the SME
purchasing policy, it is possible to observe that the difference between the two groups
is relatively constant after the policy shift. The difference between the groups narrows
dramatically after the change in the purchasing policy and then stabilizes in subsequent
periods. Figures B.1, B.2, and B.3 (appendix B) report equivalent results regarding the
distance from PBUs to winner firms, the number of participant firms, and the number
of valid bids, respectively.
In this context, the validity of the parallel trends assumption in the post-change
period might be reinforced by an institutional reason. Over time, PBUs accumulate
knowledge and develop expertise on how to buy items from the market. After the policy
change, when new restrictions are imposed, PBUs adapt to the new conditions, and
the pattern of results in tenders might change. However, in subsequent periods, it is
reasonable to expect that prices and other performance indicators in tenders tend to
vary little, ceteris paribus, given that PBUs have already adapted to the new situation.
3.3.2 Results
I perform item-level regressions in a two-period DiDiR for which t is collapsed

55
by pre and post periods. The estimations refer to the pre-switch-period effect for four
distinct outcomes: negotiated prices, the number of participant firms, the number of
valid bids, and the distance from PBUs to winner firms.
For each outcome, I run regressions for three different time windows
considering different pre- and post-change periods: (i) a 6-month window where the
pre-change period is from September 2017 to February 2018 and the post-change
period is from March 2018 to August 2018; (ii) a 12-month window where the pre-
change period is from March 2017 to February 2018 and the post-change period is
from March 2018 to February 2019; and (iii) an 18-month window where the pre-
change period is from September 2016 to February 2018 and the post-change period
from March 2018 to August 2019. The results for log prices are presented in Table 12.

56
Table 12 - Prices (log): Pre-switch-period effect on group 65 (1) (2) (3) (4) (5) (6)
6-month
window
6-month
window
12-month
window
12-month
window
18-month
window
18-month
window
g65xPre -.0719*** -.0843*** -.0469*** -.0527*** -.0484*** -.0602***
(.0121) (.0112) (.0097) (.0086) (.0092) (.0084)
Sealed bids -.4407*** -.609*** -.4373*** -.5911*** -.426*** -.5739***
(.0179) (.0212) (.0156) (.019) (.0136) (.0178)
lquantity -.3191*** -.3716*** -.313*** -.3665*** -.3024*** -.3557***
(.012) (.011) (.0104) (.0097) (.009) (.0088)
_cons 6.1259*** 6.4848*** 6.1238*** 6.8105*** 5.9612*** 6.4265***
(.1987) (.2067) (.1999) (.278) (.1821) (.1946)
Observations 213422 213422 427544 427544 632729 632729
R-squared .2817 .3867 .2748 .3698 .2704 .3541
Item Fixed Effects YES YES YES YES YES YES
Controlling for PBU NO YES NO YES NO YES
Standard errors are in parentheses
*** p<.01, ** p<.05, * p<.1
As observed, the negotiated prices are consistently lower in group 65 tenders
that occurred before March 2018. Considering all baseline specification variations, the
negotiated prices, on average, are between 4.58% and 8.08% lower for group 65 than
for other groups before March 2008.
This result emerges as expected. PBUs face better trading conditions in open
tenders than in SME-restricted tenders. Accordingly, lower prices for group 65 before
the SME tender policy shift may suggest less competition among firms. There is
evidence of a decrease in competition in Table 13, which presents estimations for the
difference in the number of participant firms.

57
Table 13 - Number of Participant Firms (log): Pre-switch-period effect on group 65 (1) (2) (3) (4) (5) (6)
6-month
window
6-month
window
12-month
window
12-month
window
18-month
window
18-month
window
g65xPre .1985*** .2081*** .1162*** .1221*** .0689*** .0763***
(.0083) (.0084) (.0064) (.0065) (.0062) (.0062)
sealed-bids .0373*** .0503*** .012 .0188* .0319*** .0461***
(.0089) (.0114) (.0078) (.0096) (.0075) (.0091)
lquantity .1458*** .144*** .149*** .1467*** .1455*** .145***
(.0022) (.0021) (.002) (.0019) (.0018) (.0018)
_cons 1.0883*** 1.3251*** 1.0625*** .9251*** 1.0742*** 1.0783***
(.0649) (.2044) (.0608) (.1153) (.0491) (.0679)
Observations 260024 260024 522289 522289 769633 769633
R-squared .1669 .2388 .1714 .2357 .1612 .2216
Item Dummies YES YES YES YES YES YES
PBU Dummies NO YES NO YES NO YES
Standard errors are in parentheses
*** p<.01, ** p<.05, * p<.1
There is a consistent increase in companies participating in group 65 bids when
PBUs only used open bids. The number of participant firms was higher for group 65
than for other groups in every time window analysis.
These effects appear higher for the short term: comparing the six months before
the policy change with the six months after this change, the number of participants in
group 65 is approximately 22% higher than that in the other groups of items in the pre-
switch period. For instance, in the 18-month time window, this effect is lower
(approximately 7%). PBUs accumulate knowledge and develop expertise on how to
buy items from the market. It is possible that after facing initial difficulty in attracting
companies to bid, PBUs might adapt to the new situation over time and be better able
to handle exclusive bids from SMEs.
A higher number of companies does not necessarily mean more competition.
Some market items consist of oligopolies with very competitive dynamics, for instance.
Thus, the number of valid bids can be complementary information to the number of
participant firms to assess the degree of competition in a tender. Table 14 reports the
estimations for the difference in the number of valid bids between groups.

58
Table 14 - Number of Valid Bids (log): Pre-switch-period effect on group 65 (1) (2) (3) (4) (5) (6)
6-month
window
6-month
window
12-month
window
12-month
window
18-month
window
18-month
window
g65xPre .2219*** .2349*** .1061*** .1145*** .0562*** .0668***
(.0118) (.0121) (.0094) (.0095) (.0094) (.0095)
sealed-bids -1.1372*** -1.1298*** -1.1653*** -1.1649*** -1.0871*** -1.0897***
(.0119) (.0159) (.0106) (.0138) (.0098) (.0127)
lquantity .1638*** .1565*** .1647*** .1582*** .1675*** .1604***
(.0031) (.003) (.0027) (.0026) (.0024) (.0025)
_cons 2.2482*** 3.0999*** 2.2302*** 1.8244*** 2.1121*** 2.1099***
(.0596) (.5513) (.0555) (.1679) (.047) (.0854)
Observations 260024 260024 522289 522289 769633 769633
R-squared .3485 .3868 .3474 .3814 .3261 .3608
Item Dummies YES YES YES YES YES YES
PBU Dummies NO YES NO YES NO YES
Standard errors are in parentheses
*** p<.01, ** p<.05, * p<.1
The pattern is the same as that for the number of participant firms. In the short
term, the effect is more pronounced (almost 25% greater), while in a longer window of
18 months, for example, the effect drops to approximately 6%.
In addition to a higher level of competition, a higher number of participants
associated with a higher number of valid proposals may indicate that the sellers’
screening process is better in open tenders. Depending on the item purchased, more
efficient companies with more flexible cost structures may participate in open tenders
rather than exclusive tenders for SMEs. These combined factors may set up the
primary mechanism that explains the lowest prices in group 65 before March 2018.
One explicit objective of the policy of restricting bids to SMEs is to encourage
local and regional development. It is expected to observe purchases from local
suppliers closer to the PBUs. Table 15 reports the estimations for the difference in the
distance from PBUs to winner firms between groups.

59
Table 15 - Distance from PBUs to winner firms: Pre-switch-period effect on group 65 (1) (2) (3) (4) (5) (6)
6-month
window
6-month
window
12-month
window
12-month
window
18-month
window
18-month
window
g65xPre 6.5123** 3.3937** 10.6433*** 5.6029** 9.8629*** 4.8085**
(2.8813) (1.8905) (2.215) (2.1899) (2.0851) (2.0442)
convite -25.2587*** -12.1397*** -22.2555*** -10.2858*** -20.9674*** -7.6826***
(2.2172) (2.3924) (1.9588) (1.9587) (1.7872) (1.7127)
lquantidade 1.4456*** 4.0076*** 1.6784*** 4.2032*** 1.3763*** 4.3312***
(.5426) (.5036) (.4589) (.3983) (.4274) (.3428)
_cons 156.8374*** 134.1891*** 162.7939*** 126.0552*** 157.0111*** 110.9477***
(6.8616) (7.044) (5.971) (33.5564) (5.1836) (15.4403)
Observations 213422 213422 427544 427544 632729 632729
R-squared .003 .147 .0024 .1321 .0021 .1258
Item Dummies YES YES YES YES YES YES
PBU Dummies NO YES NO YES NO YES
Standard errors are in parentheses
*** p<.01, ** p<.05, * p<.1
As observed, before the policy change, the companies winning tenders for items
in group 65 were more distant from the PBUs. On average, when controlled by PBUs
among other variables, the winning suppliers were located approximately 4 km away
in open public tenders for group 65. This result may indicate that the policy change has
successfully induced more local suppliers to win more bids for this group of items.
3.4 Conclusion
Governments worldwide have implemented public policies that favor SMEs
based on the potential or actual benefits these policies can bring to the economy. One
of the most widespread practices to promote local development through public
procurement is the restriction of public tenders to SMEs.
Despite the potential positive effects generated by favoring SMEs in public
tenders, such a policy may undermine the quality and efficiency of the public
procurement process generating waste of public resources. I estimated that negotiated
prices were, on average, between 4.58% and 8.08% lower when restricted tenders
were not mandatory. Moreover, the number of participants was approximately 22%
higher than that in other groups of items. Thus, from a policy perspective, incentivizing

60
restricted tenders for SMEs may bring relevant costs to PBUs.
3.5 Further Steps
Further analyses shall explore heterogeneous effects to identify if these findings
are concentrated in items that the municipality has local suppliers and observed for all
distance ranges.
The idea is to use auctions results to identify effects on SMEs' performance
(employment and revenues), evaluating winner firms in restricted tenders versus
runners-up, as in (GUGLER, WEICHSELBAUMER and ZULEHNER, 2020).

61
4 FREQUENT LOSERS IN PUBLIC TENDERS: ANTICOMPETITIVE BEHAVIOR OR BAD LUCK?
There is an intriguing phenomenon in public procurement. Some participants in
bidding contests lose out systematically for long periods and several times. This fact is
interesting because there is a fixed cost for companies to participate in public bids;
therefore, it would be expected that these companies would win some opportunities or
be excluded from the market under competitive conditions.
An alternative hypothesis is that these firms, herein referred to as ‘frequent
losers,’ are not operating autonomously but as part of a cartel that could be sustained
by means of side payments to losers. As a consequence, the presence of frequent
losers has the potential to serve as a screening for cartel detection in public bids.
Usually, antitrust authorities use two main types of cartel detection mechanisms.
The first method gained traction throughout the 1990s in the form of leniency
agreements and award-winning disclosure (Wils, 2007). The second mechanism
consists of screening methods that became predominant from the mid-2000s due to
the greater availability of data and computational capacity. Through observable data
such as prices and quantities, screening methods seek to identify behaviors that are
consistent with the cartel hypothesis (i.e., coordination among competitors) and
inconsistent with the competition hypothesis among participants in a given market.
Although these models might be insufficient to prove the bid rigging in courts, they are
essential to guide investigation and may constitute evidence for judicial authorization
for dawn-raids and wiretapping to get direct evidence of the cartel.
Screening methods available in the literature, such as Green and Porter (1984),
Haltiwanger and Harrington (1991) and Abrantes-Metz et al. (2006), have two
fundamental limitations. First, these models cannot distinguish tacit collusion from
cases of explicit collusion (i.e., cartels). This limitation is problematic for their practical
application since tacit collusion, unlike cartels, does not constitute an antitrust offense
(HARRINGTON JR., 2008).
Second, screening methods usually identify collusive behavior after its
occurrence and therefore serve as support only for the repression of cartels but not for
their prevention. In public procurement, it would be desirable for screening methods to

62
identify collusive behavior before the bidding process occurs, through observable
variables in public notices and participants’ registration, to reduce the social costs of
cartels.
This paper proposes an alternative screening method that directly addresses
these two limitations and does not require additional data beyond those already
available to competition authorities and control bodies.
Primarily, the proposed method consists of the use of frequent losers as ‘flags’
for the ex-ante screening of cartels in public tenders. To this end, this research
proposes a method for identifying frequent losers to differentiate these companies from
others that, although they may lose frequently, do not exhibit sufficiently abnormal
behavior. The article also presents frequent losers’ descriptive characteristics,
reinforcing their properties as markers of collusion.
Finally, this paper examines the relationship between the presence of frequent
losers in public bids and the price level and other indicators of competition intensity,
such as the number of participants and the number of bids. The results indicate that
tenders in which frequent losers participate have 10% higher prices, a 32% higher
number of participants, and a 29% increase in the number of bids.
These results are consistent with cartel behavior (higher prices) and a strategy
to avoid detection by increasing higher competitive intensity signs. Note that this is
precisely the expected effect of frequent losers: more participants and no competitive
pressure on the winning bid.
This paper has five sections, including this introduction. Section 2 provides an
overview of cartel screening methods to clarify the contributions of this research.
Section 3 presents the method for identifying frequent losers and its descriptive
characteristics. An analysis of the relationship between frequent losers and the results
of public tenders is presented in section 4. Finally, in section 5, I present the
implications of the results and final considerations.
4.1 Models for Detecting Cartels in Public Tenders
Cartels are a common practice and are quite costly to society. It is estimated

63
that less than 15% of US cartels are identified by the Department of Justice (BRYANT;
ECKARD, 1991). Considering that US anti-cartel policy is recognized as the most
active, it is reasonable to assume that this proportion is even lower in countries with
less antitrust enforcement tradition.
Cartels are associated with higher prices to final consumers (CONNOR, 2007),
resulting in lower production than the socially optimum level and costs of maintaining
the cartel and covering up its activities. For those reasons, the identification and
subsequent punishment of cartels are a priority for virtually all competition authorities.
Since it is a known illicit practice, it is not easy to detect cartels. There are two essential
and complementary instruments to identify this anticompetitive behavior.
The first instrument is the disclosure by one of the cartel’s participants through
leniency agreements or award-winning disclosure or of third-party claimants who had
access to direct evidence of the agreement among the cartel’s participants (WILS,
2007). Even if the competition authority develops a leniency program, its position is
predominantly passive because third parties perform the identification of the cartel and
the initial collection of evidence (WILS, 2016).
The second identification tool is predominantly active and consists of methods
for analyzing companies’ behavior in different markets with the aim of identifying
suspicious behavior that is consistent with the existence of a cartel and inconsistent
with the hypothesis of competition between companies. These methods are known as
screening methods (HARRINGTON JR., 2008).
Observing suspicious behavior is not enough to prove a cartel’s existence, but
it is a crucial tool to guide competition authorities’ investigations in their search for
direct evidence. Evidence can be obtained through search and seizure operations or
by intercepting communications, which are only authorized by the judiciary when there
is robust evidence of suspicious conduct. Screening methods could help to identify this
evidence.
Those two detection instruments - leniency agreements and screening methods
- are complementary, not substitutes (HÜSCHELRATH; VEITH, 2014; SCHINKEL,
2013). Companies’ incentives to opt for the leniency agreement by providing the
competition authority with evidence of a cartel are associated with the probability of
cartel detection. Proper screening methods can significantly increase the likelihood of

64
identifying cartels.
In addition, the most stable cartels (i.e., those with a lower probability of
detection) are possibly the most harmful to society and the least vulnerable to award-
winning disclosure. For these reasons, authorities increasingly tend to use screening
methods in their investigations (IMHOF; KARAGÖK; RUTZ, 2018; SCHINKEL, 2013).
This trend is reinforced by increased data availability and processing capacity through
machine learning and artificial intelligence, which give competition authorities a greater
capacity to identify suspicious behaviors (SANCHEZ-GRAELLS, 2019).
The literature on cartel detection models is reasonably prolific. In general,
statistical models use observed price and quantity data to infer firms’ patterns of
behavior and reaction curves to identify whether such patterns are consistent with the
cartel assumptions and inconsistent with the competition hypotheses.
Some of these models test whether the behavior of companies participating in
a cartel differs from the action of nonparticipants, such as Porter and Zona (1993) and
Porter and Zona (1999). In both cases, the model shows that the suspicion of cartel
conduct, with defined participants and a defined period of operation, presents a
correspondence with their market behavior, which has the value of proof if combined
with a plus factor (HOVENKAMP, 2005). However, it is not a full screening method; its
role is not to identify suspicious conduct but to test the relevance of evidence that may
have been brought by a complaint. Full screening methods use markers to signal which
markets and firms are engaging in suspicious behavior30. These markers can be of
three types.
The first deals with the relationship between firms’ prices and demand
movements, considering that a cartel structure reacts to demand fluctuations differently
than firms that operate in competition. Some of the most notable papers on screening
methods are from this first group, such as Green and Porter (1984) and Haltiwanger
and Harrington (1991). The second group is about the relationship between market
shares and price variance and is based on theoretical models and the empirical
regularity of greater price stability in cartelized markets, which is broadly well
documented in the literature (ABRANTES-METZ et al., 2006; IMHOF, 2019). Finally,
the third group focuses on the relationship between firms’ prices, estimating reaction
30 A comprehensive review of screening models is presented by Harrington (2008).

65
functions, and how they would be associated with competitive or collusive behavior
(BAJARI; YE, 2003).
In the case of screening methods for public procurement, the variables used for
cartel detection are specific to those observed in public tenders, such as the bidding
pattern and the existence or absence of rotation among the winners, as is the standard
of cartel operation; it has become conventional to call this bid-rigging (IMHOF, 2019).
This pattern is essential in cases where the cartel participants do not have
mechanisms for transferring the revenues derived from the cartel, so the rotation of
winners becomes a necessary mechanism to avoid defections. However, this
identification is not appropriate for cases where transfer mechanisms are feasible,
either via corporate control or informally among cartel participants.
One of the difficulties that should be addressed by screening methods is their
ability to rule out alternative hypotheses. For example, in the case of public bids, the
bidding pattern may respond to cost differentials between companies, resulting in bids
and ranking of winners that might appear to be the result of coordination between
competitors.
An interesting proposal to circumvent this problem is offered by Kawai et al.
(2019), who use the margin of victory, analogous to a discontinuous regression
method, to compare firms with supposedly similar cost structures to rule out this
alternative hypothesis. They show that the inferences of the model or the robustness
of the results are a recurring concern of the new screening methods.
There are two characteristics of the models mentioned that deserve to be
highlighted because they emphasize the contributions of this paper. First, none of the
cited models distinguishes tacit collusion from explicit collusion cases, i.e., cartel
(HARRINGTON JR., 2008). However, this distinction is fundamental to the application
of antitrust policy because, although the cartel is considered the most serious of
antitrust offenses, tacit collusion is not even an offense and, therefore, not punishable.
The second characteristic is that the models mentioned above are a means of
detecting a cartel after its occurrence. The variables used are prices, quantities, and
the winners’ rotation pattern observed in a given period. Therefore, these methods are
here called ex-post screening models. In conventional markets (i.e., those that are not
public procurement), this qualification is unnecessary because the repression of cartels

66
is typically carried out a posteriori, and preventive intervention is performed through
the control of structures such as mergers and acquisitions (HOVENKAMP, 2005).
In the case of public procurement, however, the cartel is often held before the
bidding process, i.e., before the participants disclose their bids. Identifying the cartel a
posteriori fulfills the punitive nature by intending to inhibit future illicit conduct, but it
does not prevent the loss of a fraudulent tender by the cartel’s practice. These costs
are exceptionally high in public bids, which require time for planning and high
transaction costs to cancel contracts in execution and to conduct a new tender process.
Therefore, it would be desirable to develop ex-ante cartel screening methods
that could identify suspicious behavior before the bid's execution. The use of frequent
losers as a marker for collusion may consist of ex-ante screening, thereby
distinguishing it from the other models in this regard. This is the main contribution of
this research.
This marker can also be used in conjunction with other markers and variables
in the ex-post analysis to strengthen the analysis, as recommended by (HARRINGTON
JR., 2008). The ‘frequent losers’ marker might distinguish tacit collusion from explicit
collusion, bringing more efficiency to the investigation techniques31.
Finally, it is relevant to note that cartelized companies respond strategically to
the enforcement of antitrust authorities in what Schinkel (2013) called a cat & mouse
game: cartelized companies will simultaneously seek to raise prices and to avoid
detection by the competition authority. This situation may result in high prices
coinciding with other market evidence that indicates increased competition, such as
the number of participants and price dispersion.
In addition, cartel participants will seek to alter their behavior according to the
detection model used to avoid being caught. For this reason, Schinkel (2013) argues
that the development of screening methods is a continuous process that is necessary
every time cartelized companies change their behavior to avoid detection. Companies
increase costs in this process, which may render the cartel unfeasible when avoiding
detection is more costly than its benefits.
31 See section 4 for more details.

67
4.2 Frequent Losers: Definition and Characteristics
The collusion marker proposed by this paper requires an empirical definition of
frequent losers. This section presents this definition, beginning by presenting the data
used and followed by the method of identifying frequent losers.
Finally, this section presents a descriptive analysis of the main characteristics
of this group of firms in the sample. These descriptive characteristics are already
sufficient to distinguish the behavior of this group of bidders from what would be
expected of bidders operating under competitive conditions.
4.2.1 Data Source and Description
I use administrative data on bidding-level public procurement tenders of
common goods and services in the State of Sao Paulo, Brazil, from January 2009 to
December 2019. All transactions took place under the electronic procurement platform
named Bolsa Eletronica de Compras (BEC), which is available for all PBUs (Public
Buyer Units) across the state. SEFAZ/SP (Department of Finance of Sao Paulo State)
is responsible for the operational management and centralization of BEC’s bidding
data.
In total, 1,344 PBUs make regular purchases at BEC, including state-level
executive, legislative, and judiciary bureaus in the State of Sao Paulo as well as other
affiliated entities, such as some municipalities located in the State of Sao Paulo and a
group of other private organizations. PBUs purchased 169,607 different types of items
(goods and services), totaling 3,866,407 transactions from 19,007 distinct firms in this
period.
BEC has a very detailed catalog of standardized goods and services organized
at three levels of detail: group, class, and item32. Data are organized by purchase offers
32 Office items, for instance, are classified as group 75 (Office, educational and psychological articles and utensils). Thus, the code 127817 refers to the item ‘Sulfite Stationery Paper; weight 75g / m2; A4 format; measuring (210x297) mm; minimum opacity of 87%; humidity between 3.5% (+/- 1.0), according to norma Tappi; Rotary Cut, ph alkaline in ivory color; Bopp Coated Packaging; product with fsc or cerflor environmental certification, with seal and license code printed on the packaging’, belonging to class 7520 (Materials and supplies for didactic, pedagogical, psychological use, stationery, brushes and accessories for manual painting) and group 75.

68
(PO), the electronic document issued by the PBU that identifies and quantifies a set of
goods and services that will be purchased. A PO is defined by a 22-character code
and may contain one or more items listed, but each item has its own purchase process.
Thus, the purchase of an item is uniquely identified by the item code purchase offer
(POI), consisting of the combination of the PO and the purchased item codes.
Table 16 - Descriptive Statistics: Public Tenders
Variable Obs Mean Std. Dev. Min Max
quantity 2021523 227024.46 2.273e+08 1 3.000e+11
reference price 2021523 14656.14 1509895.8 0 1.435e+09
negotiated price 2021523 5255.22 297523.82 0 1.233e+08
#firms 1859668 5.05 3.42 1 79
#bids 1859668 10.63 14.69 1 894
distance 1671773 177.7 213.06 0 2760.4
firm age 1671773 134.96 128.29 1 969
convite 2021523 .53 .5 0 1
Source: BEC-SP.
For each POI, it is possible to observe parameters such as item quantities and
reference prices and tender outcomes such as bid prices (winners and losers), the
number of participating firms, the number of bids, whether the public tender was
successfully, and the identification of the PBU and the auctioneer, among other
variables.
Additionally, there is much information about the companies that participate in
tenders. For each firm, it is possible to observe its uniquely defined firm national code
(CNPJ), firm age, geocoded address, three-digit level of the National Classification of
Economic Activities (CNAE)33, number of victories and losses in public tenders,
number of bids and all bid values offered in every tender process, among others.
4.2.2 Definition of Frequent Losers: ‘Always Losers’ Outliers
33 See more details on CNAE: https://concla.ibge.gov.br/busca-online-cnae.html. Access in: 08 Nov. 2020.
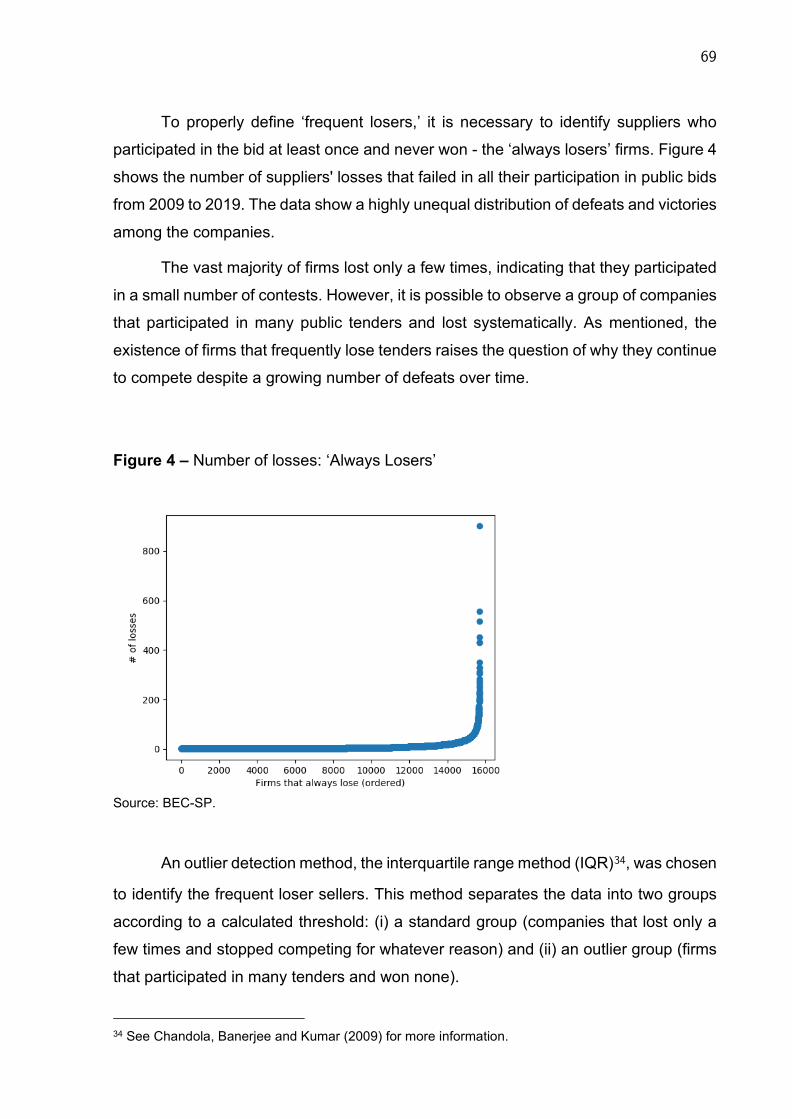
69
To properly define ‘frequent losers,’ it is necessary to identify suppliers who
participated in the bid at least once and never won - the ‘always losers’ firms. Figure 4
shows the number of suppliers' losses that failed in all their participation in public bids
from 2009 to 2019. The data show a highly unequal distribution of defeats and victories
among the companies.
The vast majority of firms lost only a few times, indicating that they participated
in a small number of contests. However, it is possible to observe a group of companies
that participated in many public tenders and lost systematically. As mentioned, the
existence of firms that frequently lose tenders raises the question of why they continue
to compete despite a growing number of defeats over time.
Figure 4 – Number of losses: ‘Always Losers’
Source: BEC-SP.
An outlier detection method, the interquartile range method (IQR)34, was chosen
to identify the frequent loser sellers. This method separates the data into two groups
according to a calculated threshold: (i) a standard group (companies that lost only a
few times and stopped competing for whatever reason) and (ii) an outlier group (firms
that participated in many tenders and won none).
34 See Chandola, Banerjee and Kumar (2009) for more information.

70
The IQR algorithm classifies the outliers as firms whose losses are 1.5 times
above the distance between the first and third quartiles plus the median of firms’ losses.
For this paper, these outlier sellers are called frequent losers. There are 2,471
companies identified as frequent losers using this classification, indicated to the right
of the red vertical line in Figure 5. At least one frequent loser participated in 73,591
tenders (approximately 3.61% of all bids).

71
Figure 5 - IQR Method: Identifying Frequent Losers
Source: BEC-SP.
It is possible to observe much better uniformity within this group. In addition,
Figures 6(a) and 3(b) suggest that frequent losers tend to lose consistently over time.
This fact reinforces the perennial character of the behavior of frequent losers.
Figure 6 - Frequent Losers: (a) Number of Months Competed. (b) Total Number of
Losses
Source: BEC-SP.

72
4.2.3 BEC Sample: Characteristics of Frequent Losers
The main objective of this section is to characterize frequent losers in the BEC
sample. First, I provide a description of the modes of tenders in which the frequent
losers participate. Frequent losers are almost equally involved in sealed-bid (convites)
and multi-round descending auctions (pregoes), but they rarely participate in direct
negotiation (dispensa de licitacao), as shown in Figure 7.
Figure 7 - Frequent Losers: Modes of Tenders
Source: BEC-SP.
Pregoes and convites are different procedures whose successive losses might
have different interpretations. There is a relatively higher transaction cost to participate
in pregoes since in this mode, it is necessary to actively participate on the day of the
tender by submitting bids and, if required, presenting appeals and questions to the
personnel in charge. In the case of convites, participants only need to submit one-shot
proposals, which reduces the costs.
In terms of participation in different modes of tenders, it is interesting to observe
that companies can also be separated into three distinct groups: (i) firms that only
participate in convites; (ii) firms that only participate in pregoes; and (iii) firms that

73
participate in both modes. Figure 8 shows that approximately 14% of frequent losers
only participate in convites, and 49.4% participate only in pregoes. Approximately 37%
of frequent losers are present in both convites and pregoes.
Figure 8 – Types of Frequent Losers
Source: BEC-SP.
Analogously, the diversity of item groups to which frequent losers are linked may
lead to another classification type. A frequent loser can compete in tenders of many
distinct groups of items or participate in bids of specific ones. Thus, the diversity (or
lack of diversity) of purchase items of a frequent loser who chooses to participate might
provide relevant additional information.
To deepen this analysis, the diversity of items in which companies participate,
Shannon’s entropy coefficient35, is calculated for each group of items and each
frequent loser firm, defined according to the following equation:
𝐻𝐻 = −�𝑝𝑝(𝑥𝑥) log 𝑝𝑝(𝑥𝑥) (6)
H is the final entropy value, and p (x) is the probability that each element would
be found randomly in the universe of elements. If H is closer to 0, it means that
35 See Dehmer and Mowshowitz (2011) for more information.

74
companies bid for only one group of items or something close to that. The higher H is,
the greater the diversity of item groups. An entropy of 5 means that the company bids
for approximately 32 different groups of items.
There are at least two valid interpretations regarding the results obtained. First,
firms can act in good faith in public tenders for different groups of items to diversify
their activities. Second, it is also possible that companies are only used to simulate
competition and manipulate the tender. Figure 9 shows the graph of the entropy of the
item groups for all frequent losers.
Figure 9 - Frequent Losers: Entropy Coefficient
Source: BEC-SP.
It is possible to observe that half of the companies participate in tenders related
to only one item, and approximately half participate in contests related to two or more
item groups. The analysis is limited to companies that participate in tenders of less
than 16 distinct item groups. The frequency at which every item appears reveals a high
concentration of tenders in a few groups of items. Figure 10 presents the graph of the
frequency of the item groups.

75
Figure 10 - Frequent Losers: Item Group Variety
Source: BEC-SP.
The high concentration of item groups explains the low entropy of companies
into a few categories. High entropy indicates the participation of some companies in
various tenders always without success.
Another dimension of the analysis is related to identifying PBUs involved in
tenders with the participation of frequent losers. PBUs involved in ‘frequent losers
tenders’ are also concentrated, as shown in Figure 11.

76
Figure 11 - Frequent Losers and PBUs
Source: BEC-SP. 4.3 Frequent Losers and Outcomes in Tenders
The outcomes observed in public tenders with participation by frequent losers
can identify evidence of explicit collusion, potentially serving as a screening
mechanism for the existence of these practices. As developed in Section 2, an
essential principle of effective screening models is their ability to distinguish collusive
behaviors from those that could arise from different competitive models.
This section investigates the properties of this collusion marker and observes
the relationship between the presence of frequent losers and the performance of
bidding contests in several dimensions, such as prices, the number of participants, and
the number of bids. Based on these results, I evaluate the effectiveness of this marker
in identifying collusive behavior.
Possible differences in bidding results are estimated by comparing public
tenders with at least one frequent loser and tenders without the presence of a frequent

77
loser36. This estimation of differences in outcomes y between purchases i, with and
without the participation of a frequent loser, of an item g and in year t has the following
baseline specification:
𝑦𝑦𝑖𝑖𝑖𝑖𝑖𝑖 = 𝛽𝛽𝑙𝑙𝑙𝑙𝑆𝑆𝑅𝑅𝑃𝑃𝑆𝑆𝑖𝑖𝑖𝑖𝑖𝑖 + 𝛼𝛼𝑖𝑖 + 𝜆𝜆𝑖𝑖 + 𝑥𝑥𝑥𝑥 + 𝜖𝜖𝑖𝑖𝑖𝑖𝑖𝑖, (7)
where 𝛂𝛂𝐠𝐠 and 𝛌𝛌𝐭𝐭 are fixed effects of purchased items and year dummies, respectively.
The variable 𝐥𝐥𝐥𝐥𝐥𝐥𝐥𝐥𝐥𝐥𝐥𝐥𝐢𝐢𝐠𝐠𝐭𝐭 has a value equal to 1 if the tender has at least one frequent
loser and 0 otherwise. Additionally, 𝐱𝐱 are the control variables, such as dummies for
purchasing units and tender mode.
The data used come from public purchases made at BEC from January 2009 to
December 2019. However, for the purposes of this section, the subsample used in the
estimates consists only of items with at least one purchasing process with the presence
of frequent losers. The estimates for the negotiated prices are presented in Table 17.
36 As in most screening models proposed by the literature, empirical results may be subject to self-selection problems because there was no randomization process in the allocation of frequent losers in the contests.
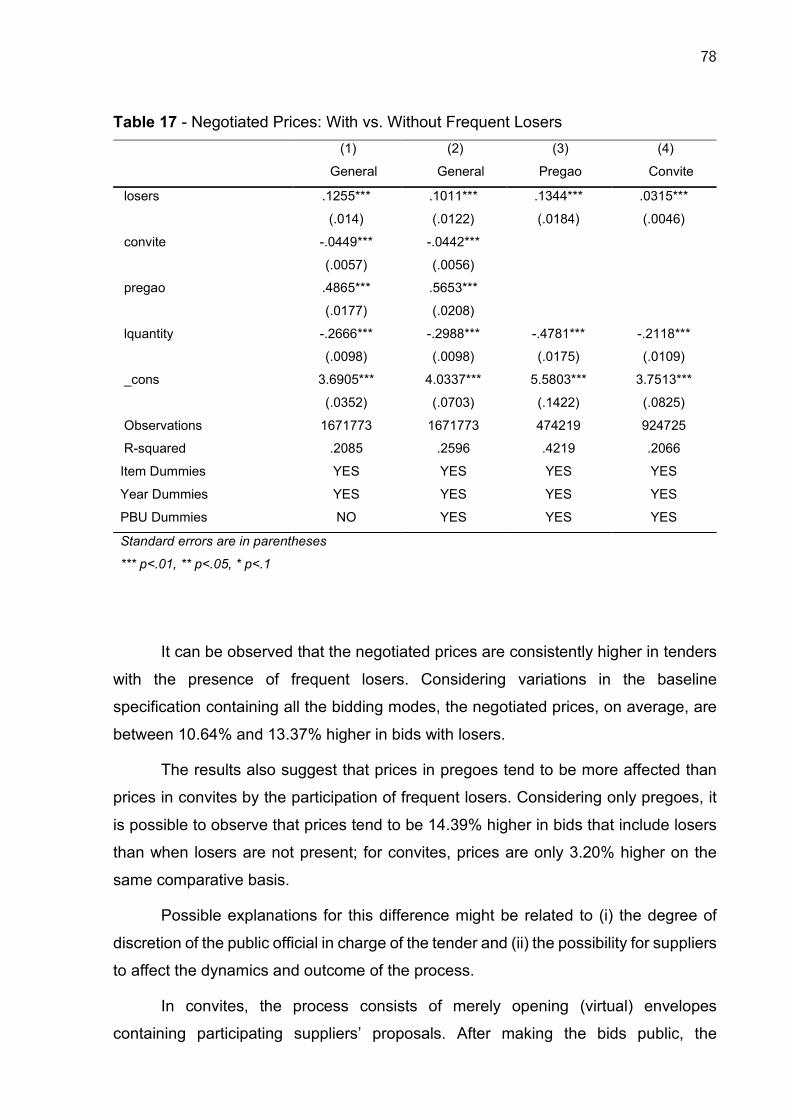
78
Table 17 - Negotiated Prices: With vs. Without Frequent Losers (1) (2) (3) (4)
General General Pregao Convite
losers .1255*** .1011*** .1344*** .0315***
(.014) (.0122) (.0184) (.0046)
convite -.0449*** -.0442***
(.0057) (.0056)
pregao .4865*** .5653***
(.0177) (.0208)
lquantity -.2666*** -.2988*** -.4781*** -.2118***
(.0098) (.0098) (.0175) (.0109)
_cons 3.6905*** 4.0337*** 5.5803*** 3.7513***
(.0352) (.0703) (.1422) (.0825)
Observations 1671773 1671773 474219 924725
R-squared .2085 .2596 .4219 .2066
Item Dummies YES YES YES YES
Year Dummies YES YES YES YES
PBU Dummies NO YES YES YES
Standard errors are in parentheses
*** p<.01, ** p<.05, * p<.1
It can be observed that the negotiated prices are consistently higher in tenders
with the presence of frequent losers. Considering variations in the baseline
specification containing all the bidding modes, the negotiated prices, on average, are
between 10.64% and 13.37% higher in bids with losers.
The results also suggest that prices in pregoes tend to be more affected than
prices in convites by the participation of frequent losers. Considering only pregoes, it
is possible to observe that prices tend to be 14.39% higher in bids that include losers
than when losers are not present; for convites, prices are only 3.20% higher on the
same comparative basis.
Possible explanations for this difference might be related to (i) the degree of
discretion of the public official in charge of the tender and (ii) the possibility for suppliers
to affect the dynamics and outcome of the process.
In convites, the process consists of merely opening (virtual) envelopes
containing participating suppliers’ proposals. After making the bids public, the

79
auctioneer’s role is restricted to declaring the firm that offered the lowest price the
winner. Thus, the interaction between the participating firms and public officers is
minimal during the purchase procedure.
In the case of the pregao, the public officer in charge has a more active role in
the process, and there is more room for firms to influence the process. In addition to
revealing the initial bids in the first phase, the auctioneer is responsible for coordinating
and monitoring firms’ bids during the auction phase.
During this auction phase, firms and PBUs interact through the real-time bidding
process and real-time chat. A great variety of information is exchanged through this
communication channel, such as confirming product specifications, complaints about
competitors’ performance, and even dissatisfaction with how the contest is conducted.
At the end of the auction phase, there is another moment of interaction between
suppliers and PBUs. There is an ex-post negotiation phase in which public and private
parties can direct bargaining for the lowest price. Thus, in pregao, there is more room
for manipulation. This situation may lead to higher prices in this type of tender.
Higher prices in tenders with frequent losers may suggest that there is less
competitiveness or aggressiveness for suppliers. This fact cannot be verified in the
estimates of Tables 19 and 20. In these tables, I compare tenders with and without
frequent losers in terms of the number of firms and bids, respectively.

80
Table 18 - Number of Firms: With vs. Without Frequent Losers (1) (2) (3) (4)
General General Pregao Convite
losers .329*** .3256*** .3104*** .2926***
(.0052) (.0048) (.008) (.0041)
convite -.7742*** -.7755***
(.0069) (.007)
pregao -.1181*** -.1228***
(.0081) (.0099)
lquantity .1504*** .151*** .0925*** .1817***
(.0021) (.0022) (.0028) (.0028)
_cons .9159*** 1.2013*** 1.0851*** .8704***
(.0093) (.028) (.0451) (.0624)
Observations 1670719 1670719 473819 924336
R-squared .3675 .3882 .2176 .2699
Items Dummies YES YES YES YES
Year Dummies YES YES YES YES
PBU Dummies NO YES YES YES
Standard errors are in parentheses
*** p<.01, ** p<.05, * p<.1
More firms participate, and more bids are offered in tenders with frequent losers
than in bids without their presence. Between 33.99% and 38.96% more firms
participate in tenders with losers, with an average of 25.51% to 34.35% more bids
offered.

81
Table 19 - Number of Bids: With vs. Without Frequent Losers (1) (2) (3) (4)
General General Pregao Convite
losers .2953*** .2937*** .2272*** .2926***
(.0062) (.006) (.0108) (.0041)
convite .0314*** .0249***
(.0093) (.0093)
pregao .931*** .9225***
(.01) (.0126)
lquantity .169*** .1674*** .1059*** .1817***
(.0026) (.0027) (.004) (.0028)
_cons .7849*** 1.5003*** 2.17*** .8704***
(.0114) (.0478) (.077) (.0624)
Observations 1670719 1670719 473819 924336
R-squared .2945 .3117 .1351 .2698
Items Dummies YES YES YES YES
Year Dummies YES YES YES YES
PBU Dummies NO YES YES YES
Standard errors are in parentheses
*** p<.01, ** p<.05, * p<.1
These results are compatible with the literature on cartels and other illicit
purchases. As Schinkel (2013) notes, cartel participants’ behavior also responds
strategically to competition policy enforcement. A higher number of participating firms
and bidders could be associated with attempting to build a mechanism to conceal
possible illicit competitive practices.
It is important to note that, assuming there is no correlation between the
companies’ cost structure and the presence of frequent losers, the simultaneous
occurrence of higher prices and a higher number of bids and participants in public
tenders is inconsistent with expectations for a model of competition or tacit collusion.
This scenario might mean that the screening proposal based on frequent losers
presents two essential properties. First, it shows that it is capable of distinguishing
collusive behaviors from those that would be expected in competition. Second and
more importantly, because the observed behavior reveals the intention to hide the
collusion, it is a marker that identifies explicit and non-tacit collusion, a recurrent

82
problem in screening models (HARRINGTON JR., 2008).
To establish the reliability of this screening model, however, it is necessary to
highlight possible alternative explanations for the presence of frequent losers in public
procurement. A first alternative hypothesis is the existence of a learning curve for
companies to become victorious at BEC. Supplying goods and services to the state
would require suppliers to develop specific processes and legal adjustments that would
demand consistent efforts over some time.
If there were such a learning curve, then companies that eventually won the first
bid would spend a considerable time losing until they became victorious. This situation
may be the case for some suppliers; however, the data suggest that this is not the
general case. Figure 12 shows the number of contests up to a company’s first victory,
limited to 100 contests for better viewing. Almost 30% of companies win one of the first
three events in which they participate.
Figure 12 - Number of Participations in Tenders until the First Victory
Source: BEC-SP.
In addition, as explained in Section 3, it is known that a small number of
companies win public tenders. Thus, a learning curve hypothesis seems unlikely,
except for a few companies that achieve very frequent wins in bids.
There is an additional alternative explanation that could be considered in this
context. Frequent losers might be a phenomenon found mostly in the short term: there

83
would be a significant number of participations without victories in a short period,
followed by the abandonment of the public contracting market. As shown in Figure 3,
presented in Section 3, companies have participated in tenders for up to ten years and
were repeatedly defeated. It is not reasonable to suppose that there is a financial
incentive to participate in tenders in good faith and to lose repeatedly.
It is also important to note that even if the companies participated for a short
time, they still participated in a sufficient number of tenders to be classified as frequent
losers by the outlier detection method.
4.4 Conclusion
Companies that systematically lose public tenders in which they participate are
not expected in a competitive environment. An analysis of the relationship between
performance variables and the participation of these companies in public bids in Sao
Paulo State between 2009 and 2019 indicates that the negotiated price was 10%
higher; however, the number of participants was 32% higher, and the number of bids
was 29% higher.
This apparent paradox, in which one variable indicates less competitive
pressure (i.e., negotiated prices) while others indicate more competition (i.e., number
of participants and number of bids), is consistent with the behavior of a cartel that seeks
to avoid detection. This scenario is the function that would intuitively be expected of a
frequent loser, that is, to simulate a higher level of competition, drive away competitors,
and avoid detection by control agencies. Precisely because of this characteristic,
frequent losers can be used as markers in a cartel screening method.
This proposal presents some virtues common to other screening methods and
addresses two limitations common to most available models. It is a simple application
method that requires only data already available to competition authorities and control
agencies.
The identification of frequent losers may occur before the public tender on the
occasion of the first stage of the bid, in which the participants are defined. Unlike all
available screening methods based on prices and quantities observed after the cartel’s

84
materialization, frequent losers may signal suspicious behavior before bidding occurs,
reducing the costs associated with a defrauded event.
This property stems from a characteristic of cartels in public tenders: the
agreement among bidders occurs before the tender takes place, and it is possible to
observe elements that may signal fraud before the conclusion of the bid. The presence
of frequent losers also emphasizes the separation between explicit collusion and tacit
collusion since the behavior identified is consistent with the deliberate act of concealing
competition.
There are, however, some limitations in the use of these screening methods;
some of these limitations are remedial, and another is common to all. The proposed
method identifies suspicious conduct only in bidding cartels cases, where some
mechanism for transferring the benefits of the cartel among its members is possible.
This is still a relevant subset of cases, but it does not apply to all cartels. However, this
limitation is remedial because the method can be associated with any other screening
method and can act in a complementary manner, as suggested by Harrington Jr.
(2008).
A common problem with all screening methods is that once they become known
to cartel participants, they will modify their behavior to avoid detection (SCHINKEL,
2013). However, this is not a reason to rule out screening methods; on the contrary, it
is necessary to develop them continuously, and the cumulative process of screening
methods is associated with increasing costs for cartel participants to avoid detection.
Eventually, this cumulative process may result in the deterrence of such an antitrust
offense.
4.5 Further Steps
Improvement of the empirical strategy through the development of a structural
model for public auctions. The idea is to identify the causal effects of the presence of
frequent losers on the auction results.

85
FINAL REMARKS
Most of the resources used to prepare and execute public policy, such as
common goods and services, are purchased from private firms. The way the planning
procedures for the acquisition of these goods is carried out may substantially affect the
procurement conditions or outcomes and, ultimately, it might influence the results of
public policies.
This dissertation investigates factors and institutional arrangements that could
undermine public tenders' performance and generate waste of public resources. An
appropriate time for identifying all needs and ends, analyzing market conditions, and
setting relevant tenders parameters (items specification, quantities, and reserve prices,
for instance) may increase the likelihood of achieving public policies goals efficiently
and effectively.
On the other hand, under unfavorable planning conditions, purchases might be
inadequate to meet public needs and more expensive, undermining public policies'
outcomes. Thus, analyzing aspects that facilitate or hinder the public procurement
process contributes to understanding the effectiveness of public policies and their
effects on economic development.

86
REFERENCES
ABRANTES-METZ, R. M. et al. A variance screen for collusion. International Journal of Industrial Organization, v. 24, n. 3, p. 467–486, 2006.
ASHRAF, N.; BANDIERA, O.; LEE, S. S. Do-gooders and Go-getters: Career Incentives, Selection, and Performance in Public Service Delivery. [s.l: s.n.].
AUTOR, D. H.; DONOHUE III, J.; SCHWAB, S. J. The costs of wrongful-discharge laws. The Review of Economics and Statistics, v. 88, n. May, p. 211–231, 2006.
BAJARI, P.; YE, L. Deciding between competition and collusion. Review of Economics and Statistics, v. 85, n. 4, p. 971–989, 2003.
BANDIERA, O. et al. Motivating bureaucrats: Autonomy vs performance pay for public procurement in Pakistan. [s.l: s.n.].
BANDIERA, O.; PRAT, A.; VALLETTI, T. Active and Passive Waste in Government Spending: Evidence from a Policy Experiment. American Economic Review, v. 99, n. 4, p. 1278–1308, ago. 2009.
BARREIRO, G. S. DE S.; FURTADO, R. P. M. Inserindo a judicialização no ciclo de políticas públicas. Revista de Administração Pública, v. 49, n. 2, p. 293–314, abr. 2015.
BASHEKA, B. Economic and political determinants of public procurement corruption in developing countries: An empirical study from uganda. Journal of Public Procurement, v. 11, n. 1, p. 33–60, 2011.
BASTOS, A. et al. Micro, Pequenas e Médias Empresas: Conceitos e Estatísticas. IPEA Radar: Tecnologia, Produção e Comércio Exterior, v. February, n. 55, p. 21–26, 2018.
BEST, M. C.; HJORT, J.; SZAKONYI, D. Individuals and Organizations as Sources of State Effectiveness. [s.l: s.n.]. Disponível em: <http://www.nber.org/papers/w23350>.
BIEHL, J.; SOCAL, M. P.; AMON, J. J. The Judicialization of Health and the Quest for State Accountability: Evidence from 1,262 Lawsuits for Access to Medicines in Southern Brazil. Health and Human Rights Journal, v. 18, n. 1, p. 209–220, 2016.
BLOOM, N. et al. The Impact of Competition on Management Quality: Evidence from Public Hospitals. The Review of Economic Studies, v. 82, n. 2, p. 457–489, 2015.

87
BREWER, G. A.; WALKER, R. M. The impact of red tape on governmental performance: An empirical analysis. Journal of Public Administration Research and Theory, v. 20, n. 1, p. 233–257, 2010.
BRYANT, P. G.; ECKARD, E. W. Price Fixing: The Probability of Getting Caught. The Review of Economics and Statistics, v. 73, n. 3, p. 531–536, 1991.
CABRAL, S. Reconciling Conflicting Policy Objectives in Public Contracting: The Enabling Role of Capabilities. Journal of Management Studies, 2017.
CARDOZA, G. et al. Barriers and public policies affecting the international expansion of Latin American SMEs: Evidence from Brazil, Colombia, and Peru. Journal of Business Research, v. 69, n. 6, p. 2030–2039, 2016.
CASTRO, M. C. et al. Brazil’s unified health system: the first 30 years and prospects for the future. The Lancet, v. 394, n. 10195, p. 345–356, 2019.
CHANDOLA, V.; BANERJEE, A.; KUMAR, V. Anomaly Detection: a Survey. ACM Computing Surveys, v. 41, n. 3, 2009.
CHEMIN, M.; WASMER, E. Using Alsace-Moselle local laws to build a difference-in-differences estimation strategy of the employment effects of the 35-hour workweek regulation in France. Journal of Labor Economics, v. 27, n. 4, p. 487–524, 2009.
CLARK, R. et al. Bid rigging and entry deterrence in public procurement: Evidence from an investigation into collusion and corruption in Quebec. Journal of Law, Economics, and Organization, v. 34, n. 3, p. 301–363, 2018.
CNJ/INSPER. Judicialização da Saúde no Brasil: Perfil das Demandas, Causas e Propostas de Solução. [s.l: s.n.].
CONNOR, J. M. Price-fixing Overcharges: Legal and Economic Evidence. Research in Law and Economics, v. 22, p. 59–153, 2007.
CULLEN, J. B. et al. Performance Information and Personnel Decisions in the Public Sector: The Case of School Principals. Cambridge, MA: [s.n.]. Disponível em: <http://www.nber.org/papers/w22881.pdf>.
DEHMER, M.; MOWSHOWITZ, A. A history of graph entropy measures. Information Sciences, v. 181, n. 1, p. 57–78, 2011.
FAFCHAMPS, M. et al. Microenterprise growth and the flypaper effect: Evidence from a randomized experiment in Ghana. Journal of Development Economics, v. 106, p. 211–226, 2014.
FERRAZ, C.; FINAN, F.; SZERMAN, D. Procuring Firm Growth: The Effects of

88
Government Purchases on Firm Dynamics. [s.l: s.n.]. Disponível em: <http://www.nber.org/papers/w21219.pdf>.
FERRAZ, O. L. M. The right to health in the courts of Brazil: worsening health inequities? Health and human rights, v. 11, n. 2, p. 33–45, 2009.
FREEDMAN, M. Targeted business incentives and local labor markets. Journal of Human Resources, v. 48, n. 2, p. 311–344, 2013.
GALLEGO, J. A.; PREM, M.; VARGAS, J. F. Corruption in the Times of PandemiaSSRN Electronic Journal. [s.l: s.n.].
GREEN, E. J.; PORTER, R. H. Noncooperative Collusion under Imperfect Price Information. Econometrica, v. 52, n. 1, p. 87–100, 1984.
GUGLER, K.; WEICHSELBAUMER, M.; ZULEHNER, C. Employment behavior and the economic crisis: Evidence from winners and runners-up in procurement auctions. Journal of Public Economics, v. 182, n. 104112, 2020.
HALTIWANGER, J.; HARRINGTON, J. E. The Impact of Cyclical Demand Movements on Collusive Behavior. The RAND Journal of Economics, v. 22, n. 1, p. 89–106, 1991.
HARRINGTON JR., J. E. Detecting cartels. In: BUCCIROSSI, P. (Ed.). . Handbook of Antitrust Economics. London: The MIT Press, 2008. p. 213–258.
HOEKMAN, B.; TAS, B. K. O. SME Participation in Public Purchasing: Procurement Policy Matters: CEPR Discussion Paper. [s.l: s.n.].
HOVENKAMP, H. Federal Antitrust Policy: the Law of Competition and its Practice. 3. ed. St. Paul: Thomson West, 2005.
HÜSCHELRATH, K.; VEITH, T. Cartel Detection in Procurement Markets. Managerial and Decision Economics, v. 35, n. 6, p. 404–422, set. 2014.
IMHOF, D. Detecting Bid-Rigging Cartels with Descriptive Statistics. Journal of Competition Law & Economics, v. 15, n. 4, p. 427–467, 31 dez. 2019.
IMHOF, D.; KARAGÖK, Y.; RUTZ, S. SCREENING FOR BID RIGGING—DOES IT WORK? Journal of Competition Law & Economics, v. 14, n. 2, p. 235–261, 1 jun. 2018.
KAWAI, K. et al. Using Close Bids to Detect Cartels in Procurement Auctions. [s.l: s.n.].
KIM, K.; LEE, M. JAE. Difference in differences in reverse. Empirical Economics, v.

89
57, n. 3, p. 705–725, 2019.
KOTCHEN, M. J.; GRANT, L. E. Does Daylight Saving Time Save Energy? Evidence From A Natural Experiment In Indiana. Review of Economics and Statistics, v. 93, n. 4, p. 1172–1185, 2011.
KVASNIČKA, M.; STANĚK, R.; KRČÁL, O. Do auctions improve public procurement? Evidence from the Czech Republic. Danube, v. 6, n. 4, p. 241–257, 2015.
LEWIS-FAUPEL, S. et al. Can Electronic Procurement Improve Infrastructure Provision? Evidence from Public Works in India and Indonesia. American Economic Journal: Economic Policy, v. 8, n. 3, p. 258–283, ago. 2016.
LOADER, K. Is public procurement a successful small business support policy? A review of the evidence. Environment and Planning C: Government and Policy, v. 31, n. 1, p. 39–55, 2013.
___. SME suppliers and the challenge of public procurement: Evidence revealed by a UK government online feedback facility. Journal of Purchasing and Supply Management, v. 21, n. 2, p. 103–112, 2015.
LUNDBERG, S.; MARKLUND, P.-O. Green public procurement and multiple environmental objectives. Economia e Politica Industriale, v. 45, n. 1, p. 37–53, 3 mar. 2018.
MCCRUDDEN, C. Buying Social Justice. [s.l.] Oxford University Press, 2007.
MCKENZIE, D.; WOODRUFF, C. Business Practices in Small Firms in Developing Countries. Cambridge, MA: [s.n.]. Disponível em: <http://www.nber.org/papers/w21505>.
MEL, S. DE; MCKENZIE, D.; WOODRUFF, C. Returns to Capital in Microenterprises: Evidence from a Field Experiment. Quarterly Journal of Economics, v. 123, n. 4, p. 1329–1372, nov. 2008.
MIRONOV, M.; ZHURAVSKAYA, E. Corruption in Procurement and the Political Cycle in Tunneling: Evidence from Financial Transactions Data. American Economic Journal: Economic Policy, v. 8, n. 2, p. 287–321, maio 2016.
MONSTAD, K.; PROPPER, C.; SALVANES, K. G. Education and fertility: Evidence from a natural experiment. Scandinavian Journal of Economics, v. 110, n. 4, p. 827–852, 2008.
MOORE, J. Cartels Facing Competition in Public Procurement: An Empirical Analysis. [s.l: s.n.]. Disponível em: <Discussion Paper Series>. Acesso em: 18 jan. 2019.

90
NAKABAYASHI, J. Small business set-asides in procurement auctions: An empirical analysis. Journal of Public Economics, v. 100, n. April 2005, p. 28–44, 2013.
NARITOMI, J. Consumers as Tax Auditors. American Economic Review, v. 109, n. 9, p. 3031–3072, 2019.
OECD. SMEs in Public Procurement: Practices and Strategies for Shared Benefits: OECD Public Governance Reviews. Paris: OECD Publishing, 26 out. 2018. Disponível em: <https://doi.org/10.1787/9789264307476-en>.
PORTER, R. H.; ZONA, J. D. Detection of Bid Rigging in Procurement Auctions. Journal of Political Economy, v. 101, n. 3, p. 518–538, 1993.
PORTER, R. H.; ZONA, J. D. Ohio School Milk Markets : An Analysis of Bidding. The RAND Journal of Economics, v. 30, n. 2, p. 263–288, 1999.
PWC. SMEs’ access to public procurement markets and aggregation of demand in the EU. [s.l: s.n.]. Disponível em: <http://ec.europa.eu/internal_market/publicprocurement/docs/modernising_rules/smes-access-and-aggregation-of-demand_en.pdf>.
RASUL, I.; ROGGER, D. Management of Bureaucrats and Public Service Delivery: Evidence from the Nigerian Civil Service. Economic Journal, v. 128, n. 608, p. 413–446, 2018.
SANCHEZ-GRAELLS, A. ‘Screening for Cartels’ in Public Procurement: Cheating at Solitaire to Sell Fool’s Gold? Journal of European Competition Law & Practice, v. 10, n. 4, p. 199–211, 2019.
SCHINKEL, M. P. Balancing Proactive and Reactive Cartel Detection Tools: Some Observations. p. 257–262, 2013.
SHAPIRO, J.; GENTZKOW, M. Preschool Television Viewing and Adolescent Test Scores: Historical Evidence from the Coleman Study. Quarterly Journal of Economics, v. 123, n. February, p. 279–323, 2008.
SIGMA. Small and Medium-sized Enterprises (SMEs) in Public Procurement. Paris: [s.n.]. Disponível em: <https://www.oecd-ilibrary.org/governance/smes-in-public-procurement_9789264307476-en>.
SOARES, A. Health system financing paradigm in the state of São Paulo: a regional analysis. Revista de saude publica, v. 53, p. 39, 2019.
THAI, K. V. (ED.). Global Public Procurement Theories and Practices. Cham: Springer International Publishing, 2017.

91
WANG, D. W. L. Right to health litigation in Brazil: The problem and the institutional responses. Human Rights Law Review, v. 15, n. 4, p. 617–641, 2015.
WILLIAMS, M. J. Management and Bureaucratic Effectiveness Evidence from the Ghanaian Civil Service. Policy Research Working Paper WPS8595, n. September, 2018.
WILS, W. P. J. Leniency in Antitrust Enforcement: Theory and Practice. World Competition, v. 30, n. 1, p. 25–63, 2007.
___. The use of leniency in EU cartel enforcement: An assessment after twenty years. World Competition, v. 39, n. 3, p. 327–388, 2016.
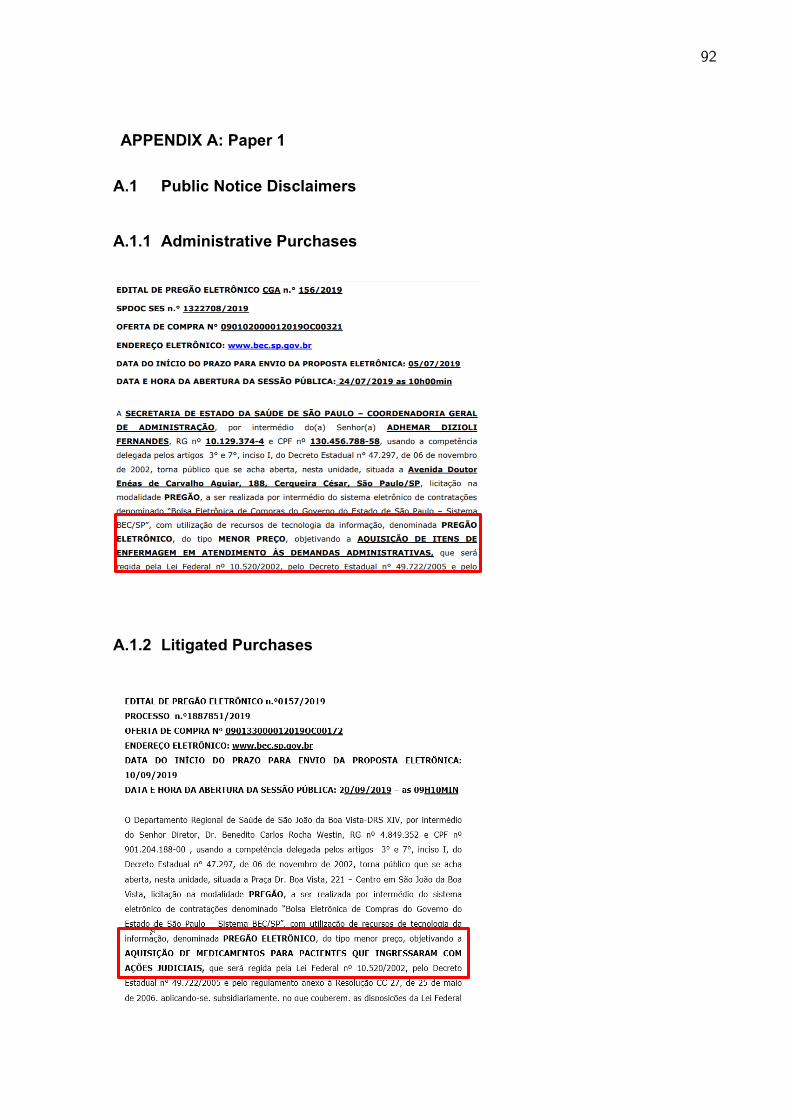
92
APPENDIX A: Paper 1
A.1 Public Notice Disclaimers A.1.1 Administrative Purchases
A.1.2 Litigated Purchases

93
A.2 Ordinary and Urgent (Litigated and Administrative) Purchases
Source: Prepared by the author.

94
A.3 Additional Graphs
A.3.1 – Log Quantity: litigated vs ordinary purchases
Source: BEC-SP.
A.3.2 – Log Reference Prices: litigated vs ordinary purchases
Source: BEC-SP.

95
A.3.3 – Log Prices: litigated vs ordinary purchases
Source: BEC-SP.
A.3.4 – Log number of participant firms: litigated vs ordinary purchases
Source: BEC-SP.
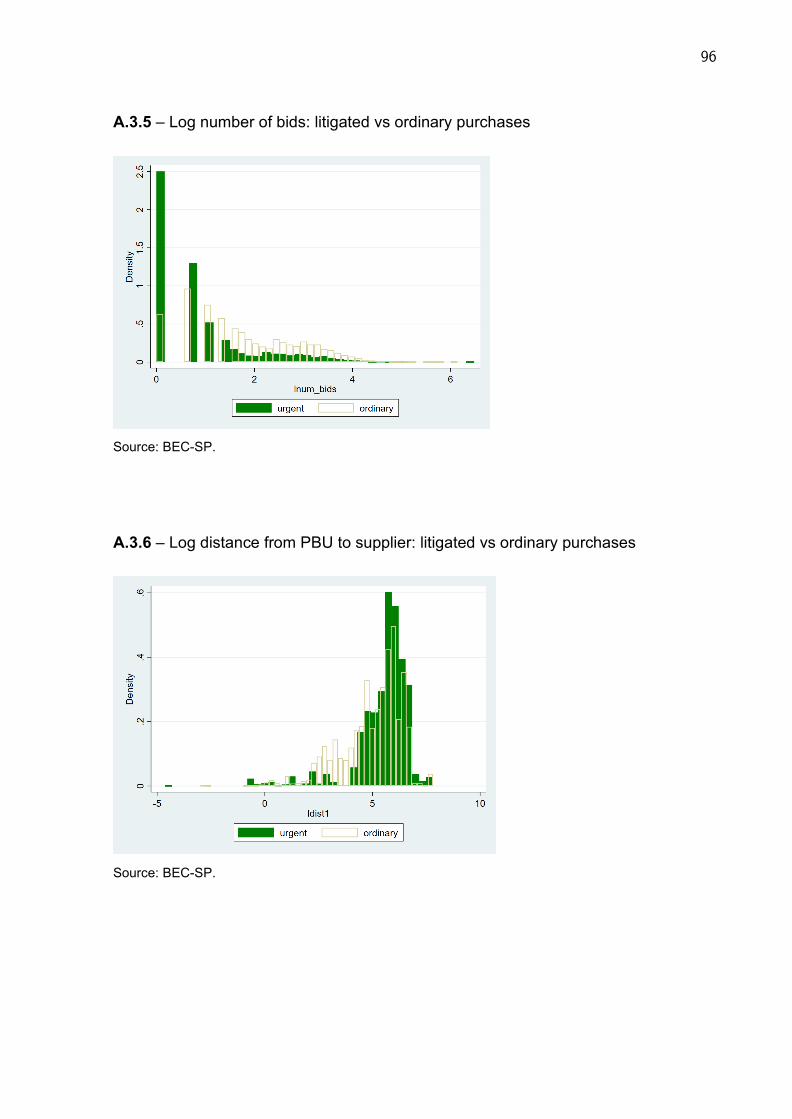
96
A.3.5 – Log number of bids: litigated vs ordinary purchases
Source: BEC-SP.
A.3.6 – Log distance from PBU to supplier: litigated vs ordinary purchases
Source: BEC-SP.

97
A.3.7 – Fines against PBUs for non-compliance with court orders
Source: S-CODES.

98
APPENDIX B: Paper 2
B.1 – Public Notice Disclaimers: SMEs restricted tenders

99
B.2 – Additional Graphs
B.2.1 - Distance from PBU to winner firms: Difference between the always treated
group and the switched group
Source: BEC-SP.
B.2.2 - Number of Participant Firms (log): Difference between the always treated
group and the switched group
Source: BEC-SP.

100
B.2.3 - Number of Valid Bids (log): Difference between the always treated group and
the switched group
Source: BEC-SP.