CIMA Learning System Fundamentals of Business Economics
359
-
Upload
khangminh22 -
Category
Documents
-
view
1 -
download
0
Transcript of CIMA Learning System Fundamentals of Business Economics


CIMA’S Official Learning System
CIMA Certificate in Business Accounting2006 SyllabusComputer based assessment
Certificate Level
Fundamentals ofBusinessEconomics
Steve Adams
Paul Periton

CIMA Publishing is an imprint of Elsevier
Linacre House, Jordan Hill, Oxford OX2 8DP, UK
30 Corporate Drive, Suite 400, Burlington, MA 01803, USA
First edition 2006
Copyright # 2006 Elsevier Ltd. All rights reserved
No part of this publication may be reproduced, stored in a retrieval system
or transmitted in any form or by any means electronic, mechanical, photocopying,
recording or otherwise without the prior written permission of the publisher
Permissions may be sought directly from Elsevier’s Science & Technology Rights
Department in Oxford, UK: phone (+44) (0) 1865 843830; fax (+44) (0) 1865 853333;
email: [email protected]. Alternatively you can submit your request online by
visiting the Elsevier web site at http://elsevier.com/locate/permissions, and selecting
Obtaining permission to use Elsevier material
Notice
No responsibility is assumed by the publisher for any injury and/or damage to persons
or property as a matter of products liability, negligence or otherwise, or from any use
or operation of any methods, products, instructions or ideas contained in the material
herein.
British Library Cataloguing in Publication Data
A catalogue record for this book is available from the British Library
ISBN-13: 978 0 7506 8034 9
ISBN-10: 0 7506 8034 2
Typeset by Integra Software Services Pvt. Ltd, Pondicherry, India
www.integra-india.com
Printed and bound in Great Britain06 07 08 09 10 10 9 8 7 6 5 4 3 2 1
For information on all CIMA publications
visit our web site at books.elsevier.com
Working together to grow libraries in developing countries
www.elsevier.com | www.bookaid.org | www.sabre.org

Contents
The CIMA Learning System ix
Acknowledgements ix
How to use your CIMA Learning System ix
Study technique x
Computer-based assessment xii
The Economics for business syllabus xiii
Learning outcomes and syllabus content xiv
1 The Goals and Decisions of Organisations 3
Learning Outcomes 3
1.1 Scarce resources 4
1.1.1 Scarcity 4
1.1.2 Production decisions 4
1.1.3 Factors of production 5
1.1.4 Production possibilities 5
1.1.5 The role of government 6
1.2 The business organisation 7
1.2.1 Profit maximisation as an objective 8
1.2.2 Principal–agent theory 8
1.2.3 Alternative theories of the firm 8
1.2.4 Not-for-profit theories of the firm 9
1.3 Profit maximisation calculation 10
1.4 The theory of costs 12
1.4.1 Costs of production 12
1.4.2 Short-run production – diminishing marginal returns 13
1.4.3 Long-run production – variable returns to scale 15
1.4.4 Economies of scale 16
1.4.5 Diseconomies of scale 17
1.4.6 Short-run and long-run production decisions 18
1.4.7 Economists’ and Accountants’ understanding of costs 19
1.5 Shareholder wealth 21
1.5.1 Short-term measures of financial performance 22
1.5.2 Long-term measures of financial performance 24
1.5.3 Share values 25
iii 2006.1
1.6 Not-for-profit organisations 26
1.6.1 Types of not-for-profit organisations 26
1.6.2 Stakeholders 28
1.7 Corporate governance 31
1.7.1 Why does corporate governance matter? 31
1.7.2 The principal – agent problem 32
1.7.3 The reform of corporate governance in the UK 34
1.8 Chapter summary 36
Revision Questions 37
Solutions to Revision Questions 41
2 The Market System and the Competitive Process 47
Learning Outcomes 47
2.1 Consumer behaviour and demand 47
2.1.1 Individual demand 47
2.1.2 Market demand 48
2.1.3 Elasticity of demand 49
2.1.4 Conditions of demand 53
2.2 Supply and market 55
2.2.1 The supply curve of a firm 55
2.2.2 The supply curve of an industry 57
2.2.3 The elasticity of supply 57
2.2.4 Shifts in supply 58
2.3 Prices 60
2.3.1 Definitions and terms 60
2.3.2 The price mechanism 60
2.3.3 Prices and resource allocation 62
2.3.4 Agricultural prices 63
2.3.5 Interference with market prices 65
2.4 Large-scale production 67
2.4.1 The growth of firms 67
2.4.2 Market concentration 69
2.5 Market structures 70
2.5.1 Markets in economies 70
2.5.2 Forms of market structure 71
2.5.3 Efficiency 73
2.6 Price and output determination 75
2.6.1 Perfect competition 75
2.6.2 Monopoly 77
2.6.3 Imperfect competition 79
2.6.4 Price discrimination 83
2.6.5 Perfect competition versus monopoly 84
2.7 The public sector 86
2.7.1 Definition 86
2.7.2 Public corporations/nationalised industries 86
2.7.3 Privatisation 88
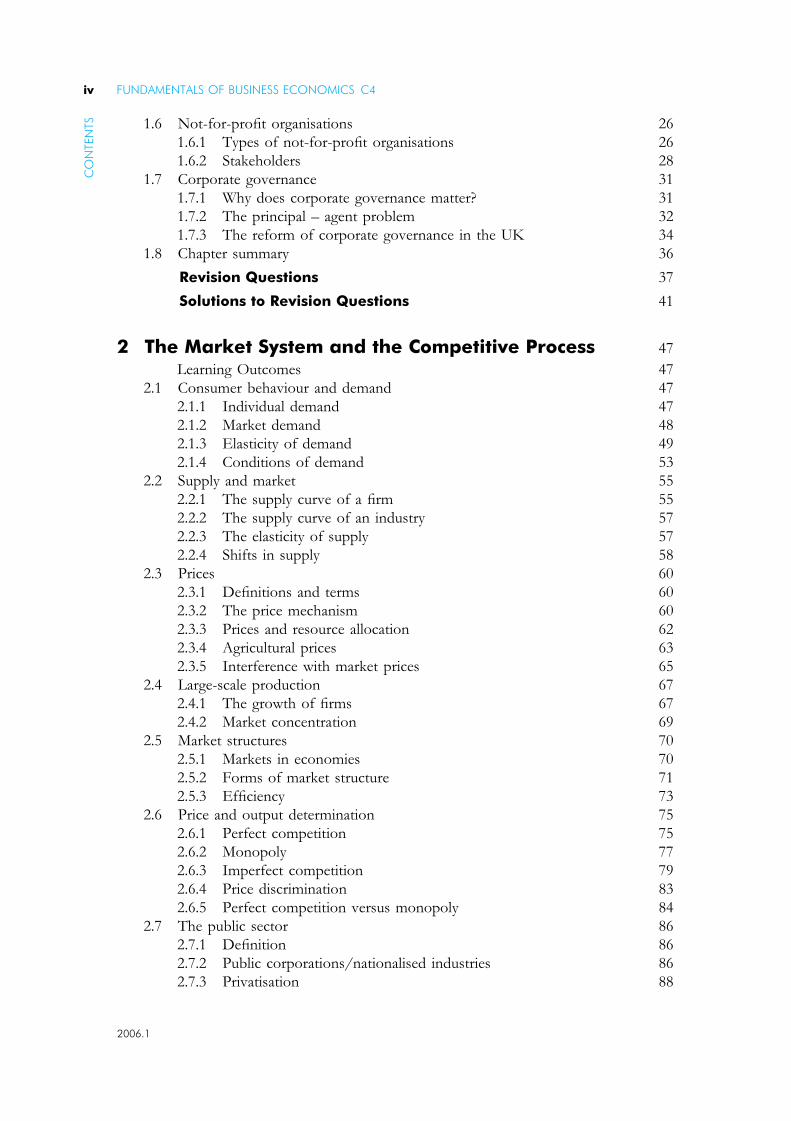
FUNDAMENTALS OF BUSINESS ECONOMICS C4ivC
ON
TEN
TS
2006.1

2.7.4 Public–private partnerships 90
2.7.5 Externalities 90
2.7.6 Public and merit goods 91
2.8 Regulation 92
2.8.1 Competition policy 92
2.8.2 The work of the MMC/CC 93
2.8.3 Restrictive practices 95
2.8.4 The European Commission 96
2.8.5 Specific industry regulators 97
2.9 Chapter summary 98
Revision Questions 101
Solutions to Revision Questions 107
3 The Financial System 113
Learning Outcomes 113
3.1 The financial needs of individuals and organisations 113
3.1.1 Functions and qualities of money 114
3.1.2 Payments and receipts 116
3.2 The organisations of the financial system 121
3.2.1 Financial intermediaries 121
3.2.2 The central bank 125
3.2.3 Financial markets 126
3.3 The credit creation process 128
3.3.1 The credit multiplier 128
3.3.2 Financial instruments: assets and liabilities 130
3.3.3 Finance for business 132
3.3.4 The stock market 134
3.3.5 Yields on assets and interest rates 136
3.3.6 Central banks and the rate of interest 138
3.4 The insurance market 143
3.4.1 Types of insurance 144
3.4.2 The providers of insurance 144
3.5 Chapter summary 145
Revision Questions 147
Solutions to Revision Questions 151
4 The Macroeconomic Context of Business:The Domestic Economy 155
Learning Outcomes 155
4.1 The economy as a whole 155
4.1.1 National income 155
4.1.2 National income calculation 158
4.1.3 The use of national income statistics 160
FUNDAMENTALS OF BUSINESS ECONOMICS vC
ON
TEN
TS
2006.1
4.2 The determination of national income: the circular flow model 162
4.2.1 The circular flow model 162
4.2.2 Consumption 164
4.2.3 Saving 167
4.2.4 Investment 168
4.2.5 The government and external sectors 171
4.2.6 The accelerator 171
4.2.7 The multiplier 171
4.3 The trade cycle and the problems of inflation and unemployment 173
4.3.1 The aggregate demand and aggregate supply model 174
4.4 The objectives of government economic policy: inflation and unemployment 179
4.4.1 Causes of inflation 179
4.4.2 The effects of inflation 181
4.4.3 The causes of unemployment 181
4.4.4 The effects of unemployment 184
4.4.5 The relationship between inflation and unemployment 185
4.5 Economic growth and external balance 190
4.5.1 Economic growth 190
4.5.2 External balance 191
4.6 Government economic policy 193
4.6.1 Monetary policy 193
4.6.2 Fiscal policy: taxation and spending 197
4.6.3 Debates over economic policy 205
4.7 Chapter summary 207
Revision Questions 209
Solutions to Revision Questions 213
5 The Macroeconomic Context of Business:The International Economy 219
Learning Outcomes 219
5.1 Economic growth 220
5.1.1 Economic growth 220
5.1.2 Record of economic growth 220
5.1.3 Factors influencing economic growth 221
5.1.4 Policies to promote economic growth 222
5.1.5 Sustainable economic growth 224
5.2 Globalisation 224
5.2.1 Context 224
5.2.2 Foreign exchange market transactions 226
5.2.3 Multinational corporations 226
5.3 International Trade 228
5.3.1 The benefits 228
5.3.2 The theory 229
5.3.3 Practical limitations 231
5.3.4 Trade protection 232
5.3.5 World Trade Organisation 235
FUNDAMENTALS OF BUSINESS ECONOMICS C4viC
ON
TEN
TS
2006.1
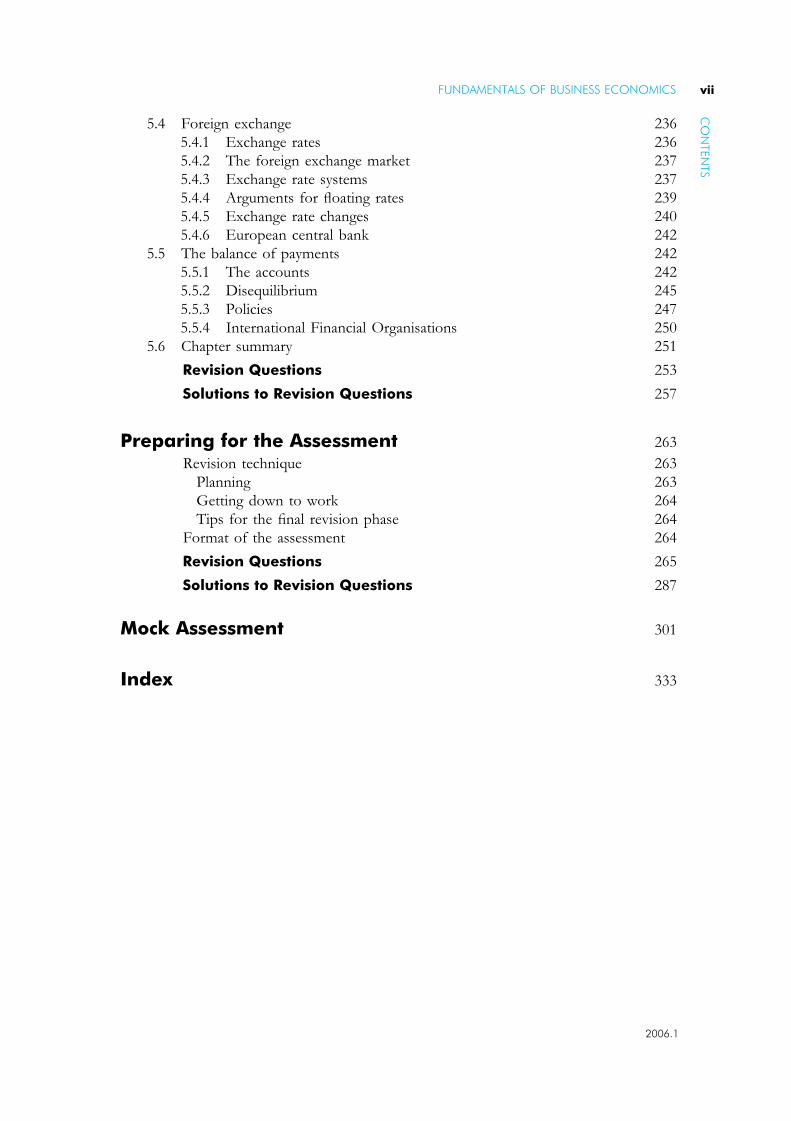
5.4 Foreign exchange 236
5.4.1 Exchange rates 236
5.4.2 The foreign exchange market 237
5.4.3 Exchange rate systems 237
5.4.4 Arguments for floating rates 239
5.4.5 Exchange rate changes 240
5.4.6 European central bank 242
5.5 The balance of payments 242
5.5.1 The accounts 242
5.5.2 Disequilibrium 245
5.5.3 Policies 247
5.5.4 International Financial Organisations 250
5.6 Chapter summary 251
Revision Questions 253
Solutions to Revision Questions 257
Preparing for the Assessment 263
Revision technique 263
Planning 263
Getting down to work 264
Tips for the final revision phase 264
Format of the assessment 264
Revision Questions 265
Solutions to Revision Questions 287
Mock Assessment 301
Index 333
FUNDAMENTALS OF BUSINESS ECONOMICS viiC
ON
TEN
TS
2006.1


The CIMALearning System
Acknowledgements
Every effort has been made to contact the holders of copyright material, but if any here
have been inadvertently overlooked the publishers will be pleased to make the necessary
arrangements at the first opportunity.
How to use your CIMA Learning System
This Fundamentals of Business Economics has been devised as a resource for students attempting
to pass their CIMA computer based assessment; and provides:
� A detailed explanation of all syllabus areas;
� extensive ‘practical’ materials, including readings from relevant journals;
� generous question practice, together with full solutions;
� an exam preparation section, complete with exam standard questions and solutions.
This Learning System has been designed with the needs of home-study and distance-
learning candidates in mind. Such students require very full coverage of the syllabus topics,
and also the facility to undertake extensive question practice. However, the Learning
System is also ideal for fully taught courses.
The main body of the text is divided into a number of chapters, each of which is
organized on the following pattern:
� Detailed learning outcomes. expected after your studies of the chapter are complete. You
should assimilate these before beginning detailed work on the chapter, so that you can
appreciate where your studies are leading.
� Step-by-step topic coverage. This is the heart of each chapter, containing detailed explanatory
text supported where appropriate by worked examples and exercises. You should work
carefully through this section, ensuring that you understand the material being explained
and can tackle the examples and exercises successfully. Remember that in many cases
knowledge is cumulative: if you fail to digest earlier material thoroughly, you may
struggle to understand later chapters.
� Readings and activities. Most chapters are illustrated by more practical elements, such as
relevant journal articles or other readings, together with comments and questions
designed to stimulate discussion.
ix 2006.1

� Question practice. The test of how well you have learned the material is your ability to tackle
exam-standard questions. Make a serious attempt at producing your own answers, but at
this stage don’t be too concerned about attempting the questions in exam conditions. In
particular, it is more important to absorb the material thoroughly by completing a full
solution than to observe the time limits that would apply in the actual exam.
� Solutions. Avoid the temptation merely to ‘audit’ the solutions provided. It is an illusion
to think that this provides the same benefits as you would gain from a serious attempt of
your own. However, if you are struggling to get started on a question you should read
the introductory guidance provided at the beginning of the solution, and then make your
own attempt before referring back to the full solution.
Having worked through the chapters you are ready to begin your final preparations for the
examination. The final section of this CIMA Learning System provides you with the
guidance you need. It includes the following features:
� A brief guide to revision technique.
� Guidance on how to tackle the assessment itself.
� A table mapping revision questions to the syllabus learning outcomes allowing you to
quickly identify questions by subject area.
� Revision questions. These are of exam standard and should be tackled in exam conditions,
especially as regards the time allocation.
� Solutions to the revision questions. As before, these indicate the length and the quality
of solution that would be expected of a well-prepared candidate.
� Mock Assessments. You should plan to attempt these just before the date of the real
exam. By this stage your revision should be complete and you should be able to attempt
the mock paper in exam conditions.
If you work conscientiously through this CIMA Learning System according to the
guidelines above you will be giving yourself an excellent chance of exam success. Good
luck with your studies!
Guide to the Icons used within this Text
Key term or definition
Equation to learn
Exam tip or topic likely to appear in the exam
Exercise
Question
Solution
Comment or Note
Study technique
Passing exams is partly a matter of intellectual ability, but however accomplished you are
in that respect you can improve your chances significantly by the use of appropriate study
FUNDAMENTALS OF BUSINESS ECONOMICS C4xTH
EC
IMA
LEA
RN
ING
SYST
EM
2006.1
and revision techniques. In this section we briefly outline some tips for effective study
during the earlier stages of your approach to the exam. Later in the text we mention some
techniques that you will find useful at the revision stage.
Planning
To begin with, formal planning is essential to get the best return from the time you
spend studying. Estimate how much time in total you are going to need for each subject
that you face. Remember that you need to allow time for revision as well as for initial
study of the material. The amount of notional study time for any subject is the minimum
estimated time that students will need to achieve the specified learning outcomes set
out earlier in this chapter. This time includes all appropriate learning activities, e.g. face-
to-face tuition, private study, directed home study, learning in the workplace, revision
time, etc. You may find it helpful to read Better exam results by Sam Malone, CIMA
Publishing, ISBN: 075066357X. This book will provide you with proven study techniques.
Chapter by chapter it covers the building blocks of successful learning and examination
techniques.
The notional study time for Foundation level Fundamentals of Business Economics is 130
hours. Note that the standard amount of notional learning hours attributed to one
full-time academic year of approximately 30 weeks is 1,200 hours.
By way of example, the notional study time might be made up as follows:
Note that all study and learning-time recommendations should be used only as a guideline
and are intended as minimum amounts. The amount of time recommended for face-to-
face tuition, personal study and/or additional learning will vary according to the type of
course undertaken, prior learning of the student, and the pace at which different students
learn.
Now split your total time requirement over the weeks between now and the examination.
This will give you an idea of how much time you need to devote to study each week.
Remember to allow for holidays or other periods during which you will not be able to study
(e.g. because of seasonal workloads).
With your study material before you, decide which chapters you are going to study in
each week, and which weeks you will devote to revision and final question practice.
Prepare a written schedule summarizing the above – and stick to it!
The amount of space allocated to a topic in the study material is not a very good
guide as to how long it will take you. Some topics require large numbers of diagrams
and/or tables and thus occupy a larger proportion of the text than their weighting in the
syllabus. The weighting of topics in the syllabus is the best guide as to how long you
should spend on it.
Hours
Face-to-face study: up to 40
Personal study: up to 65
‘Other’ study, e.g. learning in the workplace, 25
revision, etc.: up to 130
FUNDAMENTALS OF BUSINESS ECONOMICS xiTH
EC
IMA
LEARN
ING
SYSTEM
2006.1

It is essential to know your syllabus. As your course progresses you will become more
familiar with how long it takes to cover topics in sufficient depth. Your timetable may
need to be adapted to allocate enough time for the whole syllabus.
Tips for effective studying
(1) Aim to find a quiet and undisturbed location for your study, and plan as far as possible to
use the same period of time each day. Getting into a routine helps to avoid wasting time. Make
sure that you have all the materials you need before you begin so as to minimise interruptions.
(2) Store all your materials in one place, so that you do not waste time searching for
items around the house. If you have to pack everything away after each study period, keep
them in a box, or even a suitcase, which will not be disturbed until the next time.
(3) Limit distractions. To make the most effective use of your study periods you should
be able to apply total concentration, so turn off the TV, set your phones to message mode,
and put up your ‘do not disturb’ sign.
(4) Your timetable will tell you which topic to study. However, before diving in and
becoming engrossed in the finer points, make sure you have an overall picture of all the areas
that need to be covered by the end of that session. After an hour, allow yourself a short break
and move away from your books. With experience, you will learn to assess the pace you need
to work at. You should also allow enough time to read relevant articles from newspapers and
journals, which will supplement your knowledge and demonstrate a wider perspective.
(5) Work carefully through a chapter, making notes as you go. When you have covered
a suitable amount of material, vary the pattern by attempting a practice question. Preparing
an answer plan is a good habit to get into, while you are both studying and revising, and
also in the examination room. It helps to impose a structure on your solutions, and avoids
rambling. When you have finished your attempt, make notes of any mistakes you made, or
any areas that you failed to cover or covered only skimpily.
(6) Make notes as you study, and discover the techniques that work best for you. Your
notes may be in the form of lists, bullet points, diagrams, summaries, ‘mind maps’, or the
written word, but remember that you will need to refer back to them at a later date, so they
must be intelligible. If you are on a taught course, make sure you highlight any issues you
would like to follow up with your lecturer.
(7) Organise your paperwork. There are now numerous paper storage systems available to
ensure that all your notes, calculations and articles can be effectively filed and easily retrieved later.
Computer-based assessment
CIMA has introduced computer-based assessment (CBA) for all subjects at Certificate
level. The website says:
Objective questions are used. The most common type is ‘multiple choice’, where you have to choose the
correct answer from a list of possible answers, but there are a variety of other objective question types that
can be used within the system. These include true/false questions, matching pairs of text and graphic,
sequencing and ranking, labelling diagrams and single and multiple numeric entry.
Candidates answer the questions by either pointing and clicking the mouse, moving objects around
the screen, typing numbers, or a combination of these responses. Try the online demo at
www.cimaglobal.com to see how the technology works.
FUNDAMENTALS OF BUSINESS ECONOMICS C4xiiTH
EC
IMA
LEA
RN
ING
SYST
EM
2006.1

The CBA system can ensure that a wide range of the syllabus is assessed, as a pre-determined number of
questions from each syllabus area (dependent upon the syllabus weighting for that particular area) are
selected in each assessment.
In every chapter of this learning system we have introduced these types of questions but
obviously we have to label answers A, B, C, etc. rather than using click boxes. For
convenience we have retained quite a lot of questions where an initial scenario leads to a
number of sub-questions. There will be questions of this type in the CBA but they will
rarely have more than three sub-questions. In all such cases examiners will ensure that the
answer to one part does not hinge upon a prior answer.
There are two types of questions which were previously involved in objective testing in
paper-based exams and which are not at present possible in a CBA. The actual drawing
of graphs and charts is not yet possible. Equally there will be no questions calling
for comments to be written by students. Charts and interpretations remain on many syllabi
and will be examined at Certificate level but using other methods.
For further CBA practice, CIMA Publishing has produced CIMA Inter@ctive
CD-ROMs for all certificate level subjects. These products will be available at
www.cimapublishing.com.
Fundamentals of Business Economicsand computer-based assessment
The examination for Fundamentals of Business Economics is a two-hour computer-based
assessment comprising 75 compulsory questions, with one or more parts. Single part
questions are generally worth 1-2 marks each, but two and three part questions may be
worth 4 or 6 marks. There will be no choice and all questions should be attempted if time
permits. CIMA are continuously developing the question styles within the CBA system
and you are advised to try the on-line website demo, to both gain familiarity with
assessment software and examine the latest style of questions being used.
Additional Reading
J. Solman & M. Suteliffe Economics for Business 2nd ed. (Pearson Education, 2001).
M. Moschandress Business Economics 2nd ed. (Thomson Learning, 2001).
Fundamentals of Business Economics
Syllabus outline
The syllabus comprises:
Topic and Study Weighting
A – The Goals and Decisions of Organisations 20%
B – The Market System and the Competitive Process 30%
C – The Financial System 20%
D – The Macroeconomic Context of Business 30%
2006.1
TH
EC
IMA
LEARN
ING
SYSTEMFUNDAMENTALS OF BUSINESS ECONOMICS xiii

Learning aims
This syllabus aims to test student’s ability to:
� Distinguish the differing goals of organisations and identify how these differing goals
affect the decisions made by managers;
� Illustrate how market economies function and identify the reasons for and impacts of
government involvement in economic activities;
� Identify the role of financial institutions and markets in the provision of short and long
term finance to individuals, businesses and governmental organizations;
� Identify how macroeconomic variables and government economic policies affect the
organization.
Assessment strategy
There will be a computer based assessment of 2 hours duration, comprising 75
compulsory questions, each with one or more parts.
A variety of objective test question styles and types will be used within the assessment.
Learning outcomes and indicative syllabus content
A The Goals and Decisions of Organisations – 20%
Learning outcomes
On completion of their studies students should be able to:
� distinguish the goals of profit seeking organisations, not-for-profit organisations and
governmental organisations;
� compute the point of profit maximisation for a single product firm in the short run;
� distinguish the likely behaviour of a firm’s unit costs in the short run and long run;
� illustrate the effects of long run cost behaviour on prices, the size of the organisation
and the number of competitors in the industry;
� illustrate shareholder wealth, the variables affecting shareholder wealth, and its
application in management decision making;
� identify stakeholders and their likely impact on the goals of not-for-profit organisations
and the decisions of the management of not-for-profit organisations;
� distinguish between the potential objectives of management and those of shareholders,
and the effects of this
� principal-agent problem on decisions concerning price, output and growth of the firm.
� describe the main mechanisms to improve corporate governance in profit seeking
organisations.
Indicative syllabus content
The forms of ownership of organisations by which we mean public, private and mutual,
and their goals.
Graphical treatment of short run cost and revenue behaviour as output increases
(revenue and cost curves) and identification of point of short-run profit maximisation
using graphical techniques and from data.
TH
EC
IMA
LEA
RN
ING
SYST
EM
2006.1
FUNDAMENTALS OF BUSINESS ECONOMICS C4xiv

Long run cost behaviour and the impact of economies and diseconomies of scale.
Concept of returns to shareholder investment in the short run (ROCE and EPS) and
long run (NPV of free cash flows) leading to the need for firms to provide rates of return
to shareholders at least equal to the firm’s cost of capital.
Calculation of impact on the value of shares of a change to a company’s forecast cash
flows or required rate. Note: Calculations required will be either perpetual annuity
valuations with constant annual free cash flows, or NPV calculations with variable cash
flows over three years.
Types of not-for-profit organisations (NPOs) and the status of economic considera-
tions as constraints rather than primary objectives in the long run.
Role of stakeholders in setting goals and influencing decisions in not-for-profit
organisations (NPOs) and potential ways of resolving differing stakeholder demands.
The principal-agent problem, its likely effect on decision-making in profit seeking and
NPO organisations, and the concepts of scrutiny and corporate governance.
B The Market System and the CompetitiveProcess – 30%
Learning outcomes
On completion of their studies students should be able to:
� identify the equilibrium price in a product or factor markets likely to result from
specified changes in conditions of demand or supply;
� calculate the price elasticity of demand and the price elasticity of supply;
� identify the effects of price elasticity of demand on a firm’s revenues following a change
in prices.
� describe market concentration and the factors giving rise to differing levels of
concentration between markets;
� describe market failures, their effects on prices, efficiency of market operation and
economic welfare, and the likely responses of government to these;
� distinguish the nature of competition in different market structures; identify the impacts
of the different forms of competition on prices and profitability.
Indicative syllabus content
� The price mechanism: determinants of supply and demand and their interaction to form
and change equilibrium price.
� The price elasticity of demand and its effect on firms’ revenues and pricing decisions.
� The price elasticity of supply and its impact on prices, supply and buyers’ expenditure.
� Business integration: mergers, vertical integration and conglomerates.
� Calculation of market concentration and its impact on efficiency, innovation and
competitive behaviour.
� Impact of monopolies and collusive practices on prices and output and role of
competition policy in regulating this.
� Factors causing instability of prices in primary goods markets (i.e. periodic and short run
inelasticity of supply, the cobweb or hog cycle) and the implications of this for producer
2006.1
TH
EC
IMA
LEARN
ING
SYSTEMFUNDAMENTALS OF BUSINESS ECONOMICS xv
incomes, industry stability and supply and government policies to combat this (e.g.
deficiency payments, set-aside, subsidies).
� Impact of minimum price (minimum wages) and maximum price policies in goods and
factor markets.
� Positive and negative externalities in goods markets and government policies to deal
with these (including indirect taxes, subsidies, polluter pays policies and regulation).
� Public assurance of access to public goods, healthcare, education and housing.
� Public versus private provision of services (nationalisation, privatisation, contracting
out, public private partnerships).
C The Financial System – 20%
Learning outcomes
On completion of their studies students should be able to:
� identify the factors leading to liquidity surpluses and deficits in the short, medium and
long run in households, firms and governments;
� explain the role of various financial assets, markets and institutions in assisting
organisations to manage their liquidity position and to provide an economic return to
holders of liquidity;
� identify the role of insurance markets in the facilitation of the economic transfer and
bearing of risk for households, firms and governments;
� identify the role of the foreign exchange market and the factors influencing it, in setting
exchange rates and in helping organisations finance international trade and investment;
� explain the role of national and international governmental organisations in regulating
and influencing the financial system, and the likely impact of their policy instruments on
businesses.
Indicative syllabus content
� The causes of short-term, medium term and long term lack of synchronisation between
payments and receipts in households (i.e. month to month cash flow, short-term saving
and borrowing, and longer term property purchases and pensions provision).
� The causes of short-term, medium term and long term lack of synchronisation between
payments and receipts in firms (i.e. month to month cash flow management, finance of
working capital and short-term assets and long term permanent capital).
� The causes of short-term, medium term and long term lack of synchronisation between
payments and receipts in governmental organisations (i.e. month to month cash flow
management, finance of public projects and long term management of the national
debt).
� The principal contracts and assets issued by financial institutions and borrowers to
attract liquidity in the short, medium and long term (e.g. credit agreements, mortgages,
bills of exchange, bonds, certificates of deposit and equities).
� The roles and functions of financial intermediaries and the principal institutions and
markets in the financial system.
� The influence of commercial banks on the supply of liquidity to the financial system
through their activities in credit creation.
2006.1
TH
EC
IMA
LEA
RN
ING
SYST
EMFUNDAMENTALS OF BUSINESS ECONOMICS C4xvi
� Yield on financial instruments (i.e. bill rate, running yield on bonds, net dividend yield
on equity), relation between rates, role of risk, the yield curve.
� Influence of central banks on yield rates through market activity and as providers of
liquidity to the financial system.
� Principal insurance contracts available and basic operation of insurance markets
including terminology (e.g. broking, underwriting, reinsurance).
� The role of foreign exchange markets in facilitating international trade and in
determining the exchange rate.
� Effect of exchange rates on the international competitiveness of firms, including
elementary foreign exchange translation calculations.
� Credit and foreign exchange risks of international trading firms and the use of letters of
credit, export credit guarantees and exchange rate hedging to manage these risks.
� Influences on exchange rates: interest rates, inflation rates, trade balance, currency
speculation.
� Governmental and international policies on exchange rates (i.e. exchange rate
management, fixed and floating rate systems, single currency zones) and the implications
of these policies for international business.
D The Macroeconomic Context of Business – 30%
Learning outcomes
On completion of their studies students should be able to:
� explain macroeconomic phenomena, including growth, inflation, unemployment,
demand management and supply-side policies;
� explain the main measures and indicators of a country’s economic performance and the
problems of using these to assess the wealth and commercial potential of a country;
� identify the stages of the trade cycle, its causes and consequences, and discuss the
business impacts of potential policy responses of government to each stage;
� explain the main principles of public finance (i.e. deficit financing, forms of taxation)
and macroeconomic policy;
� explain the concept of the balance of payments and its implications for business and for
government policy;
� identify the main elements of national policy with respect to trade, including
protectionism, trade agreements and trading blocks;
� identify the conditions and policies necessary for economic growth in traditional,
industrial and post-industrial societies, and the potential consequences of such growth;
� explain the concept and consequences of globalisation for businesses and national
economies;
� identify the major institutions promoting global trade and development, and their
respective roles.
Indicative syllabus content
� National Income Accounting identity and the three approaches to calculation and
presentation of national income (Output, Expenditure and Income).
� Interpretation of national income accounting information for purposes of time series or
cross sectional evaluation of economic performance.
2006.1
TH
EC
IMA
LEARN
ING
SYSTEMFUNDAMENTALS OF BUSINESS ECONOMICS xvii

� The circular flow of income and the main injections and withdrawals.
� Illustration of changes to equilibrium level of national income using aggregate demand
and supply analysis.
� Government macroeconomic policy goals (low unemployment, inflation, external
equilibrium and growth) and the effects on business of the government’s pursuit of
these.
� Types and consequences of unemployment, inflation and balance of payments deficits.
� The trade cycle and the implications for unemployment, inflation and trade balance of
each stage (recession, depression, recovery, boom).
� Government policy for each stage of the business cycle and the implications of each
policy for business.
� The central government budget and forms of direct and indirect taxation. Incidence of
taxation (progressive, regressive) and potential impact of high taxation on incentives and
avoidance.
� Fiscal, monetary and supply side policies, including relative merits of each.
� Layout of balance of payments accounts and the causes and effects of fundamental
imbalances in the balance of payments.
� Arguments for and against free trade and policies to encourage free trade (e.g. bi-lateral
trade agreements, multi-lateral agreements, free trade areas, economic communities and
economic unions), and protectionist instruments (tariffs, quotas, administrative controls,
embargoes)
� Principal institutions encouraging international trade (e.g. WTO/GATT, EU, G6)
Nature of globalisation and factors driving it (e.g. improved communications, political
realignments, growth of global industries and institutions, cost differentials).
� Impacts of globalisation (e.g. industrial relocation, emergence of growth markets,
enhanced competition, cross-national business alliances and mergers, widening
economic divisions between countries)
� Role of major institutions (e.g. World Bank, International Monetary Fund, European
Bank) in fostering international development and economic stabilisation.
FUNDAMENTALS OF BUSINESS ECONOMICS C4xviiiTH
EC
IMA
LEA
RN
ING
SYST
EM
2006.1

1
The Goals and Decisionsof Organisations


The Goals andDecisions ofOrganisations
LEARNING OUTCOMES
This chapter introduces some key concepts in the study of business economics. It begins
with a discussion of the allocation of scarce resources and the ways in which this can be
resolved.
It examines the goals of organisations with special reference to the quest for profits
alongside an analysis of the cost structures of firms. It looks at the role of stakeholders
paying particular attention to shareholders. Finally, it considers how stakeholders are
involved in decision making within organisations and the ways in which such
governance can be improved.
After completing this chapter you should be able to:
" distinguish the goals of profit-seeking organisations, not-for-profit organisations and
governmental organisations;
" compute the point of profit maximisation for a single product firm in the short run;
" distinguish the likely behaviour of a firm’s unit costs in the short run and in the long
run;
" illustrate the effects of long-run cost behaviour on prices, the size of the organisation
and the number of competitors in the industry;
" illustrate shareholders wealth, the variables affecting shareholders’ wealth and its
application in management decision making;
" identify stakeholders and their likely impact on the goals of no-for-profit
organisations and the decisions of the management of not-for-profit organisations;
" distinguish between the potential objectives of management and those of
shareholders, and the effects of this principal–agent problem on decisions
concerning price, output and growth of the firm;
" describe the main mechanisms to improve corporate governance in profit-seeking
organisations.
1
3 2006.1

1.1 Scarce resources
1.1.1 Scarcity
To many people economics is about money. This is because money is used to value things.
Most of the things are more accurately termed ‘goods’ and ‘services’ and they have a price,
which shows what people are prepared to pay for the ownership of these goods and services.
The price, or exchange value, of a good/service will usually reflect the resources which are
combined to produce it. These resources, such as land and labour, also have a price and
this is largely determined by demand and supply factors. For example, coloured pencils are
cheap because wood is in plentiful supply but quill pens are more expensive as there is a
limited supply of raw materials required to produce them. Thus scarce resources usually
command a high price. Sometimes, there are competing ends for which resources could be
used. If these ends are many and varied in importance and the means of achieving them
are limited, then there is an economic problem. For example, wood can be used for a
variety of products ranging from furniture to tent pegs, and someone has to decide which
end will be satisfied through production.
The decision regarding how to use the wood will need to take into account people’s
wants. If the demand for furniture is enormous and the demand for tent pegs is minuscule,
it is likely that furniture will be produced.
Generally there are insufficient resources available to produce all the goods and services
which people want. This relative scarcity of resources means that a choice has to be made.
When a choice arises, an alternative has to be given up. Thus, a producer might have to
choose between using wood for furniture or tent pegs, because his resources are limited.
Similarly, a consumer may have a limited amount of income and thus has to choose
between two alternative products; for example a painting or a new garden mower, both
valued at £400.
The sacrifice, when a choice is made, is termed the opportunity cost because it is the
alternative forgone. Usually, the opportunity cost has a monetary value. However, it could
be a choice over the use of time, for example, write a chapter of a book or play 36 holes of
golf!
� Choice arises because of relative scarcity
� Opportunity cost is a measurement of the foregone alternative
1.1.2 Production decisions
When allocating scarce resources between competing ends, several production decisions
need to be made.
� For whom to produce?
This decision will be determined by those with political power, and it therefore largely
depends on the nature of the political system within which the economic system operates.
For example, in a communist state, such as Cuba, the government dictates that pro-
duction is organised for the equal benefit of all citizens. In contrast, in a liberal
democracy with a capitalist-oriented economy, such as the United States, the driving
force is profits. Consequently, production will be directed towards those who can afford
to purchase output as this will be the most profitable for the individuals and groups with
control over resources.
STUDY MATERIAL C44TH
EG
OA
LSA
ND
DEC
ISIO
NS
OF
ORG
AN
ISA
TIO
NS
2006.1
� What to produce?
In a market economy the goods and services produced will be those which generate the
greatest profit. Thus the American economy might produce a wide range of ostentatious
luxury services, such as drive-in funeral parlours for the busy bereaved, which can be
bought by the affluent few. However in economies where the profit motive is not
dominant, for example Cuba, output will be more oriented towards producing basic
merit goods, such as education to benefit all in society.
� How to produce?
Resources need utilizing in the most cost-efficient way. Businesses strive for the lowest
unit cost in theory. They regularly appraise production methods and may vary the
resource inputs in order to maximise output. This may mean the substitution of one
resource for another, e.g. machines for people. Generally though, the resource of labour
is kept as fully employed as possible in most economic systems for political as much as
economic reasons.
� How to distribute?
The goods and services which are produced need sharing so that consumption can take
place and wants are fulfilled. In most systems, the distribution of most goods and
services is by price – those who cannot afford to pay go without. The price may be set by
the state, in the command economy, or by the independent business, in the free-market
approach.
� In a market economy production decisions are driven by the profit motive.
1.1.3 Factors of production
The economic resources which are used in tackling the economic problem are referred to
as factors of production. These are usually classified as:
� Land. This is the term used to cover all natural resources. Although largely in limited supply
it can be improved through technological advances, for example irrigation. The reward
accruing to land in the production process is termed rent.
� Labour. This is a specific category of human resource. The quality of labour can be raised
through education and training. The application of capital, through the use of
machinery, will improve labour productivity. The reward of labour is termed wages.
� Enterprise. This is another human resource but refers to the role played by the organiser
of production, including risk. In return for risk-taking, organising and decision taking,
entrepreneurs receive profit.
� Capital. These are man-made resources. Capital may be fixed, for example a factory, or
working capital, for example raw materials and work in progress. The reward accruing to
capital in the production process is termed interest.
1.1.4 Production possibilities
The production possibilites for any economy can be shown in a simplified form by a
production possibility frontier (PPF) curve. The axes on the graph represent the
different types of goods that could be produced, such as capital goods (goods used to
produce an output of other goods and services, e.g. a machine) and consumer goods.
FUNDAMENTALS OF BUSINESS ECONOMICS 5TH
EG
OA
LSA
ND
DEC
ISIO
NS
OF
ORG
AN
ISA
TIO
NS
2006.1

Capital goods
Consumer goods
A
C
G
E
F
D
B
Figure 1.1 Production possibility curve
The curve then shows the maximum of all the possible combinations of the two types of
output that could be produced with the existing resources. It assumes an unchanging state
of technology. In Figure 1.1, AB represents all the possible output combinations. Thus at
point C, existing resources produce a large quantity of capital goods and a small quantity of
consumer goods. Point D indicates the opposite combination.
The curve is normally drawn concave to the origin, thereby showing that some resources
are better suited to the production of one good rather than another and vice versa.
� In this theory there is an optimum production point which lies along the PPF, for
example, at point E. Here resources are fully utilised at existing prices.
� An economy operating within the PPF, for example at point F, typifies an economy
operating within its potential. It is operating inefficiently and will be experiencing
unemployment.
� An outward movement in the PPF, as indicated by the dotted line in Figure 1.1 and the
point G, shows an increase in productive potential and the capacity for long-term
economic growth.
1.1.5 The role of government
The ways in which the allocation decisions are made depends upon the economic system used
to resolve the economic problem of scarcity. The economic system used depends on the
political system in a country and the political views of the prevailing government.
Usually three main types of economic system are identified: planned, market and
mixed.
The label ‘planned’ usually refers to an economy in which decisions as to resource
allocation are made by a centralised body, rather than through the price mechanism. As the
plans regarding production and distribution are determined by a powerful group who
control the use of resources, the epithet command is also used to describe such an economy.
At the other extreme of the economic spectrum, an economy may be free. In such
a system the resources are allocated through market price, with the individuals as producers
and consumers making their own economic decisions.
STUDY MATERIAL C46TH
EG
OA
LSA
ND
DEC
ISIO
NS
OF
ORG
AN
ISA
TIO
NS
2006.1

Between these two extremes, mixed economies can be located. In a mixed economy,
some resources are allocated in a planned way and others in the market way. Furthermore,
the distribution of the production may be both controlled and subject to market forces,
for example health provision by the state or by fee-paying.
This classification by resource allocation leads to the practical conclusion that all economies
are mixed but to varying degrees. In the United States, there is a small but important state
sector. In the former USSR, the bulk of resource allocation was determined by the state
but now, in Russia and the other independent states, there is a large and rapidly growing
market sector. Also, recent developments in China, which have seen an opening up of the
economy to outsiders, confirm the trend towards the acceptance of a need for a market
sector.
In mixed–market economics, governments may wish to intervene in the economy in
various ways. They may wish to influence the relative prices of goods and inputs, by taxing
or subsidising them or by direct price controls. They can affect the pattern of production
and consumption by direct provision, for example by defence and health, or by regulations
prohibiting certain type of goods, such as illicit firearms or unsafe goods. They can
influence relative incomes by the use of taxes and welfare payments. Finally, the
government concerns itself with macroeconomic issues of unemployment, inflation,
economic growth and the balance of payments.
The mixture in an economic system categorised by ownership is between a public sector
and a private sector. The relative size of each sector is often determined by political
considerations. However, the ultimate intention is to make the most efficient use of the
resources available in order to improve the well-being of the society. This usually means
improvements in the standard of living.
1.2 The business organisation
Businesses in the private sector aim to make profits, which can be distributed to their
owners. However, in the public sector, firms often have different motivations. For
example, British Universities seek to break even.
The aims and activities of firms may also be constrained in practice by factors such as:
� The law. The legal status of a firm affects its behaviour. A public company’s line of
business is determined by its Memorandum of Association. The responsibilities of
public corporations have been specified in the Act which created them.
� The nature of the business. Certain enterprises have important social considerations. Thus,
subsidies may be given to rural bus services to provide uneconomic services for
passengers. On other occasions subsidies may be given to promote environmentally
friendly output, such as wind power. For some firms ethical considerations may be
important, for example, confidentiality in private health firms. Other firms, such as
airlines, must ensure that safety precedes profit. Consequently although profit-making
may be the major driving force behind private firms, other secondary considerations
may have an important role to play in the way they operate.
� Human nature. No two entrepreneurs or managers are the same. Thus, prediction about
decision-making is difficult. Individuals have different values, morals and perceptions.
Even if senior management is united on a course of action, this may be thwarted by the
behaviour of other key people in an organisation.
FUNDAMENTALS OF BUSINESS ECONOMICS 7TH
EG
OA
LSA
ND
DEC
ISIO
NS
OF
ORG
AN
ISA
TIO
NS
2006.1

1.2.1 Profit maximisation as an objective
The profit maximising assumption is based on two premises:
� First, that owners are in control of the everyday management of the firm;
� Secondly, that the desire for owners is for the highest possible profit. This is considered
a self-evident truth of human nature in that people prefer ‘more to less’.
The case for profit maximising behaviour is undermined if either of these two premises
fails to exist in the real world of business.
1.2.2 Principal–agent theory
The owners who control the dominant form of business organisation, the public limited
comply (PLC), are the shareholders. The people who run the PLC are normally the
managers. This may lead to conflict of interest between the owners (shareholders) and the
managers whenever the managers pursue goals which differ from those of the owners.
This is referred to as a type of principal–agent problem.
� A principal–agent problem emerges when the shareholders (principals) contract a second
party, the managers (agents), to carry out some tasks on their behalf. In the contract the
principals offer their agents compensation in the form of salaries and wages.
However, as the principals are divorced from the everyday running of the business,
the agents may be able to act in their own interests. This independence of action may be
due to their superior knowledge of the business and of managerial issues in general as
well as their ability to disguise their actions from the principals.
� Thus the agents’ goals may determine the objectives of the business. This observation
has led to alternative theories of a firm’s behaviour.
The principal–agent problem is discussed in more detail in Section 1.7.2.
1.2.3 Alternative theories of the firm
Though there are many variants on the alternative theories of the firm, the following
indicate the main formats.
Managerial theoriesThese theories focus on management as the decision-maker with a maximising aim other
than profit, but subject to a profit constraint. Baumol proposed a theory in which sales
maximisation was the objective but a certain level of profits was necessary to keep
shareholders happy. The underlying aims behind sales maximisation varied from the
personal motive of higher salary through to the more laudable company objective of
increased market share. Others have interpreted the latter as a profit-maximising goal, but
in the long run.
Satisficing theoriesThese theories assume that management needs to achieve a satisfactory target for at least
two major variables. Thus, Marris suggests an approach in which managers sought to
STUDY MATERIAL C48TH
EG
OA
LSA
ND
DEC
ISIO
NS
OF
ORG
AN
ISA
TIO
NS
2006.1

satisfy certain goals of company growth and share price value. From the growth goal,
management could gain the satisfactions of power, prestige and pay while a high share
value would keep shareholders happy, reduce the threat of predatory stock market
takeovers, and enable the management to survive.
Behavioural theoriesThese are somewhat similar to the satisficing theories but differ in that they perceive that
the firm’s objective is a compatible set of target figures for the major operating variables.
The firm is recognised to be a coalition of various groups, each with its own objectives
regarding output, sales, profit, etc. The decision-makers in the firm seek acceptable levels
of attainment for each major variable. For example, a managerial approach seeking
compatibility between various objectives might expand output and sales even though total
profits fell as a result, provided that the profit level was acceptable. However, if the output
target was incompatible with total profits it would be abandoned in favour of a more
compatible level. Once compatible targets have been agreed, then pricing and output
decisions would be made accordingly.
Despite all of the above theories, the ultimate goal of many managers is survival.
1.2.4 Not-for-profit theories of the firm
Most such organisations are found in the public sector. However, interestingly there are
some private-sector firms, notably charity shops, that seek to maximise their income.
However, their ‘profits’ are termed ‘surpluses’ and are not subject to corporation tax,
because of their tax-exempt status. Increasingly the profit motive, and professional
management in accordance with commercial principles, has been inculcated into the
operation of charities. For example, Oxfam employs specialists, in addition to unpaid
volunteers, to run its retailing activities and is prepared to close down unviable shops. In
the case of charities, profits are not the be-all-and-end-all of business because for them it is
a means to an end, that is, the relief of suffering.
Public-sector bodies, agencies and government departments are examples of not-for-
profit organisations. The Conservative government decision in the 1980s to privatise some
nationalised industries and hive off certain civil service functions to separate agencies was
based on the assumption that only profit-driven organisations could be efficient. This was
a very questionable assumption. Many local government services were also privatised and
much public spending became cash-flow/budget limited rather than open-ended.
Although value for money and less waste were sought, in many practical cases such
restrictions meant a poorer service.
Thus, one clear alternative motive to profit in the public sector is service. However,
because the costs of providing the service have to be met out of the public purse, most
organisations attempt to operate efficiently. This has meant the implementation of modern
commercial practices, target-setting and certain minimum standards of work. For example,
social workers have referral response rate targets which are monitored as part of a
customer care policy. Similarly schools are set targets in respect of the percentage of their
students who pass examinations.
Production by the state sometimes does not yield revenue. Merit goods, such as
healthcare and education, are sold at zero price or heavily subsidised. They could earn large
amounts of revenue, as shown by the fact that similar services provided privately are
substantial profit-makers.
FUNDAMENTALS OF BUSINESS ECONOMICS 9TH
EG
OA
LSA
ND
DEC
ISIO
NS
OF
ORG
AN
ISA
TIO
NS
2006.1
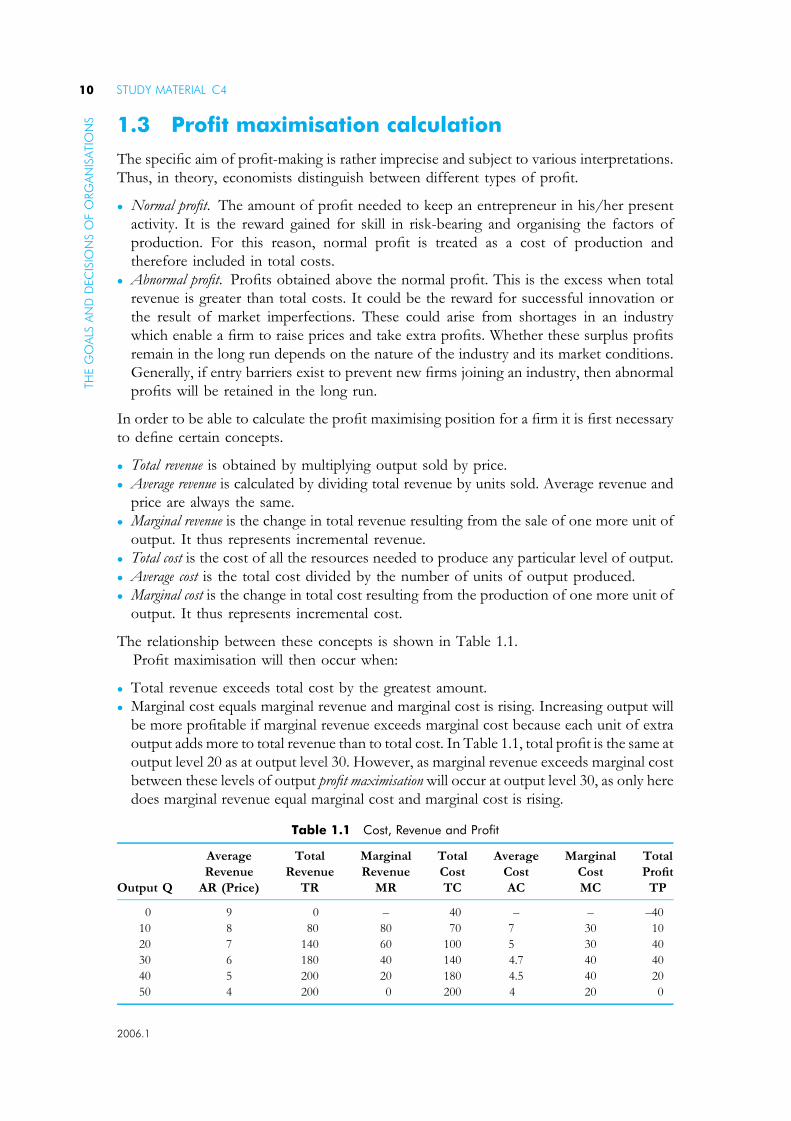
1.3 Profit maximisation calculation
The specific aim of profit-making is rather imprecise and subject to various interpretations.
Thus, in theory, economists distinguish between different types of profit.
� Normal profit. The amount of profit needed to keep an entrepreneur in his/her present
activity. It is the reward gained for skill in risk-bearing and organising the factors of
production. For this reason, normal profit is treated as a cost of production and
therefore included in total costs.
� Abnormal profit. Profits obtained above the normal profit. This is the excess when total
revenue is greater than total costs. It could be the reward for successful innovation or
the result of market imperfections. These could arise from shortages in an industry
which enable a firm to raise prices and take extra profits. Whether these surplus profits
remain in the long run depends on the nature of the industry and its market conditions.
Generally, if entry barriers exist to prevent new firms joining an industry, then abnormal
profits will be retained in the long run.
In order to be able to calculate the profit maximising position for a firm it is first necessary
to define certain concepts.
� Total revenue is obtained by multiplying output sold by price.
� Average revenue is calculated by dividing total revenue by units sold. Average revenue and
price are always the same.
� Marginal revenue is the change in total revenue resulting from the sale of one more unit of
output. It thus represents incremental revenue.
� Total cost is the cost of all the resources needed to produce any particular level of output.
� Average cost is the total cost divided by the number of units of output produced.
� Marginal cost is the change in total cost resulting from the production of one more unit of
output. It thus represents incremental cost.
The relationship between these concepts is shown in Table 1.1.
Profit maximisation will then occur when:
� Total revenue exceeds total cost by the greatest amount.
� Marginal cost equals marginal revenue and marginal cost is rising. Increasing output will
be more profitable if marginal revenue exceeds marginal cost because each unit of extra
output adds more to total revenue than to total cost. In Table 1.1, total profit is the same at
output level 20 as at output level 30. However, as marginal revenue exceeds marginal cost
between these levels of output profit maximisation will occur at output level 30, as only here
does marginal revenue equal marginal cost and marginal cost is rising.
Table 1.1 Cost, Revenue and Profit
Output Q
Average
Revenue
AR (Price)
Total
Revenue
TR
Marginal
Revenue
MR
Total
Cost
TC
Average
Cost
AC
Marginal
Cost
MC
Total
Profit
TP
0 9 0 – 40 – – –40
10 8 80 80 70 7 30 10
20 7 140 60 100 5 30 40
30 6 180 40 140 4.7 40 40
40 5 200 20 180 4.5 40 20
50 4 200 0 200 4 20 0
STUDY MATERIAL C410TH
EG
OA
LSA
ND
DEC
ISIO
NS
OF
ORG
AN
ISA
TIO
NS
2006.1

10 20 30 40 50
MC
TR
Zone of profit
Maximum profit
TC
AC
AR
MR
Cost/revenue
Output
Figure 1.2 Profit maximisation
The same point of profit maximisation can be shown in diagrammatic form as in Figure 1.2.
The top part of the figure shows total concepts while the lower part shows average and
marginal concepts. It illustrates the link between the two. The shaded area represents
the levels of output within which profits are made. The maximum profit is shown by
the greatest difference between total revenue and total cost which is at output level 30. If the
firm increased output above level 30 it would still be profitable because total revenue
exceeds total costs, but would not be operating at the point of maximum profitability
which is where marginal revenue equals marginal cost. Somewhere below output 10 and
beyond output 50 losses are suffered.
� Breakeven for a firm occurs where average revenue equals average cost and total
revenue equals total cost.
In Figure 1.2 this will occur at two points, somewhere below output level 10 and at
output level 50. A firm will expand output beyond the first point as long as marginal
revenue exceeds marginal cost. Beyond the second breakeven point at output level
50, marginal cost will be rising and exceeding marginal revenue so that losses are
incurred.
FUNDAMENTALS OF BUSINESS ECONOMICS 11TH
EG
OA
LSA
ND
DEC
ISIO
NS
OF
ORG
AN
ISA
TIO
NS
2006.1

To summarise the major points:
� Profit maximisation occurs when marginal revenue equals marginal cost.
� Total cost includes an element for normal profit.
� Breakeven profit occurs when total revenue equals total cost.
The amount of profit obtained and whether it is normal or abnormal depends upon:
� The market structure within which a firm operates.
� The time period involved.
Both of these points are considered later.
1.4 The theory of costs
1.4.1 Costs of production
These are the prices paid for the factors of production, and the opportunity cost
attributable to factors already owned. Costs are related to output over a period of time.
For simplicity the term ‘firm’ will be used for a productive unit which sells its output at a
price, irrespective of whether it is producing goods or services or whether it is in the public
sector or the private sector of the economy.
Fixed and variable costs� Fixed costs are costs which do not change with the level of production. For example,
the rent of premises, the depreciation of a machine, the managing director’s salary.
� Variable costs are costs which do change with the level of output. For example, more
steel is needed for producing 1,000 cars than for making 10 cars. Variable costs arise
from using inputs such as labour and raw materials. In practice there are costs such as
sales expenses which are semi-variable, but the analysis is simplified by distinguishing
only fixed and variable costs.
Short run� The short run, in economics, is defined as a period of time in which at least one factor
of production is fixed. Thus it is not a time period which can be measured in days or
months. This fixed-factor definition means that the level of production in the short run
can be increased only by adding more long run variable factors to the fixed factor.
Long run� In the long run, all factors are considered to be variable. However, it is assumed that the
quality of the factors stays constant. In the very long run the assumption of fixed
technology is removed. Consequently advances in technology can lead to improvements
in the productivity of factors of production.
Average costs and marginal costsIf fixed costs and variable costs are added they give the total cost of production at different
levels of output. The average cost is calculated by dividing the total costs by output.
When average cost is at its minimum, a firm is operating most efficiently. This optimum
output point is that of technical efficiency. In Figure 1.3 this is where the marginal cost curve
intersects the average cost curve. This is always at the bottom point of the AC cost curve.
STUDY MATERIAL C412TH
EG
OA
LSA
ND
DEC
ISIO
NS
OF
ORG
AN
ISA
TIO
NS
2006.1

Costs
Output
Optimum output
MC
AC
Figure 1.3 The relationship of AC to MC in the short run
Thus the marginal cost of producing different levels of output is crucial information for
a firm. When considering the best level of output, producers need to know the incremental
changes in costs when output is varied. Marginal cost is the extra cost of increasing output
by one unit. Table 1.2 illustrates the various costs which have been defined and shows how
they are related.
� If average cost is decreasing then marginal cost will be below average cost, for example,
outputs 1–4.
� If average cost is increasing then marginal cost will be above average cost, for example,
outputs 5–6.
� If average cost is constant then marginal cost will also be constant.
Generally, marginal cost falls and rises more rapidly than average cost.
1.4.2 Short-run production – diminishingmarginal returns
The theory of diminishing marginal returns explains why, eventually, in the short run
average cost starts to rise. This is illustrated in the ‘U’-shaped MC curve in Figure 1.3.
In Table 1.3 labour is being employed to raise output, but it becomes less productive
after the fourth worker is recruited. Marginal output starts to fall, ultimately being
negative.
Table 1.2 Costs
Output (units) Fixed costs Variable costs TC AC MC
1 30 10 40 40 40
2 30 40 70 35 30
3 30 60 90 30 20
4 30 70 100 25 10
5 30 120 150 30 50
6 30 180 210 35 60
7 30 250 280 40 70
FUNDAMENTALS OF BUSINESS ECONOMICS 13TH
EG
OA
LSA
ND
DEC
ISIO
NS
OF
ORG
AN
ISA
TIO
NS
2006.1
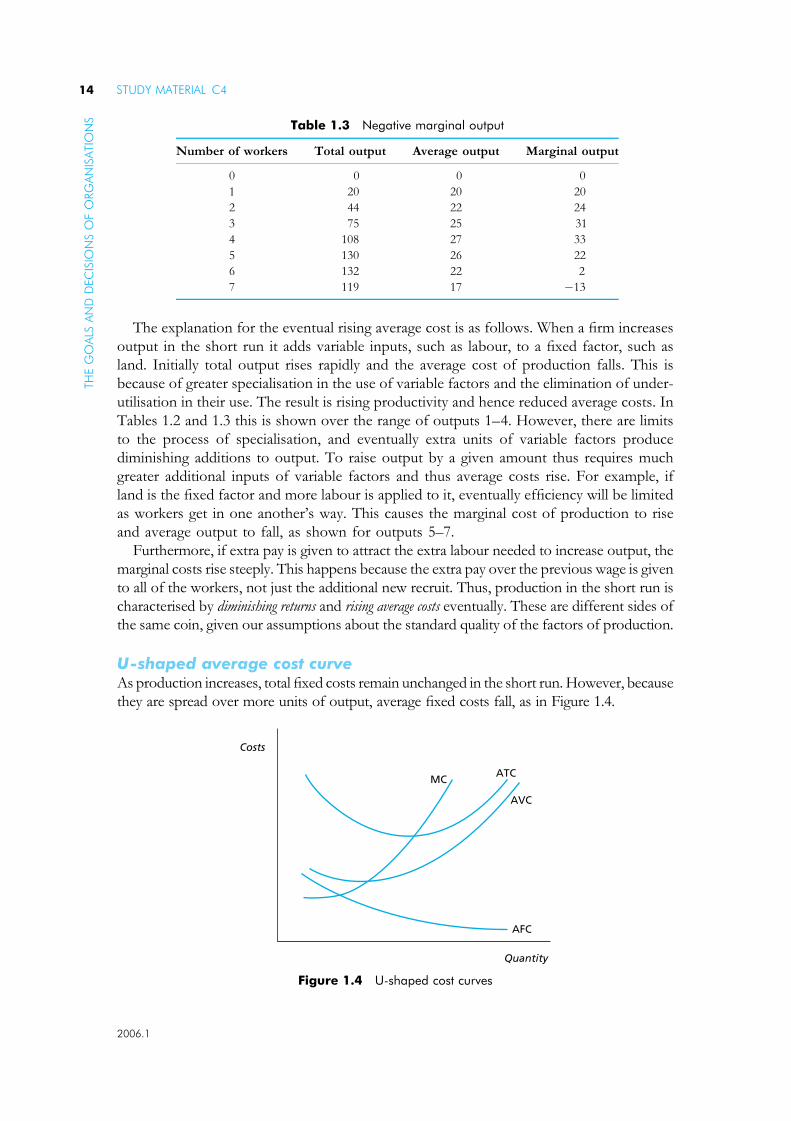
The explanation for the eventual rising average cost is as follows. When a firm increases
output in the short run it adds variable inputs, such as labour, to a fixed factor, such as
land. Initially total output rises rapidly and the average cost of production falls. This is
because of greater specialisation in the use of variable factors and the elimination of under-
utilisation in their use. The result is rising productivity and hence reduced average costs. In
Tables 1.2 and 1.3 this is shown over the range of outputs 1–4. However, there are limits
to the process of specialisation, and eventually extra units of variable factors produce
diminishing additions to output. To raise output by a given amount thus requires much
greater additional inputs of variable factors and thus average costs rise. For example, if
land is the fixed factor and more labour is applied to it, eventually efficiency will be limited
as workers get in one another’s way. This causes the marginal cost of production to rise
and average output to fall, as shown for outputs 5–7.
Furthermore, if extra pay is given to attract the extra labour needed to increase output, the
marginal costs rise steeply. This happens because the extra pay over the previous wage is given
to all of the workers, not just the additional new recruit. Thus, production in the short run is
characterised by diminishing returns and rising average costs eventually. These are different sides of
the same coin, given our assumptions about the standard quality of the factors of production.
U-shaped average cost curveAs production increases, total fixed costs remain unchanged in the short run. However, because
they are spread over more units of output, average fixed costs fall, as in Figure 1.4.
Quantity
Costs
AFC
AVC
ATCMC
Figure 1.4 U-shaped cost curves
Table 1.3 Negative marginal output
Number of workers Total output Average output Marginal output
0 0 0 0
1 20 20 20
2 44 22 24
3 75 25 31
4 108 27 33
5 130 26 22
6 132 22 2
7 119 17 �13
STUDY MATERIAL C414TH
EG
OA
LSA
ND
DEC
ISIO
NS
OF
ORG
AN
ISA
TIO
NS
2006.1
Variable costs will change with output. They are, therefore, marginal costs and the
marginal cost curve will cut both the AVC and ATC curve at its lowest point. When AVC
is added to AFC one gets ATC. Note that as AFC gets less, the gap between AVC and
ATC narrows.
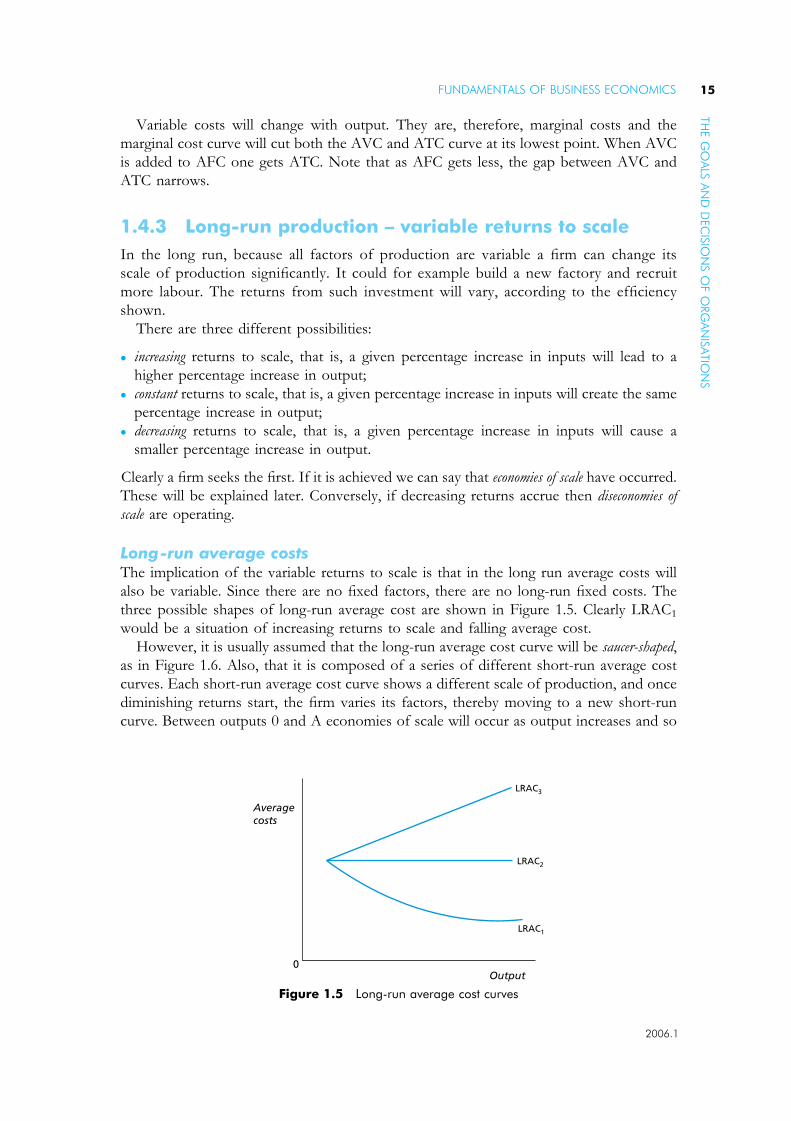
1.4.3 Long-run production – variable returns to scale
In the long run, because all factors of production are variable a firm can change its
scale of production significantly. It could for example build a new factory and recruit
more labour. The returns from such investment will vary, according to the efficiency
shown.
There are three different possibilities:
� increasing returns to scale, that is, a given percentage increase in inputs will lead to a
higher percentage increase in output;
� constant returns to scale, that is, a given percentage increase in inputs will create the same
percentage increase in output;
� decreasing returns to scale, that is, a given percentage increase in inputs will cause a
smaller percentage increase in output.
Clearly a firm seeks the first. If it is achieved we can say that economies of scale have occurred.
These will be explained later. Conversely, if decreasing returns accrue then diseconomies of
scale are operating.
Long-run average costsThe implication of the variable returns to scale is that in the long run average costs will
also be variable. Since there are no fixed factors, there are no long-run fixed costs. The
three possible shapes of long-run average cost are shown in Figure 1.5. Clearly LRAC1
would be a situation of increasing returns to scale and falling average cost.
However, it is usually assumed that the long-run average cost curve will be saucer-shaped,
as in Figure 1.6. Also, that it is composed of a series of different short-run average cost
curves. Each short-run average cost curve shows a different scale of production, and once
diminishing returns start, the firm varies its factors, thereby moving to a new short-run
curve. Between outputs 0 and A economies of scale will occur as output increases and so
Averagecosts
Output0
LRAC1
LRAC2
LRAC3
Figure 1.5 Long-run average cost curves
FUNDAMENTALS OF BUSINESS ECONOMICS 15TH
EG
OA
LSA
ND
DEC
ISIO
NS
OF
ORG
AN
ISA
TIO
NS
2006.1

average costs fall. From A to B there are constant costs (and constant returns) but after
B diseconomies of scale result. If the firm realises the latter, then in theory it could cut
back production or seek a more efficient combination of its factors of production.The following table summarises what can happen in the long run:
Variable returns
to scale
Increase
in inputs (%)
Increase
in output (%) Change in average cost
Increasing Given (%) Bigger % Fall, i.e. economies of scale
Constant Given (%) Same % Same, i.e. constant
1.4.4 Economies of scale
The advantages of producing on a large scale are known as the economies of scale.
Generally, by producing in large quantities, the average cost per unit can be reduced
because fixed costs are spread over more units.
It is useful at this point to make a distinction between increased production and
increased productivity. Increased production occurs when more is produced, but this may
be because more inputs are applied and it does not mean greater efficiency. However,
higher productivity means more produced per person, and that is more efficiency. It is
interesting to note that Britain experienced increased productivity in the 1980s in many
industries at a time of falling production, as a result of the rapid shedding of labour and
the slower fall in output. In absolute terms, Britain’s productivity is low compared to other
developed countries, especially the United States where productivity is 40 per cent above
that in the United Kingdom.
When the advantages of expanding the scale of operation accrue to just one firm, these
economies are termed internal. They can be obtained in one plant, belonging to a firm, or
across the whole company. The main internal economies are as follows:
� Technical economies. These relate to the scale of the production and are usually obtained in
one plant. Large-scale operations may make greater use of advanced machinery. Some
machines are only worth using beyond a minimum level of output which may be beyond
the capacity of a small firm, for example, robots used in car assembly. Such equipment
A0Output
Costs
Diseconomiesof scale
Economiesof scale
Constantcosts
B
SRAC1SRAC2 SRAC3
SRAC4
SRAC5
Figure 1.6 ‘Normal’ long-run AC curve
STUDY MATERIAL C416TH
EG
OA
LSA
ND
DEC
ISIO
NS
OF
ORG
AN
ISA
TIO
NS
2006.1

may facilitate the division of labour. In addition, more resources can be devoted to
research in large firms, because the cost is borne over more units of output, and this
may lead to further technical improvements and subsequent cost reductions, for the
whole company.
� Financial economies. It is usually easier for large firms with household names to borrow
money from commercial banks and raise funds on the Stock Exchange. Similarly, their
loans and overdrafts will probably be charged at lower interest rates because of their
reputation and assets.
� Trading economies. Large firms may be able to secure advantages both when buying inputs
and selling their output. They could employ specialist buyers and, through the quantity
of their purchases, gain significant discounts from their suppliers.
Similarly, bulk selling enables a large firm to make savings in distribution costs, the
time and cost of sales people and advertising expenses.
These savings are more marked when many products are sold together in related
markets. Thus, one big advantage of Nestle’s takeover of Rowntree Mackintosh was that
the goods of each could be marketed together, with little extra total cost, thereby
reducing the distribution costs of each product sold.
If a large firm produces several products in different markets, then one failure is
unlikely to cause the closure of the whole conglomerate. Thus, trading risks can be
spread when a wide range of products is sold.
� Managerial economies. These are the many administrative gains which can be achieved
when the scale of production grows. The need for management and supervision does
not increase at the same rate as output. Specialists can be employed and their talents can
be fully utilised in personnel, production, selling, accountancy, etc. Such organisational
benefits may lower the indirect costs of production and lead to the efficient use of
labour resources.
However, it is possible for general advantages to be obtained by all of the firms in an
industry, and these are classed as external economies of scale. Most of these occur when an
industry is heavily concentrated in one area. The area may develop a reputation for
success, for example, computers and electronics in Silicon Glen in Scotland. There may be
a pool of skilled labour which is available, and this may lower training costs for a firm.
Specialised training may be provided locally in accordance with the industry’s needs. This
might be provided by a training board to which firms contribute to gain access to the
available expertise. Furthermore, a localised industry may attract to it specialist suppliers
of raw materials, components and services, who gain from a large market and achieve
their own economies of scale, which are passed on through lower input prices.
Occasionally, firms in an industry share their research and development facilities, because
each firm individually could not bear the overheads involved but can fund a joint
enterprise.
1.4.5 Diseconomies of scale
These exist when the average cost rises with increased production. If they are specific to
one firm they are categorised as internal.
� Technical diseconomies. The optimum technical size of plant may create large adminis-
trative overheads in its operation, thereby raising TAC, even though the production cost
is lowered.
FUNDAMENTALS OF BUSINESS ECONOMICS 17TH
EG
OA
LSA
ND
DEC
ISIO
NS
OF
ORG
AN
ISA
TIO
NS
2006.1
� Trading diseconomies. With large-scale production, products may become standardised.
This lack of individualism may reduce consumer choice and lead to lower sales. In
addition, it may be difficult to quickly adapt mass-produced goods to changing market
trends. Marks & Spencer have experienced this problem in recent years.
� Managerial diseconomies. As the chain of command becomes longer in an expanding
hierarchy (when productive capacity grows), senior management may become too remote
and lose control. This may lead to cross-inefficiency (complacency) in middle management
and shop floor hostility. A concomitant of this is the generally poor state of labour
relations in large organisations, which are more prone to industrial stoppages than small
firms. This is partly because the trade unions are better organised. Other administrative
weaknesses faced by increasingly large organisations are the prevalence of red tape and the
conflict between departmental managers who have different objectives and priorities.
However, there may also be general disadvantages which afflict all firms as the scale of the
industry grows. The main external diseconomy is technical. If a resource is overutilised
then shortages may arise. A shortage of labour might lead to higher wages in order to
attract new recruits, while a shortage of raw materials might lower output. Both changes
would raise the average cost of production.
1.4.6 Short-run and long-run production decisions
The distinction between fixed costs and variable costs is important in deciding whether
firms should cease production. The firm is obliged to cover its fixed costs whether it
undertakes production or not. For example, even when the firm produces no output it still
incurs costs such as insurance charges, depreciation on assets, mortgage repayments, rent
on premises, and so on. However, variable costs are incurred only when the firm
undertakes production. For example, when the firm produces no output it incurs no costs
from purchasing raw materials or charges for power to drive the machinery, etc. Once a
firm has incurred fixed costs, its decision about whether to continue producing is therefore
determined by whether its total revenue (the amount it earns from production) is sufficient
to cover its total variable costs. Therefore, we must consider the circumstances in which
the firm will be prepared to produce in the short run when fixed costs exist,
and the circumstances in which it is prepared to produce in the long run when there are no
fixed costs.
In the short run, fixed costs are the same whether or not the firm undertakes production.
Variable costs are, however, avoidable if the firm chooses not to start production.
� If total revenue is greater than total variable costs, then the firm should continue
production as it is making a contribution to covering its fixed costs.
� If total revenue just covers total variable costs then the firm is neither better off nor
worse off if it continues in production. It normally would continue production in the
hope that future revenues will improve.
� If total revenue is less than total variable costs, then the firm should cease production.
In this situation, the firm’s total loss is equal to its unavoidable fixed costs, compared
with a loss equal to the deficit incurred by the variable costs plus the fixed costs if it
undertakes production.
� As average revenue is the price a firm will undertake production in the short run if the
price at which their product is sold is at least equal to the variable cost of production.
STUDY MATERIAL C418TH
EG
OA
LSA
ND
DEC
ISIO
NS
OF
ORG
AN
ISA
TIO
NS
2006.1

However in the long run a firm must cover all its costs as it cannot sustain losses
indefinitely. In the long run all costs become variable.
� In the long run, a firm will only continue in production if the price at which their
product is sold at least equals the average total cost of production.
� Hence, to reiterate, in the short run average revenue must cover average variable costs,
whereas in the long run average revenue must cover average total costs.
1.4.7 Economists’ and Accountants’ understanding of costs
� An accountant will view the cost of producing a product in terms of its historical cost.
This means the actual amount paid to factors of production to make the product.
� An economist will view the cost of a product in terms of its opportunity cost. This
means the cost is reckoned in terms of the foregone revenue which would have been
earned if the factors of production had been put to their next best alternative use.
An example will make this distinction clear.
Example 1.A
Suppose that a self-employed trader sells goods worth £500,000. His/her accounts are set out in Table 1.4.
Table 1.4 Self-employed trader
£ £
Sales 500,000Materials 250,000Labour 150,000Depreciation 40,000Other expenses 20,000 (460,000)
Gross profit 40,000
In accounting terms his profit would be £40,000.
Suppose, however, that the premises used for the business could be put to alternative use and earn arent of £10,000. The capital needed in the business could have been invested and earned £15,000 ininterest. Finally the trader’s own labour could have earned income in other employment, earning£35,000. The change in the profit/loss account can be seen in Table 1.5.
Table 1.5 Self-employed trader
£
Sales less historic costs 40,000Opportunity costs 60,000
Gross loss (20,000)
FUNDAMENTALS OF BUSINESS ECONOMICS 19TH
EG
OA
LSA
ND
DEC
ISIO
NS
OF
ORG
AN
ISA
TIO
NS
2006.1

From the economist’s perspective the trader has now made a loss. When opportunity costs areconsidered, the trader should take the decision to put his assets to alternative uses and employ his ownlabour another way.
� The economist is concerned with the allocation of resources whereas the accountant views historicrevenue and costs.
Exercise 1.1Answer the following questions based on the preceding information. You can check your
answers below.
1. What is the definition of fixed costs?
2. In what time period are all factors of production variable?
3. What is technical efficiency?
4. Why do diminishing returns occur in the short run?
5. Define constant returns to scale.
6. Using the data in Table 1.2, calculate average fixed cost and average variable cost. Plot
these on a graph with the average total cost and briefly explain the result.
7. When should a business cease production in the short run?
8. What costs need to be covered in the long run?
9. Distinguish between internal and external economies of scale.
10. Give two examples of diseconomies of scale.
Solutions1. Fixed costs are those which do not change with the level of production.
2. All factors of production are variable in the long run and in the very long run.
3. Technical efficiency is the point where average cost is at its lowest.
4. Diminishing returns occur in the short run because one factor of production is fixed.
Thus, output can be raised only by adding more units of a variable factor. This
adds progressively smaller amounts of extra output and leads to increases in average cost.
5. Constant returns to scale means that for a given percentage increase in inputs there is
the same percentage increase in output (and thus no change in average cost).
6. Costs:
Output AFC AVC ATC
1 30 10 40
2 15 20 35
3 10 20 30
4 7.5 17.5 25
5 6 24 30
6 5 30 35
7 4.3 35.7 40
STUDY MATERIAL C420TH
EG
OA
LSA
ND
DEC
ISIO
NS
OF
ORG
AN
ISA
TIO
NS
2006.1
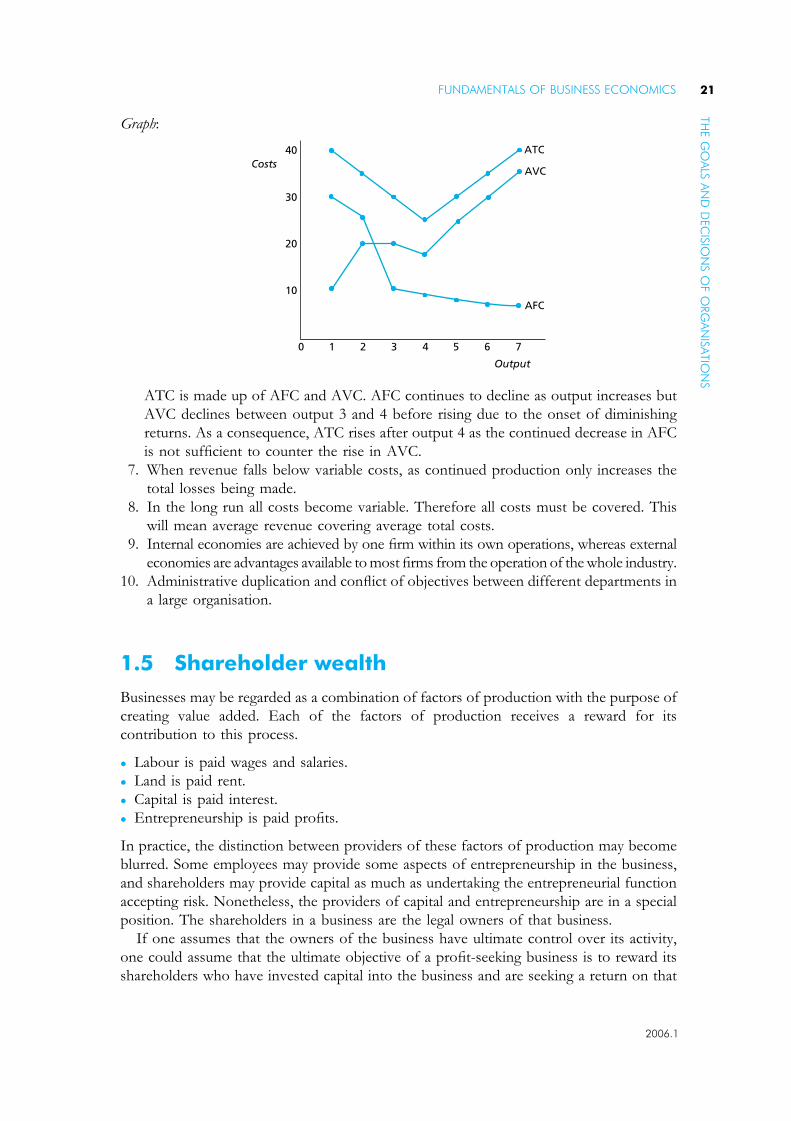
Graph:
AFC
Output
CostsAVC
ATC40
30
20
10
0 1 2 3 4 5 6 7
ATC is made up of AFC and AVC. AFC continues to decline as output increases but
AVC declines between output 3 and 4 before rising due to the onset of diminishing
returns. As a consequence, ATC rises after output 4 as the continued decrease in AFC
is not sufficient to counter the rise in AVC.
7. When revenue falls below variable costs, as continued production only increases the
total losses being made.
8. In the long run all costs become variable. Therefore all costs must be covered. This
will mean average revenue covering average total costs.
9. Internal economies are achieved by one firm within its own operations, whereas external
economies are advantages available to most firms from the operation of the whole industry.
10. Administrative duplication and conflict of objectives between different departments in
a large organisation.
1.5 Shareholder wealth
Businesses may be regarded as a combination of factors of production with the purpose of
creating value added. Each of the factors of production receives a reward for its
contribution to this process.
� Labour is paid wages and salaries.
� Land is paid rent.
� Capital is paid interest.
� Entrepreneurship is paid profits.
In practice, the distinction between providers of these factors of production may become
blurred. Some employees may provide some aspects of entrepreneurship in the business,
and shareholders may provide capital as much as undertaking the entrepreneurial function
accepting risk. Nonetheless, the providers of capital and entrepreneurship are in a special
position. The shareholders in a business are the legal owners of that business.
If one assumes that the owners of the business have ultimate control over its activity,
one could assume that the ultimate objective of a profit-seeking business is to reward its
shareholders who have invested capital into the business and are seeking a return on that
FUNDAMENTALS OF BUSINESS ECONOMICS 21TH
EG
OA
LSA
ND
DEC
ISIO
NS
OF
ORG
AN
ISA
TIO
NS
2006.1

investment. Thus the objective of a business might be seen as attempting to maximise
shareholder wealth.
Shareholder wealth has two main aspects. Shareholders are interested in:
1. the performance of the business in terms of its ability to generate the profits which
accrue to shareholders;
2. the value of the shares in the business to the investors.
There is series of accounting ratios which can be used to assess the performance of a
business in relation to the interest of the shareholders. These ratios provide information
that makes possible:
� an assessment of the financial performance of the business over time;
� a comparison of the performance of one business with another;
� an assessment of the attractiveness, or otherwise, of investing in the business.
1.5.1 Short-term measures of financial performance
It is quite possible that financial performance of a business in the short run could be
different to its performance in the long run. Thus measures are needed both of short-run
and long-run financial performance.
Two standard measures of short-run performance are:
1. the rate of return on capital employed;
2. earnings per share.
Rate of return on capital employed (ROCE)In order to assess the financial performance of companies and in order to make
comparisons over time and between companies, some measure of the return to the capital
employed must be made. The standard way of measuring this is by calculating the
productivity of the capital employed by the business: the rate of return on capital employed.
This compares:
� profits earned before interest and tax are paid: in effect the profits that is available for
distribution to shareholders in the form of dividends;
� the value of capital employed averaged out between the beginning and the end of the year.
ROCE is expressed as a percentage and is measured as:
ROCE¼ profit before interest and tax
average capital employed� 100
Another useful measure of the return to shareholders’ capital is:
Return on net assets which is measured as:
Return on net assets ¼ operating profit (before interest and tax)
Total assets minus current liabilities� 100
The higher the figure for ROCE or the return on net assets is, the more profitable the
company is.
STUDY MATERIAL C422TH
EG
OA
LSA
ND
DEC
ISIO
NS
OF
ORG
AN
ISA
TIO
NS
2006.1
Earnings per share (EPS)Measures of the productivity of capital employed (ROCE) is a measure of the
company’s ability to generate earnings from its capital. However, potential shareholders
are also interested in how much return they will get from investing in that company. In
this case the potential investor would need to take into account the price he, or she,
would have to pay to acquire the shares. Thus in this case, a comparison must be made
between:
� earnings per share, that is profit per share minus preference share payments;
� the market price that the potential investor would have to pay in order to acquire the
share.
EPS is expressed as a percentage and is measured as:
EPS¼ earnings per share
market price of one share� 100
The EPS can also be calculated by comparing the total relevant earnings of the business
with the total market value of the equity capital.
In practice, EPS ratios may vary a great deal between companies. The measure of EPS
depends on the market price of the company’s shares and this in turn reflects the
expectations of investors in the stock market about the company’s current and the future
prospects and the general level of stock market prices.
� A low EPS may indicate that investors are confident that the company will generate
higher earnings in the future – buying of these shares will boost the market price and
reduce the EPS.
� A high EPS might be typical of companies operating in more risky business areas and
the higher earnings per share reflects this perceived risk.
The EPS ratio is also used as part of an additional calculation of the performance of the
company. This is the price per earnings (P/E) ratio. The P/E ratio reflects the stock
market’s overall judgement about the current and future likely performance of the
company.
The P/E ratio is measured as:
P/E ratio¼ current market price of the share
EPS at the last publication of results
The P/E ratio effectively measures how many years it would take for earnings to be equal
to the price of buying the share.
� A very low P/E ratio would suggest a high return to the investment in the shares.
� A very high P/E ratio might suggest a risky investment because it would currently take
many years to cover the cost of acquiring the share.
P/E ratios should be viewed with some care, however the direction and rate of change in
the P/E ratio might be a better indicator of the longer-term health of the company than
the absolute value of the P/E ratio at any one time. Thus changes in the P/E ratio might
be used to take a more dynamic view of the progress of the business over time.
FUNDAMENTALS OF BUSINESS ECONOMICS 23TH
EG
OA
LSA
ND
DEC
ISIO
NS
OF
ORG
AN
ISA
TIO
NS
2006.1

1.5.2 Long-term measures of financial performance
In addition to measuring current financial performance, companies also need to be able to
measure longer-term performance, in particular, in relation to investment. In this case it is
important that a business can be sure that returns to shareholders are at least equal to the
cost of acquiring the capital required to produce a long-term flow of earnings.
In making these sorts of assessment several problems arise:
� establishing the cost of capital to finance the investment project;
� estimating the flow of income derived from the capital investment over the whole life of
the investment;
� valuing the flow of income.
The last problem arises because clearly income at some future date is worth less than the
same amount of income now. We know that this is the case since everyone who lends
money to another expects to be compensated when repayment is made at some future
date: this compensation takes the form of interest. Calculating the difference in value of
income generated at different time periods in the future is known as the problem of
discounting.
The objective of these calculations is to measure the net present value of the earnings
stream that can be expected from an investment project. This can then be compared to the
cost of the investment.
� The future flow of income must be discounted; that is future nominal income must be
calculated as a reduced value to reflect the lower value of income in future compared to
the present.
� This is done by applying a discount rate to that stream of income.
� The normal presumption is that the discount rate to be used is the current rate of interest
since it is assumed that this in turn reflects savers’ and investors’ time preferences.
Thus it is necessary to apply a rate of interest as the discount rate to the future stream of
earnings. Of course the net present value of that stream of earnings will depend on which
rate of interest is chosen to discount the stream of earnings.
� A high rate of interest implies a very low valuation of future income compared to the
present.
� A low rate of interest implies a much less low valuation of future income compared to
the present.
Which rate of discount should be used? After all, at any one time there will be a range of
market interest rates reflecting different types of lending and borrowing and different
types of lenders and borrowers. The appropriate rate to be used by a business should be
the average cost of capital to the company. Although there are some problems in identifying
this, in principle it can done.
Once the interest rate or discount rate has been applied to the stream of earnings, the
resulting calculation is the discounted cash flow (DCF).
STUDY MATERIAL C424TH
EG
OA
LSA
ND
DEC
ISIO
NS
OF
ORG
AN
ISA
TIO
NS
2006.1

The DCF is measured by applying the discount rate. Since there is a compounding
effect with interest this must be reflected in the calculation. The appropriate calculation is
that the value of $1 of income received at a future date is:
Discounted value¼ Yt
ð1þ rÞtwhere Y is the earnings in year t
r is the rate of discount
Thus if an income stream of $1000 dollars a year is expected, and a discount rate of 10% is
to be applied, the calculation for each year is:
Year 1 Year 2 Year 3 Year 4
$1000
1:1
$1000
ð1:1Þ2$1000
ð1:1Þ3$1000
ð1:1Þ4
= $909 $826 $751 $683
Thus the application of the discounting rate gives a discounted cash flow. If the discounted
cash flow for each of the years of the life of the project is added the result is the:
net present value (NPV ) of the investment project
In this case the NPV for the four-year investment is the sum of the discounted cash flow
for each of the four years and equals $3169.
Once the net present value of the project has been calculated it can be compared to the
capital cost of the investment project. If
� the NPV exceeds the cost of the project, it can be regarded as profitable and
undertaken;
� the NPV is less than the cost of the project, it can be regarded as unprofitable and
should not normally be undertaken.
Calculations of NPV can also be used to rank alternative investment projects or alternative
technologies or indeed to estimate the value of shares.
1.5.3 Share values
For shareholders there are two important elements to their return from investing in a
company:
1. the flow of dividends from the ownership of the shares;
2. change in the value (price) of the shares.
FUNDAMENTALS OF BUSINESS ECONOMICS 25TH
EG
OA
LSA
ND
DEC
ISIO
NS
OF
ORG
AN
ISA
TIO
NS
2006.1
Of course these two are not unrelated since:
� the return that a stream of dividends represents depends on the market price of the
share paid by the investor (i.e. earnings per share, EPS);
� the current and expected stream of profits and dividends will affect the value of
shares.
Many variables will affect the value of shares. These tend to fall into two groups:
1. factors external to the business which may affect a wide range of shares: the onset of
a recession would tend to depress share values in general as would a rise in interest
rates;
2. factors internal to the business that might affect the future flow of profits such
as the failure of a new products, an expected decline in sales or a significant rise in
costs.
In the latter case the impact on the share price would follow from the expected change in
the flow of profits, and in principle, this effect could be calculated. Using the net present
value method outline above, the effect of an expected fall in the flow of profits might be
calculated. In the example given the effect of an expected fall in profits in the fourth year
from $1000 to $500 could be calculated, thus:
Year 1 Year 2 Year 3 Year 4
$1000
1:1
$1000
ð1:1Þ2$1000
ð1:1Þ3$500
ð1:1Þ4
= $909 $826 $751 $342
Thus the NPV is reduced from $3169 to £2828 – fall of 10.76% and one would expect this
to be reflected in share values.
1.6 Not-for-profit organisations
1.6.1 Types of not-for-profit organisations
Not all organisations, even business organisations, are profit-making organisations. A
whole range of not-for-profit organisations exist. Some of the most important are:
� charities
� voluntary organisations
� clubs
� mutual societies
� public sector organisations
� QANGOs (quasi autonomous non-governmental organisations).
STUDY MATERIAL C426TH
EG
OA
LSA
ND
DEC
ISIO
NS
OF
ORG
AN
ISA
TIO
NS
2006.1

Although these organisation are not profit-orientated as with most business organisations,
they have some characteristics in common with them. These include:
� they use resources (factors of production) in order to produce some good or service;
� in turn, the use of resources implies a flow of expenditure to finance those resources and
other operating costs;
� the existence of a flow of expenditure requires a flow of income to finance that expenditure;
� the flow of income is derived from sales of services or goods to its customers, clients or
members.
Thus, although not-for-profit organisations are not profit making they have some things in
common with profit-seeking organisations. Indeed, some of these organisations can be
very big businesses. Examples include mutual building societies in the United Kingdom
and some Savings and Loans Companies in the United States. In the UK the John Lewis
organisation owns an extensive chain of department stores and supermarkets. However, it
is a partnership rather than a shareholder-owned business. Virtually all universities are not-
for-profit organisations yet they have very large flows of income and expenditure and
employ large numbers of people. Thus there are important economic constraints on these
organisations. These business organisations need to:
� Avoid making a financial loss: profits are not made but operating surpluses or deficits
will occur and these are carried over into future years. Continued deficits would lead to
serious financial problems and eventually the closure of the organisation.
� Be efficiently managed to ensure that the organisation achieves its objectives and
ensures financial stability. Even if the organisation is not aiming to make profits, it needs
to use its physical and financial resources in an efficient manner.
� Choose investment projects carefully so that they contribute to the achievement of the
objectives of the business in an efficient manner.
Overall, the not-for-profit organisation must be managed so that it is effective; that is, it
achieves its objectives in an efficient manner and cost-effective manner. Thus there are
important economic constraints operating on not-for-profit organisations.
Thus much of the management activity in not-for-profit organisations is similar to that
which occurs in profit-seeking businesses. Similar decisions have to be made concerning:
� types of product and service to be produced
� which markets to be emphasise
� the level of output to be produced
� the prices to be charged for the product or services
� choice of production methods and technologies
� investment decisions
� sources of finance.
However, for profit-making organisations the objectives of the business are clear: in
principle the core objective is the maximisation of shareholders’ wealth. For not-for-profit
organisations the problem is the absence of shareholders. It is therefore not clear on
whose behalf the organisation should function. What should the management of a not-for-
profit organisation aim to maximise? This question can only be answered by reference to
the concept of stakeholders.
FUNDAMENTALS OF BUSINESS ECONOMICS 27TH
EG
OA
LSA
ND
DEC
ISIO
NS
OF
ORG
AN
ISA
TIO
NS
2006.1

1.6.2 Stakeholders
Stakeholders: interest and influenceThe stakeholders in a business may be defined as:
those persons and organisations that have an interest in the strategy and
behaviour of the organisation
All business organisations have stakeholders. For the typical business the most important
stake holders are:
� shareholders
� customers
� suppliers
� employees including senior management
� the providers of finance
� relevant regulatory and statutory bodies
� the local community.
For some very large businesses, stakeholders may also include the national community
since their actions may have national or even international effects. Some companies in the
oil industry, the aviation industry and in the financial services industry may have this
feature. For not-for-profit organisations, the absence of shareholders means that the
interests of the other stakeholders become more important in influencing the strategy and
behaviour of the organisation.
How do stakeholders influence the activities of the not-for-profit organisation? This
depends first of all on two important variables:
� stakeholder interest
� stakeholder influence.
Stakeholder interest refers to the strength of the stakeholders’ interest in the organisation.
How much effort will the stakeholder put into influencing the organisation? This degree of
interest and the willingness to attempt to affect the organisation will vary from one
stakeholder to another.
� Customer interest may vary: single customers buying the occasional low price service
will have low interest, but a major and regular customer (e.g. a government buying
military equipment from an arms producer) would have a high level of interest.
� Employees are likely to have high interest as stakeholders as their working life, income
and financial futures will be affected by the behaviour of the organisation.
� Local communities may have high or low interest depending on the potential impact and
the importance of the activity on the local community. The local community will have
high stakeholder interest in a big local employer or a company whose activities have a
big impact on the local environment.
STUDY MATERIAL C428TH
EG
OA
LSA
ND
DEC
ISIO
NS
OF
ORG
AN
ISA
TIO
NS
2006.1

Stakeholder influence refers to the degree to which an individual stakeholder or group of
stakeholders can exert influence over the organisation. Thus the concern here is not the
level of interest that the stakeholder has, but the ability of the stakeholder to affect the
behaviour of the organisation. Again, the influence of stakeholders will vary:
� Stakeholders inside the organisation, such as employees and management, will have more
influence than stakeholders outside of the organisation such as the local community.
� Stakeholders who are important to the organisation, such as its major customers, will
have more influence than those who are less important. Less important stakeholder
might be suppliers for whom there are lots of alternatives for the organisation to use.
� Groups of stakeholder with common interest (‘coalitions’) will have more influence than
single stakeholders. For an organisation which is the major employer in a locality, the
interests of that local community and of the employees would be similar.
Ultimately the influence of stakeholders will vary greatly from one organisation to another.
In some cases coalitions of external stakeholders may have considerable effect on
organisations; in other cases external stakeholders may be weak and divided. Real
problems may arise for organisations if they are faced with competing groups of influential
stakeholders with different views of how the organisation should operate. In this case,
conflict between stakeholders may generate very real problems for the management of
organisations.
Stakeholders in not-for-profit organisationsWho are likely to be the important stakeholders in not-for-profit organisations? In most
profit-seeking companies one would expect shareholder and their representatives – the
managing director and the board of directors – to have both interest and influence.
However, not-for-profit organisations do not have shareholders. Who then are the
important stakeholders in these organisations? There is no simple answer to this question
as there is such a wide variety of not-for-profit organisations.
� In government-owned organisations, the government itself or the civil service
administering such organisations may have a great deal of power.
� For charities, the donors, especially if they are large donors, as the principal source of
income for the organisation may be powerful stakeholders.
� In all not-for-profit organisations, the employees, especially the management, are likely
to be powerful stakeholders.
How do stakeholders affect the management of not-for-profit organisations? Again the
effect will vary a great deal from one organisation to another, but the effect of
stakeholders will be felt in several ways. Stakeholders may affect:
� the overall goals and objectives of the organisation. Since profit cannot be the main objective,
there is more scope for debate about the goals and objectives of the organisation;
� the strategy of the organisation in attempting to reach those objectives. Since profit is
not the main objective, different strategies cannot be judged by reference to their
contribution to profits. Concepts of efficiency and effectiveness might be more
appropriate in these circumstances but problems still remain. Business strategies
have implications other than those for efficiency and effectiveness; there may, for
example, be ethical issues with different stakeholders holding different views about
those issues;
FUNDAMENTALS OF BUSINESS ECONOMICS 29TH
EG
OA
LSA
ND
DEC
ISIO
NS
OF
ORG
AN
ISA
TIO
NS
2006.1
� the organisation and management of the organisation. There clearly exist different possible
management style and structures, and stakeholders – especially employees and
management – will have both views about which are most appropriate for the
organisation and personal preferences.
All this leads to the possibility of conflict between the various stakeholders in organisations.
This will occur in profit-seeking organisations, but may be muted given the overall
objective of maximising shareholder value. The problem might be more serious in not-or-
profit organisations given the absence of a strong stakeholder with a single primary
objective.
The existence of differing demands from various stakeholders presents serious problems
for the organisation; the determination of business strategy and its implementation becomes
much more difficult. How might stakeholder conflicts in not-for-profit organisations be
resolved?
There are broadly three approaches to conflicts in stakeholder interest.
1. Developing a consensus around the aims and objectives of the senior management of
the organisation – in effect getting other stakeholders to accept the appropriateness
of the core objectives of the business. This is sometimes related to the notion of
developing strong cultures in businesses whereby there is common acceptance of the
company’s aims. The problem here is how to deal with stakeholders who are external
to the company.
2. The dominant coalition of stakeholder will impose their views about the aims and
objectives of the business. It is likely that the dominant coalition will include the senior
management and they might impose systems and controls to ensure this. Indeed, an
informal condition of employment in the business might be acceptance of those
particular stakeholder interests.
3. The business may recognise the existence of different stakeholders and acknowledge
that they have differing but legitimate interests which ought to be met. This view
suggest that it is possible to incorporate these differing interests without damage to the
core objectives of the organisation. For example, meeting employees aspirations for
good working conditions and financial rewards, through performance pay schemes,
might lead to higher productivity thus contributing to the success of the organisation.
Likewise, meeting the aspirations of suppliers and customers might lead to confidence,
flexibility and loyalty in these relationships.
Nonetheless, it remains the case that if there are irreconcilable differences in the aims and
objectives of different stakeholders, the task of the senior management in a business will
be to identify priorities and devise management system and processes to place those at the
core of the business.
STUDY MATERIAL C430TH
EG
OA
LSA
ND
DEC
ISIO
NS
OF
ORG
AN
ISA
TIO
NS
2006.1
1.7 Corporate governance
1.7.1 Why does corporate governance matter?
The final issue discussed in this chapter is that of corporate governance. Corporate governance is:
the systems by which companies and other organisations are directed and controlled.
Thus corporate governance is concerned with how power is used to direct the operations
and behaviour of organisations. In the case of companies this power, and indeed this
responsibility, rests with boards of directors. The role of shareholders in companies is to:
� appoint the directors of the company
� appoint the auditors for the company
� assure themselves that the system of governance is appropriate and effective.
Thus the board of directors has powers delegated to it from the shareholders. The main
responsibilities of the board of directors of a company are:
� to determine the broad long-term aims of the company; that is, to determine the broad
business strategy of the company.
� to provide a focus of leadership in the pursuit of the strategic goals that it has set;
� to supervise the management of the company and to monitor the performance of the
company in relation to the strategic aims of the company;
� to report to shareholders on the performance of the company.
The board of directors are collectively responsible to the shareholders who may determine
policy at a general meeting of all shareholders. In addition, the board must operate within a
particular set of laws and regulations that specify the roles and duties of directors.
In recent years in the UK and in other countries there has been a concern that the
processes of corporate governance have not been working as well as they ought. This
concern has arisen partly out of a series of scandals concerning some of the biggest and
most well-known business companies. Box 1.1 outlines some examples of these. While
there is no reason to suppose that problems were necessarily widespread in business, there
was a concern that corporate governance needed attention.
Box 1.1 Problems with corporate governance: the UK
In recent years there have been many scandals concerning some major companies. In the
UK among the more notable have been the cases of Robert Maxwell who was found to
have used employees pensions funds to finance the Mirror Group business for which he
was responsible and the Guinness company where some directors were found guilty of
falsifying the company’s accounts. Perhaps the most famous case is that of the US
company, Enron. This company, operating in the US energy market, grew very rapidly
and regularly reported strong income and profit growth. However through the use of
subsidiaries the company was hiding its debts and exaggerating its financial strength. The
Company eventually collapsed and filed for bankruptcy. Even the company’s auditors
were found to have behaved illegally.
FUNDAMENTALS OF BUSINESS ECONOMICS 31TH
EG
OA
LSA
ND
DEC
ISIO
NS
OF
ORG
AN
ISA
TIO
NS
2006.1

1.7.2 The principal – agent problem
The origins of this governance problem lies in what is known as agency theory or the
principal–agent problem. In any organisation there are:
� principals: in the case of companies the principals are the legal owners of the
organisation – the shareholders;
� agents: those appointed by the principals to act on their behalf such as the board of
directors and senior managers in a company.
The principal–agent problem is not confined to business and companies, it affects all
organisations. In the case of public sector industries, the principal is the legal owner, that is
the state represented by the government, and the agents are the senior managers placed in
charge of the industries. The issue may arise for individuals. If an individual wishes to buy
a house he or she may well appoint a lawyer to conduct the legal aspects of the
transactions. Here the house buyer is the principal, and the lawyer is the agent.
The problem posed by agency theory is how can the principal ensure that the agent will
behave in such a way as to achieve the aims and intentions of the principal? There is clearly the
possibility of conflict in that the agent may act to achieve a set of objectives reflecting their self
interest and objectives rather than those of the principals. In companies the board of directors
and/or senior management may pursue objectives that are not the same as those of the
shareholders. In effect, the shareholders may lose control of the companies they legally own.
This loss of control by shareholders over their companies is called the divorce of control
from ownership. How might this loss of control occur?
� organisations may become too large for shareholders to effectively control;
� organisations may become too complex for shareholders to effectively control; this
complexity may be in technologically, commercially or structurally;
� individual shareholders may lose control especially where they only own a small number
of shares or where they own shares in many companies because they lack the time or
incentive to exert their control.
Indeed, it is because of these sorts of problems that shareholders face that they appoint agents
to act for them in the company. The problem is less acute for institutional shareholders such as
pension funds. Because they have large shareholdings and have time and expertise they find it
rather easier to ensure that directors and managers comply with their overall wishes.
Nonetheless, shareholders still need to create mechanisms to encourage directors and
managers to act in a way that promotes shareholder interest. Since shareholders are primarily
interested in the flow of dividends and the share price, it is possible to devise incentive
schemes to encourage directors to emphasise the pursuit of profits. Examples include:
� renumeration and bonuses related to the profit performance of the company;
� share distribution schemes to encourage directors and managers to aim for a higher
share price for the company;
� bonuses related to variables that will indirectly contribute to the maximisation of
shareholders wealth such as sales growth or market share.
Even here, however, there is some disquiet. The incentive schemes are often designed by
the directors and renumeration committees that in turn often reflect the interests of
directors in general. There is thus a feeling that the schemes provide targets that are too
easy to achieve and bonuses that are often only very loosely linked to the achievement of
STUDY MATERIAL C432TH
EG
OA
LSA
ND
DEC
ISIO
NS
OF
ORG
AN
ISA
TIO
NS
2006.1

those targets. Thus the problem of the agents in a company pursuing a different set of
objectives from those of the principals remains.
What sort of objectives might directors and senior managers in companies pursue? It is likely
that their objectives will be more complex than those of the shareholders. In the first place,
management will face pressures from a wide range of stakeholders, not just the shareholders.
Moreover, management will have its own aims and objectives which may differ in important ways
from those of the shareholders. Box 1.2 illustrates the nature of this problem in the United Sates.
How might the aims and objectives of management differ from those of shareholders?
� Management will have to balance the interests of different stakeholders in the company.
Since these stakeholders have a variety of objectives, profit is unlikely to be the sole aim
of management.
� Management may have objectives of its own. These may include:
salaries
non-salary benefits (‘perks’)
power
status and prestige
safety and security
a ‘quiet life’.
The problem with these is that they may conflict with the objectives of profitability. For
example, many of the management’s objectives, such as salary, power and prestige, may be
related more strongly to the size of the company (sales, market share, number of
employees) than to the underlying profitability of the company (return on capital employed).
Box 1.2 illustrates the nature of this problem in the United States and Section 1.2.3
discusses some alternative theories of the firm based on the idea that companies reflect
managers and not owners objectives.
Box 1.2 Problems with executive pay in the USA?
Even as many investors assume they’ve seen the end of the executive – pay excesses that
flourished during the late-1990s bubble, a new gilded age is under way. The explosion of
merger related payouts raises the question of whether chief executives are doing deals
more for their own benefit than for their shareholders, argues James Melican, president
of Proxy Governance, which advises pension funds and other institutional investors.
To gauge the scope of the merger-payout trend beyond this year’s activity, Business
Week asked research firm Equilar to scour filings by America’s 100 largest
corporations and determined which have promised merger packages to their chief
executives. The study shows that roughly half have done so for an average of $28m if
the company is acquired. Once a merger gets under way, companies often
concede . . . that payouts . . . create a potential conflict of interest between investors
and chief executives who now have a huge incentive to compete the deals.
Shareholder’s often don’t pay attention until too late in the process.
Source: Emily Thornton: Independent on Sunday 11th December 2005
FUNDAMENTALS OF BUSINESS ECONOMICS 33TH
EG
OA
LSA
ND
DEC
ISIO
NS
OF
ORG
AN
ISA
TIO
NS
2006.1

Thus management may have a complex set of objectives. Nonetheless, it is likely that the
profitability of the company will remain an important, indeed probably the most important
objective. If a company has a poor profitability performance then the board of directors
and senior managers may face:
� smaller bonuses and performance related pay
� the possibility of dismissal by shareholders
� the threat of takeovers if the company share price falls significantly.
Thus the relationship between shareholders (the ‘principals’) and boards of directors (‘the
agents’) is complex one and might differ from company to company. Nonetheless, the
belief that there are problems in the process of corporate governance has prompted
attempts in many countries at reform of this relationship.
1.7.3 The reform of corporate governance in the UK
In the UK, concern over corporate governance led to the establishment in 1991 of
the Cadbury Committee. The task of this committee was to review the process of
corporate governance in the UK and to try and identify what it regarded as the best
features of the system. The intention was that it would be recommended that these best
features should become standard practice. The main recommendations of the committee
were:
� the board of directors should meet on a regular basis and that active responsibilities at board
level should be spread over the board and not concentrated in a few hands; in particular,
the roles of chairperson and chief executive should be kept separate;
� directors should have limited contracts (3 years) and all director reward and payments should
be publicly disclosed;
� there should be three sub-committees of the board: an audit committee, a nominations (to the
board) committee and a renumerations (of board members) committee;
� greater use should be made of non-executive directors with no direct financial interest in the
company in order to provide some independence within the board especially on the
board’s sub committees;
� the annual accounts should contain a statement, approved by the auditors, that the
business is financially sound and is a going concern.
Since the Cadbury Committee’s report, its recommendations have effectively become the
standard procedure for larger companies and especially those publicly quoted on the
London Stock Exchange. Since the work of the Cadbury Committee, the issue of
corporate governance has been the subject of further reports.
� The Greenbury Report (1995) looked at the issue of director’s pay.
� The Nolan Committee (1995) looked at governance issue in the public sector.
� The Hempel Committee (1998) reviewed corporate governance issues.
� The Higgs Report reviewed issues relating to the membership of boards of directors
including age, gender and skills and abilities.
The outcome of this work is the creation of the Combined Code which specifies what the
various groups and committees have come to believe represents ‘best practice’ in
STUDY MATERIAL C434TH
EG
OA
LSA
ND
DEC
ISIO
NS
OF
ORG
AN
ISA
TIO
NS
2006.1
corporate governance and what be seen as a model for companies to adopt. The main
features of this model are:
� separation of powers especially in relation to roles of the chairman and the chief executive;
� board membership to include an appropriate balance especially in relation to executive and
non-executive directors;
� the adoption of the principles of transparency, openness and fairness;
� to adopt an approach which reflects the interest of all stakeholders;
� to ensure that the board of directors are fully accountable.
Exercise 1.2Answer the following questions based on the preceding information. You can check your
answers below.
1. What does ROCE mean and what does it measure?
2. What does the term discounting mean?
3. How is the net present value (NPV) of an investment project calculated?
4. If the rate of interest is used as the discount rate in a calculation of NPV, would the
NPV rise or fall?
5. Identify four different types of not-for-profit organisations.
6. Explain what is meant by the term stakeholders.
7. Identify five stakeholders for a typical business.
8. Explain what is meant by the principal–agent problem.
9. Give two reasons why shareholders may lose control of the company they own.
10. What is meant by the term corporate governance?
Solutions1. ROCE is the rate of return on capital employed and is a measure of the flow of profits
compared to the capital employed in the business. It is thus a measure of the
profitability of that capital.
2. Discounting is the process by which future streams of income can be given a present
value; that is the value is reduced to take account of the factor that income in the future
is valued less highly that income now. This gives the discounted cash flow.
3. The NPV of a project is calculated by adding together the discounted cash flow for
each of the years of the lifetime of the investment project.
4. The value of the NVP would fall since a rise in the discount rate would mean giving
lower valuations to future streams of income.
5. Not-for-profit organisations include state-owned (public sector) activities, mutual
societies, charities, private clubs, QUANGOs and voluntary organisations.
6. Stakeholders are those persons and organisations that have an interest in the strategy
aims and behaviour of the organisation.
7. Stakeholders may include: shareholders, management, employees, suppliers, customers,
the suppliers of financial services, the local community.
FUNDAMENTALS OF BUSINESS ECONOMICS 35TH
EG
OA
LSA
ND
DEC
ISIO
NS
OF
ORG
AN
ISA
TIO
NS
2006.1

8. The principal–agent problem arises when principals (such as shareholders) appoint
some agents (such as directors) to act on their behalf (running a company) and cannot
be sure that those agents will always act so as to promote the interest of the principals.
9. There may a divorce of ownership from control because:
� companies may become too big for shareholders to effectively control
� companies may become too complex for shareholders to control
� individual shareholders may lack the power, knowledge, interest or time to control
the companies they own.
10. The term corporate governance refers to the systems by which companies and other
organisations are directed and controlled. For Plc companies this means the role of
the Board of Directors and its relationship to the shareholders.
1.8 Chapter summary
On completing this chapter you should have acquired a good grasp of some of the
important economic concepts related to the nature, aims and structure of organisations. In
particular this chapter has:
� described the different forms of ownership of organisations;
� explained the way in which costs in a business behave in the short and long run and how
this relates to the point of profit maximisation;
� demonstrated the importance of economies of scale in affecting the competitive process
and the structure of an industry;
� discussed the concept of shareholder value and explained the various short- and longer-
term measures of returns to shareholders;
� discussed the way in share values might be affected by a variety of factors, especially the
expected flow of profits;
� described various not-for-profit organisations and their objectives;
� discussed the role of stakeholders in not-for-profit organisations and their impact on
business objectives;
� outlined the principal–agent problem and the impact this has on corporate governance.
The next chapter in the text deals with the market environment within which organisations
function and the processes of competition in markets. Chapter 3 looks specially at the
financial environment for organisations and the services provided by the financial sector.
The last two chapters discuss the wider macroeconomic environment within which all
businesses function.
STUDY MATERIAL C436TH
EG
OA
LSA
ND
DEC
ISIO
NS
OF
ORG
AN
ISA
TIO
NS
2006.1

Revision Questions
You should use these questions for practice and revision for the content of this chapter.
Question 1 Multiple-choice selection1.1 In economics, ‘the central economic problem’ means that:
(A) consumers do not have as much money as they would wish.
(B) there will always be a certain level of unemployment.
(C) resources are not always allocated in an optimum way.
(D) output is restricted to the limited availability of resources.
1.2 Which one of the following best describes the opportunity cost to society of building a
new school?
(A) the increased taxation to pay for the school.
(B) the money that was spent on building the school.
(C) the other goods that could have been produced with the resources used to build
the school.
(D) the running cost of the school when it is opened.
1.3 The opportunity cost of constructing a road is:
(A) the money spent on the construction of the road.
(B) the value of the goods and services that could otherwise have been produced with
the resources used to build the road.
(C) the cost of the traffic congestion caused during the construction of the road.
(D) the value of goods that could have been produced with the labour employed in
the construction of the road.
1.4 In a market economy, the allocation of resources between different productive
activities is determined mainly by:
(A) the decisions of the government.
(B) the wealth of entrepreneurs.
(C) the pattern of consumer expenditure.
(D) the supply of factors of production.
1
37 2006.1
1.5 Which of the following would cause the production possibility frontier for an
economy to shift outwards?
(i) A reduction in the level of unemployment.
(ii) A rise in the rate of investment.
(iii) A fall in the price of one factor of production.
(iv) A rise in output per worker.
(A) (i) and (ii) only.
(B) (i), (ii) and (iii) only.
(C) (i), (iii) and (iv) only.
(D) (ii) and (iv) only.
1.6 In a market economy, the price system provides all of the following except which
one?
(A) Signals to consumers.
(B) Incentives to producers.
(C) A means of allocating scarce resources.
(D) A store of value.
1.7 The ‘law of diminishing returns’ can apply to a business only when:
(A) all factors of production can be varied.
(B) at least one factor of production is fixed.
(C) all factors of production are fixed.
(D) capital used in production is fixed.
1.8 Which of the following is not a source of economies of scale?
(A) The introduction of specalist capital equipment.
(B) Bulk-buying.
(C) The employment of specialist managers.
(D) Cost savings resulting from new production techniques.
1.9 Discounting a future stream of income means:
(A) taking into account possible future falls in the stream of income.
(B) ignoring yearly fluctuations in income and taking the average.
(C) reducing the present value of future income streams because future income is
worth less than current income.
(D) reducing the present value of future income streams to take account of the
effect of inflation.
1.10 Which one of the following would not be a stakeholder for a mutual society?
(A) shareholders.(B) customers.(C) employees.(D) managers.
REVISION QUESTIONS C438TH
EG
OA
LSA
ND
DEC
ISIO
NS
OF
ORG
AN
ISA
TIO
NS
2006.1

Question 2A company is planning to invest in a new project. The information about tis project is as
follows.
Capital cost of the project $
Expected life of the project 4 years
Scrap value of investment at end $5000
Expected net income streams Year 1 $10000
Year 2 $10000
Year 3 $10000
You are required to:
(a) Calculate the net present value of the project assuming a discount rate of 10%.
(2 marks)
(b) Calculate the net present value of the project assuming that the income stream in the
third year is reduced to $7000.
(2 marks)
(c) Calculate the net present value of the project assuming the original income streams but
a discount rate of 5%.
(2 marks)
(d) State whether each of the following would be likely to make the project more or less
profitable:
(i) a rise in interest rates more profitable/less profitable
(1 mark)
(ii) a fall in labour costs for the company more profitable/less profitable
(1 mark)
(iii) an expected fall in the value of scrap machinery more profitable/less profitable
(1 mark)
(iv) a higher than expected sales volume from the new project
more profitable/less profitable
(1 mark)
(Total marks = 10)
FUNDAMENTALS OF BUSINESS ECONOMICS 39TH
EG
OA
LSA
ND
DEC
ISIO
NS
OF
ORG
AN
ISA
TIO
NS
2006.1


Solutions toRevision Questions
The answers to the multiple-choice questions given below indicate the single correct
answer for each question. The multiple-choice questions used in examinations are a form
of objective testing. There is only one correct answer and this is not subject to differences
of opinion among economists. The task of the candidate is to identify the one correct
answer.
Solution 11.1 Solution: (D)
The central economic problem refers to the scarcity of resources relative to human
wants. A refers to money rather than real resources and B refers to a real problem but
one which, if solved, would still leave resources relatively scarce. This is also true of C;
even if resources were optimally allocated, they would still be scarce.
1.2 Solution: (C)
Opportunity cost refers to the opportunity to produce other goods and services which
are forgone when those resources are used for a particular purpose. A and B refer to
financial considerations rather than real resources and D refers to the opportunity cost
of running the school, not of building it.
1.3 Solution: (B)
A refers to the financial implications of road building and D refers to only one of the
real resources involved. Congestion, mentioned in C, is a real cost, but does refer to
the cost of the road itself.
1.4 Solution: (C)
In a market economy, producers in the search of profits must respond to consumer
demand. Thus the allocation of resources reflects consumer preferences as expressed
in their expenditure. Governments play some role in resource allocation, but in market
economies this is limited. D refers to the availability of resources not their allocation
between different uses.
1
2006.141 2006.1
1.5 Solution: (D)
The possibility production frontier shows maximum output given the total resources
available and their productivity. Thus (ii) (more resources) and (iv) (higher productiv-
ity) would have this effect. A fall in unemployment (i) would move the economy
closer to its frontier but would not lead to any shift in the frontier. A change in factor
prices (iii) would have no effect on the real resources available.
1.6 Solution: (D)
Prices are signals to both consumers and producers which influence their buying and
producing decisions and in this way help to allocate resources between different goods
and services. However, prices do not act as a store of value; this is a function of money.
1.7 Solution: (B)
The law of diminishing returns states that if more units of a variable factor are added
to a fixed factor, the increment in output will eventually decline. Responses (A) and
(C) are therefore incorrect. Response (D) is also incorrect, since the law applies for
any fixed factor, not only capital.
1.8 Solution: (D)
Economies of scale are the cost savings resulting from any activity or process which
is made possible by increasing the scale of output. This applies to responses (A), (B)
and (C), since these are made possible as the size of businesses increases. Response
(D), however, is incorrect since it refers to technical change, and this would reduce
costs for all producers, large and small.
1.9 Solution: (C)
Responses (A) and (B) are concerned with the absolute value of income streams and
not discounting those streams. Response (C) is correct since discounting is done
because future income is worth less now even in the absence of inflation. Response
(D) is concerned with the effects of inflation.
1.10 Solution: (A)
Response (A) is the correct answer as a mutual society does not have shareholders
but is owned collectively by its customers, for example a mutual building society is
owned by its depositors.
Solution 2(a) The net present value will be: $28265
For Year 1 the discounted income stream is$10000
ð1:1Þ ¼ $9091
For Year 2 the discounted income stream is$10000
ð1:21Þ ¼ $8264
SOLUTIONS TO REVISION QUESTIONS C442TH
EG
OA
LSA
ND
DEC
ISIO
NS
OF
ORG
AN
ISA
TIO
NS
2005.1

For Year 3 the discounted income stream is$10000 + $5000
ð1:331Þ ¼ $11270
The NPV is thus $9091 + $8264 + $11270 = $28265
(b) The net present value would be: $26371
For Year 3 the discounted income stream is$7000 + $5000
ð1:331Þ ¼ $9016
The NPV is thus $9091 + $8264 + $9016 = $26317
(c) In this case the NPV would be: $31534
For Year 1 the discounted income stream is$10000
ð1:05Þ ¼ $9524
For Year 2 the discounted income stream is$10000
ð1:103Þ ¼ $9066
For Year 3 the discounted income stream is$10000 + $5000
ð1:158Þ ¼ $12953
The NPV is thus $9524 + $9066 + $12953 = $31534
(d) (i) less profitable as a higher interest rate would increase the cost or capital and raise the
discount rate to be used.
(ii) more profitable as lower labour cost would raise the net income stream from the
project.
(iii) less profitable as this would reduce the scrap value of the investment at the end of
its life.
(iv) more profitable as this would raise revenue and it would be expected to raise the net
income stream from the project.
FUNDAMENTALS OF BUSINESS ECONOMICS 43TH
EG
OA
LSA
ND
DEC
ISIO
NS
OF
ORG
AN
ISA
TIO
NS
2006.1


2
The Market System and theCompetitive Process


The MarketSystem and theCompetitive Process
2.1 Consumer behaviour and demand
2.1.1 Individual demand
Individual demand shows how much of a good or service someone intends to buy at any
possible price. This demand needs to be effective in that it is backed by available money,
rather than just a general desire without the necessary financial backing. When considering
2LEARNING OUTCOMES
This chapter seeks to explain the way in which a competitive market works. The roles
of the consumer and firm are examined. The impact of consumer behaviour, both
individually and collectively, on demand allows the introduction of concepts such
as elasticity. The idea of time periods is featured as the theory of supply is developed.
Demand and supply are then put together to show how market prices are determined.
The concept of market equilibrium is developed.
The different forms of market structure are identified and explained. The effect these
structures have on price and output determination are outlined with their consequent
impact for allocative and technical efficiency.
Finally, instances of market failure are considered. The implications these have for
the operation of the market are outlined. The case for a public sector and intervention
by government is described along with some of the forms such intervention can take.
On completion of their studies students should be able to:
" identify the equilibrium price in a product or factor markets likely to result from
specified changes in conditions of demand or supply;
" calculate the price elasticity of demand and the price elasticity of supply;
" identify the effects of price elasticity of demand on a firm’s revenues following a
change in prices;
" describe market concentration and the factors giving rise to differing levels of
concentration between markets;
" describe market failures, their effects on prices, efficiency of market operation
and economic welfare, and the likely responses of government to these;
" distinguish the nature of competition in different market structures;
" identify the impacts of the different forms of competition on prices and profitability.
47 2006.1

demand at a price, we assume that the conditions of demand (i.e. other variables) are held
constant.
� Demand tends to be higher at a low price and lower at a high price for most goods and
services.
� A change in quantity demanded in response to a price change is termed an expansion or
contraction in demand. This is shown graphically in Figure 2.1 with the demand curve D1
sloping downward from left to right. This is typical of a normal good.
� For a normal good a consumer buys more when their income rises. This is partly
explained by the substitution effect. This occurs when consumers buy more of one
good and less of another good because of relative price changes. Consequently if
two types of apples are considered substitutes, then if the price of apple A falls
relative to apple B, consumers will buy more of A rather than B. The downward
sloping curve for a normal good is also reinforced by the income effect. This shows
the effect of price changes on a consumer’s income. If the price of a good falls,
other things being equal, consumers become marginally better off as their real
income has increased. They can afford to buy more of a product hence increasing
demand as price falls.
� For an inferior good a consumer buys less when their income rises. This is because
when people’s income increases they substitute better quality alternatives for their
original purchases. The latter are termed inferior goods. In this case the income effect
works in the opposite direction to the substitution effect. As a consequence price
falls which enhance consumers’ incomes enable them to buy better products. The
demand curve for the inferior good is positive sloping as with demand curve D2 in
Figure 2.1.
2.1.2 Market demand
Market demand shows the total amount of effective demand from all the consumers in a
market. It is an aggregate, like the supply curve for an industry. Market demand is usually
shortened to demand and represented by a straight-line curve on a graph. The demand
curve for most normal goods is negatively inclined sloping downwards from right to left
for reasons explained in the previous section.
Price
Quantity
D1
D2
Figure 2.1 Normal and inferior demand curves
STUDY MATERIAL C448TH
EM
ARKET
SYSTEM
AN
DTH
EC
OM
PETIT
IVE
PRO
CESS
2006.1

2.1.3 Elasticity of demand
Elasticity, generally, refers to the relationship between two variables. There are several
types which are useful to economists.
Price elasticity of demandThis concept explains the relationship between changes in quantity demand and changes in
price.
� Price elasticity of demand explains the responsiveness of demand to changes in price.
� The co-efficient of price elasticity of demand (PED) is calculated by:
Percentage change in quantity demanded
Percentage change in price
The formula can be applied either at one point (point elasticity) or over the whole curve
(arc elasticity).
The coefficient of elasticity calculations for normal goods give a negative result because
price and quantity demanded are inversely related. However, for inferior goods and
those with unusual-shaped demand curves, the elasticity will be positive, showing an
increase in quantity demanded when price rises. A summary of price elasticity is given
below:
Description of curve’s elasticity Coefficient value Actual examples
Perfectly inelastic 0 (zero) —
Relatively inelastic Between 0 and 1 Tea, salt
Unit elasticity 1 —
Relatively elastic Between 1 and 1 cameras, air travel
Perfectly elastic 1 (infinity) —
QuantityQ
D
S
Price
P
Z
0
Consumersurplus
Producersurplus
Figure 2.2 Consumer and producer surplus
FUNDAMENTALS OF BUSINESS ECONOMICS 49TH
EM
ARKET
SYSTEM
AN
DTH
EC
OM
PETIT
IVE
PRO
CESS
2006.1
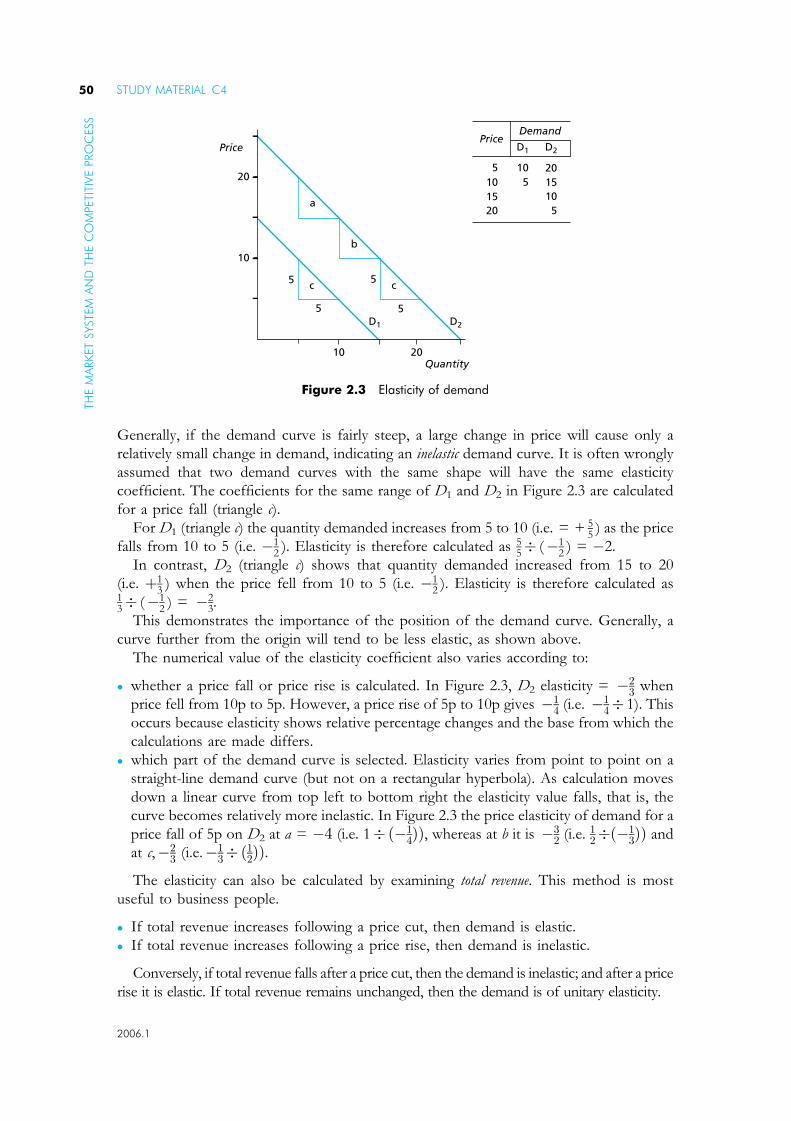
Generally, if the demand curve is fairly steep, a large change in price will cause only a
relatively small change in demand, indicating an inelastic demand curve. It is often wrongly
assumed that two demand curves with the same shape will have the same elasticity
coefficient. The coefficients for the same range of D1 and D2 in Figure 2.3 are calculated
for a price fall (triangle c).
For D1 (triangle c) the quantity demanded increases from 5 to 10 (i.e. = + 55
) as the price
falls from 10 to 5 (i.e. �12
). Elasticity is therefore calculated as 55� (�1
2) = �2.
In contrast, D2 (triangle c) shows that quantity demanded increased from 15 to 20
(i.e. þ13
) when the price fell from 10 to 5 (i.e. �12
). Elasticity is therefore calculated as13� (�1
2) = �2
3.
This demonstrates the importance of the position of the demand curve. Generally, a
curve further from the origin will tend to be less elastic, as shown above.
The numerical value of the elasticity coefficient also varies according to:
� whether a price fall or price rise is calculated. In Figure 2.3, D2 elasticity = �23 when
price fell from 10p to 5p. However, a price rise of 5p to 10p gives �14 (i.e. �1
4� 1). This
occurs because elasticity shows relative percentage changes and the base from which the
calculations are made differs.
� which part of the demand curve is selected. Elasticity varies from point to point on a
straight-line demand curve (but not on a rectangular hyperbola). As calculation moves
down a linear curve from top left to bottom right the elasticity value falls, that is, the
curve becomes relatively more inelastic. In Figure 2.3 the price elasticity of demand for a
price fall of 5p on D2 at a = �4 (i.e. 1�ð�14ÞÞ, whereas at b it is �3
2 (i.e. 12�ð�1
3ÞÞ and
at c,�23 (i.e.�1
3�ð12ÞÞ.The elasticity can also be calculated by examining total revenue. This method is most
useful to business people.
� If total revenue increases following a price cut, then demand is elastic.
� If total revenue increases following a price rise, then demand is inelastic.
Conversely, if total revenue falls after a price cut, then the demand is inelastic; and after a price
rise it is elastic. If total revenue remains unchanged, then the demand is of unitary elasticity.
20
D2D1
Quantity
10
20
PricePrice
5
5
5
1520
10
D1 D2
10 201510
Demand
5 5
c
b
c
a
5 5
10
Figure 2.3 Elasticity of demand
STUDY MATERIAL C450TH
EM
ARKET
SYSTEM
AN
DTH
EC
OM
PETIT
IVE
PRO
CESS
2006.1
There are several factors which determine the price elasticity of demand:
� Income. Where a good constitutes a small proportion of consumers’ income spent, then
a small price change will be unlikely to have much impact. Therefore, the demand for
unimportant items such as shoe polish, matches and pencils is likely to be very inelastic.
Conversely, the demand for quality clothing will probably be elastic.
� Substitutes. If there are close and available substitutes for a product, then an increase in
its price is likely to cause a much greater fall in the quantity demanded as consumers buy
suitable alternatives. Thus, the demand for a specific variety box of chocolates may be
fairly elastic because there are many competing brands in the market. In contrast, the
demand for a unique product such as the Timeform Racehorses Annual for racing
enthusiasts will tend to be inelastic.
� Necessities. The demand for vital goods such as sugar, milk and bread tends to be stable
and inelastic; conversely luxury items such as foreign skiing holidays are likely to be
fairly elastic in demand. It is interesting to note that improvements in living standards
push certain commodities such as televisions from the luxury to the necessity category.
However, with luxuries the income elasticity of demand is more significant than the
price elasticity of demand.
� Habit. When goods are purchased automatically, without customers perhaps being fully
aware of their price, for example, newspapers, the demand is inelastic. This also applies
to addictive products such as cigarettes, cocaine and heroin.
� Time. In the short run, consumers may be ignorant of possible alternative goods in
many markets, so they may continue to buy certain goods when their prices rise. Such
inelasticity may be lessened in the long run as consumers acquire greater knowledge of
markets.
� Definition of market. If a market is defined widely (e.g. food), there are likely to be fewer
alternatives and so demand will tend to be inelastic. In contrast, if a market is specified
narrowly (e.g. orange drinks) there will probably be many brands available, thereby
creating elasticity in the demand for these brands.
Income elasticity of demandIncome elasticity of demand explains the responsiveness of demand to changes in
income.
When income rises, people not only increase their demand for existing goods but
also start to demand other goods, which they previously could not afford. These goods
may be luxuries (e.g. yachts) or better quality normal goods (e.g. organic vegetables).
The purchase of such goods may be to the detriment of other goods (e.g. frozen chickens)
which then become inferior goods.
The income elasticity of demand (IED) is calculated by the formula:
Percentage change in quantity demanded
Percentage change in income
If an increase in income of 10 per cent causes a 20 per cent increase in the demand for
vegetarian food, then its income elasticity is 2 ð2010Þ.
FUNDAMENTALS OF BUSINESS ECONOMICS 51TH
EM
ARKET
SYSTEM
AN
DTH
EC
OM
PETIT
IVE
PRO
CESS
2006.1

A summary of income elasticity is given below:
Description of income elasticity Value Type of good Examples
Negative � Inferior Matches
Zero to inelastic 0–1 Basic necessities Bread, toothpaste
Positive (elastic) +1 Superior Restaurant meals
Income elasticity can be identified by market research using representative samples and by
examining the household expenditure survey statistics published by the government. The
evidence collected can be used by a business to plan its production and company strategy.
Thus, the British Match Corporation diversified from its main product, matches, into a
range of other wood-based products because it recognised matches as an inferior good
(even though it is price inelastic).
Cross-elasticity of demandCross elasticity of demand measures the responsiveness of the quantity demanded for one
good to a price change in another. It shows the relationship between two goods. It will
indicate whether the two goods are substitutes, complements or correlated.
Cross elasticity of demand is calculated by the formula:
Percentage change in quantity demanded of good A
Percentage change in price of good B
For example, if the price of muesli falls by 10 per cent and the quantity of cornflakes
bought falls by 20 per cent, then the cross-elasticity is + 2 (�20�10
). Generally a positive sign
indicates that the two goods are substitutes and the size of the number shows the strength
of the relationship. High statistics indicate strong relationships, and low ones suggest a
weak one. A summary of cross-elasticity is given below:
Description of cross-elasticity Value Example
Complements � Bread and butter
Substitutes + Apples and oranges
Close substitutes +high Worcester apples and
Granny Smith apples
Unrelated products 0 Apples and cars
The interpretation of data on cross-elasticity is difficult because the impact of just
one variable on another cannot be isolated in the real world. For example, a business
person cannot be sure that the increase in demand for their product is solely caused
by the pricing behaviour of their rivals, as other factors such as changes in income
and tastes may also have been influential. Such factors are considered in the next
section.
STUDY MATERIAL C452TH
EM
ARKET
SYSTEM
AN
DTH
EC
OM
PETIT
IVE
PRO
CESS
2006.1

2.1.4 Conditions of demand
Individual and market demand consider exclusively the influence of price on the quantity
demanded, assuming other factors to be constant. These factors, termed the conditions
of demand, will now be considered, with price held constant. Variations in the
conditions of demand create shifts in the demand curve. These shifts are falls or increases
in demand. They are not to be confused with contractions or expansions which show a
change in the quantity demanded resulting solely from price movements. The differences
are illustrated in Figure 2.4.
The main conditions of demand are as follows:
� Income. Changes in income often affect demand, as the income elasticity section illus-
trated. Lower direct taxes raise disposable incomes and, other things being equal, make
consumers better off. This might cause less demand for necessities and more demand for
luxuries. In recent years improvements in the standard of living have led to greater
spending on services and leisure activities. A redistribution of income via more
progressive and less regressive taxation might have a similar effect. Furthermore, if
average wage increases exceed the rate of inflation, consumers will become better off in
real terms and thus have greater flexibility and scope in the use of their income.
� Tastes. Tastes, in particular fashions, change frequently and it may make the demand for
certain goods volatile. For instance, the demand for jeans had rapidly risen with greater
female independence and individualism. Similarly, concern about health and the greater
awareness of the causes of senile illness have increased the demand for brown bread and
vegetable oil at the expense of white bread and animal fats. Tastes, of course, can be
manipulated by advertising and producers to try to ‘create’ markets, particularly for
ostentatious goods, for example, air conditioners which our ancestors survived perfectly
well without. Some goods are in seasonal demand (e.g. cooked meat) even though they
are available all year round, because tastes change (i.e. more salads are consumed in the
summer).
� The prices of other goods. Goods may be unrelated, or they may be complements or
substitutes. The former have no effect but the latter two are significant. If goods are in
joint demand (i.e. complements such as cars and tyres) a change in the price of one will
affect the other also. Therefore, if the price of cars falls, there is likely to be an increase
in demand for tyres. Where goods are substitutes (e.g. Quality Street chocolates and
Price
0 Q
P
Quantity
Shift in demand
Expansion of demand
Contraction of demand
D1D2
Figure 2.4 A change in quantity demanded and a shift in demand
FUNDAMENTALS OF BUSINESS ECONOMICS 53TH
EM
ARKET
SYSTEM
AN
DTH
EC
OM
PETIT
IVE
PRO
CESS
2006.1

Roses chocolates), a rise in the price of one will cause an increase in demand for the
other (and thus the demand curve will shift to the right). Sometimes, technological
breakthroughs mean that new products come into the market. For instance, the advent
of ink cartridge pens reduced the demand for fountain pens, because the former became
a cheaper (and less messy) substitute.
� Population. An increase in population creates a larger market for most goods, thereby
shifting demand outwards. For instance, an influx of immigrant workers will raise the
demand for most essential goods. Changes in population distribution will also affect
demand patterns. If the proportion of old people relative to young people increases,
then the demand for products such as false teeth, wheelchairs and old people’s homes
will increase to the detriment of gripe water, nappies and cots.
� If price changes there will be a movement along a demand curve known as contractions
or expansions of demand
� If the conditions of demand change there will be a shift in the demand curve
Exercise 2.1Answer the following questions based on the preceding information. You can check your
answers below.
1. Describe the shape of a typical demand curve.
2. What are ‘inferior’ goods?
3. What is the price elasticity of demand?
4. The price of a good falls by 10 per cent but the quantity demanded increases from 100
to 120 units. Calculate the price elasticity of demand.
5. List four factors that influence elasticity.
6. How would you classify a good with a high positive income elasticity?
7. What value would you expect from a cross-elasticity calculation where the two goods
are complements?
8. What is the difference between a shift in demand and an expansion of demand?
Solutions1. Downward sloping from top left to bottom right is the shape of a typical demand
curve.
2. Goods are ‘inferior’ where demand for them falls as their price lowers. This is because
people substitute other ‘seemingly better’ products from the extra income that the price
fall generates.
3. Price elasticity of demand shows the responsiveness of demand to a change in price.
4. 20%=10% ¼ 2. Elastic.
5. Income, substitutes, necessities, time, definition of the market.
6. A superior good has a high positive income elasticity of demand, for example, luxury
services.
7. A minus (� ) value.
8. A shift in demand occurs when the conditions of demand change, whereas an
expansion of demand is the result of a fall in price.
STUDY MATERIAL C454TH
EM
ARKET
SYSTEM
AN
DTH
EC
OM
PETIT
IVE
PRO
CESS
2006.1

2.2 Supply and market
2.2.1 The supply curve of a firm
The supply curve of a firm is underpinned by the desire to make profit. It demonstrates
what a firm will provide to the market at certain prices. Usually it is assumed that suppliers
are profit maximisers and produce where marginal cost equals marginal revenue. What a
firm will supply onto a market will be affected by the average cost of production. This will
vary between the short run and the long run.
Short run(a) The shape of the supply curve depends upon which theory of the firm is applied. In
the traditional theory, where average cost (AC) includes normal profit, the AC curve is
U-shaped in the short run with marginal cost (MC) rising more steeply than AC.
Assuming one selling price for all firms (perfect competition – see later), the firm’s
average revenue (AR) and marginal revenue (MR) will be identical. Thus the firm will
supply output where MC = MR in order to maximise profit. This is illustrated in
Figure 2.5. If the market price rises, then it is assumed that the firm has the capacity (or
stocks) to increase its sales output. In these conditions, the marginal cost curve becomes
the firm’s supply curve. Thus, at price P1 the firm supplies Q1 output because
MC = MR1. When price rises to P2 and P3, then output is also increased to Q2 and Q3
respectively. The firm is also prepared to supply at prices above P3 where MC = MR.
However, there is a minimum level below which a firm will not supply. In the short
run it will continue to supply even when making a loss, as long as the firm covers all its
variable costs. At P2 and Q4 the supplier’s average revenue will be less than its average
cost (loss) but greater than its average variable costs. This means that a loss is made but
some of the fixed costs are paid for. A complete shut-down would be financially worse
because there would be no sales income to pay for any of the fixed costs. At price P1,
average revenue (AR1) just equals average variable costs at Q1 and so output will not
be supplied onto the market below P1. Thus the firm’s supply curve equals the
marginal cost above the average variable cost curve.
(b) The new theories of the firm incorporate the cost-plus pricing approach. In this, a
firm adds a profit margin to its average cost, which has been calculated for a planned
level of output, to establish a selling price. This approach, which seems to accord with
Price, cost
Quantity
AFC
P3
P2
P1
0 Q1 Q2 Q3 Q4
MC
AC
AVC
= Supply
AR3 = MR3
AR2 = MR2
AR1 = MR1
Figure 2.5 Short-run supply curve based on marginal cost
FUNDAMENTALS OF BUSINESS ECONOMICS 55TH
EM
ARKET
SYSTEM
AN
DTH
EC
OM
PETIT
IVE
PRO
CESS
2006.1

practice, gives a horizontal supply curve. Supply is made elastic at a market price (P1),
which is determined for the whole industry.
The minimum and maximum levels of output occur where AR crosses the AC
curve. A profit maximizing or loss minimizing firm will supply only where AR exceeds
AC, that is, between Q1 and Q2 in Figure 2.6. Below output Q1 and above Q2 losses
progressively increase, at price P1.
Changes in the market price (we are still assuming perfect competition) will lead to
changes in output. A higher price such as P2 will lead to a new lower minimum level of
supply Q3 and a new higher maximum output Q4.
Long run(a) In the traditional theory, the marginal cost curve also becomes the supply curve in the
long run. However, it will not necessarily be upward sloping because AC (and thus
MC) can be increasing, constant or decreasing in the long run. The AC was increasing
in the short run because of diminishing returns caused by the fixed factor assumption.
This assumption is relaxed in the long run and so MC (and thus supply) could be
downward-sloping left to right (if economies of scale occur), constant or upward-
sloping (diseconomies). In the long run all costs of production, not just variable costs,
need to be covered, because there is no fixed factor.
(b) The full-cost pricing theory still retains a horizontal supply curve in the long run. It
will be at a higher or lower level than in the short run depending on whether or not
economies or diseconomies of scale are obtained. There will also be minimum and
maximum output levels where AC = AR.
The behaviour of suppliers will also be determined by changes in demand and the
nature of the markets within which they trade. These factors are considered in more
detail later.
� In the short run under conditions of perfect competition, the supply curve of the firm is
its marginal cost curve
� In the short run a firm must cover its variable costs if it is to continue in production
� In the long run, when all costs become variable, the firm must cover all its costs to
remain in production
Price, cost
Quantity
Profit
Supply
AR2
AR1
AC
Q2 Q4Q1Q3
P1
P2
0
Figure 2.6 Short-run supply curves based on cost-plus pricing
STUDY MATERIAL C456TH
EM
ARKET
SYSTEM
AN
DTH
EC
OM
PETIT
IVE
PRO
CESS
2006.1

2.2.2 The supply curve of an industry
Assuming that all the firms in an industry are identical, a market supply curve is composed
of all the supply curves of the individual producers in the industry. The industry supply
curve is an aggregate, which shows what producers are willing to offer for sale at any given
price. In Table 2.1, the supply schedules of three firms are combined to show the industry
supply at each price.
Thus, the supply curve of an industry is similar to that of its individual component firms
but at a higher level.
2.2.3 The elasticity of supply
The elasticity of supply is calculated by the formula:
Percentage change in quantity supplied
Percentage change in price
If a small increase in price leads to a larger rise in quantity supplied, then the supply curve
is elastic. In contrast, an inelastic supply curve shows a smaller increase in the quantity
supplied when there is a large price rise. A supply curve of unit elasticity demonstrates the
same proportionate change in price and quantity supplied.
If the supply curves are drawn as straight lines then the points of intersection with the
price and quantity axis indicate their elasticity. This is shown in Figure 2.7.
In addition, a supply curve parallel to the output axis indicates perfect elasticity, while a
supply curve parallel to the price axis demonstrates perfect inelasticity.
There are several factors which affect the elasticity of supply:
� Time. Supply tends to be more elastic in the long run. Production plans can be varied
and firms can react to price changes. In some industries, notably agriculture, supply is
fixed in the short run and thus perfectly inelastic. However, in manufacturing, supply is
more adaptable.
� Factors of production. Supply can be quickly changed (elastic) if there are available factors,
such as trained labour, unused productive capacity and plentiful raw materials, with
which output can be raised. Although one firm may be able to expand production in the
short run, a whole industry may not, so there could be a divergence between a firm’s
elasticity and that of the industry as a whole.
Table 2.1 Supply schedules
Quantity supplied
Price Firm A Firm B Firm C Industry
0 0 0 0 0
1 10 15 20 45
2 20 30 25 75
3 30 45 30 105
4 40 60 35 135
5 50 75 40 165
FUNDAMENTALS OF BUSINESS ECONOMICS 57TH
EM
ARKET
SYSTEM
AN
DTH
EC
OM
PETIT
IVE
PRO
CESS
2006.1

� Stock levels. If there are extensive stocks of finished products warehoused, then these can
be released onto the market, making supply relatively elastic. Stock levels tend to be
higher when business people are optimistic and interest rates are low.
� Number of firms in the industry. Supply will tend to be more elastic if there are many firms
in the industry, because there is a greater chance of some having the available factors
and high stock. Also, it is possible that industries with no entry barriers or import
restrictions could expand supply quickly as new firms enter the industry in response to
higher prices.
2.2.4 Shifts in supply
The analysis so far has just considered the response of suppliers to differing prices. It has
assumed that the conditions of supply which determine the costs of production are held
constant. In this section, price is assumed to be unchanged and the conditions of supply
are varied. These variations cause shifts in the supply curve.
An upward shift of supplyThis means that the cost of supply has increased. At existing prices less will now be
supplied, as shown on the upward-sloping, elastic supply curve in Figure 2.8. At price P,
the quantity supplied falls from Q to Q1 as the supply curve shifts from S2 to S1.
This results from:
� Higher production costs. In the traditional theory of the firm this means higher marginal
costs, resulting from increased average costs. In the new theory of the firm it may mean
a higher average cost of production or a higher profit margin or a combination of the
two. To keep matters simple we will assume unchanged profit margins.
The costs of production may increase because the factors of production become
expensive. Thus conditions such as higher wage costs per unit, higher input prices and
increased interest rates will lead to reductions in supply.
� Indirect taxes. The imposition of an indirect tax, or a higher rate charged, or lower
subsidies all make supply at existing prices less profitable. A tax means that the profit
Price
Output
S2
S1
S3
Figure 2.7 Supply elasticity
S1 intersects the origin and shows unit elasticity.S2 intersects the output axis and shows inelastic supply.S3 intersects the price axis and shows elastic supply.
STUDY MATERIAL C458TH
EM
ARKET
SYSTEM
AN
DTH
EC
OM
PETIT
IVE
PRO
CESS
2006.1
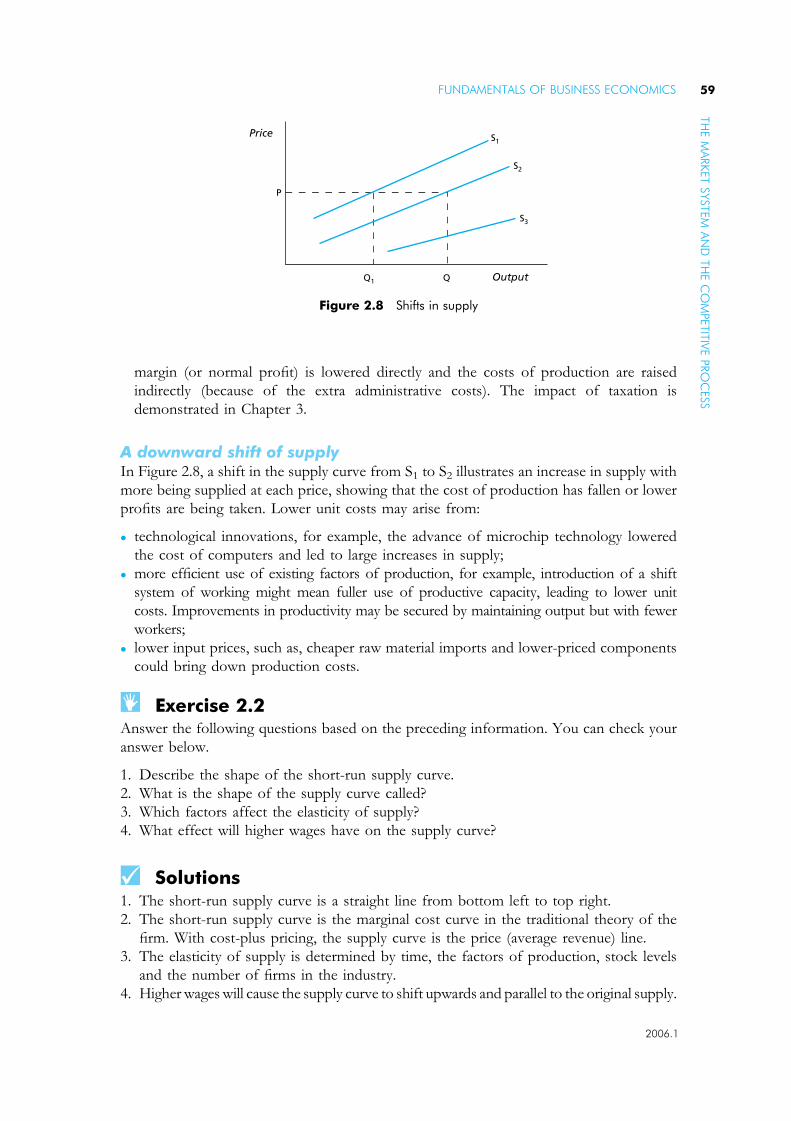
margin (or normal profit) is lowered directly and the costs of production are raised
indirectly (because of the extra administrative costs). The impact of taxation is
demonstrated in Chapter 3.
A downward shift of supplyIn Figure 2.8, a shift in the supply curve from S1 to S2 illustrates an increase in supply with
more being supplied at each price, showing that the cost of production has fallen or lower
profits are being taken. Lower unit costs may arise from:
� technological innovations, for example, the advance of microchip technology lowered
the cost of computers and led to large increases in supply;
� more efficient use of existing factors of production, for example, introduction of a shift
system of working might mean fuller use of productive capacity, leading to lower unit
costs. Improvements in productivity may be secured by maintaining output but with fewer
workers;
� lower input prices, such as, cheaper raw material imports and lower-priced components
could bring down production costs.
Exercise 2.2Answer the following questions based on the preceding information. You can check your
answer below.
1. Describe the shape of the short-run supply curve.
2. What is the shape of the supply curve called?
3. Which factors affect the elasticity of supply?
4. What effect will higher wages have on the supply curve?
Solutions1. The short-run supply curve is a straight line from bottom left to top right.
2. The short-run supply curve is the marginal cost curve in the traditional theory of the
firm. With cost-plus pricing, the supply curve is the price (average revenue) line.
3. The elasticity of supply is determined by time, the factors of production, stock levels
and the number of firms in the industry.
4. Higher wages will cause the supply curve to shift upwards and parallel to the original supply.
Price
Output
P
Q1 Q
S1
S2
S3
Figure 2.8 Shifts in supply
FUNDAMENTALS OF BUSINESS ECONOMICS 59TH
EM
ARKET
SYSTEM
AN
DTH
EC
OM
PETIT
IVE
PRO
CESS
2006.1
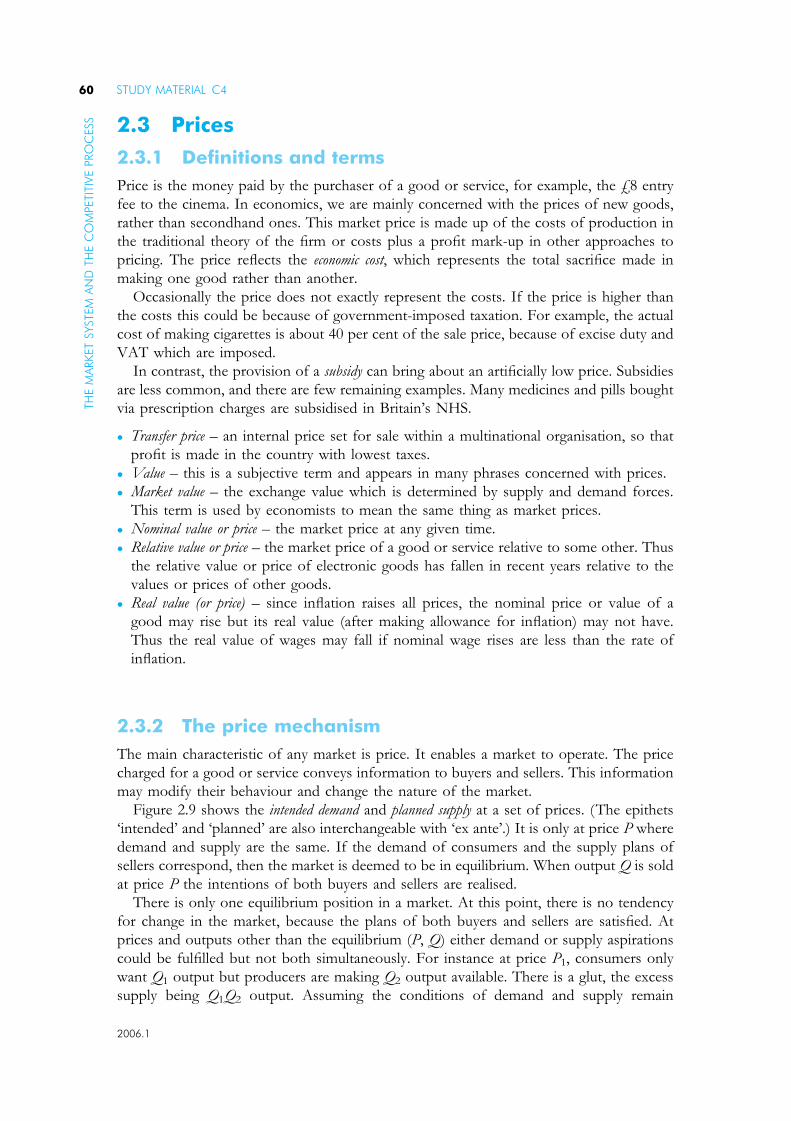
2.3 Prices
2.3.1 Definitions and terms
Price is the money paid by the purchaser of a good or service, for example, the £8 entry
fee to the cinema. In economics, we are mainly concerned with the prices of new goods,
rather than secondhand ones. This market price is made up of the costs of production in
the traditional theory of the firm or costs plus a profit mark-up in other approaches to
pricing. The price reflects the economic cost, which represents the total sacrifice made in
making one good rather than another.
Occasionally the price does not exactly represent the costs. If the price is higher than
the costs this could be because of government-imposed taxation. For example, the actual
cost of making cigarettes is about 40 per cent of the sale price, because of excise duty and
VAT which are imposed.
In contrast, the provision of a subsidy can bring about an artificially low price. Subsidies
are less common, and there are few remaining examples. Many medicines and pills bought
via prescription charges are subsidised in Britain’s NHS.
� Transfer price – an internal price set for sale within a multinational organisation, so that
profit is made in the country with lowest taxes.
� Value – this is a subjective term and appears in many phrases concerned with prices.
� Market value – the exchange value which is determined by supply and demand forces.
This term is used by economists to mean the same thing as market prices.
� Nominal value or price – the market price at any given time.
� Relative value or price – the market price of a good or service relative to some other. Thus
the relative value or price of electronic goods has fallen in recent years relative to the
values or prices of other goods.
� Real value (or price) – since inflation raises all prices, the nominal price or value of a
good may rise but its real value (after making allowance for inflation) may not have.
Thus the real value of wages may fall if nominal wage rises are less than the rate of
inflation.
2.3.2 The price mechanism
The main characteristic of any market is price. It enables a market to operate. The price
charged for a good or service conveys information to buyers and sellers. This information
may modify their behaviour and change the nature of the market.
Figure 2.9 shows the intended demand and planned supply at a set of prices. (The epithets
‘intended’ and ‘planned’ are also interchangeable with ‘ex ante’.) It is only at price P where
demand and supply are the same. If the demand of consumers and the supply plans of
sellers correspond, then the market is deemed to be in equilibrium. When output Q is sold
at price P the intentions of both buyers and sellers are realised.
There is only one equilibrium position in a market. At this point, there is no tendency
for change in the market, because the plans of both buyers and sellers are satisfied. At
prices and outputs other than the equilibrium (P, Q) either demand or supply aspirations
could be fulfilled but not both simultaneously. For instance at price P1, consumers only
want Q1 output but producers are making Q2 output available. There is a glut, the excess
supply being Q1Q2 output. Assuming the conditions of demand and supply remain
STUDY MATERIAL C460TH
EM
ARKET
SYSTEM
AN
DTH
EC
OM
PETIT
IVE
PRO
CESS
2006.1
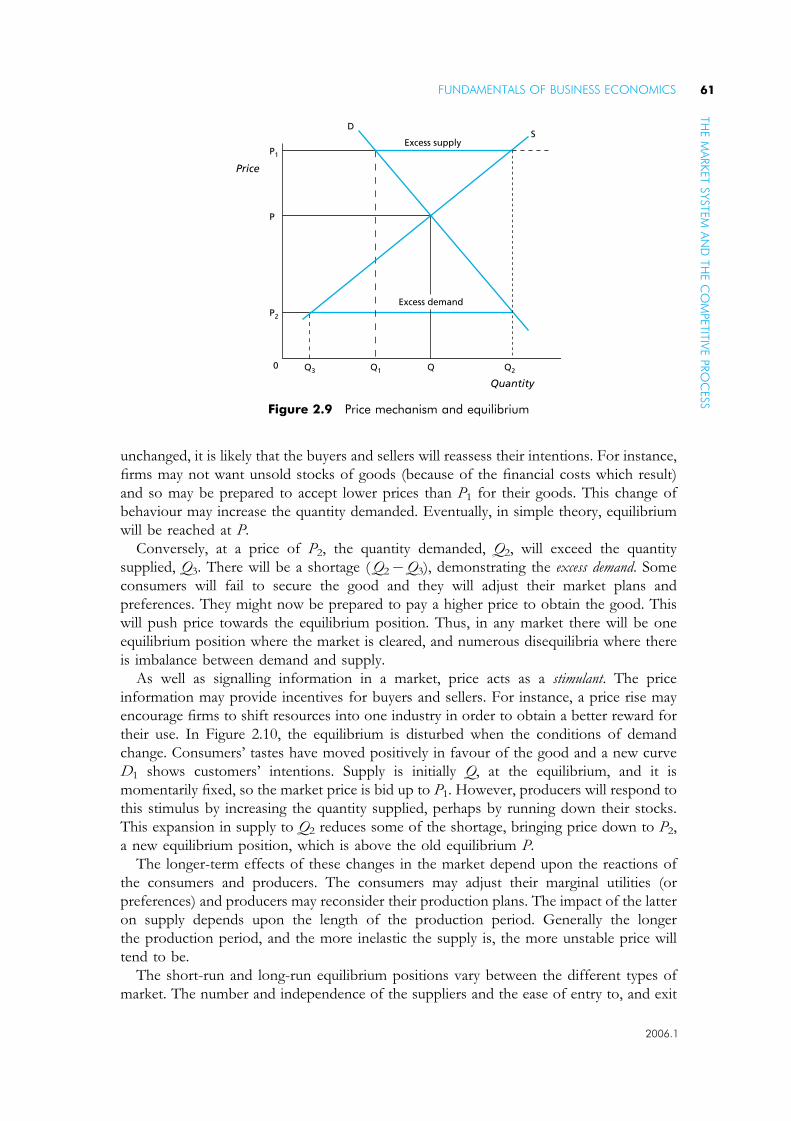
unchanged, it is likely that the buyers and sellers will reassess their intentions. For instance,
firms may not want unsold stocks of goods (because of the financial costs which result)
and so may be prepared to accept lower prices than P1 for their goods. This change of
behaviour may increase the quantity demanded. Eventually, in simple theory, equilibrium
will be reached at P.
Conversely, at a price of P2, the quantity demanded, Q2, will exceed the quantity
supplied, Q3. There will be a shortage ( Q2�Q3), demonstrating the excess demand. Some
consumers will fail to secure the good and they will adjust their market plans and
preferences. They might now be prepared to pay a higher price to obtain the good. This
will push price towards the equilibrium position. Thus, in any market there will be one
equilibrium position where the market is cleared, and numerous disequilibria where there
is imbalance between demand and supply.
As well as signalling information in a market, price acts as a stimulant. The price
information may provide incentives for buyers and sellers. For instance, a price rise may
encourage firms to shift resources into one industry in order to obtain a better reward for
their use. In Figure 2.10, the equilibrium is disturbed when the conditions of demand
change. Consumers’ tastes have moved positively in favour of the good and a new curve
D1 shows customers’ intentions. Supply is initially Q, at the equilibrium, and it is
momentarily fixed, so the market price is bid up to P1. However, producers will respond to
this stimulus by increasing the quantity supplied, perhaps by running down their stocks.
This expansion in supply to Q2 reduces some of the shortage, bringing price down to P2,
a new equilibrium position, which is above the old equilibrium P.
The longer-term effects of these changes in the market depend upon the reactions of
the consumers and producers. The consumers may adjust their marginal utilities (or
preferences) and producers may reconsider their production plans. The impact of the latter
on supply depends upon the length of the production period. Generally the longer
the production period, and the more inelastic the supply is, the more unstable price will
tend to be.
The short-run and long-run equilibrium positions vary between the different types of
market. The number and independence of the suppliers and the ease of entry to, and exit
Price
Excess supply
Excess demand
Quantity
P1
P2
P
0 Q3 Q1 Q2Q
DS
Figure 2.9 Price mechanism and equilibrium
FUNDAMENTALS OF BUSINESS ECONOMICS 61TH
EM
ARKET
SYSTEM
AN
DTH
EC
OM
PETIT
IVE
PRO
CESS
2006.1
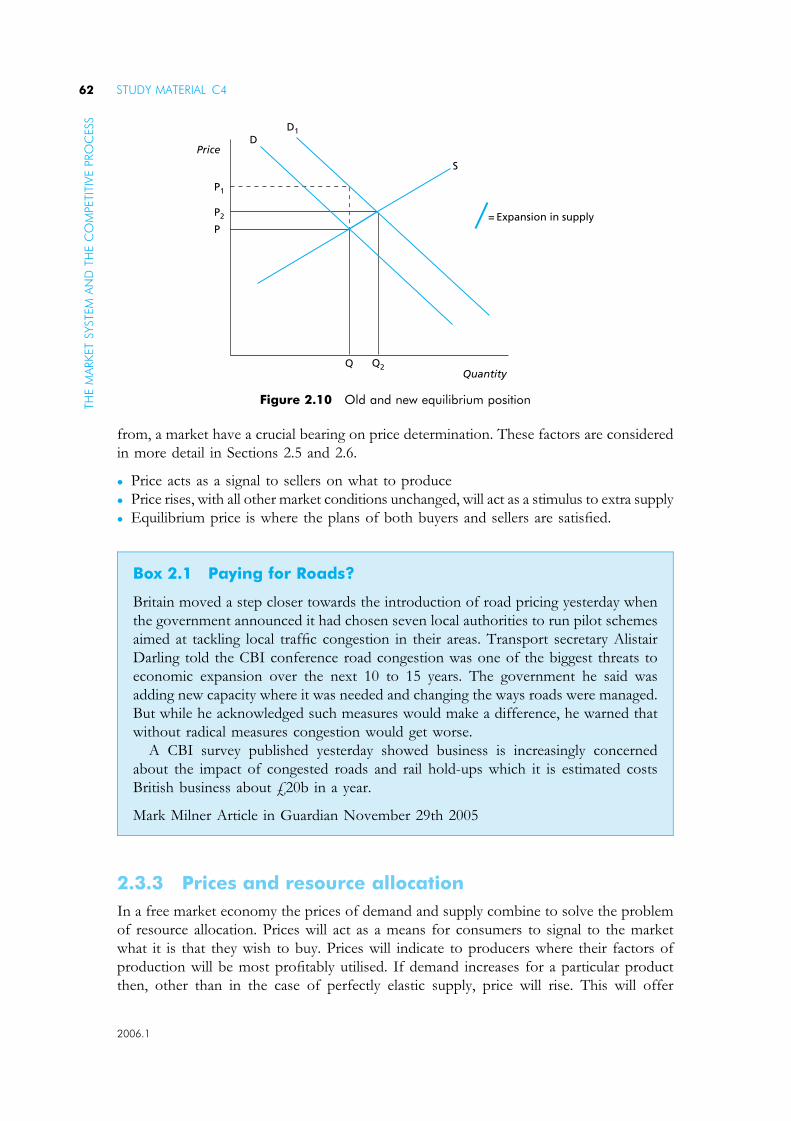
from, a market have a crucial bearing on price determination. These factors are considered
in more detail in Sections 2.5 and 2.6.
� Price acts as a signal to sellers on what to produce
� Price rises, with all other market conditions unchanged, will act as a stimulus to extra supply
� Equilibrium price is where the plans of both buyers and sellers are satisfied.
2.3.3 Prices and resource allocation
In a free market economy the prices of demand and supply combine to solve the problem
of resource allocation. Prices will act as a means for consumers to signal to the market
what it is that they wish to buy. Prices will indicate to producers where their factors of
production will be most profitably utilised. If demand increases for a particular product
then, other than in the case of perfectly elastic supply, price will rise. This will offer
Price
Quantity
= Expansion in supply
Q Q2
P2
P1
D1D
S
P
Figure 2.10 Old and new equilibrium position
Box 2.1 Paying for Roads?
Britain moved a step closer towards the introduction of road pricing yesterday when
the government announced it had chosen seven local authorities to run pilot schemes
aimed at tackling local traffic congestion in their areas. Transport secretary Alistair
Darling told the CBI conference road congestion was one of the biggest threats to
economic expansion over the next 10 to 15 years. The government he said was
adding new capacity where it was needed and changing the ways roads were managed.
But while he acknowledged such measures would make a difference, he warned that
without radical measures congestion would get worse.
A CBI survey published yesterday showed business is increasingly concerned
about the impact of congested roads and rail hold-ups which it is estimated costs
British business about £20b in a year.
Mark Milner Article in Guardian November 29th 2005
STUDY MATERIAL C462TH
EM
ARKET
SYSTEM
AN
DTH
EC
OM
PETIT
IVE
PRO
CESS
2006.1
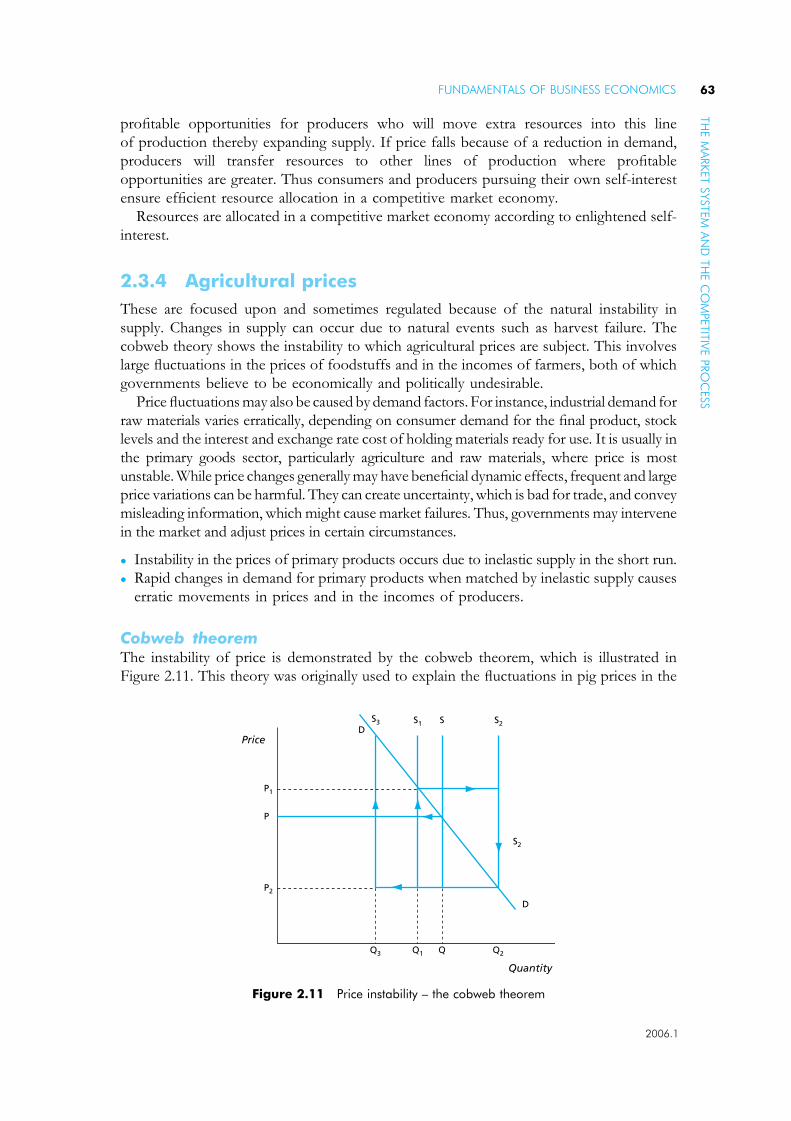
profitable opportunities for producers who will move extra resources into this line
of production thereby expanding supply. If price falls because of a reduction in demand,
producers will transfer resources to other lines of production where profitable
opportunities are greater. Thus consumers and producers pursuing their own self-interest
ensure efficient resource allocation in a competitive market economy.
Resources are allocated in a competitive market economy according to enlightened self-
interest.
2.3.4 Agricultural prices
These are focused upon and sometimes regulated because of the natural instability in
supply. Changes in supply can occur due to natural events such as harvest failure. The
cobweb theory shows the instability to which agricultural prices are subject. This involves
large fluctuations in the prices of foodstuffs and in the incomes of farmers, both of which
governments believe to be economically and politically undesirable.
Price fluctuations may also be caused by demand factors. For instance, industrial demand for
raw materials varies erratically, depending on consumer demand for the final product, stock
levels and the interest and exchange rate cost of holding materials ready for use. It is usually in
the primary goods sector, particularly agriculture and raw materials, where price is most
unstable. While price changes generally may have beneficial dynamic effects, frequent and large
price variations can be harmful. They can create uncertainty, which is bad for trade, and convey
misleading information, which might cause market failures. Thus, governments may intervene
in the market and adjust prices in certain circumstances.
� Instability in the prices of primary products occurs due to inelastic supply in the short run.
� Rapid changes in demand for primary products when matched by inelastic supply causes
erratic movements in prices and in the incomes of producers.
Cobweb theoremThe instability of price is demonstrated by the cobweb theorem, which is illustrated in
Figure 2.11. This theory was originally used to explain the fluctuations in pig prices in the
Price
Quantity
S3 S1 S2
S2
Q2Q1Q3
P2
P1
P
Q
S
D
D
Figure 2.11 Price instability – the cobweb theorem
FUNDAMENTALS OF BUSINESS ECONOMICS 63TH
EM
ARKET
SYSTEM
AN
DTH
EC
OM
PETIT
IVE
PRO
CESS
2006.1
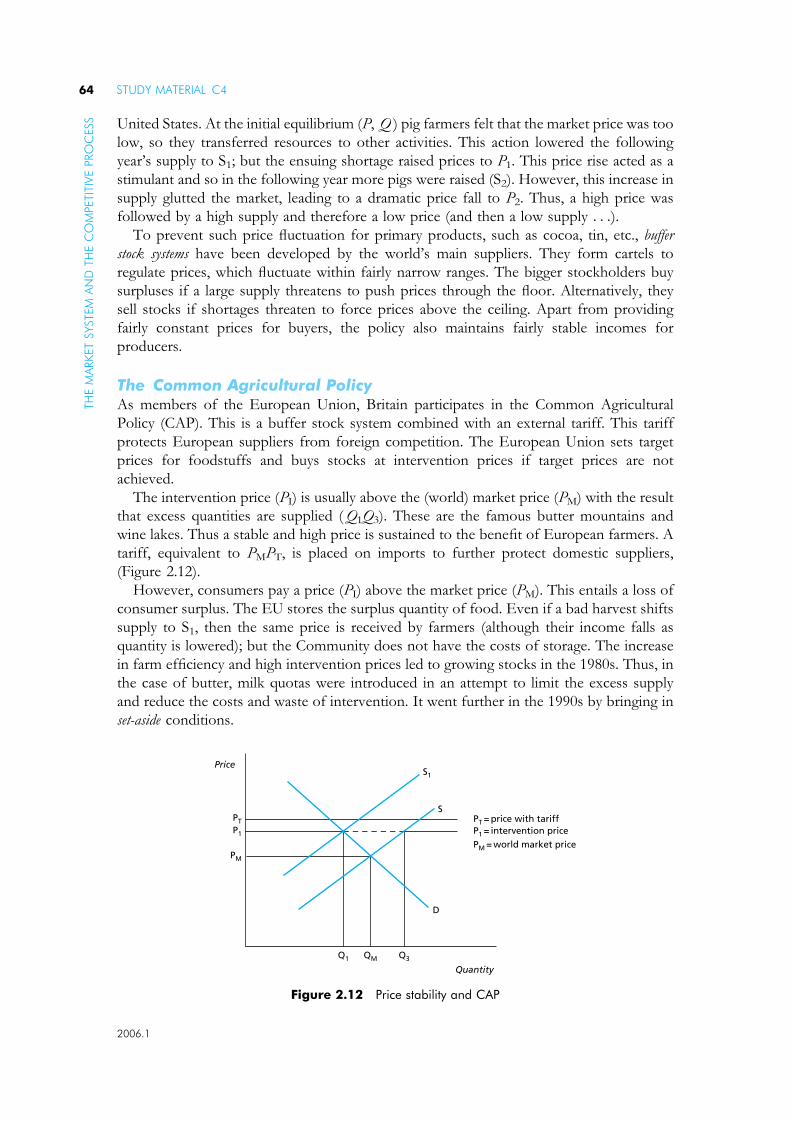
United States. At the initial equilibrium (P, Q ) pig farmers felt that the market price was too
low, so they transferred resources to other activities. This action lowered the following
year’s supply to S1; but the ensuing shortage raised prices to P1. This price rise acted as a
stimulant and so in the following year more pigs were raised (S2). However, this increase in
supply glutted the market, leading to a dramatic price fall to P2. Thus, a high price was
followed by a high supply and therefore a low price (and then a low supply . . .).To prevent such price fluctuation for primary products, such as cocoa, tin, etc., buffer
stock systems have been developed by the world’s main suppliers. They form cartels to
regulate prices, which fluctuate within fairly narrow ranges. The bigger stockholders buy
surpluses if a large supply threatens to push prices through the floor. Alternatively, they
sell stocks if shortages threaten to force prices above the ceiling. Apart from providing
fairly constant prices for buyers, the policy also maintains fairly stable incomes for
producers.
The Common Agricultural PolicyAs members of the European Union, Britain participates in the Common Agricultural
Policy (CAP). This is a buffer stock system combined with an external tariff. This tariff
protects European suppliers from foreign competition. The European Union sets target
prices for foodstuffs and buys stocks at intervention prices if target prices are not
achieved.
The intervention price (PI) is usually above the (world) market price (PM) with the result
that excess quantities are supplied ( Q1Q3). These are the famous butter mountains and
wine lakes. Thus a stable and high price is sustained to the benefit of European farmers. A
tariff, equivalent to PMPT, is placed on imports to further protect domestic suppliers,
(Figure 2.12).
However, consumers pay a price (PI) above the market price (PM). This entails a loss of
consumer surplus. The EU stores the surplus quantity of food. Even if a bad harvest shifts
supply to S1, then the same price is received by farmers (although their income falls as
quantity is lowered); but the Community does not have the costs of storage. The increase
in farm efficiency and high intervention prices led to growing stocks in the 1980s. Thus, in
the case of butter, milk quotas were introduced in an attempt to limit the excess supply
and reduce the costs and waste of intervention. It went further in the 1990s by bringing in
set-aside conditions.
PriceS1
S
D
P1
PT PT = price with tariffP1 = intervention pricePM = world market price
Q1 QM Q3
PM
Quantity
Figure 2.12 Price stability and CAP
STUDY MATERIAL C464TH
EM
ARKET
SYSTEM
AN
DTH
EC
OM
PETIT
IVE
PRO
CESS
2006.1

Exercise 2.3Answer the following questions based on the preceding information. You can check your
answers below.
1. What is the difference between a ‘real’ price and a ‘normal’ price?
2. When does excess supply occur?
3. What mainly causes the price instability of agricultural goods?
4. How can producers attempt to overcome the problems that the cobweb theory illustrates?
5. What does the operation of the CAP and similar schemes tend to cause?
Solutions1. A ‘real’ price allows for inflation whereas a ‘normal’ price is the present face value.
2. Excess supply occurs when the amount supplied is greater than the amount demanded
at a given price.
3. The price instability of agricultural goods is caused by wide variations in the supply,
which is naturally inelastic in the short run.
4. Producers can overcome the fluctuations in agricultural goods prices by price-fixing
within a narrow range. This requires them to co-operate through a cartel and storing
surplus stocks, which are then released on to the market if there is insufficiency.
5. The operation of the CAP causes higher prices, excess supplies and storage costs, but it
does stabilise farm prices.
2.3.5 Interference with market prices
There may be occasions when the equilibrium price established by the market forces of
demand and supply may not be the most desirable price. The market price might be too
low, as in the case of the wage rate, to enable workers to have an acceptable standard of
living. Alternatively the market price might be too high, as in the case of the housing rent,
to provide affordable accommodation for people. With such cases the government might
wish to set prices above or below the market equilibrium price.
Minimum priceIf the government sets a minimum price above the equilibrium price (often called a price
floor), there will be a surplus of supply created. In Figure 2.13 this surplus is Q1Q2. If this
minimum price was applied in the labour market it would be known as a minimum wage
and the surplus would be the equivalent of unemployment.
The problem with price floors is that they cause surpluses of products which have to be
stored or destroyed, or unemployment which would be a waste of a factor of production.
Another way of looking at the same problem is to state that it leads to a misallocation of
resources both in the product and/or the factor market which causes lower economic
growth. There also may be the temptation for firms to attempt to ignore the price floor,
for example, by informal arrangements with workers, which would lead to a further waste
of resources in implementing such arrangements as well as raising issues of fair treatment
for the workers involved.
FUNDAMENTALS OF BUSINESS ECONOMICS 65TH
EM
ARKET
SYSTEM
AN
DTH
EC
OM
PETIT
IVE
PRO
CESS
2006.1

Government-imposed minimum prices cause:
� Excess supply
� Misallocation of resources
� Waste of resources.
Maximum priceIf the government sets a maximum price below the equilibrium price (often called a price
ceiling), there will be a shortage of supply created. In Figure 2.14 this shortage is Q1Q2.
If the shortages of supply persist then problems can arise. The limited supply has to be
allocated by some means other than by price. This can be done by queuing, by rationing or
by some form of favouritism, for example, by giving preference to regular customers. The
difficulty with any of these alternative mechanisms is that they can be considered arbitrary
and unfair by those who fail to secure the product. A consequence of the shortage can
be the emergence of black markets. This is where buyers and sellers agree upon an
illegal price which is higher than that which has been officially sanctioned at the maximum
price.
Minimum price
Price
QuantityQ1 Q2
D
S
Equilibrium price
Figure 2.13 Minimum price/wage
Equilibrium price
Price
Quantity
Maximum price
Q1 Q2
D
S
Figure 2.14 Maximum price
STUDY MATERIAL C466TH
EM
ARKET
SYSTEM
AN
DTH
EC
OM
PETIT
IVE
PRO
CESS
2006.1

Maximum prices can also lead to a misallocation of resources. Producers will reduce
output of those products subject to price controls as these products are now relatively less
profitable than those products where no price controls exist. In the housing market this
may lead to fewer apartments for rent as landowners develop office blocks rather than
residential houses. Alternatively the quality of the product may be allowed to drop as a way
of reducing costs when profits are constrained by price controls. This failure to maintain
property can mean that apartments fall into disrepair.
Government-imposed maximum prices cause:
� Shortages of supply
� Arbitrary ways of allocating a product
� Misallocation of resources.
2.4 Large-scale production
2.4.1 The growth of firms
Firms grow through internal expansion and integration. A firm may expand by producing
and selling more of its existing products or by extending its range of products. Thus, the
general retailer Boots started off as Jesse Boot’s, a Nottingham chemists shop. Such
successful firms have often developed through enterprising management, which has
utilised a willing workforce, unused capacity and available finance.
Integration occurs when firms join together, by either merger or takeover. A merger is an
amalgamation of at least two firms into one organisation, for example, Cadbury-
Schweppes. It is usual for shareholders in the old firm to exchange their old shares for
shares in the new firm in agreed proportions.
The Monopolies and Mergers Commission, renamed the Competition Commission in
April 1999, investigates mergers and recommends a decision to the Trade and Industry
Secretary. For example, in 1998 it recommended that Bass be allowed to buy Carlsberg-
Tetley for £200m, provided that it then sold 1900 pubs. However, trade minister Margaret
Beckett blocked the bid and overturned the MMC ruling because of Bass’s ‘significant
increase’ in market power as a producer and wholesaler of beer.
A takeover differs from a merger in that the initiative for acquisition comes from the
offering company and the board of the target company is opposed to, or not fully in favour
of, the bid. In March 2000, the Royal Bank of Scotland made a hostile bid for (and took
over) Nat West. With mergers there is usually willing co-operation between the two firms.
Takeovers are financed either with cash and/or an offer in shares in the acquiring
companies, with maybe a cash adjustment. The price offered is nearly always higher than
the current Stock Exchange valuation. The Stock Exchange has a Takeover Panel which
vets the procedures to ensure fair and equal treatment for all the shareholders of the target
company.
The general objective of mergers and takeovers is to increase profits, usually in the short
run, and earnings per share. This has been criticised as short sighted as it may reduce
longer-term product development and market development.
There are three main types of integration: horizontal, vertical and diversification.
FUNDAMENTALS OF BUSINESS ECONOMICS 67TH
EM
ARKET
SYSTEM
AN
DTH
EC
OM
PETIT
IVE
PRO
CESS
2006.1

Horizontal integrationFirms in the same industry and at the same stage of production join together. This type of merger
occurs most frequently in brewing ; for instance Scottish and Newcastle Breweries took over
many regional breweries in the United Kingdom in the 1980s and 1990s and then merged
with Courage Brewery in 1995.
The reasons for such integration include:
� To obtain the benefits of economies of scale. A big retailer will have much more buying power
than two smaller retailers and so will be able to lower their input costs. The increased
financial muscle enables the large retailer to negotiate better terms with their suppliers.
In manufacturing industry, horizontal integration was justified in the 1960s as a ‘synergy’
between companies on the basis of ‘2 + 2 = 5’. However, in some cases it was
unsuccessful when rationalisation was slow. A notable example of failure was when
Asda and MFI demerged.
� To increase market share. If a takeover reduces competition, the acquiring company can
probably raise its market share. In retailing, mergers usually mean more outlets through
which to sell the products of the two companies. Outside retailing, horizontal mergers
have declined since the 1970s, partly because of the legislation on monopolies.
� To fight off imports. This defensive motive was behind the proposed GEC–Plessey merger
(which the Department of Trade supported but the Ministry of Defence opposed in evidence
to the Monopolies Commission), as they competed in an electronics industry which the
Americans and Japanese were infiltrating from their dominant international positions.
� To pool technology. The wasteful duplication of research facilities can be avoided and the
beneficial sharing of technical ‘know-how’ can be developed when manufacturers
integrate, for example, Renault–Nissan.
Vertical integrationVertical growth occurs when one firm moves into another stage of production, which might
otherwise be independent, in the same industry. This integration may be backwards towards
the source of supply, for example, Ross Foods, which sells frozen food, purchasing its own
fleet of trawlers; or forwards when the producer buys out stages nearer the market, for
example, Ross Foods purchasing a retail outlet. The reasons for vertical integration include:
� The elimination of transaction costs. This will increase cost efficiency between the various
stages of production, by reducing delivery costs and eliminating the profits of
middlemen. This partly explains the mergers in the brewing industry.
� Increasing entry barriers. By gaining more control over supplies and/or sales, it will
become more difficult for new competitors to enter the market.
� Securing supplies. By controlling its own sources of supply as a result of backward
integration, a firm can achieve more flexible production. For instance a brewer
experiencing increased demand could readily use his own lorry fleet to collect hops from
stock and thereby temporarily raise production levels.
� Improving the distribution network with better market access. Forward integration into
marketing enables a firm to control the conditions under which its goods are sold. For
instance, a brewer can dictate pricing, advertising and display of his beer to a ‘tied’ public
house.
� Gaining economies of scale ; these benefits are common
� making better use of existing technology. to vertical and horizontal integration.
�
STUDY MATERIAL C468TH
EM
ARKET
SYSTEM
AN
DTH
EC
OM
PETIT
IVE
PRO
CESS
2006.1

DiversificationThis occurs when one firm expands into an industry with which it was previously
unconnected, for example, Virgin records into travel. Some mergers are classed as lateral
where the goods being newly produced by the expanding firm have a close link with their
main products, for example, cars and lorries.
However, increasingly integration creates conglomerates, that is, groups of companies
pursuing different activities in different industries. The mergers of the 1980s have led to
many of Britain’s most successful enterprises, for example, Hanson Trust, becoming
financial holding companies, rather than integrated producers of goods and services. These
organisations sell off the inadequate parts of underperforming companies and develop
those with potential. The conglomerates thus behave like investment bankers.
The reasons, other than short-term profit motives, for diversifications are:
� To minimise risks. If its main line is subject to trade fluctuations or going out of fashion, a firm
may diversify into an expanding area to protect itself, for example, British American Tobacco
purchasing Eagle Star. Such takeovers seek financial security, and higher corporate growth;
� To make full use of expertise. Dynamic management can use the expertise residing in a
company in seemingly unconnected areas. Thus Centrica, initially a company selling gas,
took over the AA, a motoring organisation, so as to fully utilise its large customer data
base and sell a greater range of products.
� To achieve economies of scale. Particularly in administration. Thus a merger might lead to the
fuller utilisation of, and greater return from, departments such as data processing,
accounts and exports.
However, mergers are not always successful. Sometimes diseconomies of scale occur when
merged managements experience personality clashes and become divided. Rationalisation
does not always lead to lower cost production and may alienate customers and workers.
The same is true of takeovers which lead to asset stripping and to less production and
redundancies. Indeed, some have argued that the costs to society outweigh the private
gains; thus the proponents of a merger should have to ‘prove’ its virtue rather than the
critics have to demonstrate its ‘guilt’ (against the public interest) as happens now.
In 1995, the phrase ‘vertical disintegration’ entered the dictionary. This explains the hiving
off by a company of many of its service sectors or product centres, often to management
buyouts, in order to reduce costs and concentrate on its core business. Such a policy is not
quite the same as a demerger, where a firm sells off a brand (or brands) to an existing large
company. The latter is often a rival and thus augments its market share. In 1995, Forte
sold its chain of Little Chefs, Travelodges and Welcome Breaks to Whitbread, which
already owned Beefeaters, Travel Inns, Brewers Fayres and Pizza Huts.
2.4.2 Market concentration
The growth of firms has increasingly led to greater domination of individual markets by
few firms. This is referred to as market concentration and describes the extent to which the
largest firms in an industry control their output, sales and employment. Concentration
ratios can take two forms.
� Market and seller concentration
This measures the share of production, sales or employment of the largest few firms in
an industry or market. Often a five-firm concentration ratio is used. Traditionally,
FUNDAMENTALS OF BUSINESS ECONOMICS 69TH
EM
ARKET
SYSTEM
AN
DTH
EC
OM
PETIT
IVE
PRO
CESS
2006.1
manufacturing industries are the most concentrated. In 2004 the UK had five-firm
concentration ratios of over 85 per cent in car, cement, steel and tobacco production.
There is also increasing concentration in service industries such as accountancy,
advertising, banking and food retailing. The growth in five-firm concentration ratios is
driven by the desire to exploit economies of scale.
� High concentration ratios
There are associated with a high degree of market or monopoly power by the largest
firms in an industry or market sector.
Sometimes concentration ratios overstate the extent of market power in an industry
held by the leading five firms. This occurs when there is a significant amount of
competition from imports. However, concentration ratios may also understate the true
level of market power held by the leading five firms where local or regional monopolies
exist, as in the case of supermarkets.
� Aggregate concentration ratio
This measures the share of total production or employment contributed by the largest
firms in the whole economy. The oldest concentration ratio used in the UK is the 100-
firm ratio used in manufacturing. This measures the share of the largest 100 private
firms in total manufacturing net output. This ratio rose from 14.8 per cent in 1900 to
41.7 per cent in 1975 but fell back to 32 per cent in 2001.
� Increases in firm size implicit in the rise in concentration ratios have occurred more by
takeovers and mergers than by internal growth of the leading firms. We will examine the
effect on market competition and structures later in Section 2.5.
2.5 Market structures
2.5.1 Markets in economies
The word ‘market’ is used in many contexts. In economic theory a market is where goods
and services are bought and sold, although it may not be an actual place. For instance, foreign
currencies are bought and sold through international telephone deals and telex transfers
between bank accounts. The buyers and sellers must be in contact and in modern societies
the exchange is via the medium of money. The traders involved are willingly participating
in the exchange and usually require information on the prices of the goods/services
involved.
Most markets in practice are unorganised and decentralised. Governments may
influence markets generally through legal constraints but they do not decide how
much is traded. This is usually determined by price, which acts as a signal and as an
incentive.
There are many markets in all types of modern economy, ranging from large-scale and
official, for example, the Stock Exchange, to small and illegal, like a drug addict buying
heroin from a street pusher. Some markets are very specialised, for example, the copper
exchange on the London Metal Exchange. Markets tend to be dynamic, expanding and
becoming more sophisticated to meet particular needs. Thus, not only can major
commodities be bought and sold at prevailing prices (spot market), they can also be
purchased now for an agreed price to be supplied at a future date. Such a futures market
meets industry’s need to plan future production.
STUDY MATERIAL C470TH
EM
ARKET
SYSTEM
AN
DTH
EC
OM
PETIT
IVE
PRO
CESS
2006.1
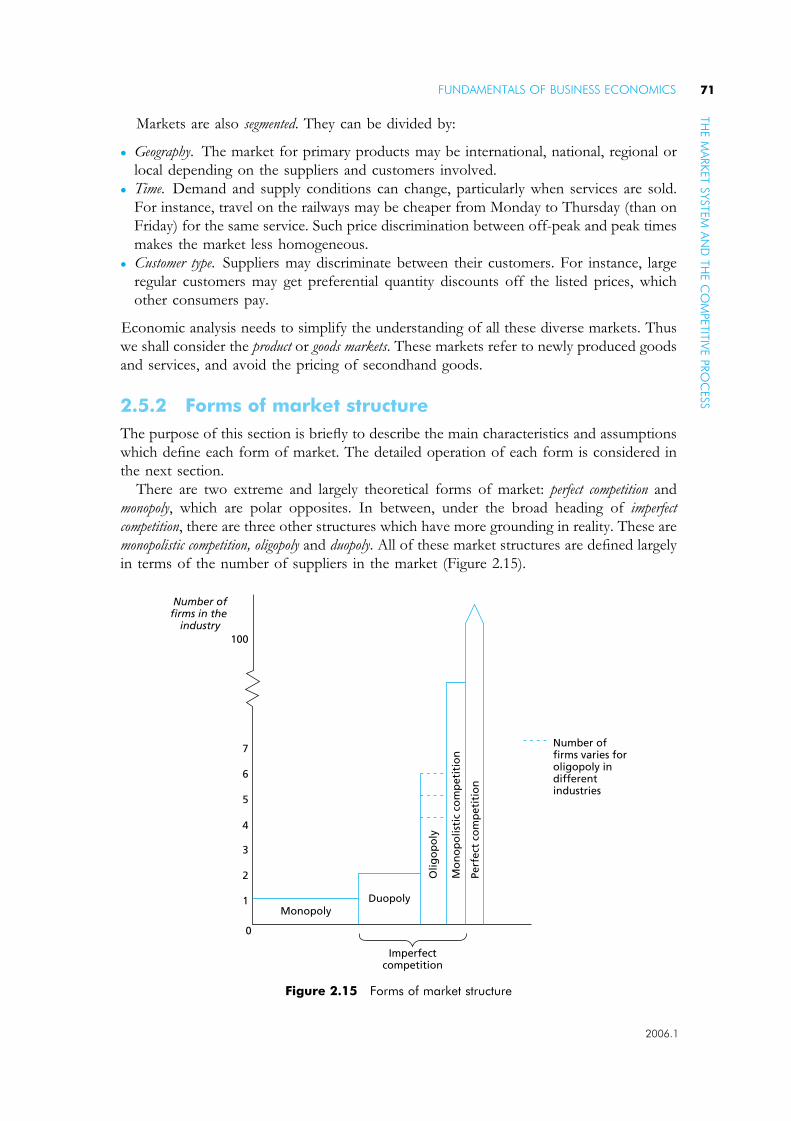
Markets are also segmented. They can be divided by:
� Geography. The market for primary products may be international, national, regional or
local depending on the suppliers and customers involved.
� Time. Demand and supply conditions can change, particularly when services are sold.
For instance, travel on the railways may be cheaper from Monday to Thursday (than on
Friday) for the same service. Such price discrimination between off-peak and peak times
makes the market less homogeneous.
� Customer type. Suppliers may discriminate between their customers. For instance, large
regular customers may get preferential quantity discounts off the listed prices, which
other consumers pay.
Economic analysis needs to simplify the understanding of all these diverse markets. Thus
we shall consider the product or goods markets. These markets refer to newly produced goods
and services, and avoid the pricing of secondhand goods.
2.5.2 Forms of market structure
The purpose of this section is briefly to describe the main characteristics and assumptions
which define each form of market. The detailed operation of each form is considered in
the next section.
There are two extreme and largely theoretical forms of market: perfect competition and
monopoly, which are polar opposites. In between, under the broad heading of imperfect
competition, there are three other structures which have more grounding in reality. These are
monopolistic competition, oligopoly and duopoly. All of these market structures are defined largely
in terms of the number of suppliers in the market (Figure 2.15).
Monopoly
Imperfectcompetition
7
100
Number offirms in the
industry
6
5
4
3
2
1
0
Duopoly
Perf
ect
com
pet
itio
n
Mo
no
po
listi
c co
mp
etit
ion
Olig
op
oly
Number offirms varies foroligopoly indifferentindustries
Figure 2.15 Forms of market structure
FUNDAMENTALS OF BUSINESS ECONOMICS 71TH
EM
ARKET
SYSTEM
AN
DTH
EC
OM
PETIT
IVE
PRO
CESS
2006.1
Perfect competitionThis structure describes an imaginary situation whose characteristics are as follows:
� Many buyers and sellers, so no one individual, can influence price by their actions. Buyers
and sellers can trade as much as they want at the ruling market price, which is
determined by the interaction of demand and supply.
� Buyers and sellers are rational economic beings. This translates into firms being profit
maximisers.
� Buyers and sellers have perfect information about the product.
� The product is homogeneous. Hence there is no brand differentiation.
� There are no entry barriers. Buyers and sellers are free to enter and leave the market and
there is no government interference in the market.
� Perfect mobility exists in the market both for products and factors of production.
� Normal profits are earned in the long run as any abnormal profits/losses are removed by
competitive forces.
In reality, perfect markets rarely exist. An approximation is the Stock Exchange or local
farmers’ markets.
MonopolyThis term is subject to two interpretations. First, in theory, it denotes a market in which
there is one supplier and many consumers. Thus in a pure monopoly the firm is the
industry, and thereby controls market supply. It can either fix price and let demand
determine the amount supplied, or fix supply and let demand determine the market price.
Second, in practice British legislation identifies a firm in the private sector as holding a
monopoly if its market share exceeds 25 per cent. As we shall see, this definition includes
duopolists and oligopolists.
In a capitalist economy, a monopolist would be a profit maximiser. However, in a planned
economy it is unlikely that state monopolies would have such a goal. In the UK mixed
economy the previously nationalised industries operated like monopolies and sought large
profits, for example, gas and electricity. Although facing competition from one another in the
market for energy, each had a monopoly in its own fuel since there were entry barriers which
limited the ability of new firms to enter the market. However, the law creating the sole supplier
rights of such public monopolies is not sacrosanct. The government sets price controls on
their operation and opened them up to competition and eventual full privatisation.
Imperfect competitionBetween perfect competition and monopoly, several forms of market exist, exhibiting
some of the characteristics of the two extreme structures.
Monopolistic competition.
This is characterised by:
� Large number of producers who supply similar but not homogeneous products.
� Products are differentiated in style, image and price.
� There is not one prevailing market price. Firms may compete on price to try and gain
market share at the expense of rivals.
� Consumers lack perfect knowledge but have a choice of products. This choice may be
extended if new firms enter the industry perhaps attracted by the prospect of abnormal
profits.
STUDY MATERIAL C472TH
EM
ARKET
SYSTEM
AN
DTH
EC
OM
PETIT
IVE
PRO
CESS
2006.1

Oligopoly.
This is characterised by:
� A few large firms with a high concentration ratio.
� There is a substantial non-price competition, for example, by advertising. Firms often
produce several branded goods in the same market. Hence products are not homogeneous.
� The behaviour of firms is often dependent on their rivals’ actions and hence the market
has a degree of uncertainty about it. A firm is not certain how rivals will respond to
action initiated by itself.
� Price stability is often associated with oligopolistic behaviour as firms choose not to
raise or lower prices as they cannot be sure how rival firms will react to any such price
changes.
� Consumers in oligopolistic markets lack detailed market information and are susceptible
to the market strategies of the suppliers.
� New firms are unlikely to enter an oligopoly. The entrenched dominance often involving
economies of scale enable them to fight off new competition. However, advances in
technology and the financial power of transnational corporations mean that existing
oligopolies can be challenged today.
In a competitive oligopoly, the features of monopolistic competition apply. However, the
large firms in an oligopoly may collude together ; oligopolists may raise the total profits which
can be made in the industry and thereby increase their own profits. In contrast, cut-throat
competition renders profit-making more difficult. The price-fixing and market-sharing
tactics, which could be used by collusive oligopolists, are likely to be investigated by the
Director General of Fair Trading as they would constitute restrictive trading practices.
However, it could be argued that consumers may benefit from an oligopoly through a wide
range of branded goods, price stability and after-sales servicing. In addition if price stability
facilitates accurate forward planning by producers, then consumers might gain from better
products and lower costs of production in the long run.
Duopoly.
This market is characterised by:
� Two, usually large, firms dominate.
� Each producer has some control over price and output, but most consider the possible
reactions of the competitor firm. Duopolists, like oligopolists, can act competitively or
collusively.
� Extensive non-price competition exists.
2.5.3 Efficiency
This much-used (and -abused) term has various adjectives applied to it in economics.
However, it is possible to discern two general meanings and associate descriptors with
each aspect of economic performance.
� Technical efficiency – production at the lowest cost. This is usually used to describe the
efficiency of a firm in the production of a good. An extension of this idea to the whole
economy is productive efficiency, which is maximised when an economic system operates at
the limit of the production frontier. This general meaning tries to relate inputs to output.
FUNDAMENTALS OF BUSINESS ECONOMICS 73TH
EM
ARKET
SYSTEM
AN
DTH
EC
OM
PETIT
IVE
PRO
CESS
2006.1
� Allocative efficiency – the best use of resources to produce goods and services which people
want. The idea is to maximise the welfare of consumers. When each market in an
economy operates so as to maximise consumer satisfaction, there is said to be economic
efficiency. This general meaning relates the use of resources to consumer satisfaction.
The issue is further complicated by time. The most efficient firm at one point in time may
not be so at a later date. For example the relative technical efficiency of one firm may
change over time as a result of investment. For the whole economy, this would be shown
by an outward movement of a production possibility curve. Similarly, people’s preferences
for goods may change and so utilities alter, thereby affecting allocative efficiency.
The result of such changes is that identification of productive and economic efficiency
for the whole economy at a macro level is impossible. Thus, it makes more sense to
concentrate on considering technical and allocative efficiency in markets in a micro
analysis.
Spotting efficiencyTechnical efficiency is shown when a firm (or industry) produces at the lowest point on its
average cost curve, that is, where MC crosses AC.
Allocative efficiency occurs when the price charged to the consumer equals the marginal
cost of its supply, that is, P = MC. This indicates that the value to the consumer equals
the cost of production to the supplier. The price paid indicates the utility gained by
the consumer and this satisfaction is represented by the demand curve. Conversely, the
marginal cost of the unit of output is shown by the supply curve. Thus, allocative efficiency
occurs where demand equals supply. This explanation of allocative efficiency makes a
significant simplifying assumption. This is that the cost of the output is the cost to society. In
practice, it is the cost to the firm, which is a private cost and not necessarily the total cost to
society. This latter includes externalities which may occur from production but are not
included in the cost. For example, if the price of a packet of twenty cigarettes is £4.00p, the
full cost including the indirect effects of extra healthcare, etc., might be £4.50.
Exercise 2.4Answer the following questions based on the preceding information. You can check your
answers below.
1. What is a market?
2. What are the main assumptions of perfect competition?
3. In a monopoly, if a firm fixes the price, what determines the amount supplied?
4. Imperfect competition can be divided into three submarkets. What are they?
5. What is allocative efficiency?
Solutions1. A market is where goods and services are bought and sold.
2. Perfect competition assumes homogeneous products where many buyers and many
sellers all have perfect information. In addition, factors of production are perfectly
mobile and there are no entry barriers or government influence.
3. Demand for the product.
STUDY MATERIAL C474TH
EM
ARKET
SYSTEM
AN
DTH
EC
OM
PETIT
IVE
PRO
CESS
2006.1

4. Imperfect competition can be subdivided into monopolistic competition, oligopoly and
duopoly.
5. Allocative efficiency refers to the best use of resources producing goods and services
which people want. At the level of an individual firm, it occurs when the prices charged
equal the marginal costs of production. In theory, it occurs only in perfect competition
in the long run (when only normal profit is made). See Figure 2.18.
2.6 Price and output determination
For each of the market forms previously described, we will now look at how price and
output decisions arise.
2.6.1 Perfect competition
In this market, individual buyers and sellers believe that their own behaviour has no
influence on market price. As explained earlier, the goods are homogeneous, there is perfect
knowledge of market conditions and there are no entry or exit barriers. These conditions
ensure that all firms charge the same price for their product as is seen in Figure 2.16.
The firm in perfect competition is thus a price taker, which accepts a market price
which is beyond its control. If the firm charged a higher price than P it would lose all its
customers, who would act rationally and buy the identical good from another supplier at a
lower price. Conversely, there is no point selling at a lower price because the firm can sell
all of its output at the market price and thereby gain higher profits. Consequently, the
demand curve for the individual firm is perfectly elastic at the price P. This horizontal
demand curve is also the average revenue curve, because all units are sold at the same
price, and the marginal revenue curve, because each additional unit of output sold brings
in the same amount of extra revenue (0P ).
The demand curve facing the industry may not be horizontal. It could be of any type of
elasticity but it is usually drawn as the normal downward-sloping variety. Similarly, market
supply is shown in the traditional way. However, the amount supplied onto the market by
an individual firm will be a very small proportion of the total quantity (given the basic
The firm
Price
D = AR = MR
Quantity
P
0 Q1 Q2 Q3
The industry
Price
Quantity
P
0 Qt
D
S
Figure 2.16 The firm and the industry in perfect competition
FUNDAMENTALS OF BUSINESS ECONOMICS 75TH
EM
ARKET
SYSTEM
AN
DTH
EC
OM
PETIT
IVE
PRO
CESS
2006.1
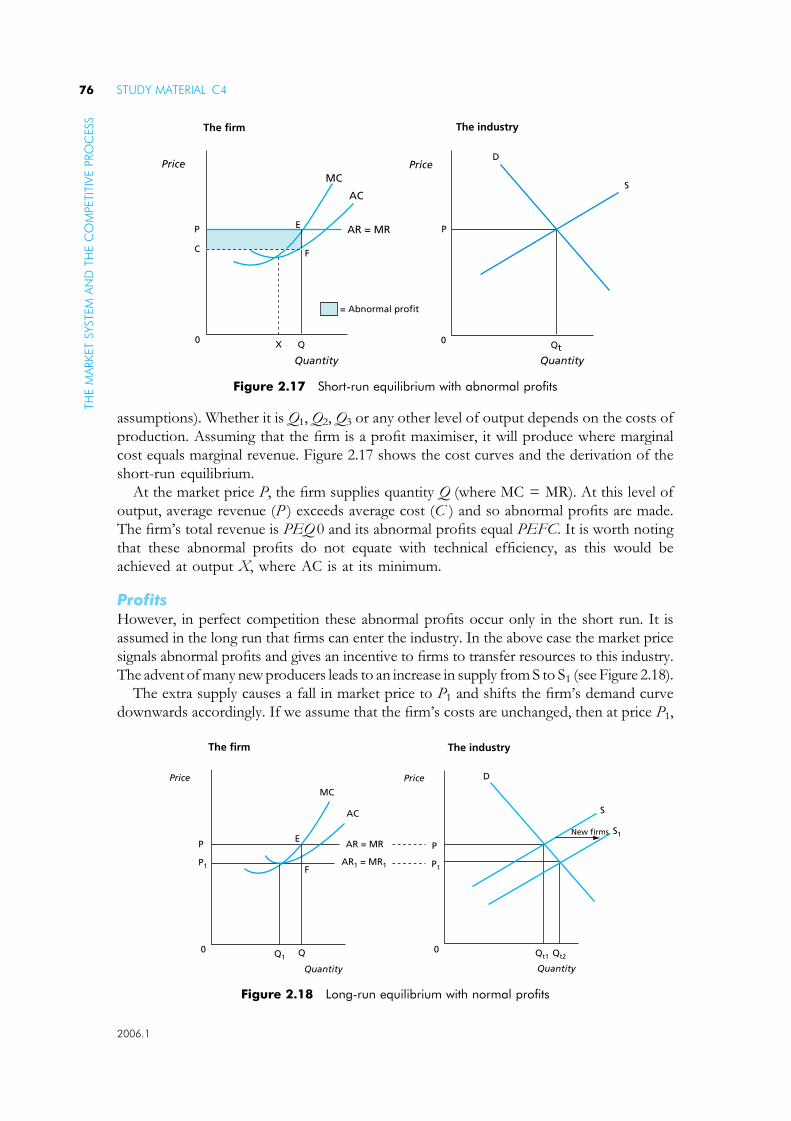
assumptions). Whether it is Q1, Q2, Q3 or any other level of output depends on the costs of
production. Assuming that the firm is a profit maximiser, it will produce where marginal
cost equals marginal revenue. Figure 2.17 shows the cost curves and the derivation of the
short-run equilibrium.
At the market price P, the firm supplies quantity Q (where MC = MR). At this level of
output, average revenue (P ) exceeds average cost (C ) and so abnormal profits are made.
The firm’s total revenue is PEQ 0 and its abnormal profits equal PEFC. It is worth noting
that these abnormal profits do not equate with technical efficiency, as this would be
achieved at output X, where AC is at its minimum.
ProfitsHowever, in perfect competition these abnormal profits occur only in the short run. It is
assumed in the long run that firms can enter the industry. In the above case the market price
signals abnormal profits and gives an incentive to firms to transfer resources to this industry.
The advent of many new producers leads to an increase in supply from S to S1 (see Figure 2.18).
The extra supply causes a fall in market price to P1 and shifts the firm’s demand curve
downwards accordingly. If we assume that the firm’s costs are unchanged, then at price P1,
The firm The industry
New firms
Price Price
MC
AC
F
EP P
QQ1 Qt1 Qt20 0
D
S
S1
P1 P1
AR = MR
AR1 = MR1
QuantityQuantity
Figure 2.18 Long-run equilibrium with normal profits
The firm The industry
Price Price
Quantity Quantity
MC
AC
AR = MR
= Abnormal profit
P
C
0 0X Q Qt
F
E P
D
S
Figure 2.17 Short-run equilibrium with abnormal profits
STUDY MATERIAL C476TH
EM
ARKET
SYSTEM
AN
DTH
EC
OM
PETIT
IVE
PRO
CESS
2006.1

MC = MR1 and profit is maximised. At this output Q1, only normal profit is made. Also,
the firm is operating at its most cost-effective point (minimum AC) and the market is cleared
with no wastage of resources. For such reasons, long-run equilibrium in perfect
competition is lauded as a desirable model for an economy.
Entry and exit(i) Long run. Whenever price is between P and P1, new firms will enter the industry to secure a
share of the abnormal profits. Conversely, at prices below P1 firms will exit from the
industry because of losses, thereby reducing supply and making the market price move
upwards. At the long-run equilibrium there will be sufficient (normal) profit to keep existing
firms in the industry and insufficient (as no abnormal) profit to attract new entrants.
(ii) Short run. A firm may not shut down production, even if it is making a loss. As long as a
firm receives enough revenue to cover its variable costs, it will continue production. The
reason for this is that it has to pay fixed costs anyway and any excess revenue over the
variable costs can offset some of the fixed costs, thereby reducing losses. The firm’s short-
run supply curve is thus the part of the marginal cost curve above the average variable cost
curve. (In the long run, the firm’s supply curve is that portion above the AC.)
EfficiencyThe long-run equilibrium position in perfect competition is unique in that price equals marginal
cost. This is significant because it gives allocative efficiency. If consumers take price as their
measure of the value of a good and marginal cost measures the cost of attracting resources
from alternative uses, then the price of the last unit of output is equal to its opportunity cost of
production. Furthermore, as already indicated, these resources are being used to maximum
technical efficiency because the firm is producing at the point of minimum average cost.
� Under perfect competition the firm is a price taker
� The demand curve for the film is horizontal so that the price equals AR which is the
same as MR
� Competition ensures only normal profits are earned in the long run
� Long run equilibrium position ensures allocative efficiency as price equals MC.
2.6.2 Monopoly
In theory, a (pure) monopoly is where one firm is the whole industry. It can be a price maker
(and thus quantity taker) or a quantity setter (and price taker). The monopolist cannot fix
both price and quantity because it cannot control market demand.
Unlike in perfect competition, the firm’s average revenue does not necessarily equal its
marginal revenue. In a monopoly, the firm, being the industry, faces a downward sloping
demand curve. Thus, to sell more, a monopolist may have to lower his price. This means
that marginal revenue will be less than average revenue. For any given price, average
revenue is twice marginal revenue (assuming straight-line average revenue curves). Total
revenue is maximised when marginal revenue is zero, that is, at Q2 on Figure 2.19. This is
because, beyond Q2, MR becomes negative and thus reduces TR.
ProfitsThe price-fixing monopolist will have the usual U-shaped cost curves in the short run
(because of the fixed factor assumption). Production will be at Q1 assuming the
FUNDAMENTALS OF BUSINESS ECONOMICS 77TH
EM
ARKET
SYSTEM
AN
DTH
EC
OM
PETIT
IVE
PRO
CESS
2006.1

monopolist is a profit maximiser and produces where MC = MR. The price will be P1,
exceeding average cost (C ) by PC, and so abnormal profits are made.
These profits remain in the long run, because of the entry barriers. It is also possible
that in the long run a monopolist’s costs may fall (although they could rise or be constant,
as the fixed factor assumption is removed) and this could raise profits even further.
Similarly, if demand becomes more inelastic then profits may increase as any rise in price
produces a smaller proportionate change in quantity demanded, thereby raising total
revenue.
Exit/entryAs explained earlier, the definition of monopoly means that new firms cannot enter the
industry. Thus, there is no need to distinguish between short-run and long-run
equilibrium. Furthermore, it means that abnormal profits are not competed away since
monopolists maintain entry barriers.
In practice, a firm may have monopoly power even if there are other firms in the
industry. An effective monopoly must be able to exclude potential rivals from the market
by creating and maintaining entry barriers.
� Legal barriers. Public corporations may be given a monopoly by statute when they are
created, for example, public utilities. This prevents wasteful duplication. Patent law also
creates a monopoly of sixteen years for new inventions.
� Geographical barriers. Markets in different parts of the UK may be separate and different
firms may be sole producers in each region. Transport costs may act as a barrier to
access. For instance, the village store may have a local monopoly.
� Economies of scale. These may give an established firm both cost and technical advantages
over potential entrants. High fixed costs of production may deter competitors and keep
one firm with a monopoly.
� Exclusive controls. A monopolist might have total control over the necessary raw
materials for production. For instance, the control of British Telecom over the
telephone network has made competition from new entrants to the UK telephone
markets more difficult. Similarly, the control over market outlets until recently allowed
breweries to have a local monopoly for their beer in tied public houses.
The firm = the industry
Price
Quantity
MC = S
AR = D
AC
MR
C
P
X
Q1 Q2
Figure 2.19 Equilibrium in (pure) monopoly
STUDY MATERIAL C478TH
EM
ARKET
SYSTEM
AN
DTH
EC
OM
PETIT
IVE
PRO
CESS
2006.1

� Cartel agreements. An effective monopoly can exist when firms in an industry agree to
co-operate rather than compete. Such collusion may be in the form of either price fixing
or market sharing. In Germany sixty-two companies in the ready-mixed concrete industry
were fined DM320 million in 2000 for operating a quota cartel, while six leading
accountancy firms in Italy were heavily fined in the same year for a price-fixing
arrangement. Market sharing is rather more acceptable in smaller markets, such as milk
and newspaper deliveries in rural areas.
EfficiencyIn a monopoly there is neither allocative nor technical efficiency. As Figure 2.19 shows,
price is higher than marginal cost (at Q1) and the firm is not producing at the lowest
average cost ( point X).
� A monopolist has a downward sloping demand curve
� A monopolist can fix price or quantity but not both
� Abnormal profits exist in the long run due to barriers to entry
2.6.3 Imperfect competition
In each of the three market structures which follow, the firm is a price searcher. Its behaviour
is to seek a price which will maximise profits, given the conditions in the market. The
traditional theory of the firm still has MC = MR as the key decision rule for production,
although in practice cost-plus pricing is probably more realistic.
Monopolistic competitionThis type of market includes features of both perfect competition and monopoly. There
are no entry barriers, which is similar to perfect competition. However, each firm has
influence over the price of its output, as in monopoly, because the products are
differentiated, by style, packaging, brand names and advertising. The newspaper industry is
a good example of such a market. Therefore, each firm faces a normal downward sloping
demand curve for its product, and so marginal revenue is less than average revenue.
The short-run equilibrium position for a firm in monopolistic competition is very
similar to that of a (pure) monopolist. The only difference is that the average revenue
(demand) curve is likely to be more elastic. This happens because of the competitive
features of the market, when the consumer has a choice between differentiated products
and is subject to persuasive advertising.
Nevertheless in the short run, firms in monopolistic competition may earn abnormal
profits, as shown in Figure 2.20. However, these profits attract new entrants and so in the
long run they are competed away. The competitive rivalry causes the loss of some of the
firm’s customers, but not all of them because brand loyalties exist. These loyalties may
be genuinely held because of a product’s peculiar satisfaction for a consumer or they
may be spuriously created by advertised images. The loss of customers is shown by the
leftward shift in the demand curve and the resultant absence of abnormal profit in
Figure 2.21. Thus, a firm in monopolistic competition makes only normal profit in the
long run.
FUNDAMENTALS OF BUSINESS ECONOMICS 79TH
EM
ARKET
SYSTEM
AN
DTH
EC
OM
PETIT
IVE
PRO
CESS
2006.1

Although the features of monopolistic competition make it more realistic than perfect
competition, the implications for the allocation of resources are undesirable for society in
two ways:
� There is no allocative efficiency because price does not equal marginal cost. Price is
greater than marginal cost at the equilibrium and so if output were expanded some
people could be made better off without others suffering:
� There is no technical efficiency because the average cost (P1) of the equilibrium output
(Q1) is greater than the lowest point of average cost (X ).
This suggests as in Figure 2.21, that the firm has excess capacity in the long run as well as
not operating at technical efficiency.
OligopolyIn the oligopolistic market structure a few large firms dominate the market, for example,
Lloyds, Barclays, HSBC and Royal Bank of Scotland are the leading lights in the UK retail
banking industry. There is price and non-price competition between firms, with pricing
behaviour being partly determined by how a firm expects its rivals to react. Thus, there is
much uncertainty in oligopolistic markets, and greater interdependence between firms than
in other market structures.
MC = S
AR = D
Price
Quantity
AC
0
XX
Q1
P1
MR
Figure 2.21 Long-run equilibrium for a firm in monopolistic competition
Price, cost
Quantity
AR = D
MC = S
AC
MR
P
C
Q
Figure 2.20 Short-run equilibrium for a firm in monopolistic competition
STUDY MATERIAL C480TH
EM
ARKET
SYSTEM
AN
DTH
EC
OM
PETIT
IVE
PRO
CESS
2006.1

There are four strategies which an oligopolist firm might adopt:
� co-operate with the other large firms. In such a collusive oligopoly, a common policy is agreed
on pricing and market sharing and joint profit maximisation is the objective. The market
structure then resembles the monopoly model. However, this may not be possible in
practice because of restrictive practices legislation. This is considered under competition
policy later in this chapter.
� make their own decisions and ignore their rivals. A firm could estimate its demand (average
revenue) curve and set a price. The effect of this depends upon other prevailing prices for
what are broadly similar goods/services, and how the rivals react. A higher price may lower
sales and lead to a fall in market share if rivals do nothing. A lower price may increase sales if
rivals do nothing but lead to lower profits (as demand tends to be inelastic). If rivals follow
suit when the firm initiates a price rise, it becomes the market leader. This position is akin to that
of a monopolist, who can make price changes with impunity. If rivals copy a price cut, there
may be price warfare. Each firm is seeking to maintain its market share and protect its profits.
The price cuts will benefit the consumer, as may some of the non-price competition.
� become a price follower by awaiting the action of the price leader. (This strategy makes the
firm a price taker.)
� do nothing. A firm may feel that any change in its price would be disadvantageous because
it faces a kinked demand curve. An increase in price above P will lead to a large drop in
revenue, as consumers now buy relatively cheaper alternatives. Conversely, a fall in price
below P creates a large fall in revenue, as existing consumers pay less for each unit of
output. Thus the curve is relatively elastic above the fulcrum point and relatively
inelastic below that point as in Figure 2.22(a).
This kinked demand curve is derived from two separate demand curves, being
composed of the upper part of D1 and the lower part of D2. As the demand curve
equals the average revenue curve, that too is obviously kinked. However, the composite
marginal revenue curve (the top of MR1 and bottom of MR2) displays a vertical
discontinuity, along the section parallel to the price axis, between points V and D. This
reinforces a tendency towards price stability because there is a series of points where
MC = MR. In the detailed diagram (Figure 2.22( b)) MC crosses MR in the section VD.
However, MC could shift upward towards V and downwards towards D and still equal
MR at this output level and price. Thus, costs can rise or fall within the range VD
without causing a profit-maximizing oligopolist to change either price or output. This is
unique to oligopoly.
(b) Detailed(a) Simple
Quantity
Q Q0 0
P
D
V
D1
D2
MR1MC
MR2D = AR
P
D
Relativelyinelastic
Relativelyelastic
Pric
e/co
st
Pric
e/co
st
Quantity
Figure 2.22 An oligopolist’s kinked demand curve
FUNDAMENTALS OF BUSINESS ECONOMICS 81TH
EM
ARKET
SYSTEM
AN
DTH
EC
OM
PETIT
IVE
PRO
CESS
2006.1
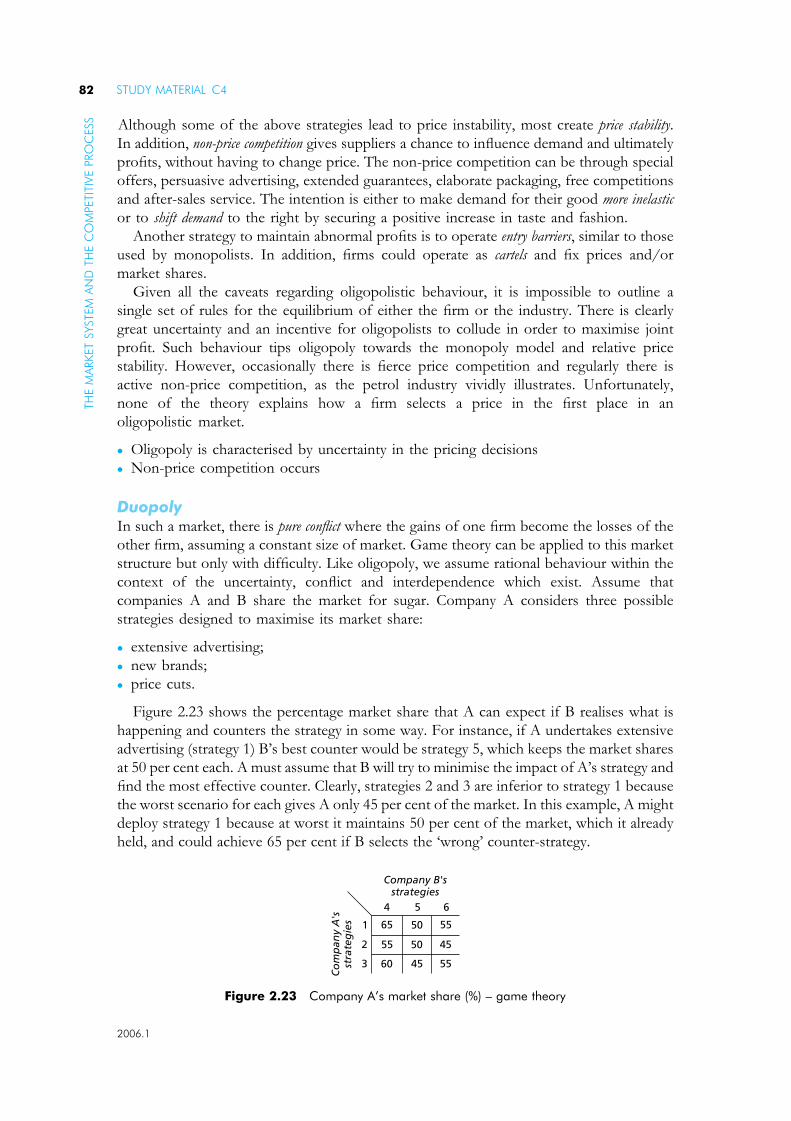
Although some of the above strategies lead to price instability, most create price stability.
In addition, non-price competition gives suppliers a chance to influence demand and ultimately
profits, without having to change price. The non-price competition can be through special
offers, persuasive advertising, extended guarantees, elaborate packaging, free competitions
and after-sales service. The intention is either to make demand for their good more inelastic
or to shift demand to the right by securing a positive increase in taste and fashion.
Another strategy to maintain abnormal profits is to operate entry barriers, similar to those
used by monopolists. In addition, firms could operate as cartels and fix prices and/or
market shares.
Given all the caveats regarding oligopolistic behaviour, it is impossible to outline a
single set of rules for the equilibrium of either the firm or the industry. There is clearly
great uncertainty and an incentive for oligopolists to collude in order to maximise joint
profit. Such behaviour tips oligopoly towards the monopoly model and relative price
stability. However, occasionally there is fierce price competition and regularly there is
active non-price competition, as the petrol industry vividly illustrates. Unfortunately,
none of the theory explains how a firm selects a price in the first place in an
oligopolistic market.
� Oligopoly is characterised by uncertainty in the pricing decisions
� Non-price competition occurs
DuopolyIn such a market, there is pure conflict where the gains of one firm become the losses of the
other firm, assuming a constant size of market. Game theory can be applied to this market
structure but only with difficulty. Like oligopoly, we assume rational behaviour within the
context of the uncertainty, conflict and interdependence which exist. Assume that
companies A and B share the market for sugar. Company A considers three possible
strategies designed to maximise its market share:
� extensive advertising;
� new brands;
� price cuts.
Figure 2.23 shows the percentage market share that A can expect if B realises what is
happening and counters the strategy in some way. For instance, if A undertakes extensive
advertising (strategy 1) B’s best counter would be strategy 5, which keeps the market shares
at 50 per cent each. A must assume that B will try to minimise the impact of A’s strategy and
find the most effective counter. Clearly, strategies 2 and 3 are inferior to strategy 1 because
the worst scenario for each gives A only 45 per cent of the market. In this example, A might
deploy strategy 1 because at worst it maintains 50 per cent of the market, which it already
held, and could achieve 65 per cent if B selects the ‘wrong’ counter-strategy.
4
Co
mp
any
A's
stra
teg
ies
Company B'sstrategies
2
1
3
65
55
60 45 55
45
5550
50
5 6
Figure 2.23 Company A’s market share (%) – game theory
STUDY MATERIAL C482TH
EM
ARKET
SYSTEM
AN
DTH
EC
OM
PETIT
IVE
PRO
CESS
2006.1
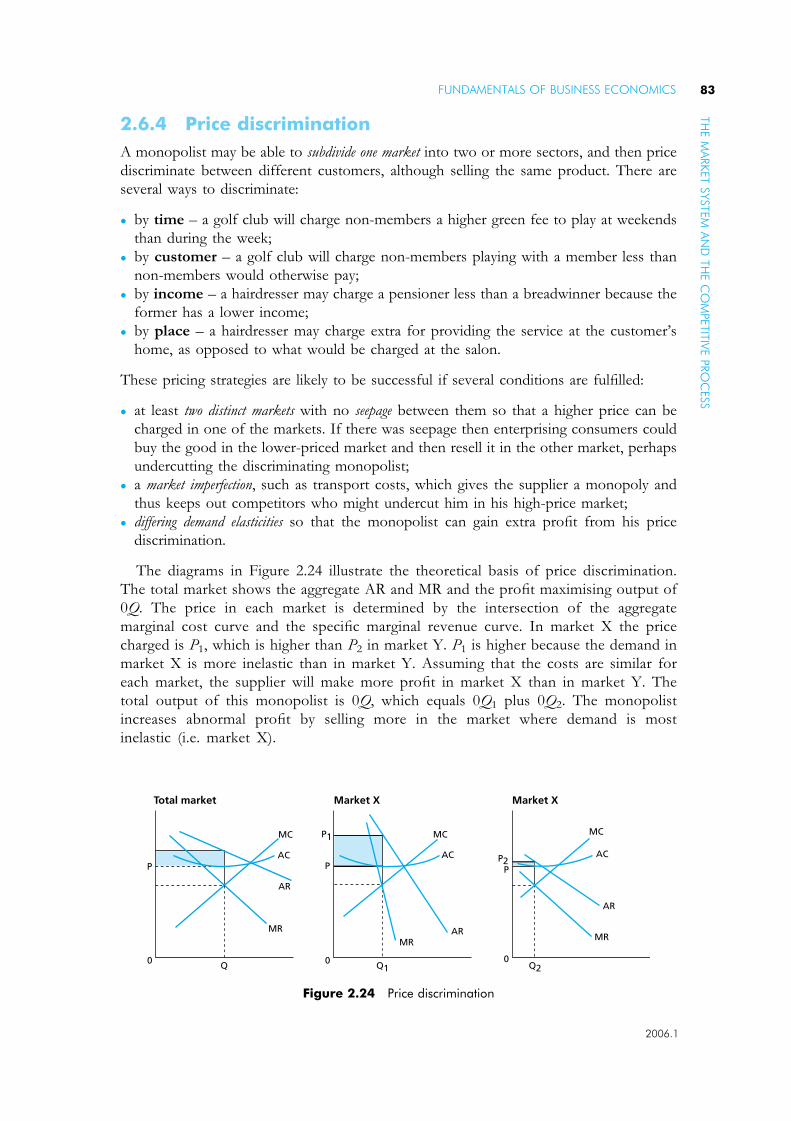
2.6.4 Price discrimination
A monopolist may be able to subdivide one market into two or more sectors, and then price
discriminate between different customers, although selling the same product. There are
several ways to discriminate:
� by time – a golf club will charge non-members a higher green fee to play at weekends
than during the week;
� by customer – a golf club will charge non-members playing with a member less than
non-members would otherwise pay;
� by income – a hairdresser may charge a pensioner less than a breadwinner because the
former has a lower income;
� by place – a hairdresser may charge extra for providing the service at the customer’s
home, as opposed to what would be charged at the salon.
These pricing strategies are likely to be successful if several conditions are fulfilled:
� at least two distinct markets with no seepage between them so that a higher price can be
charged in one of the markets. If there was seepage then enterprising consumers could
buy the good in the lower-priced market and then resell it in the other market, perhaps
undercutting the discriminating monopolist;
� a market imperfection, such as transport costs, which gives the supplier a monopoly and
thus keeps out competitors who might undercut him in his high-price market;
� differing demand elasticities so that the monopolist can gain extra profit from his price
discrimination.
The diagrams in Figure 2.24 illustrate the theoretical basis of price discrimination.
The total market shows the aggregate AR and MR and the profit maximising output of
0Q. The price in each market is determined by the intersection of the aggregate
marginal cost curve and the specific marginal revenue curve. In market X the price
charged is P1, which is higher than P2 in market Y. P1 is higher because the demand in
market X is more inelastic than in market Y. Assuming that the costs are similar for
each market, the supplier will make more profit in market X than in market Y. The
total output of this monopolist is 0Q, which equals 0Q1 plus 0Q2. The monopolist
increases abnormal profit by selling more in the market where demand is most
inelastic (i.e. market X).
Total market Market X Market X
MC MC MC
AC AC AC
AR
AR
AR
MRMR MR
P P P
P1
P2
0 0 0Q Q1 Q2
Figure 2.24 Price discrimination
FUNDAMENTALS OF BUSINESS ECONOMICS 83TH
EM
ARKET
SYSTEM
AN
DTH
EC
OM
PETIT
IVE
PRO
CESS
2006.1

Box 2.2 Contestable markets
This is a relatively new theory which accentuates the importance of entry and exit costs
into a market. A contestable market is one in which entry is relatively easy, and so is
exit. The latter is possible because there are no (or low) sunk costs. In practice, this
means that start-up costs are low and so firms can ‘hit and run’ – that is, enter the
market, take a share of the (excessive) profits and then leave the industry fairly
painlessly. Existing firms in the market have no market power to deny new entrants
and live in a very competitive environment.
A good example of a contestable market is coach travel since privatisation. The
capital costs of entry are low (i.e. buying secondhand buses), the best routes can be
cream-skimmed and once (or if ) sales begin to diminish, the operator can sell up and
leave the industry (i.e. sell secondhand buses).
2.6.5 Perfect competition versus monopoly
Making a judgment between these two extreme theories is really a pointless exercise.
Perfect competition is an ideal which does not exist and in which technical and
allocative efficiency are both achieved. Long-run equilibrium is obtained at lowest AC,
where price equals marginal cost. In contrast the longrun monopoly equilibrium is not
at lowest AC and has price above marginal cost. In Figure 2.25 we assume the
monopoly firm and the perfectly competitive firm have the same AC and MC curves.
The monopolist faces a downward sloping demand curve ARM and produces QM at
PM (where MC = MR) making abnormal profits (PMYVX). The firm in perfect
competition faces a horizontal demand curve (ARC = MRC = DC) and produces QC at
PC. At point Z, MCC will equate with MRC. Thus, the effect of a monopoly seems to
be lower output (Q M–QC) and higher prices (PM–PC), which means a welfare loss to
consumers.
Price
QuantityQM
PM
PC
X
QC
MRM
V
Y
Z
Monopoly profit
MCM
ACM
ARC = MRC = DC
ARM (DM)
Figure 2.25 Perfect competition and monopoly
STUDY MATERIAL C484TH
EM
ARKET
SYSTEM
AN
DTH
EC
OM
PETIT
IVE
PRO
CESS
2006.1
Despite monopoly being inferior to perfect competition in respect of both technical and
allocative efficiency, a case of monopoly can be justified on three grounds:
� they may be public utilities, thus organising production in the most cost-effective way;
� they may be necessary when a national producer is required in an industry;
� they may be firms achieving significant economies of scale and thereby selling their products at a
lower price than would be charged in perfect competition. This is because the monopolist’s
average and marginal cost curves are significantly lower than those of a perfect competitor
due to economies of scale. If this is the case then a monopoly can claim a better utilisation of
resources although not full allocative efficiency, and greater technical efficiency.
However the case against monopoly is powerful.
� It is allocatively inefficient as it produces less at higher prices than under perfect
competition.
� It produces welfare losses for society as there is a divergence between public interest and
the self-interest of the monopolist.
� It has less incentive to innovate because it can keep abnormal profits in the long run.
� It may restrict choice by eliminating uneconomic brands, indulging in price discri-
mination and using predatory pricing to keep out potential competitors.
Exercise 2.5Answer the following questions based on the preceding information. You can check your
answers below.
1. Why does an individual firm face a totally elastic demand at one price in perfect competition?
2. What happens to abnormal profits in the long run in perfect competition?
3. In the short run, why might a firm in perfect competition continue production even
though it is making a loss?
4. In which market is the firm a price maker?
5. What happens to abnormal profits in the long run in a monopoly?
6. Suggest three entry barriers in a monopoly.
7. Can a firm in monopolistic competition make abnormal profits?
8. Describe the demand curve in a competitive oligopoly.
9. What is the main type of competition in an oligopoly?
10. What does ‘price discrimination’ mean?
11. What is the aim of price discrimination?
12. Give two reasons to justify monopolies.
Solutions1. An individual firm faces a totally elastic demand at one price in perfect competition
because it is just one small supplier of a small share of a large market. As its product is
homogeneous, a price rise will lead to no sales, because consumers will buy other
products in the market.
2. Abnormal profits totally disappear in the long run in perfect competition.
3. A firm will continue production in the short run in perfect competition as long as it is
covering all of its variable costs. This is because it has to pay fixed costs even if there
is no production.
FUNDAMENTALS OF BUSINESS ECONOMICS 85TH
EM
ARKET
SYSTEM
AN
DTH
EC
OM
PETIT
IVE
PRO
CESS
2006.1
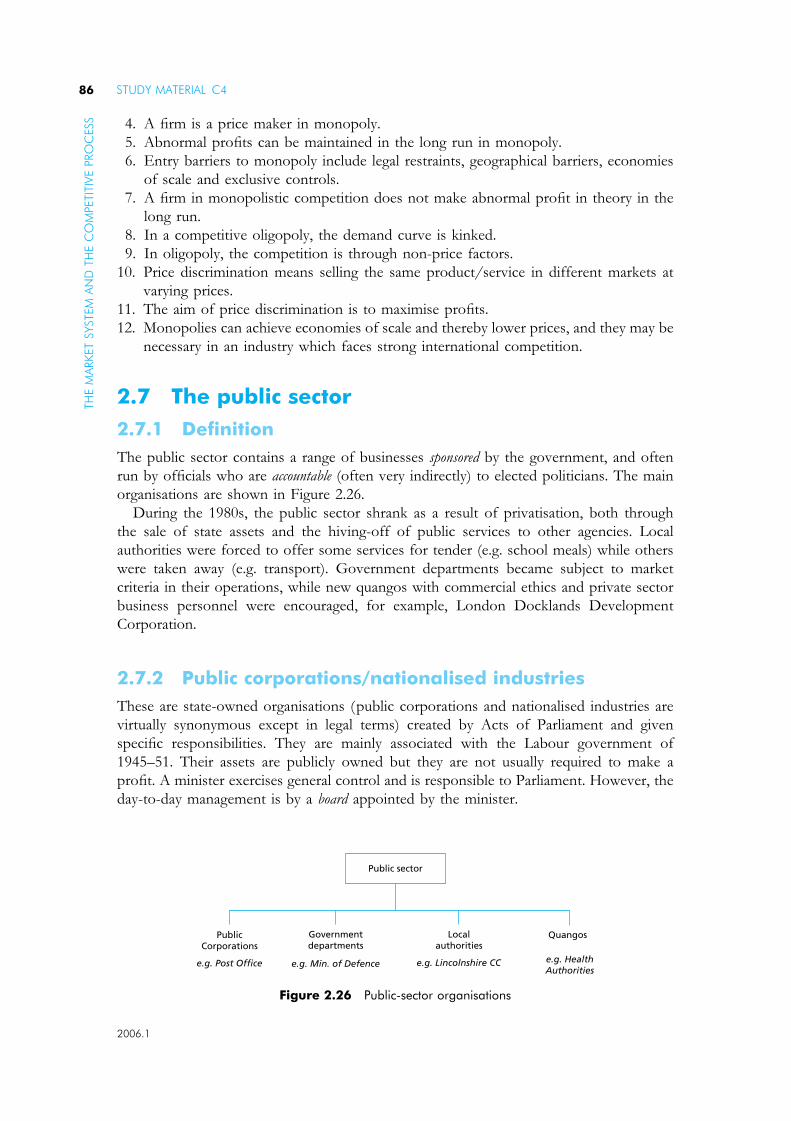
4. A firm is a price maker in monopoly.
5. Abnormal profits can be maintained in the long run in monopoly.
6. Entry barriers to monopoly include legal restraints, geographical barriers, economies
of scale and exclusive controls.
7. A firm in monopolistic competition does not make abnormal profit in theory in the
long run.
8. In a competitive oligopoly, the demand curve is kinked.
9. In oligopoly, the competition is through non-price factors.
10. Price discrimination means selling the same product/service in different markets at
varying prices.
11. The aim of price discrimination is to maximise profits.
12. Monopolies can achieve economies of scale and thereby lower prices, and they may be
necessary in an industry which faces strong international competition.
2.7 The public sector
2.7.1 Definition
The public sector contains a range of businesses sponsored by the government, and often
run by officials who are accountable (often very indirectly) to elected politicians. The main
organisations are shown in Figure 2.26.
During the 1980s, the public sector shrank as a result of privatisation, both through
the sale of state assets and the hiving-off of public services to other agencies. Local
authorities were forced to offer some services for tender (e.g. school meals) while others
were taken away (e.g. transport). Government departments became subject to market
criteria in their operations, while new quangos with commercial ethics and private sector
business personnel were encouraged, for example, London Docklands Development
Corporation.
2.7.2 Public corporations/nationalised industries
These are state-owned organisations (public corporations and nationalised industries are
virtually synonymous except in legal terms) created by Acts of Parliament and given
specific responsibilities. They are mainly associated with the Labour government of
1945–51. Their assets are publicly owned but they are not usually required to make a
profit. A minister exercises general control and is responsible to Parliament. However, the
day-to-day management is by a board appointed by the minister.
Public sector
Quangos
e.g. HealthAuthorities
e.g. Lincolnshire CCe.g. Min. of Defencee.g. Post Office
PublicCorporations
Governmentdepartments
Localauthorities
Figure 2.26 Public-sector organisations
STUDY MATERIAL C486TH
EM
ARKET
SYSTEM
AN
DTH
EC
OM
PETIT
IVE
PRO
CESS
2006.1

Arguments for nationalisation� Low costs may be obtained through economies of scale, and the avoidance of waste and
duplication. These points were particularly true of ‘natural’ monopolies such as gas,
water and other public utilities.
� Sufficient capital available for investment, because of government support. This was
particularly true for aircraft and shipbuilding, which were belatedly nationalised by
Labour in 1976.
� Provides uneconomic services for consumers. This argument places social benefit above
private profit and is the justification for keeping small railway stations open.
� Allows strategic control over key resources. This was an important factor in the immediate
postwar period but is less so today, as privatisations of steel and electricity indicate.
� Protects employment and minimises social costs. The keeping open of ‘uneconomic pits’
could be justified on this argument, because of the opportunity cost to the local
communities based on coal mines (and steel plants). Not only did closure mean lost
output, it also meant extra public spending on unemployment benefit and the intangible
social costs of ‘loss of community’, increased marital stress, higher crime, etc.
� Gives a fairer distribution of wealth whereby the surpluses could be used for the benefit of
society rather than profits being expropriated by capitalist owners. This argument also
justified high wages and job security for public employees, as well as more sympathetic
management.
Pricing
(a) Commercial principles. Nationalised industries are monopolies. If they operate like private-
sector monopolies then they can make abnormal profits by producing where MC = MR
(see Figure 2.19). However, because of public service obligations this has rarely happened.
As shown earlier such a monopoly is not technically or allocatively efficient. Since 1979 the
government has moved nationalised industries in this direction through setting them
stiffer financial targets and by requiring managers to be more commercially focused.
An alternative approach, which was tried in the 1960s and 1970s, was breakeven, or
meeting certain financial obligations.
Breakeven occurs where total cost equals total revenue, which is also where
AC = AR. However, as shown in Figure 2.27, such a policy is both allocatively and
technically inefficient. The price charged, P, does not equal MC and so it is allocatively
inefficient. Furthermore, the quantity produced, Q, is above the optimum output
Price
Quantity
MR
MC
AC
Q
P
Z
P1
Q1
AR = D
Figure 2.27 Breakeven pricing
FUNDAMENTALS OF BUSINESS ECONOMICS 87TH
EM
ARKET
SYSTEM
AN
DTH
EC
OM
PETIT
IVE
PRO
CESS
2006.1

level (Z ). However, breakeven policy does lead to greater output and lower prices
than that achieved at the point of profit maximisation, P1Q1.
(b) Marginal cost pricing. This policy will maximise allocative efficiency (as price equals MC)
but it could lead to losses if, at the point of pricing, marginal cost is below average
cost. Furthermore it does not produce the technically most efficient output because
the quantity produced is not at the minimum point of AC.
(c) Price discrimination. A nationalised industry as a monopolist can discriminate to increase
its profits/minimise its losses. Thus when the railways in the United Kingdom were a
nationalised industry, British Rail at peak travel times and on popular routes loaded the
price because demand is highly inelastic, for example, Friday travel and London
commuters. This was explained earlier.
2.7.3 Privatisation
There were two main strands to privatisation:
� Sale of state assets, either whole industries (e.g. gas) or firms (e.g. Jaguar to Ford Motors) or
parts of local authorities (e.g. council houses). This is denationalisation.
� Introduction of competition into areas previously monopolised by state suppliers,
deregulation of various industries (e.g. bus travel) and compulsory competitive
tendering (e.g. local authority refuse collection services).
Whole industries have been privatised in the United Kingdom, for example British
Telecom (BT ) in the 1980s and British Rail in the 1990s.
Arguments for privatisation
� Improved ‘efficiency’ in sleepy state monopolies. Overmanning and wasteful investment had
occurred because of demoralised management (and frequently changed government
objectives) and immunity to takeover. Thus it was claimed that the fear of takeover in the
private sector and competition would lead to innovation in the search for profit, for example,
use of minibuses after the deregulation of bus services. These pressures would also give
managers an incentive to minimise costs and shake out unproductive labour, which might
have been featherbedded in the public sector, for instance, BT axed 15,000 jobs in 1993.
� Wider share ownership. It is argued that if employees become shareholders they work harder
and strike less, thereby engendering economic gains to firms. Furthermore, the increase in
the number of adults with shares (7 per cent in 1979 to 25 per cent in 1992) will create
empathy with the private profit motive and better understanding of business problems.
� Improved quality will result because privatised concerns will have to compete to survive
and be responsive to consumer complaints. Long-distance bus travel has seen significant
price cutting and better quality coaches.
� Greater economic freedom will occur because the privatised companies will not be subject to
the ‘dead hand’ of state control. For example, nationalised industry chairmen were
sometimes pressured by government ministers to make decisions for political reasons,
for example, hold prices steady during a period of incomes policy. Market forces should
have more influence.
� Will provide funds for the Treasury. This reason brought a record £7.1 billion in 1988–99
into the Exchequer. It allowed a reduction in the public sector borrowing requirement
and tax cutting which was part of the government’s overall economic strategy.
STUDY MATERIAL C488TH
EM
ARKET
SYSTEM
AN
DTH
EC
OM
PETIT
IVE
PRO
CESS
2006.1
Criticisms of privatisation
� Fewer services and higher prices – for example, rural transport.
� Private monopolies have been created. For instance BT had 70 per cent of the domestic
market in the 1990s and faced only limited competition. Thus there were few pressures
to reduce costs and it was able to raise prices and make over £1 billion profits annually.
� Quality of service has diminished, particularly where local authority functions have been
contracted out, for instance, costs have been saved by reducing staff, paying lower wages
and reducing what was provided, like schools cleaned less frequently. The gains in
technical efficiency as cost per unit has fallen is thus an illusion as quality of service has
simultaneously declined.
� Asset sales were underpriced (to attract buyers) and this created big capital gains for private
investors. One estimate of the underpricing of Railtrack shares at the time they were
sold was £2 billion.
� Only the profitable parts of the public sector are sold off, which means that there is less public
income in the future to contribute to government spending.
� The sale of shares to overseas buyers means that other governments can influence the decisions of
British firms and dividend payments go abroad, thereby weakening the balance of payments.
� Markets have been ‘cream-skimmed’ as, with deregulation, the most profitable parts have been
supplied and the loss-making elements ignored. The previous tendency of state enterprises
to cross-subsidise has disappeared. A good example of this was BT’s attempt to remove rural
telephones until partly prevented from doing so by the regulator responsible for the industry.
� Top executives of privatised companies have paid themselves large salaries and generous share
options, while simultaneously preaching wage restraint to their trade unionists. This seems
most unfair and hardly likely to induce high productivity and employee commitment.
� Competition has not been enhanced.
Pricing
As many privatised companies are now private monopolies, they would be expected to
conform to profit maximisation principles. Indeed, in most cases they have. However, this
does not create technical or allocative efficiency. As the model for such efficiency is
perfect competition, the government has tried to create competition. For example, when
electricity was privatised, the power generation was split between National Power and
Powergen. However, this was rather artificial and still only gave a duopoly. A major
problem for the government of creating competition has been that it makes the
nationalised industry to be sold less likely to be profitable and thereby depresses the share
price, and so raises less money than required. It was for that reason that Mercury was not
allowed to become a big competitor against BT while it was being privatised.
A different approach has been to impose price limits on privatised monopolies. For
example electricity has a price formula:
RPI� X þ Y
where RPI is the change in retail prices index; X is a percentage deduction (designed
to squeeze costs); and Y is a percentage addition (for costs which cannot be passed on).
The regulator for BT has renegotiated its maximum prices. For a period in the 1990s,
BT price changes were based on (RPI–7.5 per cent) which in practice meant price cuts.
Clearly, such intervention undermines the rationale for privatisation and implies that
allocative efficiency is not being pursued, although technical efficiencies are probably
being achieved.
FUNDAMENTALS OF BUSINESS ECONOMICS 89TH
EM
ARKET
SYSTEM
AN
DTH
EC
OM
PETIT
IVE
PRO
CESS
2006.1
2.7.4 Public–private partnerships
Public-private partnerships (PPP), of which the best known example is the private finance
initiative (PFI), describes any private sector involvement in public services including the
transfer of council homes to housing associations using private loans, and contracting out
services like rubbish collection to private companies. The PFI refers to a strictly defined
legal contract for private consortiums, usually involving large construction firms, to design,
build, finance and manage a new public project, typically a school or hospital, over a 30-
year period. The building is not publicly owned but leased by a public authority.
The perceived advantages of the PFI are:
� Finances public projects without the need for government to borrow funds or raise
taxes.
� Risk is transferred to the private provider. If the private consortium misses performance
targets, it will be paid less.
� Introduces private sector qualities such as efficiency and innovation into the public
sector, thereby, raising the quality of provision.
Critics of PFI, however, point out:
� The methods of financing used to make public projects more expensive. The Edinburgh
Royal Infirmary cost £180 million to build but will cost £900 million over its 30-year
contract. This includes the operating costs but, as government has access to cheap funds, it
would still have been cheaper to build and manage using traditional public sector funding.
� There is also a question mark over how much risk is genuinely transferred to the private
sector given the government’s record of bailing out private companies managing
troubled public services.
� Efficiency savings have been made at the expense of quality deterioration in the service,
for example hospital cleaning.
However it will take a much longer period of time, when the first PFI contracts have
been completed, before the real costs and benefits of this form of PPP can be judged.
2.7.5 Externalities
� An externality occurs when the costs or benefits of an economic action are not borne
or received by the instigator. Externalities are, therefore, the spill-over effects of
production and consumption which affect society as a whole rather than just the
individual producers or consumers.
� Externalities created by nationalised industries can be good and bad. For example,
the railways may be beneficial by relieving roads of congestion and maintaining
communications for isolated communities, but may be detrimental in terms of noise and
air pollution.
� The pricing policies considered so far have been based purely on social costs. If any
pricing policy was to maximise net social benefit (or minimise net social cost) then costs
would need to include such externalities.
� Calculate social marginal costs. These would indicate the true cost to society of production
which could be matched with marginal revenue to give a socially beneficial optimum
level of production. However externalities are very difficult to calculate as they are not
always attributable, for example noise, and their impact is not universally identical.
STUDY MATERIAL C490TH
EM
ARKET
SYSTEM
AN
DTH
EC
OM
PETIT
IVE
PRO
CESS
2006.1

� Use indirect taxes and subsidies. Where private costs of production are below social costs,
an indirect tax could be imposed so that price is raised to reflect the true social costs of
production. Taxes on alcohol and tobacco can be justified on these grounds. Subsidies
to home owners to install roof insulation will reduce energy consumption and help
conserve a scarce resource for wider social benefit.
� Extend private property rights so that those suffering negative externalities can charge the
polluters for the harm they are causing. If the right level of charges are made then this
should result in a socially efficient level of production being achieved. Emission charges
on firms discharging waste are an example of this approach.
� Regulations. A government can set maximum permitted levels of emission or minimum levels
of environmental quality. The European Union has over 200 pieces of legislation covering
environmental controls. Fines can be imposed on firms contravening these limits.
� Tradable permits. A maximum permitted level of emission is set for a given pollutant, for
example carbon emissions, and a firm or a country is given a permit to emit up to this amount.
If it emits less than this amount, it is given a credit for the difference, which it can sell to
enable the buyer to go above its permitted level. Thus the overall level of emissions is set by a
government or regulatory body, whereas their distribution is determined by the market.
Despite the many measures to deal with externalities, the issue of achieving the socially
optimal level of production remains unresolved. Problems of calculating externalities and
the correct level of taxation; issues of avoidance and enforcement; administrative costs
mean that market failure and how to deal with it has yet to find an optimum solution.
2.7.6 Public and merit goods
These are provided by the government because the free market underproduces them.
Public goods are products such as defence where one person’s consumption does not diminish
someone else’s (non-rivalry) and that person cannot stop someone else benefiting from it
(non-exclusivity). This enables free-riders to take advantage and so the person would not be
prepared to pay for the service. Hence the government provides defence at zero price but
taxpayers fund the service.
As the government is providing public goods on a nationwide basis, it can benefit from
economies of scale. This could lower costs and the industry would strive for technical
efficiency. There is no allocative efficiency because consumers do not have a choice – the
services, such as police, prisons, fire, are provided whether they like it or not. However, a
consumer who seeks more protection could buy additions in the marketplace, like burglar
alarms, underground concrete bunkers, security men, etc.
Merit goods are goods which it is generally agreed should be made available to all
irrespective of whether everyone can afford to pay for them. They are different from
public goods in that their under-provision results from ignorance, lack of information and
(perhaps) irrationality. Some consumers possess the means and the willingness to buy
merit goods, such as education and healthcare. Government provision is made in the
interests of the general well-being of the nation. However, the private sector provides
alternatives, although these are often seen as ‘different’, or even superior goods/services,
for example, private school education, private health schemes.
In the case of state-provided merit goods, economies of scale could be achieved and
technical efficiency sought. The cost of education per student is about three times cheaper in
the state sector than in the private sector. However, it is rather difficult to maximise technical
FUNDAMENTALS OF BUSINESS ECONOMICS 91TH
EM
ARKET
SYSTEM
AN
DTH
EC
OM
PETIT
IVE
PRO
CESS
2006.1

efficiency as shown by the failure to close small local hospitals and village schools. Ironically,
the support for these threatened organisations comes from local users, thereby indicating that
consumer needs are being met. Also, they are making a rational choice because a local service
is better than a more distant (alternative) one in terms of time and travel cost. Free marketeers
would thus point to the folly of zero pricing, which negates allocative efficiency.
Exercise 2.6Answer the following questions based on the preceding information. You can check your
answers below.
1. What caused the shrinkage of the public sector in the 1980s?
2. Give three arguments for nationalisation.
3. What is marginal cost pricing?
4. What were three reasons for privatisation?
5. How do merit goods differ from public goods?
Solutions1. The public sector shrank in the 1980s because of privatisation.
2. Nationalisation can be justified because it provides low costs of production, uneconomic
services which otherwise might not exist and strategic control over key resources.
3. Marginal cost pricing means that price is determined by the interactions of supply and
demand. In diagrammatic form, that is where marginal cost (i.e. S) equals average
revenue (i.e. D).
4. Three reasons for privatisation are funds for the Treasury, greater economic freedom
for producers and improved efficiency within the organisation.
5. Public goods are freely provided by the government as there is non-rivalry and non-
exclusivity in their use. Merit goods are provided by the government as it is believed
they should be made available to all irrespective of the ability to pay.
2.8 Regulation
2.8.1 Competition policy
There are two aspects to this which involve government regulation:
(i) Consideration of mergers which might create monopolies. These are generally undesi-
rable, as explained earlier, because they lead to allocative inefficiency.
(ii) Investigation of restrictive trade practices which reduce competition within a market and
undermine consumer sovereignty. As markets have become more heavily concentrated
among fewer firms and competition has become more imperfect, so more controls
have been applied to restrictive trade practices and pricing. The economic justifications
for such a policy are fairly clear. Collusion by suppliers and the operation of cartels
usually lead to higher prices and/or monopoly profits and possibly lower output. These
in turn reduce the consumer surplus and thereby reduce consumer sovereignty (but increase
producer sovereignty). Furthermore, they are a diminution in allocative efficiency.
However, it must be remembered that extra profits may lead to investment in research,
which could eventually benefit consumers via new products.
STUDY MATERIAL C492TH
EM
ARKET
SYSTEM
AN
DTH
EC
OM
PETIT
IVE
PRO
CESS
2006.1
Various legislation established the basis for competition policy in the UK. The most
recent major legislation has been as follows:
� Competition Act 1980. Established a new ‘competition reference’ procedure, with the
Director General, Office of Fair Trading (OFT) investigating anti-competitive activities,
which might restrict, distort or prevent competition. The Director General can either
negotiate a voluntary undertaking with a firm to drop the activity within two months or
refer an activity to the Monopolies and Mergers Commission (MMC) replaced by the
Competition Commission (CC) in 1999 within 6 months. If the MMC decides that the
activity is ‘against the public interest’ then the Department of Trade can prohibit it. In
addition, the Department of Trade can refer nationalised industries and other bodies to
the MMC for examination of their efficiency, costs and service.
� Companies Act 1989. Requires companies planning to merge to notify the Office of Fair
Trading in advance of their intentions. Companies have to provide details of the
proposed merger. If no merger reference to the MMC/CC is made within twenty days
then the merger can go ahead. Rather than refer the merger to the MMC/CC, the
Secretary of State can ask the companies involved to sell off some of their assets in
order to decrease their market power resulting from the merger.
� Competition Act 1998. This came into force on 1 March 2000. It seeks to reform and
strengthen UK competition law by introducing prohibitions of anti-competitive
agreements and abuses of a dominant position. These prohibitions are modelled on
Articles 81 and 82 of the EC Treaty.
� Enterprise Act 2002. The competition and consumer provisions of this act came into
force in summer 2003. The Act establishes the OFT as a corporate body with
independent board members. This replaces the former statutory office of the Director
of Fair Trading. The Act builds on the Competition Act of 1998 and also introduces
new provisions relating to criminalisation of cartels, disqualification of directors for
breaches of competition law and super-complaints. The latter enables certain designated
bodies, for example the National Consumer Council, to have enhanced status in drawing
to the attention of the OFT any anti-competitive behaviour.
Up to the Competition Act 1998 the legislation has presumed that restraints on
competition should be permitted unless found to be against the public interest. Since 1998
the presumption of legislation is that any anti-competitive arrangements are against the
public interest and will be outlawed.
Since 1946, the British government has been increasingly involved in vetting the
operation of markets in the United Kingdom. The approach has been discretionary and
pragmatic. Each case has been judged on its merits, although increasingly general guidelines
and supervisory institutions have been created. Critics of this approach argue that it
has been inconsistent, weak and ineffective in dealing with mergers, monopoly power
and exploitative pricing. America has much tougher legislation which can break up
monopolies (i.e. trust-busting). It is the American approach that current legislation seeks
to mimic.
2.8.2 The work of the MMC/CC
The Monopolies and Restrictive Practices Commission was established by the Monopolies
and Restrictive Practices (Inquiry and Control) Act 1984. The Commission ceased to be
responsible for restrictive practices in 1956. These were handled by the DGFT and the
FUNDAMENTALS OF BUSINESS ECONOMICS 93TH
EM
ARKET
SYSTEM
AN
DTH
EC
OM
PETIT
IVE
PRO
CESS
2006.1

Restrictive Practices Court. The title of Monopolies and Mergers Commission (MMC)
came from the Fair Trading Act 1973 (the ‘FTA’).
The Competition Commission (CC) is a public body established by the Competition Act
1998. It replaced the Monopolies and Mergers Commission (MMC) on 1 April 1999.
The Commission has two sides to its work: a reporting side which has taken on the
former MMC role; and an appeals side which will hear appeals against decisions made
under the prohibition provisions of the new Competition Act 1998.
The CC investigates situations where one firm controls at least one-quarter of the
market, and mergers involving worldwide assets exceeding £70 million. However, firms
are not automatically investigated as it depends on a reference from the Director General.
Investigations are carried out by experts, within a limited time. However, critics feel that
too long is often taken over this work. The CC reports to the Minister, who may
implement its recommendations, ignore them or do something to the contrary.
The CC seeks to promote competition and stresses the need to extend consumer
sovereignty, efficiency and enterprise. It opposes most entry barriers, vertical integration
and aggressive competition. However, it recognises the benefits which large-scale
enterprises enjoy from economies of scale and accepts that abnormal profits may be a
justifiable reward for research and development and the risks associated with innovation.
Usually, the government complies with the spirit of a CC report, although occasionally
recommendations have been ignored and public criticism has resulted. Sanctions have been
imposed only rarely, for example, Hoffman LaRoche was ordered to repay £3 million to the
National Health Service. Proposed mergers have been stopped, for instance, Imperial
Tobacco (makers of Golden Wonder crisps) and Smiths Crisps because of the monopoly
power which would have resulted. In September 2003 the Trade and Industry Secretary
accepted the conclusion of the CC that the proposed acquisition of Safeway by Asda,
Sainsbury’s and Tesco would operate against the public interest and should be prohibited.
The proposed acquisition of Safeway by Morrisons would be allowed to proceed, subject to
Morrisons agreeing to sell 53 stores in areas where local competition concerns would arise as
a result of the acquisition. By this outcome a fourth major firm would be established in the
UK supermarket sector thereby enhancing competition.
However, not all eligible mergers are investigated by the MMC/CC. On average about
five out of 150 were referred by the Office of Fair Trading (OFT) and the Board of Trade
to the MMC for consideration. Although it could be argued that the OFT’s guidance to
firms deters unacceptable mergers from being attempted, the procedure can lead to
apparent anomalies and bias. For instance, in 1985 Imperial Tobacco’s bid for United
Biscuits was remitted ( because it would give 45 per cent of the total snacks market to
them and create a virtual duopoly with Nabisco holding another 45 per cent) but Hanson
Trust’s hostile bid for Imperial was allowed. The latter did not raise any competition
worries, although it promised the creation of a giant conglomerate.
Since 1980 the role of the MMC/CC has changed. The Conservative government’s
Competition Act gave it the power to make efficiency audits of public sector enterprises.
By the end of 1984, fifteen references had been made and reports published on eleven. In
every instance, the MMC made recommendations as to how the state concern could
improve its performance. While praising the Civil Aviation Authority’s standard of service
and safety (1983), the MMC found forty-nine ways in which performance could be
improved, largely by making more effective use of manpower.
With privatisation MMC investigations were less necessary, as each industry’s regulator
(see later) undertakes a watchdog role and reports annually. Interestingly, the conflict
STUDY MATERIAL C494TH
EM
ARKET
SYSTEM
AN
DTH
EC
OM
PETIT
IVE
PRO
CESS
2006.1

between British Gas and OFGAS led to an investigation by the MMC in 1993. This
recommended ending the British Gas monopoly of supply to domestic users by 31 March
1997 and to all consumers by 2002. It also suggested, again subject to the Trade Secretary’s
approval, splitting British Gas into two separate companies, one covering transportation
and storage assets and the other being responsible for sales of gas and appliances to
industrial, commercial and domestic consumers.
In 1997, the MMC arbitrated between the regulator and Transco and British Gas, but
largely supported OFGAS’s recommendations over transport prices. It proposed a
21 per cent first-year cut, followed by RPI minus 2 per cent over the next four years.
Improved efficiency can result from MMC proposals. For example, the Post Office
Letter Service made £23 million annual savings by implementing MMC recommendations.
The weakness of the MMC and its reliance on ministerial support to drive through its
recommendations was epitomised by the brewing industry fiasco. The government
accepted the MMC recommendations in 1990 then gradually retreated on most of the
issues, in the face of the brewers’ intransigence, over the next three years.
The 1998 Competition Act established the Competition Commission in April 1999. The
1998 Act made the prohibition of abuse of a dominant market position the principal tool
for dealing with anti-competitive conduct by monopolies. These prohibitions will be
enforced primarily by the Director General of Fair Trading who can impose fines of up to
10 per cent of UK turnover. The CC has taken on the investigating functions of the MMC
but will also hear appeals against the Director General’s decisions.
2.8.3 Restrictive practices
The Restrictive Trade Practices (RTP) Court considers registered agreements under which at
least two persons support restrictions relating to the price of goods, the conditions,
quantities, processes or areas and persons supplied. It operates on the principle of guilty
until proven innocent, assuming that restrictive practices are against the public interest.
The court could uphold the agreements or have them banned. Originally, there were eight
defences (nicknamed ‘gateways’) which could be legitimately used to justify the restrictive
practice. In addition, the benefits to the consumer needed to outweigh the costs of the
practice. Gradually, investigations have been widened as more trading activities have been
seen to offend against the public interest.
However, there are major differences of opinion over the precise nature of ‘the public
interest’ and which actions promote or undermine the public interest. The 1983 RTP
Court report on the Association of British Travel Agents’ (ABTA) stabiliser illustrates
these issues. The stabiliser was an agreement between tour operators and retail travel
agents which was aimed at limiting destructive competition and protecting consumers
against the effects of bankruptcies. This agreement restricted price competition between
tour operators within the season and thereby reduced the possibility of financial collapse.
This kept prices higher but consumers benefited from a stable market in which there was
less risk of tour operators going bankrupt. The RTP Court decided that price agreements
between tour operators and resale price maintenance between travel agents should
be abandoned. This helped the consumer through price competition in the short
term. However, if the long-run effects of competition were fewer operators and
agents (with larger market shares) and some dramatic failures, then certain unlucky
consumers would suffer immediately and most might lose out as the market became
oligopolised.
FUNDAMENTALS OF BUSINESS ECONOMICS 95TH
EM
ARKET
SYSTEM
AN
DTH
EC
OM
PETIT
IVE
PRO
CESS
2006.1

ABTA also operated an entry barrier – exclusive dealing, where ABTA operators sold
tours only through ABTA agents, who in turn only sold ABTA tours. The objective of this
restrictive practice was to enforce default rules and maintain a quality service, thereby
minimizing company failures and ultimately benefiting the consumer. The RTP Court
accepted that this was in ‘the public interest’, although a few minor limitations, such as the
requirement that travel premises should house two ABTA-trained staff, were outlawed.
Undoubtedly, many restrictive practices still exist, but in secret. The Office of Fair
Trading regularly discovers anti-competitive behaviour, particularly when frustrated
retailers are threatened by manufacturers that their supplies of products will be curtailed if
they continue to sell them at cut prices or as loss leaders (against the maker’s wishes). This
suggests that competitive policy in the area of restrictive trade practices needed to be
strengthened.
In response to this the government has placed ‘fostering competition’ at the centre
of its policy towards business. The 1998 Competition Act, which came into effect on
1 March 2000, outlaws any agreements, business practice and conduct which have a
damaging effect on competition in the United Kingdom. Such prohibition applies to
both informal and formal arrangements whether or not they are set out in writing.
These include agreements to fix prices; to limit production and technical development;
to share markets; and to make contracts subject to unrelated conditions. Equally the
prohibition covers the abuse by one or more undertakings of a dominant position in a
market. Examples of abuse of a dominant position include unfair pricing, limiting
production and attaching unrelated supplementary conditions to contracts. Although
there are exemptions from the Act, the emphasis increasingly is being placed on the
assumption that any restriction of competition is undesirable. The Act gives the
Director General wide-ranging powers to investigate infringements of the prohibitions.
Where an undertaking is found to have breached any prohibition, the Director General
may order it to terminate or amend the offending agreement. Undertakings may be
liable to a financial penalty of up to 10 per cent of their turnover in the United
Kingdom. However, smaller firms will be immune from financial penalties unless they
are involved in price fixing.
In 2003 Argos and Littlewoods were fined £22 million by the OFT for fixing the price
of toys and games together with Hasbro in breach of the Competition Act 1998. Similarly
ten businesses including Manchester United, were fined a total of £18.6 million in
October 2003 for fixing the price of Umbro replica football kits in breach of the
competition Act 1998.
2.8.4 The European Commission
The Commission of the European Union can use its powers, directly derived from the Treaty
of Rome, to control the behaviour of monopolists and to increase the degree of competition
across the European Union. It has long had powers, similar to those now adopted by the
United Kingdom in the 1998 Competition Act, to prohibit price fixing, market sharing and
production limitations. In this context they do not allow ‘dual pricing’.
This is a system whereby exports to other EU countries are not allowed to be charged at
different prices. For instance, Distillers sold whisky at higher prices in France and tried to
restrict British buyers from purchasing the whisky more cheaply in England for resale at
lower prices in France. The European Court adjudged that Distillers was distorting
competition by trying to prevent its dual pricing being undermined.
STUDY MATERIAL C496TH
EM
ARKET
SYSTEM
AN
DTH
EC
OM
PETIT
IVE
PRO
CESS
2006.1

The European Union also agreed in 1989 to cross-border merger regulations. There
were three criteria for judging such mergers. First, the merging companies needed to have
a combined world turnover of over 5 billion ECU. Second, the companies involved in the
merger must have a turnover in the EU of at least 250 million ECU each. Third, if two-
thirds of the business of the companies in the merger is within one country of the
European Union, the merger would fall within national rather than EU regulations.
Proposed mergers must be notified to the Commission of the European Union and will be
judged against any potential abuse of a dominant position. Decisions regarding the merger
will be made within five months of notification. Finally, to enhance competition the
European Union does not allow government subsidies to industries or firms which will
distort competition. In this respect Ryanair faced regulatory pressure from the European
Commission to repay financial support it received from the Wallonia region in Belgium in
establishing its operations at Brussels–Charleroi airport.
Box 2.3 Hotel prices in Paris
Anyone willing to fork out 14000 euros for a Paris hotel room is unlikely to lose
much sleep over the claim that that they may have paid marginally over the odds. But
lesser mortals learned yesterday that six super-deluxe hotels in the French capital
were guilty of regularly exchanging confidential price information. In other words,
operating a cartel
France’s competition watchdog on Monday imposed fines ranging from 55,000
euros to 248,000 euros on half-dozen obscenely opulent and staggeringly expensive
hotels known as the Palaces of Paris: the Bristol, Crillon, George V, Meurice, Plaza
Athenee, and Ritz.
The watchdog report said the six hotels were a distinct, ‘‘oligopolistic’’ market and
the exchange of information would falsify competition. It said representatives of the
hotels met regularly and exchanged mails frequently. Among evidence was a 2001
email sent by a George V manager to his rivals. Attached was a table detailing the
hotel’s occupancy rates and average room price. According to the report, the average
price of a room in the six hotels 1999 and 2001 was 700 euros a night while an
average suite cost 6,000 euros.
(Article in Guardian, November 30th 2005)
2.8.5 Specific industry regulators
As privatisation of large nationalised industries usually transformed public monopolies into
private monopolies, the government accepted the need to create regulatory watchdogs. These
bodies, such as the Office of Telecommunications (OFTEL) to supervise British Telecom,
were performing a role which government departments did formerly. They were created in
the 1980s as privatisation grew, and operated independently of any other investigatory body,
such as the MMC. For example, British Gas was privatised in 1986 and then investigated by
the MMC in 1988 and again in 1993. This latter report resulted from the long-running
dispute between British Gas and OFGAS, its regulator.
FUNDAMENTALS OF BUSINESS ECONOMICS 97TH
EM
ARKET
SYSTEM
AN
DTH
EC
OM
PETIT
IVE
PRO
CESS
2006.1

On 28 December 2003 the Office of Communications (OFCOM) was established. It
is now the regulator for the media and telecommunications industries and replaces five other
regularity bodies including OFTEL. OFCOM will regulate standards of taste and decency on
all TV and radio channels. It will licence commercial TV and radio. It will also oversee the
telecommunications industry, where OFTEL was seen to have performed poorly particularly
in relation to the regulation of BT and the deregulation of directory inquiries.
The role of specific industry regulators (SIRs) is essentially twofold. First, when large
state monopolies were privatised, they lacked effective competition. SIRs can introduce an
element of competition by setting price caps and performance standards. In this way
consumers can share in the benefits of competitive behaviour even if competition does
not actually exist in the market. Second, SIRs can speed up the introduction of
competition in such markets by reducing barriers to entry for new firms.
The SIRs have enjoyed some success in limiting price rises and in getting some price
reductions and freezes (e.g. British Gas 1992–93) and ending anti-competitive practices
(e.g. BT preventing new telephone companies, such as Cable and Wireless, having access
to its network). The regulators have also made recommendations to change the structure
of their industry to improve competition, e.g. OFGAS’s call to split British Gas into twelve
regional distributional companies. As a result of more effective competition, the share of
their respective markets for BT and British Gas have fallen considerably since
privatisation.
Exercise 2.7Answer the following questions based on the preceding information. You can check your
answers below.
1. What is the main weakness of the Monopolies and Mergers Commission/Competition
Commission?
2. Name one gateway (defence) against the charge of restrictive practice?
3. What do the regulatory watchdogs supervise?
Solutions1. The main weakness of the MMC/CC is that it can only recommend changes, and
ministers have often ignored its proposals, for example, the brewers.
2. There are many defences to the charge of restrictive practice, but the main one is
‘public interest’.
3. The main regulatory watchdogs are OFWAT, OFGAS, OFTEL, OFFER, OFLOT and
OFRAIL, and they supervise recently privatised former nationalised industries.
2.9 Chapter summary
This chapter has dealt with the way in which the individual markets which make up the
economy function. The primary model is that of market price determined by the
interaction of supply and demand. However the exact mechanisms by which this occurs
varies from market to market and from industry to industry. Thus price and output
STUDY MATERIAL C498TH
EM
ARKET
SYSTEM
AN
DTH
EC
OM
PETIT
IVE
PRO
CESS
2006.1

determination under different market structures, including the public sector, were
investigated. In particular, the chapter considered:
� The factors influencing individual and market demand;
� The importance of the price, income and cross-elasticity of demand;
� The factors influencing the structure and elasticity of supply;
� Price determination and equilibrium in the market;
� The growth of large-scale production;
� Price and output determination, and the competitive process in competitive, oligopolistic
and monopoly-dominated markets;
� Government policy towards market filure and competition including public sector
activities, regulation and competition policy.
The analysis in this chapter will equip you to understand the workings of particular
markets and the issues of policy related to them. However, the economy as a whole may
function differently from individual markets. The behaviour of the economy as a whole is
the subject of macroeconomics, and is the subject matter of the next chapter.
FUNDAMENTALS OF BUSINESS ECONOMICS 99TH
EM
ARKET
SYSTEM
AN
DTH
EC
OM
PETIT
IVE
PRO
CESS
2006.1

Revision Questions
This section of the chapter contains examination-standard questions drawn from past CIMA
examinations. You should use these for practice and revision. As in the previous chapter, the
multiple-choice questions have only one correct answer and this answer is not subject to
debate by economists. This section also contains data response questions. Again there is only
one correct answer to each of the elements of these questions.
Question 1 Multiple-choice selection1.1 A business, currently selling 10,000 units of its product per month, plans to reduce the
retail price from £1 to £0.90. It knows from previous experience that the price
elasticity of demand for this product is (�)1.5. Assuming no other changes, the sales
the business can now expect each month will be:
(A) 8,500(B) 10,500(C) 11,000
(D) 11,500
1.2 If the demand for a good is price elastic, a fall in its price will lead to:
(i) a rise in sales.
(ii) a fall in sales.
(iii) a rise in total expenditure on the good.
(iv) a fall in total expenditure on the good.
(A) (i) and (iii) only.(B) (i) and (iv) only.(C) (ii) and (iii) only.
(D) (ii) and (iv) only.
1.3 Which one of the following would not lead to a shift in the demand curve for overseas
holidays?
(A) An advertising campaign by holiday-tour operators.
(B) A fall in the disposable income of consumers.
(C) A rise in the price of domestic holidays.
(D) A rise in the exchange rate for the domestic currency.
2
101 2006.1
1.4 Which of the following is not normally a characteristic of an oligopolistic market?
(A) Heavy expenditure on advertising.(B) Abnormal profits in the long run.(C) Barriers to the entry of new firms.(D) A preference for price competition.
1.5 Which one of the following would not act as a barrier to the entry of new firms into
an industry?
(A) Perfect consumer knowledge.(B) Economies of scale.(C) High fixed costs of production.(D) Brand loyalty.
1.6 Which one of the following is not a valid economic reason for producing a good or
service in the public sector?
(A) The good is a basic commodity consumed by everyone.(B) It is a public good.(C) There is a natural monopoly in the production of the good.(D) It is a merit good.
1.7 Which one of the following is not a feature of an industry operating under conditions
of monopolistic competition?
(A) There is product differentiation.(B) Producers operate at below full capacity output.(C) Firms maximise profits where marginal cost equals marginal revenue.(D) There is one dominant producer.
1.8 Which of the following statements about a policy of privatising a public-sector
industry are true?
(i) It will permit economies of scale.
(ii) It is a means of widening share ownership.
(iii) The industry would become more responsive to the profit motive.
(iv) It is a source of funds for the government.
(A) (i) and (ii) only.(B) (i), (ii) and (iii) only.(C) (ii) and (iii) only.(D) (ii), (iii) and (iv) only.
Question 2The following data refer to the UK economy:
Estimates of price elasticities of demand for goods and services
Broad category Narrow category
Fuel & light �0.47 Dairy produce �0.05
Food �0.52 Bread & cereals �0.22
Alcohol �0.83 Entertainment �1.40
Durable goods �0.89 Travel abroad �1.63
Services �1.02 Catering �2.61
REVISION QUESTIONS C4102TH
EM
ARKET
SYSTEM
AN
DTH
EC
OM
PETIT
IVE
PRO
CESS
2006.1

Estimates of income elasticities of demand for goods and services
Broad category Narrow category
Fuel & light 0.30 Coal �2.02
Food 0.45 Bread & cereals �0.50
Alcohol 1.14 Vegetables 0.87
Durable goods 1.47 Travel abroad 1.14
Services 1.75 Wines & spirits 2.60
RequirementsUsing both your knowledge of economic theory and the data above:
(a) From the data state whether the following goods have ‘price elastic demand’ or ‘price
inelastic demand’
(i) Fuel and light.
(ii) Services.
(iii) Catering.
(3 marks)
(b) Which of the following statements best describes the concept of ‘income elasticity of
demand’?
(i) The extent to which the demand for goods and services changes in response to a
change in income.
(ii) The impact on consumer income of a change in the price of goods and services.
(iii) The extent to which the demand for a good or service rises when consumer
incomes rise.
(1 mark)
(c) State whether each of the following are true or false:
(i) In a recession, the demand for goods which have high income elasticities of
demand will fall the most.
(ii) If an indirect tax is placed on a good with a high price elasticity of demand, the
main burden of the tax will fall on the producer.
(iii) Inferior goods are those good with a price elasticity of less than �1.
(iv) A price elasticity with a negative value shows that the good in question has a very
low price elasticity.
(v) If the demand for a good has a very low price elasticity of demand, an increase in
the supply of the good will lead to a steep fall in its price.
(vi) If a good or service has a negative income elasticity of demand, the demand for it
will rise when incomes rise but at a less rapid rate.
(6 marks)
(Total marks = 10)
FUNDAMENTALS OF BUSINESS ECONOMICS 103TH
EM
ARKET
SYSTEM
AN
DTH
EC
OM
PETIT
IVE
PRO
CESS
2006.1

Question 3The following data refer to the costs of a firm and the demand for its product:
Quantity sold Price Total cost
£ £
1 34 12
2 30 20
3 27 34
4 25 53
5 23 75
6 21 102
7 19 131
RequirementsUsing both your knowledge of economic theory and the data above:
(a) State which are the correct values for the following:
(i) Marginal cost at output level 3. Is it £14, £7 or £11.33?
(ii) Marginal revenue at output level 4. Is it £2, £19 or £25?
(iii) Average cost at output level 5. Is it £15, £22, or £75?
(iv) The profit maximizing level of output. Is it 4, 5 or 6?
(v) The price elasticity of demand for a fall in price from £25 to £23. Is it �3.125,
�2 or �0.5?
(5 marks)
(b) State whether each of the following would lead to a high or a low price elasticity of
demand for the good or have no effect on price elasticity.
(i) The existence of many substitutes.
(ii) A low proportion of income spent on the good.
(iii) A long time period under consideration.
(iv) Effective differentiation of the good by strong advertising.
(v) A high indirect tax placed on the good.
(5 marks)
(Total marks = 10)
Question 4The following passage is based on a newspaper article:
British cod – the staple of fish and chips – is on the verge of becoming an endangered
species, according to the Worldwide Fund for Nature (WWF), the conservation group.
It stressed that the crisis in the fishing industry was due to poor management and to
over-fishing. The total weight of cod caught in the North Sea had halved since the 1960s.
Similar falls in catches had occurred for other types of fish.
The WWF proposes the establishment of fishing free zones to protect areas where
young fish grow and develop. The WWF said that such a strategy would lead to increased
fish stocks and a larger fishing catch for fisherman within five years. However, the
problem may become less urgent as consumer demand for this type of fish may decline in
REVISION QUESTIONS C4104TH
EM
ARKET
SYSTEM
AN
DTH
EC
OM
PETIT
IVE
PRO
CESS
2006.1

the long run. Higher prices themselves may discourage consumers and some observers
believe that for many consumers fish and chips may be an inferior good and, in many
cases, faces a growing number of alternatives.
RequirementsUsing both your knowledge of economic theory and material contained in the above
passage:
(a) State whether each of the following would lead to a shift in the demand curve for fish
or a movement along the demand curve for fish.
(i) An increase in the number of substitutes for fish.
(ii) A rise in the price of fish.
(iii) An outward shift in the supply curve of fish.
(iv) A rise in income of fish consumers.
(4 marks)
(b) State whether each of the following is true or false.
(i) If the demand for fish is very price elastic a fall in supply will raise prices a
great deal. (1 mark)
(ii) If the supply of fish is price inelastic, a reduction in supply will have a smaller
effect on price than if the supply were price elastic. (1 mark)
(iii) Price changes affect demand by leading to a shift in the demand curve for the
product. (1 mark)
(iv) Effective advertising might raise sales by shifting the demand curve to the right.
(1 mark)
(v) If the demand for fish was perfectly price inelastic, a change in income would have
no effect on demand. (1 mark)
(vi) The longer the time period considered, the greater becomes the price elasticity of
demand for goods.(1 mark)
(Total marks = 10)
FUNDAMENTALS OF BUSINESS ECONOMICS 105TH
EM
ARKET
SYSTEM
AN
DTH
EC
OM
PETIT
IVE
PRO
CESS
2006.1


Solutions toRevision Questions
The answers given for the data response questions are what might reasonably be expected
of a candidate in an examination in order to achieve a good pass mark. You should also
pay particular attention to the extracts from examiners’ reports indicating what were the
common errors in answering these questions.
Solution 11.1 Solution: (D)
PED ¼ Percentage change in demand
Percentage change in price
A value of (� )1.5 implies that a 10 per cent price cut will raise demand and sales by
15 per cent, that is, from 10,000 per month to 11,500 per month.
1.2 Solution: (A)
If the demand for a good is price elastic, the demand for it will change more than
proportionately to the change in price. Thus a price fall will raise sales and will
increase total expenditure on the good.
1.3 Solution: D
Responses (A), (B) and (C) all involve changes in the conditions of demand and
hence would lead to a shift in the demand curve. However, response (D) involves a
change in the price of the holiday (a rise in the exchange rate would reduce the price
of the holiday), and thus demand would rise as a result of a movement along the
demand curve.
1.4 Solution: D
A typical feature of oligopoly is the desire to avoid price cutting, because other firms
will react with similar price cuts. The preference in oligopolistic markets is for non-
price competition.
1.5 Solution: A
Perfect information for consumers would provide them with information about new
entrants into the industry as well as about existing producers. This would remove
2
107 2006.1

a barrier to entry. The other responses all represent significant difficulties for new
entrants and thus act as barriers to entry.
1.6 Solution: A
Because a commodity is consumed by everyone (e.g. food), it does not follow that it
has any special features such that it cannot be produced efficiently in a competitive
market in the private sector. All other responses are valid reasons why a good or
service should be produced wholly, or partly, in the public sector.
1.7 Solution: D
Monopolistic competition is a situation where a market has many suppliers
producing similar, but differentiated goods. A typical result is that no firm has a
share of the market large enough to produce at the optimum level. Response (C)
applies to all markets including monopolistic competition. Response (D)
is the correct response since this refers to a monopoly market.
1.8 Solution: D
Privatisation does not produce larger firms and often leads to smaller firms when
public-sector monopolies are broken up into smaller companies (e.g. railways) on
privatisation. Thus the privatisation process cannot increase the scope for economies
of scale. All the other responses are valid reasons for privatisation.
Solution 2
(a) (i) price inelastic demand(ii) price elastic demand
(iii) price elastic demand
(b) Statement (i)
(c) (i) True
(ii) True
(iii) False
(iv) False
(v) True
(vi) False
Solution 3
(a) (i) £14
(ii) £19
(iii) £15
(iv) Output level 4
(v) �3.125
(b) (i) high elasticity
(ii) low elasticity
(iii) high elasticity
(iv) low elasticity
(v) no effect
SOLUTIONS TO REVISION QUESTIONS C4108TH
EM
ARKET
SYSTEM
AN
DTH
EC
OM
PETIT
IVE
PRO
CESS
2006.1

Solution 4(a) (i) a shift of the demand curve.
(ii) a movement along the demand curve.
(iii) a movement along the demand curve.
(iv) a shift of the demand curve.
(b) (i) False; price will rise much more if demand is price inelastic.
(ii) True; because supply is inelastic, the reduction in supply is mitigated as is the effect
on price.
(iii) False; price changes lead to movements along the demand curve.
(iv) True; advertising may get consumers to buy more at every price.
(v) False; a change in income would lead to a shift in the demand curve.
(vi) True; the longer the time period, the easier it is to find substitutes.
FUNDAMENTALS OF BUSINESS ECONOMICS 109TH
EM
ARKET
SYSTEM
AN
DTH
EC
OM
PETIT
IVE
PRO
CESS
2006.1


3
The Financial System


The FinancialSystem
3.1 The financial needs of individualsand organisations
One of the common features of all economies is the existence of money. Moreover, all
economies have organisations whose principal activities are related to the management of
money and various other financial instruments: in effect there exists something called a
financial sytem. In order to understand the role and nature of the financial system it is
helpful to understand the nature of money itself.
Learning Outcomes
In earlier chapters you will have learned about some of the important ideas and
principles in microeconomics – that part of economics concerned with the way in
which economic agents, such as consumers and businesses organisations, function in
particular markets. This chapter introduces you to the financial system which is
concerned with the role of financial organisations and instruments in meeting the
various financial needs of individuals and businesses. After completing this chapter
you should be able to:
" identify the factors leading to liquidity surpluses and deficits in the short, medium and
long run in households, firms and governments.
" explain the role of various financial assets, markets and institutions in assisting
organisations to manage their liquidity position and to provide an economic return to
holders of liquidity;
" identify the role of insurance markets in facilitation of the economic transfer and
bearing of risks for households, firms and governments;
" explain the role of national and international government organisations in regulating
and influencing the financial system, and the likely impact of their policy instruments
on businesses.
3
113 2006.1
3.1.1 Functions and qualities of money
Functions of moneyModern economies are totally dependent upon money in its many various forms. Money
facilitates trading, both domestically and internationally, and overcomes the weaknesses of
barter, which limited primitive societies. Money is any asset that is acceptable to its users in
fulfilling the main functions of money in an economic system. The different forms of
money – gold, notes, coin, bank accounts – that are used today confirm the oft-made
remark that ‘money is what money does’. Thus as long as something is acceptable and
enables the performance of certain functions, it can be regarded as money.
There are three main functions of money.
1. A medium of exchange. The existence of money means that buyers and sellers can meet
and trade, without the problems associated with barter. Without money, trade was
limited because some goods were indivisible, a rate of exchange might be disputed and
the wants and needs of the buyer needed to match identically with the needs and wants
of the seller. With money, small quantities can be purchased, prices are largely fixed at
the point of sale, and buyers and sellers do not need to reciprocate.
2. A store of value. When people receive money they may not spend it all on consumption.
Thus money needs to be capable of storage until required for consumption while
simultaneously maintaining its value during the saving period. If there is inflation, the
value of savings held in money form or denominated in money terms will lose value;
money will not be performing this function very well and the desire to save may be
reduced.
3. A unit of account. In this role, money allows goods to be compared in a common
denomination which people understand – namely money. The prices of goods and
services reflect their scarcity values and costs of production and enable consumers to
make rational judgements. Thus money enables people to establish relative values.
4. A standard of deferred payment. This means the ability to determine the value of future
payments in contracts specifying prices and payments measured in money terms.
The issue of ‘what is money?’ has led to much discussion among economists and to
various definitions and measures of money in the economy. If something performs the
above functions and is acceptable to people it will be used as ‘money’.
In order to fulfill the functions of money, an asset must have certain characteristics.
Qualities of moneyIn order to fulfill all of the functions of money, a financial asset should have the following
characteristics:
� Acceptability. All participants in a transaction must be willing to accept money in
exchange for real goods and services in order to fulfill the function of acting as a
medium of exchange.
� Durability. It is important, especially with cash, that money does not physically
deteriorate, especially if the money is used as means of storing value over time.
� Stable value. The purchasing power of money must be stable otherwise money cannot act
as a store of value or a standard of deferred payment.
� Portable and divisible. Money needs to be convenient for small transactions and easily
transported.
STUDY MATERIAL C4114TH
EFIN
AN
CIA
LSYSTEM
2006.1

The overall quality which money derives from these features is liquidity: the ability to turn a
financial asset into a form – effectively cash, that can be used as a medium of exchange –
the primary function of money.
This raises the question of what should, and what should not, be classified as money.
Cash clearly meets all of the above requirements. Both bank and building society accounts
which give customers (fairly) immediate access to their money also meet these
requirements and are included in most measures of the total of money in the economy.
These accounts give their holders liquidity, the vital characteristic of money. They also
perform the storage function. However, credit cards which are treated as ‘money’ by their
users and enable customers to buy goods are really only money substitutes. This is because
they do not perform the storage function.
The obvious problem in modern economics with the necessary qualities of money is the
requirement for a stable value. This is only possible in the absence of inflation – the process
by which the general price level rises over time. Indeed, the clearest definition of inflation
is a decline in the purchasing power of money. If the purchasing power of money were to decline
rapidly, for example, in periods of hyper-inflation such as occurred in Germany in the early
1920s, money cannot fulfill its function as a store of value or standard of deferred payment
and this in turn makes it less and less acceptable as a medium of exchange. Thus inflation,
especially if it is rapid, will damage all forms of money and damage the workings of
financial institutions.
Money and inflationThere is a variety of measures of inflation all of which are designed to give some indication
of the rate of change in the general price level. These include:
� consumer price indices which attempt to measure the rate of change in consumer prices;
� GDP (gross domestic product) deflators which attempt to measure the rate of change of all
prices in the economy;
� special price indices which attempt to measure the rate of change in prices of a selected
range of goods or services, or prices faced by a particular part of the economy, such as
producer price indices, factor gate price indices, pensioner consumer price indices,
export and import price indices.
These indices are all constructed in much the same way and involve:
� identifying a base year from which price changes are measured;
� selecting the range of goods and services whose prices are to be monitored;
� weighting each of the goods and services included according to their relative importance
in expenditure.
The rate of inflation, or indeed the rate of disinflation where prices are falling, can be
derived by comparing the index for one period, usually a year, with another.
The most commonly used price indices are for consumer goods. Prior to 2004 the UK
used a retail price index (RPI) as the principal measure of inflation. From 2004 the UK has
used a new measure of inflation, the consumer price index. This excludes mortgage
payments and is consistent with the measure of inflation used in the rest of the European
Union. Table 3.1 shows the UK consumer price index for the years 1998 to 2004 and the
annual rate of inflation that it reveals.
FUNDAMENTALS OF BUSINESS ECONOMICS 115TH
EFIN
AN
CIA
LSYSTEM
2006.1

3.1.2 Payments and receipts
Money is the crucial element in the move from a barter economy to a market economy and
the benefits of specialisation and the division of labour. But money also introduces another
feature of market economies: the separation of income from expenditure. In a barter
economy income, that is output, and expenditure such as consumption are conducted in the
same household and, for the large part, is simultaneous. Money makes it possible for the
earning of income and its expenditure to be separated in time and space. In modern
economies, it is possible for individuals and organisations to have a flow of income and a
flow of expenditure which, in any one period of time, are not equal. This is made possible by
money and other financial assets and by the services of financial institutions. In particular, in
any one period of time there will be individuals and organisations:
� whose income exceeds their expenditure and may be defined as net savers;
� whose expenditure exceeds their income and may be defined as net borrowers.
The main function of financial institutions is to provide an efficient link between net
savers and net borrowers and to provide a range of financial instruments which are
effective in moving the surplus money of net savers to the net borrowers in forms that are
most appropriate to their needs.
� This function is known as financial intermediation.
� The financial organisations which undertake it, such as banks, is known financial
intermediaries.
This problem, the lack of synchronisation between payments and receipts has a variety of
origins and affects individuals, businesses and governments.
IndividualsThe lack of synchronisation in payments and receipts for individuals can occur in the
short, medium and long term.
Short term
Household income comes in a variety of forms. The main ones being:
� wages and salaries
� income from investments, property and savings
� social security and pension payments.
Table 3.1 Inflation in the UK
Consumer price index
(1996 = 100)
Annual rate of inflation
(annual % change)
1998 103.4 1.6
1999 104.8 1.3
2000 105.6 0.8
2001 106.9 1.2
2002 108.3 1.3
2003 109.8 1.4
2004 111.2 1.3
Source: Economic Trends
STUDY MATERIAL C4116TH
EFIN
AN
CIA
LSYSTEM
2006.1
The common feature of these is that the flow of such income tends to be regular, but not
continuous. Typically wages and salaries are paid monthly (and bonuses annually) as are
social security and pension payments. Income from investments may be monthly, but are
more commonly bi-annually or annually.
Consumption expenditure, however, is typically more or less continuous and irregular.
Most households spend some money every day but rarely exactly the same amount. Thus
there is a lack of synchronisation in the flow of receipts (income) and payments
(expenditure). Some payments may match receipts, for example monthly direct debits and
monthly salaries but this relates only to certain types of expenditure.
Households can deal with this lack of synchronization in a variety of ways. Households
can:
� retain a stock of cash to meet day-to-day expenditure;
� use credit such as credit cards and overdrafts facilities;
� save in periods when receipts exceed payments to finance periods when the reverse happens.
In all of these cases, households use the services of financial intermediaries: bank accounts,
credit cards and overdrafts.
Medium term
Such a lack of synchronization in receipts and payments for households can also occur in
the medium term and arise out of the infrequent purchase of expensive items such as
consumer durables, including cars and some services such as holidays and medical bills.
Again these expenditure flows are unrelated to the flow of income. The solutions for
households are broadly twofold:
� to save over a period of time prior to the purchase;
� to borrow and repay over a period of time.
Again both of these require appropriate financial instruments; in the first case efficient
means of saving such as deposit accounts, and in the second case, cost effective means of
borrowing, including bank loans and consumer credit. These facilities are provided by
financial intermediaries.
Long term
Over the whole lifetime of the household, one would expect that household income
(receipts) and household expenditure (payments) would match. But even in the long term
there may be a mismatch between payments and receipts. This arises from the very long-
term nature of some income and spending decisions. Examples of this include:
� long-term purchase of assets, for example housing property;
� long-term savings for pensions.
These require very long-term financial instruments with life spans of decades. It is also
important that such instruments are efficient as these savings and expenditures are
very large in relation to household income. Thus a range of different types of
mortgages have been developed to meet the needs of house buyers and if some of
these turn out to less efficient than expected, this can become a serious problem for
households. The current difficulties experienced with some endowment mortgages in
the UK illustrates this issue.
FUNDAMENTALS OF BUSINESS ECONOMICS 117TH
EFIN
AN
CIA
LSYSTEM
2006.1

BusinessAs with individuals, businesses will find that flows of payments and flows of receipts rarely
match. This is often referred to as the cash flow problem and can occur in short, medium
and long run.
Short Run
All business have day-to-day costs to meet. For most payments for wages and salaries and
for the regular flow of physical inputs such as energy, raw materials and components
represent the biggest item in these payments. In effect, businesses need working capital.
However, the receipts for the business come mainly from sales revenue and these may not
follow the same pattern of costs. For businesses then the solutions to this cash flow
problem are:
� retaining a large stock of cash to meet periods of low or delayed income;
� access to credit, for example trade credit of various kinds to pay for physical inputs;
� access to overdraft facilities with their banks.
Of course when receipts are lower than payments businesses need access to credit and
overdraft facilities, but when the reverse happens secure, and preferably profitable, savings
instruments are required.
Medium term
Cash flow issues might arise in the medium term for businesses. Examples where this may
arise include:
� sales revenue is received long after the first costs are incurred such as in building and
construction activity, shipbuilding and aerospace;
� where contracts specify part payments long before delivery;
� reorganisation costs are incurred before benefits from lower costs or increased revenues
are achieved.
Businesses thus require medium-term finance, typically 2–3 years, to meet these medium-
term financial problems.
Long term
Most long-term financing problems in business arise out of their investment activities.
This may take a variety of forms:
� investment in physical capital
� investment in long-term Research and Development programmes (R&D)
� take-overs and mergers of existing businesses.
These activities may involve very large capital outlays with the prospect of increased
incomes delayed well into the future. Businesses thus need long-term finance and have
three main options:
� the use of internally generated funds
� equity capital through the issue of shares
� debt capital including mortgages, bank borrowing and bonds.
In the latter two cases, businesses need access to the capital market as sources of funds for
long-term investment.
STUDY MATERIAL C4118TH
EFIN
AN
CIA
LSYSTEM
2006.1

GovernmentThe government may have some income from profitable state industries or charges made
to consumers for state-provided services, but the vast bulk of its income comes from
taxation. The main sources of taxation revenue are:
� a range of indirect taxes (sales taxes) such as value added tax and excise duties on alcohol,
petrol and tobacco products;
� direct taxes on individuals most importantly income tax and social security taxes;
� direct taxes on business organisations such as corporation tax.
Some of these flows of taxation revenue are quite regular, such as income tax paid through
the pay-as-you-earn system in the UK, but many are not. The flow of receipts from
corporation tax, for example, can be very uneven with significant payments towards the
end of the tax year. This, as with households, implies a problem of synchronisation of
payments and receipts.
Short term
In the short term, governments must finance their day-to-day activities such as:
� payments of wages and salaries to government employees
� payment of social security and state pensions to the unemployed and the retired
� payments to providers of goods and services to enable the day-to-day running of the
government activities.
Most of these payments are spread over the financial year and are relatively stable from
one month to another. It is therefore difficult to match tax revenue to the payments
made for these items. Thus the government, like households, needs short-term financial
facilities so that it can meet its day-to-day running expenses. The credit and savings
needs of government in this respect are often met by the central bank, one of whose
functions is to act as banker to the government and to manage the government’s
finances.
Medium term
Governments also have medium-term financial commitments that largely arise from
investment activities in the public sector. Governments engage in investment when they
finance such as:
� school and hospital building;
� construction projects for the economic infrastructure, for example motorway and
railway construction;
� loans to private sector activities to help finance investment by those organisations; this
typically occurs in high technology and risky activities such as aerospace.
These expenditures are not likely to be evenly spread over the years. Indeed, governments
may deliberately concentrate such expenditures in some years rather than other as part of a
fiscal policy designed to manage the trade cycle. In this case, government will raise such
expenditure in recessions exactly when receipts from taxation are likely to be low as
consumer incomes and spending fall. Thus governments may run budget deficits which have
to be financed by borrowing from the private sector.
FUNDAMENTALS OF BUSINESS ECONOMICS 119TH
EFIN
AN
CIA
LSYSTEM
2006.1

Long term
Since it is possible for governments to be net savers or net borrowers over very long
periods of time, they may need of the services of financial intermediaries over that period.
It is more likely that governments will be net long-term borrowers:
� governments often take responsibility for financing very long-term investment projects
in the development of the infrastructure of the economy, for example nuclear power
and telecommunications, and given that these are investments, not current consump-
tion, borrowing is an acceptable means of finance for these projects;
� governments can continue to borrow in the very long run as long as there is sufficient
taxation income to finance the subsequent debt.
Even if governments do not engage in additional long-term borrowing, all have debts
accumulated from the past – the national debt. This must be managed as there is no real
possibility of repaying it. Thus governments need the services of financial intermediaries to
manage and renew this debt.
Exercise 3.1Answer the following questions based on the preceding information. You can check your
answers below.
1. What are the four main functions of money?
2. How does the consumer price index differ from the GDP deflator?
3. Explain why there is a problem of synchronisation in monetary flows.
4. What is meant by financial intermediation?
5. What are the three main types of long-term funding for businesses?
6. What is the national debt?
Solutions1. The main functions of money are to act as:
� a medium of exchange
� a store of value
� a unit of account
� a standard of deferred payment.
2. The consumer price index is a measure of change in the prices of goods and services
bought by consumers; the GDP deflator is a measure of change in the prices of all
goods and services including those bought by businesses.
3. The lack of synchronisation arises because the flows of payments for goods and
services will not be exactly matched in time by the flow of receipts. Thus individuals
and organisations will sometimes have payments exceeding receipts and sometimes
receipts exceeding payments. Some means of financing these deficits and surpluses is
therefore required.
4. Financial intermediation is the process of bringing together those organisations and
individuals with surplus funds (‘savers’) and those with deficits (‘borrowers’). This
function is provided by financial intermediaries such as banks.
STUDY MATERIAL C4120TH
EFIN
AN
CIA
LSYSTEM
2006.1

5. The three main sources of long-term funding for businesses are:
1. internally generated funds2. equity capital (issuing shares)3. debt capital (borrowing).
6. The national debt is the accumulated sum of previous borrowing undertaken by the
government to finance its budget deficits in the past.
3.2 The organisations of the financial system
3.2.1 Financial intermediaries
Financial intermediaries: functionsFinancial intermediaries are organisations which enable money to be transferred from savers
to borrowers. They channel funds into places where the ‘best’ return can be made and given
financial advice to customers. In addition, they facilitate the spreading of risks and the
acquisition of liquidity. The main functions of financial intermediaries are as follows.
Channeling funds
The primary function of financial intermediaries is to provide an efficient means of
channeling funds from net savers to net borrowers. This removes the need for individual
savers and borrowers to make bilateral arrangements. Moreover financial intermediaries, in
providing this link between savers and borrowers also:
� provide efficient and cost-effective sources of funds for net borrowers;
� safe and profitable (that is earning interest) assets for savers.
In addition, these organisations provide a range of services for their customers who hold
accounts with them, including money transfer facilities, safe and convenient keeping of
liquid assets, foreign exchange and financial advice.
Maturity transformation
A major reason why bilateral agreements between individual savers and borrowers is
difficult is because of differing time preferences. Typically,
� lenders wish to retain a degree of liquidity in their assets and are not prepared to lend for
very long periods;
� whereas borrowers often wish to borrow for very long periods especially for long-term
financing.
Financial intermediaries are able to perform maturity transformation: they provide liquid short-
term assets for savers and long-term liabilities for borrowers. An example of this is the role
of banks and building societies in the housing market where deposits from millions of
customers are accepted on relatively short term, often instant access, and money is lent for
very long periods – up to 30 years, in the form of mortgages for house buyers.
Risk transformation
A similar function fulfilled by financial intermediaries is that of risk transformation. For an
individual saver, lending to one borrower might entail an unacceptable risk of non-
payment of the debt. However a financial intermediary, by borrowing from large number
FUNDAMENTALS OF BUSINESS ECONOMICS 121TH
EFIN
AN
CIA
LSYSTEM
2006.1

of savers and lending to large number of borrowers, can effectively spread the risk and
reduce the risk to any one saver close to zero.
Financial intermediaries: institutionsThe financial intermediaries can be classified into three principal groups:
� banks
� other authorised institutions
� non-bank financial intermediaries.
All of these institutions are formally or informally supervised by the central bank – for
example in the UK, the Bank of England; and in the USA, the Federal Reserve Board.
Banks
There are two main types of bank in operation:
� retail banks
� wholesale banks.
Retail banks are familiar to most people in the form of ‘high street’ banks, such as Barclays
and HSBC. Their principal activity is in accepting retail deposits, granting retail loans and
providing payments and money transfer facilities through the cheque and debit card
systems. The main customers of these banks are individual households and businesses.
Box 3.1 describes the evolution of banks in the UK.
Box 3.1 Banks in the UK
Before the 1979 Banking Act, any organisation could call itself a ‘bank’ and accept
deposits from the public and then lend money. The crash of several ‘fringe banks’ in
1975 and the subsequent ‘lifeboat’ action of the Bank of England to prevent a collapse
of confidence pushed the government into legislation. The main purpose of the new
Bank of England supervisory scheme is to protect depositors. Thus, no one can accept
deposits from the public without express authorisation from the Bank of England.
The 1979 and 1987 Banking Acts introduced definitions of ‘banks’ and ‘authorised
institutions’. The title ‘bank’ is reserved for institutions with not less than £5m paid-
up equity capital, and Bank of England authorisation. To be authorised, a bank or
other institution needs to pass a number of financial tests and to satisfy the Bank of
England about the quality and honesty of their management. Once authorised, an
institution is also subject to continuous monitoring. The elite among these banks are
the clearing banks. They are members of the Bankers Clearing House. They are often
termed ‘retail banks’ because of their direct relationship with their customers and
their High Street premises. Nearly all of the commercial banks are public limited
companies, part of whose profits are remitted to shareholders.
The retail or commercial banks’ main activities are as follows.
Safeguarding money
Customers’ deposits are kept in deposit and current accounts.
� Deposit (time) accounts are operated for savers who receive interest for storing their
money at the bank. The rate of interest received varies with movements in the bank’s
STUDY MATERIAL C4122TH
EFIN
AN
CIA
LSYSTEM
2006.1
base rate. If interest rates in the money market rise, then bank base rate is increased so
depositors receive more interest on their deposits.
� Current (sight) accounts do not usually gain significant amounts of interest, although they
do provide the holder with a chequebook facility. Customers can settle debts by writing
cheques or by using debit cards, and also withdraw cash on demand (i.e. no charges) in
current accounts while the customer stays in credit.
� The distinction between deposit and current accounts is becoming less clear cut, as banks devise
new financial instruments. For example, high interest cheque accounts continue the traditional
features of deposit and current accounts and were invented to attract specific customers.
Transferring money
Banks move cash between their branches when required. In operating the cheque clearing
system they transfer money between accounts within a branch, between different branches
and between different banks.
� Each clearing bank has an account at the central bank. In effect, every time one of a
bank’s customers writes a cheque, which is presented at another bank, the payer’s bank
has its account at the central bank debited. Conversely, the recipient’s bank has its account
credited. In practice, at daily clearing, each bank totals up its accounts with every other
bank and the net amount owed (or gained) is deducted from (or credited to) its account.
� This is a money transmission service. It is also undertaken by the use of direct debits,
standing orders and credit transfers.
Lending money
When goldsmiths realised that only a small proportion of their gold deposits was required
daily, they decided to put the gold to work by lending and charging interest. The banks
perform a similar profit-earning function by providing loans and overdrafts to customers.
Generally the rates of interest charged to businesses are less than those levied on personal
borrowing. Such loans generally take two forms:
� When a customer has a current account, he or she might seek an overdraft. Usually, overdrafts
are for short periods of time, allowing customers to write cheques to a value greater than the
funds in the current account. Interest is charged on a daily basis on the actual amount by
which the customer is overdrawn. This tends to be a cheaper form of borrowing, if prior
authority is given by the bank. Overdrafts are more informal and more flexible than loans,
although penalty rates of interest may be charged for unauthorised borrowing.
� Loans. These tend to be for larger amounts and over longer periods of time. They are
often tied to particular purchases and are repaid over longer periods of time.
Facilitating trade
Modern banks provide numerous services which facilitate easier trading. The accepting of
commercial bills and the provision of foreign exchange make international trade smoother
in operation. Similarly the development of advisory services for small firms, the
participation in loan guarantee schemes and the giving of financial advice and market
information encourage domestic trade.
In addition to retail banks there are also wholesale banks. These are also known as
investment or secondary banks. The most common of these banks are:
� merchant banks such as Morgan Grenfell;
� overseas banks operating in countries other than their home country.
FUNDAMENTALS OF BUSINESS ECONOMICS 123TH
EFIN
AN
CIA
LSYSTEM
2006.1

Merchant banks are banking brokers who bring together the lenders and borrowers of
large sums of money, for example business companies. Merchant banks:
� Operate in a high-risk area and deal in very large deposits and loans primarily from
industry and commerce. They often borrow from each other on what is known as the
inter-bank market.
� Advise companies on money management.
� Negotiate bills of exchange. A bill of exchange is a trading contract, usually for three
months, upon which a trader can usually get credit.
� Underwrite the launching of new shares, for example Lazard Bros. organised the
privatisation of Britoil in 1985.
� Supervise company takeovers on the stock market.
� As accepting houses, they guarantee commercial bills for companies.
They are thus wholesalers of money in the system.
Also, overseas banks now operate in most financial centres and their banking activitity is
mainly related to:
� financing international trade
� international capital movements
� international currency transactions.
In practice the distinction between retail and wholesale banks has become less clear in recent
years. Many banks which previously operated only as retail banks have taken on many of the
functions of wholesale banks, especially in relational to international transactions. They have
often achieved this by setting up or acquiring specialist subsidiary companies.
Discount houses are another type of unofficial bank, which are unique to Britain. These
nine institutions operate in the money market by borrowing from the commercial banks
for a short period (which may be as little as overnight) and lending for up to three months.
They make a profit on the difference between the interest rate paid and charged.
Non-bank financial intermediaries
These institutions are not officially authorised by the Bank of England, although they are
informally watched. However, they often perform banking tasks and since financial
deregulation in the 1980s they have competed with banks for business. The best-known
type of non-bank in the UK is the building society. Some are owned by their members
(‘mutual’ building societies), others by shareholders. They tend to ‘borrow short’ and ‘lend
long’ (via mortgages), profiting from interest-rate differentials and fulfilling the function of
maturity transformation.
Since the 1980s, building societies have became more independent and competitive. No
longer are society interest rates kept in harmony by the Building Societies Association, so
there is more competition between them. In addition, competition with banks and other
authorised institutions has increased, particularly in home loans and high-interest, instant-
access accounts. However, building societies are still constrained by the requirement that
they can lend only a maximum of 5 per cent of their assets for personal finance. Many
building societies have become banks in recent years.
Another trend has been the growth of financial conglomerates. Formerly financial
institutions tended to specialise, for example building societies and mortgages. Now they
are branching out into non-traditional lines of business and offering mortgages.
STUDY MATERIAL C4124TH
EFIN
AN
CIA
LSYSTEM
2006.1

The diversification has also brought estate agents, unit trusts and big High Street retailers
into financial intermediaries. In the mid-1990s, several building societies decided to ‘go
public’ and become banks. The process takes a while, such that it was not until 1997 that
the Halifax, Woolwich and Alliance & Leicester emerged on to the stock market. Thus the
distinction between banks and building societies is now blurred and institutions providing
the entire range of financial services are dominating the financial system.
Many other financial institutions exist, mostly providing specialist financial services. The
most important of these are:
� Investment and unit trusts which accept savings by selling shares and invest these savings,
mainly in company shares;
� Pension funds which accept savings from their customers, both individuals and
companies, normally on an ongoing basis, to invest and to provide retirement pensions
for their customers;
� Insurance companies which invest their premium income in a range of assets but mainly
long term such as shares and property.
� Finance companies which provide medium-term credit for business and individual
customers. Others act as leasing companies (leasing out capital equipment to businesses)
and factoring companies (providing funds for businesses using their creditors as
collateral).
3.2.2 The central bank
All countries have a central bank: in the UK, the Bank of England; in the USA, the Federal
Reserve Board; in the eurozone, the European Central Bank and in Japan, the Bank
of Japan. These are normally government-owned organisations. Although the functions of
central banks vary a little from country to country, there are some common functions
of these organisations.
The main functions of central banks are as follows.
Banker to the banksAll commercial banks keep accounts at the central bank. These accounts:
� act as a liquid reserve for the commercial banks;
� facilitate transfers from one bank to another arising out of the cheque clearing system.
In most countries these accounts are compulsory and must be equal to a minimum
percentage of the commercial banks liabilities.
Banker to the governmentThe central bank provides a range of banking services for the government and for
government departments:
� accounts of government departments are held at the central bank and used in the same
way as bank accounts in commercial banks; thus taxation revenue is paid into, and
government expenditure paid out of these accounts;
� debt management which involves organising the raising of new borrowing for
government when they run budget deficits, redeeming old debts when they run budget
surpluses and managing the national debt.
FUNDAMENTALS OF BUSINESS ECONOMICS 125TH
EFIN
AN
CIA
LSYSTEM
2006.1

� the central bank operates monetary policy on behalf of the government and is largely
concerned with managing the supply of money in the economy, rates of interest and the
rate of exchange for the currency.
� it manages the country’s reserves of foreign currency; in the UK this is done through the
Exchange and Equalization account which may be used to buy and sell sterling on the
foreign exchange market in order to smooth out excessive fluctuations in the value of
sterling.
Note issue
The central bank has the sole right of note issue in an economy. These notes are liabilities
on the central banks balance sheet and the matching assets are largely government
securities. Paper currency is no longer backed by gold.
Supervision of the banking system
The central bank normally has the duty of supervising the financial system and ensuring
that the banks in the system meet the requirements laid down for them. These normally
concern:
� Capital adequacy to ensure that banks have sufficient capital to meet problems arising
from business losses or loss of value in their assets, for example losses arising from bad
debts.
� Liquidity to ensure banks can meet the normal day-to-day requirements of their
customers for cash.
In order to support the banking system should problem of liquidity arise, the central bank
also acts as lender of the last resort. In this role the central bank will be willing to rediscount
bills or buy bank government stock (‘repos’) thus providing cash for the banking system.
3.2.3 Financial markets
Financial institutions operate in a range of financial markets. The most important of these
are:
� money markets
� capital markets
� international markets.
Money marketsIn most economies, the financial markets are dominated by the money market. It is here that
banks, companies, local authorities and the government operate via the discount houses in
buying and selling short-term debt. The discount houses are described as market makers in
bills. This is because they will buy (or sell) treasury and commercial bills to enable holders
to transform their assets into liquidity (or their cash into paper financial assets).
One important element of this function is the obligation of the discount houses to
purchase each week the full issue of treasury bills. These are issued in order to make up the
difference between government expenditure and reserves. Other buyers may purchase
most of the treasury bills but the discount houses guarantee to make good any shortfall in
demand.
STUDY MATERIAL C4126TH
EFIN
AN
CIA
LSYSTEM
2006.1

� The price which the discount house pays reflects the market rate of interest.
� A high bid price makes a low rate of interest, because the difference between the price
paid and the maturity value (usually three months later) is effectively the interest paid on
the loan.
� For example, a bill bought for £4,900 is redeemed for £5,000 after three months. Thus
£100 profit is made on an outlay of £4,900 over three months, approximately 8.2 per
cent per annum.
The main commercial bill is a bill of exchange.
� When a financial intermediary accepts a bill of exchange it is effectively loaning money
to a private trader upon promise of a refund by another trader.
� The bill is a contract between the two traders, with the buyer promising to pay a sum of
money in return for goods on a certain date to the seller.
� The seller may sell the bill or cash to a financial intermediary who will discount it. A
bank will discount the bill by paying less than the face value, knowing that it will receive
the full value at a later date. The difference between the two sums of money is the
interest.
These treasury and commercial bills are also often resold before maturity, again facilitating
liquidity for the seller. The discount houses, in turn, raise their funds by borrowing ‘money
at call’ from the banks, at very low rates of interest. They make a profit by charging slightly
higher rates of interest when buying bills.
The 1970s and 1980s saw enormous financial innovation and the creation of new
markets. These are known as parallel money markets. A key characteristic is that transactions
are mainly between financial intermediaries, firms and local authorities but not the
government.
Secondary markets were developed in:
� bank liabilities, such as certificates of deposit
� and in bank assets, such as resaleable bank loans.
Such markets as the inter-bank market evolved to enable banks to accommodate
fluctuations in customers’ transactions by making loans to one another. With the increase
in financial deregulation since the mid-1980s, new parallel markets in local authority debt,
inter-company deposits and finance house borrowing have also sprung up.
Foreign exchange marketsInternational markets are in broadly two groups.
1. the foreign exchange market
2. international capital markets.
Foreign exchange markets are concerned with the purchase and sale of foreign exchange.
This is primarily for three reasons:
1. the finance of international trade;
2. companies holding and managing a portfolio of currencies as part of their financial
asset management function;
3. financial institutions dealing in foreign exchange to on behalf of their customers and in
order to benefit from changes in exchange rates.
FUNDAMENTALS OF BUSINESS ECONOMICS 127TH
EFIN
AN
CIA
LSYSTEM
2006.1

International capital markets have greatly expanded since the 1950s. This has been the
result of:
� the progressive abolition of exchange controls limiting the flow of capital in and out of
economies;
� growth of multinational companies (MNCs) who often do not use capital markets in the
‘home’ country; by borrowing abroad in different currencies, MNCs can shop around
for favourable terms and also avoid any domestic government credit restraints.
The funds available on international capital markets fall into three broad categories:
1. short-term capital (Eurocurrency) borrowed mainly for the purposes of working capital;
2. medium-term capital (Eurocredit) borrowed for working capital and investment
purposes;
3. long-term capital (Eurobonds) borrowed for investment purposes and for financing
mergers and acquisitions. Eurobonds are bonds issued by very large companies, banks,
governments and supranational institutions, such as the European Commission, to raise
long-term finance (typically five years and over). These bonds are denominated in a
currency other than that of the borrower, although often US dollars are used. The
bonds are bought and traded by investment institutions and banks.
The international capital market is useful not only for business borrowers. It is also used
for government borrowers (e.g. UK local government authorities) and provides a market
for lending funds for businesses with surplus cash. Thus the market performs a useful
international element to the financial asset management function of commercial
enterprises.
Although these international markets operate in many financial centres they are
dominated by Europe and the USA, and especially London. The term ‘euromarket’ had its
origins in the 1970s. International trading expanded and this led to new foreign currency
markets, such as the Eurodollar market. In this market, dollar balances earned by
European exporters (to the USA) were held in European banks earning interest on
favourable terms because they are offshore (held outside the country of origin and not
subject to central bank control).
3.3 The credit creation process
3.3.1 The credit multiplier
Banks create credit as a way of making profit. They are able to do this because not all of
the cash that is deposited at a bank will be regularly withdrawn. Furthermore, when a bank
lends money to a borrower, some of that money may be deposited back in the bank by
another customer who deals with the borrower. This provides more cash reserves. In
practice, the banks have discovered that at most 10 per cent of the deposited cash will be
withdrawn, thereby leaving the remainder for loans and/or investment. This percentage is
known as the cash ratio.
The use of the cash ratio makes possible the multiple creation of credit by banks. In the
simple example given in Figure 3.1, the following sequence occurs.
STUDY MATERIAL C4128TH
EFIN
AN
CIA
LSYSTEM
2006.1
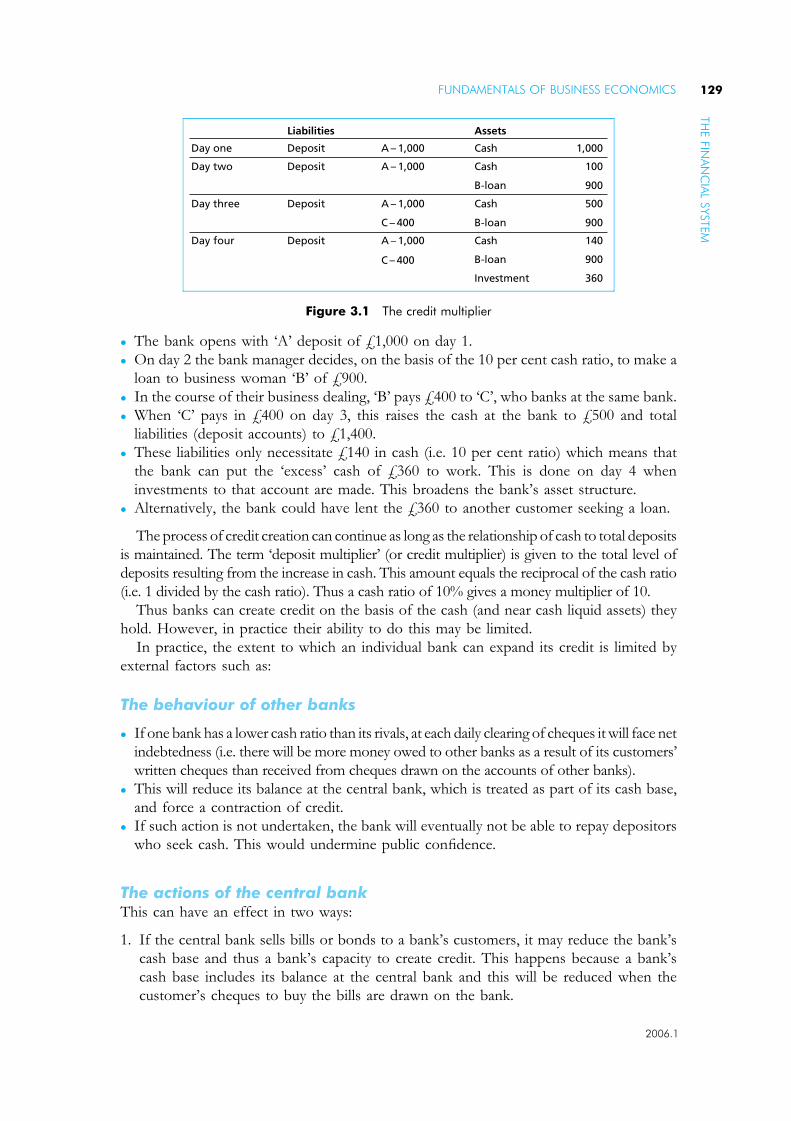
� The bank opens with ‘A’ deposit of £1,000 on day 1.
� On day 2 the bank manager decides, on the basis of the 10 per cent cash ratio, to make a
loan to business woman ‘B’ of £900.
� In the course of their business dealing, ‘B’ pays £400 to ‘C’, who banks at the same bank.
� When ‘C’ pays in £400 on day 3, this raises the cash at the bank to £500 and total
liabilities (deposit accounts) to £1,400.
� These liabilities only necessitate £140 in cash (i.e. 10 per cent ratio) which means that
the bank can put the ‘excess’ cash of £360 to work. This is done on day 4 when
investments to that account are made. This broadens the bank’s asset structure.
� Alternatively, the bank could have lent the £360 to another customer seeking a loan.
The process of credit creation can continue as long as the relationship of cash to total deposits
is maintained. The term ‘deposit multiplier’ (or credit multiplier) is given to the total level of
deposits resulting from the increase in cash. This amount equals the reciprocal of the cash ratio
(i.e. 1 divided by the cash ratio). Thus a cash ratio of 10% gives a money multiplier of 10.
Thus banks can create credit on the basis of the cash (and near cash liquid assets) they
hold. However, in practice their ability to do this may be limited.
In practice, the extent to which an individual bank can expand its credit is limited by
external factors such as:
The behaviour of other banks
� If one bank has a lower cash ratio than its rivals, at each daily clearing of cheques it will face net
indebtedness (i.e. there will be more money owed to other banks as a result of its customers’
written cheques than received from cheques drawn on the accounts of other banks).
� This will reduce its balance at the central bank, which is treated as part of its cash base,
and force a contraction of credit.
� If such action is not undertaken, the bank will eventually not be able to repay depositors
who seek cash. This would undermine public confidence.
The actions of the central bankThis can have an effect in two ways:
1. If the central bank sells bills or bonds to a bank’s customers, it may reduce the bank’s
cash base and thus a bank’s capacity to create credit. This happens because a bank’s
cash base includes its balance at the central bank and this will be reduced when the
customer’s cheques to buy the bills are drawn on the bank.
1,000
100
900
500
900
140
900
360
A – 1,000
A – 1,000
C – 400
A – 1,000
C – 400
A – 1,000
Deposit
Liabilities
Deposit
Deposit
Deposit
Cash
Assets
Cash
B-loan
B-loan
B-loan
Cash
Cash
Investment
Day one
Day two
Day three
Day four
Figure 3.1 The credit multiplier
FUNDAMENTALS OF BUSINESS ECONOMICS 129TH
EFIN
AN
CIA
LSYSTEM
2006.1

2. if the central bank forces up interest rates, it may reduce the demand for credit (because
this action makes credit more expensive) and so a bank may not have sufficient
customers seeking credit.
The behaviour of other financial institutionsAs institutional investors, such as insurance companies, save money in competing financial
institutions, interest-rate differentials are very significant for them. Thus, if one bank raises
its interest rates to attract custom, then this might limit another institution’s capacity to
create credit when it loses the deposits of an institutional investor.
Recent changesThe model of credit creation given above is the traditional one. However, since the
deregulation process started in the 1980s, financial systems have developed and changed.
This has involved the development of new financial instruments and new banking
practices. These changes have included:
� the adoption of new financial practices;
� the high level of investments as opposed to credit advances shown by financial firms;
� the growth of international trade and finance;
� libertarian economic attitudes leading to financial deregulation;
� technological innovations that integrated markets, for example electronic money
transmission.
These developments have led banks into liability management and international credit,
rather than just asset management and domestic credit as outlined earlier. The changes
have also brought new credit creators into the fray.
Banks were faced with a falling (retail) deposit base in the 1980s and so have increased
their reliance on wholesale funding. Thus cash deposits by customers only account for
about 30 per cent of total liabilities. This undermines the relationship between customers’
deposits (liabilities) and the cash base when considering credit creation.
In addition, distinctions are fading between the activities of financial institutions.
� Traditional lines of demarcation have been eroded between banks and building societies,
while some mergers have created financial conglomerates offering a wide variety of
financial services.
� Not only have non-bank institutions, such as building societies, engaged in credit
creation but also non-financial bodies, such as large companies, for example high-street
retailers.
Furthermore, the international dimension has developed rapidly, with the creation of
Euronote facilities and swap activities, as corporate borrowers search worldwide for funding.
These facilities have enabled British firms to borrow large sums abroad to finance activities in
Britain. Credit has become internationally mobile, as financial innovators package domestic
debts (e.g. cars, mortgages) into instruments marketable on world markets.
3.3.2 Financial instruments: assets and liabilities
All financial instruments are both assets to lenders and liabilities to borrowers. In the case
of retail banks, all deposits are banks’ liabilities because a bank has to provide money if a
STUDY MATERIAL C4130TH
EFIN
AN
CIA
LSYSTEM
2006.1

customer seeks a withdrawal. The bank’s assets are the ways in which the bank has used
the deposits.
The bank balance sheet shows the portfolio of assets which the bank holds. These range
from:
� the cash on the premises, which is extremely liquid but not profitable,
� through to advances which may be very difficult to repossess but yield high returns
(Figure 3.2).
Prudent banks, and other financial institutions, arrange, and regularly rearrange, their asset
structure to meet these contrasting objectives of liquidity and profitability.
� In general, the most profitable assets are the least liquid. For example, advances to the
private sector may earn in excess of 20 per cent interest but they often cannot very
quickly be called in.
� It is also true that the most liquid assets, such as notes and coin, are the least profitable.
Not only do they not earn interest but also they incur financial costs in being handled
and guarded. However, they do act as a buffer in case there is a run on the bank.
Banks also see security. Some of the assets, for example treasury bills, have government
backing, which is reassuring for the banks. However, many are risky and collateral may be
LIABILITIES
ASSETS
Money at call
Notes and coinsBalances with B of EMarket loans
Deposits
Foreign currency depositsSterling liabilitiesCapital and other funds
• UK private sector• Certificates of deposit
• Discount houses
• Treasury
• UK private sector
• Other
• Other
• Eligible bank
• Other UK banks• Certificates of deposit• Other
• Other
Bills
Advances
Investments
Other currency assets
90-day loans toGovernment
sight and timedeposits
(i.e. current anddeposit a/ cs)
Loans to localauthoritiesoverseas
Commerical billsfor 3 months
issued by privatesector and
accepted bybanks
These includemarket loans,advances andinvestments
Other shortterm loans
Capitalcontributed byshareholders
+ f50,000deposit for
fixed period oftime
Figure 3.2 Bank balance sheet
FUNDAMENTALS OF BUSINESS ECONOMICS 131TH
EFIN
AN
CIA
LSYSTEM
2006.1
sought from customers. It is interesting that in some cases a bank has been the one to ‘pull
the plug’ on a risky business, such as a football club, because it was the major creditor.
Advances and investments are considered to be illiquid. They are difficult to redeem quickly
and then sometimes only with a loss being incurred. For example, a sale of stock could raise
cash but a capital loss may result because the sale occurs when the market is depressed.
Certificates of deposit(CD) which are paper assets issued by banks to depositors who are
willing to leave their money on deposit for a specified period of time. The certificates are bought
(and sold) by banks, thereby giving their original holders, firms, access to cash. This makes a CD
liquid and it is also profitable to a bank, because it receives the interest due on the CD.
Foreign currencies also feature as assets and liabilities in the banks’ balance sheets. Their
increasing importance and size shows the international importance of British banking. As
these currencies are held on the assets side as loans, advances and investments, they are
lucrative but fairly illiquid, like their British counterparts.
The ‘banks in the UK: consolidated balance sheet’ is now shown in a rather different
way (Figure 3.2).
3.3.3 Finance for business
As discussed in Section 3.1.2, there are financial problems for businesses when there is a
lack of synchronisation in the flows of payments and receipts. The financial needs of
business vary and take a variety of forms. In general their needs can be classified as:
� funds to finance day-to-day business including payments for wages and salaries, raw
materials and components – ‘working capital ’;
� funds to finance the purchase of new capital equipment or to finance acquisitions and
mergers – ‘investment capital’;
� suitable instruments for investing any surplus funds as part of the asset management function.
In acquiring funds to finance their activities, businesses have a large range of different
types of financial instruments from which to choose. But in making the choice, businesses
will follow a general rule that the instrument should be appropriate to the use to which the
funds are to be put. Thus:
� short-term instruments should be chosen to finance the short-term needs of working
capital;
� long-term instruments should be chosen to finance the long-term needs of investment.
With the investment of surplus funds a similar rule is generally adopted and the instrument
chosen will be balanced between profitability and the needs to match the term of the
instrument to the period during which the funds will not be needed.
In most economies and for most businesses, the bulk of the financial needs of those
businesses are met by internally generated funds. For the rest of their financial needs,
businesses can employ a range of financial instruments. The most important of these are:
Short- and medium-term instrumentsThese are typically acquired from the money markets. The most important are:
� short-term bank loans and overdrafts, the latter are expensive and avoided if possible;
� bills of exchange, these are typically of 3–6 months duration are sold with a promise to
repay at that date;
STUDY MATERIAL C4132TH
EFIN
AN
CIA
LSYSTEM
2006.1
� commercial paper which are debt securities issued by the largest companies;
� trade credit which allows business to delay payment for raw materials, components,
business services, etc.
� leasing and hire purchase.
Financial intermediaries have thus built up a wide range of instruments to meet the short-
and medium-term financial needs of business. However, there has been a persistent
complaint in many countries over recent years that the system has been poor at meeting
the financial needs of small and newly established businesses. This explains the growth
various government measures designed specifically to help the small business sector.
Long-term instrumentsIn meeting their long-term financial needs, businesses have a broad choice between two
forms of long-term finance:
� equity finance
� debt finance.
Equity finance is available to limited liability companies through the issue of shares. For
publicly quoted companies, additional shares (‘rights issues’) can be issued via the Stock
Market. This is discussed in the next section.
The alternative is long-term borrowing. This might be done by long-term commercial
paper for the largest firms. Funds may also be raised by forms of Preference Shares on
which fixed rates of interest are paid and mortgaged.
Although there is a wide choice of instruments for larger firms, especially those quoted
on the stock market, there have been problems in many economies for small and new
businesses. A persistent complaint has been the difficulty that small firms face in acquiring
the finance they need from the financial system. In response many governments have
created a series of initiative designed to meet the specific financing needs of small firms.
Box 3.2 identifies some of the initiatives undertaken in the UK.
Box 3.2 The Finance of Small Firms
In the UK, a range of measures have been introduced to meet the financial needs of
small companies. These include:
The Small Firms Loan Guarantee Scheme by which the government guarantees loans
from banks to small firms.
Regional venture Capital Funds which are public/private partnerships supported by the
Department of Trade and Industry to encourage equity investment in small companies.
Phoenix Fund to support small businesses in disadvantaged urban areas.
Enterprise Investment Scheme to encourage equity investment in small and unquoted
companies.
Alternative Investment Market (AIM) which enables small and middling companies to
obtain equity capital on the London stock market.
In addition, the government has granted a series of tax concessions to help small
companies. This includes lower rates of corporation tax for small companies.
FUNDAMENTALS OF BUSINESS ECONOMICS 133TH
EFIN
AN
CIA
LSYSTEM
2006.1

3.3.4 The stock market
In the UK this encompasses several markets:
� the equities/securities market where ordinary shares, preference shares and debentures
are traded;
� the AIM where smaller companies gain access to capital, under less stringent and less
costly entry procedures;
� government bonds/gilts market where government sells short (up to 5 years) medium
(5–15 years), long (over 15 years) and undated stock.
The phrase ‘capital instruments’ refers to the means (e.g. shares, bonds, etc.) by which
organisations raise finance.
In October 1986 the ‘Big Bang’ occurred and the UK Stock Exchange radically
changed. Its central function as a market for the purchase and sale of second-hand
securities remained but its operations and procedures were reformed.
� Previously, an individual bought shares through a stockbroker.
� The broker acted as an adviser and an agent for his client (who was charged a
commission) and bought shares from a stockjobber.
� The jobber was a dealer in securities who was willing to buy and sell at a price and hold
on to unrequired shares. He did not deal with the general public.
� This system of single capacity was ended in October 1986 and the broker and jobbing
functions were merged. The new dealer, of which there are about 200, has become
known as a market-maker.
Equity marketTransactions in company securities are the most numerous but average only £15,000 per
transaction. These can be subdivided into equities (ordinary shares) and loan capital
securities.
� Equities bestow full voting rights on the shareholder and an entitlement to dividends,
once the preference shareholders and the holders of loan capital have been paid out.
� Preference shareholders receive a fixed dividend and get their capital repaid before
ordinary shareholders if a company is wound up.
� Company bond sand debentures do not confer ownership rights but their holders
receive a fixed rate of interest over a set period of time. In 1978 ‘traded options’ were
introduced, whereby an option holder can buy/sell a quantity of a company’s shares at a
fixed price on a specified date.
In 1985, convertible securities became prominent. They combine both debt and equity.
The holder of the debt has the option of converting to equity, if desired. The securities
market performs two main functions:
� It is a primary market for newly issued shares. Typically, a company’s new shares are
issued by an issuing house with the help and advice of a stockbroker. There are several
possible methods of issuing new shares – by an offer for sale, by placing, by tender and
by public issue: issuing a prospectus.
� In addition, existing companies wishing to raise capital may introduce a rights issue. This
gives existing shareholders the right to subscribe cash for more shares in proportion to
STUDY MATERIAL C4134TH
EFIN
AN
CIA
LSYSTEM
2006.1
their existing shareholdings. The stockbroker’s involvement is to obtain stock exchange
approval for the issue, which a merchant bank usually undertakes.
� A secondary market exists for the buying and selling of existing shares. Although this
does not contribute to economic production, it has some value. It raises the liquidity of
company shares because buyers of new issues know that they can sell in the future. In
addition, the worth of a company can be calculated from its share price.
� Furthermore, a company can raise further capital by an issue of extra shares more easily
and cheaply if it has a high market share price. This was very clear in the stock market
boom of 1986–87.
The stock market is usually given as an example of a perfectly competitive market because
there are many buyers and sellers with excellent knowledge and rapid reactions to price
changes. Share prices are published daily and they reflect demand changes. For instance
market-makers will ‘mark down’ the prices of shares for which they have a plentiful
supply.
However, in practice many non-economic factors affect share prices:
� political factors – wars, crises and elections tend to depress prices generally because of the
uncertainty created;
� the general mood of business – optimism about the economy and government policy may
stimulate confidence in share buying, thus raising share prices.
The price of a specific company share is more likely to be influenced by economic and
commercial considerations directly relevant to that company.
� If a company reveals lower profits than expected, its share price might fall.
� Conversely, if a companies’ prospects are enhanced by rumours, or announcements of a
takeover, its share price will tend to rise.
In Figure 3.3, the demand for a company’s shares has fallen to D1. It could be that the
institutional investors, who typically hold about 70% of equities, are concerned about the
management, recent trading or lower than expected dividends and so switch to other
equities. A similar fall in share price could result from an issue of new shares (S1), without
any change in demand.
Quantity
Share price
S
D
Q Q1
P
P1
D1
S1
Figure 3.3 A fall in share price
FUNDAMENTALS OF BUSINESS ECONOMICS 135TH
EFIN
AN
CIA
LSYSTEM
2006.1
Alternative investment market (AIM)In the UK there exists a market for shares in smaller companies. This was originally the
Unlisted Securities Market (USM) set up in 1980. The purpose was to enable smaller
companies raise sums up to £250,000 through share issues. The AIM which replaced the
USM caters for smaller companies with none of the formal requirements regarding the age
of the company and its market capitalisation for the main stock market.
Government bond marketGovernment stocks, such as Gilt-edged stocks in the UK, are fewer in number than shares
but marketed in greater volume, averaging £250,000 per transaction on long dated stock.
� The method of sale since 1979 has been by tender rather than at a fixed price (tap).
� However, the Bank of England usually sets the minimum tender price and when there is
an excess demand all allotments are made at the lowest accepted price. These bonds are
sold in £100 units, usually at a fixed interest rate.
There is a wide choice of interest payments and redemption dates to make bonds
attractive to buyers. The main buyers are pension funds and life assurance companies who
are attracted by a fixed certain income.
� As explained elsewhere the market price varies with the interest payment (called the
‘coupon’).
� For example, if interest rates are around 5 per cent then a bond with a £10 coupon will
trade at around £200 (10/200 = 5 per cent). If interest rates then rise to 6 per cent, the
bond price will move to £166 (10/166 = 6 per cent).
The supply of bonds is determined by the stock of bonds, which basically constitute the
national debt. Public sector borrowing, which necessitates debt sales, will increase the
supply of bonds.
3.3.5 Yields on assets and interest rates
The yield, or return, from an asset is calculated on the dividend relative to the market
price. It is in effect a rate of interest and can be applied to most paper assets.
� Commonly, it is used to assess the return on dated government stock. The rate of
return, or yield, varies with stocks of differing maturities. This happens partly because
the dividend amount is fixed when the stock is sold.
� For example, at a time of relatively high inflation (e.g. 1990) the dividend would have to
be high to attract investors. However, a stock sold four years later, with inflation at 2 per
cent, might offer a lower dividend.
As a stock nears maturity, its market price approaches its nominal price. Thus its yield falls.
For example:
� a £100 stock carrying a dividend of £10, and with a market value of £90, gives a yield of
11 per cent (£10 divided by £90).
� as the stock approaches maturity, its market value approaches its nominal price (£100)
and its yield becomes 10 per cent (£10 divided by £100).
Figure 3.4 shows a normal yield curve.
STUDY MATERIAL C4136TH
EFIN
AN
CIA
LSYSTEM
2006.1

Yields rise when the prices of stocks fall. This could occur because market rates of interest
on other substitutable assets are rising (i.e. their prices falling). These falling asset prices
might result from:
� lower inflation
� increased supply of the assets
� lower company profits
� or financial pessimism.
In addition, because shares can be a substitute for stocks, a bullish share market could
depress the price of stocks and so raise their yields. In January 2006 an example of the
reverse happened. A sharp fall in share prices on the Tokyo stock market led to the
following sequence of events in the UK.
� UK investors, fearing a similar fall in UK share prices, sold equity shares and bought
government stock instead.
� The result was a steep rise in the price of UK government stock (‘gilts’).
� The rise in gilt prices produced a sharp fall in their yield significantly reducing likely
incomes for large institutional investors with large gilt holdings.
The yield on equity is also important. In a perfectly efficient market, one would expect that
the yield to an investor in bonds would be equal to the yield to an investor in equities. If
this were not the case one would expect, other things being equal, that investors would sell
the lower yielding assets in order to buy the higher yielding assets.
The yield on dividends is measured as:
Dividend yield ¼ dividend per ordinary share
market price of the share
Thus if a company is paying 30 cents per ordinary share and each share has market price of
$7.50 then the dividend yield would be:
30 cents
750 cents� 100 ¼ 4%
% yield
Years to maturity
8
7
6
5
1 2 3 4 5 6 7 8 9 10
Figure 3.4 A normal yield curve
FUNDAMENTALS OF BUSINESS ECONOMICS 137TH
EFIN
AN
CIA
LSYSTEM
2006.1
Thus interest rates can affect the price of shares and their yields. If interest rates were to
rise, the yield on bonds would also tend to rise. In an efficient market the following
sequence would occur:
� investors would shift their portfolios towards bonds where yields are now rising and sell
shares to do so;
� the sale of shares would reduce the prices of shares;
� the fall in the price of shares would raise the dividend yield (in the above example if the
share price fell to $6.66, the yield would rise to 4.5%).
The falling price of shares would raise the yield on those shares until an equilibrium was
reached in which the yield on bonds and on shares was equalised. Thus changes in the rate
of interest have important impacts on the prices and thus yields of shares and bonds.
3.3.6 Central banks and the rate of interest
Money: demand and supplyIn principle the rate of interest is the price of money (or more strictly, the price of
liquidity). Therefore it should be determined, like any other price, by the interaction of the
supply and demand for money.
The supply of money
In order to establish what determines the supply of money, one needs to know what money is.
The problem here is that range of financial assets can fulfill the function of money. Thus there
is a long list of different measures of the supply of money in the economy; these range from
very liquid assets, such as cash and current accounts, to a much broader notion of which assets
should be regarded as money. The broad distinction here is between measures of:
� narrow money (or monetary bases) which includes cash in circulation;
� broad money which includes cash and current accounts but also deposit (time) accounts in
retail and wholesale banking.
In the UK many of measures of money supply have been developed, from narrow money
measures such as M0 and M2, to broader measures, such as M3 and M4.
In all cases, however, the total supply of money is linked to the amount of liquid assets
that are present in the banking system. This is because it is the basis of these liquid assets,
especially cash, that the banking system can create credit.
The demand for money
The demand for money refers to the preference for holding the highly liquid asset of cash rather
than holding other, less liquid but interest-bearing assets. For this reason the demand for
money is sometimes referred to as ‘liquidity preference’. Since holding cash means that interest
is foregone, interest is clearly the price for holding that cash. Why should people and
organisations wish to hold cash when it means foregoing the interest they could have earned?
Three general motives have been suggested as to why people seek to hold money:
Transactions Motive
As money is a medium of exchange giving liquidity, and people need to buy goods and
services, clearly they require money for this purpose. Such money is usually held in cash
and current accounts.
STUDY MATERIAL C4138TH
EFIN
AN
CIA
LSYSTEM
2006.1
The demand for money for transactions purposes will be largely affected by the
following.
� The level of real income. As living standards rise, expenditure rises and hence the demand
for money to finance those transactions will increase. Thus the supply of money needs
to be increased over time to match this rise in expenditure.
� The rate of inflation. In periods of inflation the demand for money for transactions
purposes will increase, not because there is an increase in the real volume of
expenditure, but because the total monetary value of those transactions has risen due to
the rise in prices.
� The frequency of wage and salary payments. People paid monthly will probably have a higher
average current account balance than those paid weekly.
Precautionary Motive
As money acts as a store of value, people wish to keep it in order to meet unforeseen
personal and financial contingencies.
� Such money tends to be held by individuals in bank and building society deposit
accounts which are fairly accessible in an emergency.
� However, the expansion of private insurance, the wider provision of state benefits and
the ease of transfer between deposit and current accounts have meant that people
commit less income to saving for this purpose.
� It is unlikely that small increases in income affect the level of precautionary demand for
money, although generally those on higher incomes tend to have higher savings
balances.
� However, there is a clear link between precautionary savings and inflation. At times of
rapid inflation, people tend to save more so as to maintain the real value of their money
balances in case of emergency.
Speculative Motive
As money gives immediate liquidity, some people wish to hold money in order to
speculate with it.
� An individual may hold cash ready to undertake potentially profitable risks, varying from
betting to the purchase of assets. The amount of money held for speculation is largely
dependent on individual income levels.
� However, the main money speculators are financial institutions, rather than individuals.
In 1990, over half of total M4 money in the UK was used for speculative purposes.
� Potential speculators are interested in the real rate of interest from asset buying. Thus
their calculations take into account inflation. As a simple general rule, it is probably
reasonable to say that the speculative demand for money is lowest at times of highest
inflation, other things being equal. This is because money held ready for a suitable
speculation is losing its value even more quickly at times of rapid inflation, and potential
speculators recognise this real cost.
Monetary policyFrom the foregoing discussion, it can be seen that interest rates might change if there is a
change in the supply or demand for money. Changes in the demand for money are unlikely
FUNDAMENTALS OF BUSINESS ECONOMICS 139TH
EFIN
AN
CIA
LSYSTEM
2006.1
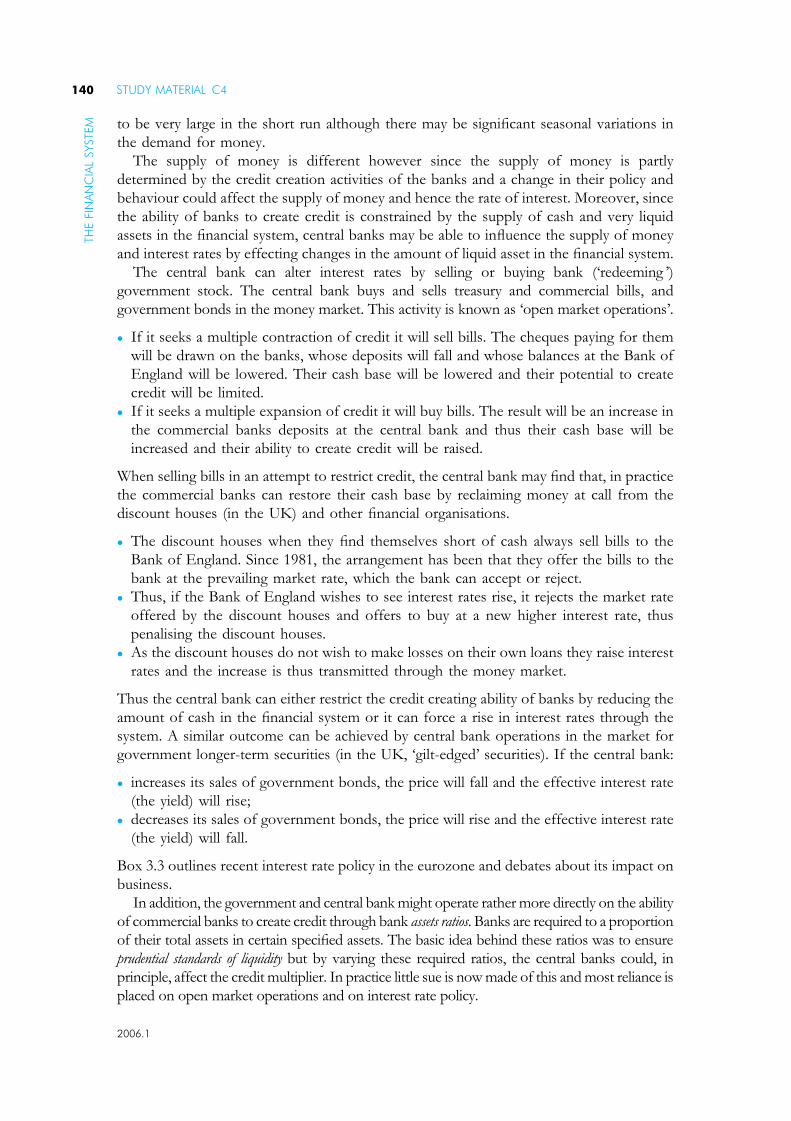
to be very large in the short run although there may be significant seasonal variations in
the demand for money.
The supply of money is different however since the supply of money is partly
determined by the credit creation activities of the banks and a change in their policy and
behaviour could affect the supply of money and hence the rate of interest. Moreover, since
the ability of banks to create credit is constrained by the supply of cash and very liquid
assets in the financial system, central banks may be able to influence the supply of money
and interest rates by effecting changes in the amount of liquid asset in the financial system.
The central bank can alter interest rates by selling or buying bank (‘redeeming ’)
government stock. The central bank buys and sells treasury and commercial bills, and
government bonds in the money market. This activity is known as ‘open market operations’.
� If it seeks a multiple contraction of credit it will sell bills. The cheques paying for them
will be drawn on the banks, whose deposits will fall and whose balances at the Bank of
England will be lowered. Their cash base will be lowered and their potential to create
credit will be limited.
� If it seeks a multiple expansion of credit it will buy bills. The result will be an increase in
the commercial banks deposits at the central bank and thus their cash base will be
increased and their ability to create credit will be raised.
When selling bills in an attempt to restrict credit, the central bank may find that, in practice
the commercial banks can restore their cash base by reclaiming money at call from the
discount houses (in the UK) and other financial organisations.
� The discount houses when they find themselves short of cash always sell bills to the
Bank of England. Since 1981, the arrangement has been that they offer the bills to the
bank at the prevailing market rate, which the bank can accept or reject.
� Thus, if the Bank of England wishes to see interest rates rise, it rejects the market rate
offered by the discount houses and offers to buy at a new higher interest rate, thus
penalising the discount houses.
� As the discount houses do not wish to make losses on their own loans they raise interest
rates and the increase is thus transmitted through the money market.
Thus the central bank can either restrict the credit creating ability of banks by reducing the
amount of cash in the financial system or it can force a rise in interest rates through the
system. A similar outcome can be achieved by central bank operations in the market for
government longer-term securities (in the UK, ‘gilt-edged’ securities). If the central bank:
� increases its sales of government bonds, the price will fall and the effective interest rate
(the yield) will rise;
� decreases its sales of government bonds, the price will rise and the effective interest rate
(the yield) will fall.
Box 3.3 outlines recent interest rate policy in the eurozone and debates about its impact on
business.
In addition, the government and central bank might operate rather more directly on the ability
of commercial banks to create credit through bank assets ratios. Banks are required to a proportion
of their total assets in certain specified assets. The basic idea behind these ratios was to ensure
prudential standards of liquidity but by varying these required ratios, the central banks could, in
principle, affect the credit multiplier. In practice little sue is now made of this and most reliance is
placed on open market operations and on interest rate policy.
STUDY MATERIAL C4140TH
EFIN
AN
CIA
LSYSTEM
2006.1

In addition to the conduct of monetary policy central banks have an important role in
supervision of the banking system.
Box 3.3 Interest rates in the Eurozone
The European Central Bank yesterday raised interest rates for the first time in five
years. But Jean-Claude Trichet, the ECB president, gave a clear signal the bank has no
plans for a series of increases. The ECB’s 18-strong governing council, warning of
risks to price stability, unanimously agreed to increase rates in the eurozone from a
30-month low of 2% to 2.25%.
As the euro dipped against the dollar and the pound, the French and German
finance ministers, Thierry Breton and Peer Steinbeck, who had both argued against
a rate increase, insisted that the moderate tightening of monetary policy would not
damage the outlook for growth. Mr Steinbeck, who saw German unemployment
drop below 11% last month said, ‘‘As long as it remains just a quarter-point rise
and is not the start of a continuing series then we can live with it. . . . I don’t
believe it will have a big negative impact’’. Karl-Heinz Grasser, Austria’s finance
minister said the decision ‘‘neither helps in the fight against inflation nor favours
growth in Europe’’. Pointing to an as yet fragile recovery, Ernest-Antoine Selliere,
president of Unice, the EU business lobby, warned that the moderate rate rise was
not a positive signal for growth — especially if it triggered renewed strength in the
euro.
(David Gow Article in Guardian December 2nd 2005)
Banking supervisionCapital adequacy rules
Banks create credit for customers in order to make profits, by charging interest. However,
not all recipients of credit repay the amount borrowed and so bad debts can arise. For
example, in the late 1980s and early 1990s the four major British clearing banks wrote off
billions of pounds of Third World debt from their balance sheets.
UK incorporated banks are watched over and advised by the Bank of England. There
are certain rules and requirements which are imposed on banks; some of these are
described below.
This problem of bad debt and the exposure of major banks throughout Europe
precipitated the Basle Agreement 1988.
� This established a risk asset ratio relating a bank’s capital to its assets and off balance
sheet exposures.
� A minimum international standard capital adequacy ratio was set but an individual
central bank was permitted to set higher levels if it wished.
The adequacy of a bank’s capital is measured against the bank’s risk assets, which are
weighted by category. ‘On balance sheet’ items are weighted according to their location
and any available collateral. For example, lending to a local authority attracts a 20 per cent
weighting. ‘Off balance sheet’ items have a credit conversion factor applied to them,
according to their perceived risk, to give them ‘on balance sheet’ equivalence. For example,
FUNDAMENTALS OF BUSINESS ECONOMICS 141TH
EFIN
AN
CIA
LSYSTEM
2006.1
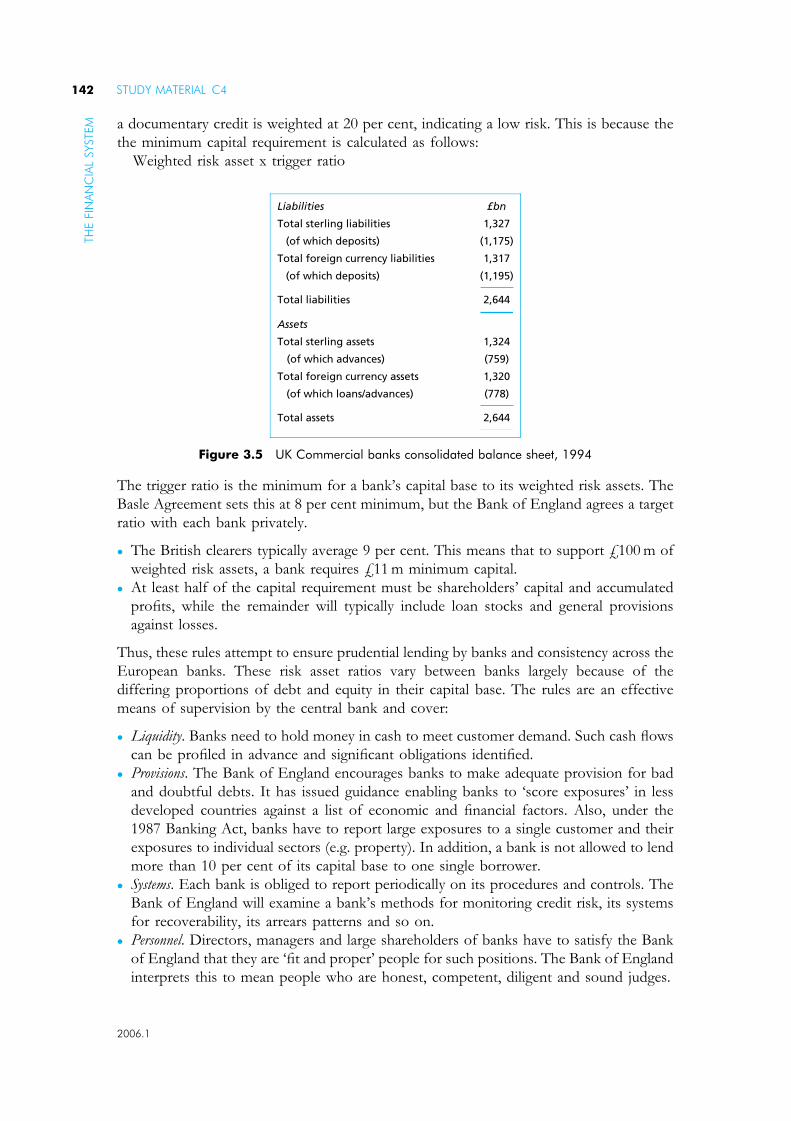
a documentary credit is weighted at 20 per cent, indicating a low risk. This is because the
the minimum capital requirement is calculated as follows:
Weighted risk asset x trigger ratio
The trigger ratio is the minimum for a bank’s capital base to its weighted risk assets. The
Basle Agreement sets this at 8 per cent minimum, but the Bank of England agrees a target
ratio with each bank privately.
� The British clearers typically average 9 per cent. This means that to support £100 m of
weighted risk assets, a bank requires £11 m minimum capital.
� At least half of the capital requirement must be shareholders’ capital and accumulated
profits, while the remainder will typically include loan stocks and general provisions
against losses.
Thus, these rules attempt to ensure prudential lending by banks and consistency across the
European banks. These risk asset ratios vary between banks largely because of the
differing proportions of debt and equity in their capital base. The rules are an effective
means of supervision by the central bank and cover:
� Liquidity. Banks need to hold money in cash to meet customer demand. Such cash flows
can be profiled in advance and significant obligations identified.
� Provisions. The Bank of England encourages banks to make adequate provision for bad
and doubtful debts. It has issued guidance enabling banks to ‘score exposures’ in less
developed countries against a list of economic and financial factors. Also, under the
1987 Banking Act, banks have to report large exposures to a single customer and their
exposures to individual sectors (e.g. property). In addition, a bank is not allowed to lend
more than 10 per cent of its capital base to one single borrower.
� Systems. Each bank is obliged to report periodically on its procedures and controls. The
Bank of England will examine a bank’s methods for monitoring credit risk, its systems
for recoverability, its arrears patterns and so on.
� Personnel. Directors, managers and large shareholders of banks have to satisfy the Bank
of England that they are ‘fit and proper’ people for such positions. The Bank of England
interprets this to mean people who are honest, competent, diligent and sound judges.
£bnLiabilities
Assets
Total sterling liabilities 1,327
2,644Total liabilities
2,644Total assets
1,317Total foreign currency liabilities
1,320Total foreign currency assets
(1,175)(of which deposits)
(1,195)(of which deposits)
(778)(of which loans/advances)
(759)(of which advances)
1,324Total sterling assets
Figure 3.5 UK Commercial banks consolidated balance sheet, 1994
STUDY MATERIAL C4142TH
EFIN
AN
CIA
LSYSTEM
2006.1

In addition, the reporting accountants of a bank have to regularly confirm that the central
bank’s guidelines have been observed. They also submit the necessary statistical returns
which will be key data in the central banks’ monitoring.
Exercise 3.21. What is a cash ratio?
2. What is the relationship between liquidity and profitability of banks assets?
3. How could a central bank reduce the supply of credit in the financial system?
4. How could a central bank reduce the demand for credit in the financial system?
5. What are the three motives for demanding money (liquidity)?
6. What are capital adequacy rules?
Solutions1. The amount of cash kept by banks in readiness to pay withdrawals as a proportion of
their total assets.
2. The most liquid assets, for example cash, are the least profitable; and the least liquid
assets, for example advances and loans to customers, are the most profitable.
3. The central bank would need to reduce the liquidity of the financial system as this is the
basis upon which credit is created. It can do this by selling government stocks to
financial institutions.
4. The central bank could raise interest rates as interest is the price of credit and a higher
price will reduce demand.
5. The three motives for demanding money are:
� the transactions motive� the precautionary motive� the speculative motive.
Together they make up the demand for money, also known as liquidity preference.
6. Capital adequacy rules attempt to ensure that banks have sufficient capital to cover
potential bad debts on risk assets.
3.4 The insurance market
All businesses face two types of risk:
1. general commercial risks which may affect their performance and profitability,
including business confidence, consumer confidence, the demand for their product and
broad economic conditions;
2. specific risks such as the loss of capital equipment and premises due to fire or accident
or the risk of accidents to employees.
In the first case these risks are undertaken by entrepreneurs or by business organisations
taking on the entrepreneurial function. The reward for accepting these risks is profit. It is
FUNDAMENTALS OF BUSINESS ECONOMICS 143TH
EFIN
AN
CIA
LSYSTEM
2006.1
not possible to insure against these sort of risks. However, in the latter case, risks are
insurable because:
� it is very unlikely that an event or process could affect most businesses in the same way
at the same time;
� therefore a probability of the risk occurring can be predicted and a premium can be calculated.
In many cases, businesses have little choice about taking out insurance for they may be
required to do so by law. In the UK, businesses must take out insurance against accidents
and ill health to their employees under the Employers’ Liability Regulations.
3.4.1 Types of insurance
Insurance is a means of providing a degree of protection, for individuals or for businesses,
against the financial consequences of range of risks including theft, or accidental damage
to property, and death or injury.
Insurable risks fall into two categories:
1. risks of events that may occur (‘insurance’)
2. risks of events that will occur (‘assurance’).
For a typical business, the general risks which they may wish to insure against include:
� fire
� theft
� employers liability
� public liability
� consequential loss
� credit (bad debts)
� engineering/marine/motor.
� sickness and critical illness of employees
Indeed, in the UK businesses must, by law, take out insurance for employers liability, motor
insurance, some forms of engineering insurance for some types of dangerous machinery
and insurance to cover contractual obligations (e.g. when the business stores or transports
other peoples’ property).
In order to acquire insurance, a business can:
� approach directly an insurance company. These may be general insurance companies
providing insurance against a range of risks or they may be companies specialising in
one particular form of insurance.
� work through an intermediary known as an insurance broker. Brokers will seek an
insurance company that can provide the business with the most appropriate policy for
their needs. Lloyds of London is one of the most well known and biggest institutions
acting as an intermediary between customers and the groups of individuals who provide
the insurance cover.
3.4.2 The providers of insurance
Most insurance cover is provided by insurance companies. These companies can operate
successfully by pooling the risks involved amongst a large number of policyholders. Given
STUDY MATERIAL C4144TH
EFIN
AN
CIA
LSYSTEM
2006.1

the large numbers the company can calculate the risks involved and thus calculate a
premium to be charged. The task of calculating risks is a specialised one undertaken by
actuaries. Thus the insurance company has two sources of income:
1. the premium income itself;
2. the income generated from that part of the premium income which can be invested by
the company.
In this process, the insurance industry is undertaken the functions of:
� Underwriting. Here the financial institution is accepting the financial risk involved in the
particular insurance transaction in return for an agreed payment (the ‘premium’). Thus
insurance companies underwrite range of insurance risks and will pay out compensation
when there are genuine claims on the insurance policy.
� Reinsurance. Some individual risks may be very large. This would be the case when
insuring ships and aircraft. In these cases insurance providers might wish to spread the
risks via reinsurance. It does so by sharing the premium with other companies in
relation to the share of the risk underwritten by each company.
In addition to these providers of standard insurance services, businesses can also use the
futures market to provide cover against certain types of financial risk. An example of a
futures market is the London International Financial Futures and Options Exchange (LIFFE).
These markets provide a form of insurance cover for businesses where:
� the organisation is faced with a fixed financial commitment sometime in the future, such
as the requirement to pay a fixed sum in a foreign currency to an overseas supplier.
� the organisation may be vulnerable to a range of financial risks arising out of price
changes in the period between signing the contract and the date of payment, such as
fluctuations in exchange rates.
Thus a business might be able to buy some foreign exchange at a fixed rate of exchange to
be delivered at some specified point in the future in order to meet a contractual financial
obligation.
3.5 Chapter summary
This chapter has discussed various roles, functions and features of the financial system. It
has developed the following main sets of related ideas and principles.
� The problem of lack of synchronisation in payments and receipts for individuals,
businesses and governments and how this problem may rise in the short, medium and
long run.
� The role of financial institutions acting as financial intermediaries. Financial
intermediation is the process of bringing together those individuals and organisations
that have financial surpluses and deficits thus providing a means of dealing with the lack
of financial synchronisation.
� The principal services and contracts provided by financial institutions to meet the
financial needs of businesses and governments.
� The process of credit creation in the financial system and the importance of various
interest rates.
FUNDAMENTALS OF BUSINESS ECONOMICS 145TH
EFIN
AN
CIA
LSYSTEM
2006.1
� The role of the central bank in influencing the supply of credit and the rate of interest
and its task of overseeing the work of the financial system.
� The importance of insurance for businesses and the different services provided by
insurance companies.
All individuals and organisations function within a monetary environment and so the
services provided by financial institutions and the efficiency and effectiveness of that
provision is a crucial factor in business operation.
STUDY MATERIAL C4146TH
EFIN
AN
CIA
LSYSTEM
2006.1

Revision Questions
This section contains examination-standard questions and solutions relevant to the content
of Chapter 3. You should use these questions for examination practice and revision.
Question 11.1 Which is the best description of the supply of money in an economy?
(A) Notes and coins issued by the central bank.
(B) Money created by the commercial banks.
(C) Coins, notes and bank deposits.
(D) All items of legal tender.
1.2 The essential condition for an asset to act as money is that it is:
(A) Legal tender.
(B) Generally acceptable.
(C) Backed by gold or foreign exchange.
(D) A physical commodity.
1.3 Which of the following are the likely consequences of a fall in interest rates?
(i) A rise in the demand for consumer goods.(ii) A fall in investment.
(iii) A fall in government spending.
(iv) A rise in the demand for housing.
(A) (i) and (ii) only.
(B) (i), (ii) and (iii) only.
(C) (i), (iii) and (iv) only.
(D) (ii), (iii) and (iv) only.
1.4 Which one of the following is not part of the transactions demand for money?
(A) Cash held to pay weekly supermarket bills.
(B) Money in the bank to meet a banks’ direct debit for telephone bills.
(C) Money in a bank account held to pay for an annual holiday.
(D) Money kept in a current account to meet unforeseen bills.
3
147 2006.1
1.5 Which of the following would be expected to lead to a rise in share prices on a stock
market?
(A) A fall in interest rates.
(B) A rise in the rate of inflation.
(C) A fall in share prices in other stock markets.
(D) An expected fall in company profits.
1.6 Reinsurance is best defined as:
(A) A business renewing its insurance cover each year.
(B) A business increasing its level of insurance to meet new needs.
(C) An insurance broker finding a suitable insurance policy for a client.
(D) An insurance company sharing a particular insurance risk with other companies.
1.7 Which one of the following could a business not insure itself against?
(A) Financial consequences of bad debts.
(B) Falling sales in the onset of a recession.
(C) Claims for damages by customers injured by faulty products of the business.
(D) Theft of the businesses property by an employee.
1.8 A $100 stock with market price of $80 and a dividend of $5 will generate a yield of:
(A) 5%
(B) 8%
(C) 6.25%
(D) 12.5%
Question 2The following financial data refer to the United Kingdom for the period 1992 to 1997.
1992 1993 1994 1995 1996 1997
Interest rates
Bank base rate (%) 8.5 7.0 5.5 6.8 5.8 6.0
Instant-access account
deposit rate (%)
6.3 4.9 3.8 4.2 2.8 2.3
90-day-access account
deposit rate (%)
8.8 6.2 4.5 4.9 3.9 3.9
Mortgage rate 11.0 9.4 7.7 8.4 7.0 7.4
Share prices
FTSE 100 index 2521 2900 2919 2314 3711 4710
Inflation
Percentage rise in RPI
(retail price index)
4.0 1.6 2.3 3.5 2.7 2.7
REVISION QUESTIONS C4148TH
EFIN
AN
CIA
LSYSTEM
2006.1

RequirementsUsing both your knowledge of economic theory and material contained in the table:
(a) With respect to the data given:
(i) using the bank base rate calculate the real rate of interest for 1994;
(ii) calculate the real mortgage rate of interest for 1995;
(iii) state whether real share prices rose or fell between 1993 and 1994. (3 marks)
(b) State whether each of the following are true or false.
(i) Rising real interest rates will encourage savings and investment.
(ii) Interest rates will only affect business investment if that investment is financed by
borrowing.
(iii) Rising interest rates in a country tend to raise the exchange rate for that country’s
currency.
(iv) Producers of consumer durable goods are more sensitive to changes in interest
rates than supermarkets.
(v) Central banks cannot increase the money supply and raise interest rates at the
same time. (5 marks)
(c) State whether the effect of a rise in interest rates will be to
(i) increase or decrease government spending;
(ii) reflate or deflate the economy. (2 marks)
(Total marks = 10)
FUNDAMENTALS OF BUSINESS ECONOMICS 149TH
EFIN
AN
CIA
LSYSTEM
2006.1


Solutions toRevision Questions
Solution 11.1 Solution: (C)
The question concerns an economic definition of money. D refers to the legal definition.
A and B are insufficient, since they refer to either cash or credit, but not to both.
1.2 Solution: (B)
The most important function of money is to act as a medium of exchange; for this the
essential condition is that it should be generally acceptable. Provided that it is
acceptable, it does not need to be legal tender, or to be backed by gold or foreign
exchange. Neither does it need to be a physical commodity; most money consists of
entries in bank accounts.
1.3 Solution: (C)
A fall in interest rates will encourage investment, not a fall. Lower interest rates reduce
government expenditure on servicing the national debt, and will encourage consumers
to take on more credit, including borrowing for house purchase. Thus C is the correct
solution.
1.4 Solution: (D)
Money held to meet unforeseen circumstances is called the precautionary motive, so
D is the correct response. All the others are monies cash or assets in bank accounts to
meet known items of expenditure and hence are for the transactions motive.
1.5 Solution: (A)
A fall in company profits would clearly discourage the purchase of shares and so share
prices would fall. Since stock markets are linked, a fall in one market tends to lead to a fall
in share prices in other markets. A rise in inflation would lead to some business
pessimism and might be expected to lead to a rise in interest rates. However, since share
prices and interest rates move in opposite directions, A is the correct solution.
1.6 Solution: (D)
Reinsurance concerns the way in which insurance companies handle large risks not
with the activities of companies seeking insurance. Thus an insurance company, faced
with a large potential risk, may share the risk and the insurance premium with other
insurance companies.
3
151 2006.1

1.7 Solution: (B)
All of the others are risks which can be calculated by insurance companies and will
affect only a predictable number of businesses in any one period. However with a
recession it would be difficult to predict and to estimate what proportion of falling
sales were the result of the recession. Moreover this would affect most businesses at
the same time. Thus no insurance company will insure such a risk and hence B is the
correct solution.
1.8 Solution: (C)
The yield of an asset is the relationship between the income derived from it and the
price that has to be paid to acquire it. In this case the market price is $80 and the
income gained is $5. The yield in percentage terms is $5 divided by $80� 100. This is
6.25%
Solution 2
(a) (i) 3.2%
(ii) 4.9%
(iii) fell
(b) (i) False. High interest rates encourage savings but discourage business investment.
(ii) False. A rise in interest rates raises the opportunity cost of using internal funds to
finance investment.
(iii) True. Higher interest rates encourage capital inflows which increase the demand
for the currency.
(iv) True. Consumer durables are often bought on credit.
(v) True. If the supply of money increases, its price, the rate of interest, will go down.
(c) A rise in interest rate would:(i) raise government spending as the cost of financing government debt would
increase.
(ii) deflate the economy since it would discourage expenditure.
SOLUTIONS TO REVISION QUESTIONS C4152TH
EFIN
AN
CIA
LSYSTEM
2006.1

4
The Macroeconomic Contextof Business: The DomesticEconomy

The MacroeconomicContext of Business:The DomesticEconomy
4.1 The economy as a whole
4.1.1 National income
So far the discussion of economic processes has concentrated on elements of the economy
such as business organisations, markets and the financial system. It is now necessary to
look at the economy as a whole, as a system. This makes it possible to answer some
important questions including:
� How large is the economy?
� How fast is the economy growing?
4
LEARNING OUTCOMES
This chapter introduces you to macroeconomics and international economics
which are concerned with how the economy as a whole functions and how it relates
to other economies. It deals with such issues as the inflation and unemployment
in the trade cycle, government economic policy and international trade and
payments.
" explain macroeconomic phenomena, including growth, inflation, unemployment,
demand management and supply side policies;
" explain the main measures and indicators of a country’s economic performance and
the problems of using these to assess the wealth and commercial potential of a
country;
" identify the stages of the trade cycle, its causes and consequences, and discuss the
business impacts of potential policy responses of government to each stage;
" explain the main principles of public finance (i.e. deficit financing, forms of taxation)
and macroeconomic policy.
2006.1155

� Why do inflation and unemployment occur?
� How may we assess the ability of the economy to generate economic welfare for its
citizens?
The starting point is to measure the size of the economy by using the concept of national
income.
National income is measured in order to assess the performance of an economy over a
period of time, usually a year. This, in turn, will give some idea of changes in living
standards and enable international comparisons to be made.
The definition of national income is:
the total value of the goods and services produced by a country’s resources over a year.
Given the scale of economic activity in a modern economy, the accounting needed to
measure national income is very complex. Measurement is done in three ways:
� by national output
� by national income
� by national expenditure.
When goods and services are produced, people receive incomes, and thus in theory the
addition of the prices of all the goods and services should equal the sum of all the income
of the population. Similarly, those figures should equate with the total amount of spending
by the population on goods and services. However, numerous adjustments have to be
made when calculating by each method.
National income can be used for a variety of purposes. In particular, when we wish to
measure
� the productivity of an economy the appropriate measure of national income is gross
domestic product (GDP);
� the standard of living in an economy the appropriate measure is gross national product
(GNP).
In a closed economy with no economic relations with the rest of the world, the measures
of GDP and GNP would be identical; in an open economy with international flows of
goods, services and payments, they may differ.
Gross domestic product (GDP)This term is often referred to by economists because it shows the value of the output
produced in an economy during one year. If it increases in real terms, then there has been
economic growth.
If we take all the domestic spending and adjust for trade as in Table 4.1, we can calculate
GDP at market prices. However, because the government interferes in the market system
through indirect taxes and subsidies, this does not show the real cost of these goods and
services (factor cost). So, taxes are deducted and subsidies added. Thus GDP at market
prices is adjusted to give the valuation of GDP at factor cost.
Gross national product (GNP)This term refers to the value of the output produced (and incomes earned) by all British
residents in a year. To calculate this, the following must be added/deducted to the figure
for GDP for a country.
STUDY MATERIAL C4156TH
EM
AC
RO
EC
ON
OM
ICC
ON
TEXT
OF
BU
SIN
ESS
2006.1
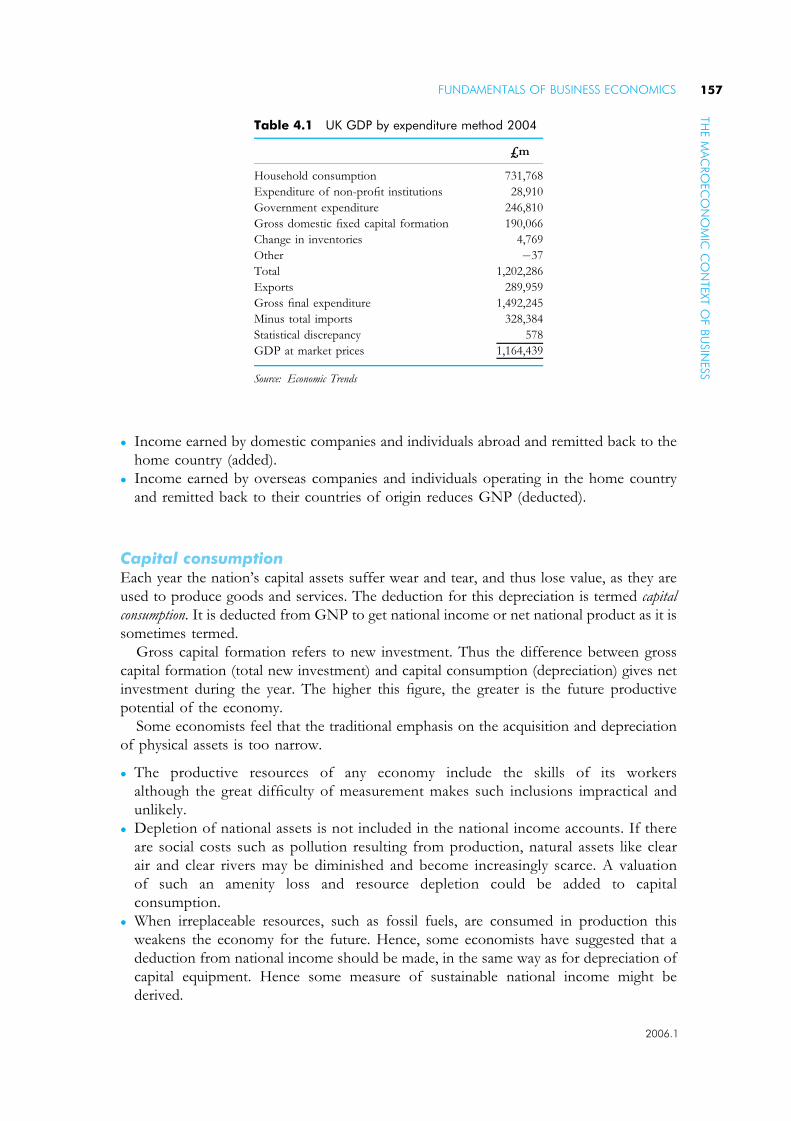
� Income earned by domestic companies and individuals abroad and remitted back to the
home country (added).
� Income earned by overseas companies and individuals operating in the home country
and remitted back to their countries of origin reduces GNP (deducted).
Capital consumptionEach year the nation’s capital assets suffer wear and tear, and thus lose value, as they are
used to produce goods and services. The deduction for this depreciation is termed capital
consumption. It is deducted from GNP to get national income or net national product as it is
sometimes termed.
Gross capital formation refers to new investment. Thus the difference between gross
capital formation (total new investment) and capital consumption (depreciation) gives net
investment during the year. The higher this figure, the greater is the future productive
potential of the economy.
Some economists feel that the traditional emphasis on the acquisition and depreciation
of physical assets is too narrow.
� The productive resources of any economy include the skills of its workers
although the great difficulty of measurement makes such inclusions impractical and
unlikely.
� Depletion of national assets is not included in the national income accounts. If there
are social costs such as pollution resulting from production, natural assets like clear
air and clear rivers may be diminished and become increasingly scarce. A valuation
of such an amenity loss and resource depletion could be added to capital
consumption.
� When irreplaceable resources, such as fossil fuels, are consumed in production this
weakens the economy for the future. Hence, some economists have suggested that a
deduction from national income should be made, in the same way as for depreciation of
capital equipment. Hence some measure of sustainable national income might be
derived.
Table 4.1 UK GDP by expenditure method 2004
£m
Household consumption 731,768
Expenditure of non-profit institutions 28,910
Government expenditure 246,810
Gross domestic fixed capital formation 190,066
Change in inventories 4,769
Other �37
Total 1,202,286
Exports 289,959
Gross final expenditure 1,492,245
Minus total imports 328,384
Statistical discrepancy 578
GDP at market prices 1,164,439
Source: Economic Trends
FUNDAMENTALS OF BUSINESS ECONOMICS 157TH
EM
AC
RO
EC
ON
OM
ICC
ON
TEXT
OF
BU
SIN
ESS
2006.1

4.1.2 National income calculation
The three methods used to calculate national income are described below.
The expenditure methodThis calculation adds together the spending on:
� consumption and investment goods and services by consumers, firms and the government;
� current output, rather than second-hand goods, and final goods/services rather than
wholesale, which is aggregated;
� changes in stocks and work in progress, with additions to stock/work in progress being
treated as spending by the firms holding them;
� exports minus imports.
There are two main technical problems with this method:
� transfer payments, such as income support, pensions, etc., are deleted from government
spending because they are a transfer from taxpayers to recipients via the government;
� taxes and subsidies distort market prices and need to be allowed for; thus taxes are
deducted and subsidies added so that the true prices of output are determined.
Usefulness of the expenditure method
� The expenditure method is useful for detecting changing trends in consumption and
investment. Thus, it could reveal any changes between the shares of public sector and
private sector, or between current and capital spending.
� However, some economists feel that certain public expenditure on administration,
policing, environmental repair and defence inflate the real value of national income. This
spending may be just making good the degradation of the environment and preventing
the misuse of resources rather than increasing the amount of final output. Thus, this
method may overestimate national output.
The income methodIn this method, the incomes received by the owners of resources (factors of production)
are totaled.
� The main groups are:
– income from employment (wages and salaries)
– income from self-employment
– trading profits of private sector companies
– trading surpluses of public sector industries
� Direct taxes and national insurance contributions being ignored because they do not
affect the price of the output.
The income method is illustrated in Table 4.2.
Usefulness of the income method
The income method is useful in showing the changes in share of income between different
factors of production. For example, the 1980s have shown an increasing share attributable
STUDY MATERIAL C4158TH
EM
AC
RO
EC
ON
OM
ICC
ON
TEXT
OF
BU
SIN
ESS
2006.1
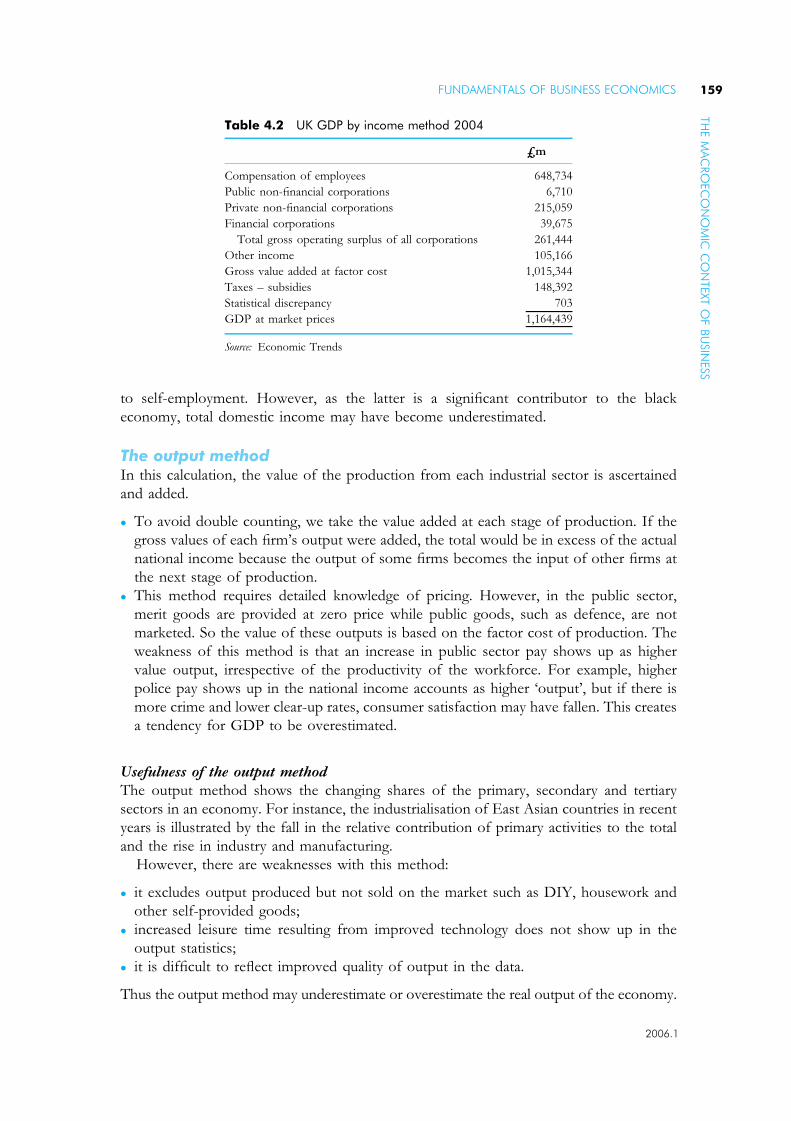
to self-employment. However, as the latter is a significant contributor to the black
economy, total domestic income may have become underestimated.
The output methodIn this calculation, the value of the production from each industrial sector is ascertained
and added.
� To avoid double counting, we take the value added at each stage of production. If the
gross values of each firm’s output were added, the total would be in excess of the actual
national income because the output of some firms becomes the input of other firms at
the next stage of production.
� This method requires detailed knowledge of pricing. However, in the public sector,
merit goods are provided at zero price while public goods, such as defence, are not
marketed. So the value of these outputs is based on the factor cost of production. The
weakness of this method is that an increase in public sector pay shows up as higher
value output, irrespective of the productivity of the workforce. For example, higher
police pay shows up in the national income accounts as higher ‘output’, but if there is
more crime and lower clear-up rates, consumer satisfaction may have fallen. This creates
a tendency for GDP to be overestimated.
Usefulness of the output method
The output method shows the changing shares of the primary, secondary and tertiary
sectors in an economy. For instance, the industrialisation of East Asian countries in recent
years is illustrated by the fall in the relative contribution of primary activities to the total
and the rise in industry and manufacturing.
However, there are weaknesses with this method:
� it excludes output produced but not sold on the market such as DIY, housework and
other self-provided goods;
� increased leisure time resulting from improved technology does not show up in the
output statistics;
� it is difficult to reflect improved quality of output in the data.
Thus the output method may underestimate or overestimate the real output of the economy.
Table 4.2 UK GDP by income method 2004
£m
Compensation of employees 648,734
Public non-financial corporations 6,710
Private non-financial corporations 215,059
Financial corporations 39,675
Total gross operating surplus of all corporations 261,444
Other income 105,166
Gross value added at factor cost 1,015,344
Taxes – subsidies 148,392
Statistical discrepancy 703
GDP at market prices 1,164,439
Source: Economic Trends
FUNDAMENTALS OF BUSINESS ECONOMICS 159TH
EM
AC
RO
EC
ON
OM
ICC
ON
TEXT
OF
BU
SIN
ESS
2006.1

4.1.3 The use of national income statistics
The difficulties of measurement and the discrepancies between the three different
methods mean that the national income figure is really just a sophisticated estimate. In
addition, in order to make valid comparisons, it requires further adjustments for inflation
and population changes. Therefore, the most useful figure is probably real national income
per head. Variations in this statistic give a general idea of changes in living standards, both
through the years and between the countries.
Comparisons over timeNational income data can be used to compare living standards in one country over time.
An increase in real national income per head would normally indicate a rise in living
standards. However, there are some difficulties with this sort of comparison.
� Allowance has to be made for inflation over the period of comparison. Thus the
required figure is the change in real national income per capita rather than the change in
nominal national income per capita.
� The distribution of national income may have changed so that although average per capita
income may have risen, the incomes of some members of society may not have risen or
may, indeed, have fallen.
� The uses to which income is put may have changed. Thus if taxation has risen to finance
increased defence expenditure, rising per capita income may not mean a rising standard
of living.
Despite these qualifications, which need to be made to national income calculations, it is
universally agreed that the most people in developed economies are better off in terms of
real income, personal assets and leisure time than in earlier decades. There may be concern
regarding the pace of life, the environment and social standards but, financially, life for
most people is now much improved compared with the inter-war years and the immediate
post-war years.
However, it is clearly the case that this improvement has varied a great deal from one
country to another. Within Europe comparisons have shown that UK per capita income,
although rising at about 2 per cent a year for much of the last 50 years, fell relative to that of
many other European economies. However, in the last decade UK performance has greatly
improved and per capita income has risen faster than in many OECD economies. Likewise,
poor growth performance in many developing economies can be contrasted to the rapid
growth in income in such countries as China and India in recent years.
Comparisons between countriesThere are many problems when making such comparisons of economic development and
growth between countries. There are two underlying differences which affect all others.
� Cultural differences mean that the way of life will place different values on different
goods and services. For example, if barter, subsistence and mutual help are part of the
culture then the official figures may understate the true level of output per head.
� The accuracy of the data will vary in quality and quantity. For instance, items included in
one economy may not be included in another country’s calculations. The integrity of the
officials and the resources devoted to collection will determine the efficiency of the
statistics.
STUDY MATERIAL C4160TH
EM
AC
RO
EC
ON
OM
ICC
ON
TEXT
OF
BU
SIN
ESS
2006.1

� National data has to be converted into a common currency (usually the US$) for
comparisons to be made. The resulting figure depends on the exchange rate used to
convert the national data into US$. If the country’s exchange rate is overvalued
(undervalued) it will tend to exaggerate (underestimate) its national income in $ terms.
There are many other factors which make comparing living standards through a
comparison of GDP figures problematic.
� Climatic and geographical differences affect what is needed and what is produced; in
warm climates, less output of energy for heating is required. Thus lower national income
in these economies does not necessarily mean lower economic welfare.
� Political factors may affect the structure of output. The end of the cold war led to lower
defence spending in many countries thus releasing resources to produce output that
generates consumer welfare. For example, the UK is currently engaged on a large-scale
programme of public expenditure on health, education and transport.
� Social indicators of the quality of life do not feature directly in national income statistics.
Social problems, such as crime or pollution, may even lead to the need for expenditures
to deal with these social costs, thus producing an apparent increase in welfare as national
income rises.
It is clear that making international comparisons of national income is fraught with
difficulty. Technical adjustments are made for the variations in price levels between
economies and changes in exchange rates against the standard of currency (the dollar)
which is used. These adjustments facilitate more accurate comparison but the use of the
mathematical mean (average) rather than the median can produce unrepresentative
results (e.g. Kuwait has the highest average national income but most of its population
receive less than what would be considered as low wages in Britain). This arises because
of the high concentration of income in a few hands and the unevenness of income
distribution.
All of the above problems and qualifications have led to comparisons using selected
items which feature in most economies, such as major consumer durables (e.g. cars,
telephones), divorce rates, doctors, stress-related illnesses and participants in higher
education. These can be calculated per head and used for relative measurement. Although
this method lacks precision, arguably it indicates the quality of life better than the bare
national income data.
Business use of national income dataNational income data is of particular use to governments in formulating economic policy
and to business when making strategic business choices. For businesses, especially large
businesses operating in more than one country, national income data is helpful in making
several types of strategic decision.
� Sales and production strategy. If a business knows that prospective rate of growth of income
in its markets and the income elasticity of demand (see Chapter 2), it can predict its
potential sales growth in those markets.
� New markets. Data on growth of income in different countries helps businesses to
identify potential new markets. Many international businesses clearly see that rapid
economic growth in China will make it a major future market for a wide range of both
consumers and capital goods.
FUNDAMENTALS OF BUSINESS ECONOMICS 161TH
EM
AC
RO
EC
ON
OM
ICC
ON
TEXT
OF
BU
SIN
ESS
2006.1
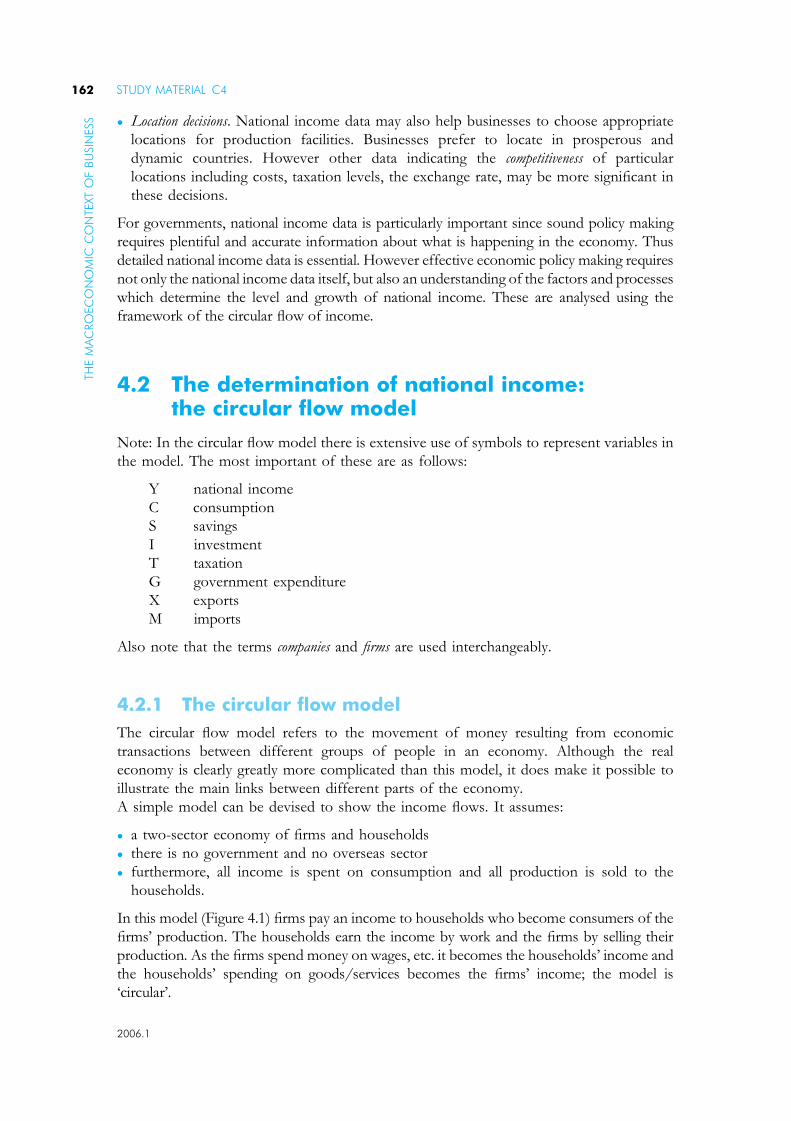
� Location decisions. National income data may also help businesses to choose appropriate
locations for production facilities. Businesses prefer to locate in prosperous and
dynamic countries. However other data indicating the competitiveness of particular
locations including costs, taxation levels, the exchange rate, may be more significant in
these decisions.
For governments, national income data is particularly important since sound policy making
requires plentiful and accurate information about what is happening in the economy. Thus
detailed national income data is essential. However effective economic policy making requires
not only the national income data itself, but also an understanding of the factors and processes
which determine the level and growth of national income. These are analysed using the
framework of the circular flow of income.
4.2 The determination of national income:the circular flow model
Note: In the circular flow model there is extensive use of symbols to represent variables in
the model. The most important of these are as follows:
Y national income
C consumption
S savings
I investment
T taxation
G government expenditure
X exports
M imports
Also note that the terms companies and firms are used interchangeably.
4.2.1 The circular flow model
The circular flow model refers to the movement of money resulting from economic
transactions between different groups of people in an economy. Although the real
economy is clearly greatly more complicated than this model, it does make it possible to
illustrate the main links between different parts of the economy.
A simple model can be devised to show the income flows. It assumes:
� a two-sector economy of firms and households
� there is no government and no overseas sector
� furthermore, all income is spent on consumption and all production is sold to the
households.
In this model (Figure 4.1) firms pay an income to households who become consumers of the
firms’ production. The households earn the income by work and the firms by selling their
production. As the firms spend money on wages, etc. it becomes the households’ income and
the households’ spending on goods/services becomes the firms’ income; the model is
‘circular’.
STUDY MATERIAL C4162TH
EM
AC
RO
EC
ON
OM
ICC
ON
TEXT
OF
BU
SIN
ESS
2006.1
Clearly, more complex models can be devised. Households may save, as well as
consume. This saving may be transferred to firms for investment, so that production can
take place. A government can be introduced and it can operate as a producer and a
consumer. In order to obtain funds it will tax, thereby influencing the consumption
behaviour of households and the production patterns of firms.
The flow of income also becomes more complicated when overseas trade is introduced.
Payments are remitted overseas to foreign producers but extra income is generated when
domestic firms accumulate earnings from foreign sales.
Therefore, when the simplifying assumptions are dropped and a more complex model is
adopted, the circular flow becomes subject to withdrawals and injections out of and in to the
circular flow of income.
� An injection (J) is any spending which is additional to the circular flow. It increases the
level of income in the circular flow. The injections are:
– business investment
– government expenditure
– exports.
� In contrast, a withdrawal (W) is some income which is not passed on as expenditure
in the circular flow. It decreases the level of income in the circular flow. The
withdrawals are:
– savings
– taxation
– imports.
EquilibriumAn economy making full use of its resources will be moving towards a state of rest, or
equilibrium. For equilibrium to be established in the circular flow, planned injections must
equal planned withdrawals.
Government
Households
Financialinstitutions
Overseassector
Firms
b = benefitse = exports
t = taxesI = importsS = savings
Injections Leakages
t
ee
e
e
t
S
S
S
SS
t
I
I
I
I
b
b
Figure 4.1 Withdrawals and injections in a the circular flow
FUNDAMENTALS OF BUSINESS ECONOMICS 163TH
EM
AC
RO
EC
ON
OM
ICC
ON
TEXT
OF
BU
SIN
ESS
2006.1

Equilibrium in national income is where
J (injections) ¼ W (withdrawals)
Thus if:
� J > W, additions to the circular flow exceed withdrawals and so the level of national
income will rise;
� J < W, additions to the circular flow are less than withdrawals so the level of national
income will fall.
Thus the full condition for equilibrium in national income for an open economy is:
I þ G þ X ¼ S þ T þM
Where I¼ investment
G¼ government expenditure
X¼ exports
9>=>;injections
And S¼ savings
T ¼ taxation withdrawals
M ¼ imports
9>=>; withdrawals
4.2.2 Consumption
The spending by people, or households on the circular flow model is termed consumption.
The single most important determinant of the level of consumption is the level of income.
This is true for both individuals and the economy as a whole. Thus the consumption
function is written as:
C ¼ f ðY Þ
(i.e. consumption is a function of national income.)
Clearly since any income that is not spent on consumer goods is saved then it
follows that:
S ¼ f ðY Þ
and
Y ¼ C þ S
The consumption function is illustrated in Figure 4.2.
STUDY MATERIAL C4164TH
EM
AC
RO
EC
ON
OM
ICC
ON
TEXT
OF
BU
SIN
ESS
2006.1

The economist J.M.Keynes suggested that consumption can be seen to consist of two
parts.
� Autonomous consumption does not vary with the level of income (denoted by a in
Figure 4.2). For instance, someone with no income will need to consume goods and
services in order to survive. This could be financed from savings. This action is
known as dis-saving.
� Non-autonomous consumption varies with the level of income (denoted by b in Figure
4.2). Generally, as income rises so does consumption, with a tendency for a larger part
of the extra income to be saved, rather than consumed, as a person becomes better off.
The extent to which consumption changes with income is termed the marginal propensity
to consume (MPC).
The marginal propensity to consume is calculated by the formula:
MPC ¼ Change in consumption;�C
Change in income;�Y
Thus, if a person’s disposable income increases from $100 to $120 per week and her
consumption increases from $90 to $105 per week, her MPC would be 0.75 (i.e. 15:20).
The MPC for the most developed economy is usually given as approximately 0.7 to 0.8.
Generally, it is assumed that the MPC is positive but likely to fall as income rises.
From these observations about autonomous and income-related consumption, Keynes
devised an algebraic equation:
C ¼ a þ bY
This is again illustrated in Figure 4.2.
� The 45� line locates the points where income on the horizontal axis equals expenditure
on the vertical axis.
� In Figure 4.2 at income Y a small proportion of income is saved. It is noticeable that if
income were 0, there would be consumption of the autonomous amount funded by dis-
saving.
� The triangle 0ZX shows that up to income level Y1, savings have to be utilised to
finance consumption. However, beyond X, savings rise.
Expenditure
Income
Dis-savinga (autonomous)
Y
X
Z
045°
Y1
b (income related)
s (savings)
AS
C
Figure 4.2 The consumption function
FUNDAMENTALS OF BUSINESS ECONOMICS 165TH
EM
AC
RO
EC
ON
OM
ICC
ON
TEXT
OF
BU
SIN
ESS
2006.1
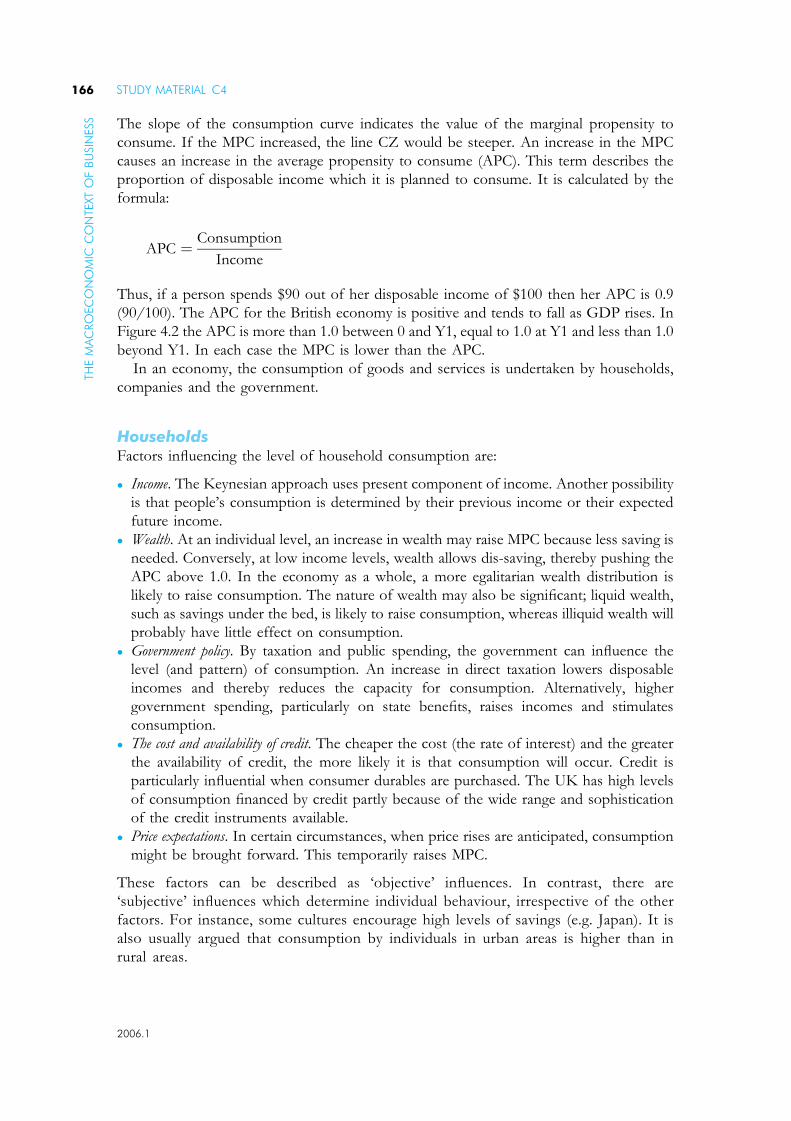
The slope of the consumption curve indicates the value of the marginal propensity to
consume. If the MPC increased, the line CZ would be steeper. An increase in the MPC
causes an increase in the average propensity to consume (APC). This term describes the
proportion of disposable income which it is planned to consume. It is calculated by the
formula:
APC ¼ Consumption
Income
Thus, if a person spends $90 out of her disposable income of $100 then her APC is 0.9
(90/100). The APC for the British economy is positive and tends to fall as GDP rises. In
Figure 4.2 the APC is more than 1.0 between 0 and Y1, equal to 1.0 at Y1 and less than 1.0
beyond Y1. In each case the MPC is lower than the APC.
In an economy, the consumption of goods and services is undertaken by households,
companies and the government.
HouseholdsFactors influencing the level of household consumption are:
� Income. The Keynesian approach uses present component of income. Another possibility
is that people’s consumption is determined by their previous income or their expected
future income.
� Wealth. At an individual level, an increase in wealth may raise MPC because less saving is
needed. Conversely, at low income levels, wealth allows dis-saving, thereby pushing the
APC above 1.0. In the economy as a whole, a more egalitarian wealth distribution is
likely to raise consumption. The nature of wealth may also be significant; liquid wealth,
such as savings under the bed, is likely to raise consumption, whereas illiquid wealth will
probably have little effect on consumption.
� Government policy. By taxation and public spending, the government can influence the
level (and pattern) of consumption. An increase in direct taxation lowers disposable
incomes and thereby reduces the capacity for consumption. Alternatively, higher
government spending, particularly on state benefits, raises incomes and stimulates
consumption.
� The cost and availability of credit. The cheaper the cost (the rate of interest) and the greater
the availability of credit, the more likely it is that consumption will occur. Credit is
particularly influential when consumer durables are purchased. The UK has high levels
of consumption financed by credit partly because of the wide range and sophistication
of the credit instruments available.
� Price expectations. In certain circumstances, when price rises are anticipated, consumption
might be brought forward. This temporarily raises MPC.
These factors can be described as ‘objective’ influences. In contrast, there are
‘subjective’ influences which determine individual behaviour, irrespective of the other
factors. For instance, some cultures encourage high levels of savings (e.g. Japan). It is
also usually argued that consumption by individuals in urban areas is higher than in
rural areas.
STUDY MATERIAL C4166TH
EM
AC
RO
EC
ON
OM
ICC
ON
TEXT
OF
BU
SIN
ESS
2006.1
CompaniesThe consumption undertaken by companies is determined by very similar factors. Their
income is mainly sales revenue and borrowing and it can be boosted from accumulated
reserves. Government tax and spending policies will influence sales revenue while the rate
of interest and credit availability will affect borrowing policies.
GovernmentThe government’s consumption of goods and services is less determined by its income and
more determined by need and political preference. Government expenditure can be
divided into two categories:
� Transfer payments such as social security payments and pensions which are not
normally counted as government consumption as this would involve double counting
when the recipients (e.g. pensions) spent their pensions on consumer goods.
� Government consumption such as expenditure on salaries of government employees,
and goods and services used in public services such as education, health and defence.
In virtually all economies households’ spending on consumption accounts for the largest
proportion, typically about two-thirds, of all domestic expenditure. The rest is split mainly
between government consumption and investment.
4.2.3 Saving
Saving is defined as the amount of income not spent. It is therefore sometimes regarded as
a residual; the amount of income left after consumption has been determined. Thus the
factors determining saving are mainly the mirror image of the factors determining
consumption.
Thus the factors influencing saving are as follows.
� Income. Both for the individual and the economy, the level of saving is determined mainly
by income. The average propensity to save (APS) is the proportion of disposable
income which is saved. It is calculated by saving divided by income. When the person in
the earlier example consumed £90 of her £100 income, her APS was 0.1 (10/100). The
APS added to the APC always equals unity (1.0) in the Keynesian model. The APS is
negative (dis-saving) at low income levels. In Figure 4.2, the APS is negative up to Y1
and then positive and increasing.
� Interest rates. In theory, an increase in the rate of interest will mean that people need to
save less in order to achieve a given target of income earned in interest. However, this
income effect can be offset by the substitution effect. With higher interest rates, people
might save more and spend less, as saving is now more attractive.
� Inflation. However, to rational consumers the money rate of interest is less important
than the real interest rate (i.e. allowing for inflation). Even if the nominal rate of interest
is high, a low real rate of interest might discourage savings. However, consumers might
suffer from the money illusion and save more when nominal interest rates are high even if
inflation reduces the real rate of interest.
� Credit. When credit is easily available consumers might acquire as much credit as they are
saving; in effect there is no net saving. In some countries, notably the USA and the UK,
the expansion of credit in recent years has meant that net household savings rates have
fallen to historic lows.
FUNDAMENTALS OF BUSINESS ECONOMICS 167TH
EM
AC
RO
EC
ON
OM
ICC
ON
TEXT
OF
BU
SIN
ESS
2006.1
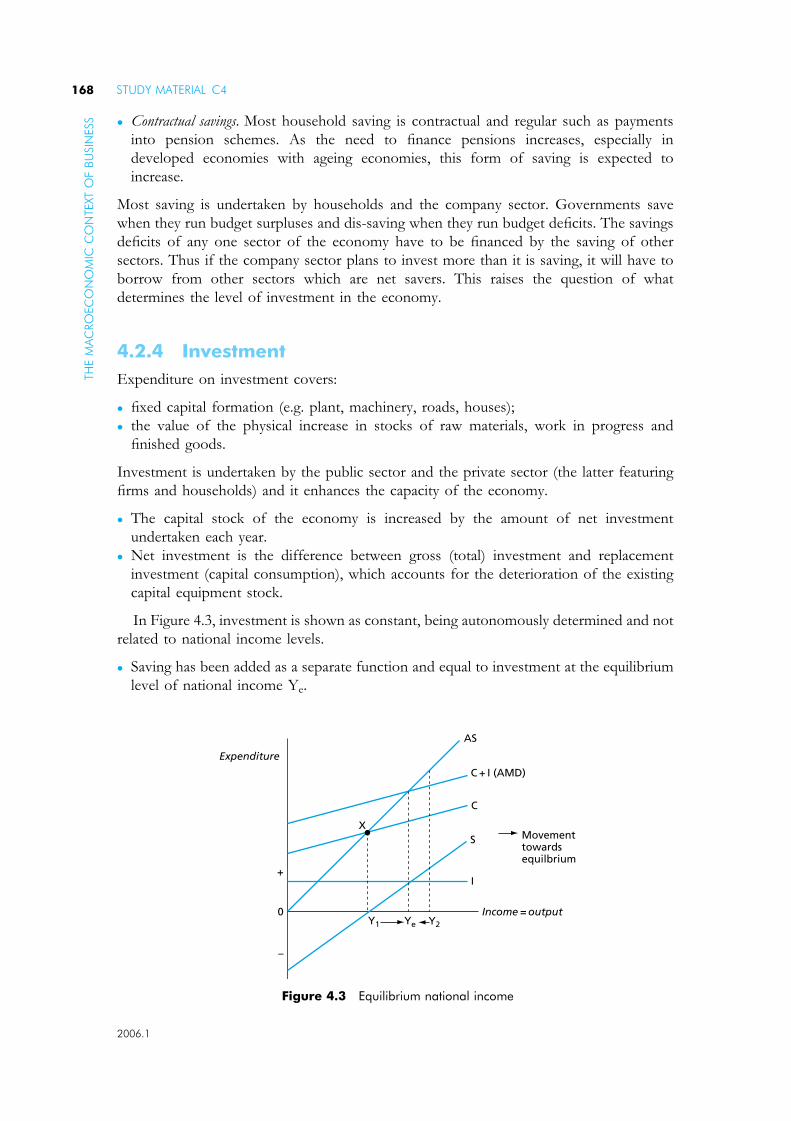
� Contractual savings. Most household saving is contractual and regular such as payments
into pension schemes. As the need to finance pensions increases, especially in
developed economies with ageing economies, this form of saving is expected to
increase.
Most saving is undertaken by households and the company sector. Governments save
when they run budget surpluses and dis-saving when they run budget deficits. The savings
deficits of any one sector of the economy have to be financed by the saving of other
sectors. Thus if the company sector plans to invest more than it is saving, it will have to
borrow from other sectors which are net savers. This raises the question of what
determines the level of investment in the economy.
4.2.4 Investment
Expenditure on investment covers:
� fixed capital formation (e.g. plant, machinery, roads, houses);
� the value of the physical increase in stocks of raw materials, work in progress and
finished goods.
Investment is undertaken by the public sector and the private sector (the latter featuring
firms and households) and it enhances the capacity of the economy.
� The capital stock of the economy is increased by the amount of net investment
undertaken each year.
� Net investment is the difference between gross (total) investment and replacement
investment (capital consumption), which accounts for the deterioration of the existing
capital equipment stock.
In Figure 4.3, investment is shown as constant, being autonomously determined and not
related to national income levels.
� Saving has been added as a separate function and equal to investment at the equilibrium
level of national income Ye.
Movementtowardsequilbrium
C + I (AMD)
Income = output
Expenditure
C
SX
AS
I
Y1 Ye
+
–
0Y2
Figure 4.3 Equilibrium national income
STUDY MATERIAL C4168TH
EM
AC
RO
EC
ON
OM
ICC
ON
TEXT
OF
BU
SIN
ESS
2006.1

� The curve Cþ I represents aggregate demand (as the government is ignored at present)
and it equals aggregate supply (45� line), which is assumed to be elastic in that it
responds to increases in aggregate demand, at Ye, too.
� Y1 is a disequilibrium position because the planned demand of firms and households
(aggregate monetary demand, AMD) exceeds the output produced (AS). This demand
can be met by destocking and so output plans in the next period are raised to meet the
extra demand and replenish stocks.
� The effect of this is to raise national income eventually to the equilibrium position, Ye.
At Y2 the reverse process would work via unintended stock accumulation and lowered
production levels.
Saving equals investment at the equilibrium level of national income in the simple
Keynesian model, because it is assumed that a savings withdrawal can be transformed into
an investment injection. Between Y1 and Ye investment exceeds saving and so planned
injections exceed planned withdrawals, causing national income to increase. At Ye the
injections equal the withdrawals and so there is national income equilibrium.
The determinants of investmentThe simple Keynesian model in Figure 4.3 has investment as a constant amount, which is
clearly unrealistic. The general determinants of private investment by firms are:
� expectations about future profit flows; these expectations will be influenced by the
anticipated revenue from the output of the investment compared with the anticipated
costs of the investment.
� the current valuation which the firms place on the likely future profits, that is the
opportunity cost of the investment.
Both of these determinants are incorporated in two very similar theories of investment
discussed below.
Discounted cash flowA firm is concerned with the net rate of return from its investment. The main factors determining
this are the expected revenue when the output is sold and the estimated operating costs. If the
former does not exceed the latter, then the investment will not be undertaken.
The rate of interest is also crucial. If the funds to be used for investment could earn
interest elsewhere, this interest is forgone when the investment is undertaken. Thus, the
income stream which the investment generates needs to be reduced (discounted) to a
present value (PV) so that the net return can be compared with the supply price of
the investment. The cash flow which the investment generates is therefore discounted. If
the present value of this discounted cash flow exceeds the supply price (current cost of the
investment), then the investment is likely to be profitable. Clearly the higher the rate of
interest, the lower the present value of the investment.
The formula used to calculate the present value shows this inverse relationship:
PV ¼ Q1
1þ rþ Q2
ð1þ rÞ2þ Q3
ð1þ rÞ3þ � � � þ Qn
ð1þ rÞn
where Q1, . . . , Qn are the anticipated yearly returns; r is the rate of interest; n is the
number of years in which returns are expected. The value of the denominator increases
FUNDAMENTALS OF BUSINESS ECONOMICS 169TH
EM
AC
RO
EC
ON
OM
ICC
ON
TEXT
OF
BU
SIN
ESS
2006.1

with each successive year, thus making returns received later in the life of the investment
progressively less valuable than that received at the beginning, assuming it is the same
nominal amount each year.
Marginal efficiency of capitalThis investment theory is associated with Keynes. It differs from discounted cash flow in
that the necessary rate of interest needed to make the present value of the income stream
equal to the supply price is calculated. This rate of discount is termed the marginal
efficiency of capital (MEC). If the MEC exceeds the current rate of interest then the
investment will be profitable.
The shape/slope of the MEC curve. The marginal efficiency of capital can be represented
diagrammatically. In Figure 4.4, at a high rate of interest the amount of investment is
lower than at a low rate of interest, because MEC needs to be higher. This in turn
means that expected returns on the investment need to be greater. The MEC is relatively
interest inelastic in Figure 4.4, suggesting that the rate of interest is a relatively
unimportant influence on investment decision making. For instance, with long-term
projects the rate of interest may vary frequently and so other factors will take
precedence.
Shifts in the MEC curve. The expected yield probably carries more importance than the
rate of interest. There are several factors which determine its value:
� The state of business confidence. If businesses are optimistic, they are likely to expect greater
returns than if they are pessimistic. Thus changes in business confidence can push MEC
to the right as shown in Figure 4.4.
� The substitution of other factors. If wages costs rise, then capital may be substituted thereby
shifting MEC to the right. Similarly, if the cost of capital falls, then MEC will shift to the
right, as the profitability of the project will increase.
� Technological innovation. If capital becomes more productive this is likely to raise the level
of investment at any given rate of interest. This will also push MEC to the right.
� Government policy. Inconsistent and varying economic policies might increase business
uncertainty and thereby deter investment. In contrast, reductions in corporation tax and
improved tax allowances will increase the expected income stream and encourage
investment. Also changes in interest rates will have direct effects on the profitability of
investment.
Rate of interest
MRC
r
MRC1
Investment quanitty
Figure 4.4 The marginal efficiency of capital
STUDY MATERIAL C4170TH
EM
AC
RO
EC
ON
OM
ICC
ON
TEXT
OF
BU
SIN
ESS
2006.1

4.2.5 The government and external sectors
The factors determining the level of government expenditure and taxation and the main
influences on the balance of imports and exports will be discussed in later sections.
4.2.6 The accelerator
One of the features of the working of economies is that there may be important
interactions between elements of the circular flow of income. One of these interactions is
the way in which investment intentions may be affected by changes in the level of output
and income in the economy. This is known as the accelerator theory.
Accelerator theory assumes that:
� firms will try to maintain a stable relationship between the amount of productive capital
stock (e.g. machinery) and the expected volume of output/sales, this is known as the
capital/output ratio.
� firms will replace worn out capital each year, this is known as replacement investment.
� total investment will be replacement investment plus additional investment to meet
expected increases in demand/sales.
Thus if a firm replaces 10% of its capital each year in the form of replacement capital but
expects no growth in sales there will be no additional investment and so total investment
will be equal to replacement investment. However, if in the following year the firm expects
sales to rise in one year by 10%, it would need to expand its total capital stock by 10% in
order to match productive capacity to expected sales. In this year total investment by the
firm will therefore be equal to 10% of its capital stock as replacement capital and 10% of
its capital stock as additional investment. Thus total investment expenditure will be double
that of the previous year.
In this example the volume of investment is raised by expected changes in the level of
income and thus expected sales. But the change in investment in this example is greater
(100% increase) than the change in income and sales (10%). The same would work in
reverse if sales were expected to fall. Thus change in income and sales produces a greater
(accelerated) effect on investment spending.
4.2.7 The multiplier
This idea shows the change in national income resulting from a change in planned
investment (in the simple model) or a change in government spending or a change in the
overseas trade sector (in the five sector model of Figure 4.1). It looks at the effect of
injections (less withdrawals) into the circular flow of income.
The simple Keynesian model featured earlier in this chapter can be extended to
include a government sector and an overseas sector. Government spending (G) is
usually added to consumption (C) and investment (I) to give aggregate monetary
demand (AMD). Changes in injections, government expenditure, investment and exports
may cause a more than proportional increase in national income. This is termed the
multiplier effect.
Multiplier effects can occur in many ways. When any planned injection into the circular
flow increases and other injections and withdrawals remain unchanged, then national
income will lead to the use of more factors of production whose earnings will be spent,
FUNDAMENTALS OF BUSINESS ECONOMICS 171TH
EM
AC
RO
EC
ON
OM
ICC
ON
TEXT
OF
BU
SIN
ESS
2006.1

thereby adding to the income of others who may then spend more, and so on. . . . Thus an
initial injection of additional expenditure in the circular flow will lead to a series of
additional rounds of expenditure.
Determinants of the multiplierA simple economy
The increase in national income caused by successive rounds of spending will not go on
for ever since with each round some extra income will be lost to the circular flow through
the operation of withdrawals. Thus each succeeding round of spending becomes smaller and
smaller. If withdrawals were 20% of income (e.g. a marginal propensity to save of 0.2) the
increases in income in each round from an initial incrase in spending of $100 would be:
Round 1 $100
Round 2 $80 ($100 minus $20 which is saved )
Round 3 $64 ($80 minus $16 which is saved )
Round 4 $51.2 ($64 minus $12.8 which is saved )
In a simple economy the obvious withdrawal is saving. In this simple economy, with no
government and no external sector, the value of the multiplier (K) is shown in the
following equation.
K ¼ 1
1�MPC¼ 1
MPS
where MPC marginal propensity to consume
MPS marginal propensity to save
If one assumed an MPC of 0.8 the multiplier would have a value of 5 and an increased
injection of $10 m would increase total national income by $50 m. This is important for
government policy making. If the economy was operating at below the full employment
level of income (Yf in Figure 4.5) the government could increase its own spending and,
through the multiplier effect, raise the level of national income by a much larger amount.
Thus is Figure 4.5, an increase in government expenditure to raise aggregate monetary
demand from AMD to AMD1 would raise national income by much greater amount – from
Y to Yf.
Expenditure
Income = output
AS
b
a
AMD
AMD1
Y Yf
Figure 4.5 The multiplier
STUDY MATERIAL C4172TH
EM
AC
RO
EC
ON
OM
ICC
ON
TEXT
OF
BU
SIN
ESS
2006.1

A real economy
In a real economy, because of the existence of the government and an external sector,
savings is not the only withdrawal. In this economy there are three withdrawals: savings,
taxation and imports. Since withdrawals reduce the value of the multiplier, in the real
world it will have a much lower value than that in the example above.
In the case of the economy with a government and an external sector, the value of the
multiplier is now given as:
K ¼ 1
MPSþMRTþMPM
Where MPS marginal propensity to save
MPT marginal rate of taxation
MPM marginal propensity to import
Thus if there is a high savings rate, a high marginal rate of taxation and an open economy
with a high tendency to import, the value of the multiplier will be very low. For typical
developed market economies the value of the multiplier is below 2.
Policy making and the multiplierIt is clear that if a government wishes to engage in some form of demand management policy,
that is using its levels of taxation and expenditure to influence the level of AMD and hence
the level of national income, it will need to have some knowledge of the working of the
multiplier and its value in their economy.
The government will also need to be aware that the value of the multiplier can vary not
only over time as savings rates and the propensity to import changes, but also between
government policy instruments.
� Expenditure tends to have a higher multiplier value than tax cuts since in the first round
all public expenditure is ‘spent’ but some of the tax cuts may be saved.
� Some expenditure has immediate spending effects (e.g. increased pensions) whereas
some (e.g. long-term investment projects) may only have their full effect over a period
of years.
� Some economist (including monetarist and new classical economists) argue that the
multiplier value of government expenditure is zero since an increase has to be financed
via government borrowing from the private sector which ‘crowds out’ an equivalent
amount of private expenditure.
4.3 The trade cycle and the problems of inflationand unemployment
The common economic issues facing all economies include the twin problems of inflation
and unemployment. Much government economic policy effort is devoted to attempts to
prevent either of these undesirable outcomes. In order to understand these economic
policies it is first necessary to see how unemployment and inflation might arise in a market
economy. The starting point for this understanding is the aggregate demand and aggregate
supply model.
FUNDAMENTALS OF BUSINESS ECONOMICS 173TH
EM
AC
RO
EC
ON
OM
ICC
ON
TEXT
OF
BU
SIN
ESS
2006.1
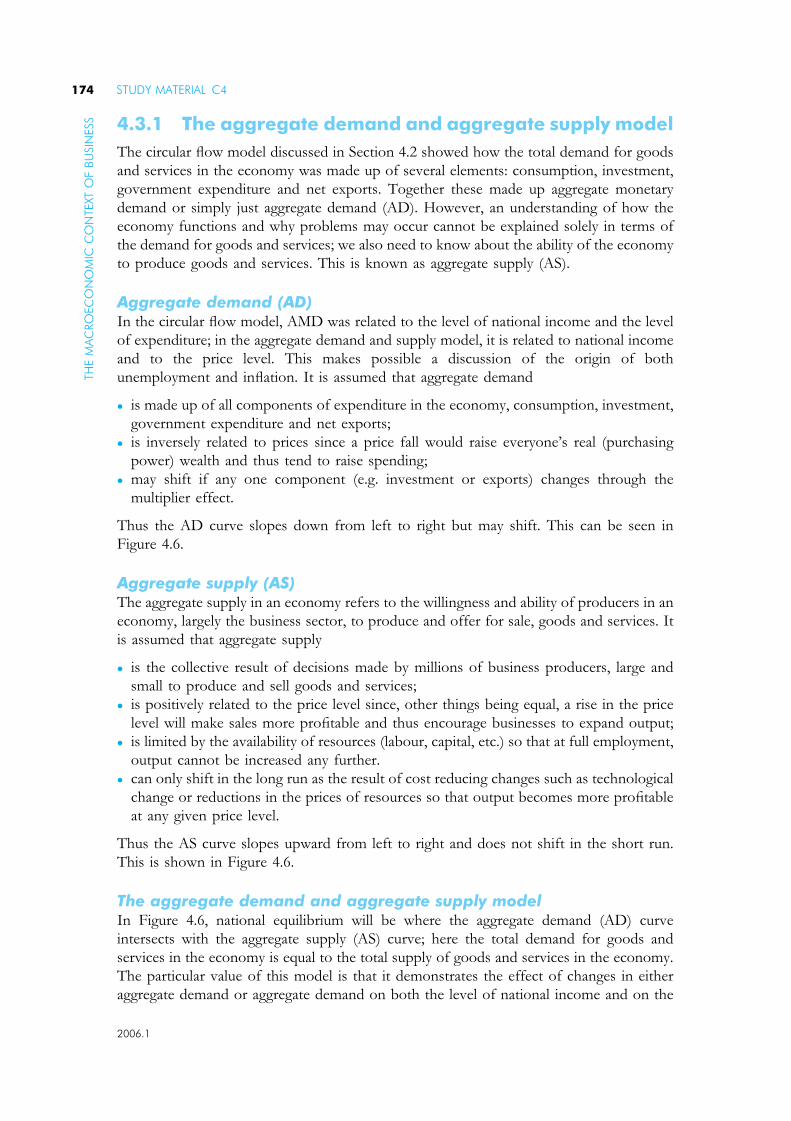
4.3.1 The aggregate demand and aggregate supply model
The circular flow model discussed in Section 4.2 showed how the total demand for goods
and services in the economy was made up of several elements: consumption, investment,
government expenditure and net exports. Together these made up aggregate monetary
demand or simply just aggregate demand (AD). However, an understanding of how the
economy functions and why problems may occur cannot be explained solely in terms of
the demand for goods and services; we also need to know about the ability of the economy
to produce goods and services. This is known as aggregate supply (AS).
Aggregate demand (AD)In the circular flow model, AMD was related to the level of national income and the level
of expenditure; in the aggregate demand and supply model, it is related to national income
and to the price level. This makes possible a discussion of the origin of both
unemployment and inflation. It is assumed that aggregate demand
� is made up of all components of expenditure in the economy, consumption, investment,
government expenditure and net exports;
� is inversely related to prices since a price fall would raise everyone’s real (purchasing
power) wealth and thus tend to raise spending;
� may shift if any one component (e.g. investment or exports) changes through the
multiplier effect.
Thus the AD curve slopes down from left to right but may shift. This can be seen in
Figure 4.6.
Aggregate supply (AS)The aggregate supply in an economy refers to the willingness and ability of producers in an
economy, largely the business sector, to produce and offer for sale, goods and services. It
is assumed that aggregate supply
� is the collective result of decisions made by millions of business producers, large and
small to produce and sell goods and services;
� is positively related to the price level since, other things being equal, a rise in the price
level will make sales more profitable and thus encourage businesses to expand output;
� is limited by the availability of resources (labour, capital, etc.) so that at full employment,
output cannot be increased any further.
� can only shift in the long run as the result of cost reducing changes such as technological
change or reductions in the prices of resources so that output becomes more profitable
at any given price level.
Thus the AS curve slopes upward from left to right and does not shift in the short run.
This is shown in Figure 4.6.
The aggregate demand and aggregate supply modelIn Figure 4.6, national equilibrium will be where the aggregate demand (AD) curve
intersects with the aggregate supply (AS) curve; here the total demand for goods and
services in the economy is equal to the total supply of goods and services in the economy.
The particular value of this model is that it demonstrates the effect of changes in either
aggregate demand or aggregate demand on both the level of national income and on the
STUDY MATERIAL C4174TH
EM
AC
RO
EC
ON
OM
ICC
ON
TEXT
OF
BU
SIN
ESS
2006.1
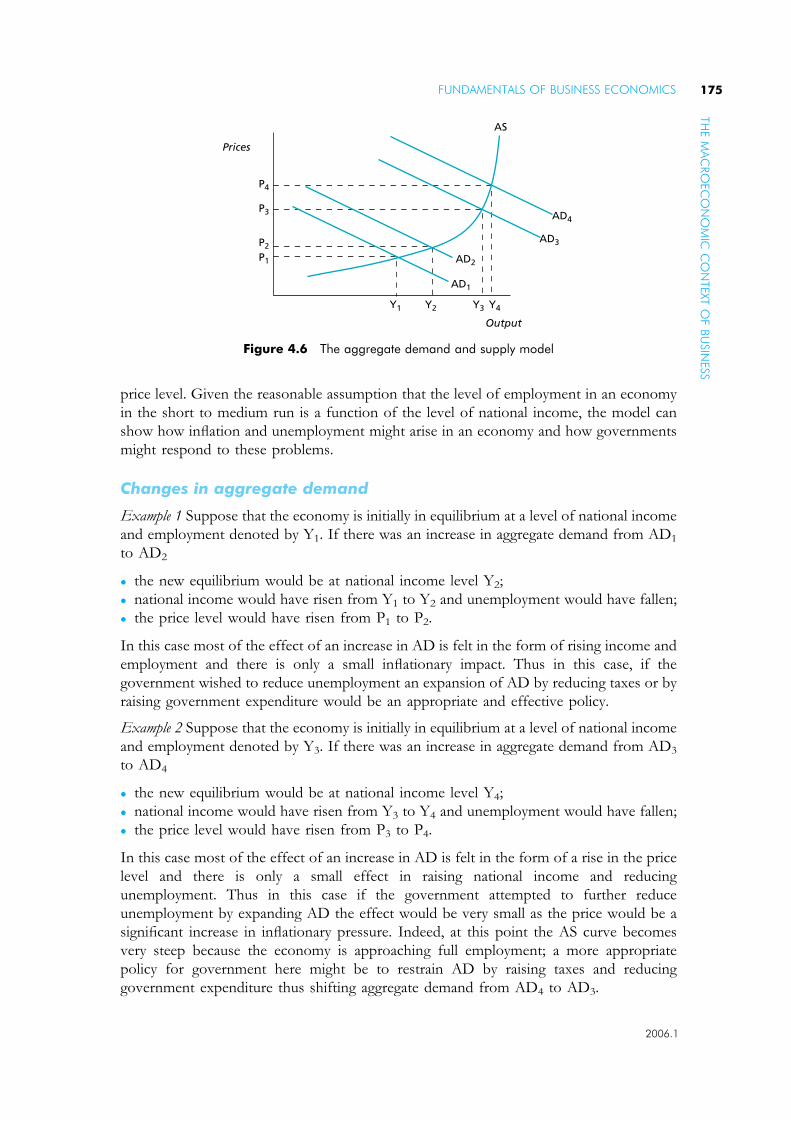
price level. Given the reasonable assumption that the level of employment in an economy
in the short to medium run is a function of the level of national income, the model can
show how inflation and unemployment might arise in an economy and how governments
might respond to these problems.
Changes in aggregate demand
Example 1 Suppose that the economy is initially in equilibrium at a level of national income
and employment denoted by Y1. If there was an increase in aggregate demand from AD1
to AD2
� the new equilibrium would be at national income level Y2;
� national income would have risen from Y1 to Y2 and unemployment would have fallen;
� the price level would have risen from P1 to P2.
In this case most of the effect of an increase in AD is felt in the form of rising income and
employment and there is only a small inflationary impact. Thus in this case, if the
government wished to reduce unemployment an expansion of AD by reducing taxes or by
raising government expenditure would be an appropriate and effective policy.
Example 2 Suppose that the economy is initially in equilibrium at a level of national income
and employment denoted by Y3. If there was an increase in aggregate demand from AD3
to AD4
� the new equilibrium would be at national income level Y4;
� national income would have risen from Y3 to Y4 and unemployment would have fallen;
� the price level would have risen from P3 to P4.
In this case most of the effect of an increase in AD is felt in the form of a rise in the price
level and there is only a small effect in raising national income and reducing
unemployment. Thus in this case if the government attempted to further reduce
unemployment by expanding AD the effect would be very small as the price would be a
significant increase in inflationary pressure. Indeed, at this point the AS curve becomes
very steep because the economy is approaching full employment; a more appropriate
policy for government here might be to restrain AD by raising taxes and reducing
government expenditure thus shifting aggregate demand from AD4 to AD3.
AD2
AD3
AD4
AS
AD1
Y1
P1
P2
P3
P4
Prices
Output
Y2 Y3 Y4
Figure 4.6 The aggregate demand and supply model
FUNDAMENTALS OF BUSINESS ECONOMICS 175TH
EM
AC
RO
EC
ON
OM
ICC
ON
TEXT
OF
BU
SIN
ESS
2006.1
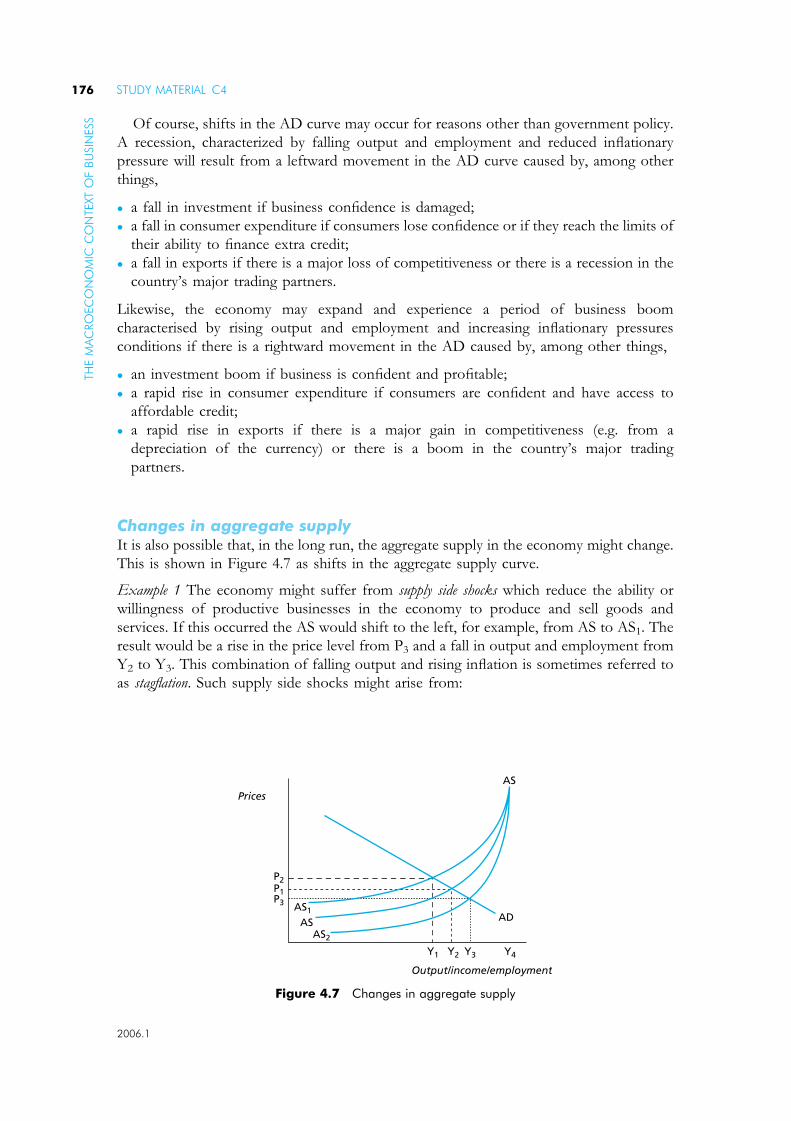
Of course, shifts in the AD curve may occur for reasons other than government policy.
A recession, characterized by falling output and employment and reduced inflationary
pressure will result from a leftward movement in the AD curve caused by, among other
things,
� a fall in investment if business confidence is damaged;
� a fall in consumer expenditure if consumers lose confidence or if they reach the limits of
their ability to finance extra credit;
� a fall in exports if there is a major loss of competitiveness or there is a recession in the
country’s major trading partners.
Likewise, the economy may expand and experience a period of business boom
characterised by rising output and employment and increasing inflationary pressures
conditions if there is a rightward movement in the AD caused by, among other things,
� an investment boom if business is confident and profitable;
� a rapid rise in consumer expenditure if consumers are confident and have access to
affordable credit;
� a rapid rise in exports if there is a major gain in competitiveness (e.g. from a
depreciation of the currency) or there is a boom in the country’s major trading
partners.
Changes in aggregate supplyIt is also possible that, in the long run, the aggregate supply in the economy might change.
This is shown in Figure 4.7 as shifts in the aggregate supply curve.
Example 1 The economy might suffer from supply side shocks which reduce the ability or
willingness of productive businesses in the economy to produce and sell goods and
services. If this occurred the AS would shift to the left, for example, from AS to AS1. The
result would be a rise in the price level from P3 and a fall in output and employment from
Y2 to Y3. This combination of falling output and rising inflation is sometimes referred to
as stagflation. Such supply side shocks might arise from:
AD
AS
AS1
Y1
P1
P2
P3
Y2 Y3 Y4
AS
Prices
Output/income/employment
AS2
Figure 4.7 Changes in aggregate supply
STUDY MATERIAL C4176TH
EM
AC
RO
EC
ON
OM
ICC
ON
TEXT
OF
BU
SIN
ESS
2006.1

� a major rise in energy and/or raw material prices such as the oil price rises in the 1970s
and early 1980s;
� a major rise in labour costs; the problems of many of the European Union larger
economies in recent years may be partly the result of social and labour legislation
significantly raising the cost of labour for businesses;
� a significant fall in productivity in businesses due to major technological problems; some
fear that attempting to deal with global warming by emissions controls may have
something of this effect on economies.
Example 2 The economy might also experience a rightward shift in the AS curve such as
from AS to AS2. This would produce a highly beneficial result that national income and
employment would expand from Y2 to Y3 and the price level would fall from P1 to P3.
This might be seen as the opposite of stagflation. Such shifts to the right in the aggregate
supply curve might arise from:
� favourable developments in the economy reducing costs such as falling energy and raw
material prices or big productivity improvements from technological change;
� deliberate government supply side policies designed to shift the AS curve to the right such
as privatisation, business tax reductions or labour market reforms.
Box 4.1 Oil, unemployment and inflation
The oil crises of the 1970s and governments’ responses to it illustrate the aggregate
demand and supply model well. The steep rise in oil prices was a supply side shock to
oil importing countries. Production costs across economies rose steeply and this was
the equivalent of a sharp shift in the aggregate supply curve to the left; the consequence
was a rise in unemployment and a sharp acceleration in the rate of inflation.
Governments, fearful of the social and electoral consequences of high unemployment
initially attempted to reduce unemployment by expansionary fiscal policy – in effect
shifting the aggregate demand curve to the right. This reduced unemployment
somewhat but resulted in a further sharp increase in inflation. Slow growth,
unemployment and inflation were thus combined: stagflation had been born. By the
1990s some governments, notably in the UK and the USA accepted the importance of
supply side policy to shift the aggregate supply curve to the right. The result was a
decade of steady growth and low unemployment without serious inflationary pressure.
The trade cycle and government policyAggregate demand and supply analysis has shown how the trade cycle of recessions,
recoveries and booms followed by further recession might occur and how government
policy might be used to deal with these problems. Table 4.3 shows the typical features,
causes and policy responses for the trade cycle in market economies.
Of course there might be a period of economic growth with all the features of a boom
but without undue inflationary pressure, if the aggregate supply of the economy
continually increases. The ability of some economies such as the UK and the USA to
maintain steady growth with high levels of employment but without serious inflationary
pressures in recent years may be, at least partly, the result of supply side reforms in these
countries since the 1980s.
FUNDAMENTALS OF BUSINESS ECONOMICS 177TH
EM
AC
RO
EC
ON
OM
ICC
ON
TEXT
OF
BU
SIN
ESS
2006.1

Exercise 4.1Answer the following questions based on the preceding information. You can check your
answers below.
1. Name two withdrawals from the circular flow.
2. What is an injection into the circular flow?
3. When, in theory, is an economy in equilibrium?
4. What does the consumption function show?
5. What does the equation ‘C¼aþ bY’ mean?
6. Apart from households and firms, what else is a major consumer of goods and
services?
7. Define net investment.
8. What does the accelerator theory show?
9. What does the multiplier show?
10. What is the formula for calculating the multiplier, K ?
Solutions1. Withdrawals from the circular flow are savings, taxes and imports.
2. An injection into the circular flow is any additional expenditure that does not arise from
the circular flow of income itself.
3. At equilibrium, injections and withdrawals are equal.
4. The consumption function shows how the level of consumption changes as the level of
income changes.
Table 4.3 The trade cycle
Stage of
trade cycle Features Causes Policy response
Recession falling output/income, high
and rising unemployment,
reduced inflationary pressure,
improving trade balance as
imports fall
falling AD from lower levels
of: consumer spending,
investment, exports,
government expenditure
raise AD by reducing
taxation, raising public
expenditure, lowering interest
rates
Stagflation:
special type
of recession
falling output, income
and employment, rising
inflationary pressure
supply side shocks reducing
aggregate supply
supply side policy to raise
aggregate supply
Recovery output and income become
to rise, unemployment begins
to fall, only moderate
inflationary pressure
returning confidence in
business and consumer
sectors, effect of government
expansionary policy
undertaken in recession
reduction in expansionary
policy to prevent to strong a
boom
Boom high output and employment,
rising inflationary pressure,
deteriorating trade balance as
imports rise
high and rising AD from
higher levels of: consumer
spending, investment,
exports, government
expenditure
reduce AD by raising
taxation, reducing public
expenditure, higher interest
rates
STUDY MATERIAL C4178TH
EM
AC
RO
EC
ON
OM
ICC
ON
TEXT
OF
BU
SIN
ESS
2006.1

5. This means that there is some consumption that is independent of the level of income
(a) (autonomous consumption) and some which is a proportion of and determined by
income received (bY).
6. There are two other major consumers of goods and services: the government and
overseas consumers (via exports).
7. Net investment is the volume of investment in capital goods over and above that
required to replace worn-out capital, that is depreciation.
8. The accelerator theory shows that changes in consumption expenditure may induce
much larger proportional changes in investment expenditure and thereby contribute
to the trade cycle.
9. The multiplier shows that an increase in expenditure (e.g. investment, government
expenditure or exports) will produce a much larger increase in total income and
expenditure through successive rounds of spending.
10. The multiplier can be calculated as K¼ 1/(1�MPC) where MPC is the marginal
propensity to consume.
4.4 The objectives of government economic policy:inflation and unemployment
4.4.1 Causes of inflation
Inflation can be explained in various ways. The three main causes usually identified are
discussed below.
Demand-pull inflationThis term is used when increases in aggregate demand pull up prices because supply is
constant or very inelastic. Supply may have been constrained by a lack of capacity in the
economy, or insufficient trained labour, or lack of capital investment.
The underlying causes of significant increases in demand may be:
� Fiscal. If a government relaxes its fiscal stance and/or runs a large budget deficit, then
total demand in the economy is stimulated. For example, a cut in income tax rates will
increase spending power, thereby raising AMD, and have a multiplier effect on the
economy. This will stimulate employment, but if supply is relatively inelastic only some
of the extra spending will be translated into output and most of the effect will be in
rising prices. Increases in government spending, other things being equal, have a similar
effect.
� Changes in monetary conditions. When extra credit is available to consumers, spending on
goods and services will also increase, with the same likely effects on output and prices.
The credit may be made available by the banks and other financial institutions primarily,
but the growth of store credit cards in recent years has added a new source of consumer
credit. In contrast, the deflationary conditions during the second half of the 1990s were
often ascribed to the unwillingness of consumers to acquire additional debt and thus
contributed to the low rates of inflation in many countries.
FUNDAMENTALS OF BUSINESS ECONOMICS 179TH
EM
AC
RO
EC
ON
OM
ICC
ON
TEXT
OF
BU
SIN
ESS
2006.1
Cost-push inflationThis inflation occurs when there is an increase in costs not matched with productivity,
which raises prices. However, the cost rise should be exogenous (from outside the system)
rather than endogenous (part of the system itself).
� An endogenous stimulus might be (say) higher demand, which makes it difficult for
supply to keep pace, thereby causing producers to pay by wage increases to attract
labour. These big wage increases might then push up costs, this is how demand-pull
inflation works.
� Supporters of cost-push explanations of inflation argue that there are examples of
genuine cost-push inflation caused by exogenous factors.
These include:
– the increased power and greater militancy of trade unions in the 1970s, because it was
not related to the state of aggregate demand. This trade union power forced
employers to concede high wage rises and so costs rose.
– imported raw materials and energy. Open economies which are dependent on such
goods, make domestic prices susceptible to changes in primary product prices. Oil
price rises in 1972 and 1981 thus contributed to domestic inflation.
Quantity theory of moneyDemand pull and cost push were essentially Keynesian explanations of inflation. However,
monetarists reject the idea of cost-push inflation, believing that inflation is caused by
increases in the money supply leading to excess demand for goods and services. In their view,
changes in the money supply affect prices but not output and employment, except in the
short run.
Monetarism is based on the quantity theory of money. The volume of expenditure in an
economy over a period of time can be identified in two ways.
1. It is the medium of exchange used to buy the output produced (M ) multiplied by its
velocity of circulation (V ). The velocity of circulation measures the average number of
times that the money is used each year.
2. Also, the volume of expenditure is calculated on real value of national income (Y )
multiplied by the average price of each sale (P ).
This can be written as MV¼PY since national expenditure must be equal to national
income. The significance of this depends on the assumptions made by monetarist
economists. These are:
� V is constant and/or predictable. V is not determined by money supply and it is
unchanging in the short run;
� Y is constant as total output is fixed in the short run, at full employment.
Given these assumptions, V and Y are constants and thus the quantity theory can be
rewritten as:
P ¼ f ðmÞ
That is, any changes in the supply of money (M ) will lead to changes in the level of prices
(P ); if the money supply increases, inflation will be the result.
STUDY MATERIAL C4180TH
EM
AC
RO
EC
ON
OM
ICC
ON
TEXT
OF
BU
SIN
ESS
2006.1
In contrast, Keynesians do not accept that the velocity of circulation (V) is fixed, or that
the level of real national income (Y) is fixed, even in the short run. Thus, for Keynesians,
the relationship between the money supply and inflation is more complex.
4.4.2 The effects of inflation
If the rate of inflation is low then the effects may be beneficial to an economy. Business
people are encouraged by fairly stable prices and the prospect of higher profits. However,
there is some argument about whether getting inflation below 3 per cent to, say, zero is
worth the economic pain (of, say, higher unemployment). There is agreement, though, that
inflation above about 5 per cent is harmful – worse still if it is accelerating. The main
arguments are that such inflation:
� Distorts consumer behaviour. People may bring forward purchases because they fear higher
prices later. This can cause hoarding and so destabilise markets.
� Redistributes income. People on fixed incomes or those lacking bargaining power will
become relatively worse off, as their purchasing power falls. This is unfair.
� Redistributes wealth. The real value of debts and financial assets is eroded by inflation.
Thus wealth is redistributed away from those with net financial assets towards those
with debts.
� Affects wage bargainers. Trade unionists on behalf of labour may submit higher claims at
times of high inflation, particularly if previously they had underestimated the future rise
in prices. If employers accept such claims this may precipitate a wage-price spiral which
exacerbates the inflation problem.
� Undermines business confidence. Wide fluctuations in inflation make it difficult for
entrepreneurs to predict the economic future and accurately calculate prices and
investment returns. This uncertainty handicaps planning and production.
� Weakens the external competitive position. If a country’s inflation exceeds its competitors then
it makes exports less attractive (assuming unchanged exchange rates) and imports more
competitive. This could mean a bigger trade deficit. For example, the decline of Britain’s
manufacturing industry can be partly attributed to the growth of cheap imports when
the UK was experiencing high inflation in 1978–83.
It is thus clear that the disadvantages of inflation, especially if it is rapid and/or
unpredictable, outweigh any benefits that might occur. Thus governments almost always
have the prevention of inflation as a major policy objective.
4.4.3 The causes of unemployment
Although it is the cause of unemployment that is closely linked to the characteristics of
unemployment, it is useful to distinguish between types of unemployment and the causes of
unemployment. The main types of unemployment are as follows.
FUNDAMENTALS OF BUSINESS ECONOMICS 181TH
EM
AC
RO
EC
ON
OM
ICC
ON
TEXT
OF
BU
SIN
ESS
2006.1

Types of unemploymentSeasonal unemployment
Some occupations experience large fluctuations in demand for their service during a year.
� For instance, agricultural labourers will be needed less in the winter months, whereas ski
instructors will not be required much in the summer.
� Such seasonal unemployment is less of an economic problem nowadays because of changes
in employment legislation, the increased use of part-time staff and improved storage and
freezing facilities which enable production in many industries to be continuous.
� The published unemployment statistics are seasonally adjusted to reduce the impact of
seasonal unemployment and school leaving dates.
Frictional (search) unemployment
There is sometimes a transition period between a worker leaving one job and starting another.
� This indicates the imperfections in the labour market, such as lack of knowledge of
available job opportunities, the geographical immobility of labour and the mismatch
between the requirements of the employers and the available skills of the unemployed.
� If the unemployed are successful in searching for jobs, then unfilled vacancies will fall and
frictional unemployment will decline. A relatively small and unchanging number of
vacancies in the an economy indicates that there is little frictional unemployment at present.
Structural unemployment
When there are significant long-term changes in the pattern of demand and techniques of
supply in an economy, then unemployment occurs in many parts of the labour market. If
those becoming unemployed lack the skills to take up the job vacancies, because the
industrial structure has changed, then the average duration of unemployment increases and
temporary frictional unemployment becomes permanent structural unemployment.
Structural unemployment may result from:
� A fall in demand for a good or service (e.g. the use of plastic instead of steel has reduced the
demand for steel workers permanently). The wholesale decline in heavy industry in
Europe and the United States (de-industrialisation) has created much of this type of
unemployment. As some of these industries were localised in particular areas, the
unemployment may be regionally concentrated and regional unemployment arises
� Changes in production methods. The installation of capital equipment may cause less demand
for labour which, without retraining, will remain unemployed. For instance, the new
technology used in printing has produced unemployment, even though the industry is
expanding. This has been termed technological unemployment because the and has largely
affected manufacturing industry, with the service industries remaining largely unscathed
because of the personal attention often needed. For instance, the impact of information
technology on the UK financial services industry was to expand business by 8 per cent
annually in 1975–85 and increase employment by 2 per cent annually. This indicated
labour saving but not to the detriment of employment.
Cyclical unemployment
The trade cycle create variations in demand in the economy. Assuming that the
demand for goods/services and the demand for labour are positively related, a boom
STUDY MATERIAL C4182TH
EM
AC
RO
EC
ON
OM
ICC
ON
TEXT
OF
BU
SIN
ESS
2006.1

in the economy will probably lower unemployment while a slump will raise
unemployment.
� These changes will probably affect most industries, and they occur in cycles. Hence the
words ‘general’ and ‘cyclical’ have been used to describe the extra unemployment
occurring in a slump or recession such as those of the 1930s and 1980s.
� Keynes used the phrase ‘demand deficient unemployment’ to explain the same
phenomenon because he argued that the cause was insufficient aggregate demand and
that extra demand could be created by a government through deficit budgeting.
Some economies are susceptible to cyclical unemployment because they are open
economies and dependent on world trade. Thus a decline in world trade, as occurred in
1979–80, adversely affects exports with domestic unemployment repercussions. In this
way recessions in other one part of the world may be communicated to other economies.
Voluntary unemployment
This unemployment has been defined following the work of the monetarist school of
economics. It is said to occur when people are unwilling to work at existing wage rates. Some
argue that relatively high levels of income support deter the unemployed from seeking jobs
because the gain in income may be marginal. In contrast, workers are involuntarily unemployed
when they would be willing to accept a job but there are no vacancies for what they can do.
Causes of unemploymentDemand deficiency
Lack of demand for goods and services causes workers to be laid off. Usually unemployment
follows a fall in economic activity, with a lag of 12–18 months. A fall in aggregate demand
below the level required for full employment may result from a fall in:
� Consumer expenditure. Unemployment in Japan in recent decades has been blamed on the
unwillingness of Japanese consumers to increase their consumption levels, preferring to
maintain very high savings ratios.
� Business investment. A decline in business confidence might lead to lower investment thus
reducing aggregate monetary demand.
� Exports. Net exports may decline if there is a loss of competitiveness or if there is a
world recession. The great depression of the 1930s had its origins in the USA but was
communicated to the rest of the world via declining exports to the USA.
� Government expenditure. Attempts to reduce in government expenditure in the 1980s
probably made the recession in the UK worse and unemployment higher.
Of course, if governments are attempting to prevent inflation by reducing aggregate
monetary demand in the economy, they face the danger that demand deficient
unemployment might result.
Structural change
Structural change in economies occurs all the time. However sometimes this change is
particularly rapid and thus structural unemployment is likely to arise. This may occur because of:
� Rapid technological change. If there are major technological changes which have widespread
effects, such as the advent of stream power in the 19th century and the impact of the
computer at the end of the 20th century, the demand for labour may change radically
leaving significant groups unemployed.
FUNDAMENTALS OF BUSINESS ECONOMICS 183TH
EM
AC
RO
EC
ON
OM
ICC
ON
TEXT
OF
BU
SIN
ESS
2006.1

� Shifts in world industry. Major changes in the structure of world industry may occur. The
rapid growth of manufacturing in Asian economies, especially China and India, is
threatening to generate structural unemployment in Europe and North America where
such activity declines in the face of cheap imports.
Of course, structural change is rarely permanent; as some industries decline, others
develop to take their place. Thus in Western economies the growth of service activities has
helped to cushion the effect on employment of the decline of older manufacturing
industry.
Supply side problems
Problems on the supply side of the economy may cause unemployment. If there is a shift
in the aggregate supply (AS) curve to the left, national income will be in equilibrium at a
lower level implying a higher rate of unemployment. The most important supply side
factors in this context are those operating in the labour market. Any feature of the labour
market which raises the cost of employing workers may result in unemployment.
� Trade unions. It is argued that strong trade unions can cause unemployment by pushing
for and obtaining wage rises for their members, they may reduce the willingness of their
employers to replace people who leave and/or to take on new recruits. Also by resisting
improvements in efficiency, trade unions might contribute to rising costs and prices
which produce lower sales and less employment. The maintenance of established
working practices, rigid demarcation and closed shops have been cited as barriers put up
by trade unions to protect the short-term interests of their members. These barriers
create imperfections in the labour market and are claimed to be detrimental to
employment in the long run.
� Labour market regulation. Labour laws especially concerning the rights of workers in terms
of conditions of employment, redundancy, working hours, sickness and holiday
entitlements may raise the cost of employing workers.
� Social security systems. Generous social security benefits for the unemployed may
encourage voluntary unemployment. In extreme cases there may a ‘poverty trap’ where
some workers are better off being unemployed than working in low paid jobs.
It is possible that shifts in the aggregate supply (AS) curve to the left causing
unemployment may arise from factors other than the labour market. For open economies,
import prices may be a source of unemployment. An example of this is energy prices. A
steep rise in energy prices would raise production costs generally in the economy thus
shifting the AS curve to the left and leading to unemployment. Figure 4.8 shows a fairly
consistent relationship between oil prices and unemployment in OECD economies over
the last 40 years.
4.4.4 The effects of unemployment
There are economic, social, financial and political costs of unemployment.
� Economic resources are not being fully used and the opportunity cost of unemployment is
the goods and services not produced as a result. Long-term economic capacity might be
damaged as unemployed labour loses skills and is unable to acquire new skills and
experience.
STUDY MATERIAL C4184TH
EM
AC
RO
EC
ON
OM
ICC
ON
TEXT
OF
BU
SIN
ESS
2006.1

� Financial costs arise for the government and hence the taxpayer. The unemployed pay
less in tax and have to be supported by state benefits.
� Social costs arise out of the impact on the unemployed themselves. The unemployed tend
to experience more mental and physical health problems and there is a clear link
between the level of unemployment and the level of crime.
4.4.5 The relationship between inflationand unemployment
The Phillips curveIt is generally believed that unemployment and inflation are linked. Phillips correlated
changes in UK money wages and the level of unemployment. The relationships suggested
that when unemployment was 2.5 per cent, the rate of change in money wages would be
non-inflationary. As wages accounted for 70 per cent of production costs and it was
assumed that cost-plus pricing was adopted, it was concluded that prices and
unemployment were also correlated. If an economy was run at a 2.5 per cent level of
unemployment, it was suggested that the general price level would be stabilised.
Furthermore, at 5.5 per cent unemployment, money wages would not rise and there would
be no inflation. For this reason some diagrams of the Phillips curve plot unemployment
against prices (Figure 4.9).
Thus the Phillips curve seemed to show a stable relationship between inflation and
unemployment. This means that
� the lower the rate of unemployment, the higher the rate of inflation;
� the higher the rate of unemployment, the lower the rate of inflation;
� there was a trade off between employment and price stability;
� governments could not simultaneously achieve price stability and full employment.
The Phillips curve was neutral between the cost-push and demand-pull theories of
inflation and between the Keynesian and monetarist schools of thought. It only showed a
link between wage inflation and unemployment levels and did not necessarily specify
causation.
� The demand-pull theorists interpreted low unemployment as an indication of excess
demand which served to ‘pull’ up wages in the labour market.
Oil price/unemployment rate scaled to logarithmic index
Real oil price
11.479
8.0860
4.6930
1.30001964 1971 1978 1985 1992 1995 1998
Unemployment rate
Figure 4.8 Oil and unemployment
FUNDAMENTALS OF BUSINESS ECONOMICS 185TH
EM
AC
RO
EC
ON
OM
ICC
ON
TEXT
OF
BU
SIN
ESS
2006.1

� The proponents of cost-push inflation saw a low level of unemployment as a measure of
trade union strength, enabling them to ‘push’ up wages when employers were vulnerable
because wage costs could be passed on as higher prices in the buoyant economy.
For a government, the Phillips curve seems to offer the option of lower unemployment
and higher inflation or higher unemployment and lower inflation. This gave policy makers
a choice, but still meant that one major economic objective could not be fulfilled. Price
stability and full employment appeared to be mutually exclusive.
Development of the Phillips curveBy the time the Phillips curve had become established, 1970, the inverse relationship
between unemployment and inflation began to break down. Monetarists were not
surprised, as they had argued that the trade-off was at best temporary. As unemployment
grew at higher rates of inflation (stagflation), Keynesian demand management was
discredited. However, in the 1980s, the trade-off reappeared but at a higher absolute level.
In effect, the Phillips curve appeared to have shifted to the right.
Several explanations have been put forward to explain this.
� Structural unemployment. The growth of structural and voluntary unemployment meant that
there could be high pressure of demand for labour even if the unemployment figures
suggested otherwise. This would mean a higher level of unemployment for each level of
inflation.
� Increased trade union power. This would suggest that trade unions were able to secure higher
wage increases at any given level of unemployment, thus generating higher inflation.
� Cost pressures. External cost rises such as that resulting from the oil price rises in the early
and late 1970s would cause a higher rate of inflation at every level of unemployment.
Administered prices in uncompetitive markets would contribute to this process.
Both of these arguments would suggest that the Phillips curve had moved outwards to the
right as shown in Figure 4.10. Thus the employment/inflation trade-off still existed but
that the inflation price of full employment had greatly risen. Cost-push pressures shift PC
to PC1.
� If the government maintains aggregate demand, prices rise to P1 and unemployment
increases to u1.
2
2
Rate ofchange in
money wages( prices )
Unemployment %
4
6
8
10
4 6 8 10
Figure 4.9 The Phillips curve
STUDY MATERIAL C4186TH
EM
AC
RO
EC
ON
OM
ICC
ON
TEXT
OF
BU
SIN
ESS
2006.1

� However, if the government decides to stimulate demand in order to maintain
unemployment at u, this will create demand-pull inflation, raising the general price level
to P2.
� This illustrates the famous ‘wage-price’ spiral whereby cost-push and demand-pull
inflation act together.
This appears to have been the experience of many industrialised economies in the 1970s
and 1980s. However, for at least some of these economies, notably the USA and the UK,
the reverse may have occurred since the mid-1990s. In both these economies
unemployment has fallen significantly but without any growth in inflationary pressures.
This implies that the Phillips curve has shifted to the right.
This may be the result of:
� declining trade union power and militancy;
� falling real energy prices from the late 1990s to 2004;
� the longer-term effects of supply side policies adopted in these countries from the 1980s
onwards.
The role of expectationsAn alternative approach to the Phillips curve incorporates price and/or wage expectations
into the inflationary process. This approach claims that the negative relationship between
inflation and unemployment is not permanent and that the long-run Phillips curve is
vertical. Thus, there are no long run trade-offs. Essentially the expectations distort the
economic process, by influencing the behaviour of its economic agents. The expectations-
augmented Phillips curve was devised by Friedman to show that the effect of expectations
could be a long period of unemployment above the natural rate where demand and supply
for labour is equal. Also, this would be the cost of irresponsible government intervention
in the market which attempted to keep unemployment unnaturally low, by such means as
Keynesian demand management policies.
Figure 4.11 explains the process. In this diagram each of the PE curves shows a
differing expectation of inflation by workers. They are short-run Phillips curves. PC is the
long-run Phillips curve.
PC PC1
u0
P
Unemployment %
Prices
u1
P1
P2
u2
Figure 4.10 A shift in the Phillips curve
FUNDAMENTALS OF BUSINESS ECONOMICS 187TH
EM
AC
RO
EC
ON
OM
ICC
ON
TEXT
OF
BU
SIN
ESS
2006.1
� If the government attempts to reduce unemployment below the natural rate to u1, when
there is no inflation (PE0), the increase in general demand needed will create excess
demand in the labour market, causing 5 per cent wage inflation.
� It is assumed that wage inflation becomes price inflation of 5 per cent. This eventually
changes price expectations from no inflation (PE0) to 5 per cent inflation (PE5) and
shifts the Phillips curve to the right.
� This means that wage and price inflation are now higher at any given rate of
unemployment. For instance, the natural rate of unemployment, u, can only be obtained
at 5 per cent inflation now because of the expectations aroused.
Where does this leave government policy? The concept of the vertical Phillips curve
appears to have removed much of the choice governments used to believe that they had
over the balance between inflation and unemployment. No government could accept a
situation in which the rate of inflation was continually accelerating since this would
ultimately lead to hyper-inflation. At the very least governments would have to accept a
level of unemployment equal to the natural rate of unemployment since at this level, the
rate of inflation would at least be stable. Thus in policy terms, the natural rate of
unemployment was also the non-accelerating inflation rate of unemployment or NAIRU.
NAIRUThe non-accelerating inflation rate of unemployment (NAIRU) has evolved from the
expectations-augmented Phillips curve.
� NAIRU is that level of unemployment where there is no tendency for inflation to
accelerate or decelerate; the rate of inflation will stabilise.
� NAIRU is effectively the natural rate of unemployment; in Figure 4.11 NAIRU would
be at u.
� This rate of unemployment may change over time and may give a clue as to why UK
and USA unemployment rose in the 1980s and then fell again from the mid-1990s.
There is much evidence to suggest that the natural rate of unemployment/NAIRU rose in
most countries during the 1970s and 1980s. This appeared to be especially marked in the
Rate ofchange of
inflation (andmoney
wages) %
PE0PE5
PE5PE0PE10
PE10
PC
10
5
u1 u2u
Unemployment %
0
Figure 4.11 The expectations-augmented Phillips curve
STUDY MATERIAL C4188TH
EM
AC
RO
EC
ON
OM
ICC
ON
TEXT
OF
BU
SIN
ESS
2006.1

UK where it rose from 4.0 per cent in the period 1971–75 to 9.2 per cent in 1981–86.
Among the reasons suggested for this are:
� increased structural unemployment where unemployed workers are effectively removed
from the labour market;
� increased frictional and voluntary unemployment;
� the emergence of serious supply side problems, with many workers effectively excluded
from the labour market because of poor education and skills, low occupational and
geographical mobility and discouragement among the long-term unemployed.
The result of this was that high levels of unemployment were inevitable as governments
attempted to reduce rates of inflation. In terms of Figure 4.11, the natural rate of
unemployment had risen (u had moved to the right) and governments had to accept
unemployment above this level as the price of slowing inflation.
However, from the early 1990s the USA and the UK experienced both falling
unemployment and falling inflation. In terms of NAIRU, it appeared that the natural rate of
unemployment was now falling and thus lower rates of inflation were becoming compatible
with lower levels of unemployment. This fall in the natural rate is ascribed to such factors as:
� generally weaker wage pressure in labour markets as trade union membership and power
declined;
� the effects of supply side policies in improving the operation of the labour market,
especially reductions in entitlement to unemployment payments;
� reductions in structural unemployment as the effects of the decline of old manufacturing
industries faded away;
� improvements in the education and skills of the labour force;
� the development of more flexible working arrangements, especially the growth of part-
time employment.
Conversely, the slow pace of reform of labour markets in most EU economies and the
attempts to further regulate labour relations such as the introduction of a maximum
working week, may have a major contributor to the continuing high levels of
unemployment is such countries as Germany, France, Spain and Italy.
Exercise 4.2Answer the following questions based on the preceding information. You can check your
answers below.
1. What could be the underlying causes of demand-pull inflation?
2. In cost-push inflation, cost rises are ‘exogenous’. What does that mean?
3. What is the quantity theory of money?
4. Suggest four effects of inflation.
5. List three important types of unemployment.
6. Specify three costs of unemployment.
7. What does the Phillips curve show?
8. How did Keynesians attempt to reduce unemployment?
9. What is NAIRU?
10. In ‘new’ macroeconomic models, what effect will an increase in aggregate supply have
on prices and unemployment?
FUNDAMENTALS OF BUSINESS ECONOMICS 189TH
EM
AC
RO
EC
ON
OM
ICC
ON
TEXT
OF
BU
SIN
ESS
2006.1

Solutions1. The principal cause is aggregate monetary demand exceeding the supply of goods and
services at current prices. This could result from increases in injections into the
circular flow when the economy is at or near full employment.
2. Exogenous cost rises are those that occur from outside of the economic system and are
not the result of excessive aggregate demand. These could include increases in import
prices or wage increases due to trade union pressure rather than the demand for labour.
3. The quantity theory of money claims that there is a stable link between the stock of
money in the economy and the level of prices; if the money stock (supply) increases,
this will raise the price level at some future date.
4. Inflation may: reduce the international competitiveness of the trade sector of an
economy; shift wealth from the holders of financial assets to the holders of debts;
discourage savings as the value of savings decreases; distort consumer expenditure as
consumers attempt to anticipate price changes.
5. The main types of unemployment are: structural, frictional, cyclical, seasonal and
voluntary.
6. The costs of unemployment include the loss of output, the loss of tax income to the
government, the loss of income to the unemployed, and damage to the unemployeds’
skills and health.
7. The Phillips curve shows the relationship between the level of unemployment and the
rate of inflation.
8. Keynesians believe that unemployment is the result of demand deficiency, and
advocate the use of the government budget to increase aggregate demand by raising
public expenditure and reducing taxation.
9. NAIRU is the non-accelerating inflation rate of unemployment – the rate of
unemployment at which the current rate of inflation will have no tendency to change.
10. An increase in aggregate supply will reduce the price level and reduce the level of
unemployment.
4.5 Economic growth and external balance
In addition to the objectives of full employment and price stability, most governments also
wish their economies to achieve:
� economics growth
� external balance.
4.5.1 Economic growth
Policies to promote economic growth are difficult to design and difficult to implement for
three main reasons.
1. Economists are less sure about the process of economic growth and why some
economies grow faster than others, than most economic processes. Some of the factors
affecting economic growth may be non-economic and thus not readily understandable
using standard economic analysis.
STUDY MATERIAL C4190TH
EM
AC
RO
EC
ON
OM
ICC
ON
TEXT
OF
BU
SIN
ESS
2006.1

2. Because the factors influencing economic growth may be non-economic as well as
economic, it is not easy to see how governments can design economic policies to
promote the rate of economic growth in their countries.
3. Economic growth is a very long-term process and may therefore need long-term
policies, consistently applied over long periods of time. Few governments have such
long time perspectives. Moreover, changes in governments in the medium term may
mean a change of emphasis in economic objectives and a change of economic policies.
The record of recent economic growth, the factors that determine the rate of economic
growth and policies to promote a higher rate of economic growth are discussed in more
detail in Section 5.1 of the next chapter.
4.5.2 External balance
In addition to the main economic objectives of full employment, price stability and
economic growth, governments have to concern themselves with the issue of external
balance. External balance refers to the international payments and receipts made by and
received by the residents of a country.
� Receipts come from exports of goods and services and inflows of capital.
� Payments arise from imports of goods and services and outflows of capital.
The balance of payments accounts are conventionally divided into:
� the current account which is the balance of imports and exports of goods and services;
� the capital account which is the balance of inflows and outflows of capital for the
acquisition of fixed assets and for government transacations (e.g. foreign aid);
� the financial account which is the balance of inflows and outflows for the sales/purchasing
of assets such as shares and bank deposits.
Since the accounts contain all international transactions, the balance of payments accounts
as a whole always balance. However, there may be surpluses or deficits in each of the sub-
accounts. Thus:
� a deficit on the current account would have to be matched (financed ) by a surplus on the
capital or financial accounts;
� a surplus on the current account would have to be matched (financed ) by a deficit on the
capital or financial account.
There would appear, therefore, to be no particular problem with respect to the balance of
payments for a country. The problem arises when there is a persistent problem on the
current account that must be financed on the capital or financial accounts.
� A persistent surplus can be financed although there may be an increase in the domestic
money supply as the net inflow of foreign currency is converted into domestic currency.
� It may not be possible to finance a persistent deficit for ever because of the nature of the
financing process.
Let us suppose that a country is running a persistent deficit on its current account – its
trade in goods and services with the rest of the world. Let us also suppose that the capital
FUNDAMENTALS OF BUSINESS ECONOMICS 191TH
EM
AC
RO
EC
ON
OM
ICC
ON
TEXT
OF
BU
SIN
ESS
2006.1
account is in balance. This means that the deficit must be financed on the financial
account. This can be done in a variety of ways:
� assets could be sold to foreigners, for example the sales of shares in domestic companies
or the sale of shares in foreign companies owned by residents;
� liabilities could be increased, for example foreign funds could be attracted into bank
accounts in the country or borrowing from foreign banks and international institutions
could be undertaken either by domestic financial institutions or by the central bank;
� reserves of foreign currency held by the central bank could be run down.
It should be noted that a balance of payments current account deficit cannot be financed
by the government through its own budget; the government accounts are quite separate
and not concerned with external payments and receipts.
Thus a current account deficit can be financed by a combination of selling assets to
foreigners, acquiring liabilities from foreigners or by running down reserves of foreign
exchange. None of these can be done indefinitely since reserves and assets would
eventually be exhausted and liabilities cannot be built up for ever without a loss of
international confidence which would lead to foreigners being unwilling to lend any
further funds to that country.
It becomes clear from this that governments need to conduct economic policy in such a
way as to achieve two objectives should a balance of payments current account deficit
arise. First is the need to finance the imbalance in the short to medium run and, secondly, to
correct the imbalance in the long run.
Financing the deficitIn order to finance a deficit on the current account of the balance of payments, a country
needs to attract capital and financial inflows into that country. It might attempt to do this by:
� creating a favourable business environment to encourage multinational companies to
invest in the country and locate production there. This inflow of capital would appear as
a credit on the capital or financial accounts. It was claimed that the large inflow of such
capital into the UK economy in the 1990s compared to other EU economies was the
result of a more ‘business friendly’ environment. However such flows are not likely to
be large and will only occur over a long period.
� encouraging a flow of international mobile liquid funds into the country’s banking
system by maintaining an attractive level of interest rates. If the return on such funds is
higher than in other countries, there is likely to be a net inflow of such funds. This is
likely to be the main means of funding a current account deficit.
For most countries then the means of financing a significant current account deficit is to
conduct monetary policy so that interest rates are relatively high compared with financial
centres in other countries. The problem that arises is that monetary policy is now being
determined by an external requirement and not by the needs of the domestic economy. It
is possible that the domestic economy may be in recession in which case the appropriate
monetary policy would be lower interest rates, but interest rates have to be raised in order to
attract in and retain foreign funds to finance an external imbalance. The severity of the
recession in the UK in the early 1990s was partly the result of the government having to
raise interest rates, rather than reduce them, because of external balance of payments
problems.
STUDY MATERIAL C4192TH
EM
AC
RO
EC
ON
OM
ICC
ON
TEXT
OF
BU
SIN
ESS
2006.1

Correcting the deficitIn the longer run therefore, the need is to correct the imbalance on the balance of payment
current account. This can be done in a variety of ways and the appropriate policy method
depends on the reasons for the imbalance on the current account in the first place. Two
broad possibilities exist.
� The deficit may be the result of excessively high aggregate monetary demand (AMD) in
the economy. In a boom period AMD is high and since imports are, in the short run, a
function of AMD, imports will also be high. The appropriate policy response in this
situation is to adopt a deflationary policy to reduce the level of aggregate demand. Higher
interest rates, lower government expenditure or raised taxation would all have this
effect.
� The deficit may be the result of a loss of competitiveness in international markets
leading to declining exports and rising imports. The appropriate policy here would
be to allow the exchange rate for the country’s currency to depreciate. This would
reduce the foreign exchange price of exports and raise the domestic price of
imports.
Both of these approaches involve costs to the economy. In the first place, a
deflationary policy would lead to lower demand for all goods and services not only
imports. Thus domestic business would experience declining sales and the result would
be falling output and employment. In the second case, devaluation might help some
business – especially those exporting or facing competition on domestic markets from
cheap imports, but businesses using imported energy, raw materials, components etc.
would face a rise in costs. Moreover, since import prices will have risen all consumers
of imported goods will experience a decline in their standard of living. Correcting a
balance of payments current account deficit involves an economic cost whatever the
policy method chosen.
A further discussion of the balance of payments and balance of payments policy can be
found in Section 5.5 in the next chapter.
4.6 Government economic policy
In order to achieve the objectives of full employment, price stability, economic growth and
external balance, governments have a range of policy instruments available to them. These
policy instruments generally fall into one of the three categories:
1. monetary policy
2. fiscal policy
3. supply side policy.
4.6.1 Monetary policy
Monetary policy is concerned with managing the monetary environment in order to
influence the decisions of economic agents including consumers, investors and businesses.
It can do this by affecting either the availability of credit or the price of credit. The main
FUNDAMENTALS OF BUSINESS ECONOMICS 193TH
EM
AC
RO
EC
ON
OM
ICC
ON
TEXT
OF
BU
SIN
ESS
2006.1

feature of monetary policy is the policy of changing interest rates since they are the price
of credit.
A central rate of interestIt is clear that there is no such thing as the rate of interest because there are many rates of
interest, which reflect varying risk. However, there has always been a central rate around
which the others vary and to which governments have paid great attention. This has
usually been the rate at which the central bank would lend to the money market, based on
the treasury bill rates.
In the case of the UK, the government in 1997 established a Monetary Policy
Committee at the Bank of England. It gave the seven members, including five external
experts, the power to decide the central rate of interest in the UK.
� The committee has a target rate of inflation of 2.0 per cent.
� Should the rate of inflation vary from this target by 1 per cent or more, the Bank of
England is required to provide a written explanation to the Chancellor of the
Exchequer.
� It is generally assumed that this would be most likely to occur if the rate of inflation
exceeded the 2.0 per cent target. However, by 2001 it was clear that inflation was
undershooting the target and it was just as likely that the Bank of England would have to
explain why the rate of inflation had fallen by 1 per cent below the target.
In the EU, the European Central bank which manages monetary policy in the eurozone, a
similar process operates with the central bank being given an inflation target. Even in
those countries were a formal target does not exist, central banks are required to regard the
rate of inflation as the main policy target for monetary policy and to conduct interest rate
policy accordingly.
Real interest ratesThe real interest rate puts interest rates in the context of inflation. It shows the interest
rate, allowing for inflation.
� When the nominal rate of interest is higher than the rate of inflation there is a positive
real rate. This means that borrowers are losing in real terms but savers are gaining.
� Conversely, when the rate of inflation exceeds the nominal rate of interest there is a
negative real rate of interest. In such a case, borrowers gain and savers lose.
For decision making by individuals and businesses, it is the real rate of interest which is the
important variable.
The effects of interest rate changesChanges in interest rates affect the economy in many ways. The following consequences
are the main effects of an increase in interest rates:
� Spending falls. Expenditure by consumers will be reduced. This occurs because the higher
interest rates raise the cost of credit and deter spending. If we take incomes as fairly
stable in the short term, higher interest payments on credit cards/mortgages, etc. leave
less income for spending on consumer goods and services.
� Investment falls. A rise in interest rates will reduce the net return to investment and thus
discourage businesses from undertaking new investment projects.
STUDY MATERIAL C4194TH
EM
AC
RO
EC
ON
OM
ICC
ON
TEXT
OF
BU
SIN
ESS
2006.1
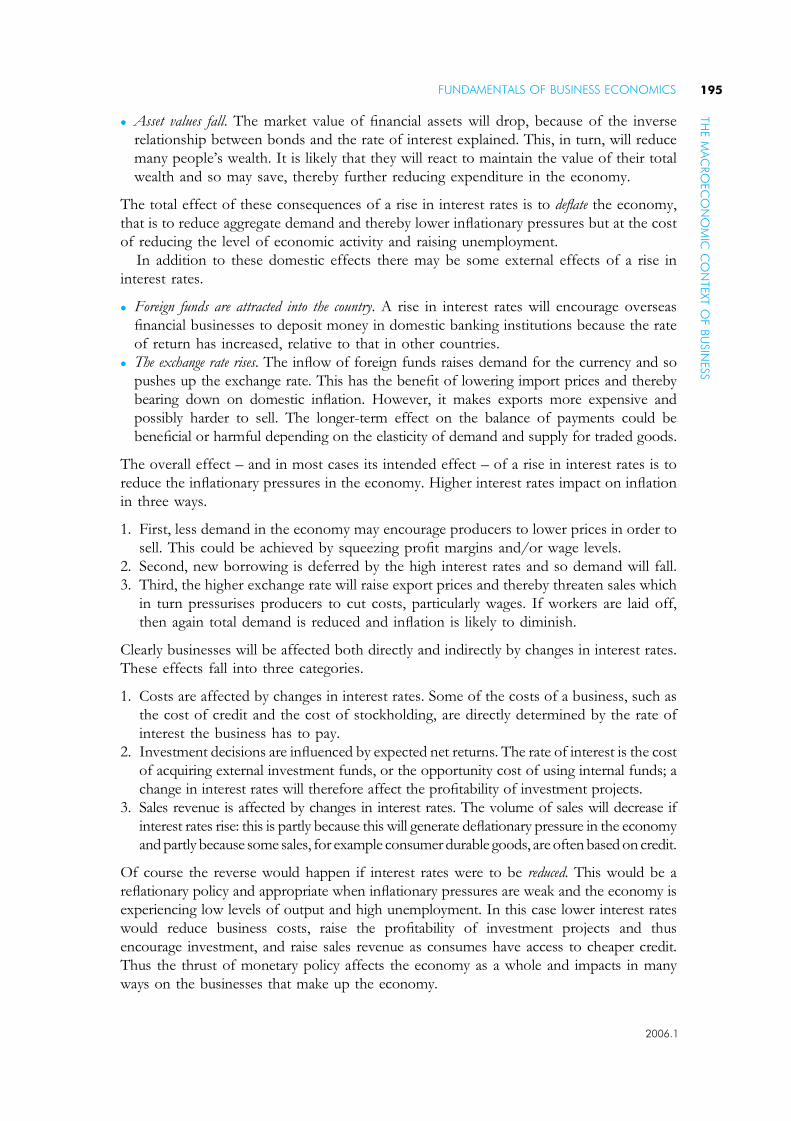
� Asset values fall. The market value of financial assets will drop, because of the inverse
relationship between bonds and the rate of interest explained. This, in turn, will reduce
many people’s wealth. It is likely that they will react to maintain the value of their total
wealth and so may save, thereby further reducing expenditure in the economy.
The total effect of these consequences of a rise in interest rates is to deflate the economy,
that is to reduce aggregate demand and thereby lower inflationary pressures but at the cost
of reducing the level of economic activity and raising unemployment.
In addition to these domestic effects there may be some external effects of a rise in
interest rates.
� Foreign funds are attracted into the country. A rise in interest rates will encourage overseas
financial businesses to deposit money in domestic banking institutions because the rate
of return has increased, relative to that in other countries.
� The exchange rate rises. The inflow of foreign funds raises demand for the currency and so
pushes up the exchange rate. This has the benefit of lowering import prices and thereby
bearing down on domestic inflation. However, it makes exports more expensive and
possibly harder to sell. The longer-term effect on the balance of payments could be
beneficial or harmful depending on the elasticity of demand and supply for traded goods.
The overall effect – and in most cases its intended effect – of a rise in interest rates is to
reduce the inflationary pressures in the economy. Higher interest rates impact on inflation
in three ways.
1. First, less demand in the economy may encourage producers to lower prices in order to
sell. This could be achieved by squeezing profit margins and/or wage levels.
2. Second, new borrowing is deferred by the high interest rates and so demand will fall.
3. Third, the higher exchange rate will raise export prices and thereby threaten sales which
in turn pressurises producers to cut costs, particularly wages. If workers are laid off,
then again total demand is reduced and inflation is likely to diminish.
Clearly businesses will be affected both directly and indirectly by changes in interest rates.
These effects fall into three categories.
1. Costs are affected by changes in interest rates. Some of the costs of a business, such as
the cost of credit and the cost of stockholding, are directly determined by the rate of
interest the business has to pay.
2. Investment decisions are influenced by expected net returns. The rate of interest is the cost
of acquiring external investment funds, or the opportunity cost of using internal funds; a
change in interest rates will therefore affect the profitability of investment projects.
3. Sales revenue is affected by changes in interest rates. The volume of sales will decrease if
interest rates rise: this is partly because this will generate deflationary pressure in the economy
and partly because some sales, for example consumer durable goods, are often based on credit.
Of course the reverse would happen if interest rates were to be reduced. This would be a
reflationary policy and appropriate when inflationary pressures are weak and the economy is
experiencing low levels of output and high unemployment. In this case lower interest rates
would reduce business costs, raise the profitability of investment projects and thus
encourage investment, and raise sales revenue as consumes have access to cheaper credit.
Thus the thrust of monetary policy affects the economy as a whole and impacts in many
ways on the businesses that make up the economy.
FUNDAMENTALS OF BUSINESS ECONOMICS 195TH
EM
AC
RO
EC
ON
OM
ICC
ON
TEXT
OF
BU
SIN
ESS
2006.1

The development of monetary policyMonetary policy is concerned with the supply and price (interest rate) of money in the
economy. Its primary objective is to limit inflation and thereby maintain the value of
money:
� a loose monetary policy (of low interest rates) leads to a lot of borrowing (and thus
spending) which will cause inflation, higher output and employment and possibly an
external trade deficit;
� a tight monetary policy (of high interest rates) may slow down demand and reduce
inflationary pressure but output may fall and cause unemployment.
Monetary policy has occupied a gradually more important place in economic management
in the post-war period. In the period through to the early 1970s monetary conditions were
seen mainly as a by-product of other policies. However, the relaxation of direct controls
(on hire purchase) and the ending of fixed exchange rates led to closer consideration of
monetary policy in many countries.
In the case of the UK monetary policy has developed through several stages since the
early 1980s.
� 1980–86 tracking the money supply. During this period the government sought to control
the money supply in the UK and gradually reduce inflation and inflation expectations.
� 1986–92 tracking exchange rates. Governments came to believe that the exchange rate for
sterling was a good indicator of monetary conditions in the UK and therefore keeping a
stable exchange rate would ensure a stable monetary environment for the economy.
� 1993–97 tracking broad money. Having abandoned exchange rate targeting and the narrow
measures of money supply, broad money, M4, became the important indicator and
target for monetary policy.
� 1997–2005 tracking inflation. From 1997 the rate of inflation itself became the focus and
direct target for monetary policy.
Thus the nature of monetary policy, in terms of the targets and indicators used, has
changed. The control of monetary policy has also changed. Also, the government has
given the Bank a degree of indepdnence in conducting monetary policy. The Bank has an
inflation target (2.0 per cent) and the Bank’s Monetary Policy Committee is free to make
interest rate decisions in the light of that target.
Figure 4.12 shows the links in the chain between policy instruments and economic
objectives. Thus the ultimate objective and target for monetary policy is the rate of
inflation. If indicators, such as money supply figures or retail sales data, suggest that the
rate of inflation will differ from its target (currently 2.0 per cent), action, such as altering
interest rates or the growth in the supply of money, is called for. If this policy is successful
it will ultimately be revealed in the behaviour of the objective, the rate of inflation.
PolicyFramework
Example
Instrument Indicator Target Objective
Interestrates
Changesin moneysupply
% moneysupplygrowth
Controlinflation
Figure 4.12 From policy instrument to economic objective
STUDY MATERIAL C4196TH
EM
AC
RO
EC
ON
OM
ICC
ON
TEXT
OF
BU
SIN
ESS
2006.1

The limitations of monetary policyA central bank faces four main problems in applying monetary policy:
1. First, the Bank lacks sufficient detailed, up-to-date information on the economy in
general and money supply in particular. For instance, general economic information is
received after the event in many cases and is often based on estimates. In particular,
money supply is difficult to measure, as the government’s changes of target measure
indicate. Further uncertainty is created by the fact that there is a time lag between the
initiation of a policy and its fruition, by which time the original problem may have been
overcome anyway.
2. A second problem is that the banks dislike close supervision. The history of monetary
policy in many countries shows that they were not averse to evading the central bank’s
restraints.
3. Third, central banks over-vigorous control may stifle the initiative of the banks and
hinder their profit-maximising ethos. As the central bank wants an efficient and
profitable banking sector, it cannot go very far in enforcing credit restraint without
undermining the banks’ ability to make profits.
4. Conflicting objectives are the fourth constraint on central bank activities. A change in
interest rates has effects on both the domestic economy and on external factors such as
the exchange rate. What is required by the domestic economy may conflict with that
need for external equilibrium.
4.6.2 Fiscal policy: taxation and spending
There are many aims to taxation and their priority varies with the political complexion of
the government. However, all governments are agreed on the need to raise revenue.
Originally this income was used to wage war, but today the bulk of it goes on more socially
desirable expenditure such as education, health and social services. Taxation, including
national insurance contributions which are termed ‘social security receipts’, provides for
the bulk of government spending as shown in Figure 4.13.
Taxation can be used to:
� Change markets. Certain potentially harmful goods, such as cigarettes and alcohol, may be
heavily taxed, thereby lowering the quantity demanded and reducing consumption
levels. Over 75 per cent of the price of cigarettes goes in tax; and at times higher taxes
on petrol have been used to deter consumption and induce energy conservation also.
� Influence the level of aggregate monetary demand. AMD can be reduced by raising taxation and
can be raised by reducing taxation.
� Finance the provision of public and merit goods. The collective provision of certain public
goods, such as defence, paid for from taxation revenue, enables it to be given free to
everyone. Similarly, the zero price provision of a merit good such as education provides
access to everyone, when market-priced supply might lead to under-consumption by
many, which society might consider to be undesirable.
� Change the distribution of income and wealth. Direct taxes and especially progressive direct
taxes fall most heavily on upper groups while indirect taxes and regressive taxes in
general fall most heavily on lower income groups. Changing the balance between
different taxes can thus alter income distribution.
FUNDAMENTALS OF BUSINESS ECONOMICS 197TH
EM
AC
RO
EC
ON
OM
ICC
ON
TEXT
OF
BU
SIN
ESS
2006.1

Principles of taxationAdam Smith outlined four canons of taxation and these are still appropriate at present.
These four principles are as follows.
1. Certainty. If people know what is expected of them in terms of what, when, how and
where to pay, then the system operates efficiently and evasion is minimised.
2. Convenience. The PAYE system in the UK operates on this basis and the payment of
local authority tax by monthly instalments has developed for this reason.
3. Equitable. They should be fairly based on an individual’s ability to pay. Equality of
sacrifice is often subject to conflicting interpretations, but it is usually agreed that a
progressive element to income tax is fair in that the better off can bear a higher tax
burden more easily than those on low incomes.
4. Economy. Taxes should be cheap to collect.
Since Smith’s day, other principles have been added. These include:
� Efficiency. A tax needs to achieve its objective efficiently and not undermine other aims
and taxes. For instance, if the basic rate of tax is reduced to encourage effort but
taxpayers substitute more leisure, then it is not operating efficiently.
� Flexibility of a tax. A tax needs to be capable of variation in order to fit with changes in
economic management.
Types of taxationTaxes can be classified in several ways:
� What is taxed? The three main categories are:
Income Expenditure Capital
Income tax VAT Inheritance tax
Corporation tax Excise duties Capital gains tax
National insurance Customs duties
NHS£54bn
Transport£9bn
Others£59bn
VAT£60bn
Corporation Tax£34bn
Defence£23bn
Education£46bn
Other Taxes£55bn
Bus.Rates£16bn
ExciseDuties£37bn
IncomeTax£96bn
CouncilTax£14bn
DebtInterest£28bn
SocialSecurity£103bn
NationalInsurance£59bn
Law andOrder£20bn
HousingEnvironment£14bn
Industry,agricultureandemployment£15bn
£371 Billion £371 Billion
Figure 4.13 UK Government income and expenditure 2000–01
STUDY MATERIAL C4198TH
EM
AC
RO
EC
ON
OM
ICC
ON
TEXT
OF
BU
SIN
ESS
2006.1

However, there are also taxes on property ownership (e.g. council tax in the UK), car use
(motor vehicle licence duty), television use (licence fee), a firm’s payroll (employers’ social
security taxes), and oil royalties (petroleum revenue tax).
� Who is levying the tax? Most taxes are imposed by central government but some local
government authorities are given the power to raise taxes.
� Who is paying the tax? Usually a distinction is made between direct and indirect taxes.
With a direct tax the person receiving the income pays the tax to the authorities, for
example income tax. In contrast, most taxes on expenditure are termed indirect, because
the purchaser who benefits from the consumption is charged, usually in the purchase
price, but the actual tax revenue is remitted, for convenience, by the seller to the
authorities. Although the seller pays in the nominal sense he/she may be able to pass on
the burden of the tax to the purchaser through a higher price.
� What percentage of income is paid in tax? – at various income levels. The main
categories here are:
– progressive – a larger percentage of income is paid in tax as income rises, e.g. income tax
(above a certain minimum).
– regressive – a smaller percentage of income is paid in tax as income rises, e.g. VAT (on
most goods and services).
– proportional – the same percentage of income is paid in tax at all income levels.
Thus, with a progressive tax the average rate of taxation rises with income, whereas with a
regressive tax the average rate falls. The average rate of tax is constant with a proportional
tax. The marginal rate of taxation (percentage of extra $1 income paid in tax) also varies
between these different types of tax. The marginal rate is higher than the average rate with
a progressive tax but lower with a regressive tax as income rises. The two rates are equal
for a proportional tax.
Box 4.2 Policy differences in taxation
Although the Conservative Party sees a more limited role for taxation funding, it
subscribes to the above functions in agreement with the Labour Party. However,
there is less agreement over issues of income and wealth distribution. Between 1979
and 1997 Conservative governments reduced the basic rate of income tax from 33
per cent to 23 per cent, and the highest rate from 83 per cent to 40 per cent, while
increasing VAT, a regressive tax, from 8.5 per cent to 17.5 per cent. This
redistributed income from the poor to the rich, but was justified by the desire to
increase incentives and encourage investment. Since 1997 the Labour government
has further reduced the standard rate of income tax to 22 per cent, but has also
introduced a range of tax and expenditure changes that redistributed income towards
lower-income groups. These changes have included the introduction of a system of
family tax credit and a significant rise in child benefit. In the 2002 budget the
government also announced a significant extension of national insurance charges
which became effective in April 2003. These were mainly designed to raise revenue
to pay for the large increases in expenditure on health and education announced
in 2002.
FUNDAMENTALS OF BUSINESS ECONOMICS 199TH
EM
AC
RO
EC
ON
OM
ICC
ON
TEXT
OF
BU
SIN
ESS
2006.1
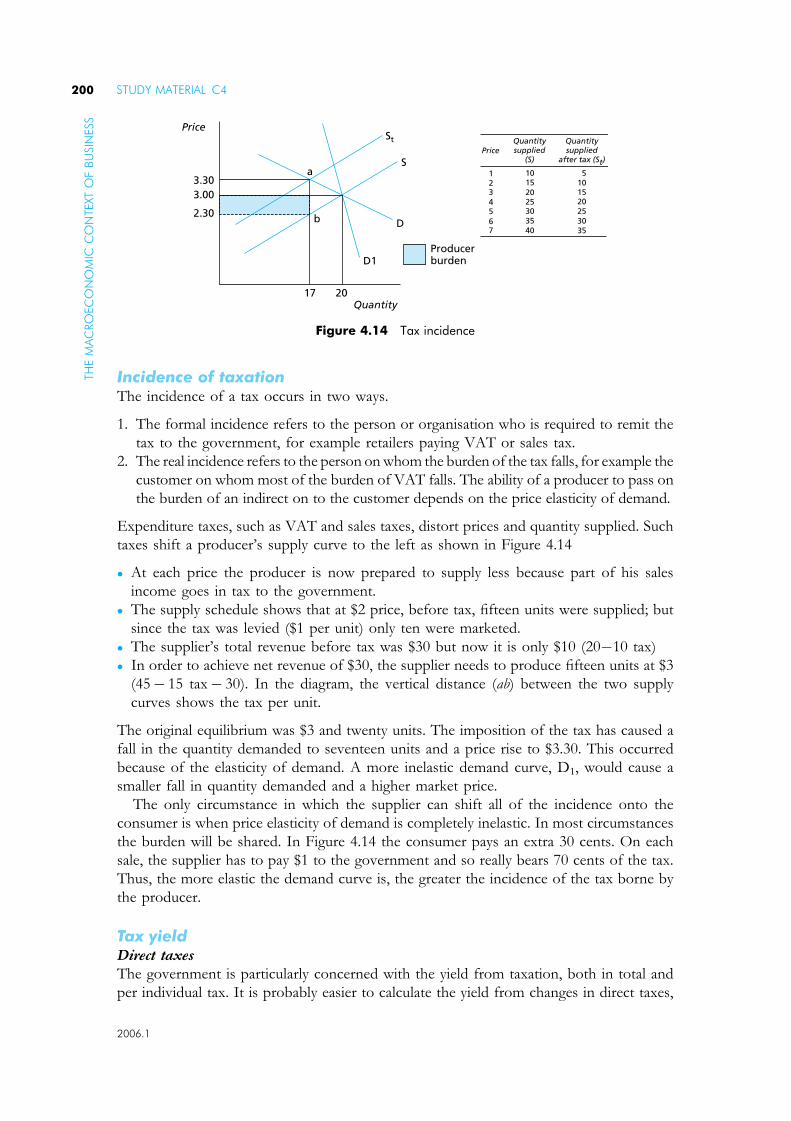
Incidence of taxationThe incidence of a tax occurs in two ways.
1. The formal incidence refers to the person or organisation who is required to remit the
tax to the government, for example retailers paying VAT or sales tax.
2. The real incidence refers to the person on whom the burden of the tax falls, for example the
customer on whom most of the burden of VAT falls. The ability of a producer to pass on
the burden of an indirect on to the customer depends on the price elasticity of demand.
Expenditure taxes, such as VAT and sales taxes, distort prices and quantity supplied. Such
taxes shift a producer’s supply curve to the left as shown in Figure 4.14
� At each price the producer is now prepared to supply less because part of his sales
income goes in tax to the government.
� The supply schedule shows that at $2 price, before tax, fifteen units were supplied; but
since the tax was levied ($1 per unit) only ten were marketed.
� The supplier’s total revenue before tax was $30 but now it is only $10 (20�10 tax)
� In order to achieve net revenue of $30, the supplier needs to produce fifteen units at $3
(45� 15 tax� 30). In the diagram, the vertical distance (ab) between the two supply
curves shows the tax per unit.
The original equilibrium was $3 and twenty units. The imposition of the tax has caused a
fall in the quantity demanded to seventeen units and a price rise to $3.30. This occurred
because of the elasticity of demand. A more inelastic demand curve, D1, would cause a
smaller fall in quantity demanded and a higher market price.
The only circumstance in which the supplier can shift all of the incidence onto the
consumer is when price elasticity of demand is completely inelastic. In most circumstances
the burden will be shared. In Figure 4.14 the consumer pays an extra 30 cents. On each
sale, the supplier has to pay $1 to the government and so really bears 70 cents of the tax.
Thus, the more elastic the demand curve is, the greater the incidence of the tax borne by
the producer.
Tax yieldDirect taxes
The government is particularly concerned with the yield from taxation, both in total and
per individual tax. It is probably easier to calculate the yield from changes in direct taxes,
Quantity
Producerburden
Quantitysupplied
(S)
Quantitysupplied
after tax (St)
D1
2017
b
aS
D
StPrice
Price
3.303.00
2.30
12345
10152025303540
1510
20253035
5
67
Figure 4.14 Tax incidence
STUDY MATERIAL C4200TH
EM
AC
RO
EC
ON
OM
ICC
ON
TEXT
OF
BU
SIN
ESS
2006.1

particularly those on income, than from changes in indirect taxes. However, higher income
tax rates may lead to evasion and tax avoidance schemes. It has been argued that the
growing black economy has resulted from higher taxes, and such activities obviously mean
a loss of government revenue. Also, citizens may substitute leisure for work because they
dislike the marginal tax rate on their earnings and this may slightly lower the tax yield. In
recent years it has been argued that lower rates of taxation, especially of income tax, may
actually raise the total tax yield. This is based on Laffer curve analysis which suggests that
there is an optimum rate of tax for maximising total revenue. If taxes go above this level,
tax revenues will fall. This suggests a strong case for reducing tax rates.
Five main arguments have been used to justify the reduced payment of income tax:
1. High levels of income tax are a disincentive to work. For instance, in the UK in 1986
the marginal rate of tax and national insurance combined was 39 per cent on most
incomes between £95 and £300 per week, and this deterred people from overtime
working. It also acted as a disincentive to the self-employed and small companies,
who faced higher marginal tax rates. In Figure 4.15, when the tax rate exceeds C total
government revenue falls because workers substitute leisure. Thus it could be argued
that the tax is no longer efficient. So a tax cut from D to C would actually increase
tax yield by £3m (23�20). Similarly, taxes could be reduced from D to B without
any negative impact on tax revenues. Furthermore, it was claimed that in America in
1981–83 such a policy had raised extra revenue. However, critics have argued that it
is virtually impossible to separate out the effects of a cut in tax rates from other
economic things that are going on at the same time. Furthermore, the ‘disincentive to
work’ argument takes a narrow view of worker motivation. Also, there is really no
satisfactory way of measuring work effort, because the number of working hours fails
to capture variables such as dedication, loyalty, drive, pride and long-term career
choice.
2. In the 1970s Britain experienced a ‘brain drain’ when well-qualified and well-paid (by
British standards) professionals, such as doctors, golfers, etc., emigrated, particularly to
the USA. One explanation given was the high rates of income tax, with a top marginal
rate of 83 per cent. This exodus meant that British investment in human resources had
been wasted.
C
DMarginaltax rate
B
A
10 20 23Government tax revenue, £m
Figure 4.15 Income tax rates and government revenue
FUNDAMENTALS OF BUSINESS ECONOMICS 201TH
EM
AC
RO
EC
ON
OM
ICC
ON
TEXT
OF
BU
SIN
ESS
2006.1

3. High tax rates mean that fewer funds are available for investment. It was claimed that
people on high incomes invested their savings.
4. Reductions in tax liability may lead to lower wage claims, and thus dampen inflation.
This may occur because the tax reductions raise the workers’ net disposable income and
so they do not seek such high future wage claims, in their attempt to keep better off.
5. Lower direct taxes would reduce the poverty trap, encouraging unemployed workers to
accept low paid employment as the post tax income would now be higher.
However, the evidence to support these claims is rather mixed and the long term
consequences of reduced direct taxation are not entirely clear.
Indirect taxes
The effect on yield of taxation on goods and services depends on consumer preferences,
demand elasticities and time. When a good has inelastic demand, then sales will not fall
and tax will be collected. However, if the good has high price elasticity of demand then
demand will fall steeply when the price rises as result of the imposition of a tax. This effect
would become stronger in the long run and the total revenue gained would be greatly
reduced. For this reason the heaviest indirect taxes are typically levied on those goods with
very low price elasticities of demand. These goods include tobacco and cigarettes, alcohol
and petrol.
The conduct of fiscal policyA government’s fiscal policy is concerned with the balance between its income and
spending and the effects which changes in the balance might have on the economy.
� The difference between central government income and expenditure is termed the budget
deficit.
� However, the balance between the income and spending of the whole of the public
sector is nowadays more significant and is termed public sector borrowing.
� Recently, the term the public-sector net cash requirement (PSNCR) has been used
instead of the PSBR; these terms are effectively interchangeable.
The PSNCR incorporates the borrowing of central government, public corporations and
local authorities. Much of the central government’s borrowing is used to subsidise public
corporations through specific grants and local authorities through support grants.
The government budget may be in:
� Deficit where the flow of government expenditure exceeds the flow of its taxation income.
� Surplus where the flow of government expenditure is less than the flow of its taxation
income.
A budget deficit (surplus) should not be confused with a trade deficit (surplus). Both are
important sets of accounts, but the latter refers to the balance of payments between a
country and its trading partners. A budget deficit shows where the flow of government
expenditure exceeds the flow of its income.
The PSNCR is the difference between two large accounting totals. It is a cash concept
which quickly and fairly accurately measures actual money flows. Thus it gives reliable and
timely information for economic decision-making. PSNCR projections, which are
generally less accurate, are given annually, from November since 1993.
STUDY MATERIAL C4202TH
EM
AC
RO
EC
ON
OM
ICC
ON
TEXT
OF
BU
SIN
ESS
2006.1

A budget deficit may occur for three main reasons.
1. In recessions, tax yields fall and public expenditure on social security for the
unemployed rise. This can be seen in many countries in the early 1980s and especially in
the recession of 1990–93. As the economy grows the reverse happens and the budget
moves into surplus as can be seen from the period 1998–2001.
2. Governments might run a budget deficit to increase aggregate demand in the economy
as part of a reflationary policy to reduce unemployment.
3. Governments might wish to undertake significant amounts of public expenditure (e.g
on health and education in the UK in recent years) and finance some of this through
borrowing rather than taxation provided that this borrowing is not believed to be
excessive or permanent.
The problem of government borrowingWhen governments run budget deficits and borrow to finance those deficits a distinction
can be made between two elements in those deficits:
1. a cyclical element in which the deficit arises as a result of the downswing phase of the trade
cycle and will decrease or even turn into a surplus in the upswing phase of the trade cycle;
2. a structural element in which the deficit is the result of a permanent imbalance between
expenditure and taxation and will not be affected by the trade cycle.
A cyclical deficit is much less concern since over the whole trade cycle, budget deficits
would be broadly balanced by budget surpluses. However, a structural deficit implies
continuous borrowing by governments and an increasing total debt (‘national debt’) owed
by the government. There are some reasons to believe that many countries are facing
pressures are tending to increase public expenditure on a long-term basis and hence
threatened the emergence of structural budget deficits.
These pressures include:
� an ageing population which increases public expenditure on health care for the elderly and
on state pensions;
� inflation in the prices of public sector goods and services which are mainly labour
intensive and thus tend to show the fastest rate of inflation;
� spending commitments for public and merit goods especially social welfare, education and
health, which are difficult to decrease in the ace of voter opposition;
� tax changes as it is always politically much easier to reduce taxes than to raise them thus
making raising more tax revenue problematic.
Thus many governments are faced with the problem of financing budget deficits. The
ways in which this might be done can be distinguished by:
� from whom the government borrows; this might be the non-bank private sector such as
pension funds or individual households;
� the type of liability the government issues where the main distinction is between different
degrees of liquidity of those liabilities. Long term government securities (in the UK,
‘gilts’) are the principal liabilities of governments.
For most governments the PSNCR arising from the budget deficit is mainly financed by
the sale of long-term government debt to the private (non-bank) sector of the economy.
This is likely to have some effects on the economy but the nature of those effects is
subject to some debate among economists.
FUNDAMENTALS OF BUSINESS ECONOMICS 203TH
EM
AC
RO
EC
ON
OM
ICC
ON
TEXT
OF
BU
SIN
ESS
2006.1

� Some, mainly Keynesians, believe that the effects are real in that a budget deficit
financed in this way will tend to affect the real variables in the economy, raising output
and employment via the effect of the deficit on aggregate demand.
� Others, including monetarists and new classical economists, believe that the effects are
monetary in that government borrowing injects liquid assets into the economy thus
boosting the money supply and casing inflation. Moreover, government borrowing may
push up interest rates thus reducing private spending. This reduction in private spending
will offset the government expenditure financed by borrowing – a process known as
‘crowding out’.
The problems of financing budget deficits and the potential problems arising from the
need to service (pay interest on) the national debt have led governments across the world
to adopt policies designed to control the level of government borrowing. In the European
Union, a condition of joining the single currency (euro) was a maximum size of national
debt and of current government borrowing in relation to the national income of the
country concerned. Once a country has joined the single currency and adopted the euro, it
is obliged to keep control of its government borrowing via the ‘stability pact’ which
specifies maximum amounts that governments can borrow. In the UK since 1997 the
government has adopted the golden rule for government finances.
This rule states that
� over the whole trade cycle, government current expenditure on goods, services and
transfer payments should not exceed its taxation income;
� only government investment expenditure may be financed by government borrowing;
� the overall burden of public debt should not go above sustainable levels, generally taken
to mean equal to 40% of GDP.
Box 4.3 Taxation and the golden rule
The Chancellor of the Exchequer, Gordon Brown, was handed a timely boost
yesterday when evidence of a surge in tax receipts from Britain’s companies eased
fears of higher taxes being needed to plug a hole in the country’s public finances.
The treasury refused to be drawn on the implications of the £2.2b surplus for next
year’s budget but expressed satisfaction that tax receipts were higher and spending
was lower than Mr Brown had predicted back in March. City analysts said that even
after October’s bumper tax receipts, Mr Brown would still face problems if he was to
meet his self-imposed rules on public spending. The Chancellor has come under fire
from several quarters including the CBI, which says that the UK’s £10b black hole in
public finances will require either raising taxes or cutting spending. Analysts said that
although the data provided a short term boost to Mr Brown, it was ‘‘disappointing’’
and it remained unclear whether he would meet his golden rule in the next economic
cycle.
Laura Smith and Larry Elliot in Guardian November 19th 2005
Thus public borrowing is constrained. The government may run a positive PSNCR in any
given year, but over the whole trade cycle its total PSNCR should not exceed its
expenditure on investment. The implication is that significant permanent increases in
STUDY MATERIAL C4204TH
EM
AC
RO
EC
ON
OM
ICC
ON
TEXT
OF
BU
SIN
ESS
2006.1
expenditure on such things as education and health will ultimately have to be financed by
increases in taxation.
4.6.3 Debates over economic policy
Keynesians and monetaristsThere are major and continuing debates over the way in which economics function and
therefore over the way in which economic policy should be conducted. The most
important elements of this debate is between those economists who can be broadly called
‘monetarists’ and those who are broadly ‘Keynesian’.
The monetarists, like the classical economists who preceded Keynes, believe that
� real and monetary forces are separate. The market forces of demand and supply
determine the level of output and relative prices, but money influences the overall price
level.
� unemployment is largely voluntary, caused by workers pricing themselves out of jobs
and by trade union activity.
� inflation is created by the government through the excessive supply of money in the
economy.
� fiscal policy is only important for its contribution towards the level of government
spending, which they seek to minimise, and its impact on money supply.
� full employment and growth are best promoted by supply side policies to ‘free up’
markets.
In contrast, Keynesians, whose beliefs have their origins in the work of the economist
J.M. Keynes in the 1930s,
� reject the quantity theory of money and maintain that money is a vital link between
markets and because money may be stored, the level of demand may be insufficient to
maintain full employment.
� argue that involuntary unemployment may arise, where workers would accept a job for
which they are qualified at the current wage but are unable to find such a job.
� believe that in such circumstances the government has a positive role to play in
stimulating aggregate demand in order to reduce unemployment.
� argue that excess demand in an economy at full employment causes inflation.
� Accept a more interventionist role for governments with. active fiscal policy to manage
aggregate demand
Although there appear to be serious differences between monetarist and Keynesian
approaches to economic policy, in practice governments of both persuasions were often
aiming at the same objectives and working within similar constraints. The result has been
some convergence of views and, by the late 1990s, the emergence of something
approaching a new consensus in the conduct of economic policy.
Objectives of economic policyA useful illustration of the economy’s performance and the success of economic policy is
the ‘economic diamond’ showing the main economic objectives of governments.
FUNDAMENTALS OF BUSINESS ECONOMICS 205TH
EM
AC
RO
EC
ON
OM
ICC
ON
TEXT
OF
BU
SIN
ESS
2006.1

Although the priority among the objectives varies with the government’s values and
political motives the following four objectives are typical of most governments:
� Price stability. a low annual rate of inflation.
� Full employment.
� External balance implying no long-term tendency for balance of payments current
account deficits.
� Economic growth as measured by the annual rise in GDP.
In effect, the bigger the diamond is, the better the performance of the economy and the
more successful economic policy might be judged. The economic daimondis illustrated in
Figure 4.16.
Of course the conduct of economic policy by any government in a market economy is
constrained by many factors, most of which are outside of the control of governments.
The most important of these constraints are:
� previous policies which cannot be abandoned or altered by new governments since there
has to be a degree of continuity in policy to ensure a reasonably stable economic
environment in which individuals and businesses can work.
� information which is always limited and imperfect and limits the value of economic
predictions upon which economic policy making must be based.
� time lags between the design and implementation of economic policy and the point at
which they start to have an effect on the economy.
� political limitations which constrain what is possible and acceptable to the electorate and
may condition what governments are prepared to do.
4 2 0 –4–2
8
2
2
4
6
8
10Economic growth,%
Inflation,%
Current account,% of GDP
8 6 4 2Unemployment, %
0
0
10
6
4
Figure 4.16 The economic diamond
STUDY MATERIAL C4206TH
EM
AC
RO
EC
ON
OM
ICC
ON
TEXT
OF
BU
SIN
ESS
2006.1

4.7 Chapter summary
So far this chapter has discussed various features of the macroeconomic environment in
which businesses operate. It has developed three main sets of related ideas and principles.
These are as follows:
� an economic model of how the economy as a whole functions – the circular flow model
which provides an explanation of the main economic processes in an economy and a
framework for considering economic problems and issues of economic policy.
� an emphasis on aggregate demand and aggregate supply for analysing problems and questions
related to the economy as a whole.
� A discussion of macroeconomic problems such as unemployment and inflation, and the ways
in which governments might use fiscal, monetary and supply side policy in approaching these
problems.
FUNDAMENTALS OF BUSINESS ECONOMICS 207TH
EM
AC
RO
EC
ON
OM
ICC
ON
TEXT
OF
BU
SIN
ESS
2006.1


Revision Questions
This section contains examination-standard questions and solutions relevant to the
content of Chapter 4. You should use these questions for examination practice and
revision.
Question 1 Multiple-choice selection1.1 GNP (gross national product) at factor cost may be best defined as:
(A) the total of goods and services produced within an economy over a given period
of time.
(B) the total expenditure of consumers on domestically produced goods and services.
(C) all income received by residents in a country in return for factor services provided
domestically and abroad.
(D) the value of total output produced domestically plus net property income from
abroad, minus capital consumption.
1.2 Structural unemployment is best defined as that caused by:
(A) the long-term decline of particular industries.
(B) the trade cycle.
(C) an insufficient level of aggregate demand.
(D) seasonal variations in demand for particular goods and services.
1.3 Which one of the following would cause a fall in the level of aggregate demand in an
economy?
(A) A decrease in government expenditure.
(B) A fall in the propensity to save.
(C) A fall in the level of imports.
(D) A decrease in the level of income tax.
1.4 The PSNCR (public-sector net cash requirement) is:
(A) the accumulated debts of the government.
(B) the total amount borrowed by all members of the public.
(C) the amount borrowed by the government and public authorities in a given period.
(D) the amount borrowed to finance a balance of payments deficit.
4
209 2006.1
1.5 A progressive tax is one where the tax payment:
(A) rises as income increases.
(B) falls as income increases.
(C) is a constant proportion of income.
(D) rises at a faster rate than income increases.
1.6 According to the advocates of supply-side economics, which one of the following
measures is most likely to reduce unemployment in an economy?
(A) Increasing labour retraining schemes.
(B) Increasing public sector investment.
(C) Increasing unemployment benefits.
(D) Decreasing the money supply.
1.7 The crowding-out effect refers to:
(A) low wages leading workers to leave an industry.
(B) firms wishing to locate production away from congested areas.
(C) public expenditure displacing private expenditure.
(D) increased rates of taxation leading to lower total tax revenue.
1.8 In an aggregate demand and supply diagram, if the aggregate supply curve shifted to
the left, the consequences would be:
(A) national income and the price level would both fall.
(B) national income and the price level would both rise.
(C) national income would fall and the price level would rise.
(D) national income would rise and the price level would fall.
Question 2The following data refer to the principal sources of taxation revenue for the UK central
government.
UK CENTRAL GOVERNMENT TAXATION REVENUE – MAIN TAX
SOURCES AS PERCENTAGE OF TOTAL TAX INCOME
1979 1993
% %
1. Income taxes 34.1 30.0
2. Social security taxes (National
Insurance contributions)
19.2 20.0
3. Corporation tax 6.8 7.9
4. Value added tax 14.7 22.9
5. Excise duties 15.9 14.3
6. Other expenditure taxes* 7.7 3.7
7. Capital gains tax 0.9 0.6
8. Inheritance tax 0.7 0.6
* includes stamp duty and motor vehicle duties
Source: CSO national income accounts
REVISION QUESTIONS C4210TH
EM
AC
RO
EC
ON
OM
ICC
ON
TEXT
OF
BU
SIN
ESS
2006.1

RequirementsUsing both your knowledge of economic theory and material contained in the table:
(a) State whether each of the following is a direct tax or an indirect tax:
(i) income tax;
(ii) corporation tax;
(iii) value added tax;
(iv) excise duties;
(v) social security taxes. (5 marks)
(b) State whether each of the following statements is true or false.
(i) Between 1979 and 1993 the burden of taxation in the UK shifted from indirect
towards direct taxation.
(ii) Retailers cannot pass all of an indirect tax onto the customer.
(iii) Most tax revenue is gained when indirect taxes are levied on goods with high price
elasticity of demand.
(iv) Taxes will have act as a disincentive if the income effect outweighs the
substitution effect.
(v) Indirect taxes are likely to more regressive than direct taxes. (5 marks)
(Total marks = 10)
FUNDAMENTALS OF BUSINESS ECONOMICS 211TH
EM
AC
RO
EC
ON
OM
ICC
ON
TEXT
OF
BU
SIN
ESS
2006.1

Question 3The following data refer to the UK economy and are drawn from HMSO Economic Trends.
Consider the data and answer the following questions:
Rate of growth
of GDP1 PSBR2Balance of
payments3
Year % £bn £bn
1980 �2.0 +11.8 +2.6
1981 �1.1 +10.5 +6.7
1982 +1.7 +4.8 +4.6
1983 +3.7 +11.5 +3.5
1984 +2.0 +10.3 +1.4
1985 +4.0 +7.4 +2.2
1986 +4.0 +2.5 �0.9
1987 +4.6 �1.4 �5.0
1988 +4.9 �11.9 �16.5
1989 +2.2 �9.3 �22.5
1990 +0.6 �2.1 �18.2
1991 �2.3 +7.7 �7.6
1992 �0.5 +28.9 �8.5
1. Annual rate of growth of gross domestic product (GDP)
2. Public sector borrowing requirement (PSBR): ‘+’ denotes net borrowing, ‘�’ denotes
repayment of previous debt.
3. Balance of payments, current account: ‘+’ denotes surplus, ‘�’ denotes deficit.
RequirementsUsing both your knowledge of economic theory and the data contained in the table:
(a) With respect to the data in the above table, identify 2 years of economic recession in
the UK and state whether in a recession: (2 marks)
(i) government borrowing increases or decreases;
(ii) the current account of the balance of payments moves towards deficit or surplus.
(2 marks)
(b) State whether, other things being equal, the following would increase or decrease the
level of government borrowing (the PSBR/PSNCR) or have no effect:
(i) a rise in exports;
(ii) a fall in unemployment. (2 marks)
(c) State whether each of the following is true or false.
(i) A current account deficit must be financed by a surplus on the capital account.
(ii) If the government has a budget deficit it must borrow from abroad to finance it.
(iii) The national debt is the amount of money owed by the UK to other countries.
(iv) The government budget acts as an automatic stabiliser in the trade cycle.
(4 marks)
(Total marks = 10)
REVISION QUESTIONS C4212TH
EM
AC
RO
EC
ON
OM
ICC
ON
TEXT
OF
BU
SIN
ESS
2006.1

Solutions toRevision Questions
The answers given below indicate what might reasonably be expected of a candidate,
under examination conditions, in order to obtain a good pass mark. It should be noted
that there is a high level of objective testing in the examination. The multiple-choice
questions have only one answer, as do of the subquestions in the data-response questions.
Solution 11.1 Solution: (C)
GNP is a measure of all incomes received by residents. (A) is incorrect since it refers
to domestic output and incomes, (B) is incorrect since it ignores incomes spent on
imports and (D) is incorrect since it considers depreciation (capital consumption) and
is a measure of net, not gross, national product.
1.2 Solution: (A)
(D) is incorrect since it clearly refers to seasonal unemployment. (B) and (C) refer to
unemployment caused by a lack of aggregate demand; this would cause unemploy-
ment in the economy as a whole. Structural unemployment is that which occurs
irrespective of the overall level of demand and affects only certain industries.
1.3 Solution: (A)
(D) would increase consumer incomes and therefore demand. (B) would mean
consumers spending a higher proportion of their income. (C) would imply an increase
in demand for home-produced goods. A is correct because government expenditure is
one component of aggregate demand.
1.4 Solution: (C)
The PSNCR refers to borrowing by the governments and other public-sector
authorities when their expenditure exceeds their income. (B) and (D) are incorrect
since the first refers to private borrowing and the second to the balance of payments,
not the government budget. (A) is incorrect: this is the accumulation of previous
borrowing, not the current level of borrowing.
4
213 2006.1
1.5 Solution: (D)
B refers to a regressive tax and (C) refers to a proportional tax. (A) is insufficient since the
tax payment could rise with regressive and proportional taxes. (D) is correct since it
identifies a progressive tax as one where the proportion of income taken in tax rises.
1.6 Solution: (A)
Supply-side theorists believe unemployment is the result of problems with the supply
of labour. (B) and (D) are concerned with aggregate demand and the demand for
labour, and are therefore incorrect. (C) is incorrect since supply-side theorists believe
that generous unemployment benefits encourage unemployment.
1.7 Solution: (C)
The crowding-out effects refers to the process by which an increase in public
expenditure may be offset by a fall in private expenditure. If the public expenditure is
financed by taxation, private expenditure will fall. If it is financed by borrowing,
interest rates are likely to increase, thus discouraging private expenditure.
1.8 Solution: (C)
On the aggregate supply and aggregate demand diagram AS/AD the horizontal axis is
national income and the vertical axis is the price level. If the AS curves shifts to the
left then, national income must fall. Since the AD curve is normally sloped down left
to right the new AS curve will intersect is a higher point. Thus the price level will rise.
Solution 2
(a) (i) direct tax(ii) direct tax(iii) indirect tax(iv) indirect tax(v) direct tax
(b) (i) False. The burden of taxation shifted towards indirect taxation.
(ii) True. A retailer can only pass on all of a tax onto customers if the demand for the
good is perfectly price inelastic.
(iii) False. Most revenue is gained from taxing goods with very low price elasticity since
consumers continue to buy even when the price has risen such as in the case of
tobacco, petrol and alcohol.
(iv) False. A rise in taxation makes people take more leisure because of the substitution
effect but to take less because of the income effect. Only if the substitution effect
is strongest is there a net disincentive effect.
(v) True. Indirect taxes are unrelated to income and therefore tend to be strongly
regressive.
SOLUTIONS TO REVISION QUESTIONS C4214TH
EM
AC
RO
EC
ON
OM
ICC
ON
TEXT
OF
BU
SIN
ESS
2006.1

Solution 3
(a) The years of recession are 1980, 1981, 1991 and 1992 and in a recession(i) government borrowing would increase.
(ii) the balance of payments current account would move towards a surplus.
(b) (i) A rise in exports would have no direct effect on the government budget and therefore
on government borrowing.
(ii) A fall in unemployment would lead to lower government borrowing as expenditure
on unemployment pay fell and tax receipts rose.
(c) (i) True. The balance of payments always balances so a deficit (surplus) on one acc-
ount is always matched by a surplus (deficit) on the other.
(ii) False. If the goverment has a budget deficit is must borrow but it can do this
domestically as well as internationally.
(iii) False. Most government borrowing is done domestically so the bulk of the national
debt is debt owed by the goverment to individuals and organisations in its own
country.
(iv) True. In a recession taxes fall and expenditure rises thus limiting the recession; the
reverse occurs in a boom period.
FUNDAMENTALS OF BUSINESS ECONOMICS 215TH
EM
AC
RO
EC
ON
OM
ICC
ON
TEXT
OF
BU
SIN
ESS
2006.1


5
The Macroeconomic Contextof Business: The InternationalEconomy


The MacroeconomicContext of Business:The InternationalEconomy
5
LEARNING OUTCOMES
This chapter is concerned with the wider macroeconomics context within which business
operates. It discusses the process of economic growth in the world economy and the
factors which affect the rate of economic growth. With respect to the international
economy, the focus is upon international trade and its consequences for business and
the financial arrangements which make international trade possible. Issues related to
the international economy, globalisation, exchange rate systems and national and
international policy towards the international economy reviewed.
After completing this chapter you should be able to:
" identify the conditions and policies necessary for economic growth in traditional,
industrial and post-industrial societies, and the potential consequences of such
growth;
" identify the role of the foreign exchange market and the factors influencing it, in
setting exchange rates and in helping organisations finance international trade and
investment;
" explain the concept of the balance of payments and its implications for business and
government policy;
" identify the main elements of national policy with respect to trade, including
protectionism, trade agreements and trading blocs;
" explain the concept and consequences of globalisation for business and national
economies;
" identify the major institutions promoting global trade and development, and their
respective roles.
219 2006.1

5.1 Economic growth
5.1.1 Economic growth
In its strictest sense economic growth, is taken to mean the growth of productive potential
for the economy. However, the usual definition of economic growth is an increase in real
gross national product (GNP).
Economic growth has been given high priority as a policy objective, because if the
growth of output exceeds the growth of population, per capita income will rise, that
is, the standard of living will rise. In the longer term, the compound effect on output
of a constant rate of growth is impressive. For example, if output grows every year by
2 per cent, GDP will double in approximately 36 years; but if the growth of output can
be increased to 3 per cent each year, output will double in approximately 24 years.
5.1.2 Record of economic growth
Rates of economic growth vary from country to country.
Table 5.1 shows that the highest rates of growth are associated with newly industrialised
countries such as Malaysia and Singapore. By comparison the United Kingdom has had a
poor economic growth record.
But one is not just concerned with long-term economic growth but also with short-term
fluctuations in an economy’s growth rate. Thus economic growth in the United Kingdom
over the last 50 years has been as high as 7 per cent and also been negative on three occasions,
as seen in Figure 5.1.
Table 5.1 Economic growth (average percentage per annum)
Growth Japan UK USA EU(15) OECD Brazil Malaysia Singapore
1960–69 10.9 2.9 4.3 3.5 4.6 5.4 6.5 8.8
1970–79 4.3 2.0 2.8 3.2 3.6 8.1 7.9 8.3
1980–89 4.0 2.4 2.5 2.2 2.6 3.0 5.8 6.1
1990–99 1.9 1.6 2.1 1.9 2.2 2.0 7.8 7.8
–3
–2
–1
0
1
2
3
4
5
6
7
An
nu
al g
row
th r
ate,
% 8
1950 1955 1960 1965 1970 1975 1980 1985 1990 1995 2000 2002
A
B
C
Figure 5.1 Fluctuations in UK growth
Source: Economic Trends
STUDY MATERIAL C4220TH
EM
AC
RO
EC
ON
OM
ICC
ON
TEXT
OF
BU
SIN
ESS
2006.1

The fluctuations in short-term economic growth can be related to the trade or business
cycle. Economies can experience high levels of economic growth which are referred to as
booms. In other years economies can experience a slowdown in economic growth. In the
United Kingdom, if negative economic growth occurs for more that two quarters, it is
officially called a recession.
The stages of the business cycle are shown in Figure 5.2.
1. The trough. This is the bottom of the cycle when the level of economic output is at its
lowest.
2. The recovery. Here economic growth is at its fastest as it picks up from the lowest level of
output in the trough.
3. The peak. Here economic output has risen to its highest level and the gap between actual
and potential output has narrowed. Economic growth, however, has slowed down and
may have even stopped.
4. The downturn. At this stage there is a decline in economic growth, which if it leads to an
actual fall in the level of output, can mean the economy could enter a recession.
5.1.3 Factors influencing economic growth
The growth potential of an economy is dependent upon two things:
1. The amount of economic resources. The more factors of production there are, in the
form of land, labour, enterprise and capital, the greater the potential for economic
growth.
2. The productivity of these factors of production.
Improvements in productivity are important for economic growth as it will not only
increase output from a given stock of factors of production but it will also improve the
competitiveness of an economy. Productivity is the amount of output produced per unit of
input. As a result higher rates of productivity would lower unit costs of production for a
firm, leading to greater competitiveness. The firm could, therefore, expect to gain sales in
domestic and international markets. Lower costs could enable a firm to lower its prices,
thereby expanding the market, and encourage it to raise its levels of investment. This in
Actual output
1
1
0
Nat
ion
al o
utp
ut
Time
23
3
4
42
Potential output
Figure 5.2 The trade/business cycle
FUNDAMENTALS OF BUSINESS ECONOMICS 221TH
EM
AC
RO
EC
ON
OM
ICC
ON
TEXT
OF
BU
SIN
ESS
2006.1
turn would expand productive potential and lead to still higher productivity which in turn
can produce a virtuous circle of economic growth. Productivity growth is, therefore,
clearly an important ingredient in achieving a higher rate of economic growth in
an economy.
Capital can play a major part in economic growth.
� The greater the capital/output ratio, the higher the productivity of labour. The greater
the levels of investment, the faster will be the growth in the capital stock.
� The higher the quality of capital, the more advanced will be the technology progress.
This will occur when machinery is updated and when investment in research and
development is high.
Labour also influences economic growth via its quantity and quality.
� Demographic factors such as the size and gender/age composition of the population
determine the size of the work force. The activity rate measures the proportion of any
age group which makes itself available for work. The greater this is, the greater the size
of the working population.
� Education and training are likely to make a work force more adaptable and enterprising.
This in turn will improve mobility of labour and raise its productivity.
5.1.4 Policies to promote economic growth
Due to the importance of economic growth in raising standards of living, governments
have always taken an interest in policies to promote it. A necessary condition is that levels
of aggregate monetary demand are kept sufficiently high to see that existing productive capacity
is fully used and that firms are encouraged to expand potential production by further
investment. Governments can use fiscal and monetary policy to keep aggregate monetary
demand close to its full employment level. Tax rates can be cut and interest rates lowered
to encourage consumer and investment spending. Doubts exist regarding the success of
such policies. The preferred route in the United Kingdom is to use fiscal and monetary
policy so as to control inflation and reduce uncertainty in government economic policy
rather than as a way of stimulating aggregate monetary demand. Government policy
tries to create favourable economic conditions for firms to thrive, thereby raising
economic growth.
However government policies will also seek to encourage aggregate supply in order to
expand production in the economy. In the United Kingdom this has been linked to a
recognition that productivity in the United Kingdom is lower than in other developed
economies. Figure 5.3 shows productivity as measured by output per worker is 13 per cent
below that in Germany, 21 per cent lower than in France and 36 per cent lower than in the
United States.
Supply side policies attempt to increase the total quantity of factors of production
especially capital as well as raise levels of productivity. Such policies can be market driven
or interventionist in nature. Market driven policies seek to create as free a market as possible
within which private enterprise and entrepreneurial activity can thrive. Such policies aim to
reduce the role of government in the economy and place a greater emphasis on the role of
the individual in driving economic activity. Thus privatisation of government industries,
e.g. electricity, gas and water in the United Kingdom, and deregulation, as with the
London Stock Exchange in 1986, have been introduced. Similarly an internal market was
STUDY MATERIAL C4222TH
EM
AC
RO
EC
ON
OM
ICC
ON
TEXT
OF
BU
SIN
ESS
2006.1
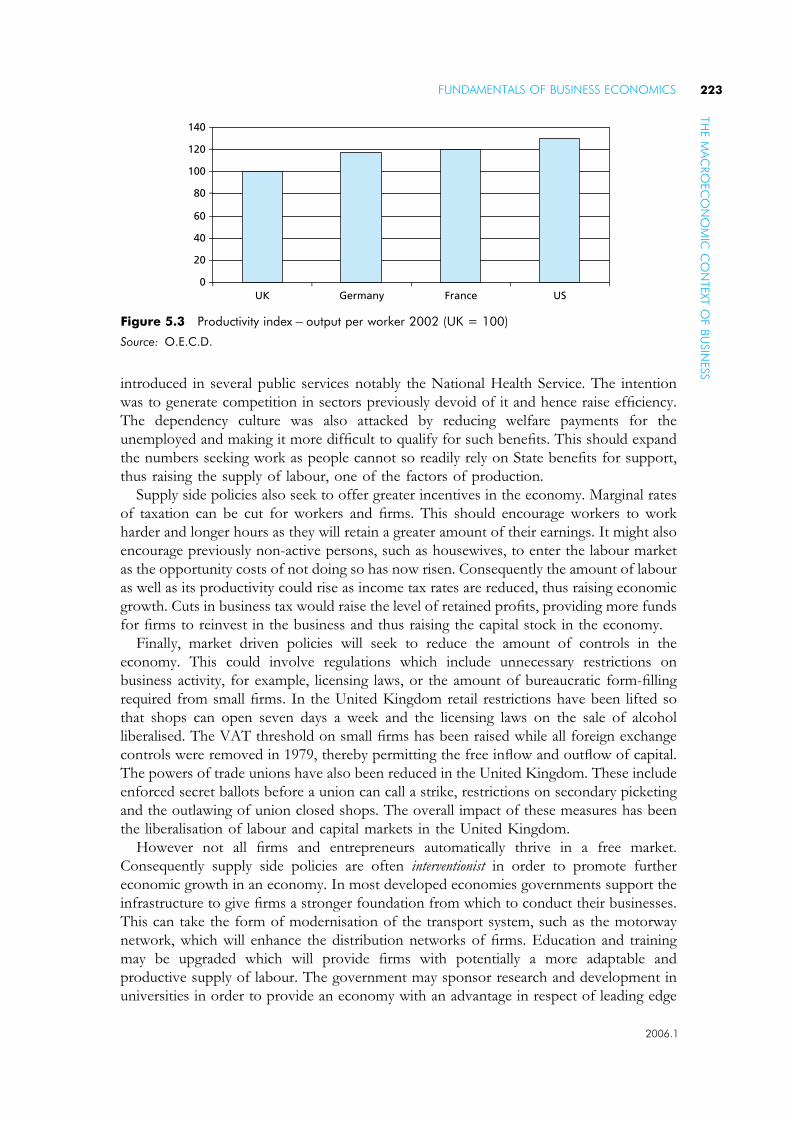
introduced in several public services notably the National Health Service. The intention
was to generate competition in sectors previously devoid of it and hence raise efficiency.
The dependency culture was also attacked by reducing welfare payments for the
unemployed and making it more difficult to qualify for such benefits. This should expand
the numbers seeking work as people cannot so readily rely on State benefits for support,
thus raising the supply of labour, one of the factors of production.
Supply side policies also seek to offer greater incentives in the economy. Marginal rates
of taxation can be cut for workers and firms. This should encourage workers to work
harder and longer hours as they will retain a greater amount of their earnings. It might also
encourage previously non-active persons, such as housewives, to enter the labour market
as the opportunity costs of not doing so has now risen. Consequently the amount of labour
as well as its productivity could rise as income tax rates are reduced, thus raising economic
growth. Cuts in business tax would raise the level of retained profits, providing more funds
for firms to reinvest in the business and thus raising the capital stock in the economy.
Finally, market driven policies will seek to reduce the amount of controls in the
economy. This could involve regulations which include unnecessary restrictions on
business activity, for example, licensing laws, or the amount of bureaucratic form-filling
required from small firms. In the United Kingdom retail restrictions have been lifted so
that shops can open seven days a week and the licensing laws on the sale of alcohol
liberalised. The VAT threshold on small firms has been raised while all foreign exchange
controls were removed in 1979, thereby permitting the free inflow and outflow of capital.
The powers of trade unions have also been reduced in the United Kingdom. These include
enforced secret ballots before a union can call a strike, restrictions on secondary picketing
and the outlawing of union closed shops. The overall impact of these measures has been
the liberalisation of labour and capital markets in the United Kingdom.
However not all firms and entrepreneurs automatically thrive in a free market.
Consequently supply side policies are often interventionist in order to promote further
economic growth in an economy. In most developed economies governments support the
infrastructure to give firms a stronger foundation from which to conduct their businesses.
This can take the form of modernisation of the transport system, such as the motorway
network, which will enhance the distribution networks of firms. Education and training
may be upgraded which will provide firms with potentially a more adaptable and
productive supply of labour. The government may sponsor research and development in
universities in order to provide an economy with an advantage in respect of leading edge
0
20
40
60
80
100
120
140
UK Germany France US
Figure 5.3 Productivity index�output per worker 2002 (UK = 100)
Source: O.E.C.D.
FUNDAMENTALS OF BUSINESS ECONOMICS 223TH
EM
AC
RO
EC
ON
OM
ICC
ON
TEXT
OF
BU
SIN
ESS
2006.1

technologies. In the United Kingdom the government recognises the importance of small
and medium size firms to the economy. It provides them with assistance in the form of
market information, advice on exporting, management training, technical assistance as well
as tax concessions. Small firms in the United Kingdom pay a 20 per cent rate of
corporation tax compared with a standard rate of 30 per cent. Thus there are many ways in
which inventionist policies of government can strengthen the position of firms in a market
economy and enhance economic growth.
5.1.5 Sustainable economic growth
A strongly expressed view is that by failing to take the environmental impact of economic
growth into account, conventional measures of GNP do not provide an accurate
indication of sustainable economic welfare, that is the flow of goods and services an economy
can generate without reducing its future economic capacity.
GNP, therefore, needs to be adjusted by omitting:
� Defensive expenditure. For example, some double glazing may be installed to reduce the
noise from increased use of lorries needed to move goods around the country.
� Environmental depreciation of natural resources. Finite mineral resources can only be used
once in the growth process. Their contribution is included in GNP at their current
market value. However, the exhaustion of such finite resources impacts negatively on
future sustainable growth.
� Pollution damage incurs costs. For example, water companies have to install treatment
plants to cleanse drinking water due to the intensive use of nitrates and fertilisers by
farmers which then runs off the land into water catchment areas.
� An Index of Sustainable Economic Welfare (ISEW) provides an alternative measure of economic growth. It
subtracts from GNP defensive expenditures, depreciation of environmental and
physical capital, as well as the costs involved in overcoming pollution. This produces a
clear distinction between conventional measures of economic growth and sustainable
economic welfare. Whereas for the UK 1996–2000, average annual growth in real GNP
was 2 percent per year, the ISEW showed only a 0.5 per cent annual growth.
5.2 Globalisation
5.2.1 Context
International trade has existed ever since economies had goods to trade. Such trade was,
however, limited and the study of economics, while acknowledging international trade,
concentrated on domestic economic matters. Over the last fifty years, dramatic increases
in the volumes of goods and services traded internationally and of currency bought and
sold in the foreign exchange markets have led people to see the world in terms of the global
economy.
The global economy refers to an open economy where the ratio of exports to output
forms a significant proportion of economic activity. The overwhelming majority of
economies are more open today than forty years ago. Figure 5.4 shows the growth in
export shares between 1960 and 1997. Most countries trade internationally at least
20 per cent of their output. Surprisingly, given the size of its trade surplus, Japan
STUDY MATERIAL C4224TH
EM
AC
RO
EC
ON
OM
ICC
ON
TEXT
OF
BU
SIN
ESS
2006.1

exports only 13.5 per cent of what it produces while the United Kingdom exports
31 per cent.
The growth of world trade has been expanding more rapidly than world output. Figures
from the World Trade Organisation (WTO) show that for the period 1973–99, world
GDP grew annually at 2.8 per cent while world trade grew annually at 4.3 per cent. As
world trade has been increasing so too has the importance of regional trade arrangements.
Regional trading blocs are particularly important in Western Europe, North America and
East Asia. Intra-regional trade accounts for over 50 per cent of total exports in the
European Union (EU) and in the North American Free Trade Agreement (NAFTA).
Neighbouring countries have always traded with each other but the tendency in recent
years has been to make such arrangements more formal. Regional trading agreements can
take several forms.
� Free trade areas agree to reduce or abolish trade restrictions between member countries
while allowing members to impose their own separate trade restrictions against
non-members.
� Custom unions encourage free trade among members but erect a common external tariff on
imports from non-member countries.
� Common markets are similar to custom unions but include the free movement of factors of
production as well as trade.
� Economic unions take the development of a common market even further by encouraging
the harmonisation of national economic policies, such as competition policy, financial
regulations, product standards.
The best known regional trading bloc is probably the EU. It came into being in
January 1993 having taken the place of its predecessor the European Economic
Community (EEC) which had been founded in January 1958. In 2006 it has 25 member
countries with 2 more due to join in 2007. It has a population of approximately 500
million and accounts for 25 per cent of world trade. It has its own central bank, its own
currency, the euro, and its own budget. It is by far the most advanced example of an
economic union in the global economy.
100
90
80
70
60
50
40
1960
1997
30
Exp
ort
s as
per
cen
tag
e o
f G
DP
20
10
0
Fran
ce
Germ
any
Greec
e
Irelan
dIta
ly
Japan
Nether
lands
Norway
Spain UK
USA
Figure 5.4 Trade ratios: exports as a percentage of GDP
Source: IMF
FUNDAMENTALS OF BUSINESS ECONOMICS 225TH
EM
AC
RO
EC
ON
OM
ICC
ON
TEXT
OF
BU
SIN
ESS
2006.1

Arguments abound regarding the effects of regional trading blocs.
� Their supporters say that they encourage trade creation by harmonizing economic policies and
standards within member countries and reducing prices as trade restrictions are
removed.
� Opponents state that they lead to trade diversion. Member countries buy within the
regional trading bloc when cheaper sources are available outside.
� Common external tariffs can encourage a regional fortress mentality which can lead to
conflicts between different regional trading blocs. For example, NAFTA has com-
plained over the EU’s agricultural imports while the EU has complained over NAFTA’s
restrictions on steel imports.
� The fear is that regional trading blocs could lead to the development of protectionism
worldwide at a time when the WTO is seeking to create free trade.
5.2.2 Foreign exchange market transactions
Globalisation is not restricted to international trade in goods and services. It also includes
transactions on the foreign exchange markets. In 2001 on an average trading day in the
foreign exchange markets, currency valued at £1.8 trillion was traded. Most of this trading
finances international capital flows rather than trade in goods and services.
Given the magnitude of these figures, one can clearly see why the global economy
forms an integral part of the economic environment. An important agent in this global
economy is the multinational or transnational corporation (MNC/TNC).
5.2.3 Multinational corporations
DefinitionsA multinational corporation is one which owns or controls production or service facilities
in more than one country. A corporation does not become multinational merely by trading
internationally, for example, by exporting its products from its home country.
MNCs can be ranked according to the amount of foreign assets they control. When
ranked in this way the United States accounts for six of the ten largest MNCs. Such MNCs
are mainly found in the petroleum, automotive and electronics/computing sectors.
Alternatively MNCs can be ranked according to a transnationality index. This is a com-
posite index that is calculated as the average of the following ratios: foreign assets/total
assets; foreign sales/total sales; foreign employment/total employment. This index gives a
different ranking to the one based solely on foreign assets. It is a better indicator of the
extent to which a corporation operates outside its home country.
Many firms with a high ranking in this index come from smaller countries with a res-
tricted domestic market and it is dominated by European Union countries.
Size of MNCsThe United Nations estimated that in 1998 there were approximately 53,000 MNCs with
around 440,000 foreign affiliates. Their sales revenue accounts for about 31 per cent of world
GDP and half of the world’s largest economic units are MNCs rather than nation states. MNCs
account for around 30 per cent of GDP in the United Kingdom and almost half of
manufacturing employment. Foreign MNCs operating in the United Kingdom account for 23
per cent of output and 11 per cent of all employment. The United Kingdom is a major recipient
STUDY MATERIAL C4226TH
EM
AC
RO
EC
ON
OM
ICC
ON
TEXT
OF
BU
SIN
ESS
2006.1

of inward direct foreign investment (DFI). For example, in recent years 30 per cent of all
Japanese DFI in the European Union has been in the United Kingdom. Likewise the United
Kingdom is a major provider of outward DFI. UK home-based MNCs were the providers of
16 per cent of all DFI in 1997 despite representing only 2 per cent of all MNCs. Thus the United
Kingdom is very much part of the globalisation process.
Explanation of MNC activityThere are several advantages for a corporation in establishing a production base overseas
rather than trading with foreign companies.
� Costs can be reduced if cheaper production facilities are available in other countries.
This is especially applicable in the manufacturing sector due to the abundance of cheap,
high-quality labour in developing countries.
� Expand sales by entering new markets. MNCs have gradually switched from exporting
to a foreign market to establishing sales outlet and finally a production facility. By
producing overseas the MNC can avoid the costs of transporting its product and also
bypass any tariffs or quotas.
� Secure supply by vertical integration backwards. Oil companies, such as BP and Shell, can
gain access to the gas and oil resources they need.
� An organisational structure to manage the operations is necessary if potential advantages
are to be realised. The MNC must be able to exploit those assets internal to the
corporation, including human capital, financial resources, marketing and managerial
skills. This process has been made possible by the use of divisional corporate structures
based on product and/or geographic characteristics which have helped the management
of complex global corporations.
� Advances in new technologies have made it easier to conduct business across national
frontiers. The spread of IT-based communications systems alongside cheaper air travel
have improved communications. The globalisation of consumer markets via media and
popular culture have opened world markets to MNCs.
Impact of MNCsAny assessment of the impact of MNCs on national economies will need to consider
various costs and benefits.
� First, DFI by an MNC should improve economic welfare as capital is transferred to
economies where the marginal rate of return on capital is highest. However, MNCs may
finance overseas investment by raising the capital on the local capital market. In such
cases inward investment may merely displace domestic investment that would otherwise
have taken place.
� The involvement of an MNC in a foreign economy may often promote technology transfer
which will be of benefit to the recipient economy. New technologies may be introduced
without the research and development costs and the learning time which would other-
wise have been needed.
� Similarly local producers can copy the superior processes and organisational patterns of
the MNCs. The latter may also establish direct linkages with domestic suppliers which
raise the productivity of the local producers.
� However, technology transfer may only be at a low level. The MNC may only use the
recipient economy as an assembly base using basic technology. Many working practices
FUNDAMENTALS OF BUSINESS ECONOMICS 227TH
EM
AC
RO
EC
ON
OM
ICC
ON
TEXT
OF
BU
SIN
ESS
2006.1

successful in an MNC’s home economy may not readily transfer to another economy
with different cultural traditions.
� MNCs will also impinge on the macro variables of an economy. The balance of payments
will gain from inflows of DFI but will suffer when profits from the investment are
remitted back to the home economy of the MNC. Employment can also be provided by
MNC activity. Direct employment in the MNC’s subsidiary can be supplemented by
further employment in local suppliers to the MNC’s operations.
� However, the employment effects can be weakened if the MNC displaces existing
domestic firms. Furthermore MNCs’ operations are mobile and they could well choose
to locate in another economy if it proved advantageous to do so.
� Finally, MNCs can affect a government’s taxation and expenditure. MNCs are notorious
for being able to reduce their tax liabilities by means of transfer pricing. Where intra-
corporation trade takes place, internal prices are set to minimise profits in economies
with the highest tax rates. On the other hand, a government often has to offer grants
and subsidies to MNCs in order to attract them to their economy.
Consequently the impact of the MNCs on national economies can be profound. To
what extent national economies benefit from their relationships with MNCs is uncertain.
The growth of globalisation seems unstoppable and with it their power to influence inter-
national trade.
5.3 International Trade
5.3.1 The benefits
Britain is a trading nation, because of its location and history. International trade is
necessary when a nation such as Britain specialises, so that its surpluses can be exchanged
for the excess output of other countries. In theory, free trade between nations is desirable,
but often in practice various forms of protection are used.
� Specialisation benefits world trade, because it enables different nations with differing skills
and resources to gain the rewards from the division of labour. In theory, nations
specialise in the production of goods for which they have a natural advantage. For
instance, Saudi Arabia extracts oil, Argentina rears beef and Britain provides financial
services. Specialisation usually enables an industry to benefit from large-scale production
and make the maximum use of resources.
� The economies of scale which can be obtained are determined by the size of the market. As
international trade opens up new markets, it facilitates economies of scale. Such
efficiency has benefits for the trading economies because it should produce lower prices
and better products, leading to improvements in general living standards.
� Competition should be fostered by world trade, particularly free trade. A domestic market
which is controlled by a monopolist might be subject to a foreign competitor. Alternatively,
the market of a few complacent home suppliers might be revitalised by the entry of foreign
firms (e.g. Japanese and American companies in British consumer goods industries).
� Lower prices and greater choice should be available to consumers. The increased choice
which results from international competition is particularly evident in the British car
industry. However, it must be noted that these benefits perhaps need to be set against
the loss of employment in domestic industries.
STUDY MATERIAL C4228TH
EM
AC
RO
EC
ON
OM
ICC
ON
TEXT
OF
BU
SIN
ESS
2006.1

5.3.2 The theory
The theory of comparative advantage was devised by David Ricardo to demonstrate the gains
from specialisation and free trade. The theory requires the following simplifying
assumptions:
� two trading economies each producing the same two goods;
� the factors of production in each economy are perfectly mobile;
� there are no trade barriers and no transport costs;
� the state of technology is unchanged.
The ‘before’ section of Table 5.2 shows the output of each economy when resources are
allocated equally between the production of each good. However, as A is more efficient at
producing Y and B is more efficient at making X, then specialisation by A in Y and B in X
leads to increased total world output. This has been achieved without the use of more
resources and represents increased efficiency. Both nations will benefit if trade takes place.
For instance, A could trade 80Y for 40X produced by B. This would give A 120Y and
40X, while B would have 140X and 80Y – so both nations would gain, although B perhaps
more so at this exchange rate.
In the above case, each nation had an absolute advantage in the production of one good
and specialisation and trade was fairly obvious. However, Ricardo showed that even where
one nation had an absolute advantage in producing both of the goods, specialisation could
still be mutually beneficial. The principle of comparative advantage explains this.
As depicted in Table 5.3 country A is more efficient in producing both X and Y. However, B
is relatively better (less worse) at producing X. If A and B then specialise where each has a
comparative advantage, A produces 160Y and B produces 180X. The total output of goods is
raised but there are now fewer X than before. Therefore, if A devotes one-fifth of its resources
Table 5.2 Specialisation and absolute advantage
Production
Before annual output After annual output
Country X Y X Y
A 30 100 0 200
B 90 40 180 0
120 140 180 200
Table 5.3 Comparative advantage
Production
Before annual output After annual output
Country X Y X Y
A 100 80 40 128
B 90 10 180 0
190 90 220 128
FUNDAMENTALS OF BUSINESS ECONOMICS 229TH
EM
AC
RO
EC
ON
OM
ICC
ON
TEXT
OF
BU
SIN
ESS
2006.1

to the production of X and four-fifths of its resources to making Y, then the total output of
both goods is increased, as shown in the ‘after’ section of Table 5.3.
If the opportunity cost ratios were identical in A and B, and B could produce 72Y, then
nothing would be gained by specialisation and trade. The principle of comparative advantage
relies on each country having different opportunity cost ratios. If the production possibility
frontier is drawn for each country and the two lines are parallel, then speciaisation and trade
will not be mutually beneficial. However, in practice, economies of scale could occur with
specialisation, thereby changing the opportunity cost ratios and facilitating trading gains.
Several conditions are necessary for international trade. In addition to transport and peace,
exchange rates need to be established. Each country needs to determine a price for its exports, and
this usually reflects the cost of resources used. Thus in Table 5.3 country A uses fewer resources
in producing each X than each Y, and we would expect X to be cheaper (approximately four-
fifths of Y ’s price as four-fifths of resource is required). Conversely, in country B, Ys are very
expensive, needing a lot of resources for their production (nine times what is needed for X ).
Thus domestic prices reflect opportunity cost ratios.
The domestic prices section of Table 5.4 gives monetary values to the goods produced,
showing that X is priced at £100 in country A and $40 in country B, and Y is priced at £125
and $360. This gives price ratios of £1 = $0.40 for X and £1 = $2.88 for Y. As long as the
exchange rate falls within these limits, trade will occur because both economies can gain. If the
exchange rate were £1 = $1.50, then country A could import X for £26.66 (price $40 in
country B = £26.66 when exported to A at this exchange rate) as shown in the ‘price to import’
section of Table 5.4. This price is cheaper than the domestic price and a clear gain if country
A imports it from B. At the exchange rate of £1 = $1.50, A might import 80X, because
with specialised production it has fewer X and more Y. With the £2,133.33 which country B
receives for selling these 80X, it could buy 25Y (at £83.33 each) because it has not produced
any Y, because of specializing in the production of Xs. Table 5.5 illustrates the final
consumption after exchange and shows that both A and B now each have more X and more Y.
The theoretical gains from free trade based on comparative advantage forms the basis
of why GATT and the WTO have sought to dismantle restrictions on trade.
Terms of tradeInternational trade is influenced by changes in relative prices. The terms of trade show such
price changes, which result from either changes in domestic prices or changes in the exchange
Table 5.4 Prices in free trade
Domestic prices Price to import at £1 = $1.50
Country X Y X Y
A, £ 100 125 26.66 83.33
B, DM 40 360 150 187.50
Table 5.5 Consumption after exchange
Country X Y
A 120 103
B 100 25
STUDY MATERIAL C4230TH
EM
AC
RO
EC
ON
OM
ICC
ON
TEXT
OF
BU
SIN
ESS
2006.1

rate or both. For instance, in Table 5.5, if country A became more efficient in producing Y
and its price fell to £100 and the exchange rate fell to £1 = $1.25, then B could import Ys
for $125, rather than $187.5.
The terms of trade indicate the relationship between the average price of a nation’s exports and
the average price of its imports. In each case the average price is weighted according to the volume
of trade in the different goods and it is expressed through an index number.
The measurement formula is:
Index of export prices
Index of import prices� 100
This ratio is taken as 100 in the base year. Britain’s terms of trade index was 98.2 in 1991
(1985 = 100) but had risen to 102.5 in 1998.
A rise in the ratio is described as an improvement because export prices are rising faster than
import prices and this means that fewer exports need to be sold to pay for each import.
However, this supposedly favourable movement in the terms of trade indicates a worsening
of the competitive position. As export prices rise, the quantity demanded will probably fall
(depending on the elasticity of demand), while cheaper imports may mean a loss of market
share for home producers, and possible unemployment.
However, the terms of trade are only a guide to competitiveness because they only
measure visible trade (i.e. trade in goods). Trade in services is not included, while non-
price factors, such as the quality of products, are not evaluated in the index.
5.3.3 Practical limitations
The advantages which can be gained from specialisation and international trade may be
limited in practice by many of the following:
� Factor immobility. Free trade theory assumed that factors were perfectly mobile, thereby
enabling resources to be shifted between different sectors of production. In the real
world, factors tend to be fairly immobile in the short run, and over longer periods in
some industries, for instance, coal. However, improved technology has lowered factor
costs and thereby facilitated more international trading.
� Transport costs. The simplifying assumption of no transport costs is clearly unrealistic.
Although the production of certain bulky intermediate goods, such as cement, may be
cheaper abroad, the distribution costs are so great that domestic suppliers still have a
stranglehold over the market. Interestingly, coal imports into Britain increased only
when the miners’ strike of 1984–85 curtailed domestic production and made importing
viable to coal users, when previously it had been uneconomic. However, generally
transport costs in world trade are falling, thereby stimulating trade.
� The size of the market. Specialisation and the resultant possible economies of scale are
only justified if the production can be sold. The attempts to build a British computer
industry between 1975 and 1985 floundered largely because the domestic market was
too small to sustain the research needed for competition with international giants, such
as the Americans. In 1985 the sale of Inmos to America recognised this failure.
As the standard of living improves around the world so the sizes of markets grow.
Generally, the development of new products, particularly in fields such as micro-
electronics, encourages world trade, as it creates new markets.
FUNDAMENTALS OF BUSINESS ECONOMICS 231TH
EM
AC
RO
EC
ON
OM
ICC
ON
TEXT
OF
BU
SIN
ESS
2006.1

� Government policies. Governments may install barriers to trade for political, economic and
social reasons. For example the United States prohibited firms from supplying goods for
the USSR’s Siberian pipeline in 1985, and Britain had restricted its arms sales. The
methods of trade restriction used are outlined in the next section.
5.3.4 Trade protection
The reasons for protection� To protect employment. The free trade theory assumes that factors of production are mobile,
but in reality they are not so. Therefore, if a nation with an absolute or comparative
advantage successfully exports a good (e.g. Chinese textiles) thereby causing
redundancies in a recipient nation (e.g. Britain), workers may become unemployed.
The de-industrialisation of the British economy has created extensive localised
unemployment because many of the redundant are not adaptable to the alternative
service sector. In addition, there are insufficient jobs in the ‘new’ industries. For
instance, the decline of the textile industry caused the British government to support the
multi-fibre agreement (since 1975), which has restricted the import of cheap textiles into
Europe so that jobs can be, at best, maintained or, at worst, only gradually shed.
� To help an infant (sunrise) industry. The classic argument for protection is that new indus-
tries require help during their infancy because of the high initial costs and lack of
economies of scale. If this help was not provided and they had to face competition from
fully developed similar industries, it is claimed that these industries might not survive.
Import controls might enable a new industry to build a solid domestic base and benefit
from economies of scale before embarking upon international competition.
� To prevent unfair competition. A government may justify protection by reference to the
trading policies of its competitor nations. For instance, certain third-world producers try
to sell fake British goods in Britain. These imitations break the copyright and patent laws
in purporting to be of British origin, and are justifiably banned. Another unfair practice,
which is not illegal, is dumping. This involves selling exports at artificially low prices, in
order to gain a start in foreign markets. For instance, Japanese excavators were sold for
export at 45 per cent of the production cost. The losses abroad were subsidised by
profits at home. Furthermore, the larger output, because of increasing exports, enabled
economies of scale to be attained and unit costs lowered.
Unfair trading can be more subtle than either of the above two varieties.
Governments often subsidise their industries to enable them to compete in world
markets, and Britain is not without its critics for giving such help to farming. Clearly, it
is very difficult to decide objectively what constitutes ‘fair trading’.
� To protect the balance of payments. One remedy suggested for persistent balance of
payments deficit is the use of import controls. This has been advocated to enable Britain
to rebuild its industries, before embarking again on world markets. It is argued that
domestic expansion leads to large increases in imports, because of Britain’s high
marginal propensity to import. The result is that frequent payments deficits have caused
deflationary domestic policies, which inhibited domestic investment and weakened
British industry. In addition, the rise in imports has reduced the market share of British
firms, thereby making them less viable and less optimistic.
� To raise revenue. Protective tariffs will raise revenue for the Exchequer if such duties are
levied on goods with inelastic demand.
STUDY MATERIAL C4232TH
EM
AC
RO
EC
ON
OM
ICC
ON
TEXT
OF
BU
SIN
ESS
2006.1

� To maintain security. Essential products may be produced at home even when foreign
goods may be more efficient, for example, defence equipment.
Arguments against protection� Inefficiency is encouraged. If British firms are protected from competition they may settle
for their existing market share and profits. Such complacency will discourage innovation
and risk-taking. New technology may not be introduced and overmanning may persist.
The protected industry (e.g. the textiles industry) may lobby to make temporary help
permanent.
� Resources are misallocated. By maintaining existing patterns of trade, resources do
not move from declining industries, which are protected, to expanding industries. In
addition, protection for one industry (e.g. steel) may adversely affect another (e.g. buyers
of steel) because unit costs are raised.
� The cost of living is raised. Protection will probably raise prices and so domestic consumers
have to pay higher prices for (the taxed) imported goods or for (the protected) home-
produced goods.
� Welfare gains will be lost. The welfare gains resulting from specialisation-trade-exchange
will be restricted if exchange is proscribed by protective measures. Ironically, it may be
because a nation feels that it is not gaining enough of the global increase in welfare that
it imposes trade restrictions. These restrictions may reduce consumer choice and
increase the cost of living.
� Retaliation may occur. Protection by one nation may provoke its trading partners to take
similar action, and this will reduce the volume of world trade with the attendant con-
sequences outlined above. This may weaken confidence, as the internationally accepted
rules for trading are weakened when governments take unilateral action.
The methods of protection� Tariffs. The most common import control is the tariff. This tax may be ad valorem – a
given percentage of the import price – or specific (a set amount per item). It is sensible to
levy tariffs on imports with an elastic demand if the objective is to reduce the volume of
imports (e.g. the 33 per cent tariff on Japanese excavators in 1986). However, if a tariff
is imposed in order to raise revenue, then goods with inelastic demand should be
chosen. Tariffs, therefore, act on the price of goods/services.
� Quotas. In contrast, quotas are restrictions on the quantity of imports. The World Trade
Organisation has tried to stop quotas, although it does permit exceptions for nations
with severe balance of payments difficulties. A more acceptable and modern type of
protection which aims to limit the amount of a certain good being imported is the
Voluntary Export Restraint Agreement ( VERA). In 1991 the EC applied a VERA to the
Japanese car industry, which was supposed to have halted its exports to Europe when
sales of Japanese cars exceeded 16 per cent of the market.
� Hidden restrictions. Also, there are hidden import restrictions and procedures which can
be utilised to subtly undermine foreign competition. Administrative devices include com-
plicated forms, special testing regulation and safety certification, unusual product
specification and the specialisation of customs posts. For instance, the colour of yellow
Trebor Refreshers had to be modified for sale in Japan because they were considered an
optical health danger. Such devices may frustrate exporters and thereby protect
FUNDAMENTALS OF BUSINESS ECONOMICS 233TH
EM
AC
RO
EC
ON
OM
ICC
ON
TEXT
OF
BU
SIN
ESS
2006.1

domestic producers from imports. They are a relatively modern development in world
trading and have accelerated since 1973. For example, in 1989 the EC banned hormone-
fed meat from America for health and safety reasons.
In addition, the British government like others has used official persuasion to exclude
imports; for example Ford Motor Company reduced the imports out of its European
factories from 50 to 30 per cent of its UK sales because of government pleas. Public
procurement can also be used to assist domestic firms. Government departments may
deliberately buy goods from British firms even though they may not be the ‘best on the
market’ (e.g. computer software for the Inland Revenue in 1993).
� Subsidies. As well as restricting imports, governments often encourage exports by various
means. The systematic use of export credits and official support for export deals by
departments is increasingly becoming part of Britain’s trading strategy. Such measures
make exporting cheaper and easier; a theme which is furthered by the government-
sponsored international promotions and exhibitions.
However, the most blatant help given to exporters is the direct subsidy, for example, the
subsidies given by both national governments and the European Commission to European
steel firms. This is outlawed by the WTO and so done in more subtle ways nowadays. For
instance, VAT on exports is refunded by the British Government to the producers. Similarly,
some European governments subsidise domestic producers. For example, Germany gives
subsidies on electricity which indirectly helps German manufacturers’ costs of production.
International friction has increased because of the expansion of protectionism. There is
friction between governments (e.g. between countries of the EU over beef and livestock
movements), and between governments and trading blocs. The EU is often in dispute with
the United States over steel and agriculture exports and with Japan over many manufac-
tured goods.
Box 5.1 Trade negotiations in trouble?
The support of western countries for farmers is at the heart of the problems facing
trade negotiators as they struggle to complete talks started in Doha in 2001.
Agriculture plays a tiny part in western economies next to manufacturing and
services, but it is of huge importance to developing countries. They are adamant that
they will not make concessions that might benefit, say, US or European utilities until
the west stops protecting European dairy farmers and US cotton growers.
The onus is on Washington and Brussels to move. The talks were billed as the
‘‘Doha development round’’, with a pledge that the pro-western bias of the last world
deal (the Uruguay round, which ended in 1993) would be remedied. Concessions
were made in areas such as export subsidies allowing farmers in Europe to dump
produce but developing countries fear they will still face big problems in gaining
access to western markets in key areas.
Pascal Lamy, the World Trade Organisation’s director, believes a deal on agriculture
would have a domino effect, with countries then able to agree on industrial tariffs, services
and special treatment for the world’s poorest countries. But that requires the west to move
further on agriculture - something that is hard for leaders such as George Bush and Jaques
Chirac to contemplate when their poll ratings are low.
Article in Guardian 14th November 2005.
STUDY MATERIAL C4234TH
EM
AC
RO
EC
ON
OM
ICC
ON
TEXT
OF
BU
SIN
ESS
2006.1
5.3.5 World Trade Organisation
The World Trade Organisation (WTO) is the only global international organisation dealing
with the rules of trade between nations. It replaced the General Agreement on Tariffs and
Trade (GATT) on 1 January 1995, and 149 countries are members. At its heart are the
WTO agreements, negotiated and signed by the bulk of the world’s nations and ratified in
their parliaments. The goal is to help producers of goods and services, exporters and
importers conduct their business.
The major functions of the WTO are:
� Administer WTO trade agreements
� Provide a forum for trade negotiations
� Handle trade disputes
� Monitor national trade policies
� Provide technical assistance and training for developing countries.
In December 2005, ministers from the WTO’s 149 member governments met in Hong
Kong. After difficult negotiations certain outcomes were agreed:
� To end export subsidies in agriculture by 2013.
� An acceleration in ending export subsidies in cotton by the end of 2006.
� Cotton exports from least developed countries will be allowed into developed countries
without tariffs or quotas from 2007.
The WTO has examined more than 250 cases of unfair trading practices and has the
power to enforce binding arbitration on its members.
The G8 also has a role in supporting the international economy. It constitutes the
heads of state or government of the major industrial democracies who meet annually to
deal with major economic and political issues facing their domestic societies and the
international community. Its members are the United States, Britain, France, Germany,
Italy, Japan, Canada and Russia. The host of the 2006 G8 summit is Russia. The G8 has
developed a network of supporting ministerial meetings, for example finance, which allow
ministers to meet regularly throughout the year to continue the work set out at each
summit.
The G8 summit has consistently dealt with:
� Macroeconomic management
� International trade
� Energy issues
� Development issues and relationships with developing countries
� Issues of international concern such as terrorism and organised crime.
The G8 does not have any formal resources or powers as is the case with other
international organisations such as the WTO.
However, it provides a forum for the most powerful nations to discuss complex
international issues and to develop the personal relations that help them respond in
effective collective fashion to sudden crises or shocks. The summit also gives direction to
the international community by setting priorities, defining new issues and providing
guidance to established international organisations.
FUNDAMENTALS OF BUSINESS ECONOMICS 235TH
EM
AC
RO
EC
ON
OM
ICC
ON
TEXT
OF
BU
SIN
ESS
2006.1

Exercise 5.1Answer the following questions based on the preceding information.You can check your
answers below.
1. International trade is based on which principle?
2. What is the difference between absolute advantage and comparative advantage?
3. Why are exchange rates important?
4. What are the terms of trade?
5. What factors inhibit international trade?
6. Give three arguments for trade protection policies.
7. What is a VERA?
8. What does the WTO attempt to do?
9. Why have some companies become multinational in structure?
10. How can multinational companies benefit national economies?
Solutions
1. International trade is theoretically based on the theory of comparative advantage.
2. Absolute advantage occurs where one country is much better than another at prod-
ucing one good (but much worse at producing a second good). However, a country
with a comparative advantage is one which is much better at producing two (or more
goods) but by different amounts.
3. Exchange rates facilitate pricing and this enables international comparisons to
be made.
4. The terms of trade refers to the average price of exports compared with the average
price of imports.
5. International trade is inhibited by transport costs, the immobility of factors, market
size and protective policies.
6. Protection is used to protect employment, help infant industries, prevent unfair
competition and help the balance of payments.
7. Voluntary export restraint agreement.
8. The WTO tries to reduce tariff barriers and other protective measures.
9. To reduce costs and expand markets and sales. This has been helped by the develop-
ment of appropriate organisational structures and technologies.
10. Direct foreign investment can boost: domestic capital fund; technology transfer;
improvement in production processes and organisational structures; employment gains.
5.4 Foreign Exchange
5.4.1 Exchange rates
The exchange rate of a currency is a price. It is the external value of a currency expressed in
another currency, for example, £1= $1.60. A more complex measure expresses the value in
terms of a weighted average of exchange rates as an index number. These are currencies of a
nation’s main trading partners in manufactured goods and collected in a representative
basket. This is known as the effective exchange rate and shows the relative importance of the
country as a competitor in export markets. Britain’s effective exchange rate has fluctuated
STUDY MATERIAL C4236TH
EM
AC
RO
EC
ON
OM
ICC
ON
TEXT
OF
BU
SIN
ESS
2006.1

since the new indexing in 1985. A fall in the index shows an overall relative depreciation of
a currency. Thus in March 1996 it had fallen to 78.2 after sterling’s exit from the ERM, and
fell to DM 2.22 from DM 2.75 but by July 2000 had risen again to DM 3.30.
The exchange of currencies is vital for trade in goods and services. British firms selling
abroad will require foreign buyers to exchange their currency into sterling to facilitate
payment. Similarly, British importers will need to pay out in foreign currencies. Also, when
funds are transferred between people in different countries, foreign exchange is required.
Today, the sale and purchase of currencies for trading purposes is dwarfed by the lending
and borrowing of funds.
5.4.2 The foreign exchange market
This market enables companies, fund managers, banks and others to buy and sell foreign
currencies. Capital flows arising from trade, investment, loans and speculative dealing
create a large demand for foreign currency, particularly sterling, US dollars and euros and
typically deals worth £400 billion are traded daily in London, the world’s largest foreign
exchange centre. London benefits from its geographical location, favourable time intervals
(with the United States and the Far East in particular) and the variety of business generated
there – insurance, commodities, banking, Eurobonds, etc.
Foreign exchange trading may be spot or forward. Spot transactions are undertaken almost
immediately and settled within two days. However, forward buying involves a future delivery
date from three months onward. Banks and brokers, on behalf of their clients, operate in the
forward market to protect the anticipated flows of foreign currency from exchange rate
volatility. The forward price of a currency is normally higher (at a premium) or lower (at a
discount) than the spot rate. Such premiums (or discounts) reflect interest rate differentials
between currencies and expectations of currency depreciations and appreciations.
As the foreign exchange market has grown, so other instruments such as futures and
options have been developed to protect foreign exchange commitments. Currency futures
involve the trading of forward transactions other than for currencies themselves, while
currency options enable buyers (at a premium paid to the writer of the option, usually
a bank) to guarantee a buying (or selling) price for a currency at a future specified date.
5.4.3 Exchange rate systems
The world economy has experienced different exchange rate mechanisms. In the
nineteenth and twentieth centuries, the gold standard was used, where exchange rates were
fixed in terms of gold. A managed exchange rate system was established at Belton Wood
(United States) in 1944. This established exchange rates between economies but allowed a
1 per cent band either side of its parity. This system ended in 1972 when the pound
sterling was allowed to float and other currencies soon followed.
Floating exchange ratesExchange rates that float are flexible and free to fluctuate in the light of changes which take
place in demand and supply. Such exchange rates are examples of nearly perfect markets.
(a) Theory. The simple theory assumes that a currency is only demanded and supplied for
trading purposes, and that the curves are elastic. The demand curve for a currency shows
the amount that traders wish to buy at various rates of exchange. This demand is
FUNDAMENTALS OF BUSINESS ECONOMICS 237TH
EM
AC
RO
EC
ON
OM
ICC
ON
TEXT
OF
BU
SIN
ESS
2006.1
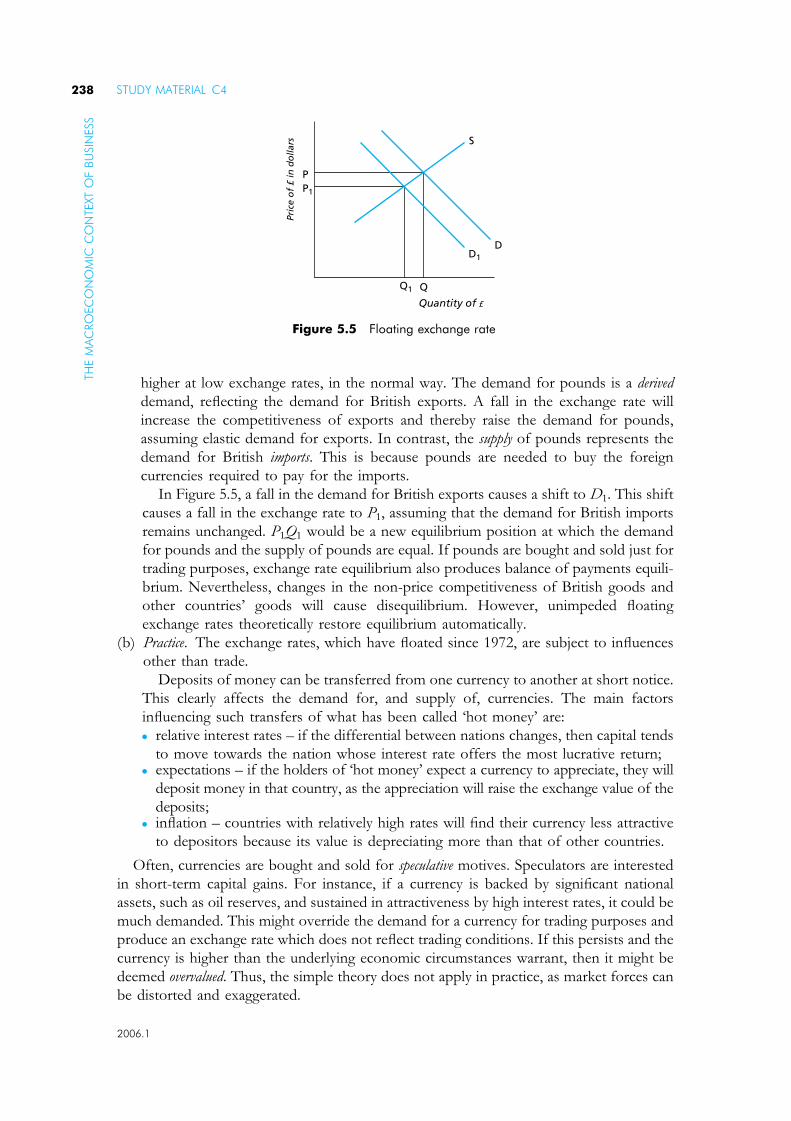
higher at low exchange rates, in the normal way. The demand for pounds is a derived
demand, reflecting the demand for British exports. A fall in the exchange rate will
increase the competitiveness of exports and thereby raise the demand for pounds,
assuming elastic demand for exports. In contrast, the supply of pounds represents the
demand for British imports. This is because pounds are needed to buy the foreign
currencies required to pay for the imports.
In Figure 5.5, a fall in the demand for British exports causes a shift to D1. This shift
causes a fall in the exchange rate to P1, assuming that the demand for British imports
remains unchanged. P1Q1 would be a new equilibrium position at which the demand
for pounds and the supply of pounds are equal. If pounds are bought and sold just for
trading purposes, exchange rate equilibrium also produces balance of payments equili-
brium. Nevertheless, changes in the non-price competitiveness of British goods and
other countries’ goods will cause disequilibrium. However, unimpeded floating
exchange rates theoretically restore equilibrium automatically.
(b) Practice. The exchange rates, which have floated since 1972, are subject to influences
other than trade.
Deposits of money can be transferred from one currency to another at short notice.
This clearly affects the demand for, and supply of, currencies. The main factors
influencing such transfers of what has been called ‘hot money’ are:
� relative interest rates – if the differential between nations changes, then capital tends
to move towards the nation whose interest rate offers the most lucrative return;� expectations – if the holders of ‘hot money’ expect a currency to appreciate, they will
deposit money in that country, as the appreciation will raise the exchange value of the
deposits;� inflation – countries with relatively high rates will find their currency less attractive
to depositors because its value is depreciating more than that of other countries.
Often, currencies are bought and sold for speculative motives. Speculators are interested
in short-term capital gains. For instance, if a currency is backed by significant national
assets, such as oil reserves, and sustained in attractiveness by high interest rates, it could be
much demanded. This might override the demand for a currency for trading purposes and
produce an exchange rate which does not reflect trading conditions. If this persists and the
currency is higher than the underlying economic circumstances warrant, then it might be
deemed overvalued. Thus, the simple theory does not apply in practice, as market forces can
be distorted and exaggerated.
P
S
D
Q
Quantity of £Pr
ice
of
£ in
do
llars
P1
D1
Q1
Figure 5.5 Floating exchange rate
STUDY MATERIAL C4238TH
EM
AC
RO
EC
ON
OM
ICC
ON
TEXT
OF
BU
SIN
ESS
2006.1

Furthermore, in the real world the demand and supply elasticities for goods and
services, as well as currencies, are not perfectly elastic. A foreign exchange rate will tend to
be unstable when the supply curve is more elastic than the demand curve. Thus, only in
theory are floating exchange rates inherently self-stabilising.
Dirty floatingGovernments often intervene in the foreign exchange markets in order to maintain or
achieve an exchange rate target. The purpose of this normally is to make a country’s exports
more competitive, by lowering the exchange rate, or to assist in the control of inflation.
The central bank will be instructed to:
� Buy or sell the currency to raise or lower the exchange rate.
� Alter interest rates to encourage the buying or selling of the currency. For example, a raising
of interest rates should encourage speculators to deposit more funds in that country. The
subsequent rise in demand for the currency should cause a rise in the exchange rate.
5.4.4 Arguments for floating rates
(a) In theory, the floating rate automatically adjusts a balance of payments disequilibrium.
This was explained above. The self-correcting mechanism means that policies, such as
deflation, to rectify a balance of payments deficit will not need to be implemented.
This gives a government greater freedom to pursue domestic policies.
� However, it can be countered that demand and supply inelasticities, the activities of
speculators and the behaviour of government prevent this adjustment from
occurring in the real world. The persistent over-valuation of the pound during the
1980s was evidence, for opponents of floating exchange rates, of the damage which
can result (i.e. de-industrialisation).
� In addition, it can be argued that the freedom leads to reckless irresponsibility.
A government may assume that a floating exchange rate will solve an inflation problem
and so not pursue necessary domestic policies, which maintenance of a fixed exchange
rate might have forced on them, thereby worsening the inflation problem.
(b) Less speculation will occur because a currency can appreciate or depreciate, whereas
under a fixed rate regime currency changes were nearly always devaluations. This
meant that speculators, who sold a currency which had been devalued, could not lose
and could only gain.
For instance, someone holding £1,000 at £1 = $1.80 moves into dollars, securing
$1800 (assuming no transaction costs). If sterling is devalued to £1 = $1.40 the dollar
holding is now worth £1286 if the switch back into sterling is made in order to secure
a capital gain. Conversely, if sterling is not devalued, the switch back into sterling is
still worth £1,000 with no loss made.
(c) A more efficient allocation of resources is secured if exchange rates reflect changed
economic conditions. It is argued that floating rates will reflect changes in demand and
supply, and that they are more sensitive and respond quickly to underlying economic trends.
This might enable the theory of comparative advantage to be operative. As floating rates
change daily, they are more subtle but probably at the cost of greater volatility.
Fluctuations in exchange rates can cause uncertainty. This could deter trade, as
contracts with fixed prices become more risky as exchange rate appreciation will cut
FUNDAMENTALS OF BUSINESS ECONOMICS 239TH
EM
AC
RO
EC
ON
OM
ICC
ON
TEXT
OF
BU
SIN
ESS
2006.1
profit margins. However, to some extent this problem can be offset by buying a
currency in the forward market.
(d) A large supply of reserves is unnecessary in a floating system because the automatic
adjustment of a balance of payments deficit (or surplus) is achieved by an exchange
rate depreciation (or appreciation). In theory, reserves will be automatically maintained
and so domestic policy changes such as interest rate increases will not be needed to
keep the exchange rate up.
5.4.5 Exchange rate changes
Long-term theoryThere are three main theories which attempt to explain the underlying reasons why
exchange rates change over time:
(a) Purchasing power parity (PPP). This theory maintains that exchange rates will tend
towards the point at which their international purchasing power is equal. Thus, if one
country’s inflation increases 5 per cent more than another’s in one year, the former’s
exchange rate would depreciate by 5 per cent. This would restore the former country’s
international purchasing power in theory.
However, there are several problems with the use of this theory:
� Inflation measurement. the usual measure (RPI) includes goods and services
(e.g. housing) which are not internationally traded, and indirect taxes which only
change domestic prices. This limits its usefulness. As an alternative measure of com-
petitiveness unit wage costs have been suggested. However, unless they are taken
just for manufactured goods, allowances will need to be made for non-tradeable
goods and services and public sector employment.
� Base year. this choice is arbitrary, unless some very unrealistic assumptions are made
about exchange rate equilibrium and inflation stability.
� Capital movements. Exchange rates, since the 1980s particularly, have reflected the
perceptions and expectations of international financiers, rather than the real trading
between economies. The massive transactions of currency relating to borrowing
exceed those connected with trade by at least 20 times (some estimates give 100
times), and so it could be argued that exchange rates do not indicate real changes in a
nation’s competitiveness. The massive rise of sterling from $1.75 to $2.50 in six
months of 1980 was against a background of dwindling manufactured exports and
rising domestic inflation.
� Empirical evidence. If PPP holds true then the ‘real exchange rate’, which is the nominal
rate adjusted for differential inflation, should remain roughly constant. At worst, it
should tend towards a long-run equilibrium, and be less volatile than the nominal rate.
Research by both Williamson and Morgan Guaranty, using different base years, shows
Britain’s real exchange rate persistently well above 100 since 1977, peaking around
150 in late 1980 and plummeting to 115 in 1985, that is significantly overvalued.
(b) The Keynesian approach. Keynesians do not see exchange rates as automatically adjusting.
They believe that the ‘real exchange rate’ can be in disequilibrium for years. There is not
a PPP equilibrium in the short or medium term because:
� prices may be very slow to adjust to changes in nominal exchange rates (mainly
because of the wage market);
STUDY MATERIAL C4240TH
EM
AC
RO
EC
ON
OM
ICC
ON
TEXT
OF
BU
SIN
ESS
2006.1

� interest rates have a distorting effect on the nominal exchange rate. High interest
rates can be used to keep up the external value of the currency. This might enable a
government’s anti-inflation strategy to succeed;
� speculators can distort market forces. If they see a price steadily falling, they sell, and
it takes a shock to reverse the trend. In recent years, speculation has destabilised the
foreign exchange market by following the trend rather than reversing it. The
continued overvaluation of the dollar in 1985–86, which was attributable to high
interest rates, fat profits and an economic boom, was only undermined by concerted
intervention in the market by several major governments, bringing a fall in the dollar
in Autumn 1986.
(c) Monetarist theory. Changes in exchange rates reflect changes in domestic money
supply conditions ( based on the quantity theory of money view of inflation). Thus, if
Britain increases its monetary growth by 20 per cent and Japan keeps its growth
unchanged, sterling will depreciate against the yen. This means that exchange rates will
modify so that home goods are priced at the world equilibrium price. If not, British
consumers will buy imports, unless trade is restricted, and eventually force down
domestic prices.
Economic growth, by absorbing some of the monetary expansion, will tend to
keep the exchange rate up. It will also encourage a currency to appreciate because
international financiers will behave rationally (expecting the appreciation) and bring
about the appreciation by buying the currency. Thus, supposedly rational factors will
determine the exchange rate.
As in other matters, monetarists do not believe in government meddling.
However, if a monetarist government has a policy rule of slow money supply growth,
then the associated policy of high interest rates to deter the demand for money will
probably cause the exchange rate to rise. Interestingly, this might bring about lower
inflation, as an appreciating exchange rate reduced import prices. In general, the
monetarists believe in the exchange rate, like other prices, being determined by market
forces. To them, the exchange rate is ‘just another price’.
Short-/medium-term factorsThe demand for the supply of currencies is determined by several economic forces, and
some other elements
� Relative inflation rates. Nations with comparatively high inflation are likely to find their
currencies in less demand, other things being equal, because funds transferred will lose
their real value more quickly.
� Trade flows. Countries with balance of payments deficits are more likely to suffer
depreciating currency because supply of their currency will exceed its demand.
� Investment flows. If foreign investment is attracted to an economy (perhaps by its internal
conditions, e.g. low wage costs) then this will stimulate demand for its currency.
� Economic prospects. If the economic forecasts for an economy are bullish, then this
will attract footloose international funds, raising demand and enhancing the exchange
rate.
� Speculators’ judgment. As 95 per cent of demand is from market makers and dealers, rather
than trade customers, if they perceive that a currency is overvalued they will sell, thereby
FUNDAMENTALS OF BUSINESS ECONOMICS 241TH
EM
AC
RO
EC
ON
OM
ICC
ON
TEXT
OF
BU
SIN
ESS
2006.1

lowering its rate. Often they react to political as well as economic news which is
unexpected, because anticipated events will have already been ‘discounted’.
� Technical analysis. Sometimes the charts of banks and brokers indicate future movements
of a currency are likely, given the underlying assumption that price movements follow
broadly predictable patterns. Such predictions may influence demand.
Box 5.2 The development of the euro
The euro has now been in operation for 6 years but it may still be too early to make a
fair assessment of its success. Since its inception it has weakened against the dollar,
strengthened and then weakened again. Nonetheless, the long-term effects of the
euro could be far reaching.
As goods and services are priced in euros, consumers will be able to compare prices
across Europe and greater price convergence can be expected.
The single currency will lead to the elimination of transactions costs in switching
from one currency to another and will remove exchange rate risks for trade within the
eurozone. As a result, intra-EU trade, with all its benefits, should expand.
Moreover all of this will increase competition within the EU and may encourage cross-
country mergers as companies seek to operate across the EU.
This is not to say that problems do not exist. The need for economic convergence
within the eurozone is crucial if one currency, and therefore one monetary policy
conducted by the European Central Bank is to be effective.
5.4.6 European central bank
The primary objective of the European Central Bank (ECB) is to maintain stability within
the euro area. This can bring it into conflict with Article 2 of the Treaty on European Union
which seeks to maintain a high level of employment and sustainable non-inflationary growth.
The basic tasks of the ECB are to:
� Implement the monetary policy of the euro area. In effect this means the operation of
interest rates to check inflation;
� Conduct foreign exchange operations;
� Hold and manage the official foreign reserves of euro area countries;
� Promote smooth operation of payment systems;
� Oversee and issue banknotes within the euro area.
5.5 The balance of payments
5.5.1 The accountsThe balance of payments is an account showing the financial transactions of one nation
with the rest of the world over a period of time. The statistics are calculated monthly and
analysed on quarterly and annual bases. The official figures are often revised. This results
from the use of estimates and the problems of information gathering. Clearly the national
accounts are difficult to assemble and revisions sometimes occur years later. For instance,
STUDY MATERIAL C4242TH
EM
AC
RO
EC
ON
OM
ICC
ON
TEXT
OF
BU
SIN
ESS
2006.1
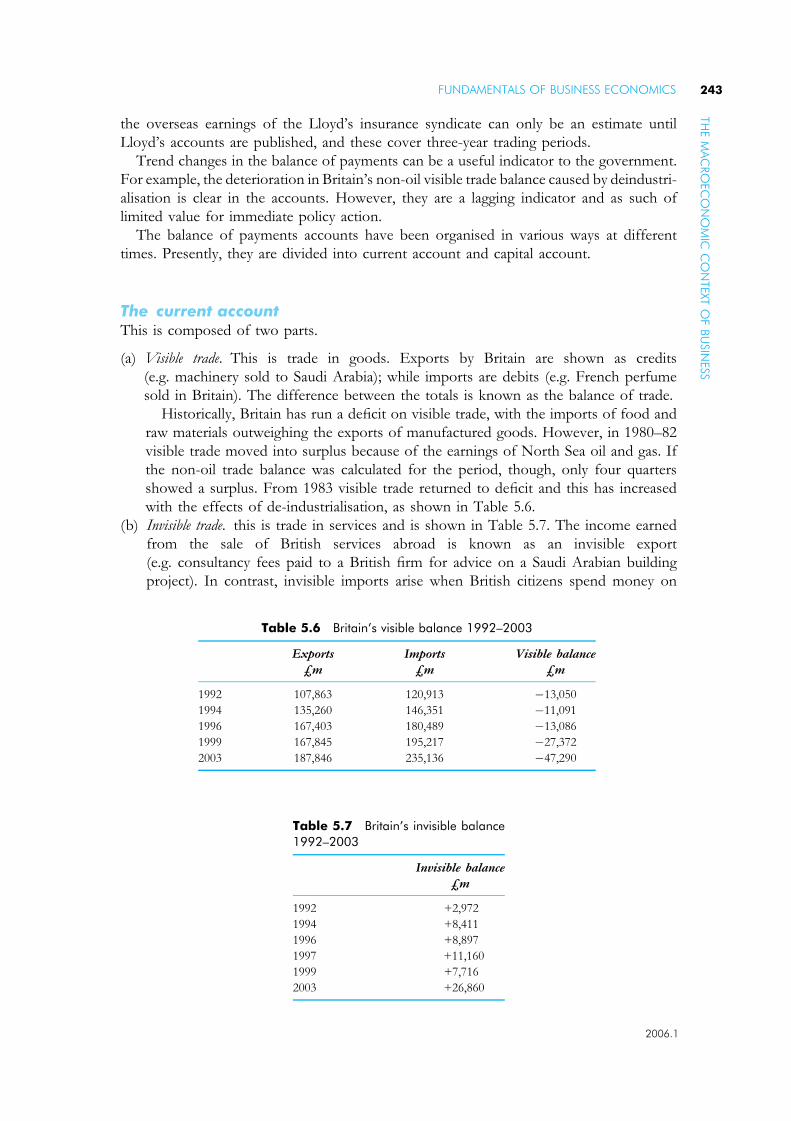
the overseas earnings of the Lloyd’s insurance syndicate can only be an estimate until
Lloyd’s accounts are published, and these cover three-year trading periods.
Trend changes in the balance of payments can be a useful indicator to the government.
For example, the deterioration in Britain’s non-oil visible trade balance caused by deindustri-
alisation is clear in the accounts. However, they are a lagging indicator and as such of
limited value for immediate policy action.
The balance of payments accounts have been organised in various ways at different
times. Presently, they are divided into current account and capital account.
The current accountThis is composed of two parts.
(a) Visible trade. This is trade in goods. Exports by Britain are shown as credits
(e.g. machinery sold to Saudi Arabia); while imports are debits (e.g. French perfume
sold in Britain). The difference between the totals is known as the balance of trade.
Historically, Britain has run a deficit on visible trade, with the imports of food and
raw materials outweighing the exports of manufactured goods. However, in 1980–82
visible trade moved into surplus because of the earnings of North Sea oil and gas. If
the non-oil trade balance was calculated for the period, though, only four quarters
showed a surplus. From 1983 visible trade returned to deficit and this has increased
with the effects of de-industrialisation, as shown in Table 5.6.
(b) Invisible trade. this is trade in services and is shown in Table 5.7. The income earned
from the sale of British services abroad is known as an invisible export
(e.g. consultancy fees paid to a British firm for advice on a Saudi Arabian building
project). In contrast, invisible imports arise when British citizens spend money on
Table 5.6 Britain’s visible balance 1992–2003
Exports Imports Visible balance
£m £m £m
1992 107,863 120,913 �13,050
1994 135,260 146,351 �11,091
1996 167,403 180,489 �13,086
1999 167,845 195,217 �27,372
2003 187,846 235,136 �47,290
Table 5.7 Britain’s invisible balance
1992–2003
Invisible balance
£m
1992 +2,972
1994 +8,411
1996 +8,897
1997 +11,160
1999 +7,716
2003 +26,860
FUNDAMENTALS OF BUSINESS ECONOMICS 243TH
EM
AC
RO
EC
ON
OM
ICC
ON
TEXT
OF
BU
SIN
ESS
2006.1

foreign services (e.g. a British tourist to Texas pays for accommodation). The invisible
account can be considered in three sectors:
� Interest, profits and dividends (IPD). This sector shows substantial surpluses (£20 billion
in 2002). Interest, profits and dividends are earned from loans made by British
institutions, from the activities of the overseas branches of British-based companies
and from the holding by Britons of overseas (paper) assets. These earnings are likely
to grow because, since 1979, with the abolition of exchange controls and the
portfolio investment of the North Sea oil surpluses, British overseas investment by
the private sector has increased. Some critics felt that it would be a once-and-for-all
adjustment in institutional portfolios, but the expertise acquired by fund managers
appears to have stimulated increasing capital outflows.
� Services. These have earned a large invisible surplus in most years. The financial
services of the City of London dominate this sector, with the earnings of solicitors,
brokers, merchants, bankers and commodity traders having a net credit of £14
billion in 2002, although transport and travel have a net debit over of £12 billion.
� Transfers. Transfers by both private individuals and the government tend to be
outward on balance, with the government’s share being larger and being spent on
embassies, military bases and contributions to international organisations, including
the EU. This sector produced a debit of over £9 billion in 2002.
Current account balanceThis combines the visible and invisible trade, as shown in Table 5.8. Generally a surplus
balance is a good sign, and can indicate a prosperous and expanding economy. Britain’s
current account was in surplus in the early 1980s, but except for 1997 and 1998 has been
in deficit ever since.
A deficit is balanced against a net inflow in the transactions in external assets and liabilities
account, which is the modern name of the old capital account. However, as changes in the
current account affect national income, a deficit means a decrease in spending power (and
a net withdrawal from the circular flow), which is deflationary.
The capital and financial accountThis account shows transactions in Britain’s external assets and liabilities, as shown in
Table 5.9. It records capital and financial movements by firms, individuals and governments. It
also includes the balancing item. A positive balancing item indicates unrecorded net exports,
while a negative total shows unrecorded net imports. Since 1988 Britain had some
unusually high balancing items. The figure arises because of the errors and omissions
Table 5.8 Britain’s current account 1992–2002
Visibles Invisibles Current account balance
£m £m £m
1992 �13,771 +2,972 �10,799
1994 �10,594 +8,411 �2,183
1996 �13,086 +8,897 �4,189
1999 �27,372 +7,716 �19,656
2003 �47,290 +26,860 �20,430
STUDY MATERIAL C4244TH
EM
AC
RO
EC
ON
OM
ICC
ON
TEXT
OF
BU
SIN
ESS
2006.1
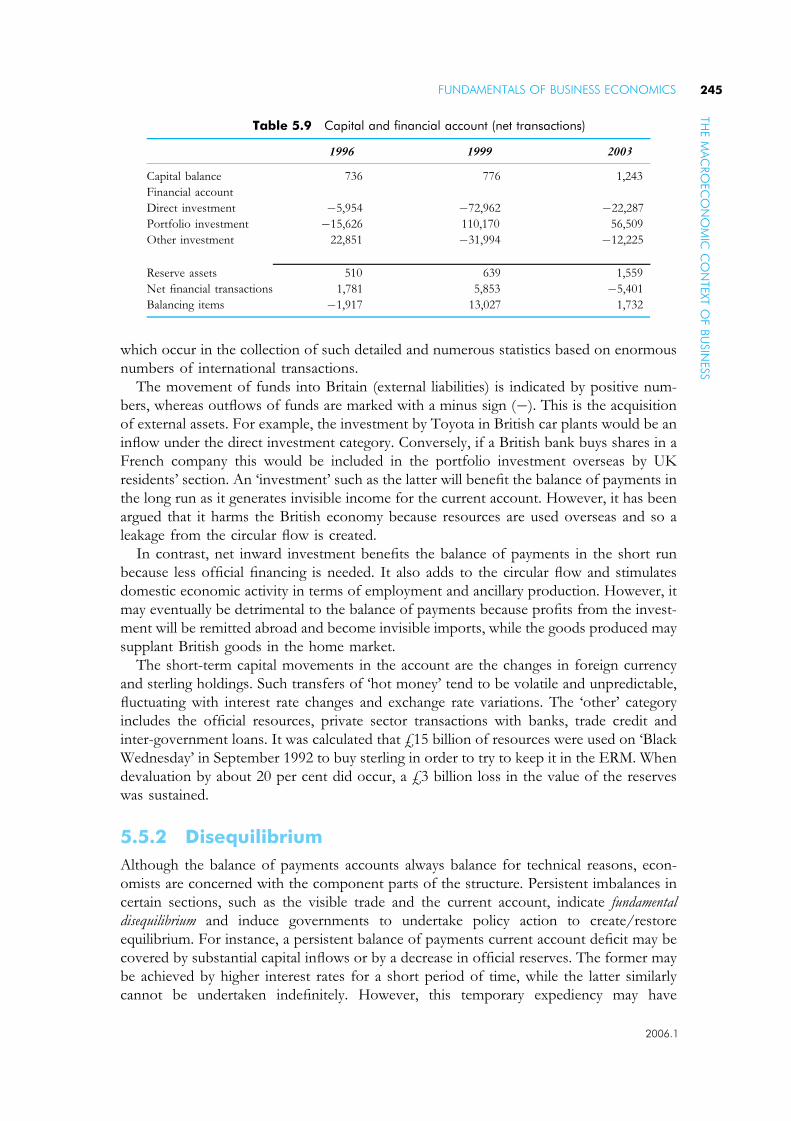
which occur in the collection of such detailed and numerous statistics based on enormous
numbers of international transactions.
The movement of funds into Britain (external liabilities) is indicated by positive num-
bers, whereas outflows of funds are marked with a minus sign (�). This is the acquisition
of external assets. For example, the investment by Toyota in British car plants would be an
inflow under the direct investment category. Conversely, if a British bank buys shares in a
French company this would be included in the portfolio investment overseas by UK
residents’ section. An ‘investment’ such as the latter will benefit the balance of payments in
the long run as it generates invisible income for the current account. However, it has been
argued that it harms the British economy because resources are used overseas and so a
leakage from the circular flow is created.
In contrast, net inward investment benefits the balance of payments in the short run
because less official financing is needed. It also adds to the circular flow and stimulates
domestic economic activity in terms of employment and ancillary production. However, it
may eventually be detrimental to the balance of payments because profits from the invest-
ment will be remitted abroad and become invisible imports, while the goods produced may
supplant British goods in the home market.
The short-term capital movements in the account are the changes in foreign currency
and sterling holdings. Such transfers of ‘hot money’ tend to be volatile and unpredictable,
fluctuating with interest rate changes and exchange rate variations. The ‘other’ category
includes the official resources, private sector transactions with banks, trade credit and
inter-government loans. It was calculated that £15 billion of resources were used on ‘Black
Wednesday’ in September 1992 to buy sterling in order to try to keep it in the ERM. When
devaluation by about 20 per cent did occur, a £3 billion loss in the value of the reserves
was sustained.
5.5.2 Disequilibrium
Although the balance of payments accounts always balance for technical reasons, econ-
omists are concerned with the component parts of the structure. Persistent imbalances in
certain sections, such as the visible trade and the current account, indicate fundamental
disequilibrium and induce governments to undertake policy action to create/restore
equilibrium. For instance, a persistent balance of payments current account deficit may be
covered by substantial capital inflows or by a decrease in official reserves. The former may
be achieved by higher interest rates for a short period of time, while the latter similarly
cannot be undertaken indefinitely. However, this temporary expediency may have
Table 5.9 Capital and financial account (net transactions)
1996 1999 2003
Capital balance 736 776 1,243
Financial account
Direct investment �5,954 �72,962 �22,287
Portfolio investment �15,626 110,170 56,509
Other investment 22,851 �31,994 �12,225
Reserve assets 510 639 1,559
Net financial transactions 1,781 5,853 �5,401
Balancing items �1,917 13,027 1,732
FUNDAMENTALS OF BUSINESS ECONOMICS 245TH
EM
AC
RO
EC
ON
OM
ICC
ON
TEXT
OF
BU
SIN
ESS
2006.1

damaging consequences for the economy, such as higher debt repayments, lower invest-
ment and a higher exchange rate. Thus, remedial action to deal with a balance of payments
problem may constrain policies which are designed to achieve other economic objectives,
that is economic, growth via lower interest rates.
Disequilibrium occurs when the balance of payments on current account is persistently
imbalanced over several years. In the case of Britain this occurred in the 1970s, when deficits
frequently arose. However, in the early 1980s there were annual surpluses, mainly because of
North Sea oil. Since 1985 the problem of persistent deficit has returned alarmingly.
In 2004 the deficit was 3 per cent of GDP. A deficit demonstrates the uncompetitiveness
of British trade. In Britain’s case, as we have seen visible trade in good suffers a comparative
disadvantage, while the service sector with invisible surpluses seems to indicate a
comparative advantage.
Causes(a) Import penetration. This can arise from imports taking larger shares of static markets or
from imports maintaining their shares of expanding markets. In Britain’s case both
occurred and most sectors of industry experienced substantial import penetration, mainly
from Europe and Japan. For instance, 7 per cent of vehicles bought in Britain came from
abroad in 1970, but by 2004 this had reached 70 per cent. These figures show the increased
competitiveness of foreign suppliers.
Import penetration has increased for many reasons.
� The income elasticity of demand for manufactured goods is high in the UK,
around +3 compared to 2 in Germany. The income elasticity of demand for all
imports is +1.8. This become particularly important as Britain has large consumption
expenditure as a proportion of GDP. The consumer boom in the late 1990s and early
21st century was, therefore, largely supported by imports.� For many goods lower unit costs in the UK’s trading partners have made imports
more competitive than domestic substitues.� The periodic overvaluation of sterling, for example in 190–82 and 1998–2003 reduced
the sterling price of imports in the UK market.� Some UK producers have lacked competitiveness in non-price factors such as design,
reliabilty, delivery and pre and after sales service.
(b) Export performance. The other main obvious symptom of Britain’s current account
deficits was the relatively poor export performance. British exports needed to grow
disproportionately faster than those of rivals because of Britain’s high importing
propensity. However, the factors determining British exports are similar to those affecting
the demand for imports.
� First, the willingness and ability of domestic producers to supply abroad. For
instance, a growing home market and a lack of surplus capacity will inhibit exporting
and lead to concentration on home sales.� Second, the price competitiveness of British exports. Unfortunately, the short-run
price elasticity of demand for British exports has been calculated as less than 0.5.� Third, the income elasticity of demand in foreign markets. This is much lower than in
Britain because other trading economies are less open and their firms tend to have
more surplus capacity which can be quickly utilised to raise output for domestic
consumption.
Specific underlying problems with Britain’s exports seem to be insufficient investment
in new technology, inadequate management and a lack of quality products. Despite
STUDY MATERIAL C4246TH
EM
AC
RO
EC
ON
OM
ICC
ON
TEXT
OF
BU
SIN
ESS
2006.1

productivity improvements, Britain’s overall productivity still lags 30 per cent behind
France, Germany and the United States (OECD 1998). Furthermore a report, Made in
Britain (IBM London Business School), reckoned that only 2 per cent of UK factories are
world class and that at least 40 per cent are beyond hope. There is a big failure to invest in
research and development. British companies spend 1.5 per cent of sales revenue on this,
compared with 4.6 per cent by the world’s 200 largest companies.
Manufacturing is highly important to Britain’s current account, with around 43 per cent
of its export earnings in 1997 coming from trade in manufactures. Since the 1970s the rate
of growth of manufacturing exports has been well below that for manufacturing imports.
As a consequence Britain’s share of world manufacturing exports fell from 17 per cent in
1960 to 6.5 per cent 2003 (OECD 1998). Some reckon that foreign-owned ‘transplants’
into Britain (e.g. Sony TV in South Wales, etc.) will act to bring British component makers
up to the quality and delivery standards of our main trading rivals. However competition
from newly industrialised countries may make this difficult to achieve. By 1997 the com-
bined manufacturing exports of Korea and Singapore were greater than those of Britain.
Britain’s structural disequilibrium in its balance of payments is due to a high demand for
imports alongside a weak export performance in manufacturing products.
5.5.3 Policies
Many policies have been advocated to restore a balance of payments account to equili-
brium, usually when deficits have been a regular feature and there is evidence of
fundamental disequilibrium.
Depreciation of the exchange ratePrior to 1972, when there was a system of fixed exchange rates, a reduction in the
exchange rate was termed a devaluation. This was undertaken in 1967 when the pounds was
devalued from $2.80 to $2.40. The objective was to make British goods more competitive
by lowering an overvalued exchange rate which had kept prices artificially high. For
instance, prior to devaluation a British export priced at £5 would sell in America for $14;
but when the exchange rate was lowered to $2.40, it would sell for $12, thus becoming
more price-competitive. Conversely, an American export at $56 would sell in Britain at
£20 before the 1967 devaluation and at £23.33 afterwards. Thus British imports would
become dearer and less competitive.
However, since 1972 exchange rates have for the most part floated, and a depreciation
refers to a downward float. Thus in spring 1986, the £ fell from $1.50 to $1.10 before
recovering. This had a similar effect, making British exports cheaper and British imports
dearer. Floating exchange rates are less under government influence and they are
supposedly determined by market forces. However, governments do intervene, by
instructing their central banks to buy or sell the currency as necessary. Such action has
been termed dirty floating. In September 1986 the Bank of England borrowed heavily to buy
pounds to maintain the value of sterling.
In addition, a government can influence the exchange rate by general and specific
policies. It can seek to persuade the market that it is pursuing economically acceptable
policies in order to retain faith in the currency and keep the rate up. Alternatively, it can
more specifically manipulate interest rates in order to artificially influence the international
demand for the currency. An increase in interest rates tends to raise demand and thus the
FUNDAMENTALS OF BUSINESS ECONOMICS 247TH
EM
AC
RO
EC
ON
OM
ICC
ON
TEXT
OF
BU
SIN
ESS
2006.1
exchange rate appreciates. In September 1986, the Bank of England’s extra purchasing of
sterling on the foreign exchanges was insufficient to cause the value of sterling to
appreciate and so the Chancellor of the Exchequer acted to raise interest rates by
1 per cent to thwart the downward pressure on the pound. In this case the exchange rate
was maintained because a fall was not desired. The primary economic objective at the time
was control of inflation, and it was feared that a lower exchange rate would raise the cost
of living, via more expensive imports, and reduce real incomes. The Treasury model
maintains that any gains from depreciating sterling turn into later losses as higher domestic
costs feed through.
Usually, though, the objective behind depreciation and devaluation has been to induce
expenditure-switching by consumers. This occurs in two ways: dearer imports hopefully lead
British consumers to buy British goods instead, while cheaper exports cause foreign
consumers to purchase British exports rather than foreign products.
The effectiveness of such an expenditure-switching policy is largely dependent upon the price
elasticities of demand for imports and exports. The British balance of payments will benefit
from devaluation only if the amount spent on imports is exceeded by the amount received from
exports. This occurs if the sum of the import and export elasticities exceeds unity (1). For
instance, if the demand for British exports is elastic, the lower price will bring about an increase
in the total revenue from exports. Conversely, if the demand for foreign imports is elastic, then
their higher price will cause a fall in total spending on imports.
However, the elasticities approach proposed by Marshall–Lerner has been heavily
criticised. It is very simple in that it assumes that goods are bought solely on the basis of
relative prices (ignoring design, delivery, etc.). In addition, it assumes that income effects are
non-existent or that income elasticities are zero for all goods. Further, by looking at just
the demand side, the Marshall–Lerner approach ignores supply. It assumes that supply is
infinitely elastic so that increases in the quantity of exports demanded can be immediately
fulfilled. Britain’s lack of spare capacity makes that assumption unrealistic. In the first
quarter after the 1992 devaluation (ERM exit), exporters responded to the new com-
petitive advantage by boosting export prices 6 per cent while export volume rose by only
0.5 per cent (thus suggesting that supply is most inelastic). Therefore, the elasticities
approach is very simplistic.
It is also non-operational, because of the enormous difficulties of calculating the
elasticity values. Estimates of the price elasticities for British goods vary between fore-
casting bodies and for different time periods. However, generally the price elasticity for
British exports is low, being 0.5, but increasing to above 1.0 after 16 quarters in most
models. As the price elasticity of imports is also low, and possibly around 0.4, it is clear
that the Marshall–Lerner condition is unlikely to be achieved (as the total elasticity is less
than 1.0). This conclusion undermines the devaluation/depreciation policy. Ironically, it
suggests that appreciation would be better, because if combined elasticities are less than
1.0, a higher valued exchange rate will raise foreign exchange receipts by more than it
increases import payments.
Even if elasticities are favourable, a depreciation/devaluation will not immediately
benefit a balance of payments in practice. There is an initial worsening of the current
account because volumes are fixed and prices adjust automatically. However, eventually
demand and supply become more elastic and so consumption and production patterns
change, creating an improvement in the accounts. This tendency for the balance of
payments to deteriorate initially following depreciation and subsequently to improve has
been termed the ‘J’-curve effect, as illustrated in Figure 5.6.
STUDY MATERIAL C4248TH
EM
AC
RO
EC
ON
OM
ICC
ON
TEXT
OF
BU
SIN
ESS
2006.1
The exact shape of the ‘J’-curve depends upon the assumptions made. In Figure 5.6 the
optimistic ‘J’-curve shows that after nine months the balance of payments gains from
devaluation and that this benefit may continue for another six quarters, yielding a net
surplus. The pessimistic curve has a wholly negative effect, because it assumes inelastic
supply and rising domestic inflation. Furthermore, there is some evidence that, following a
depreciation, British exporters maintain their foreign exchange price (i.e. raise their prices
measured in sterling) rather than lowering them; this raises their short-run profits at the
expense of long-run sales growth.
DeflationAn effective, but generally undesirable, policy used to return a balance of payments deficit
to equilibrium has been domestic deflation. The government, through either tight fiscal or
restrictive monetary policy, curbs demand at home. The balance of payments is improved
because the growth of import demand is weakened and domestic suppliers, facing a
static home market, might switch resources towards export markets in order to fully
utilise capacity. An additional gain from the government’s deflationary policies can be to
weaken trade union bargaining power, through the fear of unemployment, and this
probably restrained production costs, and inflation.
Although deflation induces beneficial expenditure-switching, it has unfortunate costs for the
economy. The tightening of fiscal policy, by either tax increases or expenditure cuts, and the
restrictions on money supply, both reduce the demand for goods. Less demand means less
supply and so unemployment rises. The general effect is to constrain the rate of economic
growth, by depressing business optimism, lowering investment and under-utilizing resources.
Deflation is often used in conjuction with depreciation (devaluation) of the currency to
improve the current account of the balance of payments.
Import controlsThese have the effect of reducing expenditure rather than causing switching. Quotas
prevent the purchase of imports, while tariffs raise import prices and possibly lower
outgoings (assuming elastic demand for imports). The advantage gained from implement-
ation will probably only be temporary because the basic weakness of price uncompeti-
tiveness has not been changed. The likelihood would be that a fundamental disequilibrium
would return once the import controls were lifted.
0One Two
Time (years)
Optimistic
Pessimistic
+
Balance ofpayment losses
Balance ofpayment
gains
Figure 5.6 Possible ‘J’-curve effect.
FUNDAMENTALS OF BUSINESS ECONOMICS 249TH
EM
AC
RO
EC
ON
OM
ICC
ON
TEXT
OF
BU
SIN
ESS
2006.1
In Britain’s case, wide-ranging import controls are not a realistic option. As a member
of the WTO Britain has disavowed such a policy, while membership of the EU obviates
such a unilateral action. There is also the danger of retaliation by our trading partners, with
the consequent diminution in world trade.
Supply-side policiesThese were the ‘solution’ advocated and attempted in the 1980s. It was claimed that by
freeing up markets, increasing incentives, deregulating and removing the ‘dead hand’ of the
state from economic activity, an economic miracle of non-inflationary economic growth
would be achieved. The aim was to transform attitudes and behaviour so that British
competitiveness re-emerged. Clearly, it would not happen overnight. However there is
little sign that the economic pain of the early 1980s has restored British competitiveness to
the extent that there has been a permanent improvement in the balance of payments.
5.5.4 International Financial Organisations
The International Monetary Fund (IMF) was created in 1945 to help promote the
health of the world economy. It is governed by and accountable to the governments of
the 184 countries that make up its near-global membership.
Its main responsibilities are to:
� Promote international monetary co-operation;
� Facilitate the expansion and balanced growth of international trade;
� Promote exchange rate stability;
� Assist in the establishment of a multilateral system of payments;
� Support members experiencing balance of payments difficulties.
To enable it to carry out these roles the IMF:
� Conducts in depth appraisal of each member country’s economic situation;
� Provides technical assistance and advice on fiscal and monetary policy, banking and
financial system supervision and regulation and statistics;
� Provides financial assistance. In 2005, $71 billion was on loan to 82 countries. Some of
these loans are used to reduce poverty, for example by the Heavily Indebted Poor
Countries (HIPC) initiative.
The World Bank is a vital source of financial and technical assistance to developing
countries. It is owned by 184 member countries who make subscriptions to enable
it to function. It supports two development institutions. The International Bank for
Reconstruction and Development (IBRD) which focuses on middle income and
creditworthy poor countries; and the International Development Association (IDA)
which deals with the world’s poorest countries.
The mission of the World Bank is to work with partner countries to alleviate poverty. It
does this by:
� Providing loans and grants on favourable terms. These can be used to improve
infrastructure or for economic and social development projects.
Each borrower’s project proposal is assessed to ensure that the project is
economically, financially, socially and environmentally sound. During negotiations
the World Bank may make the loans and/or grants conditional on the borrower country
STUDY MATERIAL C4250TH
EM
AC
RO
EC
ON
OM
ICC
ON
TEXT
OF
BU
SIN
ESS
2006.1

making changes in the management of its own economy. Such interference in domestic
economic policy making has attracted criticism of the World Bank.
� Analytical and advisory services.
Exercise 5.2Answer the following questions based on the preceding information. You can check your
answers below.
1. Name one invisible earning.
2. What does the capital account show?
3. What is ‘hot money’?
4. What has caused Britain’s balance of payments current account deficit?
5. What is the difference between devaluation and depreciation of the exchange rate?
6. How could a fall in the exchange rate help an economy?
7. What does the ‘J’-curve show?
8. How can deflation help the balance of payments deficit?
Solutions
1. A dividend from an overseas share.
2. The capital account shows changes in Britain’s external assets and liabilities when
British residents buy/sell capital items.
3. ‘Hot money’ refers to short-term capital movements of currencies by international
financiers/speculators.
4. Britain’s current account deficit has been caused by a lack of competitiveness (for many
reasons) in trade.
5. A devaluation occurs when a fixed exchange rate is lowered, whereas depreciation
refers to a floating exchange rate which is moving downwards.
6. A fall in the exchange rate could help an economy by reducing the price of exports (and
increasing the price of imports) and thereby increasing sales, which might lead to
increased employment and greater export earnings (if demand is elastic).
7. The ‘J’-curve shows the likely effect of depreciation/devaluation on the current account.
8. Deflation can help the balance of payments by suppressing domestic demand for
imports and by releasing goods for export (if home sales are stagnant).
5.6 Chapter summary
In this chapter the analysis of economic processes and economic decisions has been
extended to the international economy. Most economies are now open economies where there
are significant movements of goods, services and factors of production, especially capital,
across national borders. These movements raise a range of important issues. These have
been discussed in this chapter and the focus has been on:
� the process of economic growth in the international economy; the factors which
influence the rate of growth and policies towards growth.
FUNDAMENTALS OF BUSINESS ECONOMICS 251TH
EM
AC
RO
EC
ON
OM
ICC
ON
TEXT
OF
BU
SIN
ESS
2006.1

� the globalisation process and the forces contributing to globalisation, especially the
multinational company.
� the process of international trade in goods and services, and the theoretical explanations
of trade and its economic benefits; the institutions of international trade, especially the
World Trade Organisation, and issues of trade policy.
� the operation of foreign exchange markets and the determination of exchange rates
under different exchange rate regimes; the impact of changes in exchange rates on
businesses and economies.
� the balance of payments accounts; the structure of the balance of payments accounts,
balance of payments problems and policies towards managing the balance of payments.
STUDY MATERIAL C4252
2006.1
TH
EM
AC
RO
EC
ON
OM
ICC
ON
TEXT
OF
BU
SIN
ESS

Revision Questions
You should use these questions for practice and revision for the content of this
chapter. The first question contains a selection of multiple-choice subquestions; questions
2 and 3 are data-response questions.
Question 1 Multiple-choice selection1.1 A country is said to have a comparative advantage in the production of a good when:
(A) it can produce more of it than any other country.
(B) it has captured a larger share of the world market than any other country.
(C) it can produce it at a lower opportunity cost than its trading partners.
(D) its costs of production for the good are lower than in other countries.
1.2 The existence of international trade is best explained by the fact that countries:
(A) use different currencies.
(B) have different economic systems.
(C) have different endowments of factors of production.
(D) have specialised in different goods and services.
1.3 Which of the following might cause a country’s exports to fall?
(A) A fall in the exchange rate for that country’s currency.
(B) A reduction in other countries’ tariff barriers.
(C) A decrease in the marginal propensity to import in other countries.
(D) A rise in that country’s imports.
1.4 The current account of the balance of payments includes all of the following items
except which one?
(A) The inflow of capital investment by multinational companies.
(B) Exports of manufactured goods.
(C) Interest payments on overseas debts.
(D) Expenditure in a country by overseas visitors.
1.5 The main objective of the WTO is:
(A) to raise living standards in developing countries.
(B) to minimise barriers to international trade.
5
253 2006.1

(C) to harmonise tariffs.
(D) to eliminate customs unions.
1.6 The main advantage of a system of flexible (floating) exchange rates is that it:
(A) provides certainty for international traders.
(B) provides automatic correction of balance of payments deficits.
(C) reduces international transactions costs.
(D) provides policy discipline for governments.
1.7 Which of the following would normally result from an increase (appreciation) in a
country’s exchange rate?
(i) A fall in the country’s rate of inflation.
(ii) A rise in the volume of its exports.
(iii) An improvement in its terms of trade.
(iv) A surplus on its current account.
(A) (i), (ii) and (iii) only.
(B) (ii), (iii) and (iv) only.
(C) (i) and (iii) only.
(D) (ii) and (iv) only.
1.8 If a country has a floating ( flexible) exchange rate, which one of the following would
lead to a fall (depreciation) in the rate of exchange for its currency?
(A) A rise in capital inflows into the economy.
(B) An increase in the country’s exports.
(C) An increase in the country’s imports.
(D) A fall in the country’s rate of inflation.
Question 2 Balance of paymentsThe following data refer to a country’s balance of payments:
$m
1. Exports 65,500
2. Interest, profits and dividends (net) +1,080
3. Services (net) +2,400
4. Imports 63,200
5. Current transfers 1,810
6. Increase in external assets (net) 30,830
7. Increase in external liabilities (net) 28,570
8. Balancing item 1,710
RequirementsUsing both your knowledge of economic theory and the material contained in the table:
(a) From the table calculate the following:
(i) the visible trade balance;
(ii) the invisible trade balance;
REVISION QUESTIONS C4254TH
EM
AC
RO
EC
ON
OM
ICC
ON
TEXT
OF
BU
SIN
ESS
2006.1
(iii) the current account balance;
(iv) the net capital outflow.
(4 marks)
(b) State whether each of the following is true or false:
(i) The value of the balancing item is determined by the extent to which total
currency inflows and outflows differ.
(ii) Current account surpluses have to be financed by capital account deficits.
(iii) The ‘J’-curve shows that the short-term effect of a depreciation in the currency is
that the current account moves towards surplus.
(iv) Capital flows are counted in the capital account but interest payments on that
capital are counted in the current account.
(v) The balance of payments accounts always balance to zero.
(vi) If a country has a freely floating exchange rate system, imbalances on the current
account will not occur.
(6 marks)
(Total marks = 10)
Question 3The following passage is based on a newspaper article published in February 1997, and
discusses the effects of the rise in the sterling exchange rate in 1996:
‘UK companies are expressing alarm at the strength of sterling after seeing the rising exchange rate choke off
their exports’ the CBI (Confederation of British Industry) said yesterday as the pound sterling rose to
DM2.7070 in late trading.
The CBI said that demand for exports had levelled off for the first time since the autumn of 1993, with
optimism and order books hit by the 9 per cent appreciation of sterling in the final three months of 1996.
According to the CBI survey, prices were regarded as more of a constraint on exports than at any time since
October 1989. The picture which emerged was of weakening export orders balanced by the strength of
domestic demand for UK-produced consumer goods.
The CBI said that the decision on whether the government should raise interest rates was ‘finely balanced’.
Any rise in interest rates to prevent the very rapid recovery from recession leading to excessive inflation was likely
to further strengthen sterling and have an adverse effect on exporters’ order books.
However, the prospects of a rise in interest rates to slow inflation were lessened by the latest figures for
the growth of the money supply. They showed that broad money growth fell from an annual rate of
10.8 per cent in November to 9.6 per cent in December. However, these were still well above the
government’s target for the growth of the money supply. In response, a Government source pointed out
that the rise in sterling itself would act to reduce the rate of inflation through its effects on costs and on the
level of aggregate demand.
RequirementsUsing both your knowledge of economic theory and material contained in the above passage:
(a) State whether, other things being equal, the effect of each of the following would be to
raise the exchange rate for a currency, lower the exchange rate or leave the exchange
rate unaffected.
FUNDAMENTALS OF BUSINESS ECONOMICS 255TH
EM
AC
RO
EC
ON
OM
ICC
ON
TEXT
OF
BU
SIN
ESS
2006.1

(i) A rise in interest rates in the country.
(ii) A rise in the rate of inflation in a country.
(iii) A surplus on the current account of the balance of payments.
(iv) A government budget deficit.
(v) An increase in the export of capital from the country.
(5 marks)
(b) State whether each of the following is true or false:
(i) A rise in the exchange rate tends to reduce the domestic rate of inflation.
(ii) A rise in the exchange rate tends to reduce domestic unemployment.
(iii) A rise in the exchange rate tends to worsen the terms of trade.
(iv) A rise in the exchange rate tends to worsen the balance of trade.
(v) A rise in the exchange rate tends to raise domestic living standards.
(5 marks)
(Total marks = 10)
REVISION QUESTIONS C4256TH
EM
AC
RO
EC
ON
OM
ICC
ON
TEXT
OF
BU
SIN
ESS
2006.1
Solutions to RevisionQuestions
Solution 11.1 Solution: (C)
The comparative cost theory is concerned with costs, not the level of output. A and B
are therefore incorrect. The theory also stresses that trade is based on relative or
opportunity cost, not absolute cost. C, not D, is therefore the correct answer.
1.2 Solution: (C)
The existence of different currencies is irrelevant, as is the fact that countries may
have different economic systems. Trade occurs because of comparative advantage and
this arises mainly because different countries have different endowments of land,
labour and capital. Specialisation is not the reason for international trade, but the
consequence of it.
1.3 Solution: (C)
A fall in the exchange rate (depreciation or devaluation) or a fall in barriers to trade
will be likely to lead to increases in a country’s exports. A rise in a country’s imports
will have no direct effect on its exports, but may indirectly raise them, since it will
have increased the level of incomes in trading partners. However, if the propensity to
import in the country’s trading partners falls, exports would decline.
1.4 Solution: (A)
Exports of goods clearly appears in the balance of trade element of the current
account. Interest payments and tourist expenditure appear on the invisible items
section of the current account. The movement of capital by multinational companies,
however, is recorded on the capital account.
1.5 Solution: (B)
The WTO is an organisation concerned with trade agreements and associated matters,
and seeks a reduction in barriers to trade. The minimalisation of trade barriers is its
primary aim. The WTO may see the others as desirable, but they are not its direct
concerns.
1.6 Solution: (B)
A and B are benefits of a fixed exchange rate system since the exchange rate remains
fixed and domestic economic policy is constrained by this. Response C is incorrect
5
257 2006.1

since transaction costs occur whenever foreign exchange is bought or
sold, irrespective of the exchange rate regime. The correct solution is B since a
deficit would lead to a fall in the exchange rate, which would improve the country’s
competitiveness and thus correct the deficit.
1.7 Solution: (C)
A rise in the exchange rate will raise export prices; exports will fall and the current
account will move towards deficit. However, import prices will fall, dampening
domestic inflation. Also, since import prices will have fallen and export prices risen,
the terms of trade, the ratio of import and export prices, will have improved.
1.8 Solution: (C)
The exchange rate will rise if the demand for the currency increases; this will result
from increased inward capital flows and increased exports, especially if lower inflation
increases the demand for exports. Increased imports however will increase the supply
of the currency to pay for them; the currency will therefore depreciate.
Solution 2
(a) (all in $m)
(i) +2,300
(ii) +1,670
(iii) +3,970
(iv) �2,260
(b) (i) False
Total currency inflows and outflows are always equal; the balancing item is the
amount by which these flows have been miscounted.
(ii) True
All surpluses and deficits on the current account must be offset (‘financed’) on the
capital account.
(iii) False
The ‘J’-curve shows that in the short run the effect of a depreciation is to shift the
current account toward a deficit; only in the long run does the account move
towards a surplus.
(iv) True
The capital account is concerned with the sale and acquisition of capital assets, but
any income, such as interest or profits, appears in the current account.
(v) True
The balance of payments are a set of double entry accounts and therefore always
balance.
(vi) False
A floating exchange rate system cannot guarantee a competitive rate and so a
currency may become overvalued or undervalued.
SOLUTIONS TO REVISION QUESTIONS C4258TH
EM
AC
RO
EC
ON
OM
ICC
ON
TEXT
OF
BU
SIN
ESS
2006.1

Solution 3
(a) (i) Raise(ii) Lower
(iii) Raise
(iv) No effect
(v) Lower
(b) (i) True
A rise in the exchange rate reduces the domestic price of imports.
(ii) False
A rising exchange rate reduces exports and raises imports, thus increasing
domestic unemployment.
(iii) False
The terms of trade are a measure of the relative prices of imports and exports; a
rising exchange rate raises export prices and reduces import prices.
(iv) True
As export prices rise, total exports tend to fall, but the opposite occurs for
imports, thus worsening the trade balance.
(v) True
The rise in exchange rate reduces import prices and thus raises the purchasing
power of domestic incomes.
FUNDAMENTALS OF BUSINESS ECONOMICS 259TH
EM
AC
RO
EC
ON
OM
ICC
ON
TEXT
OF
BU
SIN
ESS
2006.1


Preparing for the Assessment


Preparing for theAssessment
This chapter is intended for use when you are ready to start revising for your assessment.
It contains:
� a summary of useful revision techniques;
� details of the format of the assessment;
� a bank of assessment-standard revision questions and suggested solutions. These
solutions are of a length and level of detail that a competent student might be expected
to produce in an assessment.
Revision technique
Planning
The first thing to say about revision is that it is an addition to your initial studies, not a
substitute for them. In other words, do not coast along early in your course in the hope of
catching up during the revision phase. On the contrary, you should be studying and revising
concurrently from the outset. At the end of each week, and at the end of each month, get into
the habit of summarizing the material you have covered to refresh your memory of it.
As with your initial studies, planning is important to maximise the value of your revision
work. You need to balance the demands of study, professional work, family life and other
commitments. To make this work, you will need to think carefully about how to make best
use of your time.
Begin as before by comparing the estimated hours you will need to devote to revision
with the hours available to you in the weeks leading up to the assessment. Prepare a written
schedule setting out the areas you intend to cover during particular weeks, and break that
down further into topics for each day’s revision. To help focus on the key areas try to establish:
� which areas you are weakest in, so that you can concentrate on the topics where effort is
particularly needed;
� which areas are especially significant for the assessment – the topics that are tested
frequently.
Don’t forget the need for relaxation, and for family commitments. Sustained intellectual
effort is only possible for limited periods, and must be broken up at intervals by lighter
activities. And don’t continue your revision timetable right up to the moment when you
enter for the assessment: you should aim to stop work a day or even two days before the
assessment. Beyond this point the most you should attempt is an occasional brief look at
your notes to refresh your memory.
263 2006.1

Getting down to work
By the time you begin your revision you should already have settled into a fixed work pattern:
a regular time of day for doing the work, a particular location where you sit, particular
equipment that you assemble before you begin and so on. If this is not already a matter of
routine for you, think carefully about it now in the last vital weeks before the exam.
You should have notes summarizing the main points of each topic you have covered.
Begin each session by reading through the relevant notes and trying to commit the
important points to memory.
Usually this will be just your starting point. Unless the area is one where you already feel
very confident, you will need to track back from your notes to the relevant chapter(s) in
the Study System. This will refresh your memory on points not covered by your notes and fill
in the detail that inevitably gets lost in the process of summarisation.
When you think you have understood and memorised the main principles and
techniques, attempt an assessment-standard question. At this stage of your studies you
should normally be expecting to complete such questions in something close to the actual
time allocation allowed in the exam. After completing your effort, check the solution
provided and add to your notes any extra points it reveals.
Tips for the final revision phase
As the assessment looms closer, consider the following list of techniques and make use of
those that work for you:
� Summarise your notes into more concise form, perhaps on index cards that you can
carry with you for revision on the way to work.
� Go through your notes with a highlighter pen, marking key concepts and definitions.
� Summarise the main points in a key area by producing a wordlist, mind map or other
mnemonic device.
� In areas that you find difficult, rework questions that you have already attempted, and
compare your answers in detail with those provided in the Learning System.
Format of the assessment
The assessment for Economics for Business is a two hour computer-based assessment
comprising 75 compulsory questions. Single part questions are generally worth 1–2 marks;
two or three part questions may be worth 4 or 6 marks. There will be no choice and all
questions should be attempted if time permits. CIMA are continuously developing the
question styles within the CBA system and you are advised to try the on-line website
demo, to both gain familiarity with the assessment software and examine the latest style of
questions being used.
In broad terms, the entire syllabus will be covered in each assessment. Please note that
the weightings of the syllabus and of the assessment are not exactly reflected in the space
allocated to the various topics in this book.
The current weightings for the syllabus sections are:
� The goals and decisions of organisations – 20 per cent
� The market system and the competitive process – 30 per cent
� The financial system – 20 per cent
� The macroeconomic context of business – 30 per cent.
STUDY MATERIAL C4264PREPA
RIN
GFO
RTH
EA
SSESSEM
EN
T
2006.1

Revision Questions
Learning Outcomes Question
number
The goals and decisions of organisations
(i) Distinguish the goals of profit-seeking organisations, not-
for-profit organisations and governmental organisations.
1
(ii) Compute the point of profit maximisation for a single
product firm in the short run.
3,6,9
(iii) Distinguish the likely behaviour of a firm’s unit costs in the
short run and in the long run.
2,7
(iv) Illustrate the effects of long-run cost behaviour on prices,
the size of the organisation and the number of competitors
in the industry.
8
(v) Illustrate shareholder wealth, the variables affecting
shareholder’s wealth and its application in management
decision making.
5,12
(vi) Identify stakeholders and their likely impact on the goals
of not-for-profit organisations and the decisions of the
management of nor-for-profit organisations.
10
(vii) Distinguish between the potential objectives of management
and those of shareholders, and the effects of this principal–
agent problem on decisions concerning price, output and
growth of the firm.
4
(viii) Describe the main mechanisms to improve corporate
governance in profit-seeking organisations.
11
The market system and the competitive process
(i) Identify the equilibrium price in a product or factor
markets likely to result from specified changes in
conditions of demand or supply.
13,16,20,21
(ii) Calculate the price elasticity of demand and the price
elasticity of supply.
22,26,30
(iii) Identify the effects of price elasticity of demand on a
firm’s revenues following a change in prices.
14,23
(iv) Describe market concentration and the factors giving rise
to differing levels of concentration between markets.
18,28
(v) Describe market failures, their effects on prices, efficiency
of market operation and economic welfare, and the likely
responses of government to these.
17,27
265 2006.1

(vi) Distinguish the nature of competition in different market
structures.
15,19,25
(vii) Identify the impacts of different forms of competition on
prices and profitability.
24,29
The financial system
(i) Identify the factors leading to liquidity surpluses and
deficits in the short, medium and long run in households,
firms and governments.
34
(ii) Explain the role of various financial assets, markets and
institutions in assisting organisations to manage their
liquidity position and to provide an economic return to
holders of liquidity.
31,32,33,39,42
(iii) Identify the role of insurance markets in the facilitation of
the economic transfer and bearing of risk for households,
firms and governments.
36,41
(iv) Identify the role of the foreign exchange market and the
factors influencing it, in setting exchange rates and in helping
organisations finance international trade and investement.
37,40
(v) Expalin the role of national and international governmental
organisations in regulating and influencing the financial
system, and the likely impact of their policy instruments on
businesses.
35,38
The macroeconomic context of business
(i) Explain macroeconomic phenomena, including growth,
inflation, unemployment, demand management and supply
side policies.
44,45,50,60
(ii) Explain the main measures and indicators of a country’s
economic performance and the problems of using these to
assess the wealth and commercial potential of a country.
47,59
(iii) Identify the stages of the trade cycle, its causes and
consequences, and discuss the business impacts of
potential policy responses of government to each stage.
46,51,60
(iv) Explain the main principles of public finance (i.e. deficit
financing, forms of taxation) and macroeconomic policy.
43,56
(v) Explain the concept of the balance of payments and its
implications for business and for government policy.
53,54
(vi) Identify the main elements of national policy with respect
to trade, including protectionism, trade agreements and
trading blocks.
55,59
(vii) Identify the conditions and policies necessary for economic
growth in traditional, industrial and post-industrial societies,
and the potential consequences of such growth.
48,57
(viii) Expalin the concept and consequences of globalisation for
businesses and national economies.
50,58
(ix) Identify the major institutions promoting global trade and
development, and their respective roles.
52
REVISION QUESTIONS C4266PREPA
RIN
GFO
RTH
EA
SSESSM
EN
T
2006.1

The goals and decisions of organisations
Question 1The term ‘opportunity cost’ means:
(A) the difference between the cost of a good and its price.
(B) a special sale of goods below their cost of production.
(C) a change in costs resulting from a shift in the production possibility frontier.
(D) the value of goods that are forgone in order to produce something else.
(2 marks)
Question 2The fall in a firm’s short-run average total cost with an increase in production would be
due to which of the following?
(A) The greater divisibility of fixed costs.
(B) Diminishing returns to a fixed factor.
(C) Economies of scale.
(D) Diseconomies of scale.
(2 marks)
Question 3According to the traditional theory of the firm, the equilibrium position for all firms will
be where:
(A) revenue is maximised.
(B) output is maximised.
(C) profits are maximised.
(D) costs are minimised.
(2 marks)
Question 4The pursuit of profit will ensure that business organisations are efficient provided that:
(A) they operate in competitive markets.
(B) they produce at the profit-maximizing level of output.
(C) prices are set where demand and supply are equal.
(D) excess profits are reinvested in the businesses.
(2 marks)
FUNDAMENTALS OF BUSINESS ECONOMICS 267PREPA
RIN
GFO
RTH
EA
SSESSM
EN
T
2006.1
Question 5Other things being equal, all of the following would lead to a rise in share prices except
which one?
(A) A rise in interest rates.
(B) A reduction in corporation tax.
(C) A rise in company profits.
(D) A decline in the number of new share issues.
(2 marks)
Question 6The following data refer to the cost and revenue schedules of a business:
(a) Calculate for each level of sales:
(i) the marginal revenue;
(ii) the marginal cost.
(2 marks)
(b) Calculate:
(i) the price elasticity of demand for a price rise from £10 to £12;
(ii) the profit maximizing level of sales and the total profits made at this point.
(2 marks)
Question 7Identify the correct word or phrase in the following to complete each of the following
statements.
(i) Internal economies of scale can only be obtained when the industry/company/market
increases in size.
(ii) Diseconomies of scale occur when the business becomes inefficient/technically
outdated/too large and, inconsequence, costs begin to rise.
(iii) External economies of scale reduce the costs of all firms when suppliers become more
efficient/the industry becomes larger/social costs of production are reduced
(iv) Technical economies of scale arise when a company is large enough to adopt new
technology/invest in research and development/produce on a large scale.
(4 marks)
Quantity sold Price Total cost
£ £
0 – 12
1 16 20
2 14 25
3 12 30
4 10 34
5 8 45
6 6 66
7 4 110
REVISION QUESTIONS C4268PREPA
RIN
GFO
RTH
EA
SSESSM
EN
T
2006.1

Question 8State whether each of the following statements is true or false.
(4 marks)
Question 9
The following data refer to the revenue and costs of a firm:
RequirementsUsing both your knowledge of economic theory and the data given above:
(a) From the data above calculate:
(i) marginal revenue for every level of output; (1 mark)
(ii) marginal cost for every level of output; (1 mark)
(iii) the firm’s fixed costs. (1 mark)
(b) Assuming that the firm is a profit maximiser, state:
(i) the level of output the firm will aim to produce; (1 mark)
(ii) the total level of profit at this level of output. (1 mark)
(Total marks = 5)
Output Total revenue (£) Total costs (£)
0 – 110
1 50 140
2 100 162
3 150 175
4 200 180
5 250 185
6 300 194
7 350 219
8 400 269
9 450 325
10 500 425
Statement True False
(i) Economies of scale act as a barrier to entry into
an industry.
(ii) If there are significant economies of scale, the number
of firms in the industry will tend to be small.
(iii) Diseconomies of scale cause the short-run average
cost curve to rise
(iv) If output rises at the same rate as average cost rises,
this is called constant returns to scale.
FUNDAMENTALS OF BUSINESS ECONOMICS 269PREPA
RIN
GFO
RTH
EA
SSESSM
EN
T
2006.1
Question 10Which of the following would be regarded as stakeholders in a not- for-profit organisation?
(i) Management
(ii) Employees
(iii) Suppliers
(iv) Customers
(v) Local community
(A) (i), and (iii) only.(B) (i), (ii) and (iv) only.(C) (iii), (iv) and (v) only.(D) all of them.
(2 marks)
Question 11All of the following have been recommended in order to improve corporate Governance
except one. Which ONE is the EXCEPTION?
(A) The separation of the powers of chairman and chief executive.
(B) Limited contract for directors.
(C) Less use should be made of non-executive directors.
(D) Annual accounts should include a statement from auditors that the company is a
‘going concern’.
(2 marks)
Question 12A Company is planning to invest in a new project. The information about this project is as
follows:
Capital cost of project $20000
Expected life of the project 3 years
Scrap value of investment at end $5000
Expected net income streams Year 1 $5000
Year 2 $5000
Year 3 $5000
You are required to:
(a) Calculate the net present value of the project assuming a discount rate of 10%.
(2 marks)
(b) Calculate the net present value of the project assuming that the income stream in the
third year is reduced to $3000.
(2 marks)
(c) Calculate the net present value of the project assuming the original income streams
but a discount rate of 5%.
(2 marks)
REVISION QUESTIONS C4270PREPA
RIN
GFO
RTH
EA
SSESSM
EN
T
2006.1

The market system and the competitive process
Question 13When the price of a good is held above the equilibrium price, the result will be:
(A) excess demand.
(B) a shortage of the good.
(C) a surplus of the good.
(D) an increase in demand.
(2 marks)
Question 14If the price of a good fell by 10 per cent and, as a result, total expenditure on the good fell
by 10 per cent, the demand for the good would be described as:
(A) perfectly inelastic.
(B) perfectly elastic.
(C) unitary elastic.
(D) elastic.
(2 marks)
Question 15One of the characteristic features of oligopoly is that:
(A) free entry of firms into the industry is always encouraged.
(B) the pricing policy of a firm is largely determined by the state.
(C) known consumers’ preferences play no part in firms’ policy decisions.
(D) the pricing policy of firms is influenced by that of rival firms.
(2 marks)
Question 16Which one of the following would not, of itself, cause a shift of the demand curve for a
product? A change in:
(A) consumers’ preferences.
(B) consumers’ income.
(C) the price of the product.
(D) the prices of related products.
(2 marks)
FUNDAMENTALS OF BUSINESS ECONOMICS 271PREPA
RIN
GFO
RTH
EA
SSESSM
EN
T
2006.1

Question 17If the social costs of producing a good exceeds its private cost, in order to improve
resource allocation, the government should:
(A) provide the producers with a subsidy equal to the difference between private and
social costs.
(B) impose an indirect tax equal to the difference between private and social costs of
producing the good.
(C) tax the profits of the producers of the good at a higher rate than normal.
(D) pay a subsidy to all consumers of the product.
(2 marks)
Question 18A horizontal merger occurs when the merging firms are:
(A) in different stages of the production chain.
(B) major firms operating in the same region.
(C) producing different goods or services.
(D) producing the same goods or services.
(2 marks)
Question 19The kinked demand curve model of oligopolistic competition is used to explain:
(A) collusion between firms.
(B) price rigidity.
(C) price leadership.
(D) price competition.
(2 marks)
Question 20The following diagram represents the demand and supply for a particular good over
a period of time:
Price
Quantity
P1
S1
D1
Q1
REVISION QUESTIONS C4272PREPA
RIN
GFO
RTH
EA
SSESSM
EN
T
2006.1
With respect to the diagram answer the following questions.
(i) Would the imposition of an indirect tax shift the supply curve or the demand curve?
(ii) Would the burden of tax be shifted most to consumers when the demand curve for
the product was price elastic or price inelastic?
(iii) Would the government get the most tax revenue from imposing the tax if the
demand for the product was price elastic or price inelastic?
(iv) Would the sales/output of the good fall most when the demand for the good was
price elastic or price inelastic?
(4 marks)
Question 21If trade unions attempt to increase the wages of their members, the result is usually that
for their members:
(A) wages rise and employment falls.
(B) wages and employment both rise.
(C) wages rise without affecting employment.
(D) wages fall but employment rises.
(2 marks)
Question 22The following passage is based on newspaper articles and refers to the market for coffee:
Supermarkets recently ended ten years of cheap coffee when some raised the price of
their own brands of instant coffee by up to 12 per cent.
Reports of severe frost damage to Brazilian coffee plantations sent the open market
price of coffee beans up from $3100 a ton to $4000 a ton – the highest price since 1986.
Even before the frost damage, the price had been rising because many coffee farmers,
discouraged by the previous low price of coffee, had moved away to other crops in the
search for more profit.
The current price increases will end a golden age for coffee drinkers. From 1986 to
1993, the retail price of coffee had fallen by more than 15 per cent; given that these were
years of rapid inflation, the real price of coffee fell even more steeply. The result was a
boom in coffee drinking, and coffee sales in the United Kingdom exceeded those of tea.
Rising coffee prices may now lead to a switch back to tea drinking. This happened in the
1970s when sharp rises in coffee prices encouraged many coffee drinkers to switch their
consumption to tea.
RequirementsUsing both your knowledge of economic theory and information in the passage:
With reference to the concept of the price elasticity of demand,
(i) which one of the following is the correct measurement of the price elasticity of
demand for coffee?
1:% change in price of coffee
% change in the demand for coffee
FUNDAMENTALS OF BUSINESS ECONOMICS 273PREPA
RIN
GFO
RTH
EA
SSESSM
EN
T
2006.1

2:change in the demand for coffee
change in the price of coffee
3:% change in the demand for coffee
% change in the price of coffee
(1 mark)
(ii) if the price elasticity of demand for coffee has a value of �2 would the demand
be said to be
1. price elastic or
2. price inelastic or
3. of unitary elasticity?
(1 mark)
(iii) if the demand for coffee was price inelastic, would the result of a shift in the
supply of coffee to the left be,
1. a large fall in price and small fall in sales or
2. a large rise in price and large fall in sales or
3. a large rise in price and a small fall in sales or
4. a small rise in price and a large fall in sales or
5. a small fall in price and a large rise in sales?
(2 marks)
(iv) if there was a high positive cross elasticity of demand between coffee and tea and
the supply of tea was price inelastic, would the result of a rise in the price of
coffee be
1. a small rise in the sales of tea and small rise in its price or
2. a large rise in the sales of tea and a large rise in its price or
3. a small rise in the sales of tea and a large rise in its price or
4. a large rise in sales of tea and small rise in its price?
(2 marks)
Question 23State whether each of the following statements is true or false.
(4 marks)
Statement True False
(i) A change in supply of a good will have the largest effect
on price when the demand is price elastic.
(ii) The cross elasticity of demand measures the relationship
between the demand for one good and demand for another.
(iii) If the cross elasticity of demand has a negative value,
it shows that the two goods are complements.
(iv) A change in the demand for a good will have no effect
on the price if the supply of the good is perfectly price elastic.
REVISION QUESTIONS C4274PREPA
RIN
GFO
RTH
EA
SSESSM
EN
T
2006.1

Question 24The following diagram shows the cost and revenue curves for a monopoly firm selling
its products in two separate markets:
With the use of the diagram
(i) show the total output the firm will aim to produce; (1 mark)
(ii) show the share of output allocated to each market; (1 mark)
(iii) identify the price that the firm will charge in each market. (1 mark)
Question 25All of the following are examples of anti-competitive behaviour by manufacturing
companies except which one?
(A) Price-fixing agreements.
(B) Minimum price contracts with retailers.
(C) Exclusive contracts with retailers.
(D) The heavy use of advertising.
(2 marks)
Question 26The following data refers to the supply and demand for a product.
Price ($) Quantity Demanded Quantity Supplied
8 130 80
9 120 95
10 100 100
11 90 105
Using the data, calculate for this product:
(i) the price elasticity of demand for a fall in price from $10 to $9.
(ii) the price elasticity of supply for a rise in price from $10 to $11.
(iii) calculate the change in total revenue for the seller of the product if the price fell
from $10 to $9. (3 marks)
A
P1
Output
Pric
e
Pric
e
Co
st a
nd
Pri
ce
0 0 0
MR
MC
OutputOutput
P2
DB
DA
MRB
MRA
Q3Q2Q1
B C (combined)
FUNDAMENTALS OF BUSINESS ECONOMICS 275PREPA
RIN
GFO
RTH
EA
SSESSM
EN
T
2006.1

Question 27If the price of producing a good involves net social costs greater than the private costs then:
(A) the private sector will produce less than the socially optimal level of output.
(B) the private sector will not produce the goods because it would not be profitable
to do so.
(C) the government could improve resource allocation by imposing a tax on the good.
(D) a subsidy should be paid to the private sector to offset the extra costs.
(2 marks)
Question 28All of the following would tend to increase the degree of competition in a market except
one. Which ONE is the EXCEPTION?
(A) An increase in the number of firms in the market.
(B) Significant economies of scale in the industry.
(C) An increase in consumer knowledge and awareness of the product.
(D) A reduction in barriers to entry into the industry.
(2 marks)
Question 29Railway companies offering off-peak services at lower prices than for peak services must
ensure that, in the short run, these lower prices cover at least
(A) the variable cost of providing the service.
(B) overhead costs.
(C) the fixed costs of production.
(D) the average cost of providing the service.
(2 marks)
Question 30State whether each of the following statements is true or false.
(4 marks)
Statement True False
(i) If the supply of a good decreases, its price will rise and the
demand curve for the product will shift to the left.
(ii) The supply of a good is described as price inelastic if a fall in
price leads to a smaller proportionate fall in the quantity supplied.
(iii) If a tax is imposed on a good, the burden of the tax shifted
to consumers will be greatest when the demand for the good is
price inelastic.
(iv) If the demand for a good has a price elasticity of �1 then a 10%
fall in price will lead to a 10% fall in demand.
REVISION QUESTIONS C4276PREPA
RIN
GFO
RTH
EA
SSESSM
EN
T
2006.1

The Financial system
Question 31Venture capital is best described as:
(A) investment funds provided for established companies.
(B) short-term investment in Eurocurrency markets.
(C) capital funds that are highly mobile between financial centres.
(D) equity finance in high-risk enterprises.
(2 marks)
Question 32Which one of the following can be used by governments to finance a public-sector
borrowing requirement (public-sector net cash requirement)?
(A) A rise in direct taxation.
(B) The sale of public assets.
(C) An increase in interest rates.
(D) An issue of government savings certificates.
(2 marks)
Question 33Financial institutions are said to provide financial intermediation. This is best defined as
providing:
(A) a means of payment by cheques.
(B) financial advice to business customers.
(C) an efficient means of linking net savers with net borrowers.
(D) a service for the purchase and sale of foreign exchange.
(2 marks)
Question 34State whether each of the following statements is true or false.
(4 marks)
Statement True False
(i) Governments will have a financial deficit if the country’s imports
exceed exports.
(ii) Companies need financial intermediaries if their receipts exceed
their payments.
(iii) Governments can finance their budget deficits by raising taxation.
(iv) An overdraft is a means for individuals to meet short-term lack of
liquidity.
FUNDAMENTALS OF BUSINESS ECONOMICS 277PREPA
RIN
GFO
RTH
EA
SSESSM
EN
T
2006.1

Question 35Which one of the following is not a function of a central bank?
(A) Management of the National Debt.
(B) Holder of the foreign exchange reserves.
(C) The conduct of fiscal policy.
(D) Lender of the last resort.
(2 marks)
Question 36Of the following risks, which ONE cannot be insured against by a business?
(A) Injury or illness of employees.
(B) Loss of sales because of a downturn in trade.
(C) Theft of company assets.
(D) Legal action taken against the company by a customer.
(2 marks)
Question 37For each of the following events, state whether the direct effect on a country with a
flexible exchange rate would be to lead to a rise (appreciation) or fall (depreciation) in the
country’s exchange rate or to leave the exchange rate unaffected.
Event Rise in the
exchange
rate
Fall in the
exchange
rate
Leave the
exchange rate
unaffected
(i) A rise in interest rates in the country.
(ii) A rise in the demand for imports in
the country.
(iii) A significant short term fall in share
prices in the country.
(iv) Purchase of foreign exchange by the
country’s central bank.
(4 marks)
Question 38All of the following would result from a rise in interest rates except one. Which ONE is
the EXCEPTION?
(A) Business investment would tend to fall.
(B) Share prices would tend to fall.
(C) Sales of consumer good would tend to fall.
(D) Government revenue would tend to rise.
(2 marks)
REVISION QUESTIONS C4278PREPA
RIN
GFO
RTH
EA
SSESSM
EN
T
2006.1

Question 39For each of the following financial instruments state whether they are money market (M)
or capital market (C) instruments.
(i) Treasury bills
(ii) Certificates of deposit
(iii) Corporate bonds
(vi) Mortgages
(v) Bills of exchange
(4 marks)
Question 40Which one of the following would not result from the United Kingdom joining the single
European currency (the Euro)?
(A) International transactions costs would rise.
(B) Exchange rate uncertainty would be reduced.
(C) The United Kingdom could no longer operate an independent monetary policy.
(D) There would be increased price transparency between the United Kingdom and
other EU countries.
(2 marks)
Question 41State whether each of the following statements is true or false.
(3 marks)
Question 42If in the short run a business’s receipts exceed its payments it can finance this financial
shortfall by all of the following except one. Which ONE is the EXCEPTION?
(A) Using its cash reserves.
(B) Issuing shares.
(C) A bank overdraft.
(D) A bill of exchange.
(2 marks)
Statement True False
(i) A insurance broker undertakes the task of underwriting
but not reinsurance.
(ii) Reinsurance occurs when an insurer shares the risk
and the premiums with other insurers.
(iii) Insurers will not insure against events they know will occur.
FUNDAMENTALS OF BUSINESS ECONOMICS 279PREPA
RIN
GFO
RTH
EA
SSESSM
EN
T
2006.1

The macroeconomic context of business
Question 43Which one of the following is likely to result from an increase in the size of the public-sector
net borrowing?
(A) A decrease in the level of inflation.
(B) A reduction in the level of taxation.
(C) A rise in the price of shares.
(D) A rise in the rate of interest.
(2 marks)
Question 44Which one of the following is a withdrawal from the circular flow of income?
(A) Investment.
(B) Exports.
(C) Taxation.
(D) Profits.
(2 marks)
Question 45The following diagram shows the relationship between income and expenditure for an
economy:
With reference to the diagram, state what are the following:
(i) two components of the expenditure curve; (2 marks)
(ii) the equilibrium level of national income; (1 mark)
(iii) the deflationary gap. (1 mark)
D Income
Expenditure
YF
EX
45°
C
E
FA
B
REVISION QUESTIONS C4280PREPA
RIN
GFO
RTH
EA
SSESSM
EN
T
2006.1

Question 46The upswing phase of the trade cycle normally leads to:
(A) A fall in structural unemployment.
(B) A reduction in inflationary pressure.
(C) The government budget moving towards a surplus.
(D) The current account of the balance of payments moving towards a surplus.
(2 marks)
Question 47Which one of the following is a transfer payment in national income accounting?
(A) Salaries of university lecturers.
(B) Payments of examination entry fees.
(C) Payments for the purchase of textbooks.
(D) Educational grants and scholarships. (2 marks)
Question 48The following diagram represents the production possibility frontiers (curves) for an economy:
Identify the point on the diagram which corresponds to:
(i) less than full employment of available resources;
(ii) a bias in production towards consumer goods;
(iii) a bias in production towards investment goods;
(iv) economic growth compared to point A. (4 marks)
Question 49The theory of the natural rate of unemployment says that:
(A) there is no inflation–unemployment trade-off in the long run.
(B) the short-run Phillips curve is steeper than the long-run Phillips curve.
(C) there will always be some workers seeking employment who cannot find jobs.
(D) there is always some frictional unemployment in an economy.
(2 marks)
A E
D
Investmentgoods
Consumer goods
B
C
PPF1 PPF2
FUNDAMENTALS OF BUSINESS ECONOMICS 281PREPA
RIN
GFO
RTH
EA
SSESSM
EN
T
2006.1
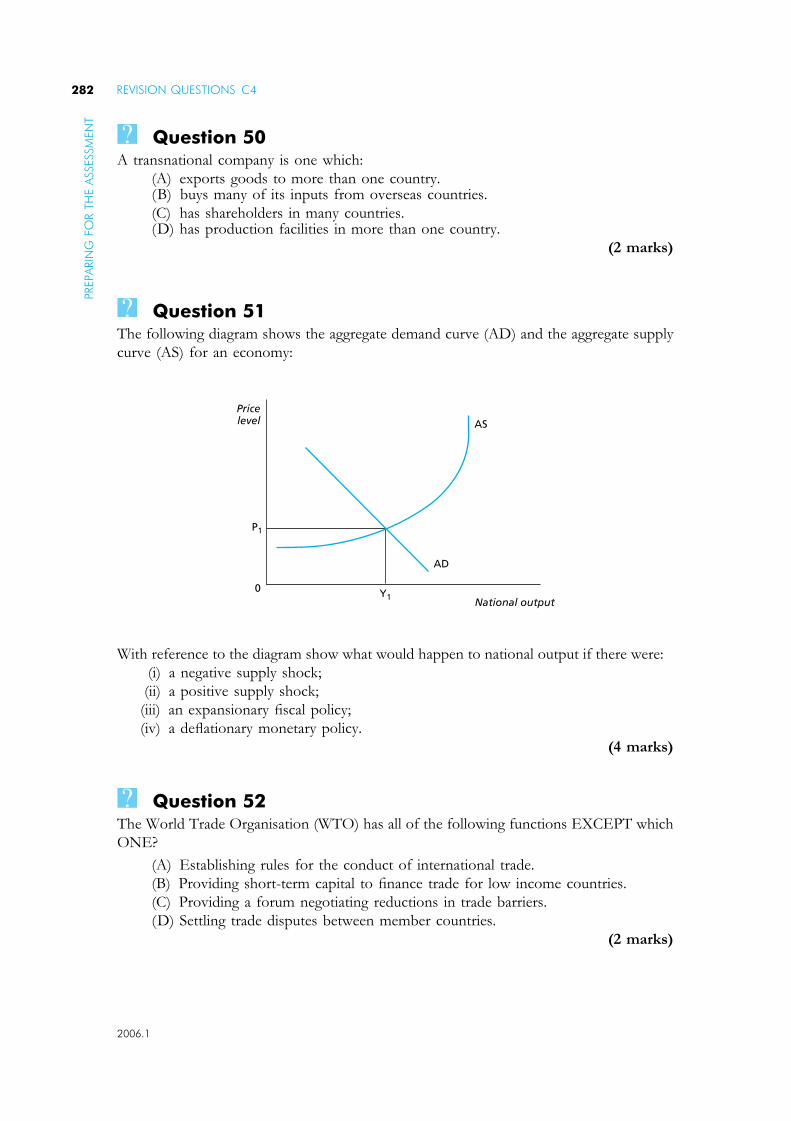
Question 50A transnational company is one which:
(A) exports goods to more than one country.(B) buys many of its inputs from overseas countries.
(C) has shareholders in many countries.(D) has production facilities in more than one country.
(2 marks)
Question 51The following diagram shows the aggregate demand curve (AD) and the aggregate supply
curve (AS) for an economy:
With reference to the diagram show what would happen to national output if there were:
(i) a negative supply shock;
(ii) a positive supply shock;
(iii) an expansionary fiscal policy;
(iv) a deflationary monetary policy.
(4 marks)
Question 52The World Trade Organisation (WTO) has all of the following functions EXCEPT which
ONE?
(A) Establishing rules for the conduct of international trade.
(B) Providing short-term capital to finance trade for low income countries.
(C) Providing a forum negotiating reductions in trade barriers.
(D) Settling trade disputes between member countries.
(2 marks)
AD
Y1
P1
AS
National output
Pricelevel
0
REVISION QUESTIONS C4282PREPA
RIN
GFO
RTH
EA
SSESSM
EN
T
2006.1

Question 53The following data refers to a country’s balance of payments accounts, measured in
billions of dollars.
Calculate the country’s:
(i) balance of trade;
(ii) balance on current account;
(iii) net flow of foreign direct investment;
(iv) adjusting item to balance the accounts.
(4 marks)
Question 54All of the following are included as invisible items on the current account of the balance of
payments except which one?
(A) Flows of profits from assets held overseas.
(B) Inflows of overseas investment.
(C) Expenditure by foreign tourists within the country.
(D) Interest payments received from bank accounts held in other countries.
(2 marks)
Question 55The European Union has all the following features except which one?
(A) The absence of barriers to trade between all member states.
(B) The absence of barriers to the movement of capital between member states.
(C) Common rates of indirect taxation.
(D) A common external tariff.
(2 marks)
Credits
$ billion
Debits
$ billion
Trade in goods 164 184
Trade in services 60 48
Investment income 105 95
Transfers 15 22
Direct investment abroad 40
Inward direct investment 29
Portfolio investment (assets) 31
Portfolio investment (liabilities) 37
Other investments 44 16
FUNDAMENTALS OF BUSINESS ECONOMICS 283PREPA
RIN
GFO
RTH
EA
SSESSM
EN
T
2006.1
Question 56State whether each of the following statements is true or false.
(4 marks)
Question 57All of the following would be likely to restrict long-term economic growth except
which one?
(A) Increasing cost of energy as oil reserves decrease.
(B) The scarcity of natural resources and raw materials.
(C) Environmental damage caused by both production and consumption.
(D) Increasing openness of economies to international trade.
(2 marks)
Question 58All of the following are features of globalisation except one. Which ONE is the
EXCEPTION?
(A) Rising trade ratios.
(B) Increased international capital flows.
(C) Improved terms of trade for all countries.
(D) Reduced barriers to international factor movements.
(2 marks)
Statement True False
(i) The heaviest indirect taxes tend to be on goods with
a high price elasticity of demand.
(ii) An indirect tax is one where the incidence and
the burden of the tax fall on different persons.
(iii) Indirect taxes on goods are desirable since the burden
of the tax falls on the foreign producer.
(iv) Direct taxes are preferred to indirect taxes because
they are always progressive.
REVISION QUESTIONS C4284PREPA
RIN
GFO
RTH
EA
SSESSM
EN
T
2006.1

Question 59State whether each of the following statements is true or false.
(2 marks).
Question 60The following refers to the Japanese economy in the 1990s:
Statement True False
(i) If a country imposes trade barriers on its imports, that
country’s economic welfare will be reduced.
(ii) An advantage of flexible exchange rate regimes is that
uncertainty is reduced for business.
(iii) Advantage of fixed exchange rate regimes is that they
make trade deficits less likely to occur.
(iv) Free trade enables a country to re-allocate its resource
to more productive uses.
Table 1 Gross domestic product (1996)
Billions Yen % of total
1. Private consumption expenditure 299,440 59.8
2. Domestic fixed capital formation 148,190 29.6
3. Government consumption expenditure 48,969 9.6
4. Stockbuilding 1,058 0.2
5. Exports 49,589 9.9
6. Imports �46,900 �9.1
Gross domestic product 500,355 100.0
Table 2 Growth rates of GDP components (% per annum)
GDP Consumption Investment
Government
expenditure Exports
1990 4.8 4.4 8.8 4.3 5.7
1991 3.8 2.3 2.8 3.8 �0.9
1992 1.0 2.2 �2.0 2.8 �0.3
1993 0.3 1.7 �2.8 2.9 �7.3
1994 0.6 2.5 �2.4 2.0 0.3
1995 1.4 2.1 0.2 4.6 2.8
1996 3.6 3.0 8.3 2.9 9.2
FUNDAMENTALS OF BUSINESS ECONOMICS 285PREPA
RIN
GFO
RTH
EA
SSESSM
EN
T
2006.1

(i) From table 1 identify the three injections into the circular flow. (3 marks)
(ii) State whether slow GDP growth would be expected to raise, lower or be of no
effect on each of the following:
� the level of employment;
� the government budget surplus;
� the level of imports. (3 marks)
REVISION QUESTIONS C4286PREPA
RIN
GFO
RTH
EA
SSESSM
EN
T
2006.1
Solutions to RevisionQuestions
Solution 1Solution (D)
Opportunity costs arise from the scarcity of resources. When an economy is fully
employed, the output of one good can only be increased by decreasing the output of
another. Thus the real, or opportunity, cost of a good is the value of the foregone
production.
Solution 2Solution (A)
Economies and diseconomies of scale refer to the long-run cost curve, hence (C) and
(D) are incorrect. Diminishing returns is the short-run process which leads to rising costs.
Short-run average costs thus fall because fixed costs are spread over a larger output.
Solution 3Solution (C)
The theory of the firm states that firms are profit maximisers. Thus, to be in
equilibrium, where the firm would have no incentive to raise or lower output, the firm
would have to be at the profit maximising level of output.
Solution 4Solution (A)
(B) and (C) are the conditions necessary for profit maximisation to take place and (D)
refers to the use of profits whether the firm is efficient or not. The necessary condition for
the pursuit of profits to lead to efficiency is competition; when competition is restricted
firms may make profits without being efficient.
287 2006.1
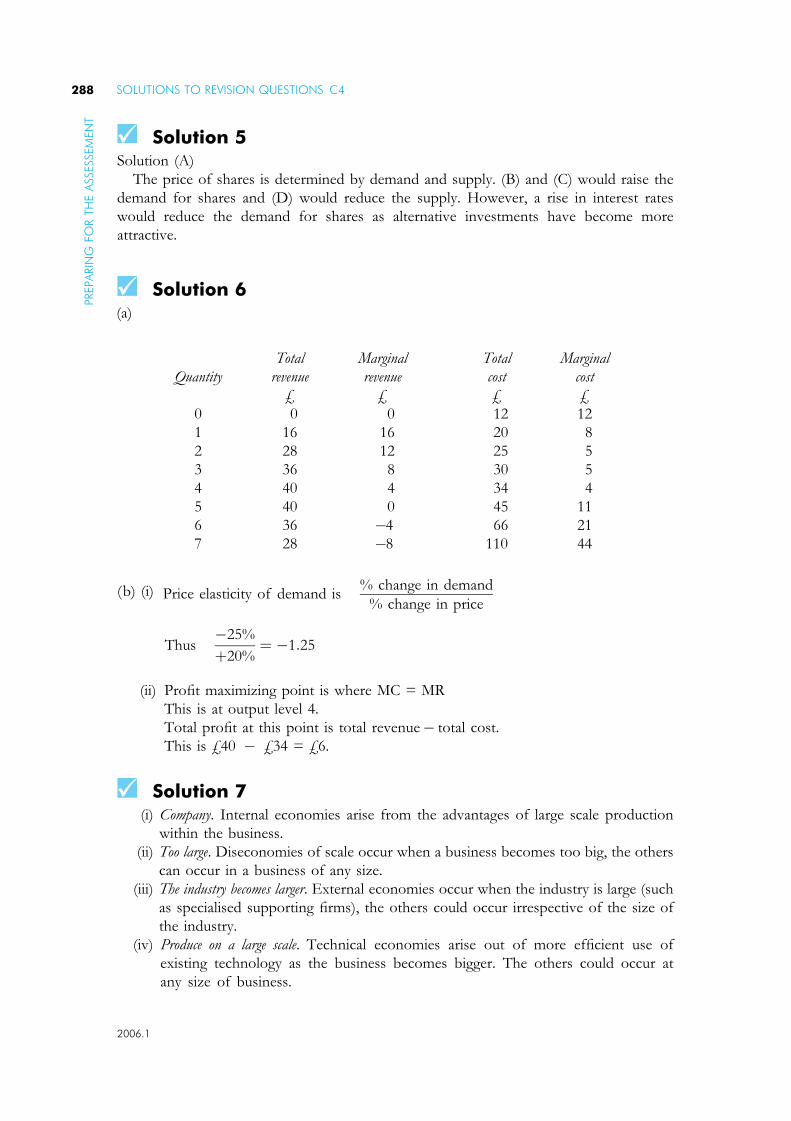
Solution 5Solution (A)
The price of shares is determined by demand and supply. (B) and (C) would raise the
demand for shares and (D) would reduce the supply. However, a rise in interest rates
would reduce the demand for shares as alternative investments have become more
attractive.
Solution 6(a)
(b) (i) Price elasticity of demand is% change in demand
% change in price
Thus�25%
þ20%¼ �1:25
(ii) Profit maximizing point is where MC = MR
This is at output level 4.
Total profit at this point is total revenue� total cost.
This is £40 � £34 = £6.
Solution 7(i) Company. Internal economies arise from the advantages of large scale production
within the business.
(ii) Too large. Diseconomies of scale occur when a business becomes too big, the others
can occur in a business of any size.
(iii) The industry becomes larger. External economies occur when the industry is large (such
as specialised supporting firms), the others could occur irrespective of the size of
the industry.
(iv) Produce on a large scale. Technical economies arise out of more efficient use of
existing technology as the business becomes bigger. The others could occur at
any size of business.
Quantity
Total
revenue
Marginal
revenue
Total
cost
Marginal
cost
£ £ £ £
0 0 0 12 12
1 16 16 20 8
2 28 12 25 5
3 36 8 30 5
4 40 4 34 4
5 40 0 45 11
6 36 �4 66 21
7 28 �8 110 44
SOLUTIONS TO REVISION QUESTIONS C4288PREPA
RIN
GFO
RTH
EA
SSESSEM
EN
T
2006.1

Solution 8Statement whether each of the following statements is true of false.
(i) Economies of scale will give a cost advantage to existing firms thus making it
difficult for new firms to enter an industry.
(ii) Economies of scale will favour large firms thus smaller firms will go out of
business, reducing the number in the industry.
(iii) Diseconomies of scale affect the long-run average cost curve not the short-run cost
curve.
(iv) Constant returns to scale occur when total costs and total output rise at the same
rate thus keeping average costs constant.
Solution 9
(a) (i) The firm’s marginal revenue is given in the table above.
(ii) The firm’s marginal cost is given in the table above.
(iii) The firm’s fixed costs are £110.
Statement True False
(i) Economies of scale act as a barrier to entry into an industry X
(ii) If there are significant economies of scale, the number
of firms in the industry will tend to be small.
X
(iii) Diseconomies of scale cause the short-run average cost
curve to rise.
X
(iv) If output rises at the same rate as average cost rises,
this is called constant returns to scale.
X
Output
Total
revenue
TR
Marginal
revenue
TRn-TRn-1
Total
costs
TC
Marginal
costs
TCn-TCn-1
Total
profit
TR-TC
0 110
1 50 50 140 30 �90
2 100 50 162 22 �62
3 150 50 175 13 �25
4 200 50 180 5 20
5 250 50 185 5 65
6 300 50 194 9 106
7 350 50 219 25 121
8 400 50 269 50 131
9 450 50 325 56 125
10 500 50 425 100 75
FUNDAMENTALS OF BUSINESS ECONOMICS 289PREPA
RIN
GFO
RTH
EA
SSESSEM
EN
T
2006.1

(b) (i) The firm will maximise profits where marginal cost and marginal revenue are
equal; this is at output level 8.
(ii) Total profit at this level of output will be the difference between total costs and
total revenue; this is £131.
Solution 10Solution (D)
Anyone with an interest in the behaviour of a business, whether profit seeking or
not, is a stakeholder in that business. All of these may have a legitimate interest in the
business.
Solution 11Solution (C)
All of the others have been recommended by various bodies such as the Greenbury
Committee. The Committee also recommended greater, not less, use of non-executive
directors.
Solution 12(a) the calculation for the net present value is to discount each years income thus
Year 1 $5000/(1.1) = $4545
Year 2 $5000/(1.1)2 = $4132
Year 3 $10000/(1.1)3 = $7513
Thus NPV of the project is $16190
(b) the calculation now becomes
Year 1 $5000/(1.1) = $4545
Year 2 $5000/(1.1)2 = $4132
Year 3 $8000/(1.1)3 = $6011
Thus the NPV of the project is $14688
(c) the calculation now becomes
Year 1 $5000/(1.05) = $4762
Year 2 $5000/(1.05)2 = $4535
Year 3 $10000/(1.05)3 = $8639
Thus the NPV of the project is $17936.
Solution 13Solution (C)
The equilibrium price is where demand and supply are equal. If the price is forced above
this level, it will lead to an extension of supply and a contraction of demand and a surplus
would exist in the market.
SOLUTIONS TO REVISION QUESTIONS C4290PREPA
RIN
GFO
RTH
EA
SSESSEM
EN
T
2006.1

Solution 14Solution (A)
If a reduction in the price of 10% resulted in a fall in total revenue of 10%, then, since
revenue is equal to price multiplied by the quantity sold, the quantity sold must have stayed
the same. This implies that the price has no effect on the quantity demanded: the demand
is perfectly inelastic.
Solution 15Solution (D)
The essential feature of oligopoly is that of interdependence: the effects of policy
decisions are crucially affected by the reaction of rival firms. Thus pricing decisions
must always take into account how rival firms are likely to react to reductions or rises
in price.
Solution 16Solution (C)
Responses (A), (B) and (D) all refer to conditions of demand which affect the
position of the demand curve. Response (C) refers to the price of the good itself; a
change in this would lead to a movement along the demand curve, not a shift in the
curve itself.
Solution 17Solution (B)
Efficient resource allocation requires that prices reflect costs. Prices will only reflect
private costs since social costs are those not incurred by the producers. To correct this, the
government should impose an indirect tax equal to the difference between private and
social costs.
Solution 18Solution (D)
A horizontal merger is one between firms producing similar goods at the same stage of
production. (A) is an example of vertical integration and (C) is a conglomerate merger. (B)
might be a merger of any sort.
Solution 19Solution (B)
The kinked demand curve shows that, under conditions of oligopoly, price competition
may be dangerous and reduce the firm’s revenue; hence there is a preference for avoiding
price changes and to concentrate on non-price competition.
FUNDAMENTALS OF BUSINESS ECONOMICS 291PREPA
RIN
GFO
RTH
EA
SSESSEM
EN
T
2006.1
Solution 20
(i) An indirect tax shifts supply curve.
(ii) The burden of tax would be shifted most to consumers when the demand curve
for the product was price inelastic.
(iii) If the demand for the product was price inelastic.
(iv) Sales/output of the good would fall most when the demand for the good was price
elastic.
Solution 21Solution (A)
If trade unions secure a wage increase for their members, employment is likely to
fall since the demand curve for labour like any other demand curve slopes downwards.
A rise in price of labour (wages) will thus reduce the demand for labour and decrease
employment.
Solution 22
(i) 3.% change in the demand for coffee
% change in the price of coffee.
(ii) 1. price elastic.
(iii) 3. a large rise in price and a small fall in sales.
(iv) 3. a small rise in the sales of tea and a large rise in its price.
Solution 23
Statement True False
(i) A change in supply of a good will have the largest
effect on price when the demand is price elastic.
X
(ii) The cross elasticity of demand measures the
relationship between the demand for one good
and the demand for another
X
(iii) If the cross elasticity of demand has a negative value,
it shows that the two goods are complements.
X
(iv) A change in the demand for a good will have no effect
on the price if the supply of the good is perfectly price
elastic.
X
SOLUTIONS TO REVISION QUESTIONS C4292PREPA
RIN
GFO
RTH
EA
SSESSEM
EN
T
2006.1

Solution 24The firm will:
(i) produce a total output of Q3 in part C of the diagram since here the combined
marginal revenue is equal to the marginal cost of production;
(ii) sell in each market an amount where the marginal cost of production is equal to the
marginal revenue in that market, that is Q2 in the market B and Q1 in market A;
(iii) charge a price determined by the demand for the product in each market, that is P2
in market B and P1 in market A.
Solution 25Solution (D)
All of the first three are attempts to limit competition in one way or another.
However, (D), the use of advertising, is not since advertising is one form of competition
and is particularly important in some markets, especially oligopolies.
Solution 26
(i) PED =%change in demand
% change in pricethus
þ20%
�10%hence PED ¼ �2
(ii) PES =% change in supply
% change in pricethus
þ5%
þ10%hence PES ¼ þ0:5
(iii) Revenue at $10 is $10� 100 = $1000
$9 is $9� 120 = $1080 thus change in revenue is +$80
Solution 27Solution (C)
If there are positive net social costs, private producers who do not pay these additional
costs will tend to overproduce the good or service. To correct this the government can
reduce demand by making the price more closely reflect total costs. It can do this by
imposing a tax on the product.
Solution 28Solution (B)
(A) and (D) would increase competition by raising the number of firms in the market.
(C) would increase competition because it would raise consumer awareness of competing
products. However, (B) would give a cost advantage to the larger firms and erect a barrier
to entry; the number of firms will fall and competition will decrease.
Solution 29Solution (A)
Since, in the short run, the business will have to pay fixed costs whatever the level of
output, the minimum they must cover is the additional variable costs of the service. Any
income above this will go towards paying the fixed cost that must be met anyway.
FUNDAMENTALS OF BUSINESS ECONOMICS 293PREPA
RIN
GFO
RTH
EA
SSESSEM
EN
T
2006.1
Solution 30
Solution 31Solution (D)
Venture capital is that invested in new and high-risk enterprises by buying shares in
those businesses.
Solution 32Solution (D)
The public sector borrowing requirement or public sector net cash requirement
(PSNCR) is the difference between government expenditure and its income from taxation;
this deficit must be financed by borrowing. Only (D) represents this borrowing. (A) and
(B) would reduce the deficit and (C) has no direct relevance.
Solution 33Solution (C)
The other three are services provided by typical commercial banks, but not by all financial
institutions. But (C) is the core function of financial intermediation performed by all
financial institutions.
Statement True False
(i) If the supply of a good decreases, its price will
rise and the demand curve for the product will
shift to the left.
X
(ii) The supply of a good is described as price inelastic
if a fall in price leads to a smaller proportionate fall
in the quantity supplied
X
(iii) If a tax is imposed on a good, the burden of the tax
shifted to consumers will be greatest when the demand
for the good is price inelastic.
X
(iv) If the demand for a good has a price elasticity of�1 then
a 10% fall in price will lead to a 10% fall in demand.
X
SOLUTIONS TO REVISION QUESTIONS C4294PREPA
RIN
GFO
RTH
EA
SSESSEM
EN
T
2006.1
Solution 34
Solution 35Solution (C)
Fiscal policy is concerned with the government budget and the balance of taxation and
public expenditure. This is the responsibility of the government, not the central bank.
Solution 36Solution (B)
Insurance can only be obtained for risks that are predictable, not likely to affect all those
insured simultaneously and can be measured. A fall in sales in a trade downturn cannot be
predicted and might affect all firms. Moreover, the fall in sales might be the result of a
wide range of factors.
Solution 37
Statement True False
(i) Governments will have a financial deficit if the
country’s imports exceed exports.
X
(ii) Companies need financial intermediaries if their
receipts exceed their payments.
X
(iii) Governments can finance their budget deficits
by raising taxation.
X
(iv) An overdraft is a means for individuals to meet
short-term lack of liquidity.
X
Event
Rise in the
exchange
rate
Fall in the
exchange
rate
Leave the
exchange
rate
unaffected
(i) A rise in interest rates in the country. X
(ii) A rise in the demand for imports in
the country.
X
(iii) A significant short-term fall in share
prices in the country.
X
(iv) Purchase of foreign exchange by the
country’s central bank.
X
FUNDAMENTALS OF BUSINESS ECONOMICS 295PREPA
RIN
GFO
RTH
EA
SSESSEM
EN
T
2006.1

Solution 38Solution (D)
Government revenue is not directly affected by interest rates. Indeed, since the
government has a net debt (‘the national debt’) its expenditure would rise rather than its
revenue. This is because with higher interest rates, the cost of servicing the national debt
would increase.
Solution 39
(i) Treasury bills M money market
(ii) Certificates of deposit M money market
(iii) Corporate bonds C capital market
(iv) Mortgages C capital market
(v) Bills of exchange M money market
Solution 40Solution (A)
The benefit of a single currency would include reduced exchange rate uncertainty (there
are no exchange rates within the eurozone) and because no currency would be exchanged
on intra-European trade, transactions costs would fall, not rise.
Solution 41
Solution 42Solution (B)
The other three are all means of acquiring short-term liquidity to meet a short-term
shortfall in finances. However, issuing shares is means of raising long-term finance
typically for investment purposes.
Statement True False
(i) A insurance broker undertakes the task of
underwriting but not reinsurance.
X
(ii) Reinsurance occurs when an insurer shares
the risk and the premiums with the other insurers.
X
(iii) Insurers will not insure against events they know
it will occur.
X
SOLUTIONS TO REVISION QUESTIONS C4296PREPA
RIN
GFO
RTH
EA
SSESSEM
EN
T
2006.1

Solution 43Solution (D)
Increased borrowing by the government is likely to lead to a rise in interest rates. This,
in turn, will normally depress share prices. Moreover, increased borrowing tends to inject
expenditure into the economy, thus raising the rate of inflation.
Solution 44Solution (C)
A withdrawal from the circular flow is a process that removes expenditure from the
circular flow. Investment and exports add expenditure to the flow and are, therefore,
injections. Profit is form of income and is neither an injection nor a withdrawal.
Solution 45(i) Any two of the following:
Consumption expenditure
Investment expenditure
Government expenditure
Net exports.
(ii) Point C at income level D (i.e. where income and expenditure are equal).
(iii) Gap EF (i.e. the level of expenditure is less than the level of income).
Solution 46Solution (C)
In the upswing phase of the trade cycle aggregate demand rises. This increases inflation-
ary pressure(‘demand pull inflation’) and pulls in extra imports worsening the
balance of payments. Cyclical unemployment will tend to fall but not structural
unemployment which is caused by long term not cyclic factors. However, the increase in
income raises tax revenue and the fall in unemployment reduces government expenditure.
The government budget moves towards surplus.
Solution 47Solution (D)
All of the other are payments in return for an economic good or service. However,
educational grants and scholarships are transfers between taxpayers and students and are not
in return for an economic goods or service.
Solution 48(i) D this is inside the production possibility frontier.
(ii) C this is close to the horizontal axis and far from the vertical axis.
(iii) A this is close to the vertical axis and far from the horizontal axis.
(iv) E this is a move to a higher possibility frontier where more of all goods can be
produced.
FUNDAMENTALS OF BUSINESS ECONOMICS 297PREPA
RIN
GFO
RTH
EA
SSESSEM
EN
T
2006.1

Solution 49Solution (A)
The natural rate of unemployment is where the demand and supply for labour are equal
and is known as the vertical long run Phillips curve. Attempts to reduce unemployment
below this level merely led to higher inflation. Responses (C) and (D) are true statements,
but have nothing to do with the natural rate hypothesis.
Solution 50Solution (D)
Transnational companies (also known as multinational companies) may have all of the
characteristics listed here. But the defining feature of such companies is that they produce
their good or service in more than one country. A company producing in just one country
may have all three of the other characteristics.
Solution 51(i) National output would fall as the AS curve would move to the left.
(ii) National output would rise as the AS curve would move to the right.
(iii) National output would rise as the AD curve would move to the right.
(iv) National output would fall as the AD curve would move to the left.
Solution 52Solution (B)
The WTO’s main functions are to promote free trade, resolve trade disputes and
provide a framework of trade rules. However, it has no financing function. This is left to
the other international bodies such as the IMF and the World Bank.
Solution 53
(i) � $20 billion Trade in goods, credits minus debits ($164–$184).
(ii) � $5 billion All trade in goods and services, credits and debits for trade in
goods, trade in services, investment income and transfers.
(iii) � $11 billion Direct investment abroad minus inward direct investment.
(iv) � $18 billion All credit minus all debits.
Solution 54Solution (B)
Responses (A), (C) and (D) are all payments for economic services received. All would
thus appear on the current account as invisible items. However, the flows of investment
are flows of capital and therefore appear on the capital account.
SOLUTIONS TO REVISION QUESTIONS C4298PREPA
RIN
GFO
RTH
EA
SSESSEM
EN
T
2006.1

Solution 55Solution (C)
The EU is a common market and thus has no internal barriers to the movement of
either goods, services or factors of production. It also maintains a common external
tariff, but indirect taxes, for example, VAT still vary from one member state to
another. The Single European Market project is designed to progressively reduce these
tax differences.
Solution 56
Solution 57Solution (D)
Increase output requires extra energy and raw materials. So a shortage of either would
constrain the rate of economic growth. Also, environmental damage from pollution may
become unacceptable (e.g. global warming) and thus places limits on output. Increased
trade does none of these things and generally tend to raise productivity and hence
economic growth.
Solution 58Solution (C)
All of the others are features of globalisation but (C) cannot happen. The terms of
trade measure the relationship between the prices of exports and imports. If they
improve for one trading partner, they must, by definition, deteriorate for the other
trading partner.
Statement True False
(i) The heaviest indirect taxes tend to be on goods
with a high price elasticity of demand.
X
(ii) An indirect tax is one where the incidence and
the burden of the tax fall on different persons.
X
(iii) Indirect taxes on imports are desirable since the
burden of the tax falls on the foreign producer.
X
(iv) Direct taxes are preferred to indirect taxes
because they are always progressive.
X
FUNDAMENTALS OF BUSINESS ECONOMICS 299PREPA
RIN
GFO
RTH
EA
SSESSEM
EN
T
2006.1

Solution 59
Solution 60(i) The three injections are:
� Domestic fixed capital formation
� Government consumption expenditure
� Exports.
(ii) Slow GDP growth would be expected to:
� Lower the level of employment
� Reduce the government budget surplus
� Lower the level of imports.
Statement True False
(i) If a country imposes trade barriers on its imports,
that country’s economic welfare will be reduced.
X
(ii) An advantage of flexible exchange rate regimes is
that uncertainty is reduced for business.
X
(iii) Advantage of fixed exchange rate regimes is that
they make trade deficits less likely to occur.
X
(iv) Free trade enables a country to re-allocate its
resource to more productive uses.
X
SOLUTIONS TO REVISION QUESTIONS C4300PREPA
RIN
GFO
RTH
EA
SSESSEM
EN
T
2006.1

Mock Assessment


Mock Assessment
Paper CO4Fundamentals of Business Economics
Instructions: attempt all 75 questions
Time allowed 2 hours
Do not turn the page until you are ready to attempt the assessment under timed
conditions
303 2006.1

Mock Assessment – Questions
Question 1Which ONE of the following would lead directly to an outward shift in a country’s
production possibility frontier?
(A) A rise in the population of working age.
(B) A fall in unemployment.
(C) An increase in outward migration.
(D) A rise in the school leaving age.
(2 marks)
Question 2The cost of one good or service measured in terms of what must be sacrificed to obtain it
is called:
(A) real cost.
(B) potential cost.
(C) opportunity cost.
(D) social cost.
(2 marks)
Question 3The following financial data refers to a company.
What is the value of the rate of return on capital for this company?
(2 marks)
Question 4All of the following are essential features of a market economy EXCEPT which ONE?
(A) Private ownership of productive resources.
(B) Allocation of resources by the price mechanism.
(C) Absence of entry and exit barriers to and from industries.
(D) Prices determined by market forces.
(2 marks)
Capital employed 1.1.06 $900000
Capital employed 31.12.06 $1100000
Gross profits for year ending 31.12.06 105000
Interest payments year ending 31.12.06 20000
Tax paid on profits year ending 31.12.06 15000
MOCK ASSESSMENT C4304M
OC
KA
SSESSM
EN
T
2006.1
Question 5Consider the following data for business:
Output Fixed Cost
Total Variable
Cost
Marginal
Revenue
10 $100 $150 $12
11 $100 $164 $12
12 $100 $176 $12
13 $100 $199 $12
14 $100 $236 $12
15 $100 $275 $12
From this data you are required to calculate for this business:
(A) the average cost of production at output level 10.
(B) the marginal cost of production at output level 11.
(C) the optimum level of output for this business.
(D) the profit maximising level of output for this business.
(4 marks)
Question 6A business will maximise profits only if it produces where:
(A) average cost = marginal revenue.
(B) marginal cost = marginal revenue.
(C) average cost = average revenue.
(D) marginal cost = average revenue.
(2 marks)
Question 7Consider the following data for a proposed investment project.
Capital cost of the project $7000
Life of the investment 3 years
Scrap value of the capital at end of Year 3 $500
Income generated by the project
Year 1 $2000
Year 2 $3000
Year 3 $2000
From this data you are required to calculate:
(a) The net present value for the project assuming a discount rate of 10%
(2 marks)
(b) Is this project profitable for the company yes/no
(1 mark)
(c) The net present value for the project assuming a discount rate of
6% and a final scrap value of $1000
(2 marks)
FUNDAMENTALS OF BUSINESS ECONOMICS 305M
OC
KA
SSESSM
EN
T
2006.1

Question 8The price earnings ratio is measured by:
(A) Dividing earnings per share by the market price of the share.
(B) Dividing the current market price of the share by the earnings per share.
(C) Dividing the earnings per share by the rate of discount.
(D) Dividing the current market price of the share by total profits.
(2 marks)
Question 9All of the following would be expected to raise share values EXCEPT which one?
(A) An announcement of higher than expected profits.
(B) A reduction in corporation tax.
(C) A rise in interest rates.
(D) A rise in share prices on overseas stock markets.
(2 marks)
Question 10The . . . (i)........ in a company are all those who have an interest in the strategy and
behaviour of the . . . (ii)........ Their interest may not always coincide with those of
the . . . (iii)........ who are principally interested in . . . (iv)........ The task of . . . . (v)........ is
to attempt to reconcile these conflicting interests.
Read the above passage and indicate where each of the following words should be placed
in the passage.
(A) Management
(B) Shareholders
(C) Stakeholders
(D) Company
(E) Profits
(5 marks)
Question 11State whether each of the following statements about limited liability companies are true or false.
(3 marks)
Statement True False
(i) Shareholders are not liable for the debts of the company.
(ii) Owners always exercise day-to-day decision making authority.
(iii) Owners share in the profits of the company, but not necessarily
in proportion to the number of shares that they own.
MOCK ASSESSMENT C4306M
OC
KA
SSESSM
EN
T
2006.1

Question 12The principal–agent problem refers to:
(A) situations where a company’s selling agents are not meeting the company’s main
sales targets.
(B) problems arising when a principal delegates authority to an agent but cannot ensure
the agent will always act in his/her interest.
(C) cases where companies lack knowledge of particular markets and have to seek
agents to act of their behalf.
(D) the power a large company may exert over suppliers when it is the dominant buyer
of that suppliers output.
(2 marks)
Question 13For each of the following economic processes, indicate whether the effect on the short run
average cost for a firm would be to raise the cost curve, lower the cost curve or to leave the
cost curve unaffected.
(4 marks)
Question 14Indicate whether each of the following statements is true or false.
(4 marks)
Economic process Raise
curve
Lower
curve
Leave curve
unaffected
A rise in wage costs
Increase opportunities for economies
of scale.
A fall in the price of raw materials
A shift in the demand curve to
the left
Statement True False
The law of diminishing returns shows how long run cost
tends to rise as if the scale of output becomes too great
A firm’s short run cost curve is always U shaped; the long
cost curve may or may not be
For most firms technological change is one of the most
important economies of scale
Economies of scale act as barrier to entry to industries.
FUNDAMENTALS OF BUSINESS ECONOMICS 307M
OC
KA
SSESSM
EN
T
2006.1

Question 15Indicate whether each of the following are typical characteristics of an oligopoly
market (yes/no).
(4 marks)
Question 16State whether each of the following statements is true or false.
(4 marks)
Question 17If a business currently sells 10,000 units of its product per month at $10 per unit and the
demand for its product has a price elasticity of �2.5, a rise in the price of the product to $11 will:
(A) raise total revenue by $7,250.
(B) reduce total revenue by $17,500.
(C) reduce total revenue by $25,000.
(D) raise total revenue by $37,500.
(2 marks)
Characteristic Yes No
A large number of small firms
A preference for non-price competition over price competition
Interdependence of decision making
Ease of entry and exit to and from the industry.
Statement True False
Collusion is more likely in oligopoly markets than in
other markets
If there are economies of scale, a monopoly firm
may charge lower prices than equivalent firms
facing competition
Oligopolistic firms can never achieve lower long run costs
than could competitive firms in the same industry
Oligopolistic firms can make excess profits but only in the
short run.
MOCK ASSESSMENT C4308M
OC
KA
SSESSM
EN
T
2006.1
Question 18In the kinked demand curve model of oligopoly, the kink in the firm’s demand curve is
due to the firm’s belief that competitors will:
(A) set a price at the kink of the demand curve.
(B) will match all price increases and price reductions.
(C) will match any price increases, but not any price reductions.
(D) will match any price reductions, but not any price increases.
(2 marks)
Question 19Which ONE of the following is a natural barrier to the entry of new firms into an industry?
(A) Large initial capital costs.
(B) The issuing of patents.
(C) A government awarded franchise.
(D) The licensing of professions.
(2 marks)
Question 20The following data refers to an industry consisting of 6 companies.
You are required to calculate:
(a) the market shares for each company.
(b) the four-firm concentration ratio for this industry.
(3 marks)
Question 21If the market supply curve for a good is inelastic, an increase in demand will:
(A) Raise total sales proportionately more than it will raise the market price.
(B) Raise total sales proportionately less than it will raise the market price.
(C) Raise the market price but leave total sales unaffected.
(D) Raise total sales but leave the market price unchanged.
(2 marks)
Company Sales Market Share
No 1 1200
No 2 800
No 3 600
No 4 600
No 5 500
No 6 500
No 7 450
No 8 350
The four-firm concentration ratio
FUNDAMENTALS OF BUSINESS ECONOMICS 309M
OC
KA
SSESSM
EN
T
2006.1

Question 22Mergers between businesses engaged in the same stage of production of a similar good or
service are known as:
(A) Horizontal mergers.
(B) Conglomerate mergers.
(C) Vertical mergers.
(D) Cross mergers.
(2 marks)
Question 23A good which is characterised by both rivalry and excludability is called:
(A) a public good.
(B) a private good.
(C) a government good.
(D) an external good.
(2 marks)
Question 24The burden of an indirect tax on a good will fall more heavily on the producer when:
(A) demand for the good is price elastic.
(B) demand for the good is price inelastic.
(C) demand for the good has unit elasticity.
(D) supply of the good is price elastic.
(2 marks)
Question 25In practice a monopoly may have its market power limited by all of the following
EXCEPT which ONE?
(A) Countervailing power from its customers.
(B) The market may be contestable.
(C) There may be close substitutes for the good.
(D) The firm’s long run average cost curve may be falling.
(2 marks)
Question 26The following is a list of possible sources of market failure.
(i) Externalities
(ii) Monopoly power
(iii) Public goods and services
(iv) Merit goods
(v) Monopsony power
(vi) Lack of knowledge
MOCK ASSESSMENT C4310M
OC
KA
SSESSM
EN
T
2006.1
For each of the following cases, indicate which one of the above sources of market
failure matches the case given:
(A) Businesses fail to properly train their employees because they fear that they will
move to other firms after their training.
(B) There is a failure to provide efficient street cleaning services because it is impossible for
the service providers to ensure that all who benefited from the services paid for them.
(C) Employers pay their workers wages which are below their productivity – their
marginal revenue product.
(D) A company’s marginal revenue is not equal to the price of the good it produces and
it therefore does not equate price with marginal cost.
(2 marks)
Question 27Which ONE of the following is the best example of a merit good?
(A) Street lighting.
(B) A national defence force.
(C) Company cars for top sales executives.
(D) A system of public libraries.
(2 marks)
Question 28There are three types of mergers
(i) Horizontal mergers
(ii) Vertical mergers
(iii) Conglomerate mergers
Match the following reasons for a merger with the appropriate type of merger listed above.
(A) To increase monopoly power and control over the market.
(B) To ensure control over supplies of raw materials and components.
(C) To secure economies of scale.
(D) To reduce risk by diversifying the range of products sold and the range of markets.
(4 marks)
Question 29State whether the following statements about the privatisation of state industries are true or false.
(4 marks)
Statement True False
(i) Privatisation increases the commercial pressure on the
business to make a profit.
(ii) Privatisation ensures the business faces competition and so
encourages greater efficiency.
(iii) Privatisation is a means of solving the principal–agent problem.
(iv) Privatisation is likely to make the business more responsive
to needs of its customers.
FUNDAMENTALS OF BUSINESS ECONOMICS 311M
OC
KA
SSESSM
EN
T
2006.1

Question 30Which of the following are features of monopolistic competition?
(i) Large numbers of producers in the industry.
(ii) Differentiated products.
(iii) Companies producing at less than optimum output.
(iv) Monopoly profits in the long run.
(A) (i), (iii) and (iv) only.
(B) (ii), (iii) and (iv).
(C) (i), (ii) and (iii) only.
(D) (i), (ii) and (iv) only.
(2 marks)
Question 31The cobweb theorem:
(A) shows that, without intervention some agricultural prices will fall continuously over
time.
(B) explains why some agricultural prices are characterised by instability from one year
to another.
(C) shows that when some agricultural prices are disturbed, prices steadily return to
their equilibrium level.
(D) the imposition of minimum prices in agricultural products always lead to unsold
surpluses.
(2 marks)
Question 32The following diagram shows the cost and revenue curves for a monopoly firm. The firm
is producing at output level Q1.
The firm = the industry
Price
Quantity
MC = S
AR = D
AC
MR
C
P
X
Q1 Q2
MOCK ASSESSMENT C4312M
OC
KA
SSESSM
EN
T
2006.1

You are required to:
(a) State whether the firm is producing at, above or below the optimum level of
output. at/above/below
(b) State whether the firm is producing at, above or below the profit maximising level
of output. at/above/below.
(c) Identify the abnormal (monopoly) profits the firm is currently earning.
(3 marks)
Question 33The necessary conditions for a firm to be able to practice price discrimination are:
(i) The firm must be a price setter.
(ii) The markets must be kept separate.
(iii) The price elasticity of demand must be different in each market.
(iv) Customers in each market must not be aware of the prices changed in other markets.
(A) (i), (ii) and (iii) only.
(B) (i), (ii) and (iv) only.
(C) (ii), (iii) and (iv) only.
(D) all of them.
(2 marks)
Question 34If an indirect tax is imposed on a good or service:
(A) The price will rise by an amount equal to the tax.
(B) The producer decides on how much of the tax to pass on to the customer.
(C) The price rise will be smaller the greater is the price elasticity of demand.
(D) The price rise will be greater the smaller is the price elasticity of supply.
(2 marks)
Question 35All of the following are examples of where externalities are likely to occur EXCEPT
which ONE?
(A) A business providing training schemes for its employees.
(B) Government expenditure on vaccination programmes for infectious diseases.
(C) Attending a concert given by a government funded orchestra.
(D) Private motorists driving cars in city centres.
(2 marks)
Question 36Whenever government intervention prevents prices from reaching their equilibrium level,
the result will always include ALL of the following EXCEPT which ONE?
(A) Shortages or surpluses.
(B) Demand and supply not equal.
(C) Reduced profits for producers.
(D) Resources not allocated by price.
(2 marks)
FUNDAMENTALS OF BUSINESS ECONOMICS 313M
OC
KA
SSESSM
EN
T
2006.1

Question 37A rise in the price of a good accompanied by a fall in the quantity sold would result from
(A) a decrease in supply.
(B) an increase in demand.
(C) a decrease in demand.
(D) an increase in supply.
(2 marks)
Question 38If the demand curve for Good A shifts to the left when the price of Good B rises, we may
conclude that
(A) the goods are substitutes.
(B) Good A is an inferior good.
(C) the goods are complements.
(D) the demand for Good A is price elastic.
(2 marks)
Question 39The introduction of a national minimum wage will lead a business to reduce its number
of employees most when
(A) the demand for its final product is price elastic.
(B) wage costs are a small proportion of total costs.
(C) there is a low degree of substitutability between capital and labour.
(D) the supply of substitute factors of production is price inelastic.
(2 marks)
Question 40The following is a list of different types of market structure.
� Perfect competition
� Monopolistic competition
� Oligopoly
� Monopoly
Match to each of the following situations the market structure that is being described.
(2 marks)
Situation Market Structure
(i) In the long run, abnormal profits are competed away by the
entry of new firms and for each firm output will be the optimum
level of output.
(ii) The behaviour of any one firm is conditioned by how it expects
its competitors to react to its price and output decisions.
MOCK ASSESSMENT C4314M
OC
KA
SSESSM
EN
T
2006.1
Question 41Which one of the following is NOT a characteristic of not-for-profit organisations?
(A) They need efficient and effective management.
(B) They make financial surpluses and deficits.
(C) They have a range of stakeholders.
(D) The absence of any principal–agent problem.
(2 marks)
Question 42In order to finance an excess of expenditure over taxation receipts, a government could:
(A) reduce its current expenditure.
(B) issue government bonds.
(C) raise income tax.
(D) run an overdraft on its account with the World Bank.
(2 marks)
Question 43A business could use all of the following to finance a lack of synchronisation in its short-
term payments and receipts EXCEPT which ONE?
(A) a bank overdraft.
(B) trade credit.
(C) its cash reserves.
(D) a hire purchase agreement.
(2 marks)
Question 44A risk that an organisation may not be able to realise its assets to meet a commitment
associated with financial instruments is known as:
(A) credit risk.
(B) liquidity risk.
(C) interest rate risk.
(D) currency risk.
(2 marks)
Question 45State whether each of the following financial instruments appearing on a commercial
bank’s balance sheet is an asset or liability for the bank.
(4 marks)
Instrument Asset Liability
Advances
Money at call with discount houses
Deposit accounts
Shareholder capital
FUNDAMENTALS OF BUSINESS ECONOMICS 315M
OC
KA
SSESSM
EN
T
2006.1

Question 46If banks are required to keep a reserve assets ratio of 10% and also wish to keep a margin
of liquid reserves of 10%, by how much would deposits ultimately rise by if they acquire an
additional $1000 of reserve assets?
(A) $10000
(B) $5000
(C) $1000
(D) $500
(2 marks)
Question 47If a commercial banks reallocates some of its assets from less profitable to more profitable
ones,
(A) the bank’s liquidity will be increased.
(B) the safety of the bank’s assets will be increased.
(C) the bank’s liquidity will be decreased.
(D) the liquidity and safety of the bank’s assets will be unaffected.
(2 marks)
Question 48Which of the following statements about the relationship between bond prices and bond
yields is true?
(A) They vary positively.
(B) They vary inversely.
(C) They vary inversely or positively depending on business conditions.
(D) They are not related.
(2 marks)
Question 49Read the following passage.
A business will need to insure itself against a range of risks. It can do so by employing
a . . . . . .(i). . . to seek out the most appropriate insurance policies. If the risks involved are
very large the insurance company . . . . . .(ii). . . . . . the risk may engage in . . .(iii). . . . . . the
risk with other companies.
You are required to indicate which of the following words should placed in each of the
gaps in the passage.
(a) Broker
(b) General insurance company
(c) Reinsuring
(d) Underwriting
(e) Assuring
(3 marks)
MOCK ASSESSMENT C4316M
OC
KA
SSESSM
EN
T
2006.1
Question 50Under a regime of flexible exchange rates, which one of the following would lead to a rise
in the exchange rate for a country’s currency?
(A) a shift in the country’s balance of payments current account towards a surplus.
(B) a rise in interest rates in other countries.
(C) an increasing balance of trade deficit.
(D) the central bank buying foreign exchange on the foreign exchange market.
(2 marks)
Question 51Exchange rates are determined by supply and demand for currencies in the foreign
exchange market. State whether each of the following would be part of the supply of a
country’s currency or part of the demand for that country’s currency.
(2 marks)
Question 52Each of the following is a source of funds for capital investment for business except one.
Which ONE is the EXCEPTION?
(A) Commercial banks.
(B) Internally generated funds.
(C) The stock market
(D) The central bank.
(2 marks)
Question 53The linking of net savers with net borrowers is known as:
(A) the savings function.
(B) financial intermediation.
(C) financial regulation.
(D) a store of value.
(2 marks)
Statement Supply Demand
Payments for imports into the country.
Inflows of capital into the country.
Purchases of foreign currency by the country’s central bank.
FUNDAMENTALS OF BUSINESS ECONOMICS 317M
OC
KA
SSESSM
EN
T
2006.1
Question 54If a consumer price index rises, it shows that
(A) the value of the currency has increased.
(B) real consumer income has fallen.
(C) all prices in the economy have risen.
(D) the purchasing power of money has decreased.
(2 marks)
Question 55The main function of the money market is to
(A) enable businesses and governments to obtain liquidity.
(B) encourage saving.
(C) permit the efficient buying and selling of shares.
(D) deal in credit instruments of more than one year maturity.
(2 marks)
Question 56The effects of low real interest rates include all of the following EXCEPT which ONE?
(A) Credit based sales will tend to be high.
(B) Nominal costs of borrowing will always be low.
(C) Business activity will tend to increase.
(D) Investment will be encouraged.
(2 marks)
Question 57Which ONE of the following would cause the value of the multiplier to fall?
(A) A fall in the level of government expenditure.
(B) A rise in the marginal propensity to consume.
(C) A fall in business investment.
(D) A rise in the marginal propensity to save.
(2 marks)
Question 58The recession phase of the trade cycle will normally be accompanied by all of the
following EXCEPT which ONE?
(A) A rise in the rate of inflation.
(B) A fall in the level of national output.
(C) An improvement in the trade balance.
(D) A rise in the level of unemployment.
(2 marks)
MOCK ASSESSMENT C4318M
OC
KA
SSESSM
EN
T
2006.1

Question 59According to the new classical school, in order to manage the economy governments
should:
(A) use active fiscal and monetary policy.
(B) adopt a laissez faire approach and leave everything to market forces.
(C) announce monetary rules to control inflation, and liberalise product and factor
markets.
(D) use only monetary policy to increase output and employment.
(2 marks)
Question 60The following is a list of types of unemployment.
Structural unemployment
Cyclical unemployment
Real wage (classical) unemployment
Frictional unemployment.
Seasonal unemployment
Match the above types of unemployment to the following definitions.
(2 marks)
Question 61All of the following will lead to a fall in the level of economic activity in an economy
EXCEPT which ONE?
(A) A rise in cyclical unemployment.
(B) A fall in business investment.
(C) A decrease in government expenditure.
(D) A rise in interest rates.
(2 marks)
Definition of unemployment Type of unemployment
(i) Unemployment that occurs in particular industries
and arises from long-term changes in the patterns
of demand and supply.
(ii) Unemployment associated with industries or regions
where the demand for labour and wage rates regularly
rise and fall over the year.
FUNDAMENTALS OF BUSINESS ECONOMICS 319M
OC
KA
SSESSM
EN
T
2006.1
Question 62The best measure of the standard of living in a country is
(A) gross domestic product per capita.
(B) per capita personal consumption.
(C) gross national product per capita.
(D) personal disposable income.
(2 marks)
Question 63Supply side policy is designed to
(A) raise the level of aggregate monetary demand in the economy.
(B) manage the money supply in the economy.
(C) improve the ability of the economy to produce goods and services.
(D) reduce unemployment by limiting the supply of labour.
(2 marks)
Question 64Indicate whether each of the following taxes are direct taxes or indirect taxes.
(4 marks)
Question 65International trade is best explained by the fact that:
(A) all countries have an absolute advantage in the production of something.
(B) all countries have specialised in the production of certain goods and services.
(C) no country has an absolute advantage in the production of all goods and
services.
(D) all countries have a comparative advantage in the production of something.
(2 marks)
Type of tax Direct Indirect
Income tax
Value added tax
Corporation tax
National insurance (social security tax)
MOCK ASSESSMENT C4320M
OC
KA
SSESSM
EN
T
2006.1
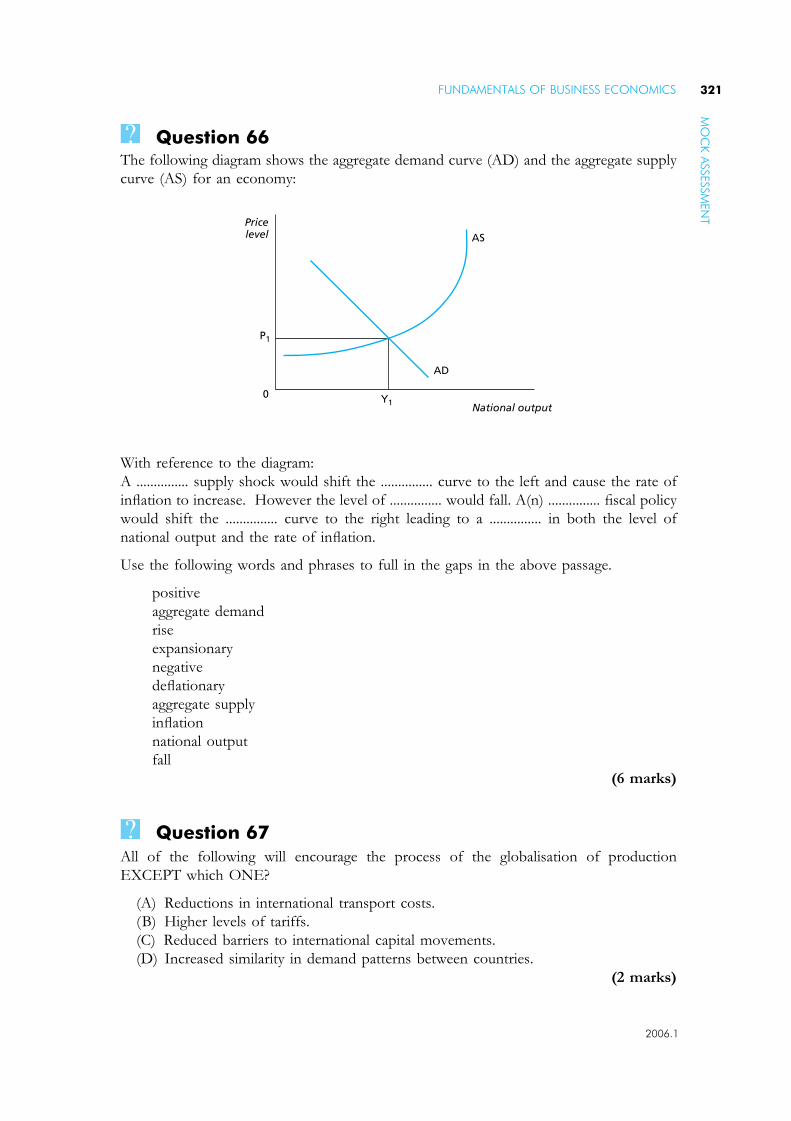
Question 66The following diagram shows the aggregate demand curve (AD) and the aggregate supply
curve (AS) for an economy:
With reference to the diagram:
A ............... supply shock would shift the ............... curve to the left and cause the rate of
inflation to increase. However the level of ............... would fall. A(n) ............... fiscal policy
would shift the ............... curve to the right leading to a ............... in both the level of
national output and the rate of inflation.
Use the following words and phrases to full in the gaps in the above passage.
positive
aggregate demand
rise
expansionary
negative
deflationary
aggregate supply
inflation
national output
fall
(6 marks)
Question 67All of the following will encourage the process of the globalisation of production
EXCEPT which ONE?
(A) Reductions in international transport costs.
(B) Higher levels of tariffs.
(C) Reduced barriers to international capital movements.
(D) Increased similarity in demand patterns between countries.
(2 marks)
Pricelevel
National output
AD
0
AS
P1
Y1
FUNDAMENTALS OF BUSINESS ECONOMICS 321M
OC
KA
SSESSM
EN
T
2006.1

Question 68Intra-industry trade occurs when a country:
(A) exports and imports different products.
(B) exports and imports the same products.
(C) imports materials to be used by its domestic industry.
(D) exports materials for use in industries in other countries.
(2 marks)
Question 69Which ONE of the following shows the lowest degree of international mobility?
(A) Unskilled labour.
(B) Financial capital.
(C) Technical knowledge.
(D) Management.
(2 marks)
Question 70Identify which of the following statements about the balance of payments is true and
which is false.
(4 marks)
Question 71A fall in the exchange rate for a country’s currency will improve the balance of payments
current account if:
(A) the price elasticity of demand for imports is greater than for exports.
(B) the price elasticity of demand for exports is greater than for imports.
(C) the sum of the price elasticities for imports and exports is less than one.
(D) the sum of the price elasticities for imports and exports is greater than one.
(2 marks)
Statement True False
(i) A deficit on a country’s balance of payments current
account can be financed by a surplus of invisible earnings.
(ii) Flows of profits and interest on capital appear in the
Capital Account.
(iii) Flexible exchange rate systems should, in principle,
prevent persistent current account imbalances.
(iv) Current account deficits tend to worsen in periods of
rapid economic growth.
MOCK ASSESSMENT C4322M
OC
KA
SSESSM
EN
T
2006.1

Question 72All of the following are benefits which all countries gain when adopting a single currency
such as the Euro, EXCEPT which ONE?
(A) Reduced transactions costs.
(B) Increased price transparency.
(C) Lower interest rates.
(D) Reduced exchange rate uncertainty.
(2 marks)
Question 73For each of the following events, indicate whether the direct effect of each on an economy
would raise inflation, reduce inflation or leave the rate of inflation unaffected. Assume that
the economy is close to full employment.
(4 marks)
Question 74Compared to a fixed exchange rate system, an economy will benefit from a flexible
exchange rate system because:
(A) it enables businesses to vary their export prices.
(B) governments will not have to deflate the economy when balance of payments
deficits occur.
(C) it reduces the cost of acquiring foreign exchange.
(D) it ensures that businesses never become uncompetitive in international markets.
(2 marks)
Event
Raise
inflation
Lower
inflation
Leave
inflation
unchanged
(i) A rise (appreciation) in the exchange for
the country’s currency.
(ii) A significant increase in the money
supply.
(iii) The removal of house prices from the
consumer price index.
(iv) A rise in business expectations leading to
an increase in investment.
FUNDAMENTALS OF BUSINESS ECONOMICS 323M
OC
KA
SSESSM
EN
T
2006.1
Question 75All of the following statements are true EXCEPT which ONE?
(A) Import quotas tend to reduce prices.
(B) Trade protection tends to reduce consumer choice.
(C) Trade protection tends to reduce exports.
(D) Tariffs tend to reduce competition.
(2 marks)
MOCK ASSESSMENT C4324M
OC
KA
SSESSM
EN
T
2006.1
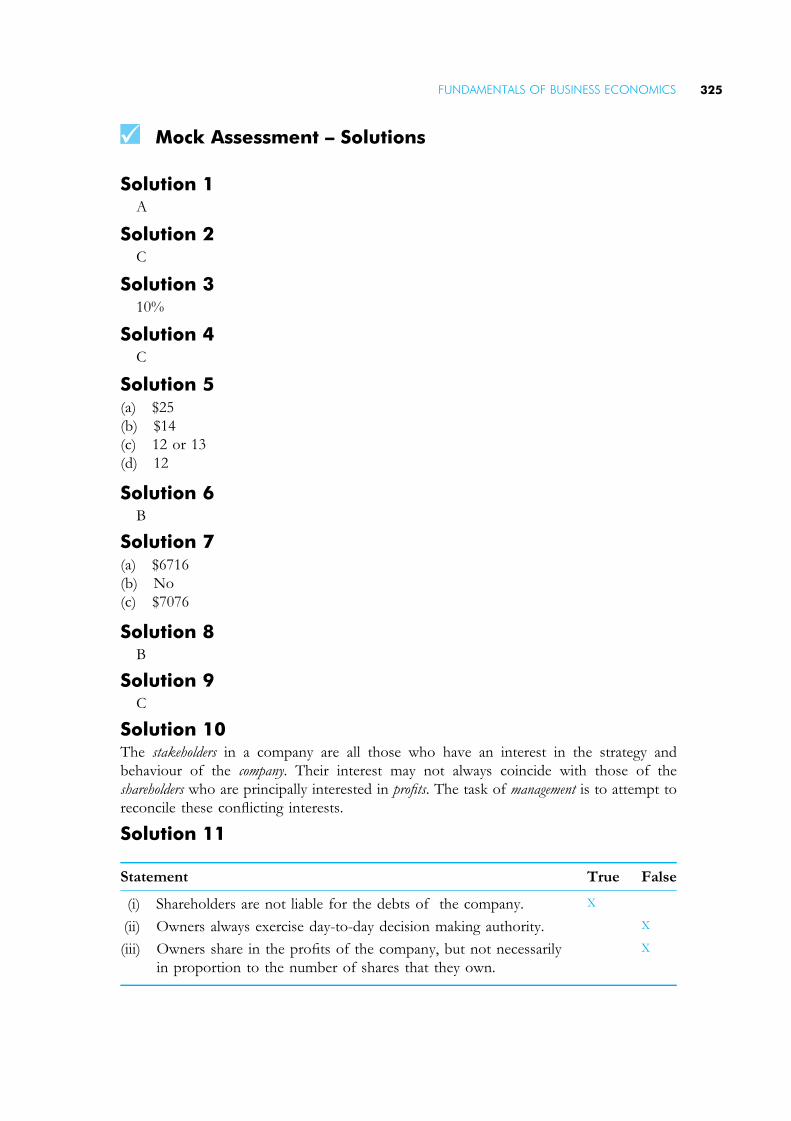
Mock Assessment – Solutions
Solution 1A
Solution 2C
Solution 310%
Solution 4C
Solution 5(a) $25
(b) $14
(c) 12 or 13
(d) 12
Solution 6B
Solution 7(a) $6716
(b) No
(c) $7076
Solution 8B
Solution 9C
Solution 10The stakeholders in a company are all those who have an interest in the strategy and
behaviour of the company. Their interest may not always coincide with those of the
shareholders who are principally interested in profits. The task of management is to attempt to
reconcile these conflicting interests.
Solution 11
Statement True False
(i) Shareholders are not liable for the debts of the company. X
(ii) Owners always exercise day-to-day decision making authority. X
(iii) Owners share in the profits of the company, but not necessarily
in proportion to the number of shares that they own.
X
FUNDAMENTALS OF BUSINESS ECONOMICS 325
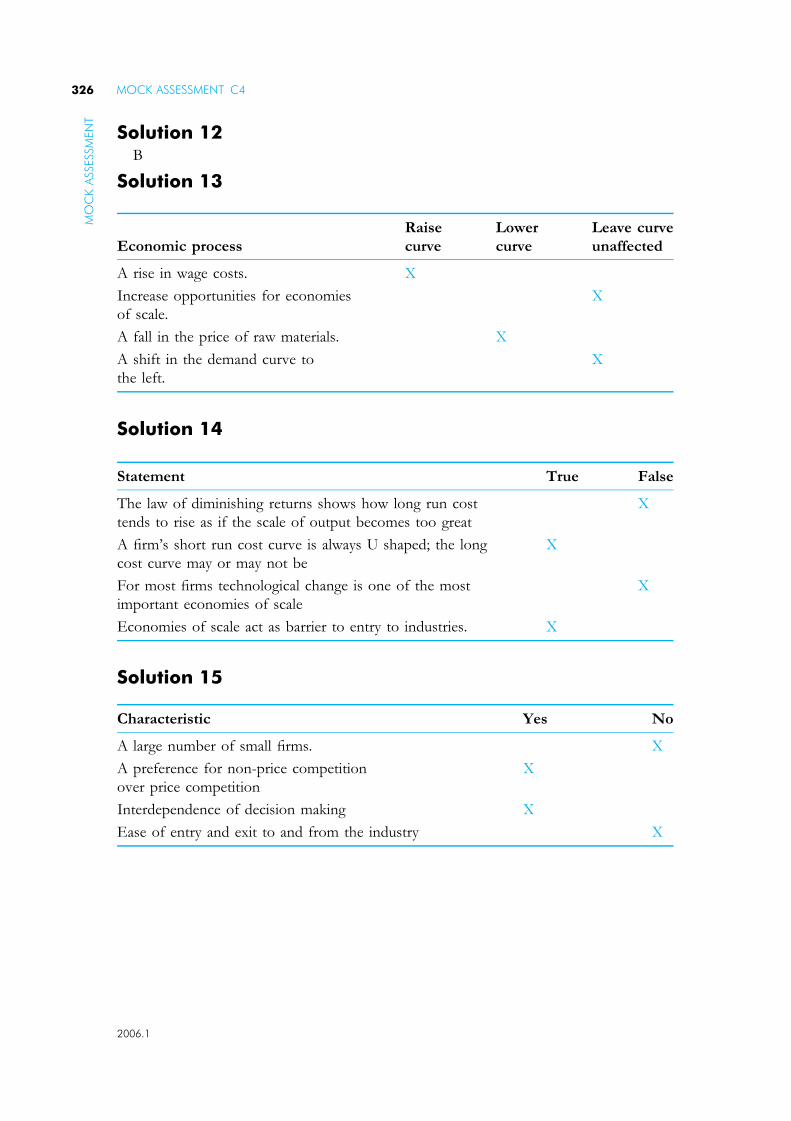
Solution 12B
Solution 13
Solution 14
Solution 15
Economic process
Raise
curve
Lower
curve
Leave curve
unaffected
A rise in wage costs. X
Increase opportunities for economies
of scale.
X
A fall in the price of raw materials. X
A shift in the demand curve to
the left.
X
Statement True False
The law of diminishing returns shows how long run cost
tends to rise as if the scale of output becomes too great
X
A firm’s short run cost curve is always U shaped; the long
cost curve may or may not be
X
For most firms technological change is one of the most
important economies of scale
X
Economies of scale act as barrier to entry to industries. X
Characteristic Yes No
A large number of small firms. X
A preference for non-price competition
over price competition
X
Interdependence of decision making X
Ease of entry and exit to and from the industry X
MOCK ASSESSMENT C4326
2006.1
MO
CK
ASSESSM
EN
T

Solution 16
Solution 17B
Solution 18D
Solution 19A
Solution 20
Solution 21B
Solution 22A
Solution 23B
Statement True False
Collusion is more likely in oligopoly markets than in
other markets
X
If there are economies of scale, a monopoly firm
may charge lower prices than equivalent firms
facing competition
X
Oligopolistic firms can never achieve lower long run costs
than could competitive firms in the same industry
X
Oligopolistic firms can make excess profits but only in the
short run.
X
Company Sales
Market Share
(in %)
No 1 1200 24
No 2 800 16
No 3 600 12
No 4 600 12
No 5 500 10
No 6 500 10
No 7 450 9
No 8 350 7
The four-firm concentration ratio 64%
FUNDAMENTALS OF BUSINESS ECONOMICS 327
2006.1327 2006.1
MO
CK
ASSESSM
EN
T

Solution 24A
Solution 25D
Solution 26(a) (i) Externalities
(b) (iii) Public goods and services
(c) (v) Monopsony power
(d) (ii) Monopoly power
Solution 27D
Solution 28(a) (i) Horizontal merger
(b) (ii) Vertical merger
(c) (i) Horizontal merger
(d) (iii) Conglomerate merger
Solution 29
Solution 30C
Solution 31B
Solution 32(a) Below the optimum output.
(b) At the profit maximising level.
(c) Area PC�Q1
Statement True False
(i) Privatisation increases the commercial pressure on the
business to make a profit.
X
(ii) Privatisation ensures the business faces competition
and so encourages greater efficiency.
X
(iii) Privatisation is a means of solving the
principal–agent problem.
X
(iv) Privatisation is likely to make the business more
responsive to needs of its customers.
X
MOCK ASSESSMENT C4328
2006.1
MO
CK
ASSESSM
EN
T

Solution 33A
Solution 34C
Solution 35C
Solution 36C
Solution 37A
Solution 38C
Solution 39A
Solution 40
Solution 41D
Solution 42B
Solution 43D
Solution 44B
Situation Market Structure
(i) In the long run, abnormal profits are competed away by
the entry of new firms and for each firm output will be the
optimum level of output.
Perfect competition
(ii) The behaviour of any one firm is conditioned by how it
expects its competitors to react to its price and output
decisions.
Oligopoly
FUNDAMENTALS OF BUSINESS ECONOMICS 329M
OC
KA
SSESSM
EN
T
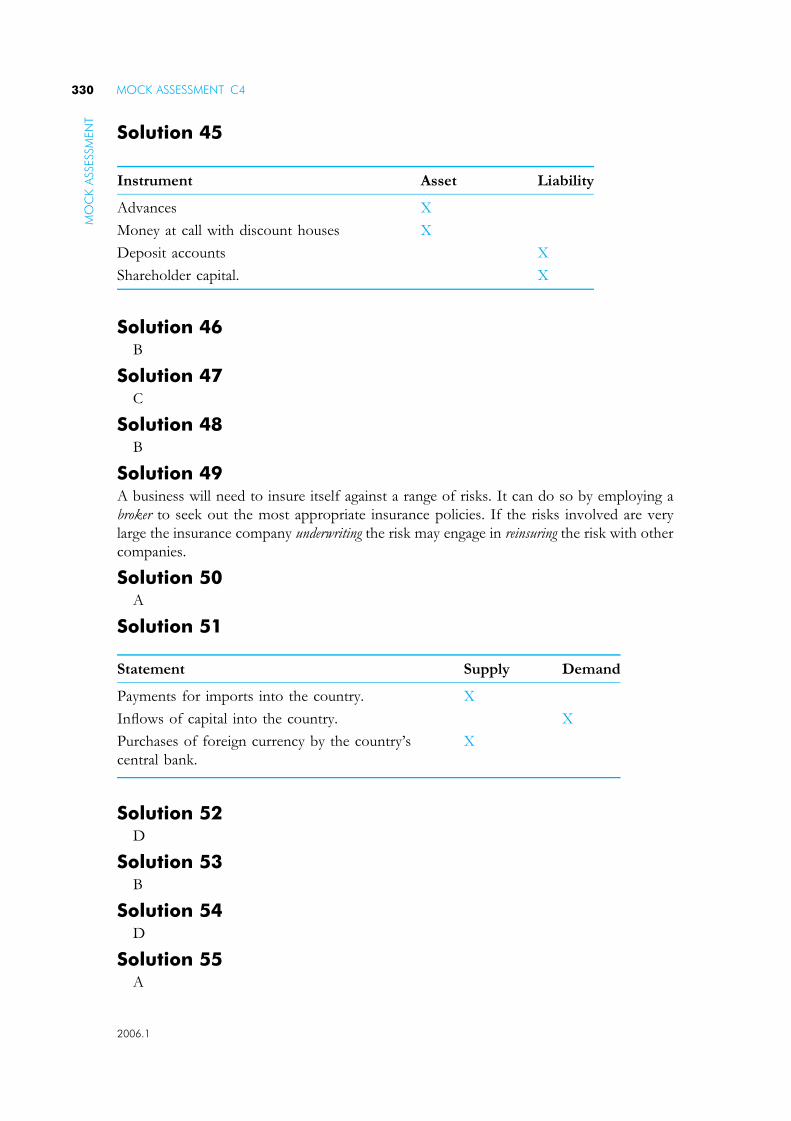
Solution 45
Solution 46B
Solution 47C
Solution 48B
Solution 49A business will need to insure itself against a range of risks. It can do so by employing a
broker to seek out the most appropriate insurance policies. If the risks involved are very
large the insurance company underwriting the risk may engage in reinsuring the risk with other
companies.
Solution 50A
Solution 51
Solution 52D
Solution 53B
Solution 54D
Solution 55A
Instrument Asset Liability
Advances X
Money at call with discount houses X
Deposit accounts X
Shareholder capital. X
Statement Supply Demand
Payments for imports into the country. X
Inflows of capital into the country. X
Purchases of foreign currency by the country’s
central bank.
X
MOCK ASSESSMENT C4330
2006.1
MO
CK
ASSESSM
EN
T

Solution 56B
Solution 57D
Solution 58A
Solution 59C
Solution 60
Solution 61A
Solution 62B
Solution 63C
Solution 64
Solution 65D
Solution 66A negative supply shock would shift the aggregate supply curve to the left and cause the rate
of inflation to increase. However the level of national output would fall. An expansionary.
fiscal policy would shift the aggregate demand curve to the right leading to a rise in both the level
of national output and the rate of inflation.
Definition of unemployment Type of unemployment
(i) Unemployment that occurs in particular
industries and arises from long-term
changes in the patterns of demand and supply.
Structural unemployment
(ii) Unemployment associated with industries or regions
where the demand for labour and wage rates regularly
rise and fall over the year.
Seasonal unemployment
Type of tax Direct Indirect
Income tax X
Value added tax X
Corporation tax X
National insurance (social security tax) X
FUNDAMENTALS OF BUSINESS ECONOMICS 331M
OC
KA
SSESSM
EN
T
2006.1
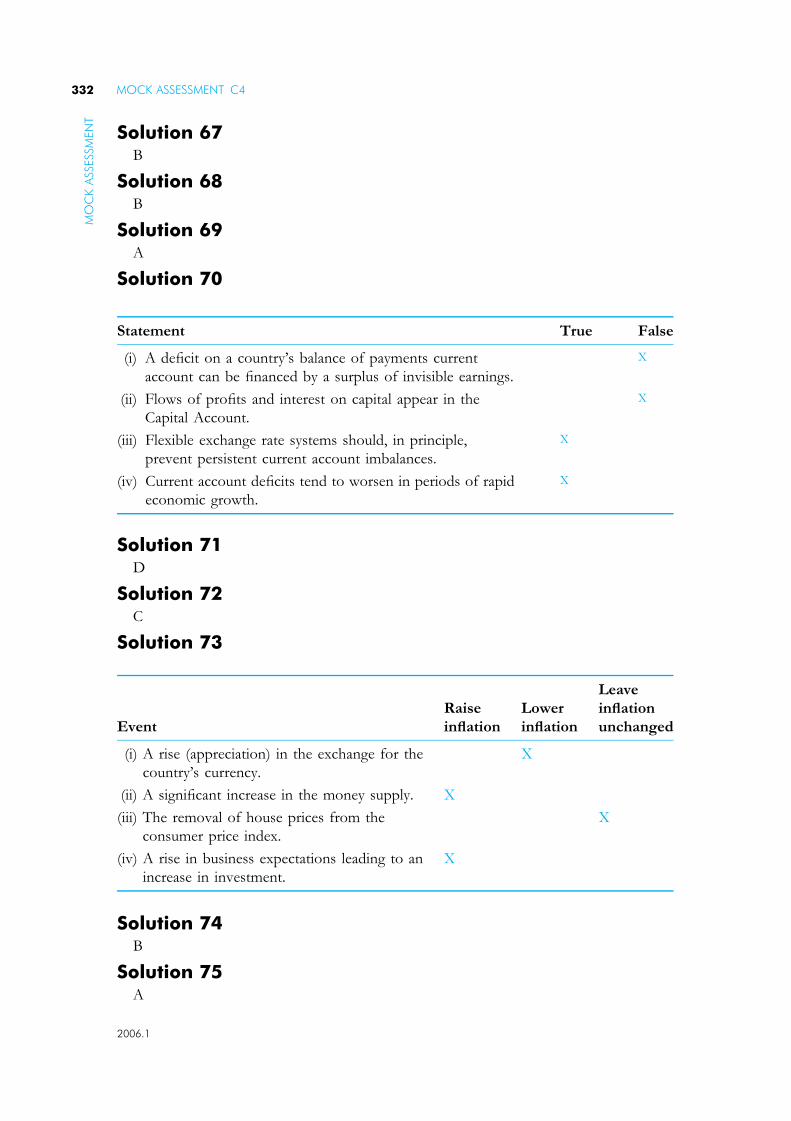
Solution 67B
Solution 68B
Solution 69A
Solution 70
Solution 71D
Solution 72C
Solution 73
Solution 74B
Solution 75A
Statement True False
(i) A deficit on a country’s balance of payments current
account can be financed by a surplus of invisible earnings.
X
(ii) Flows of profits and interest on capital appear in the
Capital Account.
X
(iii) Flexible exchange rate systems should, in principle,
prevent persistent current account imbalances.
X
(iv) Current account deficits tend to worsen in periods of rapid
economic growth.
X
Event
Raise
inflation
Lower
inflation
Leave
inflation
unchanged
(i) A rise (appreciation) in the exchange for the
country’s currency.
X
(ii) A significant increase in the money supply. X
(iii) The removal of house prices from the
consumer price index.
X
(iv) A rise in business expectations leading to an
increase in investment.
X
MOCK ASSESSMENT C4332
2006.1
MO
CK
ASSESSM
EN
T

Index
Abnormal profits, 10, 76, 78
Absolute advantage theory, 229
Accelerator effect, 171
Accelerator theory, 171
Accounts, 242–5
Ageing population, 203
Aggregate monetary demand (AMD), 169, 174, 197, 222
Aggregate supply curve (AS), 176, 177
Agricultural prices, 63
AIM see Alternative Investment Market (AIM)
Allocation of resources, 20, 80, 239
Allocative efficiency, 74, 77, 91
Alternative Investment Market (AIM), 133, 136
AMD see Aggregate monetary demand (AMD)
monetary demand, 169, 171, 174, 197
APC see Average costs
propensity to consume, 166
Arc elasticities, 49
AS see Aggregate supply curve (AS)
Assessments:
format, 264
planning, 263
preparation, 261
revision questions, 265
revision techniques, 263
tips, 264
weightings, 264
work patterns, 264
Assets, 130, 136, 192
Authorised institutions, 122, 124
Average costs, 12, 14, 15
Average propensity to consume (APC), 166
Balance of payments, 191, 228, 232, 242–50
accounts, 242–5
capital accounts, 191, 243–4
current accounts, 122–3, 138
deficits, 119, 191, 203
deflation, 249
disequilibrium, 240, 245–7
fiscal policy, 197–205
J-curve effects, 248–9
policies, 247–50
protection, 232–4
Bank of England:
actions, 129–30
background, 240
control, 32, 249–50
functions, 114, 121, 125
inflation, 115–16, 139, 167, 173, 189, 194, 196, 222
interest rates, 136–8, 167, 194–5
monetary policy, 139–41, 193–7
Banks, 122, 125, 129
assets, 130–32, 136–8, 192
balance sheets, 132, 141
Bank of England:
control, 196, 204, 222
credit creation, 128–43
definition, 122
functions, 114–16, 121, 125
liabilities, 125, 127, 130–2
new developments, 130
open market operations, 140
supervision, 126, 141–2
Barriers to entry, 79, 98
Behavioural theories, 9
Benefits, 68, 228
Bills, 126, 132, 140
Black markets, 66
Bond markets, 136
Borrowing:
government, 203
see also Public sector . . .Brain drain, 201
Breakeven issues, 11, 12, 87
Budget deficits, 119, 203
Building societies, 124
Businesses:
cycles, 221
organisation, 7–9
start-up schemes, 84
see also Firms
CAP see Common Agricultural Policy (CAP)
Capital, 5, 24, 118, 157, 170, 244
accounts, 123–5, 242–5
consumption, 157
economic growth determinants,
190–3, 220–4
international comparisons, 156, 161
international markets, 126–8
marginal efficiency, 170
markets, 126–8
production, 4–6, 12
venture capital, 133
Capital adequacy:
rules, 126, 141
Cartels, 64, 82, 92
Cash flows, 142
Cash ratio, 128–9
CC see Competition Commission (CC)
CDs see Certificates of Deposit (CDs)
Certificates of Deposit (CDs), 132
China, 7, 160–1
333 2006.1

Circular flow of income, 162–3, 171
consumption, 164–6
investments, 130, 132
multiplier effect, 171–2
savings, 162–5
Clearing banks, 122, 141
Cobweb theorem, 63–4
Coefficient of elasticity, 49
Collusion issues, market structures, 70–4, 79–80
Commercial banks, 122, 125, 142
Commercial bills, 123–4, 126
Common Agricultural Policy (CAP), 64
Common markets, 225
Companies Act 1989, 93
Comparative advantage theory, 229–31
Competing ends, 4
Competition:
cost reductions, 17
free trade, 225–6, 230
imperfect competition, 71–3, 79–82
legislation, 81, 93
monopolistic competition, 71–2, 79–80
perfect competition, 71–2, 75–7, 84–5
policies, 222–4, 247–50
prevention, 181
processes, 36, 155, 190
Competition Acts, 93–6
Competition Commission (CC), 67, 93–5
Concentration ratios, 70
Conglomerates, 69
Consumer goods, 6, 115
Consumers:
behaviour, 7, 9, 28, 47–54
needs, 47, 92
surpluses, 9, 87, 244
tastes, 53
wants, 4, 114
Consumption:
capital, 5, 157
circular flow of income, 162–3
households, 117, 164–6
Contestable markets, 84
Controls:
Bank of England, 122, 140, 142
credit, 128–43, 167
imports, 232, 249–50
reductions, 17, 58, 98
Cost-plus pricing, 55, 56
Cost-push inflation, 180
Costs:
average costs, 14–15
competition, 95
definitions, 12
economic growth, 190–3, 220–4
externalities, 90–1
fixed costs, 12, 18
marginal costs, 12–14, 90
opportunity costs, 20, 223
production, 69
sunk costs, 84
transactions, 124, 138, 226, 244
unemployment, 173–77
variable costs, 12, 55
Council Tax, 199
Credit, 128–43, 167
control, 67
creation, 128–43
demand-pull inflation, 179, 180, 187
external limitations, 197, 231–2
Cross-elasticity of demand, 52
Current account, balance of payments, 228, 242–51
Custom unions, 225
Customers, segmented markets, 71
Cycles, businesses, 221
Cyclical unemployment, 182–3
Decisions:
new theories of the firm, 55
output, 75–85
prices, 60–7, 75–86
production, 4–5
Deficit budgets, 119, 183, 202–203
Deflation, 249
see also Inflation
Demand:
aggregation, 174–8
conditions, 53–4
contractions, 53–4
curves, 48–50
deficiencies, 183
elasticity, 49–52
expansions, 53–4
individual, 47–8
Keynesian theory, 166, 180, 205, 240
money, 138–9
prices, 60–7, 174
savings, 167
for the film, 77
Demand-pull inflation, 179
Demergers, 69
Demographic factors, 222
Depreciation, 224, 247–9
Deregulations, 88–9, 124, 127
Devaluation, 247, 248
Diminishing marginal returns, 13–15
Diminishing marginal utility, 13
Direct taxation, 166, 202
Dirty floating actions, 239, 247
Discount houses, 126, 140
Discounted cash flows, 169–70
Diseconomies of scale, 15, 17–18
Disequilibrium, balance of payments, 239, 245–7
Distribution networks, 223
Diversification, 69
Doha trade meeting, 234
Duopolies, 73, 82
EC see European Economic Community (EEC)
ECB see European Central Bank (ECB)
Economic diamond, 205–206
Economic growth, 190–3, 220–4
China, 70, 160–1
economic diamond, 205–206
environmental impacts, 224
influencing factors, 221–2
international comparisons, 156, 161
policies, 190–1, 222–4
rates, 220–1
small firms, 123, 133
UK, 177, 220, 221
Economic policies see Policies
Economic welfare:
factors, 5
growth, 7, 220
FU
ND
AM
EN
TA
LSO
FBU
SIN
ESS
EC
ON
OM
ICS
INDEX334
2006.1

policies, 173, 191, 226
scarce resources, 4
sustainability, 224
unemployment, 179
Economies of scale:
concepts, 16
diseconomies, 17–18
external economies, 17
integration, 68–9
internal economies, 16
monopolies, 68
trade specialization, 228
types, 70, 198
Efficiency, 73–4
monopolies, 72, 88, 93–4
perfect competition, 72, 75–7
policies, 247–50
productivity, 16, 221, 223
Elasticity of demand, 49–52
Elasticity of supply, 57–8
Employment see Unemployment
Enterprise Act 2002, 93
Enterprise culture, 5, 94
Enterprise resources, 5, 7
Entry and exit barriers, 77
Environmental impacts, growth, 7, 224
Equilibria:
markets, 60–1, 65
monopolies, 67, 89, 93–5
national income, 155–7
perfect competition, 71–2, 75–7
Equity markets, 134–5
ERM see Exchange Rate Mechanism (ERM)
EU see European Union (EU)
Eurobonds, 128, 237
Europe:
economic growth, 190–3, 220–4
monetary integration, 67–9
single currency, 204, 242
trade, 173–8
European Central Bank (ECB), 125, 242
European Commission, 96–7
European Economic Community (EEC), 225
European Union (EU), 64, 96, 97
Euros, 97, 237
Excess demand, 61, 180, 185
Exchange Rate Mechanism (ERM), 237, 245, 248
Exchange rates, 196, 230, 236–7
changes, 226, 236–42
definitions, 236–7
depreciation, 247–9
dirty floating actions, 239, 247
economic diamond, 205–206
floating rates, 239
managed rates, 237
monetary policy, 139–41
systems, 237–9
theory of comparative advantage, 229
see also Foreign exchange
Exit see Entry and exit barriers
Expectations, Phillips curve, 187–8
Expenditure:
government, 167, 171–5, 183
method, 158
national income calculations, 160
public expenditure, 158, 161, 173, 203
switching, 248–9
Exports:
circular flow of income, 161–2, 171
globalization, 224–8
performance, 22, 246–7
protectionism, 226, 234
see also Imports
Externalities, 90–1
Fair Trading Act 1973, 94
Fashions see Tastes, consumers
Financial issues:
conglomerates, 69, 124, 130
economies, 17
innovations, 59, 130
intermediaries, 116, 121–5
PSNCR, 202–204
Firms:
consumption, 164–7
growth, 67–9
models, 63, 248
new theories, 55
perfect competition, 71–2, 75–7
profits, 76–8
size, 33, 226–7
small firms, 133
supply curves, 56–7
see also Businesses
Fiscal environment, 179, 202, 207
Fiscal policy, 197–205
Fixed capital, 168
Fixed costs, 12, 18
Floating exchange rates, 237–9
Foreign exchange, 127–8, 226, 236–42
see also Exchange rates
Foreign investment, 227, 241
Forward trading, 68, 237
France, 96, 222, 235
Free economies, 6, 62, 72, 225, 230
Free trade areas, 225
Frictional unemployment, 182
Full cost pricing, 56
Futures markets, 70, 145
GATT see General Agreement on Tariffs and Trade (GATT)
GDP see Gross domestic product (GDP)
General Agreement on Tariffs and Trade (GATT), 230, 235
Geographic markets, 78, 161, 182, 237
Germany, 189, 222, 234–5, 246–7
Globalization, 224–8
GNP see Gross national product (GNP)
Gold standard, 237
‘Golden rule’, 204
Goods, 4–6, 91–2, 115, 156, 197
Government:
banks, 122, 125, 138–43
bond markets, 136
borrowing, 125, 203–205
expenditure, 125–6, 164, 183
fiscal policy, 193, 197–205
income, 53, 119, 155–73
national debt, 120–1, 125, 136
policies, 167, 222, 224, 232
policy constraints, 20–6, 197
role, 6–7, 222
systems, 5, 31, 64, 142
see also Monetary policy; Public . . .
Government consumption, 167
2006.1
FU
ND
AM
EN
TA
LSO
FBU
SIN
ESS
EC
ON
OM
ICS
INDEX 335

Gross domestic product (GDP), 115, 156
Gross national product (GNP), 156–7, 224
Growth, economic welfare, 224, 227
Historical costs, 19
Horizontal integration, 68
Households, consumption, 164–7
Human resources, 201
see also Labour
Imperfect competition, 71–3
Imports:
circular flow of income, 162, 171
controls, 232, 249–50
penetration, 246
prices, 193, 195, 231, 249
protectionism, 234
restrictions, 58, 226, 233
unemployment, 179–89
see also Exports
Income:
circular flow, 162–73
demand, 51–2
effects, 248
elasticity of demand, 49–52
government, 198, 202
national income, 155–73
redistributions, 53
tax, 199, 201
Income method, national income calculation, 158–9
Index of sustainable economic welfare (ISEW), 224
Indirect taxation, 214
Industry:
nationalisation, 87–8
perfect competition, 71–2, 75–7
profits, 7, 9, 10, 22, 76
supply curves, 56–7
Inefficiencies, economic policies, 92, 233
Inferior goods, 48–9, 51
Inflation, 115
Bank of England, 122, 140, 142
cost-push, 180, 185–6
deflation, 249
demand-pull, 179–80, 185
economic diamond, 205–206
economic growth, 190–3
effects, 42, 179, 181
foreign exchange, 127–8, 226
gold standard, 237
measurement, 240
money supply, 180, 196
Phillips curve, 185–6
prices, 230
PSNCR, 202
retail prices, 89
savings, 17, 162–3, 168, 173
targets, 9, 32, 90
transmission mechanisms, 123, 130
unemployment, 173–89
Information, 13, 60, 72
injections, circular flow of income, 162–3, 171
Innovations, 59, 130
Integration:
diversification, 69
European monetary integration, 67–9
horizontal integration, 68
vertical integration, 68
Interest rates, 135–8
Bank of England, 122, 140, 142
central rate, 194
changes, 177–8
discounted cash flows, 24–5
Keynesian explanation, 205, 240–1
market rates, 137
monetarist explanation, 205, 241
real rates, 139, 167, 194
savings, 17, 162–9
single currency, 204
unemployment causes, 181–4
Internal economies, 16, 21
International issues:
capital, 5
markets, 126–8, 193, 221
trade, 228–35
Intervention prices, 64
Investment:
circular flow of income, 162–3, 171
determinants, 169
foreign investment, 227, 241
UK economy, 192
Invisible trade, 243–4
Ireland, 225
ISEW see Index of sustainable economic welfare (ISEW)
Italy, 79, 189, 235
Japan, 125, 183, 224, 234, 235, 241, 246
J-curve effect, 248–9
Keynesian theory:
circular flow of income, 162–3, 171
demand management, 173, 186–7
exchange rate changes, 240–2
inflation, 241
monetarism, 180
money supply, 180–1, 204–205
Phillips curve, 185–7
PSNCR, 202
taxation, 119, 197–205
Kinked demand curves, 81
Labour, 5, 17, 177, 184, 189
see also Unemployment; Wages
Laffer curves, 201
Land, 4, 5, 14, 221, 224
Large-scale production, 67–70
Legislation, competition policy, 82, 92–3
Lending, 24, 121–3, 237
Liabilities, 130–2, 192, 244
Liberalisation, trade, 223
Long run:
average costs, 12–16
equilibrium, 61, 76–8, 80
production, 15–16, 18–19
supply curves, 56–7
Long term:
exchange rate changes, 240–2
finance, 118, 128
Macroeconomics, 99, 155, 219
Man-made resources, 5
Managed exchange rates, 237
Managerial economies, 17
Managerial theories, 8
INDEX336FU
ND
AM
EN
TA
LSO
FBU
SIN
ESS
EC
ON
OM
ICS
2006.1

Manufacturing sector, 227
Marginal costs, 12–15, 75, 90
Marginal efficiency of capital (MEC), 170
Marginal output, 13–15
Marginal propensity to consume (MPC), 165–6
Marginal propensity to save (MPS), 172–3
Marginal revenues, 10, 55, 77
Marginal utility, 61
Markets:
black markets, 66
bonds, 136
capital, 126–8, 223, 227
competitive processes, 45–110
contestable markets, 84
demand, 48
equilibrium, 47, 65
equity, 118, 121, 133–4
Europe, 225–7
foreign exchange, 127
futures, 70, 145
government bonds, 134, 140
international markets, 126–8, 193, 221
market economies, 116, 173, 177
market share, 8, 68, 82, 231, 232
money, 126–7
policies, 222–3
power, 67, 70
prices, 65–7
segmented markets, 71
Stock Exchange, 17, 34, 67, 70, 72
structures, 70–4
taxation, 197
Maximum prices, 67, 89
Maximum profit, 11
MEC see Marginal efficiency of capital (MEC)
Merchant banks, 123–4
Mergers, 67–70, 94
European Commission, 96–8
investigations, 94–5
supermarkets, 27, 70
Merit goods, 5, 9, 91–2, 197
Milk quotas, 64
Minimum prices, 66
Mixed economies, 7
MMC (Monopolies and Mergers Commission)
see Competition Commission (CC)
MNCs see Multinational corporations (MNCs)
Monetarism:
exchange rate changes, 240–2
government policy, 166, 170, 177
inflation, 115, 167, 180–1
Keynesian theory, 205
money supply, 180, 196
PSNCR, 202–204
taxation, 119, 197–205
Monetary aggregates, 126, 167, 169,
312, 316, 484
Monetary conditions, inflation, 179, 196
Monetary environment, 146, 193, 196
Monetary policy:
Bank of England, 122, 140, 142
development, 130, 160, 177, 196
economic growth, 9–14, 117–19
framework, 162
limitations, 197
performance, 22–5, 156
post-1979, 196
PSNCR, 202–204
see also Policies
Money:
banking services, 125
broad targeting, 196
demand motives, 138–9
functions, 114–16
interest rates, 136–40
markets, 126–7
qualities, 114–16
quantity theory, 180–1
security, 69, 131, 197
supply, 180, 196
Monopolies:
competition, 71–2, 79–80
demand curve, downward sloping, 77, 79, 84
efficiency, 73–4
entry and exit, 77
legal definition, 151
market structures, 70–4
perfect competition, 71–2
profits, 92
Monopolies and Mergers Commission (MMC)
see Competition Commission (CC)
MPC see Marginal propensity to consume (MPC)
MPS see Marginal propensity to save (MPS)
Multinational corporations (MNCs):
activities, 227
definitions, 226
impacts, 227–8
international markets, 126–8
size, 226–7
taxation, 53, 163, 197
Multiplier effect, 171–2
NAFTA see North American Free Trade Agreement (NAFTA)
NAIRU see Non-accelerating inflation rate of
unemployment (NAIRU)
National debt, 120, 125
National income:
calculation, 158–9
capital consumption, 157
circular flow of income, 162–3, 171
economic growth, 90–3, 220–4
equilibrium, 169
expenditure calculation method, 158
income calculation method, 158–9
investment, 158, 162, 168–70
measurement, 156, 160, 231
multiplier effect, 171–2
output calculation method, 159
per head, 160
savings, 162–4
statistical limitations, 160
Nationalised industries, 86–8
Natural resources, 5, 224
Natural unemployment rate, 185
Needs, resource allocation, 6–7, 62–3
Netherlands, 225
New economy, 70, 156
New theories, firms, 55
Non-accelerating inflation rate of unemployment
(NAIRU), 188–9
Non-bank financial intermediaries, 124–5
Normal goods, 48–9, 51
Normal profits, 72, 76
INDEX 337FU
ND
AM
EN
TA
LSO
FBU
SIN
ESS
EC
ON
OM
ICS
2006.1

North American Free Trade Agreement (NAFTA), 225–6
Norway, 225
Not-for-profit organizations, 26–30
Office of Fair Trading, 93–4
Oil prices:
rises in, 177, 180, 186
Oligopolies, 73
Open economies, 180, 183, 251
Open market operations, 140
Opportunity costs, 20, 223
Output:
determination, 75–85
national income calculations, 158–9
national output, 156, 158
productivity, 159, 223
Parallel money markets, 127
Penetration, imports, 246
Perfect competition:
efficiency, 73–4
entry and exit, 77
equilibrium, 76, 163–4
market structures, 70–4
monopolies, 72, 89
profits, 72–3, 75
Performance, monetary policies, 139–41, 193–7
Phillips curve, 185–6
Planned economies, 72
Point elasticities, 49
Policies, 177, 187, 190, 222–4
balance of payments, 191, 228, 232, 242–50
CAP, 64
competition, 92–3
constraints, 27, 205–206
economic growth, 190–1
efficiency, 73–4
markets, 70–1
objectives, 179–89
performance, 22–5
supply-side policies, 250
see also Monetary policy
Political systems, 4, 6
Pollution, 90, 157, 224
Population ages, 222
PPP see Purchasing power parity (PPP)
Preparation, assessments, 263–4
Prices:
agriculture, 63–4
ceilings, 64, 66
definitions, 60
determination, 75–85
discrimination, 83
elasticity of demand, 49–52
imports, 162–4, 231
intervention prices, 64
market prices, 65–7
maximum prices, 67, 89
mechanisms, 66, 237
minimum prices, 66
nationalised industries, 86–8
oil, 177, 180, 184–6
resources, 65, 174, 184
retail index, 89, 115
shares, 23, 25, 135
stability, 27, 64, 82, 206
zero-priced goods/services, 9, 91, 197, 248
Pricing, privatisations, 87
Private sector, 7, 90–1
Privatizations, 87
advantages, 88
CC, 93–5
disadvantages, 89
pricing, 89
PSNCR, 202–204
supply-side policies, 250
Producer surpluses, 49
Production:
capacity utilisation, 166, 249
costs, 12–13
decisions, 4–5, 18–19
factors, 5, 12, 19, 21, 27, 57
large scale, 67–70
long-run, 15–16, 18–19
possibilities, 5–6, 15
short-run, 13–15, 18–19
Productivity, 16, 156, 221–3
Profits:
abnormal profits, 76, 78–9
maximisation, 8, 10–12
monopolies, 72
normal profits, 72, 76
perfect competition, 76–7
Progressive taxes, 199
Proportional taxes, 199
Protectionism, 219, 226, 234
PSBR (public-sector borrowing requirement) see Public sector net
cash requirement (PSNCR)
PSNCR see Public sector net cash requirement (PSNCR)
Public corporations, 86–8
Public goods, 91–2
Public sector, 7, 9, 86–92
see also Government
Public sector borrowing requirement (PSBR) see Public sector net
cash requirement (PSNCR)
Public sector net cash requirement (PSNCR):
background, 133, 179–80, 191–7
financing issues, 203–205
fiscal stance, 202
importance, 202
increases, 204–205
inflation problems, 203
measurement, 202
Public spending, 9, 87, 166
Purchasing power parity (PPP), 90, 240
Quantity theory of money, 180–1
Quotas, 233, 249
Rates of return, 22, 169, 227
Recessions, 119, 177, 183
Redistributed income, 199
Regressive taxes, 197
Regulations, 7, 91, 97, 223
Rent, 5, 18, 21, 65
Research and development, 17, 94, 118, 222, 223, 247
Resources:
allocation, 6, 7, 62–4, 80
categories, 128, 144
economic growth determinants, 221–2
economic resources, 5, 184, 221
prices, 4–5
scarce resources, 4–7
Restrictive practices, 93–6
INDEX338FU
ND
AM
EN
TA
LSO
FBU
SIN
ESS
EC
ON
OM
ICS
2006.1
Restrictive Trade Practices (RTP) Court, 95–6
Retail price index (RPI), 89, 95, 115
Retailing, integration, 68
Returns:
rates, 22, 195, 227
to scale, 15–16
Revenues:
elasticity of demand, 51, 200, 202, 246
marginal, 10, 75–7
Revision questions, 37–43, 101–109, 147–52, 209–15,
253–9, 265–300
Revision techniques, 263
Ricardo, David, 229
RPI see Retail price index (RPI)
Safeways supermarket, 94
Satisficing theories, 8–9
Savings:
circular flow of income, 162–3, 171
demand, 161–2
interest rates, 123–4, 167
Scarce resources, 4–7
Seasonal unemployment, 182
Secretary of State for Trade and Industry, 67, 94
Security considerations:
banks, 131
money, 69, 131, 167
protectionism, 226, 234
Segmented markets, 71
Self-employment, 158–9
Service industries, 70, 182
Services sector, 69, 232, 246
Share prices, 135, 137
Shareholders, 8–9, 21–5, 28, 32, 134
Shifts:
demand curves, 48–50
Phillips curve, 185–8
supply curves, 56–7
Short run:
costs, 55–6
equilibrium, 76, 79, 80
production, 13–15
supply curves, 56
Short-term exchange rate changes, 241–2
Single currency, 204, 242
SIRs see Specific industry regulators (SIRs)
Small and medium-sized enterprises (SMEs), 224
Small firms, 123, 133, 223
definition, 133
growth, 67
survival, 67
value, 67
see also Businesses; Firms
Social capital, 157
Spain, 189
Specialization, 14, 228–31
Specific industry regulators (SIRs), 98
Speculators, 139, 238–9, 241
Spending see Expenditure
Spot trading, 237
Stakeholders, 28–30
Standards of living, 7, 51, 156, 160, 222
Start-up schemes, 84
Statements, economists, 10, 205
Stimulants, prices, 61, 64
Stock Exchange, 17, 67, 72
Structural unemployment, 182, 186
Structures:
markets, 70–4
UK economy, 192
Subsidies, 7, 91, 156, 234
Substitutes, 51–3
Sunk costs, 84
Supermarket industry, 27, 70, 94
Supervision, banks, 126, 141
Supply:
downward shift, 59
elasticity, 57–8, 99
money, 180, 196, 204–205
upward shift, 58–9
Supply curves:
firms, 55–6
industry, 57
long run, 56
shifts, 58–9
short run, 55–6
Supply-side aspects, 250
Surpluses, 9, 64, 87, 125, 145
Sustainable economic growth, 224
Takeovers, 64
Tariffs, 233, 249
Tastes, consumers, 53, 61
Taxation:
background, 240
circular flow of income, 162, 171
demand, 53
direct taxation, 166, 202
incidence, 200
indirect taxation, 58–9, 91, 119, 201
markets, 197
multinational corporations, 226–8
principles, 198
reductions, 177, 202
tax, credits, 167
types, 198–9
yield, 200–202
see also Individual taxes
Technical economies, 16–17
Technical efficiency, 73
Technology:
economic growth, 190–3, 220–4
integration, 63
long run, 56
progress, 222
transfers, 244
Terms of trade, 230–1
The Guardian, 62, 97, 141, 204, 234
Theories of the firm, 8–9, 33
Theory of comparative advantage, 229
Theory of costs, 12–21
Time issues, 12, 22–4, 74
Total revenues, elasticity of demand, 51, 200
Trade:
balance, 243
benefits, 228
comparative advantage theory, 229–31
cycles, 173–8
Europe, 64, 128, 182, 246
international trading, 128, 231
invisible trade, 243–4
liberalisation, 223
practical limitations, 231–2
INDEX 339FU
ND
AM
EN
TA
LSO
FBU
SIN
ESS
EC
ON
OM
ICS
2006.1

Trade (Continued)
protection arguments, 232–4
terms, 230–1
visible trade, 243–5
Trade and Industry Secretary, 67, 94
Trade unions, 18, 184, 186
Trading economies, 17
Training issues, 17transactions:
costs, 68
money, 139, 242
Transfer pricing, 228
Transfers, technology, 244
Transformation curves, 12
Transmission mechanisms, 123, 130
Treasury bills, 126
UK economy:
constraints, 27, 205
export statistics, 224–5
foreign investment, 227
growth, 9–10, 118, 199–200
investment levels, 129–30, 222
management, 122, 128
national income, 155–7
performance, 160
stabilisers, 95
structure, 119–20
trade cycles, 203–204
Unemployment:
benefit payments, 139
causes, 181–4
costs, 184
economic diamond, 205–206
effects, 184–5
imports, 158, 162–4
inflation, 139, 156
NAIRU, 188–9
natural rate, 187–8
Phillips curve, 185–7
trade protection, 232–4
types, 18
see also Labour
Unions, economic, 225
Unlisted Securities Market (USM), 136
Unusual goods, 48, 233
Uruguay round, GATT talks, 234
USA, 122, 125, 128
U-shaped average cost curves, 14–15
USM see Unlisted Securities Market (USM)
Utility theory, 61, 74, 78
Value:
definition, 60
small firms, 16, 18, 123
Value added tax (VAT), 60, 119, 198
Variable costs, 12, 18, 55
VAT see Value added tax (VAT)
Venture capital, 133
VERAs see Voluntary Export Restraint Agreements (VERAs)
Vertical integration, 68
Very long run, 12, 120
Very short run, 12, 77, 79
Visible trade, 241, 243
Voluntary Export Restraint Agreements (VERAs), 233
Voluntary unemployment, 183–4, 186, 205
Wages, 5, 21, 116, 119, 185
see also Labour
Wants, resource allocation, 6–7, 62–3
Watchdogs, regulation, 97
Welfare payments, 7, 223
Withdrawals, circular flow of income, 163–4
Working capital, 5, 118
World market prices, 64
World Trade Organisation (WTO), 225–6, 235
Yield:
curves, 136–7
taxation, 200–202
Zero-priced goods/services, 9, 91–2, 159, 197
INDEX340FU
ND
AM
EN
TA
LSO
FBU
SIN
ESS
EC
ON
OM
ICS
2006.1