Cambridge Business & Economics Conference
79
Constructing an Assessment for the Imbalance Theory of Foolishness Melvin J. Woodard III, Ed.D, D.D, D.Min Indiana Wesleyan University 12/10/2013 4961 South Cobblestone Drive Zionsville, IN 46077 (317) 769-3514 H (317) 874-8399 C [email protected]
Transcript of Cambridge Business & Economics Conference
Constructing an Assessment for theImbalance Theory of Foolishness
Melvin J. Woodard III, Ed.D, D.D, D.Min
Indiana Wesleyan University
12/10/2013
4961 South Cobblestone DriveZionsville, IN 46077
(317) 769-3514 H(317) 874-8399 C
Constructing an Assessment for the Imbalance Theory ofFoolishness
ABSTRACT
This research study sought to construct a valid and reliable
assessment for the imbalance theory of foolishness (Sternberg,
2002, p. 111). This theory was first introduced in a chapter
entitled “Smart People Are Not Stupid, But They Sure Can Be
Foolish” (Sternberg, 2002, pp. 232-242). This theory builds upon
the balance theory of wisdom (Sternberg, 1998) and contains six
fallacies of thinking: unrealistic optimism, egocentrism,
omniscience, omnipotence, invulnerability, and ethical
disengagement (Sternberg, 2008b). Sternberg (2002) believed that
foolishness was the result of people in positions of great power
letting down their guard because of acquired dispositions, e.g.,
omniscience, omnipotence, and invulnerability. Jordan (2005a)
argued that in organizational environments where power and status
are highly valued, the “emphasis on gaining and retaining power
and status is expected to prime those in such environments to
develop fallacious ways of thinking about oneself and one’s
abilities” (p. 20). Power was assumed to predispose individuals

1
to foolish thinking and behavior in this study. Scale
development was initiated from an item pool of 150 questions
(reduced to 56 items) generated from articles written by
Sternberg and Jordan. Discussion includes introduction,
rationale, definitions, hypothesis, participants,
instrumentation, procedure, data analysis, results, discussion
and suggestions for future research.
Keywords: Imbalance theory of foolishness; fallacies of thinking;wisdom; scale development.
2
Introduction
The imbalance theory of foolishness was first introduced in
a chapter entitled “Smart People Are Not Stupid, But They Sure
Can Be Foolish” (Sternberg, 2002, pp. 232-242). The theory
builds upon the balance theory of wisdom (Sternberg, 1998) by
viewing foolishness as the trait opposite of wisdom. Sternberg
(2002) viewed foolishness as “an extreme failure of wisdom” (p.
236), which “occurs in the interaction between a person and a
situation” (p. 233). Sternberg (2004) wrote, “The large majority
of behaviors that we refer to as stupid are not stupid, as opposed
to intelligent in the classical sense, but rather, foolish, as
opposed to either practically intelligent or wise” (p. 146).
Smart individuals may be led to commit foolish acts of behavior
based on false beliefs (Sternberg, 2002, 2005a). Kessler and
Bailey (2007) suggested that, perhaps, the most dangerous
individuals around are “those who are exceptionally intelligent
and creative but who lack wisdom”(p. 11).
Sternberg (2002) claimed, “The beginnings of foolishness lie
in a defect in tacit knowledge” (p. 233). He defined tacit
knowledge as “action-oriented knowledge, usually acquired without
3
direct help from others, that allows individuals to achieve goals
they personally value” (Sternberg, 2002, p. 233). Tacit
knowledge is wedded to contexts and acquired through experience.
Foolishness is acquired “from defects in reading the cues in the
environment” (Sternberg, 2002, p. 234).
Sternberg (2005a) linked foolish thinking with foolish
behavior. He suggested foolish behavior “is due largely,
although not exclusively, to five fallacies of thinking. These
fallacies resemble those [cognitive biases] we might associate
with adolescent thinking, because they are the kind of thinking
often seen in adolescents” (p. 338). The fallacies of thinking
referenced were from Sternberg’s (1998) balance theory of wisdom;
namely, unrealistic optimism, egocentrism, false sense of
omniscience, false sense of omnipotence, and false sense of
invulnerability (Sternberg, 2003, 2004, 2005a, 2005b, 2005c).
With the development of the imbalance theory of foolishness
(Sternberg, 2002) a sixth fallacy was introduced – ethical
disengagement.
Jordan (2005a), a former student of Sternberg, believed
power and success could predispose an individual to foolish
4
thinking and behavior. She stated that “the pursuit of power and
status [could] lead one to fall prey to one, or several, of . . .
the fallacies of thinking” (p. 20). In her dissertation, which
investigated the relationship between business experience and
moral awareness, Jordan (2005a) hypothesized that “those with
greater experience may demonstrate poorer performance than
novices . . . on the theory that the belief that one possesses
more power and greater abilities than one realistically does will
lead to poorer decision-making in some situations” (p. 20).
Jordan (2005a) developed a scale in her dissertation, as a
secondary focus, for the five fallacies of thinking associated
with the balance theory of wisdom (Sternberg, 1998). Her measure
was known as the fallacies of thinking scale (FTS), which
contained 62 items. Items on the FTS were derived using implicit
theoretical methodology. Since the completion of Jordan’s
dissertation, no other scholarly works have used the FTS or
amplified its work (J. Jordan, personal communication, July 22,
2010). Jordan acknowledged that the FTS was an initial
developmental work and that it needed to be revised (J. Jordan,
personal communication, July 22, 2010).
5
The six fallacies of thinking in the imbalance theory of
foolishness (Sternberg, 2002) represent undesirable social
characteristics. Unrealistic optimism, egocentrism, omniscience,
omnipotence, invulnerability, and ethical disengagement
(Sternberg, 2008a, 2008b, 2009b) are to be viewed as negative
cognitive biases. The imbalance theory of foolishness had not
been studied empirically (R. Sternberg, personal communication,
June 13, 2010). After a thorough examination of the literature,
we identified no previous empirical examination of the theory
prior to the present study. The lone assumption in this study
was that positions of great power could induce fallacious
thinking, as Sternberg (2002) and Jordan (2005a) suggested. This
study sought to advance research in the domain of wisdom and
foolishness.
Rationale
Failures in leadership are inevitable. Even presidents of
countries like the United States have suffered failure in
leadership because they “are always feeling their way through”
(Pious, 2008, p. 288). Lessons can be learned from catastrophic
failures of leadership. Kilburg (2006) stated, “Every person in

6
an executive role reaches toward wisdom, is expected to have
wisdom, and wants to be wise. Unfortunately . . . all too often
senior leaders fail in this central and most important task of
their offices” (p. 22). Leaders can be derailed, meaning “off the
rails—cannot proceed in [their] present jobs, just as a derailed
train cannot continue on its intended path” (Irwin, 2009, p. 6).
Five stages to derailment of a leader were suggested: (a) a
failure of self-/other-awareness, (b) hubris, (c) missed early
warning signs, (d) rationalizations, and (e) derailment (Irwin,
2009). Sanborn (2007) suggested that leaders are headed for
impending failure when they ignore six early warning signs: (a) a
shift in focus, (b) poor communication, (c) risk aversion, (d)
ethics slip, (e) poor self-management, and (f) lost love.
Rooney and McKenna (2007) reported that wisdom is declining
in management practice. The effects of such are being evidenced
continuously by clouding judgment, degrading decision making, and
compromising ethical standards amongst leaders. Rooney and
McKenna suggested that “while most of us will never reach higher
states of wisdom, we can all become wiser than we presently are”
(p. 132). They have drawn this conclusion:
7
Wisdom requires knowledge, but not necessarily a great
accumulation of it. Wisdom is critically dependent on
ethics, judgment, insight, intuition, creativity and other
transcendent forms of human intellection. Wisdom is
concerned less with how much we know and more with what we
do and how we act. Wisdom is a fundamentally practical way
of being in a complex and uncertain world. (Rooney &
McKenna, 2007, p. 132)
Wisdom has historically been considered the pinnacle of
human development, and achieving it has been thought to be the
means and end to a good life (Baltes & Staudinger, 2000).
Aristotle understood truth to emerge from five conditions: “art,
scientific knowledge, practical wisdom (phronesis), philosophical
wisdom (sophia), and intuitive reason” (Osbeck & Robinson, 2005,
p. 67). Wisdom has blended the perfect and the practical,
thereby uniting the height of knowledge and the utility of
everyday life (Staudinger, Lopez, & Baltes, 1997). Wisdom has
been “an abstract, highly valued, multidimensional human virtue”
(Bluck & Glück, 2005, p. 87). Csikszentmihalyi and Rathunde
(1990) revealed three dimensions to wisdom: a cognitive process,
8
a virtuous guide to action, and a personal good or intrinsic
reward. These dimensions have correlated well with the
multidimensional picture of the wise person described by Chandler
and Holliday (1990): (a) general competence, (b) practical
knowledge, and (c) reflective skills (Csikszentmihalyi &
Rathunde, 1990). Executive wisdom has been no different.
Kilburg (2006) suggested that “Executive Wisdom is an emergent
property of the incredibly complex set of structures; processes;
and social, economic, political, and psychological contents in
which every leader is immersed” (p. 22).
Jordan (2005b) suggested that wisdom is an “ uncommon
ability,” even a “rare quality” (p. 163). Many have agreed that
the concept of wisdom “is perhaps the most complex characteristic
that can be attributed to individuals or cultures” (Birren &
Svensson, 2005, p. 28). Even though the concept of wisdom has
not emerged from a single trait (Birren & Fisher, 1990), it has
appeared “to be a trait more readily applied to the elders in
traditional or preliterate societies” (Birren & Svensson, 2005,
p. 27). If wisdom were placed on a continuum, people could be
wise or unwise in different situations of their life or
9
organization (Rooney & McKenna, 2007). Wisdom is “critically
dependent on ethics, judgment, insight, intuition, creativity and
other transcendent forms of human intellection” (Rooney &
McKenna, 2007, p. 132). Psychological models have differed in
their emphasis regarding wisdom, as some models have stressed
cognition, others personality, others social involvement, or some
combination thereof (Staudinger et al., 1997).
Price (2004) asked the question, “Why do leaders fail
ethically when it is so obvious to the rest of us how they should
act?” (p. 130). Organizational leaders have been expected to
show moral behavior and moral influence (Price, 2004), which
includes their thinking. Ethical leadership has been about
leading an organization to accomplish its mission and core
purposes while staying within ethical means and behavior (Price,
2004). But, leadership has exaggerated cognitive challenges, and
ethical failure has awaited leaders who do not recognize the
dangers of faulty thinking (Price, 2004). Jordan (2005a) stated,
“In domains of expertise where the attainment and retention of
power and status are central concerns, the belief that one is the
center of attention, all-knowing, all-powerful, uninhibited by
10
potentially risky outcomes, and unsusceptible to negative
results, may be commonplace” (p. 25). The presence and practice
of foolish thinking may be a portion of the reasoning why leaders
fail to make ethical decisions (Sternberg, 2002). Sternberg
(2002) suggested that the pursuit of power and status may cause
one to fall prey to the fallacies of thinking.
It is bothersome when leaders who possess wisdom,
intelligence and creativity, exhibit foolish behavior. The lack
of a referent peer group may be part of the problem for those at
the highest levels of power and status within an organization.
Jordan (2005a) wrote in her dissertation that research “has
concluded that those at the top of the corporate hierarchy are
less likely to look to others for clues to how to think and act
because there are fewer ‘others’ on their same level to look to”
(p. 25). Smart, intelligent and creative leaders that commit
foolish mistakes may have internalized faulty cognitions, e.g.,
unrealistic optimism, egocentrism, sense of omniscience, sense of
omnipotence, and a sense of invulnerability (Sternberg, 2005b).
Leaders with unrealistic optimism “believe themselves to be so
smart that . . . whatever they do, it will work out all right”
11
(Sternberg, 2005c, p. 244). Leaders with high levels of
egocentrism have lost sight of the interests of others and have
ended up being very small-minded. Leaders with a sense of
omniscience “become susceptible to remarkable downfalls because
they act as experts in areas where they are not, and can make
disastrous mistakes in doing so” (Sternberg, 2005c, p. 244).
Leaders with a sense of omnipotence have lost sight of the
limitations of their power. By acting more powerful than they
really are, they have brought disaster upon themselves and their
affiliates. Lastly, leaders with a sense of invulnerability
believe they can do anything and get away with it. “They believe
that either they are too smart to be found out or, even if found
out, they will escape any punishment for misdeeds” (Sternberg,
2005c, p. 244).
Fallacies of thinking are cognitive biases that appear under
stressful situations (Sternberg, 1998). They get in the way of
leaders’ thinking and acting ethically (Sternberg, 2009a).
Internalization of these fallacies of thinking create outcomes
that resemble moral disengagement (Bandura, 1999). Jordan
(2005a) stated, “These biases are found to be especially present
12
in individuals faced with exceptionally stressful situations;
however, they are also found in a more modest extent in
individuals not facing such extreme circumstances” (p. 21).
Jordan claimed that false beliefs make smart individuals commit
foolish mistakes.
The fallacies of thinking do not purport to serve those who
possess them in cognitively-constructive or adaptive ways.
The internalization of these fallacies is only believed to
lead the possessor to make foolish mistakes because they
influence him or her to ignore or overlook factors that
would otherwise appear important to consider during
decision-making. (Jordan, 2005a, p. 23)
Definitions
The thought that wisdom balances outcomes was crucial for
Sternberg. “In wisdom, one certainly may seek good ends for
oneself, but one also will seek good outcomes for others”
(Sternberg, 2002, p. 237). Wisdom occurs in the interaction
between a person and a situation. Sternberg (1998) wrote,
“Because wisdom is in the interaction of person and situation,
information processing in and of itself is not wise or unwise . .
13
. [but] depends on the fit of a wise solution to its context” (p.
353). If wisdom constitutes a balance of interests, the opposite
constitutes an imbalance. Like wisdom, foolishness occurs in the
interaction between a person and a situation.
The definition of wisdom used for this research study was
understood as a process that emerges in real-life contexts. It
came from the balance theory of wisdom (Sternberg, 1998), which
took an explicit theoretical approach to the study of wisdom.
Explicit theories are constructions of expert theorists and
researchers. Wisdom was defined as:
The application of tacit knowledge as mediated by values
toward the achievement of a common good through a balance
among multiple (a) intrapersonal, (b) interpersonal, and (c)
extrapersonal interests in order to achieve a balance among
(a) adaptation to existing environments, (b) shaping of
existing environments, and (c) selection of new
environments. (Sternberg, 1998, p. 347)
The imbalance theory of foolishness (Sternberg, 2002) views
foolishness as the trait opposite of wisdom. Foolishness is
thought to be a complete failure of wisdom, coming from a deficit
14
in tacit knowledge (Sternberg, 2002). Foolishness was defined
as:
The faulty acquisition or application of tacit knowledge as
guided by values away from the achievement of a common good,
through a balance among intrapersonal, interpersonal, and
extrapersonal interests of the short and long term, in order
to achieve a balance among (1) adaptation to existing
environments, (2) shaping of existing environments, and (3)
selection of new environments. (Sternberg, 2002, p. 236)
Sternberg (2008a, 2008b, 2009b) has given definitions for
the six fallacies of thinking associated with the imbalance
theory of foolishness (Sternberg, 2002) several times. The
definitions used in this research came from an article Sternberg
(2008b) entitled “The WICS Approach to Leadership: Stories of
Leadership and the Structures and Processes That Support Them.”
The six fallacies of thinking are defined below.
The unrealistic-optimism fallacy: “When [successful leaders]
think they are so smart and effective that they can do
whatever they want” (p. 367).
15
The egocentrism fallacy: “When successful leaders start to
think that they are the only ones that matter, not the
people who rely on them for leadership” (p. 367).
The omniscience fallacy: “When leaders think that they know
everything, and lose sight of the limitations of their own
knowledge” (p. 367).
The omnipotence fallacy: “When leaders think they are all-
powerful and can do whatever they want” (p. 367).
The invulnerability fallacy: “When leaders think they can
get away with anything, because they are too clever to be
caught; and even if they are caught, they figure that they
can get away with what they have done because of who they
imagine themselves to be” (p. 367).
The ethical disengagement fallacy: “When a leader believes
that ethics apply to others, but not to him or herself” (p.
367).
In this study, power referred to positional power, whereby
“the status associated with one’s position gives one power to
influence those who are lower in status” (Bass & Bass, 2008, p.
267). Ford (1980) stated the power could be wielded crudely or
16
subtlety in various ways: obtrusive or unobtrusive, overt or
covert. The word acquired was used to mean not-genetic; a new or
added characteristic as a result of interaction with the
environment. And the word disposition referred to a semi-permanent
trait-like tendency to do things in a certain way.
Hypothesis
One null hypothesis and its alternative were proposed for
this study, which sought to construct an assessment for the
imbalance theory of foolishness (Sternberg, 2002). In the
development and validation of multi-item self-administered
measures of unobservable, latent constructs, the focus is on
whether the hypothesized factor model does or does not fit the
data. The present research objective was to provide a way to
determine whether data would support a hypothesized factor model
for the imbalance theory of foolishness. The null hypothesis and
its alternative were:
H0: The model fits the data.
Ha: The model does not fit the data.
Smart, powerful people can be foolish (Sternberg, 2002) and
intelligence does not protect against foolish thinking or
17
behavior. These individuals may be led to commit foolish acts of
behavior based on false beliefs (Sternberg, 2002). It is
believed that smart, powerful leaders who commit foolish acts
have internalized negative cognitive biases.
Participants
The sample of respondents for the imbalance theory of
foolishness assessment included 150 corporate leaders from across
America, covering both for-profit and not-for-profit sectors.
Jordan (2005a) thought the pursuit of power and status could lead
some leader types to fall error to fallacious thinking; wherein,
they commit one or more of the fallacies of thinking associated
with imbalance theory of foolishness (Sternberg, 2002).
Therefore, 150 CEO and senior-level leaders participated
voluntarily in the research sample with the newly created
imbalance theory of foolishness assessment. MarketTools, a
research firm in San Francisco, administered the assessment
through their online polling website called Zoomerang (2012).
Since 1999, Zoomerang has been the industry leader in online
surveys and polls with surveys that are easy, fast and flexible,
and can be administered via email, the World Wide Web, Facebook,
18
and Twitter (MarketTools, 2011). MarketTools guaranteed that 150
CEO and senior-level leaders would actually participate in the
sampling. MarketTools made the following claim in reference to
accessing high-quality survey respondents:
Easily reach deeply profiled, global survey respondents with
MarketTools ZoomPanel, an online survey panel of more than
2.5 million people ready to take online market research
surveys. Panelists are validated with MarketTools TruSample
to provide the market research industry’s first quality-
assured sample. (MarketTools, 2011)
Instrumentation
The scale development process in this research spanned more
than a year and a half of time. The research method followed was
outlined by MacKenzie, Podsakoff, and Podsakoff – see Appendix -
with some ideas supported by Hinkin (1998). Steps were carefully
monitored throughout the study to ensure that a valid and
reliable assessment would be created for the imbalance theory of
foolishness. A three-member panel of academic experts was
utilized, as well as 23 students from a Midwestern (USA)
university engaged in a doctorate in organizational leadership

19
program. The sample of participants included 150 CEO and senior-
level leaders who participated voluntarily from Zoomerang’s
(2012) online database, known as ZoomPanel.
The scale development process utilized in the creation of
the imbalance theory of foolishness assessment began with
establishing clear construct definitions. Emphasis was placed on
content domain and the role of theory. Schriesheim, Powers,
Scandura, Gardiner, and Lankau (1993) suggested “that the
demonstration of instrument content adequacy be demanded as an
initial step toward construct validation by all studies which use
new, modified, or previously unexamined measures” (p. 385).
Validity Issues
Content validity. Content validity is an important piece of
evidence in the evaluation of construct validity because a
“test’s content should reflect the full range of the core
construct, no more and no less” (Furr & Bacharach, 2008, p. 173).
This research study employed three academic experts, all of them
with some understanding of wisdom and leadership issues, to help
provide content validity. The panel of experts was asked to rate
150 questions—questions the researcher created—pertaining to the

20
six dispositions of the imbalance theory of foolishness. It was
assumed that the panel of experts would facilitate the design of
better questions. Netemeyer, Bearden, and Sharma (2003)
suggested the following:
First, the researcher should have all elements of the items
judged for face and content validity. The items themselves,
the response formats, the number of scale points, and
instructions to the respondent all should be judged for
representativeness by using multiple expert and population
judges via qualitative and quantitative procedures. (p. 102)
The panel of experts provided stability to the internal
structure of the test, which is one facet of construct validity.
Internal structure of the test refers to “the way that the parts
of a test are related to each other” (Furr & Bacharach, 2008, p.
174). Whereas some tests include items that are highly
correlated and other tests include items that can be arranged
into two or more categories, “the actual structure of the test
should match the theoretically based structure of the construct”
(Furr & Bacharach, 2008, p. 174). The panel of experts in this
research ensured that the actual structure of the assessment
21
matched its theoretical structure, which was an important step in
the content validity of the instrument. The six fallacies of the
imbalance theory of foolishness were isolated and uniquely
identifiable.
Face validity. Face validity is not absolutely necessary
for construct validity from a psychometric perspective, but it
has important implications (Furr & Bacharach, 2008). Face
validity is the quality of a test which gives the appearance that
a measure has validity (Netemeyer et al., 2003). Tests with high
face validity are more well received and, therefore, useful to
accurately assess an individual’s psychological disposition.
Netemeyer et al. (2003) claimed:
A highly face valid instrument enhances its use in practical
situations by (among other things) inducing cooperation of
respondents via ease of use, proper reading level, clarity,
easily read instructions, and easy-to-use response formats.
[An instrument or test should appear practical, pertinent
and related to the purposes of the instrument/test as well.]
Thus, face validity may be more concerned with what
22
respondents from relevant populations infer with respect to
what is being measured. (pp. 12-13)
In order to help establish face validity with the assessment
from this research, 23 doctoral students from a Midwestern
university were asked to take the newly created survey.
Questions that appeared to adequately represent the six fallacies
of thinking were included on the version of the assessment that
was given to the sample of respondents. Incorporating
information from the students helped to strengthen the imbalance
theory of foolishness assessment, as well as enhance its
practicality.
Reliability Issues
Internal consistency reliability. At least three
methods for estimating reliability have been created: alternate
forms reliability, test-retest reliability, and internal
consistency reliability (Furr & Bacharach, 2008). Reliability is
a theoretical property of a test that cannot be computed
directly. Of the three methods used for estimating reliability,
the scale development process in this research used internal
consistency reliability. Internal consistency reliability “has

23
the practical advantage of requiring respondents to complete only
one test at only one point in time” (Furr & Bacharach, 2008, p.
111). Most psychological tests have estimated reliability using
this method.
The fundamental idea behind the internal consistency
approach is that the different ‘parts’ of a test (i.e.,
items or groups of items) can be treated as different forms
of a test. In many areas of behavioral science, the
internal consistency approach is the most widely used method
for estimating reliability. (Furr & Bacharach, 2008, p. 111)
Of the criteria used for assessing internal consistency, raw
coefficient alpha (known as Cronbach’s α) has been the most
widely used in field studies. It is computed by most statistical
software packages, e.g., SPSS (Furr & Bacharach, 2008). Osburn
(2000) stated that Cronbach’s coefficient α “is an appropriate
reliability estimator for composite measures containing multiple
components” (p. 343). Coefficient α is very flexible and
appropriate for a wide variety of circumstances and has been
commonly used throughout psychology and many other disciplines.
Procedure

24
This research study was guided by steps advocated in the
psychometric literature (Ghiselli, Campbell, & Zedeck, 1981;
Hinkin, 1998; MacKenzie et al., 2011). An overview of the scale
development process outlined by MacKenzie et al. (2011) is
provided in the Appendix. The scale development process
“involves a series of steps beginning with construct
conceptualization and culminating in the development of norms for
the scale” (MacKenzie et al., 2011, p. 296). Each step borrowed
from the scale development process of MacKenzie et al. for this
research will be discussed in more detail below.
Step 1: Develop a conceptual definition of the construct.
The first step in the development and validation process of the
assessment “involve[d] defining the conceptual domain of the
construct[s]” (MacKenzie et al., 2011, p. 298). The work of
defining the conceptual domain of the constructs for the
imbalance theory of foolishness was completed by Sternberg (2002,
2003, 2004, 2005a, 2005b, 2005c, 2008a, 2008b, 2009a, 2009b), and
further aided by Jordan (2005a).
Step 2: Generate items to represent the construct. After
the focal constructs had been defined, the next step in the

25
process was “to generate a set of items that fully represents the
conceptual domain of the construct[s]” (MacKenzie et al., 2011,
p. 304). More than 400 questions were generated to capture the
six fallacies of thinking in the imbalance theory of foolishness.
From these 400 questions, 150 were selected to represent the full
span of the fallacies. The questions selected were over
inclusive of the theory and its constructs. Netemeyer et al.
(2011) have stated:
Even with the focus on content and face validity, two other
issues should be considered in constructing a pool of items.
Clark and Watson (1995) advocated that the scale developer
go beyond his or her own view of the construct in generating
an initial item pool and that the initial pool contains
items that ultimately will be only tangentially related to
the content domain of the construct. Thus, it is better to
be overinclusive of the construct’s domain rather than
underinclusive in generating an item pool. Care must also
be taken to ensure that each content area of the construct
has an adequate sampling of items. (p. 96)

26
Step 3: Assess the content validity of the items. MacKenzie
et al. (2011) stated, “Once items have been generated for
representing the focal construct[s], they should be evaluated for
their content validity” (p. 304). The third step in the scale
development process focused on content validity. The 150
questions selected were sent to three academicians who served as
a panel of experts to rate these items. Requirements for
selection as a panelist included: (a) they must possess some
knowledge of wisdom and leadership issues, and (b) they must come
from different fields of knowledge, e.g., business, education,
psychology or theology. The three panelists were asked to rate
the 150 questions that had been created, as to whether or not
individual item questions adequately represented the construct
they were assigned to.
The academic experts were limited to two possible choices; a
question could only be rated as either good or bad. Out of the
pool of 150 questions originally developed and presented to the
raters as representing the fallacies, the experts reduced the
number to 56 questions through their selections of good and bad.
Only questions that received at least two good votes (from two of

27
the three raters) were retained. The 56 questions selected by
the panel were submitted to an Internal Review Board (IRB) for
approval. Once approval was received from the IRB to proceed,
the 56-question assessment was then given to 23 doctoral level
students.
The assessment approved by the IRB contained 56 questions,
nine questions per fallacy of thinking with one exception. The
ethical disengagement fallacy had 11 questions. No questions
were added, removed, or revised after the panelists concluded
their work.
Step 4: Formally specify the measurement model. MacKenzie
et al. (2011) stated, “Once a content valid set of items has been
generated, the next step is to formally specify a measurement
model that captures the expected relationships between the
indicators and the focal construct and/or sub-dimension they are
intended to represent” (pp. 306-307). Brown (2006) stated, “In
applied research, factor analysis is most commonly used in
psychometric evaluations of multiple-item testing instruments”
(p. 13). The common factor model was chosen as the factor
analysis approach in this research study. The common factor
28
model “postulates that each indicator in a set of observed
measures is a linear function of one or more common factors and
one unique factor” (Brown, 2006, p. 13). The common factor model
has lent itself readily to both exploratory factor analysis (EFA)
and confirmatory factor analysis (CFA). EFA and CFA were both
used in this research.
Step 5: Collect data to conduct pretest. MacKenzie et al.
(2011) stated, “Once the measurement model has been formally
specified, data need to be obtained from a sample of respondents
in order to examine the psychometric properties of the scale, and
to evaluate its convergent, discriminant, and nomological
validity” (p. 310). Using an online panel of participants from
Zoomerang (2012), the imbalance theory of foolishness assessment
was tested with 150 CEO and senior-level leaders. All persons
taking part in the sample were currently employed within their
respective organizations; both for-profit and not-for-profit
sectors of corporate America were engaged. The objective of the
test was to assess the internal psychometric properties of the
survey.
29
Step 6: Scale purification and refinement. Following data
collection, the survey needed to be evaluated. MacKenzie et al.
(2011) stated that the researcher needs “to determine whether (1)
the solution is proper, (2) the individual relationships
hypothesized are statistically significant, and (3) the
relationships are consistent with the sample data” (p. 311).
Brown (2006) said, “One of the most important aspects of model
evaluation occurs prior to the actual statistical analysis—that
is, providing a compelling rationale that the model is meaningful
and useful on the basis of prior research evidence and theory”
(p. 113). After substantive justification of the model was made,
an EFA, CFA and model fit analysis were conducted.
This research study completed Steps 1 - 6 of the scale
development process outlined by MacKenzie et al. (2011). The
final four steps of the scale development process (Steps 7 – 10)
were reserved for a time beyond this study. Completing the first
six steps of the scale development process laid the foundation
for the beginnings of a valid measure.
Data Analysis
30
A number of analytical procedures were utilized in the
development of the imbalance theory of foolishness assessment.
Analytical procedures utilized included: exploratory factor
analysis; confirmatory factor analysis; model fit using SPSS Amos
21 – included goodness-of-fit test using chi-square statistic;
and internal consistency reliability using Cronbach’s alpha.
Factor analysis has allowed test developers to address three
fundamental issues related to a test’s internal structure (Furr &
Bacharach, 2008). First, factor analysis can be used to help
clarify the number of items on a scale, but no hard-and-fast
rules have been created to guide the decision on how many items
to place on a measure (Hinkin, 1998). Factor analysis is useful
in keeping a measure short, which “is an effective means of
minimizing response biases caused by boredom or fatigue” (Hinkin,
1998, p. 109).
The number of factors to be retained depends on both
underlying theory and quantitative results. The researcher
should have a strong theoretical justification for
determining the number of factors to be retained, and

31
examination of item loadings on latent factors provides a
confirmation of expectations. (Hinkin, 1998, p. 112)
A second important use of factor analysis is “to reveal the
associations among the factors/dimensions within a
multidimensional test” (Furr & Bacharach, 2008, p. 175). Factor
analysis has been an important tool for evaluating the internal
structure (i.e., dimensionality) of psychological tests (Furr &
Bacharach, 2008). “Test developers can use a variety of
statistical procedures to evaluate a test’s dimensionality.
Although procedures such as cluster analysis and multidimensional
scaling are available, factor analysis is the most common method
of examination” (Furr & Bacharach, 2008, p. 69).
A third use of factor analysis is in “identifying which
items are linked to which factors” (Furr & Bacharach, 2008, p.
177). Specific items are generated by test developers to reflect
certain aspects of the construct. “Thus, to evaluate the quality
of the measure, we must ensure that the items that are intended
to reflect a particular factor actually are connected to that
factor and to no other factors [factor loadings]” (Furr &
Bacharach, 2008, p. 177)
32
Results
The research sample (N = 150) was comprised of CEO and
senior-level leaders who volunteered to take the imbalance theory
of foolishness assessment via Zoomerang (2012). The sample of
respondents came from Zoomerang (2012)’s 2.5 million-person
database known as ZoomPanel. When placed on Zoomerang, a more
appropriate name was given to the assessment fearing the title -
“Imbalance Theory of Foolishness Inventory” - would not be
appealing to respondents. As a result, the assessment was named
the “Leadership Influence & Decision Making Inventory” (LIDMI).
Reference to the assessment hereafter will be by that name.
Statistical procedures were performed using the Statistical
Package for Social Scientists (SPSS), Version 20. SPSS Version
21 was utilized also in the study to perform a model fit analysis
with SPSS Amos. The LIDMI contained 56 questions regarding the
construct and 11 demographic questions. There was no missing
data from the sample of respondents with respect to the 56
construct questions on the survey. All of these questions were
in the mandatory-push-answer format. Two demographic questions
were placed at the outset of the survey and both of these
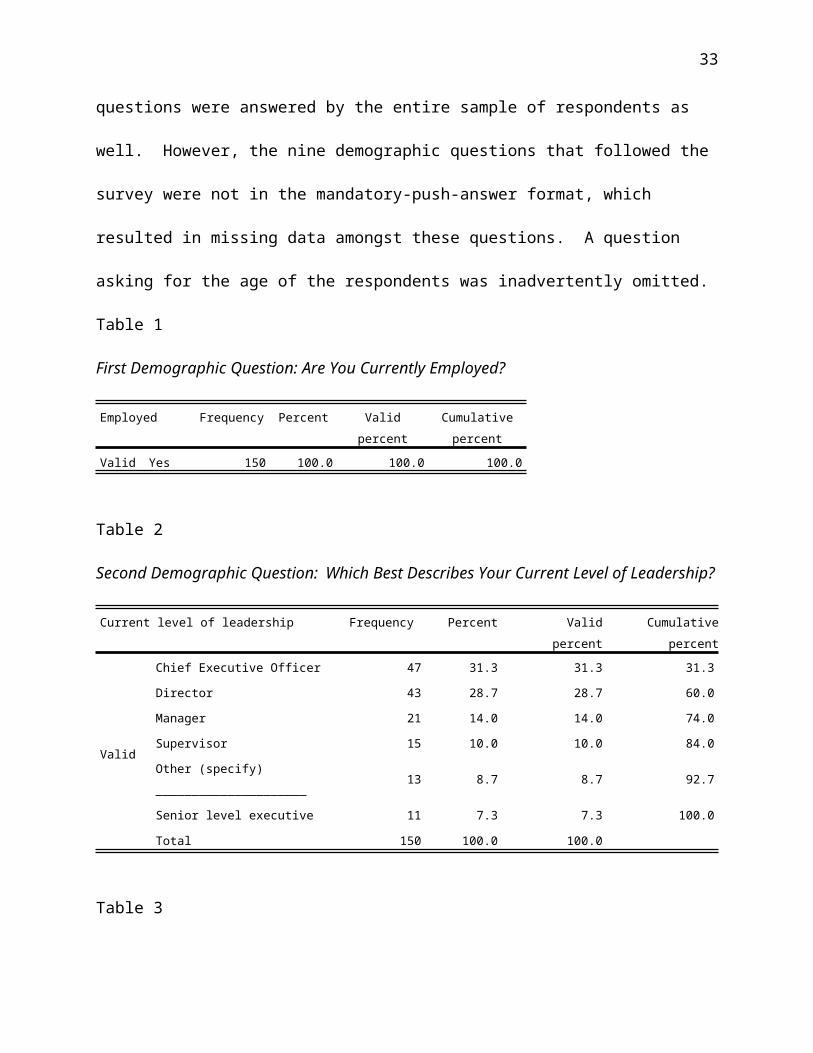
33
questions were answered by the entire sample of respondents as
well. However, the nine demographic questions that followed the
survey were not in the mandatory-push-answer format, which
resulted in missing data amongst these questions. A question
asking for the age of the respondents was inadvertently omitted.
Table 1
First Demographic Question: Are You Currently Employed?
Employed Frequency Percent Validpercent
Cumulativepercent
Valid Yes 150 100.0 100.0 100.0
Table 2
Second Demographic Question: Which Best Describes Your Current Level of Leadership?
Current level of leadership Frequency Percent Validpercent
Cumulativepercent
Valid
Chief Executive Officer 47 31.3 31.3 31.3
Director 43 28.7 28.7 60.0
Manager 21 14.0 14.0 74.0
Supervisor 15 10.0 10.0 84.0
Other (specify) _____________________
13 8.7 8.7 92.7
Senior level executive 11 7.3 7.3 100.0
Total 150 100.0 100.0
Table 3
34
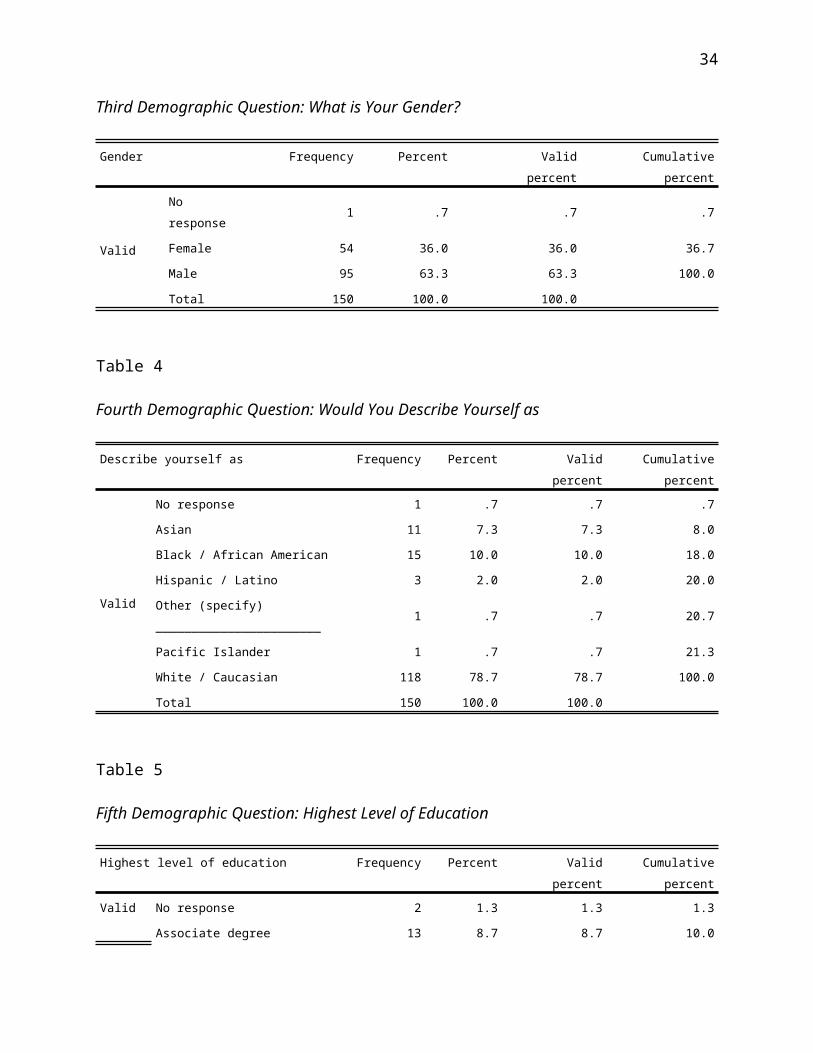
Third Demographic Question: What is Your Gender?
Gender Frequency Percent Validpercent
Cumulativepercent
Valid
No response
1 .7 .7 .7
Female 54 36.0 36.0 36.7
Male 95 63.3 63.3 100.0
Total 150 100.0 100.0
Table 4
Fourth Demographic Question: Would You Describe Yourself as
Describe yourself as Frequency Percent Validpercent
Cumulativepercent
Valid
No response 1 .7 .7 .7
Asian 11 7.3 7.3 8.0
Black / African American 15 10.0 10.0 18.0
Hispanic / Latino 3 2.0 2.0 20.0
Other (specify) _______________________
1 .7 .7 20.7
Pacific Islander 1 .7 .7 21.3
White / Caucasian 118 78.7 78.7 100.0
Total 150 100.0 100.0
Table 5
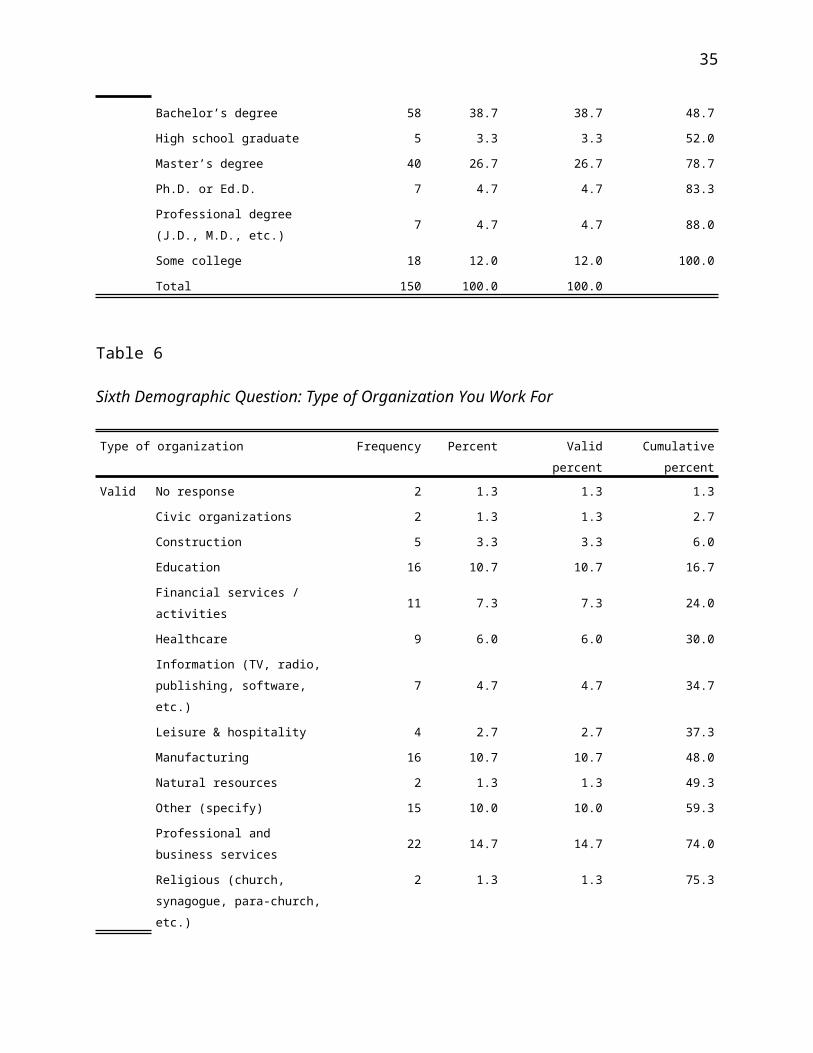
Fifth Demographic Question: Highest Level of Education
Highest level of education Frequency Percent Validpercent
Cumulativepercent
Valid No response 2 1.3 1.3 1.3
Associate degree 13 8.7 8.7 10.0
35
Bachelor’s degree 58 38.7 38.7 48.7
High school graduate 5 3.3 3.3 52.0
Master’s degree 40 26.7 26.7 78.7
Ph.D. or Ed.D. 7 4.7 4.7 83.3
Professional degree (J.D., M.D., etc.)
7 4.7 4.7 88.0
Some college 18 12.0 12.0 100.0
Total 150 100.0 100.0
Table 6
Sixth Demographic Question: Type of Organization You Work For
Type of organization Frequency Percent Validpercent
Cumulativepercent
Valid No response 2 1.3 1.3 1.3
Civic organizations 2 1.3 1.3 2.7
Construction 5 3.3 3.3 6.0
Education 16 10.7 10.7 16.7
Financial services / activities
11 7.3 7.3 24.0
Healthcare 9 6.0 6.0 30.0
Information (TV, radio, publishing, software, etc.)
7 4.7 4.7 34.7
Leisure & hospitality 4 2.7 2.7 37.3
Manufacturing 16 10.7 10.7 48.0
Natural resources 2 1.3 1.3 49.3
Other (specify) 15 10.0 10.0 59.3
Professional and business services
22 14.7 14.7 74.0
Religious (church, synagogue, para-church, etc.)
2 1.3 1.3 75.3

36
Retail trade 11 7.3 7.3 82.7
Social services 7 4.7 4.7 87.3
State or local government
5 3.3 3.3 90.7
Transportation 5 3.3 3.3 94.0
Utilities 2 1.3 1.3 95.3
Wholesale trade 7 4.7 4.7 100.0
Total 150 100.0 100.0
Table 7
Seventh Demographic Question: Number of Employees in Your Organization
Number of employees Frequency Percent Validpercent
Cumulativepercent
Valid
No response 5 3.3 3.3 3.3
Under 10 39 26.0 26.0 29.3
10 – 19 8 5.3 5.3 34.6
20 – 49 13 8.7 8.7 43.3
50 – 99 13 8.7 8.7 52.0
100 – 149 12 8.0 8.0 60.0
150 – 499 10 6.7 6.7 66.7
500 – 999 17 11.3 11.3 78.0
1000 – 4999 10 6.7 6.7 84.7
5000 – 9999 6 4.0 4.0 88.7
10000 – 14999 4 2.7 2.7 91.4
15000 – 25000 2 1.3 1.3 92.7
25000 + 9 6.0 6.0 98.7
N/A 2 1.3 1.3 100.0
Total 150 100.0 100.0
Table 8

37
Eighth Demographic Question: Number of Direct Reports
Number of direct reports
Frequency Percent Validpercent
Cumulativepercent
Valid
No response 10 6.67 6.67 6.67
Under 10 59 39.3 39.3 46.0
10 – 19 20 13.3 13.3 59.3
20 – 49 25 16.7 16.7 76.0
50 – 99 13 8.7 8.7 84.7
100 + 9 6.0 6.0 90.7
N/A 14 9.3 9.3 100.0
Total 150 100.0 100.0
Table 9
Ninth Demographic Question: How Many Years of Leadership Experience Do You Have?
Number of years Frequency Percent Validpercent
Cumulativepercent
Valid
No response 12 8.0 8.0 8.0
Under 5 10 6.7 6.7 14.7
6 – 10 38 25.3 25.3 40.0
11 – 20 41 27.3 27.3 67.3
21 – 35 31 20.7 20.7 88.0
35 + 16 10.7 10.7 98.7
N/A 2 1.3 1.3 100.0
Total 150 100.0 100.0
Respondents were asked two final demographic questions, the
results of which are not presented. The tenth demographic
question asked respondents for their country of residence, and
38
the final question asked for their state/providence of residence.
There were no appreciable frequencies in this data as all of the
respondents in the sample were from the USA. Furthermore, the
sample of respondents ranged throughout the entire country with
someone from every state.
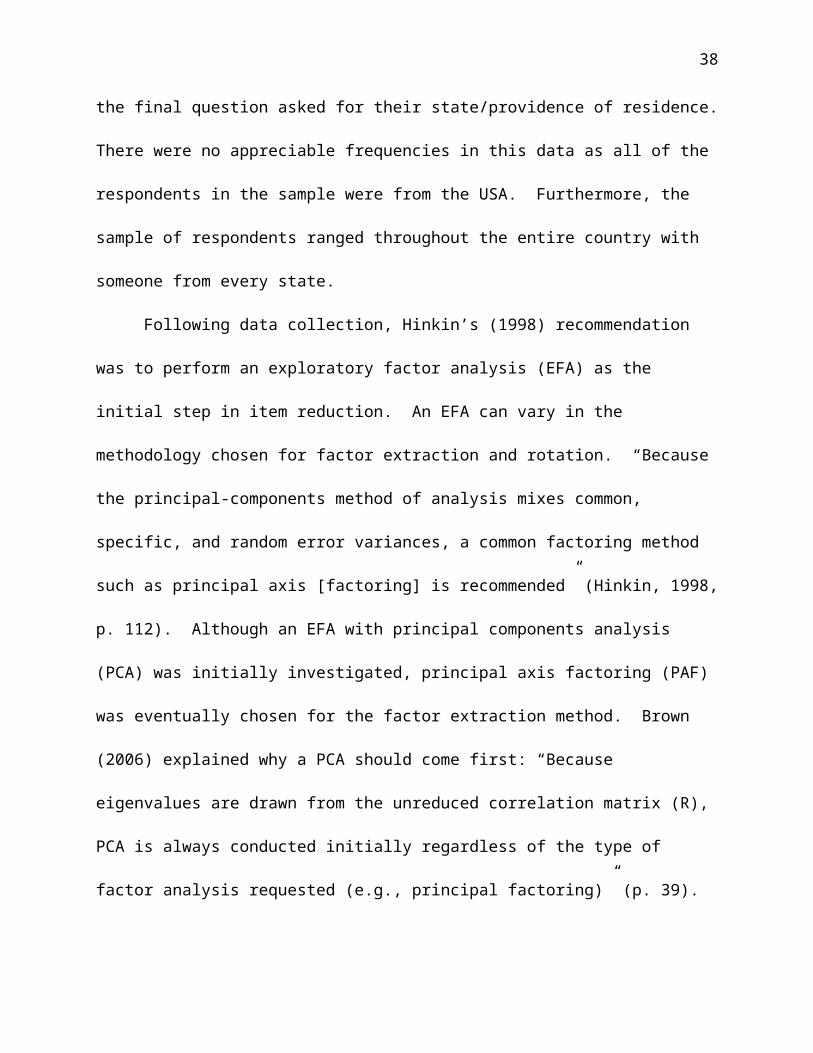
Following data collection, Hinkin’s (1998) recommendation
was to perform an exploratory factor analysis (EFA) as the
initial step in item reduction. An EFA can vary in the
methodology chosen for factor extraction and rotation. “Because
the principal-components method of analysis mixes common,
specific, and random error variances, a common factoring method
such as principal axis [factoring] is recommended” (Hinkin, 1998,
p. 112). Although an EFA with principal components analysis
(PCA) was initially investigated, principal axis factoring (PAF)
was eventually chosen for the factor extraction method. Brown
(2006) explained why a PCA should come first: “Because
eigenvalues are drawn from the unreduced correlation matrix (R),
PCA is always conducted initially regardless of the type of
factor analysis requested (e.g., principal factoring)” (p. 39).

39
The researcher performed an EFA using PAF and promax
(oblique) rotation on the data received from the sample of
respondents. Results are presented below in Tables 10 - 13. The
scree plot is given in Figure 1.
Table 10
KMO and Bartlett’s Test (Exploratory Factor Analysis)
Table 11
Total Variance Explained for Exploratory Factor Analysis with Principal Axis Factoring,
Promax Rotation, and Kaiser Normalization
Factor
Initial eigenvalues Extraction sums ofsquared loadings
Rotation sumsof squaredloadingsa
Total % ofvariance
Cumulative%
Total % ofvariance
Cumulative %
Total
1 19.331 34.519 34.519 19.005 33.937 33.937 16.7262 6.627 11.834 46.354 6.266 11.189 45.126 9.7583 2.001 3.573 49.927 1.628 2.907 48.033 5.3094 1.963 3.506 53.432 1.574 2.810 50.843 10.5465 1.810 3.232 56.664 1.407 2.513 53.356 8.3686 1.527 2.727 59.392 1.128 2.015 55.371 4.8597 1.481 2.645 62.037 1.099 1.962 57.334 5.5678 1.366 2.439 64.476 .977 1.744 59.078 4.098
Kaiser-Meyer-Olkin measure of sampling adequacy.
.893
Bartlett’s test of sphericity
Approx. chi-square 6410.054
df 1540
Sig. .000

40
9 1.291 2.306 66.782 .888 1.586 60.664 3.64510 1.203 2.148 68.930 .799 1.427 62.091 3.87811 1.085 1.938 70.868 .705 1.259 63.350 2.00512 .985 1.759 72.62713 .898 1.604 74.23014 .845 1.509 75.74015 .781 1.394 77.13416 .769 1.374 78.50817 .733 1.309 79.81718 .720 1.285 81.10219 .623 1.112 82.21320 .607 1.085 83.29821 .595 1.063 84.36122 .554 .988 85.35023 .534 .953 86.30224 .514 .918 87.22025 .470 .840 88.06126 .457 .816 88.87727 .429 .767 89.64428 .399 .712 90.35629 .392 .700 91.05630 .357 .637 91.69331 .351 .627 92.32032 .326 .582 92.90233 .315 .563 93.46534 .298 .533 93.99835 .278 .497 94.49536 .255 .455 94.95037 .239 .427 95.37638 .230 .411 95.78739 .219 .391 96.17840 .210 .376 96.55341 .190 .339 96.89242 .182 .326 97.21843 .170 .304 97.52144 .169 .302 97.82345 .159 .284 98.106

41
46 .145 .258 98.36547 .138 .246 98.61148 .131 .233 98.84449 .124 .221 99.06550 .107 .191 99.25651 .093 .166 99.42252 .087 .156 99.57853 .072 .129 99.70754 .065 .116 99.82355 .056 .100 99.92356 .043 .077 100.000
Note. Extraction Method: Principal Axis Factoring.a. When factors are correlated, sums of squared loadings cannot be added to obtain a total variance.
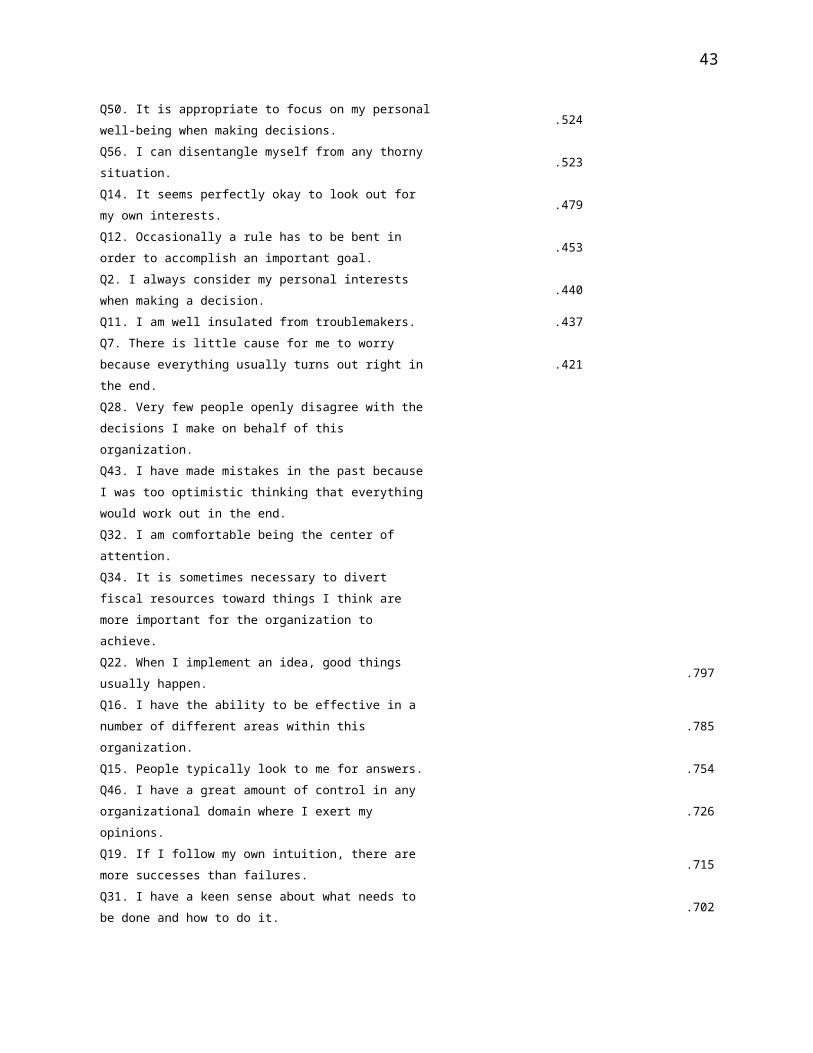
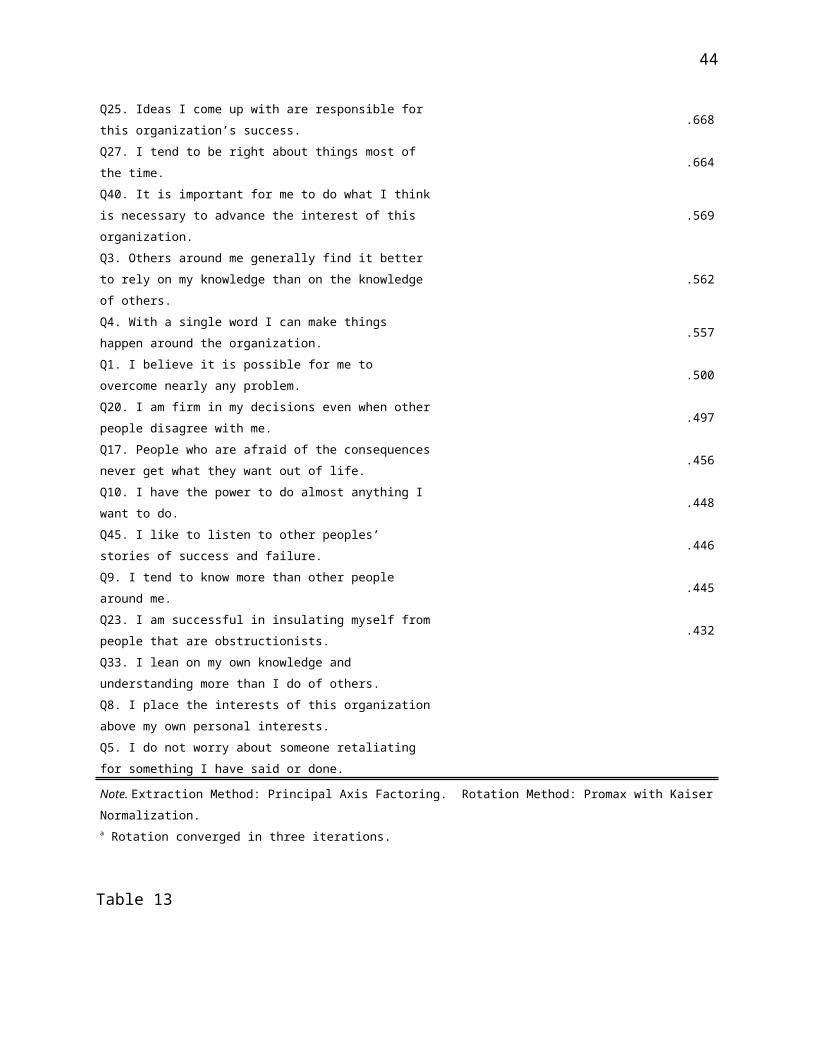
Table 12
Pattern Matrixa for Exploratory Factor Analysis with Principal Axis Factoring, Promax
Rotation and Factors to Extract Fixed 2
Factor
1 2Q6. Ethical guidelines for this organization don’t really apply to me.
.945
Q30. I believe ethics are general guidelines that can be temporarily disregarded in order to achieve some organizational goals.
.932
Q53. I feel that if I were to do something wrong, no one would ever know about it.
.909
Q36. It is more important for me to emphasize results rather than ethics.
.908
Q38. Listening to complaints is not my responsibility.
.898
Q48. I feel it is more important to appear ethical than it is to apply ethical principles.
.882
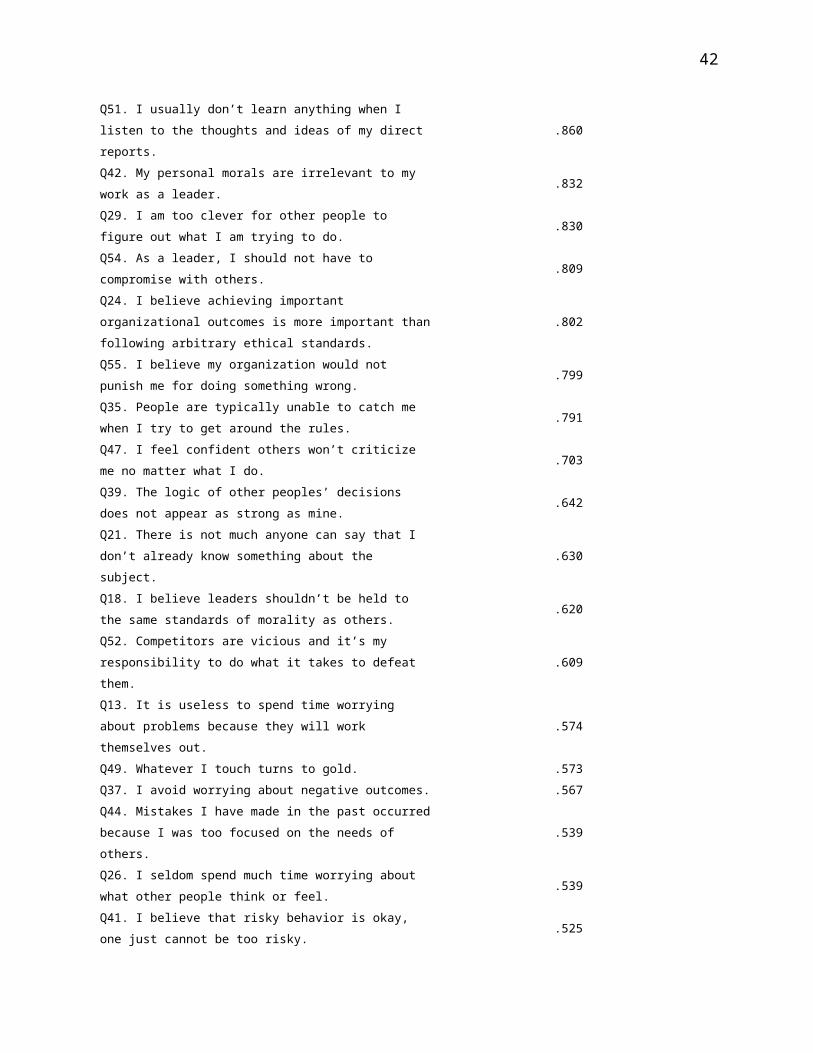
42
Q51. I usually don’t learn anything when I listen to the thoughts and ideas of my direct reports.
.860
Q42. My personal morals are irrelevant to my work as a leader.
.832
Q29. I am too clever for other people to figure out what I am trying to do.
.830
Q54. As a leader, I should not have to compromise with others.
.809
Q24. I believe achieving important organizational outcomes is more important thanfollowing arbitrary ethical standards.
.802
Q55. I believe my organization would not punish me for doing something wrong.
.799
Q35. People are typically unable to catch me when I try to get around the rules.
.791
Q47. I feel confident others won’t criticize me no matter what I do.
.703
Q39. The logic of other peoples’ decisions does not appear as strong as mine.
.642
Q21. There is not much anyone can say that I don’t already know something about the subject.
.630
Q18. I believe leaders shouldn’t be held to the same standards of morality as others.
.620
Q52. Competitors are vicious and it’s my responsibility to do what it takes to defeat them.
.609
Q13. It is useless to spend time worrying about problems because they will work themselves out.
.574
Q49. Whatever I touch turns to gold. .573Q37. I avoid worrying about negative outcomes. .567Q44. Mistakes I have made in the past occurredbecause I was too focused on the needs of others.
.539
Q26. I seldom spend much time worrying about what other people think or feel.
.539
Q41. I believe that risky behavior is okay, one just cannot be too risky.
.525
43
Q50. It is appropriate to focus on my personalwell-being when making decisions.
.524
Q56. I can disentangle myself from any thorny situation.
.523
Q14. It seems perfectly okay to look out for my own interests.
.479
Q12. Occasionally a rule has to be bent in order to accomplish an important goal.
.453
Q2. I always consider my personal interests when making a decision.
.440
Q11. I am well insulated from troublemakers. .437Q7. There is little cause for me to worry because everything usually turns out right in the end.
.421
Q28. Very few people openly disagree with the decisions I make on behalf of this organization.Q43. I have made mistakes in the past because I was too optimistic thinking that everything would work out in the end.Q32. I am comfortable being the center of attention.Q34. It is sometimes necessary to divert fiscal resources toward things I think are more important for the organization to achieve.Q22. When I implement an idea, good things usually happen.
.797
Q16. I have the ability to be effective in a number of different areas within this organization.
.785
Q15. People typically look to me for answers. .754Q46. I have a great amount of control in any organizational domain where I exert my opinions.
.726
Q19. If I follow my own intuition, there are more successes than failures.
.715
Q31. I have a keen sense about what needs to be done and how to do it.
.702
44
Q25. Ideas I come up with are responsible for this organization’s success.
.668
Q27. I tend to be right about things most of the time.
.664
Q40. It is important for me to do what I thinkis necessary to advance the interest of this organization.
.569
Q3. Others around me generally find it better to rely on my knowledge than on the knowledge of others.
.562
Q4. With a single word I can make things happen around the organization.
.557
Q1. I believe it is possible for me to overcome nearly any problem.
.500
Q20. I am firm in my decisions even when otherpeople disagree with me.
.497
Q17. People who are afraid of the consequencesnever get what they want out of life.
.456
Q10. I have the power to do almost anything I want to do.
.448
Q45. I like to listen to other peoples’ stories of success and failure.
.446
Q9. I tend to know more than other people around me.
.445
Q23. I am successful in insulating myself frompeople that are obstructionists.
.432
Q33. I lean on my own knowledge and understanding more than I do of others.Q8. I place the interests of this organizationabove my own personal interests.Q5. I do not worry about someone retaliating for something I have said or done.
Note. Extraction Method: Principal Axis Factoring. Rotation Method: Promax with KaiserNormalization.a Rotation converged in three iterations.
Table 13
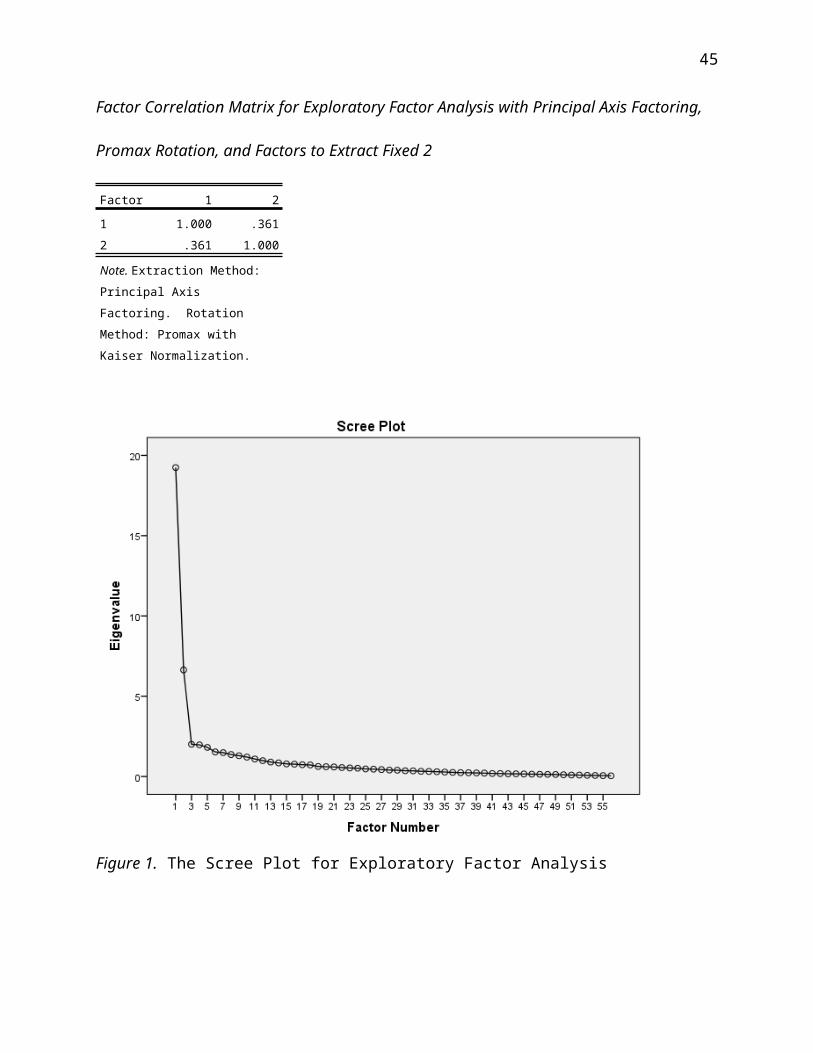
45
Factor Correlation Matrix for Exploratory Factor Analysis with Principal Axis Factoring,
Promax Rotation, and Factors to Extract Fixed 2
Factor 1 21 1.000 .3612 .361 1.000
Note. Extraction Method: Principal Axis Factoring. Rotation Method: Promax with Kaiser Normalization.
Figure 1. The Scree Plot for Exploratory Factor Analysis
46
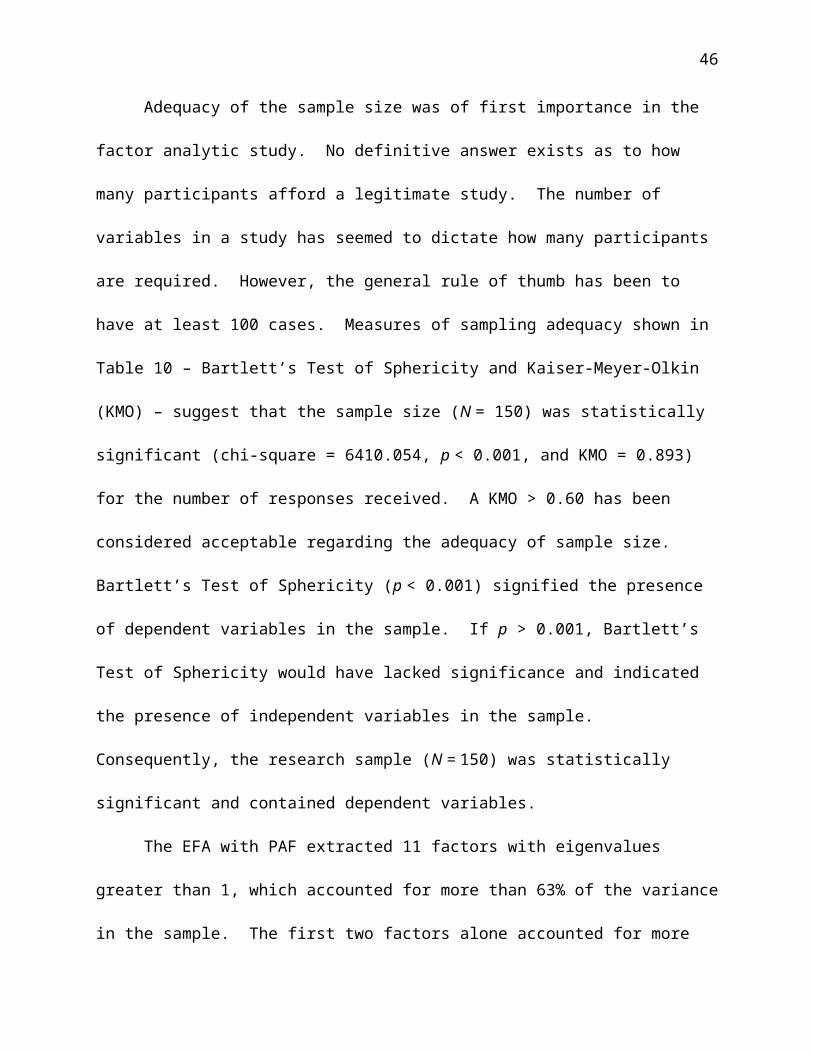
Adequacy of the sample size was of first importance in the
factor analytic study. No definitive answer exists as to how
many participants afford a legitimate study. The number of
variables in a study has seemed to dictate how many participants
are required. However, the general rule of thumb has been to
have at least 100 cases. Measures of sampling adequacy shown in
Table 10 – Bartlett’s Test of Sphericity and Kaiser-Meyer-Olkin
(KMO) – suggest that the sample size (N = 150) was statistically
significant (chi-square = 6410.054, p < 0.001, and KMO = 0.893)
for the number of responses received. A KMO > 0.60 has been
considered acceptable regarding the adequacy of sample size.
Bartlett’s Test of Sphericity (p < 0.001) signified the presence
of dependent variables in the sample. If p > 0.001, Bartlett’s
Test of Sphericity would have lacked significance and indicated
the presence of independent variables in the sample.
Consequently, the research sample (N = 150) was statistically
significant and contained dependent variables.
The EFA with PAF extracted 11 factors with eigenvalues
greater than 1, which accounted for more than 63% of the variance
in the sample. The first two factors alone accounted for more
47
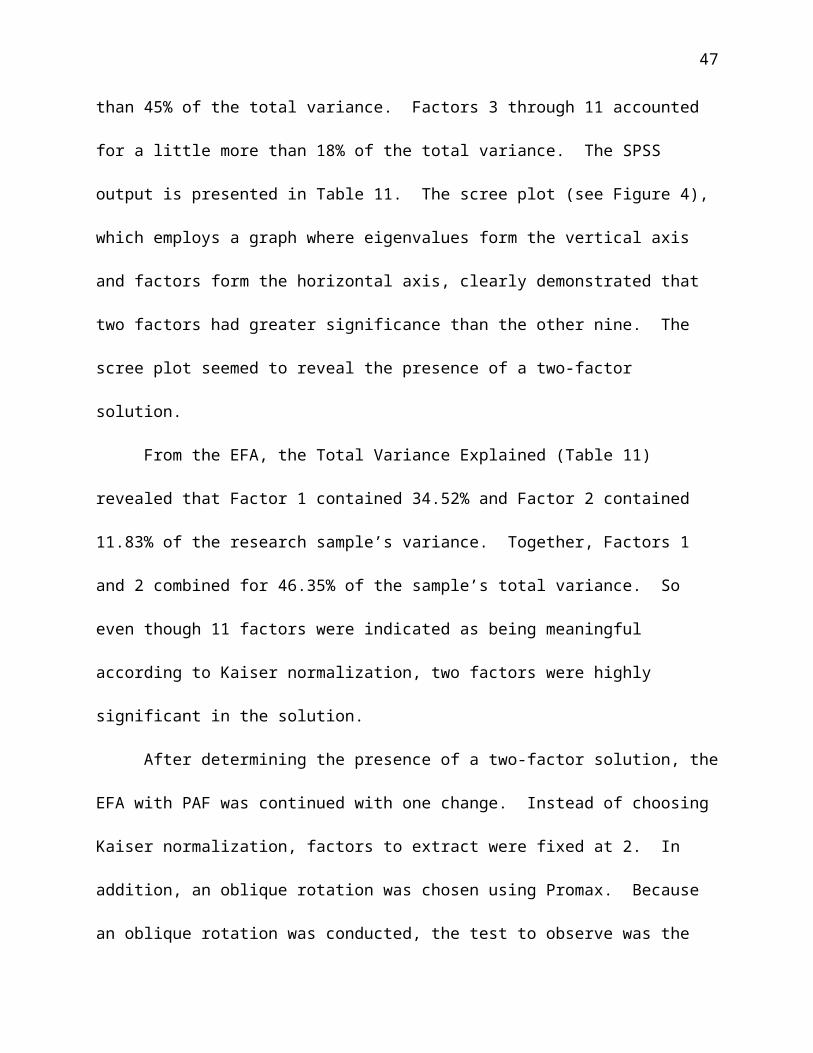
than 45% of the total variance. Factors 3 through 11 accounted
for a little more than 18% of the total variance. The SPSS
output is presented in Table 11. The scree plot (see Figure 4),
which employs a graph where eigenvalues form the vertical axis
and factors form the horizontal axis, clearly demonstrated that
two factors had greater significance than the other nine. The
scree plot seemed to reveal the presence of a two-factor
solution.
From the EFA, the Total Variance Explained (Table 11)
revealed that Factor 1 contained 34.52% and Factor 2 contained
11.83% of the research sample’s variance. Together, Factors 1
and 2 combined for 46.35% of the sample’s total variance. So
even though 11 factors were indicated as being meaningful
according to Kaiser normalization, two factors were highly
significant in the solution.
After determining the presence of a two-factor solution, the
EFA with PAF was continued with one change. Instead of choosing
Kaiser normalization, factors to extract were fixed at 2. In
addition, an oblique rotation was chosen using Promax. Because
an oblique rotation was conducted, the test to observe was the
48
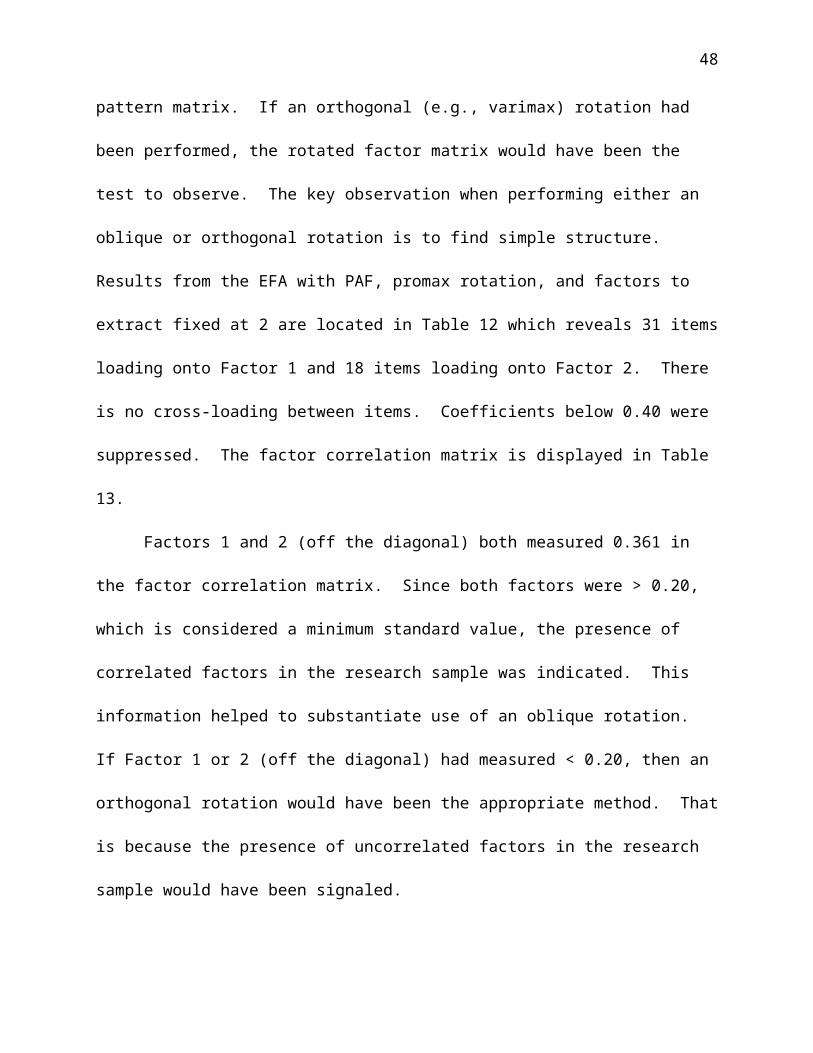
pattern matrix. If an orthogonal (e.g., varimax) rotation had
been performed, the rotated factor matrix would have been the
test to observe. The key observation when performing either an
oblique or orthogonal rotation is to find simple structure.
Results from the EFA with PAF, promax rotation, and factors to
extract fixed at 2 are located in Table 12 which reveals 31 items
loading onto Factor 1 and 18 items loading onto Factor 2. There
is no cross-loading between items. Coefficients below 0.40 were
suppressed. The factor correlation matrix is displayed in Table
13.
Factors 1 and 2 (off the diagonal) both measured 0.361 in
the factor correlation matrix. Since both factors were > 0.20,
which is considered a minimum standard value, the presence of
correlated factors in the research sample was indicated. This
information helped to substantiate use of an oblique rotation.
If Factor 1 or 2 (off the diagonal) had measured < 0.20, then an
orthogonal rotation would have been the appropriate method. That
is because the presence of uncorrelated factors in the research
sample would have been signaled.

49
In agreement with the data
analytical procedure followed by
Traüffer (2008) in her dissertation,
only items with factor loadings >0.50
were retained in this study. Items with
factor loadings <0.50 were removed from
further analysis in this study.
Therefore, based upon the revised
pattern matrix (Table 18), 38 questions
remained on the LIDMI for further
studies.
Table 18
Pattern Matrix Displaying Questions That Loaded High
and Were Retained for Further Study, With Fallacies of
Thinking Identified
Pattern Matrixa
Factor
1 2Question 6 .946 (ED)Question 30
.934 (ED)
Question 53
.911 (NV)
Question 36
.910 (ED)
Question 38
.900 (EG)
Question 48
.884 (ED)
Question 51
.863 (OM)
Question 42
.835 (ED)
Question 29
.833 (NV)
Question 54
.812 (ED)
Question 24
.805 (ED)
Question 55
.803 (NV)
Question 35
.794 (NV)
Question 47
.706 (NV)
Question 39
.641 (OM)
Question 21
.634 (OM)
Question 18
.621 (ED)
Question 52
.612 (OP)
Question 49
.578 (UO)
Question 13
.574 (UO)
Question 37
.570 (UO)
Question 44
.540 (EG)
Question 26
.537 (EG)
Question .529 (EG)
50
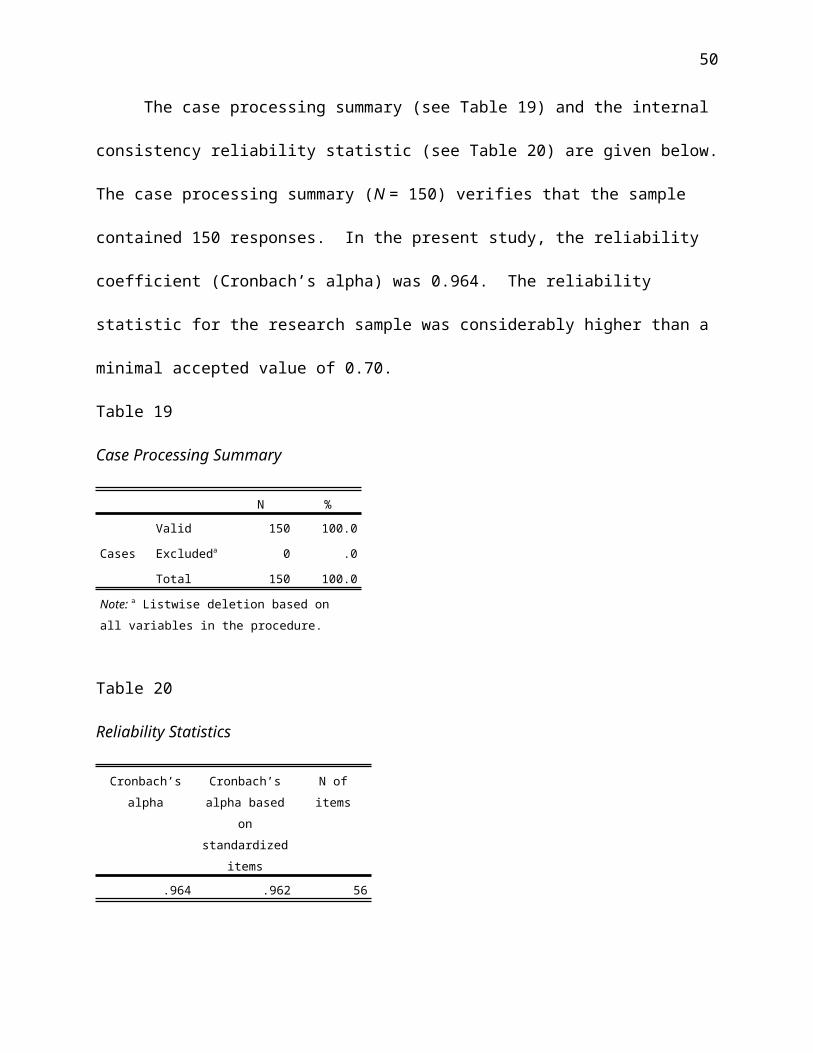
The case processing summary (see Table 19) and the internal
consistency reliability statistic (see Table 20) are given below.
The case processing summary (N = 150) verifies that the sample
contained 150 responses. In the present study, the reliability
coefficient (Cronbach’s alpha) was 0.964. The reliability
statistic for the research sample was considerably higher than a
minimal accepted value of 0.70.
Table 19
Case Processing Summary
N %
Cases
Valid 150 100.0
Excludeda 0 .0
Total 150 100.0
Note: a Listwise deletion based on all variables in the procedure.
Table 20
Reliability Statistics
Cronbach’salpha
Cronbach’salpha based
onstandardized
items
N ofitems
.964 .962 56
51
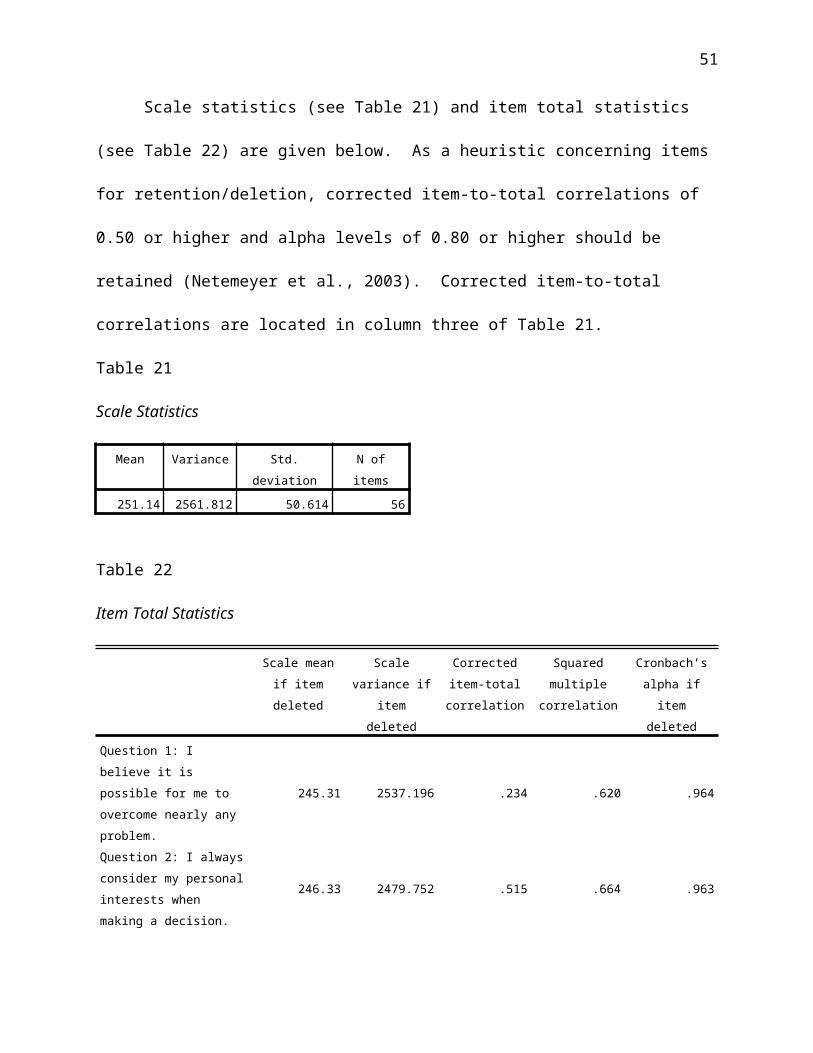
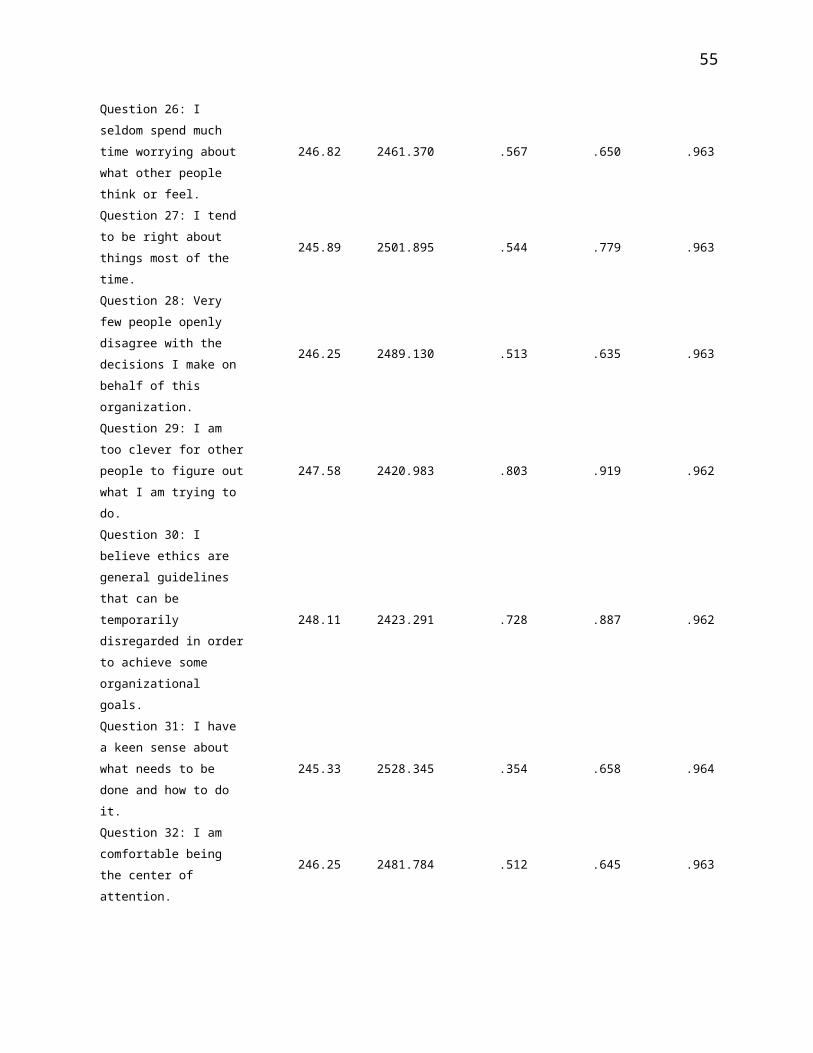
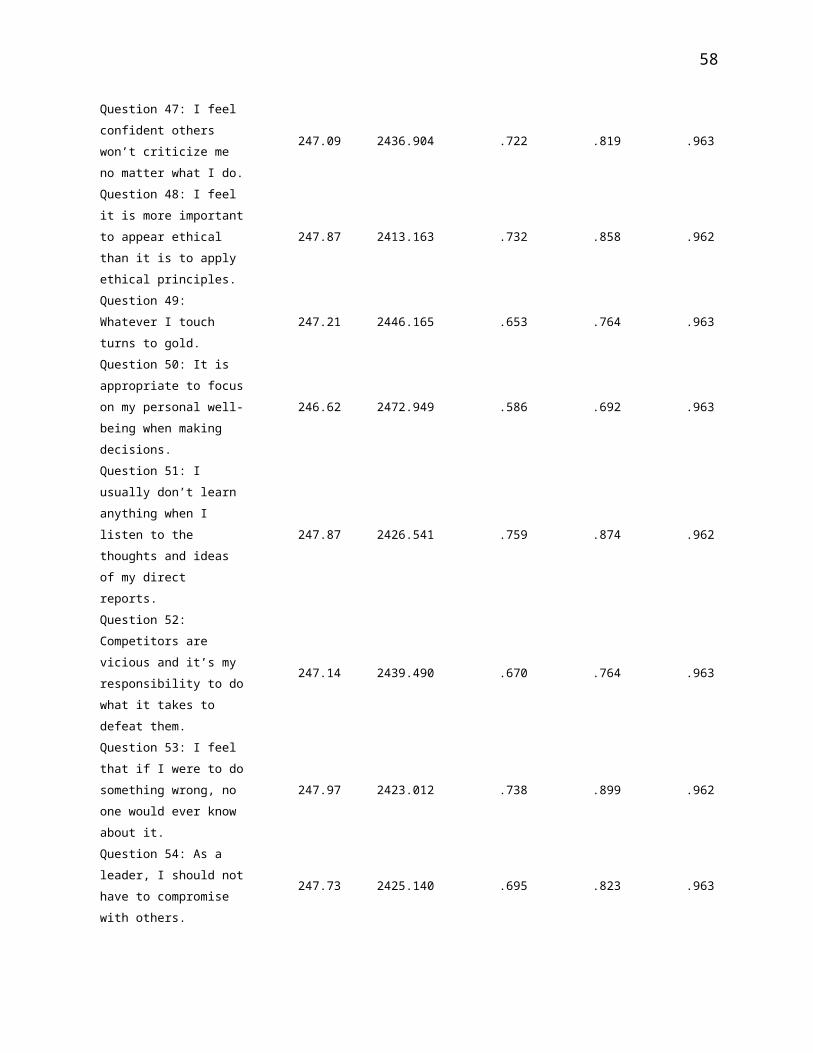
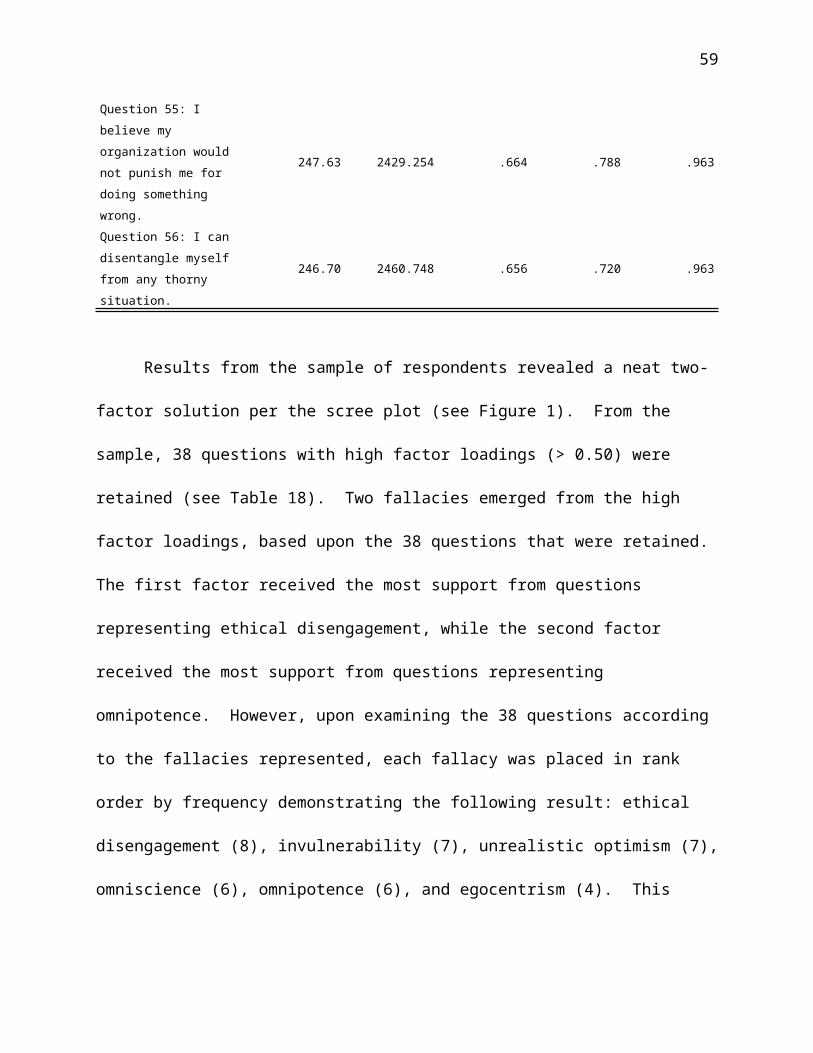
Scale statistics (see Table 21) and item total statistics
(see Table 22) are given below. As a heuristic concerning items
for retention/deletion, corrected item-to-total correlations of
0.50 or higher and alpha levels of 0.80 or higher should be
retained (Netemeyer et al., 2003). Corrected item-to-total
correlations are located in column three of Table 21.
Table 21
Scale Statistics
Mean Variance Std.deviation
N ofitems
251.14 2561.812 50.614 56
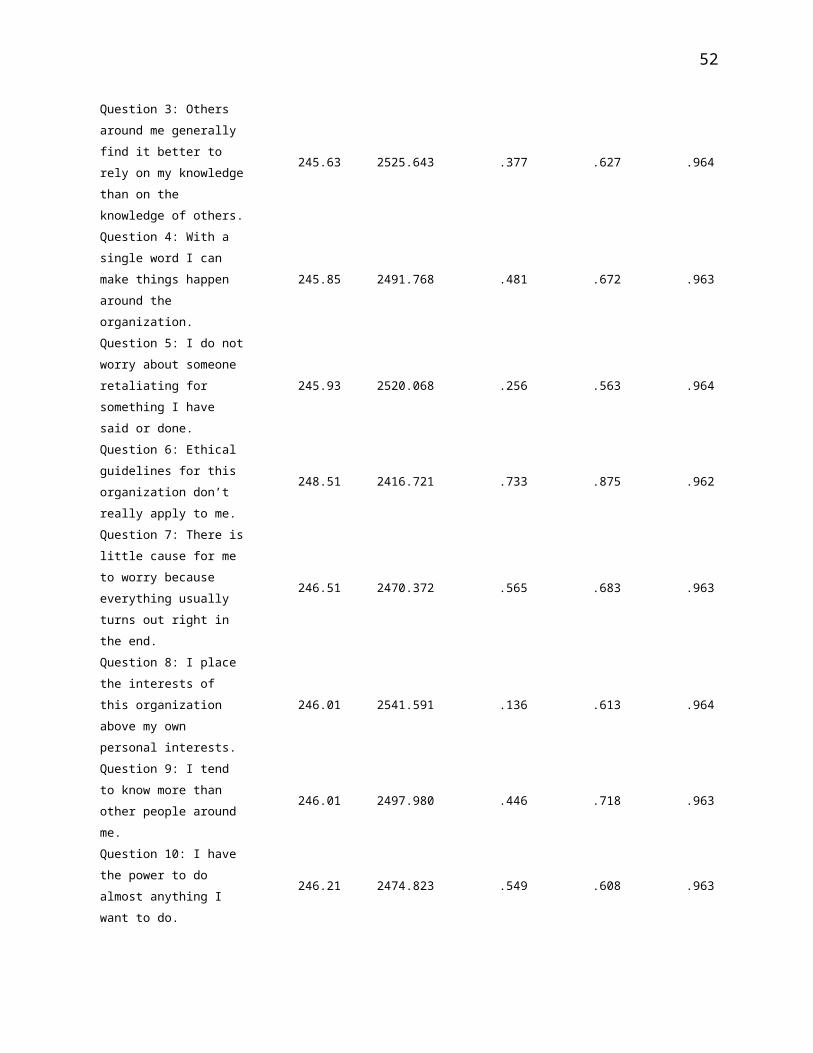
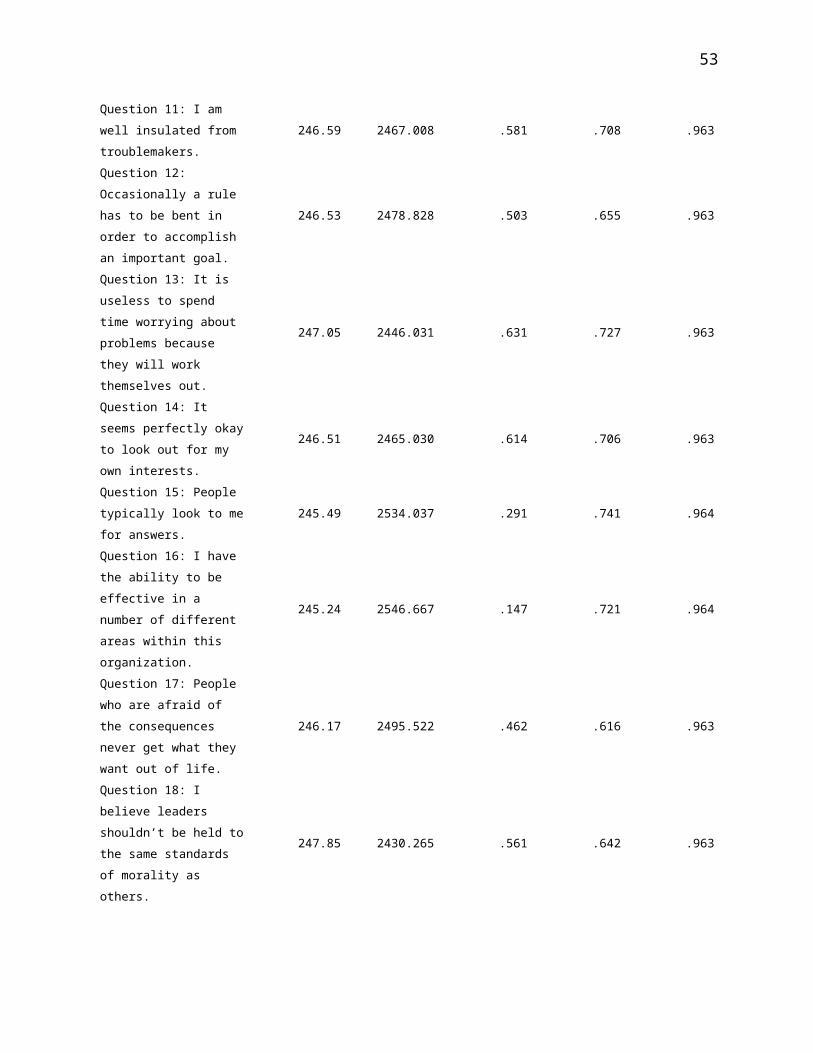
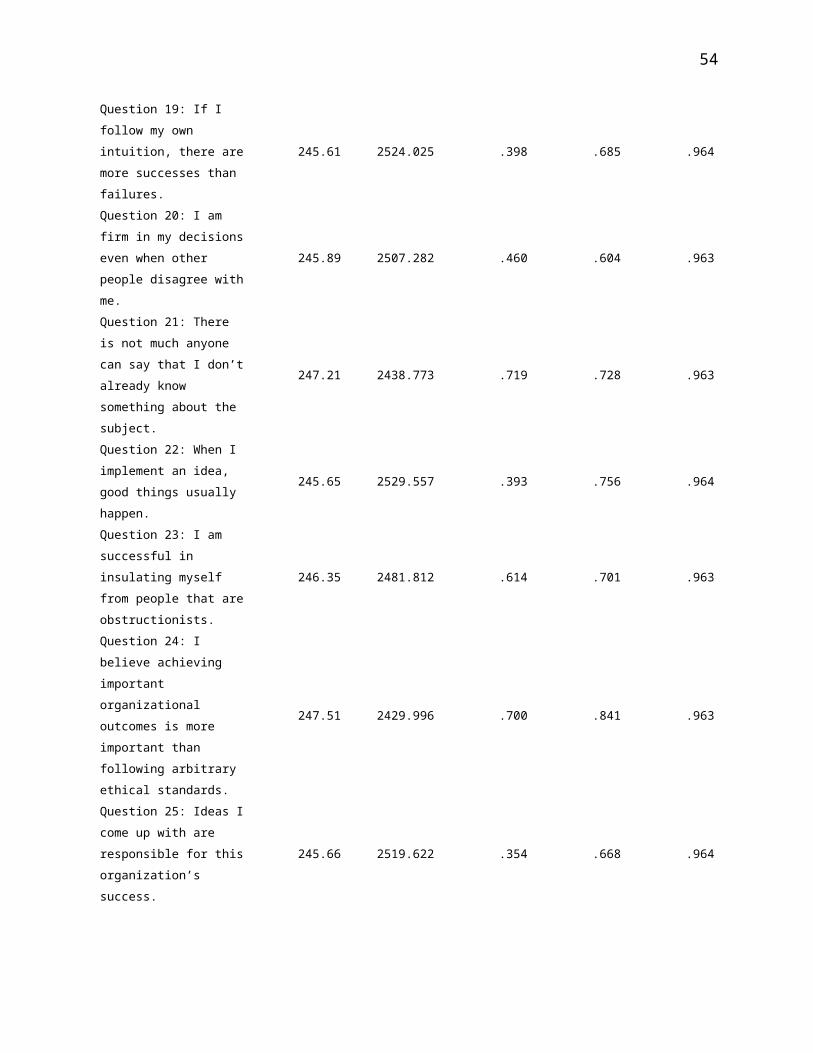
Table 22
Item Total Statistics
Scale meanif itemdeleted
Scalevariance if
itemdeleted
Correcteditem-totalcorrelation
Squaredmultiple
correlation
Cronbach’salpha if
itemdeleted
Question 1: I believe it is possible for me to overcome nearly any problem.
245.31 2537.196 .234 .620 .964
Question 2: I alwaysconsider my personalinterests when making a decision.
246.33 2479.752 .515 .664 .963
52
Question 3: Others around me generally find it better to rely on my knowledgethan on the knowledge of others.
245.63 2525.643 .377 .627 .964
Question 4: With a single word I can make things happen around the organization.
245.85 2491.768 .481 .672 .963
Question 5: I do notworry about someone retaliating for something I have said or done.
245.93 2520.068 .256 .563 .964
Question 6: Ethical guidelines for this organization don’t really apply to me.
248.51 2416.721 .733 .875 .962
Question 7: There islittle cause for me to worry because everything usually turns out right in the end.
246.51 2470.372 .565 .683 .963
Question 8: I place the interests of this organization above my own personal interests.
246.01 2541.591 .136 .613 .964
Question 9: I tend to know more than other people around me.
246.01 2497.980 .446 .718 .963
Question 10: I have the power to do almost anything I want to do.
246.21 2474.823 .549 .608 .963
53
Question 11: I am well insulated from troublemakers.
246.59 2467.008 .581 .708 .963
Question 12: Occasionally a rule has to be bent in order to accomplish an important goal.
246.53 2478.828 .503 .655 .963
Question 13: It is useless to spend time worrying about problems because they will work themselves out.
247.05 2446.031 .631 .727 .963
Question 14: It seems perfectly okayto look out for my own interests.
246.51 2465.030 .614 .706 .963
Question 15: People typically look to mefor answers.
245.49 2534.037 .291 .741 .964
Question 16: I have the ability to be effective in a number of different areas within this organization.
245.24 2546.667 .147 .721 .964
Question 17: People who are afraid of the consequences never get what they want out of life.
246.17 2495.522 .462 .616 .963
Question 18: I believe leaders shouldn’t be held tothe same standards of morality as others.
247.85 2430.265 .561 .642 .963
54
Question 19: If I follow my own intuition, there aremore successes than failures.
245.61 2524.025 .398 .685 .964
Question 20: I am firm in my decisionseven when other people disagree withme.
245.89 2507.282 .460 .604 .963
Question 21: There is not much anyone can say that I don’talready know something about the subject.
247.21 2438.773 .719 .728 .963
Question 22: When I implement an idea, good things usually happen.
245.65 2529.557 .393 .756 .964
Question 23: I am successful in insulating myself from people that areobstructionists.
246.35 2481.812 .614 .701 .963
Question 24: I believe achieving important organizational outcomes is more important than following arbitrary ethical standards.
247.51 2429.996 .700 .841 .963
Question 25: Ideas Icome up with are responsible for thisorganization’s success.
245.66 2519.622 .354 .668 .964
55
Question 26: I seldom spend much time worrying about what other people think or feel.
246.82 2461.370 .567 .650 .963
Question 27: I tend to be right about things most of the time.
245.89 2501.895 .544 .779 .963
Question 28: Very few people openly disagree with the decisions I make on behalf of this organization.
246.25 2489.130 .513 .635 .963
Question 29: I am too clever for otherpeople to figure outwhat I am trying to do.
247.58 2420.983 .803 .919 .962
Question 30: I believe ethics are general guidelines that can be temporarily disregarded in orderto achieve some organizational goals.
248.11 2423.291 .728 .887 .962
Question 31: I have a keen sense about what needs to be done and how to do it.
245.33 2528.345 .354 .658 .964
Question 32: I am comfortable being the center of attention.
246.25 2481.784 .512 .645 .963

56
Question 33: I lean on my own knowledge and understanding more than I do of others.
245.93 2497.767 .510 .742 .963
Question 34: It is sometimes necessary to divert fiscal resources toward things I think are more important for the organization to achieve.
246.10 2494.641 .502 .619 .963
Question 35: People are typically unableto catch me when I try to get around the rules.
247.60 2418.899 .749 .839 .962
Question 36: It is more important for me to emphasize results rather than ethics.
247.84 2417.558 .759 .877 .962
Question 37: I avoidworrying about negative outcomes.
246.83 2446.502 .661 .723 .963
Question 38: Listening to complaints is not myresponsibility.
247.87 2429.816 .694 .841 .963
Question 39: The logic of other peoples’ decisions does not appear as strong as mine.
247.01 2448.215 .671 .736 .963

57
Question 40: It is important for me to do what I think is necessary to advancethe interest of thisorganization.
245.86 2507.638 .429 .713 .964
Question 41: I believe that risky behavior is okay, one just cannot be too risky.
246.77 2463.777 .595 .679 .963
Question 42: My personal morals are irrelevant to my work as a leader.
247.92 2419.752 .680 .813 .963
Question 43: I have made mistakes in thepast because I was too optimistic thinking that everything would work out in the end.
246.71 2499.011 .411 .646 .964
Question 44: Mistakes I have madein the past occurredbecause I was too focused on the needsof others.
246.98 2471.255 .554 .709 .963
Question 45: I like to listen to other peoples’ stories of success and failure.
245.81 2531.616 .222 .678 .964
Question 46: I have a great amount of control in any organizational domain where I exertmy opinions.
245.80 2497.826 .457 .738 .963
58
Question 47: I feel confident others won’t criticize me no matter what I do.
247.09 2436.904 .722 .819 .963
Question 48: I feel it is more importantto appear ethical than it is to apply ethical principles.
247.87 2413.163 .732 .858 .962
Question 49: Whatever I touch turns to gold.
247.21 2446.165 .653 .764 .963
Question 50: It is appropriate to focuson my personal well-being when making decisions.
246.62 2472.949 .586 .692 .963
Question 51: I usually don’t learn anything when I listen to the thoughts and ideas of my direct reports.
247.87 2426.541 .759 .874 .962
Question 52: Competitors are vicious and it’s my responsibility to dowhat it takes to defeat them.
247.14 2439.490 .670 .764 .963
Question 53: I feel that if I were to dosomething wrong, no one would ever know about it.
247.97 2423.012 .738 .899 .962
Question 54: As a leader, I should nothave to compromise with others.
247.73 2425.140 .695 .823 .963
59
Question 55: I believe my organization would not punish me for doing something wrong.
247.63 2429.254 .664 .788 .963
Question 56: I can disentangle myself from any thorny situation.
246.70 2460.748 .656 .720 .963
Results from the sample of respondents revealed a neat two-
factor solution per the scree plot (see Figure 1). From the
sample, 38 questions with high factor loadings (> 0.50) were
retained (see Table 18). Two fallacies emerged from the high
factor loadings, based upon the 38 questions that were retained.
The first factor received the most support from questions
representing ethical disengagement, while the second factor
received the most support from questions representing
omnipotence. However, upon examining the 38 questions according
to the fallacies represented, each fallacy was placed in rank
order by frequency demonstrating the following result: ethical
disengagement (8), invulnerability (7), unrealistic optimism (7),
omniscience (6), omnipotence (6), and egocentrism (4). This

60
examination revealed that, in fact, a six-factor solution had
begun to take shape with the LIDMI.
At the conclusion of the factor analytic study, it was
determined that the model did not fit the data. Testing of the
null hypothesis had failed and the alternative hypothesis was
supported. The study was not a failure; rather, it only meant
the data did not support the expected outcome. Data from the
Zoomerang (2012) sample did not appear to respond well to the
model. Only two of the six fallacies were supported with the
results: ethical disengagement (factor one) and omnipotence
(factor two). A discussion of the findings will come next and
explore some reasons for the data behaving poorly.
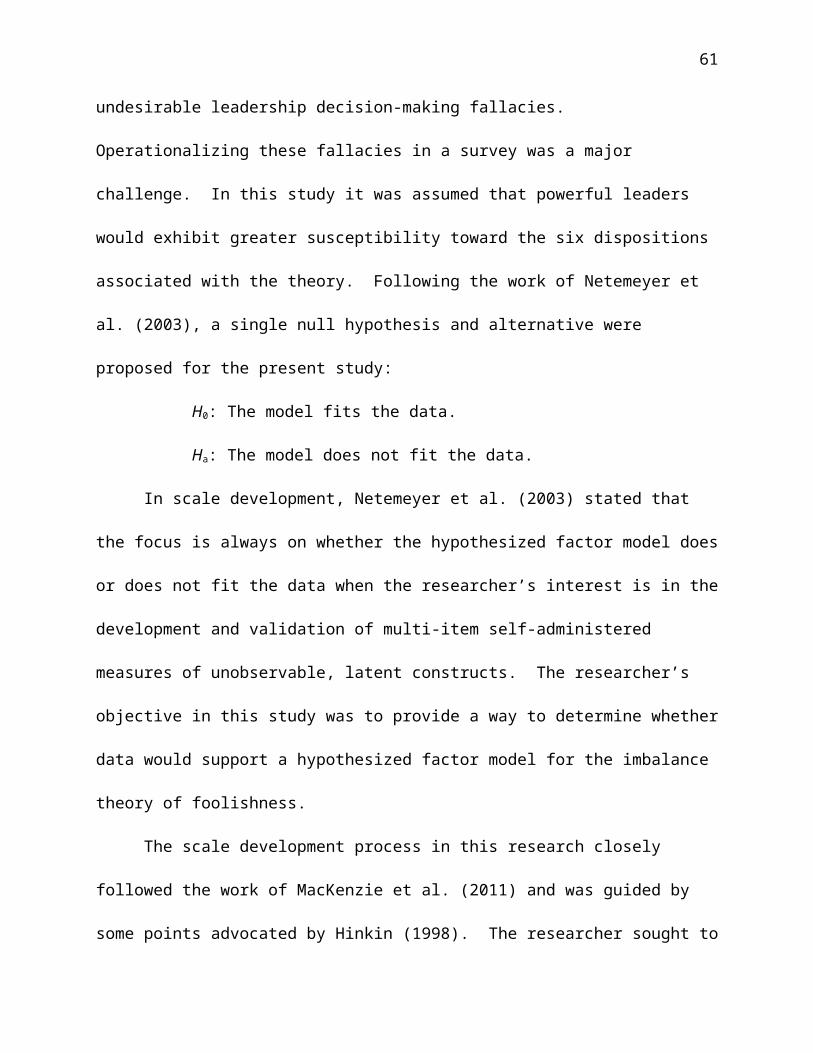
Discussion
The intended purpose of this research study was to
operationalize the imbalance theory of foolishness (Sternberg,
2002). After a thorough examination of the literature we
identified no previous empirical examination of the theory prior
to the present study. The six dispositions associated with the
theory—unrealistic optimism, egocentrism, omniscience,
omnipotence, invulnerability, and ethical disengagement—are
61
undesirable leadership decision-making fallacies.
Operationalizing these fallacies in a survey was a major
challenge. In this study it was assumed that powerful leaders
would exhibit greater susceptibility toward the six dispositions
associated with the theory. Following the work of Netemeyer et
al. (2003), a single null hypothesis and alternative were
proposed for the present study:
H0: The model fits the data.
Ha: The model does not fit the data.
In scale development, Netemeyer et al. (2003) stated that
the focus is always on whether the hypothesized factor model does
or does not fit the data when the researcher’s interest is in the
development and validation of multi-item self-administered
measures of unobservable, latent constructs. The researcher’s
objective in this study was to provide a way to determine whether
data would support a hypothesized factor model for the imbalance
theory of foolishness.
The scale development process in this research closely
followed the work of MacKenzie et al. (2011) and was guided by
some points advocated by Hinkin (1998). The researcher sought to

62
create a measure that would satisfy American Psychological
Association standards for psychometric adequacy. The assessment
for the imbalance theory of foolishness is known as the
Leadership Influence and Decision Making Inventory (LIDMI).
Recommendations for future research will propose that the scale
development process be repeated and the survey refined.
The imbalance theory of foolishness (Sternberg, 2002) had
not been studied empirically prior to the present research with
one minor exception. As a secondary focus in her dissertation,
Jordan (2005) created the fallacies of thinking scale (FTS) which
was the initial attempt to operationalize the balance theory of
wisdom with its five fallacies. Subsequent to Jordan’s research,
the imbalance theory of foolishness was created with a sixth
fallacy - ethical disengagement - built from the balance theory
of wisdom. Nevertheless, the LIDMI was an initial attempt to
operationalize the imbalance theory of foolishness.
Results from the sample of respondents revealed a neat two-
factor solution per the scree plot (see Figure 1). From the
sampling, questions with high factor loadings (> 0.50) per factor
were retained (see Table 18). Two fallacies emerged from the
63
high factor loadings, given the 38 questions that were retained.
The first fallacy (representing factor one) was ethical
disengagement and the second fallacy (representing factor two)
was omnipotence. Unsatisfied with the model fit, all 38
questions from the pattern matrix were examined according to the
fallacy of thinking they represented. The fallacies were rank
ordered according to the frequency of their appearance amongst
the questions retained: ethical disengagement (8),
invulnerability (7), unrealistic optimism (7), omniscience (6),
omnipotence (6), and egocentrism (4). This examination revealed
that, in fact, a six-factor solution was present with the LIDMI.
There was some concern regarding item discrimination because
Sternberg’s definitions are complex. Questions addressing six
different items (fallacies) may have posed a problem for the
sample of respondents. Consolidation of items is a possibility
and will be discussed under suggestions for future research. As
the LIDMI is refined, better ways of constructing questions may
be explored to address concerns pertaining to covert means of
asking sensitive questions on the survey.
Suggestions for Future Research
64
There are some items that should be considered for future
research. First, foolish thinking and foolish behavior were not
distinguished in this research. The six fallacies of thinking
associated with the imbalance theory of foolishness (Sternberg,
2002) include both foolish thinking and foolish behavior. Future
researchers may want to try to isolate foolish thinking from
foolish behavior by examining specific dispositions. Foolish
thinking does not necessarily lead to foolish behavior, but the
imbalance theory of foolishness suggests all foolish behavior
comes from foolish thinking.
A second suggestion is to consider the consolidation of the
number of fallacies associated with the imbalance theory of
foolishness. Because Sternberg did not empirically test the
theory, he had no proof that six dispositions were necessary to
complete the theoretical construct of his unknown model.
Discriminating between six dispositions might have been a problem
for the sample of respondents. Perhaps one or more of the
fallacies of thinking could be consolidated and the study
repeated. The exploratory factor analysis demonstrated that
there were 38 questions with high factor loadings (> 0.5) on two

65
factors. The questions were analyzed and arranged according to
the fallacy of thinking they represented: ethical disengagement
(8), invulnerability (7), unrealistic optimism (7), omniscience
(6), omnipotence (6), and egocentrism (4). If a future
researcher wanted to repeat this study with the LIDMI, perhaps
they could eliminate or consolidate the fallacy of egocentrism
and omnipotence.
A third suggestion is to design and conduct studies that
will develop and refine the LIDMI. The scale development process
requires retesting and refinement. Netemeyer et al. (2003)
stated that “restarts are required as researchers learn from
their efforts and mistakes and as revisions are needed” (p. 185).
One area of special concern in this research involved cognitive
complexity, an issue which was expressed several times in the
dissertation. Future studies must be on guard concerning this
issue. Sternberg’s definitions are very technical and can create
difficulties for those unfamiliar with his theory and fallacy
definitions. Testing different groups of individuals for
cognitive complexity should be considered.

66
A fourth suggestion is to seek ways for respondents to
become more transparent with their answers on the LIDMI. Hubris
is thought to be an issue with those in high leadership
positions, and it was thought to have been an issue in this
study. Hubris resists transparency. Therefore, future studies
need to be designed in such a way as to help executives provide
more honest answers. This might be done by recruiting executive
coaches to administer this tool to executives with a personal
encouragement to be transparent because it will be followed by a
discussion of the outcomes and a plan for dealing with negative
dispositions the leaders might have.
A fifth suggestion is to consider whether the LIDMI is an
instrument that would be useful in measuring moral and ethical
behavior in leaders Numerous researchers (Ciulla, 2001; Trevino,
Hartman, & Brown, 2000) have suggested that organizational
leaders have a responsibility to maintain proper ethical
standards and model moral behavior for the sake of employees and
the image of the organization. Balch and Armstrong (2010) have
suggested:
67
Future research needs to be conducted that would enable an
audit of the ethical health of an organization. . . . Such a
baseline would be useful to evaluate the ethical health of
management giving a leader the ability to enact change.” (p.
302)
The LIDMI survey, which will eventually emerge from this research
study, could conceivably help organizations conduct an audit on
management by examining the thinking behavior of executive
leaders. Organizational leaders need more ways to reflect upon
both their image and practices.

68
References
Balch, D., & Armstrong, R. (2010). Ethical marginality: The
Icarus syndrome and banality of wrongdoing. Journal of Business
Ethics, 92(2), 291-303. http://dx.doi.org/10.1007/s10551-009-
0155-4
Baltes, P. B., & Staudinger, U. M. (2000). Wisdom: A
metaheuristic (pragmatic) to orchestrate mind and virtue
toward excellence. American Psychologist, 55(1), 122-136.
http://dx.doi.org/10.1037/0003-066x.55.1.122
Bass, B. M., & Bass, R. (2008). The Bass handbook of leadership: Theory,
research, and managerial applications (4th ed.). New York, NY: Free
Press.
Birren, J. E., & Fisher, L. M. (1990). The elements of wisdom:
Overview and integration. In R. J. Sternberg (Ed.), Wisdom:
Its nature, origins, and development (pp. 317-332). New York, NY:
Cambridge University Press.
Birren, J. E., & Svensson, C. M. (2005). Wisdom in history. In R.
J. Sternberg & J. Jordan (Eds.), A handbook of wisdom:
Psychological perspectives (pp. 3-31). New York, NY: Cambridge
University Press.

69
Bluck, S., & Glück, J. (2005). From the inside out: People's
implicit theories of wisdom. In R. J. Sternberg & J. Jordan
(Eds.), A handbook of wisdom: Psychological perspectives (pp. 84-109).
New York, NY: Cambridge University Press.
Brown, T. A. (2006). Confirmatory factor analysis for applied research. New
York, NY: The Guilford Press.
Chandler, M. J., & Holliday, S. (1990). Wisdom in a
postapocalyptic age. In R. J. Sternberg (Ed.), Wisdom: Its
nature, origins, and development (pp. 121-141). New York, NY:
Cambridge University Press.
Ciulla, J. B. (2001). Carving leaders from the warped wood of
humanity. Canadian Journal of Administrative Sciences (Canadian Journal of
Administrative Sciences), 18(4), 313.
Csikszentmihalyi, M., & Rathunde, K. (1990). The psychology of
wisdom: An evolutionary interpretation. In R. J. Sternberg
(Ed.), Wisdom: Its nature, origins, and development (pp. 25-51). New
York, NY: Cambridge University Press.
Ford, J. B. (1980). The effects of covert power on the inhibition of structural
change (Doctoral dissertation). Retrieved from ProQuest
Dissertations & Theses database. (UMI No: 8024656)
70
Furr, R. M., & Bacharach, V. R. (2008). Psychometrics: An introduction.
Thousand Oaks, CA: Sage.
Ghiselli, E. E., Campbell, J. P., & Zedeck, S. (1981).
Measurement theory for the behavioral sciences. San Francisco, CA:
W.H. Freeman
Hinkin, T. R. (1998). A brief tutorial on the development of
measures for use in survey questionnaires. Organizational
Research Methods, 1(1), 104-121.
http://dx.doi.org/10.1177/109442819800100106
Irwin, T. (2009). Derailed: Five lessons learned from catastrophic failures of
leadership. Nashville, TN: Thomas Nelson.
Jordan, J. (2005a). Business experience and moral awareness: When less may
be more (Doctoral dissertation). Retrieved from ProQuest
Dissertations & Theses database. (UMI No: 3168920)
Jordan, J. (2005b). The quest for wisdom in adulthood: A
psychological perspective. In R. J. Sternberg & J. Jordan
(Eds.), A handbook of wisdom: Psychological perspectives (pp. 160-
188). New York, NY: Cambridge University Press.
Kessler, E. H., & Bailey, J. R. (Eds.). (2007). Handbook of
organizational and Managerial wisdom. Thousand Oaks, CA: Sage.
71
Kilburg, R. R. (2006). Executive wisdom: Coaching and the emergence of
virtuous leaders. Washington, DC: American Psychological
Association.
MacKenzie, S. B., Podsakoff, P. M., & Podsakoff, N. P. (2011).
Construct measurement and validation procedures in MIS and
behavioral research: Integrating new and existing
techniques. MIS Quarterly, 35(2), 293-334Retrieved from
http://misq/org
MarketTools. (2011). Fast, easy online surveys. Retrieved from
http://www.markettools.com/products/zoomerang
Netemeyer, R. G., Bearden, W. O., & Sharma, S. (2003). Scaling
procedures: Issues and applications. Thousand Oaks, CA: Sage.
Osbeck, L. M., & Robinson, D. N. (2005). Philosophical theories
of wisdom. In R. J. Sternberg & J. Jordan (Eds.), A handbook
of wisdom: Psychological perspectives (pp. 61-83). New York, NY:
Cambridge University Press.
Osburn, H. G. (2000). Coefficient alpha and related internal
consistency reliability coefficients. Psychological Methods,
5(3), 343-355. http://dx.doi.org/10.1037/1082-989X.5.3.343

72
Pious, R. M. (2008). Why presidents fail: White House decision making from
Eisenhower to Bush II. Lanham, MD: Rowman & Littlefield.
Price, T. L. (2004). Explaining ethical failures of leadership.
In J. B. Ciulla (Ed.), Ethics, the heart of leadership (2nd ed., pp.
129-146). Westport, CT: Praeger.
Rooney, D., & McKenna, B. (2007). Wisdom in organizations: Whence
and whither. Social Epistemology, 21(2), 113-138.
http://dx.doi.org/10.1080/02691720701393434
Sanborn, M. (2007). Why leaders fail. Doors and Hardware 71(6), 70-
73.
Schriesheim, C. A., Powers, K. J., Scandura, T. A., Gardiner, C.
C., & Lankau, M. J. (1993). Improving construct measurement
in management research: Comments and a quantitative approach
for assessing the theoretical content adequacy of paper-and-
pencil survey-type instruments. Journal of Management, 19(2),
385-417. http://dx.doi.org/10.1016/0149-2063(93)90058-U
Staudinger, U. M., Lopez, D. F., & Baltes, P. B. (1997). The
psychometric location of wisdom-related performance:
Intelligence, personality, and more? Personality and Social

73
Psychology Bulletin, 23(11), 1200-1214.
http://dx.doi.org/10.1177/01461672972311007
Sternberg, R. J. (1998). A balance theory of wisdom. Review of
General Psychology, 2(4), 347-365.
http://dx.doi.org/10.1037/1089-2680.2.4.347
Sternberg, R. J. (2002). Smart people are not stupid, but they
sure can be foolish: The imbalance theory of foolishness. In
R. J. Sternberg (Ed.), Why smart people can be so stupid (pp. 232-
241). New Haven, CT: Yale University Press.
Sternberg, R. J. (2003). WICS: A model of leadership in
organizations. Academy of Management Learning & Education, 2(4),
386-401. http://dx.doi.org/10.5465/AMLE.2003.11902088
Sternberg, R. J. (2004). Why smart people can be so foolish.
European Psychologist, 9(3), 145-150.
http://dx.doi.org/10.1027/1016-9040.9.3.145
Sternberg, R. J. (2005a). Foolishness. In R. J. Sternberg & J.
Jordan (Eds.), A handbook of wisdom: Psychological perspectives (pp.
331-352). New York, NY: Cambridge University Press.
Sternberg, R. J. (2005b). The WICS model of organizational leadership
(Report No. 05-06). Retrieved from Harvard Kennedy School,

74
Center for Public Leadership website:
http://hdl.handle.net/1721.1/55937
Sternberg, R. J. (2005c). WICS: A model of positive educational
leadership comprising wisdom, intelligence, and creativity
synthesized. Educational Psychology Review, 17(3), 191-262.
http://dx.doi.org/10.1007/s10648-005-5617-2
Sternberg, R. J. (2008a). It's the foolishness, stupid. [Review
of the book A short introduction to the history of human stupidity, by W.
B. Pitkin]. The American Interest, 4(1), 140-143.
Sternberg, R. J. (2008b). The WICS approach to leadership:
Stories of leadership and the structures and processes that
support them. The Leadership Quarterly, 19(3), 360-371.
http://dx.doi.org/10.1016/j.leaqua.2008.03.008
Sternberg, R. J. (2009a). We need to teach for ethical conduct.
The Educational Forum, 73(3), 190-198.
http://dx.doi.org/10.1080/00131720902991228
Sternberg, R. J. (2009b). Wisdom, intelligence and creativity
synthesized. The School Administrator, 66(2), 10-14Retrieved from
http://aasa.org/SchoolAdministrator.aspx

75
Traüffer, H. C. V. (2008). Towards an understanding of discernment: A 21st-
century model of decision-making Doctor of Philosophy in
Organizational Leadership, Regent University, ProQuest (UMI
No: 3325539)
Trevino, L. K., Hartman, L. P., & Brown, M. (2000). Moral person
and moral manager: How executives develop a reputation for
ethical leadership. California Management Review, 42(4), 128-142.
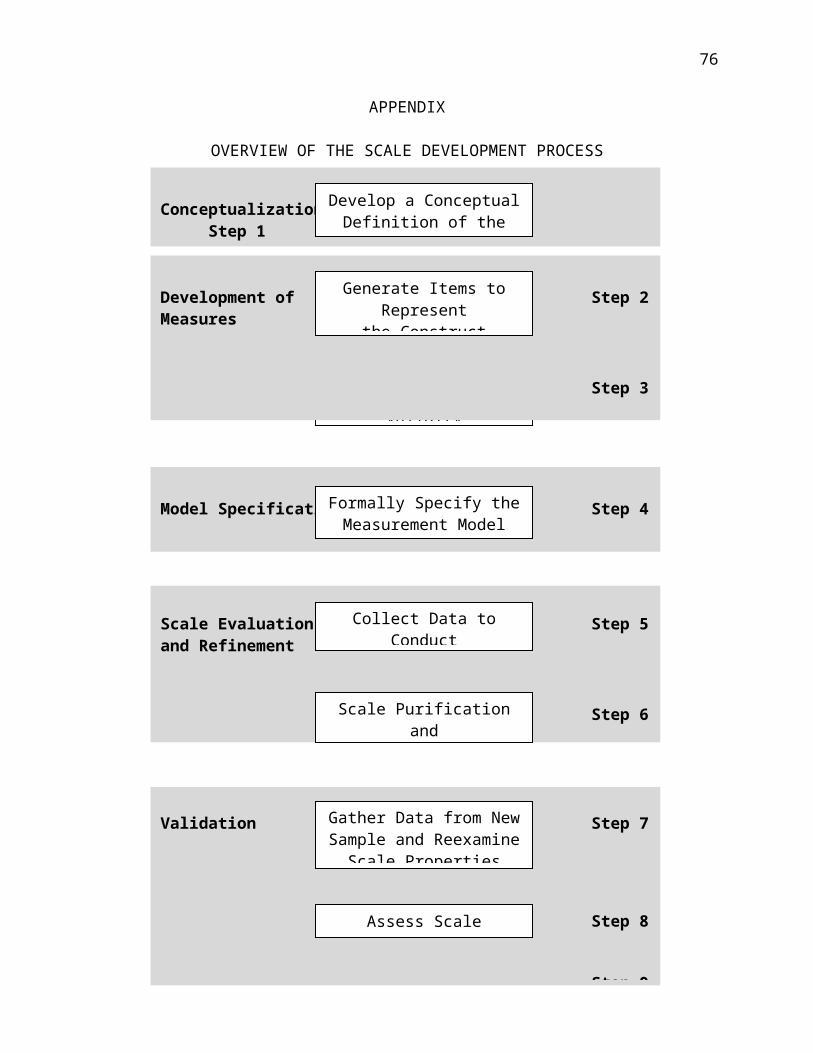
76
APPENDIX
OVERVIEW OF THE SCALE DEVELOPMENT PROCESS
ConceptualizationStep 1
Assess the ContentValidity
Model Specification Step 4Formally Specify theMeasurement Model
Scale Evaluation Step 5and Refinement
Step 6
Collect Data toConduct
Scale Purificationand
Validation Step 7
Step 8
Step 9
Gather Data from NewSample and ReexamineScale Properties
Assess ScaleValidity
Develop a ConceptualDefinition of the
Development of Step 2Measures
Step 3
Generate Items toRepresent
the Construct

77
Adapted from “Construct Measurement and Validation Procedures in MIS and Behavioral Research: Integrating New and Existing Techniques,” by S. B. MacKenzie, P. M. Podsakoff, and N. P. Podsakoff, 2011, MIS Quarterly, 35(2), p. 297.
Cross-Validate the
Norm Development Step 10
Develop Norms forthe