Download - Cenviro
74
-
Upload
khangminh22 -
Category
Documents
-
view
4 -
download
0
Transcript of Download - Cenviro

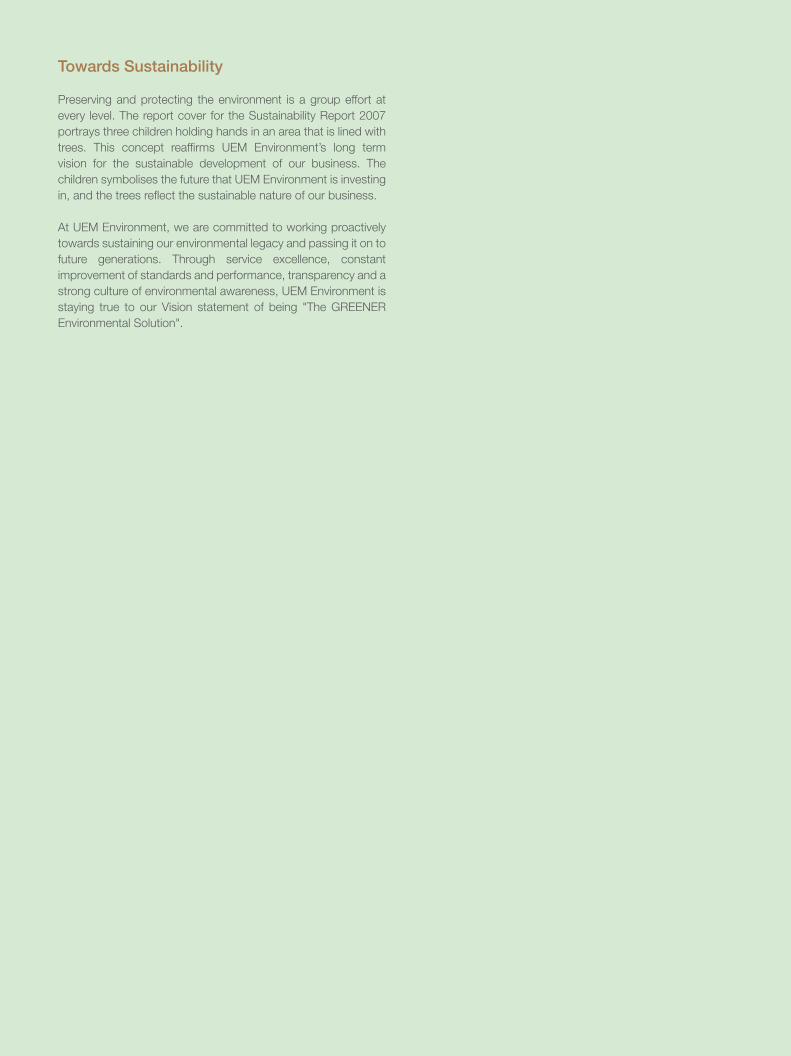
Towards Sustainability
Preserving and protecting the environment is a group effort at
every level. The report cover for the Sustainability Report 2007
portrays three children holding hands in an area that is lined with
trees. This concept reaffirms UEM Environment’s long term
vision for the sustainable development of our business. The
children symbolises the future that UEM Environment is investing
in, and the trees reflect the sustainable nature of our business.
At UEM Environment, we are committed to working proactively
towards sustaining our environmental legacy and passing it on to
future generations. Through service excellence, constant
improvement of standards and performance, transparency and a
strong culture of environmental awareness, UEM Environment is
staying true to our Vision statement of being "The GREENER
Environmental Solution".
2007 Sustainability Report
The report team wishes to thank all the individuals throughout the
organisation who contributed information, stories and data to this
report. Special thanks to the core contributors that have been helpful
in contributing towards the successful publication of this Sustainability
Report.
Core Contributors Azmanuddin Haq Ahmad
Suhaimee Mahdar
Chiew Hai Wah
Jazzita Jamaludin
Chow Yin See
Kong Lee Peng
Zurina Abdul Wahab
Salmah Kasbullah
Mohd Norsuradi Man
Jefri Mohamad Din
Mohd Sallehuddin Ibrahim
Hamdan Osman
Wan Jamshid Amourzegar
Mohd Johari Abdul Malik
Normalis Ali
Razali Abu Bakar
Abdul Rashid Mohamad
Siti Nadzriah Abdul Hamid
Sathish Kurup
Nick Chong
Barani T. Krishna Moorthy
Tan Lay Lay
Compiled & Prepared by Green Edge Consult Sdn. Bhd.
No. 28-4 Jalan 14/22, Right Angle
46100 Petaling Jaya,
Selangor.
www.greenedgeconsult.com
Designed by Octagon Creative Sdn. Bhd.
Contact Chiew Hai Wah
Corporate Communications Manager
Kualiti Alam Sdn. Bhd.
15th Floor, Menara 2, Faber Towers,
Taman Desa, Jalan Kalang Lama,
58100 Kuala Lumpur, Malaysia.
Email: [email protected]
A softcopy of the corporate
sustainability report can be
downloaded at:
www.kualitialam.com

2 About UEM Environment3 About this Report5 Our Performance at a Glance8 Our Approach to Sustainability9 Message from the Managing Director12 Our Vision and Mission14 Sustainability Cost Commitments16 Corporate Structure17 Our Management Team18 Corporate Governance21 Social Performance36 Environmental Performance52 Economic Performance55 ACCA MESRA Awards 200756 Verification Report60 GRI Index64 Glossary66 Appendix67 List of Figures and Tables
Contents

About UEM Environment2
The generation of waste is an inevitable consequence of life. A smallbut significant proportion of waste is hazardous, which by its naturehas the potential for harm to human health and pollution of theenvironment. The safe management of hazardous waste is anessential service for a modern society to protect the environmentwhile helping to sustain high standards of living.
UEM Environment Sdn Bhd (UEM Environment) is a companycommitted to making a difference for the environment, ourcommunities, employees and customers. As an industry leader inproviding hazardous waste management services, we offer acomplete solution for the management of hazardous wastes andwork in partnership with our clients to develop long term answers tothe treatment and disposal of their waste.
We strive to be a trusted and valued community partner, and wecommit our resources and resourcefulness to programmes thatbuild up our communities and our cities. As a company with 306employees as of 31 December 2007 and more than 1,700customers, we also commit our voice to calling for greater diversityin the workplace and the world around us.
As a major player in the Malaysian environmental services industry,UEM Environment has the capabilities to meet environmental needsin waste disposal and management. Our services help industriesmanage their scheduled waste in an environmentally responsiblemanner. Our group of companies include:
• Kualiti Alam Sdn Bhd (Kualiti Alam)• Kualiti Khidmat Alam Sdn Bhd (Kualiti Khidmat Alam)• Kualiti Kitar Alam Sdn Bhd (Kualiti Kitar Alam)• E-Idaman Sdn Bhd (E-Idaman)• Abu Dhabi Kualiti Alam Environmental Services LLC (ADKA)
The UEM Environment group of companies complement each otherby providing comprehensive services in the field of hazardous wastemanagement. We are able to offer the following products andservices:
• Privatisation of Hazardous, Medical & Municipal WasteManagement - Projects- Packaging & Labelling- Logistics Planning & Transportation- Hazardous Waste Recycling & Recovery- Treatment & Disposal
• Remediation of Contaminated Sites• Asbestos Survey, Removal & Disposal Services• Integrated & Comprehensive Sludge Management & Tank
Cleaning Services• Technical & Consultancy Services
- Environmental Management Services which coverLaboratory & Analytical Testing, Environmental MonitoringProgramme, Special Waste Treatment & Disposal, WasteWater Solutions and Waste Management Facilities Set-Up
- Waste IT Solution for Real-Time Waste Tracking System• Research & Technology Development (R&D) for Process
and Technology Innovation- Kualiti Alam Modular Incinerator - Waste Burner & Industrial Shredder
• Feasibility Studies & Master Plan for privatisation of wastemanagement services and/or systems
2007 was a ful l and rewarding year for UEM Environment.Consistent with other leading responsible businesses, we annuallyreport our performance for the attention of our stakeholders and thewider public. In 2006, we publish our Inaugural Sustainability Report1996-2005, which was followed by our Sustainability Report 2006the following year. This is our third Sustainability Report in the series,explaining our achievements in 2007 with reference to the objectivesset for the year in 2006 and setting objectives for 2008 to meet ouraspirations for the future. Our Safety, Health and Environment (SHE)performance in 2006 and 2007 for Kualiti Alam is documented inour separately published SHE Report 2006-2007.

UEM Environment Sustainability Report 2007 - Towards Sustainability
About this Report 3
This report shows our progress in the area of sustainability reportingover 2007. Like previous reports, this edition uses a stakeholderstructure which demonstrates how we interact with internal andexternal stakeholders.
This year’s report reflects our ongoing efforts to refine the qualityand materiality of our reporting. We continue to evaluate theseefforts year over year to understand how we can increase therelevance, engagement and effectiveness of our Corporate SocialResponsibility (CSR).
UEM Environment recognises that sustainability is an essentialelement of our business. The theme of our sustainability report thisyear is ‘Towards Sustainability’, which reflects our long term visionfor the sustainable development of our business, and our resolve topromote a positive relationship with our stakeholders and theenvironment.
This report can be viewed as a disclosure of our corporateresponsibility performance. Our intent is to share the information in astandardised way on issues that are most relevant to our internaland external stakeholders. Our transparency efforts and ourcommitment to reporting are not limited to this document. We seevalue in different methods of reporting and communicating, and thisreport complements our website (www.kualitialam.com) where wedisclose our performance.
We have structured our report to provide comprehensive coverageof sustainability issues in a manageable and straightforward manner.In each section of the report we outline our key achievementsduring 2007. We have reported each performance measure usingquantitative data where possible to assist in determining progressagainst our sustainability objectives for 2007.
Reporting ConventionsMost of this report refers to data from 2007 and the first half of2008. UEM Environment refers to the company and its subsidiaries.
Reporting BoundariesThis Sustainability Report covers our entire organisation unlessotherwise indicated. The report includes quantitative and qualitativedata for the calendar year 2007. We also describe relevant actionstaken in the first half of 2008.
Target audiencesOur target audience consists of all of our stakeholders, including butnot limited to government leaders, regulators, employees, businesspartners, academics, non-governmental organisations (NGOs),environmental groups, community leaders, individuals with interestsin corporate responsibility and the communities in which we operate.
Global Reporting Initiative (GRI) GuidelinesOur previous Sustainability Reports have followed the specificationsset forth by the GRI’s 2002 Sustainability Guidelines. For 2007, wehave used the latest GRI Guidelines, the G3 Guidelines as our mainpoint of reference.
The GRI is an independent body established in collaboration withthe United Nations Environment Programme (UNEP) to definebenchmarks for corporate sustainability reporting. The GRI Indexenables report users to:
• Determine quickly and simply where certain informationmentioned in the GRI guidelines can be found
• Obtain a clear view of the extent to which UEM Environment hasincorporated the content stated in the GRI guidelines into ourSustainability Report
The G3 Guidelines have different application levels. We apply anapplication level of C+, whereby we report on the profile disclosuresand at least 10 performance indicators. The report is also externallyassured. For further details on the application of the G3 guidelines,please refer to the GRI Index from pages 59 to 62.
About this Report4
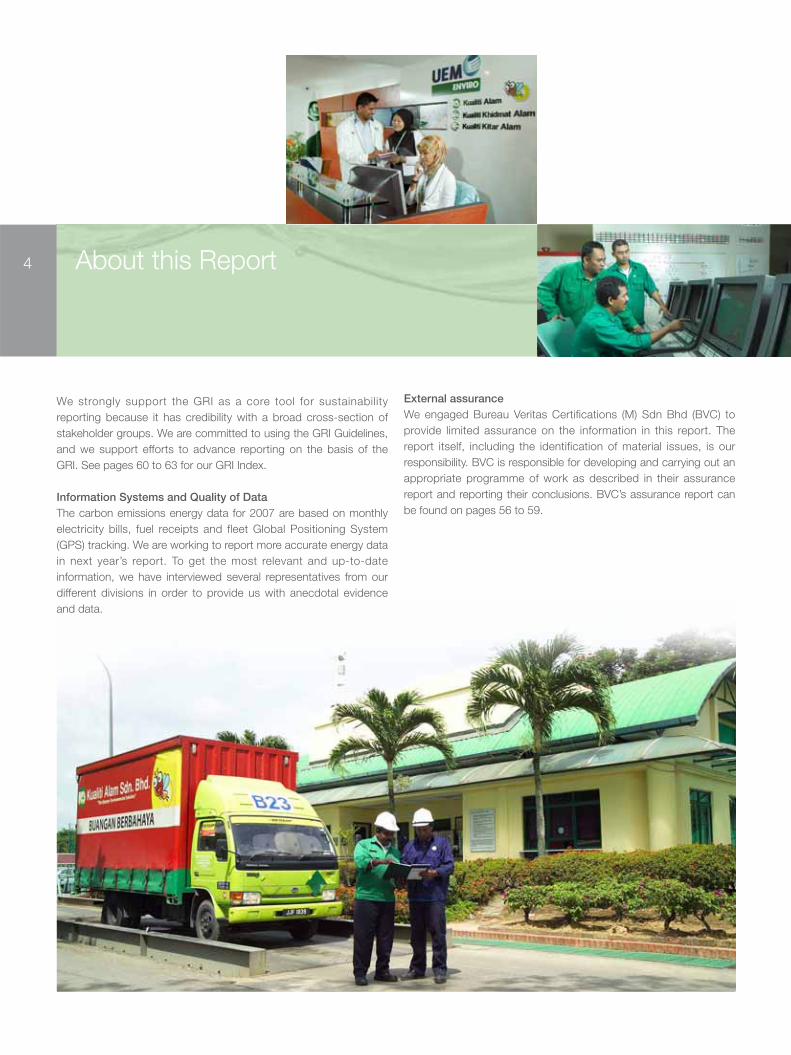
We strongly support the GRI as a core tool for sustainabilityreporting because it has credibility with a broad cross-section ofstakeholder groups. We are committed to using the GRI Guidelines,and we support efforts to advance reporting on the basis of theGRI. See pages 60 to 63 for our GRI Index.
Information Systems and Quality of DataThe carbon emissions energy data for 2007 are based on monthlyelectricity bills, fuel receipts and fleet Global Positioning System(GPS) tracking. We are working to report more accurate energy datain next year’s report. To get the most relevant and up-to-dateinformation, we have interviewed several representatives from ourdifferent divisions in order to provide us with anecdotal evidenceand data.
External assuranceWe engaged Bureau Veritas Certifications (M) Sdn Bhd (BVC) toprovide limited assurance on the information in this report. Thereport itself, including the identification of material issues, is ourresponsibility. BVC is responsible for developing and carrying out anappropriate programme of work as described in their assurancereport and reporting their conclusions. BVC’s assurance report canbe found on pages 56 to 59.

UEM Environment Sustainability Report 2007 - Towards Sustainability
5
For UEM Environment, being a sustainable waste managementcompany means managing our business in a way that enhancessocial and economic impacts to society while striving to minimise andmitigate environmental effects associated with waste management.
2007 has seen UEM Environment grow from strength to strength.Kualiti Kitar Alam, our scheduled waste recycling and recoveryfacility went into operations in December 2007 after garnering theappropriate approvals from the authorities. Not only that, we alsowitnessed our transportation and marketing subsidiary, KualitiKhidmat Alam become the latest member of UEM Environment toobtain multiple certifications in its Integrated Management System(IMS) for ISO 9001, ISO 14001 and OHSAS 18001.
We are pleased to report that we have recorded our highest revenuein 2007 since the start of our operations. With the exception of2004, we have recorded pre-tax profits for the past 5 years.Conversely, our capital expenditure has also increased as wecontinuously seek to provide better and more efficient services toour customers, and also as part of our assets managementprogramme. The capital spending for 2007 was significantly highercompared to 2006 due to the commencement of operations forKualiti Kitar Alam. The diagram below presents some key financialindicators of the Group.
FIGURE 1: UEM ENVIRONMENT’S FINANCIAL PERFORMANCEFROM 2005 TO 2007
OUR STRATEGY
UEM Environment intends to remain in its present operating sectorsand expand regionally and globally. Growth will be pursued withinthe Group, in addition to which there will be acquisitions. The groupaims to grow faster in Malaysia than the market average. The longterm growth target for the company’s net sales is more than 10 percent annually. Our growth for abroad wil l be focused onopportunities available, establishing new units and acquisitions. Inparticular, growth will be sought in Indonesia, Middle East and Asiain general.
Over the next five years, we will invest significantly both in Malaysiaand abroad, which will accelerate growth in net sales. Investment inproduct R&D will be increased.
Our competitiveness will be maintained through improved efficiencyand differentiation. Efficiency will be improved by viewing thebusiness as processes and changing its operating methods.Process evaluation will be based on time and costs evaluations.Differentiation from the customer’s perspective will be achievedthrough price, product development and services rendered. We have developed our assets management programme andinvested heavily in building the capacity of our services.
UEM Environment endeavours to exploit its expertise, especially inthe Asia and the Middle East regions, where we see greatopportunities in market development. The aim is to extend and shareour experience in waste management value chain to these markets.
Our Performance at a Glance
RM
’000
134,166
15,306
33,824
9,98610,287
104,377
15,229
18,977
123,231
2005 2006 20070
50000
100000
150000
20000
Year
Annual Revenue
Profit before Tax
Capital Spending

Our Performance at a Glance6
PROGRESS AND PRIORITIES
In our 2006 Sustainability Report, we outlined our priorities for thenear future. Here’s a snapshot of our progress:
Pursue Zero Lost Time Injuries (LTI)Setting benchmarks in workplace safety is part of what we stand for.As such, we are proud to announce that Kualiti Alam, our hazardouswaste treatment and disposal facility has continued its impeccablerecord for safety at the Integrated Scheduled Waste ManagementCentre (WMC) in Bukit Nanas, Negeri Sembilan by extending its ZeroLTI run to 2,000,000 man hours as at 30 April 2007.
Reduce our carbon footprintThe first step in managing our carbon footprint is to calculate ouremissions accurately. We are pleased to announce that we arereporting our Carbon Footprint for the first time this year. Ourcarbon emissions disclosure for 2007 includes the electricityconsumption of our various offices and plants and the fuelconsumption arising from our transportation usage and our plantoperations. We must acknowledge that we are in the early stages ofthis process and will build upon this information in years to come.
Improve revenueUEM Environment’s tax liabilities were approximately RM8.5 millionin 2007. Spending on goods and services totalled RM50 million for 2007.
Address community issues related to growthIn 2007, UEM Environment continues to f ield permanentrepresentatives to sit in on the Village Development and SecurityCommittee (JKKK) of Felda Sendayan, Kampung Jimah Baru,Kampung Jimah Lama, Taman Gadong Jaya and Tanah MerahResidents Association to participate in village development activitiesand receive feedback.
We continue to be a vocal advocate for increased public funding forthe communities in which we operate.
Recruit and retain employeesA comprehensive workforce strategy is helping UEM Environmentplan ahead to hire the people we need to implement our growthplans. Between 2006 and 2007, our workforce grew from 274 to306 employees, a rise of 12%. On top of that, staff turnover as apercentage of total workforce population decreased from 9.6% in2006 to 6.5% in 2007. This is a sign that while the competition fortalent remains intense, UEM Environment still remains the preferredchoice of our employees.
Invest in environmental technologyUEM Environment significantly expanded our oil recovery facility bysetting up a pre-treatment plant for Kualiti Kitar Alam. We are also in the midst of establishing a synergy programme with the localcement industry on the utilisation of waste as alternative fuel.
We are currently undertaking a collaborative study on pre-treatmentmethods for reduction of Total Organic Carbon (TOC) and Oil &Grease (O&G) in sludge wastes to meet solidification or landfillcriteria. Another collaborative study we have undertaken is a studyon the alternative treatment of chromate waste.

UEM Environment Sustainability Report 2007 - Towards Sustainability
7
KEY LIMITATIONS
As our sustainability programme is still in its infancy, we acknowledgethat there are still a few areas that we can improve on. We are in acontinuous process of refining our data collection and reportingprocesses with each passing year. Included below are the areas inwhich we hope to report on within the next five years:
Environmental data for all subsidiariesWe aim to report on the environmental performance data of all oursubsidiaries on an individual basis. This includes Kualiti Alam, KualitiKhidmat Alam, Kualiti Kitar Alam, E-Idaman and ADKA. At themoment, our environmental performance data is very much focusedon Kualiti Alam, with some coverage of Kualiti Khidmat Alam andKualiti Kitar Alam. We are looking at ways in which our informationcollection process can be streamlined to accommodate the differentneeds and functions of our subsidiaries.
Supplier managementAlthough our contractors currently follow the same responsibilities,standards and training that apply to our fulltime employees, wehope to have separate performance management systems for ourpermanent staff and contractors in the next five years as these twocategories have different needs.
One of the measures we have undertaken in this direction is to haveour SHE Department organise tailor-made courses which arespecifically geared towards our suppliers and contractors alike,concentrating on management systems, the use of individualprotection devices, safety instruments and operational modalitiesdue to the high rate of property damage caused by contractors.
Goals and performance We realise that we have yet to set any concrete organisation-widetargets regarding our sustainability performance. We are striving tochange that by aiming to implement Key Performance Indicators(KPIs) for our community investment programme and reporting onour carbon footprint.
LOOKING AHEAD
As we move ahead, we will focus on the following priorities:
• Advance new technologies and investments to bettermanage Greenhouse Gas (GHG) emissions. UEM Environmentis committed to being a leader in sustainable wastemanagement and aims to bring a carbon capture and storageinitiative closer to implementation.
• Drive environmental excellence further into our organisationby reducing resource consumption and waste generation. We aim to improve internal energy efficiency and ensure we usewater resources wisely.
• Establish targets for key performance areas such as GHGand energy use intensity and report our progress towardachieving those targets.
• Support community development by mitigating the impact of growth where possible and supporting broader communityefforts to enhance quality of life for the residents living in thecommunities in which we operate.
• Build and develop our workforce through recruitment andretention strategies and skills development programmes.
• Support the safety culture created through our Safety, Health,Environment and Quality (SHEQ) Policy with an increased focuson safety systems such as monitoring, process safetymanagement, incident investigation and follow-up.
• Tracking social investment in order to maximise the potentialof our investments and support, and ascertain the extent ofsuch impacts on communities and local economies.

Our Approach to Sustainability8
UEM Environment sets clear policy and objectives on ourexpectations on sustainability from the top of the management teamthroughout the organisation. We seek to follow best practice,adhere to regulatory standards as a minimum and aim to exceedthe expectations of those that regulate our businesses andstakeholders that have an interest in our operations. We recognisethat all aspects of sustainability must be firmly embedded in theculture of the company. We maintain and publish our core businessvalues which set our ethical position.
To ensure that the business achieves its objectives we invest in highquality operational facilities and monitoring equipment and employskilled and responsible people. We recognise the need for continualdevelopment and improvement in the standards of our operationsand measure performance year-on-year by reporting factually thesuccess of the objectives through annual reporting on sustainability,which demonstrates to shareholders, staff, neighbours andregulators how our objectives are being met and exceeded. We are proud of our culture where all staff members feel responsiblefor making a difference in delivering high standards within theorganisation and to our clients, stakeholders and local communities.
We realise that when we undertake social programmes, we musttake care to ensure that societal impact is our first priority. However, this should not take place in a vacuum, or in such a wayas to act against the interests of our employees and shareholders.The key is to find ways to align the interests of these diverse groups,and that usually requires a long-term view.
Starting from the June 2008, we seek to conduct feasibility studiesprior to conducting our community investment programmes in orderto maximise the potential of our investments and support, andascertain the extent of such impacts on communities and localeconomies. We aim to put in a set of KPIs to ensure that the timeand money we have donated is well-spent. In summary, ourcommunity involvement strategy is to identify the most importantinteraction between our talents and the needs of the communityand plan a structured Community Investment Policy around it.
UEM Environment is committed to conducting its businessoperations in a responsible manner and we recognise the need tocontinually improve our operations where practicable in order toreduce our effects on the environment, ensure the safety andwelfare of our personnel and neighbours, and ensure customersatisfaction through service excellence.
We seek to exceed legal obligations and be among the leadingexponents of good practice and technological development withinthe waste management industry. We aim to provide services thatachieve the professional integrity and objectivity that our customersand stakeholders require and every effort will be sustained to ensurethe accuracy and reliability of our services.
To achieve this and remain competitive, we pursue a programme ofcontinuous improvement in all aspects of our business. In achievingthis high level of regulatory compliance, customer satisfaction andoperational improvement, corporate direction will be set on anannual basis. To ensure a high standard of awareness within thecompany we provide our employees with continuous training toimprove their skills and competencies. For the maintenance ofexternal awareness and good perception, we actively liaise withregulatory bodies, environmental organisations, stakeholders, thelocal community and all other interested parties.

UEM Environment Sustainability Report 2007 - Towards Sustainability
9Message from the Managing Director
AZMANUDDIN HAQ AHMADManaging Director,UEM Environment and Kualiti Alam
Corporate CitizenshipAs global markets become more interdependent, corporatecitizenship has a larger role to play in shaping a company’ssuccess. For UEM Environment, citizenship is a businessimperative, offering opportunities and challenges to do thingsdifferently. To capitalise on these opportunities requires more thanintent – it requires investment. We are making our intent forcitizenship real by investing in people, ideas, funding and systemsthat will allow for continuous improvement in a sustainable future.
As the nation’s leading hazardous waste specialist, we advise andhelp many businesses, assisting them in understanding the manylegal and other requirements that they face to manage their wastestreams properly.
As such, it is critical to the long term future of our business andthe businesses of our clients that we operate to exemplarystandards not just within legal requirements, but exceeding them,and in doing so ensure that our waste solutions are sustainable,protecting the interests of our clients and shareholders.
UEM Environment has a history of responsible business conduct.We strongly believe that real business success is not just aboutprofits measured in numbers but also, as importantly, about howthose numbers are achieved. Our corporate strategy reflects ourcommitment to sustainable business practices and balancingresponsibility alongside growth and productivity.
Message from the Managing Director
10 UEM Environment’s position is clear. Success of our organisationis important to us. It allows us to invest in new technologies andservices for our customers. In 2007, our investment in newtechnologies includes the setting up of a pre-treatment plant in oilrecovery for Kualiti Kitar Alam and the pilot study conducted onthe extraction of oil from hydrocarbon waste as alternative fuel foruse at the WMC.
Our success also leads to an increase in revenue, enabling us topay the dividends which form such an important part of the long-term savings and pension plans of our shareholders. We areproud to announce that our revenue for 2007 was approximatelyRM134 million, a 9% increase from 2006.
Besides allowing us to contribute to public services through thetaxes we pay to governments, the growth of our company alsocreates jobs for our colleagues and suppliers. Between 2006 and2007, our workforce grew from 274 to 306 employees, signifyinga rise of 12%.
However, that is not to say that profits should be pursued withoutconcern for a company’s wider social obligations. Far from beingincompatible, long-term success and good corporate behaviourare linked inextricably.
Investing in a Sustainable FutureBy the very nature of our activities in waste treatment, recoveryand recycling, we contribute greatly to sustainable development.Nevertheless, these activities can generate environmental impacts.Our goal is to reduce these impacts and comply with legislation.
The environmental management system ISO 14001, implementedat so many of our facilities, reflects our commitment to continualenvironmental improvement. Kualiti Alam attained its certificationfor ISO 9001 and ISO 14001 in 2000, while certification for ISO/IEC 17025 and OHSAS 18001 was attained in 2001. KualitiKhidmat Alam and Kualit i Kitar Alam obtained multiplecertifications in their IMS for ISO 9001, ISO 14001 and OHSAS18001 in 2007 and 2008 respectively. E-Idaman is on its way toachieve certifications in its IMS in 2009, while UEM Environment isaiming for ISO 9001 certification in 2009.
We have invested and put in place measures to protect theenvironment as stated in our Vision and Mission from day one of ouroperations in 1996. Our WMC was designed and constructed with aclosed-storm water collection system to harvest rain water as afeature to conserve natural resources. Environmental monitoring ofthe WMC was carried out even before operation began.
To put our business on a truly sustainable footing, we need towork with our customers to develop cost-effective andenvironmentally sound solutions to minimise the hazardous wastethey produce and maximise the recycling of valuable resources.Over the past year, we greatly increased our dialogue with NGOs,members of government, community representatives and socialwelfare organisations. This dialogue has allowed us to betterunderstand how our business goals can be aligned withcommonly held social goals. The counsel we received helpedstrengthen our citizenship mission.
The fact is that we are not just a company. We are citizens of thecommunities in which we work. We realise that managing ahazardous waste management operation can have effects whichmanifest themselves beyond the boundaries of our sites. Be it atwork or at home, we have the same obligation to conductourselves in a safe and responsible manner. We have the sameduty to help build better communities, to protect our naturalresources, to respect our people, and to do the right thing.
This year represents a landmark in our operation at UEMEnvironment. Kualiti Kitar Alam, our hazardous waste recyclingsubsidiary began operations in December 2007 after receivingLicense from DOE on 22 August 2007. With the availability ofKualiti Kitar Alam, we can now pride ourselves as the mostcomprehensive one-stop scheduled waste management centre inthe country, specialising in the management of scheduled wastefor recycling and recovery, treatment and disposal.
Climate ChangeAlthough short-term priorities are very important, they must notprevent us from taking a long-term view and planning for thefuture. The challenges of climate change, water scarcity andenergy issues permeate nearly every part of the world. As aresponsible corporate citizen, we do our best to mitigate theenvironmental impacts of our operations. While the wastemanagement industry can be a notoriously energy and waterintensive industry, we realise that we can develop innovativetechnologies and services to address these challenges.

UEM Environment Sustainability Report 2007 - Towards Sustainability
11Technology will be a key driver of sustainability going forward aswe work to reduce the environmental impacts of our expandingoperations. In 2007, we set up a new process of carrying out pre-treatment of silicon waste and a storm water treatment facility atthe WMC. Investments in renewable energy will complementthose efforts in our core business. By upgrading our Rotary Kiln torun on reconstituted oil, we reduced our diesel consumption in2007 by 10%. Innovative partnerships and collaboration with allstakeholders – governments, communities, suppliers andinvestors, to name a few – will also be essential.
Although not specifically l inked to carbon emissions, ourSustainabil ity Reports in the past have always providedinformation on our use of resources. Nonetheless, we realise thatin order to successfully offset our carbon emissions, we need toreport on our carbon emissions in a more structured manner. This is why we have begun to look at our Carbon Footprint in thisyear’s report. We must acknowledge that we are in the earlystages of this process and will build upon this information in yearsto come.
People ValuesPerhaps our most significant long-term investment is being madein our people. This is an obvious priority because our peopledetermine the quality of our organisation and the satisfaction ofour clients. Our growth and international expansion plans meanthat our employee base is becoming more diverse. We believethat our commitment to sustainability inspires our employees andis one of the binding factors in our business. I am very proud ofthe commitment from all levels of staff in the UEM EnvironmentGroup. Their dedication and high-performance attitude is crucial incatapulting UEM Environment to a position among the pre-eminent players in the waste management industry today.
ConclusionBuilding on the base established by our earlier reports, this reporthighlights key initiatives and charts our progress in the community,workplace, marketplace and environment. We hope that you willhave a better understanding of how UEM Environment aims to bethe Greener Environmental Solution through our various initiativeswhich contribute to our long-term business growth, as well asbuild sustainable communities.
Our corporate citizenship strategy speaks to our strengths incompliance and governance, environmental technology as well asenvironment, health and safety policies and practices. Thosestrengths must be reflected and applied in how we do business inemerging markets, a key part of our future growth and successand an important piece of our corporate citizenship strategy.
As we strengthen our efforts to enhance our culture of integrityand innovation in communities we serve, our expectation is thatwe can help to improve the quality of life for citizens, ouremployees and our investors.
Our five key focus points are:
P Productivity of ResourcesE Expansion and Growth of BusinessP People and Organisational DevelopmentS Systems and Processes ImprovementI Image and Perception Improvement
The Vision and Mission Statements of our organization can beobjectively identified and disseminated to all levels of the workforce.
At UEM Environment, we are optimists by nature. We recognisethat there are many challenges in our world today. But we believein the imagination and power of individuals and of business to findways of dealing with these challenges. We are committed totaking on this responsibility. As a company with strong growthambitions, we will continually strive to improve our performance,based on the belief that creating value and making a positiveimpact on society go hand in hand. We at UEM Environment aredetermined to pursue this road and we look forward to continuingto work and interact with you. We hope that this report gives youa good insight into our performance and progress and inspiresyou in your daily life.
Once again, thank you to all our stakeholders for your support andconstructive comments on how we could do better – to serve better.
To all my colleagues, thank you again for all your efforts andcommitment in achieving our dream. I leave all of you with a quotefor thought:
“If you’re planning for one year, grow rice”“If you‘re planning for 20 years, grow trees’’“If you re planning for centuries, grow and preserve Natural Resources”
Thank you
Our Vision and Mission12
OUR VISION
The GREENER Environmental Solution
OUR MISSION
To be a role model as an environmentally and socially responsiblecitizen, offering innovative products and services with the higheststandards of professionalism and ethics for sustainabledevelopment
CORE VALUES
Professional EthicsTeamwork & TogethernessTechnical & Business AcumenContinuous Quality AssuranceSafety, Health & Environment Friendly
We are fully committed to ensuring a sustainable future for the futuregeneration, and in doing so have ensured that our operations haveobtained and successfully maintained the certif ications tointernationally recognised benchmarks such as ISO 9001:2000, ISO 14001:2004(UKAS), OHSAS 18001:1999 and ISO/IEC 17025certifications.
OUR PRINCIPLES
Everyone is responsible for their impacts on our environment. Webelieve in employee empowerment, the prevention of pollution andcompliance with relevant legislation and approved codes ofpractice. We will seek to ensure that all our activities are operatedsafely and in line with our SHEQ Policy. Our approach is based onthe following values:
• We will operate to the highest ethical and professional standardsthrough fostering a style of management based on honesty,trust and integrity
• We will respect our employees whilst fostering a workingenvironment that will encourage employees to operate to theirfull potential
• We have a responsibility to safeguard the communities andenvironment that come into contact with our operations
• We adopt approved codes of conduct to protect theenvironment within which we operate
• We regularly monitor, audit and review our own performance toensure continuous improvement
• We involve our employees on environmental issues and raiseawareness of their responsibilities under the law and this policy
• We require our contractors and suppliers to comply with the lawand encourage them to adopt standards that are at least asgood as ours
• We will target our efforts to reduce our significant negativeenvironmental aspects by operating comprehensiveEnvironmental and Compliance Management Systems

UEM Environment Sustainability Report 2007 - Towards Sustainability
13
Currently, UEM Environment has committed itself to the followingpolicies:
• SHEQ Policy• Employees Remuneration• Child Labour and Worker Exploitation Policy• Personal Information Privacy• Anti-Harassment• Anti-Discrimination
We seek to minimise the impact of our operations and society’swaste through the way we conduct our business, by promotingsustainable waste management practices and by integrating theconcept of sustainable development into our business activities.
VALUE CREATION
At the heart of every thriving organisation, there is a set of corevalues. At UEM Environment, we have worked hard at ensuring theaccountability of our business with our stakeholders, in particularthe local community, relevant regulatory agencies and customers. In 2006, we implemented PEPSI, a 5-point value creation strategyto enhance our performance and raise productivity.
The key areas are:
P Productivity of ResourcesE Expansion and Growth of BusinessP People and Organisational DevelopmentS Systems and Processes ImprovementI Image and Perception Improvement
Under the PEPSI value creation strategy, our workplace leaders areexpected to:
• Develop new sets of skills to lead the people, not just tomanage the business
• Develop more leaders• Be more market-driven• Be less bureaucratic• Be more creative and innovative• Be more quality-conscious• Be more strategic than operational in approach• Be more open to ideas
With the implementation of the 5-point value creation, we are morefocused in delivering our products and services to our customersand other stakeholders in a more effective, efficient and systematicmanner. In addition, it provides a clearer strategy to all levels of ourhuman capital in delivering and achieving our Vision and Missionstatements.
As the PEPSI value creation strategy was only implemented in2006, we are constantly in the process of refining the performancedata collection process. We hope to be in a position to report moreon the outcome of the PEPSI strategy in the next three years.

Sustainability Cost Commitments14
At UEM Environment, we incorporate environmental accounting in our daily management and budgeting activities. Our guidingprinciples are based on the company’s SHEQ Policy whichemphasises on a green environment; commitments to preventpollution by ensuring strategies are developed to control the qualityof air emission, to reduce effluent, and to conserve natural resources.
At UEM Environment, we have continuously invested inenvironmental management activities. At the beginning of each year,we evaluate the environmental aspects and impacts from which anEnvironmental Monitoring Programme (EMP) will be developed andimplemented to mitigate any significant impacts. This is used as anenvironmental consideration whenever decisions are made on costsand investments undertaken.
Sustainability cost presents itself in many ways. In our 2006Sustainability Report, we reported our sustainability investments from2002 to 2006 in the form of Environmental Cost Commitments, asshown in Table 1.
TABLE 1: ENVIRONMENTAL COST COMMITMENTS FROM 2002 TO 2006
YearActivity 2002 2003 2004 2005 2006
Business Area • Compliance RM3.3M RM3.7M RM3.1M RM6.2M RM11.6M• Global Environment• Conservation• Pollution Prevention• Resource Conservation
Environmental • Training & Consultancy RM0.9M RM1.5M RM1.6M RM425K RM889KManagement Activities • ISO Audits
• Area Maintenance
Activities Upstream/ • Internal Waste Processes RM4.8M RM7.5M RM10.2M RM3.95M RM13.9MDownstream • External Waste Processes
Social Activities • Social Contribution RM115K RM118K RM125K RM280K RM401K• Information Disclosure
Research & Development • Research & Development RM70K RM90K RM13K RM75K RM76K

UEM Environment Sustainability Report 2007 - Towards Sustainability
15
As part of our improvement programme, we have streamlined the layout of our Environmental Cost Commitments for 2007 into a moreauditable format. The sustainability investment figures have been reconsolidated to reflect the environmental expenditure per department.By reporting our environmental-related expenditure for the year by departments, we hope to make it easier to verify our Sustainability CostCommitments in the coming years.
TABLE 2: SUSTAINABILITY COST COMMITMENTS FOR 2007
Department Activity / Scope Total expenditure (RM)
Plant & Operations • Pollution Prevention 11.32M• Data Management & Records Retention• Training• Equipment • Internal Waste Disposal/Treatment
Support Services & Facilities Management • Plant Repairs & Maintenance 7.73M• Maintenance Personnel• Support Services/Personnel• Facility Management • Repair Works• Motor Vehicle Maintenance• Landscaping
Environmental Management Services • Lab Facilities Maintenance & Management 1.53M• Research & Development• Training• Consultancy• Pollution Prevention• Internal Waste Disposal/Treatment
Corporate Communications • Social Contribution 313K• Information Disclosure• Outreach/Awareness Programmes
Human Resources, Administration & Security • Staff Welfare 858K• Staff Uniform• Laundry Charges• Personnel Development• Staff Amenities• Security
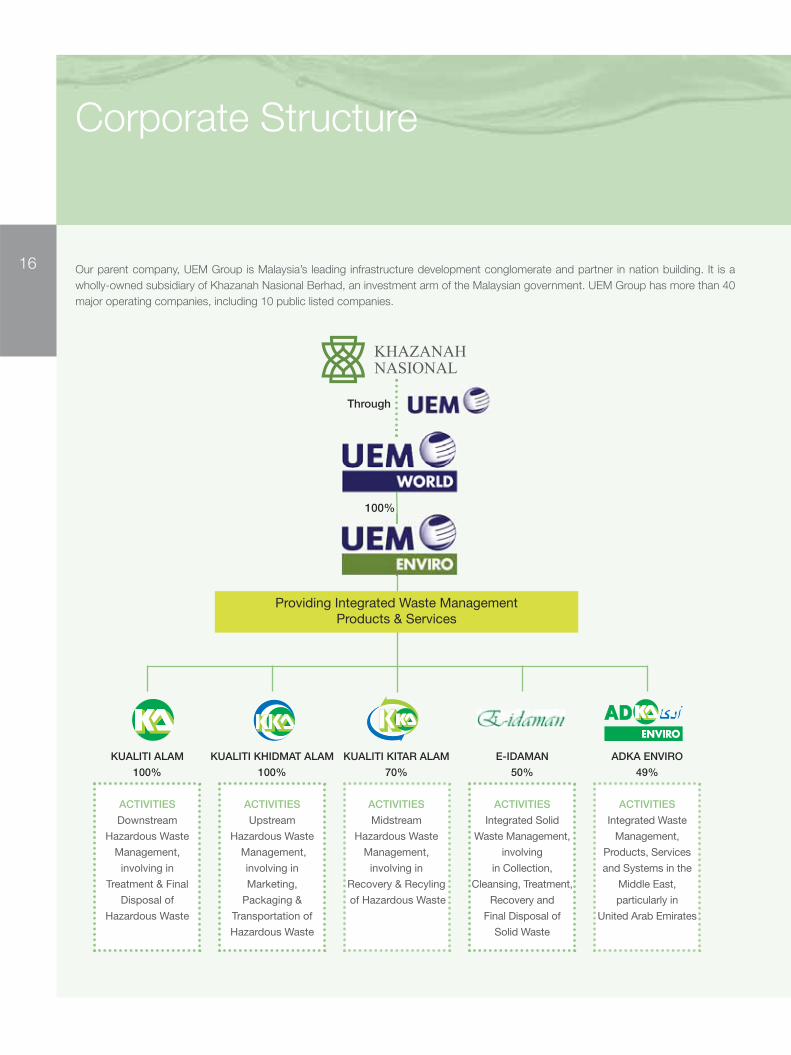
Corporate Structure
16 Our parent company, UEM Group is Malaysia’s leading infrastructure development conglomerate and partner in nation building. It is awholly-owned subsidiary of Khazanah Nasional Berhad, an investment arm of the Malaysian government. UEM Group has more than 40major operating companies, including 10 public listed companies.
KUALITI ALAM
100%
ACTIVITIES
Downstream
Hazardous Waste
Management,
involving in
Treatment & Final
Disposal of
Hazardous Waste
KUALITI KHIDMAT ALAM
100%
ACTIVITIES
Upstream
Hazardous Waste
Management,
involving in
Marketing,
Packaging &
Transportation of
Hazardous Waste
KUALITI KITAR ALAM
70%
ACTIVITIES
Midstream
Hazardous Waste
Management,
involving in
Recovery & Recyling
of Hazardous Waste
E-IDAMAN
50%
ACTIVITIES
Integrated Solid
Waste Management,
involving
in Collection,
Cleansing, Treatment,
Recovery and
Final Disposal of
Solid Waste
ADKA ENVIRO
49%
ACTIVITIES
Integrated Waste
Management,
Products, Services
and Systems in the
Middle East,
particularly in
United Arab Emirates
ADAD
Providing Integrated Waste Management Products & Services
KHAZANAHNASIONAL
Through
100%

UEM Environment Sustainability Report 2007 - Towards Sustainability
Our Management Team
17Managing Director
AZMANUDDIN HAQ AHMAD
Safety, Health & Environment (SHE)HAMDAN OSMAN
Management InformationSystem (MIS)
MOHD ZAIDI ZAKARIA
Kualiti Kitar AlamTAN LAY LAY
Customer AccountManagement (CAM)ABD HALIM SHARIF
Chief Operating OfficerSUHAIMEE MAHDAR
Plant/Operations MOHD NORSURADI MAN
AS AT 30th JUNE 2008
Kualiti Alam ModularisedIncinerator (KAMI)ROSMAN SHAARI
Environment Support Services & Logistics
NICK CHONG
MarketingSATHISH KURUP
Business Development (China & Indiochina)
Project & Technical DevelopmentTAN PIEW
Human Resource & AdministrationZURINA ABDUL WAHAB
LegalNURULHUDA FAISOL
Project Development InternationalOperations (Indonesia) Business Development (Middle East/Indonesia)
IR. SHAHARUDDIN SIDEK
Corporate CommunicationsCHIEW HAI WAH
FinanceCHOW YIN SEE
PurchasingABD RASHID MOHAMAD
Support Services & Facilities ManagementRAZALI ABU BAKAR
Kualiti Alam
EnvironmentalManagement Services
(EMS)SITI NADZRIAH
ABD HAMID
Operational ImprovementABD HALIM MD NOR
SecurityMEJAR (B) ABD KADIR
Kualiti Khidmat Alam

Corporate Governance18
Trust and transparency are the foundations of strong relationshipswith our stakeholders. Our governance practices help ensure weconduct our business responsibly and report our activities openly.
UEM Environment is committed to setting high standards for goodcorporate governance and operating with integrity. Our commitmentto perform with integrity is instilled in every employee as a non-negotiable expectation of behaviour. This expectation is backed bya culture of compliance and beliefs that are supported by a systemof an independent and fully informed Board, comprehensiveprocesses, policies, communications and training.
We strive to encourage transparency in our organisation andprovide direction on how to make the shared commitment tointegrity actionable. However, we also realise that the complexitiesof doing business in a global marketplace with changing andvariable legal and regulatory policy requirements make compliancean ever-evolving, demanding undertaking.
At UEM Environment, corporate governance means ensuring acomprehensive system of stewardship and accountability is in placeand functioning among directors, management and employees. The following are some of the targets that will help us continue tohave a strong corporate governance culture built on integrity,accountability and transparency.
• Ensure every employee complies with our internal policies • Install mechanisms in place to continually evaluate the
effectiveness of our SHE programmes• Comply with all laws and regulations that affect our business
OUR 2007 HIGHLIGHTS
• We conducted several internal audits of our SHE systemsthroughout all of our business segments and also participated inexternal audits and inspections of our operations.
• We are subject to inspections from the Department ofEnvironment (DOE), Department of Occupational Safety andHealth (DOSH) as well as other governmental departments onan annual basis. To date, we are pleased to report that since1999, we have had no incidences of non-compliances.
• We have successfully maintained our certif ications forISO9001:2000, ISO14001:2004 and OHSAS 18001:1999.Through these certif ication exercises, we are able todemonstrate continuous improvements in our safety, health,environmental and quality management programmes.
• Kualiti Alam added another ISO certification to its name: the UKAS accreditation for its ISO 14001 standards on 14 March 2007. UKAS auditors were present as observers duringour SIRIM QAS reassessment audit from 28 to 30 August 2006.With the accreditation comes proof of Kualiti Alam’s competence,impartiality and sustainable performance that undoubtedlystrengthens UEM Environment’s offerings at large.
• Kualiti Khidmat Alam became the latest member of ourorganisation to obtain multiple certifications in its IntegratedManagement System (IMS) for ISO9001:2000, ISO14001:2004and OHSAS 18001:1999 from BVC in October 2007. Thecertifications cover Kualiti Khidmat Alam’s corporate office in KualaLumpur and WMC and also its three branch offices in Penang,Kuantan and Johor Bharu.
• Kualiti Alam underwent a successful facility review by CHWMEG,Inc., a non-profit trade association based in USA that reviewswaste management facilities worldwide in August 2007.

UEM Environment Sustainability Report 2007 - Towards Sustainability
19From left to right:
1 Tan Sri Nuraizah Abdul Hamid2 Azmanuddin Haq Ahmad3 Dato’ Ahmad Pardas Senin4 Mohd Hussein AB Hamid
BOARD OF DIRECTORS
UEM Environment’s Board of Directors serves as the cornerstone ofour company’s governance system. It is appointed to act for and onbehalf of our shareholders – the owners of the business. The Boardrecognises that it has a unique role in representing and promotingthe interests of all of UEM Environment’s stakeholders and isaccountable to shareholders for the performance and activities ofthe company. The Board’s mandate includes identifying andmanaging risk, strategic planning and establishing and enforcing ourstandards of ethical conduct.
The UEM Environment Board comprises Yang Berbahagia Tan SriNuraizah Abdul Hamid as our chairman; and other board memberscomprise Azmanuddin Haq Ahmad, Dato’ Ahmad Pardas Senin andMohd Hussein Hamid.
Tan Sri Nuraizah Abdul Hamid served as the Chairman of theMalaysian Communications and Multimedia Commission (MCMC)from November 2000 to October 2003. Prior to that, from June1996 to October 2000, Tan Sri Nuraizah was the Secretary-Generalof the Ministry of Energy, Water and Communications (KTAK).
Before her retirement in 2000, Tan Sri Nuraizah had served a total of33 years in the public service in various positions in theGovernment. Apart from having served as the Secretary-General ofthe KTAK, she had also served in the Prime Minister’s Department,the Ministry of Agriculture, the Public Service Department and theMinistry of Education. Tan Sri Nuraizah was also seconded to theEconomic and Social Commission for Asia and the Pacific (ESCAP)to serve as Programme Officer for two years in its DevelopmentPlanning Division.
Tan Sri Nuraizah is currently Chairman of AKRiZ Sdn Bhd, a company focused on total solutions and systems integration in thefields of advanced technologies, defence and communications; aswell as the Chairman of RAC Development Sdn Bhd, a joint-venturecompany between AKRiZ and a subsidy company of thePerbadanan Kemajuan Negeri Perak. Tan Sri Nuraizah sits as amember in the Advisory Panel of the Cluster Schools Programme ofthe Ministry of Education.
Tan Sri Nuraizah holds a B.A (Hons) from University of Malaya and aMasters of Public Administration from The American University,Washington D.C. She also received an honorary PhD inManagement of Technology from University College of TechnologyTun Hussein Onn, Malaysia. She attended a Senior ManagementTraining Programme at the New Zealand Staff Training Institute in1984 and the Advanced Management Programme at the HarvardBusiness School in 1997.
Azmanuddin Haq Ahmad is the Managing Director of UEMEnvironment and Kualiti Alam. He is also the Executive Vice-Chairman of ADKA. He holds a BA (Honours) Degree in Accountingand Financial Management from the University of Sheffield, UnitedKingdom. He was with Aseambankers Malaysia Berhad prior tojoining the UEM Group. He joined the UEM Group as AssistantGeneral Manager in the office of Managing Director/Chief ExecutiveOfficer in October 2001. He was later promoted to the position ofDirector in the office of Managing Director/Chief Executive Officer ofUEM Group on January 2003.
His primary role at the UEM Group was to oversee the corporatefinance and merger and acquisition of the UEM Group. He is alsothe Director of Kualiti Khidmat Alam, Kualiti Kitar Alam and E-Idaman. He previously sat on the Boards of Cement Industries ofMalaysia Berhad and Faber Group Berhad. Azmanuddin has heldthe position of Honorary Secretary-General at BCSDM since 2007and has been a Council Member of ENSEARCH since 2008.

Corporate Governance20
Dato’ Ahmad Pardas Senin is a director of UEM Environment andis also the Managing Director and Chief Executive Officer of UEMWorld Berhad. He is also the Managing Director and Chief ExecutiveOfficer of UEM Group Berhad and Deputy Chairman of ProjekLebuhraya Utara-Selatan Berhad (PLUS), PLUS ExpresswaysBerhad and UEM Builders Berhad. He currently holds directorshipsin Pharmaniaga Berhad, Opus Group Berhad, UEM Land Berhadand is also Chairman of Expressway Lingkaran Tengah Sdn Bhd(ELITE) and Linkedua (Malaysia) Berhad. He is also a director ofUniversiti Teknologi Mara (UiTM).
Dato’ Ahmad Pardas is a Fellow of the Chartered Institute ofManagement Accountants (FCMA), a Chartered Member of theMalaysian Institute of Accountants (MIA) and a Member of theInstitute of Internal Auditors, Inc. He is a member of the FinancialReporting Foundation (FRF).
Prior to joining the UEM Group, Dato’ Ahmad Pardas had more than17 years of service with the British-American Tobacco (BAT) Group.
Mohd Hussein AB Hamid is a director of UEM Environment and isthe Senior Director, Direct Business Units of UEM Group and UEMWorld. He is also the director of ADKA Enviro. An associate memberof the FCMA (UK), Mohd Hussein started his career as an InventoryAccountant for ESSO Production (M) Inc in 1977. From 1985 to1994, he was the Finance Manager for Motorola (Malaysia) Sdn Bhd.In 1995, he became the General Manager, Business Development ofIntria Berhad (now known as UEM Builders Berhad). He joined PLUSin March 2000 and was the Chief Operating Officer for both PLUSExpressways Berhad and PLUS. In September 2004, he wasappointed the Chief Operating Officer, Direct Business Units of UEMGroup. Concurrent with this position, he was appointed as SeniorDirector, Direct Business Units of UEM World in July 2005. Hesubsequently became the Senior Director, Direct Business Units ofUEM Group in January 2006. He holds directorship in severalcompanies within the UEM Group.
COMMITTEES
At UEM Environment, we have established the following committeesto assist in the assurance of corporate governance:
• Audit Committee – Oversees our accounting and financialreporting processes, the quality and integrity of our financialstatements, the effectiveness of our internal controls and isdirectly responsible for the retention and oversight of the work ofour external auditors.
• Human Resources & Compensation Committee – Reviews andrecommends comprehensive principles and strategies forexecutive compensation, approves material changes in ouremployee benefits plan and reviews our management resourcesand plans to ensure appropriate succession plans forexecutives. It is comprised of the Managing Director, ChiefOperating Officer and Heads of Department.
• Corporate Governance & Nominating Committee – Assists theBoard in developing our corporate governance system, reviewsand recommends compensation for Board and Committeeservice, assesses overall performance of the Board, identifiesBoard candidates and ensures the Board functionsindependently of management.
• Safety, Health, Environment & Quality Committee – Approvesour SHEQ policy, reviews our SHEQ strategies andprogrammes, industry standards and applicable legislation andmonitors safety, health, environment and quality performance.
• Corporate Safety, Health & Environment - Comprised of seniormanagement; and representatives of employees of differentlevels and departments which are responsible in ensuring thatwe conduct our activities and operate our facilities in anenvironmentally responsible manner and maintain the integrity ofour SHEQ policies.

UEM Environment Sustainability Report 2007 - Towards Sustainability
Social Performance 21
At UEM Environment, we recognise that our relationships with thepeople with which we interface while conducting our business, bethey employees, clients, the public or regulators, have a significantinfluence on our long term success. That is why we work hard tobuild strong relationships with our stakeholders. Consistent with ourcore business values we are committed to acting responsibly, withintegrity and professionalism. We seek to create a safe working andliving environment that is not compromised by the existence of oursites or their activities. The following are some of the steps we aretaking to improve our social performance:
• Be “best-in-class” in operational health and safety in all ouractivities and strive to have zero accidents, injuries or incidents
• Set and communicate targets for days-away injury frequencyand severity, reportable vehicle accidents, emergency response,inspections, leak repairs and third-party damages
• Invest in an integrated set of talent management initiatives toattract the best talents and develop, engage and retain ourworkforce
• Increase our community investment dollars over time to meetthe objectives of the 9th Malaysian Plan
OUR 2007 HIGHLIGHTS
• We have had zero LTI for Kualiti Alam in 2007 and maintainedour zero dangerous occurrences on site.
• We won the National Council for Occupational Safety andHealth (NCOSH) Excellence Gold Award in the Utility ServicesCategory in February 2007.
• We won the ACCA MESRA award under the First Time ReporterCategory for our debut Sustainability Report 1996-2005 in May2007.
• We were awarded the Malaysian Society for OccupationalSafety and Health (MSOSH) OSH Gold Award in October 2007for our occupational safety and health record and practice at ourWMC.
• We bagged our second Prime Minister’s Hibiscus Award underthe Notable Achievement Category for our environmentalpractices and commitment in November 2007.
OUR STAKEHOLDERS
We need to earn and maintain stakeholder support for ourexpansion plans. Informing stakeholders about our business plansand responding to their concerns in a timely and respectful mannerare just how we do business.
UEM Environment defines stakeholders as groups or individuals whocould be impacted by our operations or who could, through theirown actions, affect our business. Our main stakeholders include:
• Employees• Community residents and landowners• Shareholders• Governments and regulators• NGOs• Business groups, customers and suppliers
We work to maintain good long-term relationships with thesegroups through open communication, consultation andcollaboration. These interactions occur both formally and informally.Stakeholders can be heard through workshops, multi-stakeholdercommittees and regulatory processes for growth projects. There arealso many ongoing informal settings where stakeholders can voicetheir concerns.
Our WorkforceCompanies in the current labour market are facing intensecompetition for talent. As a result, today’s employer must stand outfrom the crowd. We believe being a good employer means morethan providing a healthy paycheque. It is also about being a placewhere employees are proud to work for, feel challenged andrewarded, and have opportunities to grow.

Social Performance
22 The success of any company depends on its people. All of us areessential to providing the quality of service and the degree ofinnovation that makes this business successful. Put simply, ouremployees are the public face of our operations and can create apositive impression of UEM Environment within a community.Being a good employer is therefore not just one of our main socialresponsibilities, it makes very good business sense too.
We recognise the value of employees’ experiences andknowledge to provide powerful learning and mentoringopportunities for colleagues. Our company is committed toproviding employees with the training and learning opportunitiesthey need to excel in their careers. We strive to create a culture ofopportunity where employees can challenge themselves to reachtheir full potential.
In 2007, we continued to expand our workforce through organicgrowth in alignment with business growth. Between 2006 and2007, our workforce grew from 274 to 306 employees, a rise of12%. On top of that, staff turnover as a percentage of totalworkforce population decreased from 9.6% in 2006 to 6.5% in2007. We also regularly collaborated with consulting organisationsfor specific project needs.
UEM Environment provides competitive pay, compensation andbenefits similar to current market practices to our employees. We monitor the competitiveness of our programmes regularlythrough participation in surveys such as the Employee BenefitsReview Survey and Employee Climate Survey, as well as throughour involvement in industry groups.
Performance Management System (PMS)The aim of PMS is to achieve a perfect fit between employees’skills, work processes and organisational targets. Starting with aninventory of the available knowledge and existing behaviouralpatterns which can be influenced by human resourcesdevelopment instruments, it forms the basis of successfulperformance by the individual employees and the organisation asa whole. The company’s performance is highly dependent on thepersonal development of each of our employees. Accordingly, wehave developed a step-by-step approach to our PMS.
The Management supports employees in effectively aligning theircontributions with the strategic goals of our business. They providefeedback to employees in order to guide their performance anddevelopment in each performance year. Effective performancemanagement ensures strong performance, the ability to recogniseand reward performance and the development of opportunities foradvancement. Our Management leaders are encouraged todevelop their ability to provide effective performance feedback, torecognise and reward effective performance and to supportemployees in their development planning.
We have identified Core and Leadership Competencies that arevalued at UEM Environment – a framework that employees canapply in their development planning to prepare for opportunities.The Core Competencies are:
• Customer focus• Execution and results • Flexibility, interpersonal skills • Job/technical skills
All of our employees are required to undergo a biannualPerformance Management Review. The PerformanceManagement Review encourages both employee and supervisorto provide each other with feedback on their performance andalso acts as an opportunity for the discussion of career objectivesand direction.
Career DevelopmentUEM Environment provides programmes for the skil lsmanagement and continuous learning of our staff to support theircareer development. We provide education assistance for ouremployees who wish to pursue their higher education byabsorbing 70% of the course fees via our Continuous EducationAssistance Fund. We also provide study loan assistance of up toRM5K to our employees. Our senior management are encouragedto participate in our Master in Leadership programme organisedby the UEM Leadership Centre.

UEM Environment Sustainability Report 2007 - Towards Sustainability
23TOTAL REMUNERATION PACKAGE
A competitive total remuneration package is one of the mostimportant elements in attracting and retaining talent. Our approachto reward and benefits is anchored strongly in aligning internalneeds with shareholder interests. UEM Environment rewardsemployees for good performance, competence development andfor contributing to overall company success. This creates apositive and encouraging environment with opportunities foremployees to optimise their potential and be rewarded fairly. Ourtotal remuneration package is at the centre of our efforts to attractand retain talented employees, and is one of our key principles inour People Strategy. This is in line with our PEPSI Strategic FocusArea: People and Organisation Development.
The total remuneration package at UEM Environment consists ofbase pay, short- and long-term incentive plans, benefits, pensionand savings plans. Programme design and administration isconsistent across the company in most areas with someadjustments for local market conditions and the unique needs ofeach type of business. Rewards for good performance remain astrong theme in the total remuneration package.
Employee performance on an individual and/or group level is anintegral part of our incentive programmes. Our performance andsuccess impact our ability to provide competitive benefits, savingsand recognition programmes for employees and their families.
Employee Reward and RecognitionWe reward and recognise our employees’ environmentalcontribution through our annual performance appraisal wherebyenvironmental indicators like housekeeping and resourcesreduction are evaluated as part of their performance. Goodsuggestions will also be recorded and included as part of ourappraisal system.
Each of our businesses recognises the special achievements ofour employees on an ongoing basis. These activities includeservice awards, monetary gifts, recognition in our internalcommunications and opportunities for challenging assignments.
COMMITMENT TO A DIVERSE WORK ENVIRONMENT
At UEM Environment, we want to be a company where allemployees are optimal contributors to our business objectivesand all have equal access to the opportunities available. The company’s workplace harassment and anti-discriminationpolicies denote our strong commitment to maintaining the dignityand respect of all employees. We also subscribe to the principlesof a fair and equitable work environment. To us, building a diverseworkforce is not just a matter of doing the right thing; it is a matterof delivering value to our customers, employees and shareholders.
FIGURE 2: GENDER EQUALITY
UEM Environment had a total of 306 permanent employees as atthe end of December 2007 with 79% males and 21% females.This is similar to the gender proportion of employees in 2006which was 78% males and 22% females.
Our work environment promotes a diversity of roles and enrichedjob experience through project management and participation incross-functional teams. We also encourage our employees to takean active role in their communities through a variety of volunteeractivities. In the workplace, marketplace and community, we areworking to create an environment in which all people are valued,respected and given the opportunity to succeed.
Per
cent
ange
78.4
7
21.5
3
79.4
0
20.6
0
2006 2007Year
Male
Female
0
10
20
30
40
50
60
70
80

Social Performance
24 TRAINING
UEM Environment operates in a technically complex industry. We need people with high level skills, particularly in wasteanalysis, environmental management, health and safety and therequirements of our regulators. In parallel with these industryspecific skills, we also need sound commercial and businessmanagement skills. We have been fortunate in retaining peoplewith these skills in the businesses that we have acquired, and wehave been successful in recruiting new highly skilled people to joinus. A culture of training and development is promoted throughoutthe company by information dissemination, regular review ofprofessional development and on the job instruction.
Employee training not only benefits the company but also theindividuals themselves: therefore, UEM Environment has acomprehensive training programme in place. Nearly all staffpositions in the business are included in a training matrix, whichshows for each role the courses that are mandatory, the preferredcourses and those which are optional.
FIGURE 3: EMPLOYEE TRAINING DAYS FROM 2000 TO 2007
Our employees benefited from 138 training programmes in 2007.Our total employee training days for 2007 was 1,257. Althoughthis signifies an 8.7% decrease compared to the 1,377 trainingdays provided in 2006, we have managed to boost our trainingexpenditure to RM391,960.79 for 2007. This represents a 5%increase compared to 2006.
In 2007, our training programme included:
TABLE 3: EMPLOYEE TRAINING CONDUCTED AT UEMENVIRONMENT IN 2007
No. Month Programme Of Participants
January Personal Leadership Follow-up Programme 5February Seminar on UK Waste Management 5
TechnologiesFebruary Personal Leadership Follow-up Programme 5March Wastewater Treatment Facilities Design 5
WorkshopApril Occupational First Aid 20May AutoCAD 2007 (Basic) Training 4
International Conference on 3Radiation Protection and Workshop 2
Inventory and Stores ManagementJune Integrated Management System: 9
Legal Requirement TrainingPersonal Leadership Follow-up Programme 5
July Cylinder Management Equipment Training 11August Incineration Technology and System Design 3September Advanced Global Summit Biofuels 2007 3October Renewable Energy Seminar by 1
Solar Energy Institute (SERI)November ISO 9001: 2000 IRCA Lead Assessor 1
Waste to Wealth International 3Conference 2007 (W2W)
December Awareness Training ISO 9001:2000 19
Staff Awareness TrainingUnder our UEM Environment Training Policy and Procedures, we provide a minimum of 2 days of training on policies andprocedures concerning aspects of staff awareness which arerelevant to our operations. 86% of our employees underwent thestaff awareness training in 2007, compared with 90% in 2006.Besides that, all of our security personnel are trained in ourpolicies and procedures concerning aspects of staff awarenessthat are relevant to our operations.
0
300
600
900
1200
1500
903
682
902
791
636
539
1,37
7
1,25
7
Year2000 2001 2002 2003 2004 2005 2006 2007
Employeetrainingdays
Day
s

UEM Environment Sustainability Report 2007 - Towards Sustainability
25PROTECTING THE ENVIRONMENT
We believe staff awareness and robust management systems arekeys to our protection of the environment. We aim to:
• Raise the environmental awareness of our employees byencouraging involvement at all levels and educating throughtraining, communication and constant reappraisal of workingmethods
• Operate a comprehensive SHEQ management system• Adopt the principles of ISO14001, seeking accreditation
where appropriate• Regularly monitor, audit and review our own environmental
performance to ensure continual improvement• Share and promote Best Practice and Best Available
Techniques between business units• Publish details of our performance in our annual Sustainability
Report
EMPLOYEE HEALTH
Following on from the Occupational Health Surveil lanceProgramme that was conducted for Kualiti Alam in 2006 and2007, Kualiti Khidmat Alam and Kualiti Kitar Alam commenced asimilar programme for their staff members in 2008. The objectivesof this programme are:
• To provide an assessment on the health and safety ofemployees who are exposed or likely to be exposed tochemicals hazardous to health
• To maintain and improve the health status of employeesthrough health education and early detection
• To reduce absenteeism and disruption in lifestyle by providingaccessible health assessment promptly
The percentage of total workforce represented in formal jointmanagement-worker health and safety committees that helpmonitor and advise on occupational health and safetyprogrammes are split equally, with 50% representation at themanagement level and 50% at the non-executive level.
EMPLOYEE COMMUNICATIONS
With staff spreading across the country, a critical part of peoplemanagement is sharing information. Effective internalcommunications and employee relations are of strategic importance to UEM Environment, particularly as we continue togrow and develop our workforce to support our business growth.
We seek to foster an environment committed to open and frankcommunication with a dedicated channel for employee upwardfeedback and input. We actively engage our employees inexchange of information and communications through:
• Annual employee meetings• Human Resources communications practices and tools• Intranet and employee newsletters• Regular e-mail updates to employees• Business performance review videos• Face-to-face sessions that enable employees to meet our
Managing Director and share their questions, issues andrecommendations
• Manager and leader updates to employees• SHE committees and working groups, where employees and
management meet regularly to discuss local issues• Active employee social clubs
Employees are made aware of environmental matters throughdaily morning briefing (Toolbox meeting), memos, emails, noticeboards, KASB community newsletter (Buletin KASB), CustomerService magazine (Intouch) and Safety, Health, Environment &Quality Week (SHEQ Week).
We also encourage our employees to participate in theachievement of our overall environmental policy and objectives bysetting personal targets through job performance for yearlyperformance appraisal activity. We provide awareness training andother environmental related training. We have also developed aformal feedback system using the complaint/ suggestion forms.
Social Performance
26 SUPPLY CHAIN MANAGEMENT
At UEM Environment, we see sound environmental and socialprinciples as an important part of sustaining a successful andresponsible business. We work hard to anticipate risk,demonstrate company values, enhance our governance practices,increase employee satisfaction and look after the communitieswhere we do business.
We expect the companies in our supplier network to take a similarethical business approach and we take this into account whenselecting our suppliers and developing longer-term relationshipswith them. Our aim is to ensure that environmental, ethics, labourpractices and health and safety issues are not separate add-onfeatures, but are embedded into all our sourcing processes,including supplier selection and supplier relationship development.
Besides that, we aim to work with locally-based suppliers as faras is reasonably practicable. Not only will it lead to lower costs intransportation fees, it will also stimulate the local economy andreduce our transportation-caused carbon emissions.
Our SHEQ Policy addresses our suppliers and contractors wherewe are committed in inculcating the SHEQ Management systemsto our contractors and vendors and also provide training andcontinual education to them in order to enable them to meet ourorganisation’s environmental requirements.
We require our transportation contractors to conduct routeoptimisation to ensure the most efficient utilisation of "drive time".Our contractor’s lorries are tracked through our GPS monitoringsystem and drivers must adhere to rules in regard to driving hours,lorry parking areas and number of rest stops. Contractors are alsorequired to conduct preventive maintenance on their fleet ofvehicles to control emissions and black smoke. We conductregular training for our contractors to ensure that they are able toperform their services to the level of our requirements.
Our Purchasing Department implemented the integration of safety,health and environmental concerns into their strategic sourcing ofvendors – recognising that our company's wastes, emissions andenvironmental risks are often directly linked to the quantity andquality of the goods and raw materials that we buy. While theimplementation process can be challenging, environmentallypreferable purchasing can offer long-term business benefits.
We plan to conduct a vendor assessment in August 2008 toidentify and assess greener alternatives to currently used productsand materials, and to weigh our suppliers’ environmentalperformance and initiatives in our purchasing decisions. We striveto include safety, health and environment concerns as importantcriteria in the procedure to evaluate supplier performance. This isto ensure that our suppliers comply with our safety, health andenvironmental requirements.
ANTI-COMPETITIVE BEHAVIOUR
Although UEM Environment holds exclusivity in hazardous wastemanagement in Peninsular Malaysia, we are firmly against anti-competitive behaviour. Our marketing and transportation arm,Kualiti Khidmat Alam follows a pre-determined price range for theirservices rendered which is comparable to market prices.
Anti-competitive behaviour goes against our business ethics. Not only does it bring a negative effect on the economy as a whole,it also disadvantages other competing firms and customers who arenot able to avoid their effects, generating a significant social cost.
PARTICIPATING IN INDUSTRY ASSOCIATIONS
We are active participants in the following associations:
• Malaysian Danish Business Council (MDBC), since 1993• Malaysian International Chamber of Commerce and Industry
(MICCI), since 1992• American Malaysian Chamber of Commerce (AMCHAM),
since 2000• Association of Scheduled Waste Recyclers (ANSWERS), since
2003• Federation of Malaysian Manufacturers (FMM), since 1999• Waste Management Association of Malaysia (WMAM), since
2008• Malaysian Centre For Environmental Communicators Berhad
(MACEC), since 2006• Business Council for Sustainable Development Malaysia
(BCSDM), since 1993• Chemical Industries Council Of Malaysia (CICM), since 2006• Association of Environmental Consultants and Companies of
Malaysia (AECCOM), since 2000• Environmental Management and Research Association of
Malaysia (ENSEARCH), since 2006• Air and Waste Management Association (AWMA), since 2006
UEM Environment Sustainability Report 2007 - Towards Sustainability
27We are members of these associations to show our commitmentfor change towards environmental conservation and sustainablesocio-economic growth in the country. This includes encouragingmulti-stakeholder discussions on policy, environmentalmanagement and technology transfer, disseminating scientific andtechnical knowledge via exhibitions and conferences, developingcorporate sustainable development policies in the wastemanagement industry and cooperating with other national andinternational organisations in similar or related fields.
We do not only join these associations, we participate actively aswell. Our Managing Director, En Azmanuddin has held the positionof Honorary Secretary-General at BCSDM since 2007 and hasbeen a Council Member of ENSEARCH since 2008. Some of ourkey personnel are also active members of various workingcommittees at the national level, as listed in the table below.
TABLE 4: NATIONAL LEVEL PARTICIPATION ONENVIRONMENT IN 2007
Committee Role played
Working Group on Developing Malaysian Standards Scheduled Waste (MS) on scheduled waste sampling
Working Group on Developing National LCIA for National Life Cycle hazardous wasteInventory Assessment for Waste Management
Sub-Working Group on Developing the inventory of GHG inGreenhouse Gas Inventory solid waste disposal, domestic andfor Waste Sub-Sector commercial wastewater handling,
industrial wastewater and sludge stream, indirect emissions from human sewage and waste incineration in Malaysia for SecondNational Communication (NC2).
Institute of Environment & Participated in 3rd roundtableDevelopment (LESTARI) dialogue of MyNICHE (Malaysian
Network for IntegratedManagement of Chemicals andHazardous Substances forEnvironment and Development)
Educating Waste GeneratorsWe actively organise and support seminars, workshops anddialogue sessions to educate and create greater awareness onproper waste management for the industries with the DOE andtrade associations. Our key personnel were involved in variousenvironmental and scheduled waste management presentationsthroughout 2007.
TABLE 5: ENVIRONMENTAL AND SCHEDULED WASTEMANAGEMENT PRESENTATIONS
Month Event
January • Ceramah Pelupusan Buangan Terjadual – Building Lindungan, Wisma Persekutuan, Kuantan
March • Seminar Buangan Makmal Sekolah-Sekolah Negeri Sembilan – Seremban Golf Club
May • Certification Course for ScheduledWaste Managers – Environment Instute of Malaysia (EiMAS), Selangor
July • Taklimat Proses Pelupusan Bahan Kimia Berbahaya – Jabatan Kimia Pulau Pinang
August • Certification Course for ScheduledWaste Managers – EiMAS, Selangor
September • Seminar on E-Waste Disposal – Majlis Perbandaran Seberang Prai
October • Seminar on Chemical WasteManagement – Jabatan Kimia Malaysia Cawangan Pulau Pinang

Social Performance
28Month Event
November • Investment Opportunities in WasteManagement Facilities – Selangor StateInvestment Centre
• Seminar Pengurusan Alam Sekitar BagiAktiviti “Turnaround” Dan “Shutdown”Loji-Loji Perindustrian, Minggu AlamSekitar Malaysia 2007 – Jabatan AlamSekitar (JAS) Terengganu
• Seminar Pengurusan Alam Sekitar BagiIndustri-industri di Kemaman SupplyBase dan Bengkel Kejuruteraan, Minggu Alam Sekitar Malaysia 2007 –JAS Terengganu
• Environmental Management for Rubber Industry: Handling, Storage and Disposalof Solid Waste – Malaysian RubberBoard, Kuala Lumpur
December • Kursus pengendalian dan kaedahpelupusan serta rawatan sisa buanganterjadual – Universiti Teknologi MARA(UiTM) Arau, Perlis
• Scheduled Waste Management –Minggu Alam Sekitar Perak
• Laboratory Waste Management –Hospital Tengku Ampuan Afzan, Kuantan
• Hazardous Waste Management –Hospital University Kebangsaan Malaysia(UKM), Selangor
• Chemical Waste Disposal – NationalInstitute of Occupational Safety & Health(NIOSH), Selangor
In 2007, UEM Environment held several activities with the StateDOEs of Johor, Selangor, Pahang, Melaka, Negeri Sembilan andPenang, as well as local and international industrialrepresentatives and the public to keep them abreast withscheduled waste legislations and other waste managementissues. Some of the dialogues, seminars and visits that wereconducted in 2007 are shown below.
TABLE 6: DIALOGUES, SEMINARS AND VISITS THAT WERECONDUCTED IN 2007
Month Event
March • Melaka State DOE director, En AbdulHapiz Abdul Samad and officers visitedKualiti Alam’s WMC
• Kualiti Alam held a dialogue with NegeriSembilan waste generators in its 10thAnniversary Kopitiam Series
April • Kualiti Alam held a dialogue with Johorwaste generators in its 10th AnniversaryKopitiam Series
May • A group of 60 FMM Negeri Sembilanmembers held an educational tour ofKualiti Alam’s Integrated ScheduledWaste Management Centre
• Kualiti Alam held a dialogue withNorthern Region waste generators inits 10th Anniversary Kopitiam Series
• UEM Environment held a One-StopWaste Management Centre Forum for 50 industrial representatives and NGOsin Chennai
August • Kualiti Alam participated in the WasteManagement 2007 Exhibition organisedby ENSEARCH

UEM Environment Sustainability Report 2007 - Towards Sustainability
29STAKEHOLDER ENGAGEMENT
At UEM Environment, our stakeholders are drawn from all sectorsof society affected by our operations. They include employees,suppliers, customers, investors, government agencies,environmental groups, business partners and local communities.The time and effort we put into developing positive relationshipswith these stakeholders is an essential part of being goodneighbours and operators in our different geographic regions. This engagement occurs in many different ways, including:
• Project consultation• Public awareness• Community relations• Customer engagement• Relations with local community
We believe that by communicating with all stakeholders –including local officials, legislators and the media – we can helpidentify and resolve issues in the first stages of projectdevelopment. We benefit by learning about issues and proactivelyresponding as early in the project as possible. Our stakeholdersbenefit by an open and transparent process conducted earlyenough to have meaningful input. This is of particular importanceas we prepare for expansion in other regions outside Malaysia.
CUSTOMER ENGAGEMENT
Customer focus is a crucial element of UEM Environment’s growthstrategy. As the operator of Malaysia’s only integrated hazardouswaste management facility, we provide services to customersthroughout the country. As such, we are highly committed toproviding fair and reasonable service to our customers. Wethoroughly screen our services to ensure safety and compliancewith all relevant legal requirements.
Our commitment to our customers does not stop here. When wehave provided our services, we want to hear what customershave to tell us about their experiences. Customer feedback isgathered through regular customer engagement programmes tohelp gauge our performance against our commitment and adjustour service where necessary. We regularly engage with ourcustomers through forums. These forums provide a means tobetter understand our customer needs. We also take part inexhibitions and Safety, Health and Environment Week activitiesupon request by regulatory authorities to educate the public onthe importance of proper waste management.
A few of the comments we have received from our customersregarding our customer service are included below:
“Kualiti Alam is a one stop centre for waste disposal.Customers can easily communicate with the facility andarrange for scheduled waste disposal. It is good to know thatall wastes will be disposed of properly.” – Strategic Recycling(M) Sdn Bhd.
“The customer service at Kualiti Alam is friendly andknowledgeable. Kualiti Alam’s waste disposal facility alsocomes recommended by the DOE.” - Mieco Chipboard Berhad.
“Kualiti Alam needs to improve its delivery efficiency for itemssuch as invoices and consignments.” – Diethelm Malaysia SdnBhd, Mox Welding Products Sdn Bhd, Infineon Technologies(Malaysia) Sdn Bhd.
“The disposal fees should be reviewed to make the prices morecompetitive.” – FBK Automotive Compenents (M) Sdn Bhd,Shin-Etsu Electronics (M) Sdn Bhd.
Customer service is all about the customer’s perception. We seecomplementary comments from our clients as encouragement forthe effort we have put in and constructive criticisms as opportunitiesfor improvement in our business. Some of the improvement actionswe have undertaken are highlighted in the section below.
Customer satisfaction rating We are pleased to report that for 2007, our customer satisfactionlevels have remained relatively stable. From March to June 2007,we conducted a customer satisfaction survey on 704 out of 1760of our active customers throughout Peninsular Malaysia. Thesurvey found that satisfaction with our customer service wasgenerally high at 89%. On top of that, 86% of our clients indicatedthat they would recommend our services to other people.

Social Performance
30 We conducted a similar customer satisfaction survey in 2006,albeit at a smaller scale, which saw us interviewing 100 randomlyselected customers around Peninsular Malaysia. Of the 89customers who responded, a whopping 94.6% were satisfied orvery satisfied with our collection, treatment and disposal serviceswhile 93.3% would recommend our services to other people.
Although it appears that our customer satisfaction rating hasdropped by 5.6% from 2006 to 2007, the survey results from2007 were probably more accurate as the pool of respondentswere 7 times bigger in 2007 compared to 2006.
In both years we have taken the feedback from our clients andapplied the necessary corrective action. At UEM Environment, weseek to capitalise on our customers’ comments and use them asopportunities for further improvement. Examples of theseimprovement actions are shown below:
TABLE 7: IMPROVEMENT ACTIONS TAKEN TO ENHANCECUSTOMER SERVICE
Customer Dissatisfaction Action Taken
Customer Service staff Training in customer care unable to direct enquiries provided to staff to help themto the appropriate balance their impartialityperson for action while still remaining
polite and friendly
Lack of personal attention CSE to visit customer regularlyfrom Customer Service Representative (CSE)
Late delivery of documents Aim to speed up processing of Certificate of Waste Disposal
Expensive treatment fee Customers to be informed viaemail of any rebates or discounts
Lack of availability of light Logistics Department will be duty trucks leading adding another two 3-tonne toslow services for smaller trucks to the existing fleetwaste generators
Public Perception ReportOur parent company, UEM Group published a Public PerceptionReport by Taylor Nelson Sofres Malaysia Sdn Bhd (TNS) for itssubsidiaries in 2006 and 2007. For 2007, public perception forUEM Environment and Kualiti Alam was rated at 49% and 54%respectively. This compares favourably with our public perceptionindex of 35% for both UEM Environment and Kualiti Alam in 2006.
We are proud of the improvement we achieved in marketrecognition in just one year. This shows that the effort we put inour branding exercise in 2006 paid off. We aim to maintain ourupward trend in public perception and are working towards ascore of 70% in market recognition in the next five years.
COMMUNITY ENGAGEMENT
We care about our communities – not just because we work there– but because we live there too. We look for ways to partner withthe communities we serve. As a company, we focus our efforts onprogrammes that make our communities cleaner, safer andstronger. We want to be a part of promoting environmentalawareness and enhancing the quality of life around us.
To us, our “community” refers to the residents of Felda Sendayan,Kampung Jimah Baru, Kampung Jimah Lama, Kampung Gadongand Tanah Merah. These are the communities around our WMC.Active community engagement has continued at those sites andduring 2007 has provided a valuable vehicle for discussion ofissues pertinent to our operations.
We have a dedicated special officer who routinely visits thevillages to gain firsthand knowledge of any issues arising. Our officer will initially discuss informally with the villagers on anyissues impacting their daily lives arising from our activities prior toour dialogue session held annually with the local community.During these dialogue sessions, an engineer will brief thecommunity on the routine soil and water monitoring efforts doneto ensure their safety. They also have the opportunity to askquestions and bring up any issues regarding our activities in thevicinity. These sessions have helped us to build a greaterunderstanding of the issues surrounding operations and thecommunity, building rapport and trust.
Besides that, we also have permanent representatives who sit onthe Residents Associations of these communities since 2006. This allows us to participate in village development activities andreceive feedback from our community stakeholders.

UEM Environment Sustainability Report 2007 - Towards Sustainability
31Some of our communities are made up of indigenous people.There were no incidences involving violations involving the rightsof indigenous people at UEM Environment in 2007.
To keep our local communities informed, we publish BuletinKASB, a quarterly community newsletter in Bahasa Malaysia todistribute to the local villagers. This has proven effective ininforming those people who live closest to our sites on how weoperate and our development proposals and has stimulateddiscussion on issues that are important to the community.
Felda Sendayan was the venue for an immense 50th Merdekacelebration that saw the participation of some 500 residents fromneighbouring villages and UEM Environment employees. Thecelebration began with a “gotong-royong” and was followed bythanksgiving prayers, fireworks display and the preliminarymatches for badminton, futsal, sepak takraw and karaoke singingcompetitions that were organised by UEM Environment.
Community Investment ProgrammesAs a responsible corporate citizen in Malaysia, we make voluntarycontributions to charitable and non-profit organisations on aregular basis. Our key focus areas include education, health,environment, social services and volunteer resources. We focuson using our financial resources, partnerships and human capitalto support organisations that contribute to the economic andsocial development of communities where we live and work.
In conjunction with NGOs, business groups and localcommunities, UEM Environment supports various communityinvestment programmes. UEM Environment has an ability toimpact the communities where employees work and live—andbeyond. We donated a sum of more than RM313,000.00 throughdonations and sponsorships in 2007. Some of our communityinvestment programmes include:
• RM100,000 sponsorship of the Tree Theatre Group to performat the 24th UNEP Governing Council Conference’s openingceremony in Nairobi, Kenya in February 2007.
• Organising our first Kualiti Alam Futsal Championship inSeremban which saw participants from the DOE of variousstates, the Negeri Sembilan state government and membersof the media.
• Sponsoring 1,000 green shopping bags at the Green Festorganised by the Star Newspaper in its two-week longenvironmental campaign to raise public awareness onenvironmental protection.
• Sponsoring the 50th Hari Merdeka Celebrations at our localcommunity, Felda Sendayan.
• Assisting with the cleaning up of an illegal scheduled wastedumping site in Tiroi, near Seremban.
• Collaborating with Kumpulan Guthrie via Tanah Merah Estatein its Sungai Janging Adoption Project, aimed at improving theflora and fauna of the entire river system. As part of theproject, a Tree Planting Programme has been set up tointroduce children to environmental issues affecting theircommunities.
At UEM Environment, sustainability is not only restricted tofinancial contributions and sponsorships. We look for ways topartner with the communities we serve. As a company, we focusour efforts on programmes that make our communities cleaner,safer and stronger. This is why, starting from June 2008, we willbe undertaking feasibil ity studies prior to conducting ourcommunity investment programmes in order to make the most ofour community investments and support. One of the measures wehave planned is to establish a set of KPIs to monitor the progressof our various community involvements to ensure that the timeand money we have contributed reach their maximum potential.
SAFETY AT WORK
The waste industry has traditionally had a poor safety record. Thisis unacceptable and as a significant employer in the industry, weconsider it a priority as well as a responsibility to improve both ourown record and contribute to improvements across the sector.We take our responsibilities for the health, safety and welfare ofour employees seriously. It is the priority of all those withresponsibility for the safety and health of others, from topmanagement down to supervisory level, to take a proactiveapproach to safety and to improve our performance each year.
Safety PerformanceMuch work has been done during 2007 to address safetymanagement concerns at our various sites using the expertiseand experience of our technical team working with site operators.We see this as a positive exercise introducing the high standardsof UEM Environment’s business management system andindustrial best practice whilst learning from the existing practicesand operating styles at new sites.

Social Performance
32 We have successfully maintained our certif ications forISO9001:2000, ISO14001:2004 and OHSAS 18001:1999 atKualiti Alam. Through these certification exercises, we are able todemonstrate continuous improvements in our safety, health,environmental and quality management programmes. Kualiti Alamadded another ISO certif ication to its name: the UKASaccreditation for its ISO 14001 standards on 14 March 2007.UKAS auditors were present as observers during Kualiti Alam’sSIRIM QAS reassessment audit from the 28 to 30 August 2006.With the accreditation comes proof of Kualiti Alam’s competence,impartiality and sustainable performance that undoubtedlystrengthens UEM Environment’s offerings at large.
As indicators of our safety performance, we measure:
• Work-related injuries and illnesses that are serious enough tocause the injured or ill employees and contractors to beunable to work for one or more calendar days
• Work-related injuries that do not cause the injured employeesand contractors to be unable to work (first aid)
• Incidents that result in damages to property • Incidents that have adverse impacts on the environment
(spillage, chemical release)• Near-miss incidents where all of the effects/impacts above
could have happened but did not
FIGURE 4: INJURY DATA FOR 2006 AND 2007
FIGURE 5: ACCIDENT/INCIDENT DATA FOR 2006 AND 2007
Given the diverse nature of our activities, there are many risks thatcould arise. Overall, we have improved our safety record byreducing the accident and incident rate from 63 cases in 2006 to60 cases in 2007, a reduction of 4.7%. As part of ourimprovement measure, the SHE Department will be introducingcut resistance gloves to the operation in 2008 to eliminate injuriesinvolving cuts.
SpillageIn 2007, we recorded 6 cases of spillages which occurred duringthe transfer of waste from our waste generators to our WMC. A preventive and corrective action plan to combat spillage hasbeen implemented whereby the Operations Department isrequired to closely monitor their routine activity. Our LogisticsDepartment is responsible for replacing damaged or deterioratingpallets to reduce the probability of pallet collapse, therebyreducing the number of spillage and accidents.
LTI IndexThe main indicator we use to measure health and safety is the LTIIndex. LTI is defined as any incident which results in an employeesuffering a period of absence due to incapacity or ill health arisingout of the incident and occurring within 24 hours of the incident.
0
5
10
15
20
1612
86
46 6 6 6
1819
0 1 0 1 0 0
7
34
2006
2007
Types of Accident /Incident
Near M
iss Fire
Medica
l Trea
tmen
t
Chemica
l Rele
ase
Spillage
Property D
amag
e
Dangero
us Occ
urence
First A
id
Explosio
nOther
Freq
uenc
y
Freq
uenc
y
2
3
2 2
1
0 0 0
Sharp edge Contact withChemical
Hot VaporImpact withhard surface
Year
2006
2007
0
0.5
1.5
1.0
2.5
2.0
3.0

UEM Environment Sustainability Report 2007 - Towards Sustainability
33
TABLE 8: TYPES OF STAFF TRAINING CONDUCTED IN 2007 AT KUALITI KHIDMAT ALAM
Personnel Customer Truck Service Regional Top Office/ IMS Internal
Auditors Designation Drivers Executives Heads Management Admin
IMS Procedures ✓ ✓ ✓ ✓ ✓MY Legal Requirements ✓ ✓ ✓Defensive Driving Training ✓ ✓ ✓ ✓Emergency Response Plan (ERP) ✓ ✓ ✓ ✓ ✓Auditing skills ✓Train the Trainer ✓First Aid Training ✓ ✓ ✓ ✓Customer Service ✓ ✓ ✓
0.0
0.5
1.0
1.5
2.0
2.5
3.0
Mill
ion
man
hou
rs
1
2.5
2006 2007Year
FIGURE 6: MILLION MAN HOURS WITH ZERO LTI
We have kept our high level of safety and health performance overthe last two years as demonstrated by Kualiti Alam’s LTI figures.As of December 2007, Kualiti Alam has achieved 2,588,480 manhours without LTI.
KUALITI KHIDMAT ALAM
Kualiti Khidmat Alam is the leader in logistics and marketingservices for hazardous waste management through itscomprehensive network of branch offices located nationwide. The Kualiti Khidmat Alam team has been in this business for morethan 10 years.
Kualiti Khidmat Alam aims to be a company that acts safely andresponsibly at all times and in all places, with zero tolerance forunsafe actions, unsafe decisions, unsafe conditions, unsafeequipment and unsafe attitudes. Its mission is to provide aneffective and expedient disposal service that starts when thevehicle arrives at site.
Accreditation
Kualit i Khidmat Alam became the latest member of ourorganisation to obtain multiple certifications in its IMS forISO9001:2000, ISO14001:2004 and OHSAS 18001:1999 fromBVC in October 2007. The certifications cover Kualiti KhidmatAlam’s corporate office in Kuala Lumpur and Waste ManagementCentre and also its three branch offices in Penang, Kuantan andJohor Bharu for marketing, collection and transportation ofscheduled wastes for Kualiti Alam and Kualiti Kitar Alam.
TrainingIn 2007, we continued the awareness-raising programme forhealth and safety covering issues such as manual handling, risk assessment, accidents, near misses and operationalrequirements. Listed below are the types of training that wereconducted in 2007 for staff at Kualiti Khidmat Alam.

Social Performance
34 We also conducted a series of training courses for existing andnew drivers in 2007.
TABLE 9: TYPES OF DRIVER’S TRAINING CONDUCTED IN2007 AT KUALITI KHIDMAT ALAM
No.Month Course Title Of Participants
March Work instruction for existing 3and new drivers
May Work instruction for new drivers 16
June Driver’s refresher training and IMS awareness briefing on driver’s procedure 69
August Driver’s refresher training and IMS awareness briefing on driver’s procedure (II) 3
September Driver’s refresher training on: 46• Labelling• Waste card• ERP• Fire extinguisher use• New driver’s training 6• Consignment note• Waste card• Labelling and packaging• ERP• Driver’s procedure
Accident ManagementDespite our gains in safety performance over the last few years,we know the journey is far from over. Compared with otherindustries, the waste industry is perceived as dangerous and withgood reason. Given the diverse nature of our activities, there aremany varied risks that might arise. There were four truckaccidents that occurred in 2007 involving our contractors,compared to two in 2006. Of these four truck accidents, three ofthem saw the drivers escaping unhurt, while one of the accidentsled to the fatal injury of the other truck driver and minor injuries toour driver.
Investigations were immediately launched in each case and weworked with our contractors to improve safety processes andcommunications at our sites. We are determined to never forgetthe lessons learned from these tragedies and, of course, preventthem from happening again.
We are constantly looking for ways to reduce the number ofaccidents in order to decrease the physical and mental sufferingcaused to accident victims and their families, and to safeguard thelives and safety of our workers, be they permanent or contractemployees. Therefore, we are involved in a long term working planwith this objective in mind. We aim to:
• Continue promoting the training and education of ourpermanent and contract employees in terms of traffic safety
• Organise and participate in campaigns in favour of road safetylaunched at the international, national and industry levels
In the spirit of sharing responsibility, accidents are investigated bymanagers and supervisors who then feed back to a specialcommittee. Meetings take place regularly to ensure that whereappropriate, improvements to working practice can be made toreduce the risk of accidents and to safeguard the wellbeing of allUEM Environment employees. Additionally, this highlights wherepositive action has been taken for the overall safety of our staff.
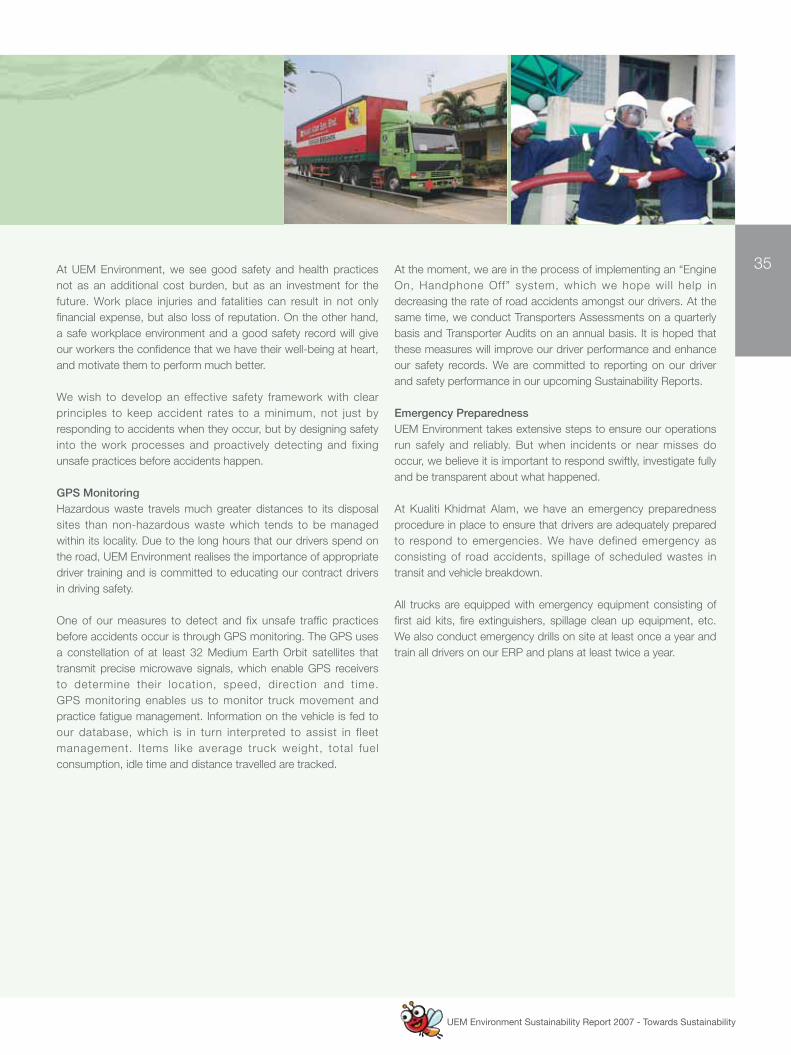
UEM Environment Sustainability Report 2007 - Towards Sustainability
35At UEM Environment, we see good safety and health practicesnot as an additional cost burden, but as an investment for thefuture. Work place injuries and fatalities can result in not onlyfinancial expense, but also loss of reputation. On the other hand,a safe workplace environment and a good safety record will giveour workers the confidence that we have their well-being at heart,and motivate them to perform much better.
We wish to develop an effective safety framework with clearprinciples to keep accident rates to a minimum, not just byresponding to accidents when they occur, but by designing safetyinto the work processes and proactively detecting and fixingunsafe practices before accidents happen.
GPS MonitoringHazardous waste travels much greater distances to its disposalsites than non-hazardous waste which tends to be managedwithin its locality. Due to the long hours that our drivers spend onthe road, UEM Environment realises the importance of appropriatedriver training and is committed to educating our contract driversin driving safety.
One of our measures to detect and fix unsafe traffic practicesbefore accidents occur is through GPS monitoring. The GPS usesa constellation of at least 32 Medium Earth Orbit satellites thattransmit precise microwave signals, which enable GPS receiversto determine their location, speed, direction and time. GPS monitoring enables us to monitor truck movement andpractice fatigue management. Information on the vehicle is fed toour database, which is in turn interpreted to assist in fleetmanagement. Items l ike average truck weight, total fuelconsumption, idle time and distance travelled are tracked.
At the moment, we are in the process of implementing an “EngineOn, Handphone Off” system, which we hope wil l help indecreasing the rate of road accidents amongst our drivers. At thesame time, we conduct Transporters Assessments on a quarterlybasis and Transporter Audits on an annual basis. It is hoped thatthese measures will improve our driver performance and enhanceour safety records. We are committed to reporting on our driverand safety performance in our upcoming Sustainability Reports.
Emergency PreparednessUEM Environment takes extensive steps to ensure our operationsrun safely and reliably. But when incidents or near misses dooccur, we believe it is important to respond swiftly, investigate fullyand be transparent about what happened.
At Kualiti Khidmat Alam, we have an emergency preparednessprocedure in place to ensure that drivers are adequately preparedto respond to emergencies. We have defined emergency asconsisting of road accidents, spillage of scheduled wastes intransit and vehicle breakdown.
All trucks are equipped with emergency equipment consisting offirst aid kits, fire extinguishers, spillage clean up equipment, etc.We also conduct emergency drills on site at least once a year andtrain all drivers on our ERP and plans at least twice a year.

Environmental Performance 36
Care for the environment is at the very heart of our business. For many organisations and individuals the act of throwing wasteinto a bin marks the end of their environmental responsibility. It isjust the beginning for us. We have a far more intimate relationshipwith the environment and accordingly, have a duty of care for itsprotection and enhancement.
This responsibility in managing our environmental performance is notconfined to the safe collection and disposal of waste. Our operationshave an impact on local air quality and the wider atmosphere throughthe use of fuel by company vehicles and our use and production ofenergy. How we manage our sites influences biodiversity and affectsthe environment of local neighbourhoods. The suppliers that we usealso have environmental impacts of their own.
We published our first SHE Report for Kualiti Alam in early 2008.The report details our safety, health and environmental performancefrom 2006 to 2007. It includes information about our emissions,injury and illness performance, as well as details about theprogrammes we have in place to address SHE issues.
In this section of our Sustainability Report, we will report on some ofthe areas mentioned in the SHE Report 2006-2007 and our progressin managing our environmental performance since then. Ourenvironmental performance for activities at the WMC is made up ofthe performance data of Kualiti Alam.
OUR 2007 HIGHLIGHTS
• As part of UEM Environment’s effort to promote continuousimprovement culture towards achieving our environmental goals,we have:• Set up a new process of carrying out pre-treatment of
silicon waste, which resulted in savings of RM299,077 perannum.
• Set-up a storm water treatment facility at the WMC, whichled to savings of RM444,570 per annum.
• We received our fifth consecutive award for Institut KimiaMalaysia (IKM) Excellence Award for excellence laboratorypractice and competency in December 2007.
MATERIALS USED
We have developed programmes to use material resourcesefficiently since 2000. Our materials are used to treat and converthazardous waste and most of our materials consumed are directlylinked to the quantity of wastes treated.
WaterApproximately 46% of our water use on site consists of recycledwater. Our wastewater treatment plant at the WMC has beendesigned to collect stormwater while the processed water from ourwaste water treatment plant is reused at our treatment facility.
FIGURE 7: COMPARISON OF WATER USAGE FROM 2002 TO 2007
Our water use in 2007 decreased by approximately 10% comparedto 2006, primarily due to a leak detected at the front wall rotary kilncooling jacket in 2006, which resulted in the loss of approximately2400 m³ of water.
We monitor our water use closely and it is our intention to ensurethat water use on site is maximised and used as efficiently aspossible.
0
30,000
60,000
90,000
120,000
150,000
74,3
91
129,
890
125,
420
73,0
00 82,2
50
76,5
65
Waterconsumed
2002 2003 2004 2005 2006 2007Year
m3

UEM Environment Sustainability Report 2007 - Towards Sustainability
37
Treatment MaterialsWe consume cement, sand, lime, caustic soda, nitrogen gas and awide range of chemicals to provide our hazardous waste treatmentservices. These materials are consumed by our incineration,solidification, physical-chemical treatment and leachate treatmentplants. Our consumption of these materials varies depending on thetype of hazardous waste treated.
As recognised in our previous Sustainability and SHE Reports, it is difficult to predict the volumes of materials used as we aredependent upon our customers. However, we place great emphasisin being efficient with the consumption of our raw materials toensure maximum utilisation of materials, cost reductions, as well as bringing additional benefits to the environment.
FIGURE 8: CONSUMPTION OF MATERIALS FROM 2002 TO 2007
Our caustic soda consumption for 2007 is drastically highercompared to 2006. This is because we commenced our newleachate treatment and storm water treatment processes in 2007which called for high usage of caustic soda to act as a stabilisingagent in the two treatment processes.
ENVIRONMENTAL MONITORING AND COMPLIANCE
Air Emissions Regulatory Compliance We strive to ensure that our air emissions arising from ouroperations are maintained below regulated limits. The major airemissions released by our WMC facilities include carbon monoxide(CO), nitrogen oxide (NOx) and Volatile Organic Compounds (VOCs).Other contaminants released but in much smaller quantities includesulfur dioxide (SO2), hydrogen sulfide (H2S) and particulate matter.We also monitor the release of dioxins and furans from ourincinerators.
Under our EMP, monitoring stations have been placed at a numberof locations to monitor ambient air quality and emissions from ourincineration, solidification and physical-chemical treatment plants.Since 2001, we have a total of six ambient air quality monitoringstations on site.
0
3000
6000
12000
9000
15000
2002 2003 2004 2005 2006 2007
2101
1218
446
7412
1 351
1555
1031
5
1120
8
2386
9427 99
1939
2323
74
2646
1159
039
7091
8756
3
42 417
3585
165
429
4107
1529
229 45
5
3678
190 38
4
Year
Lime
Sand
Cement
Caustic soda
Nitrogen
Met
ric t
onne
s
Environmental Performance
38 Ambient Air Quality PerformanceIn 2007, we managed to reduce our emissions of NOx and iron(Fe). Although our emissions of manganese (Mn), lead (Pb),copper (Cu) and zinc (Zn) increased compared to 2006, they werestill within the stipulated limits.
As part of our monitoring programme, we have initiated air qualitymonitoring at the ground level since 2006. This was done primarilyto ensure the health and safety of our employees on site. Two stations were selected where the following parameters weremonitored:
• Free Chlorine (Cl2)• Hydrochloric acid (HCl)• Polychlorinated Biphenyls (PCB)• Arsenic (As)• Cadmium (Cd)• Aluminium (Al)
As can be seen from the data presented, al l parametersmonitored were within the stipulated limits.
FIGURE 9: COMPARISON OF AMBIENT AIR MONITORINGDATA FROM 2006 TO 2007
Stack Emissions Quality PerformanceWe conduct stack emissions monitoring at the WMC on aquarterly basis. Our stack emissions monitoring covers ourincinerators, laboratory fume hood chimneys, Physical andChemical Treatment Plant and Solidification Plant. We also carryout repairs and replacements of parts regularly to ensure that theymeet regulatory criteria.
FIGURE 10: COMPARISON OF STACK EMISSIONSMONITORING DATA FROM 2006 TO 2007
Whilst there were significant increases for HCl and CO in 2007,the contaminants released were still under the stipulated limits.These increments are largely due to the types of the wastestreated at our incineration plants.
Dioxin and furan concentrations were also below the limits asstipulated by DOE guidelines. We are pleased to report that theentire test parameters monitored were in compliance with theirrespective standard limits.
0
50
100
150
200
250
300
400
350
ug/m
3
2006
2007
Limit
0.008
0.086
0.300
2.000
2.000
18.00
0.035
0.028
1.500
0.293
1.069
4.000
0.015
1.116
2.500
2.000
2.000
32.00
0.003
0.010
2.000
0.012
0.058
2.000
3.139
2.750
320.0
0.012
0.010
25.00
2.000
2.000
350.0
0.234
0.234
120.0
As CI2 Cr Fe Mn HCI Hg Ni NOx Sb SO2 Zn
Parameters
Particulatematter
HCI SO2 NO2CO0
100
250
200
150
50
350
300
450
400
Parameters
mg/
Nm
3
2006
2007
Limit
24 23
2.3
14.4 103 2
1.5 2
3.8
30
100
125
200
400

UEM Environment Sustainability Report 2007 - Towards Sustainability
39Water Quality Regulatory Compliance Our water quality monitoring stations are placed at various locationsto detect incidents of pollution for surface water and groundwater.We take extra care in ensuring that water pollution resulting fromour activities is kept to a bare minimum.
We are proud to be operating Malaysia’s most advancedLeachate Treatment Plant (LTP). As per current practice, if thewater sample is not within the prescribed limit, it will not bedischarged but reused under plant operations. Only treatedwastewater in compliance with the regulation will be discharged.Currently, boron cannot be treated to the stipulated limit prior todischarge.
Surface water Quality PerformanceWe conduct surface water monitoring based on the Water QualityIndex (WQI) and National Index Water Quality Standards forMalaysia (NIWQSM) according to DOE requirements. Since 2001,we have increased our surface water monitoring stations to eight.
The WQI values are tabulated to allow for determination on thecleanliness and availability of water usage, as shown in the tablebelow:
TABLE 10: WQI QUALITY SCALE
Descriptions Class Range Quality Scale for suitability
Class I >92.7 Excellent water No water treatment isquality needed (only
disinfection andboiling). Suitable forsensitive aquaticspecies.
Class II 92.7-76.5 Good water Water treatment quality needed.
Suitable for sensitivelife and recreationalactivities.
Class III 76.5-51.9 Medium or Intensive water average water treatment is needed.quality Still suitable for
aquatic life and haseconomic values.
Descriptions Class Range Quality Scale for suitability
Class IV 51.9-31.0 Fair water Suitable for irrigationquality activities.
Class V <31.0 Poor water Not suitable for any quality activities.
FIGURE 11: WQI INDEX FOR SURFACE WATERMONITORING FOR 2006 AND 2007
All stations have data ranging from 52 to 90, which are in class IIand class III as indicated in the WQI Quality Scale shown above.In other words, all stations demonstrated good water qualityexcept stations W2, W3, W4 and W5 which demonstratedmedium or average water quality for 2007.
WQ
I Ind
ex
81.4
3
64.1
6
89.6
7
67.1
7
52.4
1
56.1
8
53.7
9
65.3
7 75.4
1
90.1
1
77.8
187.6
2
73.1
7
85.8
9
79.6
2
83.9
7
W1 W2 W3 W4 W6 W7 W8W5
2006
2007
0
20
80
40
60
100
Stations

Environmental Performance
40 Groundwater Quality PerformanceWe conducted groundwater monitoring at seven locations, ofwhich six (WW1, WW2, WW3, WW4, WW5 & WW6) are locatedwithin the WMC area, while one point (KJL) is situated atKampung Jimah Lama – a local community nearby.
There are currently no legislative requirements in Malaysia for soiland groundwater monitoring.
TABLE 11: GROUNDWATER MONITORING FOR 2007
Parameter Location DIV limits
KJL WW2 WW3 WW4 WW5 WW6 WW7
Lead (ug/l) 0.230 0.200 0.200 0.210 0.280 0.210 0.200 0.075
Copper (ug/l) 0.073 0.067 0.070 0.100 0.190 0.110 0.170 0.075
Zinc (ug/l) 0.053 0.040 0.053 0.045 0.030 0.025 0.050 0.800
Arsenic (ug/l) 0.002 0.004 ND ND <0.001 ND ND 0.060
Cyanide (ug/l) <0.020 <0.020 <0.020 <0.020 <0.020 <0.020 <0.020 1.500
Mercury (ug/l) <0.001 0.001 <0.001 0.005 ND <0.001 0.002 0.0003
The groundwater monitoring data was compared against theDutch Intervention Values (DIV).
There were certain parameters which were below detectablevalues (ND) due to the different methodologies and equipmentused by the laboratory. We are looking to overcome this problemby sourcing for more efficient laboratories.
We realise that our lead and mercury parameters exceeded theDIV limits in 2007. We are in the process of putting in place aprogramme to mitigate these issues.
Wastewater Quality PerformanceOur WMC only discharges treated sewage effluents. Othereffluents arising from scheduled waste treatment are treated in ourLTP, which has a zero discharge policy. Leachate is treated andreused in the LTP with continuous surveillance and monitoring.
We have maintained one monitoring station at our LTP and onemonitoring station at our sewage treatment plant since 2002. As of 2006, we installed an additional monitoring point at our mainreservoir treatment plant, increasing our monitoring points to three.
Our leachate monitoring was performed at the Equalization Tankat our new LTP. We also perform reservoir water and sewagewater monitoring from time to time. Reservoir water monitoring isperformed at the reservoir, which is used to collect stormwaterand rainwater from the drainage within our vicinity.
FIGURE 12: COMPARISON OF EFFLUENT MONITORINGDATA FROM 2006 TO 2007
The figure shows our parameter testing for Biochemical OxygenDemand (BOD), Chemical Oxygen Demand (COD) and TotalSuspended Solids (TSS) for 2006 and 2007. We are pleased toreport that our COD figures for leachate water and reservoir waterwere much lower in 2007 compared to 2006.
0
100
200
300
700
600
500
800
Leachatewater
Reservoirwater
Sewagewater
2006
Leachatewater
Reservoirwater
Sewagewater
2007Types of effluent monitoring
BOD
COD
TSS
mg/
I
8573
020
14.4 72
13.4
545
25 117.
540
8.5
35
11.4
60.3
6.4 17
51.5
12

UEM Environment Sustainability Report 2007 - Towards Sustainability
41WASTE MANAGEMENT
In 2007, we generate 20,661 tonnes of waste – 91% beinghazardous waste and 9% being solid waste. In 2006, we generate20,481 tonnes of waste, of which 89% were hazardous and 11%were solid.
Our hazardous waste, which comprises spent oil, contaminateduniforms and rags, slag, fly ash and lab waste is sent to ourIncineration Plant for incineration whilst scheduled waste, such asempty drums, pallets and scrap metal is sent to steel mills forrecycling or disposed of at the Bukit Palong Municipal Landfill inLukut. Both types of waste will undergo thorough cleaningprocedures and inspection prior to leaving the WMC.
We minimise the amount of waste from our operations whereverpossible by reducing the amount of waste we generate or byfinding beneficial ways to reuse waste by-products. One of ourpriorities is to promote consistent waste management practicesacross our businesses. The development of waste managementtracking and training programmes helps our employees achievebetter waste recovery and meet regulations.
BIODIVERSITY
Biodiversity forms the foundation of a vast array of ecosystemservices that critically contribute to human well-being. We arecommitted to managing our land base in a manner that minimisesthe impact of our operations and return the land to productivecapacity as quickly as possible. We have developed plans forlandscaping and beautif ication programmes that includemonitoring and special plantings.
We regularly conduct short surveys at four study sites: AF2, AF3,AF4 and MWR. These sites are located within a 3km radius fromour WMC. Various ecological indicators are used in thebiodiversity monitoring as they form a critical component ofmonitoring, assessment and decision-making.
Bio-aquatic monitoringWe conduct bio-aquatic monitoring frequently at the WMC toquantify bio-aquatic species into relative abundance and diversityindex. The diversity index is used to assess the diversity of anypopulation in which each member belongs to a unique species.Thus, in our monitoring programme, the diversity index is used todemonstrate the biodiversity status for our four main ecologicalindicators, which are fish, zooplankton, phytoplankton andChlorophyll a.
FIGURE 13: DIVERSITY INDEX FOR FISH ANDINVERTEBRATES
Div
ersi
ty In
dex
0.86
1.33
0.76
0.69
0 0 0 0
AF2 AF3 AF5AF4
2006
2007
0
0.3
0.9
0.6
1.2
1.5
Stations

Environmental Performance
42 FIGURE 14: DIVERSITY INDEX FOR ZOOPLANKTON
FIGURE 15: DIVERSITY INDEX FOR PHYTOPLANKTON
FIGURE 16: CHLOROPHYLL A CONCENTRATION
All stations were at normal and satisfied levels in terms of diversityindex and chlorophyll a concentration. We are committed tocontinue with the monitoring of the biodiversity in our surroundingenvironment to ensure the conservation of our local ecosystem.
Bioassay monitoringBioassay monitoring is another monitoring programme to quantifytoxicity of water through the usage of bioassay species indicators.We conducted bioassay monitoring at the WMC through threemain species indicator, which are Tilapia, Chlorella vulgaris andMoina micrura at stations AF2, AF3 and AF4.
Overall, the water quality from AF2 and AF3 was found to be non-toxic. There was stimulated growth of Chlorella vulgaris in themonitoring points, indicating high content of nutrients andphosphorus in the water. Water samples from station AF4 showedrelatively high toxicity from the monitoring of Tilapia and Moinamicrura. This is mostly due to the location of station AF4, which islocated at a small stream near a main water reservoir. As the mainwater reservoir serves to collect rainwater and stormwater, thewater samples collected from it indicates the toxicity level prior to treatment.
FIGURE 17: COMPARISON OF TILAPIA FOR 2006 AND 2007
0
2
4
10
8
6
12
0h 24h 48h 72h 96h
2006
0h 24h 48h 72h 96h
2007
10 10 10 10 1010 10 10
Monitoring samples
AF2
AF3
AF4
0 0
Num
ber
of d
eath
s
Div
ersi
ty In
dex
1.92
1.9
0.76 1.
58
1.98
1.02
0 0
AF2 AF3 MWRAF4
2006
2007
0
0.5
1.5
1.0
2.0
Stations
Div
ersi
ty In
dex
1.15
1.64
0.12
1.88
1.24
1.98
0
2.03
AF2 AF3 MWRAF4
2006
2007
0
0.5
2.0
1.0
1.5
2.5
Stations
ug/I
0.58
1.36
21.2
9
0.83
31.7
4
40.3
2
57.7
3
17.8
8
AF2 AF3 MWRAF4
2006
2007
0
10
50
20
30
40
60
Stations

UEM Environment Sustainability Report 2007 - Towards Sustainability
43FIGURE 18: COMPARISON OF CHLORELLA VULGARIS FOR2006 AND 2007
FIGURE 19: COMPARISON OF MOINA MICRURA FOR 2006AND 2007
Terrestrial Flora and Fauna monitoringWe are proud of our terrestrial flora and fauna monitoringprogramme as our continuous study of our surrounding area hasidentified a total of 59 species from 31 families of avifauna. Wealso found a protected species of butterfly, the Birdwing Butterfly(Troides Helena Cerberus), as well as the observation of a leopardcat at one of the monitoring station.
We are pleased to report that for 2007, no adverse impacts on theflora and fauna were detected. It is our commitment to continuewith the monitoring of flora and fauna in our surroundingenvironment to ensure the conservation of our local ecosystem.
CARBON FOOTPRINT
The release into the atmosphere of GHG such as carbon dioxide(CO2) and methane (CH4) poses a threat to the environment dueto their potential to cause changes to the global climate, aphenomenon commonly known as “Climate Change”.
We realise our need to minimise the footprint of our operationsand are committed to reducing our emissions of the GHG thatcontribute to climate change. This is why we are proud toannounce that we have completed a Carbon Footprint Survey ofour carbon emissions in 2007. We aim to create a company-wideCarbon Management Plan and set a carbon reduction target. Weexpect this to be in place by the end of 2009.
The objective of the Carbon Footprint Survey is to initiate aprogramme for carbon offsetting. In addition to this, the outcomeof this survey would enable us to continue monitoring the carbonfootprint generated at our headquarters and various sites, as wellas provide a set methodology to other UEM Environment sitesand offices for the estimation of carbon emissions generated,should it be required.
Our Carbon Footprint Survey comprised of information obtainedfrom company documents such as fuel records, employee claimrecords, company invoices, utility bills and schematic diagrams. The scope of work for the Carbon Footprint Survey includes:
• Determination of energy consumption (for offices of KualitiAlam, Kualiti Khidmat Alam and UEM Environment located atour headquarters at Taman Desa; E-Idaman’s office in KotaDamansara and the WMC in Bukit Nanas)
• Determination of transportation impact (domestic andinternational) (for our Head Office at Taman Desa, Kualiti Alam,Kualiti Khidmat Alam, Kualiti Kitar Alam and E-Idaman)
• Determination of diesel and reconstituted oil consumption ofplant operations (for the WMC in Bukit Nanas)
• Calculation of UEM Environment’s carbon footprint
0
50
100
150
200
0h 24h 48h 72h 96h
2006
0h 24h 48h 72h 96h
2007Monitoring samples
AF2
AF3
AF4
100
71.4
100 11
4.3
100
100
100
100 11
9.7
152.
519
2.8
93.8 10
012
2.9
63 65 60
60.5
53.7
54.8
1.42
71.4
114.
32.
79
114.
4 128.
43.
27
131.
6 144.
73.
61
Gro
wth
per
cent
age
Mor
talit
y p
erce
ntag
e fo
r 48
hou
rs
33
30
33 35
95
60
AF2 AF3 AF4
2006
2007
0
20
60
80
40
100
Stations

Environmental Performance
44 Estimation of Carbon EmissionsAll data input for electricity consumption, transportation and plantoperations are identified in common units to reduce errors and toallow for consistency throughout measurements. Emissions ofcarbon have been reported according to the Greenhouse GasProtocol, which was jointly developed by the World BusinessCouncil for Sustainable Development (WBCSD) and the WorldResources Institute (WRI).
The protocol differentiates between emissions for whichbusinesses are directly responsible, indirect emissions caused inthe generation of supplied electricity and all other indirectemissions both upstream and downstream. As it is impossible toknow or control the negligible downstream emissions generatedwhen products sold by our organisation are used, they have beenexcluded from this report. Similarly, reporting on the upstreamemissions of our businesses would currently rely heavily onestimates and, as a result, they have also been excluded from thisanalysis. However, given the nature of our operations, we believethat it is appropriate to report on the emissions from third-partyprovided transportation.
ExclusionsIn this survey, the following are not included:
• Impact from contractors, suppliers, vendors• Impact from leased assets, outsourcing activities• Volumes of waste generated and disposal methods by waste
contractors• Commuting of staff to and from the workplace
ElectricityData was obtained from monthly electricity invoices issued tooffices of Kualit i Alam, Kualit i Khidmat Alam and UEMEnvironment which are located at our head office at Faber Tower,Taman Desa; E-Idaman’s office in Kota Damansara, as well as theWMC in Bukit Nanas. All data inputs are in unit kWh and coversthe period from January 2007 to December 2007.
Arising from this, the carbon emissions for UEM Environment wasdetermined as shown below.
FIGURE 20: CARBON EMISSIONS FROM ELECTRICITYUSAGE
Based on the analysis conducted, the overall carbon emissionfrom electricity usage for UEM Environment in 2007 is 6,304.99metric tonnes of CO2 units. As expected, our WMC was the mostenergy intensive part of our company, consuming almost11,600,000 kWh of electricity in 2007.
TransportationUEM Environment operates a fleet of vehicles including cars, vans,heavy goods vehicles and earthmoving equipment. We also makeuse of a variety of public transport, taxis and flights as part of ourdaily business.
As well as being concerned about the possible environmentalimpacts of fossil fuel consumption and vehicle exhaust emissions,fuel is also a significant cost to the business and therefore weendeavour to minimise fuel usage and improve efficiency whereverpossible. The CO2 emissions from our transport activities aredirectly related to the total amount of fuel consumed.
Data was collected for the following transport modes:
• Company-owned vehicles• Staff-owned vehicles• Contractor-owned transporters• Public rail transport
0
3000
2000
1000
4000
5000
6000
7000
8000
91 26
6,16
8
20
Carbon Emissions
WMC E-IdamanKualiti Khidmat Alam
Kualiti Alam
Met
ric t
onne
s
Sources

UEM Environment Sustainability Report 2007 - Towards Sustainability
45• Long distance bus travel• Taxis• Short, medium and long haul air flightsBoth domestic and international travel was evaluated.
Company- owned Vehicle TransportCompany-owned vehicles for UEM Environment range from carsand pickup trucks to lorries and forklifts. Carbon emissions fromvehicles differ according to model type and fuel efficiency. Toeliminate the discrepancies that may arise from taking thesefactors into consideration, data was collected based on type offuel used and litres of fuel consumed. Data was extracted fromrecords of fuel consumption from January 2007 to December2007. In cases where the amount of fuel consumed was notstated, the amount in litres was calculated by dividing the amountpaid for fuel with the market price for either diesel or petrol at thetime.
Fuel type Malaysian market price in 2007Petrol RM 1.92 per litreDiesel RM 1.58 per litre
The CO2 emissions for company-owned vehicles for each of ourdifferent subsidiaries are as follow:
FIGURE 21: CARBON EMISSIONS FROM COMPANY-OWNEDVEHICLE TRANSPORT
Based on the data provided, we have estimated that the CO2
emission from usage of company-owned vehicle transportation in2007 for UEM Environment to be 964.42 metric tonnes.
Staff-owned Vehicle TransportCarbon emissions from vehicles differ according to model typeand fuel efficiency. To eliminate the discrepancies that may arisefrom taking these factors into consideration, only data ondistances travelled were analysed. Data was extracted fromrecords of employee claims in km from January 2007 toDecember 2007. Calculations were made on the assumption thatall vehicles run on petrol.
Twenty of our Senior Management staff members have beenprovided with Shell Cards which cover their petrol consumptionfor both personal and company-related travelling. As it is difficultto extract company-related travelling data from the overall data,we have not included the petrol consumption of these twentyShell Card holders in our Carbon Footprint Survey this year. Weaim to refine our carbon footprint calculation process to be moreaccurate in the coming years.
FIGURE 22: CARBON EMISSIONS FROM STAFF-OWNEDVEHICLE TRANSPORT
Based on the data provided, we have estimated that the CO2
emission from usage of staff-owned vehicle transportation in 2007for UEM Environment to be 45.84 metric tonnes.
0
100
200
300
400
500
13 156
26
348
20
Carbon Emissions
84
428
47
Head offic
e
E-Idam
an
Kualiti K
hidmat Alam
Kualiti K
itar A
lam
Support Serv
ices
Production 1
Production 2
WMC
Met
ric t
onne
s
Sources
0
5
10
15
20
25
11
23 Carbon Emissions
E-IdamanHead Office Kualiti Kitar Alam
Kualiti Khidmat
Alam
Kualiti Alam
Met
ric t
onne
s
10
3
0
Sources
Environmental Performance
46 Contractor-owned TransportersAnalysis was conducted for the carbon emissions of ourcontractor-owned transporters in 2007. These transportersconsist of trucks ranging from 20 tonners to 8 tonners and 3tonners, with the majority of them being 20 tonners. Data wasextracted from the GPS monitoring records for contractortransporters from January 2007 to December 2007.
The CO2 emissions for contractor-owned transporters in 2007 areas follow:
FIGURE 23: CARBON EMISSIONS FROM CONTRACTOR-OWNED TRANSPORTERS
Based on the data provided, we have estimated that the CO2
emission from our contractor-owned transporters in 2007 for UEMEnvironment to be 3,384.14 metric tonnes.
Public Rail TransportAnalysis was conducted for UEM Environment’s use of public railtransportation as the public rail system is regularly used by ourstaff for business purposes. In this survey, public rail transportrefers to the Kelana Jaya Light Rail Transit Line (KLJ-LRT),Ampang Light Rail Transit Line (AMP-LRT) and Express Rail Link(ERL). Data was obtained from employee claim records andcovers the period from January 2007 to December 2007.
The CO2 emissions calculated for public rail transport in 2007 areas follow:
FIGURE 24: CARBON EMISSIONS FROM STAFF USAGE OFPUBLIC RAIL TRANSPORT
Based on the data provided, we have estimated that the CO2
emission from usage of public rail transportation in 2007 for UEMEnvironment to be 0.089 metric tonnes.
Long Distance Bus TransportFor UEM Environment, the bus travel undertaken for businesspurposes in 2007 were all long distance. Data was obtained fromemployee claim records and covers the period from January 2007to December 2007.
The CO2 emissions calculated for long distance bus transport in2007 are as follow:
0
1000
500
1500
2000
2500
Carbon Emissions
GapimaBiogreen
Met
ric t
onne
s
981
2,40
3
Contractors 0
0.03
0.02
0.01
0.04
0.05
0.07
0.06
0.080.
01
0.07
0.01
Carbon Emissions
Head Office Kualiti Khidmat Alam Kualiti Alam
Met
ric t
onne
s
Sources

UEM Environment Sustainability Report 2007 - Towards Sustainability
47FIGURE 25: CARBON EMISSIONS FROM STAFF LONG-DISTANCE BUS TRAVEL
Based on the data provided, we have estimated that the CO2
emission from usage of long distance bus transportation in 2007for UEM Environment to be 0.238 metric tonnes.
Taxi TravelIn recent years, taxi fleets in Malaysia have been retrofitted withnewer engines to run on natural gas as cost-efficient alternative topetrol. Its major constituent, CH4, a short and light hydrocarbonrenders natural gas less carbon emission per energy unit.
Data on distances travelled was obtained from employee claimrecords. For the purpose of this analysis, it is assumed that 50%of all taxis within the Klang Valley are using natural gas as a fuelsource.
Most of UEM Environment’s business-related taxi travels in 2007were done locally. However, there were a few that took placeoverseas. For these overseas taxi trips, we have taken intoaccount their specific fare charges, as well as the commonly usedtaxi fuels.
Based on the above, the CO2 emissions from taxi usage for UEMEnvironment between January 2007 and December 2007 wereestimated as follows:
FIGURE 26: CARBON EMISSIONS FROM STAFF TAXI TRAVEL
Based on the data provided, we have estimated that the CO2
emission from taxi travel in 2007 for UEM Environment to be 1.42metric tonnes.
Air TravelAccording to the Intergovernmental Panel on Climate Change(IPCC), aviation currently accounts for just over 3.5 percent oftotal CO2 emissions worldwide. Air travel is considered the mostemissions-intensive mode of transport.
On a yearly basis, consumption of fuel by airlines makes upmillions of metric tonnes. In the future, the effects from air travelwill be manifold as civic aviation is rapidly on the rise.
Information on start/end point locations were obtained fromemployee claim records from January 2007 to December 2007.The CO2 emissions for UEM Environment’s air travel in 2007 areas follow:
0
0.2
0.4
0.8
0.6
1.0
0.87
0.04
0.4
0.11
Carbon Emissions
Head Office Kualiti Khidmat Alam
Kualiti Kitar Alam
Kualiti Alam
Met
ric t
onne
s
Sources
0.00
0.10
0.5
0.15
0.20
0.25
Carbon Emissions
Kualiti AlamKualiti Khidmat Alam
Met
ric t
onne
s
0.23
0.01
Sources

Environmental Performance
48 FIGURE 27: CARBON EMISSIONS FROM STAFF AIR TRAVEL
Based on the data provided, we have estimated that the CO2
emission from business-related air travel in 2007 for UEMEnvironment to be 12.56 metric tonnes.
Plant OperationsHazardous waste is treated almost exclusively by incineration. Our readers should note that our diesel and reconstituted fuelconsumption for plant operations arise primarily from the activities ofthree of our incineration plants at the WMC: Incineration 1, 2 and 3.
Data was obtained from records of diesel and reconstituted fuelconsumption starting from January 2007 to December 2007. The CO2 emissions from UEM Environment’s plant operations in2007 are as follow:
FIGURE 28: CARBON EMISSIONS FROM INCINERATIONPLANTS
Based on the data provided, we have estimated that the CO2
emission from our plant operations at UEM Environment in 2007to be 9,935.74 metric tonnes.
TOTAL CO2 EMISSIONS
The total annual CO2 emissions from UEM Environment’s activitiesare:
TABLE 12: TOTAL ANNUAL CO2 EMISSIONS
Annual CO2 emissionActivities (metric tonnes)
Electricity use 6,304.99Transportation 4,408.71
Company-owned vehicle use 964.42Staff-owned vehicle use 45.84Contractor-owned transporter use 3,384.14Public rail transportation 0.09Long-distance bus travel 0.24Taxi travel 1.42Air travel 12.56
Plant Operations 9,935.74Total 20,649.44
FIGURE 29: MAJOR CARBON DIOXIDE EMITTERS AT UEMENVIRONMENT
As shown above, UEM Environment emitted 20,649.44 metrictonnes of CO2 emissions, of which 6,304.99 metric tonnes camefrom electricity consumption, 4,408.71 metric tonnes were fromtransportation and 9,935.74 metric tonnes were from plantoperations at the WMC.
0
6
3
9
12
15
Carbon Emissions
Kualiti Alam E-Idaman
Met
ric t
onne
s
12.0
6
0.5
Sources
0
3000
2000
1000
4000
7000
6000
5000
8000
Carbon Emissions
DieselReconstituted Oil
Met
ric t
onne
s
6,33
8
3,59
7
Types of oil
Plant operations
Electricity Consumption
Transportation
48%
31%
21%

UEM Environment Sustainability Report 2007 - Towards Sustainability
49PLANNING FOR THE FUTURE
As this is the first year we are actively calculating our carbonfootprint, it is expected that some of our emissions might bemisrepresented. However, we are constantly trying to refine theaccuracy of our data. The calculation of the footprint representsonly the first part of a three-stage process. The next step is toinvestigate the ways in which this footprint can be reduced andfinally to adopt mechanisms to offset the footprint.
As shown above, our plant operations use accounted for 48% ofour carbon emissions for 2007, while transportation and electricityconsumption were responsible for 21% and 31% of our emissionsrespectively. Therefore, our approach to reducing our carbonemissions should be a three-pronged process: increasing fuelefficiency of our plant operations, reducing electricity consumptionand increasing transportation fuel efficiency.
Diesel and Reconstituted Oil ConsumptionIn 2005, we invested RM 1.2 million to upgrade our Incinerator 1 torun on reconstituted oil. Incinerator 1 has the capability to run eitheron 100% diesel, 100% fuel from waste or a proportion betweenthese two fuel types.
With this new burner, we now have the ability to use eitherreconstituted oil or fuel derived from waste, providing greaterflexibility in terms of fuel source and economical savings.
FIGURE 30: COMPARISON OF DIESEL AND RECONSTITUTEDOIL CONSUMPTION FOR 2006 AND 2007
In 2006, we were running our incinerators on a combination ofdiesel and reconstituted oil; Incinerator 1 was using approximately50% diesel and 50% reconstituted oil. However in 2007, we were
able to use Incinerator 1 primarily on reconstituted oil, therebyreducing our diesel consumption by 10%.
Under our Six Sigma methodologies implemented in 2007, we aimto further reduce our diesel consumption for both Incinerators 2 and3 by setting up a new delivery and burner system which run onreconstituted oil at the two incineration plants.
While we have seen a significant reduction in cost in terms of dieselusage in our operations, we are also committed to maximise theuse of reconstituted oil in order to ensure effective use of our rawmaterials and reduce the impact on climate change. We will beexploring the use of other fuel types which will help us reduce bothour environmental and cost impacts.
Electricity ConsumptionElectricity use accounts for almost 31% of our carbon emissions,so reducing our consumption is a significant way in which we canaffect change in our carbon footprint. However, the treatment ofscheduled wastes is an energy intensive process and as qualitytargets get ever tighter we see our demand for electricity continuingto grow.
Recognising the importance in managing energy consumption, wehave incorporated the energy reduction issue into the Six SigmaMethodologies Projects. The Six Sigma Methodologies wereimplemented since May 2007 to promote continuous improvementtowards achieving our environmental goals.
A number of measures have been taken to minimise our energyconsumption under the Six Sigma methodologies. Installation of thesoft starter or inverter in the electrical motor equipment is one of theways to reduce unnecessary speed and energy consumption forpumps, fans and blowers. We managed to reduce a total of 15%-50% of our energy usage through this effort.
Air conditioning is another main source of energy consumption. Inrecognition of this, the temperature setting for our air-conditionershave been set to 22-24°C. All cooling or refrigerant systems, airconditioners, chiller compressors and heat exchanger have beenconverted to split unit air conditional systems to reduce the energyconsumption by 8-25%.
We have changed most of our normal fluorescents to energy-savingfluorescent lights to reduce energy consumption. As the Six SigmaMethodologies have only been implemented from the mid year of2007, only 283,350 kWh of energy consumption has been reducedat the end of 2007. However, our goal is to achieve energyefficiency and maximise the utilisation of materials.
Litr
e
1,40
7,04
0
1,39
7,55
4
2,23
1,86
0
1,34
2,26
0
2006 2007Year
Reconstituted Oil(for Incinerator 1)
Diesel (for Incinerators 1, 2, 3)
0
500000
1000000
1500000
2000000
2500000

Environmental Performance
50 TransportationTransportation accounts for 21% of our carbon emissions in 2007,of which our contractor-owned transporters are our biggestcarbon emitters. We recognise that our large fleet of vehicles andthe distances they travel have a significant impact on theenvironment.
FIGURE 31: CARBON EMISSIONS FROM TRANSPORTATION
As road transport emissions are one of our major environmentalimpacts – and, internationally, a major contributor to globalwarming – even small improvements can have a significantbenefit. Improved fuel consumption and cleaner fuels and enginescan cut the amount of CO2 and other combustion gasesproduced. We therefore seek to use cleaner fuel and to minimiseour consumption of the fuel we use to carry out our business by:
• Maintaining regular servicing of fleet vehicles• Reviewing the suitability of alternate fuels, such as biodiesel
and switching to them as they become commercially available• Designing more eff icient routes to minimise travell ing
distances and fuel consumption• Continuing to reduce diesel usage by focusing our ongoing
fleet replacement on newer, more fuel efficient vehicles.
Reduce, Reused, Recycle, RecoverEveryone agrees that conserving resources is the environmentallyresponsible thing to do. However, we have learned that it is easiersaid than done. The challenge of making hazardous wasterecycling and recovery a widespread practice, supported byconsumers and business alike, has been a hurdle in the wasteindustry for many years.
UEM Environment is working to overcome that hurdle. Kualiti KitarAlam, our hazardous waste recycling and recovery subsidiarybegan operations at its scheduled waste recycling and recoveryfacil ity in December 2007 after garnering the appropriateapprovals from the authorities.
We are providing leadership to make hazardous recycling aworking, sustainable solution for residential, commercial,municipal and industrial customers across the country. With theavailability of Kualiti Kitar Alam services, our WMC in Bukit Nanasnow manages scheduled waste for recycling and recovery,treatment and disposal, making us the most comprehensive one-stop scheduled waste management centre in the country.
On a more personal front, our waste management policy focuseson avoiding the creation of waste. Certain daily operationalmeasures at the office can be practiced to reduce carbonfootprint and wastage through recycling. Here are some examplesof the measures we have taken:
• Separating waste into paper, glass and plastics beforedisposal
• Using recycled paper for internal use as well as record andfiling purposes
• Replacing Styrofoam cups with ceramic mugs in the officepantry
From these measures taken, the results have been encouraging interms of minimising our carbon footprint. For the coming years,we aim to take a more structured approach in monitoring ourrecycling initiatives in the office.
0
500
1000
1500
2000
2500
3000
3500
1.42
0.24
12.5
6
0.09
20
Carbon Emissions
964.
42
45.8
5
Air trav
el
Taxi
trave
l
Long distan
ce
bus trav
el
Public R
ail tr
ansp
ort
Contrator-o
wned
tran
sporte
rs
Staff-o
wned tr
ansp
ort
Company-o
wned
vehicl
e tran
sport
Met
ric t
onne
s
3,38
4.14
Types of Transportation

UEM Environment Sustainability Report 2007 - Towards Sustainability
51Carbon offsetting Carbon offsetting is neutralising the effect of a company’s orindividual’s carbon emissions by reducing emissions elsewhere.We at UEM Environment are aware that offsetting carbon is a stepin the right direction. We are a region-wide company withemployees and customers all around the region. While we aremaking efforts to reduce energy consumption and unnecessarytravel, they are unlikely to disappear completely from our day-to-day operations.
As a start, we have started a tree planting exercise in June 2008in order to offset our carbon emissions. We hope that the trees wehave planted will help in reducing our overall carbon footprint.
Carbon Footprint CommitteeWe aim to establish a Carbon Footprint Committee by the end of2008 to effectively manage our carbon emissions and reduce ourcarbon footprint.
Through our Carbon Footprint Committee, we will continue toconsult with our stakeholders to develop a co-ordinated andeffective response to the climate change challenge. The establishment of such a committee supports our commitmentto move towards sustainable development.
Life Cycle Analysis (LCA) of LandfillsTreatment of waste to reduce its hazards, promote recovery andreduce waste to landfill will be increasingly utilised to facilitatecompliance with reduction in landfill use targets and tighterlegislative requirements on what waste is suitable for landfilldisposal. Meeting such requirements is well within UEMEnvironment’s capabilities and our treatment division will helptowards meeting such obligations.
Properly designed and managed landfills provide a safe andsecure part of sustainable waste management. UEM Environmentshares society’s concerns about the potential consequences ofpoorly managed and operated landfill sites. Our landfill sites arethe subject of expert design and constructed in accordance withdetailed quality assurance plans. Rigorous operational controls areadopted and monitoring systems are used to verify performance.
We have established the required data for our landfills as part ofthe National LCA Project to develop the National Life CycleInventory (LCI) Database. This includes information such as thetypes of waste we treat at the WMC, our utilities and fuelconsumption on a yearly basis, as well as our environmental dataon air emissions, leachate treatment and wastewater discharge.
SIRIM intends to use the Database to conduct LCA studies, supportthe National Ecolabelling Programme and fulfil the requirements offoreign legislation that requires environmental data of products andservices throughout their life cycle.

Economic Performance
52 In 2007, UEM Environment achieved several economicmilestones: spending on goods and services, revenue and ourcapital expenditures all reached new levels. We continued tomake progress along our path by investing simultaneously inconventional hydrocarbon production and renewable energy.
However, in the past few years we have seen increased costs forboth labour and materials due to an overheated economy. Growthwill continue to be both a challenge and an opportunity as wemove toward expanding and diversifying our business.
We intend to actively mitigate some of the economic impacts ofthis growth through careful workforce planning and projectmanagement. This includes building our expansion projects inmanageable stages, moving some manufacturing work to regionswith more labour capacity and working more closely with ourstakeholders. We also intend to ensure the people most directlyaffected by our organisation continue to share the economicbenefits in the form of jobs, local purchases and investments intheir communities.
UEM Environment is well placed to take advantage of currentmarket opportunities within the treatment sector as a continuedtightening of regulation will favour responsible operators with theability and vision to invest in new technologies.
OUR 2007 HIGHLIGHTS
• Achieved revenue of approximately RM134 million, a 9%increase from 2006.
• Kualiti Kitar Alam began operations at its scheduled wasterecycling and recovery facility in October 2007 after garneringthe appropriate approvals from the authorities.
• Opening of ADKA office in Abu Dhabi in May 2007.
FINANCIAL PERFORMANCE
We remain focused on our main priorities as a business togenerate long-term value for our investors. This requires that wedeliver shareholder value and maintain profitabil ity whileperforming in a socially and environmentally responsible way.
In 2007, we recorded our strongest performance yet. Revenuewas approximately RM134 million in 2007 compared with RM123million in 2006. This represents a 9% increase in our revenue ascompared to the previous year.
FIGURE 32: AUDITED FINANCIAL PERFORMANCE FROM2005 TO 2007
The 2005 and 2006 figures listed in Figure 32 above are from thefinancial performance data of UEM Environment, Kualiti Alam,Kualiti Khidmat Alam, Kualiti Kitar Alam and E-Idaman. The 2007figures are derived from the financial performance data of UEMEnvironment, Kualiti Alam. Kualiti Khidmat Alam, Kualiti Kitar Alam,E-Idaman and ADKA.
Our total long-term assets in 2007 was RM174 million, anincrease of RM4 million compared to our total assets in 2006 ofRM170 million.
RM
’000
15,2
29
18,9
77
123,
231
33,8
24
15,3
06
134,
166
104,
377
9,98
6
10,2
87
2005 2006 2007Year
Capital Spending
Annual Revenue
Profit Before Tax
0
30,000
60,000
90,000
120,000
150,000

UEM Environment Sustainability Report 2007 - Towards Sustainability
DIVERSIFICATION OF BUSINESS
At UEM Environment, we believe that there is a strategic benefit tothe search for new technologies and their commercial applicationto the sector. We continue to seek out these opportunities. Whilethe rapid pace of change in the market provides scope forsignificant organic growth, we believe that acquisitions anddiversif ication wil l play an important part in our furtherdevelopment. Our acquisition and diversification strategy iscomplementary to our drive for organic growth, as acquisitionsand diversification may bring strategic advantage either by way oflocation, integration of services or new technologies.
This is demonstrated at UEM Environment when we branched outinto hazardous waste recycling and recovering with thecommencement of operations at Kualiti Kitar Alam in 2007.Besides that, we have also expanded the net of our operations bysetting up E-Idaman, which is responsible for the management ofmunicipal solid waste collection and public cleansing for theNorthern Region of Malaysia, and ADKA, which is positioned toprovide one-stop environmental and management solutionsefficiently in the United Arab Emirates (UAE).
DEVELOPING RENEWABLE ENERGY RESOURCES
We are pleased to inform our readers that we have conducted apilot study on the extraction of oil from hydrocarbon waste aspotential alternative fuel for use at our WMC. We have also beenawarded the contract to set up a pre-treatment plant as anextension to our existing oil recovery facility at Kualiti Kitar Alam.Besides that, we are in the midst of establishing a synergyprogramme on the utilisation of waste as alternative fuel.
We are currently undertaking a collaborative study with the Facultyof Chemical & Natural Resources Engineering, Universiti TeknologiMalaysia (UTM) on pre-treatment methods for reduction of TOCand O&G in sludge wastes to meet solidification or landfill criteria.
Another collaborative study we have undertaken is a study on thealternative treatment of chromate waste with the MalaysianUniversity of Science & Technology (MUST) and the MalaysianInstitute of Chemical & Bioengineering Technology, UniversitiKuala Lumpur.
BRINGING ECONOMIC BENEFITS
Being a private limited company, UEM Environment is proud to beable to add value to the economy through our operating expensesand distributions.
TABLE 13: DISTRIBUTION OF ECONOMIC VALUE ADDEDFROM 2005 TO 2007
RM (‘000) 2005 2006 2007
Payments and benefits 15,600 16,100 21,100to employees
Taxes paid / payable -3,300 9,900 8,500to the Government
Purchase of goods and services 36,900 39,600 49,500Payments to providers of capital 11,600 13,300 8,400Corporate donations and 97 322 313sponsorships
FIGURE 33: CAPITAL EXPENDITURE FROM 2002 TO 2007
Our strategy for the provision of capital expenditure is through theprovision of new technology and R&D projects which wouldenable us to provide more efficient and effective treatment ofhazardous wastes whilst at the same time minimising ourenvironmental impacts.
53
0
10,000
5,000
15,000
20,000
25,000
35,000
30,000
2002 2003 2004 2005 2006 2007
RM
’000
9,64
2
6,55
0
17,6
20
9,98
6
15,2
29
33,8
24
Year

Economic Performance
54 Benefits to EmployeesOur business operations provide jobs and contractingopportunities to our local communities. We have 306 employeeswith an annual payroll of about RM21 million.
Benefits to CustomersEvery day through our integrated hazardous waste managementsystem, we provide our customers the assurance that theirhazardous wastes are being managed eff iciently in anenvironmentally responsible and sustainable manner whilemeeting the increasingly stringent requirements of nationallegislations. These efforts are conducted through the propermaintenance and continuous improvement of our machineries,facilities and services.
Benefits to GovernmentOur business activity brings other benefits to society. Some of thegreatest beneficiaries are the federal and state governmentswhich receive taxes from our activities. These revenues are usedto help fund local public services and infrastructure. Our currentorganisation business structure provides a one-stop centre whichwould enable local authorities to curb possibilities of wasteleakage arising from the illegal dumping of waste. Arising fromthis, benefits derived from our comprehensive integrated serviceswill be passed onto our stakeholders.
Benefits to CommunitiesAt the local level, our operations affect economies through thecreation of jobs, the purchase of goods and services, and taxespaid to governments. We also invest in community programmesand charitable organisations. Additionally, the Group also makescontributions to deserving charitable and non-profit organisationsannually..
FIGURE 34: CORPORATE DONATIONS AND SPONSORSHIPSFROM 2005 TO 2007
0
100
50
150
200
250
350
300
2005 2006 2007
RM
’000
97
322
313
Year
UEM Environment Sustainability Report 2007 - Towards Sustainability
ACCA MESRA Awards 2007
55We are proud to announce that our Sustainability Report 2006 was awarded the Best Environmental Report of the prestigious ACCAMESRA (Malaysia Environmental and Social Award) 2007.
The ACCA MESRA awards are accorded to organisations that produce stellar reporting in the areas of environment, social andsustainability, besides encouraging best practices and raising the awareness of corporate social responsibility issues and performances.
The awards are endorsed by Bursa Malaysia Berhad, the DOE, the Ministry of Natural Resources and Environment and the MalaysianInstitute of Integrity.
A subsidiary of UEM Environment, Kualiti Alam had won the ‘First Time Reporter’ Category of the ACCA MESRA Award last year.
Listed below are the judges’ comments on the report:
• Was singled out by judges for using the specifications set forth by the GRI’s 2002 Sustainability Reporting guidelines, which offers acomprehensive framework for reporting a company’s impacts and performance
• Demonstrates commitment from the top management to drive culture change that supports sustainability
• Integrates sustainability into corporate culture and business strategies
• Clearly defines the vision, strategy and goals of UEM Environment’s sustainability programme
• Defines target audiences and stakeholders
• Discloses historic environmental management costs over a five-year period in tabular format
• Highlights both positive and negative environmental impacts, such as the increase in greenhouse gas emissions
• Provides detailed quantitative and qualitative data relating to historic and current environmental performance
• Presents 5-year data for key environmental indicators including carbon dioxide emissions, energy consumption and leachatemonitoring in easy-to-read graphs
• Incorporates a GRI Content Index for easy reference and location of indicators and information
• Written in simple language that dispenses with jargon to ease communication and reader understanding
• Complements UEM Environment’s disclosure of its performance on its website enabling diverse stakeholder engagement through printand electronic channels
56

UEM Environment Sustainability Report 2007 - Towards Sustainability
57

58

UEM Environment Sustainability Report 2007 - Towards Sustainability
59
GRI Index
60 GRI # Index Listing Page (s)
STRATEGY AND ANALYSES
1.1 Statement by the Managing Director 9-11
1.2 Key impacts, risks, and opportunities 5-7
ORGANISATIONAL PROFILE
2.1 Name of organisation 2
2.2 Primary brands, products and/or services 2
2.3 Operational structure of organisation 16-17
2.4 Location of headquarters 2
2.5 Countries in which organisation is located 2
2.6 Nature of ownership and legal form 16
2.7 Markets served 2
2.8 Size of operations 2, 5-6, 22-23, 52-54
2.9 Organisational changes in 5, 52
reporting period
2.10 Awards received in reporting period 21
REPORTING PARAMETERS
3.1 Reporting period 3
3.2 Date of most recent previous report 2
3.3 Reporting cycle 3
3.4 Contact point for questions regarding report Front of
back cover
3.5 Process for defining report content 3-4
3.6 Boundary of report 3
3.7 Limitations on scope or boundary of report 6-7
3.8 Basis for reporting on joint ventures NI
3.9 Data measurement techniques
and the bases of the calculations 4, 43
3.10 Effect of any re-statements of information
provided in earlier reports and reasons for
such restatements 14-15, 52
GRI # Index Listing Page (s)
3.11 Significant changes from previous reporting
periods in the scope, boundary, or
measurement methods 4, 14-15, 43-50, 52
3.12 Standard disclosures 56-59
3.13 Policy and current practice with regard to
seeking external assurance 4-5
GOVERNANCE, COMMITMENTS AND ENGAGEMENT
4.1 Governance structure of the organisation 16-17, 19-20
4.2 Chair of the highest governance body 19-20
4.3 Members of highest governance body that
are independent and/or non-executive 19-20
4.4 Mechanisms for shareholders and employees
to provide recommendations or
direction to highest governance body 22, 25, 29-31
4.5 Compensation for highest governance body NI
4.6 Processes to ensure conflicts of interest
are avoided NI
4.7 Expertise of highest governance body 19-20
4.8 Internally developed statements of mission
or values, codes of conduct and principles 12-13
4.9 Procedures of highest governance body for
the organisation’s identification and management NI
4.10 Performance of highest governance body NI
4.11 Precautionary approach NI
4.12 Externally developed principles which
the organisation’s endorses NI
4.13 Memberships in associations 26
4.14 List of stakeholder groups engaged by
organisation 21, 29
4.15 Identification and selection of stakeholders 21, 29
4.16 Approaches to stakeholder engagement 22-31
4.17 Key topics through stakeholder engagement 22-31
UEM Environment Sustainability Report 2007 - Towards Sustainability
GRI Index
61GRI # Index Listing Page (s)
ECONOMIC INDICATORS
Economic Performance
EC1 Direct economic value 52-54
EC2 Financial implication due to climate change NI
EC3 Coverage of the organisation’s defined benefit
plan obligations NI
EC4 Financial assistance received from government NI
Market Presence
EC5 (Add.) Standard entry level wage 22
EC6 Locally-based suppliers 26
EC7 Local hiring NI
Indirect Economic Impacts
EC8 Infrastructure investments NI
EC9 (Add.) Significant indirect economic impacts 52
ENVIRONMENTAL INDICATORS
Materials
EN1 Weight of materials used 37
EN2 Recycled input materials 36
Energy
EN3 Direct energy consumption 44-50
EN4 Indirect energy consumption 44, 48-49
EN5 (Add.) Energy saved due to conservation
and efficiency improvements NI
EN6 (Add.) Initiatives on energy efficiency or
renewable energy 49-50
EN7 (Add.) Initiatives to reduce indirect energy
consumption 49
Water
EN8 Total water use 36
EN9 Water sources significantly affected by
withdrawal of water NI
EN10 Percentage and total volume of water
recycled and reused 36
GRI # Index Listing Page (s)
Biodiversity
EN11 Location and size of land in protected areas NI
EN12 Significant impacts on biodiversity 41-43
EN13 (Add.) Habitats protected or restored 43
EN14 (Add.) Strategies for managing impacts
on biodiversity NI
EN15 (Add.) Number of IUCN Red List Species
and national conservation list species NI
Emissions, Effluents and Waste
EN16 Total direct and indirect greenhouse gas
emissions by weight 48
EN17 Other relevant indirect greenhouse gas
emissions by weight NI
EN18 (Add.) Initiatives to reduce greenhouse gas
emissions 49-51
EN19 Emission of ozone-depleting substances
by weight NI
EN20 NOx, SOx, and other significant air emissions
by type and weight NI
EN21 Total water discharge by quality and destination 39-41
EN22 Total weight of waste by type and disposal method 41
EN23 Total number and volume of significant spills 32
EN24 (Add.) Weight of transported, imported,
exported or treated waste deemed hazardous 32
EN25 (Add.) Identity, size, protected status and
biodiversity value of water bodies NI
Products and Services
EN26 Initiatives to mitigate environmental impacts of
products and services 49-51
EN27 Percentage of products sold and their packaging
materials that are reclaimed by category NI

62
GRI Index
GRI # Index Listing Page (s)
Compliance
EN28 Monetary value of significant fines and total
number of non-monetary sanctions for
non-compliance with environmental laws
and regulations 21
Transport
EN29 (Add.) Significant environmental impacts of
transporting products and other goods and
materials used 46
Overall
EN30 (Add.) Total environmental protection
expenditures and investments by type 14-15
SOCIAL INDICATORS: LABOUR PRACTICES AND
DECENT WORK
Employment
LA1 Total workforce by employment type,
employment contract and region NI
LA2 Total number and rate of employee turnover
by age group, gender, and region NI
LA3 (Add.) Benefits provided to full-time 22-23, 25
employees Labour/Management Relations
LA4 Percentage of employees covered by
collective bargaining agreements NI
LA5 Minimum notice period(s) regarding
operational changes, including whether it is
specified in collective agreements NI
Occupational Health and Safety
LA6 (Add.) Percentage of total workforce represented
in formal joint management-worker health
and safety committees 25
LA7 Rates of injury, occupational diseases,
lost days and absenteeism 32-33
GRI # Index Listing Page (s)
LA8 Education, training, counselling, prevention,
and risk-control programmes regarding
serious diseases NI
LA9 (Add.) Health and safety topics covered in
formal agreements with trade unions NI
Training and Education
LA10 Average hours of training per year per employee 24
LA11 (Add.) Programmes for skills management
and lifelong learning 22, 24
LA12 (Add.) Percentage of employees receiving
regular performance and career
development reviews 22
Diversity and Equal Opportunity
LA13 Breakdown of employees according to gender,
age group, minority group membership 23
LA14 Ratio of basic salary of men to women by
employee category NI
SOCIAL INDICATORS: HUMAN RIGHTS
Investment and Procurement Practices
HR1 Significant investment agreements that include
human rights clauses NI
HR2 Significant suppliers and contractors that have
undergone screening on human rights NI
HR3 (Add.) Total hours of employee training on policies
and procedures concerning human rights 24
Non-discrimination
HR4 Incidents of discrimination and action taken NI
Freedom of Association and Collective
Bargaining
HR5 Operations indentified in which the right to
exercise freedom of association and collective
bargaining may be at a significant risk NI
UEM Environment Sustainability Report 2007 - Towards Sustainability
GRI # Index Listing Page (s)
Child Labour
HR6 Operations identified as having significant risk
for incidents of child labour NI
Forced and Compulsory Labour
HR7 Operations identified as having significant risk
for incidents of forced labour NI
Security Practices
HR8 (Add.) Percentage of security personnel trained
in policies concerning human rights 24
Indigenous Rights
HR9 (Add.) Total number of incidents of violations
involving rights of indigenous people 31
SOCIAL INDICATORS: SOCIETY
Community
SO1 Programmes that manage the impacts of
operations on communities 30-31, 37-43
Corruption
SO2 Percentage and total number of business
units analysed for risks related to corruption NI
SO3 Percentage of employees trained in
anti-corruption policies NI
SO4 Action taken in response to incidents of corruption NI
Public Policy
SO5 Public policy positions and participation in
public policy development and lobbying 27
SO6 (Add.) Total value of financial and in-kind
contributions to political parties NI
Anti-Competitive Behaviour
SO7 (Add.) Total number of legal actions for
anti-competitive behaviour, anti-trust, and
monopoly practices 26
GRI # Index Listing Page (s)
Compliance
SO8 Monetary value of significant fines and total
number of non-monetary sanctions for
non-compliance 21
SOCIAL INDICATORS: PRODUCT RESPONSIBILITY
Customer Health and Safety
PR1 Life cycle stages in which health and safety
impacts of products and services are assessed
for improvement 51
PR2 (Add.) Total number of incidents of non-
compliance with regulations concerning health
and safety impacts of products and services NI
Product and Service Labelling
PR3 Type of product and service information
required by procedures NI
PR4 (Add.) Total number of incidents of non-
compliance with regulations concerning
product and service information and labelling NI
PR5 (Add.) Practices related to customer satisfaction 29-30
Marketing Communications
PR6 Programmes for adherence to laws related to
marketing communications NI
PR7 (Add.) Total number of incidents of
non-compliance with regulations concerning
marketing communications NI
Customer Privacy
PR8 Total number of substantiated complaints
regarding breeches of customer privacy NI
Compliance
PR9 Monetary value of significant fines for
non-compliance with laws and regulations
concerning the provision and use of products
and services NI
Note: NI (Not included)
63
GRI Index
Glossary
ACCA Association of Chartered Certified Accountants
Al Aluminium
AECCOM Association of Environmental Consultants and
Companies of Malaysia
AMCHAM American Malaysian Chamber of Commerce
AMP-LRT Ampang Light Rail Transit Line
ANSWERS Association of Scheduled Waste Recyclers
As Arsenic
AWMA Air and Waste Management Association
BAT British-American Tobacco
BCSDM Business Council for Sustainable Development
Malaysia
BVC Bureau Veritas Certification Sdn Bhd
Cd Cadmium
CICM Chemical Industries Council of Malaysia
Cl2 Chlorine
CO Carbon monoxide
CO2 Carbon dioxide
CSE Customer Service Representative
CSR Corporate Social Responsibility
Cu Copper
DIV Dutch Intervention Values
DOE Department of Environment
DOSH Department of Safety and Health
EIMAS Environment Institute of Malaysia
ELITE Expressway Lingkaran Tengah Sdn Bhd
ENSEARCH Environmental Management and Research
Association of Malaysia
EMS Environmental Management System
EMP Environmental Monitoring Programme
ERL Express Rail Link
ERP Emergency Response Plan
ESCAP Economic and Social Commission for Asia and
the Pacific
FCMA Fellow of the Chartered Institute of Management
Accountants
Fe Iron
FMM Federation of Malaysian Manufacturers
FRF Financial Reporting Foundation
GCC Gulf Cooperation Council
GHG Greenhouse gases
GPS Global Positioning Satellite
GRI Global Reporting Initiative
H2 S Hydrogen sulfide
H2 SO4 Sulphuric acid
HCl Hydrochloric acid
Hg Mercury
IKM Institut Kimia Malaysia
IMS Integrated Management Systems
IPCC Intergovernmental Panel on Climate Change
JKKK Village Development and Security Committee
KJL Kampung Jimah Lama
KLJ-LRT Kelana Jaya Light Rail Transit Line
KPI Key Performance Indicator
KTAK Ministry of Energy, Water and Communications
kWh Kilowatt per hour
LCA Life Cycle Analysis
LCI Life Cycle Inventory
LESTARI Institute of Environment and Development
LTI Lost Time Injury
LTP Leachate Treatment Plant
MACEC Malaysian Centre for Environmental
Communicators Berhad
MCMC Malaysian Communications and Multimedia
Commission
MDBC Malaysian Danish Business Council
MIA Malaysian Institute of Accountants
MICCI Malaysian International Chamber of Commerce
and Industry
MESRA Malaysia Environmental and Social Reporting
Awards
Mn Manganese
64

Glossary
MS Malaysian Standards
MSOSH Malaysian Society for Occupational Safety and
Health
MUST Malaysian University of Science & Technology
MyNICHE Malaysian Network for Integrated Management
of Chemicals and Hazardous Substances for
Environment and Development
NC2 Second National Communication
NCOSH National Council for Occupational Health and
Safety
ND Not detectable
NGO Non-governmental Organisation
Ni Nickel
NI Not included
NIOSH National Institute of Occupational Safety and
Health
NIWQSM National Inland Water Quality Standards for
Malaysia
NOx Nitrogen oxide
O&G Oil & Grease
OSH Occupational Safety and Health
Pb Lead
PCB Polychlorinated Biphenyls
PLUS Projek Lebuhraya Utara-Selatan Berhad
PMS Performance Management System
R&D Research & Technology Development
Sb Antimony
SERI Solar Energy Institute
SHE Safety, Health, Environment
SHEQ Safety, Health, Environment & Quality
SO2 Sulfur dioxide
TNS Taylor Nelson Sofres Malaysia Sdn Bhd
TOC Total Organic Carbon
UAE United Arab Emirates
UiTM Universiti Teknologi Mara
UKAS United Kingdom Accreditation Services
UKM Universiti Kebangsaan Malaysia
UNEP United Nations Environmental Programme
VOCs Volatile Organic Compounds
W2W Waste to Wealth
WBCSD World Business Council Sustainable
Development
WMAM Waste Management Association of Malaysia
WMC Integrated Scheduled Waste Management
Centre
WRI World Resource Institute
WQI Water Quality Index
Zn Zinc
65
UEM Environment Sustainability Report 2007 - Towards Sustainability

Though there is currently no globally recognised standard forestimating carbon emissions, the standard used in general arederived from Greenhouse Gas Protocol, which was jointlydeveloped by the World Business Council for SustainableDevelopment (WBCSD) and the World Resources Institute (WRI).The emission factors used for the calculation of GHG emissionswere obtained from the sources:
• Department for Environment, Food and Rural Affairs (DEFRA),2007, Passenger Transport Emission Factors
• International Energy Agency (IEA), 2006, InternationalElectricity Emission Factors
• Intergovernmental Panel on Climate Change (IPCC), 2006,2006 IPCC Guidelines for National Greenhouse GasInventories
• Ministry of Agriculture and Forestry (MAF), 2003, GreenhouseEnergy Use and Carbon Dioxide Emissions
• National Energy Technology Laboratory (NETL), 2002,Greenhouse Emission Reductions and Natural Gas Vehicles: A Resource Guide on Technology Options and ProjectDevelopment
• Singapore Mass Rapid Transit (SMRT), 2008• United Nations Environmental Programme (UNEP), 2000, The
GHG Indicator: UNEP Guidelines for Calculating GreenhouseGas Emissions for Businesses and Non- CommercialOrganisations
• World Resources Institute (WRI)/World Business Council forSustainable Development (WBCSD), 2001, The GreenhouseGas Protocol and associated Stationary Combustion Tool
• World Wildlife Fund (WWF), 2007, WWF Hong Kong CarbonCalculator
For the estimation of GHG emissions, activity data obtained wasmultiplied by the emission factor to yield an emission value inmetric tonnes. Emission factors are source-specific and varyaccording to energy content and fuel efficiency. Data used for theemission factors are presented below:
66
Appendix
TABLE 14: SOURCE-SPECIFIC EMISSION FACTORS USED IN CARBON FOOTPRINT CALCULATION
Type Emission Factors (EF) Source
Electricity 0.000532 tons CO2/kWh IEA, 2006 (Malaysian grid)
TravelPetrol-based vehicle 0.00234 tons CO2/litre WRI/WBCSD, 2001Diesel-based vehicle 0.00268 tons CO2/litre WRI/WBCSD, 2001Petrol-based vehicle 0.000185 tons CO2/km UNEP, 2000Diesel-based vehicle (UK) 0.000199 tons CO2/km DEFRA, 2007Natural gas-based vehicle 0.00025 tons CO2/mile NETL, 2002LPG-based vehicle 0.000159 tons CO2/km WWF, 2007Train (Electric Rail) 0.000037 tons CO2/km SMRT, 2008Bus (Diesel-based) 0.00005 tons CO2/km WRI/WBCSD, 2001Heavy truck (Diesel-based) 0.00087 tons CO2/km WRI/WBCSD, 2001Short haul plane 0.00018 tons CO2/km WRI/WBCSD, 2001Medium haul plane 0.000126 tons CO2/km WRI/WBCSD, 2001Long haul plane 0.00011 tons CO2/km WRI/WBCSD, 2001
Plant OperationsDiesel 0.00268 tons CO2/litre WRI/WBCSD, 2001Reconstituted Oil 0.00284 tons CO2/litre IPCC, 2006 and MAF, 2003

UEM Environment Sustainability Report 2007 - Towards Sustainability
Page
Figure 1: UEM Environment’s financial 5
performance from 2005 to 2007
Figure 2: Gender equality 23
Figure 3: Employee training days from 2000 to 2007 24
Figure 4: Injury data for 2006 and 2007 32
Figure 5: Accident/incident data for 2006 and 2007 32
Figure 6: Million man hours with zero LTI 33
Figure 7: Comparison of water usage 36
from 2002 to 2007
Figure 8: Consumption of materials from 2002 to 2007 37
Figure 9: Comparison of ambient air monitoring 38
data from 2006 to 2007
Figure 10: Comparison of stack emissions monitoring 38
data from 2006 to 2007
Figure 11: WQI Index for surface water monitoring 39
for 2006 and 2007
Figure 12: Comparison of effluent monitoring 40
data from 2006 to 2007
Figure 13: Diversity index for fish and invertebrates 41
Figure 14: Diversity index for zooplankton 42
Figure 15: Diversity index for phytoplankton 42
Figure 16: Chlorophyll a concentration 42
Figure 17: Comparison of Tilapia for 2006 and 2007 42
Figure 18: Comparison of Chlorella vulgaris for 43
2006 and 2007
Figure 19: Comparison of Moina micrura for 43
2006 and 2007
Figure 20: Carbon emissions from electricity usage 44
Figure 21: Carbon emissions from company-owned 45
vehicle transport
Figure 22: Carbon emissions from staff-owned vehicle 45
transport
Figure 23: Carbon emissions from contractor-owned 46
transporters
Figure 24: Carbon emissions from staff usage of 46
public rail transport
Figure 25: Carbon emissions from staff long-distance 47
bus travel
Page
Figure 26: Carbon emissions from staff taxi travel 47
Figure 27: Carbon emissions from staff air travel 48
Figure 28: Carbon emissions from incineration plants 48
Figure 29: Major carbon dioxide emitters at 48
UEM Environment
Figure 30: Comparison of diesel and reconstituted oil 49
consumption for 2006 and 2007
Figure 31: Carbon emissions from transportation 50
Figure 32: Audited financial performance from 52
2005 to 2007
Figure 33: Capital expenditure from 2002 to 2007 53
Figure 34: Corporate donations and sponsorships 54
from 2005 to 2007
Table 1: Environmental Cost Commitments from 14
2002 to 2006
Table 2: Sustainability Cost Commitments for 2007 15
Table 3: Employee training conducted at 24
UEM Environment in 2007
Table 4: National level participation on environment 27
in 2007
Table 5: Environmental and scheduled waste 27
management presentations
Table 6: Dialogues, seminars and visits that were 28
conducted in 2007
Table 7: Improvement actions taken to enhance 30
customer service
Table 8: Types of staff training conducted in 2007 33
at Kualiti Khidmat Alam
Table 9: Types of driver’s training conducted in 2007 34
at Kualiti Khidmat Alam
Table 10: WQI Quality Scale 39
Table 11: Groundwater monitoring for 2007 40
Table 12: Total annual CO2 emissions 48
Table 13: Distribution of economic value added from 53
2005 to 2007
Table 14: Source-specific emission factors used in 65
carbon footprint calculation
67
List of Figures and Tables

68
Notes

Your Feedback
69
(please tick where appropriate)
• Can we post your view/s on our website? Yes No• Can we include your name/organisation with your comment/s on our website? Yes No• Would you like us to continue to mail materials on the social reporting
process or any other information pertaining to the Company in general to you? Yes No• Would you like to participate in our future dialogue session? Yes No
Please state reason if you answered “No”
(for disclosure purpose, if any information from absent stakeholders is intended for public disclosure as part of the social reportingprocess, the above reasons can be used to state why your organisation has chosen not to participate in the dialogue session)
Signature
Your name and address (optional)OrganisationTelephone number (home/office)Email address
REQUEST FOR A PRINTED COPY OF THE UEM ENVIRONMENT SUSTAINABILITY REPORT 2007 - TOWARDS SUSTAINABILITY
NameTelephone number (home/office)E-mail addressAddress

Chief Operating OfficerUEM Environment Sdn Bhd15th Floor, Menara 2, Faber TowersTaman Desa, Jalan Kelang Lama58100 Kuala Lumpur, Malaysia
stamp
fold here
fold here

Towards Sustainability
Preserving and protecting the environment is a group effort at
every level. The report cover for the Sustainability Report 2007
portrays three children holding hands in an area that is lined with
trees. This concept reaffirms UEM Environment’s long term
vision for the sustainable development of our business. The
children symbolises the future that UEM Environment is investing
in, and the trees reflect the sustainable nature of our business.
At UEM Environment, we are committed to working proactively
towards sustaining our environmental legacy and passing it on to
future generations. Through service excellence, constant
improvement of standards and performance, transparency and a
strong culture of environmental awareness, UEM Environment is
staying true to our Vision statement of being "The GREENER
Environmental Solution".
2007 Sustainability Report
The report team wishes to thank all the individuals throughout the
organisation who contributed information, stories and data to this
report. Special thanks to the core contributors that have been helpful
in contributing towards the successful publication of this Sustainability
Report.
Core Contributors Azmanuddin Haq Ahmad
Suhaimee Mahdar
Chiew Hai Wah
Jazzita Jamaludin
Chow Yin See
Kong Lee Peng
Zurina Abdul Wahab
Salmah Kasbullah
Mohd Norsuradi Man
Jefri Mohamad Din
Mohd Sallehuddin Ibrahim
Hamdan Osman
Wan Jamshid Amourzegar
Mohd Johari Abdul Malik
Normalis Ali
Razali Abu Bakar
Abdul Rashid Mohamad
Siti Nadzriah Abdul Hamid
Sathish Kurup
Nick Chong
Barani T. Krishna Moorthy
Tan Lay Lay
Compiled & Prepared by Green Edge Consult Sdn. Bhd.
No. 28-4 Jalan 14/22, Right Angle
46100 Petaling Jaya,
Selangor.
www.greenedgeconsult.com
Designed by Octagon Creative Sdn. Bhd.
Contact Chiew Hai Wah
Corporate Communications Manager
Kualiti Alam Sdn. Bhd.
15th Floor, Menara 2, Faber Towers,
Taman Desa, Jalan Kalang Lama,
58100 Kuala Lumpur, Malaysia.
Email: [email protected]
A softcopy of the corporate
sustainability report can be
downloaded at:
www.kualitialam.com