PROGRAMME BASED BUDGET
784
REPUBLIC OF KENYA 2016/2017 PROGRAMME BASED BUDGET OF THE NATIONAL GOVERNMENT OF KENYA FOR THE YEAR ENDING 30 TH JUNE, 2017 APRIL 2016
-
Upload
khangminh22 -
Category
Documents
-
view
0 -
download
0
Transcript of PROGRAMME BASED BUDGET

REPUBLIC OF KENYA
2016/2017
PROGRAMME BASED BUDGET
OF THENATIONAL GOVERNMENT OF KENYA
FOR THE YEAR ENDING 30TH JUNE, 2017
APRIL 2016

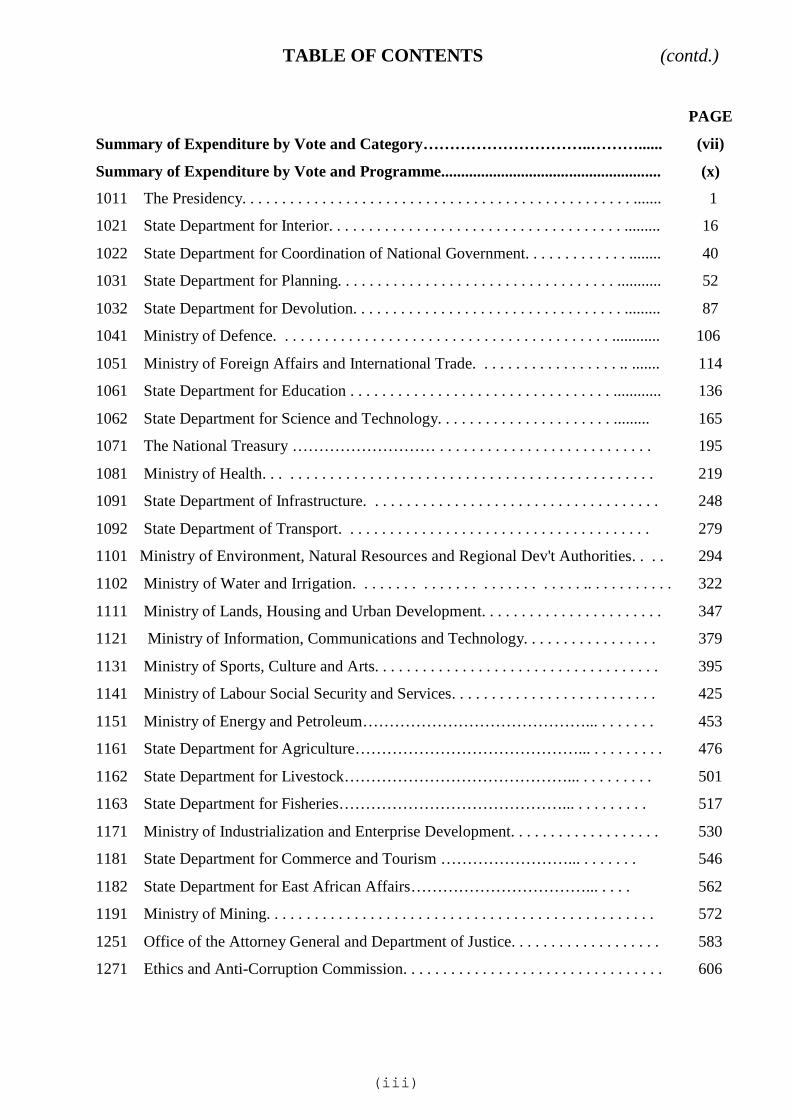
TABLE OF CONTENTS (contd.)
(iii)
1011 The Presidency. . . . . . . . . . . . . . . . . . . . . . . . . . . . . . . . . . . . . . . . . . . . . . . . . ....... 1
1021 State Department for Interior. . . . . . . . . . . . . . . . . . . . . . . . . . . . . . . . . . . . . ......... 16
1022 State Department for Coordination of National Government. . . . . . . . . . . . . ........ 40
1031 State Department for Planning. . . . . . . . . . . . . . . . . . . . . . . . . . . . . . . . . . . ........... 52
1032 State Department for Devolution. . . . . . . . . . . . . . . . . . . . . . . . . . . . . . . . . . ......... 87
1041 Ministry of Defence. . . . . . . . . . . . . . . . . . . . . . . . . . . . . . . . . . . . . . . . . . ............ 106
1051 Ministry of Foreign Affairs and International Trade. . . . . . . . . . . . . . . . . . .. ....... 114
1061 State Department for Education . . . . . . . . . . . . . . . . . . . . . . . . . . . . . . . . . ............ 136
1062 State Department for Science and Technology. . . . . . . . . . . . . . . . . . . . . . ......... 165
1071 The National Treasury ……………………… . . . . . . . . . . . . . . . . . . . . . . . . . . . 195
1081 Ministry of Health. . . . . . . . . . . . . . . . . . . . . . . . . . . . . . . . . . . . . . . . . . . . . . . . . 219
1091 State Department of Infrastructure. . . . . . . . . . . . . . . . . . . . . . . . . . . . . . . . . . . . . 248
1092 State Department of Transport. . . . . . . . . . . . . . . . . . . . . . . . . . . . . . . . . . . . . . . 279
1101 Ministry of Environment, Natural Resources and Regional Dev't Authorities. . . . 294
1102 Ministry of Water and Irrigation. . . . . . . . . . . . . . . . . . . . . . . . . . . .. . . . . . . . . . . 322
1111 Ministry of Lands, Housing and Urban Development. . . . . . . . . . . . . . . . . . . . . . . 347
1121 Ministry of Information, Communications and Technology. . . . . . . . . . . . . . . . . 379
1131 Ministry of Sports, Culture and Arts. . . . . . . . . . . . . . . . . . . . . . . . . . . . . . . . . . . . 395
1141 Ministry of Labour Social Security and Services. . . . . . . . . . . . . . . . . . . . . . . . . . 425
1151 Ministry of Energy and Petroleum……………………………………... . . . . . . . 453
1161 State Department for Agriculture……………………………………... . . . . . . . . . 476
1162 State Department for Livestock……………………………………... . . . . . . . . . 501
1163 State Department for Fisheries……………………………………... . . . . . . . . . 517
1171 Ministry of Industrialization and Enterprise Development. . . . . . . . . . . . . . . . . . . 530
1181 State Department for Commerce and Tourism ……………………... . . . . . . . 546
1182 State Department for East African Affairs……………………………... . . . . 562
1191 Ministry of Mining. . . . . . . . . . . . . . . . . . . . . . . . . . . . . . . . . . . . . . . . . . . . . . . . . 572
1251 Office of the Attorney General and Department of Justice. . . . . . . . . . . . . . . . . . . 583
1271 Ethics and Anti-Corruption Commission. . . . . . . . . . . . . . . . . . . . . . . . . . . . . . . . . 606
Summary of Expenditure by Vote and Category…………………………..………......Summary of Expenditure by Vote and Programme.......................................................
PAGE
(vii)
(x)

TABLE OF CONTENTS (contd.)
(iv)
1281 National Intelligence Service. . . . . . . . . . . . . . . . . . . . . . . . . . . . . . . . . . . . . . . . 613
1291 Office of the Director of Public Prosecutions. . . . . . . . . . . . . . . . . . . . . . . . . . . . 618
1311 Registrar of Political Parties. . . . . . . . . . . . . . . . . . . . . . . . . . . . . . . . . . . . . . . . . . 626
1321 Witness Protection Agency. . . . . . . . . . . . . . . . . . . . . . . . . . . . . . . . . . . . . . . . . . . 631
2011 Kenya National Commission on Human Rights. . . . . . . . . . . . . . . . . . . . . . . . . . . 637
2021 National Lands Commission ………………… . . . . . . . . . . …. . . . . . . . . . . . . . . 643
2031 Independent Electoral and Boundaries Commission. . . . . . . . . . . . . . . . . . . . . . . 654
2061 The Commission on Revenue Allocation. . . . . . . . . . . . . . . . . . . . . . . . . . . . . . . . 663
2071 Public Service Commission. . . . . . . . . . . . . . . . . . . . . . . . . . . . . . . . . . . . . . . . . ... 672
2081 Salaries and Remuneration Commission. . . . . . . . . . . . . . . . . . . . . . . . . . . . . . . . . 684
2091 Teachers Service Commission. . . . . . . . . . . . . . . . . . . . . . . . . . . . . . . . . . . . . . . . . 690
2101 National Police Service Commission. . . . . . . . . . . . . . . . . . . . . . . . . . . . . . . . . . . . 702
2111 Auditor-General. . . . . . . . . . . . . . . . . . . . . . . . . . . . . ..……. . . . . . . . . . . . . . . . . . 710
2121 Controller of Budget . . .. . . . . . . . . . . . . . . . . . . . . . . . . . . .……. . . . . . . . . . . . . . 717
2131 The Commission on Administrative Justice. . . . . . . . . . . . . . . . . . . . . . . . . . . . . ... 725
2141 National Gender and Equality Commission. . . . . . . . . . . . . . . . . . . . . . . . . . . . . .... 731
2151 Independent Police Oversight Authority…… .. . . . . . . . . . . . . . . . . . . . . . . . . . . ... 740
Consolidated Fund Services…… .. . . . . . . . . . . . . . . . . . . . . . . . . . . ... . . . . . . . . . . . (i)

GLOBAL BUDGET - CAPITAL & CURRENT
Summary of Expenditure by Vote and Category 2016/2017 (KShs)
VOTE CODE TITLE
GROSS CURRENT ESTIMATES
GROSS CAPITAL ESTIMATES
GROSS TOTAL ESTIMATES
2016/2017 - KSHS
1011 The Presidency7,464,465,000 481,340,000 7,945,805,000
1021 State Department for Interior103,437,340,903 16,854,796,889 120,292,137,792
1022 State Department for Coordination of NationalGovernment 19,266,107,735 1,050,000,000 20,316,107,735
1031 State Department for Planning18,088,830,671 53,834,212,460 71,923,043,131
1032 State Department for Devolution2,144,085,989 13,727,345,330 15,871,431,319
1041 Ministry of Defence98,654,161,519 45,000,000 98,699,161,519
1051 Ministry of Foreign Affairs and International Trade 18,929,069,848 3,000,000,000 21,929,069,848
1061 State Department for Education58,795,601,201 8,395,219,512 67,190,820,713
1062 State Department for Science and Technology62,894,625,170 15,145,094,384 78,039,719,554
1071 The National Treasury36,802,349,904 45,269,720,315 82,072,070,219
1081 Ministry of Health29,090,110,838 31,179,819,184 60,269,930,022
1091 State Department of Infrastructure29,039,085,190 147,711,782,851 176,750,868,041
1092 State Department of Transport5,818,097,081 175,806,596,000 181,624,693,081
1101 Ministry of Environment, Natural Resources and Regional Dev't Authorities 15,346,391,474 10,655,619,731 26,002,011,205
1102 Ministry of Water and Irrigation4,557,600,000 57,714,001,750 62,271,601,750
1111 Ministry of Land Housing and Urban Development 3,948,088,169 24,977,500,000 28,925,588,1691121 Ministry of Information Communications and Technology 2,959,552,037 22,971,000,000 25,930,552,037
1131 Ministry of Sports Culture and Arts6,257,997,000 2,361,000,000 8,618,997,000
1141 Ministry of Labour Social Security and Services 9,811,354,806 15,299,000,000 25,110,354,806
(v)

GLOBAL BUDGET - CAPITAL & CURRENT
Summary of Expenditure by Vote and Category 2016/2017 (KShs)
VOTE CODE TITLE
GROSS CURRENT ESTIMATES
GROSS CAPITAL ESTIMATES
GROSS TOTAL ESTIMATES
2016/2017 - KSHS
1151 Ministry of Energy and Petroleum2,169,703,644 120,171,731,715 122,341,435,359
1161 State Department for Agriculture.8,586,076,695 13,028,265,821 21,614,342,516
1162 State Department for Livestock.1,889,938,320 11,392,135,480 13,282,073,800
1163 State Department for Fisheries.1,653,196,791 2,530,000,000 4,183,196,791
1171 Ministry of Industrialization and Enterprise Development 5,378,792,159 5,864,787,000 11,243,579,159
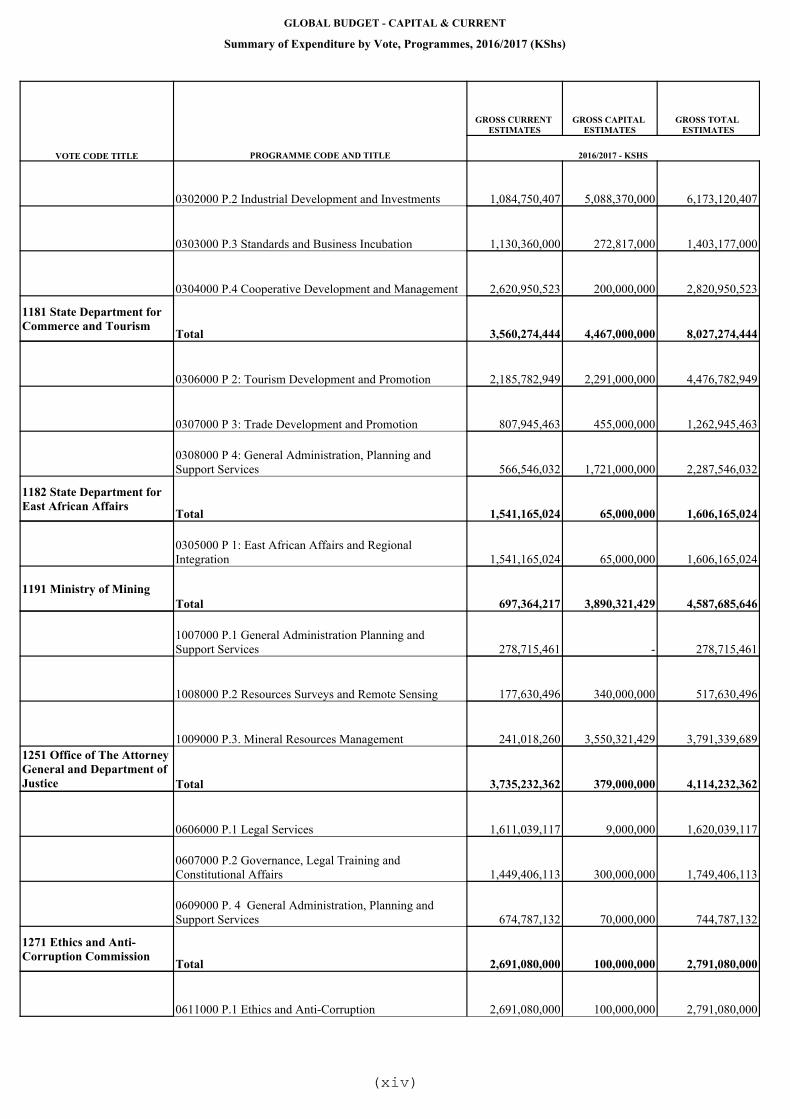
1181 State Department for Commerce and Tourism3,560,274,444 4,467,000,000 8,027,274,444
1182 State Department for East African Affairs1,541,165,024 65,000,000 1,606,165,024
1191 Ministry of Mining697,364,217 3,890,321,429 4,587,685,646
1251 Office of The Attorney General and Department of Justice 3,735,232,362 379,000,000 4,114,232,362
1271 Ethics and Anti-Corruption Commission2,691,080,000 100,000,000 2,791,080,000
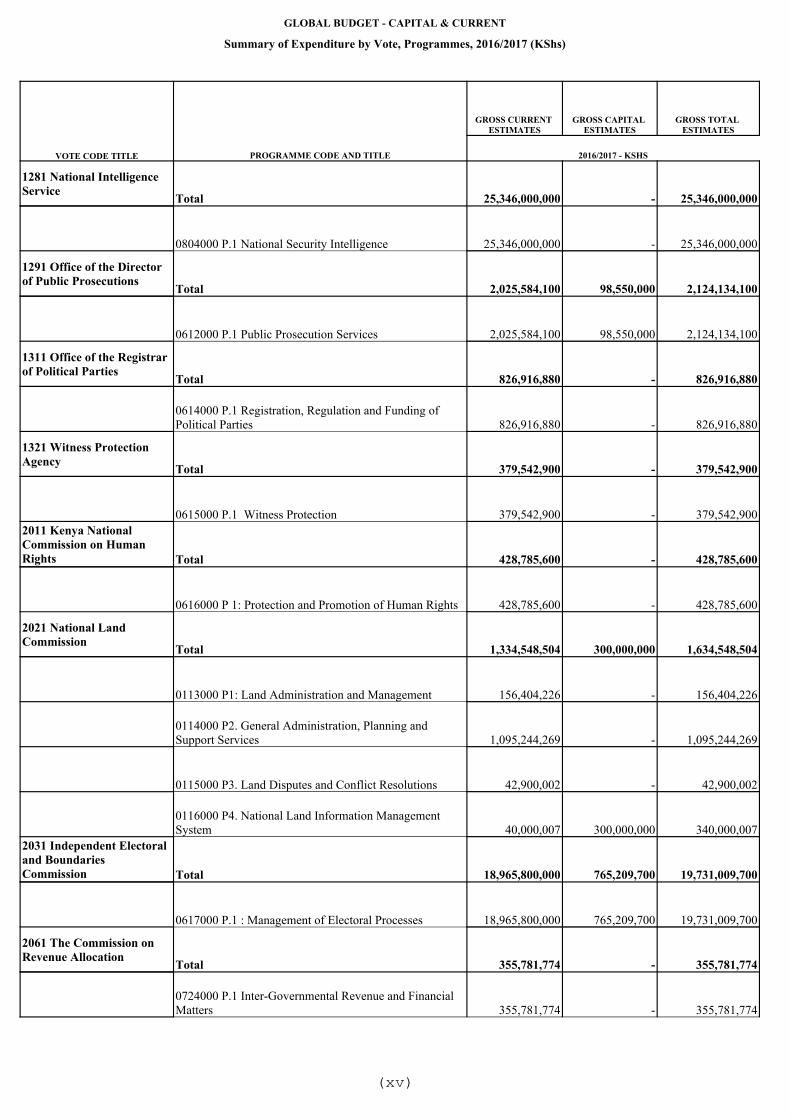
1281 National Intelligence Service25,346,000,000 - 25,346,000,000
1291 Office of the Director of Public Prosecutions2,025,584,100 98,550,000 2,124,134,100
1311 Office of the Registrar of Political Parties826,916,880 - 826,916,880
1321 Witness Protection Agency379,542,900 - 379,542,900
2011 Kenya National Commission on Human Rights428,785,600 - 428,785,600
2021 National Land Commission1,334,548,504 300,000,000 1,634,548,504
2031 Independent Electoral and Boundaries Commission 18,965,800,000 765,209,700 19,731,009,700
2061 The Commission on Revenue Allocation355,781,774 - 355,781,774
2071 Public Service Commission1,154,370,000 39,000,000 1,193,370,000
2081 Salaries and Remuneration Commission533,040,000 - 533,040,000
(vi)

GLOBAL BUDGET - CAPITAL & CURRENT
Summary of Expenditure by Vote and Category 2016/2017 (KShs)
VOTE CODE TITLE
GROSS CURRENT ESTIMATES
GROSS CAPITAL ESTIMATES
GROSS TOTAL ESTIMATES
2016/2017 - KSHS
2091 Teachers Service Commission193,993,888,900 100,000,000 194,093,888,900
2101 National Police Service Commission415,340,000 - 415,340,000
2111 Auditor General4,182,880,000 224,000,000 4,406,880,000
2121 Controller of Budget561,269,850 - 561,269,850
2131 The Commission on Administrative Justice468,632,000 - 468,632,000
2141 National Gender and Equality Commission416,270,878 - 416,270,878
2151 Independent Policing Oversight Authority411,338,899 - 411,338,899
TOTAL VOTED EXPENDITURE ... KShs. 817,007,728,476 809,894,049,551 1,626,901,778,027
(vii)
GLOBAL BUDGET - CAPITAL & CURRENT
Summary of Expenditure by Vote, Programmes, 2016/2017 (KShs)
VOTE CODE TITLE PROGRAMME CODE AND TITLE
GROSS CURRENT ESTIMATES
GROSS CAPITAL ESTIMATES
GROSS TOTAL ESTIMATES
2016/2017 - KSHS
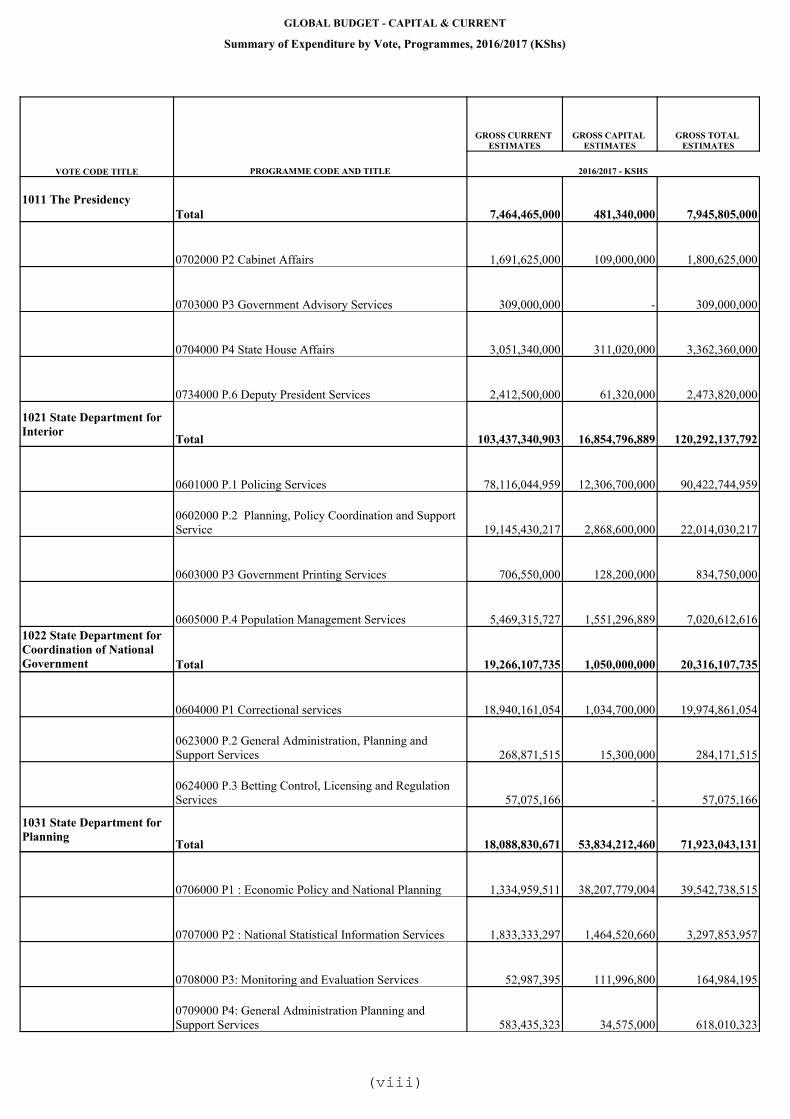
1011 The PresidencyTotal 7,464,465,000 481,340,000 7,945,805,000
0702000 P2 Cabinet Affairs 1,691,625,000 109,000,000 1,800,625,000
0703000 P3 Government Advisory Services 309,000,000 - 309,000,000
0704000 P4 State House Affairs 3,051,340,000 311,020,000 3,362,360,000
0734000 P.6 Deputy President Services 2,412,500,000 61,320,000 2,473,820,000
1021 State Department for Interior Total 103,437,340,903 16,854,796,889 120,292,137,792
0601000 P.1 Policing Services 78,116,044,959 12,306,700,000 90,422,744,959
0602000 P.2 Planning, Policy Coordination and Support Service 19,145,430,217 2,868,600,000 22,014,030,217
0603000 P3 Government Printing Services 706,550,000 128,200,000 834,750,000
0605000 P.4 Population Management Services 5,469,315,727 1,551,296,889 7,020,612,6161022 State Department for Coordination of National Government Total 19,266,107,735 1,050,000,000 20,316,107,735
0604000 P1 Correctional services 18,940,161,054 1,034,700,000 19,974,861,054
0623000 P.2 General Administration, Planning and Support Services 268,871,515 15,300,000 284,171,515
0624000 P.3 Betting Control, Licensing and Regulation Services 57,075,166 - 57,075,166
1031 State Department for Planning Total 18,088,830,671 53,834,212,460 71,923,043,131
0706000 P1 : Economic Policy and National Planning 1,334,959,511 38,207,779,004 39,542,738,515
0707000 P2 : National Statistical Information Services 1,833,333,297 1,464,520,660 3,297,853,957
0708000 P3: Monitoring and Evaluation Services 52,987,395 111,996,800 164,984,195
0709000 P4: General Administration Planning and Support Services 583,435,323 34,575,000 618,010,323
(viii)
GLOBAL BUDGET - CAPITAL & CURRENT
Summary of Expenditure by Vote, Programmes, 2016/2017 (KShs)
VOTE CODE TITLE PROGRAMME CODE AND TITLE
GROSS CURRENT ESTIMATES
GROSS CAPITAL ESTIMATES
GROSS TOTAL ESTIMATES
2016/2017 - KSHS
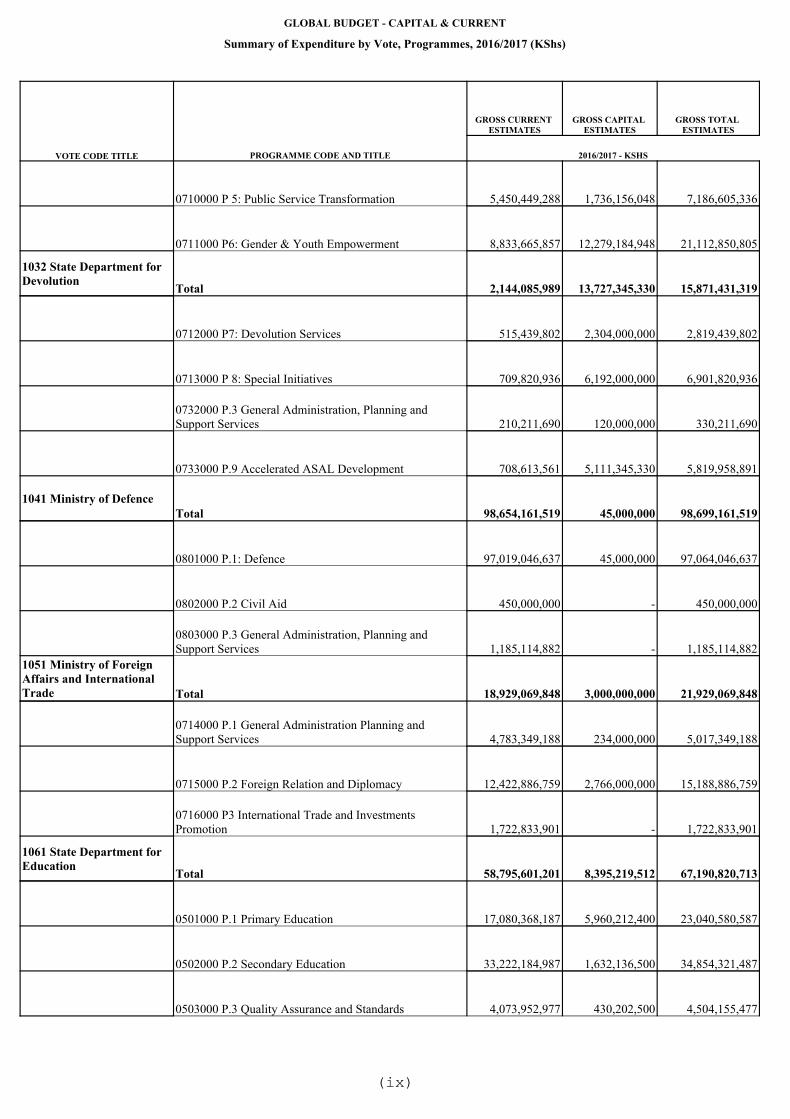
0710000 P 5: Public Service Transformation 5,450,449,288 1,736,156,048 7,186,605,336
0711000 P6: Gender & Youth Empowerment 8,833,665,857 12,279,184,948 21,112,850,805
1032 State Department for Devolution Total 2,144,085,989 13,727,345,330 15,871,431,319
0712000 P7: Devolution Services 515,439,802 2,304,000,000 2,819,439,802
0713000 P 8: Special Initiatives 709,820,936 6,192,000,000 6,901,820,936
0732000 P.3 General Administration, Planning and Support Services 210,211,690 120,000,000 330,211,690
0733000 P.9 Accelerated ASAL Development 708,613,561 5,111,345,330 5,819,958,891
1041 Ministry of DefenceTotal 98,654,161,519 45,000,000 98,699,161,519
0801000 P.1: Defence 97,019,046,637 45,000,000 97,064,046,637
0802000 P.2 Civil Aid 450,000,000 - 450,000,000
0803000 P.3 General Administration, Planning and Support Services 1,185,114,882 - 1,185,114,882
1051 Ministry of Foreign Affairs and International Trade Total 18,929,069,848 3,000,000,000 21,929,069,848
0714000 P.1 General Administration Planning and Support Services 4,783,349,188 234,000,000 5,017,349,188
0715000 P.2 Foreign Relation and Diplomacy 12,422,886,759 2,766,000,000 15,188,886,759
0716000 P3 International Trade and Investments Promotion 1,722,833,901 - 1,722,833,901
1061 State Department for Education Total 58,795,601,201 8,395,219,512 67,190,820,713
0501000 P.1 Primary Education 17,080,368,187 5,960,212,400 23,040,580,587
0502000 P.2 Secondary Education 33,222,184,987 1,632,136,500 34,854,321,487
0503000 P.3 Quality Assurance and Standards 4,073,952,977 430,202,500 4,504,155,477
(ix)
GLOBAL BUDGET - CAPITAL & CURRENT
Summary of Expenditure by Vote, Programmes, 2016/2017 (KShs)
VOTE CODE TITLE PROGRAMME CODE AND TITLE
GROSS CURRENT ESTIMATES
GROSS CAPITAL ESTIMATES
GROSS TOTAL ESTIMATES
2016/2017 - KSHS
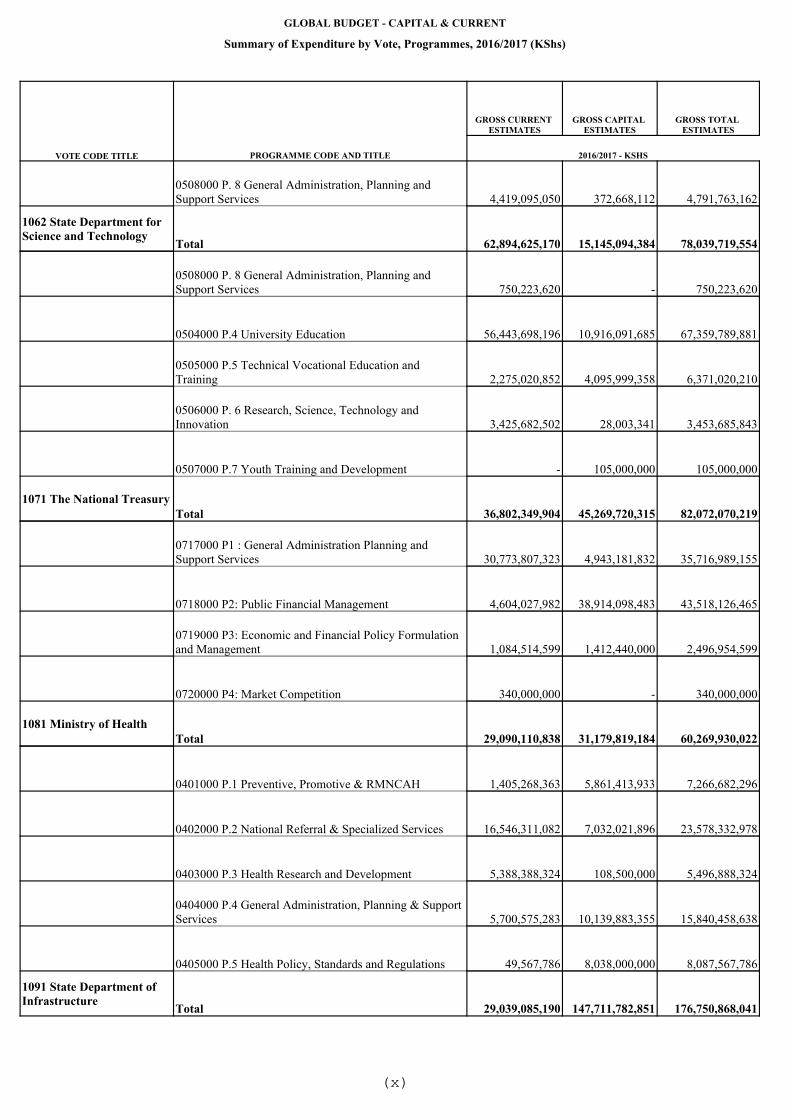
0508000 P. 8 General Administration, Planning and Support Services 4,419,095,050 372,668,112 4,791,763,162
1062 State Department for Science and Technology Total 62,894,625,170 15,145,094,384 78,039,719,554
0508000 P. 8 General Administration, Planning and Support Services 750,223,620 - 750,223,620
0504000 P.4 University Education 56,443,698,196 10,916,091,685 67,359,789,881
0505000 P.5 Technical Vocational Education and Training 2,275,020,852 4,095,999,358 6,371,020,210
0506000 P. 6 Research, Science, Technology and Innovation 3,425,682,502 28,003,341 3,453,685,843
0507000 P.7 Youth Training and Development - 105,000,000 105,000,000
1071 The National TreasuryTotal 36,802,349,904 45,269,720,315 82,072,070,219
0717000 P1 : General Administration Planning and Support Services 30,773,807,323 4,943,181,832 35,716,989,155
0718000 P2: Public Financial Management 4,604,027,982 38,914,098,483 43,518,126,465
0719000 P3: Economic and Financial Policy Formulation and Management 1,084,514,599 1,412,440,000 2,496,954,599
0720000 P4: Market Competition 340,000,000 - 340,000,000
1081 Ministry of HealthTotal 29,090,110,838 31,179,819,184 60,269,930,022
0401000 P.1 Preventive, Promotive & RMNCAH 1,405,268,363 5,861,413,933 7,266,682,296
0402000 P.2 National Referral & Specialized Services 16,546,311,082 7,032,021,896 23,578,332,978
0403000 P.3 Health Research and Development 5,388,388,324 108,500,000 5,496,888,324
0404000 P.4 General Administration, Planning & Support Services 5,700,575,283 10,139,883,355 15,840,458,638
0405000 P.5 Health Policy, Standards and Regulations 49,567,786 8,038,000,000 8,087,567,786
1091 State Department of Infrastructure Total 29,039,085,190 147,711,782,851 176,750,868,041
(x)

GLOBAL BUDGET - CAPITAL & CURRENT
Summary of Expenditure by Vote, Programmes, 2016/2017 (KShs)
VOTE CODE TITLE PROGRAMME CODE AND TITLE
GROSS CURRENT ESTIMATES
GROSS CAPITAL ESTIMATES
GROSS TOTAL ESTIMATES
2016/2017 - KSHS
0202000 P.2 Road Transport 29,039,085,190 147,711,782,851 176,750,868,041
1092 State Department of Transport Total 5,818,097,081 175,806,596,000 181,624,693,081
0201000 P.1 General Administration, Planning and Support Services 308,893,621 354,000,000 662,893,621
0203000 P3 Rail Transport - 156,285,000,000 156,285,000,000
0204000 P4 Marine Transport 644,135,291 16,720,000,000 17,364,135,291
0205000 P5 Air Transport 4,368,713,538 2,147,596,000 6,516,309,538
0206000 P6 Government Clearing Services 48,507,381 - 48,507,381
0216000000 Road Safety 447,847,250 300,000,000 747,847,2501101 Ministry of Environment, Natural Resources and Regional Dev't Authorities Total 15,346,391,474 10,655,619,731 26,002,011,205
1010000 P.1 General Administration, Planning and Support Services 400,759,424 - 400,759,424
1011000 P.2 Environment and Natural Resources Management and Protection 12,830,616,198 6,707,619,731 19,538,235,929
1012000 P.3 Meteorological Services 1,070,081,454 1,101,000,000 2,171,081,454
1013000 P.7 Integrated Regional Development 1,044,934,398 2,847,000,000 3,891,934,398
1102 Ministry of Water and Irrigation Total 4,557,600,000 57,714,001,750 62,271,601,750
1001000 P.2 General Administration, Planning and Support Services 580,391,031 56,000,000 636,391,031
1004000 P.3 Water Resources Management 3,075,986,457 45,380,072,000 48,456,058,457
1014000 P.4 Irrigation and Land Reclamation 901,222,512 12,277,929,750 13,179,152,2621111 Ministry of Land Housing and Urban Development Total 3,948,088,169 24,977,500,000 28,925,588,169
0101000 P. 1 Land Policy and Planning 2,188,601,179 3,641,480,000 5,830,081,179
(xi)
GLOBAL BUDGET - CAPITAL & CURRENT
Summary of Expenditure by Vote, Programmes, 2016/2017 (KShs)
VOTE CODE TITLE PROGRAMME CODE AND TITLE
GROSS CURRENT ESTIMATES
GROSS CAPITAL ESTIMATES
GROSS TOTAL ESTIMATES
2016/2017 - KSHS
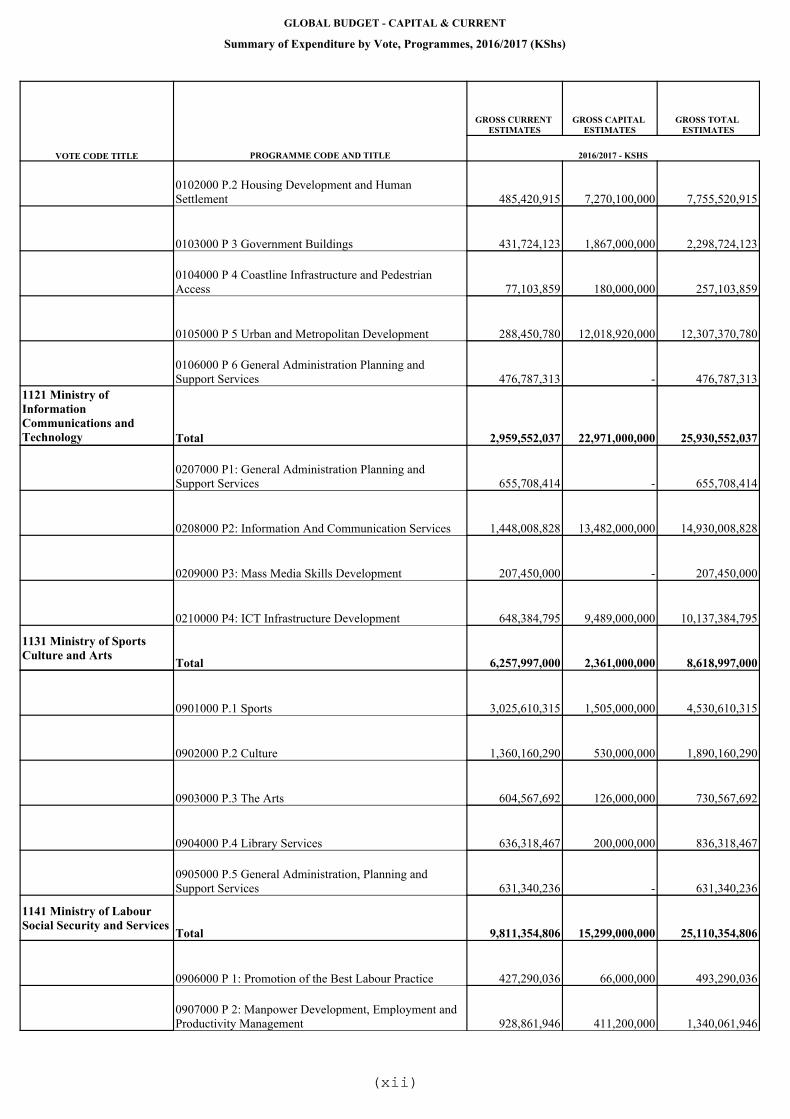
0102000 P.2 Housing Development and Human Settlement 485,420,915 7,270,100,000 7,755,520,915
0103000 P 3 Government Buildings 431,724,123 1,867,000,000 2,298,724,123
0104000 P 4 Coastline Infrastructure and Pedestrian Access 77,103,859 180,000,000 257,103,859
0105000 P 5 Urban and Metropolitan Development 288,450,780 12,018,920,000 12,307,370,780
0106000 P 6 General Administration Planning and Support Services 476,787,313 - 476,787,313
1121 Ministry of Information Communications and Technology Total 2,959,552,037 22,971,000,000 25,930,552,037
0207000 P1: General Administration Planning and Support Services 655,708,414 - 655,708,414
0208000 P2: Information And Communication Services 1,448,008,828 13,482,000,000 14,930,008,828
0209000 P3: Mass Media Skills Development 207,450,000 - 207,450,000
0210000 P4: ICT Infrastructure Development 648,384,795 9,489,000,000 10,137,384,795
1131 Ministry of Sports Culture and Arts Total 6,257,997,000 2,361,000,000 8,618,997,000
0901000 P.1 Sports 3,025,610,315 1,505,000,000 4,530,610,315
0902000 P.2 Culture 1,360,160,290 530,000,000 1,890,160,290
0903000 P.3 The Arts 604,567,692 126,000,000 730,567,692
0904000 P.4 Library Services 636,318,467 200,000,000 836,318,467
0905000 P.5 General Administration, Planning and Support Services 631,340,236 - 631,340,236
1141 Ministry of Labour Social Security and Services Total 9,811,354,806 15,299,000,000 25,110,354,806
0906000 P 1: Promotion of the Best Labour Practice 427,290,036 66,000,000 493,290,036
0907000 P 2: Manpower Development, Employment and Productivity Management 928,861,946 411,200,000 1,340,061,946
(xii)

GLOBAL BUDGET - CAPITAL & CURRENT
Summary of Expenditure by Vote, Programmes, 2016/2017 (KShs)
VOTE CODE TITLE PROGRAMME CODE AND TITLE
GROSS CURRENT ESTIMATES
GROSS CAPITAL ESTIMATES
GROSS TOTAL ESTIMATES
2016/2017 - KSHS
0908000 P 3: Social Development and Children Services 2,842,792,355 850,800,000 3,693,592,355
0909000 P 4: National Social Safety Net 4,963,643,677 13,967,000,000 18,930,643,677
0910000 P 5: General Administration Planning and Support Services 648,766,792 4,000,000 652,766,792
1151 Ministry of Energy and Petroleum Total 2,169,703,644 120,171,731,715 122,341,435,359
0211000 P 1 General Administration Planning and Support Services 321,820,594 131,836,986 453,657,580
0212000 P2 Power Generation 796,614,962 21,491,500,000 22,288,114,962
0213000 P3 Power Transmission and Distribution 797,818,604 93,441,994,729 94,239,813,333
0214000 P4 Alternative Energy Technologies 162,297,886 898,000,000 1,060,297,886
0215000 P5 Exploration and Distribution of Oil and Gas 91,151,598 4,208,400,000 4,299,551,598
1161 State Department for Agriculture. Total 8,586,076,695 13,028,265,821 21,614,342,516
0107000 P1: General Administration Planning and Support Services 2,557,041,724 888,000,000 3,445,041,724
0108000 P2: Crop Development and Management 5,829,187,677 11,211,165,821 17,040,353,498
0109000 P3: Agribusiness and Information Management 199,847,294 929,100,000 1,128,947,294
1162 State Department for Livestock. Total 1,889,938,320 11,392,135,480 13,282,073,800
0112000 P 6: Livestock Resources Management and Development 1,889,938,320 11,392,135,480 13,282,073,800
1163 State Department for Fisheries. Total 1,653,196,791 2,530,000,000 4,183,196,791
0111000 P5: Fisheries Development and Management 1,653,196,791 2,530,000,000 4,183,196,7911171 Ministry of Industrialization and Enterprise Development Total 5,378,792,159 5,864,787,000 11,243,579,159
0301000 P.1 General Administration Planning and Support Services 542,731,229 303,600,000 846,331,229
(xiii)
GLOBAL BUDGET - CAPITAL & CURRENT
Summary of Expenditure by Vote, Programmes, 2016/2017 (KShs)
VOTE CODE TITLE PROGRAMME CODE AND TITLE
GROSS CURRENT ESTIMATES
GROSS CAPITAL ESTIMATES
GROSS TOTAL ESTIMATES
2016/2017 - KSHS
0302000 P.2 Industrial Development and Investments 1,084,750,407 5,088,370,000 6,173,120,407
0303000 P.3 Standards and Business Incubation 1,130,360,000 272,817,000 1,403,177,000
0304000 P.4 Cooperative Development and Management 2,620,950,523 200,000,000 2,820,950,523
1181 State Department for Commerce and Tourism Total 3,560,274,444 4,467,000,000 8,027,274,444
0306000 P 2: Tourism Development and Promotion 2,185,782,949 2,291,000,000 4,476,782,949
0307000 P 3: Trade Development and Promotion 807,945,463 455,000,000 1,262,945,463
0308000 P 4: General Administration, Planning and Support Services 566,546,032 1,721,000,000 2,287,546,032
1182 State Department for East African Affairs Total 1,541,165,024 65,000,000 1,606,165,024
0305000 P 1: East African Affairs and Regional Integration 1,541,165,024 65,000,000 1,606,165,024
1191 Ministry of MiningTotal 697,364,217 3,890,321,429 4,587,685,646
1007000 P.1 General Administration Planning and Support Services 278,715,461 - 278,715,461
1008000 P.2 Resources Surveys and Remote Sensing 177,630,496 340,000,000 517,630,496
1009000 P.3. Mineral Resources Management 241,018,260 3,550,321,429 3,791,339,6891251 Office of The AttorneyGeneral and Department of Justice Total 3,735,232,362 379,000,000 4,114,232,362
0606000 P.1 Legal Services 1,611,039,117 9,000,000 1,620,039,117
0607000 P.2 Governance, Legal Training and Constitutional Affairs 1,449,406,113 300,000,000 1,749,406,113
0609000 P. 4 General Administration, Planning and Support Services 674,787,132 70,000,000 744,787,132
1271 Ethics and Anti-Corruption Commission Total 2,691,080,000 100,000,000 2,791,080,000
0611000 P.1 Ethics and Anti-Corruption 2,691,080,000 100,000,000 2,791,080,000
(xiv)
GLOBAL BUDGET - CAPITAL & CURRENT
Summary of Expenditure by Vote, Programmes, 2016/2017 (KShs)
VOTE CODE TITLE PROGRAMME CODE AND TITLE
GROSS CURRENT ESTIMATES
GROSS CAPITAL ESTIMATES
GROSS TOTAL ESTIMATES
2016/2017 - KSHS
1281 National Intelligence Service Total 25,346,000,000 - 25,346,000,000
0804000 P.1 National Security Intelligence 25,346,000,000 - 25,346,000,000
1291 Office of the Director of Public Prosecutions Total 2,025,584,100 98,550,000 2,124,134,100
0612000 P.1 Public Prosecution Services 2,025,584,100 98,550,000 2,124,134,100
1311 Office of the Registrar of Political Parties Total 826,916,880 - 826,916,880
0614000 P.1 Registration, Regulation and Funding of Political Parties 826,916,880 - 826,916,880
1321 Witness Protection Agency Total 379,542,900 - 379,542,900
0615000 P.1 Witness Protection 379,542,900 - 379,542,9002011 Kenya National Commission on Human Rights Total 428,785,600 - 428,785,600
0616000 P 1: Protection and Promotion of Human Rights 428,785,600 - 428,785,600
2021 National Land Commission Total 1,334,548,504 300,000,000 1,634,548,504
0113000 P1: Land Administration and Management 156,404,226 - 156,404,226
0114000 P2. General Administration, Planning and Support Services 1,095,244,269 - 1,095,244,269
0115000 P3. Land Disputes and Conflict Resolutions 42,900,002 - 42,900,002
0116000 P4. National Land Information Management System 40,000,007 300,000,000 340,000,007
2031 Independent Electoral and Boundaries Commission Total 18,965,800,000 765,209,700 19,731,009,700
0617000 P.1 : Management of Electoral Processes 18,965,800,000 765,209,700 19,731,009,700
2061 The Commission on Revenue Allocation Total 355,781,774 - 355,781,774
0724000 P.1 Inter-Governmental Revenue and Financial Matters 355,781,774 - 355,781,774
(xv)

GLOBAL BUDGET - CAPITAL & CURRENT
Summary of Expenditure by Vote, Programmes, 2016/2017 (KShs)
VOTE CODE TITLE PROGRAMME CODE AND TITLE
GROSS CURRENT ESTIMATES
GROSS CAPITAL ESTIMATES
GROSS TOTAL ESTIMATES
2016/2017 - KSHS
2071 Public Service Commission Total 1,154,370,000 39,000,000 1,193,370,000
0725000 P.1 General Administration, Planning and Support Services 858,361,963 39,000,000 897,361,963
0726000 P.2 Human Resource management and Development 183,856,044 - 183,856,044
0727000 P.3 Governance and National Values 112,151,993 - 112,151,993
2081 Salaries and Remuneration Commission Total 533,040,000 - 533,040,000
0728000 P.1 Salaries and Remuneration Management 533,040,000 - 533,040,000
2091 Teachers Service Commission Total 193,993,888,900 100,000,000 194,093,888,900
0509000 P.1 Teacher Resource Management 187,874,006,553 - 187,874,006,553
0510000 P.2 Governance and Standards 62,185,250 - 62,185,250
0511000 P.3 General Administration, Planning and Support Services 6,057,697,097 100,000,000 6,157,697,097
2101 National Police ServiceCommission Total 415,340,000 - 415,340,000
0620000 P.1 National Police Service Human Resource Management 415,340,000 - 415,340,000
2111 Auditor GeneralTotal 4,182,880,000 224,000,000 4,406,880,000
0729000 P.1 Audit Services 4,182,880,000 224,000,000 4,406,880,000
2121 Controller of BudgetTotal 561,269,850 - 561,269,850
0730000 P.1 Control and Management of Public finances 561,269,850 - 561,269,850
2131 The Commission on Administrative Justice Total 468,632,000 - 468,632,000
0731000 P.1 Promotion of Administrative Justice 468,632,000 - 468,632,000
2141 National Gender and Equality Commission Total 416,270,878 - 416,270,878
(xvi)
GLOBAL BUDGET - CAPITAL & CURRENT
Summary of Expenditure by Vote, Programmes, 2016/2017 (KShs)
VOTE CODE TITLE PROGRAMME CODE AND TITLE
GROSS CURRENT ESTIMATES
GROSS CAPITAL ESTIMATES
GROSS TOTAL ESTIMATES
2016/2017 - KSHS
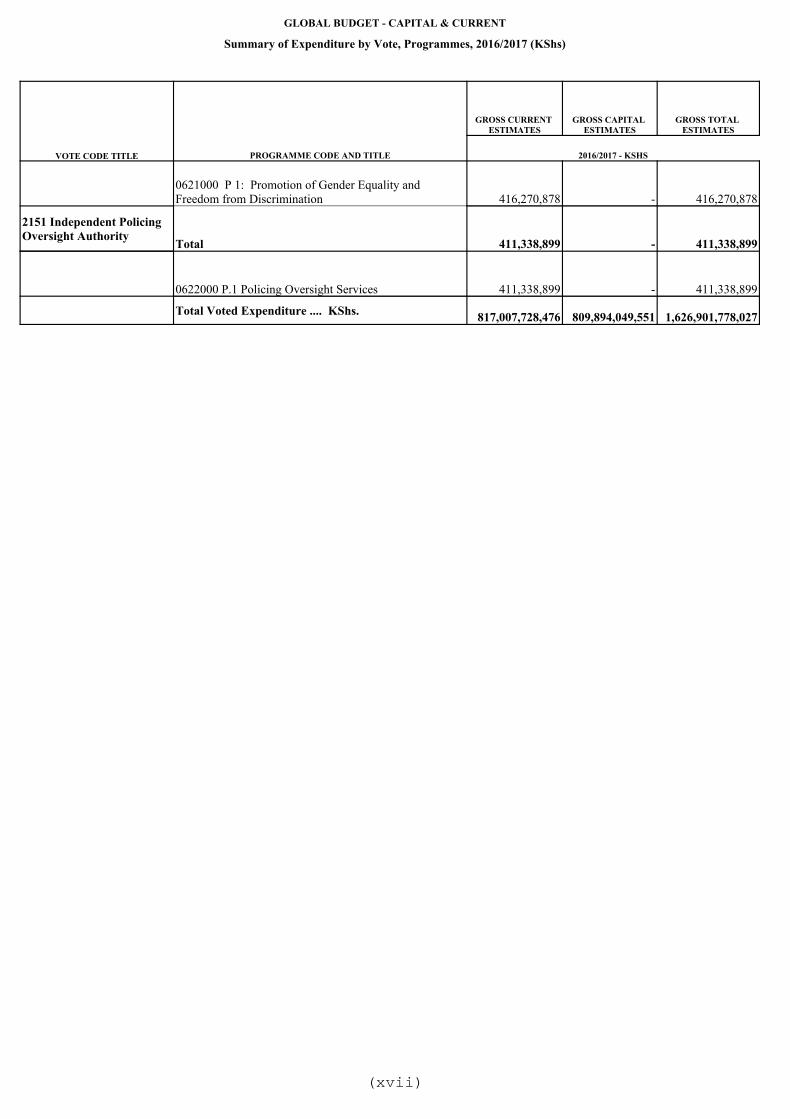
0621000 P 1: Promotion of Gender Equality and Freedom from Discrimination 416,270,878 - 416,270,878
2151 Independent Policing Oversight Authority Total 411,338,899 - 411,338,899
0622000 P.1 Policing Oversight Services 411,338,899 - 411,338,899
Total Voted Expenditure .... KShs. 817,007,728,476 809,894,049,551 1,626,901,778,027
(xvii)
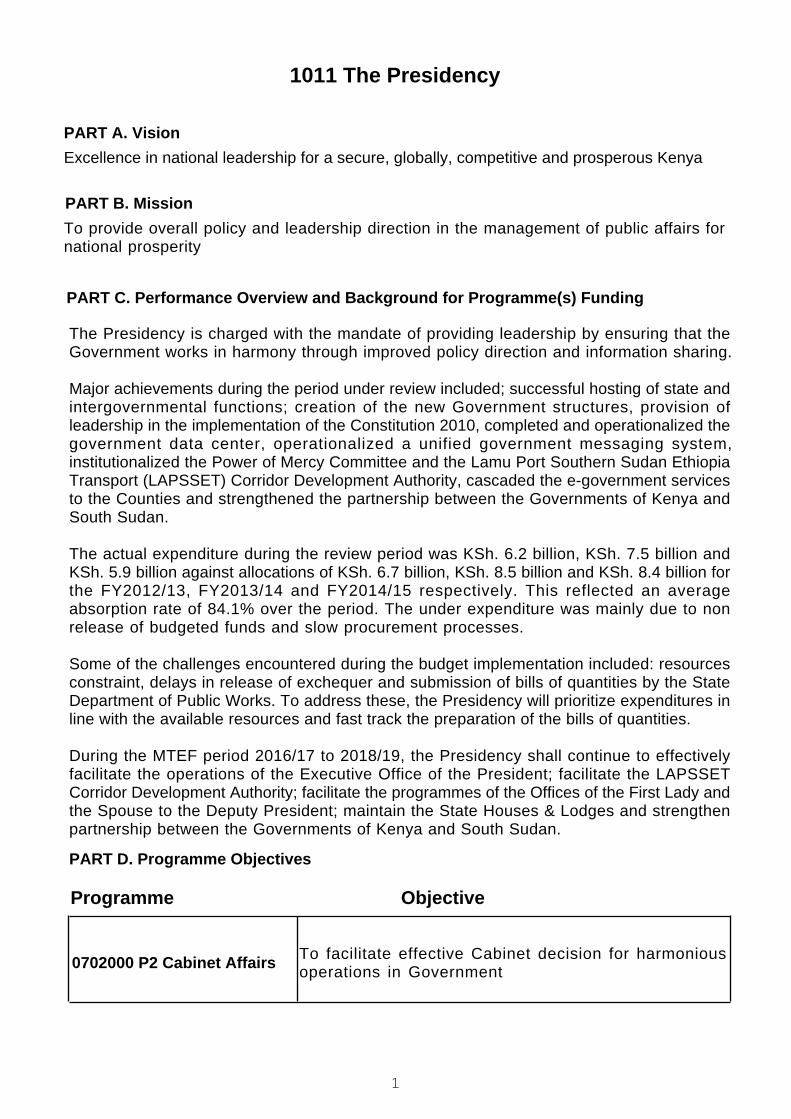
1011 The Presidency
Excellence in national leadership for a secure, globally, competitive and prosperous Kenya
To provide overall policy and leadership direction in the management of public affairs fornational prosperity
PART A. Vision
PART B. Mission
PART C. Performance Overview and Background for Programme(s) Funding
PART D. Programme Objectives
The Presidency is charged with the mandate of providing leadership by ensuring that theGovernment works in harmony through improved policy direction and information sharing.
Major achievements during the period under review included; successful hosting of state andintergovernmental functions; creation of the new Government structures, provision ofleadership in the implementation of the Constitution 2010, completed and operationalized thegovernment data center, operationalized a unified government messaging system,institutionalized the Power of Mercy Committee and the Lamu Port Southern Sudan EthiopiaTransport (LAPSSET) Corridor Development Authority, cascaded the e-government servicesto the Counties and strengthened the partnership between the Governments of Kenya andSouth Sudan.
The actual expenditure during the review period was KSh. 6.2 billion, KSh. 7.5 billion andKSh. 5.9 billion against allocations of KSh. 6.7 billion, KSh. 8.5 billion and KSh. 8.4 billion forthe FY2012/13, FY2013/14 and FY2014/15 respectively. This reflected an averageabsorption rate of 84.1% over the period. The under expenditure was mainly due to nonrelease of budgeted funds and slow procurement processes.
Some of the challenges encountered during the budget implementation included: resourcesconstraint, delays in release of exchequer and submission of bills of quantities by the StateDepartment of Public Works. To address these, the Presidency will prioritize expenditures inline with the available resources and fast track the preparation of the bills of quantities.
During the MTEF period 2016/17 to 2018/19, the Presidency shall continue to effectivelyfacilitate the operations of the Executive Office of the President; facilitate the LAPSSETCorridor Development Authority; facilitate the programmes of the Offices of the First Lady andthe Spouse to the Deputy President; maintain the State Houses & Lodges and strengthenpartnership between the Governments of Kenya and South Sudan.
ObjectiveProgramme
0702000 P2 Cabinet Affairs To facilitate effective Cabinet decision for harmoniousoperations in Government
1

1011 The Presidency
ObjectiveProgramme
0703000 P3 GovernmentAdvisory Services
To enhance Public advisory for effective management ofpublic affairs
0704000 P4 State HouseAffairs
To facilitate the Presidency carry out its Constitutionalmandate
0734000 P.6 DeputyPresident Services
To facilitate effective support to the Presidency in providingoverall policy direction and leadership
2
PART E. SUMMARY OF PROGRAMME OUTPUTS AND PERFORMANCE INDICATORS FOR 2016/2017 - 2018/2019
1011 The Presidency
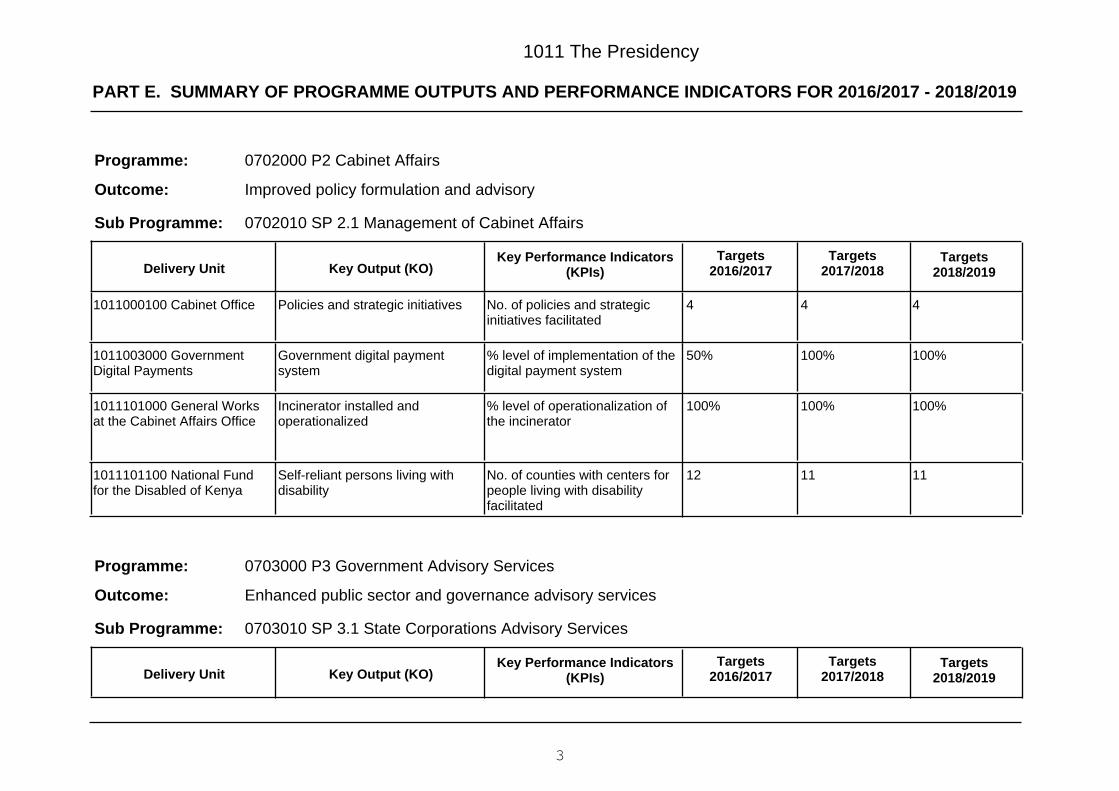
0702000 P2 Cabinet Affairs
Improved policy formulation and advisory
Programme:
Outcome:
0702010 SP 2.1 Management of Cabinet AffairsSub Programme:
Key Output (KO)Targets
2018/2019Targets
2017/2018Key Performance Indicators
(KPIs)Targets
2016/2017Delivery Unit
444No. of policies and strategicinitiatives facilitated
Policies and strategic initiatives1011000100 Cabinet Office
100%100%50%% level of implementation of thedigital payment system
Government digital paymentsystem
1011003000 GovernmentDigital Payments
100%100%100%% level of operationalization ofthe incinerator
Incinerator installed andoperationalized
1011101000 General Worksat the Cabinet Affairs Office
111112No. of counties with centers forpeople living with disabilityfacilitated
Self-reliant persons living withdisability
1011101100 National Fundfor the Disabled of Kenya
0703000 P3 Government Advisory Services
Enhanced public sector and governance advisory services
Programme:
Outcome:
0703010 SP 3.1 State Corporations Advisory ServicesSub Programme:
Key Output (KO)Targets
2018/2019Targets
2017/2018Key Performance Indicators
(KPIs)Targets
2016/2017Delivery Unit
3
PART E. SUMMARY OF PROGRAMME OUTPUTS AND PERFORMANCE INDICATORS FOR 2016/2017 - 2018/2019
1011 The Presidency
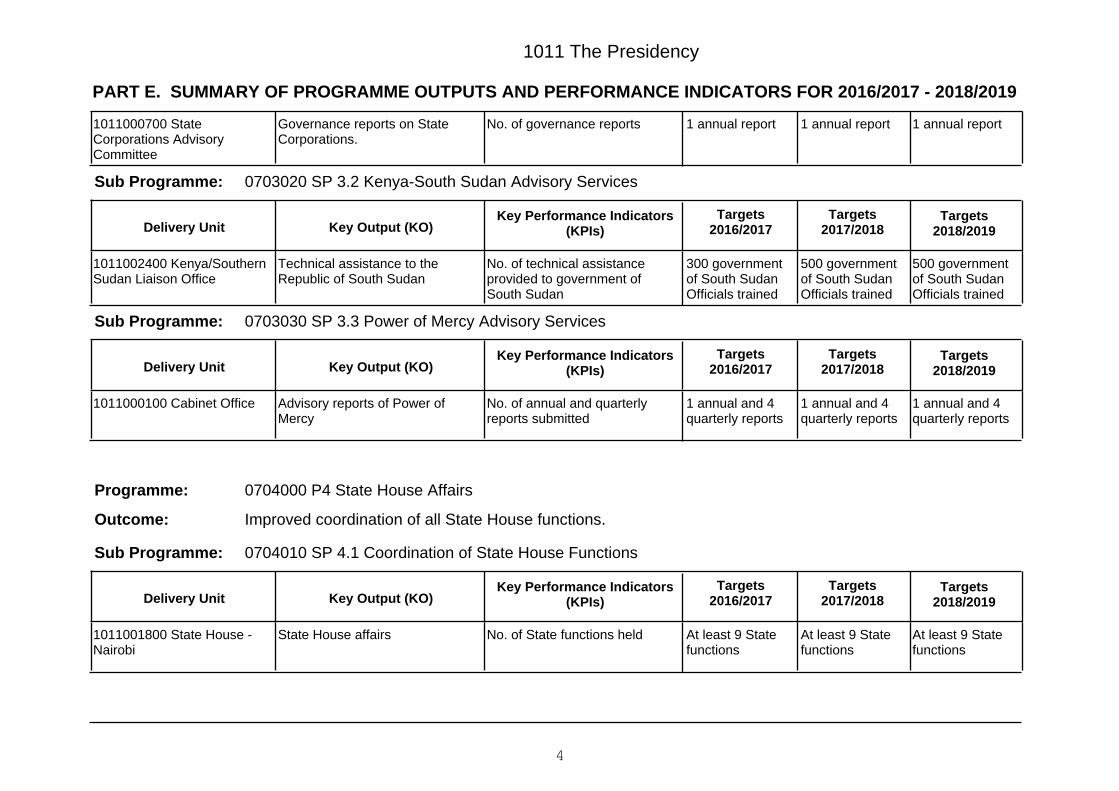
1 annual report1 annual report1 annual reportNo. of governance reportsGovernance reports on StateCorporations.
1011000700 StateCorporations AdvisoryCommittee
0703020 SP 3.2 Kenya-South Sudan Advisory ServicesSub Programme:
Key Output (KO)Targets
2018/2019Targets
2017/2018Key Performance Indicators
(KPIs)Targets
2016/2017Delivery Unit
500 governmentof South SudanOfficials trained
500 governmentof South SudanOfficials trained
300 governmentof South SudanOfficials trained
No. of technical assistanceprovided to government ofSouth Sudan
Technical assistance to theRepublic of South Sudan
1011002400 Kenya/SouthernSudan Liaison Office
0703030 SP 3.3 Power of Mercy Advisory ServicesSub Programme:
Key Output (KO)Targets
2018/2019Targets
2017/2018Key Performance Indicators
(KPIs)Targets
2016/2017Delivery Unit
1 annual and 4quarterly reports
1 annual and 4quarterly reports
1 annual and 4quarterly reports
No. of annual and quarterlyreports submitted
Advisory reports of Power ofMercy
1011000100 Cabinet Office
0704000 P4 State House Affairs
Improved coordination of all State House functions.
Programme:
Outcome:
0704010 SP 4.1 Coordination of State House FunctionsSub Programme:
Key Output (KO)Targets
2018/2019Targets
2017/2018Key Performance Indicators
(KPIs)Targets
2016/2017Delivery Unit
At least 9 Statefunctions
At least 9 Statefunctions
At least 9 Statefunctions
No. of State functions heldState House affairs1011001800 State House -Nairobi
4
PART E. SUMMARY OF PROGRAMME OUTPUTS AND PERFORMANCE INDICATORS FOR 2016/2017 - 2018/2019
1011 The Presidency
At least 3 Statefunctions
At least 3 Statefunctions
At least 3 Statefunctions
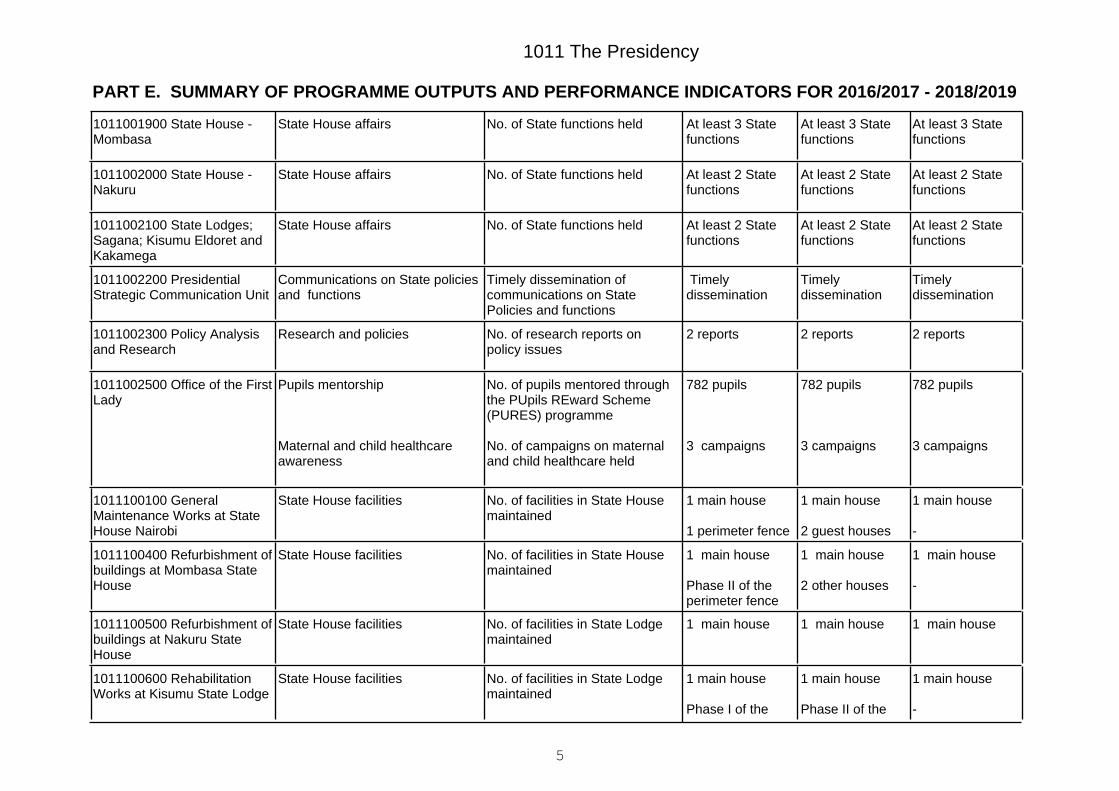
No. of State functions heldState House affairs1011001900 State House -Mombasa
At least 2 Statefunctions
At least 2 Statefunctions
At least 2 Statefunctions
No. of State functions heldState House affairs1011002000 State House -Nakuru
At least 2 Statefunctions
At least 2 Statefunctions
At least 2 Statefunctions
No. of State functions heldState House affairs1011002100 State Lodges;Sagana; Kisumu Eldoret andKakamega
Timelydissemination
Timelydissemination
Timelydissemination
Timely dissemination ofcommunications on StatePolicies and functions
Communications on State policiesand functions
1011002200 PresidentialStrategic Communication Unit
2 reports2 reports2 reportsNo. of research reports onpolicy issues
Research and policies1011002300 Policy Analysisand Research
782 pupils
3 campaigns
782 pupils
3 campaigns
782 pupils
3 campaigns
No. of pupils mentored throughthe PUpils REward Scheme(PURES) programme
No. of campaigns on maternaland child healthcare held
Pupils mentorship
Maternal and child healthcareawareness
1011002500 Office of the FirstLady
1 main house
-
1 main house
2 guest houses
1 main house
1 perimeter fence
No. of facilities in State Housemaintained
State House facilities1011100100 GeneralMaintenance Works at StateHouse Nairobi
1 main house
-
1 main house
2 other houses
1 main house
Phase II of theperimeter fence
No. of facilities in State Housemaintained
State House facilities1011100400 Refurbishment ofbuildings at Mombasa StateHouse
1 main house1 main house1 main houseNo. of facilities in State Lodgemaintained
State House facilities1011100500 Refurbishment ofbuildings at Nakuru StateHouse
1 main house
-
1 main house
Phase II of the
1 main house
Phase I of the
No. of facilities in State Lodgemaintained
State House facilities1011100600 RehabilitationWorks at Kisumu State Lodge
5

PART E. SUMMARY OF PROGRAMME OUTPUTS AND PERFORMANCE INDICATORS FOR 2016/2017 - 2018/2019
1011 The Presidency
perimeter fenceperimeter fence
1 main house
-
1 main house
-
1 main house
1 store
No. of facilities in State Lodgemaintained
State House facilities1011100700 RehabilitationWorks at Kakamega StateLodge
1 office building1 office building1 office buildingNo. of facilities in the offices ofthe retired Presidentsmaintained
State House facilities1011100800 Refurbishment ofRetired Presidents' Offices
0704020 SP 4.2 Administration of Statutory benefits for the retired PresidentsSub Programme:
Key Output (KO)Targets
2018/2019Targets
2017/2018Key Performance Indicators
(KPIs)Targets
2016/2017Delivery Unit
100%100%100%% level of provision of statutorybenefits to the retired presidentsas per the Retired PresidentsBenefits Act
Statutory benefits for the RetiredPresidents
1011000300 Administration ofStatutory Benefits to RetiredPresident
0734000 P.6 Deputy President Services
Efficient coordination and supervision of Government operations for attainment of Vision 2030
Programme:
Outcome:
0734010 SP 6.1 General Administration and Support ServicesSub Programme:
Key Output (KO)Targets
2018/2019Targets
2017/2018Key Performance Indicators
(KPIs)Targets
2016/2017Delivery Unit
Timely andefficient servicedelivery
Timely andefficient servicedelivery
Timely andefficient servicedelivery
Customer satisfactionAdministrative services1011000400 Headquartersand Administrative Services
444No. of IntergovernmentalBudget and Economic (IBEC)meetings held
Deputy President affairs1011000500 Office of theDeputy President
6

PART E. SUMMARY OF PROGRAMME OUTPUTS AND PERFORMANCE INDICATORS FOR 2016/2017 - 2018/2019
1011 The Presidency
-100%75%% Completion rate ofrefurbishment of HarambeeHouse Annex and DP's officialresidences
Deputy President affairs1011100900 General Worksat the Office of the DeputyPresident
0734020 SP 6.2 Coordination and SupervisionSub Programme:
Key Output (KO)Targets
2018/2019Targets
2017/2018Key Performance Indicators
(KPIs)Targets
2016/2017Delivery Unit
444No. of IntergovernmentalBudget and EconomicCommittee (IBEC) meetingsheld
Deputy President affairs1011000500 Office of theDeputy President
Timelydissemination
-
Timelydissemination
-
Timelydissemination
-
Timely dissemination ofinformation to media houses
% level of operationalization ofdigital archive
Deputy President affairs1011000600 Communicationand Press Services
All MDAsAll MDAsAll MDAsNo. of MDAs guided throughpolicy direction
Deputy President affairs1011001000 Co-ordinationand Supervisory Services
4500
700
4500
700
4500
700
No. of women trained on tablebanking, livelihood projects,markets access andentrepreneurship
Scholarships provided to needystudents
Deputy President affairs1011002600 Office of theSpouse to the DeputyPresident
282828No. of Counties provided withtechnical support on policy andlegislation drafting
Deputy President affairs1011002700 Legislative andIntergovernmental LiaisonOffice
100%50%30%% completion rate of modernconference facilities constructed
Deputy President affairs1011100900 General Worksat the Office of the DeputyPresident
7

PART E. SUMMARY OF PROGRAMME OUTPUTS AND PERFORMANCE INDICATORS FOR 2016/2017 - 2018/2019
1011 The Presidency
0734030 SP 6.3 Effeciency Monitoring and Inspectorate ServicesSub Programme:
Key Output (KO)Targets
2018/2019Targets
2017/2018Key Performance Indicators
(KPIs)Targets
2016/2017Delivery Unit
444No. of quarterly reports oninspection of State Corporationsprepared
Accountability and transparency inState Corporations
1011002800 Inspectorate ofState Corporations
444No. of advisory reports onefficiency of public institutions
Internal control systems in publicinstitutions
1011002900 EfficiencyMonitoring Unit
8
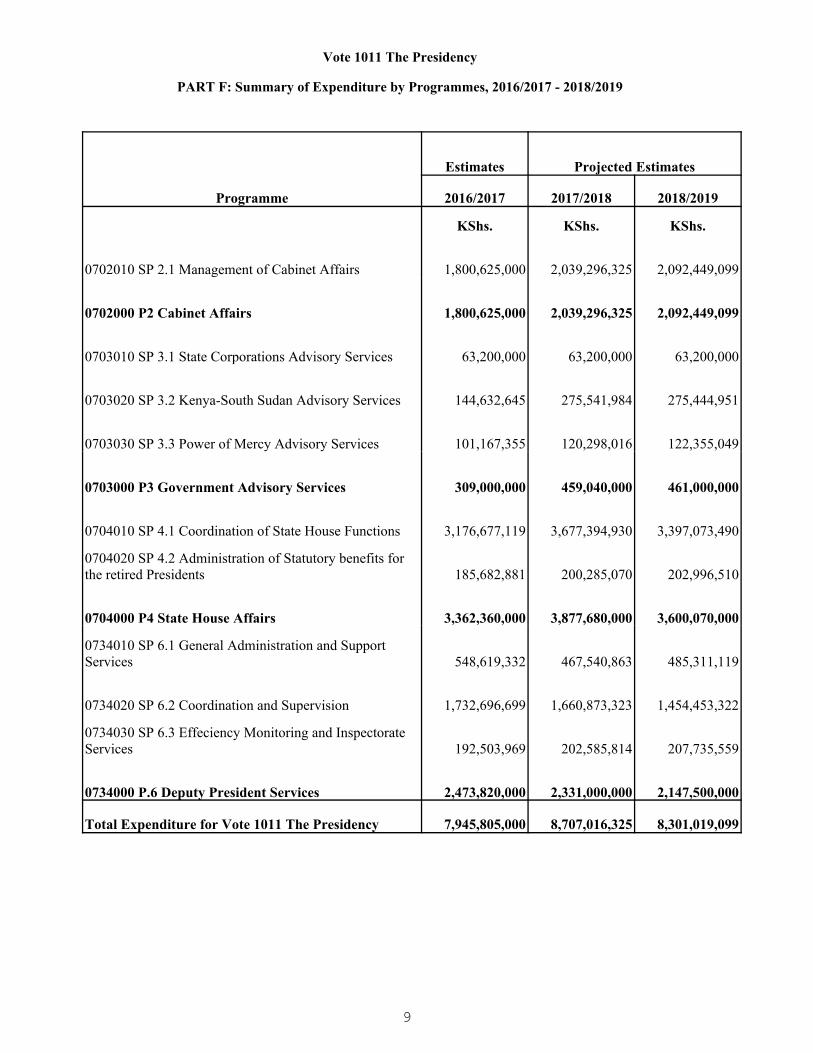
Vote 1011 The Presidency
PART F: Summary of Expenditure by Programmes, 2016/2017 - 2018/2019
Programme
Estimates Projected Estimates
2016/2017 2017/2018 2018/2019
KShs. KShs. KShs.
0702010 SP 2.1 Management of Cabinet Affairs 1,800,625,000 2,039,296,325 2,092,449,099
0702000 P2 Cabinet Affairs 1,800,625,000 2,039,296,325 2,092,449,099
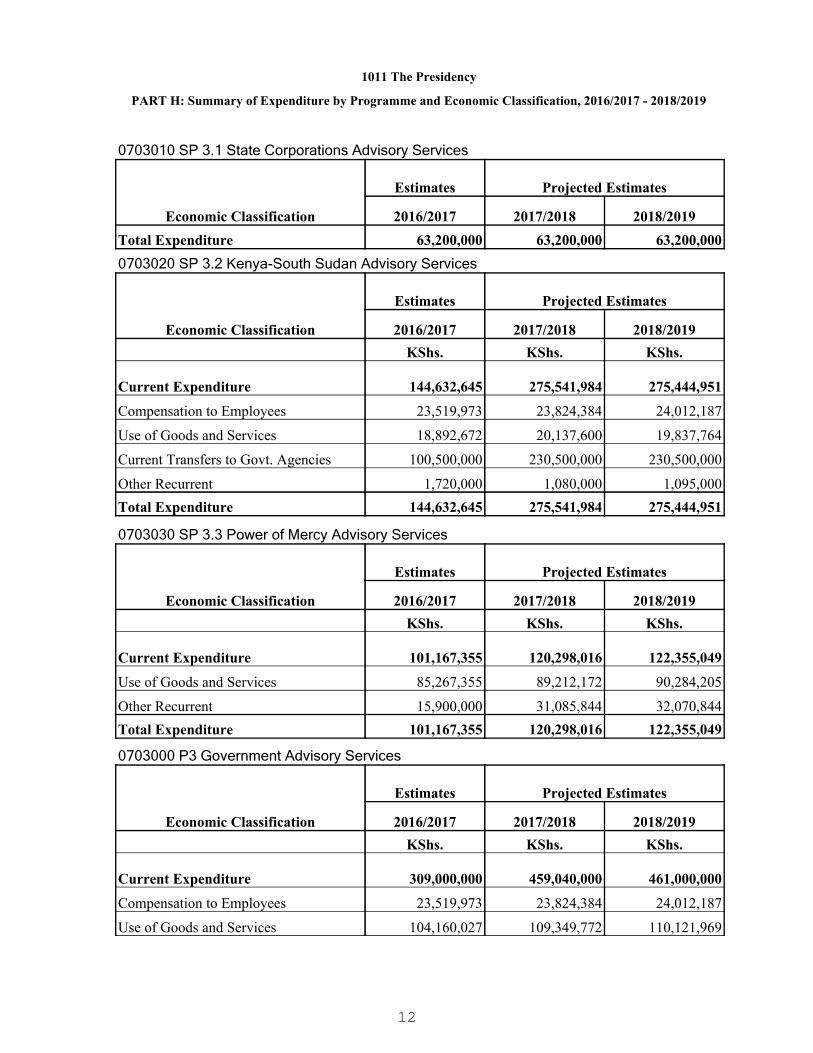
0703010 SP 3.1 State Corporations Advisory Services 63,200,000 63,200,000 63,200,000
0703020 SP 3.2 Kenya-South Sudan Advisory Services 144,632,645 275,541,984 275,444,951
0703030 SP 3.3 Power of Mercy Advisory Services 101,167,355 120,298,016 122,355,049
0703000 P3 Government Advisory Services 309,000,000 459,040,000 461,000,000
0704010 SP 4.1 Coordination of State House Functions 3,176,677,119 3,677,394,930 3,397,073,490
0704020 SP 4.2 Administration of Statutory benefits for the retired Presidents 185,682,881 200,285,070 202,996,510
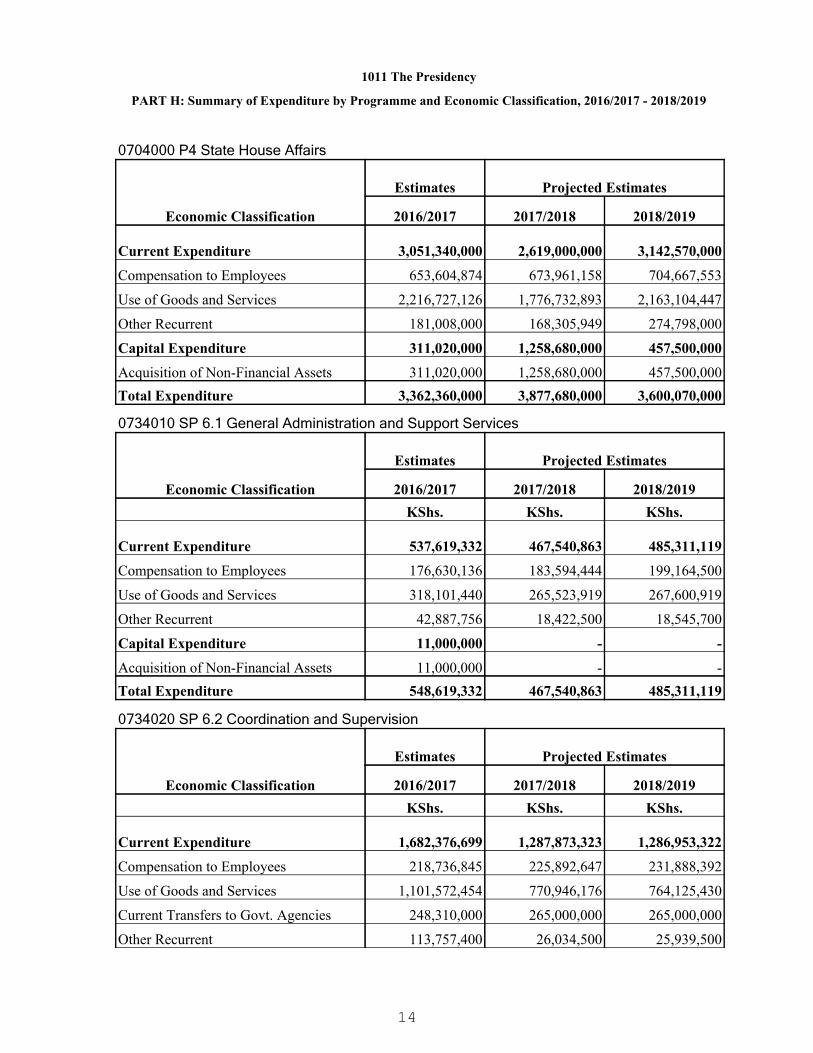
0704000 P4 State House Affairs 3,362,360,000 3,877,680,000 3,600,070,000
0734010 SP 6.1 General Administration and Support Services 548,619,332 467,540,863 485,311,119
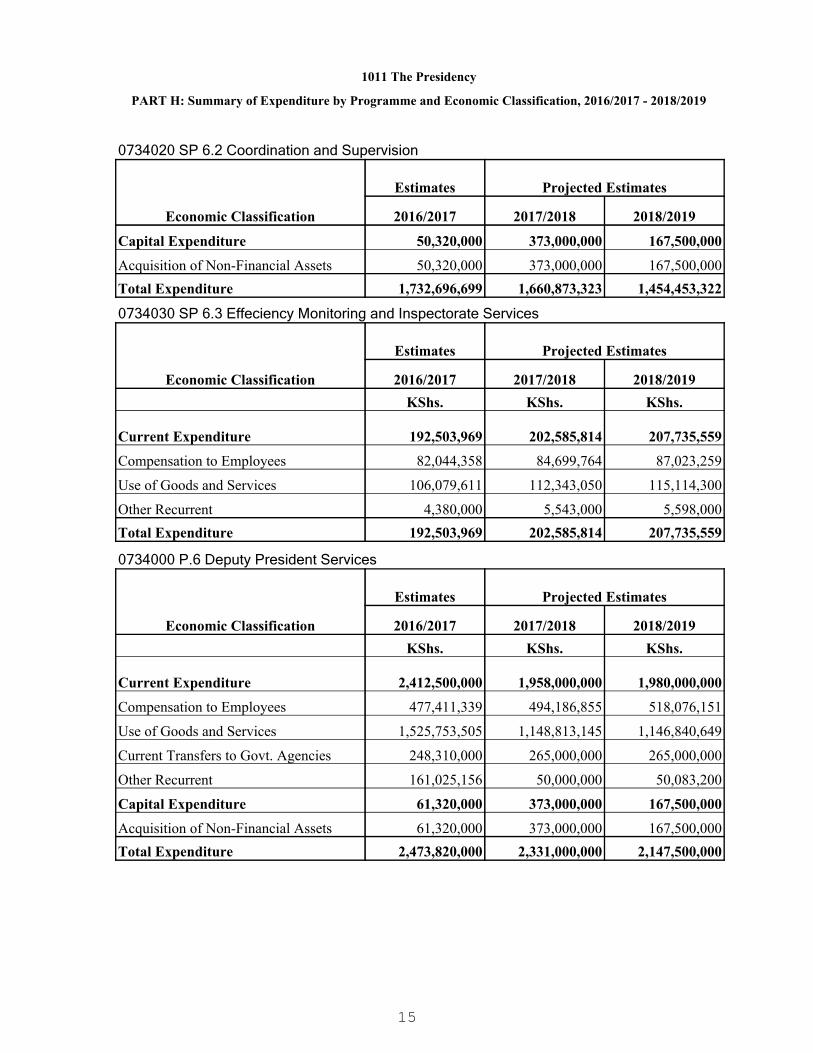
0734020 SP 6.2 Coordination and Supervision 1,732,696,699 1,660,873,323 1,454,453,322
0734030 SP 6.3 Effeciency Monitoring and Inspectorate Services 192,503,969 202,585,814 207,735,559
0734000 P.6 Deputy President Services 2,473,820,000 2,331,000,000 2,147,500,000
Total Expenditure for Vote 1011 The Presidency 7,945,805,000 8,707,016,325 8,301,019,099
9

1011 The Presidency
PART G: Summary of Expenditure by Vote and Economic Classification, 2016/2017 - 2018/2019
Economic Classification
Estimates Projected Estimates
2016/2017 2017/2018 2018/2019KShs. KShs. KShs.
Current Expenditure 7,464,465,000 6,861,016,325 7,455,019,099
Compensation to Employees 1,629,910,000 1,677,170,000 1,739,670,000
Use of Goods and Services 4,808,562,083 4,141,993,264 4,586,901,736
Current Transfers to Govt. Agencies 412,010,000 558,700,000 558,700,000
Other Recurrent 613,982,917 483,153,061 569,747,363
Capital Expenditure 481,340,000 1,846,000,000 846,000,000
Acquisition of Non-Financial Assets 381,340,000 1,646,000,000 646,000,000
Capital Grants to Govt. Agencies 100,000,000 200,000,000 200,000,000Total Expenditure 7,945,805,000 8,707,016,325 8,301,019,099
10

1011 The Presidency
PART H: Summary of Expenditure by Programme and Economic Classification, 2016/2017 - 2018/2019
0702010 SP 2.1 Management of Cabinet Affairs
Economic Classification
Estimates Projected Estimates
2016/2017 2017/2018 2018/2019KShs. KShs. KShs.
Current Expenditure 1,691,625,000 1,824,976,325 1,871,449,099
Compensation to Employees 475,373,814 485,197,603 492,914,109
Use of Goods and Services 961,921,425 1,107,097,454 1,166,834,671
Other Recurrent 254,329,761 232,681,268 211,700,319
Capital Expenditure 109,000,000 214,320,000 221,000,000
Acquisition of Non-Financial Assets 9,000,000 14,320,000 21,000,000
Capital Grants to Govt. Agencies 100,000,000 200,000,000 200,000,000Total Expenditure 1,800,625,000 2,039,296,325 2,092,449,099
0702000 P2 Cabinet Affairs
Economic Classification
Estimates Projected Estimates
2016/2017 2017/2018 2018/2019KShs. KShs. KShs.
Current Expenditure 1,691,625,000 1,824,976,325 1,871,449,099
Compensation to Employees 475,373,814 485,197,603 492,914,109
Use of Goods and Services 961,921,425 1,107,097,454 1,166,834,671
Other Recurrent 254,329,761 232,681,268 211,700,319
Capital Expenditure 109,000,000 214,320,000 221,000,000
Acquisition of Non-Financial Assets 9,000,000 14,320,000 21,000,000
Capital Grants to Govt. Agencies 100,000,000 200,000,000 200,000,000Total Expenditure 1,800,625,000 2,039,296,325 2,092,449,099
0703010 SP 3.1 State Corporations Advisory Services
Economic Classification
Estimates Projected Estimates
2016/2017 2017/2018 2018/2019KShs. KShs. KShs.
Current Expenditure 63,200,000 63,200,000 63,200,000
Current Transfers to Govt. Agencies 63,200,000 63,200,000 63,200,000
11
1011 The Presidency
PART H: Summary of Expenditure by Programme and Economic Classification, 2016/2017 - 2018/2019
0703010 SP 3.1 State Corporations Advisory Services
Economic Classification
Estimates Projected Estimates
2016/2017 2017/2018 2018/2019Total Expenditure 63,200,000 63,200,000 63,200,0000703020 SP 3.2 Kenya-South Sudan Advisory Services
Economic Classification
Estimates Projected Estimates
2016/2017 2017/2018 2018/2019KShs. KShs. KShs.
Current Expenditure 144,632,645 275,541,984 275,444,951
Compensation to Employees 23,519,973 23,824,384 24,012,187
Use of Goods and Services 18,892,672 20,137,600 19,837,764
Current Transfers to Govt. Agencies 100,500,000 230,500,000 230,500,000
Other Recurrent 1,720,000 1,080,000 1,095,000Total Expenditure 144,632,645 275,541,984 275,444,951
0703030 SP 3.3 Power of Mercy Advisory Services
Economic Classification
Estimates Projected Estimates
2016/2017 2017/2018 2018/2019KShs. KShs. KShs.
Current Expenditure 101,167,355 120,298,016 122,355,049
Use of Goods and Services 85,267,355 89,212,172 90,284,205
Other Recurrent 15,900,000 31,085,844 32,070,844Total Expenditure 101,167,355 120,298,016 122,355,049
0703000 P3 Government Advisory Services
Economic Classification
Estimates Projected Estimates
2016/2017 2017/2018 2018/2019KShs. KShs. KShs.
Current Expenditure 309,000,000 459,040,000 461,000,000
Compensation to Employees 23,519,973 23,824,384 24,012,187
Use of Goods and Services 104,160,027 109,349,772 110,121,969
12

1011 The Presidency
PART H: Summary of Expenditure by Programme and Economic Classification, 2016/2017 - 2018/2019
0703000 P3 Government Advisory Services
Economic Classification
Estimates Projected Estimates
2016/2017 2017/2018 2018/2019
Current Transfers to Govt. Agencies 163,700,000 293,700,000 293,700,000
Other Recurrent 17,620,000 32,165,844 33,165,844Total Expenditure 309,000,000 459,040,000 461,000,000
0704010 SP 4.1 Coordination of State House Functions
Economic Classification
Estimates Projected Estimates
2016/2017 2017/2018 2018/2019KShs. KShs. KShs.
Current Expenditure 2,865,657,119 2,418,714,930 2,939,573,490
Compensation to Employees 530,580,603 549,907,388 583,321,243
Use of Goods and Services 2,154,068,516 1,700,711,593 2,081,454,247
Other Recurrent 181,008,000 168,095,949 274,798,000
Capital Expenditure 311,020,000 1,258,680,000 457,500,000
Acquisition of Non-Financial Assets 311,020,000 1,258,680,000 457,500,000Total Expenditure 3,176,677,119 3,677,394,930 3,397,073,490
0704020 SP 4.2 Administration of Statutory benefits for the retired Presidents
Economic Classification
Estimates Projected Estimates
2016/2017 2017/2018 2018/2019KShs. KShs. KShs.
Current Expenditure 185,682,881 200,285,070 202,996,510
Compensation to Employees 123,024,271 124,053,770 121,346,310
Use of Goods and Services 62,658,610 76,021,300 81,650,200
Other Recurrent - 210,000 -Total Expenditure 185,682,881 200,285,070 202,996,510
0704000 P4 State House Affairs
Economic Classification
Estimates Projected Estimates
2016/2017 2017/2018 2018/2019KShs. KShs. KShs.
13
1011 The Presidency
PART H: Summary of Expenditure by Programme and Economic Classification, 2016/2017 - 2018/2019
0704000 P4 State House Affairs
Economic Classification
Estimates Projected Estimates
2016/2017 2017/2018 2018/2019
Current Expenditure 3,051,340,000 2,619,000,000 3,142,570,000
Compensation to Employees 653,604,874 673,961,158 704,667,553
Use of Goods and Services 2,216,727,126 1,776,732,893 2,163,104,447
Other Recurrent 181,008,000 168,305,949 274,798,000
Capital Expenditure 311,020,000 1,258,680,000 457,500,000
Acquisition of Non-Financial Assets 311,020,000 1,258,680,000 457,500,000Total Expenditure 3,362,360,000 3,877,680,000 3,600,070,000
0734010 SP 6.1 General Administration and Support Services
Economic Classification
Estimates Projected Estimates
2016/2017 2017/2018 2018/2019KShs. KShs. KShs.
Current Expenditure 537,619,332 467,540,863 485,311,119
Compensation to Employees 176,630,136 183,594,444 199,164,500
Use of Goods and Services 318,101,440 265,523,919 267,600,919
Other Recurrent 42,887,756 18,422,500 18,545,700
Capital Expenditure 11,000,000 - -
Acquisition of Non-Financial Assets 11,000,000 - -Total Expenditure 548,619,332 467,540,863 485,311,119
0734020 SP 6.2 Coordination and Supervision
Economic Classification
Estimates Projected Estimates
2016/2017 2017/2018 2018/2019KShs. KShs. KShs.
Current Expenditure 1,682,376,699 1,287,873,323 1,286,953,322
Compensation to Employees 218,736,845 225,892,647 231,888,392
Use of Goods and Services 1,101,572,454 770,946,176 764,125,430
Current Transfers to Govt. Agencies 248,310,000 265,000,000 265,000,000
Other Recurrent 113,757,400 26,034,500 25,939,500
14
1011 The Presidency
PART H: Summary of Expenditure by Programme and Economic Classification, 2016/2017 - 2018/2019
0734020 SP 6.2 Coordination and Supervision
Economic Classification
Estimates Projected Estimates
2016/2017 2017/2018 2018/2019
Capital Expenditure 50,320,000 373,000,000 167,500,000
Acquisition of Non-Financial Assets 50,320,000 373,000,000 167,500,000Total Expenditure 1,732,696,699 1,660,873,323 1,454,453,322
0734030 SP 6.3 Effeciency Monitoring and Inspectorate Services
Economic Classification
Estimates Projected Estimates
2016/2017 2017/2018 2018/2019KShs. KShs. KShs.
Current Expenditure 192,503,969 202,585,814 207,735,559
Compensation to Employees 82,044,358 84,699,764 87,023,259
Use of Goods and Services 106,079,611 112,343,050 115,114,300
Other Recurrent 4,380,000 5,543,000 5,598,000Total Expenditure 192,503,969 202,585,814 207,735,559
0734000 P.6 Deputy President Services
Economic Classification
Estimates Projected Estimates
2016/2017 2017/2018 2018/2019KShs. KShs. KShs.
Current Expenditure 2,412,500,000 1,958,000,000 1,980,000,000
Compensation to Employees 477,411,339 494,186,855 518,076,151
Use of Goods and Services 1,525,753,505 1,148,813,145 1,146,840,649
Current Transfers to Govt. Agencies 248,310,000 265,000,000 265,000,000
Other Recurrent 161,025,156 50,000,000 50,083,200
Capital Expenditure 61,320,000 373,000,000 167,500,000
Acquisition of Non-Financial Assets 61,320,000 373,000,000 167,500,000Total Expenditure 2,473,820,000 2,331,000,000 2,147,500,000
15
1021 State Department for Interior
To ensure a secure, cohesive and crime free society.
To provide security and safety to people and property, maintain a credible national populationregister, enhance nationhood, facilitate administration of justice and coordinate nationalgovernment functions for socio-economic and political development in Kenya.
PART A. Vision
PART B. Mission
PART C. Performance Overview and Background for Programme(s) Funding
The State Department for Interior is charged with National Government Coordination; InternalState Functions; National Cohesion and Reconciliation Management; Government Printer;Disasters and Emergency Response Coordination; National Disaster and Operation Centre;Policy on training of security Personnel; Citizenship and Immigration policy and service;Border Control Point Management; Registration of Persons Services; Registration of Birthsand Deaths Services; Management of Refugee Policy; Internal Security Affairs; Drug andNarcotic Substance Control; Security of Airstrips and Roads; Small Arms and Light WeaponsManagement; Criminal Investigations and Civilian Oversight over police.
Major achievements during the period under review included: reduced crime prevalence by10%; improved police-population ratio to 1: 530 by recruiting 20,000 police; increased policepatrols through acquisition/leasing of over 3,024 assorted police vehicles, acquisition of 1 andoverhaul of 3 helicopters; improved police response time through acquisition of assortedsecurity equipment, establishment and operationalization of Nyumba Kumi” initiative, aCommand and Control Centre (CCC), 24 hour call center with operational emergencynumbers 999 & 112 and construction of a forensic laboratory which is at 74% completion rate;improved police welfare through provision of Group Life Insurance covering 83,165 policeofficers, construction of 308 and leasing of 310 housing units; improved coordination ofNational Government functions and conflict resolution through acquisition of 320 vehicles and3,000 motorbikes for County Commissioners (CCs), Deputy County Commissioners (DCCs),Assistant County Commissioners (ACCs) & Chiefs, construction of 28 Sub-Countyheadquarters and recruitment of 700 ACCs; enhanced Government Press printing capacity toa level of 40 million secure government documents.
Under Population Management Services, registration coverage for births and deathsimproved to 62.2% and 45.8% respectively; processed and issued 1,384,334 ID cards,165,518 passports, 135,000 temporary passes, 12,776 visas and 20,133 work permits;relocated 2,501 and registered 55,040 refugees; improved the ease of doing business bylinking 49 institutions to the Integrated Population Registration System (IPRS) includingKenya Revenue Authority (KRA), Higher Education Loans Board (HELB), National HospitalInsurance Fund (NHIF), major banks and other financial institutions.
The total allocation for the State Department progressively increased by 6.94% from Kshs.78.9 billion in the FY2012/13 to Kshs 84.4 billion in the FY2013/14 and by 10% to Kshs.100.2 billion in the FY2014/15. The rise in allocation was necessitated by the policemodernization programme, police comprehensive life insurance, recruitment of immigrationofficers, civil registration and registrar of persons. However the actual expenditure level waslow at 84.9% in the FY2012/13, 97.41% in the FY2013/14 and 88.58% in the FY2014/15mainly due to non release of budgeted funds.
16

1021 State Department for Interior
PART D. Programme Objectives
Constraints and challenges during the period under review included: youth and vulnerablegroups radicalization; heightened terrorism threats and attacks in the country; re-emergenceof criminal gangs in major towns; inter-clan conflicts and political intolerance; high prevalenceof illicit brews and drugs in the country; frequent systems breakdown in the Department ofImmigration due to work overloads; inadequate capacity to match increased demand forprinting of security documents for both levels of Government by the Government Press;limited training facilities for government and security personnel at Kenya School of Adventure& Leadership (KESAL); proliferation of illicit Small Arms and Light Weapons (SALW); porousborders; continuous influx of refugees; manual registration processes resulting in delays andinefficieny in service delivery.
To address these challenges, the State Department will employ the following strategies:engage key stakeholders in the fight against radicalization of youth and vulnerable groups;enhance intelligence gathering, enhance patrols and crackdowns; strengthen reportingmechanisms as per Presidential directive on alcohol and illicit brews; prioritize and realignexpenditures for upgrade of requisite systems; initiate expansion of training facilities atKESAL; continue crackdown and public sensitization on illegal SALW; undertakesecuritization of borders and enhance border patrols; repatriate refugees; and enhanceautomation of registration processes.
Major services/outputs for the MTEF period 2016/17-2018/19 will include; 10% reduction incrime prevalence through acquisition of assorted security equipment; improve Police kitting;recruit additional Police (10,000 annually); enhance ground and air mobility by acquiring1,000 more vehicles and 4 helicopters; improve Police welfare through acquisition of acomprehensive medical cover and Police housing units; enhance coordination of NationalGovernment functions and service delivery through acquisition of 3,200 additional vehiclesfor CCs, DCCs & ACCs, additional 5,000 motorcycles for Chiefs & Assistant Chiefs andrecruitment of additional 700 ACCs; establishment of National Government AdministrationAcademy and enhancing the National Cohesion and Integration Commission (NCIC) capacityto deal with emerging intolerance.
The State Department will enhance the printing capacity of the Government Press throughpurchase of specialized printing equipment, roll out comprehensive population registration;issue 2.5 million IDs through scheduled mobile registration; birth & death registrationcoverage will be increased to 88%, issue 2,078,500 birth and 107,322 death certficates; IPRSwill be upgraded and connected to 17 new secondary agencies; issue 300,000 passports,14,500 visas and 21,000 work permits and about 100,000 refugees repatriated legally.
ObjectiveProgramme
0601000 P.1 PolicingServices To improve security in the country.
17

1021 State Department for Interior
ObjectiveProgramme
0602000 P.2 Planning,Policy Coordination andSupport Service
To ensure effective and efficient coordination of the NationalGovernment services.
0603000 P3 GovernmentPrinting Services
To enhance printing capacity, supply and security ofGovernment documents.
0605000 P.4 PopulationManagement Services
To provide comprehensive population database and securetravel documents to Kenyan citizens and foreigners.
18

PART E. SUMMARY OF PROGRAMME OUTPUTS AND PERFORMANCE INDICATORS FOR 2016/2017 - 2018/2019
1021 State Department for Interior
0601000 P.1 Policing Services
A secure Nation.
Programme:
Outcome:
0601010 SP1.1 Kenya Police ServicesSub Programme:
Key Output (KO)Targets
2018/2019Targets
2017/2018Key Performance Indicators
(KPIs)Targets
2016/2017Delivery Unit
909090No. of new community policingcentres created at national andcounty levels.
Community policing1021001700 CommunityPolicing
Crime reductionfrom 130 to 120cases
Crime reductionfrom 140 to 130cases
Crime reductionfrom 150 to 140cases
Crime index per population of100,000
Security sector policy1021001800 Office of theDeputy Inspector General -Kenya Police Service
Crime reductionfrom 140 to 130cases
Crime reductionfrom 150 to 140cases
Crime reductionfrom 160 to 150cases
Crime index per population of100,000
Policing services1021001900 County PoliceServices
4,0004,0004,000No. of police officers recruitedand trained
Police graduates1021002000 Kenya PoliceCollege Kiganjo
Crime reductionfrom 140 to 130cases
Crime reductionfrom 150 to 140cases
Crime reductionfrom 160 to 150cases
Crime index per population of100,000
Policing services1021002100 Divisional PoliceServices
80%75%60%% of traffic cases prosecutedPolicing services1021002200 Traffic Section
100%100%100%% of security coverage foridentified VIPs
Protected VIPs1021002300 PresidentialEscort
Crime reductionfrom 140 to 130cases
Crime reductionfrom 150 to 140cases
Crime reductionfrom 160 to 150cases
Crime index per population of100,000
Policing services1021002400 Kenya PoliceNairobi Region
19

PART E. SUMMARY OF PROGRAMME OUTPUTS AND PERFORMANCE INDICATORS FOR 2016/2017 - 2018/2019
1021 State Department for Interior
111No. of additional Police Dogs foreach police stations
Policing services1021002500 Police Dog Unit
100%100%100%% reduction in reported cattletheft and related crimes
Policing services1021002600 Anti-stock TheftUnit
100%100%100%% security coverage in allrailways
Policing services1021002700 Railway Police
100%100%100%% level of police communicationservices offered
Police communication services1021002800Telecommunication Branch
350035003500No of police operational vehiclesPolicing services1021002900 Motor TransportBranch
444No. of aircrafts acquired andmaintained
Policing services1021003000 Police Airwing
400004000040000No. of police officers equippedand kitted
Police officers equipped and kitted1021003100 Kenya PoliceService Quartermaster
5230 acquired
26800 maintained
5230 acquired
26800 maintained
5230 acquired
26800 maintained
No. of state owned firearmsprocured and maintained
Policing supplies1021003200 Kenya PoliceService Armourer
700700600No. of civilian firearms licensedCivilian firearms licensed1021003300 Civilian FirearmsLicencing Bureau
100%100%100%% crime reduction at all nationalairports
Policing services1021003400 Airport PoliceUnit
100%100%100%% of goverment vehiclesinspected
Policing services1021003600 GovernmentVehicle Check Unit
100%1005100%% coverage of tourist sites andresidences
Policing services1021003700 Kenya PoliceTourist Protection Unit
20
PART E. SUMMARY OF PROGRAMME OUTPUTS AND PERFORMANCE INDICATORS FOR 2016/2017 - 2018/2019
1021 State Department for Interior
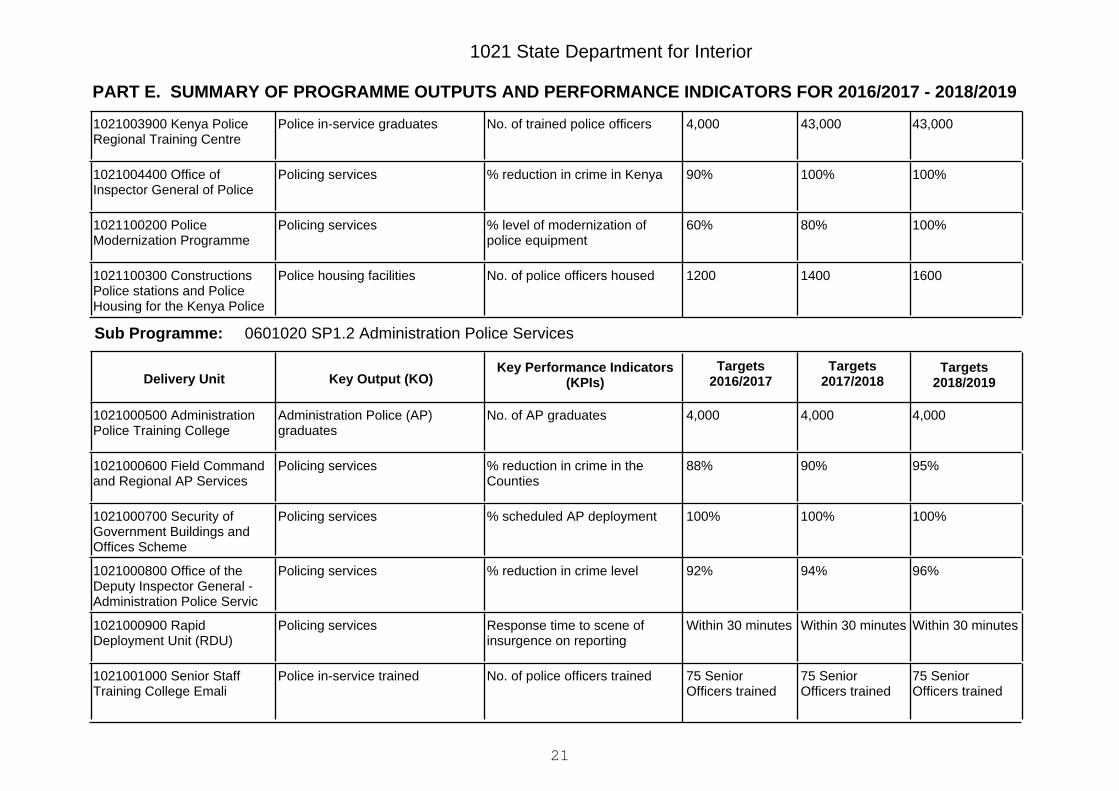
43,00043,0004,000No. of trained police officersPolice in-service graduates1021003900 Kenya PoliceRegional Training Centre
100%100%90%% reduction in crime in KenyaPolicing services1021004400 Office ofInspector General of Police
100%80%60%% level of modernization ofpolice equipment
Policing services1021100200 PoliceModernization Programme
160014001200No. of police officers housedPolice housing facilities1021100300 ConstructionsPolice stations and PoliceHousing for the Kenya Police
0601020 SP1.2 Administration Police ServicesSub Programme:
Key Output (KO)Targets
2018/2019Targets
2017/2018Key Performance Indicators
(KPIs)Targets
2016/2017Delivery Unit
4,0004,0004,000No. of AP graduatesAdministration Police (AP)graduates
1021000500 AdministrationPolice Training College
95%90%88%% reduction in crime in theCounties
Policing services1021000600 Field Commandand Regional AP Services
100%100%100%% scheduled AP deploymentPolicing services1021000700 Security ofGovernment Buildings andOffices Scheme
96%94%92%% reduction in crime levelPolicing services1021000800 Office of theDeputy Inspector General -Administration Police Servic
Within 30 minutesWithin 30 minutesWithin 30 minutesResponse time to scene ofinsurgence on reporting
Policing services1021000900 RapidDeployment Unit (RDU)
75 SeniorOfficers trained
75 SeniorOfficers trained
75 SeniorOfficers trained
No. of police officers trainedPolice in-service trained1021001000 Senior StaffTraining College Emali
21

PART E. SUMMARY OF PROGRAMME OUTPUTS AND PERFORMANCE INDICATORS FOR 2016/2017 - 2018/2019
1021 State Department for Interior
1,000 middlelevel officerstrained
1,000 middlelevel officerstrained
1,000 middlelevel officerstrained
86%86%84%% reduction in rural bordercrimes
Policing services1021001100 AP Rural BorderPatrol Unit
100%100%90%% reduction in crime in theCounties
Policing services1021001200 Sub County APServices
4048-No. of AP houses and campsconstructed
Police officers housing facilities1021100400 Construction ofPolice stations & Housing forAdministration Police
0601030 SP1.3 Criminal Investigation ServicesSub Programme:
Key Output (KO)Targets
2018/2019Targets
2017/2018Key Performance Indicators
(KPIs)Targets
2016/2017Delivery Unit
100%
100
100%
100
80%
100
% of requested forensic reportsproduced
% completion refurbishment ofDCI offices
Forensic reports
Police offices and housingfacilities
1021001400 DCIHeadquarters AdministrationServices
100%100%100%% of reported/detected criminalcases investigated
Policing services1021001500 DCI FieldServices
650000600000550000No. of police clearancecertificate issued.
Certificates of Good Conduct1021001600 DCI SpecializedUnits
100%100%100%% resolution of cross bordersecurity cases
Police services1021003800 DCI InterpolServices
22

PART E. SUMMARY OF PROGRAMME OUTPUTS AND PERFORMANCE INDICATORS FOR 2016/2017 - 2018/2019
1021 State Department for Interior
100%100%90%% completion rate of theforensic lab
Police offices and housingfacilities
1021100600 Construction &Modernization of NationalForensic Facilities
200015001250No. of residential housing unitsacquired
Police services1021100700 ConstructionsPolice stations and PoliceHousing for the DCI
0601040 SP1.4 General-Paramilitary ServiceSub Programme:
Key Output (KO)Targets
2018/2019Targets
2017/2018Key Performance Indicators
(KPIs)Targets
2016/2017Delivery Unit
2,0002,0002,000No. of trained police officersParamilitary graduates1021004000 GSU TrainingCollege Embakasi
100%100%100%% of crime prevention anddeterrence
Policing services1021004100 GSUHeadquarters AdministrativeServices
1616-No. of GSU camps and housesconstructed
Police offices and housingfacilities
1021100800 Construction ofPolice stations, Housing &other facilities for GSU
--1No. of helipads constructedHelipad Constructed1021103500 Construction of 2No. Helipads at GSU RecceCompany Ruiru
0602000 P.2 Planning, Policy Coordination and Support Service
Effective coordination of National Government functions.
Programme:
Outcome:
23

PART E. SUMMARY OF PROGRAMME OUTPUTS AND PERFORMANCE INDICATORS FOR 2016/2017 - 2018/2019
1021 State Department for Interior
0602010 SP2.1 Planning, Policy Coordination and Support ServiceSub Programme:
Key Output (KO)Targets
2018/2019Targets
2017/2018Key Performance Indicators
(KPIs)Targets
2016/2017Delivery Unit
500
500
250
20
15
500
500
250
20
15
500
500
250
20
15
Milestones achieved
No. of vehicles acquired forDCC’s & ACC’s
No. of motor cycles acquired forChiefs & Assistant Chiefs
Security roads constructed inKMs
No. of security airstripsrehabilitated
National GovernmentCoordination services
1021000100 OOPHeadquarters
Many securityoperationsconducted
Many securityoperationsconducted
Many securityoperationsconducted
No. of security operationsconducted
Regional security operations1021000300 RegionalAdministration
65%60%55%% level of implementation ofNyumba Kumi initiatives
Nyumba kumi initiatives1021000400 CountyAdministration
100%70%40%% completion of construction ofthe Academy
National Administration Academy1021004200 The KenyaSchool of Leadership
Within 30 minutesWithin 30 minutesWithin 30 minutesResponse timeTimely response to disasters1021006900 National DisasterOperations
100,00090,00070,000No. of citizens sensitized onNational cohesion and Nationalvalues
A cohesive country1021100100 DeepeningFoundations ForPeacebuilding And
24
PART E. SUMMARY OF PROGRAMME OUTPUTS AND PERFORMANCE INDICATORS FOR 2016/2017 - 2018/2019
1021 State Department for Interior
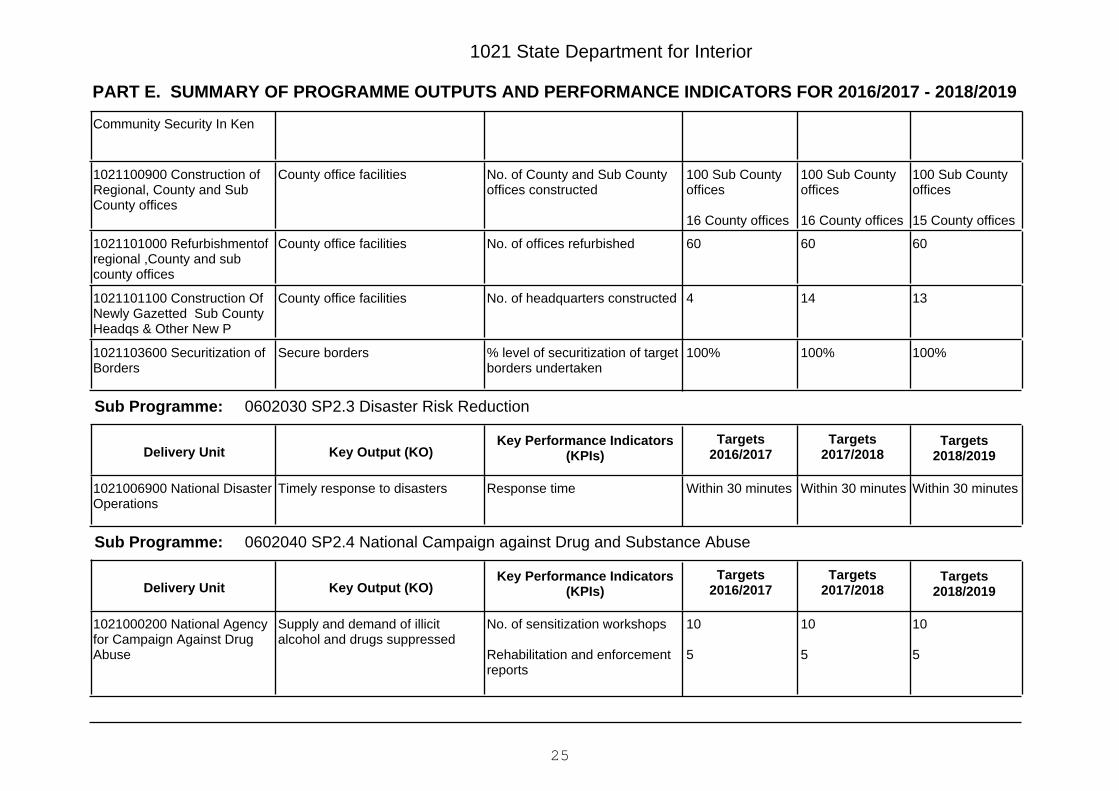
Community Security In Ken
100 Sub Countyoffices
15 County offices
100 Sub Countyoffices
16 County offices
100 Sub Countyoffices
16 County offices
No. of County and Sub Countyoffices constructed
County office facilities1021100900 Construction ofRegional, County and SubCounty offices
606060No. of offices refurbishedCounty office facilities1021101000 Refurbishmentofregional ,County and subcounty offices
13144No. of headquarters constructedCounty office facilities1021101100 Construction OfNewly Gazetted Sub CountyHeadqs & Other New P
100%100%100%% level of securitization of targetborders undertaken
Secure borders1021103600 Securitization ofBorders
0602030 SP2.3 Disaster Risk ReductionSub Programme:
Key Output (KO)Targets
2018/2019Targets
2017/2018Key Performance Indicators
(KPIs)Targets
2016/2017Delivery Unit
Within 30 minutesWithin 30 minutesWithin 30 minutesResponse timeTimely response to disasters1021006900 National DisasterOperations
0602040 SP2.4 National Campaign against Drug and Substance AbuseSub Programme:
Key Output (KO)Targets
2018/2019Targets
2017/2018Key Performance Indicators
(KPIs)Targets
2016/2017Delivery Unit
10
5
10
5
10
5
No. of sensitization workshops
Rehabilitation and enforcementreports
Supply and demand of illicitalcohol and drugs suppressed
1021000200 National Agencyfor Campaign Against DrugAbuse
25

PART E. SUMMARY OF PROGRAMME OUTPUTS AND PERFORMANCE INDICATORS FOR 2016/2017 - 2018/2019
1021 State Department for Interior
0602050 SP2.5 Peace Building, National Cohesion and ValuesSub Programme:
Key Output (KO)Targets
2018/2019Targets
2017/2018Key Performance Indicators
(KPIs)Targets
2016/2017Delivery Unit
45,000
47
County Peacestructures fullyoperational
40,300
47
Nationalinfrastructureinstitutionalized
39,400
25
Legal frameworkenacted
No. of sensitization workshops
No. of Counties with CountyPeaceforums/Early warning hubs
Legal framework on NationalPeace Building and ConflictManagement Policy in place
Peaceful co-existence1021006600 NationalCohesion
100,00090,00070,000No. of citizens sensitized onNational cohesion and Nationalvalues
A cohesive country1021100100 DeepeningFoundations ForPeacebuilding AndCommunity Security In Ken
0603000 P3 Government Printing Services
Enhanced government printing services.
Programme:
Outcome:
0603010 SP3.1 Government Printing ServicesSub Programme:
Key Output (KO)Targets
2018/2019Targets
2017/2018Key Performance Indicators
(KPIs)Targets
2016/2017Delivery Unit
60 million55 million50 millionNo. of secure governmentdocuments printed
Government Printer services1021001300 Office of theGovernment Printer
26
PART E. SUMMARY OF PROGRAMME OUTPUTS AND PERFORMANCE INDICATORS FOR 2016/2017 - 2018/2019
1021 State Department for Interior
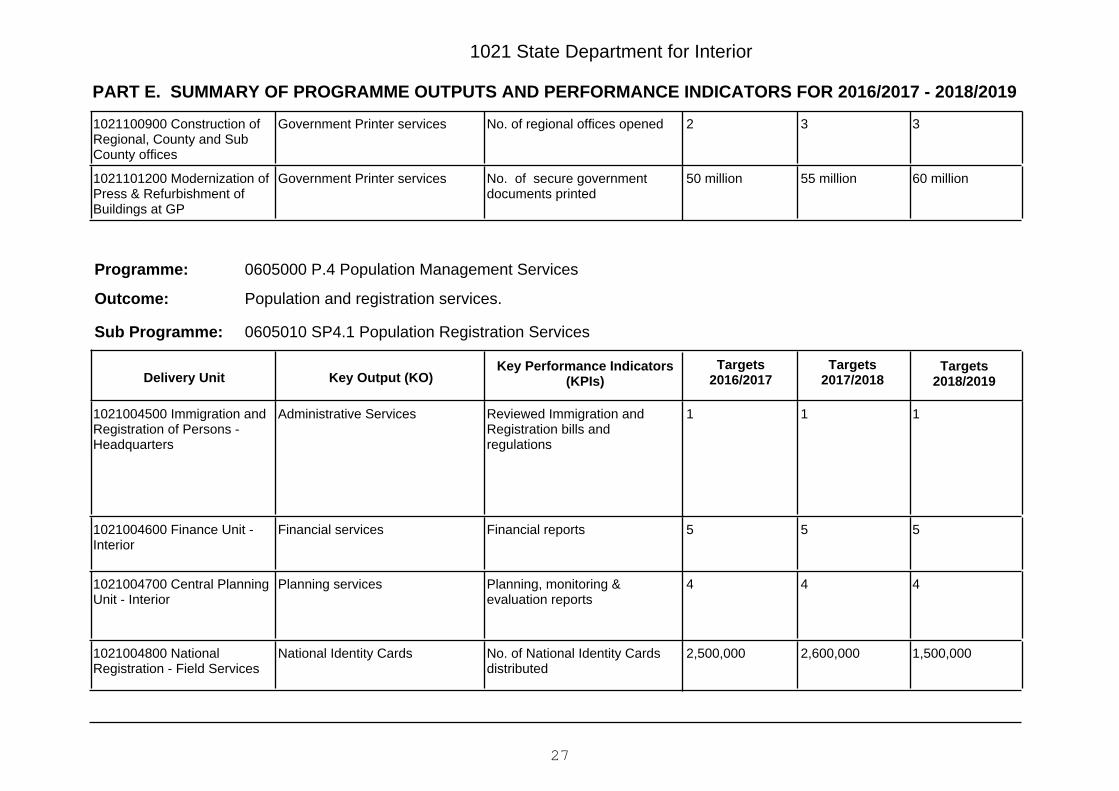
332No. of regional offices openedGovernment Printer services1021100900 Construction ofRegional, County and SubCounty offices
60 million55 million50 millionNo. of secure governmentdocuments printed
Government Printer services1021101200 Modernization ofPress & Refurbishment ofBuildings at GP
0605000 P.4 Population Management Services
Population and registration services.
Programme:
Outcome:
0605010 SP4.1 Population Registration ServicesSub Programme:
Key Output (KO)Targets
2018/2019Targets
2017/2018Key Performance Indicators
(KPIs)Targets
2016/2017Delivery Unit
111Reviewed Immigration andRegistration bills andregulations
Administrative Services1021004500 Immigration andRegistration of Persons -Headquarters
555Financial reportsFinancial services1021004600 Finance Unit -Interior
444Planning, monitoring &evaluation reports
Planning services1021004700 Central PlanningUnit - Interior
1,500,0002,600,0002,500,000No. of National Identity Cardsdistributed
National Identity Cards1021004800 NationalRegistration - Field Services
27
PART E. SUMMARY OF PROGRAMME OUTPUTS AND PERFORMANCE INDICATORS FOR 2016/2017 - 2018/2019
1021 State Department for Interior
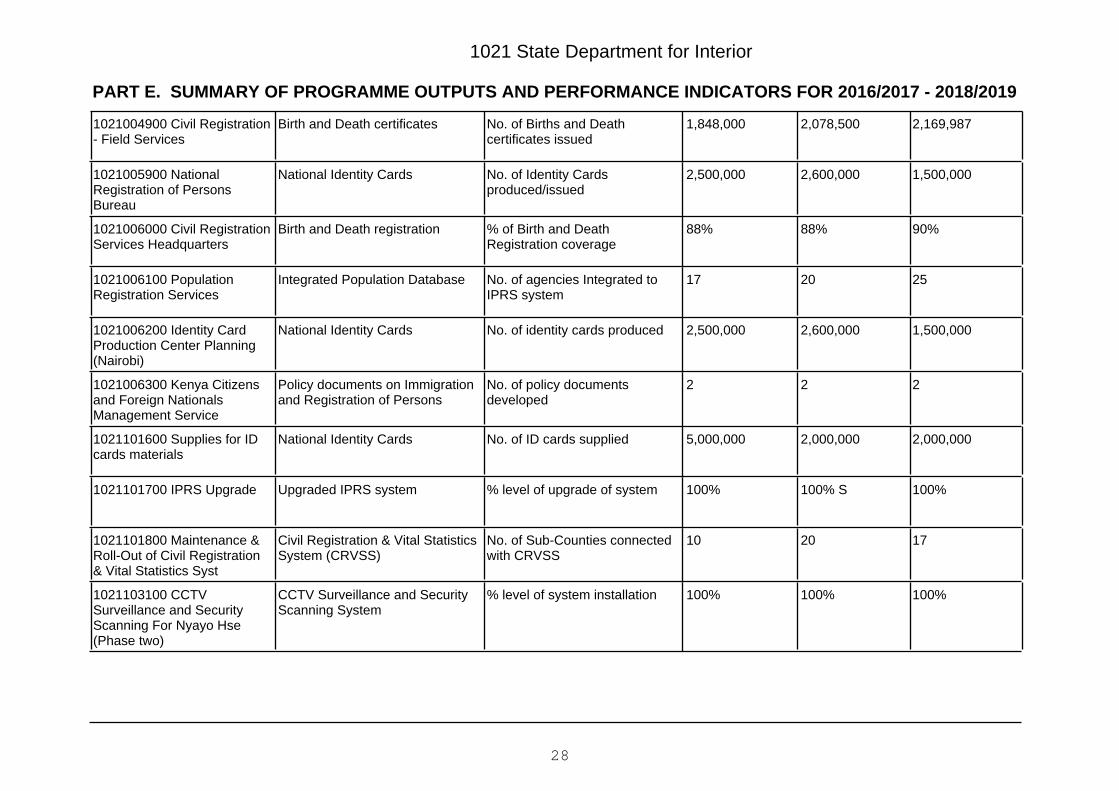
2,169,9872,078,5001,848,000No. of Births and Deathcertificates issued
Birth and Death certificates1021004900 Civil Registration- Field Services
1,500,0002,600,0002,500,000No. of Identity Cardsproduced/issued
National Identity Cards1021005900 NationalRegistration of PersonsBureau
90%88%88%% of Birth and DeathRegistration coverage
Birth and Death registration1021006000 Civil RegistrationServices Headquarters
252017No. of agencies Integrated toIPRS system
Integrated Population Database1021006100 PopulationRegistration Services
1,500,0002,600,0002,500,000No. of identity cards producedNational Identity Cards1021006200 Identity CardProduction Center Planning(Nairobi)
222No. of policy documentsdeveloped
Policy documents on Immigrationand Registration of Persons
1021006300 Kenya Citizensand Foreign NationalsManagement Service
2,000,0002,000,0005,000,000No. of ID cards suppliedNational Identity Cards1021101600 Supplies for IDcards materials
100%100% S100%% level of upgrade of systemUpgraded IPRS system1021101700 IPRS Upgrade
172010No. of Sub-Counties connectedwith CRVSS
Civil Registration & Vital StatisticsSystem (CRVSS)
1021101800 Maintenance &Roll-Out of Civil Registration& Vital Statistics Syst
100%100%100%% level of system installationCCTV Surveillance and SecurityScanning System
1021103100 CCTVSurveillance and SecurityScanning For Nyayo Hse(Phase two)
28
PART E. SUMMARY OF PROGRAMME OUTPUTS AND PERFORMANCE INDICATORS FOR 2016/2017 - 2018/2019
1021 State Department for Interior
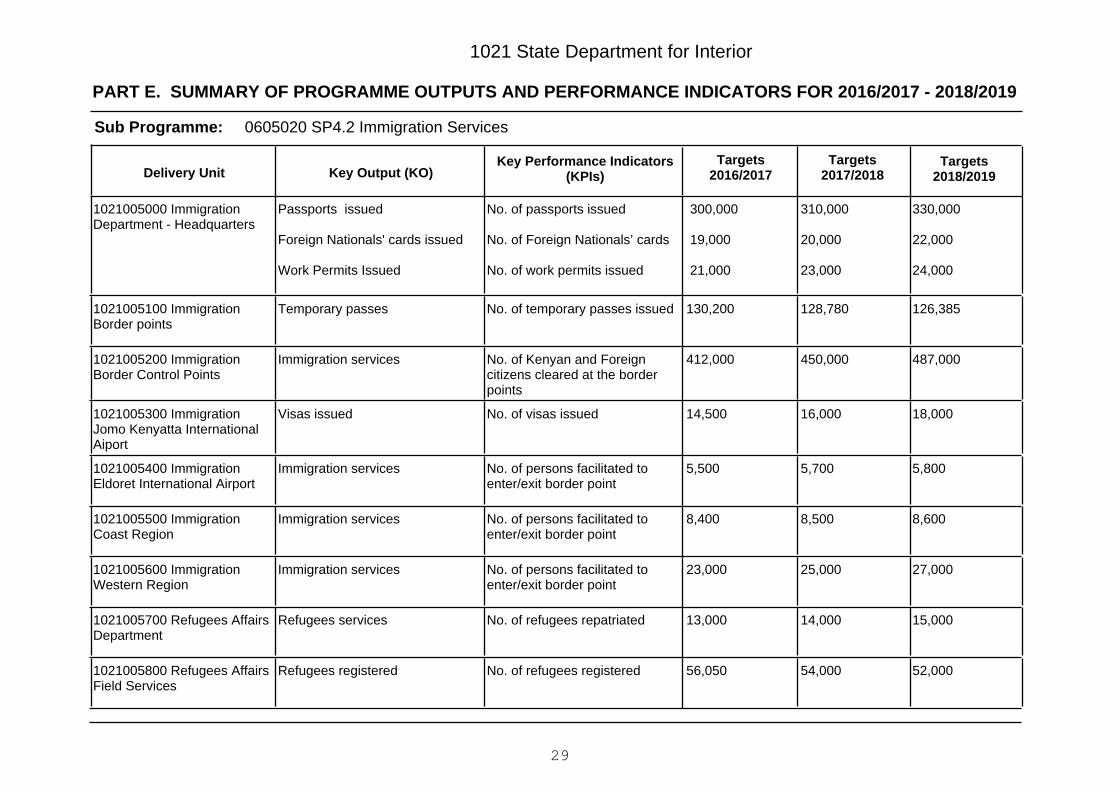
0605020 SP4.2 Immigration ServicesSub Programme:
Key Output (KO)Targets
2018/2019Targets
2017/2018Key Performance Indicators
(KPIs)Targets
2016/2017Delivery Unit
330,000
22,000
24,000
310,000
20,000
23,000
300,000
19,000
21,000
No. of passports issued
No. of Foreign Nationals’ cards
No. of work permits issued
Passports issued
Foreign Nationals' cards issued
Work Permits Issued
1021005000 ImmigrationDepartment - Headquarters
126,385128,780130,200No. of temporary passes issuedTemporary passes1021005100 ImmigrationBorder points
487,000450,000412,000No. of Kenyan and Foreigncitizens cleared at the borderpoints
Immigration services1021005200 ImmigrationBorder Control Points
18,00016,00014,500No. of visas issuedVisas issued1021005300 ImmigrationJomo Kenyatta InternationalAiport
5,8005,7005,500No. of persons facilitated toenter/exit border point
Immigration services1021005400 ImmigrationEldoret International Airport
8,6008,5008,400No. of persons facilitated toenter/exit border point
Immigration services1021005500 ImmigrationCoast Region
27,00025,00023,000No. of persons facilitated toenter/exit border point
Immigration services1021005600 ImmigrationWestern Region
15,00014,00013,000No. of refugees repatriatedRefugees services1021005700 Refugees AffairsDepartment
52,00054,00056,050No. of refugees registeredRefugees registered1021005800 Refugees AffairsField Services
29

PART E. SUMMARY OF PROGRAMME OUTPUTS AND PERFORMANCE INDICATORS FOR 2016/2017 - 2018/2019
1021 State Department for Interior
100% 100%100%% reduction in cases of lost filesFile movement and trackingsystem
1021102200 Harmonization offile movement and trackingsystems
555No. of foreign missions with e-passport System
e-Passports system1021102300 Cascading of thee-Passport System to ForeignMissions
100% 100%100%% level of installation of AFISmodule
AFIS module1021102400 Installation of anAFIS module in the FNMSystem
-22No. of border points constructedand functional
Border points constructed1021102500 Construction ofLokiriama and Suam border
100% 100%100%% level of upgrade of serverImmigration services1021102600 Upgrade ofServer room
100%100%100%% level of maintenance ofsystem
Immigration services1021102700 Maintenance ofpassport system (bothHardware, software andlicenses
250,000250,000250,000No. of visa stickers purchasedVisa stickers purchased1021102800 Purchase of VisaStickers
200,000200,000200,000No. of e-passport bookspurchased
e-Passports books purchased1021103300 Purchase of e-Passport books
30
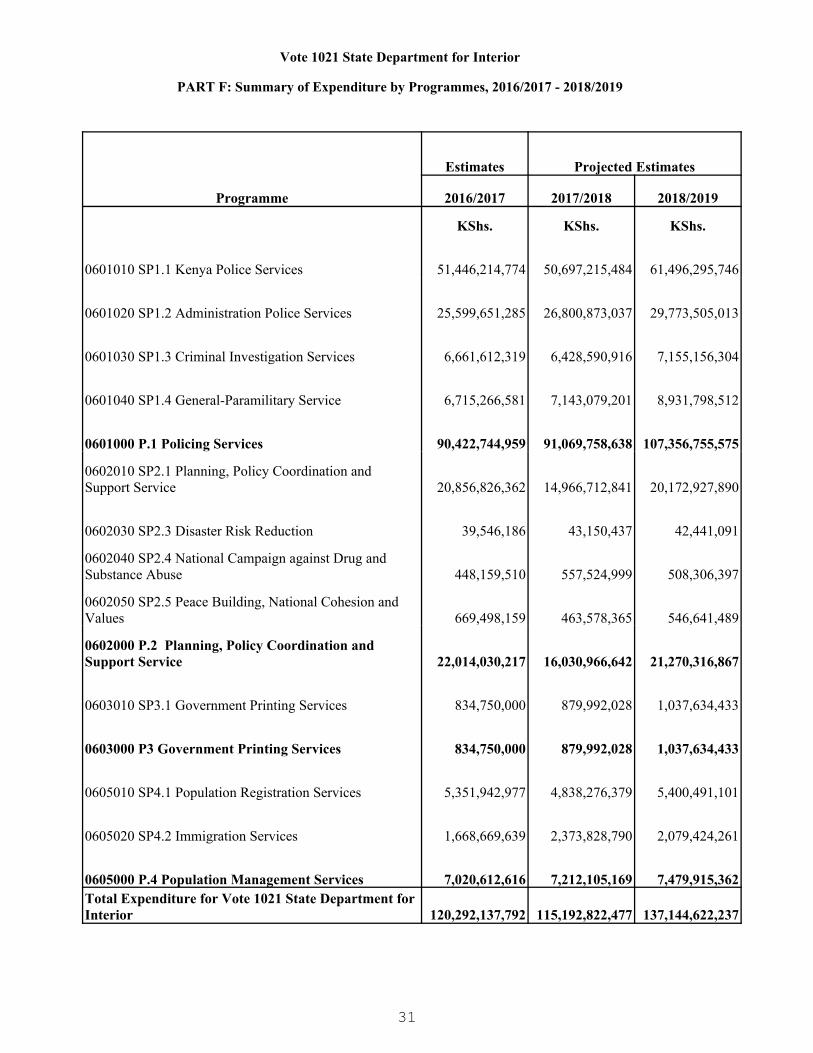
Vote 1021 State Department for Interior
PART F: Summary of Expenditure by Programmes, 2016/2017 - 2018/2019
Programme
Estimates Projected Estimates
2016/2017 2017/2018 2018/2019
KShs. KShs. KShs.
0601010 SP1.1 Kenya Police Services 51,446,214,774 50,697,215,484 61,496,295,746
0601020 SP1.2 Administration Police Services 25,599,651,285 26,800,873,037 29,773,505,013
0601030 SP1.3 Criminal Investigation Services 6,661,612,319 6,428,590,916 7,155,156,304
0601040 SP1.4 General-Paramilitary Service 6,715,266,581 7,143,079,201 8,931,798,512
0601000 P.1 Policing Services 90,422,744,959 91,069,758,638 107,356,755,575
0602010 SP2.1 Planning, Policy Coordination and Support Service 20,856,826,362 14,966,712,841 20,172,927,890
0602030 SP2.3 Disaster Risk Reduction 39,546,186 43,150,437 42,441,091
0602040 SP2.4 National Campaign against Drug and Substance Abuse 448,159,510 557,524,999 508,306,397
0602050 SP2.5 Peace Building, National Cohesion and Values 669,498,159 463,578,365 546,641,489
0602000 P.2 Planning, Policy Coordination and Support Service 22,014,030,217 16,030,966,642 21,270,316,867
0603010 SP3.1 Government Printing Services 834,750,000 879,992,028 1,037,634,433
0603000 P3 Government Printing Services 834,750,000 879,992,028 1,037,634,433
0605010 SP4.1 Population Registration Services 5,351,942,977 4,838,276,379 5,400,491,101
0605020 SP4.2 Immigration Services 1,668,669,639 2,373,828,790 2,079,424,261
0605000 P.4 Population Management Services 7,020,612,616 7,212,105,169 7,479,915,362Total Expenditure for Vote 1021 State Department for Interior 120,292,137,792 115,192,822,477 137,144,622,237
31

1021 State Department for Interior
PART G: Summary of Expenditure by Vote and Economic Classification, 2016/2017 - 2018/2019
Economic Classification
Estimates Projected Estimates
2016/2017 2017/2018 2018/2019KShs. KShs. KShs.
Current Expenditure 103,437,340,903 98,703,322,477 120,274,122,237
Compensation to Employees 64,852,397,379 66,634,469,300 69,799,203,379
Use of Goods and Services 36,279,012,278 29,599,298,456 45,730,835,500
Current Transfers to Govt. Agencies 829,891,850 902,963,073 916,507,519
Other Recurrent 1,476,039,396 1,566,591,648 3,827,575,839
Capital Expenditure 16,854,796,889 16,489,500,000 16,870,500,000
Acquisition of Non-Financial Assets 15,628,200,000 15,624,200,000 15,959,200,000
Other Development 1,226,596,889 865,300,000 911,300,000Total Expenditure 120,292,137,792 115,192,822,477 137,144,622,237
32
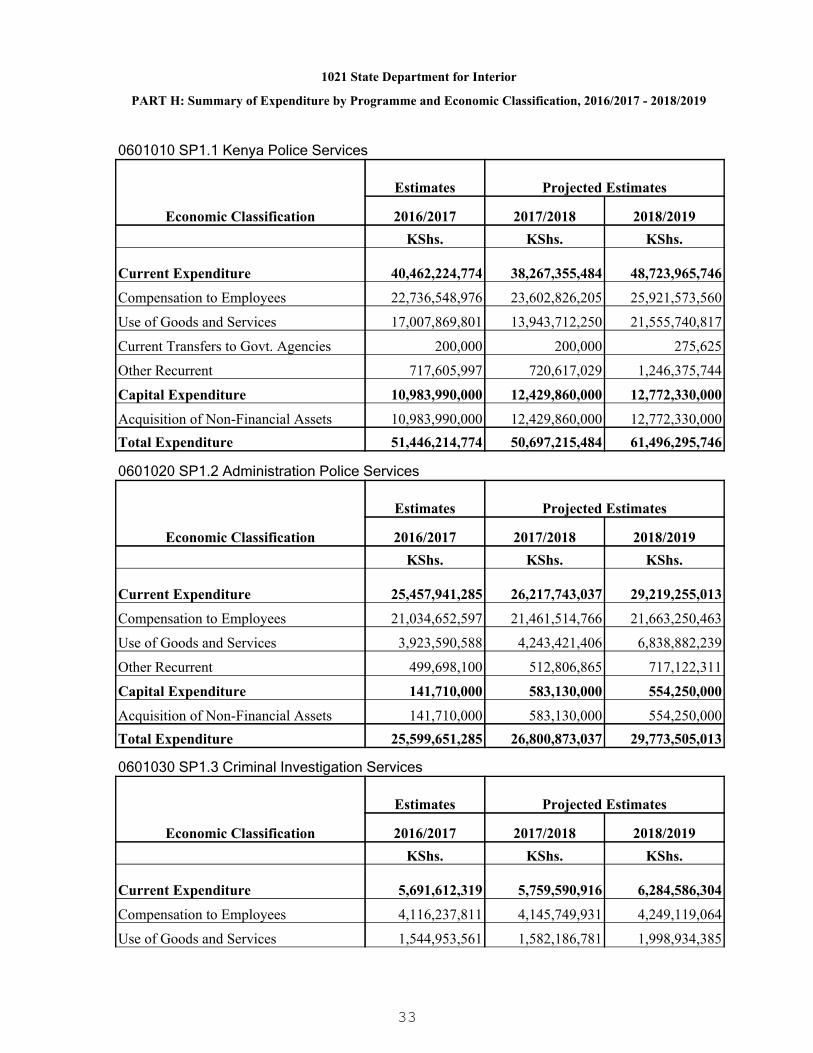
1021 State Department for Interior
PART H: Summary of Expenditure by Programme and Economic Classification, 2016/2017 - 2018/2019
0601010 SP1.1 Kenya Police Services
Economic Classification
Estimates Projected Estimates
2016/2017 2017/2018 2018/2019KShs. KShs. KShs.
Current Expenditure 40,462,224,774 38,267,355,484 48,723,965,746
Compensation to Employees 22,736,548,976 23,602,826,205 25,921,573,560
Use of Goods and Services 17,007,869,801 13,943,712,250 21,555,740,817
Current Transfers to Govt. Agencies 200,000 200,000 275,625
Other Recurrent 717,605,997 720,617,029 1,246,375,744
Capital Expenditure 10,983,990,000 12,429,860,000 12,772,330,000
Acquisition of Non-Financial Assets 10,983,990,000 12,429,860,000 12,772,330,000Total Expenditure 51,446,214,774 50,697,215,484 61,496,295,746
0601020 SP1.2 Administration Police Services
Economic Classification
Estimates Projected Estimates
2016/2017 2017/2018 2018/2019KShs. KShs. KShs.
Current Expenditure 25,457,941,285 26,217,743,037 29,219,255,013
Compensation to Employees 21,034,652,597 21,461,514,766 21,663,250,463
Use of Goods and Services 3,923,590,588 4,243,421,406 6,838,882,239
Other Recurrent 499,698,100 512,806,865 717,122,311
Capital Expenditure 141,710,000 583,130,000 554,250,000
Acquisition of Non-Financial Assets 141,710,000 583,130,000 554,250,000Total Expenditure 25,599,651,285 26,800,873,037 29,773,505,013
0601030 SP1.3 Criminal Investigation Services
Economic Classification
Estimates Projected Estimates
2016/2017 2017/2018 2018/2019KShs. KShs. KShs.
Current Expenditure 5,691,612,319 5,759,590,916 6,284,586,304
Compensation to Employees 4,116,237,811 4,145,749,931 4,249,119,064
Use of Goods and Services 1,544,953,561 1,582,186,781 1,998,934,385
33
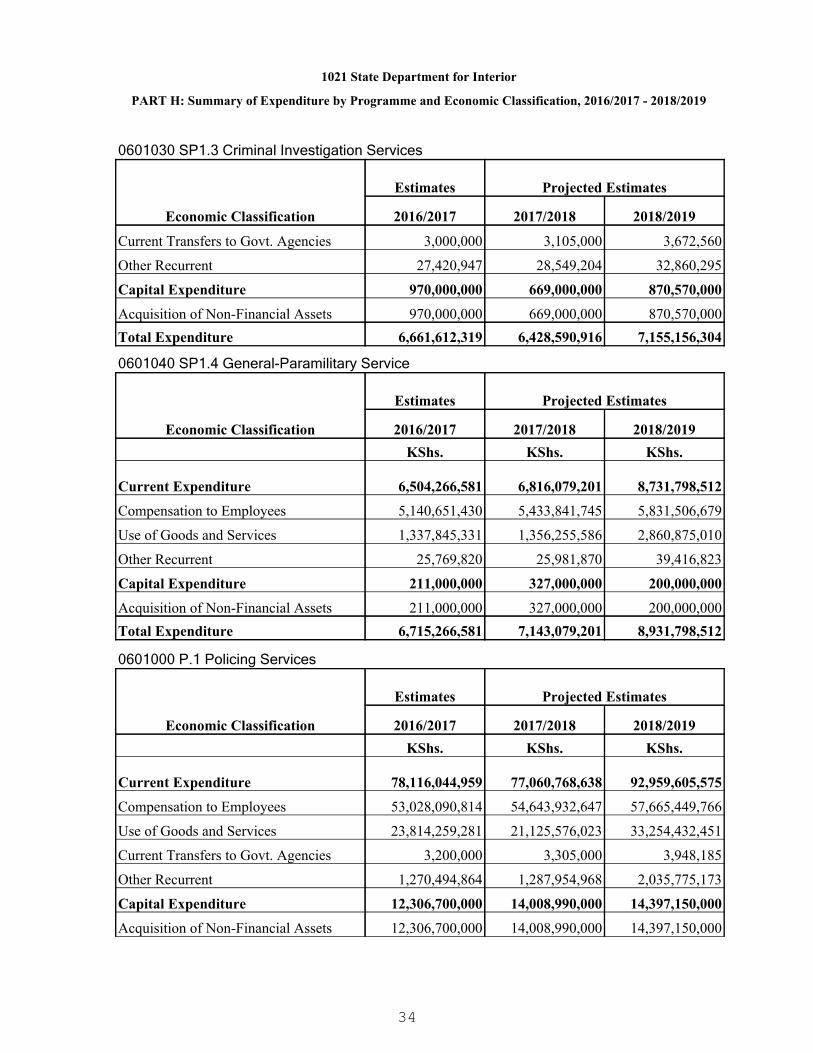
1021 State Department for Interior
PART H: Summary of Expenditure by Programme and Economic Classification, 2016/2017 - 2018/2019
0601030 SP1.3 Criminal Investigation Services
Economic Classification
Estimates Projected Estimates
2016/2017 2017/2018 2018/2019
Current Transfers to Govt. Agencies 3,000,000 3,105,000 3,672,560
Other Recurrent 27,420,947 28,549,204 32,860,295
Capital Expenditure 970,000,000 669,000,000 870,570,000
Acquisition of Non-Financial Assets 970,000,000 669,000,000 870,570,000Total Expenditure 6,661,612,319 6,428,590,916 7,155,156,304
0601040 SP1.4 General-Paramilitary Service
Economic Classification
Estimates Projected Estimates
2016/2017 2017/2018 2018/2019KShs. KShs. KShs.
Current Expenditure 6,504,266,581 6,816,079,201 8,731,798,512
Compensation to Employees 5,140,651,430 5,433,841,745 5,831,506,679
Use of Goods and Services 1,337,845,331 1,356,255,586 2,860,875,010
Other Recurrent 25,769,820 25,981,870 39,416,823
Capital Expenditure 211,000,000 327,000,000 200,000,000
Acquisition of Non-Financial Assets 211,000,000 327,000,000 200,000,000Total Expenditure 6,715,266,581 7,143,079,201 8,931,798,512
0601000 P.1 Policing Services
Economic Classification
Estimates Projected Estimates
2016/2017 2017/2018 2018/2019KShs. KShs. KShs.
Current Expenditure 78,116,044,959 77,060,768,638 92,959,605,575
Compensation to Employees 53,028,090,814 54,643,932,647 57,665,449,766
Use of Goods and Services 23,814,259,281 21,125,576,023 33,254,432,451
Current Transfers to Govt. Agencies 3,200,000 3,305,000 3,948,185
Other Recurrent 1,270,494,864 1,287,954,968 2,035,775,173
Capital Expenditure 12,306,700,000 14,008,990,000 14,397,150,000
Acquisition of Non-Financial Assets 12,306,700,000 14,008,990,000 14,397,150,000
34
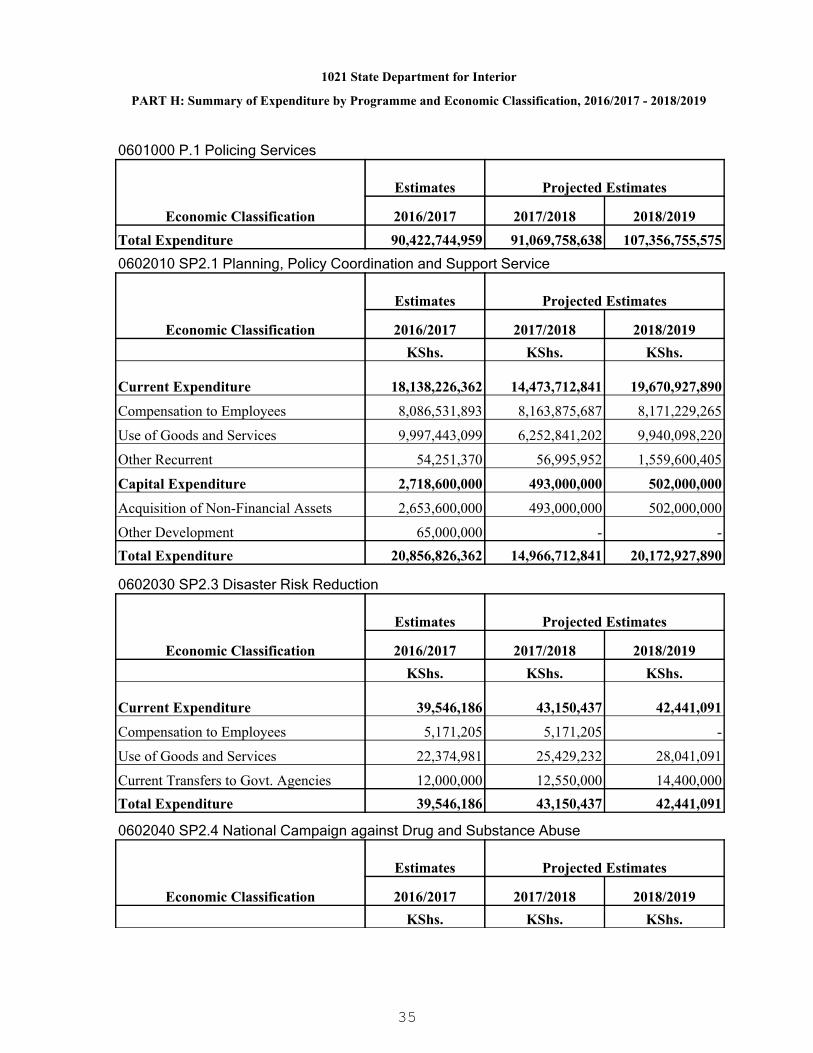
1021 State Department for Interior
PART H: Summary of Expenditure by Programme and Economic Classification, 2016/2017 - 2018/2019
0601000 P.1 Policing Services
Economic Classification
Estimates Projected Estimates
2016/2017 2017/2018 2018/2019Total Expenditure 90,422,744,959 91,069,758,638 107,356,755,5750602010 SP2.1 Planning, Policy Coordination and Support Service
Economic Classification
Estimates Projected Estimates
2016/2017 2017/2018 2018/2019KShs. KShs. KShs.
Current Expenditure 18,138,226,362 14,473,712,841 19,670,927,890
Compensation to Employees 8,086,531,893 8,163,875,687 8,171,229,265
Use of Goods and Services 9,997,443,099 6,252,841,202 9,940,098,220
Other Recurrent 54,251,370 56,995,952 1,559,600,405
Capital Expenditure 2,718,600,000 493,000,000 502,000,000
Acquisition of Non-Financial Assets 2,653,600,000 493,000,000 502,000,000
Other Development 65,000,000 - -Total Expenditure 20,856,826,362 14,966,712,841 20,172,927,890
0602030 SP2.3 Disaster Risk Reduction
Economic Classification
Estimates Projected Estimates
2016/2017 2017/2018 2018/2019KShs. KShs. KShs.
Current Expenditure 39,546,186 43,150,437 42,441,091
Compensation to Employees 5,171,205 5,171,205 -
Use of Goods and Services 22,374,981 25,429,232 28,041,091
Current Transfers to Govt. Agencies 12,000,000 12,550,000 14,400,000Total Expenditure 39,546,186 43,150,437 42,441,091
0602040 SP2.4 National Campaign against Drug and Substance Abuse
Economic Classification
Estimates Projected Estimates
2016/2017 2017/2018 2018/2019KShs. KShs. KShs.
35
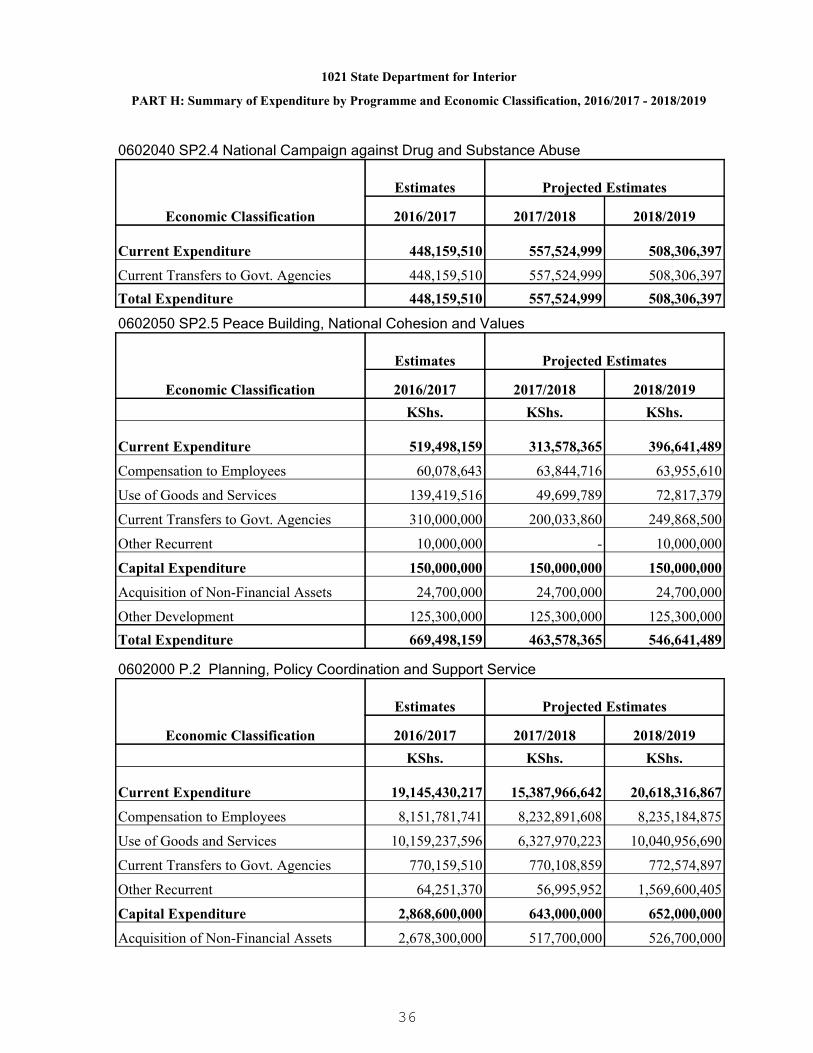
1021 State Department for Interior
PART H: Summary of Expenditure by Programme and Economic Classification, 2016/2017 - 2018/2019
0602040 SP2.4 National Campaign against Drug and Substance Abuse
Economic Classification
Estimates Projected Estimates
2016/2017 2017/2018 2018/2019
Current Expenditure 448,159,510 557,524,999 508,306,397
Current Transfers to Govt. Agencies 448,159,510 557,524,999 508,306,397Total Expenditure 448,159,510 557,524,999 508,306,397
0602050 SP2.5 Peace Building, National Cohesion and Values
Economic Classification
Estimates Projected Estimates
2016/2017 2017/2018 2018/2019KShs. KShs. KShs.
Current Expenditure 519,498,159 313,578,365 396,641,489
Compensation to Employees 60,078,643 63,844,716 63,955,610
Use of Goods and Services 139,419,516 49,699,789 72,817,379
Current Transfers to Govt. Agencies 310,000,000 200,033,860 249,868,500
Other Recurrent 10,000,000 - 10,000,000
Capital Expenditure 150,000,000 150,000,000 150,000,000
Acquisition of Non-Financial Assets 24,700,000 24,700,000 24,700,000
Other Development 125,300,000 125,300,000 125,300,000Total Expenditure 669,498,159 463,578,365 546,641,489
0602000 P.2 Planning, Policy Coordination and Support Service
Economic Classification
Estimates Projected Estimates
2016/2017 2017/2018 2018/2019KShs. KShs. KShs.
Current Expenditure 19,145,430,217 15,387,966,642 20,618,316,867
Compensation to Employees 8,151,781,741 8,232,891,608 8,235,184,875
Use of Goods and Services 10,159,237,596 6,327,970,223 10,040,956,690
Current Transfers to Govt. Agencies 770,159,510 770,108,859 772,574,897
Other Recurrent 64,251,370 56,995,952 1,569,600,405
Capital Expenditure 2,868,600,000 643,000,000 652,000,000
Acquisition of Non-Financial Assets 2,678,300,000 517,700,000 526,700,000
36
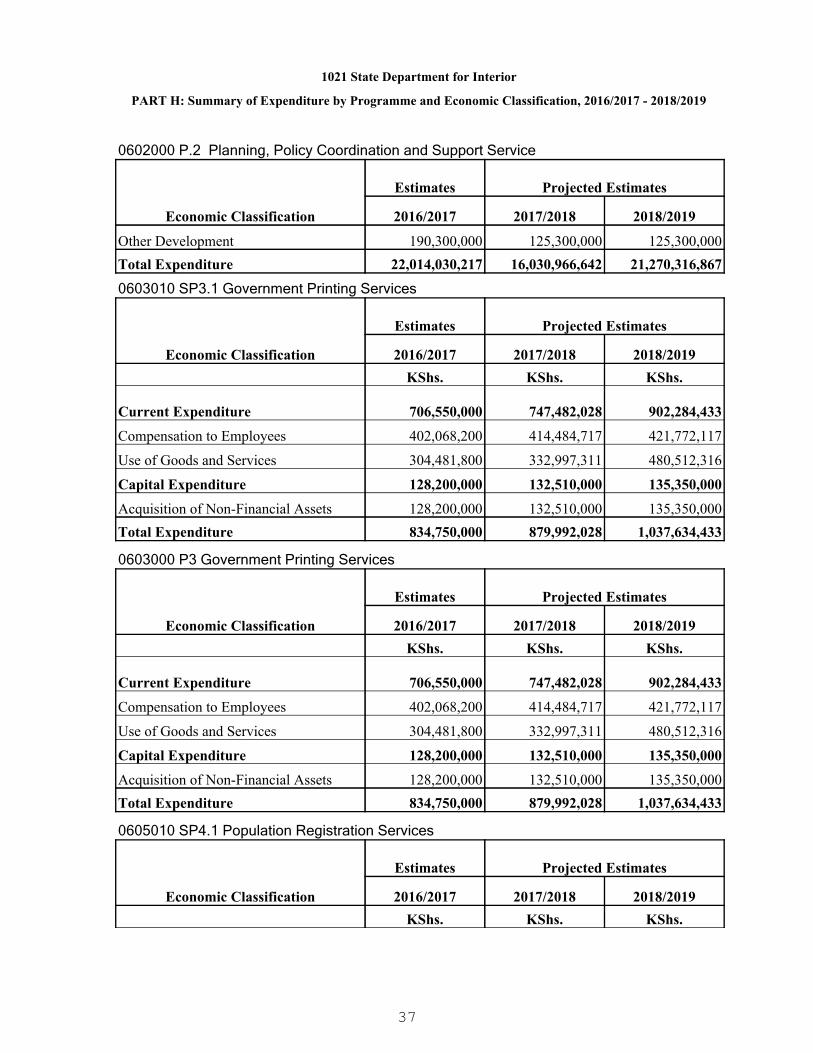
1021 State Department for Interior
PART H: Summary of Expenditure by Programme and Economic Classification, 2016/2017 - 2018/2019
0602000 P.2 Planning, Policy Coordination and Support Service
Economic Classification
Estimates Projected Estimates
2016/2017 2017/2018 2018/2019
Other Development 190,300,000 125,300,000 125,300,000Total Expenditure 22,014,030,217 16,030,966,642 21,270,316,867
0603010 SP3.1 Government Printing Services
Economic Classification
Estimates Projected Estimates
2016/2017 2017/2018 2018/2019KShs. KShs. KShs.
Current Expenditure 706,550,000 747,482,028 902,284,433
Compensation to Employees 402,068,200 414,484,717 421,772,117
Use of Goods and Services 304,481,800 332,997,311 480,512,316
Capital Expenditure 128,200,000 132,510,000 135,350,000
Acquisition of Non-Financial Assets 128,200,000 132,510,000 135,350,000Total Expenditure 834,750,000 879,992,028 1,037,634,433
0603000 P3 Government Printing Services
Economic Classification
Estimates Projected Estimates
2016/2017 2017/2018 2018/2019KShs. KShs. KShs.
Current Expenditure 706,550,000 747,482,028 902,284,433
Compensation to Employees 402,068,200 414,484,717 421,772,117
Use of Goods and Services 304,481,800 332,997,311 480,512,316
Capital Expenditure 128,200,000 132,510,000 135,350,000
Acquisition of Non-Financial Assets 128,200,000 132,510,000 135,350,000Total Expenditure 834,750,000 879,992,028 1,037,634,433
0605010 SP4.1 Population Registration Services
Economic Classification
Estimates Projected Estimates
2016/2017 2017/2018 2018/2019KShs. KShs. KShs.
37

1021 State Department for Interior
PART H: Summary of Expenditure by Programme and Economic Classification, 2016/2017 - 2018/2019
0605010 SP4.1 Population Registration Services
Economic Classification
Estimates Projected Estimates
2016/2017 2017/2018 2018/2019
Current Expenditure 4,200,646,088 3,878,276,379 4,160,491,101
Compensation to Employees 2,473,005,786 2,427,224,199 2,556,980,174
Use of Goods and Services 1,567,652,136 1,290,892,447 1,432,517,627
Current Transfers to Govt. Agencies 37,597,140 33,598,207 43,976,469
Other Recurrent 122,391,026 126,561,526 127,016,831
Capital Expenditure 1,151,296,889 960,000,000 1,240,000,000
Acquisition of Non-Financial Assets 325,000,000 690,000,000 840,000,000
Other Development 826,296,889 270,000,000 400,000,000Total Expenditure 5,351,942,977 4,838,276,379 5,400,491,101
0605020 SP4.2 Immigration Services
Economic Classification
Estimates Projected Estimates
2016/2017 2017/2018 2018/2019KShs. KShs. KShs.
Current Expenditure 1,268,669,639 1,628,828,790 1,633,424,261
Compensation to Employees 797,450,838 915,936,129 919,816,447
Use of Goods and Services 433,381,465 521,862,452 522,416,416
Current Transfers to Govt. Agencies 18,935,200 95,951,007 96,007,968
Other Recurrent 18,902,136 95,079,202 95,183,430
Capital Expenditure 400,000,000 745,000,000 446,000,000
Acquisition of Non-Financial Assets 190,000,000 275,000,000 60,000,000
Other Development 210,000,000 470,000,000 386,000,000Total Expenditure 1,668,669,639 2,373,828,790 2,079,424,261
0605000 P.4 Population Management Services
Economic Classification
Estimates Projected Estimates
2016/2017 2017/2018 2018/2019KShs. KShs. KShs.
Current Expenditure 5,469,315,727 5,507,105,169 5,793,915,362
38

1021 State Department for Interior
PART H: Summary of Expenditure by Programme and Economic Classification, 2016/2017 - 2018/2019
0605000 P.4 Population Management Services
Economic Classification
Estimates Projected Estimates
2016/2017 2017/2018 2018/2019
Compensation to Employees 3,270,456,624 3,343,160,328 3,476,796,621
Use of Goods and Services 2,001,033,601 1,812,754,899 1,954,934,043
Current Transfers to Govt. Agencies 56,532,340 129,549,214 139,984,437
Other Recurrent 141,293,162 221,640,728 222,200,261
Capital Expenditure 1,551,296,889 1,705,000,000 1,686,000,000
Acquisition of Non-Financial Assets 515,000,000 965,000,000 900,000,000
Other Development 1,036,296,889 740,000,000 786,000,000Total Expenditure 7,020,612,616 7,212,105,169 7,479,915,362
39

1022 State Department for Coordination of National Government
An instituion of excellence in offender correction and regulation of gaming industry.
To contribute to the promotion of a just, secure, and good governance through containment,rehabilitation, reintegration of offenders and regulation of gaming.
PART A. Vision
PART B. Mission
PART C. Performance Overview and Background for Programme(s) Funding
PART D. Programme Objectives
The State Department for Coordination of National Government is mandated to providecorrectional services to all offenders, contribute to expeditious administration of justice andregulate the gaming industry.
During the period under review, the State Department achieved the following; enhanced anddiversified prisoners rehabilitation programs through provision of support to 461 needy schoolgoing probationers, education, training and counseling to 87,903 inmates, 608 offenders and256 probationers; The expansion and modernization of Prisons Staff Training Collegecontinued, established Girls Borstal Institution and constructed 17 new prisons which are at90%, 80% and 40% completion rates respectively. 335 staff houses, 75 prisons wards and 5health facilities were completed; generated and submitted 143,802 social enquiry reports tocourts and other penal organs; and issued 126 licenses , presided over 307 prizecompetitions & carried out 20 spot checks of gaming institutions to enforce compliance.
The approved budget was KShs. 16.7 billion, KSh.16.4 billion and KSh. 17.7 billion againstactual expenditure of KSh. 16.6 billion, KSh. 16 billion, and KSh. 18 billion for the FY12/13,FY2013/14 and FY2014/15 respectively. This reflected an average of 97% absorption rate.
Constraints and challenges in budget implementation included; handling of highly radicalizedcriminals, criminals using ICT to continue with criminal activities even while serving theirsentences in prison facilities, delay in exchequer issues resulting in pending bills particularlyon the items of food & ration and wood fuel. However, the State Department plans to recruitadditional prison/social welfare officers and acquisition of new security equipment to enhancethe level of supervision and detections.
During the MTEF period 2016/17-2018/19, the state Department will continue to build thecapacity of prison staff, improve inmate wfare and rehabilitatio seres; support the needyschool going probationers, offer formal education and vocational training; completeconstruction of penal facilities, probation hostels & offices and modernize penal facilities;improve security in penal institutions; enforce compliance in the regulation of gamingactivities; initiate irrigation in prisons; modernize prison industries; and construct Prisons farmstores & staff housing.
ObjectiveProgramme
40

1022 State Department for Coordination of National Government
ObjectiveProgramme
0604000 P1 Correctionalservices
To facilitate increased access to justice, provide qualityservices for custody, containment, supervision, rehabilitationand reintegration of all categories of offenders.
0623000 P.2 GeneralAdministration, Planningand Support Services
To provide better planning, policy direction and supportservices for improved service delivery.
0624000 P.3 Betting Control,Licensing and RegulationServices
Improved, responsive, effective and efficient delivery ofgaming services
41
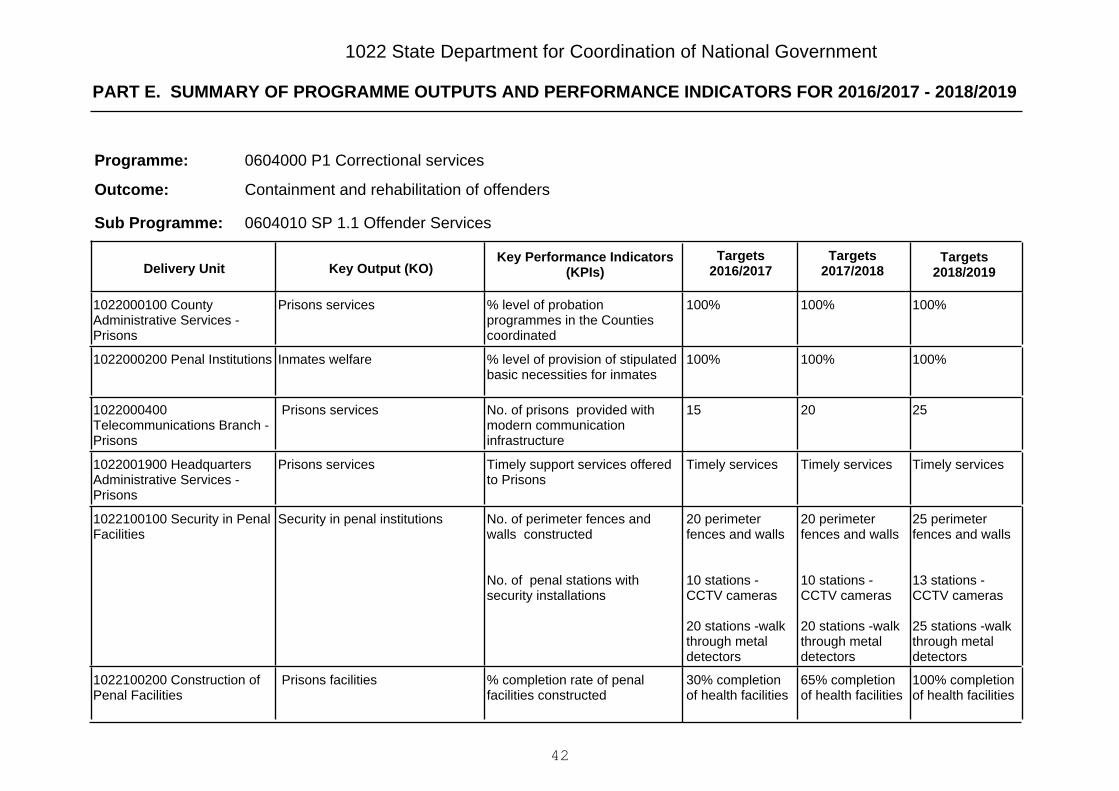
PART E. SUMMARY OF PROGRAMME OUTPUTS AND PERFORMANCE INDICATORS FOR 2016/2017 - 2018/2019
1022 State Department for Coordination of National Government
0604000 P1 Correctional services
Containment and rehabilitation of offenders
Programme:
Outcome:
0604010 SP 1.1 Offender ServicesSub Programme:
Key Output (KO)Targets
2018/2019Targets
2017/2018Key Performance Indicators
(KPIs)Targets
2016/2017Delivery Unit
100%100%100%% level of probationprogrammes in the Countiescoordinated
Prisons services1022000100 CountyAdministrative Services -Prisons
100%100%100%% level of provision of stipulatedbasic necessities for inmates
Inmates welfare1022000200 Penal Institutions
252015No. of prisons provided withmodern communicationinfrastructure
Prisons services1022000400Telecommunications Branch -Prisons
Timely servicesTimely servicesTimely servicesTimely support services offeredto Prisons
Prisons services1022001900 HeadquartersAdministrative Services -Prisons
25 perimeterfences and walls
13 stations -CCTV cameras
25 stations -walkthrough metaldetectors
20 perimeterfences and walls
10 stations -CCTV cameras
20 stations -walkthrough metaldetectors
20 perimeterfences and walls
10 stations -CCTV cameras
20 stations -walkthrough metaldetectors
No. of perimeter fences andwalls constructed
No. of penal stations withsecurity installations
Security in penal institutions1022100100 Security in PenalFacilities
100% completionof health facilities
65% completionof health facilities
30% completionof health facilities
% completion rate of penalfacilities constructed
Prisons facilities1022100200 Construction ofPenal Facilities
42

PART E. SUMMARY OF PROGRAMME OUTPUTS AND PERFORMANCE INDICATORS FOR 2016/2017 - 2018/2019
1022 State Department for Coordination of National Government
100% completionof prison wards
100% completionof magerezahouse
45% completionof dining halls
100% completionof workshops
7 boreholes
75% completionof prison wards
80% completionof magerezahouse
35% completionof dining halls
70% completionof workshops
7 boreholes
40% completionof prison wards
50% completionof magerezahouse
25% completionof dining halls
35% completionof workshops
7 boreholesNo. of boreholes drilled
303040No. of green houses establishedRehabilitation services1022100300 Irrigation andModernization of PrisonFarms
151515No. high-end and overclockingmachines acquired
Rehabilitation services1022100400 Modernization ofPrison Industries
686868No. of prisons staff housesconstructed
Prisons facilities1022100500 Prison StaffHousing
12105No. of farm stores constructedPrisons facilities1022100600 Construction ofFarm Stores
0604020 SP 1.2 Capacity DevelopmentSub Programme:
Key Output (KO)Targets
2018/2019Targets
2017/2018Key Performance Indicators
(KPIs)Targets
2016/2017Delivery Unit
150035003500No. of prisons officers trainedPrisons officers trained1022000300 Prisons StaffTraining College
43

PART E. SUMMARY OF PROGRAMME OUTPUTS AND PERFORMANCE INDICATORS FOR 2016/2017 - 2018/2019
1022 State Department for Coordination of National Government
252015No. of stations provided withmodern communicationinfrastructure
Prisons services1022000400Telecommunications Branch -Prisons
230
450
200
400
180
370
No. of offenders offered formaleducation.
No. of offenders offeredvocational training.
Rehabilitation services1022000500 BorstalInstitutions
15108No. of rehabilitation trainingprogrammes offered
Rehabilitation services1022000600 Directorate ofRehabilitation
100
100
90
65
75
30
% completion rate ofrefurbishment of Prison SchoolTraining College (PSTC)
% completion rate ofclassrooms constructed
Training facilities1022100700 Modernization ofPenal Training Facilities
0604040 SP 1.4 Probation and After Care ServiceSub Programme:
Key Output (KO)Targets
2018/2019Targets
2017/2018Key Performance Indicators
(KPIs)Targets
2016/2017Delivery Unit
Timely servicedelivery
Timely servicedelivery
Timely servicedelivery
Timely probation servicesdelivery
Probation services1022000800 ProbationServices
450
1200
400
800
350
600
No. of offenders accommodated
No. of probationers providedwith formal education andvocational trainings
Probation facilities1022000900 ProbationHostels
100%100%100%% level of Probationprogrammes in the Counties co-ordinated
Probation services1022001000 CountyProbation Services
44

PART E. SUMMARY OF PROGRAMME OUTPUTS AND PERFORMANCE INDICATORS FOR 2016/2017 - 2018/2019
1022 State Department for Coordination of National Government
200000150000120000No. of social inquiry reportsgenerated and submitted tocourts and penal institutions
Probation services1022001100 Sub-CountyProbation Services
600004500036000No. of offenders servingcommunity services order
Correctional services1022001200 CommunityService Order
12001000750No. of offenders housed,supported and provided withtools and other equipment
Rehabilitated and reintegratedex–offenders.
1022001300 AftercareServices
100%100%100%% level of Community ServiceOrders coordinated
Community Service Orderservices
1022001400 CommunityService Order Secretariat
100%90%70%% completion rate of probationhostels constructed
Probation facilities1022100800 Construction ofProbation Hostel
100%90%80%% completion rate of probationoffices constructed
Probation facilities1022100900 OfficeAccommodation
0623000 P.2 General Administration, Planning and Support Services
Improved delivery of responsive, effective and efficient services to Kenyans
Programme:
Outcome:
0623010 SP 2.1 Planning, Policy Coordination and Support ServiceSub Programme:
Key Output (KO)Targets
2018/2019Targets
2017/2018Key Performance Indicators
(KPIs)Targets
2016/2017Delivery Unit
100%100%100%% financial services facilitationto correctionalprogrammes/projects
Financial services1022001500 Finance andProcurement Services -Coordination
45
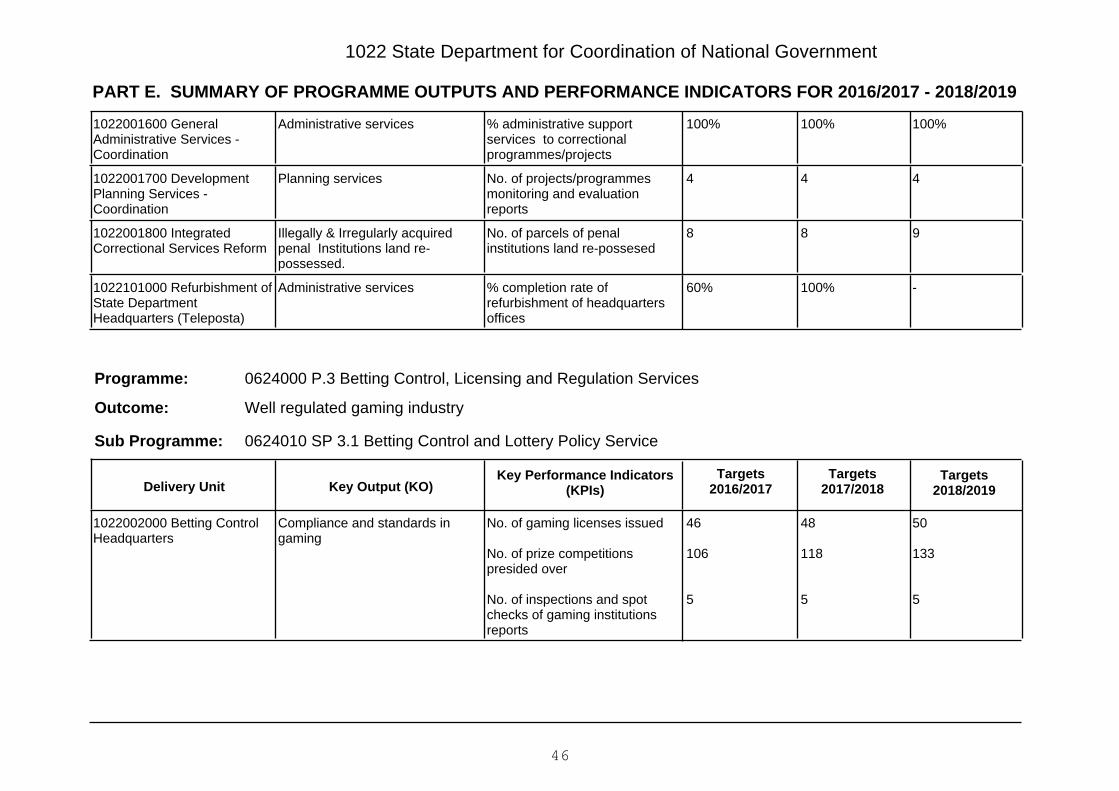
PART E. SUMMARY OF PROGRAMME OUTPUTS AND PERFORMANCE INDICATORS FOR 2016/2017 - 2018/2019
1022 State Department for Coordination of National Government
100%100%100%% administrative supportservices to correctionalprogrammes/projects
Administrative services1022001600 GeneralAdministrative Services -Coordination
444No. of projects/programmesmonitoring and evaluationreports
Planning services1022001700 DevelopmentPlanning Services -Coordination
988No. of parcels of penalinstitutions land re-possesed
Illegally & Irregularly acquiredpenal Institutions land re-possessed.
1022001800 IntegratedCorrectional Services Reform
-100%60%% completion rate ofrefurbishment of headquartersoffices
Administrative services1022101000 Refurbishment ofState DepartmentHeadquarters (Teleposta)
0624000 P.3 Betting Control, Licensing and Regulation Services
Well regulated gaming industry
Programme:
Outcome:
0624010 SP 3.1 Betting Control and Lottery Policy ServiceSub Programme:
Key Output (KO)Targets
2018/2019Targets
2017/2018Key Performance Indicators
(KPIs)Targets
2016/2017Delivery Unit
50
133
5
48
118
5
46
106
5
No. of gaming licenses issued
No. of prize competitionspresided over
No. of inspections and spotchecks of gaming institutionsreports
Compliance and standards ingaming
1022002000 Betting ControlHeadquarters
46
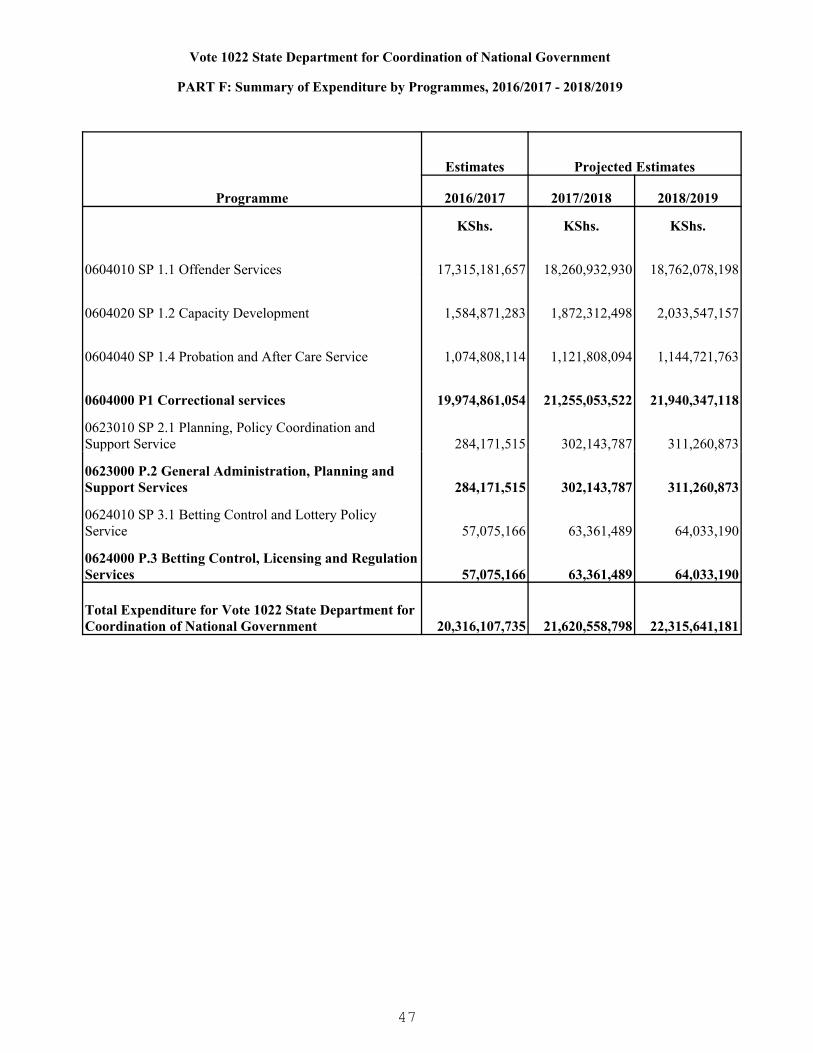
Vote 1022 State Department for Coordination of National Government
PART F: Summary of Expenditure by Programmes, 2016/2017 - 2018/2019
Programme
Estimates Projected Estimates
2016/2017 2017/2018 2018/2019
KShs. KShs. KShs.
0604010 SP 1.1 Offender Services 17,315,181,657 18,260,932,930 18,762,078,198
0604020 SP 1.2 Capacity Development 1,584,871,283 1,872,312,498 2,033,547,157
0604040 SP 1.4 Probation and After Care Service 1,074,808,114 1,121,808,094 1,144,721,763
0604000 P1 Correctional services 19,974,861,054 21,255,053,522 21,940,347,118
0623010 SP 2.1 Planning, Policy Coordination and Support Service 284,171,515 302,143,787 311,260,873
0623000 P.2 General Administration, Planning and Support Services 284,171,515 302,143,787 311,260,873
0624010 SP 3.1 Betting Control and Lottery Policy Service 57,075,166 63,361,489 64,033,190
0624000 P.3 Betting Control, Licensing and RegulationServices 57,075,166 63,361,489 64,033,190
Total Expenditure for Vote 1022 State Department for Coordination of National Government 20,316,107,735 21,620,558,798 22,315,641,181
47

1022 State Department for Coordination of National Government
PART G: Summary of Expenditure by Vote and Economic Classification, 2016/2017 - 2018/2019
Economic Classification
Estimates Projected Estimates
2016/2017 2017/2018 2018/2019KShs. KShs. KShs.
Current Expenditure 19,266,107,735 20,249,558,798 20,909,641,181
Compensation to Employees 12,617,176,930 12,973,192,238 13,339,888,005
Use of Goods and Services 6,485,669,198 7,150,822,428 7,444,206,572
Current Transfers to Govt. Agencies 3,120,000 3,191,760 3,239,636
Other Recurrent 160,141,607 122,352,372 122,306,968
Capital Expenditure 1,050,000,000 1,371,000,000 1,406,000,000
Acquisition of Non-Financial Assets 1,050,000,000 1,371,000,000 1,406,000,000Total Expenditure 20,316,107,735 21,620,558,798 22,315,641,181
48

1022 State Department for Coordination of National Government
PART H: Summary of Expenditure by Programme and Economic Classification, 2016/2017 - 2018/2019
0604010 SP 1.1 Offender Services
Economic Classification
Estimates Projected Estimates
2016/2017 2017/2018 2018/2019KShs. KShs. KShs.
Current Expenditure 16,508,881,657 17,138,932,930 17,613,078,198
Compensation to Employees 11,082,671,702 11,400,158,904 11,728,239,901
Use of Goods and Services 5,314,469,423 5,665,932,379 5,811,675,515
Current Transfers to Govt. Agencies 3,120,000 3,191,760 3,239,636
Other Recurrent 108,620,532 69,649,887 69,923,146
Capital Expenditure 806,300,000 1,122,000,000 1,149,000,000
Acquisition of Non-Financial Assets 806,300,000 1,122,000,000 1,149,000,000Total Expenditure 17,315,181,657 18,260,932,930 18,762,078,198
0604020 SP 1.2 Capacity Development
Economic Classification
Estimates Projected Estimates
2016/2017 2017/2018 2018/2019KShs. KShs. KShs.
Current Expenditure 1,461,871,283 1,761,312,498 1,910,547,157
Compensation to Employees 658,569,121 674,336,752 689,673,757
Use of Goods and Services 752,512,760 1,035,123,818 1,169,382,678
Other Recurrent 50,789,402 51,851,928 51,490,722
Capital Expenditure 123,000,000 111,000,000 123,000,000
Acquisition of Non-Financial Assets 123,000,000 111,000,000 123,000,000Total Expenditure 1,584,871,283 1,872,312,498 2,033,547,157
0604040 SP 1.4 Probation and After Care Service
Economic Classification
Estimates Projected Estimates
2016/2017 2017/2018 2018/2019KShs. KShs. KShs.
Current Expenditure 969,408,114 1,003,808,094 1,031,721,763
Compensation to Employees 732,429,132 751,482,990 770,878,544
Use of Goods and Services 236,597,819 251,939,191 260,437,994
49

1022 State Department for Coordination of National Government
PART H: Summary of Expenditure by Programme and Economic Classification, 2016/2017 - 2018/2019
0604040 SP 1.4 Probation and After Care Service
Economic Classification
Estimates Projected Estimates
2016/2017 2017/2018 2018/2019
Other Recurrent 381,163 385,913 405,225
Capital Expenditure 105,400,000 118,000,000 113,000,000
Acquisition of Non-Financial Assets 105,400,000 118,000,000 113,000,000Total Expenditure 1,074,808,114 1,121,808,094 1,144,721,763
0604000 P1 Correctional services
Economic Classification
Estimates Projected Estimates
2016/2017 2017/2018 2018/2019KShs. KShs. KShs.
Current Expenditure 18,940,161,054 19,904,053,522 20,555,347,118
Compensation to Employees 12,473,669,955 12,825,978,646 13,188,792,202
Use of Goods and Services 6,303,580,002 6,952,995,388 7,241,496,187
Current Transfers to Govt. Agencies 3,120,000 3,191,760 3,239,636
Other Recurrent 159,791,097 121,887,728 121,819,093
Capital Expenditure 1,034,700,000 1,351,000,000 1,385,000,000
Acquisition of Non-Financial Assets 1,034,700,000 1,351,000,000 1,385,000,000Total Expenditure 19,974,861,054 21,255,053,522 21,940,347,118
0623010 SP 2.1 Planning, Policy Coordination and Support Service
Economic Classification
Estimates Projected Estimates
2016/2017 2017/2018 2018/2019KShs. KShs. KShs.
Current Expenditure 268,871,515 282,143,787 290,260,873
Compensation to Employees 118,834,855 121,932,570 125,181,524
Use of Goods and Services 149,686,150 159,746,573 164,591,474
Other Recurrent 350,510 464,644 487,875
Capital Expenditure 15,300,000 20,000,000 21,000,000
Acquisition of Non-Financial Assets 15,300,000 20,000,000 21,000,000Total Expenditure 284,171,515 302,143,787 311,260,873
50

1022 State Department for Coordination of National Government
PART H: Summary of Expenditure by Programme and Economic Classification, 2016/2017 - 2018/2019
0623000 P.2 General Administration, Planning and Support Services
Economic Classification
Estimates Projected Estimates
2016/2017 2017/2018 2018/2019KShs. KShs. KShs.
Current Expenditure 268,871,515 282,143,787 290,260,873
Compensation to Employees 118,834,855 121,932,570 125,181,524
Use of Goods and Services 149,686,150 159,746,573 164,591,474
Other Recurrent 350,510 464,644 487,875
Capital Expenditure 15,300,000 20,000,000 21,000,000
Acquisition of Non-Financial Assets 15,300,000 20,000,000 21,000,000Total Expenditure 284,171,515 302,143,787 311,260,873
0624010 SP 3.1 Betting Control and Lottery Policy Service
Economic Classification
Estimates Projected Estimates
2016/2017 2017/2018 2018/2019KShs. KShs. KShs.
Current Expenditure 57,075,166 63,361,489 64,033,190
Compensation to Employees 24,672,120 25,281,022 25,914,279
Use of Goods and Services 32,403,046 38,080,467 38,118,911Total Expenditure 57,075,166 63,361,489 64,033,190
0624000 P.3 Betting Control, Licensing and Regulation Services
Economic Classification
Estimates Projected Estimates
2016/2017 2017/2018 2018/2019KShs. KShs. KShs.
Current Expenditure 57,075,166 63,361,489 64,033,190
Compensation to Employees 24,672,120 25,281,022 25,914,279
Use of Goods and Services 32,403,046 38,080,467 38,118,911Total Expenditure 57,075,166 63,361,489 64,033,190
51
1031 State Department for Planning
A Centre of excellence in planning, public service management and development, nurturingempowered and responsible youth and women for globally competitive and prosperous nationwith high quality of life for all Kenyans.
To provide leadership in planning and policy formulation, human resource management anddevelopment, maximize full potential of youth and women through participatory engagementand tracking of results for a globally competitive and prosperous nation.
PART A. Vision
PART B. Mission
PART C. Performance Overview and Background for Programme(s) Funding
The role of State Department for Planning is to formulate and coordinate nationaldevelopment, mainstream youth into development and empower them, build fairer genderequality, and track development results.
During the period 2012/13 - 2014/15 the State Department conducted capacity building toCounty Governments on development planning, developed and disseminated keygovernment policies and plans, undertook African Peer Review Mechanism (APRM),produced and published public policy research and analysis reports, tracked and reported onthe implementation of government projects and programmes, strengthened populationmanagement and development through population policies, published key national statisticaldocuments, transformed public service through a number of initiatives such as HudumaKenya and medical insurance scheme for civil servants among others, and implementedvarious initiatives and programmes aimed at empowering women, youth and People withDisabilities in national development.
The State Department's expenditure allocation increased from Kshs. 41.2 billion in 2012/13 toKshs. 62.2 billion in 2013/14 and Kshs. 78.3 billion in 2014/15 financial years. A similar trendwas depicted in the actual expenditure which rose from Kshs. 34.1 billion in 2012/13 to Kshs.51.3 billion in 2013/14 and Kshs. 71.4 billion in 2014/15 financial years. The increase wasoccasioned by the additional allocation to the National Youth service in line with the increasedmandate under the five point vision and the integrated service delivery under Huduma Kenyaprogramme.
Despite the above listed achievements, the State Department faced challenges whileundertaking its mandate. These include: capacity constraints particularly inadequate staffingof professional/technical levels and high staff turnover, weak institutional linkages betweenNational and County Governments, and inadequate funding which resulted in delays andnon-completion of projects and programmes. However, these challenges are beingaddressed in number of ways including improvement of terms of employment for staff andfilling of vacant positions, sensitizing and building capacity for National and CountyGovernments officials; strengthening intergovernmental institutions and relations; andstrengthening the linkages between policy formulation and budget.
During the period 2016/17 - 2018/19, State Department for Planning plans to provide countyplanning support and community development services; coordinate implementation ofSustainable Development Goals (SDGs); develop and disseminate socioeconomic policiesand plans; promote regional and international economic agenda; produce and publish public
52

1031 State Department for Planning
PART D. Programme Objectives
policy research and analysis reports; conduct monitoring and evaluation of governmentprojects and programmes; produce national statistical publication, surveys and censusreports; transform public service through the existing initiatives and develop new innovativeways of service delivery in the public service; and continue to implement projects andprogrammes aimed at empowering women, youth and People With Disabilities (PWDs) inparticipating in national development.
ObjectiveProgramme
0706000 P1 : EconomicPolicy and National Planning
To strengthen policy formulation , planning, budgeting andimplementation of Vision 2030.
0707000 P2 : NationalStatistical InformationServices
To enhance production and dissemination of quality officialstatistics for policy formulation, research, planning andmonitoring socio-economic development.
0708000 P3: Monitoring andEvaluation Services
To improve tracking of implementation of developmentpolicies, strategies and programmes.
0709000 P4: GeneralAdministration Planning andSupport Services
To provide leadership and policy direction for effectiveservice delivery.
0710000 P 5: Public ServiceTransformation
To transform the quality and efficiency of public servicedelivery.
0711000 P6: Gender & YouthEmpowerment
Enhance empowerment and participation of youth, womenand other vulnerable groups in all aspects of nationaldevelopment.
53

PART E. SUMMARY OF PROGRAMME OUTPUTS AND PERFORMANCE INDICATORS FOR 2016/2017 - 2018/2019
1031 State Department for Planning
0706000 P1 : Economic Policy and National Planning
Strengthened policy formulation , planning, budgeting and implementation of Vision 2030.
Programme:
Outcome:
0706010 S.P.1.1 Economic Planning Coordination servicesSub Programme:
Key Output (KO)Targets
2018/2019Targets
2017/2018Key Performance Indicators
(KPIs)Targets
2016/2017Delivery Unit
CIDP Mid-TermReviewguidelinesdeveloped anddisseminated
47
CIDP preparationstatus reviewreport preparedand disseminated
47
CIDPs Guidelinesrevised anddisseminated
47
CIDP Mid-Term Reviewguidelines;Reviewed CIDP guidelines;
No. of counties providedtechnical assistance ondevelopment planning
Guidelines for County IntegratedDevelopment Plans
1031000400 EconomicDevelopment CoordinationDepartment
8080100No. of county planning officerstrained on developmentplanning
Capacity building in planning1031000500 Coordination andTraining Unit
111No. of economic policy papersproduced
Economic and social advice to theGovernment of Kenya to improvemanagement of economy
1031012200 NationalEconomic and Social Council
111No of forums on SDGs andpost 2015 development agendaheld
Framework for implementation ofSDGs
1031102400 MDGsImplementation Unit
-
-
-
-
22
23,000
No. of projects completed andoperational;No. of targeted beneficiariesreached under each projectcomponent
Community support projects1031102800 ProjectManangement Unit
54
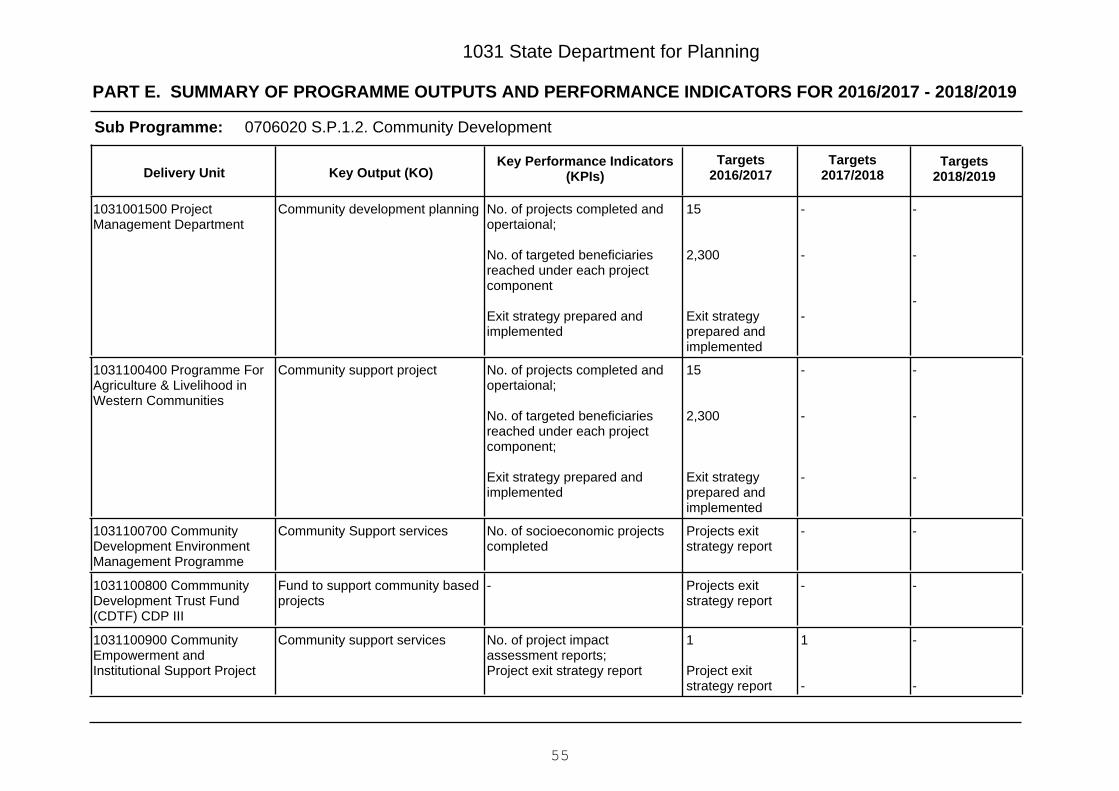
PART E. SUMMARY OF PROGRAMME OUTPUTS AND PERFORMANCE INDICATORS FOR 2016/2017 - 2018/2019
1031 State Department for Planning
0706020 S.P.1.2. Community DevelopmentSub Programme:
Key Output (KO)Targets
2018/2019Targets
2017/2018Key Performance Indicators
(KPIs)Targets
2016/2017Delivery Unit
-
-
-
-
-
-
15
2,300
Exit strategyprepared andimplemented
No. of projects completed andopertaional;
No. of targeted beneficiariesreached under each projectcomponent
Exit strategy prepared andimplemented
Community development planning1031001500 ProjectManagement Department
-
-
-
-
-
-
15
2,300
Exit strategyprepared andimplemented
No. of projects completed andopertaional;
No. of targeted beneficiariesreached under each projectcomponent;
Exit strategy prepared andimplemented
Community support project1031100400 Programme ForAgriculture & Livelihood inWestern Communities
--Projects exitstrategy report
No. of socioeconomic projectscompleted
Community Support services1031100700 CommunityDevelopment EnvironmentManagement Programme
--Projects exitstrategy report
-Fund to support community basedprojects
1031100800 CommmunityDevelopment Trust Fund(CDTF) CDP III
-
-
1
-
1
Project exitstrategy report
No. of project impactassessment reports;Project exit strategy report
Community support services1031100900 CommunityEmpowerment andInstitutional Support Project
55
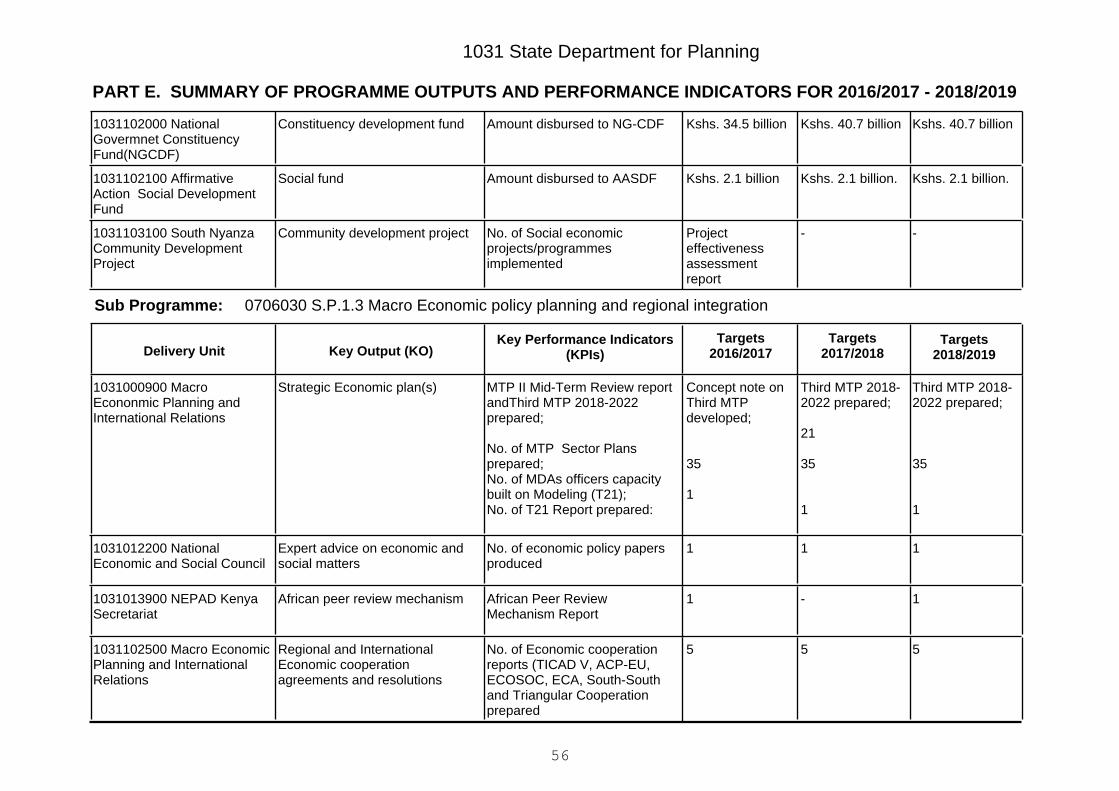
PART E. SUMMARY OF PROGRAMME OUTPUTS AND PERFORMANCE INDICATORS FOR 2016/2017 - 2018/2019
1031 State Department for Planning
Kshs. 40.7 billionKshs. 40.7 billionKshs. 34.5 billionAmount disbursed to NG-CDFConstituency development fund1031102000 NationalGovermnet ConstituencyFund(NGCDF)
Kshs. 2.1 billion.Kshs. 2.1 billion.Kshs. 2.1 billionAmount disbursed to AASDFSocial fund1031102100 AffirmativeAction Social DevelopmentFund
--Projecteffectivenessassessmentreport
No. of Social economicprojects/programmesimplemented
Community development project1031103100 South NyanzaCommunity DevelopmentProject
0706030 S.P.1.3 Macro Economic policy planning and regional integrationSub Programme:
Key Output (KO)Targets
2018/2019Targets
2017/2018Key Performance Indicators
(KPIs)Targets
2016/2017Delivery Unit
Third MTP 2018-2022 prepared;
35
1
Third MTP 2018-2022 prepared;
21
35
1
Concept note onThird MTPdeveloped;
35
1
MTP II Mid-Term Review reportandThird MTP 2018-2022prepared;
No. of MTP Sector Plansprepared;No. of MDAs officers capacitybuilt on Modeling (T21);No. of T21 Report prepared:
Strategic Economic plan(s)1031000900 MacroEcononmic Planning andInternational Relations
111No. of economic policy papersproduced
Expert advice on economic andsocial matters
1031012200 NationalEconomic and Social Council
1-1African Peer ReviewMechanism Report
African peer review mechanism1031013900 NEPAD KenyaSecretariat
555No. of Economic cooperationreports (TICAD V, ACP-EU,ECOSOC, ECA, South-Southand Triangular Cooperationprepared
Regional and InternationalEconomic cooperationagreements and resolutions
1031102500 Macro EconomicPlanning and InternationalRelations
56

PART E. SUMMARY OF PROGRAMME OUTPUTS AND PERFORMANCE INDICATORS FOR 2016/2017 - 2018/2019
1031 State Department for Planning
0706040 S.P.1.4 Policy ResearchSub Programme:
Key Output (KO)Targets
2018/2019Targets
2017/2018Key Performance Indicators
(KPIs)Targets
2016/2017Delivery Unit
127
18
127
18
121
17
No. of policy Research Papersand Reports Prepared anddisseminated;
No. of Journal and InternationalWorking Papers published
Public Policy Research andAnalysis
1031000100 HeadquartersAdministrative Services -Planning
12
956
12
956
12
914
No. of Young Professionalstrained;
No. of Government and PrivateSector Officers Trained /capacity-built
Capacity building on Public PolicyFormulation
1031100500 ACBF Support toKenya Institute for PublicPolicy Research & Analysis
0706050 S.P.1.5 Coordination of Vision 2030Sub Programme:
Key Output (KO)Targets
2018/2019Targets
2017/2018Key Performance Indicators
(KPIs)Targets
2016/2017Delivery Unit
444No. of quarterly M&E reports onKenya Vision 2030 flagshipprojects
Monitoring and evaluation ofVision 2030 flagship projects
1031000600 Vision 2030
0706060 S.P.1.6 Infrastructure, science, technology and innovationSub Programme:
Key Output (KO)Targets
2018/2019Targets
2017/2018Key Performance Indicators
(KPIs)Targets
2016/2017Delivery Unit
111No. of project impact reportsprepared;
Science Technology &Innovations(ST&I) services
1031000700 EnablersCoordination Department
57

PART E. SUMMARY OF PROGRAMME OUTPUTS AND PERFORMANCE INDICATORS FOR 2016/2017 - 2018/2019
1031 State Department for Planning
11-Participatory PovertyAssessment V & VI reportprepared
Advise on poverty reduction1031000800 PovertyEradication Commission
1
-
1
1
-
1
1
8th NationalHumanDevelopmentreport
1
No. of report on knowledgemanagement prepared;
8th National HumanDevelopment report
No. of Kenya Vision 2030 socialpillar flagship reports prepared
Reporting on social economicdevelopment
1031001000 Social andGovernance Department
50
6
50
6
50
10
No. of sensitization forums onpopulation programmes held
No. of county population officesestablished
Population control1031001200 NationalCoordinating Agency forPopulation and Development
141414No. of County Biashara Centerscapacity built on MSEs
Economic empowerment services1031101000 EconomicEmpowerment Programme
50
6
50
6
50
10
No. of sensitization forums onpopulation programmes held
No. of county population officesestablished
Population control1031101100 Integration andCoordination with ICPD POA-NCAPD
151515No of counties capacity built onSB/SIR real time system
County social budgeting andSocial Intelligence Reportingcapacity building
1031101600 Social Policy andResearch
0707000 P2 : National Statistical Information Services
Enhanced evidence based decision making.
Programme:
Outcome:
58

PART E. SUMMARY OF PROGRAMME OUTPUTS AND PERFORMANCE INDICATORS FOR 2016/2017 - 2018/2019
1031 State Department for Planning
0707010 S.P. 2.1. Census and SurveysSub Programme:
Key Output (KO)Targets
2018/2019Targets
2017/2018Key Performance Indicators
(KPIs)Targets
2016/2017Delivery Unit
4
-
4
-
4
National Strategyfor theDevelopment ofStatistics (NSDS)produced anddisseminated
No. of statistical and surveyreports produced
National Strategy for theDevelopment of Statistics(NSDS) produced anddisseminated
Statistical information1031001900 Kenya NationalBureau of Statistics
343434No. of Annual, quarterly and,monthly statistical publicationsand economic indicator reportsproduced and published
Economic indicators1031101200 Data Collectionand Data Base Development
222No. of survey reports producedStatistical information1031101500 Social Policy andStatistics (KNBS)
232321No. of Survey and censusesreports produced anddisseminated
Statistical information1031102900 Kenya NationalBureau of Statistics-Census
0707020 S.P. 2.2 SurveysSub Programme:
Key Output (KO)Targets
2018/2019Targets
2017/2018Key Performance Indicators
(KPIs)Targets
2016/2017Delivery Unit
232321No. of Survey and censusesreports produced anddisseminated (KCHSP),)
Statistical information1031001900 Kenya NationalBureau of Statistics
222No. of surveys and surveyreports produced
Statistical information1031103000 Kenya StatisticsProgramme For Results
59
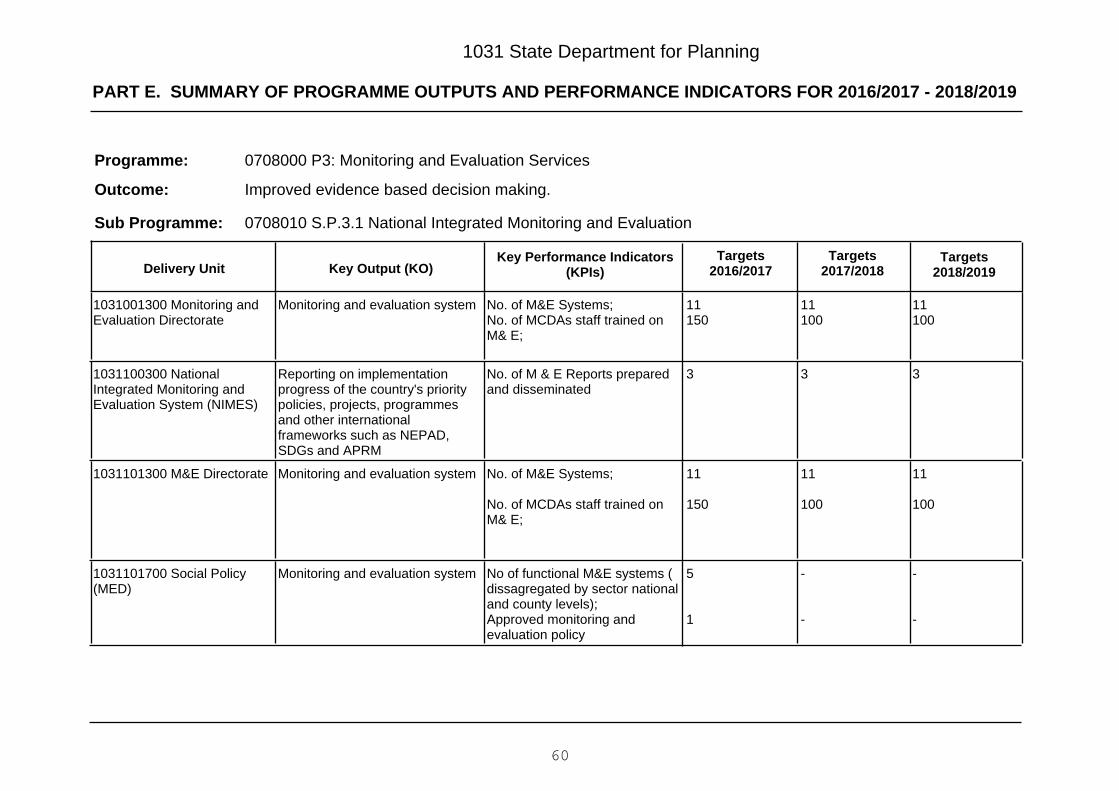
PART E. SUMMARY OF PROGRAMME OUTPUTS AND PERFORMANCE INDICATORS FOR 2016/2017 - 2018/2019
1031 State Department for Planning
0708000 P3: Monitoring and Evaluation Services
Improved evidence based decision making.
Programme:
Outcome:
0708010 S.P.3.1 National Integrated Monitoring and EvaluationSub Programme:
Key Output (KO)Targets
2018/2019Targets
2017/2018Key Performance Indicators
(KPIs)Targets
2016/2017Delivery Unit
11100
11100
11150
No. of M&E Systems;No. of MCDAs staff trained onM& E;
Monitoring and evaluation system1031001300 Monitoring andEvaluation Directorate
333No. of M & E Reports preparedand disseminated
Reporting on implementationprogress of the country's prioritypolicies, projects, programmesand other internationalframeworks such as NEPAD,SDGs and APRM
1031100300 NationalIntegrated Monitoring andEvaluation System (NIMES)
11
100
11
100
11
150
No. of M&E Systems;
No. of MCDAs staff trained onM& E;
Monitoring and evaluation system1031101300 M&E Directorate
-
-
-
-
5
1
No of functional M&E systems (dissagregated by sector nationaland county levels);Approved monitoring andevaluation policy
Monitoring and evaluation system1031101700 Social Policy(MED)
60

PART E. SUMMARY OF PROGRAMME OUTPUTS AND PERFORMANCE INDICATORS FOR 2016/2017 - 2018/2019
1031 State Department for Planning
0709000 P4: General Administration Planning and Support Services
Improved and efficient administrative, financial and planning support services.
Programme:
Outcome:
0709010 S.P.4.1 Human Resources and Support ServicesSub Programme:
Key Output (KO)Targets
2018/2019Targets
2017/2018Key Performance Indicators
(KPIs)Targets
2016/2017Delivery Unit
Timely release ofresources to allspending units inthe Ministry
Timely release ofresources to allspending units inthe Ministry
Timely release ofresources to allspending units inthe Ministry
Time taken to release ofresources to all spending unitsin the Ministry
Financial Management Services1031000100 HeadquartersAdministrative Services -Planning
474747No. of counties providedtechnical assistance ondevelopment planning
County planning services1031000400 EconomicDevelopment CoordinationDepartment
111No of Customer and employeeSatisfaction Survey Reports
Administrative Services1031009000 GeneralAdministration and PlanningServices
101010No. of institutions benefitingfrom the presidential awardscheme
Youth services1031013800 President AwardScheme Secretariat
--100%% completion of project workRefurbished offices1031101900 Refurbishment ofoffices occupied by theMinistry staffs
0709020 S.P.4.2 Financial Management ServicesSub Programme:
Key Output (KO)Targets
2018/2019Targets
2017/2018Key Performance Indicators
(KPIs)Targets
2016/2017Delivery Unit
Timely release ofresources to allspending units in
Timely release ofresources to allspending units in
Timely release ofresources to allspending units in
Time taken to release ofresources to all spending unitsin the Ministry
Financial Management Services1031000100 HeadquartersAdministrative Services -Planning
61
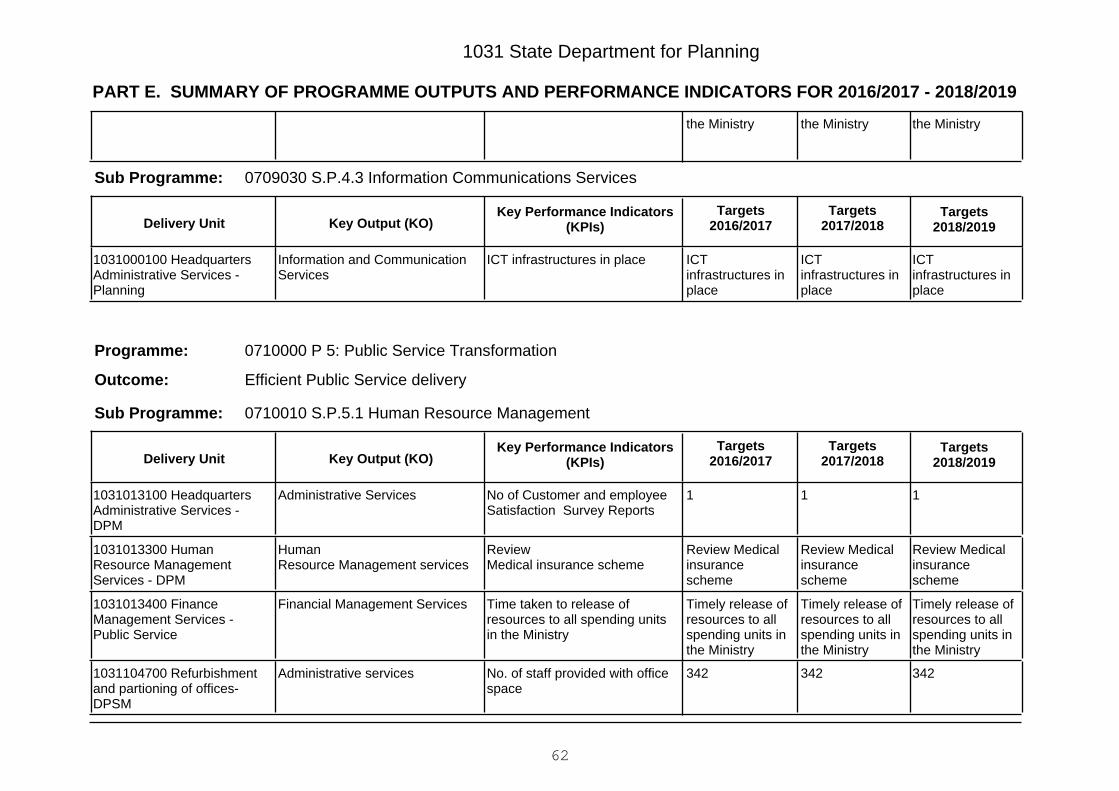
PART E. SUMMARY OF PROGRAMME OUTPUTS AND PERFORMANCE INDICATORS FOR 2016/2017 - 2018/2019
1031 State Department for Planning
the Ministrythe Ministrythe Ministry
0709030 S.P.4.3 Information Communications ServicesSub Programme:
Key Output (KO)Targets
2018/2019Targets
2017/2018Key Performance Indicators
(KPIs)Targets
2016/2017Delivery Unit
ICTinfrastructures inplace
ICTinfrastructures inplace
ICTinfrastructures inplace
ICT infrastructures in placeInformation and CommunicationServices
1031000100 HeadquartersAdministrative Services -Planning
0710000 P 5: Public Service Transformation
Efficient Public Service delivery
Programme:
Outcome:
0710010 S.P.5.1 Human Resource ManagementSub Programme:
Key Output (KO)Targets
2018/2019Targets
2017/2018Key Performance Indicators
(KPIs)Targets
2016/2017Delivery Unit
111No of Customer and employeeSatisfaction Survey Reports
Administrative Services1031013100 HeadquartersAdministrative Services -DPM
Review Medicalinsurancescheme
Review Medicalinsurancescheme
Review Medicalinsurancescheme
ReviewMedical insurance scheme
HumanResource Management services
1031013300 HumanResource ManagementServices - DPM
Timely release ofresources to allspending units inthe Ministry
Timely release ofresources to allspending units inthe Ministry
Timely release ofresources to allspending units inthe Ministry
Time taken to release ofresources to all spending unitsin the Ministry
Financial Management Services1031013400 FinanceManagement Services -Public Service
342342342No. of staff provided with officespace
Administrative services1031104700 Refurbishmentand partioning of offices-DPSM
62

PART E. SUMMARY OF PROGRAMME OUTPUTS AND PERFORMANCE INDICATORS FOR 2016/2017 - 2018/2019
1031 State Department for Planning
0710020 S.P.5.2 Human Resource DevelopmentSub Programme:
Key Output (KO)Targets
2018/2019Targets
2017/2018Key Performance Indicators
(KPIs)Targets
2016/2017Delivery Unit
800800750No. of graduates in public sectormanagement
Graduates in public sectormanagement
1031012600 BaringoGovernment Training Institute
790790750No. of graduates in public sectormanagement
Graduates in public sectormanagement
1031012700 EmbuGovernment Training Institute
All humanresource policiesaligned with theconstitution;Increase uptakeby 5%
100%
All humanresource policiesaligned with theconstitution;Increase uptakeby 5%
80%
All humanresource policiesaligned with theconstitution;Increase uptakeby 5%
60%
No. of Human resource policiesaligned with the constitution
% of staff accessing publicservice Training RevolvingFund;% level of implementation ofNational capacity BuildingFramework
Human resource managementservices
1031012800 HumanResource Development
900900900No. of graduates in public sectormanagement
Graduates in public sectormanagement
1031012900 GovernmentTraining Institute - Mombasa
650650650No. of graduates in public sectormanagement
Graduates in public sectormanagement
1031013000 MatugaGovernment Training Institute
500050005000No. of graduates in public sectormanagement
Graduates in public sectormanagement
1031014200 Kenya School ofGovernment
conferencecapacityincreased
conferencecapacityincreased
conferencecapacityincreased
conference capacity increasedConference facility1031104300 Furnishing ofKSG-Matuga ConferenceComplex
10,00010,00010,000No. of students accommodatedHostels facilities1031104400 Refurbishment ofKSG-Matuga, Embu,Mombasa & Baringo
63
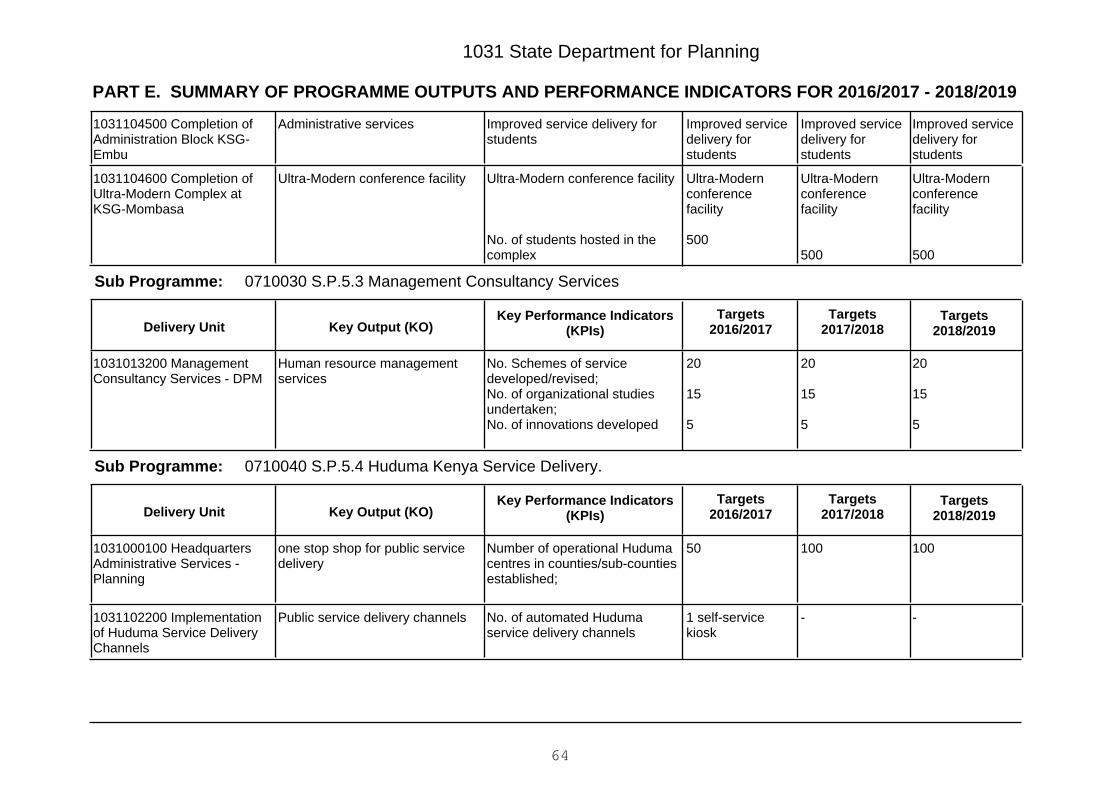
PART E. SUMMARY OF PROGRAMME OUTPUTS AND PERFORMANCE INDICATORS FOR 2016/2017 - 2018/2019
1031 State Department for Planning
Improved servicedelivery forstudents
Improved servicedelivery forstudents
Improved servicedelivery forstudents
Improved service delivery forstudents
Administrative services1031104500 Completion ofAdministration Block KSG-Embu
Ultra-Modernconferencefacility
500
Ultra-Modernconferencefacility
500
Ultra-Modernconferencefacility
500
Ultra-Modern conference facility
No. of students hosted in thecomplex
Ultra-Modern conference facility1031104600 Completion ofUltra-Modern Complex atKSG-Mombasa
0710030 S.P.5.3 Management Consultancy ServicesSub Programme:
Key Output (KO)Targets
2018/2019Targets
2017/2018Key Performance Indicators
(KPIs)Targets
2016/2017Delivery Unit
20
15
5
20
15
5
20
15
5
No. Schemes of servicedeveloped/revised;No. of organizational studiesundertaken;No. of innovations developed
Human resource managementservices
1031013200 ManagementConsultancy Services - DPM
0710040 S.P.5.4 Huduma Kenya Service Delivery.Sub Programme:
Key Output (KO)Targets
2018/2019Targets
2017/2018Key Performance Indicators
(KPIs)Targets
2016/2017Delivery Unit
10010050Number of operational Hudumacentres in counties/sub-countiesestablished;
one stop shop for public servicedelivery
1031000100 HeadquartersAdministrative Services -Planning
--1 self-servicekiosk
No. of automated Hudumaservice delivery channels
Public service delivery channels1031102200 Implementationof Huduma Service DeliveryChannels
64

PART E. SUMMARY OF PROGRAMME OUTPUTS AND PERFORMANCE INDICATORS FOR 2016/2017 - 2018/2019
1031 State Department for Planning
0710050 S.P.5.5 Performance ManagementSub Programme:
Key Output (KO)Targets
2018/2019Targets
2017/2018Key Performance Indicators
(KPIs)Targets
2016/2017Delivery Unit
295 MDA s and47 counties
35
295 MDA s and47 counties
35
295 MDA s and47 counties
30
Number of public institutionsand counties underPerformance Contract;Number of MDAs implementingthe transformed strategy (RRI,BPR)
Performance managementservices
1031000100 HeadquartersAdministrative Services -Planning
0711000 P6: Gender & Youth Empowerment
Empowerment of women, youth and vulnerable groups.
Programme:
Outcome:
0711010 S.P.6.1. National Youth ServiceSub Programme:
Key Output (KO)Targets
2018/2019Targets
2017/2018Key Performance Indicators
(KPIs)Targets
2016/2017Delivery Unit
21,870
150,000
21,870
150,000
21,870
150,000
No. of youth recruits regimentedand trained ;No. of community youth trainedon social transformation
NYS graduates1031009200 N.Y.S.Headquarters AdministrativeServices
90
500
7
90
500
7
60
500
7
No. of constituencies undernational service;No. of dams/water pansConstructed under NYSprogramme;No of regions covered undervector control NYS programme
Youth support services1031009300 NYSEngineering Institute -Ruaraka
21,87021,87021,870No. of youth recruits regimentedand trained
NYS graduates1031009400 NYS SecretarialCollege - Ruaraka
65

PART E. SUMMARY OF PROGRAMME OUTPUTS AND PERFORMANCE INDICATORS FOR 2016/2017 - 2018/2019
1031 State Department for Planning
21,87021,87021,870No. of youth recruits regimentedand trained ;
NYS graduates1031009500 NairobiEngineering Craft School
21,87021,87021,870No. of youth recruits regimentedand trained ;
NYS graduates1031009600 Yatta Complex
330
150,00
330
150,00
300
150,000
No. of community youthbenefitting from NYS SACCOs;
No. of youth benefiting from thecommunity Youth SACCO
Sustainable youth-led enterprisesand employment creation services
1031009700 NYS StreetYouth Rehabilitation
21,87021,87021,870No. of youth recruits regimentedand trained
NYS graduates1031009800 NYS CateringSchool - Gilgil
21,870
150,000
21,870
150,000
21,870
150,000
No. of youth recruits regimentedand trained ;No. of community youth trainedon social transformation
NYS graduates1031009900 NYS TrainingUnits
48,600 damsconstruction;38,470 roadconstruction;21,870 vectorcontrol; 12,150slums civil works,43,680 hudumakitchens, 1,215traffic control,1,280 publicsecurity, 14,100serviceconstabulary, and48,600agribusiness
48,600 damsconstruction;38,470 roadconstruction;21,870 vectorcontrol; 12,150slums civil works,43,680 hudumakitchens, 1,215traffic control,1,280 publicsecurity, 14,100serviceconstabulary, and48,600agribusiness
48,600 damsconstruction;38,470 roadconstruction;21,870 vectorcontrol; 12,150slums civil works,43,680 hudumakitchens, 1,215traffic control,1,280 publicsecurity, 14,100serviceconstabulary, and48,600agribusiness
No. of NYS projectsimplemented
community projects1031010000 Production Units
All NYSequipmentmaintained and
All NYSequipmentmaintained and
All NYSequipmentmaintained and
NYS equipment maintained andserviced
Administrative services1031010100 MaintenanceServices
66
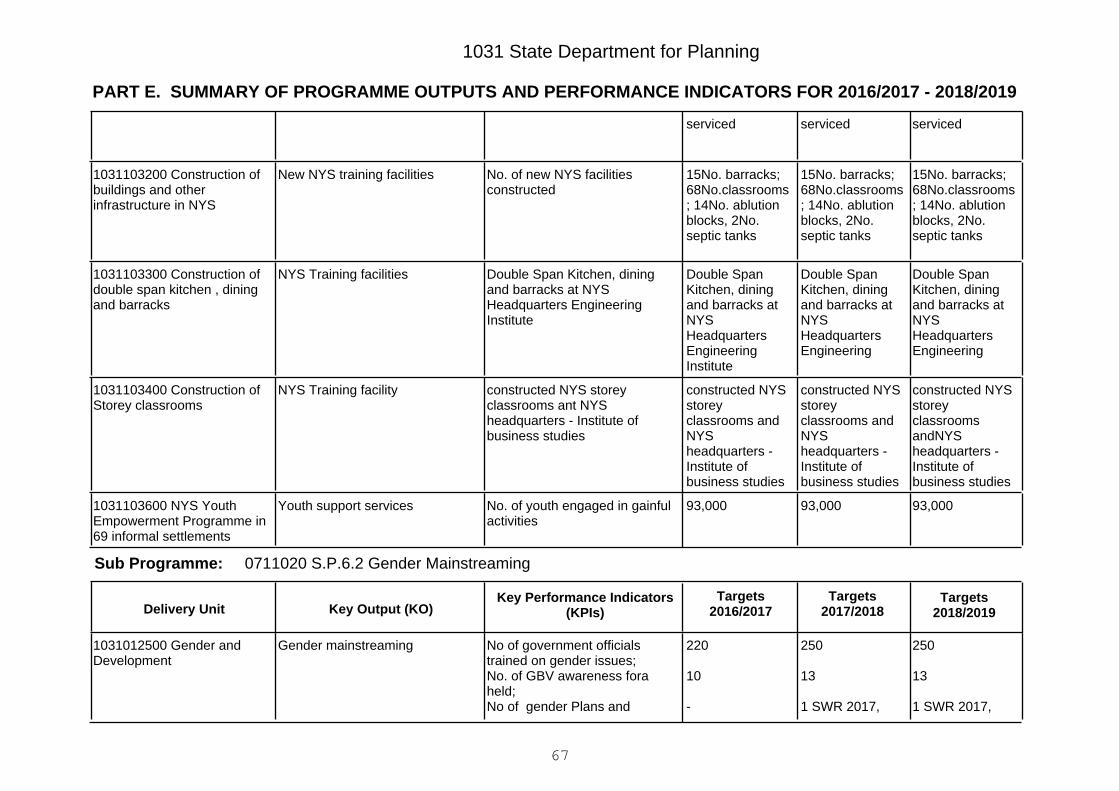
PART E. SUMMARY OF PROGRAMME OUTPUTS AND PERFORMANCE INDICATORS FOR 2016/2017 - 2018/2019
1031 State Department for Planning
servicedservicedserviced
15No. barracks;68No.classrooms; 14No. ablutionblocks, 2No.septic tanks
15No. barracks;68No.classrooms; 14No. ablutionblocks, 2No.septic tanks
15No. barracks;68No.classrooms; 14No. ablutionblocks, 2No.septic tanks
No. of new NYS facilitiesconstructed
New NYS training facilities1031103200 Construction ofbuildings and otherinfrastructure in NYS
Double SpanKitchen, diningand barracks atNYSHeadquartersEngineering
Double SpanKitchen, diningand barracks atNYSHeadquartersEngineering
Double SpanKitchen, diningand barracks atNYSHeadquartersEngineeringInstitute
Double Span Kitchen, diningand barracks at NYSHeadquarters EngineeringInstitute
NYS Training facilities1031103300 Construction ofdouble span kitchen , diningand barracks
constructed NYSstoreyclassroomsandNYSheadquarters -Institute ofbusiness studies
constructed NYSstoreyclassrooms andNYSheadquarters -Institute ofbusiness studies
constructed NYSstoreyclassrooms andNYSheadquarters -Institute ofbusiness studies
constructed NYS storeyclassrooms ant NYSheadquarters - Institute ofbusiness studies
NYS Training facility1031103400 Construction ofStorey classrooms
93,00093,00093,000No. of youth engaged in gainfulactivities
Youth support services1031103600 NYS YouthEmpowerment Programme in69 informal settlements
0711020 S.P.6.2 Gender MainstreamingSub Programme:
Key Output (KO)Targets
2018/2019Targets
2017/2018Key Performance Indicators
(KPIs)Targets
2016/2017Delivery Unit
250
13
1 SWR 2017,
250
13
1 SWR 2017,
220
10
-
No of government officialstrained on gender issues;No. of GBV awareness foraheld;No of gender Plans and
Gender mainstreaming1031012500 Gender andDevelopment
67

PART E. SUMMARY OF PROGRAMME OUTPUTS AND PERFORMANCE INDICATORS FOR 2016/2017 - 2018/2019
1031 State Department for Planning
Action plan forNEP and NGDP
Action plan forNEP and NGDP
Policies developed anddisseminated
171717No. of Anti FGM countycampaign fora held
Anti FGM campaigns1031014100 Anti FGM Board
--1 Status ofWomen Report(SWR)
No of gender Plans andPolicies developed
Gender mainstreaming1031101400 Ministry ofDevolution and PlanningGender Directorate
Kshs. 2.8 billionKshs. 2.8 billionKshs. 2.5 billionAmount disbursed to Womenentrepreneurs through differentloan products
Women empowerment1031104200 WomenEnterprise Fund
0711030 S.P.6.3 Youth Development ServicesSub Programme:
Key Output (KO)Targets
2018/2019Targets
2017/2018Key Performance Indicators
(KPIs)Targets
2016/2017Delivery Unit
111No of Customer and employeeSatisfaction Survey Reports
Administrative services1031009000 GeneralAdministration and PlanningServices
5,000
31,000
5,640
1
5,00
31,000
5,640
1
5,500
30,000
5,170
1
No. of youth mentored onleadership and National Values;No. of youth sensitized onEntrepreneurship skills, andsocial vices;No. of youth engaged ininternships and ApprenticeshipNo. of ICGLR Summitsparticipated/host
Youth support services1031009100 DevelopmentPlanning Services
Ksh 6.5 billionKsh 6.5 billionKsh 6 billionAmount disbursed to Youth,Women and PWDs Groups
Youth, Women and PWDs supportservices
1031010500 YouthDevelopment Services
68

PART E. SUMMARY OF PROGRAMME OUTPUTS AND PERFORMANCE INDICATORS FOR 2016/2017 - 2018/2019
1031 State Department for Planning
5030
5030
6040
No. of YEC Committees trained;No. of YEC established
Youth services1031100600 Kenya YouthEmpowerment
0711040 S.P.6.4 Youth Employment SchemeSub Programme:
Key Output (KO)Targets
2018/2019Targets
2017/2018Key Performance Indicators
(KPIs)Targets
2016/2017Delivery Unit
Kshs. 800 million44,300
Kshs. 800 million44,300
Kshs. 750 million44,200
Amount disbursed to youthgroups;No. of youth trained onentrepreneurship skills
Youth entrepreneurial services1031010500 YouthDevelopment Services
Kshs. 6.5 billionKshs. 6.5 billionKshs. 6 billionAmount disbursed to Youth,Women and PWDs Groups
Youth entrepreneurial services1031103900 YouthEmployment and Enterprises-UWEZO
Kshs. 800 million44,300
Kshs. 800 million44,300
Kshs. 750 million44,200
Amount disbursed to youthgroups;No. of youth trained onentrepreneurship skills
Youth entrepreneurial Services1031104000 Youth EnterpriseDevelopment Fund
0711050 S.P.6.5 Youth Coordination and RepresentationSub Programme:
Key Output (KO)Targets
2018/2019Targets
2017/2018Key Performance Indicators
(KPIs)Targets
2016/2017Delivery Unit
5-
5-
4-
No of youth forums held;NYP 2007 and NYC Actreviewed
Youth services1031010500 YouthDevelopment Services
0711060 S.P.6.6 Gender & Socio-economic empowermentSub Programme:
Key Output (KO)Targets
2018/2019Targets
2017/2018Key Performance Indicators
(KPIs)Targets
2016/2017Delivery Unit
222215No. of forums in counties held tosensitize women entrepreneurson 30% affirmative action on
Affirmative services1031012500 Gender andDevelopment
69

PART E. SUMMARY OF PROGRAMME OUTPUTS AND PERFORMANCE INDICATORS FOR 2016/2017 - 2018/2019
1031 State Department for Planning
-
1
2.8 billion to28,658 groups
175,000
576
Women, Youthand PWDssupportedfinancially;
188
-
1
2.8 billion to28,658 groups
175,000
576
Women, Youthand PWDssupportedfinancially;
188
1
1
2.5 billion to24158 groups
170,000
490
Women, Youthand PWDssupportedfinancially;
188
government procurementpolicies;
Women economicempowerment strategydeveloped and disseminated;
No. of reports on Commissionon Status of Women (CSW)prepared and disseminated;
Amount disbursed and no. ofwomen groups supportedfinancially;No. of Women trained onentrepreneurship skillsNo. of women linked to largeentrepreses
No of Women, Youth and PWDssupported financially;
No of forums held in counties onaffirmative actions programme
111No. of NGO sector reportsprepared
NGO registration and regulationservices
1031013500 Non-Governmental Organizations
302010Gender Based Violence Centresestablished for counseling
Campaigns against Gender BasedViolence
1031014300 Gender Affairs
1
-
1
-
1
1
Report on 30% of Governmenttenders allocated to Youth,Women and PWDs preparedand disseminated;Women economic
Affirmative services1031101800 InstitutionalStrengthening of GenderDirectorate's Role in GenderMa
70
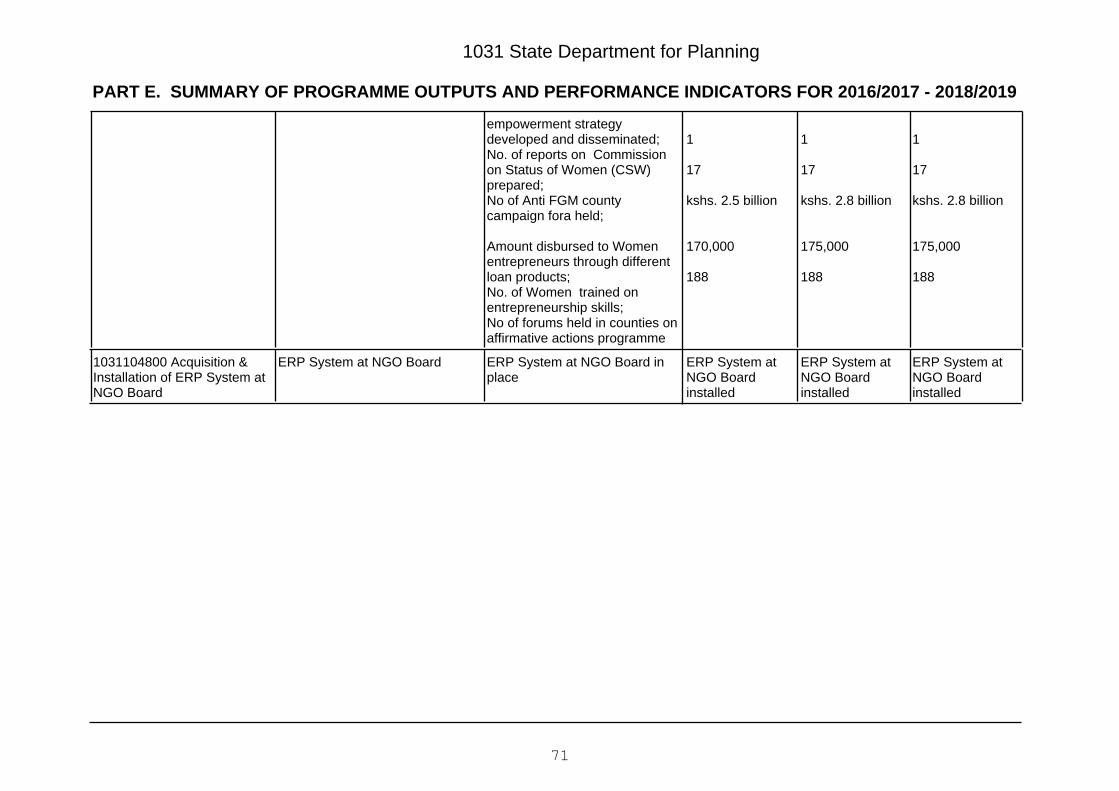
PART E. SUMMARY OF PROGRAMME OUTPUTS AND PERFORMANCE INDICATORS FOR 2016/2017 - 2018/2019
1031 State Department for Planning
1
17
kshs. 2.8 billion
175,000
188
1
17
kshs. 2.8 billion
175,000
188
1
17
kshs. 2.5 billion
170,000
188
empowerment strategydeveloped and disseminated;No. of reports on Commissionon Status of Women (CSW)prepared;No of Anti FGM countycampaign fora held;
Amount disbursed to Womenentrepreneurs through differentloan products;No. of Women trained onentrepreneurship skills;No of forums held in counties onaffirmative actions programme
ERP System atNGO Boardinstalled
ERP System atNGO Boardinstalled
ERP System atNGO Boardinstalled
ERP System at NGO Board inplace
ERP System at NGO Board1031104800 Acquisition &Installation of ERP System atNGO Board
71

Vote 1031 State Department for Planning
PART F: Summary of Expenditure by Programmes, 2016/2017 - 2018/2019
Programme
Estimates Projected Estimates
2016/2017 2017/2018 2018/2019
KShs. KShs. KShs.
0706010 S.P.1.1 Economic Planning Coordination services 148,694,033 164,124,908 171,341,805
0706020 S.P.1.2. Community Development 37,558,474,662 45,118,781,913 48,119,953,519
0706030 S.P.1.3 Macro Economic policy planning and regional integration 531,074,161 572,983,713 578,169,579
0706040 S.P.1.4 Policy Research 390,781,487 430,781,487 430,781,487
0706050 S.P.1.5 Coordination of Vision 2030 205,751,864 263,474,624 267,181,549
0706060 S.P.1.6 Infrastructure, science, technology and innovation 707,962,308 834,885,041 844,305,941
0706000 P1 : Economic Policy and National Planning 39,542,738,515 47,385,031,686 50,411,733,880
0707010 S.P. 2.1. Census and Surveys 858,853,957 858,853,957 841,123,957
0707020 S.P. 2.2 Surveys 2,439,000,000 2,439,000,000 2,439,000,000
0707000 P2 : National Statistical Information Services 3,297,853,957 3,297,853,957 3,280,123,957
0708010 S.P.3.1 National Integrated Monitoring and Evaluation 164,984,195 170,339,400 163,111,976
0708000 P3: Monitoring and Evaluation Services 164,984,195 170,339,400 163,111,976
0709010 S.P.4.1 Human Resources and Support Services 489,136,155 685,586,137 725,390,826
0709020 S.P.4.2 Financial Management Services 106,092,551 123,160,441 116,117,255
0709030 S.P.4.3 Information Communications Services 22,781,617 36,525,693 43,363,916
0709000 P4: General Administration Planning and Support Services 618,010,323 845,272,271 884,871,997
0710010 S.P.5.1 Human Resource Management 3,811,857,843 5,303,949,424 5,277,419,908
72

Vote 1031 State Department for Planning
PART F: Summary of Expenditure by Programmes, 2016/2017 - 2018/2019
Programme
Estimates Projected Estimates
2016/2017 2017/2018 2018/2019
0710020 S.P.5.2 Human Resource Development 737,671,421 995,117,991 1,095,150,809
0710030 S.P.5.3 Management Consultancy Services 76,371,371 80,943,660 79,318,408
0710040 S.P.5.4 Huduma Kenya Service Delivery. 2,421,560,661 2,809,114,661 3,271,664,564
0710050 S.P.5.5 Performance Management 139,144,040 171,725,845 194,860,010
0710000 P 5: Public Service Transformation 7,186,605,336 9,360,851,581 9,918,413,699
0711010 S.P.6.1. National Youth Service 16,864,708,079 28,784,234,952 27,919,410,145
0711020 S.P.6.2 Gender Mainstreaming 1,051,280,266 1,052,147,209 1,052,339,511
0711030 S.P.6.3 Youth Development Services 1,194,253,858 1,260,025,569 1,570,213,345
0711040 S.P.6.4 Youth Employment Scheme 1,096,824,800 1,096,824,800 1,096,824,800
0711050 S.P.6.5 Youth Coordination and Representation 34,200,000 34,200,000 34,200,000
0711060 S.P.6.6 Gender & Socio-economic empowerment 871,583,802 950,422,435 958,220,550
0711000 P6: Gender & Youth Empowerment 21,112,850,805 33,177,854,965 32,631,208,351Total Expenditure for Vote 1031 State Department for Planning 71,923,043,131 94,237,203,860 97,289,463,860
73

1031 State Department for Planning
PART G: Summary of Expenditure by Vote and Economic Classification, 2016/2017 - 2018/2019
Economic Classification
Estimates Projected Estimates
2016/2017 2017/2018 2018/2019KShs. KShs. KShs.
Current Expenditure 18,088,830,671 21,879,685,680 21,886,868,160
Compensation to Employees 6,167,000,000 7,717,940,000 7,822,730,000
Use of Goods and Services 7,122,477,999 9,235,012,157 9,314,939,433
Current Transfers to Govt. Agencies 4,059,000,000 4,058,000,000 4,058,000,000
Other Recurrent 740,352,672 868,733,523 691,198,727
Capital Expenditure 53,834,212,460 72,357,518,180 75,402,595,700
Acquisition of Non-Financial Assets 6,869,631,988 13,687,955,383 13,721,629,397
Capital Grants to Govt. Agencies 39,754,275,947 47,387,275,947 50,369,545,947
Other Development 7,210,304,525 11,282,286,850 11,311,420,356Total Expenditure 71,923,043,131 94,237,203,860 97,289,463,860
74
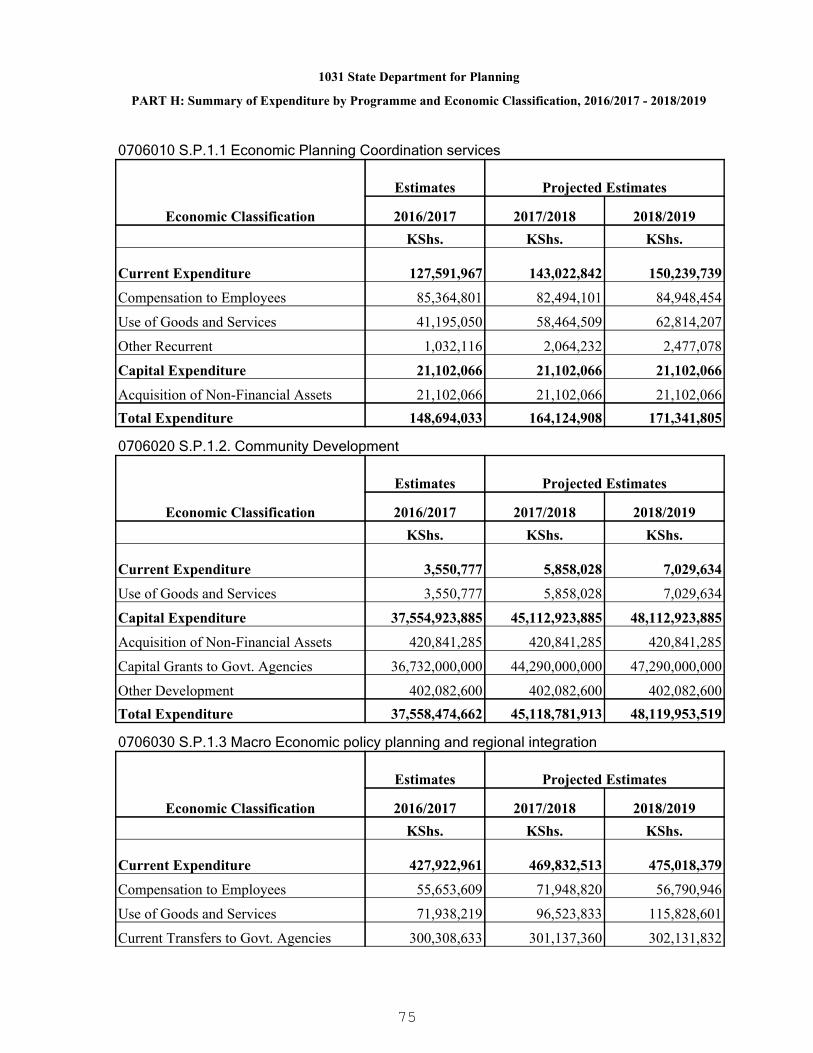
1031 State Department for Planning
PART H: Summary of Expenditure by Programme and Economic Classification, 2016/2017 - 2018/2019
0706010 S.P.1.1 Economic Planning Coordination services
Economic Classification
Estimates Projected Estimates
2016/2017 2017/2018 2018/2019KShs. KShs. KShs.
Current Expenditure 127,591,967 143,022,842 150,239,739
Compensation to Employees 85,364,801 82,494,101 84,948,454
Use of Goods and Services 41,195,050 58,464,509 62,814,207
Other Recurrent 1,032,116 2,064,232 2,477,078
Capital Expenditure 21,102,066 21,102,066 21,102,066
Acquisition of Non-Financial Assets 21,102,066 21,102,066 21,102,066Total Expenditure 148,694,033 164,124,908 171,341,805
0706020 S.P.1.2. Community Development
Economic Classification
Estimates Projected Estimates
2016/2017 2017/2018 2018/2019KShs. KShs. KShs.
Current Expenditure 3,550,777 5,858,028 7,029,634
Use of Goods and Services 3,550,777 5,858,028 7,029,634
Capital Expenditure 37,554,923,885 45,112,923,885 48,112,923,885
Acquisition of Non-Financial Assets 420,841,285 420,841,285 420,841,285
Capital Grants to Govt. Agencies 36,732,000,000 44,290,000,000 47,290,000,000
Other Development 402,082,600 402,082,600 402,082,600Total Expenditure 37,558,474,662 45,118,781,913 48,119,953,519
0706030 S.P.1.3 Macro Economic policy planning and regional integration
Economic Classification
Estimates Projected Estimates
2016/2017 2017/2018 2018/2019KShs. KShs. KShs.
Current Expenditure 427,922,961 469,832,513 475,018,379
Compensation to Employees 55,653,609 71,948,820 56,790,946
Use of Goods and Services 71,938,219 96,523,833 115,828,601
Current Transfers to Govt. Agencies 300,308,633 301,137,360 302,131,832
75

1031 State Department for Planning
PART H: Summary of Expenditure by Programme and Economic Classification, 2016/2017 - 2018/2019
0706030 S.P.1.3 Macro Economic policy planning and regional integration
Economic Classification
Estimates Projected Estimates
2016/2017 2017/2018 2018/2019
Other Recurrent 22,500 222,500 267,000
Capital Expenditure 103,151,200 103,151,200 103,151,200
Acquisition of Non-Financial Assets 103,151,200 103,151,200 103,151,200Total Expenditure 531,074,161 572,983,713 578,169,579
0706040 S.P.1.4 Policy Research
Economic Classification
Estimates Projected Estimates
2016/2017 2017/2018 2018/2019KShs. KShs. KShs.
Current Expenditure 238,545,000 278,545,000 278,545,000
Current Transfers to Govt. Agencies 238,545,000 278,545,000 278,545,000
Capital Expenditure 152,236,487 152,236,487 152,236,487
Capital Grants to Govt. Agencies 152,236,487 152,236,487 152,236,487Total Expenditure 390,781,487 430,781,487 430,781,487
0706050 S.P.1.5 Coordination of Vision 2030
Economic Classification
Estimates Projected Estimates
2016/2017 2017/2018 2018/2019KShs. KShs. KShs.
Current Expenditure 205,751,864 263,474,624 267,181,549
Use of Goods and Services 10,811,864 18,534,624 22,241,549
Current Transfers to Govt. Agencies 194,940,000 244,940,000 244,940,000Total Expenditure 205,751,864 263,474,624 267,181,549
0706060 S.P.1.6 Infrastructure, science, technology and innovation
Economic Classification
Estimates Projected Estimates
2016/2017 2017/2018 2018/2019KShs. KShs. KShs.
Current Expenditure 331,596,942 438,519,675 447,940,575
76
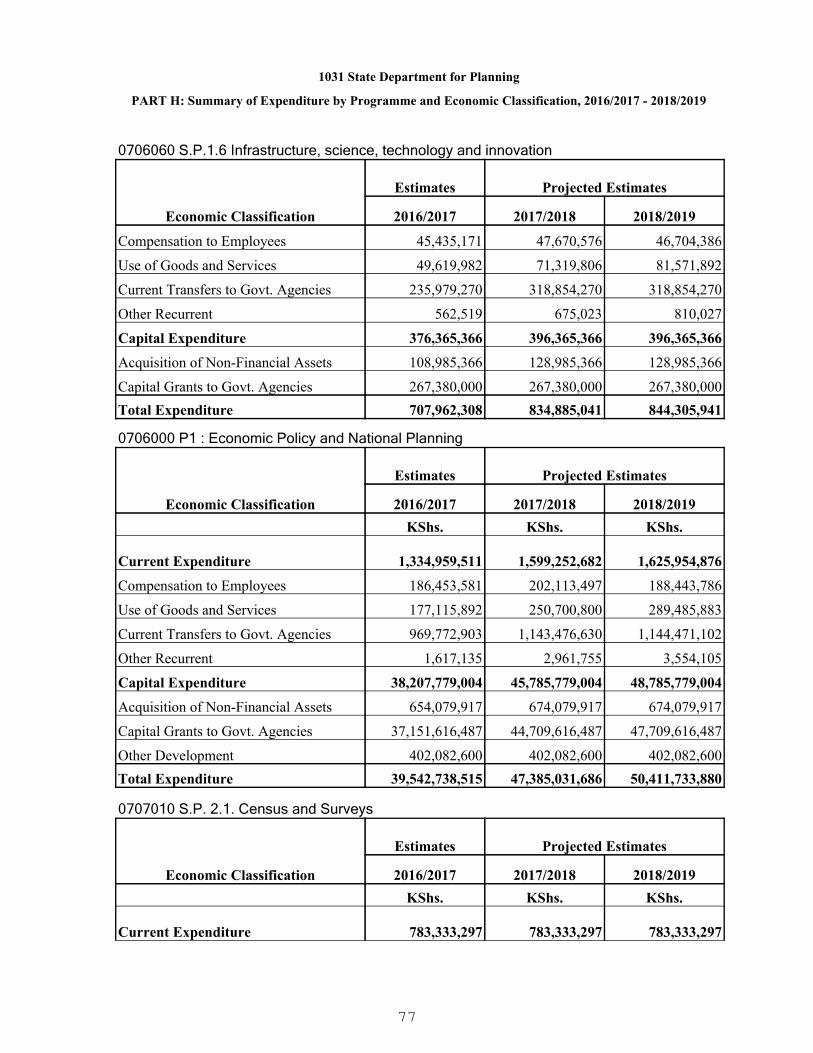
1031 State Department for Planning
PART H: Summary of Expenditure by Programme and Economic Classification, 2016/2017 - 2018/2019
0706060 S.P.1.6 Infrastructure, science, technology and innovation
Economic Classification
Estimates Projected Estimates
2016/2017 2017/2018 2018/2019
Compensation to Employees 45,435,171 47,670,576 46,704,386
Use of Goods and Services 49,619,982 71,319,806 81,571,892
Current Transfers to Govt. Agencies 235,979,270 318,854,270 318,854,270
Other Recurrent 562,519 675,023 810,027
Capital Expenditure 376,365,366 396,365,366 396,365,366
Acquisition of Non-Financial Assets 108,985,366 128,985,366 128,985,366
Capital Grants to Govt. Agencies 267,380,000 267,380,000 267,380,000Total Expenditure 707,962,308 834,885,041 844,305,941
0706000 P1 : Economic Policy and National Planning
Economic Classification
Estimates Projected Estimates
2016/2017 2017/2018 2018/2019KShs. KShs. KShs.
Current Expenditure 1,334,959,511 1,599,252,682 1,625,954,876
Compensation to Employees 186,453,581 202,113,497 188,443,786
Use of Goods and Services 177,115,892 250,700,800 289,485,883
Current Transfers to Govt. Agencies 969,772,903 1,143,476,630 1,144,471,102
Other Recurrent 1,617,135 2,961,755 3,554,105
Capital Expenditure 38,207,779,004 45,785,779,004 48,785,779,004
Acquisition of Non-Financial Assets 654,079,917 674,079,917 674,079,917
Capital Grants to Govt. Agencies 37,151,616,487 44,709,616,487 47,709,616,487
Other Development 402,082,600 402,082,600 402,082,600Total Expenditure 39,542,738,515 47,385,031,686 50,411,733,880
0707010 S.P. 2.1. Census and Surveys
Economic Classification
Estimates Projected Estimates
2016/2017 2017/2018 2018/2019KShs. KShs. KShs.
Current Expenditure 783,333,297 783,333,297 783,333,297
77

1031 State Department for Planning
PART H: Summary of Expenditure by Programme and Economic Classification, 2016/2017 - 2018/2019
0707010 S.P. 2.1. Census and Surveys
Economic Classification
Estimates Projected Estimates
2016/2017 2017/2018 2018/2019
Current Transfers to Govt. Agencies 783,333,297 783,333,297 783,333,297
Capital Expenditure 75,520,660 75,520,660 57,790,660
Capital Grants to Govt. Agencies 75,520,660 75,520,660 57,790,660Total Expenditure 858,853,957 858,853,957 841,123,957
0707020 S.P. 2.2 Surveys
Economic Classification
Estimates Projected Estimates
2016/2017 2017/2018 2018/2019KShs. KShs. KShs.
Current Expenditure 1,050,000,000 1,050,000,000 1,050,000,000
Current Transfers to Govt. Agencies 1,050,000,000 1,050,000,000 1,050,000,000
Capital Expenditure 1,389,000,000 1,389,000,000 1,389,000,000
Capital Grants to Govt. Agencies 1,389,000,000 1,389,000,000 1,389,000,000Total Expenditure 2,439,000,000 2,439,000,000 2,439,000,000
0707000 P2 : National Statistical Information Services
Economic Classification
Estimates Projected Estimates
2016/2017 2017/2018 2018/2019KShs. KShs. KShs.
Current Expenditure 1,833,333,297 1,833,333,297 1,833,333,297
Current Transfers to Govt. Agencies 1,833,333,297 1,833,333,297 1,833,333,297
Capital Expenditure 1,464,520,660 1,464,520,660 1,446,790,660
Capital Grants to Govt. Agencies 1,464,520,660 1,464,520,660 1,446,790,660Total Expenditure 3,297,853,957 3,297,853,957 3,280,123,957
0708010 S.P.3.1 National Integrated Monitoring and Evaluation
Economic Classification
Estimates Projected Estimates
2016/2017 2017/2018 2018/2019KShs. KShs. KShs.
78

1031 State Department for Planning
PART H: Summary of Expenditure by Programme and Economic Classification, 2016/2017 - 2018/2019
0708010 S.P.3.1 National Integrated Monitoring and Evaluation
Economic Classification
Estimates Projected Estimates
2016/2017 2017/2018 2018/2019
Current Expenditure 52,987,395 58,342,600 51,115,176
Compensation to Employees 27,375,593 28,014,234 23,928,072
Use of Goods and Services 25,611,802 30,328,366 27,187,104
Capital Expenditure 111,996,800 111,996,800 111,996,800
Acquisition of Non-Financial Assets 102,569,000 102,569,000 102,569,000
Capital Grants to Govt. Agencies 9,427,800 9,427,800 9,427,800Total Expenditure 164,984,195 170,339,400 163,111,976
0708000 P3: Monitoring and Evaluation Services
Economic Classification
Estimates Projected Estimates
2016/2017 2017/2018 2018/2019KShs. KShs. KShs.
Current Expenditure 52,987,395 58,342,600 51,115,176
Compensation to Employees 27,375,593 28,014,234 23,928,072
Use of Goods and Services 25,611,802 30,328,366 27,187,104
Capital Expenditure 111,996,800 111,996,800 111,996,800
Acquisition of Non-Financial Assets 102,569,000 102,569,000 102,569,000
Capital Grants to Govt. Agencies 9,427,800 9,427,800 9,427,800Total Expenditure 164,984,195 170,339,400 163,111,976
0709010 S.P.4.1 Human Resources and Support Services
Economic Classification
Estimates Projected Estimates
2016/2017 2017/2018 2018/2019KShs. KShs. KShs.
Current Expenditure 454,561,155 551,011,137 590,815,826
Compensation to Employees 148,533,447 183,504,400 158,672,687
Use of Goods and Services 285,885,708 347,364,737 412,143,139
Current Transfers to Govt. Agencies 20,000,000 20,000,000 20,000,000
Other Recurrent 142,000 142,000 -
79

1031 State Department for Planning
PART H: Summary of Expenditure by Programme and Economic Classification, 2016/2017 - 2018/2019
0709010 S.P.4.1 Human Resources and Support Services
Economic Classification
Estimates Projected Estimates
2016/2017 2017/2018 2018/2019
Capital Expenditure 34,575,000 134,575,000 134,575,000
Acquisition of Non-Financial Assets 34,575,000 134,575,000 134,575,000Total Expenditure 489,136,155 685,586,137 725,390,826
0709020 S.P.4.2 Financial Management Services
Economic Classification
Estimates Projected Estimates
2016/2017 2017/2018 2018/2019KShs. KShs. KShs.
Current Expenditure 106,092,551 123,160,441 116,117,255
Compensation to Employees 55,965,632 58,137,842 56,594,656
Use of Goods and Services 50,126,919 65,022,599 59,522,599Total Expenditure 106,092,551 123,160,441 116,117,255
0709030 S.P.4.3 Information Communications Services
Economic Classification
Estimates Projected Estimates
2016/2017 2017/2018 2018/2019KShs. KShs. KShs.
Current Expenditure 22,781,617 36,525,693 43,363,916
Compensation to Employees 2,337,624 2,531,600 2,571,005
Use of Goods and Services 16,255,894 21,994,093 26,392,911
Other Recurrent 4,188,099 12,000,000 14,400,000Total Expenditure 22,781,617 36,525,693 43,363,916
0709000 P4: General Administration Planning and Support Services
Economic Classification
Estimates Projected Estimates
2016/2017 2017/2018 2018/2019KShs. KShs. KShs.
Current Expenditure 583,435,323 710,697,271 750,296,997
Compensation to Employees 206,836,703 244,173,842 217,838,348
80

1031 State Department for Planning
PART H: Summary of Expenditure by Programme and Economic Classification, 2016/2017 - 2018/2019
0709000 P4: General Administration Planning and Support Services
Economic Classification
Estimates Projected Estimates
2016/2017 2017/2018 2018/2019
Use of Goods and Services 352,268,521 434,381,429 498,058,649
Current Transfers to Govt. Agencies 20,000,000 20,000,000 20,000,000
Other Recurrent 4,330,099 12,142,000 14,400,000
Capital Expenditure 34,575,000 134,575,000 134,575,000
Acquisition of Non-Financial Assets 34,575,000 134,575,000 134,575,000Total Expenditure 618,010,323 845,272,271 884,871,997
0710010 S.P.5.1 Human Resource Management
Economic Classification
Estimates Projected Estimates
2016/2017 2017/2018 2018/2019KShs. KShs. KShs.
Current Expenditure 3,780,344,268 5,266,133,134 5,232,040,360
Compensation to Employees 3,402,456,606 4,759,193,760 4,615,730,415
Use of Goods and Services 316,676,296 441,197,767 525,420,016
Other Recurrent 61,211,366 65,741,607 90,889,929
Capital Expenditure 31,513,575 37,816,290 45,379,548
Other Development 31,513,575 37,816,290 45,379,548Total Expenditure 3,811,857,843 5,303,949,424 5,277,419,908
0710020 S.P.5.2 Human Resource Development
Economic Classification
Estimates Projected Estimates
2016/2017 2017/2018 2018/2019KShs. KShs. KShs.
Current Expenditure 607,816,209 661,577,736 694,902,502
Compensation to Employees 245,251,229 259,346,336 265,178,676
Use of Goods and Services 156,607,480 188,084,502 218,731,400
Current Transfers to Govt. Agencies 205,957,500 214,146,898 210,992,426
Capital Expenditure 129,855,212 333,540,255 400,248,307
Acquisition of Non-Financial Assets 129,855,212 333,540,255 400,248,307
81
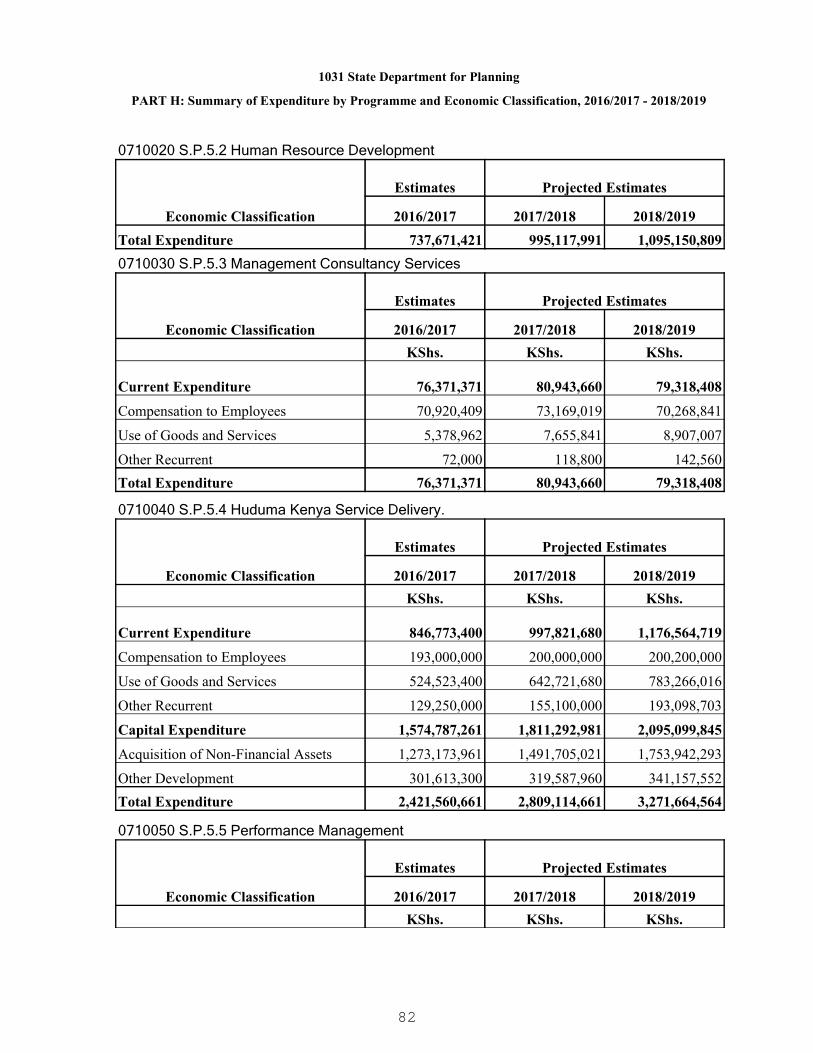
1031 State Department for Planning
PART H: Summary of Expenditure by Programme and Economic Classification, 2016/2017 - 2018/2019
0710020 S.P.5.2 Human Resource Development
Economic Classification
Estimates Projected Estimates
2016/2017 2017/2018 2018/2019Total Expenditure 737,671,421 995,117,991 1,095,150,8090710030 S.P.5.3 Management Consultancy Services
Economic Classification
Estimates Projected Estimates
2016/2017 2017/2018 2018/2019KShs. KShs. KShs.
Current Expenditure 76,371,371 80,943,660 79,318,408
Compensation to Employees 70,920,409 73,169,019 70,268,841
Use of Goods and Services 5,378,962 7,655,841 8,907,007
Other Recurrent 72,000 118,800 142,560Total Expenditure 76,371,371 80,943,660 79,318,408
0710040 S.P.5.4 Huduma Kenya Service Delivery.
Economic Classification
Estimates Projected Estimates
2016/2017 2017/2018 2018/2019KShs. KShs. KShs.
Current Expenditure 846,773,400 997,821,680 1,176,564,719
Compensation to Employees 193,000,000 200,000,000 200,200,000
Use of Goods and Services 524,523,400 642,721,680 783,266,016
Other Recurrent 129,250,000 155,100,000 193,098,703
Capital Expenditure 1,574,787,261 1,811,292,981 2,095,099,845
Acquisition of Non-Financial Assets 1,273,173,961 1,491,705,021 1,753,942,293
Other Development 301,613,300 319,587,960 341,157,552Total Expenditure 2,421,560,661 2,809,114,661 3,271,664,564
0710050 S.P.5.5 Performance Management
Economic Classification
Estimates Projected Estimates
2016/2017 2017/2018 2018/2019KShs. KShs. KShs.
82
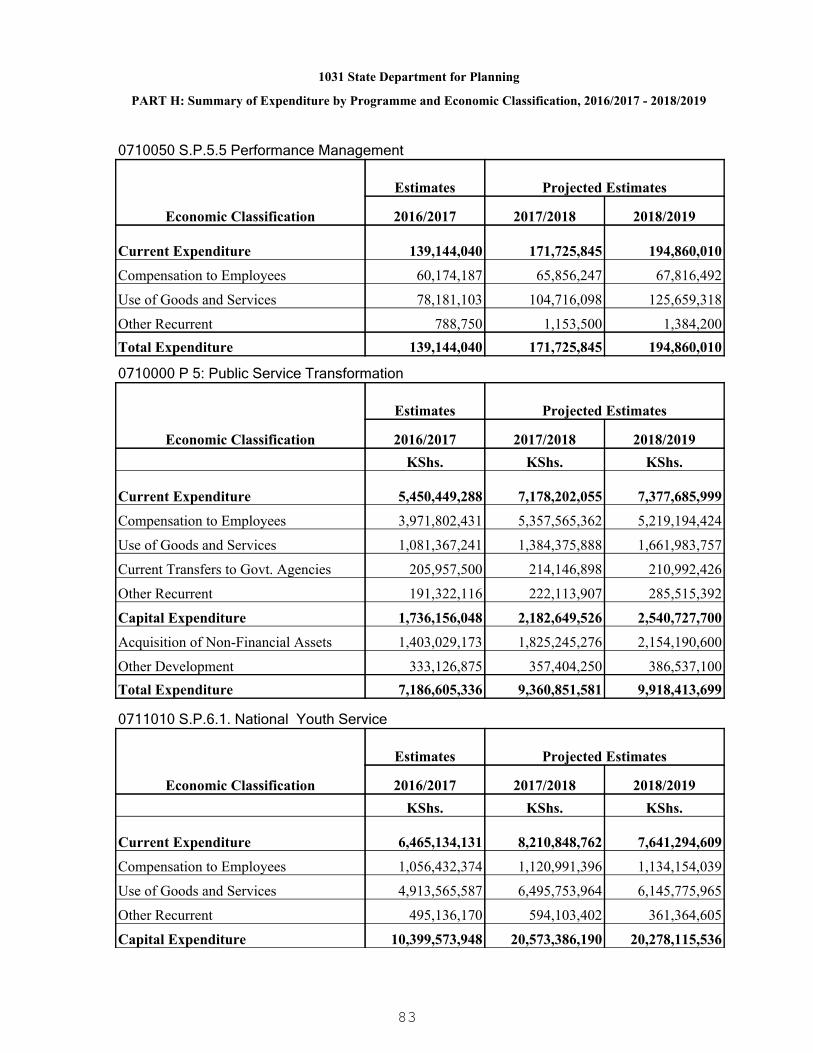
1031 State Department for Planning
PART H: Summary of Expenditure by Programme and Economic Classification, 2016/2017 - 2018/2019
0710050 S.P.5.5 Performance Management
Economic Classification
Estimates Projected Estimates
2016/2017 2017/2018 2018/2019
Current Expenditure 139,144,040 171,725,845 194,860,010
Compensation to Employees 60,174,187 65,856,247 67,816,492
Use of Goods and Services 78,181,103 104,716,098 125,659,318
Other Recurrent 788,750 1,153,500 1,384,200Total Expenditure 139,144,040 171,725,845 194,860,010
0710000 P 5: Public Service Transformation
Economic Classification
Estimates Projected Estimates
2016/2017 2017/2018 2018/2019KShs. KShs. KShs.
Current Expenditure 5,450,449,288 7,178,202,055 7,377,685,999
Compensation to Employees 3,971,802,431 5,357,565,362 5,219,194,424
Use of Goods and Services 1,081,367,241 1,384,375,888 1,661,983,757
Current Transfers to Govt. Agencies 205,957,500 214,146,898 210,992,426
Other Recurrent 191,322,116 222,113,907 285,515,392
Capital Expenditure 1,736,156,048 2,182,649,526 2,540,727,700
Acquisition of Non-Financial Assets 1,403,029,173 1,825,245,276 2,154,190,600
Other Development 333,126,875 357,404,250 386,537,100Total Expenditure 7,186,605,336 9,360,851,581 9,918,413,699
0711010 S.P.6.1. National Youth Service
Economic Classification
Estimates Projected Estimates
2016/2017 2017/2018 2018/2019KShs. KShs. KShs.
Current Expenditure 6,465,134,131 8,210,848,762 7,641,294,609
Compensation to Employees 1,056,432,374 1,120,991,396 1,134,154,039
Use of Goods and Services 4,913,565,587 6,495,753,964 6,145,775,965
Other Recurrent 495,136,170 594,103,402 361,364,605
Capital Expenditure 10,399,573,948 20,573,386,190 20,278,115,536
83

1031 State Department for Planning
PART H: Summary of Expenditure by Programme and Economic Classification, 2016/2017 - 2018/2019
0711010 S.P.6.1. National Youth Service
Economic Classification
Estimates Projected Estimates
2016/2017 2017/2018 2018/2019
Acquisition of Non-Financial Assets 4,608,478,898 10,884,586,190 10,589,314,880
Other Development 5,791,095,050 9,688,800,000 9,688,800,656Total Expenditure 16,864,708,079 28,784,234,952 27,919,410,145
0711020 S.P.6.2 Gender Mainstreaming
Economic Classification
Estimates Projected Estimates
2016/2017 2017/2018 2018/2019KShs. KShs. KShs.
Current Expenditure 226,780,266 227,647,209 227,839,511
Compensation to Employees 19,557,766 20,424,709 20,617,011
Current Transfers to Govt. Agencies 207,222,500 207,222,500 207,222,500
Capital Expenditure 824,500,000 824,500,000 824,500,000
Acquisition of Non-Financial Assets 24,500,000 24,500,000 24,500,000
Capital Grants to Govt. Agencies 323,000,000 323,000,000 323,000,000
Other Development 477,000,000 477,000,000 477,000,000Total Expenditure 1,051,280,266 1,052,147,209 1,052,339,511
0711030 S.P.6.3 Youth Development Services
Economic Classification
Estimates Projected Estimates
2016/2017 2017/2018 2018/2019KShs. KShs. KShs.
Current Expenditure 987,253,858 903,025,569 1,213,213,345
Compensation to Employees 400,541,552 446,656,960 720,554,320
Use of Goods and Services 214,384,306 262,150,009 296,171,705
Current Transfers to Govt. Agencies 371,875,000 193,675,000 195,835,000
Other Recurrent 453,000 543,600 652,320
Capital Expenditure 207,000,000 357,000,000 357,000,000
Other Development 207,000,000 357,000,000 357,000,000Total Expenditure 1,194,253,858 1,260,025,569 1,570,213,345
84

1031 State Department for Planning
PART H: Summary of Expenditure by Programme and Economic Classification, 2016/2017 - 2018/2019
0711040 S.P.6.4 Youth Employment Scheme
Economic Classification
Estimates Projected Estimates
2016/2017 2017/2018 2018/2019KShs. KShs. KShs.
Current Expenditure 291,488,800 291,488,800 291,488,800
Current Transfers to Govt. Agencies 291,488,800 291,488,800 291,488,800
Capital Expenditure 805,336,000 805,336,000 805,336,000
Capital Grants to Govt. Agencies 805,336,000 805,336,000 805,336,000Total Expenditure 1,096,824,800 1,096,824,800 1,096,824,800
0711050 S.P.6.5 Youth Coordination and Representation
Economic Classification
Estimates Projected Estimates
2016/2017 2017/2018 2018/2019KShs. KShs. KShs.
Current Expenditure 34,200,000 34,200,000 34,200,000
Current Transfers to Govt. Agencies 34,200,000 34,200,000 34,200,000Total Expenditure 34,200,000 34,200,000 34,200,000
0711060 S.P.6.6 Gender & Socio-economic empowerment
Economic Classification
Estimates Projected Estimates
2016/2017 2017/2018 2018/2019KShs. KShs. KShs.
Current Expenditure 828,808,802 832,647,435 840,445,550
Compensation to Employees 298,000,000 298,000,000 298,000,000
Use of Goods and Services 358,164,650 377,321,701 396,276,370
Current Transfers to Govt. Agencies 125,150,000 120,456,875 120,456,875
Other Recurrent 47,494,152 36,868,859 25,712,305
Capital Expenditure 42,775,000 117,775,000 117,775,000
Acquisition of Non-Financial Assets 42,400,000 42,400,000 42,400,000
Capital Grants to Govt. Agencies 375,000 75,375,000 75,375,000Total Expenditure 871,583,802 950,422,435 958,220,550
85

1031 State Department for Planning
PART H: Summary of Expenditure by Programme and Economic Classification, 2016/2017 - 2018/2019
0711000 P6: Gender & Youth Empowerment
Economic Classification
Estimates Projected Estimates
2016/2017 2017/2018 2018/2019KShs. KShs. KShs.
Current Expenditure 8,833,665,857 10,499,857,775 10,248,481,815
Compensation to Employees 1,774,531,692 1,886,073,065 2,173,325,370
Use of Goods and Services 5,486,114,543 7,135,225,674 6,838,224,040
Current Transfers to Govt. Agencies 1,029,936,300 847,043,175 849,203,175
Other Recurrent 543,083,322 631,515,861 387,729,230
Capital Expenditure 12,279,184,948 22,677,997,190 22,382,726,536
Acquisition of Non-Financial Assets 4,675,378,898 10,951,486,190 10,656,214,880
Capital Grants to Govt. Agencies 1,128,711,000 1,203,711,000 1,203,711,000
Other Development 6,475,095,050 10,522,800,000 10,522,800,656Total Expenditure 21,112,850,805 33,177,854,965 32,631,208,351
86
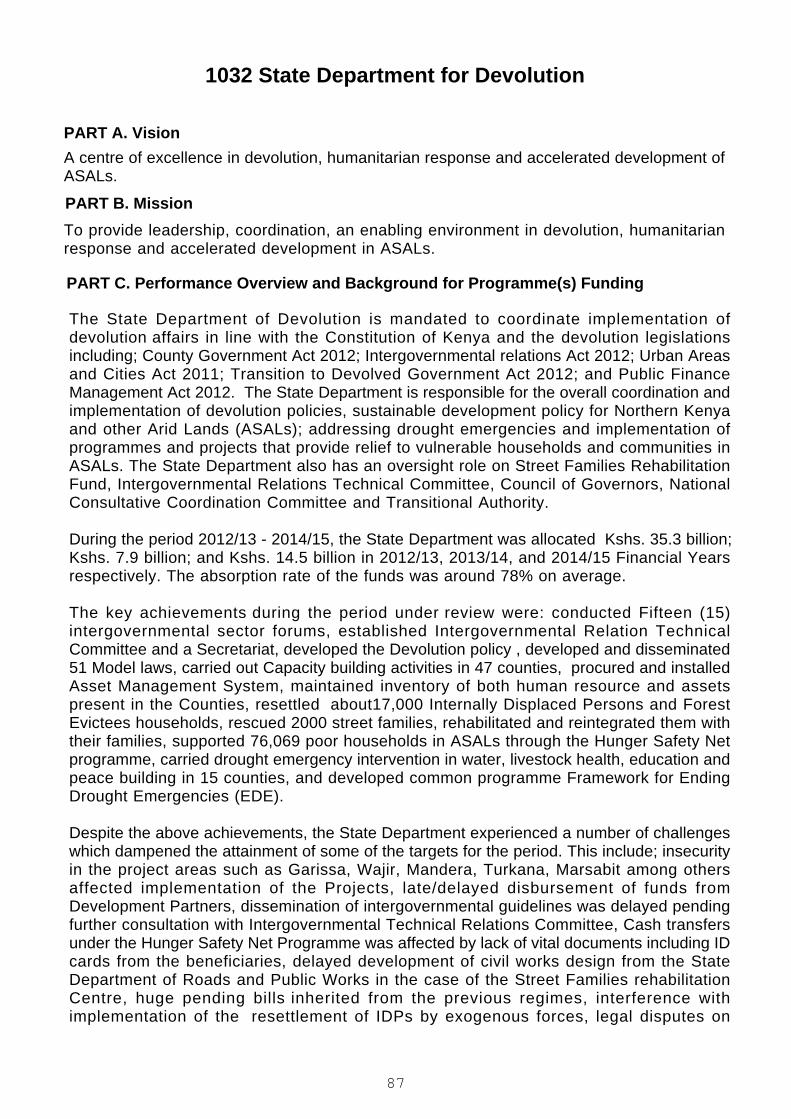
1032 State Department for Devolution
A centre of excellence in devolution, humanitarian response and accelerated development ofASALs.
To provide leadership, coordination, an enabling environment in devolution, humanitarianresponse and accelerated development in ASALs.
PART A. Vision
PART B. Mission
PART C. Performance Overview and Background for Programme(s) Funding
The State Department of Devolution is mandated to coordinate implementation ofdevolution affairs in line with the Constitution of Kenya and the devolution legislationsincluding; County Government Act 2012; Intergovernmental relations Act 2012; Urban Areasand Cities Act 2011; Transition to Devolved Government Act 2012; and Public FinanceManagement Act 2012. The State Department is responsible for the overall coordination andimplementation of devolution policies, sustainable development policy for Northern Kenyaand other Arid Lands (ASALs); addressing drought emergencies and implementation ofprogrammes and projects that provide relief to vulnerable households and communities inASALs. The State Department also has an oversight role on Street Families RehabilitationFund, Intergovernmental Relations Technical Committee, Council of Governors, NationalConsultative Coordination Committee and Transitional Authority.
During the period 2012/13 - 2014/15, the State Department was allocated Kshs. 35.3 billion;Kshs. 7.9 billion; and Kshs. 14.5 billion in 2012/13, 2013/14, and 2014/15 Financial Yearsrespectively. The absorption rate of the funds was around 78% on average.
The key achievements during the period under review were: conducted Fifteen (15)intergovernmental sector forums, established Intergovernmental Relation TechnicalCommittee and a Secretariat, developed the Devolution policy , developed and disseminated51 Model laws, carried out Capacity building activities in 47 counties, procured and installedAsset Management System, maintained inventory of both human resource and assetspresent in the Counties, resettled about17,000 Internally Displaced Persons and ForestEvictees households, rescued 2000 street families, rehabilitated and reintegrated them withtheir families, supported 76,069 poor households in ASALs through the Hunger Safety Netprogramme, carried drought emergency intervention in water, livestock health, education andpeace building in 15 counties, and developed common programme Framework for EndingDrought Emergencies (EDE).
Despite the above achievements, the State Department experienced a number of challengeswhich dampened the attainment of some of the targets for the period. This include; insecurityin the project areas such as Garissa, Wajir, Mandera, Turkana, Marsabit among othersaffected implementation of the Projects, late/delayed disbursement of funds fromDevelopment Partners, dissemination of intergovernmental guidelines was delayed pendingfurther consultation with Intergovernmental Technical Relations Committee, Cash transfersunder the Hunger Safety Net Programme was affected by lack of vital documents including IDcards from the beneficiaries, delayed development of civil works design from the StateDepartment of Roads and Public Works in the case of the Street Families rehabilitationCentre, huge pending bills inherited from the previous regimes, interference withimplementation of the resettlement of IDPs by exogenous forces, legal disputes on
87

1032 State Department for Devolution
PART D. Programme Objectives
Government procured land for resettlement and allegations of ineligible expenditure inWestern Kenya flood mitigation project.
To address the highlighted challenges above, the State Department has adopted e-procurement which reduces procurement bureaucracy and application of exchequer earlyenough to make expenditures in time.
In the period 2016/2017-2018/19 the State Department will undertake the following: continuedoperationalization of devolution/devolved government programmes, operationalize the IDPAct whose NCC Committee came into place in November 2014, construct a Rehabilitationcentre, procure food and non-food items to cater for 1.3 million Kenyans in need of relief foodand 1000 people on emergency situation, initiate various programmes and projects toaddress the Arid and Semi-Arid regions of the country including Hunger safety net cashtransfer to 830,000 people, respond to drought through Drought Contingency Funds anddrought early information collection and dissemination, develop a human resourceinformation system, undertake capacity building for public officers and improve workenvironment. The State Department will also put emphasize in the implementation andmonitoring of the MTP II and other key sector policies.
ObjectiveProgramme
0712000 P7: DevolutionServices
To strengthen capacity of County Governments andpromote Intergovernmental relations.
0713000 P 8: SpecialInitiatives
To provide humanitarian response, rehabil i tat ion,reconstruction and re-integration of affected individuals andcommunities
0732000 P.3 GeneralAdministration, Planningand Support Services
To provide efficient administrative services to supporteffective execution of technical mandates of the StateDepartment
0733000 P.9 AcceleratedASAL Development
To ensure accelerated and sustained socio-economicdevelopment in the ASALs, build community resilience andend drought emergencies in Kenya
88
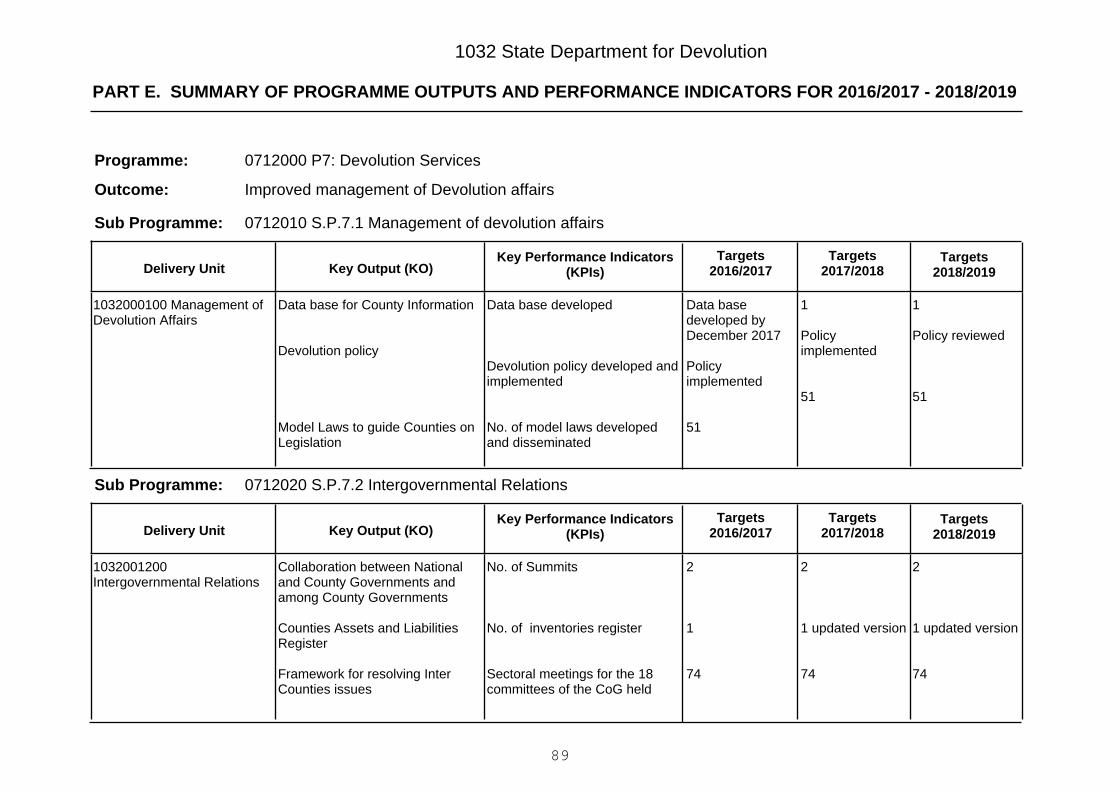
PART E. SUMMARY OF PROGRAMME OUTPUTS AND PERFORMANCE INDICATORS FOR 2016/2017 - 2018/2019
1032 State Department for Devolution
0712000 P7: Devolution Services
Improved management of Devolution affairs
Programme:
Outcome:
0712010 S.P.7.1 Management of devolution affairsSub Programme:
Key Output (KO)Targets
2018/2019Targets
2017/2018Key Performance Indicators
(KPIs)Targets
2016/2017Delivery Unit
1
Policy reviewed
51
1
Policyimplemented
51
Data basedeveloped byDecember 2017
Policyimplemented
51
Data base developed
Devolution policy developed andimplemented
No. of model laws developedand disseminated
Data base for County Information
Devolution policy
Model Laws to guide Counties onLegislation
1032000100 Management ofDevolution Affairs
0712020 S.P.7.2 Intergovernmental RelationsSub Programme:
Key Output (KO)Targets
2018/2019Targets
2017/2018Key Performance Indicators
(KPIs)Targets
2016/2017Delivery Unit
2
1 updated version
74
2
1 updated version
74
2
1
74
No. of Summits
No. of inventories register
Sectoral meetings for the 18committees of the CoG held
Collaboration between Nationaland County Governments andamong County Governments
Counties Assets and LiabilitiesRegister
Framework for resolving InterCounties issues
1032001200Intergovernmental Relations
89
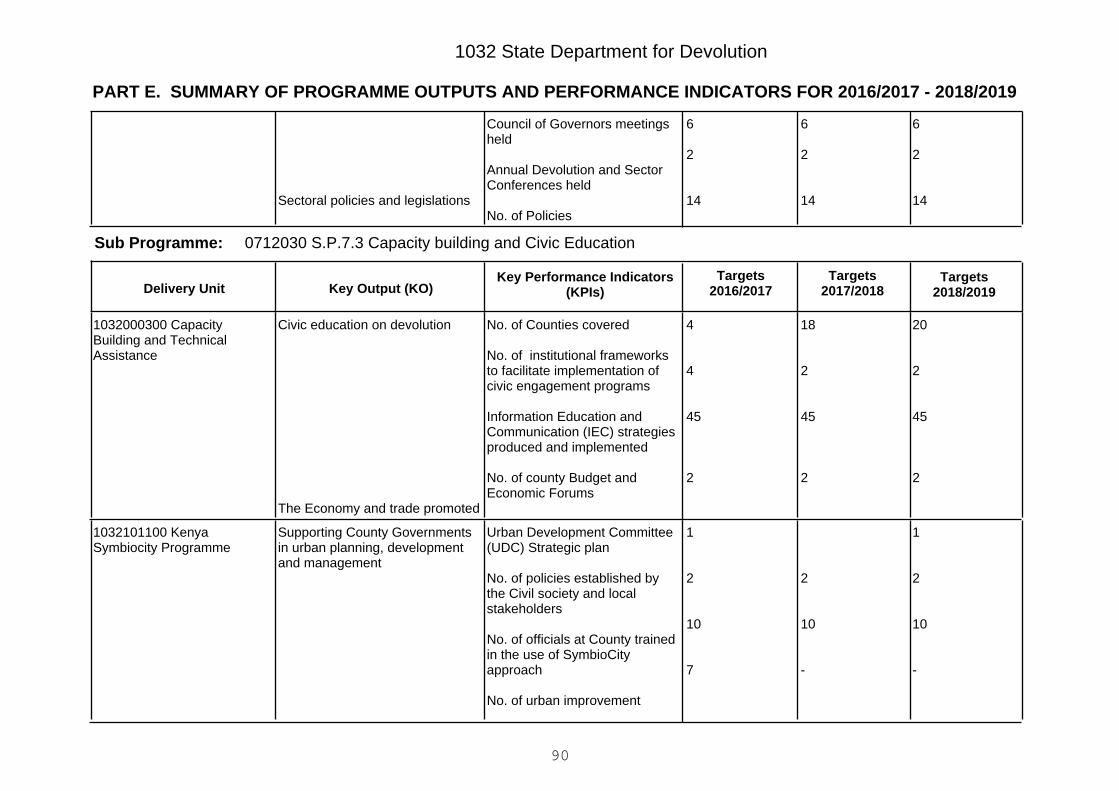
PART E. SUMMARY OF PROGRAMME OUTPUTS AND PERFORMANCE INDICATORS FOR 2016/2017 - 2018/2019
1032 State Department for Devolution
6
2
14
6
2
14
6
2
14
Council of Governors meetingsheld
Annual Devolution and SectorConferences held
No. of PoliciesSectoral policies and legislations
0712030 S.P.7.3 Capacity building and Civic EducationSub Programme:
Key Output (KO)Targets
2018/2019Targets
2017/2018Key Performance Indicators
(KPIs)Targets
2016/2017Delivery Unit
20
2
45
2
18
2
45
2
4
4
45
2
No. of Counties covered
No. of institutional frameworksto facilitate implementation ofcivic engagement programs
Information Education andCommunication (IEC) strategiesproduced and implemented
No. of county Budget andEconomic Forums
Civic education on devolution
The Economy and trade promoted
1032000300 CapacityBuilding and TechnicalAssistance
1
2
10
-
2
10
-
1
2
10
7
Urban Development Committee(UDC) Strategic plan
No. of policies established bythe Civil society and localstakeholders
No. of officials at County trainedin the use of SymbioCityapproach
No. of urban improvement
Supporting County Governmentsin urban planning, developmentand management
1032101100 KenyaSymbiocity Programme
90
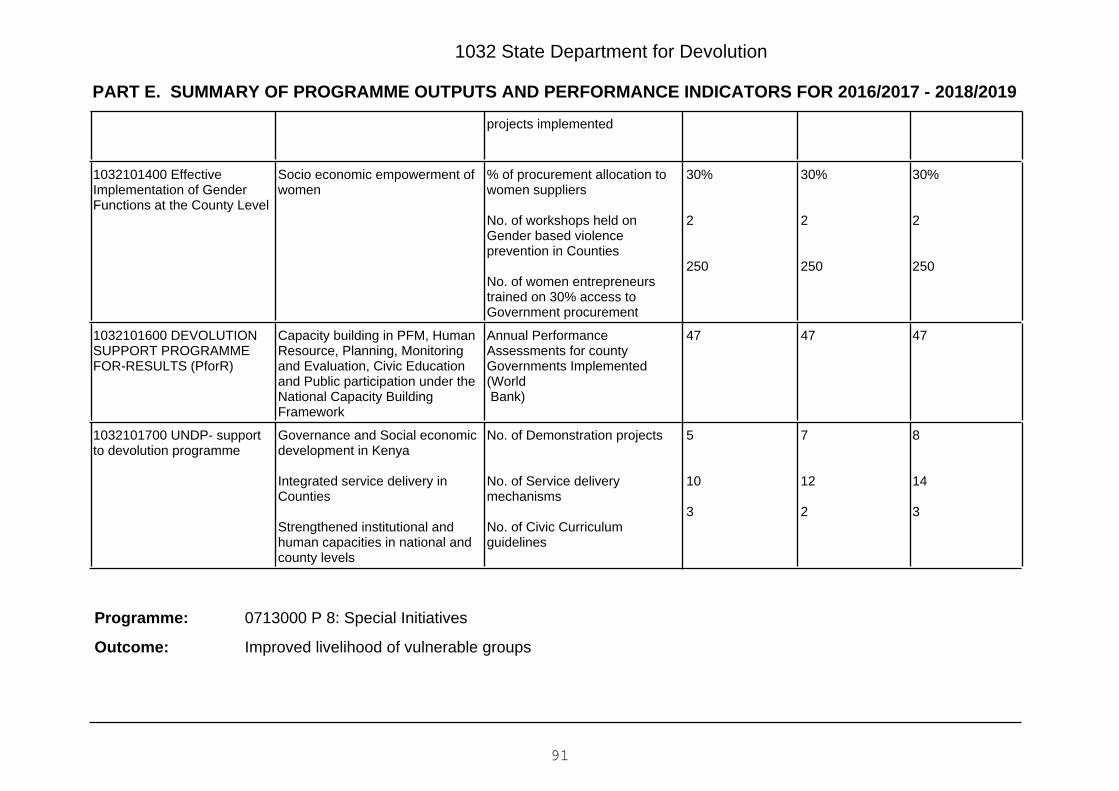
PART E. SUMMARY OF PROGRAMME OUTPUTS AND PERFORMANCE INDICATORS FOR 2016/2017 - 2018/2019
1032 State Department for Devolution
projects implemented
30%
2
250
30%
2
250
30%
2
250
% of procurement allocation towomen suppliers
No. of workshops held onGender based violenceprevention in Counties
No. of women entrepreneurstrained on 30% access toGovernment procurement
Socio economic empowerment ofwomen
1032101400 EffectiveImplementation of GenderFunctions at the County Level
474747Annual PerformanceAssessments for countyGovernments Implemented(World Bank)
Capacity building in PFM, HumanResource, Planning, Monitoringand Evaluation, Civic Educationand Public participation under theNational Capacity BuildingFramework
1032101600 DEVOLUTIONSUPPORT PROGRAMMEFOR-RESULTS (PforR)
8
14
3
7
12
2
5
10
3
No. of Demonstration projects
No. of Service deliverymechanisms
No. of Civic Curriculumguidelines
Governance and Social economicdevelopment in Kenya
Integrated service delivery inCounties
Strengthened institutional andhuman capacities in national andcounty levels
1032101700 UNDP- supportto devolution programme
0713000 P 8: Special Initiatives
Improved livelihood of vulnerable groups
Programme:
Outcome:
91

PART E. SUMMARY OF PROGRAMME OUTPUTS AND PERFORMANCE INDICATORS FOR 2016/2017 - 2018/2019
1032 State Department for Devolution
0713010 S.P.8.1 Relief & RehabilitationSub Programme:
Key Output (KO)Targets
2018/2019Targets
2017/2018Key Performance Indicators
(KPIs)Targets
2016/2017Delivery Unit
2
1,000
2
1,000
2
1,000
No. of Food Security Reports
No. of people covered bystrategic Non-Food reserve
Social safety net support services1032001000 Relief andRehabilitation
65
60
50
60
55
45
50
50
40
% of Customer Satisfaction
% of Employee Satisfaction
% of Work Environmentsatisfaction
Administrative Services1032001100 GeneralAdministrative Services -Special Programmes
0713020 S.P.8.2 Resettlement & ReconstructionSub Programme:
Key Output (KO)Targets
2018/2019Targets
2017/2018Key Performance Indicators
(KPIs)Targets
2016/2017Delivery Unit
1 UpdatedVersion
1 UpdatedVersion
1 UpdatedVersion
No. of IDPs RegisterIDPs Register1032001400 Resettlementand Reconstruction
40,64833,64828,573No. of IDPs resettledResettled IDP households1032102600 Resettlement ofIDPs and Restorative Justice
0713040 8.4 Family Protection - Street FamiliesSub Programme:
Key Output (KO)Targets
2018/2019Targets
2017/2018Key Performance Indicators
(KPIs)Targets
2016/2017Delivery Unit
92

PART E. SUMMARY OF PROGRAMME OUTPUTS AND PERFORMANCE INDICATORS FOR 2016/2017 - 2018/2019
1032 State Department for Devolution
-
3,500
3,000
1,500
-
3,500
3,000
1,500
Final Policy
3,500
3,000
1,500
National policy on Streetfamilies
No. of street families providedwith rescue facilities.
No. of Street childrenreintegrated with their families
No. of street children sponsoredon education or Vocationaltraining
Street families rescued andrehabilitated
1032001300 FamilyProtection - Street Families
1006030% CompletionA rehabilitation centre1032102000 Model StreetFamilies Rehabilitation Centre
0732000 P.3 General Administration, Planning and Support Services
Efficient and Effective Services
Programme:
Outcome:
0732010 SP 3.1 Human Resource and Support ServicesSub Programme:
Key Output (KO)Targets
2018/2019Targets
2017/2018Key Performance Indicators
(KPIs)Targets
2016/2017Delivery Unit
75
75
50
70
70
45
65
65
40
% of Customer Satisfaction
% of Employee Satisfaction
% of Work Environmentsatisfaction
Administrative Services1032000400 Headquartersand Administrative Services
93
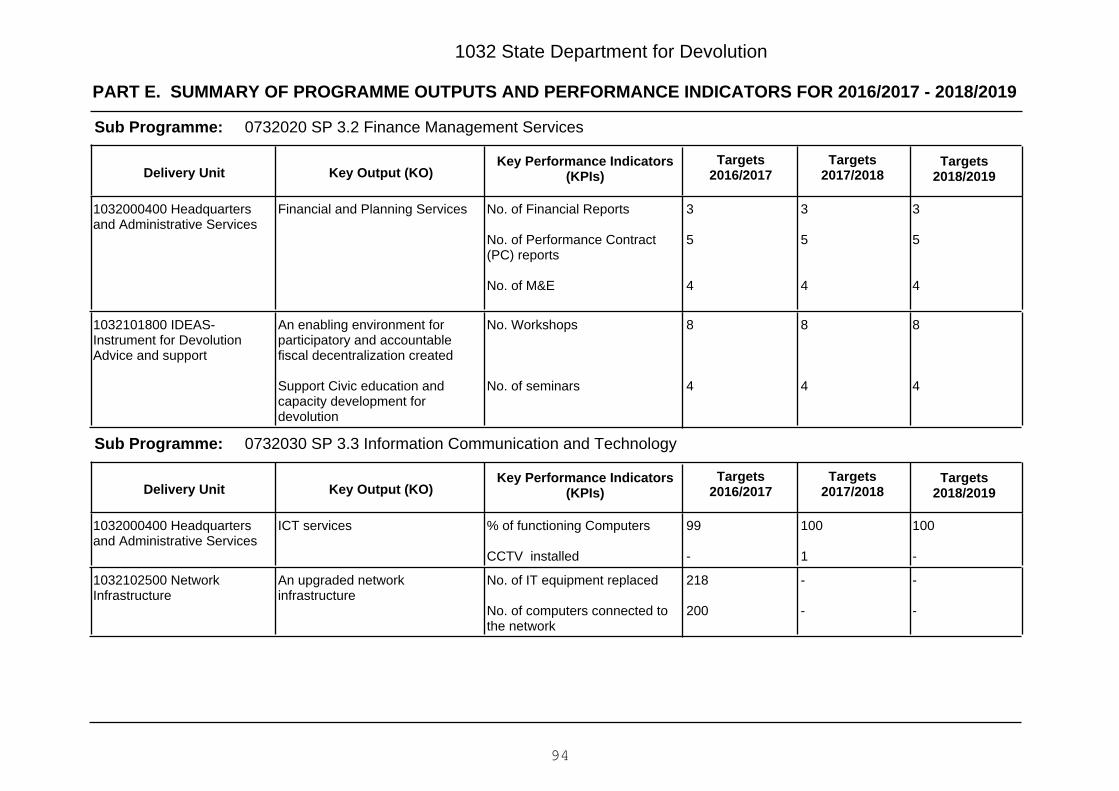
PART E. SUMMARY OF PROGRAMME OUTPUTS AND PERFORMANCE INDICATORS FOR 2016/2017 - 2018/2019
1032 State Department for Devolution
0732020 SP 3.2 Finance Management ServicesSub Programme:
Key Output (KO)Targets
2018/2019Targets
2017/2018Key Performance Indicators
(KPIs)Targets
2016/2017Delivery Unit
3
5
4
3
5
4
3
5
4
No. of Financial Reports
No. of Performance Contract(PC) reports
No. of M&E
Financial and Planning Services1032000400 Headquartersand Administrative Services
8
4
8
4
8
4
No. Workshops
No. of seminars
An enabling environment forparticipatory and accountablefiscal decentralization created
Support Civic education andcapacity development fordevolution
1032101800 IDEAS-Instrument for DevolutionAdvice and support
0732030 SP 3.3 Information Communication and TechnologySub Programme:
Key Output (KO)Targets
2018/2019Targets
2017/2018Key Performance Indicators
(KPIs)Targets
2016/2017Delivery Unit
100
-
100
1
99
-
% of functioning Computers
CCTV installed
ICT services1032000400 Headquartersand Administrative Services
-
-
-
-
218
200
No. of IT equipment replaced
No. of computers connected tothe network
An upgraded networkinfrastructure
1032102500 NetworkInfrastructure
94

PART E. SUMMARY OF PROGRAMME OUTPUTS AND PERFORMANCE INDICATORS FOR 2016/2017 - 2018/2019
1032 State Department for Devolution
0733000 P.9 Accelerated ASAL Development
Improved standard of living of communities in Arid Areas
Programme:
Outcome:
0733010 SP.1 ASAL DevelopmentSub Programme:
Key Output (KO)Targets
2018/2019Targets
2017/2018Key Performance Indicators
(KPIs)Targets
2016/2017Delivery Unit
-
-
1
18
-
-
1
8
-
-
1
10
No. of operational ASALinstitutions
The ASAL Policy
No. of policies reviewed andimplemented
No. of Sectoral policiesreviewed and Implemented
Administrative Services1032000600 Arid ResourceManagement Project
5
40
7
5
30
7
5
20
7
No of projects supportingcommunity resilience in ASALs
No. of institutions accessingASAL GIS data from theKnowledge Management Centre
No of ASAL transformationstructures supported
ASAL development effortsaccelerated
1032102300 Medium TermAsal Programme(MTAP111)
-10075% of completionSewerage Services1032102400 Construction ofVarious works for WajirSewerage Project Phase IV
95

PART E. SUMMARY OF PROGRAMME OUTPUTS AND PERFORMANCE INDICATORS FOR 2016/2017 - 2018/2019
1032 State Department for Devolution
0733020 SP.2 Drought ManagementSub Programme:
Key Output (KO)Targets
2018/2019Targets
2017/2018Key Performance Indicators
(KPIs)Targets
2016/2017Delivery Unit
24
23
24
23
24
23
No. of drought coordinationstructures
No. of County Steering GroupMeetings
Drought coordination structuresoperationalized and strengthenedat national and county levels
1032000600 Arid ResourceManagement Project
100,000
150,000
100,000
150,000
100,000
150,000
No. of households receivingregular cash transfers
No. of households receivingcash transfers under the scaleup program
Hunger Safety Net Services -ASAL Counties
1032100300 Kenya HungerSafety Net Programme
70
23
10
6
70
23
10
8
46
23
8
10
No. of food security reports
No. of Drought CountyContingency Plans
No. of preparedness micro-projects implemented
No. of counties receivingsupport for drought emergencyresponse from NDMA
Food Security AssessmentReports
Drought Contingency PlansProduced for ASAL Counties
Counties supported with droughtpreparedness micro-projects
County drought emergencyresponse initiatives financed
1032100600 KRDP ASALDrought Contingency FundProject
124,214
3,000
124,214
3,000
124,214
3,000
No. of vulnerable householdsbenefitting from asset creationand resilience buildinginterventions
No. of community based micro-projects implemented
Resilience of communities builtthrough creation of assets
Save lives and protect livelihoodsin emergencies
1032101200 Protracted Reliefand Recovery
96
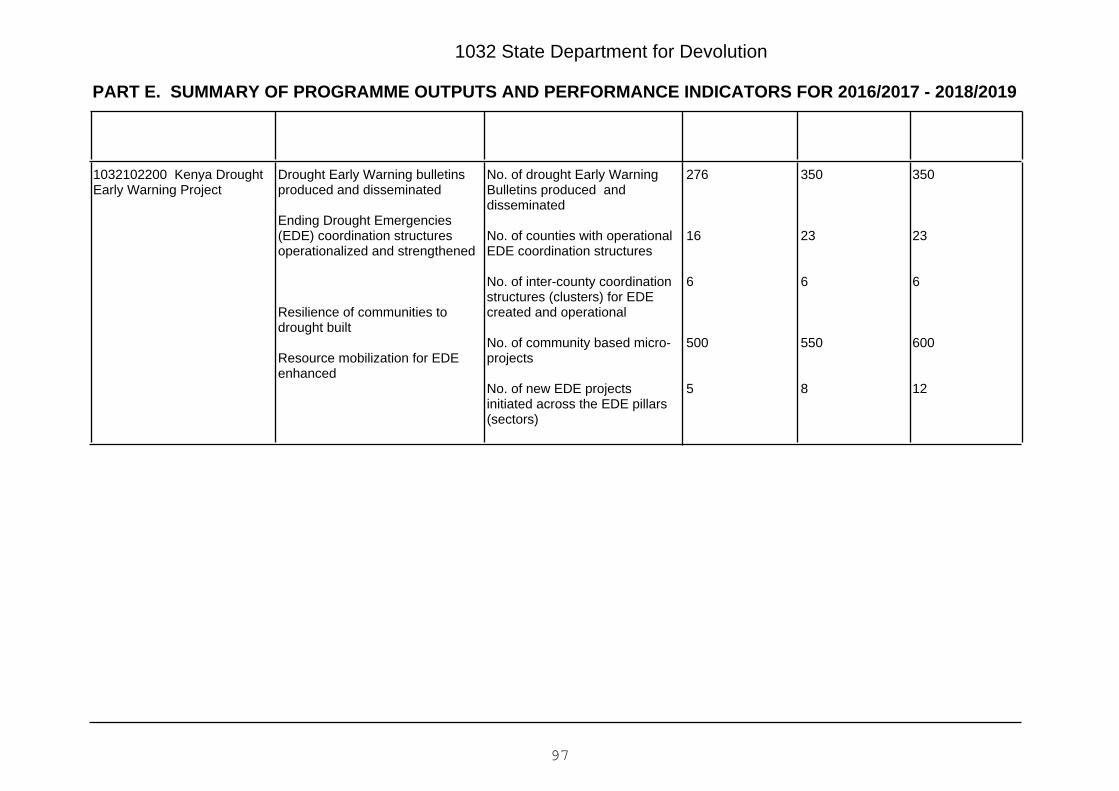
PART E. SUMMARY OF PROGRAMME OUTPUTS AND PERFORMANCE INDICATORS FOR 2016/2017 - 2018/2019
1032 State Department for Devolution
350
23
6
600
12
350
23
6
550
8
276
16
6
500
5
No. of drought Early WarningBulletins produced anddisseminated
No. of counties with operationalEDE coordination structures
No. of inter-county coordinationstructures (clusters) for EDEcreated and operational
No. of community based micro-projects
No. of new EDE projectsinitiated across the EDE pillars(sectors)
Drought Early Warning bulletinsproduced and disseminated
Ending Drought Emergencies(EDE) coordination structuresoperationalized and strengthened
Resilience of communities todrought built
Resource mobilization for EDEenhanced
1032102200 Kenya DroughtEarly Warning Project
97

Vote 1032 State Department for Devolution
PART F: Summary of Expenditure by Programmes, 2016/2017 - 2018/2019
Programme
Estimates Projected Estimates
2016/2017 2017/2018 2018/2019
KShs. KShs. KShs.
0712010 S.P.7.1 Management of devolution affairs 86,649,492 306,560,211 342,523,082
0712020 S.P.7.2 Intergovernmental Relations 413,826,250 503,600,000 523,924,622
0712030 S.P.7.3 Capacity building and Civic Education 2,318,964,060 2,268,495,000 2,167,285,000
0712000 P7: Devolution Services 2,819,439,802 3,078,655,211 3,033,732,704
0713010 S.P.8.1 Relief & Rehabilitation 432,245,586 1,611,877,514 2,350,297,895
0713020 S.P.8.2 Resettlement & Reconstruction 6,012,623,250 1,055,830,404 1,064,530,404
0713040 8.4 Family Protection - Street Families 456,952,100 708,275,000 677,275,000
0713000 P 8: Special Initiatives 6,901,820,936 3,375,982,918 4,092,103,299
0732010 SP 3.1 Human Resource and Support Services 196,394,540 340,030,045 391,207,742
0732020 SP 3.2 Finance Management Services 107,381,400 118,360,000 34,150,000
0732030 SP 3.3 Information Communication and Technology 26,435,750 20,270,000 28,820,000
0732000 P.3 General Administration, Planning and Support Services 330,211,690 478,660,045 454,177,742
0733010 SP.1 ASAL Development 189,738,490 441,750,428 214,917,015
0733020 SP.2 Drought Management 5,630,220,401 3,450,961,398 1,708,089,240
0733000 P.9 Accelerated ASAL Development 5,819,958,891 3,892,711,826 1,923,006,255Total Expenditure for Vote 1032 State Department for Devolution 15,871,431,319 10,826,010,000 9,503,020,000
98

1032 State Department for Devolution
PART G: Summary of Expenditure by Vote and Economic Classification, 2016/2017 - 2018/2019
Economic Classification
Estimates Projected Estimates
2016/2017 2017/2018 2018/2019KShs. KShs. KShs.
Current Expenditure 2,144,085,989 3,775,850,000 4,805,520,000
Compensation to Employees 309,158,191 392,490,443 392,515,575
Use of Goods and Services 443,324,377 904,356,785 1,205,417,360
Current Transfers to Govt. Agencies 1,379,383,421 2,442,823,339 3,188,587,065
Other Recurrent 12,220,000 36,179,433 19,000,000
Capital Expenditure 13,727,345,330 7,050,160,000 4,697,500,000
Acquisition of Non-Financial Assets 242,000,000 666,000,000 302,000,000
Capital Grants to Govt. Agencies 12,660,645,330 5,607,660,000 3,699,000,000
Other Development 824,700,000 776,500,000 696,500,000Total Expenditure 15,871,431,319 10,826,010,000 9,503,020,000
99

1032 State Department for Devolution
PART H: Summary of Expenditure by Programme and Economic Classification, 2016/2017 - 2018/2019
0712010 S.P.7.1 Management of devolution affairs
Economic Classification
Estimates Projected Estimates
2016/2017 2017/2018 2018/2019KShs. KShs. KShs.
Current Expenditure 86,649,492 256,560,211 311,023,082
Compensation to Employees 66,977,004 84,062,061 80,969,932
Use of Goods and Services 19,672,488 172,498,150 230,053,150
Capital Expenditure - 50,000,000 31,500,000
Other Development - 50,000,000 31,500,000Total Expenditure 86,649,492 306,560,211 342,523,082
0712020 S.P.7.2 Intergovernmental Relations
Economic Classification
Estimates Projected Estimates
2016/2017 2017/2018 2018/2019KShs. KShs. KShs.
Current Expenditure 413,826,250 503,600,000 523,924,622
Use of Goods and Services 5,470,000 33,600,000 50,300,000
Current Transfers to Govt. Agencies 408,356,250 470,000,000 473,624,622Total Expenditure 413,826,250 503,600,000 523,924,622
0712030 S.P.7.3 Capacity building and Civic Education
Economic Classification
Estimates Projected Estimates
2016/2017 2017/2018 2018/2019KShs. KShs. KShs.
Current Expenditure 14,964,060 26,035,000 27,285,000
Use of Goods and Services 14,964,060 26,035,000 27,285,000
Capital Expenditure 2,304,000,000 2,242,460,000 2,140,000,000
Capital Grants to Govt. Agencies 1,614,300,000 1,635,960,000 1,500,000,000
Other Development 689,700,000 606,500,000 640,000,000Total Expenditure 2,318,964,060 2,268,495,000 2,167,285,000
100
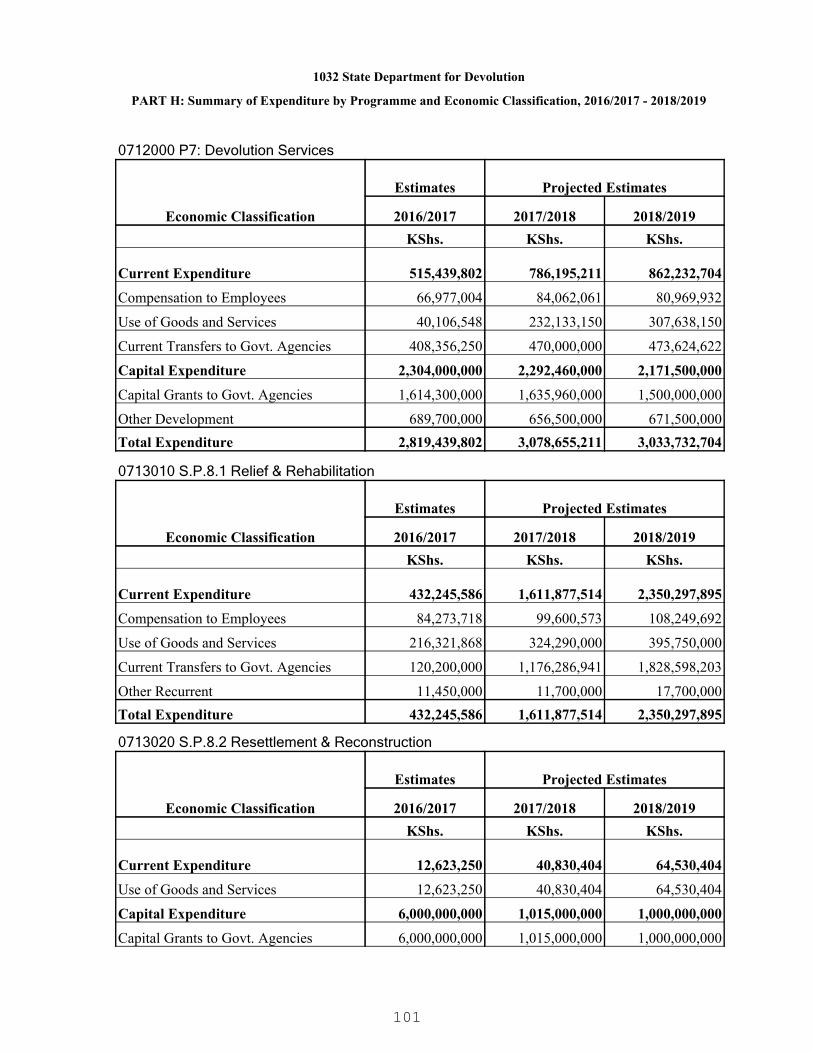
1032 State Department for Devolution
PART H: Summary of Expenditure by Programme and Economic Classification, 2016/2017 - 2018/2019
0712000 P7: Devolution Services
Economic Classification
Estimates Projected Estimates
2016/2017 2017/2018 2018/2019KShs. KShs. KShs.
Current Expenditure 515,439,802 786,195,211 862,232,704
Compensation to Employees 66,977,004 84,062,061 80,969,932
Use of Goods and Services 40,106,548 232,133,150 307,638,150
Current Transfers to Govt. Agencies 408,356,250 470,000,000 473,624,622
Capital Expenditure 2,304,000,000 2,292,460,000 2,171,500,000
Capital Grants to Govt. Agencies 1,614,300,000 1,635,960,000 1,500,000,000
Other Development 689,700,000 656,500,000 671,500,000Total Expenditure 2,819,439,802 3,078,655,211 3,033,732,704
0713010 S.P.8.1 Relief & Rehabilitation
Economic Classification
Estimates Projected Estimates
2016/2017 2017/2018 2018/2019KShs. KShs. KShs.
Current Expenditure 432,245,586 1,611,877,514 2,350,297,895
Compensation to Employees 84,273,718 99,600,573 108,249,692
Use of Goods and Services 216,321,868 324,290,000 395,750,000
Current Transfers to Govt. Agencies 120,200,000 1,176,286,941 1,828,598,203
Other Recurrent 11,450,000 11,700,000 17,700,000Total Expenditure 432,245,586 1,611,877,514 2,350,297,895
0713020 S.P.8.2 Resettlement & Reconstruction
Economic Classification
Estimates Projected Estimates
2016/2017 2017/2018 2018/2019KShs. KShs. KShs.
Current Expenditure 12,623,250 40,830,404 64,530,404
Use of Goods and Services 12,623,250 40,830,404 64,530,404
Capital Expenditure 6,000,000,000 1,015,000,000 1,000,000,000
Capital Grants to Govt. Agencies 6,000,000,000 1,015,000,000 1,000,000,000
101
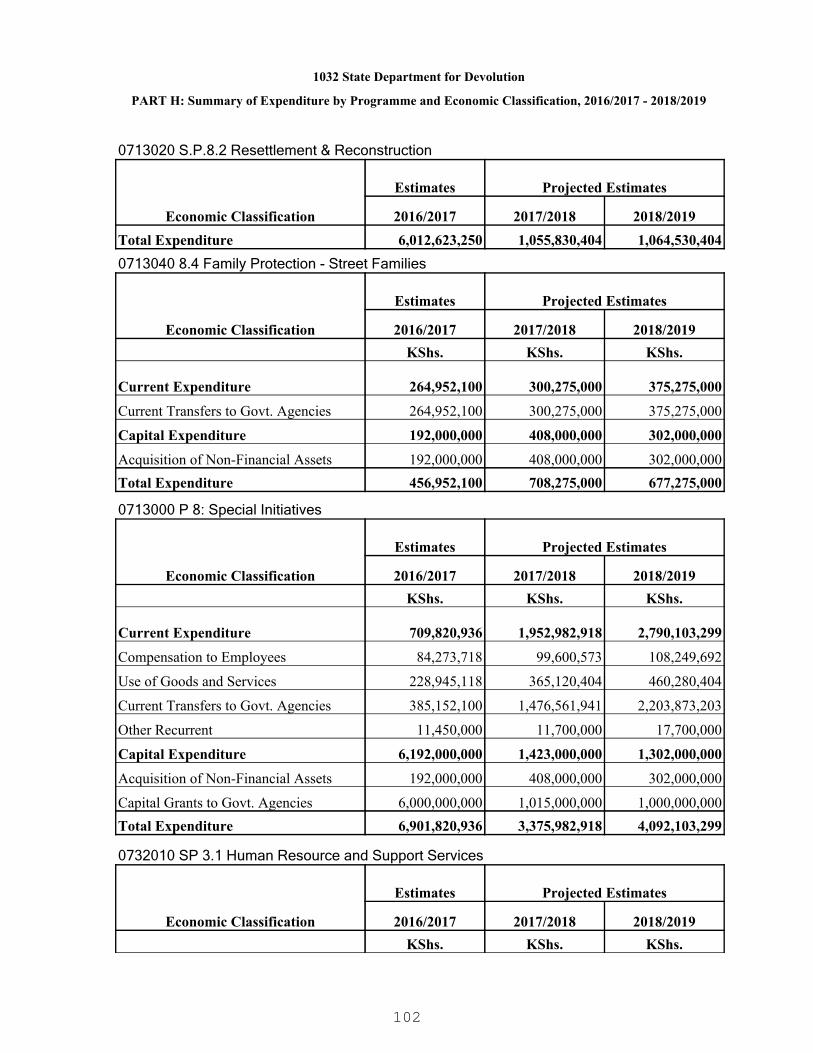
1032 State Department for Devolution
PART H: Summary of Expenditure by Programme and Economic Classification, 2016/2017 - 2018/2019
0713020 S.P.8.2 Resettlement & Reconstruction
Economic Classification
Estimates Projected Estimates
2016/2017 2017/2018 2018/2019Total Expenditure 6,012,623,250 1,055,830,404 1,064,530,4040713040 8.4 Family Protection - Street Families
Economic Classification
Estimates Projected Estimates
2016/2017 2017/2018 2018/2019KShs. KShs. KShs.
Current Expenditure 264,952,100 300,275,000 375,275,000
Current Transfers to Govt. Agencies 264,952,100 300,275,000 375,275,000
Capital Expenditure 192,000,000 408,000,000 302,000,000
Acquisition of Non-Financial Assets 192,000,000 408,000,000 302,000,000Total Expenditure 456,952,100 708,275,000 677,275,000
0713000 P 8: Special Initiatives
Economic Classification
Estimates Projected Estimates
2016/2017 2017/2018 2018/2019KShs. KShs. KShs.
Current Expenditure 709,820,936 1,952,982,918 2,790,103,299
Compensation to Employees 84,273,718 99,600,573 108,249,692
Use of Goods and Services 228,945,118 365,120,404 460,280,404
Current Transfers to Govt. Agencies 385,152,100 1,476,561,941 2,203,873,203
Other Recurrent 11,450,000 11,700,000 17,700,000
Capital Expenditure 6,192,000,000 1,423,000,000 1,302,000,000
Acquisition of Non-Financial Assets 192,000,000 408,000,000 302,000,000
Capital Grants to Govt. Agencies 6,000,000,000 1,015,000,000 1,000,000,000Total Expenditure 6,901,820,936 3,375,982,918 4,092,103,299
0732010 SP 3.1 Human Resource and Support Services
Economic Classification
Estimates Projected Estimates
2016/2017 2017/2018 2018/2019KShs. KShs. KShs.
102
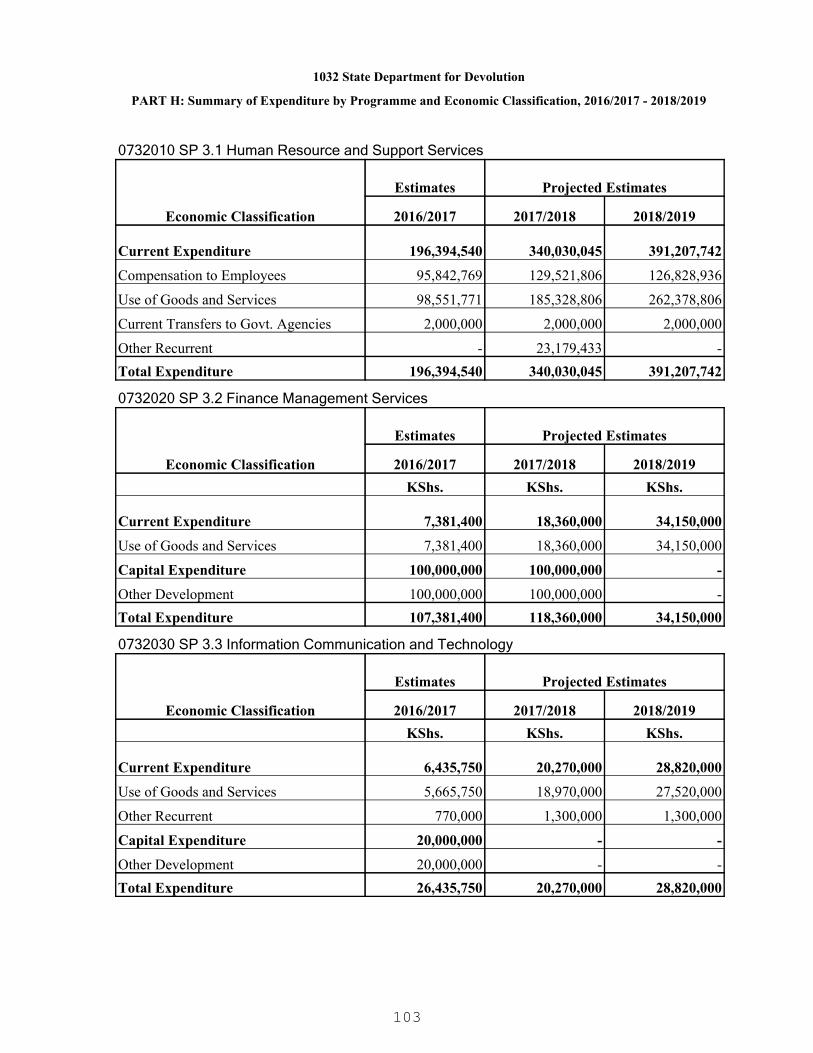
1032 State Department for Devolution
PART H: Summary of Expenditure by Programme and Economic Classification, 2016/2017 - 2018/2019
0732010 SP 3.1 Human Resource and Support Services
Economic Classification
Estimates Projected Estimates
2016/2017 2017/2018 2018/2019
Current Expenditure 196,394,540 340,030,045 391,207,742
Compensation to Employees 95,842,769 129,521,806 126,828,936
Use of Goods and Services 98,551,771 185,328,806 262,378,806
Current Transfers to Govt. Agencies 2,000,000 2,000,000 2,000,000
Other Recurrent - 23,179,433 -Total Expenditure 196,394,540 340,030,045 391,207,742
0732020 SP 3.2 Finance Management Services
Economic Classification
Estimates Projected Estimates
2016/2017 2017/2018 2018/2019KShs. KShs. KShs.
Current Expenditure 7,381,400 18,360,000 34,150,000
Use of Goods and Services 7,381,400 18,360,000 34,150,000
Capital Expenditure 100,000,000 100,000,000 -
Other Development 100,000,000 100,000,000 -Total Expenditure 107,381,400 118,360,000 34,150,000
0732030 SP 3.3 Information Communication and Technology
Economic Classification
Estimates Projected Estimates
2016/2017 2017/2018 2018/2019KShs. KShs. KShs.
Current Expenditure 6,435,750 20,270,000 28,820,000
Use of Goods and Services 5,665,750 18,970,000 27,520,000
Other Recurrent 770,000 1,300,000 1,300,000
Capital Expenditure 20,000,000 - -
Other Development 20,000,000 - -Total Expenditure 26,435,750 20,270,000 28,820,000
103
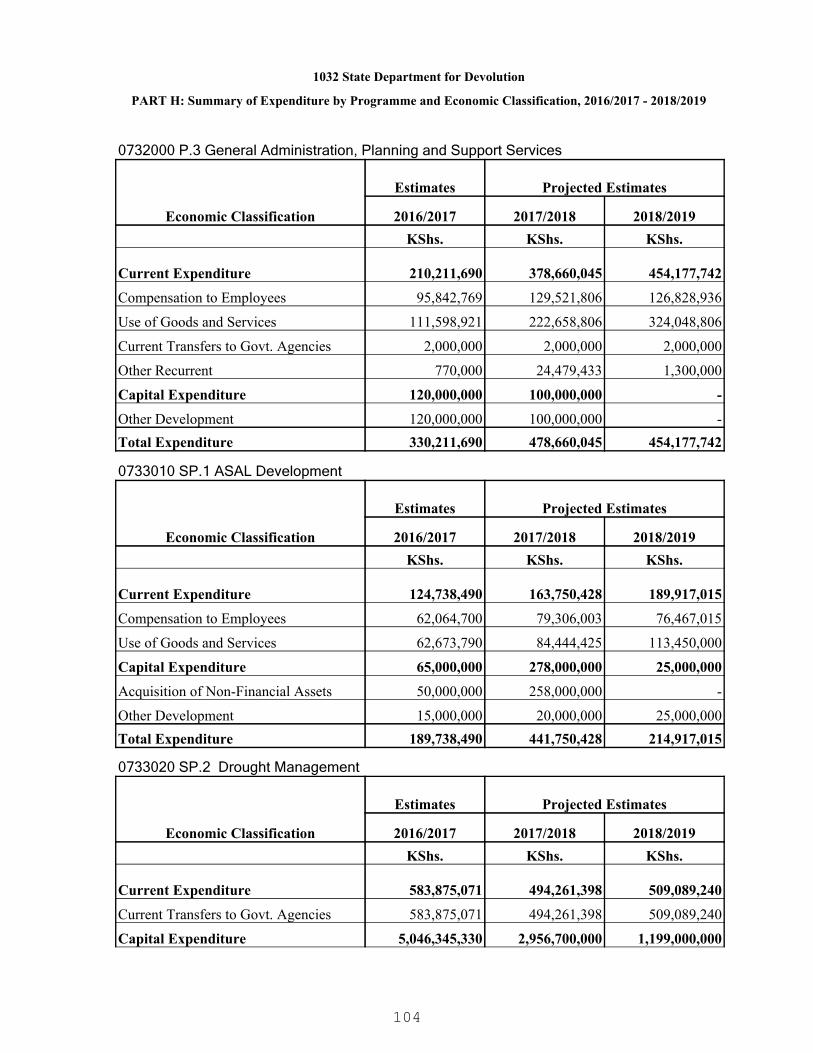
1032 State Department for Devolution
PART H: Summary of Expenditure by Programme and Economic Classification, 2016/2017 - 2018/2019
0732000 P.3 General Administration, Planning and Support Services
Economic Classification
Estimates Projected Estimates
2016/2017 2017/2018 2018/2019KShs. KShs. KShs.
Current Expenditure 210,211,690 378,660,045 454,177,742
Compensation to Employees 95,842,769 129,521,806 126,828,936
Use of Goods and Services 111,598,921 222,658,806 324,048,806
Current Transfers to Govt. Agencies 2,000,000 2,000,000 2,000,000
Other Recurrent 770,000 24,479,433 1,300,000
Capital Expenditure 120,000,000 100,000,000 -
Other Development 120,000,000 100,000,000 -Total Expenditure 330,211,690 478,660,045 454,177,742
0733010 SP.1 ASAL Development
Economic Classification
Estimates Projected Estimates
2016/2017 2017/2018 2018/2019KShs. KShs. KShs.
Current Expenditure 124,738,490 163,750,428 189,917,015
Compensation to Employees 62,064,700 79,306,003 76,467,015
Use of Goods and Services 62,673,790 84,444,425 113,450,000
Capital Expenditure 65,000,000 278,000,000 25,000,000
Acquisition of Non-Financial Assets 50,000,000 258,000,000 -
Other Development 15,000,000 20,000,000 25,000,000Total Expenditure 189,738,490 441,750,428 214,917,015
0733020 SP.2 Drought Management
Economic Classification
Estimates Projected Estimates
2016/2017 2017/2018 2018/2019KShs. KShs. KShs.
Current Expenditure 583,875,071 494,261,398 509,089,240
Current Transfers to Govt. Agencies 583,875,071 494,261,398 509,089,240
Capital Expenditure 5,046,345,330 2,956,700,000 1,199,000,000
104
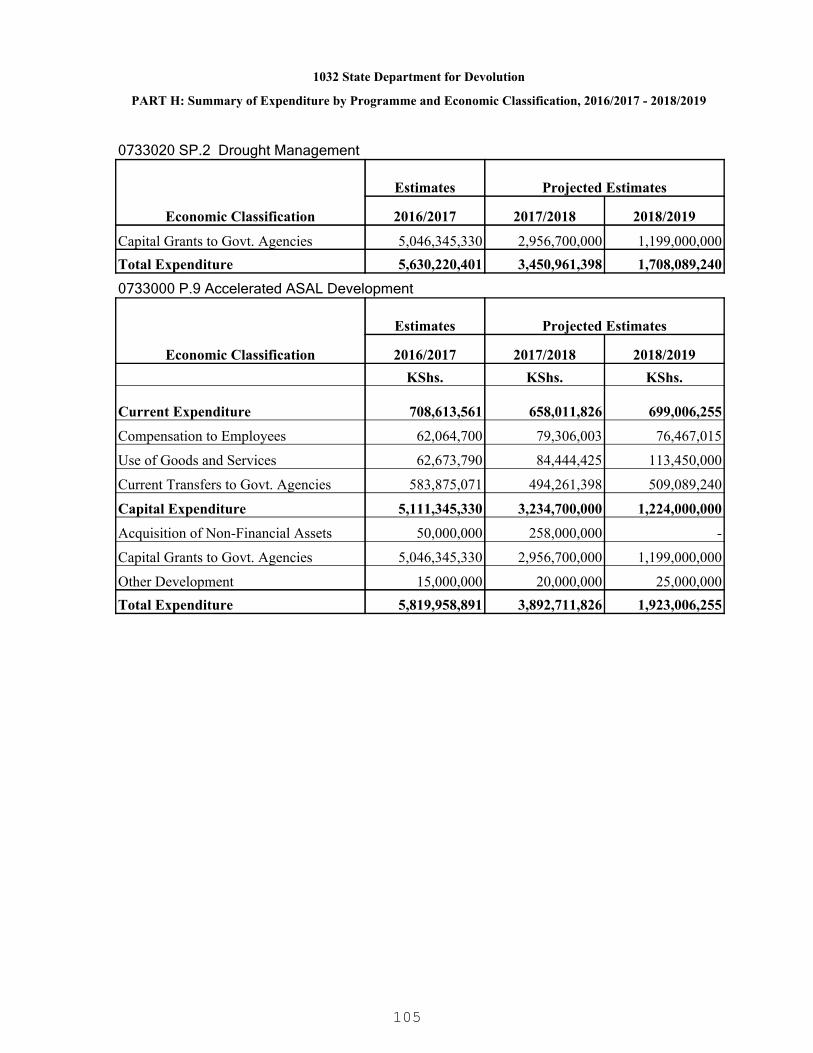
1032 State Department for Devolution
PART H: Summary of Expenditure by Programme and Economic Classification, 2016/2017 - 2018/2019
0733020 SP.2 Drought Management
Economic Classification
Estimates Projected Estimates
2016/2017 2017/2018 2018/2019
Capital Grants to Govt. Agencies 5,046,345,330 2,956,700,000 1,199,000,000Total Expenditure 5,630,220,401 3,450,961,398 1,708,089,240
0733000 P.9 Accelerated ASAL Development
Economic Classification
Estimates Projected Estimates
2016/2017 2017/2018 2018/2019KShs. KShs. KShs.
Current Expenditure 708,613,561 658,011,826 699,006,255
Compensation to Employees 62,064,700 79,306,003 76,467,015
Use of Goods and Services 62,673,790 84,444,425 113,450,000
Current Transfers to Govt. Agencies 583,875,071 494,261,398 509,089,240
Capital Expenditure 5,111,345,330 3,234,700,000 1,224,000,000
Acquisition of Non-Financial Assets 50,000,000 258,000,000 -
Capital Grants to Govt. Agencies 5,046,345,330 2,956,700,000 1,199,000,000
Other Development 15,000,000 20,000,000 25,000,000Total Expenditure 5,819,958,891 3,892,711,826 1,923,006,255
105
1041 Ministry of Defence
A premier, credible and mission capable force deeply rooted in professionalism.
To deter aggression, and defend the Republic and provide support to civil power in themaintenance of peace and order.
PART A. Vision
PART B. Mission
PART C. Performance Overview and Background for Programme(s) Funding
PART D. Programme Objectives
Ministry of Defence is charged with the mandate of defence and protection of the sovereigntyand territorial integrity of the Republic. It also assists in situations of emergency/disaster andmay be deployed to restore peace in any part of the Republic affected by unrest or instabilitywhen called upon.
During the period under review, the Kenya Defence Forces continued with security operationsin Somalia under African Union Mission in Somalia (AMISOM). They also undertook rear anddeep operations along Kenya Somalia border from time to time. The military also participatedin several peace keeping missions, disarmament exercises, enhanced security operationswithin the country and provided humanitarian assistance to Kenyans in distress.
The actual expenditure during the period under review was KSh. 73.0 billion, KSh. 74.2billion and KSh. 74.6 billion against budgetary provision of KSh. 77.5 billion, KSh. 78.1 billionand KSh. 78.8 billion in the FYs 2012/13, 2013/14 and 2014/15 respectively. The underexpenditure was mainly due to non-release of budgeted funds.
The Ministry faced a number of challenges in the delivery of its mandate including increasedsecurity threats, currency fluctuation which had adverse effect on implementation ofinternational contracts. The Ministry has endevoured to mitigate these challenges throughreprioritization of its programmes to address the emerging issues.
The outputs/services to be provided by the Ministry during the MTEF period 2016/17 –2018/19 include; protection of the territorial integrity & sovereignty, enhanced regional andinternational peace and security, aid to civil authority among others.
ObjectiveProgramme
0801000 P.1: Defence To maintain territorial integrity, protect sovereignty, andpromote Regional and International peace & security.
106

1041 Ministry of Defence
ObjectiveProgramme
0802000 P.2 Civil Aid To support internal security operations and humanitarianactivities.
0803000 P.3 GeneralAdministration, Planningand Support Services
To provide support services for efficient and effectiveprovision of national defence.
107
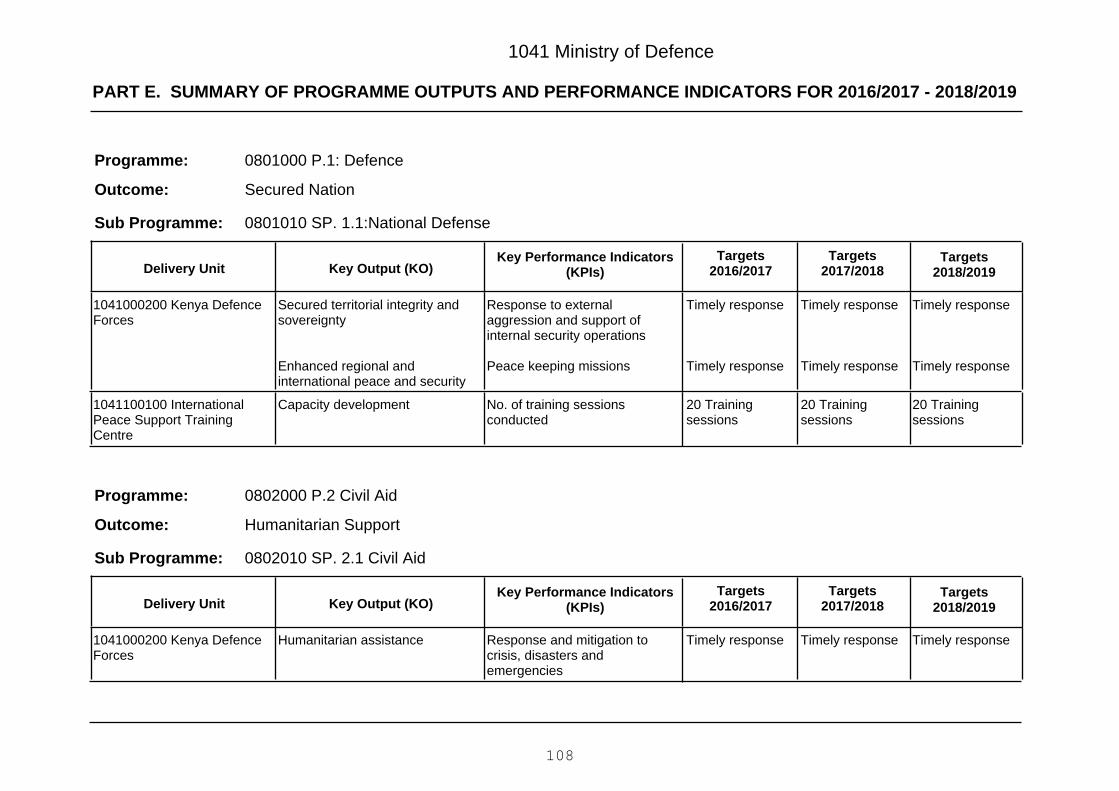
PART E. SUMMARY OF PROGRAMME OUTPUTS AND PERFORMANCE INDICATORS FOR 2016/2017 - 2018/2019
1041 Ministry of Defence
0801000 P.1: Defence
Secured Nation
Programme:
Outcome:
0801010 SP. 1.1:National DefenseSub Programme:
Key Output (KO)Targets
2018/2019Targets
2017/2018Key Performance Indicators
(KPIs)Targets
2016/2017Delivery Unit
Timely response
Timely response
Timely response
Timely response
Timely response
Timely response
Response to externalaggression and support ofinternal security operations
Peace keeping missions
Secured territorial integrity andsovereignty
Enhanced regional andinternational peace and security
1041000200 Kenya DefenceForces
20 Trainingsessions
20 Trainingsessions
20 Trainingsessions
No. of training sessionsconducted
Capacity development1041100100 InternationalPeace Support TrainingCentre
0802000 P.2 Civil Aid
Humanitarian Support
Programme:
Outcome:
0802010 SP. 2.1 Civil AidSub Programme:
Key Output (KO)Targets
2018/2019Targets
2017/2018Key Performance Indicators
(KPIs)Targets
2016/2017Delivery Unit
Timely responseTimely responseTimely responseResponse and mitigation tocrisis, disasters andemergencies
Humanitarian assistance1041000200 Kenya DefenceForces
108

PART E. SUMMARY OF PROGRAMME OUTPUTS AND PERFORMANCE INDICATORS FOR 2016/2017 - 2018/2019
1041 Ministry of Defence
0803000 P.3 General Administration, Planning and Support Services
Effective Service Delivery
Programme:
Outcome:
0803010 SP.3.1 Administration, planning and support servicesSub Programme:
Key Output (KO)Targets
2018/2019Targets
2017/2018Key Performance Indicators
(KPIs)Targets
2016/2017Delivery Unit
Mid and annualreports
Mid and annualreports
Mid and annualreports
Mid and annualreports
Mid and annualreports
Mid and annualreports
Defence policy reviewed
Planning and administrativeservices provided
Effective and efficient supportservices
1041000100 HeadquartersAdministrative Services
109
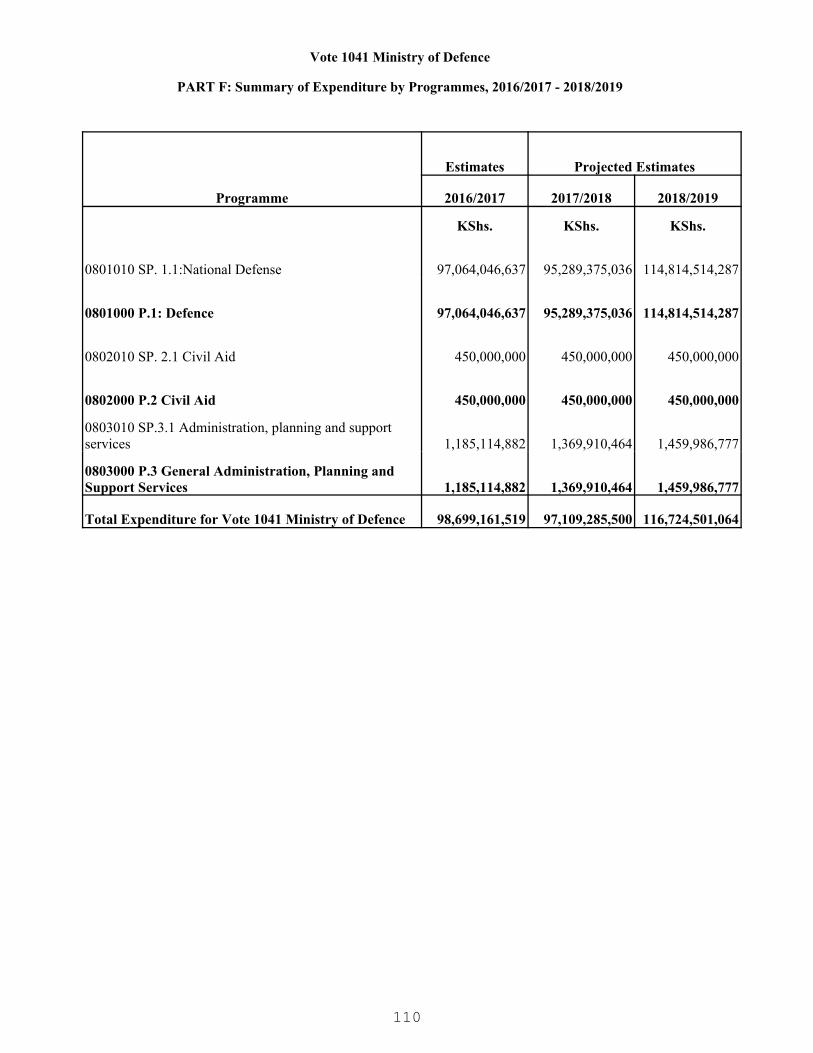
Vote 1041 Ministry of Defence
PART F: Summary of Expenditure by Programmes, 2016/2017 - 2018/2019
Programme
Estimates Projected Estimates
2016/2017 2017/2018 2018/2019
KShs. KShs. KShs.
0801010 SP. 1.1:National Defense 97,064,046,637 95,289,375,036 114,814,514,287
0801000 P.1: Defence 97,064,046,637 95,289,375,036 114,814,514,287
0802010 SP. 2.1 Civil Aid 450,000,000 450,000,000 450,000,000
0802000 P.2 Civil Aid 450,000,000 450,000,000 450,000,000
0803010 SP.3.1 Administration, planning and support services 1,185,114,882 1,369,910,464 1,459,986,777
0803000 P.3 General Administration, Planning and Support Services 1,185,114,882 1,369,910,464 1,459,986,777
Total Expenditure for Vote 1041 Ministry of Defence 98,699,161,519 97,109,285,500 116,724,501,064
110
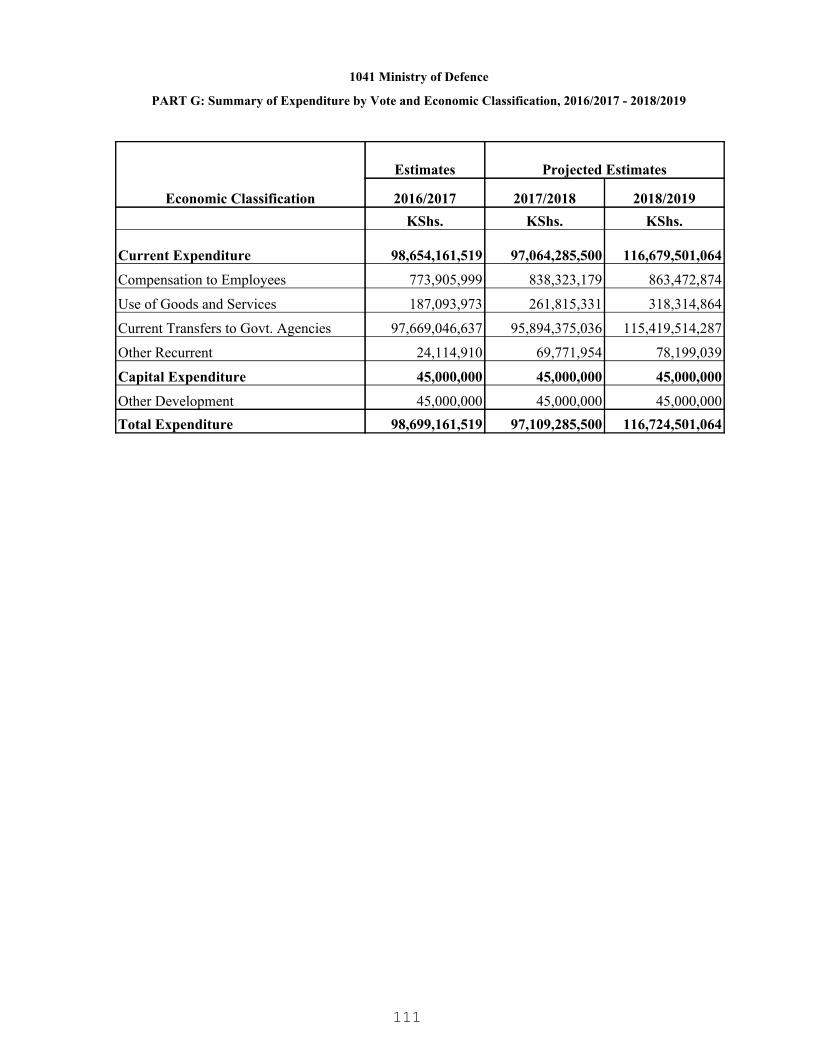
1041 Ministry of Defence
PART G: Summary of Expenditure by Vote and Economic Classification, 2016/2017 - 2018/2019
Economic Classification
Estimates Projected Estimates
2016/2017 2017/2018 2018/2019KShs. KShs. KShs.
Current Expenditure 98,654,161,519 97,064,285,500 116,679,501,064
Compensation to Employees 773,905,999 838,323,179 863,472,874
Use of Goods and Services 187,093,973 261,815,331 318,314,864
Current Transfers to Govt. Agencies 97,669,046,637 95,894,375,036 115,419,514,287
Other Recurrent 24,114,910 69,771,954 78,199,039
Capital Expenditure 45,000,000 45,000,000 45,000,000
Other Development 45,000,000 45,000,000 45,000,000Total Expenditure 98,699,161,519 97,109,285,500 116,724,501,064
111

1041 Ministry of Defence
PART H: Summary of Expenditure by Programme and Economic Classification, 2016/2017 - 2018/2019
0801010 SP. 1.1:National Defense
Economic Classification
Estimates Projected Estimates
2016/2017 2017/2018 2018/2019KShs. KShs. KShs.
Current Expenditure 97,019,046,637 95,244,375,036 114,769,514,287
Current Transfers to Govt. Agencies 97,019,046,637 95,244,375,036 114,769,514,287
Capital Expenditure 45,000,000 45,000,000 45,000,000
Other Development 45,000,000 45,000,000 45,000,000Total Expenditure 97,064,046,637 95,289,375,036 114,814,514,287
0801000 P.1: Defence
Economic Classification
Estimates Projected Estimates
2016/2017 2017/2018 2018/2019KShs. KShs. KShs.
Current Expenditure 97,019,046,637 95,244,375,036 114,769,514,287
Current Transfers to Govt. Agencies 97,019,046,637 95,244,375,036 114,769,514,287
Capital Expenditure 45,000,000 45,000,000 45,000,000
Other Development 45,000,000 45,000,000 45,000,000Total Expenditure 97,064,046,637 95,289,375,036 114,814,514,287
0802010 SP. 2.1 Civil Aid
Economic Classification
Estimates Projected Estimates
2016/2017 2017/2018 2018/2019KShs. KShs. KShs.
Current Expenditure 450,000,000 450,000,000 450,000,000
Current Transfers to Govt. Agencies 450,000,000 450,000,000 450,000,000Total Expenditure 450,000,000 450,000,000 450,000,000
0802000 P.2 Civil Aid
Economic Classification
Estimates Projected Estimates
2016/2017 2017/2018 2018/2019KShs. KShs. KShs.
112

1041 Ministry of Defence
PART H: Summary of Expenditure by Programme and Economic Classification, 2016/2017 - 2018/2019
0802000 P.2 Civil Aid
Economic Classification
Estimates Projected Estimates
2016/2017 2017/2018 2018/2019
Current Expenditure 450,000,000 450,000,000 450,000,000
Current Transfers to Govt. Agencies 450,000,000 450,000,000 450,000,000Total Expenditure 450,000,000 450,000,000 450,000,000
0803010 SP.3.1 Administration, planning and support services
Economic Classification
Estimates Projected Estimates
2016/2017 2017/2018 2018/2019KShs. KShs. KShs.
Current Expenditure 1,185,114,882 1,369,910,464 1,459,986,777
Compensation to Employees 773,905,999 838,323,179 863,472,874
Use of Goods and Services 187,093,973 261,815,331 318,314,864
Current Transfers to Govt. Agencies 200,000,000 200,000,000 200,000,000
Other Recurrent 24,114,910 69,771,954 78,199,039Total Expenditure 1,185,114,882 1,369,910,464 1,459,986,777
0803000 P.3 General Administration, Planning and Support Services
Economic Classification
Estimates Projected Estimates
2016/2017 2017/2018 2018/2019KShs. KShs. KShs.
Current Expenditure 1,185,114,882 1,369,910,464 1,459,986,777
Compensation to Employees 773,905,999 838,323,179 863,472,874
Use of Goods and Services 187,093,973 261,815,331 318,314,864
Current Transfers to Govt. Agencies 200,000,000 200,000,000 200,000,000
Other Recurrent 24,114,910 69,771,954 78,199,039Total Expenditure 1,185,114,882 1,369,910,464 1,459,986,777
113
1051 Ministry of Foreign Affairs and International Trade
A peaceful, prosperous and globally competitive Kenya
To protect, promote, and protect Kenya's interests and image globally through innovativediplomacy and contribute towards a just, peaceful and equitable world
PART A. Vision
PART B. Mission
PART C. Performance Overview and Background for Programme(s) Funding
The Ministry of Foreign Affairs and International Trade is charged with the mandate offormulation, articulation and implementation of Kenya's Foreign Policy.
During the period 2012/13-2014/15, the Ministry achieved the following: published andlaunched various policies namely; the Kenya Foreign Policy, Kenya Diaspora Policy,Ministerial Strategic Plan, the Foreign Service Institute curriculum; finalized the ForeignService Bill and Trade Remedy Bill; expanded Kenya's Diplomatic presence andrepresentation by opening four Missions in Algeria, Angola, Morocco and UN-Habitat and twoliaison offices in Kismayu and Hargeissa; renovated, upgraded and completed construction ofseveral Kenya's properties abroad; commissioned Kenya's new Chancery in Windhoek,Namibia and signed 38 memoranda of understanding with nineteen countries, seven bilateralagreements, and three trade agreements with three countries on various thematic areasincluding Agriculture,Cooperatives, Security and Education.
The Gross budgetary allocation for the Ministry over the same period was KSh.12.6 billion inFY 2012/13, KSh.13.7billion in FY 2014/15 and Ksh 15.5 billion in the FY 2015/16 andexpenditure
Some of the challenges faced during implementation of the budget include; high cost ofrenting Chanceries and staff residence in Kenyan Missions abroad, fluctuation of Kenyanshilling against major world currencies leading to huge foreign exchange losses, lowabsorption of development funds, application of local Public Procurement and Disposal Actwhich is inapplicable in some foreign countries, and unforeseen emergencies like evacuationof Kenyans in Foreign countries with security challeges. To address these, the Ministry isworking with the National Treasury to roll out IFMIS in all missions abroad to improve timelycapturing and reporting of expenditures. The Ministry will also continue to expand itsownership of properties abroad through purchase of Chanries, Ambassadors Residences andstaff houses to cut down on rent costs. Further, the Ministry will explore with the NationalTreasury whether waivers /amendments to the Procurement law can be granted in someinstances where Kenya's procurement laws are inconsistent with laws of the countries whereKenya missions are domiciled.
During the period 2016/17-2018/19, the Ministry will expand Kenya's diplomatic presence andrepresentation abroad by opening new fully fledged missions in Malawi, Senegal, Djibouti &Cuba, and consulates in Arusha, Tanzania, Garowe in Somalia, Lagos in Nigeria, and Gomain the Democratic Republic of Congo; promote trade and investments by concluding sevenJoint Commission for Cooperation Agreements/Joint Partnership for Cooperation with tradingpartners, and agreements between Kenya and Middle East on migrant workers; strengthenoperations in all existing missions abroad, continue to articulate the Kenya Foreign Policy and
114
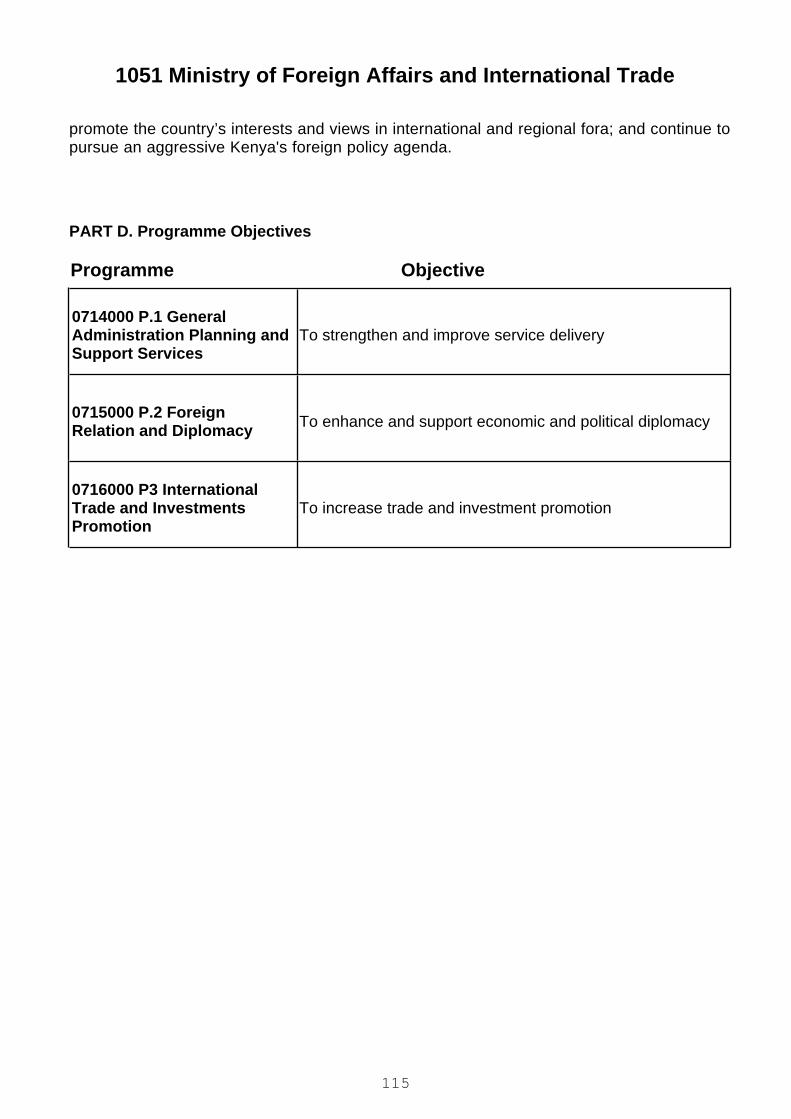
1051 Ministry of Foreign Affairs and International Trade
PART D. Programme Objectives
promote the country’s interests and views in international and regional fora; and continue topursue an aggressive Kenya's foreign policy agenda.
ObjectiveProgramme
0714000 P.1 GeneralAdministration Planning andSupport Services
To strengthen and improve service delivery
0715000 P.2 ForeignRelation and Diplomacy To enhance and support economic and political diplomacy
0716000 P3 InternationalTrade and InvestmentsPromotion
To increase trade and investment promotion
115

PART E. SUMMARY OF PROGRAMME OUTPUTS AND PERFORMANCE INDICATORS FOR 2016/2017 - 2018/2019
1051 Ministry of Foreign Affairs and International Trade
0714000 P.1 General Administration Planning and Support Services
Improved service delivery
Programme:
Outcome:
0714010 SP. 1.1 Administration servicesSub Programme:
Key Output (KO)Targets
2018/2019Targets
2017/2018Key Performance Indicators
(KPIs)Targets
2016/2017Delivery Unit
5000
20,000
30
5
40
50
4000
17,000
30
4
40
50
3000
15,000
30
3
50
50
Number of Visa applicationsprocessed
Number of official legaldocuments authenticated
Number of Joint Commissionsfor Cooperation (JCC)initiated,negotiated,concludedand monitored.
Number candidatures lobbiedfor and secured
Number of high level visitsfacilitated
Number of meetings held withdiplomatic missions resident inKenya
Consular services provided
Joint Commissionsfor Cooperation (JCC)initiated,negotiated,concluded andmonitored
Lobby for Kenyan candidatures inmajor international and regionalorganizations
High level visits facilitated(state/official)
Liaison and cooperation withdiplomatic missions resident inKenya
1051000100 HeadquartersAdministrative Services
116

PART E. SUMMARY OF PROGRAMME OUTPUTS AND PERFORMANCE INDICATORS FOR 2016/2017 - 2018/2019
1051 Ministry of Foreign Affairs and International Trade
25
30
20
30
15
30
Number of Foreign serviceofficers/ Diplomats trained withinthe region trained
Number of officers trained oninternational relations, tradeanalysis and negotiations
Trained Foreign ServiceOfficers/Diplomats within theregion
Trained officers on internationalrelations, trade analysis andnegotiations
1051000200 Foreign ServiceInstitute
Timely procesingoftransactions
Timely procesingoftransactions
Timely procesingoftransactions
Effective and efficient servicedelivery
Financial services1051000300 FinancialManagement andProcurement Services
252015Number of Multilateralagreements/ MoUs signed
Multilateral agreements/MoUssigned
1051002700 UNON
555Number of position paperspresented during the UNGAsessions
Kenya’s interests articulated in UNsessions
1051005900 United NationsOrganizations
333Number of position papersprepared for articulation ofKenya’s position
Kenya’s interests articulated in theCommonwealth
1051006000 TheCommonwealth
666Number of position papersprepared for articulation ofKenya’s position
Kenya’s interests articulated inAU, IGAD and the Great Lakesforums
1051006100 African Union
111Number of position papersprepared for articulation ofKenya’s position
Kenya’s position articulated in theRECSA
1051006200 Grants toInternational Organizations
25
30
20
30
15
30
Number of Foreign serviceofficers/ Diplomats trained withinthe region trained
Number of officers trained oninternational relations, tradeanalysis and negotiations
Trained Foreign ServiceOfficers/Diplomats within theregion
Trained officers on internationalrelations, trade analysis andnegotiations
1051102600 Technical fundfor regional cooperation
117

PART E. SUMMARY OF PROGRAMME OUTPUTS AND PERFORMANCE INDICATORS FOR 2016/2017 - 2018/2019
1051 Ministry of Foreign Affairs and International Trade
0715000 P.2 Foreign Relation and Diplomacy
Enhanced and effective diplomacy presence and representation abroad
Programme:
Outcome:
0715010 SP. 2.1 Management of Kenya missions abroadSub Programme:
Key Output (KO)Targets
2018/2019Targets
2017/2018Key Performance Indicators
(KPIs)Targets
2016/2017Delivery Unit
252015Number of multi lateralagreements/MoUs signed
Multilateral agreements/MoUsreached
1051000700 New York
25
12,000 visas
20
10,000 visas
15
8,000 visas
Number of inbound investmentagreements/MoUS,and bilateralagreements/MoUs signed
Number of visas and passportsissued.
Bilateral agreements andmarketing Kenya internationally
Consular services
1051000800 Washington
25
13,000 visas
20
10,000 visas
15
7,000 visas
Number of inbound investmentagreements/MoUS,and bilateralagreements/MoUs signed
Number of visas and passportsissued.
Bilateral agreements andmarketing Kenya internationally
Consular services
1051000900 London
25
8,000 visas
20
5,000 visas
15
3,000 visas
Number of inbound investmentagreements/MoUS,and bilateralagreements/MoUs signed
Number of visas and passportsissued.
Bilateral agreements andmarketing Kenya internationally
Consular services
1051001000 Moscow
1086Number of inbound investmentagreements/MoUS,and bilateralagreements/MoUs signed
Bilateral agreements andmarketing Kenya internationally
1051001100 Addis Ababa
118
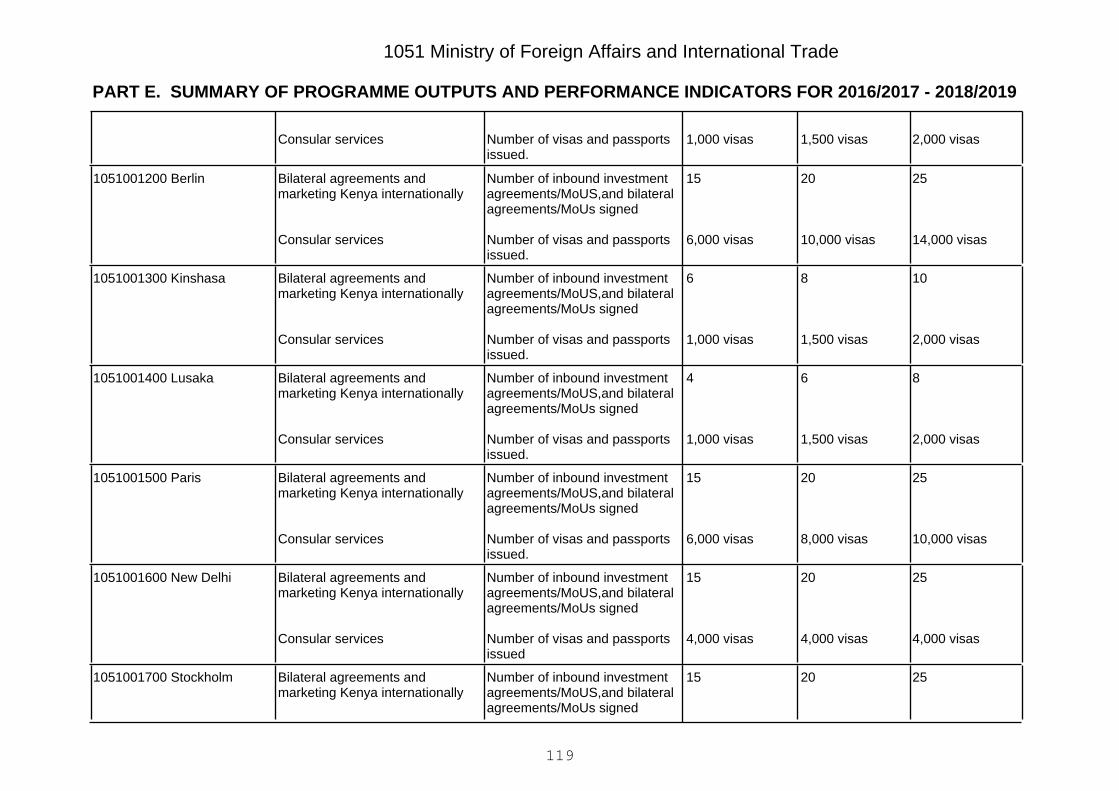
PART E. SUMMARY OF PROGRAMME OUTPUTS AND PERFORMANCE INDICATORS FOR 2016/2017 - 2018/2019
1051 Ministry of Foreign Affairs and International Trade
2,000 visas1,500 visas1,000 visasNumber of visas and passportsissued.
Consular services
25
14,000 visas
20
10,000 visas
15
6,000 visas
Number of inbound investmentagreements/MoUS,and bilateralagreements/MoUs signed
Number of visas and passportsissued.
Bilateral agreements andmarketing Kenya internationally
Consular services
1051001200 Berlin
10
2,000 visas
8
1,500 visas
6
1,000 visas
Number of inbound investmentagreements/MoUS,and bilateralagreements/MoUs signed
Number of visas and passportsissued.
Bilateral agreements andmarketing Kenya internationally
Consular services
1051001300 Kinshasa
8
2,000 visas
6
1,500 visas
4
1,000 visas
Number of inbound investmentagreements/MoUS,and bilateralagreements/MoUs signed
Number of visas and passportsissued.
Bilateral agreements andmarketing Kenya internationally
Consular services
1051001400 Lusaka
25
10,000 visas
20
8,000 visas
15
6,000 visas
Number of inbound investmentagreements/MoUS,and bilateralagreements/MoUs signed
Number of visas and passportsissued.
Bilateral agreements andmarketing Kenya internationally
Consular services
1051001500 Paris
25
4,000 visas
20
4,000 visas
15
4,000 visas
Number of inbound investmentagreements/MoUS,and bilateralagreements/MoUs signed
Number of visas and passportsissued
Bilateral agreements andmarketing Kenya internationally
Consular services
1051001600 New Delhi
252015Number of inbound investmentagreements/MoUS,and bilateralagreements/MoUs signed
Bilateral agreements andmarketing Kenya internationally
1051001700 Stockholm
119
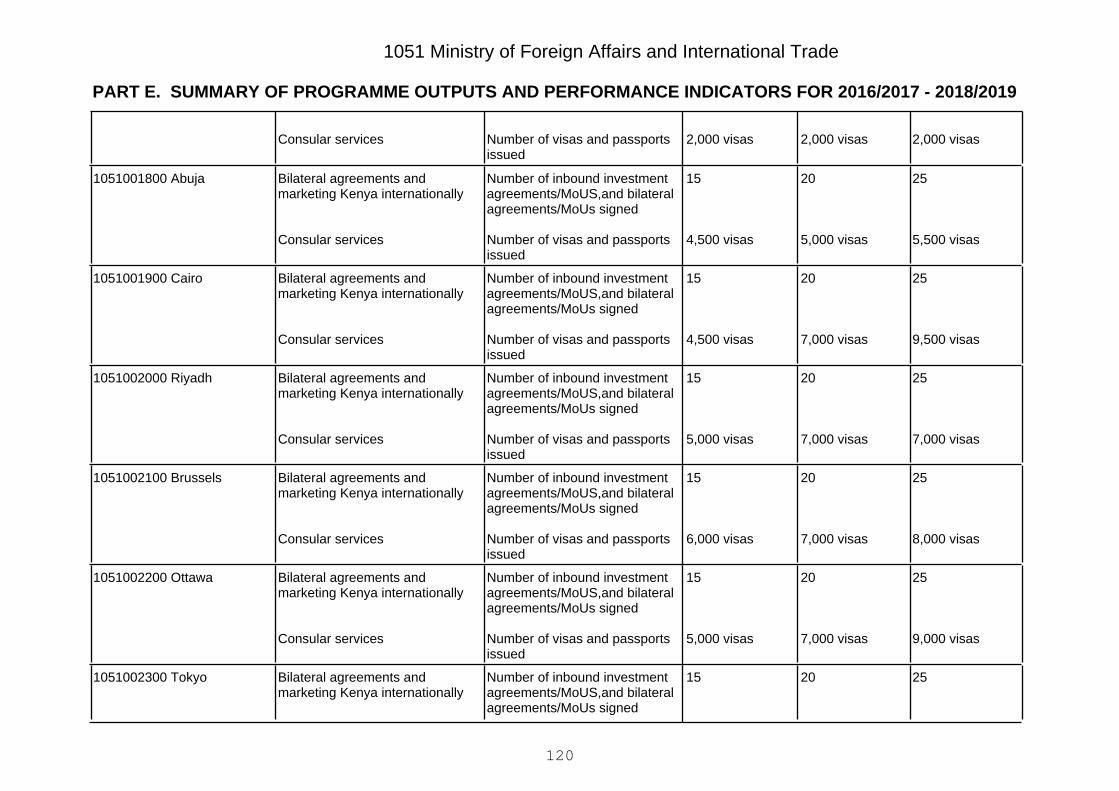
PART E. SUMMARY OF PROGRAMME OUTPUTS AND PERFORMANCE INDICATORS FOR 2016/2017 - 2018/2019
1051 Ministry of Foreign Affairs and International Trade
2,000 visas2,000 visas2,000 visasNumber of visas and passportsissued
Consular services
25
5,500 visas
20
5,000 visas
15
4,500 visas
Number of inbound investmentagreements/MoUS,and bilateralagreements/MoUs signed
Number of visas and passportsissued
Bilateral agreements andmarketing Kenya internationally
Consular services
1051001800 Abuja
25
9,500 visas
20
7,000 visas
15
4,500 visas
Number of inbound investmentagreements/MoUS,and bilateralagreements/MoUs signed
Number of visas and passportsissued
Bilateral agreements andmarketing Kenya internationally
Consular services
1051001900 Cairo
25
7,000 visas
20
7,000 visas
15
5,000 visas
Number of inbound investmentagreements/MoUS,and bilateralagreements/MoUs signed
Number of visas and passportsissued
Bilateral agreements andmarketing Kenya internationally
Consular services
1051002000 Riyadh
25
8,000 visas
20
7,000 visas
15
6,000 visas
Number of inbound investmentagreements/MoUS,and bilateralagreements/MoUs signed
Number of visas and passportsissued
Bilateral agreements andmarketing Kenya internationally
Consular services
1051002100 Brussels
25
9,000 visas
20
7,000 visas
15
5,000 visas
Number of inbound investmentagreements/MoUS,and bilateralagreements/MoUs signed
Number of visas and passportsissued
Bilateral agreements andmarketing Kenya internationally
Consular services
1051002200 Ottawa
252015Number of inbound investmentagreements/MoUS,and bilateralagreements/MoUs signed
Bilateral agreements andmarketing Kenya internationally
1051002300 Tokyo
120
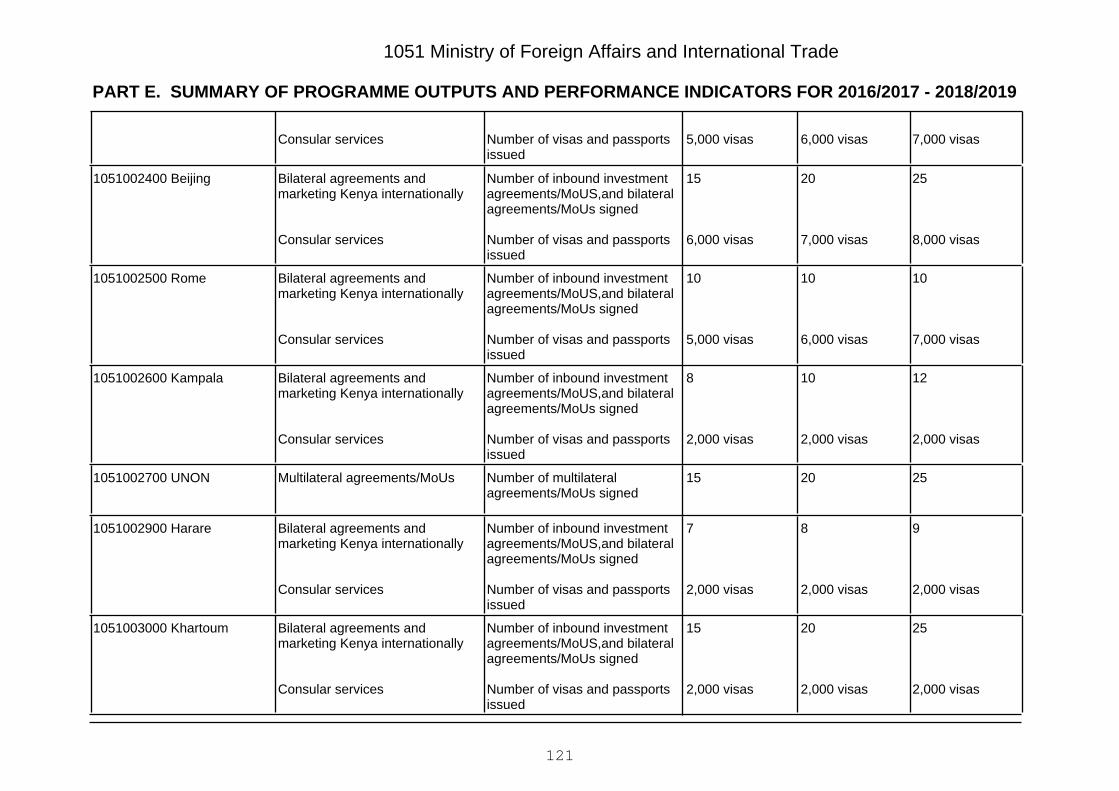
PART E. SUMMARY OF PROGRAMME OUTPUTS AND PERFORMANCE INDICATORS FOR 2016/2017 - 2018/2019
1051 Ministry of Foreign Affairs and International Trade
7,000 visas6,000 visas5,000 visasNumber of visas and passportsissued
Consular services
25
8,000 visas
20
7,000 visas
15
6,000 visas
Number of inbound investmentagreements/MoUS,and bilateralagreements/MoUs signed
Number of visas and passportsissued
Bilateral agreements andmarketing Kenya internationally
Consular services
1051002400 Beijing
10
7,000 visas
10
6,000 visas
10
5,000 visas
Number of inbound investmentagreements/MoUS,and bilateralagreements/MoUs signed
Number of visas and passportsissued
Bilateral agreements andmarketing Kenya internationally
Consular services
1051002500 Rome
12
2,000 visas
10
2,000 visas
8
2,000 visas
Number of inbound investmentagreements/MoUS,and bilateralagreements/MoUs signed
Number of visas and passportsissued
Bilateral agreements andmarketing Kenya internationally
Consular services
1051002600 Kampala
252015Number of multilateralagreements/MoUs signed
Multilateral agreements/MoUs1051002700 UNON
9
2,000 visas
8
2,000 visas
7
2,000 visas
Number of inbound investmentagreements/MoUS,and bilateralagreements/MoUs signed
Number of visas and passportsissued
Bilateral agreements andmarketing Kenya internationally
Consular services
1051002900 Harare
25
2,000 visas
20
2,000 visas
15
2,000 visas
Number of inbound investmentagreements/MoUS,and bilateralagreements/MoUs signed
Number of visas and passportsissued
Bilateral agreements andmarketing Kenya internationally
Consular services
1051003000 Khartoum
121
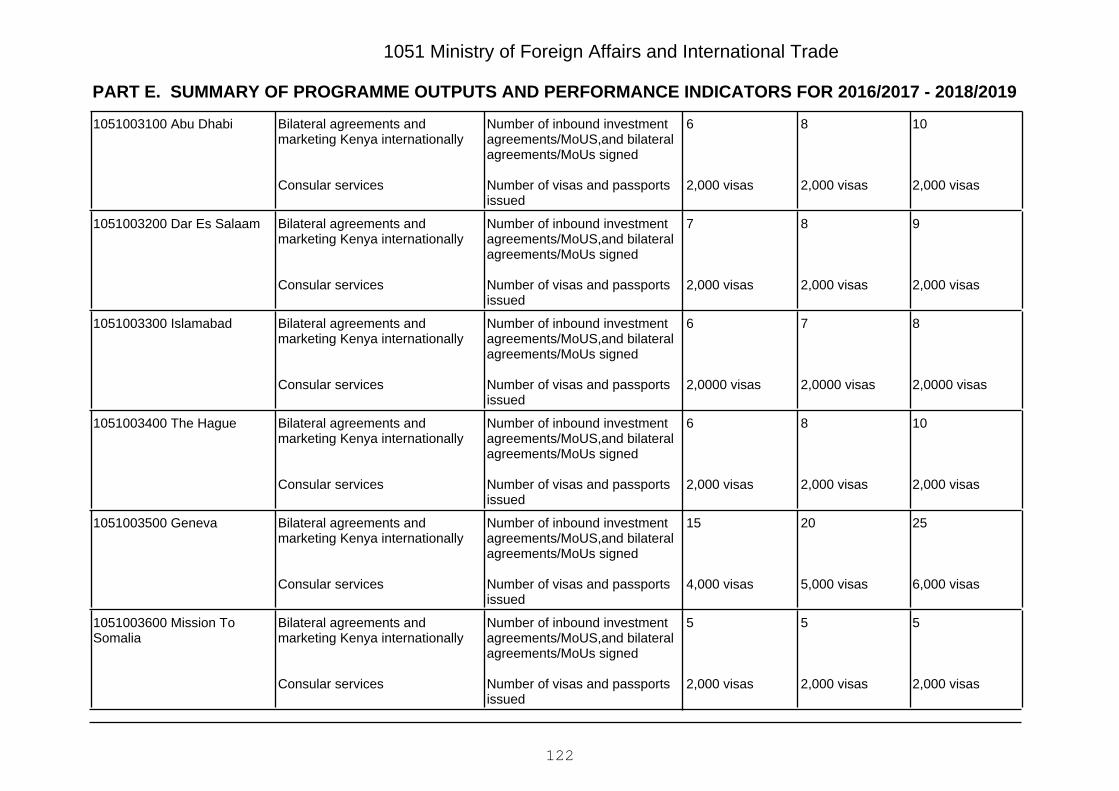
PART E. SUMMARY OF PROGRAMME OUTPUTS AND PERFORMANCE INDICATORS FOR 2016/2017 - 2018/2019
1051 Ministry of Foreign Affairs and International Trade
10
2,000 visas
8
2,000 visas
6
2,000 visas
Number of inbound investmentagreements/MoUS,and bilateralagreements/MoUs signed
Number of visas and passportsissued
Bilateral agreements andmarketing Kenya internationally
Consular services
1051003100 Abu Dhabi
9
2,000 visas
8
2,000 visas
7
2,000 visas
Number of inbound investmentagreements/MoUS,and bilateralagreements/MoUs signed
Number of visas and passportsissued
Bilateral agreements andmarketing Kenya internationally
Consular services
1051003200 Dar Es Salaam
8
2,0000 visas
7
2,0000 visas
6
2,0000 visas
Number of inbound investmentagreements/MoUS,and bilateralagreements/MoUs signed
Number of visas and passportsissued
Bilateral agreements andmarketing Kenya internationally
Consular services
1051003300 Islamabad
10
2,000 visas
8
2,000 visas
6
2,000 visas
Number of inbound investmentagreements/MoUS,and bilateralagreements/MoUs signed
Number of visas and passportsissued
Bilateral agreements andmarketing Kenya internationally
Consular services
1051003400 The Hague
25
6,000 visas
20
5,000 visas
15
4,000 visas
Number of inbound investmentagreements/MoUS,and bilateralagreements/MoUs signed
Number of visas and passportsissued
Bilateral agreements andmarketing Kenya internationally
Consular services
1051003500 Geneva
5
2,000 visas
5
2,000 visas
5
2,000 visas
Number of inbound investmentagreements/MoUS,and bilateralagreements/MoUs signed
Number of visas and passportsissued
Bilateral agreements andmarketing Kenya internationally
Consular services
1051003600 Mission ToSomalia
122
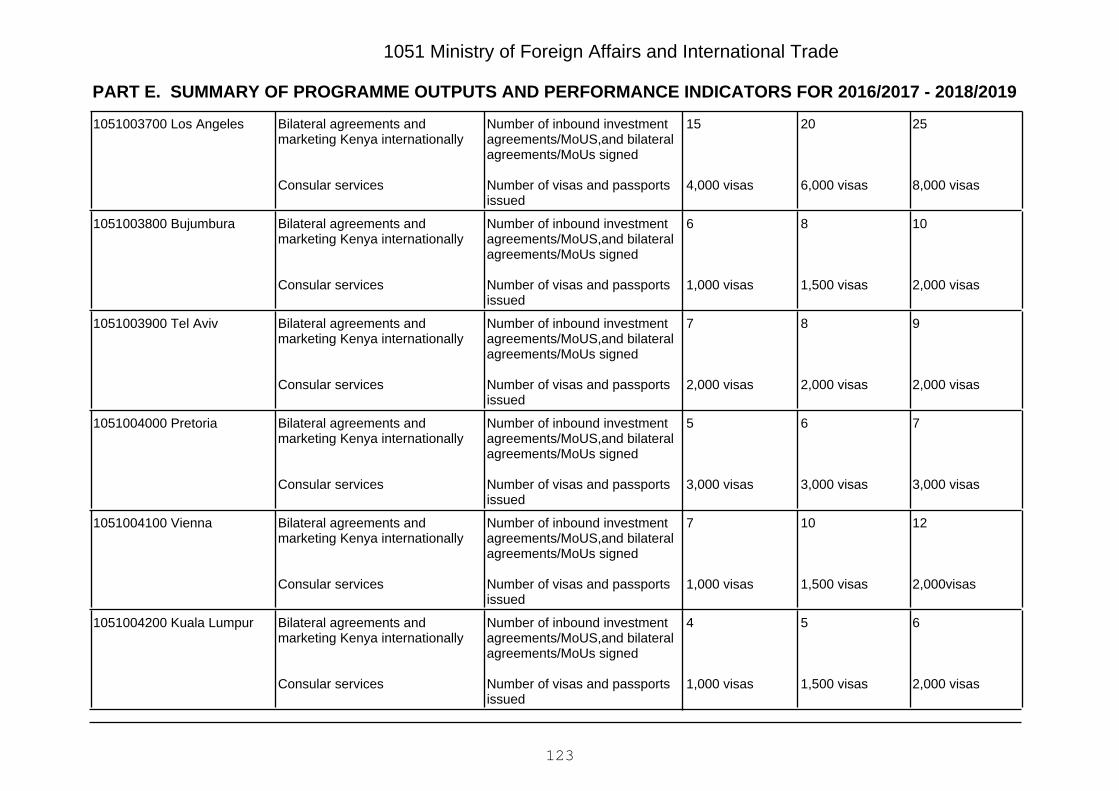
PART E. SUMMARY OF PROGRAMME OUTPUTS AND PERFORMANCE INDICATORS FOR 2016/2017 - 2018/2019
1051 Ministry of Foreign Affairs and International Trade
25
8,000 visas
20
6,000 visas
15
4,000 visas
Number of inbound investmentagreements/MoUS,and bilateralagreements/MoUs signed
Number of visas and passportsissued
Bilateral agreements andmarketing Kenya internationally
Consular services
1051003700 Los Angeles
10
2,000 visas
8
1,500 visas
6
1,000 visas
Number of inbound investmentagreements/MoUS,and bilateralagreements/MoUs signed
Number of visas and passportsissued
Bilateral agreements andmarketing Kenya internationally
Consular services
1051003800 Bujumbura
9
2,000 visas
8
2,000 visas
7
2,000 visas
Number of inbound investmentagreements/MoUS,and bilateralagreements/MoUs signed
Number of visas and passportsissued
Bilateral agreements andmarketing Kenya internationally
Consular services
1051003900 Tel Aviv
7
3,000 visas
6
3,000 visas
5
3,000 visas
Number of inbound investmentagreements/MoUS,and bilateralagreements/MoUs signed
Number of visas and passportsissued
Bilateral agreements andmarketing Kenya internationally
Consular services
1051004000 Pretoria
12
2,000visas
10
1,500 visas
7
1,000 visas
Number of inbound investmentagreements/MoUS,and bilateralagreements/MoUs signed
Number of visas and passportsissued
Bilateral agreements andmarketing Kenya internationally
Consular services
1051004100 Vienna
6
2,000 visas
5
1,500 visas
4
1,000 visas
Number of inbound investmentagreements/MoUS,and bilateralagreements/MoUs signed
Number of visas and passportsissued
Bilateral agreements andmarketing Kenya internationally
Consular services
1051004200 Kuala Lumpur
123

PART E. SUMMARY OF PROGRAMME OUTPUTS AND PERFORMANCE INDICATORS FOR 2016/2017 - 2018/2019
1051 Ministry of Foreign Affairs and International Trade
6
3,000 visas
5
2,000 visas
4
1,000 visas
Number of inbound investmentagreements/MoUS,and bilateralagreements/MoUs signed
Number of visas and passportsissued
Bilateral agreements andmarketing Kenya internationally
Consular services
1051004300 Kuwait
6
2,000 visas
5
2,000 visas
4
1,000 visas
Number of inbound investmentagreements/MoUS,and bilateralagreements/MoUs signed
Number of visas and passportsissued
Bilateral agreements andmarketing Kenya internationally
Consular services
1051004400 Dublin
9
2,000 visas
8
2,000 visas
7
2,000 visas
agreements/MoUS,and bilateralagreements/MoUs signed
Number of visas and passportsissued
Bilateral agreements andmarketing Kenya internationally
Consular services
1051004500 Madrid
8
3,000 visas
6
2,000 visas
4
1,000 visas
Number of inbound investmentagreements/MoUS,and bilateralagreements/MoUs signed
Number of visas and passportsissued
Bilateral agreements andmarketing Kenya internationally
Consular services
1051004600 Seoul
8
2,000 visas
7
2,000 visas
6
2,000 visas
Number of inbound investmentagreements/MoUS,and bilateralagreements/MoUs signed
Number of visas and passportsissued
Bilateral agreements andmarketing Kenya internationally
Consular services
1051004700 Kigali
9
2,000 visas
8
2,000 visas
7
2,000 visas
Number of inbound investmentagreements/MoUS,and bilateralagreements/MoUs signed
Number of visas and passportsissued
Bilateral agreements andmarketing Kenya internationally
Consular services
1051004800 Canberra
124
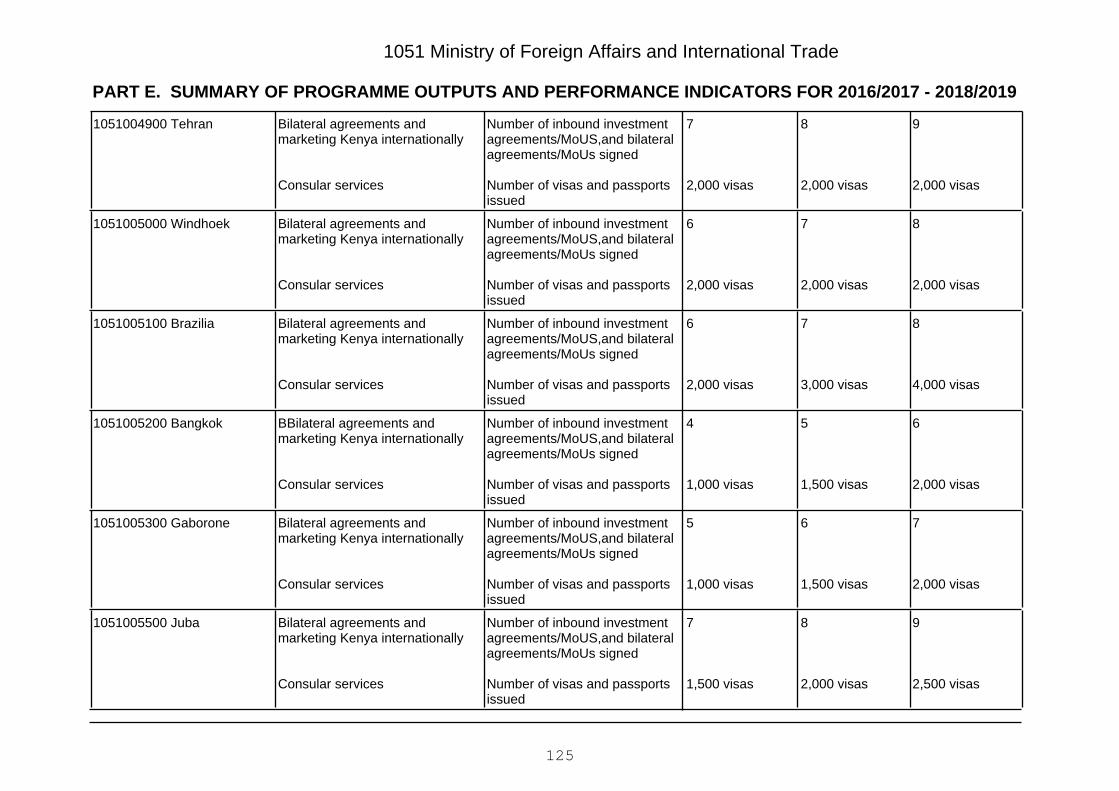
PART E. SUMMARY OF PROGRAMME OUTPUTS AND PERFORMANCE INDICATORS FOR 2016/2017 - 2018/2019
1051 Ministry of Foreign Affairs and International Trade
9
2,000 visas
8
2,000 visas
7
2,000 visas
Number of inbound investmentagreements/MoUS,and bilateralagreements/MoUs signed
Number of visas and passportsissued
Bilateral agreements andmarketing Kenya internationally
Consular services
1051004900 Tehran
8
2,000 visas
7
2,000 visas
6
2,000 visas
Number of inbound investmentagreements/MoUS,and bilateralagreements/MoUs signed
Number of visas and passportsissued
Bilateral agreements andmarketing Kenya internationally
Consular services
1051005000 Windhoek
8
4,000 visas
7
3,000 visas
6
2,000 visas
Number of inbound investmentagreements/MoUS,and bilateralagreements/MoUs signed
Number of visas and passportsissued
Bilateral agreements andmarketing Kenya internationally
Consular services
1051005100 Brazilia
6
2,000 visas
5
1,500 visas
4
1,000 visas
Number of inbound investmentagreements/MoUS,and bilateralagreements/MoUs signed
Number of visas and passportsissued
BBilateral agreements andmarketing Kenya internationally
Consular services
1051005200 Bangkok
7
2,000 visas
6
1,500 visas
5
1,000 visas
Number of inbound investmentagreements/MoUS,and bilateralagreements/MoUs signed
Number of visas and passportsissued
Bilateral agreements andmarketing Kenya internationally
Consular services
1051005300 Gaborone
9
2,500 visas
8
2,000 visas
7
1,500 visas
Number of inbound investmentagreements/MoUS,and bilateralagreements/MoUs signed
Number of visas and passportsissued
Bilateral agreements andmarketing Kenya internationally
Consular services
1051005500 Juba
125
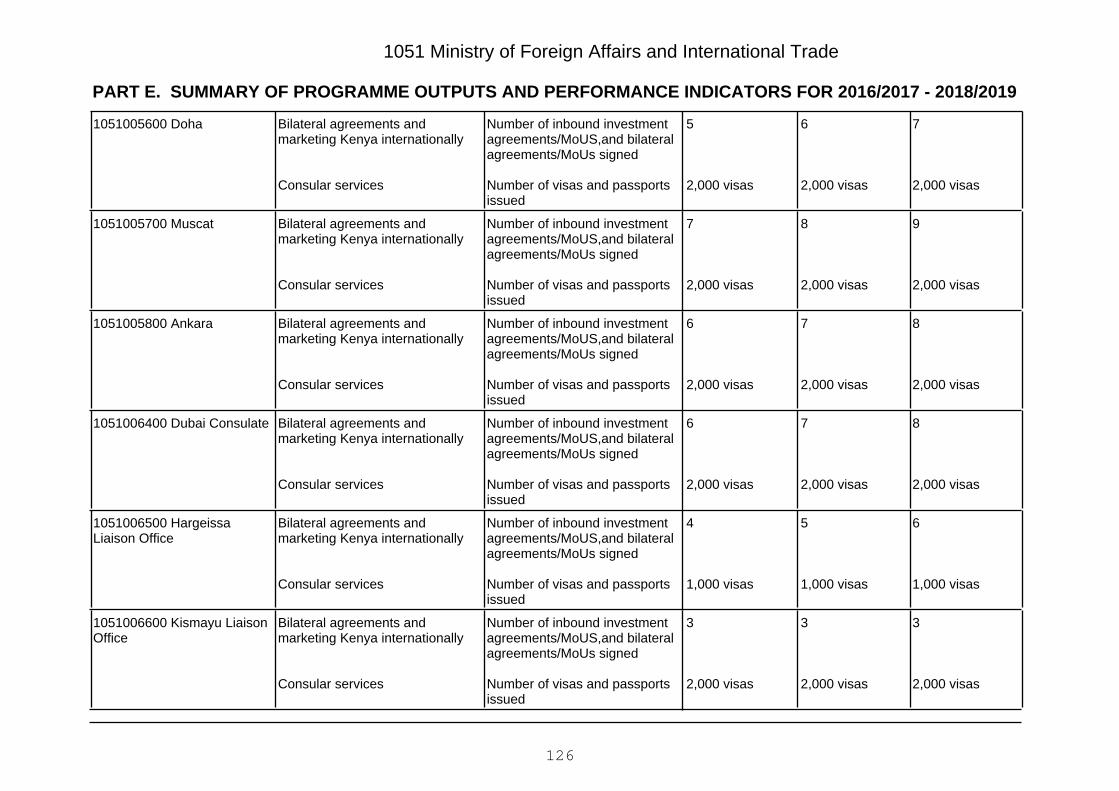
PART E. SUMMARY OF PROGRAMME OUTPUTS AND PERFORMANCE INDICATORS FOR 2016/2017 - 2018/2019
1051 Ministry of Foreign Affairs and International Trade
7
2,000 visas
6
2,000 visas
5
2,000 visas
Number of inbound investmentagreements/MoUS,and bilateralagreements/MoUs signed
Number of visas and passportsissued
Bilateral agreements andmarketing Kenya internationally
Consular services
1051005600 Doha
9
2,000 visas
8
2,000 visas
7
2,000 visas
Number of inbound investmentagreements/MoUS,and bilateralagreements/MoUs signed
Number of visas and passportsissued
Bilateral agreements andmarketing Kenya internationally
Consular services
1051005700 Muscat
8
2,000 visas
7
2,000 visas
6
2,000 visas
Number of inbound investmentagreements/MoUS,and bilateralagreements/MoUs signed
Number of visas and passportsissued
Bilateral agreements andmarketing Kenya internationally
Consular services
1051005800 Ankara
8
2,000 visas
7
2,000 visas
6
2,000 visas
Number of inbound investmentagreements/MoUS,and bilateralagreements/MoUs signed
Number of visas and passportsissued
Bilateral agreements andmarketing Kenya internationally
Consular services
1051006400 Dubai Consulate
6
1,000 visas
5
1,000 visas
4
1,000 visas
Number of inbound investmentagreements/MoUS,and bilateralagreements/MoUs signed
Number of visas and passportsissued
Bilateral agreements andmarketing Kenya internationally
Consular services
1051006500 HargeissaLiaison Office
3
2,000 visas
3
2,000 visas
3
2,000 visas
Number of inbound investmentagreements/MoUS,and bilateralagreements/MoUs signed
Number of visas and passportsissued
Bilateral agreements andmarketing Kenya internationally
Consular services
1051006600 Kismayu LiaisonOffice
126
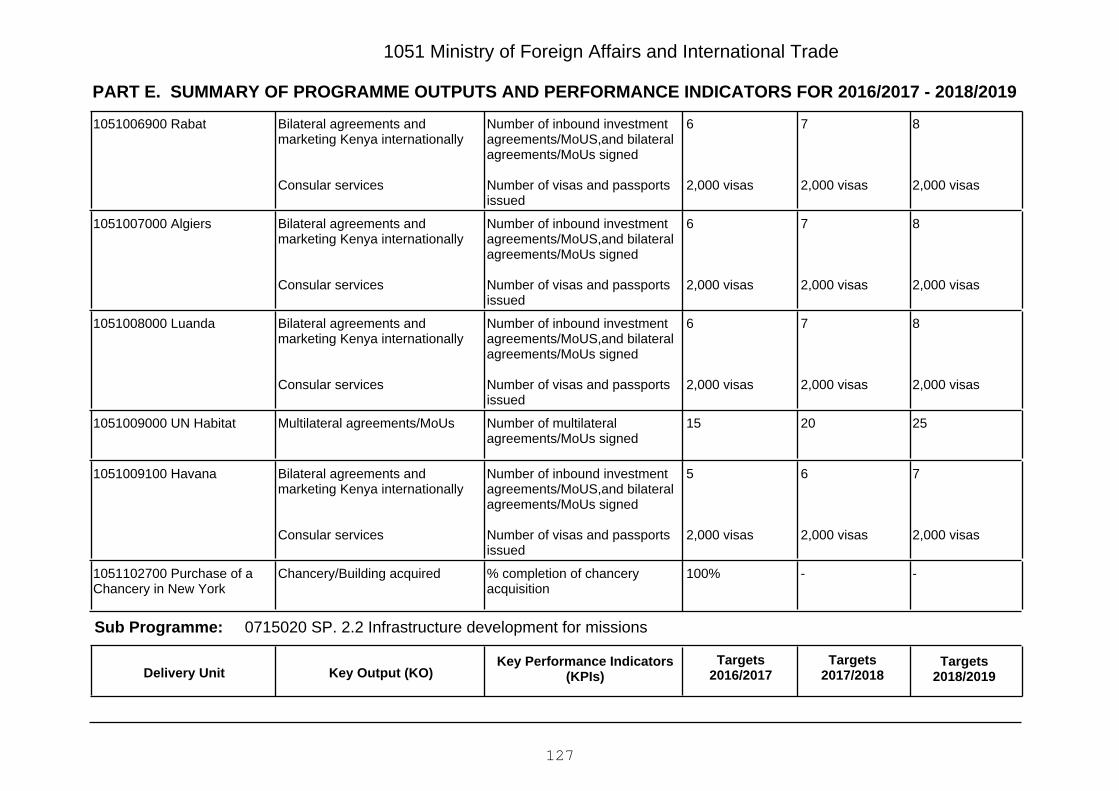
PART E. SUMMARY OF PROGRAMME OUTPUTS AND PERFORMANCE INDICATORS FOR 2016/2017 - 2018/2019
1051 Ministry of Foreign Affairs and International Trade
8
2,000 visas
7
2,000 visas
6
2,000 visas
Number of inbound investmentagreements/MoUS,and bilateralagreements/MoUs signed
Number of visas and passportsissued
Bilateral agreements andmarketing Kenya internationally
Consular services
1051006900 Rabat
8
2,000 visas
7
2,000 visas
6
2,000 visas
Number of inbound investmentagreements/MoUS,and bilateralagreements/MoUs signed
Number of visas and passportsissued
Bilateral agreements andmarketing Kenya internationally
Consular services
1051007000 Algiers
8
2,000 visas
7
2,000 visas
6
2,000 visas
Number of inbound investmentagreements/MoUS,and bilateralagreements/MoUs signed
Number of visas and passportsissued
Bilateral agreements andmarketing Kenya internationally
Consular services
1051008000 Luanda
252015Number of multilateralagreements/MoUs signed
Multilateral agreements/MoUs1051009000 UN Habitat
7
2,000 visas
6
2,000 visas
5
2,000 visas
Number of inbound investmentagreements/MoUS,and bilateralagreements/MoUs signed
Number of visas and passportsissued
Bilateral agreements andmarketing Kenya internationally
Consular services
1051009100 Havana
--100%% completion of chanceryacquisition
Chancery/Building acquired1051102700 Purchase of aChancery in New York
0715020 SP. 2.2 Infrastructure development for missionsSub Programme:
Key Output (KO)Targets
2018/2019Targets
2017/2018Key Performance Indicators
(KPIs)Targets
2016/2017Delivery Unit
127
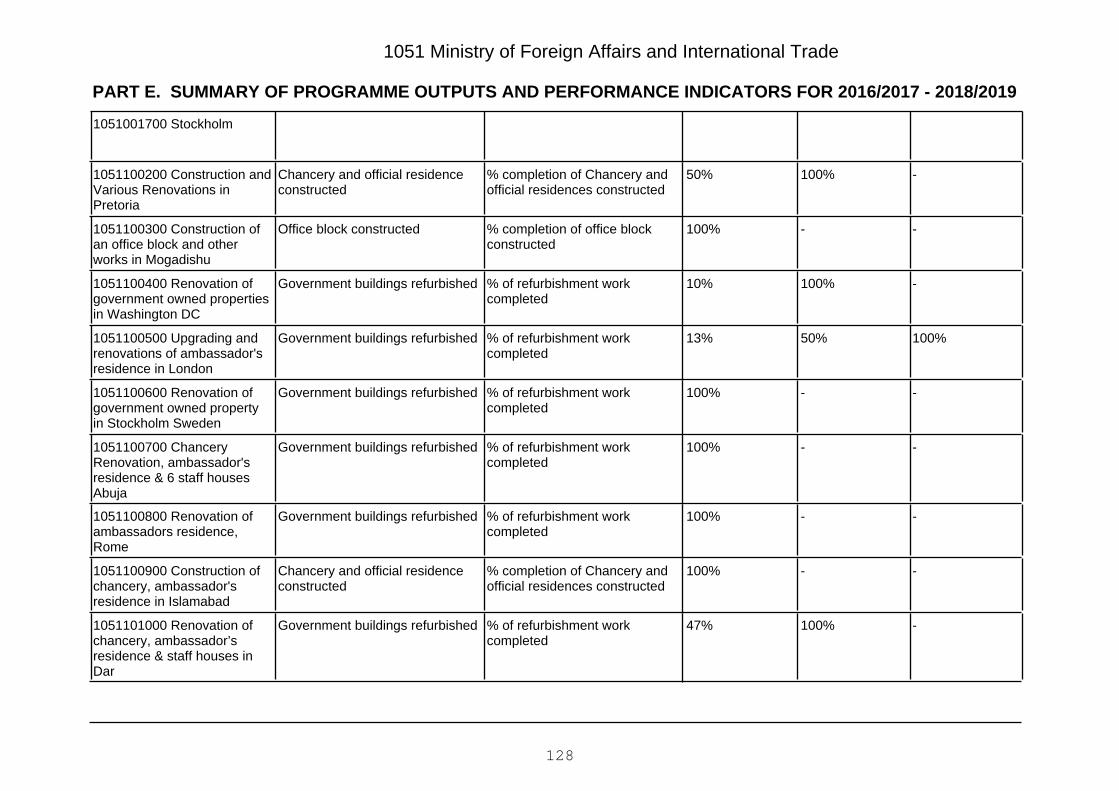
PART E. SUMMARY OF PROGRAMME OUTPUTS AND PERFORMANCE INDICATORS FOR 2016/2017 - 2018/2019
1051 Ministry of Foreign Affairs and International Trade
1051001700 Stockholm
-100%50%% completion of Chancery andofficial residences constructed
Chancery and official residenceconstructed
1051100200 Construction andVarious Renovations inPretoria
--100%% completion of office blockconstructed
Office block constructed1051100300 Construction ofan office block and otherworks in Mogadishu
-100%10%% of refurbishment workcompleted
Government buildings refurbished1051100400 Renovation ofgovernment owned propertiesin Washington DC
100%50%13%% of refurbishment workcompleted
Government buildings refurbished1051100500 Upgrading andrenovations of ambassador'sresidence in London
--100%% of refurbishment workcompleted
Government buildings refurbished1051100600 Renovation ofgovernment owned propertyin Stockholm Sweden
--100%% of refurbishment workcompleted
Government buildings refurbished1051100700 ChanceryRenovation, ambassador'sresidence & 6 staff housesAbuja
--100%% of refurbishment workcompleted
Government buildings refurbished1051100800 Renovation ofambassadors residence,Rome
--100%% completion of Chancery andofficial residences constructed
Chancery and official residenceconstructed
1051100900 Construction ofchancery, ambassador'sresidence in Islamabad
-100%47%% of refurbishment workcompleted
Government buildings refurbished1051101000 Renovation ofchancery, ambassador’sresidence & staff houses inDar
128

PART E. SUMMARY OF PROGRAMME OUTPUTS AND PERFORMANCE INDICATORS FOR 2016/2017 - 2018/2019
1051 Ministry of Foreign Affairs and International Trade
0716000 P3 International Trade and Investments Promotion
Increased foreign trade and investments
Programme:
Outcome:
0716010 SP. 3.1 International TradeSub Programme:
Key Output (KO)Targets
2018/2019Targets
2017/2018Key Performance Indicators
(KPIs)Targets
2016/2017Delivery Unit
8
17
7
16
6
14
Number of Trade, tourism andinvestment exhibitions/meetings/trade fairs andcultural diplomacy missionsattended/organized/facilitated
Number of missions that haveestablished showrooms todisplay Kenyan products
Established export market inforeign countries
1051006700 External TradePromotion Services
0716020 SP. 3.2 Investments promotionSub Programme:
Key Output (KO)Targets
2018/2019Targets
2017/2018Key Performance Indicators
(KPIs)Targets
2016/2017Delivery Unit
28
28
9
25
25
8
20
20
7
Number of inbound investmentmeetings held and the attendantresolutions
Number of business forums held
Number of Bilateral tradeagreements/MOUs signed
Increased Foreign DirectInvestment (FDI) and overseasdevelopment assistance(ODA)
Increased market access forKenyan products
Trading partners expanded
1051006800 Foreign TradeServices
129
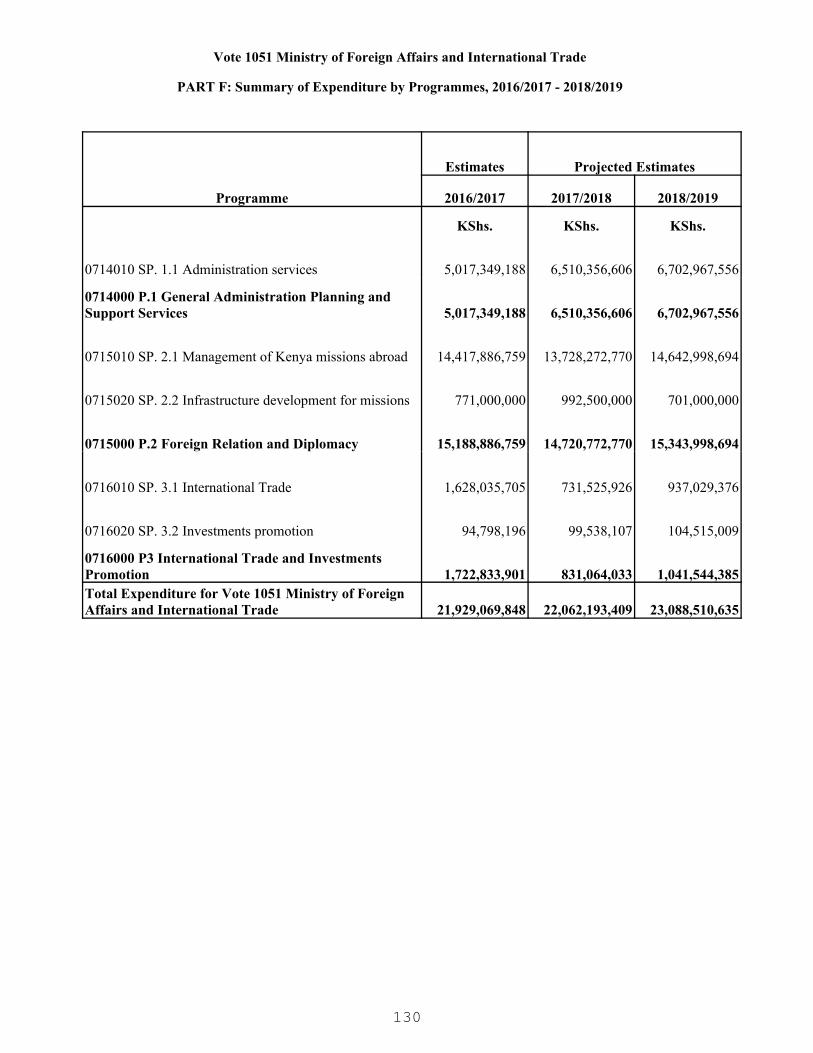
Vote 1051 Ministry of Foreign Affairs and International Trade
PART F: Summary of Expenditure by Programmes, 2016/2017 - 2018/2019
Programme
Estimates Projected Estimates
2016/2017 2017/2018 2018/2019
KShs. KShs. KShs.
0714010 SP. 1.1 Administration services 5,017,349,188 6,510,356,606 6,702,967,556
0714000 P.1 General Administration Planning and Support Services 5,017,349,188 6,510,356,606 6,702,967,556
0715010 SP. 2.1 Management of Kenya missions abroad 14,417,886,759 13,728,272,770 14,642,998,694
0715020 SP. 2.2 Infrastructure development for missions 771,000,000 992,500,000 701,000,000
0715000 P.2 Foreign Relation and Diplomacy 15,188,886,759 14,720,772,770 15,343,998,694
0716010 SP. 3.1 International Trade 1,628,035,705 731,525,926 937,029,376
0716020 SP. 3.2 Investments promotion 94,798,196 99,538,107 104,515,009
0716000 P3 International Trade and Investments Promotion 1,722,833,901 831,064,033 1,041,544,385Total Expenditure for Vote 1051 Ministry of Foreign Affairs and International Trade 21,929,069,848 22,062,193,409 23,088,510,635
130

1051 Ministry of Foreign Affairs and International Trade
PART G: Summary of Expenditure by Vote and Economic Classification, 2016/2017 - 2018/2019
Economic Classification
Estimates Projected Estimates
2016/2017 2017/2018 2018/2019KShs. KShs. KShs.
Current Expenditure 18,929,069,848 19,713,193,409 21,005,510,635
Compensation to Employees 6,844,090,000 7,648,760,000 8,346,310,000
Use of Goods and Services 8,208,692,467 8,304,311,594 8,403,742,713
Current Transfers to Govt. Agencies 3,607,010,000 3,570,800,000 4,070,800,000
Other Recurrent 269,277,381 189,321,815 184,657,922
Capital Expenditure 3,000,000,000 2,349,000,000 2,083,000,000
Acquisition of Non-Financial Assets 2,766,000,000 1,920,000,000 1,448,000,000
Capital Grants to Govt. Agencies 234,000,000 429,000,000 635,000,000Total Expenditure 21,929,069,848 22,062,193,409 23,088,510,635
131

1051 Ministry of Foreign Affairs and International Trade
PART H: Summary of Expenditure by Programme and Economic Classification, 2016/2017 - 2018/2019
0714010 SP. 1.1 Administration services
Economic Classification
Estimates Projected Estimates
2016/2017 2017/2018 2018/2019KShs. KShs. KShs.
Current Expenditure 4,783,349,188 5,143,856,606 5,305,967,556
Compensation to Employees 503,231,249 626,010,006 629,027,905
Use of Goods and Services 2,065,692,609 2,276,703,599 2,309,447,350
Current Transfers to Govt. Agencies 2,164,935,806 2,182,994,426 2,308,505,126
Other Recurrent 49,489,524 58,148,575 58,987,175
Capital Expenditure 234,000,000 1,366,500,000 1,397,000,000
Acquisition of Non-Financial Assets - 937,500,000 762,000,000
Capital Grants to Govt. Agencies 234,000,000 429,000,000 635,000,000Total Expenditure 5,017,349,188 6,510,356,606 6,702,967,556
0714000 P.1 General Administration Planning and Support Services
Economic Classification
Estimates Projected Estimates
2016/2017 2017/2018 2018/2019KShs. KShs. KShs.
Current Expenditure 4,783,349,188 5,143,856,606 5,305,967,556
Compensation to Employees 503,231,249 626,010,006 629,027,905
Use of Goods and Services 2,065,692,609 2,276,703,599 2,309,447,350
Current Transfers to Govt. Agencies 2,164,935,806 2,182,994,426 2,308,505,126
Other Recurrent 49,489,524 58,148,575 58,987,175
Capital Expenditure 234,000,000 1,366,500,000 1,397,000,000
Acquisition of Non-Financial Assets - 937,500,000 762,000,000
Capital Grants to Govt. Agencies 234,000,000 429,000,000 635,000,000Total Expenditure 5,017,349,188 6,510,356,606 6,702,967,556
0715010 SP. 2.1 Management of Kenya missions abroad
Economic Classification
Estimates Projected Estimates
2016/2017 2017/2018 2018/2019KShs. KShs. KShs.
132
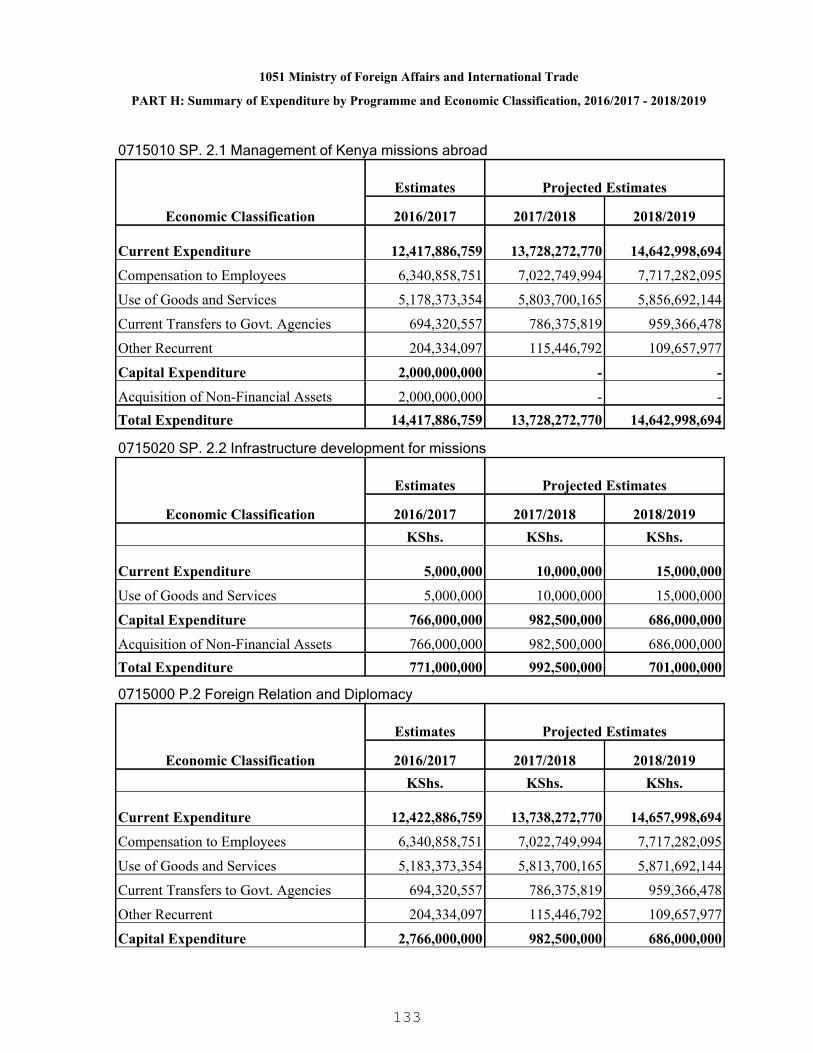
1051 Ministry of Foreign Affairs and International Trade
PART H: Summary of Expenditure by Programme and Economic Classification, 2016/2017 - 2018/2019
0715010 SP. 2.1 Management of Kenya missions abroad
Economic Classification
Estimates Projected Estimates
2016/2017 2017/2018 2018/2019
Current Expenditure 12,417,886,759 13,728,272,770 14,642,998,694
Compensation to Employees 6,340,858,751 7,022,749,994 7,717,282,095
Use of Goods and Services 5,178,373,354 5,803,700,165 5,856,692,144
Current Transfers to Govt. Agencies 694,320,557 786,375,819 959,366,478
Other Recurrent 204,334,097 115,446,792 109,657,977
Capital Expenditure 2,000,000,000 - -
Acquisition of Non-Financial Assets 2,000,000,000 - -Total Expenditure 14,417,886,759 13,728,272,770 14,642,998,694
0715020 SP. 2.2 Infrastructure development for missions
Economic Classification
Estimates Projected Estimates
2016/2017 2017/2018 2018/2019KShs. KShs. KShs.
Current Expenditure 5,000,000 10,000,000 15,000,000
Use of Goods and Services 5,000,000 10,000,000 15,000,000
Capital Expenditure 766,000,000 982,500,000 686,000,000
Acquisition of Non-Financial Assets 766,000,000 982,500,000 686,000,000Total Expenditure 771,000,000 992,500,000 701,000,000
0715000 P.2 Foreign Relation and Diplomacy
Economic Classification
Estimates Projected Estimates
2016/2017 2017/2018 2018/2019KShs. KShs. KShs.
Current Expenditure 12,422,886,759 13,738,272,770 14,657,998,694
Compensation to Employees 6,340,858,751 7,022,749,994 7,717,282,095
Use of Goods and Services 5,183,373,354 5,813,700,165 5,871,692,144
Current Transfers to Govt. Agencies 694,320,557 786,375,819 959,366,478
Other Recurrent 204,334,097 115,446,792 109,657,977
Capital Expenditure 2,766,000,000 982,500,000 686,000,000
133
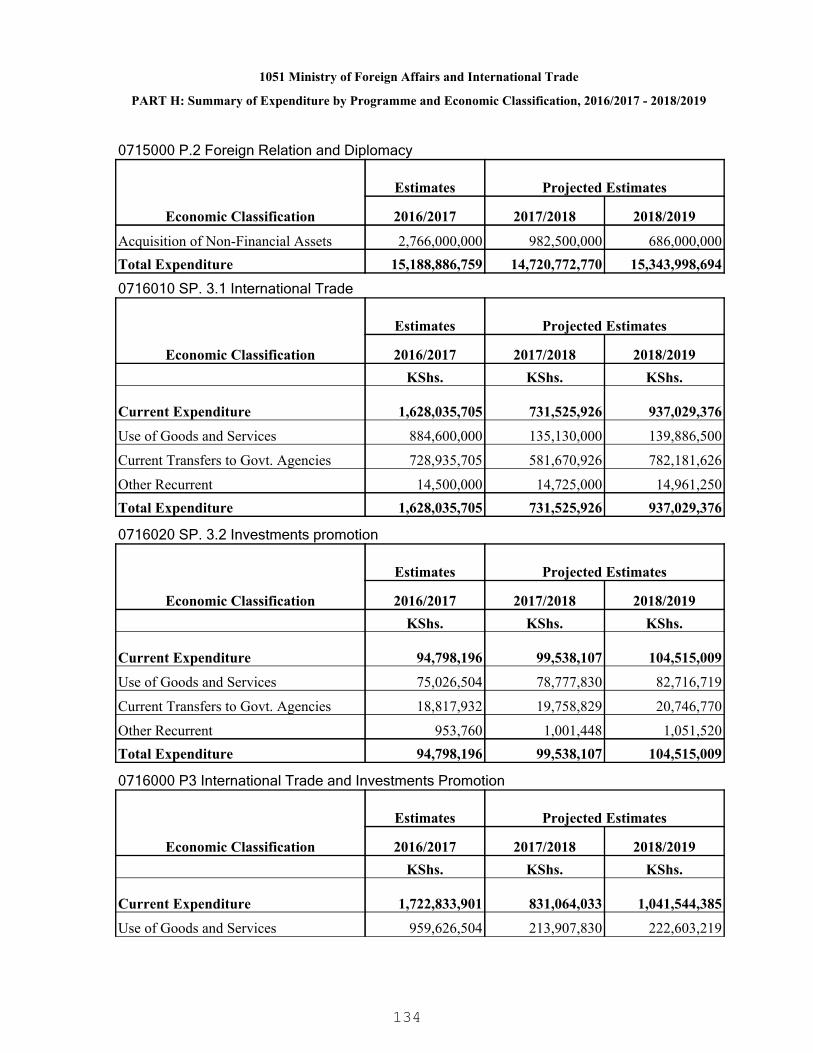
1051 Ministry of Foreign Affairs and International Trade
PART H: Summary of Expenditure by Programme and Economic Classification, 2016/2017 - 2018/2019
0715000 P.2 Foreign Relation and Diplomacy
Economic Classification
Estimates Projected Estimates
2016/2017 2017/2018 2018/2019
Acquisition of Non-Financial Assets 2,766,000,000 982,500,000 686,000,000Total Expenditure 15,188,886,759 14,720,772,770 15,343,998,694
0716010 SP. 3.1 International Trade
Economic Classification
Estimates Projected Estimates
2016/2017 2017/2018 2018/2019KShs. KShs. KShs.
Current Expenditure 1,628,035,705 731,525,926 937,029,376
Use of Goods and Services 884,600,000 135,130,000 139,886,500
Current Transfers to Govt. Agencies 728,935,705 581,670,926 782,181,626
Other Recurrent 14,500,000 14,725,000 14,961,250Total Expenditure 1,628,035,705 731,525,926 937,029,376
0716020 SP. 3.2 Investments promotion
Economic Classification
Estimates Projected Estimates
2016/2017 2017/2018 2018/2019KShs. KShs. KShs.
Current Expenditure 94,798,196 99,538,107 104,515,009
Use of Goods and Services 75,026,504 78,777,830 82,716,719
Current Transfers to Govt. Agencies 18,817,932 19,758,829 20,746,770
Other Recurrent 953,760 1,001,448 1,051,520Total Expenditure 94,798,196 99,538,107 104,515,009
0716000 P3 International Trade and Investments Promotion
Economic Classification
Estimates Projected Estimates
2016/2017 2017/2018 2018/2019KShs. KShs. KShs.
Current Expenditure 1,722,833,901 831,064,033 1,041,544,385
Use of Goods and Services 959,626,504 213,907,830 222,603,219
134
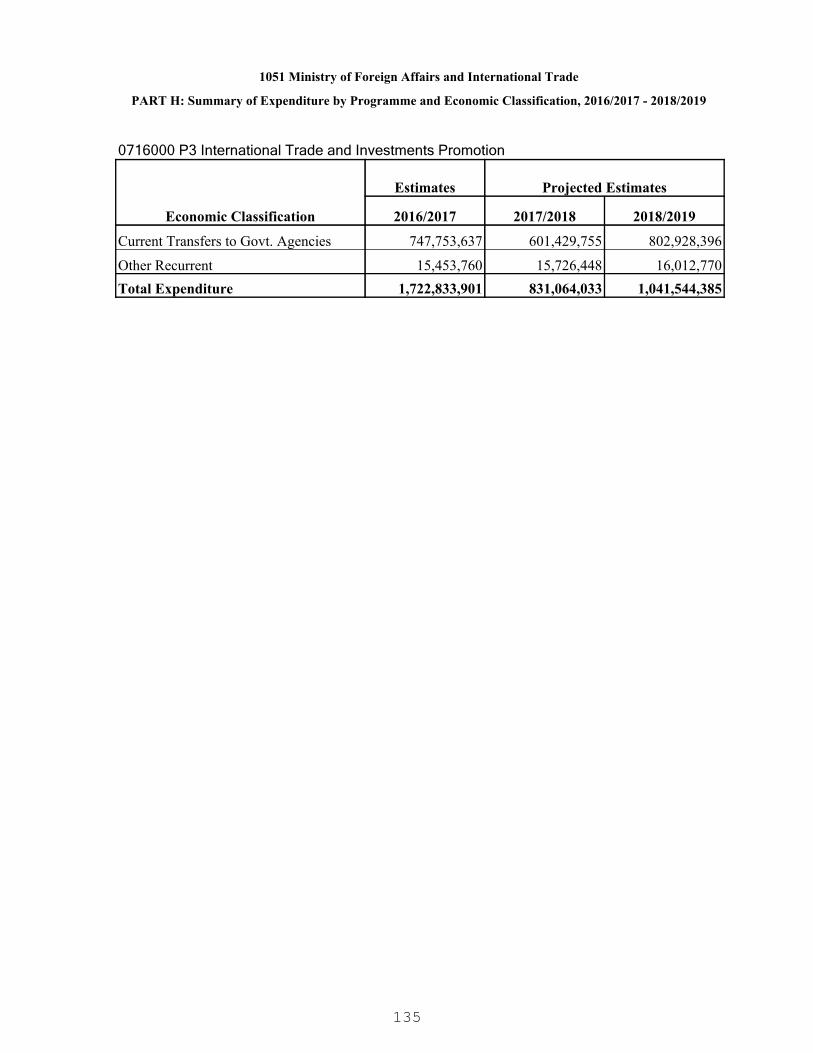
1051 Ministry of Foreign Affairs and International Trade
PART H: Summary of Expenditure by Programme and Economic Classification, 2016/2017 - 2018/2019
0716000 P3 International Trade and Investments Promotion
Economic Classification
Estimates Projected Estimates
2016/2017 2017/2018 2018/2019
Current Transfers to Govt. Agencies 747,753,637 601,429,755 802,928,396
Other Recurrent 15,453,760 15,726,448 16,012,770Total Expenditure 1,722,833,901 831,064,033 1,041,544,385
135

1061 State Department for Education
A globally competitive quality education, training and research for Kenya's sustainabledevelopment.
To provide, promote, co-ordinate quality education, training and research for empowerment ofindividuals to become caring, competent and responsible citizens who value education as alifelong process.
PART A. Vision
PART B. Mission
PART C. Performance Overview and Background for Programme(s) Funding
The State Department for Education is mandated to undertake the Education Policy;alternative provision of basic education and training; management of education standards;management of national examinations and certification; curriculum development; qualityassurance in education; special needs education management; adult education management;teacher education and management; school administration and programmes of trainingInstitutions; primary and secondary education Institutions management and representation ofKenya in United Nations Education Science and Cultural Organizations.
During the period under review the achievements for the State Department for Educationincluded the following: primary enrollment increased from 9.8.million (5 million boys and 4.8million girls) in 2012 to 9.9 million (5.0 boys and 4.9 girls) in 2013, 10.0 million (5.0 boys and5.0 girls) in 2014 and 10.0 million (5.0 boys and 5.0 girls) in 2015. Gross enrollment ratemoved from 106 % (108.6 percent boys and 104.2 percent for girls) in 2012 to 105 percent(107.1 boys and 102.5 girls) in 2013 ; 103 percent (105.6 male and 101.4 female) in 2014and further to103.6.percent (105.6 male and 101.4 female ) in 2015. The Primary GenderParity Index improved from 1.0 in 2013 to 1.0 in 2014 and maintained at 1.0 in 2015. Thepupil completion rate remained above 75% during the period with transition from primary tosecondary increasing from 66 per cent in 2012 to 73.2 in 2013 and 73.3 per cent in 2014. Thenumber of public primary schools increased from 20,307 in 2012 to 21,205 in 2013 and21,718 in 2014 and further to 22,861 in 2015.
In addition, school feeding programme provided mid-day meals to approximately1.3 millionpreprimary and primary school pupils in the Arid and Semi-Arid Lands and informalsettlements in Nairobi. The number of beneficiaries increased to 1.6 million in the financialyear 2014/15. The number of primary school girls benefiting from provision of sanitary towelsincreased from 568,925 in the FY 2012/13 to 665,251 in FY 2013/14 and further increased to1,143,548 in the FY 2014/15.
Secondary school enrollment grew from 1.9 million (1.01 million male and 0.896 millionfemale) in 2012 to 2.1 million (1,127,697 male and 976,565 female) in 2013 increasing furtherto 2.3 million (1.202 male and 1.107 female) in 2014 and 2.56 million (1.348 male and 1.210female) in 2015.The number of public secondary schools increased from 7,268 in 2012 to7,297 in 2013 and 7,686 in 2014 and further to 8,297 in 2015.
The KCPE examination candidature increased from 811,930 (415,620 male and 396,310female) in 2012 to 839,759 (426,369 male and 413,390 female) in 2013 and 880,486(443,258 male and 437,228 female) in 2014 increasing further to 927,789 (467,904 male and459,885 female) in 2015. The KCSE candidature increased from 436,349 (241,139 boys and
136
1061 State Department for Education
PART D. Programme Objectives
195,210 girls) in 2012 to 436,349 (241,139 boys and 195,210 girls) in 2013 and 436,349(241,139 boys and 195,210 girls) in 2014 and further to 522,870 (279,289 male and 243,581female) in 2015. During the FY 2014/15, Kenya Institute of Curriculum Developmentdeveloped 900 Educational radio and TV programmes for Primary and secondary schools invarious subjects which transmits 2,700 radio programmes annually. The Institute alsodeveloped digital content for 12 subjects (English, Mathematics, Kiswahili, Biology,Chemistry, Physics, Geography History& Government, Agriculture, Business studies,Computer studies and Home science) for secondary school use and 5 Subjects (Mathematics, Sciences, social studies, Kiswahili and English) for primary school use.
The State Department of Education experienced numerous challenges including:uncoordinated establishment of secondary schools especially under CDF initiative which laterrequire costing of teachers and additional facilities, inadequate funding to cater for Ministry’sprogrammes and activities; inadequate trained literacy and adult education teachers; lack ofdetailed and reliable data on Special Needs Education; negative cultural and religiouspractices which hinder access to education; lack of appropriate facilities for the children andyouth with severe special needs.
During the MTEF period, the State Department of Education priority areas of expenditure willinclude: continued support to Free Primary Education and Free Day Secondary Education,curriculum reform and review, support to Special needs education, infrastructureimprovement (expansion and rehabilitation of primary, secondary and Primary TeacherTraining Colleges), ICT integration (digital literacy programme - training of teachers andsupply of computers to secondary schools); and improve quality and standards of educationthrough initiatives (Early Grade Mathematics and Tusome).
ObjectiveProgramme
0501000 P.1 PrimaryEducation
To enhance access, quality, equity and relevance of PrimaryEducation.
0502000 P.2 SecondaryEducation
To enhance access, quality, equity and relevance ofSecondary Education.
0503000 P.3 QualityAssurance and Standards
To develop, maintain and enhance education qualitystandards.
0508000 P. 8 GeneralAdministration, Planningand Support Services
To provide effective and efficient support services.
137

PART E. SUMMARY OF PROGRAMME OUTPUTS AND PERFORMANCE INDICATORS FOR 2016/2017 - 2018/2019
1061 State Department for Education
0501000 P.1 Primary Education
Improved access, equity, quality and relevance of Basic Education.
Programme:
Outcome:
0501010 SP. 1.1 Free Primary EducationSub Programme:
Key Output (KO)Targets
2018/2019Targets
2017/2018Key Performance Indicators
(KPIs)Targets
2016/2017Delivery Unit
10,420,711
3
10,420,711
10,019,914
3
10,019,914
9,634,533
3
9,634,533
Number of pupils enrolled
Number of Free PrimaryEducation monitoring reportsprepared
Number of pupils in schoolsreceiving top up capitationdisbursement on free primaryeducation
Pupils enrolled in public primaryschools.
Capitation disbursement to freeprimary education.
1061001500 Directorate ofBasic Education
999Number of primary andsecondary schools covered
School infrastructure1061100100 SchoolInfrastructure in NorthNyamira/ Borabu
101010Number of regions coveredNational Cohesion and Integration1061100200 NationalVolunteers Programme
180,400180,200180,000Number of pupils enrolledPupils enrolled in public primaryschools in nomadic counties
1061100600 NomadicEducation
400040004000Number of Primary Schoolscovered
Kenya Primary Education Project1061101400 Kenya PrimaryEducation Project - GPE
227208189Number of primary schools’infrastructureconstructed,expanded/rehabilita
Infrastructure facilities in primaryschools
1061101500 Primary Schoolsinfrastructure Improvement
138

PART E. SUMMARY OF PROGRAMME OUTPUTS AND PERFORMANCE INDICATORS FOR 2016/2017 - 2018/2019
1061 State Department for Education
0501020 SP. 1.2 Special Needs EducationSub Programme:
Key Output (KO)Targets
2018/2019Targets
2017/2018Key Performance Indicators
(KPIs)Targets
2016/2017Delivery Unit
61,00053,00051,000Number of special needlearners enrolled in post PrimaryEducation and receiving the topups
Special needs learners enrolled inpost primary education.
1061001200 Post PrimarySchools
97,36694,54192,680Number of Special NeedsEducation learners enrolled inPrimary Education and receivingthe top ups
Special need learners enrolled inpost primary education.
1061001800 Special PrimarySchools
850
1100
500
350
750
1000
400
300
700
800
400
100
Number of special needsteachers trained
Number of gifted and talentedchildren and youth with specialneeds assisted
Number of stakeholderssensitized on Special NeedsEducation issues
No. of children rehabilitated andvisually impaired personsoriented and rehabilitated
Trained Special Needs Teachers.1061001900 Kenya Instituteof Special Education - KISE
780
6
780
6
780
6
No. of braille books in terms ofvolumes produced
No. of newly blinded persons
Blind persons receivingspecialized education
1061004000 Kenya Instituteof Blind
139

PART E. SUMMARY OF PROGRAMME OUTPUTS AND PERFORMANCE INDICATORS FOR 2016/2017 - 2018/2019
1061 State Department for Education
rehabilitated
125110100Number of children withdisabilities enrolled
Children withdisabilities enrolled in specialschools
1061005200 EducationAssessment and ResourceCentre (EARC)
-100%80%Percentage completion levelPsycho-educational facility1061102100 Construct &Equip the National Psycho-Education Assessment Centre
0501040 SP. 1.4 Early Child Development and EducationSub Programme:
Key Output (KO)Targets
2018/2019Targets
2017/2018Key Performance Indicators
(KPIs)Targets
2016/2017Delivery Unit
100010001000Number of stakeholderssensitized on Early ChildhoodDevelopment Education policy.
ECDE Policy in Education1061001400 Early ChildhoodDevelopment Education(ECDE)
111Dissemination of relevantpolicies, guidelines, strategiesand training modules on EarlyChildhood Development.
ECDE Policy in Education1061100500 Early ChildhoodDevelopment
0501050 SP. 1.5 Primary Teachers Training and In-servicingSub Programme:
Key Output (KO)Targets
2018/2019Targets
2017/2018Key Performance Indicators
(KPIs)Targets
2016/2017Delivery Unit
14,00013,00012,200Number of primary teacherstrained
Primary teachers graduates1061001700 PrimaryTeachers Training Colleges
100%30%30%Percentage completion level ofnewly constructed TTCs
PTTCs facilities1061101800 Construction of10 New TTCs
140
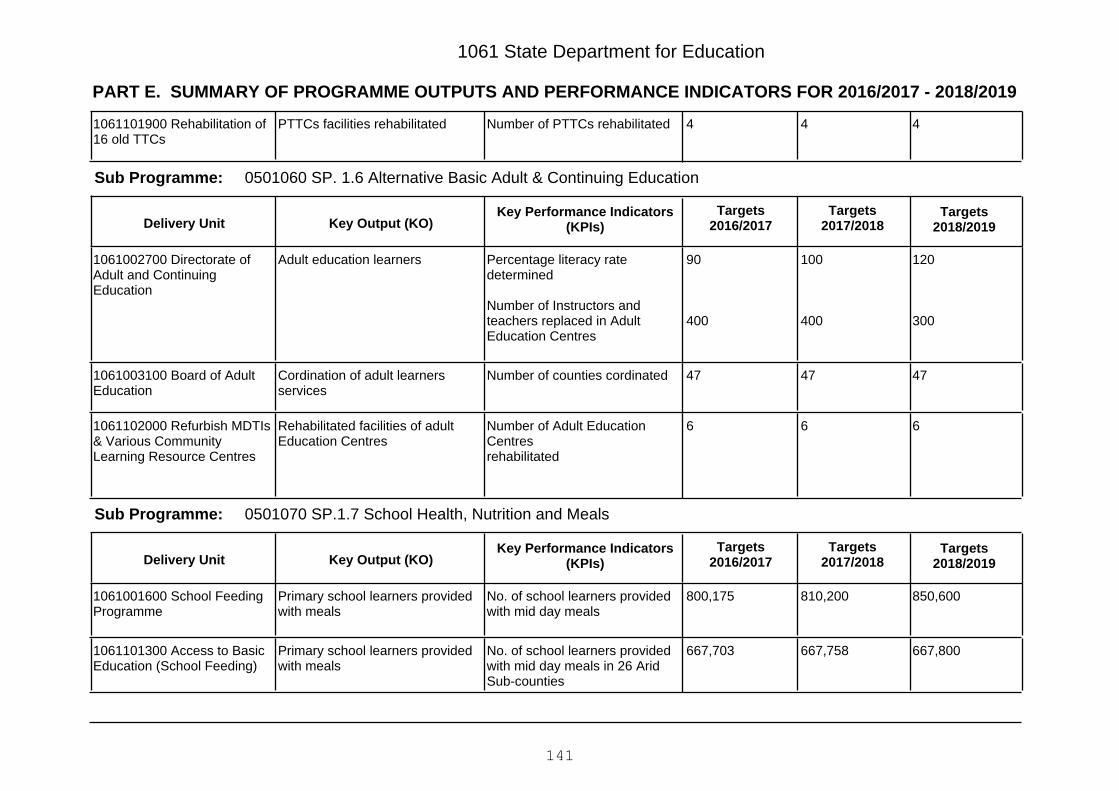
PART E. SUMMARY OF PROGRAMME OUTPUTS AND PERFORMANCE INDICATORS FOR 2016/2017 - 2018/2019
1061 State Department for Education
444Number of PTTCs rehabilitatedPTTCs facilities rehabilitated1061101900 Rehabilitation of16 old TTCs
0501060 SP. 1.6 Alternative Basic Adult & Continuing EducationSub Programme:
Key Output (KO)Targets
2018/2019Targets
2017/2018Key Performance Indicators
(KPIs)Targets
2016/2017Delivery Unit
120
300
100
400
90
400
Percentage literacy ratedetermined
Number of Instructors andteachers replaced in AdultEducation Centres
Adult education learners1061002700 Directorate ofAdult and ContinuingEducation
474747Number of counties cordinatedCordination of adult learnersservices
1061003100 Board of AdultEducation
666Number of Adult EducationCentresrehabilitated
Rehabilitated facilities of adultEducation Centres
1061102000 Refurbish MDTIs& Various CommunityLearning Resource Centres
0501070 SP.1.7 School Health, Nutrition and MealsSub Programme:
Key Output (KO)Targets
2018/2019Targets
2017/2018Key Performance Indicators
(KPIs)Targets
2016/2017Delivery Unit
850,600810,200800,175No. of school learners providedwith mid day meals
Primary school learners providedwith meals
1061001600 School FeedingProgramme
667,800667,758667,703No. of school learners providedwith mid day meals in 26 AridSub-counties
Primary school learners providedwith meals
1061101300 Access to BasicEducation (School Feeding)
141
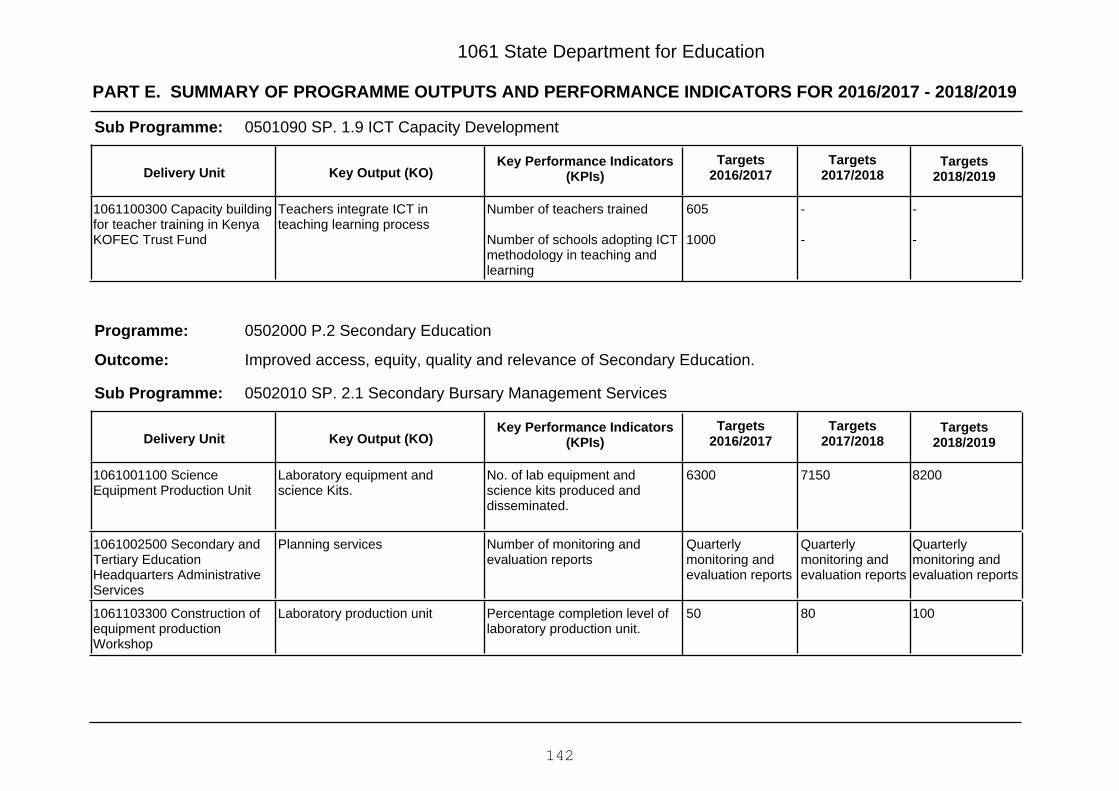
PART E. SUMMARY OF PROGRAMME OUTPUTS AND PERFORMANCE INDICATORS FOR 2016/2017 - 2018/2019
1061 State Department for Education
0501090 SP. 1.9 ICT Capacity DevelopmentSub Programme:
Key Output (KO)Targets
2018/2019Targets
2017/2018Key Performance Indicators
(KPIs)Targets
2016/2017Delivery Unit
-
-
-
-
605
1000
Number of teachers trained
Number of schools adopting ICTmethodology in teaching andlearning
Teachers integrate ICT inteaching learning process
1061100300 Capacity buildingfor teacher training in KenyaKOFEC Trust Fund
0502000 P.2 Secondary Education
Improved access, equity, quality and relevance of Secondary Education.
Programme:
Outcome:
0502010 SP. 2.1 Secondary Bursary Management ServicesSub Programme:
Key Output (KO)Targets
2018/2019Targets
2017/2018Key Performance Indicators
(KPIs)Targets
2016/2017Delivery Unit
820071506300No. of lab equipment andscience kits produced anddisseminated.
Laboratory equipment andscience Kits.
1061001100 ScienceEquipment Production Unit
Quarterlymonitoring andevaluation reports
Quarterlymonitoring andevaluation reports
Quarterlymonitoring andevaluation reports
Number of monitoring andevaluation reports
Planning services1061002500 Secondary andTertiary EducationHeadquarters AdministrativeServices
1008050Percentage completion level oflaboratory production unit.
Laboratory production unit1061103300 Construction ofequipment productionWorkshop
142

PART E. SUMMARY OF PROGRAMME OUTPUTS AND PERFORMANCE INDICATORS FOR 2016/2017 - 2018/2019
1061 State Department for Education
0502020 SP. 2.2 Free Day Secondary EducationSub Programme:
Key Output (KO)Targets
2018/2019Targets
2017/2018Key Performance Indicators
(KPIs)Targets
2016/2017Delivery Unit
2,800,500
1
2,800,500
2,778,787
1
2,778,787
2,561,094
1
2,561,094
No. of students enrolled andreceiving Free Day SecondaryEducation capitation.
No. of monitoring and evaluationreport prepared.
Number of students in schoolsreceiving top up capitationdisbursement on free daysecondary education
Enrolment in Public SecondarySchools.
1061002500 Secondary andTertiary EducationHeadquarters AdministrativeServices
242424Number of National schoolsinfrastructure upgraded
National schools infrastructureupgraded
1061102300 Upgrading ofNational Schools
350290266Number of public secondaryschools’infrastructure constructed,expanded/rehabilitated
Public secondary schoolsinfrastructure constructed,expanded/rehabilitated
1061102400 SecondaryInfrastructure Improvement
600500400Number of beneficiary SchoolsICT services in secondary schools1061102600 ICT integration inSecondary Schools
85017501600Number of laboratoriesconstructed, expanded andrehabilitated
Secondary schools laboratories1061102700 Laboratorymaterials supplies and smallequipment
143
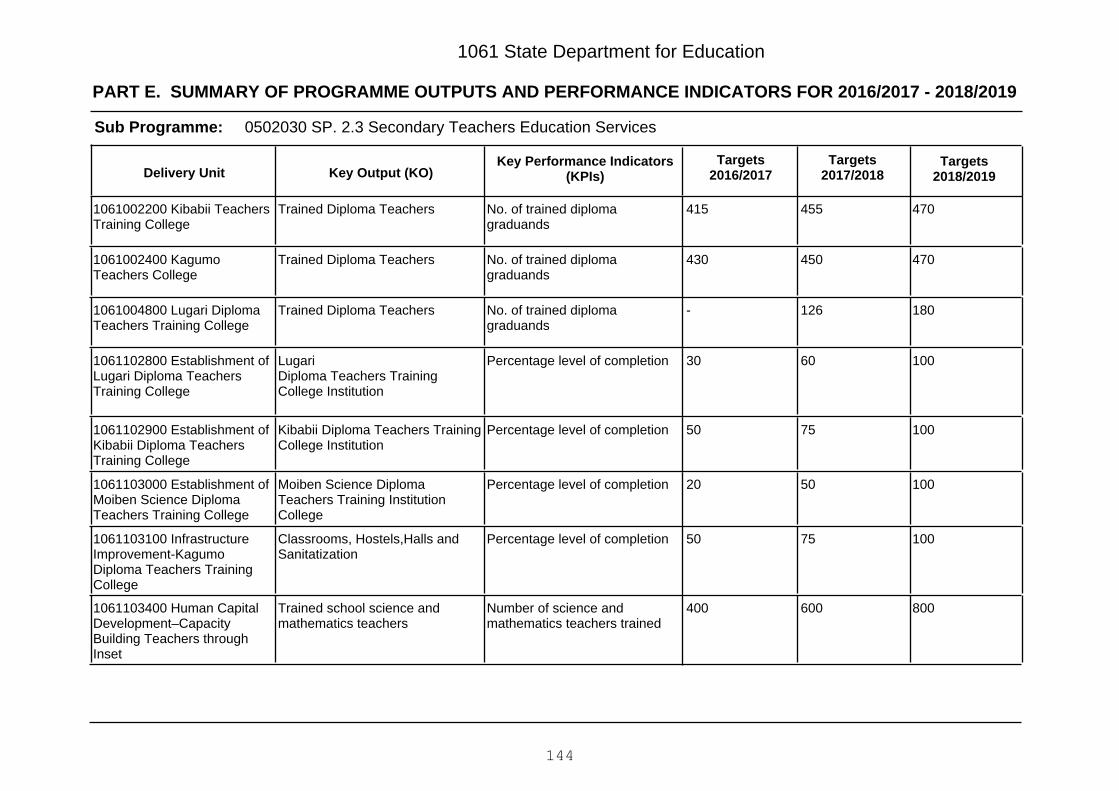
PART E. SUMMARY OF PROGRAMME OUTPUTS AND PERFORMANCE INDICATORS FOR 2016/2017 - 2018/2019
1061 State Department for Education
0502030 SP. 2.3 Secondary Teachers Education ServicesSub Programme:
Key Output (KO)Targets
2018/2019Targets
2017/2018Key Performance Indicators
(KPIs)Targets
2016/2017Delivery Unit
470455415No. of trained diplomagraduands
Trained Diploma Teachers1061002200 Kibabii TeachersTraining College
470450430No. of trained diplomagraduands
Trained Diploma Teachers1061002400 KagumoTeachers College
180126-No. of trained diplomagraduands
Trained Diploma Teachers1061004800 Lugari DiplomaTeachers Training College
1006030Percentage level of completionLugariDiploma Teachers TrainingCollege Institution
1061102800 Establishment ofLugari Diploma TeachersTraining College
1007550Percentage level of completionKibabii Diploma Teachers TrainingCollege Institution
1061102900 Establishment ofKibabii Diploma TeachersTraining College
1005020Percentage level of completionMoiben Science DiplomaTeachers Training InstitutionCollege
1061103000 Establishment ofMoiben Science DiplomaTeachers Training College
1007550Percentage level of completionClassrooms, Hostels,Halls andSanitatization
1061103100 InfrastructureImprovement-KagumoDiploma Teachers TrainingCollege
800600400Number of science andmathematics teachers trained
Trained school science andmathematics teachers
1061103400 Human CapitalDevelopment–CapacityBuilding Teachers throughInset
144
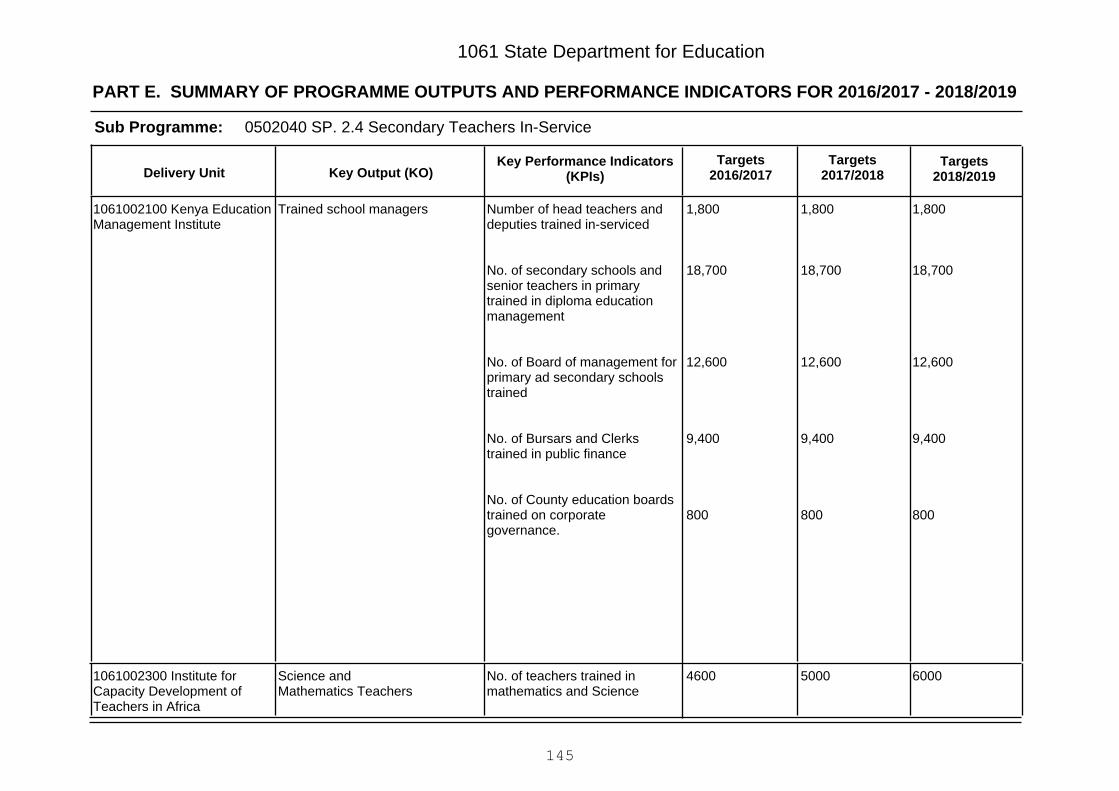
PART E. SUMMARY OF PROGRAMME OUTPUTS AND PERFORMANCE INDICATORS FOR 2016/2017 - 2018/2019
1061 State Department for Education
0502040 SP. 2.4 Secondary Teachers In-ServiceSub Programme:
Key Output (KO)Targets
2018/2019Targets
2017/2018Key Performance Indicators
(KPIs)Targets
2016/2017Delivery Unit
1,800
18,700
12,600
9,400
800
1,800
18,700
12,600
9,400
800
1,800
18,700
12,600
9,400
800
Number of head teachers anddeputies trained in-serviced
No. of secondary schools andsenior teachers in primarytrained in diploma educationmanagement
No. of Board of management forprimary ad secondary schoolstrained
No. of Bursars and Clerkstrained in public finance
No. of County education boardstrained on corporategovernance.
Trained school managers1061002100 Kenya EducationManagement Institute
600050004600No. of teachers trained inmathematics and Science
Science andMathematics Teachers
1061002300 Institute forCapacity Development ofTeachers in Africa
145

PART E. SUMMARY OF PROGRAMME OUTPUTS AND PERFORMANCE INDICATORS FOR 2016/2017 - 2018/2019
1061 State Department for Education
0502050 SP. 2.5 Special Needs educationSub Programme:
Key Output (KO)Targets
2018/2019Targets
2017/2018Key Performance Indicators
(KPIs)Targets
2016/2017Delivery Unit
380036663510Number of special needlearners enrolled in studentsenrolled in secondary schools
Special need learners.1061001300 SpecialSecondary Schools
0503000 P.3 Quality Assurance and Standards
Improved Education Quality and Standards.
Programme:
Outcome:
0503010 SP. 3.1 Curriculum DevelopmentSub Programme:
Key Output (KO)Targets
2018/2019Targets
2017/2018Key Performance Indicators
(KPIs)Targets
2016/2017Delivery Unit
62
100
300
2700
1
62
100
300
2700
1
62
100
300
2700
1
No. of curriculum designed
Percentage of Radio and TVprogramme developed
No. of Radio and TVprogrammes disseminated
No. of Broadcasting andevaluation reports prepared
Digital content procured andinstalled
Compliance and standards1061001000 Kenya Instituteof Curriculum Development
1008064Percentage completion levelWorkshops, Laboratories andPrint Press
1061103600 Construction ofEducation Resource Centre atKICD-Phase I
146
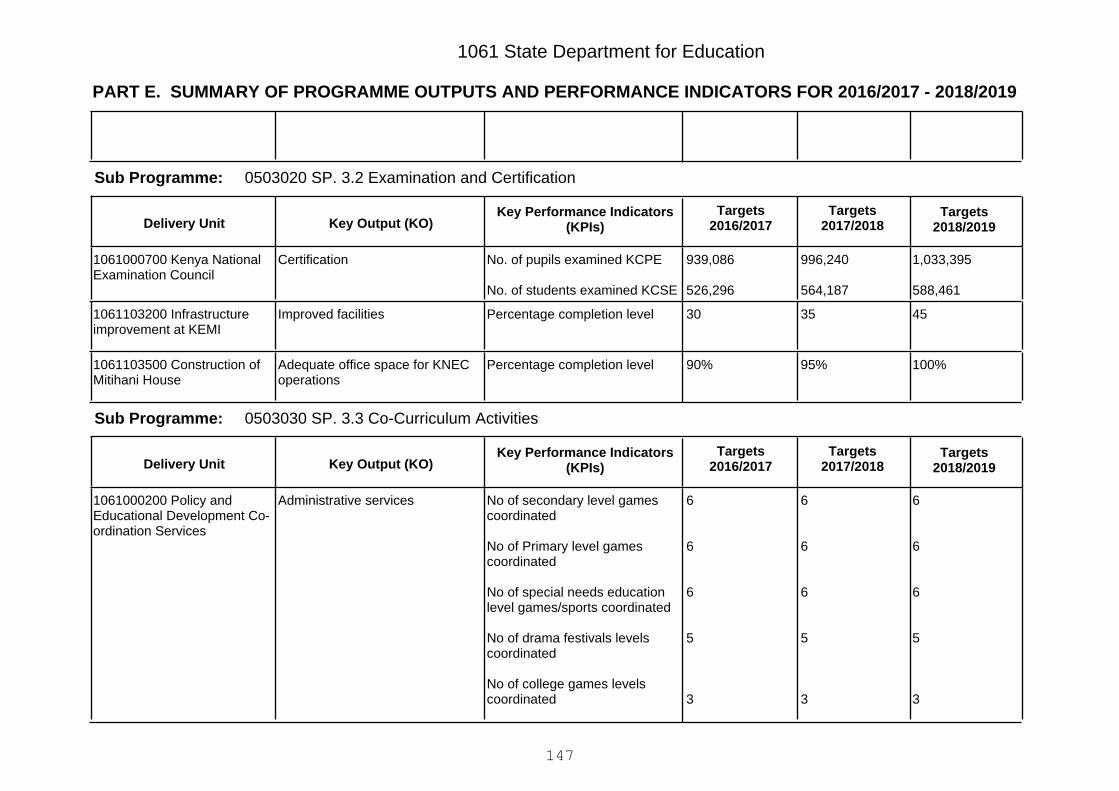
PART E. SUMMARY OF PROGRAMME OUTPUTS AND PERFORMANCE INDICATORS FOR 2016/2017 - 2018/2019
1061 State Department for Education
0503020 SP. 3.2 Examination and CertificationSub Programme:
Key Output (KO)Targets
2018/2019Targets
2017/2018Key Performance Indicators
(KPIs)Targets
2016/2017Delivery Unit
1,033,395
588,461
996,240
564,187
939,086
526,296
No. of pupils examined KCPE
No. of students examined KCSE
Certification1061000700 Kenya NationalExamination Council
453530Percentage completion levelImproved facilities1061103200 Infrastructureimprovement at KEMI
100%95%90%Percentage completion levelAdequate office space for KNECoperations
1061103500 Construction ofMitihani House
0503030 SP. 3.3 Co-Curriculum ActivitiesSub Programme:
Key Output (KO)Targets
2018/2019Targets
2017/2018Key Performance Indicators
(KPIs)Targets
2016/2017Delivery Unit
6
6
6
5
3
6
6
6
5
3
6
6
6
5
3
No of secondary level gamescoordinated
No of Primary level gamescoordinated
No of special needs educationlevel games/sports coordinated
No of drama festivals levelscoordinated
No of college games levelscoordinated
Administrative services1061000200 Policy andEducational Development Co-ordination Services
147

PART E. SUMMARY OF PROGRAMME OUTPUTS AND PERFORMANCE INDICATORS FOR 2016/2017 - 2018/2019
1061 State Department for Education
444No of music festivals levelscordinated(sub county, county, regional,national and East Africa)
10,000
-
5
320
2
120
10,000
-
5
320
2
120
10,000
-
5
320
2
120
No. of institutions assessed
No. of guidelines developed
Quality monitoring reportsprepared
No. of publications printed
No. of learning competenceguides developed
No. of handbooks printed anddisseminated
Compliance and Standards1061002000 Directorate ofQuality Assurance andStandards
1064896808,800Number of teachers trained onpedagogical skills
Improved pedagogy1061100800 Child FriendlySchools
0508000 P. 8 General Administration, Planning and Support Services
Enhanced Accountability, efficiency and effectiveness in Service Delivery.
Programme:
Outcome:
0508010 S.P.8.1 Headquarters Administrative ServicesSub Programme:
Key Output (KO)Targets
2018/2019Targets
2017/2018Key Performance Indicators
(KPIs)Targets
2016/2017Delivery Unit
QuarterlyQuarterlyQuarterlyReports prepared andimplemented
Administrative services1061000100 Directorate ofField Services
148

PART E. SUMMARY OF PROGRAMME OUTPUTS AND PERFORMANCE INDICATORS FOR 2016/2017 - 2018/2019
1061 State Department for Education
Quarterly reportsfromDirectorates
Quarterly reportsfromDirectorates
Quarterly reportsfromDirectorates
Reports prepared andimplemented
Administrative services1061000200 Policy andEducational Development Co-ordination Services
444No. of monitoring and evaluationreports produced
Planning services1061000300 DevelopmentPlanning Services
75
50
2100
90
72
50
2000
80
70.1
50
1500
50
Percentage of disability friendlyfacility established/installed
Percentage level of workenvironment index improved
No of staff and stakeholdersensitised on citizen servicedelivery charter
Percentage levels of customersatisfaction
Administrative services1061000400 HeadquartersAdministrative Services
6
2
6
2
6
2
Number of Reports prepared oncustomable management ofheritage in Kenya
Number of Reports prepared ondevelopment of creativeindustries
Auxiliary and education supportservices
1061000600 Kenya NationalCommission for UNESCO &Commonwealth London Office
All public schoolsinKenya
All public schoolsinKenya
All public schoolsinKenya
Number of audits and reportsgenerated
Audit services1061000800 School AuditUnit
5300
10
5,000
10
4,200
19
Number of Teachers trained
Number of National EducationSector Programmes reportsprinted and disseminated
Auxiliary and education supportservices
1061002600 Directorate ofPolicy Partnership and EastAfrica Community
149
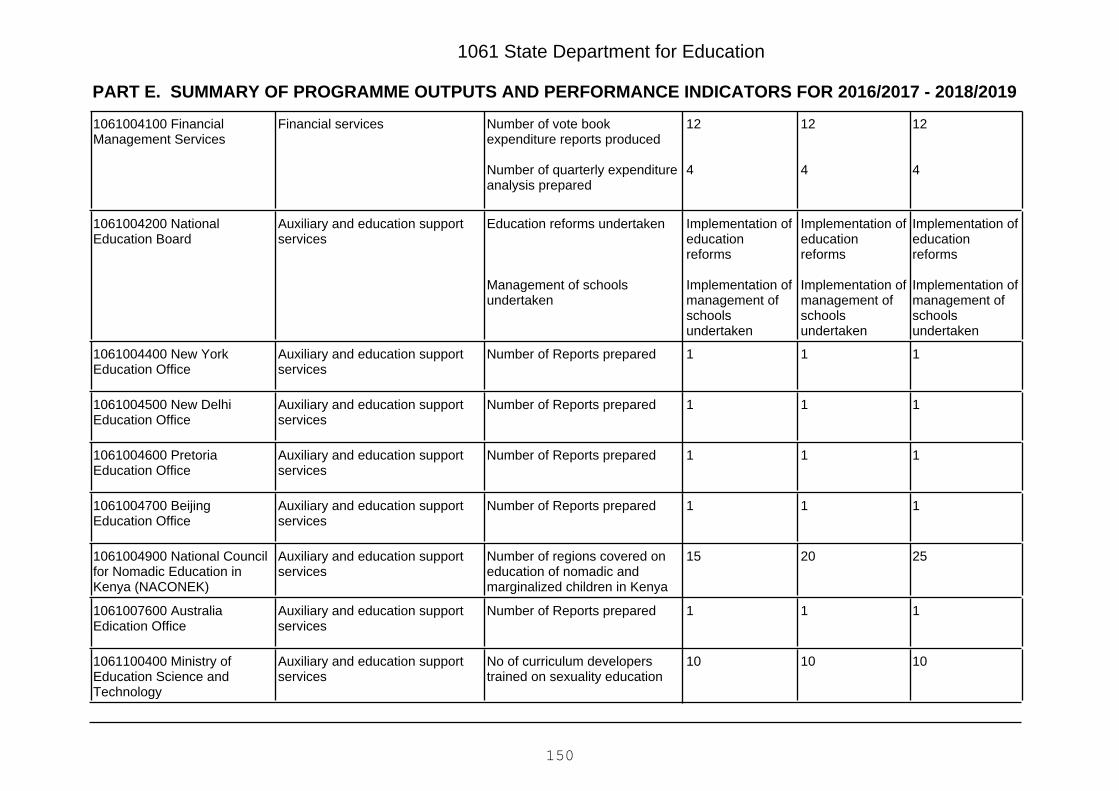
PART E. SUMMARY OF PROGRAMME OUTPUTS AND PERFORMANCE INDICATORS FOR 2016/2017 - 2018/2019
1061 State Department for Education
12
4
12
4
12
4
Number of vote bookexpenditure reports produced
Number of quarterly expenditureanalysis prepared
Financial services1061004100 FinancialManagement Services
Implementation ofeducationreforms
Implementation ofmanagement ofschoolsundertaken
Implementation ofeducationreforms
Implementation ofmanagement ofschoolsundertaken
Implementation ofeducationreforms
Implementation ofmanagement ofschoolsundertaken
Education reforms undertaken
Management of schoolsundertaken
Auxiliary and education supportservices
1061004200 NationalEducation Board
111Number of Reports preparedAuxiliary and education supportservices
1061004400 New YorkEducation Office
111Number of Reports preparedAuxiliary and education supportservices
1061004500 New DelhiEducation Office
111Number of Reports preparedAuxiliary and education supportservices
1061004600 PretoriaEducation Office
111Number of Reports preparedAuxiliary and education supportservices
1061004700 BeijingEducation Office
252015Number of regions covered oneducation of nomadic andmarginalized children in Kenya
Auxiliary and education supportservices
1061004900 National Councilfor Nomadic Education inKenya (NACONEK)
111Number of Reports preparedAuxiliary and education supportservices
1061007600 AustraliaEdication Office
101010No of curriculum developerstrained on sexuality education
Auxiliary and education supportservices
1061100400 Ministry ofEducation Science andTechnology
150
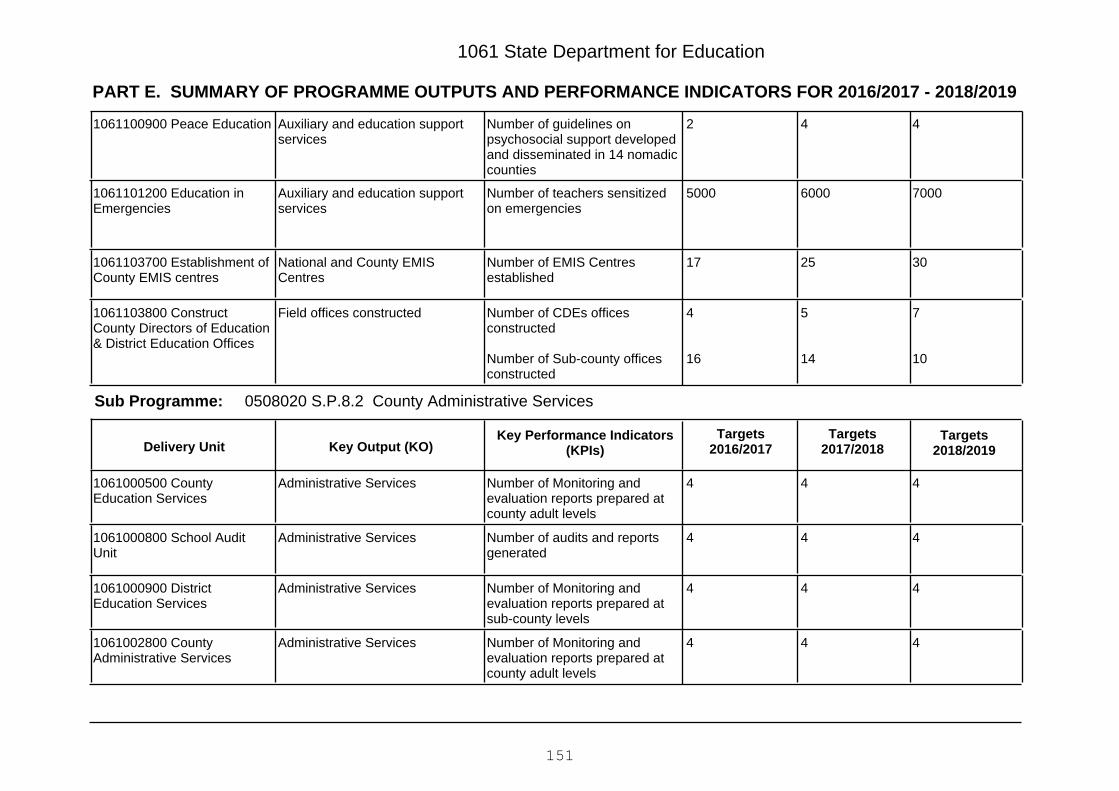
PART E. SUMMARY OF PROGRAMME OUTPUTS AND PERFORMANCE INDICATORS FOR 2016/2017 - 2018/2019
1061 State Department for Education
442Number of guidelines onpsychosocial support developedand disseminated in 14 nomadiccounties
Auxiliary and education supportservices
1061100900 Peace Education
700060005000Number of teachers sensitizedon emergencies
Auxiliary and education supportservices
1061101200 Education inEmergencies
302517Number of EMIS Centresestablished
National and County EMISCentres
1061103700 Establishment ofCounty EMIS centres
7
10
5
14
4
16
Number of CDEs officesconstructed
Number of Sub-county officesconstructed
Field offices constructed1061103800 ConstructCounty Directors of Education& District Education Offices
0508020 S.P.8.2 County Administrative ServicesSub Programme:
Key Output (KO)Targets
2018/2019Targets
2017/2018Key Performance Indicators
(KPIs)Targets
2016/2017Delivery Unit
444Number of Monitoring andevaluation reports prepared atcounty adult levels
Administrative Services1061000500 CountyEducation Services
444Number of audits and reportsgenerated
Administrative Services1061000800 School AuditUnit
444Number of Monitoring andevaluation reports prepared atsub-county levels
Administrative Services1061000900 DistrictEducation Services
444Number of Monitoring andevaluation reports prepared atcounty adult levels
Administrative Services1061002800 CountyAdministrative Services
151
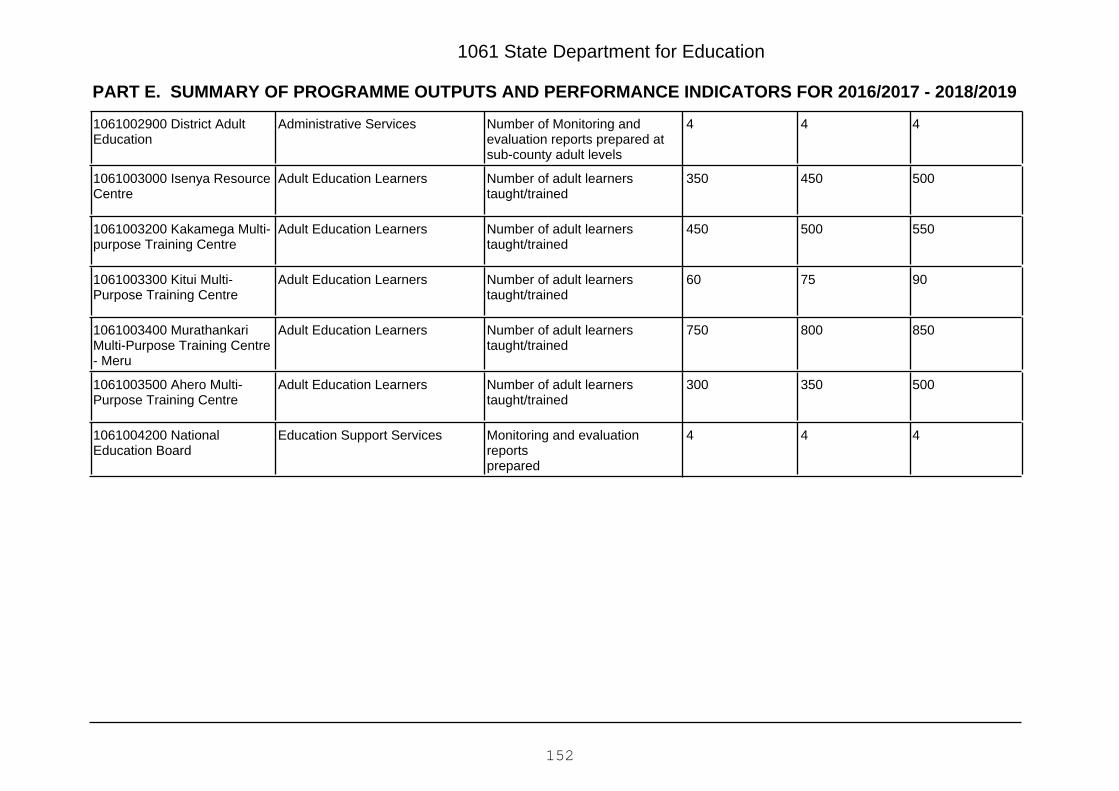
PART E. SUMMARY OF PROGRAMME OUTPUTS AND PERFORMANCE INDICATORS FOR 2016/2017 - 2018/2019
1061 State Department for Education
444Number of Monitoring andevaluation reports prepared atsub-county adult levels
Administrative Services1061002900 District AdultEducation
500450350Number of adult learnerstaught/trained
Adult Education Learners1061003000 Isenya ResourceCentre
550500450Number of adult learnerstaught/trained
Adult Education Learners1061003200 Kakamega Multi-purpose Training Centre
907560Number of adult learnerstaught/trained
Adult Education Learners1061003300 Kitui Multi-Purpose Training Centre
850800750Number of adult learnerstaught/trained
Adult Education Learners1061003400 MurathankariMulti-Purpose Training Centre- Meru
500350300Number of adult learnerstaught/trained
Adult Education Learners1061003500 Ahero Multi-Purpose Training Centre
444Monitoring and evaluationreportsprepared
Education Support Services1061004200 NationalEducation Board
152
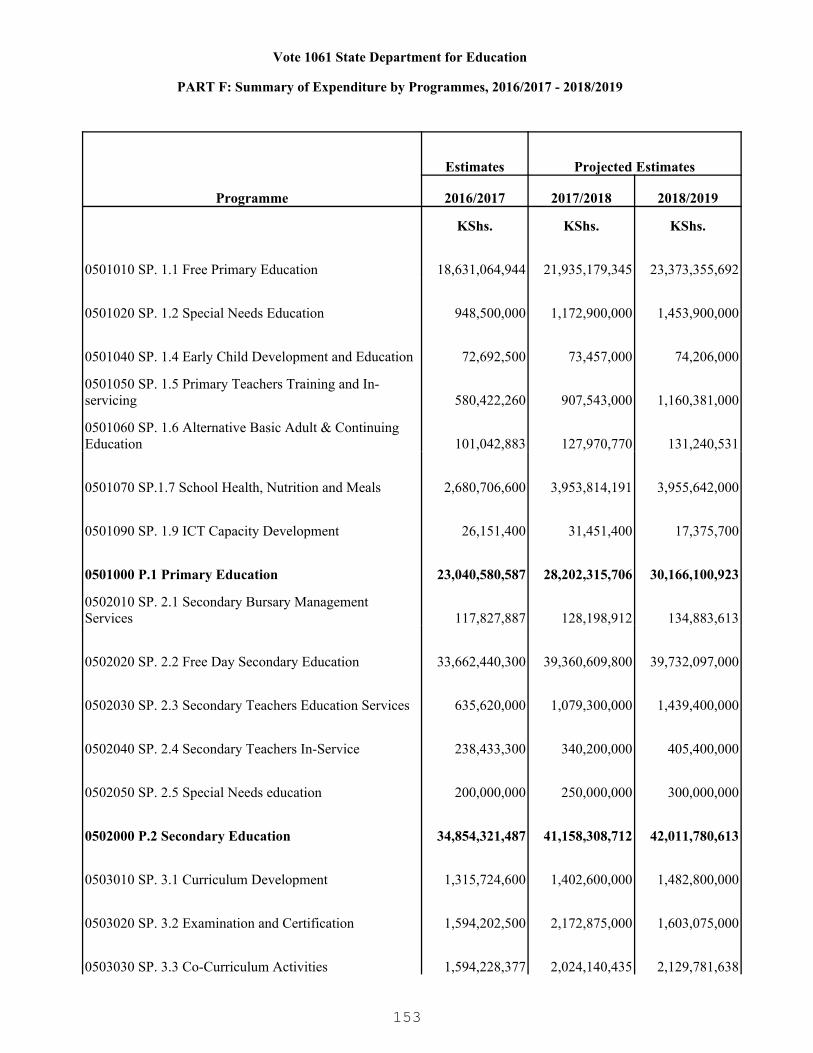
Vote 1061 State Department for Education
PART F: Summary of Expenditure by Programmes, 2016/2017 - 2018/2019
Programme
Estimates Projected Estimates
2016/2017 2017/2018 2018/2019
KShs. KShs. KShs.
0501010 SP. 1.1 Free Primary Education 18,631,064,944 21,935,179,345 23,373,355,692
0501020 SP. 1.2 Special Needs Education 948,500,000 1,172,900,000 1,453,900,000
0501040 SP. 1.4 Early Child Development and Education 72,692,500 73,457,000 74,206,000
0501050 SP. 1.5 Primary Teachers Training and In-servicing 580,422,260 907,543,000 1,160,381,000
0501060 SP. 1.6 Alternative Basic Adult & Continuing Education 101,042,883 127,970,770 131,240,531
0501070 SP.1.7 School Health, Nutrition and Meals 2,680,706,600 3,953,814,191 3,955,642,000
0501090 SP. 1.9 ICT Capacity Development 26,151,400 31,451,400 17,375,700
0501000 P.1 Primary Education 23,040,580,587 28,202,315,706 30,166,100,923
0502010 SP. 2.1 Secondary Bursary Management Services 117,827,887 128,198,912 134,883,613
0502020 SP. 2.2 Free Day Secondary Education 33,662,440,300 39,360,609,800 39,732,097,000
0502030 SP. 2.3 Secondary Teachers Education Services 635,620,000 1,079,300,000 1,439,400,000
0502040 SP. 2.4 Secondary Teachers In-Service 238,433,300 340,200,000 405,400,000
0502050 SP. 2.5 Special Needs education 200,000,000 250,000,000 300,000,000
0502000 P.2 Secondary Education 34,854,321,487 41,158,308,712 42,011,780,613
0503010 SP. 3.1 Curriculum Development 1,315,724,600 1,402,600,000 1,482,800,000
0503020 SP. 3.2 Examination and Certification 1,594,202,500 2,172,875,000 1,603,075,000
0503030 SP. 3.3 Co-Curriculum Activities 1,594,228,377 2,024,140,435 2,129,781,638
153
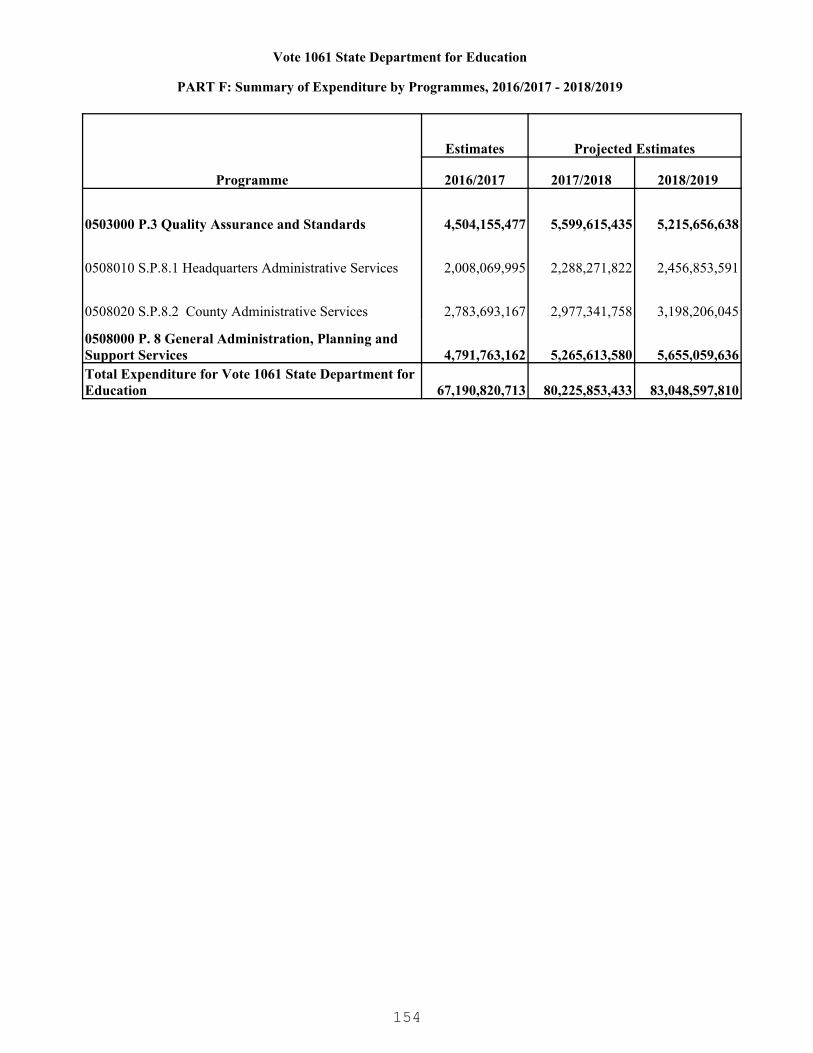
Vote 1061 State Department for Education
PART F: Summary of Expenditure by Programmes, 2016/2017 - 2018/2019
Programme
Estimates Projected Estimates
2016/2017 2017/2018 2018/2019
0503000 P.3 Quality Assurance and Standards 4,504,155,477 5,599,615,435 5,215,656,638
0508010 S.P.8.1 Headquarters Administrative Services 2,008,069,995 2,288,271,822 2,456,853,591
0508020 S.P.8.2 County Administrative Services 2,783,693,167 2,977,341,758 3,198,206,045
0508000 P. 8 General Administration, Planning and Support Services 4,791,763,162 5,265,613,580 5,655,059,636Total Expenditure for Vote 1061 State Department for Education 67,190,820,713 80,225,853,433 83,048,597,810
154

1061 State Department for Education
PART G: Summary of Expenditure by Vote and Economic Classification, 2016/2017 - 2018/2019
Economic Classification
Estimates Projected Estimates
2016/2017 2017/2018 2018/2019KShs. KShs. KShs.
Current Expenditure 58,795,601,201 70,093,489,921 72,338,109,998
Compensation to Employees 3,411,757,890 3,574,874,241 3,680,907,939
Use of Goods and Services 5,131,886,221 7,618,588,929 7,978,957,299
Current Transfers to Govt. Agencies 19,911,366,060 24,096,784,851 25,856,010,960
Other Recurrent 30,340,591,030 34,803,241,900 34,822,233,800
Capital Expenditure 8,395,219,512 10,132,363,512 10,710,487,812
Acquisition of Non-Financial Assets 68,000,000 81,000,000 109,000,000
Capital Grants to Govt. Agencies 6,353,723,244 8,072,567,244 8,448,767,244
Other Development 1,973,496,268 1,978,796,268 2,152,720,568Total Expenditure 67,190,820,713 80,225,853,433 83,048,597,810
155

1061 State Department for Education
PART H: Summary of Expenditure by Programme and Economic Classification, 2016/2017 - 2018/2019
0501010 SP. 1.1 Free Primary Education
Economic Classification
Estimates Projected Estimates
2016/2017 2017/2018 2018/2019KShs. KShs. KShs.
Current Expenditure 14,683,064,944 17,853,179,345 18,933,655,692
Compensation to Employees 58,369,002 62,326,745 64,010,492
Use of Goods and Services 1,223,259,042 2,342,727,400 2,545,270,200
Current Transfers to Govt. Agencies 13,401,436,900 15,448,125,200 16,324,375,000
Capital Expenditure 3,948,000,000 4,082,000,000 4,439,700,000
Acquisition of Non-Financial Assets 55,000,000 56,000,000 69,000,000
Capital Grants to Govt. Agencies 3,768,000,000 3,901,000,000 4,057,700,000
Other Development 125,000,000 125,000,000 313,000,000Total Expenditure 18,631,064,944 21,935,179,345 23,373,355,692
0501020 SP. 1.2 Special Needs Education
Economic Classification
Estimates Projected Estimates
2016/2017 2017/2018 2018/2019KShs. KShs. KShs.
Current Expenditure 843,100,000 1,016,500,000 1,246,500,000
Use of Goods and Services 89,100,000 106,500,000 126,500,000
Current Transfers to Govt. Agencies 754,000,000 910,000,000 1,120,000,000
Capital Expenditure 105,400,000 156,400,000 207,400,000
Capital Grants to Govt. Agencies 105,400,000 156,400,000 207,400,000Total Expenditure 948,500,000 1,172,900,000 1,453,900,000
0501040 SP. 1.4 Early Child Development and Education
Economic Classification
Estimates Projected Estimates
2016/2017 2017/2018 2018/2019KShs. KShs. KShs.
Current Expenditure 12,742,500 13,507,000 14,256,000
Use of Goods and Services 12,742,500 13,507,000 14,256,000
Capital Expenditure 59,950,000 59,950,000 59,950,000
156
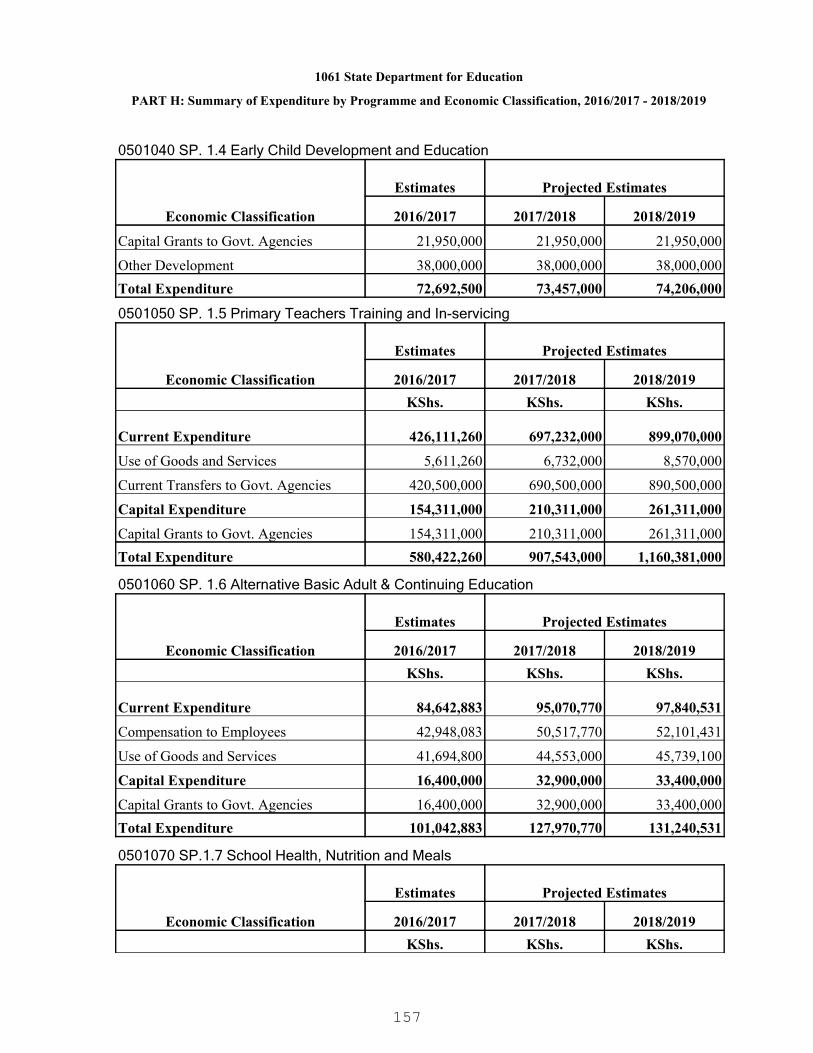
1061 State Department for Education
PART H: Summary of Expenditure by Programme and Economic Classification, 2016/2017 - 2018/2019
0501040 SP. 1.4 Early Child Development and Education
Economic Classification
Estimates Projected Estimates
2016/2017 2017/2018 2018/2019
Capital Grants to Govt. Agencies 21,950,000 21,950,000 21,950,000
Other Development 38,000,000 38,000,000 38,000,000Total Expenditure 72,692,500 73,457,000 74,206,000
0501050 SP. 1.5 Primary Teachers Training and In-servicing
Economic Classification
Estimates Projected Estimates
2016/2017 2017/2018 2018/2019KShs. KShs. KShs.
Current Expenditure 426,111,260 697,232,000 899,070,000
Use of Goods and Services 5,611,260 6,732,000 8,570,000
Current Transfers to Govt. Agencies 420,500,000 690,500,000 890,500,000
Capital Expenditure 154,311,000 210,311,000 261,311,000
Capital Grants to Govt. Agencies 154,311,000 210,311,000 261,311,000Total Expenditure 580,422,260 907,543,000 1,160,381,000
0501060 SP. 1.6 Alternative Basic Adult & Continuing Education
Economic Classification
Estimates Projected Estimates
2016/2017 2017/2018 2018/2019KShs. KShs. KShs.
Current Expenditure 84,642,883 95,070,770 97,840,531
Compensation to Employees 42,948,083 50,517,770 52,101,431
Use of Goods and Services 41,694,800 44,553,000 45,739,100
Capital Expenditure 16,400,000 32,900,000 33,400,000
Capital Grants to Govt. Agencies 16,400,000 32,900,000 33,400,000Total Expenditure 101,042,883 127,970,770 131,240,531
0501070 SP.1.7 School Health, Nutrition and Meals
Economic Classification
Estimates Projected Estimates
2016/2017 2017/2018 2018/2019KShs. KShs. KShs.
157

1061 State Department for Education
PART H: Summary of Expenditure by Programme and Economic Classification, 2016/2017 - 2018/2019
0501070 SP.1.7 School Health, Nutrition and Meals
Economic Classification
Estimates Projected Estimates
2016/2017 2017/2018 2018/2019
Current Expenditure 1,030,706,600 2,303,814,191 2,305,642,000
Use of Goods and Services 180,706,600 353,000,300 305,642,000
Current Transfers to Govt. Agencies 850,000,000 1,950,813,891 2,000,000,000
Capital Expenditure 1,650,000,000 1,650,000,000 1,650,000,000
Other Development 1,650,000,000 1,650,000,000 1,650,000,000Total Expenditure 2,680,706,600 3,953,814,191 3,955,642,000
0501090 SP. 1.9 ICT Capacity Development
Economic Classification
Estimates Projected Estimates
2016/2017 2017/2018 2018/2019KShs. KShs. KShs.
Capital Expenditure 26,151,400 31,451,400 17,375,700
Other Development 26,151,400 31,451,400 17,375,700Total Expenditure 26,151,400 31,451,400 17,375,700
0501000 P.1 Primary Education
Economic Classification
Estimates Projected Estimates
2016/2017 2017/2018 2018/2019KShs. KShs. KShs.
Current Expenditure 17,080,368,187 21,979,303,306 23,496,964,223
Compensation to Employees 101,317,085 112,844,515 116,111,923
Use of Goods and Services 1,553,114,202 2,867,019,700 3,045,977,300
Current Transfers to Govt. Agencies 15,425,936,900 18,999,439,091 20,334,875,000
Capital Expenditure 5,960,212,400 6,223,012,400 6,669,136,700
Acquisition of Non-Financial Assets 55,000,000 56,000,000 69,000,000
Capital Grants to Govt. Agencies 4,066,061,000 4,322,561,000 4,581,761,000
Other Development 1,839,151,400 1,844,451,400 2,018,375,700Total Expenditure 23,040,580,587 28,202,315,706 30,166,100,923
158
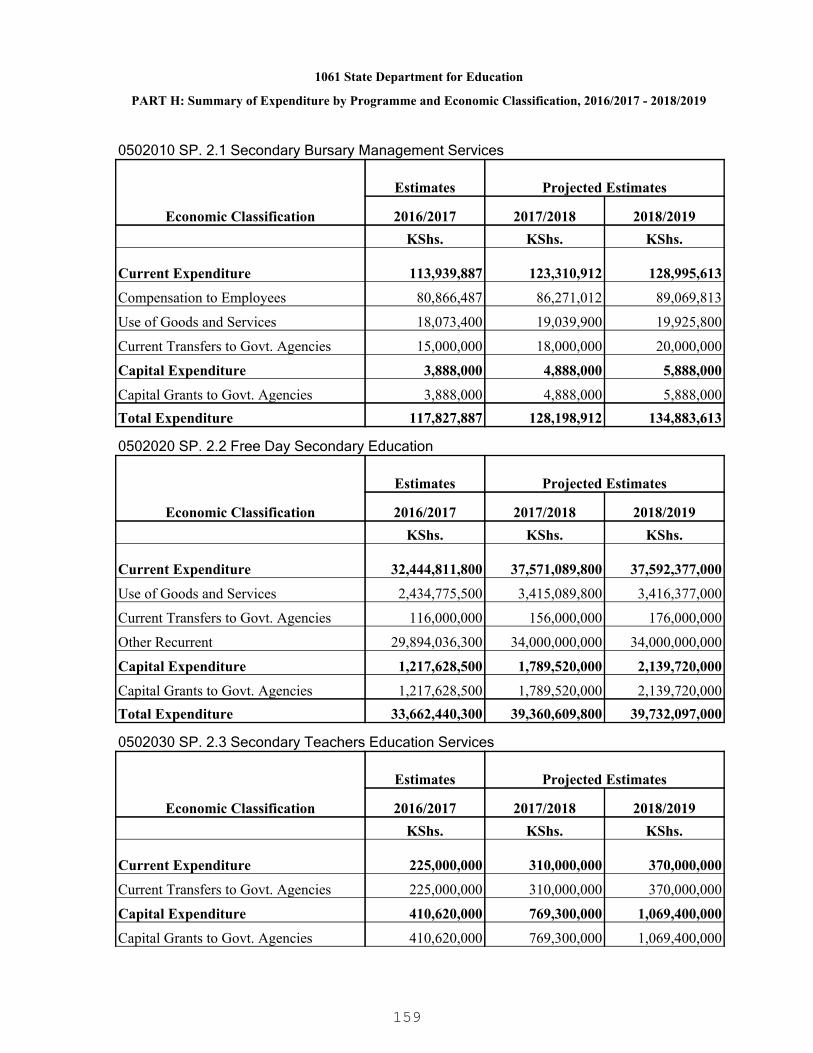
1061 State Department for Education
PART H: Summary of Expenditure by Programme and Economic Classification, 2016/2017 - 2018/2019
0502010 SP. 2.1 Secondary Bursary Management Services
Economic Classification
Estimates Projected Estimates
2016/2017 2017/2018 2018/2019KShs. KShs. KShs.
Current Expenditure 113,939,887 123,310,912 128,995,613
Compensation to Employees 80,866,487 86,271,012 89,069,813
Use of Goods and Services 18,073,400 19,039,900 19,925,800
Current Transfers to Govt. Agencies 15,000,000 18,000,000 20,000,000
Capital Expenditure 3,888,000 4,888,000 5,888,000
Capital Grants to Govt. Agencies 3,888,000 4,888,000 5,888,000Total Expenditure 117,827,887 128,198,912 134,883,613
0502020 SP. 2.2 Free Day Secondary Education
Economic Classification
Estimates Projected Estimates
2016/2017 2017/2018 2018/2019KShs. KShs. KShs.
Current Expenditure 32,444,811,800 37,571,089,800 37,592,377,000
Use of Goods and Services 2,434,775,500 3,415,089,800 3,416,377,000
Current Transfers to Govt. Agencies 116,000,000 156,000,000 176,000,000
Other Recurrent 29,894,036,300 34,000,000,000 34,000,000,000
Capital Expenditure 1,217,628,500 1,789,520,000 2,139,720,000
Capital Grants to Govt. Agencies 1,217,628,500 1,789,520,000 2,139,720,000Total Expenditure 33,662,440,300 39,360,609,800 39,732,097,000
0502030 SP. 2.3 Secondary Teachers Education Services
Economic Classification
Estimates Projected Estimates
2016/2017 2017/2018 2018/2019KShs. KShs. KShs.
Current Expenditure 225,000,000 310,000,000 370,000,000
Current Transfers to Govt. Agencies 225,000,000 310,000,000 370,000,000
Capital Expenditure 410,620,000 769,300,000 1,069,400,000
Capital Grants to Govt. Agencies 410,620,000 769,300,000 1,069,400,000
159

1061 State Department for Education
PART H: Summary of Expenditure by Programme and Economic Classification, 2016/2017 - 2018/2019
0502030 SP. 2.3 Secondary Teachers Education Services
Economic Classification
Estimates Projected Estimates
2016/2017 2017/2018 2018/2019Total Expenditure 635,620,000 1,079,300,000 1,439,400,0000502040 SP. 2.4 Secondary Teachers In-Service
Economic Classification
Estimates Projected Estimates
2016/2017 2017/2018 2018/2019KShs. KShs. KShs.
Current Expenditure 238,433,300 340,200,000 405,400,000
Current Transfers to Govt. Agencies 238,433,300 340,200,000 405,400,000Total Expenditure 238,433,300 340,200,000 405,400,000
0502050 SP. 2.5 Special Needs education
Economic Classification
Estimates Projected Estimates
2016/2017 2017/2018 2018/2019KShs. KShs. KShs.
Current Expenditure 200,000,000 250,000,000 300,000,000
Current Transfers to Govt. Agencies 200,000,000 250,000,000 300,000,000Total Expenditure 200,000,000 250,000,000 300,000,000
0502000 P.2 Secondary Education
Economic Classification
Estimates Projected Estimates
2016/2017 2017/2018 2018/2019KShs. KShs. KShs.
Current Expenditure 33,222,184,987 38,594,600,712 38,796,772,613
Compensation to Employees 80,866,487 86,271,012 89,069,813
Use of Goods and Services 2,452,848,900 3,434,129,700 3,436,302,800
Current Transfers to Govt. Agencies 794,433,300 1,074,200,000 1,271,400,000
Other Recurrent 29,894,036,300 34,000,000,000 34,000,000,000
Capital Expenditure 1,632,136,500 2,563,708,000 3,215,008,000
Capital Grants to Govt. Agencies 1,632,136,500 2,563,708,000 3,215,008,000
160

1061 State Department for Education
PART H: Summary of Expenditure by Programme and Economic Classification, 2016/2017 - 2018/2019
0502000 P.2 Secondary Education
Economic Classification
Estimates Projected Estimates
2016/2017 2017/2018 2018/2019Total Expenditure 34,854,321,487 41,158,308,712 42,011,780,6130503010 SP. 3.1 Curriculum Development
Economic Classification
Estimates Projected Estimates
2016/2017 2017/2018 2018/2019KShs. KShs. KShs.
Current Expenditure 1,083,724,600 1,158,600,000 1,208,800,000
Current Transfers to Govt. Agencies 1,083,724,600 1,158,600,000 1,208,800,000
Capital Expenditure 232,000,000 244,000,000 274,000,000
Capital Grants to Govt. Agencies 232,000,000 244,000,000 274,000,000Total Expenditure 1,315,724,600 1,402,600,000 1,482,800,000
0503020 SP. 3.2 Examination and Certification
Economic Classification
Estimates Projected Estimates
2016/2017 2017/2018 2018/2019KShs. KShs. KShs.
Current Expenditure 1,527,000,000 1,593,000,000 1,593,000,000
Current Transfers to Govt. Agencies 1,527,000,000 1,593,000,000 1,593,000,000
Capital Expenditure 67,202,500 579,875,000 10,075,000
Capital Grants to Govt. Agencies 67,202,500 579,875,000 10,075,000Total Expenditure 1,594,202,500 2,172,875,000 1,603,075,000
0503030 SP. 3.3 Co-Curriculum Activities
Economic Classification
Estimates Projected Estimates
2016/2017 2017/2018 2018/2019KShs. KShs. KShs.
Current Expenditure 1,463,228,377 1,893,140,435 1,998,781,638
Compensation to Employees 621,257,148 642,132,736 644,607,639
Use of Goods and Services 36,971,229 42,007,699 43,034,699
161
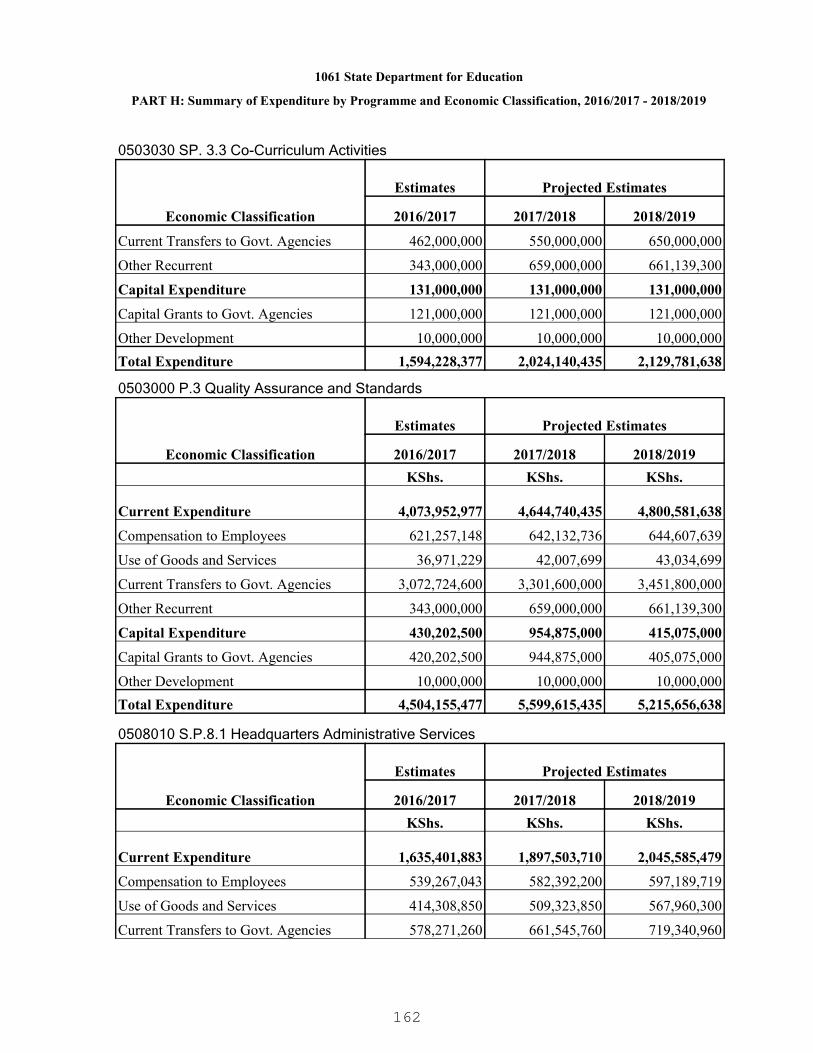
1061 State Department for Education
PART H: Summary of Expenditure by Programme and Economic Classification, 2016/2017 - 2018/2019
0503030 SP. 3.3 Co-Curriculum Activities
Economic Classification
Estimates Projected Estimates
2016/2017 2017/2018 2018/2019
Current Transfers to Govt. Agencies 462,000,000 550,000,000 650,000,000
Other Recurrent 343,000,000 659,000,000 661,139,300
Capital Expenditure 131,000,000 131,000,000 131,000,000
Capital Grants to Govt. Agencies 121,000,000 121,000,000 121,000,000
Other Development 10,000,000 10,000,000 10,000,000Total Expenditure 1,594,228,377 2,024,140,435 2,129,781,638
0503000 P.3 Quality Assurance and Standards
Economic Classification
Estimates Projected Estimates
2016/2017 2017/2018 2018/2019KShs. KShs. KShs.
Current Expenditure 4,073,952,977 4,644,740,435 4,800,581,638
Compensation to Employees 621,257,148 642,132,736 644,607,639
Use of Goods and Services 36,971,229 42,007,699 43,034,699
Current Transfers to Govt. Agencies 3,072,724,600 3,301,600,000 3,451,800,000
Other Recurrent 343,000,000 659,000,000 661,139,300
Capital Expenditure 430,202,500 954,875,000 415,075,000
Capital Grants to Govt. Agencies 420,202,500 944,875,000 405,075,000
Other Development 10,000,000 10,000,000 10,000,000Total Expenditure 4,504,155,477 5,599,615,435 5,215,656,638
0508010 S.P.8.1 Headquarters Administrative Services
Economic Classification
Estimates Projected Estimates
2016/2017 2017/2018 2018/2019KShs. KShs. KShs.
Current Expenditure 1,635,401,883 1,897,503,710 2,045,585,479
Compensation to Employees 539,267,043 582,392,200 597,189,719
Use of Goods and Services 414,308,850 509,323,850 567,960,300
Current Transfers to Govt. Agencies 578,271,260 661,545,760 719,340,960
162
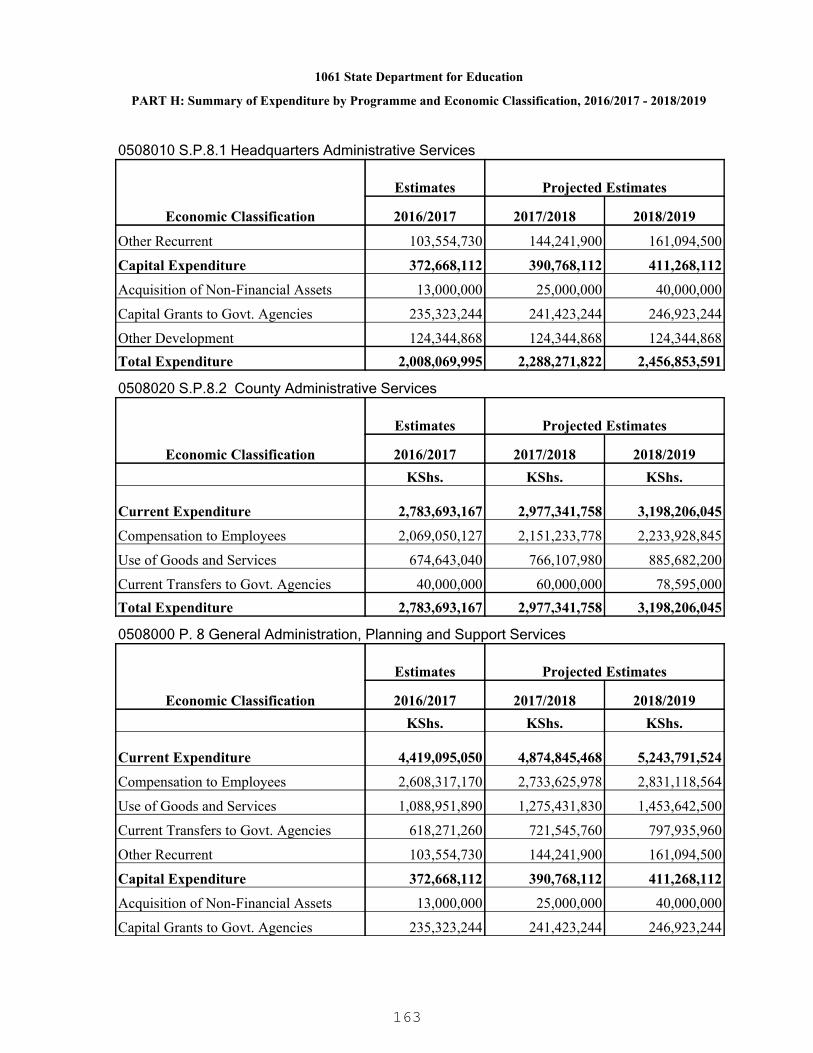
1061 State Department for Education
PART H: Summary of Expenditure by Programme and Economic Classification, 2016/2017 - 2018/2019
0508010 S.P.8.1 Headquarters Administrative Services
Economic Classification
Estimates Projected Estimates
2016/2017 2017/2018 2018/2019
Other Recurrent 103,554,730 144,241,900 161,094,500
Capital Expenditure 372,668,112 390,768,112 411,268,112
Acquisition of Non-Financial Assets 13,000,000 25,000,000 40,000,000
Capital Grants to Govt. Agencies 235,323,244 241,423,244 246,923,244
Other Development 124,344,868 124,344,868 124,344,868Total Expenditure 2,008,069,995 2,288,271,822 2,456,853,591
0508020 S.P.8.2 County Administrative Services
Economic Classification
Estimates Projected Estimates
2016/2017 2017/2018 2018/2019KShs. KShs. KShs.
Current Expenditure 2,783,693,167 2,977,341,758 3,198,206,045
Compensation to Employees 2,069,050,127 2,151,233,778 2,233,928,845
Use of Goods and Services 674,643,040 766,107,980 885,682,200
Current Transfers to Govt. Agencies 40,000,000 60,000,000 78,595,000Total Expenditure 2,783,693,167 2,977,341,758 3,198,206,045
0508000 P. 8 General Administration, Planning and Support Services
Economic Classification
Estimates Projected Estimates
2016/2017 2017/2018 2018/2019KShs. KShs. KShs.
Current Expenditure 4,419,095,050 4,874,845,468 5,243,791,524
Compensation to Employees 2,608,317,170 2,733,625,978 2,831,118,564
Use of Goods and Services 1,088,951,890 1,275,431,830 1,453,642,500
Current Transfers to Govt. Agencies 618,271,260 721,545,760 797,935,960
Other Recurrent 103,554,730 144,241,900 161,094,500
Capital Expenditure 372,668,112 390,768,112 411,268,112
Acquisition of Non-Financial Assets 13,000,000 25,000,000 40,000,000
Capital Grants to Govt. Agencies 235,323,244 241,423,244 246,923,244
163

1061 State Department for Education
PART H: Summary of Expenditure by Programme and Economic Classification, 2016/2017 - 2018/2019
0508000 P. 8 General Administration, Planning and Support Services
Economic Classification
Estimates Projected Estimates
2016/2017 2017/2018 2018/2019
Other Development 124,344,868 124,344,868 124,344,868Total Expenditure 4,791,763,162 5,265,613,580 5,655,059,636
164

1062 State Department for Science and Technology
A globally competitive education, training, research and innovation system for sustainabledevelopment.
To provide, promote and coordinate quality education and training; integration of Science,Technology and Innovation in sustainable socio-economic development processes.
PART A. Vision
PART B. Mission
PART C. Performance Overview and Background for Programme(s) Funding
The mandate of the State Department includes the provision of quality assurance services toTechnical education Institutions, University Education, Science, coordination, formulation andimplementation of the Technology and Innovation Policy, Registration of Technical TrainingInstitutes and Institutes of Technology, Management of Research, Science and Technology,Research Authorization, Coordination, Inventory and Dissemination.
During the period under review the State Department of Science and Technology realizedsignificant achievements. The number of universities both public and private increased from65 in 2012/2013 to 67 in 2014/2015. This expansion in universities has led to the steady risein Gross Enrollment in both public and private universities to stand at 421,152. This was as aresult of accelerated intake as well as expansion of physical infrastructure in various publicuniversities. Enrollment and retention at university education was further enhanced throughincreased provision of bursaries. In 2012/13 a total of 118,530 students were awarded Loansamounting to Kshs. 4.48 billion. In 2013/2014 the number of beneficiaries increased to144,785 with a Loans award of Ksh. 6.17 billion. The number further increased to 167,803students and funds rose to Kshs. 7.1 billion in 2014/15. The number of students receivingTVET bursary increased from 4,415 in 2013/2014 to 7071 in 2014/15. Admission of the firstcohort of 58 international students from over 10 African Countries to the Pan AfricanUniversity of Basic Science, Technology and Innovation (PAUISTI) was done in November,2012.
The State Department of Science and Technology undertook various activities in order toexpand training facilities in TVET between 2012/13 and 2014/15. These includeddevelopment of eight new TTIs under ADB financing and establishment of another five newtechnical training institutes in under-served regions, construction of sixty (60) new TTIs inconstituencies without a TTI under phase I, and identification of sites for the construction ofseventy (70) more TTIs under Phase II. There was also upgrading of training equipment in anumber of technical institutions under this sub-programme. Workshops and laboratories in 48TVET institutions were constructed. In addition, state-of-the-art equipment was procured forthe newly established Institutes and for the newly constructed workshops and laboratories inexisting TVET Institutions to ensure quality of training.
The National Commission for Science Technology and Innovation (NACOSTI) funded 1,283research proposals 316 in 2012/2013, 308 in 2013/2014 and 226 in 2014/2015. The NACOSTI has developed a National Research Policy, Regulations, Guidelines andCodes on registration and accreditation of research institutions, quality assurance andlicensing, awarded 54 DAAD PhD scholarships in specialized areas in Science andTechnology development at Kshs. 78million each financial year, held three annual nationalscience, technology and innovation week which have increased public
165
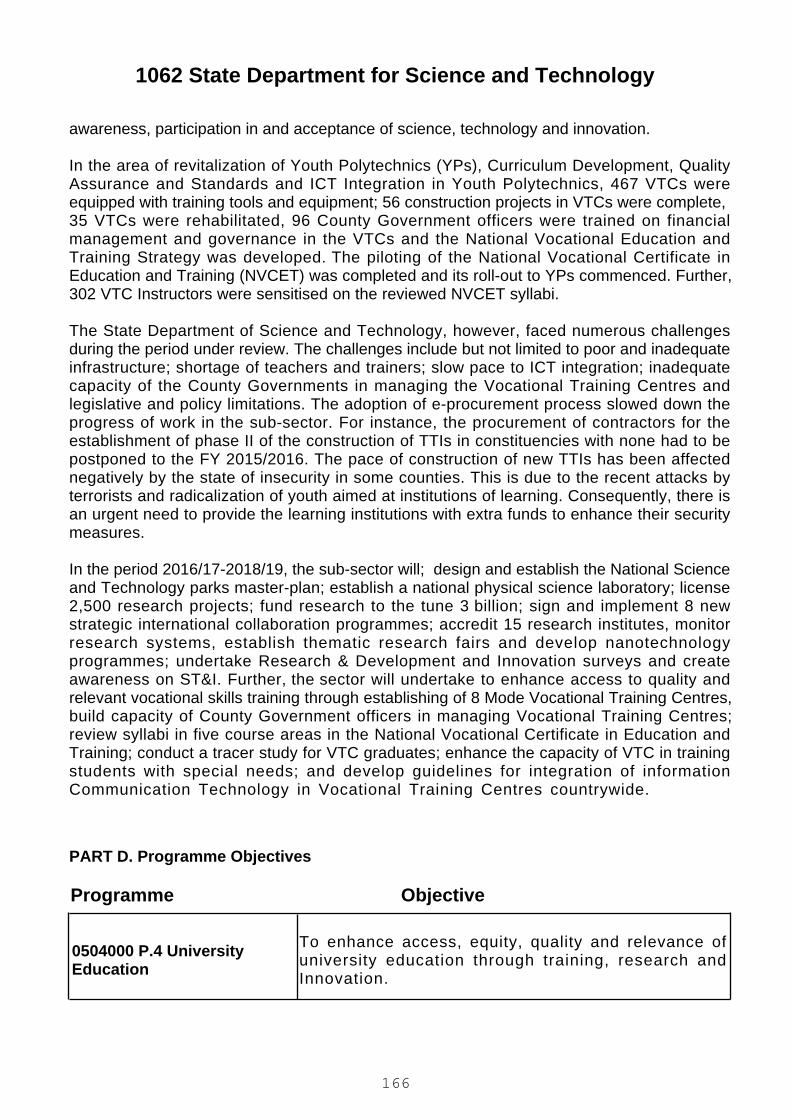
1062 State Department for Science and Technology
PART D. Programme Objectives
awareness, participation in and acceptance of science, technology and innovation.
In the area of revitalization of Youth Polytechnics (YPs), Curriculum Development, QualityAssurance and Standards and ICT Integration in Youth Polytechnics, 467 VTCs wereequipped with training tools and equipment; 56 construction projects in VTCs were complete, 35 VTCs were rehabilitated, 96 County Government officers were trained on financialmanagement and governance in the VTCs and the National Vocational Education andTraining Strategy was developed. The piloting of the National Vocational Certificate inEducation and Training (NVCET) was completed and its roll-out to YPs commenced. Further,302 VTC Instructors were sensitised on the reviewed NVCET syllabi.
The State Department of Science and Technology, however, faced numerous challengesduring the period under review. The challenges include but not limited to poor and inadequateinfrastructure; shortage of teachers and trainers; slow pace to ICT integration; inadequatecapacity of the County Governments in managing the Vocational Training Centres andlegislative and policy limitations. The adoption of e-procurement process slowed down theprogress of work in the sub-sector. For instance, the procurement of contractors for theestablishment of phase II of the construction of TTIs in constituencies with none had to bepostponed to the FY 2015/2016. The pace of construction of new TTIs has been affectednegatively by the state of insecurity in some counties. This is due to the recent attacks byterrorists and radicalization of youth aimed at institutions of learning. Consequently, there isan urgent need to provide the learning institutions with extra funds to enhance their securitymeasures.
In the period 2016/17-2018/19, the sub-sector will; design and establish the National Scienceand Technology parks master-plan; establish a national physical science laboratory; license2,500 research projects; fund research to the tune 3 billion; sign and implement 8 newstrategic international collaboration programmes; accredit 15 research institutes, monitorresearch systems, establish thematic research fairs and develop nanotechnologyprogrammes; undertake Research & Development and Innovation surveys and createawareness on ST&I. Further, the sector will undertake to enhance access to quality andrelevant vocational skills training through establishing of 8 Mode Vocational Training Centres,build capacity of County Government officers in managing Vocational Training Centres;review syllabi in five course areas in the National Vocational Certificate in Education andTraining; conduct a tracer study for VTC graduates; enhance the capacity of VTC in trainingstudents with special needs; and develop guidelines for integration of informationCommunication Technology in Vocational Training Centres countrywide.
ObjectiveProgramme
0504000 P.4 UniversityEducation
To enhance access, equity, quality and relevance ofuniversity education through training, research andInnovation.
166
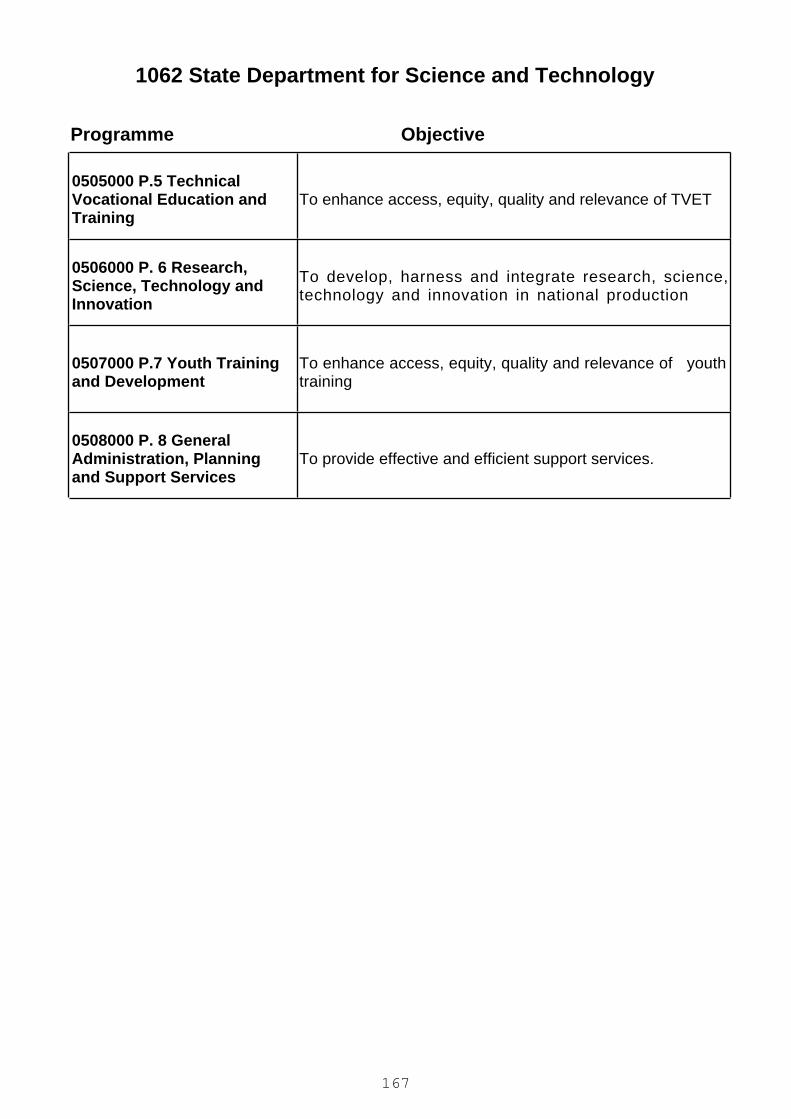
1062 State Department for Science and Technology
ObjectiveProgramme
0505000 P.5 TechnicalVocational Education andTraining
To enhance access, equity, quality and relevance of TVET
0506000 P. 6 Research,Science, Technology andInnovation
To develop, harness and integrate research, science,technology and innovation in national production
0507000 P.7 Youth Trainingand Development
To enhance access, equity, quality and relevance of youthtraining
0508000 P. 8 GeneralAdministration, Planningand Support Services
To provide effective and efficient support services.
167
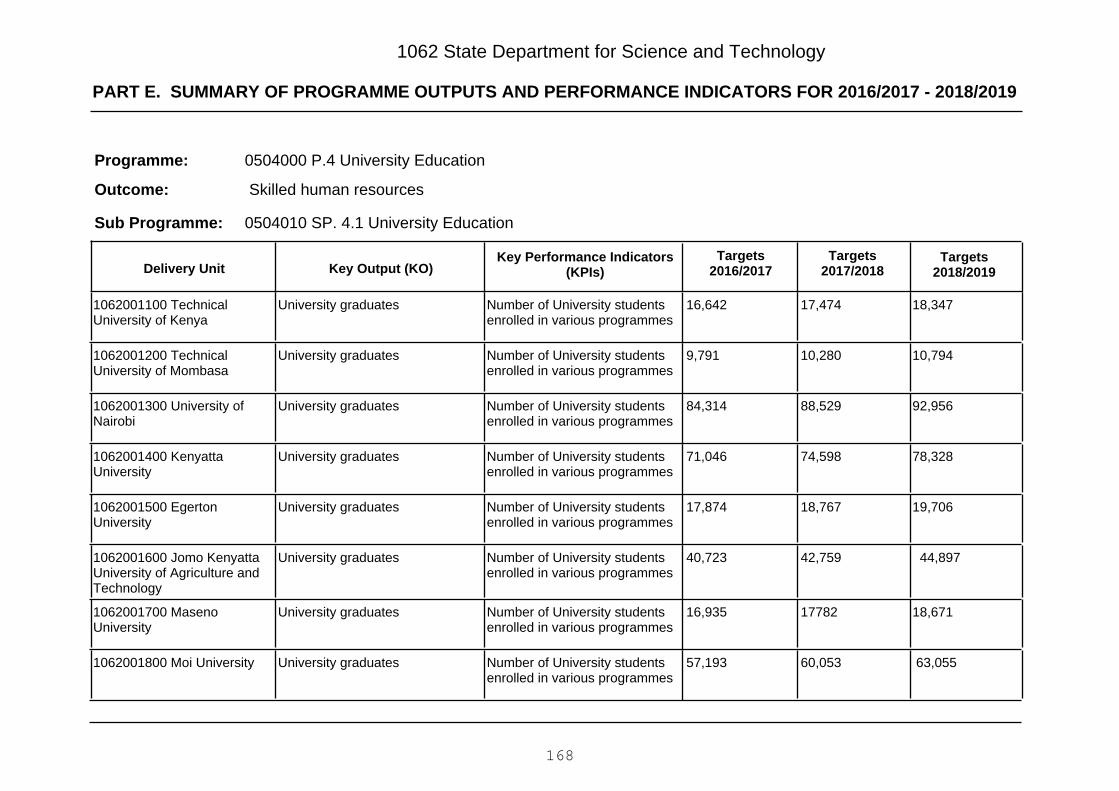
PART E. SUMMARY OF PROGRAMME OUTPUTS AND PERFORMANCE INDICATORS FOR 2016/2017 - 2018/2019
1062 State Department for Science and Technology
0504000 P.4 University Education
Skilled human resources
Programme:
Outcome:
0504010 SP. 4.1 University EducationSub Programme:
Key Output (KO)Targets
2018/2019Targets
2017/2018Key Performance Indicators
(KPIs)Targets
2016/2017Delivery Unit
18,34717,47416,642Number of University studentsenrolled in various programmes
University graduates1062001100 TechnicalUniversity of Kenya
10,79410,2809,791Number of University studentsenrolled in various programmes
University graduates1062001200 TechnicalUniversity of Mombasa
92,95688,52984,314Number of University studentsenrolled in various programmes
University graduates1062001300 University ofNairobi
78,32874,59871,046Number of University studentsenrolled in various programmes
University graduates1062001400 KenyattaUniversity
19,70618,76717,874Number of University studentsenrolled in various programmes
University graduates1062001500 EgertonUniversity
44,89742,75940,723Number of University studentsenrolled in various programmes
University graduates1062001600 Jomo KenyattaUniversity of Agriculture andTechnology
18,6711778216,935Number of University studentsenrolled in various programmes
University graduates1062001700 MasenoUniversity
63,05560,05357,193Number of University studentsenrolled in various programmes
University graduates1062001800 Moi University
168
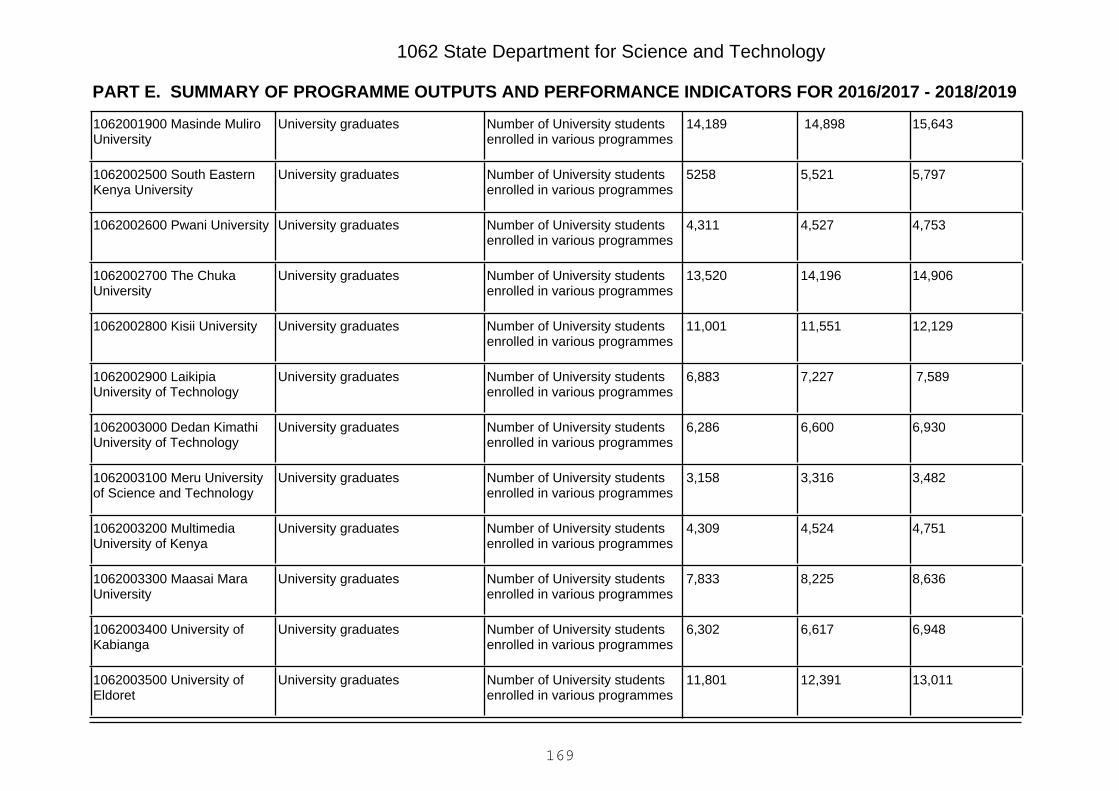
PART E. SUMMARY OF PROGRAMME OUTPUTS AND PERFORMANCE INDICATORS FOR 2016/2017 - 2018/2019
1062 State Department for Science and Technology
15,643 14,89814,189Number of University studentsenrolled in various programmes
University graduates1062001900 Masinde MuliroUniversity
5,7975,5215258Number of University studentsenrolled in various programmes
University graduates1062002500 South EasternKenya University
4,7534,5274,311Number of University studentsenrolled in various programmes
University graduates1062002600 Pwani University
14,90614,19613,520Number of University studentsenrolled in various programmes
University graduates1062002700 The ChukaUniversity
12,12911,55111,001Number of University studentsenrolled in various programmes
University graduates1062002800 Kisii University
7,5897,2276,883Number of University studentsenrolled in various programmes
University graduates1062002900 LaikipiaUniversity of Technology
6,9306,6006,286Number of University studentsenrolled in various programmes
University graduates1062003000 Dedan KimathiUniversity of Technology
3,4823,3163,158Number of University studentsenrolled in various programmes
University graduates1062003100 Meru Universityof Science and Technology
4,7514,5244,309Number of University studentsenrolled in various programmes
University graduates1062003200 MultimediaUniversity of Kenya
8,6368,2257,833Number of University studentsenrolled in various programmes
University graduates1062003300 Maasai MaraUniversity
6,9486,6176,302Number of University studentsenrolled in various programmes
University graduates1062003400 University ofKabianga
13,01112,39111,801Number of University studentsenrolled in various programmes
University graduates1062003500 University ofEldoret
169

PART E. SUMMARY OF PROGRAMME OUTPUTS AND PERFORMANCE INDICATORS FOR 2016/2017 - 2018/2019
1062 State Department for Science and Technology
5,7235,4515,191Number of University studentsenrolled in various programmes
University graduates1062003600 KaratinaUniversity
6,6276,3126,011Number of University studentsenrolled in various programmes
University graduates1062003700 Jaramogi OgingaOdinga University of Scienceand Technology
250250250Masters and Phd graduatesQuality university faculty1062101500 Support ToEnhancement Of Quality AndRelevance In HigherEducation
20%40%40%project completion rateUniversity infrastructure facilities1062101900 TechnicalUniversity of Mombasa
20%40%40%project completion rateUniversity infrastructure facilities1062102000 TechnicalUniversity of Kenya
20%40%40%project completion rateUniversity infrastructure facilities1062102100 University ofNairobi
20%40%40%project completion rateUniversity infrastructure facilities1062102200 Murang'aUniversity College
20%40%40%project completion rateUniversity infrastructure facilities1062102300 KenyattaUniversity
20%40%40%project completion rateUniversity infrastructure facilities1062102400 EgertonUniversity
20%40%40%project completion rateUniversity infrastructure facilities1062102500 Jomo KenyattaUniversity of Agriculture andTechnol
20%40%40%project completion rateUniversity infrastructure facilities1062102600 MasenoUniversity
170
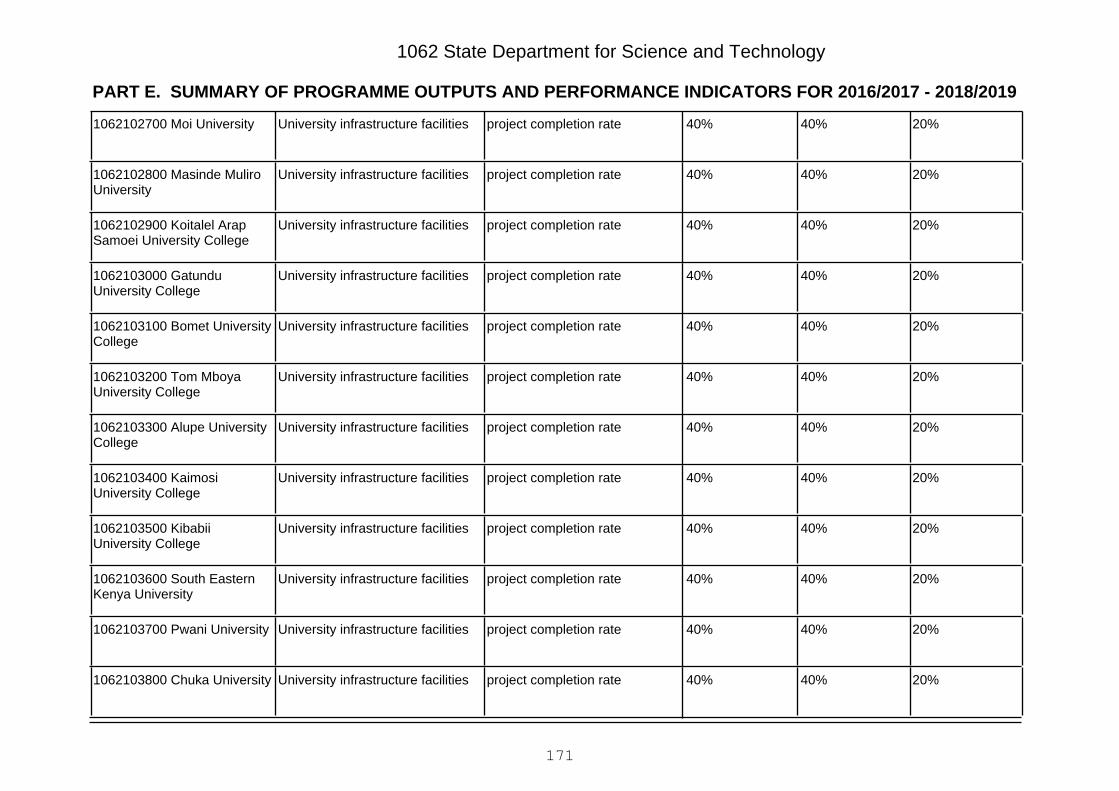
PART E. SUMMARY OF PROGRAMME OUTPUTS AND PERFORMANCE INDICATORS FOR 2016/2017 - 2018/2019
1062 State Department for Science and Technology
20%40%40%project completion rateUniversity infrastructure facilities1062102700 Moi University
20%40%40%project completion rateUniversity infrastructure facilities1062102800 Masinde MuliroUniversity
20%40%40%project completion rateUniversity infrastructure facilities1062102900 Koitalel ArapSamoei University College
20%40%40%project completion rateUniversity infrastructure facilities1062103000 GatunduUniversity College
20%40%40%project completion rateUniversity infrastructure facilities1062103100 Bomet UniversityCollege
20%40%40%project completion rateUniversity infrastructure facilities1062103200 Tom MboyaUniversity College
20%40%40%project completion rateUniversity infrastructure facilities1062103300 Alupe UniversityCollege
20%40%40%project completion rateUniversity infrastructure facilities1062103400 KaimosiUniversity College
20%40%40%project completion rateUniversity infrastructure facilities1062103500 KibabiiUniversity College
20%40%40%project completion rateUniversity infrastructure facilities1062103600 South EasternKenya University
20%40%40%project completion rateUniversity infrastructure facilities1062103700 Pwani University
20%40%40%project completion rateUniversity infrastructure facilities1062103800 Chuka University
171
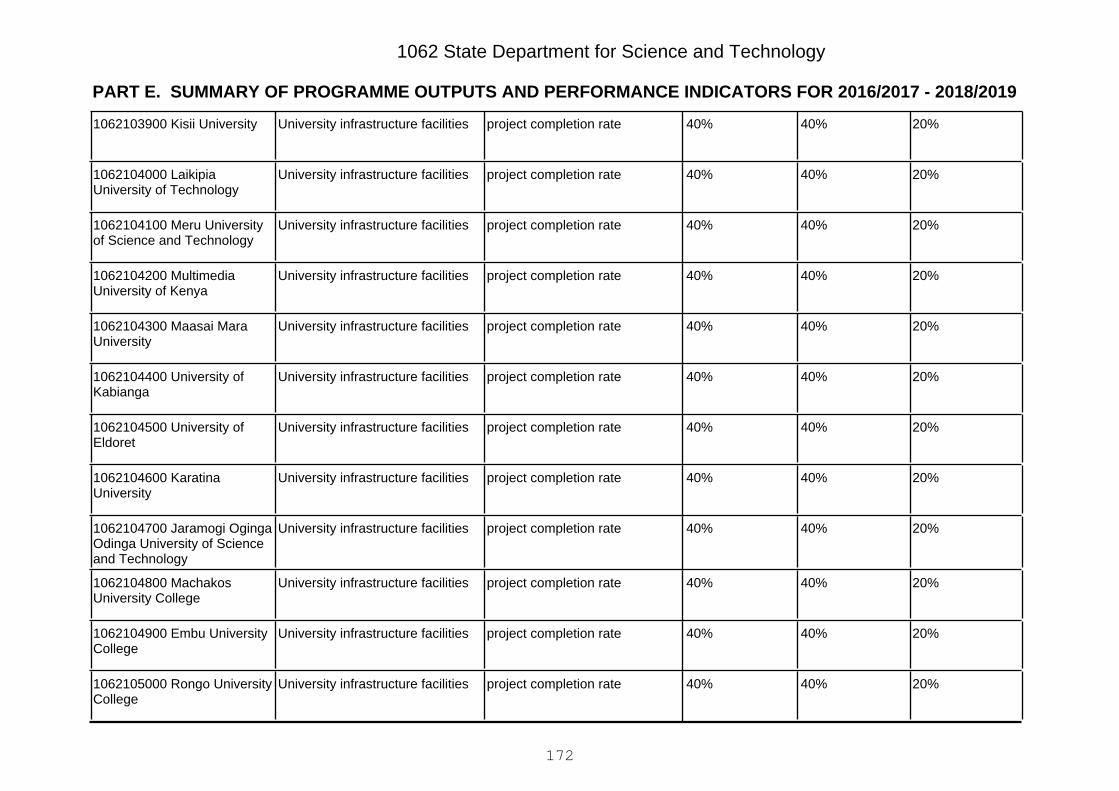
PART E. SUMMARY OF PROGRAMME OUTPUTS AND PERFORMANCE INDICATORS FOR 2016/2017 - 2018/2019
1062 State Department for Science and Technology
20%40%40%project completion rateUniversity infrastructure facilities1062103900 Kisii University
20%40%40%project completion rateUniversity infrastructure facilities1062104000 LaikipiaUniversity of Technology
20%40%40%project completion rateUniversity infrastructure facilities1062104100 Meru Universityof Science and Technology
20%40%40%project completion rateUniversity infrastructure facilities1062104200 MultimediaUniversity of Kenya
20%40%40%project completion rateUniversity infrastructure facilities1062104300 Maasai MaraUniversity
20%40%40%project completion rateUniversity infrastructure facilities1062104400 University ofKabianga
20%40%40%project completion rateUniversity infrastructure facilities1062104500 University ofEldoret
20%40%40%project completion rateUniversity infrastructure facilities1062104600 KaratinaUniversity
20%40%40%project completion rateUniversity infrastructure facilities1062104700 Jaramogi OgingaOdinga University of Scienceand Technology
20%40%40%project completion rateUniversity infrastructure facilities1062104800 MachakosUniversity College
20%40%40%project completion rateUniversity infrastructure facilities1062104900 Embu UniversityCollege
20%40%40%project completion rateUniversity infrastructure facilities1062105000 Rongo UniversityCollege
172

PART E. SUMMARY OF PROGRAMME OUTPUTS AND PERFORMANCE INDICATORS FOR 2016/2017 - 2018/2019
1062 State Department for Science and Technology
20%40%40%project completion rateUniversity infrastructure facilities1062105100 Co-operativeUniversity College of Kenya
20%40%40%project completion rateUniversity infrastructure facilities1062105200 GarissaUniversity College
20%40%40%project completion rateUniversity infrastructure facilities1062105300 KirinyagaUniversity College
20%40%40%project completion rateUniversity infrastructure facilities1062105400 Dedan KimathiUniversity of Technology
20%40%40%project completion rateUniversity infrastructure facilities1062105500 Taita TavetaUniversity College
20%40%40%project completion rateUniversity infrastructure facilities1062105600 Science andTechnology ProgrammeActivities
0504020 SP. 4.2 Quality Assurance and StandardsSub Programme:
Key Output (KO)Targets
2018/2019Targets
2017/2018Key Performance Indicators
(KPIs)Targets
2016/2017Delivery Unit
443,171422,067401,969Number of students in publicuniversities
Improved access to UniversityEducation
1062002000 Directorate ofHigher Education
160130100Number of universitiesinspected
Quality University Education1062002100 Commission forUniversities Education
0504030 SP. 4.3 Higher Education Support ServicesSub Programme:
Key Output (KO)Targets
2018/2019Targets
2017/2018Key Performance Indicators
(KPIs)Targets
2016/2017Delivery Unit
173

PART E. SUMMARY OF PROGRAMME OUTPUTS AND PERFORMANCE INDICATORS FOR 2016/2017 - 2018/2019
1062 State Department for Science and Technology
102,94889,52077,843Governmentsponsored students admitted touniversities and tertiaryinstitutions
Accessiblehigher education
1062000900 The KenyaUniversities and CollegesCentral Placement Services
443,171422,067401,969Number of students in publicuniversities
Improvedaccess to University Education
1062002000 Directorate ofHigher Education
305,855265,961231,271Number of students awardedloans, bursaries at theuniversities and TVET
Increased Accessibility tobursaries, loans and scholarships.Number of students awardedloans, bursaries at the universitiesand TVET
1062002200 HigherEducation Loans Board(HELB)
101010Number of students receivingGovernment support
Accessible Higher Education1062002300 Bursaries;Scholarships; Subsidies andEducation Attachments
Equitableallocation offunds to all publicsponsoreduniversities
Equitableallocation offunds to all publicsponsoreduniversities
Funding criteriafinalized
Funding criteriaAccessible Higher Education1062006100 UniversityFunding Board
0505000 P.5 Technical Vocational Education and Training
Increased enrollment in TVET institutions
Programme:
Outcome:
0505010 SP. 5.1 Technical Accreditation and Quality AssuranceSub Programme:
Key Output (KO)Targets
2018/2019Targets
2017/2018Key Performance Indicators
(KPIs)Targets
2016/2017Delivery Unit
600400200Number of TVET InstitutionsLicensed and accredited
Quality and relevant humanresource skills
1062000200 TVET Authority
174

PART E. SUMMARY OF PROGRAMME OUTPUTS AND PERFORMANCE INDICATORS FOR 2016/2017 - 2018/2019
1062 State Department for Science and Technology
200150100Number of competency basedtraining programs developed forTVET
Quality/Demand-Driven CBETcurriculum for TVET
1062004100 CurriculumDevelopment Assessmentand Certification Council(CDACC)
0505020 SP. 5.2 Technical Trainers and Instructor ServicesSub Programme:
Key Output (KO)Targets
2018/2019Targets
2017/2018Key Performance Indicators
(KPIs)Targets
2016/2017Delivery Unit
577552504773Number of students enrolledEnrolled students1062000300 KisumuPolytechnic
193717611601Number of students enrolledEnrolled students1062000400 Kenya TechnicalTeachers College
577575250647733Number of students enrolledEnrolled students1062000500 TechnicalTraining Institutes
339563086928069Number of students enrolledEnrolled students1062000600 Institutes ofTechnology
865278657150Number of students enrolledEnrolled students1062000700 EldoretPolytechnic
758026891060019Number of students enrolledEnrolled students1062000800 Directorate ofTechnical Education
40%30%30%% completion of assignedactivities
Effective administration of TVETat county level
1062003800 County Directorsof TVET
Ksh. 16BKsh. 13BKsh. 10BAmount of funds mobilizedannually for TVET sector(Kshs.Billion)
Enhanced TVET funding1062004300 TVET FundingBoard
175

PART E. SUMMARY OF PROGRAMME OUTPUTS AND PERFORMANCE INDICATORS FOR 2016/2017 - 2018/2019
1062 State Department for Science and Technology
311228292572Number of students enrolledEnrolled students1062005300 The KabetePolytechnic
173315561300Number of students enrolledEnrolled students1062005400 KitalePolytechnic
338830802800Number of students enrolledEnrolled students1062005500 MeruPolytechnic
302127462496Number of students enrolledEnrolled students1062005600 The KenyaCoast Polytechnic
324429492681Number of students enrolledEnrolled students1062005700 NyeriPolytechnic
363433043004Number of students enrolledEnrolled students1062005800 SigalagalaPolytechnic
154814081280Number of students enrolledEnrolled students1062005900 North EasternPolytechnic
319429042640Number of students enrolledEnrolled students1062006000 GusiiPolytechnic
0505030 SP. 5.3 Special Needs in Technical and Vocational EducationSub Programme:
Key Output (KO)Targets
2018/2019Targets
2017/2018Key Performance Indicators
(KPIs)Targets
2016/2017Delivery Unit
440400250numberof student enrolled
Students enrolled1062004600 MachakosInstitute for the Blind
440400250numberof student enrolled
Students enrolled1062004700 Karen Institutefor the Deaf
176

PART E. SUMMARY OF PROGRAMME OUTPUTS AND PERFORMANCE INDICATORS FOR 2016/2017 - 2018/2019
1062 State Department for Science and Technology
440400100numberof student enrolled
Students enrolled1062004800 Sikri TechnicalTraining Institute
440400200numberof student enrolled
Students enrolled1062004900 NyangomaTechnical Training Institute
0505040 SP. 5.4 Infrastructure Development and ExpansionSub Programme:
Key Output (KO)Targets
2018/2019Targets
2017/2018Key Performance Indicators
(KPIs)Targets
2016/2017Delivery Unit
100%60%30%completion levelQuality technical education1062106100 38 GOK-AfDBTTIs PHASE II
222Number of Departmentsprovided with training equipment
Quality technical education1062106200 GoK 9 TTIs INCOUNTIES
111111Number of TTI provided withtraining equipment
Quality technical education1062106300 GoK-Netherlands PHASE II
--50%Completion levelQuality technical education1062106400 GOK KIPKABUSAND MURANGA TTIs
606060Number of Departmentsprovided with training equipment
Quality technical education1062106500 GoK 60 TTIsEQUIPPING
111Number of Departmentsprovided with training equipment
Quality technical education1062106600 Aldai TTI
222Number of Departmentsprovided with training equipment
Quality technical education1062106700 Baringo TTI
222Number of Departmentsprovided with training equipment
Quality technical education1062106800 Bondo TTI
177

PART E. SUMMARY OF PROGRAMME OUTPUTS AND PERFORMANCE INDICATORS FOR 2016/2017 - 2018/2019
1062 State Department for Science and Technology
222Number of Departmentsprovided with training equipment
Quality technical education1062106900 Mathenge TTI
222Number of Departmentsprovided with training equipment
Quality technical education1062107100 Bumbe TTI
222Number of Departmentsprovided with training equipment
Quality technical education1062107200 Bureti TTI
222Number of Departmentsprovided with training equipment
Quality technical education1062107300 Bushiangala TTI
222Number of Departmentsprovided with training equipment
Quality technical education1062107400 Ekerubo GietaiTTI
111Number of Departmentsprovided with training equipment
Quality technical education1062107500 Emining TTI
222Number of Departmentsprovided with training equipment
Quality technical education1062107600 Gitwebe TTI
111Number of Departmentsprovided with training equipment
Quality technical education1062107700 Godoma TTI
222Number of Departmentsprovided with training equipment
Quality technical education1062107800 Kabete TTI
222Number of Departmentsprovided with training equipment
Quality technical education1062107900 Kaiboi TTI
111Number of Departmentsprovided with training equipment
Quality technical education1062108000 Karumo TTI
222Number of Departmentsprovided with training equipment
Quality technical education1062108100 Katine TTI
178

PART E. SUMMARY OF PROGRAMME OUTPUTS AND PERFORMANCE INDICATORS FOR 2016/2017 - 2018/2019
1062 State Department for Science and Technology
222Number of Departmentsprovided with training equipment
Quality technical education1062108200 Keroka TTI
222Number of Departmentsprovided with training equipment
Quality technical education1062108300 Kiirua TTI
222Number of Departmentsprovided with training equipment
Quality technical education1062108400 Kisiwa TTI
221Number of Departmentsprovided with training equipment
Quality technical education1062108500 Kitale TTI
221Number of Departmentsprovided with training equipment
Quality technical education1062108600 Masai TTI
222Number of Departmentsprovided with training equipment
Quality technical education1062108700 Matili TTI
221Number of Departmentsprovided with training equipment
Quality technical education1062108800 Mawego TTI
222Number of Departmentsprovided with training equipment
Quality technical education1062108900 Meru TTI
222Number of Departmentsprovided with training equipment
Quality technical education1062109000 Michuki TTI
222Number of Departmentsprovided with training equipment
Quality technical education1062109100 Mitunguu TTI
222Number of Departmentsprovided with training equipment
Quality technical education1062109200 Mombasa TTI
111Number of Departmentsprovided with training equipment
Quality technical education1062109300 Mukiria TTI
179
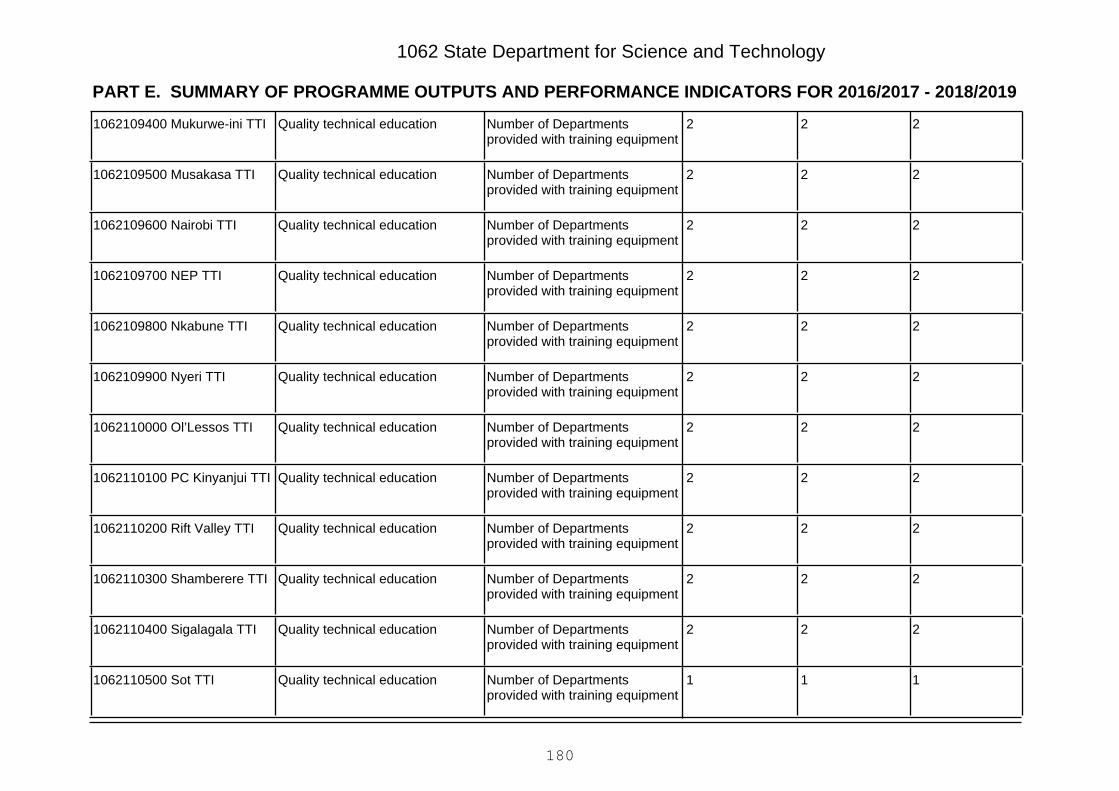
PART E. SUMMARY OF PROGRAMME OUTPUTS AND PERFORMANCE INDICATORS FOR 2016/2017 - 2018/2019
1062 State Department for Science and Technology
222Number of Departmentsprovided with training equipment
Quality technical education1062109400 Mukurwe-ini TTI
222Number of Departmentsprovided with training equipment
Quality technical education1062109500 Musakasa TTI
222Number of Departmentsprovided with training equipment
Quality technical education1062109600 Nairobi TTI
222Number of Departmentsprovided with training equipment
Quality technical education1062109700 NEP TTI
222Number of Departmentsprovided with training equipment
Quality technical education1062109800 Nkabune TTI
222Number of Departmentsprovided with training equipment
Quality technical education1062109900 Nyeri TTI
222Number of Departmentsprovided with training equipment
Quality technical education1062110000 Ol’Lessos TTI
222Number of Departmentsprovided with training equipment
Quality technical education1062110100 PC Kinyanjui TTI
222Number of Departmentsprovided with training equipment
Quality technical education1062110200 Rift Valley TTI
222Number of Departmentsprovided with training equipment
Quality technical education1062110300 Shamberere TTI
222Number of Departmentsprovided with training equipment
Quality technical education1062110400 Sigalagala TTI
111Number of Departmentsprovided with training equipment
Quality technical education1062110500 Sot TTI
180

PART E. SUMMARY OF PROGRAMME OUTPUTS AND PERFORMANCE INDICATORS FOR 2016/2017 - 2018/2019
1062 State Department for Science and Technology
222Number of Departmentsprovided with training equipment
Quality technical education1062110600 Thika TTI
221Number of Departmentsprovided with training equipment
Quality technical education1062110700 Tseikuru TTI
222Number of Departmentsprovided with training equipment
Quality technical education1062110800 Wote TTI
111Number of Departmentsprovided with training equipment
Quality technical education1062110900 Ziwa TTI
222Number of Departmentsprovided with training equipment
Quality technical education1062111000 Coast IT
222Number of Departmentsprovided with training equipment
Quality technical education1062111100 Friends KaimosiCollege
222Number of Departmentsprovided with training equipment
Quality technical education1062111200 Gusii IT
122Number of Departmentsprovided with training equipment
Quality technical education1062111300 Kiambu IST
122Number of Departmentsprovided with training equipment
Quality technical education1062111400 Nyandarua IST
222Number of Departmentsprovided with training equipment
Quality technical education1062111500 Ramogi IAT
222Number of Departmentsprovided with training equipment
Quality technical education1062111600 Rift Valley IST
222Number of Departmentsprovided with training equipment
Quality technical education1062111700 Rwika TI
181

PART E. SUMMARY OF PROGRAMME OUTPUTS AND PERFORMANCE INDICATORS FOR 2016/2017 - 2018/2019
1062 State Department for Science and Technology
222Number of Departmentsprovided with training equipment
Quality technical education1062111800 Sang’alo IST
222Number of Departmentsprovided with training equipment
Quality technical education1062111900 Siaya IT
222Number of Departmentsprovided with training equipment
Accessible and quality technicaleducation
1062112000 Kenya TechnicalTrainers College
111Number of Departmentsprovided with training equipment
Quality technical education1062112200 Sikri TTI for theBlind and Deaf
222Number of Departmentsprovided with training equipment
Quality technical education1062112300 MachakosTechnical Institute for theBlind
111Number of Departmentsprovided with training equipment
Quality technical education1062112400 Karen TechnicalTraining Institute for the Deaf
222Number of Departmentsprovided with training equipment
Quality technical education1062112500 St. Joseph’sTechnical Institute for theDeaf, Nyang’oma
222Number of Departmentsprovided with training equipment
Accessible and quality technicaleducation
1062112600 KisumuPolytechnic
222Number of Departmentsprovided with training equipment
Quality technical education1062112700 EldoretPolytechnic
0506000 P. 6 Research, Science, Technology and Innovation
National Physical Science Research Laboratory established
Programme:
Outcome:
182
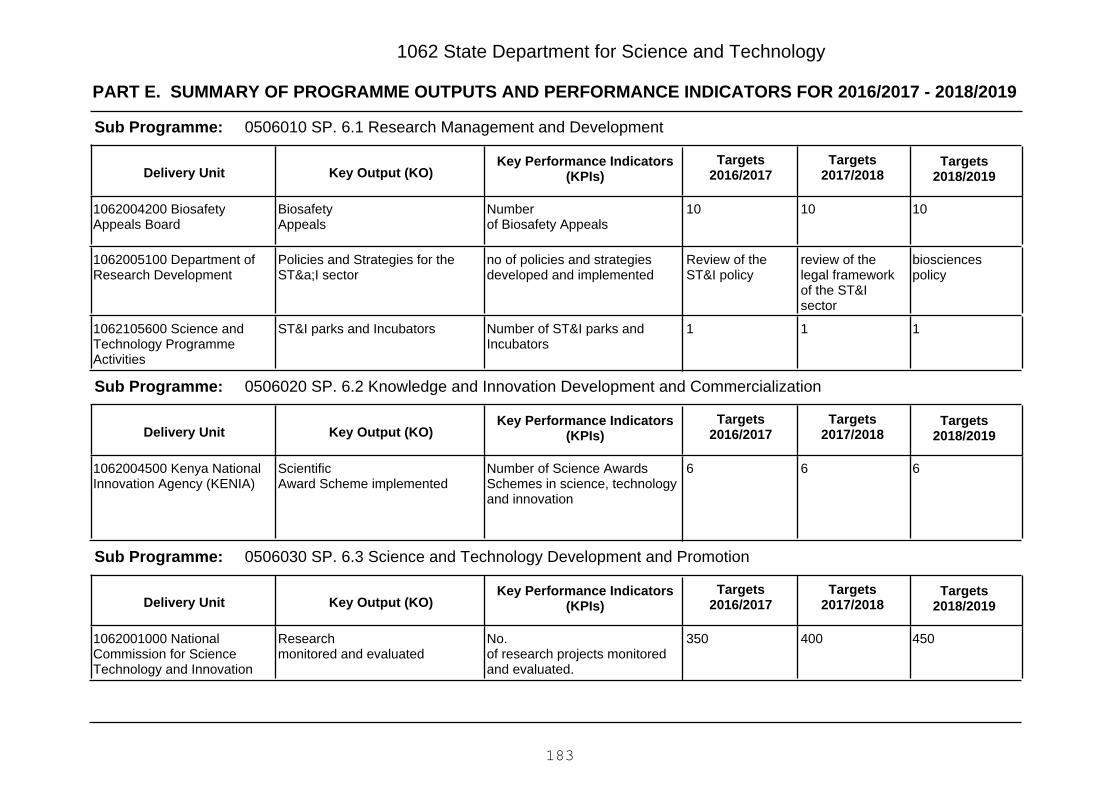
PART E. SUMMARY OF PROGRAMME OUTPUTS AND PERFORMANCE INDICATORS FOR 2016/2017 - 2018/2019
1062 State Department for Science and Technology
0506010 SP. 6.1 Research Management and DevelopmentSub Programme:
Key Output (KO)Targets
2018/2019Targets
2017/2018Key Performance Indicators
(KPIs)Targets
2016/2017Delivery Unit
101010Numberof Biosafety Appeals
BiosafetyAppeals
1062004200 BiosafetyAppeals Board
biosciencespolicy
review of thelegal frameworkof the ST&Isector
Review of theST&I policy
no of policies and strategiesdeveloped and implemented
Policies and Strategies for theST&a;I sector
1062005100 Department ofResearch Development
111Number of ST&I parks andIncubators
ST&I parks and Incubators1062105600 Science andTechnology ProgrammeActivities
0506020 SP. 6.2 Knowledge and Innovation Development and CommercializationSub Programme:
Key Output (KO)Targets
2018/2019Targets
2017/2018Key Performance Indicators
(KPIs)Targets
2016/2017Delivery Unit
666Number of Science AwardsSchemes in science, technologyand innovation
ScientificAward Scheme implemented
1062004500 Kenya NationalInnovation Agency (KENIA)
0506030 SP. 6.3 Science and Technology Development and PromotionSub Programme:
Key Output (KO)Targets
2018/2019Targets
2017/2018Key Performance Indicators
(KPIs)Targets
2016/2017Delivery Unit
450400350No.of research projects monitoredand evaluated.
Researchmonitored and evaluated
1062001000 NationalCommission for ScienceTechnology and Innovation
183

PART E. SUMMARY OF PROGRAMME OUTPUTS AND PERFORMANCE INDICATORS FOR 2016/2017 - 2018/2019
1062 State Department for Science and Technology
21.51Gross Expenditure on Researchand Development
Increased investment in researchand development
1062004400 NationalResearch Fund
0507000 P.7 Youth Training and Development
Enhanced vocational skills
Programme:
Outcome:
0507010 SP. 7.1 Revitalization of Youth PolytechnicsSub Programme:
Key Output (KO)Targets
2018/2019Targets
2017/2018Key Performance Indicators
(KPIs)Targets
2016/2017Delivery Unit
111No.of workshops/ classrooms/hostels constructed
ModelVocational Training Centresestablished in each County
1062100100 Mbaa-Ini YouthPolytechnic
111No.of workshops/ classrooms/hostels constructed
ModelVocational Training Centresestablished in each County
1062100200 Lereshwa YouthPolytechnic
111No.of workshops/ classrooms/hostels constructed
ModelVocational Training Centresestablished in each County
1062100400 Lucy OnonoKinda Umala YouthPolytechnic
202020Gross EnrollmentStudent enrolled in YPs1062100600 Scholarships ForStudents In 18yrs
111No.of workshops/ classrooms/hostels constructed<
ModelVocational Training Centresestablished in each County
1062100700 NyagwetheYouth Polytechnic (DebtSwap)
11No.of workshops/ classrooms/hostels constructed
ModelVocational Training Centresestablished in each County>
1062100800 Vitengeni YouthPolytechnic (Debt Swap)
111No.of workshops/ classrooms/hostels constructed
Model Vocational TrainingCentres established in eachCounty
1062100900 Ebusiralo YouthPolytechnic (Debt Swap)
184
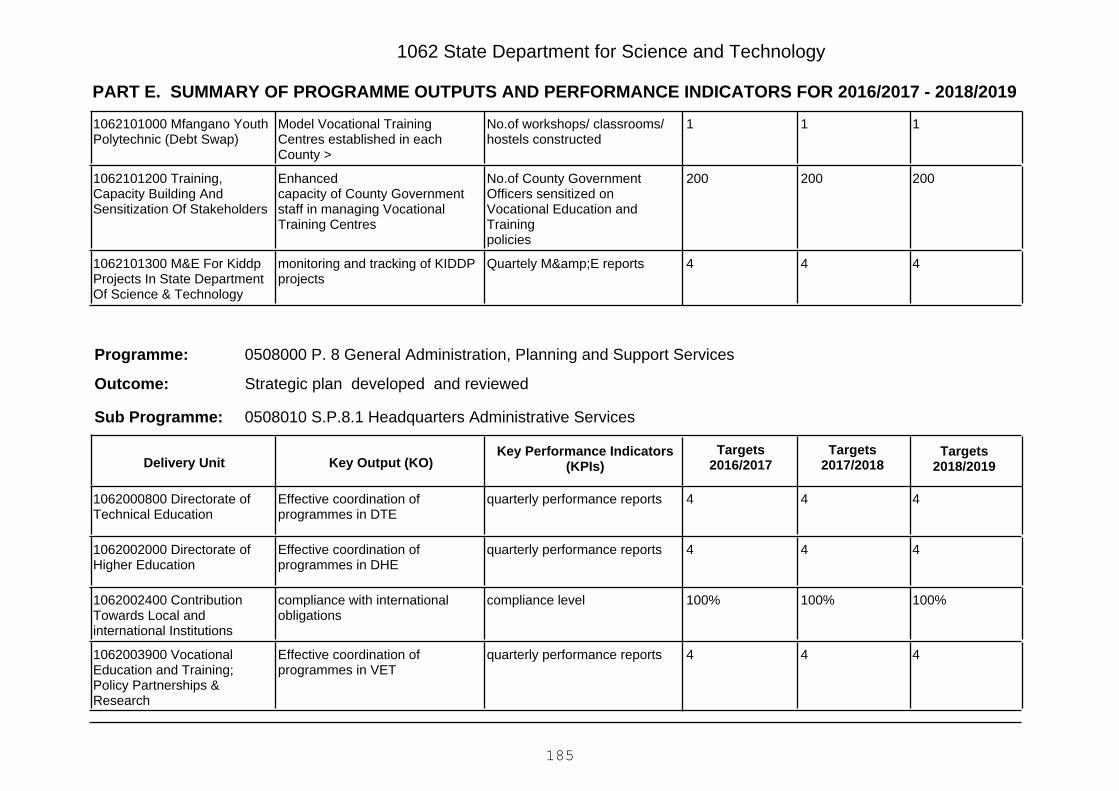
PART E. SUMMARY OF PROGRAMME OUTPUTS AND PERFORMANCE INDICATORS FOR 2016/2017 - 2018/2019
1062 State Department for Science and Technology
111No.of workshops/ classrooms/hostels constructed
Model Vocational TrainingCentres established in eachCounty >
1062101000 Mfangano YouthPolytechnic (Debt Swap)
200200200No.of County GovernmentOfficers sensitized onVocational Education andTrainingpolicies
Enhancedcapacity of County Governmentstaff in managing VocationalTraining Centres
1062101200 Training,Capacity Building AndSensitization Of Stakeholders
444Quartely M&E reportsmonitoring and tracking of KIDDPprojects
1062101300 M&E For KiddpProjects In State DepartmentOf Science & Technology
0508000 P. 8 General Administration, Planning and Support Services
Strategic plan developed and reviewed
Programme:
Outcome:
0508010 S.P.8.1 Headquarters Administrative ServicesSub Programme:
Key Output (KO)Targets
2018/2019Targets
2017/2018Key Performance Indicators
(KPIs)Targets
2016/2017Delivery Unit
444quarterly performance reportsEffective coordination ofprogrammes in DTE
1062000800 Directorate ofTechnical Education
444quarterly performance reportsEffective coordination ofprogrammes in DHE
1062002000 Directorate ofHigher Education
100%100%100%compliance levelcompliance with internationalobligations
1062002400 ContributionTowards Local andinternational Institutions
444quarterly performance reportsEffective coordination ofprogrammes in VET
1062003900 VocationalEducation and Training;Policy Partnerships &Research
185

PART E. SUMMARY OF PROGRAMME OUTPUTS AND PERFORMANCE INDICATORS FOR 2016/2017 - 2018/2019
1062 State Department for Science and Technology
44Number of monitoring andevaluation report
Monitoring and Evaluationconducted
1062005000 DevelopmentPlanning Services
444quarterly performance reportsEffective coordination ofprogrammes
1062005200 HeadquartersAdministrative Services
444quarterly performance reportsEffective coordination ofprogrammes
1062006200 HeadquartersAdinistrative Services (VTT)
186
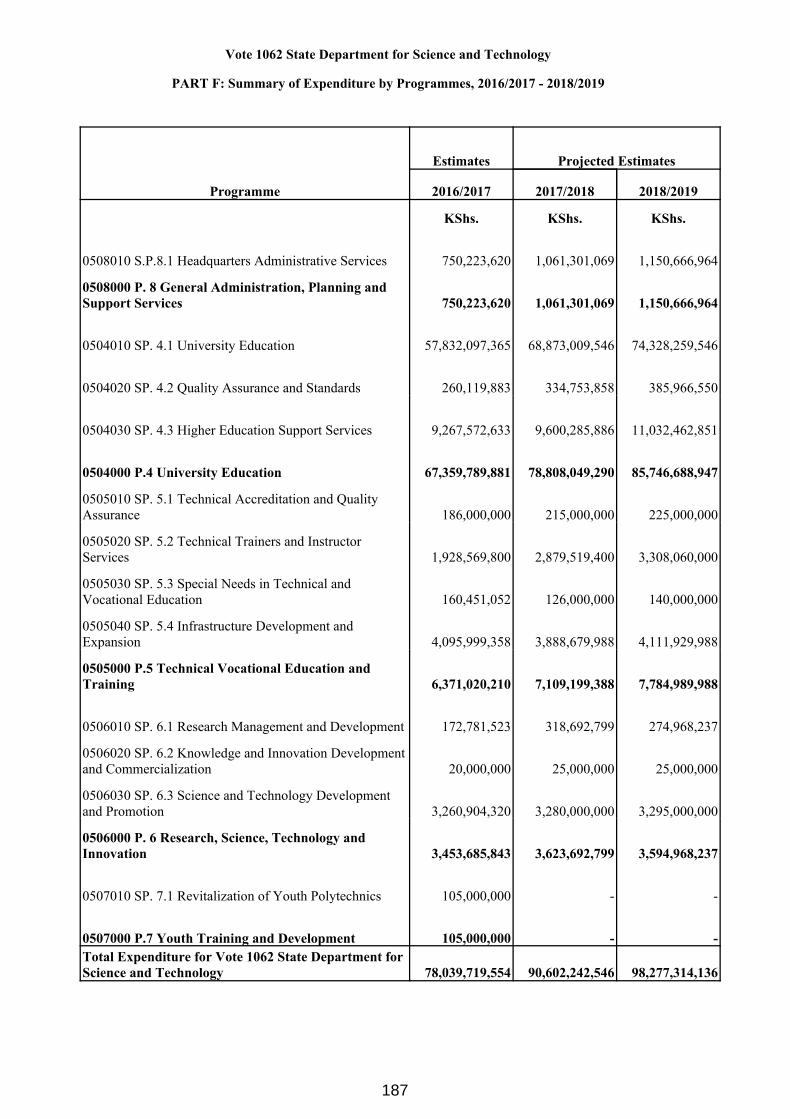
Vote 1062 State Department for Science and Technology
PART F: Summary of Expenditure by Programmes, 2016/2017 - 2018/2019
Programme
Estimates Projected Estimates
2016/2017 2017/2018 2018/2019
KShs. KShs. KShs.
0508010 S.P.8.1 Headquarters Administrative Services 750,223,620 1,061,301,069 1,150,666,964
0508000 P. 8 General Administration, Planning and Support Services 750,223,620 1,061,301,069 1,150,666,964
0504010 SP. 4.1 University Education 57,832,097,365 68,873,009,546 74,328,259,546
0504020 SP. 4.2 Quality Assurance and Standards 260,119,883 334,753,858 385,966,550
0504030 SP. 4.3 Higher Education Support Services 9,267,572,633 9,600,285,886 11,032,462,851
0504000 P.4 University Education 67,359,789,881 78,808,049,290 85,746,688,947
0505010 SP. 5.1 Technical Accreditation and Quality Assurance 186,000,000 215,000,000 225,000,000
0505020 SP. 5.2 Technical Trainers and Instructor Services 1,928,569,800 2,879,519,400 3,308,060,000
0505030 SP. 5.3 Special Needs in Technical and Vocational Education 160,451,052 126,000,000 140,000,000
0505040 SP. 5.4 Infrastructure Development and Expansion 4,095,999,358 3,888,679,988 4,111,929,988
0505000 P.5 Technical Vocational Education and Training 6,371,020,210 7,109,199,388 7,784,989,988
0506010 SP. 6.1 Research Management and Development 172,781,523 318,692,799 274,968,237
0506020 SP. 6.2 Knowledge and Innovation Developmentand Commercialization 20,000,000 25,000,000 25,000,000
0506030 SP. 6.3 Science and Technology Development and Promotion 3,260,904,320 3,280,000,000 3,295,000,000
0506000 P. 6 Research, Science, Technology and Innovation 3,453,685,843 3,623,692,799 3,594,968,237
0507010 SP. 7.1 Revitalization of Youth Polytechnics 105,000,000 - -
0507000 P.7 Youth Training and Development 105,000,000 - -Total Expenditure for Vote 1062 State Department for Science and Technology 78,039,719,554 90,602,242,546 98,277,314,136
187

1062 State Department for Science and Technology
PART G: Summary of Expenditure by Vote and Economic Classification, 2016/2017 - 2018/2019
Economic Classification
Estimates Projected Estimates
2016/2017 2017/2018 2018/2019KShs. KShs. KShs.
Current Expenditure 62,894,625,170 73,580,148,162 79,682,219,752
Compensation to Employees 415,847,585 429,053,012 435,124,602
Use of Goods and Services 569,533,007 759,650,200 850,554,360
Current Transfers to Govt. Agencies 53,178,331,253 63,396,095,150 68,072,095,150
Other Recurrent 8,730,913,325 8,995,349,800 10,324,445,640
Capital Expenditure 15,145,094,384 17,022,094,384 18,595,094,384
Acquisition of Non-Financial Assets 2,229,500,000 2,140,500,000 2,140,500,000
Capital Grants to Govt. Agencies 10,199,094,396 12,621,094,396 14,194,094,396
Other Development 2,716,499,988 2,260,499,988 2,260,499,988Total Expenditure 78,039,719,554 90,602,242,546 98,277,314,136
188

1062 State Department for Science and Technology
PART H: Summary of Expenditure by Programme and Economic Classification, 2016/2017 - 2018/2019
0508010 S.P.8.1 Headquarters Administrative Services
Economic Classification
Estimates Projected Estimates
2016/2017 2017/2018 2018/2019KShs. KShs. KShs.
Current Expenditure 750,223,620 1,061,301,069 1,150,666,964
Compensation to Employees 326,996,583 335,784,455 337,998,870
Use of Goods and Services 315,687,037 456,969,200 521,164,430
Current Transfers to Govt. Agencies 70,000,000 160,000,000 170,000,000
Other Recurrent 37,540,000 108,547,414 121,503,664
Total Expenditure 750,223,620 1,061,301,069 1,150,666,964
0508000 P. 8 General Administration, Planning and Support Services
Economic Classification
Estimates Projected Estimates
2016/2017 2017/2018 2018/2019KShs. KShs. KShs.
Current Expenditure 750,223,620 1,061,301,069 1,150,666,964
Compensation to Employees 326,996,583 335,784,455 337,998,870
Use of Goods and Services 315,687,037 456,969,200 521,164,430
Current Transfers to Govt. Agencies 70,000,000 160,000,000 170,000,000
Other Recurrent 37,540,000 108,547,414 121,503,664
Total Expenditure 750,223,620 1,061,301,069 1,150,666,964
189
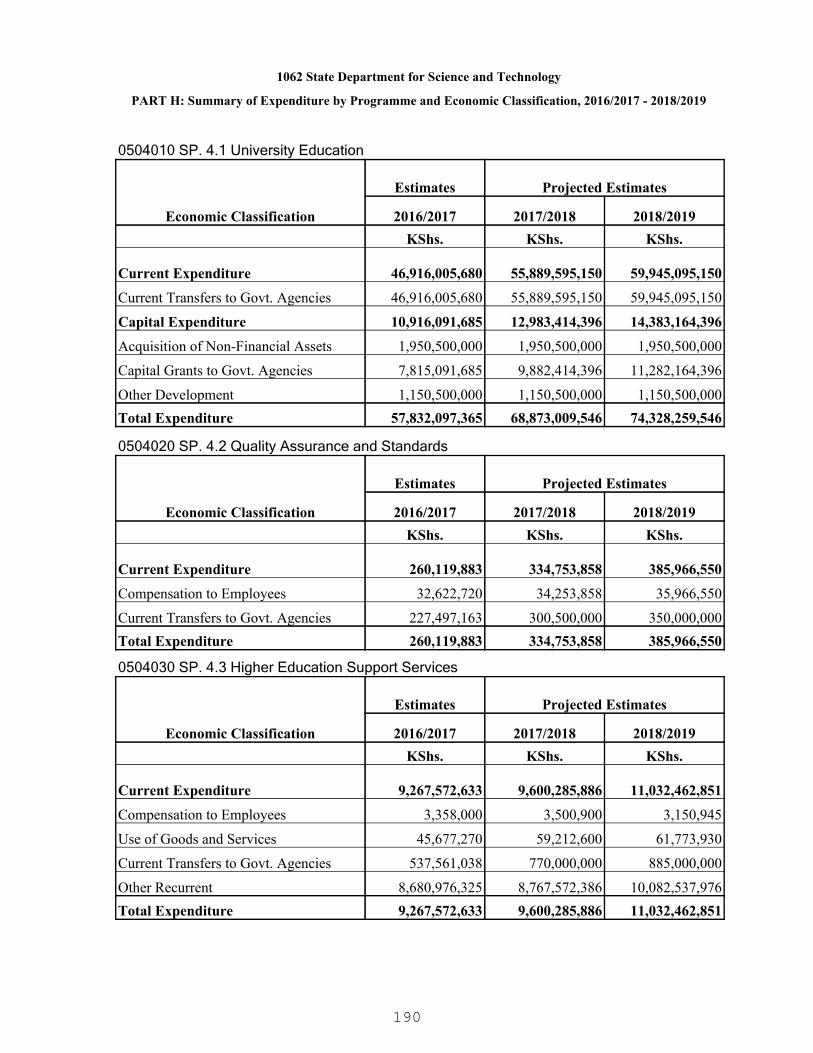
1062 State Department for Science and Technology
PART H: Summary of Expenditure by Programme and Economic Classification, 2016/2017 - 2018/2019
0504010 SP. 4.1 University Education
Economic Classification
Estimates Projected Estimates
2016/2017 2017/2018 2018/2019KShs. KShs. KShs.
Current Expenditure 46,916,005,680 55,889,595,150 59,945,095,150
Current Transfers to Govt. Agencies 46,916,005,680 55,889,595,150 59,945,095,150
Capital Expenditure 10,916,091,685 12,983,414,396 14,383,164,396
Acquisition of Non-Financial Assets 1,950,500,000 1,950,500,000 1,950,500,000
Capital Grants to Govt. Agencies 7,815,091,685 9,882,414,396 11,282,164,396
Other Development 1,150,500,000 1,150,500,000 1,150,500,000Total Expenditure 57,832,097,365 68,873,009,546 74,328,259,546
0504020 SP. 4.2 Quality Assurance and Standards
Economic Classification
Estimates Projected Estimates
2016/2017 2017/2018 2018/2019KShs. KShs. KShs.
Current Expenditure 260,119,883 334,753,858 385,966,550
Compensation to Employees 32,622,720 34,253,858 35,966,550
Current Transfers to Govt. Agencies 227,497,163 300,500,000 350,000,000Total Expenditure 260,119,883 334,753,858 385,966,550
0504030 SP. 4.3 Higher Education Support Services
Economic Classification
Estimates Projected Estimates
2016/2017 2017/2018 2018/2019KShs. KShs. KShs.
Current Expenditure 9,267,572,633 9,600,285,886 11,032,462,851
Compensation to Employees 3,358,000 3,500,900 3,150,945
Use of Goods and Services 45,677,270 59,212,600 61,773,930
Current Transfers to Govt. Agencies 537,561,038 770,000,000 885,000,000
Other Recurrent 8,680,976,325 8,767,572,386 10,082,537,976Total Expenditure 9,267,572,633 9,600,285,886 11,032,462,851
190
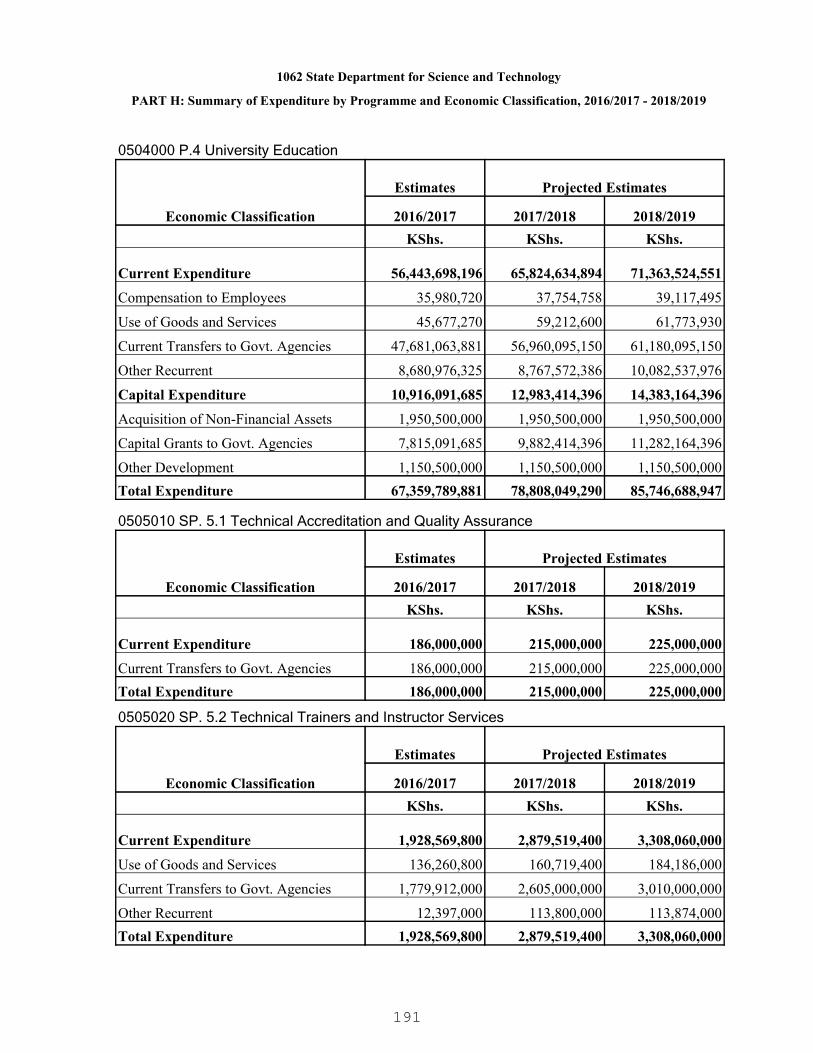
1062 State Department for Science and Technology
PART H: Summary of Expenditure by Programme and Economic Classification, 2016/2017 - 2018/2019
0504000 P.4 University Education
Economic Classification
Estimates Projected Estimates
2016/2017 2017/2018 2018/2019KShs. KShs. KShs.
Current Expenditure 56,443,698,196 65,824,634,894 71,363,524,551
Compensation to Employees 35,980,720 37,754,758 39,117,495
Use of Goods and Services 45,677,270 59,212,600 61,773,930
Current Transfers to Govt. Agencies 47,681,063,881 56,960,095,150 61,180,095,150
Other Recurrent 8,680,976,325 8,767,572,386 10,082,537,976
Capital Expenditure 10,916,091,685 12,983,414,396 14,383,164,396
Acquisition of Non-Financial Assets 1,950,500,000 1,950,500,000 1,950,500,000
Capital Grants to Govt. Agencies 7,815,091,685 9,882,414,396 11,282,164,396
Other Development 1,150,500,000 1,150,500,000 1,150,500,000Total Expenditure 67,359,789,881 78,808,049,290 85,746,688,947
0505010 SP. 5.1 Technical Accreditation and Quality Assurance
Economic Classification
Estimates Projected Estimates
2016/2017 2017/2018 2018/2019KShs. KShs. KShs.
Current Expenditure 186,000,000 215,000,000 225,000,000
Current Transfers to Govt. Agencies 186,000,000 215,000,000 225,000,000Total Expenditure 186,000,000 215,000,000 225,000,000
0505020 SP. 5.2 Technical Trainers and Instructor Services
Economic Classification
Estimates Projected Estimates
2016/2017 2017/2018 2018/2019KShs. KShs. KShs.
Current Expenditure 1,928,569,800 2,879,519,400 3,308,060,000
Use of Goods and Services 136,260,800 160,719,400 184,186,000
Current Transfers to Govt. Agencies 1,779,912,000 2,605,000,000 3,010,000,000
Other Recurrent 12,397,000 113,800,000 113,874,000Total Expenditure 1,928,569,800 2,879,519,400 3,308,060,000
191

1062 State Department for Science and Technology
PART H: Summary of Expenditure by Programme and Economic Classification, 2016/2017 - 2018/2019
0505030 SP. 5.3 Special Needs in Technical and Vocational Education
Economic Classification
Estimates Projected Estimates
2016/2017 2017/2018 2018/2019KShs. KShs. KShs.
Current Expenditure 160,451,052 126,000,000 140,000,000
Current Transfers to Govt. Agencies 160,451,052 126,000,000 140,000,000Total Expenditure 160,451,052 126,000,000 140,000,000
0505040 SP. 5.4 Infrastructure Development and Expansion
Economic Classification
Estimates Projected Estimates
2016/2017 2017/2018 2018/2019KShs. KShs. KShs.
Capital Expenditure 4,095,999,358 3,888,679,988 4,111,929,988
Acquisition of Non-Financial Assets 190,000,000 190,000,000 190,000,000
Capital Grants to Govt. Agencies 2,345,999,370 2,588,680,000 2,811,930,000
Other Development 1,559,999,988 1,109,999,988 1,109,999,988Total Expenditure 4,095,999,358 3,888,679,988 4,111,929,988
0505000 P.5 Technical Vocational Education and Training
Economic Classification
Estimates Projected Estimates
2016/2017 2017/2018 2018/2019KShs. KShs. KShs.
Current Expenditure 2,275,020,852 3,220,519,400 3,673,060,000
Use of Goods and Services 136,260,800 160,719,400 184,186,000
Current Transfers to Govt. Agencies 2,126,363,052 2,946,000,000 3,375,000,000
Other Recurrent 12,397,000 113,800,000 113,874,000
Capital Expenditure 4,095,999,358 3,888,679,988 4,111,929,988
Acquisition of Non-Financial Assets 190,000,000 190,000,000 190,000,000
Capital Grants to Govt. Agencies 2,345,999,370 2,588,680,000 2,811,930,000
Other Development 1,559,999,988 1,109,999,988 1,109,999,988Total Expenditure 6,371,020,210 7,109,199,388 7,784,989,988
192

1062 State Department for Science and Technology
PART H: Summary of Expenditure by Programme and Economic Classification, 2016/2017 - 2018/2019
0506010 SP. 6.1 Research Management and Development
Economic Classification
Estimates Projected Estimates
2016/2017 2017/2018 2018/2019KShs. KShs. KShs.
Current Expenditure 144,778,182 168,692,799 174,968,237
Compensation to Employees 52,870,282 55,513,799 58,008,237
Use of Goods and Services 71,907,900 82,749,000 83,430,000
Current Transfers to Govt. Agencies 20,000,000 25,000,000 27,000,000
Other Recurrent - 5,430,000 6,530,000
Capital Expenditure 28,003,341 150,000,000 100,000,000
Capital Grants to Govt. Agencies 28,003,341 150,000,000 100,000,000Total Expenditure 172,781,523 318,692,799 274,968,237
0506020 SP. 6.2 Knowledge and Innovation Development and Commercialization
Economic Classification
Estimates Projected Estimates
2016/2017 2017/2018 2018/2019KShs. KShs. KShs.
Current Expenditure 20,000,000 25,000,000 25,000,000
Current Transfers to Govt. Agencies 20,000,000 25,000,000 25,000,000Total Expenditure 20,000,000 25,000,000 25,000,000
0506030 SP. 6.3 Science and Technology Development and Promotion
Economic Classification
Estimates Projected Estimates
2016/2017 2017/2018 2018/2019KShs. KShs. KShs.
Current Expenditure 3,260,904,320 3,280,000,000 3,295,000,000
Current Transfers to Govt. Agencies 3,260,904,320 3,280,000,000 3,295,000,000Total Expenditure 3,260,904,320 3,280,000,000 3,295,000,000
0506000 P. 6 Research, Science, Technology and Innovation
Economic Classification
Estimates Projected Estimates
2016/2017 2017/2018 2018/2019
193

1062 State Department for Science and Technology
PART H: Summary of Expenditure by Programme and Economic Classification, 2016/2017 - 2018/2019
0506000 P. 6 Research, Science, Technology and Innovation
Economic Classification
Estimates Projected Estimates
2016/2017 2017/2018 2018/2019KShs. KShs. KShs.
Current Expenditure 3,425,682,502 3,473,692,799 3,494,968,237
Compensation to Employees 52,870,282 55,513,799 58,008,237
Use of Goods and Services 71,907,900 82,749,000 83,430,000
Current Transfers to Govt. Agencies 3,300,904,320 3,330,000,000 3,347,000,000
Other Recurrent - 5,430,000 6,530,000
Capital Expenditure 28,003,341 150,000,000 100,000,000
Capital Grants to Govt. Agencies 28,003,341 150,000,000 100,000,000Total Expenditure 3,453,685,843 3,623,692,799 3,594,968,237
0507010 SP. 7.1 Revitalization of Youth Polytechnics
Economic Classification
Estimates Projected Estimates
2016/2017 2017/2018 2018/2019KShs. KShs. KShs.
Capital Expenditure 105,000,000 - -
Acquisition of Non-Financial Assets 89,000,000 - -
Capital Grants to Govt. Agencies 10,000,000 - -
Other Development 6,000,000 - -Total Expenditure 105,000,000 - -
0507000 P.7 Youth Training and Development
Economic Classification
Estimates Projected Estimates
2016/2017 2017/2018 2018/2019KShs. KShs. KShs.
Capital Expenditure 105,000,000 - -
Acquisition of Non-Financial Assets 89,000,000 - -
Capital Grants to Govt. Agencies 10,000,000 - -
Other Development 6,000,000 - -Total Expenditure 105,000,000 - -
194

1071 The National Treasury
An institution of excellence in public financial management
To promote economic transformation for shared growth through formulation, implementationand monitoring of prudent economic and financial policies at both national and county levelsof government
PART A. Vision
PART B. Mission
PART C. Performance Overview and Background for Programme(s) Funding
The National Treasury's mandate includes the following: formulation, implementation andmonitoring of macro-economic policies involving expenditure and revenue; management ofthe level and composition of national public debt; national guarantees and other financialobligations of the National Government; formulation, evaluation and promotion of economicand financial policies; mobilization of domestic and external resources for financing Nationaland County Governments budgets; designing and prescribing an efficient financialmanagement system for the National and County Governments to ensure transparentfinancial management and standard financial reporting; in consultation with the Public SectorAccounting Standards Board, ensuring that uniform accounting standards are applied by theNational Government and its entities; development of policy for the establishment,management, operation and winding up of public funds; preparation of the annual Division ofRevenue Bill and County Allocation of Revenue Bill; strengthening financial and fiscalrelations between the National Government and County Governments and encouragingfinancial support for County Governments; assisting County Governments to develop theircapacity for efficient, effective and transparent financial management; and preparation of theNational Budget and both initiating action for and monitoring of the absorption and control ofapproved budgetary resources by Ministries, Departments and Agencies (MDAs).
During the 2012/13 – 2014/15 period, the National Treasury spent KSh.21.8 billion, KSh.22.2billion and KSh.29.3 billion in recurrent expenditures; and KSh.10.8 billion, Ksh.10.2 billionand KSh.19.8 billion in development expenditures in the Financial Years 2012/13, 2013/14and 2014/15 respectively.
Major achievements during the period include: operationalization of the Public FinanceManagement Act, 2012; roll-out of the Integrated Financial Management Information System(IFMIS) to all Counties, line ministries and Semi-Autonomous Government Agencies (SAGAs)under the National Treasury; development and publication of guidelines for an institutionalrisk management policy framework; roll-out of Teammate audit management software to allline ministries and completion of value for money audits in selected MDAs and foreignmissions; reduction of pension payment cycle-time through implementation of the PensionsManagement Information System (PMIS) and enactment of Pension Superannuation Schemelaw; implementation of the integrated tax management system for the improvement of revenue administration; enactment of Public Private Partnership law and approval by theCabinet of a pipeline of 69 projects; procurement and distribution of medical supplies in thefight against HIV/AIDS, Tuberculosis and Malaria worth KSh.8.8 billion; development andoperationalization of the Kenya National Electronic Single Window System to reduce delaysand costs in the processing of import and export documentation; operationalization of theUnclaimed Financial Assets Act, 2011 and creation of the Unclaimed Financial AssetsAuthority; completion of Phases 1 & II of the National Treasury’s Disaster Data Recovery
195

1071 The National Treasury
PART D. Programme Objectives
Centre; review of the Public Procurement and Asset Disposal (PPAD) Act and Regulationsand registration of applicants for access to Government procurement opportunities forwomen, the youth and persons with disabilities in 43 counties; establishment of the PublicSector Accounting Standards Board; construction of 3 and refurbishment of 26 National Sub-County Treasuries; launch of sovereign bond and receipt of proceeds worth USD 2 billion andreopening of bids for tap sale proceeds of USD750 million; and development and launch ofthe e-Citizen Portal.
The challenges encountered during implementation of the budget included the following: theimplementation of the Constitution, 2010 has resulted in pressure for the National Treasury toraise adequate resources to finance the structures and systems recommended for thedevolved system of Government; the implementation of Vision 2030 as reflected in its SecondMedium Term Plan (MTP II) requires a radical shift in expenditures from low to high priorityareas to ensure that resources are progressively realigned to meet desired developmentgoals; the participation of the National Assembly in budget preparation as prescribed by thePublic Finance Management Act, 2012 has led to Parliament’s reallocation of budgetaryresources despite the ramifications of its decisions for savings and investment; delays inbudget approval have affected the implementation of priority programmes by MDAs, resultingin frequent requests for revision of the budget; and the need for increased vigilance in thewake of the country’s security operations in Somalia and subsequent attacks by terrorists onhome soil coupled with efforts to quell crime have led to the increased allocation of resourcesto security interventions, denying other social programmes much needed funding.
In the period 2016/17 – 2018/19, the National Treasury will deliver on the following: increasethe value of tenders awarded to vulnerable groups, such as women, the youth and personswith disabilities by adherence to PPAD Act quotas; Improve the Kenya Revenue Authority’sinformation system security to decrease the number of incidences of data security breachesand restructure KRA to provide leadership in border control and security; review andimplement the superanuation schemes for the Armed Forces, Judiciary and Parliament;equip, certify and commission the Disaster Data Recovery Centre; undertake all bankablePublic Private Partnerships projects; oversee the production of public sector financialstatements under International Public Sector Accounting Standards; roll out IFMIS and e-procurement to all national sub-county Treasuries; develop and implement integratedunclaimed financial assets management information system; provide oversight role in theproduction of public sector financial statements under International Public Sector AccountingStandards; and roll out IFMIS e- procurement to all State-Owned Corporations.
ObjectiveProgramme
0717000 P1 : GeneralAdministration Planning andSupport Services
To enhance institutional and human resource capacity forquality delivery of services
196
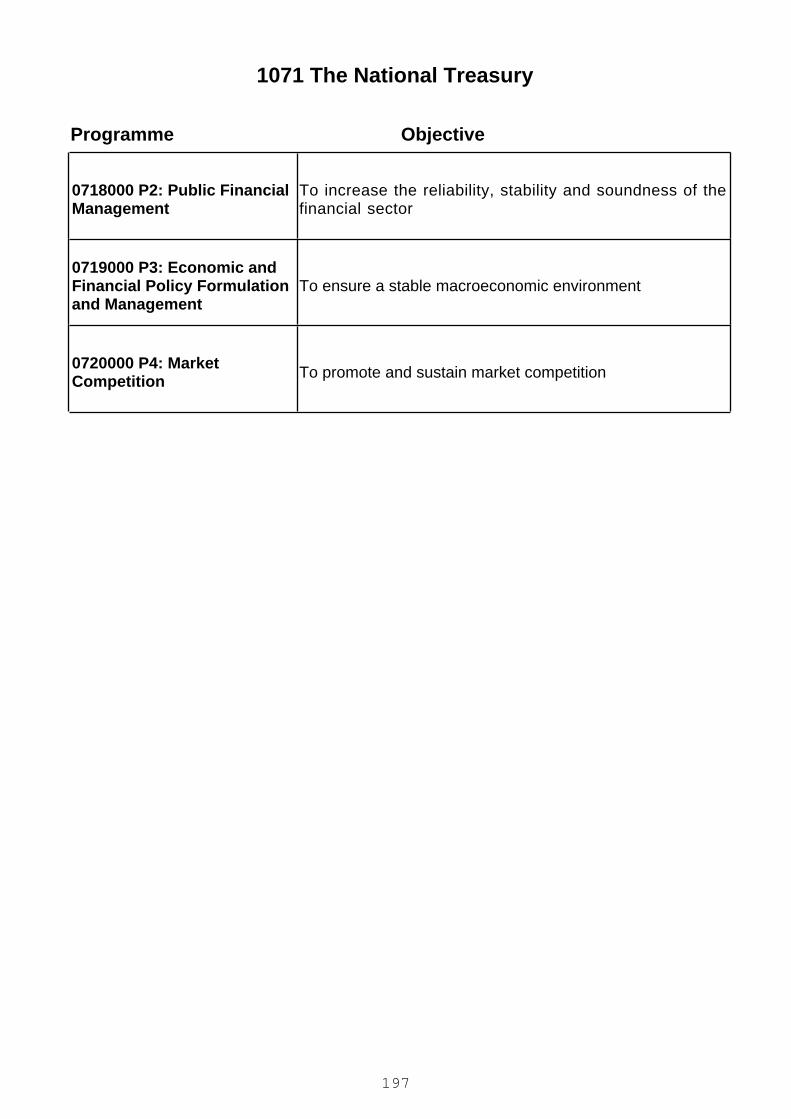
1071 The National Treasury
ObjectiveProgramme
0718000 P2: Public FinancialManagement
To increase the reliability, stability and soundness of thefinancial sector
0719000 P3: Economic andFinancial Policy Formulationand Management
To ensure a stable macroeconomic environment
0720000 P4: MarketCompetition To promote and sustain market competition
197
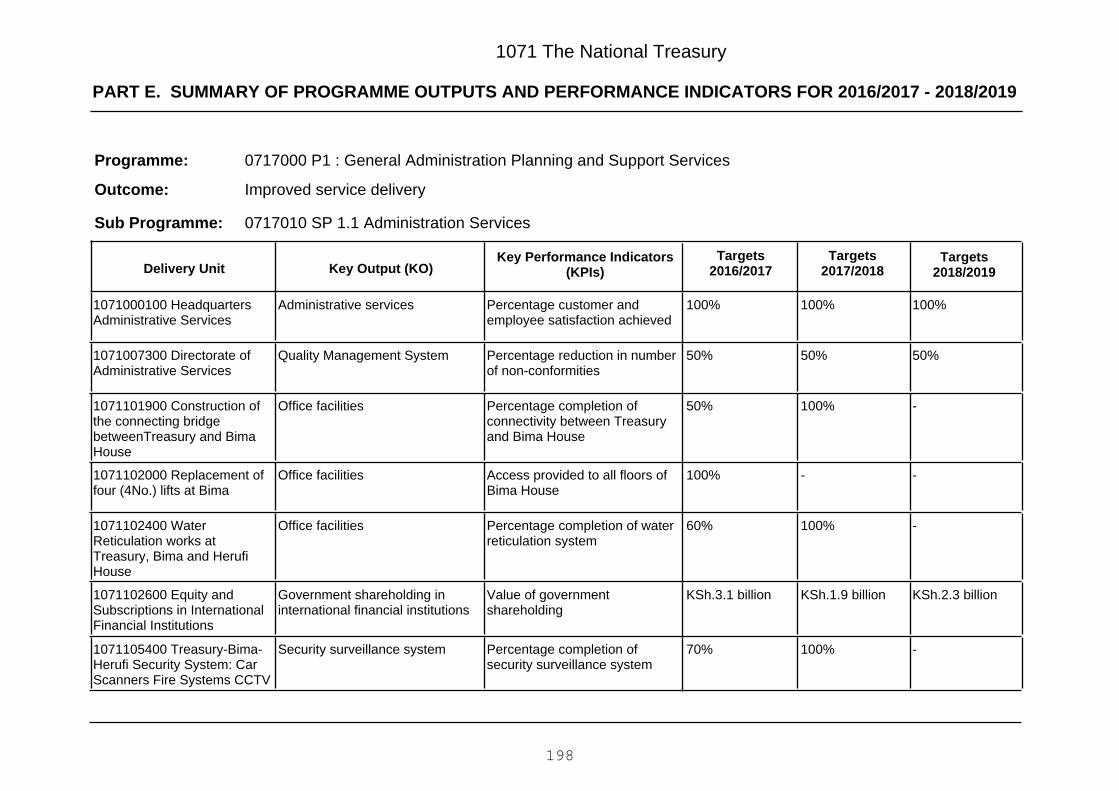
PART E. SUMMARY OF PROGRAMME OUTPUTS AND PERFORMANCE INDICATORS FOR 2016/2017 - 2018/2019
1071 The National Treasury
0717000 P1 : General Administration Planning and Support Services
Improved service delivery
Programme:
Outcome:
0717010 SP 1.1 Administration ServicesSub Programme:
Key Output (KO)Targets
2018/2019Targets
2017/2018Key Performance Indicators
(KPIs)Targets
2016/2017Delivery Unit
100%100%100%Percentage customer andemployee satisfaction achieved
Administrative services1071000100 HeadquartersAdministrative Services
50%50%50%Percentage reduction in numberof non-conformities
Quality Management System1071007300 Directorate ofAdministrative Services
-100%50%Percentage completion ofconnectivity between Treasuryand Bima House
Office facilities1071101900 Construction ofthe connecting bridgebetweenTreasury and BimaHouse
--100%Access provided to all floors ofBima House
Office facilities1071102000 Replacement offour (4No.) lifts at Bima
-100%60%Percentage completion of waterreticulation system
Office facilities1071102400 WaterReticulation works atTreasury, Bima and HerufiHouse
KSh.2.3 billionKSh.1.9 billionKSh.3.1 billionValue of governmentshareholding
Government shareholding ininternational financial institutions
1071102600 Equity andSubscriptions in InternationalFinancial Institutions
-100%70%Percentage completion ofsecurity surveillance system
Security surveillance system1071105400 Treasury-Bima-Herufi Security System: CarScanners Fire Systems CCTV
198
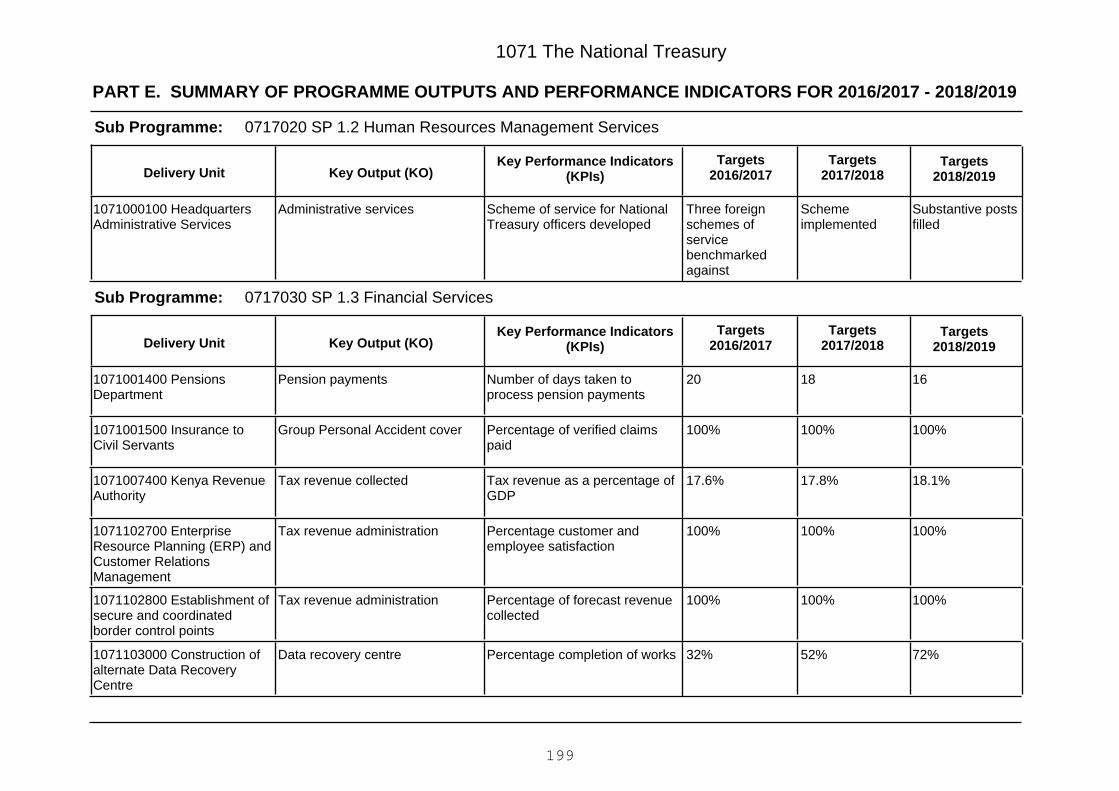
PART E. SUMMARY OF PROGRAMME OUTPUTS AND PERFORMANCE INDICATORS FOR 2016/2017 - 2018/2019
1071 The National Treasury
0717020 SP 1.2 Human Resources Management ServicesSub Programme:
Key Output (KO)Targets
2018/2019Targets
2017/2018Key Performance Indicators
(KPIs)Targets
2016/2017Delivery Unit
Substantive postsfilled
Schemeimplemented
Three foreignschemes ofservicebenchmarkedagainst
Scheme of service for NationalTreasury officers developed
Administrative services1071000100 HeadquartersAdministrative Services
0717030 SP 1.3 Financial ServicesSub Programme:
Key Output (KO)Targets
2018/2019Targets
2017/2018Key Performance Indicators
(KPIs)Targets
2016/2017Delivery Unit
161820Number of days taken toprocess pension payments
Pension payments1071001400 PensionsDepartment
100%100%100%Percentage of verified claimspaid
Group Personal Accident cover1071001500 Insurance toCivil Servants
18.1%17.8%17.6%Tax revenue as a percentage ofGDP
Tax revenue collected1071007400 Kenya RevenueAuthority
100%100%100%Percentage customer andemployee satisfaction
Tax revenue administration1071102700 EnterpriseResource Planning (ERP) andCustomer RelationsManagement
100%100%100%Percentage of forecast revenuecollected
Tax revenue administration1071102800 Establishment ofsecure and coordinatedborder control points
72%52%32%Percentage completion of worksData recovery centre1071103000 Construction ofalternate Data RecoveryCentre
199
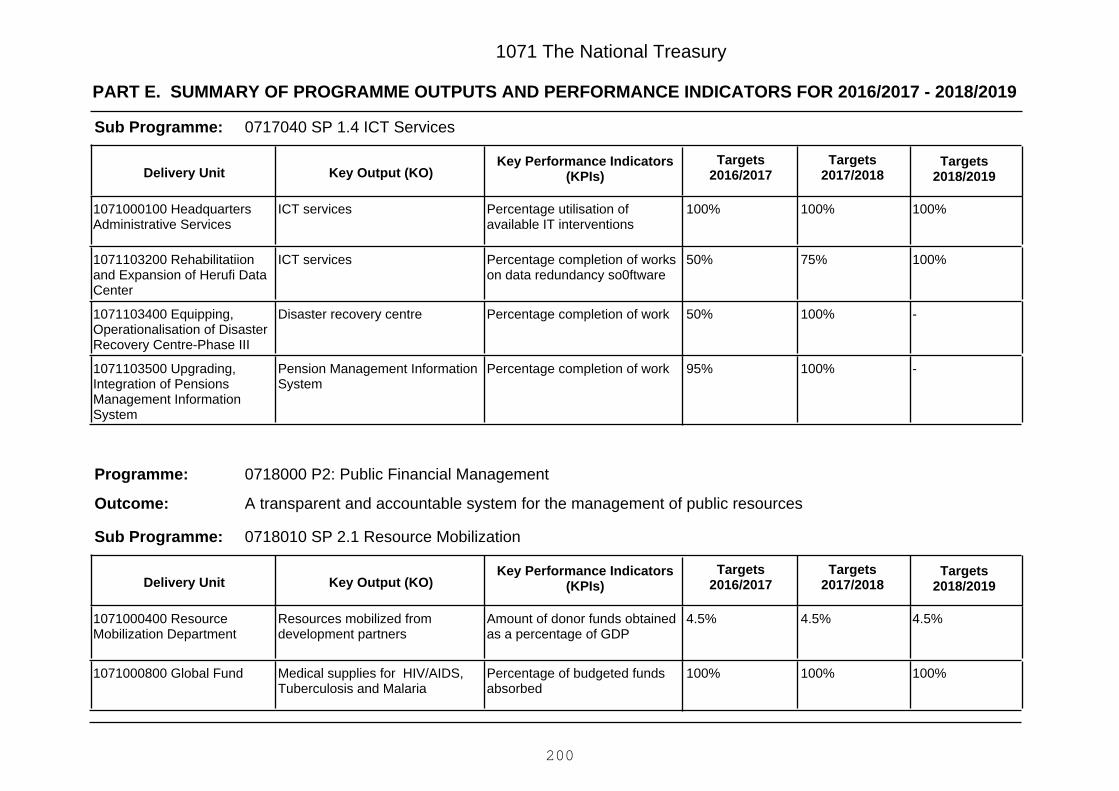
PART E. SUMMARY OF PROGRAMME OUTPUTS AND PERFORMANCE INDICATORS FOR 2016/2017 - 2018/2019
1071 The National Treasury
0717040 SP 1.4 ICT ServicesSub Programme:
Key Output (KO)Targets
2018/2019Targets
2017/2018Key Performance Indicators
(KPIs)Targets
2016/2017Delivery Unit
100%100%100%Percentage utilisation ofavailable IT interventions
ICT services1071000100 HeadquartersAdministrative Services
100%75%50%Percentage completion of workson data redundancy so0ftware
ICT services1071103200 Rehabilitatiionand Expansion of Herufi DataCenter
-100%50%Percentage completion of workDisaster recovery centre1071103400 Equipping,Operationalisation of DisasterRecovery Centre-Phase III
-100%95%Percentage completion of workPension Management InformationSystem
1071103500 Upgrading,Integration of PensionsManagement InformationSystem
0718000 P2: Public Financial Management
A transparent and accountable system for the management of public resources
Programme:
Outcome:
0718010 SP 2.1 Resource MobilizationSub Programme:
Key Output (KO)Targets
2018/2019Targets
2017/2018Key Performance Indicators
(KPIs)Targets
2016/2017Delivery Unit
4.5%4.5%4.5%Amount of donor funds obtainedas a percentage of GDP
Resources mobilized fromdevelopment partners
1071000400 ResourceMobilization Department
100%100%100%Percentage of budgeted fundsabsorbed
Medical supplies for HIV/AIDS,Tuberculosis and Malaria
1071000800 Global Fund
200
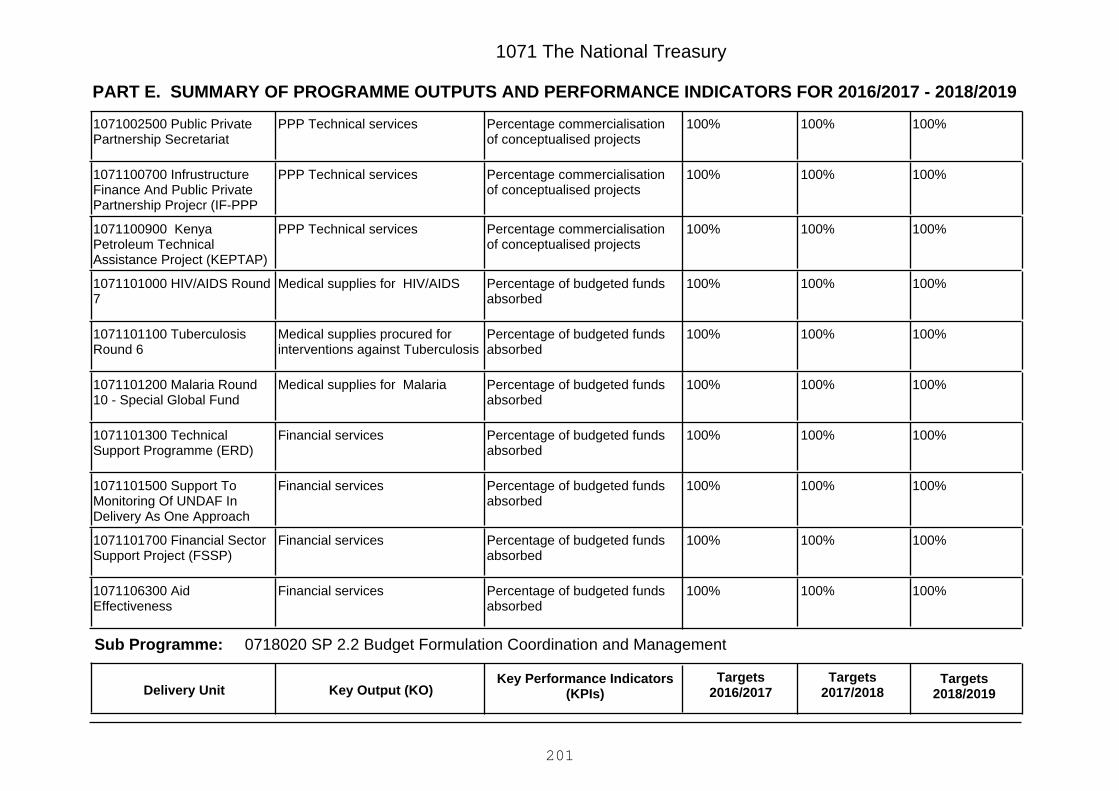
PART E. SUMMARY OF PROGRAMME OUTPUTS AND PERFORMANCE INDICATORS FOR 2016/2017 - 2018/2019
1071 The National Treasury
100%100%100%Percentage commercialisationof conceptualised projects
PPP Technical services1071002500 Public PrivatePartnership Secretariat
100%100%100%Percentage commercialisationof conceptualised projects
PPP Technical services1071100700 InfrustructureFinance And Public PrivatePartnership Projecr (IF-PPP
100%100%100%Percentage commercialisationof conceptualised projects
PPP Technical services1071100900 KenyaPetroleum TechnicalAssistance Project (KEPTAP)
100%100%100%Percentage of budgeted fundsabsorbed
Medical supplies for HIV/AIDS1071101000 HIV/AIDS Round7
100%100%100%Percentage of budgeted fundsabsorbed
Medical supplies procured forinterventions against Tuberculosis
1071101100 TuberculosisRound 6
100%100%100%Percentage of budgeted fundsabsorbed
Medical supplies for Malaria1071101200 Malaria Round10 - Special Global Fund
100%100%100%Percentage of budgeted fundsabsorbed
Financial services1071101300 TechnicalSupport Programme (ERD)
100%100%100%Percentage of budgeted fundsabsorbed
Financial services1071101500 Support ToMonitoring Of UNDAF InDelivery As One Approach
100%100%100%Percentage of budgeted fundsabsorbed
Financial services1071101700 Financial SectorSupport Project (FSSP)
100%100%100%Percentage of budgeted fundsabsorbed
Financial services1071106300 AidEffectiveness
0718020 SP 2.2 Budget Formulation Coordination and ManagementSub Programme:
Key Output (KO)Targets
2018/2019Targets
2017/2018Key Performance Indicators
(KPIs)Targets
2016/2017Delivery Unit
201

PART E. SUMMARY OF PROGRAMME OUTPUTS AND PERFORMANCE INDICATORS FOR 2016/2017 - 2018/2019
1071 The National Treasury
Budget presentedto Parliament by30th April, 2018
Budget presentedto Parliament by30th April, 2017
Budget presentedto Parliament by30th April, 2016
Budget presented to Parliamentby 30th April as required byConstitution
National Budget1071000200 BudgetarySupply Department
Budget presentedto Parliament by30th April, 2019
Budget presentedto Parliament by30th April, 2018
Budget presentedto Parliament by30th April, 2017
Fiscal policy aligned to nationaldevelopment priorities
National Budget1071008100 Directorate ofBudget, Fiscal & EconomicAffairs
100%100%100%Percentage of disasters andemergencies as funded by thecontingency fund
National Budget1071104400 ContingencyFund Transfers
100%100%100%Percentage of funds disbursedto equate marginalised counties'allocations with those of well-endowed counties
National Budget1071104500 EqualisationFund Transfers
0718030 SP 2.3 Audit ServicesSub Programme:
Key Output (KO)Targets
2018/2019Targets
2017/2018Key Performance Indicators
(KPIs)Targets
2016/2017Delivery Unit
565656Number of MDAs and foreignmissions in which VFMconducted
Audit services1071001000 Internal AuditDepartment
80%60%40%Percentage completion of worksSub county Treasuries officefacilities
1071103900 Construction ofSub-county Treasuries andInternal Audit Offices
0718040 SP 2.4 Accounting ServicesSub Programme:
Key Output (KO)Targets
2018/2019Targets
2017/2018Key Performance Indicators
(KPIs)Targets
2016/2017Delivery Unit
Accountssubmitted by 30thSeptember, 2018
Accountssubmitted by 30thSeptember, 2017
Accountssubmitted by 30thSeptember, 2016
Final Accounts submitted foraudit by 30th September
Accounting services1071001200 AccountingServices
202

PART E. SUMMARY OF PROGRAMME OUTPUTS AND PERFORMANCE INDICATORS FOR 2016/2017 - 2018/2019
1071 The National Treasury
100%100%100%Percentage of revenue collecteddisbursed and accounted for
Accounting services1071001300 GovernmentAccounting Services
101010Number of accounting reportsproduced
Accounting services1071001900 National Sub-County Treasuries - FieldServices
303030Number of parastatals to whiche-procurement rolled out
Integrated Financial ManagementInformation System
1071002100 FinancialManagement InformationServices
50%50%50%Percentage year-on-yearreduction in audit queries
Accounting standards1071008400 Directorate ofAccounting Services & QualityAssurance
80%60%40%Percentage of works completedSub County Treasuries officefacilities
1071103900 Construction ofSub-county Treasuries andInternal Audit Offices
100%100%100%Application support provided forIFMIS
Integrated Financial ManagementInformation System
1071104000 Renewal ofOracle Licenses, AnnualSupport for IFMIS Apps,Hardware
100%100%100%Capacity built for both IFMISend-users and super users
Integrated Financial ManagementInformation System
1071104100 Development,Implementation of IFMISAcademy and Oracle SOASuite
70%40%20%Percentage of work completedunder Data Recovery Centre
Integrated Financial ManagementInformation System
1071104300 Installation,Operational'n of DRCEquipment-Government DataCentre
100%75%50%Infrastructure for IFMISconnectivity in the countiesprovided
Integrated Financial ManagementInformation System
1071104800 Procurement ofcounty point to pointconnectivity for IFMIS system
565656No. of State Corporations on e-procurement
Integrated Financial ManagementInformation System
1071105100 Provision ofProcure to Pay - SystemIntegrator for Parastatals
203
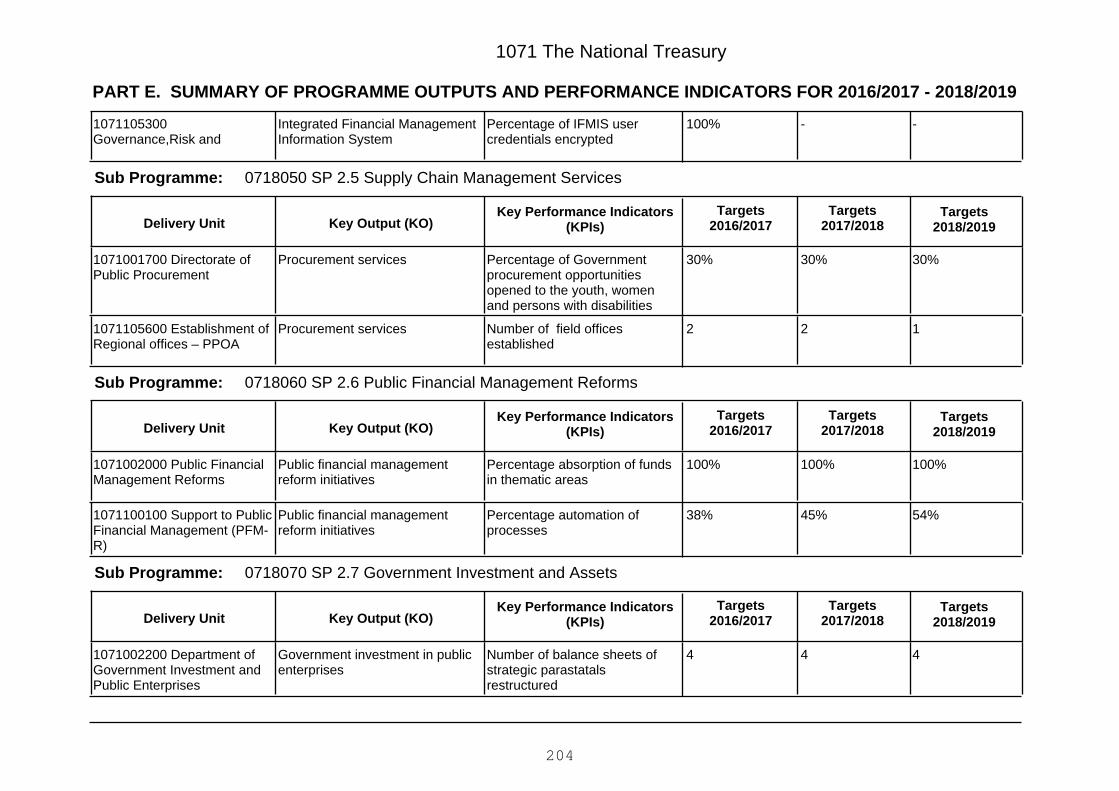
PART E. SUMMARY OF PROGRAMME OUTPUTS AND PERFORMANCE INDICATORS FOR 2016/2017 - 2018/2019
1071 The National Treasury
--100%Percentage of IFMIS usercredentials encrypted
Integrated Financial ManagementInformation System
1071105300Governance,Risk and
0718050 SP 2.5 Supply Chain Management ServicesSub Programme:
Key Output (KO)Targets
2018/2019Targets
2017/2018Key Performance Indicators
(KPIs)Targets
2016/2017Delivery Unit
30%30%30%Percentage of Governmentprocurement opportunitiesopened to the youth, womenand persons with disabilities
Procurement services1071001700 Directorate ofPublic Procurement
122Number of field officesestablished
Procurement services1071105600 Establishment ofRegional offices – PPOA
0718060 SP 2.6 Public Financial Management ReformsSub Programme:
Key Output (KO)Targets
2018/2019Targets
2017/2018Key Performance Indicators
(KPIs)Targets
2016/2017Delivery Unit
100%100%100%Percentage absorption of fundsin thematic areas
Public financial managementreform initiatives
1071002000 Public FinancialManagement Reforms
54%45%38%Percentage automation ofprocesses
Public financial managementreform initiatives
1071100100 Support to PublicFinancial Management (PFM-R)
0718070 SP 2.7 Government Investment and AssetsSub Programme:
Key Output (KO)Targets
2018/2019Targets
2017/2018Key Performance Indicators
(KPIs)Targets
2016/2017Delivery Unit
444Number of balance sheets ofstrategic parastatalsrestructured
Government investment in publicenterprises
1071002200 Department ofGovernment Investment andPublic Enterprises
204
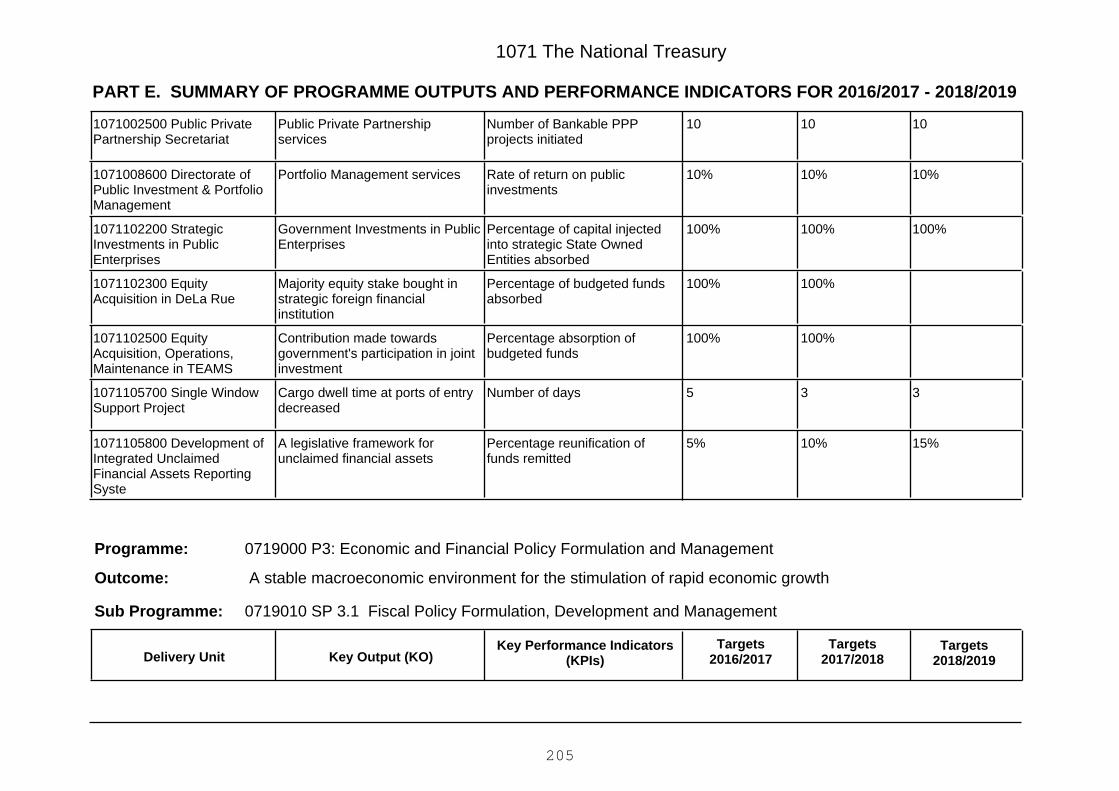
PART E. SUMMARY OF PROGRAMME OUTPUTS AND PERFORMANCE INDICATORS FOR 2016/2017 - 2018/2019
1071 The National Treasury
101010Number of Bankable PPPprojects initiated
Public Private Partnershipservices
1071002500 Public PrivatePartnership Secretariat
10%10%10%Rate of return on publicinvestments
Portfolio Management services1071008600 Directorate ofPublic Investment & PortfolioManagement
100%100%100%Percentage of capital injectedinto strategic State OwnedEntities absorbed
Government Investments in PublicEnterprises
1071102200 StrategicInvestments in PublicEnterprises
100%100%Percentage of budgeted fundsabsorbed
Majority equity stake bought instrategic foreign financialinstitution
1071102300 EquityAcquisition in DeLa Rue
100%100%Percentage absorption ofbudgeted funds
Contribution made towardsgovernment's participation in jointinvestment
1071102500 EquityAcquisition, Operations,Maintenance in TEAMS
335Number of daysCargo dwell time at ports of entrydecreased
1071105700 Single WindowSupport Project
15%10%5%Percentage reunification offunds remitted
A legislative framework forunclaimed financial assets
1071105800 Development ofIntegrated UnclaimedFinancial Assets ReportingSyste
0719000 P3: Economic and Financial Policy Formulation and Management
A stable macroeconomic environment for the stimulation of rapid economic growth
Programme:
Outcome:
0719010 SP 3.1 Fiscal Policy Formulation, Development and ManagementSub Programme:
Key Output (KO)Targets
2018/2019Targets
2017/2018Key Performance Indicators
(KPIs)Targets
2016/2017Delivery Unit
205
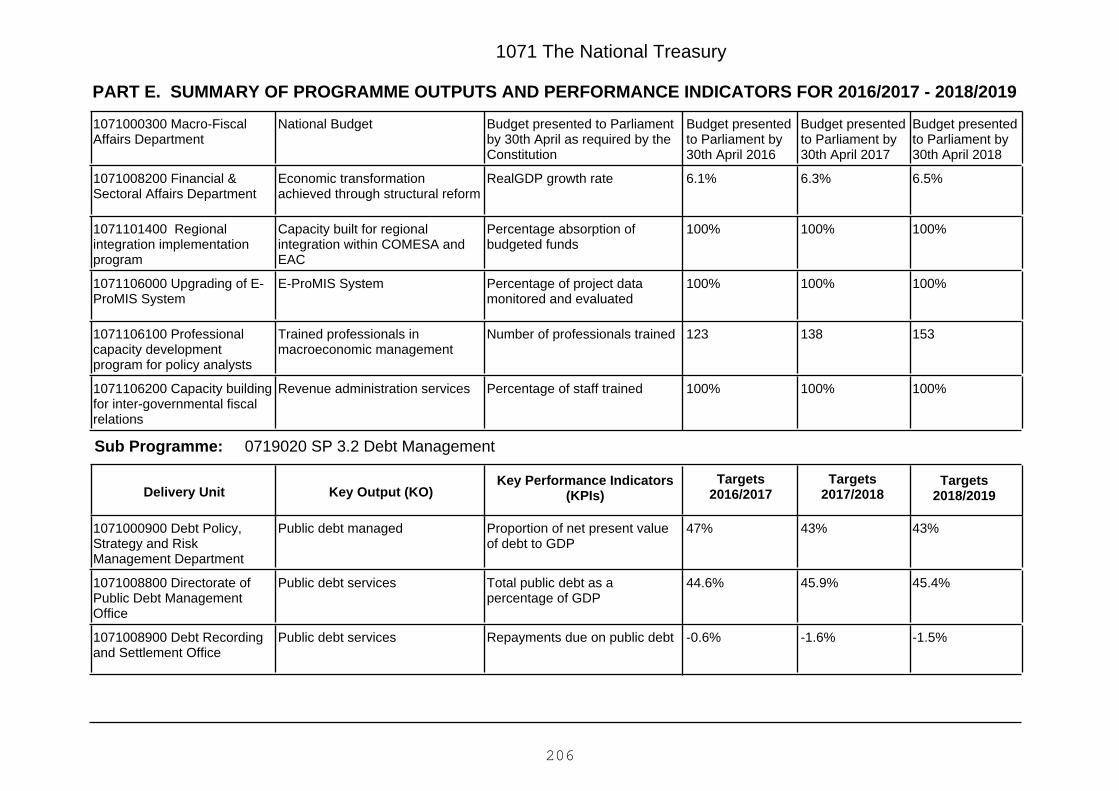
PART E. SUMMARY OF PROGRAMME OUTPUTS AND PERFORMANCE INDICATORS FOR 2016/2017 - 2018/2019
1071 The National Treasury
Budget presentedto Parliament by30th April 2018
Budget presentedto Parliament by30th April 2017
Budget presentedto Parliament by30th April 2016
Budget presented to Parliamentby 30th April as required by theConstitution
National Budget1071000300 Macro-FiscalAffairs Department
6.5%6.3%6.1%RealGDP growth rateEconomic transformationachieved through structural reform
1071008200 Financial &Sectoral Affairs Department
100%100%100%Percentage absorption ofbudgeted funds
Capacity built for regionalintegration within COMESA andEAC
1071101400 Regionalintegration implementationprogram
100%100%100%Percentage of project datamonitored and evaluated
E-ProMIS System1071106000 Upgrading of E-ProMIS System
153138123Number of professionals trainedTrained professionals inmacroeconomic management
1071106100 Professionalcapacity developmentprogram for policy analysts
100%100%100%Percentage of staff trainedRevenue administration services1071106200 Capacity buildingfor inter-governmental fiscalrelations
0719020 SP 3.2 Debt ManagementSub Programme:
Key Output (KO)Targets
2018/2019Targets
2017/2018Key Performance Indicators
(KPIs)Targets
2016/2017Delivery Unit
43%43%47%Proportion of net present valueof debt to GDP
Public debt managed1071000900 Debt Policy,Strategy and RiskManagement Department
45.4%45.9%44.6%Total public debt as apercentage of GDP
Public debt services1071008800 Directorate ofPublic Debt ManagementOffice
-1.5%-1.6%-0.6%Repayments due on public debtPublic debt services1071008900 Debt Recordingand Settlement Office
206
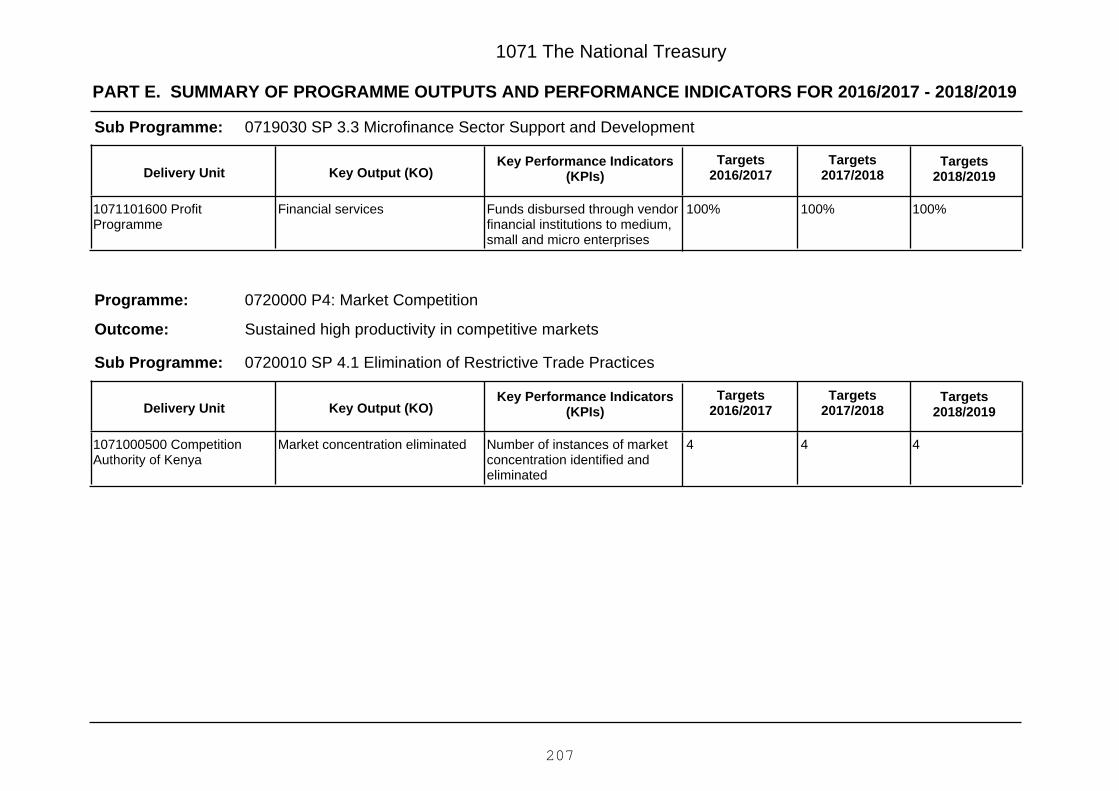
PART E. SUMMARY OF PROGRAMME OUTPUTS AND PERFORMANCE INDICATORS FOR 2016/2017 - 2018/2019
1071 The National Treasury
0719030 SP 3.3 Microfinance Sector Support and DevelopmentSub Programme:
Key Output (KO)Targets
2018/2019Targets
2017/2018Key Performance Indicators
(KPIs)Targets
2016/2017Delivery Unit
100%100%100%Funds disbursed through vendorfinancial institutions to medium,small and micro enterprises
Financial services1071101600 ProfitProgramme
0720000 P4: Market Competition
Sustained high productivity in competitive markets
Programme:
Outcome:
0720010 SP 4.1 Elimination of Restrictive Trade PracticesSub Programme:
Key Output (KO)Targets
2018/2019Targets
2017/2018Key Performance Indicators
(KPIs)Targets
2016/2017Delivery Unit
444Number of instances of marketconcentration identified andeliminated
Market concentration eliminated1071000500 CompetitionAuthority of Kenya
207
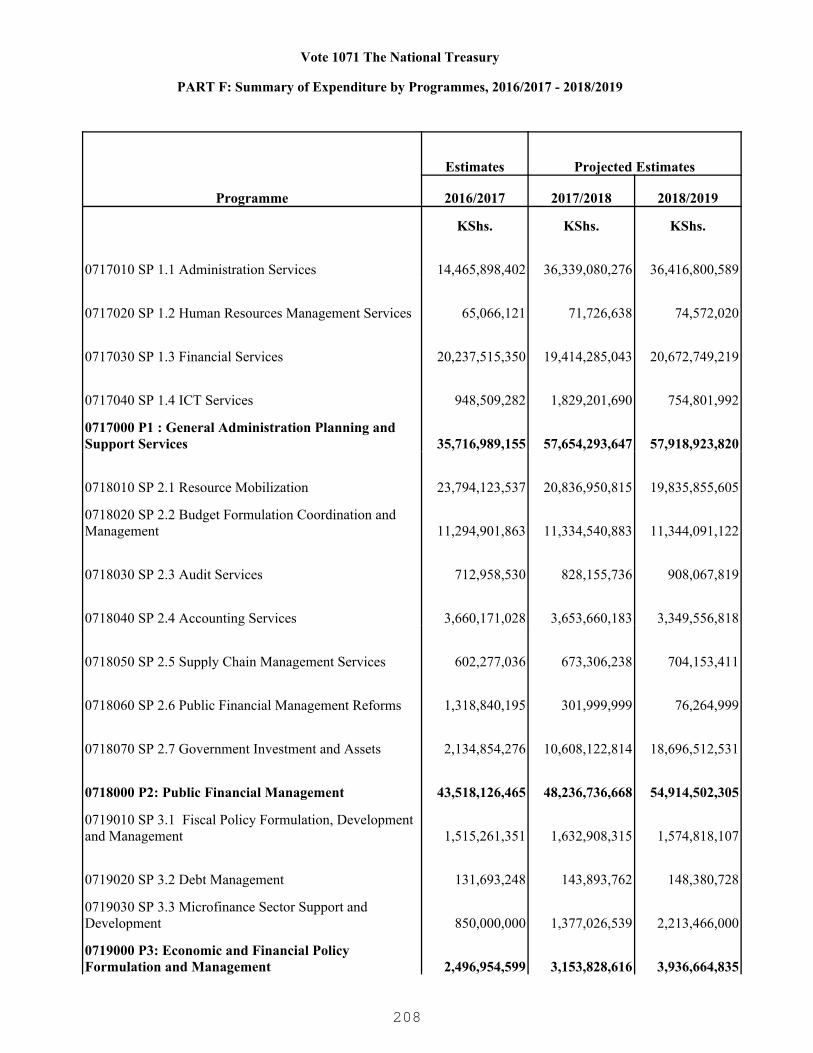
Vote 1071 The National Treasury
PART F: Summary of Expenditure by Programmes, 2016/2017 - 2018/2019
Programme
Estimates Projected Estimates
2016/2017 2017/2018 2018/2019
KShs. KShs. KShs.
0717010 SP 1.1 Administration Services 14,465,898,402 36,339,080,276 36,416,800,589
0717020 SP 1.2 Human Resources Management Services 65,066,121 71,726,638 74,572,020
0717030 SP 1.3 Financial Services 20,237,515,350 19,414,285,043 20,672,749,219
0717040 SP 1.4 ICT Services 948,509,282 1,829,201,690 754,801,992
0717000 P1 : General Administration Planning and Support Services 35,716,989,155 57,654,293,647 57,918,923,820
0718010 SP 2.1 Resource Mobilization 23,794,123,537 20,836,950,815 19,835,855,605
0718020 SP 2.2 Budget Formulation Coordination and Management 11,294,901,863 11,334,540,883 11,344,091,122
0718030 SP 2.3 Audit Services 712,958,530 828,155,736 908,067,819
0718040 SP 2.4 Accounting Services 3,660,171,028 3,653,660,183 3,349,556,818
0718050 SP 2.5 Supply Chain Management Services 602,277,036 673,306,238 704,153,411
0718060 SP 2.6 Public Financial Management Reforms 1,318,840,195 301,999,999 76,264,999
0718070 SP 2.7 Government Investment and Assets 2,134,854,276 10,608,122,814 18,696,512,531
0718000 P2: Public Financial Management 43,518,126,465 48,236,736,668 54,914,502,305
0719010 SP 3.1 Fiscal Policy Formulation, Development and Management 1,515,261,351 1,632,908,315 1,574,818,107
0719020 SP 3.2 Debt Management 131,693,248 143,893,762 148,380,728
0719030 SP 3.3 Microfinance Sector Support and Development 850,000,000 1,377,026,539 2,213,466,000
0719000 P3: Economic and Financial Policy Formulation and Management 2,496,954,599 3,153,828,616 3,936,664,835
208

Vote 1071 The National Treasury
PART F: Summary of Expenditure by Programmes, 2016/2017 - 2018/2019
Programme
Estimates Projected Estimates
2016/2017 2017/2018 2018/2019
0720010 SP 4.1 Elimination of Restrictive Trade Practices 340,000,000 455,000,000 555,000,000
0720000 P4: Market Competition 340,000,000 455,000,000 555,000,000Total Expenditure for Vote 1071 The National Treasury 82,072,070,219 109,499,858,931 117,325,090,960
209

1071 The National Treasury
PART G: Summary of Expenditure by Vote and Economic Classification, 2016/2017 - 2018/2019
Economic Classification
Estimates Projected Estimates
2016/2017 2017/2018 2018/2019KShs. KShs. KShs.
Current Expenditure 36,802,349,904 59,374,050,960 59,699,290,960
Compensation to Employees 2,530,110,000 21,963,600,000 22,016,010,000
Use of Goods and Services 12,486,053,019 15,044,378,756 15,069,601,576
Current Transfers to Govt. Agencies 18,181,690,961 18,191,700,961 18,425,700,961
Other Recurrent 3,604,495,924 4,174,371,243 4,187,978,423
Capital Expenditure 45,269,720,315 50,125,807,971 57,625,800,000
Acquisition of Non-Financial Assets 4,059,302,482 3,653,685,992 2,125,812,911
Capital Grants to Govt. Agencies 11,957,505,000 10,238,056,035 10,469,348,990
Other Development 29,252,912,833 36,234,065,944 45,030,638,099Total Expenditure 82,072,070,219 109,499,858,931 117,325,090,960
210

1071 The National Treasury
PART H: Summary of Expenditure by Programme and Economic Classification, 2016/2017 - 2018/2019
0717010 SP 1.1 Administration Services
Economic Classification
Estimates Projected Estimates
2016/2017 2017/2018 2018/2019KShs. KShs. KShs.
Current Expenditure 11,024,462,691 34,379,860,528 34,018,580,842
Compensation to Employees 228,688,557 19,578,534,000 19,543,954,030
Use of Goods and Services 8,549,269,759 12,026,914,923 11,673,671,047
Current Transfers to Govt. Agencies 238,056,005 261,861,605 288,047,765
Other Recurrent 2,008,448,370 2,512,550,000 2,512,908,000
Capital Expenditure 3,441,435,711 1,959,219,748 2,398,219,747
Acquisition of Non-Financial Assets 293,691,511 50,000,000 -
Other Development 3,147,744,200 1,909,219,748 2,398,219,747Total Expenditure 14,465,898,402 36,339,080,276 36,416,800,589
0717020 SP 1.2 Human Resources Management Services
Economic Classification
Estimates Projected Estimates
2016/2017 2017/2018 2018/2019KShs. KShs. KShs.
Current Expenditure 65,066,121 71,726,638 74,572,020
Compensation to Employees 47,237,443 49,126,938 51,092,020
Use of Goods and Services 16,508,678 19,849,700 20,580,000
Other Recurrent 1,320,000 2,750,000 2,900,000Total Expenditure 65,066,121 71,726,638 74,572,020
0717030 SP 1.3 Financial Services
Economic Classification
Estimates Projected Estimates
2016/2017 2017/2018 2018/2019KShs. KShs. KShs.
Current Expenditure 19,594,515,350 18,406,758,250 18,584,749,219
Compensation to Employees 239,007,002 244,752,195 250,727,198
Use of Goods and Services 2,049,142,323 1,102,560,322 1,165,958,341
Current Transfers to Govt. Agencies 15,806,008,761 15,559,070,606 15,667,669,796
211

1071 The National Treasury
PART H: Summary of Expenditure by Programme and Economic Classification, 2016/2017 - 2018/2019
0717030 SP 1.3 Financial Services
Economic Classification
Estimates Projected Estimates
2016/2017 2017/2018 2018/2019
Other Recurrent 1,500,357,264 1,500,375,127 1,500,393,884
Capital Expenditure 643,000,000 1,007,526,793 2,088,000,000
Capital Grants to Govt. Agencies 643,000,000 1,007,526,793 2,088,000,000Total Expenditure 20,237,515,350 19,414,285,043 20,672,749,219
0717040 SP 1.4 ICT Services
Economic Classification
Estimates Projected Estimates
2016/2017 2017/2018 2018/2019KShs. KShs. KShs.
Current Expenditure 89,763,161 100,948,231 104,801,992
Compensation to Employees 52,016,376 54,097,029 56,260,911
Use of Goods and Services 27,438,591 32,338,788 33,768,667
Other Recurrent 10,308,194 14,512,414 14,772,414
Capital Expenditure 858,746,121 1,728,253,459 650,000,000
Acquisition of Non-Financial Assets 858,746,121 1,728,253,459 650,000,000Total Expenditure 948,509,282 1,829,201,690 754,801,992
0717000 P1 : General Administration Planning and Support Services
Economic Classification
Estimates Projected Estimates
2016/2017 2017/2018 2018/2019KShs. KShs. KShs.
Current Expenditure 30,773,807,323 52,959,293,647 52,782,704,073
Compensation to Employees 566,949,378 19,926,510,162 19,902,034,159
Use of Goods and Services 10,642,359,351 13,181,663,733 12,893,978,055
Current Transfers to Govt. Agencies 16,044,064,766 15,820,932,211 15,955,717,561
Other Recurrent 3,520,433,828 4,030,187,541 4,030,974,298
Capital Expenditure 4,943,181,832 4,695,000,000 5,136,219,747
Acquisition of Non-Financial Assets 1,152,437,632 1,778,253,459 650,000,000
Capital Grants to Govt. Agencies 643,000,000 1,007,526,793 2,088,000,000
212

1071 The National Treasury
PART H: Summary of Expenditure by Programme and Economic Classification, 2016/2017 - 2018/2019
0717000 P1 : General Administration Planning and Support Services
Economic Classification
Estimates Projected Estimates
2016/2017 2017/2018 2018/2019
Other Development 3,147,744,200 1,909,219,748 2,398,219,747Total Expenditure 35,716,989,155 57,654,293,647 57,918,923,820
0718010 SP 2.1 Resource Mobilization
Economic Classification
Estimates Projected Estimates
2016/2017 2017/2018 2018/2019KShs. KShs. KShs.
Current Expenditure 630,303,223 277,706,596 285,031,099
Compensation to Employees 83,673,273 86,962,646 90,383,599
Use of Goods and Services 396,109,500 49,667,500 52,427,500
Current Transfers to Govt. Agencies 149,896,450 139,996,450 140,000,000
Other Recurrent 624,000 1,080,000 2,220,000
Capital Expenditure 23,163,820,314 20,559,244,219 19,550,824,506
Acquisition of Non-Financial Assets 2,035,286,681 1,325,432,532 595,812,910
Capital Grants to Govt. Agencies 3,414,605,000 2,340,800,000 1,965,819,748
Other Development 17,713,928,633 16,893,011,687 16,989,191,848Total Expenditure 23,794,123,537 20,836,950,815 19,835,855,605
0718020 SP 2.2 Budget Formulation Coordination and Management
Economic Classification
Estimates Projected Estimates
2016/2017 2017/2018 2018/2019KShs. KShs. KShs.
Current Expenditure 294,901,863 334,540,883 344,091,122
Compensation to Employees 85,591,813 88,783,383 92,102,622
Use of Goods and Services 191,710,050 215,432,500 220,898,500
Current Transfers to Govt. Agencies 4,400,000 4,500,000 4,600,000
Other Recurrent 13,200,000 25,825,000 26,490,000
Capital Expenditure 11,000,000,000 11,000,000,000 11,000,000,000
Capital Grants to Govt. Agencies 6,000,000,000 6,000,000,000 6,000,000,000
213
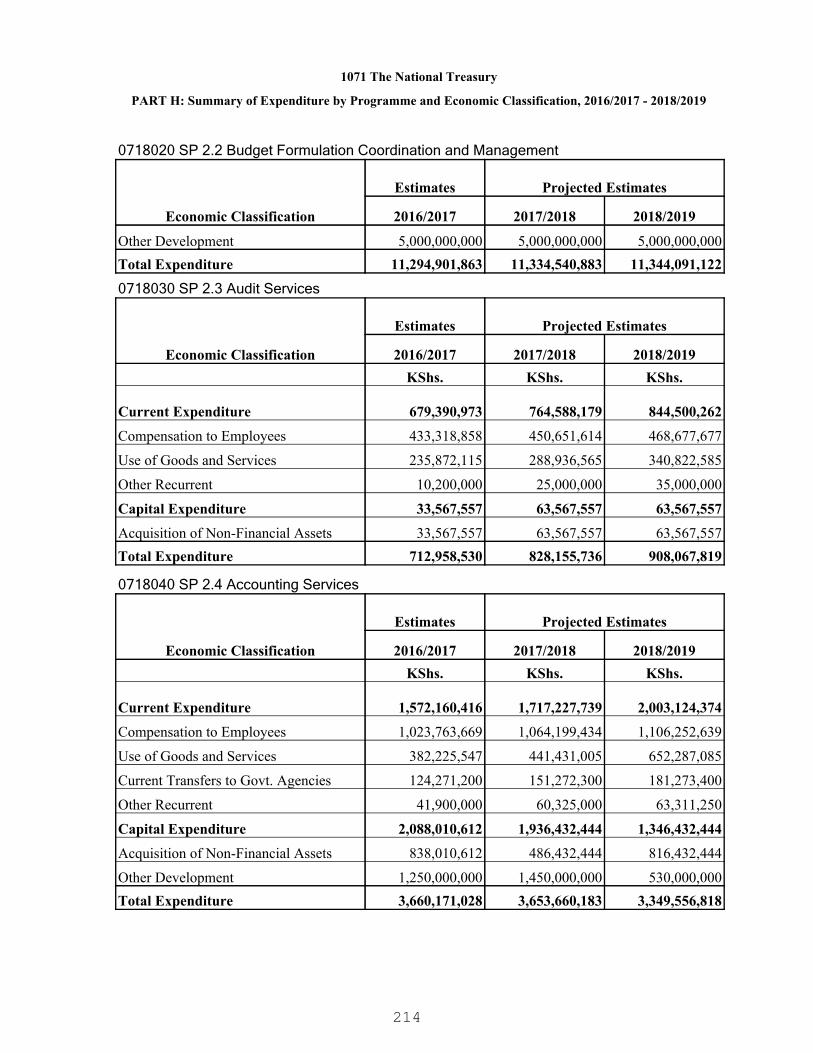
1071 The National Treasury
PART H: Summary of Expenditure by Programme and Economic Classification, 2016/2017 - 2018/2019
0718020 SP 2.2 Budget Formulation Coordination and Management
Economic Classification
Estimates Projected Estimates
2016/2017 2017/2018 2018/2019
Other Development 5,000,000,000 5,000,000,000 5,000,000,000Total Expenditure 11,294,901,863 11,334,540,883 11,344,091,122
0718030 SP 2.3 Audit Services
Economic Classification
Estimates Projected Estimates
2016/2017 2017/2018 2018/2019KShs. KShs. KShs.
Current Expenditure 679,390,973 764,588,179 844,500,262
Compensation to Employees 433,318,858 450,651,614 468,677,677
Use of Goods and Services 235,872,115 288,936,565 340,822,585
Other Recurrent 10,200,000 25,000,000 35,000,000
Capital Expenditure 33,567,557 63,567,557 63,567,557
Acquisition of Non-Financial Assets 33,567,557 63,567,557 63,567,557Total Expenditure 712,958,530 828,155,736 908,067,819
0718040 SP 2.4 Accounting Services
Economic Classification
Estimates Projected Estimates
2016/2017 2017/2018 2018/2019KShs. KShs. KShs.
Current Expenditure 1,572,160,416 1,717,227,739 2,003,124,374
Compensation to Employees 1,023,763,669 1,064,199,434 1,106,252,639
Use of Goods and Services 382,225,547 441,431,005 652,287,085
Current Transfers to Govt. Agencies 124,271,200 151,272,300 181,273,400
Other Recurrent 41,900,000 60,325,000 63,311,250
Capital Expenditure 2,088,010,612 1,936,432,444 1,346,432,444
Acquisition of Non-Financial Assets 838,010,612 486,432,444 816,432,444
Other Development 1,250,000,000 1,450,000,000 530,000,000Total Expenditure 3,660,171,028 3,653,660,183 3,349,556,818
214

1071 The National Treasury
PART H: Summary of Expenditure by Programme and Economic Classification, 2016/2017 - 2018/2019
0718050 SP 2.5 Supply Chain Management Services
Economic Classification
Estimates Projected Estimates
2016/2017 2017/2018 2018/2019KShs. KShs. KShs.
Current Expenditure 502,277,036 523,306,238 554,153,411
Compensation to Employees 65,365,363 67,880,139 70,495,506
Use of Goods and Services 46,911,673 55,426,099 63,657,905
Current Transfers to Govt. Agencies 390,000,000 400,000,000 420,000,000
Capital Expenditure 100,000,000 150,000,000 150,000,000
Capital Grants to Govt. Agencies 100,000,000 150,000,000 150,000,000Total Expenditure 602,277,036 673,306,238 704,153,411
0718060 SP 2.6 Public Financial Management Reforms
Economic Classification
Estimates Projected Estimates
2016/2017 2017/2018 2018/2019KShs. KShs. KShs.
Current Expenditure 40,140,195 56,199,999 40,464,999
Use of Goods and Services 31,002,099 44,446,297 32,002,124
Other Recurrent 9,138,096 11,753,702 8,462,875
Capital Expenditure 1,278,700,000 245,800,000 35,800,000
Capital Grants to Govt. Agencies 1,242,900,000 210,000,000 -
Other Development 35,800,000 35,800,000 35,800,000Total Expenditure 1,318,840,195 301,999,999 76,264,999
0718070 SP 2.7 Government Investment and Assets
Economic Classification
Estimates Projected Estimates
2016/2017 2017/2018 2018/2019KShs. KShs. KShs.
Current Expenditure 884,854,276 939,114,844 996,752,027
Compensation to Employees 86,725,015 89,727,737 92,850,565
Use of Goods and Services 66,729,261 72,787,107 77,751,462
Current Transfers to Govt. Agencies 729,000,000 772,200,000 821,310,000
215

1071 The National Treasury
PART H: Summary of Expenditure by Programme and Economic Classification, 2016/2017 - 2018/2019
0718070 SP 2.7 Government Investment and Assets
Economic Classification
Estimates Projected Estimates
2016/2017 2017/2018 2018/2019
Other Recurrent 2,400,000 4,400,000 4,840,000
Capital Expenditure 1,250,000,000 9,669,007,970 17,699,760,504
Capital Grants to Govt. Agencies 350,000,000 400,000,000 135,800,000
Other Development 900,000,000 9,269,007,970 17,563,960,504Total Expenditure 2,134,854,276 10,608,122,814 18,696,512,531
0718000 P2: Public Financial Management
Economic Classification
Estimates Projected Estimates
2016/2017 2017/2018 2018/2019KShs. KShs. KShs.
Current Expenditure 4,604,027,982 4,612,684,478 5,068,117,294
Compensation to Employees 1,778,437,991 1,848,204,953 1,920,762,608
Use of Goods and Services 1,350,560,245 1,168,127,073 1,439,847,161
Current Transfers to Govt. Agencies 1,397,567,650 1,467,968,750 1,567,183,400
Other Recurrent 77,462,096 128,383,702 140,324,125
Capital Expenditure 38,914,098,483 43,624,052,190 49,846,385,011
Acquisition of Non-Financial Assets 2,906,864,850 1,875,432,533 1,475,812,911
Capital Grants to Govt. Agencies 11,107,505,000 9,100,800,000 8,251,619,748
Other Development 24,899,728,633 32,647,819,657 40,118,952,352Total Expenditure 43,518,126,465 48,236,736,668 54,914,502,305
0719010 SP 3.1 Fiscal Policy Formulation, Development and Management
Economic Classification
Estimates Projected Estimates
2016/2017 2017/2018 2018/2019KShs. KShs. KShs.
Current Expenditure 952,821,351 1,258,179,073 1,200,088,865
Compensation to Employees 132,348,006 135,555,673 138,891,655
Use of Goods and Services 418,614,800 612,823,400 651,397,210
Current Transfers to Govt. Agencies 400,058,545 502,800,000 402,800,000
216
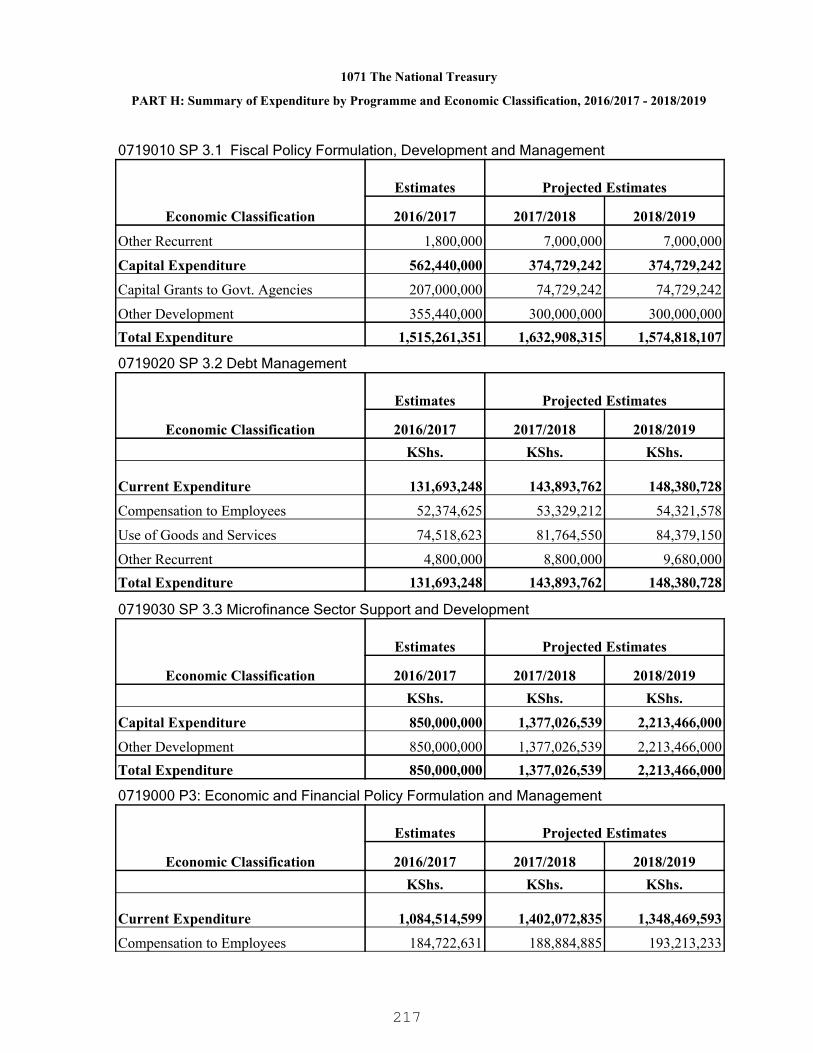
1071 The National Treasury
PART H: Summary of Expenditure by Programme and Economic Classification, 2016/2017 - 2018/2019
0719010 SP 3.1 Fiscal Policy Formulation, Development and Management
Economic Classification
Estimates Projected Estimates
2016/2017 2017/2018 2018/2019
Other Recurrent 1,800,000 7,000,000 7,000,000
Capital Expenditure 562,440,000 374,729,242 374,729,242
Capital Grants to Govt. Agencies 207,000,000 74,729,242 74,729,242
Other Development 355,440,000 300,000,000 300,000,000Total Expenditure 1,515,261,351 1,632,908,315 1,574,818,107
0719020 SP 3.2 Debt Management
Economic Classification
Estimates Projected Estimates
2016/2017 2017/2018 2018/2019KShs. KShs. KShs.
Current Expenditure 131,693,248 143,893,762 148,380,728
Compensation to Employees 52,374,625 53,329,212 54,321,578
Use of Goods and Services 74,518,623 81,764,550 84,379,150
Other Recurrent 4,800,000 8,800,000 9,680,000Total Expenditure 131,693,248 143,893,762 148,380,728
0719030 SP 3.3 Microfinance Sector Support and Development
Economic Classification
Estimates Projected Estimates
2016/2017 2017/2018 2018/2019KShs. KShs. KShs.
Capital Expenditure 850,000,000 1,377,026,539 2,213,466,000
Other Development 850,000,000 1,377,026,539 2,213,466,000Total Expenditure 850,000,000 1,377,026,539 2,213,466,000
0719000 P3: Economic and Financial Policy Formulation and Management
Economic Classification
Estimates Projected Estimates
2016/2017 2017/2018 2018/2019KShs. KShs. KShs.
Current Expenditure 1,084,514,599 1,402,072,835 1,348,469,593
Compensation to Employees 184,722,631 188,884,885 193,213,233
217

1071 The National Treasury
PART H: Summary of Expenditure by Programme and Economic Classification, 2016/2017 - 2018/2019
0719000 P3: Economic and Financial Policy Formulation and Management
Economic Classification
Estimates Projected Estimates
2016/2017 2017/2018 2018/2019
Use of Goods and Services 493,133,423 694,587,950 735,776,360
Current Transfers to Govt. Agencies 400,058,545 502,800,000 402,800,000
Other Recurrent 6,600,000 15,800,000 16,680,000
Capital Expenditure 1,412,440,000 1,751,755,781 2,588,195,242
Capital Grants to Govt. Agencies 207,000,000 74,729,242 74,729,242
Other Development 1,205,440,000 1,677,026,539 2,513,466,000Total Expenditure 2,496,954,599 3,153,828,616 3,936,664,835
0720010 SP 4.1 Elimination of Restrictive Trade Practices
Economic Classification
Estimates Projected Estimates
2016/2017 2017/2018 2018/2019KShs. KShs. KShs.
Current Expenditure 340,000,000 400,000,000 500,000,000
Current Transfers to Govt. Agencies 340,000,000 400,000,000 500,000,000
Capital Expenditure - 55,000,000 55,000,000
Capital Grants to Govt. Agencies - 55,000,000 55,000,000Total Expenditure 340,000,000 455,000,000 555,000,000
0720000 P4: Market Competition
Economic Classification
Estimates Projected Estimates
2016/2017 2017/2018 2018/2019KShs. KShs. KShs.
Current Expenditure 340,000,000 400,000,000 500,000,000
Current Transfers to Govt. Agencies 340,000,000 400,000,000 500,000,000
Capital Expenditure - 55,000,000 55,000,000
Capital Grants to Govt. Agencies - 55,000,000 55,000,000Total Expenditure 340,000,000 455,000,000 555,000,000
218

1081 Ministry of Health
A healthy, Productive and Globally competitive Nation
To build a Progressive, Responsive and sustainable health system for accelerated attainmentof the highest standard of health to all Kenyans
PART A. Vision
PART B. Mission
PART C. Performance Overview and Background for Programme(s) Funding
The Ministry's functions derived from Executive order No 2 of May 2013 and include Healthpolicy and regulations, National Referral Services, Capacity building and Technicalassistance to counties. To achieve its mandate the Ministry has programmed its activities into5 major Programmes namely Preventive, Promotive and Reproductive, Maternal, New born,Child, and Adolescent Health services (RMNCAH), National Referral and specializedservices, Health Research and Development, General administration and support servicesand Health policy, standards and regulations.
The budgetary allocation for the Ministry of health increased from Kshs 44.8 Billion in theFinancial Year 2014/15 to Kshs.59.2 billion in the Financial Year 2015/16. The increase ofKshs 14.4 Billion is attributed to increased Development partners funding and Governmentallocation in strategic health interventions e.g Free maternity, Hire of Medical equipment,Slum upgrading program and Universal health coverage.
The major achievements in the period under review include;Equipping 7 hospitals with stateof art diagnostic equipment under the Managed equipment services project that aims atequipping 98 hospitals across the country;The continued implementation of Free maternityservices in all public hospitals as well as the compensation of user fees that was removedfrom Health centers and dispensaries;National Hospital Insurance fund has increased its totalprincipal membership to 580,000 as at December 2015;The Ministry introduced the RotaVirus vaccine to protect children against severe diarrhea among infants and young children.
The challenges experienced during budget implementation include rising incidence of NonCommunicable Diseases, re-emergence of Neglected tropical diseases and inadequatbudgetary provision for medical commodities and technologies to match the country'sgrowing population.
The Financial Year 2016/2017 budget will give priority to the following interventions:Roll outof the specialized medical equipment project under the Managed Equipment Servicesframework (Theater,Dialysis,ICU and imaging equipment) in 98 public hospitalscountrywide.Provision of free maternity services by reimbursing deliveries in public healthfacilities which ensures that most deliveries are conducted under the care of skilled healthworkers;Improving the immunization coverage for children by rolling out the Kenya ExpandedProgram on Immunization (KEPI) and Increase access to specialized referral health services
219

1081 Ministry of Health
PART D. Programme Objectives
ObjectiveProgramme
0401000 P.1 Preventive,Promotive & RMNCAH
To increase access to quality promotive, preventive healthcare services and Reproductive, Maternal Newborn Childand Adolescent Health services (RMHCAH)
0402000 P.2 NationalReferral & SpecializedServices
To improve provision of quality specialized healthcareservices
0403000 P.3 Health Researchand Development
To increase knowledge through training, research anddevelopment in human health
0404000 P.4 GeneralAdministration, Planning &Support Services
To strengthen leadership, management and administrationof the health sector
0405000 P.5 Health Policy,Standards and Regulations
To strengthen health policy standards and regulations forattainment of health care services
220

PART E. SUMMARY OF PROGRAMME OUTPUTS AND PERFORMANCE INDICATORS FOR 2016/2017 - 2018/2019
1081 Ministry of Health
0401000 P.1 Preventive, Promotive & RMNCAH
Reduced morbidity and mortality due to preventable causes
Programme:
Outcome:
0401010 SP. 1.1 Health PromotionSub Programme:
Key Output (KO)Targets
2018/2019Targets
2017/2018Key Performance Indicators
(KPIs)Targets
2016/2017Delivery Unit
80%80%70%Proportion of children withsevere and moderatemalnutrition receiving treatment
Increased coverage formanagement of acute malnutrition
1081003200 Nutrition
474747No of Counties implementingthe Kenya Open defecation(ODF) free strategy
Environmental Health Services1081007800 EnvironmentalHealth Services
70%65%40%% of staff who have undergonecontinuous professionaldevelopment
Health Education Services1081008300 Health Education
80%80%70%Proportion of children withsevere and moderatemalnutrition receiving treatment
Increased coverage formanagement of acute malnutrition
1081103200 Nutrition
474747No of Counties implementingthe Kenya Open defecation(ODF) free strategy
Environmental Health1081103300 EnvironmentalHealth Services
250,000250,000250,000No of Vulnerable personsaffected by HIV/AIDS accessingNutritional feeds as prescription
Access to Nutritional supplementsby vulnerable persons affected byHIV/AIDs
1081103400 Food andNutrition Support forVulnerable PopulationsAffected by HIV
0401020 SP. 1.2 Non-communicable Disease Prevention & ControlSub Programme:
Key Output (KO)Targets
2018/2019Targets
2017/2018Key Performance Indicators
(KPIs)Targets
2016/2017Delivery Unit
221

PART E. SUMMARY OF PROGRAMME OUTPUTS AND PERFORMANCE INDICATORS FOR 2016/2017 - 2018/2019
1081 Ministry of Health
400,000400,000350,000No of Women of reproductiveage screened for CervicalCancer
Cancer prevention services1081000200 HeadquartersAdministrative Professionalservices
800080008000No of suspected MDR - TBpatients screened
Public health lab services1081008400 National PublicHealth Laboratory Services
800080008000No of suspected MDR - TBpatients screened
Public health lab services1081102100 East AfricaPublic Laboratory NetworkingProject
0401040 SP. 1.4 Radiation ProtectionSub Programme:
Key Output (KO)Targets
2018/2019Targets
2017/2018Key Performance Indicators
(KPIs)Targets
2016/2017Delivery Unit
100%100%100%% of Radiation sourcesmonitored for safety
Radioactive waste management1081000100 HeadquartersAdministrative and TechnicalServices
100%100%100%% of Radiation sourcesmonitored for safety
Radioactive waste management1081010400 RadiationProtection Board
100%100%100%% of Radiation sourcesmonitored for safety
Radioactive waste management1081104200 Construct aRadioactive WasteManagement Facility(CRWFP) - Ololua
0401050 SP. 1.5 Communicable Disease ControlSub Programme:
Key Output (KO)Targets
2018/2019Targets
2017/2018Key Performance Indicators
(KPIs)Targets
2016/2017Delivery Unit
443Per capita outpatient utilizationrate
Health services1081000100 HeadquartersAdministrative and TechnicalServices
444No of quarterly meetings heldcoordinated G.F activities1081000500 KenyaCoordinating Mechanism forGlobal Fund (KCM-GF)
222
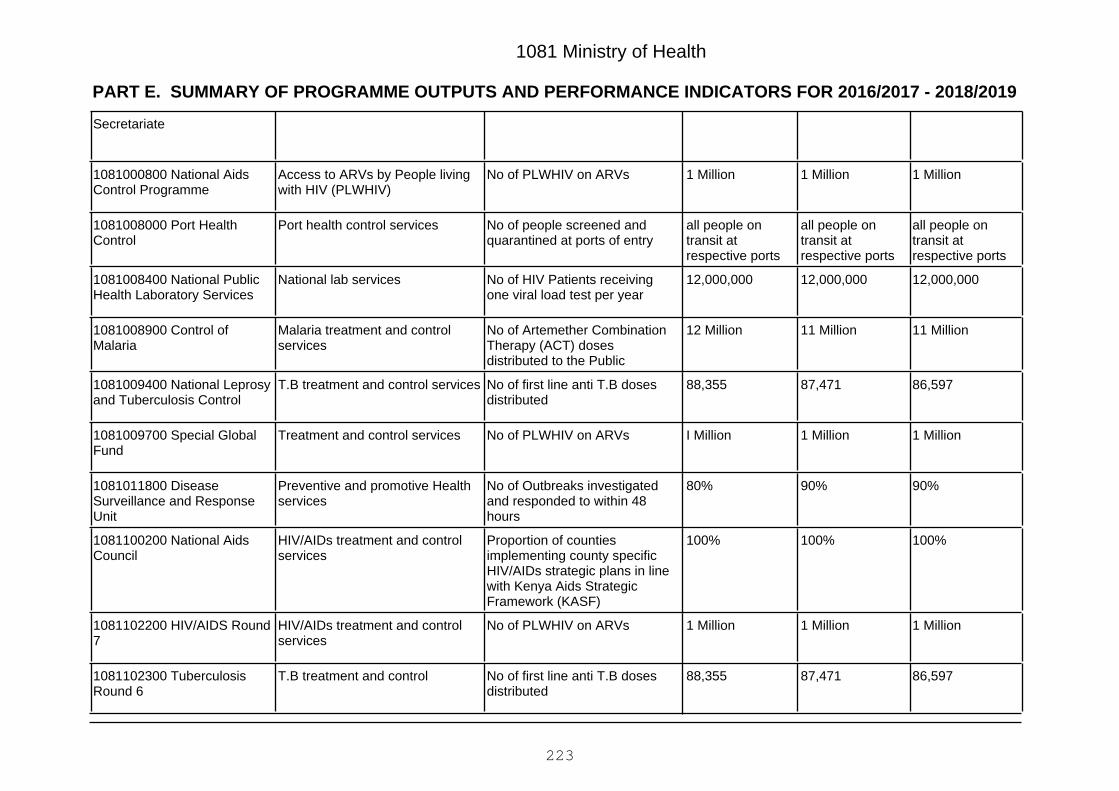
PART E. SUMMARY OF PROGRAMME OUTPUTS AND PERFORMANCE INDICATORS FOR 2016/2017 - 2018/2019
1081 Ministry of Health
Secretariate
1 Million1 Million1 MillionNo of PLWHIV on ARVsAccess to ARVs by People livingwith HIV (PLWHIV)
1081000800 National AidsControl Programme
all people ontransit atrespective ports
all people ontransit atrespective ports
all people ontransit atrespective ports
No of people screened andquarantined at ports of entry
Port health control services1081008000 Port HealthControl
12,000,00012,000,00012,000,000No of HIV Patients receivingone viral load test per year
National lab services1081008400 National PublicHealth Laboratory Services
11 Million11 Million12 MillionNo of Artemether CombinationTherapy (ACT) dosesdistributed to the Public
Malaria treatment and controlservices
1081008900 Control ofMalaria
86,59787,47188,355No of first line anti T.B dosesdistributed
T.B treatment and control services1081009400 National Leprosyand Tuberculosis Control
1 Million1 MillionI MillionNo of PLWHIV on ARVsTreatment and control services1081009700 Special GlobalFund
90%90%80%No of Outbreaks investigatedand responded to within 48hours
Preventive and promotive Healthservices
1081011800 DiseaseSurveillance and ResponseUnit
100%100%100%Proportion of countiesimplementing county specificHIV/AIDs strategic plans in linewith Kenya Aids StrategicFramework (KASF)
HIV/AIDs treatment and controlservices
1081100200 National AidsCouncil
1 Million1 Million1 MillionNo of PLWHIV on ARVsHIV/AIDs treatment and controlservices
1081102200 HIV/AIDS Round7
86,59787,47188,355No of first line anti T.B dosesdistributed
T.B treatment and control1081102300 TuberculosisRound 6
223

PART E. SUMMARY OF PROGRAMME OUTPUTS AND PERFORMANCE INDICATORS FOR 2016/2017 - 2018/2019
1081 Ministry of Health
11 Million11 Million12 MillionNo of Artemether CombinationTherapy (ACT) dosesdistributed to the Public
Malaria treatment and controlservices
1081102400 Malaria Round10 - Special Global Fund
100%100%100%Proportion of countiesimplementing county specificHIV/AIDs strategic plans in linewith Kenya Aids StrategicFramework (KASF)
HIV/AIDs treatment and controlservices
1081102900 National AidsControl Council
86,59787,47188,355No of first line anti T.B dosesdistributed
T.B treatment and control1081105200 Procurement ofAnti TB Drugs Not coveredunder Global fund TB progra
100%100%100%Proportion of countiesimplementing county specificHIV/AIDs strategic plans in linewith Kenya Aids StrategicFramework (KASF)
HIV/AIDs treatment and controlservices
1081107500 Situation Roomfor Real Time Data &Information on HIV & AIDS -MTRH
0402000 P.2 National Referral & Specialized Services
Quality specialized health services
Programme:
Outcome:
0402010 SP. 2.1 National Referral ServicesSub Programme:
Key Output (KO)Targets
2018/2019Targets
2017/2018Key Performance Indicators
(KPIs)Targets
2016/2017Delivery Unit
15,00015,00015,000No of patients receiving Mentalhealth services
Mental health services1081001800 Mathari NationalTeaching and ReferralHospital
250250250No of patients receiving Spinalhealth services
Spinal health services1081002000 Spinal InjuryHospital
224

PART E. SUMMARY OF PROGRAMME OUTPUTS AND PERFORMANCE INDICATORS FOR 2016/2017 - 2018/2019
1081 Ministry of Health
10.3
179
10.3
179
11.7
172
ALOS for Trauma patients
No of Open heart surgeries
Specialized National Referralhealth services
1081005900 KenyattaNational Hospital
36
3780
36
3780
36
3780
No of renal transplants done
No of minimally invasivesurgeries done
Specialized National Referralhealth services
1081006000 Moi Referral andTeaching Hospital
N/A11Functional referral hospitalSpecialized National Referralhealth services
1081101600 Wajir DistrictHospital
10.3
179
10.3
179
11.7
172
ALOS for Trauma patients
No of Open heart surgeries
Specialized National Referralhealth services
1081101700 KenyattaNational Hospital
36
3780
36
3780
36
3780
No of renal transplants done
No of minimally invasivesurgeries done
Specialized National Referralhealth services
1081101900 Moi Teachingand Referral Hospital :Academic Model ProvidingAccess
10.3
179
10.3
179
11.7
172
ALOS for Trauma patients
No of Open heart surgeries
Specialized National Referralhealth services
1081102600 KenyattaNational Hospital
10.3
179
10.3
179
11.7
172
ALOS for Trauma patients
No of Open heart surgeries
Specialized National Referralhealth services
1081102800 KenyattaNational Hospital
225
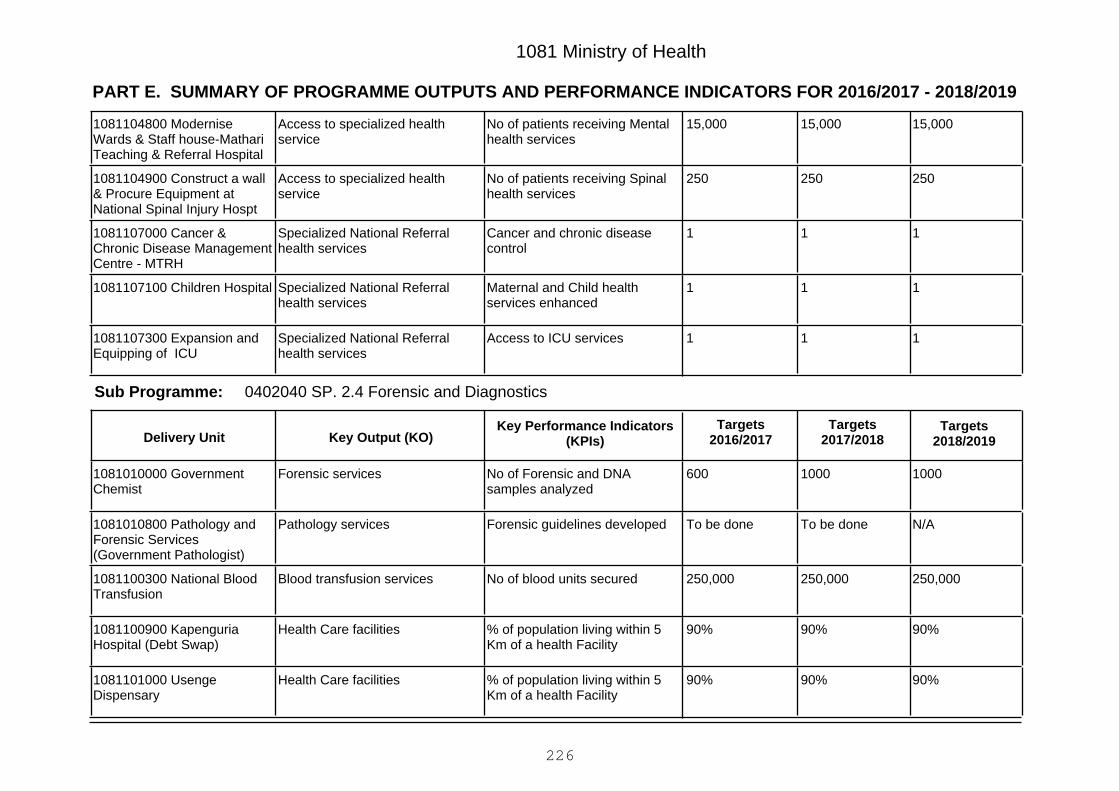
PART E. SUMMARY OF PROGRAMME OUTPUTS AND PERFORMANCE INDICATORS FOR 2016/2017 - 2018/2019
1081 Ministry of Health
15,00015,00015,000No of patients receiving Mentalhealth services
Access to specialized healthservice
1081104800 ModerniseWards & Staff house-MathariTeaching & Referral Hospital
250250250No of patients receiving Spinalhealth services
Access to specialized healthservice
1081104900 Construct a wall& Procure Equipment atNational Spinal Injury Hospt
111Cancer and chronic diseasecontrol
Specialized National Referralhealth services
1081107000 Cancer &Chronic Disease ManagementCentre - MTRH
111Maternal and Child healthservices enhanced
Specialized National Referralhealth services
1081107100 Children Hospital
111Access to ICU servicesSpecialized National Referralhealth services
1081107300 Expansion andEquipping of ICU
0402040 SP. 2.4 Forensic and DiagnosticsSub Programme:
Key Output (KO)Targets
2018/2019Targets
2017/2018Key Performance Indicators
(KPIs)Targets
2016/2017Delivery Unit
10001000600No of Forensic and DNAsamples analyzed
Forensic services1081010000 GovernmentChemist
N/ATo be doneTo be doneForensic guidelines developedPathology services1081010800 Pathology andForensic Services(Government Pathologist)
250,000250,000250,000No of blood units securedBlood transfusion services1081100300 National BloodTransfusion
90%90%90%% of population living within 5Km of a health Facility
Health Care facilities1081100900 KapenguriaHospital (Debt Swap)
90%90%90%% of population living within 5Km of a health Facility
Health Care facilities1081101000 UsengeDispensary
226
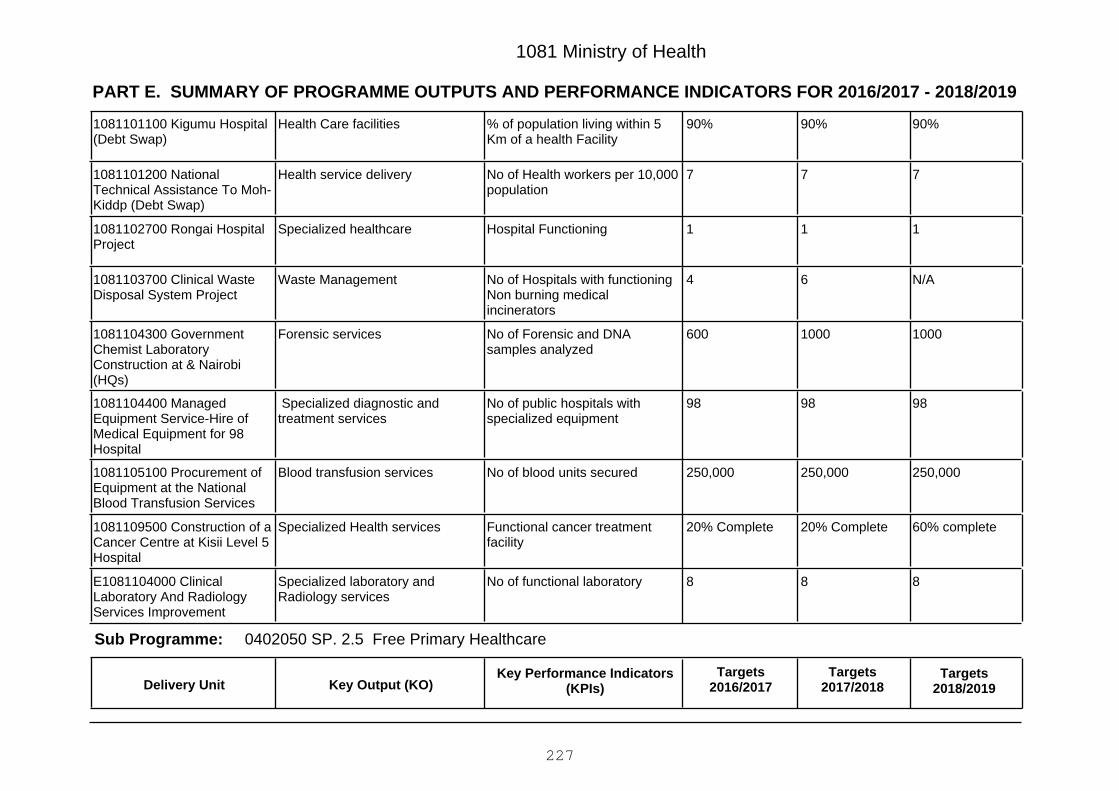
PART E. SUMMARY OF PROGRAMME OUTPUTS AND PERFORMANCE INDICATORS FOR 2016/2017 - 2018/2019
1081 Ministry of Health
90%90%90%% of population living within 5Km of a health Facility
Health Care facilities1081101100 Kigumu Hospital(Debt Swap)
777No of Health workers per 10,000population
Health service delivery1081101200 NationalTechnical Assistance To Moh-Kiddp (Debt Swap)
111Hospital FunctioningSpecialized healthcare1081102700 Rongai HospitalProject
N/A64No of Hospitals with functioningNon burning medicalincinerators
Waste Management1081103700 Clinical WasteDisposal System Project
10001000600No of Forensic and DNAsamples analyzed
Forensic services1081104300 GovernmentChemist LaboratoryConstruction at & Nairobi(HQs)
989898No of public hospitals withspecialized equipment
Specialized diagnostic andtreatment services
1081104400 ManagedEquipment Service-Hire ofMedical Equipment for 98Hospital
250,000250,000250,000No of blood units securedBlood transfusion services1081105100 Procurement ofEquipment at the NationalBlood Transfusion Services
60% complete20% Complete20% CompleteFunctional cancer treatmentfacility
Specialized Health services1081109500 Construction of aCancer Centre at Kisii Level 5Hospital
888No of functional laboratorySpecialized laboratory andRadiology services
E1081104000 ClinicalLaboratory And RadiologyServices Improvement
0402050 SP. 2.5 Free Primary HealthcareSub Programme:
Key Output (KO)Targets
2018/2019Targets
2017/2018Key Performance Indicators
(KPIs)Targets
2016/2017Delivery Unit
227
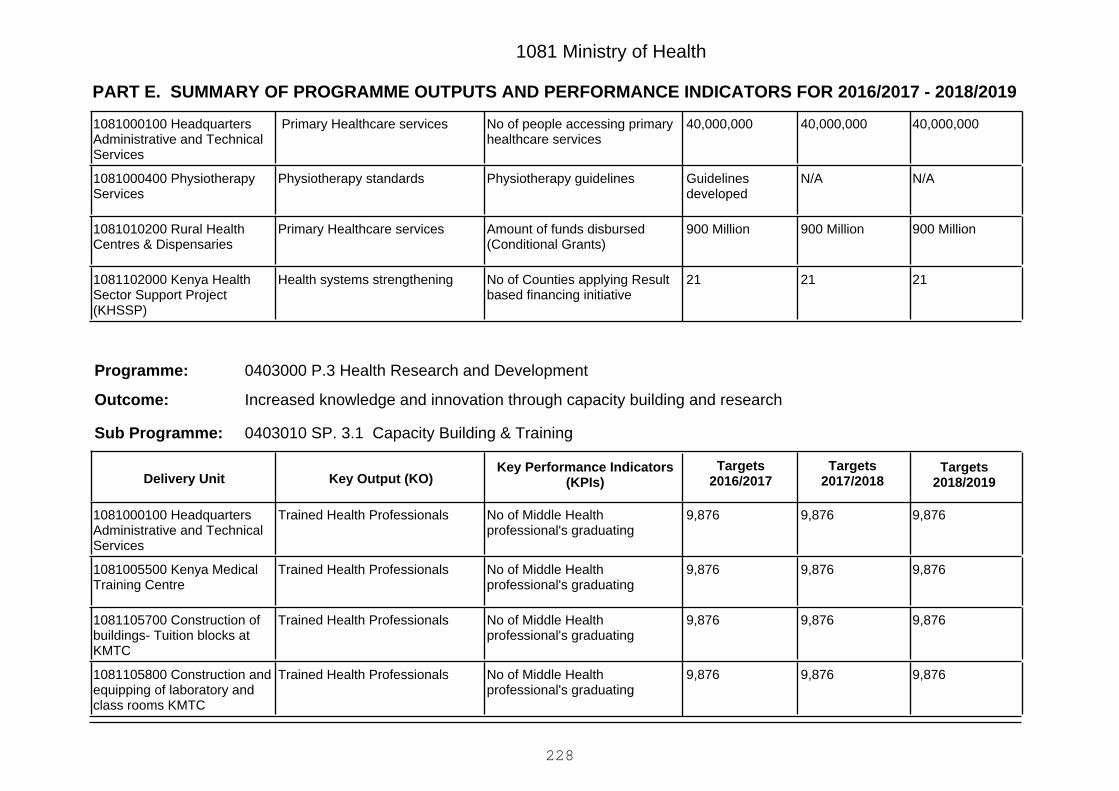
PART E. SUMMARY OF PROGRAMME OUTPUTS AND PERFORMANCE INDICATORS FOR 2016/2017 - 2018/2019
1081 Ministry of Health
40,000,00040,000,00040,000,000No of people accessing primaryhealthcare services
Primary Healthcare services1081000100 HeadquartersAdministrative and TechnicalServices
N/AN/AGuidelinesdeveloped
Physiotherapy guidelinesPhysiotherapy standards1081000400 PhysiotherapyServices
900 Million900 Million900 MillionAmount of funds disbursed(Conditional Grants)
Primary Healthcare services1081010200 Rural HealthCentres & Dispensaries
212121No of Counties applying Resultbased financing initiative
Health systems strengthening1081102000 Kenya HealthSector Support Project(KHSSP)
0403000 P.3 Health Research and Development
Increased knowledge and innovation through capacity building and research
Programme:
Outcome:
0403010 SP. 3.1 Capacity Building & TrainingSub Programme:
Key Output (KO)Targets
2018/2019Targets
2017/2018Key Performance Indicators
(KPIs)Targets
2016/2017Delivery Unit
9,8769,8769,876No of Middle Healthprofessional's graduating
Trained Health Professionals1081000100 HeadquartersAdministrative and TechnicalServices
9,8769,8769,876No of Middle Healthprofessional's graduating
Trained Health Professionals1081005500 Kenya MedicalTraining Centre
9,8769,8769,876No of Middle Healthprofessional's graduating
Trained Health Professionals1081105700 Construction ofbuildings- Tuition blocks atKMTC
9,8769,8769,876No of Middle Healthprofessional's graduating
Trained Health Professionals1081105800 Construction andequipping of laboratory andclass rooms KMTC
228

PART E. SUMMARY OF PROGRAMME OUTPUTS AND PERFORMANCE INDICATORS FOR 2016/2017 - 2018/2019
1081 Ministry of Health
0403020 SP. 3.2 Research & InnovationsSub Programme:
Key Output (KO)Targets
2018/2019Targets
2017/2018Key Performance Indicators
(KPIs)Targets
2016/2017Delivery Unit
101010No of research briefs informinghealth policy
Medical research1081007500 Kenya MedicalResearch Institute
101010No of research briefs informinghealth policy
Medical research1081107900 Construction andupgrading of Laboratories(Nairobi, Kwale,Busia)
101010No of research briefs informinghealth policy
Medical research1081108100 Sample Storagefacility
101010No of research briefs informinghealth policy
Medical research1081108400 Perimeterfencing around KEMRIparcels of land (Taveta &Kirinyaga)
0404000 P.4 General Administration, Planning & Support Services
Ministry’s leadership and management mechanisms strengthened
Programme:
Outcome:
0404010 SP. 4.1 Health Policy, Planning & FinancingSub Programme:
Key Output (KO)Targets
2018/2019Targets
2017/2018Key Performance Indicators
(KPIs)Targets
2016/2017Delivery Unit
300,000300,000300,000No of Vulnerable personsaccessing subsidized healthinsurance
Health Administration Services1081000100 HeadquartersAdministrative and TechnicalServices
300,000300,000300,000No of Vulnerable personsaccessing subsidized healthinsurance
Health Administration Services1081000200 HeadquartersAdministrative Professionalservices
229
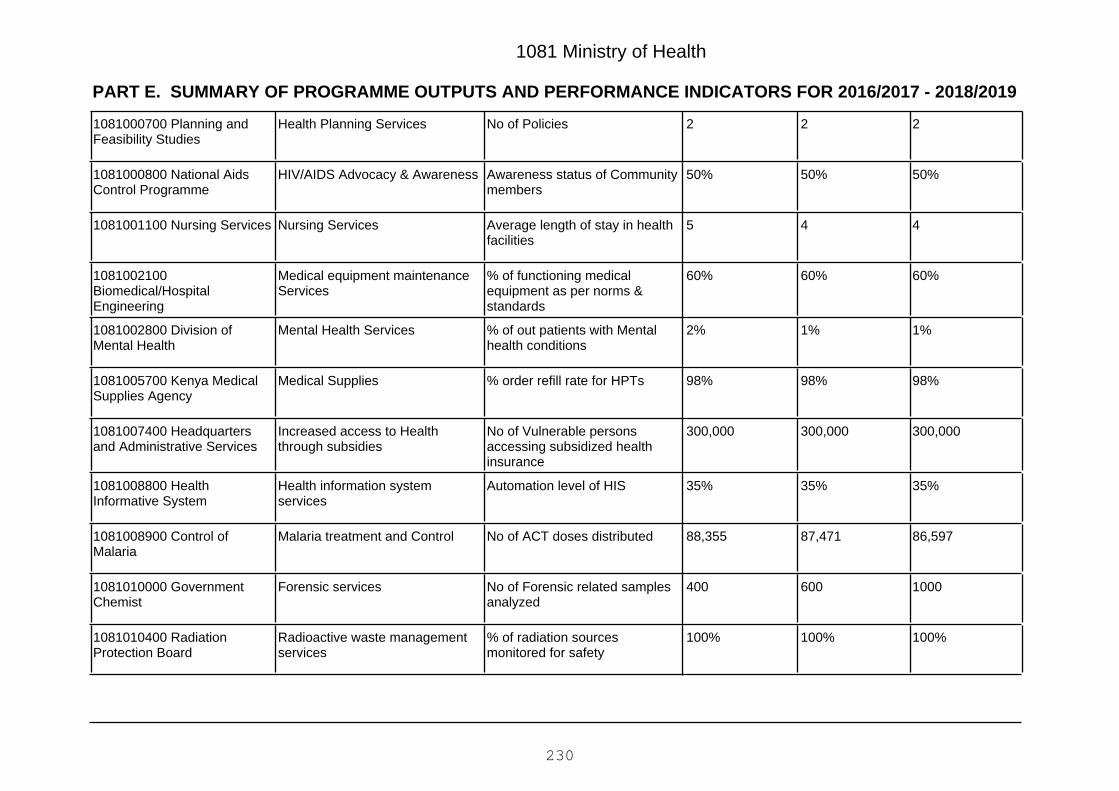
PART E. SUMMARY OF PROGRAMME OUTPUTS AND PERFORMANCE INDICATORS FOR 2016/2017 - 2018/2019
1081 Ministry of Health
222No of PoliciesHealth Planning Services1081000700 Planning andFeasibility Studies
50%50%50%Awareness status of Communitymembers
HIV/AIDS Advocacy & Awareness1081000800 National AidsControl Programme
445Average length of stay in healthfacilities
Nursing Services1081001100 Nursing Services
60%60%60%% of functioning medicalequipment as per norms &standards
Medical equipment maintenanceServices
1081002100Biomedical/HospitalEngineering
1%1%2%% of out patients with Mentalhealth conditions
Mental Health Services1081002800 Division ofMental Health
98%98%98%% order refill rate for HPTsMedical Supplies1081005700 Kenya MedicalSupplies Agency
300,000300,000300,000No of Vulnerable personsaccessing subsidized healthinsurance
Increased access to Healththrough subsidies
1081007400 Headquartersand Administrative Services
35%35%35%Automation level of HISHealth information systemservices
1081008800 HealthInformative System
86,59787,47188,355No of ACT doses distributedMalaria treatment and Control1081008900 Control ofMalaria
1000600400No of Forensic related samplesanalyzed
Forensic services1081010000 GovernmentChemist
100%100%100%% of radiation sourcesmonitored for safety
Radioactive waste managementservices
1081010400 RadiationProtection Board
230
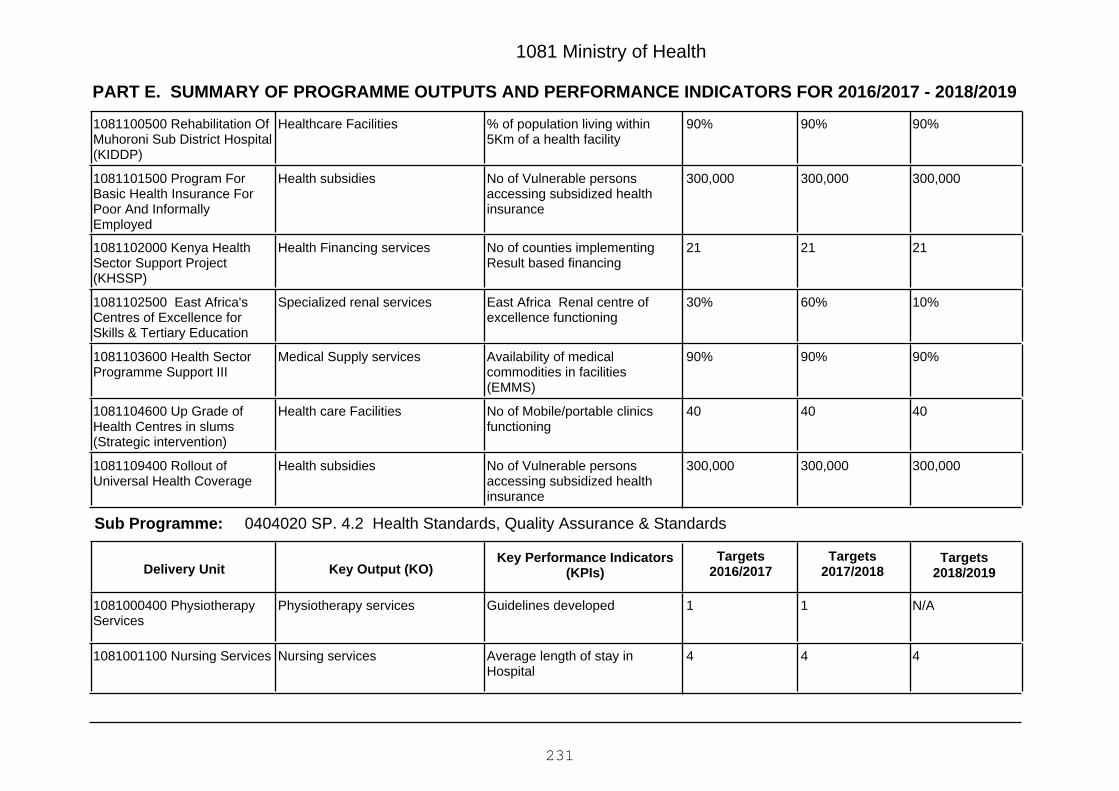
PART E. SUMMARY OF PROGRAMME OUTPUTS AND PERFORMANCE INDICATORS FOR 2016/2017 - 2018/2019
1081 Ministry of Health
90%90%90%% of population living within5Km of a health facility
Healthcare Facilities1081100500 Rehabilitation OfMuhoroni Sub District Hospital(KIDDP)
300,000300,000300,000No of Vulnerable personsaccessing subsidized healthinsurance
Health subsidies1081101500 Program ForBasic Health Insurance ForPoor And InformallyEmployed
212121No of counties implementingResult based financing
Health Financing services1081102000 Kenya HealthSector Support Project(KHSSP)
10%60%30%East Africa Renal centre ofexcellence functioning
Specialized renal services1081102500 East Africa'sCentres of Excellence forSkills & Tertiary Education
90%90%90%Availability of medicalcommodities in facilities(EMMS)
Medical Supply services1081103600 Health SectorProgramme Support III
404040No of Mobile/portable clinicsfunctioning
Health care Facilities1081104600 Up Grade ofHealth Centres in slums(Strategic intervention)
300,000300,000300,000No of Vulnerable personsaccessing subsidized healthinsurance
Health subsidies1081109400 Rollout ofUniversal Health Coverage
0404020 SP. 4.2 Health Standards, Quality Assurance & StandardsSub Programme:
Key Output (KO)Targets
2018/2019Targets
2017/2018Key Performance Indicators
(KPIs)Targets
2016/2017Delivery Unit
N/A11Guidelines developedPhysiotherapy services1081000400 PhysiotherapyServices
444Average length of stay inHospital
Nursing services1081001100 Nursing Services
231
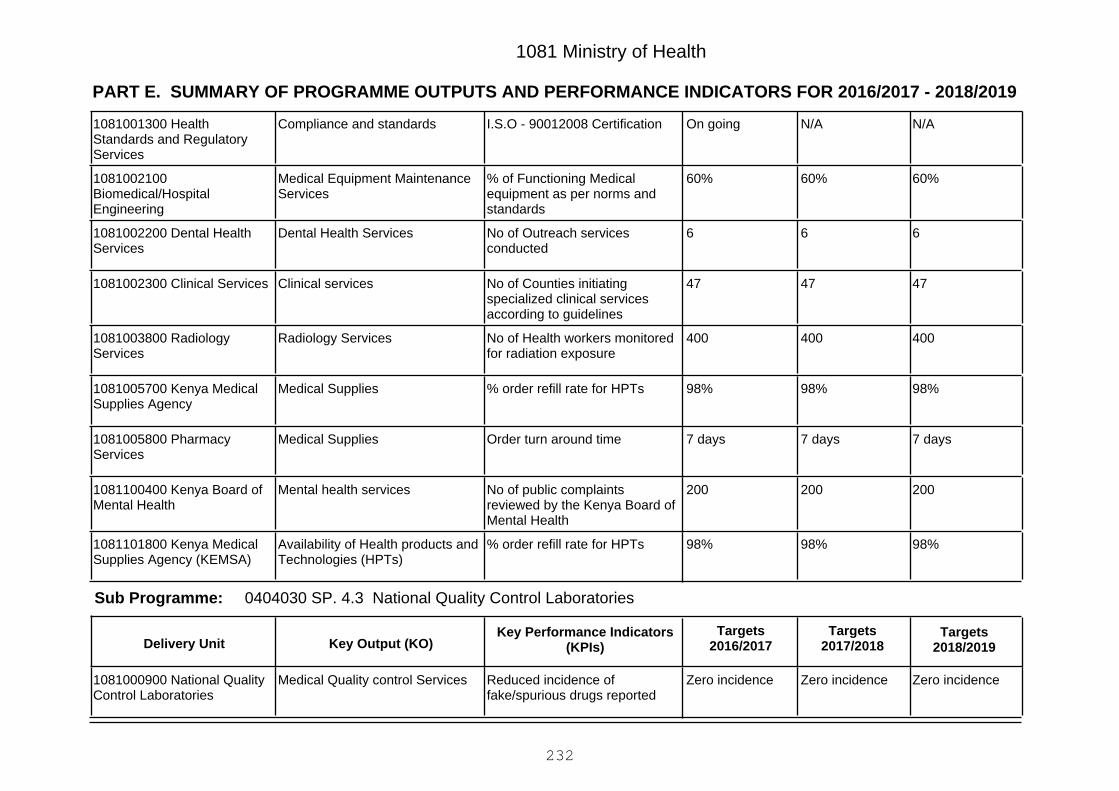
PART E. SUMMARY OF PROGRAMME OUTPUTS AND PERFORMANCE INDICATORS FOR 2016/2017 - 2018/2019
1081 Ministry of Health
N/AN/AOn goingI.S.O - 90012008 CertificationCompliance and standards1081001300 HealthStandards and RegulatoryServices
60%60%60%% of Functioning Medicalequipment as per norms andstandards
Medical Equipment MaintenanceServices
1081002100Biomedical/HospitalEngineering
666No of Outreach servicesconducted
Dental Health Services1081002200 Dental HealthServices
474747No of Counties initiatingspecialized clinical servicesaccording to guidelines
Clinical services1081002300 Clinical Services
400400400No of Health workers monitoredfor radiation exposure
Radiology Services1081003800 RadiologyServices
98%98%98%% order refill rate for HPTsMedical Supplies1081005700 Kenya MedicalSupplies Agency
7 days7 days7 daysOrder turn around timeMedical Supplies1081005800 PharmacyServices
200200200No of public complaintsreviewed by the Kenya Board ofMental Health
Mental health services1081100400 Kenya Board ofMental Health
98%98%98%% order refill rate for HPTsAvailability of Health products andTechnologies (HPTs)
1081101800 Kenya MedicalSupplies Agency (KEMSA)
0404030 SP. 4.3 National Quality Control LaboratoriesSub Programme:
Key Output (KO)Targets
2018/2019Targets
2017/2018Key Performance Indicators
(KPIs)Targets
2016/2017Delivery Unit
Zero incidenceZero incidenceZero incidenceReduced incidence offake/spurious drugs reported
Medical Quality control Services1081000900 National QualityControl Laboratories
232
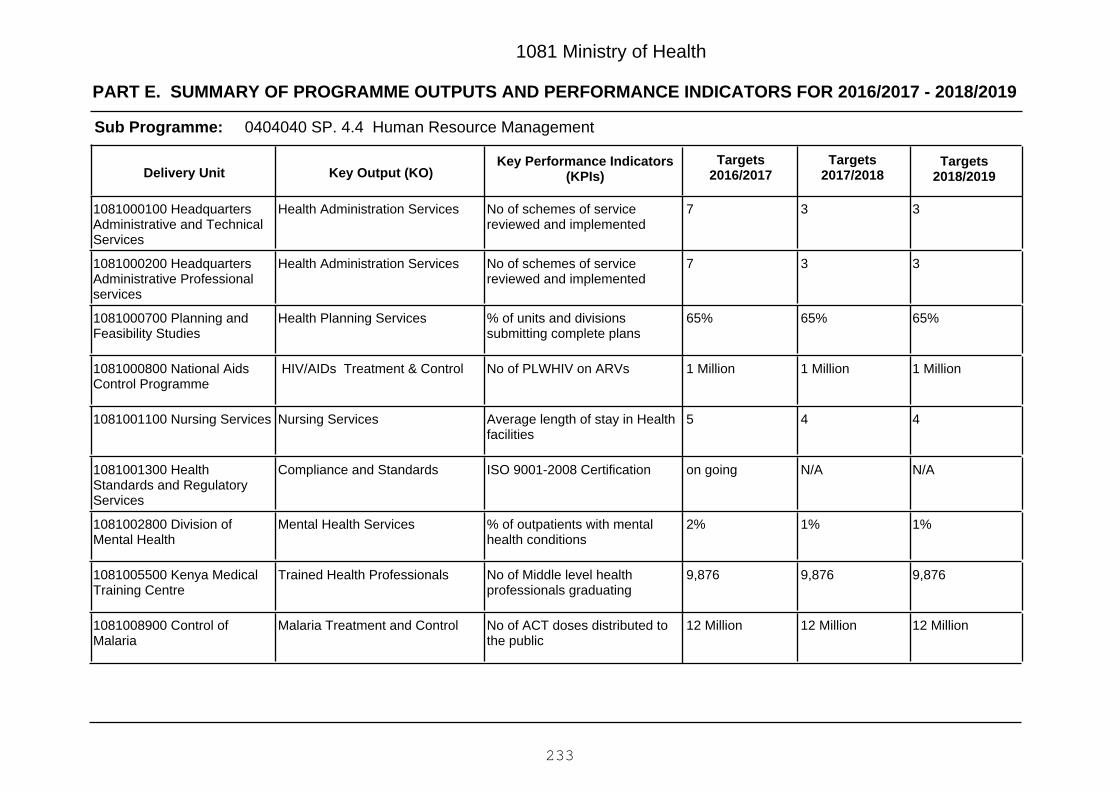
PART E. SUMMARY OF PROGRAMME OUTPUTS AND PERFORMANCE INDICATORS FOR 2016/2017 - 2018/2019
1081 Ministry of Health
0404040 SP. 4.4 Human Resource ManagementSub Programme:
Key Output (KO)Targets
2018/2019Targets
2017/2018Key Performance Indicators
(KPIs)Targets
2016/2017Delivery Unit
337No of schemes of servicereviewed and implemented
Health Administration Services1081000100 HeadquartersAdministrative and TechnicalServices
337No of schemes of servicereviewed and implemented
Health Administration Services1081000200 HeadquartersAdministrative Professionalservices
65%65%65%% of units and divisionssubmitting complete plans
Health Planning Services1081000700 Planning andFeasibility Studies
1 Million1 Million1 MillionNo of PLWHIV on ARVs HIV/AIDs Treatment & Control1081000800 National AidsControl Programme
445Average length of stay in Healthfacilities
Nursing Services1081001100 Nursing Services
N/AN/Aon goingISO 9001-2008 CertificationCompliance and Standards1081001300 HealthStandards and RegulatoryServices
1%1%2%% of outpatients with mentalhealth conditions
Mental Health Services1081002800 Division ofMental Health
9,8769,8769,876No of Middle level healthprofessionals graduating
Trained Health Professionals1081005500 Kenya MedicalTraining Centre
12 Million12 Million12 MillionNo of ACT doses distributed tothe public
Malaria Treatment and Control1081008900 Control ofMalaria
233
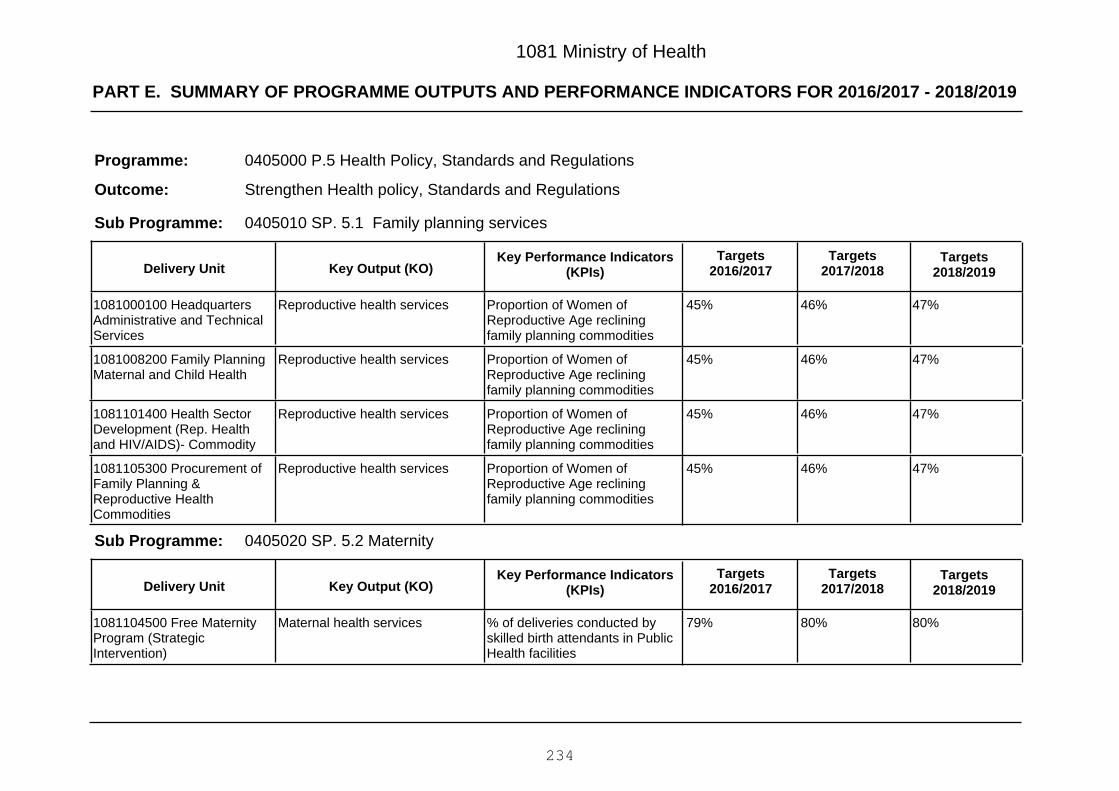
PART E. SUMMARY OF PROGRAMME OUTPUTS AND PERFORMANCE INDICATORS FOR 2016/2017 - 2018/2019
1081 Ministry of Health
0405000 P.5 Health Policy, Standards and Regulations
Strengthen Health policy, Standards and Regulations
Programme:
Outcome:
0405010 SP. 5.1 Family planning servicesSub Programme:
Key Output (KO)Targets
2018/2019Targets
2017/2018Key Performance Indicators
(KPIs)Targets
2016/2017Delivery Unit
47%46%45%Proportion of Women ofReproductive Age recliningfamily planning commodities
Reproductive health services1081000100 HeadquartersAdministrative and TechnicalServices
47%46%45%Proportion of Women ofReproductive Age recliningfamily planning commodities
Reproductive health services1081008200 Family PlanningMaternal and Child Health
47%46%45%Proportion of Women ofReproductive Age recliningfamily planning commodities
Reproductive health services1081101400 Health SectorDevelopment (Rep. Healthand HIV/AIDS)- Commodity
47%46%45%Proportion of Women ofReproductive Age recliningfamily planning commodities
Reproductive health services1081105300 Procurement ofFamily Planning &Reproductive HealthCommodities
0405020 SP. 5.2 MaternitySub Programme:
Key Output (KO)Targets
2018/2019Targets
2017/2018Key Performance Indicators
(KPIs)Targets
2016/2017Delivery Unit
80%80%79%% of deliveries conducted byskilled birth attendants in PublicHealth facilities
Maternal health services1081104500 Free MaternityProgram (StrategicIntervention)
234
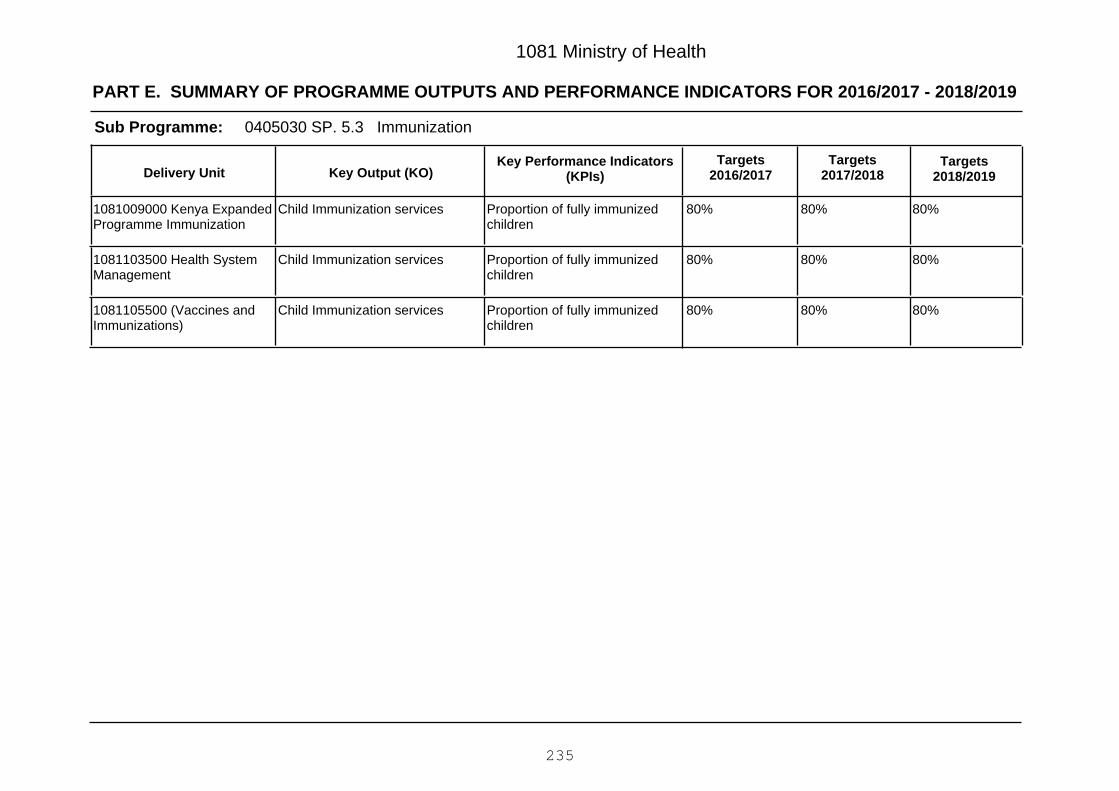
PART E. SUMMARY OF PROGRAMME OUTPUTS AND PERFORMANCE INDICATORS FOR 2016/2017 - 2018/2019
1081 Ministry of Health
0405030 SP. 5.3 ImmunizationSub Programme:
Key Output (KO)Targets
2018/2019Targets
2017/2018Key Performance Indicators
(KPIs)Targets
2016/2017Delivery Unit
80%80%80%Proportion of fully immunizedchildren
Child Immunization services1081009000 Kenya ExpandedProgramme Immunization
80%80%80%Proportion of fully immunizedchildren
Child Immunization services1081103500 Health SystemManagement
80%80%80%Proportion of fully immunizedchildren
Child Immunization services1081105500 (Vaccines andImmunizations)
235

Vote 1081 Ministry of Health
PART F: Summary of Expenditure by Programmes, 2016/2017 - 2018/2019
Programme
Estimates Projected Estimates
2016/2017 2017/2018 2018/2019
KShs. KShs. KShs.
0401010 SP. 1.1 Health Promotion 1,383,627,161 1,393,265,508 1,396,944,626
0401020 SP. 1.2 Non-communicable Disease Prevention & Control 803,149,198 827,127,000 835,050,000
0401040 SP. 1.4 Radiation Protection 181,334,201 240,750,256 269,491,009
0401050 SP. 1.5 Communicable Disease Control 4,898,571,736 5,063,353,046 4,954,448,562
0401000 P.1 Preventive, Promotive & RMNCAH 7,266,682,296 7,524,495,810 7,455,934,197
0402010 SP. 2.1 National Referral Services 16,274,828,685 17,542,532,637 18,138,946,288
0402040 SP. 2.4 Forensic and Diagnostics 5,617,134,423 5,639,042,940 5,967,871,809
0402050 SP. 2.5 Free Primary Healthcare 1,686,369,870 1,686,487,725 1,686,631,141
0402000 P.2 National Referral & Specialized Services 23,578,332,978 24,868,063,302 25,793,449,238
0403010 SP. 3.1 Capacity Building & Training 3,661,926,059 4,161,644,988 4,251,403,585
0403020 SP. 3.2 Research & Innovations 1,834,962,265 2,250,500,000 2,335,000,000
0403000 P.3 Health Research and Development 5,496,888,324 6,412,144,988 6,586,403,585
0404010 SP. 4.1 Health Policy, Planning & Financing 8,050,197,509 8,184,473,226 8,274,340,490
0404020 SP. 4.2 Health Standards, Quality Assurance & Standards 3,707,651,015 3,853,308,045 3,869,355,428
0404030 SP. 4.3 National Quality Control Laboratories 189,766,648 224,908,929 239,203,397
0404040 SP. 4.4 Human Resource Management 3,892,843,466 4,179,590,580 4,328,886,464
0404000 P.4 General Administration, Planning & Support Services 15,840,458,638 16,442,280,780 16,711,785,779
236
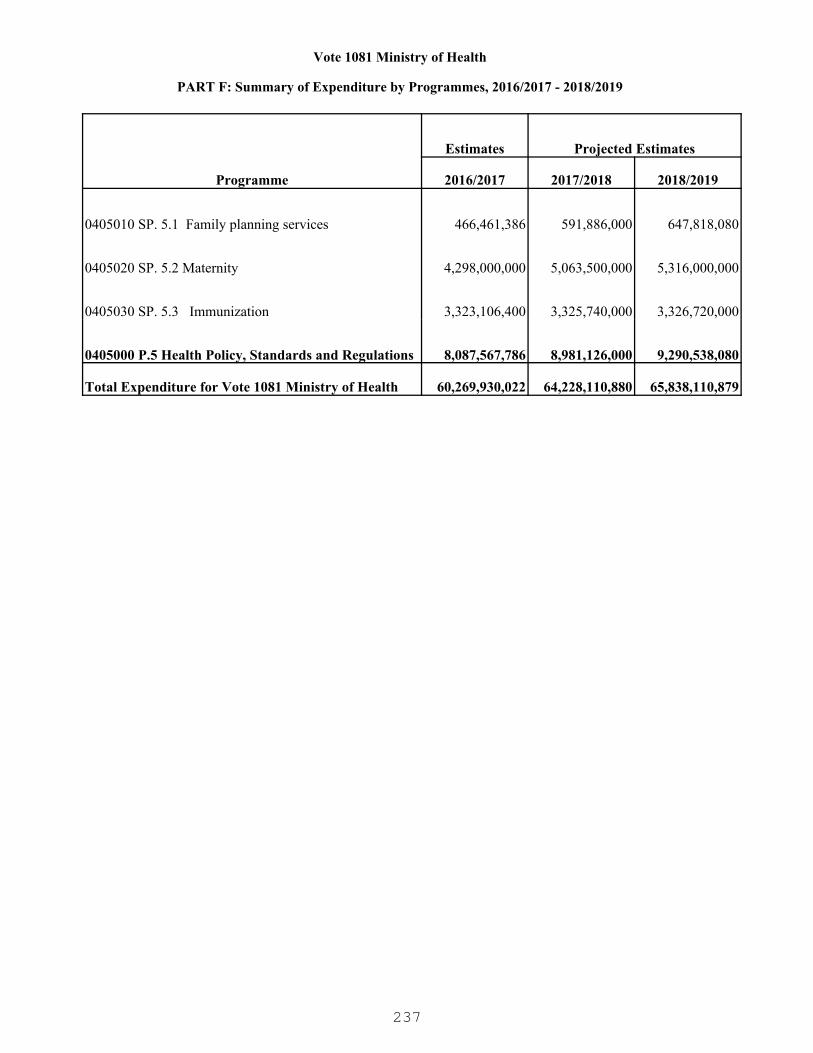
Vote 1081 Ministry of Health
PART F: Summary of Expenditure by Programmes, 2016/2017 - 2018/2019
Programme
Estimates Projected Estimates
2016/2017 2017/2018 2018/2019
0405010 SP. 5.1 Family planning services 466,461,386 591,886,000 647,818,080
0405020 SP. 5.2 Maternity 4,298,000,000 5,063,500,000 5,316,000,000
0405030 SP. 5.3 Immunization 3,323,106,400 3,325,740,000 3,326,720,000
0405000 P.5 Health Policy, Standards and Regulations 8,087,567,786 8,981,126,000 9,290,538,080
Total Expenditure for Vote 1081 Ministry of Health 60,269,930,022 64,228,110,880 65,838,110,879
237

1081 Ministry of Health
PART G: Summary of Expenditure by Vote and Economic Classification, 2016/2017 - 2018/2019
Economic Classification
Estimates Projected Estimates
2016/2017 2017/2018 2018/2019KShs. KShs. KShs.
Current Expenditure 29,090,110,838 30,476,670,839 30,761,670,838
Compensation to Employees 5,720,719,716 5,903,983,300 6,081,983,300
Use of Goods and Services 1,672,439,932 1,926,849,348 2,025,576,774
Current Transfers to Govt. Agencies 21,500,333,190 22,214,533,191 22,218,685,764
Other Recurrent 196,618,000 431,305,000 435,425,000
Capital Expenditure 31,179,819,184 33,751,440,041 35,076,440,041
Acquisition of Non-Financial Assets 1,764,000,000 1,957,000,000 2,025,000,000
Capital Grants to Govt. Agencies 15,305,856,164 17,689,977,021 18,789,977,021
Other Development 14,109,963,020 14,104,463,020 14,261,463,020Total Expenditure 60,269,930,022 64,228,110,880 65,838,110,879
238

1081 Ministry of Health
PART H: Summary of Expenditure by Programme and Economic Classification, 2016/2017 - 2018/2019
0401010 SP. 1.1 Health Promotion
Economic Classification
Estimates Projected Estimates
2016/2017 2017/2018 2018/2019KShs. KShs. KShs.
Current Expenditure 104,327,161 113,965,508 117,644,626
Compensation to Employees 6,898,330 7,000,000 7,210,000
Use of Goods and Services 29,930,605 39,467,282 42,936,400
Current Transfers to Govt. Agencies 67,498,226 67,498,226 67,498,226
Capital Expenditure 1,279,300,000 1,279,300,000 1,279,300,000
Other Development 1,279,300,000 1,279,300,000 1,279,300,000Total Expenditure 1,383,627,161 1,393,265,508 1,396,944,626
0401020 SP. 1.2 Non-communicable Disease Prevention & Control
Economic Classification
Estimates Projected Estimates
2016/2017 2017/2018 2018/2019KShs. KShs. KShs.
Current Expenditure 68,184,198 92,162,000 100,085,000
Compensation to Employees 5,022,636 5,000,000 5,150,000
Use of Goods and Services 40,162,610 57,912,000 64,535,000
Current Transfers to Govt. Agencies 22,810,952 29,000,000 30,000,000
Other Recurrent 188,000 250,000 400,000
Capital Expenditure 734,965,000 734,965,000 734,965,000
Capital Grants to Govt. Agencies 734,965,000 734,965,000 734,965,000Total Expenditure 803,149,198 827,127,000 835,050,000
0401040 SP. 1.4 Radiation Protection
Economic Classification
Estimates Projected Estimates
2016/2017 2017/2018 2018/2019KShs. KShs. KShs.
Current Expenditure 121,334,201 163,750,256 169,491,009
Compensation to Employees 26,206,114 26,892,388 27,533,434
Use of Goods and Services 77,528,087 82,057,868 87,122,247
239

1081 Ministry of Health
PART H: Summary of Expenditure by Programme and Economic Classification, 2016/2017 - 2018/2019
0401040 SP. 1.4 Radiation Protection
Economic Classification
Estimates Projected Estimates
2016/2017 2017/2018 2018/2019
Current Transfers to Govt. Agencies 17,600,000 54,800,000 54,835,328
Capital Expenditure 60,000,000 77,000,000 100,000,000
Acquisition of Non-Financial Assets 60,000,000 77,000,000 100,000,000Total Expenditure 181,334,201 240,750,256 269,491,009
0401050 SP. 1.5 Communicable Disease Control
Economic Classification
Estimates Projected Estimates
2016/2017 2017/2018 2018/2019KShs. KShs. KShs.
Current Expenditure 1,111,422,803 1,180,083,256 1,199,178,772
Compensation to Employees 465,132,903 471,910,756 483,103,272
Use of Goods and Services 32,289,900 40,172,500 47,575,500
Current Transfers to Govt. Agencies 614,000,000 668,000,000 668,500,000
Capital Expenditure 3,787,148,933 3,883,269,790 3,755,269,790
Capital Grants to Govt. Agencies 3,384,148,933 3,580,269,790 3,755,269,790
Other Development 403,000,000 303,000,000 -Total Expenditure 4,898,571,736 5,063,353,046 4,954,448,562
0401000 P.1 Preventive, Promotive & RMNCAH
Economic Classification
Estimates Projected Estimates
2016/2017 2017/2018 2018/2019KShs. KShs. KShs.
Current Expenditure 1,405,268,363 1,549,961,020 1,586,399,407
Compensation to Employees 503,259,983 510,803,144 522,996,706
Use of Goods and Services 179,911,202 219,609,650 242,169,147
Current Transfers to Govt. Agencies 721,909,178 819,298,226 820,833,554
Other Recurrent 188,000 250,000 400,000
Capital Expenditure 5,861,413,933 5,974,534,790 5,869,534,790
Acquisition of Non-Financial Assets 60,000,000 77,000,000 100,000,000
240

1081 Ministry of Health
PART H: Summary of Expenditure by Programme and Economic Classification, 2016/2017 - 2018/2019
0401000 P.1 Preventive, Promotive & RMNCAH
Economic Classification
Estimates Projected Estimates
2016/2017 2017/2018 2018/2019
Capital Grants to Govt. Agencies 4,119,113,933 4,315,234,790 4,490,234,790
Other Development 1,682,300,000 1,582,300,000 1,279,300,000Total Expenditure 7,266,682,296 7,524,495,810 7,455,934,197
0402010 SP. 2.1 National Referral Services
Economic Classification
Estimates Projected Estimates
2016/2017 2017/2018 2018/2019KShs. KShs. KShs.
Current Expenditure 15,086,806,789 15,188,510,741 15,223,924,392
Compensation to Employees 693,045,381 702,562,041 720,225,182
Use of Goods and Services 154,823,000 174,961,000 190,017,000
Current Transfers to Govt. Agencies 14,122,138,408 14,187,332,700 14,189,332,210
Other Recurrent 116,800,000 123,655,000 124,350,000
Capital Expenditure 1,188,021,896 2,354,021,896 2,915,021,896
Acquisition of Non-Financial Assets 734,000,000 766,000,000 796,000,000
Capital Grants to Govt. Agencies 90,000,000 1,224,000,000 1,755,000,000
Other Development 364,021,896 364,021,896 364,021,896Total Expenditure 16,274,828,685 17,542,532,637 18,138,946,288
0402040 SP. 2.4 Forensic and Diagnostics
Economic Classification
Estimates Projected Estimates
2016/2017 2017/2018 2018/2019KShs. KShs. KShs.
Current Expenditure 553,134,423 581,042,940 594,871,809
Compensation to Employees 216,007,996 219,036,350 224,429,637
Use of Goods and Services 304,763,087 331,766,590 337,997,172
Current Transfers to Govt. Agencies 1,723,340 1,740,000 1,820,000
Other Recurrent 30,640,000 28,500,000 30,625,000
Capital Expenditure 5,064,000,000 5,058,000,000 5,373,000,000
241

1081 Ministry of Health
PART H: Summary of Expenditure by Programme and Economic Classification, 2016/2017 - 2018/2019
0402040 SP. 2.4 Forensic and Diagnostics
Economic Classification
Estimates Projected Estimates
2016/2017 2017/2018 2018/2019
Acquisition of Non-Financial Assets 240,000,000 284,000,000 199,000,000
Other Development 4,824,000,000 4,774,000,000 5,174,000,000Total Expenditure 5,617,134,423 5,639,042,940 5,967,871,809
0402050 SP. 2.5 Free Primary Healthcare
Economic Classification
Estimates Projected Estimates
2016/2017 2017/2018 2018/2019KShs. KShs. KShs.
Current Expenditure 906,369,870 906,487,725 906,631,141
Compensation to Employees 6,369,870 6,487,725 6,631,141
Current Transfers to Govt. Agencies 900,000,000 900,000,000 900,000,000
Capital Expenditure 780,000,000 780,000,000 780,000,000
Other Development 780,000,000 780,000,000 780,000,000Total Expenditure 1,686,369,870 1,686,487,725 1,686,631,141
0402000 P.2 National Referral & Specialized Services
Economic Classification
Estimates Projected Estimates
2016/2017 2017/2018 2018/2019KShs. KShs. KShs.
Current Expenditure 16,546,311,082 16,676,041,406 16,725,427,342
Compensation to Employees 915,423,247 928,086,116 951,285,960
Use of Goods and Services 459,586,087 506,727,590 528,014,172
Current Transfers to Govt. Agencies 15,023,861,748 15,089,072,700 15,091,152,210
Other Recurrent 147,440,000 152,155,000 154,975,000
Capital Expenditure 7,032,021,896 8,192,021,896 9,068,021,896
Acquisition of Non-Financial Assets 974,000,000 1,050,000,000 995,000,000
Capital Grants to Govt. Agencies 90,000,000 1,224,000,000 1,755,000,000
Other Development 5,968,021,896 5,918,021,896 6,318,021,896Total Expenditure 23,578,332,978 24,868,063,302 25,793,449,238
242

1081 Ministry of Health
PART H: Summary of Expenditure by Programme and Economic Classification, 2016/2017 - 2018/2019
0403010 SP. 3.1 Capacity Building & Training
Economic Classification
Estimates Projected Estimates
2016/2017 2017/2018 2018/2019KShs. KShs. KShs.
Current Expenditure 3,588,926,059 3,918,644,988 3,921,403,585
Compensation to Employees 105,226,059 108,482,723 110,703,585
Current Transfers to Govt. Agencies 3,483,700,000 3,810,162,265 3,810,700,000
Capital Expenditure 73,000,000 243,000,000 330,000,000
Capital Grants to Govt. Agencies 73,000,000 243,000,000 330,000,000Total Expenditure 3,661,926,059 4,161,644,988 4,251,403,585
0403020 SP. 3.2 Research & Innovations
Economic Classification
Estimates Projected Estimates
2016/2017 2017/2018 2018/2019KShs. KShs. KShs.
Current Expenditure 1,799,462,265 2,124,000,000 2,124,000,000
Current Transfers to Govt. Agencies 1,799,462,265 1,900,000,000 1,900,000,000
Other Recurrent - 224,000,000 224,000,000
Capital Expenditure 35,500,000 126,500,000 211,000,000
Capital Grants to Govt. Agencies 35,500,000 126,500,000 211,000,000Total Expenditure 1,834,962,265 2,250,500,000 2,335,000,000
0403000 P.3 Health Research and Development
Economic Classification
Estimates Projected Estimates
2016/2017 2017/2018 2018/2019KShs. KShs. KShs.
Current Expenditure 5,388,388,324 6,042,644,988 6,045,403,585
Compensation to Employees 105,226,059 108,482,723 110,703,585
Current Transfers to Govt. Agencies 5,283,162,265 5,710,162,265 5,710,700,000
Other Recurrent - 224,000,000 224,000,000
Capital Expenditure 108,500,000 369,500,000 541,000,000
Capital Grants to Govt. Agencies 108,500,000 369,500,000 541,000,000
243
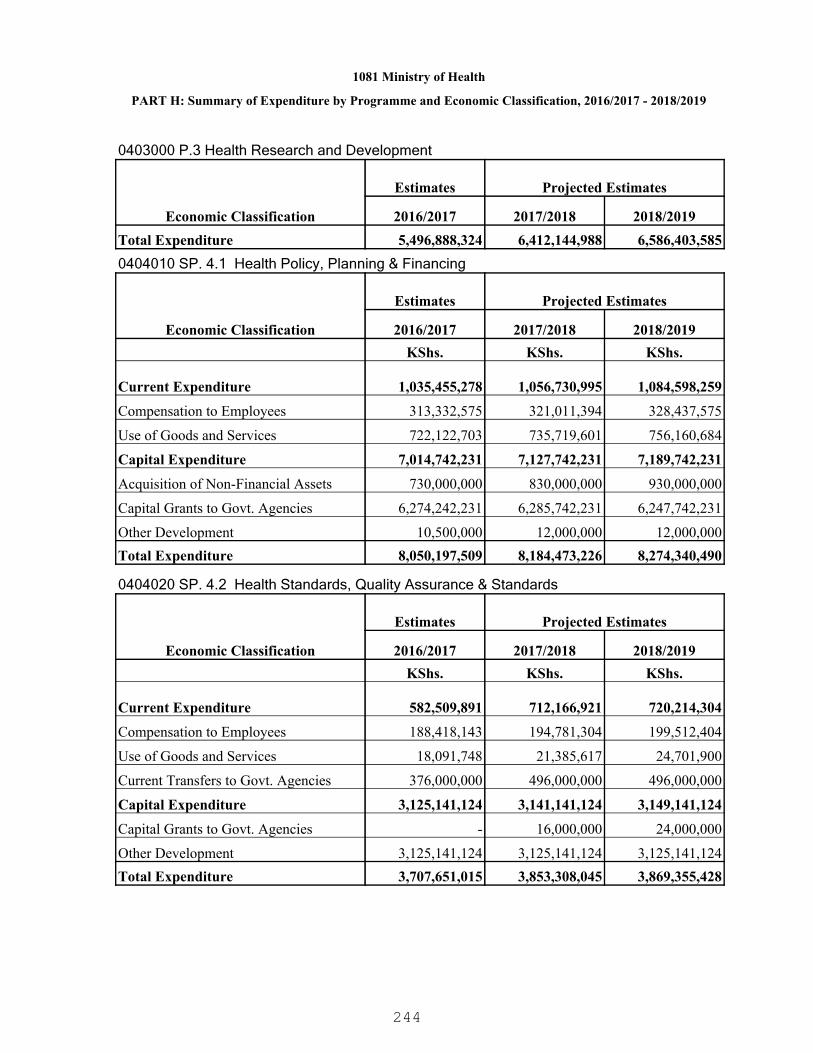
1081 Ministry of Health
PART H: Summary of Expenditure by Programme and Economic Classification, 2016/2017 - 2018/2019
0403000 P.3 Health Research and Development
Economic Classification
Estimates Projected Estimates
2016/2017 2017/2018 2018/2019Total Expenditure 5,496,888,324 6,412,144,988 6,586,403,5850404010 SP. 4.1 Health Policy, Planning & Financing
Economic Classification
Estimates Projected Estimates
2016/2017 2017/2018 2018/2019KShs. KShs. KShs.
Current Expenditure 1,035,455,278 1,056,730,995 1,084,598,259
Compensation to Employees 313,332,575 321,011,394 328,437,575
Use of Goods and Services 722,122,703 735,719,601 756,160,684
Capital Expenditure 7,014,742,231 7,127,742,231 7,189,742,231
Acquisition of Non-Financial Assets 730,000,000 830,000,000 930,000,000
Capital Grants to Govt. Agencies 6,274,242,231 6,285,742,231 6,247,742,231
Other Development 10,500,000 12,000,000 12,000,000Total Expenditure 8,050,197,509 8,184,473,226 8,274,340,490
0404020 SP. 4.2 Health Standards, Quality Assurance & Standards
Economic Classification
Estimates Projected Estimates
2016/2017 2017/2018 2018/2019KShs. KShs. KShs.
Current Expenditure 582,509,891 712,166,921 720,214,304
Compensation to Employees 188,418,143 194,781,304 199,512,404
Use of Goods and Services 18,091,748 21,385,617 24,701,900
Current Transfers to Govt. Agencies 376,000,000 496,000,000 496,000,000
Capital Expenditure 3,125,141,124 3,141,141,124 3,149,141,124
Capital Grants to Govt. Agencies - 16,000,000 24,000,000
Other Development 3,125,141,124 3,125,141,124 3,125,141,124Total Expenditure 3,707,651,015 3,853,308,045 3,869,355,428
244

1081 Ministry of Health
PART H: Summary of Expenditure by Programme and Economic Classification, 2016/2017 - 2018/2019
0404030 SP. 4.3 National Quality Control Laboratories
Economic Classification
Estimates Projected Estimates
2016/2017 2017/2018 2018/2019KShs. KShs. KShs.
Current Expenditure 189,766,648 199,908,929 204,203,397
Compensation to Employees 121,434,426 125,654,216 128,200,184
Use of Goods and Services 20,332,222 21,254,713 21,903,213
Other Recurrent 48,000,000 53,000,000 54,100,000
Capital Expenditure - 25,000,000 35,000,000
Other Development - 25,000,000 35,000,000Total Expenditure 189,766,648 224,908,929 239,203,397
0404040 SP. 4.4 Human Resource Management
Economic Classification
Estimates Projected Estimates
2016/2017 2017/2018 2018/2019KShs. KShs. KShs.
Current Expenditure 3,892,843,466 4,179,590,580 4,328,886,464
Compensation to Employees 3,570,876,897 3,712,428,403 3,838,028,806
Use of Goods and Services 240,576,570 380,262,177 403,907,658
Current Transfers to Govt. Agencies 80,399,999 85,000,000 85,000,000
Other Recurrent 990,000 1,900,000 1,950,000Total Expenditure 3,892,843,466 4,179,590,580 4,328,886,464
0404000 P.4 General Administration, Planning & Support Services
Economic Classification
Estimates Projected Estimates
2016/2017 2017/2018 2018/2019KShs. KShs. KShs.
Current Expenditure 5,700,575,283 6,148,397,425 6,337,902,424
Compensation to Employees 4,194,062,041 4,353,875,317 4,494,178,969
Use of Goods and Services 1,001,123,243 1,158,622,108 1,206,673,455
Current Transfers to Govt. Agencies 456,399,999 581,000,000 581,000,000
Other Recurrent 48,990,000 54,900,000 56,050,000
245
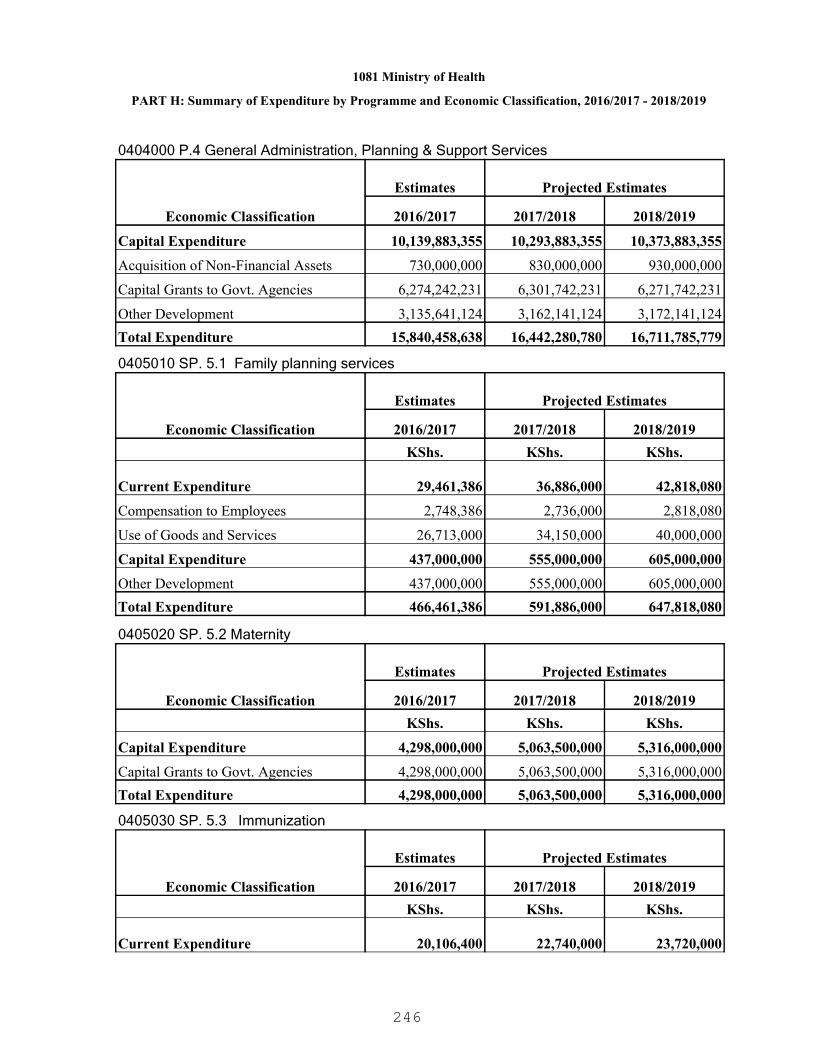
1081 Ministry of Health
PART H: Summary of Expenditure by Programme and Economic Classification, 2016/2017 - 2018/2019
0404000 P.4 General Administration, Planning & Support Services
Economic Classification
Estimates Projected Estimates
2016/2017 2017/2018 2018/2019
Capital Expenditure 10,139,883,355 10,293,883,355 10,373,883,355
Acquisition of Non-Financial Assets 730,000,000 830,000,000 930,000,000
Capital Grants to Govt. Agencies 6,274,242,231 6,301,742,231 6,271,742,231
Other Development 3,135,641,124 3,162,141,124 3,172,141,124Total Expenditure 15,840,458,638 16,442,280,780 16,711,785,779
0405010 SP. 5.1 Family planning services
Economic Classification
Estimates Projected Estimates
2016/2017 2017/2018 2018/2019KShs. KShs. KShs.
Current Expenditure 29,461,386 36,886,000 42,818,080
Compensation to Employees 2,748,386 2,736,000 2,818,080
Use of Goods and Services 26,713,000 34,150,000 40,000,000
Capital Expenditure 437,000,000 555,000,000 605,000,000
Other Development 437,000,000 555,000,000 605,000,000Total Expenditure 466,461,386 591,886,000 647,818,080
0405020 SP. 5.2 Maternity
Economic Classification
Estimates Projected Estimates
2016/2017 2017/2018 2018/2019KShs. KShs. KShs.
Capital Expenditure 4,298,000,000 5,063,500,000 5,316,000,000
Capital Grants to Govt. Agencies 4,298,000,000 5,063,500,000 5,316,000,000Total Expenditure 4,298,000,000 5,063,500,000 5,316,000,000
0405030 SP. 5.3 Immunization
Economic Classification
Estimates Projected Estimates
2016/2017 2017/2018 2018/2019KShs. KShs. KShs.
Current Expenditure 20,106,400 22,740,000 23,720,000
246
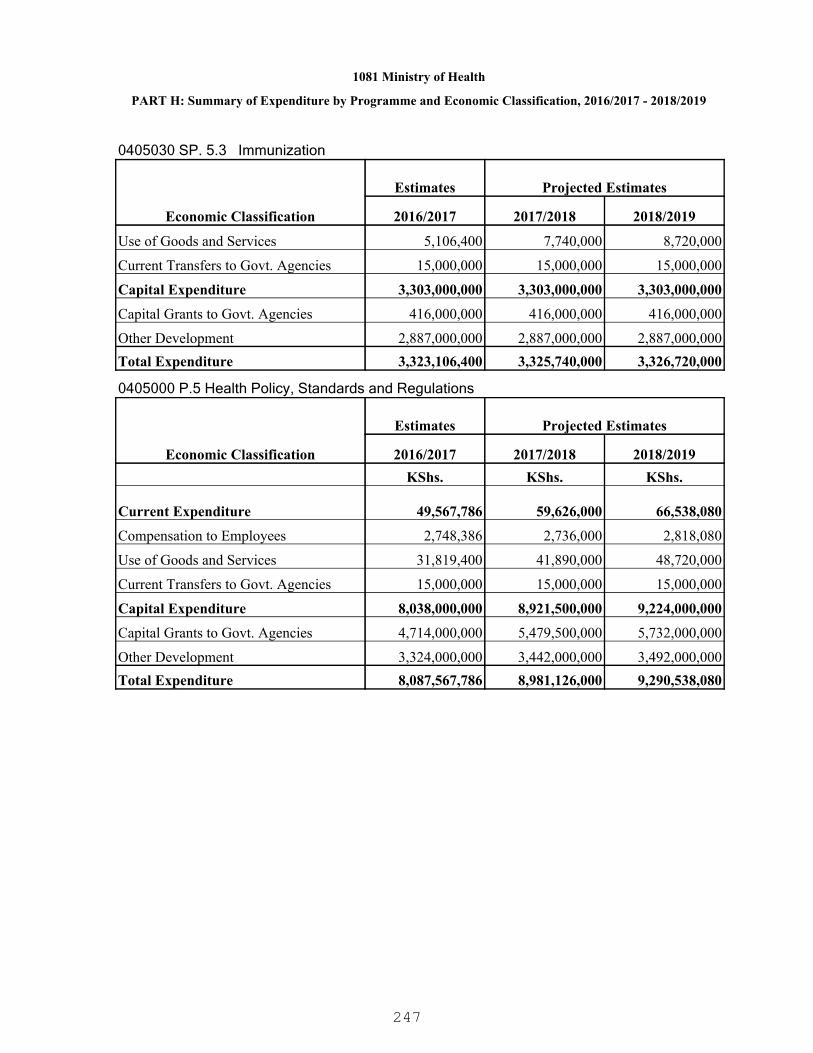
1081 Ministry of Health
PART H: Summary of Expenditure by Programme and Economic Classification, 2016/2017 - 2018/2019
0405030 SP. 5.3 Immunization
Economic Classification
Estimates Projected Estimates
2016/2017 2017/2018 2018/2019
Use of Goods and Services 5,106,400 7,740,000 8,720,000
Current Transfers to Govt. Agencies 15,000,000 15,000,000 15,000,000
Capital Expenditure 3,303,000,000 3,303,000,000 3,303,000,000
Capital Grants to Govt. Agencies 416,000,000 416,000,000 416,000,000
Other Development 2,887,000,000 2,887,000,000 2,887,000,000Total Expenditure 3,323,106,400 3,325,740,000 3,326,720,000
0405000 P.5 Health Policy, Standards and Regulations
Economic Classification
Estimates Projected Estimates
2016/2017 2017/2018 2018/2019KShs. KShs. KShs.
Current Expenditure 49,567,786 59,626,000 66,538,080
Compensation to Employees 2,748,386 2,736,000 2,818,080
Use of Goods and Services 31,819,400 41,890,000 48,720,000
Current Transfers to Govt. Agencies 15,000,000 15,000,000 15,000,000
Capital Expenditure 8,038,000,000 8,921,500,000 9,224,000,000
Capital Grants to Govt. Agencies 4,714,000,000 5,479,500,000 5,732,000,000
Other Development 3,324,000,000 3,442,000,000 3,492,000,000Total Expenditure 8,087,567,786 8,981,126,000 9,290,538,080
247
1091 State Department of Infrastructure
A global leader in road transport infrastructure and services
Develop, operate and maintain world class road infrastructure
PART A. Vision
PART B. Mission
PART C. Performance Overview and Background for Programme(s) Funding
The Kenya Vision 2030 recognizes the need for seamless road connectivity to spur economicgrowth and alleviate poverty. The Second MTP (2013-2017) aims to sustain and expand ourphysical infrastructure to ensure that it can support the rapidly growing economy. Thesedemands are imposed by higher rural-urban migrations, and by new economic activities.TheState Department of Infrastructure is mandated to do road construction, rehabilitation,maintenance and design. The department aims at improving both the quality and quantity ofRoad Infrastructure facilities in the country to attain sustainable economic growth.
The State Department of Infrastructure has spearheaded the expansion of the road networkin a bid to enhance road connectivity.During the financial year 2014/2015, a total of 494 Kmof new roads were constructed while 183 Km of roads were rehabilitated. On routinemaintenance, the state department maintained a total of 66,336 Km of roads and 1,391 Kmunder periodic maintenance. In addition, 301 Km of roads were designed, and 11No.bridgescompleted as at 31st march 2016 of the financial year 2015/16. The State Department wasable to complete construction of 177 km of new road and 88km was rehabilitated while 59 kmhave been completed under periodic maintenance. The on going projects are the constructionof 1,260 km of new road and 417km under rehabilitation.
The department trained 1,143 No. Plant Operators and 1,245 contractors during the MTEFperiod 2013/14-2014/15, 14 contractors were also trained on capacity building on roadsconstruction in highway engineering. The trainees were from both the public and privatesectors.The materials Testing and Research division completed research on the Prospectingand mapping of hard stone sources for road pavement construction in Kitui, Meru, Embu,Machakos, Makueni and Tharaka/Nithi Counties; research on prospecting and mapping ofgravel/natural material sources for road construction in Machakos, akueni and Tharaka/NithiCounties and finally Research Trials on mixes using 40/50 (35/50) Penetration GradeBitumen Studies on alternative soil stabilizers.
Infrastructure department faced the following challenges; pending bills as a result ofconstrained Net GoK/budgetary provisions compared to the portfolio of projects, exorbitantland acquisition and relocation of services costs. To effectively implement its projects andprogrammes the Department has had to devise ways of implementing its programmes withinthe constrained budgetary ceiling. This includes among others; controlled uptake of newprojects in a bid to cushion itself from costs associated with accrued interests due to delayedpayment of certified works.
During the F/Y 2016/17 the department intends to fund the construction of 5,000 Km of roadsto bitumen standards and the rehabilitation of a further 298 Km. This target will be achievedthrough the construction of low volume seal roads in rural areas and the implementation of a
248

1091 State Department of Infrastructure
PART D. Programme Objectives
number of projects in major urban centres in a bid to improve the flow of traffic. Projects suchas the improvement of Nairobi OuteringRoad and the construction of Meru Bypass under theNational Urban Transport Improvement Project are meant to decongest Nairobi City andMeru counties respectively. Other projects under the decongestion programme is theconstruction of Miritini Mwache, Kipevu Link Road and Moi International Airport Access Road(under the Mombasa Port Area Development Project), rehabilitation of Bachuma Gate – Majiya Chumvi (A109) road under the Kenya Transport Sector Support Project), in order tofacilitate regional trade the development will continue with the construction of Merille River –Marsabit, Marsabit – Turbi, Turbi – Moyale and Mwatate – Taveta among other projects. TheDepartment has also planned to maintain 54,908 Km of roads from funds emanating from theRoad Maintenance Levy Fund.
Other services/outputs to be provided inlude supporting the construction, rehabilitation andmaintenance of road by equipping the Mechanical and Transport Division through theacquisition of new road construction equipment, modernize regional Mechanical andMaterials Testing and Research offices and the Kenya Institute of Highways & BuildingTechnology (Main campus and Kisii Training Centre).
ObjectiveProgramme
0202000 P.2 Road Transport To develop and manage an effective, efficient and secureroad network
249

PART E. SUMMARY OF PROGRAMME OUTPUTS AND PERFORMANCE INDICATORS FOR 2016/2017 - 2018/2019
1091 State Department of Infrastructure
0202000 P.2 Road Transport
Increased national and regional road connectivity
Programme:
Outcome:
0202010 SP. 2.1 Construction of Roads and BridgesSub Programme:
Key Output (KO)Targets
2018/2019Targets
2017/2018Key Performance Indicators
(KPIs)Targets
2016/2017Delivery Unit
755010No. of kilometersKm of road constructed1091100300 Nuno-ModogashiRoad
352No. of kilometersKm of road constructed1091100400 Mombasa PortArea Roads Developmentproject
0.41.80.4Number of kilometersKm of road constructed1091100500 Dualling OfNairobi- Dagoretti CornerRoad Phase 1
004No. of kilometersKm of road constructed1091100600 Nairobi SouthernBypass Project
000No. of kilometersKm of road constructed1091101000 NorthernCorridor TransportImprovement Project
005% completionBoarder posts constructed1091101100 East AfricanTrade and TransportFacilitation Project (KRA)
535144No. of kilometersKm of road constructed1091101200 Kenya TransportSector Support Programme
252410No. of kilometersKm of road constructed1091101300 National UrbanTransport ImprovementProject (NUTRIP)
250
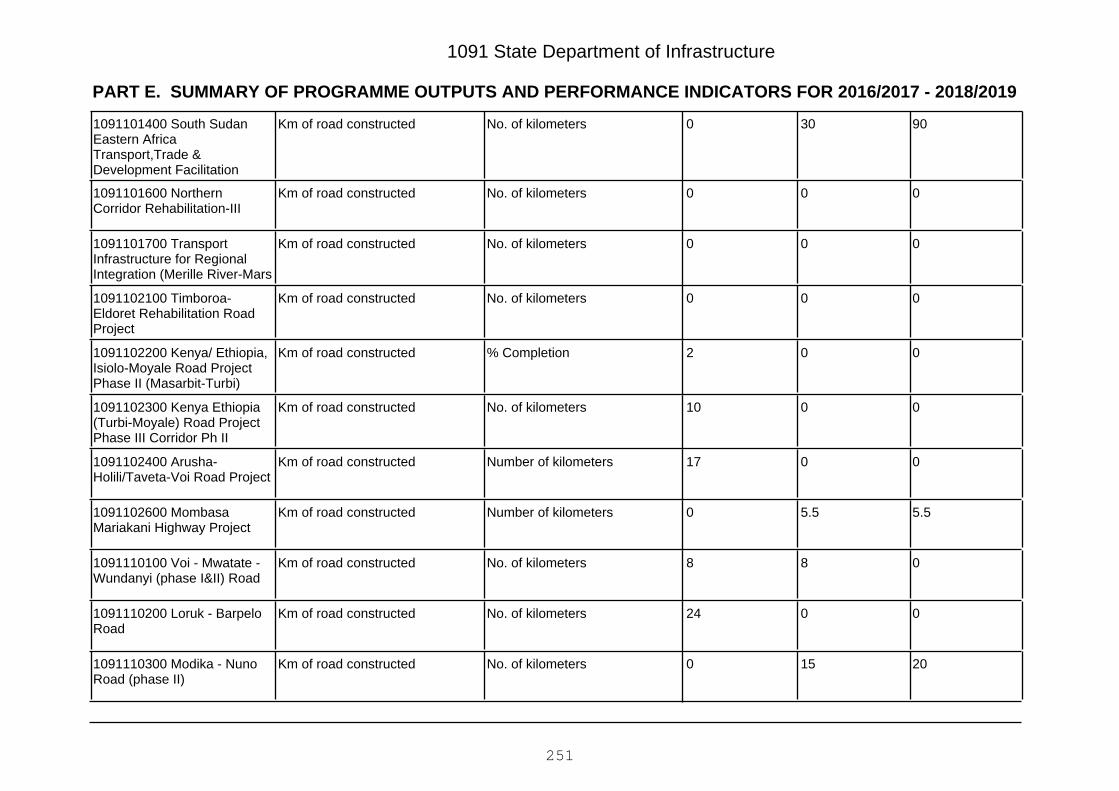
PART E. SUMMARY OF PROGRAMME OUTPUTS AND PERFORMANCE INDICATORS FOR 2016/2017 - 2018/2019
1091 State Department of Infrastructure
90300No. of kilometersKm of road constructed1091101400 South SudanEastern AfricaTransport,Trade &Development Facilitation
000No. of kilometersKm of road constructed1091101600 NorthernCorridor Rehabilitation-III
000No. of kilometersKm of road constructed1091101700 TransportInfrastructure for RegionalIntegration (Merille River-Mars
000No. of kilometersKm of road constructed1091102100 Timboroa-Eldoret Rehabilitation RoadProject
002% CompletionKm of road constructed1091102200 Kenya/ Ethiopia,Isiolo-Moyale Road ProjectPhase II (Masarbit-Turbi)
0010No. of kilometersKm of road constructed1091102300 Kenya Ethiopia(Turbi-Moyale) Road ProjectPhase III Corridor Ph II
0017Number of kilometersKm of road constructed1091102400 Arusha-Holili/Taveta-Voi Road Project
5.55.50Number of kilometersKm of road constructed1091102600 MombasaMariakani Highway Project
088No. of kilometersKm of road constructed1091110100 Voi - Mwatate -Wundanyi (phase I&II) Road
0024No. of kilometersKm of road constructed1091110200 Loruk - BarpeloRoad
20150No. of kilometersKm of road constructed1091110300 Modika - NunoRoad (phase II)
251
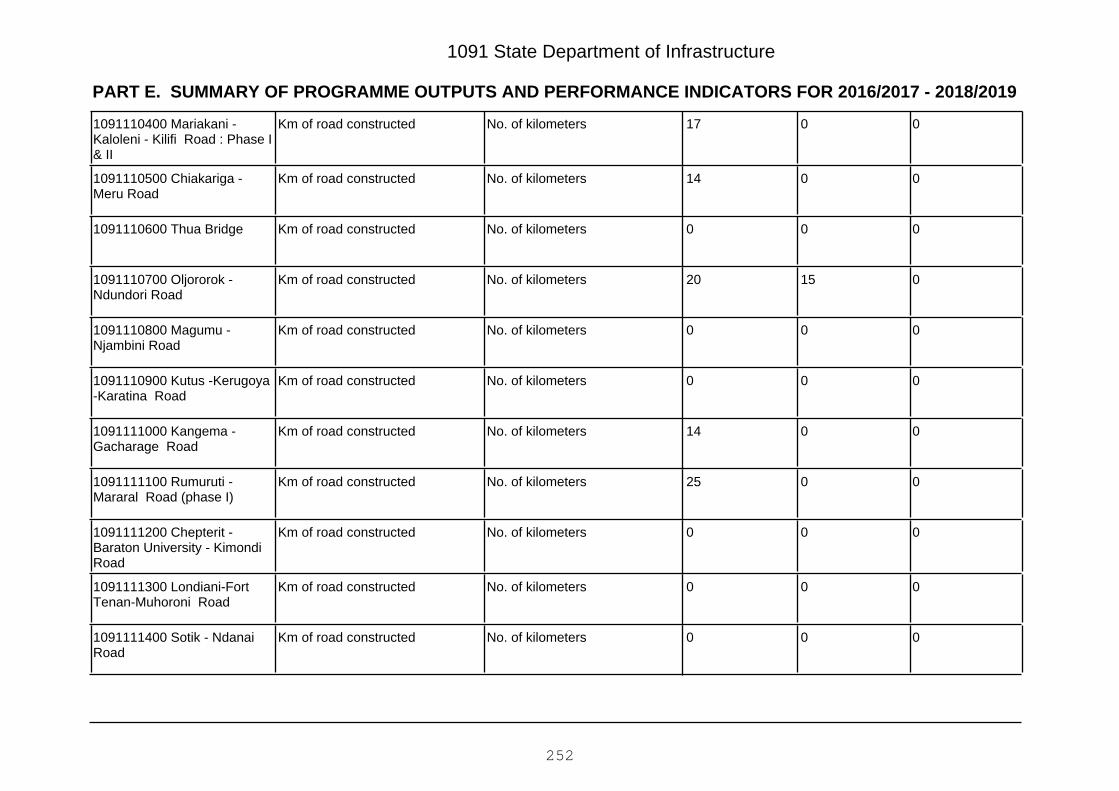
PART E. SUMMARY OF PROGRAMME OUTPUTS AND PERFORMANCE INDICATORS FOR 2016/2017 - 2018/2019
1091 State Department of Infrastructure
0017No. of kilometersKm of road constructed1091110400 Mariakani -Kaloleni - Kilifi Road : Phase I& II
0014No. of kilometersKm of road constructed1091110500 Chiakariga -Meru Road
000No. of kilometersKm of road constructed1091110600 Thua Bridge
01520No. of kilometersKm of road constructed1091110700 Oljororok -Ndundori Road
000No. of kilometersKm of road constructed1091110800 Magumu -Njambini Road
000No. of kilometersKm of road constructed1091110900 Kutus -Kerugoya-Karatina Road
0014No. of kilometersKm of road constructed1091111000 Kangema -Gacharage Road
0025No. of kilometersKm of road constructed1091111100 Rumuruti -Mararal Road (phase I)
000No. of kilometersKm of road constructed1091111200 Chepterit -Baraton University - KimondiRoad
000No. of kilometersKm of road constructed1091111300 Londiani-FortTenan-Muhoroni Road
000No. of kilometersKm of road constructed1091111400 Sotik - NdanaiRoad
252

PART E. SUMMARY OF PROGRAMME OUTPUTS AND PERFORMANCE INDICATORS FOR 2016/2017 - 2018/2019
1091 State Department of Infrastructure
0013.40No. of kilometersKm of road constructed1091111500 Ndanai - GorgorRoad
000No. of kilometersKm of road constructed1091111700 Ndori- Ng'iya &Kogelo Access Road
001No. of kilometersKm of road constructed1091111800 Rangala-Siaya-Bondo Road
005No. of kilometersKm of road constructed1091111900 Maumau -Ruambwa - Nyadorera - SiayaRoad
000No. of kilometersKm of road constructed1091112000 Kendu Bay-Homa Bay Road
000No. of kilometersKm of road constructed1091112100 Homa Bay-MbitaRoad
000% of completionKm of road constructed1091112200 Mbita cause wayBridge
004No. of kilometersKm of road constructed1091112300 Rodi Kopany -Ndhiwa - Karungu Road
0014No. of kilometersKm of road constructed1091112400 Kehancha-Suna- Masara Road
01919No. of kilometersKm of road constructed1091112500 Chebilat - Ikonge- Chabera Road
000% of completionKm of road constructed1091112600 Kitui Turn Off-Mwingi- Garissa Road
000% of completionKm of road constructed1091113000 Wajir - Buna -Moyale Road - Design
253
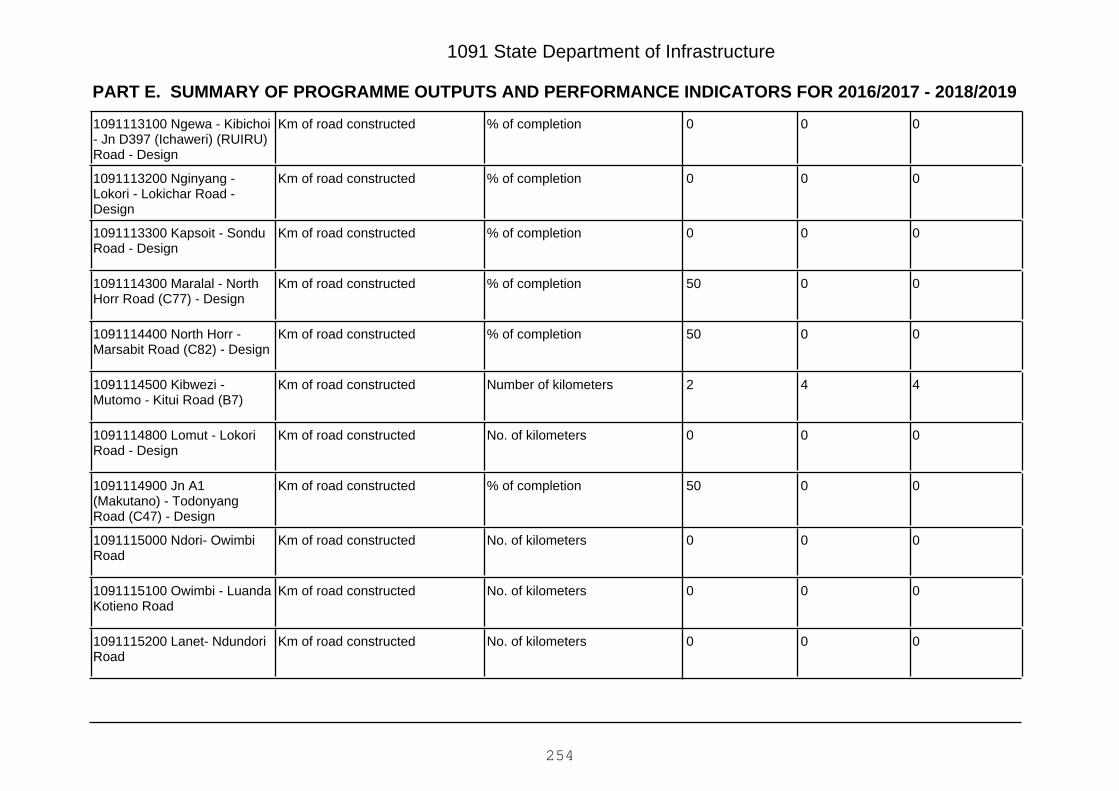
PART E. SUMMARY OF PROGRAMME OUTPUTS AND PERFORMANCE INDICATORS FOR 2016/2017 - 2018/2019
1091 State Department of Infrastructure
000% of completionKm of road constructed1091113100 Ngewa - Kibichoi- Jn D397 (Ichaweri) (RUIRU)Road - Design
000% of completionKm of road constructed1091113200 Nginyang -Lokori - Lokichar Road -Design
000% of completionKm of road constructed1091113300 Kapsoit - SonduRoad - Design
0050% of completionKm of road constructed1091114300 Maralal - NorthHorr Road (C77) - Design
0050% of completionKm of road constructed1091114400 North Horr -Marsabit Road (C82) - Design
442Number of kilometersKm of road constructed1091114500 Kibwezi -Mutomo - Kitui Road (B7)
000No. of kilometersKm of road constructed1091114800 Lomut - LokoriRoad - Design
0050% of completionKm of road constructed1091114900 Jn A1(Makutano) - TodonyangRoad (C47) - Design
000No. of kilometersKm of road constructed1091115000 Ndori- OwimbiRoad
000No. of kilometersKm of road constructed1091115100 Owimbi - LuandaKotieno Road
000No. of kilometersKm of road constructed1091115200 Lanet- NdundoriRoad
254

PART E. SUMMARY OF PROGRAMME OUTPUTS AND PERFORMANCE INDICATORS FOR 2016/2017 - 2018/2019
1091 State Department of Infrastructure
000No. of kilometersKm of road constructed1091115300 Kisii - ChemositRoad(C21)
50200No. of kilometersKm of road constructed1091115400 Isebania -Mukuyu - Kisii - Ahero Road(A1) Lot 1 & 2
0050% of completionKm of road constructed1091115600 Kenol - Muranga- Sagana Road (C71/C73) -Design
000% of completionKm of road constructed1091115700 LAPSSETGarissa-Isiolo Road - Design
000% of completionKm of road constructed1091115800 LAPSSET Lamu- Garissa Road - Design
000% of completionKm of road constructed1091115900 LAPSSET Isiolo- Nginyang Road - Design
01010No. of kilometersKm of road constructed1091116000 Kitale -Endebes- Suam Road
01010No. of kilometersKm of road constructed1091116100 Eldoret TownBypass Road
000No. of kilometersKm of road constructed1091116400 Athi River -Namanga Road includingNamanga One Stop BorderPost
000No. of kilometersKm of road constructed1091116600 Nairobi - ThikaHighway Improvement ProjectLot 1 & 2
000No. of kilometersKm of road constructed1091116700 Nairobi - ThikaHighway Improvement ProjectLot 3
255

PART E. SUMMARY OF PROGRAMME OUTPUTS AND PERFORMANCE INDICATORS FOR 2016/2017 - 2018/2019
1091 State Department of Infrastructure
000No. of kilometersKm of road constructed1091116800 Emali- OloitoktokRoad
02525% of completionKm of road constructed1091116900 DevelopmentProjects M& E, QualityAssurance & Audits
006.40No. of kilometersKm of road constructed1091117000 Changamweroundabout - Moi Int’l AirportAccess Road & Port Reitz Rd
000No. of kilometersKm of road constructed1091117100 Isiolo - MerilleRoad
000No. of kilometersKm of road constructed1091117700 Stand Khisa-Khumsalaba Road
02525No. of kilometersKm of road constructed1091117800 Road ReservesMapping, protection &Network Management
02525No. of kilometersKm of road constructed1091117900 Bypass RdsDevelopment Project (Nbi andAberdare ranges)
103010No. of kilometersKm of road constructed1091118300 Elwak-WargadudRoad (B9)
102710No. of kilometersKm of road constructed1091118400 Wargadud -Bambo Road (B9)
20150No. of kilometersKm of road constructed1091119200 Garsen - Witu -Lamu Road(C112)
07020% of completionKm of road constructed1091119900 Bomas - OngataRongai - Kiserian RoadDualling - Design
256

PART E. SUMMARY OF PROGRAMME OUTPUTS AND PERFORMANCE INDICATORS FOR 2016/2017 - 2018/2019
1091 State Department of Infrastructure
530No. of kilometersKm of road constructed1091120000 Changamwe-Magongo - Kwa Jomvu(A109L) Road dualling
000.2Number of kilometersKm of road constructed1091120200 Construction OfThe Interchange At CityCabanas
000Number of kilometersKm of road constructed1091120400 RehabilitationAnd Upgrading Of FirstAvenue Eastleigh AndGeneral W
000Number of kilometersKm of road constructed1091120500 RehabilitationAnd Upgrading Of Upper HillRoads, Phase 1
0.52.51.0Number of kilometersKm of road constructed1091121700 Mlolongo-Kware-Katani-Kamulu Link
00.70.3Number of kilometersKm of road constructed1091121800 Link RoadUpperhill To Mbagathi Way
0.52.51.5Number of kilometersKm of road constructed1091121900 Waiyaki Way -Redhill Link Road
01.81.3Number of kilometersKm of road constructed1091122000 Ngong Road -Kibera - Kungukarumba -Langata Road (Missing LinkNo.
001.0kilometers of road doneKm of road constructed1091122100 Access Road ToRuai Police Station
06.04.0Number of loop radsKm of road constructed1091122200 Eldoret AnnexLoop Roads
004.7kilometers of roadKm of road constructed1091122300 Eastlands Roads
257
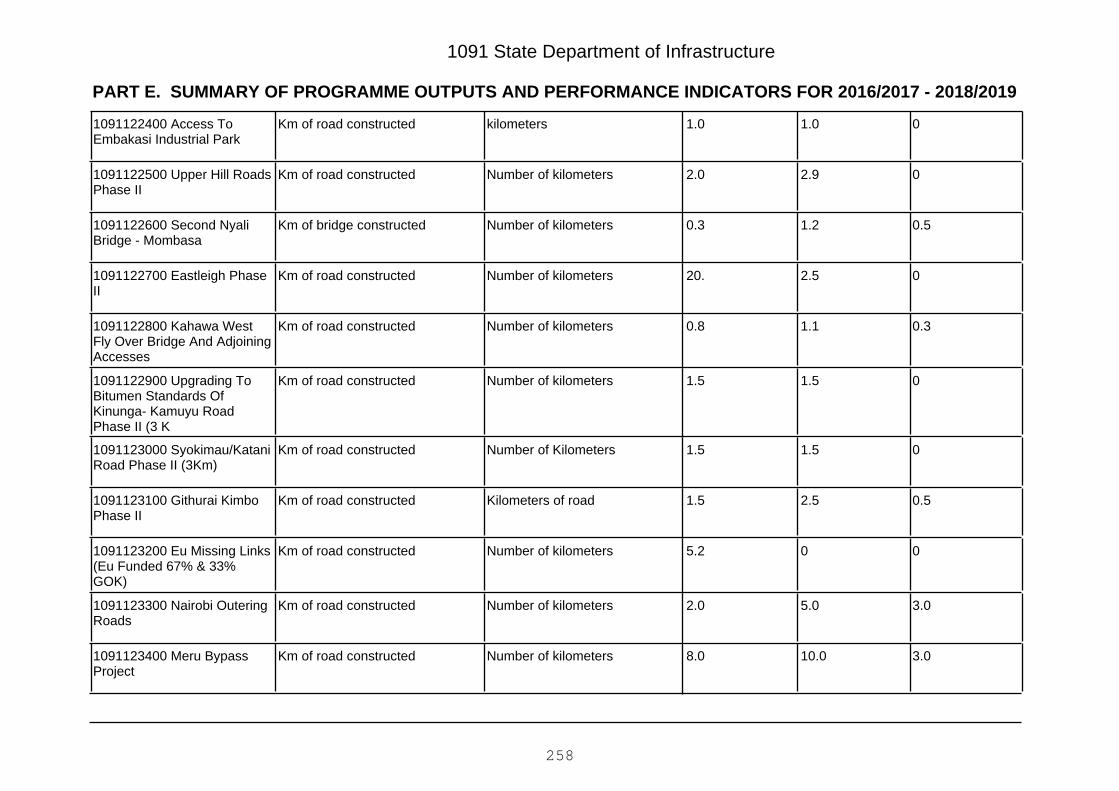
PART E. SUMMARY OF PROGRAMME OUTPUTS AND PERFORMANCE INDICATORS FOR 2016/2017 - 2018/2019
1091 State Department of Infrastructure
01.01.0kilometersKm of road constructed1091122400 Access ToEmbakasi Industrial Park
02.92.0Number of kilometersKm of road constructed1091122500 Upper Hill RoadsPhase II
0.51.20.3Number of kilometersKm of bridge constructed1091122600 Second NyaliBridge - Mombasa
02.520.Number of kilometersKm of road constructed1091122700 Eastleigh PhaseII
0.31.10.8Number of kilometersKm of road constructed1091122800 Kahawa WestFly Over Bridge And AdjoiningAccesses
01.51.5Number of kilometersKm of road constructed1091122900 Upgrading ToBitumen Standards OfKinunga- Kamuyu RoadPhase II (3 K
01.51.5Number of KilometersKm of road constructed1091123000 Syokimau/KataniRoad Phase II (3Km)
0.52.51.5Kilometers of roadKm of road constructed1091123100 Githurai KimboPhase II
005.2Number of kilometersKm of road constructed1091123200 Eu Missing Links(Eu Funded 67% & 33%GOK)
3.05.02.0Number of kilometersKm of road constructed1091123300 Nairobi OuteringRoads
3.010.08.0Number of kilometersKm of road constructed1091123400 Meru BypassProject
258
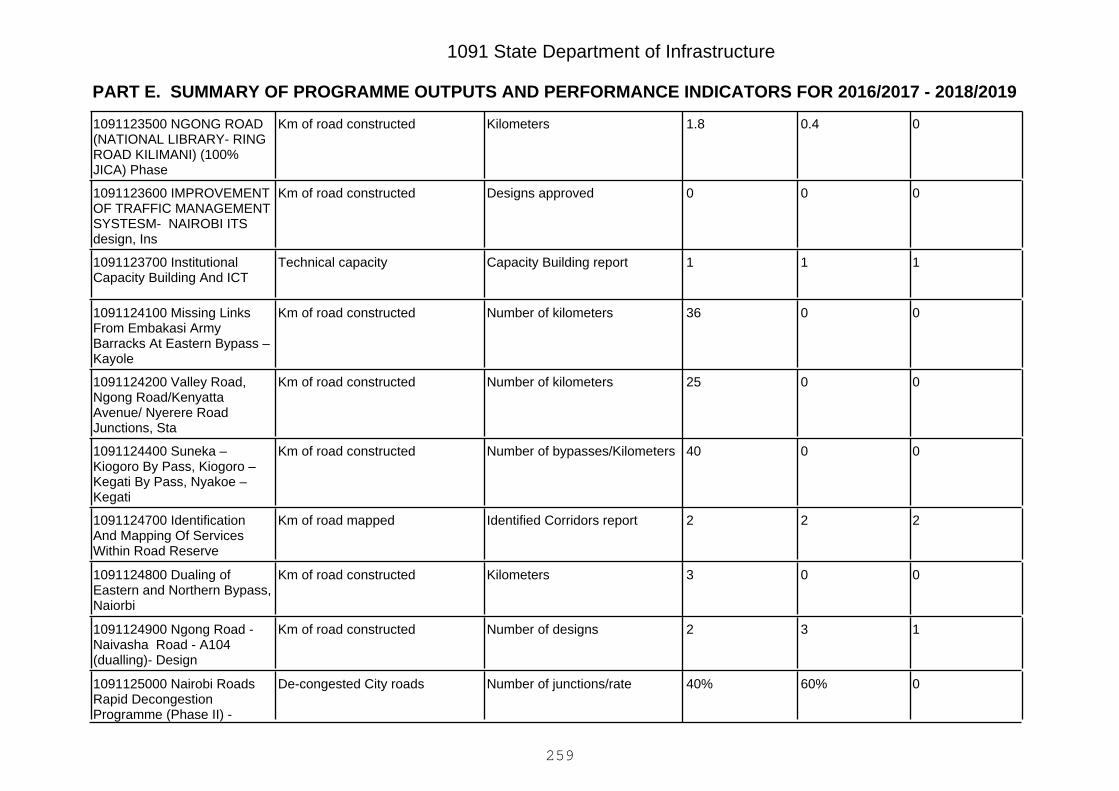
PART E. SUMMARY OF PROGRAMME OUTPUTS AND PERFORMANCE INDICATORS FOR 2016/2017 - 2018/2019
1091 State Department of Infrastructure
00.41.8KilometersKm of road constructed1091123500 NGONG ROAD(NATIONAL LIBRARY- RINGROAD KILIMANI) (100%JICA) Phase
000Designs approvedKm of road constructed1091123600 IMPROVEMENTOF TRAFFIC MANAGEMENTSYSTESM- NAIROBI ITSdesign, Ins
111Capacity Building reportTechnical capacity1091123700 InstitutionalCapacity Building And ICT
0036Number of kilometersKm of road constructed1091124100 Missing LinksFrom Embakasi ArmyBarracks At Eastern Bypass –Kayole
0025Number of kilometersKm of road constructed1091124200 Valley Road,Ngong Road/KenyattaAvenue/ Nyerere RoadJunctions, Sta
0040Number of bypasses/KilometersKm of road constructed1091124400 Suneka –Kiogoro By Pass, Kiogoro –Kegati By Pass, Nyakoe –Kegati
222Identified Corridors reportKm of road mapped1091124700 IdentificationAnd Mapping Of ServicesWithin Road Reserve
003KilometersKm of road constructed1091124800 Dualing ofEastern and Northern Bypass,Naiorbi
132Number of designsKm of road constructed1091124900 Ngong Road -Naivasha Road - A104(dualling)- Design
060%40%Number of junctions/rateDe-congested City roads1091125000 Nairobi RoadsRapid DecongestionProgramme (Phase II) -
259

PART E. SUMMARY OF PROGRAMME OUTPUTS AND PERFORMANCE INDICATORS FOR 2016/2017 - 2018/2019
1091 State Department of Infrastructure
Annex Of Jun
442Number of kilometersKm of road constructed1091125100 Dualing ofNgong Road Phase II (AdamsArcade - Ngong Town-Kiserian,
303015Volume/percentage of workdone
Over-bridge and inter-changesconstructed
1091125200 Upper hill / railover bridge-Langata/hailessalaseoverpasses/ City
303020% Number of feasibility studiesconducted
Km of road constructed1091125300 FeasibilityStudies For Upgrading Of AllCounty Headquarter Roads
1285kilometers of bypass-roadKm of road constructed1091125400 Kisii By-Pass
1073kilometers of bypass-roadKm of road constructed1091125500 Kericho By-Pass
1284kilometers of bypass-roadKm of road constructed1091125600 Nyahururu By-Pass
3.01.50.9Number of kilometers/roadsKm of road constructed1091125900 Eastlands RoadsPhase II
25%15%0Number of kilometers/ % ofwork done
Inter-change constructed1091126200 Nairobi EasternInterchanges (Landhies -Jogoo Road Corridor)
203030Junctions ImprovedKm of road constructed1091126400 Nairobi RaodsRapid DecongestionProgramme
800600537Number of kilometersKm of road constructed1091128000 Annuity LowVolume Seal Roads
260

PART E. SUMMARY OF PROGRAMME OUTPUTS AND PERFORMANCE INDICATORS FOR 2016/2017 - 2018/2019
1091 State Department of Infrastructure
033Number of kilometersKm of road constructed1091132100 Lenana-Muchugia-Dagoretti Market
0202020 SP. 2.2 Rehabilitation of RoadsSub Programme:
Key Output (KO)Targets
2018/2019Targets
2017/2018Key Performance Indicators
(KPIs)Targets
2016/2017Delivery Unit
444Number of reportsMonitoring & Evaluation reports1091000800 Other Roads
50239408Number of Kilometerskm of road rehabilitated1091100200 Roads 2000Phase II
202034Number of Kilometerskm of road rehabilitated1091101200 Kenya TransportSector Support Programme
1550Number of Kilometerskm of road rehabilitated1091101300 National UrbanTransport ImprovementProject (NUTRIP)
07.60Number of kilometerskm of road rehabilitated1091102700 Kamukunywa -Kaptama – Kapsokwony –Sirisia (D275) Road
0015.5Number of kilometerskm of road rehabilitated1091102800 Sotik -Cheborge-Roret -Kebenet -SigowetRoad (D226)/Litein -Cheborge
02024Number of Kilometerskm of road rehabilitated1091102900 Naro Moru -Munyu - Karisheni
000Number of Kilometerskm of road rehabilitated1091103000 Iten - KapsowarPhase I
0010Number of Kilometerskm of road rehabilitated1091103100 Nambengele -Rwambwa - Port Victoria
261
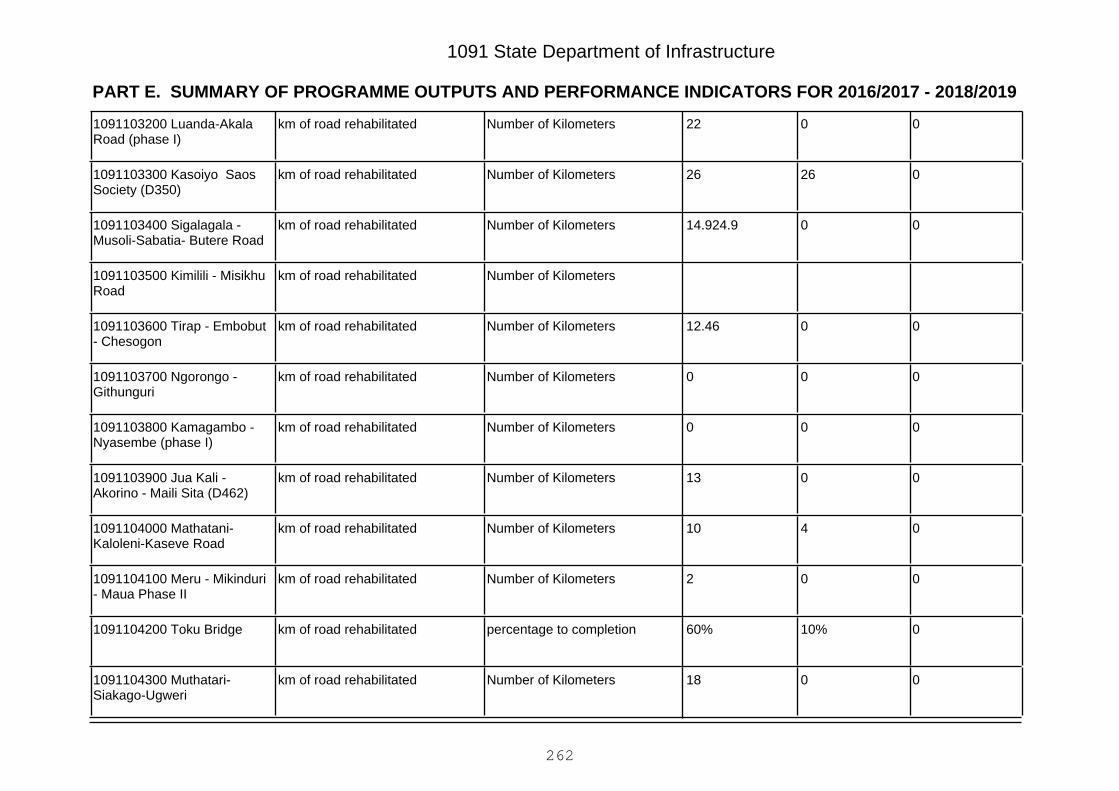
PART E. SUMMARY OF PROGRAMME OUTPUTS AND PERFORMANCE INDICATORS FOR 2016/2017 - 2018/2019
1091 State Department of Infrastructure
0022Number of Kilometerskm of road rehabilitated1091103200 Luanda-AkalaRoad (phase I)
02626Number of Kilometerskm of road rehabilitated1091103300 Kasoiyo SaosSociety (D350)
0014.924.9Number of Kilometerskm of road rehabilitated1091103400 Sigalagala -Musoli-Sabatia- Butere Road
Number of Kilometerskm of road rehabilitated1091103500 Kimilili - MisikhuRoad
0012.46Number of Kilometerskm of road rehabilitated1091103600 Tirap - Embobut- Chesogon
000Number of Kilometerskm of road rehabilitated1091103700 Ngorongo -Githunguri
000Number of Kilometerskm of road rehabilitated1091103800 Kamagambo -Nyasembe (phase I)
0013Number of Kilometerskm of road rehabilitated1091103900 Jua Kali -Akorino - Maili Sita (D462)
0410Number of Kilometerskm of road rehabilitated1091104000 Mathatani-Kaloleni-Kaseve Road
002Number of Kilometerskm of road rehabilitated1091104100 Meru - Mikinduri- Maua Phase II
010%60%percentage to completionkm of road rehabilitated1091104200 Toku Bridge
0018Number of Kilometerskm of road rehabilitated1091104300 Muthatari-Siakago-Ugweri
262

PART E. SUMMARY OF PROGRAMME OUTPUTS AND PERFORMANCE INDICATORS FOR 2016/2017 - 2018/2019
1091 State Department of Infrastructure
0015Number of Kilometerskm of road rehabilitated1091104400 St. Mary's-Kinooro, Igoji TeachersCollege & Kanyakine AccessRoads
008Number of Kilometerskm of road rehabilitated1091104500 Riruta-Ndunyu
005.7Number of Kilometerskm of road rehabilitated1091104600 Juakali-Sugoi
02020Number of Kilometerskm of road rehabilitated1091104700 Muranga - Gitugi
0010Number of Kilometerskm of road rehabilitated1091104800 Mairi -Makomboki
Number of Kilometerskm of road rehabilitated1091104900 Lanet -Elementaita - Mau Narok (D320) Road
000Number of Kilometerskm of road rehabilitated1091105000 Moi North LakeRoad Naivasha
003.0Number of Kilometerskm of road rehabilitated1091105100 Mosoriot -Chepterwai - Kipkaren River
008.2Number of Kilometerskm of road rehabilitated1091105200 Manga-Kemera-Amabuko (D223/D221)
01012Number of Kilometerskm of road rehabilitated1091105300 Giakanja -TetuMission Road(D4340
01013.0Number of Kilometerskm of road rehabilitated1091105400 Mweiga-Brookside-Kimathi University(D449/D450A)
263
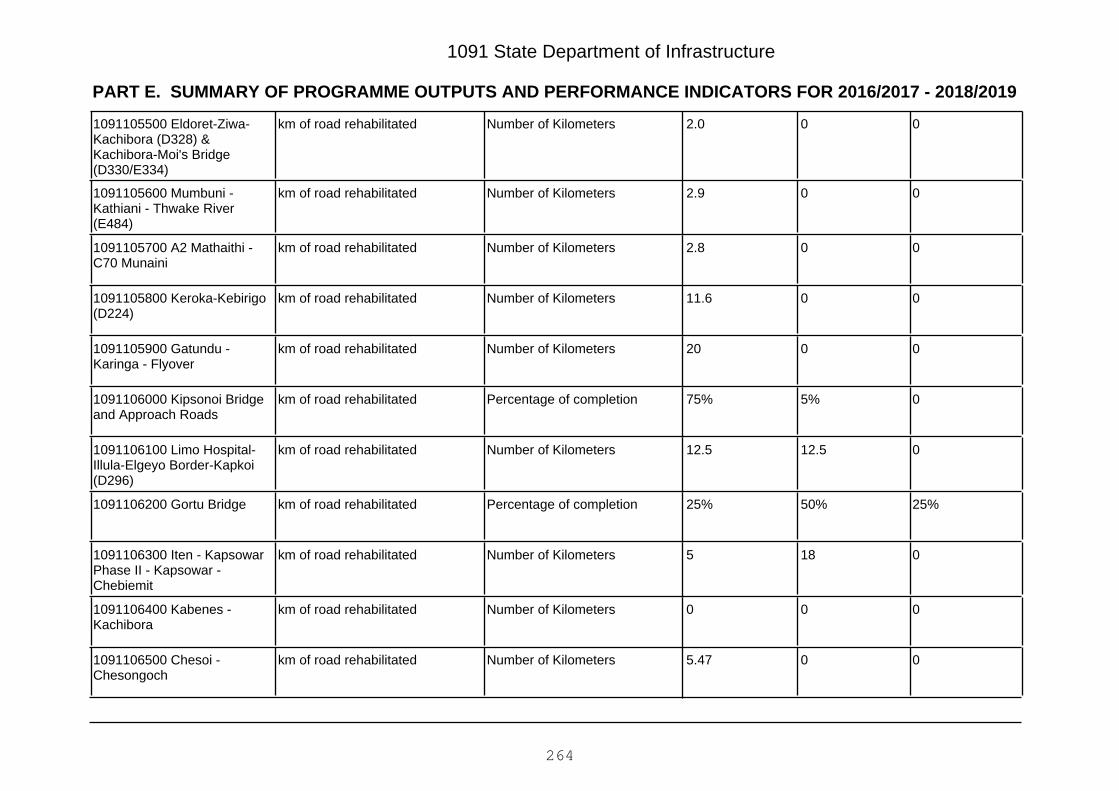
PART E. SUMMARY OF PROGRAMME OUTPUTS AND PERFORMANCE INDICATORS FOR 2016/2017 - 2018/2019
1091 State Department of Infrastructure
002.0Number of Kilometerskm of road rehabilitated1091105500 Eldoret-Ziwa-Kachibora (D328) &Kachibora-Moi's Bridge(D330/E334)
002.9Number of Kilometerskm of road rehabilitated1091105600 Mumbuni -Kathiani - Thwake River(E484)
002.8Number of Kilometerskm of road rehabilitated1091105700 A2 Mathaithi -C70 Munaini
0011.6Number of Kilometerskm of road rehabilitated1091105800 Keroka-Kebirigo(D224)
0020Number of Kilometerskm of road rehabilitated1091105900 Gatundu -Karinga - Flyover
05%75%Percentage of completionkm of road rehabilitated1091106000 Kipsonoi Bridgeand Approach Roads
012.512.5Number of Kilometerskm of road rehabilitated1091106100 Limo Hospital-Illula-Elgeyo Border-Kapkoi(D296)
25%50%25%Percentage of completionkm of road rehabilitated1091106200 Gortu Bridge
0185Number of Kilometerskm of road rehabilitated1091106300 Iten - KapsowarPhase II - Kapsowar -Chebiemit
000Number of Kilometerskm of road rehabilitated1091106400 Kabenes -Kachibora
005.47Number of Kilometerskm of road rehabilitated1091106500 Chesoi -Chesongoch
264
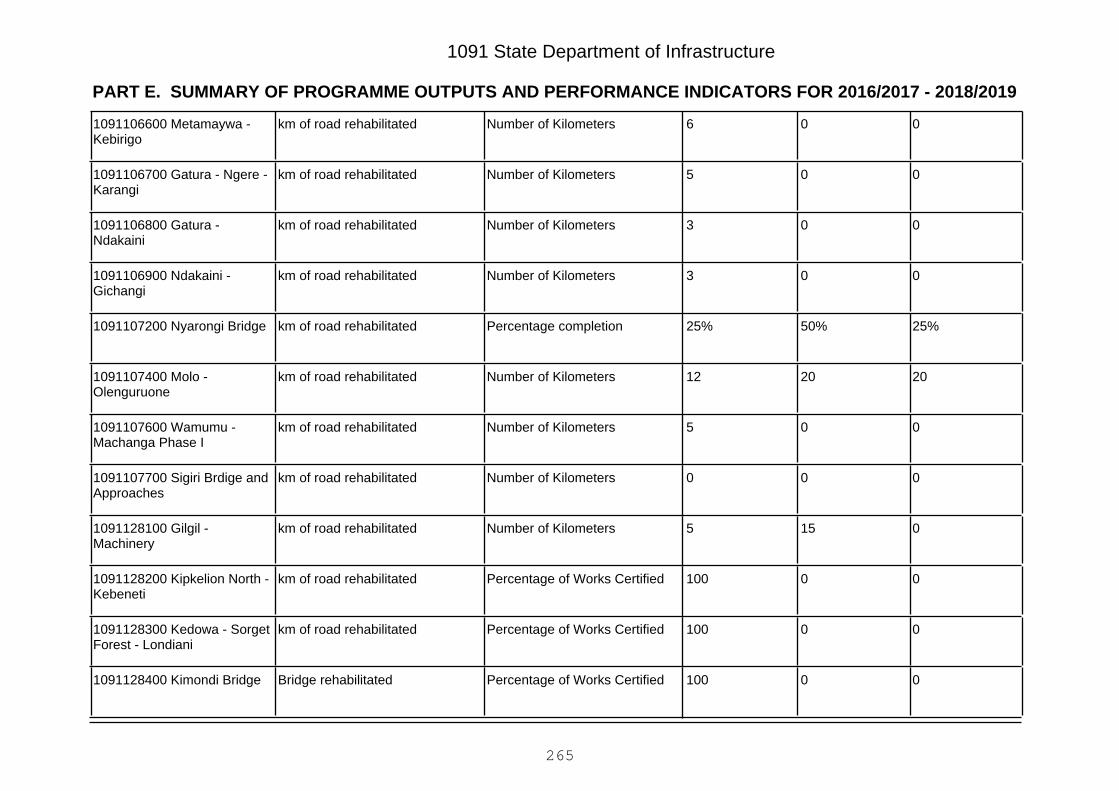
PART E. SUMMARY OF PROGRAMME OUTPUTS AND PERFORMANCE INDICATORS FOR 2016/2017 - 2018/2019
1091 State Department of Infrastructure
006Number of Kilometerskm of road rehabilitated1091106600 Metamaywa -Kebirigo
005Number of Kilometerskm of road rehabilitated1091106700 Gatura - Ngere -Karangi
003Number of Kilometerskm of road rehabilitated1091106800 Gatura -Ndakaini
003Number of Kilometerskm of road rehabilitated1091106900 Ndakaini -Gichangi
25%50%25%Percentage completionkm of road rehabilitated1091107200 Nyarongi Bridge
202012Number of Kilometerskm of road rehabilitated1091107400 Molo -Olenguruone
005Number of Kilometerskm of road rehabilitated1091107600 Wamumu -Machanga Phase I
000Number of Kilometerskm of road rehabilitated1091107700 Sigiri Brdige andApproaches
0155Number of Kilometerskm of road rehabilitated1091128100 Gilgil -Machinery
00100Percentage of Works Certifiedkm of road rehabilitated1091128200 Kipkelion North -Kebeneti
00100Percentage of Works Certifiedkm of road rehabilitated1091128300 Kedowa - SorgetForest - Londiani
00100Percentage of Works CertifiedBridge rehabilitated1091128400 Kimondi Bridge
265

PART E. SUMMARY OF PROGRAMME OUTPUTS AND PERFORMANCE INDICATORS FOR 2016/2017 - 2018/2019
1091 State Department of Infrastructure
00100Percentage of Works CertifiedBridge rehabilitated1091128500 Kaberer/MalabaBridge
05.74Number of Kilometerskm of road rehabilitated1091128600 Riosiri - Ensoko -Nyabigena - Ogembo
00100Percentage of Works Certifiedkm of road rehabilitated1091128700 Kipawa - EkaTano
00100Percentage of Works Certifiedkm of road rehabilitated1091128800 E263 - JunctionC57 Engentia
00100Percentage of Works Certifiedkm of road rehabilitated1091128900 Korowe - Nduru
00100Percentage of Works Certifiedkm of road rehabilitated1091129000 Tarbaj - Batalu
00100Percentage of Works Certifiedkm of road rehabilitated1091129100 Ndovu Crescent/Ndovu Lane
00100Percentage of Works Certifiedkm of road rehabilitated1091129200 Gwa Kiongo -Tumaini
00100Percentage of Works Certifiedkm of road rehabilitated1091129300 Kadel - Kodula
085Number of Kilometerskm of road rehabilitated1091129400 Githembe -Mathareini -
00100Percentage of Works Certifiedkm of road rehabilitated1091129500 Maili Kumi -Solai - Subukia
--20Number of Kilometerskm of road rehabilitated1091129600 Othaya - Karima- Kiandu
266

PART E. SUMMARY OF PROGRAMME OUTPUTS AND PERFORMANCE INDICATORS FOR 2016/2017 - 2018/2019
1091 State Department of Infrastructure
00100Percentage of Works Certifiedkm of road rehabilitated1091129700 Zombe - Mutito
00100Percentage of Works Certifiedkm of road rehabilitated1091129800 C556 Gacharage- Wanugu - Wamwangi - Juja
00100Percentage of Works Certifiedkm of road rehabilitated1091129900 C558 Gitithia-Escarpment- Matathia-Kimende
00100Percentage of Works Certifiedkm of road rehabilitated1091130000 C593 Konyao-Kainuk
00100Percentage of Works Certifiedkm of road rehabilitated1091130100 Chepereria-Ptoyo
00100Percentage of Works Certifiedkm of road rehabilitated1091130200 D249 Sidindi -Muthiero
00100Percentage of Works Certifiedkm of road rehabilitated1091130300 D204 A1 Ranen- Maroo
00100Percentage of Works Certifiedkm of road rehabilitated1091130400 Elburgon -Salgaa - Rongai
00100Percentage of Works Certifiedkm of road rehabilitated1091130500 Busia- Mayenje -Mundika
00100Percentage of Works Certifiedkm of road rehabilitated1091130600 D249 Siaya -Yala Swamp
03020Number of Kilometerskm of road rehabilitated1091130700 Kipsigak - Serem- Shamakhokho
01025Number of Kilometerskm of road rehabilitated1091130800 Murang'a -Kiriani
267
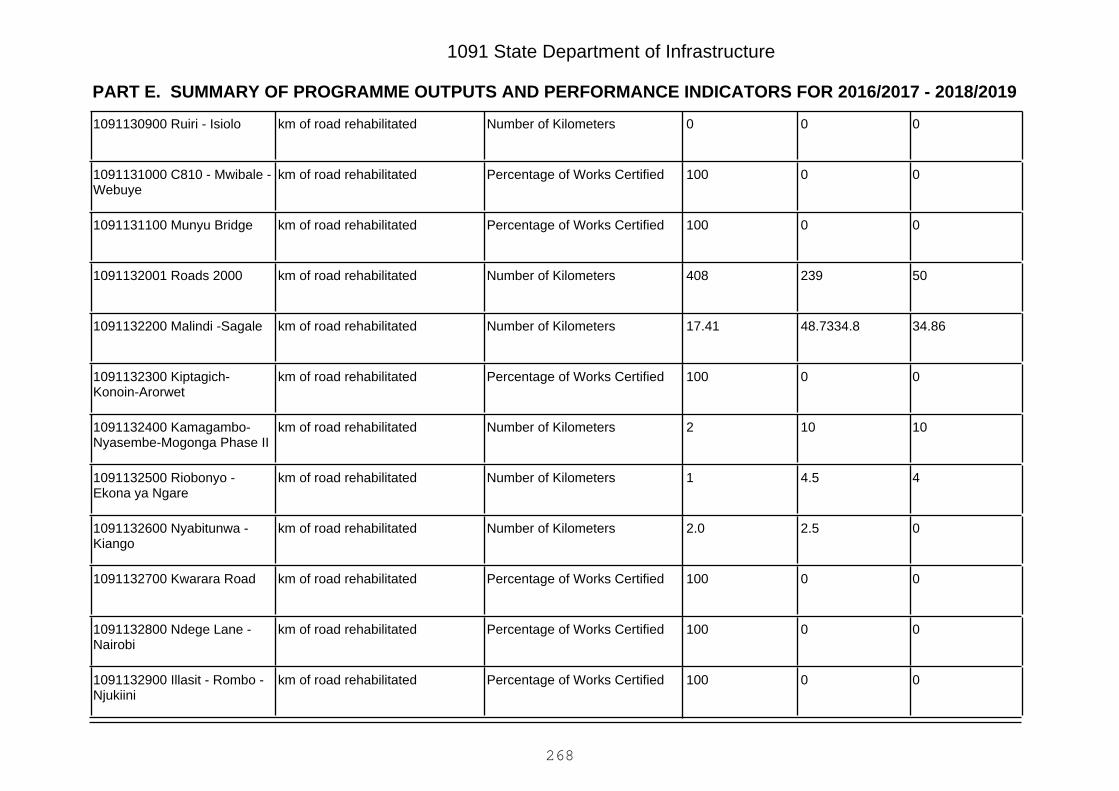
PART E. SUMMARY OF PROGRAMME OUTPUTS AND PERFORMANCE INDICATORS FOR 2016/2017 - 2018/2019
1091 State Department of Infrastructure
000Number of Kilometerskm of road rehabilitated1091130900 Ruiri - Isiolo
00100Percentage of Works Certifiedkm of road rehabilitated1091131000 C810 - Mwibale -Webuye
00100Percentage of Works Certifiedkm of road rehabilitated1091131100 Munyu Bridge
50239408Number of Kilometerskm of road rehabilitated1091132001 Roads 2000
34.8648.7334.817.41Number of Kilometerskm of road rehabilitated1091132200 Malindi -Sagale
00100Percentage of Works Certifiedkm of road rehabilitated1091132300 Kiptagich-Konoin-Arorwet
10102Number of Kilometerskm of road rehabilitated1091132400 Kamagambo-Nyasembe-Mogonga Phase II
44.51Number of Kilometerskm of road rehabilitated1091132500 Riobonyo -Ekona ya Ngare
02.52.0Number of Kilometerskm of road rehabilitated1091132600 Nyabitunwa -Kiango
00100Percentage of Works Certifiedkm of road rehabilitated1091132700 Kwarara Road
00100Percentage of Works Certifiedkm of road rehabilitated1091132800 Ndege Lane -Nairobi
00100Percentage of Works Certifiedkm of road rehabilitated1091132900 Illasit - Rombo -Njukiini
268

PART E. SUMMARY OF PROGRAMME OUTPUTS AND PERFORMANCE INDICATORS FOR 2016/2017 - 2018/2019
1091 State Department of Infrastructure
00100Percentage of Works Certifiedkm of road rehabilitated1091133000 Nkama -Inkisanjani
00100Percentage of Works Certifiedkm of road rehabilitated1091133100 Thimjope -Bware
00100Percentage of Works Certifiedkm of road rehabilitated1091133200 Adera Bridge
00100Percentage of Works Certifiedkm of road rehabilitated1091133300 Buruduras -Kiliwehiri
00100Percentage of Works Certifiedkm of road rehabilitated1091133400 C311 Drift Benilo- Lulis - Malkamari
00100Percentage of Works Certifiedkm of road rehabilitated1091133500 Kodula - HomaHills Center
02.21Number of Kilometerskm of road rehabilitated1091133600 Ikoba - Tabaka -Riosiri
179.92179.9289.96Number of Kilometerskm of road rehabilitated1091133700 Low VolumeSealed Roads (Lvsr); Phase 1- Batch 1A
661661332Number of Kilometerskm of road rehabilitated1091133800 Low VolumeSeals Phase 1 Batch 2
16516581Number of Kilometerskm of road rehabilitated1091133900 Low VolumeSeals Phase 1 Batch 2
01010Number of Kilometerskm of road rehabilitated1091134000 Ogembo -Tabaka - Nyanchenge
179.92179.9289.96Number of Kilometerskm of road rehabilitated1091134100 Low VolumeSeal Roads Batch 1
269
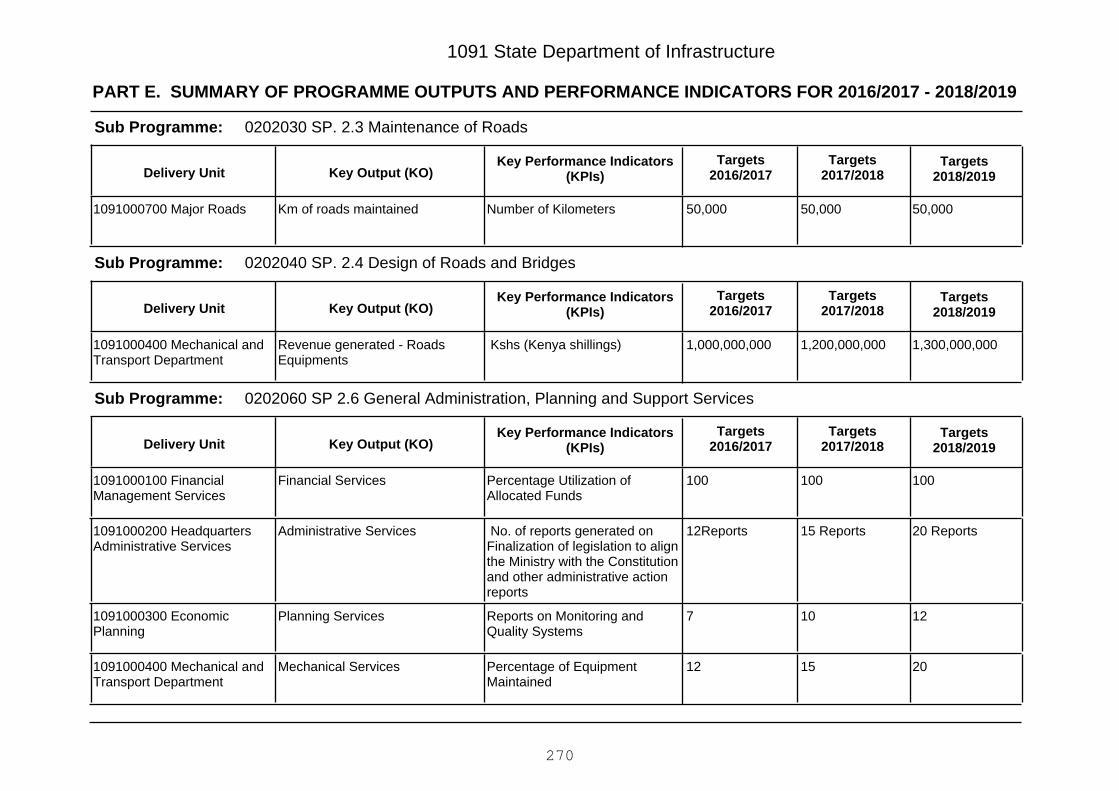
PART E. SUMMARY OF PROGRAMME OUTPUTS AND PERFORMANCE INDICATORS FOR 2016/2017 - 2018/2019
1091 State Department of Infrastructure
0202030 SP. 2.3 Maintenance of RoadsSub Programme:
Key Output (KO)Targets
2018/2019Targets
2017/2018Key Performance Indicators
(KPIs)Targets
2016/2017Delivery Unit
50,00050,00050,000Number of KilometersKm of roads maintained1091000700 Major Roads
0202040 SP. 2.4 Design of Roads and BridgesSub Programme:
Key Output (KO)Targets
2018/2019Targets
2017/2018Key Performance Indicators
(KPIs)Targets
2016/2017Delivery Unit
1,300,000,0001,200,000,0001,000,000,000 Kshs (Kenya shillings)Revenue generated - RoadsEquipments
1091000400 Mechanical andTransport Department
0202060 SP 2.6 General Administration, Planning and Support ServicesSub Programme:
Key Output (KO)Targets
2018/2019Targets
2017/2018Key Performance Indicators
(KPIs)Targets
2016/2017Delivery Unit
100100100Percentage Utilization ofAllocated Funds
Financial Services1091000100 FinancialManagement Services
20 Reports15 Reports12Reports No. of reports generated onFinalization of legislation to alignthe Ministry with the Constitutionand other administrative actionreports
Administrative Services1091000200 HeadquartersAdministrative Services
12107Reports on Monitoring andQuality Systems
Planning Services1091000300 EconomicPlanning
201512Percentage of EquipmentMaintained
Mechanical Services1091000400 Mechanical andTransport Department
270
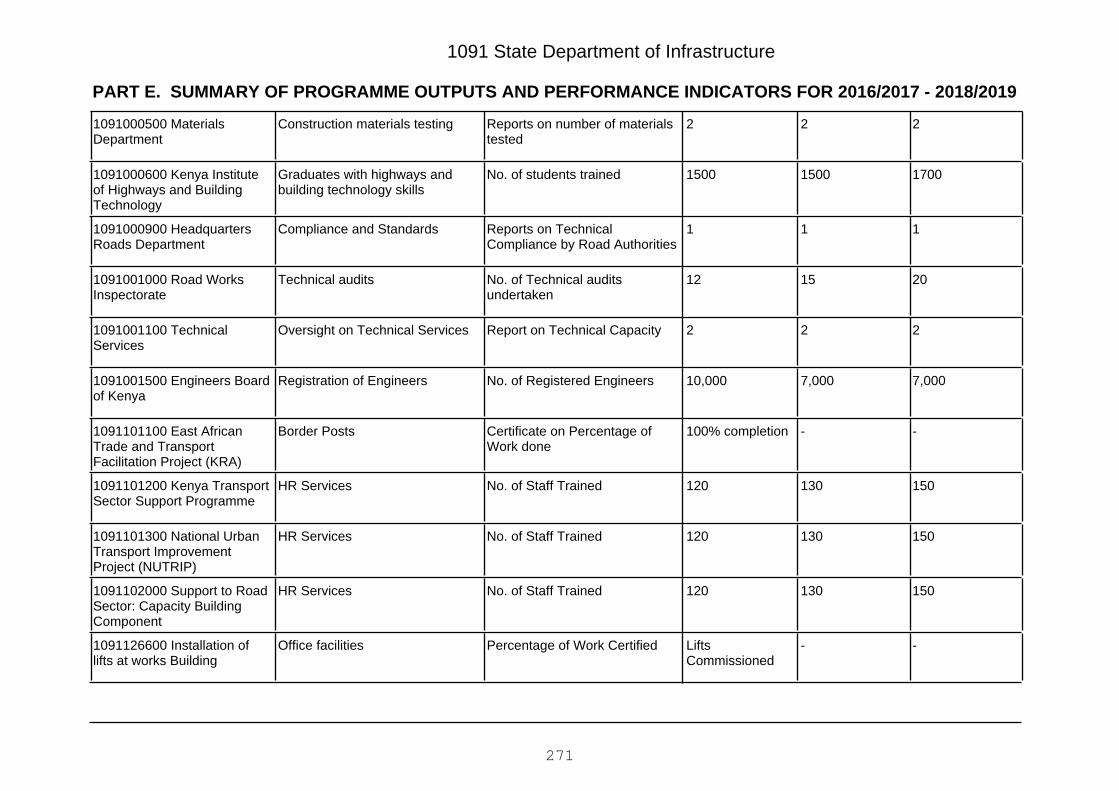
PART E. SUMMARY OF PROGRAMME OUTPUTS AND PERFORMANCE INDICATORS FOR 2016/2017 - 2018/2019
1091 State Department of Infrastructure
222Reports on number of materialstested
Construction materials testing1091000500 MaterialsDepartment
170015001500No. of students trainedGraduates with highways andbuilding technology skills
1091000600 Kenya Instituteof Highways and BuildingTechnology
111Reports on TechnicalCompliance by Road Authorities
Compliance and Standards1091000900 HeadquartersRoads Department
201512No. of Technical auditsundertaken
Technical audits1091001000 Road WorksInspectorate
222Report on Technical CapacityOversight on Technical Services1091001100 TechnicalServices
7,0007,00010,000No. of Registered EngineersRegistration of Engineers1091001500 Engineers Boardof Kenya
--100% completionCertificate on Percentage ofWork done
Border Posts1091101100 East AfricanTrade and TransportFacilitation Project (KRA)
150130120No. of Staff TrainedHR Services1091101200 Kenya TransportSector Support Programme
150130120No. of Staff TrainedHR Services1091101300 National UrbanTransport ImprovementProject (NUTRIP)
150130120No. of Staff TrainedHR Services1091102000 Support to RoadSector: Capacity BuildingComponent
--LiftsCommissioned
Percentage of Work CertifiedOffice facilities1091126600 Installation oflifts at works Building
271

PART E. SUMMARY OF PROGRAMME OUTPUTS AND PERFORMANCE INDICATORS FOR 2016/2017 - 2018/2019
1091 State Department of Infrastructure
442Monitoring and EvaluationReports on Maintenance Levels
Maintenance and RehabilitationServices
1091126700 MechanicalYards maintenance andrehabilitation
201512No. of Reports on ResearchResearch on ConstructionMaterials
1091126900 Modernization ofMaterials Testing andResearch facilities Phase One
100%100%100%Percentage of Work CertifiedMaintenance and RehabilitationServices
1091127000 Renovation ofhostels - KIHBT- MainCampus
75% certifiedworks
30% certifiedworks
Payment ofMobilization Feesto Contractor
Percentage of Work doneResource Centre Constructed1091127100 Construction ofTraining Resource Centre-KIHBT Ngong Campus PhaseOne
250250240No. of Students practicallytrained
Maintenance and RehabilitationServices
1091127200 Rehabilitatingand Maintenance of TrainingSites- KIHBT-Ngong Campus
75% certifiedworks
30% certifiedworks
Payment ofMobilization Feesto Contractor
Percentage of Work doneTraining facilities1091127300 Hostelconstruction - KIHBT - KisiiCampus
250250240No. of Students practicallytrained
Maintenance and RehabilitationServices
1091127400 Overhaul andMaintenance of Training Sitesat Kisii Campus of KIHBT
75% certifiedworks
30% certifiedworks
Payment ofMobilization Feesto Contractor
Percentage of Work doneTraining facilities1091127500 Construction ofmultipurpose Hall - KIHBT -Kisii Campus
4 Reports3 Reports2 ReportsNo. of Monitoring andEvaluation Reports
Planning Services1091127600 Roads projectmonitoring and evaluation
---Percentage of Work CertifiedGalana River Bridge1091127700 Construction ofBridge over Galana River
nilnil20Number of kilometerskm of road constructed1091127800 Improvement ofRoads in Mt. Kenya andArberdare National Park
272
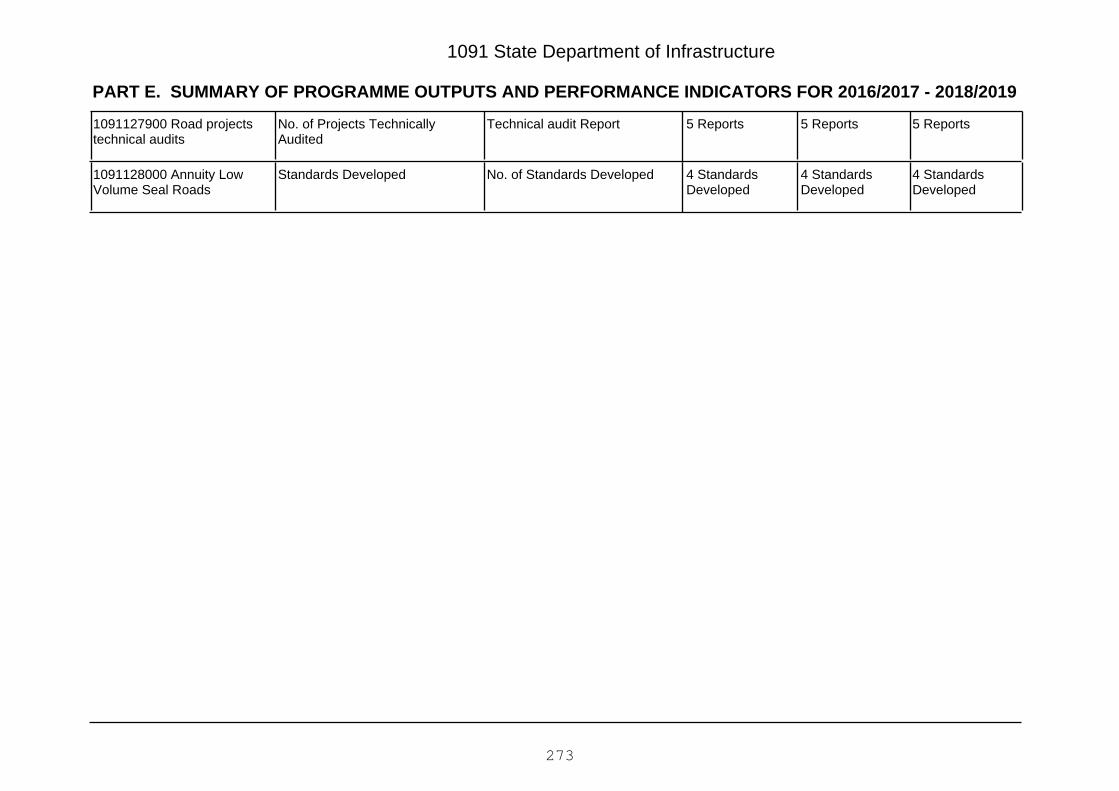
PART E. SUMMARY OF PROGRAMME OUTPUTS AND PERFORMANCE INDICATORS FOR 2016/2017 - 2018/2019
1091 State Department of Infrastructure
5 Reports5 Reports5 ReportsTechnical audit ReportNo. of Projects TechnicallyAudited
1091127900 Road projectstechnical audits
4 StandardsDeveloped
4 StandardsDeveloped
4 StandardsDeveloped
No. of Standards DevelopedStandards Developed1091128000 Annuity LowVolume Seal Roads
273
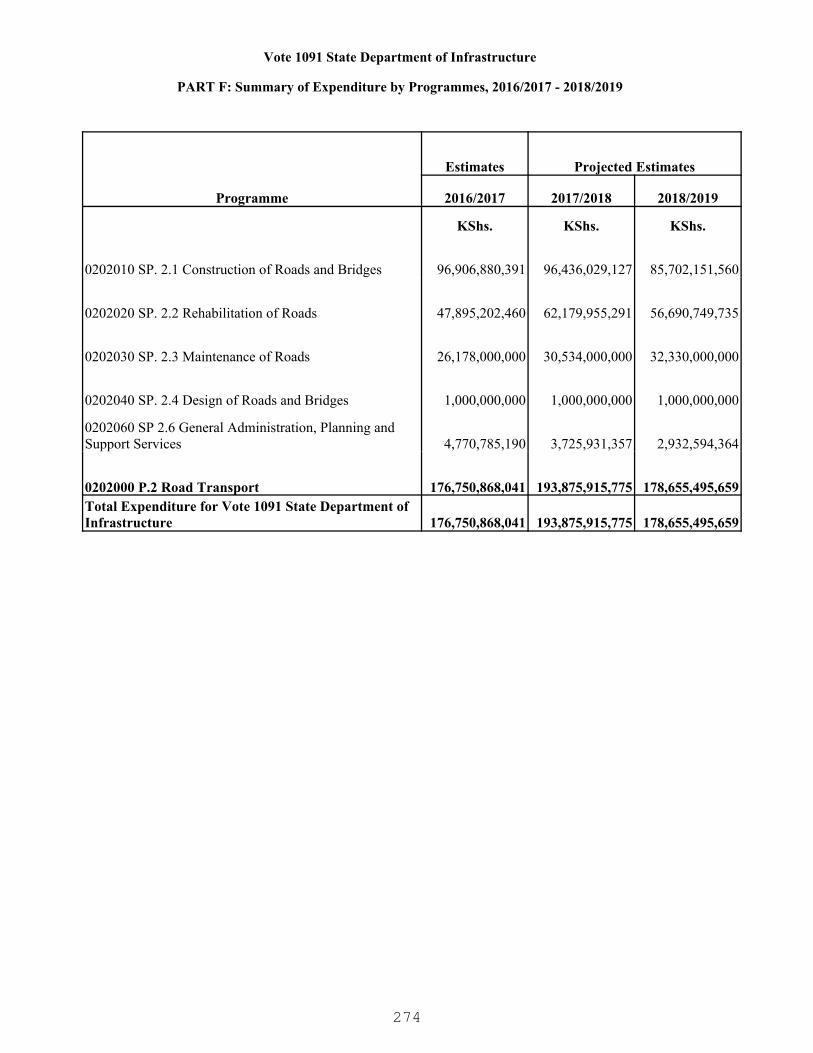
Vote 1091 State Department of Infrastructure
PART F: Summary of Expenditure by Programmes, 2016/2017 - 2018/2019
Programme
Estimates Projected Estimates
2016/2017 2017/2018 2018/2019
KShs. KShs. KShs.
0202010 SP. 2.1 Construction of Roads and Bridges 96,906,880,391 96,436,029,127 85,702,151,560
0202020 SP. 2.2 Rehabilitation of Roads 47,895,202,460 62,179,955,291 56,690,749,735
0202030 SP. 2.3 Maintenance of Roads 26,178,000,000 30,534,000,000 32,330,000,000
0202040 SP. 2.4 Design of Roads and Bridges 1,000,000,000 1,000,000,000 1,000,000,000
0202060 SP 2.6 General Administration, Planning and Support Services 4,770,785,190 3,725,931,357 2,932,594,364
0202000 P.2 Road Transport 176,750,868,041 193,875,915,775 178,655,495,659Total Expenditure for Vote 1091 State Department of Infrastructure 176,750,868,041 193,875,915,775 178,655,495,659
274

1091 State Department of Infrastructure
PART G: Summary of Expenditure by Vote and Economic Classification, 2016/2017 - 2018/2019
Economic Classification
Estimates Projected Estimates
2016/2017 2017/2018 2018/2019KShs. KShs. KShs.
Current Expenditure 29,039,085,190 33,682,671,357 35,567,794,364
Compensation to Employees 1,264,533,520 1,335,671,357 1,380,794,364
Use of Goods and Services 354,517,958 487,911,372 525,945,622
Current Transfers to Govt. Agencies 27,408,500,000 31,838,000,000 33,634,000,000
Other Recurrent 11,533,712 21,088,628 27,054,378
Capital Expenditure 147,711,782,851 160,193,244,418 143,087,701,295
Acquisition of Non-Financial Assets 10,811,700,000 10,513,260,000 10,205,800,000
Capital Grants to Govt. Agencies 134,933,082,851 148,702,984,418 132,684,901,295
Other Development 1,967,000,000 977,000,000 197,000,000Total Expenditure 176,750,868,041 193,875,915,775 178,655,495,659
275
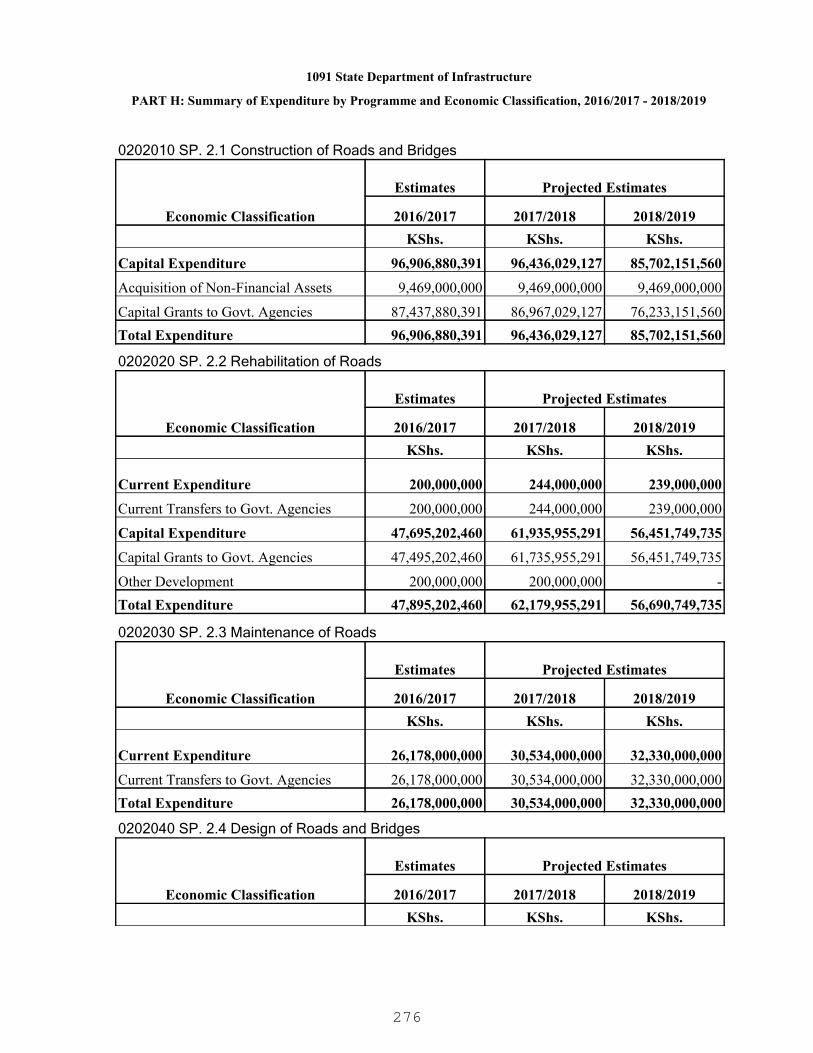
1091 State Department of Infrastructure
PART H: Summary of Expenditure by Programme and Economic Classification, 2016/2017 - 2018/2019
0202010 SP. 2.1 Construction of Roads and Bridges
Economic Classification
Estimates Projected Estimates
2016/2017 2017/2018 2018/2019KShs. KShs. KShs.
Capital Expenditure 96,906,880,391 96,436,029,127 85,702,151,560
Acquisition of Non-Financial Assets 9,469,000,000 9,469,000,000 9,469,000,000
Capital Grants to Govt. Agencies 87,437,880,391 86,967,029,127 76,233,151,560Total Expenditure 96,906,880,391 96,436,029,127 85,702,151,560
0202020 SP. 2.2 Rehabilitation of Roads
Economic Classification
Estimates Projected Estimates
2016/2017 2017/2018 2018/2019KShs. KShs. KShs.
Current Expenditure 200,000,000 244,000,000 239,000,000
Current Transfers to Govt. Agencies 200,000,000 244,000,000 239,000,000
Capital Expenditure 47,695,202,460 61,935,955,291 56,451,749,735
Capital Grants to Govt. Agencies 47,495,202,460 61,735,955,291 56,451,749,735
Other Development 200,000,000 200,000,000 -Total Expenditure 47,895,202,460 62,179,955,291 56,690,749,735
0202030 SP. 2.3 Maintenance of Roads
Economic Classification
Estimates Projected Estimates
2016/2017 2017/2018 2018/2019KShs. KShs. KShs.
Current Expenditure 26,178,000,000 30,534,000,000 32,330,000,000
Current Transfers to Govt. Agencies 26,178,000,000 30,534,000,000 32,330,000,000Total Expenditure 26,178,000,000 30,534,000,000 32,330,000,000
0202040 SP. 2.4 Design of Roads and Bridges
Economic Classification
Estimates Projected Estimates
2016/2017 2017/2018 2018/2019KShs. KShs. KShs.
276
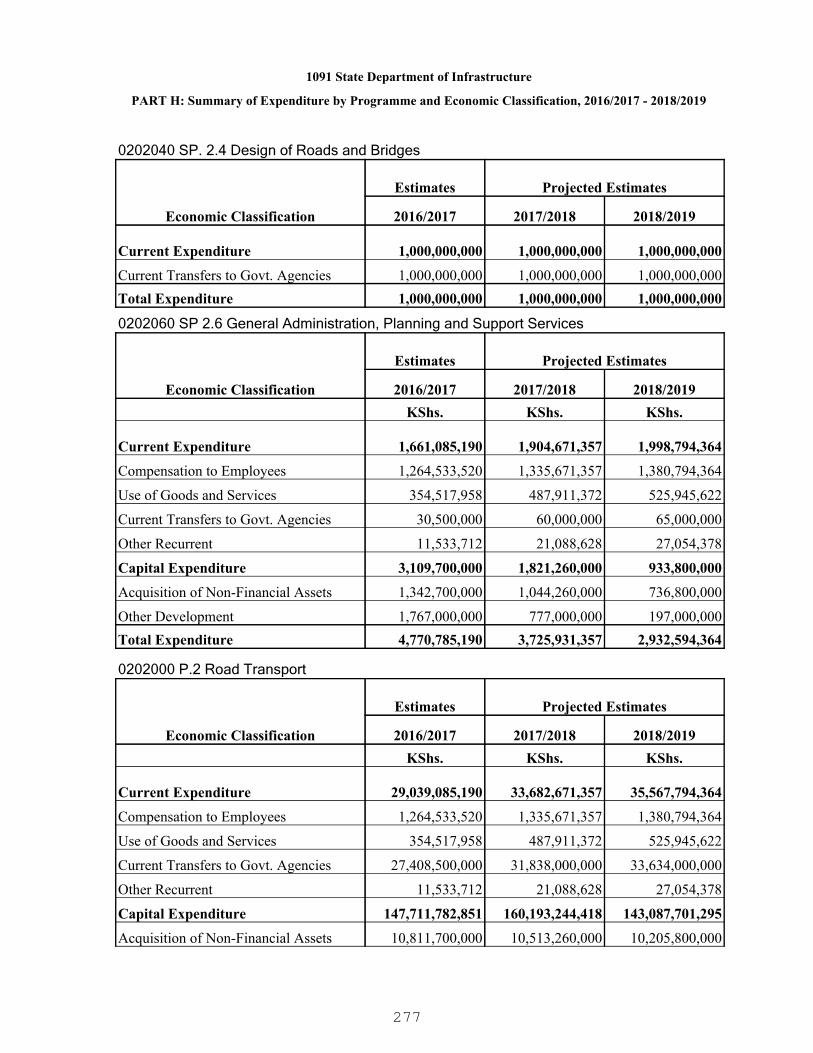
1091 State Department of Infrastructure
PART H: Summary of Expenditure by Programme and Economic Classification, 2016/2017 - 2018/2019
0202040 SP. 2.4 Design of Roads and Bridges
Economic Classification
Estimates Projected Estimates
2016/2017 2017/2018 2018/2019
Current Expenditure 1,000,000,000 1,000,000,000 1,000,000,000
Current Transfers to Govt. Agencies 1,000,000,000 1,000,000,000 1,000,000,000Total Expenditure 1,000,000,000 1,000,000,000 1,000,000,000
0202060 SP 2.6 General Administration, Planning and Support Services
Economic Classification
Estimates Projected Estimates
2016/2017 2017/2018 2018/2019KShs. KShs. KShs.
Current Expenditure 1,661,085,190 1,904,671,357 1,998,794,364
Compensation to Employees 1,264,533,520 1,335,671,357 1,380,794,364
Use of Goods and Services 354,517,958 487,911,372 525,945,622
Current Transfers to Govt. Agencies 30,500,000 60,000,000 65,000,000
Other Recurrent 11,533,712 21,088,628 27,054,378
Capital Expenditure 3,109,700,000 1,821,260,000 933,800,000
Acquisition of Non-Financial Assets 1,342,700,000 1,044,260,000 736,800,000
Other Development 1,767,000,000 777,000,000 197,000,000Total Expenditure 4,770,785,190 3,725,931,357 2,932,594,364
0202000 P.2 Road Transport
Economic Classification
Estimates Projected Estimates
2016/2017 2017/2018 2018/2019KShs. KShs. KShs.
Current Expenditure 29,039,085,190 33,682,671,357 35,567,794,364
Compensation to Employees 1,264,533,520 1,335,671,357 1,380,794,364
Use of Goods and Services 354,517,958 487,911,372 525,945,622
Current Transfers to Govt. Agencies 27,408,500,000 31,838,000,000 33,634,000,000
Other Recurrent 11,533,712 21,088,628 27,054,378
Capital Expenditure 147,711,782,851 160,193,244,418 143,087,701,295
Acquisition of Non-Financial Assets 10,811,700,000 10,513,260,000 10,205,800,000
277

1091 State Department of Infrastructure
PART H: Summary of Expenditure by Programme and Economic Classification, 2016/2017 - 2018/2019
0202000 P.2 Road Transport
Economic Classification
Estimates Projected Estimates
2016/2017 2017/2018 2018/2019
Capital Grants to Govt. Agencies 134,933,082,851 148,702,984,418 132,684,901,295
Other Development 1,967,000,000 977,000,000 197,000,000Total Expenditure 176,750,868,041 193,875,915,775 178,655,495,659
278

1092 State Department of Transport
A global leader in transport infrastructure and logistics
To develop, operate and sustain world class transport infrastructure and services
PART A. Vision
PART B. Mission
PART C. Performance Overview and Background for Programme(s) Funding
PART D. Programme Objectives
The mandate of the State Department of Transport is to formulate transport policies to guidein the development of the sector and to develop an enabling regulatory framework for thetransport sector to ensure effective service delivery that conforms to international standards.
The State Department of Transport budgetary allocations have increased over the years fromKSh. 17.5 billion in FY 2012/13 to KSh. 35.8 billion in FY 2013/14 and KSh.187.7 billion in FY2014/15 and KSh.169.3 billion in FY 2015/16 in support of railway expansion. Some of thekey achievements realized by the department during the period under review were; control ofroad fatalities; completed Syokimau railway station and spur lines; refurbishment of Nairobirailway stations; completion and launching of Makadara and Imara Daima railway line;construction of 1816 housing units out of the expected 9005 units under the relocation actionplan for Kibera and Mukuru.
Other key achievements include: launching of port community charter ; commissioning ofberth 19; reduction in dwelling time for container clearance from 6 to 3 days; operationalizedMerchants and Shipping Act , 2009; completed dredging of Mombasa port to a depth of 15meters in order to accommodate post panama vessels; completion of second containerterminal(phase I); expansion of Kisumu International Airport together with the extension of therunway and airfield lighting system; completion of detailed design for the second runway atJKIA; completion of Kenya Civil Aviation Authority Headquarter; installation of moderncommunication navigation and surveillance; conclusion of 6 new bilateral air servicesagreement; and reviewed 16 bilateral air service agreement among other achievements.
During the implementation of the budget, the Department experienced several challenes thatslowed the implementation of projects and programmes. These included litigation by projectsaffected persons; high prices on land compensation for land on the project area;encroachment on the transport corridors; austerity measures by the Government therebyaffecting the execution of some of the key projects.
In view of the challenges, the State Department involves the stakeholders at all levels of theprojects to minimize court cases by the project affected persons. Prioritization of the projectthough at times the Department is compelled to forgo some critical activities because ofresource limitation. In the FY 2016/17 the Department will continue to implement the ongoingprojects in the expansion of rail, road, air and water transport.
279
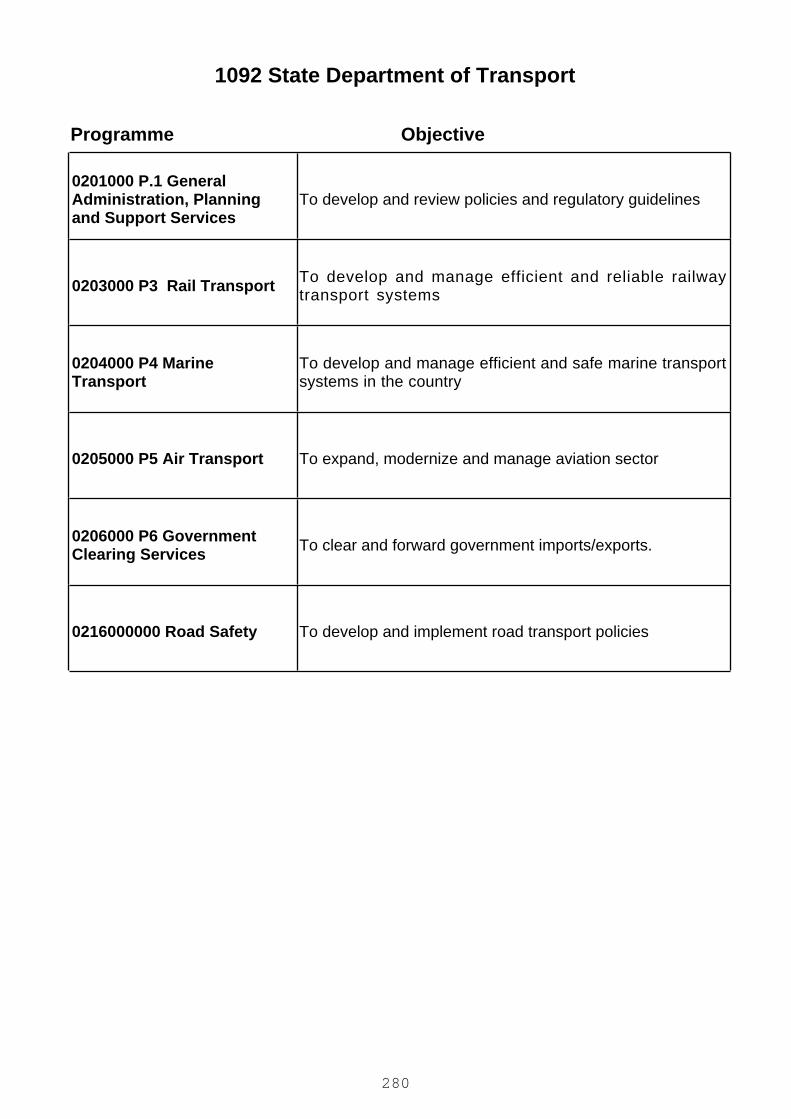
1092 State Department of Transport
ObjectiveProgramme
0201000 P.1 GeneralAdministration, Planningand Support Services
To develop and review policies and regulatory guidelines
0203000 P3 Rail Transport To develop and manage efficient and reliable railwaytransport systems
0204000 P4 MarineTransport
To develop and manage efficient and safe marine transportsystems in the country
0205000 P5 Air Transport To expand, modernize and manage aviation sector
0206000 P6 GovernmentClearing Services To clear and forward government imports/exports.
0216000000 Road Safety To develop and implement road transport policies
280
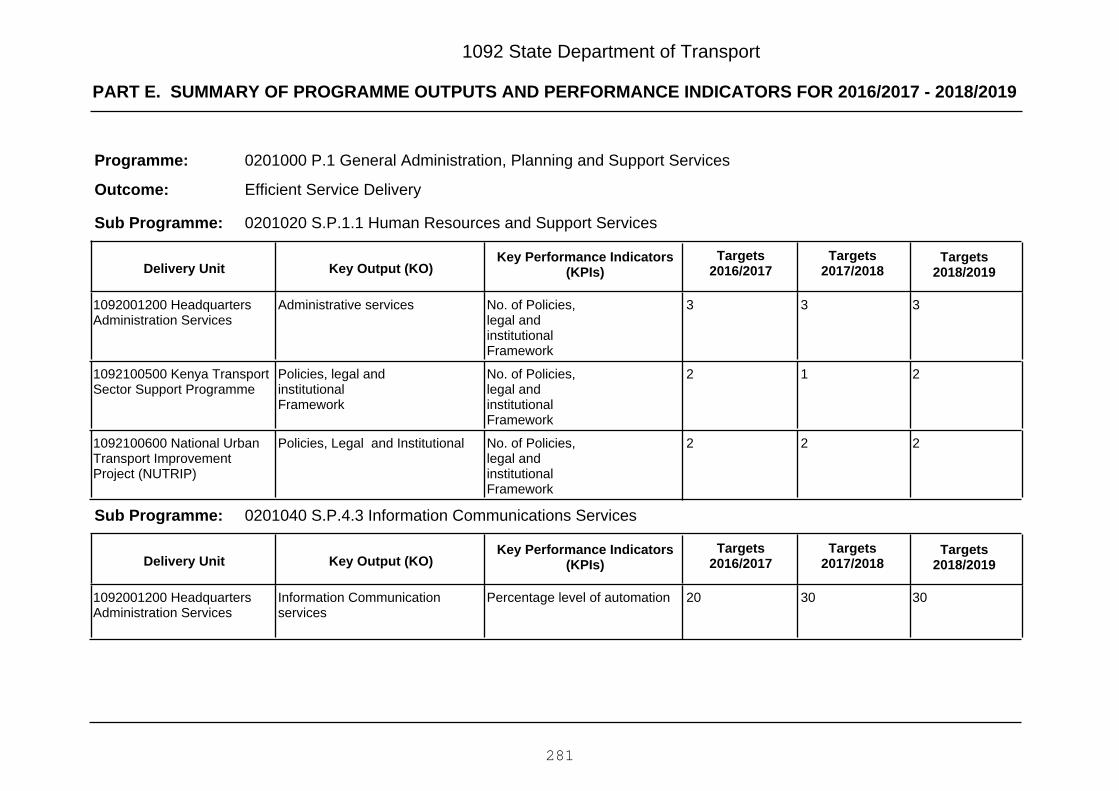
PART E. SUMMARY OF PROGRAMME OUTPUTS AND PERFORMANCE INDICATORS FOR 2016/2017 - 2018/2019
1092 State Department of Transport
0201000 P.1 General Administration, Planning and Support Services
Efficient Service Delivery
Programme:
Outcome:
0201020 S.P.1.1 Human Resources and Support ServicesSub Programme:
Key Output (KO)Targets
2018/2019Targets
2017/2018Key Performance Indicators
(KPIs)Targets
2016/2017Delivery Unit
333No. of Policies,legal andinstitutionalFramework
Administrative services1092001200 HeadquartersAdministration Services
212No. of Policies,legal andinstitutionalFramework
Policies, legal andinstitutionalFramework
1092100500 Kenya TransportSector Support Programme
222No. of Policies,legal andinstitutionalFramework
Policies, Legal and Institutional1092100600 National UrbanTransport ImprovementProject (NUTRIP)
0201040 S.P.4.3 Information Communications ServicesSub Programme:
Key Output (KO)Targets
2018/2019Targets
2017/2018Key Performance Indicators
(KPIs)Targets
2016/2017Delivery Unit
303020Percentage level of automationInformation Communicationservices
1092001200 HeadquartersAdministration Services
281

PART E. SUMMARY OF PROGRAMME OUTPUTS AND PERFORMANCE INDICATORS FOR 2016/2017 - 2018/2019
1092 State Department of Transport
0203000 P3 Rail Transport
Reduced cost of transportation within the region
Programme:
Outcome:
0203010 SP. 3.1 Rail TransportSub Programme:
Key Output (KO)Targets
2018/2019Targets
2017/2018Key Performance Indicators
(KPIs)Targets
2016/2017Delivery Unit
0202270 KM of Modern standard Gaugerailwayline phase 1 constructed -Mombasa - Nairobi
Standard Gauge Railway Linetrack Constructed
1092100200 Development ofMombasa to Nairobi StandardGauge Railway
122No. of Policies,legal andinstitutionalFramework
Policies, legal andinstitutionalframework Developed
1092100600 National UrbanTransport ImprovementProject (NUTRIP)
50045002000Number of housingUnits constructed
HousingUnits constructed
1092101000 Relocation Unitsat Kibera&Mukuru
0204000 P4 Marine Transport
Efficient and safe marine transport system
Programme:
Outcome:
0204010 SP. 4.1 Marine TransportSub Programme:
Key Output (KO)Targets
2018/2019Targets
2017/2018Key Performance Indicators
(KPIs)Targets
2016/2017Delivery Unit
282

PART E. SUMMARY OF PROGRAMME OUTPUTS AND PERFORMANCE INDICATORS FOR 2016/2017 - 2018/2019
1092 State Department of Transport
423No. of Policies,legal andinstitutionalFramework
Policies, legal andinstitutionalFramework
1092000200 Shipping andMaritime Affairs Department
333No. of Policies,legal andinstitutionalFramework
Policies, legal andinstitutionalFramework
1092001200 HeadquartersAdministration Services
155030% completion of the secondterminal
Second container Terminalconstructed phase 2
1092100100 Mombasa PortDevelopment project
--2No. of ferries purchasedFerries purchased1092101600 Acqusition oftwo ferries for Likoni channel
-3070Percentage of civil worksFerry Maintenance facility1092101700 Establishment ofFerry Maintenance facility
111Number of Ferries maintainedFerries and Jetties1092101800 Maintenance offerries and jetties project
-5050Percentage of civil works doneSecurity System installed andoperationalized
1092101900 Implementationof integrated security system
324520Percentage completionConstruction of first 3 berths atLamu
1092103900 LAPSSETProject
0205000 P5 Air Transport
Improved air transport management and connectivity
Programme:
Outcome:
283

PART E. SUMMARY OF PROGRAMME OUTPUTS AND PERFORMANCE INDICATORS FOR 2016/2017 - 2018/2019
1092 State Department of Transport
0205010 SP. 5.1 Air TransportSub Programme:
Key Output (KO)Targets
2018/2019Targets
2017/2018Key Performance Indicators
(KPIs)Targets
2016/2017Delivery Unit
100100100% of air accidents andincidences investigationconducted
Air accidents and incidenceinvestigated
1092000300 Aircraft AccidentInvestigation
3
4
3
4
3
4
No. of new BASAs
No of reviewed BASAs
Negotiated Bilateral AirService Agreements (BASAs)
1092000600 Air Transport
231No. of Policies,legal andinstitutionalFramework Developed
Policies, legal andinstitutionalFramework
1092001200 HeadquartersAdministration Services
-5050% of completion ofair accident hanger
Air accident hanger constructed1092100500 Kenya TransportSector Support Programme
103020% of completionJKIA, MIA, Kisumu and Eldoretairports Expanded andmodernized
1092100600 National UrbanTransport ImprovementProject (NUTRIP)
0550
KM of runway constructed andrehabilitated
Acres of Land for Airportexpansion acquired
Runway extended and airportrehabilitated
1092101100 MalindiExpansion Project
--10percentage completion of civilworks
Runway extended and airportrehabilitated
1092101200 Isiolo AirportExpansion Project
-5050percentage completion of civilworks
Terminal constructed1092101300 Suneka Airstrip
284
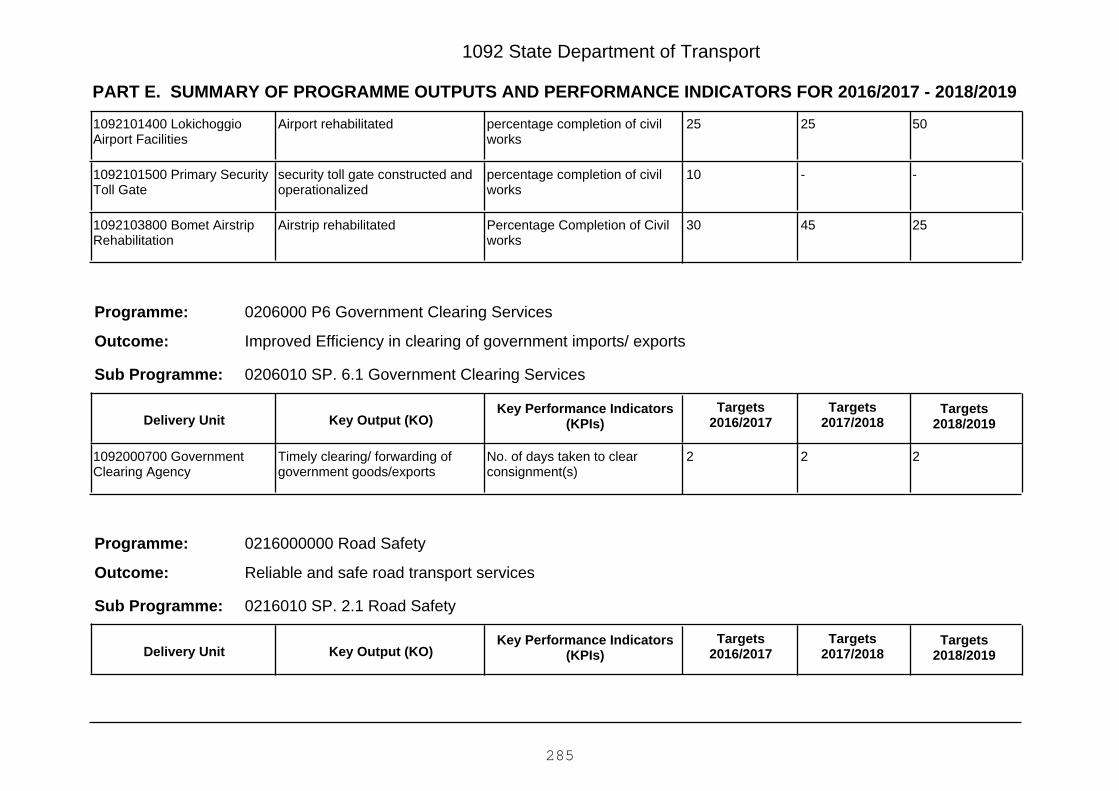
PART E. SUMMARY OF PROGRAMME OUTPUTS AND PERFORMANCE INDICATORS FOR 2016/2017 - 2018/2019
1092 State Department of Transport
502525percentage completion of civilworks
Airport rehabilitated1092101400 LokichoggioAirport Facilities
--10percentage completion of civilworks
security toll gate constructed andoperationalized
1092101500 Primary SecurityToll Gate
254530Percentage Completion of Civilworks
Airstrip rehabilitated1092103800 Bomet AirstripRehabilitation
0206000 P6 Government Clearing Services
Improved Efficiency in clearing of government imports/ exports
Programme:
Outcome:
0206010 SP. 6.1 Government Clearing ServicesSub Programme:
Key Output (KO)Targets
2018/2019Targets
2017/2018Key Performance Indicators
(KPIs)Targets
2016/2017Delivery Unit
222No. of days taken to clearconsignment(s)
Timely clearing/ forwarding ofgovernment goods/exports
1092000700 GovernmentClearing Agency
0216000000 Road Safety
Reliable and safe road transport services
Programme:
Outcome:
0216010 SP. 2.1 Road SafetySub Programme:
Key Output (KO)Targets
2018/2019Targets
2017/2018Key Performance Indicators
(KPIs)Targets
2016/2017Delivery Unit
285

PART E. SUMMARY OF PROGRAMME OUTPUTS AND PERFORMANCE INDICATORS FOR 2016/2017 - 2018/2019
1092 State Department of Transport
555No. of Policies,legal andinstitutionalFramework
Administrative Services1092001200 HeadquartersAdministration Services
111111% Reduction in Road fatalitiesReduction in road fatalities1092001800 Road TransportDepartment
222Number of Motor vehicleInspection centres rehabilitatedand modernized
Motor vehicle Inspection Centers1092103600 Rehabilitate &Modernize Motor VehicleInspection Centre (2)–Phase I
222Number of driving test centresRehabilitated and modernized
Driving test centers1092103700 Rehabilitate &Modernize Driving TestCentres (2) – Phase I
286

Vote 1092 State Department of Transport
PART F: Summary of Expenditure by Programmes, 2016/2017 - 2018/2019
Programme
Estimates Projected Estimates
2016/2017 2017/2018 2018/2019
KShs. KShs. KShs.
0201020 S.P.1.1 Human Resources and Support Services 657,646,211 724,620,795 404,543,737
0201040 S.P.4.3 Information Communications Services 5,247,410 6,500,000 7,000,000
0201000 P.1 General Administration, Planning and Support Services 662,893,621 731,120,795 411,543,737
0203010 SP. 3.1 Rail Transport 156,285,000,000 89,064,000,000 88,254,000,000
0203000 P3 Rail Transport 156,285,000,000 89,064,000,000 88,254,000,000
0204010 SP. 4.1 Marine Transport 17,364,135,291 3,545,062,751 5,692,620,677
0204000 P4 Marine Transport 17,364,135,291 3,545,062,751 5,692,620,677
0205010 SP. 5.1 Air Transport 6,516,309,538 8,754,385,399 8,780,657,683
0205000 P5 Air Transport 6,516,309,538 8,754,385,399 8,780,657,683
0206010 SP. 6.1 Government Clearing Services 48,507,381 67,794,806 77,441,827
0206000 P6 Government Clearing Services 48,507,381 67,794,806 77,441,827
0216010 SP. 2.1 Road Safety 747,847,250 747,780,249 749,736,076
0216000000 Road Safety 747,847,250 747,780,249 749,736,076Total Expenditure for Vote 1092 State Department of Transport 181,624,693,081 102,910,144,000 103,966,000,000
287
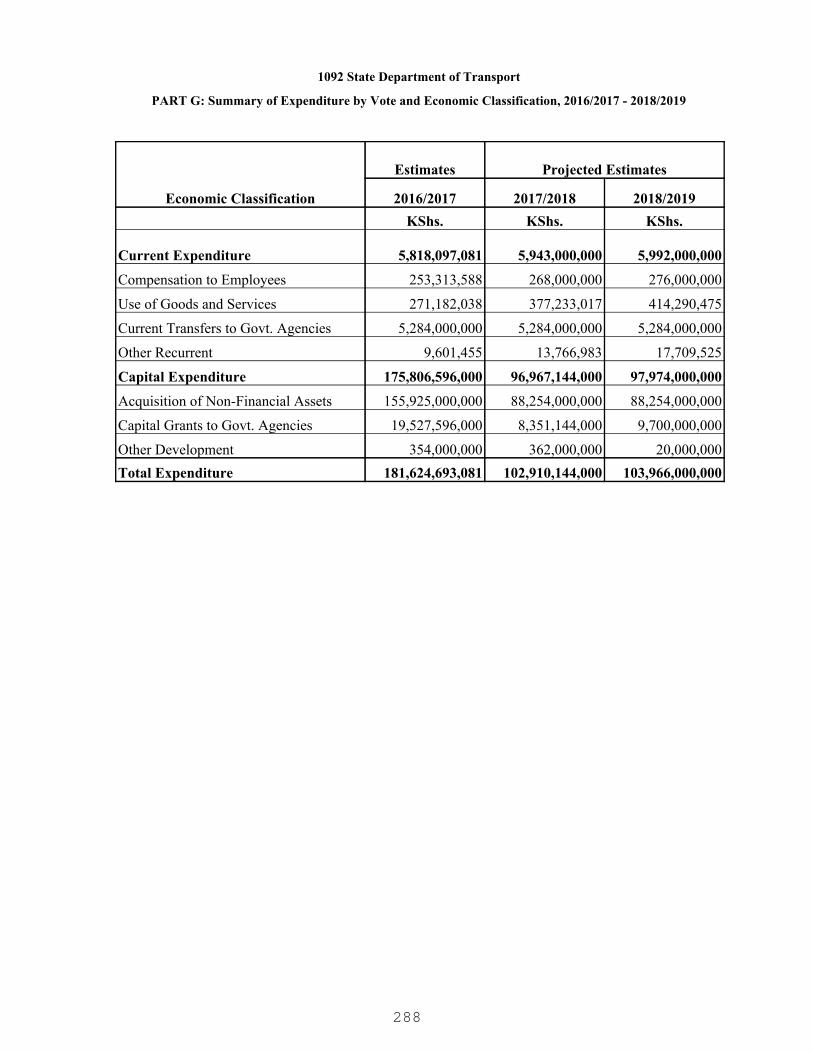
1092 State Department of Transport
PART G: Summary of Expenditure by Vote and Economic Classification, 2016/2017 - 2018/2019
Economic Classification
Estimates Projected Estimates
2016/2017 2017/2018 2018/2019KShs. KShs. KShs.
Current Expenditure 5,818,097,081 5,943,000,000 5,992,000,000
Compensation to Employees 253,313,588 268,000,000 276,000,000
Use of Goods and Services 271,182,038 377,233,017 414,290,475
Current Transfers to Govt. Agencies 5,284,000,000 5,284,000,000 5,284,000,000
Other Recurrent 9,601,455 13,766,983 17,709,525
Capital Expenditure 175,806,596,000 96,967,144,000 97,974,000,000
Acquisition of Non-Financial Assets 155,925,000,000 88,254,000,000 88,254,000,000
Capital Grants to Govt. Agencies 19,527,596,000 8,351,144,000 9,700,000,000
Other Development 354,000,000 362,000,000 20,000,000Total Expenditure 181,624,693,081 102,910,144,000 103,966,000,000
288

1092 State Department of Transport
PART H: Summary of Expenditure by Programme and Economic Classification, 2016/2017 - 2018/2019
0201020 S.P.1.1 Human Resources and Support Services
Economic Classification
Estimates Projected Estimates
2016/2017 2017/2018 2018/2019KShs. KShs. KShs.
Current Expenditure 303,646,211 362,620,795 384,543,737
Compensation to Employees 158,167,146 162,690,693 165,688,254
Use of Goods and Services 132,309,286 185,189,987 200,261,436
Current Transfers to Govt. Agencies 7,961,800 8,283,460 8,283,460
Other Recurrent 5,207,979 6,456,655 10,310,587
Capital Expenditure 354,000,000 362,000,000 20,000,000
Other Development 354,000,000 362,000,000 20,000,000Total Expenditure 657,646,211 724,620,795 404,543,737
0201040 S.P.4.3 Information Communications Services
Economic Classification
Estimates Projected Estimates
2016/2017 2017/2018 2018/2019KShs. KShs. KShs.
Current Expenditure 5,247,410 6,500,000 7,000,000
Use of Goods and Services 5,082,934 6,317,432 6,802,826
Other Recurrent 164,476 182,568 197,174Total Expenditure 5,247,410 6,500,000 7,000,000
0201000 P.1 General Administration, Planning and Support Services
Economic Classification
Estimates Projected Estimates
2016/2017 2017/2018 2018/2019KShs. KShs. KShs.
Current Expenditure 308,893,621 369,120,795 391,543,737
Compensation to Employees 158,167,146 162,690,693 165,688,254
Use of Goods and Services 137,392,220 191,507,419 207,064,262
Current Transfers to Govt. Agencies 7,961,800 8,283,460 8,283,460
Other Recurrent 5,372,455 6,639,223 10,507,761
Capital Expenditure 354,000,000 362,000,000 20,000,000
289
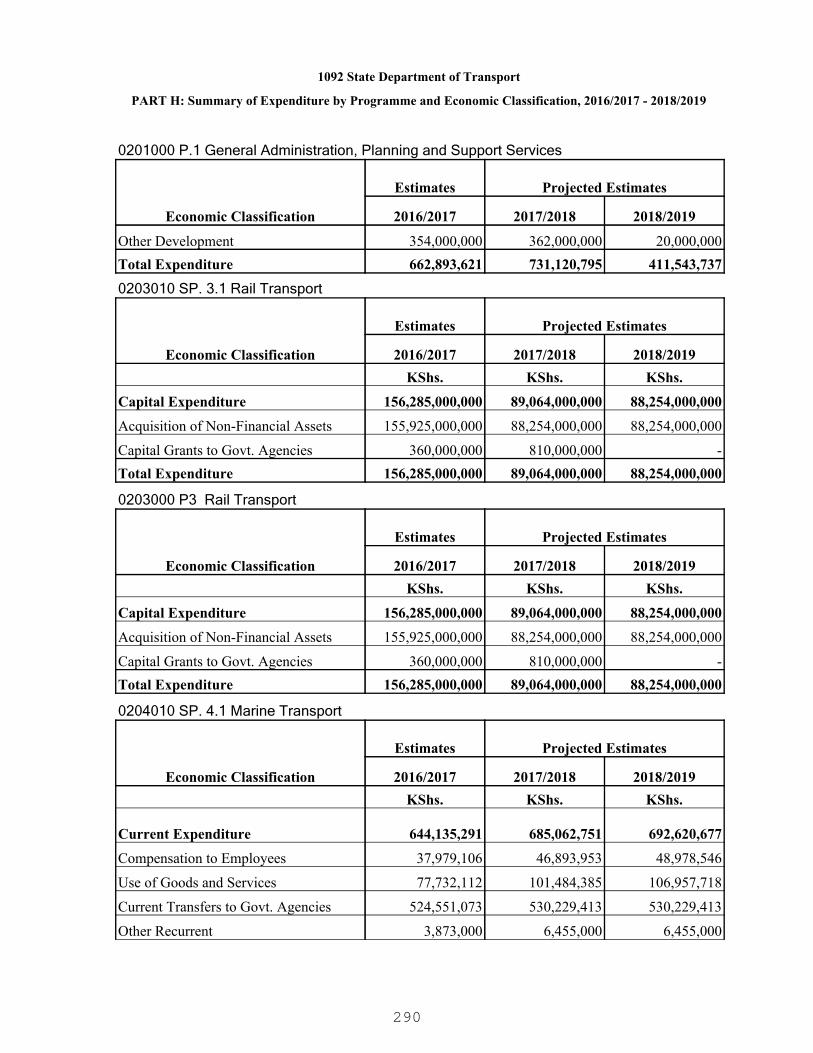
1092 State Department of Transport
PART H: Summary of Expenditure by Programme and Economic Classification, 2016/2017 - 2018/2019
0201000 P.1 General Administration, Planning and Support Services
Economic Classification
Estimates Projected Estimates
2016/2017 2017/2018 2018/2019
Other Development 354,000,000 362,000,000 20,000,000Total Expenditure 662,893,621 731,120,795 411,543,737
0203010 SP. 3.1 Rail Transport
Economic Classification
Estimates Projected Estimates
2016/2017 2017/2018 2018/2019KShs. KShs. KShs.
Capital Expenditure 156,285,000,000 89,064,000,000 88,254,000,000
Acquisition of Non-Financial Assets 155,925,000,000 88,254,000,000 88,254,000,000
Capital Grants to Govt. Agencies 360,000,000 810,000,000 -Total Expenditure 156,285,000,000 89,064,000,000 88,254,000,000
0203000 P3 Rail Transport
Economic Classification
Estimates Projected Estimates
2016/2017 2017/2018 2018/2019KShs. KShs. KShs.
Capital Expenditure 156,285,000,000 89,064,000,000 88,254,000,000
Acquisition of Non-Financial Assets 155,925,000,000 88,254,000,000 88,254,000,000
Capital Grants to Govt. Agencies 360,000,000 810,000,000 -Total Expenditure 156,285,000,000 89,064,000,000 88,254,000,000
0204010 SP. 4.1 Marine Transport
Economic Classification
Estimates Projected Estimates
2016/2017 2017/2018 2018/2019KShs. KShs. KShs.
Current Expenditure 644,135,291 685,062,751 692,620,677
Compensation to Employees 37,979,106 46,893,953 48,978,546
Use of Goods and Services 77,732,112 101,484,385 106,957,718
Current Transfers to Govt. Agencies 524,551,073 530,229,413 530,229,413
Other Recurrent 3,873,000 6,455,000 6,455,000
290

1092 State Department of Transport
PART H: Summary of Expenditure by Programme and Economic Classification, 2016/2017 - 2018/2019
0204010 SP. 4.1 Marine Transport
Economic Classification
Estimates Projected Estimates
2016/2017 2017/2018 2018/2019
Capital Expenditure 16,720,000,000 2,860,000,000 5,000,000,000
Capital Grants to Govt. Agencies 16,720,000,000 2,860,000,000 5,000,000,000Total Expenditure 17,364,135,291 3,545,062,751 5,692,620,677
0204000 P4 Marine Transport
Economic Classification
Estimates Projected Estimates
2016/2017 2017/2018 2018/2019KShs. KShs. KShs.
Current Expenditure 644,135,291 685,062,751 692,620,677
Compensation to Employees 37,979,106 46,893,953 48,978,546
Use of Goods and Services 77,732,112 101,484,385 106,957,718
Current Transfers to Govt. Agencies 524,551,073 530,229,413 530,229,413
Other Recurrent 3,873,000 6,455,000 6,455,000
Capital Expenditure 16,720,000,000 2,860,000,000 5,000,000,000
Capital Grants to Govt. Agencies 16,720,000,000 2,860,000,000 5,000,000,000Total Expenditure 17,364,135,291 3,545,062,751 5,692,620,677
0205010 SP. 5.1 Air Transport
Economic Classification
Estimates Projected Estimates
2016/2017 2017/2018 2018/2019KShs. KShs. KShs.
Current Expenditure 4,368,713,538 4,373,241,399 4,380,657,683
Compensation to Employees 25,596,696 26,073,976 27,168,068
Use of Goods and Services 27,329,715 31,075,296 37,330,938
Current Transfers to Govt. Agencies 4,315,487,127 4,315,487,127 4,315,487,127
Other Recurrent 300,000 605,000 671,550
Capital Expenditure 2,147,596,000 4,381,144,000 4,400,000,000
Capital Grants to Govt. Agencies 2,147,596,000 4,381,144,000 4,400,000,000Total Expenditure 6,516,309,538 8,754,385,399 8,780,657,683
291
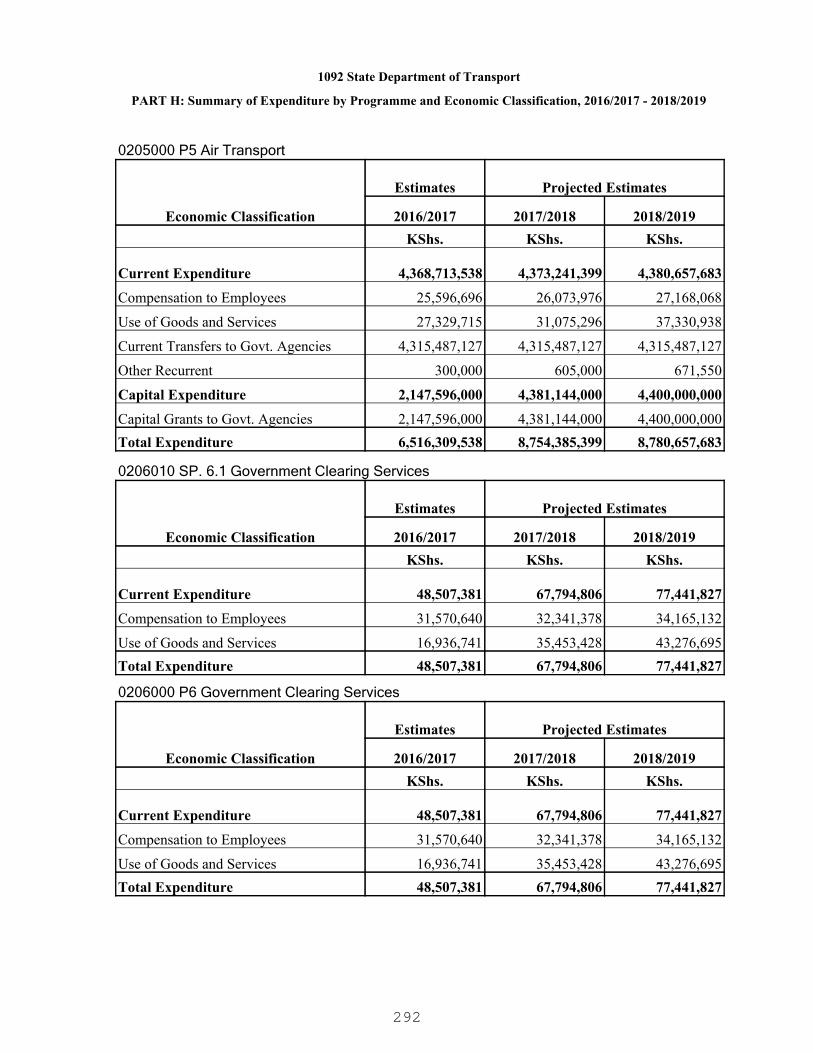
1092 State Department of Transport
PART H: Summary of Expenditure by Programme and Economic Classification, 2016/2017 - 2018/2019
0205000 P5 Air Transport
Economic Classification
Estimates Projected Estimates
2016/2017 2017/2018 2018/2019KShs. KShs. KShs.
Current Expenditure 4,368,713,538 4,373,241,399 4,380,657,683
Compensation to Employees 25,596,696 26,073,976 27,168,068
Use of Goods and Services 27,329,715 31,075,296 37,330,938
Current Transfers to Govt. Agencies 4,315,487,127 4,315,487,127 4,315,487,127
Other Recurrent 300,000 605,000 671,550
Capital Expenditure 2,147,596,000 4,381,144,000 4,400,000,000
Capital Grants to Govt. Agencies 2,147,596,000 4,381,144,000 4,400,000,000Total Expenditure 6,516,309,538 8,754,385,399 8,780,657,683
0206010 SP. 6.1 Government Clearing Services
Economic Classification
Estimates Projected Estimates
2016/2017 2017/2018 2018/2019KShs. KShs. KShs.
Current Expenditure 48,507,381 67,794,806 77,441,827
Compensation to Employees 31,570,640 32,341,378 34,165,132
Use of Goods and Services 16,936,741 35,453,428 43,276,695Total Expenditure 48,507,381 67,794,806 77,441,827
0206000 P6 Government Clearing Services
Economic Classification
Estimates Projected Estimates
2016/2017 2017/2018 2018/2019KShs. KShs. KShs.
Current Expenditure 48,507,381 67,794,806 77,441,827
Compensation to Employees 31,570,640 32,341,378 34,165,132
Use of Goods and Services 16,936,741 35,453,428 43,276,695Total Expenditure 48,507,381 67,794,806 77,441,827
292

1092 State Department of Transport
PART H: Summary of Expenditure by Programme and Economic Classification, 2016/2017 - 2018/2019
0216010 SP. 2.1 Road Safety
Economic Classification
Estimates Projected Estimates
2016/2017 2017/2018 2018/2019KShs. KShs. KShs.
Current Expenditure 447,847,250 447,780,249 449,736,076
Use of Goods and Services 11,791,250 17,712,489 19,660,862
Current Transfers to Govt. Agencies 436,000,000 430,000,000 430,000,000
Other Recurrent 56,000 67,760 75,214
Capital Expenditure 300,000,000 300,000,000 300,000,000
Capital Grants to Govt. Agencies 300,000,000 300,000,000 300,000,000Total Expenditure 747,847,250 747,780,249 749,736,076
0216000000 Road Safety
Economic Classification
Estimates Projected Estimates
2016/2017 2017/2018 2018/2019KShs. KShs. KShs.
Current Expenditure 447,847,250 447,780,249 449,736,076
Use of Goods and Services 11,791,250 17,712,489 19,660,862
Current Transfers to Govt. Agencies 436,000,000 430,000,000 430,000,000
Other Recurrent 56,000 67,760 75,214
Capital Expenditure 300,000,000 300,000,000 300,000,000
Capital Grants to Govt. Agencies 300,000,000 300,000,000 300,000,000Total Expenditure 747,847,250 747,780,249 749,736,076
293

1101 Ministry of Environment, Natural Resources and RegionalDev't Authorities
A clean, healthy, safe and sustainably managed Environment and Natural Resources.
To facilitate good governance in the protection, restoration, conservation, development andmanagement of environment and natural resources for equitable and sustainabledevelopment.
PART A. Vision
PART B. Mission
PART C. Performance Overview and Background for Programme(s) Funding
The Ministry of Environment, Natural Resources and Regional Development Authorities ischarged with management of policies, strategies and development plans relating toconservation, protection and management of environment and natural resources. It is furthermandated to safeguard water catchment areas and sustainable utilization of basin basedresources.
During the MTEF period 2012/13 – 2014/15, the Ministry of Environment, Natural Resourcesand Regional Development Authorities approved budget was KSh 17.9 billion, KSh 17.1billion and KSh 19.3 billion for the FYs 2012/13, 2013/14 and 2014/15 respectively, while theactual expenditure was KSh 15.6 billion, KSh 14.7 billion and KSh16.3 billion during the sameperiod.
The Ministry realized the following achievements during the period under review: developed aNational Solid Waste Management Strategy; reviewed Environmental Management and Co-ordination Act; developed seven environmental management guidelines including SEAguidelines, e-waste guidelines, used oil guidelines, Ozone Depleting Substances (ODS)guidelines, waste tyres guidelines, asbestos disposal guidelines and safe disposal of expired,condemned, damaged and counterfeit goods guidelines. In addition, the ministry realized thefollowing: reduction in elephants and rhino poaching by 67.6%; enactment andoperationalization of Wildlife Act 2013; constructed and operationalized wildlife DNA forensicand genetics laboratory. Other notable achievements were installation of automatic weatherstations, three airport weather observing systems, three pilot briefing systems, seventeenAutomatic Hydro-Meteorological Stations; completion and handing over of twenty water pansto the respective communities. Further, more than 1,213,300 tree seedlings were producedand planted using community based approaches under the development programmes thatconserve and protect river banks, water bodies and catchment areas.
Despit the achievements, the Minisry experienced numerous challenges including inadequatebudgetary allocations, delayed disbursement of development funds, price fluctuations due toinflation, reduced internally generated revenues at the Kenya Wildlife Service due to declinein international visitors arising from negative travel advisories by major market segments,invasive plant species posing remarkable challenges to the integrity of various ecosystemsacross the country, and increased human wildlife
During the MTEF 2016/17-2018/19, the ministry will implement the following major projectsand programmes among others: Medical Waste And Hazardous Waste Project, LowEmission And Climate Resilient Development In Kenya, Phasing out Ozone DepletingSubstances Project Operationalized, Green Innovation Award, Urban Rivers RehabilitationProject, Green Growth & Employment, Construction of Centres of excellence and innovation
294

1101 Ministry of Environment, Natural Resources and RegionalDev't Authorities
PART D. Programme Objectives
on environment, Forest Irrigation Climate and Green Energy, Forest rangers CampsRehabilitation, Mitigation & Management of Soil Loss, Development of Drought TolerantTrees for Adaptation to Climate Change, Construction of Farmers Resource Centre- TaitaTaveta, and Vulnerable and Endangered Species Restoration Programme
ObjectiveProgramme
1010000 P.1 GeneralAdministration, Planningand Support Services
To provide policy and legal framework for efficient andeffective management of the environment and naturalresources.
1011000 P.2 Environmentand Natural ResourcesManagement and Protection
To sustainably manage and conserve environment andnatural resources.
1012000 P.3 MeteorologicalServices
To provide reliable weather and climate information fordecision making.
1013000 P.7 IntegratedRegional Development
Equitable national socio-economic development throughsustainable utilization of basin based resources.
295
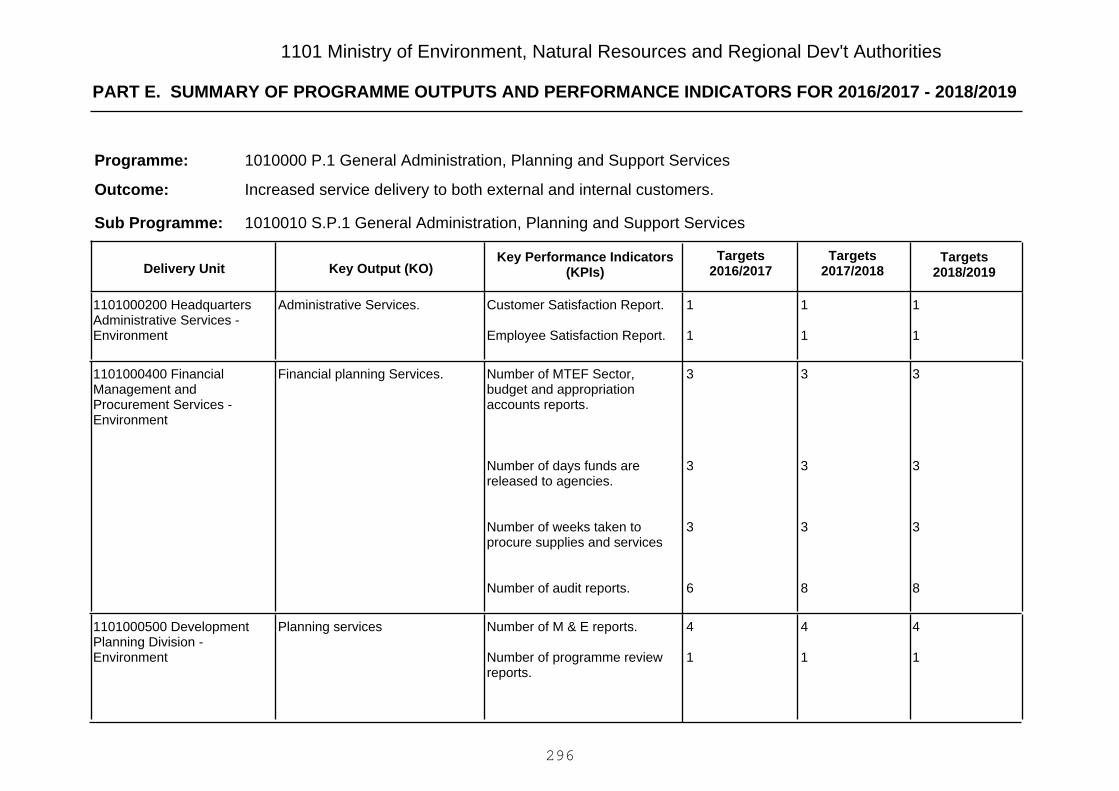
PART E. SUMMARY OF PROGRAMME OUTPUTS AND PERFORMANCE INDICATORS FOR 2016/2017 - 2018/2019
1101 Ministry of Environment, Natural Resources and Regional Dev't Authorities
1010000 P.1 General Administration, Planning and Support Services
Increased service delivery to both external and internal customers.
Programme:
Outcome:
1010010 S.P.1 General Administration, Planning and Support ServicesSub Programme:
Key Output (KO)Targets
2018/2019Targets
2017/2018Key Performance Indicators
(KPIs)Targets
2016/2017Delivery Unit
1
1
1
1
1
1
Customer Satisfaction Report.
Employee Satisfaction Report.
Administrative Services.1101000200 HeadquartersAdministrative Services -Environment
3
3
3
8
3
3
3
8
3
3
3
6
Number of MTEF Sector,budget and appropriationaccounts reports.
Number of days funds arereleased to agencies.
Number of weeks taken toprocure supplies and services
Number of audit reports.
Financial planning Services.1101000400 FinancialManagement andProcurement Services -Environment
4
1
4
1
4
1
Number of M & E reports.
Number of programme reviewreports.
Planning services1101000500 DevelopmentPlanning Division -Environment
296

PART E. SUMMARY OF PROGRAMME OUTPUTS AND PERFORMANCE INDICATORS FOR 2016/2017 - 2018/2019
1101 Ministry of Environment, Natural Resources and Regional Dev't Authorities
1011000 P.2 Environment and Natural Resources Management and Protection
Sustainably managed environment and natural resources.
Programme:
Outcome:
1011010 SP2.1 Policy & Governance in Environment & Natural Resources ManagementSub Programme:
Key Output (KO)Targets
2018/2019Targets
2017/2018Key Performance Indicators
(KPIs)Targets
2016/2017Delivery Unit
2
2
2
7
10
2
2
2
5
10
2
2
2
4
10
Number of policy documentsdeveloped and implemented.
Number of legislation developedand reviewed.
Number of regulationsdeveloped and reviewed.
Number of forum on creation ofawareness and sensitizationcarried out.
Number of MultilateralEnvironment Agreementsratified and implemented.
Environmental governance.1101000600 Directorate ofEnvironment
111Number of policies, bills andlegislation developed andreviewed.
Forest and wildlife governance.1101001400 ConservationDepartment - Forestry
444Ministry departments offeredwith financial and Procurementservices
Administrative services1101003500 HeadquartersAdministrative Services-Natural Resources
297

PART E. SUMMARY OF PROGRAMME OUTPUTS AND PERFORMANCE INDICATORS FOR 2016/2017 - 2018/2019
1101 Ministry of Environment, Natural Resources and Regional Dev't Authorities
112Number of floors renovated.Habitable working environment.1101109300 Refurbishment ofNSSF Building
1011020 SP2.2 National Environment ManagementSub Programme:
Key Output (KO)Targets
2018/2019Targets
2017/2018Key Performance Indicators
(KPIs)Targets
2016/2017Delivery Unit
47
10
100%
4000
1
6
47
10
100%
4000
1
6
47
10
100%
3800
1
6
Number of counties monitoredon the implementation of thewaste management strategy.
Number of counties pollutionand waste sources mapped.
Percentage of environmentalcases prosecuted.
Number of licenses issued asper regulations.
Number of regulations reviewed.
Number of wetlands gazettedas conservation areas/reserves
Waste management strategyimplementation by counties.
Mapped waste and pollutionsources in counties.
Compliance with environmentallaws
Degraded sites rehabilitated.
1101000700 NationalEnvironment ManagementAuthority
650550500Number of cases handled andfinalized.
Investigations on state ofenvironment.
1101000800 PublicComplaints Committee -Environment
4 departments4 departments4 departmentsMinistry departments offeredwith financial, procurement andother services
Administrative service1101003500 HeadquartersAdministrative Services-Natural Resources
5
89000 Ha
5
89000 Ha
5
89000 Ha
Number of awarenesscampaigns.
Area of patrols in Ha. by Joint
Awareness creation onsustainable management of watertowers.
1101003600 Kenya WaterTowers Agency
298

PART E. SUMMARY OF PROGRAMME OUTPUTS AND PERFORMANCE INDICATORS FOR 2016/2017 - 2018/2019
1101 Ministry of Environment, Natural Resources and Regional Dev't Authorities
Enforcement Unit (JEU)
Ksh.120 million
45
Ksh.180 million
36
Ksh.150 million
28
Amount of funds forEnvironmental awards
No of projects implemented andmonitored
Environmental awardsmanagement & Improved M&EServices
1101003700 NationalEnvironmental Trust Fund(NETFUND)
100 Institutions
-
80 Institutions
_
60 Institutions
5 acres
Number of institutionsseparating, medical waste atsource.
Size of land procured.
Reduced pollution and dioxinpollution and bronchial poisoning.
1101100500 Medical WasteAnd Hazardous Waste Project
100%100%100%Proportion of waste disposalreduction in lake Victoria
Reduce environmental stress inLake Victoria and enhancingbasin's ecological integrity
1101100700 Lake VictoriaEnvironment ManagementProject (LVEMP Phase 11)
1
1
1
1
1
1
No. of reports on inventories onmercury use in Kenya.
No. of reports on inventories onthe laws and policies onmercury.
Ratification of the MinamataConvention on Mercury.
1101100800 Mercury InitialActions for Kenya
1
3
1
3
5
3
Number oftechnologies/managementpractice made available fortransfer.
Number of policies supported.
Reduced emissionsand enhanced resilience toclimate change impacts.
1101101000 Support To LowCarbon Climate ResilientDevelopment For PovertyReduc
1
3
1
3
5
3
Number oftechnologies/managementpractice made available fortransfer.
Number of policies supported.
Reduced emissionsand enhanced resilience toclimate change impacts.
1101101100 Low EmissionAnd Climate ResilientDevelopment In Kenya
299
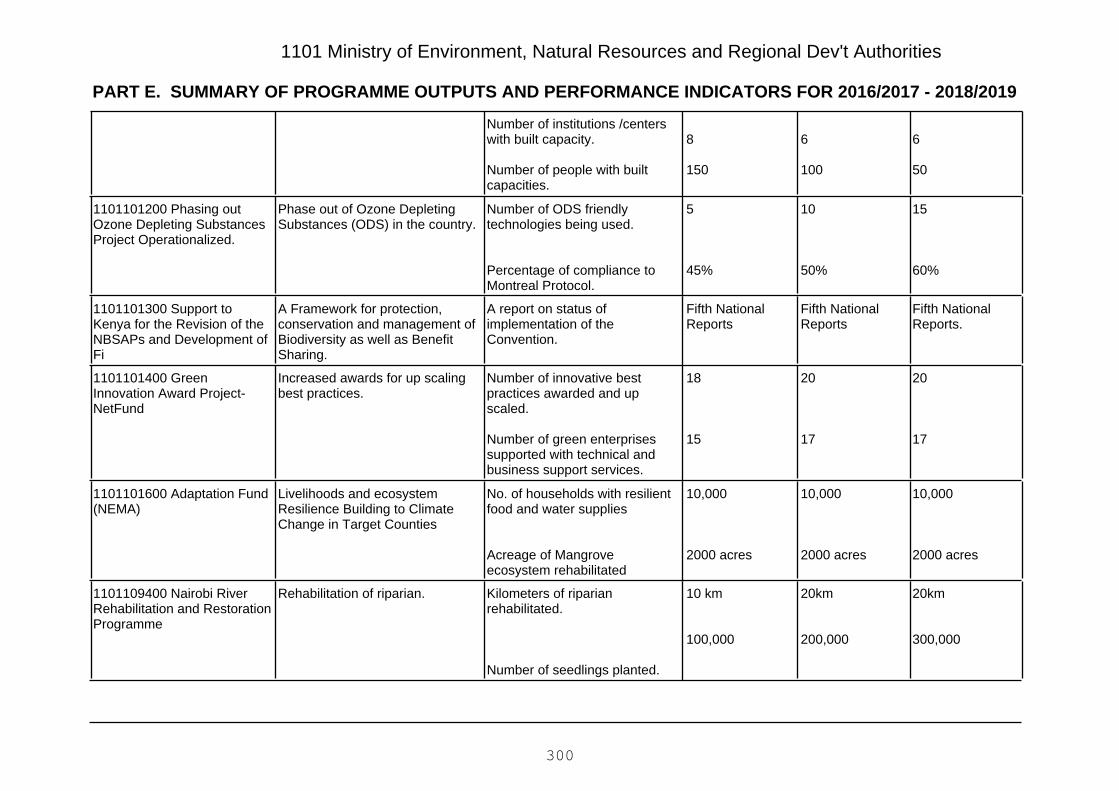
PART E. SUMMARY OF PROGRAMME OUTPUTS AND PERFORMANCE INDICATORS FOR 2016/2017 - 2018/2019
1101 Ministry of Environment, Natural Resources and Regional Dev't Authorities
6
50
6
100
8
150
Number of institutions /centerswith built capacity.
Number of people with builtcapacities.
15
60%
10
50%
5
45%
Number of ODS friendlytechnologies being used.
Percentage of compliance toMontreal Protocol.
Phase out of Ozone DepletingSubstances (ODS) in the country.
1101101200 Phasing outOzone Depleting SubstancesProject Operationalized.
Fifth NationalReports.
Fifth NationalReports
Fifth NationalReports
A report on status ofimplementation of theConvention.
A Framework for protection,conservation and management ofBiodiversity as well as BenefitSharing.
1101101300 Support toKenya for the Revision of theNBSAPs and Development ofFi
20
17
20
17
18
15
Number of innovative bestpractices awarded and upscaled.
Number of green enterprisessupported with technical andbusiness support services.
Increased awards for up scalingbest practices.
1101101400 GreenInnovation Award Project-NetFund
10,000
2000 acres
10,000
2000 acres
10,000
2000 acres
No. of households with resilientfood and water supplies
Acreage of Mangroveecosystem rehabilitated
Livelihoods and ecosystemResilience Building to ClimateChange in Target Counties
1101101600 Adaptation Fund(NEMA)
20km
300,000
20km
200,000
10 km
100,000
Kilometers of riparianrehabilitated.
Number of seedlings planted.
Rehabilitation of riparian.1101109400 Nairobi RiverRehabilitation and RestorationProgramme
300

PART E. SUMMARY OF PROGRAMME OUTPUTS AND PERFORMANCE INDICATORS FOR 2016/2017 - 2018/2019
1101 Ministry of Environment, Natural Resources and Regional Dev't Authorities
45 km
800,000
45 km
700,000
40 km
600,000
Kilometers rehabilitated.
Number of seedlings planted.
Rehabilitation of riparian.1101109500 Urban RiversRihabilitation Project
444Green growth projectsEnhanced green growth andemployment in the country.
1101109600 Green Growth &Employment
664Number of centers of excellencecompleted.
Green points (offices) constructedin counties.
1101109700 Construction ofCentres of excellence andinnovation on environment
320 Ha
960000
13
5
288 Ha
864000
13
5
240 Ha
720000
13
5
Hectares of rehabilitated riverriparian .
Number of trees planted.
No. of community outreachforums within the catchment.
No. of alternative livelihoodsystems supported within thebasin.
Rehabilitated of degraded riverriparian catchment
Land usemanagement/improvement.
Information Management &Sharing
1101110600 Imarisha LakeNaivasha CatchmentManagement in Kenya
444No. of policies, strategies,regulatory and frameworkintegrating the provisions ofstreamlining chemicalsmanagement into developmentactivities.
Reduction of the release of U-POPs and other substances ofconcern and the related healthrisks
1101110700 SoundChemicals ManagementMainstreaming & UPOPsReduction in Kenya
1,000ha
10
300ha
5
300ha
5
Area rehabilitated in Ha
No. of nature based enterprisesdeveloped
Increased vegetation cover ondegraded water towers andriparian reserve.
Established nature basedenterprises
1101111400 Mitigation &Management of Soil Loss -Under Kenya Water TowersAgency
301

PART E. SUMMARY OF PROGRAMME OUTPUTS AND PERFORMANCE INDICATORS FOR 2016/2017 - 2018/2019
1101 Ministry of Environment, Natural Resources and Regional Dev't Authorities
111
No. of water towers withMonitoring systems
Established System for Monitoringstatus of water towers
1011030 SP2.3 Forest Conservation and ManagementSub Programme:
Key Output (KO)Targets
2018/2019Targets
2017/2018Key Performance Indicators
(KPIs)Targets
2016/2017Delivery Unit
7.27.17Total area under tree and forest(%).
Increasing tree and forest cover.1101002200 Kenya ForestService
1
1
1
1
1
1
1
1
1
1
1
1
1
1
1
1
1
1
Reporting Tool on Emissionsfrom the land sector.
Policy Estimation Scenario Tool.
Project Estimation ScenarioTool.
Forest Tracker.
Crop Insurance Application.
Functional Measurement,Reporting and Verificationsystem.9
Functional national system forreporting emissions and removalsfrom the land sector.
1101101500 System for Land-Based Emissions Estimationin Kenya (SLEEK)
170,000 ha.170,000 ha.170,000 ha.Area of forest conserved andprotected in the water towers.
Conservation and protection ofwater towers.
1101101800 Kenya's WaterTower Protection & ClimateChange (WaTER)Programme- EU
3,500ha2,500ha1,400haArea of dry land under forestirrigation.
Increased forest cover in theASALS and dry land.
1101101900 Forest IrrigationClimate and Green EnergyPROJECT (FICaGE)
302
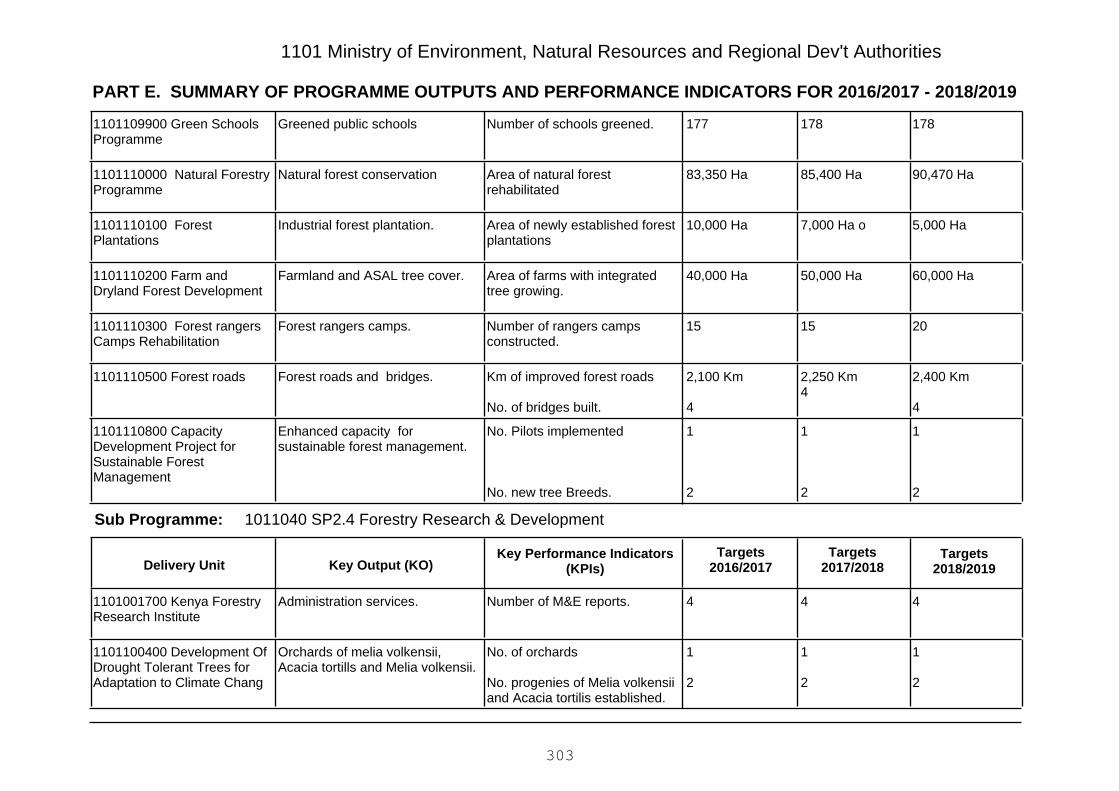
PART E. SUMMARY OF PROGRAMME OUTPUTS AND PERFORMANCE INDICATORS FOR 2016/2017 - 2018/2019
1101 Ministry of Environment, Natural Resources and Regional Dev't Authorities
178178177Number of schools greened.Greened public schools1101109900 Green SchoolsProgramme
90,470 Ha85,400 Ha83,350 HaArea of natural forestrehabilitated
Natural forest conservation1101110000 Natural ForestryProgramme
5,000 Ha7,000 Ha o10,000 HaArea of newly established forestplantations
Industrial forest plantation.1101110100 ForestPlantations
60,000 Ha50,000 Ha40,000 HaArea of farms with integratedtree growing.
Farmland and ASAL tree cover.1101110200 Farm andDryland Forest Development
201515Number of rangers campsconstructed.
Forest rangers camps.1101110300 Forest rangersCamps Rehabilitation
2,400 Km
4
2,250 Km4
2,100 Km
4
Km of improved forest roads
No. of bridges built.
Forest roads and bridges.1101110500 Forest roads
1
2
1
2
1
2
No. Pilots implemented
No. new tree Breeds.
Enhanced capacity forsustainable forest management.
1101110800 CapacityDevelopment Project forSustainable ForestManagement
1011040 SP2.4 Forestry Research & DevelopmentSub Programme:
Key Output (KO)Targets
2018/2019Targets
2017/2018Key Performance Indicators
(KPIs)Targets
2016/2017Delivery Unit
444Number of M&E reports.Administration services.1101001700 Kenya ForestryResearch Institute
1
2
1
2
1
2
No. of orchards
No. progenies of Melia volkensiiand Acacia tortilis established.
Orchards of melia volkensii,Acacia tortills and Melia volkensii.
1101100400 Development OfDrought Tolerant Trees forAdaptation to Climate Chang
303
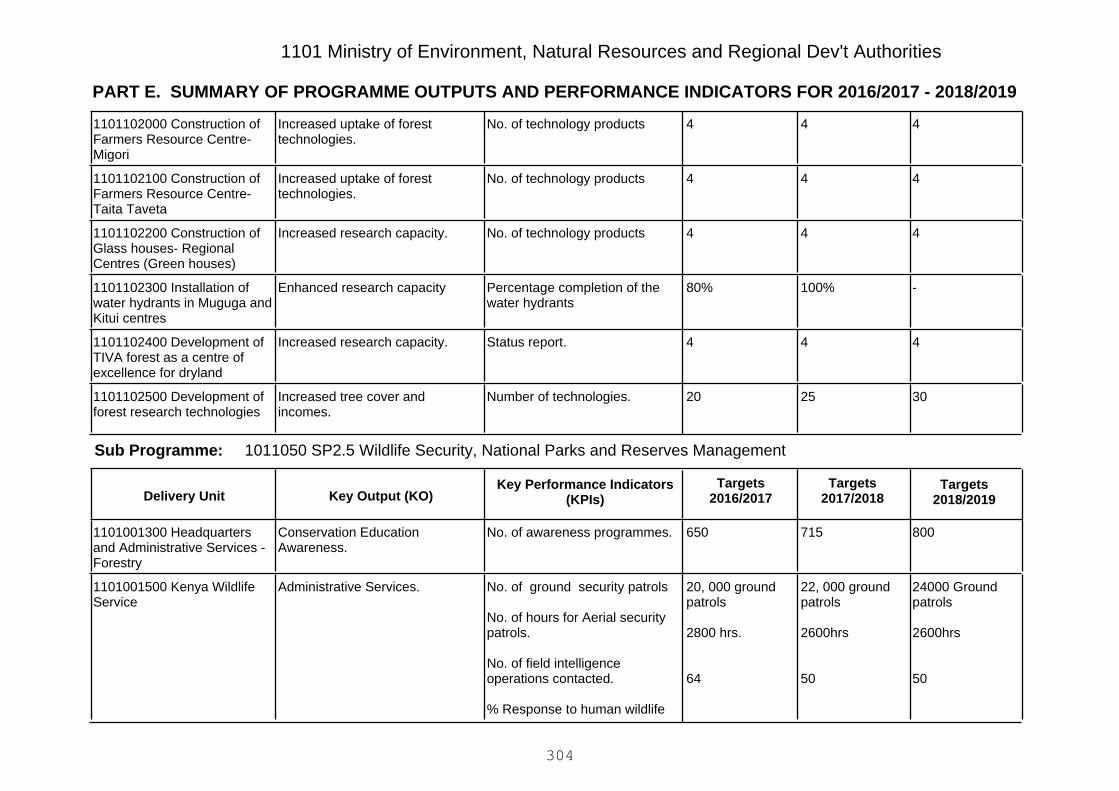
PART E. SUMMARY OF PROGRAMME OUTPUTS AND PERFORMANCE INDICATORS FOR 2016/2017 - 2018/2019
1101 Ministry of Environment, Natural Resources and Regional Dev't Authorities
444No. of technology productsIncreased uptake of foresttechnologies.
1101102000 Construction ofFarmers Resource Centre-Migori
444No. of technology productsIncreased uptake of foresttechnologies.
1101102100 Construction ofFarmers Resource Centre-Taita Taveta
444No. of technology productsIncreased research capacity.1101102200 Construction ofGlass houses- RegionalCentres (Green houses)
-100%80%Percentage completion of thewater hydrants
Enhanced research capacity1101102300 Installation ofwater hydrants in Muguga andKitui centres
444Status report.Increased research capacity.1101102400 Development ofTIVA forest as a centre ofexcellence for dryland
302520Number of technologies.Increased tree cover andincomes.
1101102500 Development offorest research technologies
1011050 SP2.5 Wildlife Security, National Parks and Reserves ManagementSub Programme:
Key Output (KO)Targets
2018/2019Targets
2017/2018Key Performance Indicators
(KPIs)Targets
2016/2017Delivery Unit
800715650No. of awareness programmes.Conservation EducationAwareness.
1101001300 Headquartersand Administrative Services -Forestry
24000 Groundpatrols
2600hrs
50
22, 000 groundpatrols
2600hrs
50
20, 000 groundpatrols
2800 hrs.
64
No. of ground security patrols
No. of hours for Aerial securitypatrols.
No. of field intelligenceoperations contacted.
% Response to human wildlife
Administrative Services.1101001500 Kenya WildlifeService
304
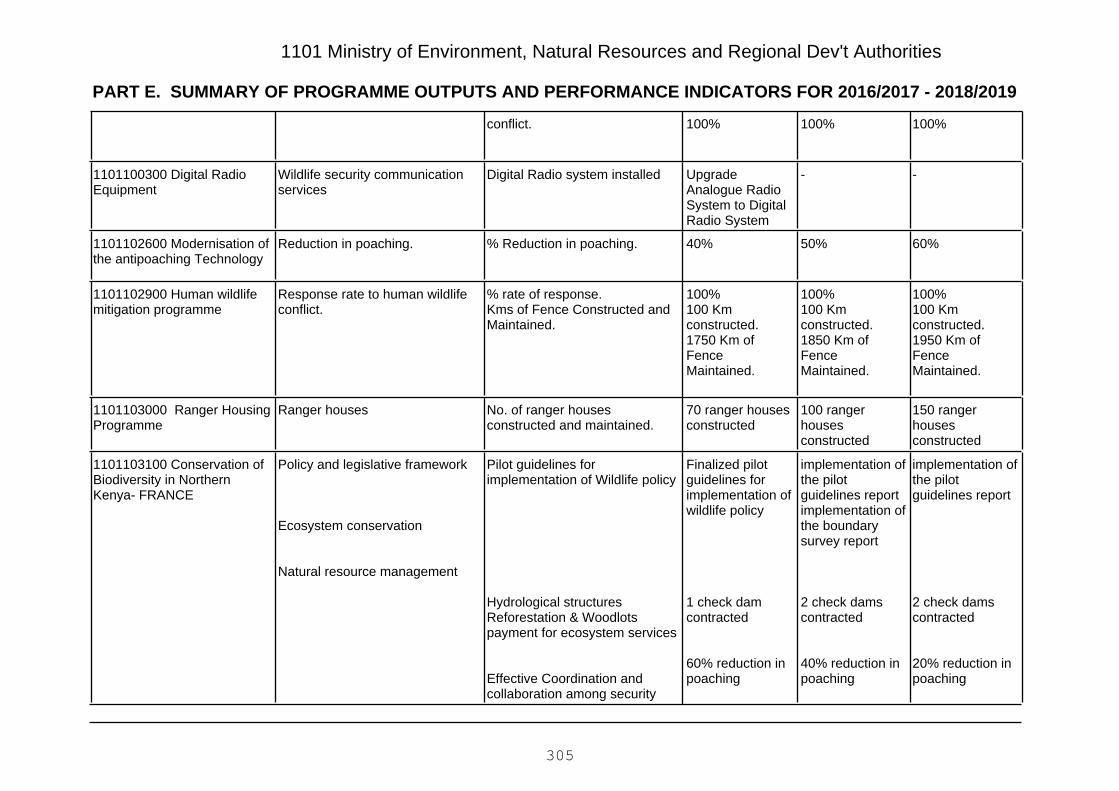
PART E. SUMMARY OF PROGRAMME OUTPUTS AND PERFORMANCE INDICATORS FOR 2016/2017 - 2018/2019
1101 Ministry of Environment, Natural Resources and Regional Dev't Authorities
100%100%100%conflict.
--UpgradeAnalogue RadioSystem to DigitalRadio System
Digital Radio system installedWildlife security communicationservices
1101100300 Digital RadioEquipment
60%50%40%% Reduction in poaching.Reduction in poaching.1101102600 Modernisation ofthe antipoaching Technology
100%100 Kmconstructed.1950 Km ofFenceMaintained.
100%100 Kmconstructed.1850 Km ofFenceMaintained.
100%100 Kmconstructed.1750 Km ofFenceMaintained.
% rate of response.Kms of Fence Constructed andMaintained.
Response rate to human wildlifeconflict.
1101102900 Human wildlifemitigation programme
150 rangerhousesconstructed
100 rangerhousesconstructed
70 ranger housesconstructed
No. of ranger housesconstructed and maintained.
Ranger houses1101103000 Ranger HousingProgramme
implementation ofthe pilotguidelines report
2 check damscontracted
20% reduction inpoaching
implementation ofthe pilotguidelines reportimplementation ofthe boundarysurvey report
2 check damscontracted
40% reduction inpoaching
Finalized pilotguidelines forimplementation ofwildlife policy
1 check damcontracted
60% reduction inpoaching
Pilot guidelines forimplementation of Wildlife policy
Hydrological structuresReforestation & Woodlotspayment for ecosystem services
Effective Coordination andcollaboration among security
Policy and legislative framework
Ecosystem conservation
Natural resource management
1101103100 Conservation ofBiodiversity in NorthernKenya- FRANCE
305

PART E. SUMMARY OF PROGRAMME OUTPUTS AND PERFORMANCE INDICATORS FOR 2016/2017 - 2018/2019
1101 Ministry of Environment, Natural Resources and Regional Dev't Authorities
333No of renovated youth hostels inMombasa, Nakuru and Kisumu
WCK regional offices1101103200 Wildlife resourcecentres
1012000 P.3 Meteorological Services
Reliable weather and climate information.
Programme:
Outcome:
1012010 SP3.1 Modernization of Meteorological ServicesSub Programme:
Key Output (KO)Targets
2018/2019Targets
2017/2018Key Performance Indicators
(KPIs)Targets
2016/2017Delivery Unit
20
5
8
3
1
20
5
8
3
1
20
5
8
3
1
No. of Staff houses renovated
No. of offices renovated
No. of Km of Perimeter wallconstructed
No. of water and seweragesystems repaired
Number of forecasting andanalysis systems
Meteorological services1101001000 MeteorologicalDepartment
100100100Number of digital weatherinstruments (Non-mercury).
Meteorological services1101103300 Purchase ofdigital instrument
222No. of Hydrogen GeneratorsMeteorological services1101103400 Upper WindObservation Station Network
2
1
2
1
2
1
No. of systems
Number of ground
Meteorological services1101103500 HighPerformance ComputingPlatform
306
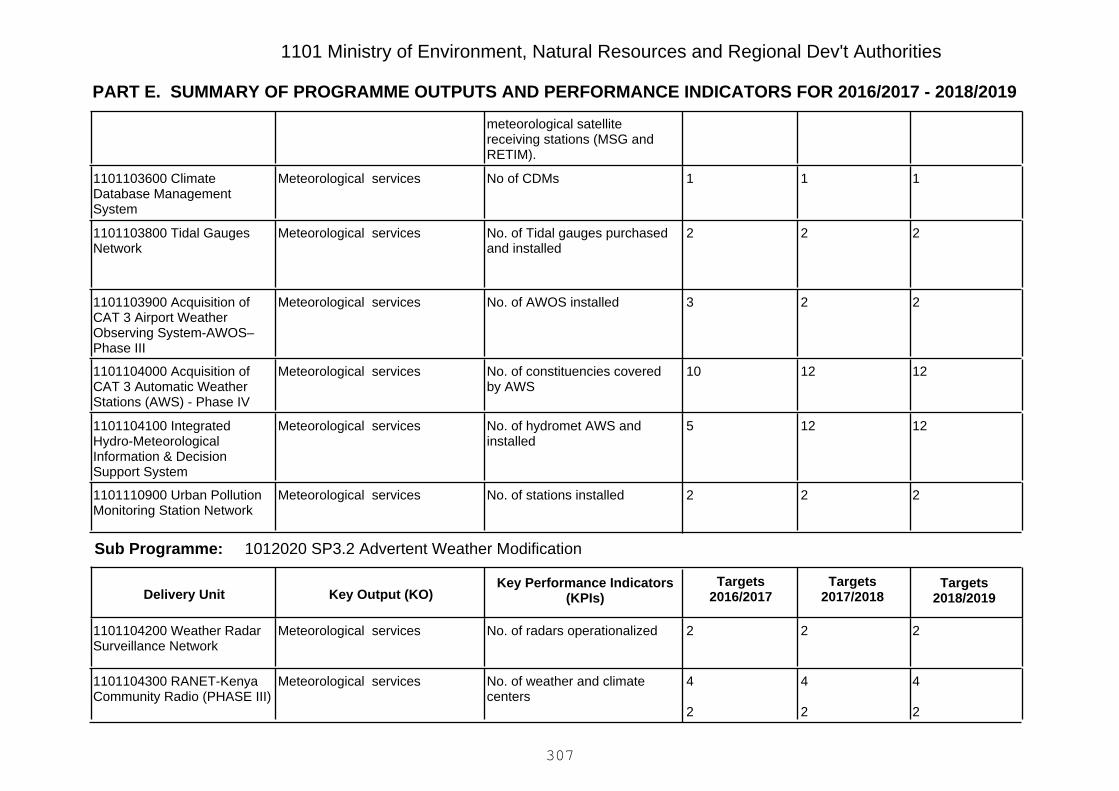
PART E. SUMMARY OF PROGRAMME OUTPUTS AND PERFORMANCE INDICATORS FOR 2016/2017 - 2018/2019
1101 Ministry of Environment, Natural Resources and Regional Dev't Authorities
meteorological satellitereceiving stations (MSG andRETIM).
111No of CDMsMeteorological services1101103600 ClimateDatabase ManagementSystem
222No. of Tidal gauges purchasedand installed
Meteorological services1101103800 Tidal GaugesNetwork
223No. of AWOS installedMeteorological services1101103900 Acquisition ofCAT 3 Airport WeatherObserving System-AWOS–Phase III
121210No. of constituencies coveredby AWS
Meteorological services1101104000 Acquisition ofCAT 3 Automatic WeatherStations (AWS) - Phase IV
12125No. of hydromet AWS andinstalled
Meteorological services1101104100 IntegratedHydro-MeteorologicalInformation & DecisionSupport System
222No. of stations installedMeteorological services1101110900 Urban PollutionMonitoring Station Network
1012020 SP3.2 Advertent Weather ModificationSub Programme:
Key Output (KO)Targets
2018/2019Targets
2017/2018Key Performance Indicators
(KPIs)Targets
2016/2017Delivery Unit
222No. of radars operationalizedMeteorological services1101104200 Weather RadarSurveillance Network
4
2
4
2
4
2
No. of weather and climatecenters
Meteorological services1101104300 RANET-KenyaCommunity Radio (PHASE III)
307

PART E. SUMMARY OF PROGRAMME OUTPUTS AND PERFORMANCE INDICATORS FOR 2016/2017 - 2018/2019
1101 Ministry of Environment, Natural Resources and Regional Dev't Authorities
No. of RANET Stations
1013000 P.7 Integrated Regional Development
Equitable national socio economic development through sustainable utilization of basin based resources.
Programme:
Outcome:
1013010 SP. 7.1 Integrated basin based DevelopmentSub Programme:
Key Output (KO)Targets
2018/2019Targets
2017/2018Key Performance Indicators
(KPIs)Targets
2016/2017Delivery Unit
42. No.Projects/programmes
40 No.projects/programmes
37 No. ofprojects/programmes
Regional policy and sustainableprogrammes/projectsimplemented
Operational regional developmentpolicy
1101002700 ConservationDepartment - RegionalDevelopment
15128Number of new projects initiatedRegional development projects1101002800 Kerio ValleyDevelopment Authority
1396Number of new projects initiatedRegional development projects110100300 Tana and AthiRivers Development Authority(TARDA)
1297Number of new projects initiatedRegional development projects1101003100 Lake BasinDevelopment Authority(LBDA)
1496Number of new projects initiatedRegional development projects1101003200 Ewaso NyiroSouth Development (ENSDA)
171512Number of new projects initiatedRegional development projects1101003300 CoastDevelopment Authority (CDA)
1175Number of new projects initiatedRegional development projects1101003400 Ewaso NyiroNorth Development (ENNDA)
308

PART E. SUMMARY OF PROGRAMME OUTPUTS AND PERFORMANCE INDICATORS FOR 2016/2017 - 2018/2019
1101 Ministry of Environment, Natural Resources and Regional Dev't Authorities
Equippedregionalintegrateddatabase
Equippedregionalintegrateddatabase
Equippedregionalintegrateddatabase
Integrated regional databaseIntegrated regional developmentdata
1101104700 Regional Dataand Resource Center Project
10 tones5 tones1 toneTones of gum and resinprocessed
Regional Development Projects1101104800 Gum Arabic andResins IntegratedDevelopment Programme
200,000
5 ha
200,000
5 ha
200,000
4 ha.
No. of bamboo tree seedlingplanted
Hectare of catchment andriparian areas conserved/Rehabilitated
Regional Development Project1101104900 Ewaso Ng’iroNorth Catchment & RiparianConservation Project
11-No of multi-purpose damsconstructed
Regional Development1101105000 Daua RiverTransboundary ManagementProgramme
12,000
3,000 ha
20,000
5,000 ha
20,000
5,000ha
No. of households with accessto water
No. of hectares irrigated,
Water for Irrigation1101105100 Kieni IntegratedIrrigation Project
50,000
80,000 ha
100,000
50,000 ha
50,000
50,000 ha
No. of people accessing cleanwater
No. of hectares irrigated,
Water1101105200 High Grand FallsMultipurpose Dam
65,000Tonnes65,000Tonnes65,000TonnesNo. of tonnes of rice producedannually
Rice production1101105300 Tana Delta RiceIrrigation Project (TDIP)
500 ha
4,150
300 ha
4,150
100 ha
4,150
Size of land under irrigation
No. of households with accessto clean water
Clean water1101105400 Murangaintergrated Programme
100% operationof the Tanneryand Leather
100% equippedtannery effluenttreatment plant
100% completetannery buildingand Effluent
% completion and equipment ofTannery and leather factory,
Leather Factory1101106000 Ewaso NgiroLeather Factory
309

PART E. SUMMARY OF PROGRAMME OUTPUTS AND PERFORMANCE INDICATORS FOR 2016/2017 - 2018/2019
1101 Ministry of Environment, Natural Resources and Regional Dev't Authorities
factory,
US$8-
treatment plant
-
Amount of Revenue generated,No. of employment created
5,000 acres
500
700 Ha
60Km
5,000 acres
500
700 Ha
60Km
5,000 acres
500
700 Ha
60Km
Acreage of bamboo nuclearplantation established,
Number of out grower farmersrecruited
Hectare of degraded catchmentarea rehabilitated
Km of riparian land protectedand conserved,
Regional development1101106100 IntegratedBamboo commercialisationand Value addition
-
4.2M m3
100,000 people
1000 Ha
70%
-
-
-
30%
-
-
-
% completion of multipurposedam,
Volume of water stored
size of population served
Acreage of new irrigation area
Multipurpose dam1101106300 Olkejuadomultipurpose dam project
-
2.0M m3
50,000 people,
400Ha
60%
-
-
-
40%
-
-
-
% completion of multipurposedam
Volume of water stored
No. of population served,
Acreage of new irrigation area
Multipurpose dam1101106400 Nkorienito damdevelopment project
-
1.3M m3
50,000 people
75%
-
-
25%
-
-
% completion of multipurposedam
Volume of water stored
Multipurpose dam1101106500 Olooltepes damdevelopment project
310
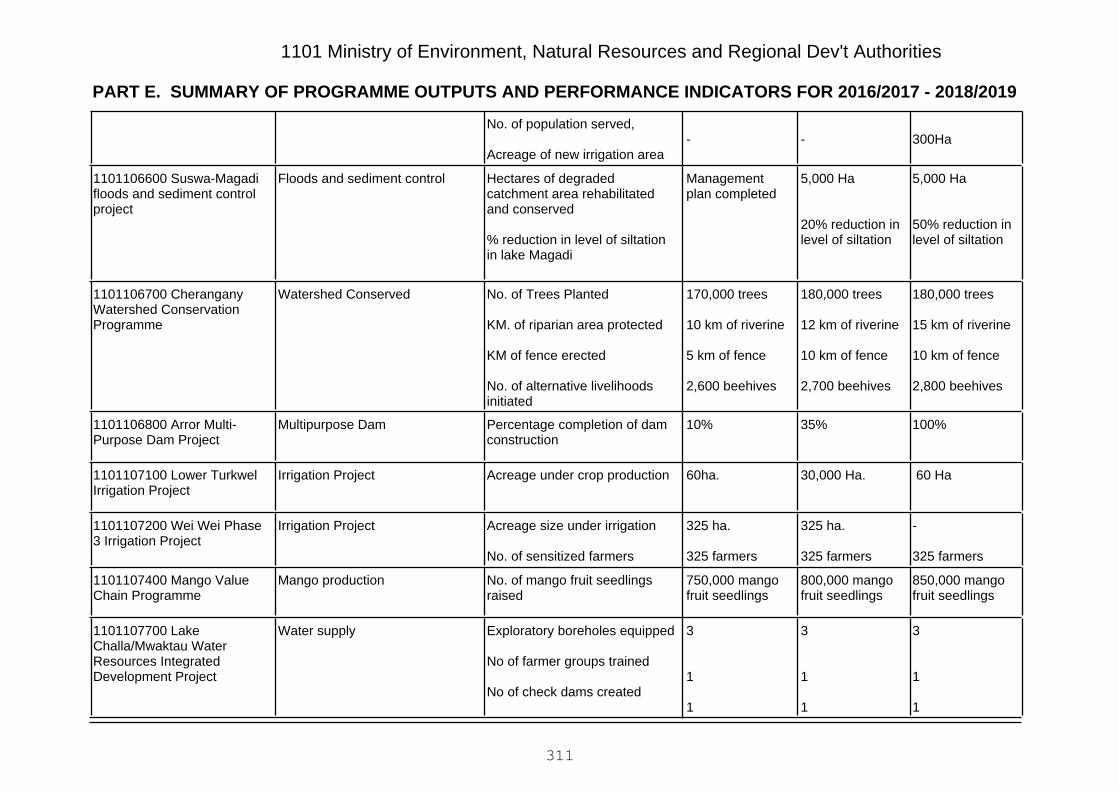
PART E. SUMMARY OF PROGRAMME OUTPUTS AND PERFORMANCE INDICATORS FOR 2016/2017 - 2018/2019
1101 Ministry of Environment, Natural Resources and Regional Dev't Authorities
300Ha--No. of population served,
Acreage of new irrigation area
5,000 Ha
50% reduction inlevel of siltation
5,000 Ha
20% reduction inlevel of siltation
Managementplan completed
Hectares of degradedcatchment area rehabilitatedand conserved
% reduction in level of siltationin lake Magadi
Floods and sediment control1101106600 Suswa-Magadifloods and sediment controlproject
180,000 trees
15 km of riverine
10 km of fence
2,800 beehives
180,000 trees
12 km of riverine
10 km of fence
2,700 beehives
170,000 trees
10 km of riverine
5 km of fence
2,600 beehives
No. of Trees Planted
KM. of riparian area protected
KM of fence erected
No. of alternative livelihoodsinitiated
Watershed Conserved1101106700 CheranganyWatershed ConservationProgramme
100%35%10%Percentage completion of damconstruction
Multipurpose Dam1101106800 Arror Multi-Purpose Dam Project
60 Ha30,000 Ha.60ha.Acreage under crop productionIrrigation Project1101107100 Lower TurkwelIrrigation Project
-
325 farmers
325 ha.
325 farmers
325 ha.
325 farmers
Acreage size under irrigation
No. of sensitized farmers
Irrigation Project1101107200 Wei Wei Phase3 Irrigation Project
850,000 mangofruit seedlings
800,000 mangofruit seedlings
750,000 mangofruit seedlings
No. of mango fruit seedlingsraised
Mango production1101107400 Mango ValueChain Programme
3
1
1
3
1
1
3
1
1
Exploratory boreholes equipped
No of farmer groups trained
No of check dams created
Water supply1101107700 LakeChalla/Mwaktau WaterResources IntegratedDevelopment Project
311
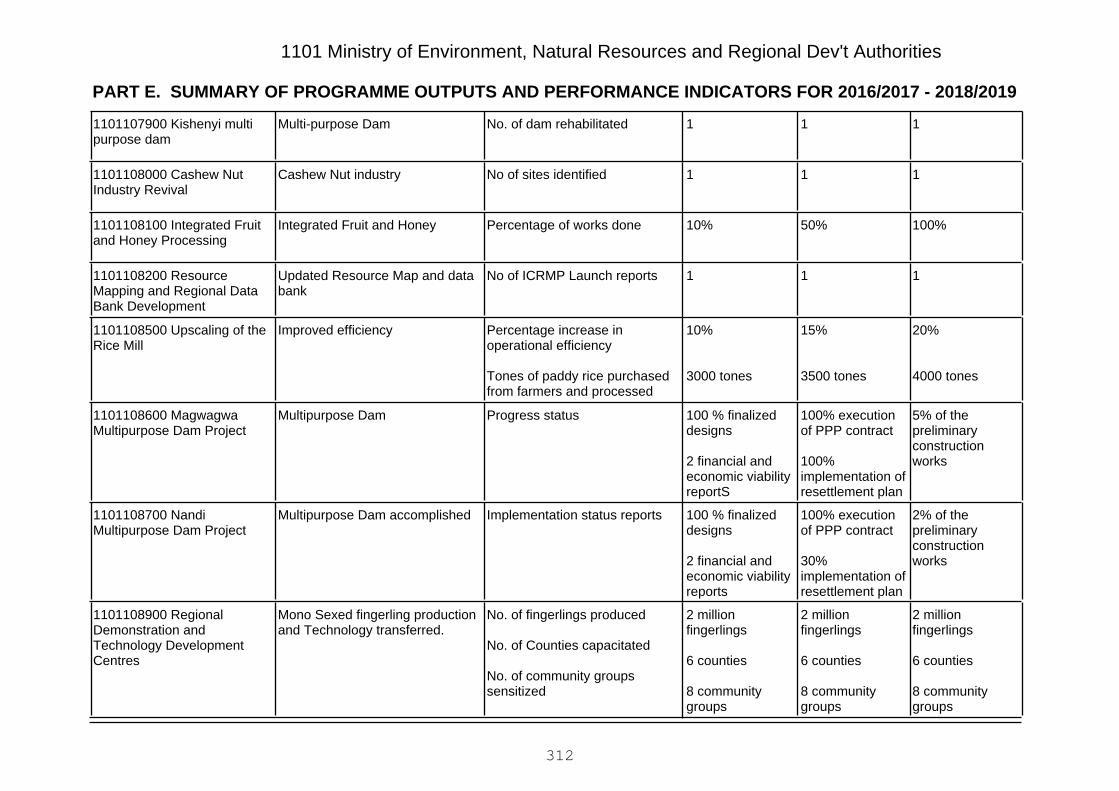
PART E. SUMMARY OF PROGRAMME OUTPUTS AND PERFORMANCE INDICATORS FOR 2016/2017 - 2018/2019
1101 Ministry of Environment, Natural Resources and Regional Dev't Authorities
111No. of dam rehabilitatedMulti-purpose Dam1101107900 Kishenyi multipurpose dam
111No of sites identifiedCashew Nut industry1101108000 Cashew NutIndustry Revival
100%50%10%Percentage of works doneIntegrated Fruit and Honey1101108100 Integrated Fruitand Honey Processing
111No of ICRMP Launch reportsUpdated Resource Map and databank
1101108200 ResourceMapping and Regional DataBank Development
20%
4000 tones
15%
3500 tones
10%
3000 tones
Percentage increase inoperational efficiency
Tones of paddy rice purchasedfrom farmers and processed
Improved efficiency1101108500 Upscaling of theRice Mill
5% of thepreliminaryconstructionworks
100% executionof PPP contract
100%implementation ofresettlement plan
100 % finalizeddesigns
2 financial andeconomic viabilityreportS
Progress statusMultipurpose Dam1101108600 MagwagwaMultipurpose Dam Project
2% of thepreliminaryconstructionworks
100% executionof PPP contract
30%implementation ofresettlement plan
100 % finalizeddesigns
2 financial andeconomic viabilityreports
Implementation status reportsMultipurpose Dam accomplished1101108700 NandiMultipurpose Dam Project
2 millionfingerlings
6 counties
8 communitygroups
2 millionfingerlings
6 counties
8 communitygroups
2 millionfingerlings
6 counties
8 communitygroups
No. of fingerlings produced
No. of Counties capacitated
No. of community groupssensitized
Mono Sexed fingerling productionand Technology transferred.
1101108900 RegionalDemonstration andTechnology DevelopmentCentres
312
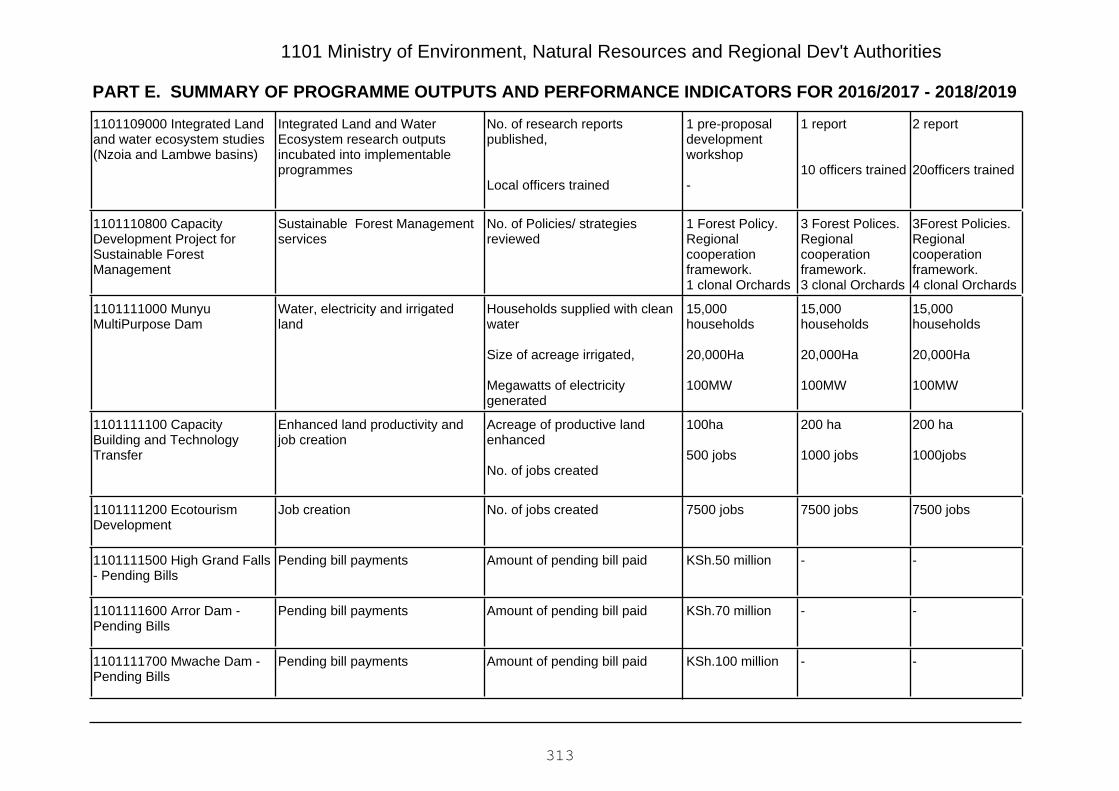
PART E. SUMMARY OF PROGRAMME OUTPUTS AND PERFORMANCE INDICATORS FOR 2016/2017 - 2018/2019
1101 Ministry of Environment, Natural Resources and Regional Dev't Authorities
2 report
20officers trained
1 report
10 officers trained
1 pre-proposaldevelopmentworkshop
-
No. of research reportspublished,
Local officers trained
Integrated Land and WaterEcosystem research outputsincubated into implementableprogrammes
1101109000 Integrated Landand water ecosystem studies(Nzoia and Lambwe basins)
3Forest Policies.Regionalcooperationframework.4 clonal Orchards
3 Forest Polices.Regionalcooperationframework.3 clonal Orchards
1 Forest Policy.Regionalcooperationframework.1 clonal Orchards
No. of Policies/ strategiesreviewed
Sustainable Forest Managementservices
1101110800 CapacityDevelopment Project forSustainable ForestManagement
15,000households
20,000Ha
100MW
15,000households
20,000Ha
100MW
15,000households
20,000Ha
100MW
Households supplied with cleanwater
Size of acreage irrigated,
Megawatts of electricitygenerated
Water, electricity and irrigatedland
1101111000 MunyuMultiPurpose Dam
200 ha
1000jobs
200 ha
1000 jobs
100ha
500 jobs
Acreage of productive landenhanced
No. of jobs created
Enhanced land productivity andjob creation
1101111100 CapacityBuilding and TechnologyTransfer
7500 jobs7500 jobs7500 jobsNo. of jobs createdJob creation1101111200 EcotourismDevelopment
--KSh.50 millionAmount of pending bill paidPending bill payments1101111500 High Grand Falls- Pending Bills
--KSh.70 millionAmount of pending bill paidPending bill payments1101111600 Arror Dam -Pending Bills
--KSh.100 millionAmount of pending bill paidPending bill payments1101111700 Mwache Dam -Pending Bills
313

PART E. SUMMARY OF PROGRAMME OUTPUTS AND PERFORMANCE INDICATORS FOR 2016/2017 - 2018/2019
1101 Ministry of Environment, Natural Resources and Regional Dev't Authorities
--KSh.190 millionAmount of pending bill paidPending bill payments1101111800 Lower EwasoNgiro South Dam - PendingBills
--KSh.187 millionAmount of pending bill paidPending bill payments1101111900 Kimira Olouch -Pending Bills
483417No. of small damsconstructed/rehabilitated
Increased water storage1101112000 Water Pans -RDAs
314
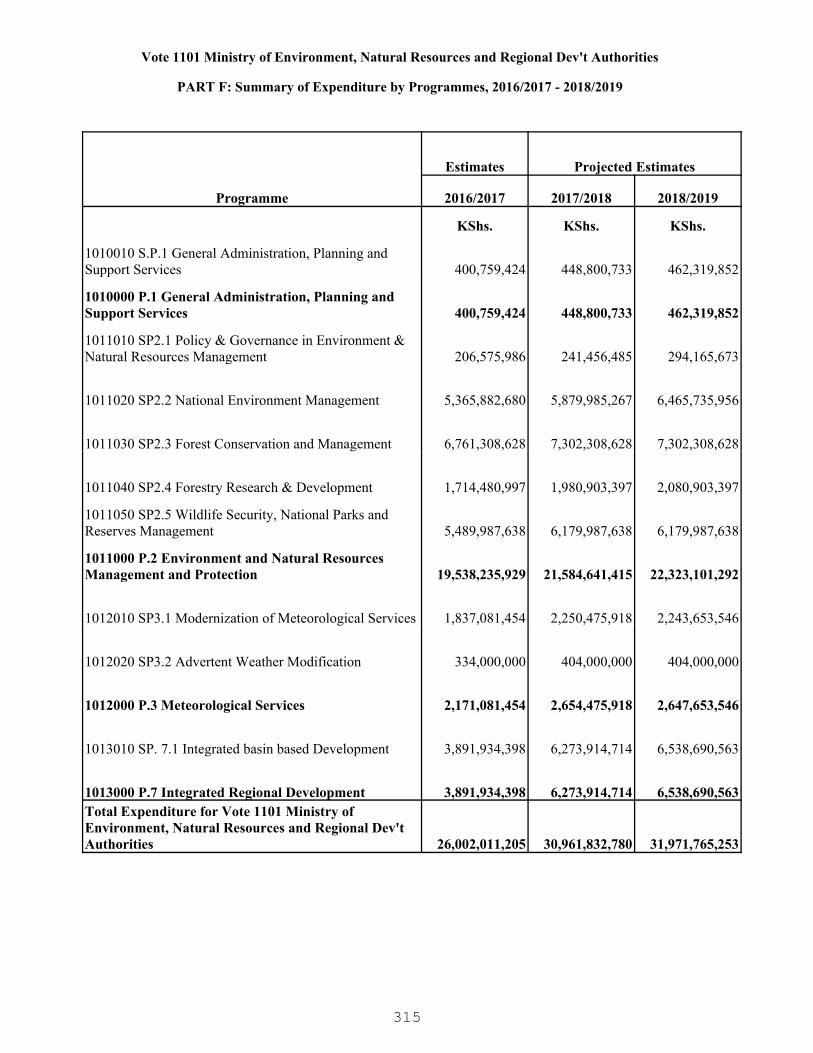
Vote 1101 Ministry of Environment, Natural Resources and Regional Dev't Authorities
PART F: Summary of Expenditure by Programmes, 2016/2017 - 2018/2019
Programme
Estimates Projected Estimates
2016/2017 2017/2018 2018/2019
KShs. KShs. KShs.
1010010 S.P.1 General Administration, Planning and Support Services 400,759,424 448,800,733 462,319,852
1010000 P.1 General Administration, Planning and Support Services 400,759,424 448,800,733 462,319,852
1011010 SP2.1 Policy & Governance in Environment & Natural Resources Management 206,575,986 241,456,485 294,165,673
1011020 SP2.2 National Environment Management 5,365,882,680 5,879,985,267 6,465,735,956
1011030 SP2.3 Forest Conservation and Management 6,761,308,628 7,302,308,628 7,302,308,628
1011040 SP2.4 Forestry Research & Development 1,714,480,997 1,980,903,397 2,080,903,397
1011050 SP2.5 Wildlife Security, National Parks and Reserves Management 5,489,987,638 6,179,987,638 6,179,987,638
1011000 P.2 Environment and Natural Resources Management and Protection 19,538,235,929 21,584,641,415 22,323,101,292
1012010 SP3.1 Modernization of Meteorological Services 1,837,081,454 2,250,475,918 2,243,653,546
1012020 SP3.2 Advertent Weather Modification 334,000,000 404,000,000 404,000,000
1012000 P.3 Meteorological Services 2,171,081,454 2,654,475,918 2,647,653,546
1013010 SP. 7.1 Integrated basin based Development 3,891,934,398 6,273,914,714 6,538,690,563
1013000 P.7 Integrated Regional Development 3,891,934,398 6,273,914,714 6,538,690,563Total Expenditure for Vote 1101 Ministry of Environment, Natural Resources and Regional Dev't Authorities 26,002,011,205 30,961,832,780 31,971,765,253
315

1101 Ministry of Environment, Natural Resources and Regional Dev't Authorities
PART G: Summary of Expenditure by Vote and Economic Classification, 2016/2017 - 2018/2019
Economic Classification
Estimates Projected Estimates
2016/2017 2017/2018 2018/2019KShs. KShs. KShs.
Current Expenditure 15,346,391,474 16,842,115,780 17,428,048,253
Compensation to Employees 1,236,326,000 1,264,415,780 1,272,348,253
Use of Goods and Services 885,908,181 1,108,335,389 1,131,849,082
Current Transfers to Govt. Agencies 13,201,050,000 14,437,700,000 14,991,700,000
Other Recurrent 23,107,293 31,664,611 32,150,918
Capital Expenditure 10,655,619,731 14,119,717,000 14,543,717,000
Acquisition of Non-Financial Assets 2,488,100,000 3,685,100,000 3,685,100,000
Capital Grants to Govt. Agencies 7,895,619,731 10,154,717,000 10,578,717,000
Other Development 271,900,000 279,900,000 279,900,000Total Expenditure 26,002,011,205 30,961,832,780 31,971,765,253
316

1101 Ministry of Environment, Natural Resources and Regional Dev't Authorities
PART H: Summary of Expenditure by Programme and Economic Classification, 2016/2017 - 2018/2019
1010010 S.P.1 General Administration, Planning and Support Services
Economic Classification
Estimates Projected Estimates
2016/2017 2017/2018 2018/2019KShs. KShs. KShs.
Current Expenditure 400,759,424 448,800,733 462,319,852
Compensation to Employees 250,512,973 260,403,680 270,613,232
Use of Goods and Services 141,338,891 173,748,987 176,572,247
Other Recurrent 8,907,560 14,648,066 15,134,373Total Expenditure 400,759,424 448,800,733 462,319,852
1010000 P.1 General Administration, Planning and Support Services
Economic Classification
Estimates Projected Estimates
2016/2017 2017/2018 2018/2019KShs. KShs. KShs.
Current Expenditure 400,759,424 448,800,733 462,319,852
Compensation to Employees 250,512,973 260,403,680 270,613,232
Use of Goods and Services 141,338,891 173,748,987 176,572,247
Other Recurrent 8,907,560 14,648,066 15,134,373Total Expenditure 400,759,424 448,800,733 462,319,852
1011010 SP2.1 Policy & Governance in Environment & Natural Resources Management
Economic Classification
Estimates Projected Estimates
2016/2017 2017/2018 2018/2019KShs. KShs. KShs.
Current Expenditure 181,575,986 215,456,485 268,165,673
Compensation to Employees 111,236,018 115,885,486 120,002,155
Use of Goods and Services 50,336,968 79,567,999 128,160,518
Current Transfers to Govt. Agencies 20,003,000 20,003,000 20,003,000
Capital Expenditure 25,000,000 26,000,000 26,000,000
Capital Grants to Govt. Agencies 25,000,000 26,000,000 26,000,000Total Expenditure 206,575,986 241,456,485 294,165,673
317
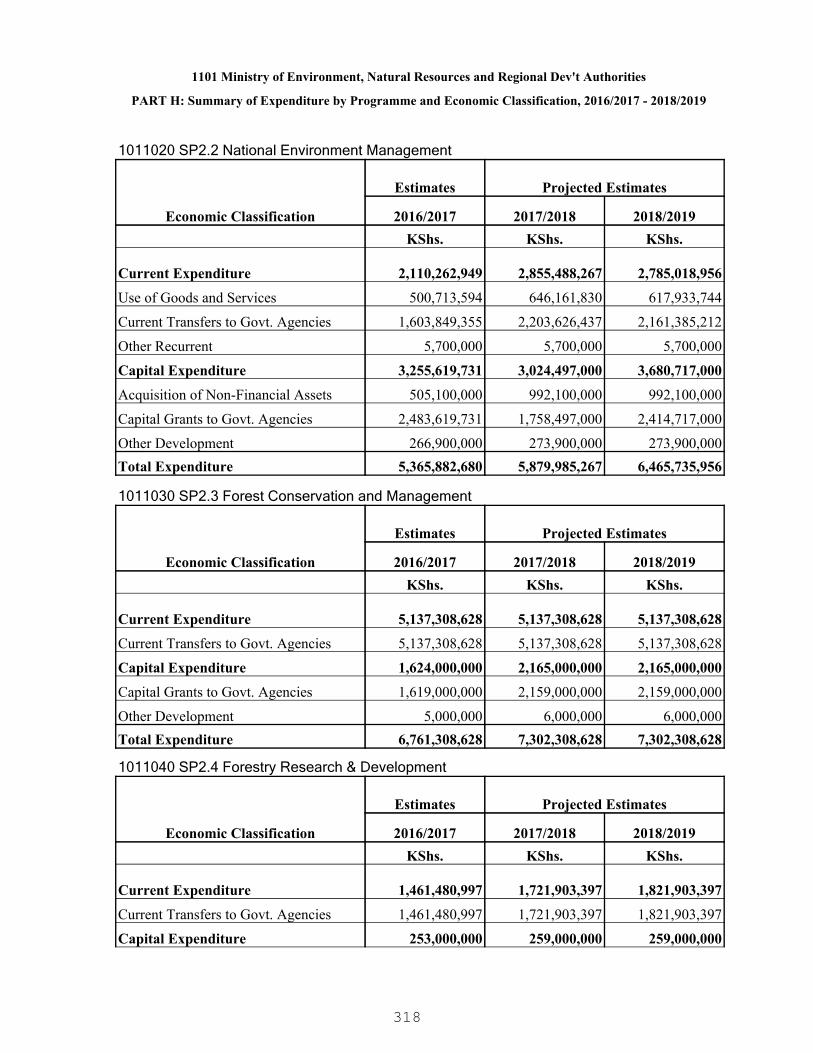
1101 Ministry of Environment, Natural Resources and Regional Dev't Authorities
PART H: Summary of Expenditure by Programme and Economic Classification, 2016/2017 - 2018/2019
1011020 SP2.2 National Environment Management
Economic Classification
Estimates Projected Estimates
2016/2017 2017/2018 2018/2019KShs. KShs. KShs.
Current Expenditure 2,110,262,949 2,855,488,267 2,785,018,956
Use of Goods and Services 500,713,594 646,161,830 617,933,744
Current Transfers to Govt. Agencies 1,603,849,355 2,203,626,437 2,161,385,212
Other Recurrent 5,700,000 5,700,000 5,700,000
Capital Expenditure 3,255,619,731 3,024,497,000 3,680,717,000
Acquisition of Non-Financial Assets 505,100,000 992,100,000 992,100,000
Capital Grants to Govt. Agencies 2,483,619,731 1,758,497,000 2,414,717,000
Other Development 266,900,000 273,900,000 273,900,000Total Expenditure 5,365,882,680 5,879,985,267 6,465,735,956
1011030 SP2.3 Forest Conservation and Management
Economic Classification
Estimates Projected Estimates
2016/2017 2017/2018 2018/2019KShs. KShs. KShs.
Current Expenditure 5,137,308,628 5,137,308,628 5,137,308,628
Current Transfers to Govt. Agencies 5,137,308,628 5,137,308,628 5,137,308,628
Capital Expenditure 1,624,000,000 2,165,000,000 2,165,000,000
Capital Grants to Govt. Agencies 1,619,000,000 2,159,000,000 2,159,000,000
Other Development 5,000,000 6,000,000 6,000,000Total Expenditure 6,761,308,628 7,302,308,628 7,302,308,628
1011040 SP2.4 Forestry Research & Development
Economic Classification
Estimates Projected Estimates
2016/2017 2017/2018 2018/2019KShs. KShs. KShs.
Current Expenditure 1,461,480,997 1,721,903,397 1,821,903,397
Current Transfers to Govt. Agencies 1,461,480,997 1,721,903,397 1,821,903,397
Capital Expenditure 253,000,000 259,000,000 259,000,000
318
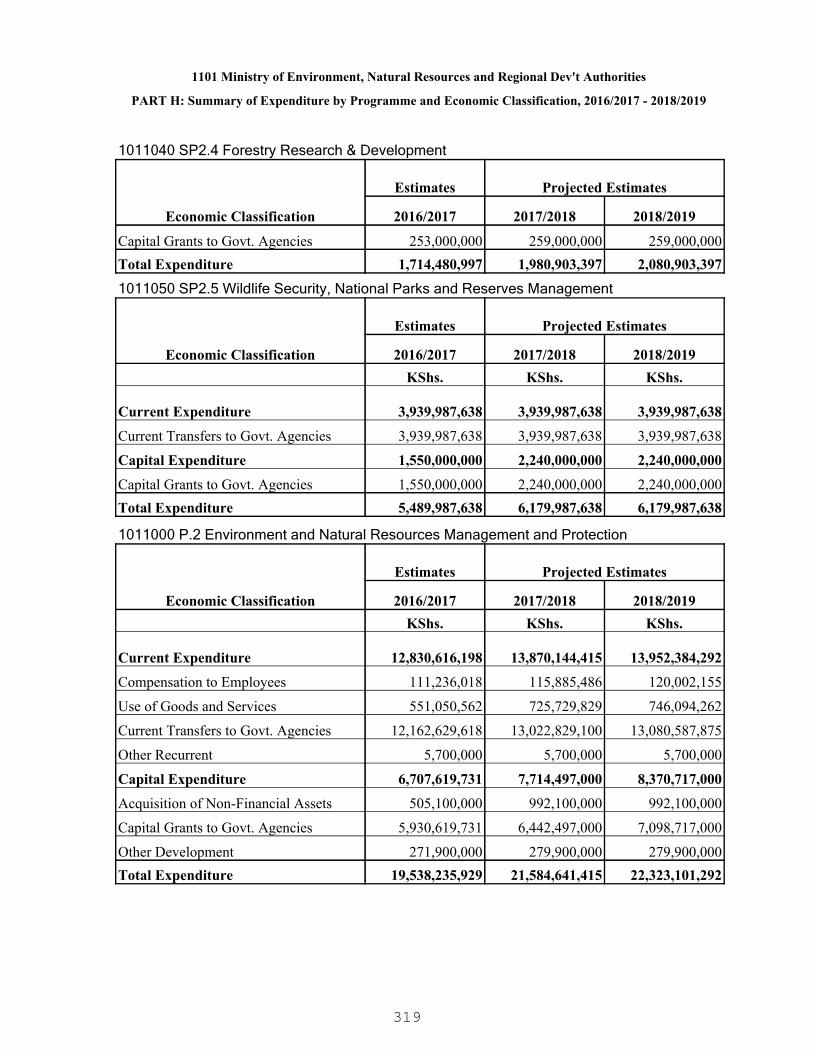
1101 Ministry of Environment, Natural Resources and Regional Dev't Authorities
PART H: Summary of Expenditure by Programme and Economic Classification, 2016/2017 - 2018/2019
1011040 SP2.4 Forestry Research & Development
Economic Classification
Estimates Projected Estimates
2016/2017 2017/2018 2018/2019
Capital Grants to Govt. Agencies 253,000,000 259,000,000 259,000,000Total Expenditure 1,714,480,997 1,980,903,397 2,080,903,397
1011050 SP2.5 Wildlife Security, National Parks and Reserves Management
Economic Classification
Estimates Projected Estimates
2016/2017 2017/2018 2018/2019KShs. KShs. KShs.
Current Expenditure 3,939,987,638 3,939,987,638 3,939,987,638
Current Transfers to Govt. Agencies 3,939,987,638 3,939,987,638 3,939,987,638
Capital Expenditure 1,550,000,000 2,240,000,000 2,240,000,000
Capital Grants to Govt. Agencies 1,550,000,000 2,240,000,000 2,240,000,000Total Expenditure 5,489,987,638 6,179,987,638 6,179,987,638
1011000 P.2 Environment and Natural Resources Management and Protection
Economic Classification
Estimates Projected Estimates
2016/2017 2017/2018 2018/2019KShs. KShs. KShs.
Current Expenditure 12,830,616,198 13,870,144,415 13,952,384,292
Compensation to Employees 111,236,018 115,885,486 120,002,155
Use of Goods and Services 551,050,562 725,729,829 746,094,262
Current Transfers to Govt. Agencies 12,162,629,618 13,022,829,100 13,080,587,875
Other Recurrent 5,700,000 5,700,000 5,700,000
Capital Expenditure 6,707,619,731 7,714,497,000 8,370,717,000
Acquisition of Non-Financial Assets 505,100,000 992,100,000 992,100,000
Capital Grants to Govt. Agencies 5,930,619,731 6,442,497,000 7,098,717,000
Other Development 271,900,000 279,900,000 279,900,000Total Expenditure 19,538,235,929 21,584,641,415 22,323,101,292
319
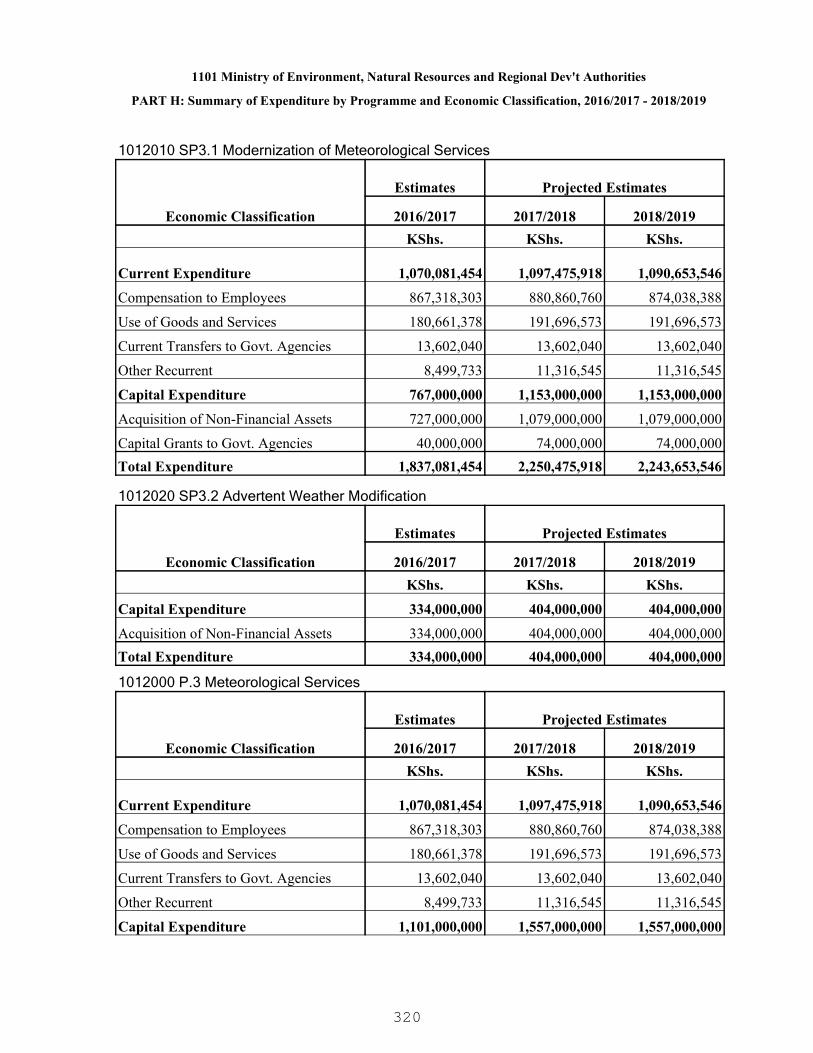
1101 Ministry of Environment, Natural Resources and Regional Dev't Authorities
PART H: Summary of Expenditure by Programme and Economic Classification, 2016/2017 - 2018/2019
1012010 SP3.1 Modernization of Meteorological Services
Economic Classification
Estimates Projected Estimates
2016/2017 2017/2018 2018/2019KShs. KShs. KShs.
Current Expenditure 1,070,081,454 1,097,475,918 1,090,653,546
Compensation to Employees 867,318,303 880,860,760 874,038,388
Use of Goods and Services 180,661,378 191,696,573 191,696,573
Current Transfers to Govt. Agencies 13,602,040 13,602,040 13,602,040
Other Recurrent 8,499,733 11,316,545 11,316,545
Capital Expenditure 767,000,000 1,153,000,000 1,153,000,000
Acquisition of Non-Financial Assets 727,000,000 1,079,000,000 1,079,000,000
Capital Grants to Govt. Agencies 40,000,000 74,000,000 74,000,000Total Expenditure 1,837,081,454 2,250,475,918 2,243,653,546
1012020 SP3.2 Advertent Weather Modification
Economic Classification
Estimates Projected Estimates
2016/2017 2017/2018 2018/2019KShs. KShs. KShs.
Capital Expenditure 334,000,000 404,000,000 404,000,000
Acquisition of Non-Financial Assets 334,000,000 404,000,000 404,000,000Total Expenditure 334,000,000 404,000,000 404,000,000
1012000 P.3 Meteorological Services
Economic Classification
Estimates Projected Estimates
2016/2017 2017/2018 2018/2019KShs. KShs. KShs.
Current Expenditure 1,070,081,454 1,097,475,918 1,090,653,546
Compensation to Employees 867,318,303 880,860,760 874,038,388
Use of Goods and Services 180,661,378 191,696,573 191,696,573
Current Transfers to Govt. Agencies 13,602,040 13,602,040 13,602,040
Other Recurrent 8,499,733 11,316,545 11,316,545
Capital Expenditure 1,101,000,000 1,557,000,000 1,557,000,000
320

1101 Ministry of Environment, Natural Resources and Regional Dev't Authorities
PART H: Summary of Expenditure by Programme and Economic Classification, 2016/2017 - 2018/2019
1012000 P.3 Meteorological Services
Economic Classification
Estimates Projected Estimates
2016/2017 2017/2018 2018/2019
Acquisition of Non-Financial Assets 1,061,000,000 1,483,000,000 1,483,000,000
Capital Grants to Govt. Agencies 40,000,000 74,000,000 74,000,000Total Expenditure 2,171,081,454 2,654,475,918 2,647,653,546
1013010 SP. 7.1 Integrated basin based Development
Economic Classification
Estimates Projected Estimates
2016/2017 2017/2018 2018/2019KShs. KShs. KShs.
Current Expenditure 1,044,934,398 1,425,694,714 1,922,690,563
Compensation to Employees 7,258,706 7,265,854 7,694,478
Use of Goods and Services 12,857,350 17,160,000 17,486,000
Current Transfers to Govt. Agencies 1,024,818,342 1,401,268,860 1,897,510,085
Capital Expenditure 2,847,000,000 4,848,220,000 4,616,000,000
Acquisition of Non-Financial Assets 922,000,000 1,210,000,000 1,210,000,000
Capital Grants to Govt. Agencies 1,925,000,000 3,638,220,000 3,406,000,000Total Expenditure 3,891,934,398 6,273,914,714 6,538,690,563
1013000 P.7 Integrated Regional Development
Economic Classification
Estimates Projected Estimates
2016/2017 2017/2018 2018/2019KShs. KShs. KShs.
Current Expenditure 1,044,934,398 1,425,694,714 1,922,690,563
Compensation to Employees 7,258,706 7,265,854 7,694,478
Use of Goods and Services 12,857,350 17,160,000 17,486,000
Current Transfers to Govt. Agencies 1,024,818,342 1,401,268,860 1,897,510,085
Capital Expenditure 2,847,000,000 4,848,220,000 4,616,000,000
Acquisition of Non-Financial Assets 922,000,000 1,210,000,000 1,210,000,000
Capital Grants to Govt. Agencies 1,925,000,000 3,638,220,000 3,406,000,000Total Expenditure 3,891,934,398 6,273,914,714 6,538,690,563
321
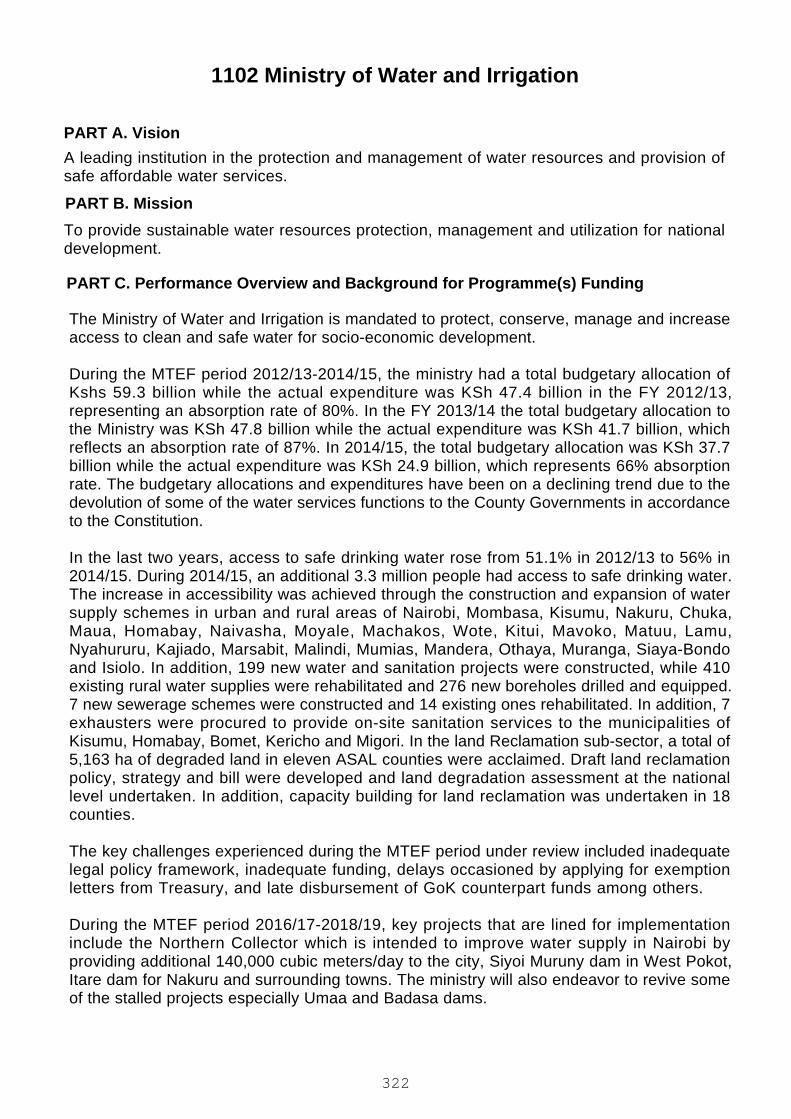
1102 Ministry of Water and Irrigation
A leading institution in the protection and management of water resources and provision ofsafe affordable water services.
To provide sustainable water resources protection, management and utilization for nationaldevelopment.
PART A. Vision
PART B. Mission
PART C. Performance Overview and Background for Programme(s) Funding
The Ministry of Water and Irrigation is mandated to protect, conserve, manage and increaseaccess to clean and safe water for socio-economic development.
During the MTEF period 2012/13-2014/15, the ministry had a total budgetary allocation ofKshs 59.3 billion while the actual expenditure was KSh 47.4 billion in the FY 2012/13,representing an absorption rate of 80%. In the FY 2013/14 the total budgetary allocation tothe Ministry was KSh 47.8 billion while the actual expenditure was KSh 41.7 billion, whichreflects an absorption rate of 87%. In 2014/15, the total budgetary allocation was KSh 37.7billion while the actual expenditure was KSh 24.9 billion, which represents 66% absorptionrate. The budgetary allocations and expenditures have been on a declining trend due to thedevolution of some of the water services functions to the County Governments in accordanceto the Constitution.
In the last two years, access to safe drinking water rose from 51.1% in 2012/13 to 56% in2014/15. During 2014/15, an additional 3.3 million people had access to safe drinking water.The increase in accessibility was achieved through the construction and expansion of watersupply schemes in urban and rural areas of Nairobi, Mombasa, Kisumu, Nakuru, Chuka,Maua, Homabay, Naivasha, Moyale, Machakos, Wote, Kitui, Mavoko, Matuu, Lamu,Nyahururu, Kajiado, Marsabit, Malindi, Mumias, Mandera, Othaya, Muranga, Siaya-Bondoand Isiolo. In addition, 199 new water and sanitation projects were constructed, while 410existing rural water supplies were rehabilitated and 276 new boreholes drilled and equipped.7 new sewerage schemes were constructed and 14 existing ones rehabilitated. In addition, 7exhausters were procured to provide on-site sanitation services to the municipalities ofKisumu, Homabay, Bomet, Kericho and Migori. In the land Reclamation sub-sector, a total of5,163 ha of degraded land in eleven ASAL counties were acclaimed. Draft land reclamationpolicy, strategy and bill were developed and land degradation assessment at the nationallevel undertaken. In addition, capacity building for land reclamation was undertaken in 18counties.
The key challenges experienced during the MTEF period under review included inadequatelegal policy framework, inadequate funding, delays occasioned by applying for exemptionletters from Treasury, and late disbursement of GoK counterpart funds among others.
During the MTEF period 2016/17-2018/19, key projects that are lined for implementationinclude the Northern Collector which is intended to improve water supply in Nairobi byproviding additional 140,000 cubic meters/day to the city, Siyoi Muruny dam in West Pokot,Itare dam for Nakuru and surrounding towns. The ministry will also endeavor to revive someof the stalled projects especially Umaa and Badasa dams.
322

1102 Ministry of Water and Irrigation
PART D. Programme Objectives
ObjectiveProgramme
1001000 P.2 GeneralAdministration, Planningand Support Services
To promote good governance in the management of waterand basin based resources.
1004000 P.3 WaterResources Management
To increase access and availability of adequate and qualitywater resources.
1014000 P.4 Irrigation andLand Reclamation
To increase utilization of land through irrigation anddrainage.
323
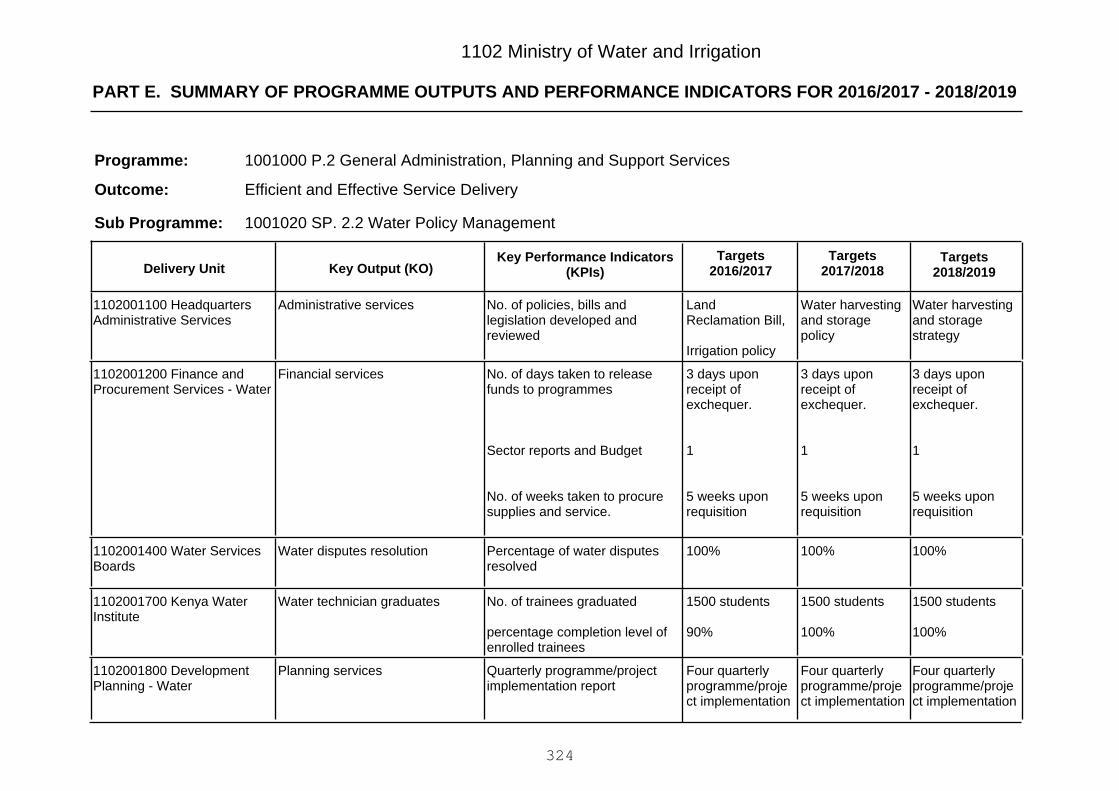
PART E. SUMMARY OF PROGRAMME OUTPUTS AND PERFORMANCE INDICATORS FOR 2016/2017 - 2018/2019
1102 Ministry of Water and Irrigation
1001000 P.2 General Administration, Planning and Support Services
Efficient and Effective Service Delivery
Programme:
Outcome:
1001020 SP. 2.2 Water Policy ManagementSub Programme:
Key Output (KO)Targets
2018/2019Targets
2017/2018Key Performance Indicators
(KPIs)Targets
2016/2017Delivery Unit
Water harvestingand storagestrategy
Water harvestingand storagepolicy
LandReclamation Bill,
Irrigation policy
No. of policies, bills andlegislation developed andreviewed
Administrative services1102001100 HeadquartersAdministrative Services
3 days uponreceipt ofexchequer.
1
5 weeks uponrequisition
3 days uponreceipt ofexchequer.
1
5 weeks uponrequisition
3 days uponreceipt ofexchequer.
1
5 weeks uponrequisition
No. of days taken to releasefunds to programmes
Sector reports and Budget
No. of weeks taken to procuresupplies and service.
Financial services1102001200 Finance andProcurement Services - Water
100%100%100%Percentage of water disputesresolved
Water disputes resolution1102001400 Water ServicesBoards
1500 students
100%
1500 students
100%
1500 students
90%
No. of trainees graduated
percentage completion level ofenrolled trainees
Water technician graduates1102001700 Kenya WaterInstitute
Four quarterlyprogramme/project implementation
Four quarterlyprogramme/project implementation
Four quarterlyprogramme/project implementation
Quarterly programme/projectimplementation report
Planning services1102001800 DevelopmentPlanning - Water
324
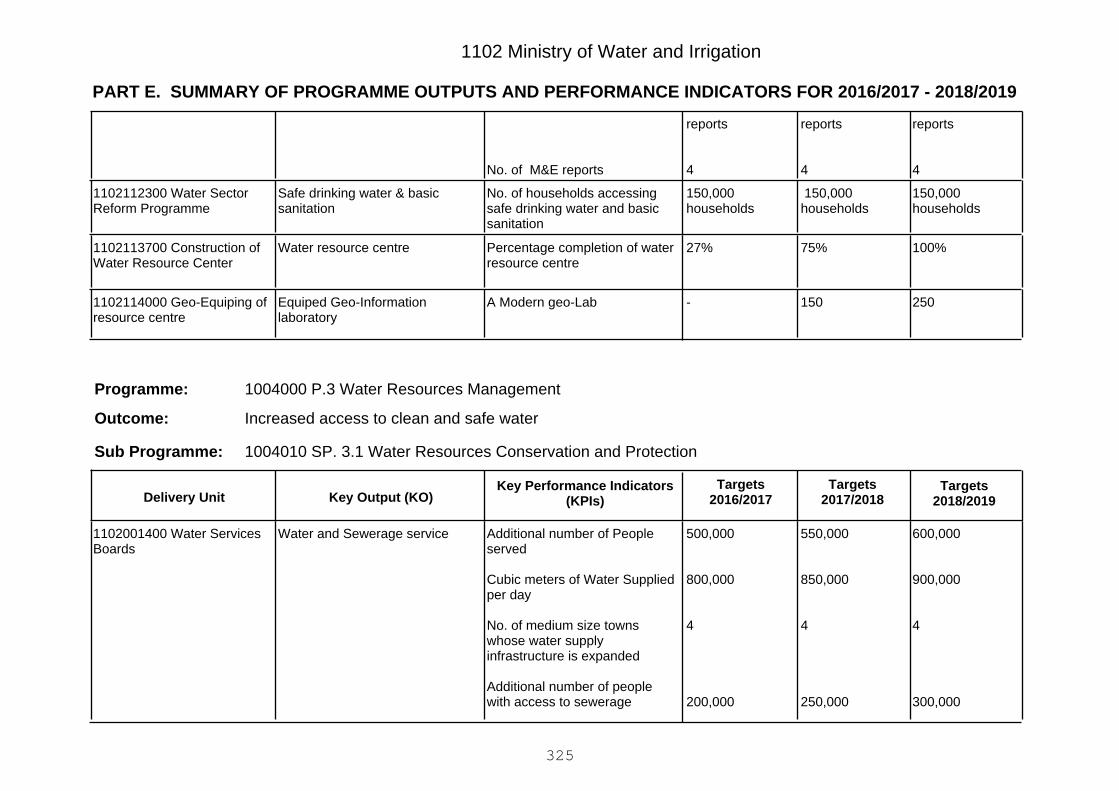
PART E. SUMMARY OF PROGRAMME OUTPUTS AND PERFORMANCE INDICATORS FOR 2016/2017 - 2018/2019
1102 Ministry of Water and Irrigation
reports
4
reports
4
reports
4No. of M&E reports
150,000households
150,000households
150,000households
No. of households accessingsafe drinking water and basicsanitation
Safe drinking water & basicsanitation
1102112300 Water SectorReform Programme
100%75%27%Percentage completion of waterresource centre
Water resource centre1102113700 Construction ofWater Resource Center
250150-A Modern geo-LabEquiped Geo-Informationlaboratory
1102114000 Geo-Equiping ofresource centre
1004000 P.3 Water Resources Management
Increased access to clean and safe water
Programme:
Outcome:
1004010 SP. 3.1 Water Resources Conservation and ProtectionSub Programme:
Key Output (KO)Targets
2018/2019Targets
2017/2018Key Performance Indicators
(KPIs)Targets
2016/2017Delivery Unit
600,000
900,000
4
300,000
550,000
850,000
4
250,000
500,000
800,000
4
200,000
Additional number of Peopleserved
Cubic meters of Water Suppliedper day
No. of medium size townswhose water supplyinfrastructure is expanded
Additional number of peoplewith access to sewerage
Water and Sewerage service1102001400 Water ServicesBoards
325
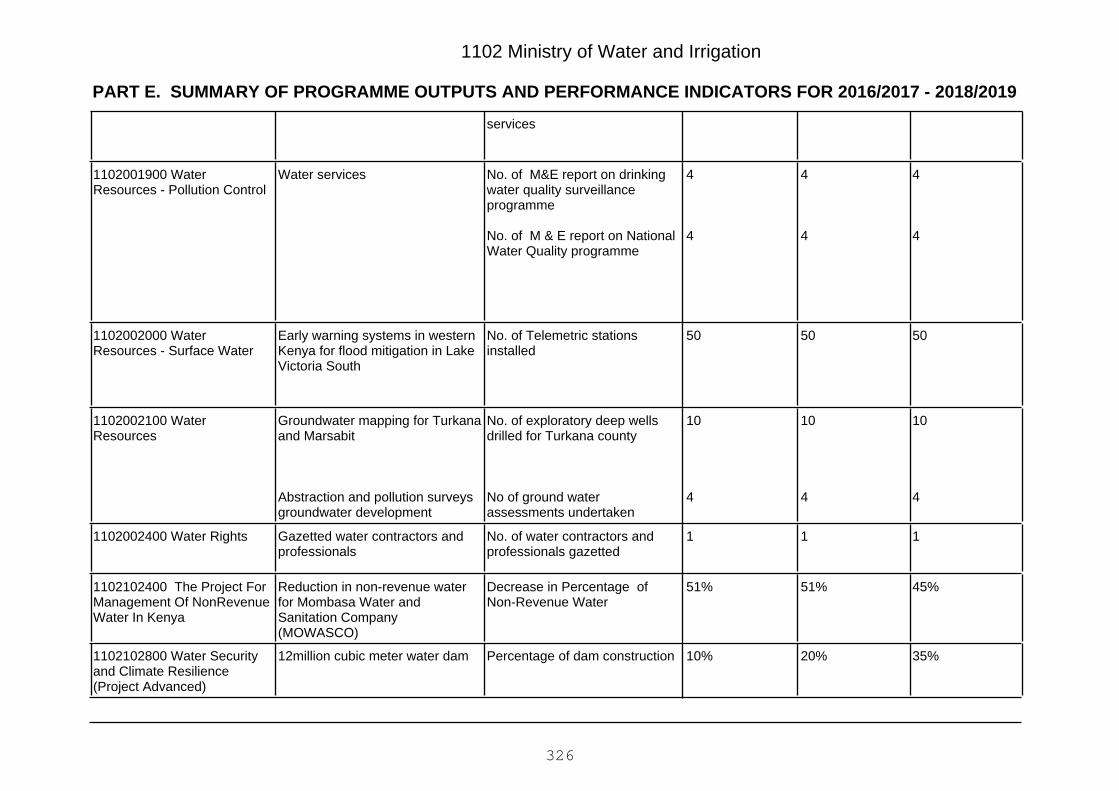
PART E. SUMMARY OF PROGRAMME OUTPUTS AND PERFORMANCE INDICATORS FOR 2016/2017 - 2018/2019
1102 Ministry of Water and Irrigation
services
4
4
4
4
4
4
No. of M&E report on drinkingwater quality surveillanceprogramme
No. of M & E report on NationalWater Quality programme
Water services1102001900 WaterResources - Pollution Control
505050No. of Telemetric stationsinstalled
Early warning systems in westernKenya for flood mitigation in LakeVictoria South
1102002000 WaterResources - Surface Water
10
4
10
4
10
4
No. of exploratory deep wellsdrilled for Turkana county
No of ground waterassessments undertaken
Groundwater mapping for Turkanaand Marsabit
Abstraction and pollution surveysgroundwater development
1102002100 WaterResources
111No. of water contractors andprofessionals gazetted
Gazetted water contractors andprofessionals
1102002400 Water Rights
45%51%51%Decrease in Percentage ofNon-Revenue Water
Reduction in non-revenue waterfor Mombasa Water andSanitation Company(MOWASCO)
1102102400 The Project ForManagement Of NonRevenueWater In Kenya
35%20%10%Percentage of dam construction12million cubic meter water dam1102102800 Water Securityand Climate Resilience(Project Advanced)
326

PART E. SUMMARY OF PROGRAMME OUTPUTS AND PERFORMANCE INDICATORS FOR 2016/2017 - 2018/2019
1102 Ministry of Water and Irrigation
58%
15%
20%
5%
40%
10%
10%
4%
30%
5%
5%
2%
Percentage reduction of povertyprevalence rate in the projectarea
Percentage increase inhousehold average realincomes
Percentage reduction insediment load in rivers andwater reservoirs in Upper TanaCatchment
Increase in hectare of forestreserve protected/rehabilitated
Communities with increasedawareness & capacity to managenatural resources sustainably;
Sustainably managed waterresources, forest and agriculturalecosystems;
1102104000 Upper TanaNatural ResourcesManagement Project
--Athi River BasinImproved water safety in RiverBasins
Water safety and security1102106400 Athi RiverRestoration Programme
2210No.of boreholes drilledWater supply services1102106500 Drilling ofExploratory Boreholes forTurkana, Marsabit, Garissa,Wa
505050No. of SCMPs developed andimplemented
Formulation of WRUAs SCMPsdeveloped and implemented
1102106600 Implementationof Sub CatchmentManagement Plans
505050No. of stations established/rehabiliated
Water Resource MonitoringStations
1102106700 Construction andRehabilitation of WaterResource Monitoring Station
-2012Number of abstraction andpollution surveys conducted
Planning and enforcement inwater resources management
1102106800 WaterAbstraction and PollutionControl Surveys
327
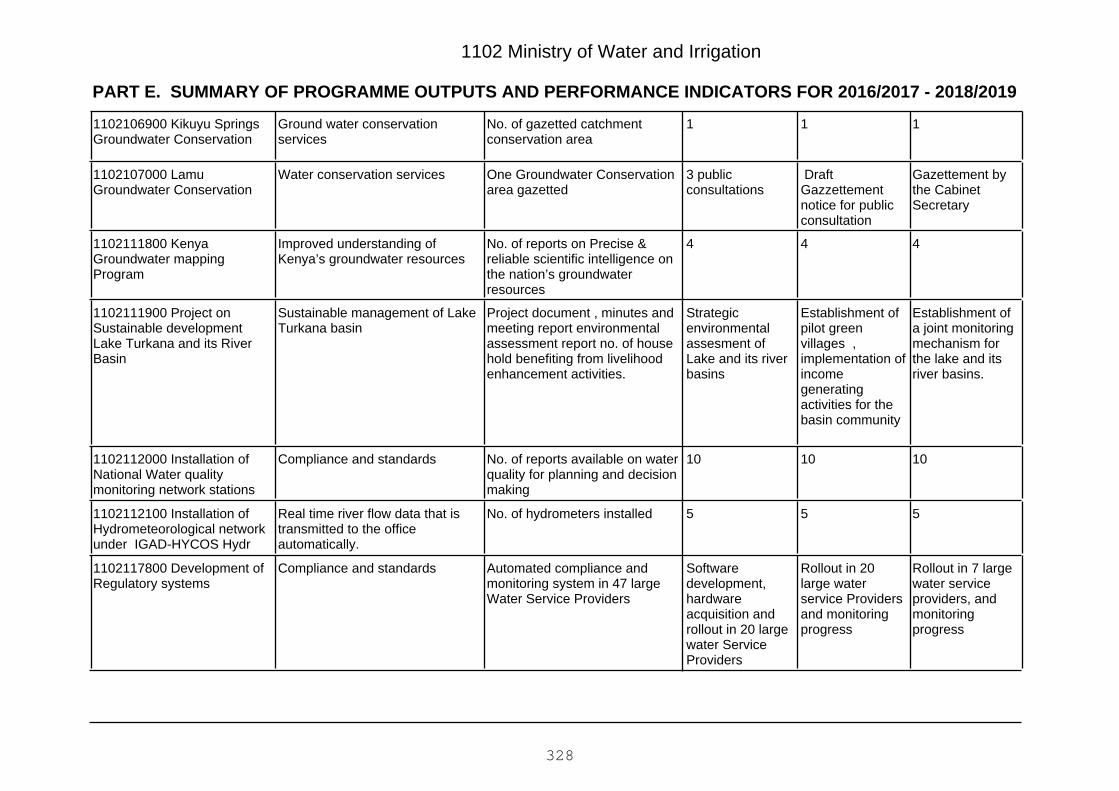
PART E. SUMMARY OF PROGRAMME OUTPUTS AND PERFORMANCE INDICATORS FOR 2016/2017 - 2018/2019
1102 Ministry of Water and Irrigation
111No. of gazetted catchmentconservation area
Ground water conservationservices
1102106900 Kikuyu SpringsGroundwater Conservation
Gazettement bythe CabinetSecretary
DraftGazzettementnotice for publicconsultation
3 publicconsultations
One Groundwater Conservationarea gazetted
Water conservation services1102107000 LamuGroundwater Conservation
444No. of reports on Precise &reliable scientific intelligence onthe nation’s groundwaterresources
Improved understanding ofKenya’s groundwater resources
1102111800 KenyaGroundwater mappingProgram
Establishment ofa joint monitoringmechanism forthe lake and itsriver basins.
Establishment ofpilot greenvillages ,implementation ofincomegeneratingactivities for thebasin community
Strategicenvironmentalassesment ofLake and its riverbasins
Project document , minutes andmeeting report environmentalassessment report no. of household benefiting from livelihoodenhancement activities.
Sustainable management of LakeTurkana basin
1102111900 Project onSustainable developmentLake Turkana and its RiverBasin
101010No. of reports available on waterquality for planning and decisionmaking
Compliance and standards1102112000 Installation ofNational Water qualitymonitoring network stations
555No. of hydrometers installedReal time river flow data that istransmitted to the officeautomatically.
1102112100 Installation ofHydrometeorological networkunder IGAD-HYCOS Hydr
Rollout in 7 largewater serviceproviders, andmonitoringprogress
Rollout in 20large waterservice Providersand monitoringprogress
Softwaredevelopment,hardwareacquisition androllout in 20 largewater ServiceProviders
Automated compliance andmonitoring system in 47 largeWater Service Providers
Compliance and standards1102117800 Development ofRegulatory systems
328
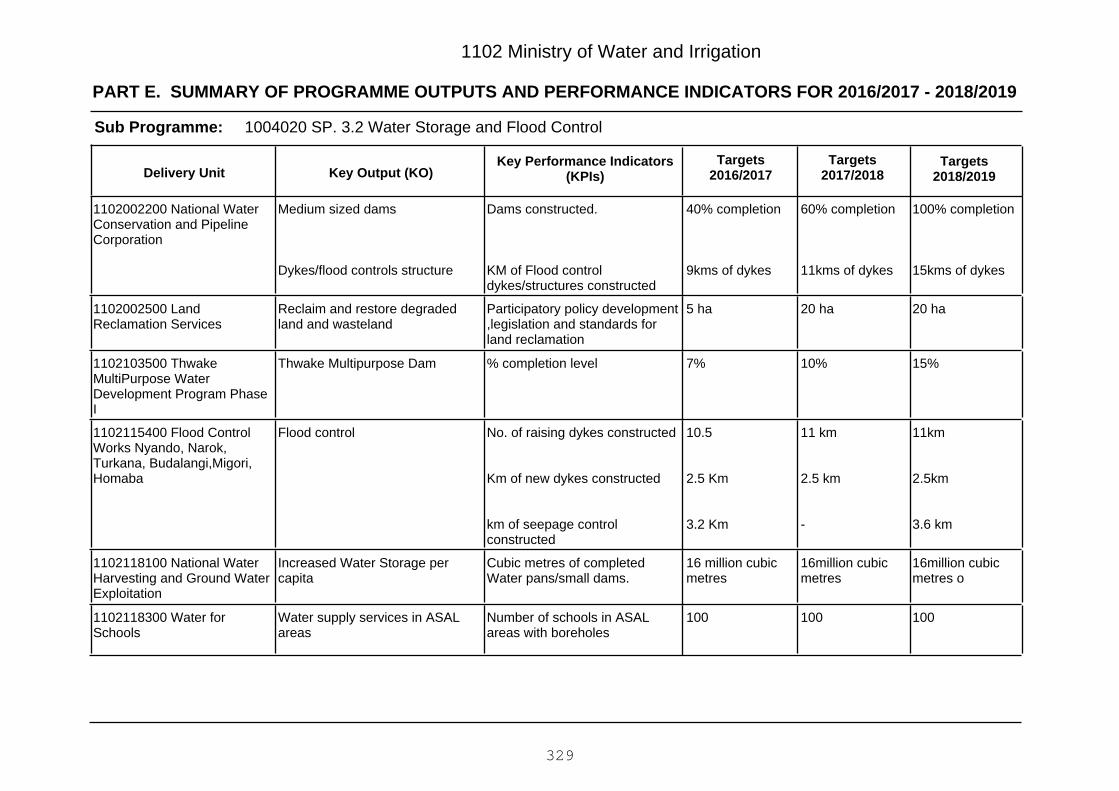
PART E. SUMMARY OF PROGRAMME OUTPUTS AND PERFORMANCE INDICATORS FOR 2016/2017 - 2018/2019
1102 Ministry of Water and Irrigation
1004020 SP. 3.2 Water Storage and Flood ControlSub Programme:
Key Output (KO)Targets
2018/2019Targets
2017/2018Key Performance Indicators
(KPIs)Targets
2016/2017Delivery Unit
100% completion
15kms of dykes
60% completion
11kms of dykes
40% completion
9kms of dykes
Dams constructed.
KM of Flood controldykes/structures constructed
Medium sized dams
Dykes/flood controls structure
1102002200 National WaterConservation and PipelineCorporation
20 ha20 ha5 haParticipatory policy development,legislation and standards forland reclamation
Reclaim and restore degradedland and wasteland
1102002500 LandReclamation Services
15%10%7%% completion levelThwake Multipurpose Dam1102103500 ThwakeMultiPurpose WaterDevelopment Program PhaseI
11km
2.5km
3.6 km
11 km
2.5 km
-
10.5
2.5 Km
3.2 Km
No. of raising dykes constructed
Km of new dykes constructed
km of seepage controlconstructed
Flood control1102115400 Flood ControlWorks Nyando, Narok,Turkana, Budalangi,Migori,Homaba
16million cubicmetres o
16million cubicmetres
16 million cubicmetres
Cubic metres of completedWater pans/small dams.
Increased Water Storage percapita
1102118100 National WaterHarvesting and Ground WaterExploitation
100100100Number of schools in ASALareas with boreholes
Water supply services in ASALareas
1102118300 Water forSchools
329
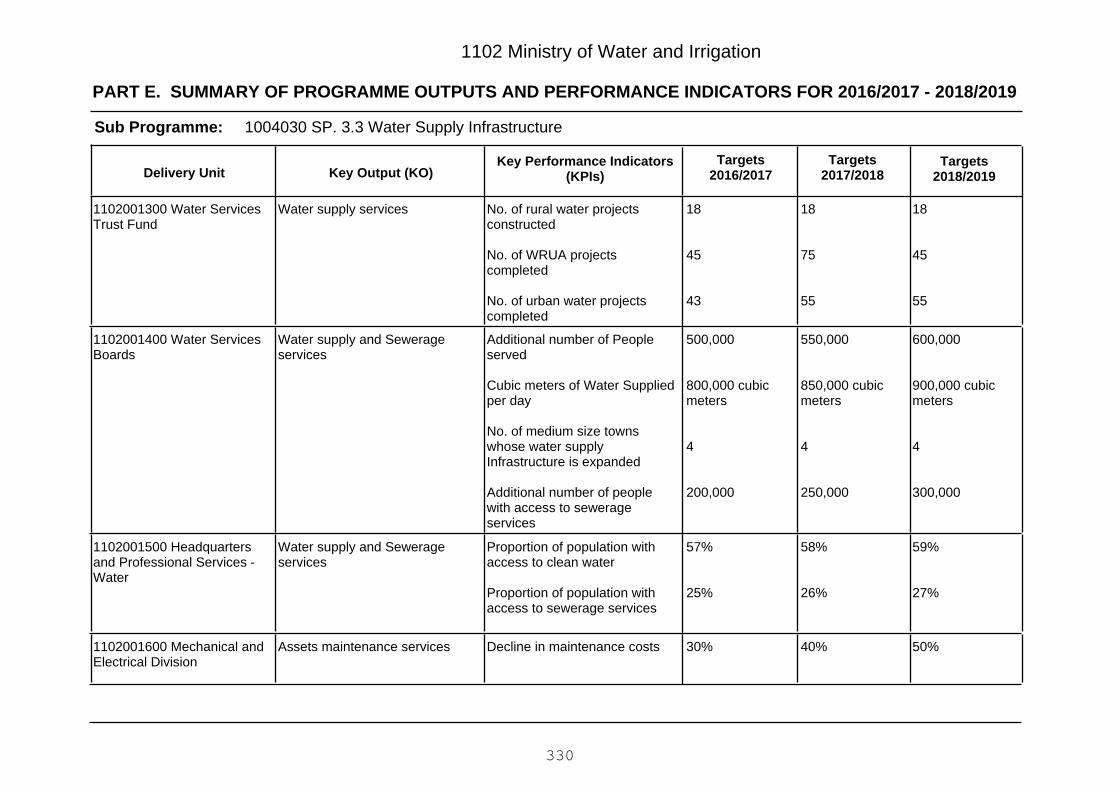
PART E. SUMMARY OF PROGRAMME OUTPUTS AND PERFORMANCE INDICATORS FOR 2016/2017 - 2018/2019
1102 Ministry of Water and Irrigation
1004030 SP. 3.3 Water Supply InfrastructureSub Programme:
Key Output (KO)Targets
2018/2019Targets
2017/2018Key Performance Indicators
(KPIs)Targets
2016/2017Delivery Unit
18
45
55
18
75
55
18
45
43
No. of rural water projectsconstructed
No. of WRUA projectscompleted
No. of urban water projectscompleted
Water supply services1102001300 Water ServicesTrust Fund
600,000
900,000 cubicmeters
4
300,000
550,000
850,000 cubicmeters
4
250,000
500,000
800,000 cubicmeters
4
200,000
Additional number of Peopleserved
Cubic meters of Water Suppliedper day
No. of medium size townswhose water supplyInfrastructure is expanded
Additional number of peoplewith access to sewerageservices
Water supply and Sewerageservices
1102001400 Water ServicesBoards
59%
27%
58%
26%
57%
25%
Proportion of population withaccess to clean water
Proportion of population withaccess to sewerage services
Water supply and Sewerageservices
1102001500 Headquartersand Professional Services -Water
50%40%30%Decline in maintenance costsAssets maintenance services1102001600 Mechanical andElectrical Division
330
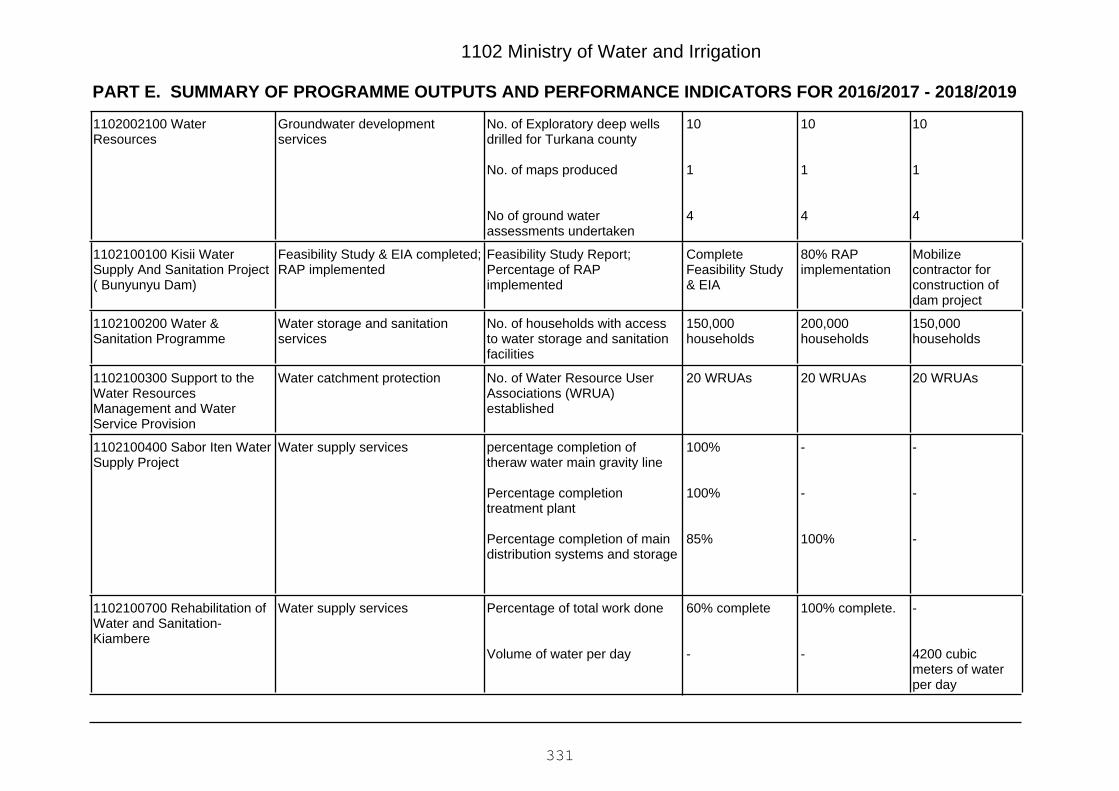
PART E. SUMMARY OF PROGRAMME OUTPUTS AND PERFORMANCE INDICATORS FOR 2016/2017 - 2018/2019
1102 Ministry of Water and Irrigation
10
1
4
10
1
4
10
1
4
No. of Exploratory deep wellsdrilled for Turkana county
No. of maps produced
No of ground waterassessments undertaken
Groundwater developmentservices
1102002100 WaterResources
Mobilizecontractor forconstruction ofdam project
80% RAPimplementation
CompleteFeasibility Study& EIA
Feasibility Study Report;Percentage of RAPimplemented
Feasibility Study & EIA completed;RAP implemented
1102100100 Kisii WaterSupply And Sanitation Project( Bunyunyu Dam)
150,000households
200,000households
150,000households
No. of households with accessto water storage and sanitationfacilities
Water storage and sanitationservices
1102100200 Water &Sanitation Programme
20 WRUAs20 WRUAs20 WRUAsNo. of Water Resource UserAssociations (WRUA)established
Water catchment protection1102100300 Support to theWater ResourcesManagement and WaterService Provision
-
-
-
-
-
100%
100%
100%
85%
percentage completion oftheraw water main gravity line
Percentage completiontreatment plant
Percentage completion of maindistribution systems and storage
Water supply services1102100400 Sabor Iten WaterSupply Project
-
4200 cubicmeters of waterper day
100% complete.
-
60% complete
-
Percentage of total work done
Volume of water per day
Water supply services1102100700 Rehabilitation ofWater and Sanitation-Kiambere
331

PART E. SUMMARY OF PROGRAMME OUTPUTS AND PERFORMANCE INDICATORS FOR 2016/2017 - 2018/2019
1102 Ministry of Water and Irrigation
63%41%23%Percentage of total work doneWater supply services1102100800 Rehabilitation ofWater and Sanitation -Kirandich
-
2000 m3/day
-
2000 m3/day
Project 100%complete
-
Percentage of total work done
Volume of water generated
Water supply services1102101300 Manooni WaterProject Makueni (Debt Swap)
60% completion30% completionMobilizecontractor
Percentage of total work doneWater supply services1102101500 Water SectorDevelopment (Lake VictoriaSouth)
60% completion30% completionMobilizecontractor
Percentage of total work doneWater supply services1102101600 Water SectorDevelopment (Support WSTF)
100% complete80% complete50% completePercentage of total work doneWater supply services1102101700 Nairobi WaterDistribution Network
-20000 people16,000 peopleAdditional population servedWater supply services1102101800 Nairobi SateliteTowns Water and SanitationProgram
30,000households
40,000households
30,000households
Additional number ofhouseholds connected to pipedwater
Water supply services1102102000 ComplimentaryFunding For Kisumu WaterAnd Sewerage
100% complete80% complete45% completePercentage of total work doneWater supply services1102102100 Extension OfNairobi Water Supply(Northern Collector)
45%51%51%Decrease in Percentage of Non-Revenue Water
Water supply services1102102400 The Project ForManagement Of NonRevenueWater In Kenya
11 Km
2.5 Km
3.6 Km
11 Km
2.5 Km
-
10.5 Km
2.5 Km
3.2 Km
Km. of rising dykes
Km of new dykes
Km of seepage control
Dykes, seepage control and rivertraining.
1102102500 The Project OnCapacity Development ForEffective Flood Management I
332
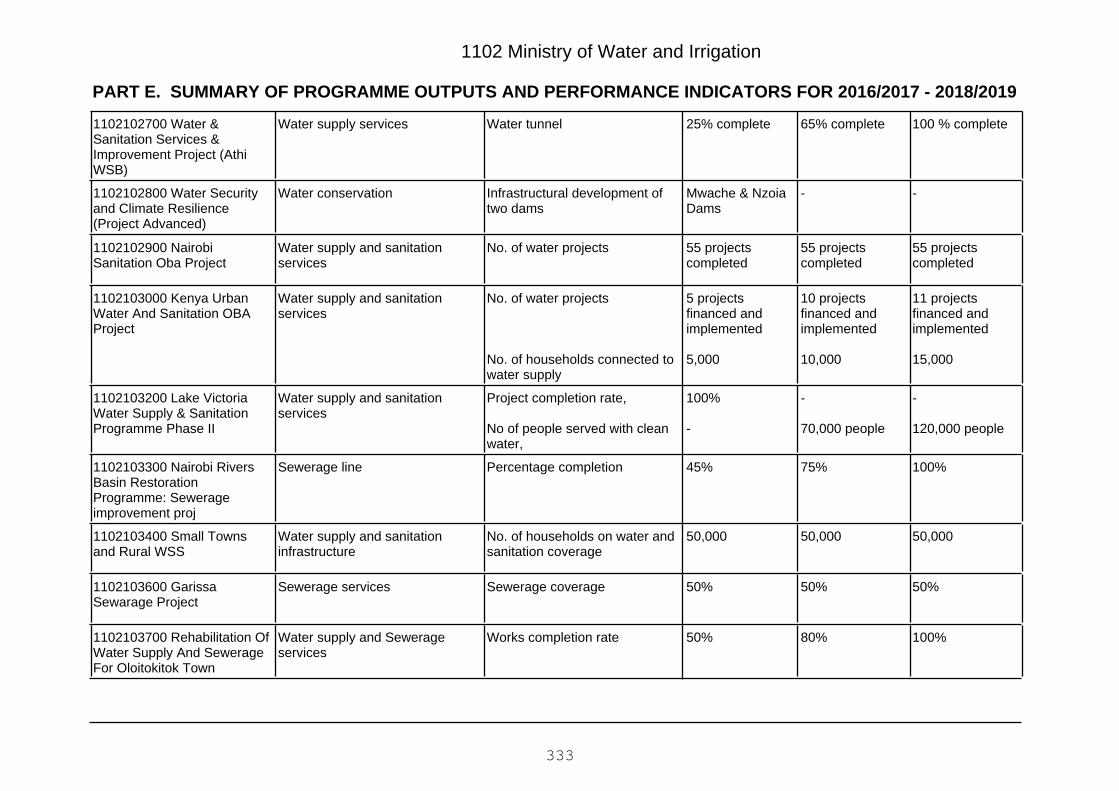
PART E. SUMMARY OF PROGRAMME OUTPUTS AND PERFORMANCE INDICATORS FOR 2016/2017 - 2018/2019
1102 Ministry of Water and Irrigation
100 % complete65% complete25% completeWater tunnelWater supply services1102102700 Water &Sanitation Services &Improvement Project (AthiWSB)
--Mwache & NzoiaDams
Infrastructural development oftwo dams
Water conservation1102102800 Water Securityand Climate Resilience(Project Advanced)
55 projectscompleted
55 projectscompleted
55 projectscompleted
No. of water projectsWater supply and sanitationservices
1102102900 NairobiSanitation Oba Project
11 projectsfinanced andimplemented
15,000
10 projectsfinanced andimplemented
10,000
5 projectsfinanced andimplemented
5,000
No. of water projects
No. of households connected towater supply
Water supply and sanitationservices
1102103000 Kenya UrbanWater And Sanitation OBAProject
-
120,000 people
-
70,000 people
100%
-
Project completion rate,
No of people served with cleanwater,
Water supply and sanitationservices
1102103200 Lake VictoriaWater Supply & SanitationProgramme Phase II
100%75%45%Percentage completionSewerage line1102103300 Nairobi RiversBasin RestorationProgramme: Sewerageimprovement proj
50,00050,00050,000No. of households on water andsanitation coverage
Water supply and sanitationinfrastructure
1102103400 Small Townsand Rural WSS
50%50%50%Sewerage coverageSewerage services1102103600 GarissaSewarage Project
100%80%50%Works completion rateWater supply and Sewerageservices
1102103700 Rehabilitation OfWater Supply And SewerageFor Oloitokitok Town
333
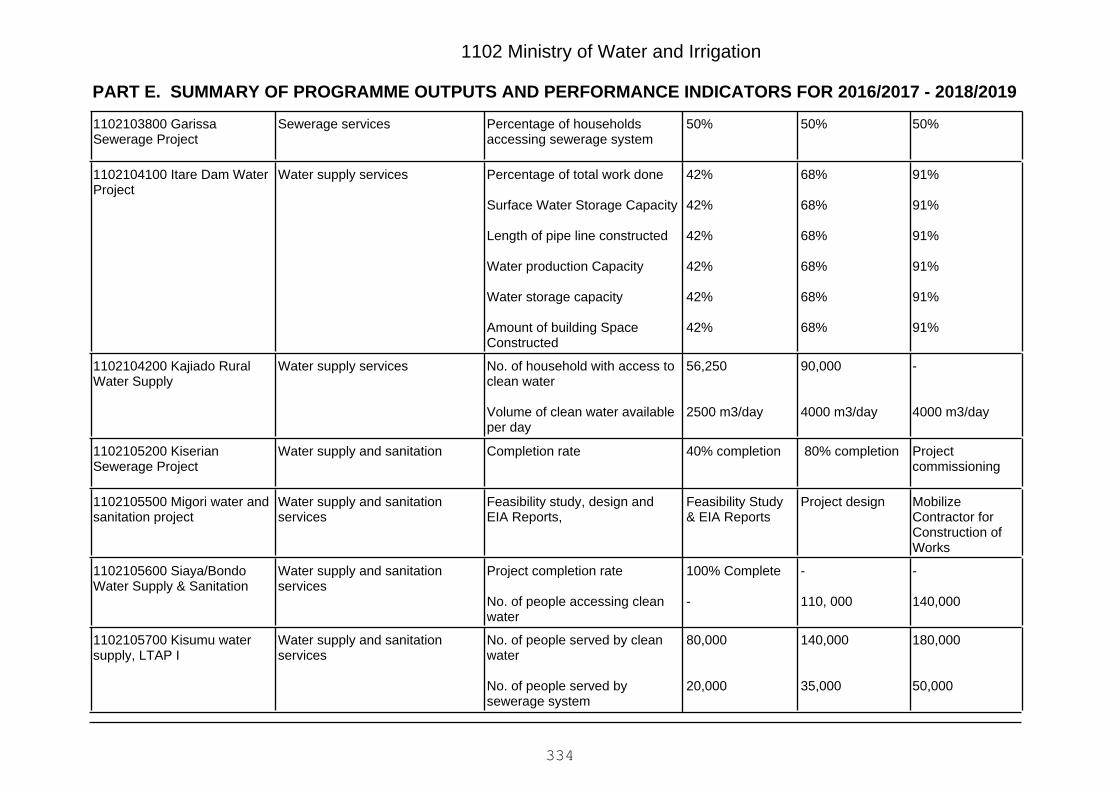
PART E. SUMMARY OF PROGRAMME OUTPUTS AND PERFORMANCE INDICATORS FOR 2016/2017 - 2018/2019
1102 Ministry of Water and Irrigation
50%50%50%Percentage of householdsaccessing sewerage system
Sewerage services1102103800 GarissaSewerage Project
91%
91%
91%
91%
91%
91%
68%
68%
68%
68%
68%
68%
42%
42%
42%
42%
42%
42%
Percentage of total work done
Surface Water Storage Capacity
Length of pipe line constructed
Water production Capacity
Water storage capacity
Amount of building SpaceConstructed
Water supply services1102104100 Itare Dam WaterProject
-
4000 m3/day
90,000
4000 m3/day
56,250
2500 m3/day
No. of household with access toclean water
Volume of clean water availableper day
Water supply services1102104200 Kajiado RuralWater Supply
Projectcommissioning
80% completion40% completionCompletion rateWater supply and sanitation1102105200 KiserianSewerage Project
MobilizeContractor forConstruction ofWorks
Project designFeasibility Study& EIA Reports
Feasibility study, design andEIA Reports,
Water supply and sanitationservices
1102105500 Migori water andsanitation project
-
140,000
-
110, 000
100% Complete
-
Project completion rate
No. of people accessing cleanwater
Water supply and sanitationservices
1102105600 Siaya/BondoWater Supply & Sanitation
180,000
50,000
140,000
35,000
80,000
20,000
No. of people served by cleanwater
No. of people served bysewerage system
Water supply and sanitationservices
1102105700 Kisumu watersupply, LTAP I
334
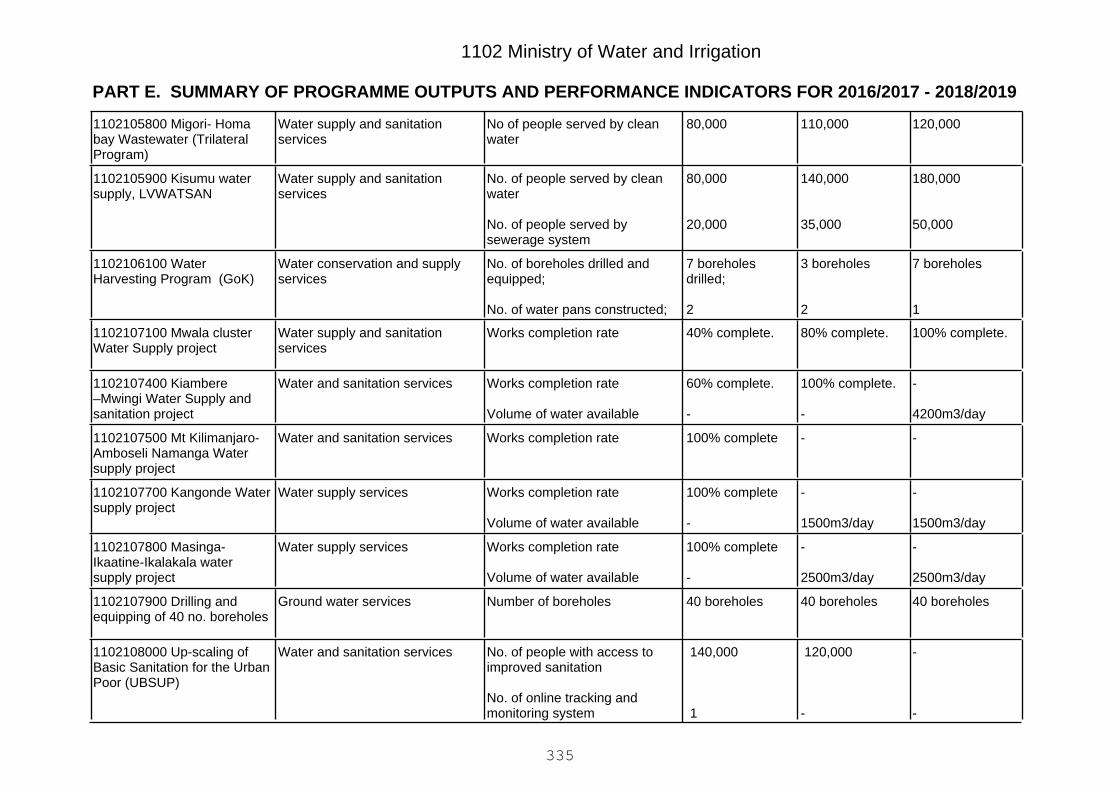
PART E. SUMMARY OF PROGRAMME OUTPUTS AND PERFORMANCE INDICATORS FOR 2016/2017 - 2018/2019
1102 Ministry of Water and Irrigation
120,000110,00080,000No of people served by cleanwater
Water supply and sanitationservices
1102105800 Migori- Homabay Wastewater (TrilateralProgram)
180,000
50,000
140,000
35,000
80,000
20,000
No. of people served by cleanwater
No. of people served bysewerage system
Water supply and sanitationservices
1102105900 Kisumu watersupply, LVWATSAN
7 boreholes
1
3 boreholes
2
7 boreholesdrilled;
2
No. of boreholes drilled andequipped;
No. of water pans constructed;
Water conservation and supplyservices
1102106100 WaterHarvesting Program (GoK)
100% complete.80% complete.40% complete.Works completion rateWater supply and sanitationservices
1102107100 Mwala clusterWater Supply project
-
4200m3/day
100% complete.
-
60% complete.
-
Works completion rate
Volume of water available
Water and sanitation services1102107400 Kiambere–Mwingi Water Supply andsanitation project
--100% completeWorks completion rateWater and sanitation services1102107500 Mt Kilimanjaro-Amboseli Namanga Watersupply project
-
1500m3/day
-
1500m3/day
100% complete
-
Works completion rate
Volume of water available
Water supply services1102107700 Kangonde Watersupply project
-
2500m3/day
-
2500m3/day
100% complete
-
Works completion rate
Volume of water available
Water supply services1102107800 Masinga-Ikaatine-Ikalakala watersupply project
40 boreholes40 boreholes40 boreholesNumber of boreholesGround water services1102107900 Drilling andequipping of 40 no. boreholes
-
-
120,000
-
140,000
1
No. of people with access toimproved sanitation
No. of online tracking andmonitoring system
Water and sanitation services1102108000 Up-scaling ofBasic Sanitation for the UrbanPoor (UBSUP)
335
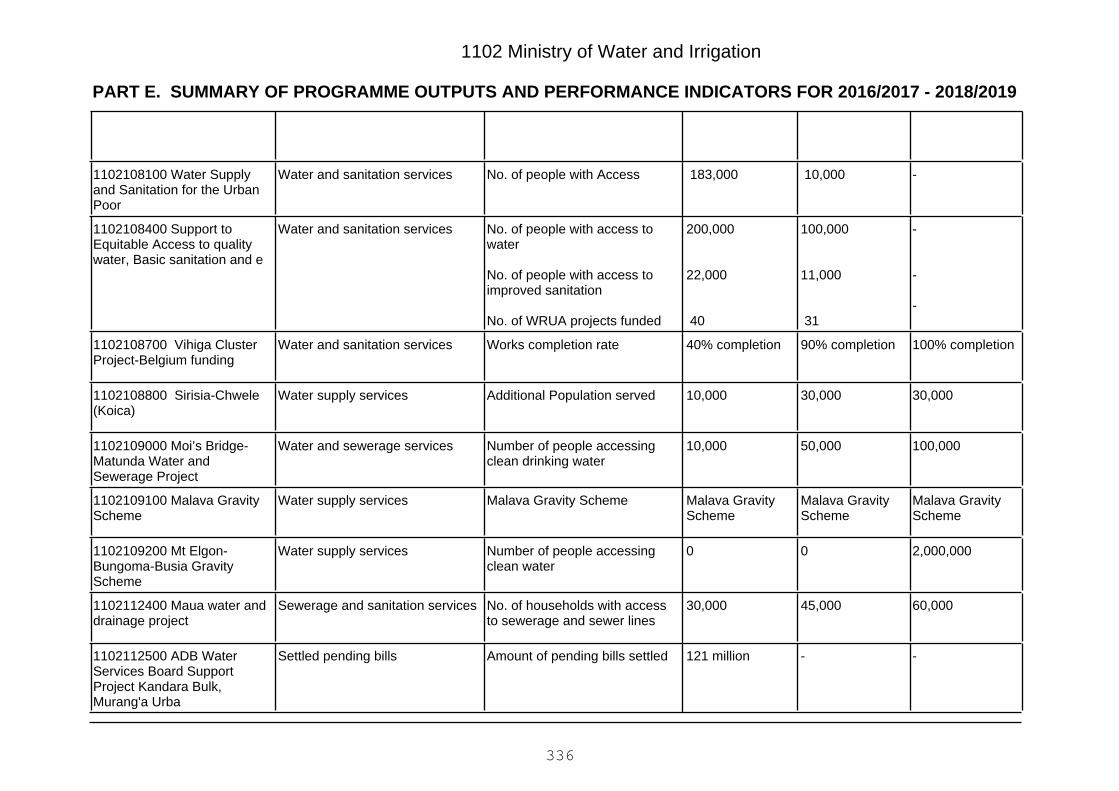
PART E. SUMMARY OF PROGRAMME OUTPUTS AND PERFORMANCE INDICATORS FOR 2016/2017 - 2018/2019
1102 Ministry of Water and Irrigation
- 10,000 183,000No. of people with AccessWater and sanitation services1102108100 Water Supplyand Sanitation for the UrbanPoor
-
-
-
100,000
11,000
31
200,000
22,000
40
No. of people with access towater
No. of people with access toimproved sanitation
No. of WRUA projects funded
Water and sanitation services1102108400 Support toEquitable Access to qualitywater, Basic sanitation and e
100% completion90% completion40% completionWorks completion rateWater and sanitation services1102108700 Vihiga ClusterProject-Belgium funding
30,00030,00010,000Additional Population servedWater supply services1102108800 Sirisia-Chwele(Koica)
100,00050,00010,000Number of people accessingclean drinking water
Water and sewerage services1102109000 Moi’s Bridge-Matunda Water andSewerage Project
Malava GravityScheme
Malava GravityScheme
Malava GravityScheme
Malava Gravity SchemeWater supply services1102109100 Malava GravityScheme
2,000,00000Number of people accessingclean water
Water supply services1102109200 Mt Elgon-Bungoma-Busia GravityScheme
60,00045,00030,000No. of households with accessto sewerage and sewer lines
Sewerage and sanitation services1102112400 Maua water anddrainage project
--121 millionAmount of pending bills settledSettled pending bills1102112500 ADB WaterServices Board SupportProject Kandara Bulk,Murang'a Urba
336

PART E. SUMMARY OF PROGRAMME OUTPUTS AND PERFORMANCE INDICATORS FOR 2016/2017 - 2018/2019
1102 Ministry of Water and Irrigation
--20 millionAmount of pending bills settledSettled pending bills1102112600 RuwaciondoEarth Dam
63%41%23%% of total work doneWater supply services1102116300 ChemususuDam Water Supply Project
-100%96%Percentageof total work doneWater supply services1102116500 Sabor – Iten –Tambach Water SupplyProject
-100%81%Percentage of total work doneWater supply services1102116700 Pusol waterprojects KIDDP (Kenya ItalyDept for Development Progra
-100%60%Percentage level of projectcompletion
Water supply services1102116800 Nyahururu waterProject
100%50%15%Percentage level of projectcompletion
Water supply services1102118400 Soy-KosacheiWater Project
1014000 P.4 Irrigation and Land Reclamation
Increased agricultural production
Programme:
Outcome:
1014010 SP 4.1 Promotion of Irrigation and Drainage Development and ManagementSub Programme:
Key Output (KO)Targets
2018/2019Targets
2017/2018Key Performance Indicators
(KPIs)Targets
2016/2017Delivery Unit
100%100%100%percentage of coordination &completion of the targeted acres
Irrigation support services1102002600 Irrigation andDrainage Services
100%100%100%percentage of coordination &completion of the targeted acres
Irrigation support services1102002700 NationalIrrigation Board
337
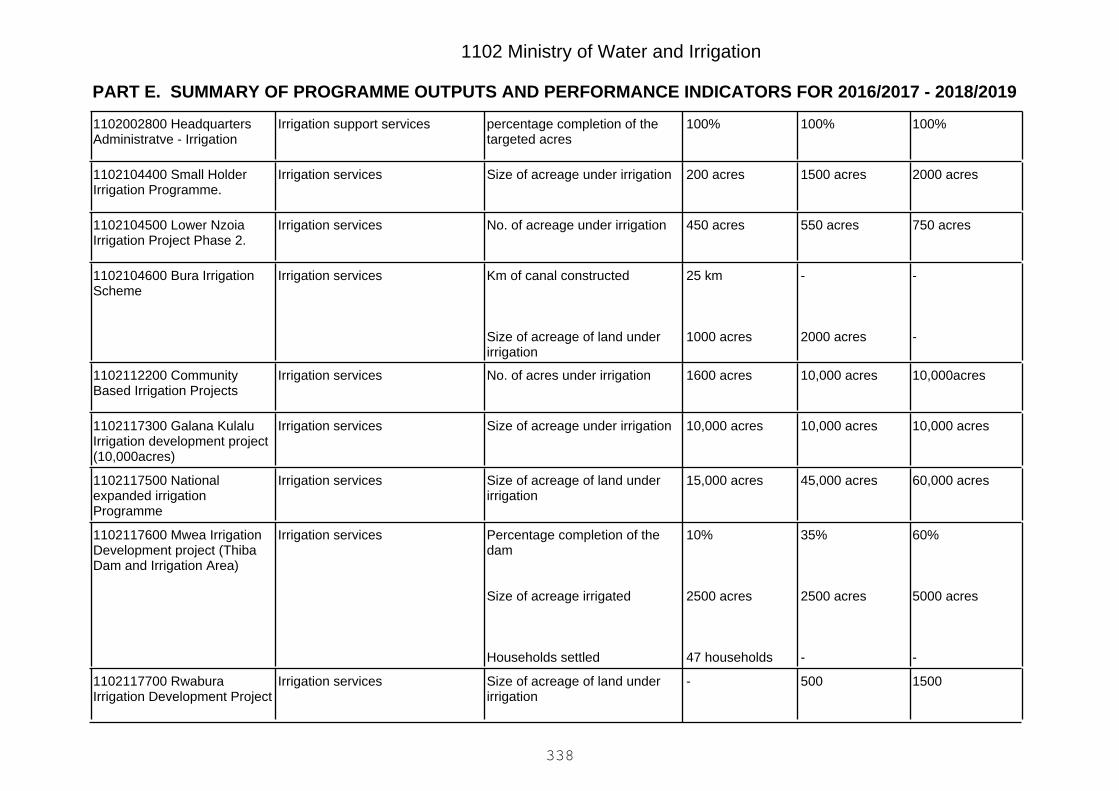
PART E. SUMMARY OF PROGRAMME OUTPUTS AND PERFORMANCE INDICATORS FOR 2016/2017 - 2018/2019
1102 Ministry of Water and Irrigation
100%100%100%percentage completion of thetargeted acres
Irrigation support services1102002800 HeadquartersAdministratve - Irrigation
2000 acres1500 acres200 acresSize of acreage under irrigationIrrigation services1102104400 Small HolderIrrigation Programme.
750 acres550 acres450 acresNo. of acreage under irrigationIrrigation services1102104500 Lower NzoiaIrrigation Project Phase 2.
-
-
-
2000 acres
25 km
1000 acres
Km of canal constructed
Size of acreage of land underirrigation
Irrigation services1102104600 Bura IrrigationScheme
10,000acres10,000 acres1600 acresNo. of acres under irrigationIrrigation services1102112200 CommunityBased Irrigation Projects
10,000 acres10,000 acres10,000 acresSize of acreage under irrigationIrrigation services1102117300 Galana KulaluIrrigation development project(10,000acres)
60,000 acres45,000 acres15,000 acresSize of acreage of land underirrigation
Irrigation services1102117500 Nationalexpanded irrigationProgramme
60%
5000 acres
-
35%
2500 acres
-
10%
2500 acres
47 households
Percentage completion of thedam
Size of acreage irrigated
Households settled
Irrigation services1102117600 Mwea IrrigationDevelopment project (ThibaDam and Irrigation Area)
1500500-Size of acreage of land underirrigation
Irrigation services1102117700 RwaburaIrrigation Development Project
338
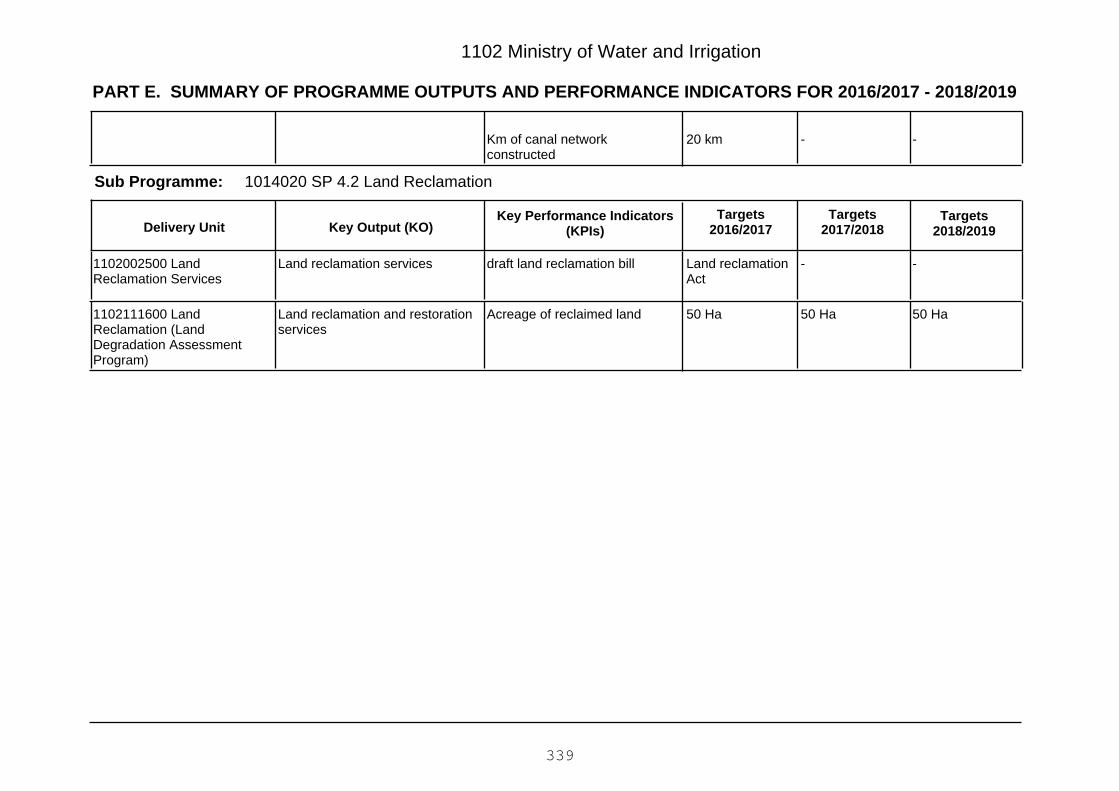
PART E. SUMMARY OF PROGRAMME OUTPUTS AND PERFORMANCE INDICATORS FOR 2016/2017 - 2018/2019
1102 Ministry of Water and Irrigation
--20 kmKm of canal networkconstructed
1014020 SP 4.2 Land ReclamationSub Programme:
Key Output (KO)Targets
2018/2019Targets
2017/2018Key Performance Indicators
(KPIs)Targets
2016/2017Delivery Unit
--Land reclamationAct
draft land reclamation billLand reclamation services1102002500 LandReclamation Services
50 Ha50 Ha50 HaAcreage of reclaimed landLand reclamation and restorationservices
1102111600 LandReclamation (LandDegradation AssessmentProgram)
339

Vote 1102 Ministry of Water and Irrigation
PART F: Summary of Expenditure by Programmes, 2016/2017 - 2018/2019
Programme
Estimates Projected Estimates
2016/2017 2017/2018 2018/2019
KShs. KShs. KShs.
1001020 SP. 2.2 Water Policy Management 636,391,031 704,813,448 718,546,058
1001000 P.2 General Administration, Planning and Support Services 636,391,031 704,813,448 718,546,058
1004010 SP. 3.1 Water Resources Conservation and Protection 2,947,927,573 3,502,885,418 2,788,383,893
1004020 SP. 3.2 Water Storage and Flood Control 6,364,650,059 7,047,099,363 7,604,510,710
1004030 SP. 3.3 Water Supply Infrastructure 39,143,480,825 38,864,172,730 36,279,037,508
1004000 P.3 Water Resources Management 48,456,058,457 49,414,157,511 46,671,932,111
1014010 SP 4.1 Promotion of Irrigation and Drainage Development and Management 13,158,913,841 14,693,467,988 13,802,487,428
1014020 SP 4.2 Land Reclamation 20,238,421 25,249,053 17,036,153
1014000 P.4 Irrigation and Land Reclamation 13,179,152,262 14,718,717,041 13,819,523,581Total Expenditure for Vote 1102 Ministry of Water and Irrigation 62,271,601,750 64,837,688,000 61,210,001,750
340

1102 Ministry of Water and Irrigation
PART G: Summary of Expenditure by Vote and Economic Classification, 2016/2017 - 2018/2019
Economic Classification
Estimates Projected Estimates
2016/2017 2017/2018 2018/2019KShs. KShs. KShs.
Current Expenditure 4,557,600,000 5,151,000,000 5,263,000,000
Compensation to Employees 752,000,000 778,000,000 786,000,000
Use of Goods and Services 252,843,272 300,427,006 320,475,989
Current Transfers to Govt. Agencies 3,543,000,000 4,061,000,000 4,144,000,000
Other Recurrent 9,756,728 11,572,994 12,524,011
Capital Expenditure 57,714,001,750 59,686,688,000 55,947,001,750
Acquisition of Non-Financial Assets 21,707,449,750 21,815,356,000 18,845,449,750
Capital Grants to Govt. Agencies 36,006,552,000 37,871,332,000 37,101,552,000Total Expenditure 62,271,601,750 64,837,688,000 61,210,001,750
341
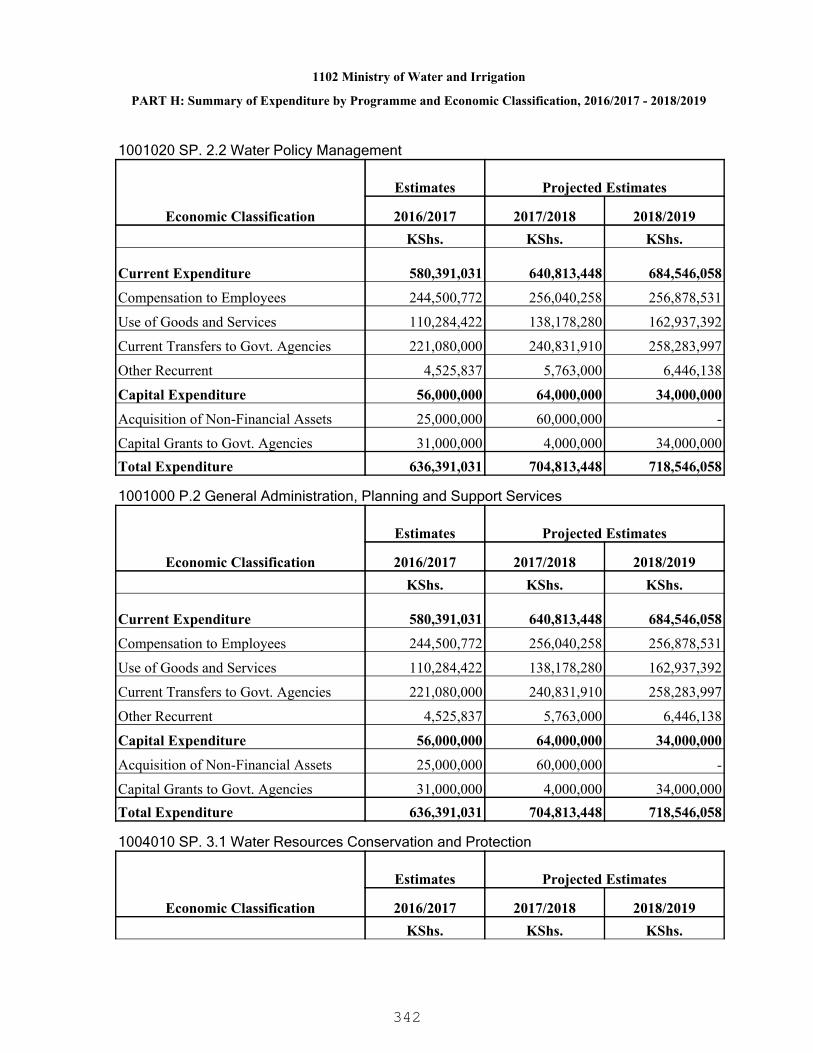
1102 Ministry of Water and Irrigation
PART H: Summary of Expenditure by Programme and Economic Classification, 2016/2017 - 2018/2019
1001020 SP. 2.2 Water Policy Management
Economic Classification
Estimates Projected Estimates
2016/2017 2017/2018 2018/2019KShs. KShs. KShs.
Current Expenditure 580,391,031 640,813,448 684,546,058
Compensation to Employees 244,500,772 256,040,258 256,878,531
Use of Goods and Services 110,284,422 138,178,280 162,937,392
Current Transfers to Govt. Agencies 221,080,000 240,831,910 258,283,997
Other Recurrent 4,525,837 5,763,000 6,446,138
Capital Expenditure 56,000,000 64,000,000 34,000,000
Acquisition of Non-Financial Assets 25,000,000 60,000,000 -
Capital Grants to Govt. Agencies 31,000,000 4,000,000 34,000,000Total Expenditure 636,391,031 704,813,448 718,546,058
1001000 P.2 General Administration, Planning and Support Services
Economic Classification
Estimates Projected Estimates
2016/2017 2017/2018 2018/2019KShs. KShs. KShs.
Current Expenditure 580,391,031 640,813,448 684,546,058
Compensation to Employees 244,500,772 256,040,258 256,878,531
Use of Goods and Services 110,284,422 138,178,280 162,937,392
Current Transfers to Govt. Agencies 221,080,000 240,831,910 258,283,997
Other Recurrent 4,525,837 5,763,000 6,446,138
Capital Expenditure 56,000,000 64,000,000 34,000,000
Acquisition of Non-Financial Assets 25,000,000 60,000,000 -
Capital Grants to Govt. Agencies 31,000,000 4,000,000 34,000,000Total Expenditure 636,391,031 704,813,448 718,546,058
1004010 SP. 3.1 Water Resources Conservation and Protection
Economic Classification
Estimates Projected Estimates
2016/2017 2017/2018 2018/2019KShs. KShs. KShs.
342
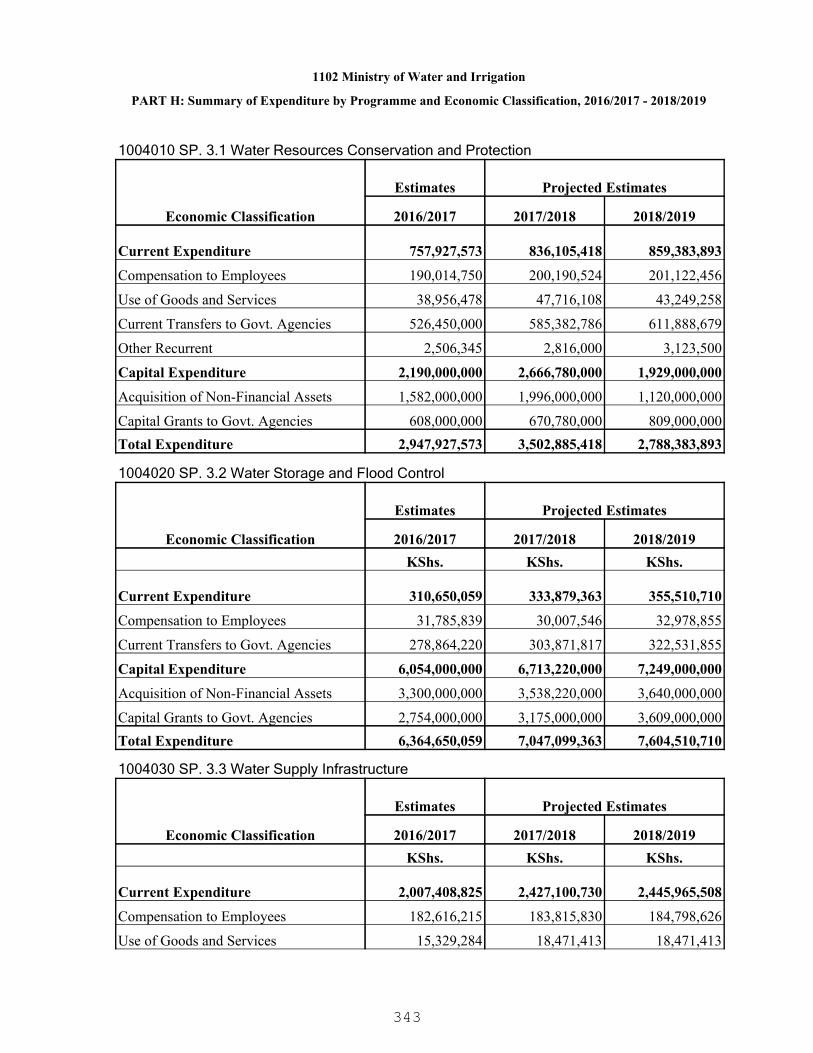
1102 Ministry of Water and Irrigation
PART H: Summary of Expenditure by Programme and Economic Classification, 2016/2017 - 2018/2019
1004010 SP. 3.1 Water Resources Conservation and Protection
Economic Classification
Estimates Projected Estimates
2016/2017 2017/2018 2018/2019
Current Expenditure 757,927,573 836,105,418 859,383,893
Compensation to Employees 190,014,750 200,190,524 201,122,456
Use of Goods and Services 38,956,478 47,716,108 43,249,258
Current Transfers to Govt. Agencies 526,450,000 585,382,786 611,888,679
Other Recurrent 2,506,345 2,816,000 3,123,500
Capital Expenditure 2,190,000,000 2,666,780,000 1,929,000,000
Acquisition of Non-Financial Assets 1,582,000,000 1,996,000,000 1,120,000,000
Capital Grants to Govt. Agencies 608,000,000 670,780,000 809,000,000Total Expenditure 2,947,927,573 3,502,885,418 2,788,383,893
1004020 SP. 3.2 Water Storage and Flood Control
Economic Classification
Estimates Projected Estimates
2016/2017 2017/2018 2018/2019KShs. KShs. KShs.
Current Expenditure 310,650,059 333,879,363 355,510,710
Compensation to Employees 31,785,839 30,007,546 32,978,855
Current Transfers to Govt. Agencies 278,864,220 303,871,817 322,531,855
Capital Expenditure 6,054,000,000 6,713,220,000 7,249,000,000
Acquisition of Non-Financial Assets 3,300,000,000 3,538,220,000 3,640,000,000
Capital Grants to Govt. Agencies 2,754,000,000 3,175,000,000 3,609,000,000Total Expenditure 6,364,650,059 7,047,099,363 7,604,510,710
1004030 SP. 3.3 Water Supply Infrastructure
Economic Classification
Estimates Projected Estimates
2016/2017 2017/2018 2018/2019KShs. KShs. KShs.
Current Expenditure 2,007,408,825 2,427,100,730 2,445,965,508
Compensation to Employees 182,616,215 183,815,830 184,798,626
Use of Goods and Services 15,329,284 18,471,413 18,471,413
343

1102 Ministry of Water and Irrigation
PART H: Summary of Expenditure by Programme and Economic Classification, 2016/2017 - 2018/2019
1004030 SP. 3.3 Water Supply Infrastructure
Economic Classification
Estimates Projected Estimates
2016/2017 2017/2018 2018/2019
Current Transfers to Govt. Agencies 1,808,705,780 2,223,913,487 2,241,795,469
Other Recurrent 757,546 900,000 900,000
Capital Expenditure 37,136,072,000 36,437,072,000 33,833,072,000
Acquisition of Non-Financial Assets 15,949,520,000 15,445,520,000 13,213,520,000
Capital Grants to Govt. Agencies 21,186,552,000 20,991,552,000 20,619,552,000Total Expenditure 39,143,480,825 38,864,172,730 36,279,037,508
1004000 P.3 Water Resources Management
Economic Classification
Estimates Projected Estimates
2016/2017 2017/2018 2018/2019KShs. KShs. KShs.
Current Expenditure 3,075,986,457 3,597,085,511 3,660,860,111
Compensation to Employees 404,416,804 414,013,900 418,899,937
Use of Goods and Services 54,285,762 66,187,521 61,720,671
Current Transfers to Govt. Agencies 2,614,020,000 3,113,168,090 3,176,216,003
Other Recurrent 3,263,891 3,716,000 4,023,500
Capital Expenditure 45,380,072,000 45,817,072,000 43,011,072,000
Acquisition of Non-Financial Assets 20,831,520,000 20,979,740,000 17,973,520,000
Capital Grants to Govt. Agencies 24,548,552,000 24,837,332,000 25,037,552,000Total Expenditure 48,456,058,457 49,414,157,511 46,671,932,111
1014010 SP 4.1 Promotion of Irrigation and Drainage Development and Management
Economic Classification
Estimates Projected Estimates
2016/2017 2017/2018 2018/2019KShs. KShs. KShs.
Current Expenditure 885,984,091 897,851,988 900,557,678
Compensation to Employees 99,498,003 104,351,989 106,627,679
Use of Goods and Services 76,619,088 84,406,005 82,375,626
Current Transfers to Govt. Agencies 707,900,000 707,000,000 709,500,000
344

1102 Ministry of Water and Irrigation
PART H: Summary of Expenditure by Programme and Economic Classification, 2016/2017 - 2018/2019
1014010 SP 4.1 Promotion of Irrigation and Drainage Development and Management
Economic Classification
Estimates Projected Estimates
2016/2017 2017/2018 2018/2019
Other Recurrent 1,967,000 2,093,994 2,054,373
Capital Expenditure 12,272,929,750 13,795,616,000 12,901,929,750
Acquisition of Non-Financial Assets 845,929,750 765,616,000 871,929,750
Capital Grants to Govt. Agencies 11,427,000,000 13,030,000,000 12,030,000,000Total Expenditure 13,158,913,841 14,693,467,988 13,802,487,428
1014020 SP 4.2 Land Reclamation
Economic Classification
Estimates Projected Estimates
2016/2017 2017/2018 2018/2019KShs. KShs. KShs.
Current Expenditure 15,238,421 15,249,053 17,036,153
Compensation to Employees 3,584,421 3,593,853 3,593,853
Use of Goods and Services 11,654,000 11,655,200 13,442,300
Capital Expenditure 5,000,000 10,000,000 -
Acquisition of Non-Financial Assets 5,000,000 10,000,000 -Total Expenditure 20,238,421 25,249,053 17,036,153
1014000 P.4 Irrigation and Land Reclamation
Economic Classification
Estimates Projected Estimates
2016/2017 2017/2018 2018/2019KShs. KShs. KShs.
Current Expenditure 901,222,512 913,101,041 917,593,831
Compensation to Employees 103,082,424 107,945,842 110,221,532
Use of Goods and Services 88,273,088 96,061,205 95,817,926
Current Transfers to Govt. Agencies 707,900,000 707,000,000 709,500,000
Other Recurrent 1,967,000 2,093,994 2,054,373
Capital Expenditure 12,277,929,750 13,805,616,000 12,901,929,750
Acquisition of Non-Financial Assets 850,929,750 775,616,000 871,929,750
Capital Grants to Govt. Agencies 11,427,000,000 13,030,000,000 12,030,000,000
345
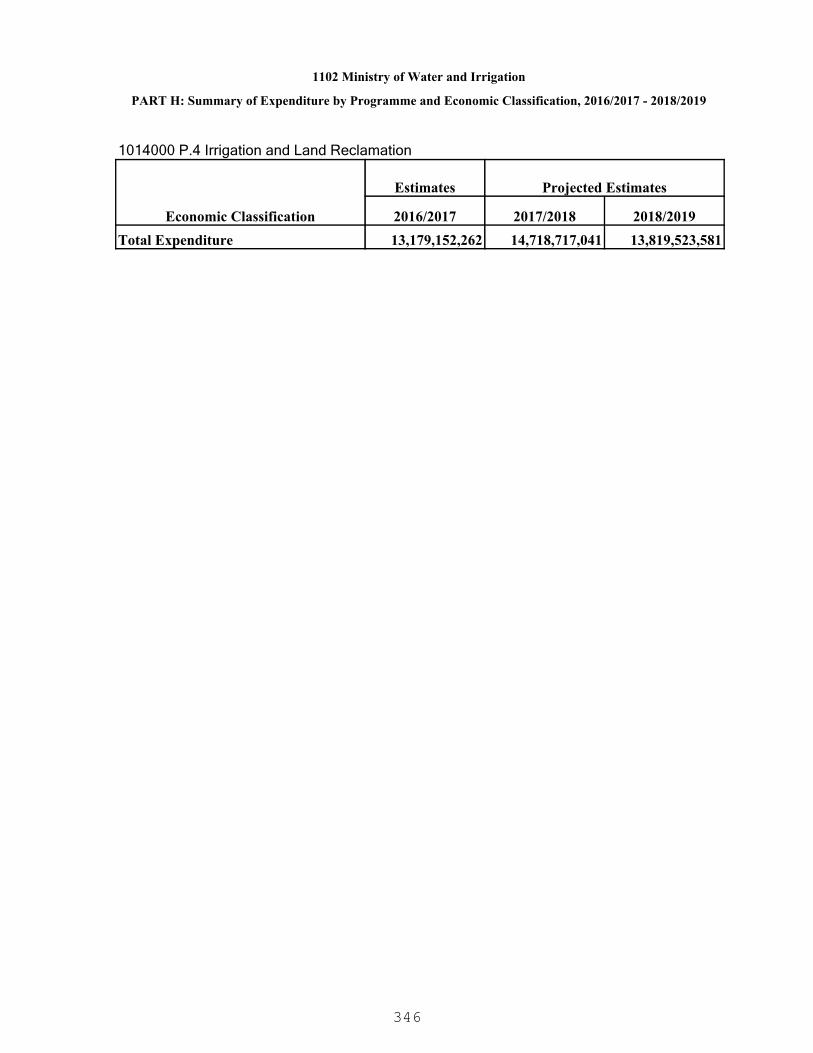
1102 Ministry of Water and Irrigation
PART H: Summary of Expenditure by Programme and Economic Classification, 2016/2017 - 2018/2019
1014000 P.4 Irrigation and Land Reclamation
Economic Classification
Estimates Projected Estimates
2016/2017 2017/2018 2018/2019Total Expenditure 13,179,152,262 14,718,717,041 13,819,523,581
346

1111 Ministry of Land Housing and Urban Development
A globally competitive organization in sustainable management of land and the builtenvironment.
To facilitate efficient land administration and management, access to adequate andaffordable housing, social and physical infrastructure for national development.
PART A. Vision
PART B. Mission
PART C. Performance Overview and Background for Programme(s) Funding
The Ministry is mandated to provide policy direction on matters related to land, housing andurban development. The core functions of the Ministry is to facilitate efficient landadministration and management, access to adequate and affordable housing, social andphysical infrastructure for national development. During the period 2012/13-2014/15, the Ministry implemented the following programmesfocusing on land reforms, provision of affordable housing, completion of stalled governmentbuildings and other public works, social and physical infrastructure in urban and metropolitanregions.Under Land Policy and Planning programme, the Ministry registered 2,204,141 titledeeds countrywide; constructed 7 modern land registries; re-organized 21 and digitized 13land registries; surveyed and maintained international boundaries along Somalia, Uganda,Ethiopia and southern Sudan borders.
During the same period, the Ministry under Housing Development and Human Settlementprogramme completed 822 housing units in Kibera Soweto East village Zone A and 729housing units for Civil Servants; facilitated 690 civil servants to access housing throughmortgage scheme amounting to Ksh. 1.5billion;installed trunk sewerage, water lines andaccess roads respectively in various urban areas to open up land for housing development;undertook training on utilization of low cost building materials and technologies in 7 regions;refurbished 2,691 and registered 1,535 government houses country wide. In addition, theMinistry installed social and physical infrastructure in slums and informal settlements asfollows: 82 high-mast floodlights in 15 urban areas; 10 classrooms and sanitary facilities inHuruma primary school, Eldoret; 13.622kms drainage works; 26kms access roads and 21ablution blocks.
Under Government Buildings programme during the same period, the Ministry completed 7stalled Government building projects (Kibabii Teachers Training College, Garissa PTTC,Longisa District Hospital, Sigowet Hospital, Nyanza Provincial Headquarters, MutyambuaDispensary, flats at Runyenjes Health Center); maintained and rehabilitated 188 governmentbuildings and conducted research on appropriate locally available building materials in Coastregion. During the same period under review, the Coastline Infrastructure and PedestrianAccess programme, the Ministry constructed Lamu Customs and Matondoni Jetties wererehabilitated; 1,495 metres of seawall constructed in Ndau, Lamu, Kizingitini and Shimoni and73 foot bridges and river protection works along River Suam in Kongelai in West Pokotcompleted. Further, Shimoni Fisheries Jetty was implemented to 60% completion level.
347
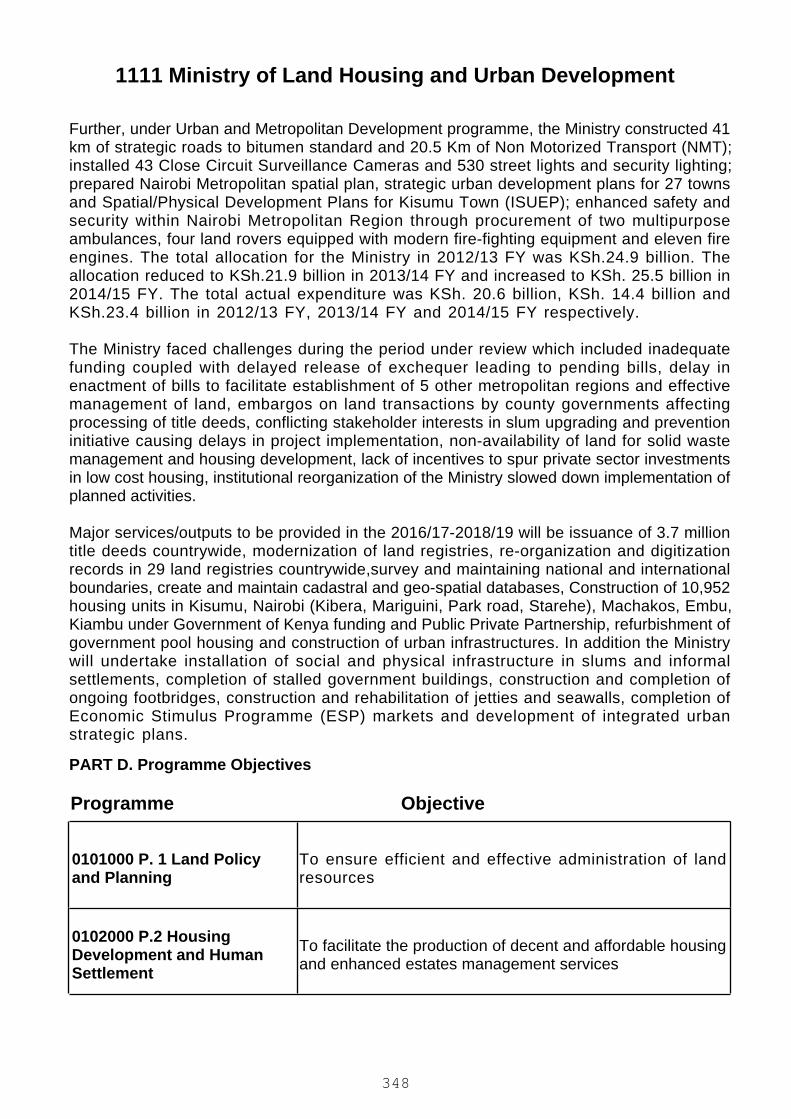
1111 Ministry of Land Housing and Urban Development
PART D. Programme Objectives
Further, under Urban and Metropolitan Development programme, the Ministry constructed 41km of strategic roads to bitumen standard and 20.5 Km of Non Motorized Transport (NMT);installed 43 Close Circuit Surveillance Cameras and 530 street lights and security lighting;prepared Nairobi Metropolitan spatial plan, strategic urban development plans for 27 townsand Spatial/Physical Development Plans for Kisumu Town (ISUEP); enhanced safety andsecurity within Nairobi Metropolitan Region through procurement of two multipurposeambulances, four land rovers equipped with modern fire-fighting equipment and eleven fireengines. The total allocation for the Ministry in 2012/13 FY was KSh.24.9 billion. Theallocation reduced to KSh.21.9 billion in 2013/14 FY and increased to KSh. 25.5 billion in2014/15 FY. The total actual expenditure was KSh. 20.6 billion, KSh. 14.4 billion andKSh.23.4 billion in 2012/13 FY, 2013/14 FY and 2014/15 FY respectively.
The Ministry faced challenges during the period under review which included inadequatefunding coupled with delayed release of exchequer leading to pending bills, delay inenactment of bills to facilitate establishment of 5 other metropolitan regions and effectivemanagement of land, embargos on land transactions by county governments affectingprocessing of title deeds, conflicting stakeholder interests in slum upgrading and preventioninitiative causing delays in project implementation, non-availability of land for solid wastemanagement and housing development, lack of incentives to spur private sector investmentsin low cost housing, institutional reorganization of the Ministry slowed down implementation ofplanned activities.
Major services/outputs to be provided in the 2016/17-2018/19 will be issuance of 3.7 milliontitle deeds countrywide, modernization of land registries, re-organization and digitizationrecords in 29 land registries countrywide,survey and maintaining national and internationalboundaries, create and maintain cadastral and geo-spatial databases, Construction of 10,952housing units in Kisumu, Nairobi (Kibera, Mariguini, Park road, Starehe), Machakos, Embu,Kiambu under Government of Kenya funding and Public Private Partnership, refurbishment ofgovernment pool housing and construction of urban infrastructures. In addition the Ministrywill undertake installation of social and physical infrastructure in slums and informalsettlements, completion of stalled government buildings, construction and completion ofongoing footbridges, construction and rehabilitation of jetties and seawalls, completion ofEconomic Stimulus Programme (ESP) markets and development of integrated urbanstrategic plans.
ObjectiveProgramme
0101000 P. 1 Land Policyand Planning
To ensure efficient and effective administration of landresources
0102000 P.2 HousingDevelopment and HumanSettlement
To facilitate the production of decent and affordable housingand enhanced estates management services
348
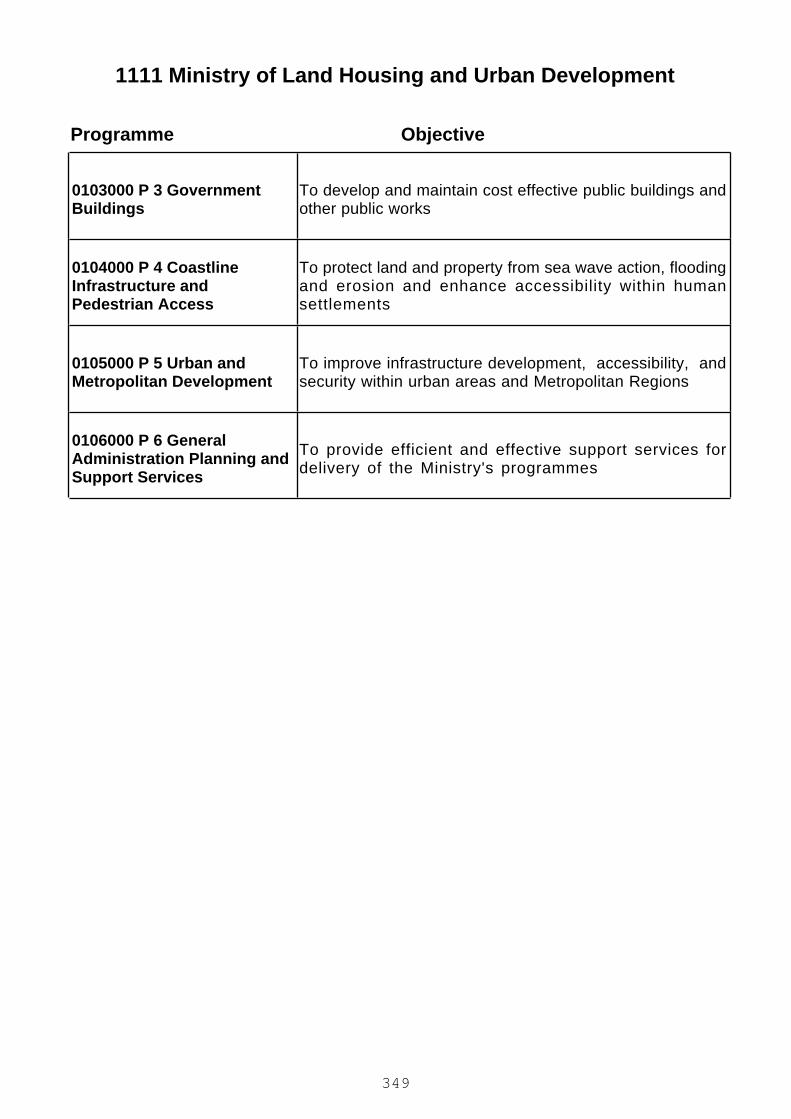
1111 Ministry of Land Housing and Urban Development
ObjectiveProgramme
0103000 P 3 GovernmentBuildings
To develop and maintain cost effective public buildings andother public works
0104000 P 4 CoastlineInfrastructure andPedestrian Access
To protect land and property from sea wave action, floodingand erosion and enhance accessibility within humansettlements
0105000 P 5 Urban andMetropolitan Development
To improve infrastructure development, accessibility, andsecurity within urban areas and Metropolitan Regions
0106000 P 6 GeneralAdministration Planning andSupport Services
To provide efficient and effective support services fordelivery of the Ministry's programmes
349
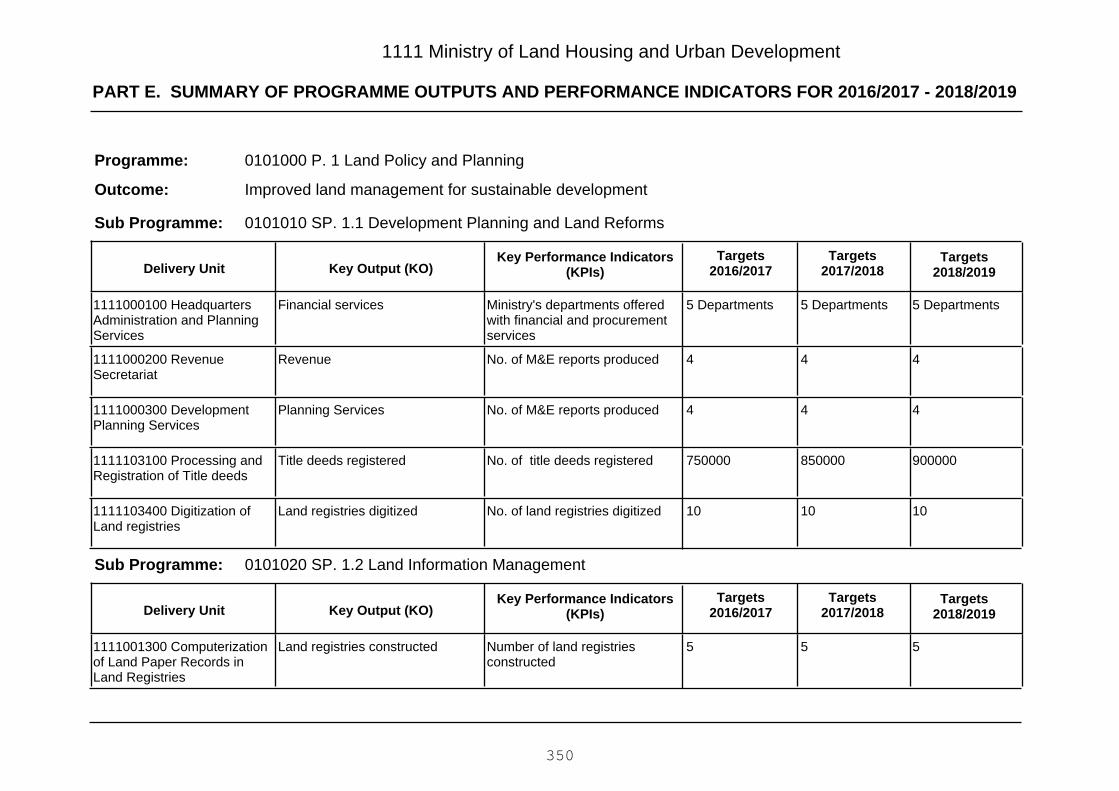
PART E. SUMMARY OF PROGRAMME OUTPUTS AND PERFORMANCE INDICATORS FOR 2016/2017 - 2018/2019
1111 Ministry of Land Housing and Urban Development
0101000 P. 1 Land Policy and Planning
Improved land management for sustainable development
Programme:
Outcome:
0101010 SP. 1.1 Development Planning and Land ReformsSub Programme:
Key Output (KO)Targets
2018/2019Targets
2017/2018Key Performance Indicators
(KPIs)Targets
2016/2017Delivery Unit
5 Departments5 Departments5 DepartmentsMinistry's departments offeredwith financial and procurementservices
Financial services1111000100 HeadquartersAdministration and PlanningServices
444No. of M&E reports producedRevenue1111000200 RevenueSecretariat
444No. of M&E reports producedPlanning Services1111000300 DevelopmentPlanning Services
900000850000750000No. of title deeds registeredTitle deeds registered1111103100 Processing andRegistration of Title deeds
101010No. of land registries digitizedLand registries digitized1111103400 Digitization ofLand registries
0101020 SP. 1.2 Land Information ManagementSub Programme:
Key Output (KO)Targets
2018/2019Targets
2017/2018Key Performance Indicators
(KPIs)Targets
2016/2017Delivery Unit
555Number of land registriesconstructed
Land registries constructed1111001300 Computerizationof Land Paper Records inLand Registries
350

PART E. SUMMARY OF PROGRAMME OUTPUTS AND PERFORMANCE INDICATORS FOR 2016/2017 - 2018/2019
1111 Ministry of Land Housing and Urban Development
121212Number of land registriesrehabilitated
Land registries rehabilitated andrefurbished
1111001400 District LandOffices
555Number of land registriesconstructed
Land registries constructed1111103200 Construction ofLand registries
121212Number of land registriesrehabilitated
Land registries rehabilitated andrefurbished
1111103300 Renovation ofLand Offices
0101030 SP. 1.3 Land SurveySub Programme:
Key Output (KO)Targets
2018/2019Targets
2017/2018Key Performance Indicators
(KPIs)Targets
2016/2017Delivery Unit
400350300Number of plots Geo-referencedon the National Map
Geospatial database1111000900 SurveyDepartment - National BulkTilting Centre
330330330No. of students trained onSurveying and Mapping Skills
Graduates trained on Surveyingand Mapping skills
1111001200 Kenya Instituteof Surveying and Mapping
100100100No. of Students trained onGeographical InformationScience
Graduates trained onGeographical Information Science
1111100900 Third CountryTraining Programme onGeographical InformationScience
400350300Kms. of Kenya boarders withUganda, Tanzania ,Ethiopia,South Sudan and Somaliasurveyed and maintained.
National and Internationalboundaries surveyed andmaintained.
1111103500 Survey,Inspection & MaintainingNational & InternationalBoundaries
400000380000350000Number of plots Geo-referencedon the National Map
Geospatial data developed1111103600 Development ofGeo- Spatial Data
351
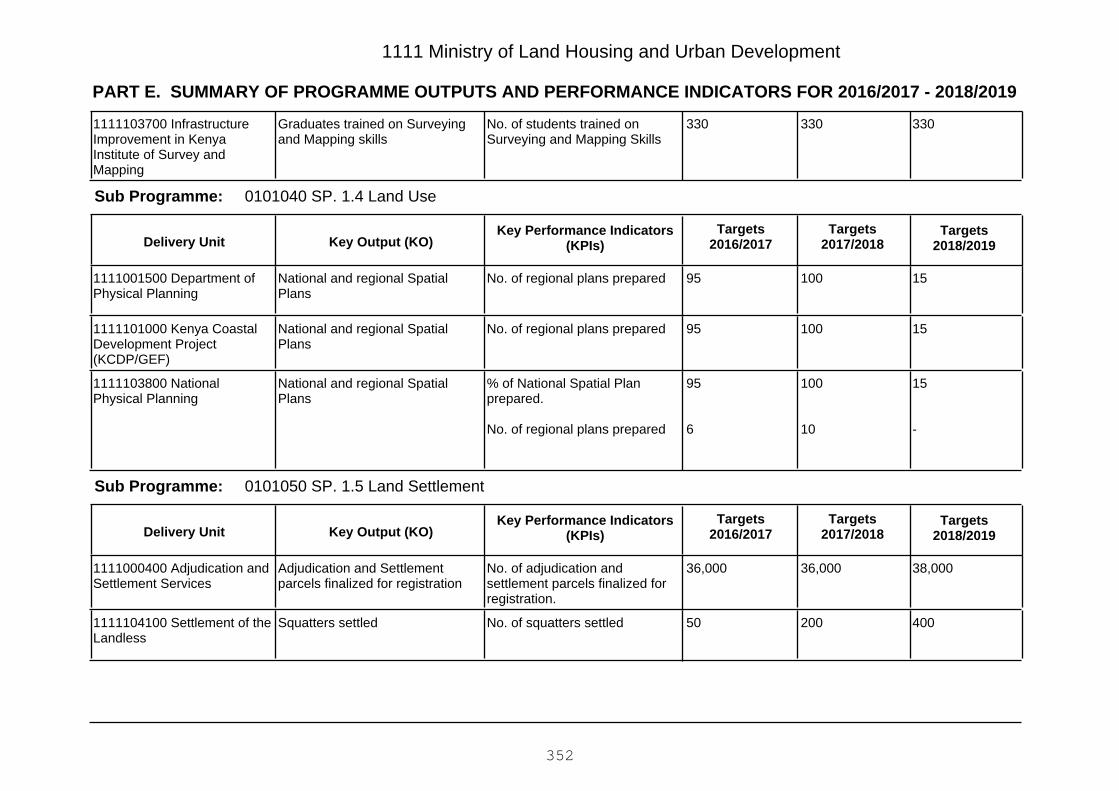
PART E. SUMMARY OF PROGRAMME OUTPUTS AND PERFORMANCE INDICATORS FOR 2016/2017 - 2018/2019
1111 Ministry of Land Housing and Urban Development
330330330No. of students trained onSurveying and Mapping Skills
Graduates trained on Surveyingand Mapping skills
1111103700 InfrastructureImprovement in KenyaInstitute of Survey andMapping
0101040 SP. 1.4 Land UseSub Programme:
Key Output (KO)Targets
2018/2019Targets
2017/2018Key Performance Indicators
(KPIs)Targets
2016/2017Delivery Unit
1510095No. of regional plans preparedNational and regional SpatialPlans
1111001500 Department ofPhysical Planning
1510095No. of regional plans preparedNational and regional SpatialPlans
1111101000 Kenya CoastalDevelopment Project(KCDP/GEF)
15
-
100
10
95
6
% of National Spatial Planprepared.
No. of regional plans prepared
National and regional SpatialPlans
1111103800 NationalPhysical Planning
0101050 SP. 1.5 Land SettlementSub Programme:
Key Output (KO)Targets
2018/2019Targets
2017/2018Key Performance Indicators
(KPIs)Targets
2016/2017Delivery Unit
38,00036,00036,000No. of adjudication andsettlement parcels finalized forregistration.
Adjudication and Settlementparcels finalized for registration
1111000400 Adjudication andSettlement Services
40020050No. of squatters settledSquatters settled1111104100 Settlement of theLandless
352
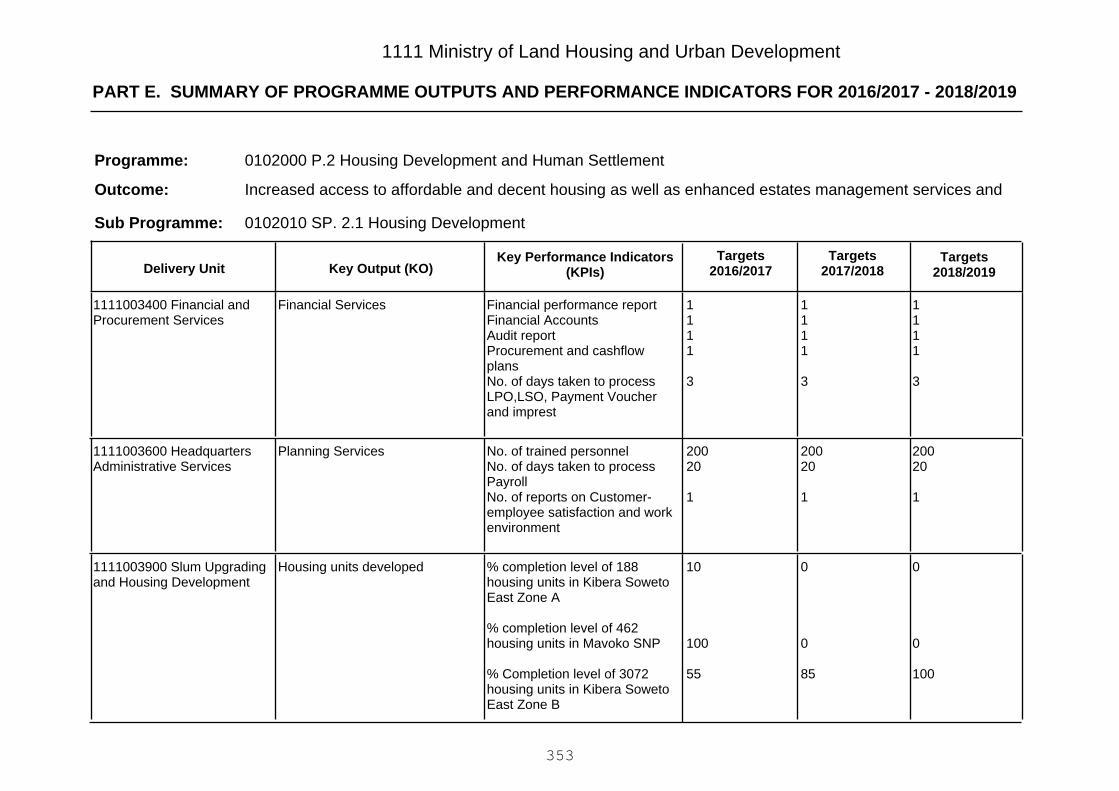
PART E. SUMMARY OF PROGRAMME OUTPUTS AND PERFORMANCE INDICATORS FOR 2016/2017 - 2018/2019
1111 Ministry of Land Housing and Urban Development
0102000 P.2 Housing Development and Human Settlement
Increased access to affordable and decent housing as well as enhanced estates management services and
Programme:
Outcome:
0102010 SP. 2.1 Housing DevelopmentSub Programme:
Key Output (KO)Targets
2018/2019Targets
2017/2018Key Performance Indicators
(KPIs)Targets
2016/2017Delivery Unit
1111
3
1111
3
1111
3
Financial performance reportFinancial AccountsAudit reportProcurement and cashflowplansNo. of days taken to processLPO,LSO, Payment Voucherand imprest
Financial Services1111003400 Financial andProcurement Services
20020
1
20020
1
20020
1
No. of trained personnelNo. of days taken to processPayrollNo. of reports on Customer-employee satisfaction and workenvironment
Planning Services1111003600 HeadquartersAdministrative Services
0
0
100
0
0
85
10
100
55
% completion level of 188housing units in Kibera SowetoEast Zone A
% completion level of 462housing units in Mavoko SNP
% Completion level of 3072housing units in Kibera SowetoEast Zone B
Housing units developed1111003900 Slum Upgradingand Housing Development
353
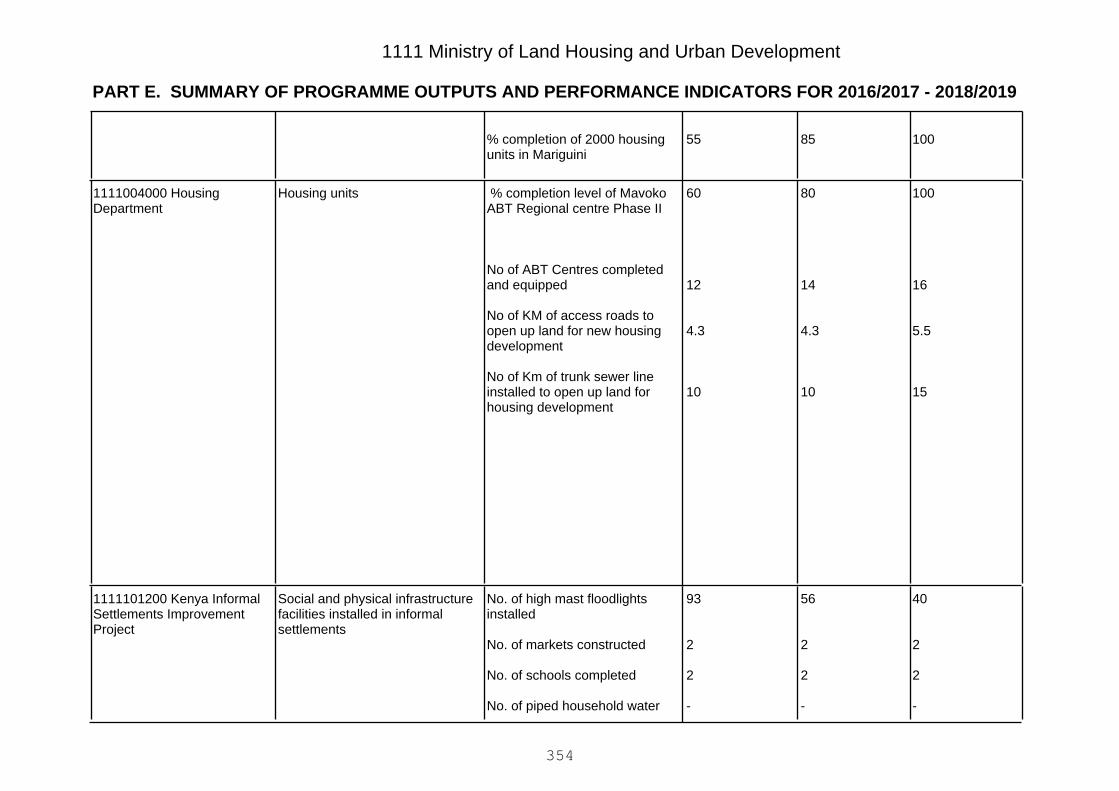
PART E. SUMMARY OF PROGRAMME OUTPUTS AND PERFORMANCE INDICATORS FOR 2016/2017 - 2018/2019
1111 Ministry of Land Housing and Urban Development
1008555% completion of 2000 housingunits in Mariguini
100
16
5.5
15
80
14
4.3
10
60
12
4.3
10
% completion level of MavokoABT Regional centre Phase II
No of ABT Centres completedand equipped
No of KM of access roads toopen up land for new housingdevelopment
No of Km of trunk sewer lineinstalled to open up land forhousing development
Housing units1111004000 HousingDepartment
40
2
2
-
56
2
2
-
93
2
2
-
No. of high mast floodlightsinstalled
No. of markets constructed
No. of schools completed
No. of piped household water
Social and physical infrastructurefacilities installed in informalsettlements
1111101200 Kenya InformalSettlements ImprovementProject
354
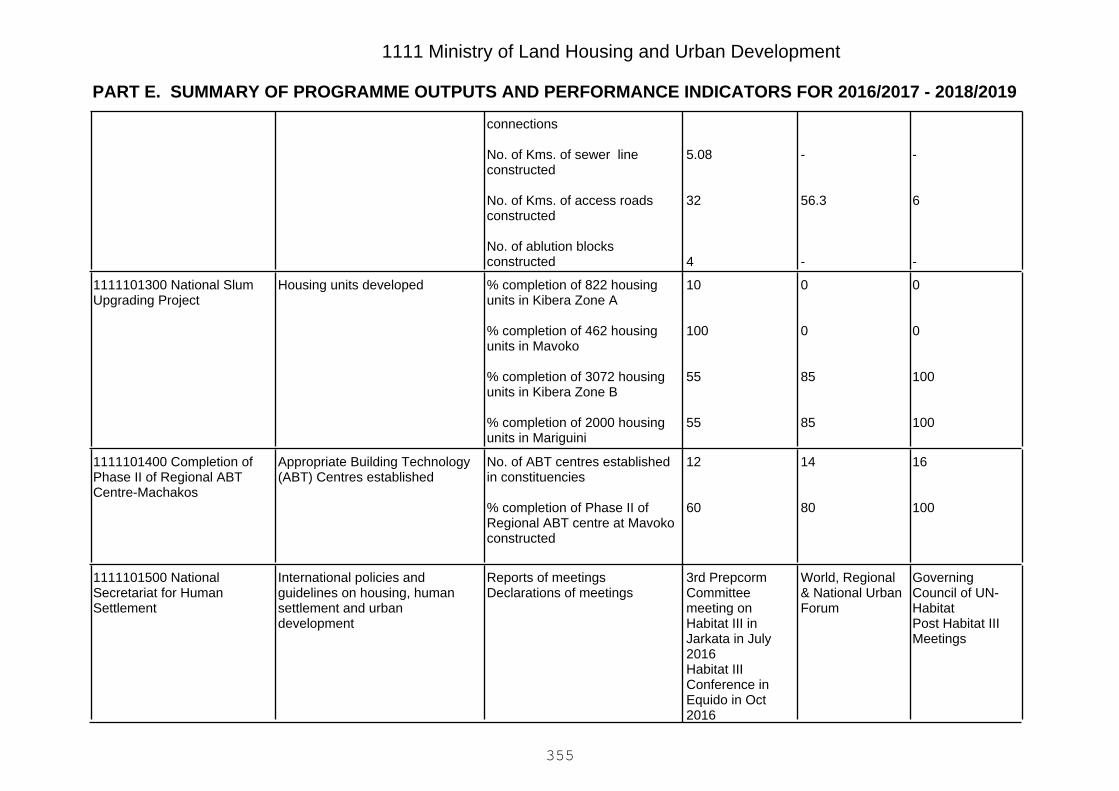
PART E. SUMMARY OF PROGRAMME OUTPUTS AND PERFORMANCE INDICATORS FOR 2016/2017 - 2018/2019
1111 Ministry of Land Housing and Urban Development
-
6
-
-
56.3
-
5.08
32
4
connections
No. of Kms. of sewer lineconstructed
No. of Kms. of access roadsconstructed
No. of ablution blocksconstructed
0
0
100
100
0
0
85
85
10
100
55
55
% completion of 822 housingunits in Kibera Zone A
% completion of 462 housingunits in Mavoko
% completion of 3072 housingunits in Kibera Zone B
% completion of 2000 housingunits in Mariguini
Housing units developed1111101300 National SlumUpgrading Project
16
100
14
80
12
60
No. of ABT centres establishedin constituencies
% completion of Phase II ofRegional ABT centre at Mavokoconstructed
Appropriate Building Technology(ABT) Centres established
1111101400 Completion ofPhase II of Regional ABTCentre-Machakos
GoverningCouncil of UN-HabitatPost Habitat IIIMeetings
World, Regional& National UrbanForum
3rd PrepcormCommitteemeeting onHabitat III inJarkata in July2016Habitat IIIConference inEquido in Oct2016
Reports of meetingsDeclarations of meetings
International policies andguidelines on housing, humansettlement and urbandevelopment
1111101500 NationalSecretariat for HumanSettlement
355
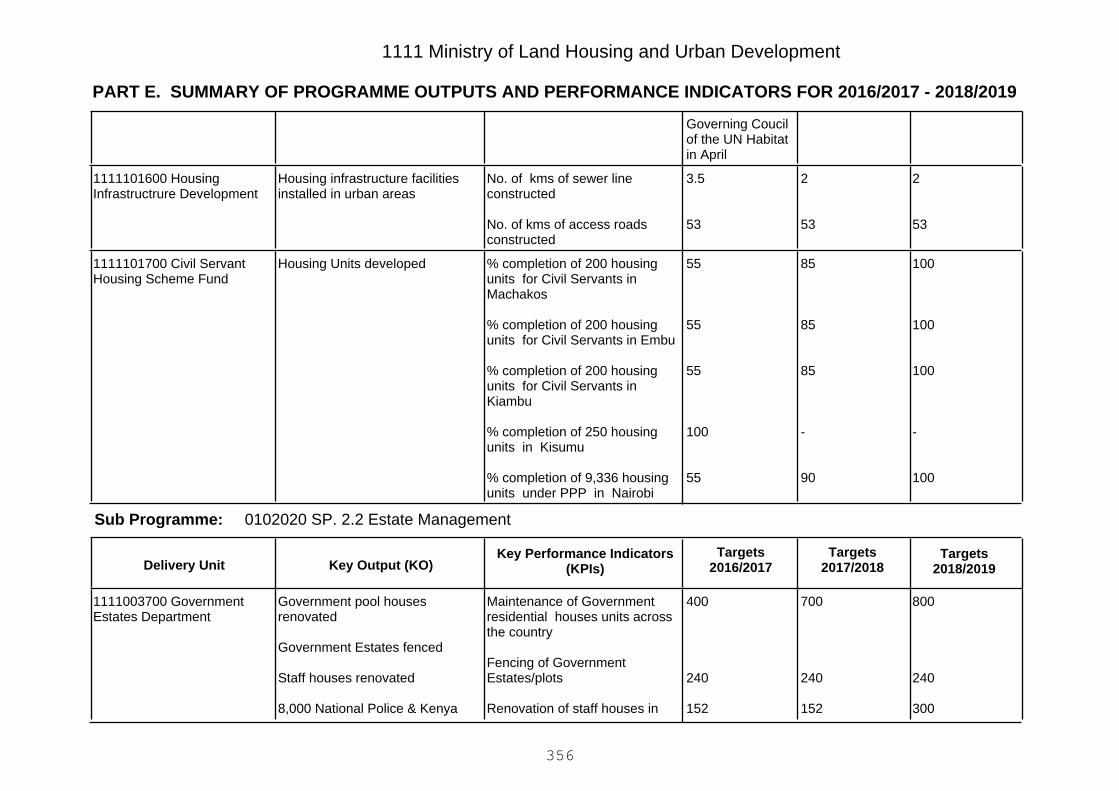
PART E. SUMMARY OF PROGRAMME OUTPUTS AND PERFORMANCE INDICATORS FOR 2016/2017 - 2018/2019
1111 Ministry of Land Housing and Urban Development
Governing Coucilof the UN Habitatin April
2
53
2
53
3.5
53
No. of kms of sewer lineconstructed
No. of kms of access roadsconstructed
Housing infrastructure facilitiesinstalled in urban areas
1111101600 HousingInfrastructrure Development
100
100
100
-
100
85
85
85
-
90
55
55
55
100
55
% completion of 200 housingunits for Civil Servants inMachakos
% completion of 200 housingunits for Civil Servants in Embu
% completion of 200 housingunits for Civil Servants inKiambu
% completion of 250 housingunits in Kisumu
% completion of 9,336 housingunits under PPP in Nairobi
Housing Units developed1111101700 Civil ServantHousing Scheme Fund
0102020 SP. 2.2 Estate ManagementSub Programme:
Key Output (KO)Targets
2018/2019Targets
2017/2018Key Performance Indicators
(KPIs)Targets
2016/2017Delivery Unit
800
240
300
700
240
152
400
240
152
Maintenance of Governmentresidential houses units acrossthe country
Fencing of GovernmentEstates/plots
Renovation of staff houses in
Government pool housesrenovated
Government Estates fenced
Staff houses renovated
8,000 National Police & Kenya
1111003700 GovernmentEstates Department
356
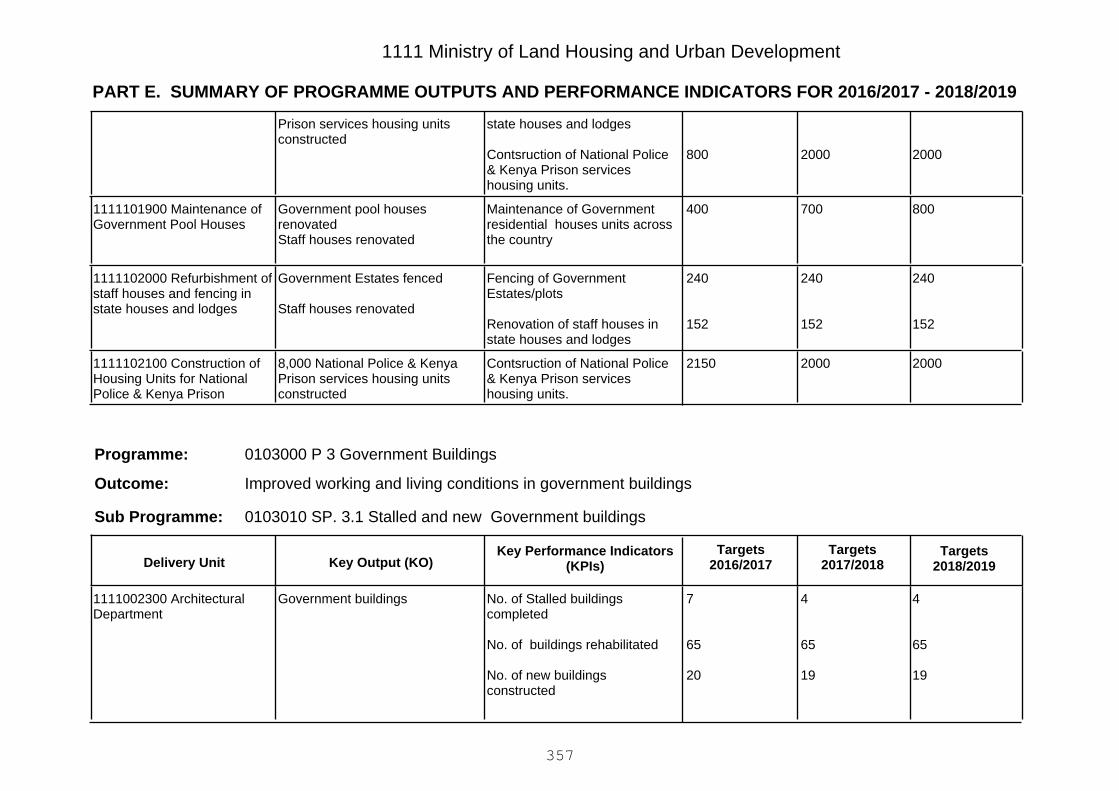
PART E. SUMMARY OF PROGRAMME OUTPUTS AND PERFORMANCE INDICATORS FOR 2016/2017 - 2018/2019
1111 Ministry of Land Housing and Urban Development
20002000800
state houses and lodges
Contsruction of National Police& Kenya Prison serviceshousing units.
Prison services housing unitsconstructed
800700400Maintenance of Governmentresidential houses units acrossthe country
Government pool housesrenovatedStaff houses renovated
1111101900 Maintenance ofGovernment Pool Houses
240
152
240
152
240
152
Fencing of GovernmentEstates/plots
Renovation of staff houses instate houses and lodges
Government Estates fenced
Staff houses renovated
1111102000 Refurbishment ofstaff houses and fencing instate houses and lodges
200020002150Contsruction of National Police& Kenya Prison serviceshousing units.
8,000 National Police & KenyaPrison services housing unitsconstructed
1111102100 Construction ofHousing Units for NationalPolice & Kenya Prison
0103000 P 3 Government Buildings
Improved working and living conditions in government buildings
Programme:
Outcome:
0103010 SP. 3.1 Stalled and new Government buildingsSub Programme:
Key Output (KO)Targets
2018/2019Targets
2017/2018Key Performance Indicators
(KPIs)Targets
2016/2017Delivery Unit
4
65
19
4
65
19
7
65
20
No. of Stalled buildingscompleted
No. of buildings rehabilitated
No. of new buildingsconstructed
Government buildings1111002300 ArchitecturalDepartment
357

PART E. SUMMARY OF PROGRAMME OUTPUTS AND PERFORMANCE INDICATORS FOR 2016/2017 - 2018/2019
1111 Ministry of Land Housing and Urban Development
10
10
10
10
10
10
No. of Consituency Districtheadquarters completed
No. of Regional Works officesBuildings completed
505050No. of BOQsBills of Quantities (BOQs) forGovernment Buildings
1111002400 Quantities andContracts Department
606040No. of buildings maintained andrefurbished
Government building maintained1111002600 GovernmentBuildings
2
1
2
1
2
1
No.of PABX installed
No.of lift maintained
Government building maintained1111002700 ElectricalDepartment
2711Number of stalled buildingscompleted
Stalled government buildingscompleted
1111102700 Construction &Completion of StalledGovernment Buildings
04223No of ESP District Headquarterscompleted
Construction of ESP DistrictHeadquarters
1111104000 ESP DistrictHeadquarters
202020completion of countryheadquarters offices
Construction of Countyheadquarters offices
1111107200 Construction ofCounty Headquarters
0103020 SP. 3.2 Building Standards and ResearchSub Programme:
Key Output (KO)Targets
2018/2019Targets
2017/2018Key Performance Indicators
(KPIs)Targets
2016/2017Delivery Unit
222Number of researchesconducted and disseminated
Research and dissemination onappropriate technologies
1111002800 Kenya BuildingResearch Centre
358
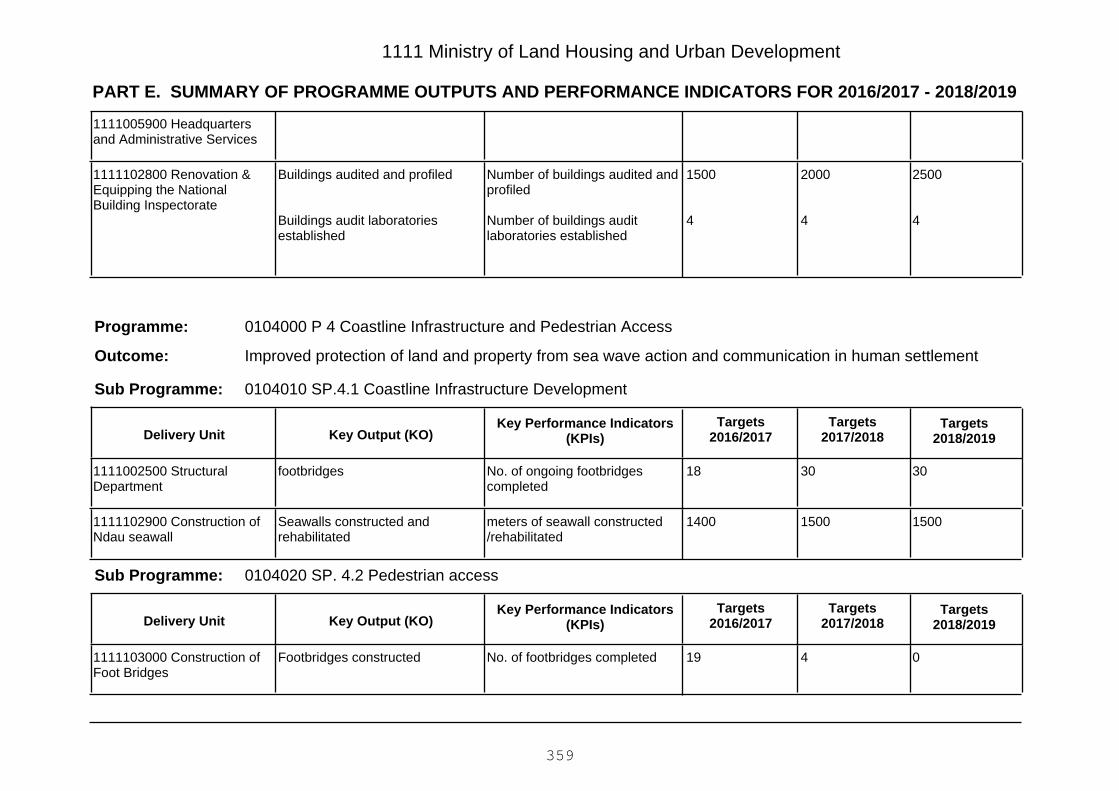
PART E. SUMMARY OF PROGRAMME OUTPUTS AND PERFORMANCE INDICATORS FOR 2016/2017 - 2018/2019
1111 Ministry of Land Housing and Urban Development
1111005900 Headquartersand Administrative Services
2500
4
2000
4
1500
4
Number of buildings audited andprofiled
Number of buildings auditlaboratories established
Buildings audited and profiled
Buildings audit laboratoriesestablished
1111102800 Renovation &Equipping the NationalBuilding Inspectorate
0104000 P 4 Coastline Infrastructure and Pedestrian Access
Improved protection of land and property from sea wave action and communication in human settlement
Programme:
Outcome:
0104010 SP.4.1 Coastline Infrastructure DevelopmentSub Programme:
Key Output (KO)Targets
2018/2019Targets
2017/2018Key Performance Indicators
(KPIs)Targets
2016/2017Delivery Unit
303018No. of ongoing footbridgescompleted
footbridges1111002500 StructuralDepartment
150015001400meters of seawall constructed/rehabilitated
Seawalls constructed andrehabilitated
1111102900 Construction ofNdau seawall
0104020 SP. 4.2 Pedestrian accessSub Programme:
Key Output (KO)Targets
2018/2019Targets
2017/2018Key Performance Indicators
(KPIs)Targets
2016/2017Delivery Unit
0419No. of footbridges completedFootbridges constructed1111103000 Construction ofFoot Bridges
359
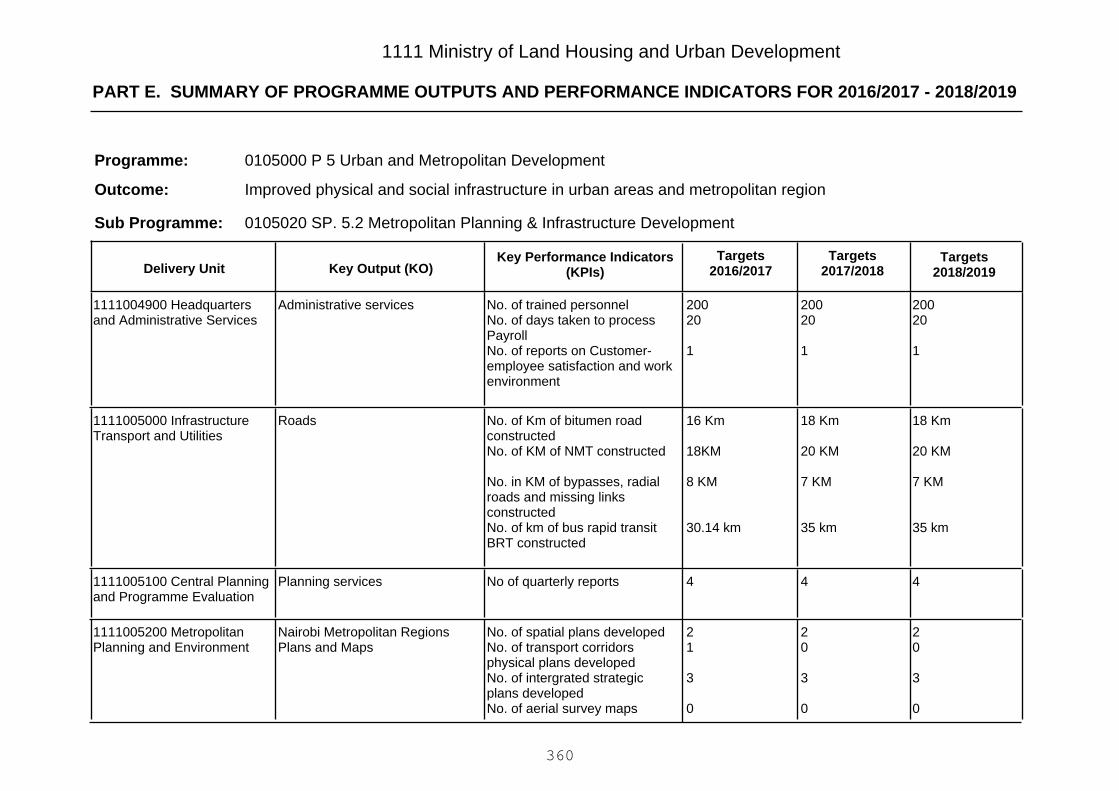
PART E. SUMMARY OF PROGRAMME OUTPUTS AND PERFORMANCE INDICATORS FOR 2016/2017 - 2018/2019
1111 Ministry of Land Housing and Urban Development
0105000 P 5 Urban and Metropolitan Development
Improved physical and social infrastructure in urban areas and metropolitan region
Programme:
Outcome:
0105020 SP. 5.2 Metropolitan Planning & Infrastructure DevelopmentSub Programme:
Key Output (KO)Targets
2018/2019Targets
2017/2018Key Performance Indicators
(KPIs)Targets
2016/2017Delivery Unit
20020
1
20020
1
20020
1
No. of trained personnelNo. of days taken to processPayrollNo. of reports on Customer-employee satisfaction and workenvironment
Administrative services1111004900 Headquartersand Administrative Services
18 Km
20 KM
7 KM
35 km
18 Km
20 KM
7 KM
35 km
16 Km
18KM
8 KM
30.14 km
No. of Km of bitumen roadconstructedNo. of KM of NMT constructed
No. in KM of bypasses, radialroads and missing linksconstructedNo. of km of bus rapid transitBRT constructed
Roads1111005000 InfrastructureTransport and Utilities
444No of quarterly reportsPlanning services1111005100 Central Planningand Programme Evaluation
20
3
0
20
3
0
21
3
0
No. of spatial plans developedNo. of transport corridorsphysical plans developedNo. of intergrated strategicplans developedNo. of aerial survey maps
Nairobi Metropolitan RegionsPlans and Maps
1111005200 MetropolitanPlanning and Environment
360

PART E. SUMMARY OF PROGRAMME OUTPUTS AND PERFORMANCE INDICATORS FOR 2016/2017 - 2018/2019
1111 Ministry of Land Housing and Urban Development
4
25%
4
25%
4
25%
No. of fresh produce marketsconstructed% of Kamukunji recreationalgrounds rehabilitated
Urban infrastructure services1111005300 SocialInfrastructure
1111
3
1111
3
1111
3
Financial performance reportFinancial AccountsAudit reportProcurement and cashflowplansNo. of days taken to processLPO,LSO, Payment Voucherand imprest
Financial services1111005400 Finance andManagement Services
555No. of new investors sensitizedMetropolitan investments1111005500 MetropolitanInvestments
811.210No. of kms of roads constructedTransport mobility enhanced1111102500 Construction andRehabilitation of AccessRoads
5
10
720
15
13
3
10
650
73
12
0
9
589
64
10
No. of bus parks completed
No. of kms of Non-MotorizedTransport (NMT) facilitiesconstructed
No. of street lights installed
No. of High Mast lights installed
No. of Firefighting Vehiclesprocured
Transport mobility and safetyenhanced
Safety and security enhanced
1111102600 NairobiMetroplitan ServicesImprovement Project(NAMSIP)
361
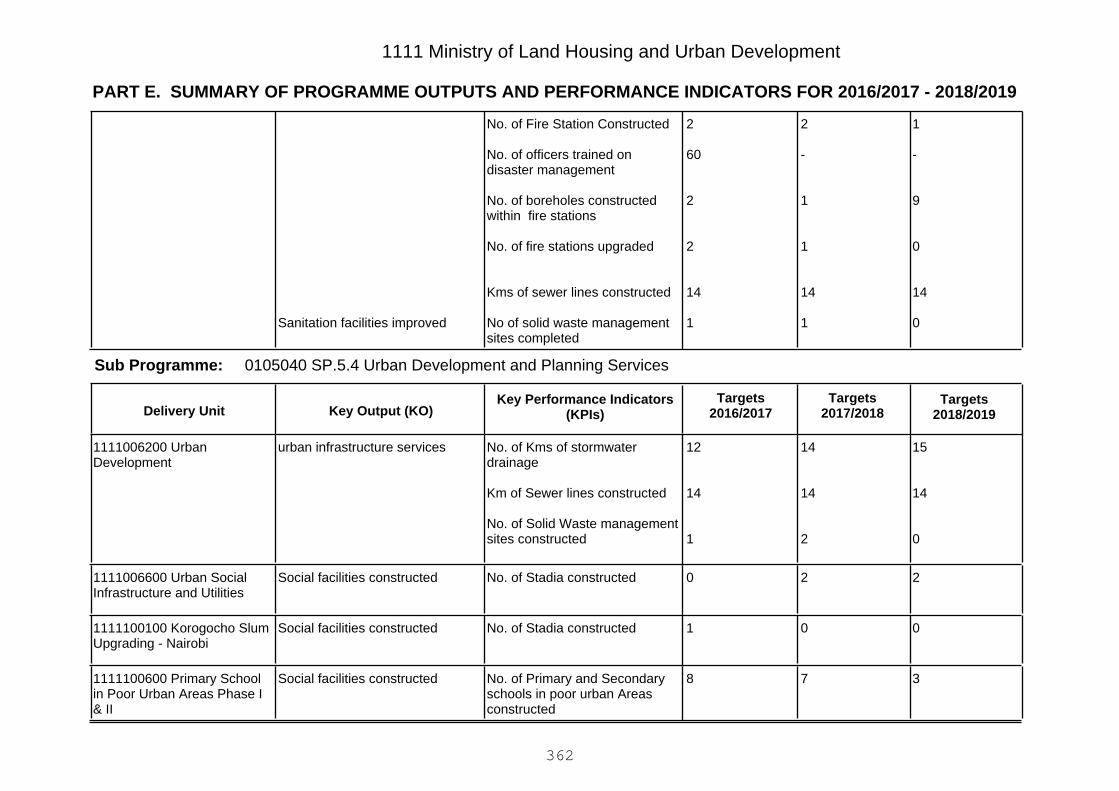
PART E. SUMMARY OF PROGRAMME OUTPUTS AND PERFORMANCE INDICATORS FOR 2016/2017 - 2018/2019
1111 Ministry of Land Housing and Urban Development
1
-
9
0
14
0
2
-
1
1
14
1
2
60
2
2
14
1
No. of Fire Station Constructed
No. of officers trained ondisaster management
No. of boreholes constructedwithin fire stations
No. of fire stations upgraded
Kms of sewer lines constructed
No of solid waste managementsites completed
Sanitation facilities improved
0105040 SP.5.4 Urban Development and Planning ServicesSub Programme:
Key Output (KO)Targets
2018/2019Targets
2017/2018Key Performance Indicators
(KPIs)Targets
2016/2017Delivery Unit
15
14
0
14
14
2
12
14
1
No. of Kms of stormwaterdrainage
Km of Sewer lines constructed
No. of Solid Waste managementsites constructed
urban infrastructure services1111006200 UrbanDevelopment
220No. of Stadia constructedSocial facilities constructed1111006600 Urban SocialInfrastructure and Utilities
001No. of Stadia constructedSocial facilities constructed1111100100 Korogocho SlumUpgrading - Nairobi
378No. of Primary and Secondaryschools in poor urban Areasconstructed
Social facilities constructed1111100600 Primary Schoolin Poor Urban Areas Phase I& II
362

PART E. SUMMARY OF PROGRAMME OUTPUTS AND PERFORMANCE INDICATORS FOR 2016/2017 - 2018/2019
1111 Ministry of Land Housing and Urban Development
056No. of Primary and Secondaryschools in poor urban Areasconstructed
Social facilities constructed1111100700 Primary andSecondary Phase III
0
0
0
0
0
0
0
1
15
10
1
1
1
1
10
25
2
5
No. of Stadia constructed
No of social halls constructed
No of Kms of roads constructed
No of Kms of non motorizedtransport facilities constructed
No. of markets (ESP, markethubs and wholesale) completed
No. of Primary and Secondaryschools constructed
Social facilities constructed
Transport mobility and safetyenhanced
Markets constructed
Social facilities constructed
1111100800 Kisumu UrbanProject
4
9
No of Kms of roads constructed
No of Kms of non motorizedtransport facilities constructed
Transport mobility and safetyenhanced
1111101100 Kenya MunicipalProgramme II
15
14
0
14
14
2
12
14
1
No. of Km of storm waterdrainage Constructed
Km. of Sewer lines constructed
No. of solid waste managementsites completed
Sanitation facilities improved1111102200 Rehabilitation ofStormwater Drainage andSolid Waste Management
363
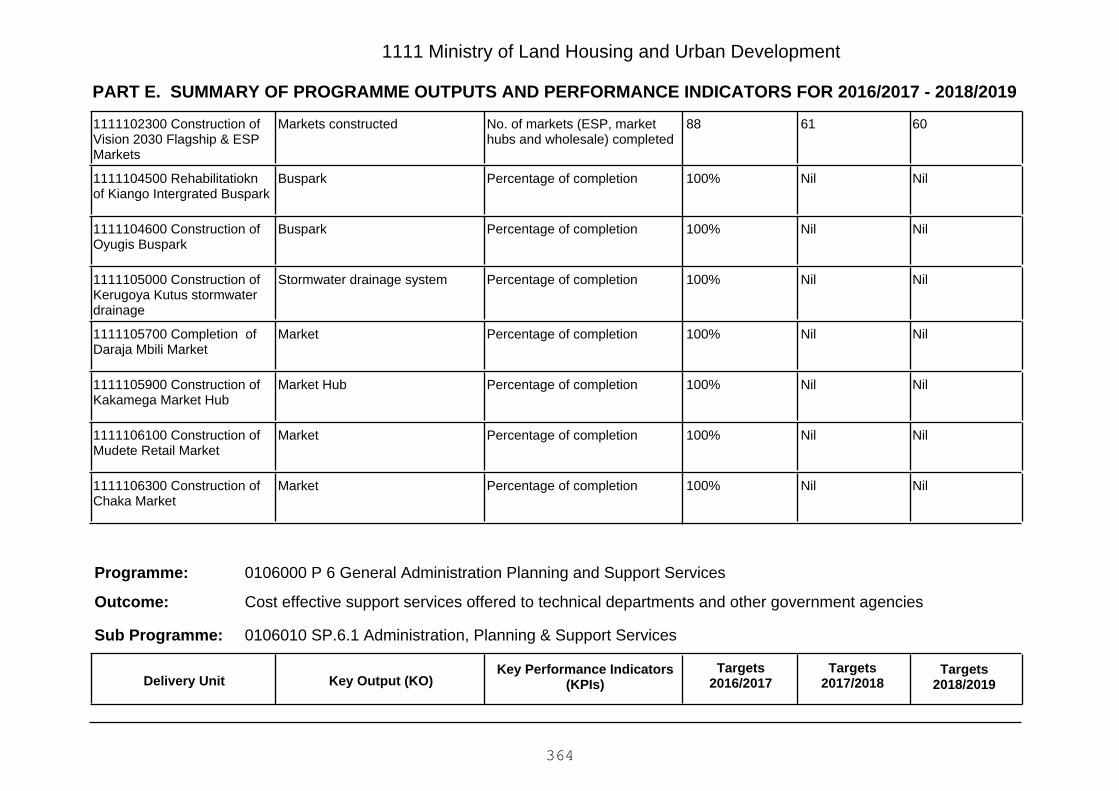
PART E. SUMMARY OF PROGRAMME OUTPUTS AND PERFORMANCE INDICATORS FOR 2016/2017 - 2018/2019
1111 Ministry of Land Housing and Urban Development
606188No. of markets (ESP, markethubs and wholesale) completed
Markets constructed1111102300 Construction ofVision 2030 Flagship & ESPMarkets
NilNil100%Percentage of completionBuspark1111104500 Rehabilitatioknof Kiango Intergrated Buspark
NilNil100%Percentage of completionBuspark1111104600 Construction ofOyugis Buspark
NilNil100%Percentage of completionStormwater drainage system1111105000 Construction ofKerugoya Kutus stormwaterdrainage
NilNil100%Percentage of completionMarket1111105700 Completion ofDaraja Mbili Market
NilNil100%Percentage of completionMarket Hub1111105900 Construction ofKakamega Market Hub
NilNil100%Percentage of completionMarket1111106100 Construction ofMudete Retail Market
NilNil100%Percentage of completionMarket1111106300 Construction ofChaka Market
0106000 P 6 General Administration Planning and Support Services
Cost effective support services offered to technical departments and other government agencies
Programme:
Outcome:
0106010 SP.6.1 Administration, Planning & Support ServicesSub Programme:
Key Output (KO)Targets
2018/2019Targets
2017/2018Key Performance Indicators
(KPIs)Targets
2016/2017Delivery Unit
364
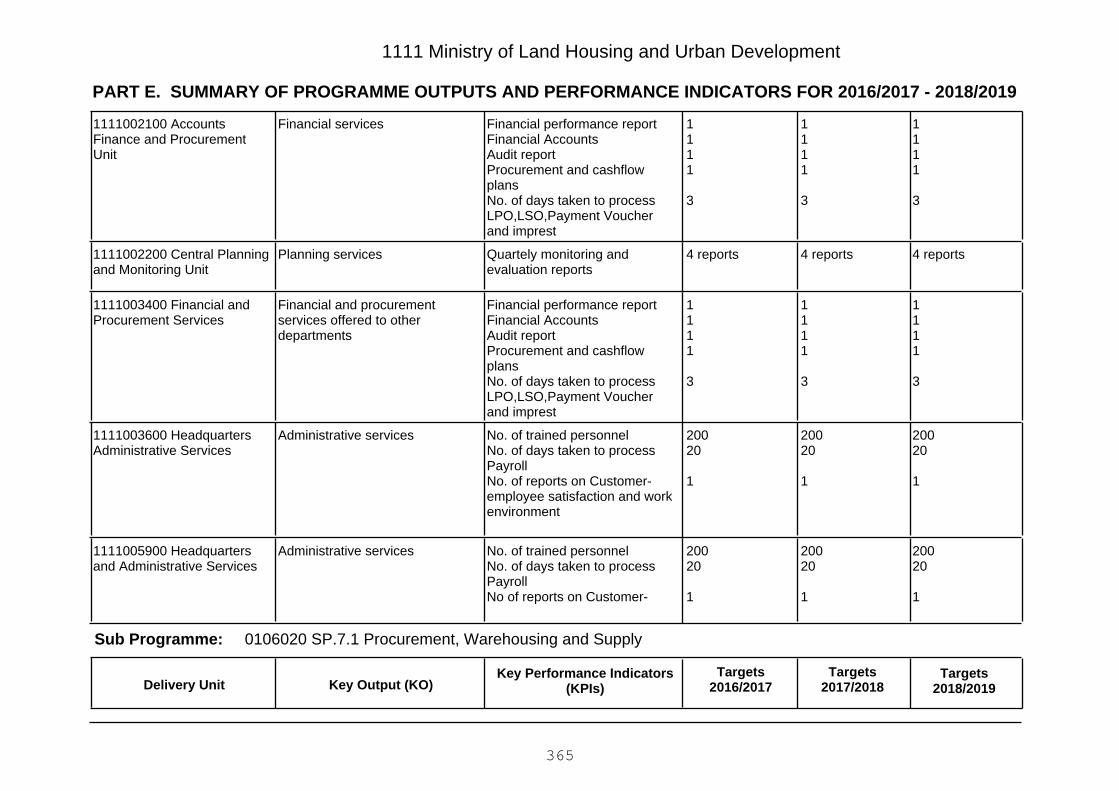
PART E. SUMMARY OF PROGRAMME OUTPUTS AND PERFORMANCE INDICATORS FOR 2016/2017 - 2018/2019
1111 Ministry of Land Housing and Urban Development
1111
3
1111
3
1111
3
Financial performance reportFinancial AccountsAudit reportProcurement and cashflowplansNo. of days taken to processLPO,LSO,Payment Voucherand imprest
Financial services1111002100 AccountsFinance and ProcurementUnit
4 reports4 reports4 reportsQuartely monitoring andevaluation reports
Planning services1111002200 Central Planningand Monitoring Unit
1111
3
1111
3
1111
3
Financial performance reportFinancial AccountsAudit reportProcurement and cashflowplansNo. of days taken to processLPO,LSO,Payment Voucherand imprest
Financial and procurementservices offered to otherdepartments
1111003400 Financial andProcurement Services
20020
1
20020
1
20020
1
No. of trained personnelNo. of days taken to processPayrollNo. of reports on Customer-employee satisfaction and workenvironment
Administrative services1111003600 HeadquartersAdministrative Services
20020
1
20020
1
20020
1
No. of trained personnelNo. of days taken to processPayrollNo of reports on Customer-
Administrative services1111005900 Headquartersand Administrative Services
0106020 SP.7.1 Procurement, Warehousing and SupplySub Programme:
Key Output (KO)Targets
2018/2019Targets
2017/2018Key Performance Indicators
(KPIs)Targets
2016/2017Delivery Unit
365
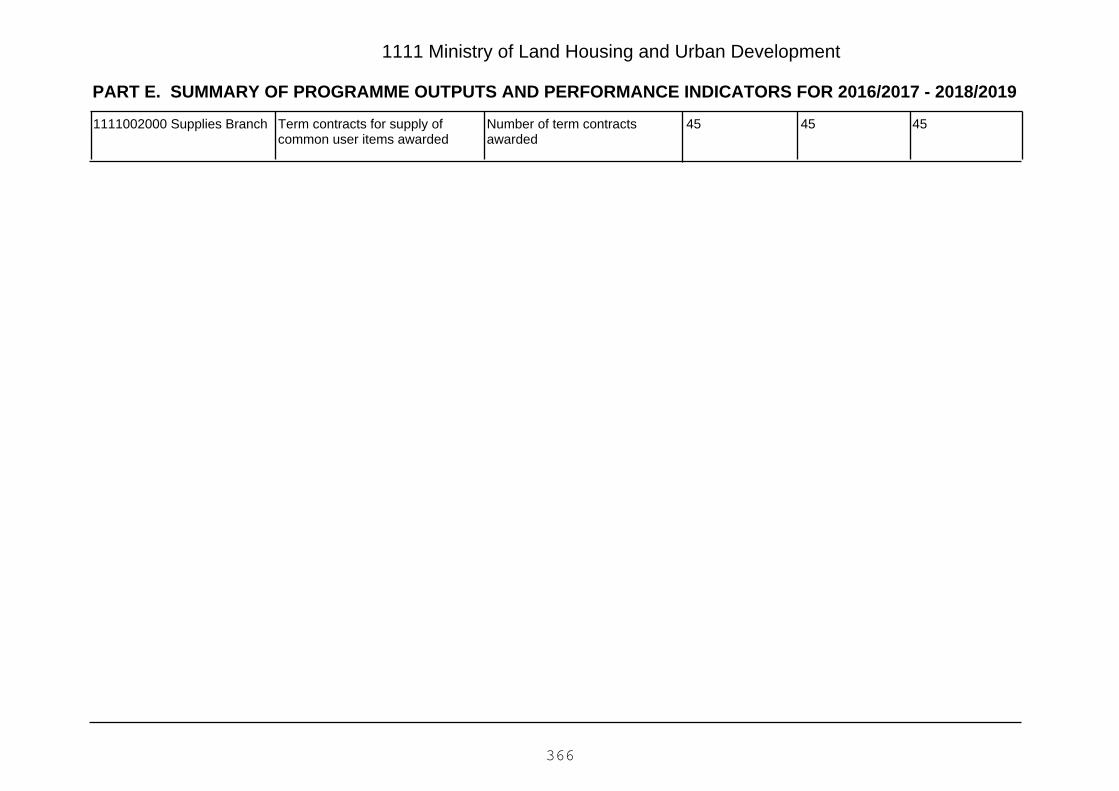
PART E. SUMMARY OF PROGRAMME OUTPUTS AND PERFORMANCE INDICATORS FOR 2016/2017 - 2018/2019
1111 Ministry of Land Housing and Urban Development
454545Number of term contractsawarded
Term contracts for supply ofcommon user items awarded
1111002000 Supplies Branch
366

Vote 1111 Ministry of Land Housing and Urban Development
PART F: Summary of Expenditure by Programmes, 2016/2017 - 2018/2019
Programme
Estimates Projected Estimates
2016/2017 2017/2018 2018/2019
KShs. KShs. KShs.
0101010 SP. 1.1 Development Planning and Land Reforms 3,155,732,909 4,306,133,655 2,849,308,051
0101020 SP. 1.2 Land Information Management 761,011,036 908,650,006 962,853,900
0101030 SP. 1.3 Land Survey 1,145,608,815 1,070,385,979 1,701,811,374
0101040 SP. 1.4 Land Use 277,710,112 277,645,517 434,650,124
0101050 SP. 1.5 Land Settlement 490,018,307 741,091,510 808,147,682
0101000 P. 1 Land Policy and Planning 5,830,081,179 7,303,906,667 6,756,771,131
0102010 SP. 2.1 Housing Development 5,728,246,937 6,856,809,766 8,145,308,543
0102020 SP. 2.2 Estate Management 2,027,273,978 996,837,100 1,398,005,778
0102000 P.2 Housing Development and Human Settlement 7,755,520,915 7,853,646,866 9,543,314,321
0103010 SP. 3.1 Stalled and new Government buildings 2,146,732,286 3,468,971,639 3,515,126,636
0103020 SP. 3.2 Building Standards and Research 151,991,837 166,258,145 109,568,597
0103000 P 3 Government Buildings 2,298,724,123 3,635,229,784 3,624,695,233
0104010 SP.4.1 Coastline Infrastructure Development 180,103,859 79,638,088 83,234,418
0104020 SP. 4.2 Pedestrian access 77,000,000 31,026,581 -
0104000 P 4 Coastline Infrastructure and Pedestrian Access 257,103,859 110,664,669 83,234,418
0105020 SP. 5.2 Metropolitan Planning & Infrastructure Development 6,595,312,128 7,026,682,855 8,837,781,311
0105040 SP.5.4 Urban Development and Planning Services 5,712,058,652 5,231,479,945 1,832,599,899
367
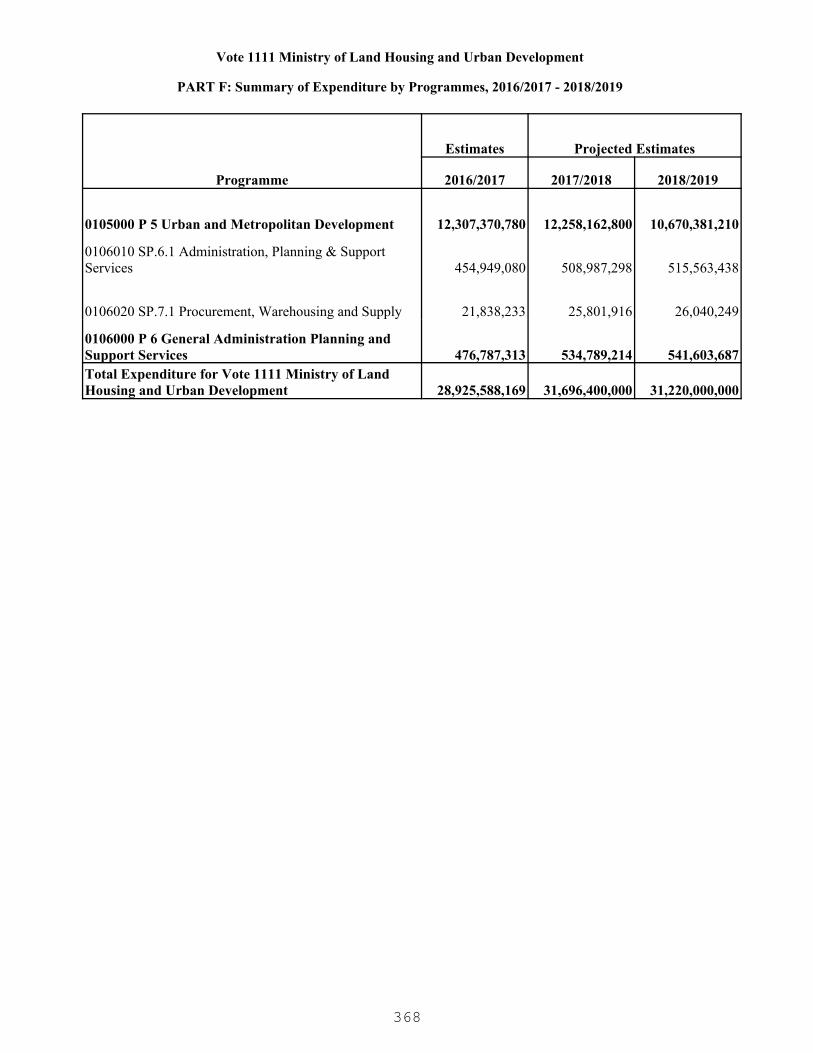
Vote 1111 Ministry of Land Housing and Urban Development
PART F: Summary of Expenditure by Programmes, 2016/2017 - 2018/2019
Programme
Estimates Projected Estimates
2016/2017 2017/2018 2018/2019
0105000 P 5 Urban and Metropolitan Development 12,307,370,780 12,258,162,800 10,670,381,210
0106010 SP.6.1 Administration, Planning & Support Services 454,949,080 508,987,298 515,563,438
0106020 SP.7.1 Procurement, Warehousing and Supply 21,838,233 25,801,916 26,040,249
0106000 P 6 General Administration Planning and Support Services 476,787,313 534,789,214 541,603,687Total Expenditure for Vote 1111 Ministry of Land Housing and Urban Development 28,925,588,169 31,696,400,000 31,220,000,000
368

1111 Ministry of Land Housing and Urban Development
PART G: Summary of Expenditure by Vote and Economic Classification, 2016/2017 - 2018/2019
Economic Classification
Estimates Projected Estimates
2016/2017 2017/2018 2018/2019KShs. KShs. KShs.
Current Expenditure 3,948,088,169 4,297,000,000 4,445,000,000
Compensation to Employees 2,876,000,000 3,012,000,000 3,102,000,000
Use of Goods and Services 930,640,046 1,129,833,455 1,185,427,010
Current Transfers to Govt. Agencies 92,402,944 102,834,724 104,834,724
Other Recurrent 49,045,179 52,331,821 52,738,266
Capital Expenditure 24,977,500,000 27,399,400,000 26,775,000,000
Acquisition of Non-Financial Assets 22,031,600,000 23,185,301,760 23,454,080,000
Capital Grants to Govt. Agencies 109,000,000 1,166,000,000 1,011,000,000
Other Development 2,836,900,000 3,048,098,240 2,309,920,000Total Expenditure 28,925,588,169 31,696,400,000 31,220,000,000
369

1111 Ministry of Land Housing and Urban Development
PART H: Summary of Expenditure by Programme and Economic Classification, 2016/2017 - 2018/2019
0101010 SP. 1.1 Development Planning and Land Reforms
Economic Classification
Estimates Projected Estimates
2016/2017 2017/2018 2018/2019KShs. KShs. KShs.
Current Expenditure 365,652,909 387,053,655 395,308,051
Compensation to Employees 272,011,772 279,088,600 284,104,043
Use of Goods and Services 70,973,477 102,339,914 105,410,113
Other Recurrent 22,667,660 5,625,141 5,793,895
Capital Expenditure 2,790,080,000 3,919,080,000 2,454,000,000
Acquisition of Non-Financial Assets 1,030,080,000 1,685,080,000 1,294,080,000
Other Development 1,760,000,000 2,234,000,000 1,159,920,000Total Expenditure 3,155,732,909 4,306,133,655 2,849,308,051
0101020 SP. 1.2 Land Information Management
Economic Classification
Estimates Projected Estimates
2016/2017 2017/2018 2018/2019KShs. KShs. KShs.
Current Expenditure 656,011,036 726,650,006 742,853,900
Compensation to Employees 578,739,527 638,147,560 649,926,332
Use of Goods and Services 76,717,469 87,532,876 91,909,519
Other Recurrent 554,040 969,570 1,018,049
Capital Expenditure 105,000,000 182,000,000 220,000,000
Acquisition of Non-Financial Assets 105,000,000 182,000,000 220,000,000Total Expenditure 761,011,036 908,650,006 962,853,900
0101030 SP. 1.3 Land Survey
Economic Classification
Estimates Projected Estimates
2016/2017 2017/2018 2018/2019KShs. KShs. KShs.
Current Expenditure 607,208,815 598,287,739 636,811,374
Compensation to Employees 543,088,546 526,143,172 562,138,236
Use of Goods and Services 52,908,487 59,539,200 61,672,264
370

1111 Ministry of Land Housing and Urban Development
PART H: Summary of Expenditure by Programme and Economic Classification, 2016/2017 - 2018/2019
0101030 SP. 1.3 Land Survey
Economic Classification
Estimates Projected Estimates
2016/2017 2017/2018 2018/2019
Current Transfers to Govt. Agencies 10,000,000 10,300,000 10,609,000
Other Recurrent 1,211,782 2,305,367 2,391,874
Capital Expenditure 538,400,000 472,098,240 1,065,000,000
Acquisition of Non-Financial Assets 208,000,000 230,000,000 485,000,000
Capital Grants to Govt. Agencies 10,000,000 10,000,000 10,000,000
Other Development 320,400,000 232,098,240 570,000,000Total Expenditure 1,145,608,815 1,070,385,979 1,701,811,374
0101040 SP. 1.4 Land Use
Economic Classification
Estimates Projected Estimates
2016/2017 2017/2018 2018/2019KShs. KShs. KShs.
Current Expenditure 120,710,112 124,645,517 126,650,124
Compensation to Employees 112,766,917 115,130,879 116,659,757
Use of Goods and Services 6,101,195 7,580,538 7,959,562
Other Recurrent 1,842,000 1,934,100 2,030,805
Capital Expenditure 157,000,000 153,000,000 308,000,000
Acquisition of Non-Financial Assets 145,000,000 125,000,000 308,000,000
Capital Grants to Govt. Agencies 12,000,000 28,000,000 -Total Expenditure 277,710,112 277,645,517 434,650,124
0101050 SP. 1.5 Land Settlement
Economic Classification
Estimates Projected Estimates
2016/2017 2017/2018 2018/2019KShs. KShs. KShs.
Current Expenditure 439,018,307 481,091,510 496,147,682
Compensation to Employees 437,216,110 479,117,561 494,114,513
Use of Goods and Services 1,802,197 1,973,949 2,033,169
Capital Expenditure 51,000,000 260,000,000 312,000,000
371

1111 Ministry of Land Housing and Urban Development
PART H: Summary of Expenditure by Programme and Economic Classification, 2016/2017 - 2018/2019
0101050 SP. 1.5 Land Settlement
Economic Classification
Estimates Projected Estimates
2016/2017 2017/2018 2018/2019
Acquisition of Non-Financial Assets 26,000,000 235,000,000 287,000,000
Other Development 25,000,000 25,000,000 25,000,000Total Expenditure 490,018,307 741,091,510 808,147,682
0101000 P. 1 Land Policy and Planning
Economic Classification
Estimates Projected Estimates
2016/2017 2017/2018 2018/2019KShs. KShs. KShs.
Current Expenditure 2,188,601,179 2,317,728,427 2,397,771,131
Compensation to Employees 1,943,822,872 2,037,627,772 2,106,942,881
Use of Goods and Services 208,502,825 258,966,477 268,984,627
Current Transfers to Govt. Agencies 10,000,000 10,300,000 10,609,000
Other Recurrent 26,275,482 10,834,178 11,234,623
Capital Expenditure 3,641,480,000 4,986,178,240 4,359,000,000
Acquisition of Non-Financial Assets 1,514,080,000 2,457,080,000 2,594,080,000
Capital Grants to Govt. Agencies 22,000,000 38,000,000 10,000,000
Other Development 2,105,400,000 2,491,098,240 1,754,920,000Total Expenditure 5,830,081,179 7,303,906,667 6,756,771,131
0102010 SP. 2.1 Housing Development
Economic Classification
Estimates Projected Estimates
2016/2017 2017/2018 2018/2019KShs. KShs. KShs.
Current Expenditure 158,146,937 177,344,362 181,308,543
Compensation to Employees 127,413,162 140,923,109 144,134,967
Use of Goods and Services 14,193,775 19,821,253 20,075,576
Current Transfers to Govt. Agencies 16,400,000 16,400,000 16,892,000
Other Recurrent 140,000 200,000 206,000
Capital Expenditure 5,570,100,000 6,679,465,404 7,964,000,000
372

1111 Ministry of Land Housing and Urban Development
PART H: Summary of Expenditure by Programme and Economic Classification, 2016/2017 - 2018/2019
0102010 SP. 2.1 Housing Development
Economic Classification
Estimates Projected Estimates
2016/2017 2017/2018 2018/2019
Acquisition of Non-Financial Assets 5,343,100,000 5,356,465,404 6,773,000,000
Capital Grants to Govt. Agencies 87,000,000 1,128,000,000 1,001,000,000
Other Development 140,000,000 195,000,000 190,000,000Total Expenditure 5,728,246,937 6,856,809,766 8,145,308,543
0102020 SP. 2.2 Estate Management
Economic Classification
Estimates Projected Estimates
2016/2017 2017/2018 2018/2019KShs. KShs. KShs.
Current Expenditure 327,273,978 368,917,100 397,005,778
Compensation to Employees 234,801,752 254,416,857 261,461,267
Use of Goods and Services 92,472,226 114,500,243 135,544,511
Capital Expenditure 1,700,000,000 627,920,000 1,001,000,000
Acquisition of Non-Financial Assets 1,700,000,000 627,920,000 1,001,000,000Total Expenditure 2,027,273,978 996,837,100 1,398,005,778
0102000 P.2 Housing Development and Human Settlement
Economic Classification
Estimates Projected Estimates
2016/2017 2017/2018 2018/2019KShs. KShs. KShs.
Current Expenditure 485,420,915 546,261,462 578,314,321
Compensation to Employees 362,214,914 395,339,966 405,596,234
Use of Goods and Services 106,666,001 134,321,496 155,620,087
Current Transfers to Govt. Agencies 16,400,000 16,400,000 16,892,000
Other Recurrent 140,000 200,000 206,000
Capital Expenditure 7,270,100,000 7,307,385,404 8,965,000,000
Acquisition of Non-Financial Assets 7,043,100,000 5,984,385,404 7,774,000,000
Capital Grants to Govt. Agencies 87,000,000 1,128,000,000 1,001,000,000
Other Development 140,000,000 195,000,000 190,000,000
373

1111 Ministry of Land Housing and Urban Development
PART H: Summary of Expenditure by Programme and Economic Classification, 2016/2017 - 2018/2019
0102000 P.2 Housing Development and Human Settlement
Economic Classification
Estimates Projected Estimates
2016/2017 2017/2018 2018/2019Total Expenditure 7,755,520,915 7,853,646,866 9,543,314,3210103010 SP. 3.1 Stalled and new Government buildings
Economic Classification
Estimates Projected Estimates
2016/2017 2017/2018 2018/2019KShs. KShs. KShs.
Current Expenditure 359,732,286 396,161,864 400,126,636
Compensation to Employees 281,246,169 281,479,156 288,443,928
Use of Goods and Services 70,506,117 97,034,708 94,034,708
Other Recurrent 7,980,000 17,648,000 17,648,000
Capital Expenditure 1,787,000,000 3,072,809,775 3,115,000,000
Acquisition of Non-Financial Assets 1,758,000,000 3,035,809,775 3,115,000,000
Other Development 29,000,000 37,000,000 -Total Expenditure 2,146,732,286 3,468,971,639 3,515,126,636
0103020 SP. 3.2 Building Standards and Research
Economic Classification
Estimates Projected Estimates
2016/2017 2017/2018 2018/2019KShs. KShs. KShs.
Current Expenditure 71,991,837 86,258,145 89,568,597
Compensation to Employees 16,478,049 16,779,425 17,089,877
Use of Goods and Services 55,513,788 67,478,720 70,478,720
Other Recurrent - 2,000,000 2,000,000
Capital Expenditure 80,000,000 80,000,000 20,000,000
Acquisition of Non-Financial Assets 50,000,000 50,000,000 10,000,000
Other Development 30,000,000 30,000,000 10,000,000Total Expenditure 151,991,837 166,258,145 109,568,597
374
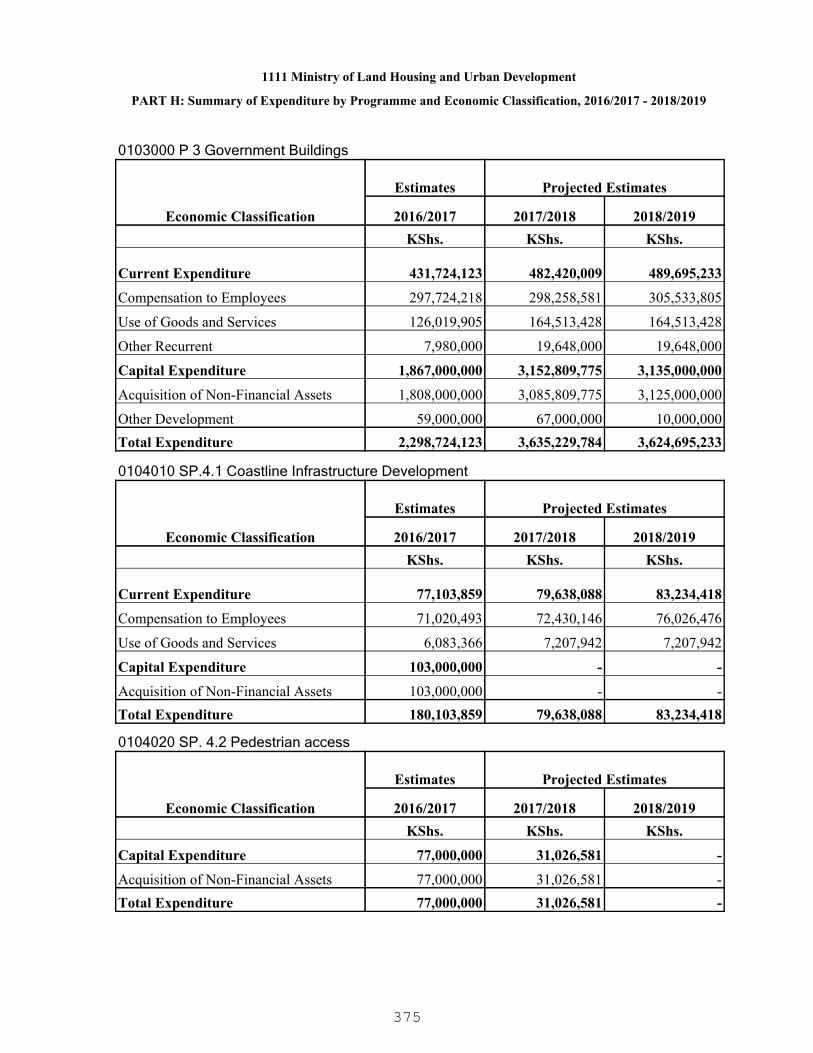
1111 Ministry of Land Housing and Urban Development
PART H: Summary of Expenditure by Programme and Economic Classification, 2016/2017 - 2018/2019
0103000 P 3 Government Buildings
Economic Classification
Estimates Projected Estimates
2016/2017 2017/2018 2018/2019KShs. KShs. KShs.
Current Expenditure 431,724,123 482,420,009 489,695,233
Compensation to Employees 297,724,218 298,258,581 305,533,805
Use of Goods and Services 126,019,905 164,513,428 164,513,428
Other Recurrent 7,980,000 19,648,000 19,648,000
Capital Expenditure 1,867,000,000 3,152,809,775 3,135,000,000
Acquisition of Non-Financial Assets 1,808,000,000 3,085,809,775 3,125,000,000
Other Development 59,000,000 67,000,000 10,000,000Total Expenditure 2,298,724,123 3,635,229,784 3,624,695,233
0104010 SP.4.1 Coastline Infrastructure Development
Economic Classification
Estimates Projected Estimates
2016/2017 2017/2018 2018/2019KShs. KShs. KShs.
Current Expenditure 77,103,859 79,638,088 83,234,418
Compensation to Employees 71,020,493 72,430,146 76,026,476
Use of Goods and Services 6,083,366 7,207,942 7,207,942
Capital Expenditure 103,000,000 - -
Acquisition of Non-Financial Assets 103,000,000 - -Total Expenditure 180,103,859 79,638,088 83,234,418
0104020 SP. 4.2 Pedestrian access
Economic Classification
Estimates Projected Estimates
2016/2017 2017/2018 2018/2019KShs. KShs. KShs.
Capital Expenditure 77,000,000 31,026,581 -
Acquisition of Non-Financial Assets 77,000,000 31,026,581 -Total Expenditure 77,000,000 31,026,581 -
375

1111 Ministry of Land Housing and Urban Development
PART H: Summary of Expenditure by Programme and Economic Classification, 2016/2017 - 2018/2019
0104000 P 4 Coastline Infrastructure and Pedestrian Access
Economic Classification
Estimates Projected Estimates
2016/2017 2017/2018 2018/2019KShs. KShs. KShs.
Current Expenditure 77,103,859 79,638,088 83,234,418
Compensation to Employees 71,020,493 72,430,146 76,026,476
Use of Goods and Services 6,083,366 7,207,942 7,207,942
Capital Expenditure 180,000,000 31,026,581 -
Acquisition of Non-Financial Assets 180,000,000 31,026,581 -Total Expenditure 257,103,859 110,664,669 83,234,418
0105020 SP. 5.2 Metropolitan Planning & Infrastructure Development
Economic Classification
Estimates Projected Estimates
2016/2017 2017/2018 2018/2019KShs. KShs. KShs.
Current Expenditure 205,312,128 237,682,855 252,781,311
Compensation to Employees 110,246,545 114,415,181 112,293,764
Use of Goods and Services 91,948,595 120,150,686 137,370,559
Current Transfers to Govt. Agencies 539,248 539,248 539,248
Other Recurrent 2,577,740 2,577,740 2,577,740
Capital Expenditure 6,390,000,000 6,789,000,000 8,585,000,000
Acquisition of Non-Financial Assets 6,157,500,000 6,494,000,000 8,230,000,000
Other Development 232,500,000 295,000,000 355,000,000Total Expenditure 6,595,312,128 7,026,682,855 8,837,781,311
0105040 SP.5.4 Urban Development and Planning Services
Economic Classification
Estimates Projected Estimates
2016/2017 2017/2018 2018/2019KShs. KShs. KShs.
Current Expenditure 83,138,652 98,479,945 101,599,899
Use of Goods and Services 80,021,572 89,945,145 93,065,099
Other Recurrent 3,117,080 8,534,800 8,534,800
376

1111 Ministry of Land Housing and Urban Development
PART H: Summary of Expenditure by Programme and Economic Classification, 2016/2017 - 2018/2019
0105040 SP.5.4 Urban Development and Planning Services
Economic Classification
Estimates Projected Estimates
2016/2017 2017/2018 2018/2019
Capital Expenditure 5,628,920,000 5,133,000,000 1,731,000,000
Acquisition of Non-Financial Assets 5,328,920,000 5,133,000,000 1,731,000,000
Other Development 300,000,000 - -Total Expenditure 5,712,058,652 5,231,479,945 1,832,599,899
0105000 P 5 Urban and Metropolitan Development
Economic Classification
Estimates Projected Estimates
2016/2017 2017/2018 2018/2019KShs. KShs. KShs.
Current Expenditure 288,450,780 336,162,800 354,381,210
Compensation to Employees 110,246,545 114,415,181 112,293,764
Use of Goods and Services 171,970,167 210,095,831 230,435,658
Current Transfers to Govt. Agencies 539,248 539,248 539,248
Other Recurrent 5,694,820 11,112,540 11,112,540
Capital Expenditure 12,018,920,000 11,922,000,000 10,316,000,000
Acquisition of Non-Financial Assets 11,486,420,000 11,627,000,000 9,961,000,000
Other Development 532,500,000 295,000,000 355,000,000Total Expenditure 12,307,370,780 12,258,162,800 10,670,381,210
0106010 SP.6.1 Administration, Planning & Support Services
Economic Classification
Estimates Projected Estimates
2016/2017 2017/2018 2018/2019KShs. KShs. KShs.
Current Expenditure 454,949,080 508,987,298 515,563,438
Compensation to Employees 79,057,633 81,611,943 83,052,096
Use of Goods and Services 302,651,911 343,352,039 347,289,026
Current Transfers to Govt. Agencies 65,463,696 75,595,476 76,794,476
Other Recurrent 7,775,840 8,427,840 8,427,840Total Expenditure 454,949,080 508,987,298 515,563,438
377
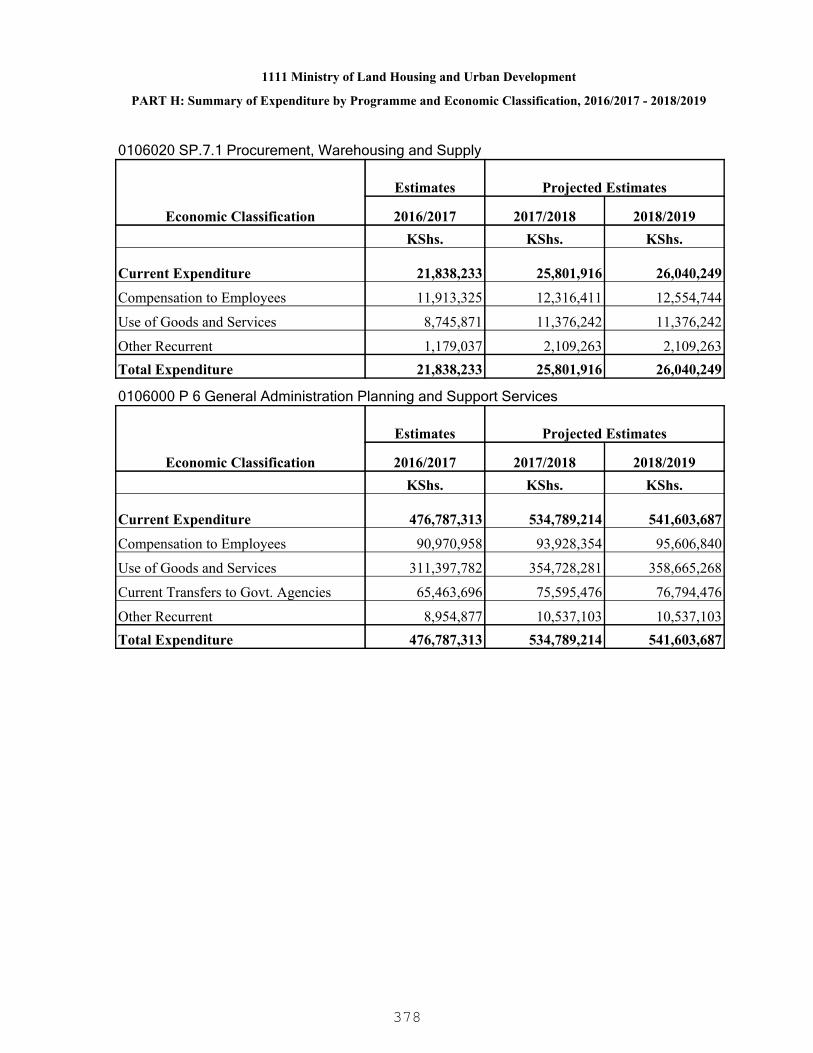
1111 Ministry of Land Housing and Urban Development
PART H: Summary of Expenditure by Programme and Economic Classification, 2016/2017 - 2018/2019
0106020 SP.7.1 Procurement, Warehousing and Supply
Economic Classification
Estimates Projected Estimates
2016/2017 2017/2018 2018/2019KShs. KShs. KShs.
Current Expenditure 21,838,233 25,801,916 26,040,249
Compensation to Employees 11,913,325 12,316,411 12,554,744
Use of Goods and Services 8,745,871 11,376,242 11,376,242
Other Recurrent 1,179,037 2,109,263 2,109,263Total Expenditure 21,838,233 25,801,916 26,040,249
0106000 P 6 General Administration Planning and Support Services
Economic Classification
Estimates Projected Estimates
2016/2017 2017/2018 2018/2019KShs. KShs. KShs.
Current Expenditure 476,787,313 534,789,214 541,603,687
Compensation to Employees 90,970,958 93,928,354 95,606,840
Use of Goods and Services 311,397,782 354,728,281 358,665,268
Current Transfers to Govt. Agencies 65,463,696 75,595,476 76,794,476
Other Recurrent 8,954,877 10,537,103 10,537,103Total Expenditure 476,787,313 534,789,214 541,603,687
378

1121 Ministry of Information Communications and Technology
A globally competitive knowledge based economy
To facilitate universal access to ICT infrastructure and services all over the country
PART A. Vision
PART B. Mission
PART C. Performance Overview and Background for Programme(s) Funding
PART D. Programme Objectives
The Ministry implements its mandate through four major programmes namely; GeneralAdministration Planning and Support Services; Information and Communication Services; ICT& Mass Media Skills Development and ICT Infrastructure Development.
During the period under review the Ministry made the following achievements; laying fibreunder NOFBI phase II in all counties, digital TV migration coverage to 58%, installation ofadditional transmitters in 23 sites is ongoing, establishment Konza Technopolis phase 1Ahorizontal infrastructure which includes 8.5Km access road, six boreholes equipped andconnected to the water tower, water and sewerage design developed and detailed design forthe Konza Local Physical Development Plan (LPDP) developed and approved. Under thepresidential digital talent, 100 ICT interns graduated and 22 of them have been absorbed bythe private sector, shortlisting of additional 400 interns is ongoing. Tendering and award forDigital Literacy Programme finalized, 150 devices for pilot schools has been delivered, and83% of reported media disputes resolved by the Complaints Commission of the Council.
The Ministry has been allocated a total of KSh.26 billion for Financial year 2016/17 of whichKSh.3 billion is current expenditure and KSh. 23 billion is capital expenditure. With the abovefunding, the Ministry will endeavor to fast track the following major projects for the delivery ofthe following output or services; laying of the final 900Km of backbone fibre cable, Roll outinfrastructure on digital migration to cover the whole Country, installation and commissioningof 600,000 devices to 11,000 public primary schools, recruitment of 400 ICT interns,rehabilitation of 22 information county offices, completion of 450 bed Capacity hostel andcompletion of the film laboratory at the Kenya Institute of Mass Communication, constructionof 6.2 Km access road in KONZA, Servicing of government shared services contract andconnect the remaining 19 counties under the County Connectivity Programme Phase II.Under the East Africa Regional Transport, Trade and Development Facilitation Project, theMinistry will enhance internet connectivity by constructing the fibre optic along the northerncorridor,develop various ICT applications and infrastructure for e-government services underthe Kenya Transparency Communication Information Programme (KTCIP). Roll out studioMashinani in Mombasa, Nyeri and Kisumu and establishment of the ICT hub in all thecounties among others.
ObjectiveProgramme
379
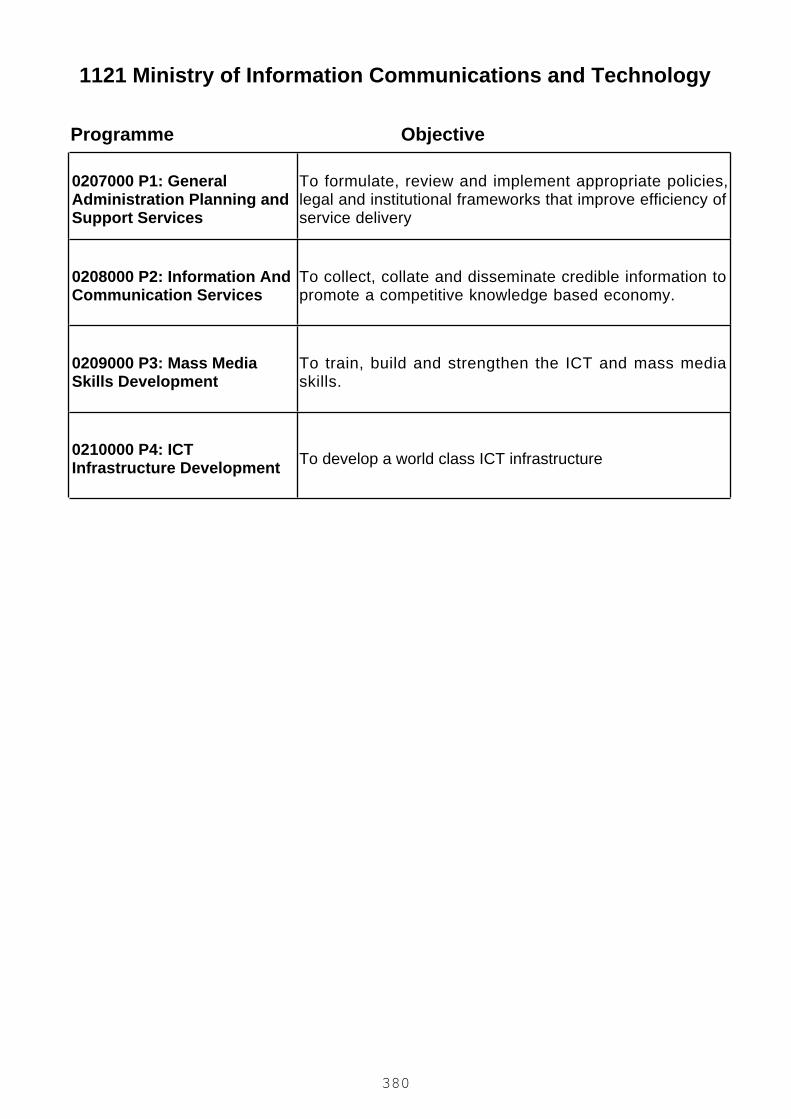
1121 Ministry of Information Communications and Technology
ObjectiveProgramme
0207000 P1: GeneralAdministration Planning andSupport Services
To formulate, review and implement appropriate policies,legal and institutional frameworks that improve efficiency ofservice delivery
0208000 P2: Information AndCommunication Services
To collect, collate and disseminate credible information topromote a competitive knowledge based economy.
0209000 P3: Mass MediaSkills Development
To train, build and strengthen the ICT and mass mediaskills.
0210000 P4: ICTInfrastructure Development To develop a world class ICT infrastructure
380
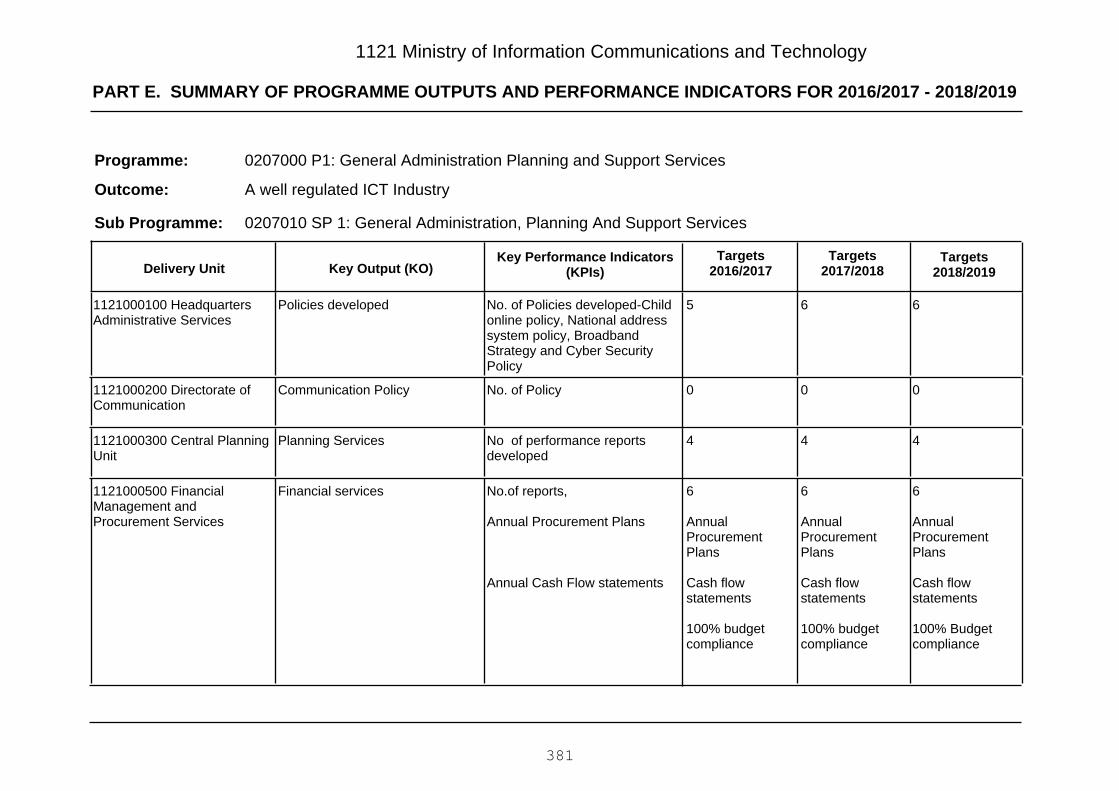
PART E. SUMMARY OF PROGRAMME OUTPUTS AND PERFORMANCE INDICATORS FOR 2016/2017 - 2018/2019
1121 Ministry of Information Communications and Technology
0207000 P1: General Administration Planning and Support Services
A well regulated ICT Industry
Programme:
Outcome:
0207010 SP 1: General Administration, Planning And Support ServicesSub Programme:
Key Output (KO)Targets
2018/2019Targets
2017/2018Key Performance Indicators
(KPIs)Targets
2016/2017Delivery Unit
665No. of Policies developed-Childonline policy, National addresssystem policy, BroadbandStrategy and Cyber SecurityPolicy
Policies developed1121000100 HeadquartersAdministrative Services
000No. of PolicyCommunication Policy1121000200 Directorate ofCommunication
444No of performance reportsdeveloped
Planning Services1121000300 Central PlanningUnit
6
AnnualProcurementPlans
Cash flowstatements
100% Budgetcompliance
6
AnnualProcurementPlans
Cash flowstatements
100% budgetcompliance
6
AnnualProcurementPlans
Cash flowstatements
100% budgetcompliance
No.of reports,
Annual Procurement Plans
Annual Cash Flow statements
Financial services1121000500 FinancialManagement andProcurement Services
381
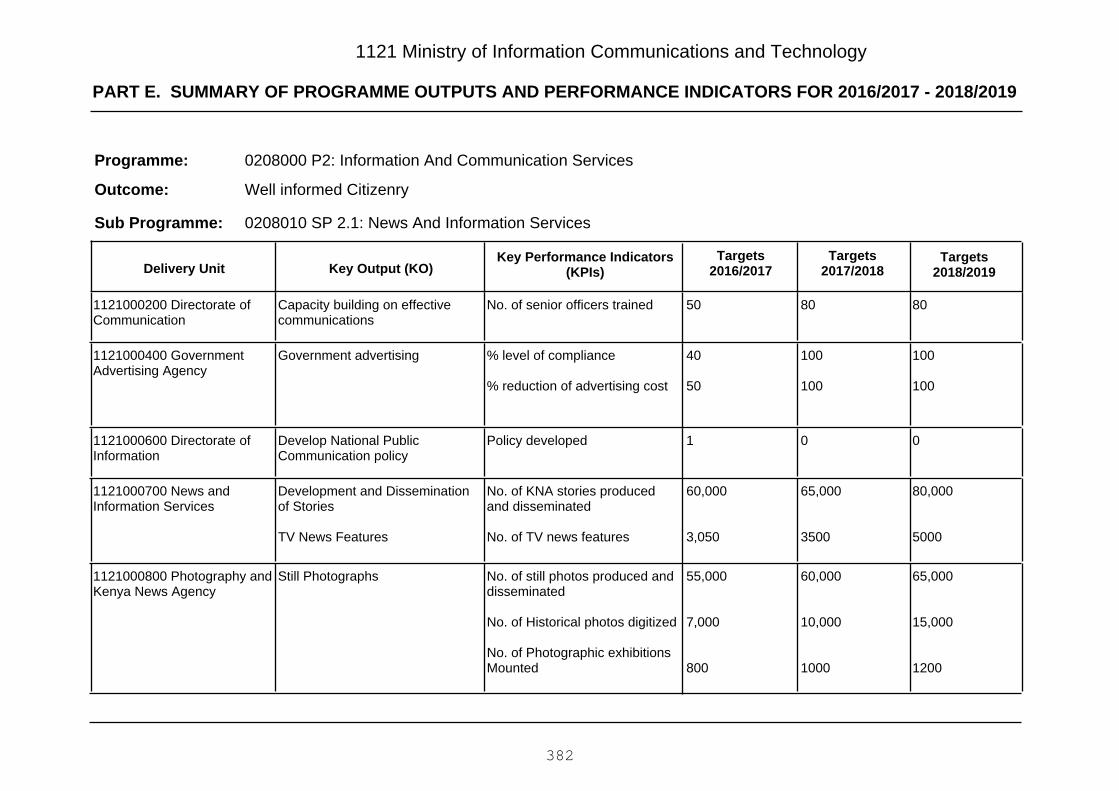
PART E. SUMMARY OF PROGRAMME OUTPUTS AND PERFORMANCE INDICATORS FOR 2016/2017 - 2018/2019
1121 Ministry of Information Communications and Technology
0208000 P2: Information And Communication Services
Well informed Citizenry
Programme:
Outcome:
0208010 SP 2.1: News And Information ServicesSub Programme:
Key Output (KO)Targets
2018/2019Targets
2017/2018Key Performance Indicators
(KPIs)Targets
2016/2017Delivery Unit
808050No. of senior officers trainedCapacity building on effectivecommunications
1121000200 Directorate ofCommunication
100
100
100
100
40
50
% level of compliance
% reduction of advertising cost
Government advertising1121000400 GovernmentAdvertising Agency
001Policy developedDevelop National PublicCommunication policy
1121000600 Directorate ofInformation
80,000
5000
65,000
3500
60,000
3,050
No. of KNA stories producedand disseminated
No. of TV news features
Development and Disseminationof Stories
TV News Features
1121000700 News andInformation Services
65,000
15,000
1200
60,000
10,000
1000
55,000
7,000
800
No. of still photos produced anddisseminated
No. of Historical photos digitized
No. of Photographic exhibitionsMounted
Still Photographs1121000800 Photography andKenya News Agency
382

PART E. SUMMARY OF PROGRAMME OUTPUTS AND PERFORMANCE INDICATORS FOR 2016/2017 - 2018/2019
1121 Ministry of Information Communications and Technology
800700500No. of Cinema showsCinema Shows1121000900 Mobile Cinemaand Library Services
95,000
5
0
95,000
5
100
95,000
5
75
No. of rural press produced andcirculated
No. of county editions produced
% of completion of countyedition online
Regional Press Magazines
County Editions
% of completion of county editiononline
1121001000 RegionalPublications
0
5
0
5
1
5
No of printing press
No. of of re branded radioservices
Central Media services1121001100 Central MediaServices
1
0
1
0
1
1
No of digitization soft ware
No of online editing soft ware
Information services1121002100 PublicCommunications Office
10
10
10
10
17
15
No. of field stations refurbished
No. of vehicles procured
KNA National Desk and Presscentre services
1121102200 Modernization ofKNA National Desk and PressCentre
0208020 SP 2.2: Brand Kenya InitiativeSub Programme:
Key Output (KO)Targets
2018/2019Targets
2017/2018Key Performance Indicators
(KPIs)Targets
2016/2017Delivery Unit
5,000
2,500
2,000
4,000
2,000
2,000
3,500
2,000
2,000
No.of yearbook published
No. of Profile
No. of copies of investmentopportunities publications
Kenya Year Book1121002300 Kenya YearBook Board
383

PART E. SUMMARY OF PROGRAMME OUTPUTS AND PERFORMANCE INDICATORS FOR 2016/2017 - 2018/2019
1121 Ministry of Information Communications and Technology
0208030 SP 2.3: ICT and Media Regulatory ServicesSub Programme:
Key Output (KO)Targets
2018/2019Targets
2017/2018Key Performance Indicators
(KPIs)Targets
2016/2017Delivery Unit
100
5,500
4,500
100
5,500
4,000
100
4,000
3,500
% of disputes reported andreported
No. of Journalist accredited
No.of Media personnel trained
Media disputes reported andarbitrated
Accredited journalist and mediaenterprises
Capacity building on journalismskills
1121002400 Media Council ofKenya
0208040 SP 2.4 E-Government ServicesSub Programme:
Key Output (KO)Targets
2018/2019Targets
2017/2018Key Performance Indicators
(KPIs)Targets
2016/2017Delivery Unit
1008060% of implementationImplement the Cyber securitymaster plan and strategyimplemented
1121001900 Directorate ofICT
80
400
80
300
60
250
No. of MDAs digitized
No. of Government officialstrained on information security
E-registries/ Digitization
National and county capacitybuilding on ICT informationsecurity rolled out
1121002200 Information,Communication andTechnology Authority (ICTA)
-400,000600,000No.of digital devices procuredDigital devices procured1121102000 Digital LiteracyProgramme- laptop
384

PART E. SUMMARY OF PROGRAMME OUTPUTS AND PERFORMANCE INDICATORS FOR 2016/2017 - 2018/2019
1121 Ministry of Information Communications and Technology
0209000 P3: Mass Media Skills Development
Enhanced talent pool in ICT and Mass Media skills.
Programme:
Outcome:
0209010 SP 1: Mass Media Skills DevelopmentSub Programme:
Key Output (KO)Targets
2018/2019Targets
2017/2018Key Performance Indicators
(KPIs)Targets
2016/2017Delivery Unit
700
100
610
100
551
80
No. of practitioners graduated
% Modernized equipment andfacilities
Media practitioners graduates
Modernize training equipment andfacilities
1121001200 Kenya Instituteof Mass Communication
0210000 P4: ICT Infrastructure Development
Universal access to affordable and quality ICT Infrastructure and Services
Programme:
Outcome:
0210010 SP1: ICT Infrastructure ConnectivitySub Programme:
Key Output (KO)Targets
2018/2019Targets
2017/2018Key Performance Indicators
(KPIs)Targets
2016/2017Delivery Unit
1007050% of installationIP telephone services1121100100 Supply andInstallation of an InternetBased 4000 Network
0030No. Of MDAs connected toGCCN network
GCCN Phase II1121100400 KenyaTransparency &Communication InfrastructureProject (TCIP)
385

PART E. SUMMARY OF PROGRAMME OUTPUTS AND PERFORMANCE INDICATORS FOR 2016/2017 - 2018/2019
1121 Ministry of Information Communications and Technology
705030% of completionConnectivity1121100500 East AfricanTrade and TransportFacilitation Project
00800No. of KmNOFBI Phase II1121100700 NOFBI II
10010050No. of counties and subcounties connected
NOFBI Phase II extension1121100800 NOFBI Phase IIExpansion
202017No. of information centresconnected
47 Rural information centres1121100900 GovernmentShared Services
1006040% of completion405 Bed hostel established1121101000 450 bed capacityfive storey building - KIMC
1007050% of completionModernized Training Facilities1121101100 Modernization ofKIMC Film, Television &Radio Training Facilities
400400400No. of internsPresidential digital talent interns1121102100 PresidentialDigital Talent Programme
0210020 SP2: ICT and BPO DevelopmentSub Programme:
Key Output (KO)Targets
2018/2019Targets
2017/2018Key Performance Indicators
(KPIs)Targets
2016/2017Delivery Unit
2,0002,0002,000No of jobs createdBusiness process outsourcingservices
1121002600 BusinessProcess Outsourcing
100100100% of operationalizationOperationalization of KOTDA1121002700 KonzaTechnopolis DevelopmentAuthority (KOTDA)
20
20
30
30
30
30
% of staff rationalizationRe-branding of KBC
Operationalization of KBC1121002800 KenyaBroadcasting Corporation(KBC)
386
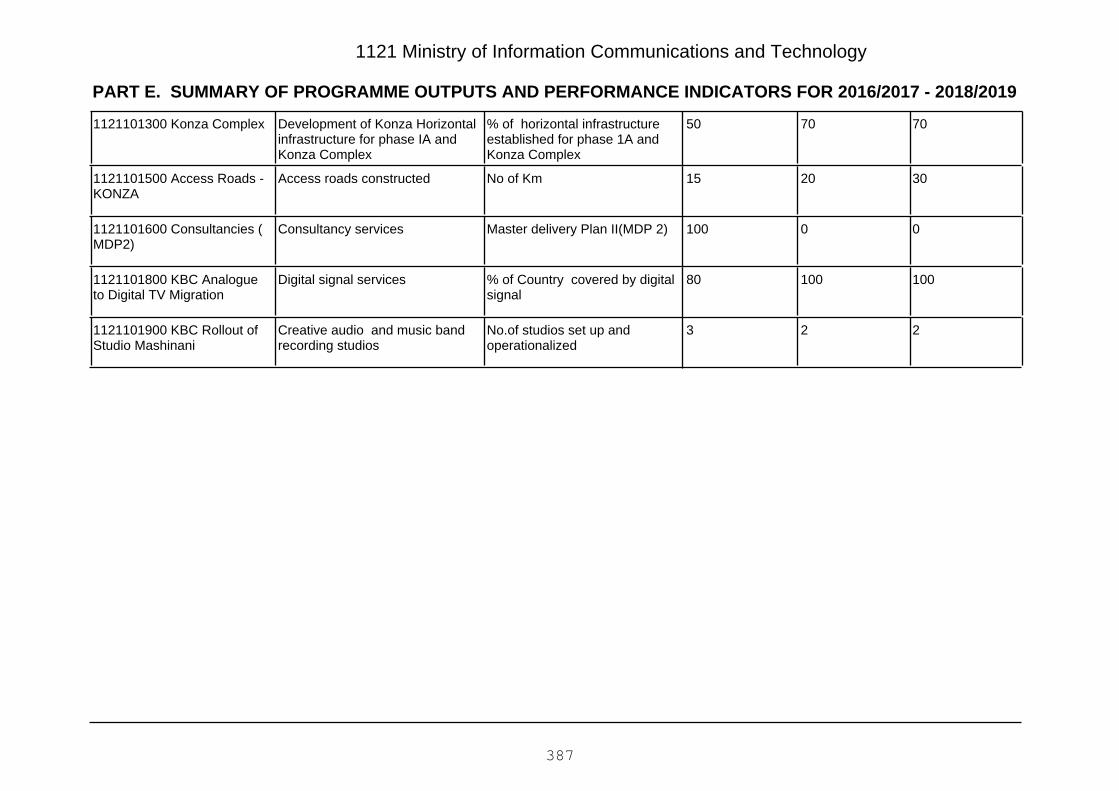
PART E. SUMMARY OF PROGRAMME OUTPUTS AND PERFORMANCE INDICATORS FOR 2016/2017 - 2018/2019
1121 Ministry of Information Communications and Technology
707050% of horizontal infrastructureestablished for phase 1A andKonza Complex
Development of Konza Horizontalinfrastructure for phase IA andKonza Complex
1121101300 Konza Complex
302015No of KmAccess roads constructed1121101500 Access Roads -KONZA
00100Master delivery Plan II(MDP 2)Consultancy services1121101600 Consultancies (MDP2)
10010080% of Country covered by digitalsignal
Digital signal services1121101800 KBC Analogueto Digital TV Migration
223No.of studios set up andoperationalized
Creative audio and music bandrecording studios
1121101900 KBC Rollout ofStudio Mashinani
387
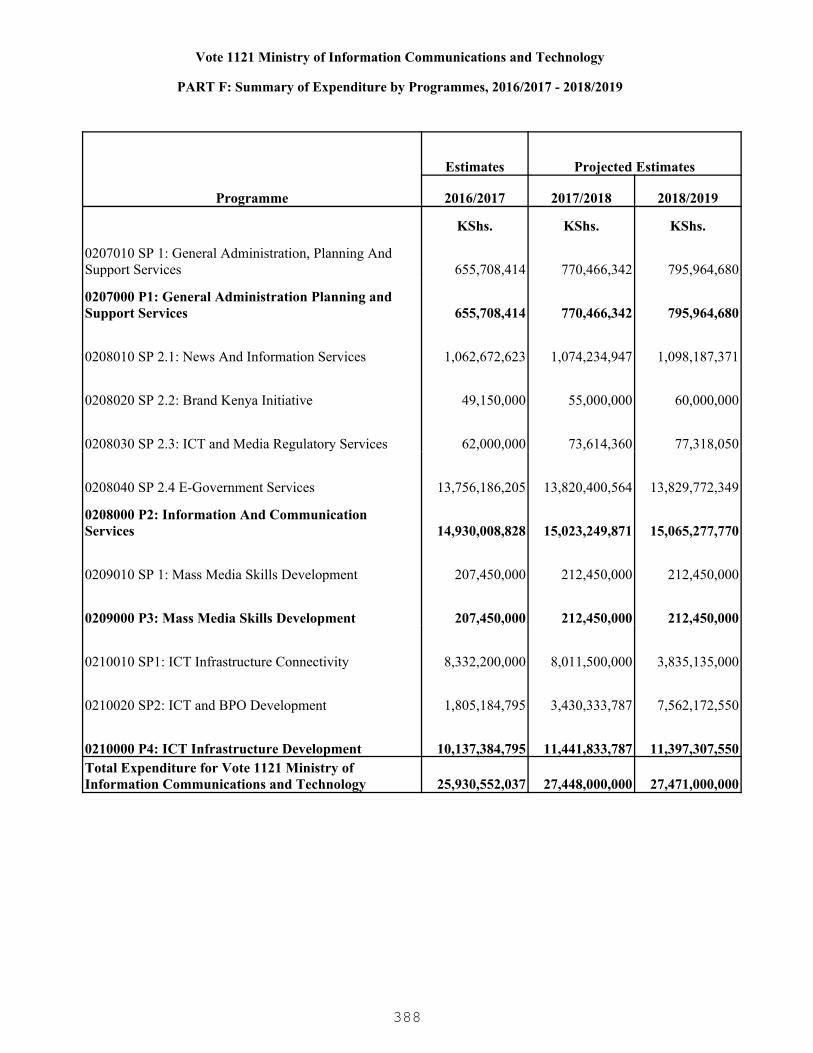
Vote 1121 Ministry of Information Communications and Technology
PART F: Summary of Expenditure by Programmes, 2016/2017 - 2018/2019
Programme
Estimates Projected Estimates
2016/2017 2017/2018 2018/2019
KShs. KShs. KShs.
0207010 SP 1: General Administration, Planning And Support Services 655,708,414 770,466,342 795,964,680
0207000 P1: General Administration Planning and Support Services 655,708,414 770,466,342 795,964,680
0208010 SP 2.1: News And Information Services 1,062,672,623 1,074,234,947 1,098,187,371
0208020 SP 2.2: Brand Kenya Initiative 49,150,000 55,000,000 60,000,000
0208030 SP 2.3: ICT and Media Regulatory Services 62,000,000 73,614,360 77,318,050
0208040 SP 2.4 E-Government Services 13,756,186,205 13,820,400,564 13,829,772,349
0208000 P2: Information And Communication Services 14,930,008,828 15,023,249,871 15,065,277,770
0209010 SP 1: Mass Media Skills Development 207,450,000 212,450,000 212,450,000
0209000 P3: Mass Media Skills Development 207,450,000 212,450,000 212,450,000
0210010 SP1: ICT Infrastructure Connectivity 8,332,200,000 8,011,500,000 3,835,135,000
0210020 SP2: ICT and BPO Development 1,805,184,795 3,430,333,787 7,562,172,550
0210000 P4: ICT Infrastructure Development 10,137,384,795 11,441,833,787 11,397,307,550Total Expenditure for Vote 1121 Ministry of Information Communications and Technology 25,930,552,037 27,448,000,000 27,471,000,000
388

1121 Ministry of Information Communications and Technology
PART G: Summary of Expenditure by Vote and Economic Classification, 2016/2017 - 2018/2019
Economic Classification
Estimates Projected Estimates
2016/2017 2017/2018 2018/2019KShs. KShs. KShs.
Current Expenditure 2,959,552,037 3,388,000,000 3,444,000,000
Compensation to Employees 474,498,912 495,000,000 510,000,000
Use of Goods and Services 1,231,566,927 1,443,821,146 1,482,930,916
Current Transfers to Govt. Agencies 1,207,350,000 1,377,000,000 1,377,000,000
Other Recurrent 46,136,198 72,178,854 74,069,084
Capital Expenditure 22,971,000,000 24,060,000,000 24,027,000,000
Acquisition of Non-Financial Assets 330,000,000 180,000,000 155,000,000
Capital Grants to Govt. Agencies 19,115,000,000 19,702,000,000 20,394,000,000
Other Development 3,526,000,000 4,178,000,000 3,478,000,000Total Expenditure 25,930,552,037 27,448,000,000 27,471,000,000
389
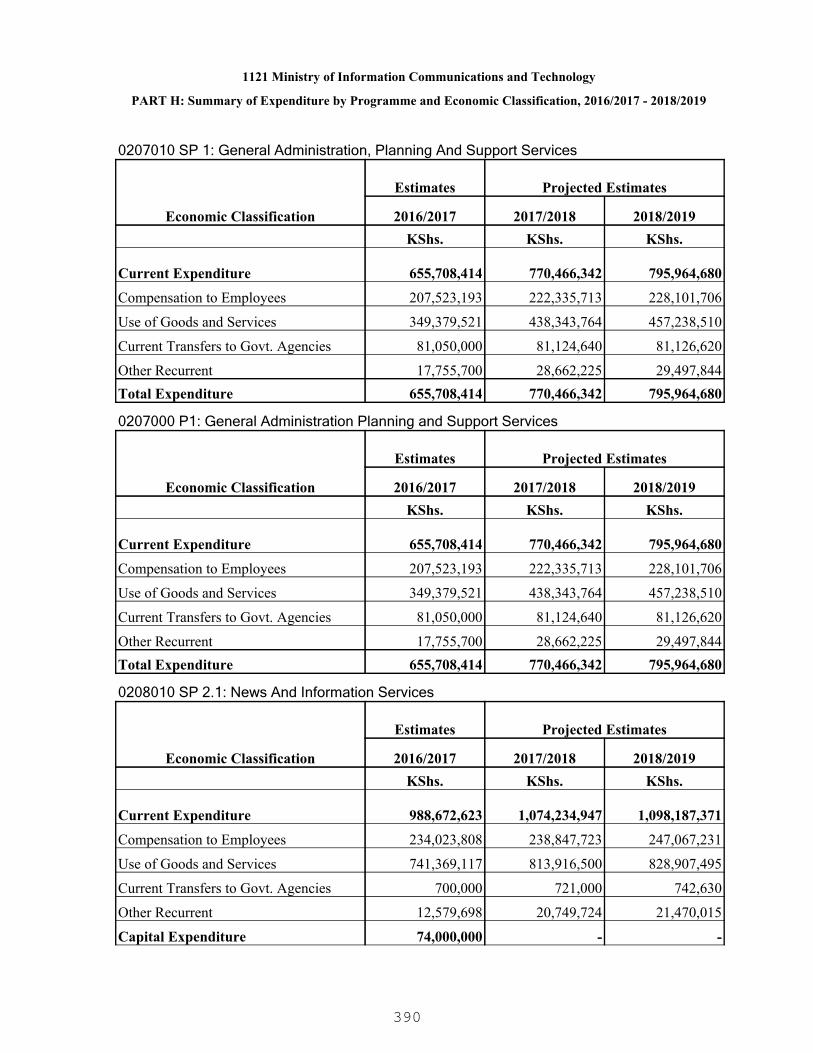
1121 Ministry of Information Communications and Technology
PART H: Summary of Expenditure by Programme and Economic Classification, 2016/2017 - 2018/2019
0207010 SP 1: General Administration, Planning And Support Services
Economic Classification
Estimates Projected Estimates
2016/2017 2017/2018 2018/2019KShs. KShs. KShs.
Current Expenditure 655,708,414 770,466,342 795,964,680
Compensation to Employees 207,523,193 222,335,713 228,101,706
Use of Goods and Services 349,379,521 438,343,764 457,238,510
Current Transfers to Govt. Agencies 81,050,000 81,124,640 81,126,620
Other Recurrent 17,755,700 28,662,225 29,497,844Total Expenditure 655,708,414 770,466,342 795,964,680
0207000 P1: General Administration Planning and Support Services
Economic Classification
Estimates Projected Estimates
2016/2017 2017/2018 2018/2019KShs. KShs. KShs.
Current Expenditure 655,708,414 770,466,342 795,964,680
Compensation to Employees 207,523,193 222,335,713 228,101,706
Use of Goods and Services 349,379,521 438,343,764 457,238,510
Current Transfers to Govt. Agencies 81,050,000 81,124,640 81,126,620
Other Recurrent 17,755,700 28,662,225 29,497,844Total Expenditure 655,708,414 770,466,342 795,964,680
0208010 SP 2.1: News And Information Services
Economic Classification
Estimates Projected Estimates
2016/2017 2017/2018 2018/2019KShs. KShs. KShs.
Current Expenditure 988,672,623 1,074,234,947 1,098,187,371
Compensation to Employees 234,023,808 238,847,723 247,067,231
Use of Goods and Services 741,369,117 813,916,500 828,907,495
Current Transfers to Govt. Agencies 700,000 721,000 742,630
Other Recurrent 12,579,698 20,749,724 21,470,015
Capital Expenditure 74,000,000 - -
390

1121 Ministry of Information Communications and Technology
PART H: Summary of Expenditure by Programme and Economic Classification, 2016/2017 - 2018/2019
0208010 SP 2.1: News And Information Services
Economic Classification
Estimates Projected Estimates
2016/2017 2017/2018 2018/2019
Other Development 74,000,000 - -Total Expenditure 1,062,672,623 1,074,234,947 1,098,187,371
0208020 SP 2.2: Brand Kenya Initiative
Economic Classification
Estimates Projected Estimates
2016/2017 2017/2018 2018/2019KShs. KShs. KShs.
Current Expenditure 49,150,000 55,000,000 60,000,000
Current Transfers to Govt. Agencies 49,150,000 55,000,000 60,000,000Total Expenditure 49,150,000 55,000,000 60,000,000
0208030 SP 2.3: ICT and Media Regulatory Services
Economic Classification
Estimates Projected Estimates
2016/2017 2017/2018 2018/2019KShs. KShs. KShs.
Current Expenditure 62,000,000 73,614,360 77,318,050
Current Transfers to Govt. Agencies 62,000,000 73,614,360 77,318,050Total Expenditure 62,000,000 73,614,360 77,318,050
0208040 SP 2.4 E-Government Services
Economic Classification
Estimates Projected Estimates
2016/2017 2017/2018 2018/2019KShs. KShs. KShs.
Current Expenditure 348,186,205 412,400,564 421,772,349
Compensation to Employees 32,951,911 33,816,564 34,831,063
Use of Goods and Services 97,555,494 118,749,500 120,601,361
Current Transfers to Govt. Agencies 203,000,000 239,090,000 245,362,700
Other Recurrent 14,678,800 20,744,500 20,977,225
Capital Expenditure 13,408,000,000 13,408,000,000 13,408,000,000
391

1121 Ministry of Information Communications and Technology
PART H: Summary of Expenditure by Programme and Economic Classification, 2016/2017 - 2018/2019
0208040 SP 2.4 E-Government Services
Economic Classification
Estimates Projected Estimates
2016/2017 2017/2018 2018/2019
Capital Grants to Govt. Agencies 13,408,000,000 13,408,000,000 13,408,000,000Total Expenditure 13,756,186,205 13,820,400,564 13,829,772,349
0208000 P2: Information And Communication Services
Economic Classification
Estimates Projected Estimates
2016/2017 2017/2018 2018/2019KShs. KShs. KShs.
Current Expenditure 1,448,008,828 1,615,249,871 1,657,277,770
Compensation to Employees 266,975,719 272,664,287 281,898,294
Use of Goods and Services 838,924,611 932,666,000 949,508,856
Current Transfers to Govt. Agencies 314,850,000 368,425,360 383,423,380
Other Recurrent 27,258,498 41,494,224 42,447,240
Capital Expenditure 13,482,000,000 13,408,000,000 13,408,000,000
Capital Grants to Govt. Agencies 13,408,000,000 13,408,000,000 13,408,000,000
Other Development 74,000,000 - -Total Expenditure 14,930,008,828 15,023,249,871 15,065,277,770
0209010 SP 1: Mass Media Skills Development
Economic Classification
Estimates Projected Estimates
2016/2017 2017/2018 2018/2019KShs. KShs. KShs.
Current Expenditure 207,450,000 212,450,000 212,450,000
Current Transfers to Govt. Agencies 207,450,000 212,450,000 212,450,000Total Expenditure 207,450,000 212,450,000 212,450,000
0209000 P3: Mass Media Skills Development
Economic Classification
Estimates Projected Estimates
2016/2017 2017/2018 2018/2019KShs. KShs. KShs.
392

1121 Ministry of Information Communications and Technology
PART H: Summary of Expenditure by Programme and Economic Classification, 2016/2017 - 2018/2019
0209000 P3: Mass Media Skills Development
Economic Classification
Estimates Projected Estimates
2016/2017 2017/2018 2018/2019
Current Expenditure 207,450,000 212,450,000 212,450,000
Current Transfers to Govt. Agencies 207,450,000 212,450,000 212,450,000Total Expenditure 207,450,000 212,450,000 212,450,000
0210010 SP1: ICT Infrastructure Connectivity
Economic Classification
Estimates Projected Estimates
2016/2017 2017/2018 2018/2019KShs. KShs. KShs.
Current Expenditure 145,200,000 203,500,000 202,135,000
Use of Goods and Services 11,200,000 16,480,000 16,974,400
Current Transfers to Govt. Agencies 134,000,000 187,020,000 185,160,600
Capital Expenditure 8,187,000,000 7,808,000,000 3,633,000,000
Acquisition of Non-Financial Assets 330,000,000 180,000,000 155,000,000
Capital Grants to Govt. Agencies 4,405,000,000 3,450,000,000 -
Other Development 3,452,000,000 4,178,000,000 3,478,000,000Total Expenditure 8,332,200,000 8,011,500,000 3,835,135,000
0210020 SP2: ICT and BPO Development
Economic Classification
Estimates Projected Estimates
2016/2017 2017/2018 2018/2019KShs. KShs. KShs.
Current Expenditure 503,184,795 586,333,787 576,172,550
Use of Goods and Services 32,062,795 56,331,382 59,209,150
Current Transfers to Govt. Agencies 470,000,000 527,980,000 514,839,400
Other Recurrent 1,122,000 2,022,405 2,124,000
Capital Expenditure 1,302,000,000 2,844,000,000 6,986,000,000
Capital Grants to Govt. Agencies 1,302,000,000 2,844,000,000 6,986,000,000Total Expenditure 1,805,184,795 3,430,333,787 7,562,172,550
393

1121 Ministry of Information Communications and Technology
PART H: Summary of Expenditure by Programme and Economic Classification, 2016/2017 - 2018/2019
0210000 P4: ICT Infrastructure Development
Economic Classification
Estimates Projected Estimates
2016/2017 2017/2018 2018/2019KShs. KShs. KShs.
Current Expenditure 648,384,795 789,833,787 778,307,550
Use of Goods and Services 43,262,795 72,811,382 76,183,550
Current Transfers to Govt. Agencies 604,000,000 715,000,000 700,000,000
Other Recurrent 1,122,000 2,022,405 2,124,000
Capital Expenditure 9,489,000,000 10,652,000,000 10,619,000,000
Acquisition of Non-Financial Assets 330,000,000 180,000,000 155,000,000
Capital Grants to Govt. Agencies 5,707,000,000 6,294,000,000 6,986,000,000
Other Development 3,452,000,000 4,178,000,000 3,478,000,000Total Expenditure 10,137,384,795 11,441,833,787 11,397,307,550
394

1131 Ministry of Sports Culture and Arts
A global leader in the provision of sports, arts and cultural services
To develop, promote, preserve and disseminate Kenya’s diverse cultural and arts heritage;and promote sports and film industry to build national pride and improve livelihoods of theKenyan people.
PART A. Vision
PART B. Mission
PART C. Performance Overview and Background for Programme(s) Funding
The mandate for the Ministry of Sports, Culture and the Arts include: development andcoordination of sports; promotion and development of sports facilities; sports industry policyand development; sports academy; expansion of sports industry; promotion anddiversification of sports; national culture promotion and policy; national heritage policy andmanagement; promotion of the national archives and public records management;development of the film industry, film policy and promotion of local content; promotion oflibrary services; and promotion of research and conservation of music.
During the period under review, the Ministry focused on implementation of programmes underthree key areas namely Sports, Arts and Culture. Overall implementation of the targetedprogrammes was successful with actual expenditures standing at 98% and 95% and 93% ofthe approved budgets. In promoting sports, the Ministry facilitated the passing of the SportsAct, 2013 to regulate all sporting activities in the Country. Implementation of the Sports Acthas culminated to the establishment and operationalization of new sports organizationsnamely; Sports Registrar, Sports Tribunal, Kenya Academy of Sports, National Sports Fundand Sports Kenya. In addition, the Ministry continued with the construction of phase I of theKenya Academy of Sports and finalized feasibility studies on the three National Stadianamely; Shimo La Tewa in Mombasa, Ngong Road in Nairobi and Eldoret.
To promote national heritage, the Ministry continued with the identification, preservation andpromotion of Kenya’s national heritage through the operational management of monuments,historical sites and museums currently in existence across the country. This included therestoration of historical sites and monuments and renovation of the National Museum.Towards the promotion of culture, the Ministry empowered Cultural practitioners throughcapacity building to enhance HR skills and hence further the cultural creative industries andsafeguarded intangible cultural heritage elements present in Kenyan communities. Furtherthe National Theater was renovated to expand the cultural space available to culturalpractitioners to further and utilize their talents. The Ministry also undertook to identify, nurtureand develop talent in music and dance through training for the youth, provision of rehearsalspaces, equipment and performance opportunities to over 450 youths to enable them launchtheir careers in the music industry.
Towards the promotion of the film industry, the Ministry finalized the development of thenational film policy and drafted a film industry bill to guide activities in the film industry. Keyachievements in the film industry included the rapid modernization and automation of its filmproduction facilities to enhance productivity and reduce costs by improving timeliness, andincreasing speed and accuracy with which Kenyans receive information. The Ministrycontinued to empower film makers through trainings, facilitated local films screening,produced and disseminated documentaries and news features, issued film licenses and
395
1131 Ministry of Sports Culture and Arts
PART D. Programme Objectives
accreditation of local film agents and operators, classified both local and international films,sensitized media and the public about the importance of ensuring the content aired isappropriate for public viewership.
Due to high demand for library and information services, construction of an Ultra- ModernNational library is underway. The library will act as the repository for the country’s information.In addition, expansion of the library network nationwide continued with a total of 60 librariesoperating across the country. This was achieved through the upgrading and equipping of theexisting library facilities as well as increasing access to information materials.
In implementing its mandate as illustrated above, the Ministry faced a number of challengeswhich slowed the implementation of programmes. These included; inadequate legal,institutional and policy framework in respect to the film industry, public archives and recordsmanagement, use of Kenya languages, music, and public libraries. Another major challengewas inadequacy of funds as reflected in Kshs 11.09 billion resource gap in the 2014 SocialProtection, Culture and Recreation MTEF Sector Report. This led to the postponement ofsome of the projects and focused on what could be completed within the available resources.Insecurity is also a concern as high crime rates; piracy and terrorism have greatly affectedoperations of the sector and led to difficulties in accessing our products and services to localand international markets. There is need therefore to address the security concerns to avertpossible relocation of the Ministry’s interests to other countries as well as attracting local andforeign direct investments. There was also the challenge of losing elite sportsmen andwomen to other countries due to a poor incentive system. To counter this trend, the Ministryestablished and started its implementation an honors and awards scheme during the periodunder review.
During the next MTEF period, 2016/17 – 2018/19, the Ministry will continue to emphasize oncompleting continuing projects and the programmes contained in the 2nd Medium Term Plan(MTP) of the Vision 2030. This includes completion of the National Library, establishment of aFilm School to fill the technical skills gap in the industry, and operationalize Kenya SportsAcademy. Other programmes will include documentation and safeguarding of Elementsinscribed in the UNESCO list of Intangible Cultural Heritage traditions present in Kenyancommunities, training of youths in different aspects of music and dance and the installation ofmobile shelves at the National Archives to enhance preservation of public archival materials.
ObjectiveProgramme
0901000 P.1 Sports To improve Sports Performance in Kenya
0902000 P.2 Culture To improve heritage and culture awareness, knowledge,appreciation and conservation
396

1131 Ministry of Sports Culture and Arts
ObjectiveProgramme
0903000 P.3 The Arts To develop a vibrant Arts Industry
0904000 P.4 Library Services To improve reading culture
0905000 P.5 GeneralAdministration, Planningand Support Services
To improve service delivery and coordination of ministerialfunctions, programmes and activities.
397
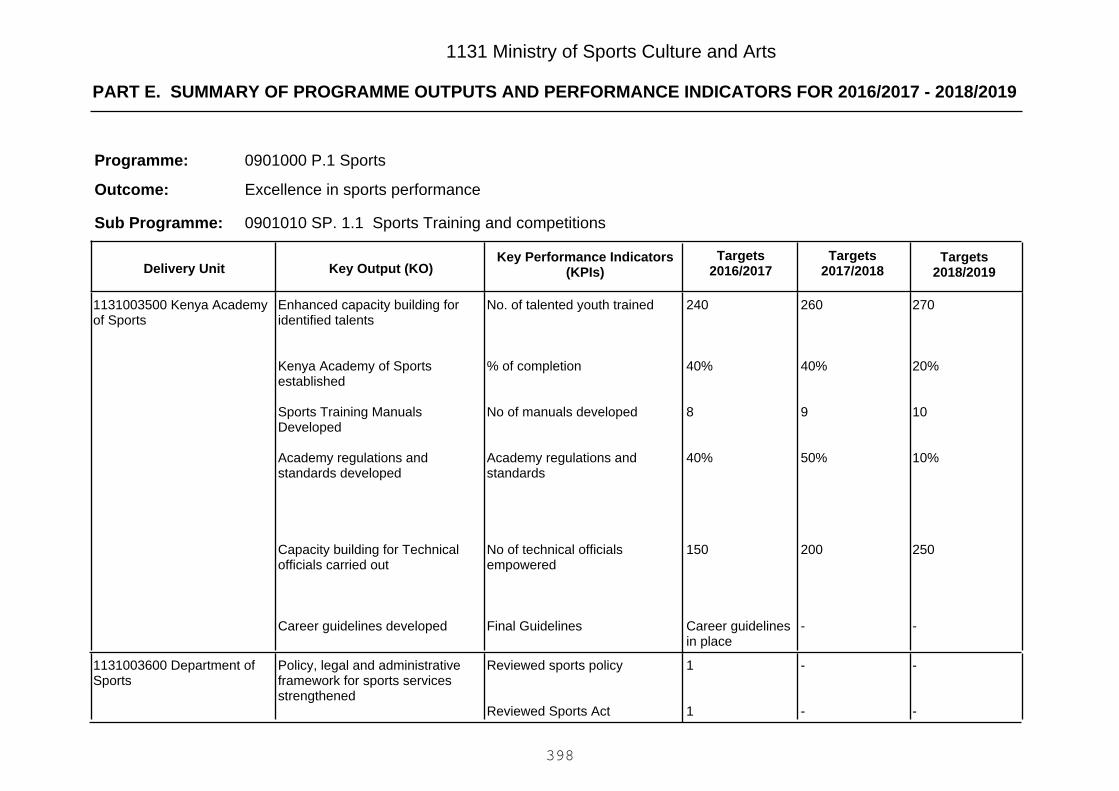
PART E. SUMMARY OF PROGRAMME OUTPUTS AND PERFORMANCE INDICATORS FOR 2016/2017 - 2018/2019
1131 Ministry of Sports Culture and Arts
0901000 P.1 Sports
Excellence in sports performance
Programme:
Outcome:
0901010 SP. 1.1 Sports Training and competitionsSub Programme:
Key Output (KO)Targets
2018/2019Targets
2017/2018Key Performance Indicators
(KPIs)Targets
2016/2017Delivery Unit
270
20%
10
10%
250
-
260
40%
9
50%
200
-
240
40%
8
40%
150
Career guidelinesin place
No. of talented youth trained
% of completion
No of manuals developed
Academy regulations andstandards
No of technical officialsempowered
Final Guidelines
Enhanced capacity building foridentified talents
Kenya Academy of Sportsestablished
Sports Training ManualsDeveloped
Academy regulations andstandards developed
Capacity building for Technicalofficials carried out
Career guidelines developed
1131003500 Kenya Academyof Sports
-
-
-
-
1
1
Reviewed sports policy
Reviewed Sports Act
Policy, legal and administrativeframework for sports servicesstrengthened
1131003600 Department ofSports
398
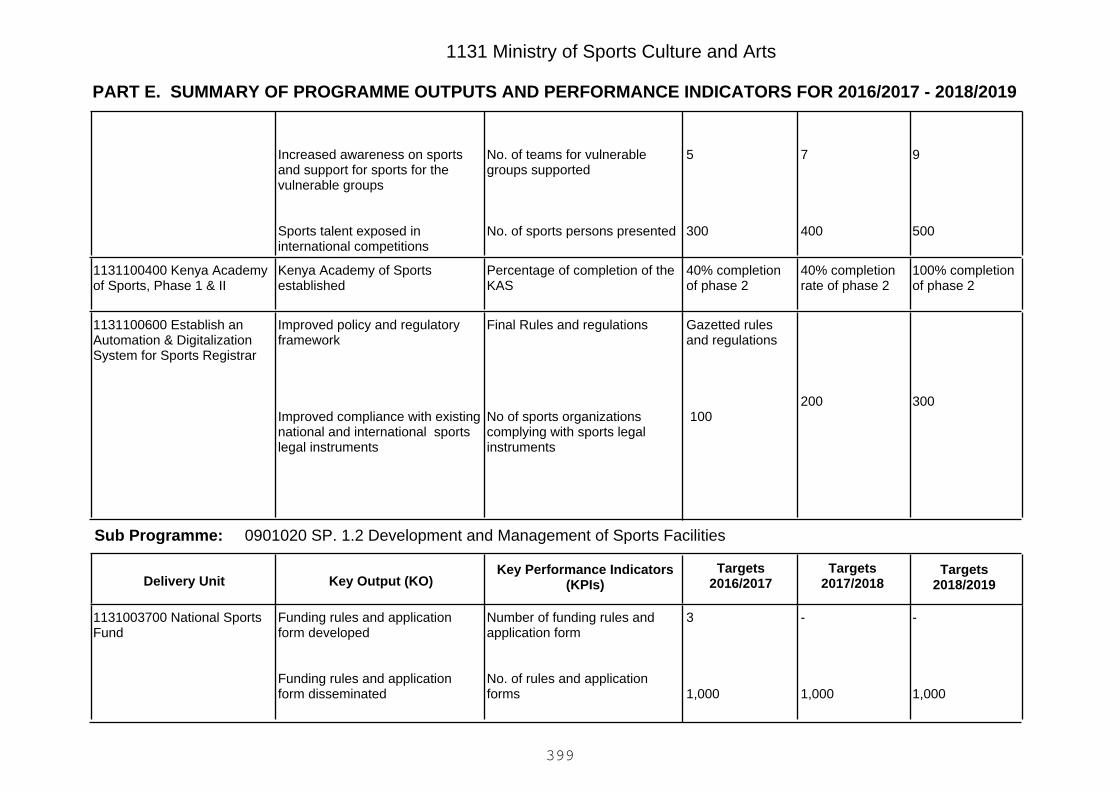
PART E. SUMMARY OF PROGRAMME OUTPUTS AND PERFORMANCE INDICATORS FOR 2016/2017 - 2018/2019
1131 Ministry of Sports Culture and Arts
9
500
7
400
5
300
No. of teams for vulnerablegroups supported
No. of sports persons presented
Increased awareness on sportsand support for sports for thevulnerable groups
Sports talent exposed ininternational competitions
100% completionof phase 2
40% completionrate of phase 2
40% completionof phase 2
Percentage of completion of theKAS
Kenya Academy of Sportsestablished
1131100400 Kenya Academyof Sports, Phase 1 & II
300200
Gazetted rulesand regulations
100
Final Rules and regulations
No of sports organizationscomplying with sports legalinstruments
Improved policy and regulatoryframework
Improved compliance with existingnational and international sportslegal instruments
1131100600 Establish anAutomation & DigitalizationSystem for Sports Registrar
0901020 SP. 1.2 Development and Management of Sports FacilitiesSub Programme:
Key Output (KO)Targets
2018/2019Targets
2017/2018Key Performance Indicators
(KPIs)Targets
2016/2017Delivery Unit
-
1,000
-
1,000
3
1,000
Number of funding rules andapplication form
No. of rules and applicationforms
Funding rules and applicationform developed
Funding rules and applicationform disseminated
1131003700 National SportsFund
399
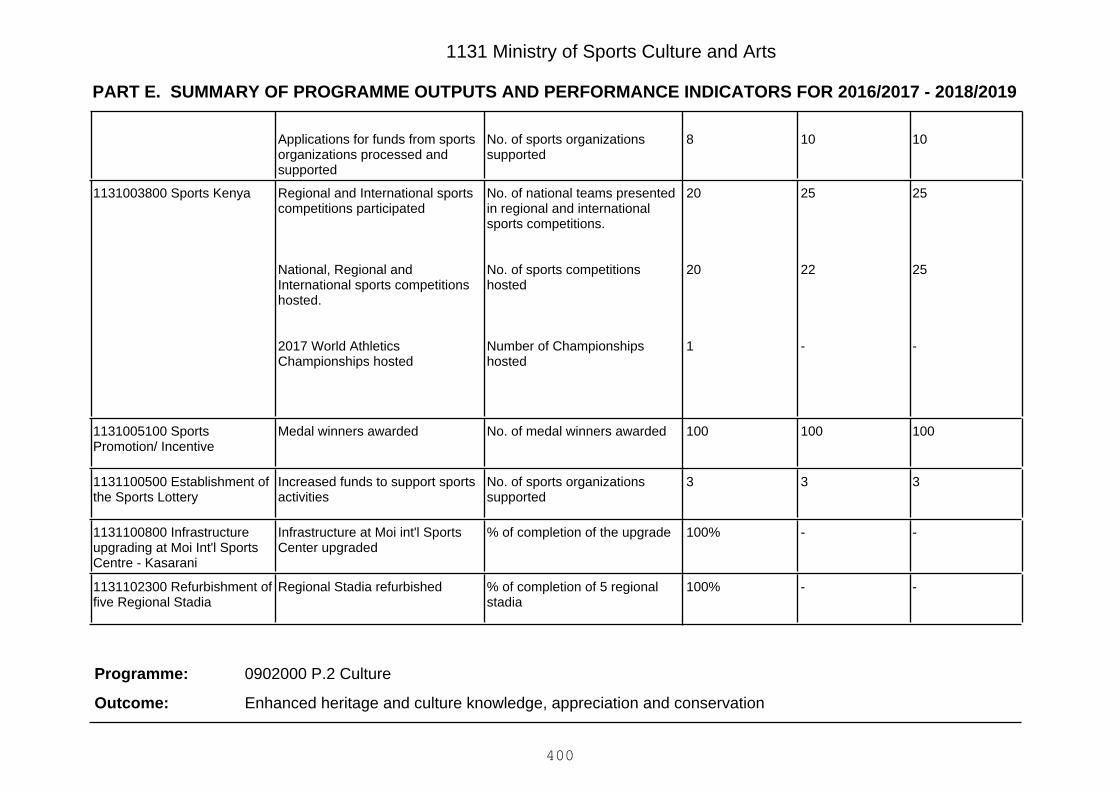
PART E. SUMMARY OF PROGRAMME OUTPUTS AND PERFORMANCE INDICATORS FOR 2016/2017 - 2018/2019
1131 Ministry of Sports Culture and Arts
10108No. of sports organizationssupported
Applications for funds from sportsorganizations processed andsupported
25
25
-
25
22
-
20
20
1
No. of national teams presentedin regional and internationalsports competitions.
No. of sports competitionshosted
Number of Championshipshosted
Regional and International sportscompetitions participated
National, Regional andInternational sports competitionshosted.
2017 World AthleticsChampionships hosted
1131003800 Sports Kenya
100100100No. of medal winners awardedMedal winners awarded1131005100 SportsPromotion/ Incentive
333No. of sports organizationssupported
Increased funds to support sportsactivities
1131100500 Establishment ofthe Sports Lottery
--100%% of completion of the upgradeInfrastructure at Moi int'l SportsCenter upgraded
1131100800 Infrastructureupgrading at Moi Int'l SportsCentre - Kasarani
--100%% of completion of 5 regionalstadia
Regional Stadia refurbished1131102300 Refurbishment offive Regional Stadia
0902000 P.2 Culture
Enhanced heritage and culture knowledge, appreciation and conservation
Programme:
Outcome:
400
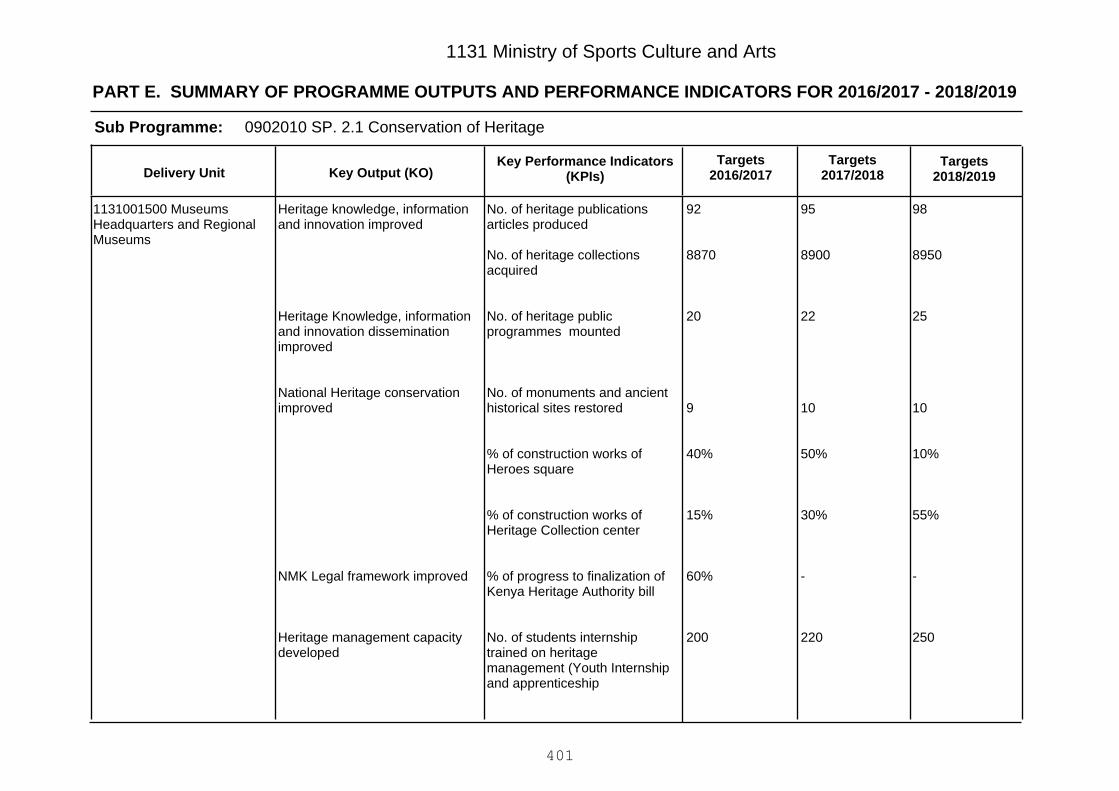
PART E. SUMMARY OF PROGRAMME OUTPUTS AND PERFORMANCE INDICATORS FOR 2016/2017 - 2018/2019
1131 Ministry of Sports Culture and Arts
0902010 SP. 2.1 Conservation of HeritageSub Programme:
Key Output (KO)Targets
2018/2019Targets
2017/2018Key Performance Indicators
(KPIs)Targets
2016/2017Delivery Unit
98
8950
25
10
10%
55%
-
250
95
8900
22
10
50%
30%
-
220
92
8870
20
9
40%
15%
60%
200
No. of heritage publicationsarticles produced
No. of heritage collectionsacquired
No. of heritage publicprogrammes mounted
No. of monuments and ancienthistorical sites restored
% of construction works ofHeroes square
% of construction works ofHeritage Collection center
% of progress to finalization ofKenya Heritage Authority bill
No. of students internshiptrained on heritagemanagement (Youth Internshipand apprenticeship
Heritage knowledge, informationand innovation improved
Heritage Knowledge, informationand innovation disseminationimproved
National Heritage conservationimproved
NMK Legal framework improved
Heritage management capacitydeveloped
1131001500 MuseumsHeadquarters and RegionalMuseums
401
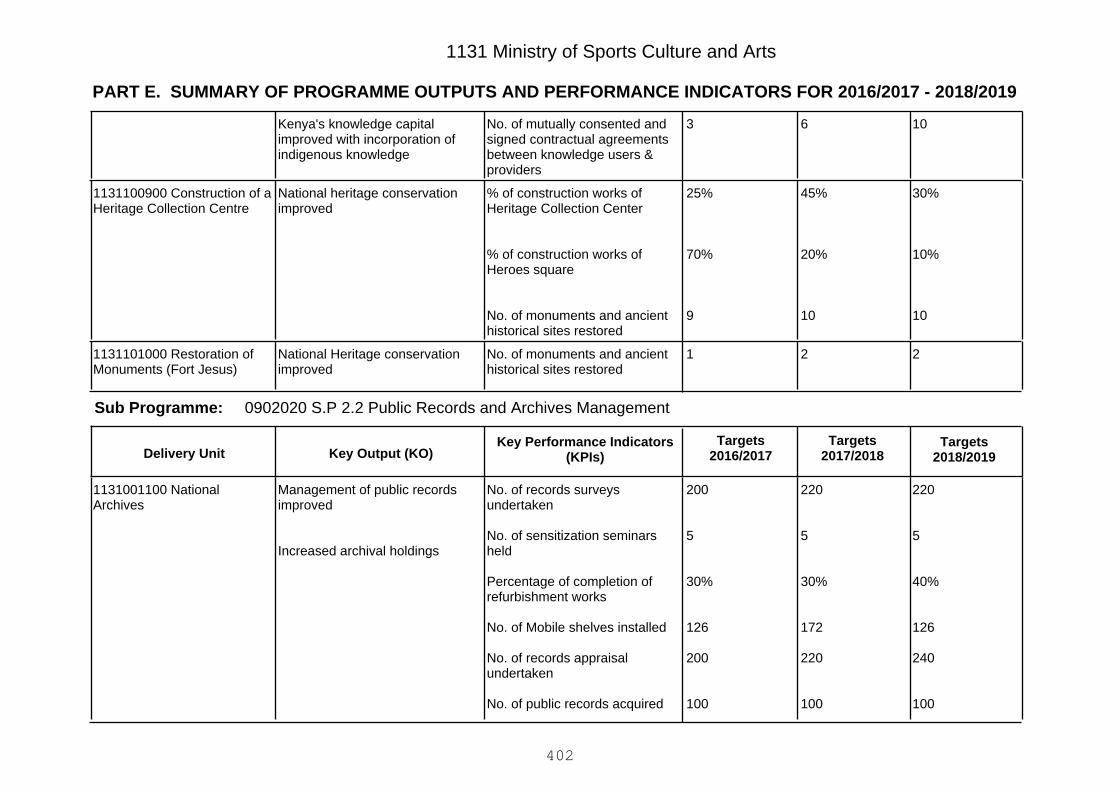
PART E. SUMMARY OF PROGRAMME OUTPUTS AND PERFORMANCE INDICATORS FOR 2016/2017 - 2018/2019
1131 Ministry of Sports Culture and Arts
1063No. of mutually consented andsigned contractual agreementsbetween knowledge users &providers
Kenya's knowledge capitalimproved with incorporation ofindigenous knowledge
30%
10%
10
45%
20%
10
25%
70%
9
% of construction works ofHeritage Collection Center
% of construction works ofHeroes square
No. of monuments and ancienthistorical sites restored
National heritage conservationimproved
1131100900 Construction of aHeritage Collection Centre
221No. of monuments and ancienthistorical sites restored
National Heritage conservationimproved
1131101000 Restoration ofMonuments (Fort Jesus)
0902020 S.P 2.2 Public Records and Archives ManagementSub Programme:
Key Output (KO)Targets
2018/2019Targets
2017/2018Key Performance Indicators
(KPIs)Targets
2016/2017Delivery Unit
220
5
40%
126
240
100
220
5
30%
172
220
100
200
5
30%
126
200
100
No. of records surveysundertaken
No. of sensitization seminarsheld
Percentage of completion ofrefurbishment works
No. of Mobile shelves installed
No. of records appraisalundertaken
No. of public records acquired
Management of public recordsimproved
Increased archival holdings
1131001100 NationalArchives
402
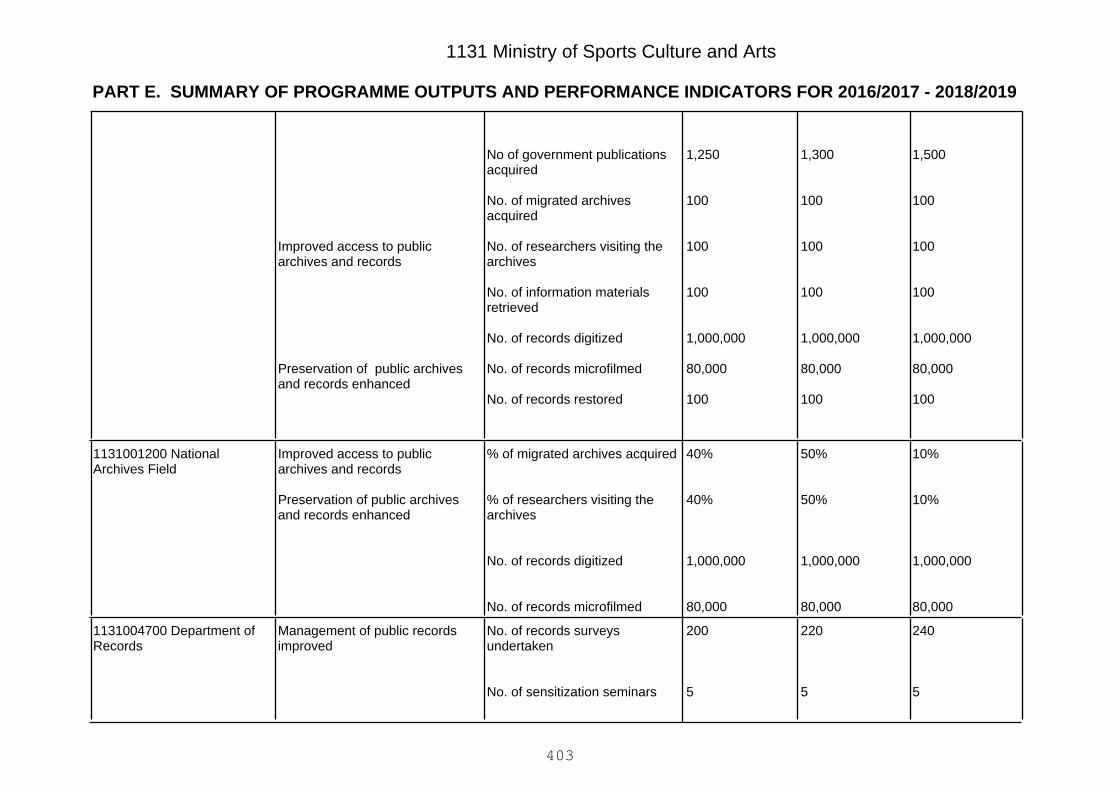
PART E. SUMMARY OF PROGRAMME OUTPUTS AND PERFORMANCE INDICATORS FOR 2016/2017 - 2018/2019
1131 Ministry of Sports Culture and Arts
1,500
100
100
100
1,000,000
80,000
100
1,300
100
100
100
1,000,000
80,000
100
1,250
100
100
100
1,000,000
80,000
100
No of government publicationsacquired
No. of migrated archivesacquired
No. of researchers visiting thearchives
No. of information materialsretrieved
No. of records digitized
No. of records microfilmed
No. of records restored
Improved access to publicarchives and records
Preservation of public archivesand records enhanced
10%
10%
1,000,000
80,000
50%
50%
1,000,000
80,000
40%
40%
1,000,000
80,000
% of migrated archives acquired
% of researchers visiting thearchives
No. of records digitized
No. of records microfilmed
Improved access to publicarchives and records
Preservation of public archivesand records enhanced
1131001200 NationalArchives Field
240
5
220
5
200
5
No. of records surveysundertaken
No. of sensitization seminars
Management of public recordsimproved
1131004700 Department ofRecords
403

PART E. SUMMARY OF PROGRAMME OUTPUTS AND PERFORMANCE INDICATORS FOR 2016/2017 - 2018/2019
1131 Ministry of Sports Culture and Arts
240
10%
1,500
220
50%
1,300
200
40%
1,250
No. of records appraisalundertaken
% of public records acquired
No. of government publicationsacquired
303030Percentage of installation of anIntegrated RecordsManagement System (IRMS).
Improved records managementpractices in public offices
1131101400 Establishment ofan Integrated RecordsManagement System (IRMS)
40%30%30%% of completion ofrefurbishment works
Increased archival holdings1131101500 Refurbishment ofArchives offices, Mombasa
126172126No. of Mobile shelves installedMobile shelves installed1131101600 Installation ofmobile shelves
0902030 S.P 2.3 Development And Promotion of CultureSub Programme:
Key Output (KO)Targets
2018/2019Targets
2017/2018Key Performance Indicators
(KPIs)Targets
2016/2017Delivery Unit
Implement theBill
Disseminate andimplement theNational CulturePolicy
Disseminate andimplement thepolicy
Implement the Bill
Disseminate andimplement theNational CulturePolicy
Disseminate andimplement thepolicy
Implement theBill
Disseminate andimplement theNational CulturePolicy
Disseminate andimplement thepolicy
Approved Culture Bill
Approved National Policy onCulture
Approved Languages of Kenyapolicy
Strengthened policy, legal andinstitutional framework for culturesector
1131002700 HeadquartersCultural Services
404
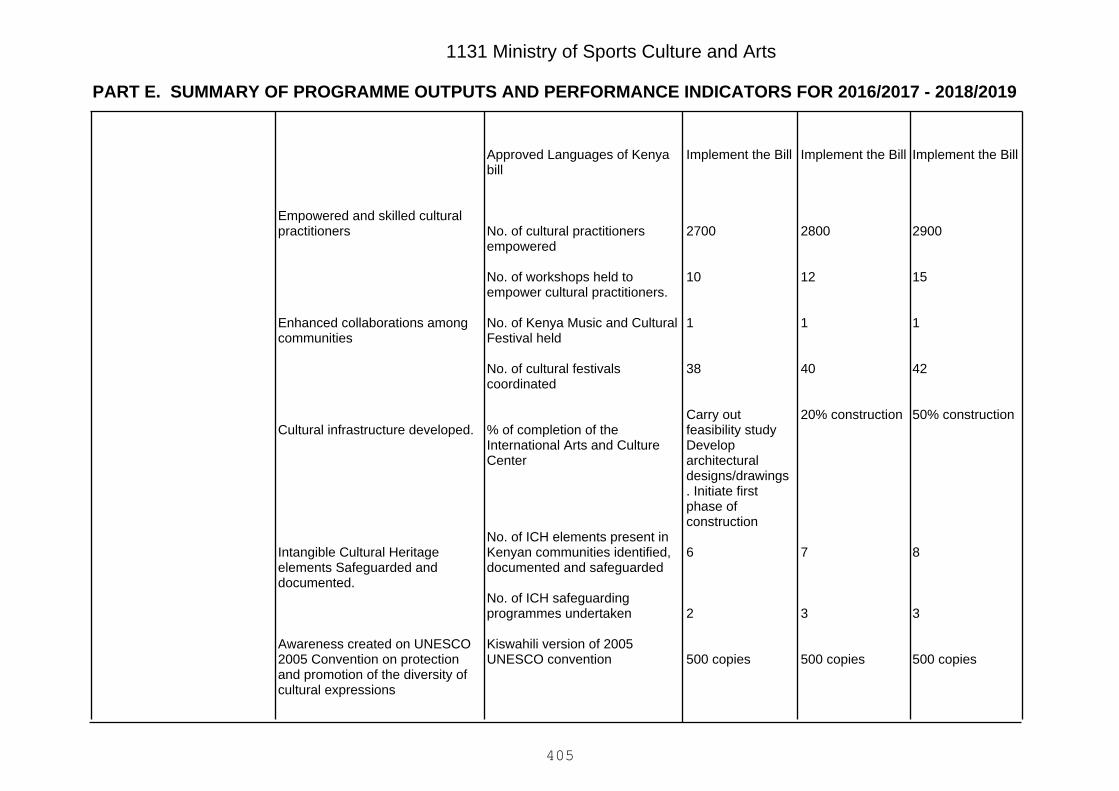
PART E. SUMMARY OF PROGRAMME OUTPUTS AND PERFORMANCE INDICATORS FOR 2016/2017 - 2018/2019
1131 Ministry of Sports Culture and Arts
Implement the Bill
2900
15
1
42
50% construction
8
3
500 copies
Implement the Bill
2800
12
1
40
20% construction
7
3
500 copies
Implement the Bill
2700
10
1
38
Carry outfeasibility studyDeveloparchitecturaldesigns/drawings. Initiate firstphase ofconstruction
6
2
500 copies
Approved Languages of Kenyabill
No. of cultural practitionersempowered
No. of workshops held toempower cultural practitioners.
No. of Kenya Music and CulturalFestival held
No. of cultural festivalscoordinated
% of completion of theInternational Arts and CultureCenter
No. of ICH elements present inKenyan communities identified,documented and safeguarded
No. of ICH safeguardingprogrammes undertaken
Kiswahili version of 2005UNESCO convention
Empowered and skilled culturalpractitioners
Enhanced collaborations amongcommunities
Cultural infrastructure developed.
Intangible Cultural Heritageelements Safeguarded anddocumented.
Awareness created on UNESCO2005 Convention on protectionand promotion of the diversity ofcultural expressions
405
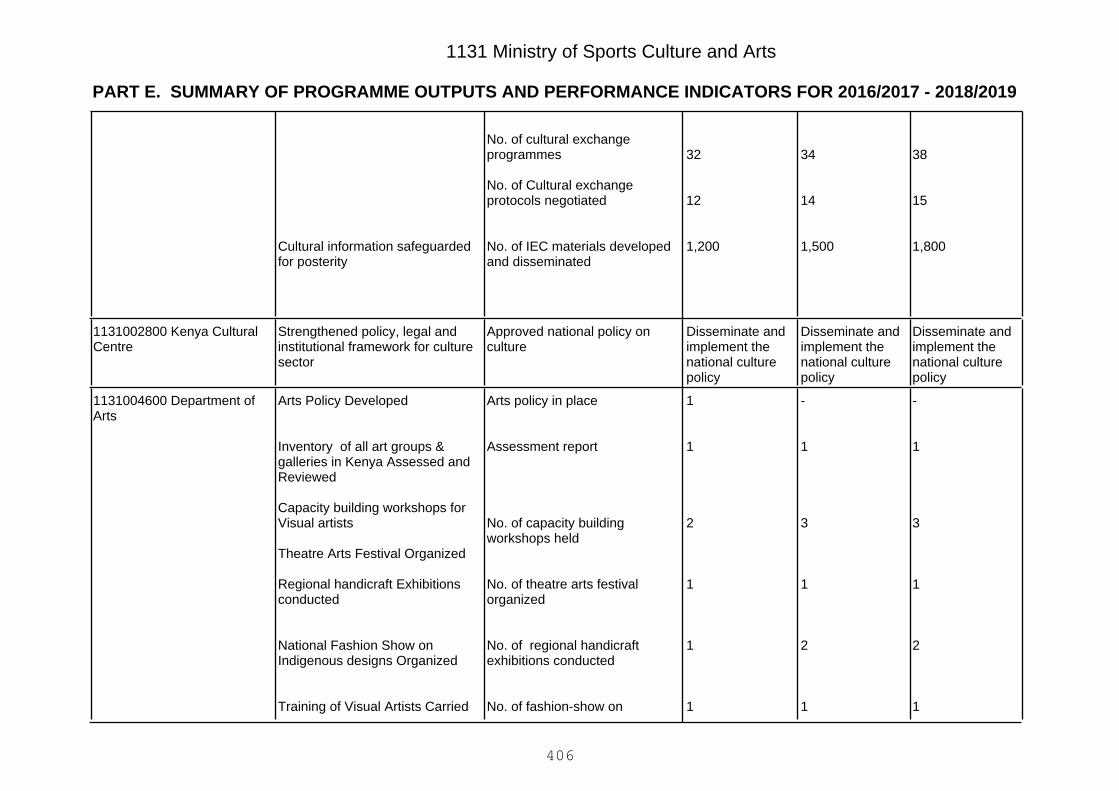
PART E. SUMMARY OF PROGRAMME OUTPUTS AND PERFORMANCE INDICATORS FOR 2016/2017 - 2018/2019
1131 Ministry of Sports Culture and Arts
38
15
1,800
34
14
1,500
32
12
1,200
No. of cultural exchangeprogrammes
No. of Cultural exchangeprotocols negotiated
No. of IEC materials developedand disseminated
Cultural information safeguardedfor posterity
Disseminate andimplement thenational culturepolicy
Disseminate andimplement thenational culturepolicy
Disseminate andimplement thenational culturepolicy
Approved national policy onculture
Strengthened policy, legal andinstitutional framework for culturesector
1131002800 Kenya CulturalCentre
-
1
3
1
2
1
-
1
3
1
2
1
1
1
2
1
1
1
Arts policy in place
Assessment report
No. of capacity buildingworkshops held
No. of theatre arts festivalorganized
No. of regional handicraftexhibitions conducted
No. of fashion-show on
Arts Policy Developed
Inventory of all art groups &galleries in Kenya Assessed andReviewed
Capacity building workshops forVisual artists
Theatre Arts Festival Organized
Regional handicraft Exhibitionsconducted
National Fashion Show onIndigenous designs Organized
Training of Visual Artists Carried
1131004600 Department ofArts
406

PART E. SUMMARY OF PROGRAMME OUTPUTS AND PERFORMANCE INDICATORS FOR 2016/2017 - 2018/2019
1131 Ministry of Sports Culture and Arts
120
10
-
110
10
-
100
10
-
indigenous designs
No of visual artists trained
No of fashion designers taken
No. of programmes of visualestablished
out
Benchmarking tour of fashiondesigners
Programs of visual and LiteraryArts established
383432No. of cultural exchangeprogrammes
Strengthened cultural relationswith other countries
1131101100 International Artsand Culture Centre
0902040 SP. 2.4 Promotion of Kenyan Music and DanceSub Programme:
Key Output (KO)Targets
2018/2019Targets
2017/2018Key Performance Indicators
(KPIs)Targets
2016/2017Delivery Unit
200
10
3
420
150
37
150
10
3
420
140
35
100
10
3
400
130
32
No. of youths empowered withmusic and dance skills
No. of musicians presented
No. of band equipment acquired
No. of audio visual recordingsprepared and disseminated.
No. of groups presented forperformance
No. of research paperscompiled for future publication
Music and dance talents in Kenyaidentified, nurtured and developed
Music and dance heritage ofKenya developed, promoted,documented and preserved
1131001700 PermanentPresidential Commission OnMusic
407

PART E. SUMMARY OF PROGRAMME OUTPUTS AND PERFORMANCE INDICATORS FOR 2016/2017 - 2018/2019
1131 Ministry of Sports Culture and Arts
The nationalmusic policy
The Nationalmusic Billsubmitted toparliament forenactment
A National Music PolicyImprove policy environment forthe development of music industry
-75%25%% of completion Phase 1 of amusic recording studioestablished
Music development facilitiesprovided
1131101300 Music Studio atthe Permanent PresidentialMusic Commission
0903000 P.3 The Arts
A vibrant Arts industry
Programme:
Outcome:
0903010 SP. 3.1 Film ServicesSub Programme:
Key Output (KO)Targets
2018/2019Targets
2017/2018Key Performance Indicators
(KPIs)Targets
2016/2017Delivery Unit
80%80%80%% completion of the Kenya FilmSchool
Kenya Film School1131000400 Film ProductionDepartment - Headquarters
95
243
67
80
-
95
250
70
75
-
90
290
59
70
100%
No. of documentaries producedand disseminated
No. of film licences issued
No. of local film agentsregistered
No. of SMEs registered.
A complete Film Archive (%)
Documentaries Produced anddisseminated
Film production complianceenhanced
Film production infrastructure
1131000500 Film ProductionDepartment - Field
408

PART E. SUMMARY OF PROGRAMME OUTPUTS AND PERFORMANCE INDICATORS FOR 2016/2017 - 2018/2019
1131 Ministry of Sports Culture and Arts
-
2 backupcameras, 2editing suites.
-
Soundequipment,camera lensesupgrade
100%
3 cameras,3editing suites,lightingequipmentupgrade
A complete sound studio (%).
No. of modern film -equipment(cameras and editing suites)acquired-
developed
2000
15
1
4
1
1,150
14
4
1,750
10
1
4
1
1,100
12
4
1,700
8
1
4
1
1,050
12
4
No. of film titles digitized and thecatalogue published
Number of positive coveragearticles generated
No. of film industry reportsproduced
No. of media briefing reports
No of reports on the filmdistribution channel
No. of local and internationalentries inKalasha festival & Markethosted
No. Local and international filmindustry events undertaken
No. of professional filmorganizations subscribed to.
No. of film makers trained
Film titles digitized and catalogueproduced
Film industry marketing, researchand development enhanced.
Capacity for local film makersenhanced.
1131000600 Film CensorshipServices
409

PART E. SUMMARY OF PROGRAMME OUTPUTS AND PERFORMANCE INDICATORS FOR 2016/2017 - 2018/2019
1131 Ministry of Sports Culture and Arts
1,150
230
30
40
1,150
-
20
400,000
6,000
2200
50
500
40 TV60 Radio
1,100
215
25
20
1,100
-
40
350,000
5,500
2000
45
450
25 TV60 Radio
1085
200
20
30
1,050
-
40
320,000
5,000
1,800
42
400
18 TV40 Radio
No. of local films Screened
No. of local film ProjectsSupported/sponsored tointernational markets
No. of Film incubation centreEstablished
Percentage of completion of theFilm Resource Centre
No. of films digitized
Reviewed Films & Stage playsAct CAP 222 in place
No of Classification labelsissued
No. of Licenses issued
No. of Random inspectionscarried out
No of sensitization programmesconducted
No. of Films Classified
No. of TV and radio stationmonitored
Improved legal framework for filmindustry developmentFilm infrastructure enhanced
Film Compliance Enforced
Increased Public Awareness onfilm consumption
Film Examination & Classificationenhanced
Broadcast Monitoring enhanced
50%30%10%Percentage of CompletionKenya Film School Established1131101700 Establishment ofthe Kenya Film School
410
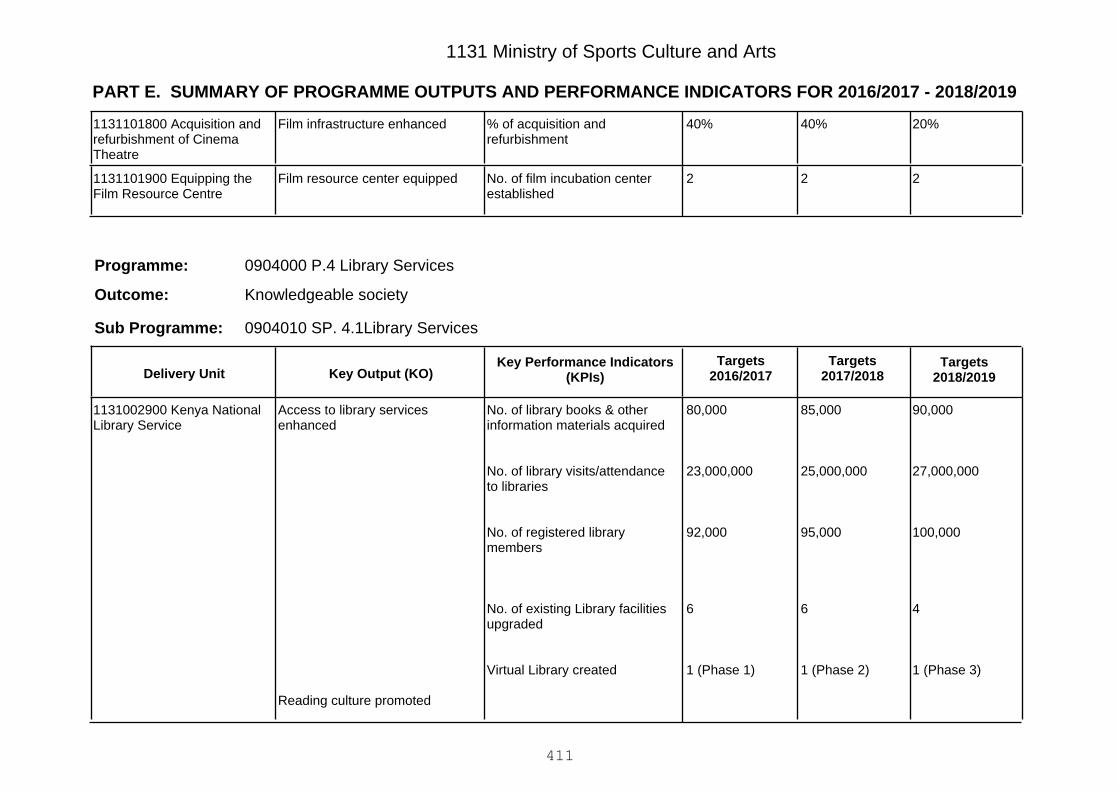
PART E. SUMMARY OF PROGRAMME OUTPUTS AND PERFORMANCE INDICATORS FOR 2016/2017 - 2018/2019
1131 Ministry of Sports Culture and Arts
20%40%40%% of acquisition andrefurbishment
Film infrastructure enhanced1131101800 Acquisition andrefurbishment of CinemaTheatre
222No. of film incubation centerestablished
Film resource center equipped1131101900 Equipping theFilm Resource Centre
0904000 P.4 Library Services
Knowledgeable society
Programme:
Outcome:
0904010 SP. 4.1Library ServicesSub Programme:
Key Output (KO)Targets
2018/2019Targets
2017/2018Key Performance Indicators
(KPIs)Targets
2016/2017Delivery Unit
90,000
27,000,000
100,000
4
1 (Phase 3)
85,000
25,000,000
95,000
6
1 (Phase 2)
80,000
23,000,000
92,000
6
1 (Phase 1)
No. of library books & otherinformation materials acquired
No. of library visits/attendanceto libraries
No. of registered librarymembers
No. of existing Library facilitiesupgraded
Virtual Library created
Access to library servicesenhanced
Reading culture promoted
1131002900 Kenya NationalLibrary Service
411
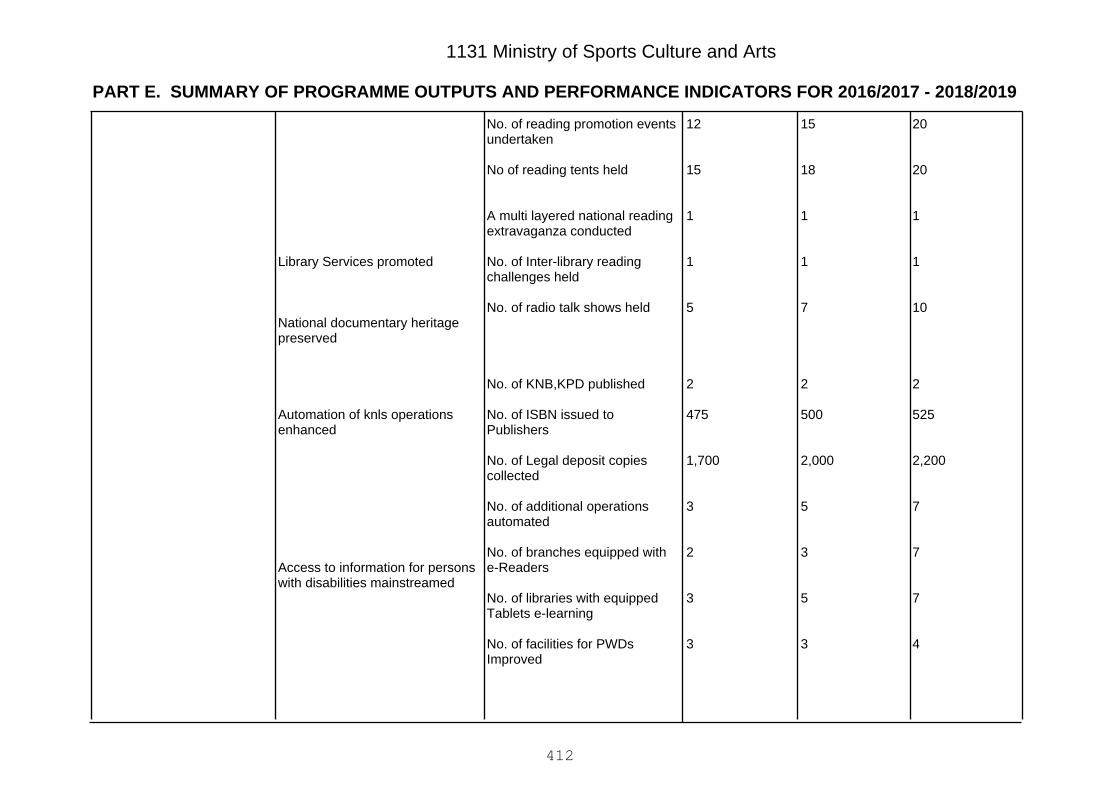
PART E. SUMMARY OF PROGRAMME OUTPUTS AND PERFORMANCE INDICATORS FOR 2016/2017 - 2018/2019
1131 Ministry of Sports Culture and Arts
20
20
1
1
10
2
525
2,200
7
7
7
4
15
18
1
1
7
2
500
2,000
5
3
5
3
12
15
1
1
5
2
475
1,700
3
2
3
3
No. of reading promotion eventsundertaken
No of reading tents held
A multi layered national readingextravaganza conducted
No. of Inter-library readingchallenges held
No. of radio talk shows held
No. of KNB,KPD published
No. of ISBN issued toPublishers
No. of Legal deposit copiescollected
No. of additional operationsautomated
No. of branches equipped withe-Readers
No. of libraries with equippedTablets e-learning
No. of facilities for PWDsImproved
Library Services promoted
National documentary heritagepreserved
Automation of knls operationsenhanced
Access to information for personswith disabilities mainstreamed
412

PART E. SUMMARY OF PROGRAMME OUTPUTS AND PERFORMANCE INDICATORS FOR 2016/2017 - 2018/2019
1131 Ministry of Sports Culture and Arts
150125115
1(KNLS Act)
No. of staff trained
Final National Library of KenyaBill
Staff capacity and competenciesenhanced
Policy, legal and administrativeframework for library andinformation services strengthened
Libraries Act
-
20
40
1
20
5
2 (2nd draftPolicy & draft Bill)
-
15
25
1
10
3
1 (1st DraftPolicy)
1(Publication andDissemination)
12
15
1
5
2
National policy on Libraries andLibraries Act
Final National GovernmentLibraries Standards andGuidelines
No. of equipment for PLWDsacquired
No. of users with printdisabilities accessing libraryservices
Annual Library of the YearAwards. (Maktaba Awards)Supported
No. of schools supported toestablish libraries
No. Research in the field oflibrary services conducted.
No. of capacity building
Policy, legal and administrativeframework for library andinformation services strengthened
Standards and Guidelines forNational Government Librariesfinalized and disseminated
Library services for persons withprint disabilities mainstreamed.
Library Services promoted
Access to library services byschool going children promoted.
Library Services enhanced
Capacity and competencies for
1131003200 Library Services
413
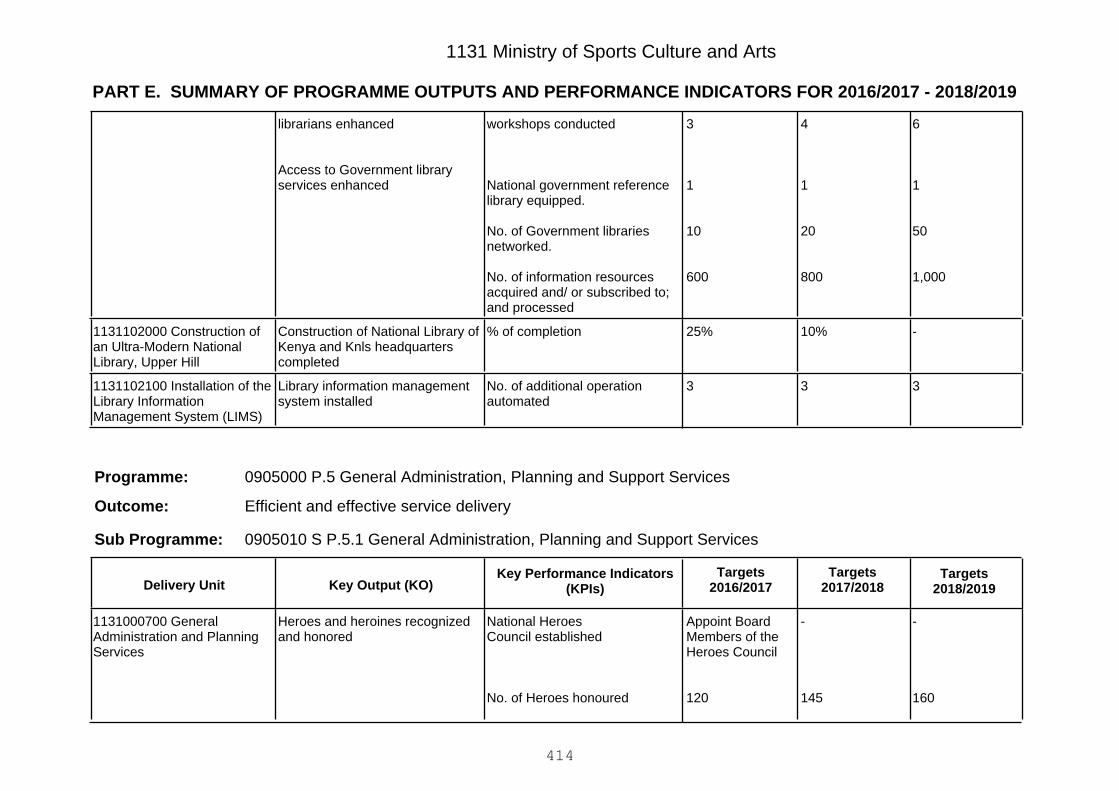
PART E. SUMMARY OF PROGRAMME OUTPUTS AND PERFORMANCE INDICATORS FOR 2016/2017 - 2018/2019
1131 Ministry of Sports Culture and Arts
6
1
50
1,000
4
1
20
800
3
1
10
600
workshops conducted
National government referencelibrary equipped.
No. of Government librariesnetworked.
No. of information resourcesacquired and/ or subscribed to;and processed
librarians enhanced
Access to Government libraryservices enhanced
-10%25%% of completionConstruction of National Library ofKenya and Knls headquarterscompleted
1131102000 Construction ofan Ultra-Modern NationalLibrary, Upper Hill
333No. of additional operationautomated
Library information managementsystem installed
1131102100 Installation of theLibrary InformationManagement System (LIMS)
0905000 P.5 General Administration, Planning and Support Services
Efficient and effective service delivery
Programme:
Outcome:
0905010 S P.5.1 General Administration, Planning and Support ServicesSub Programme:
Key Output (KO)Targets
2018/2019Targets
2017/2018Key Performance Indicators
(KPIs)Targets
2016/2017Delivery Unit
-
160
-
145
Appoint BoardMembers of theHeroes Council
120
National HeroesCouncil established
No. of Heroes honoured
Heroes and heroines recognizedand honored
1131000700 GeneralAdministration and PlanningServices
414
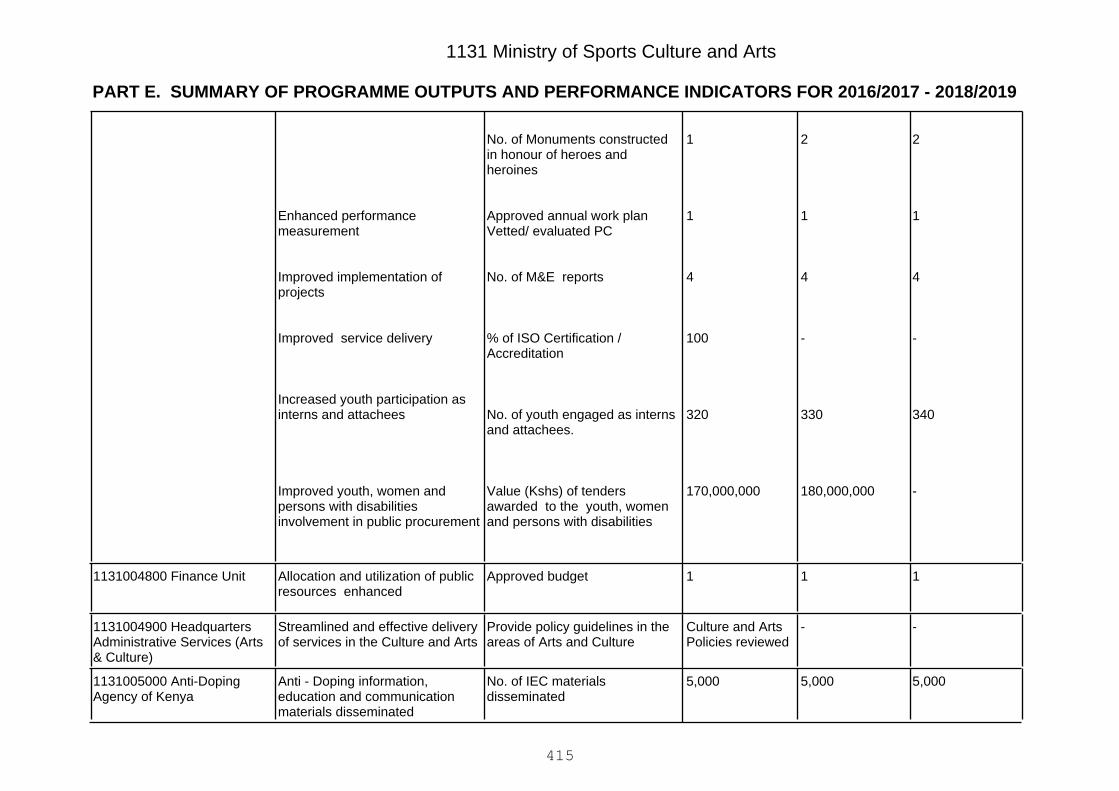
PART E. SUMMARY OF PROGRAMME OUTPUTS AND PERFORMANCE INDICATORS FOR 2016/2017 - 2018/2019
1131 Ministry of Sports Culture and Arts
2
1
4
-
340
-
2
1
4
-
330
180,000,000
1
1
4
100
320
170,000,000
No. of Monuments constructedin honour of heroes andheroines
Approved annual work planVetted/ evaluated PC
No. of M&E reports
% of ISO Certification /Accreditation
No. of youth engaged as internsand attachees.
Value (Kshs) of tendersawarded to the youth, womenand persons with disabilities
Enhanced performancemeasurement
Improved implementation ofprojects
Improved service delivery
Increased youth participation asinterns and attachees
Improved youth, women andpersons with disabilitiesinvolvement in public procurement
111Approved budgetAllocation and utilization of publicresources enhanced
1131004800 Finance Unit
--Culture and ArtsPolicies reviewed
Provide policy guidelines in theareas of Arts and Culture
Streamlined and effective deliveryof services in the Culture and Arts
1131004900 HeadquartersAdministrative Services (Arts& Culture)
5,0005,0005,000No. of IEC materialsdisseminated
Anti - Doping information,education and communicationmaterials disseminated
1131005000 Anti-DopingAgency of Kenya
415

PART E. SUMMARY OF PROGRAMME OUTPUTS AND PERFORMANCE INDICATORS FOR 2016/2017 - 2018/2019
1131 Ministry of Sports Culture and Arts
-
800
12
4
-
780
9
4
-
750
7
4
No. of DCOs and BCOs
No. of collected samples
No. of applications on TUEs
No. of investigation reports
Doping Control Officers (DCOs)and Blood Control Officers(BCOs) trained
Samples for testing collected
Applications on Therapeutic UseExemptions (TUEs) administered
Reports on doping cases underinvestigations
416

Vote 1131 Ministry of Sports Culture and Arts
PART F: Summary of Expenditure by Programmes, 2016/2017 - 2018/2019
Programme
Estimates Projected Estimates
2016/2017 2017/2018 2018/2019
KShs. KShs. KShs.
0901010 SP. 1.1 Sports Training and competitions 381,260,369 286,955,023 121,390,300
0901020 SP. 1.2 Development and Management of SportsFacilities 4,149,349,946 4,645,212,412 4,225,088,862
0901000 P.1 Sports 4,530,610,315 4,932,167,435 4,346,479,162
0902010 SP. 2.1 Conservation of Heritage 1,298,545,000 1,616,387,084 1,803,864,162
0902020 S.P 2.2 Public Records and Archives Management 226,241,601 247,361,300 252,415,266
0902030 S.P 2.3 Development And Promotion of Culture 237,255,258 315,021,482 1,118,789,974
0902040 SP. 2.4 Promotion of Kenyan Music and Dance 128,118,431 87,732,641 88,842,385
0902000 P.2 Culture 1,890,160,290 2,266,502,507 3,263,911,787
0903010 SP. 3.1 Film Services 730,567,692 750,983,706 768,309,231
0903000 P.3 The Arts 730,567,692 750,983,706 768,309,231
0904010 SP. 4.1Library Services 836,318,467 779,059,715 651,774,449
0904000 P.4 Library Services 836,318,467 779,059,715 651,774,449
0905010 S P.5.1 General Administration, Planning and Support Services 631,340,236 855,753,637 939,642,371
0905000 P.5 General Administration, Planning and Support Services 631,340,236 855,753,637 939,642,371Total Expenditure for Vote 1131 Ministry of Sports Culture and Arts 8,618,997,000 9,584,467,000 9,970,117,000
417

1131 Ministry of Sports Culture and Arts
PART G: Summary of Expenditure by Vote and Economic Classification, 2016/2017 - 2018/2019
Economic Classification
Estimates Projected Estimates
2016/2017 2017/2018 2018/2019KShs. KShs. KShs.
Current Expenditure 6,257,997,000 5,876,467,000 6,013,117,000
Compensation to Employees 429,397,000 441,607,000 454,257,000
Use of Goods and Services 2,074,543,965 2,109,628,850 2,195,032,839
Current Transfers to Govt. Agencies 3,715,283,830 3,289,960,000 3,328,060,000
Other Recurrent 38,772,205 35,271,150 35,767,161
Capital Expenditure 2,361,000,000 3,708,000,000 3,957,000,000
Acquisition of Non-Financial Assets 117,000,000 65,000,000 67,000,000
Capital Grants to Govt. Agencies 2,244,000,000 3,643,000,000 3,890,000,000Total Expenditure 8,618,997,000 9,584,467,000 9,970,117,000
418
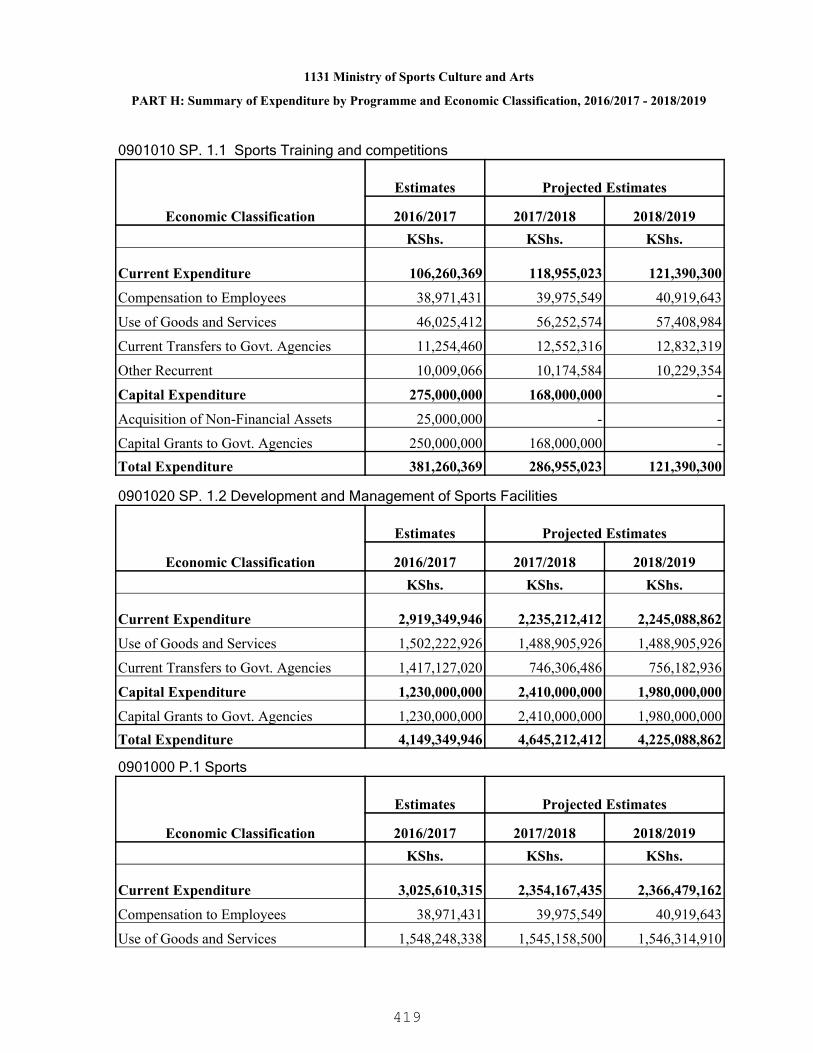
1131 Ministry of Sports Culture and Arts
PART H: Summary of Expenditure by Programme and Economic Classification, 2016/2017 - 2018/2019
0901010 SP. 1.1 Sports Training and competitions
Economic Classification
Estimates Projected Estimates
2016/2017 2017/2018 2018/2019KShs. KShs. KShs.
Current Expenditure 106,260,369 118,955,023 121,390,300
Compensation to Employees 38,971,431 39,975,549 40,919,643
Use of Goods and Services 46,025,412 56,252,574 57,408,984
Current Transfers to Govt. Agencies 11,254,460 12,552,316 12,832,319
Other Recurrent 10,009,066 10,174,584 10,229,354
Capital Expenditure 275,000,000 168,000,000 -
Acquisition of Non-Financial Assets 25,000,000 - -
Capital Grants to Govt. Agencies 250,000,000 168,000,000 -Total Expenditure 381,260,369 286,955,023 121,390,300
0901020 SP. 1.2 Development and Management of Sports Facilities
Economic Classification
Estimates Projected Estimates
2016/2017 2017/2018 2018/2019KShs. KShs. KShs.
Current Expenditure 2,919,349,946 2,235,212,412 2,245,088,862
Use of Goods and Services 1,502,222,926 1,488,905,926 1,488,905,926
Current Transfers to Govt. Agencies 1,417,127,020 746,306,486 756,182,936
Capital Expenditure 1,230,000,000 2,410,000,000 1,980,000,000
Capital Grants to Govt. Agencies 1,230,000,000 2,410,000,000 1,980,000,000Total Expenditure 4,149,349,946 4,645,212,412 4,225,088,862
0901000 P.1 Sports
Economic Classification
Estimates Projected Estimates
2016/2017 2017/2018 2018/2019KShs. KShs. KShs.
Current Expenditure 3,025,610,315 2,354,167,435 2,366,479,162
Compensation to Employees 38,971,431 39,975,549 40,919,643
Use of Goods and Services 1,548,248,338 1,545,158,500 1,546,314,910
419
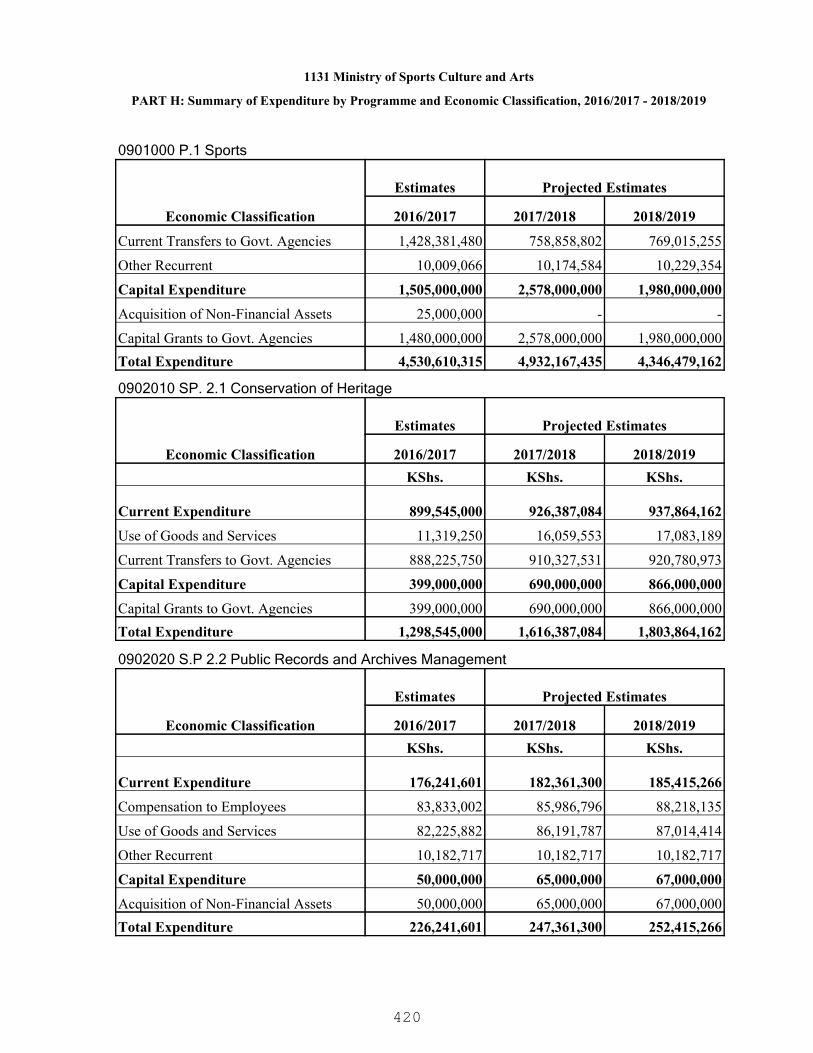
1131 Ministry of Sports Culture and Arts
PART H: Summary of Expenditure by Programme and Economic Classification, 2016/2017 - 2018/2019
0901000 P.1 Sports
Economic Classification
Estimates Projected Estimates
2016/2017 2017/2018 2018/2019
Current Transfers to Govt. Agencies 1,428,381,480 758,858,802 769,015,255
Other Recurrent 10,009,066 10,174,584 10,229,354
Capital Expenditure 1,505,000,000 2,578,000,000 1,980,000,000
Acquisition of Non-Financial Assets 25,000,000 - -
Capital Grants to Govt. Agencies 1,480,000,000 2,578,000,000 1,980,000,000Total Expenditure 4,530,610,315 4,932,167,435 4,346,479,162
0902010 SP. 2.1 Conservation of Heritage
Economic Classification
Estimates Projected Estimates
2016/2017 2017/2018 2018/2019KShs. KShs. KShs.
Current Expenditure 899,545,000 926,387,084 937,864,162
Use of Goods and Services 11,319,250 16,059,553 17,083,189
Current Transfers to Govt. Agencies 888,225,750 910,327,531 920,780,973
Capital Expenditure 399,000,000 690,000,000 866,000,000
Capital Grants to Govt. Agencies 399,000,000 690,000,000 866,000,000Total Expenditure 1,298,545,000 1,616,387,084 1,803,864,162
0902020 S.P 2.2 Public Records and Archives Management
Economic Classification
Estimates Projected Estimates
2016/2017 2017/2018 2018/2019KShs. KShs. KShs.
Current Expenditure 176,241,601 182,361,300 185,415,266
Compensation to Employees 83,833,002 85,986,796 88,218,135
Use of Goods and Services 82,225,882 86,191,787 87,014,414
Other Recurrent 10,182,717 10,182,717 10,182,717
Capital Expenditure 50,000,000 65,000,000 67,000,000
Acquisition of Non-Financial Assets 50,000,000 65,000,000 67,000,000Total Expenditure 226,241,601 247,361,300 252,415,266
420

1131 Ministry of Sports Culture and Arts
PART H: Summary of Expenditure by Programme and Economic Classification, 2016/2017 - 2018/2019
0902030 S.P 2.3 Development And Promotion of Culture
Economic Classification
Estimates Projected Estimates
2016/2017 2017/2018 2018/2019KShs. KShs. KShs.
Current Expenditure 188,255,258 198,021,482 202,789,974
Compensation to Employees 27,800,428 28,542,082 29,181,666
Use of Goods and Services 141,454,830 147,560,333 151,944,536
Current Transfers to Govt. Agencies 19,000,000 21,919,067 21,663,772
Capital Expenditure 49,000,000 117,000,000 916,000,000
Capital Grants to Govt. Agencies 49,000,000 117,000,000 916,000,000Total Expenditure 237,255,258 315,021,482 1,118,789,974
0902040 SP. 2.4 Promotion of Kenyan Music and Dance
Economic Classification
Estimates Projected Estimates
2016/2017 2017/2018 2018/2019KShs. KShs. KShs.
Current Expenditure 96,118,431 87,732,641 88,842,385
Compensation to Employees 20,124,927 20,652,759 21,199,592
Use of Goods and Services 65,993,504 62,079,882 62,642,793
Other Recurrent 10,000,000 5,000,000 5,000,000
Capital Expenditure 32,000,000 - -
Acquisition of Non-Financial Assets 32,000,000 - -Total Expenditure 128,118,431 87,732,641 88,842,385
0902000 P.2 Culture
Economic Classification
Estimates Projected Estimates
2016/2017 2017/2018 2018/2019KShs. KShs. KShs.
Current Expenditure 1,360,160,290 1,394,502,507 1,414,911,787
Compensation to Employees 131,758,357 135,181,637 138,599,393
Use of Goods and Services 300,993,466 311,891,555 318,684,932
Current Transfers to Govt. Agencies 907,225,750 932,246,598 942,444,745
421

1131 Ministry of Sports Culture and Arts
PART H: Summary of Expenditure by Programme and Economic Classification, 2016/2017 - 2018/2019
0902000 P.2 Culture
Economic Classification
Estimates Projected Estimates
2016/2017 2017/2018 2018/2019
Other Recurrent 20,182,717 15,182,717 15,182,717
Capital Expenditure 530,000,000 872,000,000 1,849,000,000
Acquisition of Non-Financial Assets 82,000,000 65,000,000 67,000,000
Capital Grants to Govt. Agencies 448,000,000 807,000,000 1,782,000,000Total Expenditure 1,890,160,290 2,266,502,507 3,263,911,787
0903010 SP. 3.1 Film Services
Economic Classification
Estimates Projected Estimates
2016/2017 2017/2018 2018/2019KShs. KShs. KShs.
Current Expenditure 604,567,692 622,983,706 640,309,231
Compensation to Employees 89,566,006 91,681,573 93,873,193
Use of Goods and Services 33,949,803 36,023,466 35,395,828
Current Transfers to Govt. Agencies 476,676,600 490,854,600 506,600,000
Other Recurrent 4,375,283 4,424,067 4,440,210
Capital Expenditure 126,000,000 128,000,000 128,000,000
Capital Grants to Govt. Agencies 126,000,000 128,000,000 128,000,000Total Expenditure 730,567,692 750,983,706 768,309,231
0903000 P.3 The Arts
Economic Classification
Estimates Projected Estimates
2016/2017 2017/2018 2018/2019KShs. KShs. KShs.
Current Expenditure 604,567,692 622,983,706 640,309,231
Compensation to Employees 89,566,006 91,681,573 93,873,193
Use of Goods and Services 33,949,803 36,023,466 35,395,828
Current Transfers to Govt. Agencies 476,676,600 490,854,600 506,600,000
Other Recurrent 4,375,283 4,424,067 4,440,210
Capital Expenditure 126,000,000 128,000,000 128,000,000
422

1131 Ministry of Sports Culture and Arts
PART H: Summary of Expenditure by Programme and Economic Classification, 2016/2017 - 2018/2019
0903000 P.3 The Arts
Economic Classification
Estimates Projected Estimates
2016/2017 2017/2018 2018/2019
Capital Grants to Govt. Agencies 126,000,000 128,000,000 128,000,000Total Expenditure 730,567,692 750,983,706 768,309,231
0904010 SP. 4.1Library Services
Economic Classification
Estimates Projected Estimates
2016/2017 2017/2018 2018/2019KShs. KShs. KShs.
Current Expenditure 636,318,467 649,059,715 651,774,449
Use of Goods and Services 33,318,467 41,059,715 41,774,449
Current Transfers to Govt. Agencies 603,000,000 608,000,000 610,000,000
Capital Expenditure 200,000,000 130,000,000 -
Acquisition of Non-Financial Assets 10,000,000 - -
Capital Grants to Govt. Agencies 190,000,000 130,000,000 -Total Expenditure 836,318,467 779,059,715 651,774,449
0904000 P.4 Library Services
Economic Classification
Estimates Projected Estimates
2016/2017 2017/2018 2018/2019KShs. KShs. KShs.
Current Expenditure 636,318,467 649,059,715 651,774,449
Use of Goods and Services 33,318,467 41,059,715 41,774,449
Current Transfers to Govt. Agencies 603,000,000 608,000,000 610,000,000
Capital Expenditure 200,000,000 130,000,000 -
Acquisition of Non-Financial Assets 10,000,000 - -
Capital Grants to Govt. Agencies 190,000,000 130,000,000 -Total Expenditure 836,318,467 779,059,715 651,774,449
0905010 S P.5.1 General Administration, Planning and Support Services
Economic Classification
Estimates Projected Estimates
2016/2017 2017/2018 2018/2019
423

1131 Ministry of Sports Culture and Arts
PART H: Summary of Expenditure by Programme and Economic Classification, 2016/2017 - 2018/2019
0905010 S P.5.1 General Administration, Planning and Support Services
Economic Classification
Estimates Projected Estimates
2016/2017 2017/2018 2018/2019KShs. KShs. KShs.
Current Expenditure 631,340,236 855,753,637 939,642,371
Compensation to Employees 169,101,206 174,768,241 180,864,771
Use of Goods and Services 158,033,891 175,495,614 252,862,720
Current Transfers to Govt. Agencies 300,000,000 500,000,000 500,000,000
Other Recurrent 4,205,139 5,489,782 5,914,880Total Expenditure 631,340,236 855,753,637 939,642,371
0905000 P.5 General Administration, Planning and Support Services
Economic Classification
Estimates Projected Estimates
2016/2017 2017/2018 2018/2019KShs. KShs. KShs.
Current Expenditure 631,340,236 855,753,637 939,642,371
Compensation to Employees 169,101,206 174,768,241 180,864,771
Use of Goods and Services 158,033,891 175,495,614 252,862,720
Current Transfers to Govt. Agencies 300,000,000 500,000,000 500,000,000
Other Recurrent 4,205,139 5,489,782 5,914,880Total Expenditure 631,340,236 855,753,637 939,642,371
424

1141 Ministry of Labour Social Security and Services
A competitive workforce and a just society
To promote decent work and enhance empowerment of vulnerable groups
PART A. Vision
PART B. Mission
PART C. Performance Overview and Background for Programme(s) Funding
The Ministry of Labour, Social Security and Services plays a critical role in the country’sdevelopment through promotion of harmonious industrial relations; safety and health atworkplace; social development, employment promotion; industrial training; productivitymanagement; national human resource planning and utilization; provision of social security;registration and regulation of trade unions; welfare of children and care and empowerment ofPersons With Disabilities (PWDs), older persons and other vulnerable group.
The allocation to the Ministry increased from KShs. 12.7 billion in 2012/13 FY to KShs. 15.9billion in 2013/14 and further to KShs. 20.8 billion. This reflects an increase of 24.9% and30.7% from the financial year 2012/13 to 2013/14 and 2014/15 respectively. The increasewas mainly in the cash transfer programmes which increased by KShs. 4.1 billion from KShs.10.36 billion to KShs. 14.46 billion. Over the same period, the actual expenditure increasedfrom KShs. 15.89 billion in 203/14 to KShs. 16.64 billion in 2014/15 FY.
During the period under review, 34,912 labour disputes were resolved, time taken to resolvedisputes was reduced from 4 months to 80 days, 38,601 workplace inspections were carriedout, 12,685 backlog Workmen Compensation settled, attested 13,504 Foreign Contracts andbeneficiaries travelled abroad for employment and reduced time taken for attestation of thecontracts from 3 months to 5 days. The National Policy on Occupational Safety and Healthwas finalized; trained 35,410 members of Workplace Safety and Health Committees onoccupational safety and health matters, examined 36,088 hazardous industrial equipmentand 151,614 workers in hazardous workplaces. Further, the time taken to process claims forwork injury compensation was progressively reduced from 30 days to 12 days and safety andhealth laboratories upgraded through procurement of modern specialized equipment forrveillance of work environment and workers’ health.
To enhance freedom of association as enshrined in the constitution, the Ministry registeredfifteen (15) additional Trade Unions and 73 branch offices and inspected books of accountsfor 1,356 Trade Union. A Labour Market Information System (LMIS) was established basedon the information collected during the National Manpower survey, developed the NationalEmployment Policy and Strategy for Kenya, placed 48,141 job seekers in employmentthrough the Public Employment Services; Placed 44,134 students on industrial attachment,trained 95,800 students in relevant industrial skills, tested 143,153 candidates for governmenttrade test certificates in various trades, sponsored 75 needy female students frommarginalized areas to undertake Engineering Courses as an affirmative action and developedthe Industrial Training Attachment Portal (ITAP) www.nita.go.ke/itap to facilitate industrialattachment. In addition, expansion and upgrading works were carried out at TechnologyDevelopment Centre, Athi River to enable the Centre offer modernized industrial training. Inaddition, the Ministry trained 704 Technical Service Providers (TSP) on productivity and
425

1141 Ministry of Labour Social Security and Services
developed 70 pilot model companies/firms on productivity improvement.
Under social development and children services, the Ministry registered 60,100 Self HelpGroups and Community Based Organizations (CBOs) with a total membership of 1.1 million, trained 1,470 students in Vocational Rehabilitation Centres on various market orientedcourses, provided sunscreen lotion to 2,792 Persons with Albinism, provided 6,374 PWDswith assistive and supportive devices, 1,557 PWD with education scholarships, trained 97workers offering essential services in sign language and provided 877 PWDs self-help groupswith grants for economic empowerment. In addition, the Ministry finalized 841childrenadoptions, stablished 3 Child Protection Centres nd opened 3 child helpline stationsin Eldoret, Garissa and Nairobi and launched 112 Area Advisory Councils. In addition;National Standards and Regulations for Charitable Children Institutions (CCIs) were finalized;399 CCIs registered; 3,270 children in rehabilitation institutions trained on various skills. TheMinistry also protected and supported 170,516 children in emergencies, withdrew 27,936children from worst form of child labour and undertook capacity building for 14,445 dutybearers to enhance care and protection of children. Under the National Social Safety NetProgramme (Cash Transfer programmes) the number of beneficiaries/households increasedfrom 239,000 in 2012/13 to 507,000 in 2014/15 Financial Years while the budgetaryallocation increased from KShs. 2.972 billion to KShs. 14.46 billion respectively. In addition,an integrated Single Registry for the National Safety Net Programme was established anddecentralized to 10 Counties to improve on transparence and accountability.
The Ministry has experienced various challenges in budget preparation which includereduction in budgetary allocation in the last phases of budget preparation which resulted in towithdrawal of funding earmarked for key projects; and delay and lack of exchequer releaseleading to accumulation of pending bills. Given the strategic interventions programmes (cashtransfers) there has been increased demand for universal coverage of vulnerable groupswithout corresponding budgetary allocation. In addition; the budget ceiling for use of goodsand acquisition of assets has remained unchanged for the last three years. Consequently, ithas been difficult to accommodate any new and ongoing strategic priorities with no resourcereallocation. Further, the Ministry has continued to operate with low staffing level at both theheadquarters and field offices which stands at 40.5% attributed to natura attrition.Furthermore, the procurement procedures for donor funded projects ave been an impedimentto smooth implementation of the projects. The number of Workmen Compensation casessettled is dependent on the budgetary allocation to the Ministry. The settlement of theseclaims is hampered by delays in the presentation of the relevant documents by the claimantsto facilitate processing.
During the planned period, the Ministry will continue with the construction and initiateequipping the Occupational Safety and Health institute, a Centre of Excellence inoccupational safety and health; a Labour Market information System will be operationalized toaddress the various aspects of the labour market; strengthen the National Labour Board,Wages Councils and Productivity Centre; continue with streamlining the management oflabour migration and foreign employment to avert the challenges facing Kenyans working inforeign countries. To improve the coordination and provide information on employment, theMinistry will continue with the construction of the National Employment Promotion Centre andconstruct two model employment offices. Further, the Ministry will continue to provideindustrial training in relevant skills and attachment of students and employees in industry toenable them acquire hands-on experience in their areas of training; upgrade the existingindustrial centres and vocational centres and review and development of Industrial training
426

1141 Ministry of Labour Social Security and Services
PART D. Programme Objectives
curricula and skills assessment guidelines.
Further, within the MTEF period, the Ministry will improve facilities and institutions thatprovide custody, care and protection of children; provide educational scholarships, regulatethe Charitable Children Institutions (CCI), provide rapid rescue and response services tochildren in distress, foster care and guardianship to children in need. In addition, the Ministrywill continue to empower communities through registrtion of Self Help Groups and CBOs,empower the Persons With Disablities (PWDs) through registration, capacity building,scholarships, provision of assistance devices to PWDs and sun screen lotion to persons withAlbinism. The Ministry will continue with cushioning the vulnerable members of societythrough the Cash Transfer Programme which is targeted to increase from 717,000 in 2015/16to 1,047,000 in 2016/17. The National Safety Net Programme Single Registry will bedecentralized to all the 47 counties.
ObjectiveProgramme
0906000 P 1: Promotion ofthe Best Labour Practice
To promote harmonious industrial relations and a safety andhealth culture at work.
0907000 P 2: ManpowerDevelopment, Employmentand ProductivityManagement
To enhance competitiveness of the country’s workforce
0908000 P 3: SocialDevelopment and ChildrenServices
To empower communities and provide protection and careto children
0909000 P 4: National SocialSafety Net To cushion vulnerable groups to meet basic human needs
0910000 P 5: GeneralAdministration Planning andSupport Services
To improve service delivery and coordination of Ministryfunctions, programmes and activities
427

PART E. SUMMARY OF PROGRAMME OUTPUTS AND PERFORMANCE INDICATORS FOR 2016/2017 - 2018/2019
1141 Ministry of Labour Social Security and Services
0906000 P 1: Promotion of the Best Labour Practice
Sustainable industrial peace
Programme:
Outcome:
0906010 S.P 1.1 Promotion of harmonious industrial relationsSub Programme:
Key Output (KO)Targets
2018/2019Targets
2017/2018Key Performance Indicators
(KPIs)Targets
2016/2017Delivery Unit
101010No. of reports on complianceratified conventions
Compliance with ratifiedconventions
1141000400 DiplomaticMission Labour Attache‚Geneva
13,50060
200
13,50060
200
13,00070
500
No. of disputes resolvedNo. of days taken to resolvelabour disputes reducedNo. of claims processed
Resolved Labour disputesWorkmen’s Compensation claimssettled
1141000500 Office of theLabour Commissioner
14,800
20,000
12
14,800
20,000
12
14,200
5,000
10
No. of workplace inspectionscarried outNo. of children withdrawn fromchild labourNo. of child labour free zonesestablished
Compliance with labour laws1141000700 Labour ServiceField Offices
00100%% completion of the officeMeru County Labour OfficeConstructed
1141100500 Construction ofMeru County Labour offices
0
0
0
0
100%
100%
% completion of office
% completion of ramps
Voi County Labour officereconstructedRamps constructed in EmbuCounty Labour Office
1141100600 Reconstructionof county Labour Offices(Molo, Kakamega, Embu, Voi)
0906020 S.P 1.2: Regulation of Trade UnionsSub Programme:
Key Output (KO)Targets
2018/2019Targets
2017/2018Key Performance Indicators
(KPIs)Targets
2016/2017Delivery Unit
428
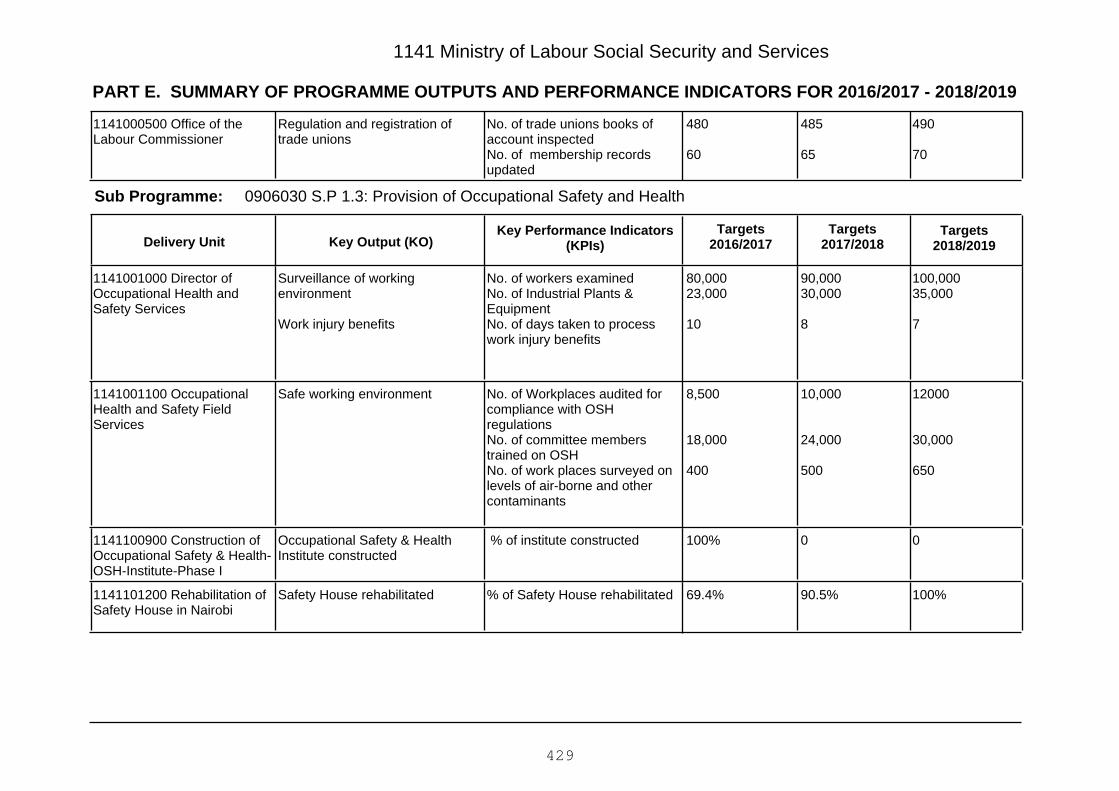
PART E. SUMMARY OF PROGRAMME OUTPUTS AND PERFORMANCE INDICATORS FOR 2016/2017 - 2018/2019
1141 Ministry of Labour Social Security and Services
490
70
485
65
480
60
No. of trade unions books ofaccount inspectedNo. of membership recordsupdated
Regulation and registration oftrade unions
1141000500 Office of theLabour Commissioner
0906030 S.P 1.3: Provision of Occupational Safety and HealthSub Programme:
Key Output (KO)Targets
2018/2019Targets
2017/2018Key Performance Indicators
(KPIs)Targets
2016/2017Delivery Unit
100,00035,000
7
90,00030,000
8
80,00023,000
10
No. of workers examinedNo. of Industrial Plants &EquipmentNo. of days taken to processwork injury benefits
Surveillance of workingenvironment
Work injury benefits
1141001000 Director ofOccupational Health andSafety Services
12000
30,000
650
10,000
24,000
500
8,500
18,000
400
No. of Workplaces audited forcompliance with OSHregulationsNo. of committee memberstrained on OSHNo. of work places surveyed onlevels of air-borne and othercontaminants
Safe working environment1141001100 OccupationalHealth and Safety FieldServices
00100% % of institute constructedOccupational Safety & HealthInstitute constructed
1141100900 Construction ofOccupational Safety & Health-OSH-Institute-Phase I
100%90.5%69.4%% of Safety House rehabilitatedSafety House rehabilitated1141101200 Rehabilitation ofSafety House in Nairobi
429

PART E. SUMMARY OF PROGRAMME OUTPUTS AND PERFORMANCE INDICATORS FOR 2016/2017 - 2018/2019
1141 Ministry of Labour Social Security and Services
0907000 P 2: Manpower Development, Employment and Productivity Management
Optimal human resource utilization and competitive workforce.
Programme:
Outcome:
0907010 S.P 2.1 Human Resource Planning & DevelopmentSub Programme:
Key Output (KO)Targets
2018/2019Targets
2017/2018Key Performance Indicators
(KPIs)Targets
2016/2017Delivery Unit
StrategyImplementation
Labour ForceSurvey Report
StrategyImplementation
Labour ForceSurvey
StrategyFinalized
Pilot LabourForce Survey
National Human ResourceDevelopment Strategy
Labour Force Survey (LFS)Report
Accurate and timely informationon labour market
1141001400 ManpowerPlanning Department
Projected skillsdemanddatabase
Projected skillsdemanddatabase
Projected skillsdemanddatabase
Skills databaseAccurate and timely informationon labour market
1141001500 ManpowerDevelopment Department
Software for JobOpportunity IndexandEmployer/Employee moduledeveloped
Software for JobOpportunity IndexandEmployer/Employee moduledeveloped
Quartertly andannual UpdatedLabour marketReports
Operational Labour MarketInformation System (LMIS)
Accurate and timely informationon labour market
1141101300 Establishment ofNational Labour MarketInformation System (LMIS)
0907020 S.P 2.2 Provision of Industrial SkillsSub Programme:
Key Output (KO)Targets
2018/2019Targets
2017/2018Key Performance Indicators
(KPIs)Targets
2016/2017Delivery Unit
35,00035,00032,000No of students/employeestrained on industrial skills
Skilled manpower for the industry
Trade testing and certification
1141002900 NationalIndustrial Training Authority(NITA)
430
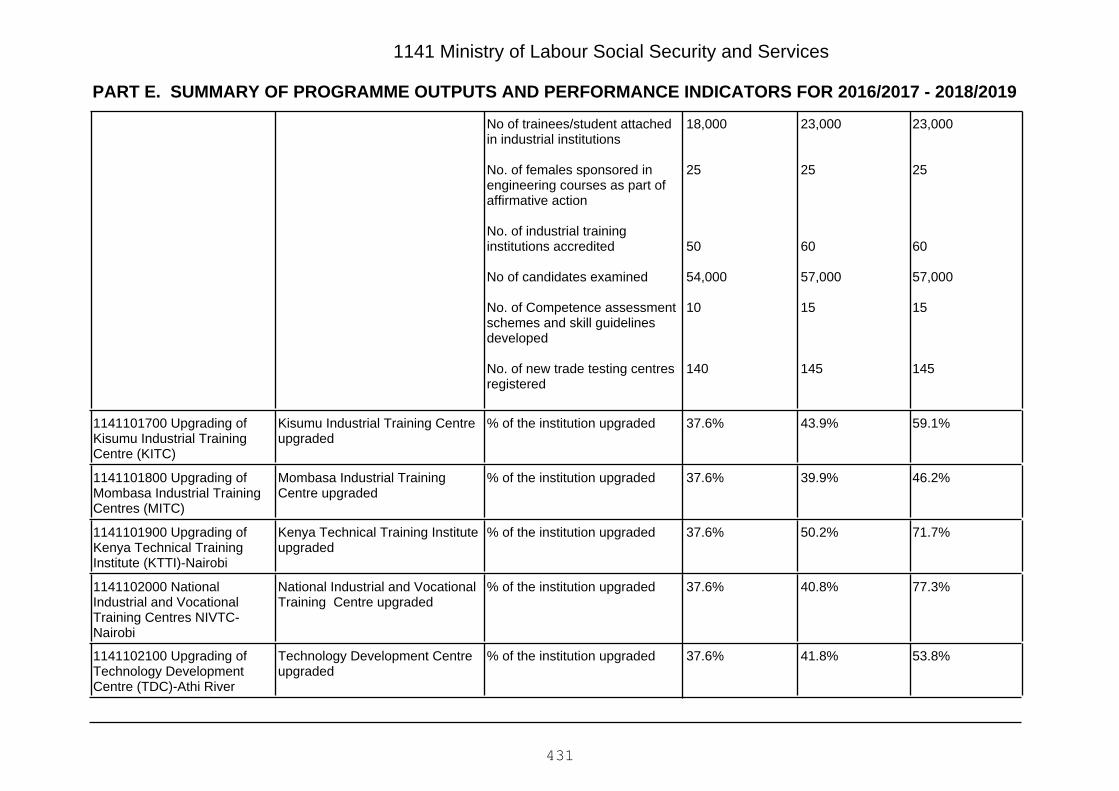
PART E. SUMMARY OF PROGRAMME OUTPUTS AND PERFORMANCE INDICATORS FOR 2016/2017 - 2018/2019
1141 Ministry of Labour Social Security and Services
23,000
25
60
57,000
15
145
23,000
25
60
57,000
15
145
18,000
25
50
54,000
10
140
No of trainees/student attachedin industrial institutions
No. of females sponsored inengineering courses as part ofaffirmative action
No. of industrial traininginstitutions accredited
No of candidates examined
No. of Competence assessmentschemes and skill guidelinesdeveloped
No. of new trade testing centresregistered
59.1%43.9%37.6%% of the institution upgradedKisumu Industrial Training Centreupgraded
1141101700 Upgrading ofKisumu Industrial TrainingCentre (KITC)
46.2%39.9%37.6%% of the institution upgradedMombasa Industrial TrainingCentre upgraded
1141101800 Upgrading ofMombasa Industrial TrainingCentres (MITC)
71.7%50.2%37.6%% of the institution upgradedKenya Technical Training Instituteupgraded
1141101900 Upgrading ofKenya Technical TrainingInstitute (KTTI)-Nairobi
77.3%40.8%37.6%% of the institution upgradedNational Industrial and VocationalTraining Centre upgraded
1141102000 NationalIndustrial and VocationalTraining Centres NIVTC-Nairobi
53.8%41.8%37.6%% of the institution upgradedTechnology Development Centreupgraded
1141102100 Upgrading ofTechnology DevelopmentCentre (TDC)-Athi River
431
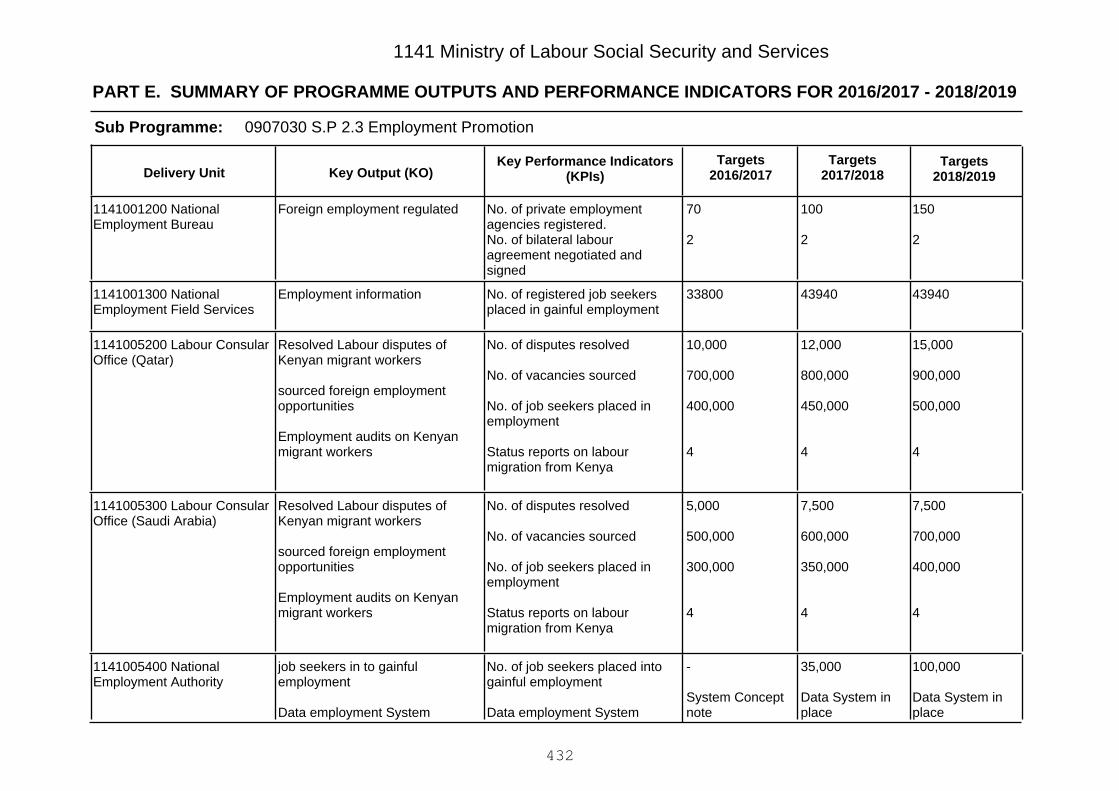
PART E. SUMMARY OF PROGRAMME OUTPUTS AND PERFORMANCE INDICATORS FOR 2016/2017 - 2018/2019
1141 Ministry of Labour Social Security and Services
0907030 S.P 2.3 Employment PromotionSub Programme:
Key Output (KO)Targets
2018/2019Targets
2017/2018Key Performance Indicators
(KPIs)Targets
2016/2017Delivery Unit
150
2
100
2
70
2
No. of private employmentagencies registered.No. of bilateral labouragreement negotiated andsigned
Foreign employment regulated1141001200 NationalEmployment Bureau
439404394033800No. of registered job seekersplaced in gainful employment
Employment information1141001300 NationalEmployment Field Services
15,000
900,000
500,000
4
12,000
800,000
450,000
4
10,000
700,000
400,000
4
No. of disputes resolved
No. of vacancies sourced
No. of job seekers placed inemployment
Status reports on labourmigration from Kenya
Resolved Labour disputes ofKenyan migrant workers
sourced foreign employmentopportunities
Employment audits on Kenyanmigrant workers
1141005200 Labour ConsularOffice (Qatar)
7,500
700,000
400,000
4
7,500
600,000
350,000
4
5,000
500,000
300,000
4
No. of disputes resolved
No. of vacancies sourced
No. of job seekers placed inemployment
Status reports on labourmigration from Kenya
Resolved Labour disputes ofKenyan migrant workers
sourced foreign employmentopportunities
Employment audits on Kenyanmigrant workers
1141005300 Labour ConsularOffice (Saudi Arabia)
100,000
Data System inplace
35,000
Data System inplace
-
System Conceptnote
No. of job seekers placed intogainful employment
Data employment System
job seekers in to gainfulemployment
Data employment System
1141005400 NationalEmployment Authority
432
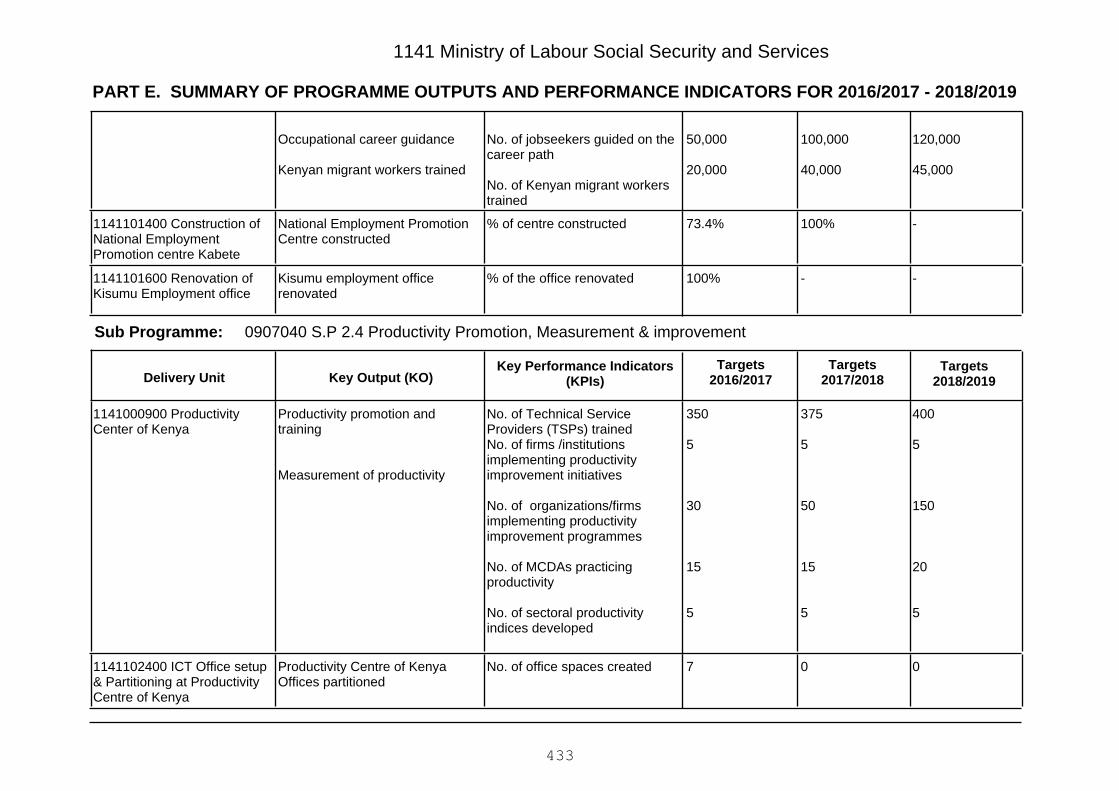
PART E. SUMMARY OF PROGRAMME OUTPUTS AND PERFORMANCE INDICATORS FOR 2016/2017 - 2018/2019
1141 Ministry of Labour Social Security and Services
120,000
45,000
100,000
40,000
50,000
20,000
No. of jobseekers guided on thecareer path
No. of Kenyan migrant workerstrained
Occupational career guidance
Kenyan migrant workers trained
-100%73.4%% of centre constructedNational Employment PromotionCentre constructed
1141101400 Construction ofNational EmploymentPromotion centre Kabete
--100%% of the office renovatedKisumu employment officerenovated
1141101600 Renovation ofKisumu Employment office
0907040 S.P 2.4 Productivity Promotion, Measurement & improvementSub Programme:
Key Output (KO)Targets
2018/2019Targets
2017/2018Key Performance Indicators
(KPIs)Targets
2016/2017Delivery Unit
400
5
150
20
5
375
5
50
15
5
350
5
30
15
5
No. of Technical ServiceProviders (TSPs) trainedNo. of firms /institutionsimplementing productivityimprovement initiatives
No. of organizations/firmsimplementing productivityimprovement programmes
No. of MCDAs practicingproductivity
No. of sectoral productivityindices developed
Productivity promotion andtraining
Measurement of productivity
1141000900 ProductivityCenter of Kenya
007No. of office spaces createdProductivity Centre of KenyaOffices partitioned
1141102400 ICT Office setup& Partitioning at ProductivityCentre of Kenya
433

PART E. SUMMARY OF PROGRAMME OUTPUTS AND PERFORMANCE INDICATORS FOR 2016/2017 - 2018/2019
1141 Ministry of Labour Social Security and Services
0908000 P 3: Social Development and Children Services
Focused community mobilization and protected Children
Programme:
Outcome:
0908010 S.P 3.1: Social Welfare and vocational rehabilitationSub Programme:
Key Output (KO)Targets
2018/2019Targets
2017/2018Key Performance Indicators
(KPIs)Targets
2016/2017Delivery Unit
1141001100 OccupationalHealth and Safety FieldServices
700500300No. of officers trained andcounseled on retirement
Pre-retirement training andcounseling services
1141003600 SocialDevelopment Services
25
NationalVolunteerism Act
25
Enactment of theNationalVolunteerism Bill
20
Draft NationalVolunteerism Bill
No. of elderly persons rescued
National Volunteerism BillDeveloped
Protection of the elderly personsin distress
National volunteerism policyimplemented
1141003700 Social Welfare
600
3
600
3
550
3
No. of PWDs trained in VRCs tobuild capacity for self-relianceNo. of training curriculum forPWD developed
Persons with Disabilitiessupported
1141003800 Vocationalrehabilitation
223No. of VRCs renovatedVocational Rehabilitation Centresrenovated
1141102500 Renovation ofVocation RehabilitationCentres (VRCs)
100%80%60%% of centres equippedVocational Rehabilitation Centresequipped
1141102600 EducationalEquipment for VocationalRehabilitation Centres
--100%%of the office constructedSocial Development officeEmbakasi
1141102700 Construction ofEmbakasi sub- County SocialDevelopment office
434

PART E. SUMMARY OF PROGRAMME OUTPUTS AND PERFORMANCE INDICATORS FOR 2016/2017 - 2018/2019
1141 Ministry of Labour Social Security and Services
--100%% of the office constructedSocial Development office in Buuriconstructed
1141102800 Construction ofBuuri sub- County SocialDevelopment office
100%76%51.8%% of the centre upgradedKirinyaga and Kilifi communitysupport centres upgraded
1141103000 Upgrading ofCommunity Capacity SupportCentres in Kirinyaga & Kilif
800
5,000
900
70
250,000
3,500
800
5,000
900
70
250,000
3,400
700
4,000
800
65
200,000
3,200
Number of PWD groupsprovided with grants foreconomic empowerment
Number of PWDs provided withassistive devices and services
Number of Scholarship awardedto PWDs
Number of workers offeringessential services trained onSign language
No. of PWDs registered
Number of Persons withAlbinism supported withsunscreen lotions
Persons with Disabilitiesregistered and supported
Persons with Albinism supported
1141103100 NationalDevelopment Fund forPersons With Disabilities(PWDs)
0908020 S.P 3.2: Community Mobilization and developmentSub Programme:
Key Output (KO)Targets
2018/2019Targets
2017/2018Key Performance Indicators
(KPIs)Targets
2016/2017Delivery Unit
65000
Updateddatabase
60,000
Updateddatabase
45,000
Databaseestablished
Number of SHGs and CBOsregistered
Community groupsManagement Information (MIS
Empowered Self Help Groups(SHGs) and Community BasedOrganizations (CBOs)
1141003600 SocialDevelopment Services
435
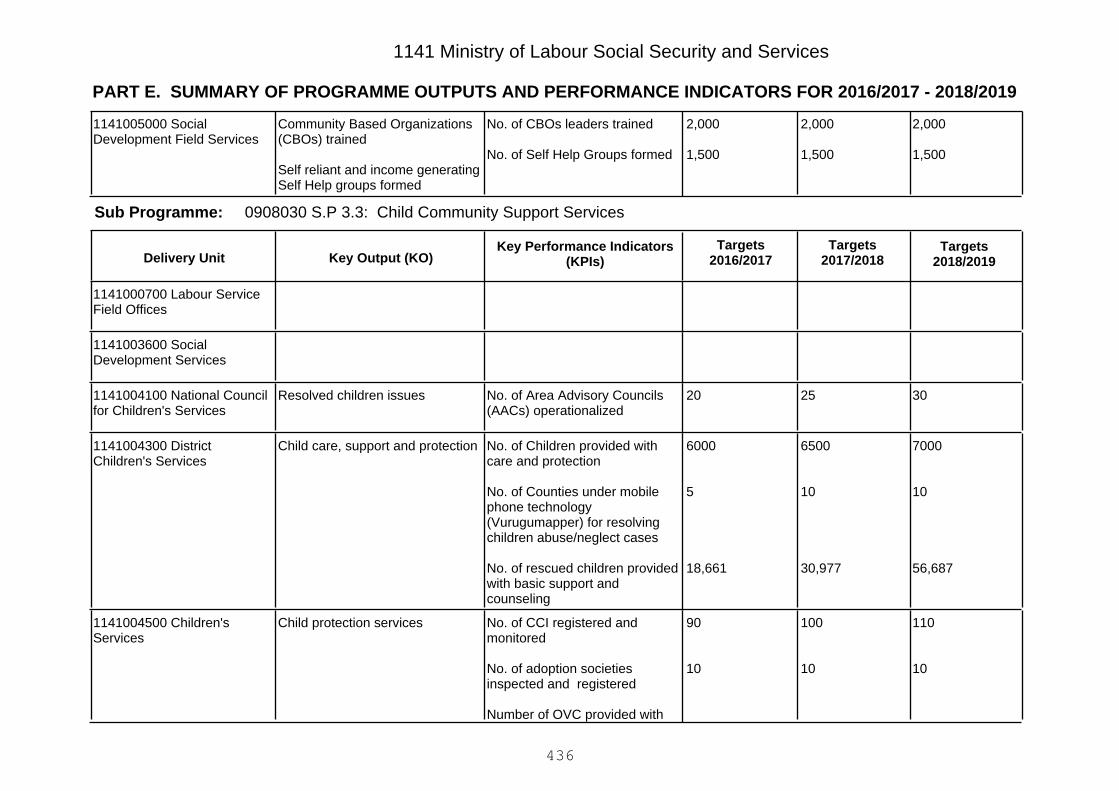
PART E. SUMMARY OF PROGRAMME OUTPUTS AND PERFORMANCE INDICATORS FOR 2016/2017 - 2018/2019
1141 Ministry of Labour Social Security and Services
2,000
1,500
2,000
1,500
2,000
1,500
No. of CBOs leaders trained
No. of Self Help Groups formed
Community Based Organizations(CBOs) trained
Self reliant and income generatingSelf Help groups formed
1141005000 SocialDevelopment Field Services
0908030 S.P 3.3: Child Community Support ServicesSub Programme:
Key Output (KO)Targets
2018/2019Targets
2017/2018Key Performance Indicators
(KPIs)Targets
2016/2017Delivery Unit
1141000700 Labour ServiceField Offices
1141003600 SocialDevelopment Services
302520No. of Area Advisory Councils(AACs) operationalized
Resolved children issues1141004100 National Councilfor Children's Services
7000
10
56,687
6500
10
30,977
6000
5
18,661
No. of Children provided withcare and protection
No. of Counties under mobilephone technology(Vurugumapper) for resolvingchildren abuse/neglect cases
No. of rescued children providedwith basic support andcounseling
Child care, support and protection1141004300 DistrictChildren's Services
110
10
100
10
90
10
No. of CCI registered andmonitored
No. of adoption societiesinspected and registered
Number of OVC provided with
Child protection services1141004500 Children'sServices
436

PART E. SUMMARY OF PROGRAMME OUTPUTS AND PERFORMANCE INDICATORS FOR 2016/2017 - 2018/2019
1141 Ministry of Labour Social Security and Services
60,000
10823
50,000
5194
45,000
3563
education scholarships
No. of children Provided withfamily tracing and reunification
30%40%50%%reduction in violence againstchildren
Child Protection Services1141100200 IntegratedProtective Services
2
20
2
18
2
15
No. of child protection centresestablishedNo. of free Child help lines
Child protection Services1141100400 Child Protectionand Coordination
70.4%59.5%48.3%% of foster care homeconstructed
Foster care services1141103600 Construction ofa foster care centre in CWSKIsiolo
100%77.8%55.5%% of foster care homeconstructed
Foster care services1141103700 Construction of afoster care centre in CWSKMuranga
62%49.9%37.2%% of foster care homeconstructed
Foster care services1141103800 CConstructionof a foster care centre inCWSK Nanyuki
87.4%65.5%45.7%% of foster care homeconstructed
Foster care services1141103900 Construction ofa Foster Care centre inCWSK Mama Ngina Kenyatta
39.2%31%22.8%% of foster care homeconstructed
Foster care services1141104100 Construction ofa foster care centre in CWSKJoska
100%100%100%% of perimeter fenceconstructed
CWSK HQ secured1141104200 Securing CWSKHQ - Nairobi
21.3%16.4%11.5%% of foster care homeconstructed
Foster care services1141104300 Construction ofa foster care centre in CWSKBomet
437

PART E. SUMMARY OF PROGRAMME OUTPUTS AND PERFORMANCE INDICATORS FOR 2016/2017 - 2018/2019
1141 Ministry of Labour Social Security and Services
40%30.5%19.6%% of foster care homeconstructed
Foster care services1141104400 Construction ofa foster care centre in CWSKEmbu
20.4%16.4%12.4%% of foster care homeconstructed
Foster care services1141104500 Construction ofa foster care centre in CWSKKisumu
13%10.2%7.4%% of foster care homeconstructed
Foster care services1141104600 Construction ofa foster care centre in CWSKBungoma
23226012691876457No. of OVCs supportedOVCs supported1141104800 Support toOrphans and VulnerableChildren outside households
0908040 S.P 3.4: Child Rehabilitation and CustodySub Programme:
Key Output (KO)Targets
2018/2019Targets
2017/2018Key Performance Indicators
(KPIs)Targets
2016/2017Delivery Unit
525420415No. of children rehabilitated andtrained on various skills
Children rehabilitation services1141003900 RehabilitationSchool
333No. of children remand homesestablished and managed
Safe custody of children1141004000 Children'sRemand Homes
--100%% of remand centre constructedSafe custody of children1141103200 Construction ofMeru Children’s RemandHome
--100%% of school constructedChildren rehabilitation services1141103300 Construction ofFacilities at Kisumu Children’sRehabilitation Schoo
--100%% of school constructedChildren rehabilitation services1141103400 ConstructKitchen & Dormitory atDagoretti Children's Rehab.School
438
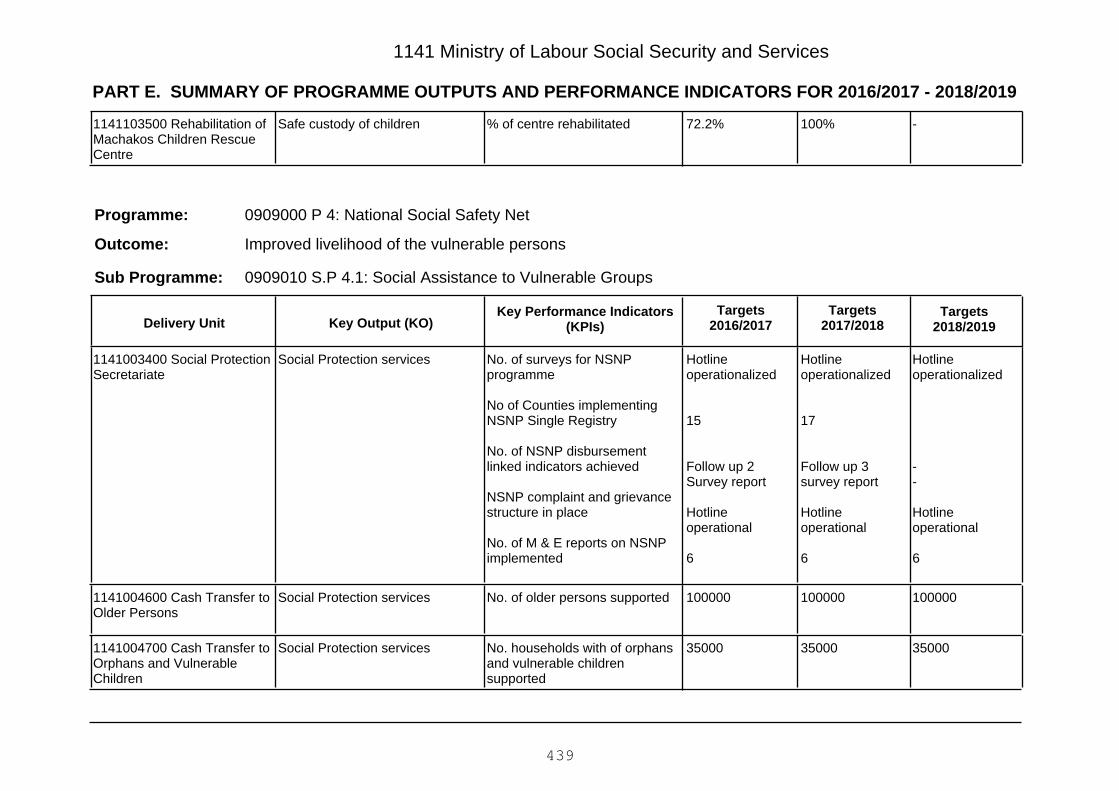
PART E. SUMMARY OF PROGRAMME OUTPUTS AND PERFORMANCE INDICATORS FOR 2016/2017 - 2018/2019
1141 Ministry of Labour Social Security and Services
-100%72.2%% of centre rehabilitatedSafe custody of children1141103500 Rehabilitation ofMachakos Children RescueCentre
0909000 P 4: National Social Safety Net
Improved livelihood of the vulnerable persons
Programme:
Outcome:
0909010 S.P 4.1: Social Assistance to Vulnerable GroupsSub Programme:
Key Output (KO)Targets
2018/2019Targets
2017/2018Key Performance Indicators
(KPIs)Targets
2016/2017Delivery Unit
Hotlineoperationalized
--
Hotlineoperational
6
Hotlineoperationalized
17
Follow up 3survey report
Hotlineoperational
6
Hotlineoperationalized
15
Follow up 2Survey report
Hotlineoperational
6
No. of surveys for NSNPprogramme
No of Counties implementingNSNP Single Registry
No. of NSNP disbursementlinked indicators achieved
NSNP complaint and grievancestructure in place
No. of M & E reports on NSNPimplemented
Social Protection services1141003400 Social ProtectionSecretariate
100000100000100000No. of older persons supportedSocial Protection services1141004600 Cash Transfer toOlder Persons
350003500035000No. households with of orphansand vulnerable childrensupported
Social Protection services1141004700 Cash Transfer toOrphans and VulnerableChildren
439
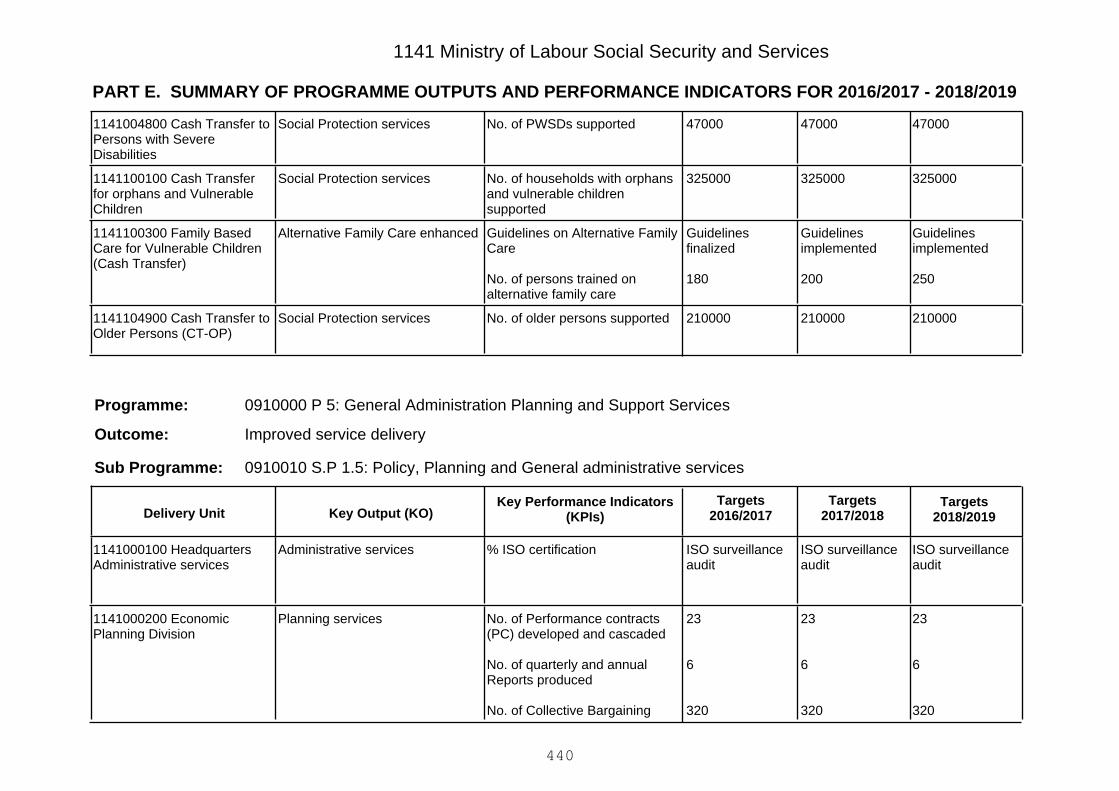
PART E. SUMMARY OF PROGRAMME OUTPUTS AND PERFORMANCE INDICATORS FOR 2016/2017 - 2018/2019
1141 Ministry of Labour Social Security and Services
470004700047000No. of PWSDs supportedSocial Protection services1141004800 Cash Transfer toPersons with SevereDisabilities
325000325000325000No. of households with orphansand vulnerable childrensupported
Social Protection services1141100100 Cash Transferfor orphans and VulnerableChildren
Guidelinesimplemented
250
Guidelinesimplemented
200
Guidelinesfinalized
180
Guidelines on Alternative FamilyCare
No. of persons trained onalternative family care
Alternative Family Care enhanced1141100300 Family BasedCare for Vulnerable Children(Cash Transfer)
210000210000210000No. of older persons supportedSocial Protection services1141104900 Cash Transfer toOlder Persons (CT-OP)
0910000 P 5: General Administration Planning and Support Services
Improved service delivery
Programme:
Outcome:
0910010 S.P 1.5: Policy, Planning and General administrative servicesSub Programme:
Key Output (KO)Targets
2018/2019Targets
2017/2018Key Performance Indicators
(KPIs)Targets
2016/2017Delivery Unit
ISO surveillanceaudit
ISO surveillanceaudit
ISO surveillanceaudit
% ISO certificationAdministrative services1141000100 HeadquartersAdministrative services
23
6
320
23
6
320
23
6
320
No. of Performance contracts(PC) developed and cascaded
No. of quarterly and annualReports produced
No. of Collective Bargaining
Planning services1141000200 EconomicPlanning Division
440
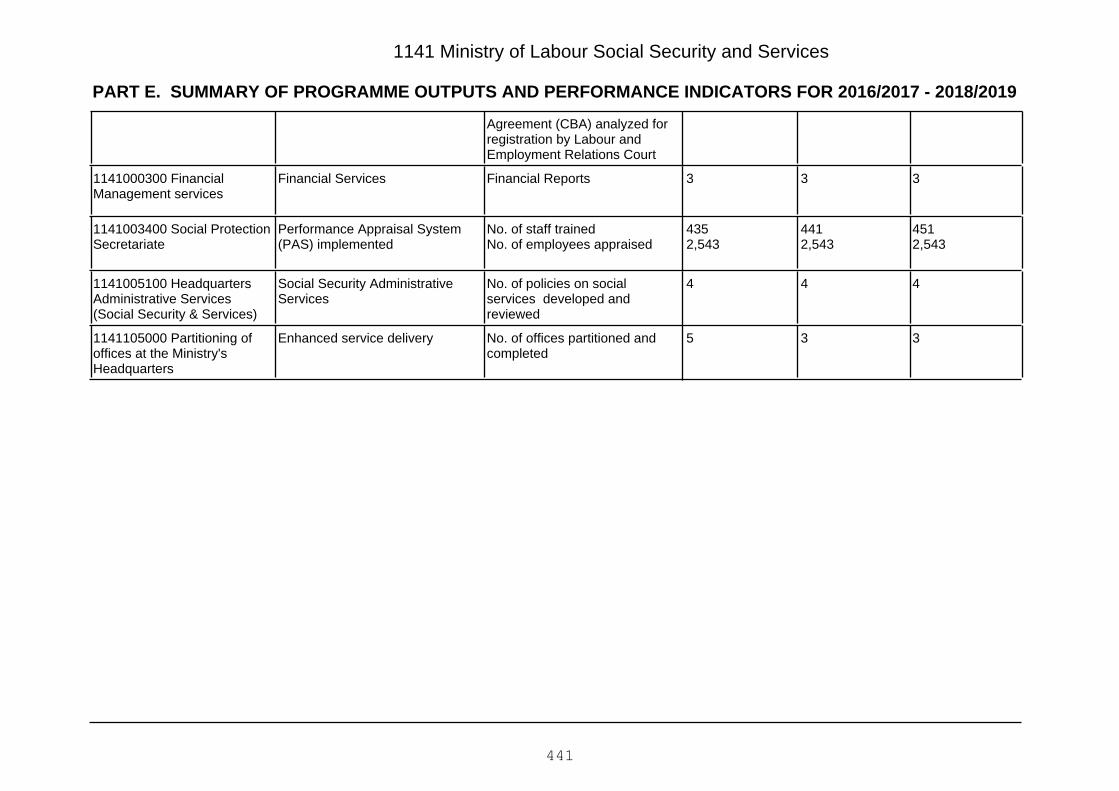
PART E. SUMMARY OF PROGRAMME OUTPUTS AND PERFORMANCE INDICATORS FOR 2016/2017 - 2018/2019
1141 Ministry of Labour Social Security and Services
Agreement (CBA) analyzed forregistration by Labour andEmployment Relations Court
333Financial ReportsFinancial Services1141000300 FinancialManagement services
4512,543
4412,543
4352,543
No. of staff trainedNo. of employees appraised
Performance Appraisal System(PAS) implemented
1141003400 Social ProtectionSecretariate
444No. of policies on socialservices developed andreviewed
Social Security AdministrativeServices
1141005100 HeadquartersAdministrative Services(Social Security & Services)
335No. of offices partitioned andcompleted
Enhanced service delivery1141105000 Partitioning ofoffices at the Ministry'sHeadquarters
441

Vote 1141 Ministry of Labour Social Security and Services
PART F: Summary of Expenditure by Programmes, 2016/2017 - 2018/2019
Programme
Estimates Projected Estimates
2016/2017 2017/2018 2018/2019
KShs. KShs. KShs.
0906010 S.P 1.1 Promotion of harmonious industrial relations 286,367,860 322,718,507 311,851,578
0906020 S.P 1.2: Regulation of Trade Unions 3,483,287 4,773,429 4,803,068
0906030 S.P 1.3: Provision of Occupational Safety and Health 203,438,889 211,469,721 238,643,571
0906000 P 1: Promotion of the Best Labour Practice 493,290,036 538,961,657 555,298,217
0907010 S.P 2.1 Human Resource Planning & Development 206,172,249 68,527,154 73,776,974
0907020 S.P 2.2 Provision of Industrial Skills 597,975,517 639,172,209 948,266,463
0907030 S.P 2.3 Employment Promotion 488,032,428 582,864,736 459,521,449
0907040 S.P 2.4 Productivity Promotion, Measurement & improvement 47,881,752 47,930,276 50,758,588
0907000 P 2: Manpower Development, Employment and Productivity Management 1,340,061,946 1,338,494,375 1,532,323,474
0908010 S.P 3.1: Social Welfare and vocational rehabilitation 1,063,768,768 1,023,881,363 1,012,711,190
0908020 S.P 3.2: Community Mobilization and development 152,377,022 156,045,022 160,358,216
0908030 S.P 3.3: Child Community Support Services 2,040,707,295 2,176,752,577 2,267,378,230
0908040 S.P 3.4: Child Rehabilitation and Custody 436,739,270 390,902,505 383,515,792
0908000 P 3: Social Development and Children Services 3,693,592,355 3,747,581,467 3,823,963,428
0909010 S.P 4.1: Social Assistance to Vulnerable Groups 18,930,643,677 19,014,045,949 19,016,073,597
0909000 P 4: National Social Safety Net 18,930,643,677 19,014,045,949 19,016,073,597
0910010 S.P 1.5: Policy, Planning and General administrative services 652,766,792 662,795,017 674,289,610
442

Vote 1141 Ministry of Labour Social Security and Services
PART F: Summary of Expenditure by Programmes, 2016/2017 - 2018/2019
Programme
Estimates Projected Estimates
2016/2017 2017/2018 2018/2019
0910000 P 5: General Administration Planning and Support Services 652,766,792 662,795,017 674,289,610Total Expenditure for Vote 1141 Ministry of Labour Social Security and Services 25,110,354,806 25,301,878,465 25,601,948,326
443

1141 Ministry of Labour Social Security and Services
PART G: Summary of Expenditure by Vote and Economic Classification, 2016/2017 - 2018/2019
Economic Classification
Estimates Projected Estimates
2016/2017 2017/2018 2018/2019KShs. KShs. KShs.
Current Expenditure 9,811,354,806 10,132,878,465 10,281,948,326
Compensation to Employees 1,653,086,142 1,701,189,459 1,742,971,163
Use of Goods and Services 1,956,782,613 2,114,986,203 2,191,224,437
Current Transfers to Govt. Agencies 6,156,341,484 6,277,708,167 6,307,266,463
Other Recurrent 45,144,567 38,994,636 40,486,263
Capital Expenditure 15,299,000,000 15,169,000,000 15,320,000,000
Acquisition of Non-Financial Assets 582,740,200 385,695,000 274,109,800
Capital Grants to Govt. Agencies 12,905,694,062 12,883,215,296 13,163,325,296
Other Development 1,810,565,738 1,900,089,704 1,882,564,904Total Expenditure 25,110,354,806 25,301,878,465 25,601,948,326
444

1141 Ministry of Labour Social Security and Services
PART H: Summary of Expenditure by Programme and Economic Classification, 2016/2017 - 2018/2019
0906010 S.P 1.1 Promotion of harmonious industrial relations
Economic Classification
Estimates Projected Estimates
2016/2017 2017/2018 2018/2019KShs. KShs. KShs.
Current Expenditure 263,867,860 274,718,507 285,361,578
Compensation to Employees 164,919,462 167,504,556 176,073,967
Use of Goods and Services 88,865,465 96,976,018 99,044,678
Current Transfers to Govt. Agencies 9,462,933 9,462,933 9,462,933
Other Recurrent 620,000 775,000 780,000
Capital Expenditure 22,500,000 48,000,000 26,490,000
Acquisition of Non-Financial Assets 22,500,000 48,000,000 26,490,000Total Expenditure 286,367,860 322,718,507 311,851,578
0906020 S.P 1.2: Regulation of Trade Unions
Economic Classification
Estimates Projected Estimates
2016/2017 2017/2018 2018/2019KShs. KShs. KShs.
Current Expenditure 3,483,287 4,773,429 4,803,068
Compensation to Employees 192,000 192,000 192,000
Use of Goods and Services 3,291,287 4,581,429 4,611,068Total Expenditure 3,483,287 4,773,429 4,803,068
0906030 S.P 1.3: Provision of Occupational Safety and Health
Economic Classification
Estimates Projected Estimates
2016/2017 2017/2018 2018/2019KShs. KShs. KShs.
Current Expenditure 159,938,889 173,869,721 180,143,571
Compensation to Employees 106,781,210 110,133,113 113,488,529
Use of Goods and Services 46,385,718 54,824,597 56,722,993
Current Transfers to Govt. Agencies 6,000,000 8,000,000 9,000,000
Other Recurrent 771,961 912,011 932,049
Capital Expenditure 43,500,000 37,600,000 58,500,000
445
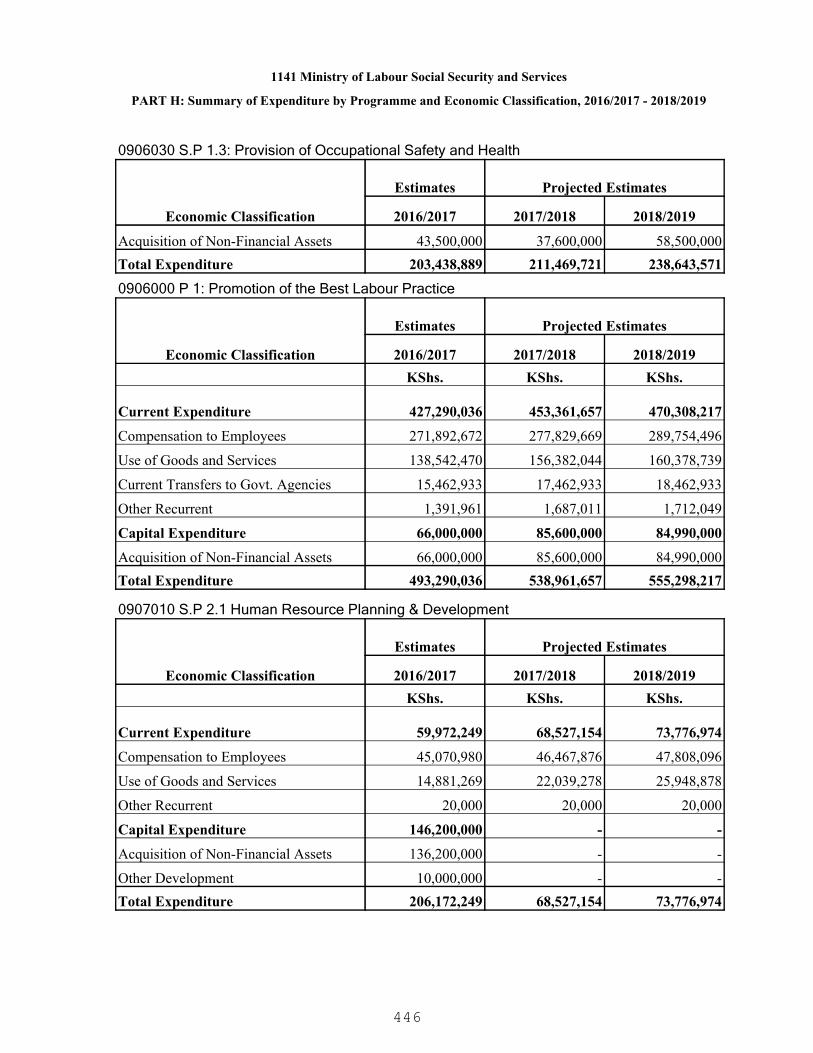
1141 Ministry of Labour Social Security and Services
PART H: Summary of Expenditure by Programme and Economic Classification, 2016/2017 - 2018/2019
0906030 S.P 1.3: Provision of Occupational Safety and Health
Economic Classification
Estimates Projected Estimates
2016/2017 2017/2018 2018/2019
Acquisition of Non-Financial Assets 43,500,000 37,600,000 58,500,000Total Expenditure 203,438,889 211,469,721 238,643,571
0906000 P 1: Promotion of the Best Labour Practice
Economic Classification
Estimates Projected Estimates
2016/2017 2017/2018 2018/2019KShs. KShs. KShs.
Current Expenditure 427,290,036 453,361,657 470,308,217
Compensation to Employees 271,892,672 277,829,669 289,754,496
Use of Goods and Services 138,542,470 156,382,044 160,378,739
Current Transfers to Govt. Agencies 15,462,933 17,462,933 18,462,933
Other Recurrent 1,391,961 1,687,011 1,712,049
Capital Expenditure 66,000,000 85,600,000 84,990,000
Acquisition of Non-Financial Assets 66,000,000 85,600,000 84,990,000Total Expenditure 493,290,036 538,961,657 555,298,217
0907010 S.P 2.1 Human Resource Planning & Development
Economic Classification
Estimates Projected Estimates
2016/2017 2017/2018 2018/2019KShs. KShs. KShs.
Current Expenditure 59,972,249 68,527,154 73,776,974
Compensation to Employees 45,070,980 46,467,876 47,808,096
Use of Goods and Services 14,881,269 22,039,278 25,948,878
Other Recurrent 20,000 20,000 20,000
Capital Expenditure 146,200,000 - -
Acquisition of Non-Financial Assets 136,200,000 - -
Other Development 10,000,000 - -Total Expenditure 206,172,249 68,527,154 73,776,974
446
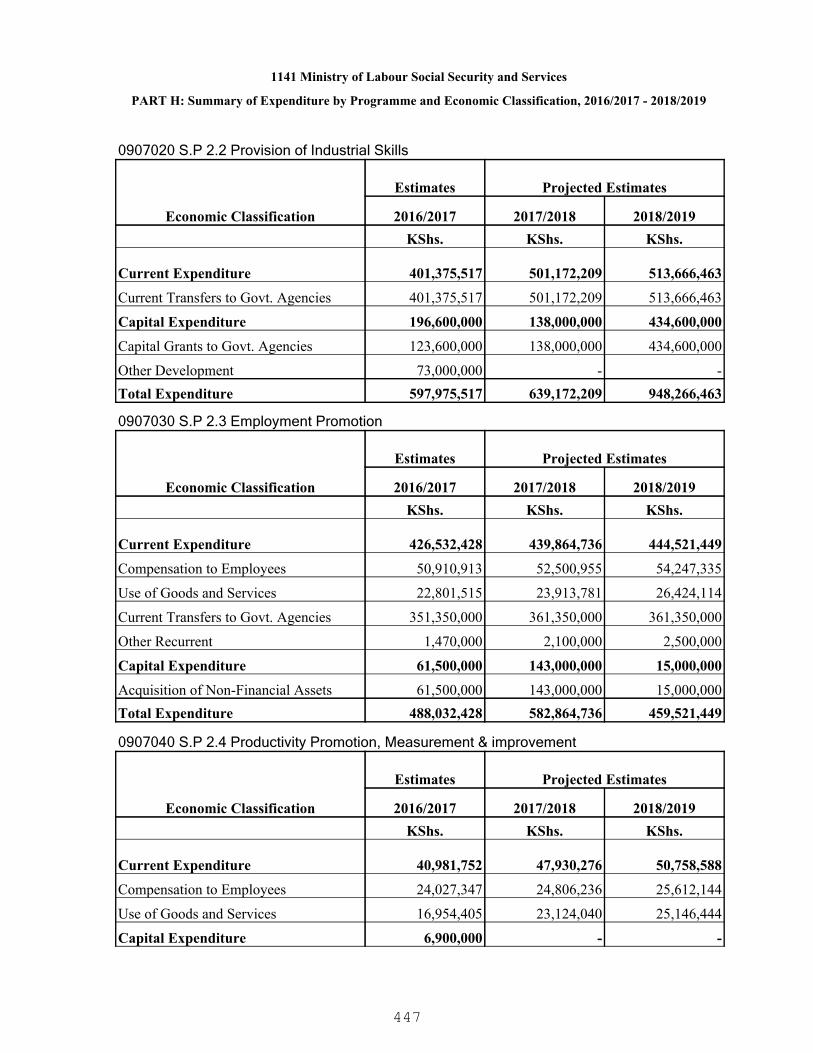
1141 Ministry of Labour Social Security and Services
PART H: Summary of Expenditure by Programme and Economic Classification, 2016/2017 - 2018/2019
0907020 S.P 2.2 Provision of Industrial Skills
Economic Classification
Estimates Projected Estimates
2016/2017 2017/2018 2018/2019KShs. KShs. KShs.
Current Expenditure 401,375,517 501,172,209 513,666,463
Current Transfers to Govt. Agencies 401,375,517 501,172,209 513,666,463
Capital Expenditure 196,600,000 138,000,000 434,600,000
Capital Grants to Govt. Agencies 123,600,000 138,000,000 434,600,000
Other Development 73,000,000 - -Total Expenditure 597,975,517 639,172,209 948,266,463
0907030 S.P 2.3 Employment Promotion
Economic Classification
Estimates Projected Estimates
2016/2017 2017/2018 2018/2019KShs. KShs. KShs.
Current Expenditure 426,532,428 439,864,736 444,521,449
Compensation to Employees 50,910,913 52,500,955 54,247,335
Use of Goods and Services 22,801,515 23,913,781 26,424,114
Current Transfers to Govt. Agencies 351,350,000 361,350,000 361,350,000
Other Recurrent 1,470,000 2,100,000 2,500,000
Capital Expenditure 61,500,000 143,000,000 15,000,000
Acquisition of Non-Financial Assets 61,500,000 143,000,000 15,000,000Total Expenditure 488,032,428 582,864,736 459,521,449
0907040 S.P 2.4 Productivity Promotion, Measurement & improvement
Economic Classification
Estimates Projected Estimates
2016/2017 2017/2018 2018/2019KShs. KShs. KShs.
Current Expenditure 40,981,752 47,930,276 50,758,588
Compensation to Employees 24,027,347 24,806,236 25,612,144
Use of Goods and Services 16,954,405 23,124,040 25,146,444
Capital Expenditure 6,900,000 - -
447

1141 Ministry of Labour Social Security and Services
PART H: Summary of Expenditure by Programme and Economic Classification, 2016/2017 - 2018/2019
0907040 S.P 2.4 Productivity Promotion, Measurement & improvement
Economic Classification
Estimates Projected Estimates
2016/2017 2017/2018 2018/2019
Acquisition of Non-Financial Assets 6,900,000 - -Total Expenditure 47,881,752 47,930,276 50,758,588
0907000 P 2: Manpower Development, Employment and Productivity Management
Economic Classification
Estimates Projected Estimates
2016/2017 2017/2018 2018/2019KShs. KShs. KShs.
Current Expenditure 928,861,946 1,057,494,375 1,082,723,474
Compensation to Employees 120,009,240 123,775,067 127,667,575
Use of Goods and Services 54,637,189 69,077,099 77,519,436
Current Transfers to Govt. Agencies 752,725,517 862,522,209 875,016,463
Other Recurrent 1,490,000 2,120,000 2,520,000
Capital Expenditure 411,200,000 281,000,000 449,600,000
Acquisition of Non-Financial Assets 204,600,000 143,000,000 15,000,000
Capital Grants to Govt. Agencies 123,600,000 138,000,000 434,600,000
Other Development 83,000,000 - -Total Expenditure 1,340,061,946 1,338,494,375 1,532,323,474
0908010 S.P 3.1: Social Welfare and vocational rehabilitation
Economic Classification
Estimates Projected Estimates
2016/2017 2017/2018 2018/2019KShs. KShs. KShs.
Current Expenditure 717,268,768 629,381,363 628,711,190
Compensation to Employees 375,458,502 385,972,565 388,353,375
Use of Goods and Services 129,935,056 53,408,798 44,293,773
Current Transfers to Govt. Agencies 200,400,000 190,000,000 196,064,042
Other Recurrent 11,475,210 - -
Capital Expenditure 346,500,000 394,500,000 384,000,000
Acquisition of Non-Financial Assets 87,500,000 90,500,000 80,000,000
448
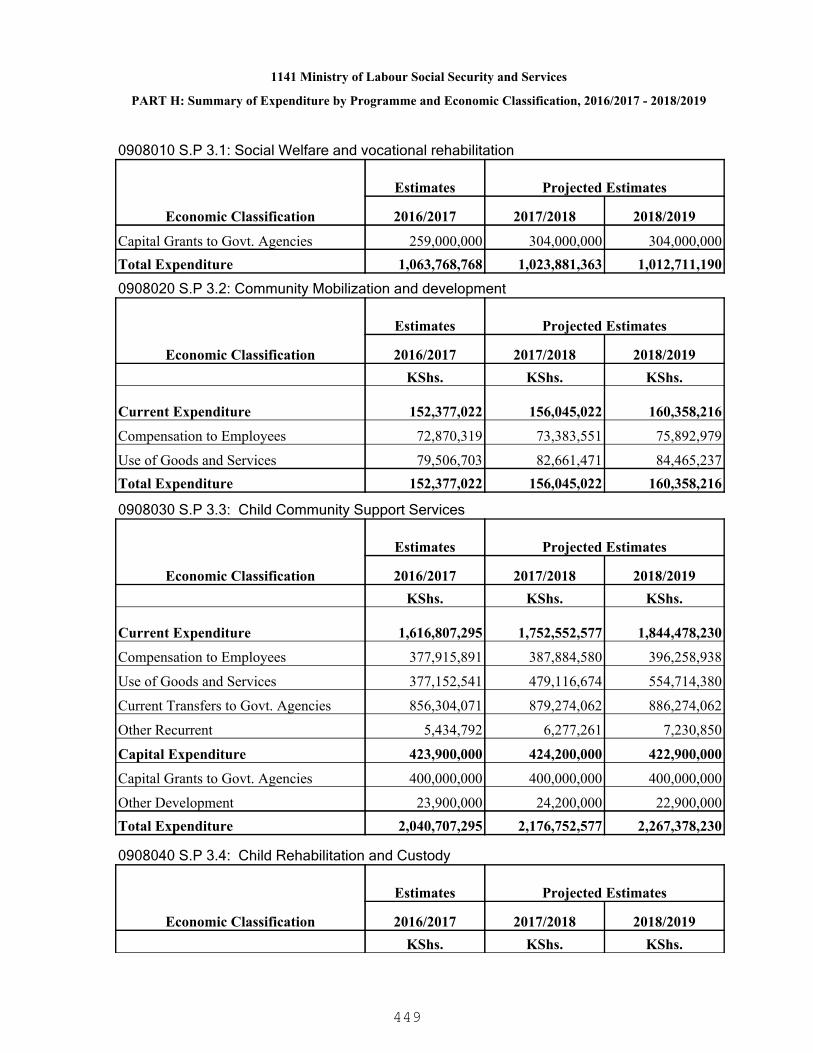
1141 Ministry of Labour Social Security and Services
PART H: Summary of Expenditure by Programme and Economic Classification, 2016/2017 - 2018/2019
0908010 S.P 3.1: Social Welfare and vocational rehabilitation
Economic Classification
Estimates Projected Estimates
2016/2017 2017/2018 2018/2019
Capital Grants to Govt. Agencies 259,000,000 304,000,000 304,000,000Total Expenditure 1,063,768,768 1,023,881,363 1,012,711,190
0908020 S.P 3.2: Community Mobilization and development
Economic Classification
Estimates Projected Estimates
2016/2017 2017/2018 2018/2019KShs. KShs. KShs.
Current Expenditure 152,377,022 156,045,022 160,358,216
Compensation to Employees 72,870,319 73,383,551 75,892,979
Use of Goods and Services 79,506,703 82,661,471 84,465,237Total Expenditure 152,377,022 156,045,022 160,358,216
0908030 S.P 3.3: Child Community Support Services
Economic Classification
Estimates Projected Estimates
2016/2017 2017/2018 2018/2019KShs. KShs. KShs.
Current Expenditure 1,616,807,295 1,752,552,577 1,844,478,230
Compensation to Employees 377,915,891 387,884,580 396,258,938
Use of Goods and Services 377,152,541 479,116,674 554,714,380
Current Transfers to Govt. Agencies 856,304,071 879,274,062 886,274,062
Other Recurrent 5,434,792 6,277,261 7,230,850
Capital Expenditure 423,900,000 424,200,000 422,900,000
Capital Grants to Govt. Agencies 400,000,000 400,000,000 400,000,000
Other Development 23,900,000 24,200,000 22,900,000Total Expenditure 2,040,707,295 2,176,752,577 2,267,378,230
0908040 S.P 3.4: Child Rehabilitation and Custody
Economic Classification
Estimates Projected Estimates
2016/2017 2017/2018 2018/2019KShs. KShs. KShs.
449

1141 Ministry of Labour Social Security and Services
PART H: Summary of Expenditure by Programme and Economic Classification, 2016/2017 - 2018/2019
0908040 S.P 3.4: Child Rehabilitation and Custody
Economic Classification
Estimates Projected Estimates
2016/2017 2017/2018 2018/2019
Current Expenditure 356,339,270 383,402,505 383,515,792
Compensation to Employees 163,333,655 167,639,522 172,159,742
Use of Goods and Services 191,709,615 214,463,983 210,083,050
Other Recurrent 1,296,000 1,299,000 1,273,000
Capital Expenditure 80,400,000 7,500,000 -
Acquisition of Non-Financial Assets 80,400,000 7,500,000 -Total Expenditure 436,739,270 390,902,505 383,515,792
0908000 P 3: Social Development and Children Services
Economic Classification
Estimates Projected Estimates
2016/2017 2017/2018 2018/2019KShs. KShs. KShs.
Current Expenditure 2,842,792,355 2,921,381,467 3,017,063,428
Compensation to Employees 989,578,367 1,014,880,218 1,032,665,034
Use of Goods and Services 778,303,915 829,650,926 893,556,440
Current Transfers to Govt. Agencies 1,056,704,071 1,069,274,062 1,082,338,104
Other Recurrent 18,206,002 7,576,261 8,503,850
Capital Expenditure 850,800,000 826,200,000 806,900,000
Acquisition of Non-Financial Assets 167,900,000 98,000,000 80,000,000
Capital Grants to Govt. Agencies 659,000,000 704,000,000 704,000,000
Other Development 23,900,000 24,200,000 22,900,000Total Expenditure 3,693,592,355 3,747,581,467 3,823,963,428
0909010 S.P 4.1: Social Assistance to Vulnerable Groups
Economic Classification
Estimates Projected Estimates
2016/2017 2017/2018 2018/2019KShs. KShs. KShs.
Current Expenditure 4,963,643,677 5,040,645,949 5,040,363,597
Compensation to Employees 16,512,500 21,711,875 21,800,000
450

1141 Ministry of Labour Social Security and Services
PART H: Summary of Expenditure by Programme and Economic Classification, 2016/2017 - 2018/2019
0909010 S.P 4.1: Social Assistance to Vulnerable Groups
Economic Classification
Estimates Projected Estimates
2016/2017 2017/2018 2018/2019
Use of Goods and Services 593,560,214 664,871,001 661,404,634
Current Transfers to Govt. Agencies 4,331,448,963 4,328,448,963 4,331,448,963
Other Recurrent 22,122,000 25,614,110 25,710,000
Capital Expenditure 13,967,000,000 13,973,400,000 13,975,710,000
Acquisition of Non-Financial Assets 140,240,200 56,295,000 91,319,800
Capital Grants to Govt. Agencies 12,123,094,062 12,041,215,296 12,024,725,296
Other Development 1,703,665,738 1,875,889,704 1,859,664,904Total Expenditure 18,930,643,677 19,014,045,949 19,016,073,597
0909000 P 4: National Social Safety Net
Economic Classification
Estimates Projected Estimates
2016/2017 2017/2018 2018/2019KShs. KShs. KShs.
Current Expenditure 4,963,643,677 5,040,645,949 5,040,363,597
Compensation to Employees 16,512,500 21,711,875 21,800,000
Use of Goods and Services 593,560,214 664,871,001 661,404,634
Current Transfers to Govt. Agencies 4,331,448,963 4,328,448,963 4,331,448,963
Other Recurrent 22,122,000 25,614,110 25,710,000
Capital Expenditure 13,967,000,000 13,973,400,000 13,975,710,000
Acquisition of Non-Financial Assets 140,240,200 56,295,000 91,319,800
Capital Grants to Govt. Agencies 12,123,094,062 12,041,215,296 12,024,725,296
Other Development 1,703,665,738 1,875,889,704 1,859,664,904Total Expenditure 18,930,643,677 19,014,045,949 19,016,073,597
0910010 S.P 1.5: Policy, Planning and General administrative services
Economic Classification
Estimates Projected Estimates
2016/2017 2017/2018 2018/2019KShs. KShs. KShs.
Current Expenditure 648,766,792 659,995,017 671,489,610
451
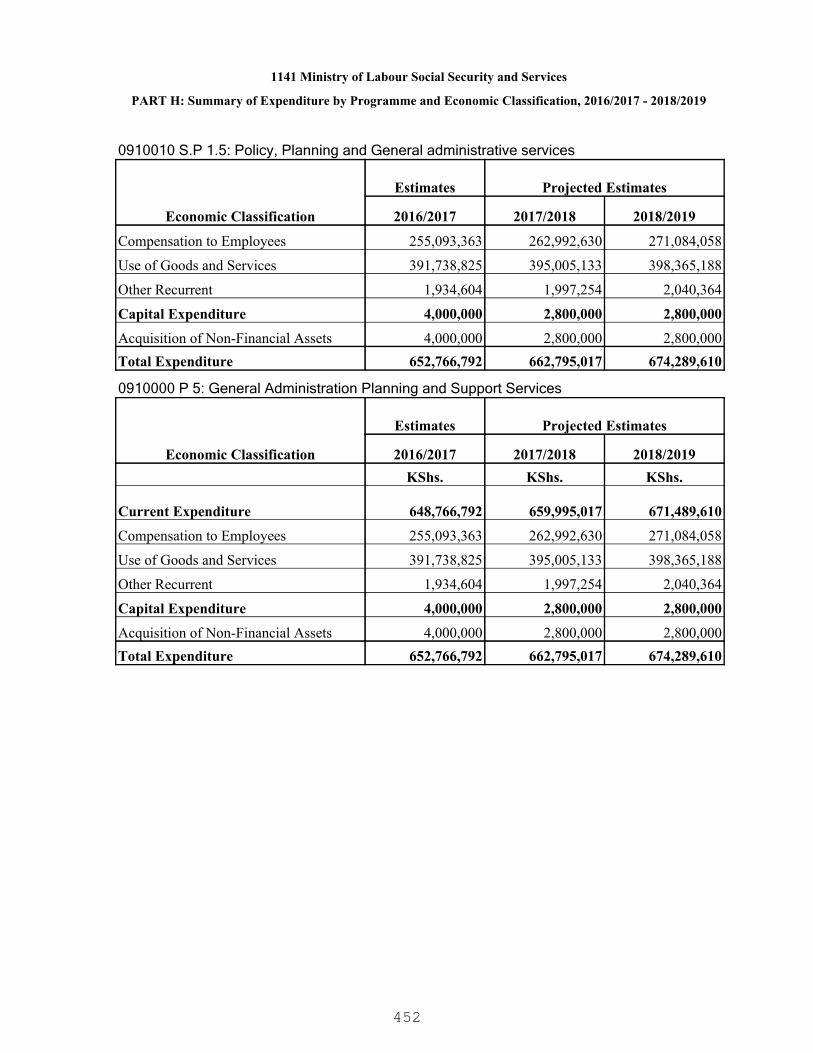
1141 Ministry of Labour Social Security and Services
PART H: Summary of Expenditure by Programme and Economic Classification, 2016/2017 - 2018/2019
0910010 S.P 1.5: Policy, Planning and General administrative services
Economic Classification
Estimates Projected Estimates
2016/2017 2017/2018 2018/2019
Compensation to Employees 255,093,363 262,992,630 271,084,058
Use of Goods and Services 391,738,825 395,005,133 398,365,188
Other Recurrent 1,934,604 1,997,254 2,040,364
Capital Expenditure 4,000,000 2,800,000 2,800,000
Acquisition of Non-Financial Assets 4,000,000 2,800,000 2,800,000Total Expenditure 652,766,792 662,795,017 674,289,610
0910000 P 5: General Administration Planning and Support Services
Economic Classification
Estimates Projected Estimates
2016/2017 2017/2018 2018/2019KShs. KShs. KShs.
Current Expenditure 648,766,792 659,995,017 671,489,610
Compensation to Employees 255,093,363 262,992,630 271,084,058
Use of Goods and Services 391,738,825 395,005,133 398,365,188
Other Recurrent 1,934,604 1,997,254 2,040,364
Capital Expenditure 4,000,000 2,800,000 2,800,000
Acquisition of Non-Financial Assets 4,000,000 2,800,000 2,800,000Total Expenditure 652,766,792 662,795,017 674,289,610
452
1151 Ministry of Energy and Petroleum
Affordable quality energy for all Kenyan
To facilitate provision of clean, sustainable, affordable, competitive, reliable and secureenergy services at least cost while protecting the environment.
PART A. Vision
PART B. Mission
PART C. Performance Overview and Background for Programme(s) Funding
The Ministry of Energy and Petroleum ( MOEP) is mandated to develop energy policy, hydroand thermal power generation, Geothermal exploration, oil and gas exploration, ruralelectrification programme, management of petroleum products, renewable energy promotionand energy regulation among others.
The Ministry was allocated KSh. 82,309 million in the financial year 2012/13, KSh.73,663million in the financial year 2013/14 and KSh. 90,325 million in the financial year 2014/15.The expenditure fluctuated on the same trend from KSh. 65,020 million, KSh. 54,656 millionand KSh. 57,031 million for 2012/13, 2013/14 and 2014/15 FYs respectively. Recurrentbudget has been going down from KSh. 2,448 million, KSh. 2,355 million and KSh. 2,022million in the F/Y 2012/13, 2013/14 and 2014/2015 respectively while Development budgethas been fluctuating from KSh. 79,870 million to KSh. 71,327 million and KSh. 88,326 millionin the said financial years. Recurrent expenditure has been fluctuating from KSh. 2,092million to KSh. 1,833 million and KSh. 2,011 million respectively for the years under review.On the other hand, the absorption rate for development budget has been 79%, 76% and 62%respectively in the period under review.
The Ministry and its agencies utilized these resources to generate 592 MW and commissionof 280 MW Olkaria I and IV Geothermal project; Olkaria I & IV steam field development;Olkaria IV Units 1 & 2 Power Plant which are under defect liability period. In addition, 6.8MWand 13.6MW Ngong Wind Project was commissioned. Development of Nuclear EnergyProgram established Kenya Nuclear Energy Board (KNEB) secretariat and inter-ministerialcommittee to assist in drafting nuclear legislation. Several Stakeholder meetings were held toeducate, inform and broaden information of nuclear energy, both at County and Nationallevel. The Ministry also constructed 469.5 km of electricity transmission lines that is; 34 km1 3 2 k V M u m i a s - R a n g a l a , 3 0 k m 1 3 2 k V T h i k a - G a t u n d u , 7 7 k m 1 2 k VKilimambogo–Thika–Githambo, 328.5 km 220kV Rabai-Malindi-Garsen-Lamu. In addition2,326 km of transmission lines were started and additional 1,632 km with committed fundingwas prepared for implementation.During the period under review 1,576,772 new customerswere connected to electricity. Factors contributing to this included increased availability ofloans to prospective customers, a Ksh.2.7 billion government subsidy applied in the firstquarter of FY 2013/14, an increase in number of new applications received and intensifiedmobilization of resources to accelerate new connections. 14,619 Public Primary schools wereconnected to electricity and solar PVs from July, 2013 to 30th June, 2015.
Renewable and Alternative Energy Technologies distributed 250 Solar Home Systems, 155public institutions installed with Solar PV systems, 348 solar PVs completed andcommissioned, 16 wind turbine systems installed to existing solar water pumps 1 biogassystem completed at Kaimosi Teachers College, 295 ha re-aforestrated (Ndoinet- 85.4ha,
453
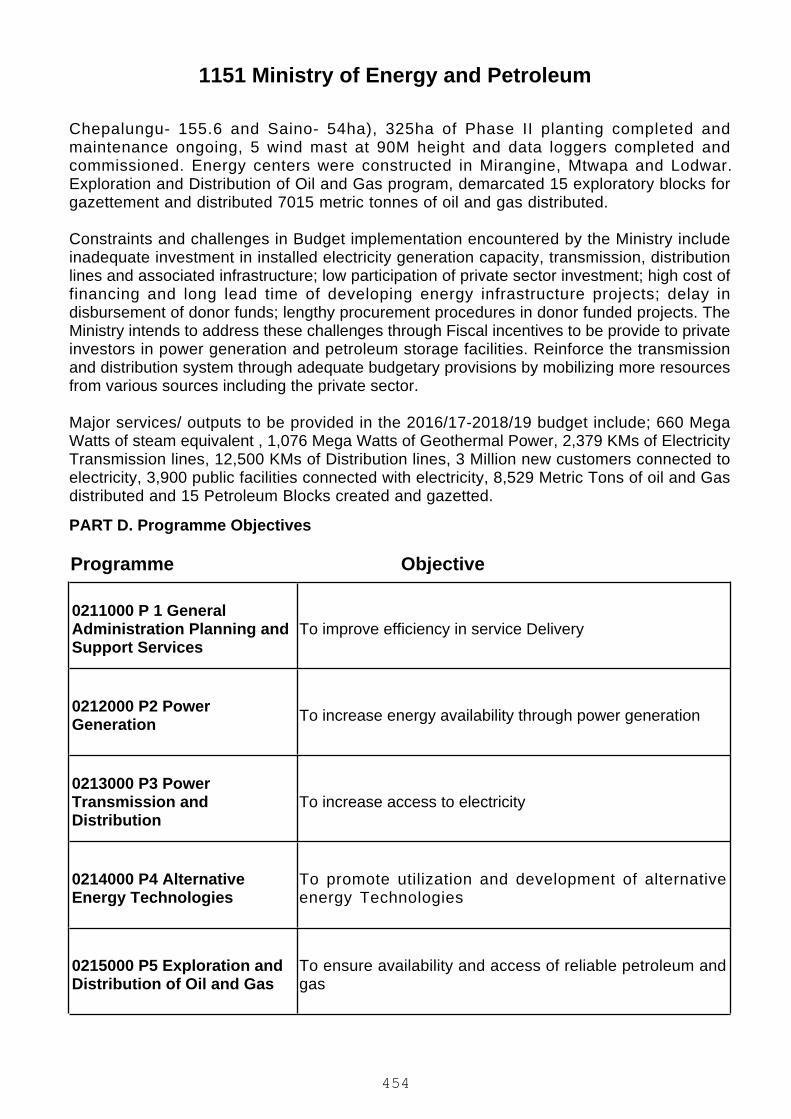
1151 Ministry of Energy and Petroleum
PART D. Programme Objectives
Chepalungu- 155.6 and Saino- 54ha), 325ha of Phase II planting completed andmaintenance ongoing, 5 wind mast at 90M height and data loggers completed andcommissioned. Energy centers were constructed in Mirangine, Mtwapa and Lodwar.Exploration and Distribution of Oil and Gas program, demarcated 15 exploratory blocks forgazettement and distributed 7015 metric tonnes of oil and gas distributed.
Constraints and challenges in Budget implementation encountered by the Ministry includeinadequate investment in installed electricity generation capacity, transmission, distributionlines and associated infrastructure; low participation of private sector investment; high cost offinancing and long lead time of developing energy infrastructure projects; delay indisbursement of donor funds; lengthy procurement procedures in donor funded projects. TheMinistry intends to address these challenges through Fiscal incentives to be provide to privateinvestors in power generation and petroleum storage facilities. Reinforce the transmissionand distribution system through adequate budgetary provisions by mobilizing more resourcesfrom various sources including the private sector.
Major services/ outputs to be provided in the 2016/17-2018/19 budget include; 660 MegaWatts of steam equivalent , 1,076 Mega Watts of Geothermal Power, 2,379 KMs of ElectricityTransmission lines, 12,500 KMs of Distribution lines, 3 Million new customers connected toelectricity, 3,900 public facilities connected with electricity, 8,529 Metric Tons of oil and Gasdistributed and 15 Petroleum Blocks created and gazetted.
ObjectiveProgramme
0211000 P 1 GeneralAdministration Planning andSupport Services
To improve efficiency in service Delivery
0212000 P2 PowerGeneration To increase energy availability through power generation
0213000 P3 PowerTransmission andDistribution
To increase access to electricity
0214000 P4 AlternativeEnergy Technologies
To promote utilization and development of alternativeenergy Technologies
0215000 P5 Exploration andDistribution of Oil and Gas
To ensure availability and access of reliable petroleum andgas
454

PART E. SUMMARY OF PROGRAMME OUTPUTS AND PERFORMANCE INDICATORS FOR 2016/2017 - 2018/2019
1151 Ministry of Energy and Petroleum
0211000 P 1 General Administration Planning and Support Services
Improved and efficient administrative,financial and planning support services
Programme:
Outcome:
0211010 SP1 Administrative ServicesSub Programme:
Key Output (KO)Targets
2018/2019Targets
2017/2018Key Performance Indicators
(KPIs)Targets
2016/2017Delivery Unit
111No. of Bills developedAdministrative Services1151000100 HeadquartersAdministrative Services
444No. of Monitoring andEvaluation reports
Planning Services1151000200 HeadquartersAdministration and PlanningServices
1
1
1
1
1
1
1
1
1
No. of Sector reports
Draft Estimates
Supplementary Estimates
Financial Services1151000300 FinancialManagement andProcurement Services
001No. of Energy Master Plansdeveloped
Energy Master Plan1151100600 TechnicalAssistance to Ministry
101010No. of Officers trainedOfficers Trained1151101900 Kenya ElectricityExpansion Project
10%10%80%Integrated Energy ManagementSystem (IEMS)
Integrated Energy ManagementSystem (IEMS)
1151110600 IntegratedEnergy Sector InformationManagement System Project
455
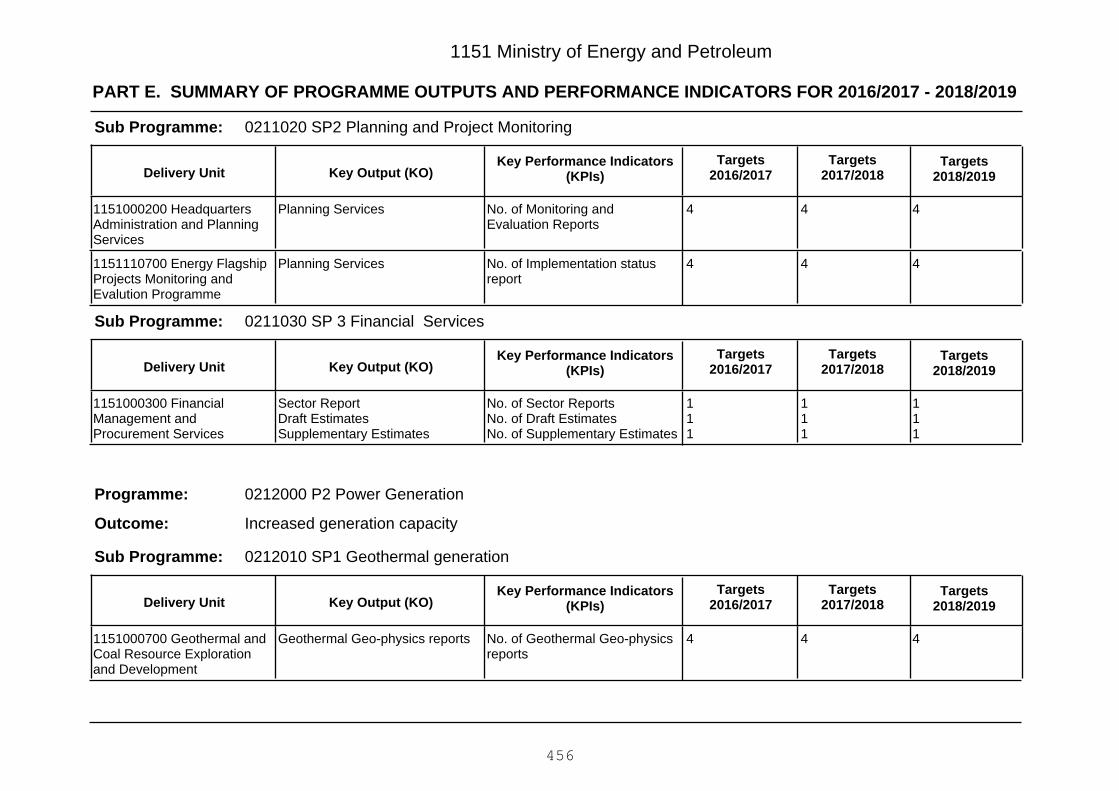
PART E. SUMMARY OF PROGRAMME OUTPUTS AND PERFORMANCE INDICATORS FOR 2016/2017 - 2018/2019
1151 Ministry of Energy and Petroleum
0211020 SP2 Planning and Project MonitoringSub Programme:
Key Output (KO)Targets
2018/2019Targets
2017/2018Key Performance Indicators
(KPIs)Targets
2016/2017Delivery Unit
444No. of Monitoring andEvaluation Reports
Planning Services1151000200 HeadquartersAdministration and PlanningServices
444No. of Implementation statusreport
Planning Services1151110700 Energy FlagshipProjects Monitoring andEvalution Programme
0211030 SP 3 Financial ServicesSub Programme:
Key Output (KO)Targets
2018/2019Targets
2017/2018Key Performance Indicators
(KPIs)Targets
2016/2017Delivery Unit
111
111
111
No. of Sector ReportsNo. of Draft EstimatesNo. of Supplementary Estimates
Sector ReportDraft EstimatesSupplementary Estimates
1151000300 FinancialManagement andProcurement Services
0212000 P2 Power Generation
Increased generation capacity
Programme:
Outcome:
0212010 SP1 Geothermal generationSub Programme:
Key Output (KO)Targets
2018/2019Targets
2017/2018Key Performance Indicators
(KPIs)Targets
2016/2017Delivery Unit
444No. of Geothermal Geo-physicsreports
Geothermal Geo-physics reports1151000700 Geothermal andCoal Resource Explorationand Development
456

PART E. SUMMARY OF PROGRAMME OUTPUTS AND PERFORMANCE INDICATORS FOR 2016/2017 - 2018/2019
1151 Ministry of Energy and Petroleum
160
12
100
10
50
10
MW of steam equivalentgenerated
No. of Geothermal wells drilled
MW of Steam
Geothermal wells
1151100500 Bogoria SilaliGeothermal Project
1055No. of MW of Power GeneratedMW of Power1151100800 Olkaria I and IV
201510MW of Power GeneratedMW of power1151100900 Support for theDevelopment of RenewableEnergy (GDC)
040
030
025
MW of power generatedNumbers of officer trained onplant maintenance
MW of power1151101900 Kenya ElectricityExpansion Project
41710512
357024
237014
MW of steam equivalentgeneratedMW of power generatedNo. of Geothermal wells drilled
Steam generatedPower generatedGeothermal wells
1151102500 MenengaiGeothermal DevelopmentProject
14000Number of MW of powergenerated
Power generated1151107300 Olkaria V(Geothermal)
444434Number of wells drilled Geothermal wells1151107700 460MWMenengai Project
10500Number MW of powergenerated
Power generated1151110300 GeothermalProjects
185150120Number of Persons trained inNuclear related courses
Persons trained1151110400 NuclearResource Exploration andDevelopment
0212020 SP2 Development of Nuclear EnergySub Programme:
Key Output (KO)Targets
2018/2019Targets
2017/2018Key Performance Indicators
(KPIs)Targets
2016/2017Delivery Unit
457
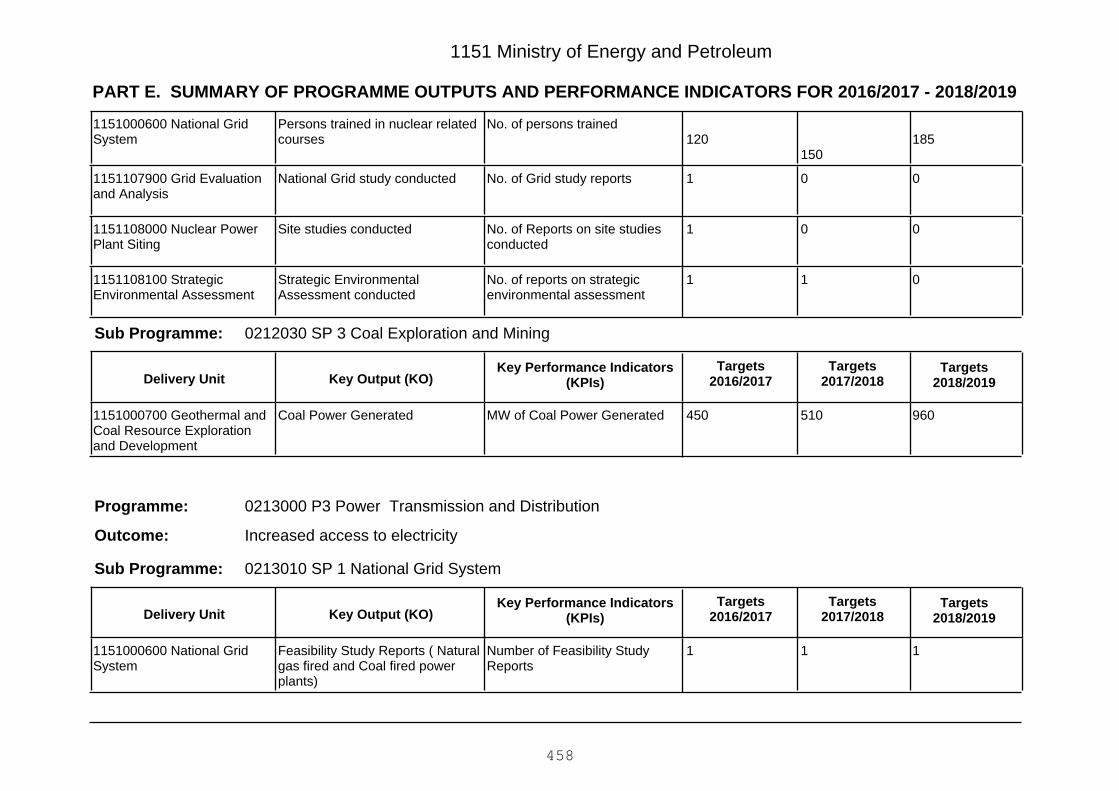
PART E. SUMMARY OF PROGRAMME OUTPUTS AND PERFORMANCE INDICATORS FOR 2016/2017 - 2018/2019
1151 Ministry of Energy and Petroleum
185150
120No. of persons trainedPersons trained in nuclear related
courses1151000600 National GridSystem
001No. of Grid study reportsNational Grid study conducted1151107900 Grid Evaluationand Analysis
001No. of Reports on site studiesconducted
Site studies conducted1151108000 Nuclear PowerPlant Siting
011No. of reports on strategicenvironmental assessment
Strategic EnvironmentalAssessment conducted
1151108100 StrategicEnvironmental Assessment
0212030 SP 3 Coal Exploration and MiningSub Programme:
Key Output (KO)Targets
2018/2019Targets
2017/2018Key Performance Indicators
(KPIs)Targets
2016/2017Delivery Unit
960510450MW of Coal Power GeneratedCoal Power Generated1151000700 Geothermal andCoal Resource Explorationand Development
0213000 P3 Power Transmission and Distribution
Increased access to electricity
Programme:
Outcome:
0213010 SP 1 National Grid SystemSub Programme:
Key Output (KO)Targets
2018/2019Targets
2017/2018Key Performance Indicators
(KPIs)Targets
2016/2017Delivery Unit
111Number of Feasibility StudyReports
Feasibility Study Reports ( Naturalgas fired and Coal fired powerplants)
1151000600 National GridSystem
458

PART E. SUMMARY OF PROGRAMME OUTPUTS AND PERFORMANCE INDICATORS FOR 2016/2017 - 2018/2019
1151 Ministry of Energy and Petroleum
000Number of National OutagesReliable and additional supply ofpower to the National Grid
1151100100 Juja RoadElectricity Power DistributionSubstation Project
000
000
5510
% of tower foundations done% of towers erected % of stringing done
132kV transmission lines1151100200 Nanyuki-Isiolo-Meru
0203000
3555603570
4525104530
% of tower foundations done% of towers erected% of stringing done% of civil works done% of electromechanical works
132kV transmission lines1151100300 SonduHomabayNdhiwa Awendo ElectrificationProject
00000
00000
45651003575
% of tower foundations done% of towers erected% of stringing done % of civil works done% of electromechanical works
400kV transmission line andsubstation
1151100400 Loiyangalani -Suswa transmission line
101010No. of officers trainedTechnical Capacity build1151100600 TechnicalAssistance to Ministry
000
000
269
%. of tower foundations done%. of towers erected% of stringing done
400/220kV transmission line and220kV substations
1151100700 Transmissionline Mombasa-Nairobi
00
2550
4530
% of civil works done% of electromechanical works
220KV substations1151101000 Nairobi 220KVRing
600500150No. of customers connectedCustomers Connected1151101100 The Scaling - UpAccess To Energy Project
000
254590
705510
% of tower foundations done% of towers erected% of stringing done
300km 400/220kV transmissionline and 220kV substation
1151101400 Olkaria LessosKisumu Power LinesConstruction Project
459

PART E. SUMMARY OF PROGRAMME OUTPUTS AND PERFORMANCE INDICATORS FOR 2016/2017 - 2018/2019
1151 Ministry of Energy and Petroleum
00
2080
6520
% of civil works done% of electromechanical works
00000
00000
515701530
% of tower foundations done% of towers erected% of stringing done% of civil works done% of electromechanical works
220kV transmission lines and twosubstations
1151101600 Turkwell- Ortum-Kitale
010No. of Sub Station constructedSub Station1151101800 Nairobi 132kvAnd 66kv Network UgradeAnd Reinforcement
005No. of sub stations constructedSub Station1151101900 Kenya ElectricityExpansion Project
0700010
5530206580
450753510
% of civil works done% of electromechanical works%. of tower foundations done%. of towers erected% of stringing done
2000MW capacity 500kVConvertor StationHVDC transmission line
1151102000 EasternElectricity Highway Project(Ethiopia- KenyaInterconnector)
00000
1535601070
6555402530
% of tower foundations done% of towers erected% of stringing done% of civil works done% of electromechanical works
400kV transmission line and220kV substation
1151102700 InterconnectionProject of Electric Grids ofNile Equitorial lakes Co
600,000400,000383,000No. of new customersconnected
New customers connected1151103000 Last MileElectricity Connectivity
52090
605510
35250
% of tower foundations done% of towers erected% of stringing done
HVDC transmission line1151103400 Multi-NationalKenya-TZ PowerInterconnection Project
460
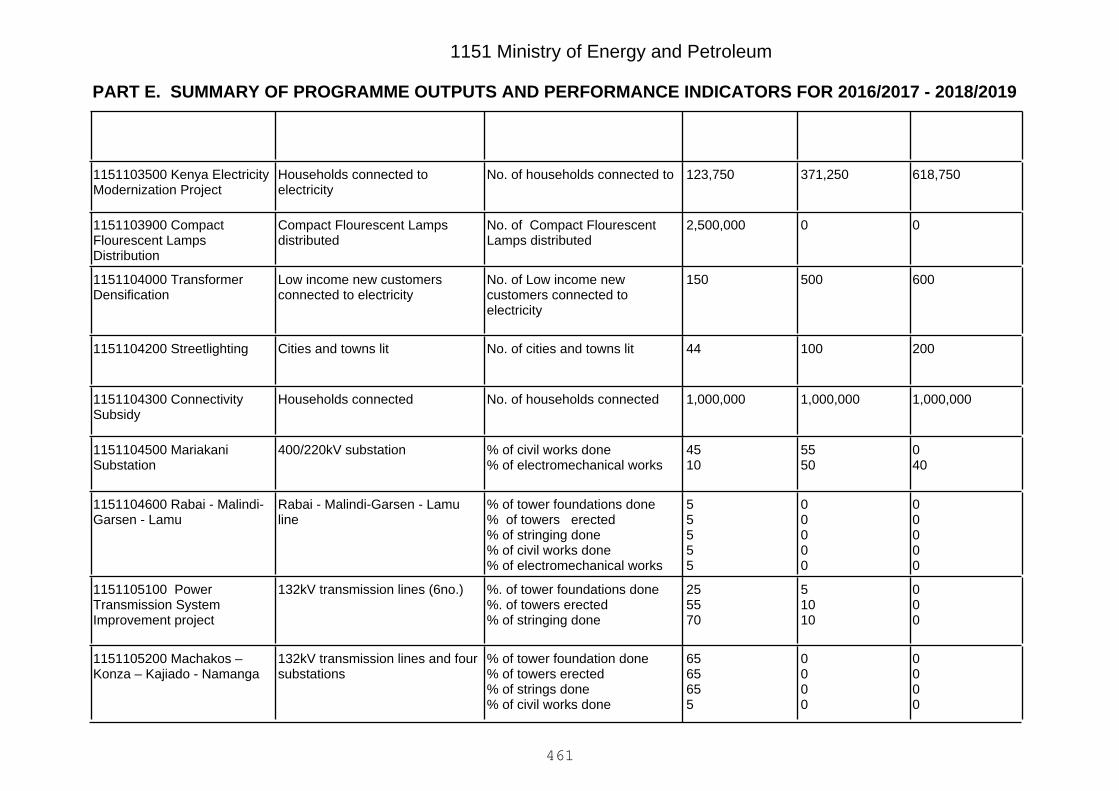
PART E. SUMMARY OF PROGRAMME OUTPUTS AND PERFORMANCE INDICATORS FOR 2016/2017 - 2018/2019
1151 Ministry of Energy and Petroleum
618,750371,250123,750No. of households connected toHouseholds connected toelectricity
1151103500 Kenya ElectricityModernization Project
002,500,000No. of Compact FlourescentLamps distributed
Compact Flourescent Lampsdistributed
1151103900 CompactFlourescent LampsDistribution
600500150No. of Low income newcustomers connected toelectricity
Low income new customersconnected to electricity
1151104000 TransformerDensification
20010044No. of cities and towns litCities and towns lit1151104200 Streetlighting
1,000,0001,000,0001,000,000No. of households connectedHouseholds connected1151104300 ConnectivitySubsidy
040
5550
4510
% of civil works done% of electromechanical works
400/220kV substation1151104500 MariakaniSubstation
00000
00000
55555
% of tower foundations done% of towers erected% of stringing done% of civil works done% of electromechanical works
Rabai - Malindi-Garsen - Lamuline
1151104600 Rabai - Malindi-Garsen - Lamu
000
51010
255570
%. of tower foundations done%. of towers erected% of stringing done
132kV transmission lines (6no.)1151105100 PowerTransmission SystemImprovement project
0000
0000
6565655
% of tower foundation done% of towers erected% of strings done% of civil works done
132kV transmission lines and foursubstations
1151105200 Machakos –Konza – Kajiado - Namanga
461

PART E. SUMMARY OF PROGRAMME OUTPUTS AND PERFORMANCE INDICATORS FOR 2016/2017 - 2018/2019
1151 Ministry of Energy and Petroleum
0030% of electro magnetic works
000
000
0010
%. of tower foundations done%. of towers erected% of stringing done
Menengai - Soilo transmissionline
1151105400 Menengai - Soilo
00
00
7716,323,200
No. of People compensatedAmount in Ksh forCompensation
Kilimambogo-Thika-Githambo line1151105800 Kilimambogo-Thika-Githambo
00
00
17511,929,984
No. of People compensatedAmount in Ksh. forCompensation
Mumias- Rang'ala line1151105900 Mumias-Rang'ala
0213020 SP2 Rural ElectrificationSub Programme:
Key Output (KO)Targets
2018/2019Targets
2017/2018Key Performance Indicators
(KPIs)Targets
2016/2017Delivery Unit
118296177No. of public facilities connectedPower connectivity in publicfacilities
1151000800 RuralElectrification Programme
0
00
0
0
00
0
420
8840
32
No. of KMs ConstructedNo. of trading centersconnectedNo. of health CentersconnectedNo. of households connected
Power connectivity in publicfacilities
1151101900 Kenya ElectricityExpansion Project
054
054
21054
No. of Panels installedNo. of MW generated
54 MW of solar power1151103300 KenyaDevelopment of Solar PowerPlants (Garissa)
033No. of off-grid Thermal hybridmini-grid implemented
Power connectivity in publicfacilities
1151103500 Kenya ElectricityModernization Project
462

PART E. SUMMARY OF PROGRAMME OUTPUTS AND PERFORMANCE INDICATORS FOR 2016/2017 - 2018/2019
1151 Ministry of Energy and Petroleum
500
18535023387
7,000
800
27625864285
17,500
1200
15444183289
10,500
No. of schools connectedNo. of market centersconnectedNo. of health centers connectedNo. of other public facilitiesconnectedNo. of households connected
Power connectivity in publicfacilities
1151106200 Electrification ofPublic Facilities
0
00
0
00
1
1200
No. of substations constructedNo. of KM of 66KV lineconstructedNo. of KM of 33KV lineconstructed
Two sub stations and anddistribution lines installed betweenTurkwel and Lokichar
1151106300 Turkwel -Lokichar 66KV Line
20001200800No. of solar projectsmaintained/serviced
Solar Projects maintained1151106600 SolarMaintenance Programme
008No. of Off grid Diesel PowerStations Constructed
Off grid Diesel Power Station1151106800 Off-grid DieselPower Stations
001,450No. of Transformers installed inconstituencies
Power connectivity1151110900 Installation ofTransformers inConstituencies
0214000 P4 Alternative Energy Technologies
Clean alternative energy sources to supplement the existing mix of energy
Programme:
Outcome:
0214010 SP 1 Alternative Energy TechnologiesSub Programme:
Key Output (KO)Targets
2018/2019Targets
2017/2018Key Performance Indicators
(KPIs)Targets
2016/2017Delivery Unit
609500500Hectares of Water catchmentre-afforested
Water catchment re-afforestedand maintained
1151000400 WoodfuelResources Development
463
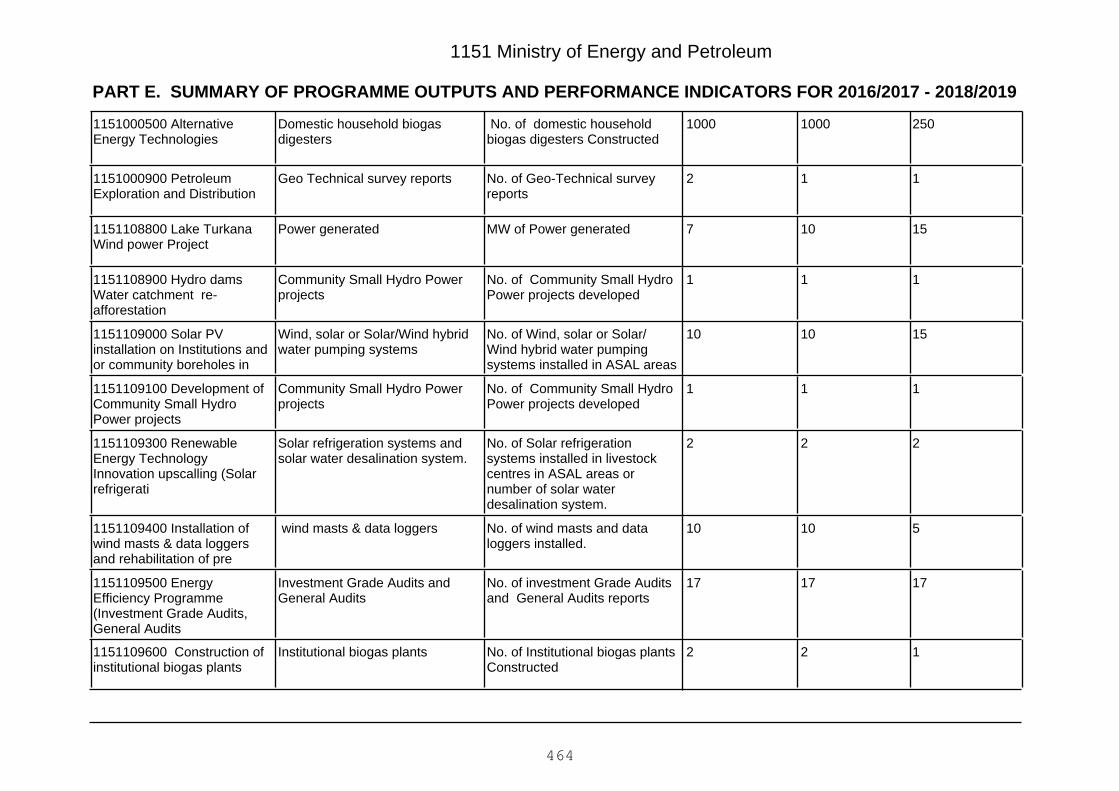
PART E. SUMMARY OF PROGRAMME OUTPUTS AND PERFORMANCE INDICATORS FOR 2016/2017 - 2018/2019
1151 Ministry of Energy and Petroleum
25010001000 No. of domestic householdbiogas digesters Constructed
Domestic household biogasdigesters
1151000500 AlternativeEnergy Technologies
112No. of Geo-Technical surveyreports
Geo Technical survey reports1151000900 PetroleumExploration and Distribution
15107MW of Power generatedPower generated1151108800 Lake TurkanaWind power Project
111No. of Community Small HydroPower projects developed
Community Small Hydro Powerprojects
1151108900 Hydro damsWater catchment re-afforestation
151010No. of Wind, solar or Solar/Wind hybrid water pumpingsystems installed in ASAL areas
Wind, solar or Solar/Wind hybridwater pumping systems
1151109000 Solar PVinstallation on Institutions andor community boreholes in
111No. of Community Small HydroPower projects developed
Community Small Hydro Powerprojects
1151109100 Development ofCommunity Small HydroPower projects
222No. of Solar refrigerationsystems installed in livestockcentres in ASAL areas ornumber of solar waterdesalination system.
Solar refrigeration systems andsolar water desalination system.
1151109300 RenewableEnergy TechnologyInnovation upscalling (Solarrefrigerati
51010No. of wind masts and dataloggers installed.
wind masts & data loggers1151109400 Installation ofwind masts & data loggersand rehabilitation of pre
171717No. of investment Grade Auditsand General Audits reports
Investment Grade Audits andGeneral Audits
1151109500 EnergyEfficiency Programme(Investment Grade Audits,General Audits
122No. of Institutional biogas plantsConstructed
Institutional biogas plants1151109600 Construction ofinstitutional biogas plants
464
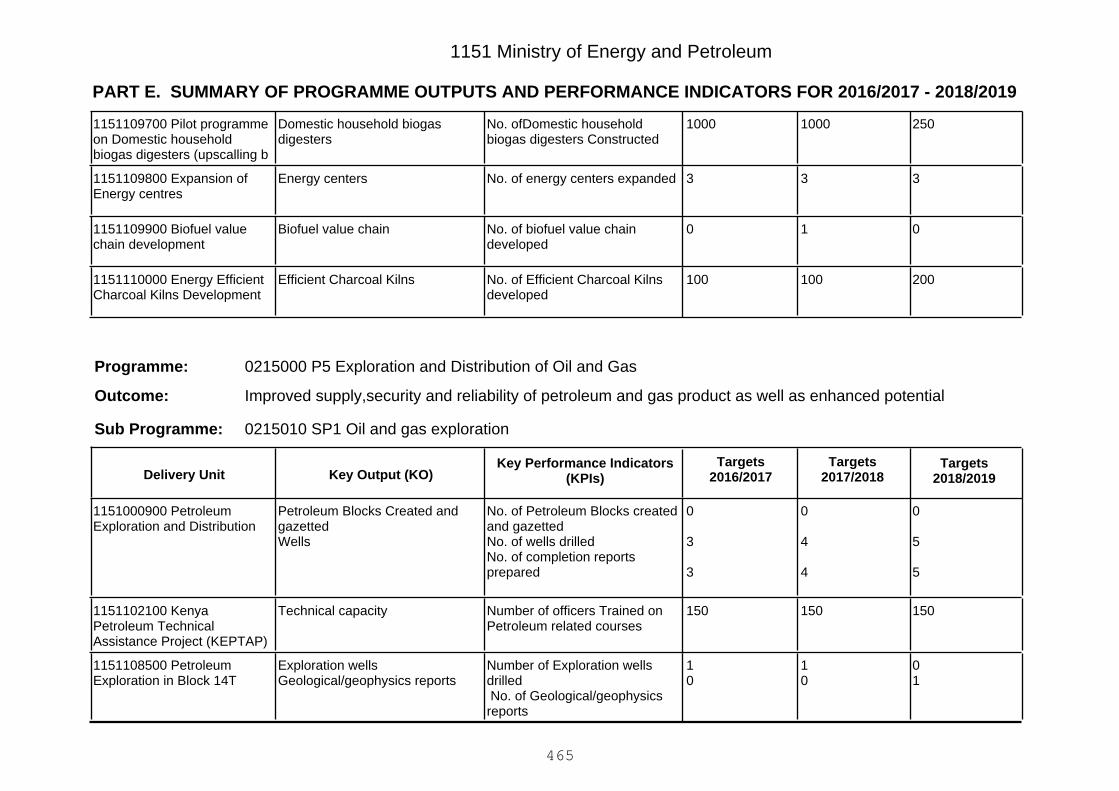
PART E. SUMMARY OF PROGRAMME OUTPUTS AND PERFORMANCE INDICATORS FOR 2016/2017 - 2018/2019
1151 Ministry of Energy and Petroleum
25010001000No. ofDomestic householdbiogas digesters Constructed
Domestic household biogasdigesters
1151109700 Pilot programmeon Domestic householdbiogas digesters (upscalling b
333No. of energy centers expandedEnergy centers1151109800 Expansion ofEnergy centres
010No. of biofuel value chaindeveloped
Biofuel value chain1151109900 Biofuel valuechain development
200100100No. of Efficient Charcoal Kilnsdeveloped
Efficient Charcoal Kilns1151110000 Energy EfficientCharcoal Kilns Development
0215000 P5 Exploration and Distribution of Oil and Gas
Improved supply,security and reliability of petroleum and gas product as well as enhanced potential
Programme:
Outcome:
0215010 SP1 Oil and gas explorationSub Programme:
Key Output (KO)Targets
2018/2019Targets
2017/2018Key Performance Indicators
(KPIs)Targets
2016/2017Delivery Unit
0
5
5
0
4
4
0
3
3
No. of Petroleum Blocks createdand gazettedNo. of wells drilledNo. of completion reportsprepared
Petroleum Blocks Created andgazettedWells
1151000900 PetroleumExploration and Distribution
150150150Number of officers Trained onPetroleum related courses
Technical capacity1151102100 KenyaPetroleum TechnicalAssistance Project (KEPTAP)
01
10
10
Number of Exploration wellsdrilled No. of Geological/geophysicsreports
Exploration wellsGeological/geophysics reports
1151108500 PetroleumExploration in Block 14T
465
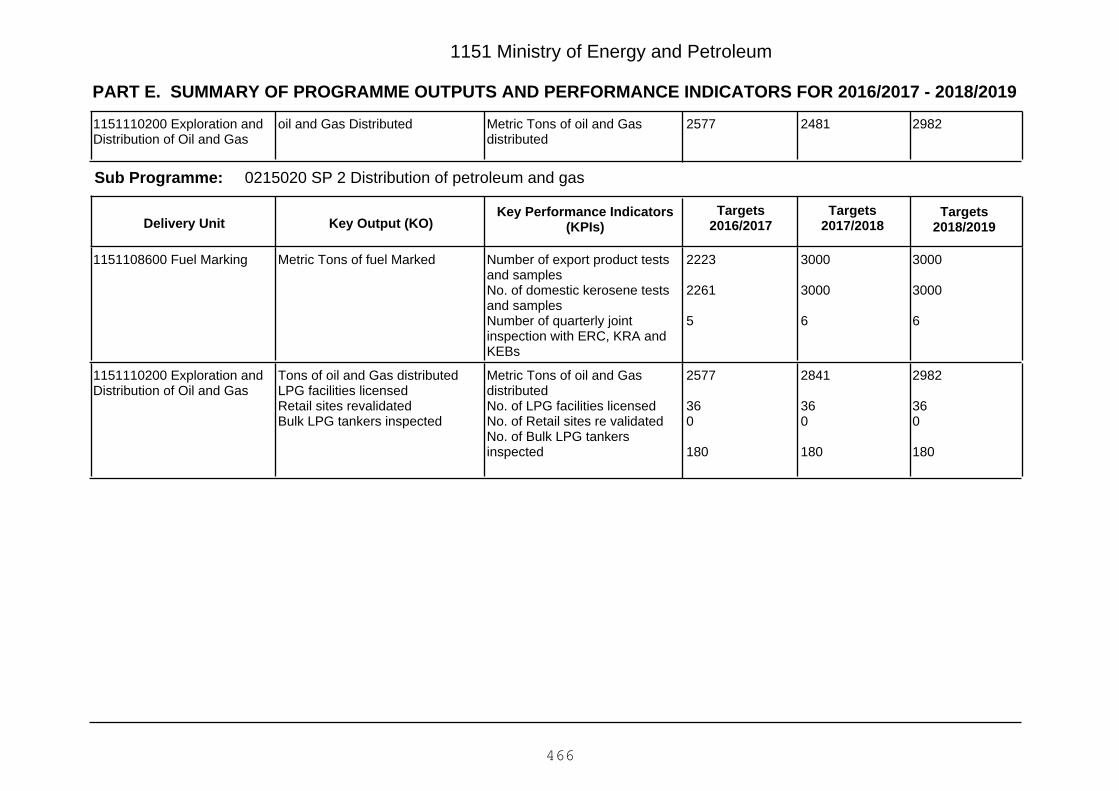
PART E. SUMMARY OF PROGRAMME OUTPUTS AND PERFORMANCE INDICATORS FOR 2016/2017 - 2018/2019
1151 Ministry of Energy and Petroleum
298224812577Metric Tons of oil and Gasdistributed
oil and Gas Distributed1151110200 Exploration andDistribution of Oil and Gas
0215020 SP 2 Distribution of petroleum and gasSub Programme:
Key Output (KO)Targets
2018/2019Targets
2017/2018Key Performance Indicators
(KPIs)Targets
2016/2017Delivery Unit
3000
3000
6
3000
3000
6
2223
2261
5
Number of export product testsand samplesNo. of domestic kerosene testsand samplesNumber of quarterly jointinspection with ERC, KRA andKEBs
Metric Tons of fuel Marked1151108600 Fuel Marking
2982
360
180
2841
360
180
2577
360
180
Metric Tons of oil and GasdistributedNo. of LPG facilities licensedNo. of Retail sites re validatedNo. of Bulk LPG tankersinspected
Tons of oil and Gas distributedLPG facilities licensedRetail sites revalidatedBulk LPG tankers inspected
1151110200 Exploration andDistribution of Oil and Gas
466
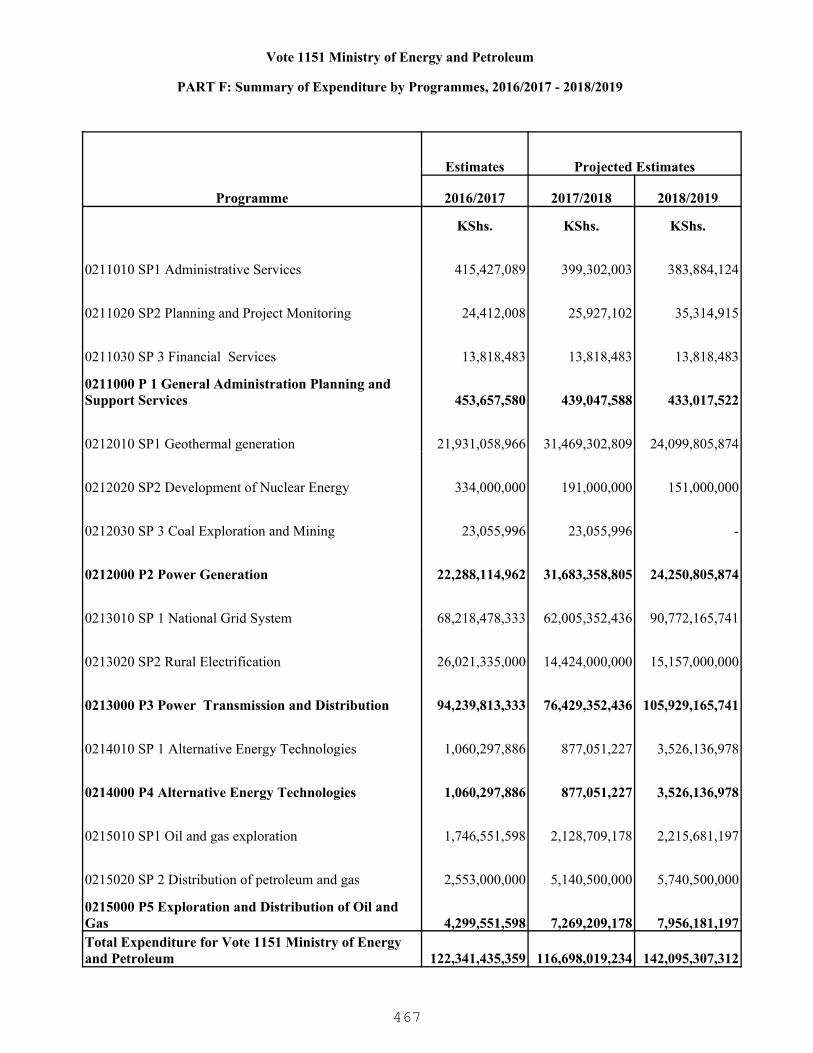
Vote 1151 Ministry of Energy and Petroleum
PART F: Summary of Expenditure by Programmes, 2016/2017 - 2018/2019
Programme
Estimates Projected Estimates
2016/2017 2017/2018 2018/2019
KShs. KShs. KShs.
0211010 SP1 Administrative Services 415,427,089 399,302,003 383,884,124
0211020 SP2 Planning and Project Monitoring 24,412,008 25,927,102 35,314,915
0211030 SP 3 Financial Services 13,818,483 13,818,483 13,818,483
0211000 P 1 General Administration Planning and Support Services 453,657,580 439,047,588 433,017,522
0212010 SP1 Geothermal generation 21,931,058,966 31,469,302,809 24,099,805,874
0212020 SP2 Development of Nuclear Energy 334,000,000 191,000,000 151,000,000
0212030 SP 3 Coal Exploration and Mining 23,055,996 23,055,996 -
0212000 P2 Power Generation 22,288,114,962 31,683,358,805 24,250,805,874
0213010 SP 1 National Grid System 68,218,478,333 62,005,352,436 90,772,165,741
0213020 SP2 Rural Electrification 26,021,335,000 14,424,000,000 15,157,000,000
0213000 P3 Power Transmission and Distribution 94,239,813,333 76,429,352,436 105,929,165,741
0214010 SP 1 Alternative Energy Technologies 1,060,297,886 877,051,227 3,526,136,978
0214000 P4 Alternative Energy Technologies 1,060,297,886 877,051,227 3,526,136,978
0215010 SP1 Oil and gas exploration 1,746,551,598 2,128,709,178 2,215,681,197
0215020 SP 2 Distribution of petroleum and gas 2,553,000,000 5,140,500,000 5,740,500,000
0215000 P5 Exploration and Distribution of Oil and Gas 4,299,551,598 7,269,209,178 7,956,181,197Total Expenditure for Vote 1151 Ministry of Energy and Petroleum 122,341,435,359 116,698,019,234 142,095,307,312
467

1151 Ministry of Energy and Petroleum
PART G: Summary of Expenditure by Vote and Economic Classification, 2016/2017 - 2018/2019
Economic Classification
Estimates Projected Estimates
2016/2017 2017/2018 2018/2019KShs. KShs. KShs.
Current Expenditure 2,169,703,644 2,337,019,234 2,388,307,312
Compensation to Employees 347,033,644 357,019,234 367,307,312
Use of Goods and Services 273,061,614 344,463,503 385,448,123
Current Transfers to Govt. Agencies 1,527,550,000 1,604,000,000 1,604,000,000
Other Recurrent 22,058,386 31,536,497 31,551,877
Capital Expenditure 120,171,731,715 114,361,000,000 139,707,000,000
Acquisition of Non-Financial Assets 92,999,779,747 88,569,785,388 91,840,425,000
Capital Grants to Govt. Agencies 26,168,115,000 24,680,614,612 44,156,675,000
Other Development 1,003,836,968 1,110,600,000 3,709,900,000Total Expenditure 122,341,435,359 116,698,019,234 142,095,307,312
468

1151 Ministry of Energy and Petroleum
PART H: Summary of Expenditure by Programme and Economic Classification, 2016/2017 - 2018/2019
0211010 SP1 Administrative Services
Economic Classification
Estimates Projected Estimates
2016/2017 2017/2018 2018/2019KShs. KShs. KShs.
Current Expenditure 296,590,103 347,633,519 376,884,124
Compensation to Employees 151,885,568 156,558,191 185,669,934
Use of Goods and Services 132,370,861 170,661,289 170,800,151
Other Recurrent 12,333,674 20,414,039 20,414,039
Capital Expenditure 118,836,986 51,668,484 7,000,000
Acquisition of Non-Financial Assets 59,500,018 27,668,484 7,000,000
Other Development 59,336,968 24,000,000 -Total Expenditure 415,427,089 399,302,003 383,884,124
0211020 SP2 Planning and Project Monitoring
Economic Classification
Estimates Projected Estimates
2016/2017 2017/2018 2018/2019KShs. KShs. KShs.
Current Expenditure 11,412,008 12,927,102 22,314,915
Compensation to Employees 11,412,008 12,927,102 22,314,915
Capital Expenditure 13,000,000 13,000,000 13,000,000
Acquisition of Non-Financial Assets 13,000,000 13,000,000 13,000,000Total Expenditure 24,412,008 25,927,102 35,314,915
0211030 SP 3 Financial Services
Economic Classification
Estimates Projected Estimates
2016/2017 2017/2018 2018/2019KShs. KShs. KShs.
Current Expenditure 13,818,483 13,818,483 13,818,483
Compensation to Employees 13,818,483 13,818,483 13,818,483Total Expenditure 13,818,483 13,818,483 13,818,483
469

1151 Ministry of Energy and Petroleum
PART H: Summary of Expenditure by Programme and Economic Classification, 2016/2017 - 2018/2019
0211000 P 1 General Administration Planning and Support Services
Economic Classification
Estimates Projected Estimates
2016/2017 2017/2018 2018/2019KShs. KShs. KShs.
Current Expenditure 321,820,594 374,379,104 413,017,522
Compensation to Employees 177,116,059 183,303,776 221,803,332
Use of Goods and Services 132,370,861 170,661,289 170,800,151
Other Recurrent 12,333,674 20,414,039 20,414,039
Capital Expenditure 131,836,986 64,668,484 20,000,000
Acquisition of Non-Financial Assets 72,500,018 40,668,484 20,000,000
Other Development 59,336,968 24,000,000 -Total Expenditure 453,657,580 439,047,588 433,017,522
0212010 SP1 Geothermal generation
Economic Classification
Estimates Projected Estimates
2016/2017 2017/2018 2018/2019KShs. KShs. KShs.
Current Expenditure 692,558,966 745,802,809 746,805,874
Compensation to Employees 15,461,548 33,435,391 34,438,456
Use of Goods and Services 9,951,418 9,951,418 9,951,418
Current Transfers to Govt. Agencies 666,730,000 702,000,000 702,000,000
Other Recurrent 416,000 416,000 416,000
Capital Expenditure 21,238,500,000 30,723,500,000 23,353,000,000
Acquisition of Non-Financial Assets 19,179,500,000 29,206,500,000 21,052,000,000
Capital Grants to Govt. Agencies 2,047,000,000 1,505,000,000 2,289,000,000
Other Development 12,000,000 12,000,000 12,000,000Total Expenditure 21,931,058,966 31,469,302,809 24,099,805,874
0212020 SP2 Development of Nuclear Energy
Economic Classification
Estimates Projected Estimates
2016/2017 2017/2018 2018/2019KShs. KShs. KShs.
470

1151 Ministry of Energy and Petroleum
PART H: Summary of Expenditure by Programme and Economic Classification, 2016/2017 - 2018/2019
0212020 SP2 Development of Nuclear Energy
Economic Classification
Estimates Projected Estimates
2016/2017 2017/2018 2018/2019
Current Expenditure 81,000,000 81,000,000 81,000,000
Current Transfers to Govt. Agencies 81,000,000 81,000,000 81,000,000
Capital Expenditure 253,000,000 110,000,000 70,000,000
Capital Grants to Govt. Agencies 253,000,000 110,000,000 70,000,000Total Expenditure 334,000,000 191,000,000 151,000,000
0212030 SP 3 Coal Exploration and Mining
Economic Classification
Estimates Projected Estimates
2016/2017 2017/2018 2018/2019KShs. KShs. KShs.
Current Expenditure 23,055,996 23,055,996 -
Compensation to Employees 23,055,996 23,055,996 -Total Expenditure 23,055,996 23,055,996 -
0212000 P2 Power Generation
Economic Classification
Estimates Projected Estimates
2016/2017 2017/2018 2018/2019KShs. KShs. KShs.
Current Expenditure 796,614,962 849,858,805 827,805,874
Compensation to Employees 38,517,544 56,491,387 34,438,456
Use of Goods and Services 9,951,418 9,951,418 9,951,418
Current Transfers to Govt. Agencies 747,730,000 783,000,000 783,000,000
Other Recurrent 416,000 416,000 416,000
Capital Expenditure 21,491,500,000 30,833,500,000 23,423,000,000
Acquisition of Non-Financial Assets 19,179,500,000 29,206,500,000 21,052,000,000
Capital Grants to Govt. Agencies 2,300,000,000 1,615,000,000 2,359,000,000
Other Development 12,000,000 12,000,000 12,000,000Total Expenditure 22,288,114,962 31,683,358,805 24,250,805,874
471

1151 Ministry of Energy and Petroleum
PART H: Summary of Expenditure by Programme and Economic Classification, 2016/2017 - 2018/2019
0213010 SP 1 National Grid System
Economic Classification
Estimates Projected Estimates
2016/2017 2017/2018 2018/2019KShs. KShs. KShs.
Current Expenditure 319,098,604 325,520,920 322,665,741
Compensation to Employees 12,835,044 3,334,728 -
Use of Goods and Services 4,233,560 4,256,192 4,735,741
Current Transfers to Govt. Agencies 301,100,000 317,000,000 317,000,000
Other Recurrent 930,000 930,000 930,000
Capital Expenditure 67,899,379,729 61,679,831,516 90,449,500,000
Acquisition of Non-Financial Assets 51,192,279,729 48,766,116,904 61,088,425,000
Capital Grants to Govt. Agencies 16,640,000,000 12,770,114,612 29,313,175,000
Other Development 67,100,000 143,600,000 47,900,000Total Expenditure 68,218,478,333 62,005,352,436 90,772,165,741
0213020 SP2 Rural Electrification
Economic Classification
Estimates Projected Estimates
2016/2017 2017/2018 2018/2019KShs. KShs. KShs.
Current Expenditure 478,720,000 504,000,000 504,000,000
Current Transfers to Govt. Agencies 478,720,000 504,000,000 504,000,000
Capital Expenditure 25,542,615,000 13,920,000,000 14,653,000,000
Acquisition of Non-Financial Assets 18,670,000,000 3,980,000,000 2,524,000,000
Capital Grants to Govt. Agencies 6,872,615,000 9,940,000,000 12,129,000,000Total Expenditure 26,021,335,000 14,424,000,000 15,157,000,000
0213000 P3 Power Transmission and Distribution
Economic Classification
Estimates Projected Estimates
2016/2017 2017/2018 2018/2019KShs. KShs. KShs.
Current Expenditure 797,818,604 829,520,920 826,665,741
Compensation to Employees 12,835,044 3,334,728 -
472
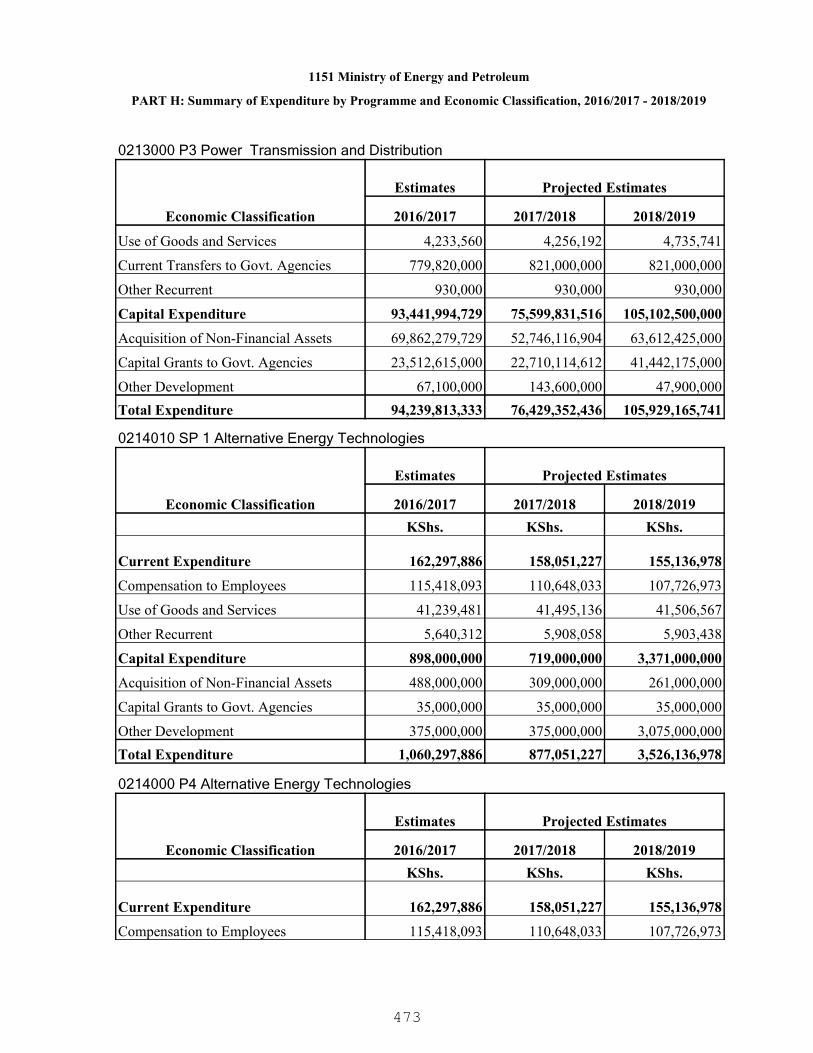
1151 Ministry of Energy and Petroleum
PART H: Summary of Expenditure by Programme and Economic Classification, 2016/2017 - 2018/2019
0213000 P3 Power Transmission and Distribution
Economic Classification
Estimates Projected Estimates
2016/2017 2017/2018 2018/2019
Use of Goods and Services 4,233,560 4,256,192 4,735,741
Current Transfers to Govt. Agencies 779,820,000 821,000,000 821,000,000
Other Recurrent 930,000 930,000 930,000
Capital Expenditure 93,441,994,729 75,599,831,516 105,102,500,000
Acquisition of Non-Financial Assets 69,862,279,729 52,746,116,904 63,612,425,000
Capital Grants to Govt. Agencies 23,512,615,000 22,710,114,612 41,442,175,000
Other Development 67,100,000 143,600,000 47,900,000Total Expenditure 94,239,813,333 76,429,352,436 105,929,165,741
0214010 SP 1 Alternative Energy Technologies
Economic Classification
Estimates Projected Estimates
2016/2017 2017/2018 2018/2019KShs. KShs. KShs.
Current Expenditure 162,297,886 158,051,227 155,136,978
Compensation to Employees 115,418,093 110,648,033 107,726,973
Use of Goods and Services 41,239,481 41,495,136 41,506,567
Other Recurrent 5,640,312 5,908,058 5,903,438
Capital Expenditure 898,000,000 719,000,000 3,371,000,000
Acquisition of Non-Financial Assets 488,000,000 309,000,000 261,000,000
Capital Grants to Govt. Agencies 35,000,000 35,000,000 35,000,000
Other Development 375,000,000 375,000,000 3,075,000,000Total Expenditure 1,060,297,886 877,051,227 3,526,136,978
0214000 P4 Alternative Energy Technologies
Economic Classification
Estimates Projected Estimates
2016/2017 2017/2018 2018/2019KShs. KShs. KShs.
Current Expenditure 162,297,886 158,051,227 155,136,978
Compensation to Employees 115,418,093 110,648,033 107,726,973
473

1151 Ministry of Energy and Petroleum
PART H: Summary of Expenditure by Programme and Economic Classification, 2016/2017 - 2018/2019
0214000 P4 Alternative Energy Technologies
Economic Classification
Estimates Projected Estimates
2016/2017 2017/2018 2018/2019
Use of Goods and Services 41,239,481 41,495,136 41,506,567
Other Recurrent 5,640,312 5,908,058 5,903,438
Capital Expenditure 898,000,000 719,000,000 3,371,000,000
Acquisition of Non-Financial Assets 488,000,000 309,000,000 261,000,000
Capital Grants to Govt. Agencies 35,000,000 35,000,000 35,000,000
Other Development 375,000,000 375,000,000 3,075,000,000Total Expenditure 1,060,297,886 877,051,227 3,526,136,978
0215010 SP1 Oil and gas exploration
Economic Classification
Estimates Projected Estimates
2016/2017 2017/2018 2018/2019KShs. KShs. KShs.
Current Expenditure 91,151,598 125,209,178 165,681,197
Compensation to Employees 3,146,904 3,241,310 3,338,551
Use of Goods and Services 85,266,294 118,099,468 158,454,246
Other Recurrent 2,738,400 3,868,400 3,888,400
Capital Expenditure 1,655,400,000 2,003,500,000 2,050,000,000
Acquisition of Non-Financial Assets 885,000,000 1,167,500,000 1,195,000,000
Capital Grants to Govt. Agencies 280,000,000 280,000,000 280,000,000
Other Development 490,400,000 556,000,000 575,000,000Total Expenditure 1,746,551,598 2,128,709,178 2,215,681,197
0215020 SP 2 Distribution of petroleum and gas
Economic Classification
Estimates Projected Estimates
2016/2017 2017/2018 2018/2019KShs. KShs. KShs.
Capital Expenditure 2,553,000,000 5,140,500,000 5,740,500,000
Acquisition of Non-Financial Assets 2,512,500,000 5,100,000,000 5,700,000,000
Capital Grants to Govt. Agencies 40,500,000 40,500,000 40,500,000Total Expenditure 2,553,000,000 5,140,500,000 5,740,500,000
474

1151 Ministry of Energy and Petroleum
PART H: Summary of Expenditure by Programme and Economic Classification, 2016/2017 - 2018/2019
0215000 P5 Exploration and Distribution of Oil and Gas
Economic Classification
Estimates Projected Estimates
2016/2017 2017/2018 2018/2019KShs. KShs. KShs.
Current Expenditure 91,151,598 125,209,178 165,681,197
Compensation to Employees 3,146,904 3,241,310 3,338,551
Use of Goods and Services 85,266,294 118,099,468 158,454,246
Other Recurrent 2,738,400 3,868,400 3,888,400
Capital Expenditure 4,208,400,000 7,144,000,000 7,790,500,000
Acquisition of Non-Financial Assets 3,397,500,000 6,267,500,000 6,895,000,000
Capital Grants to Govt. Agencies 320,500,000 320,500,000 320,500,000
Other Development 490,400,000 556,000,000 575,000,000Total Expenditure 4,299,551,598 7,269,209,178 7,956,181,197
475
1161 State Department for Agriculture.
A food secure and wealthy nation anchored on an innovative, commercially oriented andcompetitive agricultural sector.
To improve the livelihoods of Kenyans and ensure food and nutrition security through creationof an enabling environment and ensuring sustainable natural resource management.
PART A. Vision
PART B. Mission
PART C. Performance Overview and Background for Programme(s) Funding
The State Department of Agriculture is mandated to ensure sustainable development ofagriculture for food security and economic development. The specific mandates include;Agriculture policy and services, national food security policy, agricultural land resourcesinventory and management, cotton development, crop research and development,agricultural machinery service management, agriculture training colleges, food safety andinspections, food security, agricultural insurance policy, bio-safety management. Programmesbeing implemented include; General Administration Planning and Support Service, CropsDevelopment and Management and, Agribusiness and Information Management.
The State Department's total allocation was KSh.23 billion in 2012/13 Financial Year.Theallocation increased to KSh.38.3 billion in 2013/14 Financial Year and further increased toKSh.39.1 billion in 2014/15 Financial Year. The total actual expenditure was KSh.18.5 billion,KSh.30.6 billion and KSh.30.0 billion in 2012/13, 2013/14 and 2014/15 Financial Yearsrespectively.
The major achievements during the period under review included development of fourteenpolicies, five bills and nine legal notices. Agriculture legislation were consolidated into threeActs that is, Agriculture Food and Fisheries Authority (AFFA) Act, the Crops Act 2013, andKenya Agricultural Livestock Research Organization (KALRO) Act. For reduction of fertilizercost and improved accessibility a strategic partner for setting up a fertilizer plant wasidentified and the construction of the plant is ongoing, fertilizer and seed fund was alsoestablished which led to bulk procurement of 439,396 metric tones of fertilizer which wasdistributed to farmers at subsidized price. In addition, 3.1 million bags of maize were procuredto enhance strategic grain reserves, 4,187 metric tones of drought tolerant food crops seedwere supplied to farmers000 groups were supported on community driven food securityimprovement initiatives, 4,707 value chain organization were formed, released 35 cropvarieties after certification by Kenya Plant Health Inspectorate Services (KEPHIS), procured72 tractors, 71 reapers and 5 trailers, constructed and commissioned 7 stores to reduce postharvest losses and constructed 10 markets targeting improved horticultural production.
Major services ouputs to be provided in the period 2016/17-2018/19 will focus on thefollowing priority areas; increasing agricultural production and productivity, increasingagricultural market access, enhancing national food security, reforming agriculture sectorinstitutions, promoting crop diversification, researching on miraa agronomy, varietyimprovement, value addition and identification of new markets. These will be achievedthrough creation of an enabling environment for agricultural development by development ofappropriate policies, strategies, legislation guidelines, standards, rules and regulations.
476

1161 State Department for Agriculture.
PART D. Programme Objectives
Sustainable national food security will be achieved by establishment of fertilizer costreduction system which will include bulk fertilizer procurement, local fertilizer blending andestablishment of a fertilizer plant and introduction of e-fertilizer subsidy management system.Diversification and expansion of the strategic food reserves to include other agriculturalproducts such as rice, beans canned meat and powdered milk. Efforts will also be made toembrace demand driven agricultural; research, improving market access through provision ofmarket information and development of market infrastructure and finally strategic pests anddiseases control and management.
ObjectiveProgramme
0107000 P1: GeneralAdministration Planning andSupport Services
To provide efficient and effective support services
0108000 P2: CropDevelopment andManagement
To increase agricultural productivity and outputs
0109000 P3: Agribusinessand InformationManagement
To promote market access and product development
477
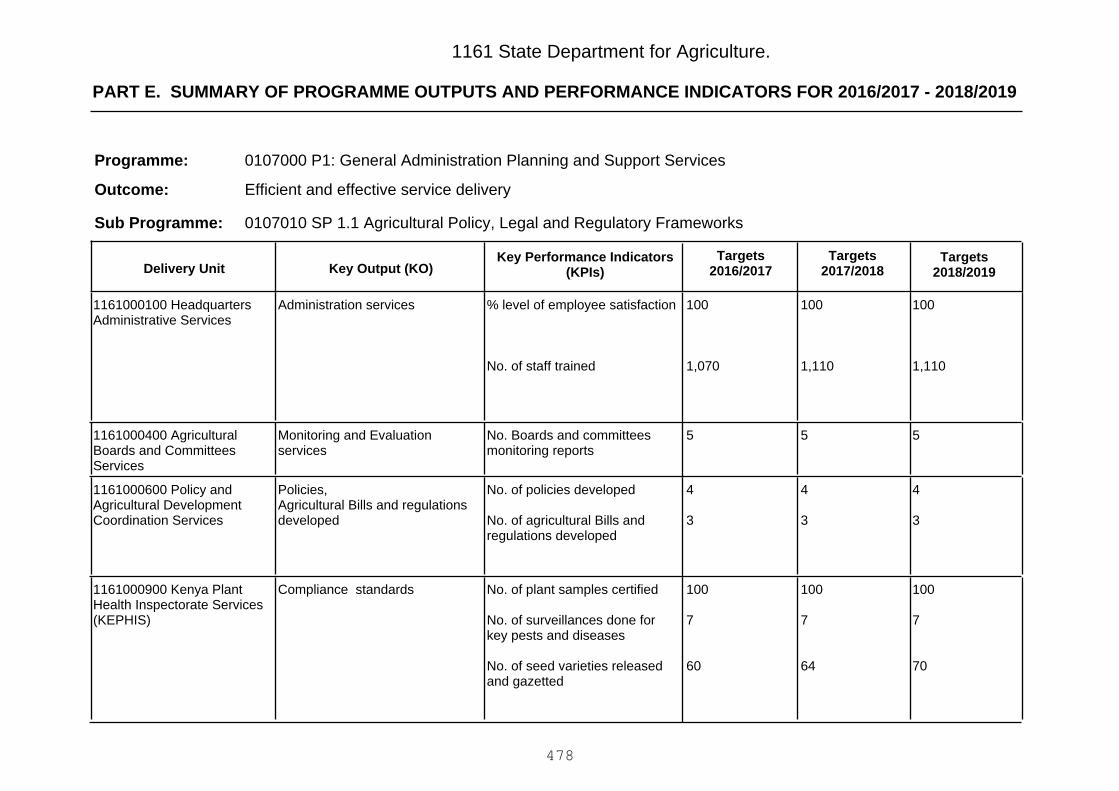
PART E. SUMMARY OF PROGRAMME OUTPUTS AND PERFORMANCE INDICATORS FOR 2016/2017 - 2018/2019
1161 State Department for Agriculture.
0107000 P1: General Administration Planning and Support Services
Efficient and effective service delivery
Programme:
Outcome:
0107010 SP 1.1 Agricultural Policy, Legal and Regulatory FrameworksSub Programme:
Key Output (KO)Targets
2018/2019Targets
2017/2018Key Performance Indicators
(KPIs)Targets
2016/2017Delivery Unit
100
1,110
100
1,110
100
1,070
% level of employee satisfaction
No. of staff trained
Administration services1161000100 HeadquartersAdministrative Services
555No. Boards and committeesmonitoring reports
Monitoring and Evaluationservices
1161000400 AgriculturalBoards and CommitteesServices
4
3
4
3
4
3
No. of policies developed
No. of agricultural Bills andregulations developed
Policies,Agricultural Bills and regulationsdeveloped
1161000600 Policy andAgricultural DevelopmentCoordination Services
100
7
70
100
7
64
100
7
60
No. of plant samples certified
No. of surveillances done forkey pests and diseases
No. of seed varieties releasedand gazetted
Compliance standards1161000900 Kenya PlantHealth Inspectorate Services(KEPHIS)
478
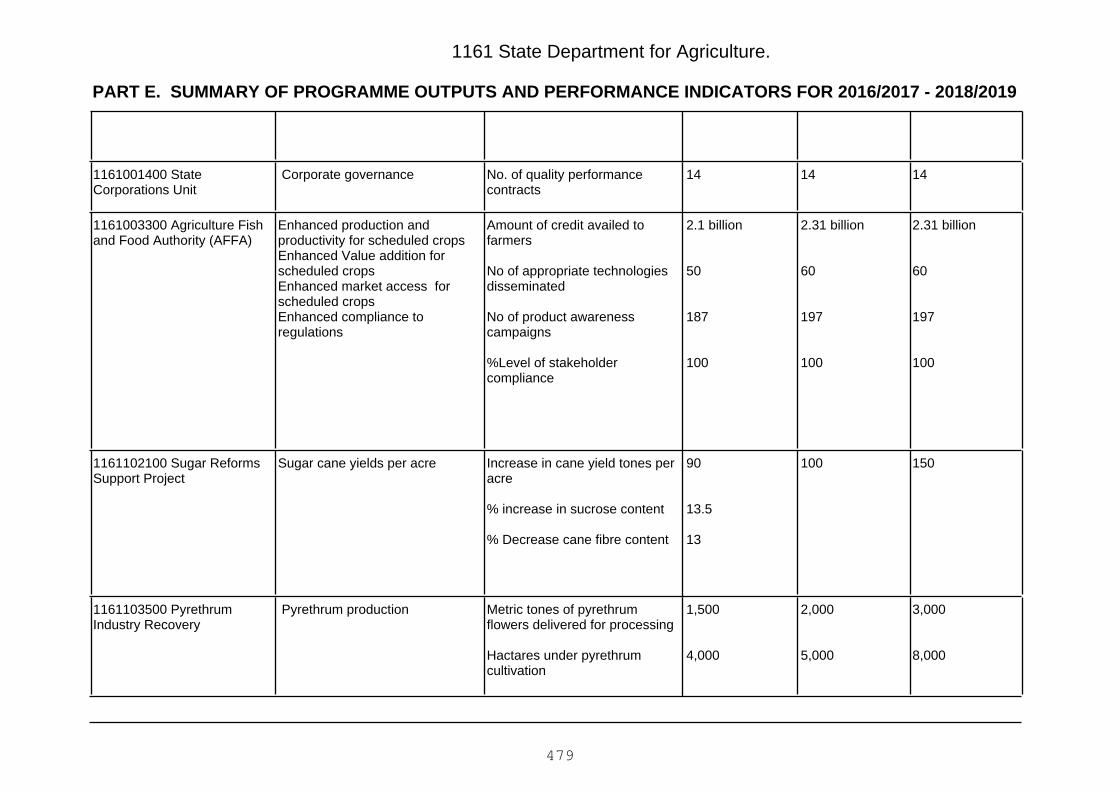
PART E. SUMMARY OF PROGRAMME OUTPUTS AND PERFORMANCE INDICATORS FOR 2016/2017 - 2018/2019
1161 State Department for Agriculture.
141414No. of quality performancecontracts
Corporate governance1161001400 StateCorporations Unit
2.31 billion
60
197
100
2.31 billion
60
197
100
2.1 billion
50
187
100
Amount of credit availed tofarmers
No of appropriate technologiesdisseminated
No of product awarenesscampaigns
%Level of stakeholdercompliance
Enhanced production andproductivity for scheduled cropsEnhanced Value addition forscheduled cropsEnhanced market access forscheduled cropsEnhanced compliance toregulations
1161003300 Agriculture Fishand Food Authority (AFFA)
15010090
13.5
13
Increase in cane yield tones peracre
% increase in sucrose content
% Decrease cane fibre content
Sugar cane yields per acre1161102100 Sugar ReformsSupport Project
3,000
8,000
2,000
5,000
1,500
4,000
Metric tones of pyrethrumflowers delivered for processing
Hactares under pyrethrumcultivation
Pyrethrum production1161103500 PyrethrumIndustry Recovery
479
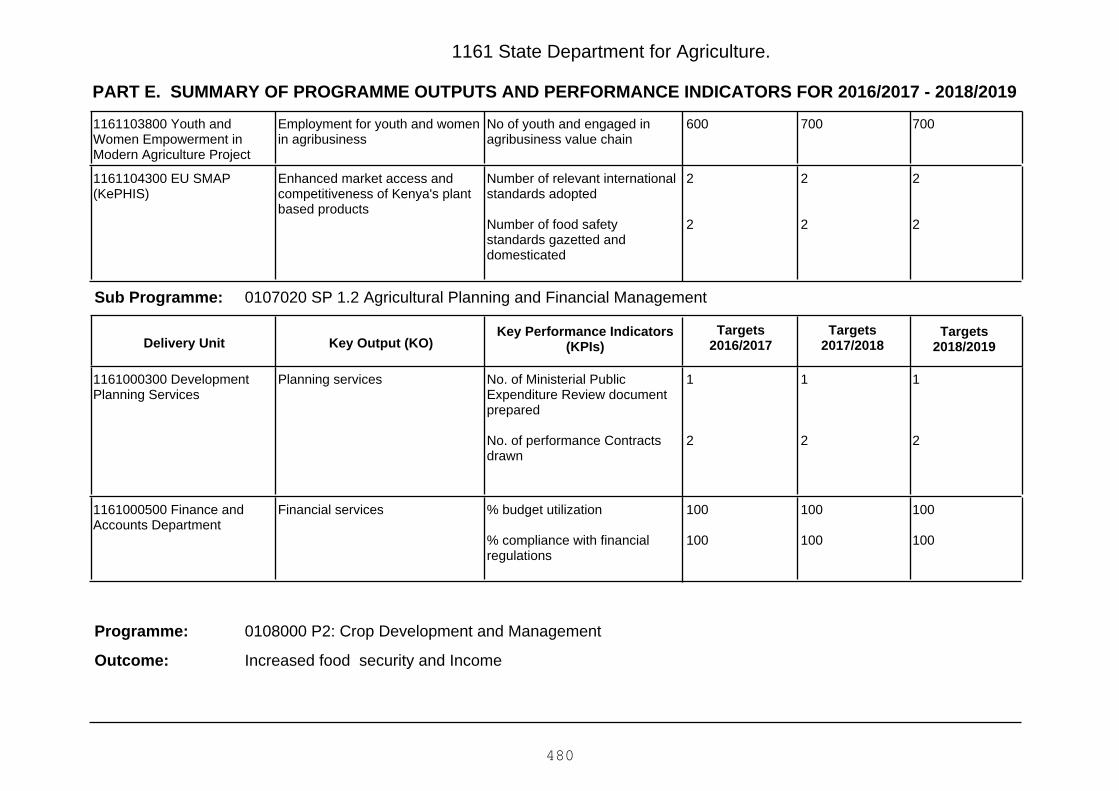
PART E. SUMMARY OF PROGRAMME OUTPUTS AND PERFORMANCE INDICATORS FOR 2016/2017 - 2018/2019
1161 State Department for Agriculture.
700700600No of youth and engaged inagribusiness value chain
Employment for youth and womenin agribusiness
1161103800 Youth andWomen Empowerment inModern Agriculture Project
2
2
2
2
2
2
Number of relevant internationalstandards adopted
Number of food safetystandards gazetted anddomesticated
Enhanced market access andcompetitiveness of Kenya's plantbased products
1161104300 EU SMAP(KePHIS)
0107020 SP 1.2 Agricultural Planning and Financial ManagementSub Programme:
Key Output (KO)Targets
2018/2019Targets
2017/2018Key Performance Indicators
(KPIs)Targets
2016/2017Delivery Unit
1
2
1
2
1
2
No. of Ministerial PublicExpenditure Review documentprepared
No. of performance Contractsdrawn
Planning services1161000300 DevelopmentPlanning Services
100
100
100
100
100
100
% budget utilization
% compliance with financialregulations
Financial services1161000500 Finance andAccounts Department
0108000 P2: Crop Development and Management
Increased food security and Income
Programme:
Outcome:
480
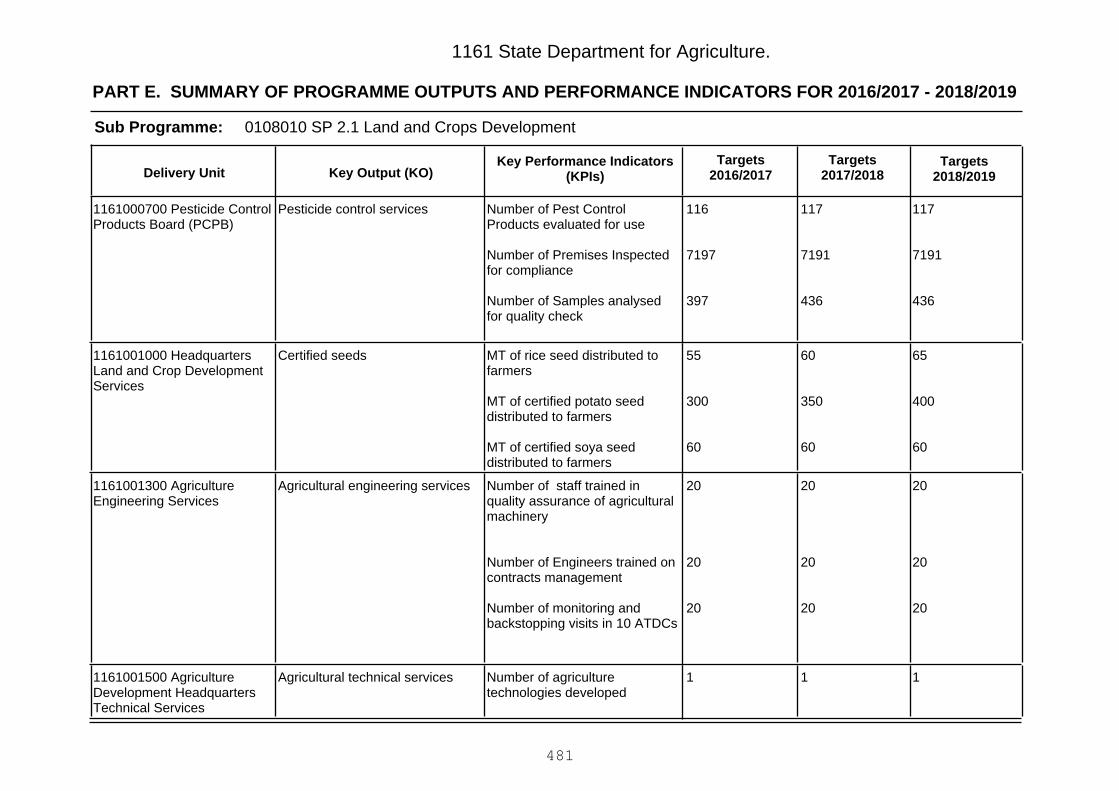
PART E. SUMMARY OF PROGRAMME OUTPUTS AND PERFORMANCE INDICATORS FOR 2016/2017 - 2018/2019
1161 State Department for Agriculture.
0108010 SP 2.1 Land and Crops DevelopmentSub Programme:
Key Output (KO)Targets
2018/2019Targets
2017/2018Key Performance Indicators
(KPIs)Targets
2016/2017Delivery Unit
117
7191
436
117
7191
436
116
7197
397
Number of Pest ControlProducts evaluated for use
Number of Premises Inspectedfor compliance
Number of Samples analysedfor quality check
Pesticide control services1161000700 Pesticide ControlProducts Board (PCPB)
65
400
60
60
350
60
55
300
60
MT of rice seed distributed tofarmers
MT of certified potato seeddistributed to farmers
MT of certified soya seeddistributed to farmers
Certified seeds1161001000 HeadquartersLand and Crop DevelopmentServices
20
20
20
20
20
20
20
20
20
Number of staff trained inquality assurance of agriculturalmachinery
Number of Engineers trained oncontracts management
Number of monitoring andbackstopping visits in 10 ATDCs
Agricultural engineering services1161001300 AgricultureEngineering Services
111Number of agriculturetechnologies developed
Agricultural technical services1161001500 AgricultureDevelopment HeadquartersTechnical Services
481
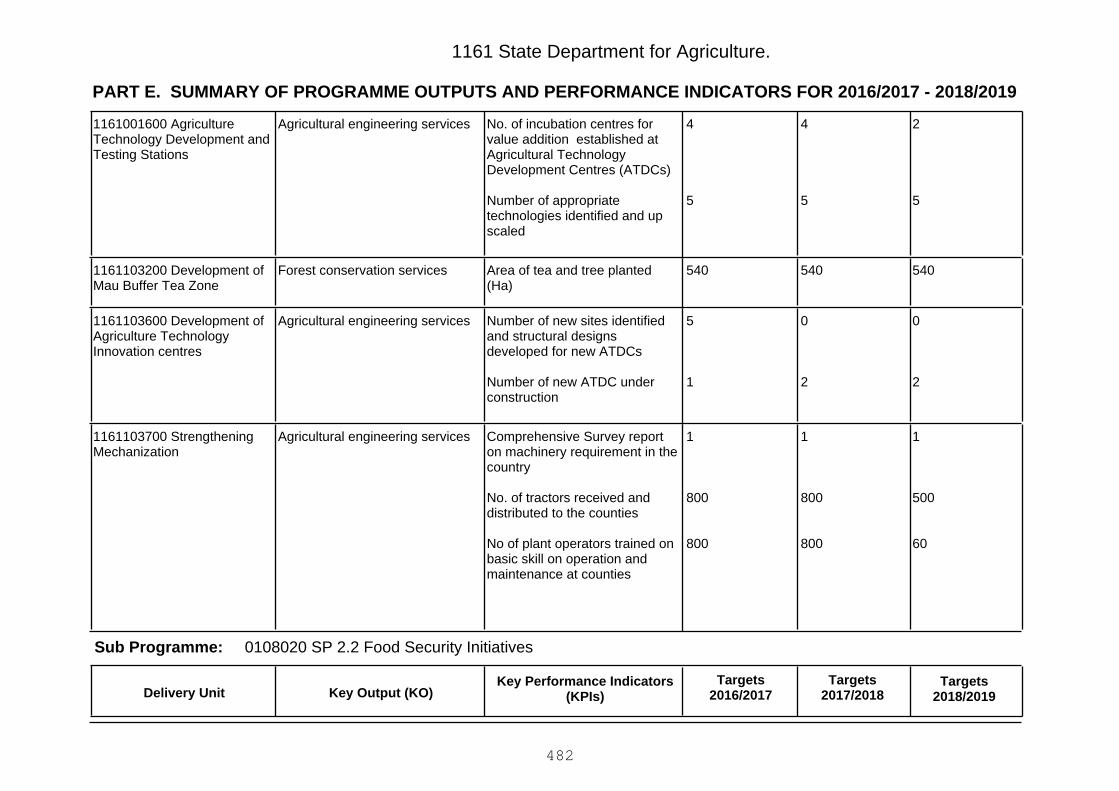
PART E. SUMMARY OF PROGRAMME OUTPUTS AND PERFORMANCE INDICATORS FOR 2016/2017 - 2018/2019
1161 State Department for Agriculture.
2
5
4
5
4
5
No. of incubation centres forvalue addition established atAgricultural TechnologyDevelopment Centres (ATDCs)
Number of appropriatetechnologies identified and upscaled
Agricultural engineering services1161001600 AgricultureTechnology Development andTesting Stations
540540540Area of tea and tree planted(Ha)
Forest conservation services1161103200 Development ofMau Buffer Tea Zone
0
2
0
2
5
1
Number of new sites identifiedand structural designsdeveloped for new ATDCs
Number of new ATDC underconstruction
Agricultural engineering services1161103600 Development ofAgriculture TechnologyInnovation centres
1
500
60
1
800
800
1
800
800
Comprehensive Survey reporton machinery requirement in thecountry
No. of tractors received anddistributed to the counties
No of plant operators trained onbasic skill on operation andmaintenance at counties
Agricultural engineering services1161103700 StrengtheningMechanization
0108020 SP 2.2 Food Security InitiativesSub Programme:
Key Output (KO)Targets
2018/2019Targets
2017/2018Key Performance Indicators
(KPIs)Targets
2016/2017Delivery Unit
482

PART E. SUMMARY OF PROGRAMME OUTPUTS AND PERFORMANCE INDICATORS FOR 2016/2017 - 2018/2019
1161 State Department for Agriculture.
220200188No. of groups monitoredCommunity support services1161001100 Food Securityand Management Programme'Njaa Marufuku Kenya'
1 million1 million0.7 millionNo. of 90Kg bags of maizeprocured (million)
Strategic Food Reserves1161003100 National FoodSecurity
14
10
2
14
10
2
12
8
2
No. of approved laboratory andgreen house based experimentsfor monitoring.
No. of approved confined fieldtrials for monitoring
No. of environmental release ofGMOs for monitoring of furtherresearch.
Genetically Modified Organisms(GMOs) technologies
1161003200 BiosafetyAuthority
1,080
54
100
1,080
54
100
300
24
30
No. of Hectares under irrigation
No. of water points
Hectares of improved pasture
Increased access to water forirrigation and domestic useImprove livestock health andmanagement
1161102400 DroughtResilience and SustainableLivelihood Programme inHorn of Af
0
40,000
0
40,000
40,000
40,000
No of farmers mobilised andselected to participate in cerealssubsidy programme
No of farmers facilitated withfarm inputs(Fertilizer,seeds andstorage bags)
Cereals productivity enhanced1161102900 Kenya CerealEnhancement Programme(KCEP)
483
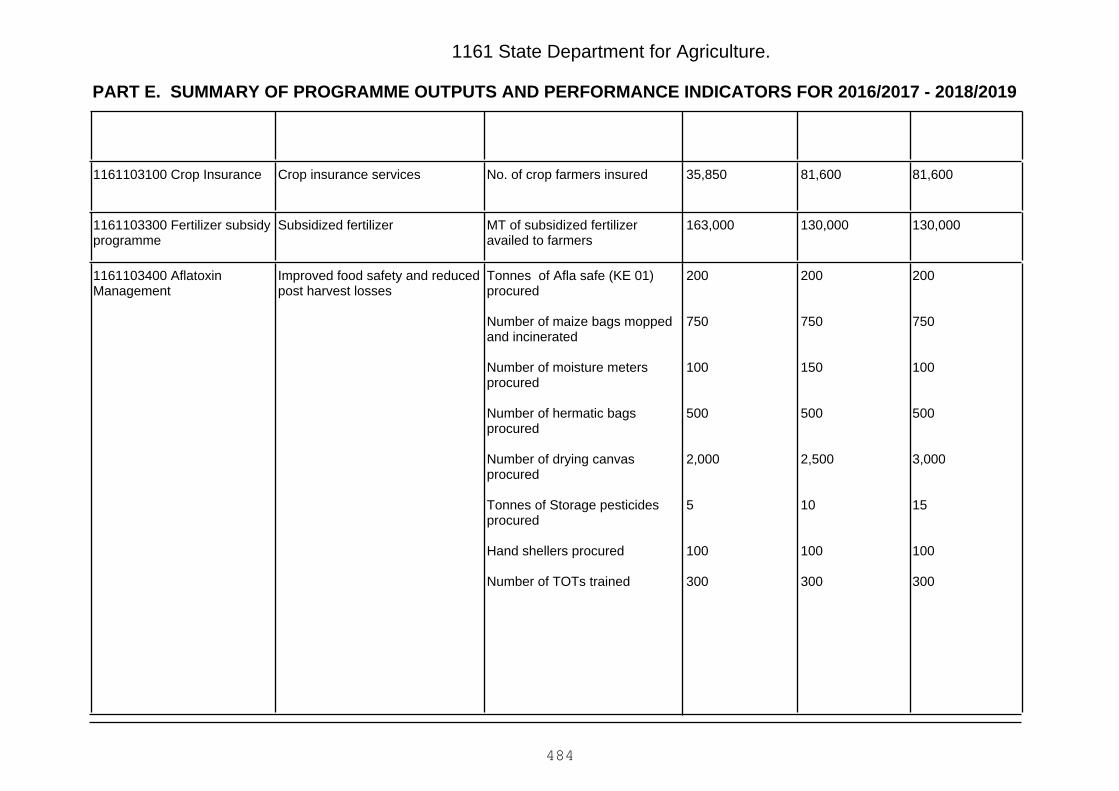
PART E. SUMMARY OF PROGRAMME OUTPUTS AND PERFORMANCE INDICATORS FOR 2016/2017 - 2018/2019
1161 State Department for Agriculture.
81,60081,60035,850No. of crop farmers insuredCrop insurance services1161103100 Crop Insurance
130,000130,000163,000MT of subsidized fertilizeravailed to farmers
Subsidized fertilizer1161103300 Fertilizer subsidyprogramme
200
750
100
500
3,000
15
100
300
200
750
150
500
2,500
10
100
300
200
750
100
500
2,000
5
100
300
Tonnes of Afla safe (KE 01)procured
Number of maize bags moppedand incinerated
Number of moisture metersprocured
Number of hermatic bagsprocured
Number of drying canvasprocured
Tonnes of Storage pesticidesprocured
Hand shellers procured
Number of TOTs trained
Improved food safety and reducedpost harvest losses
1161103400 AflatoxinManagement
484

PART E. SUMMARY OF PROGRAMME OUTPUTS AND PERFORMANCE INDICATORS FOR 2016/2017 - 2018/2019
1161 State Department for Agriculture.
1,200
20
10
1
10
20
100
17
21
6,290
8
1,200
20
10
1
10
20
100
17
21
6,290
8
1,200
20
10
1
10
20
100
17
21
6,290
8
Metric tones of Assorted seed
Number of Trainings
Number of Monitoring andevaluation visits
Number of dams constructed
Number of water pansconstructed
Number of demonstration sitesestablished and field days
Number of green houses, drip kits and water pumpsprocured
Number of monitoring visits
Number of trainings held incounties
Number of beneficiaries trained
Number of Steering committeemeetings
Improved livelihood for miraafarmers
Integrated cluster for diversifiedcrop, aquaculture and livestockproduction in ASAL areas
1161103900 Food Securityand Crop DiversificationProject
485

PART E. SUMMARY OF PROGRAMME OUTPUTS AND PERFORMANCE INDICATORS FOR 2016/2017 - 2018/2019
1161 State Department for Agriculture.
002No of county management planswith concrete climate riskmanagement activities reflectedin county integrateddevelopment plans
Intergration of climate action intocounty development plans
1161104600 KenyaAdaptation to Climate Changein Arid & Semi Arid Lands-KACCAL
26
14
Number of 90 KG rice bags peracre
Number of 90 KG bags ofratoon per acre
Agricultural production andmarketing services
1161104700 Rice BasedMarketing AgriculturePromotion Project (RICEMAP)
0108030 SP 2.3 Quality Assurance and Monitoring of Outreach ServicesSub Programme:
Key Output (KO)Targets
2018/2019Targets
2017/2018Key Performance Indicators
(KPIs)Targets
2016/2017Delivery Unit
111Number of agriculturetechnologies developed
Agricultural technical services1161001500 AgricultureDevelopment HeadquartersTechnical Services
222No. of regulations formulatedAgricultural advisory services1161001700 HeadquartersExtension Research Liaisonand Technical Building Servic
200200200No. of silk farmers supportedSericulture support services1161001800 SericultureStations - Thika
140140120No. of staff trained on skillbased short courses
Graduates trained on skill basedshort courses
1161002300 Kenya School ofAgriculture
Furnishing andequiping offices
Furnishing andequipinglaboratories,lecture theatres
Completion ofsecond and thirdfloor withmechanical
Completion certificatesEducational complex completedand equiped
1161002400 BukuraAgricultural College
486
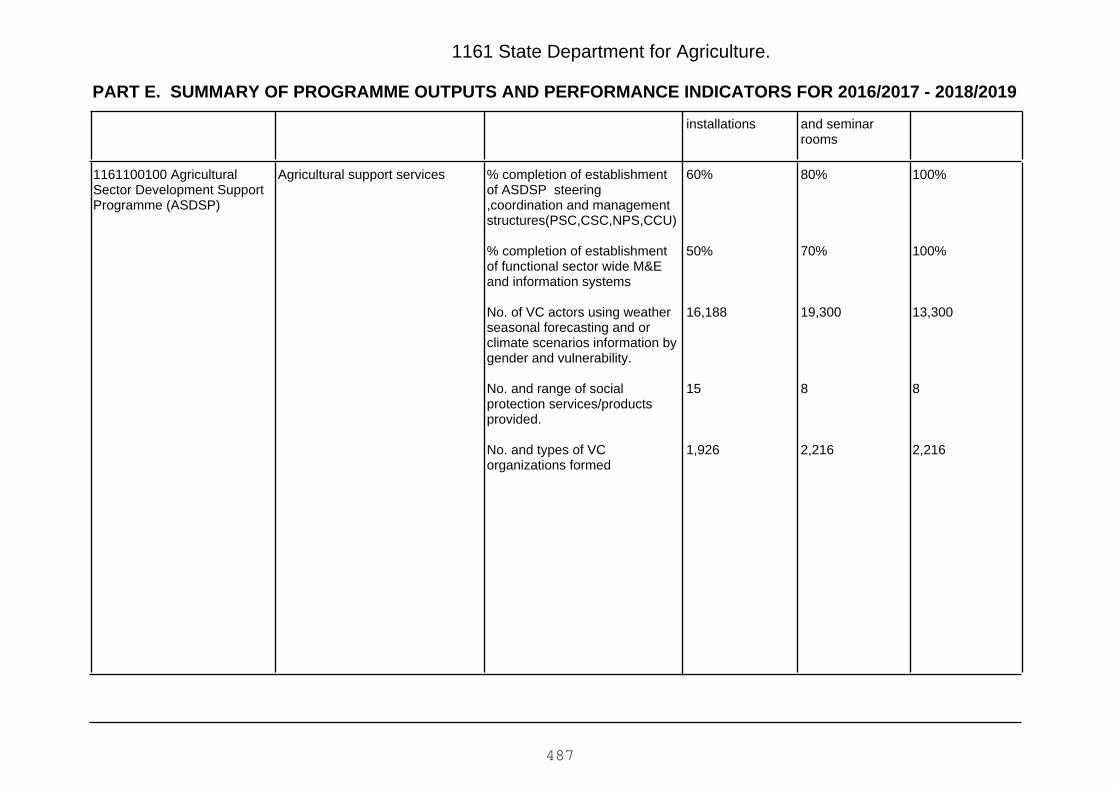
PART E. SUMMARY OF PROGRAMME OUTPUTS AND PERFORMANCE INDICATORS FOR 2016/2017 - 2018/2019
1161 State Department for Agriculture.
and seminarrooms
installations
100%
100%
13,300
8
2,216
80%
70%
19,300
8
2,216
60%
50%
16,188
15
1,926
% completion of establishmentof ASDSP steering,coordination and managementstructures(PSC,CSC,NPS,CCU)
% completion of establishmentof functional sector wide M&Eand information systems
No. of VC actors using weatherseasonal forecasting and orclimate scenarios information bygender and vulnerability.
No. and range of socialprotection services/productsprovided.
No. and types of VCorganizations formed
Agricultural support services1161100100 AgriculturalSector Development SupportProgramme (ASDSP)
487
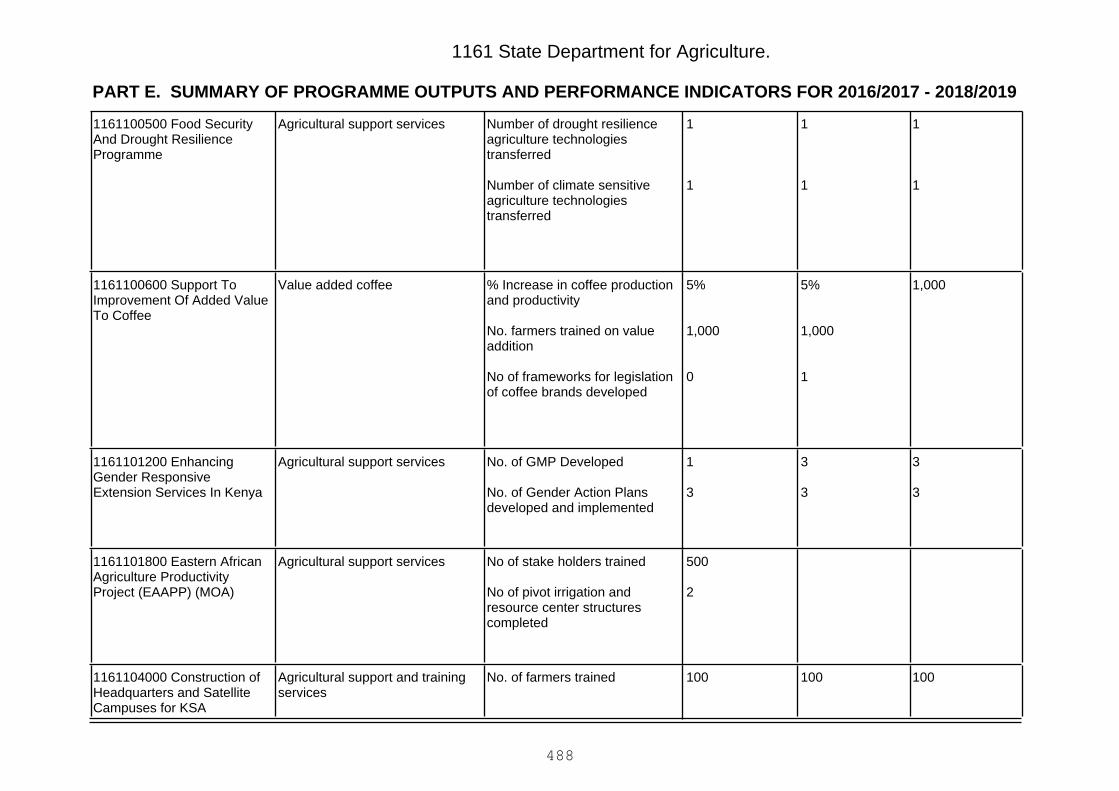
PART E. SUMMARY OF PROGRAMME OUTPUTS AND PERFORMANCE INDICATORS FOR 2016/2017 - 2018/2019
1161 State Department for Agriculture.
1
1
1
1
1
1
Number of drought resilienceagriculture technologiestransferred
Number of climate sensitiveagriculture technologiestransferred
Agricultural support services1161100500 Food SecurityAnd Drought ResilienceProgramme
1,0005%
1,000
1
5%
1,000
0
% Increase in coffee productionand productivity
No. farmers trained on valueaddition
No of frameworks for legislationof coffee brands developed
Value added coffee1161100600 Support ToImprovement Of Added ValueTo Coffee
3
3
3
3
1
3
No. of GMP Developed
No. of Gender Action Plansdeveloped and implemented
Agricultural support services1161101200 EnhancingGender ResponsiveExtension Services In Kenya
500
2
No of stake holders trained
No of pivot irrigation andresource center structurescompleted
Agricultural support services1161101800 Eastern AfricanAgriculture ProductivityProject (EAAPP) (MOA)
100100100No. of farmers trainedAgricultural support and trainingservices
1161104000 Construction ofHeadquarters and SatelliteCampuses for KSA
488
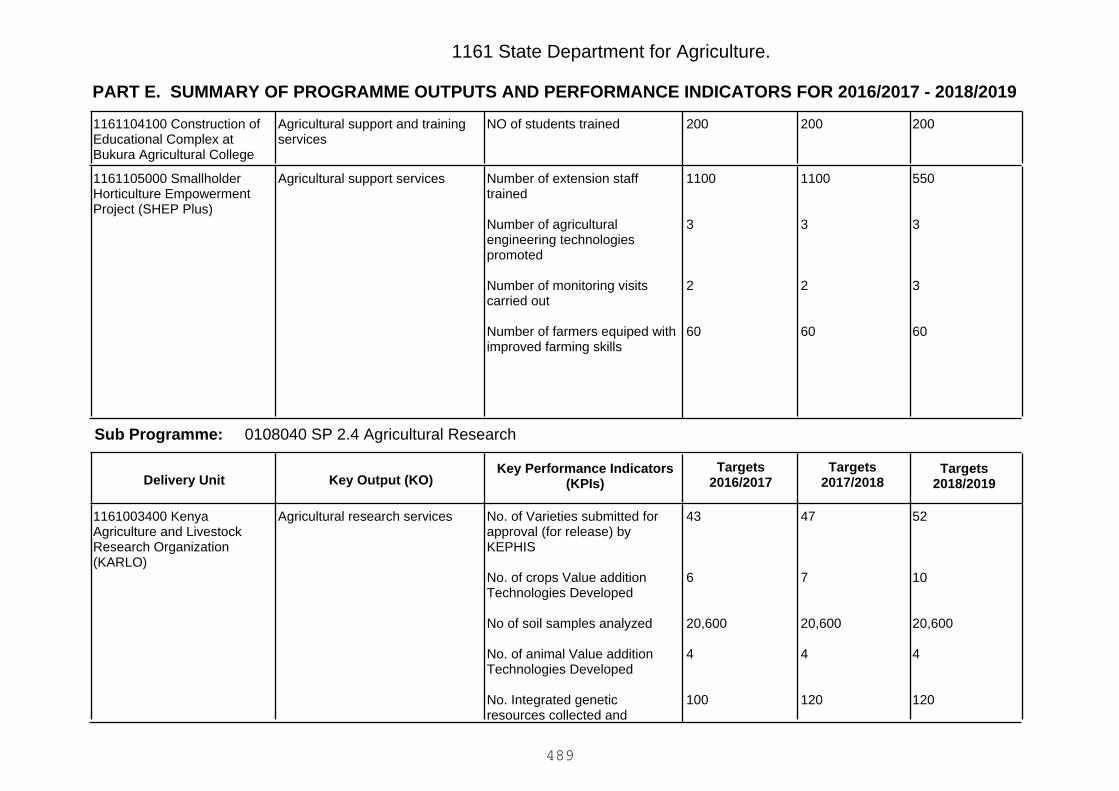
PART E. SUMMARY OF PROGRAMME OUTPUTS AND PERFORMANCE INDICATORS FOR 2016/2017 - 2018/2019
1161 State Department for Agriculture.
200200200NO of students trainedAgricultural support and trainingservices
1161104100 Construction ofEducational Complex atBukura Agricultural College
550
3
3
60
1100
3
2
60
1100
3
2
60
Number of extension stafftrained
Number of agriculturalengineering technologiespromoted
Number of monitoring visitscarried out
Number of farmers equiped withimproved farming skills
Agricultural support services1161105000 SmallholderHorticulture EmpowermentProject (SHEP Plus)
0108040 SP 2.4 Agricultural ResearchSub Programme:
Key Output (KO)Targets
2018/2019Targets
2017/2018Key Performance Indicators
(KPIs)Targets
2016/2017Delivery Unit
52
10
20,600
4
120
47
7
20,600
4
120
43
6
20,600
4
100
No. of Varieties submitted forapproval (for release) byKEPHIS
No. of crops Value additionTechnologies Developed
No of soil samples analyzed
No. of animal Value additionTechnologies Developed
No. Integrated geneticresources collected and
Agricultural research services1161003400 KenyaAgriculture and LivestockResearch Organization(KARLO)
489
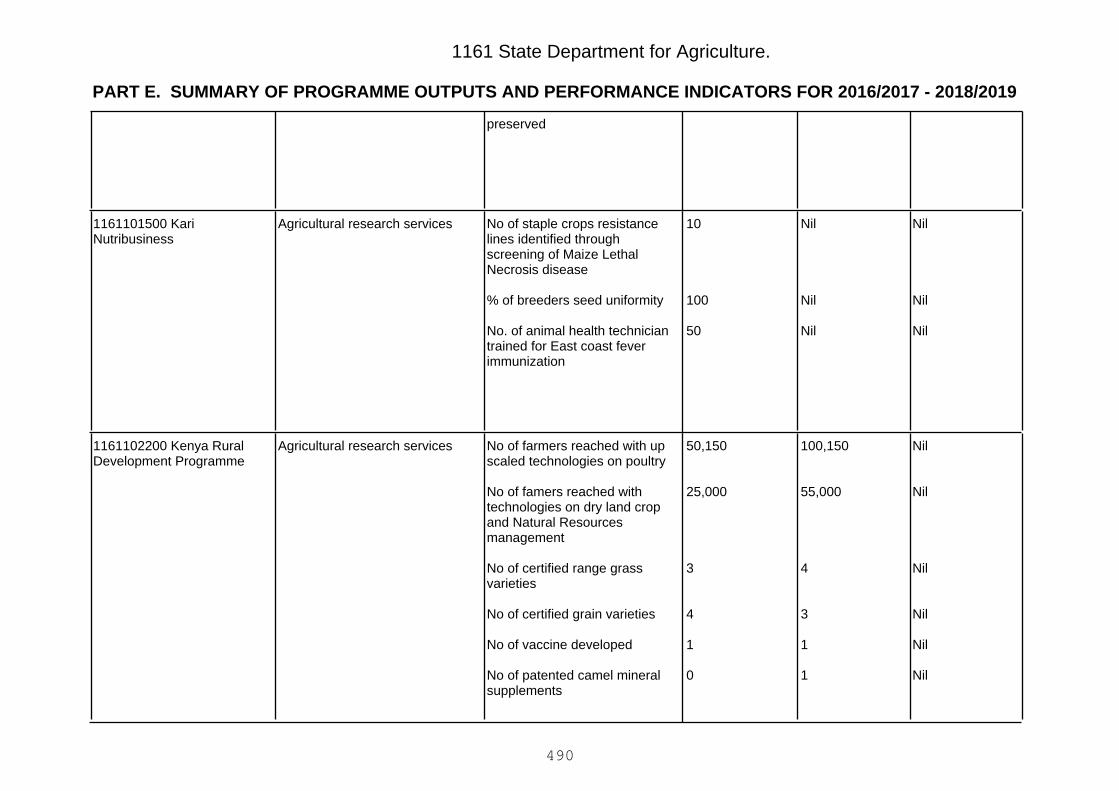
PART E. SUMMARY OF PROGRAMME OUTPUTS AND PERFORMANCE INDICATORS FOR 2016/2017 - 2018/2019
1161 State Department for Agriculture.
preserved
Nil
Nil
Nil
Nil
Nil
Nil
10
100
50
No of staple crops resistancelines identified throughscreening of Maize LethalNecrosis disease
% of breeders seed uniformity
No. of animal health techniciantrained for East coast feverimmunization
Agricultural research services1161101500 KariNutribusiness
Nil
Nil
Nil
Nil
Nil
Nil
100,150
55,000
4
3
1
1
50,150
25,000
3
4
1
0
No of farmers reached with upscaled technologies on poultry
No of famers reached withtechnologies on dry land cropand Natural Resourcesmanagement
No of certified range grassvarieties
No of certified grain varieties
No of vaccine developed
No of patented camel mineralsupplements
Agricultural research services1161102200 Kenya RuralDevelopment Programme
490
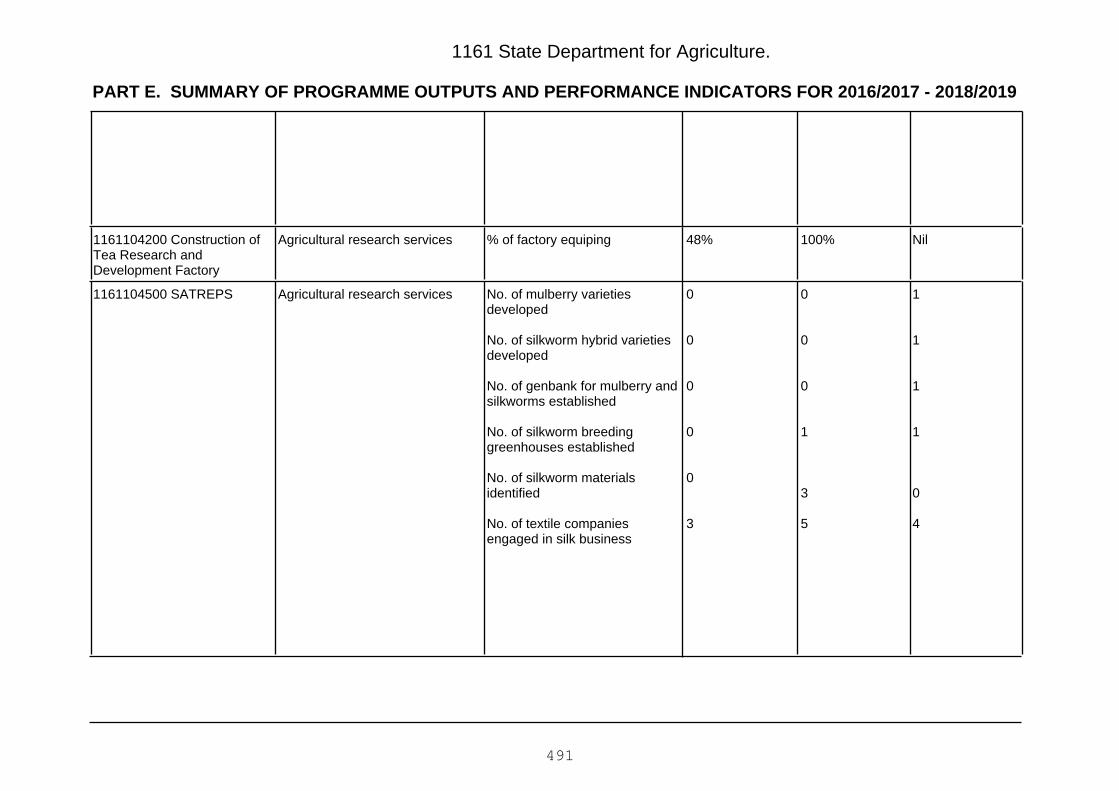
PART E. SUMMARY OF PROGRAMME OUTPUTS AND PERFORMANCE INDICATORS FOR 2016/2017 - 2018/2019
1161 State Department for Agriculture.
Nil100%48%% of factory equipingAgricultural research services1161104200 Construction ofTea Research andDevelopment Factory
1
1
1
1
0
4
0
0
0
1
3
5
0
0
0
0
0
3
No. of mulberry varietiesdeveloped
No. of silkworm hybrid varietiesdeveloped
No. of genbank for mulberry andsilkworms established
No. of silkworm breedinggreenhouses established
No. of silkworm materialsidentified
No. of textile companiesengaged in silk business
Agricultural research services1161104500 SATREPS
491

PART E. SUMMARY OF PROGRAMME OUTPUTS AND PERFORMANCE INDICATORS FOR 2016/2017 - 2018/2019
1161 State Department for Agriculture.
0109000 P3: Agribusiness and Information Management
Improved agricultural performance
Programme:
Outcome:
0109010 SP 3.1 Agribusiness and Market DevelopmentSub Programme:
Key Output (KO)Targets
2018/2019Targets
2017/2018Key Performance Indicators
(KPIs)Targets
2016/2017Delivery Unit
3
10
3
10
3
10
No. of new international marketsopened
No. of bilateral ,multilateralagreements initiated.
Agricultural production andmarketing services
1161000200 AgricultureAttache`s Offices
7
500
5
500
3
500
No. of agribusinesstechnologies developed
No. of farmers trained inagribusiness practices
Agricultural production andmarketing services
1161002100 AgriculturalBusiness MarketDevelopment and AgriculturalInformati
1172
5
822
2
1110
0
Ha of land under irrigation
Number of post harvesthandling facilities constructed
Agricultural production andmarketing services
1161105100 Small ScaleIrrigation and Value AdditionProject
0
2
0
3
5
0
No of market designs developed
No of markets improved
Agricultural production andmarketing services
1161105200 Improvement ofMarket Infrastructure inWestern Kenya
492
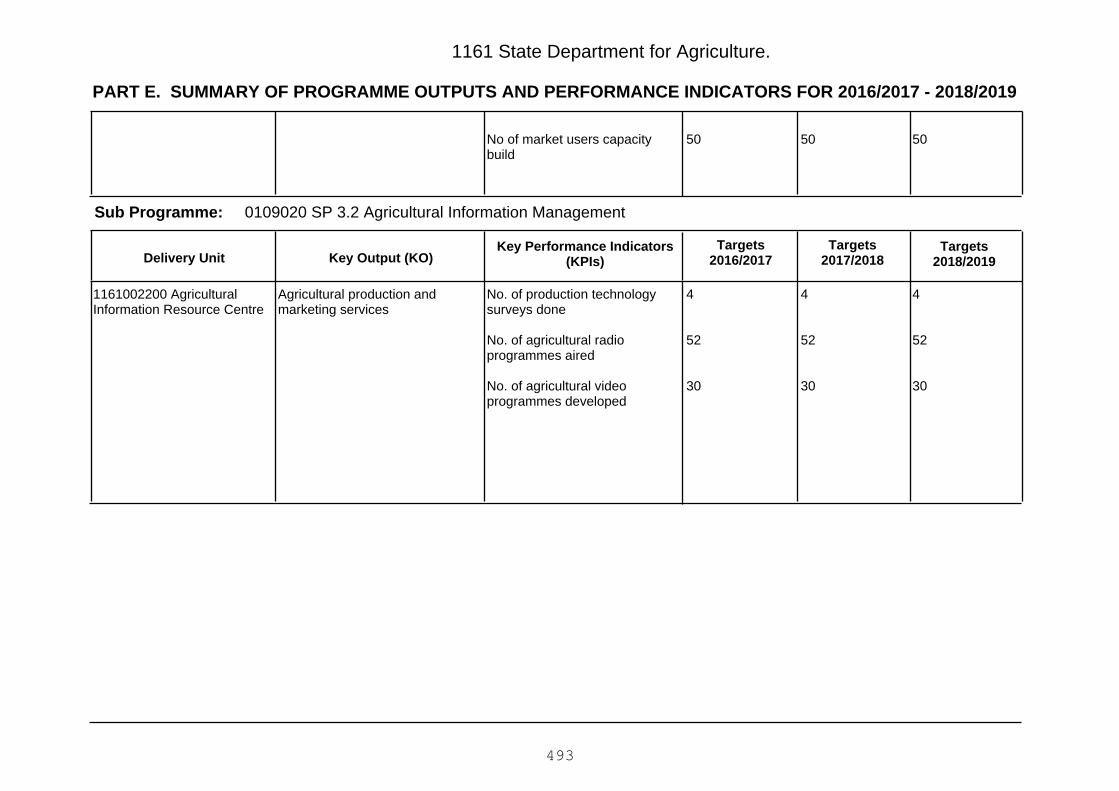
PART E. SUMMARY OF PROGRAMME OUTPUTS AND PERFORMANCE INDICATORS FOR 2016/2017 - 2018/2019
1161 State Department for Agriculture.
505050No of market users capacitybuild
0109020 SP 3.2 Agricultural Information ManagementSub Programme:
Key Output (KO)Targets
2018/2019Targets
2017/2018Key Performance Indicators
(KPIs)Targets
2016/2017Delivery Unit
4
52
30
4
52
30
4
52
30
No. of production technologysurveys done
No. of agricultural radioprogrammes aired
No. of agricultural videoprogrammes developed
Agricultural production andmarketing services
1161002200 AgriculturalInformation Resource Centre
493

Vote 1161 State Department for Agriculture.
PART F: Summary of Expenditure by Programmes, 2016/2017 - 2018/2019
Programme
Estimates Projected Estimates
2016/2017 2017/2018 2018/2019
KShs. KShs. KShs.
0107010 SP 1.1 Agricultural Policy, Legal and RegulatoryFrameworks 3,390,690,208 3,345,448,127 3,132,493,834
0107020 SP 1.2 Agricultural Planning and Financial Management 54,351,516 59,578,775 60,797,386
0107000 P1: General Administration Planning and Support Services 3,445,041,724 3,405,026,902 3,193,291,220
0108010 SP 2.1 Land and Crops Development 655,628,798 1,068,255,587 1,556,090,784
0108020 SP 2.2 Food Security Initiatives 11,106,244,295 8,594,642,812 7,923,218,677
0108030 SP 2.3 Quality Assurance and Monitoring of Outreach Services 2,075,466,392 1,270,068,196 1,070,577,559
0108040 SP 2.4 Agricultural Research 3,203,014,013 3,741,676,679 3,102,267,523
0108000 P2: Crop Development and Management 17,040,353,498 14,674,643,274 13,652,154,543
0109010 SP 3.1 Agribusiness and Market Development 1,077,730,299 1,227,370,498 1,401,671,201
0109020 SP 3.2 Agricultural Information Management 51,216,995 50,569,577 51,493,286
0109000 P3: Agribusiness and Information Management 1,128,947,294 1,277,940,075 1,453,164,487Total Expenditure for Vote 1161 State Department for Agriculture. 21,614,342,516 19,357,610,251 18,298,610,250
494

1161 State Department for Agriculture.
PART G: Summary of Expenditure by Vote and Economic Classification, 2016/2017 - 2018/2019
Economic Classification
Estimates Projected Estimates
2016/2017 2017/2018 2018/2019KShs. KShs. KShs.
Current Expenditure 8,586,076,695 9,768,099,999 9,862,099,998
Compensation to Employees 982,000,000 1,010,000,000 1,040,999,999
Use of Goods and Services 696,117,051 846,111,117 874,158,013
Current Transfers to Govt. Agencies 5,288,400,000 5,586,099,999 5,594,099,999
Other Recurrent 1,619,559,644 2,325,888,883 2,352,841,987
Capital Expenditure 13,028,265,821 9,589,510,252 8,436,510,252
Acquisition of Non-Financial Assets 1,173,489,606 1,154,962,252 1,147,962,252
Capital Grants to Govt. Agencies 6,400,228,215 4,910,000,000 3,664,000,000
Other Development 5,454,548,000 3,524,548,000 3,624,548,000Total Expenditure 21,614,342,516 19,357,610,251 18,298,610,250
495
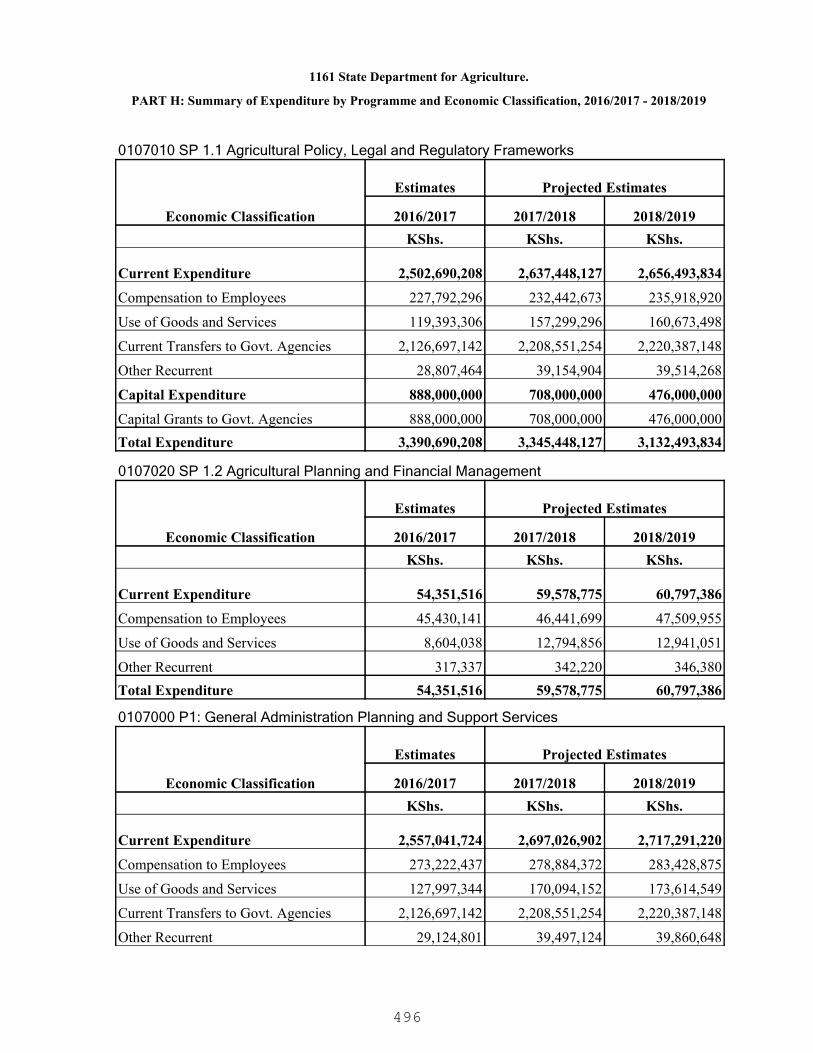
1161 State Department for Agriculture.
PART H: Summary of Expenditure by Programme and Economic Classification, 2016/2017 - 2018/2019
0107010 SP 1.1 Agricultural Policy, Legal and Regulatory Frameworks
Economic Classification
Estimates Projected Estimates
2016/2017 2017/2018 2018/2019KShs. KShs. KShs.
Current Expenditure 2,502,690,208 2,637,448,127 2,656,493,834
Compensation to Employees 227,792,296 232,442,673 235,918,920
Use of Goods and Services 119,393,306 157,299,296 160,673,498
Current Transfers to Govt. Agencies 2,126,697,142 2,208,551,254 2,220,387,148
Other Recurrent 28,807,464 39,154,904 39,514,268
Capital Expenditure 888,000,000 708,000,000 476,000,000
Capital Grants to Govt. Agencies 888,000,000 708,000,000 476,000,000Total Expenditure 3,390,690,208 3,345,448,127 3,132,493,834
0107020 SP 1.2 Agricultural Planning and Financial Management
Economic Classification
Estimates Projected Estimates
2016/2017 2017/2018 2018/2019KShs. KShs. KShs.
Current Expenditure 54,351,516 59,578,775 60,797,386
Compensation to Employees 45,430,141 46,441,699 47,509,955
Use of Goods and Services 8,604,038 12,794,856 12,941,051
Other Recurrent 317,337 342,220 346,380Total Expenditure 54,351,516 59,578,775 60,797,386
0107000 P1: General Administration Planning and Support Services
Economic Classification
Estimates Projected Estimates
2016/2017 2017/2018 2018/2019KShs. KShs. KShs.
Current Expenditure 2,557,041,724 2,697,026,902 2,717,291,220
Compensation to Employees 273,222,437 278,884,372 283,428,875
Use of Goods and Services 127,997,344 170,094,152 173,614,549
Current Transfers to Govt. Agencies 2,126,697,142 2,208,551,254 2,220,387,148
Other Recurrent 29,124,801 39,497,124 39,860,648
496
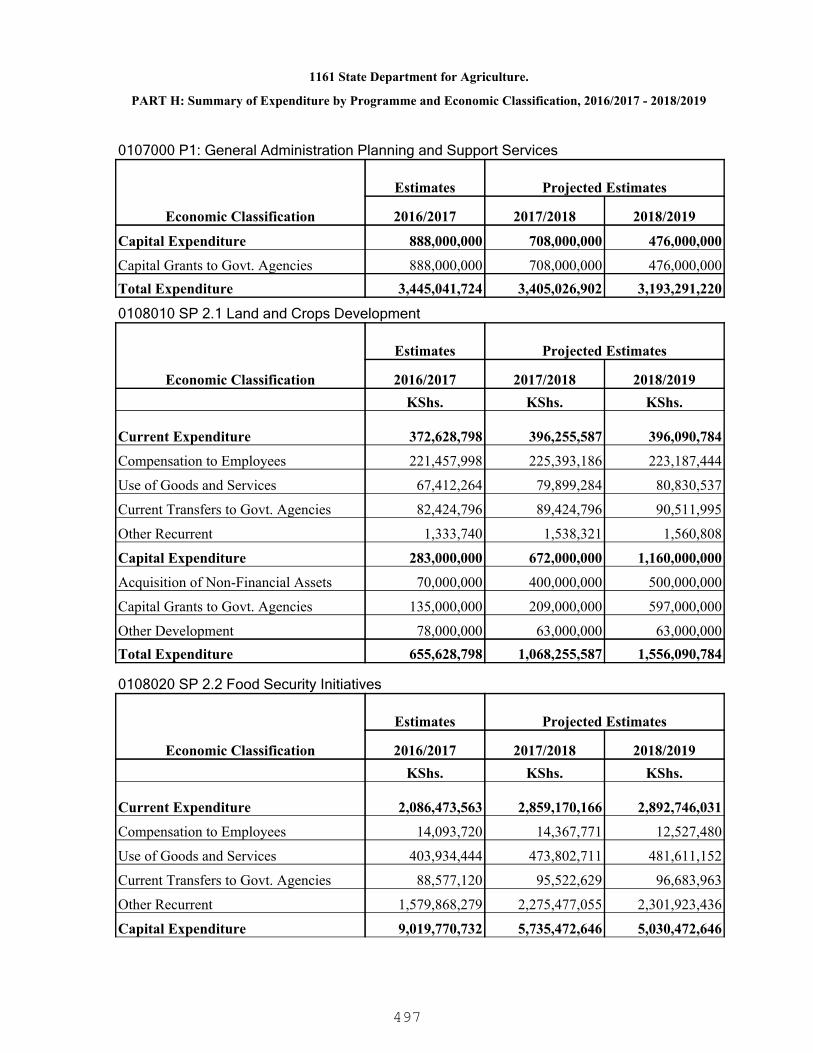
1161 State Department for Agriculture.
PART H: Summary of Expenditure by Programme and Economic Classification, 2016/2017 - 2018/2019
0107000 P1: General Administration Planning and Support Services
Economic Classification
Estimates Projected Estimates
2016/2017 2017/2018 2018/2019
Capital Expenditure 888,000,000 708,000,000 476,000,000
Capital Grants to Govt. Agencies 888,000,000 708,000,000 476,000,000Total Expenditure 3,445,041,724 3,405,026,902 3,193,291,220
0108010 SP 2.1 Land and Crops Development
Economic Classification
Estimates Projected Estimates
2016/2017 2017/2018 2018/2019KShs. KShs. KShs.
Current Expenditure 372,628,798 396,255,587 396,090,784
Compensation to Employees 221,457,998 225,393,186 223,187,444
Use of Goods and Services 67,412,264 79,899,284 80,830,537
Current Transfers to Govt. Agencies 82,424,796 89,424,796 90,511,995
Other Recurrent 1,333,740 1,538,321 1,560,808
Capital Expenditure 283,000,000 672,000,000 1,160,000,000
Acquisition of Non-Financial Assets 70,000,000 400,000,000 500,000,000
Capital Grants to Govt. Agencies 135,000,000 209,000,000 597,000,000
Other Development 78,000,000 63,000,000 63,000,000Total Expenditure 655,628,798 1,068,255,587 1,556,090,784
0108020 SP 2.2 Food Security Initiatives
Economic Classification
Estimates Projected Estimates
2016/2017 2017/2018 2018/2019KShs. KShs. KShs.
Current Expenditure 2,086,473,563 2,859,170,166 2,892,746,031
Compensation to Employees 14,093,720 14,367,771 12,527,480
Use of Goods and Services 403,934,444 473,802,711 481,611,152
Current Transfers to Govt. Agencies 88,577,120 95,522,629 96,683,963
Other Recurrent 1,579,868,279 2,275,477,055 2,301,923,436
Capital Expenditure 9,019,770,732 5,735,472,646 5,030,472,646
497

1161 State Department for Agriculture.
PART H: Summary of Expenditure by Programme and Economic Classification, 2016/2017 - 2018/2019
0108020 SP 2.2 Food Security Initiatives
Economic Classification
Estimates Projected Estimates
2016/2017 2017/2018 2018/2019
Acquisition of Non-Financial Assets 924,452,000 190,924,646 190,924,646
Capital Grants to Govt. Agencies 2,718,770,732 2,083,000,000 1,278,000,000
Other Development 5,376,548,000 3,461,548,000 3,561,548,000Total Expenditure 11,106,244,295 8,594,642,812 7,923,218,677
0108030 SP 2.3 Quality Assurance and Monitoring of Outreach Services
Economic Classification
Estimates Projected Estimates
2016/2017 2017/2018 2018/2019KShs. KShs. KShs.
Current Expenditure 479,423,909 511,068,196 554,577,559
Compensation to Employees 334,666,527 347,530,009 374,696,042
Use of Goods and Services 47,109,188 58,813,608 73,877,012
Current Transfers to Govt. Agencies 89,485,998 96,502,774 97,676,025
Other Recurrent 8,162,196 8,221,805 8,328,480
Capital Expenditure 1,596,042,483 759,000,000 516,000,000
Acquisition of Non-Financial Assets 153,000,000 538,000,000 431,000,000
Capital Grants to Govt. Agencies 1,443,042,483 221,000,000 85,000,000Total Expenditure 2,075,466,392 1,270,068,196 1,070,577,559
0108040 SP 2.4 Agricultural Research
Economic Classification
Estimates Projected Estimates
2016/2017 2017/2018 2018/2019KShs. KShs. KShs.
Current Expenditure 2,890,661,407 3,083,639,073 3,076,229,917
Current Transfers to Govt. Agencies 2,890,661,407 3,083,639,073 3,076,229,917
Capital Expenditure 312,352,606 658,037,606 26,037,606
Acquisition of Non-Financial Assets 26,037,606 26,037,606 26,037,606
Capital Grants to Govt. Agencies 286,315,000 632,000,000 -Total Expenditure 3,203,014,013 3,741,676,679 3,102,267,523
498
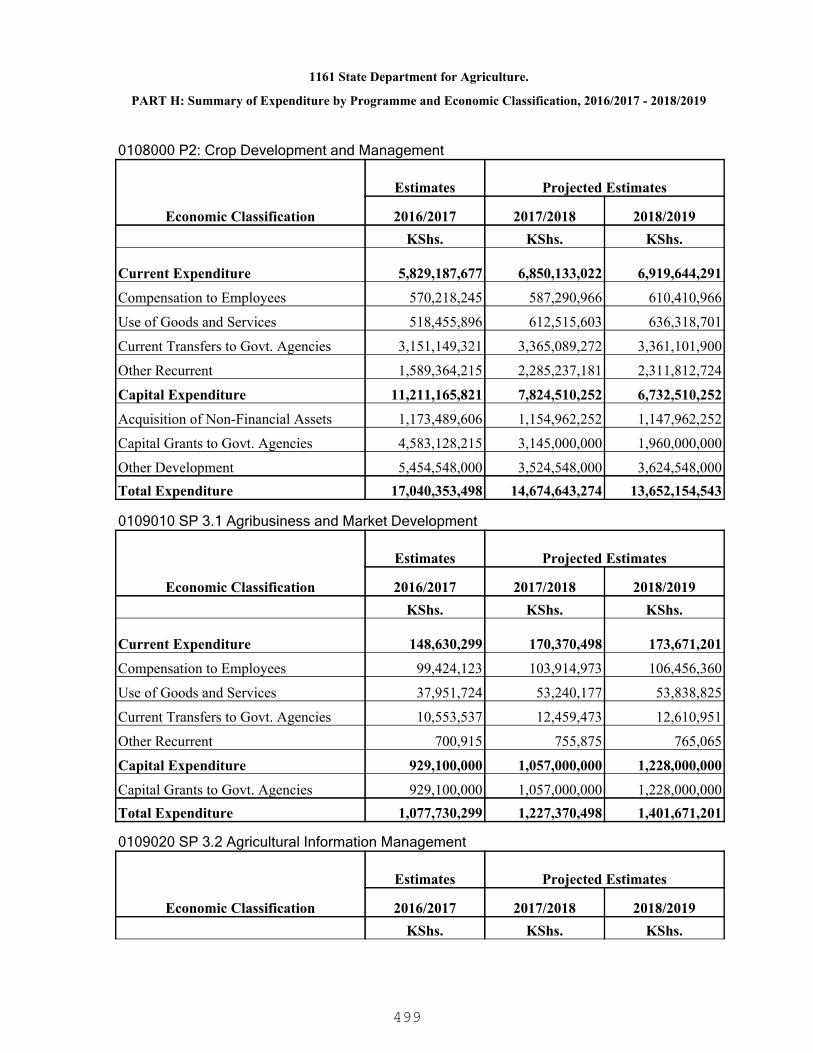
1161 State Department for Agriculture.
PART H: Summary of Expenditure by Programme and Economic Classification, 2016/2017 - 2018/2019
0108000 P2: Crop Development and Management
Economic Classification
Estimates Projected Estimates
2016/2017 2017/2018 2018/2019KShs. KShs. KShs.
Current Expenditure 5,829,187,677 6,850,133,022 6,919,644,291
Compensation to Employees 570,218,245 587,290,966 610,410,966
Use of Goods and Services 518,455,896 612,515,603 636,318,701
Current Transfers to Govt. Agencies 3,151,149,321 3,365,089,272 3,361,101,900
Other Recurrent 1,589,364,215 2,285,237,181 2,311,812,724
Capital Expenditure 11,211,165,821 7,824,510,252 6,732,510,252
Acquisition of Non-Financial Assets 1,173,489,606 1,154,962,252 1,147,962,252
Capital Grants to Govt. Agencies 4,583,128,215 3,145,000,000 1,960,000,000
Other Development 5,454,548,000 3,524,548,000 3,624,548,000Total Expenditure 17,040,353,498 14,674,643,274 13,652,154,543
0109010 SP 3.1 Agribusiness and Market Development
Economic Classification
Estimates Projected Estimates
2016/2017 2017/2018 2018/2019KShs. KShs. KShs.
Current Expenditure 148,630,299 170,370,498 173,671,201
Compensation to Employees 99,424,123 103,914,973 106,456,360
Use of Goods and Services 37,951,724 53,240,177 53,838,825
Current Transfers to Govt. Agencies 10,553,537 12,459,473 12,610,951
Other Recurrent 700,915 755,875 765,065
Capital Expenditure 929,100,000 1,057,000,000 1,228,000,000
Capital Grants to Govt. Agencies 929,100,000 1,057,000,000 1,228,000,000Total Expenditure 1,077,730,299 1,227,370,498 1,401,671,201
0109020 SP 3.2 Agricultural Information Management
Economic Classification
Estimates Projected Estimates
2016/2017 2017/2018 2018/2019KShs. KShs. KShs.
499
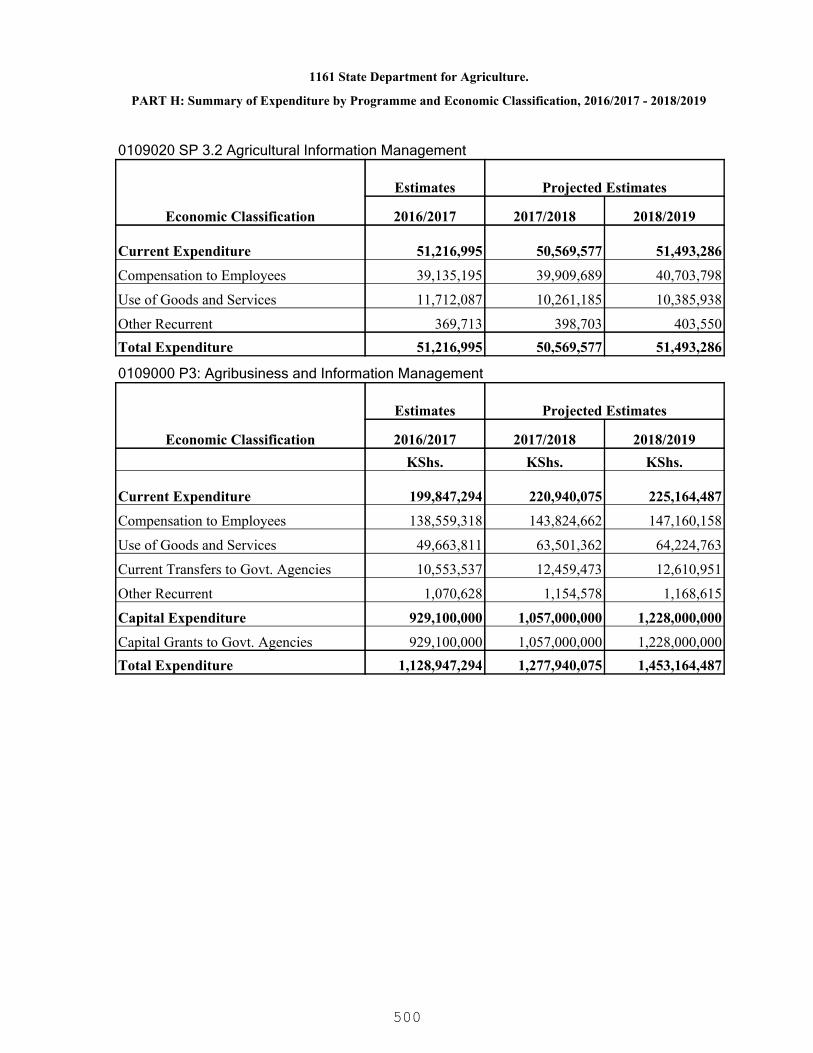
1161 State Department for Agriculture.
PART H: Summary of Expenditure by Programme and Economic Classification, 2016/2017 - 2018/2019
0109020 SP 3.2 Agricultural Information Management
Economic Classification
Estimates Projected Estimates
2016/2017 2017/2018 2018/2019
Current Expenditure 51,216,995 50,569,577 51,493,286
Compensation to Employees 39,135,195 39,909,689 40,703,798
Use of Goods and Services 11,712,087 10,261,185 10,385,938
Other Recurrent 369,713 398,703 403,550Total Expenditure 51,216,995 50,569,577 51,493,286
0109000 P3: Agribusiness and Information Management
Economic Classification
Estimates Projected Estimates
2016/2017 2017/2018 2018/2019KShs. KShs. KShs.
Current Expenditure 199,847,294 220,940,075 225,164,487
Compensation to Employees 138,559,318 143,824,662 147,160,158
Use of Goods and Services 49,663,811 63,501,362 64,224,763
Current Transfers to Govt. Agencies 10,553,537 12,459,473 12,610,951
Other Recurrent 1,070,628 1,154,578 1,168,615
Capital Expenditure 929,100,000 1,057,000,000 1,228,000,000
Capital Grants to Govt. Agencies 929,100,000 1,057,000,000 1,228,000,000Total Expenditure 1,128,947,294 1,277,940,075 1,453,164,487
500
1162 State Department for Livestock.
A leading agent in facilitating efficient delivery of services for a sustainable and prosperouslivestock sector
To create a favourable policy and legal framework and provide services that increaseproductivity, value addition and improved incomes in the livestock industry
PART A. Vision
PART B. Mission
PART C. Performance Overview and Background for Programme(s) Funding
The State Department of Livestock is mandated to promote, regulate and facilitate livestocksub sector for socio-economic development and industrialization. The State Departmentimplemented sub-programmes in five priority areas namely; creation of an enablingenvironment for livestock development, increasing productivity and outputs, enhancingnational food and nutrition security, improving market access and trade in livestock industryand strengthening institutional capacity in the sector.
To create enabling environment and institutional reforms, 3 sessional papers on poultry,beekeeping and dairy policies were finalized, 4 draft policies on veterinary, livestockbreeding, livestock feeds and camel were developed and Sessional Paper No. 2 of 2008 onNational Livestock Policy was reviewed to ensure consistency with the Constitution. Toimprove the regulatory framework, the veterinary surgeons and paraprofessional Act 2011was enacted and 4 draft Bills namely the Livestock bill, Dairy Industry bill, Bee keeping Billand Tsetse and Trypanosomiasis eradication (T&T) bill were developed. Regardinginstitutional reforms, infrastructures and specialized laboratory equipment was improved atKenya Veterinary Vaccines Production Institutes (KEVEVAPI) for production of oil based Footand Mouth Disease (FMD) and thermostable Newcastle disease vaccines with longer shelflife, a modern quality control laboratory was constructed at Kenya Animal Genetic ResourceCentre (KAGRC) for semen quality assurance and modernization of the plant and staffrationalization is on-going at Kenya Meat Commission (KMC). Further livestock breeding andresearch farms, veterinary diagnostic and efficacy trial centers, veterinary laboratories,training institutions were rehabilitated and a modern conference facility was constructed atthe Dairy Training Institute (DTI) in Naivasha.
To increase livestock productivity, modern semen production plant was installed at theKAGRC in 2013/ FY resulting to an increase of semen production from 700,000 to 854,372doses. Also 6 Liquid Nitrogen plants were installed in Kirinyaga, Sotik, Uasin Gishu, Meru,Nyahururu and Kabete resulting to distribution of 220,727 litres of liquid Nitrogen.Modernization and expansion of KEVEVAPI infrastructure resulted to an increase in vaccineproduction from 30 million to 48 million doses. In addition, regular disease control andsurveillance operations were also conducted to mitigate against livestock diseases outbreaks.
On national food and nutrition security, 25,060 tropical livestock units have been insured inTurkana and Wajir while expansion to all other counties has been initiated, geared towardsminimizing risks emanating from drought-related disasters and build resilience of pastoralistsfor enhanced and sustainable food security. To enhance national foods and nutrition security,the government targets to insure 2,857,143 livestock units belonging to 571,429 householdsin 14 Arid and Semi-Arid Land counties, expand the national food reserves to includepowdered milk and canned beef. Further, the department strives to establish strategic
501
1162 State Department for Livestock.
PART D. Programme Objectives
livestock feeds reserves as part of the national food security strategy.
Regarding market access and trade improvement in livestock industry, the first phase of theestablishment of a Livestock Export Zone in Bachuma is at 45% completion rate. To enhancemarket access the State Department embraced business process re-engineering through theKenya Electronic Single Window System (KESWS) which reduced the time taken to processexport/import permits for trade in livestock and livestock products from ten (10) to two (2)days. To facilitate milk marketing and reduction of post harvest loss, 2 milk bulking andcooling equipments, were procured and distributed to various counties. Livestock productivityand sustainable food security will be improved through development of genetic material thatis designed to produce high yielding varieties of livestock that will adapt to specific climaticregions of the country and genetic stock for diversified animal breeds other than cattle will beavailed. Capacity for constant surveillance of emergence of disease outbreaks will beenhanced by improving disease diagnostic and analysis facilities. Incidences of Tsetseinfestation and Trypanosomiasis will be suppressed and eradicated. Facilities for productionof vaccines and sera will be upgraded to improve the ability to produce potent and longerlasting vaccines for both the domestic and export market. The Livestock Insurance Schemeoperations will be up-scaled to provide a wider coverage to livestock farmers in ASAL areas.
The State Department's budget allocation was KSh.7.5 billion in the 2012/13 FY. Theallocation reduced to KSh.4.7 billion in 2013/14 FY and increased to KSh.5.6 billion in2014/15 FY. The actual expenditure was KSh.7.3 billion, KSh.4.0 billion and KSh.5.2 billion in2012/13 FY, 2013/14 FY and 2014/15 FY respectively.
Implementation of the program mes was however constrained by government austeritymeasures that affected execution of the work plans, low absorption donor funds, inadequatedisbursement of funds, slow and delay in procurement of goods and services by developmentpartners.
In the period 2016/17 - 2018/19 the State Department will improve market access and tradeby modernizing the existing processing plant at the KMC, establish Livestock Export Zonesby scaling up the creation of Disease Free Zones and promotion of value addition forlivestock products. The sanitary standards of the food of animal origin will be monitored tocontain the levels of chemical residues for health safety and international market.
On policies and legal framework, the Department targets to finalize the draft policies and billsto guide the livestock industry. Institutional reforms in the livestock sub-sector will beundertaken in various training institutions to build capacity in various stake-holders animalhealth, increasing productivity of livestock and ensuring safety of food products. The reformswill also apply to state corporations namely; KMC, KAGRC and KEVEVAPI.
ObjectiveProgramme
0112000 P 6: LivestockResources Management andDevelopment
To promote, regulate and facilitate livestock production forsocio-economic development and industrialisation
502

PART E. SUMMARY OF PROGRAMME OUTPUTS AND PERFORMANCE INDICATORS FOR 2016/2017 - 2018/2019
1162 State Department for Livestock.
0112000 P 6: Livestock Resources Management and Development
To promote, regulate and facilitate livestock production for socio-economic development and industrialization.
Programme:
Outcome:
0112010 SP 6.1 Livestock Policy Development and capacity building ProgrammeSub Programme:
Key Output (KO)Targets
2018/2019Targets
2017/2018Key Performance Indicators
(KPIs)Targets
2016/2017Delivery Unit
100%
Certification andaccreditationreport
100%
Certification andaccreditationreport
100%
Certification andaccreditationreport
% budget utilizationFinancial Services1162000100 Finance andProcurement Services
505050No. of staff sensitized on HIVand AIDS
HIV/AIDS Awareness1162000200 AIDS ControlUnit
222No.of Veterinary policies andstrategies development
Administrative services1162000300 HeadquartersAdministrative and TechnicalServices
444No. of monitoring andEvaluation reports
Planning Services1162000400 DevelopmentPlanning Services
432No. of National livestockpolicies and strategies onlivestock development andmarketing services developed
Livestock Development andmarketing services improved
1162000600 LivestockResources and MarketDevelopement SupportServices
120120120No. of staff trainedlivestock production andmarketing services
1162001100 LivestockTechnical Training - SupportServices
503
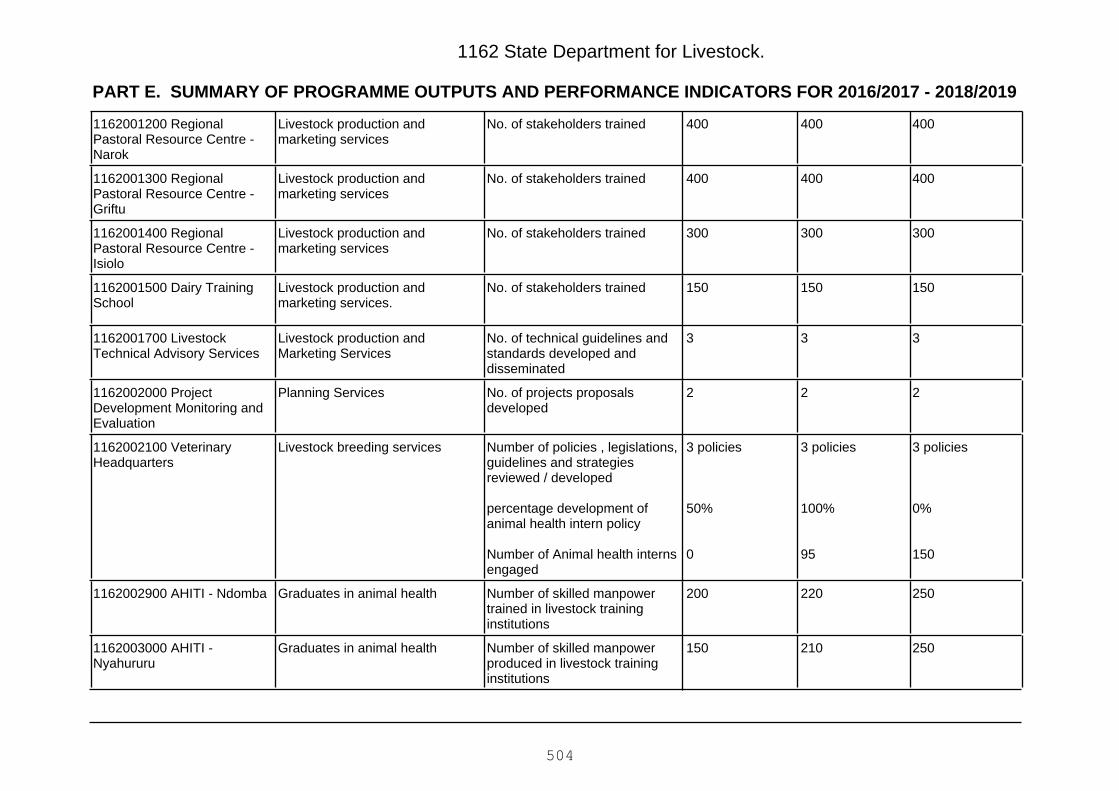
PART E. SUMMARY OF PROGRAMME OUTPUTS AND PERFORMANCE INDICATORS FOR 2016/2017 - 2018/2019
1162 State Department for Livestock.
400400400No. of stakeholders trainedLivestock production andmarketing services
1162001200 RegionalPastoral Resource Centre -Narok
400400400No. of stakeholders trainedLivestock production andmarketing services
1162001300 RegionalPastoral Resource Centre -Griftu
300300300No. of stakeholders trainedLivestock production andmarketing services
1162001400 RegionalPastoral Resource Centre -Isiolo
150150150No. of stakeholders trainedLivestock production andmarketing services.
1162001500 Dairy TrainingSchool
333No. of technical guidelines andstandards developed anddisseminated
Livestock production andMarketing Services
1162001700 LivestockTechnical Advisory Services
222No. of projects proposalsdeveloped
Planning Services1162002000 ProjectDevelopment Monitoring andEvaluation
3 policies
0%
150
3 policies
100%
95
3 policies
50%
0
Number of policies , legislations,guidelines and strategiesreviewed / developed
percentage development ofanimal health intern policy
Number of Animal health internsengaged
Livestock breeding services1162002100 VeterinaryHeadquarters
250220200Number of skilled manpowertrained in livestock traininginstitutions
Graduates in animal health1162002900 AHITI - Ndomba
250210150Number of skilled manpowerproduced in livestock traininginstitutions
Graduates in animal health1162003000 AHITI -Nyahururu
504

PART E. SUMMARY OF PROGRAMME OUTPUTS AND PERFORMANCE INDICATORS FOR 2016/2017 - 2018/2019
1162 State Department for Livestock.
250220200Number of skilled manpowertrained in livestock traininginstitutions
Graduates in animal health1162003100 AHITI - Kabete
150150100Number of skilled manpowertrained in livestock traininginstitutions
Graduates in animal health1162003200 Meat TrainingSchool - Athi River
200,000120,000100,000No. of tropical units insuredLivestock insurance1162100600 Kenya LivestockInsurance Scheme
001Designs for the proposedbuilding
Office facility1162101500 Designs forMifugo house
100%70%41%Percentage level of completionof construction of infrastructure(classrooms, Kitchen, Dininghall, laboratories, staff houses)
Graduates in animal health1162101700 Construction oflearning facilities (New Site) atAHITI
0112020 SP 6.2 Livestock Production and ManagementSub Programme:
Key Output (KO)Targets
2018/2019Targets
2017/2018Key Performance Indicators
(KPIs)Targets
2016/2017Delivery Unit
600500450No. of quality sheep and goatsavailed to stakeholders
Livestock breeding services1162000500 Sheep andGoats Breeding Farms
250200200No. of quality cattle stock breedand availed to stakeholders
Livestock breeding services1162000800 Breeding andLivestock Research Farms
1,000800700No. of quality breeding rabbitsavailed to stakeholders
livestock breeding services1162000900 Animal ResourceDevelopment Services
2
5
2
5
2
5
No. of apiculture and emerginglivestock guidelines developed
No. of bee- bulking sitesestablished and maintained
Apiculture services1162001900 Apicultural andEmerging Livestock Services
505
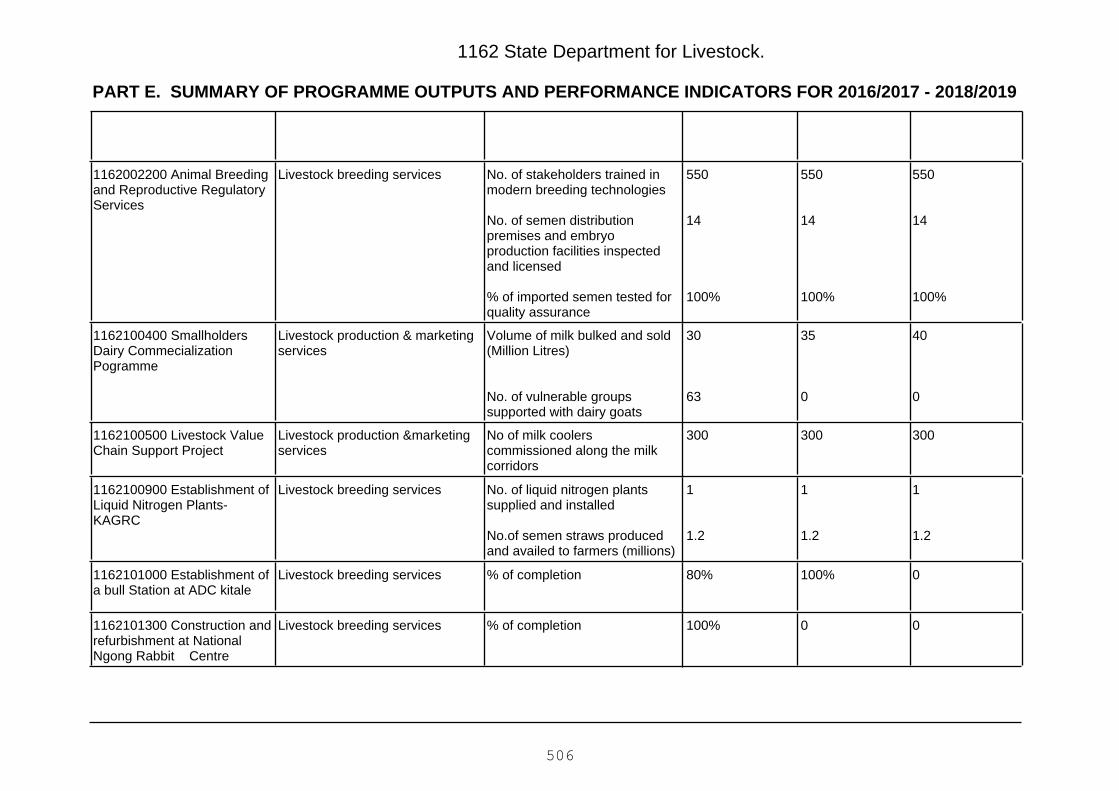
PART E. SUMMARY OF PROGRAMME OUTPUTS AND PERFORMANCE INDICATORS FOR 2016/2017 - 2018/2019
1162 State Department for Livestock.
550
14
100%
550
14
100%
550
14
100%
No. of stakeholders trained inmodern breeding technologies
No. of semen distributionpremises and embryoproduction facilities inspectedand licensed
% of imported semen tested forquality assurance
Livestock breeding services1162002200 Animal Breedingand Reproductive RegulatoryServices
40
0
35
0
30
63
Volume of milk bulked and sold(Million Litres)
No. of vulnerable groupssupported with dairy goats
Livestock production & marketingservices
1162100400 SmallholdersDairy CommecializationPogramme
300300300No of milk coolerscommissioned along the milkcorridors
Livestock production &marketingservices
1162100500 Livestock ValueChain Support Project
1
1.2
1
1.2
1
1.2
No. of liquid nitrogen plantssupplied and installed
No.of semen straws producedand availed to farmers (millions)
Livestock breeding services1162100900 Establishment ofLiquid Nitrogen Plants-KAGRC
0100%80%% of completionLivestock breeding services1162101000 Establishment ofa bull Station at ADC kitale
00100%% of completionLivestock breeding services1162101300 Construction andrefurbishment at NationalNgong Rabbit Centre
506

PART E. SUMMARY OF PROGRAMME OUTPUTS AND PERFORMANCE INDICATORS FOR 2016/2017 - 2018/2019
1162 State Department for Livestock.
0112030 SP 6.3 Livestock Products Value Addition and MarketingSub Programme:
Key Output (KO)Targets
2018/2019Targets
2017/2018Key Performance Indicators
(KPIs)Targets
2016/2017Delivery Unit
10,000
22,000
10,000
22,000
9,300
22,000
Number of milk handlingpremises inspected
MT of milk powder in strategicfood reserves
Livestock production &marketingservices
1162000600 LivestockResources and MarketDevelopement SupportServices
3
60%
2
3
60%
2
3
60%
2
No. of strategic facilitiesdeveloped in stock routes (waterpans, handling pens and haysheds)
% completion of beef industrymaster plan
No. of guidelines for rangelivestock grazing developed
Livestock production& marketingservices
1162001000 RangelandEcosystems DevelopmentServices
333No. of livestock markets linkedto the National LivestockMarketing Information System
Livestock production & marketingservices
1162001600 Livestock Marketand AgribusinessDevelopment Services
6%
75%
6%
0
5%
0
% increase in value of leatherand leather products traded
% completion of Institute ofleather science
Quality of hides, skins and leatherproducts improved
1162002500 Veterinary PublicHealth Hides and Skins andLeather Quality Control
6%
6.3%
5.3 %
5.8%
4.3 %
4.8%
% increase in number ofanimals traded in selectedproject market .
% increase in trade real value inlivestock and livestock products
Livestock production &marketingservices
1162100100 RegionalPastoral Livelihood Resilienceproject
507

PART E. SUMMARY OF PROGRAMME OUTPUTS AND PERFORMANCE INDICATORS FOR 2016/2017 - 2018/2019
1162 State Department for Livestock.
16
95
16
95
13
70
traded in selected projectmarkets
Number of livestock marketingfacilities developed/rehabilitated
Number of wateringinfrastructure along cross bordermigration routes developed/rehabilitated
3,000
2,480
3,000
1,280
2,500
1,880
Hectare of land reseeded inpastoral and agro- pastoralareas
Hectares where SLM practiceshave been adapted in projectarea
Range land conservation1162100300 Mainstreamingsustainable land management(SLM) in Agropastoral produ
1008060Improved efficiency of meatprocessing facility
Livestock production &marketing1162100800Modernization/Rehabilitationof Kenya Meat CommissionFactory
0112040 SP 6.4 Food Safety and Animal Products DevelopmentSub Programme:
Key Output (KO)Targets
2018/2019Targets
2017/2018Key Performance Indicators
(KPIs)Targets
2016/2017Delivery Unit
400
800
400
800
350
700
Number of honey samplesanalyzed
Number of stakeholders trainedon bee keeping
Apiculture services1162000700 National BeeKeeping Institute
12
8,000
12
7,800
12
7,500
No. of herds evaluated
Number of Milk samplesanalysed
Livestock breeding services1162001800 LivestockBreeding and LaboratoryServices
508

PART E. SUMMARY OF PROGRAMME OUTPUTS AND PERFORMANCE INDICATORS FOR 2016/2017 - 2018/2019
1162 State Department for Livestock.
6
75
6
0
5
0
Percentage increase in value ofleather and leather productstraded
Percentage completion ofinstitute of Leather Science
Livestock production & marketingservices
1162002500 Veterinary PublicHealth Hides and Skins andLeather Quality Control
65,00065,00065,000No. of samples analysed foranimal diseases
Animal health & disease control1162003300 VeterinaryInvestigation LaboratoryServices
100100100Percentage of animal healthinputs tested
Animal health &disease control1162003400 VeterinaryDiagnostics and Efficacy TrialCenters
PPR-3,729
FMD-15,915
PPR-3,729
FMD-15,915
PPR-3,388
FMD-13,388
Number of PPR and FMD casesreported and tested
Animal health and disease control1162003500 CentralVeterinary LaboratoryServices - Kabete
1
8
1
8
1
8
Number of standards andregulations on animal productsdeveloped
No. of laboratories supported
Livestock production & marketingservices
1162100200 Standards andMarket Access Programme(SMAP)
0112050 SP 6.5 Livestock Diseases Management and ControlSub Programme:
Key Output (KO)Targets
2018/2019Targets
2017/2018Key Performance Indicators
(KPIs)Targets
2016/2017Delivery Unit
686855percentage level of completionof refurbishment ofinfrastructure (Hostels ,Laboratories, conferencefacilities)
Livestock breeding services1162002100 VeterinaryHeadquarters
600
1
300
1
550
1
Number of samples analysed forpest and vectors
Number of Risk maps on vectordiversity and distribution
Animal health & disease control1162002700 VectorRegulatory and ZoologicalServices
509

PART E. SUMMARY OF PROGRAMME OUTPUTS AND PERFORMANCE INDICATORS FOR 2016/2017 - 2018/2019
1162 State Department for Livestock.
developed and reviewed
707060Doses of vaccines produced foranimal disease control andexport (Millions)
Animal health and disease control1162002800 National AnimalDisease Strategies andProgrammes
5,0005,0005,000Number of samples analysed forFoot and Mouth disease
Animal health and disease control1162003600 Foot and MouthDisease National ReferenceLaboratory
100
30
100
30
90
0
percentage completion ofDisease Free Zone facilities inBachuma
Percentage completion ofDisease Free Zone facilities inKurawa and Miritini
Animal health and disease control1162003700 Disease FreeZoning Programme
444Number of ports of entry andand one stop border pointsequiped
Animal health and disease control1162003800 Ports of Entryand Border Posts VeterinaryInspection Services
5
4
5
4
5
4
Number of belts targeted fortsetse eradication
Number ofTsetse andTrypanosomiasis controlprocedures developed andadopted
Animal health & disease control1162003900 Kenya Tsetseand TrypanosomiasisEradication Council(KENTTEC)
857757Percentage hactarage of landreclaimed in Coast, Eastern,Western,Nyanza and Rift valleyregion
Animal health & disease control1162101100 SustainableTseTse and Trypanosomiasisfree areas in Kenya -KENTTEC
867648Percentage level of acquisitionof modern vaccine productionequipment and renovation oflaboratories
Animal health & disease control1162101200 Modernize Foot& Mouth Disease Laboratoryfor GMP standards-KEVEVAPI
510

PART E. SUMMARY OF PROGRAMME OUTPUTS AND PERFORMANCE INDICATORS FOR 2016/2017 - 2018/2019
1162 State Department for Livestock.
928246percentage level of completionof equiping the laboratoty andconstructing training center
Animal health & disease control1162101400 Modernization ofKiboko Zoological andEfficacy Trial Centre
857345percentage level of completionof construction of the Laboratory
Animal health& disease control1162101600 Construction &equipping the Bio-safety Level3 Laboratory at Kabete
511
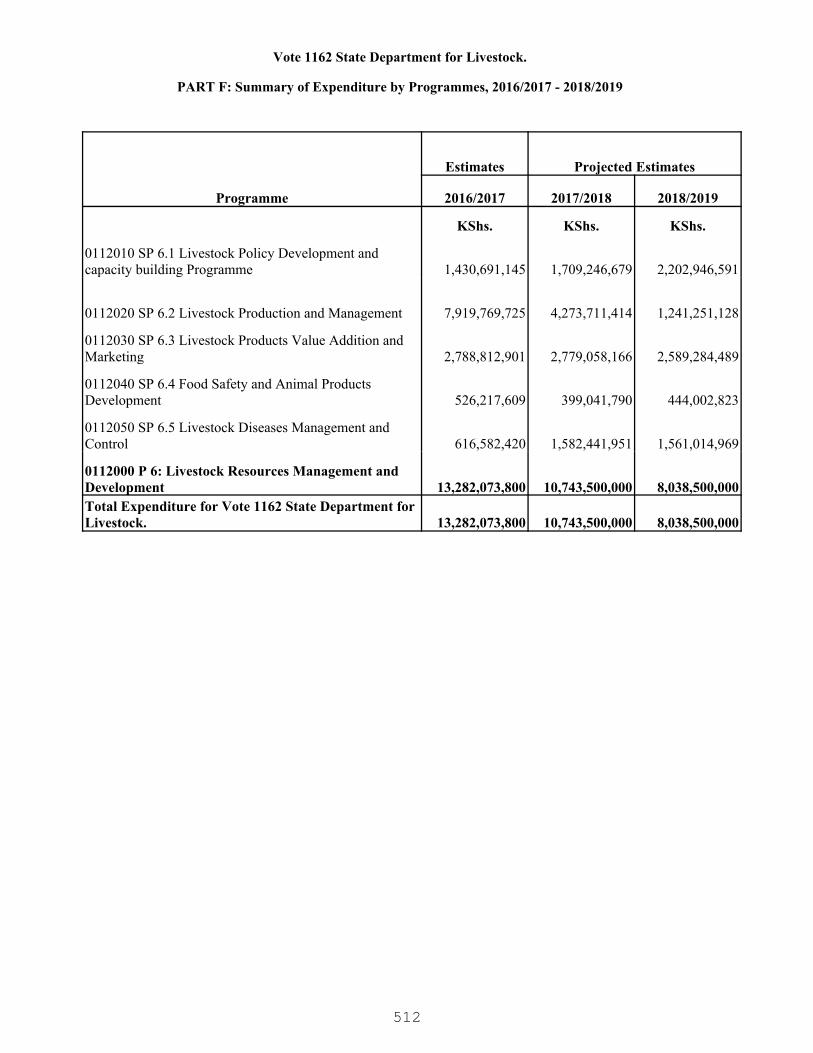
Vote 1162 State Department for Livestock.
PART F: Summary of Expenditure by Programmes, 2016/2017 - 2018/2019
Programme
Estimates Projected Estimates
2016/2017 2017/2018 2018/2019
KShs. KShs. KShs.
0112010 SP 6.1 Livestock Policy Development and capacity building Programme 1,430,691,145 1,709,246,679 2,202,946,591
0112020 SP 6.2 Livestock Production and Management 7,919,769,725 4,273,711,414 1,241,251,128
0112030 SP 6.3 Livestock Products Value Addition and Marketing 2,788,812,901 2,779,058,166 2,589,284,489
0112040 SP 6.4 Food Safety and Animal Products Development 526,217,609 399,041,790 444,002,823
0112050 SP 6.5 Livestock Diseases Management and Control 616,582,420 1,582,441,951 1,561,014,969
0112000 P 6: Livestock Resources Management and Development 13,282,073,800 10,743,500,000 8,038,500,000Total Expenditure for Vote 1162 State Department for Livestock. 13,282,073,800 10,743,500,000 8,038,500,000
512

1162 State Department for Livestock.
PART G: Summary of Expenditure by Vote and Economic Classification, 2016/2017 - 2018/2019
Economic Classification
Estimates Projected Estimates
2016/2017 2017/2018 2018/2019KShs. KShs. KShs.
Current Expenditure 1,889,938,320 2,175,000,000 2,276,000,000
Compensation to Employees 1,383,000,000 1,518,000,000 1,563,000,000
Use of Goods and Services 358,672,295 499,198,761 553,368,228
Current Transfers to Govt. Agencies 136,000,000 142,000,000 142,000,000
Other Recurrent 12,266,025 15,801,239 17,631,772
Capital Expenditure 11,392,135,480 8,568,500,000 5,762,500,000
Acquisition of Non-Financial Assets 6,706,000,000 3,949,000,000 2,049,000,000
Capital Grants to Govt. Agencies 4,613,135,480 4,619,500,000 3,713,500,000
Other Development 73,000,000 - -Total Expenditure 13,282,073,800 10,743,500,000 8,038,500,000
513

1162 State Department for Livestock.
PART H: Summary of Expenditure by Programme and Economic Classification, 2016/2017 - 2018/2019
0112010 SP 6.1 Livestock Policy Development and capacity building Programme
Economic Classification
Estimates Projected Estimates
2016/2017 2017/2018 2018/2019KShs. KShs. KShs.
Current Expenditure 1,012,691,145 1,199,246,679 1,252,946,591
Compensation to Employees 728,916,382 811,660,214 825,029,284
Use of Goods and Services 264,304,918 364,798,184 404,179,837
Current Transfers to Govt. Agencies 13,300,000 15,000,000 15,000,000
Other Recurrent 6,169,845 7,788,281 8,737,470
Capital Expenditure 418,000,000 510,000,000 950,000,000
Acquisition of Non-Financial Assets 45,000,000 50,000,000 490,000,000
Capital Grants to Govt. Agencies 300,000,000 460,000,000 460,000,000
Other Development 73,000,000 - -Total Expenditure 1,430,691,145 1,709,246,679 2,202,946,591
0112020 SP 6.2 Livestock Production and Management
Economic Classification
Estimates Projected Estimates
2016/2017 2017/2018 2018/2019KShs. KShs. KShs.
Current Expenditure 174,634,245 198,211,414 210,751,128
Compensation to Employees 141,889,303 149,723,892 158,013,930
Use of Goods and Services 22,152,792 32,625,460 36,230,390
Current Transfers to Govt. Agencies 6,800,000 11,008,000 11,118,880
Other Recurrent 3,792,150 4,854,062 5,387,928
Capital Expenditure 7,745,135,480 4,075,500,000 1,030,500,000
Acquisition of Non-Financial Assets 6,631,000,000 3,129,000,000 239,000,000
Capital Grants to Govt. Agencies 1,114,135,480 946,500,000 791,500,000Total Expenditure 7,919,769,725 4,273,711,414 1,241,251,128
0112030 SP 6.3 Livestock Products Value Addition and Marketing
Economic Classification
Estimates Projected Estimates
2016/2017 2017/2018 2018/2019
514

1162 State Department for Livestock.
PART H: Summary of Expenditure by Programme and Economic Classification, 2016/2017 - 2018/2019
0112030 SP 6.3 Livestock Products Value Addition and Marketing
Economic Classification
Estimates Projected Estimates
2016/2017 2017/2018 2018/2019KShs. KShs. KShs.
Current Expenditure 127,812,901 141,058,166 156,284,489
Compensation to Employees 86,150,976 97,652,419 112,504,108
Use of Goods and Services 2,761,925 4,413,747 4,899,261
Current Transfers to Govt. Agencies 38,900,000 38,992,000 38,881,120
Capital Expenditure 2,661,000,000 2,638,000,000 2,433,000,000
Acquisition of Non-Financial Assets - - 500,000,000
Capital Grants to Govt. Agencies 2,661,000,000 2,638,000,000 1,933,000,000Total Expenditure 2,788,812,901 2,779,058,166 2,589,284,489
0112040 SP 6.4 Food Safety and Animal Products Development
Economic Classification
Estimates Projected Estimates
2016/2017 2017/2018 2018/2019KShs. KShs. KShs.
Current Expenditure 338,217,609 374,041,790 389,002,823
Compensation to Employees 286,149,750 302,517,422 309,710,772
Use of Goods and Services 51,015,829 69,942,992 77,536,724
Other Recurrent 1,052,030 1,581,376 1,755,327
Capital Expenditure 188,000,000 25,000,000 55,000,000
Acquisition of Non-Financial Assets - - 40,000,000
Capital Grants to Govt. Agencies 188,000,000 25,000,000 15,000,000Total Expenditure 526,217,609 399,041,790 444,002,823
0112050 SP 6.5 Livestock Diseases Management and Control
Economic Classification
Estimates Projected Estimates
2016/2017 2017/2018 2018/2019KShs. KShs. KShs.
Current Expenditure 236,582,420 262,441,951 267,014,969
Compensation to Employees 139,893,589 156,446,053 157,741,906
515
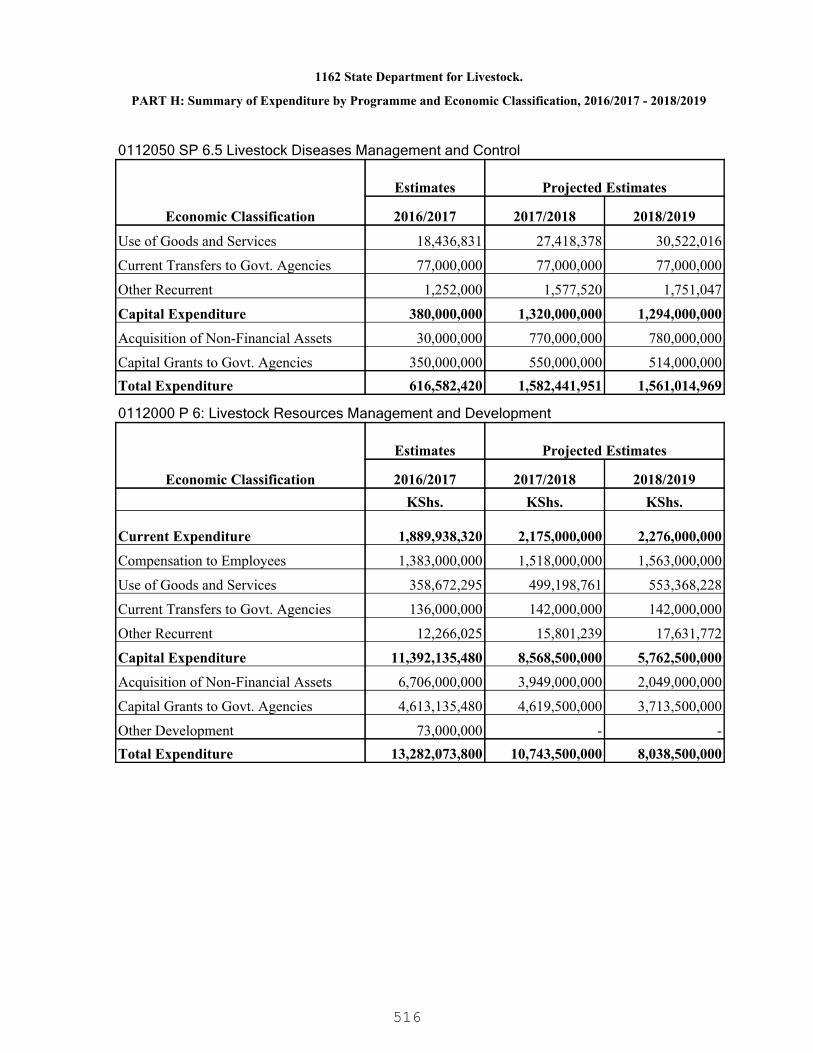
1162 State Department for Livestock.
PART H: Summary of Expenditure by Programme and Economic Classification, 2016/2017 - 2018/2019
0112050 SP 6.5 Livestock Diseases Management and Control
Economic Classification
Estimates Projected Estimates
2016/2017 2017/2018 2018/2019
Use of Goods and Services 18,436,831 27,418,378 30,522,016
Current Transfers to Govt. Agencies 77,000,000 77,000,000 77,000,000
Other Recurrent 1,252,000 1,577,520 1,751,047
Capital Expenditure 380,000,000 1,320,000,000 1,294,000,000
Acquisition of Non-Financial Assets 30,000,000 770,000,000 780,000,000
Capital Grants to Govt. Agencies 350,000,000 550,000,000 514,000,000Total Expenditure 616,582,420 1,582,441,951 1,561,014,969
0112000 P 6: Livestock Resources Management and Development
Economic Classification
Estimates Projected Estimates
2016/2017 2017/2018 2018/2019KShs. KShs. KShs.
Current Expenditure 1,889,938,320 2,175,000,000 2,276,000,000
Compensation to Employees 1,383,000,000 1,518,000,000 1,563,000,000
Use of Goods and Services 358,672,295 499,198,761 553,368,228
Current Transfers to Govt. Agencies 136,000,000 142,000,000 142,000,000
Other Recurrent 12,266,025 15,801,239 17,631,772
Capital Expenditure 11,392,135,480 8,568,500,000 5,762,500,000
Acquisition of Non-Financial Assets 6,706,000,000 3,949,000,000 2,049,000,000
Capital Grants to Govt. Agencies 4,613,135,480 4,619,500,000 3,713,500,000
Other Development 73,000,000 - -Total Expenditure 13,282,073,800 10,743,500,000 8,038,500,000
516
1163 State Department for Fisheries.
A leading institution in management, research and development of fisheries resources
To facilitate sustainable management and development of fishery resources and products foraccelerated socioeconomic development
PART A. Vision
PART B. Mission
PART C. Performance Overview and Background for Programme(s) Funding
The State Department of Fisheries is mandated to undertake exploitation, utilization,management, development and conservation of fisheries resources, aquaculturedevelopment and research. The core functions of the Department includes formulation andreview of fisheries policies, legislation, regulations, fisheries licensing, management anddevelopment of both fresh water and marine fisheries, assurance of fish safety, value additionand marketing.
During the period under review, the State Department realized a number of achievementsincluding Developing the National Aquaculture Residue Monitoring Plan to facilitate exportmarketing of farmed fish, improved tilapia and catfish seed varieties; three innovativetechniques for reducing fish post harvest losses in fisheries, constructed three fish mini-processing plants in Nyeri, Meru and Kakamega Counties, initiated the acquisition of anOffshore Patrol Vessel (OPV) and fast tracked its construction to 50% Hull completion,prepared the Tuna development and management Strategy and ring net management tounlock the tuna fishery potential in the marine waters; procured two patrol boats for LakesVictoria and Turkana and launched to strengthen monitoring and surveillance of the waterbodies to ensure sustainability of livelihoods of the fishing communities. The StateDepartment also restocked a number of rivers and dams with tilapia, catfish and troutfingerlings to enhance fish production and developed the fisheries development andmanagement bill.
During the period under review, the State Department's total allocation was KSh.4.0 billion in2012/13 FY. The allocation decreased to KSh.2.9 billion in 2013/14 FY and increased to Ksh3.2 billion in 2014/15 FY.The actual expenditure was KSh.3.5 billion, KSh.2.1 billion andKSh.3.2 billion in 2012/13 FY, 2013/14 FY and 2014/15 FY respectively.
Despite the above achievements, the State Department encountered a number of challenges;including illegal unreported and unregulated (IUU) fishing in the EEZ due to inadequatesurveillance capability leading to an estimated loss of about KSh.10 billion annually inpotential revenue, inadequate compliance with sanitary and phyto-sanitary (SPS)requirements due to non- attendance by the competent authority in regional and internationalfisheries regulatory training, meetings and workshops, inadequate human and financialresources, inadequate capacity for data collection and inadequate facilities and equipment forfish safety and quality assurance at entry and exit points.
During the period 2016/17 – 2018/19, the State Department will finalize construction ofmonitoring, control and surveillance (MCS) centre and procurement of the Offshore PatrolVessel (OPV) and train technical officers on navigation and MCS to deter illegal unreported
517

1163 State Department for Fisheries.
PART D. Programme Objectives
and unregulated fishing in the EEZ, establish referral fish quality control laboratory in Nairobiwith branches in Kisumu and Mombasa, implement a residue monitoring plan for farmed fishto tap the European Union market, establish border inspection points, participate in regionaland international trade negotiations and standard setting forums, develop and transferaquaculture and mariculture technologies, promote uptake of appropriate technologies forvalue addition and reduction of post harvest losses and implement the fisheries managementand development bill 2014.
ObjectiveProgramme
0111000 P5: FisheriesDevelopment andManagement
To maximize the contribution of fisheries to povertyreduction, food security, and wealth creation
518

PART E. SUMMARY OF PROGRAMME OUTPUTS AND PERFORMANCE INDICATORS FOR 2016/2017 - 2018/2019
1163 State Department for Fisheries.
0111000 P5: Fisheries Development and Management
Increased Food Security and Income
Programme:
Outcome:
0111010 SP 5.1 Fisheries Policy, Strategy and capacity buildingSub Programme:
Key Output (KO)Targets
2018/2019Targets
2017/2018Key Performance Indicators
(KPIs)Targets
2016/2017Delivery Unit
1
1
20
1
1
20
1
1
20
Number of policies reviewed
Annual Monitoring andEvaluation reports
No of staff sensitized on HIVAND AIDS
Administrative services
Planning Services
1163000100 Headquartersand Administrative Services
1
1
1
1
1
1
1
1
1
Annual Ministerial budget
Annual Financial Report
Annual Procurement plan
Financial Services1163000200 FinanceAccounts and ProcurementServices
0111020 SP 5.2 Aquaculture DevelopmentSub Programme:
Key Output (KO)Targets
2018/2019Targets
2017/2018Key Performance Indicators
(KPIs)Targets
2016/2017Delivery Unit
1
2
1
2
1
2
Number of aquacultureinnovations and technologiespromoted
Number of intensive productiontechnologies systems promoted
Innovations and technologiespromoted
Intensive fish productiontechnologies systems
1163000500 Directorate ofAcquaculture Development
519
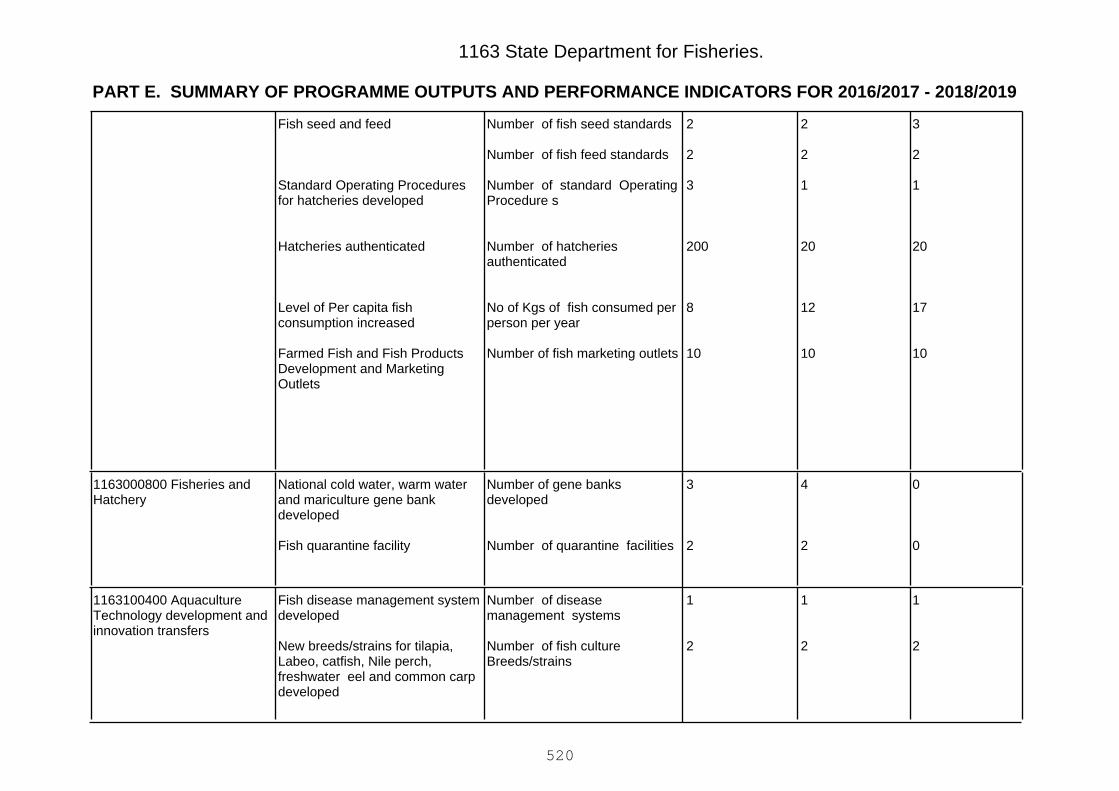
PART E. SUMMARY OF PROGRAMME OUTPUTS AND PERFORMANCE INDICATORS FOR 2016/2017 - 2018/2019
1163 State Department for Fisheries.
3
2
1
20
17
10
2
2
1
20
12
10
2
2
3
200
8
10
Number of fish seed standards
Number of fish feed standards
Number of standard OperatingProcedure s
Number of hatcheriesauthenticated
No of Kgs of fish consumed perperson per year
Number of fish marketing outlets
Fish seed and feed
Standard Operating Proceduresfor hatcheries developed
Hatcheries authenticated
Level of Per capita fishconsumption increased
Farmed Fish and Fish ProductsDevelopment and MarketingOutlets
0
0
4
2
3
2
Number of gene banksdeveloped
Number of quarantine facilities
National cold water, warm waterand mariculture gene bankdeveloped
Fish quarantine facility
1163000800 Fisheries andHatchery
1
2
1
2
1
2
Number of diseasemanagement systems
Number of fish cultureBreeds/strains
Fish disease management systemdeveloped
New breeds/strains for tilapia,Labeo, catfish, Nile perch,freshwater eel and common carpdeveloped
1163100400 AquacultureTechnology development andinnovation transfers
520

PART E. SUMMARY OF PROGRAMME OUTPUTS AND PERFORMANCE INDICATORS FOR 2016/2017 - 2018/2019
1163 State Department for Fisheries.
222Number of mariculture breedsand strains
New breeds and strains formariculture species developed
0070% completioncold storage facility established1163100500 Construction ofAquaculture, Processing &Cold Facility in Migori
0111030 SP 5.3 Management and Development of Capture FisheriesSub Programme:
Key Output (KO)Targets
2018/2019Targets
2017/2018Key Performance Indicators
(KPIs)Targets
2016/2017Delivery Unit
0
25
10
4
1
2540
20
0
25
10
4
1
2200
15
30
5
5
4
2
2150
10
No. of Fisheries Managerstrained
Number of locally owned multi-day fishing crafts targetingpelagic offshore resources
Number of Joint ventures/leaseagreements between privateforeign vessels and local fishingcompanies
Number of quarterly catchassessments
Number of frame surveysconducted for marine and freshwater
Number of artisan fishinglicenses granted
Percentage proportion of Lamu
Trained technical officers onnavigation and Monitoring, Controland surveillance (MCS) capability
Fleet management plan anddomestic fishing fleet/ companydeveloped
Optimal management objective forsustainable marine resourceutilization developed
Tradable Permit Scheme (TPS)
Fish port infrastructure at Lamu,
1163000300 Directorate ofMarine and Coastal Fisheries
521

PART E. SUMMARY OF PROGRAMME OUTPUTS AND PERFORMANCE INDICATORS FOR 2016/2017 - 2018/2019
1163 State Department for Fisheries.
111
fish port completed
Number of incentive schemestargeted to support landings inMombasa Port
promoted
20
9
1
20
9
1
20
9
1
Number of water bodiesrestocked
Number of trained BMUs inselected BMU modules basedon capacity needs assessment
Number of management plansdeveloped
Fish stocks in water bodies
Strengthened the capacity ofBeach Management Units role inCo-management
Developed Management Plans forInland water systems
1163000400 Directorate ofInland and Riverine Fisheries
0
0
1
0
0
2
100
0
3
% of National Oceans andFisheries Policy reviewed
Fisheries Management Plandeveloped
No. of regulations developed
National Oceans and Fisheriesand National Aquaculture Policies
Regulations to operationilizeFisheries Management andDevelopment Act of 2015developed
1163000700 Directorate ofFisheries
140
1
120
1
100
0
Number of inshore patrols forcoastal fishery waters
Reports
MCS Command Centre andVessel Monitoring System (VMS)established
Coordinated implementation of aFisheries Management Plan forLake Turkana
1163000900 FisheriesRegional Centres
522
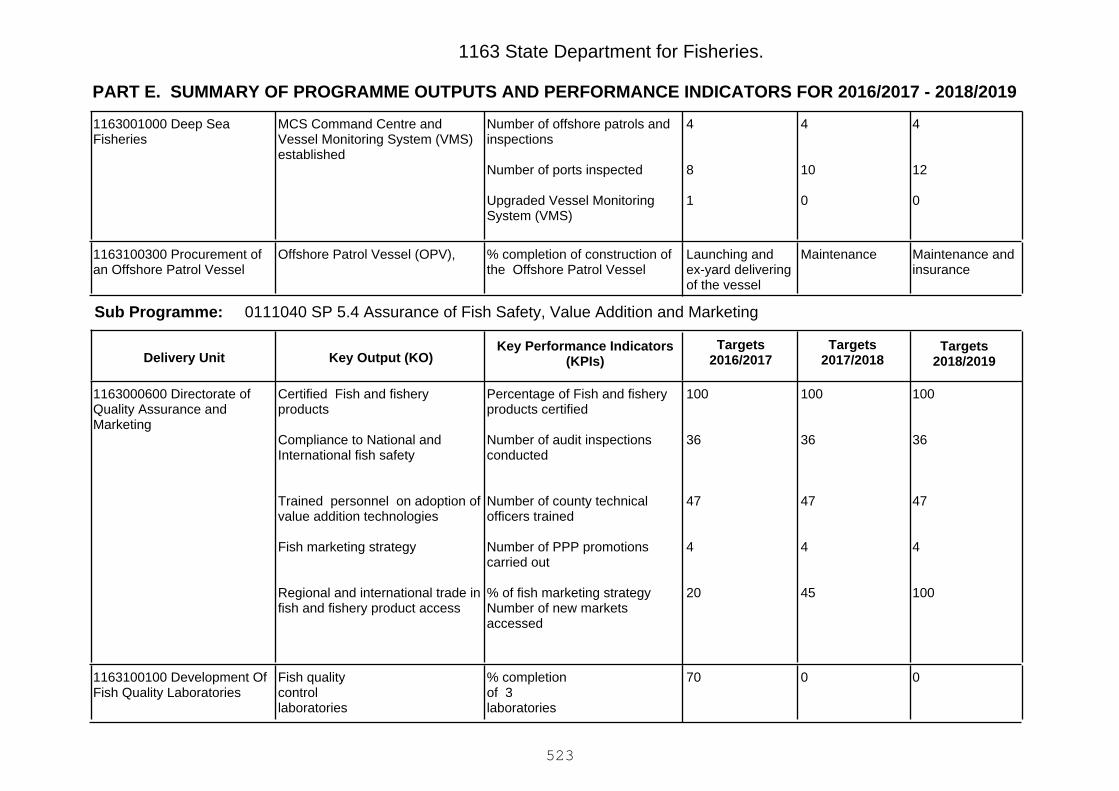
PART E. SUMMARY OF PROGRAMME OUTPUTS AND PERFORMANCE INDICATORS FOR 2016/2017 - 2018/2019
1163 State Department for Fisheries.
4
12
0
4
10
0
4
8
1
Number of offshore patrols andinspections
Number of ports inspected
Upgraded Vessel MonitoringSystem (VMS)
MCS Command Centre andVessel Monitoring System (VMS)established
1163001000 Deep SeaFisheries
Maintenance andinsurance
MaintenanceLaunching andex-yard deliveringof the vessel
% completion of construction ofthe Offshore Patrol Vessel
Offshore Patrol Vessel (OPV),1163100300 Procurement ofan Offshore Patrol Vessel
0111040 SP 5.4 Assurance of Fish Safety, Value Addition and MarketingSub Programme:
Key Output (KO)Targets
2018/2019Targets
2017/2018Key Performance Indicators
(KPIs)Targets
2016/2017Delivery Unit
100
36
47
4
100
100
36
47
4
45
100
36
47
4
20
Percentage of Fish and fisheryproducts certified
Number of audit inspectionsconducted
Number of county technicalofficers trained
Number of PPP promotionscarried out
% of fish marketing strategyNumber of new marketsaccessed
Certified Fish and fisheryproducts
Compliance to National andInternational fish safety
Trained personnel on adoption ofvalue addition technologies
Fish marketing strategy
Regional and international trade infish and fishery product access
1163000600 Directorate ofQuality Assurance andMarketing
0070% completionof 3laboratories
Fish qualitycontrollaboratories
1163100100 Development OfFish Quality Laboratories
523
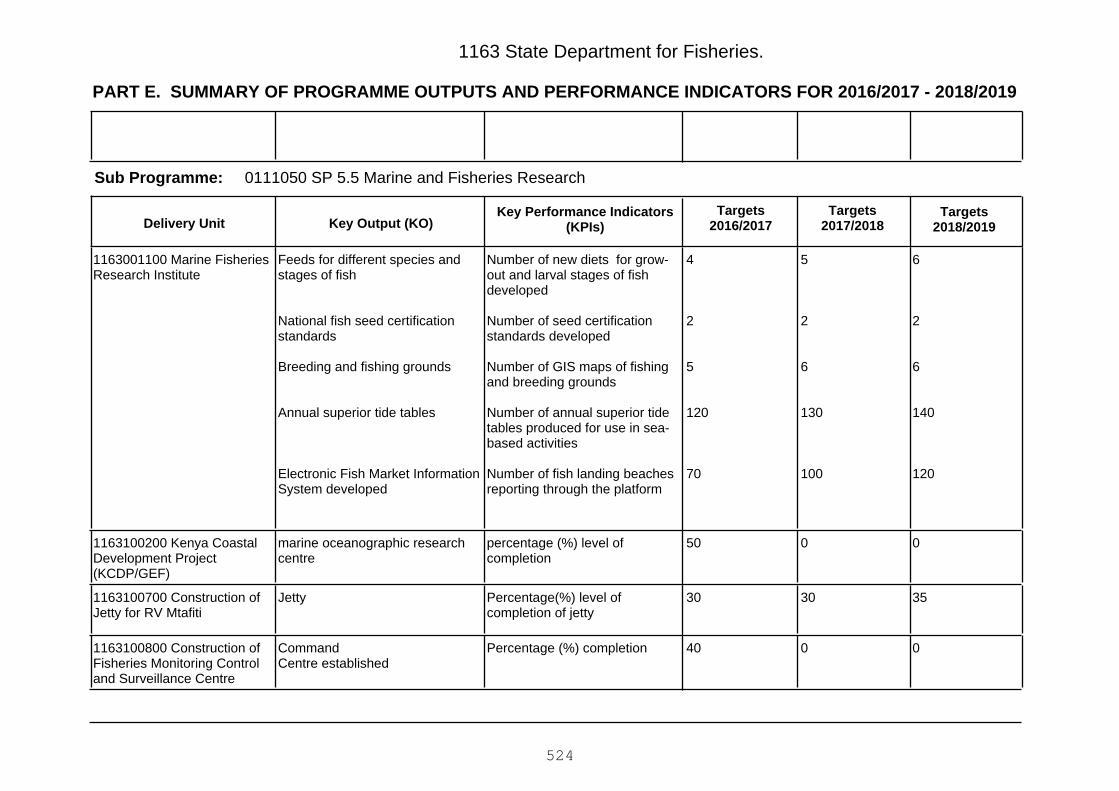
PART E. SUMMARY OF PROGRAMME OUTPUTS AND PERFORMANCE INDICATORS FOR 2016/2017 - 2018/2019
1163 State Department for Fisheries.
0111050 SP 5.5 Marine and Fisheries ResearchSub Programme:
Key Output (KO)Targets
2018/2019Targets
2017/2018Key Performance Indicators
(KPIs)Targets
2016/2017Delivery Unit
6
2
6
140
120
5
2
6
130
100
4
2
5
120
70
Number of new diets for grow-out and larval stages of fishdeveloped
Number of seed certificationstandards developed
Number of GIS maps of fishingand breeding grounds
Number of annual superior tidetables produced for use in sea-based activities
Number of fish landing beachesreporting through the platform
Feeds for different species andstages of fish
National fish seed certificationstandards
Breeding and fishing grounds
Annual superior tide tables
Electronic Fish Market InformationSystem developed
1163001100 Marine FisheriesResearch Institute
0050percentage (%) level ofcompletion
marine oceanographic researchcentre
1163100200 Kenya CoastalDevelopment Project(KCDP/GEF)
353030Percentage(%) level ofcompletion of jetty
Jetty1163100700 Construction ofJetty for RV Mtafiti
0040Percentage (%) completionCommandCentre established
1163100800 Construction ofFisheries Monitoring Controland Surveillance Centre
524

Vote 1163 State Department for Fisheries.
PART F: Summary of Expenditure by Programmes, 2016/2017 - 2018/2019
Programme
Estimates Projected Estimates
2016/2017 2017/2018 2018/2019
KShs. KShs. KShs.
0111010 SP 5.1 Fisheries Policy, Strategy and capacity building 116,854,813 152,613,381 171,117,133
0111020 SP 5.2 Aquaculture Development 127,925,910 744,599,338 633,215,833
0111030 SP 5.3 Management and Development of Capture Fisheries 1,066,517,134 333,944,582 482,265,556
0111040 SP 5.4 Assurance of Fish Safety, Value Additionand Marketing 553,398,934 117,342,699 58,901,478
0111050 SP 5.5 Marine and Fisheries Research 2,318,500,000 1,899,800,000 1,971,500,000
0111000 P5: Fisheries Development and Management 4,183,196,791 3,248,300,000 3,317,000,000Total Expenditure for Vote 1163 State Department for Fisheries. 4,183,196,791 3,248,300,000 3,317,000,000
525

1163 State Department for Fisheries.
PART G: Summary of Expenditure by Vote and Economic Classification, 2016/2017 - 2018/2019
Economic Classification
Estimates Projected Estimates
2016/2017 2017/2018 2018/2019KShs. KShs. KShs.
Current Expenditure 1,653,196,791 1,856,000,000 1,921,000,000
Compensation to Employees 249,000,000 256,000,000 263,000,000
Use of Goods and Services 119,098,744 236,051,087 290,853,976
Current Transfers to Govt. Agencies 1,281,500,000 1,357,000,000 1,359,000,000
Other Recurrent 3,598,047 6,948,913 8,146,024
Capital Expenditure 2,530,000,000 1,392,300,000 1,396,000,000
Acquisition of Non-Financial Assets 1,568,000,000 1,193,000,000 1,308,000,000
Capital Grants to Govt. Agencies 945,000,000 49,300,000 -
Other Development 17,000,000 150,000,000 88,000,000Total Expenditure 4,183,196,791 3,248,300,000 3,317,000,000
526

1163 State Department for Fisheries.
PART H: Summary of Expenditure by Programme and Economic Classification, 2016/2017 - 2018/2019
0111010 SP 5.1 Fisheries Policy, Strategy and capacity building
Economic Classification
Estimates Projected Estimates
2016/2017 2017/2018 2018/2019KShs. KShs. KShs.
Current Expenditure 116,854,813 152,613,381 171,117,133
Compensation to Employees 79,223,702 82,374,920 82,586,090
Use of Goods and Services 36,257,867 67,042,061 84,656,043
Other Recurrent 1,373,244 3,196,400 3,875,000Total Expenditure 116,854,813 152,613,381 171,117,133
0111020 SP 5.2 Aquaculture Development
Economic Classification
Estimates Projected Estimates
2016/2017 2017/2018 2018/2019KShs. KShs. KShs.
Current Expenditure 73,925,910 94,599,338 105,215,833
Compensation to Employees 42,008,241 44,608,158 44,844,582
Use of Goods and Services 31,317,669 49,241,180 59,378,251
Other Recurrent 600,000 750,000 993,000
Capital Expenditure 54,000,000 650,000,000 528,000,000
Acquisition of Non-Financial Assets 37,000,000 500,000,000 440,000,000
Other Development 17,000,000 150,000,000 88,000,000Total Expenditure 127,925,910 744,599,338 633,215,833
0111030 SP 5.3 Management and Development of Capture Fisheries
Economic Classification
Estimates Projected Estimates
2016/2017 2017/2018 2018/2019KShs. KShs. KShs.
Current Expenditure 153,517,134 204,944,582 234,265,556
Compensation to Employees 106,535,182 103,751,717 111,044,344
Use of Goods and Services 39,357,149 91,690,352 112,443,188
Current Transfers to Govt. Agencies 6,000,000 6,500,000 7,500,000
Other Recurrent 1,624,803 3,002,513 3,278,024
527

1163 State Department for Fisheries.
PART H: Summary of Expenditure by Programme and Economic Classification, 2016/2017 - 2018/2019
0111030 SP 5.3 Management and Development of Capture Fisheries
Economic Classification
Estimates Projected Estimates
2016/2017 2017/2018 2018/2019
Capital Expenditure 913,000,000 129,000,000 248,000,000
Acquisition of Non-Financial Assets 913,000,000 129,000,000 248,000,000Total Expenditure 1,066,517,134 333,944,582 482,265,556
0111040 SP 5.4 Assurance of Fish Safety, Value Addition and Marketing
Economic Classification
Estimates Projected Estimates
2016/2017 2017/2018 2018/2019KShs. KShs. KShs.
Current Expenditure 33,398,934 53,342,699 58,901,478
Compensation to Employees 21,232,875 25,265,205 24,524,984
Use of Goods and Services 12,166,059 28,077,494 34,376,494
Capital Expenditure 520,000,000 64,000,000 -
Acquisition of Non-Financial Assets 520,000,000 64,000,000 -Total Expenditure 553,398,934 117,342,699 58,901,478
0111050 SP 5.5 Marine and Fisheries Research
Economic Classification
Estimates Projected Estimates
2016/2017 2017/2018 2018/2019KShs. KShs. KShs.
Current Expenditure 1,275,500,000 1,350,500,000 1,351,500,000
Current Transfers to Govt. Agencies 1,275,500,000 1,350,500,000 1,351,500,000
Capital Expenditure 1,043,000,000 549,300,000 620,000,000
Acquisition of Non-Financial Assets 98,000,000 500,000,000 620,000,000
Capital Grants to Govt. Agencies 945,000,000 49,300,000 -Total Expenditure 2,318,500,000 1,899,800,000 1,971,500,000
0111000 P5: Fisheries Development and Management
Economic Classification
Estimates Projected Estimates
2016/2017 2017/2018 2018/2019KShs. KShs. KShs.
528

1163 State Department for Fisheries.
PART H: Summary of Expenditure by Programme and Economic Classification, 2016/2017 - 2018/2019
0111000 P5: Fisheries Development and Management
Economic Classification
Estimates Projected Estimates
2016/2017 2017/2018 2018/2019
Current Expenditure 1,653,196,791 1,856,000,000 1,921,000,000
Compensation to Employees 249,000,000 256,000,000 263,000,000
Use of Goods and Services 119,098,744 236,051,087 290,853,976
Current Transfers to Govt. Agencies 1,281,500,000 1,357,000,000 1,359,000,000
Other Recurrent 3,598,047 6,948,913 8,146,024
Capital Expenditure 2,530,000,000 1,392,300,000 1,396,000,000
Acquisition of Non-Financial Assets 1,568,000,000 1,193,000,000 1,308,000,000
Capital Grants to Govt. Agencies 945,000,000 49,300,000 -
Other Development 17,000,000 150,000,000 88,000,000Total Expenditure 4,183,196,791 3,248,300,000 3,317,000,000
529
1171 Ministry of Industrialization and Enterprise Development
A leader in transforming Kenya into a rapidly industrializing middle income economy.
To facilitate the creation of an enabling environment for a vibrant, globally competitive, andsustainable industrial and enterprise sector.
PART A. Vision
PART B. Mission
PART C. Performance Overview and Background for Programme(s) Funding
The Mandate of the Ministry is to provide an enabling policy environment for rapid andsustainable industrial and enterprise development. This will be achieved, through formulationand implementation of industrialization and co-operative policy; industrial property rightsregime; private sector development policy and strategy; quality control including industrialstandards development; co-operative savings, credit and other financial services policy andregulation; development of Micro, Small and Medium Enterprises and Buy Kenya Build Kenyapolicy.The Ministry’s priority programs and projects are expected to support the country’sdevelopment agenda through the creation of jobs, attracting local and foreign investmentsand increasing manufactured exports. The key programs include; promotion of industrialdevelopment and investment, co-operative development and management and generaladministration, planning &support services.
The specific achievements include; presentation of the special economic zones bill to theNational Assembly and master planning for DongoKundu in Mombasa ; regulations foroperating a private free trade zones; business processes re-engineered in 6 priority indicatorsimproved as per the World Bank ranking criteria; development of the textile city started in AthiRiver together with requisite infrastructure.
The challenges experienced during implementation of the programmes include; inadequatefunding, inadequate technical staff, difficulty in accessing land for industrial activities, lowrankings in ease of doing business hence low foreign direct investments, market access ofKenya’s manufactured goods and counterfeiting, dumping and substandard goods amongothers. These have occasioned challenges in realizing the achievements of the objectives ofthe programmes within the stipulated time.
In the 2016/17-2018/19 the funding will target ; modernization of Rivatex,ease of doingbusiness, development of special economic zones/ free trade zones; development of a freeport & industrial park in Mombasa, development of leather Industrial park Kenanie, Kariokorleather manufacturing facility, development of Athi River textile hub and agro processinghubs,ongoing construction and equipping of industrial research and innovation centers, skilldevelopment for the manufacturing sector, policy development including buy Kenya buildKenya and subcontracting policies and cooperative development. These initiatives areexpected to create 675,000 jobs in textile sector in 3 years and also create 400,000 jobs in5years in leather sub-sector, entrepreneurship development , MSE development through sub-contracting, coordinate ease of doing business activities aimed at improving country’s globalrankings.
530
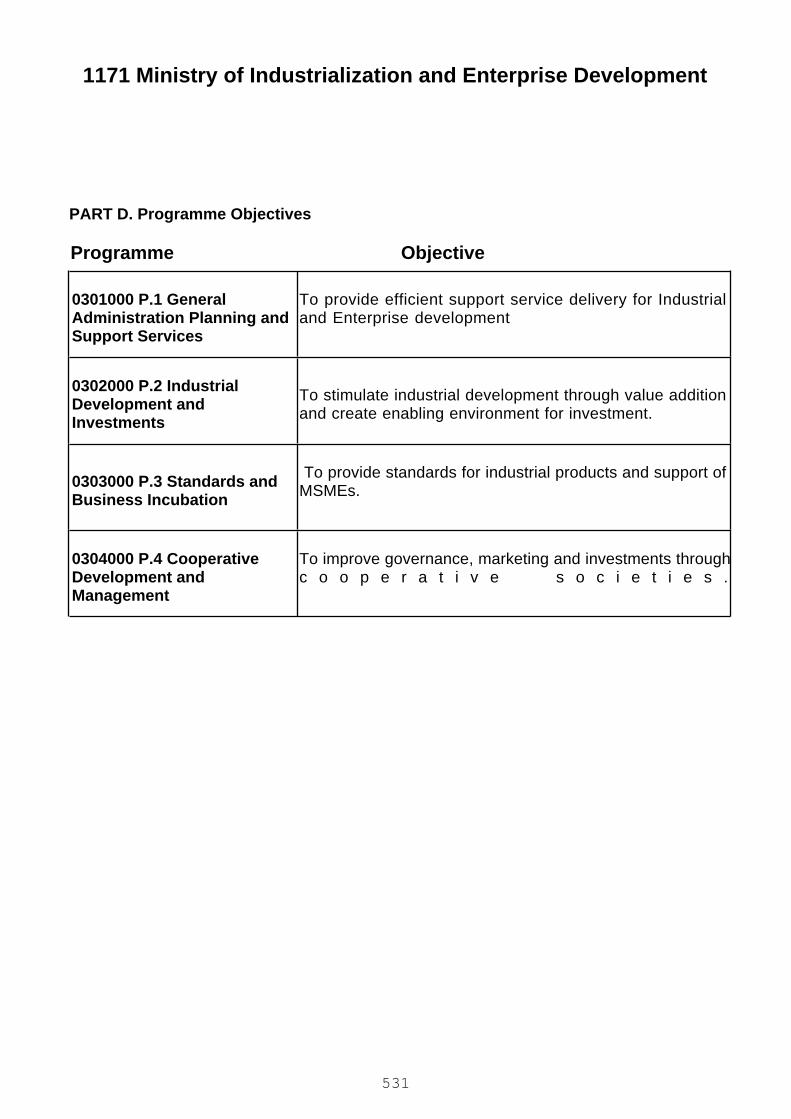
1171 Ministry of Industrialization and Enterprise Development
PART D. Programme Objectives
ObjectiveProgramme
0301000 P.1 GeneralAdministration Planning andSupport Services
To provide efficient support service delivery for Industrialand Enterprise development
0302000 P.2 IndustrialDevelopment andInvestments
To stimulate industrial development through value additionand create enabling environment for investment.
0303000 P.3 Standards andBusiness Incubation
To provide standards for industrial products and support ofMSMEs.
0304000 P.4 CooperativeDevelopment andManagement
To improve governance, marketing and investments throughc o o p e r a t i v e s o c i e t i e s .
531
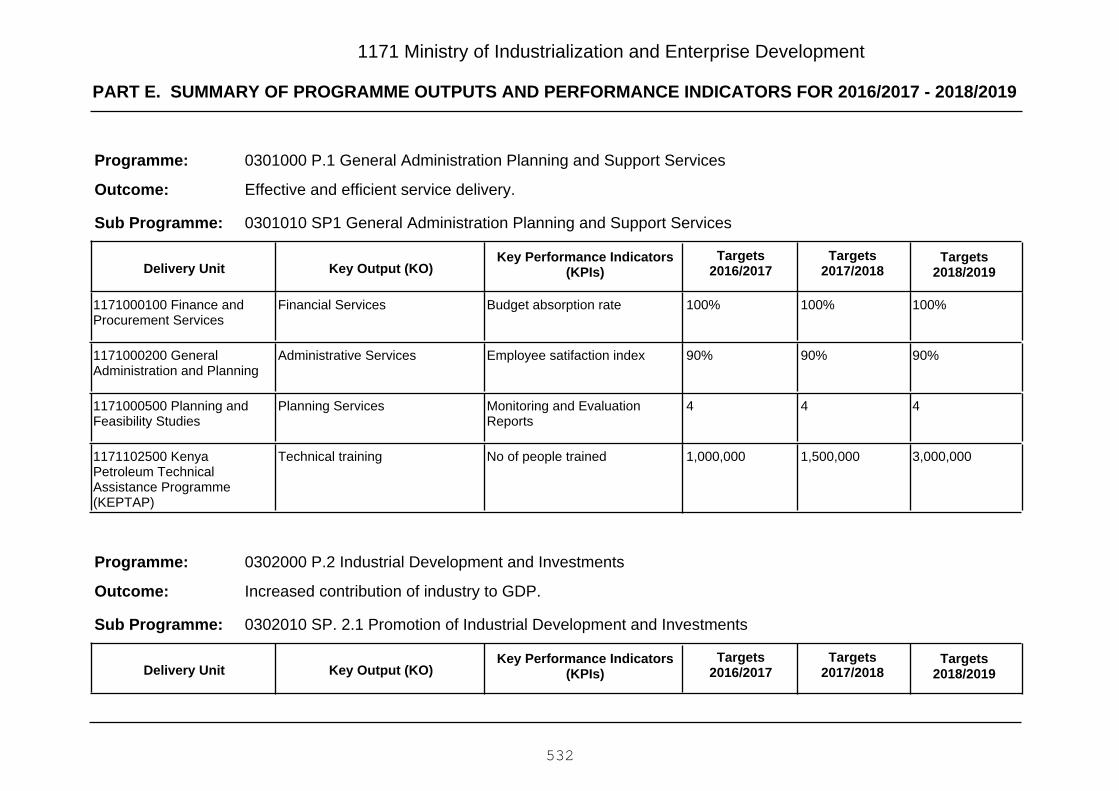
PART E. SUMMARY OF PROGRAMME OUTPUTS AND PERFORMANCE INDICATORS FOR 2016/2017 - 2018/2019
1171 Ministry of Industrialization and Enterprise Development
0301000 P.1 General Administration Planning and Support Services
Effective and efficient service delivery.
Programme:
Outcome:
0301010 SP1 General Administration Planning and Support ServicesSub Programme:
Key Output (KO)Targets
2018/2019Targets
2017/2018Key Performance Indicators
(KPIs)Targets
2016/2017Delivery Unit
100%100%100%Budget absorption rateFinancial Services1171000100 Finance andProcurement Services
90%90%90%Employee satifaction indexAdministrative Services1171000200 GeneralAdministration and Planning
444Monitoring and EvaluationReports
Planning Services1171000500 Planning andFeasibility Studies
3,000,0001,500,0001,000,000No of people trainedTechnical training1171102500 KenyaPetroleum TechnicalAssistance Programme(KEPTAP)
0302000 P.2 Industrial Development and Investments
Increased contribution of industry to GDP.
Programme:
Outcome:
0302010 SP. 2.1 Promotion of Industrial Development and InvestmentsSub Programme:
Key Output (KO)Targets
2018/2019Targets
2017/2018Key Performance Indicators
(KPIs)Targets
2016/2017Delivery Unit
532

PART E. SUMMARY OF PROGRAMME OUTPUTS AND PERFORMANCE INDICATORS FOR 2016/2017 - 2018/2019
1171 Ministry of Industrialization and Enterprise Development
000Master Plan reportsEconomic Zones master plan1171001800 Headquartersand Administrative Services
200200150Number of sub contractedMSEs
Sub contracted MSEs1171002400 IndustrialSupport Services
424242No. of field officers offeredtechnicaladvice and support
Technical support services1171002500 Small Scale andIndustrial Services
202020% increase in Foreign DirectInvestments in theManufacturing sector
Foreign Direct Investment1171002700 IndustrializationSecretariat
35003500300No. of SMEs supported.Technical support services1171003200 Small ScaleIndustries - Field Services
30,00030,00030,000Number of new jobs createdEmployment creation throughEPZA
1171004100 ExportProcessing Zones Authority
885Number of exbition heldTechnical support services1171004600 Directorate ofMicro and Small Enterprise
14
300
14
300
12
250
Number of investmentpromotion fora
Number of viable businessidentified
Argo-industry and New businessinvestments
1171005000 Vision 2030Delivery Unit
2,0002,0002,000Number of trees plantedTrees planted1171100200 Low Carbon LowEmission Clean EnergyTechnology Transfer Program(Ken
65,00030,00020,000Number of jobs createdFree Port and industrial parks1171100300 Develop aFreeport & Industrial parks-Special Economic ZoneMombasa
533
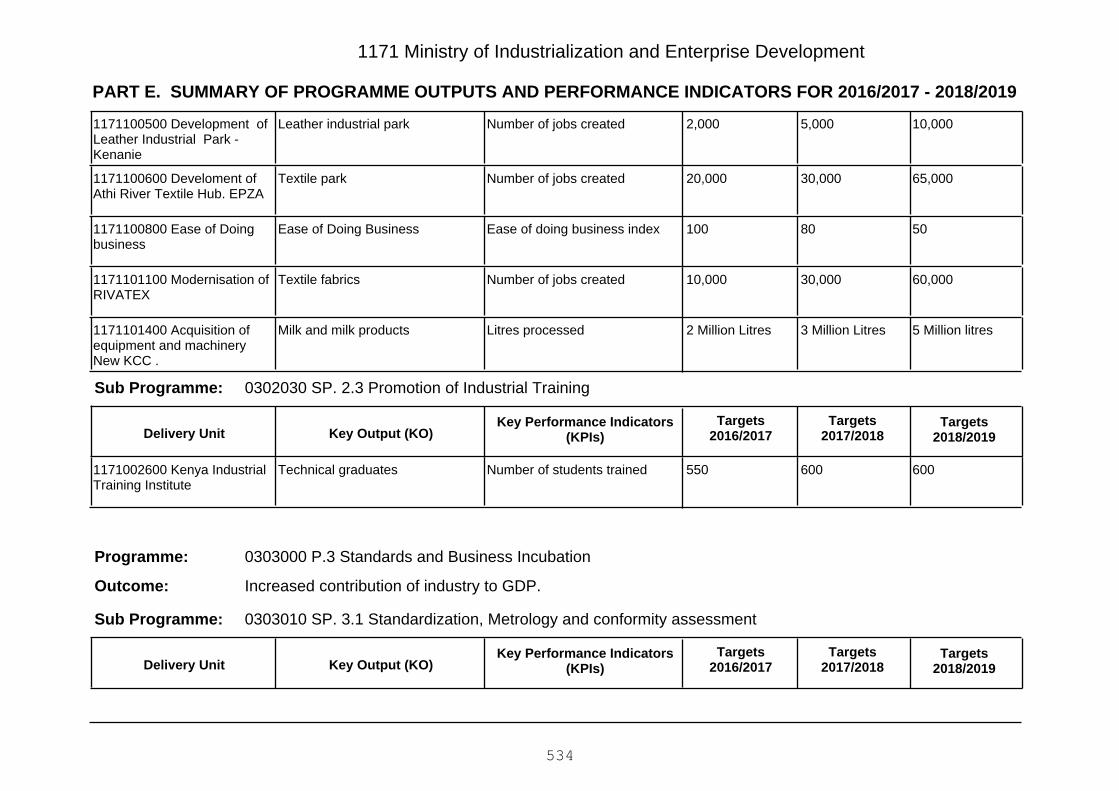
PART E. SUMMARY OF PROGRAMME OUTPUTS AND PERFORMANCE INDICATORS FOR 2016/2017 - 2018/2019
1171 Ministry of Industrialization and Enterprise Development
10,0005,0002,000Number of jobs createdLeather industrial park1171100500 Development ofLeather Industrial Park -Kenanie
65,00030,00020,000Number of jobs createdTextile park1171100600 Develoment ofAthi River Textile Hub. EPZA
5080100Ease of doing business indexEase of Doing Business1171100800 Ease of Doingbusiness
60,00030,00010,000Number of jobs createdTextile fabrics1171101100 Modernisation ofRIVATEX
5 Million litres3 Million Litres2 Million LitresLitres processedMilk and milk products1171101400 Acquisition ofequipment and machineryNew KCC .
0302030 SP. 2.3 Promotion of Industrial TrainingSub Programme:
Key Output (KO)Targets
2018/2019Targets
2017/2018Key Performance Indicators
(KPIs)Targets
2016/2017Delivery Unit
600600550Number of students trainedTechnical graduates1171002600 Kenya IndustrialTraining Institute
0303000 P.3 Standards and Business Incubation
Increased contribution of industry to GDP.
Programme:
Outcome:
0303010 SP. 3.1 Standardization, Metrology and conformity assessmentSub Programme:
Key Output (KO)Targets
2018/2019Targets
2017/2018Key Performance Indicators
(KPIs)Targets
2016/2017Delivery Unit
534

PART E. SUMMARY OF PROGRAMME OUTPUTS AND PERFORMANCE INDICATORS FOR 2016/2017 - 2018/2019
1171 Ministry of Industrialization and Enterprise Development
8,5008,5008,000Number of productsstandardized
Compliance and Standards1171001800 Headquartersand Administrative Services
20%20%15%% increase in Foreign DirectInvestment in the Manufacturingsector
Foreign Direct Investments1171002700 IndustrializationSecretariat
808050Number of cases investigatedand concluded
Compliance and Standards1171100100 Standards andMarket Access Programme(SMAP)
0303020 SP. 3.2 Business financing & incubation for MSMEsSub Programme:
Key Output (KO)Targets
2018/2019Targets
2017/2018Key Performance Indicators
(KPIs)Targets
2016/2017Delivery Unit
900900700Number of MSMEs accessingcredit
Credit disbursed to SMEs1171002900 Kenya IndustrialEstates
664Number centers constructedand equipped
Centers of excellence1171004700 Micro & SmallEnterprises Authority
0303040 SP. 3.4 Industrial Research, Development and InnovationSub Programme:
Key Output (KO)Targets
2018/2019Targets
2017/2018Key Performance Indicators
(KPIs)Targets
2016/2017Delivery Unit
200200150Number of technologiesdeveloped and transferred
Developed Technologies1171001900 Kenya IndustrialResearch DevelopmentInstitute (KIRDI)
900090008500Number of IP registedRegistered IP1171002100 Kenya IndustrialProperty Institute
535
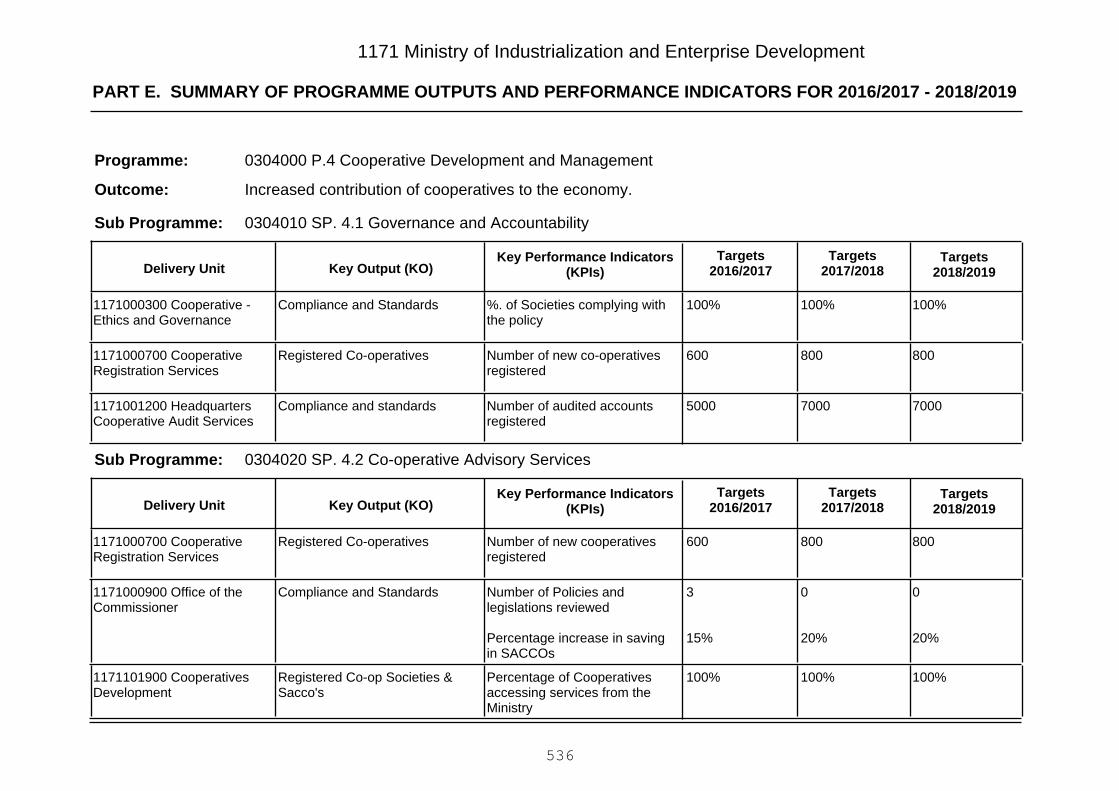
PART E. SUMMARY OF PROGRAMME OUTPUTS AND PERFORMANCE INDICATORS FOR 2016/2017 - 2018/2019
1171 Ministry of Industrialization and Enterprise Development
0304000 P.4 Cooperative Development and Management
Increased contribution of cooperatives to the economy.
Programme:
Outcome:
0304010 SP. 4.1 Governance and AccountabilitySub Programme:
Key Output (KO)Targets
2018/2019Targets
2017/2018Key Performance Indicators
(KPIs)Targets
2016/2017Delivery Unit
100%100%100%%. of Societies complying withthe policy
Compliance and Standards1171000300 Cooperative -Ethics and Governance
800800600Number of new co-operativesregistered
Registered Co-operatives1171000700 CooperativeRegistration Services
700070005000Number of audited accountsregistered
Compliance and standards1171001200 HeadquartersCooperative Audit Services
0304020 SP. 4.2 Co-operative Advisory ServicesSub Programme:
Key Output (KO)Targets
2018/2019Targets
2017/2018Key Performance Indicators
(KPIs)Targets
2016/2017Delivery Unit
800800600Number of new cooperativesregistered
Registered Co-operatives1171000700 CooperativeRegistration Services
0
20%
0
20%
3
15%
Number of Policies andlegislations reviewed
Percentage increase in savingin SACCOs
Compliance and Standards1171000900 Office of theCommissioner
100%100%100%Percentage of Cooperativesaccessing services from theMinistry
Registered Co-op Societies &Sacco's
1171101900 CooperativesDevelopment
536
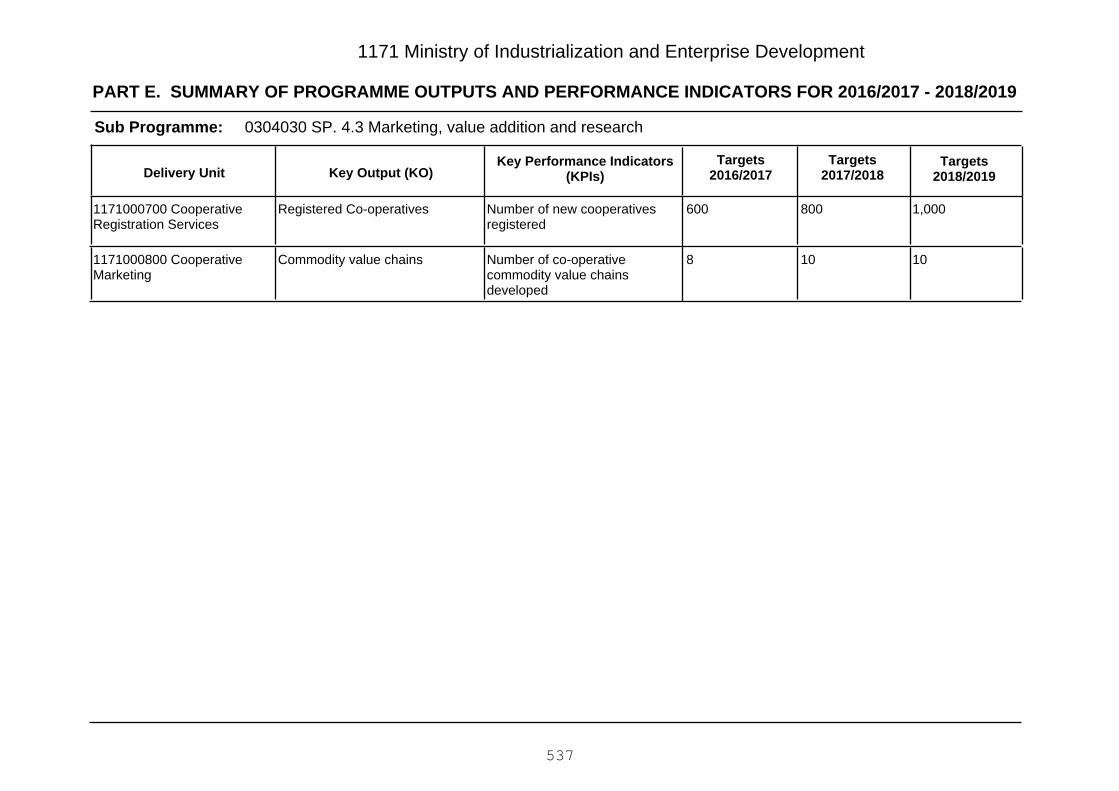
PART E. SUMMARY OF PROGRAMME OUTPUTS AND PERFORMANCE INDICATORS FOR 2016/2017 - 2018/2019
1171 Ministry of Industrialization and Enterprise Development
0304030 SP. 4.3 Marketing, value addition and researchSub Programme:
Key Output (KO)Targets
2018/2019Targets
2017/2018Key Performance Indicators
(KPIs)Targets
2016/2017Delivery Unit
1,000800600Number of new cooperativesregistered
Registered Co-operatives1171000700 CooperativeRegistration Services
10108Number of co-operativecommodity value chainsdeveloped
Commodity value chains1171000800 CooperativeMarketing
537

Vote 1171 Ministry of Industrialization and Enterprise Development
PART F: Summary of Expenditure by Programmes, 2016/2017 - 2018/2019
Programme
Estimates Projected Estimates
2016/2017 2017/2018 2018/2019
KShs. KShs. KShs.
0301010 SP1 General Administration Planning and Support Services 846,331,229 901,139,693 840,278,221
0301000 P.1 General Administration Planning and Support Services 846,331,229 901,139,693 840,278,221
0302010 SP. 2.1 Promotion of Industrial Development and Investments 6,034,325,651 4,130,664,737 3,895,689,481
0302030 SP. 2.3 Promotion of Industrial Training 138,794,756 510,184,573 524,067,714
0302000 P.2 Industrial Development and Investments 6,173,120,407 4,640,849,310 4,419,757,195
0303010 SP. 3.1 Standardization, Metrology and conformity assessment 613,257,400 721,455,400 720,304,212
0303020 SP. 3.2 Business financing & incubation for MSMEs 152,733,821 1,469,433,822 1,490,400,288
0303040 SP. 3.4 Industrial Research, Development and Innovation 637,185,779 1,536,927,778 1,538,000,000
0303000 P.3 Standards and Business Incubation 1,403,177,000 3,727,817,000 3,748,704,500
0304010 SP. 4.1 Governance and Accountability 51,333,577 63,804,017 66,392,140
0304020 SP. 4.2 Co-operative Advisory Services 2,754,077,450 299,180,463 306,861,893
0304030 SP. 4.3 Marketing, value addition and research 15,539,496 22,568,685 23,447,804
0304000 P.4 Cooperative Development and Management 2,820,950,523 385,553,165 396,701,837Total Expenditure for Vote 1171 Ministry of Industrialization and Enterprise Development 11,243,579,159 9,655,359,168 9,405,441,753
538

1171 Ministry of Industrialization and Enterprise Development
PART G: Summary of Expenditure by Vote and Economic Classification, 2016/2017 - 2018/2019
Economic Classification
Estimates Projected Estimates
2016/2017 2017/2018 2018/2019KShs. KShs. KShs.
Current Expenditure 5,378,792,159 2,772,172,168 2,822,254,753
Compensation to Employees 552,751,561 572,172,168 591,254,753
Use of Goods and Services 2,715,714,142 655,481,207 696,354,723
Current Transfers to Govt. Agencies 2,072,560,000 1,491,000,000 1,491,000,000
Other Recurrent 37,766,456 53,518,793 43,645,277
Capital Expenditure 5,864,787,000 6,883,187,000 6,583,187,000
Acquisition of Non-Financial Assets 200,000,000 457,000,000 512,000,000
Capital Grants to Govt. Agencies 4,035,000,000 4,385,000,000 4,405,000,000
Other Development 1,629,787,000 2,041,187,000 1,666,187,000Total Expenditure 11,243,579,159 9,655,359,168 9,405,441,753
539

1171 Ministry of Industrialization and Enterprise Development
PART H: Summary of Expenditure by Programme and Economic Classification, 2016/2017 - 2018/2019
0301010 SP1 General Administration Planning and Support Services
Economic Classification
Estimates Projected Estimates
2016/2017 2017/2018 2018/2019KShs. KShs. KShs.
Current Expenditure 542,731,229 619,139,693 633,278,221
Compensation to Employees 257,964,833 265,328,305 269,650,590
Use of Goods and Services 263,252,632 315,646,333 336,218,761
Current Transfers to Govt. Agencies 1,700,000 1,700,000 1,700,000
Other Recurrent 19,813,764 36,465,055 25,708,870
Capital Expenditure 303,600,000 282,000,000 207,000,000
Other Development 303,600,000 282,000,000 207,000,000Total Expenditure 846,331,229 901,139,693 840,278,221
0301000 P.1 General Administration Planning and Support Services
Economic Classification
Estimates Projected Estimates
2016/2017 2017/2018 2018/2019KShs. KShs. KShs.
Current Expenditure 542,731,229 619,139,693 633,278,221
Compensation to Employees 257,964,833 265,328,305 269,650,590
Use of Goods and Services 263,252,632 315,646,333 336,218,761
Current Transfers to Govt. Agencies 1,700,000 1,700,000 1,700,000
Other Recurrent 19,813,764 36,465,055 25,708,870
Capital Expenditure 303,600,000 282,000,000 207,000,000
Other Development 303,600,000 282,000,000 207,000,000Total Expenditure 846,331,229 901,139,693 840,278,221
0302010 SP. 2.1 Promotion of Industrial Development and Investments
Economic Classification
Estimates Projected Estimates
2016/2017 2017/2018 2018/2019KShs. KShs. KShs.
Current Expenditure 945,955,651 544,294,737 554,319,481
Compensation to Employees 145,420,908 152,786,292 157,209,778
540
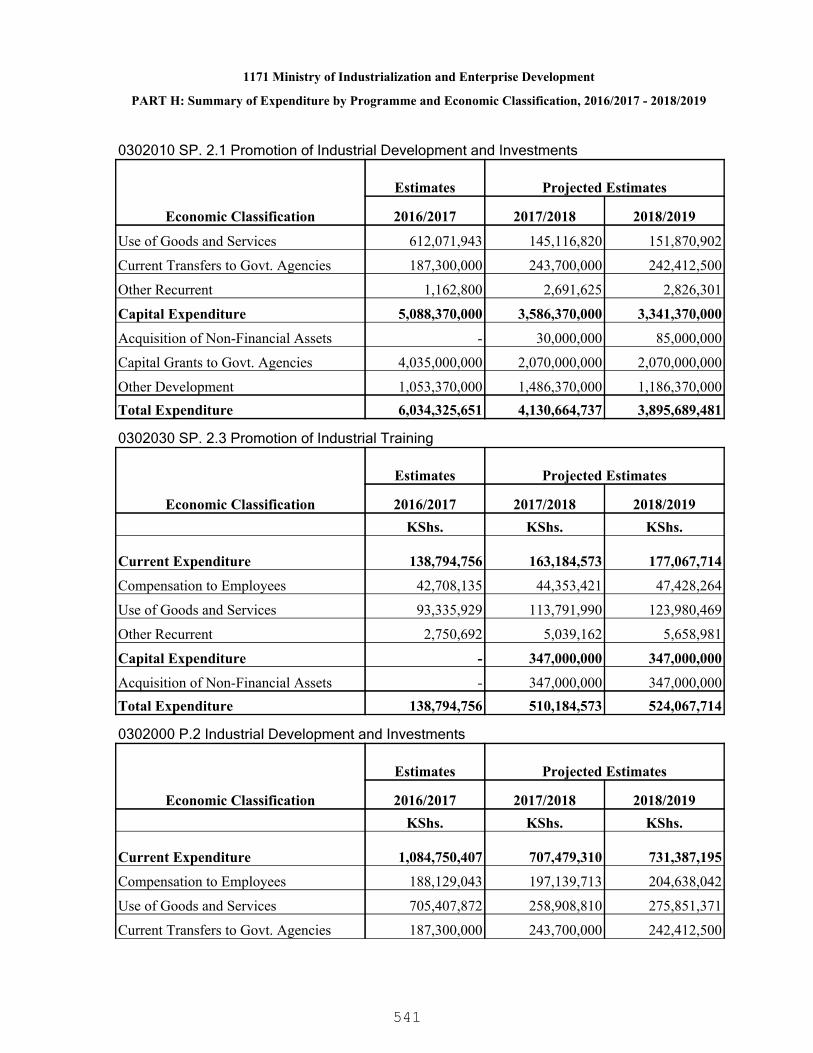
1171 Ministry of Industrialization and Enterprise Development
PART H: Summary of Expenditure by Programme and Economic Classification, 2016/2017 - 2018/2019
0302010 SP. 2.1 Promotion of Industrial Development and Investments
Economic Classification
Estimates Projected Estimates
2016/2017 2017/2018 2018/2019
Use of Goods and Services 612,071,943 145,116,820 151,870,902
Current Transfers to Govt. Agencies 187,300,000 243,700,000 242,412,500
Other Recurrent 1,162,800 2,691,625 2,826,301
Capital Expenditure 5,088,370,000 3,586,370,000 3,341,370,000
Acquisition of Non-Financial Assets - 30,000,000 85,000,000
Capital Grants to Govt. Agencies 4,035,000,000 2,070,000,000 2,070,000,000
Other Development 1,053,370,000 1,486,370,000 1,186,370,000Total Expenditure 6,034,325,651 4,130,664,737 3,895,689,481
0302030 SP. 2.3 Promotion of Industrial Training
Economic Classification
Estimates Projected Estimates
2016/2017 2017/2018 2018/2019KShs. KShs. KShs.
Current Expenditure 138,794,756 163,184,573 177,067,714
Compensation to Employees 42,708,135 44,353,421 47,428,264
Use of Goods and Services 93,335,929 113,791,990 123,980,469
Other Recurrent 2,750,692 5,039,162 5,658,981
Capital Expenditure - 347,000,000 347,000,000
Acquisition of Non-Financial Assets - 347,000,000 347,000,000Total Expenditure 138,794,756 510,184,573 524,067,714
0302000 P.2 Industrial Development and Investments
Economic Classification
Estimates Projected Estimates
2016/2017 2017/2018 2018/2019KShs. KShs. KShs.
Current Expenditure 1,084,750,407 707,479,310 731,387,195
Compensation to Employees 188,129,043 197,139,713 204,638,042
Use of Goods and Services 705,407,872 258,908,810 275,851,371
Current Transfers to Govt. Agencies 187,300,000 243,700,000 242,412,500
541
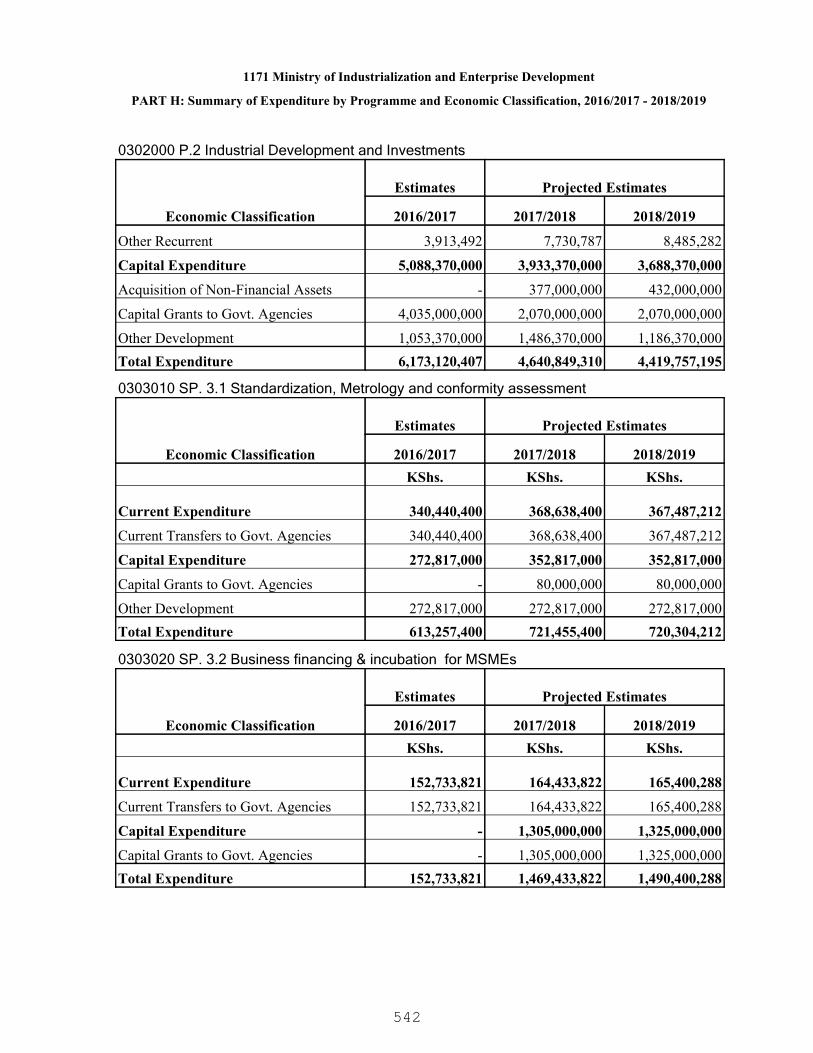
1171 Ministry of Industrialization and Enterprise Development
PART H: Summary of Expenditure by Programme and Economic Classification, 2016/2017 - 2018/2019
0302000 P.2 Industrial Development and Investments
Economic Classification
Estimates Projected Estimates
2016/2017 2017/2018 2018/2019
Other Recurrent 3,913,492 7,730,787 8,485,282
Capital Expenditure 5,088,370,000 3,933,370,000 3,688,370,000
Acquisition of Non-Financial Assets - 377,000,000 432,000,000
Capital Grants to Govt. Agencies 4,035,000,000 2,070,000,000 2,070,000,000
Other Development 1,053,370,000 1,486,370,000 1,186,370,000Total Expenditure 6,173,120,407 4,640,849,310 4,419,757,195
0303010 SP. 3.1 Standardization, Metrology and conformity assessment
Economic Classification
Estimates Projected Estimates
2016/2017 2017/2018 2018/2019KShs. KShs. KShs.
Current Expenditure 340,440,400 368,638,400 367,487,212
Current Transfers to Govt. Agencies 340,440,400 368,638,400 367,487,212
Capital Expenditure 272,817,000 352,817,000 352,817,000
Capital Grants to Govt. Agencies - 80,000,000 80,000,000
Other Development 272,817,000 272,817,000 272,817,000Total Expenditure 613,257,400 721,455,400 720,304,212
0303020 SP. 3.2 Business financing & incubation for MSMEs
Economic Classification
Estimates Projected Estimates
2016/2017 2017/2018 2018/2019KShs. KShs. KShs.
Current Expenditure 152,733,821 164,433,822 165,400,288
Current Transfers to Govt. Agencies 152,733,821 164,433,822 165,400,288
Capital Expenditure - 1,305,000,000 1,325,000,000
Capital Grants to Govt. Agencies - 1,305,000,000 1,325,000,000Total Expenditure 152,733,821 1,469,433,822 1,490,400,288
542

1171 Ministry of Industrialization and Enterprise Development
PART H: Summary of Expenditure by Programme and Economic Classification, 2016/2017 - 2018/2019
0303040 SP. 3.4 Industrial Research, Development and Innovation
Economic Classification
Estimates Projected Estimates
2016/2017 2017/2018 2018/2019KShs. KShs. KShs.
Current Expenditure 637,185,779 636,927,778 638,000,000
Current Transfers to Govt. Agencies 637,185,779 636,927,778 638,000,000
Capital Expenditure - 900,000,000 900,000,000
Capital Grants to Govt. Agencies - 900,000,000 900,000,000Total Expenditure 637,185,779 1,536,927,778 1,538,000,000
0303000 P.3 Standards and Business Incubation
Economic Classification
Estimates Projected Estimates
2016/2017 2017/2018 2018/2019KShs. KShs. KShs.
Current Expenditure 1,130,360,000 1,170,000,000 1,170,887,500
Current Transfers to Govt. Agencies 1,130,360,000 1,170,000,000 1,170,887,500
Capital Expenditure 272,817,000 2,557,817,000 2,577,817,000
Capital Grants to Govt. Agencies - 2,285,000,000 2,305,000,000
Other Development 272,817,000 272,817,000 272,817,000Total Expenditure 1,403,177,000 3,727,817,000 3,748,704,500
0304010 SP. 4.1 Governance and Accountability
Economic Classification
Estimates Projected Estimates
2016/2017 2017/2018 2018/2019KShs. KShs. KShs.
Current Expenditure 51,333,577 63,804,017 66,392,140
Compensation to Employees 30,653,255 31,950,344 32,588,344
Use of Goods and Services 17,041,122 28,031,922 29,952,671
Other Recurrent 3,639,200 3,821,751 3,851,125Total Expenditure 51,333,577 63,804,017 66,392,140
543

1171 Ministry of Industrialization and Enterprise Development
PART H: Summary of Expenditure by Programme and Economic Classification, 2016/2017 - 2018/2019
0304020 SP. 4.2 Co-operative Advisory Services
Economic Classification
Estimates Projected Estimates
2016/2017 2017/2018 2018/2019KShs. KShs. KShs.
Current Expenditure 2,554,077,450 189,180,463 196,861,893
Compensation to Employees 67,718,898 69,036,621 75,445,592
Use of Goods and Services 1,722,758,552 39,042,642 39,816,301
Current Transfers to Govt. Agencies 753,200,000 75,600,000 76,000,000
Other Recurrent 10,400,000 5,501,200 5,600,000
Capital Expenditure 200,000,000 110,000,000 110,000,000
Acquisition of Non-Financial Assets 200,000,000 80,000,000 80,000,000
Capital Grants to Govt. Agencies - 30,000,000 30,000,000Total Expenditure 2,754,077,450 299,180,463 306,861,893
0304030 SP. 4.3 Marketing, value addition and research
Economic Classification
Estimates Projected Estimates
2016/2017 2017/2018 2018/2019KShs. KShs. KShs.
Current Expenditure 15,539,496 22,568,685 23,447,804
Compensation to Employees 8,285,532 8,717,185 8,932,185
Use of Goods and Services 7,253,964 13,851,500 14,515,619Total Expenditure 15,539,496 22,568,685 23,447,804
0304000 P.4 Cooperative Development and Management
Economic Classification
Estimates Projected Estimates
2016/2017 2017/2018 2018/2019KShs. KShs. KShs.
Current Expenditure 2,620,950,523 275,553,165 286,701,837
Compensation to Employees 106,657,685 109,704,150 116,966,121
Use of Goods and Services 1,747,053,638 80,926,064 84,284,591
Current Transfers to Govt. Agencies 753,200,000 75,600,000 76,000,000
Other Recurrent 14,039,200 9,322,951 9,451,125
544
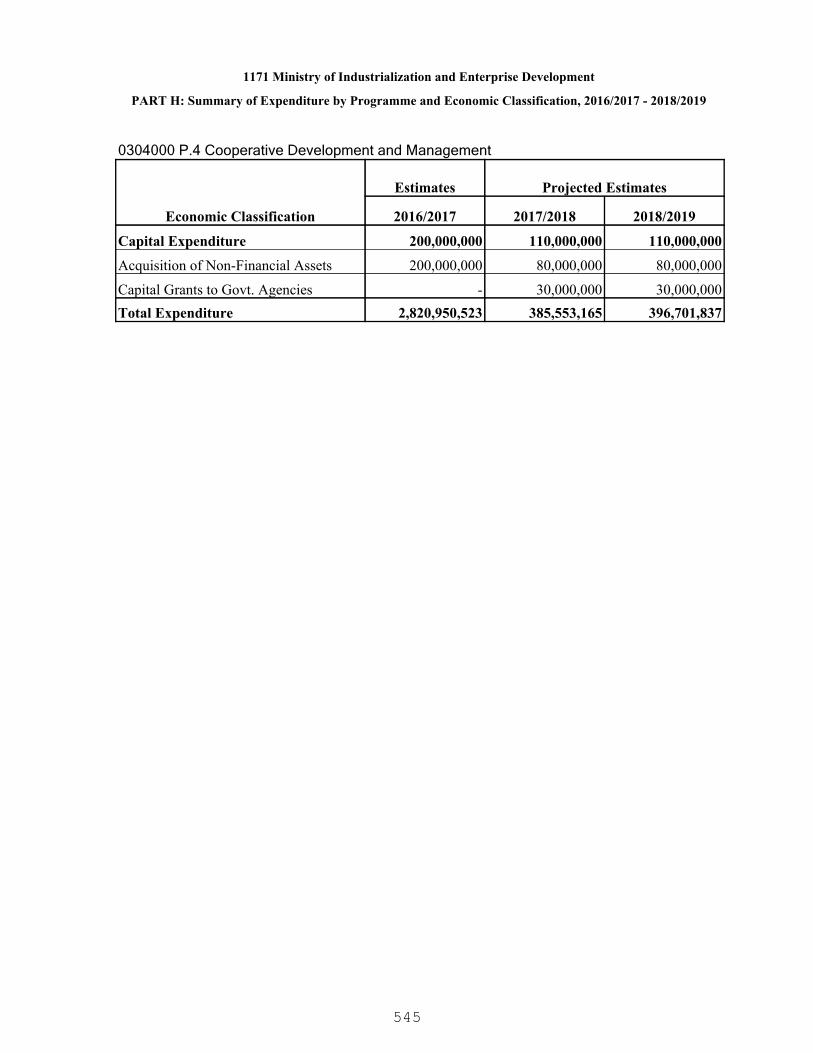
1171 Ministry of Industrialization and Enterprise Development
PART H: Summary of Expenditure by Programme and Economic Classification, 2016/2017 - 2018/2019
0304000 P.4 Cooperative Development and Management
Economic Classification
Estimates Projected Estimates
2016/2017 2017/2018 2018/2019
Capital Expenditure 200,000,000 110,000,000 110,000,000
Acquisition of Non-Financial Assets 200,000,000 80,000,000 80,000,000
Capital Grants to Govt. Agencies - 30,000,000 30,000,000Total Expenditure 2,820,950,523 385,553,165 396,701,837
545

1181 State Department for Commerce and Tourism
A preferred commercial hub and tourism destination in the world.
To facilitate development and promotion of commerce and tourism to make Kenya apreferred commercial hub and tourism destination.
PART A. Vision
PART B. Mission
PART C. Performance Overview and Background for Programme(s) Funding
The mandate of the State Department for Commerce and Tourism is to undertake nationaltrade policy development; tourism policy management; promotion of exports; promotion ofMicro & Small Medium Enterprises (MSMEs); promotion of retail and wholesale trade;tourism development; and tourism promotion.
Key programmes being undertaken include tourism recovery, tourism promotion andmarketing; improving quality and standards of tourism products/services; establishment ofKenya Commodities Exchange Platform; promotion of conference and cultural tourism;domestic trade development; fair trade and consumer protection;branding Kenya; creation ofan enabling environment for doing business and growth of both domestic and internationalinvestment; export market development and regional economic integration initiatives.
Key achievements during the period under review includes: improved performance inwholesale and retail trade; increase in exports from KSh.455.7 billion in 2013 to KSh.460.6billion in 2014; KSh. 191.2 billion worth of new investments in 2014/2015, up from KSh.101.02 billion in 2013/2014; verified and stamped 275,645 trade weighing and measuringequipment; up-scaled the Legal Metrology Volume Laboratory to comply with ISO 17025Standards.
Except for FY2013/14, the budgetary allocation to the State Department has been on therise reflecting the increased responsibilities and importance attached to tourism andcommerce and the resultant contribution to the economy. Budget absorption rate has alsobeen on the rise. in the FY2014/15, the absorption rate averaged 93%.
Key challenges faced in the budget implementation include: travel advisories; multiple traderegulations; and weak implementation of policies and regulations. To address some of theseconcerns, the State Department has undertaken to initiate early preparations in line withprocurement plan and also emphasize on M&E for identiication of gaps and institution ofcorrective measures in good time.
In the MTEF period 2016/17 - 2018/19, the funding will be directed towards tourism recovery,tourism product development, promotion of exports, investments and growth of retail andwholesale trade. Some of the major outputs expected are: increased tourist arrivals andearnings; increased bed nights by Kenyans; improved and diversified tourism products;improved quality and standards of tourism services; increased exports to the region;expansion of training and conference facilities; increased skilled tourism manpower; MSMEscapacity building; and ensuring fair trade practices and consumer protection.
546
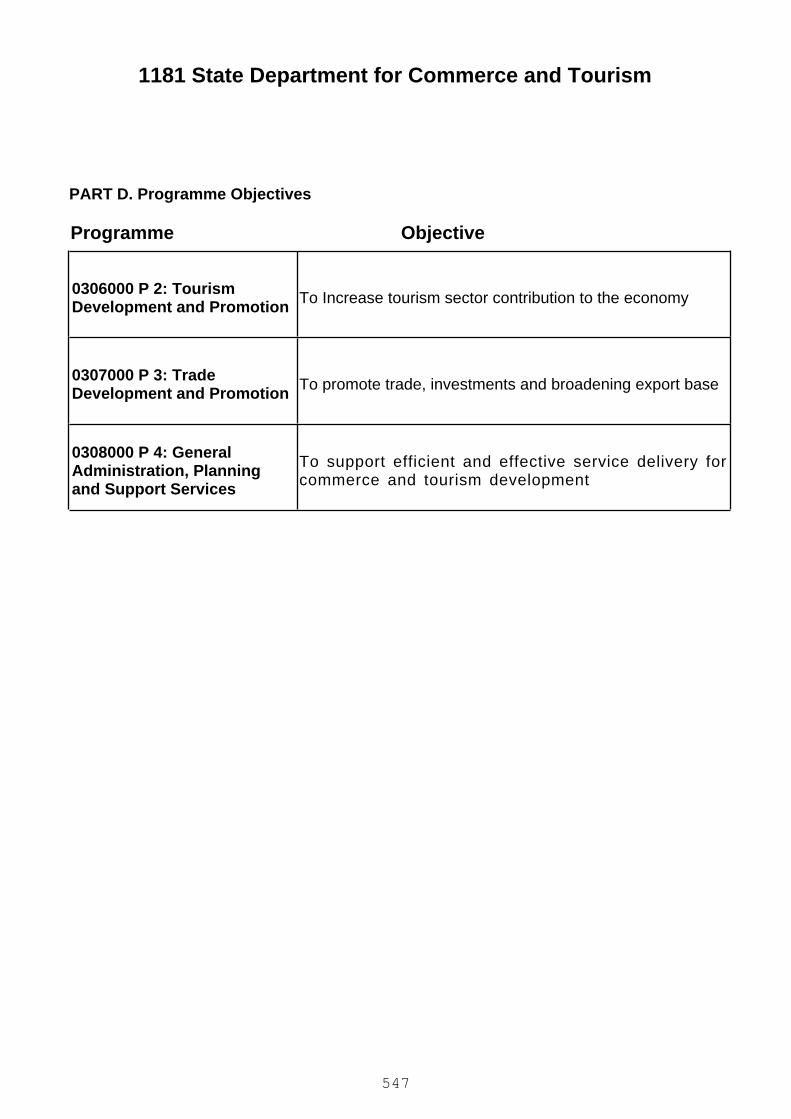
1181 State Department for Commerce and Tourism
PART D. Programme Objectives
ObjectiveProgramme
0306000 P 2: TourismDevelopment and Promotion To Increase tourism sector contribution to the economy
0307000 P 3: TradeDevelopment and Promotion To promote trade, investments and broadening export base
0308000 P 4: GeneralAdministration, Planningand Support Services
To support efficient and effective service delivery forcommerce and tourism development
547

PART E. SUMMARY OF PROGRAMME OUTPUTS AND PERFORMANCE INDICATORS FOR 2016/2017 - 2018/2019
1181 State Department for Commerce and Tourism
0306000 P 2: Tourism Development and Promotion
Increased tourism sector contribution to the economy
Programme:
Outcome:
0306010 S.P 2.1: Tourism Promotion and MarketingSub Programme:
Key Output (KO)Targets
2018/2019Targets
2017/2018Key Performance Indicators
(KPIs)Targets
2016/2017Delivery Unit
150150100No. of Agro-tourism operatorssensitized.
Agro-tourism operators sensitized1181001700 TourismServices Headquarters
4,000
10
3,500
15
3,300
10
No. of registered tourismestablishmentsinspected/licensed
No. of hotels and restaurantsclassified
Compliance and Standards1181001800 TourismRegulatory Authority
200
4.1
200
4.1
172
3.8
Earnings from tourism (KSh.Billion)
No. of bed nights by domestictourists (Million)
Increased tourism earnings1181001900 TourismMarketing and Promotion
--80No. of athletes trained on mediarelations and etiquette
Positive media engagement1181100900 Road to Rio -BKB
161510No. of counties adoptingbranding guidelines
Improved county competitiveness1181101000 CountryCompetitive Index - BKB
625245No. of firms adopting the 'markof identity' as a unique identifier
Enhanced competitiveness ofKenyan products
1181101100 Mark of Identity -BKB
548
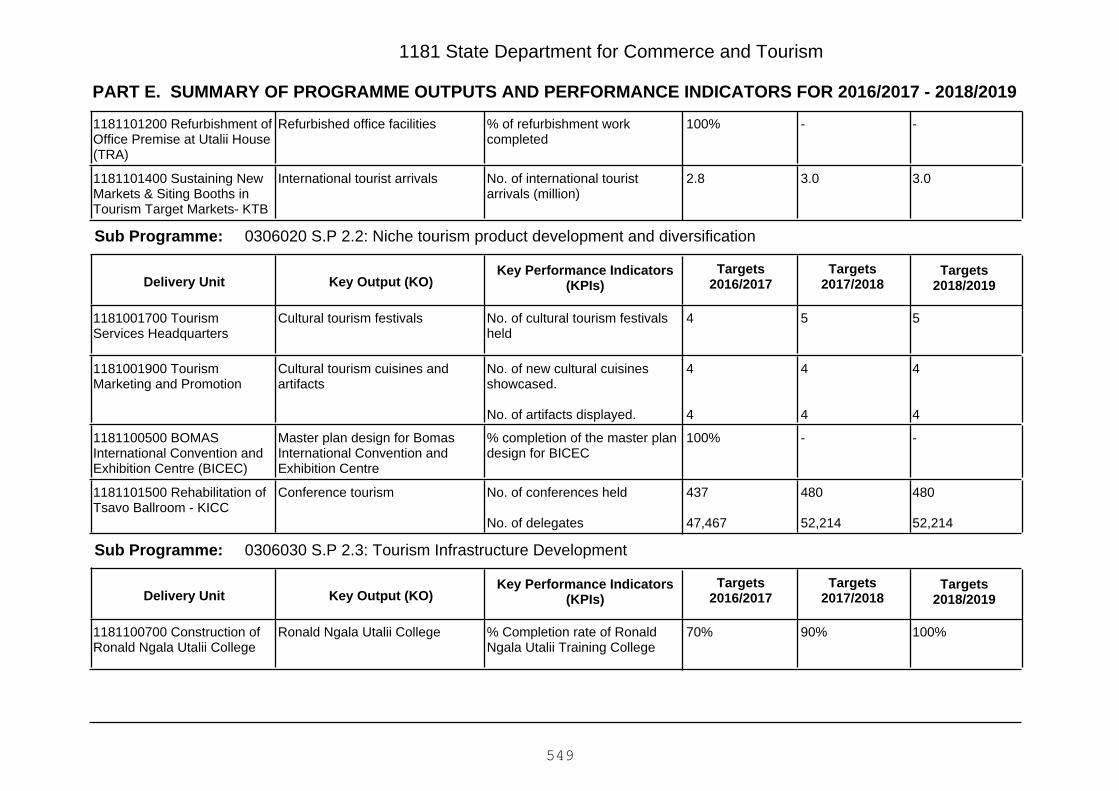
PART E. SUMMARY OF PROGRAMME OUTPUTS AND PERFORMANCE INDICATORS FOR 2016/2017 - 2018/2019
1181 State Department for Commerce and Tourism
--100%% of refurbishment workcompleted
Refurbished office facilities1181101200 Refurbishment ofOffice Premise at Utalii House(TRA)
3.03.02.8No. of international touristarrivals (million)
International tourist arrivals1181101400 Sustaining NewMarkets & Siting Booths inTourism Target Markets- KTB
0306020 S.P 2.2: Niche tourism product development and diversificationSub Programme:
Key Output (KO)Targets
2018/2019Targets
2017/2018Key Performance Indicators
(KPIs)Targets
2016/2017Delivery Unit
554No. of cultural tourism festivalsheld
Cultural tourism festivals1181001700 TourismServices Headquarters
4
4
4
4
4
4
No. of new cultural cuisinesshowcased.
No. of artifacts displayed.
Cultural tourism cuisines andartifacts
1181001900 TourismMarketing and Promotion
--100%% completion of the master plandesign for BICEC
Master plan design for BomasInternational Convention andExhibition Centre
1181100500 BOMASInternational Convention andExhibition Centre (BICEC)
480
52,214
480
52,214
437
47,467
No. of conferences held
No. of delegates
Conference tourism1181101500 Rehabilitation ofTsavo Ballroom - KICC
0306030 S.P 2.3: Tourism Infrastructure DevelopmentSub Programme:
Key Output (KO)Targets
2018/2019Targets
2017/2018Key Performance Indicators
(KPIs)Targets
2016/2017Delivery Unit
100%90%70%% Completion rate of RonaldNgala Utalii Training College
Ronald Ngala Utalii College1181100700 Construction ofRonald Ngala Utalii College
549

PART E. SUMMARY OF PROGRAMME OUTPUTS AND PERFORMANCE INDICATORS FOR 2016/2017 - 2018/2019
1181 State Department for Commerce and Tourism
0306040 S.P.2.4: Tourism Training& Capacity BuildingSub Programme:
Key Output (KO)Targets
2018/2019Targets
2017/2018Key Performance Indicators
(KPIs)Targets
2016/2017Delivery Unit
3,4003,3003,150No. of graduates in tourism andhospitality training
Tourism and hospitality graduates1181001900 TourismMarketing and Promotion
100%90%25%% of the facility completedPractical training facilities1181100800 New PracticalsTraining Block (Kitchen &Housekeeping Laboratory)-KUC
0307000 P 3: Trade Development and Promotion
Increased contribution of commerce to the economy
Programme:
Outcome:
0307010 S.P 3.1: Domestic Trade DevelopmentSub Programme:
Key Output (KO)Targets
2018/2019Targets
2017/2018Key Performance Indicators
(KPIs)Targets
2016/2017Delivery Unit
--100%% completion of master designof wholesale hub in Maragua
Maragua wholesale hub1181000800 Department ofInternal Trade
Updateinformation in thedata bank
Updateinformation in thedata bank
100%% completion rate of trade databank
Trade data bank1181001100 Trade Monitoringand Research
Operational E-trade portal
Operational E-trade portal
Operational E-trade portal
Operationalization of the E-tradeportal
E-trade portal1181102000 Establishment ofE-Trade Portal
--100%% completion rate of the designwork
Maragua wholesale hub1181102600 MaraguaWholesale Hub
550
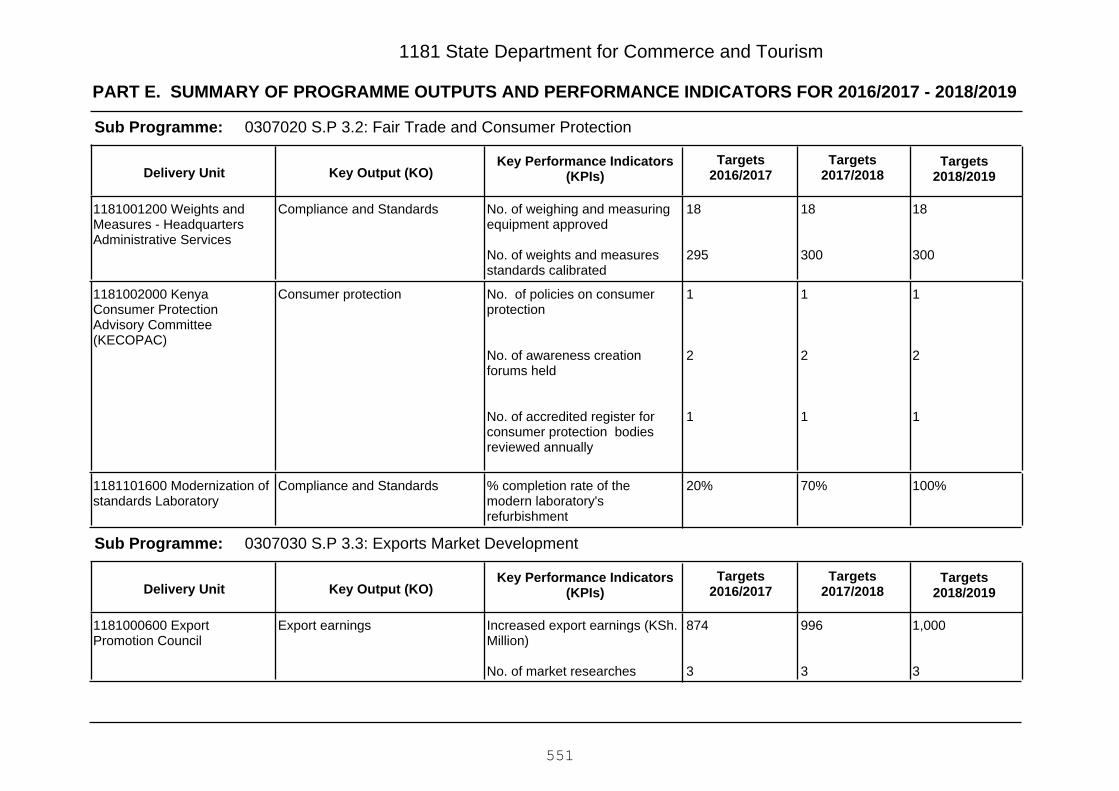
PART E. SUMMARY OF PROGRAMME OUTPUTS AND PERFORMANCE INDICATORS FOR 2016/2017 - 2018/2019
1181 State Department for Commerce and Tourism
0307020 S.P 3.2: Fair Trade and Consumer ProtectionSub Programme:
Key Output (KO)Targets
2018/2019Targets
2017/2018Key Performance Indicators
(KPIs)Targets
2016/2017Delivery Unit
18
300
18
300
18
295
No. of weighing and measuringequipment approved
No. of weights and measuresstandards calibrated
Compliance and Standards1181001200 Weights andMeasures - HeadquartersAdministrative Services
1
2
1
1
2
1
1
2
1
No. of policies on consumerprotection
No. of awareness creationforums held
No. of accredited register forconsumer protection bodiesreviewed annually
Consumer protection1181002000 KenyaConsumer ProtectionAdvisory Committee(KECOPAC)
100%70%20%% completion rate of themodern laboratory'srefurbishment
Compliance and Standards1181101600 Modernization ofstandards Laboratory
0307030 S.P 3.3: Exports Market DevelopmentSub Programme:
Key Output (KO)Targets
2018/2019Targets
2017/2018Key Performance Indicators
(KPIs)Targets
2016/2017Delivery Unit
1,000
3
996
3
874
3
Increased export earnings (KSh.Million)
No. of market researches
Export earnings1181000600 ExportPromotion Council
551
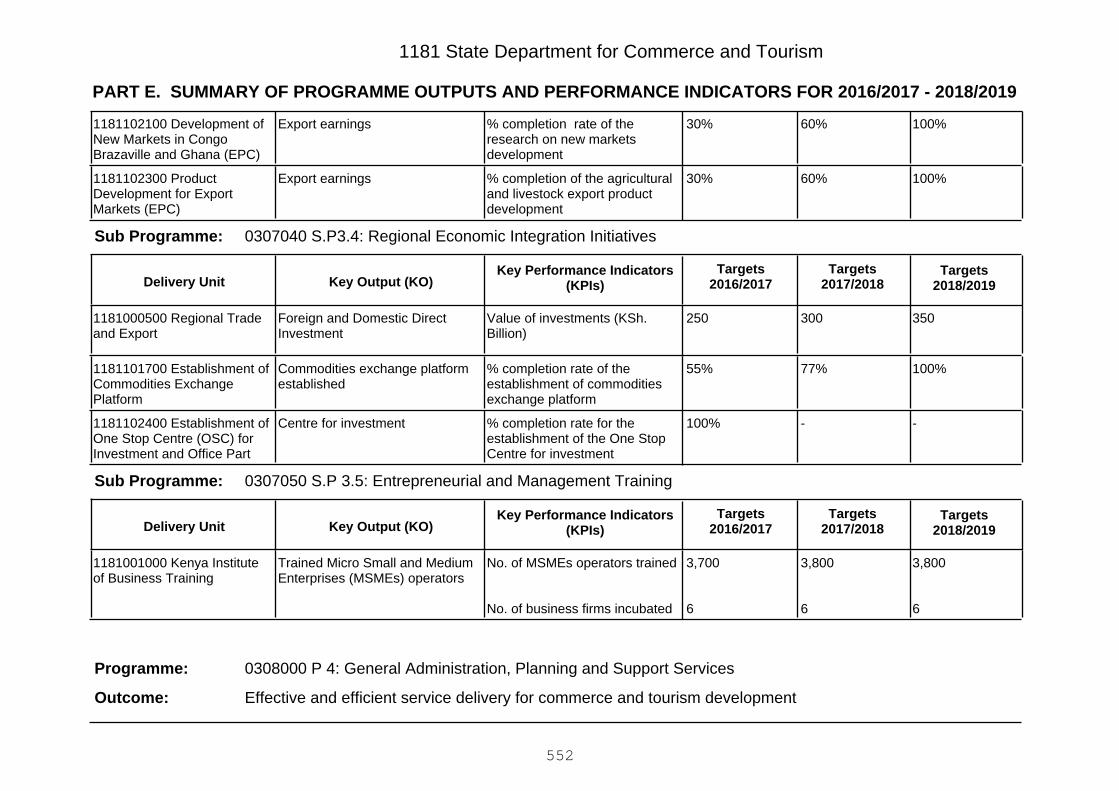
PART E. SUMMARY OF PROGRAMME OUTPUTS AND PERFORMANCE INDICATORS FOR 2016/2017 - 2018/2019
1181 State Department for Commerce and Tourism
100%60%30%% completion rate of theresearch on new marketsdevelopment
Export earnings1181102100 Development ofNew Markets in CongoBrazaville and Ghana (EPC)
100%60%30%% completion of the agriculturaland livestock export productdevelopment
Export earnings1181102300 ProductDevelopment for ExportMarkets (EPC)
0307040 S.P3.4: Regional Economic Integration InitiativesSub Programme:
Key Output (KO)Targets
2018/2019Targets
2017/2018Key Performance Indicators
(KPIs)Targets
2016/2017Delivery Unit
350300250Value of investments (KSh.Billion)
Foreign and Domestic DirectInvestment
1181000500 Regional Tradeand Export
100%77%55%% completion rate of theestablishment of commoditiesexchange platform
Commodities exchange platformestablished
1181101700 Establishment ofCommodities ExchangePlatform
--100%% completion rate for theestablishment of the One StopCentre for investment
Centre for investment1181102400 Establishment ofOne Stop Centre (OSC) forInvestment and Office Part
0307050 S.P 3.5: Entrepreneurial and Management TrainingSub Programme:
Key Output (KO)Targets
2018/2019Targets
2017/2018Key Performance Indicators
(KPIs)Targets
2016/2017Delivery Unit
3,800
6
3,800
6
3,700
6
No. of MSMEs operators trained
No. of business firms incubated
Trained Micro Small and MediumEnterprises (MSMEs) operators
1181001000 Kenya Instituteof Business Training
0308000 P 4: General Administration, Planning and Support Services
Effective and efficient service delivery for commerce and tourism development
Programme:
Outcome:
552

PART E. SUMMARY OF PROGRAMME OUTPUTS AND PERFORMANCE INDICATORS FOR 2016/2017 - 2018/2019
1181 State Department for Commerce and Tourism
0308010 S.P 4.1: General administration planning and support servicesSub Programme:
Key Output (KO)Targets
2018/2019Targets
2017/2018Key Performance Indicators
(KPIs)Targets
2016/2017Delivery Unit
100%100%100%% number of customers servedsatisfactorily
Administrative services1181000100 HeadquartersAdministrative Services
100%100%100%% financial services facilitationto commerce and tourismprogrammes/projects
Financial services1181000300 Finance andProcurement Services
100%100%100%% number of customers servedsatisfactorily
Administrative services1181001500 HeadquartersAdministrative Services
444No. of projects/programmesplanning, monitoring andevaluation reports
Planning services1181001600 Central PlanningUnit
554No. of cultural tourism festivalsheld
Cultural tourism services1181001700 TourismServices Headquarters
200
3
4.1
200
3
4.1
172
2.8
3.8
Increased earning from tourism(Ksh. billion)
No. of international touristarrivals (million)
No. of bed nights occupied byKenyans (million)
Tourism earnings
International tourist arrivals
Domestic tourism bed occupancy
1181100200 TourismRecovery
350222105No. of direct charter planeslanding
Tourist arrival1181100300 Charter IncentiveProgramme (CIP)
--100%% completion rate of openspace office refurbishment
Secure office facilities1181100400 Open SpaceOffice Modelling and SecuritySystem Fitting
553
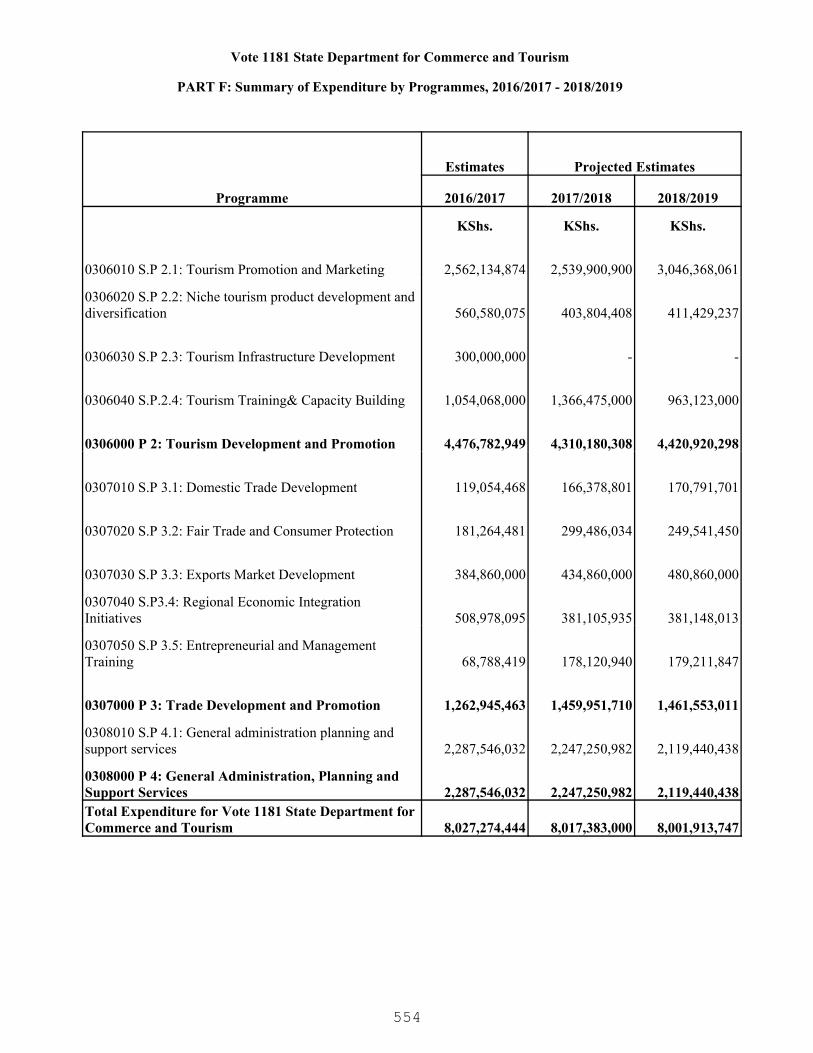
Vote 1181 State Department for Commerce and Tourism
PART F: Summary of Expenditure by Programmes, 2016/2017 - 2018/2019
Programme
Estimates Projected Estimates
2016/2017 2017/2018 2018/2019
KShs. KShs. KShs.
0306010 S.P 2.1: Tourism Promotion and Marketing 2,562,134,874 2,539,900,900 3,046,368,061
0306020 S.P 2.2: Niche tourism product development and diversification 560,580,075 403,804,408 411,429,237
0306030 S.P 2.3: Tourism Infrastructure Development 300,000,000 - -
0306040 S.P.2.4: Tourism Training& Capacity Building 1,054,068,000 1,366,475,000 963,123,000
0306000 P 2: Tourism Development and Promotion 4,476,782,949 4,310,180,308 4,420,920,298
0307010 S.P 3.1: Domestic Trade Development 119,054,468 166,378,801 170,791,701
0307020 S.P 3.2: Fair Trade and Consumer Protection 181,264,481 299,486,034 249,541,450
0307030 S.P 3.3: Exports Market Development 384,860,000 434,860,000 480,860,000
0307040 S.P3.4: Regional Economic Integration Initiatives 508,978,095 381,105,935 381,148,013
0307050 S.P 3.5: Entrepreneurial and Management Training 68,788,419 178,120,940 179,211,847
0307000 P 3: Trade Development and Promotion 1,262,945,463 1,459,951,710 1,461,553,011
0308010 S.P 4.1: General administration planning and support services 2,287,546,032 2,247,250,982 2,119,440,438
0308000 P 4: General Administration, Planning and Support Services 2,287,546,032 2,247,250,982 2,119,440,438Total Expenditure for Vote 1181 State Department for Commerce and Tourism 8,027,274,444 8,017,383,000 8,001,913,747
554

1181 State Department for Commerce and Tourism
PART G: Summary of Expenditure by Vote and Economic Classification, 2016/2017 - 2018/2019
Economic Classification
Estimates Projected Estimates
2016/2017 2017/2018 2018/2019KShs. KShs. KShs.
Current Expenditure 3,560,274,444 3,975,383,000 4,111,913,747
Compensation to Employees 376,524,096 381,000,000 392,500,000
Use of Goods and Services 416,251,511 571,281,069 601,221,783
Current Transfers to Govt. Agencies 2,744,635,137 3,002,083,137 3,097,113,884
Other Recurrent 22,863,700 21,018,794 21,078,080
Capital Expenditure 4,467,000,000 4,042,000,000 3,890,000,000
Acquisition of Non-Financial Assets 866,000,000 2,022,000,000 1,824,000,000
Capital Grants to Govt. Agencies 2,571,000,000 2,020,000,000 2,066,000,000
Other Development 1,030,000,000 - -Total Expenditure 8,027,274,444 8,017,383,000 8,001,913,747
555
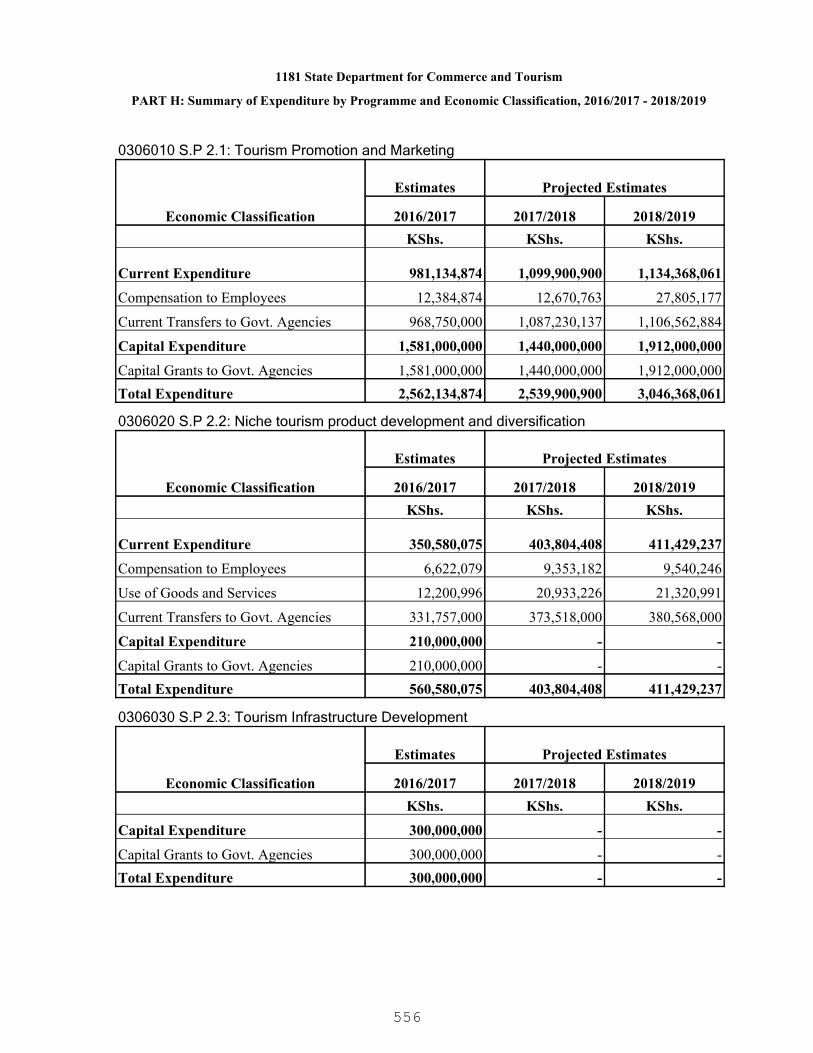
1181 State Department for Commerce and Tourism
PART H: Summary of Expenditure by Programme and Economic Classification, 2016/2017 - 2018/2019
0306010 S.P 2.1: Tourism Promotion and Marketing
Economic Classification
Estimates Projected Estimates
2016/2017 2017/2018 2018/2019KShs. KShs. KShs.
Current Expenditure 981,134,874 1,099,900,900 1,134,368,061
Compensation to Employees 12,384,874 12,670,763 27,805,177
Current Transfers to Govt. Agencies 968,750,000 1,087,230,137 1,106,562,884
Capital Expenditure 1,581,000,000 1,440,000,000 1,912,000,000
Capital Grants to Govt. Agencies 1,581,000,000 1,440,000,000 1,912,000,000Total Expenditure 2,562,134,874 2,539,900,900 3,046,368,061
0306020 S.P 2.2: Niche tourism product development and diversification
Economic Classification
Estimates Projected Estimates
2016/2017 2017/2018 2018/2019KShs. KShs. KShs.
Current Expenditure 350,580,075 403,804,408 411,429,237
Compensation to Employees 6,622,079 9,353,182 9,540,246
Use of Goods and Services 12,200,996 20,933,226 21,320,991
Current Transfers to Govt. Agencies 331,757,000 373,518,000 380,568,000
Capital Expenditure 210,000,000 - -
Capital Grants to Govt. Agencies 210,000,000 - -Total Expenditure 560,580,075 403,804,408 411,429,237
0306030 S.P 2.3: Tourism Infrastructure Development
Economic Classification
Estimates Projected Estimates
2016/2017 2017/2018 2018/2019KShs. KShs. KShs.
Capital Expenditure 300,000,000 - -
Capital Grants to Govt. Agencies 300,000,000 - -Total Expenditure 300,000,000 - -
556

1181 State Department for Commerce and Tourism
PART H: Summary of Expenditure by Programme and Economic Classification, 2016/2017 - 2018/2019
0306040 S.P.2.4: Tourism Training& Capacity Building
Economic Classification
Estimates Projected Estimates
2016/2017 2017/2018 2018/2019KShs. KShs. KShs.
Current Expenditure 854,068,000 866,475,000 935,123,000
Current Transfers to Govt. Agencies 854,068,000 866,475,000 935,123,000
Capital Expenditure 200,000,000 500,000,000 28,000,000
Capital Grants to Govt. Agencies 200,000,000 500,000,000 28,000,000Total Expenditure 1,054,068,000 1,366,475,000 963,123,000
0306000 P 2: Tourism Development and Promotion
Economic Classification
Estimates Projected Estimates
2016/2017 2017/2018 2018/2019KShs. KShs. KShs.
Current Expenditure 2,185,782,949 2,370,180,308 2,480,920,298
Compensation to Employees 19,006,953 22,023,945 37,345,423
Use of Goods and Services 12,200,996 20,933,226 21,320,991
Current Transfers to Govt. Agencies 2,154,575,000 2,327,223,137 2,422,253,884
Capital Expenditure 2,291,000,000 1,940,000,000 1,940,000,000
Capital Grants to Govt. Agencies 2,291,000,000 1,940,000,000 1,940,000,000Total Expenditure 4,476,782,949 4,310,180,308 4,420,920,298
0307010 S.P 3.1: Domestic Trade Development
Economic Classification
Estimates Projected Estimates
2016/2017 2017/2018 2018/2019KShs. KShs. KShs.
Current Expenditure 59,054,468 68,378,801 68,791,701
Compensation to Employees 30,158,787 33,041,513 33,698,589
Use of Goods and Services 27,964,481 33,713,235 33,468,282
Other Recurrent 931,200 1,624,053 1,624,830
Capital Expenditure 60,000,000 98,000,000 102,000,000
Acquisition of Non-Financial Assets 30,000,000 98,000,000 102,000,000
557
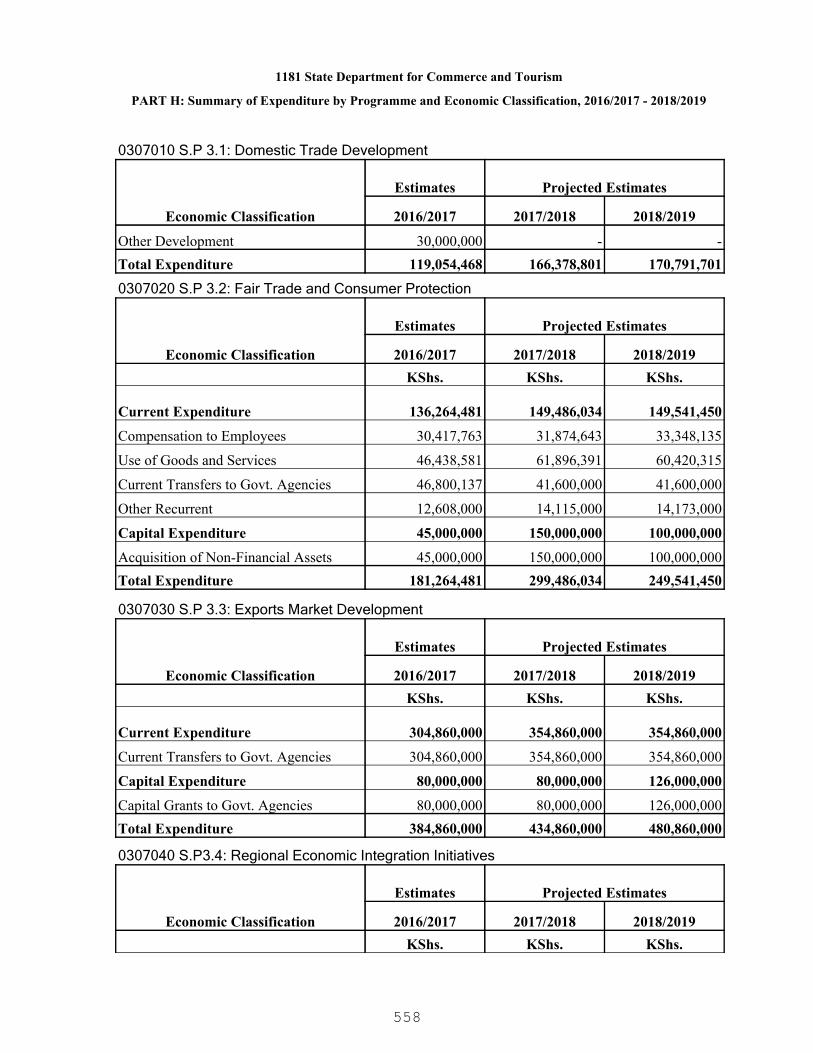
1181 State Department for Commerce and Tourism
PART H: Summary of Expenditure by Programme and Economic Classification, 2016/2017 - 2018/2019
0307010 S.P 3.1: Domestic Trade Development
Economic Classification
Estimates Projected Estimates
2016/2017 2017/2018 2018/2019
Other Development 30,000,000 - -Total Expenditure 119,054,468 166,378,801 170,791,701
0307020 S.P 3.2: Fair Trade and Consumer Protection
Economic Classification
Estimates Projected Estimates
2016/2017 2017/2018 2018/2019KShs. KShs. KShs.
Current Expenditure 136,264,481 149,486,034 149,541,450
Compensation to Employees 30,417,763 31,874,643 33,348,135
Use of Goods and Services 46,438,581 61,896,391 60,420,315
Current Transfers to Govt. Agencies 46,800,137 41,600,000 41,600,000
Other Recurrent 12,608,000 14,115,000 14,173,000
Capital Expenditure 45,000,000 150,000,000 100,000,000
Acquisition of Non-Financial Assets 45,000,000 150,000,000 100,000,000Total Expenditure 181,264,481 299,486,034 249,541,450
0307030 S.P 3.3: Exports Market Development
Economic Classification
Estimates Projected Estimates
2016/2017 2017/2018 2018/2019KShs. KShs. KShs.
Current Expenditure 304,860,000 354,860,000 354,860,000
Current Transfers to Govt. Agencies 304,860,000 354,860,000 354,860,000
Capital Expenditure 80,000,000 80,000,000 126,000,000
Capital Grants to Govt. Agencies 80,000,000 80,000,000 126,000,000Total Expenditure 384,860,000 434,860,000 480,860,000
0307040 S.P3.4: Regional Economic Integration Initiatives
Economic Classification
Estimates Projected Estimates
2016/2017 2017/2018 2018/2019KShs. KShs. KShs.
558

1181 State Department for Commerce and Tourism
PART H: Summary of Expenditure by Programme and Economic Classification, 2016/2017 - 2018/2019
0307040 S.P3.4: Regional Economic Integration Initiatives
Economic Classification
Estimates Projected Estimates
2016/2017 2017/2018 2018/2019
Current Expenditure 238,978,095 281,105,935 281,148,013
Compensation to Employees 858,159 872,953 888,033
Use of Goods and Services 3,119,936 5,232,982 5,259,980
Current Transfers to Govt. Agencies 235,000,000 275,000,000 275,000,000
Capital Expenditure 270,000,000 100,000,000 100,000,000
Acquisition of Non-Financial Assets 70,000,000 100,000,000 100,000,000
Capital Grants to Govt. Agencies 200,000,000 - -Total Expenditure 508,978,095 381,105,935 381,148,013
0307050 S.P 3.5: Entrepreneurial and Management Training
Economic Classification
Estimates Projected Estimates
2016/2017 2017/2018 2018/2019KShs. KShs. KShs.
Current Expenditure 68,788,419 78,120,940 79,211,847
Compensation to Employees 32,518,059 35,097,554 35,726,013
Use of Goods and Services 32,253,360 38,831,386 39,293,834
Other Recurrent 4,017,000 4,192,000 4,192,000
Capital Expenditure - 100,000,000 100,000,000
Acquisition of Non-Financial Assets - 100,000,000 100,000,000Total Expenditure 68,788,419 178,120,940 179,211,847
0307000 P 3: Trade Development and Promotion
Economic Classification
Estimates Projected Estimates
2016/2017 2017/2018 2018/2019KShs. KShs. KShs.
Current Expenditure 807,945,463 931,951,710 933,553,011
Compensation to Employees 93,952,768 100,886,663 103,660,770
Use of Goods and Services 109,776,358 139,673,994 138,442,411
Current Transfers to Govt. Agencies 586,660,137 671,460,000 671,460,000
559
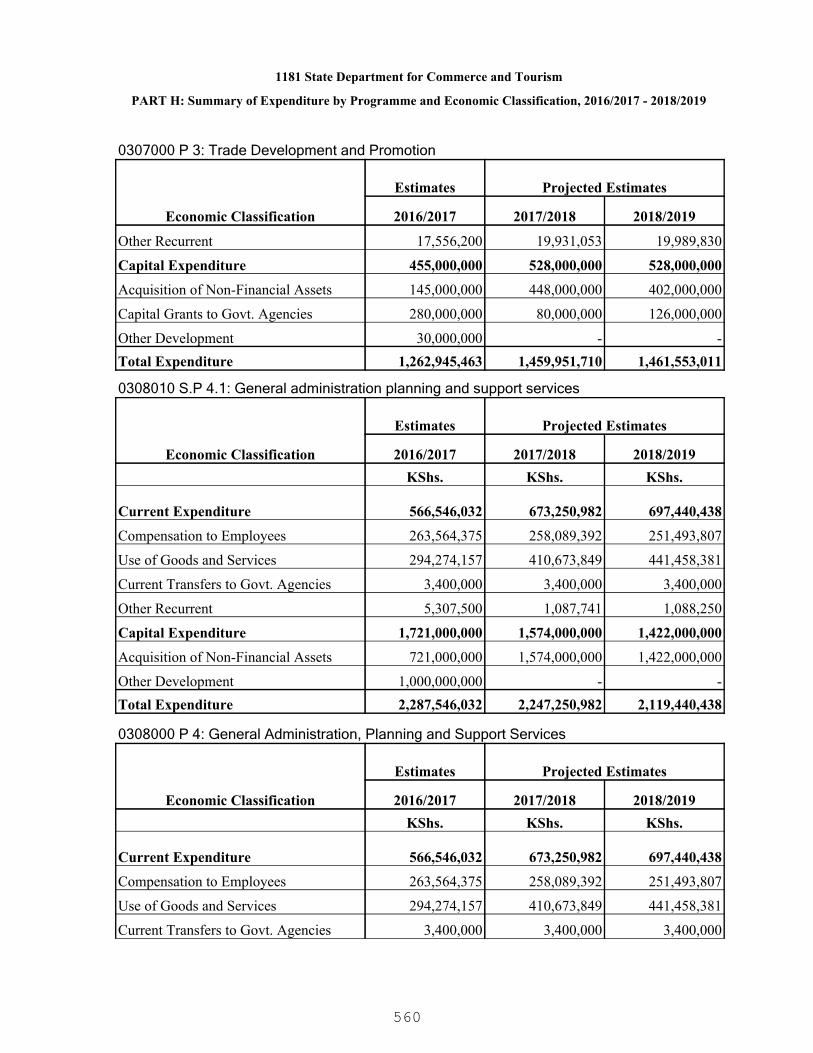
1181 State Department for Commerce and Tourism
PART H: Summary of Expenditure by Programme and Economic Classification, 2016/2017 - 2018/2019
0307000 P 3: Trade Development and Promotion
Economic Classification
Estimates Projected Estimates
2016/2017 2017/2018 2018/2019
Other Recurrent 17,556,200 19,931,053 19,989,830
Capital Expenditure 455,000,000 528,000,000 528,000,000
Acquisition of Non-Financial Assets 145,000,000 448,000,000 402,000,000
Capital Grants to Govt. Agencies 280,000,000 80,000,000 126,000,000
Other Development 30,000,000 - -Total Expenditure 1,262,945,463 1,459,951,710 1,461,553,011
0308010 S.P 4.1: General administration planning and support services
Economic Classification
Estimates Projected Estimates
2016/2017 2017/2018 2018/2019KShs. KShs. KShs.
Current Expenditure 566,546,032 673,250,982 697,440,438
Compensation to Employees 263,564,375 258,089,392 251,493,807
Use of Goods and Services 294,274,157 410,673,849 441,458,381
Current Transfers to Govt. Agencies 3,400,000 3,400,000 3,400,000
Other Recurrent 5,307,500 1,087,741 1,088,250
Capital Expenditure 1,721,000,000 1,574,000,000 1,422,000,000
Acquisition of Non-Financial Assets 721,000,000 1,574,000,000 1,422,000,000
Other Development 1,000,000,000 - -Total Expenditure 2,287,546,032 2,247,250,982 2,119,440,438
0308000 P 4: General Administration, Planning and Support Services
Economic Classification
Estimates Projected Estimates
2016/2017 2017/2018 2018/2019KShs. KShs. KShs.
Current Expenditure 566,546,032 673,250,982 697,440,438
Compensation to Employees 263,564,375 258,089,392 251,493,807
Use of Goods and Services 294,274,157 410,673,849 441,458,381
Current Transfers to Govt. Agencies 3,400,000 3,400,000 3,400,000
560
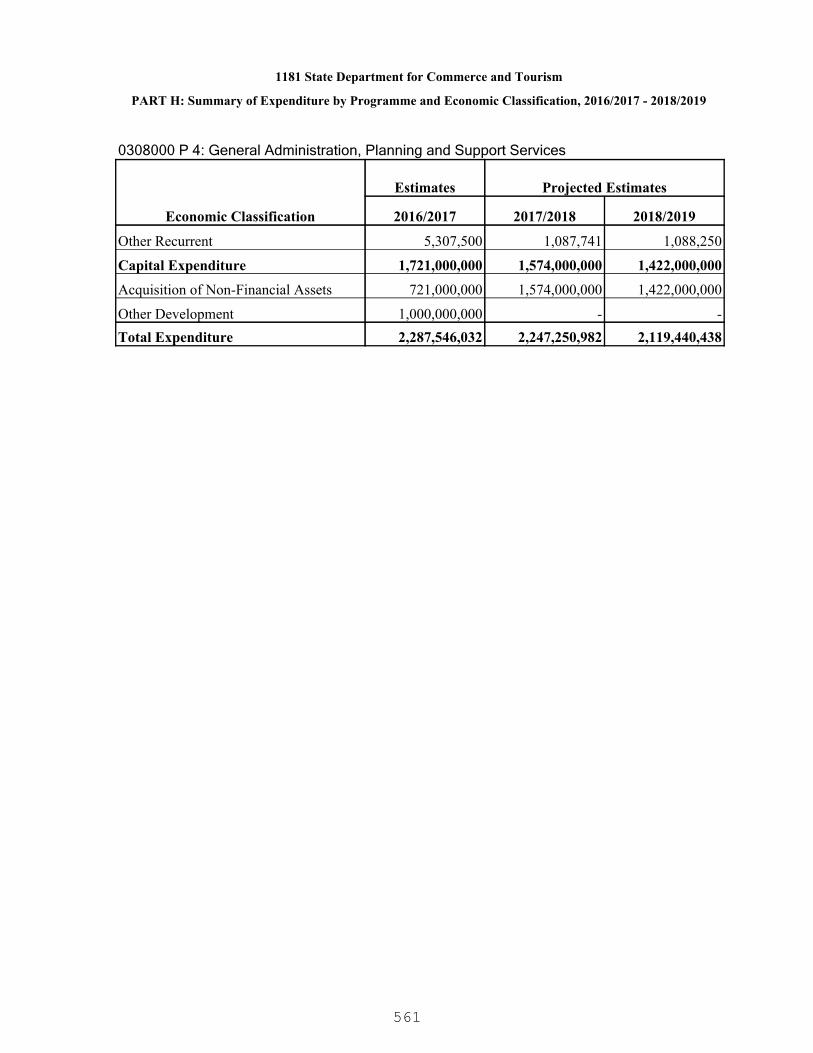
1181 State Department for Commerce and Tourism
PART H: Summary of Expenditure by Programme and Economic Classification, 2016/2017 - 2018/2019
0308000 P 4: General Administration, Planning and Support Services
Economic Classification
Estimates Projected Estimates
2016/2017 2017/2018 2018/2019
Other Recurrent 5,307,500 1,087,741 1,088,250
Capital Expenditure 1,721,000,000 1,574,000,000 1,422,000,000
Acquisition of Non-Financial Assets 721,000,000 1,574,000,000 1,422,000,000
Other Development 1,000,000,000 - -Total Expenditure 2,287,546,032 2,247,250,982 2,119,440,438
561
1182 State Department for East African Affairs
A champion of regional integration matters for sustainable development.
To promote, direct, coordinate and monitor all regional integration activities in Kenya.
PART A. Vision
PART B. Mission
PART C. Performance Overview and Background for Programme(s) Funding
PART D. Programme Objectives
The Mandate of the State Department of East African Affairs (SDEAA) includes coordinationof Government participation in East African Affairs; implementation of regional integrationinitiatives such as COMESA, EAC and COMESA-EAC-SADC Tripartite Free Trade Area;implementation of the EAC regional programmes and projects; implementation of the Treatyfor the establishment for the EAC and promotion and fast tracking of East African integration.
During the MTEF 2012/13 – 2014/15 review period, the State Department's resourceallocation increased marginally from Kshs.1.12billion in 2012/13 to Kshs.1.45 billion in the FY2013/14 and further to Kshs.1.608billion in the FY 2014/15.
Some of the key achievements during the period under review include: implementation of theEAC Customs Union Protocol; EAC Common Market Protocol; and successful negotiationtowards finalization, signing and ratification of the EAC Monetary Union Protocol. The StateDepartment also undertook sensitization programmes in 15 Counties; coordinated thenegotiation and eventual signing of trade agreements under Economic PartnershipAgreements (EPA); and hosted the EAC Heads of State Summit in Nairobi.
The challenges and constraints faced during the budget implementation under the reviewperiod include: inadequate funding for programmes; low levels of awareness on opportunityand benefits arising from regional integration despite intense sensitization; harsh investmentclimate; limited human resource capacity, emerging issues such as insecurity and climatechange are of concern to the execution of the Department operations.
The resource funding for the next MTEF 2016/17 - 2018/19 will be geared towads thefollowing areas: improving implementation of EAC Customs Union, Common Market andMonetary Union Protocols; promoting regional infrastructural and productive projects;promoting regional social and political programmes; and elimination of Non Tariff Barriers(NTBs). The resources will also be directed towards mapping of opportunities available toKenyans within the EAC region, undertaking sensitization on the benefits from regionalintegration, undertaking strategic information education communication programmes toempower Kenyans, coordinate the construction of modern boarder post markets in LungaLunga, Taita Taveta, Namanga, Isebania and Busia to enhance cross border trade,implement short message services (SMS)-based mechanism and online reporting of NTBs.
562

1182 State Department for East African Affairs
ObjectiveProgramme
0305000 P 1: East AfricanAffairs and RegionalIntegration
To Coordinate and monitor implementation of the EACCouncil decisions and regional programmes.
563

PART E. SUMMARY OF PROGRAMME OUTPUTS AND PERFORMANCE INDICATORS FOR 2016/2017 - 2018/2019
1182 State Department for East African Affairs
0305000 P 1: East African Affairs and Regional Integration
Intergrated EAC region and improved socio - economic status of all Kenyans
Programme:
Outcome:
0305010 S.P 1.1: East African Customs UnionSub Programme:
Key Output (KO)Targets
2018/2019Targets
2017/2018Key Performance Indicators
(KPIs)Targets
2016/2017Delivery Unit
90%
95%
96%
85%
92%
90%
80%
89%
87%
% index of work environmentSatisfaction
% index of customerSatisfaction
% index of employeeSatisfaction
Administrative Services1182000100 HeadquartersAdministrative Services
5%
3
30%
5%
3
30%
5%
3
30%
% compliance with harmonizedinternal tariffs
No. of non-tariff barriersreduced
% compliance with commonexternal tariffs
Harmonized tariffs1182000200 RegionalIntegrational Centres
1
1
1
0
1
0
Framework for EAC MonetaryInstitutions Established
EAC Monetary Union instituteestablished
Monetary Union1182000400Research/ReferenceDocumentation Centre
564
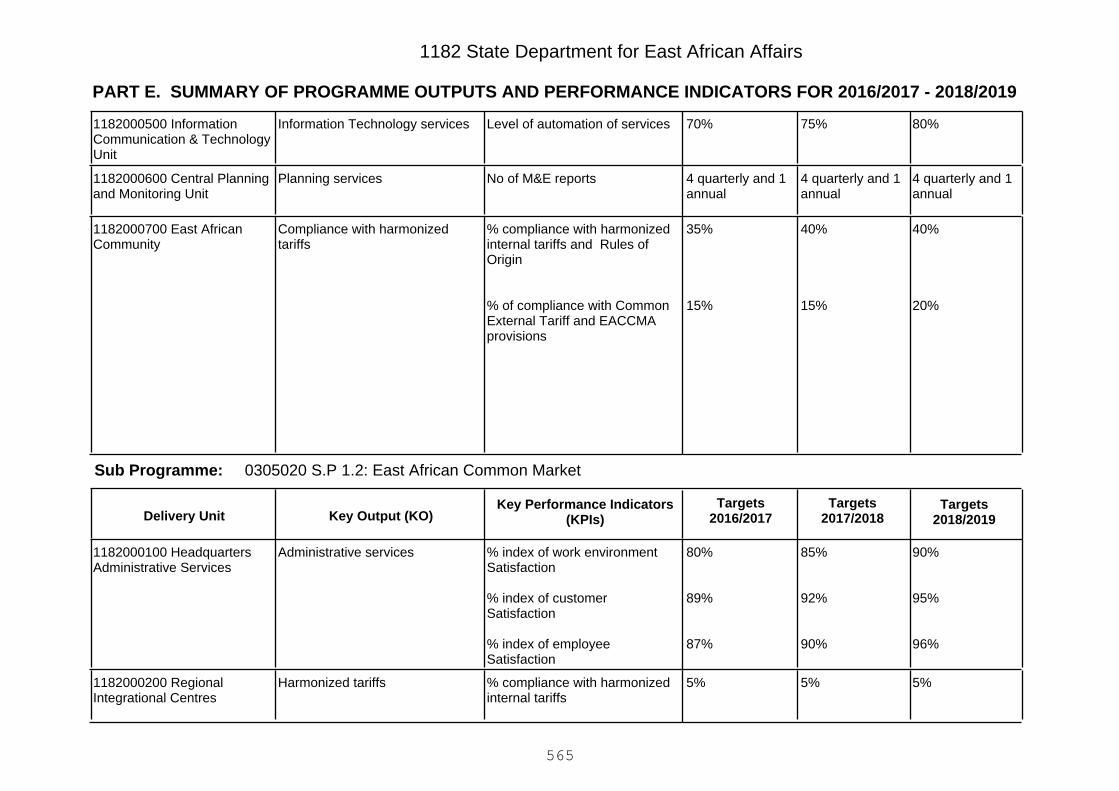
PART E. SUMMARY OF PROGRAMME OUTPUTS AND PERFORMANCE INDICATORS FOR 2016/2017 - 2018/2019
1182 State Department for East African Affairs
80%75%70%Level of automation of servicesInformation Technology services1182000500 InformationCommunication & TechnologyUnit
4 quarterly and 1annual
4 quarterly and 1annual
4 quarterly and 1annual
No of M&E reportsPlanning services1182000600 Central Planningand Monitoring Unit
40%
20%
40%
15%
35%
15%
% compliance with harmonizedinternal tariffs and Rules ofOrigin
% of compliance with CommonExternal Tariff and EACCMAprovisions
Compliance with harmonizedtariffs
1182000700 East AfricanCommunity
0305020 S.P 1.2: East African Common MarketSub Programme:
Key Output (KO)Targets
2018/2019Targets
2017/2018Key Performance Indicators
(KPIs)Targets
2016/2017Delivery Unit
90%
95%
96%
85%
92%
90%
80%
89%
87%
% index of work environmentSatisfaction
% index of customerSatisfaction
% index of employeeSatisfaction
Administrative services1182000100 HeadquartersAdministrative Services
5%5%5%% compliance with harmonizedinternal tariffs
Harmonized tariffs1182000200 RegionalIntegrational Centres
565

PART E. SUMMARY OF PROGRAMME OUTPUTS AND PERFORMANCE INDICATORS FOR 2016/2017 - 2018/2019
1182 State Department for East African Affairs
333No. of non-tariff barriersreduced
151210No. of sensitization workshopsheld with stakeholders
Informed & Empoweredstakeholders on customs unions,common market, monetary unionand political federation
1182000300 NationalPublicity and Advocacy forEAC Regional Integration
1
1
1
0
1
0
Framework for EAC MonetaryInstitutions Established
EAC Monetary Union instituteestablished
Monetary Union1182000400Research/ReferenceDocumentation Centre
80%75%70%Level of automation of servicesInformation technology services1182000500 InformationCommunication & TechnologyUnit
4 Quarterly and 1Annual
4 Quarterly and 1Annual
4 Quarterly and 1Annual
No. of M&E ReportsPlanning services1182000600 Central Planningand Monitoring Unit
35%
20%
35%
15%
35%
15%
% compliance with harmonizedinternal tariffs
% of compliance with CommonExternal Tariff
Harmonized tariffs1182000700 East AfricanCommunity
0305030 S.P 1.3: EAC Monetary UnionSub Programme:
Key Output (KO)Targets
2018/2019Targets
2017/2018Key Performance Indicators
(KPIs)Targets
2016/2017Delivery Unit
566

PART E. SUMMARY OF PROGRAMME OUTPUTS AND PERFORMANCE INDICATORS FOR 2016/2017 - 2018/2019
1182 State Department for East African Affairs
101515No. of sensitization workshopsheld with stakeholders
Informed & Empoweredstakeholders on customs unions,common market, monetary unionand political federation
1182000300 NationalPublicity and Advocacy forEAC Regional Integration
1
1
1
0
1
0
Framework for EAC MonetaryInstitutions Established
EAC Monetary Union instituteestablished
Monetary Union1182000400Research/ReferenceDocumentation Centre
1
1
1
1
1
1
No. of ratified East AfricanMonetary Union (EAMU)Protocols
No. of EAC – COMESA - SADCtripartite agreement ratified
East African Monetary Unionprotocol
EAC –COMESA-SADC tripartiteagreement
1182000700 East AfricanCommunity
101010No. of sensitization workshopsheld
Regional integration1182100100 Trade Mark EastAfrica Programme
567
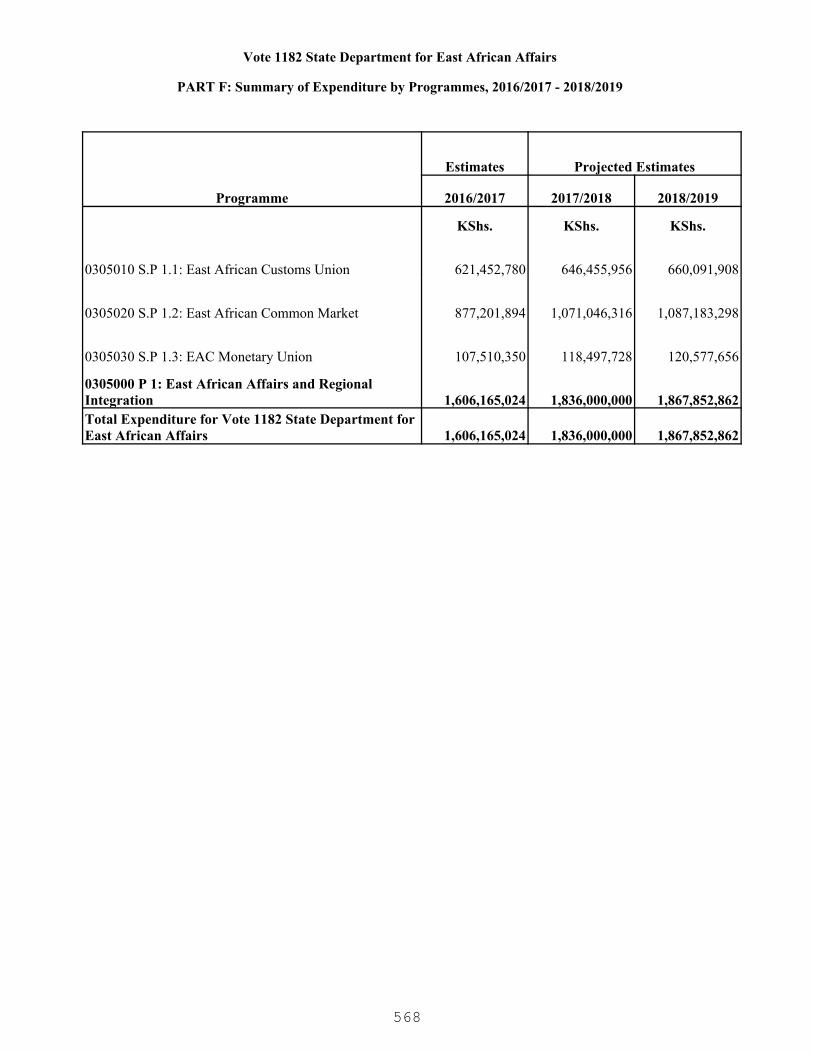
Vote 1182 State Department for East African Affairs
PART F: Summary of Expenditure by Programmes, 2016/2017 - 2018/2019
Programme
Estimates Projected Estimates
2016/2017 2017/2018 2018/2019
KShs. KShs. KShs.
0305010 S.P 1.1: East African Customs Union 621,452,780 646,455,956 660,091,908
0305020 S.P 1.2: East African Common Market 877,201,894 1,071,046,316 1,087,183,298
0305030 S.P 1.3: EAC Monetary Union 107,510,350 118,497,728 120,577,656
0305000 P 1: East African Affairs and Regional Integration 1,606,165,024 1,836,000,000 1,867,852,862Total Expenditure for Vote 1182 State Department for East African Affairs 1,606,165,024 1,836,000,000 1,867,852,862
568

1182 State Department for East African Affairs
PART G: Summary of Expenditure by Vote and Economic Classification, 2016/2017 - 2018/2019
Economic Classification
Estimates Projected Estimates
2016/2017 2017/2018 2018/2019KShs. KShs. KShs.
Current Expenditure 1,541,165,024 1,771,000,000 1,802,852,862
Compensation to Employees 186,000,000 191,000,000 199,852,862
Use of Goods and Services 346,450,229 456,698,695 477,246,644
Current Transfers to Govt. Agencies 1,002,250,000 1,107,000,000 1,107,000,000
Other Recurrent 6,464,795 16,301,305 18,753,356
Capital Expenditure 65,000,000 65,000,000 65,000,000
Acquisition of Non-Financial Assets 15,000,000 15,000,000 15,000,000
Other Development 50,000,000 50,000,000 50,000,000Total Expenditure 1,606,165,024 1,836,000,000 1,867,852,862
569

1182 State Department for East African Affairs
PART H: Summary of Expenditure by Programme and Economic Classification, 2016/2017 - 2018/2019
0305010 S.P 1.1: East African Customs Union
Economic Classification
Estimates Projected Estimates
2016/2017 2017/2018 2018/2019KShs. KShs. KShs.
Current Expenditure 621,452,780 646,455,956 660,091,908
Compensation to Employees 173,563,878 178,185,021 186,972,332
Use of Goods and Services 57,821,696 71,018,845 73,737,403
Current Transfers to Govt. Agencies 388,467,817 389,000,000 389,000,000
Other Recurrent 1,599,389 8,252,090 10,382,173Total Expenditure 621,452,780 646,455,956 660,091,908
0305020 S.P 1.2: East African Common Market
Economic Classification
Estimates Projected Estimates
2016/2017 2017/2018 2018/2019KShs. KShs. KShs.
Current Expenditure 877,201,894 1,071,046,316 1,087,183,298
Compensation to Employees 12,436,122 12,814,979 12,880,530
Use of Goods and Services 246,118,183 332,182,122 347,931,585
Current Transfers to Govt. Agencies 613,782,183 718,000,000 718,000,000
Other Recurrent 4,865,406 8,049,215 8,371,183Total Expenditure 877,201,894 1,071,046,316 1,087,183,298
0305030 S.P 1.3: EAC Monetary Union
Economic Classification
Estimates Projected Estimates
2016/2017 2017/2018 2018/2019KShs. KShs. KShs.
Current Expenditure 42,510,350 53,497,728 55,577,656
Use of Goods and Services 42,510,350 53,497,728 55,577,656
Capital Expenditure 65,000,000 65,000,000 65,000,000
Acquisition of Non-Financial Assets 15,000,000 15,000,000 15,000,000
Other Development 50,000,000 50,000,000 50,000,000Total Expenditure 107,510,350 118,497,728 120,577,656
570

1182 State Department for East African Affairs
PART H: Summary of Expenditure by Programme and Economic Classification, 2016/2017 - 2018/2019
0305000 P 1: East African Affairs and Regional Integration
Economic Classification
Estimates Projected Estimates
2016/2017 2017/2018 2018/2019KShs. KShs. KShs.
Current Expenditure 1,541,165,024 1,771,000,000 1,802,852,862
Compensation to Employees 186,000,000 191,000,000 199,852,862
Use of Goods and Services 346,450,229 456,698,695 477,246,644
Current Transfers to Govt. Agencies 1,002,250,000 1,107,000,000 1,107,000,000
Other Recurrent 6,464,795 16,301,305 18,753,356
Capital Expenditure 65,000,000 65,000,000 65,000,000
Acquisition of Non-Financial Assets 15,000,000 15,000,000 15,000,000
Other Development 50,000,000 50,000,000 50,000,000Total Expenditure 1,606,165,024 1,836,000,000 1,867,852,862
571

1191 Ministry of Mining
A world-class institution in the management of mineral resources and geo-spatial data.
To promote and maximize benefits from mineral resource exploitation and geo-spatialinformation use for sustainable development.
PART A. Vision
PART B. Mission
PART C. Performance Overview and Background for Programme(s) Funding
PART D. Programme Objectives
The objective of the Ministry of Mining is to make Kenya an economic hub for metals andminerals trade and become a key pillar in the realization of the Kenya Vision 2030.
During the period under review, actual expenditure for the ministry increased from KSh 643million in 2012/13 to KSh 1.2 billion in 2014/15 representing 87% growth. The majorachievements over the medium term included: finalization of Minerals and Mining Policy andBill 2014; draft National Remote Sensing Policy; 85% completion of civil works of newlaboratory; establishment of the Mineral Audit Unit, ground geological surveys for iron ore andcoal. The ministry also mapped land use/land cover, land degradation in various counties,and mangrove forests along the coastal region. It has further mapped dams in the Easternregion, water towers in Cherangany, Ewaso Ngiro and Mt Elgon. Rangeland assessment andmonitoring of livestock and wildlife population in the Rift Valley were also conducted as wellas installation of web based GIS infrastructure and update of Geo-spatial databases.
The ministry experienced a number of challenges during the implementation of the mediumterm budget including cash rationing, staff shortages, inadequate office space andspecialized equipment. To address these challenges, development partners and PublicPrivate Partnership (PPP) initiatives were pursued. On staff shortage, the ministry is planningto recruit more staff after getting the necessary approvals. With regard to equipment, theministry undertook repairs and maintenance of the existing specialized equipment, aircraft,cameras and motor vehicles.
During the next MTEF period 2016/17-2018/19, the Ministry will undertake the followingprojects and programmes: Geological Data Bank, Mineral Certification Laboratory, GeologicalMapping and Mineral Exploration, acquisition of Airborne Survey Equipment; OnlineTransactional Mining Cadaster portal; Mineral Audit Support; Resource AssessmentMappinnd Monitoring; African Mineral Development Center; strengthening of Geo-informationinfrastructure for land based resource mapping; overhaul of aircraft; gemstone value additioncenter; review of policies, laws and regulations in the mining sector. The services and outputsto be derived from these projects and programmes include: improved revenue to governmentfrom minerals; improved regulatory environment; improved social and economic welfare inareas where exploration and mining activities are taking place; geological data andinformation generation; Geo-information services of updated data-sets from various sources;remote sensing applications and services; spatial maps of land use/land cover; rangelandresources; and statistics on livestock, wildlife and environmental concerns.
572
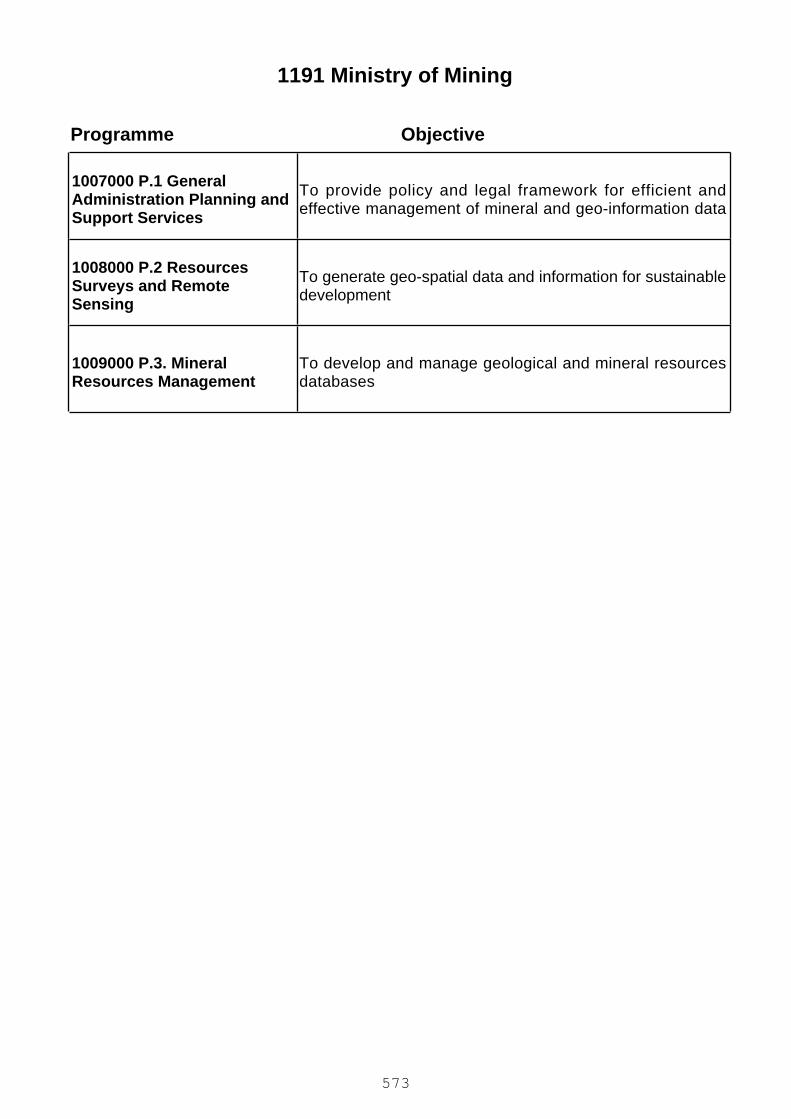
1191 Ministry of Mining
ObjectiveProgramme
1007000 P.1 GeneralAdministration Planning andSupport Services
To provide policy and legal framework for efficient andeffective management of mineral and geo-information data
1008000 P.2 ResourcesSurveys and RemoteSensing
To generate geo-spatial data and information for sustainabledevelopment
1009000 P.3. MineralResources Management
To develop and manage geological and mineral resourcesdatabases
573

PART E. SUMMARY OF PROGRAMME OUTPUTS AND PERFORMANCE INDICATORS FOR 2016/2017 - 2018/2019
1191 Ministry of Mining
1007000 P.1 General Administration Planning and Support Services
A functional legal and regulatory framework for effective coordination and management of mining sector
Programme:
Outcome:
1007010 SP. 1.1 Mining Policy Development and CoordinationSub Programme:
Key Output (KO)Targets
2018/2019Targets
2017/2018Key Performance Indicators
(KPIs)Targets
2016/2017Delivery Unit
Review thePolicies and Bills
Within three 3days
2
Within 3 days
1
Within 3 days
Number of draft policies
Timely processing ofcommitments
Administrative services1191000500 Directorate ofCorporate Affairs(GeneralAdministration and Planning)
1008000 P.2 Resources Surveys and Remote Sensing
Sustainably managed environment and natural resources
Programme:
Outcome:
1008010 SP. 2.1 Resources Surveys and Remote SensingSub Programme:
Key Output (KO)Targets
2018/2019Targets
2017/2018Key Performance Indicators
(KPIs)Targets
2016/2017Delivery Unit
1
4
1
4
1
4
Number of forest blocksmapped.
No. of counties mapped &assessed
Data on forests cover
Data on land degradation
1191000400 Directorate ofResource Survey and RemoteSensing
15%10%5%Percentage mapping of mining,forestry, agriculture and urbanareas
Lidar data and images1191100900 Acquisition ofSurvey Equipment - LidarScanner
574
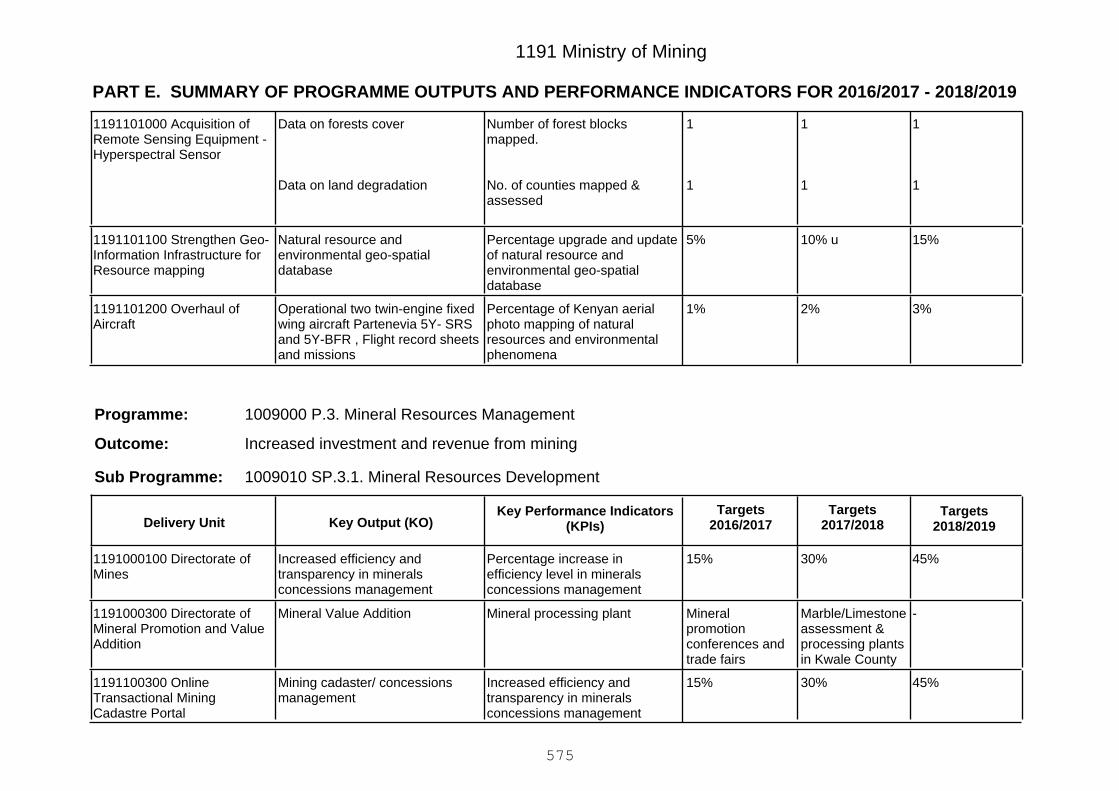
PART E. SUMMARY OF PROGRAMME OUTPUTS AND PERFORMANCE INDICATORS FOR 2016/2017 - 2018/2019
1191 Ministry of Mining
1
1
1
1
1
1
Number of forest blocksmapped.
No. of counties mapped &assessed
Data on forests cover
Data on land degradation
1191101000 Acquisition ofRemote Sensing Equipment -Hyperspectral Sensor
15%10% u5%Percentage upgrade and updateof natural resource andenvironmental geo-spatialdatabase
Natural resource andenvironmental geo-spatialdatabase
1191101100 Strengthen Geo-Information Infrastructure forResource mapping
3%2%1%Percentage of Kenyan aerialphoto mapping of naturalresources and environmentalphenomena
Operational two twin-engine fixedwing aircraft Partenevia 5Y- SRSand 5Y-BFR , Flight record sheetsand missions
1191101200 Overhaul ofAircraft
1009000 P.3. Mineral Resources Management
Increased investment and revenue from mining
Programme:
Outcome:
1009010 SP.3.1. Mineral Resources DevelopmentSub Programme:
Key Output (KO)Targets
2018/2019Targets
2017/2018Key Performance Indicators
(KPIs)Targets
2016/2017Delivery Unit
45%30%15%Percentage increase inefficiency level in mineralsconcessions management
Increased efficiency andtransparency in mineralsconcessions management
1191000100 Directorate ofMines
-Marble/Limestoneassessment &processing plantsin Kwale County
Mineralpromotionconferences andtrade fairs
Mineral processing plantMineral Value Addition1191000300 Directorate ofMineral Promotion and ValueAddition
45%30%15%Increased efficiency andtransparency in mineralsconcessions management
Mining cadaster/ concessionsmanagement
1191100300 OnlineTransactional MiningCadastre Portal
575

PART E. SUMMARY OF PROGRAMME OUTPUTS AND PERFORMANCE INDICATORS FOR 2016/2017 - 2018/2019
1191 Ministry of Mining
30%20%10%Percentage increase in revenuecollected
Increased revenues1191100400 Mineral AuditSupport
Procurelaboratoryequipment
Procurelaboratoryequipment
Graniteassessment &Processing Plant
Equipped processing plantGemology center1191100700 Gemstone ValueAddition Centre- Taita Taveta
Equipment ofAMDC
Equipment ofAMDC
Equipment ofAMDC
African mineral developmentcenter (AMDC) established
Nairobi Mining hub1191100800 African MineralDevelopment Centre
1009020 SP.3.2 Geological survey and mineral explorationSub Programme:
Key Output (KO)Targets
2018/2019Targets
2017/2018Key Performance Indicators
(KPIs)Targets
2016/2017Delivery Unit
3
3
3
4
3
4
No. of Geological mineral &exploration reports and maps
No. of Geo-hazard reports andmaps
Information on mineraloccurrences and deposits
Information on geo-hazard proneareas in the Country
1191000600 Directorate ofGeological Survey
Equipment ofgeo-data bank
Equipment ofgeo-data bank
Equipment ofgeo-data bank
Equipped geo- data bankequipped
Geo-data bank1191100100 ExtractiveIndustries For SustainableDevelopment In Kenya
Equipment ofgeo-data bank
Equipment ofgeo-data bank
Equipment ofgeo-data bank
Equipped geo- data bankequipped
Geo-data bank1191100200 Geological DataBank Project
Equipment of labEquipment of labEquipment of labLab equippedEstablished mineral certificationlab
1191100500 MineralCertification Laboratory
576
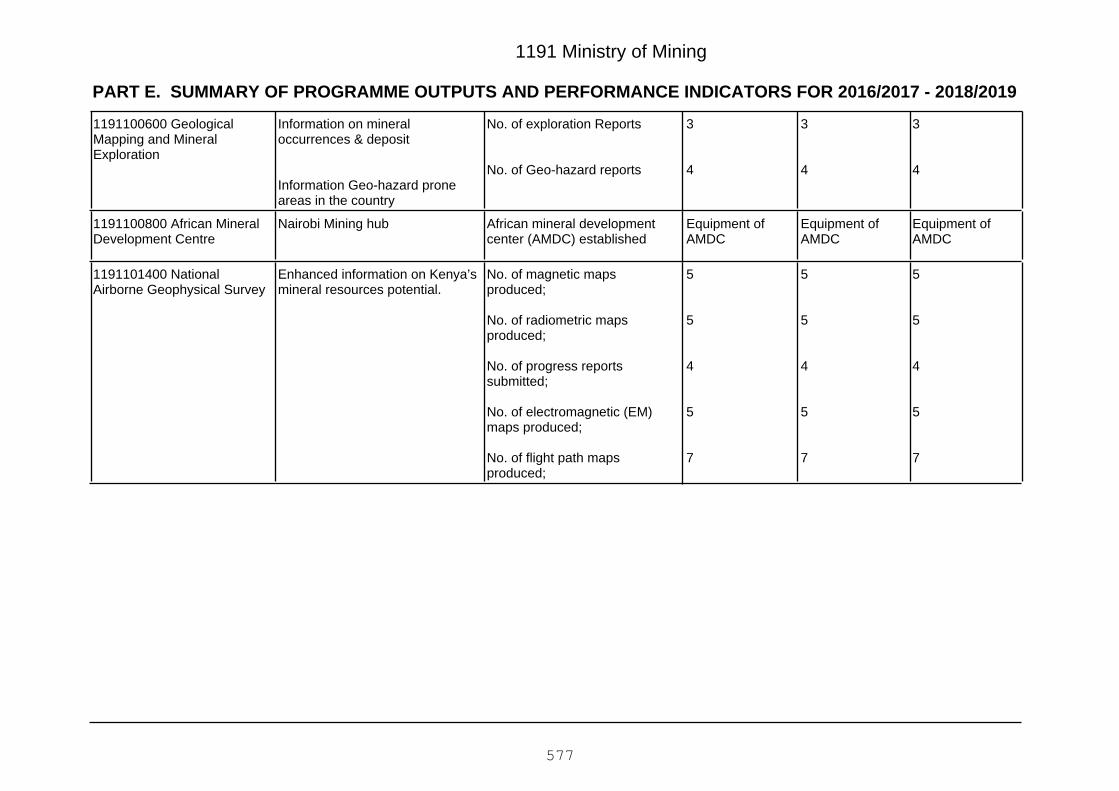
PART E. SUMMARY OF PROGRAMME OUTPUTS AND PERFORMANCE INDICATORS FOR 2016/2017 - 2018/2019
1191 Ministry of Mining
3
4
3
4
3
4
No. of exploration Reports
No. of Geo-hazard reports
Information on mineraloccurrences & deposit
Information Geo-hazard proneareas in the country
1191100600 GeologicalMapping and MineralExploration
Equipment ofAMDC
Equipment ofAMDC
Equipment ofAMDC
African mineral developmentcenter (AMDC) established
Nairobi Mining hub1191100800 African MineralDevelopment Centre
5
5
4
5
7
5
5
4
5
7
5
5
4
5
7
No. of magnetic mapsproduced;
No. of radiometric mapsproduced;
No. of progress reportssubmitted;
No. of electromagnetic (EM)maps produced;
No. of flight path mapsproduced;
Enhanced information on Kenya’smineral resources potential.
1191101400 NationalAirborne Geophysical Survey
577
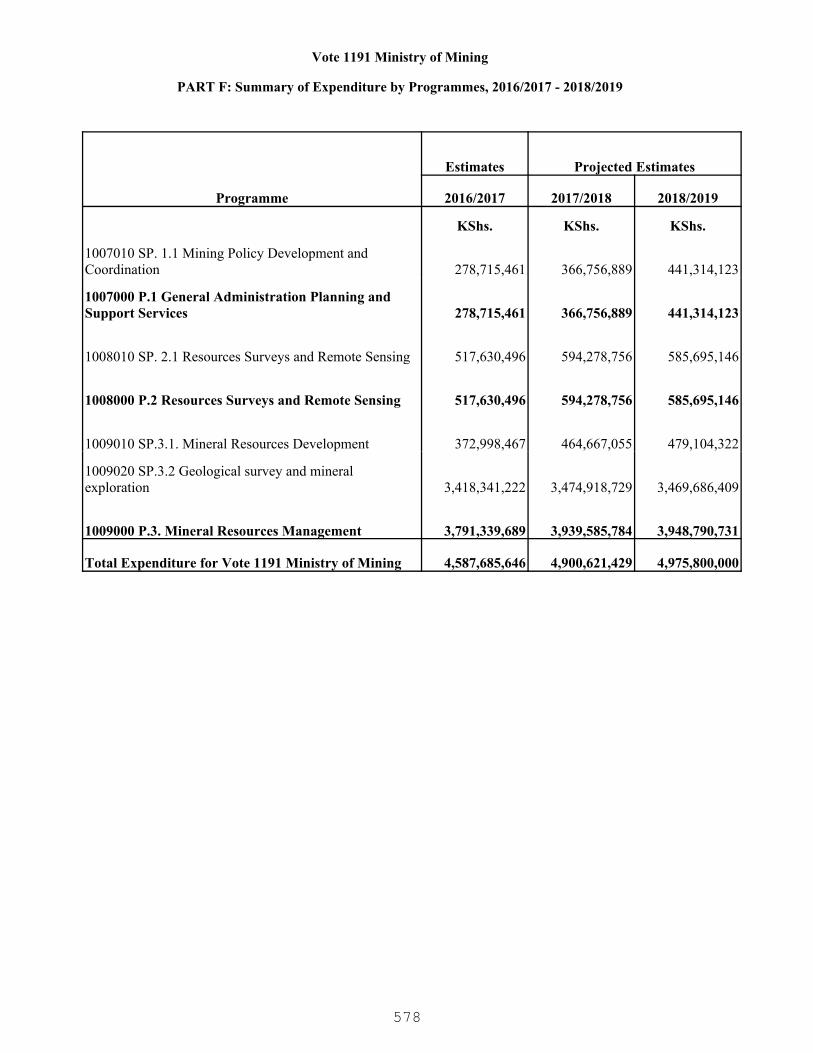
Vote 1191 Ministry of Mining
PART F: Summary of Expenditure by Programmes, 2016/2017 - 2018/2019
Programme
Estimates Projected Estimates
2016/2017 2017/2018 2018/2019
KShs. KShs. KShs.
1007010 SP. 1.1 Mining Policy Development and Coordination 278,715,461 366,756,889 441,314,123
1007000 P.1 General Administration Planning and Support Services 278,715,461 366,756,889 441,314,123
1008010 SP. 2.1 Resources Surveys and Remote Sensing 517,630,496 594,278,756 585,695,146
1008000 P.2 Resources Surveys and Remote Sensing 517,630,496 594,278,756 585,695,146
1009010 SP.3.1. Mineral Resources Development 372,998,467 464,667,055 479,104,322
1009020 SP.3.2 Geological survey and mineral exploration 3,418,341,222 3,474,918,729 3,469,686,409
1009000 P.3. Mineral Resources Management 3,791,339,689 3,939,585,784 3,948,790,731
Total Expenditure for Vote 1191 Ministry of Mining 4,587,685,646 4,900,621,429 4,975,800,000
578
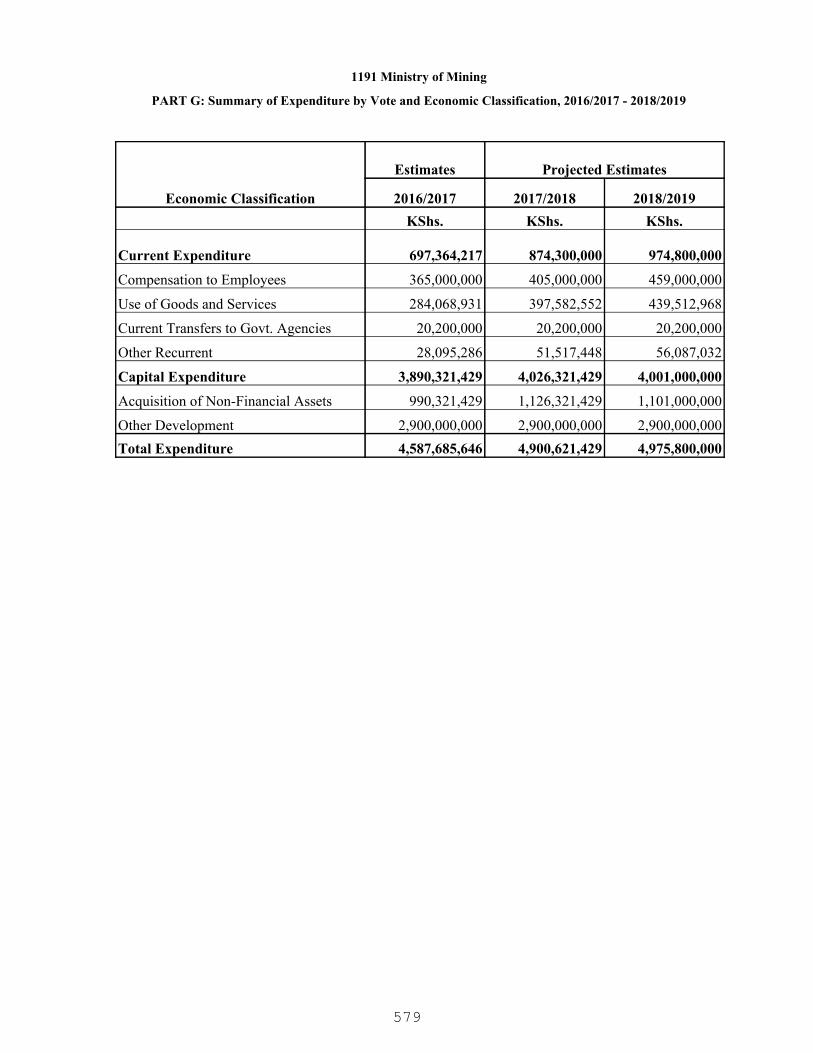
1191 Ministry of Mining
PART G: Summary of Expenditure by Vote and Economic Classification, 2016/2017 - 2018/2019
Economic Classification
Estimates Projected Estimates
2016/2017 2017/2018 2018/2019KShs. KShs. KShs.
Current Expenditure 697,364,217 874,300,000 974,800,000
Compensation to Employees 365,000,000 405,000,000 459,000,000
Use of Goods and Services 284,068,931 397,582,552 439,512,968
Current Transfers to Govt. Agencies 20,200,000 20,200,000 20,200,000
Other Recurrent 28,095,286 51,517,448 56,087,032
Capital Expenditure 3,890,321,429 4,026,321,429 4,001,000,000
Acquisition of Non-Financial Assets 990,321,429 1,126,321,429 1,101,000,000
Other Development 2,900,000,000 2,900,000,000 2,900,000,000Total Expenditure 4,587,685,646 4,900,621,429 4,975,800,000
579
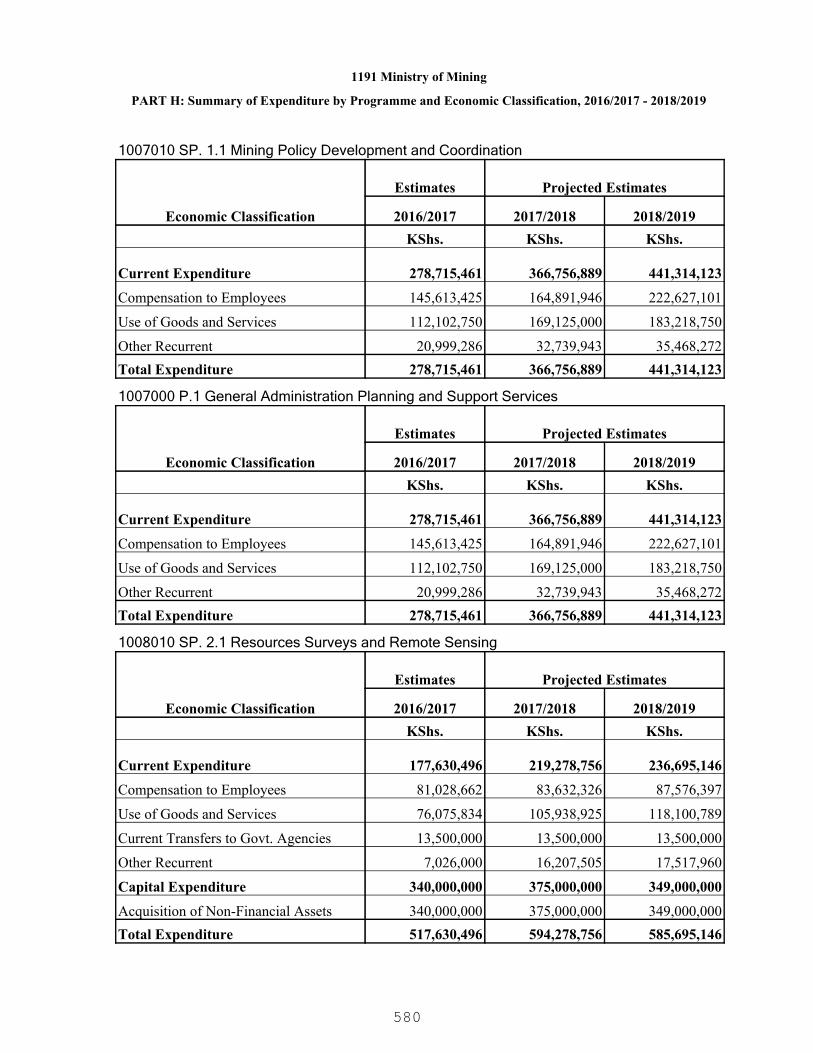
1191 Ministry of Mining
PART H: Summary of Expenditure by Programme and Economic Classification, 2016/2017 - 2018/2019
1007010 SP. 1.1 Mining Policy Development and Coordination
Economic Classification
Estimates Projected Estimates
2016/2017 2017/2018 2018/2019KShs. KShs. KShs.
Current Expenditure 278,715,461 366,756,889 441,314,123
Compensation to Employees 145,613,425 164,891,946 222,627,101
Use of Goods and Services 112,102,750 169,125,000 183,218,750
Other Recurrent 20,999,286 32,739,943 35,468,272Total Expenditure 278,715,461 366,756,889 441,314,123
1007000 P.1 General Administration Planning and Support Services
Economic Classification
Estimates Projected Estimates
2016/2017 2017/2018 2018/2019KShs. KShs. KShs.
Current Expenditure 278,715,461 366,756,889 441,314,123
Compensation to Employees 145,613,425 164,891,946 222,627,101
Use of Goods and Services 112,102,750 169,125,000 183,218,750
Other Recurrent 20,999,286 32,739,943 35,468,272Total Expenditure 278,715,461 366,756,889 441,314,123
1008010 SP. 2.1 Resources Surveys and Remote Sensing
Economic Classification
Estimates Projected Estimates
2016/2017 2017/2018 2018/2019KShs. KShs. KShs.
Current Expenditure 177,630,496 219,278,756 236,695,146
Compensation to Employees 81,028,662 83,632,326 87,576,397
Use of Goods and Services 76,075,834 105,938,925 118,100,789
Current Transfers to Govt. Agencies 13,500,000 13,500,000 13,500,000
Other Recurrent 7,026,000 16,207,505 17,517,960
Capital Expenditure 340,000,000 375,000,000 349,000,000
Acquisition of Non-Financial Assets 340,000,000 375,000,000 349,000,000Total Expenditure 517,630,496 594,278,756 585,695,146
580

1191 Ministry of Mining
PART H: Summary of Expenditure by Programme and Economic Classification, 2016/2017 - 2018/2019
1008000 P.2 Resources Surveys and Remote Sensing
Economic Classification
Estimates Projected Estimates
2016/2017 2017/2018 2018/2019KShs. KShs. KShs.
Current Expenditure 177,630,496 219,278,756 236,695,146
Compensation to Employees 81,028,662 83,632,326 87,576,397
Use of Goods and Services 76,075,834 105,938,925 118,100,789
Current Transfers to Govt. Agencies 13,500,000 13,500,000 13,500,000
Other Recurrent 7,026,000 16,207,505 17,517,960
Capital Expenditure 340,000,000 375,000,000 349,000,000
Acquisition of Non-Financial Assets 340,000,000 375,000,000 349,000,000Total Expenditure 517,630,496 594,278,756 585,695,146
1009010 SP.3.1. Mineral Resources Development
Economic Classification
Estimates Projected Estimates
2016/2017 2017/2018 2018/2019KShs. KShs. KShs.
Current Expenditure 187,998,467 228,667,055 232,104,322
Compensation to Employees 134,557,913 152,295,728 144,426,502
Use of Goods and Services 53,370,554 73,801,327 84,577,020
Other Recurrent 70,000 2,570,000 3,100,800
Capital Expenditure 185,000,000 236,000,000 247,000,000
Acquisition of Non-Financial Assets 185,000,000 236,000,000 247,000,000Total Expenditure 372,998,467 464,667,055 479,104,322
1009020 SP.3.2 Geological survey and mineral exploration
Economic Classification
Estimates Projected Estimates
2016/2017 2017/2018 2018/2019KShs. KShs. KShs.
Current Expenditure 53,019,793 59,597,300 64,686,409
Compensation to Employees 3,800,000 4,180,000 4,370,000
Use of Goods and Services 42,519,793 48,717,300 53,616,409
581

1191 Ministry of Mining
PART H: Summary of Expenditure by Programme and Economic Classification, 2016/2017 - 2018/2019
1009020 SP.3.2 Geological survey and mineral exploration
Economic Classification
Estimates Projected Estimates
2016/2017 2017/2018 2018/2019
Current Transfers to Govt. Agencies 6,700,000 6,700,000 6,700,000
Capital Expenditure 3,365,321,429 3,415,321,429 3,405,000,000
Acquisition of Non-Financial Assets 465,321,429 515,321,429 505,000,000
Other Development 2,900,000,000 2,900,000,000 2,900,000,000Total Expenditure 3,418,341,222 3,474,918,729 3,469,686,409
1009000 P.3. Mineral Resources Management
Economic Classification
Estimates Projected Estimates
2016/2017 2017/2018 2018/2019KShs. KShs. KShs.
Current Expenditure 241,018,260 288,264,355 296,790,731
Compensation to Employees 138,357,913 156,475,728 148,796,502
Use of Goods and Services 95,890,347 122,518,627 138,193,429
Current Transfers to Govt. Agencies 6,700,000 6,700,000 6,700,000
Other Recurrent 70,000 2,570,000 3,100,800
Capital Expenditure 3,550,321,429 3,651,321,429 3,652,000,000
Acquisition of Non-Financial Assets 650,321,429 751,321,429 752,000,000
Other Development 2,900,000,000 2,900,000,000 2,900,000,000Total Expenditure 3,791,339,689 3,939,585,784 3,948,790,731
582

1251 Office of The Attorney General and Department of Justice
An institution of excellence in provision of public legal services and promotion of a just,democratic and corruption-free nation.
To facilitate realization of good governance and respect for the rule of law through provisionof public legal services, protection and promotion of human rights and upholding of ethics andintegrity.
PART A. Vision
PART B. Mission
PART C. Performance Overview and Background for Programme(s) Funding
The Office of the Attorney General and Department of Justice (OAG & DOJ) is mandated toenhance access to justice,provide legal advice to the government and defend public interest.
During the period under review the OAG & DOJ achieved the following: reduction of backlogof cases filed and petitioned; Bills for the harmonization of existing laws with the Constitutionwere finalized; improved court attendance; participated in the negotiation and ratification ofvarious international instruments; conducted research and published peer review articles inreputable journals on topical legal issues and participated in regional and internationalmeetings pertaining to matters related to international law; all complaints were subjected toAlternative Dispute Resolution (ADR); decentralization of litigation, registration and PublicTrustee services; automation of Public Trustee, Companies Registry and AdvocatesComplaints Commission services; Litigants were trained on self-representation in family,children and robbery with violence cases; the office also developed the Kenya Integrity Plan(KIP); facilitated the development of the following Acts: Crops, Agriculture Fisheries and FoodAuthority, Mining, Ratification of Treaties, Kenya School of Government, Public ServiceCommission, and Teachers Service Commission. In addition the Kenya Law ReformCommission (KLRC) developed legislation, regulations and administrative procedures toimplement the Constitution under the 5th and non-5th Schedule Laws, provided technicalassistance to County Governments on the Development and Reform of County Legislationimplemented the report on the Audit, Prioritization and harmonization of legislation with theConstitution of Kenya.
The challenges faced during the period under review include: Inability to attract and retainqualified staff due to lack of harmonized terms of services within the law and justice sector,which results in high staff turn over and mass migration to other government agencies; lack oftrained paralegals which results in poor handling and management of office records which inturn adversely impacts on handling of court cases by counsel; lack of proper co-ordinationbetween the OAG & DOJ and the Ministries, Departments and Government Agencies (MDAs)on matters of civil litigation; and inadequate transport to and from Courts.
To address these challenges, in the 2016/17 - 2018/19 MTEF period the OAG & DOJ willcontinue to decentralize its services to enable the public access legal services; undertakemassive public awareness campaigns through its Public Trustee and Advocates ComplaintsCommission Departments; modernize and automate the Companies Registry and CivilLitigation Departments to ease file retrieval and reduce backlog of civil cases; introducealternative dispute resolution mechanisms to deal with complaints against the Advocates;
583
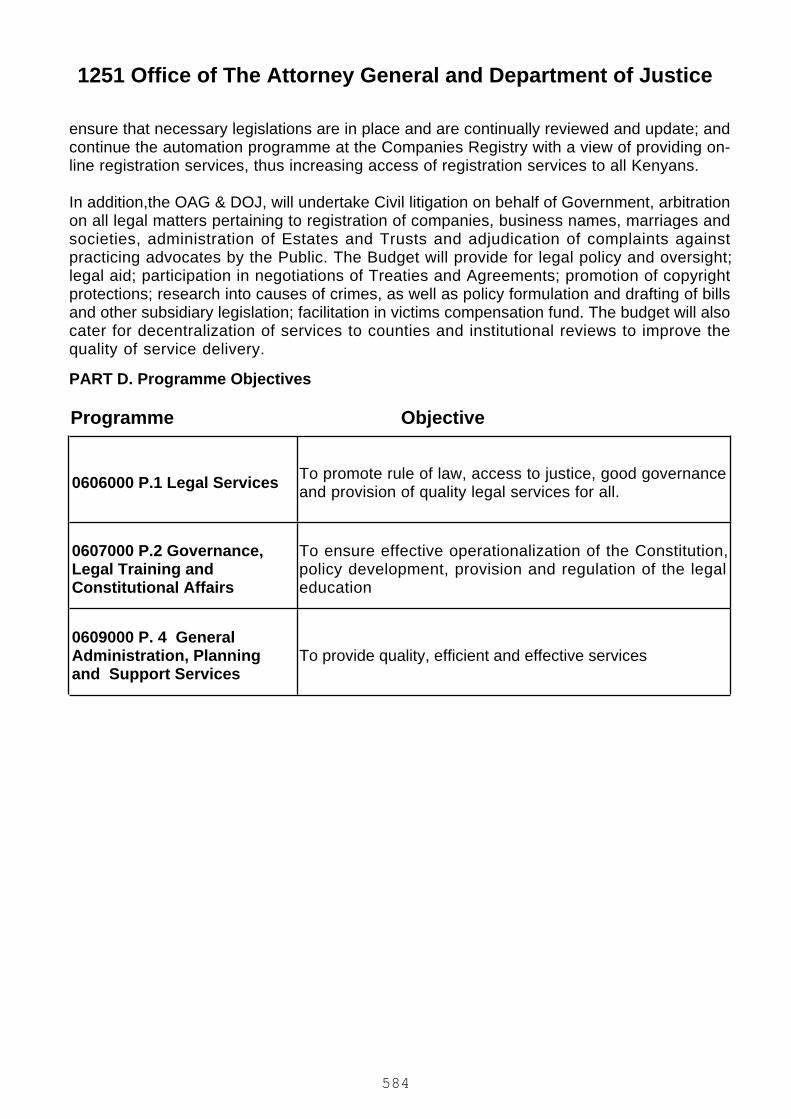
1251 Office of The Attorney General and Department of Justice
PART D. Programme Objectives
ensure that necessary legislations are in place and are continually reviewed and update; andcontinue the automation programme at the Companies Registry with a view of providing on-line registration services, thus increasing access of registration services to all Kenyans.
In addition,the OAG & DOJ, will undertake Civil litigation on behalf of Government, arbitrationon all legal matters pertaining to registration of companies, business names, marriages andsocieties, administration of Estates and Trusts and adjudication of complaints againstpracticing advocates by the Public. The Budget will provide for legal policy and oversight;legal aid; participation in negotiations of Treaties and Agreements; promotion of copyrightprotections; research into causes of crimes, as well as policy formulation and drafting of billsand other subsidiary legislation; facilitation in victims compensation fund. The budget will alsocater for decentralization of services to counties and institutional reviews to improve thequality of service delivery.
ObjectiveProgramme
0606000 P.1 Legal Services To promote rule of law, access to justice, good governanceand provision of quality legal services for all.
0607000 P.2 Governance,Legal Training andConstitutional Affairs
To ensure effective operationalization of the Constitution,policy development, provision and regulation of the legaleducation
0609000 P. 4 GeneralAdministration, Planningand Support Services
To provide quality, efficient and effective services
584
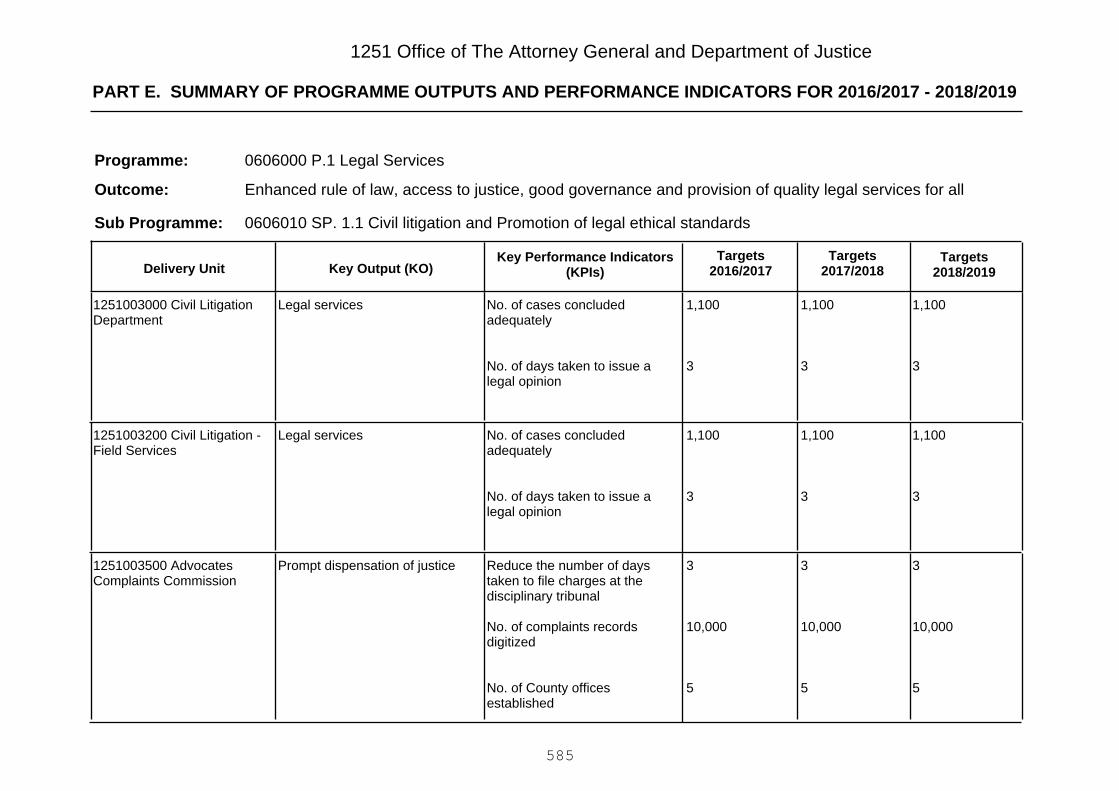
PART E. SUMMARY OF PROGRAMME OUTPUTS AND PERFORMANCE INDICATORS FOR 2016/2017 - 2018/2019
1251 Office of The Attorney General and Department of Justice
0606000 P.1 Legal Services
Enhanced rule of law, access to justice, good governance and provision of quality legal services for all
Programme:
Outcome:
0606010 SP. 1.1 Civil litigation and Promotion of legal ethical standardsSub Programme:
Key Output (KO)Targets
2018/2019Targets
2017/2018Key Performance Indicators
(KPIs)Targets
2016/2017Delivery Unit
1,100
3
1,100
3
1,100
3
No. of cases concludedadequately
No. of days taken to issue alegal opinion
Legal services1251003000 Civil LitigationDepartment
1,100
3
1,100
3
1,100
3
No. of cases concludedadequately
No. of days taken to issue alegal opinion
Legal services1251003200 Civil Litigation -Field Services
3
10,000
5
3
10,000
5
3
10,000
5
Reduce the number of daystaken to file charges at thedisciplinary tribunal
No. of complaints recordsdigitized
No. of County officesestablished
Prompt dispensation of justice1251003500 AdvocatesComplaints Commission
585

PART E. SUMMARY OF PROGRAMME OUTPUTS AND PERFORMANCE INDICATORS FOR 2016/2017 - 2018/2019
1251 Office of The Attorney General and Department of Justice
101010No. of counties programsconducted
-55%45%% completion of the casemanagement system
Improve case management1251101500 Automation ofcivil litigation BusinessProcesses
0606020 SP. 1.2 Legislations, Treaties and Advisory ServicesSub Programme:
Key Output (KO)Targets
2018/2019Targets
2017/2018Key Performance Indicators
(KPIs)Targets
2016/2017Delivery Unit
7
5
3
7
7
7
5
3
7
7
7
5
3
7
7
No. of days taken to providelegal advice to the Government
No. of days taken to providelegal advice to CountyGovernments
No. of days taken to providelegal advice on GovernmentTransactions
No. of days taken to furnishreports
No. of days taken to furnishreports
Legal advice to the Governmenton its obligations on InternationalLaw
Legal advisory services to CountyGovernment
Legal advisory services onGovernment Transactions toMDAs
Commercial and financialagreements
Legal services to the Governmentduring negotiations and ratificationprocess of regional andinternational legal instruments
1251003100 Treaties andAgreement Department
586
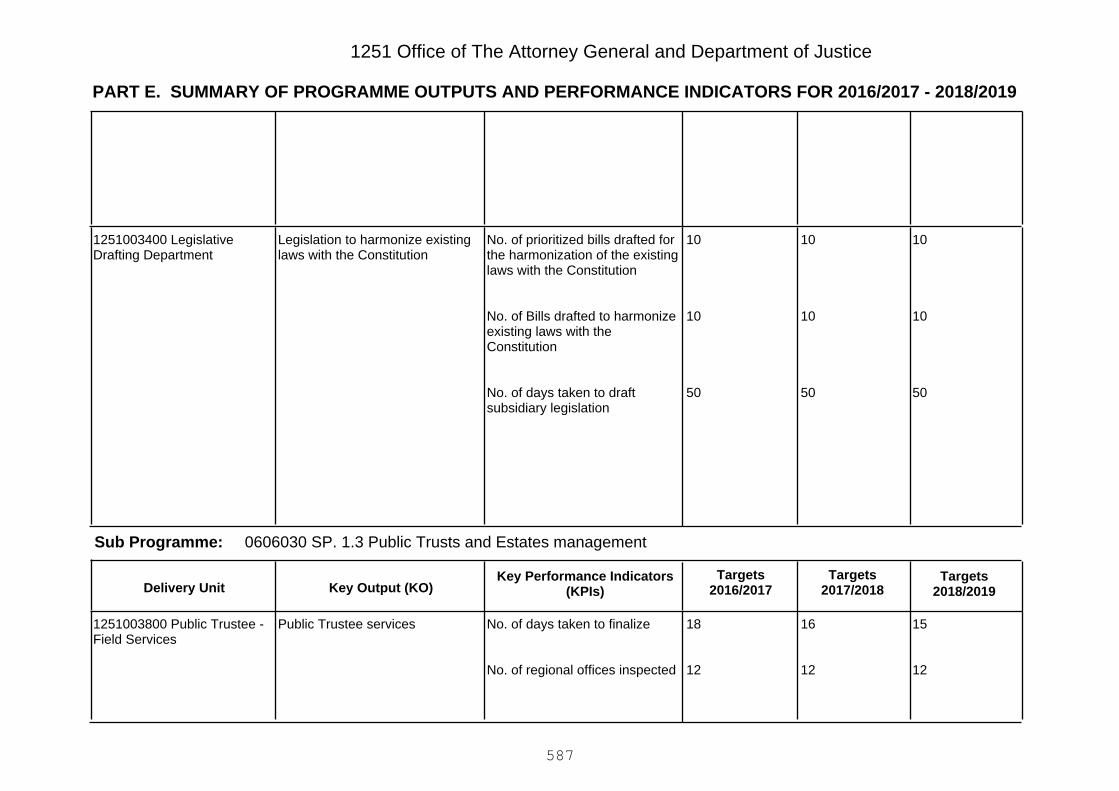
PART E. SUMMARY OF PROGRAMME OUTPUTS AND PERFORMANCE INDICATORS FOR 2016/2017 - 2018/2019
1251 Office of The Attorney General and Department of Justice
10
10
50
10
10
50
10
10
50
No. of prioritized bills drafted forthe harmonization of the existinglaws with the Constitution
No. of Bills drafted to harmonizeexisting laws with theConstitution
No. of days taken to draftsubsidiary legislation
Legislation to harmonize existinglaws with the Constitution
1251003400 LegislativeDrafting Department
0606030 SP. 1.3 Public Trusts and Estates managementSub Programme:
Key Output (KO)Targets
2018/2019Targets
2017/2018Key Performance Indicators
(KPIs)Targets
2016/2017Delivery Unit
15
12
16
12
18
12
No. of days taken to finalize
No. of regional offices inspected
Public Trustee services1251003800 Public Trustee -Field Services
587
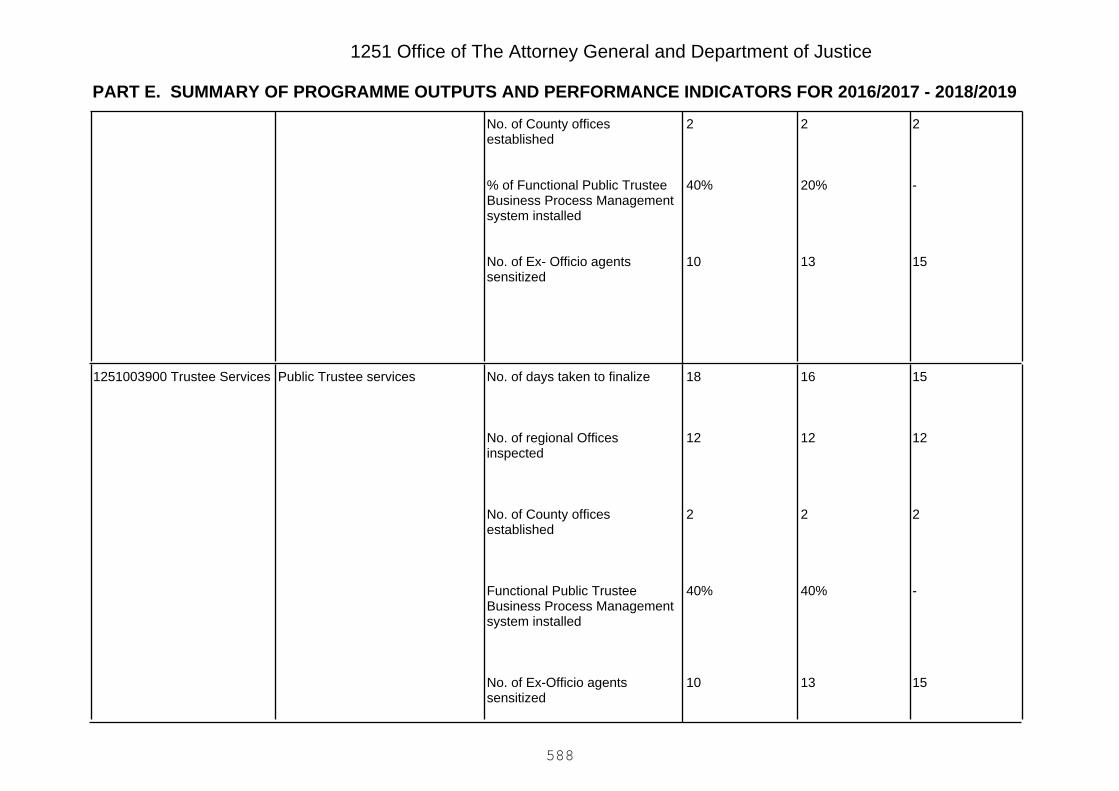
PART E. SUMMARY OF PROGRAMME OUTPUTS AND PERFORMANCE INDICATORS FOR 2016/2017 - 2018/2019
1251 Office of The Attorney General and Department of Justice
2
-
15
2
20%
13
2
40%
10
No. of County officesestablished
% of Functional Public TrusteeBusiness Process Managementsystem installed
No. of Ex- Officio agentssensitized
15
12
2
-
15
16
12
2
40%
13
18
12
2
40%
10
No. of days taken to finalize
No. of regional Officesinspected
No. of County officesestablished
Functional Public TrusteeBusiness Process Managementsystem installed
No. of Ex-Officio agentssensitized
Public Trustee services1251003900 Trustee Services
588

PART E. SUMMARY OF PROGRAMME OUTPUTS AND PERFORMANCE INDICATORS FOR 2016/2017 - 2018/2019
1251 Office of The Attorney General and Department of Justice
0606040 SP. 1.4 Registration ServicesSub Programme:
Key Output (KO)Targets
2018/2019Targets
2017/2018Key Performance Indicators
(KPIs)Targets
2016/2017Delivery Unit
-
1
1
1
40%
1
1
1
35%
1
1
1
% of digitized records
No. of days taken to undertakeregistration of companies
No. of days taken to registerchattel mortgages
No. of days taken to undertakeregistration of welfare services
Registration services1251003600 Registrar-General - Field Services
-
1
1
30%
1
1
45%
1
1
% of digitized records
No. of days taken to undertakeregistration of companies
No. of days taken to registerchattel mortgages
Registration services1251003700 RegistrationServices
589
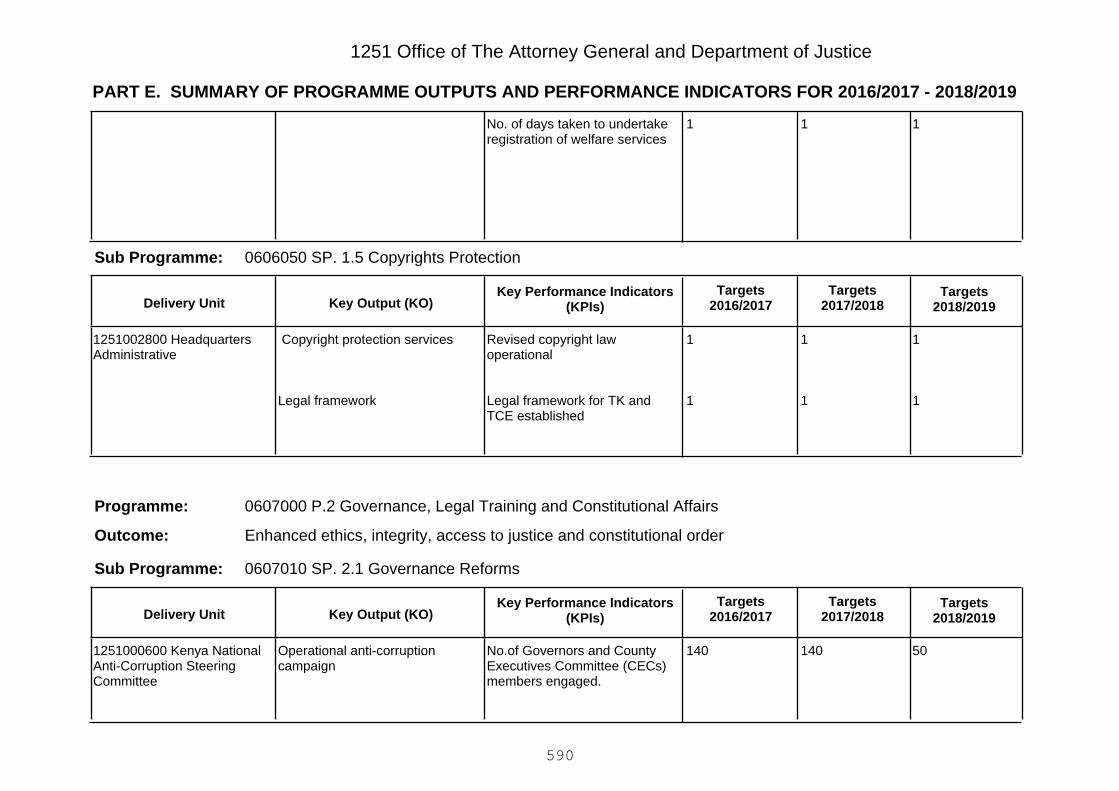
PART E. SUMMARY OF PROGRAMME OUTPUTS AND PERFORMANCE INDICATORS FOR 2016/2017 - 2018/2019
1251 Office of The Attorney General and Department of Justice
111No. of days taken to undertakeregistration of welfare services
0606050 SP. 1.5 Copyrights ProtectionSub Programme:
Key Output (KO)Targets
2018/2019Targets
2017/2018Key Performance Indicators
(KPIs)Targets
2016/2017Delivery Unit
1
1
1
1
1
1
Revised copyright lawoperational
Legal framework for TK andTCE established
Copyright protection services
Legal framework
1251002800 HeadquartersAdministrative
0607000 P.2 Governance, Legal Training and Constitutional Affairs
Enhanced ethics, integrity, access to justice and constitutional order
Programme:
Outcome:
0607010 SP. 2.1 Governance ReformsSub Programme:
Key Output (KO)Targets
2018/2019Targets
2017/2018Key Performance Indicators
(KPIs)Targets
2016/2017Delivery Unit
50140140No.of Governors and CountyExecutives Committee (CECs)members engaged.
Operational anti-corruptioncampaign
1251000600 Kenya NationalAnti-Corruption SteeringCommittee
590
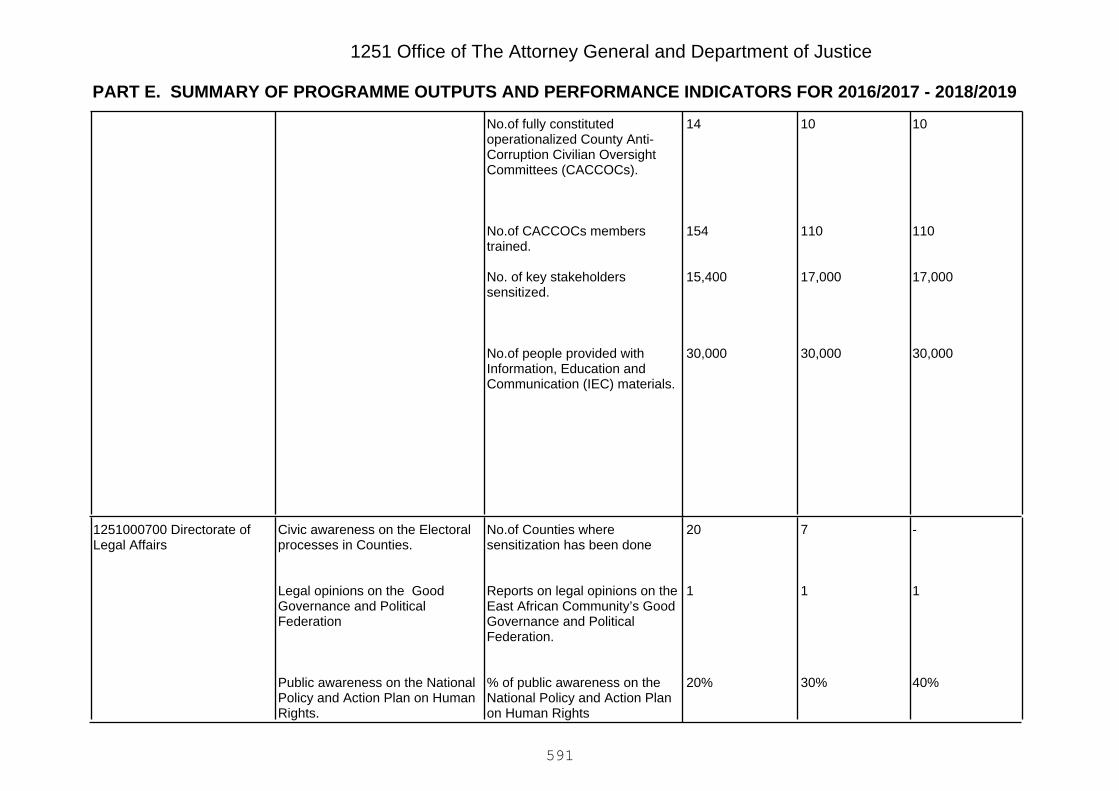
PART E. SUMMARY OF PROGRAMME OUTPUTS AND PERFORMANCE INDICATORS FOR 2016/2017 - 2018/2019
1251 Office of The Attorney General and Department of Justice
10
110
17,000
30,000
10
110
17,000
30,000
14
154
15,400
30,000
No.of fully constitutedoperationalized County Anti-Corruption Civilian OversightCommittees (CACCOCs).
No.of CACCOCs memberstrained.
No. of key stakeholderssensitized.
No.of people provided withInformation, Education andCommunication (IEC) materials.
-
1
40%
7
1
30%
20
1
20%
No.of Counties wheresensitization has been done
Reports on legal opinions on theEast African Community’s GoodGovernance and PoliticalFederation.
% of public awareness on theNational Policy and Action Planon Human Rights
Civic awareness on the Electoralprocesses in Counties.
Legal opinions on the GoodGovernance and PoliticalFederation
Public awareness on the NationalPolicy and Action Plan on HumanRights.
1251000700 Directorate ofLegal Affairs
591

PART E. SUMMARY OF PROGRAMME OUTPUTS AND PERFORMANCE INDICATORS FOR 2016/2017 - 2018/2019
1251 Office of The Attorney General and Department of Justice
40%
10%
5,000
30%
10%
5,000
20%
40%
4,500
%completion of the NationalPolicy on Legal Education AndTraining
No. of justice sector actorstrained on ADR mediation andpool established in Nairobi,Mombasa, Kisumu, Nakuru andEldoret
No.of members of public offeredlegal aid in the six pilot projects
National Policy on LegalEducation and Training
Enhanced awareness of theNational Assembly on the LegalAid Bill, 2015.
Enhanced public awareness onfree legal services.Provide legal aid
40%40%30%% satisfaction of victimscompensation services offered
Provision of victims compensationservices
1251005000 VictimsCompensation Fund
592

PART E. SUMMARY OF PROGRAMME OUTPUTS AND PERFORMANCE INDICATORS FOR 2016/2017 - 2018/2019
1251 Office of The Attorney General and Department of Justice
444No. of Counties where goodgovernance program isimplemented
County Good GovernanceProgram implemented
1251100400 GJLOSProgramme
0607020 SP. 2.2 Constitutional and Legal ReformsSub Programme:
Key Output (KO)Targets
2018/2019Targets
2017/2018Key Performance Indicators
(KPIs)Targets
2016/2017Delivery Unit
5
10
10
4
10
5
4
10
5
No. of draft Bills, Rules andRegulations to implement theConstitution developed (non-5th Schedule legislation).
Number of new Draft Billsand/or Amendment Billsdeveloped
Draft Bills developed inconsultation with respectiveCounty Governments
Legislation, Regulations andAdministrative Procedures toimplement the Constitution ofKenya (non-5th Schedule Laws).
Harmonize legislation with theConstitution of Kenya
Capacity of County Governmentson the Development and reform ofCountyegislation
1251000500 Kenya LawReform Commission
593

PART E. SUMMARY OF PROGRAMME OUTPUTS AND PERFORMANCE INDICATORS FOR 2016/2017 - 2018/2019
1251 Office of The Attorney General and Department of Justice
0607030 SP.2.3 Legal Education Training and PolicySub Programme:
Key Output (KO)Targets
2018/2019Targets
2017/2018Key Performance Indicators
(KPIs)Targets
2016/2017Delivery Unit
10
9
10
9
40
7
No. of Legal Education andTraining Policies developed
No. of Legal education providersevaluated and accreditedprovision of short courses
National Legal Education andTraining Policy.
Legal education providersevaluated and accreditedprovision of short courses
1251001500 Kenya School ofLaw
150
-
150
10
150
40
No. of paralegal studentstrained
No. of National Legal Educationand Training Policy developed
Paralegal professionals
National Legal Education andTraining Policy
1251001600 Council for LegalEducation
594

PART E. SUMMARY OF PROGRAMME OUTPUTS AND PERFORMANCE INDICATORS FOR 2016/2017 - 2018/2019
1251 Office of The Attorney General and Department of Justice
1197No.of Legal education providersevaluated and accredited
Legal education providers
0607040 SP.2.4 Crime ResearchSub Programme:
Key Output (KO)Targets
2018/2019Targets
2017/2018Key Performance Indicators
(KPIs)Targets
2016/2017Delivery Unit
10107No. of crime research reportsprepared
Crime research1251002800 HeadquartersAdministrative
0609000 P. 4 General Administration, Planning and Support Services
Efficient and effective service delivery
Programme:
Outcome:
0609010 SP. 4.1 Transformation of Public legal servicesSub Programme:
Key Output (KO)Targets
2018/2019Targets
2017/2018Key Performance Indicators
(KPIs)Targets
2016/2017Delivery Unit
-
35
850M
-
35
750M
-
25
500M
No. of ADR Rules Developed onmanagement of Disputes.
No. of cases filed and/orenjoined
Value of assets frozen
Justice through utilization of ADRmechanisms
Cases filed and/or agencyenjoined on proceeds of crime.
Assets arising from proceeds ofcrime frozen
1251002800 HeadquartersAdministrative
595

PART E. SUMMARY OF PROGRAMME OUTPUTS AND PERFORMANCE INDICATORS FOR 2016/2017 - 2018/2019
1251 Office of The Attorney General and Department of Justice
75M75M50MValue of assets recoveredAssets arising from proceeds ofcrime recovered
0609020 SP. 4.2 Administrative servicesSub Programme:
Key Output (KO)Targets
2018/2019Targets
2017/2018Key Performance Indicators
(KPIs)Targets
2016/2017Delivery Unit
3%3%4%% reduction in customers'complaints
financial services1251002600 Finance andProcurement Services
100%100%100%% of customer satisfactionPlanning services1251002700 Central PlanningUnit
200
2
200
2
180
2
No.of lawyers taken throughPupil-age Programme
No.of responsive polices oneach of the areas
Administration services1251002800 HeadquartersAdministrative
101010No.of staff trainedCapacity building of OAG& DOJstaff
1251100200 Support To TheOffice Of The AttorneyGeneral & Department OfJustice
35%35%20%% of offices partitioned andrefurbished
Offices partitioned refurbished1251100500 Refurbishmentsheria House and company'sRegistry-Nairobi
596

PART E. SUMMARY OF PROGRAMME OUTPUTS AND PERFORMANCE INDICATORS FOR 2016/2017 - 2018/2019
1251 Office of The Attorney General and Department of Justice
111No.of regional offices partitionedand refurbished
Regional offices partitionedrefurbished
1251100600 Refurbishment ofRegional offices-MachakosKisii Kisumu & Malindi
-30%40%% of server modernizedIncrease storage capacity1251101000 Modernization ofOAG & DOJ Server Room
5%5%5%% of business processesimproved
Enhanced efficiency of services1251101100 UpgradingCompanies RegistryBusiness ProcessManagement System
435No. of regional offices installedwith LAN
Improved internet connectivity1251101600 Installation ofLocal Area Networks (LAN)
597

Vote 1251 Office of The Attorney General and Department of Justice
PART F: Summary of Expenditure by Programmes, 2016/2017 - 2018/2019
Programme
Estimates Projected Estimates
2016/2017 2017/2018 2018/2019
KShs. KShs. KShs.
0606010 SP. 1.1 Civil litigation and Promotion of legal ethical standards 577,979,698 744,105,037 828,866,085
0606020 SP. 1.2 Legislations, Treaties and Advisory Services 213,219,708 313,342,195 271,049,904
0606030 SP. 1.3 Public Trusts and Estates management 189,218,717 257,120,064 228,792,394
0606040 SP. 1.4 Registration Services 505,620,994 635,586,631 671,371,573
0606050 SP. 1.5 Copyrights Protection 134,000,000 141,000,000 151,000,000
0606000 P.1 Legal Services 1,620,039,117 2,091,153,927 2,151,079,956
0607010 SP. 2.1 Governance Reforms 618,406,113 702,867,087 730,618,396
0607020 SP. 2.2 Constitutional and Legal Reforms 230,000,000 240,000,000 250,000,000
0607030 SP.2.3 Legal Education Training and Policy 741,000,000 806,500,000 825,000,000
0607040 SP.2.4 Crime Research 160,000,000 181,000,000 185,000,000
0607000 P.2 Governance, Legal Training and Constitutional Affairs 1,749,406,113 1,930,367,087 1,990,618,396
0609010 SP. 4.1 Transformation of Public legal services 120,000,000 155,000,000 150,000,000
0609020 SP. 4.2 Administrative services 624,787,132 816,990,558 827,215,867
0609000 P. 4 General Administration, Planning and Support Services 744,787,132 971,990,558 977,215,867Total Expenditure for Vote 1251 Office of The Attorney General and Department of Justice 4,114,232,362 4,993,511,572 5,118,914,219
598

1251 Office of The Attorney General and Department of Justice
PART G: Summary of Expenditure by Vote and Economic Classification, 2016/2017 - 2018/2019
Economic Classification
Estimates Projected Estimates
2016/2017 2017/2018 2018/2019KShs. KShs. KShs.
Current Expenditure 3,735,232,362 4,392,511,572 4,509,914,219
Compensation to Employees 888,984,398 1,304,357,306 1,306,960,016
Use of Goods and Services 677,521,564 709,648,562 744,384,602
Current Transfers to Govt. Agencies 2,156,928,000 2,362,659,784 2,441,649,681
Other Recurrent 11,798,400 15,845,920 16,919,920
Capital Expenditure 379,000,000 601,000,000 609,000,000
Acquisition of Non-Financial Assets 374,000,000 516,000,000 511,000,000
Capital Grants to Govt. Agencies - 80,000,000 93,000,000
Other Development 5,000,000 5,000,000 5,000,000Total Expenditure 4,114,232,362 4,993,511,572 5,118,914,219
599

1251 Office of The Attorney General and Department of Justice
PART H: Summary of Expenditure by Programme and Economic Classification, 2016/2017 - 2018/2019
0606010 SP. 1.1 Civil litigation and Promotion of legal ethical standards
Economic Classification
Estimates Projected Estimates
2016/2017 2017/2018 2018/2019KShs. KShs. KShs.
Current Expenditure 568,979,698 718,105,037 813,866,085
Compensation to Employees 227,794,239 330,791,748 421,614,977
Use of Goods and Services 131,185,459 157,313,289 152,251,108
Current Transfers to Govt. Agencies 210,000,000 230,000,000 240,000,000
Capital Expenditure 9,000,000 26,000,000 15,000,000
Acquisition of Non-Financial Assets 9,000,000 26,000,000 15,000,000Total Expenditure 577,979,698 744,105,037 828,866,085
0606020 SP. 1.2 Legislations, Treaties and Advisory Services
Economic Classification
Estimates Projected Estimates
2016/2017 2017/2018 2018/2019KShs. KShs. KShs.
Current Expenditure 213,219,708 313,342,195 271,049,904
Compensation to Employees 150,277,216 253,074,949 207,849,015
Use of Goods and Services 62,648,492 59,921,246 62,710,889
Other Recurrent 294,000 346,000 490,000Total Expenditure 213,219,708 313,342,195 271,049,904
0606030 SP. 1.3 Public Trusts and Estates management
Economic Classification
Estimates Projected Estimates
2016/2017 2017/2018 2018/2019KShs. KShs. KShs.
Current Expenditure 189,218,717 257,120,064 228,792,394
Compensation to Employees 137,867,483 200,756,918 171,253,894
Use of Goods and Services 51,351,234 56,363,146 57,538,500Total Expenditure 189,218,717 257,120,064 228,792,394
600
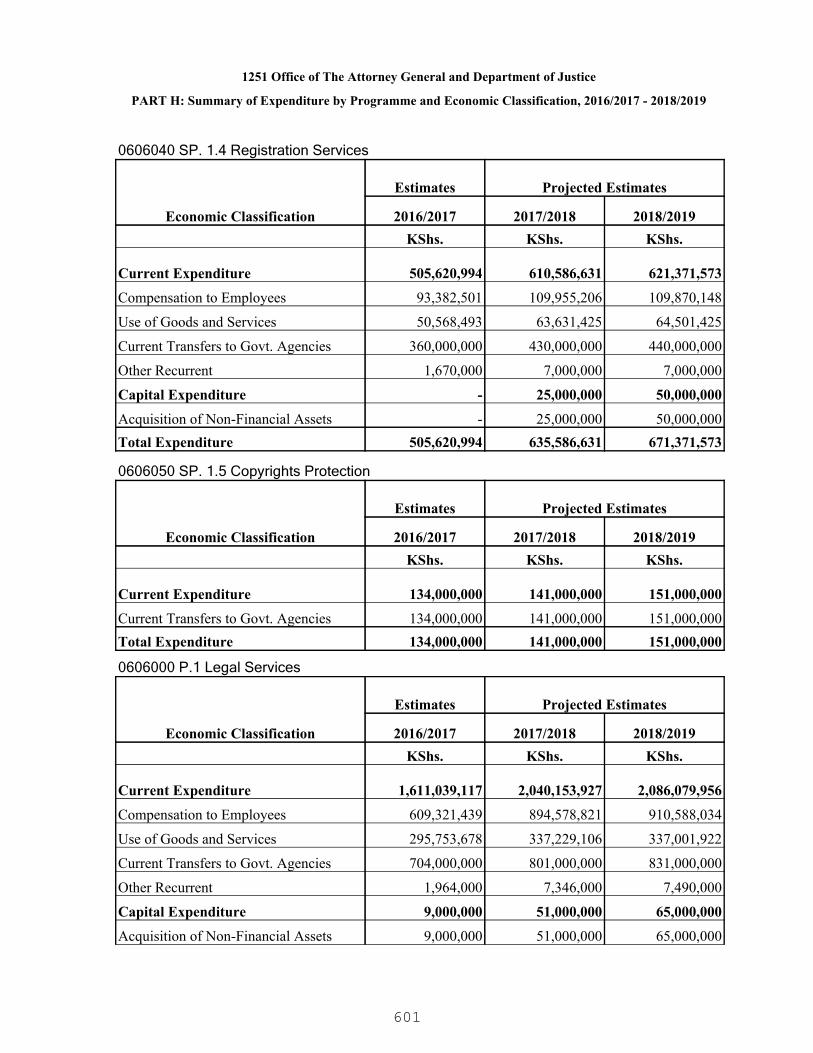
1251 Office of The Attorney General and Department of Justice
PART H: Summary of Expenditure by Programme and Economic Classification, 2016/2017 - 2018/2019
0606040 SP. 1.4 Registration Services
Economic Classification
Estimates Projected Estimates
2016/2017 2017/2018 2018/2019KShs. KShs. KShs.
Current Expenditure 505,620,994 610,586,631 621,371,573
Compensation to Employees 93,382,501 109,955,206 109,870,148
Use of Goods and Services 50,568,493 63,631,425 64,501,425
Current Transfers to Govt. Agencies 360,000,000 430,000,000 440,000,000
Other Recurrent 1,670,000 7,000,000 7,000,000
Capital Expenditure - 25,000,000 50,000,000
Acquisition of Non-Financial Assets - 25,000,000 50,000,000Total Expenditure 505,620,994 635,586,631 671,371,573
0606050 SP. 1.5 Copyrights Protection
Economic Classification
Estimates Projected Estimates
2016/2017 2017/2018 2018/2019KShs. KShs. KShs.
Current Expenditure 134,000,000 141,000,000 151,000,000
Current Transfers to Govt. Agencies 134,000,000 141,000,000 151,000,000Total Expenditure 134,000,000 141,000,000 151,000,000
0606000 P.1 Legal Services
Economic Classification
Estimates Projected Estimates
2016/2017 2017/2018 2018/2019KShs. KShs. KShs.
Current Expenditure 1,611,039,117 2,040,153,927 2,086,079,956
Compensation to Employees 609,321,439 894,578,821 910,588,034
Use of Goods and Services 295,753,678 337,229,106 337,001,922
Current Transfers to Govt. Agencies 704,000,000 801,000,000 831,000,000
Other Recurrent 1,964,000 7,346,000 7,490,000
Capital Expenditure 9,000,000 51,000,000 65,000,000
Acquisition of Non-Financial Assets 9,000,000 51,000,000 65,000,000
601
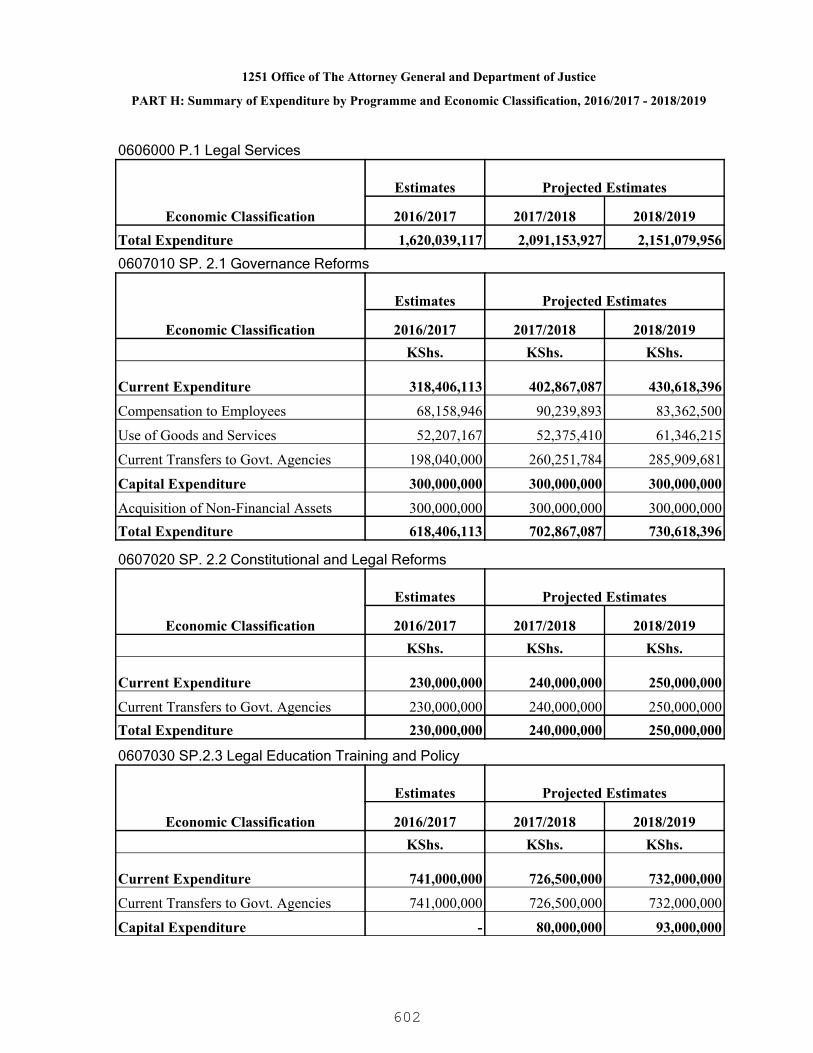
1251 Office of The Attorney General and Department of Justice
PART H: Summary of Expenditure by Programme and Economic Classification, 2016/2017 - 2018/2019
0606000 P.1 Legal Services
Economic Classification
Estimates Projected Estimates
2016/2017 2017/2018 2018/2019Total Expenditure 1,620,039,117 2,091,153,927 2,151,079,9560607010 SP. 2.1 Governance Reforms
Economic Classification
Estimates Projected Estimates
2016/2017 2017/2018 2018/2019KShs. KShs. KShs.
Current Expenditure 318,406,113 402,867,087 430,618,396
Compensation to Employees 68,158,946 90,239,893 83,362,500
Use of Goods and Services 52,207,167 52,375,410 61,346,215
Current Transfers to Govt. Agencies 198,040,000 260,251,784 285,909,681
Capital Expenditure 300,000,000 300,000,000 300,000,000
Acquisition of Non-Financial Assets 300,000,000 300,000,000 300,000,000Total Expenditure 618,406,113 702,867,087 730,618,396
0607020 SP. 2.2 Constitutional and Legal Reforms
Economic Classification
Estimates Projected Estimates
2016/2017 2017/2018 2018/2019KShs. KShs. KShs.
Current Expenditure 230,000,000 240,000,000 250,000,000
Current Transfers to Govt. Agencies 230,000,000 240,000,000 250,000,000Total Expenditure 230,000,000 240,000,000 250,000,000
0607030 SP.2.3 Legal Education Training and Policy
Economic Classification
Estimates Projected Estimates
2016/2017 2017/2018 2018/2019KShs. KShs. KShs.
Current Expenditure 741,000,000 726,500,000 732,000,000
Current Transfers to Govt. Agencies 741,000,000 726,500,000 732,000,000
Capital Expenditure - 80,000,000 93,000,000
602

1251 Office of The Attorney General and Department of Justice
PART H: Summary of Expenditure by Programme and Economic Classification, 2016/2017 - 2018/2019
0607030 SP.2.3 Legal Education Training and Policy
Economic Classification
Estimates Projected Estimates
2016/2017 2017/2018 2018/2019
Capital Grants to Govt. Agencies - 80,000,000 93,000,000Total Expenditure 741,000,000 806,500,000 825,000,000
0607040 SP.2.4 Crime Research
Economic Classification
Estimates Projected Estimates
2016/2017 2017/2018 2018/2019KShs. KShs. KShs.
Current Expenditure 160,000,000 181,000,000 185,000,000
Current Transfers to Govt. Agencies 160,000,000 181,000,000 185,000,000Total Expenditure 160,000,000 181,000,000 185,000,000
0607000 P.2 Governance, Legal Training and Constitutional Affairs
Economic Classification
Estimates Projected Estimates
2016/2017 2017/2018 2018/2019KShs. KShs. KShs.
Current Expenditure 1,449,406,113 1,550,367,087 1,597,618,396
Compensation to Employees 68,158,946 90,239,893 83,362,500
Use of Goods and Services 52,207,167 52,375,410 61,346,215
Current Transfers to Govt. Agencies 1,329,040,000 1,407,751,784 1,452,909,681
Capital Expenditure 300,000,000 380,000,000 393,000,000
Acquisition of Non-Financial Assets 300,000,000 300,000,000 300,000,000
Capital Grants to Govt. Agencies - 80,000,000 93,000,000Total Expenditure 1,749,406,113 1,930,367,087 1,990,618,396
0609010 SP. 4.1 Transformation of Public legal services
Economic Classification
Estimates Projected Estimates
2016/2017 2017/2018 2018/2019KShs. KShs. KShs.
Current Expenditure 120,000,000 150,000,000 150,000,000
603
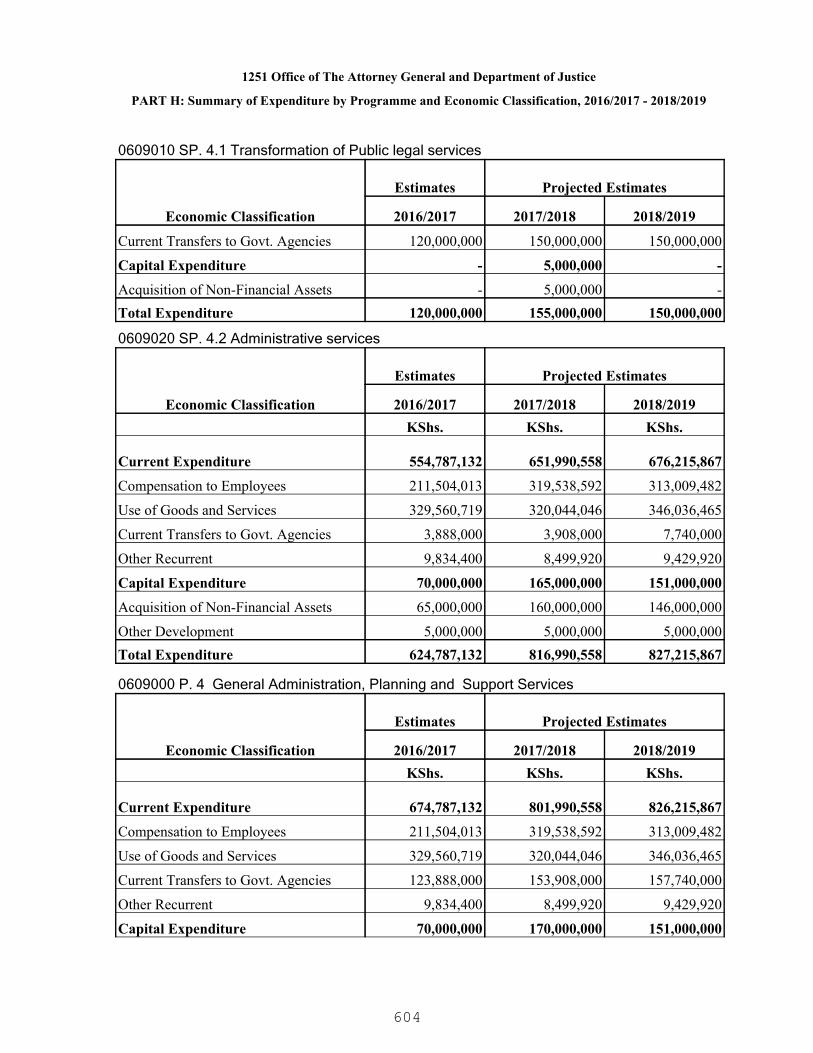
1251 Office of The Attorney General and Department of Justice
PART H: Summary of Expenditure by Programme and Economic Classification, 2016/2017 - 2018/2019
0609010 SP. 4.1 Transformation of Public legal services
Economic Classification
Estimates Projected Estimates
2016/2017 2017/2018 2018/2019
Current Transfers to Govt. Agencies 120,000,000 150,000,000 150,000,000
Capital Expenditure - 5,000,000 -
Acquisition of Non-Financial Assets - 5,000,000 -Total Expenditure 120,000,000 155,000,000 150,000,000
0609020 SP. 4.2 Administrative services
Economic Classification
Estimates Projected Estimates
2016/2017 2017/2018 2018/2019KShs. KShs. KShs.
Current Expenditure 554,787,132 651,990,558 676,215,867
Compensation to Employees 211,504,013 319,538,592 313,009,482
Use of Goods and Services 329,560,719 320,044,046 346,036,465
Current Transfers to Govt. Agencies 3,888,000 3,908,000 7,740,000
Other Recurrent 9,834,400 8,499,920 9,429,920
Capital Expenditure 70,000,000 165,000,000 151,000,000
Acquisition of Non-Financial Assets 65,000,000 160,000,000 146,000,000
Other Development 5,000,000 5,000,000 5,000,000Total Expenditure 624,787,132 816,990,558 827,215,867
0609000 P. 4 General Administration, Planning and Support Services
Economic Classification
Estimates Projected Estimates
2016/2017 2017/2018 2018/2019KShs. KShs. KShs.
Current Expenditure 674,787,132 801,990,558 826,215,867
Compensation to Employees 211,504,013 319,538,592 313,009,482
Use of Goods and Services 329,560,719 320,044,046 346,036,465
Current Transfers to Govt. Agencies 123,888,000 153,908,000 157,740,000
Other Recurrent 9,834,400 8,499,920 9,429,920
Capital Expenditure 70,000,000 170,000,000 151,000,000
604
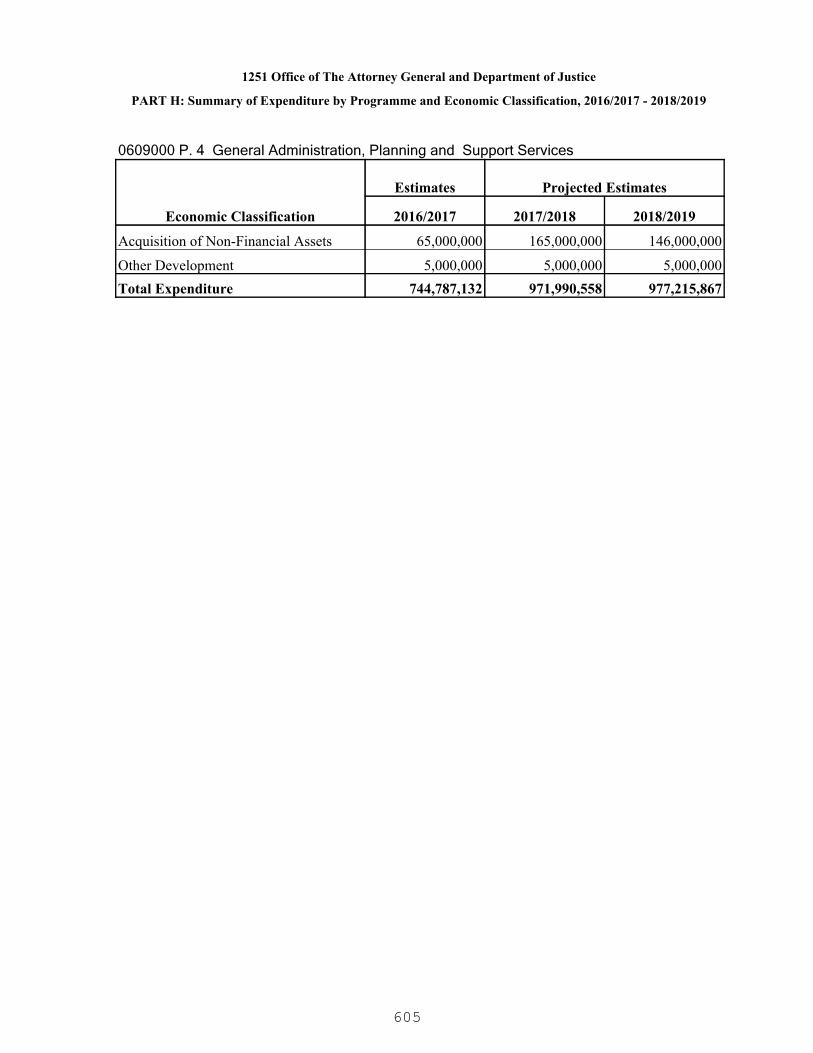
1251 Office of The Attorney General and Department of Justice
PART H: Summary of Expenditure by Programme and Economic Classification, 2016/2017 - 2018/2019
0609000 P. 4 General Administration, Planning and Support Services
Economic Classification
Estimates Projected Estimates
2016/2017 2017/2018 2018/2019
Acquisition of Non-Financial Assets 65,000,000 165,000,000 146,000,000
Other Development 5,000,000 5,000,000 5,000,000Total Expenditure 744,787,132 971,990,558 977,215,867
605

1271 Ethics and Anti-Corruption Commission
A Corruption free Kenyan Society that upholds integrity and rule of law.
To promote integrity and combat corruption through law enforcement, prevention andeducation.
PART A. Vision
PART B. Mission
PART C. Performance Overview and Background for Programme(s) Funding
The Ethics and Anti-Corruption Commission (EACC) as established under Section 3(1) of theEthics and Anti-Corruption Commission Act, 2011, is mandated with combating andpreventing corruption and economic crimes through law enforcement, preventive measures,public education and promotion of standards and practices of integrity, ethics and anti-corruption.
The Commission completed 230 Forensic investigations on corruption and economic crimecases; disrupted 32 corruption networks and averted an estimated loss of KSHs. 70.8 billion;completed the investigation of 9 case files on ethical breaches; Completed 61 Asset tracinginquiries and recovered assets valued at KSHs. 7.5 billion; trained, educated and enlisted 8.8million Kenyans to combat corruption; completed 9 system review and examinations; trained1390 Integrity Assurance Officers and 2654 members of Corruption Prevention Committees;developed Leadership and integrity regulations; received and processed 9294 clearancerequests for appointment to public offices; and undertook 3 national surveys to gauge thestatus of corruption and unethical conduct.
The Commission’s budgetary allocation to Recurrent vote in the printed estimates for 2012/13financial year was KSHs.1,590.7 million. This provision was however reduced toKSHs.1,381.7 million in the Approved Estimates based on projected expenditure for theremainder of the year and the austerity measures introduced by The National Treasury in thatperiod. Actual recurrent expenditure by end of June 2013 totaled KSHs.1,256.3 million,implying that the Commission did not use about KSHs.125.4 million under the Recurrent Voteas provided for in the 2012/13 Approved Estimates. In the 2013/14 Financial Year,Commission’s allocation for Recurrent Budget in the Printed Estimates was KSHs 1045million which was revised to KSHs. 1,245 million in the Supplementary Estimates. Actualexpenditure during the year was KSHs 1,164 million which translates to 93.57 percent of theApproved Estimates. In the 2014/15 Financial Year, Commissions’ Recurrent Vote wasallocated KSHs. 1,546 million in the Printed Estimates. This provision was increased toKSHs. 1,742 million in the Approved Estimates based on projected expenditure for theremainder of the year. The overall actual recurrent expenditure by end of June 2015 totaledKSHs.1,738 million, implying that the Commission did not use KSHs. 4 Million under theRecurrent Vote.
The Commission’s allocation to Development vote in the Printed Estimates for 2012/13Financial Year was KSHs. 222 million. This included a grant of KSHs. 22 million from UNDPand KSHs. 5 million counterpart funds earmarked for the Wealth Declaration Project (WDP).The remaining KSHs. 195 million was allocated to the development of EACC HeadquarterOffice building. Allocation to the Development vote was reduced to KSHs. 34.5 millioncomprising KSHs. 22 million grant from UNDP and KSHs. 5 million counterpart funds and
606
1271 Ethics and Anti-Corruption Commission
PART D. Programme Objectives
Approved Estimates based on the projected expenditure for the remainder of the year. Actualdevelopment expenditure by end of June 2013 totaled KSHs. 23.2 million of which KSHs.17.4 million is under the UNDP funds for WDP and KSHs. 5.8 million under the constructionof EACC Headquarter Office Building. In the 2013/14 financial year, Commission’s allocationfor the Development budget in the Printed Estimates was KSHs. 54 million but was laterremoved in the Supplementary Estimates. In the 2014/15 Financial Year, Commissions’Development Vote was allocated KSHs. 277.6 million in the Printed Estimates andmaintained at the same level in the Approved Estimates based on the projected expenditurefor the remainder of the year.
The Commission’s had a staff establishment of 436 officers in 2014/15 financial year. Thenumber was grossly inadequate and therefore meant that the Commission could only executeits activities to a limited degree despite the huge mandate and the high demand for itsservices that was manifested by the high number of cases reported to the Commission duringthe review period. In order to address the challenge, the Commission will be seekingadditional funds to allow the expansion of its staff establishment. A live to the fact that suchan expansion will definitely require huge budgetary allocation for Personnel Emolument, theCommission will be lobbying the National Treasury for phased expansion of its staffcomplement by an average of 200 officers annually over the next MTEF period. TheCommission had identified and negotiated with NSSF to purchase office premise. However,this agreement was later rescinded as the two parties could not reach an agreement on themodalities of making the payments. The Commission has started the process of identifyinganother suitable premise for purchase. The Commission will be requesting for adequatebudgetary allocation to allow it finalize this project over this MTEF period.
ObjectiveProgramme
0611000 P.1 Ethics and Anti-Corruption
To reduce prevalence of corruption and unethical conduct.
607
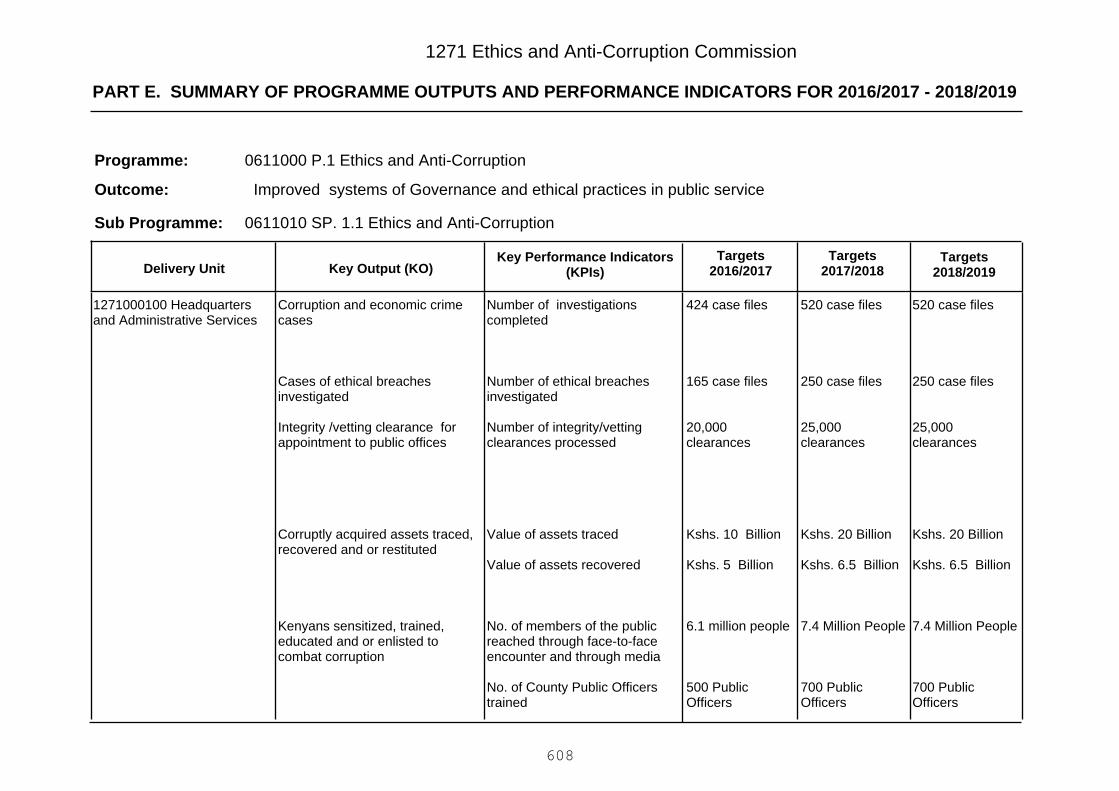
PART E. SUMMARY OF PROGRAMME OUTPUTS AND PERFORMANCE INDICATORS FOR 2016/2017 - 2018/2019
1271 Ethics and Anti-Corruption Commission
0611000 P.1 Ethics and Anti-Corruption
Improved systems of Governance and ethical practices in public service
Programme:
Outcome:
0611010 SP. 1.1 Ethics and Anti-CorruptionSub Programme:
Key Output (KO)Targets
2018/2019Targets
2017/2018Key Performance Indicators
(KPIs)Targets
2016/2017Delivery Unit
520 case files
250 case files
25,000clearances
Kshs. 20 Billion
Kshs. 6.5 Billion
7.4 Million People
700 PublicOfficers
520 case files
250 case files
25,000clearances
Kshs. 20 Billion
Kshs. 6.5 Billion
7.4 Million People
700 PublicOfficers
424 case files
165 case files
20,000clearances
Kshs. 10 Billion
Kshs. 5 Billion
6.1 million people
500 PublicOfficers
Number of investigationscompleted
Number of ethical breachesinvestigated
Number of integrity/vettingclearances processed
Value of assets traced
Value of assets recovered
No. of members of the publicreached through face-to-faceencounter and through media
No. of County Public Officerstrained
Corruption and economic crimecases
Cases of ethical breachesinvestigated
Integrity /vetting clearance forappointment to public offices
Corruptly acquired assets traced,recovered and or restituted
Kenyans sensitized, trained,educated and or enlisted tocombat corruption
1271000100 Headquartersand Administrative Services
608
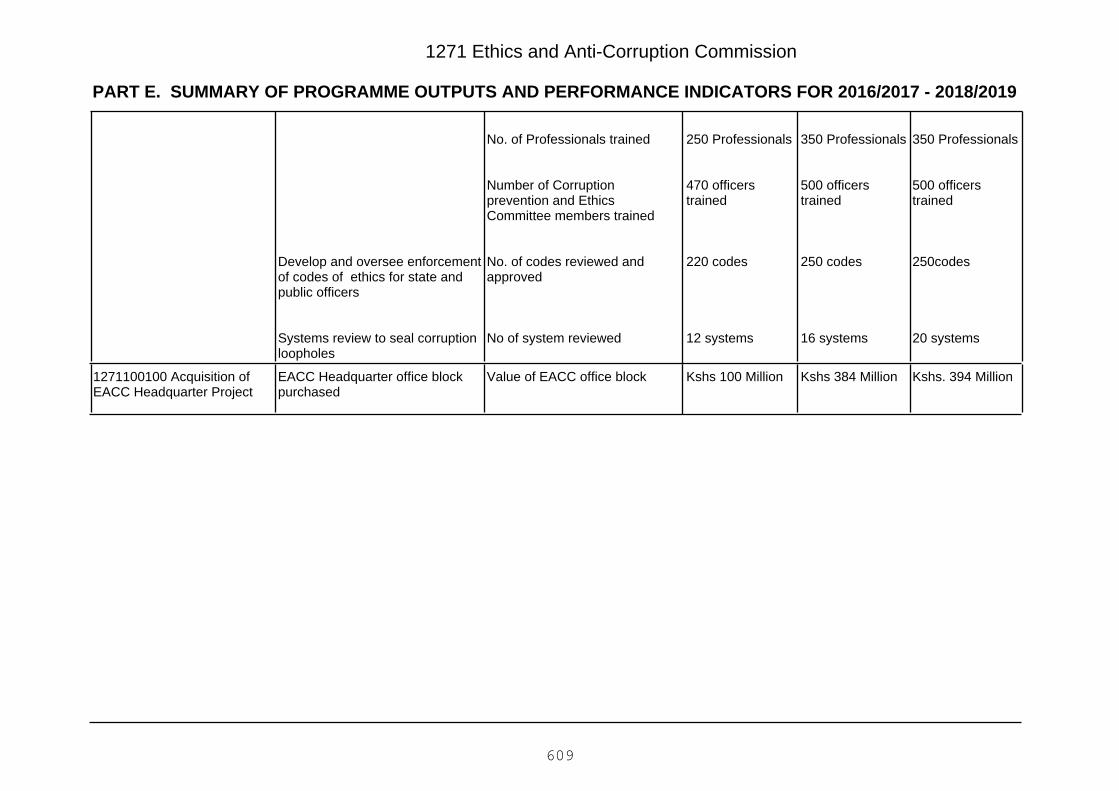
PART E. SUMMARY OF PROGRAMME OUTPUTS AND PERFORMANCE INDICATORS FOR 2016/2017 - 2018/2019
1271 Ethics and Anti-Corruption Commission
350 Professionals
500 officerstrained
250codes
20 systems
350 Professionals
500 officerstrained
250 codes
16 systems
250 Professionals
470 officerstrained
220 codes
12 systems
No. of Professionals trained
Number of Corruptionprevention and EthicsCommittee members trained
No. of codes reviewed andapproved
No of system reviewed
Develop and oversee enforcementof codes of ethics for state andpublic officers
Systems review to seal corruptionloopholes
Kshs. 394 MillionKshs 384 MillionKshs 100 MillionValue of EACC office blockEACC Headquarter office blockpurchased
1271100100 Acquisition ofEACC Headquarter Project
609

Vote 1271 Ethics and Anti-Corruption Commission
PART F: Summary of Expenditure by Programmes, 2016/2017 - 2018/2019
Programme
Estimates Projected Estimates
2016/2017 2017/2018 2018/2019
KShs. KShs. KShs.
0611010 SP. 1.1 Ethics and Anti-Corruption 2,791,080,000 3,270,380,000 3,316,175,000
0611000 P.1 Ethics and Anti-Corruption 2,791,080,000 3,270,380,000 3,316,175,000Total Expenditure for Vote 1271 Ethics and Anti-Corruption Commission 2,791,080,000 3,270,380,000 3,316,175,000
610
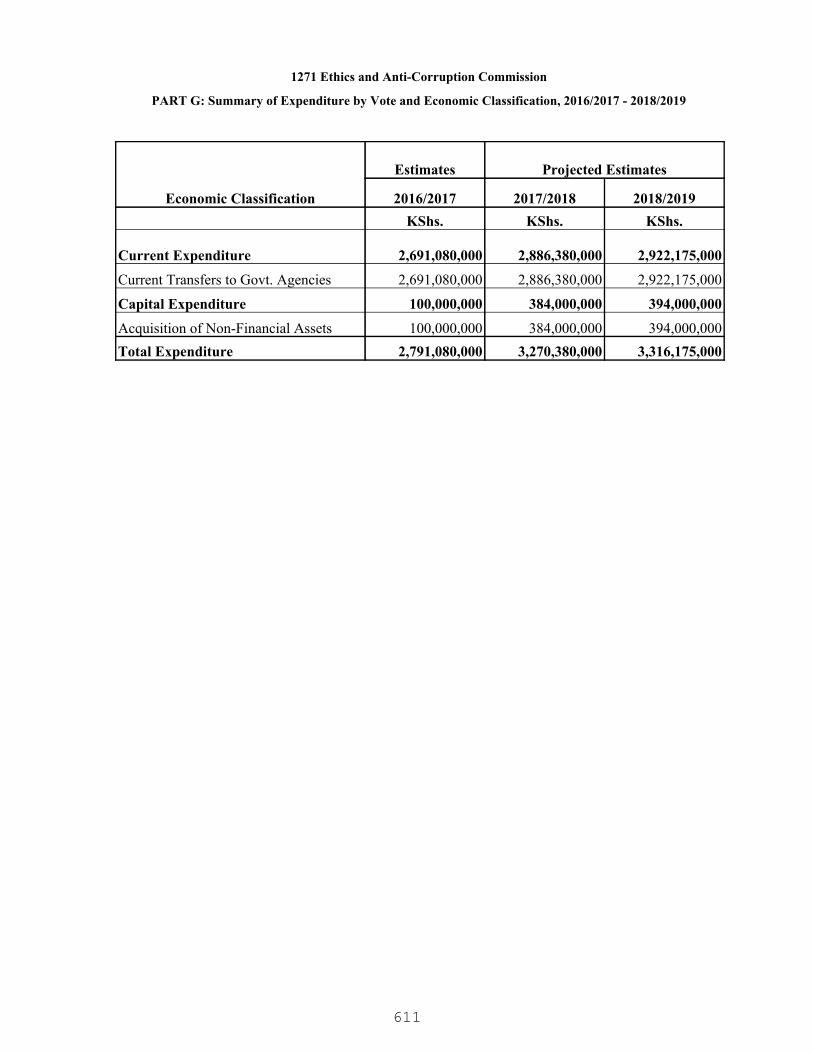
1271 Ethics and Anti-Corruption Commission
PART G: Summary of Expenditure by Vote and Economic Classification, 2016/2017 - 2018/2019
Economic Classification
Estimates Projected Estimates
2016/2017 2017/2018 2018/2019KShs. KShs. KShs.
Current Expenditure 2,691,080,000 2,886,380,000 2,922,175,000
Current Transfers to Govt. Agencies 2,691,080,000 2,886,380,000 2,922,175,000
Capital Expenditure 100,000,000 384,000,000 394,000,000
Acquisition of Non-Financial Assets 100,000,000 384,000,000 394,000,000Total Expenditure 2,791,080,000 3,270,380,000 3,316,175,000
611

1271 Ethics and Anti-Corruption Commission
PART H: Summary of Expenditure by Programme and Economic Classification, 2016/2017 - 2018/2019
0611010 SP. 1.1 Ethics and Anti-Corruption
Economic Classification
Estimates Projected Estimates
2016/2017 2017/2018 2018/2019KShs. KShs. KShs.
Current Expenditure 2,691,080,000 2,886,380,000 2,922,175,000
Current Transfers to Govt. Agencies 2,691,080,000 2,886,380,000 2,922,175,000
Capital Expenditure 100,000,000 384,000,000 394,000,000
Acquisition of Non-Financial Assets 100,000,000 384,000,000 394,000,000Total Expenditure 2,791,080,000 3,270,380,000 3,316,175,000
0611000 P.1 Ethics and Anti-Corruption
Economic Classification
Estimates Projected Estimates
2016/2017 2017/2018 2018/2019KShs. KShs. KShs.
Current Expenditure 2,691,080,000 2,886,380,000 2,922,175,000
Current Transfers to Govt. Agencies 2,691,080,000 2,886,380,000 2,922,175,000
Capital Expenditure 100,000,000 384,000,000 394,000,000
Acquisition of Non-Financial Assets 100,000,000 384,000,000 394,000,000Total Expenditure 2,791,080,000 3,270,380,000 3,316,175,000
612
1281 National Intelligence Service
A professional Intelligence Service comparable to none that shall ensure a secure andprosperous Kenya.
To safeguard the security of the Republic of Kenya against any threats emanating both fromwithin and without.
PART A. Vision
PART B. Mission
PART C. Performance Overview and Background for Programme(s) Funding
PART D. Programme Objectives
The National Intelligence Service (NIS) is charged with the mandate of security intelligenceand counter intelligence to enhance National Security.
During the period under review, NIS provided timely reports on actionable intelligence andcounter intelligence that added value to the decision making processes by the Government. Ithad a 99% absorption rate of the budget allocated during the period as follows: KSh.13.8billion in FY2012/13, KSh.15.7 billion in FY2013/14 and KSh.19.1 billion in FY2014/15.
During the period under review, the Service experienced challenges including inadequatefunding and late release of budgeted funds. These constraints were addressed through re-adjustments of the cash-flow projections to cater for the delays.
During the MTEF period 2016/17-2018/19, the Agency will seek to provide timely andactionable intelligence that will add value to decision making by the Government.
ObjectiveProgramme
0804000 P.1 NationalSecurity Intelligence
To safeguard the sovereignty and security of Kenya and hercitizens through provision of competitive, reliable andactionable intelligence that adds value to decision making
613

PART E. SUMMARY OF PROGRAMME OUTPUTS AND PERFORMANCE INDICATORS FOR 2016/2017 - 2018/2019
1281 National Intelligence Service
0804000 P.1 National Security Intelligence
Secured and protected Nation
Programme:
Outcome:
0804010 SP. 1.1 Security IntelligenceSub Programme:
Key Output (KO)Targets
2018/2019Targets
2017/2018Key Performance Indicators
(KPIs)Targets
2016/2017Delivery Unit
Timelydissemination ofreports
Timelydissemination ofreports
Timelydissemination ofreports
Actionable intelligence andcounter intelligence reportsdisseminated
Actionable intelligence andcounter intelligence
1281000100 HeadquartersField Services TrainingSchool and Liaison Office
614
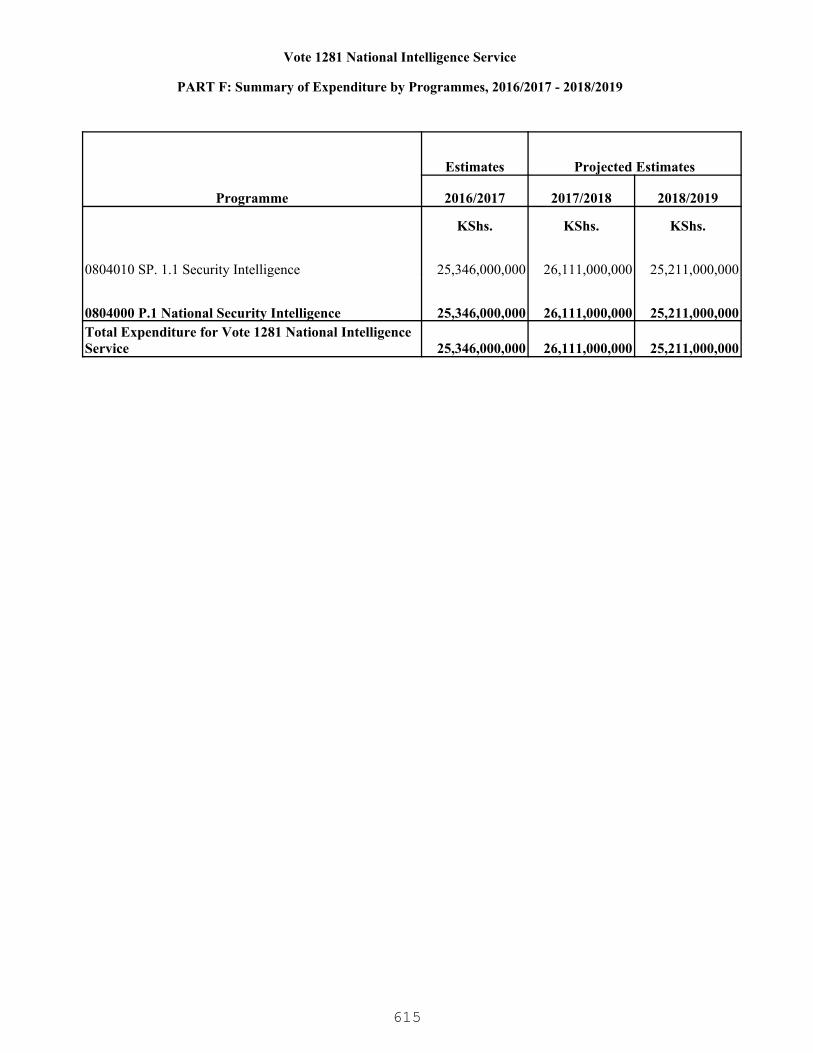
Vote 1281 National Intelligence Service
PART F: Summary of Expenditure by Programmes, 2016/2017 - 2018/2019
Programme
Estimates Projected Estimates
2016/2017 2017/2018 2018/2019
KShs. KShs. KShs.
0804010 SP. 1.1 Security Intelligence 25,346,000,000 26,111,000,000 25,211,000,000
0804000 P.1 National Security Intelligence 25,346,000,000 26,111,000,000 25,211,000,000Total Expenditure for Vote 1281 National Intelligence Service 25,346,000,000 26,111,000,000 25,211,000,000
615

1281 National Intelligence Service
PART G: Summary of Expenditure by Vote and Economic Classification, 2016/2017 - 2018/2019
Economic Classification
Estimates Projected Estimates
2016/2017 2017/2018 2018/2019KShs. KShs. KShs.
Current Expenditure 25,346,000,000 26,111,000,000 25,211,000,000
Current Transfers to Govt. Agencies 25,346,000,000 26,111,000,000 25,211,000,000Total Expenditure 25,346,000,000 26,111,000,000 25,211,000,000
616

1281 National Intelligence Service
PART H: Summary of Expenditure by Programme and Economic Classification, 2016/2017 - 2018/2019
0804010 SP. 1.1 Security Intelligence
Economic Classification
Estimates Projected Estimates
2016/2017 2017/2018 2018/2019KShs. KShs. KShs.
Current Expenditure 25,346,000,000 26,111,000,000 25,211,000,000
Current Transfers to Govt. Agencies 25,346,000,000 26,111,000,000 25,211,000,000Total Expenditure 25,346,000,000 26,111,000,000 25,211,000,000
0804000 P.1 National Security Intelligence
Economic Classification
Estimates Projected Estimates
2016/2017 2017/2018 2018/2019KShs. KShs. KShs.
Current Expenditure 25,346,000,000 26,111,000,000 25,211,000,000
Current Transfers to Govt. Agencies 25,346,000,000 26,111,000,000 25,211,000,000Total Expenditure 25,346,000,000 26,111,000,000 25,211,000,000
617
1291 Office of the Director of Public Prosecutions
An Independent Prosecution Authority providing efficient, effective, fair and just prosecutionservices for the people of Kenya.
To serve the public by providing quality, impartial and timely prosecution services anchoredon the values and principles enshrined in the Constitution.
PART A. Vision
PART B. Mission
PART C. Performance Overview and Background for Programme(s) Funding
The Office of the Director of Public Prosecutions (ODPP) is an independent ConstitutionalOffice established under Article 157 of Constitution of Kenya, 2010 to ensure an independent,accountable and professional prosecution service.
The ODPP total approved budget over the last medium term 2012/13 – 2014/15 was KSHs.1.07 billion, KSHs. 1.3 billion and KSHs. 1.7 billion in financial years 2012/13, 2013/14 and2014/15 respectively. The increased resources allocation over the duration under reviewreflects the continued expansion of prosecution services which has been among othersdecentralized to all the 47 Counties and 121 sub Counties. The budget absorption rate overthe same period averaged at 87%, this is however expected to increase to 95% for FY2015/16 with projection of 99% in the coming MTEF period 2016/17-2018/19 due toincreased capacity.
During the period under review, the ODPP recruited 562 staff raising staffing levels from aninitial 205 to 936 officers. An additional 341 officers (210 legal staff and 131 non-legal staff)will be recruited in the coming MTEF period to reach the optimal level. In FY 2013/14, 88,038cases were registered of which 42,877 were concluded with a conviction rate of 82%;similarly in FY 2014/15 a total of 137,301 files were registered, 48,101 were concluded with aconviction rate of 89.52%, meanwhile, the ODPP is currently undertaking to conclude150,000 cases and attain a conviction rate of 90%. Towards this, the Office has initiated aquality assurance process that ensures only files that meet the threshold of prosecution arefiled in court in order to achieve this, the ODPP has taken over the prosecutorial role frompolice prosecutors in subordinate courts in all the 47 counties. To provide a sound policyframework for prosecutions in line with the ODPP Act of 2013, the Office reviewed theNational Prosecution Policy and Code of Ethics and Conduct for Prosecutors. In addition theOffice developed prosecution guidelines on sexual and gender-based violence, economiccrimes and trafficking in persons. Further, the Office developed standard operatingprocedures for investigation and prosecution of crimes in terrorism, wildlife, Female GenitalMutilation , international crimes, piracy and other maritime crimes in form of manuals forprosecutors use.
The office continues to face the following challenges: heavy case load relative to the currenthuman resource capacity; inadequate specialised skills to handle emerging crimes; weaklinkages with other criminal justice agencies; inadequate office space and automation ofservices among others. To mitigate against these challenges, the ODPP will undertake arecruitment exercise to be completed by the end of FY 2016/17 aimed at filling the staffestablishment gap; the ODPP has also prioritised staff training for the coming MTEF periodwith a view of improving our technical capacity to handle emerging crimes; the ODPP is in the
618

1291 Office of the Director of Public Prosecutions
PART D. Programme Objectives
process of developing an ICT network covering the entire organisation and installing a casemanagement system to leverage the organisational performance on ICT; the ODPP is part ofa multi-agency team composed of all criminal justice agencies; that was created to fast trackthe investigation and prosecution of economic crimes and corruption cases. Finally the ODPPcontinues to welcome partnership opportunities with development partners where the focus isin meeting its core mandate on delivery of services to the public.
For the coming MTEF period 2016/17-2018/19, the ODPP will continue implementing itsprogramme of Public Prosecution Services, with an expectation of concluding the number ofcases pending in court of laws. Towards this the resources allocated for the period will beapplied for the following areas: further decentralization of prosecution services and buildinghuman resources and material capacity; deployment of prosecution counsel in all courtstations countrywide; quality assurance of all prosecutions; enhancing the witness andvictims support programme; improving staff welfare by increasing the remuneration package;automation and modernization of ODPP services/processes through the development of acase management system; establishment of resource centres in all of the field offices andconstruction of more offices in identified 10 Counties.
ObjectiveProgramme
0612000 P.1 PublicProsecution Services To provide efficient, effective and fair prosecution services
619
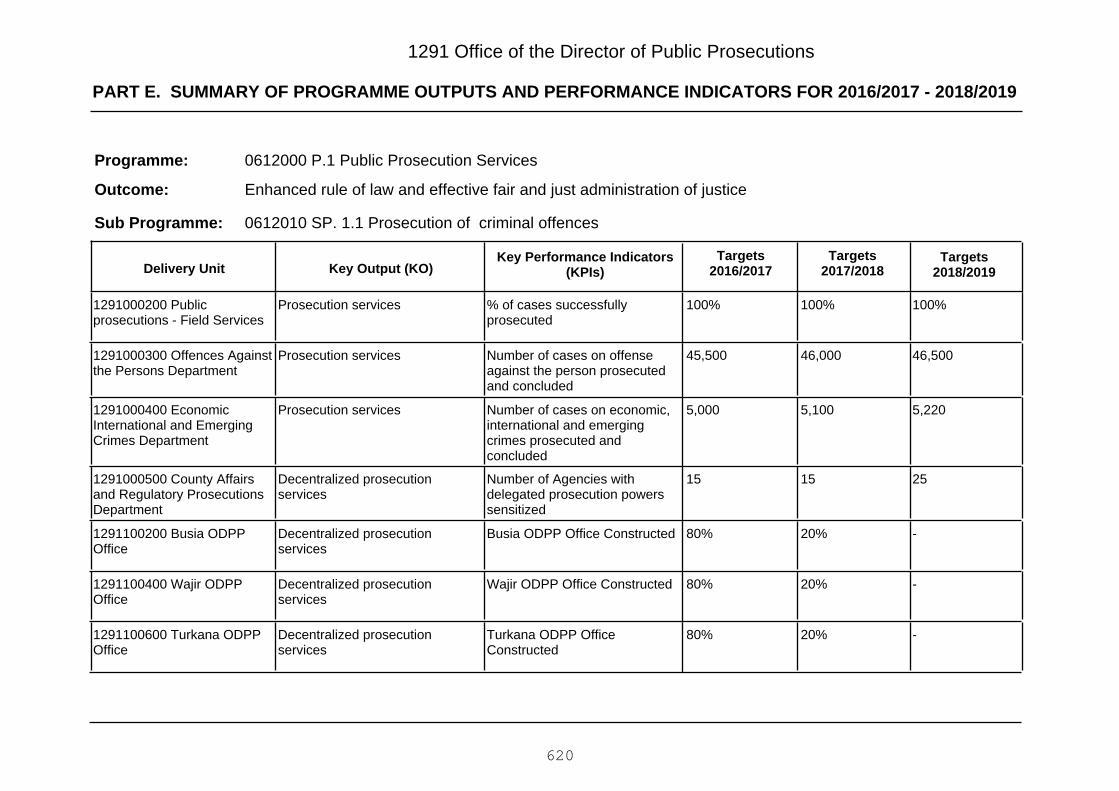
PART E. SUMMARY OF PROGRAMME OUTPUTS AND PERFORMANCE INDICATORS FOR 2016/2017 - 2018/2019
1291 Office of the Director of Public Prosecutions
0612000 P.1 Public Prosecution Services
Enhanced rule of law and effective fair and just administration of justice
Programme:
Outcome:
0612010 SP. 1.1 Prosecution of criminal offencesSub Programme:
Key Output (KO)Targets
2018/2019Targets
2017/2018Key Performance Indicators
(KPIs)Targets
2016/2017Delivery Unit
100%100%100%% of cases successfullyprosecuted
Prosecution services1291000200 Publicprosecutions - Field Services
46,50046,00045,500Number of cases on offenseagainst the person prosecutedand concluded
Prosecution services1291000300 Offences Againstthe Persons Department
5,2205,1005,000Number of cases on economic,international and emergingcrimes prosecuted andconcluded
Prosecution services1291000400 EconomicInternational and EmergingCrimes Department
251515Number of Agencies withdelegated prosecution powerssensitized
Decentralized prosecutionservices
1291000500 County Affairsand Regulatory ProsecutionsDepartment
-20%80%Busia ODPP Office ConstructedDecentralized prosecutionservices
1291100200 Busia ODPPOffice
-20%80%Wajir ODPP Office ConstructedDecentralized prosecutionservices
1291100400 Wajir ODPPOffice
-20%80%Turkana ODPP OfficeConstructed
Decentralized prosecutionservices
1291100600 Turkana ODPPOffice
620

PART E. SUMMARY OF PROGRAMME OUTPUTS AND PERFORMANCE INDICATORS FOR 2016/2017 - 2018/2019
1291 Office of the Director of Public Prosecutions
666Number of ContainerizedOffices erected
Decentralized prosecutionservices
1291100700 ContainerizedOffices
853Number of County Officesrefurbished
Decentralized prosecutionservices
1291100800 Refurbishmentof ODPP County Office
0612020 SP. 1.2 Witnesses and victims of crime servicesSub Programme:
Key Output (KO)Targets
2018/2019Targets
2017/2018Key Performance Indicators
(KPIs)Targets
2016/2017Delivery Unit
4710Number of days taken toprovide legal advice toinvestigative and other agencies
Prosecution services1291000200 Publicprosecutions - Field Services
4710Number of days taken toprovide legal advice toinvestigative and other agencies
Prosecution services1291000300 Offences Againstthe Persons Department
4710Number of days taken toprovide legal advice toinvestigative and other agencies
Prosecution services1291000400 EconomicInternational and EmergingCrimes Department
0612050 SP. 1.5 General Administration Planning and Support ServicesSub Programme:
Key Output (KO)Targets
2018/2019Targets
2017/2018Key Performance Indicators
(KPIs)Targets
2016/2017Delivery Unit
1055Number of penal and criminallaws developed, reviewed andrevised
Responsive penal and criminallaws
1291000600 CentralFacilitation ServicesDepartment
621
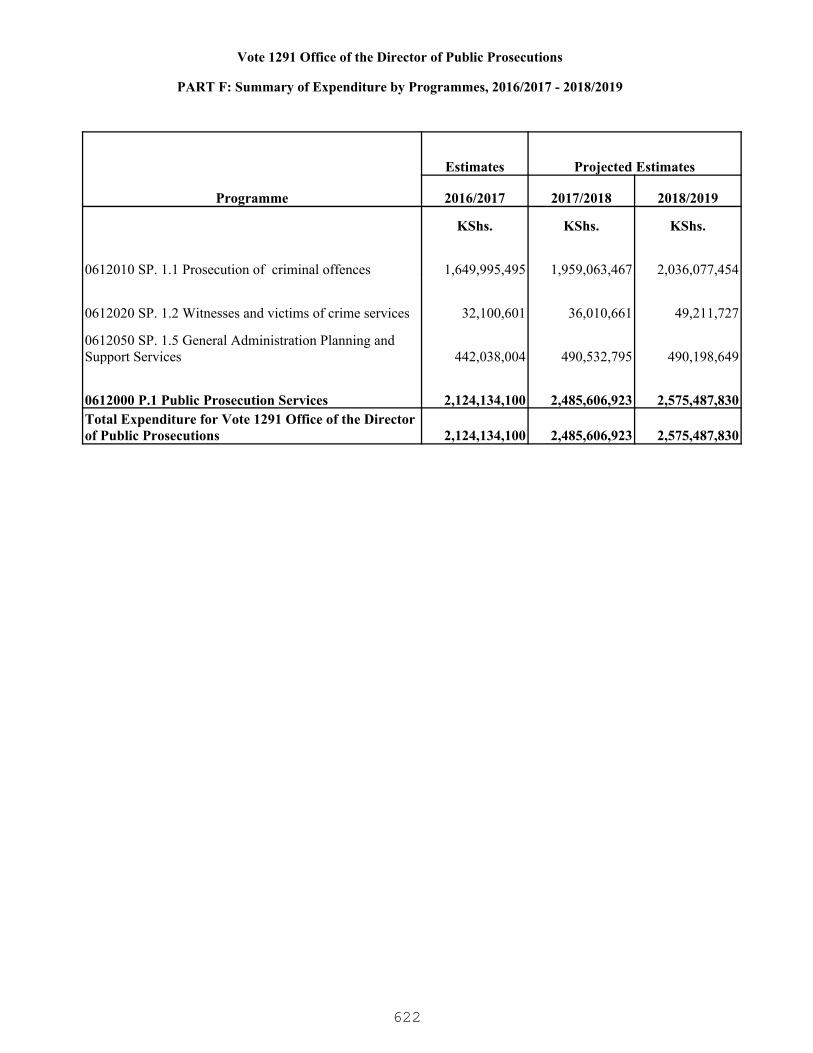
Vote 1291 Office of the Director of Public Prosecutions
PART F: Summary of Expenditure by Programmes, 2016/2017 - 2018/2019
Programme
Estimates Projected Estimates
2016/2017 2017/2018 2018/2019
KShs. KShs. KShs.
0612010 SP. 1.1 Prosecution of criminal offences 1,649,995,495 1,959,063,467 2,036,077,454
0612020 SP. 1.2 Witnesses and victims of crime services 32,100,601 36,010,661 49,211,727
0612050 SP. 1.5 General Administration Planning and Support Services 442,038,004 490,532,795 490,198,649
0612000 P.1 Public Prosecution Services 2,124,134,100 2,485,606,923 2,575,487,830Total Expenditure for Vote 1291 Office of the Director of Public Prosecutions 2,124,134,100 2,485,606,923 2,575,487,830
622

1291 Office of the Director of Public Prosecutions
PART G: Summary of Expenditure by Vote and Economic Classification, 2016/2017 - 2018/2019
Economic Classification
Estimates Projected Estimates
2016/2017 2017/2018 2018/2019KShs. KShs. KShs.
Current Expenditure 2,025,584,100 2,156,606,923 2,238,487,830
Compensation to Employees 1,192,794,100 1,226,396,923 1,261,007,830
Use of Goods and Services 814,150,547 888,016,602 921,367,262
Other Recurrent 18,639,453 42,193,398 56,112,738
Capital Expenditure 98,550,000 329,000,000 337,000,000
Acquisition of Non-Financial Assets 96,000,000 329,000,000 337,000,000
Other Development 2,550,000 - -Total Expenditure 2,124,134,100 2,485,606,923 2,575,487,830
623

1291 Office of the Director of Public Prosecutions
PART H: Summary of Expenditure by Programme and Economic Classification, 2016/2017 - 2018/2019
0612010 SP. 1.1 Prosecution of criminal offences
Economic Classification
Estimates Projected Estimates
2016/2017 2017/2018 2018/2019KShs. KShs. KShs.
Current Expenditure 1,551,445,495 1,630,063,467 1,699,077,454
Compensation to Employees 1,123,482,910 1,154,155,747 1,189,250,513
Use of Goods and Services 416,923,132 460,714,322 488,714,203
Other Recurrent 11,039,453 15,193,398 21,112,738
Capital Expenditure 98,550,000 329,000,000 337,000,000
Acquisition of Non-Financial Assets 96,000,000 329,000,000 337,000,000
Other Development 2,550,000 - -Total Expenditure 1,649,995,495 1,959,063,467 2,036,077,454
0612020 SP. 1.2 Witnesses and victims of crime services
Economic Classification
Estimates Projected Estimates
2016/2017 2017/2018 2018/2019KShs. KShs. KShs.
Current Expenditure 32,100,601 36,010,661 49,211,727
Use of Goods and Services 32,100,601 36,010,661 49,211,727Total Expenditure 32,100,601 36,010,661 49,211,727
0612050 SP. 1.5 General Administration Planning and Support Services
Economic Classification
Estimates Projected Estimates
2016/2017 2017/2018 2018/2019KShs. KShs. KShs.
Current Expenditure 442,038,004 490,532,795 490,198,649
Compensation to Employees 69,311,190 72,241,176 71,757,317
Use of Goods and Services 365,126,814 391,291,619 383,441,332
Other Recurrent 7,600,000 27,000,000 35,000,000Total Expenditure 442,038,004 490,532,795 490,198,649
624

1291 Office of the Director of Public Prosecutions
PART H: Summary of Expenditure by Programme and Economic Classification, 2016/2017 - 2018/2019
0612000 P.1 Public Prosecution Services
Economic Classification
Estimates Projected Estimates
2016/2017 2017/2018 2018/2019KShs. KShs. KShs.
Current Expenditure 2,025,584,100 2,156,606,923 2,238,487,830
Compensation to Employees 1,192,794,100 1,226,396,923 1,261,007,830
Use of Goods and Services 814,150,547 888,016,602 921,367,262
Other Recurrent 18,639,453 42,193,398 56,112,738
Capital Expenditure 98,550,000 329,000,000 337,000,000
Acquisition of Non-Financial Assets 96,000,000 329,000,000 337,000,000
Other Development 2,550,000 - -Total Expenditure 2,124,134,100 2,485,606,923 2,575,487,830
625
1311 Office of the Registrar of Political Parties
An inclusive and viable democratic multi-party system
To promote institutionalized political parties in Kenya
PART A. Vision
PART B. Mission
PART C. Performance Overview and Background for Programme(s) Funding
PART D. Programme Objectives
The mandate of the Office of the Register of Political Parties (ORPP) is to register, regulateand administer the Political Parties Fund.
In 2013/2014 financial year the ORPP budgetary allocation was KShs. 324 million but theactual expenditure was KShs. 314 million, representing an absorption rate of 96.9%. Theallocation for FY 2014/2015 was KShs. 476 million while the actual expenditure was KShs.463 million, representing an absorption rate of 97.2 %.
During the period under review, the ORPP strengthened the political parties leadership bytraining political parties Secretary Generals on leadership and integrity, and accountingprocesses according to Public Finance Management Act, 2012. To ensure compliance withthe Political Parties Act, 2011 the ORPP updated and disseminated Political PartiesRegulations on registration and funding. The office also upgraded the Political PartiesMembership Software.
The Office faced several challenges including being enjoined in many cases involving interand intra political parties and the Independent Electoral and Boundaries Commission (IEBC).Further, the ORPP has a shortage of staff and the registrar and three assistant registrarshave not been appointed as per the Political Parties Act, 2011.
In 2016/2017 – 2018/2019 MTEF period, the ORPP undertakes to prepare political parties toensure the 2017 general elections are credible and peaceful. The Office also plans tostrengthen the Political Parties Liaison Committee which is a forum for dialogue between thepolitical parties, Registrar of Political Parties and the IEBC.
ObjectiveProgramme
0614000 P.1 Registration,Regulation and Funding ofPolitical Parties
To promote competitive and issue based political parties
626

PART E. SUMMARY OF PROGRAMME OUTPUTS AND PERFORMANCE INDICATORS FOR 2016/2017 - 2018/2019
1311 Office of the Registrar of Political Parties
0614000 P.1 Registration, Regulation and Funding of Political Parties
Competitive and issue based political parties
Programme:
Outcome:
0614010 SP. 1.1Registration and regulation of political partiesSub Programme:
Key Output (KO)Targets
2018/2019Targets
2017/2018Key Performance Indicators
(KPIs)Targets
2016/2017Delivery Unit
65
130
24
65
130
30
62
124
24
Number of Political Partiesconstitutions reviewed forcompliance
Number of Political PartiesOfficials Sensitizes on PublicManagement
Number of Resolutions passedon issues affecting politicalparties
Political parties compliant withPolitical Parties Act 2011
Political Parties FundAdministered
Political Parties LiaisonCommittee administered
1311000200 Registrar ofPolitical Parties
627
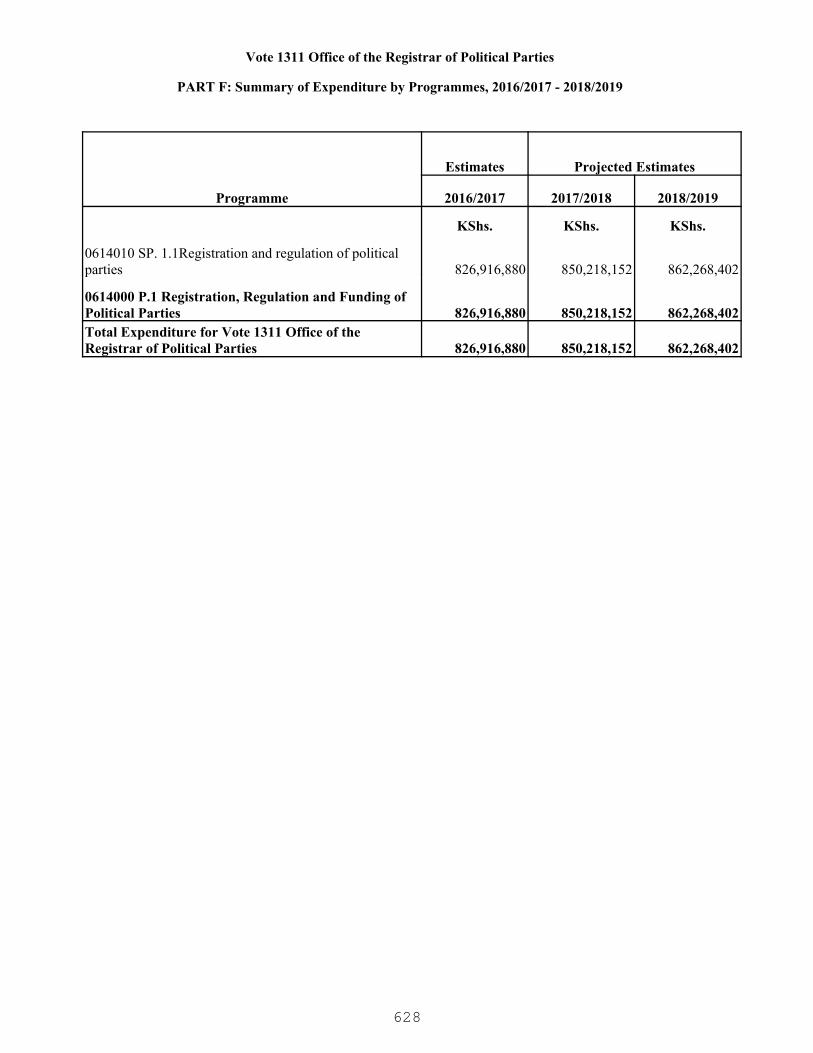
Vote 1311 Office of the Registrar of Political Parties
PART F: Summary of Expenditure by Programmes, 2016/2017 - 2018/2019
Programme
Estimates Projected Estimates
2016/2017 2017/2018 2018/2019
KShs. KShs. KShs.
0614010 SP. 1.1Registration and regulation of political parties 826,916,880 850,218,152 862,268,402
0614000 P.1 Registration, Regulation and Funding of Political Parties 826,916,880 850,218,152 862,268,402Total Expenditure for Vote 1311 Office of the Registrar of Political Parties 826,916,880 850,218,152 862,268,402
628

1311 Office of the Registrar of Political Parties
PART G: Summary of Expenditure by Vote and Economic Classification, 2016/2017 - 2018/2019
Economic Classification
Estimates Projected Estimates
2016/2017 2017/2018 2018/2019KShs. KShs. KShs.
Current Expenditure 826,916,880 850,218,152 862,268,402
Compensation to Employees 115,322,080 117,161,742 119,056,595
Use of Goods and Services 272,415,606 279,966,000 287,513,980
Current Transfers to Govt. Agencies 370,504,800 379,026,410 384,711,807
Other Recurrent 68,674,394 74,064,000 70,986,020Total Expenditure 826,916,880 850,218,152 862,268,402
629
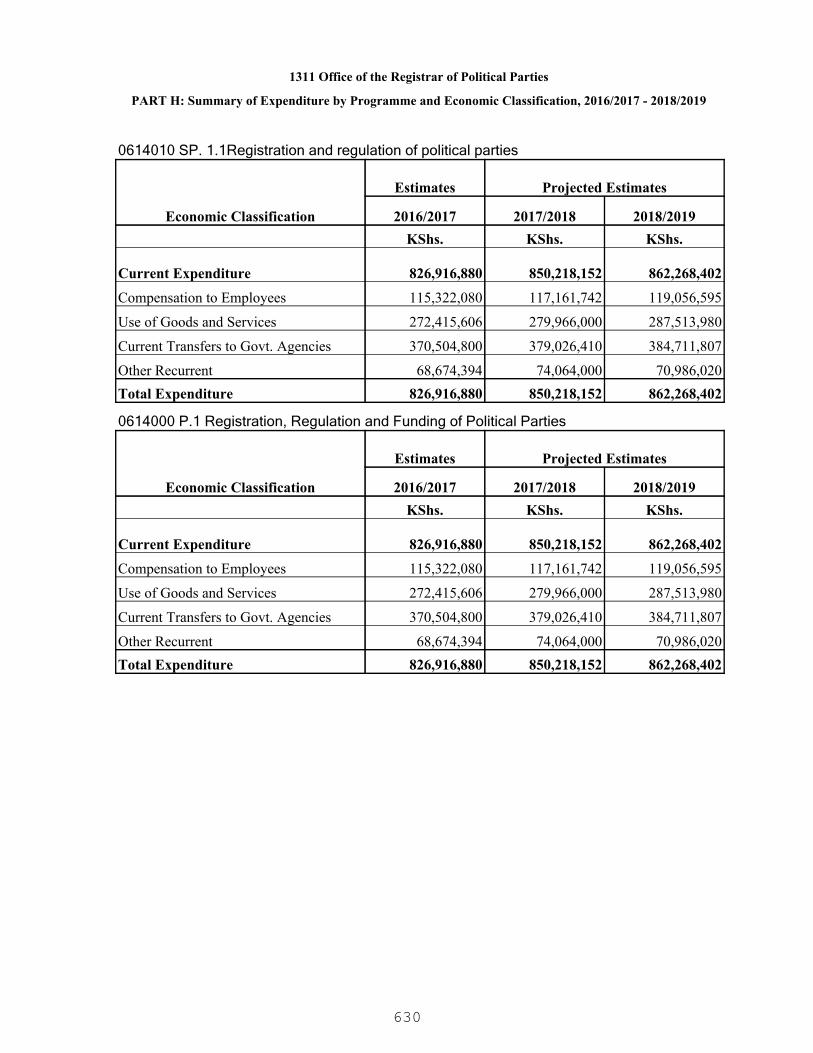
1311 Office of the Registrar of Political Parties
PART H: Summary of Expenditure by Programme and Economic Classification, 2016/2017 - 2018/2019
0614010 SP. 1.1Registration and regulation of political parties
Economic Classification
Estimates Projected Estimates
2016/2017 2017/2018 2018/2019KShs. KShs. KShs.
Current Expenditure 826,916,880 850,218,152 862,268,402
Compensation to Employees 115,322,080 117,161,742 119,056,595
Use of Goods and Services 272,415,606 279,966,000 287,513,980
Current Transfers to Govt. Agencies 370,504,800 379,026,410 384,711,807
Other Recurrent 68,674,394 74,064,000 70,986,020Total Expenditure 826,916,880 850,218,152 862,268,402
0614000 P.1 Registration, Regulation and Funding of Political Parties
Economic Classification
Estimates Projected Estimates
2016/2017 2017/2018 2018/2019KShs. KShs. KShs.
Current Expenditure 826,916,880 850,218,152 862,268,402
Compensation to Employees 115,322,080 117,161,742 119,056,595
Use of Goods and Services 272,415,606 279,966,000 287,513,980
Current Transfers to Govt. Agencies 370,504,800 379,026,410 384,711,807
Other Recurrent 68,674,394 74,064,000 70,986,020Total Expenditure 826,916,880 850,218,152 862,268,402
630
1321 Witness Protection Agency
A leading witness protection agency in the world.
To promote the rule of law by providing an effective and efficient Witness ProtectionProgramme in Kenya
PART A. Vision
PART B. Mission
PART C. Performance Overview and Background for Programme(s) Funding
PART D. Programme Objectives
The Agency is mandated to provide special protection, on behalf of the State, to persons inpossession of important information and who are facing potential risk or intimidation due totheir co-operation with prosecution and law enforcement agencies.
During the period under review, the Agency has enhanced human capacity from a staffing ofseven to sixty five; participated in awareness campaigns and aired witness protectioninfomercials in local languages to sensitize the public and stakeholders on the functions androles of Witness Protection Agency (WPA)/Witness Protection Programme (WPP); DevelopedStandard Operating Procedures (SOPs) for security of WPA assets and management ofwitnesses,Intelligence gathering mechanism policy to guide intelligence gathering,Developedand implemented Standard Advisory and Referral Mechanisms for WitnessProtection;devolved its services to Western region, put necessary structures, opened theoffice and posted staff in order to enhance service delivery;Implemented Enterprise ResourcePlanning (ERP) software for Accounting, payroll and Procurement functions as its servicedelivery improvement;provided of advisory services to other agencies on protection measuresand reviewed the Witness Protection Act and proposed amendments to align it with theConstitution and other enabling laws.
The expenditure trends for the WPP has increased as follows; in FY 2011/12 the expenditurewas KSHs.163 million; it increased to KSHs. 201.9 million in FY 2012/13; in FY 2013/14 theexpenditure was KSHs. 249.7 million; it increased to KSHs. 302.2 million in FY 2014/15.
During the period under review the Agency experienced several challenges including weaklegal and institutional framework, inadequate awareness of the Agency and programme,inadequate automation, inadequate local and international collaborations and lack of courtfacilities such as witness box, witness waiting room, separate access doors for protectedwitnesses. The above challenges have been addressed through facilitating the review of legalframe work to align with institutional and other legislation, Implementation of legal framework,resource mobilization, developed service level agreements, created linkages both local andinternational and developed rules of court.
The major services/outputs to be provided in the MTEF period 2015/16 - 2017/18 include;continued admission of threatened witnesses; and maintenance and management ofwitnesses. The Agency projects to maintain a maximum of 50 witnesses and their relatedpersons for the FY 2015/16; facilitate the administration of justice through testimonies in acourt of law; resettle and re-integrate witnesses; and enhanced institutional capacity tosupport the programme.
631

1321 Witness Protection Agency
ObjectiveProgramme
0615000 P.1 WitnessProtection
Improved administration of and access to justice and rule oflaw
632
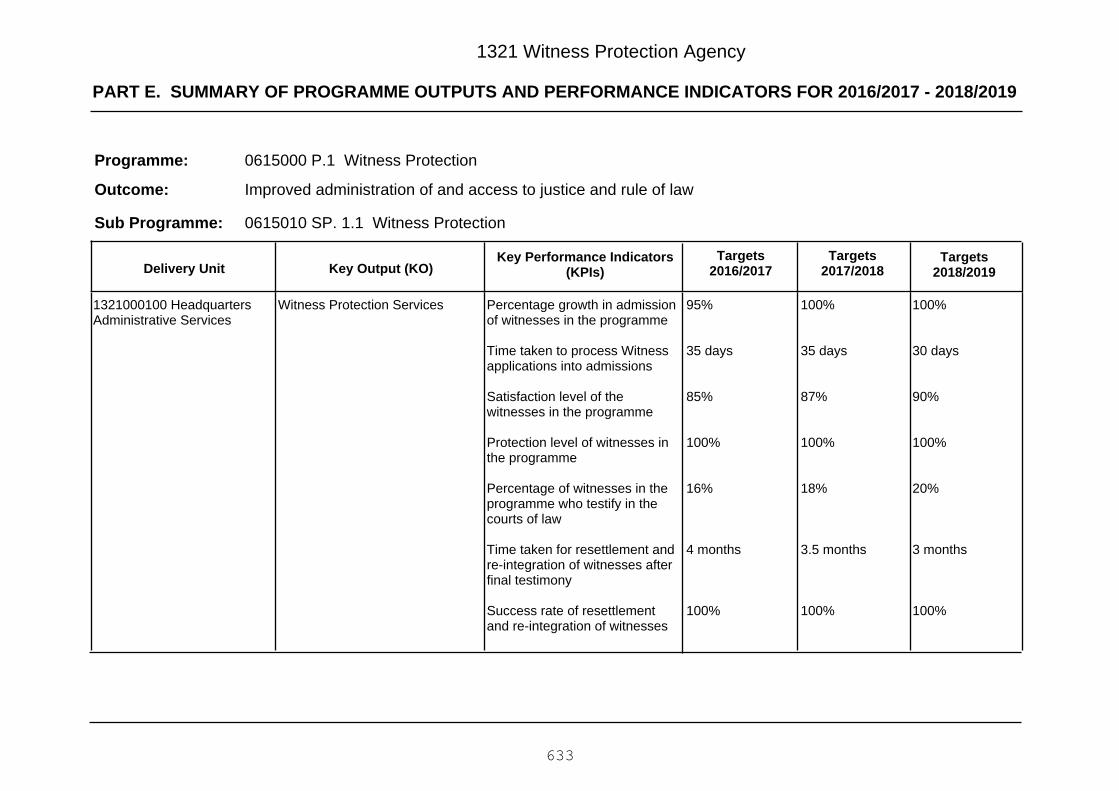
PART E. SUMMARY OF PROGRAMME OUTPUTS AND PERFORMANCE INDICATORS FOR 2016/2017 - 2018/2019
1321 Witness Protection Agency
0615000 P.1 Witness Protection
Improved administration of and access to justice and rule of law
Programme:
Outcome:
0615010 SP. 1.1 Witness ProtectionSub Programme:
Key Output (KO)Targets
2018/2019Targets
2017/2018Key Performance Indicators
(KPIs)Targets
2016/2017Delivery Unit
100%
30 days
90%
100%
20%
3 months
100%
100%
35 days
87%
100%
18%
3.5 months
100%
95%
35 days
85%
100%
16%
4 months
100%
Percentage growth in admissionof witnesses in the programme
Time taken to process Witnessapplications into admissions
Satisfaction level of thewitnesses in the programme
Protection level of witnesses inthe programme
Percentage of witnesses in theprogramme who testify in thecourts of law
Time taken for resettlement andre-integration of witnesses afterfinal testimony
Success rate of resettlementand re-integration of witnesses
Witness Protection Services1321000100 HeadquartersAdministrative Services
633
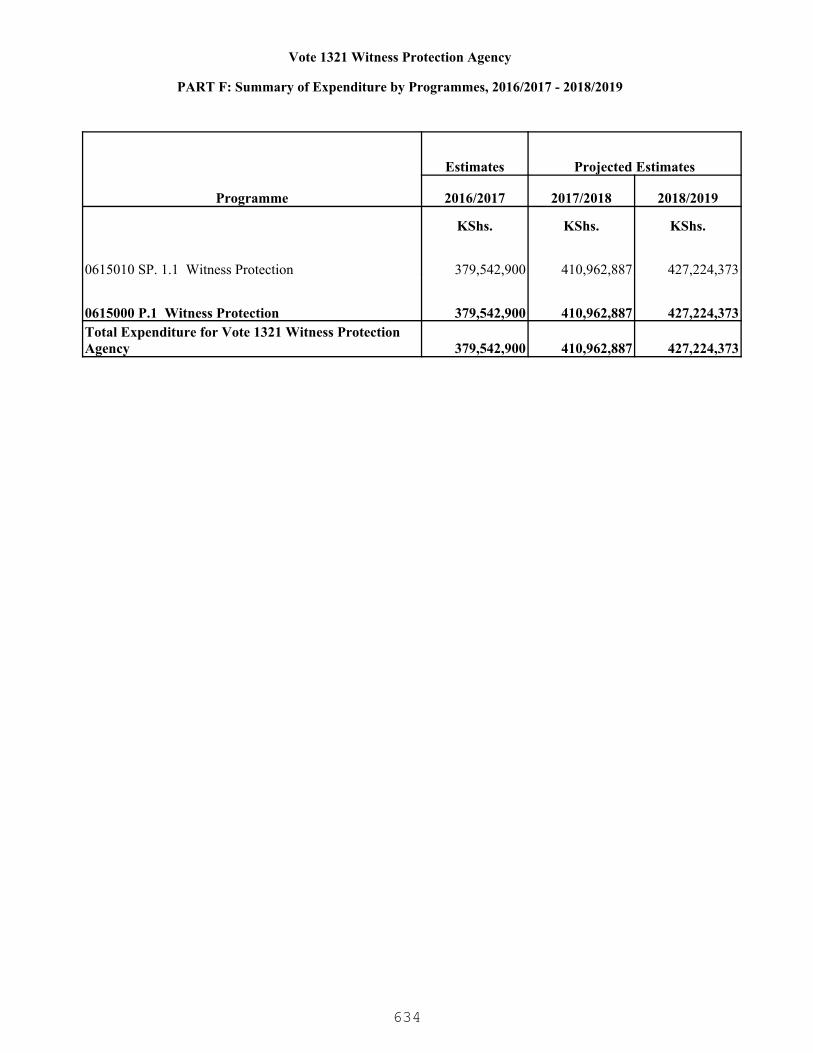
Vote 1321 Witness Protection Agency
PART F: Summary of Expenditure by Programmes, 2016/2017 - 2018/2019
Programme
Estimates Projected Estimates
2016/2017 2017/2018 2018/2019
KShs. KShs. KShs.
0615010 SP. 1.1 Witness Protection 379,542,900 410,962,887 427,224,373
0615000 P.1 Witness Protection 379,542,900 410,962,887 427,224,373Total Expenditure for Vote 1321 Witness Protection Agency 379,542,900 410,962,887 427,224,373
634
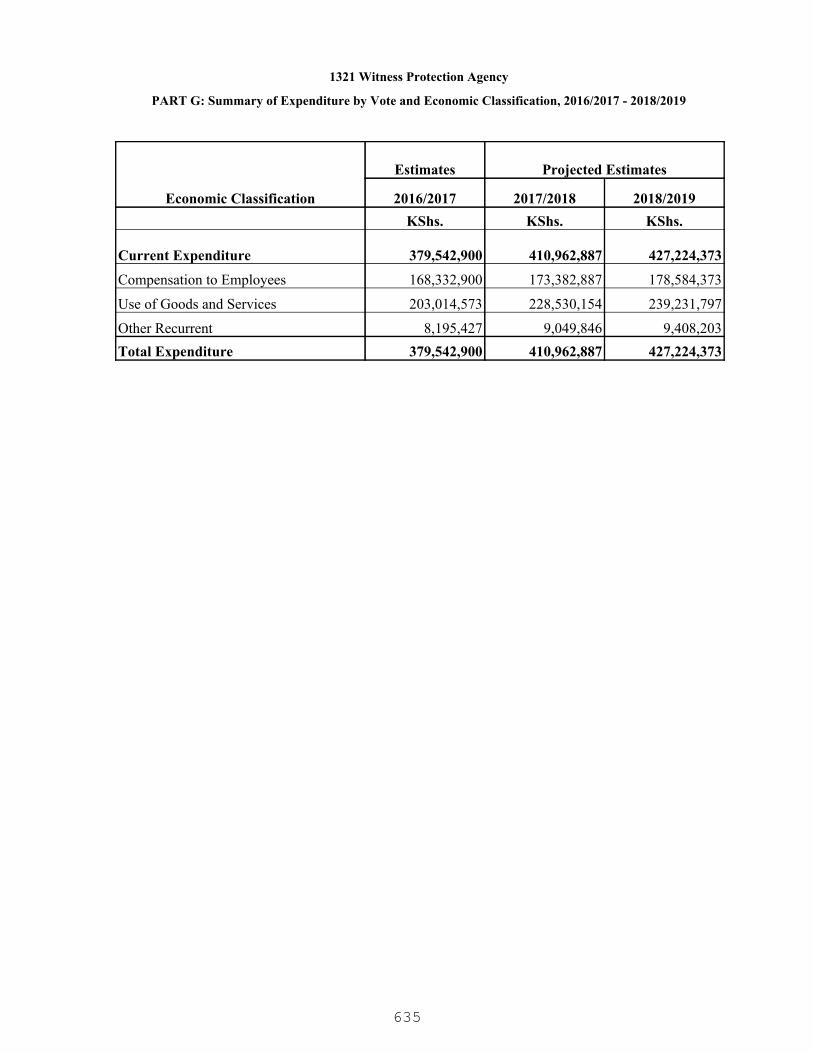
1321 Witness Protection Agency
PART G: Summary of Expenditure by Vote and Economic Classification, 2016/2017 - 2018/2019
Economic Classification
Estimates Projected Estimates
2016/2017 2017/2018 2018/2019KShs. KShs. KShs.
Current Expenditure 379,542,900 410,962,887 427,224,373
Compensation to Employees 168,332,900 173,382,887 178,584,373
Use of Goods and Services 203,014,573 228,530,154 239,231,797
Other Recurrent 8,195,427 9,049,846 9,408,203Total Expenditure 379,542,900 410,962,887 427,224,373
635

1321 Witness Protection Agency
PART H: Summary of Expenditure by Programme and Economic Classification, 2016/2017 - 2018/2019
0615010 SP. 1.1 Witness Protection
Economic Classification
Estimates Projected Estimates
2016/2017 2017/2018 2018/2019KShs. KShs. KShs.
Current Expenditure 379,542,900 410,962,887 427,224,373
Compensation to Employees 168,332,900 173,382,887 178,584,373
Use of Goods and Services 203,014,573 228,530,154 239,231,797
Other Recurrent 8,195,427 9,049,846 9,408,203Total Expenditure 379,542,900 410,962,887 427,224,373
0615000 P.1 Witness Protection
Economic Classification
Estimates Projected Estimates
2016/2017 2017/2018 2018/2019KShs. KShs. KShs.
Current Expenditure 379,542,900 410,962,887 427,224,373
Compensation to Employees 168,332,900 173,382,887 178,584,373
Use of Goods and Services 203,014,573 228,530,154 239,231,797
Other Recurrent 8,195,427 9,049,846 9,408,203Total Expenditure 379,542,900 410,962,887 427,224,373
636
2011 Kenya National Commission on Human Rights
A society that upholds human rights for all
To protect, promote and monitor the respect for human rights in Kenya through law, policyand practice.
PART A. Vision
PART B. Mission
PART C. Performance Overview and Background for Programme(s) Funding
The Kenya National Commission on Human Rights (KNCHR) is an independent nationalhuman rights institution (NHRI) first established as statutory body under the KNCR Act No. 8of 2002 and subsequently entrenched in the constitution of Kenya 2010 with both watch dogand advisory roles to ensure promotion and protection of human rights.
During the period under review 2012/13-2014/15, the commission received and resolved6476 complaints on alleged human rights violations as follows: (2014/2015, 3,003 complaints,2013/2014, 1,808 complaints, 2012/2013, 1,665 complaints) . The commission participated inat least 41 public interest litigation cases either as an interested party or friend of the court,trained a total of 1,254 public officers and 684 members from Civil Societies Organizations(CSO) on Human Rights Based Approach (HRBA) principles, inspected 46 prisons to assesscompliance to human rights principles and standards as enshrined in the Constitution and inthe international minimum rules on treatment of prisoners, 39 Human Rights bills werereviewed, 3 policies written and 3 advisories given, finalization of the Bails and Bonds Policy,Prisons Act (Cap 90) and the Borstal Institutions Act, drafted the Preservation of HumanDignity and Enforcement of Economic and Social Rights Bill. In line with the transitionaljustice and human rights, the Commission has been a strong advocate of justice for victimswho have suffered violations by State authorities.
Challenges faced by the Commission during the review period include: limited financialresources,limited regional presence and accessibility to areas where the commission has nopresence; inadequate staffing hence the commission operates at one third of itsrecommended capacity, insecurity issues hampering Commission's activities in areas such asBaringo, Wajir, Mandera, Marsabit, Garissa; non submission of critical documents bypetitioners after lodging their petitions leading to prolonged investigations and poor responseto Commission's queries by some government agencies.
During the next MTEF 2016/17-2018/19, the commission aims to achieve the followingoutputs; resolution of public complaints alleging human rights violations; enhance awarenesson human rights, review of policies and legislation on human rights and principles; researchand produce thematic/ occasional reports on Human Rights; conduct institutional audits forimproved protection of human rights; enhance the capacity of state and non state actors onprogramming on HRBA; enhance resolution of human rights petitions through human rightsmediation and Alternative Dispute Resolution (ADR) and interventions towards the realizationof Sustainable Development Goals 2015-2030.
637
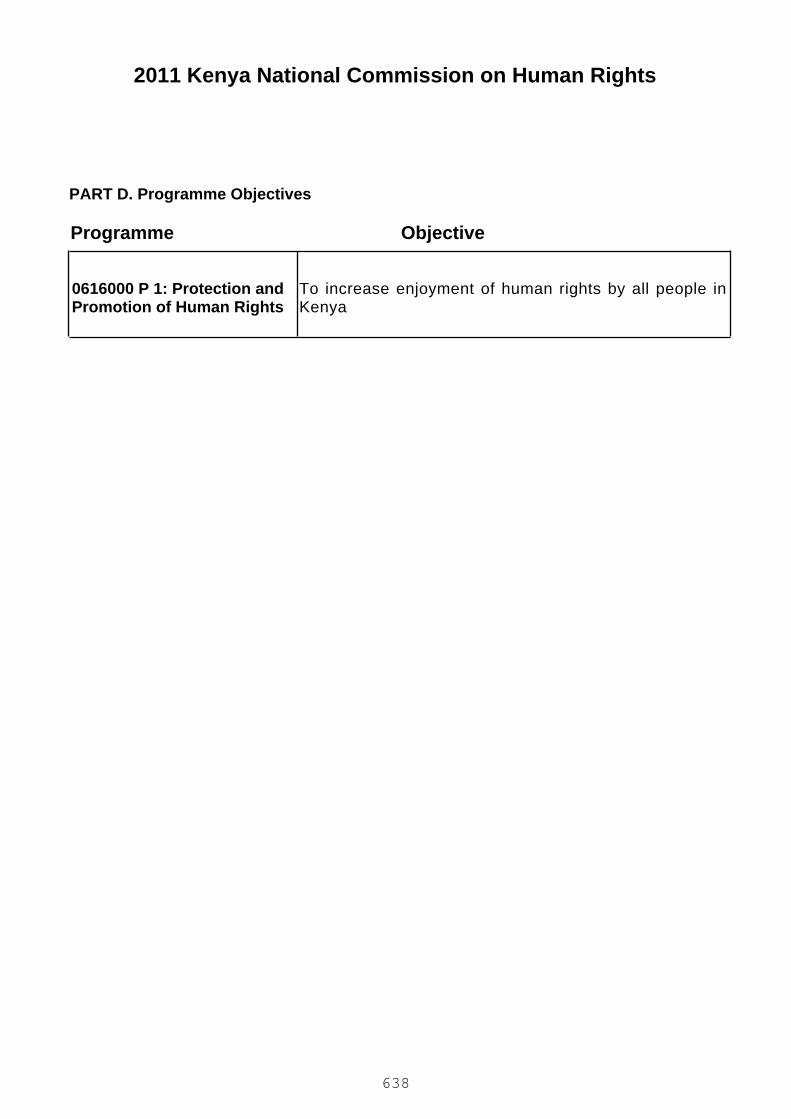
2011 Kenya National Commission on Human Rights
PART D. Programme Objectives
ObjectiveProgramme
0616000 P 1: Protection andPromotion of Human Rights
To increase enjoyment of human rights by all people inKenya
638
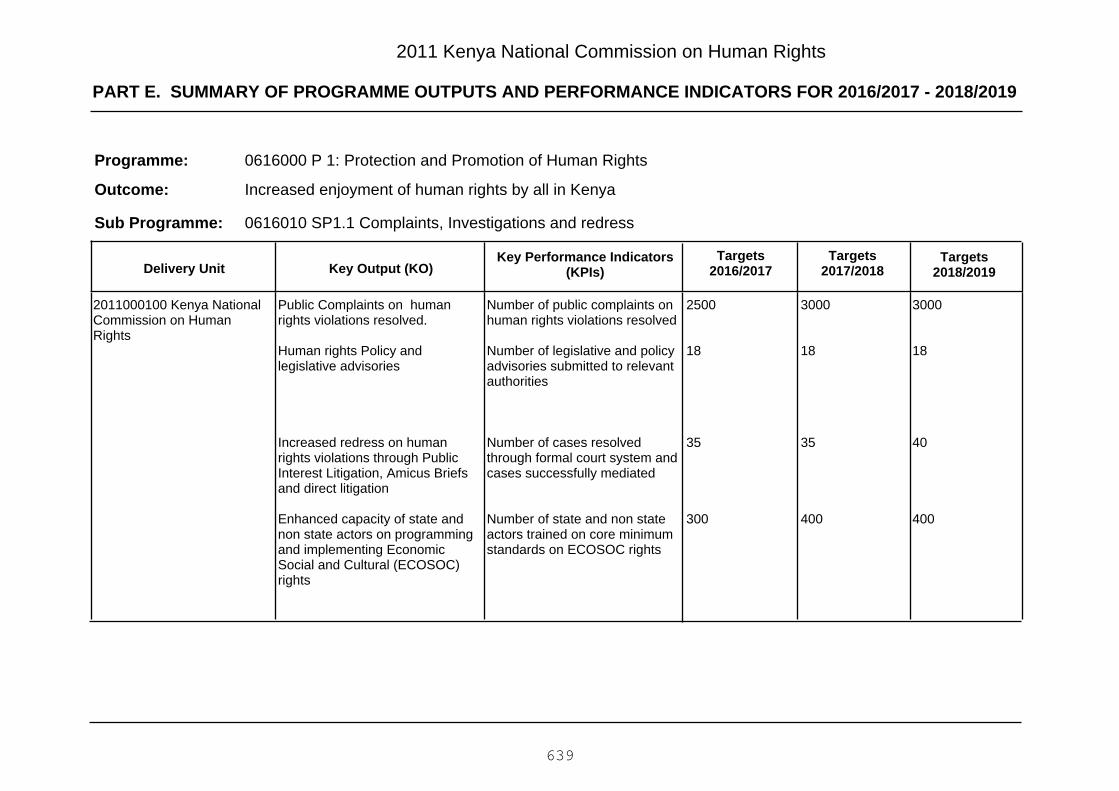
PART E. SUMMARY OF PROGRAMME OUTPUTS AND PERFORMANCE INDICATORS FOR 2016/2017 - 2018/2019
2011 Kenya National Commission on Human Rights
0616000 P 1: Protection and Promotion of Human Rights
Increased enjoyment of human rights by all in Kenya
Programme:
Outcome:
0616010 SP1.1 Complaints, Investigations and redressSub Programme:
Key Output (KO)Targets
2018/2019Targets
2017/2018Key Performance Indicators
(KPIs)Targets
2016/2017Delivery Unit
3000
18
40
400
3000
18
35
400
2500
18
35
300
Number of public complaints onhuman rights violations resolved
Number of legislative and policyadvisories submitted to relevantauthorities
Number of cases resolvedthrough formal court system andcases successfully mediated
Number of state and non stateactors trained on core minimumstandards on ECOSOC rights
Public Complaints on humanrights violations resolved.
Human rights Policy andlegislative advisories
Increased redress on humanrights violations through PublicInterest Litigation, Amicus Briefsand direct litigation
Enhanced capacity of state andnon state actors on programmingand implementing EconomicSocial and Cultural (ECOSOC)rights
2011000100 Kenya NationalCommission on HumanRights
639
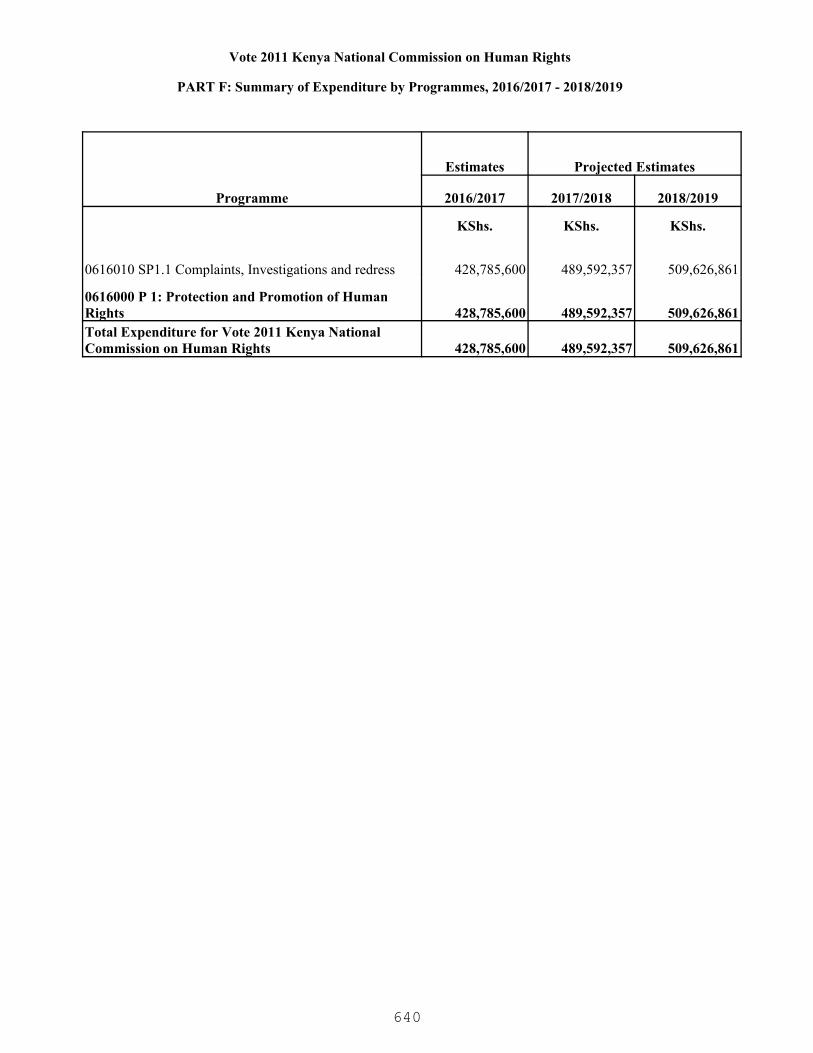
Vote 2011 Kenya National Commission on Human Rights
PART F: Summary of Expenditure by Programmes, 2016/2017 - 2018/2019
Programme
Estimates Projected Estimates
2016/2017 2017/2018 2018/2019
KShs. KShs. KShs.
0616010 SP1.1 Complaints, Investigations and redress 428,785,600 489,592,357 509,626,861
0616000 P 1: Protection and Promotion of Human Rights 428,785,600 489,592,357 509,626,861Total Expenditure for Vote 2011 Kenya National Commission on Human Rights 428,785,600 489,592,357 509,626,861
640

2011 Kenya National Commission on Human Rights
PART G: Summary of Expenditure by Vote and Economic Classification, 2016/2017 - 2018/2019
Economic Classification
Estimates Projected Estimates
2016/2017 2017/2018 2018/2019KShs. KShs. KShs.
Current Expenditure 428,785,600 489,592,357 509,626,861
Compensation to Employees 220,075,600 231,827,868 238,782,704
Use of Goods and Services 171,060,166 199,459,015 212,046,699
Current Transfers to Govt. Agencies 630,000 644,489 654,157
Other Recurrent 37,019,834 57,660,985 58,143,301Total Expenditure 428,785,600 489,592,357 509,626,861
641
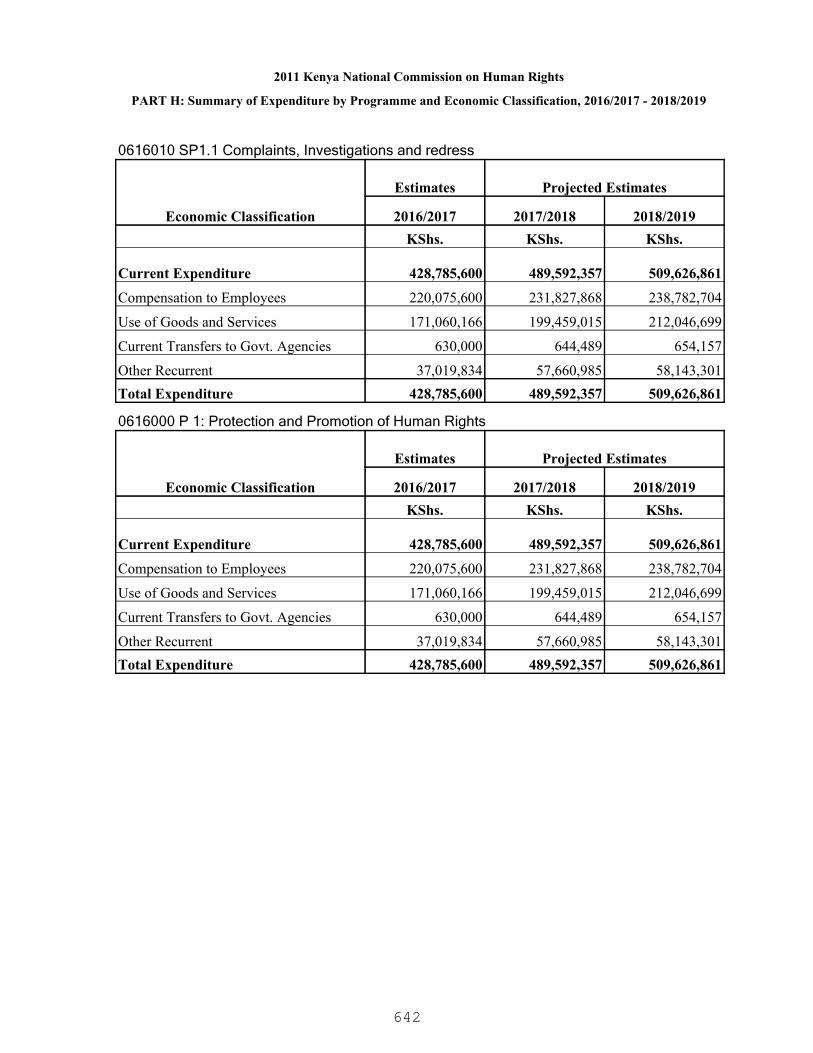
2011 Kenya National Commission on Human Rights
PART H: Summary of Expenditure by Programme and Economic Classification, 2016/2017 - 2018/2019
0616010 SP1.1 Complaints, Investigations and redress
Economic Classification
Estimates Projected Estimates
2016/2017 2017/2018 2018/2019KShs. KShs. KShs.
Current Expenditure 428,785,600 489,592,357 509,626,861
Compensation to Employees 220,075,600 231,827,868 238,782,704
Use of Goods and Services 171,060,166 199,459,015 212,046,699
Current Transfers to Govt. Agencies 630,000 644,489 654,157
Other Recurrent 37,019,834 57,660,985 58,143,301Total Expenditure 428,785,600 489,592,357 509,626,861
0616000 P 1: Protection and Promotion of Human Rights
Economic Classification
Estimates Projected Estimates
2016/2017 2017/2018 2018/2019KShs. KShs. KShs.
Current Expenditure 428,785,600 489,592,357 509,626,861
Compensation to Employees 220,075,600 231,827,868 238,782,704
Use of Goods and Services 171,060,166 199,459,015 212,046,699
Current Transfers to Govt. Agencies 630,000 644,489 654,157
Other Recurrent 37,019,834 57,660,985 58,143,301Total Expenditure 428,785,600 489,592,357 509,626,861
642

2021 National Land Commission
Excellence in administration and management of land for sustainable development.
To facilitate sustainable land use in Kenya through a holistic land policy, efficient landmanagement practices, equitable access to land, comprehensive land registration andapplying appropriate land dispute handling mechanisms.
PART A. Vision
PART B. Mission
PART C. Performance Overview and Background for Programme(s) Funding
The Commission is charged with the mandate of managing public land on behalf of theNational and County Governments and it also plays the role of advising and processing publicland title deeds, review and disposition of grants and leases.
During the period under review, the Commission developed regulations in respect of reviewof grants and dispositions of public land, land use planning bill, amendments to the valuationfor the rating Act, Physical planning bill, investigation and adjudication of historical landinjustices bill, alternate dispute resolution and traditional dispute resolution framework. Thecommission established GIS laboratory unit to support data entity portal into the NationalLand Management System, prepared land use monitoring and oversight practice guidelinesand gazetted land use, developed control guidelines to guide the operations of the CountyLand Management Boards.The Commission also reviewed 3,000 grants and dispositions inNairobi, Kirinyaga, Kwale, Nakuru, Uasin Gishu and Mombasa Counties, revoked grants in15 ranches in Lamu County and facilitated land relocation for Mwea dam expansion forirrigation project.
During the financial year 2012/13, the Commission was allocated KSh.206 million under theMinistry of Land, Housing and Urban Development to cater for the recurrent expenditure. In2013/14 FY, the Commission's allocation for the recurrent vote was KSh.606 million.Subsequently, in 2014/15 FY the allocation for the Commission increased to KSh.1,093million for recurrent expenditure and KSh. 442 million for development expenditure. Duringthe 2012/13 FY, the actual recurrent expenditure was KSh.516 milon while in 2013/14 FY, theactual expenditure was KSh.398 million for recurrent and KSh.118 million for development.Further, in 2014/15 FY, the expenditure was KSh.810 million and KSh.428 million forrecurrent and development respectively.
The challenges and constraints faced by the Commission include, inadequate funding,pending bills, inadequate technical staff in valuation and land adjudication and inadequatemotor vehicles to facilitate the operations of the County Land Management Boards.
The Commission will utilize the allocated funds to develop National Land InformationManagement System (NLIMS) and ICT infrastructure to support both the National and CountyGovernments, digitize land records, review 2,000 grants and leases, verify 4,500 allotmentletters, develop 18 advocacy programmes, develop 19 land use plans for across the Country,develop 8 natural resource maps and databases, resolve 4,000 land cases throughAlternative Dispute Resolution.
The Commission also intends to manage public land on behalf of National and CountyGovernments, manage and administer all Unregistered Trust Land and Community Land on
643
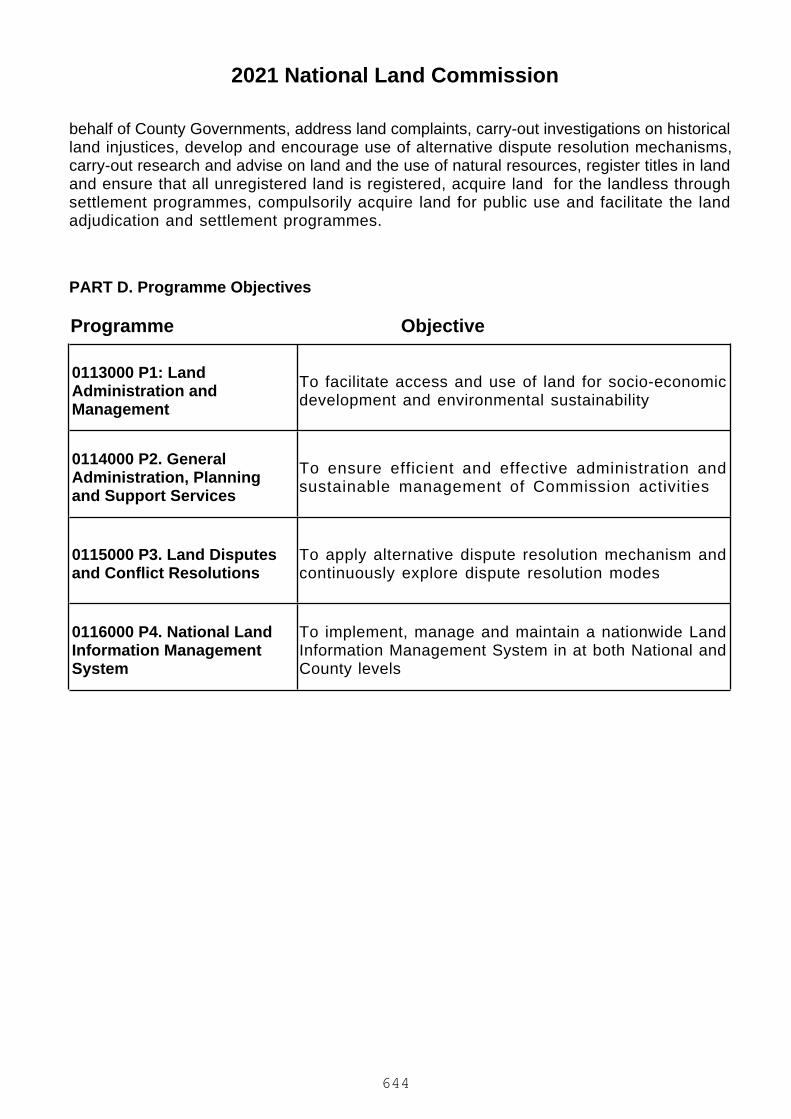
2021 National Land Commission
PART D. Programme Objectives
behalf of County Governments, address land complaints, carry-out investigations on historicalland injustices, develop and encourage use of alternative dispute resolution mechanisms,carry-out research and advise on land and the use of natural resources, register titles in landand ensure that all unregistered land is registered, acquire land for the landless throughsettlement programmes, compulsorily acquire land for public use and facilitate the landadjudication and settlement programmes.
ObjectiveProgramme
0113000 P1: LandAdministration andManagement
To facilitate access and use of land for socio-economicdevelopment and environmental sustainability
0114000 P2. GeneralAdministration, Planningand Support Services
To ensure efficient and effective administration andsustainable management of Commission activities
0115000 P3. Land Disputesand Conflict Resolutions
To apply alternative dispute resolution mechanism andcontinuously explore dispute resolution modes
0116000 P4. National LandInformation ManagementSystem
To implement, manage and maintain a nationwide LandInformation Management System in at both National andCounty levels
644

PART E. SUMMARY OF PROGRAMME OUTPUTS AND PERFORMANCE INDICATORS FOR 2016/2017 - 2018/2019
2021 National Land Commission
0113000 P1: Land Administration and Management
Enhance Access on use of land for social economic and environmental sustainability
Programme:
Outcome:
0113010 SP1: Land Administration and ManagementSub Programme:
Key Output (KO)Targets
2018/2019Targets
2017/2018Key Performance Indicators
(KPIs)Targets
2016/2017Delivery Unit
3,500
9,000
3
35
10
75
2
1
3,000
8,000
3
30
10
56
2
1
2,000
4,500
3
19
8
40
2
1
No. of grants and leasesexecuted, reviewed andrevoked.
No. of verified allotment letters
No. of rules and regulationsdeveloped
No.of land use plans and naturalresources oversight advisoryreports to Counties
No. of natural resource mapsand databases developed
No. of application from acquiringbodies
No. of rules and regulationsdeveloped
Land use planning annual report
Executed, reviewed and revokedleases and grants
Verified allotment letters
Rules and regulations developedfor land administration
Land use plans and naturalresources oversight advisoryreports
Natural Resource Maps
Compulsory Acquisitions
Rules and regulations developedfor compulsory acquisition
State of Land Use Planning in
2021000100 National LandCommission
645

PART E. SUMMARY OF PROGRAMME OUTPUTS AND PERFORMANCE INDICATORS FOR 2016/2017 - 2018/2019
2021 National Land Commission
15
25
15,000
16
20
12,000
16
16
9,000
Spatial plan manuals
No. of adjudicated sections
No. of squatters settled in TeitaSettlement Scheme, Manda andMkokoni in Lamu County andChakama Phase II, BureniPhase I & II and Gongoni in KilifiCounty
Kenya annual report
County Spatial Plan PreparationManuals
Adjudicated sections in Mweke,Simakeni, Kitengwani in Kilifi;Karare and Hulahula in MarsabitSimakeni completed
Settlement programmescompleted
0114000 P2. General Administration, Planning and Support Services
Effective and Efficient Commission on execution of its Mandate
Programme:
Outcome:
0114010 P2.1 General Administration, Planning and Support ServicesSub Programme:
Key Output (KO)Targets
2018/2019Targets
2017/2018Key Performance Indicators
(KPIs)Targets
2016/2017Delivery Unit
Nil
1
4
Nil
1
4
3
1
4
No. of CLMBs established andoperational
Brand audit report
Quarterly reports on M&Erecommendations
EstablishedCounty Land ManagementBoards(CLMBs)
Brand position knowledge
Monitoring and evaluation policyframework in place
2021000100 National LandCommission
646

PART E. SUMMARY OF PROGRAMME OUTPUTS AND PERFORMANCE INDICATORS FOR 2016/2017 - 2018/2019
2021 National Land Commission
4
30
4
20
3
16
No. of audit risk managementreports
% of processes and proceduresautomated
Audit and Risk ManagementReports
Automated NLC processes andprocedures
0115000 P3. Land Disputes and Conflict Resolutions
Peaceful resolutions of complains
Programme:
Outcome:
P0115010 P3.1 Land Disputes and Conflict ResolutionsSub Programme:
Key Output (KO)Targets
2018/2019Targets
2017/2018Key Performance Indicators
(KPIs)Targets
2016/2017Delivery Unit
1
1
4,640
15
40
1
1
5,640
10
34
1
1
3,940
7
25
No. of bills developed
No of cases resolved throughADR
No. of frameworks developed
No. of stakeholder groupstrained on TDR and ADR
% of complaints casesaddressed
Historical land injusticeregulations and bill developed
Alternative Dispute Resolution(ADR) Framework developed andimplemented
Complaints Handling Mechanismdeveloped and implemented
2021000100 National LandCommission
647
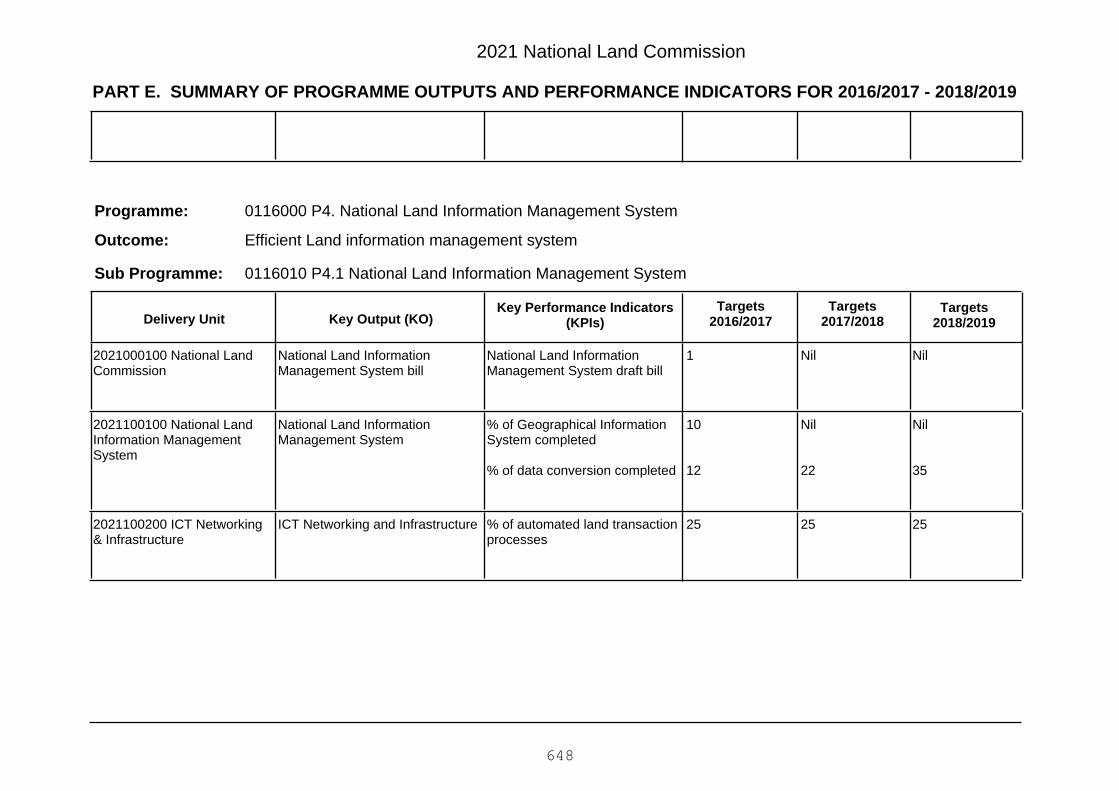
PART E. SUMMARY OF PROGRAMME OUTPUTS AND PERFORMANCE INDICATORS FOR 2016/2017 - 2018/2019
2021 National Land Commission
0116000 P4. National Land Information Management System
Efficient Land information management system
Programme:
Outcome:
0116010 P4.1 National Land Information Management SystemSub Programme:
Key Output (KO)Targets
2018/2019Targets
2017/2018Key Performance Indicators
(KPIs)Targets
2016/2017Delivery Unit
NilNil1National Land InformationManagement System draft bill
National Land InformationManagement System bill
2021000100 National LandCommission
Nil
35
Nil
22
10
12
% of Geographical InformationSystem completed
% of data conversion completed
National Land InformationManagement System
2021100100 National LandInformation ManagementSystem
252525% of automated land transactionprocesses
ICT Networking and Infrastructure2021100200 ICT Networking& Infrastructure
648
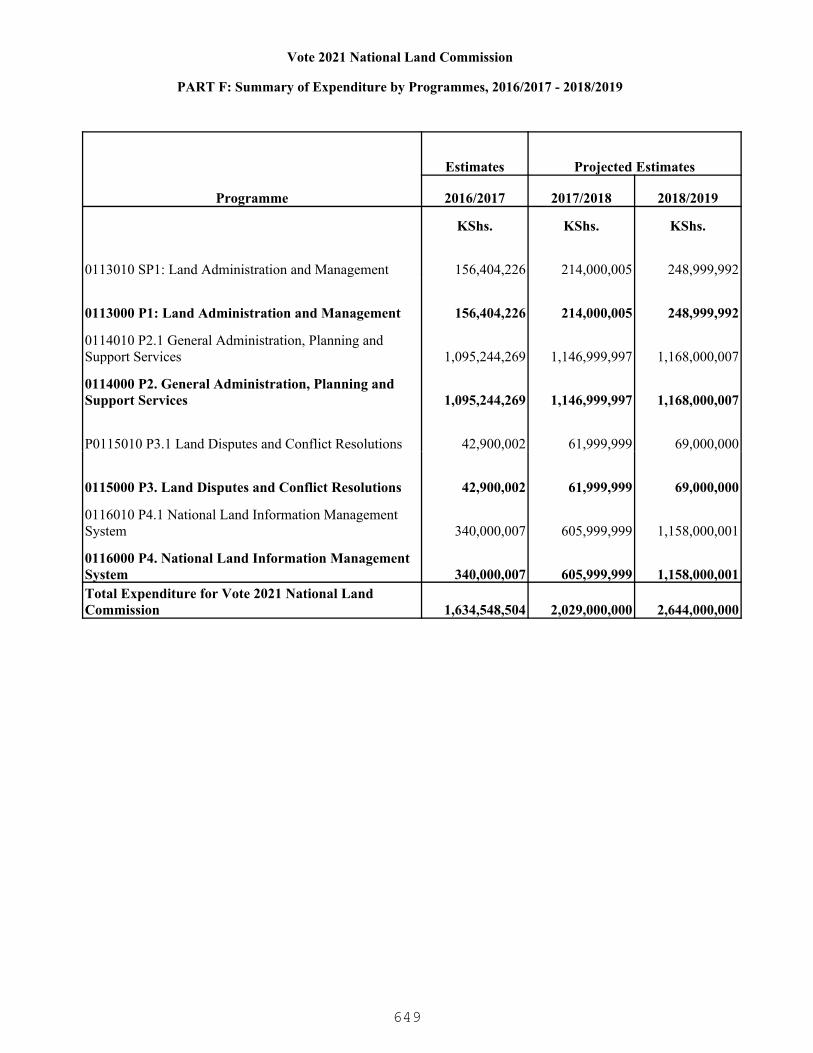
Vote 2021 National Land Commission
PART F: Summary of Expenditure by Programmes, 2016/2017 - 2018/2019
Programme
Estimates Projected Estimates
2016/2017 2017/2018 2018/2019
KShs. KShs. KShs.
0113010 SP1: Land Administration and Management 156,404,226 214,000,005 248,999,992
0113000 P1: Land Administration and Management 156,404,226 214,000,005 248,999,992
0114010 P2.1 General Administration, Planning and Support Services 1,095,244,269 1,146,999,997 1,168,000,007
0114000 P2. General Administration, Planning and Support Services 1,095,244,269 1,146,999,997 1,168,000,007
P0115010 P3.1 Land Disputes and Conflict Resolutions 42,900,002 61,999,999 69,000,000
0115000 P3. Land Disputes and Conflict Resolutions 42,900,002 61,999,999 69,000,000
0116010 P4.1 National Land Information Management System 340,000,007 605,999,999 1,158,000,001
0116000 P4. National Land Information Management System 340,000,007 605,999,999 1,158,000,001Total Expenditure for Vote 2021 National Land Commission 1,634,548,504 2,029,000,000 2,644,000,000
649

2021 National Land Commission
PART G: Summary of Expenditure by Vote and Economic Classification, 2016/2017 - 2018/2019
Economic Classification
Estimates Projected Estimates
2016/2017 2017/2018 2018/2019KShs. KShs. KShs.
Current Expenditure 1,334,548,504 1,473,000,000 1,543,000,000
Compensation to Employees 723,440,016 737,000,000 751,000,000
Use of Goods and Services 554,077,540 660,426,055 705,244,622
Other Recurrent 57,030,948 75,573,945 86,755,378
Capital Expenditure 300,000,000 556,000,000 1,101,000,000
Acquisition of Non-Financial Assets 100,000,000 171,000,000 234,000,000
Other Development 200,000,000 385,000,000 867,000,000Total Expenditure 1,634,548,504 2,029,000,000 2,644,000,000
650

2021 National Land Commission
PART H: Summary of Expenditure by Programme and Economic Classification, 2016/2017 - 2018/2019
0113010 SP1: Land Administration and Management
Economic Classification
Estimates Projected Estimates
2016/2017 2017/2018 2018/2019KShs. KShs. KShs.
Current Expenditure 156,404,226 214,000,005 248,999,992
Use of Goods and Services 154,387,867 203,767,240 236,999,518
Other Recurrent 2,016,359 10,232,765 12,000,474Total Expenditure 156,404,226 214,000,005 248,999,992
0113000 P1: Land Administration and Management
Economic Classification
Estimates Projected Estimates
2016/2017 2017/2018 2018/2019KShs. KShs. KShs.
Current Expenditure 156,404,226 214,000,005 248,999,992
Use of Goods and Services 154,387,867 203,767,240 236,999,518
Other Recurrent 2,016,359 10,232,765 12,000,474Total Expenditure 156,404,226 214,000,005 248,999,992
0114010 P2.1 General Administration, Planning and Support Services
Economic Classification
Estimates Projected Estimates
2016/2017 2017/2018 2018/2019KShs. KShs. KShs.
Current Expenditure 1,095,244,269 1,146,999,997 1,168,000,007
Compensation to Employees 723,440,016 737,000,000 751,000,000
Use of Goods and Services 332,850,391 364,930,542 367,178,807
Other Recurrent 38,953,862 45,069,455 49,821,200Total Expenditure 1,095,244,269 1,146,999,997 1,168,000,007
0114000 P2. General Administration, Planning and Support Services
Economic Classification
Estimates Projected Estimates
2016/2017 2017/2018 2018/2019KShs. KShs. KShs.
651

2021 National Land Commission
PART H: Summary of Expenditure by Programme and Economic Classification, 2016/2017 - 2018/2019
0114000 P2. General Administration, Planning and Support Services
Economic Classification
Estimates Projected Estimates
2016/2017 2017/2018 2018/2019
Current Expenditure 1,095,244,269 1,146,999,997 1,168,000,007
Compensation to Employees 723,440,016 737,000,000 751,000,000
Use of Goods and Services 332,850,391 364,930,542 367,178,807
Other Recurrent 38,953,862 45,069,455 49,821,200Total Expenditure 1,095,244,269 1,146,999,997 1,168,000,007
P0115010 P3.1 Land Disputes and Conflict Resolutions
Economic Classification
Estimates Projected Estimates
2016/2017 2017/2018 2018/2019KShs. KShs. KShs.
Current Expenditure 42,900,002 61,999,999 69,000,000
Use of Goods and Services 42,900,002 61,999,999 69,000,000Total Expenditure 42,900,002 61,999,999 69,000,000
0115000 P3. Land Disputes and Conflict Resolutions
Economic Classification
Estimates Projected Estimates
2016/2017 2017/2018 2018/2019KShs. KShs. KShs.
Current Expenditure 42,900,002 61,999,999 69,000,000
Use of Goods and Services 42,900,002 61,999,999 69,000,000Total Expenditure 42,900,002 61,999,999 69,000,000
0116010 P4.1 National Land Information Management System
Economic Classification
Estimates Projected Estimates
2016/2017 2017/2018 2018/2019KShs. KShs. KShs.
Current Expenditure 40,000,007 49,999,999 57,000,001
Use of Goods and Services 23,939,280 29,728,274 32,066,297
Other Recurrent 16,060,727 20,271,725 24,933,704
652

2021 National Land Commission
PART H: Summary of Expenditure by Programme and Economic Classification, 2016/2017 - 2018/2019
0116010 P4.1 National Land Information Management System
Economic Classification
Estimates Projected Estimates
2016/2017 2017/2018 2018/2019
Capital Expenditure 300,000,000 556,000,000 1,101,000,000
Acquisition of Non-Financial Assets 100,000,000 171,000,000 234,000,000
Other Development 200,000,000 385,000,000 867,000,000Total Expenditure 340,000,007 605,999,999 1,158,000,001
0116000 P4. National Land Information Management System
Economic Classification
Estimates Projected Estimates
2016/2017 2017/2018 2018/2019KShs. KShs. KShs.
Current Expenditure 40,000,007 49,999,999 57,000,001
Use of Goods and Services 23,939,280 29,728,274 32,066,297
Other Recurrent 16,060,727 20,271,725 24,933,704
Capital Expenditure 300,000,000 556,000,000 1,101,000,000
Acquisition of Non-Financial Assets 100,000,000 171,000,000 234,000,000
Other Development 200,000,000 385,000,000 867,000,000Total Expenditure 340,000,007 605,999,999 1,158,000,001
653
2031 Independent Electoral and Boundaries Commission
A credible electoral management body committed to strengthening democracy inKenya
To conduct free and fair elections and to institutionalize sustainable electoralprocesses
PART A. Vision
PART B. Mission
PART C. Performance Overview and Background for Programme(s) Funding
The Independent Electoral and Boundaries Commission (IEBC), was established underArticle 88 of the Constitution of Kenya, 2010. The IEBC is responsible for conducting andsupervising referendum and elections to any elective body or office established under theConstitution or as prescribed by an Act of Parliament.
In the FY 2012/2013, the approved current budget was Kshs. 25.3 billion while theexpenditure was Kshs. 25.3 billion whereas in the FY 2013/14 the approved current budgetfor the Commission was Kshs. 5.2 billion as compared to actual expenditure of Kshs. 5.1billion. The approved current budget for the FY 2014/15 was Kshs. 6.9 billion whereas theactual expenditure was Kshs. 5.4 billion. With regard to capital expenditure in the FY 2012/13the Commission did not have any allocation. For FY 2013/14 the approved capital budgetwas Kshs. 63.2 million as compared to actual expenditure of Kshs. 62.3 million. In the FY2014/15 the approved capital budget was Kshs. 74 million while the actual expenditure wasKshs. 74 million reflecting an absorption rate of 100%.
In the FY 2012/13 the Commission established 24,614 registration centers across 290constituencies in the country and prepared a new National Voter Register of 14,388,781representing 72% of the target. This was done with technology in voter registration throughBio-metric Voter Registration in all the 290 constituencies. The General Elections wasconducted successfully with a voter turnout of 86.0 %. The Commission successfullydefended itself in 23 Gubernatorial, 71 Member of the National Assembly, 12 Senator, 67County Ward Representative, 9 Women Representative petitions. 17 by-elections arose frompetitions of which 16 candidates were re-elected.
In 2013/14 financial year the Commission conducted 5 Parliamentary, 2 Senatorial, 1Gubernatorial and15 County Assembly/Ward by elections successfully with a voter turnout of60.49 %. The electronic transmission of results was successfully conducted in all the by-elections. During the by-elections the Commission accredited and inducted 987 observers ofthe by-elections. Further elections for 4 institutions (LSK, Kenya Children Assembly, ImpalaClub and Nguraru Primary School Pupils’ Council Elections) were conducted during theperiod.
In 2014/15 financial year the Commission registered additional 98,755 new voters across 290constituencies in the country representing 0.67% increase in the number of registered votersfrom 14,492,227 to 14,590,982. The Commission conducted 3 parliamentary, 1 Senatorial 1Gubernatorial and 3 County Assembly Ward by-elections successfully with an average voterturnout of 55.1 %. A total of 588 observers, 189 media persons and 11,339 political party
654
2031 Independent Electoral and Boundaries Commission
PART D. Programme Objectives
agents and independent candidates’ agents to observe seven by-elections were accredited.
During the period under review the Commission has faced some challenges including but notlimited to; various electoral laws and regulations that were enacted whose implementationshave brought into the fore substantive gaps which require reviewing of most of the electorallaws. In addition, the escalating costs of elections owing to high commercialization ofelectoral works, goods and services by service providers has increased the overall cost.
Further, security concerns over large number of voters concentrated in some polling stationsmostly found in cities and large urban settings; slow issuance and collection of nationalidentification documents; rapid technology changes leading to obsolescent of existing electiontechnologies and high level of adult illiteracy in some electoral areas leading to high numberof assisted voters thereby compromising secrecy of the ballot. The Commission plans toengage in aggressive and strategic voter awareness and education targeting illiteratemembers of the society.
ObjectiveProgramme
0617000 P.1 : Managementof Electoral Processes To deliver free, fair and credible elections
655
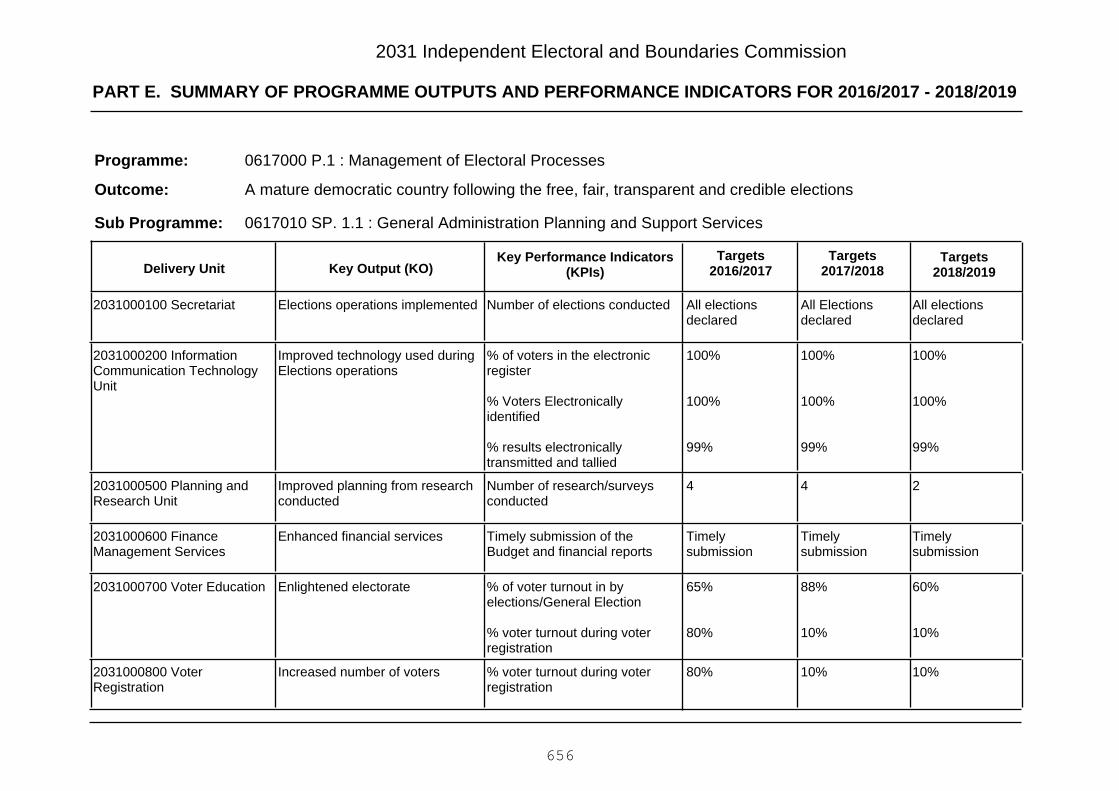
PART E. SUMMARY OF PROGRAMME OUTPUTS AND PERFORMANCE INDICATORS FOR 2016/2017 - 2018/2019
2031 Independent Electoral and Boundaries Commission
0617000 P.1 : Management of Electoral Processes
A mature democratic country following the free, fair, transparent and credible elections
Programme:
Outcome:
0617010 SP. 1.1 : General Administration Planning and Support ServicesSub Programme:
Key Output (KO)Targets
2018/2019Targets
2017/2018Key Performance Indicators
(KPIs)Targets
2016/2017Delivery Unit
All electionsdeclared
All Electionsdeclared
All electionsdeclared
Number of elections conductedElections operations implemented2031000100 Secretariat
100%
100%
99%
100%
100%
99%
100%
100%
99%
% of voters in the electronicregister
% Voters Electronicallyidentified
% results electronicallytransmitted and tallied
Improved technology used duringElections operations
2031000200 InformationCommunication TechnologyUnit
244Number of research/surveysconducted
Improved planning from researchconducted
2031000500 Planning andResearch Unit
Timelysubmission
Timelysubmission
Timelysubmission
Timely submission of theBudget and financial reports
Enhanced financial services2031000600 FinanceManagement Services
60%
10%
88%
10%
65%
80%
% of voter turnout in byelections/General Election
% voter turnout during voterregistration
Enlightened electorate2031000700 Voter Education
10%10%80%% voter turnout during voterregistration
Increased number of voters2031000800 VoterRegistration
656
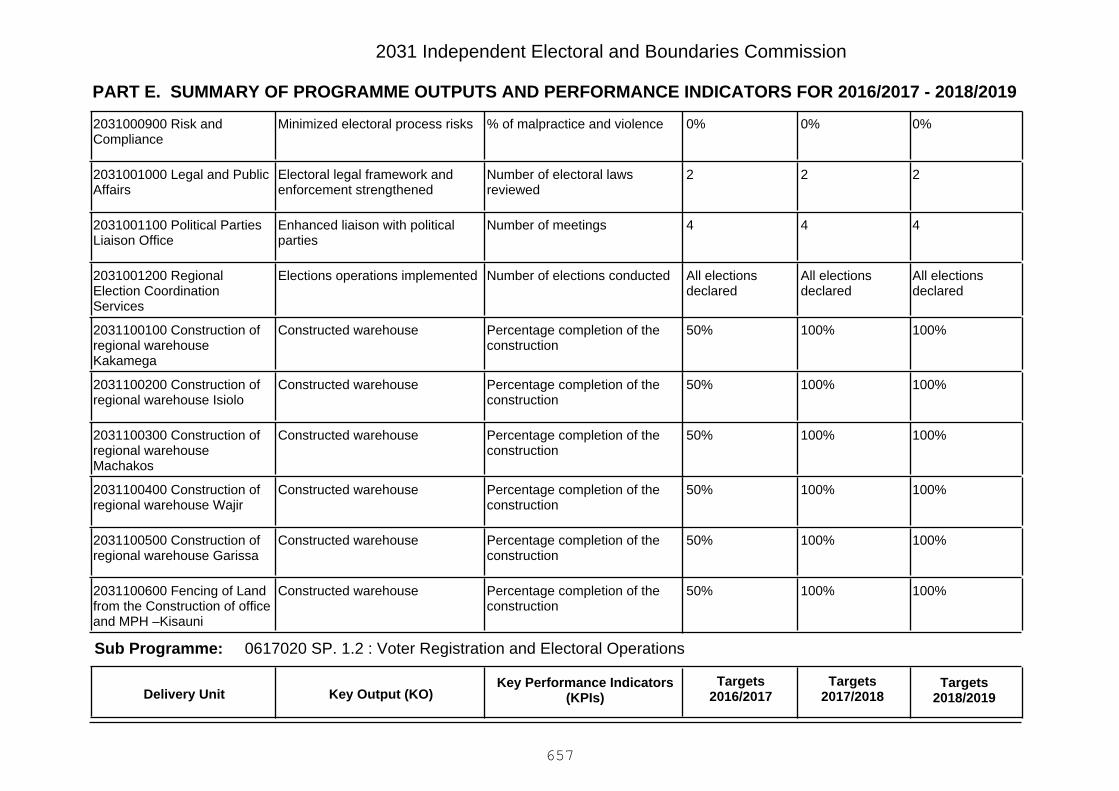
PART E. SUMMARY OF PROGRAMME OUTPUTS AND PERFORMANCE INDICATORS FOR 2016/2017 - 2018/2019
2031 Independent Electoral and Boundaries Commission
0%0%0%% of malpractice and violenceMinimized electoral process risks2031000900 Risk andCompliance
222Number of electoral lawsreviewed
Electoral legal framework andenforcement strengthened
2031001000 Legal and PublicAffairs
444Number of meetingsEnhanced liaison with politicalparties
2031001100 Political PartiesLiaison Office
All electionsdeclared
All electionsdeclared
All electionsdeclared
Number of elections conductedElections operations implemented2031001200 RegionalElection CoordinationServices
100%100%50%Percentage completion of theconstruction
Constructed warehouse2031100100 Construction ofregional warehouseKakamega
100%100%50%Percentage completion of theconstruction
Constructed warehouse2031100200 Construction ofregional warehouse Isiolo
100%100%50%Percentage completion of theconstruction
Constructed warehouse2031100300 Construction ofregional warehouseMachakos
100%100%50%Percentage completion of theconstruction
Constructed warehouse2031100400 Construction ofregional warehouse Wajir
100%100%50%Percentage completion of theconstruction
Constructed warehouse2031100500 Construction ofregional warehouse Garissa
100%100%50%Percentage completion of theconstruction
Constructed warehouse2031100600 Fencing of Landfrom the Construction of officeand MPH –Kisauni
0617020 SP. 1.2 : Voter Registration and Electoral OperationsSub Programme:
Key Output (KO)Targets
2018/2019Targets
2017/2018Key Performance Indicators
(KPIs)Targets
2016/2017Delivery Unit
657

PART E. SUMMARY OF PROGRAMME OUTPUTS AND PERFORMANCE INDICATORS FOR 2016/2017 - 2018/2019
2031 Independent Electoral and Boundaries Commission
All operationsimplementedwithin thestatutorytimelines
All operationsimplementedwithin thestatutorytimelines
All operationsimplementedwithin thestatutorytimelines
Number of operationsimplemented
Elections operations implementedfor enhanced voter experience
2031000100 Secretariat
100,000100,0008,500,000Number of additional eligiblevoters registered
Eligible Kenyan citizens registeredas voters
2031000800 VoterRegistration
0617030 SP. 1.3 : Voter Education and PartnershipsSub Programme:
Key Output (KO)Targets
2018/2019Targets
2017/2018Key Performance Indicators
(KPIs)Targets
2016/2017Delivery Unit
60%
10%
88%
10%
65%
80%
% of voter turnout in byelections/General Election
% of voter turnout during voterregistration
Kenyans empowered to effectivelyparticipate in the electoral process
2031000700 Voter Education
2031101500 Strengtheningthe Electoral Process inKenya
0617040 SP. 1.4 : Electoral Information and Communication TechnologySub Programme:
Key Output (KO)Targets
2018/2019Targets
2017/2018Key Performance Indicators
(KPIs)Targets
2016/2017Delivery Unit
100%
100%
100%
100%
100%
100%
100%
100%
100%
% of voters in the electronicregister
% of voters Electronicallyidentified
% results electronicallytransmitted and tallied.
Business processes across IEBCre-engineered
2031000200 InformationCommunication TechnologyUnit
658

Vote 2031 Independent Electoral and Boundaries Commission
PART F: Summary of Expenditure by Programmes, 2016/2017 - 2018/2019
Programme
Estimates Projected Estimates
2016/2017 2017/2018 2018/2019
KShs. KShs. KShs.
0617010 SP. 1.1 : General Administration Planning and Support Services 4,959,237,976 4,715,418,807 4,346,662,605
0617020 SP. 1.2 : Voter Registration and Electoral Operations 8,529,911,189 11,715,762,308 87,128,222
0617030 SP. 1.3 : Voter Education and Partnerships 2,362,732,574 129,083,981 128,407,459
0617040 SP. 1.4 : Electoral Information and Communication Technology 3,879,127,961 562,327,104 236,202,814
0617000 P.1 : Management of Electoral Processes 19,731,009,700 17,122,592,200 4,798,401,100Total Expenditure for Vote 2031 Independent Electoral and Boundaries Commission 19,731,009,700 17,122,592,200 4,798,401,100
659
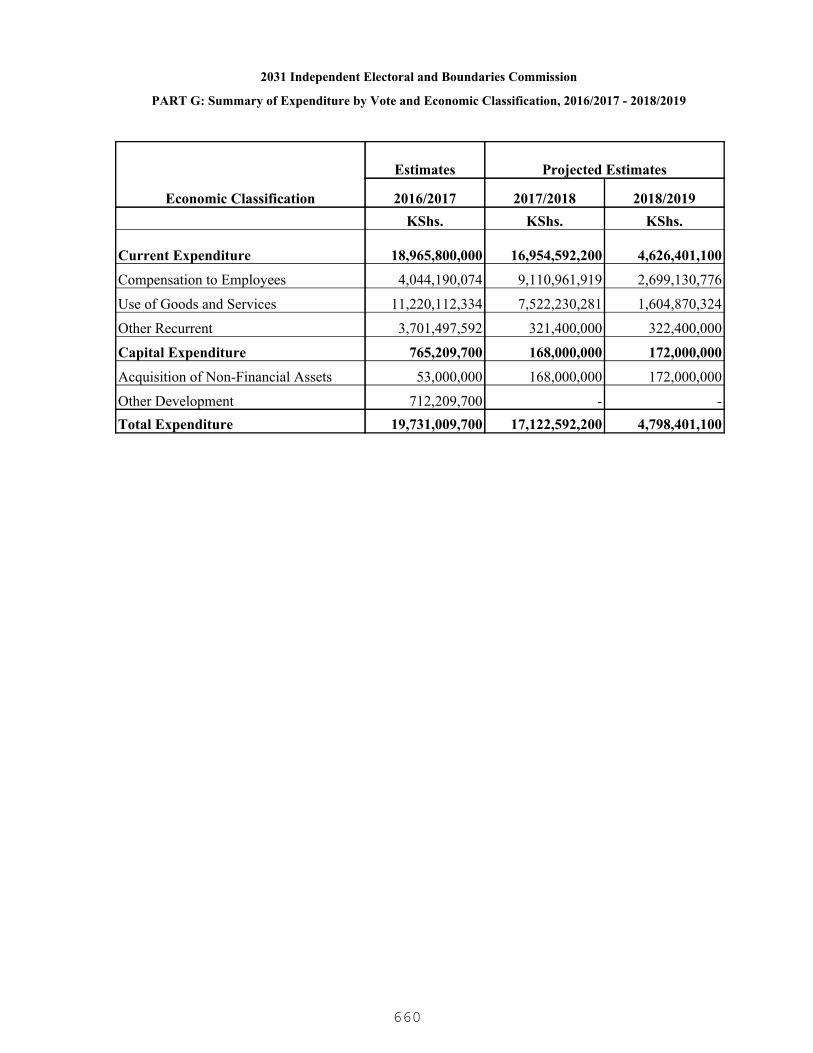
2031 Independent Electoral and Boundaries Commission
PART G: Summary of Expenditure by Vote and Economic Classification, 2016/2017 - 2018/2019
Economic Classification
Estimates Projected Estimates
2016/2017 2017/2018 2018/2019KShs. KShs. KShs.
Current Expenditure 18,965,800,000 16,954,592,200 4,626,401,100
Compensation to Employees 4,044,190,074 9,110,961,919 2,699,130,776
Use of Goods and Services 11,220,112,334 7,522,230,281 1,604,870,324
Other Recurrent 3,701,497,592 321,400,000 322,400,000
Capital Expenditure 765,209,700 168,000,000 172,000,000
Acquisition of Non-Financial Assets 53,000,000 168,000,000 172,000,000
Other Development 712,209,700 - -Total Expenditure 19,731,009,700 17,122,592,200 4,798,401,100
660
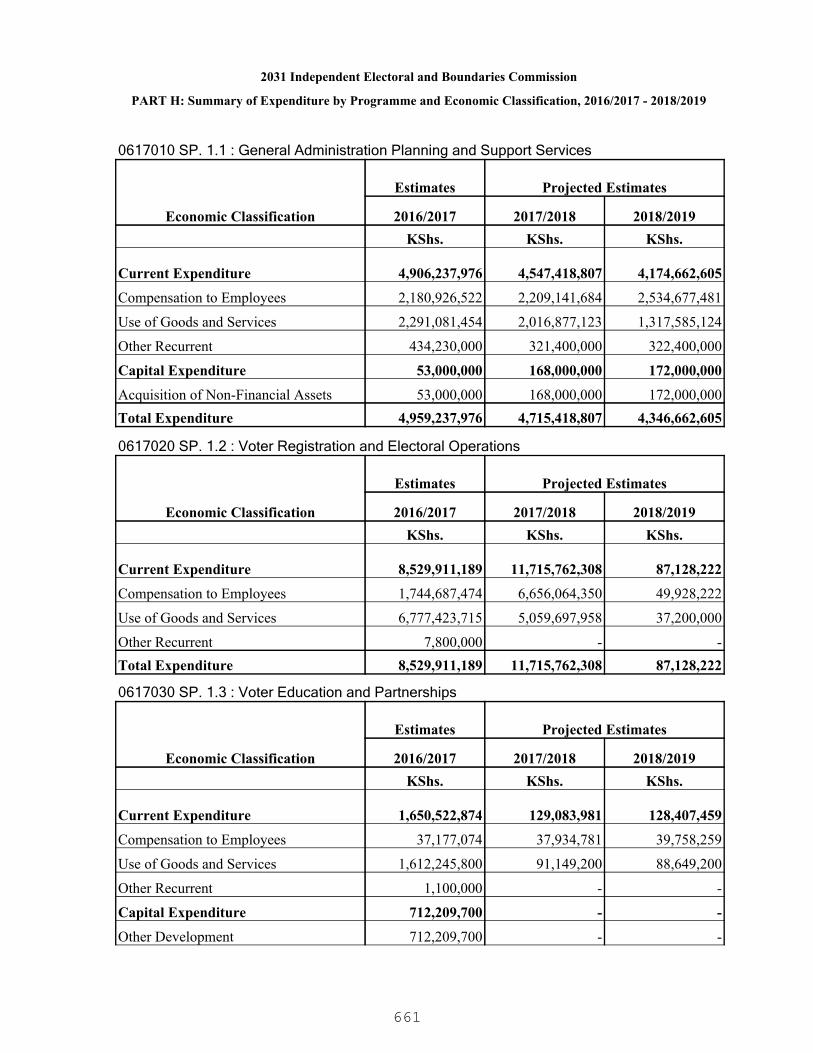
2031 Independent Electoral and Boundaries Commission
PART H: Summary of Expenditure by Programme and Economic Classification, 2016/2017 - 2018/2019
0617010 SP. 1.1 : General Administration Planning and Support Services
Economic Classification
Estimates Projected Estimates
2016/2017 2017/2018 2018/2019KShs. KShs. KShs.
Current Expenditure 4,906,237,976 4,547,418,807 4,174,662,605
Compensation to Employees 2,180,926,522 2,209,141,684 2,534,677,481
Use of Goods and Services 2,291,081,454 2,016,877,123 1,317,585,124
Other Recurrent 434,230,000 321,400,000 322,400,000
Capital Expenditure 53,000,000 168,000,000 172,000,000
Acquisition of Non-Financial Assets 53,000,000 168,000,000 172,000,000Total Expenditure 4,959,237,976 4,715,418,807 4,346,662,605
0617020 SP. 1.2 : Voter Registration and Electoral Operations
Economic Classification
Estimates Projected Estimates
2016/2017 2017/2018 2018/2019KShs. KShs. KShs.
Current Expenditure 8,529,911,189 11,715,762,308 87,128,222
Compensation to Employees 1,744,687,474 6,656,064,350 49,928,222
Use of Goods and Services 6,777,423,715 5,059,697,958 37,200,000
Other Recurrent 7,800,000 - -Total Expenditure 8,529,911,189 11,715,762,308 87,128,222
0617030 SP. 1.3 : Voter Education and Partnerships
Economic Classification
Estimates Projected Estimates
2016/2017 2017/2018 2018/2019KShs. KShs. KShs.
Current Expenditure 1,650,522,874 129,083,981 128,407,459
Compensation to Employees 37,177,074 37,934,781 39,758,259
Use of Goods and Services 1,612,245,800 91,149,200 88,649,200
Other Recurrent 1,100,000 - -
Capital Expenditure 712,209,700 - -
Other Development 712,209,700 - -
661

2031 Independent Electoral and Boundaries Commission
PART H: Summary of Expenditure by Programme and Economic Classification, 2016/2017 - 2018/2019
0617030 SP. 1.3 : Voter Education and Partnerships
Economic Classification
Estimates Projected Estimates
2016/2017 2017/2018 2018/2019Total Expenditure 2,362,732,574 129,083,981 128,407,4590617040 SP. 1.4 : Electoral Information and Communication Technology
Economic Classification
Estimates Projected Estimates
2016/2017 2017/2018 2018/2019KShs. KShs. KShs.
Current Expenditure 3,879,127,961 562,327,104 236,202,814
Compensation to Employees 81,399,004 207,821,104 74,766,814
Use of Goods and Services 539,361,365 354,506,000 161,436,000
Other Recurrent 3,258,367,592 - -Total Expenditure 3,879,127,961 562,327,104 236,202,814
0617000 P.1 : Management of Electoral Processes
Economic Classification
Estimates Projected Estimates
2016/2017 2017/2018 2018/2019KShs. KShs. KShs.
Current Expenditure 18,965,800,000 16,954,592,200 4,626,401,100
Compensation to Employees 4,044,190,074 9,110,961,919 2,699,130,776
Use of Goods and Services 11,220,112,334 7,522,230,281 1,604,870,324
Other Recurrent 3,701,497,592 321,400,000 322,400,000
Capital Expenditure 765,209,700 168,000,000 172,000,000
Acquisition of Non-Financial Assets 53,000,000 168,000,000 172,000,000
Other Development 712,209,700 - -Total Expenditure 19,731,009,700 17,122,592,200 4,798,401,100
662
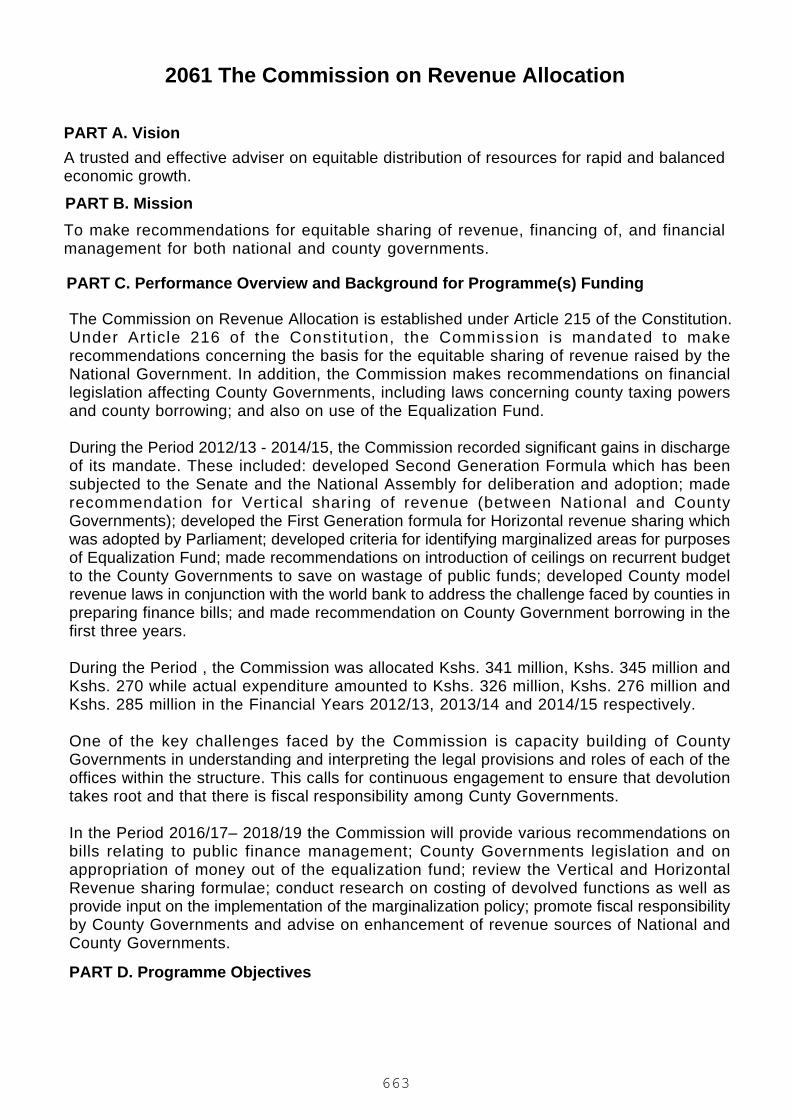
2061 The Commission on Revenue Allocation
A trusted and effective adviser on equitable distribution of resources for rapid and balancedeconomic growth.
To make recommendations for equitable sharing of revenue, financing of, and financialmanagement for both national and county governments.
PART A. Vision
PART B. Mission
PART C. Performance Overview and Background for Programme(s) Funding
PART D. Programme Objectives
The Commission on Revenue Allocation is established under Article 215 of the Constitution.Under Article 216 of the Constitution, the Commission is mandated to makerecommendations concerning the basis for the equitable sharing of revenue raised by theNational Government. In addition, the Commission makes recommendations on financiallegislation affecting County Governments, including laws concerning county taxing powersand county borrowing; and also on use of the Equalization Fund.
During the Period 2012/13 - 2014/15, the Commission recorded significant gains in dischargeof its mandate. These included: developed Second Generation Formula which has beensubjected to the Senate and the National Assembly for deliberation and adoption; maderecommendation for Vertical sharing of revenue (between National and CountyGovernments); developed the First Generation formula for Horizontal revenue sharing whichwas adopted by Parliament; developed criteria for identifying marginalized areas for purposesof Equalization Fund; made recommendations on introduction of ceilings on recurrent budgetto the County Governments to save on wastage of public funds; developed County modelrevenue laws in conjunction with the world bank to address the challenge faced by counties inpreparing finance bills; and made recommendation on County Government borrowing in thefirst three years.
During the Period , the Commission was allocated Kshs. 341 million, Kshs. 345 million andKshs. 270 while actual expenditure amounted to Kshs. 326 million, Kshs. 276 million andKshs. 285 million in the Financial Years 2012/13, 2013/14 and 2014/15 respectively.
One of the key challenges faced by the Commission is capacity building of CountyGovernments in understanding and interpreting the legal provisions and roles of each of theoffices within the structure. This calls for continuous engagement to ensure that devolutiontakes root and that there is fiscal responsibility among Cunty Governments.
In the Period 2016/17– 2018/19 the Commission will provide various recommendations onbills relating to public finance management; County Governments legislation and onappropriation of money out of the equalization fund; review the Vertical and HorizontalRevenue sharing formulae; conduct research on costing of devolved functions as well asprovide input on the implementation of the marginalization policy; promote fiscal responsibilityby County Governments and advise on enhancement of revenue sources of National andCounty Governments.
663
2061 The Commission on Revenue Allocation
ObjectiveProgramme
0724000 P.1 Inter-Governmental Revenue andFinancial Matters
To make recommendations concerning the basis for theequitable sharing of revenue raised by the nationalgovernment, financing and financial management by countygovernment.
664

PART E. SUMMARY OF PROGRAMME OUTPUTS AND PERFORMANCE INDICATORS FOR 2016/2017 - 2018/2019
2061 The Commission on Revenue Allocation
0724000 P.1 Inter-Governmental Revenue and Financial Matters
Enhanced economic growth and equitable National development
Programme:
Outcome:
0724010 SP. 1.1 Legal and Public AffairsSub Programme:
Key Output (KO)Targets
2018/2019Targets
2017/2018Key Performance Indicators
(KPIs)Targets
2016/2017Delivery Unit
1
1
1
1
1
1
County Allocation Revenue Act(CARA)
Division of Revenue Bill
Annual Revenue Bills2061000100 Legal and PublicAffairs
0724020 SP. 1.2 Research and PolicySub Programme:
Key Output (KO)Targets
2018/2019Targets
2017/2018Key Performance Indicators
(KPIs)Targets
2016/2017Delivery Unit
1
1
1
2
1
1
1
2
1
1
1
2
No. of Recommendations on thebasis of revenue sharingbetween National and CountyGovernments
No. of Recommendations on thebasis of revenue sharing amongcounty governments
No. of recommendations onmarginalized areas
No. of policy advisories
Division of revenue betweenNational and CountyGovernments
Division of revenue among CountyGovernments
Equalization fund
Policy Advisories on Revenueenhancement
2061000200 Research andPolicy Development
665

PART E. SUMMARY OF PROGRAMME OUTPUTS AND PERFORMANCE INDICATORS FOR 2016/2017 - 2018/2019
2061 The Commission on Revenue Allocation
0724030 SP. 1.3 General Administration Planning and Support ServicesSub Programme:
Key Output (KO)Targets
2018/2019Targets
2017/2018Key Performance Indicators
(KPIs)Targets
2016/2017Delivery Unit
3
30
3
25
3
20
No. of satisfaction surveys
No. of employees trained
Administrative services2061000300 GeneralAdministration and Planning
0724040 SP. 1.4 County Co-ordination ServicesSub Programme:
Key Output (KO)Targets
2018/2019Targets
2017/2018Key Performance Indicators
(KPIs)Targets
2016/2017Delivery Unit
47
47
47
47
2
47
47
47
47
2
47
47
47
47
2
No. of finance bills reviewed
No. of County Fiscal StrategyPapers reviewed
No. of annual developmentplans reviewed
No. of county budgets reviewed
No. of advisories on revenueenhancement
Financial Services2061000400 CountyCoordination Services
666

PART E. SUMMARY OF PROGRAMME OUTPUTS AND PERFORMANCE INDICATORS FOR 2016/2017 - 2018/2019
2061 The Commission on Revenue Allocation
667
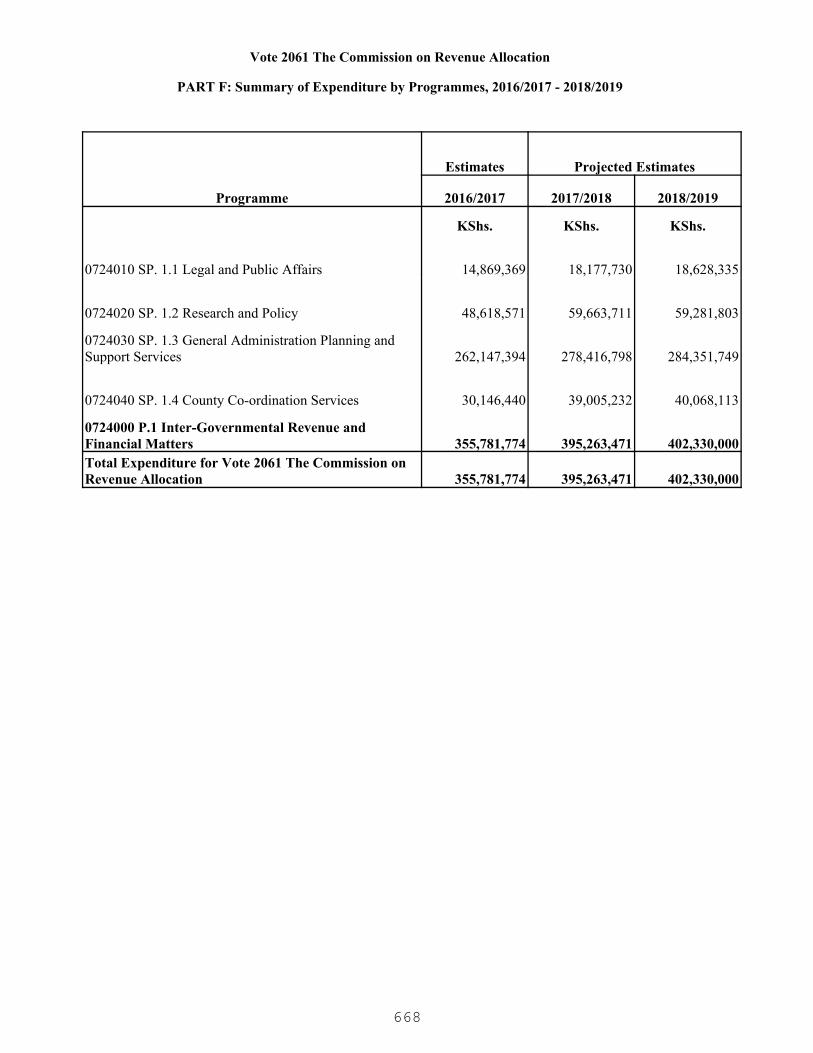
Vote 2061 The Commission on Revenue Allocation
PART F: Summary of Expenditure by Programmes, 2016/2017 - 2018/2019
Programme
Estimates Projected Estimates
2016/2017 2017/2018 2018/2019
KShs. KShs. KShs.
0724010 SP. 1.1 Legal and Public Affairs 14,869,369 18,177,730 18,628,335
0724020 SP. 1.2 Research and Policy 48,618,571 59,663,711 59,281,803
0724030 SP. 1.3 General Administration Planning and Support Services 262,147,394 278,416,798 284,351,749
0724040 SP. 1.4 County Co-ordination Services 30,146,440 39,005,232 40,068,113
0724000 P.1 Inter-Governmental Revenue and Financial Matters 355,781,774 395,263,471 402,330,000Total Expenditure for Vote 2061 The Commission on Revenue Allocation 355,781,774 395,263,471 402,330,000
668

2061 The Commission on Revenue Allocation
PART G: Summary of Expenditure by Vote and Economic Classification, 2016/2017 - 2018/2019
Economic Classification
Estimates Projected Estimates
2016/2017 2017/2018 2018/2019KShs. KShs. KShs.
Current Expenditure 355,781,774 395,263,471 402,330,000
Compensation to Employees 189,750,000 194,970,000 200,730,000
Use of Goods and Services 149,427,609 182,324,721 182,631,250
Other Recurrent 16,604,165 17,968,750 18,968,750Total Expenditure 355,781,774 395,263,471 402,330,000
669

2061 The Commission on Revenue Allocation
PART H: Summary of Expenditure by Programme and Economic Classification, 2016/2017 - 2018/2019
0724010 SP. 1.1 Legal and Public Affairs
Economic Classification
Estimates Projected Estimates
2016/2017 2017/2018 2018/2019KShs. KShs. KShs.
Current Expenditure 14,869,369 18,177,730 18,628,335
Compensation to Employees 9,912,410 10,320,771 10,771,376
Use of Goods and Services 4,956,959 7,856,959 7,856,959Total Expenditure 14,869,369 18,177,730 18,628,335
0724020 SP. 1.2 Research and Policy
Economic Classification
Estimates Projected Estimates
2016/2017 2017/2018 2018/2019KShs. KShs. KShs.
Current Expenditure 48,618,571 59,663,711 59,281,803
Compensation to Employees 36,506,763 37,973,159 39,591,251
Use of Goods and Services 9,611,808 19,111,808 17,111,808
Other Recurrent 2,500,000 2,578,744 2,578,744Total Expenditure 48,618,571 59,663,711 59,281,803
0724030 SP. 1.3 General Administration Planning and Support Services
Economic Classification
Estimates Projected Estimates
2016/2017 2017/2018 2018/2019KShs. KShs. KShs.
Current Expenditure 262,147,394 278,416,798 284,351,749
Compensation to Employees 121,548,400 123,995,996 126,696,794
Use of Goods and Services 126,494,829 139,030,796 141,264,949
Other Recurrent 14,104,165 15,390,006 16,390,006Total Expenditure 262,147,394 278,416,798 284,351,749
0724040 SP. 1.4 County Co-ordination Services
Economic Classification
Estimates Projected Estimates
2016/2017 2017/2018 2018/2019
670

2061 The Commission on Revenue Allocation
PART H: Summary of Expenditure by Programme and Economic Classification, 2016/2017 - 2018/2019
0724040 SP. 1.4 County Co-ordination Services
Economic Classification
Estimates Projected Estimates
2016/2017 2017/2018 2018/2019KShs. KShs. KShs.
Current Expenditure 30,146,440 39,005,232 40,068,113
Compensation to Employees 21,782,427 22,680,074 23,670,579
Use of Goods and Services 8,364,013 16,325,158 16,397,534Total Expenditure 30,146,440 39,005,232 40,068,113
0724000 P.1 Inter-Governmental Revenue and Financial Matters
Economic Classification
Estimates Projected Estimates
2016/2017 2017/2018 2018/2019KShs. KShs. KShs.
Current Expenditure 355,781,774 395,263,471 402,330,000
Compensation to Employees 189,750,000 194,970,000 200,730,000
Use of Goods and Services 149,427,609 182,324,721 182,631,250
Other Recurrent 16,604,165 17,968,750 18,968,750Total Expenditure 355,781,774 395,263,471 402,330,000
671

2071 Public Service Commission
A lead Commission in the provision, management and development of competent humanresources in the Public Service.
To transform the public service to become dynamic, professional, efficient and effective forthe realization of national development goals
PART A. Vision
PART B. Mission
PART C. Performance Overview and Background for Programme(s) Funding
The mandate of the Commission is to assist Ministries, Departments and Agencies(MDAs) indeveloping organizational structures for the provision, development and management ofcompetent human resources and the promotion of values and good governance in the publicservice for effective and efficient service delivery.
During the period 2012/13 - 2014/15, the Commission implemented the following programmes: general administration, planning and support services; human resourcemanagement and development; and governance and national values in the public service.The absorbed allocated funds amounted to kshs.808 million in 2012/13, kshs.883 million in2013/14 and kshs.1,011 million in 2014/15 against an allocation of Kshs.808 million,Kshs.883 million and Kshs.1,201 million respectively and thus representing an average absorption rate of 99% for the three financial years.
The major achievements realized during the period under review included: recruitment of1,609 officers comprising of 48.5 per cent male and 51 .5 per cent female; promotion of30,308 officers comprising of 62.8 per cent male and 37.2 per cent female; development anddissemination of ten (10) human resource management and development policies andguidelines to MDAs; annual evaluation reports for 2012/13, 2013/14 and 2014/15 on theextent to which the public service complied with values and principles in Articles 10 and 232of the Constitution; assisted 26 MDAs in the formulation and approval of the organizationalstructures; and upgraded 5 service related ICT systems to enhance recruitment andmanagement of human resources.
The challenges the Commission experienced during the period under were: inadequatefunding; delay in the enactment of the proposed Public Service Commission (Amendment)Bill and Regulations; inadequate office accomodation; and delays and unpredictabledetermination of disciplinary cases by lawcourts . The Commisson will address thechallenges by: phasing out the implementation of some activities; liaising with the NationalAssembly to fast track enactment of the Public Service Commission Bill; construction ofadditional offices and refurbishment and minor alteration of the existing Commission House;engage private lawyers to represent the Commission in litigation of the cases; and implement discipline management system.
During the period 2016/17 – 2018/19 the Commission will target major service/outputs fortransformation of public service which include:promotion of values and principles to 284MDAs; developing, reviewing, publicizing and disseminating human resource managementand development policies; strengthening and mainstreaming monitoring and evaluation; andimplementing Integrated Management Information System (IMIS).
672

2071 Public Service Commission
PART D. Programme Objectives
ObjectiveProgramme
0725000 P.1 GeneralAdministration, Planningand Support Services
To formulate, implement and review appropriate supportpolicies and institutional frameworks for efficient andeffective sevice delivery.
0726000 P.2 HumanResource management andDevelopment
To transform Public Service to be professional, efficient andeffective
0727000 P.3 Governance andNational Values
To promote good governance, values and principles in thePublic Service
673

PART E. SUMMARY OF PROGRAMME OUTPUTS AND PERFORMANCE INDICATORS FOR 2016/2017 - 2018/2019
2071 Public Service Commission
0725000 P.1 General Administration, Planning and Support Services
Effective and efficient delivery of public service
Programme:
Outcome:
0725010 SP. 1.1 AdministrationSub Programme:
Key Output (KO)Targets
2018/2019Targets
2017/2018Key Performance Indicators
(KPIs)Targets
2016/2017Delivery Unit
87 %
80%
85 %
78%
80 %
75%
Customer satisfaction level
Employee Satisfaction level
Administrative services2071000100 Administration
100 %50 %2 %Refurbished Commission HouseOffice facilities for theCommission
2071100100 Refurbishment ofOld Commission House WPItem No. D207 NB-NB 1501
--1Installed passenger liftOffice facilities for theCommission
2071100200 Supply,Installation andCommissioning of PassengerLift
-100 %90 %Percentage completion rateOffice facilities for theCommission
2071100300 Construction ofAdditional Offices at thePublic Service Commission
0725020 SP. 1.2 Board Management ServiceSub Programme:
Key Output (KO)Targets
2018/2019Targets
2017/2018Key Performance Indicators
(KPIs)Targets
2016/2017Delivery Unit
5 days
5 days
6 days
5 days
7 days
7 days
Reduced time lag on thematters received by theCommission
No. of days taken to implementBoard Decisions
Board decisions on humanresource management andgovernance in the public service
2071000200 BoardManagement Services
674

PART E. SUMMARY OF PROGRAMME OUTPUTS AND PERFORMANCE INDICATORS FOR 2016/2017 - 2018/2019
2071 Public Service Commission
0726000 P.2 Human Resource management and Development
Quality service delivery to the public service
Programme:
Outcome:
0726010 SP. 2.1 Establishment and Management and Consultancy ServiceSub Programme:
Key Output (KO)Targets
2018/2019Targets
2017/2018Key Performance Indicators
(KPIs)Targets
2016/2017Delivery Unit
100 %100 %100 %Percentage of organizationstructures established, reviewedand approved
Approved service structures2071000300 Establishmentand ManagementConsultancy Services
0726020 SP. 2.2 Human Resource ManagementSub Programme:
Key Output (KO)Targets
2018/2019Targets
2017/2018Key Performance Indicators
(KPIs)Targets
2016/2017Delivery Unit
100 %
3:7
1.5 %
1.3 %
100 %
100 %
3:7
1.2 %
1.1 %
100 %
100 %
3:7
1 %
1 %
100 %
Percentage of approvedrecruitment undertaken
Ratio of gender distribution
Percentage growth of PWDsrepresentation improved
Percentage growth of minorityand marginalized groupsrepresentation improved
Percentage of disciplinary andappeal cases determined
Human resource managementservices
2071000400 HumanResource Management
675
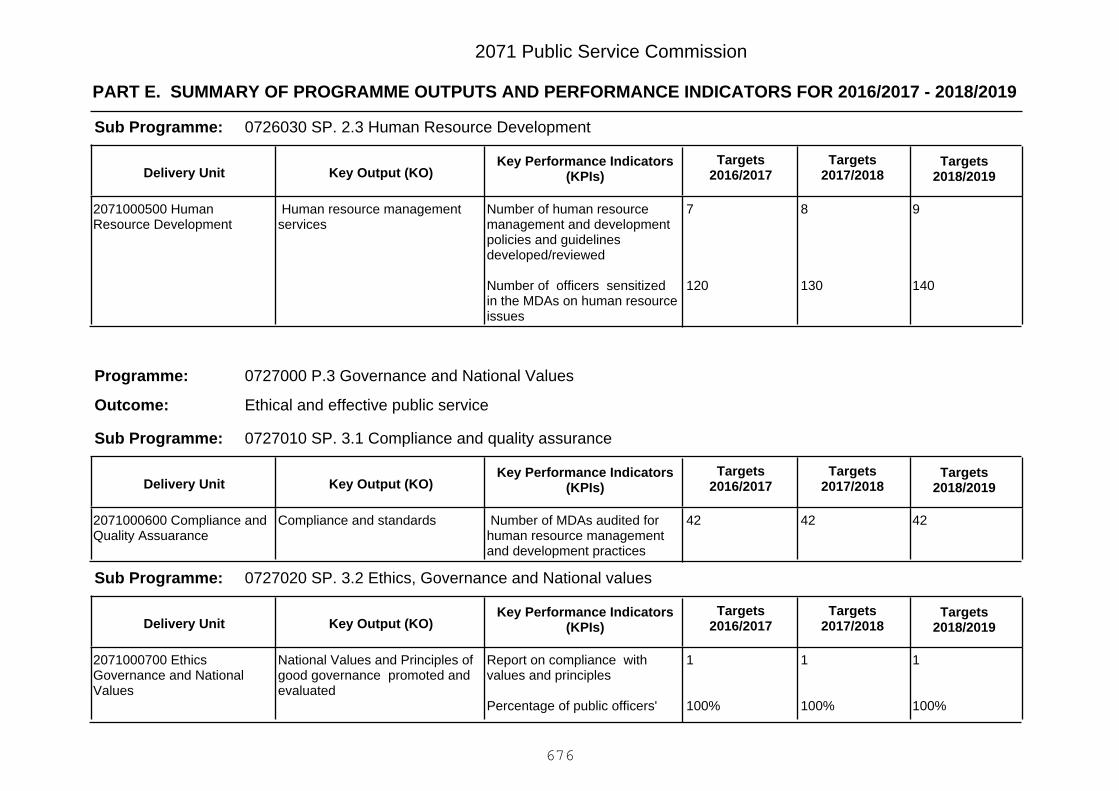
PART E. SUMMARY OF PROGRAMME OUTPUTS AND PERFORMANCE INDICATORS FOR 2016/2017 - 2018/2019
2071 Public Service Commission
0726030 SP. 2.3 Human Resource DevelopmentSub Programme:
Key Output (KO)Targets
2018/2019Targets
2017/2018Key Performance Indicators
(KPIs)Targets
2016/2017Delivery Unit
9
140
8
130
7
120
Number of human resourcemanagement and developmentpolicies and guidelinesdeveloped/reviewed
Number of officers sensitizedin the MDAs on human resourceissues
Human resource managementservices
2071000500 HumanResource Development
0727000 P.3 Governance and National Values
Ethical and effective public service
Programme:
Outcome:
0727010 SP. 3.1 Compliance and quality assuranceSub Programme:
Key Output (KO)Targets
2018/2019Targets
2017/2018Key Performance Indicators
(KPIs)Targets
2016/2017Delivery Unit
424242 Number of MDAs audited forhuman resource managementand development practices
Compliance and standards2071000600 Compliance andQuality Assuarance
0727020 SP. 3.2 Ethics, Governance and National valuesSub Programme:
Key Output (KO)Targets
2018/2019Targets
2017/2018Key Performance Indicators
(KPIs)Targets
2016/2017Delivery Unit
1
100%
1
100%
1
100%
Report on compliance withvalues and principles
Percentage of public officers'
National Values and Principles ofgood governance promoted andevaluated
2071000700 EthicsGovernance and NationalValues
676

PART E. SUMMARY OF PROGRAMME OUTPUTS AND PERFORMANCE INDICATORS FOR 2016/2017 - 2018/2019
2071 Public Service Commission
compliance to wealthdeclaration requirements
677
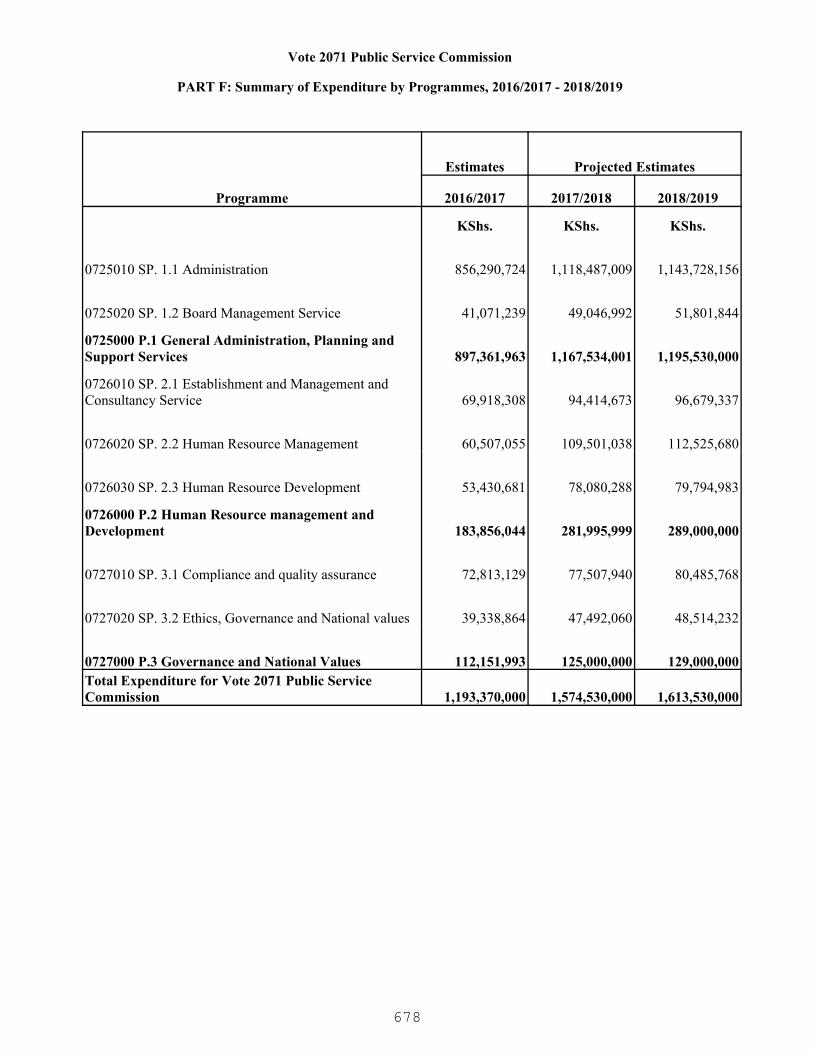
Vote 2071 Public Service Commission
PART F: Summary of Expenditure by Programmes, 2016/2017 - 2018/2019
Programme
Estimates Projected Estimates
2016/2017 2017/2018 2018/2019
KShs. KShs. KShs.
0725010 SP. 1.1 Administration 856,290,724 1,118,487,009 1,143,728,156
0725020 SP. 1.2 Board Management Service 41,071,239 49,046,992 51,801,844
0725000 P.1 General Administration, Planning and Support Services 897,361,963 1,167,534,001 1,195,530,000
0726010 SP. 2.1 Establishment and Management and Consultancy Service 69,918,308 94,414,673 96,679,337
0726020 SP. 2.2 Human Resource Management 60,507,055 109,501,038 112,525,680
0726030 SP. 2.3 Human Resource Development 53,430,681 78,080,288 79,794,983
0726000 P.2 Human Resource management and Development 183,856,044 281,995,999 289,000,000
0727010 SP. 3.1 Compliance and quality assurance 72,813,129 77,507,940 80,485,768
0727020 SP. 3.2 Ethics, Governance and National values 39,338,864 47,492,060 48,514,232
0727000 P.3 Governance and National Values 112,151,993 125,000,000 129,000,000Total Expenditure for Vote 2071 Public Service Commission 1,193,370,000 1,574,530,000 1,613,530,000
678
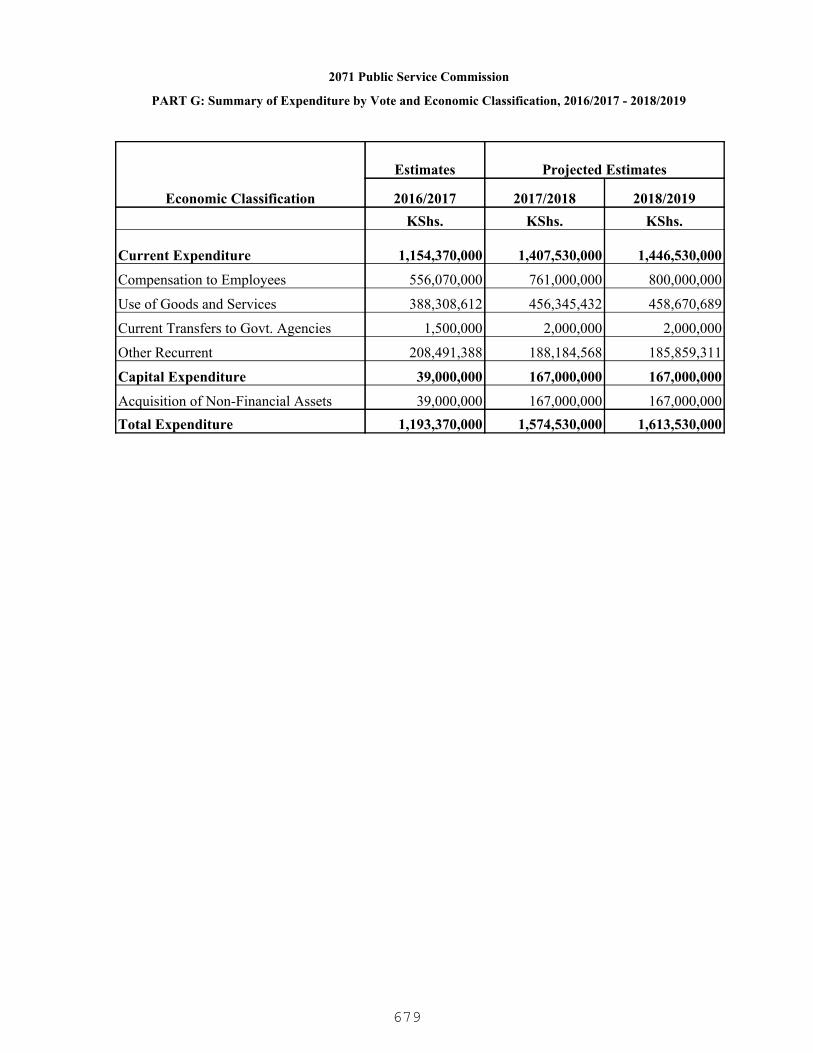
2071 Public Service Commission
PART G: Summary of Expenditure by Vote and Economic Classification, 2016/2017 - 2018/2019
Economic Classification
Estimates Projected Estimates
2016/2017 2017/2018 2018/2019KShs. KShs. KShs.
Current Expenditure 1,154,370,000 1,407,530,000 1,446,530,000
Compensation to Employees 556,070,000 761,000,000 800,000,000
Use of Goods and Services 388,308,612 456,345,432 458,670,689
Current Transfers to Govt. Agencies 1,500,000 2,000,000 2,000,000
Other Recurrent 208,491,388 188,184,568 185,859,311
Capital Expenditure 39,000,000 167,000,000 167,000,000
Acquisition of Non-Financial Assets 39,000,000 167,000,000 167,000,000Total Expenditure 1,193,370,000 1,574,530,000 1,613,530,000
679
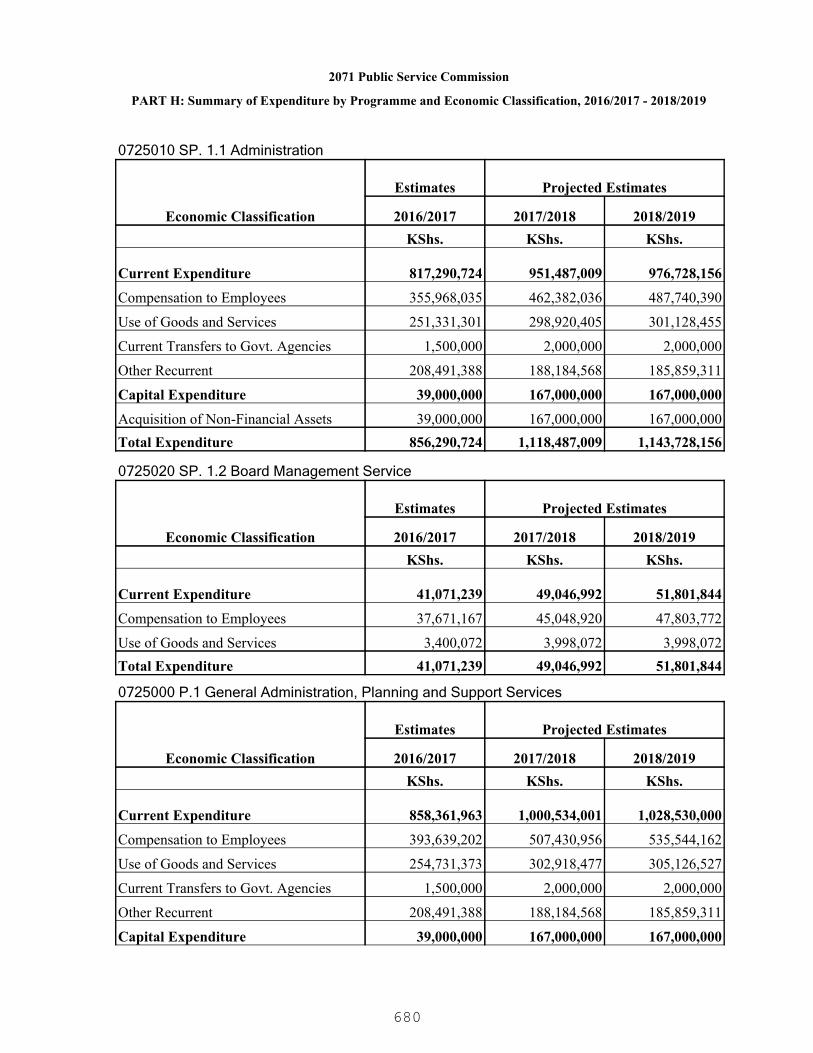
2071 Public Service Commission
PART H: Summary of Expenditure by Programme and Economic Classification, 2016/2017 - 2018/2019
0725010 SP. 1.1 Administration
Economic Classification
Estimates Projected Estimates
2016/2017 2017/2018 2018/2019KShs. KShs. KShs.
Current Expenditure 817,290,724 951,487,009 976,728,156
Compensation to Employees 355,968,035 462,382,036 487,740,390
Use of Goods and Services 251,331,301 298,920,405 301,128,455
Current Transfers to Govt. Agencies 1,500,000 2,000,000 2,000,000
Other Recurrent 208,491,388 188,184,568 185,859,311
Capital Expenditure 39,000,000 167,000,000 167,000,000
Acquisition of Non-Financial Assets 39,000,000 167,000,000 167,000,000Total Expenditure 856,290,724 1,118,487,009 1,143,728,156
0725020 SP. 1.2 Board Management Service
Economic Classification
Estimates Projected Estimates
2016/2017 2017/2018 2018/2019KShs. KShs. KShs.
Current Expenditure 41,071,239 49,046,992 51,801,844
Compensation to Employees 37,671,167 45,048,920 47,803,772
Use of Goods and Services 3,400,072 3,998,072 3,998,072Total Expenditure 41,071,239 49,046,992 51,801,844
0725000 P.1 General Administration, Planning and Support Services
Economic Classification
Estimates Projected Estimates
2016/2017 2017/2018 2018/2019KShs. KShs. KShs.
Current Expenditure 858,361,963 1,000,534,001 1,028,530,000
Compensation to Employees 393,639,202 507,430,956 535,544,162
Use of Goods and Services 254,731,373 302,918,477 305,126,527
Current Transfers to Govt. Agencies 1,500,000 2,000,000 2,000,000
Other Recurrent 208,491,388 188,184,568 185,859,311
Capital Expenditure 39,000,000 167,000,000 167,000,000
680
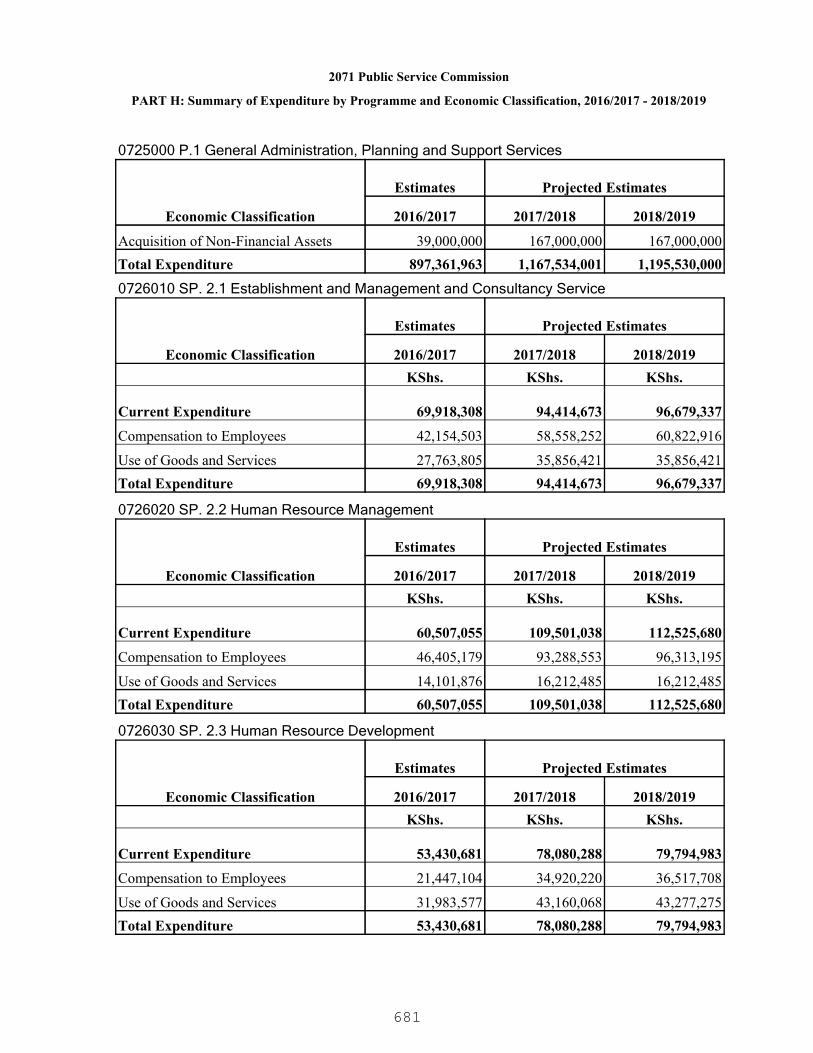
2071 Public Service Commission
PART H: Summary of Expenditure by Programme and Economic Classification, 2016/2017 - 2018/2019
0725000 P.1 General Administration, Planning and Support Services
Economic Classification
Estimates Projected Estimates
2016/2017 2017/2018 2018/2019
Acquisition of Non-Financial Assets 39,000,000 167,000,000 167,000,000Total Expenditure 897,361,963 1,167,534,001 1,195,530,000
0726010 SP. 2.1 Establishment and Management and Consultancy Service
Economic Classification
Estimates Projected Estimates
2016/2017 2017/2018 2018/2019KShs. KShs. KShs.
Current Expenditure 69,918,308 94,414,673 96,679,337
Compensation to Employees 42,154,503 58,558,252 60,822,916
Use of Goods and Services 27,763,805 35,856,421 35,856,421Total Expenditure 69,918,308 94,414,673 96,679,337
0726020 SP. 2.2 Human Resource Management
Economic Classification
Estimates Projected Estimates
2016/2017 2017/2018 2018/2019KShs. KShs. KShs.
Current Expenditure 60,507,055 109,501,038 112,525,680
Compensation to Employees 46,405,179 93,288,553 96,313,195
Use of Goods and Services 14,101,876 16,212,485 16,212,485Total Expenditure 60,507,055 109,501,038 112,525,680
0726030 SP. 2.3 Human Resource Development
Economic Classification
Estimates Projected Estimates
2016/2017 2017/2018 2018/2019KShs. KShs. KShs.
Current Expenditure 53,430,681 78,080,288 79,794,983
Compensation to Employees 21,447,104 34,920,220 36,517,708
Use of Goods and Services 31,983,577 43,160,068 43,277,275Total Expenditure 53,430,681 78,080,288 79,794,983
681
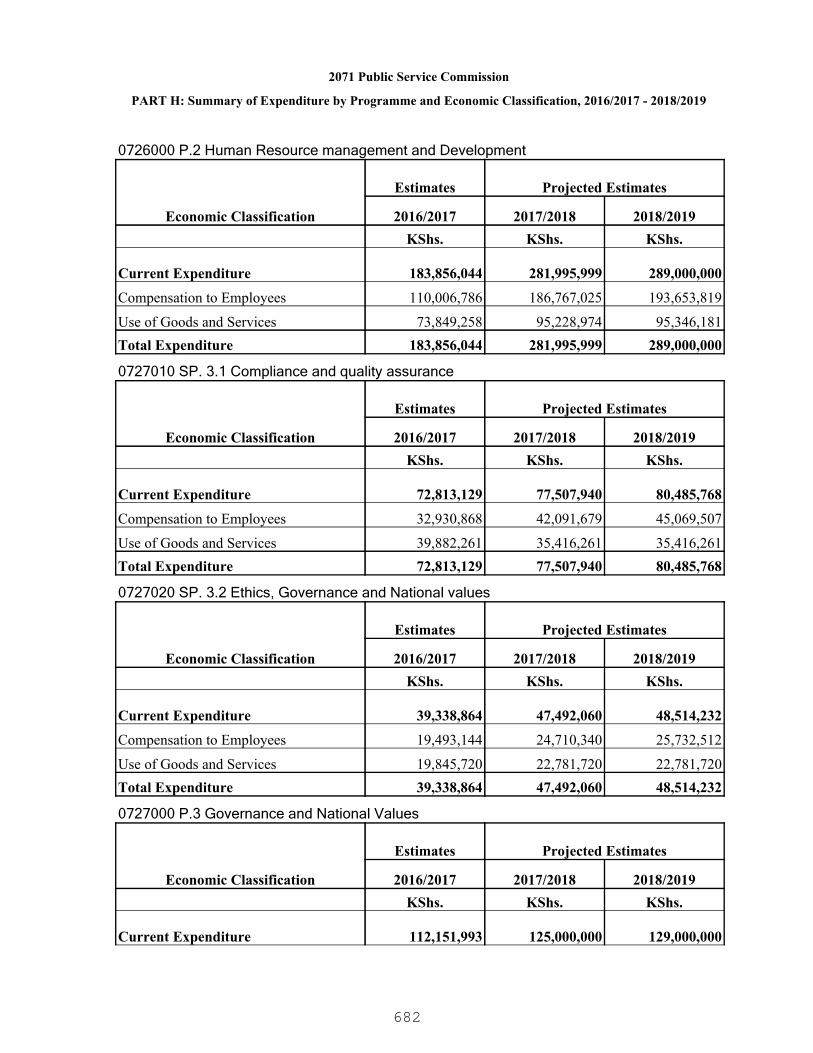
2071 Public Service Commission
PART H: Summary of Expenditure by Programme and Economic Classification, 2016/2017 - 2018/2019
0726000 P.2 Human Resource management and Development
Economic Classification
Estimates Projected Estimates
2016/2017 2017/2018 2018/2019KShs. KShs. KShs.
Current Expenditure 183,856,044 281,995,999 289,000,000
Compensation to Employees 110,006,786 186,767,025 193,653,819
Use of Goods and Services 73,849,258 95,228,974 95,346,181Total Expenditure 183,856,044 281,995,999 289,000,000
0727010 SP. 3.1 Compliance and quality assurance
Economic Classification
Estimates Projected Estimates
2016/2017 2017/2018 2018/2019KShs. KShs. KShs.
Current Expenditure 72,813,129 77,507,940 80,485,768
Compensation to Employees 32,930,868 42,091,679 45,069,507
Use of Goods and Services 39,882,261 35,416,261 35,416,261Total Expenditure 72,813,129 77,507,940 80,485,768
0727020 SP. 3.2 Ethics, Governance and National values
Economic Classification
Estimates Projected Estimates
2016/2017 2017/2018 2018/2019KShs. KShs. KShs.
Current Expenditure 39,338,864 47,492,060 48,514,232
Compensation to Employees 19,493,144 24,710,340 25,732,512
Use of Goods and Services 19,845,720 22,781,720 22,781,720Total Expenditure 39,338,864 47,492,060 48,514,232
0727000 P.3 Governance and National Values
Economic Classification
Estimates Projected Estimates
2016/2017 2017/2018 2018/2019KShs. KShs. KShs.
Current Expenditure 112,151,993 125,000,000 129,000,000
682
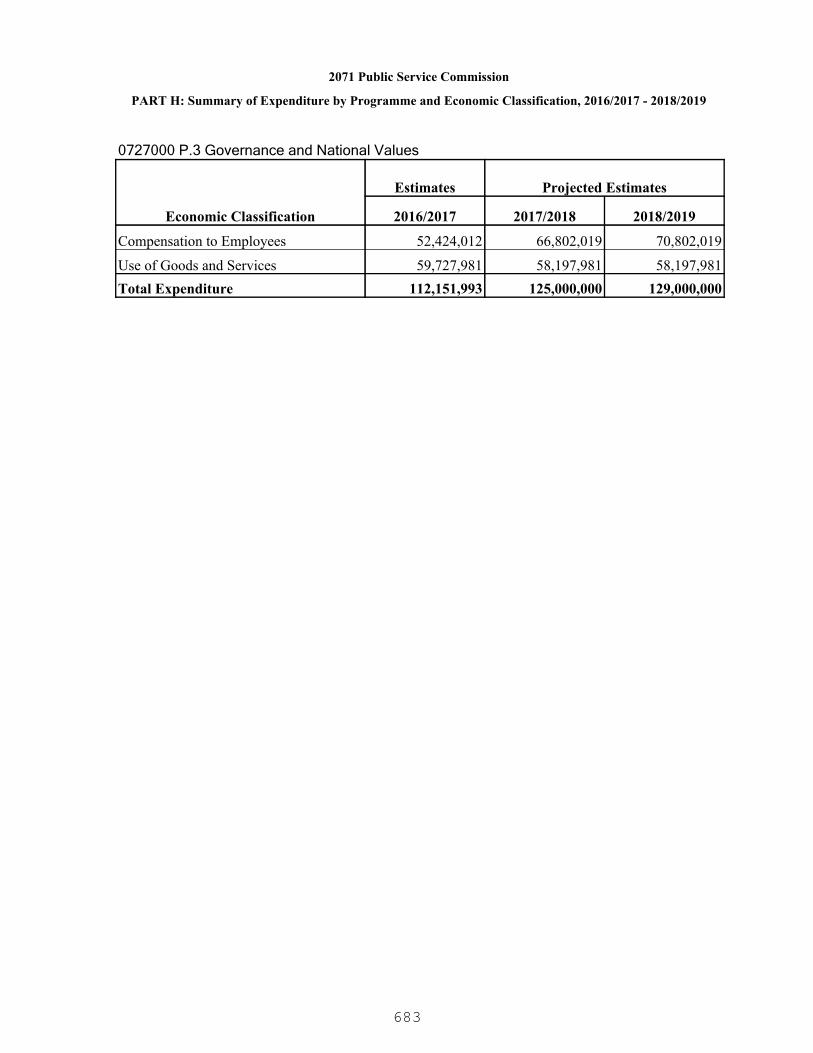
2071 Public Service Commission
PART H: Summary of Expenditure by Programme and Economic Classification, 2016/2017 - 2018/2019
0727000 P.3 Governance and National Values
Economic Classification
Estimates Projected Estimates
2016/2017 2017/2018 2018/2019
Compensation to Employees 52,424,012 66,802,019 70,802,019
Use of Goods and Services 59,727,981 58,197,981 58,197,981Total Expenditure 112,151,993 125,000,000 129,000,000
683
2081 Salaries and Remuneration Commission
An equitable, competitive and sustainable remuneration for public officers in Kenya
To set, review and advise on equitable, competitive and sustainable remuneration andbenefits through research and analysis
PART A. Vision
PART B. Mission
PART C. Performance Overview and Background for Programme(s) Funding
PART D. Programme Objectives
The Salaries and Remuneration Commission (SRC) is established under Chapter 12 Article230 (1) of the Constitution of Kenya 2010. The powers and functions of the SRC as providedunder Article 230 (4) of the Constitution of Kenya 2010 are to set and regularly review theremuneration and benefits of all State officers; and to advice the National and CountyGovernments on the remuneration and benefits of all other public officers.
During the period 2012/13-2014/15, the Commission achieved the following: developed andlaunched the Public Sector Remuneration and Benefits Policy; developed Pension ReviewPolicy; audited the legal remunerative and benefits framework; harmonized remunerationstructure for State Officers in the County Governments; and reviewed and harmonized keyallowances in the Public Service.
The approved budget for the period was KShs. 492.7 million, KShs. 506.6 million, and KShs.840.1 million with an absorption level of 70%, 85% and 79% for the Financial Years 2012/13,2013/14, and 2014/15 respectively.
The Commission faced the following challenges during the period under review: inadequatefunding, resistance to commission’s mandate leading to unnecessary litigation; andinadequate legal framework which affected compliance and management of sustainability ofthe wage bill.
For the period 2016/17-2018/19, the Commission plans to accomplish the following:completion of the job evaluation exercise for the Public Service and submission ofrecommendations to the Government; developing a Remuneration and Benefits Act andRegulations; review the Remuneration and Benefits Structure of State Officers; undertake acomprehensive study on the review of pensions payable to public officers; carry out a surveyon wage differentials between public and private sector; and build capacity ad sensitize thePublic Service on remuneration and benefits management.
ObjectiveProgramme
0728000 P.1 Salaries andRemuneration Management
To develop a harmonized, competitive and sustainableremuneration system in the Public Sector
684
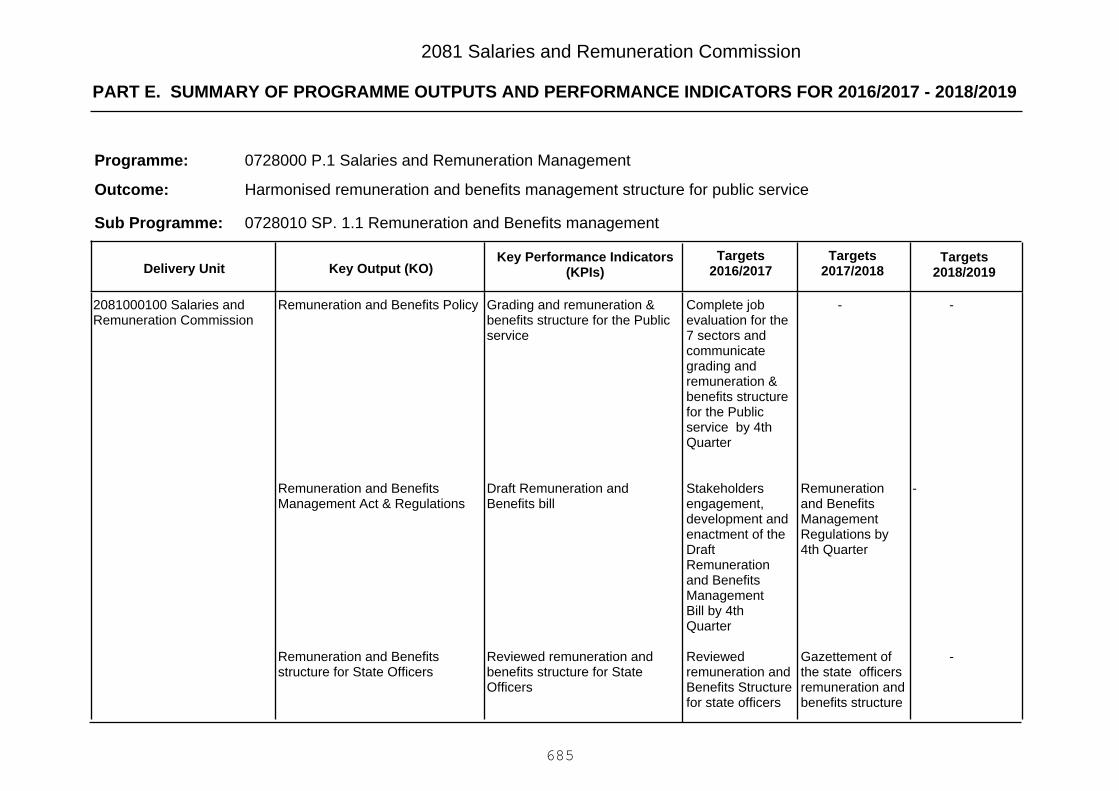
PART E. SUMMARY OF PROGRAMME OUTPUTS AND PERFORMANCE INDICATORS FOR 2016/2017 - 2018/2019
2081 Salaries and Remuneration Commission
0728000 P.1 Salaries and Remuneration Management
Harmonised remuneration and benefits management structure for public service
Programme:
Outcome:
0728010 SP. 1.1 Remuneration and Benefits managementSub Programme:
Key Output (KO)Targets
2018/2019Targets
2017/2018Key Performance Indicators
(KPIs)Targets
2016/2017Delivery Unit
-
-
-
-
Remunerationand BenefitsManagementRegulations by4th Quarter
Gazettement ofthe state officersremuneration andbenefits structure
Complete jobevaluation for the7 sectors andcommunicategrading andremuneration &benefits structurefor the Publicservice by 4thQuarter
Stakeholdersengagement,development andenactment of theDraftRemunerationand BenefitsManagementBill by 4thQuarter
Reviewedremuneration andBenefits Structurefor state officers
Grading and remuneration &benefits structure for the Publicservice
Draft Remuneration andBenefits bill
Reviewed remuneration andbenefits structure for StateOfficers
Remuneration and Benefits Policy
Remuneration and BenefitsManagement Act & Regulations
Remuneration and Benefitsstructure for State Officers
2081000100 Salaries andRemuneration Commission
685
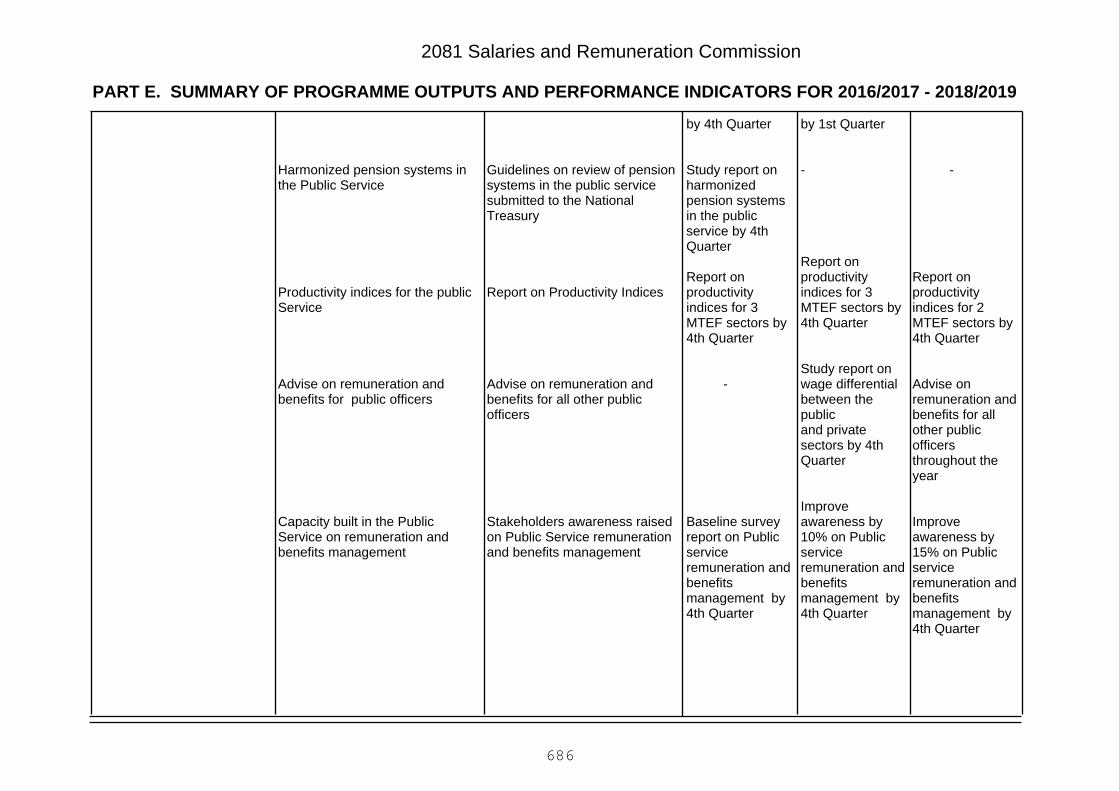
PART E. SUMMARY OF PROGRAMME OUTPUTS AND PERFORMANCE INDICATORS FOR 2016/2017 - 2018/2019
2081 Salaries and Remuneration Commission
-
Report onproductivityindices for 2MTEF sectors by4th Quarter
Advise onremuneration andbenefits for allother publicofficersthroughout theyear
Improveawareness by15% on Publicserviceremuneration andbenefitsmanagement by4th Quarter
by 1st Quarter
-
Report onproductivityindices for 3MTEF sectors by4th Quarter
Study report onwage differentialbetween thepublicand privatesectors by 4thQuarter
Improveawareness by10% on Publicserviceremuneration andbenefitsmanagement by4th Quarter
by 4th Quarter
Study report onharmonizedpension systemsin the publicservice by 4thQuarter
Report onproductivityindices for 3MTEF sectors by4th Quarter
-
Baseline surveyreport on Publicserviceremuneration andbenefitsmanagement by4th Quarter
Guidelines on review of pensionsystems in the public servicesubmitted to the NationalTreasury
Report on Productivity Indices
Advise on remuneration andbenefits for all other publicofficers
Stakeholders awareness raisedon Public Service remunerationand benefits management
Harmonized pension systems inthe Public Service
Productivity indices for the publicService
Advise on remuneration andbenefits for public officers
Capacity built in the PublicService on remuneration andbenefits management
686
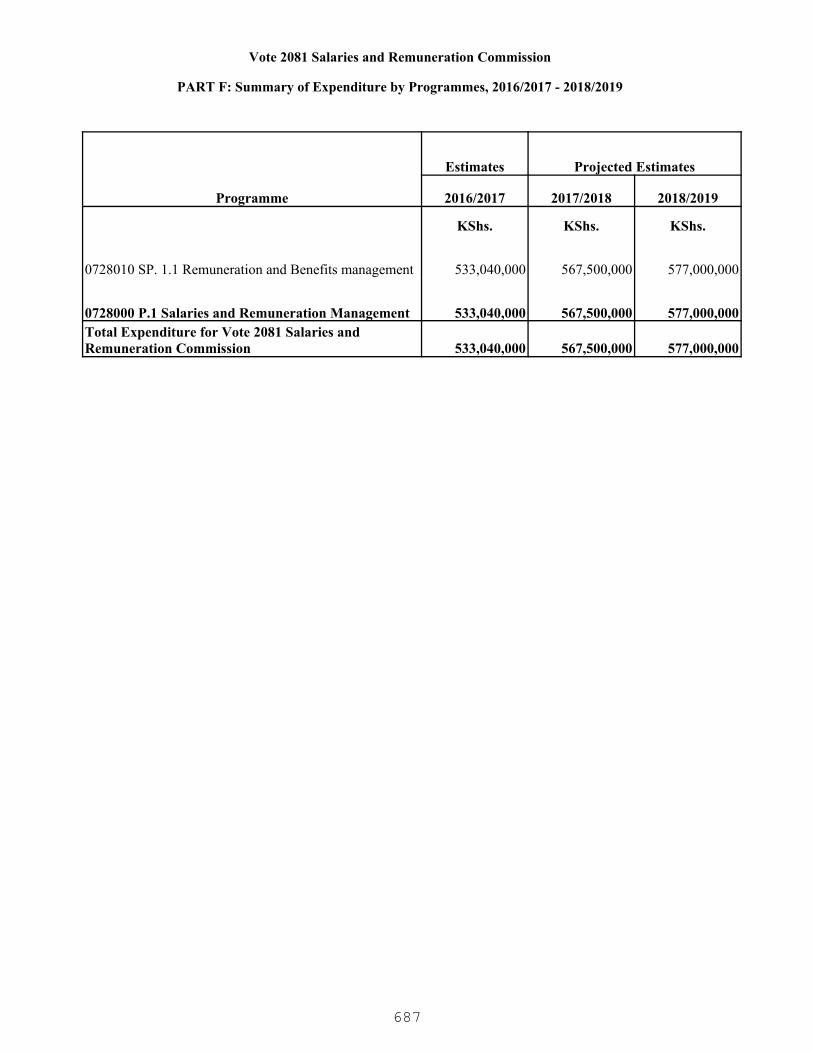
Vote 2081 Salaries and Remuneration Commission
PART F: Summary of Expenditure by Programmes, 2016/2017 - 2018/2019
Programme
Estimates Projected Estimates
2016/2017 2017/2018 2018/2019
KShs. KShs. KShs.
0728010 SP. 1.1 Remuneration and Benefits management 533,040,000 567,500,000 577,000,000
0728000 P.1 Salaries and Remuneration Management 533,040,000 567,500,000 577,000,000Total Expenditure for Vote 2081 Salaries and Remuneration Commission 533,040,000 567,500,000 577,000,000
687

2081 Salaries and Remuneration Commission
PART G: Summary of Expenditure by Vote and Economic Classification, 2016/2017 - 2018/2019
Economic Classification
Estimates Projected Estimates
2016/2017 2017/2018 2018/2019KShs. KShs. KShs.
Current Expenditure 533,040,000 567,500,000 577,000,000
Compensation to Employees 227,730,000 237,700,000 247,200,000
Use of Goods and Services 305,310,000 329,800,000 329,800,000Total Expenditure 533,040,000 567,500,000 577,000,000
688

2081 Salaries and Remuneration Commission
PART H: Summary of Expenditure by Programme and Economic Classification, 2016/2017 - 2018/2019
0728010 SP. 1.1 Remuneration and Benefits management
Economic Classification
Estimates Projected Estimates
2016/2017 2017/2018 2018/2019KShs. KShs. KShs.
Current Expenditure 533,040,000 567,500,000 577,000,000
Compensation to Employees 227,730,000 237,700,000 247,200,000
Use of Goods and Services 305,310,000 329,800,000 329,800,000Total Expenditure 533,040,000 567,500,000 577,000,000
0728000 P.1 Salaries and Remuneration Management
Economic Classification
Estimates Projected Estimates
2016/2017 2017/2018 2018/2019KShs. KShs. KShs.
Current Expenditure 533,040,000 567,500,000 577,000,000
Compensation to Employees 227,730,000 237,700,000 247,200,000
Use of Goods and Services 305,310,000 329,800,000 329,800,000Total Expenditure 533,040,000 567,500,000 577,000,000
689

2091 Teachers Service Commission
To be a trans formative teaching service for quality education
To professionalize the teaching service for quality education and development
PART A. Vision
PART B. Mission
PART C. Performance Overview and Background for Programme(s) Funding
The functions of the Commission are spelt out under article 237 sub-section 1-3 of theConstitution of Kenya as follows: - To register trained teachers; To recruit and employregistered teachers; To assign teachers employed by the Commission for service in anypublic school or institution; To promote and transfer teachers; To exercise disciplinary controlover teachers; and To terminate employment of teachers.
The commissions’ budget grew from Kshs.140 Billion to Kshs. 170 Billion in the MTEF period2012/13-2014/15, representing an increase of Kshs. 30 Billion. This is attributed to:Harmonization of teachers’ salaries with those of civil servants at a cost of Kshs. 17 Billion,recruitment of 25,000 new teachers at a cost of Kshs. 12 Billion, conversion of 18,060teachers previously employed on contract to permanent and pensionable and promotion ofteachers across all cadres. The Absorption rate of the budget was 100% throughout theMTEF period.
Major Achievements for the period were: Increased staffing levels by 26,000 to addressincreasing enrollments, development of Teacher Professional Development modules,improvement of terms and conditions of service for teachers and secretariat staff throughsalary increments, promotions and other benefits, decentralization of discipline, recruitmentand transfer functions to the counties to improve efficiency, digitization of 7,000 teacherrecords, development of VPN infrastructure in 41 counties and LAN in 11 counties, 63,784teachers were trained in ICT integration in primary education from all 47 counties to equipthem with ICT skills and competencies to effectively handle the digital literacy programme. Inthis regard, teacher online services were enhanced for use in teacher registration, applicationfor promotion and online pay slips. GP 178 and 213 pension claim forms were alsocomputerized to improve on accuracy and speed of processing pension claims.
Constraints and challenges experienced during the budget implementation were; teachersstrikes, Inadequacy of funds to undertake Commission programs, unplanned opening of newschools requiring additional teachers, increased enrolment in schools overstretching existingteacher establishment, increasing cases of litigation and indiscipline where teacher arechallenging the decisions of the Commission, and inadequate ICT infrastructure funding.
To counter this challenges, the Commission is seeking alternative source of funding throughpartnering with donors, and the Ministry of Education to implement the basic educationregulations on opening of new schools, fast track approval and implementation of newstaffing norms, disseminate Code of Regulation of Teachers, Code of Conduct and Ethicsand sensitize agents and Head of Institutions, and procure the necessary ICT equipment tofast track all functions.
690

2091 Teachers Service Commission
PART D. Programme Objectives
Major services/ outputs to be provided in MTEF period 2016/17 – 2018/19 include: paymentof salaries and allowances to teachers and secretariat staff, roll out of Teacher ProfessionalDevelopment (TPD) modules, develop capacity of field officers (County and Sub-county),digitization of 250,000 teacher records, development of ICT connectivity with counties andadministrative expenses.
ObjectiveProgramme
0509000 P.1 TeacherResource Management
To provide and maintain a sufficient and equitablydistributed teaching force in all public primary and postprimary institutions.
0510000 P.2 Governance andStandards
To enhance quality teaching, professionalism and integrityin the teaching service
0511000 P.3 GeneralAdministration, Planningand Support Services
To enhance efficiency and effectiveness in service delivery.
691

PART E. SUMMARY OF PROGRAMME OUTPUTS AND PERFORMANCE INDICATORS FOR 2016/2017 - 2018/2019
2091 Teachers Service Commission
0509000 P.1 Teacher Resource Management
Improved quality teaching
Programme:
Outcome:
0509010 SP. 1.1 Teacher Management- PrimarySub Programme:
Key Output (KO)Targets
2018/2019Targets
2017/2018Key Performance Indicators
(KPIs)Targets
2016/2017Delivery Unit
2,6622,6622,662Number of Teachers RecruitedTeachers Administration Services2091000200 TeacherResource Management
0509020 SP. 1.2 Teacher management - SecondarySub Programme:
Key Output (KO)Targets
2018/2019Targets
2017/2018Key Performance Indicators
(KPIs)Targets
2016/2017Delivery Unit
2,3382,3382,338Number of Teachers RecruitedTeachers Administration Services2091000200 TeacherResource Management
0509030 SP. 1.3 Teacher management - TertiarySub Programme:
Key Output (KO)Targets
2018/2019Targets
2017/2018Key Performance Indicators
(KPIs)Targets
2016/2017Delivery Unit
100100100Number Of Teachers RecruitedTeachers Administration Services2091000200 TeacherResource Management
0510000 P.2 Governance and Standards
Improved governance and education standards
Programme:
Outcome:
692

PART E. SUMMARY OF PROGRAMME OUTPUTS AND PERFORMANCE INDICATORS FOR 2016/2017 - 2018/2019
2091 Teachers Service Commission
0510010 SP. 2.1 Quality assurance and standardsSub Programme:
Key Output (KO)Targets
2018/2019Targets
2017/2018Key Performance Indicators
(KPIs)Targets
2016/2017Delivery Unit
11%
300,060
95%
15%
300,060
90%
21%
300,060
85%
Percentage Reduction inTeacher Absenteeism
Number of Teachers Appraisedand Meeting Standards
Percentage of Schools withfavorable standards assessmentreports
Quality assurance standards2091000300 Governance andTeaching Standards
0510020 SP. 2.2 Teacher professional developmentSub Programme:
Key Output (KO)Targets
2018/2019Targets
2017/2018Key Performance Indicators
(KPIs)Targets
2016/2017Delivery Unit
20%19%18%Percentage Reduction inDiscipline Cases
Governance and Standardsenhanced
2091000300 Governance andTeaching Standards
0510030 SP. 2.3 Teacher capacity developmentSub Programme:
Key Output (KO)Targets
2018/2019Targets
2017/2018Key Performance Indicators
(KPIs)Targets
2016/2017Delivery Unit
35%
5,000
30%
5,000
25%
5,000
Percentage of Teacherscompleting TeacherProfessional DevelopmentModules
Number of TeachersCompleting TPC
Quality and Relevant TeachingServices
2091000300 Governance andTeaching Standards
693
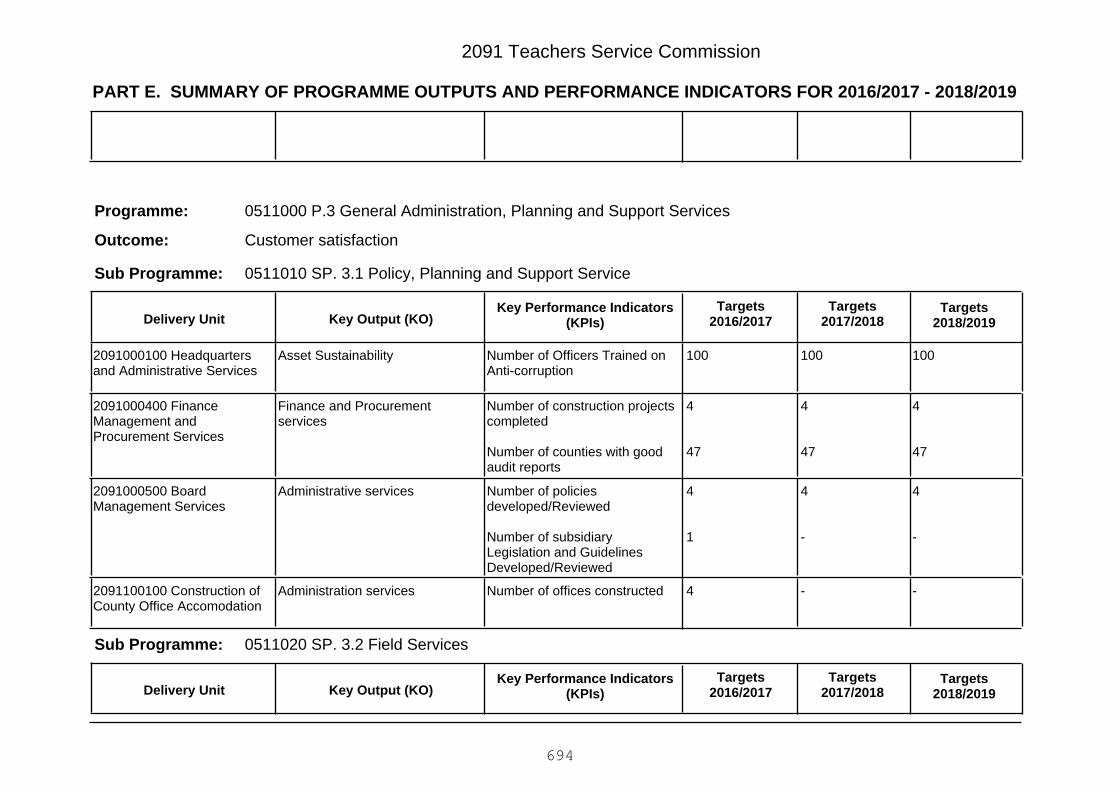
PART E. SUMMARY OF PROGRAMME OUTPUTS AND PERFORMANCE INDICATORS FOR 2016/2017 - 2018/2019
2091 Teachers Service Commission
0511000 P.3 General Administration, Planning and Support Services
Customer satisfaction
Programme:
Outcome:
0511010 SP. 3.1 Policy, Planning and Support ServiceSub Programme:
Key Output (KO)Targets
2018/2019Targets
2017/2018Key Performance Indicators
(KPIs)Targets
2016/2017Delivery Unit
100100100Number of Officers Trained onAnti-corruption
Asset Sustainability2091000100 Headquartersand Administrative Services
4
47
4
47
4
47
Number of construction projectscompleted
Number of counties with goodaudit reports
Finance and Procurementservices
2091000400 FinanceManagement andProcurement Services
4
-
4
-
4
1
Number of policiesdeveloped/Reviewed
Number of subsidiaryLegislation and GuidelinesDeveloped/Reviewed
Administrative services2091000500 BoardManagement Services
--4Number of offices constructedAdministration services2091100100 Construction ofCounty Office Accomodation
0511020 SP. 3.2 Field ServicesSub Programme:
Key Output (KO)Targets
2018/2019Targets
2017/2018Key Performance Indicators
(KPIs)Targets
2016/2017Delivery Unit
694
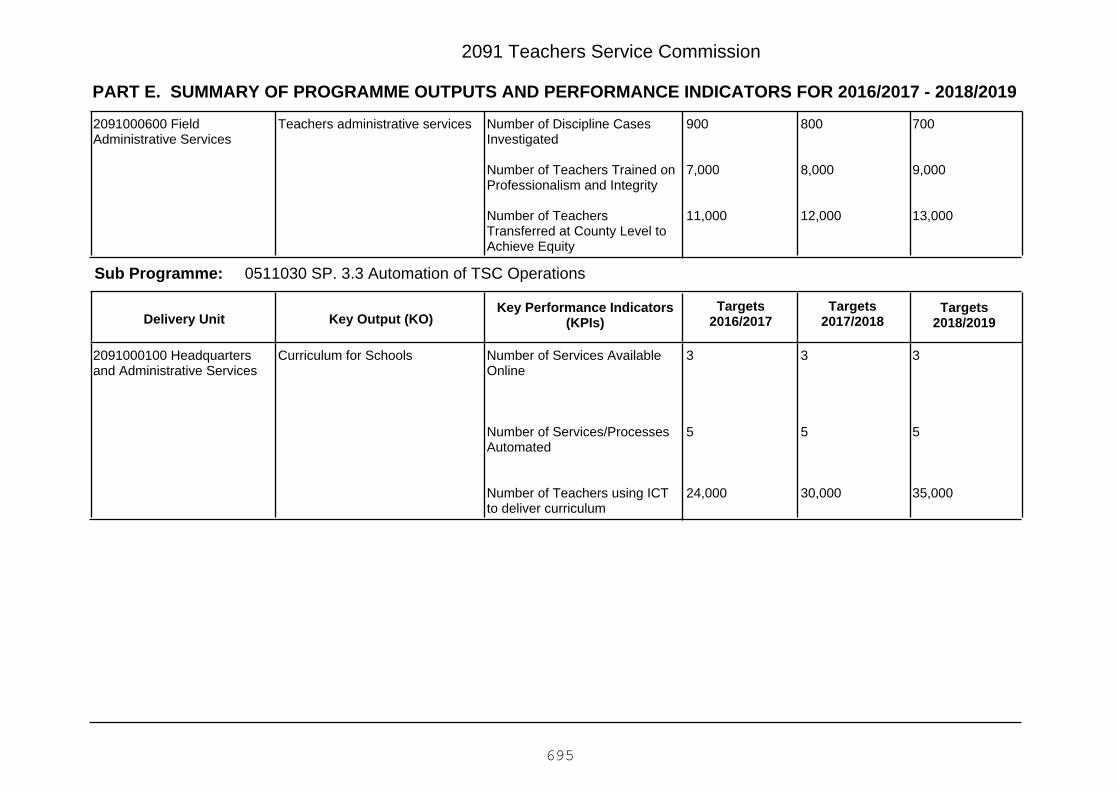
PART E. SUMMARY OF PROGRAMME OUTPUTS AND PERFORMANCE INDICATORS FOR 2016/2017 - 2018/2019
2091 Teachers Service Commission
700
9,000
13,000
800
8,000
12,000
900
7,000
11,000
Number of Discipline CasesInvestigated
Number of Teachers Trained onProfessionalism and Integrity
Number of TeachersTransferred at County Level toAchieve Equity
Teachers administrative services2091000600 FieldAdministrative Services
0511030 SP. 3.3 Automation of TSC OperationsSub Programme:
Key Output (KO)Targets
2018/2019Targets
2017/2018Key Performance Indicators
(KPIs)Targets
2016/2017Delivery Unit
3
5
35,000
3
5
30,000
3
5
24,000
Number of Services AvailableOnline
Number of Services/ProcessesAutomated
Number of Teachers using ICTto deliver curriculum
Curriculum for Schools2091000100 Headquartersand Administrative Services
695
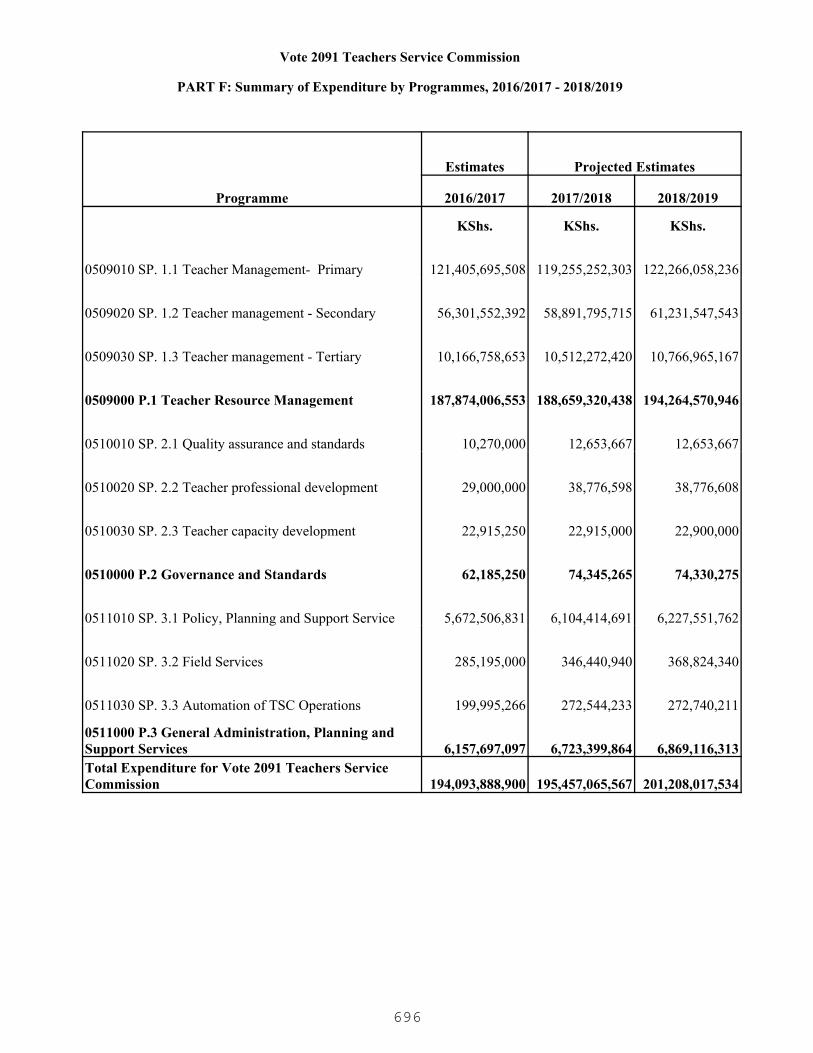
Vote 2091 Teachers Service Commission
PART F: Summary of Expenditure by Programmes, 2016/2017 - 2018/2019
Programme
Estimates Projected Estimates
2016/2017 2017/2018 2018/2019
KShs. KShs. KShs.
0509010 SP. 1.1 Teacher Management- Primary 121,405,695,508 119,255,252,303 122,266,058,236
0509020 SP. 1.2 Teacher management - Secondary 56,301,552,392 58,891,795,715 61,231,547,543
0509030 SP. 1.3 Teacher management - Tertiary 10,166,758,653 10,512,272,420 10,766,965,167
0509000 P.1 Teacher Resource Management 187,874,006,553 188,659,320,438 194,264,570,946
0510010 SP. 2.1 Quality assurance and standards 10,270,000 12,653,667 12,653,667
0510020 SP. 2.2 Teacher professional development 29,000,000 38,776,598 38,776,608
0510030 SP. 2.3 Teacher capacity development 22,915,250 22,915,000 22,900,000
0510000 P.2 Governance and Standards 62,185,250 74,345,265 74,330,275
0511010 SP. 3.1 Policy, Planning and Support Service 5,672,506,831 6,104,414,691 6,227,551,762
0511020 SP. 3.2 Field Services 285,195,000 346,440,940 368,824,340
0511030 SP. 3.3 Automation of TSC Operations 199,995,266 272,544,233 272,740,211
0511000 P.3 General Administration, Planning and Support Services 6,157,697,097 6,723,399,864 6,869,116,313Total Expenditure for Vote 2091 Teachers Service Commission 194,093,888,900 195,457,065,567 201,208,017,534
696

2091 Teachers Service Commission
PART G: Summary of Expenditure by Vote and Economic Classification, 2016/2017 - 2018/2019
Economic Classification
Estimates Projected Estimates
2016/2017 2017/2018 2018/2019KShs. KShs. KShs.
Current Expenditure 193,993,888,900 195,239,065,567 200,980,017,534
Compensation to Employees 192,655,888,900 193,665,065,567 199,391,017,534
Use of Goods and Services 996,274,734 1,200,144,374 1,214,708,396
Other Recurrent 341,725,266 373,855,626 374,291,604
Capital Expenditure 100,000,000 218,000,000 228,000,000
Acquisition of Non-Financial Assets 100,000,000 218,000,000 228,000,000Total Expenditure 194,093,888,900 195,457,065,567 201,208,017,534
697
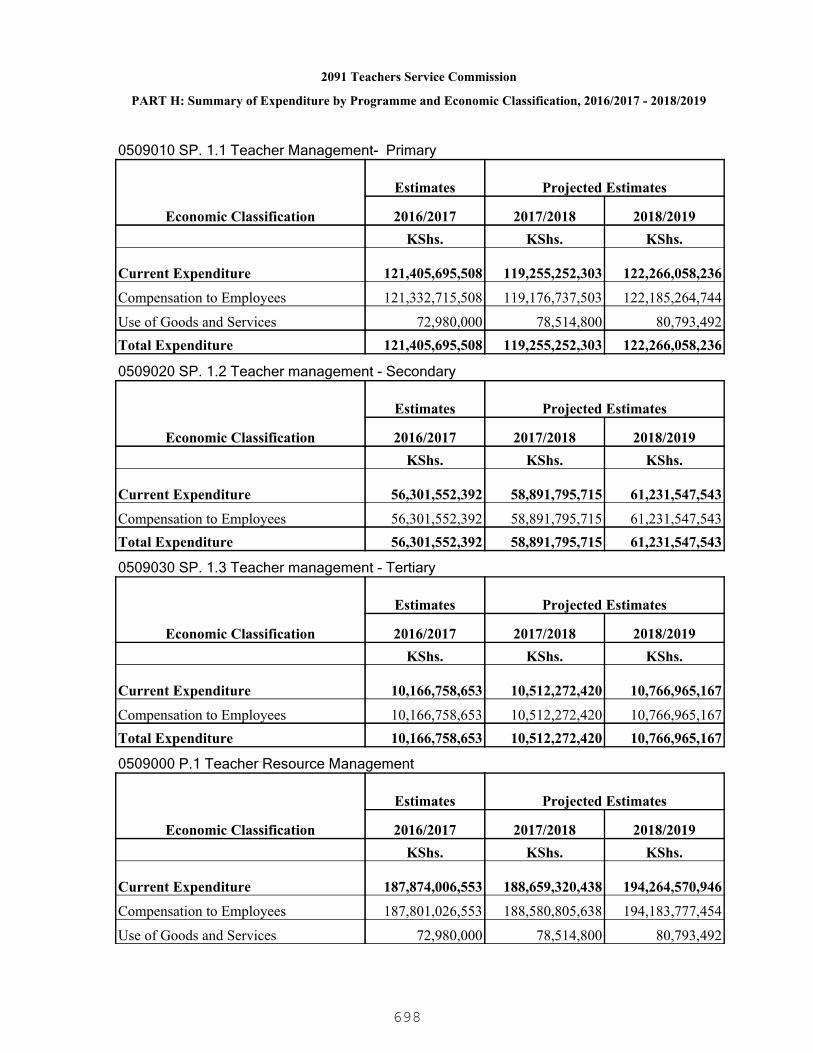
2091 Teachers Service Commission
PART H: Summary of Expenditure by Programme and Economic Classification, 2016/2017 - 2018/2019
0509010 SP. 1.1 Teacher Management- Primary
Economic Classification
Estimates Projected Estimates
2016/2017 2017/2018 2018/2019KShs. KShs. KShs.
Current Expenditure 121,405,695,508 119,255,252,303 122,266,058,236
Compensation to Employees 121,332,715,508 119,176,737,503 122,185,264,744
Use of Goods and Services 72,980,000 78,514,800 80,793,492Total Expenditure 121,405,695,508 119,255,252,303 122,266,058,236
0509020 SP. 1.2 Teacher management - Secondary
Economic Classification
Estimates Projected Estimates
2016/2017 2017/2018 2018/2019KShs. KShs. KShs.
Current Expenditure 56,301,552,392 58,891,795,715 61,231,547,543
Compensation to Employees 56,301,552,392 58,891,795,715 61,231,547,543Total Expenditure 56,301,552,392 58,891,795,715 61,231,547,543
0509030 SP. 1.3 Teacher management - Tertiary
Economic Classification
Estimates Projected Estimates
2016/2017 2017/2018 2018/2019KShs. KShs. KShs.
Current Expenditure 10,166,758,653 10,512,272,420 10,766,965,167
Compensation to Employees 10,166,758,653 10,512,272,420 10,766,965,167Total Expenditure 10,166,758,653 10,512,272,420 10,766,965,167
0509000 P.1 Teacher Resource Management
Economic Classification
Estimates Projected Estimates
2016/2017 2017/2018 2018/2019KShs. KShs. KShs.
Current Expenditure 187,874,006,553 188,659,320,438 194,264,570,946
Compensation to Employees 187,801,026,553 188,580,805,638 194,183,777,454
Use of Goods and Services 72,980,000 78,514,800 80,793,492
698

2091 Teachers Service Commission
PART H: Summary of Expenditure by Programme and Economic Classification, 2016/2017 - 2018/2019
0509000 P.1 Teacher Resource Management
Economic Classification
Estimates Projected Estimates
2016/2017 2017/2018 2018/2019Total Expenditure 187,874,006,553 188,659,320,438 194,264,570,9460510010 SP. 2.1 Quality assurance and standards
Economic Classification
Estimates Projected Estimates
2016/2017 2017/2018 2018/2019KShs. KShs. KShs.
Current Expenditure 10,270,000 12,653,667 12,653,667
Use of Goods and Services 10,270,000 12,653,667 12,653,667Total Expenditure 10,270,000 12,653,667 12,653,667
0510020 SP. 2.2 Teacher professional development
Economic Classification
Estimates Projected Estimates
2016/2017 2017/2018 2018/2019KShs. KShs. KShs.
Current Expenditure 29,000,000 38,776,598 38,776,608
Use of Goods and Services 29,000,000 38,776,598 38,776,608Total Expenditure 29,000,000 38,776,598 38,776,608
0510030 SP. 2.3 Teacher capacity development
Economic Classification
Estimates Projected Estimates
2016/2017 2017/2018 2018/2019KShs. KShs. KShs.
Current Expenditure 22,915,250 22,915,000 22,900,000
Use of Goods and Services 22,915,250 22,915,000 22,900,000Total Expenditure 22,915,250 22,915,000 22,900,000
0510000 P.2 Governance and Standards
Economic Classification
Estimates Projected Estimates
2016/2017 2017/2018 2018/2019KShs. KShs. KShs.
699
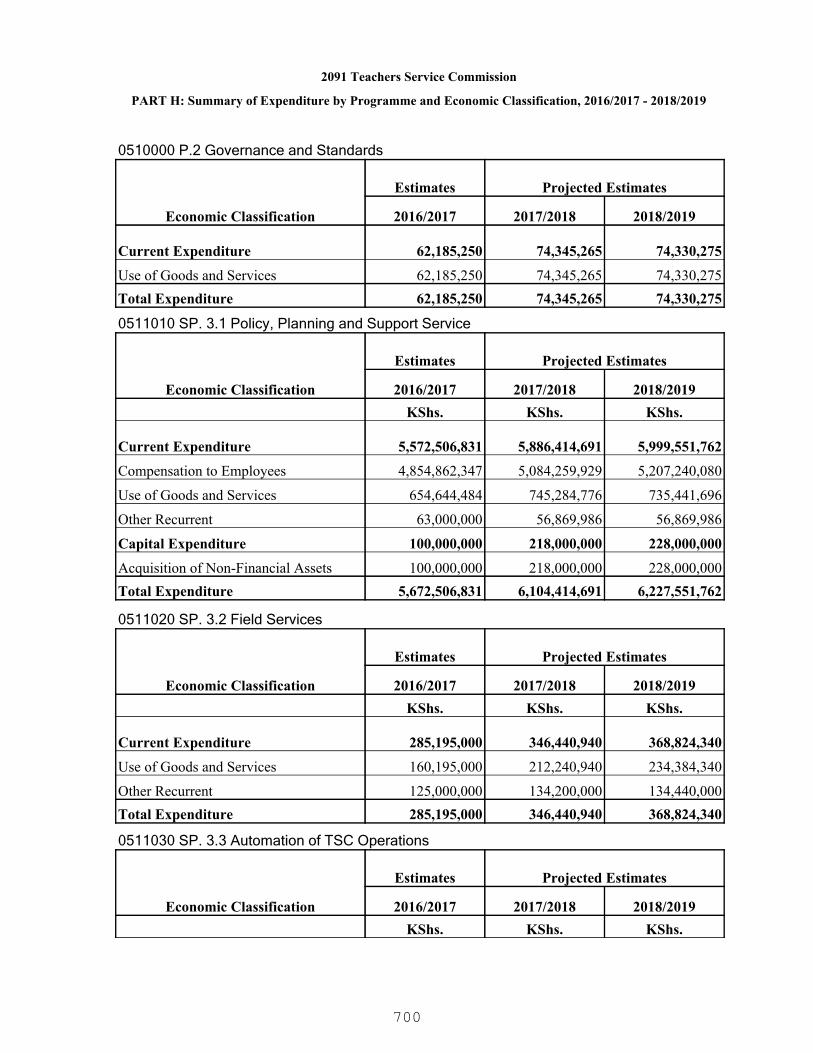
2091 Teachers Service Commission
PART H: Summary of Expenditure by Programme and Economic Classification, 2016/2017 - 2018/2019
0510000 P.2 Governance and Standards
Economic Classification
Estimates Projected Estimates
2016/2017 2017/2018 2018/2019
Current Expenditure 62,185,250 74,345,265 74,330,275
Use of Goods and Services 62,185,250 74,345,265 74,330,275Total Expenditure 62,185,250 74,345,265 74,330,275
0511010 SP. 3.1 Policy, Planning and Support Service
Economic Classification
Estimates Projected Estimates
2016/2017 2017/2018 2018/2019KShs. KShs. KShs.
Current Expenditure 5,572,506,831 5,886,414,691 5,999,551,762
Compensation to Employees 4,854,862,347 5,084,259,929 5,207,240,080
Use of Goods and Services 654,644,484 745,284,776 735,441,696
Other Recurrent 63,000,000 56,869,986 56,869,986
Capital Expenditure 100,000,000 218,000,000 228,000,000
Acquisition of Non-Financial Assets 100,000,000 218,000,000 228,000,000Total Expenditure 5,672,506,831 6,104,414,691 6,227,551,762
0511020 SP. 3.2 Field Services
Economic Classification
Estimates Projected Estimates
2016/2017 2017/2018 2018/2019KShs. KShs. KShs.
Current Expenditure 285,195,000 346,440,940 368,824,340
Use of Goods and Services 160,195,000 212,240,940 234,384,340
Other Recurrent 125,000,000 134,200,000 134,440,000Total Expenditure 285,195,000 346,440,940 368,824,340
0511030 SP. 3.3 Automation of TSC Operations
Economic Classification
Estimates Projected Estimates
2016/2017 2017/2018 2018/2019KShs. KShs. KShs.
700

2091 Teachers Service Commission
PART H: Summary of Expenditure by Programme and Economic Classification, 2016/2017 - 2018/2019
0511030 SP. 3.3 Automation of TSC Operations
Economic Classification
Estimates Projected Estimates
2016/2017 2017/2018 2018/2019
Current Expenditure 199,995,266 272,544,233 272,740,211
Use of Goods and Services 46,270,000 89,758,593 89,758,593
Other Recurrent 153,725,266 182,785,640 182,981,618Total Expenditure 199,995,266 272,544,233 272,740,211
0511000 P.3 General Administration, Planning and Support Services
Economic Classification
Estimates Projected Estimates
2016/2017 2017/2018 2018/2019KShs. KShs. KShs.
Current Expenditure 6,057,697,097 6,505,399,864 6,641,116,313
Compensation to Employees 4,854,862,347 5,084,259,929 5,207,240,080
Use of Goods and Services 861,109,484 1,047,284,309 1,059,584,629
Other Recurrent 341,725,266 373,855,626 374,291,604
Capital Expenditure 100,000,000 218,000,000 228,000,000
Acquisition of Non-Financial Assets 100,000,000 218,000,000 228,000,000Total Expenditure 6,157,697,097 6,723,399,864 6,869,116,313
701
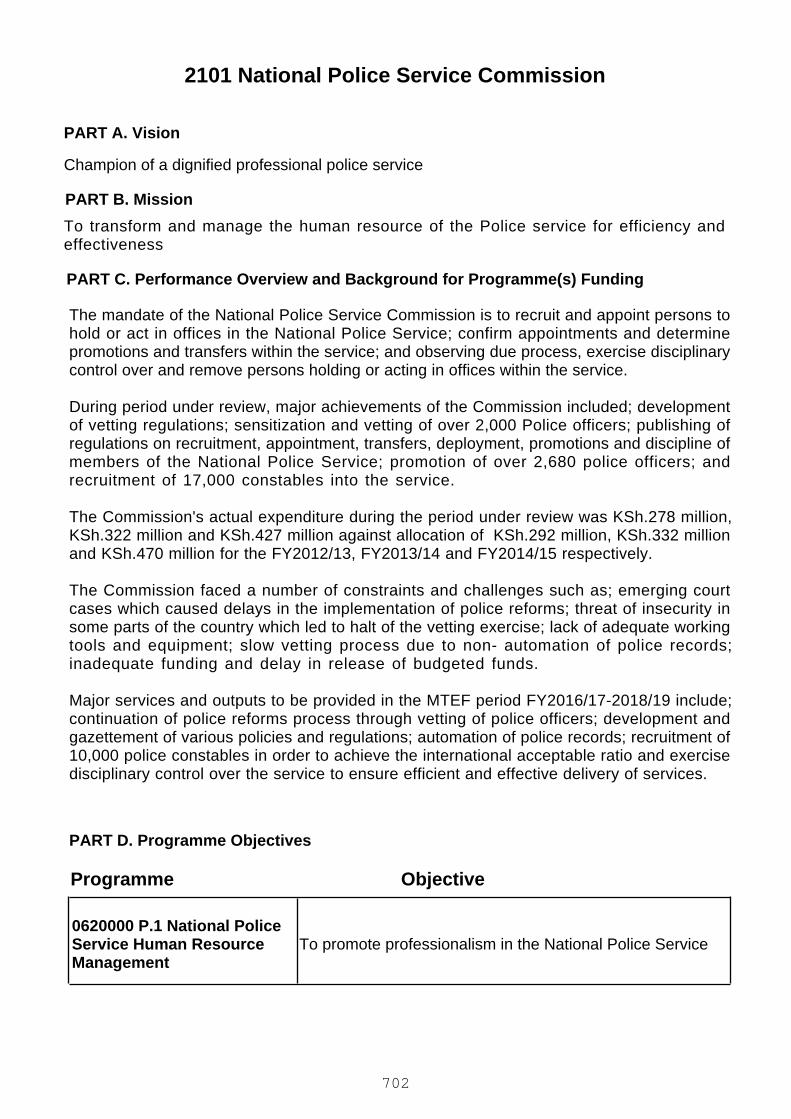
2101 National Police Service Commission
Champion of a dignified professional police service
To transform and manage the human resource of the Police service for efficiency andeffectiveness
PART A. Vision
PART B. Mission
PART C. Performance Overview and Background for Programme(s) Funding
PART D. Programme Objectives
The mandate of the National Police Service Commission is to recruit and appoint persons tohold or act in offices in the National Police Service; confirm appointments and determinepromotions and transfers within the service; and observing due process, exercise disciplinarycontrol over and remove persons holding or acting in offices within the service.
During period under review, major achievements of the Commission included; developmentof vetting regulations; sensitization and vetting of over 2,000 Police officers; publishing ofregulations on recruitment, appointment, transfers, deployment, promotions and discipline ofmembers of the National Police Service; promotion of over 2,680 police officers; andrecruitment of 17,000 constables into the service.
The Commission's actual expenditure during the period under review was KSh.278 million,KSh.322 million and KSh.427 million against allocation of KSh.292 million, KSh.332 millionand KSh.470 million for the FY2012/13, FY2013/14 and FY2014/15 respectively.
The Commission faced a number of constraints and challenges such as; emerging courtcases which caused delays in the implementation of police reforms; threat of insecurity insome parts of the country which led to halt of the vetting exercise; lack of adequate workingtools and equipment; slow vetting process due to non- automation of police records;inadequate funding and delay in release of budgeted funds.
Major services and outputs to be provided in the MTEF period FY2016/17-2018/19 include;continuation of police reforms process through vetting of police officers; development andgazettement of various policies and regulations; automation of police records; recruitment of10,000 police constables in order to achieve the international acceptable ratio and exercisedisciplinary control over the service to ensure efficient and effective delivery of services.
ObjectiveProgramme
0620000 P.1 National PoliceService Human ResourceManagement
To promote professionalism in the National Police Service
702

PART E. SUMMARY OF PROGRAMME OUTPUTS AND PERFORMANCE INDICATORS FOR 2016/2017 - 2018/2019
2101 National Police Service Commission
0620000 P.1 National Police Service Human Resource Management
An efficient and effective National Police Service
Programme:
Outcome:
0620010 SP. 1.1 Human Resource ManagementSub Programme:
Key Output (KO)Targets
2018/2019Targets
2017/2018Key Performance Indicators
(KPIs)Targets
2016/2017Delivery Unit
1:500
100
100
-
1:550
100
100
1- civilian servicescheme
1:600
100
100
1- uniformedservice scheme
Police to citizen ratio
% of promotions / appointmentsfinalized
% of disciplinary cases andappeals received and finalized
No. of schemes of servicedeveloped
Improved police citizen ratio
Promotions and appointments
Discipline and appealsadjudicated
National Police Service schemesof service developed
2101000100 HeadquartersAdministrative Services
0620020 SP. 1.2 Police VettingSub Programme:
Key Output (KO)Targets
2018/2019Targets
2017/2018Key Performance Indicators
(KPIs)Targets
2016/2017Delivery Unit
703

PART E. SUMMARY OF PROGRAMME OUTPUTS AND PERFORMANCE INDICATORS FOR 2016/2017 - 2018/2019
2101 National Police Service Commission
18,00015,00012,000No. of police officers vetted.Vetted Police officers2101000100 HeadquartersAdministrative Services
0620030 SP. 1.3 Administration and Standards SettingSub Programme:
Key Output (KO)Targets
2018/2019Targets
2017/2018Key Performance Indicators
(KPIs)Targets
2016/2017Delivery Unit
70%
Implement
1 regulation onhours of duty forpolice officers
1policy onwelfare maters:housing , healthcare and otherbenefits
-
-
70%
Implement
1 regulation onpoliceengagement totrade
1 regulation onrecognition ofPoliceAssociations
1 Policy on termsand conditions ofservice
-
50%
Initiate andpretest
1 policy ontraining
1 regulation onappeals anddisciplinaryprocedures
1 regulation onvetting ofReserve Police
1 guideline onexamination andcertification ofPolice trainees
% level of automation
Performance Appraisal tooloperationalised
No. of policies and regulations
Automated police services
Performance Appraisal tool forNational Police Service
Policies and regulationsdeveloped
2101000100 HeadquartersAdministrative Services
704
PART E. SUMMARY OF PROGRAMME OUTPUTS AND PERFORMANCE INDICATORS FOR 2016/2017 - 2018/2019
2101 National Police Service Commission
705

Vote 2101 National Police Service Commission
PART F: Summary of Expenditure by Programmes, 2016/2017 - 2018/2019
Programme
Estimates Projected Estimates
2016/2017 2017/2018 2018/2019
KShs. KShs. KShs.
0620010 SP. 1.1 Human Resource Management 195,070,000 204,305,600 210,561,768
0620020 SP. 1.2 Police Vetting 72,800,000 116,670,000 122,890,000
0620030 SP. 1.3 Administration and Standards Setting 147,470,000 147,170,000 154,420,000
0620000 P.1 National Police Service Human Resource Management 415,340,000 468,145,600 487,871,768Total Expenditure for Vote 2101 National Police Service Commission 415,340,000 468,145,600 487,871,768
706

2101 National Police Service Commission
PART G: Summary of Expenditure by Vote and Economic Classification, 2016/2017 - 2018/2019
Economic Classification
Estimates Projected Estimates
2016/2017 2017/2018 2018/2019KShs. KShs. KShs.
Current Expenditure 415,340,000 468,145,600 487,871,768
Compensation to Employees 189,520,000 195,205,600 201,061,768
Use of Goods and Services 197,474,000 263,140,000 268,185,000
Other Recurrent 28,346,000 9,800,000 18,625,000Total Expenditure 415,340,000 468,145,600 487,871,768
707

2101 National Police Service Commission
PART H: Summary of Expenditure by Programme and Economic Classification, 2016/2017 - 2018/2019
0620010 SP. 1.1 Human Resource Management
Economic Classification
Estimates Projected Estimates
2016/2017 2017/2018 2018/2019KShs. KShs. KShs.
Current Expenditure 195,070,000 204,305,600 210,561,768
Compensation to Employees 189,520,000 195,205,600 201,061,768
Use of Goods and Services 5,550,000 9,100,000 9,500,000Total Expenditure 195,070,000 204,305,600 210,561,768
0620020 SP. 1.2 Police Vetting
Economic Classification
Estimates Projected Estimates
2016/2017 2017/2018 2018/2019KShs. KShs. KShs.
Current Expenditure 72,800,000 116,670,000 122,890,000
Use of Goods and Services 72,800,000 116,670,000 122,890,000Total Expenditure 72,800,000 116,670,000 122,890,000
0620030 SP. 1.3 Administration and Standards Setting
Economic Classification
Estimates Projected Estimates
2016/2017 2017/2018 2018/2019KShs. KShs. KShs.
Current Expenditure 147,470,000 147,170,000 154,420,000
Use of Goods and Services 119,124,000 137,370,000 135,795,000
Other Recurrent 28,346,000 9,800,000 18,625,000Total Expenditure 147,470,000 147,170,000 154,420,000
0620000 P.1 National Police Service Human Resource Management
Economic Classification
Estimates Projected Estimates
2016/2017 2017/2018 2018/2019KShs. KShs. KShs.
Current Expenditure 415,340,000 468,145,600 487,871,768
Compensation to Employees 189,520,000 195,205,600 201,061,768
708

2101 National Police Service Commission
PART H: Summary of Expenditure by Programme and Economic Classification, 2016/2017 - 2018/2019
0620000 P.1 National Police Service Human Resource Management
Economic Classification
Estimates Projected Estimates
2016/2017 2017/2018 2018/2019
Use of Goods and Services 197,474,000 263,140,000 268,185,000
Other Recurrent 28,346,000 9,800,000 18,625,000Total Expenditure 415,340,000 468,145,600 487,871,768
709
2111 Auditor General
A lead agency in promoting good governance and accountability in the management of publicresources
To provide assurance to stakeholders on the use of public resources through quality andtimely audit reports.
PART A. Vision
PART B. Mission
PART C. Performance Overview and Background for Programme(s) Funding
PART D. Programme Objectives
The mandate of the Auditor-General is enshrined in the Constitution of Kenya and the PublicAudit Act, 2015. The core mandate is to carry out audits and report to Parliament and therelevant County Assemblies within statutory timelines. It includes carrying out audits oneconomy, efficiency and effectiveness of public resources by the National Government,County Governments, the Judiciary and other independent offices.
During the period 2012/13 - 2014/15, the Office was allocated KSh. 2 billion, KSh. 3.3 billionand KSh. 3.3 billion in 2014/15 while actual expenditure amounted to KSh.1.8 billion, KSh.3.1billion and KSh.2.8 billion in the Financial Years 2012/13, 2013/14 and 2014/15 respectively.
During the period under review, the Office achieved the following: audited financialstatements for both National and County levels of government in line with the newconstitution; conducted special and performance audits on various public organizations andtransactions of special interest including the Kenyatta National Hospital, Judiciary, NarokCounty Government among others; and issued both the National and County Governmentaudit reports for 2013/14.
In the period 2016/17 – 2018/19, the Office intends to deliver audit reports within the statutorydeadlies. In each of the three financal years, the Office is expected to deliver 607 NationalGovernent financial audit reports, 290 CDF financial audit reports, 47 County Governmentsfinancial audit reports and 110 specialised audit reports. The Office also intends to opencounty offices so as to ensure a continuous presence at the point where expenditure isincurred.
ObjectiveProgramme
0729000 P.1 Audit ServicesTo promote and suppor t good governance andaccountability in the public sector as the country movestowards achievement of the Vision 2030
710
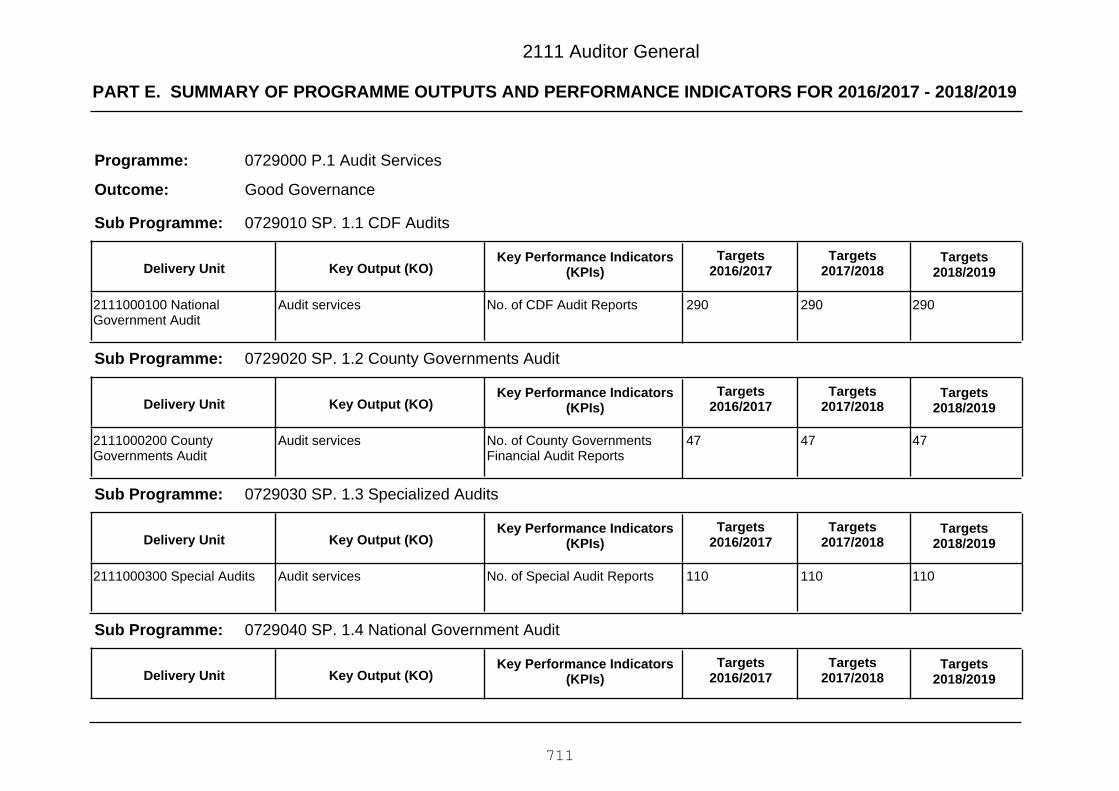
PART E. SUMMARY OF PROGRAMME OUTPUTS AND PERFORMANCE INDICATORS FOR 2016/2017 - 2018/2019
2111 Auditor General
0729000 P.1 Audit Services
Good Governance
Programme:
Outcome:
0729010 SP. 1.1 CDF AuditsSub Programme:
Key Output (KO)Targets
2018/2019Targets
2017/2018Key Performance Indicators
(KPIs)Targets
2016/2017Delivery Unit
290290290No. of CDF Audit ReportsAudit services2111000100 NationalGovernment Audit
0729020 SP. 1.2 County Governments AuditSub Programme:
Key Output (KO)Targets
2018/2019Targets
2017/2018Key Performance Indicators
(KPIs)Targets
2016/2017Delivery Unit
474747No. of County GovernmentsFinancial Audit Reports
Audit services2111000200 CountyGovernments Audit
0729030 SP. 1.3 Specialized AuditsSub Programme:
Key Output (KO)Targets
2018/2019Targets
2017/2018Key Performance Indicators
(KPIs)Targets
2016/2017Delivery Unit
110110110No. of Special Audit ReportsAudit services2111000300 Special Audits
0729040 SP. 1.4 National Government AuditSub Programme:
Key Output (KO)Targets
2018/2019Targets
2017/2018Key Performance Indicators
(KPIs)Targets
2016/2017Delivery Unit
711
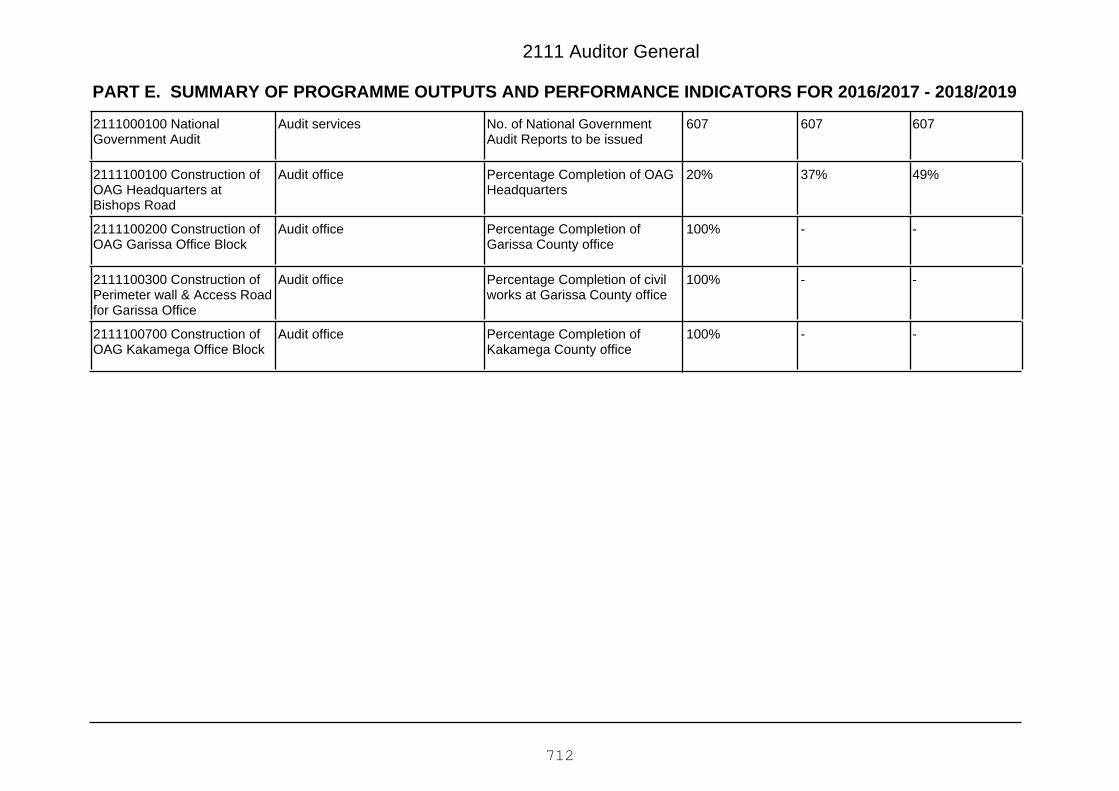
PART E. SUMMARY OF PROGRAMME OUTPUTS AND PERFORMANCE INDICATORS FOR 2016/2017 - 2018/2019
2111 Auditor General
607607607No. of National GovernmentAudit Reports to be issued
Audit services2111000100 NationalGovernment Audit
49%37%20%Percentage Completion of OAGHeadquarters
Audit office2111100100 Construction ofOAG Headquarters atBishops Road
--100%Percentage Completion ofGarissa County office
Audit office2111100200 Construction ofOAG Garissa Office Block
--100%Percentage Completion of civilworks at Garissa County office
Audit office2111100300 Construction ofPerimeter wall & Access Roadfor Garissa Office
--100%Percentage Completion ofKakamega County office
Audit office2111100700 Construction ofOAG Kakamega Office Block
712
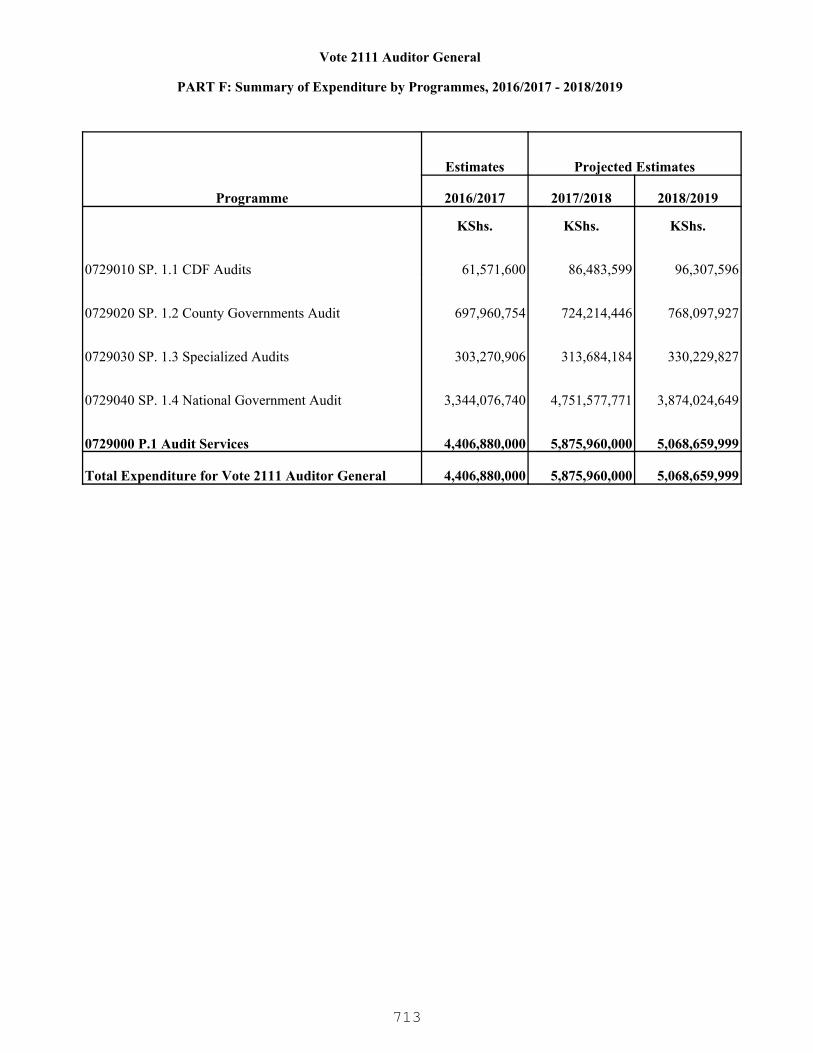
Vote 2111 Auditor General
PART F: Summary of Expenditure by Programmes, 2016/2017 - 2018/2019
Programme
Estimates Projected Estimates
2016/2017 2017/2018 2018/2019
KShs. KShs. KShs.
0729010 SP. 1.1 CDF Audits 61,571,600 86,483,599 96,307,596
0729020 SP. 1.2 County Governments Audit 697,960,754 724,214,446 768,097,927
0729030 SP. 1.3 Specialized Audits 303,270,906 313,684,184 330,229,827
0729040 SP. 1.4 National Government Audit 3,344,076,740 4,751,577,771 3,874,024,649
0729000 P.1 Audit Services 4,406,880,000 5,875,960,000 5,068,659,999
Total Expenditure for Vote 2111 Auditor General 4,406,880,000 5,875,960,000 5,068,659,999
713

2111 Auditor General
PART G: Summary of Expenditure by Vote and Economic Classification, 2016/2017 - 2018/2019
Economic Classification
Estimates Projected Estimates
2016/2017 2017/2018 2018/2019KShs. KShs. KShs.
Current Expenditure 4,182,880,000 4,375,960,000 4,666,660,000
Compensation to Employees 2,540,220,000 2,609,300,000 2,700,000,000
Use of Goods and Services 1,196,633,200 1,294,136,098 1,441,141,889
Current Transfers to Govt. Agencies 6,000,000 6,000,000 6,000,000
Other Recurrent 440,026,800 466,523,902 519,518,111
Capital Expenditure 224,000,000 1,500,000,000 401,999,999
Acquisition of Non-Financial Assets 224,000,000 1,500,000,000 401,999,999Total Expenditure 4,406,880,000 5,875,960,000 5,068,659,999
714
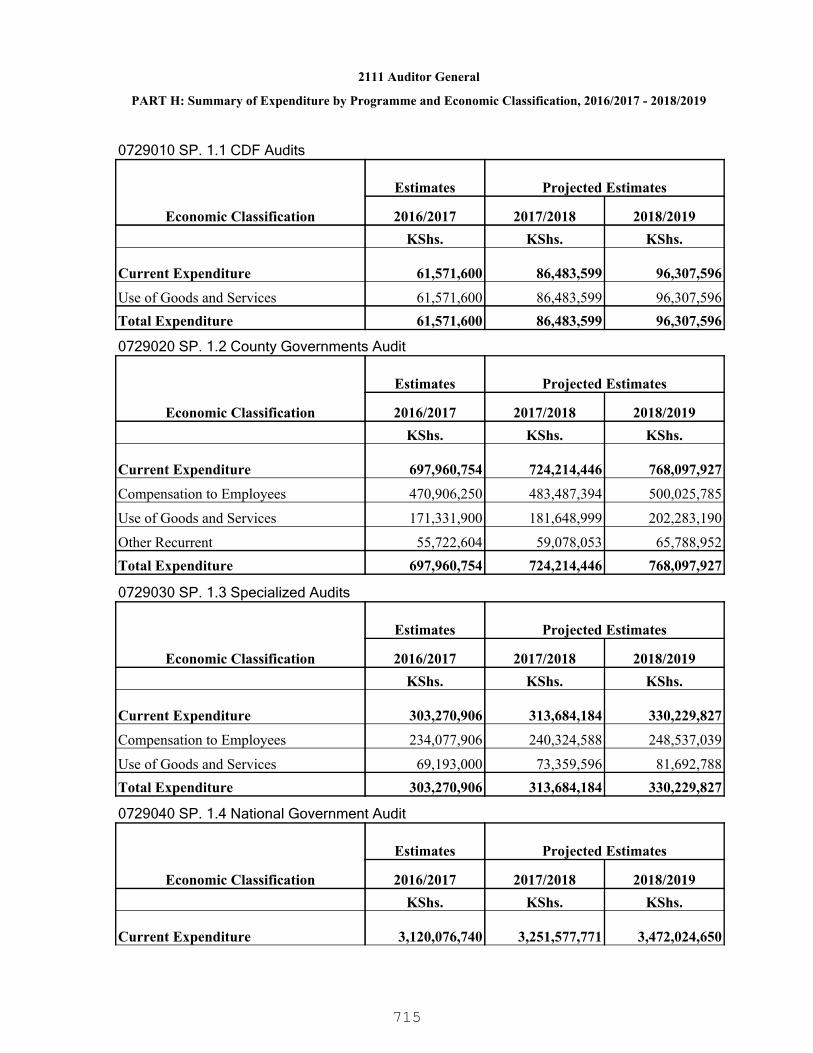
2111 Auditor General
PART H: Summary of Expenditure by Programme and Economic Classification, 2016/2017 - 2018/2019
0729010 SP. 1.1 CDF Audits
Economic Classification
Estimates Projected Estimates
2016/2017 2017/2018 2018/2019KShs. KShs. KShs.
Current Expenditure 61,571,600 86,483,599 96,307,596
Use of Goods and Services 61,571,600 86,483,599 96,307,596Total Expenditure 61,571,600 86,483,599 96,307,596
0729020 SP. 1.2 County Governments Audit
Economic Classification
Estimates Projected Estimates
2016/2017 2017/2018 2018/2019KShs. KShs. KShs.
Current Expenditure 697,960,754 724,214,446 768,097,927
Compensation to Employees 470,906,250 483,487,394 500,025,785
Use of Goods and Services 171,331,900 181,648,999 202,283,190
Other Recurrent 55,722,604 59,078,053 65,788,952Total Expenditure 697,960,754 724,214,446 768,097,927
0729030 SP. 1.3 Specialized Audits
Economic Classification
Estimates Projected Estimates
2016/2017 2017/2018 2018/2019KShs. KShs. KShs.
Current Expenditure 303,270,906 313,684,184 330,229,827
Compensation to Employees 234,077,906 240,324,588 248,537,039
Use of Goods and Services 69,193,000 73,359,596 81,692,788Total Expenditure 303,270,906 313,684,184 330,229,827
0729040 SP. 1.4 National Government Audit
Economic Classification
Estimates Projected Estimates
2016/2017 2017/2018 2018/2019KShs. KShs. KShs.
Current Expenditure 3,120,076,740 3,251,577,771 3,472,024,650
715
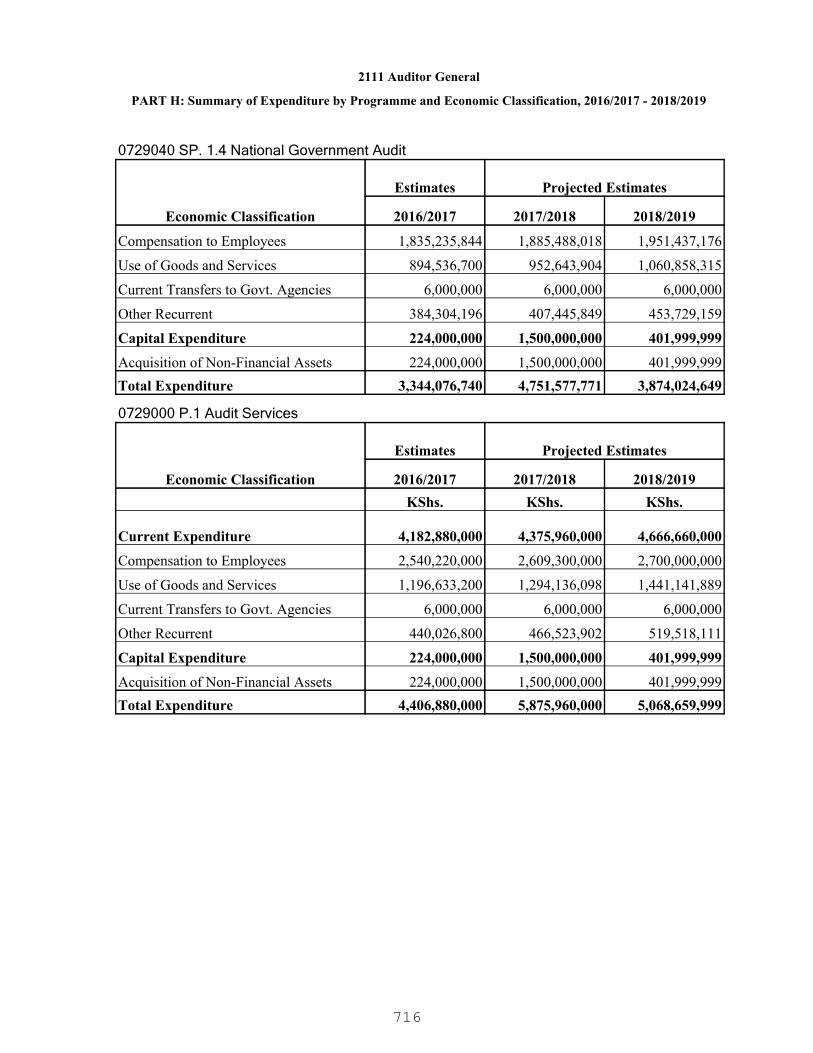
2111 Auditor General
PART H: Summary of Expenditure by Programme and Economic Classification, 2016/2017 - 2018/2019
0729040 SP. 1.4 National Government Audit
Economic Classification
Estimates Projected Estimates
2016/2017 2017/2018 2018/2019
Compensation to Employees 1,835,235,844 1,885,488,018 1,951,437,176
Use of Goods and Services 894,536,700 952,643,904 1,060,858,315
Current Transfers to Govt. Agencies 6,000,000 6,000,000 6,000,000
Other Recurrent 384,304,196 407,445,849 453,729,159
Capital Expenditure 224,000,000 1,500,000,000 401,999,999
Acquisition of Non-Financial Assets 224,000,000 1,500,000,000 401,999,999Total Expenditure 3,344,076,740 4,751,577,771 3,874,024,649
0729000 P.1 Audit Services
Economic Classification
Estimates Projected Estimates
2016/2017 2017/2018 2018/2019KShs. KShs. KShs.
Current Expenditure 4,182,880,000 4,375,960,000 4,666,660,000
Compensation to Employees 2,540,220,000 2,609,300,000 2,700,000,000
Use of Goods and Services 1,196,633,200 1,294,136,098 1,441,141,889
Current Transfers to Govt. Agencies 6,000,000 6,000,000 6,000,000
Other Recurrent 440,026,800 466,523,902 519,518,111
Capital Expenditure 224,000,000 1,500,000,000 401,999,999
Acquisition of Non-Financial Assets 224,000,000 1,500,000,000 401,999,999Total Expenditure 4,406,880,000 5,875,960,000 5,068,659,999
716

2121 Controller of Budget
A leading and independent oversight institution in public financial management
To guarantee prudent public financial management through overseeing implementation of theGovernment budgets by controlling and monitoring the use of public funds and reporting onbudget implementation for the benefit of all Kenyans
PART A. Vision
PART B. Mission
PART C. Performance Overview and Background for Programme(s) Funding
PART D. Programme Objectives
The mandate of the Office of the Controller of Budget (OCoB) is to manage and advise on theimplementation of National and County Government budgets.
During the Period 2012/13- 2014/15, the Office achieved the following: facilitated timelyapproval of exchequer requisitions for both the National and County Governments; produced32,050 Quarterly Budget Implementation Review Reports (BIRR) as required by law for boththe National and County Governments and special reports to the Executive and Legislature;reviewed systems and procedures for Exchequer withdrawal for the County Governments;ensured the Exchequer Accounts were not overdrawn; held two (2) public sensitizationforums in Uasin Gishu and Nyeri counties to sensitize the public on the OCoB mandate andpublic particiption in budgeting process; oversaw and regularly monitored the utilization ofpublic funds released to spending units both at National and county level; operationalized itsmonitoring and evaluation framework and carried out monitoring of projects in all the 47counties; provided advice on financial planning and budgeting issues through preparation ofpresentations on key issues on budget implementation to Committees of Parliament andother key stakeholders; prepared its annual report in line with Article 254 of the Constitution;and reviewed the Draft County budgets for the financial year 2014/2015 and advised on theircompliance with the law.
During the period under review, the Office was allocated Kshs. 381 million, Kshs 371.4 millionand Kshs. 395.9 million while actual expenditure was Kshs. 240.7 million, Kshs. 306.7 millionand Kshs.368.8 million respectively in the Financial years 2012/13, 2013/14 and 2014/15
The Office experienced the following challenges: inadequate staff capacity in the BudgetImplementation Department, delay in publishing and publicizing the Quarterly BudgetImplementation Review Reports (BIRR) due to late and incomplete submission of financialreports by Ministries, Departments and Agencies.
In the period 2016/17-2018/19, the Office will implement the following: control withdrawal ofpublic funds in a timely manner; continuous budget implementation and monitoring; buildcapacity of staff and equip them with skills necessary to deliver on the Office’s mandate; andconduct public participation forums to ensure that the public has access to information andparticipate in the preparation and execution of the budget.
717
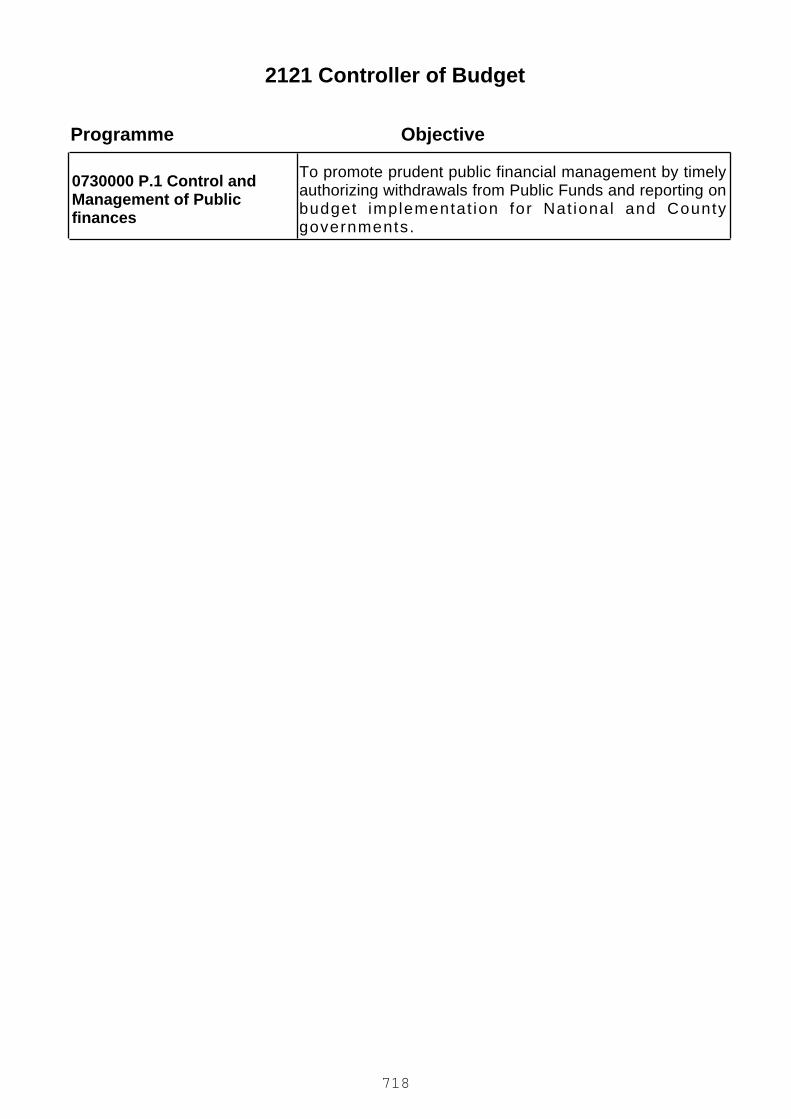
2121 Controller of Budget
ObjectiveProgramme
0730000 P.1 Control andManagement of Publicfinances
To promote prudent public financial management by timelyauthorizing withdrawals from Public Funds and reporting onbudget implementat ion for Nat ional and Countygovernments.
718

PART E. SUMMARY OF PROGRAMME OUTPUTS AND PERFORMANCE INDICATORS FOR 2016/2017 - 2018/2019
2121 Controller of Budget
0730000 P.1 Control and Management of Public finances
Improved accountability and transparency in themanagement of public financial public resources
Programme:
Outcome:
0730010 SP. 1.1 Authorization of withdrawal from public FundsSub Programme:
Key Output (KO)Targets
2018/2019Targets
2017/2018Key Performance Indicators
(KPIs)Targets
2016/2017Delivery Unit
1 day1 day1 dayNo. of days taken to approveExchequer requisitions.
Timely approval of MDAsexchequer requisitions
2121000400 County Services
0730020 SP.1.2 Budget implementation and MonitoringSub Programme:
Key Output (KO)Targets
2018/2019Targets
2017/2018Key Performance Indicators
(KPIs)Targets
2016/2017Delivery Unit
26,500 copies ofCounty Reports
14,000 copies ofNational BudgetImplementationreports
25,300 copies ofCounty reports
14,000 copies ofNational BudgetImplementationreports
24,000 copies ofCounty reports
14,000 copies ofNational BudgetImplementationreports
No. of Quarterly reportsBudget Implementation reviewreports
2121000300 Budget Reviewand Analysis
0730030 SP.1.3 General Administration Planning and Support ServicesSub Programme:
Key Output (KO)Targets
2018/2019Targets
2017/2018Key Performance Indicators
(KPIs)Targets
2016/2017Delivery Unit
719

PART E. SUMMARY OF PROGRAMME OUTPUTS AND PERFORMANCE INDICATORS FOR 2016/2017 - 2018/2019
2121 Controller of Budget
95%
500 copies
90%
500 copies
80%
500 copies
Employee satisfaction levels.
No. of annual reports
Administration support services2121000100 AdministrationSupport Services
0730040 SP.1.4 Research & Development.Sub Programme:
Key Output (KO)Targets
2018/2019Targets
2017/2018Key Performance Indicators
(KPIs)Targets
2016/2017Delivery Unit
1 Report1 Report1 ReportNo. of M&E reports producedMonitoring and Evaluation reports2121000200 Research andPlanning
720

Vote 2121 Controller of Budget
PART F: Summary of Expenditure by Programmes, 2016/2017 - 2018/2019
Programme
Estimates Projected Estimates
2016/2017 2017/2018 2018/2019
KShs. KShs. KShs.
0730010 SP. 1.1 Authorization of withdrawal from public Funds 204,026,756 226,155,092 230,745,631
0730020 SP.1.2 Budget implementation and Monitoring 41,633,736 46,157,140 47,570,047
0730030 SP.1.3 General Administration Planning and Support Services 300,015,724 316,488,281 321,346,871
0730040 SP.1.4 Research & Development. 15,593,634 18,909,487 19,467,451
0730000 P.1 Control and Management of Public finances 561,269,850 607,710,000 619,130,000
Total Expenditure for Vote 2121 Controller of Budget 561,269,850 607,710,000 619,130,000
721

2121 Controller of Budget
PART G: Summary of Expenditure by Vote and Economic Classification, 2016/2017 - 2018/2019
Economic Classification
Estimates Projected Estimates
2016/2017 2017/2018 2018/2019KShs. KShs. KShs.
Current Expenditure 561,269,850 607,710,000 619,130,000
Compensation to Employees 276,579,850 285,380,000 296,800,000
Use of Goods and Services 215,755,486 261,154,898 261,154,898
Other Recurrent 68,934,514 61,175,102 61,175,102Total Expenditure 561,269,850 607,710,000 619,130,000
722
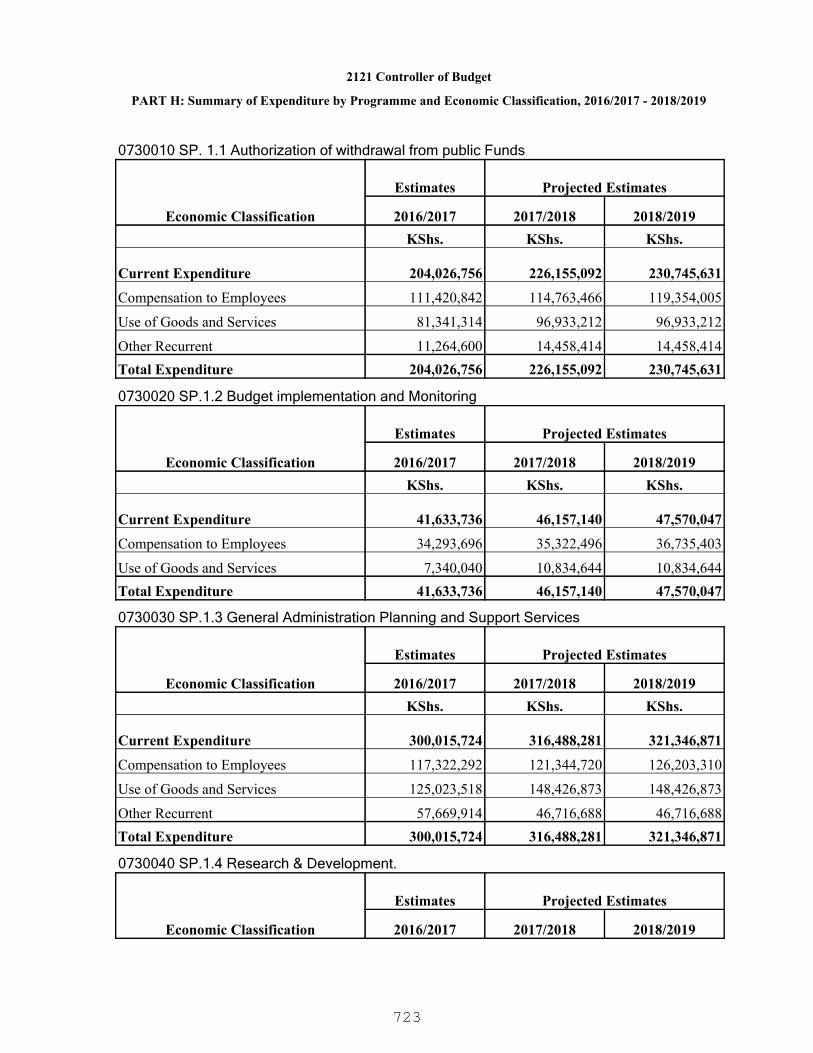
2121 Controller of Budget
PART H: Summary of Expenditure by Programme and Economic Classification, 2016/2017 - 2018/2019
0730010 SP. 1.1 Authorization of withdrawal from public Funds
Economic Classification
Estimates Projected Estimates
2016/2017 2017/2018 2018/2019KShs. KShs. KShs.
Current Expenditure 204,026,756 226,155,092 230,745,631
Compensation to Employees 111,420,842 114,763,466 119,354,005
Use of Goods and Services 81,341,314 96,933,212 96,933,212
Other Recurrent 11,264,600 14,458,414 14,458,414Total Expenditure 204,026,756 226,155,092 230,745,631
0730020 SP.1.2 Budget implementation and Monitoring
Economic Classification
Estimates Projected Estimates
2016/2017 2017/2018 2018/2019KShs. KShs. KShs.
Current Expenditure 41,633,736 46,157,140 47,570,047
Compensation to Employees 34,293,696 35,322,496 36,735,403
Use of Goods and Services 7,340,040 10,834,644 10,834,644Total Expenditure 41,633,736 46,157,140 47,570,047
0730030 SP.1.3 General Administration Planning and Support Services
Economic Classification
Estimates Projected Estimates
2016/2017 2017/2018 2018/2019KShs. KShs. KShs.
Current Expenditure 300,015,724 316,488,281 321,346,871
Compensation to Employees 117,322,292 121,344,720 126,203,310
Use of Goods and Services 125,023,518 148,426,873 148,426,873
Other Recurrent 57,669,914 46,716,688 46,716,688Total Expenditure 300,015,724 316,488,281 321,346,871
0730040 SP.1.4 Research & Development.
Economic Classification
Estimates Projected Estimates
2016/2017 2017/2018 2018/2019
723

2121 Controller of Budget
PART H: Summary of Expenditure by Programme and Economic Classification, 2016/2017 - 2018/2019
0730040 SP.1.4 Research & Development.
Economic Classification
Estimates Projected Estimates
2016/2017 2017/2018 2018/2019KShs. KShs. KShs.
Current Expenditure 15,593,634 18,909,487 19,467,451
Compensation to Employees 13,543,020 13,949,318 14,507,282
Use of Goods and Services 2,050,614 4,960,169 4,960,169Total Expenditure 15,593,634 18,909,487 19,467,451
0730000 P.1 Control and Management of Public finances
Economic Classification
Estimates Projected Estimates
2016/2017 2017/2018 2018/2019KShs. KShs. KShs.
Current Expenditure 561,269,850 607,710,000 619,130,000
Compensation to Employees 276,579,850 285,380,000 296,800,000
Use of Goods and Services 215,755,486 261,154,898 261,154,898
Other Recurrent 68,934,514 61,175,102 61,175,102Total Expenditure 561,269,850 607,710,000 619,130,000
724

2131 The Commission on Administrative Justice
An effective overseer of responsiveness and servant-hood in public offices at National andCounty levels.
To enforce administrative justice and promote constitutional values by addressingmaladministration through effective complaints handling and dispute resolution.
PART A. Vision
PART B. Mission
PART C. Performance Overview and Background for Programme(s) Funding
The Commission is anchored on Article 59(4) of the Constitution and the Commission onAdministrative Justice Act, 2011. Its mandate entails promotion and enforcement ofadministrative Justice in the public sector by addressing maladministration through effectivecomplaints handling and alternative dispute resolution.
In the period under review, the Commission was allocated KSHs.216.2 million, KSHs. 297.4million and KSHs.394.5 million in 2012/13, 2013/15 and 2014/15 financial years respectivelywhich was utilized to carry out planned activities. The absorption rates for the respectivefinancial years was 99.9%, 96% and 89.3% respectively. The Commission achieved variousmilestones key among them handling of 109,224 complaints against various MDAs;increased access to Ombudsman services by establishing branch offices in Mombasa andEldoret as well as deployed staff to Huduma Centers in 13 Counties; conducted spot checksin various MDAs; trained 1,859 public officers to strengthen complaint handling in the publicsector, conducted 11 investigations on various issues of national interests, hosted theSecond Regional Colloquium of African Ombudsman Institutions and fortified its humanresource capacity by recruiting 21 additional officers. However, a number of challenges were encountered among them delayed or lack ofresponse to Commission’s inquiries; budgetary constraints to scale up the outreachprogramme and conduct public education on matters of administrative Justice andinadequate human resource capacity. To address these challenges, the Commission hasrevised the guideline on resolution of public complaints in order to enhance the rate ofresponse to its inquiries and embarked on reviewing its legal framework to entrenchenforcement of the recommendations.
The Commission has also established desks in various Huduma Centers, to address thechallenge on decentralization as its services to the Counties. In the 2016/2017 – 2018/19MTEF Period, the Commission intends to utilize the allocated funds to further decentralize itsservices by establishing a branch office in Isiolo, support the strengthening of complaintmanagement systems in public institutions; support County Governments in setting upcomplaints management infrastructure, scaling up outreach and public awareness resolutionof public complaints and to conduct investigations on various systemic issues.
725
2131 The Commission on Administrative Justice
PART D. Programme Objectives
ObjectiveProgramme
0731000 P.1 Promotion ofAdministrative Justice
To address Maladministration and promote fairness inPublic Service delivery.
726

PART E. SUMMARY OF PROGRAMME OUTPUTS AND PERFORMANCE INDICATORS FOR 2016/2017 - 2018/2019
2131 The Commission on Administrative Justice
0731000 P.1 Promotion of Administrative Justice
Effective Public Service Delivery.
Programme:
Outcome:
0731010 SP. 1.1 Ombudsman servicesSub Programme:
Key Output (KO)Targets
2018/2019Targets
2017/2018Key Performance Indicators
(KPIs)Targets
2016/2017Delivery Unit
100%
86%
280
5
15
100%
85%
270
5
15
100%
84%
260
5
15
Percentage of complaintshandled.
Percentage of complaintsresolved.
No. of MDAs certified forcompliance on resolution ofpublic complaints
No. of additional Regionaloffices and Ombudsman desksat Huduma Centres established
No. of outreach fora held.
Addressed and/or Resolved publiccomplaints on maladministration.
Increased Ombudsman servicedelivery points.
2131000100 HeadquartersAdministrative Services
727
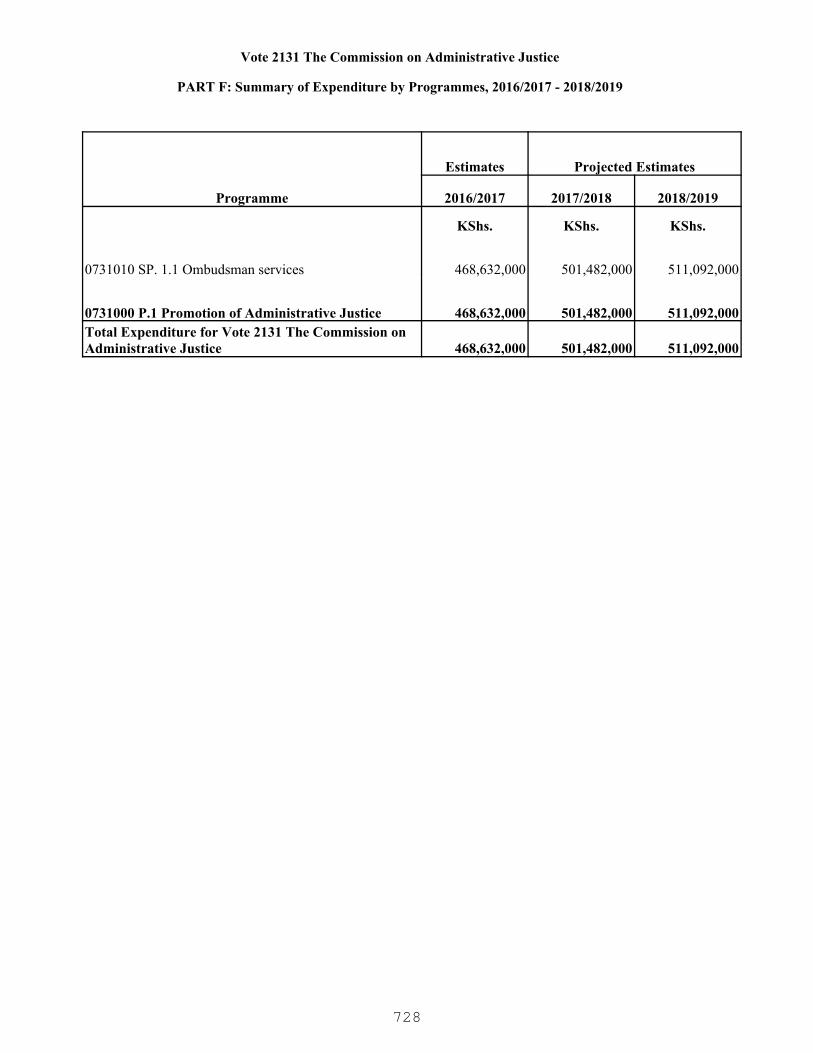
Vote 2131 The Commission on Administrative Justice
PART F: Summary of Expenditure by Programmes, 2016/2017 - 2018/2019
Programme
Estimates Projected Estimates
2016/2017 2017/2018 2018/2019
KShs. KShs. KShs.
0731010 SP. 1.1 Ombudsman services 468,632,000 501,482,000 511,092,000
0731000 P.1 Promotion of Administrative Justice 468,632,000 501,482,000 511,092,000Total Expenditure for Vote 2131 The Commission on Administrative Justice 468,632,000 501,482,000 511,092,000
728
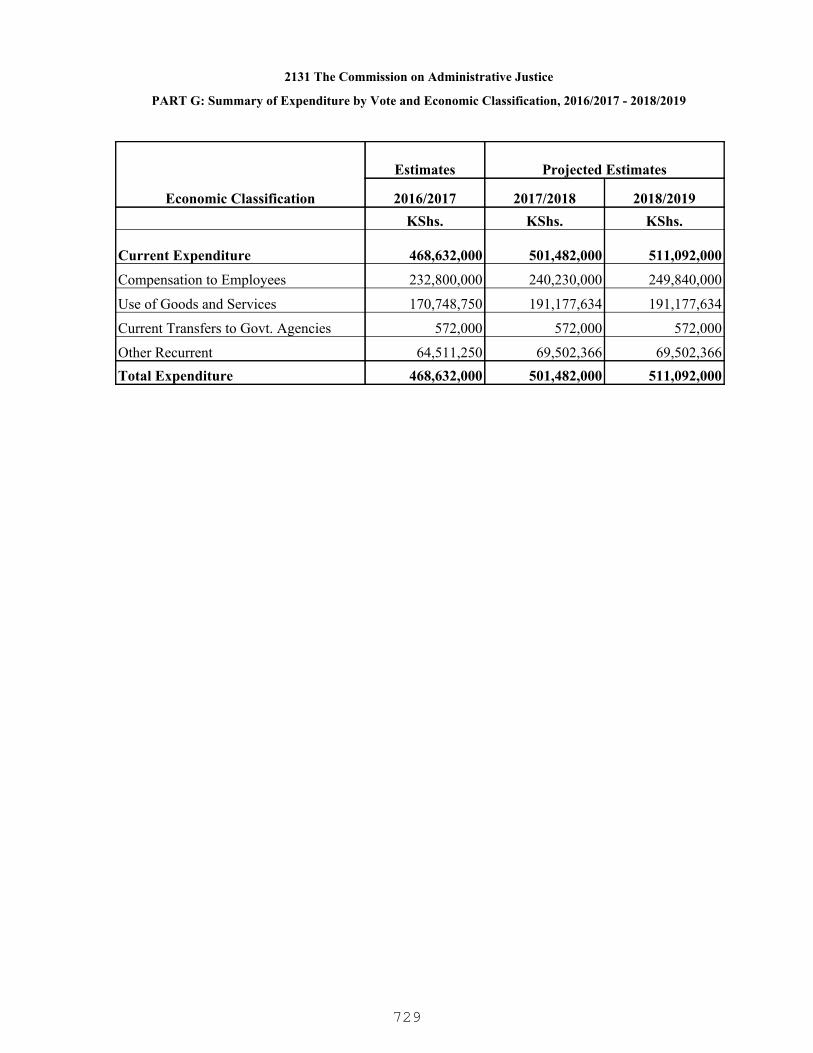
2131 The Commission on Administrative Justice
PART G: Summary of Expenditure by Vote and Economic Classification, 2016/2017 - 2018/2019
Economic Classification
Estimates Projected Estimates
2016/2017 2017/2018 2018/2019KShs. KShs. KShs.
Current Expenditure 468,632,000 501,482,000 511,092,000
Compensation to Employees 232,800,000 240,230,000 249,840,000
Use of Goods and Services 170,748,750 191,177,634 191,177,634
Current Transfers to Govt. Agencies 572,000 572,000 572,000
Other Recurrent 64,511,250 69,502,366 69,502,366Total Expenditure 468,632,000 501,482,000 511,092,000
729

2131 The Commission on Administrative Justice
PART H: Summary of Expenditure by Programme and Economic Classification, 2016/2017 - 2018/2019
0731010 SP. 1.1 Ombudsman services
Economic Classification
Estimates Projected Estimates
2016/2017 2017/2018 2018/2019KShs. KShs. KShs.
Current Expenditure 468,632,000 501,482,000 511,092,000
Compensation to Employees 232,800,000 240,230,000 249,840,000
Use of Goods and Services 170,748,750 191,177,634 191,177,634
Current Transfers to Govt. Agencies 572,000 572,000 572,000
Other Recurrent 64,511,250 69,502,366 69,502,366Total Expenditure 468,632,000 501,482,000 511,092,000
0731000 P.1 Promotion of Administrative Justice
Economic Classification
Estimates Projected Estimates
2016/2017 2017/2018 2018/2019KShs. KShs. KShs.
Current Expenditure 468,632,000 501,482,000 511,092,000
Compensation to Employees 232,800,000 240,230,000 249,840,000
Use of Goods and Services 170,748,750 191,177,634 191,177,634
Current Transfers to Govt. Agencies 572,000 572,000 572,000
Other Recurrent 64,511,250 69,502,366 69,502,366Total Expenditure 468,632,000 501,482,000 511,092,000
730
2141 National Gender and Equality Commission
A society that upholds gender equality, dignity, respect and fairness for all
To effectively and efficiently promote gender equality and freedom from discrimination of all
persons in Kenya
PART A. Vision
PART B. Mission
PART C. Performance Overview and Background for Programme(s) Funding
The National Gender and Equality Commission (NGEC) is an Independent ConstitutionalCommission with the mandate to promote gender equality and freedom from discriminationamong all Kenyans.
During the period under review, the Commission reported on 42 international and regionalforums on state compliance to the international and regional Conventions and Treaties oninclusion principles. The Commission provided 37 advisories to public and private institutionson violation of the rights to equality, received and investigated 291 complaints on similarviolations. In addition, the Commission was involved in litigation of 22 matters of strategicpublic interest audited 22 public institutions on issues related to equality and inclusion andcompleted an inquiry into Child pregnancy from selected counties in Kenya. NGEC monitoredcompliance with the not more than two-third gender principle in elective and appointivepositions in public and private sectors. Subject to the Supreme Court ruling, the Commissionthrough the technical working group convened, identified the framework and maderecommendations to the immediate realization of gender equality in elected positions to theCabinet for adoption.
A national multi-sectoral monitoring and evaluation framework for prevention and response toSGBV in Kenya was developed and implemented during the review period. Subsequently,development of a gender based violence database begun. A comprehensive monitoring andevaluation framework on equality and inclusion was developed and will be piloted in nextfinancial year. Four sensitization forums were completed for planning and finance officers oninclusion in the budget making process, 2 gender equality and inclusion analyses onresponsiveness of budgets to special interest groups was commissioned at national level. Apre-national budget analysis for financial year 2015/16 focusing on the general economic andcommercial affairs sector and a post national analysis on tde and agriculture completed.
National Gender & Equality Commission monitored compliance with principles of equality andinclusion in 210 public institutions through performance contracting analysis exercise, acosting study on the economic burden of gender based violence; survivor’s and serviceprovider perspectives launched. NGEC audited 14 issues affecting special interest groupsincluding perceptions on the status of the boy child, access to free maternity services, CashTransfer Programmes, exclusion of minority groups in land use and natural resources anddrug rehabilitation centers in selected counties in Kenya. NGEC mapped Equality andInclusion in Counties gazetted to receive the equalization fund in Water, Health andInfrastructure Sectors. The Commission held 53 coordination meetings with key stakeholders,produced and disseminated 6,630 publications on 18 issues reaching 32,940 people withinformation on the rights of special interest groups.
731

2141 National Gender and Equality Commission
PART D. Programme Objectives
Lack of a legal framework to enforce equity and inclusion related constitutional provisionsincluding two thirds gender rule; five percent progressive recruitment and representations ofPWDs. Limited human and fixed assets to deliver on the mandate of the Commission. Lack ofvehicle has reduced efficiency of the Commission in service delivery at county levels.Theover-arching goal for NGEC is to contribute to the reduction of gender inequalities and thediscrimination against all; women, men, PWDs, the youth, children, the elderly, marginalizedgroups, minorities and marginalized communities.
The over-arching goal for NGEC is to contribute to the reduction of gender inequalities andthe discrimination against all; women, men, PWDs, the youth, children, the elderly,marginalized groups, minorities and marginalized communities. and marginalizedcommunities.
ObjectiveProgramme
0621000 P 1: Promotion ofGender Equality andFreedom fromDiscrimination
To promote gender equal i ty and f reedom f romdiscr iminat ion.
732

PART E. SUMMARY OF PROGRAMME OUTPUTS AND PERFORMANCE INDICATORS FOR 2016/2017 - 2018/2019
2141 National Gender and Equality Commission
0621000 P 1: Promotion of Gender Equality and Freedom from Discrimination
Enhanced gender equality, inclusion and freedom from discrimination in national and county governments,
Programme:
Outcome:
0621010 SP1.1. Legal Compliance and RedressSub Programme:
Key Output (KO)Targets
2018/2019Targets
2017/2018Key Performance Indicators
(KPIs)Targets
2016/2017Delivery Unit
6
3
30
90
10
5
6
3
25
80
10
5
6
2
20
70
10
5
-No. Report on state compliancewith international treaties andconventions
-No. of Standards on access toECOSOC rights
-No. advisories on nationaland/or county policies, laws,admin. regulations and plansreviewed
-No. Cases received/investigated
-No. Cases litigated
-No. public inquiries conductedon issues affecting SIG
-Reports on state compliancewith international conventionsand treaties
-Standards on access toECOSOC rights (health , water,food , housing and education) forcounty governments developed
-Advisory to County and Nationalgovernment on affirmative actionfor SIGs
-Cases received /investigated onviolation of rights to inclusion
-Public interest cases litigation inCourt
-Public enquiry on issues affectingSIG’s held
2141000200 Field Services
733

PART E. SUMMARY OF PROGRAMME OUTPUTS AND PERFORMANCE INDICATORS FOR 2016/2017 - 2018/2019
2141 National Gender and Equality Commission
65
5
5
60
3
4
55
1
3
-No. of county policies, laws,Administrative regulations andplans reviewed
-No. Modules
-No. Bills passed
-National and county policies ,laws, administrative regulationsand plans reviewed forcompliance with principles ofequality and inclusion
-Database on equality andinclusion modules developed
-State laws related to affirmativeaction amended/reviewed
0621020 SP1.2. Mainstreaming and CoordinationSub Programme:
Key Output (KO)Targets
2018/2019Targets
2017/2018Key Performance Indicators
(KPIs)Targets
2016/2017Delivery Unit
20
2
36
18
2
36
15
2
36
-No. Reports
-No. of reports
-No. Coordination meetings
-Audit reports on issues affectingSIG
-Reports performance contractsby MCDA’s on mainstreamingissues on SIG’s
-Stakeholders coordinationmeetings held
2141000200 Field Services
0621030 SP1.3. Public Education, Advocacy, And ResearchSub Programme:
Key Output (KO)Targets
2018/2019Targets
2017/2018Key Performance Indicators
(KPIs)Targets
2016/2017Delivery Unit
6
30,000
5
28,0000
4
25,000
-No. Guidelines developed
-No. of people reached
-Guidelines for public educationon select themes (affirmativeaction)
-Public awareness education on
2141000200 Field Services
734

PART E. SUMMARY OF PROGRAMME OUTPUTS AND PERFORMANCE INDICATORS FOR 2016/2017 - 2018/2019
2141 National Gender and Equality Commission
6
15
4
12
4
8
-No. Research reports
-No. reports disseminate
SIG rights held
-Research conducted on issuesaffecting Special interest groups
-Dissemination of reports onissues affecting SIG conducted
0621040 SP1.4. General Administration Planning and Support ServicesSub Programme:
Key Output (KO)Targets
2018/2019Targets
2017/2018Key Performance Indicators
(KPIs)Targets
2016/2017Delivery Unit
31
100%
2
10
80%
2
10
70%
3
-No. of staff recruited
-No. & % staff trainings ongender mainstreaming/HIV/AIDS/Drug abuse
-No. Policies developed
-Staff recruited to enableCommission deliver on mandate
-Institutional staff training
-Policies developed
2141000100 HeadquartersAdministrative Services
735

Vote 2141 National Gender and Equality Commission
PART F: Summary of Expenditure by Programmes, 2016/2017 - 2018/2019
Programme
Estimates Projected Estimates
2016/2017 2017/2018 2018/2019
KShs. KShs. KShs.
0621010 SP1.1. Legal Compliance and Redress 57,937,103 71,081,293 71,715,030
0621020 SP1.2. Mainstreaming and Coordination 63,145,364 73,314,579 73,892,350
0621030 SP1.3. Public Education, Advocacy, And Research 46,426,965 64,675,647 66,873,693
0621040 SP1.4. General Administration Planning and Support Services 248,761,446 279,260,690 290,553,036
0621000 P 1: Promotion of Gender Equality and Freedom from Discrimination 416,270,878 488,332,209 503,034,109Total Expenditure for Vote 2141 National Gender and Equality Commission 416,270,878 488,332,209 503,034,109
736

2141 National Gender and Equality Commission
PART G: Summary of Expenditure by Vote and Economic Classification, 2016/2017 - 2018/2019
Economic Classification
Estimates Projected Estimates
2016/2017 2017/2018 2018/2019KShs. KShs. KShs.
Current Expenditure 416,270,878 488,332,209 503,034,109
Compensation to Employees 154,105,584 168,032,744 171,543,727
Use of Goods and Services 204,437,886 253,280,247 264,471,164
Other Recurrent 57,727,408 67,019,218 67,019,218Total Expenditure 416,270,878 488,332,209 503,034,109
737
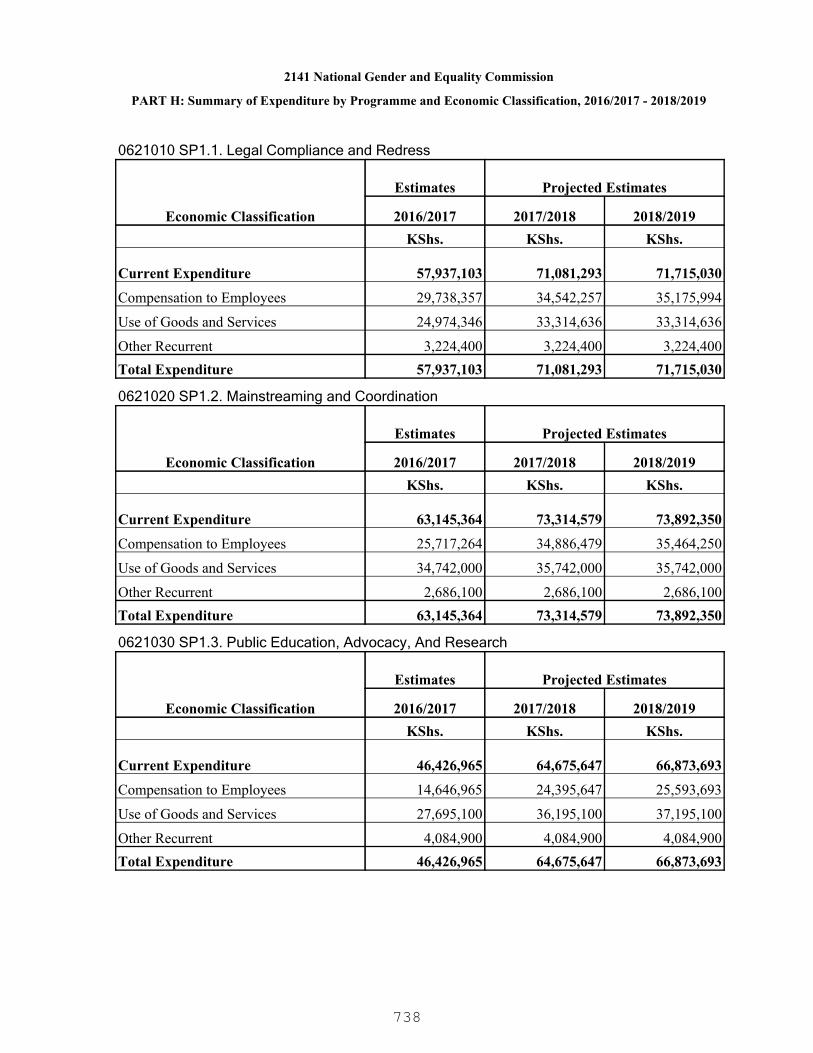
2141 National Gender and Equality Commission
PART H: Summary of Expenditure by Programme and Economic Classification, 2016/2017 - 2018/2019
0621010 SP1.1. Legal Compliance and Redress
Economic Classification
Estimates Projected Estimates
2016/2017 2017/2018 2018/2019KShs. KShs. KShs.
Current Expenditure 57,937,103 71,081,293 71,715,030
Compensation to Employees 29,738,357 34,542,257 35,175,994
Use of Goods and Services 24,974,346 33,314,636 33,314,636
Other Recurrent 3,224,400 3,224,400 3,224,400Total Expenditure 57,937,103 71,081,293 71,715,030
0621020 SP1.2. Mainstreaming and Coordination
Economic Classification
Estimates Projected Estimates
2016/2017 2017/2018 2018/2019KShs. KShs. KShs.
Current Expenditure 63,145,364 73,314,579 73,892,350
Compensation to Employees 25,717,264 34,886,479 35,464,250
Use of Goods and Services 34,742,000 35,742,000 35,742,000
Other Recurrent 2,686,100 2,686,100 2,686,100Total Expenditure 63,145,364 73,314,579 73,892,350
0621030 SP1.3. Public Education, Advocacy, And Research
Economic Classification
Estimates Projected Estimates
2016/2017 2017/2018 2018/2019KShs. KShs. KShs.
Current Expenditure 46,426,965 64,675,647 66,873,693
Compensation to Employees 14,646,965 24,395,647 25,593,693
Use of Goods and Services 27,695,100 36,195,100 37,195,100
Other Recurrent 4,084,900 4,084,900 4,084,900Total Expenditure 46,426,965 64,675,647 66,873,693
738

2141 National Gender and Equality Commission
PART H: Summary of Expenditure by Programme and Economic Classification, 2016/2017 - 2018/2019
0621040 SP1.4. General Administration Planning and Support Services
Economic Classification
Estimates Projected Estimates
2016/2017 2017/2018 2018/2019KShs. KShs. KShs.
Current Expenditure 248,761,446 279,260,690 290,553,036
Compensation to Employees 84,002,998 74,208,361 75,309,790
Use of Goods and Services 117,026,440 148,028,511 158,219,428
Other Recurrent 47,732,008 57,023,818 57,023,818Total Expenditure 248,761,446 279,260,690 290,553,036
0621000 P 1: Promotion of Gender Equality and Freedom from Discrimination
Economic Classification
Estimates Projected Estimates
2016/2017 2017/2018 2018/2019KShs. KShs. KShs.
Current Expenditure 416,270,878 488,332,209 503,034,109
Compensation to Employees 154,105,584 168,032,744 171,543,727
Use of Goods and Services 204,437,886 253,280,247 264,471,164
Other Recurrent 57,727,408 67,019,218 67,019,218Total Expenditure 416,270,878 488,332,209 503,034,109
739
2151 Independent Policing Oversight Authority
A robust civilian accountability mechanism that promotes public trust and confidence in theNational Police Service.
To conduct impartial investigations, inspections, audits and monitoring of the National PoliceService to prevent impunity and enhance professionalism in the interest of the public.
PART A. Vision
PART B. Mission
PART C. Performance Overview and Background for Programme(s) Funding
PART D. Programme Objectives
The mandate of Independent Police Oversight Authority (IPOA) includes conductinginvestigations on police misconduct; carrying out inspections of police premises; monitoringpolice operations; reviewing and auditing investigations and actions taken by the InternalAffairs Unit (IAU); and making recommendations to the National Police Service (NPS) or anystate organ.
During the period under review, the major achievements of the Authority included; 77% of3,247 complaints received were appraised and recommendations for investigations or referralfor action by other agencies made; 21 out of 141 investigation completed were recommendedto the Office of the Director of Public Prosecution (ODPP) for prosecution; 5 cases out of therecommended 21 are matters in court; made recommendations to NPS on action areas forimprovement based on inspection of 239 police premises and 12 police operations monitored.Outstanding Police Services Awards (OPSW) presented to 58 police officers.
The Authority's actual expenditure during the period under review was KSh.175 million,KSh.219 million and KSh.265 million against allocation of KSh. 246 million, KSh.279 millionand KSh.291 million for the FY2012/13, FY2013/14 and FY2014/15 respectively. Thisreflected an average of 80% absorption rate mainly due to low operational capacity of theAuthority.
The key challenges experienced during the period under review included staff capacityconstraints mainly in investigations and reluctance by the police in providing critical evidencecausing delays in completion of cases. The Authority intends to recruit additional investigatorsand complaints officers during the FY2016/17 to upscale the level of investigation cases.
In the next MTEF period 2016/17-2018/19, funds will be utilized to ensure that 100% of thereceived complaints are processed within time; 432 cases are conclusively investigated;100% of the investigated cases recommended for prosecution are forwarded to ODPP withintime; 320 initial inspections of police premises and facilities conducted across the country andappropriate recommendations made to NPS and other stakeholders; 980 follow-upinspections conducted to assess implementation of improvement actions on police premises;790 police operations monitored; 100% complaints handled by IAU effectively monitored andreviewed; 9 regional units established for enhanced public and police access to IPOA’sservices; 75 country-wide awareness campaigns conducted to facilitate public participation inholding the police accountable for their actions.
740
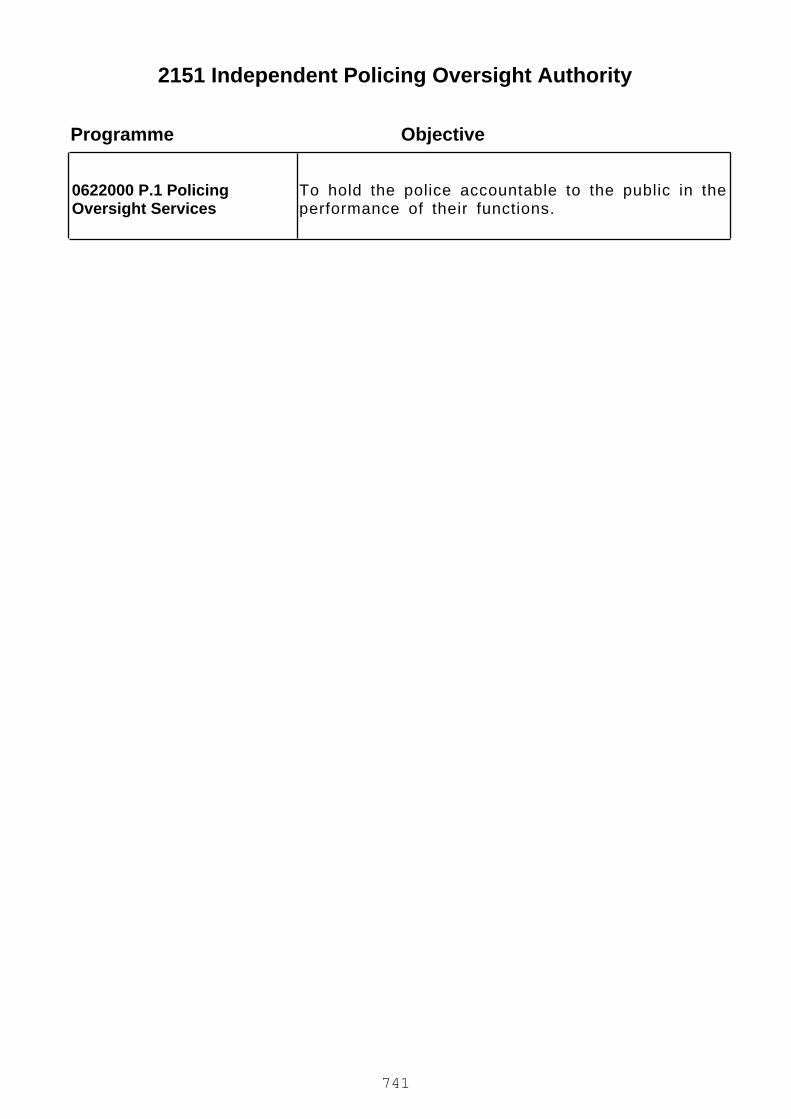
2151 Independent Policing Oversight Authority
ObjectiveProgramme
0622000 P.1 PolicingOversight Services
To hold the police accountable to the public in theperformance of their functions.
741
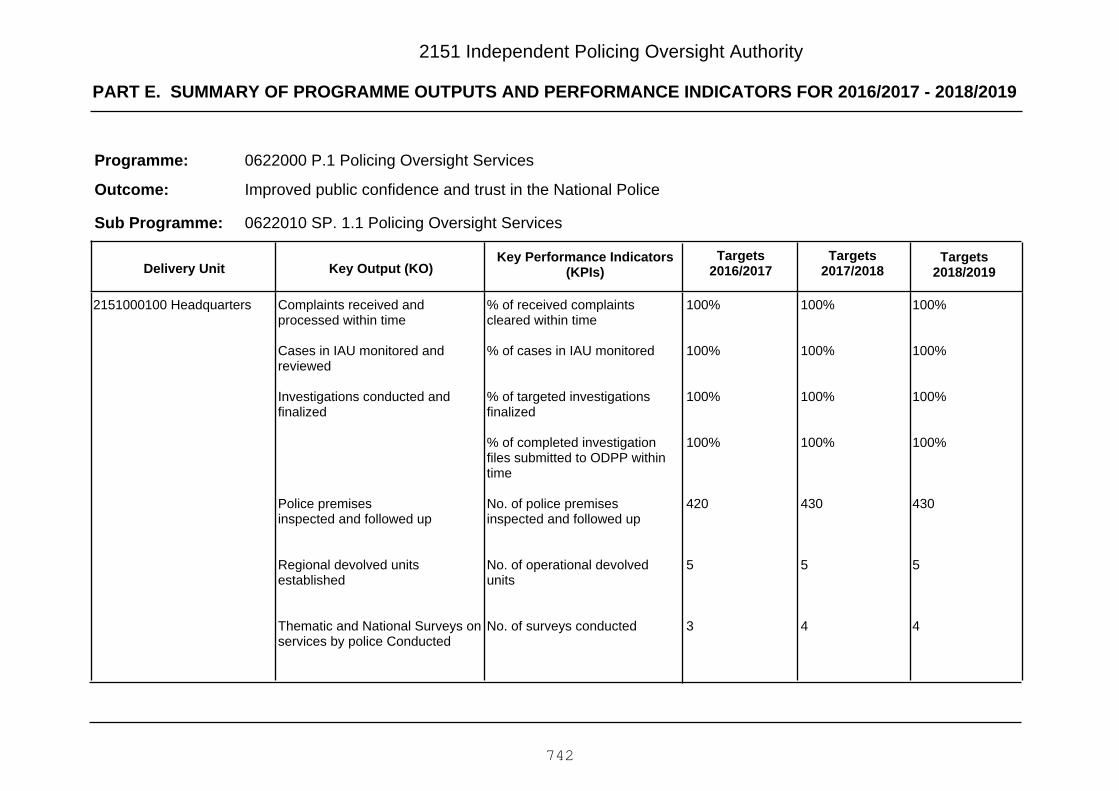
PART E. SUMMARY OF PROGRAMME OUTPUTS AND PERFORMANCE INDICATORS FOR 2016/2017 - 2018/2019
2151 Independent Policing Oversight Authority
0622000 P.1 Policing Oversight Services
Improved public confidence and trust in the National Police
Programme:
Outcome:
0622010 SP. 1.1 Policing Oversight ServicesSub Programme:
Key Output (KO)Targets
2018/2019Targets
2017/2018Key Performance Indicators
(KPIs)Targets
2016/2017Delivery Unit
100%
100%
100%
100%
430
5
4
100%
100%
100%
100%
430
5
4
100%
100%
100%
100%
420
5
3
% of received complaintscleared within time
% of cases in IAU monitored
% of targeted investigationsfinalized
% of completed investigationfiles submitted to ODPP withintime
No. of police premisesinspected and followed up
No. of operational devolvedunits
No. of surveys conducted
Complaints received andprocessed within time
Cases in IAU monitored andreviewed
Investigations conducted andfinalized
Police premisesinspected and followed up
Regional devolved unitsestablished
Thematic and National Surveys onservices by police Conducted
2151000100 Headquarters
742

Vote 2151 Independent Policing Oversight Authority
PART F: Summary of Expenditure by Programmes, 2016/2017 - 2018/2019
Programme
Estimates Projected Estimates
2016/2017 2017/2018 2018/2019
KShs. KShs. KShs.
0622010 SP. 1.1 Policing Oversight Services 411,338,899 459,987,267 477,911,085
0622000 P.1 Policing Oversight Services 411,338,899 459,987,267 477,911,085Total Expenditure for Vote 2151 Independent Policing Oversight Authority 411,338,899 459,987,267 477,911,085
743

2151 Independent Policing Oversight Authority
PART G: Summary of Expenditure by Vote and Economic Classification, 2016/2017 - 2018/2019
Economic Classification
Estimates Projected Estimates
2016/2017 2017/2018 2018/2019KShs. KShs. KShs.
Current Expenditure 411,338,899 459,987,267 477,911,085
Compensation to Employees 239,178,900 246,027,267 253,081,085
Use of Goods and Services 152,559,999 183,460,000 191,480,000
Other Recurrent 19,600,000 30,500,000 33,350,000Total Expenditure 411,338,899 459,987,267 477,911,085
744
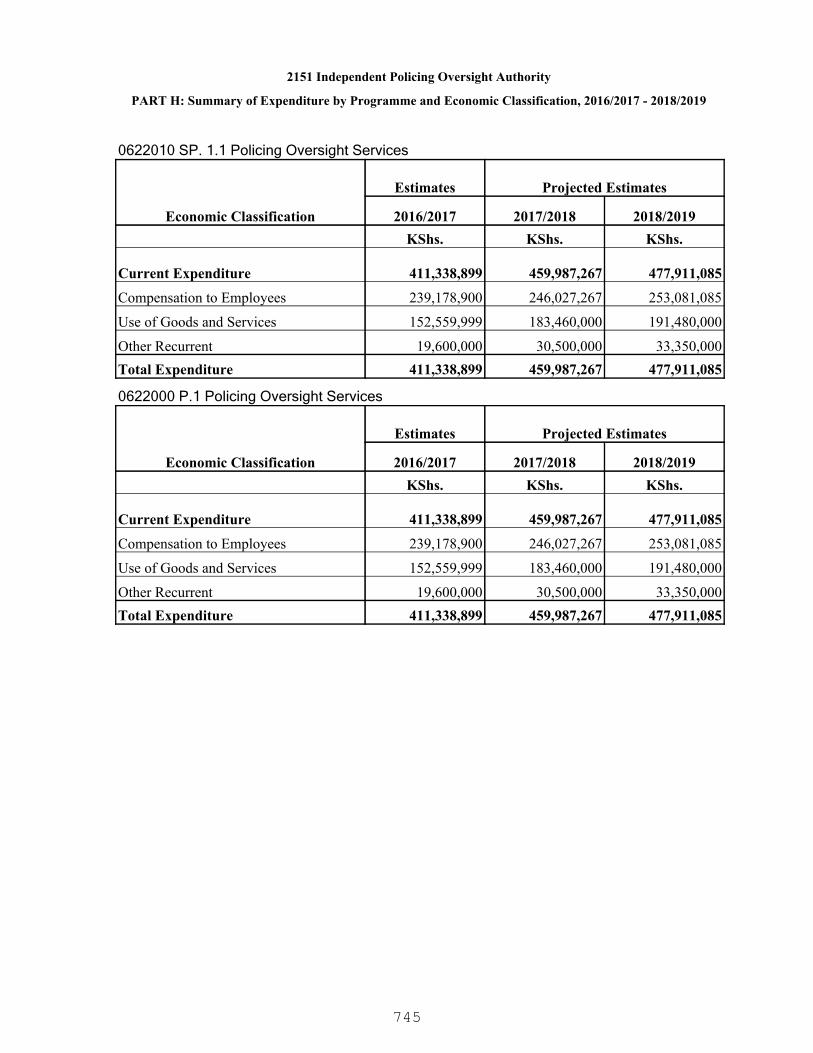
2151 Independent Policing Oversight Authority
PART H: Summary of Expenditure by Programme and Economic Classification, 2016/2017 - 2018/2019
0622010 SP. 1.1 Policing Oversight Services
Economic Classification
Estimates Projected Estimates
2016/2017 2017/2018 2018/2019KShs. KShs. KShs.
Current Expenditure 411,338,899 459,987,267 477,911,085
Compensation to Employees 239,178,900 246,027,267 253,081,085
Use of Goods and Services 152,559,999 183,460,000 191,480,000
Other Recurrent 19,600,000 30,500,000 33,350,000Total Expenditure 411,338,899 459,987,267 477,911,085
0622000 P.1 Policing Oversight Services
Economic Classification
Estimates Projected Estimates
2016/2017 2017/2018 2018/2019KShs. KShs. KShs.
Current Expenditure 411,338,899 459,987,267 477,911,085
Compensation to Employees 239,178,900 246,027,267 253,081,085
Use of Goods and Services 152,559,999 183,460,000 191,480,000
Other Recurrent 19,600,000 30,500,000 33,350,000Total Expenditure 411,338,899 459,987,267 477,911,085
745

CONSOLIDATED FUND SERVICES
REVISED ESTIMATES ESTIMATES ESTIMATES ESTIMATES
2015/2016 2016/2017 2017/2018 2018/2019PUBLIC DEBT Kshs Kshs Kshs Kshs
INTEREST2420000 Internal 160,676,458,521 197,266,820,801 196,858,117,631 189,184,064,784
2410100 External 34,562,450,450 53,520,419,000 55,214,952,658 52,916,304,459
Sub Totals Kshs 195,238,908,971 250,787,239,801 252,073,070,289 242,100,369,243
REDEMPTION
5510200 Internal 187,263,324,920 172,104,225,000 161,779,603,953 154,732,061,050
5510600 External 34,688,666,820 43,622,575,368 128,566,443,176 131,759,844,818
Sub Totals Kshs 221,951,991,740 215,726,800,368 290,346,047,129 286,491,905,868
Total: INTEREST & REDEMPTION Kshs 417,190,900,711 466,514,040,169 542,419,117,418 528,592,275,111
PENSIONS, SALARIES, ALLOWANCES & OTHERS
2710000 Pensions 42,991,127,200 55,691,127,200 63,111,127,200 61,311,127,200
2110000 Salaries 4,437,766,235 3,955,968,495 4,148,978,495 4,326,602,758
2211200 Miscellaneous services 128,000,000 128,000,000 128,000,000 128,000,000
5510600 Guaranteed Debt 944,691,483 1,017,185,821 993,547,504 969,909,187
2620100 Subscriptions to International Organisations 2,243,458 500,000 500,000 500,000
Sub-Totals Kshs 48,503,828,376 60,792,781,516 68,382,153,199 66,736,139,145
GRAND TOTAL Kshs 465,694,729,087 527,306,821,685 610,801,270,617 595,328,414,256
(i)
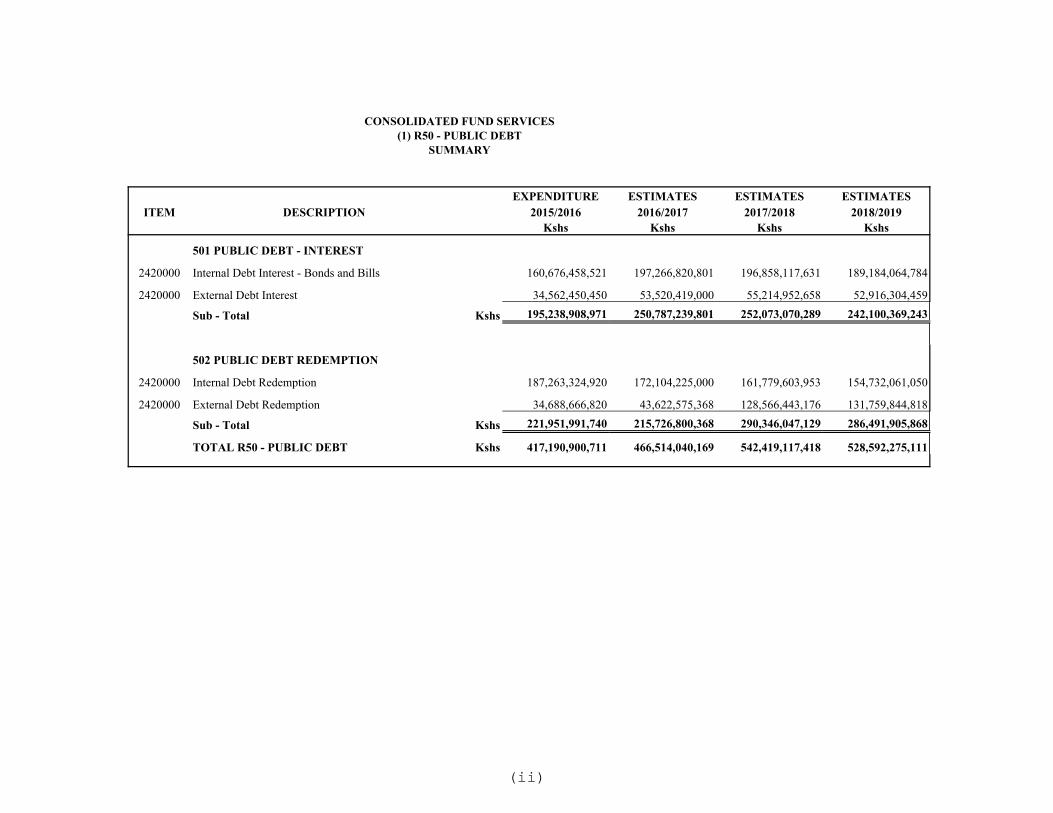
CONSOLIDATED FUND SERVICES(1) R50 - PUBLIC DEBT
SUMMARY
EXPENDITURE ESTIMATES ESTIMATES ESTIMATESITEM DESCRIPTION 2015/2016 2016/2017 2017/2018 2018/2019
Kshs Kshs Kshs Kshs
501 PUBLIC DEBT - INTEREST
2420000 Internal Debt Interest - Bonds and Bills 160,676,458,521 197,266,820,801 196,858,117,631 189,184,064,784
2420000 External Debt Interest 34,562,450,450 53,520,419,000 55,214,952,658 52,916,304,459
Sub - Total Kshs 195,238,908,971 250,787,239,801 252,073,070,289 242,100,369,243
502 PUBLIC DEBT REDEMPTION
2420000 Internal Debt Redemption 187,263,324,920 172,104,225,000 161,779,603,953 154,732,061,050
2420000 External Debt Redemption 34,688,666,820 43,622,575,368 128,566,443,176 131,759,844,818
Sub - Total Kshs 221,951,991,740 215,726,800,368 290,346,047,129 286,491,905,868
TOTAL R50 - PUBLIC DEBT Kshs 417,190,900,711 466,514,040,169 542,419,117,418 528,592,275,111
(ii)

CONSOLIDATED FUND SERVICES(1) R50 PUBLIC DEBT
242000 - INTEREST ON INTERNAL DEBT
EXPENDITURE ESTIMATES ESTIMATES ESTIMATES
ITEM 2015/2016 2016/2017 2017/2018 2018/2019OTHER LOANS:
2420101 002000401 Pre - 1997 Government Overdraft debt 791,806,095 758,506,095 725,206,095 700,162,671002000402 Government Overdraft 4,023,690,011 3,768,430,400 5,383,472,000 5,383,472,000002000403 Tax Reserve Certificate - - - -002000404 Miscellaneous (Advertising) 30,000,000 30,000,000 30,000,000 30,000,000002000405 SDR Allocation Charges - - - -002000406 GoK onlent Loan (IMF) - - - -002000407 Short Term Borrowing (T. Bills Interest) 30,920,866,413 52,002,996,751 56,620,978,160 54,600,197,096002000408 Commissions to CBK 3,000,000,000 3,000,000,000 3,000,000,000 3,000,000,000002000409 Redemption of Treasury Bills - Shortfall - - - -002000498 Devolved Functions - - - -SUB-TOTAL 38,766,362,519 59,559,933,246 65,759,656,255 63,713,831,767
TOTAL INTEREST ON BONDS &OTHER LOANS 160,676,458,521 197,266,820,801 196,858,117,631 189,184,064,784
GRAND TOTAL INTERNAL DEBT - INTEREST 160,676,458,521 197,266,820,801 196,858,117,631 189,184,064,784Note: 1. Net domestic financing has been assumed at Kshs 197.3 billion in the fiscal year 2016/17 2. Of the Kshs 197.3 billion net domestic borrowing , 30% is assumed to be (Kshs 59.19 billion) through bills and 70% (Kshs 138.11 billion) through bonds. 3. Interest rates will be stable between 9.32% p.a-12.70% ,11.93% p.a - 13.80% p.a and 13.25% p.a- 14.71% p.a - for 91 days,182 days and 364 days. 4. Assumed coupon rates for benchmark Bonds of 2, 5, 10, 15, and 20 years are 11.25%, 12.70%, 12.319%, 15.76% respectively. 5. The usage of the overdraft at CBK will fluctuate within the year but close at zero at end June 2016.Interest will be charged at the CBR rate and the facility will be utilized at 100% of the set ceiling of Kshs 46.8 billion.
(iii)
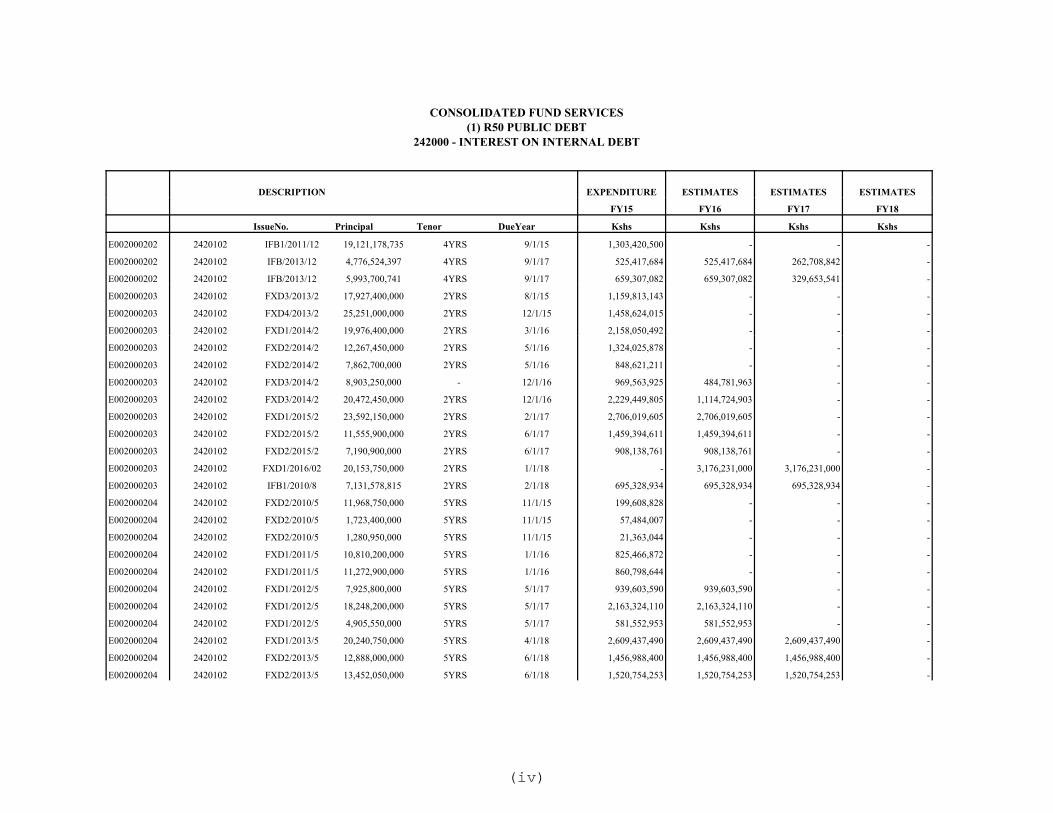
CONSOLIDATED FUND SERVICES(1) R50 PUBLIC DEBT
242000 - INTEREST ON INTERNAL DEBT
DESCRIPTION EXPENDITURE ESTIMATES ESTIMATES ESTIMATES
FY15 FY16 FY17 FY18
IssueNo. Principal Tenor DueYear Kshs Kshs Kshs Kshs
E002000202 2420102 IFB1/2011/12 19,121,178,735 4YRS 9/1/15 1,303,420,500 - - -
E002000202 2420102 IFB/2013/12 4,776,524,397 4YRS 9/1/17 525,417,684 525,417,684 262,708,842 -
E002000202 2420102 IFB/2013/12 5,993,700,741 4YRS 9/1/17 659,307,082 659,307,082 329,653,541 -
E002000203 2420102 FXD3/2013/2 17,927,400,000 2YRS 8/1/15 1,159,813,143 - - -
E002000203 2420102 FXD4/2013/2 25,251,000,000 2YRS 12/1/15 1,458,624,015 - - -
E002000203 2420102 FXD1/2014/2 19,976,400,000 2YRS 3/1/16 2,158,050,492 - - -
E002000203 2420102 FXD2/2014/2 12,267,450,000 2YRS 5/1/16 1,324,025,878 - - -
E002000203 2420102 FXD2/2014/2 7,862,700,000 2YRS 5/1/16 848,621,211 - - -
E002000203 2420102 FXD3/2014/2 8,903,250,000 - 12/1/16 969,563,925 484,781,963 - -
E002000203 2420102 FXD3/2014/2 20,472,450,000 2YRS 12/1/16 2,229,449,805 1,114,724,903 - -
E002000203 2420102 FXD1/2015/2 23,592,150,000 2YRS 2/1/17 2,706,019,605 2,706,019,605 - -
E002000203 2420102 FXD2/2015/2 11,555,900,000 2YRS 6/1/17 1,459,394,611 1,459,394,611 - -
E002000203 2420102 FXD2/2015/2 7,190,900,000 2YRS 6/1/17 908,138,761 908,138,761 - -
E002000203 2420102 FXD1/2016/02 20,153,750,000 2YRS 1/1/18 - 3,176,231,000 3,176,231,000 -
E002000203 2420102 IFB1/2010/8 7,131,578,815 2YRS 2/1/18 695,328,934 695,328,934 695,328,934 -
E002000204 2420102 FXD2/2010/5 11,968,750,000 5YRS 11/1/15 199,608,828 - - -
E002000204 2420102 FXD2/2010/5 1,723,400,000 5YRS 11/1/15 57,484,007 - - -
E002000204 2420102 FXD2/2010/5 1,280,950,000 5YRS 11/1/15 21,363,044 - - -
E002000204 2420102 FXD1/2011/5 10,810,200,000 5YRS 1/1/16 825,466,872 - - -
E002000204 2420102 FXD1/2011/5 11,272,900,000 5YRS 1/1/16 860,798,644 - - -
E002000204 2420102 FXD1/2012/5 7,925,800,000 5YRS 5/1/17 939,603,590 939,603,590 - -
E002000204 2420102 FXD1/2012/5 18,248,200,000 5YRS 5/1/17 2,163,324,110 2,163,324,110 - -
E002000204 2420102 FXD1/2012/5 4,905,550,000 5YRS 5/1/17 581,552,953 581,552,953 - -
E002000204 2420102 FXD1/2013/5 20,240,750,000 5YRS 4/1/18 2,609,437,490 2,609,437,490 2,609,437,490 -
E002000204 2420102 FXD2/2013/5 12,888,000,000 5YRS 6/1/18 1,456,988,400 1,456,988,400 1,456,988,400 -
E002000204 2420102 FXD2/2013/5 13,452,050,000 5YRS 6/1/18 1,520,754,253 1,520,754,253 1,520,754,253 -
(iv)

CONSOLIDATED FUND SERVICES(1) R50 PUBLIC DEBT
242000 - INTEREST ON INTERNAL DEBT
DESCRIPTION EXPENDITURE ESTIMATES ESTIMATES ESTIMATES
FY15 FY16 FY17 FY18
IssueNo. Principal Tenor DueYear Kshs Kshs Kshs Kshs
E002000204 2420102 FXD3/2013/5 14,937,800,000 5YRS 11/1/18 1,785,365,856 1,785,365,856 1,785,365,856 892,682,928
E002000204 2420102 FXD1/2014/5 17,511,200,000 5YRS 4/1/19 1,903,467,440 1,903,467,440 1,903,467,440 1,903,467,440
E002000204 2420102 FXD1/2014/5 8,222,500,000 5YRS 4/1/19 893,785,750 893,785,750 893,785,750 893,785,750
E002000204 2420102 FXD2/2014/5 2,132,650,000 5YRS 6/1/19 254,510,451 254,510,451 254,510,451 254,510,451
E002000204 2420102 FXD2/2014/5 14,285,600,000 5YRS 6/1/19 1,704,843,504 1,704,843,504 1,704,843,504 1,704,843,504
E002000204 2420102 FXD1/2015/5 5,566,200,000 5YRS 6/1/20 734,348,766 734,348,766 734,348,766 734,348,766
E002000204 2420102 FXD1/2015/5 12,461,700,000 5YRS 6/1/20 1,644,072,081 1,644,072,081 1,644,072,081 1,644,072,081
E002000204 2420102 FXD2/2015/5 30,673,850,000 5YRS 11/1/20 2,134,899,960 4,269,799,920 4,269,799,920 4,269,799,920
E002000204 2420102 IFB1/2015/9 1,625,415,750 5YRS 12/1/20 119,898,793 239,797,586 239,797,586 239,797,586
E002000204 2420102 IFB1/2015/9 822,238,500 5YRS 12/1/20 60,652,423 121,304,846 121,304,846 121,304,846
E002000204 2420102 IFB1/2015/9 509,202,750 5YRS 12/1/20 - 75,122,682 75,122,682 75,122,682
E002000204 2420102 IFB1/2015/9 5,709,387,750 5YRS 12/1/20 421,152,987 421,152,987 421,152,987 421,152,987
E002000204 2420102 FXD 1/2016/5 19,545,570,000 5YRS 5/1/21 - 2,801,662,004 2,801,662,004 2,801,662,004
E002000205 2420102 IFB2/2009/12 9,193,700,000 6YRS 11/1/15 275,811,000 - - -
E002000205 2420102 IFB1/2010/8 8,776,471,185 6YRS 2/1/16 855,705,941 - - -
E002000205 2420102 IFB2/2010/9 14,200,000,000 6YRS 8/1/16 986,146,500 493,073,250 - -
E002000206 2420102 IFB2/2010/9 8,700,000,000 7YRS 8/1/17 522,000,000 522,000,000 261,000,000 -
E002000206 2420102 IFB1/2015/9 766,621,692 7YRS 12/1/22 56,549,849 113,099,698 113,099,698 113,099,698
E002000206 2420102 IFB1/2015/9 474,759,907 7YRS 12/1/22 - 70,041,329 70,041,329 70,041,329
E002000206 2420102 IFB1/2015/9 798,225,421 7YRS 12/1/22 58,881,098 117,762,196 117,762,196 117,762,196
E002000206 2420102 IFB1/2015/9 5,323,200,625 7YRS 12/1/22 392,665,894 785,331,788 785,331,788 785,331,788
E002000207 2420102 IFB1/2011/12 14,399,102,964 8YRS 9/1/19 1,702,968,480 1,727,892,356 1,702,968,480 1,702,968,480
E002000207 2420102 IFB1/2013/12 5,494,159,495 8YRS 9/1/21 604,357,544 604,357,544 604,357,544 604,357,544
E002000207 2420102 IFB1/2013/12 6,894,206,979 8YRS 9/1/21 758,362,768 758,362,768 758,362,768 758,362,768
E002000208 2420102 IFB2/2009/12 5,361,889,815 9YRS 11/1/18 617,400,000 617,400,000 617,400,000 308,700,000
E002000208 2420102 IFB2/2010/9 9,971,550,000 9YRS 8/1/19 598,293,000 598,293,000 598,293,000 598,293,000
(v)
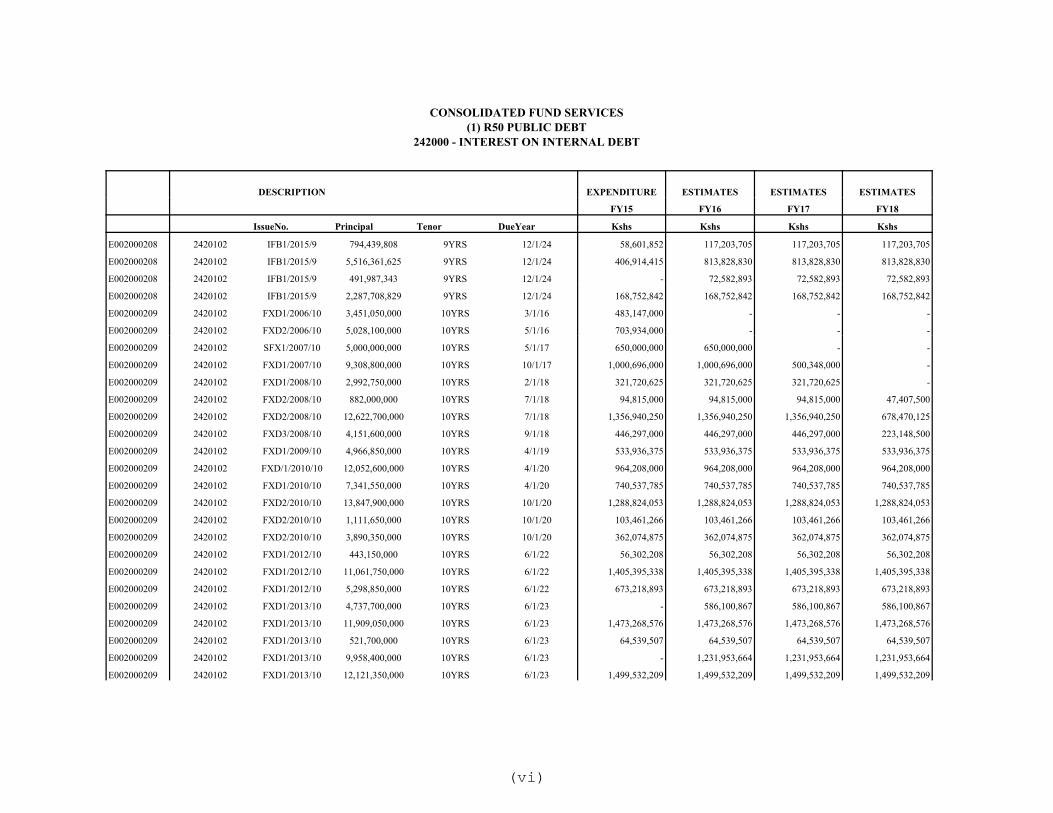
CONSOLIDATED FUND SERVICES(1) R50 PUBLIC DEBT
242000 - INTEREST ON INTERNAL DEBT
DESCRIPTION EXPENDITURE ESTIMATES ESTIMATES ESTIMATES
FY15 FY16 FY17 FY18
IssueNo. Principal Tenor DueYear Kshs Kshs Kshs Kshs
E002000208 2420102 IFB1/2015/9 794,439,808 9YRS 12/1/24 58,601,852 117,203,705 117,203,705 117,203,705
E002000208 2420102 IFB1/2015/9 5,516,361,625 9YRS 12/1/24 406,914,415 813,828,830 813,828,830 813,828,830
E002000208 2420102 IFB1/2015/9 491,987,343 9YRS 12/1/24 - 72,582,893 72,582,893 72,582,893
E002000208 2420102 IFB1/2015/9 2,287,708,829 9YRS 12/1/24 168,752,842 168,752,842 168,752,842 168,752,842
E002000209 2420102 FXD1/2006/10 3,451,050,000 10YRS 3/1/16 483,147,000 - - -
E002000209 2420102 FXD2/2006/10 5,028,100,000 10YRS 5/1/16 703,934,000 - - -
E002000209 2420102 SFX1/2007/10 5,000,000,000 10YRS 5/1/17 650,000,000 650,000,000 - -
E002000209 2420102 FXD1/2007/10 9,308,800,000 10YRS 10/1/17 1,000,696,000 1,000,696,000 500,348,000 -
E002000209 2420102 FXD1/2008/10 2,992,750,000 10YRS 2/1/18 321,720,625 321,720,625 321,720,625 -
E002000209 2420102 FXD2/2008/10 882,000,000 10YRS 7/1/18 94,815,000 94,815,000 94,815,000 47,407,500
E002000209 2420102 FXD2/2008/10 12,622,700,000 10YRS 7/1/18 1,356,940,250 1,356,940,250 1,356,940,250 678,470,125
E002000209 2420102 FXD3/2008/10 4,151,600,000 10YRS 9/1/18 446,297,000 446,297,000 446,297,000 223,148,500
E002000209 2420102 FXD1/2009/10 4,966,850,000 10YRS 4/1/19 533,936,375 533,936,375 533,936,375 533,936,375
E002000209 2420102 FXD/1/2010/10 12,052,600,000 10YRS 4/1/20 964,208,000 964,208,000 964,208,000 964,208,000
E002000209 2420102 FXD1/2010/10 7,341,550,000 10YRS 4/1/20 740,537,785 740,537,785 740,537,785 740,537,785
E002000209 2420102 FXD2/2010/10 13,847,900,000 10YRS 10/1/20 1,288,824,053 1,288,824,053 1,288,824,053 1,288,824,053
E002000209 2420102 FXD2/2010/10 1,111,650,000 10YRS 10/1/20 103,461,266 103,461,266 103,461,266 103,461,266
E002000209 2420102 FXD2/2010/10 3,890,350,000 10YRS 10/1/20 362,074,875 362,074,875 362,074,875 362,074,875
E002000209 2420102 FXD1/2012/10 443,150,000 10YRS 6/1/22 56,302,208 56,302,208 56,302,208 56,302,208
E002000209 2420102 FXD1/2012/10 11,061,750,000 10YRS 6/1/22 1,405,395,338 1,405,395,338 1,405,395,338 1,405,395,338
E002000209 2420102 FXD1/2012/10 5,298,850,000 10YRS 6/1/22 673,218,893 673,218,893 673,218,893 673,218,893
E002000209 2420102 FXD1/2013/10 4,737,700,000 10YRS 6/1/23 - 586,100,867 586,100,867 586,100,867
E002000209 2420102 FXD1/2013/10 11,909,050,000 10YRS 6/1/23 1,473,268,576 1,473,268,576 1,473,268,576 1,473,268,576
E002000209 2420102 FXD1/2013/10 521,700,000 10YRS 6/1/23 64,539,507 64,539,507 64,539,507 64,539,507
E002000209 2420102 FXD1/2013/10 9,958,400,000 10YRS 6/1/23 - 1,231,953,664 1,231,953,664 1,231,953,664
E002000209 2420102 FXD1/2013/10 12,121,350,000 10YRS 6/1/23 1,499,532,209 1,499,532,209 1,499,532,209 1,499,532,209
(vi)
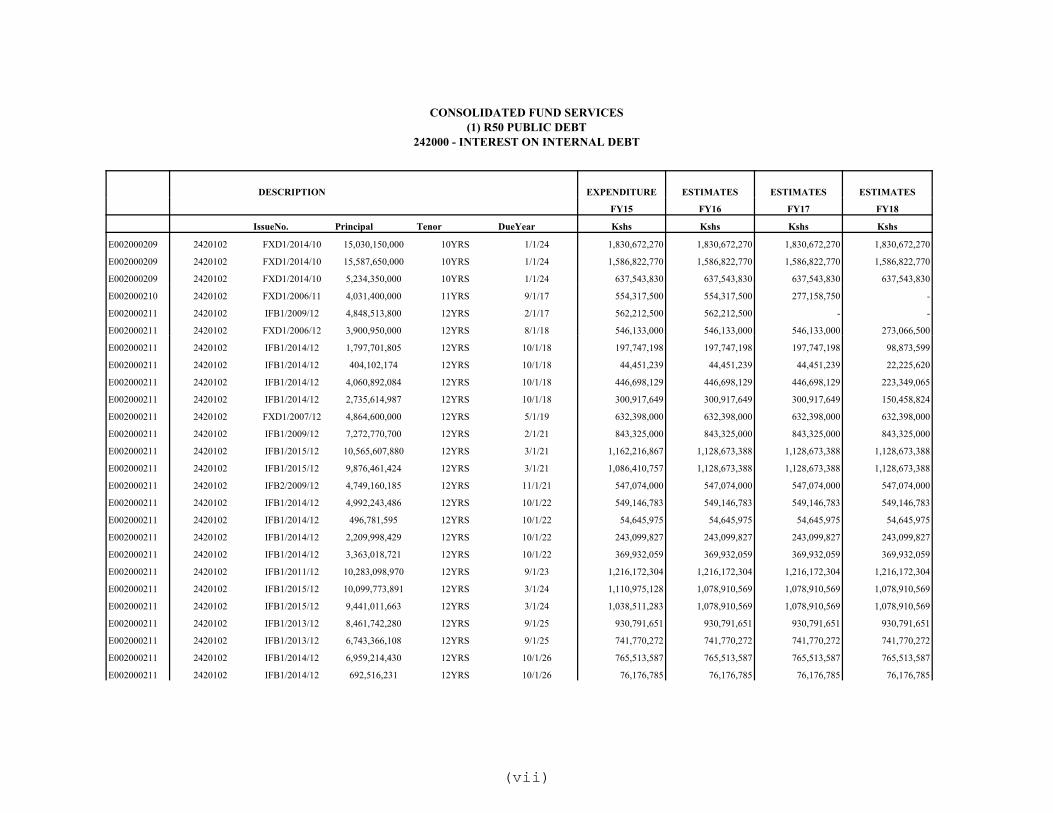
CONSOLIDATED FUND SERVICES(1) R50 PUBLIC DEBT
242000 - INTEREST ON INTERNAL DEBT
DESCRIPTION EXPENDITURE ESTIMATES ESTIMATES ESTIMATES
FY15 FY16 FY17 FY18
IssueNo. Principal Tenor DueYear Kshs Kshs Kshs Kshs
E002000209 2420102 FXD1/2014/10 15,030,150,000 10YRS 1/1/24 1,830,672,270 1,830,672,270 1,830,672,270 1,830,672,270
E002000209 2420102 FXD1/2014/10 15,587,650,000 10YRS 1/1/24 1,586,822,770 1,586,822,770 1,586,822,770 1,586,822,770
E002000209 2420102 FXD1/2014/10 5,234,350,000 10YRS 1/1/24 637,543,830 637,543,830 637,543,830 637,543,830
E002000210 2420102 FXD1/2006/11 4,031,400,000 11YRS 9/1/17 554,317,500 554,317,500 277,158,750 -
E002000211 2420102 IFB1/2009/12 4,848,513,800 12YRS 2/1/17 562,212,500 562,212,500 - -
E002000211 2420102 FXD1/2006/12 3,900,950,000 12YRS 8/1/18 546,133,000 546,133,000 546,133,000 273,066,500
E002000211 2420102 IFB1/2014/12 1,797,701,805 12YRS 10/1/18 197,747,198 197,747,198 197,747,198 98,873,599
E002000211 2420102 IFB1/2014/12 404,102,174 12YRS 10/1/18 44,451,239 44,451,239 44,451,239 22,225,620
E002000211 2420102 IFB1/2014/12 4,060,892,084 12YRS 10/1/18 446,698,129 446,698,129 446,698,129 223,349,065
E002000211 2420102 IFB1/2014/12 2,735,614,987 12YRS 10/1/18 300,917,649 300,917,649 300,917,649 150,458,824
E002000211 2420102 FXD1/2007/12 4,864,600,000 12YRS 5/1/19 632,398,000 632,398,000 632,398,000 632,398,000
E002000211 2420102 IFB1/2009/12 7,272,770,700 12YRS 2/1/21 843,325,000 843,325,000 843,325,000 843,325,000
E002000211 2420102 IFB1/2015/12 10,565,607,880 12YRS 3/1/21 1,162,216,867 1,128,673,388 1,128,673,388 1,128,673,388
E002000211 2420102 IFB1/2015/12 9,876,461,424 12YRS 3/1/21 1,086,410,757 1,128,673,388 1,128,673,388 1,128,673,388
E002000211 2420102 IFB2/2009/12 4,749,160,185 12YRS 11/1/21 547,074,000 547,074,000 547,074,000 547,074,000
E002000211 2420102 IFB1/2014/12 4,992,243,486 12YRS 10/1/22 549,146,783 549,146,783 549,146,783 549,146,783
E002000211 2420102 IFB1/2014/12 496,781,595 12YRS 10/1/22 54,645,975 54,645,975 54,645,975 54,645,975
E002000211 2420102 IFB1/2014/12 2,209,998,429 12YRS 10/1/22 243,099,827 243,099,827 243,099,827 243,099,827
E002000211 2420102 IFB1/2014/12 3,363,018,721 12YRS 10/1/22 369,932,059 369,932,059 369,932,059 369,932,059
E002000211 2420102 IFB1/2011/12 10,283,098,970 12YRS 9/1/23 1,216,172,304 1,216,172,304 1,216,172,304 1,216,172,304
E002000211 2420102 IFB1/2015/12 10,099,773,891 12YRS 3/1/24 1,110,975,128 1,078,910,569 1,078,910,569 1,078,910,569
E002000211 2420102 IFB1/2015/12 9,441,011,663 12YRS 3/1/24 1,038,511,283 1,078,910,569 1,078,910,569 1,078,910,569
E002000211 2420102 IFB1/2013/12 8,461,742,280 12YRS 9/1/25 930,791,651 930,791,651 930,791,651 930,791,651
E002000211 2420102 IFB1/2013/12 6,743,366,108 12YRS 9/1/25 741,770,272 741,770,272 741,770,272 741,770,272
E002000211 2420102 IFB1/2014/12 6,959,214,430 12YRS 10/1/26 765,513,587 765,513,587 765,513,587 765,513,587
E002000211 2420102 IFB1/2014/12 692,516,231 12YRS 10/1/26 76,176,785 76,176,785 76,176,785 76,176,785
(vii)
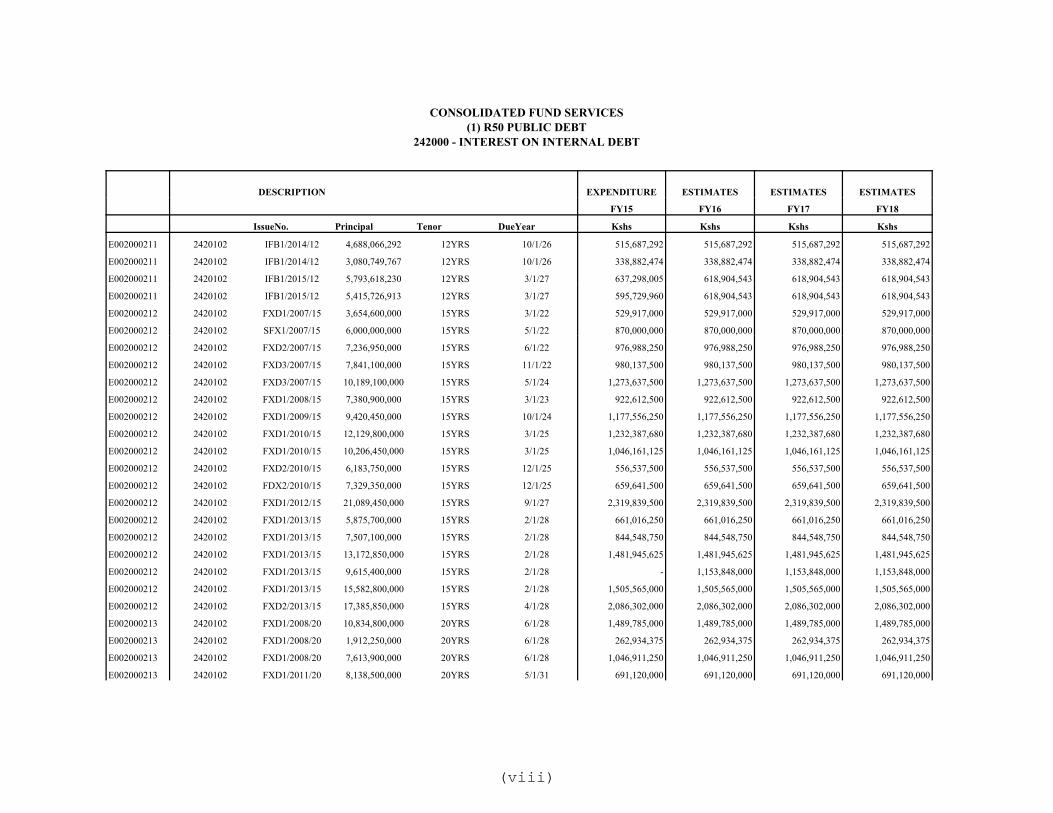
CONSOLIDATED FUND SERVICES(1) R50 PUBLIC DEBT
242000 - INTEREST ON INTERNAL DEBT
DESCRIPTION EXPENDITURE ESTIMATES ESTIMATES ESTIMATES
FY15 FY16 FY17 FY18
IssueNo. Principal Tenor DueYear Kshs Kshs Kshs Kshs
E002000211 2420102 IFB1/2014/12 4,688,066,292 12YRS 10/1/26 515,687,292 515,687,292 515,687,292 515,687,292
E002000211 2420102 IFB1/2014/12 3,080,749,767 12YRS 10/1/26 338,882,474 338,882,474 338,882,474 338,882,474
E002000211 2420102 IFB1/2015/12 5,793,618,230 12YRS 3/1/27 637,298,005 618,904,543 618,904,543 618,904,543
E002000211 2420102 IFB1/2015/12 5,415,726,913 12YRS 3/1/27 595,729,960 618,904,543 618,904,543 618,904,543
E002000212 2420102 FXD1/2007/15 3,654,600,000 15YRS 3/1/22 529,917,000 529,917,000 529,917,000 529,917,000
E002000212 2420102 SFX1/2007/15 6,000,000,000 15YRS 5/1/22 870,000,000 870,000,000 870,000,000 870,000,000
E002000212 2420102 FXD2/2007/15 7,236,950,000 15YRS 6/1/22 976,988,250 976,988,250 976,988,250 976,988,250
E002000212 2420102 FXD3/2007/15 7,841,100,000 15YRS 11/1/22 980,137,500 980,137,500 980,137,500 980,137,500
E002000212 2420102 FXD3/2007/15 10,189,100,000 15YRS 5/1/24 1,273,637,500 1,273,637,500 1,273,637,500 1,273,637,500
E002000212 2420102 FXD1/2008/15 7,380,900,000 15YRS 3/1/23 922,612,500 922,612,500 922,612,500 922,612,500
E002000212 2420102 FXD1/2009/15 9,420,450,000 15YRS 10/1/24 1,177,556,250 1,177,556,250 1,177,556,250 1,177,556,250
E002000212 2420102 FXD1/2010/15 12,129,800,000 15YRS 3/1/25 1,232,387,680 1,232,387,680 1,232,387,680 1,232,387,680
E002000212 2420102 FXD1/2010/15 10,206,450,000 15YRS 3/1/25 1,046,161,125 1,046,161,125 1,046,161,125 1,046,161,125
E002000212 2420102 FXD2/2010/15 6,183,750,000 15YRS 12/1/25 556,537,500 556,537,500 556,537,500 556,537,500
E002000212 2420102 FDX2/2010/15 7,329,350,000 15YRS 12/1/25 659,641,500 659,641,500 659,641,500 659,641,500
E002000212 2420102 FXD1/2012/15 21,089,450,000 15YRS 9/1/27 2,319,839,500 2,319,839,500 2,319,839,500 2,319,839,500
E002000212 2420102 FXD1/2013/15 5,875,700,000 15YRS 2/1/28 661,016,250 661,016,250 661,016,250 661,016,250
E002000212 2420102 FXD1/2013/15 7,507,100,000 15YRS 2/1/28 844,548,750 844,548,750 844,548,750 844,548,750
E002000212 2420102 FXD1/2013/15 13,172,850,000 15YRS 2/1/28 1,481,945,625 1,481,945,625 1,481,945,625 1,481,945,625
E002000212 2420102 FXD1/2013/15 9,615,400,000 15YRS 2/1/28 - 1,153,848,000 1,153,848,000 1,153,848,000
E002000212 2420102 FXD1/2013/15 15,582,800,000 15YRS 2/1/28 1,505,565,000 1,505,565,000 1,505,565,000 1,505,565,000
E002000212 2420102 FXD2/2013/15 17,385,850,000 15YRS 4/1/28 2,086,302,000 2,086,302,000 2,086,302,000 2,086,302,000
E002000213 2420102 FXD1/2008/20 10,834,800,000 20YRS 6/1/28 1,489,785,000 1,489,785,000 1,489,785,000 1,489,785,000
E002000213 2420102 FXD1/2008/20 1,912,250,000 20YRS 6/1/28 262,934,375 262,934,375 262,934,375 262,934,375
E002000213 2420102 FXD1/2008/20 7,613,900,000 20YRS 6/1/28 1,046,911,250 1,046,911,250 1,046,911,250 1,046,911,250
E002000213 2420102 FXD1/2011/20 8,138,500,000 20YRS 5/1/31 691,120,000 691,120,000 691,120,000 691,120,000
(viii)
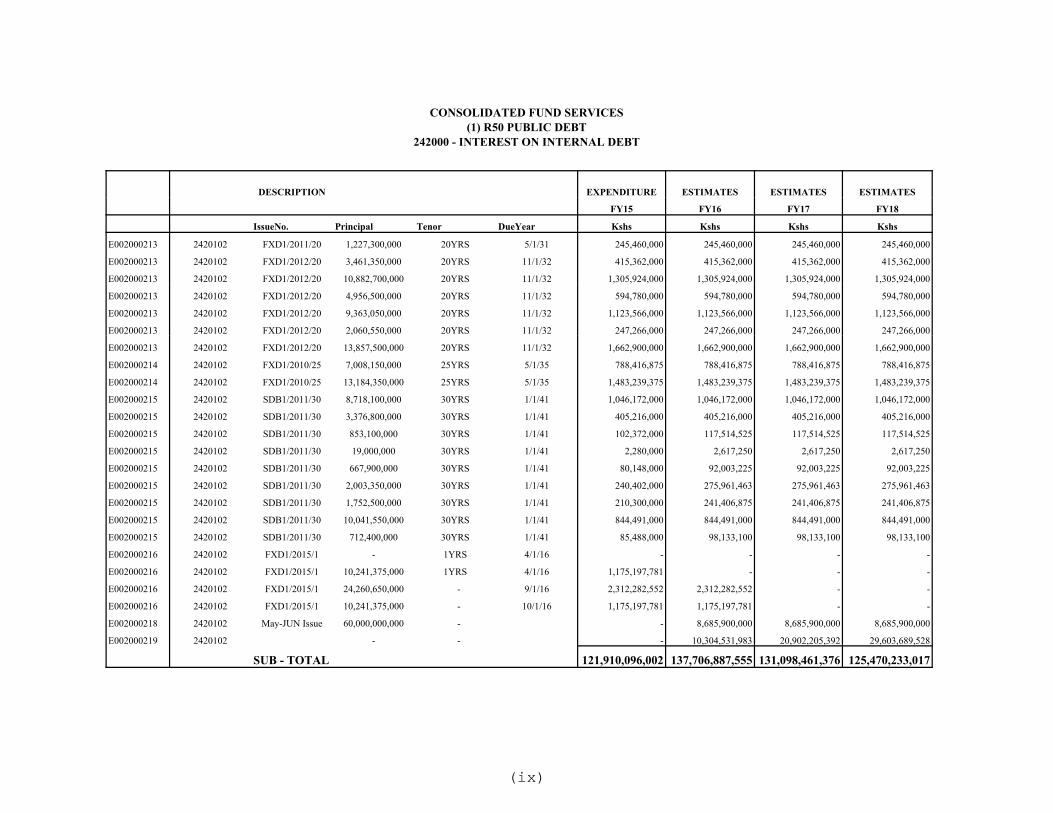
CONSOLIDATED FUND SERVICES(1) R50 PUBLIC DEBT
242000 - INTEREST ON INTERNAL DEBT
DESCRIPTION EXPENDITURE ESTIMATES ESTIMATES ESTIMATES
FY15 FY16 FY17 FY18
IssueNo. Principal Tenor DueYear Kshs Kshs Kshs Kshs
E002000213 2420102 FXD1/2011/20 1,227,300,000 20YRS 5/1/31 245,460,000 245,460,000 245,460,000 245,460,000
E002000213 2420102 FXD1/2012/20 3,461,350,000 20YRS 11/1/32 415,362,000 415,362,000 415,362,000 415,362,000
E002000213 2420102 FXD1/2012/20 10,882,700,000 20YRS 11/1/32 1,305,924,000 1,305,924,000 1,305,924,000 1,305,924,000
E002000213 2420102 FXD1/2012/20 4,956,500,000 20YRS 11/1/32 594,780,000 594,780,000 594,780,000 594,780,000
E002000213 2420102 FXD1/2012/20 9,363,050,000 20YRS 11/1/32 1,123,566,000 1,123,566,000 1,123,566,000 1,123,566,000
E002000213 2420102 FXD1/2012/20 2,060,550,000 20YRS 11/1/32 247,266,000 247,266,000 247,266,000 247,266,000
E002000213 2420102 FXD1/2012/20 13,857,500,000 20YRS 11/1/32 1,662,900,000 1,662,900,000 1,662,900,000 1,662,900,000
E002000214 2420102 FXD1/2010/25 7,008,150,000 25YRS 5/1/35 788,416,875 788,416,875 788,416,875 788,416,875
E002000214 2420102 FXD1/2010/25 13,184,350,000 25YRS 5/1/35 1,483,239,375 1,483,239,375 1,483,239,375 1,483,239,375
E002000215 2420102 SDB1/2011/30 8,718,100,000 30YRS 1/1/41 1,046,172,000 1,046,172,000 1,046,172,000 1,046,172,000
E002000215 2420102 SDB1/2011/30 3,376,800,000 30YRS 1/1/41 405,216,000 405,216,000 405,216,000 405,216,000
E002000215 2420102 SDB1/2011/30 853,100,000 30YRS 1/1/41 102,372,000 117,514,525 117,514,525 117,514,525
E002000215 2420102 SDB1/2011/30 19,000,000 30YRS 1/1/41 2,280,000 2,617,250 2,617,250 2,617,250
E002000215 2420102 SDB1/2011/30 667,900,000 30YRS 1/1/41 80,148,000 92,003,225 92,003,225 92,003,225
E002000215 2420102 SDB1/2011/30 2,003,350,000 30YRS 1/1/41 240,402,000 275,961,463 275,961,463 275,961,463
E002000215 2420102 SDB1/2011/30 1,752,500,000 30YRS 1/1/41 210,300,000 241,406,875 241,406,875 241,406,875
E002000215 2420102 SDB1/2011/30 10,041,550,000 30YRS 1/1/41 844,491,000 844,491,000 844,491,000 844,491,000
E002000215 2420102 SDB1/2011/30 712,400,000 30YRS 1/1/41 85,488,000 98,133,100 98,133,100 98,133,100
E002000216 2420102 FXD1/2015/1 - 1YRS 4/1/16 - - - -
E002000216 2420102 FXD1/2015/1 10,241,375,000 1YRS 4/1/16 1,175,197,781 - - -
E002000216 2420102 FXD1/2015/1 24,260,650,000 - 9/1/16 2,312,282,552 2,312,282,552 - -
E002000216 2420102 FXD1/2015/1 10,241,375,000 - 10/1/16 1,175,197,781 1,175,197,781 - -
E002000218 2420102 May-JUN Issue 60,000,000,000 - - 8,685,900,000 8,685,900,000 8,685,900,000
E002000219 2420102 - - - 10,304,531,983 20,902,205,392 29,603,689,528
SUB - TOTAL 121,910,096,002 137,706,887,555 131,098,461,376 125,470,233,017
(ix)

CONSOLIDATED FUND SERVICES(1) R50 - PUBLIC DEBT
2410100 - INTEREST ON EXTERNAL DEBT
ITEM CREDITOR 2015/2016 2016/2017 2017/2018 2018/2019Kshs Kshs Kshs Kshs
2410101 Foreign Governments 002000501 GERMANY 255,960,792 271,279,150 298,183,621 320,091,289
002000502 ITALY 608,725 298,466,085 500,612,420 768,795,025
002000503 JAPAN 607,981,997 686,625,832 655,483,326 690,466,542
002000506 U.S.A. 150,242,736 165,981,756 139,758,838 110,714,112
002000508 NETHERLANDS 51,992,149 43,531,687 30,184,277 15,537,494
002000511 FRANCE 1,306,896,557 1,324,873,091 1,384,203,555 1,471,997,727
002000514 AUSTRIA 9,260,555 6,299,470 3,463,938 913,341
002000515 SWITZERLAND 2,116,007 7,473,147 18,020,884 32,330,947
002000517 BELGIUM 73,541,832 60,244,241 46,061,341 34,958,699
002000518 FINLAND 22,262,545 9,684,453 7,263,978 1,616,158
002000519 CHINA 4,675,683,837 16,197,830,411 19,741,081,083 22,241,516,367
002000520 SPAIN 164,212,371 200,969,967 274,497,699 360,904,127
002000521 KUWAIT 29,742,536 32,326,825 59,431,809 96,058,877
002000522 EXIM BANK OF KOREA 27,699,083 30,222,939 31,615,380 31,948,676
002000523 CANADA 7,853,102 7,847,703 5,254,686 2,315,235
002000524 SWEDEN 1,110,037 745,702 431,224 89,006
002000525 UNITED KINGDOM 44,852,998 10,768,190 6,675,998 2,149,691
002000528 NEW LOANS/ 2,354,530,000 2,354,530,000 2,354,530,000 2,354,530,000
2410102 International Organizations 002000504 IDA 3,450,710,200 4,550,949,204 4,831,058,081 5,143,648,127
002000505 ADB/ADF 1,523,289,695 2,001,991,646 2,070,777,145 2,160,336,546
002000509 OPEC 85,155,160 92,009,322 114,931,387 154,419,017
002000510 BADEA 49,810,237 52,340,021 66,937,749 83,547,780
002000512 EIB 391,662,233 308,196,497 294,604,514 263,117,330
002000513 SAUDI FUND 36,099,098 33,645,615 28,270,552 20,347,059
002000516 EEC 29,486,086 28,258,401 24,543,467 21,732,183
002000526 IFAD 95,412,089 112,937,216 124,303,303 132,277,070
(x)
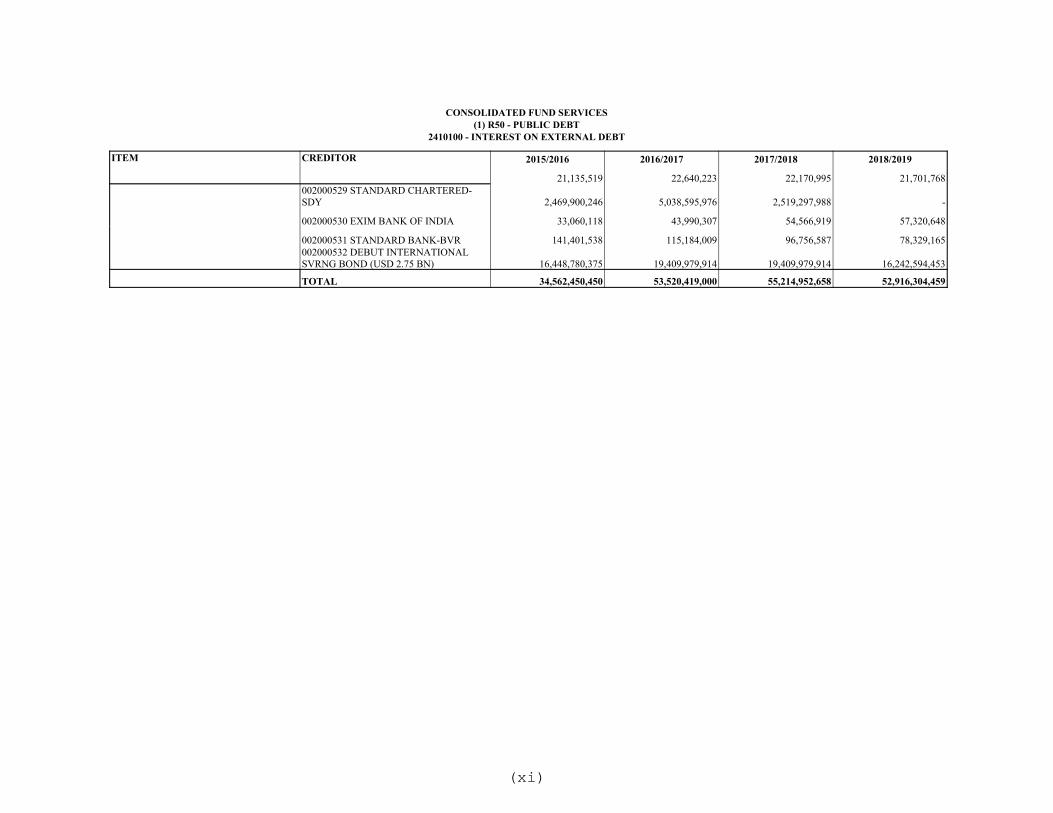
CONSOLIDATED FUND SERVICES(1) R50 - PUBLIC DEBT
2410100 - INTEREST ON EXTERNAL DEBT
ITEM CREDITOR 2015/2016 2016/2017 2017/2018 2018/2019
21,135,519 22,640,223 22,170,995 21,701,768002000529 STANDARD CHARTERED-SDY 2,469,900,246 5,038,595,976 2,519,297,988 -
002000530 EXIM BANK OF INDIA 33,060,118 43,990,307 54,566,919 57,320,648
002000531 STANDARD BANK-BVR 141,401,538 115,184,009 96,756,587 78,329,165002000532 DEBUT INTERNATIONAL SVRNG BOND (USD 2.75 BN) 16,448,780,375 19,409,979,914 19,409,979,914 16,242,594,453
TOTAL 34,562,450,450 53,520,419,000 55,214,952,658 52,916,304,459
(xi)

CONSOLIDATED FUND SERVICES(1) R50 PUBLIC DEBT
5210000 - INTERNAL DEBT REDEMPTION
SUB-HEAD DESCRIPTION DESCRIPTION DESCRIPTION EXPENDITURE ESTIMATES ESTIMATES ESTIMATES
2015/2016 2016/2017 2017/2018 2018/2019
IssueNo. DUE YR. TENOR Kshs Kshs Kshs Kshs
KENYA STOCKS:
E002000203 5510202 FXD3/2013/2 8/1/15 2YRS 17,927,400,000 - - -
5510202 FXD4/2013/2 12/1/15 2YRS 25,251,000,000 - - -
5510202 FXD1/2014/2 3/1/16 2YRS 19,976,400,000 - - -
5510202 FXD2/2014/2 5/1/16 2YRS 12,267,450,000 - - -
5510202 FXD2/2014/3 5/1/16 2YRS 7,862,700,000 - - -
5510202 FXD3/2014/2 12/1/16 2YRS - 20,472,450,000 - -
5510202 FXD3/2014/2 12/1/16 2YRS - 8,903,250,000 - -
5510202 FXD1/2015/2 2/1/17 2YRS - 23,592,150,000 - -
5510202 FXD2/2015/2 6/1/17 2YRS - 7,190,900,000 - -
5510202 FXD1/2016/2 1/1/18 2YRS - - 20,153,750,000 -
E002000204 5510202 FXD2/2010/5 11/1/15 5YRS 11,968,750,000 - - -
5510202 FXD2/2010/5 11/1/15 5YRS 1,280,950,000 - - -
5510202 FXD2/2010/5 11/1/15 5YRS 1,723,400,000 - - -
5510202 FXD1/2011/5 1/1/16 5YRS 10,810,200,000 - - -
5510202 FXD1/2011/5 1/1/16 5YRS 11,272,900,000 - - -
5510202 FXD1/2012/5 5/1/17 5YRS - 7,925,800,000 - -
5510202 FXD1/2012/5 5/1/17 5YRS - 4,905,550,000 - -
5510202 FXD1/2013/5 4/1/18 5YRS - - 20,240,750,000 -
5510202 FXD2/2013/5 6/1/18 5YRS - - 13,452,050,000 -
5510202 FXD2/2013/5 6/1/18 5YRS - - 12,888,000,000 -
5510202 FXD3/2013/5 11/1/18 5YRS - - - 14,937,800,000
5510202 FXD1/2014/5 4/1/19 5YRS - - - 17,511,200,000
5510202 FXD1/2014/5 4/1/19 5YRS - - - 8,222,500,000
5510202 FXD2/2014/5 6/1/19 5YRS - - - 14,285,600,000
5510202 FXD2/2014/5 6/1/19 5YRS - - - 2,132,650,000
E002000205 5510202 IFB2/2009/1 11/1/15 6YRS 9,193,700,000 - - -
5510202 FXD1/2012/6 5/1/17 5YRS - 18,248,200,000 - -
(xii)

CONSOLIDATED FUND SERVICES(1) R50 PUBLIC DEBT
5210000 - INTERNAL DEBT REDEMPTION
SUB-HEAD DESCRIPTION DESCRIPTION DESCRIPTION EXPENDITURE ESTIMATES ESTIMATES ESTIMATES
2015/2016 2016/2017 2017/2018 2018/2019
IssueNo. DUE YR. TENOR Kshs Kshs Kshs Kshs
E002000208 5510202 FXD2/2015/2 6/1/17 2YRS - 11,555,900,000 - -
5510202 IFB2/2010/9 8/1/17 7YRS - - 8,700,000,000 -
5510202 IFB2/2009/12 11/1/18 9YRS - - - 5,145,000,000
E002000209 5510202 FXD1/2006/10 3/1/16 10YRS 3,451,050,000 - - -
5510202 FXD2/2006/10 5/1/16 10YRS 5,028,100,000 - - -
5510202 SFX1/2007/10 5/1/17 10YRS - 5,000,000,000 - -
5510202 FXD1/2007/10 10/1/17 10YRS - - 9,308,800,000 -
5510202 FXD1/2008/10 2/1/18 10YRS - - 2,992,750,000 -
5510202 FXD2/2008/10 7/1/18 10YRS - - - 12,622,700,000
5510202 FXD2/2008/10 7/1/18 10YRS - - - 882,000,000
5510202 FXD3/2008/10 9/1/18 10YRS - - - 4,151,600,000
5510202 FXD1/2009/10 4/1/19 10YRS - - - 4,966,850,000
E002000210 5510202 FXD1/2006/11 9/1/17 11YRS - - 4,031,400,000 -
E002000211 5510202 IFB/1/2011/1 9/1/15 4YRS 19,121,178,735 - - -
5510202 IFB1/2010/8 2/1/16 8YRS 8,776,471,185 - - -
5510202 IFB2/2010/9 8/1/16 6YRS - 14,200,000,000 - -
5510202 IFB1/2009/12 2/1/17 12YRS - 4,497,700,000 - -
5510202 IFB1/2013/12 9/1/17 4YRS - - 4,776,524,397 -
5510202 IFB1/2013/12 9/1/17 4YRS - - 5,993,700,741 -
5510202 IFB1/2010/8 2/1/18 6YRS - - 7,131,578,815 -
5510202 FXD1/2006/12 8/1/18 12YRS - - - 3,900,950,000
5510202 IFB1/2014/12 10/1/18 12YRS - - - 404,102,174
5510202 IFB1/2014/12 10/1/18 12YRS - - - 2,735,614,987
5510202 IFB1/2014/12 10/1/18 12YRS - - - 1,797,701,805
5510202 IFB1/2014/12 10/1/18 12YRS - - - 4,060,892,084
5510202 FXD1/2007/12 5/1/19 12YRS - - - 4,864,600,000
E002000216 5510202 FXD1/2015/1 4/1/16 1YRS 10,241,375,000 - - -
5510202 FXD1/2015/1 9/1/16 1YRS - 24,260,650,000 - -
(xiii)
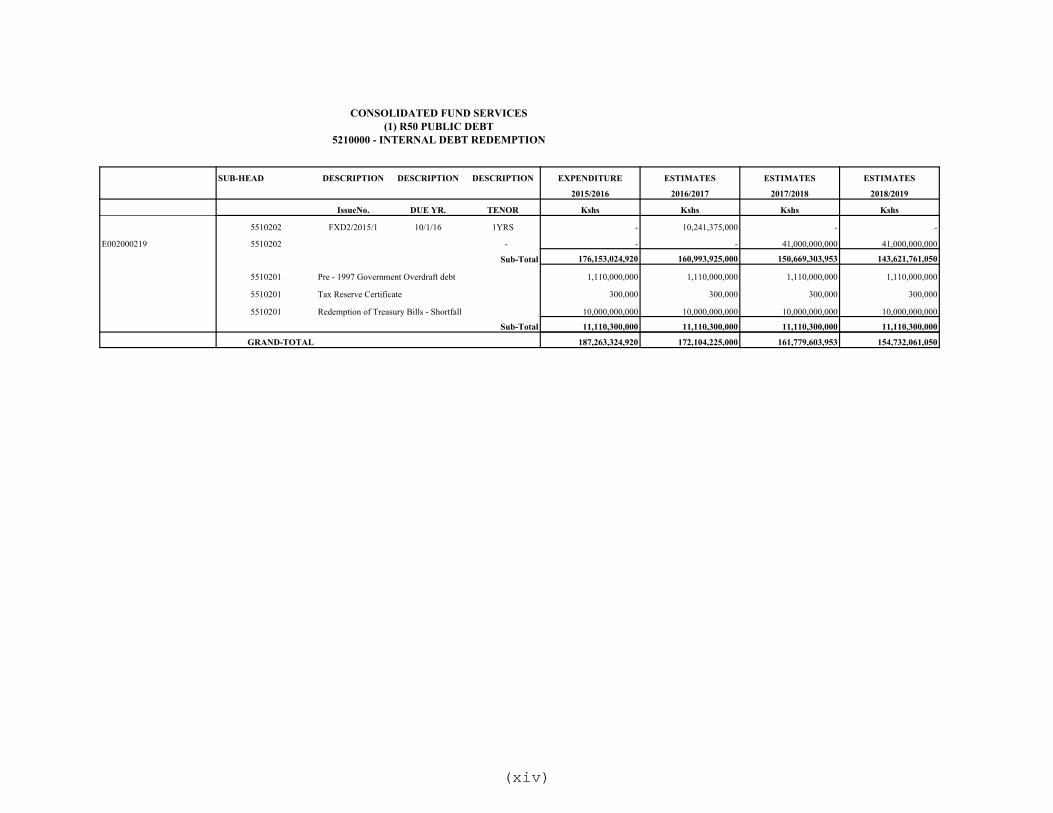
CONSOLIDATED FUND SERVICES(1) R50 PUBLIC DEBT
5210000 - INTERNAL DEBT REDEMPTION
SUB-HEAD DESCRIPTION DESCRIPTION DESCRIPTION EXPENDITURE ESTIMATES ESTIMATES ESTIMATES
2015/2016 2016/2017 2017/2018 2018/2019
IssueNo. DUE YR. TENOR Kshs Kshs Kshs Kshs
5510202 FXD2/2015/1 10/1/16 1YRS - 10,241,375,000 - -
E002000219 5510202 - - - 41,000,000,000 41,000,000,000
Sub-Total 176,153,024,920 160,993,925,000 150,669,303,953 143,621,761,050
5510201 Pre - 1997 Government Overdraft debt 1,110,000,000 1,110,000,000 1,110,000,000 1,110,000,000
5510201 Tax Reserve Certificate 300,000 300,000 300,000 300,000
5510201 Redemption of Treasury Bills - Shortfall 10,000,000,000 10,000,000,000 10,000,000,000 10,000,000,000
Sub-Total 11,110,300,000 11,110,300,000 11,110,300,000 11,110,300,000
GRAND-TOTAL 187,263,324,920 172,104,225,000 161,779,603,953 154,732,061,050
(xiv)

CONSOLIDATED FUND SERVICES(1) R50 - PUBLIC DEBT
5210600 - EXTERNAL DEBT REDEMPTION
ITEM CREDITOR EXPENDITURE ESTIMATES ESTIMATES ESTIMATES
2015/2016 2016/2017 2017/2018 2018/2019Kshs Kshs Kshs Kshs
5510601 002000501 GERMANY 1,723,146,451 929,217,523 939,362,958 1,946,969,701
002000502 ITALY 491,995,250 2,171,092,516 1,639,576,867 551,525,259
002000503 JAPAN 5,076,990,867 6,005,486,229 5,760,940,820 5,509,802,546
002000506 U.S.A. 481,672,416 646,121,054 712,606,377 624,365,627
002000507 DENMARK 147,168,922 258,872,867 258,872,867 258,872,867
002000508 NETHERLANDS 440,254,639 488,150,495 461,743,977 502,180,778
002000511 FRANCE 3,717,386,207 5,120,208,077 6,227,562,704 6,837,851,136
002000513 SAUDI FUND 518,414,446 637,933,318 665,240,385 718,862,228
002000514 AUSTRIA 125,948,268 150,722,140 164,248,486 87,212,726
002000515 SWITZERLAND 48,616,048 69,478,281 75,713,511 40,202,390
002000517 BELGIUM 1,782,480,405 1,778,384,031 1,869,393,668 1,929,858,815
002000518 FINLAND 244,924,475 270,442,926 272,388,585 261,307,601
002000519 CHINA 2,345,598,108 4,578,529,932 7,095,846,756 9,051,558,041
002000520 SPAIN 1,142,005,914 1,258,263,785 1,236,509,641 1,470,431,341
002000521 KUWAIT 224,980,140 277,778,194 272,050,808 248,783,305
002000522 EXIM BANK OF KOREA 51,834,000 114,567,459 114,567,459 143,276,857
002000523 CANADA 164,618,101 221,212,850 252,630,536 186,669,612
002000524 SWEDEN 52,972,187 61,528,303 67,050,073 35,602,274
002000525 UNITED KINGDOM 310,188,083 377,762,214 418,750,393 254,533,877
5510602 002000504 IDA 10,418,775,533 12,772,277,756 13,729,911,675 14,320,845,939
002000505 ADB/ADF 1,099,768,455 1,596,041,302 2,021,793,445 2,106,597,490
(xv)

CONSOLIDATED FUND SERVICES(1) R50 - PUBLIC DEBT
5210600 - EXTERNAL DEBT REDEMPTION
ITEM CREDITOR EXPENDITURE ESTIMATES ESTIMATES ESTIMATES
2015/2016 2016/2017 2017/2018 2018/2019
537,661,100 784,106,351 806,396,090 828,651,620
002000510 BADEA 139,973,601 192,322,500 220,117,858 223,645,731
002000512 EIB 1,949,392,042 1,185,869,752 1,196,393,525 1,206,917,298
002000516 EEC 363,191,657 401,585,619 280,454,964 283,363,213
002000526 IFAD 275,919,589 385,920,251 425,111,695 435,160,833
002000527 NORDIC DEVELOPMENT FUND 57,219,679 62,563,656 62,563,656 62,563,656
002000529 STANDARD CHARTERED-SDY - - 80,178,918,750 -
002000530 EXIM BANK OF INDIA - - 313,588,660 627,177,320
002000531 STANDARD BANK-BVR 755,570,238 826,135,987 826,135,987 826,135,987002000532 DEBUT INTERNATIONAL SVRNG BOND (USD 2.75 BN) - - - 80,178,918,750
TOTAL EXTERNAL DEBT REDEMPTION Kshs 34,688,666,820 43,622,575,368 128,566,443,176 131,759,844,818
(xvi)
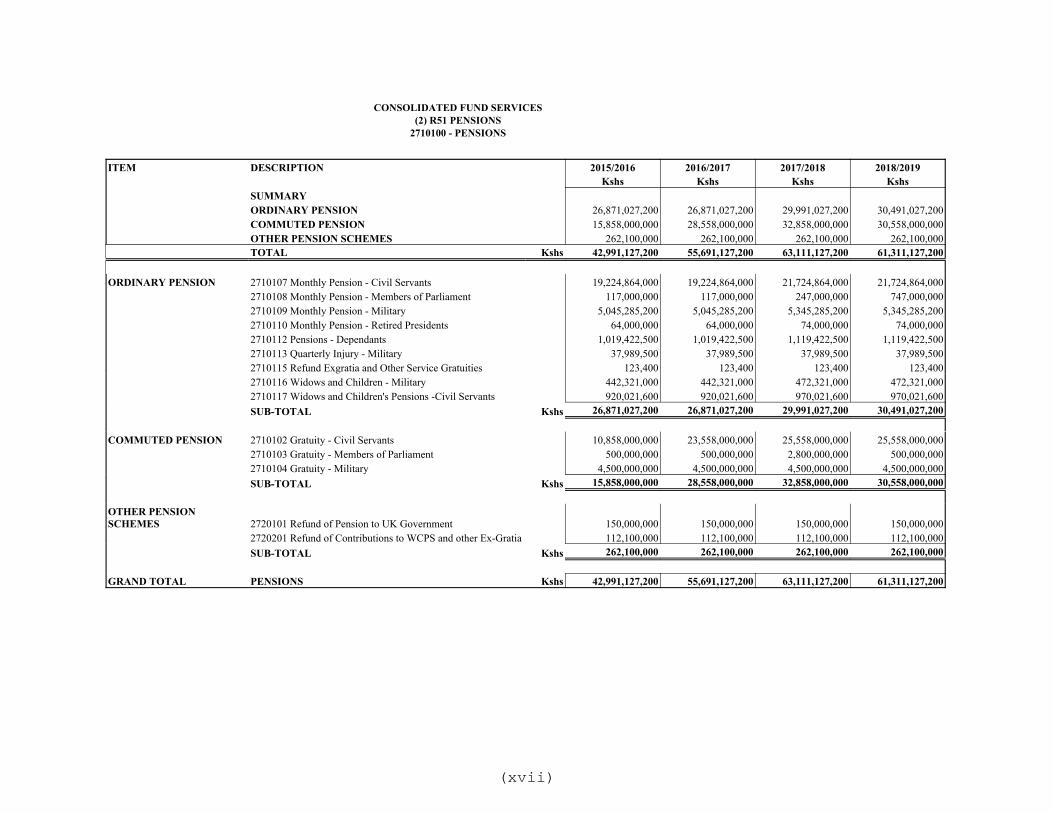
CONSOLIDATED FUND SERVICES(2) R51 PENSIONS
2710100 - PENSIONS
ITEM DESCRIPTION 2015/2016 2016/2017 2017/2018 2018/2019Kshs Kshs Kshs Kshs
SUMMARYORDINARY PENSION 26,871,027,200 26,871,027,200 29,991,027,200 30,491,027,200COMMUTED PENSION 15,858,000,000 28,558,000,000 32,858,000,000 30,558,000,000OTHER PENSION SCHEMES 262,100,000 262,100,000 262,100,000 262,100,000TOTAL Kshs 42,991,127,200 55,691,127,200 63,111,127,200 61,311,127,200
ORDINARY PENSION 2710107 Monthly Pension - Civil Servants 19,224,864,000 19,224,864,000 21,724,864,000 21,724,864,0002710108 Monthly Pension - Members of Parliament 117,000,000 117,000,000 247,000,000 747,000,0002710109 Monthly Pension - Military 5,045,285,200 5,045,285,200 5,345,285,200 5,345,285,2002710110 Monthly Pension - Retired Presidents 64,000,000 64,000,000 74,000,000 74,000,0002710112 Pensions - Dependants 1,019,422,500 1,019,422,500 1,119,422,500 1,119,422,5002710113 Quarterly Injury - Military 37,989,500 37,989,500 37,989,500 37,989,5002710115 Refund Exgratia and Other Service Gratuities 123,400 123,400 123,400 123,4002710116 Widows and Children - Military 442,321,000 442,321,000 472,321,000 472,321,0002710117 Widows and Children's Pensions -Civil Servants 920,021,600 920,021,600 970,021,600 970,021,600SUB-TOTAL Kshs 26,871,027,200 26,871,027,200 29,991,027,200 30,491,027,200
COMMUTED PENSION 2710102 Gratuity - Civil Servants 10,858,000,000 23,558,000,000 25,558,000,000 25,558,000,0002710103 Gratuity - Members of Parliament 500,000,000 500,000,000 2,800,000,000 500,000,0002710104 Gratuity - Military 4,500,000,000 4,500,000,000 4,500,000,000 4,500,000,000SUB-TOTAL Kshs 15,858,000,000 28,558,000,000 32,858,000,000 30,558,000,000
OTHER PENSION SCHEMES 2720101 Refund of Pension to UK Government 150,000,000 150,000,000 150,000,000 150,000,000
2720201 Refund of Contributions to WCPS and other Ex-Gratia 112,100,000 112,100,000 112,100,000 112,100,000SUB-TOTAL Kshs 262,100,000 262,100,000 262,100,000 262,100,000
GRAND TOTAL PENSIONS Kshs 42,991,127,200 55,691,127,200 63,111,127,200 61,311,127,200
(xvii)

CONSOLIDATED FUND SERVICES(3) R52 - SALARIES, ALLOWANCES AND OTHERS
SUMMARY
ITEM EXPENDITURE ESTIMATES ESTIMATES ESTIMATES
2015/2016 2016/2017 2017/2018 2018/2019
Kshs Kshs Kshs Kshs
2110000 SALARIES AND ALLOWANCES Kshs 4,437,766,235 3,955,968,495 4,148,978,495 4,326,602,758
5220200 MISCELLANEOUS SERVICES Kshs 128,000,000 128,000,000 128,000,000 128,000,000
5210600 GUARANTEED DEBT Kshs 944,691,483 1,017,185,821 993,547,504 969,909,187
TOTAL Kshs 5,510,457,718 5,101,154,316 5,270,525,999 5,424,511,945
(xviii)

CONSOLIDATED FUND SERVICES(3) R52 - SALARIES, ALLOWANCES AND MISCELLANEOUS
APPROVED ESTIMATES ESTIMATES ESTIMATES
2015/2016 2016/2017 2017/2018 2018/2019
Kshs Kshs Kshs Kshs
SUMMARYSALARIES AND ALLOWANCES 2110000 4,437,766,235 3,955,968,495 4,148,978,495 4,326,602,758
MISCELLANEOUS 2111200 128,000,000 128,000,000 128,000,000 128,000,000
GUARANTEED DEBT 5510600 944,691,483 1,017,185,821 993,547,504 969,909,187
TOTAL KShs 5,510,457,718 5,101,154,316 5,270,525,999 5,424,511,945
004000100 Office of the President 2110110 Basic Salaries - Constitutional Office Holders 36,630,000 36,630,000 40,293,000 44,322,300
2110300 Personal Allowance - Paid as Part of Salary 14,652,000 14,652,000 14,652,000 14,652,000
Sub-Total KShs 51,282,000 51,282,000 54,945,000 58,974,300
004000200 Office of the Attorney General 2110110 Basic Salaries - Constitutional Office Holders 18,416,640 19,337,472 20,304,345 21,319,562
2110300 Personal Allowance - Paid as Part of Salary 13,683,376 11,467,027 12,613,730 13,875,103
Sub-Total KShs 32,100,016 30,804,499 32,918,075 35,194,665
004000300 Judicial Department 2110110 Basic Salaries - Constitutional Office Holders 1,593,927,720 1,991,120,492 2,090,676,516 2,195,210,342
2110300 Personal Allowance - Paid as Part of Salary 1,102,618,480 609,525,465 670,478,011 704,855,813
Sub-Total KShs 2,696,546,200 2,600,645,957 2,761,154,527 2,900,066,155
004000400 Kenya National Audit Office 2110110 Basic Salaries - Constitutional Office Holders 12,219,432 12,830,404 13,471,924 14,145,520
2110300 Personal Allowance - Paid as Part of Salary 6,926,059 6,926,059 7,272,362 7,635,980
Sub-Total KShs 19,145,491 19,756,463 20,744,286 21,781,500
004000500 Public Service Commission of Kenya 2110110 Basic Salaries - Constitutional Office Holders 72,319,638 72,319,638 75,935,620 79,732,401
2110300 Personal Allowance - Paid as Part of Salary 48,213,092 50,623,747 50,623,747 50,623,747
Sub-Total KShs 120,532,730 122,943,385 126,559,367 130,356,148
004000600 Independent Electoral and Boundaries Commission 2110110 Basic Salaries - Constitutional Office Holders 82,007,136 82,007,136 83,237,243 84,485,802
2110300 Personal Allowance - Paid as Part of Salary 50,833,682 50,833,682 61,000,418 73,200,502
Sub-Total KShs 132,840,818 132,840,818 144,237,661 157,686,304
004000700 Kenya National Commission on Human Rights 2110110 Basic Salaries - Constitutional Office Holders 133,771,765 135,778,341 137,815,017 141,980,476
2110300 Personal Allowance - Paid as Part of Salary 89,181,177 89,181,177 89,181,177 89,181,177
Sub-Total KShs 222,952,942 224,959,518 226,996,194 231,161,653
004000800 Former President'sRetirement Benefits 2110110 Basic Salaries - Constitutional Office Holders 37,620,000 37,620,000 37,620,000 37,620,000
(xix)

CONSOLIDATED FUND SERVICES(3) R52 - SALARIES, ALLOWANCES AND MISCELLANEOUS
APPROVED ESTIMATES ESTIMATES ESTIMATES
2015/2016 2016/2017 2017/2018 2018/2019
Kshs Kshs Kshs Kshs
2110300 Personal Allowance - Paid as Part of Salary 21,200,000 21,200,000 21,200,000 21,200,000
Sub-Total KShs 58,820,000 58,820,000 58,820,000 58,820,000
004001000 Committee of Experts on Constitution Review 2110110 Basic Salaries - Constitutional Office Holders 78,175,656 - - -
2110300 Personal Allowance - Paid as Part of Salary 315,502,890 - - -
Sub-Total KShs 393,678,546 - - -
004001300 National Cohessionand Integration Commission 2110110 Basic Salaries - Constitutional Office Holders 63,111,158 63,111,158 64,057,825 65,018,693
2110300 Personal Allowance - Paid as Part of Salary 42,074,105 42,074,105 42,074,105 42,074,105
Sub-Total KShs 105,185,263 105,185,263 106,131,930 107,092,798
004001600 Teachers Service Commission 2110110 Basic Salaries - Constitutional Office Holders 73,176,039 73,176,039 76,834,841 80,676,583
2110300 Personal Allowance - Paid as Part of Salary 48,784,026 48,784,026 48,784,026 48,784,026
Sub-Total KShs 121,960,065 121,960,065 125,618,867 129,460,609
004001700 Commission On Revenue Allocation 2110110 Basic Salaries - Constitutional Office Holders 69,890,892 70,939,255 72,003,344 73,083,394
2110300 Personal Allowance - Paid as Part of Salary 56,604,933 56,604,933 56,604,933 56,604,933
Sub-Total KShs 126,495,825 127,544,188 128,608,277 129,688,327
004001800 Salaries & Remuneration Commission 2110110 Basic Salaries - Constitutional Office Holders 38,595,600 38,595,600 39,174,534 39,762,152
2110300 Personal Allowance - Paid as Part of Salary 37,090,900 37,090,900 37,090,900 37,090,900
Sub-Total KShs 75,686,500 75,686,500 76,265,434 76,853,052
004001900 National Land Commission 2110110 Basic Salaries - Constitutional Office Holders 79,816,043 79,816,043 81,113,284 82,228,483
2110300 Personal Allowance - Paid as Part of Salary 53,210,695 53,210,695 53,210,695 53,210,695
Sub-Total KShs 133,026,738 133,026,738 134,323,979 135,439,178
004002000 Controller of Budget 2110110 Basic Salaries - Constitutional Office Holders 10,570,810 10,570,810 10,579,372 11,802,309
2110300 Personal Allowance - Paid as Part of Salary 7,047,206 7,047,206 7,047,206 7,047,206
Sub-Total KShs 17,618,016 17,618,016 17,626,578 18,849,515
004002100 National Police Service Commission 2110110 Basic Salaries - Constitutional Office Holders 72,549,003 75,549,003 76,682,238 77,832,472
2110300 Personal Allowance - Paid as Part of Salary 57,346,082 57,346,082 57,346,082 57,346,082
Sub-Total KShs 129,895,085 132,895,085 134,028,320 135,178,554TOTAL SALARIES AND ALLOWANCES 4,437,766,235 3,955,968,495 4,148,978,495 4,326,602,758MISCELLANEOUS SERVICES & GUARANTEED DEBT
005000101 National Social Security Fund
2120199 Employer Contributions to Compulsory National Social Security Schemes 125,000,000 125,000,000 125,000,000 125,000,000
(xx)
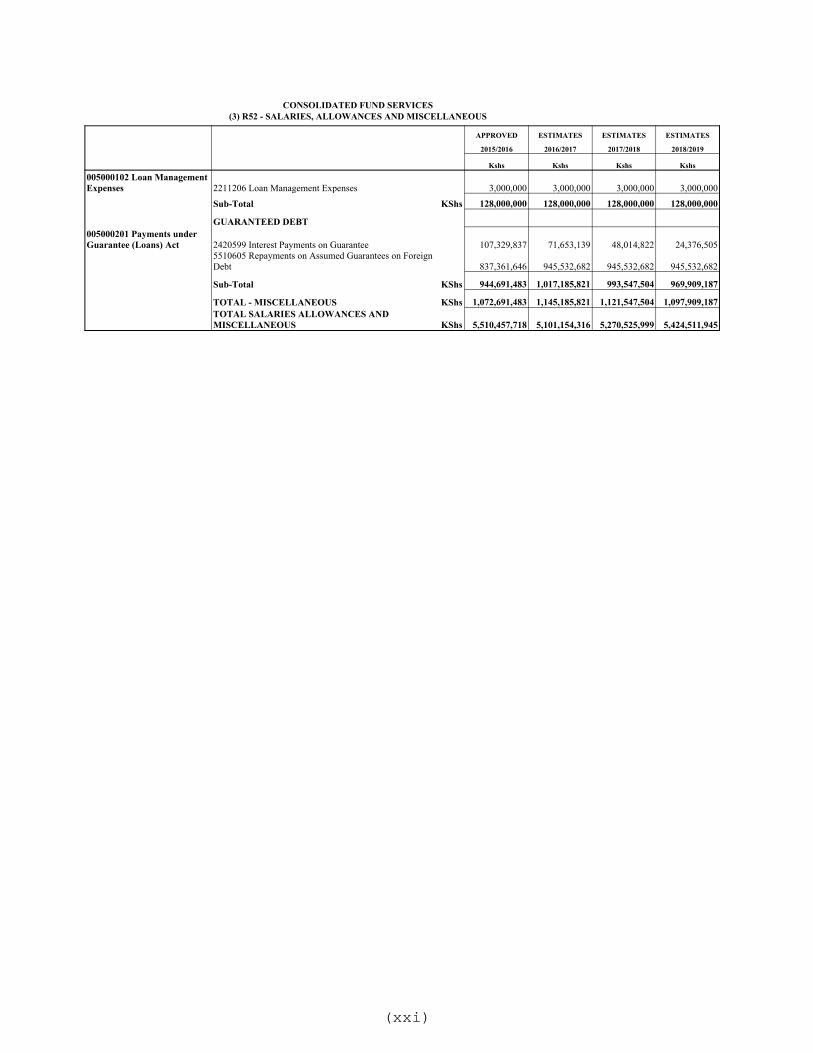
CONSOLIDATED FUND SERVICES(3) R52 - SALARIES, ALLOWANCES AND MISCELLANEOUS
APPROVED ESTIMATES ESTIMATES ESTIMATES
2015/2016 2016/2017 2017/2018 2018/2019
Kshs Kshs Kshs Kshs005000102 Loan ManagementExpenses 2211206 Loan Management Expenses 3,000,000 3,000,000 3,000,000 3,000,000
Sub-Total KShs 128,000,000 128,000,000 128,000,000 128,000,000
GUARANTEED DEBT005000201 Payments under Guarantee (Loans) Act 2420599 Interest Payments on Guarantee 107,329,837 71,653,139 48,014,822 24,376,505
5510605 Repayments on Assumed Guarantees on Foreign Debt 837,361,646 945,532,682 945,532,682 945,532,682
Sub-Total KShs 944,691,483 1,017,185,821 993,547,504 969,909,187
TOTAL - MISCELLANEOUS KShs 1,072,691,483 1,145,185,821 1,121,547,504 1,097,909,187TOTAL SALARIES ALLOWANCES AND MISCELLANEOUS KShs 5,510,457,718 5,101,154,316 5,270,525,999 5,424,511,945
(xxi)

CONSOLIDATED FUND SERVICES(3) R 53 SUBSCRIPTIONS TO INTERNATIONAL ORGANIZATIONS
ITEM DESCRIPTION EXPENDITURE ESTIMATES ESTIMATES ESTIMATES
2015/2016 2016/2017 2017/2018 2018/2019
Kshs Kshs Kshs Kshs
2620101 006000200 International Bank of Reconstruction and Development/IDA 2/3 1,843,458 100,000 100,000 100,0002620107 006000400 International Monetary Fund 2 100,000 100,000 100,000 100,0002620108 006000500 Multilateral Investment Guarantee Agency (M.I.G.A.) 100,000 100,000 100,000 100,0002620109 006000300 African Development Bank 4 100,000 100,000 100,000 100,0002620110 006000100 International Finance Corporation 1 100,000 100,000 100,000 100,000
TOTAL KShs 2,243,458 500,000 500,000 500,000
1 Expenditure charged on Consolidated Fund Services in accordance with section 4 of the IFC Act Cap 466
2 Expenditure charged on Consolidated Fund Services in accordance with section 4 of the Brettons Woods Agreement Act Cap 464
3 Expenditure charged on Consolidated Fund Services in accordance with section 4 of the IDA Act Cap 465
4 Expenditure charged on Consolidated Fund Services in accordance with section 3 of the ADB Act cap 492
(xxii)